UNITED STATES
SECURITIES AND EXCHANGE COMMISSION
Washington, D.C. 20549
Form N-CSR
CERTIFIED SHAREHOLDER REPORT OF REGISTERED
MANAGEMENT INVESTMENT COMPANIES
Investment Company Act File Number: 811-03416
THE CALVERT FUND
(Exact Name of Registrant as Specified in Charter)
2050 M Street NW, Washington, DC 20036
(Address of Principal Executive Offices)
Deidre E. Walsh
Two International Place, Boston, Massachusetts 02110
(Name and Address of Agent for Services)
(202) 238-2200
(Registrant’s Telephone Number)
September 30
Date of Fiscal Year End
September 30, 2023
Date of Reporting Period
Item 1. Reports to Stockholders
Calvert
High Yield Bond Fund
Annual Report
September 30, 2023
Commodity Futures Trading Commission Registration. The Commodity Futures Trading Commission (“CFTC”) has adopted regulations that subject registered investment companies and advisers to regulation by the CFTC if a fund invests more than a prescribed level of its assets in certain CFTC-regulated instruments (including futures, certain options and swap agreements) or markets itself as providing investment exposure to such instruments. The adviser has claimed an exclusion from the definition of “commodity pool operator” under the Commodity Exchange Act with respect to its management of the Fund and the other funds it manages. Accordingly, neither the Fund nor the adviser is subject to CFTC regulation.
Fund shares are not insured by the FDIC and are not deposits or other obligations of, or guaranteed by, any depository institution. Shares are subject to investment risks, including possible loss of principal invested.
This report must be preceded or accompanied by a current summary prospectus or prospectus. Before investing, investors should consider carefully the investment objective, risks, and charges and expenses of a mutual fund. This and other important information is contained in the summary prospectus and prospectus, which can be obtained from a financial intermediary. Prospective investors should read the prospectus carefully before investing. For further information, please call 1-800-368-2745.
Choose Planet-friendly E-delivery!
Sign up now for on-line statements, prospectuses, and fund reports. In less than five minutes you can help reduce paper mail and lower fund costs.
Just go to www.calvert.com. If you already have an online account with the Calvert funds, click on Login to access your Account and select the documents you would like to receive via e-mail.
If you’re new to online account access, click on Login, then Register to create your user name and password. Once you’re in, click on the E-delivery sign-up on the Account Portfolio page and follow the quick, easy steps.
Note: If your shares are not held directly with the Calvert funds but through a brokerage firm, you must contact your broker for electronic delivery options available through their firm.
Annual Report September 30, 2023
Calvert
High Yield Bond Fund
Calvert
High Yield Bond Fund
September 30, 2023
Management's Discussion of Fund Performance†
Economic and Market Conditions
U.S. and global high yield bond markets got off to a strong start during the 12-month period ended September 30, 2023. At the outset, investors hoped inflation would subside and the U.S. Federal Reserve (the Fed) would ease off federal funds rate hikes to pursue a soft economic landing. However, bond markets weakened toward the end of the fourth quarter of 2022 as the Fed indicated its long-term interest rate target was higher than investors expected. For the remainder of the period, the high yield market rose and fell as prospects for a soft landing alternately brightened and dimmed.
In the first quarter of 2023, returns remained healthy, but were dampened by concerns over the failures of Silicon Valley Bank and Signature Bank, as well as the general health of regional U.S. banks. Returns softened further in the second quarter over concerns that the U.S. Congress might not pass legislation to meet the country’s looming debt ceiling, and fears of a resurgence in inflation fueled by persistently strong consumer spending and jobs growth data.
In the third quarter of 2023, the high yield market cooled as global interest rates moved sharply higher in response to hawkish monetary policy rhetoric by the Fed and the European Central Bank.
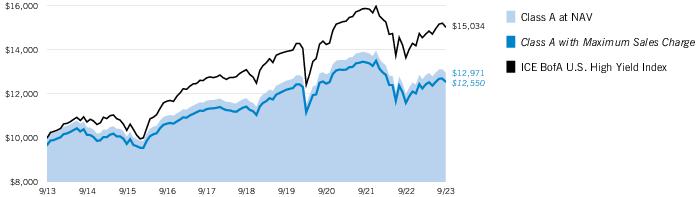
For the period as a whole, the ICE BofA U.S. High Yield Index returned 10.19%, while the Bloomberg U.S. Aggregate Bond Index returned 0.64%.
High yield issuance totaled $153.1 billion during the period, with refinancing accounting for approximately 60% of new issuances, and acquisition financing accounting for about 20%. According to preliminary Lipper estimates, U.S. high yield retail funds experienced a net outflow of $9.2 billion during the period.
The trailing 12-month par-weighted default rate increased to 1.32%, up from 0.83% at the end of the prior one-year period.
Fund Performance
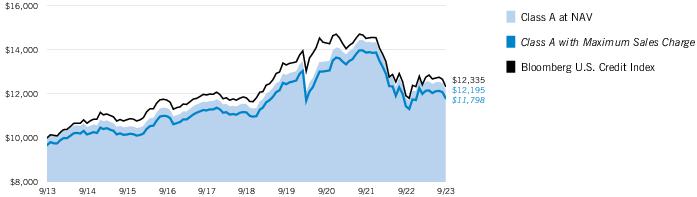
For the 12-month period ended September 30, 2023, Calvert High Yield Bond Fund (the Fund) returned 8.24% for Class A shares at net asset value (NAV), underperforming its benchmark, the ICE BofA U.S. High Yield Index (the Index), which returned 10.19%.
Sector allocations in the Fund, particularly underweight exposures to the leisure and energy sectors, detracted from returns relative to the Index during the period. Security selections also detracted from relative performance, particularly in the banking & thrifts, utilities, and diversified financial services sectors.
In contrast, credit selections in the telecommunications, broadcasting, healthcare, and retail sectors contributed to returns relative to the Index during the period.
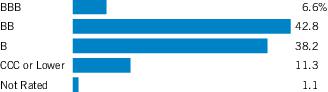
Allocation by credit quality detracted from performance relative to the Index during the period. An out-of-Index allocation to nonrated bonds was particularly challenging; however, this was mostly offset by positive credit quality selections. An overweight exposure to BBB-rated bonds was also a headwind. Security selections by credit quality presented an additional impediment to relative returns, with the most challenging selections among BB-rated securities.
Selections among BBB, CC, and nonrated securities, and an underweight exposure to BB-rated bonds, however, contributed to relative performance during the period.
Security selections and allocations by duration produced mixed results. Selections in bonds with durations between 2-5 years, 5-10 years, and under 2 years hindered returns, and a modest allocation to cash also weighed on relative performance during the period.
In contrast, an underweight allocation and credit selections among bonds with durations of more than 10 years benefitted relative performance, along with a slight overweight exposure to short duration securities during the period.
See Endnotes and Additional Disclosures in this report.
Past performance is no guarantee of future results. Returns are historical and are calculated by determining the percentage change in net asset value (NAV) or offering price (as applicable) with all distributions reinvested. Furthermore, returns do not reflect the deduction of taxes that shareholders may have to pay on Fund distributions or upon the redemption of Fund shares. Investment return and principal value will fluctuate so that shares, when redeemed, may be worth more or less than their original cost. Performance for periods less than or equal to one year is cumulative. Performance is for the stated time period only; due to market volatility, current Fund performance may be lower or higher than the quoted return. For performance as of the most recent month-end, please refer to www.calvert.com.
Calvert
High Yield Bond Fund
September 30, 2023
Performance
Portfolio Manager(s) Stephen C. Concannon and Raphael A. Leeman, each of Calvert Research and Management
| % Average Annual Total Returns1,2 | Class
Inception Date | Performance
Inception Date | One Year | Five Years | Ten Years |
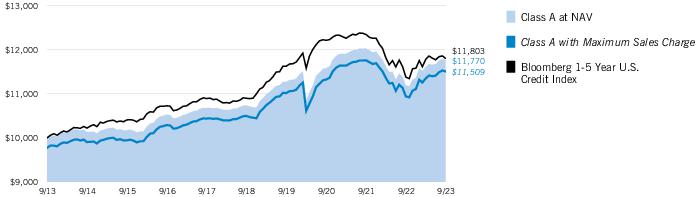
| Class A at NAV | 07/09/2001 | 07/09/2001 | 8.24% | 1.90% | 2.63% |
| Class A with 3.25% Maximum Sales Charge | — | — | 4.74 | 1.23 | 2.30 |
| Class C at NAV | 10/31/2011 | 07/09/2001 | 7.48 | 1.15 | 1.96 |
| Class C with 1% Maximum Deferred Sales Charge | — | — | 6.48 | 1.15 | 1.96 |
| Class I at NAV | 07/09/2001 | 07/09/2001 | 8.55 | 2.16 | 2.93 |
| Class R6 at NAV | 02/01/2019 | 07/09/2001 | 8.64 | 2.24 | 2.98 |
|
| ICE BofA U.S. High Yield Index | — | — | 10.19% | 2.80% | 4.16% |
| % Total Annual Operating Expense Ratios3 | Class A | Class C | Class I | Class R6 |
| | 1.02% | 1.77% | 0.77% | 0.69% |
Growth of $10,000
This graph shows the change in value of a hypothetical investment of $10,000 in Class A of the Fund for the period indicated. For comparison, the same investment is shown in the indicated index.
| Growth of Investment | Amount Invested | Period Beginning | At NAV | With Maximum Sales Charge |
| Class C | $10,000 | 09/30/2013 | $12,143 | N.A. |
| Class I, at minimum investment | $1,000,000 | 09/30/2013 | $1,335,592 | N.A. |
| Class R6, at minimum investment | $5,000,000 | 09/30/2013 | $6,705,101 | N.A. |
See Endnotes and Additional Disclosures in this report.
Past performance is no guarantee of future results. Returns are historical and are calculated by determining the percentage change in net asset value (NAV) or offering price (as applicable) with all distributions reinvested. Furthermore, returns do not reflect the deduction of taxes that shareholders may have to pay on Fund distributions or upon the redemption of Fund shares. Investment return and principal value will fluctuate so that shares, when redeemed, may be worth more or less than their original cost. Performance for periods less than or equal to one year is cumulative. Performance is for the stated time period only; due to market volatility, current Fund performance may be lower or higher than the quoted return. For performance as of the most recent month-end, please refer to www.calvert.com.
Calvert
High Yield Bond Fund
September 30, 2023
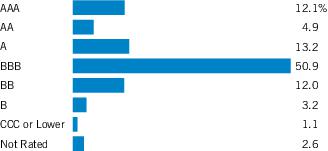
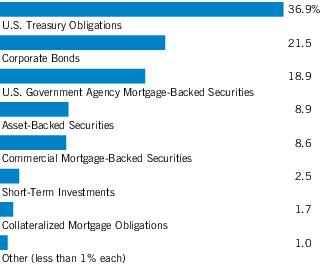
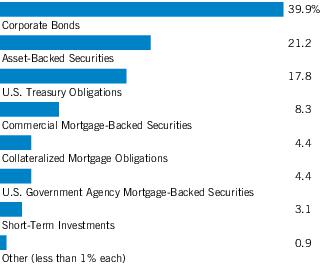
| Asset Allocation (% of total investments) |
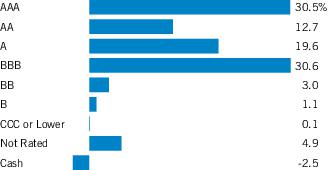
| Credit Quality (% of bond and loan holdings)1 |
Footnotes:
| 1 | For purposes of the Fund’s rating restrictions, credit quality ratings are based on Moody’s Investor Service, Inc. (“Moody’s”), S&P Global Ratings (“S&P”) and Fitch Ratings (“Fitch”). The breakdown assigns a numeric equivalent to the ratings from the aforementioned agencies and the average is converted back to an equivalent S&P major rating category, rounded to the nearest integer. When the ratings agencies rate a security differently, the median is used if three ratings are available and if there are only two ratings available, the lower is used. Ratings, which are subject to change, apply to the creditworthiness of the issuers of the underlying securities and not to the Fund or its shares. Credit ratings measure the quality of a bond based on the issuer’s creditworthiness, with ratings ranging from AAA, being the highest, to D, being the lowest based on S&P’s measures. Ratings of BBB or higher by S&P or Fitch (Baa or higher by Moody’s) are considered to be investment-grade quality. Credit ratings are based largely on the ratings agency’s analysis at the time of rating. The rating assigned to any particular security is not necessarily a reflection of the issuer’s current financial condition and does not necessarily reflect its assessment of the volatility of a security’s market value or of the liquidity of an investment in the security. Holdings designated as “Not Rated” (if any) are not rated by the national ratings agencies stated above. |
Calvert
High Yield Bond Fund
September 30, 2023
Endnotes and Additional Disclosures
| † | The views expressed in this report are those of the portfolio manager(s) and are current only through the date stated at the top of this page. These views are subject to change at any time based upon market or other conditions, and Calvert and the Fund(s) disclaim any responsibility to update such views. These views may not be relied upon as investment advice and, because investment decisions are based on many factors, may not be relied upon as an indication of trading intent on behalf of any Calvert fund. This commentary may contain statements that are not historical facts, referred to as “forward-looking statements.” The Fund’s actual future results may differ significantly from those stated in any forward-looking statement, depending on factors such as changes in securities or financial markets or general economic conditions, the volume of sales and purchases of Fund shares, the continuation of investment advisory, administrative and service contracts, and other risks discussed from time to time in the Fund’s filings with the Securities and Exchange Commission. |
| | |
| 1 | ICE BofA U.S. High Yield Index is an unmanaged index of below-investment grade U.S. corporate bonds. ICE® BofA® indices are not for redistribution or other uses; provided “as is”, without warranties, and with no liability. Eaton Vance has prepared this report and ICE Data Indices, LLC does not endorse it, or guarantee, review, or endorse Eaton Vance’s products. BofA® is a licensed registered trademark of Bank of America Corporation in the United States and other countries. Unless otherwise stated, index returns do not reflect the effect of any applicable sales charges, commissions, expenses, taxes or leverage, as applicable. It is not possible to invest directly in an index. |
| 2 | Total Returns at NAV do not include applicable sales charges. If sales charges were deducted, the returns would be lower. Total Returns shown with maximum sales charge reflect the stated maximum sales charge. Unless otherwise stated, performance does not reflect the deduction of taxes on Fund distributions or redemptions of Fund shares.Performance prior to the inception date of a class may be linked to the performance of an older class of the Fund. This linked performance is adjusted for any applicable sales charge, but is not adjusted for class expense differences. If adjusted for such differences, the performance would be different. The performance of Class R6 is linked to Class I. Performance presented in the Financial Highlights included in the financial statements is not linked.Effective November 5, 2020, Class C shares automatically convert to Class A shares eight years after purchase. The average annual total returns listed for Class C reflect conversion to Class A shares after eight years. Prior to November 5, 2020, Class C shares automatically converted to Class A shares ten years after purchase. |
| | Calvert Research and Management became the investment adviser to the Fund on December 31, 2016. Performance reflected prior to such date is that of the Fund’s former investment adviser. |
| 3 | Source: Fund prospectus. Net expense ratios reflect a contractual expense reimbursement that continues through 2/1/25. The expense ratios for the current reporting period can be found in the Financial Highlights section of this report. Performance reflects expenses waived and/or reimbursed, if applicable. Without such waivers and/or reimbursements, performance would have been lower. |
| Fund profile subject to change due to active management. |
| | Additional Information |
| | Duration is a measure of the expected change in price of a bond — in percentage terms — given a one percent change in interest rates, all else being constant. Securities with lower durations tend to be less sensitive to interest rate changes. |
| | Bloomberg U.S. Aggregate Bond Index is an unmanaged index of domestic investment-grade bonds, including corporate, government and mortgage-backed securities. |
| | Important Notice to Shareholders |
| | Effective December 1, 2023, the portfolio managers of the Fund are Stephen C. Concannon, Kelley Gerrity and Jack Cimarosa. |
Calvert
High Yield Bond Fund
September 30, 2023
Example
As a Fund shareholder, you incur two types of costs: (1) transaction costs, including sales charges (loads) on purchases; and (2) ongoing costs, including management fees; distribution and/or service fees; and other Fund expenses. This Example is intended to help you understand your ongoing costs (in dollars) of Fund investing and to compare these costs with the ongoing costs of investing in other mutual funds. The Example is based on an investment of $1,000 invested at the beginning of the period and held for the entire period (April 1, 2023 to September 30, 2023).
Actual Expenses
The first section of the table below provides information about actual account values and actual expenses. You may use the information in this section, together with the amount you invested, to estimate the expenses that you paid over the period. Simply divide your account value by $1,000 (for example, an $8,600 account value divided by $1,000 = 8.6), then multiply the result by the number in the first section under the heading entitled “Expenses Paid During Period” to estimate the expenses you paid on your account during this period.
Hypothetical Example for Comparison Purposes
The second section of the table below provides information about hypothetical account values and hypothetical expenses based on the actual Fund expense ratio and an assumed rate of return of 5% per year (before expenses), which is not the actual Fund return. The hypothetical account values and expenses may not be used to estimate the actual ending account balance or expenses you paid for the period. You may use this information to compare the ongoing costs of investing in the Fund and other funds. To do so, compare this 5% hypothetical example with the 5% hypothetical examples that appear in the shareholder reports of the other funds.
Please note that the expenses shown in the table are meant to highlight your ongoing costs only and do not reflect any transactional costs, such as sales charges (loads). Therefore, the second section of the table is useful in comparing ongoing costs only, and will not help you determine the relative total costs of owning different funds. In addition, if these transactional costs were included, your costs would be higher.
| | Beginning
Account Value
(4/1/23) | Ending
Account Value
(9/30/23) | Expenses Paid
During Period*
(4/1/23 – 9/30/23) | Annualized
Expense
Ratio |
| Actual | | | | |
| Class A | $1,000.00 | $1,009.50 | $5.14 ** | 1.02% |
| Class C | $1,000.00 | $1,005.50 | $8.90 ** | 1.77% |
| Class I | $1,000.00 | $1,010.90 | $3.88 ** | 0.77% |
| Class R6 | $1,000.00 | $1,010.90 | $3.43 ** | 0.68% |
| Hypothetical | | | | |
| (5% return per year before expenses) | | | | |
| Class A | $1,000.00 | $1,019.95 | $5.17 ** | 1.02% |
| Class C | $1,000.00 | $1,016.19 | $8.95 ** | 1.77% |
| Class I | $1,000.00 | $1,021.21 | $3.90 ** | 0.77% |
| Class R6 | $1,000.00 | $1,021.66 | $3.45 ** | 0.68% |
| * | Expenses are equal to the Fund’s annualized expense ratio for the indicated Class, multiplied by the average account value over the period, multiplied by 183/365 (to reflect the one-half year period). The Example assumes that the $1,000 was invested at the net asset value per share determined at the close of business on March 31, 2023. Expenses do not include fees and expenses incurred indirectly from investment in underlying affiliated funds. |
| ** | Absent a waiver and/or reimbursement of expenses by affiliate(s), expenses would be higher. |
Calvert
High Yield Bond Fund
September 30, 2023
| Security | Shares | Value |
| Diversified Media — 0.1% |
| National CineMedia, Inc.(1) | | 125,048 | $ 561,466 |
| | | | $ 561,466 |
| Environmental — 0.4% |
| GFL Environmental, Inc.(2) | | 47,500 | $ 1,508,600 |
| | | | $ 1,508,600 |
Total Common Stocks
(identified cost $1,518,017) | | | $ 2,070,066 |
| Security | Principal
Amount
(000's omitted) | Value |
| Containers — 0.4% |
| CryoPort, Inc., 0.75%, 12/1/26(3) | $ | 1,877 | $ 1,492,215 |
| | | | $ 1,492,215 |
| Utilities — 0.2% |
| NextEra Energy Partners, L.P., 2.50%, 6/15/26(3) | $ | 1,196 | $ 1,020,188 |
| | | | $ 1,020,188 |
Total Convertible Bonds
(identified cost $2,593,706) | | | $ 2,512,403 |
| Security | Principal
Amount*
(000's omitted) | Value |
| Aerospace — 0.6% |
| Moog, Inc., 4.25%, 12/15/27(3) | | 1,329 | $ 1,201,449 |
| Science Applications International Corp., 4.875%, 4/1/28(3) | | 1,571 | 1,427,678 |
| | | | $ 2,629,127 |
| Air Transportation — 1.3% |
| American Airlines, Inc., 7.25%, 2/15/28(2)(3) | | 383 | $ 366,568 |
| American Airlines, Inc./AAdvantage Loyalty IP, Ltd.: | | | |
| 5.50%, 4/20/26(3) | | 1,972 | 1,928,386 |
| 5.75%, 4/20/29(3) | | 652 | 606,931 |
| VistaJet Malta Finance PLC/Vista Management Holding, Inc.: | | | |
| 6.375%, 2/1/30(3) | | 2,303 | 1,782,579 |
| 9.50%, 6/1/28(3) | | 771 | 677,941 |
| | | | $ 5,362,405 |
| Automotive & Auto Parts — 4.9% |
| Clarios Global, L.P., 6.75%, 5/15/25(3) | | 182 | $ 180,815 |
| Security | Principal
Amount*
(000's omitted) | Value |
| Automotive & Auto Parts (continued) |
| Clarios Global, L.P./Clarios U.S. Finance Co.: | | | |
| 4.375%, 5/15/26(4) | EUR | 1,272 | $ 1,295,712 |
| 6.25%, 5/15/26(3) | | 420 | 411,431 |
| 8.50%, 5/15/27(2)(3) | | 3,491 | 3,487,531 |
| Ford Motor Co.: | | | |
| 3.25%, 2/12/32 | | 2,124 | 1,638,971 |
| 4.75%, 1/15/43 | | 2,109 | 1,541,629 |
| 7.45%, 7/16/31(2) | | 356 | 369,712 |
| 9.625%, 4/22/30 | | 1,157 | 1,323,014 |
| Ford Motor Credit Co., LLC: | | | |
| 2.90%, 2/16/28 | | 241 | 205,494 |
| 3.37%, 11/17/23 | | 200 | 199,017 |
| 3.625%, 6/17/31 | | 824 | 666,696 |
| 3.815%, 11/2/27 | | 242 | 215,745 |
| 4.00%, 11/13/30 | | 1,519 | 1,270,090 |
| 4.125%, 8/17/27 | | 3,341 | 3,045,742 |
| 4.271%, 1/9/27 | | 236 | 218,218 |
| 5.125%, 6/16/25 | | 3,018 | 2,924,209 |
| Real Hero Merger Sub 2, Inc., 6.25%, 2/1/29(2)(3) | | 1,568 | 1,212,857 |
| Wheel Pros, Inc., 6.50%, 5/15/29(3) | | 1,592 | 535,310 |
| | | | $ 20,742,193 |
| Banks & Thrifts — 0.7% |
| JPMorgan Chase & Co., Series HH, 4.60% to 2/1/25(5)(6) | | 3,066 | $ 2,875,876 |
| | | | $ 2,875,876 |
| Broadcasting — 1.6% |
| Audacy Capital Corp., 6.75%, 3/31/29(3) | | 2,210 | $ 44,598 |
| Beasley Mezzanine Holdings, LLC, 8.625%, 2/1/26(3) | | 1,606 | 1,032,533 |
| Playtika Holding Corp., 4.25%, 3/15/29(3) | | 1,848 | 1,544,965 |
| Sirius XM Radio, Inc.: | | | |
| 3.125%, 9/1/26(3) | | 488 | 435,438 |
| 4.125%, 7/1/30(3) | | 2,417 | 1,937,878 |
| 5.00%, 8/1/27(3) | | 354 | 323,699 |
| Univision Communications, Inc., 4.50%, 5/1/29(3) | | 1,668 | 1,359,935 |
| | | | $ 6,679,046 |
| Building Materials — 2.1% |
| Masonite International Corp., 5.375%, 2/1/28(3) | | 1,000 | $ 931,310 |
| MIWD Holdco II, LLC/MIWD Finance Corp., 5.50%, 2/1/30(3) | | 994 | 822,281 |
| SRM Escrow Issuer, LLC, 6.00%, 11/1/28(3) | | 3,042 | 2,811,876 |
| Standard Industries, Inc.: | | | |
| 2.25%, 11/21/26(4) | EUR | 1,157 | 1,083,406 |
| 3.375%, 1/15/31(3) | | 556 | 430,475 |
| 4.375%, 7/15/30(3) | | 988 | 819,293 |
| 4.75%, 1/15/28(3) | | 2,000 | 1,806,498 |
| 5.00%, 2/15/27(3) | | 495 | 459,326 |
| | | | $ 9,164,465 |
7
See Notes to Financial Statements.
Calvert
High Yield Bond Fund
September 30, 2023
Schedule of Investments — continued
| Security | Principal
Amount*
(000's omitted) | Value |
| Cable/Satellite TV — 2.6% |
| CCO Holdings, LLC/CCO Holdings Capital Corp.: | | | |
| 4.25%, 2/1/31(3) | | 914 | $ 728,470 |
| 4.50%, 8/15/30(3) | | 1,846 | 1,517,630 |
| 4.50%, 5/1/32 | | 273 | 214,543 |
| 4.75%, 3/1/30(3) | | 3,913 | 3,289,645 |
| 4.75%, 2/1/32(3) | | 821 | 657,715 |
| 5.00%, 2/1/28(3) | | 1,000 | 909,233 |
| 5.375%, 6/1/29(3) | | 1,500 | 1,347,357 |
| 6.375%, 9/1/29(3) | | 1,734 | 1,618,638 |
| UPC Holding B.V., 5.50%, 1/15/28(3) | | 766 | 680,668 |
| | | | $ 10,963,899 |
| Capital Goods — 1.4% |
| Calderys Financing, LLC, 11.25%, 6/1/28(3) | | 1,134 | $ 1,162,981 |
| Chart Industries, Inc., 9.50%, 1/1/31(3) | | 1,389 | 1,477,481 |
| Dornoch Debt Merger Sub, Inc., 6.625%, 10/15/29(2)(3) | | 998 | 826,256 |
| Emerald Debt Merger Sub, LLC, 6.625%, 12/15/30(3) | | 306 | 294,961 |
| Madison IAQ, LLC, 5.875%, 6/30/29(3) | | 2,585 | 2,084,756 |
| | | | $ 5,846,435 |
| Chemicals — 3.2% |
| ASP Unifrax Holdings, Inc., 5.25%, 9/30/28(3) | | 1,411 | $ 1,007,045 |
| Avient Corp., 7.125%, 8/1/30(3) | | 1,957 | 1,924,931 |
| Compass Minerals International, Inc., 6.75%, 12/1/27(3) | | 3,004 | 2,849,925 |
| Herens Holdco S.a.r.l., 4.75%, 5/15/28(3) | | 1,787 | 1,389,816 |
| Nufarm Australia, Ltd./Nufarm Americas, Inc., 5.00%, 1/27/30(3) | | 1,535 | 1,356,334 |
| Olympus Water U.S. Holding Corp., 9.75%, 11/15/28(3) | | 1,742 | 1,740,412 |
| SNF Group SACA: | | | |
| 2.625%, 2/1/29(4) | EUR | 1,289 | 1,203,996 |
| 2.625%, 2/1/29(3) | EUR | 100 | 93,405 |
| WR Grace Holdings, LLC: | | | |
| 4.875%, 6/15/27(3) | | 1,723 | 1,582,899 |
| 7.375%, 3/1/31(2)(3) | | 493 | 478,438 |
| | | | $ 13,627,201 |
| Consumer Products — 1.4% |
| Acushnet Co., 7.375%, 10/15/28(3)(7) | | 322 | $ 324,818 |
| CD&R Smokey Buyer, Inc., 6.75%, 7/15/25(2)(3) | | 626 | 603,993 |
| Edgewell Personal Care Co.: | | | |
| 4.125%, 4/1/29(3) | | 1,333 | 1,135,109 |
| 5.50%, 6/1/28(3) | | 954 | 882,398 |
| Energizer Gamma Acquisition BV, 3.50%, 6/30/29(4) | EUR | 1,250 | 1,061,736 |
| Tempur Sealy International, Inc., 3.875%, 10/15/31(3) | | 2,537 | 1,960,294 |
| | | | $ 5,968,348 |
| Security | Principal
Amount*
(000's omitted) | Value |
| Containers — 1.9% |
| Ardagh Metal Packaging Finance USA, LLC/Ardagh Metal Packaging Finance PLC: | | | |
| 3.00%, 9/1/29(4) | EUR | 350 | $ 281,960 |
| 4.00%, 9/1/29(2)(3) | | 698 | 547,180 |
| Ball Corp., 6.875%, 3/15/28 | | 382 | 384,715 |
| Canpack SA/Canpack US, LLC, 3.875%, 11/15/29(3) | | 1,786 | 1,461,558 |
| Crown Americas, LLC/Crown Americas Capital Corp. V, 4.25%, 9/30/26 | | 1,165 | 1,096,236 |
| Crown Americas, LLC/Crown Americas Capital Corp. VI, 4.75%, 2/1/26 | | 554 | 532,666 |
| Owens-Brockway Glass Container, Inc., 7.25%, 5/15/31(2)(3) | | 1,636 | 1,601,235 |
| Trivium Packaging Finance B.V.: | | | |
| 5.50%, 8/15/26(3) | | 1,852 | 1,728,903 |
| 8.50%, 8/15/27(3) | | 660 | 603,936 |
| | | | $ 8,238,389 |
| Diversified Financial Services — 3.0% |
| AG TTMT Escrow Issuer, LLC, 8.625%, 9/30/27(3) | | 1,495 | $ 1,505,487 |
| Ally Financial, Inc., 4.70% to 5/15/26(5)(6) | | 1,926 | 1,327,717 |
| Compass Group Diversified Holdings, LLC, 5.25%, 4/15/29(3) | | 1,768 | 1,547,519 |
| GTCR W-2 Merger Sub, LLC, 7.50%, 1/15/31(3)(7) | | 1,072 | 1,074,868 |
| Macquarie Airfinance Holdings, Ltd., 8.125%, 3/30/29(3) | | 650 | 651,284 |
| MSCI, Inc.: | | | |
| 3.625%, 9/1/30(3) | | 1,178 | 988,744 |
| 3.875%, 2/15/31(3) | | 1,435 | 1,217,641 |
| Oxford Finance, LLC/Oxford Finance Co-Issuer II, Inc., 6.375%, 2/1/27(3) | | 1,454 | 1,352,882 |
| PROG Holdings, Inc., 6.00%, 11/15/29(3) | | 1,250 | 1,092,125 |
| Rocket Mortgage, LLC/Rocket Mortgage Co-Issuer, Inc.: | | | |
| 2.875%, 10/15/26(3) | | 953 | 840,160 |
| 3.625%, 3/1/29(3) | | 1,415 | 1,171,323 |
| 4.00%, 10/15/33(3) | | 195 | 147,527 |
| | | | $ 12,917,277 |
| Diversified Media — 2.3% |
| Arches Buyer, Inc.: | | | |
| 4.25%, 6/1/28(3) | | 553 | $ 472,150 |
| 6.125%, 12/1/28(3) | | 1,976 | 1,606,360 |
| Cars.com, Inc., 6.375%, 11/1/28(3) | | 1,968 | 1,790,162 |
| Clear Channel Outdoor Holdings, Inc.: | | | |
| 5.125%, 8/15/27(3) | | 1,509 | 1,341,452 |
| 7.75%, 4/15/28(2)(3) | | 1,700 | 1,359,867 |
| CMG Media Corp., 8.875%, 12/15/27(3) | | 1,218 | 955,198 |
| Esc Cb National Cineme, 5.75%, 8/15/26(8) | | 679 | 0 |
| Stagwell Global, LLC, 5.625%, 8/15/29(3) | | 1,304 | 1,054,571 |
| TripAdvisor, Inc., 7.00%, 7/15/25(2)(3) | | 1,103 | 1,102,084 |
| | | | $ 9,681,844 |
8
See Notes to Financial Statements.
Calvert
High Yield Bond Fund
September 30, 2023
Schedule of Investments — continued
| Security | Principal
Amount*
(000's omitted) | Value |
| Energy — 1.8% |
| Crestwood Midstream Partners, L.P./Crestwood Midstream Finance Corp.: | | | |
| 5.625%, 5/1/27(3) | | 2,038 | $ 1,955,108 |
| 6.00%, 2/1/29(2)(3) | | 1,000 | 966,290 |
| Neptune Energy Bondco PLC, 6.625%, 5/15/25(3) | | 3,000 | 2,974,500 |
| Occidental Petroleum Corp., 8.50%, 7/15/27 | | 1,500 | 1,607,558 |
| | | | $ 7,503,456 |
| Entertainment/Film — 0.6% |
| Cinemark USA, Inc.: | | | |
| 5.25%, 7/15/28(3) | | 1,517 | $ 1,348,355 |
| 5.875%, 3/15/26(2)(3) | | 744 | 715,163 |
| 8.75%, 5/1/25(3) | | 670 | 674,821 |
| | | | $ 2,738,339 |
| Environmental — 2.0% |
| Clean Harbors, Inc.: | | | |
| 4.875%, 7/15/27(3) | | 500 | $ 471,721 |
| 5.125%, 7/15/29(3) | | 1,000 | 921,131 |
| Covanta Holding Corp.: | | | |
| 4.875%, 12/1/29(3) | | 1,948 | 1,601,090 |
| 5.00%, 9/1/30 | | 500 | 400,088 |
| GFL Environmental, Inc.: | | | |
| 3.50%, 9/1/28(3) | | 1,631 | 1,405,605 |
| 3.75%, 8/1/25(3) | | 387 | 367,231 |
| 4.00%, 8/1/28(3) | | 1,500 | 1,312,135 |
| 4.25%, 6/1/25(3) | | 1,000 | 962,025 |
| 4.75%, 6/15/29(3) | | 1,389 | 1,236,458 |
| | | | $ 8,677,484 |
| Food & Drug Retail — 1.8% |
| Albertsons Cos., LLC/Safeway, Inc./New Albertsons, L.P./Albertsons, LLC: | | | |
| 4.875%, 2/15/30(3) | | 2,549 | $ 2,300,088 |
| 5.875%, 2/15/28(3) | | 1,295 | 1,247,815 |
| Arko Corp., 5.125%, 11/15/29(3) | | 2,387 | 1,928,004 |
| Ingles Markets, Inc., 4.00%, 6/15/31(3) | | 2,595 | 2,133,946 |
| | | | $ 7,609,853 |
| Food, Beverage & Tobacco — 4.4% |
| BellRing Brands, Inc., 7.00%, 3/15/30(2)(3) | | 3,032 | $ 2,989,505 |
| Chobani, LLC/Chobani Finance Corp., Inc., 7.50%, 4/15/25(2)(3) | | 2,089 | 2,071,327 |
| Darling Ingredients, Inc.: | | | |
| 5.25%, 4/15/27(3) | | 500 | 476,897 |
| 6.00%, 6/15/30(3) | | 1,093 | 1,036,008 |
| Herbalife Nutrition, Ltd./HLF Financing, Inc., 7.875%, 9/1/25(3) | | 1,000 | 954,150 |
| Kraft Heinz Foods Co.: | | | |
| 4.25%, 3/1/31 | | 2,852 | 2,599,844 |
| Security | Principal
Amount*
(000's omitted) | Value |
| Food, Beverage & Tobacco (continued) |
| Kraft Heinz Foods Co.: (continued) | | | |
| 4.625%, 1/30/29 | | 1,000 | $ 958,799 |
| Performance Food Group, Inc.: | | | |
| 4.25%, 8/1/29(3) | | 2,496 | 2,159,210 |
| 5.50%, 10/15/27(3) | | 1,727 | 1,637,793 |
| 6.875%, 5/1/25(2)(3) | | 231 | 230,907 |
| Pilgrim's Pride Corp., 3.50%, 3/1/32 | | 2,000 | 1,548,895 |
| US Foods, Inc., 4.75%, 2/15/29(3) | | 2,490 | 2,228,420 |
| | | | $ 18,891,755 |
| Healthcare — 11.3% |
| Avantor Funding, Inc.: | | | |
| 3.875%, 7/15/28(2)(4) | EUR | 600 | $ 584,871 |
| 4.625%, 7/15/28(3) | | 1,001 | 913,677 |
| Catalent Pharma Solutions, Inc.: | | | |
| 2.375%, 3/1/28(4) | EUR | 893 | 793,064 |
| 3.50%, 4/1/30(2)(3) | | 1,078 | 888,957 |
| Centene Corp.: | | | |
| 3.375%, 2/15/30 | | 1,616 | 1,349,695 |
| 4.25%, 12/15/27 | | 1,339 | 1,235,582 |
| 4.625%, 12/15/29 | | 2,093 | 1,887,457 |
| Encompass Health Corp., 4.75%, 2/1/30 | | 1,247 | 1,104,987 |
| Fortrea Holdings, Inc., 7.50%, 7/1/30(3) | | 1,541 | 1,501,343 |
| Grifols S.A.: | | | |
| 1.625%, 2/15/25(4) | EUR | 500 | 511,038 |
| 2.25%, 11/15/27(4) | EUR | 965 | 899,883 |
| 4.75%, 10/15/28(2)(3) | | 1,446 | 1,234,602 |
| HealthEquity, Inc., 4.50%, 10/1/29(3) | | 2,383 | 2,055,636 |
| Heartland Dental, LLC/Heartland Dental Finance Corp., 10.50%, 4/30/28(3) | | 2,447 | 2,465,352 |
| Horizon Therapeutics USA, Inc., 5.50%, 8/1/27(3) | | 929 | 954,548 |
| IQVIA, Inc.: | | | |
| 2.25%, 3/15/29(4) | EUR | 769 | 682,542 |
| 5.00%, 5/15/27(3) | | 594 | 560,515 |
| Jazz Securities DAC, 4.375%, 1/15/29(3) | | 1,376 | 1,200,806 |
| LifePoint Health, Inc.: | | | |
| 4.375%, 2/15/27(3) | | 1,260 | 1,085,137 |
| 5.375%, 1/15/29(3) | | 2,679 | 1,873,978 |
| 9.875%, 8/15/30(3) | | 655 | 634,944 |
| Minerva Merger Sub, Inc., 6.50%, 2/15/30(3) | | 2,263 | 1,895,584 |
| ModivCare Escrow Issuer, Inc., 5.00%, 10/1/29(2)(3) | | 1,048 | 753,701 |
| ModivCare, Inc., 5.875%, 11/15/25(3) | | 1,290 | 1,227,474 |
| Molina Healthcare, Inc.: | | | |
| 3.875%, 11/15/30(3) | | 2,357 | 1,953,418 |
| 3.875%, 5/15/32(3) | | 1,089 | 874,734 |
| 4.375%, 6/15/28(3) | | 2,231 | 2,001,593 |
| Mozart Debt Merger Sub, Inc.: | | | |
| 3.875%, 4/1/29(3) | | 2,000 | 1,692,625 |
| 5.25%, 10/1/29(2)(3) | | 3,062 | 2,650,180 |
| Option Care Health, Inc., 4.375%, 10/31/29(3) | | 2,023 | 1,749,743 |
9
See Notes to Financial Statements.
Calvert
High Yield Bond Fund
September 30, 2023
Schedule of Investments — continued
| Security | Principal
Amount*
(000's omitted) | Value |
| Healthcare (continued) |
| Perrigo Finance Unlimited Co.: | | | |
| 4.375%, 3/15/26 | | 750 | $ 702,053 |
| 4.65%, 6/15/30(2) | | 2,023 | 1,727,178 |
| 4.90%, 12/15/44 | | 513 | 380,777 |
| PRA Health Sciences, Inc., 2.875%, 7/15/26(3) | | 434 | 392,025 |
| RegionalCare Hospital Partners Holdings, Inc./LifePoint Health, Inc., 9.75%, 12/1/26(3) | | 1,334 | 1,293,359 |
| Team Health Holdings, Inc., 6.375%, 2/1/25(3) | | 1,285 | 992,531 |
| US Acute Care Solutions, LLC, 6.375%, 3/1/26(3) | | 2,658 | 2,290,066 |
| Varex Imaging Corp., 7.875%, 10/15/27(3) | | 1,056 | 1,059,648 |
| | | | $ 48,055,303 |
| Homebuilders/Real Estate — 4.7% |
| Ashton Woods USA, LLC/Ashton Woods Finance Co.: | | | |
| 4.625%, 8/1/29(3) | | 312 | $ 263,632 |
| 4.625%, 4/1/30(3) | | 1,060 | 868,871 |
| Brundage-Bone Concrete Pumping Holdings, Inc., 6.00%, 2/1/26(3) | | 1,124 | 1,070,469 |
| CTR Partnership, L.P./CareTrust Capital Corp., 3.875%, 6/30/28(3) | | 2,496 | 2,136,998 |
| Cushman & Wakefield U.S. Borrower LLC, 8.875%, 9/1/31(3) | | 691 | 669,161 |
| Dycom Industries, Inc., 4.50%, 4/15/29(3) | | 1,630 | 1,411,622 |
| Greystar Real Estate Partners, LLC, 7.75%, 9/1/30(3) | | 1,970 | 1,948,195 |
| HAT Holdings I, LLC/HAT Holdings II, LLC: | | | |
| 3.375%, 6/15/26(3) | | 1,294 | 1,151,541 |
| 3.75%, 9/15/30(3) | | 1,740 | 1,333,718 |
| KB Home: | | | |
| 4.00%, 6/15/31 | | 75 | 60,540 |
| 4.80%, 11/15/29 | | 491 | 432,610 |
| Outfront Media Capital, LLC/Outfront Media Capital Corp.: | | | |
| 4.625%, 3/15/30(2)(3) | | 1,713 | 1,348,628 |
| 6.25%, 6/15/25(3) | | 1,341 | 1,317,044 |
| Starwood Property Trust, Inc., 3.75%, 12/31/24(3) | | 1,250 | 1,191,378 |
| Taylor Morrison Communities, Inc.: | | | |
| 5.125%, 8/1/30(2)(3) | | 1,309 | 1,145,224 |
| 5.75%, 1/15/28(3) | | 306 | 285,392 |
| 5.875%, 6/15/27(3) | | 974 | 927,026 |
| TopBuild Corp.: | | | |
| 3.625%, 3/15/29(3) | | 1,000 | 852,580 |
| 4.125%, 2/15/32(3) | | 1,851 | 1,504,949 |
| | | | $ 19,919,578 |
| Insurance — 1.8% |
| Alliant Holdings Intermediate, LLC/Alliant Holdings Co-Issuer, 6.75%, 10/15/27(3) | | 1,014 | $ 944,091 |
| AmWINS Group, Inc., 4.875%, 6/30/29(3) | | 1,173 | 1,029,347 |
| BroadStreet Partners, Inc., 5.875%, 4/15/29(3) | | 2,510 | 2,217,380 |
| GTCR AP Finance, Inc., 8.00%, 5/15/27(3) | | 1,043 | 1,026,206 |
| Jones Deslauriers Insurance Management, Inc., 10.50%, 12/15/30(3) | | 1,264 | 1,288,344 |
| Security | Principal
Amount*
(000's omitted) | Value |
| Insurance (continued) |
| USI, Inc., 6.875%, 5/1/25(3) | | 1,000 | $ 993,372 |
| | | | $ 7,498,740 |
| Leisure — 0.8% |
| Boyne USA, Inc., 4.75%, 5/15/29(3) | | 1,580 | $ 1,383,820 |
| Life Time, Inc.: | | | |
| 5.75%, 1/15/26(3) | | 960 | 931,055 |
| 8.00%, 4/15/26(2)(3) | | 1,172 | 1,152,738 |
| | | | $ 3,467,613 |
| Metals/Mining — 1.7% |
| Constellium SE: | | | |
| 3.125%, 7/15/29(4) | EUR | 1,150 | $ 1,034,757 |
| 5.625%, 6/15/28(3) | | 1,000 | 942,146 |
| 5.875%, 2/15/26(3) | | 522 | 510,955 |
| Hudbay Minerals, Inc.: | | | |
| 4.50%, 4/1/26(3) | | 1,721 | 1,612,519 |
| 6.125%, 4/1/29(3) | | 995 | 921,757 |
| Novelis Corp.: | | | |
| 3.25%, 11/15/26(3) | | 500 | 447,168 |
| 3.875%, 8/15/31(3) | | 1,500 | 1,199,872 |
| 4.75%, 1/30/30(3) | | 927 | 803,514 |
| | | | $ 7,472,688 |
| Paper — 0.7% |
| Enviva Partners, L.P./Enviva Partners Finance Corp., 6.50%, 1/15/26(3) | | 3,767 | $ 3,076,019 |
| | | | $ 3,076,019 |
| Publishing/Printing — 1.1% |
| LABL, Inc.: | | | |
| 5.875%, 11/1/28(3) | | 906 | $ 815,032 |
| 6.75%, 7/15/26(3) | | 300 | 291,097 |
| 8.25%, 11/1/29(2)(3) | | 793 | 648,773 |
| 10.50%, 7/15/27(2)(3) | | 300 | 282,401 |
| McGraw-Hill Education, Inc.: | | | |
| 5.75%, 8/1/28(3) | | 1,345 | 1,162,161 |
| 8.00%, 8/1/29(3) | | 1,906 | 1,655,437 |
| | | | $ 4,854,901 |
| Railroad — 0.3% |
| Watco Cos., LLC/Watco Finance Corp., 6.50%, 6/15/27(3) | | 1,450 | $ 1,378,682 |
| | | | $ 1,378,682 |
| Restaurants �� 1.6% |
| Dave & Buster's, Inc., 7.625%, 11/1/25(3) | | 3,154 | $ 3,155,788 |
| IRB Holding Corp., 7.00%, 6/15/25(3) | | 2,429 | 2,432,352 |
| Yum! Brands, Inc., 3.625%, 3/15/31 | | 1,519 | 1,252,020 |
| | | | $ 6,840,160 |
10
See Notes to Financial Statements.
Calvert
High Yield Bond Fund
September 30, 2023
Schedule of Investments — continued
| Security | Principal
Amount*
(000's omitted) | Value |
| Services — 7.4% |
| Adtalem Global Education, Inc., 5.50%, 3/1/28(3) | | 2,087 | $ 1,913,893 |
| APi Escrow Corp., 4.75%, 10/15/29(3) | | 1,582 | 1,391,083 |
| BCPE Empire Holdings, Inc., 7.625%, 5/1/27(3) | | 3,132 | 2,978,438 |
| Clarivate Science Holdings Corp., 4.875%, 7/1/29(2)(3) | | 1,713 | 1,462,161 |
| Gartner, Inc.: | | | |
| 3.625%, 6/15/29(3) | | 788 | 674,912 |
| 3.75%, 10/1/30(3) | | 333 | 279,778 |
| 4.50%, 7/1/28(3) | | 1,143 | 1,044,130 |
| GEMS MENASA Cayman, Ltd./GEMS Education Delaware, LLC, 7.125%, 7/31/26(3) | | 2,720 | 2,648,913 |
| Imola Merger Corp., 4.75%, 5/15/29(3) | | 3,140 | 2,754,992 |
| Korn Ferry, 4.625%, 12/15/27(3) | | 2,039 | 1,878,082 |
| NESCO Holdings II, Inc., 5.50%, 4/15/29(3) | | 1,614 | 1,418,232 |
| Ritchie Bros Holdings, Inc.: | | | |
| 6.75%, 3/15/28(3) | | 1,000 | 998,950 |
| 7.75%, 3/15/31(2)(3) | | 820 | 833,325 |
| SRS Distribution, Inc.: | | | |
| 6.00%, 12/1/29(2)(3) | | 490 | 412,146 |
| 6.125%, 7/1/29(3) | | 1,438 | 1,226,081 |
| Summer BC Bidco B, LLC, 5.50%, 10/31/26(3) | | 1,617 | 1,451,877 |
| VT Topco, Inc., 8.50%, 8/15/30(3) | | 1,499 | 1,486,341 |
| WASH Multifamily Acquisition, Inc., 5.75%, 4/15/26(3) | | 2,737 | 2,558,821 |
| WESCO Distribution, Inc.: | | | |
| 7.125%, 6/15/25(3) | | 934 | 937,195 |
| 7.25%, 6/15/28(3) | | 1,637 | 1,646,563 |
| Windsor Holdings III, LLC, 8.50%, 6/15/30(3) | | 1,647 | 1,626,815 |
| | | | $ 31,622,728 |
| Steel — 0.3% |
| TMS International Corp., 6.25%, 4/15/29(3) | | 1,511 | $ 1,251,273 |
| | | | $ 1,251,273 |
| Super Retail — 5.5% |
| Asbury Automotive Group, Inc.: | | | |
| 4.50%, 3/1/28 | | 691 | $ 619,401 |
| 4.625%, 11/15/29(2)(3) | | 398 | 342,362 |
| 4.75%, 3/1/30 | | 1,118 | 957,581 |
| 5.00%, 2/15/32(2)(3) | | 162 | 134,414 |
| Bath & Body Works, Inc.: | | | |
| 6.625%, 10/1/30(3) | | 435 | 408,282 |
| 6.75%, 7/1/36(2) | | 196 | 171,952 |
| 6.95%, 3/1/33 | | 1,244 | 1,114,515 |
| 7.60%, 7/15/37 | | 88 | 77,333 |
| 9.375%, 7/1/25(2)(3) | | 578 | 601,724 |
| Evergreen Acqco 1 LP/TVI, Inc., 9.75%, 4/26/28(3) | | 2,064 | 2,127,210 |
| Group 1 Automotive, Inc., 4.00%, 8/15/28(3) | | 1,761 | 1,530,611 |
| Ken Garff Automotive, LLC, 4.875%, 9/15/28(3) | | 1,490 | 1,274,086 |
| Kohl's Corp., 4.625%, 5/1/31 | | 698 | 470,068 |
| Security | Principal
Amount*
(000's omitted) | Value |
| Super Retail (continued) |
| LCM Investments Holdings II, LLC: | | | |
| 4.875%, 5/1/29(3) | | 2,095 | $ 1,783,727 |
| 8.25%, 8/1/31(3) | | 209 | 203,208 |
| Lithia Motors, Inc.: | | | |
| 3.875%, 6/1/29(3) | | 958 | 808,456 |
| 4.375%, 1/15/31(3) | | 1,324 | 1,096,665 |
| 4.625%, 12/15/27(3) | | 1,173 | 1,072,351 |
| Metis Merger Sub, LLC, 6.50%, 5/15/29(3) | | 2,343 | 1,982,028 |
| Penske Automotive Group, Inc., 3.50%, 9/1/25 | | 947 | 897,095 |
| PetSmart, Inc./PetSmart Finance Corp.: | | | |
| 4.75%, 2/15/28(3) | | 1,709 | 1,498,201 |
| 7.75%, 2/15/29(3) | | 1,875 | 1,749,344 |
| Sonic Automotive, Inc.: | | | |
| 4.625%, 11/15/29(2)(3) | | 2,129 | 1,767,717 |
| 4.875%, 11/15/31(2)(3) | | 816 | 650,519 |
| | | | $ 23,338,850 |
| Technology — 6.3% |
| Black Knight InfoServ, LLC, 3.625%, 9/1/28(3) | | 1,622 | $ 1,457,773 |
| Booz Allen Hamilton, Inc.: | | | |
| 3.875%, 9/1/28(3) | | 2,313 | 2,074,576 |
| 4.00%, 7/1/29(3) | | 977 | 862,896 |
| Central Parent, LLC/CDK Global II, LLC/CDK Financing Co., Inc., 8.00%, 6/15/29(3) | | 873 | 870,555 |
| Ciena Corp., 4.00%, 1/31/30(2)(3) | | 1,374 | 1,164,197 |
| Cloud Software Group, Inc.: | | | |
| 6.50%, 3/31/29(3) | | 786 | 695,878 |
| 9.00%, 9/30/29(2)(3) | | 1,006 | 875,608 |
| Fair Isaac Corp., 4.00%, 6/15/28(3) | | 2,050 | 1,835,002 |
| II-VI, Inc., 5.00%, 12/15/29(2)(3) | | 1,411 | 1,225,327 |
| McAfee Corp., 7.375%, 2/15/30(3) | | 1,443 | 1,209,758 |
| NCR Corp.: | | | |
| 5.125%, 4/15/29(3) | | 751 | 662,452 |
| 5.25%, 10/1/30(3) | | 693 | 597,902 |
| ON Semiconductor Corp., 3.875%, 9/1/28(3) | | 1,767 | 1,566,375 |
| Open Text Corp., 3.875%, 2/15/28(3) | | 1,045 | 913,878 |
| Open Text Holdings, Inc., 4.125%, 2/15/30(2)(3) | | 1,352 | 1,132,559 |
| Presidio Holdings, Inc.: | | | |
| 4.875%, 2/1/27(3) | | 782 | 724,334 |
| 8.25%, 2/1/28(2)(3) | | 1,599 | 1,530,158 |
| Seagate HDD Cayman: | | | |
| 4.091%, 6/1/29 | | 328 | 283,248 |
| 9.625%, 12/1/32(3) | | 1,277 | 1,376,960 |
| Sensata Technologies B.V., 5.00%, 10/1/25(3) | | 385 | 373,653 |
| Sensata Technologies, Inc.: | | | |
| 3.75%, 2/15/31(3) | | 1,480 | 1,199,318 |
| 4.375%, 2/15/30(3) | | 199 | 172,047 |
| SS&C Technologies, Inc., 5.50%, 9/30/27(3) | | 1,148 | 1,084,476 |
| Viavi Solutions, Inc., 3.75%, 10/1/29(3) | | 1,378 | 1,121,623 |
11
See Notes to Financial Statements.
Calvert
High Yield Bond Fund
September 30, 2023
Schedule of Investments — continued
| Security | Principal
Amount*
(000's omitted) | Value |
| Technology (continued) |
| VM Consolidated, Inc., 5.50%, 4/15/29(3) | | 2,312 | $ 2,083,664 |
| | | | $ 27,094,217 |
| Telecommunications — 4.7% |
| Connect Finco S.a.r.l./Connect US Finco, LLC, 6.75%, 10/1/26(3) | | 3,000 | $ 2,801,843 |
| Iliad Holding SASU: | | | |
| 6.50%, 10/15/26(3) | | 1,164 | 1,094,850 |
| 7.00%, 10/15/28(3) | | 1,625 | 1,480,938 |
| LCPR Senior Secured Financing DAC: | | | |
| 5.125%, 7/15/29(3) | | 531 | 427,789 |
| 6.75%, 10/15/27(3) | | 1,820 | 1,673,963 |
| Sprint Capital Corp., 6.875%, 11/15/28 | | 2,159 | 2,231,049 |
| Sprint, LLC: | | | |
| 7.125%, 6/15/24 | | 1,000 | 1,006,948 |
| 7.625%, 2/15/25 | | 1,206 | 1,224,607 |
| 7.625%, 3/1/26 | | 1,500 | 1,542,740 |
| Telecom Italia SpA, 5.303%, 5/30/24(3) | | 1,116 | 1,098,332 |
| T-Mobile USA, Inc.: | | | |
| 2.875%, 2/15/31 | | 365 | 296,262 |
| 4.75%, 2/1/28 | | 275 | 263,865 |
| 5.375%, 4/15/27 | | 455 | 448,281 |
| Viasat, Inc., 5.625%, 4/15/27(3) | | 225 | 195,188 |
| Virgin Media Vendor Financing Notes III DAC, 4.875%, 7/15/28(4) | GBP | 283 | 288,285 |
| Virgin Media Vendor Financing Notes IV DAC, 5.00%, 7/15/28(3) | | 1,925 | 1,663,354 |
| Vmed O2 UK Financing I PLC, 4.75%, 7/15/31(3) | | 1,000 | 809,068 |
| Ziggo B.V., 4.875%, 1/15/30(3) | | 506 | 412,842 |
| Ziggo Bond Co. B.V., 6.00%, 1/15/27(3) | | 1,420 | 1,301,772 |
| | | | $ 20,261,976 |
| Transport Excluding Air & Rail — 0.3% |
| Seaspan Corp., 5.50%, 8/1/29(3) | | 1,835 | $ 1,474,899 |
| | | | $ 1,474,899 |
| Utilities — 2.8% |
| Clearway Energy Operating, LLC, 4.75%, 3/15/28(3) | | 1,196 | $ 1,070,922 |
| Ferrellgas LP/Ferrellgas Finance Corp., 5.875%, 4/1/29(3) | | 1,228 | 1,105,665 |
| Leeward Renewable Energy Operations, LLC, 4.25%, 7/1/29(3) | | 1,270 | 1,045,416 |
| NextEra Energy Operating Partners, L.P.: | | | |
| 4.25%, 9/15/24(3) | | 14 | 13,455 |
| 4.50%, 9/15/27(3) | | 904 | 820,472 |
| NRG Energy, Inc.: | | | |
| 3.375%, 2/15/29(3) | | 3,000 | 2,430,998 |
| 5.75%, 1/15/28 | | 1,000 | 938,697 |
| 10.25% to 3/15/28(3)(5)(6) | | 1,061 | 1,040,220 |
| Pattern Energy Operations, L.P./Pattern Energy Operations, Inc., 4.50%, 8/15/28(3) | | 1,602 | 1,393,131 |
| Security | Principal
Amount*
(000's omitted) | Value |
| Utilities (continued) |
| TerraForm Power Operating, LLC: | | | |
| 4.75%, 1/15/30(3) | | 1,000 | $ 855,655 |
| 5.00%, 1/31/28(3) | | 1,402 | 1,273,948 |
| | | | $ 11,988,579 |
Total Corporate Bonds
(identified cost $422,482,864) | | | $379,713,598 |
| Security | Shares | Value |
| Services — 0.3% |
| WESCO International, Inc., Series A, 10.625% to 6/22/25(5)(6) | | 45,970 | $ 1,214,068 |
Total Preferred Stocks
(identified cost $1,291,567) | | | $ 1,214,068 |
| Senior Floating-Rate Loans — 5.4%(9) |
| Borrower/Description | Principal
Amount
(000's omitted) | Value |
| Air Transportation — 0.6% |
| Air Canada, Term Loan, 9.129%, (SOFR + 3.50%), 8/11/28 | $ | 1,369 | $ 1,371,608 |
| SkyMiles IP, Ltd., Term Loan, 9.076%, (SOFR + 3.75%), 10/20/27 | | 1,179 | 1,224,634 |
| | | | $ 2,596,242 |
| Automotive & Auto Parts — 0.2% |
| Clarios Global, L.P., Term Loan, 9.066%, (SOFR + 3.75%), 5/6/30 | $ | 754 | $ 754,094 |
| | | | $ 754,094 |
| Broadcasting — 0.1% |
| ABG Intermediate Holdings 2, LLC, Term Loan, 8.916%, (SOFR + 3.50%), 12/21/28 | $ | 495 | $ 494,762 |
| | | | $ 494,762 |
| Capital Goods — 0.2% |
| DexKo Global, Inc., Term Loan, 9.64%, (SOFR + 4.25%), 10/4/28 | $ | 594 | $ 586,575 |
| EMRLD Borrower LP, Term Loan, 8.316%, (SOFR + 3.00%), 5/31/30 | | 359 | 358,935 |
| | | | $ 945,510 |
| Healthcare — 1.1% |
| Jazz Financing Lux S.a.r.l., Term Loan, 8.931%, (SOFR + 3.50%), 5/5/28 | $ | 1,461 | $ 1,461,941 |
12
See Notes to Financial Statements.
Calvert
High Yield Bond Fund
September 30, 2023
Schedule of Investments — continued
| Borrower/Description | Principal
Amount
(000's omitted) | Value |
| Healthcare (continued) |
| Pearl Intermediate Parent, LLC, Term Loan, 11.661%, (SOFR + 6.25%), 2/13/26 | $ | 325 | $ 321,547 |
| Pluto Acquisition I, Inc., Term Loan, 9.684%, (SOFR + 4.00%), 6/22/26 | | 1,683 | 1,478,646 |
| Verscend Holding Corp., Term Loan, 9.43%, (SOFR + 4.00%), 8/27/25 | | 1,635 | 1,637,901 |
| | | | $ 4,900,035 |
| Restaurants — 0.3% |
| IRB Holding Corp., Term Loan, 8.416%, (SOFR + 3.00%), 12/15/27 | $ | 1,333 | $ 1,329,556 |
| | | | $ 1,329,556 |
| Services — 1.1% |
| AlixPartners, LLP, Term Loan, 8.181%, (SOFR + 2.75%), 2/4/28 | $ | 2,616 | $ 2,617,055 |
| Spin Holdco, Inc., Term Loan, 9.664%, (SOFR + 4.00%), 3/4/28 | | 1,289 | 1,118,860 |
| SRS Distribution, Inc., Term Loan, 8.93%, (SOFR + 3.50%), 6/2/28 | | 764 | 757,549 |
| | | | $ 4,493,464 |
| Super Retail — 1.1% |
| Mavis Tire Express Services Corp., Term Loan, 9.43%, (SOFR + 4.00%), 5/4/28 | $ | 915 | $ 914,731 |
| Michaels Companies, Inc., Term Loan, 9.902%, (SOFR + 4.25%), 4/15/28 | | 930 | 851,757 |
| PetSmart, Inc., Term Loan, 9.166%, (SOFR + 3.75%), 2/11/28 | | 2,808 | 2,804,424 |
| | | | $ 4,570,912 |
| Technology — 0.7% |
| Riverbed Technology, Inc., Term Loan, 9.89%, (SOFR + 4.50%), 7/1/28 | $ | 402 | $ 262,502 |
| SS&C European Holdings S.a.r.l., Term Loan, 7.18%, (SOFR + 1.75%), 4/16/25 | | 58 | 57,702 |
| SS&C Technologies, Inc.: | | | |
| Term Loan, 7.181%, (SOFR + 1.75%), 4/16/25 | | 62 | 62,283 |
| Term Loan, 7.181%, (SOFR + 1.75%), 4/16/25 | | 399 | 399,382 |
| Travelport Finance (Luxembourg) S.a.r.l., Term Loan, 12.652%, (SOFR + 7.00%), 2/28/25 | | 2,200 | 2,096,289 |
| | | | $ 2,878,158 |
Total Senior Floating-Rate Loans
(identified cost $23,131,889) | | | $ 22,962,733 |
| Short-Term Investments — 9.9% |
| Affiliated Fund — 3.3% | | | |
| Security | Shares | Value |
| Morgan Stanley Institutional Liquidity Funds - Government Portfolio, Institutional Class, 5.27%(10) | | 14,175,350 | $ 14,175,350 |
Total Affiliated Fund
(identified cost $14,175,350) | | | $ 14,175,350 |
| Securities Lending Collateral — 6.6% | | | |
| Security | Shares | Value |
| State Street Navigator Securities Lending Government Money Market Portfolio, 5.36%(11) | | 28,240,331 | $ 28,240,331 |
Total Securities Lending Collateral
(identified cost $28,240,331) | | | $ 28,240,331 |
Total Short-Term Investments
(identified cost $42,415,681) | | | $ 42,415,681 |
Total Investments — 105.6%
(identified cost $493,433,724) | | | $450,888,549 |
| | | |
| Other Assets, Less Liabilities — (5.6)% | | $ (24,055,993) |
| | | |
| Net Assets — 100.0% | | $426,832,556 |
| The percentage shown for each investment category in the Schedule of Investments is based on net assets. |
| * | In U.S. dollars unless otherwise indicated. |
| (1) | Non-income producing security. |
| (2) | All or a portion of this security was on loan at September 30, 2023. The aggregate market value of securities on loan at September 30, 2023 was $28,260,636. |
| (3) | Security exempt from registration under Rule 144A of the Securities Act of 1933, as amended. These securities may be sold in certain transactions in reliance on an exemption from registration (normally to qualified institutional buyers). At September 30, 2023, the aggregate value of these securities is $322,662,736 or 75.6% of the Fund's net assets. |
| (4) | Security exempt from registration under Regulation S of the Securities Act of 1933, as amended, which exempts from registration securities offered and sold outside the United States. Security may not be offered or sold in the United States except pursuant to an exemption from, or in a transaction not subject to, the registration requirements of the Securities Act of 1933, as amended. At September 30, 2023, the aggregate value of these securities is $9,721,250 or 2.2% of the Fund's net assets. |
| (5) | Security converts to variable rate after the indicated fixed-rate coupon period. |
| (6) | Perpetual security with no stated maturity date but may be subject to calls by the issuer. |
| (7) | When-issued security. |
13
See Notes to Financial Statements.
Calvert
High Yield Bond Fund
September 30, 2023
Schedule of Investments — continued
| (8) | For fair value measurement disclosure purposes, security is categorized as Level 3 (see Note 1A). |
| (9) | Senior floating-rate loans (Senior Loans) often require prepayments from excess cash flows or permit the borrowers to repay at their election. The degree to which borrowers repay, whether as a contractual requirement or at their election, cannot be predicted with accuracy. As a result, the actual remaining maturity may be substantially less than the stated maturities shown. However, Senior Loans will typically have an expected average life of approximately two to four years. Senior Loans typically have rates of interest which are redetermined periodically by reference to a base lending rate, plus a spread. These base lending rates are primarily the Secured Overnight Financing Rate (“SOFR”) (or the London Interbank Offered Rate (“LIBOR”) for those loans whose rates reset prior to the discontinuance of LIBOR on June 30, 2023) and secondarily, the prime rate offered by one or more major United States banks (the “Prime Rate”). Base lending rates may be subject to a floor, or minimum rate. Rates for SOFR are generally 1 or 3-month tenors and may also be subject to a credit spread adjustment. Senior Loans are generally subject to contractual restrictions that must be satisfied before they can be bought or sold. |
| (10) | May be deemed to be an affiliated investment company. The rate shown is the annualized seven-day yield as of September 30, 2023. |
| (11) | Represents investment of cash collateral received in connection with securities lending. |
14
See Notes to Financial Statements.
Calvert
High Yield Bond Fund
September 30, 2023
Schedule of Investments — continued
Forward Foreign Currency Exchange Contracts (OTC)
| Currency Purchased | Currency Sold | Counterparty | Settlement
Date | Unrealized
Appreciation | Unrealized
(Depreciation) |
| USD | 10,014,972 | EUR | 9,057,578 | State Street Bank and Trust Company | 10/31/23 | $ 427,826 | $ — |
| USD | 124,963 | EUR | 113,144 | State Street Bank and Trust Company | 10/31/23 | 5,203 | — |
| USD | 99,843 | EUR | 91,105 | State Street Bank and Trust Company | 10/31/23 | 3,412 | — |
| USD | 294,294 | GBP | 229,100 | State Street Bank and Trust Company | 10/31/23 | 14,720 | — |
| USD | 6,784 | GBP | 5,328 | State Street Bank and Trust Company | 10/31/23 | 282 | — |
| USD | 9,414 | GBP | 7,582 | State Street Bank and Trust Company | 10/31/23 | 162 | — |
| USD | 1,797 | GBP | 1,398 | State Street Bank and Trust Company | 10/31/23 | 91 | — |
| | | | | | | $451,696 | $ — |
| Abbreviations: |
| OTC | – Over-the-counter |
| SOFR | – Secured Overnight Financing Rate |
| Currency Abbreviations: |
| EUR | – Euro |
| GBP | – British Pound Sterling |
| USD | – United States Dollar |
15
See Notes to Financial Statements.
Calvert
High Yield Bond Fund
September 30, 2023
Statement of Assets and Liabilities
| | September 30, 2023 |
| Assets | |
Investments in securities of unaffiliated issuers, at value (identified cost $479,258,374) - including
$28,260,636 of securities on loan | $ 436,713,199 |
| Investments in securities of affiliated issuers, at value (identified cost $14,175,350) | 14,175,350 |
| Receivable for open forward foreign currency exchange contracts | 451,696 |
| Cash | 457,902 |
| Cash denominated in foreign currency, at value (cost $2,313) | 2,238 |
| Receivable for investments sold | 832,901 |
| Receivable for capital shares sold | 465,171 |
| Dividends and interest receivable | 6,672,698 |
| Dividends receivable - affiliated | 73,215 |
| Securities lending income receivable | 6,788 |
| Trustees' deferred compensation plan | 144,982 |
| Total assets | $459,996,140 |
| Liabilities | |
| Payable for investments purchased | $ 1,994,439 |
| Payable for when-issued securities | 1,394,000 |
| Payable for capital shares redeemed | 816,011 |
| Distributions payable | 184,218 |
| Deposits for securities loaned | 28,240,331 |
| Payable to affiliates: | |
| Investment advisory fee | 168,757 |
| Administrative fee | 42,711 |
| Distribution and service fees | 12,034 |
| Sub-transfer agency fee | 4,501 |
| Trustees' deferred compensation plan | 144,982 |
| Other | 5,918 |
| Accrued expenses | 155,682 |
| Total liabilities | $ 33,163,584 |
| Net Assets | $426,832,556 |
| Sources of Net Assets | |
| Paid-in capital | $ 506,134,671 |
| Accumulated loss | (79,302,115) |
| Net Assets | $426,832,556 |
| Class A Shares | |
| Net Assets | $ 48,171,720 |
| Shares Outstanding | 2,060,954 |
Net Asset Value and Redemption Price Per Share
(net assets ÷ shares of beneficial interest outstanding) | $ 23.37 |
Maximum Offering Price Per Share
(100 ÷ 96.75 of net asset value per share) | $ 24.16 |
| Class C Shares | |
| Net Assets | $ 2,395,644 |
| Shares Outstanding | 100,917 |
Net Asset Value and Offering Price Per Share*
(net assets ÷ shares of beneficial interest outstanding) | $ 23.74 |
16
See Notes to Financial Statements.
Calvert
High Yield Bond Fund
September 30, 2023
Statement of Assets and Liabilities — continued
| | September 30, 2023 |
| Class I Shares | |
| Net Assets | $ 302,348,380 |
| Shares Outstanding | 13,122,856 |
Net Asset Value, Offering Price and Redemption Price Per Share
(net assets ÷ shares of beneficial interest outstanding) | $ 23.04 |
| Class R6 Shares | |
| Net Assets | $ 73,916,812 |
| Shares Outstanding | 3,206,691 |
Net Asset Value, Offering Price and Redemption Price Per Share
(net assets ÷ shares of beneficial interest outstanding) | $ 23.05 |
| On sales of $100,000 or more, the offering price of Class A shares is reduced. |
| * | Redemption price per share is equal to the net asset value less any applicable contingent deferred sales charge. |
17
See Notes to Financial Statements.
Calvert
High Yield Bond Fund
September 30, 2023
| | Year Ended |
| | September 30, 2023 |
| Investment Income | |
| Dividend income (net of foreign taxes withheld of $185) | $ 203,316 |
| Dividend income - affiliated issuers | 687,881 |
| Interest and other income | 25,264,459 |
| Securities lending income, net | 203,832 |
| Total investment income | $ 26,359,488 |
| Expenses | |
| Investment advisory fee | $ 2,081,520 |
| Administrative fee | 520,380 |
| Distribution and service fees: | |
| Class A | 118,973 |
| Class C | 27,975 |
| Trustees' fees and expenses | 29,156 |
| Custodian fees | 11,310 |
| Transfer agency fees and expenses | 351,357 |
| Accounting fees | 100,380 |
| Professional fees | 59,473 |
| Registration fees | 68,055 |
| Reports to shareholders | 31,743 |
| Miscellaneous | 32,856 |
| Total expenses | $ 3,433,178 |
| Waiver and/or reimbursement of expenses by affiliates | $ (21,965) |
| Net expenses | $ 3,411,213 |
| Net investment income | $ 22,948,275 |
| Realized and Unrealized Gain (Loss) | |
| Net realized gain (loss): | |
| Investment securities | $ (18,119,257) |
| Foreign currency transactions | 6,239 |
| Forward foreign currency exchange contracts | (491,553) |
| Net realized loss | $(18,604,571) |
| Change in unrealized appreciation (depreciation): | |
| Investment securities | $ 31,219,684 |
| Foreign currency | 2,131 |
| Forward foreign currency exchange contracts | 11,796 |
| Net change in unrealized appreciation (depreciation) | $ 31,233,611 |
| Net realized and unrealized gain | $ 12,629,040 |
| Net increase in net assets from operations | $ 35,577,315 |
18
See Notes to Financial Statements.
Calvert
High Yield Bond Fund
September 30, 2023
Statements of Changes in Net Assets
| | Year Ended September 30, |
| | 2023 | 2022 |
| Increase (Decrease) in Net Assets | | |
| From operations: | | |
| Net investment income | $ 22,948,275 | $ 21,017,146 |
| Net realized loss | (18,604,571) | (5,994,859) |
| Net change in unrealized appreciation (depreciation) | 31,233,611 | (86,761,001) |
| Net increase (decrease) in net assets from operations | $ 35,577,315 | $ (71,738,714) |
| Distributions to shareholders: | | |
| Class A | $ (2,455,800) | $ (2,193,558) |
| Class C | (122,960) | (136,527) |
| Class I | (16,512,044) | (15,852,882) |
| Class R6 | (4,258,271) | (3,531,631) |
| Total distributions to shareholders | $ (23,349,075) | $ (21,714,598) |
| Capital share transactions: | | |
| Class A | $ (107,692) | $ 1,025,988 |
| Class C | (692,976) | (1,480,727) |
| Class I | (5,307,961) | (13,640,991) |
| Class R6 | (13,687,695) | 49,316,498 |
| Net increase (decrease) in net assets from capital share transactions | $ (19,796,324) | $ 35,220,768 |
| Net decrease in net assets | $ (7,568,084) | $ (58,232,544) |
| Net Assets | | |
| At beginning of year | $ 434,400,640 | $ 492,633,184 |
| At end of year | $426,832,556 | $434,400,640 |
19
See Notes to Financial Statements.
Calvert
High Yield Bond Fund
September 30, 2023
| | Class A |
| | Year Ended September 30, |
| | 2023 | 2022 | 2021 | 2020 | 2019 |
| Net asset value — Beginning of year | $ 22.73 | $ 27.47 | $ 26.56 | $ 27.20 | $ 26.73 |
| Income (Loss) From Operations | | | | | |
| Net investment income(1) | $ 1.19 | $ 1.03 | $ 1.08 | $ 1.15 | $ 1.24 |
| Net realized and unrealized gain (loss) | 0.67 | (4.71) | 0.95 | (0.56) | 0.49 |
| Total income (loss) from operations | $ 1.86 | $ (3.68) | $ 2.03 | $ 0.59 | $ 1.73 |
| Less Distributions | | | | | |
| From net investment income | $ (1.22) | $ (1.06) | $ (1.12) | $ (1.23) | $ (1.26) |
| Total distributions | $ (1.22) | $ (1.06) | $ (1.12) | $ (1.23) | $ (1.26) |
| Net asset value — End of year | $ 23.37 | $ 22.73 | $ 27.47 | $ 26.56 | $ 27.20 |
| Total Return(2) | 8.24% | (13.69)% | 7.74% | 2.30% | 6.70% |
| Ratios/Supplemental Data | | | | | |
| Net assets, end of year (000’s omitted) | $48,172 | $46,982 | $55,740 | $49,682 | $51,273 |
| Ratios (as a percentage of average daily net assets):(3) | | | | | |
| Total expenses | 1.02% | 1.02% | 1.01% | 1.04% | 1.07% |
| Net expenses | 1.02% (4) | 1.02% (4) | 1.01% | 1.02% | 1.04% |
| Net investment income | 5.07% | 4.03% | 3.95% | 4.36% | 4.65% |
| Portfolio Turnover | 24% | 28% | 43% | 49% | 39% |
| (1) | Computed using average shares outstanding. |
| (2) | Returns are historical and are calculated by determining the percentage change in net asset value with all distributions reinvested and do not reflect the effect of sales charges, if any. |
| (3) | Total expenses do not reflect amounts reimbursed and/or waived by the adviser and certain of its affiliates, if applicable. Net expenses are net of all reductions and represent the net expenses paid by the Fund. |
| (4) | Includes a reduction by the investment adviser of a portion of its advisory fee due to the Fund’s investment in the Liquidity Fund (equal to less than 0.01% and less than 0.005% of average daily net assets for the years ended September 30, 2023 and 2022, respectively). |
20
See Notes to Financial Statements.
Calvert
High Yield Bond Fund
September 30, 2023
Financial Highlights — continued
| | Class C |
| | Year Ended September 30, |
| | 2023 | 2022 | 2021 | 2020 | 2019 |
| Net asset value — Beginning of year | $ 23.08 | $ 27.89 | $ 26.98 | $ 27.62 | $ 27.14 |
| Income (Loss) From Operations | | | | | |
| Net investment income(1) | $ 1.03 | $ 0.84 | $ 0.89 | $ 0.96 | $ 1.05 |
| Net realized and unrealized gain (loss) | 0.69 | (4.76) | 0.95 | (0.55) | 0.50 |
| Total income (loss) from operations | $ 1.72 | $ (3.92) | $ 1.84 | $ 0.41 | $ 1.55 |
| Less Distributions | | | | | |
| From net investment income | $ (1.06) | $ (0.89) | $ (0.93) | $ (1.05) | $ (1.07) |
| Total distributions | $ (1.06) | $ (0.89) | $ (0.93) | $ (1.05) | $ (1.07) |
| Net asset value — End of year | $23.74 | $ 23.08 | $27.89 | $26.98 | $27.62 |
| Total Return(2) | 7.48% | (14.33)% | 6.88% | 1.58% | 5.89% |
| Ratios/Supplemental Data | | | | | |
| Net assets, end of year (000’s omitted) | $ 2,396 | $ 2,998 | $ 5,199 | $ 5,106 | $ 3,977 |
| Ratios (as a percentage of average daily net assets):(3) | | | | | |
| Total expenses | 1.77% | 1.77% | 1.76% | 1.79% | 1.82% |
| Net expenses | 1.77% (4) | 1.77% (4) | 1.76% | 1.77% | 1.79% |
| Net investment income | 4.30% | 3.24% | 3.21% | 3.58% | 3.91% |
| Portfolio Turnover | 24% | 28% | 43% | 49% | 39% |
| (1) | Computed using average shares outstanding. |
| (2) | Returns are historical and are calculated by determining the percentage change in net asset value with all distributions reinvested and do not reflect the effect of sales charges, if any. |
| (3) | Total expenses do not reflect amounts reimbursed and/or waived by the adviser and certain of its affiliates, if applicable. Net expenses are net of all reductions and represent the net expenses paid by the Fund. |
| (4) | Includes a reduction by the investment adviser of a portion of its advisory fee due to the Fund’s investment in the Liquidity Fund (equal to less than 0.01% and less than 0.005% of average daily net assets for the years ended September 30, 2023 and 2022, respectively). |
21
See Notes to Financial Statements.
Calvert
High Yield Bond Fund
September 30, 2023
Financial Highlights — continued
| | Class I |
| | Year Ended September 30, |
| | 2023 | 2022 | 2021 | 2020 | 2019 |
| Net asset value — Beginning of year | $ 22.40 | $ 27.07 | $ 26.18 | $ 26.80 | $ 26.35 |
| Income (Loss) From Operations | | | | | |
| Net investment income(1) | $ 1.23 | $ 1.07 | $ 1.13 | $ 1.18 | $ 1.29 |
| Net realized and unrealized gain (loss) | 0.67 | (4.63) | 0.93 | (0.52) | 0.47 |
| Total income (loss) from operations | $ 1.90 | $ (3.56) | $ 2.06 | $ 0.66 | $ 1.76 |
| Less Distributions | | | | | |
| From net investment income | $ (1.26) | $ (1.11) | $ (1.17) | $ (1.28) | $ (1.31) |
| Total distributions | $ (1.26) | $ (1.11) | $ (1.17) | $ (1.28) | $ (1.31) |
| Net asset value — End of year | $ 23.04 | $ 22.40 | $ 27.07 | $ 26.18 | $ 26.80 |
| Total Return(2) | 8.55% | (13.47)% | 7.98% | 2.59% | 6.93% |
| Ratios/Supplemental Data | | | | | |
| Net assets, end of year (000’s omitted) | $302,348 | $299,339 | $380,659 | $274,030 | $149,733 |
| Ratios (as a percentage of average daily net assets):(3) | | | | | |
| Total expenses | 0.77% | 0.77% | 0.76% | 0.79% | 0.82% |
| Net expenses | 0.77% (4) | 0.77% (4) | 0.76% | 0.77% | 0.76% |
| Net investment income | 5.31% | 4.27% | 4.18% | 4.53% | 4.92% |
| Portfolio Turnover | 24% | 28% | 43% | 49% | 39% |
| (1) | Computed using average shares outstanding. |
| (2) | Returns are historical and are calculated by determining the percentage change in net asset value with all distributions reinvested and do not reflect the effect of sales charges, if any. |
| (3) | Total expenses do not reflect amounts reimbursed and/or waived by the adviser and certain of its affiliates, if applicable. Net expenses are net of all reductions and represent the net expenses paid by the Fund. |
| (4) | Includes a reduction by the investment adviser of a portion of its advisory fee due to the Fund’s investment in the Liquidity Fund (equal to less than 0.01% and less than 0.005% of average daily net assets for the years ended September 30, 2023 and 2022, respectively). |
22
See Notes to Financial Statements.
Calvert
High Yield Bond Fund
September 30, 2023
Financial Highlights — continued
| | Class R6 |
| | Year Ended September 30, | Period Ended
September 30,
2019(1) |
| | 2023 | 2022 | 2021 | 2020 |
| Net asset value — Beginning of period | $ 22.41 | $ 27.08 | $ 26.19 | $ 26.81 | $ 25.96 |
| Income (Loss) From Operations | | | | | |
| Net investment income(2) | $ 1.25 | $ 1.11 | $ 1.14 | $ 1.17 | $ 0.85 |
| Net realized and unrealized gain (loss) | 0.67 | (4.65) | 0.95 | (0.49) | 0.86 |
| Total income (loss) from operations | $ 1.92 | $ (3.54) | $ 2.09 | $ 0.68 | $ 1.71 |
| Less Distributions | | | | | |
| From net investment income | $ (1.28) | $ (1.13) | $ (1.20) | $ (1.30) | $ (0.86) |
| Total distributions | $ (1.28) | $ (1.13) | $ (1.20) | $ (1.30) | $ (0.86) |
| Net asset value — End of period | $ 23.05 | $ 22.41 | $ 27.08 | $26.19 | $26.81 |
| Total Return(3) | 8.64% | (13.39)% | 8.07% | 2.66% | 6.67% (4) |
| Ratios/Supplemental Data | | | | | |
| Net assets, end of period (000’s omitted) | $73,917 | $85,082 | $51,035 | $ 244 | $ 57 |
| Ratios (as a percentage of average daily net assets):(5) | | | | | |
| Total expenses | 0.69% | 0.69% | 0.69% | 0.73% | 0.74% (6) |
| Net expenses | 0.68% (7) | 0.69% (7) | 0.69% | 0.71% | 0.71% (6) |
| Net investment income | 5.40% | 4.47% | 4.22% | 4.51% | 4.85% (6) |
| Portfolio Turnover | 24% | 28% | 43% | 49% | 39% (8) |
| (1) | For the period from the commencement of operations, February 1, 2019, to September 30, 2019. |
| (2) | Computed using average shares outstanding. |
| (3) | Returns are historical and are calculated by determining the percentage change in net asset value with all distributions reinvested and do not reflect the effect of sales charges, if any. |
| (4) | Not annualized. |
| (5) | Total expenses do not reflect amounts reimbursed and/or waived by the adviser and certain of its affiliates, if applicable. Net expenses are net of all reductions and represent the net expenses paid by the Fund. |
| (6) | Annualized. |
| (7) | Includes a reduction by the investment adviser of a portion of its advisory fee due to the Fund’s investment in the Liquidity Fund (equal to less than 0.01% and less than 0.005% of average daily net assets for the years ended September 30, 2023 and 2022, respectively). |
| (8) | For the year ended September 30, 2019. |
23
See Notes to Financial Statements.
Calvert
High Yield Bond Fund
September 30, 2023
Notes to Financial Statements
1 Significant Accounting Policies
Calvert High Yield Bond Fund (the Fund) is a diversified series of The Calvert Fund (the Trust). The Trust is a Massachusetts business trust registered under the Investment Company Act of 1940, as amended (the 1940 Act), as an open-end management investment company. The investment objective of the Fund is to seek high current income and capital appreciation, secondarily. The Fund invests primarily in high-yield, high-risk bonds, with varying maturities.
The Fund offers four classes of shares. Class A shares are generally sold subject to a sales charge imposed at time of purchase. A contingent deferred sales charge of 0.75% may apply to certain redemptions of Class A shares for accounts for which no sales charge was paid, if redeemed within 12 months of purchase. Class C shares are sold without a front-end sales charge, and with certain exceptions, are charged a contingent deferred sales charge of 1% on shares redeemed within 12 months of purchase. Class C shares are only available for purchase through a financial intermediary. Effective November 5, 2020, Class C shares automatically convert to Class A shares eight years after their purchase as described in the Fund's prospectus. Class I and Class R6 shares are sold at net asset value, are not subject to a sales charge and are sold only to certain eligible investors. Each class represents a pro rata interest in the Fund, but votes separately on class-specific matters and is subject to different expenses.
The Fund applies the accounting and reporting guidance in the Financial Accounting Standards Board (FASB) Accounting Standards Codification Topic 946, Financial Services – Investment Companies (ASC 946). Subsequent events, if any, through the date that the financial statements were issued have been evaluated in the preparation of the financial statements.
A Investment Valuation— Net asset value per share is determined every business day as of the close of the regular session of the New York Stock Exchange (generally 4:00 p.m. Eastern time). The Fund uses independent pricing services approved by the Board of Trustees (the Board) to value its investments wherever possible. Investments for which market quotations are not available or deemed not reliable are fair valued in good faith by the Board’s valuation designee.
U.S. generally accepted accounting principles (U.S. GAAP) establishes a disclosure hierarchy that categorizes the inputs to valuation techniques used to value assets and liabilities at measurement date. These inputs are summarized in the three broad levels listed below:
Level 1 - quoted prices in active markets for identical securities
Level 2 - other significant observable inputs (including quoted prices for similar securities, interest rates, prepayment speeds, credit risk, etc.)
Level 3 - significant unobservable inputs (including the Fund’s own assumptions in determining the fair value of investments)
The inputs or methodologies used for valuing securities are not necessarily an indication of the risk associated with investing in those securities.
Valuation techniques used to value the Fund’s investments by major category are as follows:
Equity Securities. Equity securities (including warrants and rights) listed on a U.S. securities exchange generally are valued at the last sale or closing price as reported by an independent pricing service on the primary market or exchange on which they are traded and are categorized as Level 1 in the hierarchy. Equity securities listed on the NASDAQ National Market System are valued at the NASDAQ official closing price and are categorized as Level 1 in the hierarchy. Unlisted or listed securities for which closing sales prices or closing quotations are not available are valued at the mean between the latest available bid and ask prices and are categorized as Level 2 in the hierarchy.
Debt Securities. Debt securities are generally valued based on valuations provided by third party pricing services, as derived from such services’ pricing models. Inputs to the models may include, but are not limited to, reported trades, executable bid and ask prices, broker/dealer quotations, prices or yields of securities with similar characteristics, interest rates, anticipated prepayments, benchmark curves or information pertaining to the issuer, as well as industry and economic events. Accordingly, debt securities are generally categorized as Level 2 in the hierarchy. Short-term debt securities with a remaining maturity at time of purchase of more than sixty days are valued based on valuations provided by a third party pricing service. Such securities are generally categorized as Level 2 in the hierarchy. Short-term debt securities of sufficient credit quality purchased with remaining maturities of sixty days or less for which a valuation from a third party pricing service is not readily available may be valued at amortized cost, which approximates fair value, and are categorized as Level 2 in the hierarchy.
Senior Floating-Rate Loans. Interests in senior floating-rate loans for which reliable market quotations are readily available are valued generally at the average mean of bid and ask quotations obtained from a third party pricing service, and are categorized as Level 2 in the hierarchy.
Other Securities. Investments in management investment companies (including money market funds) that do not trade on an exchange are valued at the net asset value as of the close of each business day and are categorized as Level 1 in the hierarchy.
Derivatives. Forward foreign currency exchange contracts are generally valued at the mean of the average bid and average ask prices that are reported by currency dealers to a third party pricing service at the valuation time. Such third party pricing service valuations are supplied for specific settlement periods and the Fund's forward foreign currency exchange contracts are valued at an interpolated rate between the closest preceding and subsequent settlement period reported by the third party pricing service and are categorized as Level 2 in the hierarchy.
Calvert
High Yield Bond Fund
September 30, 2023
Notes to Financial Statements — continued
Fair Valuation. In connection with Rule 2a-5 of the 1940 Act, the Board has designated the Fund’s investment adviser as its valuation designee. Investments for which valuations or market quotations are not readily available or are deemed unreliable are valued by the investment adviser, as valuation designee, at fair value using methods that most fairly reflect the security’s “fair value”, which is the amount that the Fund might reasonably expect to receive for the security upon its current sale in the ordinary course. Each such determination is based on a consideration of relevant factors, which are likely to vary from one pricing context to another. These factors may include, but are not limited to, the type of security, the existence of any contractual restrictions on the security’s disposition, the price and extent of public trading in similar securities of the issuer or of comparable companies or entities, quotations or relevant information obtained from broker/dealers or other market participants, information obtained from the issuer, analysts, and/or the appropriate stock exchange (for exchange-traded securities), an analysis of the company’s or entity’s financial statements, and an evaluation of the forces that influence the issuer and the market(s) in which the security is purchased and sold.
The values assigned to fair value investments are based on available information and do not necessarily represent amounts that might ultimately be realized. Further, due to the inherent uncertainty of valuations of such investments, the fair values may differ significantly from the values that would have been used had an active market existed, and the differences could be material.
The following table summarizes the market value of the Fund's holdings as of September 30, 2023, based on the inputs used to value them:
| Asset Description | Level 1 | Level 2 | Level 3(1) | Total |
| Common Stocks | $ 2,070,066(2) | $ — | $ — | $ 2,070,066 |
| Convertible Bonds | — | 2,512,403 | — | 2,512,403 |
| Corporate Bonds | — | 379,713,598 | 0 | 379,713,598 |
| Preferred Stocks | 1,214,068 | — | — | 1,214,068 |
| Senior Floating-Rate Loans | — | 22,962,733 | — | 22,962,733 |
| Short-Term Investments: | | | | |
| Affiliated Fund | 14,175,350 | — | — | 14,175,350 |
| Securities Lending Collateral | 28,240,331 | — | — | 28,240,331 |
| Total Investments | $45,699,815 | $405,188,734 | $ 0 | $450,888,549 |
| Forward Foreign Currency Exchange Contracts | $ — | $ 451,696 | $ — | $ 451,696 |
| Total | $45,699,815 | $405,640,430 | $ 0 | $451,340,245 |
| (1) | None of the unobservable inputs for Level 3 assets, individually or collectively, had a material impact on the Fund. |
| (2) | The level classification by major category of investments is the same as the category presentation in the Schedule of Investments. |
B Investment Transactions and Income— Investment transactions for financial statement purposes are accounted for on trade date. Realized gains and losses are recorded on an identified cost basis and may include proceeds from litigation. Dividend income is recorded on the ex-dividend date for dividends received in cash and/or securities. Non-cash dividends are recorded at the fair value of the securities received. Withholding taxes on foreign dividends, if any, have been provided for in accordance with the Fund’s understanding of the applicable country’s tax rules and rates. Interest income, which includes amortization of premium and accretion of discount on debt securities, is accrued as earned. The Fund may earn certain fees in connection with its investments in senior floating-rate loans. These fees are in addition to interest payments earned and may include amendment fees, consent fees and prepayment fees, which are recorded to income as earned.
C Share Class Accounting— Realized and unrealized gains and losses are allocated daily to each class of shares based upon the relative net assets of each class to the total net assets of the Fund. Net investment income, other than class-specific expenses, is allocated daily to each class of shares based upon the ratio of the value of each class's paid shares to the total value of all paid shares. Expenses arising in connection with a specific class are charged directly to that class. Sub-accounting, recordkeeping and similar administrative fees payable to financial intermediaries, which are a component of transfer agency fees and expenses on the Statement of Operations, are not allocated to Class R6 shares.
D Foreign Currency Transactions— The Fund’s accounting records are maintained in U.S. dollars. For valuation of assets and liabilities on each date of net asset value determination, foreign denominations are converted into U.S. dollars using the current exchange rate. Security transactions, income and expenses are translated at the prevailing rate of exchange on the date of the event. Recognized gains or losses on investment transactions attributable to changes in foreign currency exchange rates are recorded for financial statement purposes as net realized gains and losses on investments. That portion of unrealized gains and losses on investments that results from fluctuations in foreign currency exchange rates is not separately disclosed.
E Senior Floating-Rate Loans— The Fund may invest in direct debt instruments, which are interests in amounts owed to lenders or lending syndicates by corporate, governmental, or other borrowers. The Fund’s investment in loans may be in the form of participations in loans or assignments of all or a portion of loans from third parties. A loan is often administered by a bank or other financial institution (the lender) that acts as agent for all holders. The agent
Calvert
High Yield Bond Fund
September 30, 2023
Notes to Financial Statements — continued
administers the terms of the loan, as specified in the loan agreement. The Fund may invest in multiple series or tranches of a loan, which may have varying terms and carry different associated risks. When the Fund purchases assignments from lenders, it acquires direct rights against the borrower of the loan. When investing in a loan participation, the Fund has the right to receive payments of principal, interest and any fees to which it is entitled only from the lender selling the loan agreement and only upon receipt of such payments by the lender from the borrower. The Fund generally has no right to enforce compliance by the borrower with the terms of the loan agreement. As a result, the Fund may be subject to the credit risk of both the borrower and the lender that is issuing the participation interest.
F Forward Foreign Currency Exchange Contracts— The Fund may enter into forward foreign currency exchange contracts for the purchase or sale of a specific foreign currency at a fixed price on a future date. The forward foreign currency exchange contracts are adjusted by the daily exchange rate of the underlying currency and any gains or losses are recorded as unrealized until such time as the contracts have been closed. Risks may arise upon entering these contracts from the potential inability of counterparties to meet the terms of their contracts and from movements in the value of a foreign currency relative to the U.S. dollar.
G Distributions to Shareholders— Distributions to shareholders are recorded by the Fund on ex-dividend date. The Fund declares income distributions daily to shareholders of record at the time of declaration and generally pays them monthly. The Fund makes distributions of net realized capital gains, if any, at least annually. Distributions are declared separately for each class of shares. Distributions are determined in accordance with income tax regulations, which may differ from U.S. GAAP; accordingly, periodic reclassifications are made within the Fund’s capital accounts to reflect income and gains available for distribution under income tax regulations.
H Estimates— The preparation of financial statements in conformity with U.S. GAAP requires management to make estimates and assumptions that affect the reported amounts of assets and liabilities and disclosure of contingent assets and liabilities at the date of the financial statements and the reported amounts of increases and decreases in net assets from operations during the reporting period. Actual results could differ from those estimates.
I Indemnifications— Under the Trust’s organizational document, its officers and Trustees may be indemnified against certain liabilities and expenses arising out of the performance of their duties to the Fund. Under Massachusetts law, if certain conditions prevail, shareholders of a Massachusetts business trust (such as the Trust) could be deemed to have personal liability for the obligations of the Trust. However, the Trust’s Declaration of Trust contains an express disclaimer of liability on the part of Fund shareholders and provides that the Trust shall assume, upon request by the shareholder, the defense on behalf of any Fund shareholders or former shareholders. Additionally, in the normal course of business, the Fund enters into agreements with service providers that may contain indemnification clauses. The Fund’s maximum exposure under these arrangements is unknown as this would involve future claims that may be made against the Fund that have not yet occurred.
J Federal Income Taxes— No provision for federal income or excise tax is required since the Fund intends to continue to qualify as a regulated investment company under the Internal Revenue Code and to distribute substantially all of its taxable earnings.
Management has analyzed the Fund's tax positions taken for all open federal income tax years and has concluded that no provision for federal income tax is required in the Fund's financial statements. A Fund's federal tax return is subject to examination by the Internal Revenue Service for a period of three years from the date of filing.
K When-Issued Securities and Delayed Delivery Transactions— The Fund may purchase securities on a delayed delivery or when-issued basis. Payment and delivery may take place after the customary settlement period for that security. At the time the transaction is negotiated, the price of the security that will be delivered is fixed. The Fund maintains cash and/or security positions for these commitments such that sufficient liquid assets will be available to make payments upon settlement. Securities purchased on a delayed delivery or when-issued basis are marked-to-market daily and begin earning interest on settlement date. Such security purchases are subject to the risk that when delivered they will be worth less than the agreed upon payment price. Losses may also arise if the counterparty does not perform under the contract.
2 Related Party Transactions
The investment advisory fee is earned by Calvert Research and Management (CRM), an indirect, wholly-owned subsidiary of Morgan Stanley, as compensation for investment advisory services rendered to the Fund. The investment advisory fee is computed at the annual rate of 0.48% of the Fund’s average daily net assets and is payable monthly. For the year ended September 30, 2023, the investment advisory fee amounted to $2,081,520.
The Fund may invest in a money market fund, the Institutional Class of the Morgan Stanley Institutional Liquidity Funds - Government Portfolio (the “Liquidity Fund”), an open-end management investment company managed by Morgan Stanley Investment Management Inc., a wholly-owned subsidiary of Morgan Stanley. The investment advisory fee paid by the Fund is reduced by an amount equal to its pro rata share of the advisory and administration fees paid by the Fund due to its investment in the Liquidity Fund. For the year ended September 30, 2023, the investment advisory fee paid was reduced by $21,965 relating to the Fund’s investment in the Liquidity Fund.
Calvert
High Yield Bond Fund
September 30, 2023
Notes to Financial Statements — continued
CRM has agreed to reimburse the Fund's operating expenses to the extent that total annual operating expenses (relating to ordinary operating expenses only and excluding expenses such as brokerage commissions, acquired fund fees and expenses of unaffiliated funds, borrowing costs, taxes or litigation expenses) exceed 1.02%, 1.77%, 0.77% and 0.71% for Class A, Class C, Class I and Class R6, respectively, of such class’s average daily net assets. The expense reimbursement agreement with CRM may be changed or terminated after February 1, 2025. For the year ended September 30, 2023, no expenses were waived or reimbursed by CRM.
The administrative fee is earned by CRM as compensation for administrative services rendered to the Fund. The fee is computed at an annual rate of 0.12% of the Fund’s average daily net assets attributable to Class A, Class C, Class I and Class R6 and is payable monthly. For the year ended September 30, 2023, CRM was paid administrative fees of $520,380.
The Fund has in effect a distribution plan for Class A shares (Class A Plan) pursuant to Rule 12b-1 under the 1940 Act. Pursuant to the Class A Plan, the Fund pays Eaton Vance Distributors, Inc. (EVD), an affiliate of CRM and the Fund’s principal underwriter, a distribution and service fee of 0.25% per annum of its average daily net assets attributable to Class A shares for distribution services and facilities provided to the Fund by EVD, as well as for personal services and/or the maintenance of shareholder accounts. The Fund also has in effect a distribution plan for Class C shares (Class C Plan) pursuant to Rule 12b-1 under the 1940 Act. Pursuant to the Class C Plan, the Fund pays EVD amounts equal to 0.75% per annum of its average daily net assets attributable to Class C shares for providing ongoing distribution services and facilities to the Fund. In addition, pursuant to the Class C Plan, the Fund also makes payments of service fees to EVD, financial intermediaries and other persons in amounts equal to 0.25% per annum of its average daily net assets attributable to that class. Service fees paid or accrued are for personal services and/or the maintenance of shareholder accounts. Distribution and service fees paid or accrued for the year ended September 30, 2023 amounted to $118,973 and $27,975 for Class A shares and Class C shares, respectively.
The Fund was informed that EVD received $3,482 as its portion of the sales charge on sales of Class A shares for the year ended September 30, 2023. The Fund was also informed that EVD received less than $500 and less than $100 of contingent deferred sales charges paid by Class A and Class C shareholders, respectively, for the same period.
Eaton Vance Management (EVM), an affiliate of CRM, provides sub-transfer agency and related services to the Fund pursuant to a Sub-Transfer Agency Support Services Agreement. For the year ended September 30, 2023, sub-transfer agency fees and expenses incurred to EVM amounted to $18,193 and are included in transfer agency fees and expenses on the Statement of Operations.
During the year ended September 30, 2023, CRM reimbursed the Fund $19,958 for a net realized loss due to a trading error. The impact of the reimbursement was less than $0.01 per share for each class and had no significant impact on total return.
Each Trustee of the Fund who is not an employee of CRM or its affiliates receives an annual fee of $214,000, an annual Committee fee ranging from $8,500 to $16,500 depending on the Committee, and may receive a fee of $10,000 for special meetings. The Board chair receives an additional $40,000 ($30,000 prior to January 1, 2023) annual fee, Committee chairs receive an additional $15,000 ($6,000 prior to January 1, 2023) annual fee and the special equities liaison receives an additional $2,500 annual fee. Eligible Trustees may participate in a Deferred Compensation Plan (the Plan). Amounts deferred under the Plan are treated as though equal dollar amounts had been invested in shares of the Fund or other Calvert funds selected by the Trustees. The Fund purchases shares of the funds selected equal to the dollar amounts deferred under the Plan, resulting in an asset equal to the deferred compensation liability. Obligations of the Plan are paid solely from the Fund's assets. Trustees’ fees are allocated to each of the Calvert funds served. Salaries and fees of officers and Trustees of the Fund who are employees of CRM or its affiliates are paid by CRM.
3 Investment Activity
During the year ended September 30, 2023, the cost of purchases and proceeds from sales of investments, other than short-term securities and including principal repayments on senior floating-rate loans, were $98,764,768 and $120,247,840, respectively.
4 Distributions to Shareholders and Income Tax Information
The tax character of distributions declared for the years ended September 30, 2023 and September 30, 2022 was as follows:
| | Year Ended September 30, |
| | 2023 | 2022 |
| Ordinary income | $23,349,075 | $21,714,598 |
Calvert
High Yield Bond Fund
September 30, 2023
Notes to Financial Statements — continued
During the year ended September 30, 2023, accumulated loss was increased by $63,733 and paid-in capital was increased by $63,733 due to the Fund’s use of equalization accounting. Tax equalization accounting allows the Fund to treat as a distribution that portion of redemption proceeds representing a redeeming shareholder’s portion of undistributed taxable income and net capital gains. These reclassifications had no effect on the net assets or net asset value per share of the Fund.
As of September 30, 2023, the components of distributable earnings (accumulated loss) on a tax basis were as follows:
| Undistributed ordinary income | $ 390,281 |
| Deferred capital losses | (35,873,419) |
| Net unrealized depreciation | (43,634,759) |
| Distributions payable | (184,218) |
| Accumulated loss | $(79,302,115) |
At September 30, 2023, the Fund, for federal income tax purposes, had deferred capital losses of $35,873,419 which would reduce the Fund's taxable income arising from future net realized gains on investment transactions, if any, to the extent permitted by the Internal Revenue Code, and thus would reduce the amount of distributions to shareholders, which would otherwise be necessary to relieve the Fund of any liability for federal income or excise tax. The deferred capital losses are treated as arising on the first day of the Fund's next taxable year, can be carried forward for an unlimited period, and retain the same short-term or long-term character as when originally deferred. Of the deferred capital losses at September 30, 2023, $9,542,715 are short-term and $26,330,704 are long-term.
The cost and unrealized appreciation (depreciation) of investments, including open derivative contracts, of the Fund at September 30, 2023, as determined on a federal income tax basis, were as follows:
| Aggregate cost | $494,520,554 |
| Gross unrealized appreciation | $ 1,735,907 |
| Gross unrealized depreciation | (45,367,912) |
| Net unrealized depreciation | $ (43,632,005) |
5 Financial Instruments
The Fund may trade in financial instruments with off-balance sheet risk in the normal course of its investing activities. These financial instruments may include forward foreign currency exchange contracts and may involve, to a varying degree, elements of risk in excess of the amounts recognized for financial statement purposes. The notional or contractual amounts of these instruments represent the investment the Fund has in particular classes of financial instruments and do not necessarily represent the amounts potentially subject to risk. The measurement of the risks associated with these instruments is meaningful only when all related and offsetting transactions are considered. A summary of obligations under these financial instruments at September 30, 2023 is included in the Schedule of Investments. At September 30, 2023, the Fund had sufficient cash and/or securities to cover commitments under these contracts.
The Fund is subject to foreign exchange risk in the normal course of pursuing its investment objectives. During the year ended September 30, 2023, the Fund entered into forward foreign currency exchange contracts to seek to hedge against the decline in the value of currencies in which its portfolio holdings are denominated against the U.S. dollar.
The Fund enters into forward foreign currency exchange contracts that may contain provisions whereby the counterparty may terminate the contract under certain conditions, including but not limited to a decline in the Fund’s net assets below a certain level over a certain period of time, which would trigger a payment by the Fund for those derivatives in a liability position. At September 30, 2023, the Fund had no open derivatives with credit-related contingent features in a net liability position.
The over-the-counter (OTC) derivatives in which the Fund invests are subject to the risk that the counterparty to the contract fails to perform its obligations under the contract. To mitigate this risk, the Fund has entered into an International Swaps and Derivatives Association, Inc. Master Agreement (“ISDA Master Agreement”) with its derivative counterparty. The ISDA Master Agreement is a bilateral agreement between the Fund and the counterparty that governs certain OTC derivatives and typically contains, among other things, set-off provisions in the event of a default and/or termination event as defined under the ISDA Master Agreement. Under the ISDA Master Agreement, the Fund may, under certain circumstances, offset with the counterparty certain derivative financial instruments’ payables and/or receivables with collateral held and/or posted and create one single net payment. The provisions of the ISDA Master Agreement typically permit a single net payment in the event of default including the bankruptcy or insolvency of the counterparty. However,
Calvert
High Yield Bond Fund
September 30, 2023
Notes to Financial Statements — continued
bankruptcy or insolvency laws of a particular jurisdiction may impose restrictions on or prohibitions against the right of offset in bankruptcy or insolvency. The ISDA Master Agreement allows the counterparty to OTC derivatives to terminate derivative contracts prior to maturity in the event the Fund’s net assets decline by a stated percentage or the Fund fails to meet the terms of its ISDA Master Agreement, which would cause the counterparty to accelerate payment by the Fund of any net liability owed to it.
The collateral requirements for derivatives traded under the ISDA Master Agreement are governed by a Credit Support Annex to the ISDA Master Agreement. Collateral requirements are determined at the close of business each day and are typically based on changes in market values for each transaction under the ISDA Master Agreement and netted into one amount for such agreement. Generally, the amount of collateral due from or to a counterparty is subject to a minimum transfer threshold amount before a transfer is required. Collateral pledged for the benefit of the Fund and/or counterparty is held in segregated accounts by the Fund’s custodian and cannot be sold, re-pledged, assigned or otherwise used while pledged. The portion of such collateral representing cash, if any, is reflected as deposits for derivatives collateral and, in the case of cash pledged by a counterparty for the benefit of the Fund, a corresponding liability on the Statement of Assets and Liabilities. Securities pledged by the Fund as collateral, if any, are identified as such in the Schedule of Investments.
At September 30, 2023, the fair value of open derivative instruments (not considered to be hedging instruments for accounting disclosure purposes) and whose primary underlying risk exposure is foreign exchange risk was as follows:
| Derivative | Statement of Assets and Liabilities Caption | Assets | Liabilities |
| Forward foreign currency exchange contracts | Receivable/Payable for open forward foreign currency
exchange contracts | $451,696 | $ — |
The Fund’s derivative assets at fair value by type, which are reported gross in the Statement of Assets and Liabilities, are presented in the table above. The following table presents the Fund’s derivative assets by counterparty, net of amounts available for offset under a master netting agreement and net of the related collateral received by the Fund for such assets as of September 30, 2023.
| Counterparty | Derivative
Assets Subject to
Master Netting
Agreement | Derivatives
Available
for Offset | Non-cash
Collateral
Received(a) | Cash
Collateral
Received(a) | Net Amount
of Derivative
Assets(b) |
| State Street Bank and Trust Company | $451,696 | $ — | $(295,748) | $ — | $155,948 |
| (a) | In some instances, the total collateral received and/or pledged may be more than the amount shown due to overcollateralization. |
| (b) | Net amount represents the net amount due from the counterparty in the event of default. |
The effect of derivative instruments (not considered to be hedging instruments for accounting disclosure purposes) on the Statement of Operations and whose primary underlying risk exposure is foreign exchange risk for the year ended September 30, 2023 was as follows:
| | Statement of Operations Caption | |
| Derivative | Net realized gain (loss):
Forward foreign currency exchange contracts | Change in unrealized appreciation
(depreciation): Forward foreign currency exchange contracts |
| Forward foreign currency exchange contracts | $ (491,553) | $ 11,796 |
The average notional amount of forward foreign currency exchange contracts (based on the absolute value of notional amounts of currency purchased and currency sold) outstanding during the year ended September 30, 2023, which is indicative of the volume of this derivative type, was approximately $10,379,000.
Calvert
High Yield Bond Fund
September 30, 2023
Notes to Financial Statements — continued
6 Securities Lending
To generate additional income, the Fund may lend its securities pursuant to a securities lending agency agreement with State Street Bank and Trust Company (SSBT), the securities lending agent. Security loans are subject to termination by the Fund at any time and, therefore, are not considered illiquid investments. The Fund requires that the loan be continuously collateralized by either cash or securities in an amount at least equal to the market value of the securities on loan. The market value of securities loaned is determined daily and any additional required collateral is delivered to the Fund on the next business day. Cash collateral is generally invested in a money market fund registered under the 1940 Act that is managed by an affiliate of SSBT. Any gain or loss in the market price of the loaned securities that might occur and any interest earned or dividends declared during the term of the loan would accrue to the account of the Fund. Income earned on the investment of collateral, net of broker rebates and other expenses incurred by the securities lending agent, is split between the Fund and the securities lending agent based on agreed upon contractual terms. Non-cash collateral, if any, is held by the lending agent on behalf of the Fund and cannot be sold or re-pledged by the Fund; accordingly, such collateral is not reflected in the Statement of Assets and Liabilities.
The risks associated with lending portfolio securities include, but are not limited to, possible delays in receiving additional collateral or in the recovery of the loaned securities, possible loss of rights to the collateral should the borrower fail financially, as well as risk of loss in the value of the collateral or the value of the investments made with the collateral. The securities lending agent shall indemnify the Fund in the case of default of any securities borrower.
At September 30, 2023, the total value of securities on loan, including accrued interest, was $28,764,508 and the total value of collateral received was $29,404,453, comprised of cash of $28,240,331 and U.S. government and/or agencies securities of $1,164,122.
The following table provides a breakdown of securities lending transactions accounted for as secured borrowings, the obligations by class of collateral pledged, and the remaining contractual maturity of those transactions as of September 30, 2023.
| | Remaining Contractual Maturity of the Transactions |
| | Overnight and
Continuous | <30 days | 30 to 90 days | >90 days | Total |
| Common Stocks | $ 556,750 | $ — | $ — | $ — | $ 556,750 |
| Corporate Bonds | 27,683,581 | — | — | — | 27,683,581 |
| Total | $28,240,331 | $ — | $ — | $ — | $28,240,331 |
The carrying amount of the liability for deposits for securities loaned at September 30, 2023 approximated its fair value. If measured at fair value, such liability would have been considered as Level 2 in the fair value hierarchy (see Note 1A) at September 30, 2023.
7 Line of Credit
The Fund participates with other portfolios and funds managed by EVM and its affiliates, including CRM, in a $725 million unsecured revolving line of credit agreement with a group of banks, which is in effect through October 24, 2023. Borrowings are made by the Fund solely for temporary purposes related to redemptions and other short-term cash needs. Interest is charged to the Fund based on its borrowings at an amount above either the Secured Overnight Financing Rate (SOFR) or Federal Funds rate. In addition, a fee computed at an annual rate of 0.15% on the daily unused portion of the line of credit is allocated among the participating portfolios and funds at the end of each quarter. In connection with the renewal of the agreement in October 2022, an arrangement fee of $150,000 was incurred that was allocated to the participating portfolios and funds. Because the line of credit is not available exclusively to the Fund, it may be unable to borrow some or all of its requested amounts at any particular time.
The Fund had no borrowings outstanding pursuant to its line of credit at September 30, 2023. The Fund did not have any significant borrowings or allocated fees during the year ended September 30, 2023. Effective October 24, 2023, the Fund renewed its line of credit agreement, which expires October 22, 2024. In connection with the renewal, the borrowing limit was decreased to $650 million.
Calvert
High Yield Bond Fund
September 30, 2023
Notes to Financial Statements — continued
8 Affiliated Investments
At September 30, 2023, the value of the Fund’s investment in funds that may be deemed to be affiliated was $14,175,350, which represents 3.3% of the Fund’s net assets. Transactions in such funds by the Fund for the year ended September 30, 2023 were as follows:
| Name | Value,
beginning
of period | Purchases | Sales
proceeds | Net
realized
gain
(loss) | Change in
unrealized
appreciation
(depreciation) | Value,
end of
period | Dividend
income | Shares,
end of
period |
| Short-Term Investments | | | | | | |
| Liquidity Fund | $12,432,367 | $127,561,145 | $(125,818,162) | $ — | $ — | $14,175,350 | $687,881 | 14,175,350 |
9 Capital Shares
The Fund’s Declaration of Trust permits the Trustees to issue an unlimited number of full and fractional shares of beneficial interest (without par value). Such shares may be issued in a number of different series (such as the Fund) and classes.
Transactions in capital shares, including direct exchanges pursuant to share class conversions for all periods presented, were as follows:
| | Year Ended
September 30, 2023 | | Year Ended
September 30, 2022 |
| | Shares | Amount | | Shares | Amount |
| Class A | | | | | |
| Shares sold | 364,246 | $ 8,605,638 | | 421,951 | $ 10,802,332 |
| Reinvestment of distributions | 100,625 | 2,374,569 | | 84,221 | 2,119,029 |
| Shares redeemed | (471,133) | (11,087,899) | | (468,433) | (11,895,373) |
| Net increase (decrease) | (6,262) | $ (107,692) | | 37,739 | $ 1,025,988 |
| Class C | | | | | |
| Shares sold | 14,152 | $ 338,161 | | 12,288 | $ 332,264 |
| Reinvestment of distributions | 5,026 | 120,457 | | 5,219 | 134,257 |
| Shares redeemed | (48,155) | (1,151,594) | | (74,010) | (1,947,248) |
| Net decrease | (28,977) | $ (692,976) | | (56,503) | $ (1,480,727) |
| Class I | | | | | |
| Shares sold | 4,576,002 | $ 106,518,931 | | 5,576,938 | $ 141,926,091 |
| Reinvestment of distributions | 643,301 | 14,965,277 | | 576,189 | 14,311,643 |
| Shares redeemed | (5,458,633) | (126,792,169) | | (6,851,650) | (169,878,725) |
| Net decrease | (239,330) | $ (5,307,961) | | (698,523) | $ (13,640,991) |
| Class R6 | | | | | |
| Shares sold | 423,300 | $ 9,883,414 | | 2,505,103 | $ 63,244,797 |
| Reinvestment of distributions | 161,783 | 3,764,923 | | 117,989 | 2,874,336 |
| Shares redeemed | (1,174,731) | (27,336,032) | | (711,187) | (16,802,635) |
| Net increase (decrease) | (589,648) | $ (13,687,695) | | 1,911,905 | $ 49,316,498 |
10 Risks and Uncertainties
Credit Risk
The Fund primarily invests in securities rated below investment grade and comparable unrated investments. These investments can involve a substantial risk of loss and are considered speculative with respect to the issuer’s ability to pay interest and principal. These investments also have a higher risk of issuer default, are subject to greater price volatility than investment grade securities and may be illiquid.
Calvert
High Yield Bond Fund
September 30, 2023
Report of Independent Registered Public Accounting Firm
To the Board of Trustees of The Calvert Fund and Shareholders of Calvert High Yield Bond Fund:
Opinion on the Financial Statements and Financial Highlights
We have audited the accompanying statement of assets and liabilities of Calvert High Yield Bond Fund (the "Fund") (one of the funds constituting The Calvert Fund), including the schedule of investments, as of September 30, 2023, the related statement of operations for the year then ended, the statements of changes in net assets for each of the two years in the period then ended, the financial highlights for each of the three years in the period then ended, and the related notes. In our opinion, the financial statements and financial highlights present fairly, in all material respects, the financial position of the Fund as of September 30, 2023, and the results of its operations for the year then ended, the changes in its net assets for each of the two years in the period then ended, and the financial highlights for each of the three years in the period then ended, in conformity with accounting principles generally accepted in the United States of America. The financial highlights for the years ended September 30, 2020 and 2019 were audited by other auditors whose report, dated November 20, 2020, expressed an unqualified opinion on those financial highlights.
Basis for Opinion
These financial statements and financial highlights are the responsibility of the Fund's management. Our responsibility is to express an opinion on the Fund's financial statements and financial highlights based on our audits. We are a public accounting firm registered with the Public Company Accounting Oversight Board (United States) (PCAOB) and are required to be independent with respect to the Fund in accordance with the U.S. federal securities laws and the applicable rules and regulations of the Securities and Exchange Commission and the PCAOB.
We conducted our audits in accordance with the standards of the PCAOB. Those standards require that we plan and perform the audit to obtain reasonable assurance about whether the financial statements and financial highlights are free of material misstatement, whether due to error or fraud. The Fund is not required to have, nor were we engaged to perform, an audit of its internal control over financial reporting. As part of our audits, we are required to obtain an understanding of internal control over financial reporting but not for the purpose of expressing an opinion on the effectiveness of the Fund’s internal control over financial reporting. Accordingly, we express no such opinion.
Our audits included performing procedures to assess the risks of material misstatement of the financial statements and financial highlights, whether due to error or fraud, and performing procedures that respond to those risks. Such procedures included examining, on a test basis, evidence regarding the amounts and disclosures in the financial statements and financial highlights. Our audits also included evaluating the accounting principles used and significant estimates made by management, as well as evaluating the overall presentation of the financial statements and financial highlights. Our procedures included confirmation of securities and senior loans owned as of September 30, 2023, by correspondence with the custodian, brokers and agent banks; when replies were not received from brokers and agent banks, we performed other auditing procedures. We believe that our audits provide a reasonable basis for our opinion.
/s/ Deloitte & Touche LLP
Boston, Massachusetts
November 22, 2023
We have served as the auditor of one or more Calvert investment companies since 2021.
Calvert
High Yield Bond Fund
September 30, 2023
Federal Tax Information (Unaudited)
The Form 1099-DIV you receive in February 2024 will show the tax status of all distributions paid to your account in calendar year 2023. Shareholders are advised to consult their own tax adviser with respect to the tax consequences of their investment in the Fund. As required by the Internal Revenue Code and/or regulations, shareholders must be notified regarding the status of qualified dividend income for individuals, the dividends received deduction for corporations and 163(j) interest dividends.
Qualified Dividend Income. For the fiscal year ended September 30, 2023, the Fund designates approximately $275,477, or up to the maximum amount of such dividends allowable pursuant to the Internal Revenue Code, as qualified dividend income eligible for the reduced tax rate of 15%.
Dividends Received Deduction. Corporate shareholders are generally entitled to take the dividends received deduction on the portion of the Fund's dividend distribution that qualifies under tax law. For the Fund's fiscal 2023 ordinary income dividends, 1.02% qualifies for the corporate dividends received deduction.
163(j) Interest Dividends. For the fiscal year ended September 30, 2023, the Fund designates 88.08% of distributions from net investment income as a 163(j) interest dividend.
Calvert
High Yield Bond Fund
September 30, 2023
Board of Trustees' Contract Approval
Overview of the Contract Review Process
The Investment Company Act of 1940, as amended, provides, in substance, that each investment advisory agreement between a fund and its investment adviser will continue in effect from year to year only if its continuation is approved at least annually by the fund’s board of directors, including by a vote of a majority of the directors who are not “interested persons” of the fund (“Independent Trustees”), cast in person at a meeting called for the purpose of considering such approval.
At an in-person meeting of the Boards of Trustees/Directors (each a “Board”) of the registered investment companies advised by Calvert Research and Management (“CRM” or the “Adviser”) (the “Calvert Funds”) held on June 12-13, 2023, the Board, including a majority of the Independent Trustees, voted to approve continuation of existing investment advisory and investment sub-advisory agreements for the Calvert Funds for an additional one-year period.
In evaluating the investment advisory and investment sub-advisory agreements for the Calvert Funds, the Board considered a variety of information relating to the Calvert Funds and various service providers, including the Adviser. The Independent Trustees reviewed a report prepared by the Adviser regarding various services provided to the Calvert Funds by the Adviser and its affiliates. Such report included, among other data, information regarding the Adviser’s personnel and the Adviser’s revenue and cost of providing services to the Calvert Funds, and a separate report prepared by an independent data provider, which compared each fund’s investment performance, fees and expenses to those of comparable funds as identified by such independent data provider (“comparable funds”).
The Independent Trustees were separately represented by independent legal counsel with respect to their consideration of the continuation of the investment advisory and investment sub-advisory agreements for the Calvert Funds. Prior to voting, the Independent Trustees reviewed the proposed continuation of the Calvert Funds’ investment advisory and investment sub-advisory agreements with management and also met in private sessions with their counsel at which time no representatives of management were present.
The information that the Board considered included, among other things, the following (for funds that invest through one or more affiliated underlying fund(s), references to “each fund” in this section may include information that was considered at the underlying fund-level):
Information about Fees, Performance and Expenses
| • | A report from an independent data provider comparing the advisory and related fees paid by each fund with fees paid by comparable funds; |
| • | A report from an independent data provider comparing each fund’s total expense ratio and its components to comparable funds; |
| • | A report from an independent data provider comparing the investment performance of each fund to the investment performance of comparable funds over various time periods; |
| • | Data regarding investment performance in comparison to benchmark indices; |
| • | For each fund, comparative information concerning the fees charged and the services provided by the Adviser in managing other accounts (including mutual funds, other collective investment funds and institutional accounts) using investment strategies and techniques similar to those used in managing such fund; |
| • | Profitability analyses for the Adviser with respect to each fund; |
Information about Portfolio Management and Trading
| • | Descriptions of the investment management services provided to each fund, including investment strategies and processes it employs; |
| • | Information about the Adviser’s policies and practices with respect to trading, including the Adviser’s processes for monitoring best execution of portfolio transactions; |
| • | Information about the allocation of brokerage transactions and the benefits received by the Adviser as a result of brokerage allocation, including information concerning the acquisition of research through client commission arrangements and policies with respect to “soft dollars”; |
Information about the Adviser
| • | Reports detailing the financial results and condition of CRM; |
| • | Descriptions of the qualifications, education and experience of the individual investment professionals whose responsibilities include portfolio management and investment research for the funds, and information relating to their compensation and responsibilities with respect to managing other mutual funds and investment accounts; |
| • | Policies and procedures relating to proxy voting and the handling of corporate actions and class actions; |
| • | A description of CRM’s procedures for overseeing sub-advisers, including with respect to regulatory and compliance issues, investment management and other matters; |
Calvert
High Yield Bond Fund
September 30, 2023
Board of Trustees' Contract Approval — continued
Other Relevant Information
| • | Information concerning the nature, cost and character of the administrative and other non-investment advisory services provided by CRM and its affiliates; and |
| • | The terms of each investment advisory agreement. |
Over the course of the year, the Board and its committees held regular quarterly meetings. During these meetings, the Trustees participated in investment and performance reviews with the portfolio managers and other investment professionals of the Adviser relating to each fund and considered various investment and trading strategies used in pursuing each fund’s investment objective(s), such as the use of derivative instruments, as well as risk management techniques. The Board and its committees also evaluated issues pertaining to industry and regulatory developments, compliance procedures, corporate governance and other issues with respect to the funds and received and participated in reports and presentations provided by CRM and its affiliates with respect to such matters. In addition to the formal meetings of the Board and its committees, the Independent Trustees held regular video conferences in between meetings to discuss, among other topics, matters relating to the continuation of the Calvert Funds’ investment advisory and investment sub-advisory agreements.
For funds that invest through one or more affiliated underlying funds, the Board considered similar information about the underlying fund(s) when considering the approval of investment advisory agreements. In addition, in cases where the Adviser has engaged a sub-adviser, the Board considered similar information about the sub-adviser when considering the approval of any investment sub-advisory agreement.
The Independent Trustees were assisted throughout the contract review process by their independent legal counsel. The Independent Trustees relied upon the advice of such counsel and their own business judgment in determining the material factors to be considered in evaluating each investment advisory and investment sub-advisory agreement and the weight to be given to each such factor. The Board, including the Independent Trustees, did not identify any single factor as controlling, and each Trustee may have attributed different weight to various factors.
Results of the Contract Review Process
Based on its consideration of the foregoing, and such other information as it deemed relevant, including the factors and conclusions described below, the Board, including the Independent Trustees, concluded that the continuation of the investment advisory agreement of Calvert High Yield Bond Fund (the “Fund”), including the fee payable under the agreement, is in the best interests of the Fund’s shareholders. Accordingly, the Board, including a majority of the Independent Trustees, voted to approve the continuation of the investment advisory agreement of the Fund.
Nature, Extent and Quality of Services
In considering the nature, extent and quality of the services provided by the Adviser under the investment advisory agreement, the Board reviewed information provided by the Adviser relating to its operations and personnel, including, among other information, biographical information on the Adviser’s investment personnel and descriptions of its organizational and management structure. The Board also took into account similar information provided periodically throughout the previous year by the Adviser as well as the Board’s familiarity with management through Board meetings, discussions and other reports. The Board considered the Adviser’s management style and its performance in employing its investment strategies as well as its current level of staffing and overall resources. The Board also noted that it reviewed on a quarterly basis information regarding the Adviser’s compliance with applicable policies and procedures, including those related to personal investing. The Board took into account, among other items, periodic reports received from the Adviser over the past year concerning the Adviser’s ongoing review and enhancement of certain processes, policies and procedures of the Calvert Funds and the Adviser. The Board concluded that it was satisfied with the nature, extent and quality of services provided to the Fund by the Adviser under the investment advisory agreement.
Fund Performance
In considering the Fund’s performance, the Board noted that it reviewed on a quarterly basis detailed information about the Fund’s performance results, portfolio composition and investment strategies. The Board compared the Fund’s investment performance to that of the Fund’s peer universe and its benchmark index. The Board’s review included comparative performance data for the one-, three- and five-year periods ended December 31, 2022. This performance data indicated that the Fund had underperformed the median of its peer universe for the one-, three- and five-year periods ended December 31, 2022. This performance data also indicated that the Fund had outperformed its benchmark index for the one-year period ended
Calvert
High Yield Bond Fund
September 30, 2023
Board of Trustees' Contract Approval — continued
December 31, 2022, while it had underperformed its benchmark index for the three- and five-year periods ended December 31, 2022. The Board took into account management’s discussion of the Fund’s performance. Based upon its review, the Board concluded that the Fund’s performance was satisfactory relative to the performance of its peer universe and its benchmark index.
Management Fees and Expenses
In considering the Fund’s fees and expenses, the Board compared the Fund’s fees and total expense ratio with those of comparable funds in its expense group. Among other findings, the data indicated that the Fund’s advisory and administrative fees (referred to collectively as “management fees”) and the Fund’s total expenses were each above the respective median of the Fund’s expense group. The Board took into account the Adviser’s current undertaking to maintain expense limitations for the Fund and that the Adviser was waiving and/or reimbursing a portion of the Fund’s expenses. Based upon its review, the Board concluded that the management fees were reasonable in view of the nature, extent and quality of services provided by the Adviser.
Profitability and Other “Fall-Out” Benefits
The Board reviewed the Adviser’s profitability in regard to the Fund and the Calvert Funds in the aggregate. In reviewing the overall profitability of the Fund to the Adviser, the Board also considered the fact that the Adviser and its affiliates provided sub-transfer agency support, administrative and distribution services to the Fund for which they received compensation. The information considered by the Board included the profitability of the Fund to the Adviser and its affiliates without regard to any marketing support or other payments by the Adviser and its affiliates to third parties in respect of distribution services. The Board also considered that the Adviser and its affiliates derived benefits to their reputation and other indirect benefits from their relationships with the Fund. Based upon its review, the Board concluded that the Adviser’s and its affiliates’ level of profitability from their relationships with the Fund was reasonable.
Economies of Scale
The Board considered the effect of the Fund’s current size and its potential growth on its performance and fees. The Board concluded that adding breakpoints to the advisory fee at specified asset levels would not be appropriate at this time. The Board noted that if the Fund’s assets increased over time, the Fund might realize other economies of scale if assets increased proportionally more than certain other expenses.
Calvert
High Yield Bond Fund
September 30, 2023
Liquidity Risk Management Program
The Fund has implemented a written liquidity risk management program (Program) and related procedures to manage its liquidity in accordance with Rule 22e-4 under the Investment Company Act of 1940, as amended (Liquidity Rule). The Liquidity Rule defines “liquidity risk” as the risk that a fund could not meet requests to redeem shares issued by the fund without significant dilution of the remaining investors’ interests in the fund. The Fund’s Board of Trustees/Directors has designated the investment adviser to serve as the administrator of the Program and the related procedures. The administrator has established a Liquidity Risk Management Oversight Committee (Committee) to perform the functions necessary to administer the Program. As part of the Program, the administrator is responsible for identifying illiquid investments and categorizing the relative liquidity of the Fund’s investments in accordance with the Liquidity Rule. Under the Program, the administrator assesses, manages, and periodically reviews the Fund’s liquidity risk, and is responsible for making certain reports to the Fund’s Board of Trustees/Directors and the Securities and Exchange Commission (SEC) regarding the liquidity of the Fund’s investments, and to notify the Board of Trustees/Directors and the SEC of certain liquidity events specified in the Liquidity Rule. The liquidity of the Fund’s portfolio investments is determined based on a number of factors including, but not limited to, relevant market, trading and investment-specific considerations under the Program.
At a meeting of the Fund’s Board of Trustees/Directors on June 13, 2023, the Committee provided a written report to the Fund’s Board of Trustees/ Directors pertaining to the operation, adequacy, and effectiveness of implementation of the Program, as well as the operation of the highly liquid investment minimum (if applicable) for the period January 1, 2022 through December 31, 2022 (Review Period). The Program operated effectively during the Review Period, supporting the administrator’s ability to assess, manage and monitor Fund liquidity risk, including during periods of market volatility and net redemptions. During the Review Period, the Fund met redemption requests on a timely basis.
There can be no assurance that the Program will achieve its objectives in the future. Please refer to the Fund’s prospectus for more information regarding the Fund’s exposure to liquidity risk and other principal risks to which an investment in the Fund may be subject.
Calvert
High Yield Bond Fund
September 30, 2023
Management and Organization
Fund Management. The Trustees of The Calvert Fund (the Trust) are responsible for the overall management and supervision of the affairs of the Trust. The Board members and officers of the Trust are listed below. Except as indicated, each individual has held the office shown or other offices in the same company for the last five years. Board members hold indefinite terms of office. Each Board member holds office until his or her successor is elected and qualified, or until his or her earlier death, resignation, retirement, removal or disqualification. Under the terms of the Fund's current Board member retirement policy, an Independent Board member must retire at the end of the calendar year in which he or she turns 75. However, if such retirement would cause the Fund to be out of compliance with Section 16 of the 1940 Act or any other regulations or guidance of the SEC, then such retirement will not become effective until such time as action has been taken for the Fund to be in compliance therewith. The “noninterested Trustees” consist of those Trustees who are not “interested persons” of the Trust, as that term is defined under the 1940 Act. The business address of each Board member and the Chief Compliance Officer is 2050 M Street NW, Washington, DC 20036 and the business address of the Secretary, Vice President and Chief Legal Officer and the Treasurer is Two International Place, Boston, Massachusetts 02110. As used below, “CRM” refers to Calvert Research and Management and “Eaton Vance” refers to Eaton Vance Management. Each Trustee oversees 46 funds in the Calvert fund complex. Each of Eaton Vance and CRM are indirect, wholly owned subsidiaries of Morgan Stanley. Each officer affiliated with CRM may hold a position with other CRM affiliates that is comparable to his or her position with CRM listed below.
| Name and Year of Birth | Trust
Position(s) | Length of
Service | Principal Occupation(s) and Other Directorships
During Past Five Years and Other Relevant Experience |
| Interested Trustee | | | |
Theodore H. Eliopoulos(1)
1964 | Trustee and
President | Since 2022 | President and Chief Executive Officer of CRM and senior sponsor of Morgan Stanley Investment Management’s (MSIM) Diversity Council. Formerly, Vice Chairman & Head of Strategic Partnerships at MSIM (2019-2022). Former Chief Investment Officer and interim Chief Investment Officer (2014-2018) and Senior Investment Officer of Real Estate and Real Assets at California Public Employees’ Retirement System (CalPERS) (2007-2014). Former Chief Deputy Treasurer and Deputy Treasurer at the California State Treasurer's Office (2002-2006). Mr. Eliopoulos is an interested person because of his positions with CRM and certain affiliates.
Other Directorships. The Robert Toigo Foundation; Pacific Pension & Investment Institute (PPI). |
| Noninterested Trustees |
Richard L. Baird, Jr.(2)
1948 | Trustee | Since 1982 | Regional Disaster Recovery Lead, American Red Cross of Greater
Pennsylvania (since 2017). Volunteer, American Red Cross (since 2015).
Former President and CEO of Adagio Health Inc. (retired in 2014) in
Pittsburgh, PA.
Other Directorships. None. |
Alice Gresham Bullock
1950 | Chair and
Trustee | Since 2016 | Professor Emerita at Howard University School of Law. Dean Emerita of
Howard University School of Law and Deputy Director of the Association
of American Law Schools (1992-1994).
Other Directorships. None. |
Cari M. Dominguez
1949 | Trustee | Since 2016 | Former Chair of the U.S. Equal Employment Opportunity Commission.
Other Directorships. ManpowerGroup Inc. (workforce solutions company);
Triple S Management Corporation (managed care); National Association of Corporate Directors. |
Karen Fang(3)
1958 | Trustee | Since 2023 | Formerly, Managing Director, Wealth Management at GAMCO Asset Management (asset management firm) (2020-2023). Formerly, Managing Director, Senior Portfolio Manager of Fiduciary Trust Company International (wealth management firm) (1993-2019).
Other Directorships. None. |
John G. Guffey, Jr.(2)
1948 | Trustee | Since 1982 | President of Aurora Press Inc., a privately held publisher of trade paperbacks
(since January 1997).
Other Directorships. Calvert Impact Capital, Inc. (through December 31, 2018); Calvert Ventures, LLC. |
Miles D. Harper, III
1962 | Trustee | Since 2016 | Partner, Carr Riggs & Ingram (public accounting firm) since October 2014.
Partner, Gainer Donnelly & Desroches (public accounting firm) (now Carr
Riggs & Ingram) (November 1999 - September 2014).
Other Directorships. Bridgeway Funds (9) (asset management). |
Joy V. Jones
1950 | Trustee | Since 2016 | Attorney.
Other Directorships. Palm Management Corporation. |
Calvert
High Yield Bond Fund
September 30, 2023
Management and Organization — continued
| Name and Year of Birth | Trust
Position(s) | Length of
Service | Principal Occupation(s) and Other Directorships
During Past Five Years and Other Relevant Experience |
| Noninterested Trustees (continued) |
Eddie Ramos(3)
1967 | Trustee | Since 2023 | Private investor (2022-present). Formerly, Head of External Advisors/Diversity Portfolio Management at the New Jersey Division of Investment (2020-2022). Formerly, Chief Investment Officer and Lead Portfolio Manager – Global Fundamental Equities at Cornerstone Capital Management (asset management firm) (2011-2017).
Other Directorships. Macquarie Optimum Funds (6) (asset management). |
Anthony A. Williams
1951 | Trustee | Since 2010 | CEO and Executive Director of the Federal City Council (July 2012 to
present); Senior Adviser and Independent Consultant for King and
Spalding LLP (September 2015 to present); Executive Director of Global
Government Practice at the Corporate Executive Board (January 2010 to
January 2012).
Other Directorships. Freddie Mac; Evoq Properties/Meruelo Maddux
Properties, Inc. (real estate management); Weston Solutions, Inc.
(environmental services); Bipartisan Policy Center’s Debt Reduction Task Force;
Chesapeake Bay Foundation; Catholic University of America; Urban Institute (research organization); The Howard Hughes Corporation (real estate development); Old Dominion National Bank. |
| Name and Year of Birth | Trust
Position(s) | Length of
Service | Principal Occupation(s)
During Past Five Years |
| Principal Officers who are not Trustees |
Hope L. Brown
1973 | Chief
Compliance
Officer | Since 2014 | Chief Compliance Officer of 46 registered investment companies advised
by CRM (since 2014). Vice President and Chief Compliance Officer,
Wilmington Funds (2012-2014). |
Deidre E. Walsh
1971 | Secretary,
Vice President
and Chief
Legal Officer | Since 2021 | Vice President of CRM and officer of 46 registered investment companies
advised by CRM (since 2021). Also Vice President of Eaton Vance and
certain of its affiliates and officer of 127 registered investment companies
advised or administered by Eaton Vance. |
James F. Kirchner
1967 | Treasurer | Since 2016 | Vice President of CRM and officer of 46 registered investment companies
advised by CRM (since 2016). Also Vice President of Eaton Vance and
certain of its affiliates and officer of 127 registered investment companies
advised or administered by Eaton Vance. |
| | | | |
| (1) Mr. Eliopoulos is an interested person of the Fund because of his positions with the Fund’s adviser and certain affiliates. |
| (2) Effective December 31, 2023, Richard L. Baird, Jr. and John G. Guffey, Jr. will retire from the Board of Trustees. |
| (3) Ms. Fang and Mr. Ramos began serving as Trustees effective October 30, 2023. |
The SAI for the Fund includes additional information about the Trustees and officers of the Fund and can be obtained without charge on Calvert’s website at www.calvert.com or by calling 1-800-368-2745.
| FACTS | WHAT DOES EATON VANCE DO WITH YOUR
PERSONAL INFORMATION? |
| Why? | Financial companies choose how they share your personal information. Federal law gives consumers the right to limit some but not all sharing. Federal law also requires us to tell you how we collect, share, and protect your personal information. Please read this notice carefully to understand what we do. |
| |
| What? | The types of personal information we collect and share depend on the product or service you have with us. This information can include:■ Social Security number and income
■
investment experience and risk tolerance
■
checking account number and wire transfer instructions |
| |
| How? | All financial companies need to share customers’ personal information to run their everyday business. In the section below, we list the reasons financial companies can share their customers’ personal information; the reasons Eaton Vance chooses to share; and whether you can limit this sharing. |
Reasons we can share your
personal information | Does Eaton Vance
share? | Can you limit
this sharing? |
| For our everyday business purposes — such as to process your transactions, maintain your account(s), respond to court orders and legal investigations, or report to credit bureaus | Yes | No |
| For our marketing purposes — to offer our products and services to you | Yes | No |
| For joint marketing with other financial companies | No | We don’t share |
| For our investment management affiliates’ everyday business purposes — information about your transactions, experiences, and creditworthiness | Yes | Yes |
| For our affiliates’ everyday business purposes — information about your transactions and experiences | Yes | No |
| For our affiliates’ everyday business purposes — information about your creditworthiness | No | We don’t share |
| For our investment management affiliates to market to you | Yes | Yes |
| For our affiliates to market to you | No | We don’t share |
| For nonaffiliates to market to you | No | We don’t share |
To limit our
sharing | Call toll-free 1-800-368-2745 or email: CRMPrivacy@calvert.comPlease note:If you are a new customer, we can begin sharing your information 30 days from the date we sent this notice. When you are no longer our customer, we continue to share your information as described in this notice. However, you can contact us at any time to limit our sharing. |
| Questions? | Call toll-free 1-800-368-2745 or email: CRMPrivacy@calvert.com |
| Privacy Notice — continued | April 2021 |
| Who we are |
| Who is providing this notice? | Eaton Vance Management, Eaton Vance Distributors, Inc., Eaton Vance Trust Company, Eaton Vance Management (International) Limited, Eaton Vance Advisers International Ltd., Eaton Vance Global Advisors Limited, Eaton Vance Management’s Real Estate Investment Group, Boston Management and Research, Calvert Research and Management, Eaton Vance and Calvert Fund Families and our investment advisory affiliates (“Eaton Vance”) (see Investment Management Affiliates definition below) |
| What we do |
How does Eaton Vance
protect my personal
information? | To protect your personal information from unauthorized access and use, we use security measures that comply with federal law. These measures include computer safeguards and secured files and buildings. We have policies governing the proper handling of customer information by personnel and requiring third parties that provide support to adhere to appropriate security standards with respect to such information. |
How does Eaton Vance
collect my personal
information? | We collect your personal information, for example, when you■ open an account or make deposits or withdrawals from your account
■
buy securities from us or make a wire transfer
■
give us your contact informationWe also collect your personal information from others, such as credit bureaus, affiliates, or other companies. |
| Why can’t I limit all sharing? | Federal law gives you the right to limit only■ sharing for affiliates’ everyday business purposes — information about your creditworthiness
■
affiliates from using your information to market to you
■
sharing for nonaffiliates to market to youState laws and individual companies may give you additional rights to limit sharing. See below for more on your rights under state law. |
| Definitions |
Investment Management
Affiliates | Eaton Vance Investment Management Affiliates include registered investment advisers, registered broker- dealers, and registered and unregistered funds. Investment Management Affiliates does not include entities associated with Morgan Stanley Wealth Management, such as Morgan Stanley Smith Barney LLC and Morgan Stanley & Co. |
| Affiliates | Companies related by common ownership or control. They can be financial and nonfinancial companies.■ Our affiliates include companies with a Morgan Stanley name and financial companies such as Morgan Stanley Smith Barney LLC and Morgan Stanley & Co. |
| Nonaffiliates | Companies not related by common ownership or control. They can be financial and nonfinancial companies.■ Eaton Vance does not share with nonaffiliates so they can market to you. |
| Joint marketing | A formal agreement between nonaffiliated financial companies that together market financial products or services to you.■ Eaton Vance doesn’t jointly market. |
| Other important information |
| Vermont: Except as permitted by law, we will not share personal information we collect about Vermont residents with Nonaffiliates unless you provide us with your written consent to share such information.California: Except as permitted by law, we will not share personal information we collect about California residents with Nonaffiliates and we will limit sharing such personal information with our Affiliates to comply with California privacy laws that apply to us. |
Delivery of Shareholder Documents. The Securities and Exchange Commission (SEC) permits funds to deliver only one copy of shareholder documents, including prospectuses, proxy statements and shareholder reports, to fund investors with multiple accounts at the same residential or post office box address. This practice is often called “householding” and it helps eliminate duplicate mailings to shareholders. Calvert funds, or your financial intermediary, may household the mailing of your documents indefinitely unless you instruct Calvert funds, or your financial intermediary, otherwise. If you would prefer that your Calvert fund documents not be householded, please contact Calvert funds at 1-800-368-2745, or contact your financial intermediary. Your instructions that householding not apply to delivery of your Calvert fund documents will typically be effective within 30 days of receipt by Calvert funds or your financial intermediary.
Portfolio Holdings. Each Calvert fund files a schedule of portfolio holdings on Part F to Form N-PORT with the SEC. Certain information filed on Form N-PORT may be viewed on the Calvert website at www.calvert.com, by calling Calvert at 1-800-368-2745 or in the EDGAR database on the SEC’s website at www.sec.gov.
Proxy Voting. The Proxy Voting Guidelines that each Calvert fund uses to determine how to vote proxies relating to portfolio securities is provided as an Appendix to the fund’s Statement of Additional Information. The Statement of Additional Information can be obtained free of charge by calling the Calvert funds at 1-800-368-2745, by visiting the Calvert funds’ website at www.calvert.com or visiting the SEC’s website at www.sec.gov. Information regarding how a Calvert fund voted proxies relating to portfolio securities during the most recent 12-month period ended June 30 is available by calling Calvert funds, by visiting the Calvert funds’ website at www.calvert.com or by visiting the SEC’s website at www.sec.gov.
Tailored Shareholder Reports. Effective January 24, 2023, the SEC adopted rule and form amendments to require open-end mutual funds and ETFs to transmit concise and visually engaging streamlined annual and semiannual reports to shareholders that highlight key information. Other information, including financial statements, will no longer appear in a streamlined shareholder report but must be available online, delivered free of charge upon request, and filed on a semiannual basis on Form N-CSR. The rule and form amendments have a compliance date of July 24, 2024. At this time, management is evaluating the impact of these amendments on the shareholder reports for the Calvert Funds.
This Page Intentionally Left Blank
This Page Intentionally Left Blank
Investment Adviser and Administrator
Calvert Research and Management
2050 M Street NW
Washington, DC 20036
Principal Underwriter*
Eaton Vance Distributors, Inc.
Two International Place
Boston, MA 02110
(617) 482-8260
Custodian
State Street Bank and Trust Company
One Congress Street, Suite 1
Boston, MA 02114-2016
Transfer Agent
SS&C Global Investor & Distribution Solutions, Inc.
2000 Crown Colony Drive
Quincy, MA 02169
Independent Registered Public Accounting Firm
Deloitte & Touche LLP
200 Berkeley Street
Boston, MA 02116-5022
Fund Offices
2050 M Street NW
Washington, DC 20036
* FINRA BrokerCheck. Investors may check the background of their Investment Professional by contacting the Financial Industry Regulatory Authority (FINRA). FINRA BrokerCheck is a free tool to help investors check the professional background of current and former FINRA-registered securities firms and brokers. FINRA BrokerCheck is available by calling 1-800-289-9999 and at www.FINRA.org. The FINRA BrokerCheck brochure describing this program is available to investors at www.FINRA.org.
Printed on recycled paper.
24185 9.30.23
Calvert
Mortgage Access Fund
Annual Report
September 30, 2023
Commodity Futures Trading Commission Registration. The Commodity Futures Trading Commission (“CFTC”) has adopted regulations that subject registered investment companies and advisers to regulation by the CFTC if a fund invests more than a prescribed level of its assets in certain CFTC-regulated instruments (including futures, certain options and swap agreements) or markets itself as providing investment exposure to such instruments. The adviser has claimed an exclusion from the definition of “commodity pool operator” under the Commodity Exchange Act with respect to its management of the Fund and the other funds it manages. Accordingly, neither the Fund nor the adviser is subject to CFTC regulation.
Fund shares are not insured by the FDIC and are not deposits or other obligations of, or guaranteed by, any depository institution. Shares are subject to investment risks, including possible loss of principal invested.
This report must be preceded or accompanied by a current summary prospectus or prospectus. Before investing, investors should consider carefully the investment objective, risks, and charges and expenses of a mutual fund. This and other important information is contained in the summary prospectus and prospectus, which can be obtained from a financial intermediary. Prospective investors should read the prospectus carefully before investing. For further information, please call 1-800-368-2745.
Choose Planet-friendly E-delivery!
Sign up now for on-line statements, prospectuses, and fund reports. In less than five minutes you can help reduce paper mail and lower fund costs.
Just go to www.calvert.com. If you already have an online account with the Calvert funds, click on Login to access your Account and select the documents you would like to receive via e-mail.
If you’re new to online account access, click on Login, then Register to create your user name and password. Once you’re in, click on the E-delivery sign-up on the Account Portfolio page and follow the quick, easy steps.
Note: If your shares are not held directly with the Calvert funds but through a brokerage firm, you must contact your broker for electronic delivery options available through their firm.
Annual Report September 30, 2023
Calvert
Mortgage Access Fund
Calvert
Mortgage Access Fund
September 30, 2023
Management's Discussion of Fund Performance†
Economic and Market Conditions
For fixed-income investors, the dominant event during the 12-month period ended September 30, 2023, was the series of U.S. Federal Reserve (Fed) interest rate hikes -- six during the period, and 11 in total -- that brought the federal funds rate to its highest level in 22 years.
But while the Fed’s campaign to tamp down inflation led to negative performance for government bonds, corporate bond returns were strongly positive during the period -- buoyed in part by the very factors that were fueling inflation: record low unemployment, strong job creation, and robust consumer spending.
By the summer of 2023, a majority of economists and market observers seemed to be coming around to the view that Jerome Powell’s Fed might be able to accomplish what had seldom, if ever, been done before: raise rates significantly to lower inflation and still bring the economy in for a soft landing without a recession.
One cloud that hung over fixed-income markets during the period, however, was fear that even after it finished raising rates, the Fed would leave rates higher for longer than investors had previously anticipated. During the final two months of the period -- and especially after the Fed’s September 2023 meeting -- longer-term interest rates rose dramatically, as investor expectations of how high rates would go -- and how long they would stay there -- seemed to get higher and longer.
Against the backdrop of the Fed’s aggressive monetary tightening campaign, U.S. Treasurys were the worst-performing major fixed-income asset class during the 12-month period, with the Bloomberg U.S. Treasury Index returning -0.81%.
In contrast, the strong U.S. economy and increasing confidence in a soft-landing scenario served as tailwinds for investment-grade corporate bonds. Even in a rising-rate environment, the Bloomberg U.S. Corporate Bond Index returned 3.65% during the period.
High yield bonds were the standout performer among major fixed-income asset classes, with the Bloomberg U.S. Corporate High Yield Index returning 10.28% during the period. With a strong U.S. economy helping keep bond defaults low, and a recession looking increasingly remote, investors gravitated toward riskier investments with greater yields.
Asset-backed securities -- including bonds backed by automobile and consumer loans -- benefited from strong consumer balance sheets and spending during the period, with the Bloomberg U.S. Asset-Backed Securities Index returning 2.81%.
Mortgage-backed securities (MBS), however, were dogged by two technical factors that depressed prices, causing the Bloomberg U.S. Mortgage Backed Securities Index to return -0.17% during the period. As the Fed lowered its balance sheet, it sold off much of its MBS holdings. And several regional banks that had been significant buyers of MBS were forced by the banking crisis of March 2023 to liquidate their assets. The resulting release of a significant amount of MBS into the market led prices to fall and the asset class to deliver negative returns.
Fund Performance
For the 12-month period ended September 30, 2023, Calvert Mortgage Access Fund (the Fund) returned 2.73% for Class A shares at net asset value (NAV), outperforming its benchmark, the Bloomberg U.S. Mortgage Backed Securities Index (the Index), which returned -0.17%. The Fund’s allocation to non-agency mortgage-backed securities (MBS) contributed to returns relative to the Index during the period. An allocation to loans issued by the Federal Agricultural Mortgage Corp., which seeks to benefit small family farms, also contributed to performance relative to the Index during the period. Exposure to U.S. Government-guaranteed agency MBS, issued by state housing finance agencies, further enhanced relative returns during the period. In contrast, the Fund’s modest allocation to fixed-rate collateralized mortgage obligations (CMOs) weighed on returns relative to the Index during the period. CMOs underperformed the Index as a result of widening MBS spreads and the sharp rise in interest rates during the period. The Fund’s use of U.S. Treasury futures contracts to hedge interest rate exposure further detracted from returns relative to the Index. Their value declined as U.S. Treasury yields rose during the period.
See Endnotes and Additional Disclosures in this report.
Past performance is no guarantee of future results. Returns are historical and are calculated by determining the percentage change in net asset value (NAV) or offering price (as applicable) with all distributions reinvested. Furthermore, returns do not reflect the deduction of taxes that shareholders may have to pay on Fund distributions or upon the redemption of Fund shares. Investment return and principal value will fluctuate so that shares, when redeemed, may be worth more or less than their original cost. Performance for periods less than or equal to one year is cumulative. Performance is for the stated time period only; due to market volatility, current Fund performance may be lower or higher than the quoted return. For performance as of the most recent month-end, please refer to www.calvert.com.
Calvert
Mortgage Access Fund
September 30, 2023
Performance
Portfolio Manager(s) Andrew Szczurowski, CFA and Alexander Payne, CFA, each of Calvert Research and Management
| % Average Annual Total Returns1,2 | Class
Inception Date | Performance
Inception Date | One Year | Five Years | Since
Inception |
| Class A at NAV | 04/29/2022 | 04/29/2022 | 2.73% | —% | 0.21% |
| Class A with 3.25% Maximum Sales Charge | — | — | (0.56) | — | (2.12) |
| Class C at NAV | 04/29/2022 | 04/29/2022 | 1.96 | — | (0.56) |
| Class C with 1% Maximum Deferred Sales Charge | — | — | 0.99 | — | (0.56) |
| Class I at NAV | 04/29/2022 | 04/29/2022 | 2.99 | — | 0.44 |
| Class R6 at NAV | 04/29/2022 | 04/29/2022 | 2.99 | — | 0.48 |
|
| Bloomberg U.S. Mortgage Backed Securities Index | — | — | (0.17)% | (0.77)% | 0.61% |
| % Total Annual Operating Expense Ratios3 | Class A | Class C | Class I | Class R6 |
| Gross | 1.59% | 2.34% | 1.34% | 1.34% |
| Net | 0.74 | 1.49 | 0.49 | 0.49 |
Growth of $10,000
This graph shows the change in value of a hypothetical investment of $10,000 in Class A of the Fund for the period indicated. For comparison, the same investment is shown in the indicated index.
| Growth of Investment | Amount Invested | Period Beginning | At NAV | With Maximum Sales Charge |
| Class C | $10,000 | 04/29/2022 | $9,920 | N.A. |
| Class I, at minimum investment | $1,000,000 | 04/29/2022 | $1,006,238 | N.A. |
| Class R6, at minimum investment | $5,000,000 | 04/29/2022 | $5,034,113 | N.A. |
See Endnotes and Additional Disclosures in this report.
Past performance is no guarantee of future results. Returns are historical and are calculated by determining the percentage change in net asset value (NAV) or offering price (as applicable) with all distributions reinvested. Furthermore, returns do not reflect the deduction of taxes that shareholders may have to pay on Fund distributions or upon the redemption of Fund shares. Investment return and principal value will fluctuate so that shares, when redeemed, may be worth more or less than their original cost. Performance for periods less than or equal to one year is cumulative. Performance is for the stated time period only; due to market volatility, current Fund performance may be lower or higher than the quoted return. For performance as of the most recent month-end, please refer to www.calvert.com.
Calvert
Mortgage Access Fund
September 30, 2023
| Asset Allocation (% of total investments) |
Calvert
Mortgage Access Fund
September 30, 2023
Endnotes and Additional Disclosures
| † | The views expressed in this report are those of the portfolio manager(s) and are current only through the date stated at the top of this page. These views are subject to change at any time based upon market or other conditions, and Calvert and the Fund(s) disclaim any responsibility to update such views. These views may not be relied upon as investment advice and, because investment decisions are based on many factors, may not be relied upon as an indication of trading intent on behalf of any Calvert fund. This commentary may contain statements that are not historical facts, referred to as “forward-looking statements.” The Fund’s actual future results may differ significantly from those stated in any forward-looking statement, depending on factors such as changes in securities or financial markets or general economic conditions, the volume of sales and purchases of Fund shares, the continuation of investment advisory, administrative and service contracts, and other risks discussed from time to time in the Fund’s filings with the Securities and Exchange Commission. |
| | |
| 1 | Bloomberg U.S. Mortgage Backed Securities Index measures agency mortgage-backed pass-through securities issued by Ginnie Mae (GNMA), Fannie Mae (FNMA), and Freddie Mac (FHLMC). Unless otherwise stated, index returns do not reflect the effect of any applicable sales charges, commissions, expenses, taxes or leverage, as applicable. It is not possible to invest directly in an index. |
| 2 | Total Returns at NAV do not include applicable sales charges. If sales charges were deducted, the returns would be lower. Total Returns shown with maximum sales charge reflect the stated maximum sales charge. Unless otherwise stated, performance does not reflect the deduction of taxes on Fund distributions or redemptions of Fund shares. Performance since inception for an index, if presented, is the performance since the Fund’s or oldest share class’s inception, as applicable. |
| 3 | Source: Fund prospectus. Net expense ratios reflect a contractual expense reimbursement that continues through 2/1/25. The expense ratios for the current reporting period can be found in the Financial Highlights section of this report. Performance reflects expenses waived and/or reimbursed, if applicable. Without such waivers and/or reimbursements, performance would have been lower. |
| | Fund profile subject to change due to active management. |
| | Additional Information |
| | Bloomberg U.S. Treasury Index measures the performance of U.S. Treasuries with a maturity of one year or more. Bloomberg U.S. Corporate Bond Index measures the performance of investment-grade U.S. corporate securities with a maturity of one year or more. Bloomberg U.S. Corporate High Yield Index measures USD-denominated, non-investment grade corporate securities. Bloomberg |
| | U.S. Asset-Backed Securities Index tracks the performance of U.S. dollar denominated investment grade fixed rate asset-backed securities publicly issued in the U.S. domestic market. |
| | Spread is the difference in yield between a U.S. Treasury bond and another debt security of the same maturity but different credit quality. |
Calvert
Mortgage Access Fund
September 30, 2023
Example
As a Fund shareholder, you incur two types of costs: (1) transaction costs, including sales charges (loads) on purchases; and (2) ongoing costs, including management fees; distribution and/or service fees; and other Fund expenses. This Example is intended to help you understand your ongoing costs (in dollars) of Fund investing and to compare these costs with the ongoing costs of investing in other mutual funds. The Example is based on an investment of $1,000 invested at the beginning of the period and held for the entire period (April 1, 2023 to September 30, 2023).
Actual Expenses
The first section of the table below provides information about actual account values and actual expenses. You may use the information in this section, together with the amount you invested, to estimate the expenses that you paid over the period. Simply divide your account value by $1,000 (for example, an $8,600 account value divided by $1,000 = 8.6), then multiply the result by the number in the first section under the heading entitled “Expenses Paid During Period” to estimate the expenses you paid on your account during this period.
Hypothetical Example for Comparison Purposes
The second section of the table below provides information about hypothetical account values and hypothetical expenses based on the actual Fund expense ratio and an assumed rate of return of 5% per year (before expenses), which is not the actual Fund return. The hypothetical account values and expenses may not be used to estimate the actual ending account balance or expenses you paid for the period. You may use this information to compare the ongoing costs of investing in the Fund and other funds. To do so, compare this 5% hypothetical example with the 5% hypothetical examples that appear in the shareholder reports of the other funds.
Please note that the expenses shown in the table are meant to highlight your ongoing costs only and do not reflect any transactional costs, such as sales charges (loads). Therefore, the second section of the table is useful in comparing ongoing costs only, and will not help you determine the relative total costs of owning different funds. In addition, if these transactional costs were included, your costs would be higher.
| | Beginning
Account Value
(4/1/23) | Ending
Account Value
(9/30/23) | Expenses Paid
During Period*
(4/1/23 – 9/30/23) | Annualized
Expense
Ratio |
| Actual | | | | |
| Class A | $1,000.00 | $ 970.90 | $ 6.13** | 1.24% |
| Class C | $1,000.00 | $ 966.30 | $ 9.81** | 1.99% |
| Class I | $1,000.00 | $ 971.10 | $ 4.89** | 0.99% |
| Class R6 | $1,000.00 | $ 971.10 | $ 4.89** | 0.99% |
| Hypothetical | | | | |
| (5% return per year before expenses) | | | | |
| Class A | $1,000.00 | $1,018.85 | $ 6.28** | 1.24% |
| Class C | $1,000.00 | $1,015.09 | $10.05 ** | 1.99% |
| Class I | $1,000.00 | $1,020.10 | $ 5.01** | 0.99% |
| Class R6 | $1,000.00 | $1,020.10 | $ 5.01** | 0.99% |
| * | Expenses are equal to the Fund's annualized expense ratio for the indicated Class, multiplied by the average account value over the period, multiplied by 183/365 (to reflect the one-half year period). The Example assumes that the $1,000 was invested at the net asset value per share determined at the close of business on March 31, 2023. |
| ** | Absent a waiver and/or reimbursement of expenses by affiliate(s), expenses would be higher. |
Calvert
Mortgage Access Fund
September 30, 2023
| Collateralized Mortgage Obligations — 45.1% |
| Security | Principal
Amount
(000's omitted) | Value |
| Angel Oak Mortgage Trust, Series 2021-5, Class A2, 1.208%, 7/25/66(1)(2) | $ | 70 | $ 56,070 |
| Angel Oak Mortgage Trust I, LLC, Series 2019-1, Class B1, 5.40%, 11/25/48(1)(2) | | 250 | 245,118 |
| Bellemeade Re, Ltd., Series 2022-2, Class M1A, 9.315%, (30-day average SOFR + 4.00%), 9/27/32(1)(3) | | 500 | 513,388 |
| BRAVO Residential Funding Trust: | | | |
| Series 2021-NQM1, Class A3, 1.332%, 2/25/49(1)(2) | | 80 | 69,164 |
| Series 2021-NQM3, Class A3, 1.956%, 4/25/60(1)(2) | | 122 | 106,637 |
| Cascade MH Asset Trust, Series 2022-MH1, Class A, 4.25% to 7/25/27, 8/25/54(1)(4) | | 945 | 830,980 |
| CHNGE Mortgage Trust: | | | |
| Series 2022-4, Class A1, 6.00% to 9/25/24, 10/25/57(1)(4) | | 825 | 804,452 |
| Series 2022-NQM1, Class A3, 5.82% to 8/25/25, 6/25/67(1)(4) | | 89 | 84,368 |
| Series 2022-NQM1, Class M1, 5.82% to 8/25/25, 6/25/67(1)(4) | | 500 | 439,109 |
| Series 2023-1, Class A1, 7.065% to 2/25/26, 3/25/58(1)(2) | | 415 | 412,389 |
| Series 2023-4, Class A3, 8.38%, 9/25/58(1)(4) | | 969 | 968,996 |
| Deephaven Residential Mortgage Trust, Series 2020-2, Class B2, 5.804%, 5/25/65(1)(2) | | 500 | 473,682 |
| FARM Mortgage Trust: | | | |
| Series 2021-1, Class B, 3.241% to 7/25/47, 7/25/51(1)(2) | | 768 | 528,138 |
| Series 2022-1, Class B, 2.945%, 1/25/52(1)(2) | | 381 | 256,645 |
| Series 2023-1, Class B, 3.033%, 3/25/52(1)(2) | | 974 | 659,018 |
| Federal Home Loan Mortgage Corp., Series 5327, Class B, 6.00%, 8/25/53 | | 650 | 637,413 |
| Federal Home Loan Mortgage Corp. Structured Agency Credit Risk Debt Notes: | | | |
| Series 2019-HQA3, Class B2, 12.929%, (30-day average SOFR + 7.61%), 9/25/49(1)(3) | | 250 | 274,933 |
| Series 2021-HQA1, Class B2, 10.315%, (30-day average SOFR + 5.00%), 8/25/33(1)(3) | | 750 | 723,442 |
| Series 2022-HQA1, Class M1B, 8.815%, (30-day average SOFR + 3.50%), 3/25/42(1)(3) | | 500 | 517,743 |
| Series 2022-HQA2, Class M1B, 9.315%, (30-day average SOFR + 4.00%), 7/25/42(1)(3) | | 500 | 523,480 |
| Series 2023-HQA2, Class M1B, 8.665%, (30-day average SOFR + 3.35%), 6/25/43(1)(3) | | 750 | 770,680 |
| Federal National Mortgage Association, Series 2023-12, Class LW, 6.00%, 4/25/53 | | 500 | 491,026 |
| Federal National Mortgage Association Connecticut Avenue Securities: | | | |
| Series 2019-R06, Class 2B1, 9.179%, (30-day average SOFR + 3.864%), 9/25/39(1)(3) | | 233 | 239,424 |
| Series 2023-R03, Class 2M2, 9.215%, (30-day average SOFR + 3.90%), 4/25/43(1)(3) | | 500 | 523,572 |
| GCAT Trust: | | | |
| Series 2022-NQM4, Class A3, 5.73% to 8/25/25, 8/25/67(1)(4) | | 91 | 87,905 |
| Series 2022-NQM4, Class M1, 5.743%, 8/25/67(1)(2) | | 100 | 89,637 |
| Series 2023-NQM2, Class A2, 6.243% to 2/25/26, 11/25/67(1)(4) | | 451 | 445,555 |
| Security | Principal
Amount
(000's omitted) | Value |
| Government National Mortgage Association: | | | |
| Series 2021-160, Class DI, 3.00%, 9/20/51(5) | $ | 604 | $ 93,215 |
| Series 2022-126, Class AS, 0.00%, (3.69% - 30-day average SOFR, Floor 0.00%), 7/20/52(5)(6) | | 840 | 11,673 |
| Series 2022-173, Class S, 3.248%, (22.733% - 30-day average SOFR x 3.667), 10/20/52(6) | | 229 | 208,384 |
| Series 2022-195, Class AS, 3.462%, (23.125% - 30-day average SOFR x 3.70), 11/20/52(6) | | 241 | 239,841 |
| Series 2022-197, Class SW, 3.566%, (16.32% - 30-day average SOFR x 2.40), 11/20/52(6) | | 226 | 210,062 |
| Series 2023-13, Class SA, 0.086%, (5.40% - 30-day average SOFR), 1/20/53(5)(6) | | 1,896 | 39,862 |
| Series 2023-149, Class S, 5.505%, (21.45% - 30-day average SOFR x 3.00), 9/1/53(6) | | 500 | 498,657 |
| Series 2023-19, Class SD, 0.986%, (6.30% - 30-day average SOFR), 2/20/53(5)(6) | | 968 | 47,039 |
| Series 2023-22, Class ES, 0.986%, (6.30% - 30-day average SOFR), 2/20/53(5)(6) | | 973 | 48,349 |
| Series 2023-24, Class SB, 0.00%, (5.15% - 30-day average SOFR, Floor 0.00%), 2/20/53(5)(6) | | 1,945 | 44,329 |
| Series 2023-24, Class SG, 0.986%, (6.30% - 30-day average SOFR), 2/20/53(5)(6) | | 973 | 48,349 |
| Series 2023-38, Class LS, 0.986%, (6.30% - 30-day average SOFR), 3/20/53(5)(6) | | 978 | 48,945 |
| Series 2023-47, Class HS, 0.986%, (6.30% - 30-day average SOFR), 3/20/53(5)(6) | | 342 | 17,131 |
| Series 2023-47, Class SC, 0.936%, (6.25% - 30-day average SOFR), 3/20/53(5)(6) | | 488 | 23,767 |
| Series 2023-65, Class G, 3.064%, (22.55% - 30-day average SOFR x 3.667), 5/20/53(6) | | 498 | 444,381 |
| Series 2023-89, Class SE, 0.736%, (6.05% - 30-day average SOFR), 6/20/53(5)(6) | | 2,485 | 122,448 |
| Series 2023-96, Class BL, 6.00%, 7/20/53 | | 650 | 636,591 |
| Series 2023-96, Class DB, 6.00%, 7/20/53 | | 750 | 733,449 |
| Series 2023-98, Class BW, 6.00%, 7/20/53 | | 250 | 244,582 |
| Series 2023-99, Class AL, 6.00%, 7/20/53 | | 1,000 | 978,069 |
| Series 2023-100, Class AY, 6.00%, 7/20/53 | | 2,000 | 1,957,091 |
| Series 2023-100, Class JL, 6.00%, 7/20/53 | | 500 | 489,882 |
| Series 2023-102, Class SG, 2.742%, (22.55% - 30-day average SOFR x 3.727), 7/20/53(6) | | 348 | 316,618 |
| Series 2023-133, Class S, 5.66%, (21.60% - 30-day average SOFR x 3.00), 9/20/53(6) | | 700 | 676,127 |
| New Residential Mortgage Loan Trust, Series 2021-NQM2R, Class M1, 2.201%, 10/25/58(1)(2) | | 130 | 110,821 |
| NewRez Warehouse Securitization Trust, Series 2021-1, Class F, 10.684%, (1 mo. SOFR + 5.36%), 5/25/55(1)(3) | | 841 | 844,934 |
| PNMAC GMSR Issuer Trust: | | | |
| Series 2018-GT1, Class A, 9.284%, (1 mo. SOFR + 3.85%), 2/25/25(1)(3) | | 1,250 | 1,249,875 |
| Series 2022-FT1, Class A, 9.505%, (30-day average SOFR + 4.19%), 6/25/27(1)(3) | | 300 | 300,484 |
| Series 2022-GT1, Class A, 9.565%, (30-day average SOFR + 4.25%), 5/25/27(1)(3) | | 500 | 501,378 |
| Radnor RE, Ltd., Series 2022-1, Class M1A, 9.065%, (30-day average SOFR + 3.75%), 9/25/32(1)(3) | | 500 | 510,527 |
Calvert
Mortgage Access Fund
September 30, 2023
Schedule of Investments — continued
| Security | Principal
Amount
(000's omitted) | Value |
| SG Residential Mortgage Trust, Series 2019-3, Class A1, 2.703%, 9/25/59(1)(2) | $ | 14 | $ 13,200 |
Total Collateralized Mortgage Obligations
(identified cost $23,868,198) | | | $23,483,024 |
| U.S. Government Agency Mortgage-Backed Securities — 98.8% |
| Security | Principal
Amount
(000's omitted) | Value |
| Federal Home Loan Mortgage Corp., 5.00%, 9/1/52 | $ | 246 | $ 233,177 |
| Federal National Mortgage Association: | | | |
| 4.50%, 8/1/52 | | 49 | 45,180 |
| 5.00%, with various maturities to 2052 | | 1,326 | 1,255,582 |
| 5.50%, 11/1/52 | | 99 | 95,879 |
| 6.00%, 7/1/53 | | 499 | 500,146 |
| 6.50%, with various maturities to 2053 | | 1,499 | 1,519,376 |
| 7.00%, 6/1/53 | | 499 | 518,293 |
| Government National Mortgage Association: | | | |
| 5.50%, 30-Year, TBA(7) | | 9,900 | 9,611,078 |
| 6.00%, 30-Year, TBA(7) | | 7,400 | 7,335,223 |
| 6.50%, 30-Year, TBA(7) | | 2,600 | 2,616,565 |
| 4.00%, with various maturities to 2052 | | 963 | 864,959 |
| 4.50%, with various maturities to 2052 | | 391 | 362,801 |
| 5.00%, with various maturities to 2052(8) | | 7,483 | 7,101,054 |
| 5.50%, with various maturities to 2062(8) | | 3,370 | 3,275,829 |
| 6.00%, with various maturities to 2053 | | 6,601 | 6,575,355 |
| 6.50%, with various maturities to 2063(8) | | 6,396 | 6,473,478 |
| 7.00%, with various maturities to 2062(8) | | 3,023 | 3,109,959 |
Total U.S. Government Agency Mortgage-Backed Securities
(identified cost $52,825,420) | | $51,493,934 |
| Short-Term Investments — 3.6% | | | |
| Security | Shares | Value |
| Morgan Stanley Institutional Liquidity Funds - Government Portfolio, Institutional Class, 5.27%(9) | | 1,881,424 | $ 1,881,424 |
Total Short-Term Investments
(identified cost $1,881,424) | | | $ 1,881,424 |
Total Investments — 147.5%
(identified cost $78,575,042) | | | $76,858,382 |
| Other Assets, Less Liabilities — (47.5)% | | | $ (24,740,023) |
| Net Assets — 100.0% | | | $ 52,118,359 |
| The percentage shown for each investment category in the Schedule of Investments is based on net assets. |
| (1) | Security exempt from registration under Rule 144A of the Securities Act of 1933, as amended. These securities may be sold in certain transactions in reliance on an exemption from registration (normally to qualified institutional buyers). At September 30, 2023, the aggregate value of these securities is $14,175,744 or 27.2% of the Fund's net assets. |
| (2) | Weighted average fixed-rate coupon that changes/updates monthly. Rate shown is the rate at September 30, 2023. |
| (3) | Variable rate security. The stated interest rate represents the rate in effect at September 30, 2023. |
| (4) | Step coupon security. Interest rate represents the rate in effect at
September 30, 2023. |
| (5) | Interest only security that entitles the holder to receive only interest payments on the underlying mortgages. Principal amount shown is the notional amount of the underlying mortgages on which coupon interest is calculated. |
| (6) | Inverse floating-rate security whose coupon varies inversely with changes in the interest rate index. The stated interest rate represents the coupon rate in effect at September 30, 2023. |
| (7) | TBA (To Be Announced) securities are purchased on a forward commitment basis with an approximate principal amount and maturity date. The actual principal amount and maturity date are determined upon settlement. |
| (8) | Security (or a portion thereof) has been pledged for the benefit of the counterparty for reverse repurchase agreements. |
| (9) | May be deemed to be an affiliated investment company. The rate shown is the annualized seven-day yield as of September 30, 2023. |
| Abbreviations: |
| SOFR | – Secured Overnight Financing Rate |
| TBA | – To Be Announced |
Calvert
Mortgage Access Fund
September 30, 2023
Schedule of Investments — continued
Futures Contracts
| Description | Number of
Contracts | Position | Expiration
Date | Notional
Amount | Value/
Unrealized
Appreciation
(Depreciation) |
| Interest Rate Futures | | | | | |
| U.S. 5-Year Treasury Note | 95 | Long | 12/29/23 | $10,009,141 | $ (101,431) |
| | | | | | $(101,431) |
Calvert
Mortgage Access Fund
September 30, 2023
Statement of Assets and Liabilities
| | September 30, 2023 |
| Assets | |
| Investments in securities of unaffiliated issuers, at value (identified cost $76,693,618) | $ 74,976,958 |
| Investments in securities of affiliated issuers, at value (identified cost $1,881,424) | 1,881,424 |
| Receivable for variation margin on open futures contracts | 14,879 |
| Deposits at broker for futures contracts | 138,463 |
| Receivable for investments sold | 3,033,563 |
| Receivable for capital shares sold | 16,063 |
| Interest receivable | 310,250 |
| Dividends receivable - affiliated | 9,313 |
| Trustees' deferred compensation plan | 209 |
| Total assets | $80,381,122 |
| Liabilities | |
| Payable for reverse repurchase agreements, including accrued interest of $33,122 | $ 4,782,910 |
| Payable for when-issued/delayed delivery/forward commitment securities | 23,362,703 |
| Payable for capital shares redeemed | 12,775 |
| Payable to affiliates: | |
| Investment advisory fee | 11,818 |
| Administrative fee | 5,179 |
| Distribution and service fees | 72 |
| Sub-transfer agency fee | 59 |
| Trustees' deferred compensation plan | 209 |
| Other | 28,718 |
| Accrued expenses | 58,320 |
| Total liabilities | $28,262,763 |
| Net Assets | $52,118,359 |
| Sources of Net Assets | |
| Paid-in capital | $ 54,402,851 |
| Accumulated loss | (2,284,492) |
| Net Assets | $52,118,359 |
| Class A Shares | |
| Net Assets | $ 142,220 |
| Shares Outstanding | 15,081 |
Net Asset Value and Redemption Price Per Share
(net assets ÷ shares of beneficial interest outstanding) | $ 9.43 |
Maximum Offering Price Per Share
(100 ÷ 96.75 of net asset value per share) | $ 9.75 |
| Class C Shares | |
| Net Assets | $ 49,611 |
| Shares Outstanding | 5,260 |
Net Asset Value and Offering Price Per Share*
(net assets ÷ shares of beneficial interest outstanding) | $ 9.43 |
| Class I Shares | |
| Net Assets | $ 51,875,997 |
| Shares Outstanding | 5,499,829 |
Net Asset Value, Offering Price and Redemption Price Per Share
(net assets ÷ shares of beneficial interest outstanding) | $ 9.43 |
10
See Notes to Financial Statements.
Calvert
Mortgage Access Fund
September 30, 2023
Statement of Assets and Liabilities — continued
| | September 30, 2023 |
| Class R6 Shares | |
| Net Assets | $ 50,531 |
| Shares Outstanding | 5,358 |
Net Asset Value, Offering Price and Redemption Price Per Share
(net assets ÷ shares of beneficial interest outstanding) | $ 9.43 |
| On sales of $100,000 or more, the offering price of Class A shares is reduced. |
| * | Redemption price per share is equal to the net asset value less any applicable contingent deferred sales charge. |
11
See Notes to Financial Statements.
Calvert
Mortgage Access Fund
September 30, 2023
| | Year Ended |
| | September 30, 2023 |
| Investment Income | |
| Dividend income - affiliated issuers | $ 63,891 |
| Interest income | 2,016,082 |
| Total investment income | $ 2,079,973 |
| Expenses | |
| Investment advisory fee | $ 90,112 |
| Administrative fee | 38,620 |
| Distribution and service fees: | |
| Class A | 226 |
| Class C | 502 |
| Trustees' fees and expenses | 2,120 |
| Custodian fees | 6,680 |
| Transfer agency fees and expenses | 1,760 |
| Accounting fees | 7,061 |
| Professional fees | 35,150 |
| Offering costs | 53,311 |
| Registration fees | 8,417 |
| Reports to shareholders | 373 |
| Interest expense and fees | 129,963 |
| Miscellaneous | 14,045 |
| Total expenses | $ 388,340 |
| Waiver and/or reimbursement of expenses by affiliates | $ (101,989) |
| Net expenses | $ 286,351 |
| Net investment income | $ 1,793,622 |
| Realized and Unrealized Gain (Loss) | |
| Net realized gain (loss): | |
| Investment securities | $ (172,415) |
| Futures contracts | (257,652) |
| Net realized loss | $ (430,067) |
| Change in unrealized appreciation (depreciation): | |
| Investment securities | $ (920,131) |
| Futures contracts | (101,431) |
| Net change in unrealized appreciation (depreciation) | $(1,021,562) |
| Net realized and unrealized loss | $(1,451,629) |
| Net increase in net assets from operations | $ 341,993 |
12
See Notes to Financial Statements.
Calvert
Mortgage Access Fund
September 30, 2023
Statements of Changes in Net Assets
| | Year Ended
September 30,
2023 | Period Ended
September 30,
2022(1) |
| Increase (Decrease) in Net Assets | | |
| From operations: | | |
| Net investment income | $ 1,793,622 | $ 253,634 |
| Net realized loss | (430,067) | (42,514) |
| Net change in unrealized appreciation (depreciation) | (1,021,562) | (796,529) |
| Net increase (decrease) in net assets from operations | $ 341,993 | $ (585,409) |
| Distributions to shareholders: | | |
| Class A | $ (4,790) | $ (556) |
| Class C | (2,244) | (301) |
| Class I | (1,775,398) | (254,504) |
| Class R6 | (2,772) | (511) |
| Total distributions to shareholders | $ (1,785,204) | $ (255,872) |
| Capital share transactions: | | |
| Class A | $ 81,894 | $ 66,558 |
| Class C | 2,241 | 50,304 |
| Class I | 28,833,498 | 25,314,857 |
| Class R6 | 2,988 | 50,511 |
| Net increase in net assets from capital share transactions | $28,920,621 | $25,482,230 |
| Net increase in net assets | $27,477,410 | $24,640,949 |
| Net Assets | | |
| At beginning of year | $ 24,640,949 | $ — |
| At end of year | $52,118,359 | $24,640,949 |
| (1) | For the period from the commencement of operations, April 29, 2022, to September 30, 2022. |
13
See Notes to Financial Statements.
Calvert
Mortgage Access Fund
September 30, 2023
| | Class A |
| | Year Ended
September 30,
2023 | Period Ended
September 30,
2022(1) |
| |
| Net asset value — Beginning of period | $ 9.67 | $10.00 |
| Income (Loss) From Operations | | |
| Net investment income(2) | $ 0.52 | $ 0.09 |
| Net realized and unrealized loss | (0.25) | (0.33) |
| Total income (loss) from operations | $ 0.27 | $ (0.24) |
| Less Distributions | | |
| From net investment income | $ (0.51) | $ (0.09) |
| Total distributions | $(0.51) | $ (0.09) |
| Net asset value — End of period | $ 9.43 | $ 9.67 |
| Total Return(3) | 2.73% | (2.37)% (4) |
| Ratios/Supplemental Data | | |
| Net assets, end of period (000’s omitted) | $ 142 | $ 65 |
| Ratios (as a percentage of average daily net assets):(5) | | |
| Total expenses | 1.45% (6) | 1.58% (7) |
| Net expenses | 1.14% (6)(8) | 0.66% (7)(8) |
| Net investment income | 5.31% | 2.26% (7) |
| Portfolio Turnover | 392% (9) | 155% (4)(9) |
| (1) | For the period from the commencement of operations, April 29, 2022, to September 30, 2022. |
| (2) | Computed using average shares outstanding. |
| (3) | Returns are historical and are calculated by determining the percentage change in net asset value with all distributions reinvested and do not reflect the effect of sales charges, if any. |
| (4) | Not annualized. |
| (5) | Total expenses do not reflect amounts reimbursed and/or waived by the adviser and certain of its affiliates, if applicable. Net expenses are net of all reductions and represent the net expenses paid by the Fund. |
| (6) | Includes interest expense of 0.40% of average daily net assets for the year ended September 30, 2023. |
| (7) | Annualized. |
| (8) | Includes a reduction by the investment adviser of a portion of its advisory fee due to the Fund’s investment in the Liquidity Fund (equal to less than 0.01% and 0.08% of average daily net assets for the year ended September 30, 2023 and the period ended September 30, 2022, respectively). |
| (9) | Includes the effect of To Be Announced (TBA) transactions. |
14
See Notes to Financial Statements.
Calvert
Mortgage Access Fund
September 30, 2023
Financial Highlights — continued
| | Class C |
| | Year Ended
September 30,
2023 | Period Ended
September 30,
2022(1) |
| |
| Net asset value — Beginning of period | $ 9.67 | $10.00 |
| Income (Loss) From Operations | | |
| Net investment income(2) | $ 0.44 | $ 0.06 |
| Net realized and unrealized loss | (0.24) | (0.33) |
| Total income (loss) from operations | $ 0.20 | $ (0.27) |
| Less Distributions | | |
| From net investment income | $ (0.44) | $ (0.06) |
| Total distributions | $(0.44) | $ (0.06) |
| Net asset value — End of period | $ 9.43 | $ 9.67 |
| Total Return(3) | 1.96% | (2.70)% (4) |
| Ratios/Supplemental Data | | |
| Net assets, end of period (000’s omitted) | $ 50 | $ 49 |
| Ratios (as a percentage of average daily net assets):(5) | | |
| Total expenses | 2.20% (6) | 2.33% (7) |
| Net expenses | 1.89% (6)(8) | 1.41% (7)(8) |
| Net investment income | 4.50% | 1.42% (7) |
| Portfolio Turnover | 392% (9) | 155% (4)(9) |
| (1) | For the period from the commencement of operations, April 29, 2022, to September 30, 2022. |
| (2) | Computed using average shares outstanding. |
| (3) | Returns are historical and are calculated by determining the percentage change in net asset value with all distributions reinvested and do not reflect the effect of sales charges, if any. |
| (4) | Not annualized. |
| (5) | Total expenses do not reflect amounts reimbursed and/or waived by the adviser and certain of its affiliates, if applicable. Net expenses are net of all reductions and represent the net expenses paid by the Fund. |
| (6) | Includes interest expense of 0.40% of average daily net assets for the year ended September 30, 2023. |
| (7) | Annualized. |
| (8) | Includes a reduction by the investment adviser of a portion of its advisory fee due to the Fund’s investment in the Liquidity Fund (equal to less than 0.01% and 0.08% of average daily net assets for the year ended September 30, 2023 and the period ended September 30, 2022, respectively). |
| (9) | Includes the effect of To Be Announced (TBA) transactions. |
15
See Notes to Financial Statements.
Calvert
Mortgage Access Fund
September 30, 2023
Financial Highlights — continued
| | Class I |
| | Year Ended
September 30,
2023 | Period Ended
September 30,
2022(1) |
| |
| Net asset value — Beginning of period | $ 9.67 | $ 10.00 |
| Income (Loss) From Operations | | |
| Net investment income(2) | $ 0.54 | $ 0.10 |
| Net realized and unrealized loss | (0.24) | (0.33) |
| Total income (loss) from operations | $ 0.30 | $ (0.23) |
| Less Distributions | | |
| From net investment income | $ (0.54) | $ (0.10) |
| Total distributions | $ (0.54) | $ (0.10) |
| Net asset value — End of period | $ 9.43 | $ 9.67 |
| Total Return(3) | 2.99% | (2.30)% (4) |
| Ratios/Supplemental Data | | |
| Net assets, end of period (000’s omitted) | $51,876 | $24,479 |
| Ratios (as a percentage of average daily net assets):(5) | | |
| Total expenses | 1.20% (6) | 1.34% (7) |
| Net expenses | 0.89% (6)(8) | 0.41% (7)(8) |
| Net investment income | 5.55% | 2.42% (7) |
| Portfolio Turnover | 392% (9) | 155% (4)(9) |
| (1) | For the period from the commencement of operations, April 29, 2022, to September 30, 2022. |
| (2) | Computed using average shares outstanding. |
| (3) | Returns are historical and are calculated by determining the percentage change in net asset value with all distributions reinvested and do not reflect the effect of sales charges, if any. |
| (4) | Not annualized. |
| (5) | Total expenses do not reflect amounts reimbursed and/or waived by the adviser and certain of its affiliates, if applicable. Net expenses are net of all reductions and represent the net expenses paid by the Fund. |
| (6) | Includes interest expense of 0.40% of average daily net assets for the year ended September 30, 2023. |
| (7) | Annualized. |
| (8) | Includes a reduction by the investment adviser of a portion of its advisory fee due to the Fund’s investment in the Liquidity Fund (equal to less than 0.01% and 0.08% of average daily net assets for the year ended September 30, 2023 and the period ended September 30, 2022, respectively). |
| (9) | Includes the effect of To Be Announced (TBA) transactions. |
16
See Notes to Financial Statements.
Calvert
Mortgage Access Fund
September 30, 2023
Financial Highlights — continued
| | Class R6 |
| | Year Ended
September 30,
2023 | Period Ended
September 30,
2022(1) |
| |
| Net asset value — Beginning of period | $ 9.67 | $10.00 |
| Income (Loss) From Operations | | |
| Net investment income(2) | $ 0.54 | $ 0.10 |
| Net realized and unrealized loss | (0.25) | (0.32) |
| Total income (loss) from operations | $ 0.29 | $ (0.22) |
| Less Distributions | | |
| From net investment income | $ (0.53) | $ (0.11) |
| Total distributions | $(0.53) | $ (0.11) |
| Net asset value — End of period | $ 9.43 | $ 9.67 |
| Total Return(3) | 2.99% | (2.24)% (4) |
| Ratios/Supplemental Data | | |
| Net assets, end of period (000’s omitted) | $ 51 | $ 49 |
| Ratios (as a percentage of average daily net assets):(5) | | |
| Total expenses | 1.20% (6) | 1.34% (7) |
| Net expenses | 0.89% (6)(8) | 0.41% (7)(8) |
| Net investment income | 5.49% | 2.42% (7) |
| Portfolio Turnover | 392% (9) | 155% (4)(9) |
| (1) | For the period from the commencement of operations, April 29, 2022, to September 30, 2022. |
| (2) | Computed using average shares outstanding. |
| (3) | Returns are historical and are calculated by determining the percentage change in net asset value with all distributions reinvested and do not reflect the effect of sales charges, if any. |
| (4) | Not annualized. |
| (5) | Total expenses do not reflect amounts reimbursed and/or waived by the adviser and certain of its affiliates, if applicable. Net expenses are net of all reductions and represent the net expenses paid by the Fund. |
| (6) | Includes interest expense of 0.40% of average daily net assets for the year ended September 30, 2023. |
| (7) | Annualized. |
| (8) | Includes a reduction by the investment adviser of a portion of its advisory fee due to the Fund’s investment in the Liquidity Fund (equal to less than 0.01% and 0.08% of average daily net assets for the year ended September 30, 2023 and the period ended September 30, 2022, respectively). |
| (9) | Includes the effect of To Be Announced (TBA) transactions. |
17
See Notes to Financial Statements.
Calvert
Mortgage Access Fund
September 30, 2023
Notes to Financial Statements
1 Significant Accounting Policies
Calvert Mortgage Access Fund (the Fund) is a non-diversified series of The Calvert Fund (the Trust). The Trust is a Massachusetts business trust registered under the Investment Company Act of 1940, as amended (the 1940 Act), as an open-end management investment company. The investment objective of the Fund is total return.
The Fund offers four classes of shares. Class A shares are generally sold subject to a sales charge imposed at time of purchase. A contingent deferred sales charge of 1% may apply to certain redemptions of Class A shares for accounts for which no sales charge was paid, if redeemed within 12 months of purchase. Class C shares are sold without a front-end sales charge, and with certain exceptions, are charged a contingent deferred sales charge of 1% on shares redeemed within 12 months of purchase. Class C shares are only available for purchase through a financial intermediary. Class C shares automatically convert to Class A shares eight years after their purchase as described in the Fund's prospectus. Class I and Class R6 shares are sold at net asset value, are not subject to a sales charge and are sold only to certain eligible investors. Each class represents a pro rata interest in the Fund, but votes separately on class-specific matters and is subject to different expenses.
The Fund applies the accounting and reporting guidance in the Financial Accounting Standards Board (FASB) Accounting Standards Codification Topic 946, Financial Services – Investment Companies (ASC 946). Subsequent events, if any, through the date that the financial statements were issued have been evaluated in the preparation of the financial statements.
A Investment Valuation— Net asset value per share is determined every business day as of the close of the regular session of the New York Stock Exchange (generally 4:00 p.m. Eastern time). The Fund uses independent pricing services approved by the Board of Trustees (the Board) to value its investments wherever possible. Investments for which market quotations are not available or deemed not reliable are fair valued in good faith by the Board’s valuation designee.
U.S. generally accepted accounting principles (U.S. GAAP) establishes a disclosure hierarchy that categorizes the inputs to valuation techniques used to value assets and liabilities at measurement date. These inputs are summarized in the three broad levels listed below:
Level 1 - quoted prices in active markets for identical securities
Level 2 - other significant observable inputs (including quoted prices for similar securities, interest rates, prepayment speeds, credit risk, etc.)
Level 3 - significant unobservable inputs (including the Fund’s own assumptions in determining the fair value of investments)
The inputs or methodologies used for valuing securities are not necessarily an indication of the risk associated with investing in those securities.
Valuation techniques used to value the Fund’s investments by major category are as follows:
Debt Securities. Debt securities are generally valued based on valuations provided by third party pricing services, as derived from such services’ pricing models. Inputs to the models may include, but are not limited to, reported trades, executable bid and ask prices, broker/dealer quotations, prices or yields of securities with similar characteristics, interest rates, anticipated prepayments, benchmark curves or information pertaining to the issuer, as well as industry and economic events. Accordingly, debt securities are generally categorized as Level 2 in the hierarchy. Short-term debt securities with a remaining maturity at time of purchase of more than sixty days are valued based on valuations provided by a third party pricing service. Such securities are generally categorized as Level 2 in the hierarchy. Short-term debt securities of sufficient credit quality purchased with remaining maturities of sixty days or less for which a valuation from a third party pricing service is not readily available may be valued at amortized cost, which approximates fair value, and are categorized as Level 2 in the hierarchy.
Other Securities. Investments in management investment companies (including money market funds) that do not trade on an exchange are valued at the net asset value as of the close of each business day and are categorized as Level 1 in the hierarchy.
Derivatives. Futures contracts are valued at unrealized appreciation (depreciation) based on the settlement price established each day by the board of trade or exchange on which they are traded and are categorized as Level 1 in the hierarchy.
Fair Valuation. In connection with Rule 2a-5 of the 1940 Act, the Board has designated the Fund’s investment adviser as its valuation designee. Investments for which valuations or market quotations are not readily available or are deemed unreliable are valued by the investment adviser, as valuation designee, at fair value using methods that most fairly reflect the security’s “fair value”, which is the amount that the Fund might reasonably expect to receive for the security upon its current sale in the ordinary course. Each such determination is based on a consideration of relevant factors, which are likely to vary from one pricing context to another. These factors may include, but are not limited to, the type of security, the existence of any contractual restrictions on the security’s disposition, the price and extent of public trading in similar securities of the issuer or of comparable companies or entities, quotations or relevant information obtained from broker/dealers or other market participants, information obtained from the issuer, analysts, and/or the appropriate stock exchange (for exchange-traded securities), an analysis of the company’s or entity’s financial statements, and an evaluation of the forces that influence the issuer and the market(s) in which the security is purchased and sold.
The values assigned to fair value investments are based on available information and do not necessarily represent amounts that might ultimately be realized. Further, due to the inherent uncertainty of valuations of such investments, the fair values may differ significantly from the values that would have been used had an active market existed, and the differences could be material.
Calvert
Mortgage Access Fund
September 30, 2023
Notes to Financial Statements — continued
The following table summarizes the market value of the Fund's holdings as of September 30, 2023, based on the inputs used to value them:
| Asset Description | Level 1 | Level 2 | Level 3 | Total |
| Collateralized Mortgage Obligations | $ — | $ 23,483,024 | $ — | $ 23,483,024 |
| U.S. Government Agency Mortgage-Backed Securities | — | 51,493,934 | — | 51,493,934 |
| Short-Term Investments | 1,881,424 | — | — | 1,881,424 |
| Total Investments | $1,881,424 | $74,976,958 | $ — | $76,858,382 |
| Liability Description | | | | |
| Futures Contracts | $ (101,431) | $ — | $ — | $ (101,431) |
| Total | $ (101,431) | $ — | $ — | $ (101,431) |
B Investment Transactions and Income— Investment transactions for financial statement purposes are accounted for on trade date. Realized gains and losses are recorded on an identified cost basis and may include proceeds from litigation. Dividend income is recorded on the ex-dividend date for dividends received in cash and/or securities. Interest income, which includes amortization of premium and accretion of discount on debt securities, is accrued as earned.
C Share Class Accounting— Realized and unrealized gains and losses are allocated daily to each class of shares based upon the relative net assets of each class to the total net assets of the Fund. Net investment income, other than class-specific expenses, is allocated daily to each class of shares based upon the ratio of the value of each class’s paid shares to the total value of all paid shares. Expenses arising in connection with a specific class are charged directly to that class. Sub-accounting, recordkeeping and similar administrative fees payable to financial intermediaries, which are a component of transfer agency fees and expenses on the Statement of Operations, are not allocated to Class R6 shares.
D Futures Contracts— The Fund may enter into futures contracts to buy or sell a financial instrument for a set price at a future date. Initial margin deposits of either cash or securities as required by the broker are made upon entering into the contract. While the contract is open, daily variation margin payments are made to or received from the broker reflecting the daily change in market value of the contract and are recorded for financial reporting purposes as unrealized gains or losses by the Fund. When a futures contract is closed, a realized gain or loss is recorded equal to the difference between the opening and closing value of the contract. The risks associated with entering into futures contracts may include the possible illiquidity of the secondary market which would limit the Fund’s ability to close out a futures contract prior to the settlement date, an imperfect correlation between the value of the contracts and the underlying financial instruments, or that the counterparty will fail to perform its obligations under the contracts’ terms. Futures contracts are designed by boards of trade, which are designated “contracts markets” by the Commodities Futures Trading Commission. Futures contracts trade on the contracts markets in a manner that is similar to the way a stock trades on a stock exchange, and the boards of trade, through their clearing corporations, guarantee the futures contracts against default. As a result, there is minimal counterparty credit risk to the Fund.
E Reverse Repurchase Agreements— Under a reverse repurchase agreement, the Fund temporarily transfers possession of a portfolio security to another party, such as a bank or broker/dealer, in return for cash. At the same time, the Fund agrees to repurchase the security at an agreed upon time and price, which reflects an interest payment. In periods of increased demand for a security, the Fund may receive a payment from the counterparty for the use of the security, which is recorded as interest income. Because the Fund retains effective control over the transferred security, the transaction is accounted for as a secured borrowing. The Fund may enter into such agreements when it believes it is able to invest the cash acquired at a rate higher than the cost of the agreement, which would increase earned income. When the Fund enters into a reverse repurchase agreement, any fluctuations in the market value of either the securities transferred to another party or the securities in which the proceeds may be invested would affect the market value of the Fund’s assets. Because reverse repurchase agreements may be considered to be the practical equivalent of borrowing funds (and the counterparty making a loan), they constitute a form of leverage. The Fund segregates cash or liquid assets equal to its obligation to repurchase the security. During the term of the agreement, the Fund may also be obligated to pledge additional cash and/or securities in the event of a decline in the fair value of the transferred security. In the event the counterparty to a reverse repurchase agreement becomes insolvent, recovery of the security transferred by the Fund may be delayed or the Fund may incur a loss equal to the amount by which the value of the security transferred by the Fund exceeds the repurchase price payable by the Fund.
F Distributions to Shareholders— Distributions to shareholders are recorded by the Fund on ex-dividend date. The Fund declares income distributions daily to shareholders of record at the time of declaration and generally pays them monthly. The Fund makes distributions of net realized capital gains, if any, at least annually. Distributions are declared separately for each class of shares. Distributions are determined in accordance with income tax regulations, which may differ from U.S. GAAP; accordingly, periodic reclassifications are made within the Fund’s capital accounts to reflect income and gains available for distribution under income tax regulations.
G Estimates— The preparation of financial statements in conformity with U.S. GAAP requires management to make estimates and assumptions that affect the reported amounts of assets and liabilities and disclosure of contingent assets and liabilities at the date of the financial statements and the reported amounts of increases and decreases in net assets from operations during the reporting period. Actual results could differ from those estimates.
Calvert
Mortgage Access Fund
September 30, 2023
Notes to Financial Statements — continued
H Indemnifications— Under the Trust’s organizational document, its officers and Trustees may be indemnified against certain liabilities and expenses arising out of the performance of their duties to the Fund. Under Massachusetts law, if certain conditions prevail, shareholders of a Massachusetts business trust (such as the Trust) could be deemed to have personal liability for the obligations of the Trust. However, the Trust’s Declaration of Trust contains an express disclaimer of liability on the part of Fund shareholders and provides that the Trust shall assume, upon request by the shareholder, the defense on behalf of any Fund shareholders or former shareholders. Additionally, in the normal course of business, the Fund enters into agreements with service providers that may contain indemnification clauses. The Fund’s maximum exposure under these arrangements is unknown as this would involve future claims that may be made against the Fund that have not yet occurred.
I Federal Income Taxes— No provision for federal income or excise tax is required since the Fund intends to continue to qualify as a regulated investment company under the Internal Revenue Code and to distribute substantially all of its taxable earnings.
Management has analyzed the Fund's tax positions taken for all open federal income tax years and has concluded that no provision for federal income tax is required in the Fund's financial statements. A Fund's federal tax return is subject to examination by the Internal Revenue Service for a period of three years from the date of filing.
J When-Issued Securities and Delayed Delivery Transactions— The Fund may purchase securities on a delayed delivery, when-issued or forward commitment basis, including TBA (To Be Announced) securities. Payment and delivery may take place after the customary settlement period for that security. At the time the transaction is negotiated, the price of the security that will be delivered is fixed. Securities purchased on a delayed delivery, when-issued or forward commitment basis are marked-to-market daily and begin earning interest on settlement date. Such security purchases are subject to the risk that when delivered they will be worth less than the agreed upon payment price. Losses may also arise if the counterparty does not perform under the contract. A forward purchase commitment may be closed by entering into an offsetting commitment. If an offsetting commitment is entered into, the Fund will realize a gain or loss on investments based on the price established when the Fund entered into the commitment.
K Offering Costs— Offering costs incurred in connection with the initial offering of the Fund’s shares are amortized on a straight-line basis over twelve months from commencement of operations of the Fund.
2 Related Party Transactions
The investment advisory fee is earned by Calvert Research and Management (CRM), an indirect, wholly-owned subsidiary of Morgan Stanley, as compensation for investment advisory services rendered to the Fund. The investment advisory fee is computed at the annual rate of 0.28% of the Fund’s average daily net assets and is payable monthly. For the year ended September 30, 2023, the investment advisory fee amounted to $90,112.
The Fund may invest in a money market fund, the Institutional Class of the Morgan Stanley Institutional Liquidity Funds - Government Portfolio (the “Liquidity Fund”), an open-end management investment company managed by Morgan Stanley Investment Management Inc., a wholly-owned subsidiary of Morgan Stanley. The investment advisory fee paid by the Fund is reduced by an amount equal to its pro rata share of the advisory and administration fees paid by the Fund due to its investment in the Liquidity Fund. For the year ended September 30, 2023, the investment advisory fee paid was reduced by $2,041 relating to the Fund’s investment in the Liquidity Fund.
CRM has agreed to reimburse the Fund's operating expenses to the extent that total annual operating expenses (relating to ordinary operating expenses only and excluding expenses such as brokerage commissions, acquired fund fees and expenses of unaffiliated funds, borrowing costs, taxes or litigation expenses) exceed 0.74%, 1.49%, 0.49% and 0.49% for Class A, Class C, Class I and Class R6, respectively, of such class’s average daily net assets. The expense reimbursement agreement with CRM may be changed or terminated after February 1, 2025. For the year ended September 30, 2023, CRM waived or reimbursed expenses of $99,948.
The administrative fee is earned by CRM as compensation for administrative services rendered to the Fund. The fee is computed at an annual rate of 0.12% of the Fund’s average daily net assets attributable to Class A, Class C, Class I and Class R6 and is payable monthly. For the year ended September 30, 2023, CRM was paid administrative fees of $38,620.
The Fund has in effect a distribution plan for Class A shares (Class A Plan) pursuant to Rule 12b-1 under the 1940 Act. Pursuant to the Class A Plan, the Fund pays Eaton Vance Distributors, Inc. (EVD), an affiliate of CRM and the Fund’s principal underwriter, a distribution and service fee of 0.25% per annum of its average daily net assets attributable to Class A shares for distribution services and facilities provided to the Fund by EVD, as well as for personal services and/or the maintenance of shareholder accounts. The Fund also has in effect a distribution plan for Class C shares (Class C Plan) pursuant to Rule 12b-1 under the 1940 Act. Pursuant to the Class C Plan, the Fund pays EVD amounts equal to 0.75% per annum of its average daily net assets attributable to Class C shares for providing ongoing distribution services and facilities to the Fund. In addition, pursuant to the Class C Plan, the Fund also makes payments of service fees to EVD, financial intermediaries and other persons in amounts equal to 0.25% per annum of its average daily net assets attributable to that class. Service fees paid or accrued are for personal services and/or the maintenance of shareholder accounts. Distribution and service fees paid or accrued for the year ended September 30, 2023 amounted to $226 and $502 for Class A shares and Class C shares, respectively.
The Fund was informed that EVD received $13 as its portion of the sales charge on sales of Class A shares for the year ended September 30, 2023 and no contingent deferred sales charges paid by Class A and Class C shareholders for the same period.
Calvert
Mortgage Access Fund
September 30, 2023
Notes to Financial Statements — continued
Eaton Vance Management (EVM), an affiliate of CRM, provides sub-transfer agency and related services to the Fund pursuant to a Sub-Transfer Agency Support Services Agreement. For the year ended September 30, 2023, sub-transfer agency fees and expenses incurred to EVM amounted to $322 and are included in transfer agency fees and expenses on the Statement of Operations.
Each Trustee of the Fund who is not an employee of CRM or its affiliates receives an annual fee of $214,000, an annual Committee fee ranging from $8,500 to $16,500 depending on the Committee, and may receive a fee of $10,000 for special meetings. The Board chair receives an additional $40,000 ($30,000 prior to January 1, 2023) annual fee, Committee chairs receive an additional $15,000 ($6,000 prior to January 1, 2023) annual fee and the special equities liaison receives an additional $2,500 annual fee. Eligible Trustees may participate in a Deferred Compensation Plan (the Plan). Amounts deferred under the Plan are treated as though equal dollar amounts had been invested in shares of the Fund or other Calvert funds selected by the Trustees. The Fund purchases shares of the funds selected equal to the dollar amounts deferred under the Plan, resulting in an asset equal to the deferred compensation liability. Obligations of the Plan are paid solely from the Fund’s assets. Trustees’ fees are allocated to each of the Calvert funds served. Salaries and fees of officers and Trustees of the Fund who are employees of CRM or its affiliates are paid by CRM.
3 Investment Activity
During the year ended September 30, 2023, the cost of purchases and proceeds from sales of investments, other than U.S. government and agency securities and short-term securities and including paydowns, were $6,044,857 and $1,178,324, respectively. Purchases and sales of U.S. government and agency securities, including paydowns and TBA transactions, were $214,529,330 and $168,932,865, respectively.
4 Distributions to Shareholders and Income Tax Information
The tax character of distributions declared for the year ended September 30, 2023 and period ended September 30, 2022 was as follows:
| | Year Ended
September 30,
2023 | Period Ended
September 30,
2022(1) |
| Ordinary income | $1,785,204 | $255,872 |
| (1) | For the period from the commencement of operations, April 29, 2022, to September 30, 2022. |
As of September 30, 2023, the components of distributable earnings (accumulated loss) on a tax basis were as follows:
| Undistributed ordinary income | $ 20,395 |
| Deferred capital losses | (578,015) |
| Net unrealized depreciation | (1,726,872) |
| Accumulated loss | $(2,284,492) |
At September 30, 2023, the Fund, for federal income tax purposes, had deferred capital losses of $578,015 which would reduce the Fund's taxable income arising from future net realized gains on investment transactions, if any, to the extent permitted by the Internal Revenue Code, and thus would reduce the amount of distributions to shareholders, which would otherwise be necessary to relieve the Fund of any liability for federal income or excise tax. The deferred capital losses are treated as arising on the first day of the Fund's next taxable year, can be carried forward for an unlimited period, and retain the same short-term or long-term character as when originally deferred. Of the deferred capital losses at September 30, 2023, $350,840 are short-term and $227,175 are long-term.
The cost and unrealized appreciation (depreciation) of investments, including open derivative contracts, of the Fund at September 30, 2023, as determined on a federal income tax basis, were as follows:
| Aggregate cost | $78,585,254 |
| Gross unrealized appreciation | $ 214,174 |
| Gross unrealized depreciation | (1,941,046) |
| Net unrealized depreciation | $ (1,726,872) |
Calvert
Mortgage Access Fund
September 30, 2023
Notes to Financial Statements — continued
5 Financial Instruments
A summary of futures contracts outstanding at September 30, 2023 is included in the Schedule of Investments. During the year ended September 30, 2023, the Fund used futures contracts to hedge interest rate risks and to manage duration.
At September 30, 2023, the fair value of open derivative instruments (not considered to be hedging instruments for accounting disclosure purposes) and whose primary underlying risk exposure is interest rate risk was as follows:
| Derivative | Statement of Assets and Liabilities Caption | Assets | Liabilities |
| Futures contracts | Accumulated loss | | $ — | $(101,431) (1) |
| (1) | Only the current day’s variation margin is reported within the Statement of Assets and Liabilities as Receivable or Payable for variation margin on open futures contracts, as applicable. |
The effect of derivative instruments (not considered to be hedging instruments for accounting disclosure purposes) on the Statement of Operations and whose primary underlying risk exposure is interest rate risk for the year ended September 30, 2023 was as follows:
| | Statement of Operations Caption | |
| Derivative | Net realized gain (loss): Futures
contracts | Change in unrealized appreciation
(depreciation): Futures contracts |
| Futures contracts | $ (257,652) | $ (101,431) |
The average notional cost of futures contracts (long) outstanding during the year ended September 30, 2023 was approximately $4,783,000.
6 Line of Credit
The Fund participates with other portfolios and funds managed by EVM and its affiliates, including CRM, in a $725 million unsecured revolving line of credit agreement with a group of banks, which is in effect through October 24, 2023. Borrowings are made by the Fund solely for temporary purposes related to redemptions and other short-term cash needs. Interest is charged to the Fund based on its borrowings at an amount above either the Secured Overnight Financing Rate (SOFR) or Federal Funds rate. In addition, a fee computed at an annual rate of 0.15% on the daily unused portion of the line of credit is allocated among the participating portfolios and funds at the end of each quarter. In connection with the renewal of the agreement in October 2022, an arrangement fee of $150,000 was incurred that was allocated to the participating portfolios and funds. Because the line of credit is not available exclusively to the Fund, it may be unable to borrow some or all of its requested amounts at any particular time.
The Fund had no borrowings outstanding pursuant to its line of credit at September 30, 2023. The Fund did not have any significant borrowings or allocated fees during the year ended September 30, 2023. Effective October 24, 2023, the Fund renewed its line of credit agreement, which expires October 22, 2024. In connection with the renewal, the borrowing limit was decreased to $650 million.
7 Reverse Repurchase Agreements
Reverse repurchase agreements outstanding as of September 30, 2023 were as follows:
| Counterparty | Trade
Date | Maturity
Date | Interest
Rate Paid
(Received) | Principal
Amount | Value
Including
Accrued
Interest |
| MUFG Securities Americas, Inc. | 7/31/23 | On Demand(1) | 5.50% | $909,121 | $917,732 |
| MUFG Securities Americas, Inc. | 8/11/23 | On Demand(1) | 5.50 | 640,183 | 644,879 |
| MUFG Securities Americas, Inc. | 8/21/23 | On Demand(1) | 5.50 | 2,695,351 | 2,712,233 |
| MUFG Securities Americas, Inc. | 8/23/23 | On Demand(1) | 5.50 | 505,133 | 508,066 |
| Total Investments | | | | $4,749,788 | $4,782,910 |
| (1) | Open reverse repurchase agreement with no specific maturity date. Either party may terminate the agreement upon demand. |
Calvert
Mortgage Access Fund
September 30, 2023
Notes to Financial Statements — continued
At September 30, 2023, the remaining contractual maturity of all open reverse repurchase agreements was less than 30 days. The type of securities pledged as collateral for all open reverse repurchase agreements was U.S. Government Agency Mortgage-Backed Securities.
For the year ended September 30, 2023, the average borrowings under settled reverse repurchase agreements and the average annual interest rate paid were approximately $2,473,000 and 5.21%, respectively. Based on the short-term nature of the borrowings under the reverse repurchase agreements, the carrying value of the payable for reverse repurchase agreements approximated its fair value at September 30, 2023. If measured at fair value, borrowings under the reverse repurchase agreements would have been considered as Level 2 in the fair value hierarchy (see Note 1A) at September 30, 2023.
Reverse repurchase agreements entered into by the Fund are subject to Master Repurchase Agreements (MRA), which permit the Fund, under certain circumstances, including an event of default (such as bankruptcy or insolvency), to offset payables and/or receivables under the MRA with collateral held and/or posted to the counterparty and create one single net payment due to or from the Fund.
The following table presents the Fund’s reverse repurchase agreements net of amounts available for offset under an MRA and net of the related collateral pledged by the Fund as of September 30, 2023.
| Counterparty | Reverse
Repurchase
Agreements* | Assets
Available For
Offset | Securities
Collateral
Pledged(a) | Net
Amount(b) |
| MUFG Securities Americas, Inc. | $(4,782,910) | $ — | $4,782,910 | $ — |
| * | Including accrued interest |
| (a) | In some instances, the total collateral pledged may be more than the amount shown due to overcollateralization. |
| (b) | Net amount represents the net amount payable to the counterparty in the event of default. |
8 Affiliated Investments
At September 30, 2023, the value of the Fund’s investment in funds that may be deemed to be affiliated was $1,881,424, which represents 3.6% of the Fund’s net assets. Transactions in such investments by the Fund for the year ended September 30, 2023 were as follows:
| Name | Value,
beginning
of period | Purchases | Sales
proceeds | Net
realized
gain
(loss) | Change in
unrealized
appreciation
(depreciation) | Value,
end of
period | Dividend
income | Shares,
end of
period |
| Short-Term Investments | | | | | | |
| Liquidity Fund | $4,695,050 | $31,565,099 | $(34,378,725) | $ — | $ — | $1,881,424 | $63,891 | 1,881,424 |
9 Capital Shares
The Fund’s Declaration of Trust permits the Trustees to issue an unlimited number of full and fractional shares of beneficial interest (without par value). Such shares may be issued in a number of different series (such as the Fund) and classes.
Transactions in capital shares were as follows:
| | Year Ended
September 30, 2023 | | Period Ended
September 30, 2022(1) |
| | Shares | Amount | | Shares | Amount |
| Class A | | | | | |
| Shares sold | 8,973 | $ 87,174 | | 6,615 | $ 66,000 |
| Reinvestment of distributions | 471 | 4,588 | | 56 | 558 |
| Shares redeemed | (1,034) | (9,868) | | — | — |
| Net increase | 8,410 | $ 81,894 | | 6,671 | $ 66,558 |
Calvert
Mortgage Access Fund
September 30, 2023
Notes to Financial Statements — continued
| | Year Ended
September 30, 2023 | | Period Ended
September 30, 2022(1) |
| | Shares | Amount | | Shares | Amount |
| Class C | | | | | |
| Shares sold | — | $ — | | 5,000 | $ 50,000 |
| Reinvestment of distributions | 229 | 2,241 | | 31 | 304 |
| Net increase | 229 | $ 2,241 | | 5,031 | $ 50,304 |
| Class I | | | | | |
| Shares sold | 2,790,545 | $ 27,105,577 | | 2,506,080 | $ 25,060,000 |
| Reinvestment of distributions | 182,231 | 1,775,046 | | 25,779 | 254,857 |
| Shares redeemed | (4,806) | (47,125) | | — | — |
| Net increase | 2,967,970 | $28,833,498 | | 2,531,859 | $25,314,857 |
| Class R6 | | | | | |
| Shares sold | 23 | $ 217 | | 5,000 | $ 50,000 |
| Reinvestment of distributions | 283 | 2,771 | | 52 | 511 |
| Net increase | 306 | $ 2,988 | | 5,052 | $ 50,511 |
| (1) | For the period from the commencement of operations, April 29, 2022, to September 30, 2022. |
At September 30, 2023, EVM, Calvert Conservative Allocation Fund and Calvert Moderate Allocation Fund owned in the aggregate 94.2% of the value of the outstanding shares of the Fund.
Calvert
Mortgage Access Fund
September 30, 2023
Report of Independent Registered Public Accounting Firm
To the Board of Trustees of The Calvert Fund and Shareholders of Calvert Mortgage Access Fund:
Opinion on the Financial Statements and Financial Highlights
We have audited the accompanying statement of assets and liabilities of Calvert Mortgage Access Fund (the "Fund") (one of the funds constituting The Calvert Fund), including the schedule of investments, as of September 30, 2023, the related statement of operations for the year then ended, the statements of changes in net assets and the financial highlights for the year then ended and for the period from April 29, 2022 (commencement of operations) to September 30, 2022, and the related notes. In our opinion, the financial statements and financial highlights present fairly, in all material respects, the financial position of the Fund as of September 30, 2023, and the results of its operations for the year then ended, and the changes in its net assets and the financial highlights for the year then ended and for the period from April 29, 2022 (commencement of operations) to September 30, 2022, in conformity with accounting principles generally accepted in the United States of America.
Basis for Opinion
These financial statements and financial highlights are the responsibility of the Fund's management. Our responsibility is to express an opinion on the Fund's financial statements and financial highlights based on our audits. We are a public accounting firm registered with the Public Company Accounting Oversight Board (United States) (PCAOB) and are required to be independent with respect to the Fund in accordance with the U.S. federal securities laws and the applicable rules and regulations of the Securities and Exchange Commission and the PCAOB.
We conducted our audits in accordance with the standards of the PCAOB. Those standards require that we plan and perform the audit to obtain reasonable assurance about whether the financial statements and financial highlights are free of material misstatement, whether due to error or fraud. The Fund is not required to have, nor were we engaged to perform, an audit of its internal control over financial reporting. As part of our audits, we are required to obtain an understanding of internal control over financial reporting but not for the purpose of expressing an opinion on the effectiveness of the Fund’s internal control over financial reporting. Accordingly, we express no such opinion.
Our audits included performing procedures to assess the risks of material misstatement of the financial statements and financial highlights, whether due to error or fraud, and performing procedures that respond to those risks. Such procedures included examining, on a test basis, evidence regarding the amounts and disclosures in the financial statements and financial highlights. Our audits also included evaluating the accounting principles used and significant estimates made by management, as well as evaluating the overall presentation of the financial statements and financial highlights. Our procedures included confirmation of securities owned as of September 30, 2023, by correspondence with the custodian and brokers; when replies were not received from brokers, we performed other auditing procedures. We believe that our audits provide a reasonable basis for our opinion.
/s/ Deloitte & Touche LLP
Boston, Massachusetts
November 22, 2023
We have served as the auditor of one or more Calvert investment companies since 2021.
Calvert
Mortgage Access Fund
September 30, 2023
Federal Tax Information (Unaudited)
The Form 1099-DIV you receive in February 2024 will show the tax status of all distributions paid to your account in calendar year 2023. Shareholders are advised to consult their own tax adviser with respect to the tax consequences of their investment in the Fund. As required by the Internal Revenue Code and/or regulations, shareholders must be notified regarding the status of 163(j) interest dividends.
163(j) Interest Dividends. For the fiscal year ended September 30, 2023, the Fund designates 100% of distributions from net investment income as a 163(j) interest dividend.
Calvert
Mortgage Access Fund
September 30, 2023
Board of Trustees' Contract Approval
Overview of the Contract Review Process
The Investment Company Act of 1940, as amended, provides, in substance, that each investment advisory agreement between a fund and its investment adviser will continue in effect from year to year only if its continuation is approved at least annually by the fund’s board of directors, including by a vote of a majority of the directors who are not “interested persons” of the fund (“Independent Directors”), cast in person at a meeting called for the purpose of considering such approval.
At an in-person meeting of the Boards of Trustees/Directors (each a “Board”) of the registered investment companies advised by Calvert Research and Management (“CRM” or the “Adviser”) (the “Calvert Funds”) held on June 12-13, 2023, the Board, including a majority of the Independent Directors, voted to approve continuation of existing investment advisory and investment sub-advisory agreements for the Calvert Funds for an additional one-year period.
In evaluating the investment advisory and investment sub-advisory agreements for the Calvert Funds, the Board considered a variety of information relating to the Calvert Funds and various service providers, including the Adviser. The Independent Directors reviewed a report prepared by the Adviser regarding various services provided to the Calvert Funds by the Adviser and its affiliates. Such report included, among other data, information regarding the Adviser’s personnel and the Adviser’s revenue and cost of providing services to the Calvert Funds, and a separate report prepared by an independent data provider, which compared each fund’s investment performance, fees and expenses to those of comparable funds as identified by such independent data provider (“comparable funds”).
The Independent Directors were separately represented by independent legal counsel with respect to their consideration of the continuation of the investment advisory and investment sub-advisory agreements for the Calvert Funds. Prior to voting, the Independent Directors reviewed the proposed continuation of the Calvert Funds’ investment advisory and investment sub-advisory agreements with management and also met in private sessions with their counsel at which time no representatives of management were present.
The information that the Board considered included, among other things, the following (for funds that invest through one or more affiliated underlying fund(s), references to “each fund” in this section may include information that was considered at the underlying fund-level):
Information about Fees, Performance and Expenses
| • | A report from an independent data provider comparing the advisory and related fees paid by each fund with fees paid by comparable funds; |
| • | A report from an independent data provider comparing each fund’s total expense ratio and its components to comparable funds; |
| • | A report from an independent data provider comparing the investment performance of each fund to the investment performance of comparable funds over various time periods; |
| • | Data regarding investment performance in comparison to benchmark indices; |
| • | For each fund, comparative information concerning the fees charged and the services provided by the Adviser in managing other accounts (including mutual funds, other collective investment funds and institutional accounts) using investment strategies and techniques similar to those used in managing such fund; |
| • | Profitability analyses for the Adviser with respect to each fund; |
Information about Portfolio Management and Trading
| • | Descriptions of the investment management services provided to each fund, including investment strategies and processes it employs; |
| • | Information about the Adviser’s policies and practices with respect to trading, including the Adviser’s processes for monitoring best execution of portfolio transactions; |
| • | Information about the allocation of brokerage transactions and the benefits received by the Adviser as a result of brokerage allocation, including information concerning the acquisition of research through client commission arrangements and policies with respect to “soft dollars”; |
Information about the Adviser
| • | Reports detailing the financial results and condition of CRM; |
| • | Descriptions of the qualifications, education and experience of the individual investment professionals whose responsibilities include portfolio management and investment research for the funds, and information relating to their compensation and responsibilities with respect to managing other mutual funds and investment accounts; |
| • | Policies and procedures relating to proxy voting and the handling of corporate actions and class actions; |
| • | A description of CRM’s procedures for overseeing sub-advisers, including with respect to regulatory and compliance issues, investment management and other matters; |
Calvert
Mortgage Access Fund
September 30, 2023
Board of Trustees' Contract Approval — continued
Other Relevant Information
| • | Information concerning the nature, cost and character of the administrative and other non-investment advisory services provided by CRM and its affiliates; and |
| • | The terms of each investment advisory agreement. |
Over the course of the year, the Board and its committees held regular quarterly meetings. During these meetings, the Directors participated in investment and performance reviews with the portfolio managers and other investment professionals of the Adviser relating to each fund and considered various investment and trading strategies used in pursuing each fund’s investment objective(s), such as the use of derivative instruments, as well as risk management techniques. The Board and its committees also evaluated issues pertaining to industry and regulatory developments, compliance procedures, corporate governance and other issues with respect to the funds and received and participated in reports and presentations provided by CRM and its affiliates with respect to such matters. In addition to the formal meetings of the Board and its committees, the Independent Directors held regular video conferences in between meetings to discuss, among other topics, matters relating to the continuation of the Calvert Funds’ investment advisory and investment sub-advisory agreements.
For funds that invest through one or more affiliated underlying funds, the Board considered similar information about the underlying fund(s) when considering the approval of investment advisory agreements. In addition, in cases where the Adviser has engaged a sub-adviser, the Board considered similar information about the sub-adviser when considering the approval of any investment sub-advisory agreement.
The Independent Directors were assisted throughout the contract review process by their independent legal counsel. The Independent Directors relied upon the advice of such counsel and their own business judgment in determining the material factors to be considered in evaluating each investment advisory and investment sub-advisory agreement and the weight to be given to each such factor. The Board, including the Independent Directors, did not identify any single factor as controlling, and each Director may have attributed different weight to various factors.
Results of the Contract Review Process
Based on its consideration of the foregoing, and such other information as it deemed relevant, including the factors and conclusions described below, the Board, including the Independent Directors, concluded that the continuation of the investment advisory agreement of Calvert Mortgage Access Fund (the “Fund”), including the fee payable under the agreement, is in the best interests of the Fund’s shareholders. Accordingly, the Board, including a majority of the Independent Directors, voted to approve the continuation of the investment advisory agreement of the Fund.
Nature, Extent and Quality of Services
In considering the nature, extent and quality of the services provided by the Adviser under the investment advisory agreement, the Board reviewed information provided by the Adviser relating to its operations and personnel, including, among other information, biographical information on the Adviser’s investment personnel and descriptions of its organizational and management structure. The Board also took into account similar information provided periodically throughout the previous year by the Adviser as well as the Board’s familiarity with management through Board meetings, discussions and other reports. The Board considered the Adviser’s management style and its performance in employing its investment strategies as well as its current level of staffing and overall resources. The Board also noted that it reviewed on a quarterly basis information regarding the Adviser’s compliance with applicable policies and procedures, including those related to personal investing. The Board took into account, among other items, periodic reports received from the Adviser over the past year concerning the Adviser’s ongoing review and enhancement of certain processes, policies and procedures of the Calvert Funds and the Adviser. The Board concluded that it was satisfied with the nature, extent and quality of services provided to the Fund by the Adviser under the investment advisory agreement.
Fund Performance
In considering the Fund’s performance, the Board noted that it reviewed on a quarterly basis detailed information about the Fund’s performance results, portfolio composition and investment strategies. The Board compared the Fund’s investment performance to that of the Fund’s peer universe and its benchmark index. The Board’s review included comparative performance data for the one-year period ended April 30, 2023. This performance data indicated that the Fund had outperformed the median of its peer universe and its benchmark index for the one-year period ended April 30, 2023. Based upon its review, the Board concluded that the Adviser is qualified to manage the Fund’s assets in accordance with the Fund’s investment objective and strategies and that the Adviser’s investment strategies are appropriate for pursing the Fund’s investment objective.
Management Fees and Expenses
In considering the Fund’s fees and expenses, the Board compared the Fund’s fees and total expense ratio with those of comparable funds in its expense group. Among other findings, the data indicated that the Fund’s advisory and administrative fees (after taking into account waivers and/or reimbursements) (referred to collectively as “management fees”) and the Fund’s total expenses (net of waivers and/or reimbursements) were each below the respective
Calvert
Mortgage Access Fund
September 30, 2023
Board of Trustees' Contract Approval — continued
median of the Fund’s expense group. The Board took into account the Adviser’s current undertaking to maintain expense limitations for the Fund and that the Adviser was waiving and/or reimbursing a portion of the Fund’s expenses. Based upon its review, the Board concluded that the management fees were reasonable in view of the nature, extent and quality of services provided by the Adviser.
Profitability and Other “Fall-Out” Benefits
The Board reviewed the Adviser’s profitability in regard to the Fund and the Calvert Funds in the aggregate. In reviewing the overall profitability of the Fund to the Adviser, the Board also considered the fact that the Adviser and its affiliates provided sub-transfer agency support, administrative and distribution services to the Fund for which they received compensation. The information considered by the Board included the profitability of the Fund to the Adviser and its affiliates without regard to any marketing support or other payments by the Adviser and its affiliates to third parties in respect of distribution services. The Board also considered that the Adviser and its affiliates derived benefits to their reputation and other indirect benefits from their relationships with the Fund. Based upon its review, the Board concluded that the Adviser’s and its affiliates’ level of profitability from their relationships with the Fund was reasonable.
Economies of Scale
The Board considered the effect of the Fund’s current size and its potential growth on its performance and fees. The Board concluded that adding breakpoints to the advisory fee at specified asset levels would not be appropriate at this time. The Board noted that if the Fund’s assets increased over time, the Fund might realize other economies of scale if assets increased proportionally more than certain other expenses.
Calvert
Mortgage Access Fund
September 30, 2023
Liquidity Risk Management Program
The Fund has implemented a written liquidity risk management program (Program) and related procedures to manage its liquidity in accordance with Rule 22e-4 under the Investment Company Act of 1940, as amended (Liquidity Rule). The Liquidity Rule defines “liquidity risk” as the risk that a fund could not meet requests to redeem shares issued by the fund without significant dilution of the remaining investors’ interests in the fund. The Fund’s Board of Trustees/Directors has designated the investment adviser to serve as the administrator of the Program and the related procedures. The administrator has established a Liquidity Risk Management Oversight Committee (Committee) to perform the functions necessary to administer the Program. As part of the Program, the administrator is responsible for identifying illiquid investments and categorizing the relative liquidity of the Fund’s investments in accordance with the Liquidity Rule. Under the Program, the administrator assesses, manages, and periodically reviews the Fund’s liquidity risk, and is responsible for making certain reports to the Fund’s Board of Trustees/Directors and the Securities and Exchange Commission (SEC) regarding the liquidity of the Fund’s investments, and to notify the Board of Trustees/Directors and the SEC of certain liquidity events specified in the Liquidity Rule. The liquidity of the Fund’s portfolio investments is determined based on a number of factors including, but not limited to, relevant market, trading and investment-specific considerations under the Program.
At a meeting of the Fund’s Board of Trustees/Directors on June 13, 2023, the Committee provided a written report to the Fund’s Board of Trustees/ Directors pertaining to the operation, adequacy, and effectiveness of implementation of the Program, as well as the operation of the highly liquid investment minimum (if applicable) for the period January 1, 2022 through December 31, 2022 (Review Period). The Program operated effectively during the Review Period, supporting the administrator’s ability to assess, manage and monitor Fund liquidity risk, including during periods of market volatility and net redemptions. During the Review Period, the Fund met redemption requests on a timely basis.
There can be no assurance that the Program will achieve its objectives in the future. Please refer to the Fund’s prospectus for more information regarding the Fund’s exposure to liquidity risk and other principal risks to which an investment in the Fund may be subject.
Calvert
Mortgage Access Fund
September 30, 2023
Management and Organization
Fund Management. The Trustees of The Calvert Fund (the Trust) are responsible for the overall management and supervision of the affairs of the Trust. The Board members and officers of the Trust are listed below. Except as indicated, each individual has held the office shown or other offices in the same company for the last five years. Board members hold indefinite terms of office. Each Board member holds office until his or her successor is elected and qualified, or until his or her earlier death, resignation, retirement, removal or disqualification. Under the terms of the Fund's current Board member retirement policy, an Independent Board member must retire at the end of the calendar year in which he or she turns 75. However, if such retirement would cause the Fund to be out of compliance with Section 16 of the 1940 Act or any other regulations or guidance of the SEC, then such retirement will not become effective until such time as action has been taken for the Fund to be in compliance therewith. The “noninterested Trustees” consist of those Trustees who are not “interested persons” of the Trust, as that term is defined under the 1940 Act. The business address of each Board member and the Chief Compliance Officer is 2050 M Street NW, Washington, DC 20036 and the business address of the Secretary, Vice President and Chief Legal Officer and the Treasurer is Two International Place, Boston, Massachusetts 02110. As used below, “CRM” refers to Calvert Research and Management and “Eaton Vance” refers to Eaton Vance Management. Each Trustee oversees 46 funds in the Calvert fund complex. Each of Eaton Vance and CRM are indirect, wholly owned subsidiaries of Morgan Stanley. Each officer affiliated with CRM may hold a position with other CRM affiliates that is comparable to his or her position with CRM listed below.
| Name and Year of Birth | Trust
Position(s) | Length of
Service | Principal Occupation(s) and Other Directorships
During Past Five Years and Other Relevant Experience |
| Interested Trustee | | | |
Theodore H. Eliopoulos(1)
1964 | Trustee and
President | Since 2022 | President and Chief Executive Officer of CRM and senior sponsor of Morgan Stanley Investment Management’s (MSIM) Diversity Council. Formerly, Vice Chairman & Head of Strategic Partnerships at MSIM (2019-2022). Former Chief Investment Officer and interim Chief Investment Officer (2014-2018) and Senior Investment Officer of Real Estate and Real Assets at California Public Employees’ Retirement System (CalPERS) (2007-2014). Former Chief Deputy Treasurer and Deputy Treasurer at the California State Treasurer's Office (2002-2006). Mr. Eliopoulos is an interested person because of his positions with CRM and certain affiliates.
Other Directorships. The Robert Toigo Foundation; Pacific Pension & Investment Institute (PPI). |
| Noninterested Trustees |
Richard L. Baird, Jr.(2)
1948 | Trustee | Since 1982 | Regional Disaster Recovery Lead, American Red Cross of Greater
Pennsylvania (since 2017). Volunteer, American Red Cross (since 2015).
Former President and CEO of Adagio Health Inc. (retired in 2014) in
Pittsburgh, PA.
Other Directorships. None. |
Alice Gresham Bullock
1950 | Chair and
Trustee | Since 2016 | Professor Emerita at Howard University School of Law. Dean Emerita of
Howard University School of Law and Deputy Director of the Association
of American Law Schools (1992-1994).
Other Directorships. None. |
Cari M. Dominguez
1949 | Trustee | Since 2016 | Former Chair of the U.S. Equal Employment Opportunity Commission.
Other Directorships. ManpowerGroup Inc. (workforce solutions company);
Triple S Management Corporation (managed care); National Association of Corporate Directors. |
Karen Fang(3)
1958 | Trustee | Since 2023 | Formerly, Managing Director, Wealth Management at GAMCO Asset Management (asset management firm) (2020-2023). Formerly, Managing Director, Senior Portfolio Manager of Fiduciary Trust Company International (wealth management firm) (1993-2019).
Other Directorships. None. |
John G. Guffey, Jr.(2)
1948 | Trustee | Since 1982 | President of Aurora Press Inc., a privately held publisher of trade paperbacks
(since January 1997).
Other Directorships. Calvert Impact Capital, Inc. (through December 31, 2018); Calvert Ventures, LLC. |
Miles D. Harper, III
1962 | Trustee | Since 2016 | Partner, Carr Riggs & Ingram (public accounting firm) since October 2014.
Partner, Gainer Donnelly & Desroches (public accounting firm) (now Carr
Riggs & Ingram) (November 1999 - September 2014).
Other Directorships. Bridgeway Funds (9) (asset management). |
Joy V. Jones
1950 | Trustee | Since 2016 | Attorney.
Other Directorships. Palm Management Corporation. |
Calvert
Mortgage Access Fund
September 30, 2023
Management and Organization — continued
| Name and Year of Birth | Trust
Position(s) | Length of
Service | Principal Occupation(s) and Other Directorships
During Past Five Years and Other Relevant Experience |
| Noninterested Trustees (continued) |
Eddie Ramos(3)
1967 | Trustee | Since 2023 | Private investor (2022-present). Formerly, Head of External Advisors/Diversity Portfolio Management at the New Jersey Division of Investment (2020-2022). Formerly, Chief Investment Officer and Lead Portfolio Manager – Global Fundamental Equities at Cornerstone Capital Management (asset management firm) (2011-2017).
Other Directorships. Macquarie Optimum Funds (6) (asset management). |
Anthony A. Williams
1951 | Trustee | Since 2010 | CEO and Executive Director of the Federal City Council (July 2012 to
present); Senior Adviser and Independent Consultant for King and
Spalding LLP (September 2015 to present); Executive Director of Global
Government Practice at the Corporate Executive Board (January 2010 to
January 2012).
Other Directorships. Freddie Mac; Evoq Properties/Meruelo Maddux
Properties, Inc. (real estate management); Weston Solutions, Inc.
(environmental services); Bipartisan Policy Center’s Debt Reduction Task Force;
Chesapeake Bay Foundation; Catholic University of America; Urban Institute (research organization); The Howard Hughes Corporation (real estate development); Old Dominion National Bank. |
| Name and Year of Birth | Trust
Position(s) | Length of
Service | Principal Occupation(s)
During Past Five Years |
| Principal Officers who are not Trustees |
Hope L. Brown
1973 | Chief
Compliance
Officer | Since 2014 | Chief Compliance Officer of 46 registered investment companies advised
by CRM (since 2014). Vice President and Chief Compliance Officer,
Wilmington Funds (2012-2014). |
Deidre E. Walsh
1971 | Secretary,
Vice President
and Chief
Legal Officer | Since 2021 | Vice President of CRM and officer of 46 registered investment companies
advised by CRM (since 2021). Also Vice President of Eaton Vance and
certain of its affiliates and officer of 127 registered investment companies
advised or administered by Eaton Vance. |
James F. Kirchner
1967 | Treasurer | Since 2016 | Vice President of CRM and officer of 46 registered investment companies
advised by CRM (since 2016). Also Vice President of Eaton Vance and
certain of its affiliates and officer of 127 registered investment companies
advised or administered by Eaton Vance. |
| | | | |
| (1) Mr. Eliopoulos is an interested person of the Fund because of his positions with the Fund’s adviser and certain affiliates. |
| (2) Effective December 31, 2023, Richard L. Baird, Jr. and John G. Guffey, Jr. will retire from the Board of Trustees. |
| (3) Ms. Fang and Mr. Ramos began serving as Trustees effective October 30, 2023. |
The SAI for the Fund includes additional information about the Trustees and officers of the Fund and can be obtained without charge on Calvert’s website at www.calvert.com or by calling 1-800-368-2745.
| FACTS | WHAT DOES EATON VANCE DO WITH YOUR
PERSONAL INFORMATION? |
| Why? | Financial companies choose how they share your personal information. Federal law gives consumers the right to limit some but not all sharing. Federal law also requires us to tell you how we collect, share, and protect your personal information. Please read this notice carefully to understand what we do. |
| |
| What? | The types of personal information we collect and share depend on the product or service you have with us. This information can include:■ Social Security number and income
■
investment experience and risk tolerance
■
checking account number and wire transfer instructions |
| |
| How? | All financial companies need to share customers’ personal information to run their everyday business. In the section below, we list the reasons financial companies can share their customers’ personal information; the reasons Eaton Vance chooses to share; and whether you can limit this sharing. |
Reasons we can share your
personal information | Does Eaton Vance
share? | Can you limit
this sharing? |
| For our everyday business purposes — such as to process your transactions, maintain your account(s), respond to court orders and legal investigations, or report to credit bureaus | Yes | No |
| For our marketing purposes — to offer our products and services to you | Yes | No |
| For joint marketing with other financial companies | No | We don’t share |
| For our investment management affiliates’ everyday business purposes — information about your transactions, experiences, and creditworthiness | Yes | Yes |
| For our affiliates’ everyday business purposes — information about your transactions and experiences | Yes | No |
| For our affiliates’ everyday business purposes — information about your creditworthiness | No | We don’t share |
| For our investment management affiliates to market to you | Yes | Yes |
| For our affiliates to market to you | No | We don’t share |
| For nonaffiliates to market to you | No | We don’t share |
To limit our
sharing | Call toll-free 1-800-368-2745 or email: CRMPrivacy@calvert.comPlease note:If you are a new customer, we can begin sharing your information 30 days from the date we sent this notice. When you are no longer our customer, we continue to share your information as described in this notice. However, you can contact us at any time to limit our sharing. |
| Questions? | Call toll-free 1-800-368-2745 or email: CRMPrivacy@calvert.com |
| Privacy Notice — continued | April 2021 |
| Who we are |
| Who is providing this notice? | Eaton Vance Management, Eaton Vance Distributors, Inc., Eaton Vance Trust Company, Eaton Vance Management (International) Limited, Eaton Vance Advisers International Ltd., Eaton Vance Global Advisors Limited, Eaton Vance Management’s Real Estate Investment Group, Boston Management and Research, Calvert Research and Management, Eaton Vance and Calvert Fund Families and our investment advisory affiliates (“Eaton Vance”) (see Investment Management Affiliates definition below) |
| What we do |
How does Eaton Vance
protect my personal
information? | To protect your personal information from unauthorized access and use, we use security measures that comply with federal law. These measures include computer safeguards and secured files and buildings. We have policies governing the proper handling of customer information by personnel and requiring third parties that provide support to adhere to appropriate security standards with respect to such information. |
How does Eaton Vance
collect my personal
information? | We collect your personal information, for example, when you■ open an account or make deposits or withdrawals from your account
■
buy securities from us or make a wire transfer
■
give us your contact informationWe also collect your personal information from others, such as credit bureaus, affiliates, or other companies. |
| Why can’t I limit all sharing? | Federal law gives you the right to limit only■ sharing for affiliates’ everyday business purposes — information about your creditworthiness
■
affiliates from using your information to market to you
■
sharing for nonaffiliates to market to youState laws and individual companies may give you additional rights to limit sharing. See below for more on your rights under state law. |
| Definitions |
Investment Management
Affiliates | Eaton Vance Investment Management Affiliates include registered investment advisers, registered broker- dealers, and registered and unregistered funds. Investment Management Affiliates does not include entities associated with Morgan Stanley Wealth Management, such as Morgan Stanley Smith Barney LLC and Morgan Stanley & Co. |
| Affiliates | Companies related by common ownership or control. They can be financial and nonfinancial companies.■ Our affiliates include companies with a Morgan Stanley name and financial companies such as Morgan Stanley Smith Barney LLC and Morgan Stanley & Co. |
| Nonaffiliates | Companies not related by common ownership or control. They can be financial and nonfinancial companies.■ Eaton Vance does not share with nonaffiliates so they can market to you. |
| Joint marketing | A formal agreement between nonaffiliated financial companies that together market financial products or services to you.■ Eaton Vance doesn’t jointly market. |
| Other important information |
| Vermont: Except as permitted by law, we will not share personal information we collect about Vermont residents with Nonaffiliates unless you provide us with your written consent to share such information.California: Except as permitted by law, we will not share personal information we collect about California residents with Nonaffiliates and we will limit sharing such personal information with our Affiliates to comply with California privacy laws that apply to us. |
Delivery of Shareholder Documents. The Securities and Exchange Commission (SEC) permits funds to deliver only one copy of shareholder documents, including prospectuses, proxy statements and shareholder reports, to fund investors with multiple accounts at the same residential or post office box address. This practice is often called “householding” and it helps eliminate duplicate mailings to shareholders. Calvert funds, or your financial intermediary, may household the mailing of your documents indefinitely unless you instruct Calvert funds, or your financial intermediary, otherwise. If you would prefer that your Calvert fund documents not be householded, please contact Calvert funds at 1-800-368-2745, or contact your financial intermediary. Your instructions that householding not apply to delivery of your Calvert fund documents will typically be effective within 30 days of receipt by Calvert funds or your financial intermediary.
Portfolio Holdings. Each Calvert fund files a schedule of portfolio holdings on Part F to Form N-PORT with the SEC. Certain information filed on Form N-PORT may be viewed on the Calvert website at www.calvert.com, by calling Calvert at 1-800-368-2745 or in the EDGAR database on the SEC’s website at www.sec.gov.
Proxy Voting. The Proxy Voting Guidelines that each Calvert fund uses to determine how to vote proxies relating to portfolio securities is provided as an Appendix to the fund’s Statement of Additional Information. The Statement of Additional Information can be obtained free of charge by calling the Calvert funds at 1-800-368-2745, by visiting the Calvert funds’ website at www.calvert.com or visiting the SEC’s website at www.sec.gov. Information regarding how a Calvert fund voted proxies relating to portfolio securities during the most recent 12-month period ended June 30 is available by calling Calvert funds, by visiting the Calvert funds’ website at www.calvert.com or by visiting the SEC’s website at www.sec.gov.
Tailored Shareholder Reports. Effective January 24, 2023, the SEC adopted rule and form amendments to require open-end mutual funds and ETFs to transmit concise and visually engaging streamlined annual and semiannual reports to shareholders that highlight key information. Other information, including financial statements, will no longer appear in a streamlined shareholder report but must be available online, delivered free of charge upon request, and filed on a semiannual basis on Form N-CSR. The rule and form amendments have a compliance date of July 24, 2024. At this time, management is evaluating the impact of these amendments on the shareholder reports for the Calvert Funds.
This Page Intentionally Left Blank
Investment Adviser and Administrator
Calvert Research and Management
2050 M Street NW
Washington, DC 20036
Principal Underwriter*
Eaton Vance Distributors, Inc.
Two International Place
Boston, MA 02110
(617) 482-8260
Custodian
State Street Bank and Trust Company
One Congress Street, Suite 1
Boston, MA 02114-2016
Transfer Agent
SS&C Global Investor & Distribution Solutions, Inc.
2000 Crown Colony Drive
Quincy, MA 02169
Independent Registered Public Accounting Firm
Deloitte & Touche LLP
200 Berkeley Street
Boston, MA 02116-5022
Fund Offices
2050 M Street NW
Washington, DC 20036
* FINRA BrokerCheck. Investors may check the background of their Investment Professional by contacting the Financial Industry Regulatory Authority (FINRA). FINRA BrokerCheck is a free tool to help investors check the professional background of current and former FINRA-registered securities firms and brokers. FINRA BrokerCheck is available by calling 1-800-289-9999 and at www.FINRA.org. The FINRA BrokerCheck brochure describing this program is available to investors at www.FINRA.org.
Printed on recycled paper.
41206 9.30.23
Calvert
Income Fund
Annual Report
September 30, 2023
Commodity Futures Trading Commission Registration. The Commodity Futures Trading Commission (“CFTC”) has adopted regulations that subject registered investment companies and advisers to regulation by the CFTC if a fund invests more than a prescribed level of its assets in certain CFTC-regulated instruments (including futures, certain options and swap agreements) or markets itself as providing investment exposure to such instruments. The adviser has claimed an exclusion from the definition of “commodity pool operator” under the Commodity Exchange Act with respect to its management of the Fund and the other funds it manages. Accordingly, neither the Fund nor the adviser is subject to CFTC regulation.
Fund shares are not insured by the FDIC and are not deposits or other obligations of, or guaranteed by, any depository institution. Shares are subject to investment risks, including possible loss of principal invested.
This report must be preceded or accompanied by a current summary prospectus or prospectus. Before investing, investors should consider carefully the investment objective, risks, and charges and expenses of a mutual fund. This and other important information is contained in the summary prospectus and prospectus, which can be obtained from a financial intermediary. Prospective investors should read the prospectus carefully before investing. For further information, please call 1-800-368-2745.
Choose Planet-friendly E-delivery!
Sign up now for on-line statements, prospectuses, and fund reports. In less than five minutes you can help reduce paper mail and lower fund costs.
Just go to www.calvert.com. If you already have an online account with the Calvert funds, click on Login to access your Account and select the documents you would like to receive via e-mail.
If you’re new to online account access, click on Login, then Register to create your user name and password. Once you’re in, click on the E-delivery sign-up on the Account Portfolio page and follow the quick, easy steps.
Note: If your shares are not held directly with the Calvert funds but through a brokerage firm, you must contact your broker for electronic delivery options available through their firm.
Annual Report September 30, 2023
Calvert
Income Fund
Calvert
Income Fund
September 30, 2023
Management's Discussion of Fund Performance†
Economic and Market Conditions
For fixed-income investors, the dominant event during the 12-month period ended September 30, 2023, was the series of U.S. Federal Reserve (Fed) interest rate hikes -- six during the period, and 11 in total -- that brought the federal funds rate to its highest level in 22 years.
But while the Fed’s campaign to tamp down inflation led to negative performance for government bonds, corporate bond returns were strongly positive during the period -- buoyed in part by the very factors that were fueling inflation: record low unemployment, strong job creation, and robust consumer spending.
By the summer of 2023, a majority of economists and market observers seemed to be coming around to the view that Jerome Powell’s Fed might be able to accomplish what had seldom, if ever, been done before: raise rates significantly to lower inflation and still bring the economy in for a soft landing without a recession.
One cloud that hung over fixed-income markets during the period, however, was fear that even after it finished raising rates, the Fed would leave rates higher for longer than investors had previously anticipated. During the final two months of the period -- and especially after the Fed’s September 2023 meeting -- longer-term interest rates rose dramatically, as investor expectations of how high rates would go -- and how long they would stay there -- seemed to get higher and longer.
Against the backdrop of the Fed’s aggressive monetary tightening campaign, U.S. Treasurys were the worst-performing major fixed-income asset class during the 12-month period, with the Bloomberg U.S. Treasury Index returning -0.81%.
In contrast, the strong U.S. economy and increasing confidence in a soft-landing scenario served as tailwinds for investment-grade corporate bonds. Even in a rising-rate environment, the Bloomberg U.S. Corporate Bond Index returned 3.65% during the period.
High yield bonds were the standout performer among major fixed-income asset classes, with the Bloomberg U.S. Corporate High Yield Index returning 10.28% during the period. With a strong U.S. economy helping keep bond defaults low, and a recession looking increasingly remote, investors gravitated toward riskier investments with greater yields.
Asset-backed securities -- including bonds backed by automobile and consumer loans -- benefited from strong consumer balance sheets and spending during the period, with the Bloomberg U.S. Asset-Backed Securities Index returning 2.81%.
Mortgage-backed securities (MBS), however, were dogged by two technical factors that depressed prices, causing the Bloomberg U.S. Mortgage-Backed Securities Index to return -0.17% during the period. As the Fed lowered its balance sheet, it sold off much of its MBS holdings. And several regional banks that had been significant buyers of MBS were forced by the banking crisis of March 2023 to liquidate their assets. The resulting release of a significant amount of MBS into the market led prices to fall and the asset class to deliver negative returns.
Fund Performance
For the 12-month period ended September 30, 2023, Calvert Income Fund (the Fund) returned 3.14% for Class A shares at net asset value (NAV), underperforming its benchmark, the Bloomberg U.S. Credit Index (the Index), which returned 3.47%.
Sector allocations in the Fund detracted most from performance relative to the Index during the period. An out-of-Index allocation to commercial mortgage-backed securities particularly weighed on relative returns. Out-of-Index allocations to U.S. Treasurys and asset-backed securities, and an underweight exposure to investment-grade corporate securities further detracted from returns relative to the Index.
The use of derivatives also had a significant negative impact on relative performance during the period.
On the positive side, the Fund’s slightly shorter-than-Index duration, which is sensitive to changes in interest rates, contributed most to returns relative to the Index during the period. Security selections in investment-grade corporate bonds were also beneficial to relative returns. Although sector allocations hindered relative returns overall, an out-of-Index allocation to high yield corporate bonds and an underweight exposure to government-related securities enhanced returns relative to the Index during the period.
See Endnotes and Additional Disclosures in this report.
Past performance is no guarantee of future results. Returns are historical and are calculated by determining the percentage change in net asset value (NAV) or offering price (as applicable) with all distributions reinvested. Furthermore, returns do not reflect the deduction of taxes that shareholders may have to pay on Fund distributions or upon the redemption of Fund shares. Investment return and principal value will fluctuate so that shares, when redeemed, may be worth more or less than their original cost. Performance for periods less than or equal to one year is cumulative. Performance is for the stated time period only; due to market volatility, current Fund performance may be lower or higher than the quoted return. For performance as of the most recent month-end, please refer to www.calvert.com.
Calvert
Income Fund
September 30, 2023
Performance
Portfolio Manager(s) Vishal Khanduja, CFA and Brian S. Ellis, CFA, each of Calvert Research and Management
| % Average Annual Total Returns1,2 | Class
Inception Date | Performance
Inception Date | One Year | Five Years | Ten Years |
| Class A at NAV | 10/12/1982 | 10/12/1982 | 3.14% | 1.12% | 2.00% |
| Class A with 3.25% Maximum Sales Charge | — | — | (0.20) | 0.46 | 1.67 |
| Class C at NAV | 07/31/2000 | 10/12/1982 | 2.44 | 0.36 | 1.39 |
| Class C with 1% Maximum Deferred Sales Charge | — | — | 1.46 | 0.36 | 1.39 |
| Class I at NAV | 02/26/1999 | 10/12/1982 | 3.40 | 1.37 | 2.37 |
| Class R6 at NAV | 02/01/2023 | 10/12/1982 | 3.44 | 1.38 | 2.38 |
|
| Bloomberg U.S. Credit Index | — | — | 3.47% | 0.86% | 2.12% |
| % Total Annual Operating Expense Ratios3 | Class A | Class C | Class I | Class R6 |
| | 0.91% | 1.66% | 0.66% | 0.60% |
Growth of $10,000
This graph shows the change in value of a hypothetical investment of $10,000 in Class A of the Fund for the period indicated. For comparison, the same investment is shown in the indicated index.
| Growth of Investment | Amount Invested | Period Beginning | At NAV | With Maximum Sales Charge |
| Class C | $10,000 | 09/30/2013 | $11,485 | N.A. |
| Class I, at minimum investment | $1,000,000 | 09/30/2013 | $1,264,699 | N.A. |
| Class R6, at minimum investment | $5,000,000 | 09/30/2013 | $6,325,845 | N.A. |
See Endnotes and Additional Disclosures in this report.
Past performance is no guarantee of future results. Returns are historical and are calculated by determining the percentage change in net asset value (NAV) or offering price (as applicable) with all distributions reinvested. Furthermore, returns do not reflect the deduction of taxes that shareholders may have to pay on Fund distributions or upon the redemption of Fund shares. Investment return and principal value will fluctuate so that shares, when redeemed, may be worth more or less than their original cost. Performance for periods less than or equal to one year is cumulative. Performance is for the stated time period only; due to market volatility, current Fund performance may be lower or higher than the quoted return. For performance as of the most recent month-end, please refer to www.calvert.com.
Calvert
Income Fund
September 30, 2023
| Asset Allocation (% of total investments) |
| Credit Quality (% of bond and loan holdings)1 |
Footnotes:
| 1 | For purposes of the Fund’s rating restrictions, ratings are based on Moody’s Investors Service, Inc. (“Moody’s”), S&P Global Ratings (“S&P”) or Fitch Ratings (“Fitch”), or Kroll Bond Rating Agency, LLC (“Kroll”) for securitized debt instruments only (such as asset-backed securities (“ABS”) and mortgage-backed securities (“MBS”)), as applicable. If securities are rated differently by the ratings agencies, the highest rating is applied. Ratings, which are subject to change, apply to the creditworthiness of the issuers of the underlying securities and not to the Fund or its shares. Credit ratings measure the quality of an issuance based on the issuer’s creditworthiness, with ratings ranging from AAA, being the highest, to D, being the lowest based on S&P’s measures. Ratings of BBB or higher by S&P, Fitch or Kroll (Baa or higher by Moody’s) are considered to be investment-grade quality. Credit ratings are based largely on the ratings agency’s analysis at the time of rating. The rating assigned to any particular security is not necessarily a reflection of the issuer’s current financial condition and does not necessarily reflect its assessment of the volatility of a security’s market value or of the liquidity of an investment in the security. Holdings designated as “Not Rated” (if any) are not rated by the national ratings agencies stated above. |
Calvert
Income Fund
September 30, 2023
Endnotes and Additional Disclosures
| † | The views expressed in this report are those of the portfolio manager(s) and are current only through the date stated at the top of this page. These views are subject to change at any time based upon market or other conditions, and Calvert and the Fund(s) disclaim any responsibility to update such views. These views may not be relied upon as investment advice and, because investment decisions are based on many factors, may not be relied upon as an indication of trading intent on behalf of any Calvert fund. This commentary may contain statements that are not historical facts, referred to as “forward-looking statements.” The Fund’s actual future results may differ significantly from those stated in any forward-looking statement, depending on factors such as changes in securities or financial markets or general economic conditions, the volume of sales and purchases of Fund shares, the continuation of investment advisory, administrative and service contracts, and other risks discussed from time to time in the Fund’s filings with the Securities and Exchange Commission. |
| | |
| 1 | Bloomberg U.S. Credit Index measures the performance of investment-grade U.S. corporate securities and government-related bonds with a maturity of one year or more. Unless otherwise stated, index returns do not reflect the effect of any applicable sales charges, commissions, expenses, taxes or leverage, as applicable. It is not possible to invest directly in an index. |
| 2 | Total Returns at NAV do not include applicable sales charges. If sales charges were deducted, the returns would be lower. Total Returns shown with maximum sales charge reflect the stated maximum sales charge. Unless otherwise stated, performance does not reflect the deduction of taxes on Fund distributions or redemptions of Fund shares.Performance prior to the inception date of a class may be linked to the performance of an older class of the Fund. This linked performance is adjusted for any applicable sales charge, but is not adjusted for class expense differences. If adjusted for such differences, the performance would be different. The performance of Class R6 is linked to Class I. Performance since inception for an index, if presented, is the performance since the Fund’s or oldest share class's inception, as applicable. Performance presented in the Financial Highlights included in the financial statements is not linked.Effective November 5, 2020, Class C shares automatically convert to Class A shares eight years after purchase. The average annual total returns listed for Class C reflect conversion to Class A shares after eight years. Prior to November 5, 2020, Class C shares automatically converted to Class A shares ten years after purchase.Calvert Research and Management became the investment adviser to the Fund on December 31, 2016. Performance reflected prior to such date is that of the Fund’s former investment adviser. |
| 3 | Source: Fund prospectus. The expense ratios for the current reporting period can be found in the Financial Highlights section of this report. Performance reflects expenses waived and/or reimbursed, if applicable. Without such waivers and/or reimbursements, performance would have been lower. |
| Fund profile subject to change due to active management. |
| | Additional Information |
| | Bloomberg U.S. Treasury Index measures the performance of U.S. Treasuries with a maturity of one year or more. Bloomberg U.S. Corporate Bond Index measures the performance of investment-grade U.S. corporate securities with a maturity of one yearor more. Bloomberg U.S. Corporate High Yield Index measures USD-denominated, non-investment grade corporate securities. Bloomberg U.S. Mortgage-Backed Securities Index measures agency mortgage-backed pass-through securities issued by Ginnie Mae (GNMA), Fannie Mae (FNMA), and Freddie Mac (FHLMC). Bloomberg U.S. Asset-Backed Securities Index tracks the performance of U.S. dollar denominated investment grade, fixed rate asset-backed securities publicly issued in the U.S. domestic market. |
| | Duration is a measure of the expected change in price of a bond — in percentage terms — given a one percent change in interest rates, all else being constant. Securities with lower durations tend to be less sensitive to interest rate changes. |
| | Yield curve is a graphical representation of the yields offered by bonds of various maturities. The yield curve flattens when long-term interest rates fall and/or short-term interest rates increase, and the yield curve steepens when long-term interest rates increase and/or short-term interest rates fall. |
Calvert
Income Fund
September 30, 2023
Example
As a Fund shareholder, you incur two types of costs: (1) transaction costs, including sales charges (loads) on purchases; and (2) ongoing costs, including management fees; distribution and/or service fees; and other Fund expenses. This Example is intended to help you understand your ongoing costs (in dollars) of Fund investing and to compare these costs with the ongoing costs of investing in other mutual funds. The Example is based on an investment of $1,000 invested at the beginning of the period and held for the entire period (April 1, 2023 to September 30, 2023).
Actual Expenses
The first section of the table below provides information about actual account values and actual expenses. You may use the information in this section, together with the amount you invested, to estimate the expenses that you paid over the period. Simply divide your account value by $1,000 (for example, an $8,600 account value divided by $1,000 = 8.6), then multiply the result by the number in the first section under the heading entitled “Expenses Paid During Period” to estimate the expenses you paid on your account during this period.
Hypothetical Example for Comparison Purposes
The second section of the table below provides information about hypothetical account values and hypothetical expenses based on the actual Fund expense ratio and an assumed rate of return of 5% per year (before expenses), which is not the actual Fund return. The hypothetical account values and expenses may not be used to estimate the actual ending account balance or expenses you paid for the period. You may use this information to compare the ongoing costs of investing in the Fund and other funds. To do so, compare this 5% hypothetical example with the 5% hypothetical examples that appear in the shareholder reports of the other funds.
Please note that the expenses shown in the table are meant to highlight your ongoing costs only and do not reflect any transactional costs, such as sales charges (loads). Therefore, the second section of the table is useful in comparing ongoing costs only, and will not help you determine the relative total costs of owning different funds. In addition, if these transactional costs were included, your costs would be higher.
| | Beginning
Account Value
(4/1/23) | Ending
Account Value
(9/30/23) | Expenses Paid
During Period*
(4/1/23 – 9/30/23) | Annualized
Expense
Ratio |
| Actual | | | | |
| Class A | $1,000.00 | $ 971.70 | $4.60 | 0.93% |
| Class C | $1,000.00 | $ 968.70 | $8.29 | 1.68% |
| Class I | $1,000.00 | $ 973.10 | $3.36 | 0.68% |
| Class R6 | $1,000.00 | $ 973.30 | $3.12 | 0.63% |
| Hypothetical | | | | |
| (5% return per year before expenses) | | | | |
| Class A | $1,000.00 | $1,020.41 | $4.71 | 0.93% |
| Class C | $1,000.00 | $1,016.65 | $8.49 | 1.68% |
| Class I | $1,000.00 | $1,021.66 | $3.45 | 0.68% |
| Class R6 | $1,000.00 | $1,021.91 | $3.19 | 0.63% |
| * | Expenses are equal to the Fund’s annualized expense ratio for the indicated Class, multiplied by the average account value over the period, multiplied by 183/365 (to reflect the one-half year period). The Example assumes that the $1,000 was invested at the net asset value per share determined at the close of business on March 31, 2023. |
Calvert
Income Fund
September 30, 2023
| Asset-Backed Securities — 13.1% |
| Security | Principal
Amount
(000's omitted)* | Value |
| AASET US, Ltd., Series 2018-1A, Class C, 6.413%, 1/16/38(1)(2) | | 509 | $ 56,558 |
| Business Jet Securities, LLC, Series 2020-1A, Class A, 2.981%, 11/15/35(1) | | 494 | 463,854 |
| Coinstar Funding, LLC, Series 2017-1A, Class A2, 5.216%, 4/25/47(1) | | 2,494 | 2,085,529 |
| Cologix Canadian Issuer, L.P., Series 2022-1CAN, Class C, 7.74%, 1/25/52(1) | CAD | 2,700 | 1,776,444 |
| Cologix Data Centers US Issuer, LLC: | | | |
| Series 2021-1A, Class B, 3.79%, 12/26/51(1) | | 4,000 | 3,475,296 |
| Series 2021-1A, Class C, 5.99%, 12/26/51(1) | | 2,900 | 2,379,201 |
| Conn's Receivables Funding, LLC: | | | |
| Series 2021-A, Class C, 4.59%, 5/15/26(1) | | 4,495 | 4,484,723 |
| Series 2022-A, Class B, 9.52%, 12/15/26(1) | | 2,602 | 2,613,288 |
| Series 2022-A, Class C, 0.00%, 12/15/26(1) | | 2,600 | 2,220,496 |
| Series 2023-A, Class B, 10.00%, 1/17/28(1) | | 1,360 | 1,364,309 |
| DataBank Issuer, Series 2021-2A, Class A2, 2.40%, 10/25/51(1) | | 1,050 | 906,492 |
| Diamond Infrastructure Funding, LLC, Series 2021-1A, Class C, 3.475%, 4/15/49(1) | | 757 | 658,819 |
| Driven Brands Funding, LLC: | | | |
| Series 2018-1A, Class A2, 4.739%, 4/20/48(1) | | 3,174 | 3,065,978 |
| Series 2019-1A, Class A2, 4.641%, 4/20/49(1) | | 1,400 | 1,323,992 |
| Series 2019-2A, Class A2, 3.981%, 10/20/49(1) | | 1,203 | 1,101,260 |
| ExteNet, LLC: | | | |
| Series 2019-1A, Class B, 4.14%, 7/25/49(1) | | 1,913 | 1,836,458 |
| Series 2019-1A, Class C, 5.219%, 7/25/49(1) | | 3,110 | 2,953,315 |
| FMC GMSR Issuer Trust: | | | |
| Series 2021-GT2, Class A, 3.85%, 10/25/26(1)(3) | | 3,360 | 2,765,498 |
| Series 2022-GT2, Class B, 10.07%, 7/25/27(1) | | 2,000 | 1,891,114 |
| FOCUS Brands Funding, LLC, Series 2017-1A, Class A2II, 5.093%, 4/30/47(1) | | 1,345 | 1,247,223 |
| Hardee's Funding, LLC, Series 2020-1A, Class A2, 3.981%, 12/20/50(1) | | 1,760 | 1,485,823 |
| Jersey Mike's Funding, Series 2019-1A, Class A2, 4.433%, 2/15/50(1) | | 1,344 | 1,237,958 |
| Lunar Aircraft, Ltd.: | | | |
| Series 2020-1A, Class B, 4.335%, 2/15/45(1) | | 329 | 234,602 |
| Series 2020-1A, Class C, 6.413%, 2/15/45(1) | | 243 | 55,242 |
| Mosaic Solar Loan Trust: | | | |
| Series 2020-1A, Class B, 3.10%, 4/20/46(1) | | 96 | 82,006 |
| Series 2022-2A, Class D, 8.29%, 1/21/53(1) | | 3,583 | 3,001,974 |
| Neighborly Issuer, LLC, Series 2021-1A, Class A2, 3.584%, 4/30/51(1) | | 2,585 | 2,165,905 |
| NRZ Excess Spread-Collateralized Notes: | | | |
| Series 2021-FHT1, Class A, 3.104%, 7/25/26(1) | | 373 | 333,565 |
| Series 2021-GNT1, Class A, 3.474%, 11/25/26(1) | | 3,254 | 2,935,371 |
| Oportun Issuance Trust, Series 2021-C, Class C, 3.61%, 10/8/31(1) | | 1,175 | 1,046,632 |
| Security | Principal
Amount
(000's omitted)* | Value |
| Pagaya AI Debt Selection Trust: | | | |
| Series 2021-3, Class C, 3.27%, 5/15/29(1) | | 5,900 | $ 5,109,394 |
| Series 2021-5, Class C, 3.93%, 8/15/29(1) | | 4,014 | 3,503,581 |
| Planet Fitness Master Issuer, LLC: | | | |
| Series 2018-1A, Class A2II, 4.666%, 9/5/48(1) | | 2,256 | 2,169,028 |
| Series 2019-1A, Class A2, 3.858%, 12/5/49(1) | | 2,478 | 2,072,983 |
| Prodigy Finance CM2021-1 DAC, Series 2021-1A, Class D, 11.334%, (1 mo. SOFR + 6.01%), 7/25/51(1)(4) | | 1,308 | 1,305,259 |
| Retained Vantage Data Centers Issuer, LLC: | | | |
| Series 2023-1A, Class A2B, 5.25%, 9/15/48(1) | CAD | 3,274 | 2,142,581 |
| Series 2023-1A, Class B, 5.75%, 9/15/48(1) | | 3,288 | 2,931,876 |
| ServiceMaster Funding, LLC: | | | |
| Series 2020-1, Class A2I, 2.841%, 1/30/51(1) | | 621 | 526,453 |
| Series 2020-1, Class A2II, 3.337%, 1/30/51(1) | | 1,328 | 1,046,686 |
| SERVPRO Master Issuer, LLC, Series 2019-1A, Class A2, 3.882%, 10/25/49(1) | | 4,726 | 4,332,867 |
| SolarCity LMC Series I, LLC, Series 2013-1, Class A, 4.80%, 11/20/38(1) | | 304 | 303,135 |
| Sonic Capital, LLC, Series 2020-1A, Class A2I, 3.845%, 1/20/50(1) | | 2,897 | 2,633,784 |
| Stack Infrastructure Issuer, LLC: | | | |
| Series 2019-1A, Class A2, 4.54%, 2/25/44(1) | | 1,024 | 1,014,357 |
| Series 2019-2A, Class A2, 3.08%, 10/25/44(1) | | 720 | 690,545 |
| Sunnova Helios II Issuer, LLC, Series 2021-B, Class B, 2.01%, 7/20/48(1) | | 1,965 | 1,582,854 |
| Sunnova Helios V Issuer, LLC, Series 2021-A, Class B, 3.15%, 2/20/48(1) | | 1,774 | 1,384,545 |
| Sunnova Helios X Issuer, LLC, Series 2022-C, Class B, 5.60%, 11/22/49(1) | | 3,794 | 3,549,501 |
| Sunnova Sol II Issuer, LLC, Series 2020-2A, Class B, 5.47%, 11/1/55(1) | | 856 | 679,826 |
| Sunnova Sol Issuer, LLC, Series 2020-1A, Class B, 5.54%, 2/1/55(1) | | 2,096 | 1,745,951 |
| Sunrun Xanadu Issuer, LLC, Series 2019-1A, Class A, 3.98%, 6/30/54(1) | | 392 | 343,461 |
| Theorem Funding Trust, Series 2021-1A, Class B, 1.84%, 12/15/27(1) | | 850 | 834,773 |
| Vantage Data Centers Issuer, LLC: | | | |
| Series 2019-1A, Class A2, 3.188%, 7/15/44(1) | | 358 | 347,566 |
| Series 2020-2A, Class A2, 1.992%, 9/15/45(1) | | 2,545 | 2,131,891 |
| Willis Engine Structured Trust V: | | | |
| Series 2020-A, Class B, 4.212%, 3/15/45(1) | | 640 | 517,093 |
| Series 2020-A, Class C, 6.657%, 3/15/45(1) | | 289 | 208,388 |
Total Asset-Backed Securities
(identified cost $103,480,021) | | | $ 94,357,303 |
7
See Notes to Financial Statements.
Calvert
Income Fund
September 30, 2023
Schedule of Investments — continued
| Collateralized Mortgage Obligations — 6.8% |
| Security | Principal
Amount
(000's omitted) | Value |
| Bellemeade Re, Ltd.: | | | |
| Series 2021-1A, Class M1C, 8.265%, (30-day average SOFR + 2.95%), 3/25/31(1)(4) | $ | 1,130 | $ 1,151,709 |
| Series 2021-3A, Class M1B, 6.715%, (30-day average SOFR + 1.40%), 9/25/31(1)(4) | | 4,195 | 4,145,091 |
| Eagle Re, Ltd., Series 2021-2, Class M1C, 8.765%, (30-day average SOFR + 3.45%), 4/25/34(1)(4) | | 2,810 | 2,876,866 |
| Federal Home Loan Mortgage Corp., Series 5324, Class MZ, 6.00%, 7/25/53 | | 162 | 150,615 |
| Federal Home Loan Mortgage Corp. Structured Agency Credit Risk Debt Notes: | | | |
| Series 2019-DNA3, Class B2, 13.579%, (30-day average SOFR + 8.264%), 7/25/49(1)(4) | | 500 | 555,387 |
| Series 2019-HQA4, Class B1, 8.379%, (30-day average SOFR + 3.064%), 11/25/49(1)(4) | | 873 | 899,214 |
| Series 2020-DNA6, Class B1, 8.315%, (30-day average SOFR + 3.00%), 12/25/50(1)(4) | | 900 | 904,492 |
| Series 2020-HQA2, Class B1, 9.529%, (30-day average SOFR + 4.214%), 3/25/50(1)(4) | | 1,748 | 1,906,228 |
| Federal National Mortgage Association Connecticut Avenue Securities: | | | |
| Series 2019-R01, Class 2B1, 9.779%, (30-day average SOFR + 4.464%), 7/25/31(1)(4) | | 1,295 | 1,379,815 |
| Series 2019-R02, Class 1B1, 9.579%, (30-day average SOFR + 4.264%), 8/25/31(1)(4) | | 517 | 546,121 |
| Series 2019-R03, Class 1B1, 9.529%, (30-day average SOFR + 4.214%), 9/25/31(1)(4) | | 1,050 | 1,108,216 |
| Series 2019-R06, Class 2B1, 9.179%, (30-day average SOFR + 3.864%), 9/25/39(1)(4) | | 1,923 | 1,974,825 |
| Series 2019-R07, Class 1B1, 8.829%, (30-day average SOFR + 3.514%), 10/25/39(1)(4) | | 4,664 | 4,768,308 |
| Series 2020-R02, Class 2B1, 8.429%, (30-day average SOFR + 3.114%), 1/25/40(1)(4) | | 1,497 | 1,513,303 |
| Series 2021-R01, Class 1B2, 11.315%, (30-day average SOFR + 6.00%), 10/25/41(1)(4) | | 4,457 | 4,532,866 |
| Series 2021-R02, Class 2B1, 8.615%, (30-day average SOFR + 3.30%), 11/25/41(1)(4) | | 543 | 547,078 |
| Government National Mortgage Association: | | | |
| Series 2023-84, Class DL, 6.00%, 6/20/53 | | 716 | 699,957 |
| Series 2023-84, Class MW, 6.00%, 6/20/53 | | 751 | 733,890 |
| Series 2023-98, Class BW, 6.00%, 7/20/53 | | 832 | 813,969 |
| Series 2023-99, Class AL, 6.00%, 7/20/53 | | 832 | 813,753 |
| Series 2023-102, Class SG, 2.742%, (22.55% - 30-day average SOFR x 3.727), 7/20/53(5) | | 1,239 | 1,126,257 |
| Series 2023-116, Class CY, 6.00%, 8/20/53 | | 1,959 | 1,916,017 |
| Home Re, Ltd.: | | | |
| Series 2021-1, Class M1C, 7.734%, (30-day average SOFR + 2.414%), 7/25/33(1)(4) | | 1,011 | 1,016,896 |
| Series 2021-1, Class M2, 8.284%, (30-day average SOFR + 2.964%), 7/25/33(1)(4) | | 4,340 | 4,352,456 |
| LHOME Mortgage Trust: | | | |
| Series 2023-RTL2, Class A1, 8.00%, 6/25/28(1)(6) | | 1,050 | 1,049,756 |
| Series 2023-RTL3, Class A1, 8.00%, 8/25/28(1)(3) | | 1,080 | 1,080,187 |
| Security | Principal
Amount
(000's omitted) | Value |
| PNMAC GMSR Issuer Trust: | | | |
| Series 2018-GT2, Class A, 8.084%, (1 mo. SOFR + 2.65%), 8/25/25(1)(4) | $ | 2,000 | $ 2,000,078 |
| Series 2022-FT1, Class A, 9.505%, (30-day average SOFR + 4.19%), 6/25/27(1)(4) | | 2,500 | 2,504,029 |
| Triangle Re, Ltd., Series 2021-3, Class B1, 10.265%, (30-day average SOFR + 4.95%), 2/25/34(1)(4) | | 2,202 | 2,191,693 |
Total Collateralized Mortgage Obligations
(identified cost $48,939,583) | | | $ 49,259,072 |
| Commercial Mortgage-Backed Securities — 6.9% |
| Security | Principal
Amount
(000's omitted) | Value |
| BAMLL Commercial Mortgage Securities Trust: | | | |
| Series 2019-BPR, Class ENM, 3.843%, 11/5/32(1)(3) | $ | 11,165 | $ 3,693,708 |
| Series 2019-BPR, Class FNM, 3.843%, 11/5/32(1)(3) | | 4,545 | 1,006,130 |
| BX Commercial Mortgage Trust, Series 2021-VOLT, Class D, 7.097%, (1 mo. SOFR + 1.764%), 9/15/36(1)(4) | | 5,509 | 5,266,337 |
| CSMC: | | | |
| Series 2020-TMIC, Class A, 8.948%, (1 mo. SOFR + 3.614%), 12/15/35(1)(4) | | 3,385 | 3,382,599 |
| Series 2021-4SZN, Class A, 9.30%, (1 mo. SOFR + 3.967%), 11/15/23(1)(4) | | 3,490 | 3,385,129 |
| Series 2021-BPNY, Class A, 9.162%, (1 mo. SOFR + 3.829%), 8/15/26(1)(4) | | 2,725 | 2,394,106 |
| Series 2022-CNTR, Class A, 9.277%, (1 mo. SOFR + 3.944%), 1/15/24(1)(4) | | 1,333 | 1,145,596 |
| Extended Stay America Trust, Series 2021-ESH, Class D, 7.697%, (1 mo. SOFR + 2.36%), 7/15/38(1)(4) | | 2,376 | 2,341,689 |
| Federal National Mortgage Association Multifamily Connecticut Avenue Securities Trust: | | | |
| Series 2019-01, Class M10, 8.679%, (30-day average SOFR + 3.364%), 10/25/49(1)(4) | | 2,474 | 2,418,755 |
| Series 2020-01, Class M10, 9.179%, (30-day average SOFR + 3.864%), 3/25/50(1)(4) | | 3,178 | 3,107,961 |
| JPMorgan Chase Commercial Mortgage Securities Trust: | | | |
| Series 2014-DSTY, Class B, 3.771%, 6/10/27(1) | | 2,485 | 363,990 |
| Series 2014-DSTY, Class C, 3.931%, 6/10/27(1)(3) | | 1,120 | 76,205 |
| Med Trust: | | | |
| Series 2021-MDLN, Class E, 8.597%, (1 mo. SOFR + 3.264%), 11/15/38(1)(4) | | 2,204 | 2,101,397 |
| Series 2021-MDLN, Class F, 9.447%, (1 mo. SOFR + 4.114%), 11/15/38(1)(4) | | 2,224 | 2,114,687 |
| Morgan Stanley Capital I Trust: | | | |
| Series 2019-BPR, Class B, 8.022%, (1 mo. SOFR + 2.692%), 5/15/36(1)(4)(7) | | 6,576 | 6,288,978 |
| Series 2019-BPR, Class C, 8.972%, (1 mo. SOFR + 3.642%), 5/15/36(1)(4)(7) | | 3,045 | 2,882,406 |
8
See Notes to Financial Statements.
Calvert
Income Fund
September 30, 2023
Schedule of Investments — continued
| Security | Principal
Amount
(000's omitted) | Value |
| VMC Finance, LLC, Series 2021-HT1, Class B, 9.945%, (1 mo. SOFR + 4.614%), 1/18/37(1)(4) | $ | 7,908 | $ 7,500,953 |
Total Commercial Mortgage-Backed Securities
(identified cost $63,856,282) | | | $ 49,470,626 |
| Security | Principal
Amount*
(000’s omitted) | Value |
| Basic Materials — 1.1% | |
| Celanese U.S. Holdings, LLC: | | | |
| 6.35%, 11/15/28 | | 4,101 | $ 4,051,565 |
| 6.70%, 11/15/33 | | 2,102 | 2,047,660 |
| South32 Treasury, Ltd., 4.35%, 4/14/32(1) | | 2,596 | 2,191,735 |
| | | | $ 8,290,960 |
| Communications — 4.6% | |
| AT&T, Inc.: | | | |
| 3.55%, 9/15/55 | | 8,993 | $ 5,510,789 |
| 3.65%, 6/1/51 | | 3,115 | 2,009,991 |
| Charter Communications Operating, LLC/Charter Communications Operating Capital, 4.80%, 3/1/50 | | 7,960 | 5,571,890 |
| Connect Finco S.a.r.l./Connect US Finco, LLC, 6.75%, 10/1/26(1) | | 2,000 | 1,867,896 |
| Discovery Communications, LLC, 5.20%, 9/20/47 | | 1,870 | 1,419,307 |
| Nokia Oyj, 4.375%, 6/12/27 | | 565 | 523,684 |
| Rogers Communications, Inc., 4.55%, 3/15/52 | | 6,336 | 4,626,472 |
| SES Global Americas Holdings GP, 5.30%, 3/25/44(1) | | 1,378 | 929,251 |
| SES S.A., 5.30%, 4/4/43(1) | | 820 | 552,940 |
| Sprint, LLC: | | | |
| 7.125%, 6/15/24 | | 6,864 | 6,911,691 |
| 7.625%, 3/1/26 | | 3,000 | 3,085,479 |
| | | | $ 33,009,390 |
| Consumer, Cyclical — 6.2% | |
| Bath & Body Works, Inc.: | | | |
| 6.875%, 11/1/35 | | 1,690 | $ 1,511,254 |
| 7.60%, 7/15/37 | | 802 | 704,786 |
| Brunswick Corp., 5.10%, 4/1/52 | | 5,210 | 3,592,920 |
| Delta Air Lines, Inc./SkyMiles IP, Ltd.: | | | |
| 4.50%, 10/20/25(1) | | 5,291 | 5,141,126 |
| 4.75%, 10/20/28(1) | | 2,475 | 2,353,013 |
| Dick's Sporting Goods, Inc., 4.10%, 1/15/52 | | 4,978 | 3,027,088 |
| Ferrellgas LP/Ferrellgas Finance Corp., 5.875%, 4/1/29(1) | | 1,700 | 1,530,644 |
| Ford Motor Co.: | | | |
| 3.25%, 2/12/32 | | 2,879 | 2,221,561 |
| 4.75%, 1/15/43 | | 2,483 | 1,815,015 |
| General Motors Co., 5.15%, 4/1/38 | | 3,000 | 2,507,955 |
| General Motors Financial Co., Inc., 5.85%, 4/6/30(8) | | 4,309 | 4,130,221 |
| Hyundai Capital America, 5.70%, 6/26/30(1) | | 7,333 | 7,059,446 |
| Security | Principal
Amount*
(000’s omitted) | Value |
| Consumer, Cyclical (continued) | |
| Lithia Motors, Inc., 4.375%, 1/15/31(1) | | 2,074 | $ 1,717,888 |
| Macy's Retail Holdings, LLC: | | | |
| 4.30%, 2/15/43 | | 1,500 | 839,690 |
| 5.875%, 4/1/29(1)(8) | | 2,231 | 1,955,572 |
| Michaels Cos., Inc. (The), 5.25%, 5/1/28(1)(8) | | 1,750 | 1,399,624 |
| PetSmart, Inc./PetSmart Finance Corp., 4.75%, 2/15/28(1) | | 1,500 | 1,314,980 |
| WarnerMedia Holdings, Inc.: | | | |
| 5.05%, 3/15/42 | | 1,550 | 1,199,612 |
| 5.391%, 3/15/62 | | 1,257 | 929,242 |
| | | | $ 44,951,637 |
| Consumer, Non-cyclical — 3.2% | |
| Ashtead Capital, Inc.: | | | |
| 4.00%, 5/1/28(1) | | 732 | $ 666,252 |
| 4.25%, 11/1/29(1) | | 4,166 | 3,692,023 |
| 5.95%, 10/15/33(1) | | 2,870 | 2,727,664 |
| Centene Corp.: | | | |
| 2.50%, 3/1/31 | | 2,700 | 2,077,349 |
| 3.375%, 2/15/30 | | 1,171 | 978,027 |
| 4.25%, 12/15/27 | | 1,068 | 985,513 |
| 4.625%, 12/15/29 | | 1,226 | 1,105,601 |
| CVS Health Corp., 5.875%, 6/1/53 | | 1,747 | 1,616,920 |
| CVS Pass-Through Trust, 6.036%, 12/10/28 | | 1,451 | 1,436,569 |
| LifePoint Health, Inc., 9.875%, 8/15/30(1)(8) | | 1,500 | 1,454,070 |
| ModivCare, Inc., 5.875%, 11/15/25(1) | | 1,500 | 1,427,295 |
| Natura & Co. Luxembourg Holdings S.a.r.l., 6.00%, 4/19/29(1) | | 573 | 526,581 |
| Natura Cosmeticos S.A., 4.125%, 5/3/28(1)(8) | | 703 | 604,375 |
| Smithfield Foods, Inc.: | | | |
| 2.625%, 9/13/31(1) | | 2,227 | 1,598,707 |
| 3.00%, 10/15/30(1) | | 238 | 182,119 |
| 5.20%, 4/1/29(1) | | 1,831 | 1,674,429 |
| | | | $ 22,753,494 |
| Diversified — 0.3% | |
| Inversiones La Construccion S.A., 4.75%, 2/7/32(9) | | 2,962 | $ 2,312,967 |
| | | | $ 2,312,967 |
| Energy — 1.2% | |
| Enviva Partners, L.P./Enviva Partners Finance Corp., 6.50%, 1/15/26(1) | | 2,538 | $ 2,072,455 |
| Neptune Energy Bondco PLC, 6.625%, 5/15/25(1) | | 939 | 931,018 |
| Occidental Petroleum Corp., 7.50%, 5/1/31 | | 3,500 | 3,718,289 |
| TerraForm Power Operating, LLC, 4.75%, 1/15/30(1) | | 2,104 | 1,800,298 |
| | | | $ 8,522,060 |
| Financial — 39.7% | |
| ABN AMRO Bank NV, 6.339% to 9/18/26, 9/18/27(1)(10) | | 1,600 | $ 1,596,685 |
| AerCap Holdings N.V., 5.875% to 10/10/24, 10/10/79(10) | | 504 | 490,862 |
9
See Notes to Financial Statements.
Calvert
Income Fund
September 30, 2023
Schedule of Investments — continued
| Security | Principal
Amount*
(000’s omitted) | Value |
| Financial (continued) | |
| AerCap Ireland Capital DAC/AerCap Global Aviation Trust, 1.65%, 10/29/24 | | 3,500 | $ 3,330,604 |
| Affiliated Managers Group, Inc., 3.30%, 6/15/30 | | 4,003 | 3,329,513 |
| AIB Group PLC, 6.608% to 9/13/28, 9/13/29(1)(10) | | 3,515 | 3,502,668 |
| Alliant Holdings Intermediate, LLC/Alliant Holdings Co-Issuer, 6.75%, 10/15/27(1) | | 2,600 | 2,420,747 |
| Ally Financial, Inc., 8.00%, 11/1/31 | | 5,205 | 5,259,650 |
| American Assets Trust, L.P., 3.375%, 2/1/31 | | 4,214 | 3,159,969 |
| American National Group, LLC, 6.144%, 6/13/32(1) | | 2,600 | 2,355,265 |
| ASR Nederland N.V., 7.00% to 9/7/33, 12/7/43(9)(10) | EUR | 1,945 | 2,117,319 |
| Assurant, Inc., 6.10%, 2/27/26 | | 1,138 | 1,133,116 |
| Australia & New Zealand Banking Group, Ltd., 2.95% to 7/22/25, 7/22/30(1)(10) | | 2,114 | 1,963,472 |
| Aviation Capital Group, LLC: | | | |
| 6.25%, 4/15/28(1) | | 1,920 | 1,879,379 |
| 6.375%, 7/15/30(1) | | 3,315 | 3,212,999 |
| Avolon Holdings Funding, Ltd., 5.25%, 5/15/24(1) | | 6,503 | 6,442,087 |
| Banco Mercantil del Norte S.A.: | | | |
| 7.625% to 1/10/28(1)(10)(11) | | 495 | 456,073 |
| 8.375% to 10/14/30(1)(10)(11) | | 1,195 | 1,135,058 |
| Banco Santander S.A.: | | | |
| 1.722% to 9/14/26, 9/14/27(10) | | 1,800 | 1,574,787 |
| 3.80%, 2/23/28 | | 2,460 | 2,219,130 |
| 4.175% to 3/24/27, 3/24/28(10) | | 400 | 369,525 |
| 6.921%, 8/8/33 | | 4,000 | 3,827,469 |
| Bank Leumi Le-Israel BM, 7.129% to 4/18/28, 7/18/33(1)(9)(10) | | 2,137 | 2,102,299 |
| Bank of America Corp.: | | | |
| 1.843% to 2/4/24, 2/4/25(10) | | 3,000 | 2,951,124 |
| 2.456% to 10/22/24, 10/22/25(10) | | 1,900 | 1,825,285 |
| 3.846% to 3/8/32, 3/8/37(10) | | 3,607 | 2,936,500 |
| 4.376% to 4/27/27, 4/27/28(10) | | 662 | 625,282 |
| 5.819% to 9/15/28, 9/15/29(10) | | 1,757 | 1,736,165 |
| 5.872% to 9/15/33, 9/15/34(10) | | 6,077 | 5,917,196 |
| 6.204% to 11/10/27, 11/10/28(10) | | 4,045 | 4,064,774 |
| Bank of Nova Scotia (The), 4.90% to 6/4/25(10)(11) | | 5,896 | 5,407,316 |
| BBVA Bancomer S.A./Texas: | | | |
| 5.125% to 1/18/28, 1/18/33(1)(10) | | 3,947 | 3,401,562 |
| 8.45% to 6/29/33, 6/29/38(1)(10) | | 1,577 | 1,555,488 |
| BNP Paribas S.A.: | | | |
| 7.75% to 8/16/29(1)(10)(11) | | 1,714 | 1,631,324 |
| 8.50% to 8/14/28(1)(10)(11) | | 700 | 686,576 |
| 9.25% to 11/17/27(1)(8)(10)(11) | | 1,314 | 1,347,612 |
| BPCE S.A., 3.648% to 1/14/32, 1/14/37(1)(10) | | 1,261 | 971,633 |
| Broadstone Net Lease, LLC, 2.60%, 9/15/31 | | 2,073 | 1,453,803 |
| Brookfield Finance, Inc., 4.70%, 9/20/47 | | 3,500 | 2,730,421 |
| CaixaBank S.A., 6.208% to 1/18/28, 1/18/29(1)(10) | | 4,235 | 4,146,386 |
| Capital One Financial Corp., 3.273% to 3/1/29, 3/1/30(10) | | 3,345 | 2,800,048 |
| CBRE Services, Inc., 5.95%, 8/15/34 | | 2,620 | 2,474,370 |
| Security | Principal
Amount*
(000’s omitted) | Value |
| Financial (continued) | |
| Charles Schwab Corp. (The): | | | |
| 4.00% to 6/1/26(10)(11) | | 1,726 | $ 1,443,724 |
| 6.136% to 8/24/33, 8/24/34(10) | | 799 | 777,672 |
| CI Financial Corp.: | | | |
| 3.20%, 12/17/30 | | 4,088 | 3,103,923 |
| 4.10%, 6/15/51 | | 3,326 | 1,928,092 |
| Citigroup, Inc., 4.00% to 12/10/25(10)(11) | | 2,510 | 2,201,901 |
| Corporate Office Properties, L.P., 2.90%, 12/1/33 | | 2,795 | 1,963,402 |
| Cushman & Wakefield US Borrower, LLC, 6.75%, 5/15/28(1)(8) | | 1,500 | 1,385,558 |
| Danske Bank A/S, 1.621% to 9/11/25, 9/11/26(1)(10) | | 3,504 | 3,193,565 |
| Discover Bank, 5.974%, 8/9/28 | | 822 | 752,921 |
| EPR Properties: | | | |
| 3.75%, 8/15/29 | | 6,012 | 4,835,187 |
| 4.95%, 4/15/28 | | 2,465 | 2,186,455 |
| Extra Space Storage, L.P., 2.55%, 6/1/31 | | 2,585 | 2,014,902 |
| F&G Annuities & Life, Inc., 7.40%, 1/13/28 | | 8,242 | 8,234,226 |
| Fifth Third Bancorp, 6.339% to 7/27/28, 7/27/29(10) | | 4,850 | 4,793,738 |
| Global Atlantic Fin Co.: | | | |
| 3.125%, 6/15/31(1) | | 6,521 | 4,654,424 |
| 7.95%, 6/15/33(1) | | 800 | 769,594 |
| HAT Holdings I, LLC/HAT Holdings II, LLC: | | | |
| 3.375%, 6/15/26(1) | | 2,750 | 2,447,248 |
| 3.75%, 9/15/30(1)(8) | | 4,715 | 3,614,069 |
| 6.00%, 4/15/25(1) | | 193 | 188,009 |
| HSBC Holdings PLC: | | | |
| 6.161% to 3/9/28, 3/9/29(10) | | 2,572 | 2,547,514 |
| 7.39% to 11/3/27, 11/3/28(10) | | 4,008 | 4,147,968 |
| Intesa Sanpaolo SpA: | | | |
| 7.778% to 6/20/53, 6/20/54(1)(10) | | 2,100 | 1,895,630 |
| 8.248% to 11/21/32, 11/21/33(1)(10) | | 3,523 | 3,553,624 |
| Iron Mountain, Inc., 4.50%, 2/15/31(1) | | 2,667 | 2,196,537 |
| Itau Unibanco Holding S.A., 3.875% to 1/15/26, 4/15/31(1)(10) | | 2,339 | 2,153,797 |
| Jefferies Financial Group, Inc., 5.875%, 7/21/28 | | 3,674 | 3,597,724 |
| JPMorgan Chase & Co.: | | | |
| 3.845% to 6/14/24, 6/14/25(10) | | 3,675 | 3,610,842 |
| 4.005% to 4/23/28, 4/23/29(10) | | 4,572 | 4,215,866 |
| 4.203% to 7/23/28, 7/23/29(10) | | 2,600 | 2,410,334 |
| KeyBank N.A.: | | | |
| 4.15%, 8/8/25 | | 2,290 | 2,157,467 |
| 5.85%, 11/15/27 | | 2,039 | 1,940,273 |
| KeyCorp, 4.789% to 6/1/32, 6/1/33(10) | | 1,000 | 834,145 |
| KKR Group Finance Co. VII, LLC, 3.625%, 2/25/50(1) | | 2,450 | 1,562,047 |
| KKR Group Finance Co. X, LLC, 3.25%, 12/15/51(1) | | 882 | 517,342 |
| Liberty Mutual Group, Inc., 4.125% to 9/15/26, 12/15/51(1)(10) | | 4,066 | 3,349,428 |
| Macquarie Bank, Ltd., 6.798%, 1/18/33(1) | | 2,179 | 2,140,320 |
| Newmark Group, Inc., 6.125%, 11/15/23 | | 3,997 | 3,993,423 |
| OneMain Finance Corp., 3.50%, 1/15/27 | | 4,218 | 3,615,902 |
| PennyMac Financial Services, Inc., 4.25%, 2/15/29(1) | | 1,959 | 1,586,833 |
10
See Notes to Financial Statements.
Calvert
Income Fund
September 30, 2023
Schedule of Investments — continued
| Security | Principal
Amount*
(000’s omitted) | Value |
| Financial (continued) | |
| PNC Financial Services Group, Inc. (The), Series W, 6.25% to 3/15/30(10)(11) | | 5,132 | $ 4,412,055 |
| Radian Group, Inc., 4.875%, 3/15/27 | | 5,750 | 5,378,780 |
| Rocket Mortgage, LLC/Rocket Mortgage Co-Issuer, Inc., 3.875%, 3/1/31(1) | | 3,754 | 2,998,263 |
| Santander UK Group Holdings PLC, 1.532% to 8/21/25, 8/21/26(10) | | 4,317 | 3,915,101 |
| SITE Centers Corp., 3.625%, 2/1/25 | | 3,000 | 2,857,497 |
| Societe Generale S.A.: | | | |
| 6.221% to 6/15/32, 6/15/33(1)(10) | | 1,815 | 1,645,918 |
| 9.375% to 11/22/27(1)(10)(11) | | 2,658 | 2,611,129 |
| Stifel Financial Corp.: | | | |
| 4.00%, 5/15/30 | | 3,254 | 2,753,245 |
| 4.25%, 7/18/24 | | 3,000 | 2,952,314 |
| Sun Communities Operating, L.P.: | | | |
| 2.70%, 7/15/31 | | 1,360 | 1,048,037 |
| 4.20%, 4/15/32 | | 1,375 | 1,174,149 |
| Synchrony Bank: | | | |
| 5.40%, 8/22/25 | | 3,225 | 3,109,560 |
| 5.625%, 8/23/27 | | 1,285 | 1,200,167 |
| Synchrony Financial, 4.875%, 6/13/25 | | 628 | 602,335 |
| Synovus Bank/Columbus, GA: | | | |
| 4.00% to 10/29/25, 10/29/30(10) | | 2,376 | 1,919,485 |
| 5.625%, 2/15/28 | | 1,876 | 1,700,949 |
| Synovus Financial Corp., 5.90% to 2/7/24, 2/7/29(10) | | 1,589 | 1,479,073 |
| Texas Capital Bancshares, Inc., 4.00% to 5/6/26, 5/6/31(10) | | 3,542 | 2,941,518 |
| Toronto-Dominion Bank (The), 8.125% to 10/31/27, 10/31/82(10) | | 6,955 | 6,936,596 |
| Truist Financial Corp.: | | | |
| 5.10% to 3/1/30(10)(11) | | 3,231 | 2,778,537 |
| 5.867% to 6/8/33, 6/8/34(10) | | 6,987 | 6,581,253 |
| U.S. Bancorp, 5.836% to 6/10/33, 6/12/34(10) | | 7,167 | 6,765,123 |
| UBS Group AG: | | | |
| 4.375% to 2/10/31(1)(10)(11) | | 3,883 | 2,791,579 |
| 4.703% to 8/5/26, 8/5/27(1)(10) | | 918 | 880,579 |
| UniCredit SpA: | | | |
| 5.459% to 6/30/30, 6/30/35(1)(10) | | 1,295 | 1,086,496 |
| 5.861% to 6/19/27, 6/19/32(1)(10) | | 3,643 | 3,317,625 |
| 7.83%, 12/4/23(1) | | 2,000 | 2,002,517 |
| VistaJet Malta Finance PLC/Vista Management Holding, Inc., 6.375%, 2/1/30(1) | | 1,700 | 1,315,842 |
| Westpac Banking Corp., 3.02% to 11/18/31, 11/18/36(10) | | 1,406 | 1,041,697 |
| | | | $285,254,586 |
| Government - Multinational — 0.3% | |
| International Bank for Reconstruction & Development, 8.50%, 4/6/26 | MXN | 36,300 | $ 1,959,659 |
| | | | $ 1,959,659 |
| Security | Principal
Amount*
(000’s omitted) | Value |
| Industrial — 2.0% | |
| Avnet, Inc., 3.00%, 5/15/31 | | 7,000 | $ 5,456,612 |
| Cemex SAB de CV, 9.125% to 3/14/28(1)(10)(11) | | 2,207 | 2,300,257 |
| Jabil, Inc., 3.00%, 1/15/31 | | 1,698 | 1,377,245 |
| Penske Truck Leasing Co., L.P./PTL Finance Corp., 6.20%, 6/15/30(1) | | 3,585 | 3,535,800 |
| Seaspan Corp., 5.50%, 8/1/29(1) | | 1,800 | 1,446,768 |
| | | | $ 14,116,682 |
| Technology — 3.5% | |
| Concentrix Corp.: | | | |
| 6.60%, 8/2/28 | | 5,774 | $ 5,575,301 |
| 6.85%, 8/2/33 | | 3,316 | 3,066,004 |
| Foundry JV Holdco, LLC, 5.875%, 1/25/34(1) | | 2,894 | 2,767,643 |
| Intel Corp., 5.70%, 2/10/53 | | 3,005 | 2,820,108 |
| Kyndryl Holdings, Inc.: | | | |
| 2.70%, 10/15/28 | | 5,617 | 4,621,137 |
| 3.15%, 10/15/31(8) | | 3,666 | 2,779,413 |
| Micron Technology, Inc., 2.703%, 4/15/32 | | 545 | 416,464 |
| Seagate HDD Cayman, 5.75%, 12/1/34 | | 4,113 | 3,478,102 |
| | | | $ 25,524,172 |
| Utilities — 2.3% | |
| AES Corp. (The), 2.45%, 1/15/31 | | 3,947 | $ 3,038,829 |
| Clearway Energy Operating, LLC, 3.75%, 1/15/32(1) | | 1,129 | 878,932 |
| Enel Finance International N.V., 5.00%, 6/15/32(1) | | 3,658 | 3,312,611 |
| New England Power Co., 5.936%, 11/25/52(1) | | 3,127 | 2,977,779 |
| NextEra Energy Capital Holdings, Inc., 6.051%, 3/1/25 | | 2,000 | 2,003,741 |
| NextEra Energy Operating Partners, L.P., 4.25%, 9/15/24(1) | | 136 | 130,710 |
| Pattern Energy Operations, L.P./Pattern Energy Operations, Inc., 4.50%, 8/15/28(1) | | 1,744 | 1,516,617 |
| Terraform Global Operating, LLC, 6.125%, 3/1/26(1) | | 2,795 | 2,745,403 |
| | | | $ 16,604,622 |
Total Corporate Bonds
(identified cost $513,232,578) | | | $463,300,229 |
| High Social Impact Investments — 0.2% |
| Security | Principal
Amount
(000's omitted) | Value |
| Calvert Impact Capital, Inc., Community Investment Notes, 1.50%, 12/15/23(12)(13) | $ | 1,500 | $ 1,479,435 |
Total High Social Impact Investments
(identified cost $1,500,000) | | | $ 1,479,435 |
11
See Notes to Financial Statements.
Calvert
Income Fund
September 30, 2023
Schedule of Investments — continued
| Security | Shares | Value |
| Real Estate Management & Development — 0.5% | |
| Brookfield Property Partners, L.P.: | | | |
| Series A, 5.75% | | 70,736 | $ 901,177 |
| Series A2, 6.375% | | 212,000 | 2,862,000 |
| | | | $ 3,763,177 |
| Wireless Telecommunication Services — 0.5% | |
| United States Cellular Corp.: | | | |
| 5.50% | | 97,800 | $ 1,609,788 |
| 6.25% | | 87,200 | 1,582,680 |
| | | | $ 3,192,468 |
Total Preferred Stocks
(identified cost $11,815,480) | | | $ 6,955,645 |
| Senior Floating-Rate Loans(14) — 0.2% |
| Borrower/Description | Principal
Amount
(000's omitted) | Value |
| Diversified Telecommunication Services — 0.2% | |
| CenturyLink, Inc., Term Loan, 7.681%, (SOFR + 2.25%), 3/15/27 | $ | 1,625 | $ 1,161,168 |
Total Senior Floating-Rate Loans
(identified cost $1,617,420) | | | $ 1,161,168 |
| Taxable Municipal Obligations — 0.2% |
| Security | Principal
Amount
(000's omitted) | Value |
| Special Tax Revenue — 0.1% | |
| California Health Facilities Financing Authority, (No Place Like Home Program), Social Bonds, 2.984%, 6/1/33 | $ | 1,000 | $ 817,530 |
| | | | $ 817,530 |
| Water and Sewer — 0.1% | |
| San Diego County Water Authority, CA, Green Bonds, 1.951%, 5/1/34 | $ | 1,120 | $ 816,592 |
| | | | $ 816,592 |
Total Taxable Municipal Obligations
(identified cost $2,120,000) | | | $ 1,634,122 |
| U.S. Government Agency Mortgage-Backed Securities — 9.4% |
| Security | Principal
Amount
(000's omitted) | Value |
| Federal National Mortgage Association: | | | |
| 5.50%, 30-Year, TBA(15) | $ | 53,305 | $ 51,539,298 |
| 6.00%, 30-Year, TBA(15) | | 16,100 | 15,896,855 |
Total U.S. Government Agency Mortgage-Backed Securities
(identified cost $67,939,933) | | $ 67,436,153 |
| U.S. Treasury Obligations — 4.4% |
| Security | Principal
Amount
(000's omitted) | Value |
| U.S. Treasury Bond: | | | |
| 1.875%, 11/15/51 | $ | 5,750 | $ 3,206,748 |
| 3.375%, 8/15/42 | | 3,548 | 2,875,231 |
| 3.875%, 2/15/43 | | 1,698 | 1,478,056 |
| 3.875%, 5/15/43 | | 2,544 | 2,212,087 |
| U.S. Treasury Floating Rate Notes, 5.44%, (3 mo. USTMMR + 0.037%), 7/31/24(4) | | 19,715 | 19,720,114 |
| U.S. Treasury Notes, 4.00%, 6/30/28 | | 2,105 | 2,049,045 |
Total U.S. Treasury Obligations
(identified cost $33,835,445) | | | $ 31,541,281 |
12
See Notes to Financial Statements.
Calvert
Income Fund
September 30, 2023
Schedule of Investments — continued
| Short-Term Investments — 2.9% | | | |
| Affiliated Fund — 1.4% |
| Security | Shares | Value |
| Morgan Stanley Institutional Liquidity Funds - Government Portfolio, Institutional Class, 5.27%(16) | | 9,680,308 | $ 9,680,308 |
Total Affiliated Fund
(identified cost $9,680,308) | | | $ 9,680,308 |
| Securities Lending Collateral — 1.5% |
| Security | Shares | Value |
| State Street Navigator Securities Lending Government Money Market Portfolio, 5.36%(17) | | 11,027,720 | $ 11,027,720 |
Total Securities Lending Collateral
(identified cost $11,027,720) | | | $ 11,027,720 |
Total Short-Term Investments
(identified cost $20,708,028) | | | $ 20,708,028 |
Total Purchased Call Options — 0.0%(18)
(identified cost $76,280) | | | $ 78,375 |
Total Investments — 109.5%
(identified cost $869,121,050) | | | $787,381,437 |
| Other Assets, Less Liabilities — (9.5)% | | | $ (68,194,650) |
| Net Assets — 100.0% | | | $ 719,186,787 |
| The percentage shown for each investment category in the Schedule of Investments is based on net assets. |
| * | In U.S. dollars unless otherwise indicated. |
| (1) | Security exempt from registration under Rule 144A of the Securities Act of 1933, as amended. These securities may be sold in certain transactions in reliance on an exemption from registration (normally to qualified institutional buyers). At September 30, 2023, the aggregate value of these securities is $350,481,750 or 48.7% of the Fund's net assets. |
| (2) | Issuer is in default with respect to interest and/or principal payments. |
| (3) | Weighted average fixed-rate coupon that changes/updates monthly. Rate shown is the rate at September 30, 2023. |
| (4) | Variable rate security. The stated interest rate represents the rate in effect at September 30, 2023. |
| (5) | Inverse floating-rate security whose coupon varies inversely with changes in the interest rate index. The stated interest rate represents the coupon rate in effect at September 30, 2023. |
| (6) | Step coupon security. Interest rate represents the rate in effect at
September 30, 2023. |
| (7) | Represents an investment in an issuer that may be deemed to be an affiliate (see Note 8). |
| (8) | All or a portion of this security was on loan at September 30, 2023. The aggregate market value of securities on loan at September 30, 2023 was $15,546,246. |
| (9) | Security exempt from registration under Regulation S of the Securities Act of 1933, as amended, which exempts from registration securities offered and sold outside the United States. Security may not be offered or sold in the United States except pursuant to an exemption from, or in a transaction not subject to, the registration requirements of the Securities Act of 1933, as amended. At September 30, 2023, the aggregate value of these securities is $6,532,585 or 0.9% of the Fund's net assets. |
| (10) | Security converts to variable rate after the indicated fixed-rate coupon period. |
| (11) | Perpetual security with no stated maturity date but may be subject to calls by the issuer. |
| (12) | May be deemed to be an affiliated company (see Note 8). |
| (13) | Restricted security. Total market value of restricted securities amounts to $1,479,435, which represents 0.2% of the net assets of the Fund as of September 30, 2023. |
| (14) | Senior floating-rate loans (Senior Loans) often require prepayments from excess cash flows or permit the borrowers to repay at their election. The degree to which borrowers repay, whether as a contractual requirement or at their election, cannot be predicted with accuracy. As a result, the actual remaining maturity may be substantially less than the stated maturities shown. However, Senior Loans will typically have an expected average life of approximately two to four years. Senior Loans typically have rates of interest which are redetermined periodically by reference to a base lending rate, plus a spread. These base lending rates are primarily the Secured Overnight Financing Rate (“SOFR”) (or the London Interbank Offered Rate (“LIBOR”) for those loans whose rates reset prior to the discontinuance of LIBOR on June 30, 2023) and secondarily, the prime rate offered by one or more major United States banks (the “Prime Rate”). Base lending rates may be subject to a floor, or minimum rate. Rates for SOFR are generally 1 or 3-month tenors and may also be subject to a credit spread adjustment. Senior Loans are generally subject to contractual restrictions that must be satisfied before they can be bought or sold. |
| (15) | TBA (To Be Announced) securities are purchased on a forward commitment basis with an approximate principal amount and maturity date. The actual principal amount and maturity date are determined upon settlement. |
| (16) | May be deemed to be an affiliated investment company. The rate shown is the annualized seven-day yield as of September 30, 2023. |
| (17) | Represents investment of cash collateral received in connection with securities lending. |
| (18) | Amount is less than 0.05%. |
13
See Notes to Financial Statements.
Calvert
Income Fund
September 30, 2023
Schedule of Investments — continued
Purchased Call Options (Exchange-Traded) — 0.0%(1)
| Description | Number of
Contracts | Notional
Amount | Exercise
Price | Expiration
Date | Value |
| U.S. 10-Year Treasury Note Futures 12/2023 | 152 | $16,425,500 | $110.00 | 11/24/23 | $ 78,375 |
| Total | | | | | $78,375 |
| (1) | Amount is less than 0.05%. |
Forward Foreign Currency Exchange Contracts (OTC)
| Currency Purchased | Currency Sold | Counterparty | Settlement
Date | Unrealized
Appreciation | Unrealized
(Depreciation) |
| BRL | 9,439,444 | USD | 1,890,914 | State Street Bank and Trust Company | 11/10/23 | $ — | $ (22,683) |
| BRL | 8,800,000 | USD | 1,788,073 | State Street Bank and Trust Company | 11/10/23 | — | (46,398) |
| USD | 2,027,292 | CAD | 2,699,036 | Citibank, N.A. | 11/10/23 | 39,105 | — |
| USD | 2,156,226 | CAD | 2,913,860 | State Street Bank and Trust Company | 11/10/23 | 9,794 | — |
| USD | 2,272,703 | EUR | 2,050,537 | JPMorgan Chase Bank, N.A. | 11/10/23 | 101,351 | — |
| | | | | | | $150,250 | $(69,081) |
Futures Contracts
| Description | Number of
Contracts | Position | Expiration
Date | Notional
Amount | Value/
Unrealized
Appreciation
(Depreciation) |
| Interest Rate Futures | | | | | |
| U.S. 2-Year Treasury Note | 1,064 | Long | 12/29/23 | $215,684,438 | $ (758,855) |
| U.S. 5-Year Treasury Note | 262 | Long | 12/29/23 | 27,604,156 | (174,221) |
| U.S. 10-Year Treasury Note | 82 | Long | 12/19/23 | 8,861,125 | (2,296) |
| U.S. Long Treasury Bond | 373 | Long | 12/19/23 | 42,440,406 | (1,821,492) |
| U.S. Ultra-Long Treasury Bond | 189 | Long | 12/19/23 | 22,431,938 | (1,548,693) |
| U.S. Ultra 10-Year Treasury Note | (167) | Short | 12/19/23 | (18,630,937) | 533,931 |
| | | | | | $(3,771,626) |
Restricted Securities
| Description | Acquisition Date | Cost |
| Calvert Impact Capital, Inc., Community Investment Notes, 1.50%, 12/15/23 | 12/14/20 | $1,500,000 |
| Abbreviations: |
| SOFR | – Secured Overnight Financing Rate |
| TBA | – To Be Announced |
| USTMMR | – U.S. Treasury Money Market Rate |
14
See Notes to Financial Statements.
Calvert
Income Fund
September 30, 2023
Schedule of Investments — continued
| Currency Abbreviations: |
| BRL | – Brazilian Real |
| CAD | – Canadian Dollar |
| EUR | – Euro |
| MXN | – Mexican Peso |
| USD | – United States Dollar |
15
See Notes to Financial Statements.
Calvert
Income Fund
September 30, 2023
Statement of Assets and Liabilities
| | September 30, 2023 |
| Assets | |
Investments in securities of unaffiliated issuers, at value (identified cost $848,431,062) - including
$15,546,246 of securities on loan | $ 767,050,310 |
| Investments in securities of affiliated issuers, at value (identified cost $20,689,988) | 20,331,127 |
| Receivable for variation margin on open futures contracts | 309,407 |
| Receivable for open forward foreign currency exchange contracts | 150,250 |
| Cash denominated in foreign currency, at value (cost $2,668) | 2,649 |
| Deposits at broker for futures contracts | 3,977,004 |
| Deposits for forward commitment securities | 1,000,000 |
| Receivable for investments sold | 41,806,574 |
| Receivable for capital shares sold | 2,119,987 |
| Dividends and interest receivable | 7,756,978 |
| Dividends and interest receivable - affiliated | 139,044 |
| Securities lending income receivable | 6,531 |
| Tax reclaims receivable | 52,656 |
| Trustees' deferred compensation plan | 395,377 |
| Total assets | $ 845,097,894 |
| Liabilities | |
| Payable for open forward foreign currency exchange contracts | $ 69,081 |
| Due to custodian | 9,469 |
| Payable for investments purchased | 11,818,726 |
| Payable for when-issued/delayed delivery/forward commitment securities | 100,547,338 |
| Payable for capital shares redeemed | 1,216,322 |
| Distributions payable | 212,550 |
| Deposits for securities loaned | 11,027,720 |
| Payable to affiliates: | |
| Investment advisory fee | 235,818 |
| Administrative fee | 71,502 |
| Distribution and service fees | 43,062 |
| Sub-transfer agency fee | 15,780 |
| Trustees' deferred compensation plan | 395,377 |
| Other | 27,434 |
| Accrued expenses | 220,928 |
| Total liabilities | $ 125,911,107 |
| Net Assets | $ 719,186,787 |
| Sources of Net Assets | |
| Paid-in capital | $1,075,110,051 |
| Accumulated loss | (355,923,264) |
| Net Assets | $ 719,186,787 |
| Class A Shares | |
| Net Assets | $ 184,562,501 |
| Shares Outstanding | 13,071,168 |
Net Asset Value and Redemption Price Per Share
(net assets ÷ shares of beneficial interest outstanding) | $ 14.12 |
Maximum Offering Price Per Share
(100 ÷ 96.75 of net asset value per share) | $ 14.59 |
16
See Notes to Financial Statements.
Calvert
Income Fund
September 30, 2023
Statement of Assets and Liabilities — continued
| | September 30, 2023 |
| Class C Shares | |
| Net Assets | $ 5,401,982 |
| Shares Outstanding | 382,910 |
Net Asset Value and Offering Price Per Share*
(net assets ÷ shares of beneficial interest outstanding) | $ 14.11 |
| Class I Shares | |
| Net Assets | $ 529,174,401 |
| Shares Outstanding | 37,389,257 |
Net Asset Value, Offering Price and Redemption Price Per Share
(net assets ÷ shares of beneficial interest outstanding) | $ 14.15 |
| Class R6 Shares | |
| Net Assets | $ 47,903 |
| Shares Outstanding | 3,384 |
Net Asset Value, Offering Price and Redemption Price Per Share
(net assets ÷ shares of beneficial interest outstanding) | $ 14.15 |
| On sales of $100,000 or more, the offering price of Class A shares is reduced. |
| * | Redemption price per share is equal to the net asset value less any applicable contingent deferred sales charge. |
17
See Notes to Financial Statements.
Calvert
Income Fund
September 30, 2023
| | Year Ended |
| | September 30, 2023 |
| Investment Income | |
| Dividend income (net of foreign taxes withheld of $42,207) | $ 992,698 |
| Dividend income - affiliated issuers | 712,235 |
| Interest and other income (net of foreign taxes withheld of $10,344) | 36,724,492 |
| Interest income - affiliated issuers | 736,853 |
| Securities lending income, net | 52,180 |
| Total investment income | $ 39,218,458 |
| Expenses | |
| Investment advisory fee | $ 2,760,114 |
| Administrative fee | 828,034 |
| Distribution and service fees: | |
| Class A | 488,861 |
| Class C | 58,168 |
| Trustees' fees and expenses | 46,825 |
| Custodian fees | 24,062 |
| Transfer agency fees and expenses | 587,122 |
| Accounting fees | 158,319 |
| Professional fees | 65,735 |
| Registration fees | 96,336 |
| Reports to shareholders | 63,559 |
| Miscellaneous | 49,938 |
| Total expenses | $ 5,227,073 |
| Waiver and/or reimbursement of expenses by affiliates | $ (23,525) |
| Net expenses | $ 5,203,548 |
| Net investment income | $ 34,014,910 |
| Realized and Unrealized Gain (Loss) | |
| Net realized gain (loss): | |
| Investment securities | $ (41,238,759) |
| Investment securities - affiliated issuers | 1,101 |
| Futures contracts | (9,340,507) |
| Foreign currency transactions | (11,334) |
| Forward foreign currency exchange contracts | 39,225 |
| Net realized loss | $(50,550,274) |
| Change in unrealized appreciation (depreciation): | |
| Investment securities | $ 37,925,988 |
| Investment securities - affiliated issuers | 29,795 |
| Futures contracts | (378,931) |
| Foreign currency | (3,080) |
| Forward foreign currency exchange contracts | (82,856) |
| Net change in unrealized appreciation (depreciation) | $ 37,490,916 |
| Net realized and unrealized loss | $(13,059,358) |
| Net increase in net assets from operations | $ 20,955,552 |
18
See Notes to Financial Statements.
Calvert
Income Fund
September 30, 2023
Statements of Changes in Net Assets
| | Year Ended September 30, |
| | 2023 | 2022 |
| Increase (Decrease) in Net Assets | | |
| From operations: | | |
| Net investment income | $ 34,014,910 | $ 24,096,106 |
| Net realized loss | (50,550,274) | (21,811,123) |
| Net change in unrealized appreciation (depreciation) | 37,490,916 | (143,376,701) |
| Net increase (decrease) in net assets from operations | $ 20,955,552 | $(141,091,718) |
| Distributions to shareholders: | | |
| Class A | $ (9,348,591) | $ (7,349,743) |
| Class C | (234,613) | (162,543) |
| Class I | (24,641,832) | (16,988,953) |
| Class R6(1) | (1,708) | — |
| Total distributions to shareholders | $ (34,226,744) | $ (24,501,239) |
| Capital share transactions: | | |
| Class A | $ (9,135,875) | $ (24,920,169) |
| Class C | (114,935) | (1,105,779) |
| Class I | 75,802,981 | 73,658,561 |
| Class R6(1) | 51,708 | — |
| Net increase in net assets from capital share transactions | $ 66,603,879 | $ 47,632,613 |
| Net increase (decrease) in net assets | $ 53,332,687 | $(117,960,344) |
| Net Assets | | |
| At beginning of year | $ 665,854,100 | $ 783,814,444 |
| At end of year | $719,186,787 | $ 665,854,100 |
| (1) | For the period from the commencement of operations, February 1, 2023, to September 30, 2023. |
19
See Notes to Financial Statements.
Calvert
Income Fund
September 30, 2023
| | Class A |
| | Year Ended September 30, |
| | 2023 | 2022 | 2021 | 2020 | 2019 |
| Net asset value — Beginning of year | $ 14.36 | $ 17.98 | $ 17.37 | $ 17.11 | $ 15.91 |
| Income (Loss) From Operations | | | | | |
| Net investment income(1) | $ 0.70 | $ 0.50 | $ 0.49 | $ 0.55 | $ 0.56 |
| Net realized and unrealized gain (loss) | (0.24) | (3.61) | 0.61 | 0.26 | 1.22 |
| Total income (loss) from operations | $ 0.46 | $ (3.11) | $ 1.10 | $ 0.81 | $ 1.78 |
| Less Distributions | | | | | |
| From net investment income | $ (0.70) | $ (0.51) | $ (0.49) | $ (0.54) | $ (0.58) |
| Tax return of capital | — | — | — | (0.01) | — |
| Total distributions | $ (0.70) | $ (0.51) | $ (0.49) | $ (0.55) | $ (0.58) |
| Net asset value — End of year | $ 14.12 | $ 14.36 | $ 17.98 | $ 17.37 | $ 17.11 |
| Total Return(2) | 3.14% | (17.56)% | 6.41% | 4.83% | 11.45% |
| Ratios/Supplemental Data | | | | | |
| Net assets, end of year (000’s omitted) | $184,563 | $196,638 | $272,840 | $277,617 | $279,886 |
| Ratios (as a percentage of average daily net assets):(3) | | | | | |
| Total expenses | 0.93% | 0.91% | 0.92% | 0.94% | 0.97% |
| Net expenses | 0.93% (4) | 0.91% (4) | 0.92% | 0.94% | 0.96% |
| Net investment income | 4.75% | 3.05% | 2.75% | 3.21% | 3.47% |
| Portfolio Turnover | 153% (5) | 51% (5) | 48% | 74% | 57% |
| (1) | Computed using average shares outstanding. |
| (2) | Returns are historical and are calculated by determining the percentage change in net asset value with all distributions reinvested and do not reflect the effect of sales charges, if any. |
| (3) | Total expenses do not reflect amounts reimbursed and/or waived by the adviser and certain of its affiliates, if applicable. Net expenses are net of all reductions and represent the net expenses paid by the Fund. |
| (4) | Includes a reduction by the investment adviser of a portion of its advisory fee due to the Fund’s investment in the Liquidity Fund (equal to less than 0.005% of average daily net assets for the years ended September 30, 2023 and 2022). |
| (5) | Includes the effect of To-Be-Announced (TBA) transactions. |
20
See Notes to Financial Statements.
Calvert
Income Fund
September 30, 2023
Financial Highlights — continued
| | Class C |
| | Year Ended September 30, |
| | 2023 | 2022 | 2021 | 2020 | 2019 |
| Net asset value — Beginning of year | $ 14.34 | $ 17.96 | $ 17.36 | $ 17.10 | $ 15.91 |
| Income (Loss) From Operations | | | | | |
| Net investment income(1) | $ 0.59 | $ 0.38 | $ 0.35 | $ 0.42 | $ 0.44 |
| Net realized and unrealized gain (loss) | (0.23) | (3.61) | 0.61 | 0.26 | 1.22 |
| Total income (loss) from operations | $ 0.36 | $ (3.23) | $ 0.96 | $ 0.68 | $ 1.66 |
| Less Distributions | | | | | |
| From net investment income | $ (0.59) | $ (0.39) | $ (0.36) | $ (0.41) | $ (0.47) |
| Tax return of capital | — | — | — | (0.01) | — |
| Total distributions | $ (0.59) | $ (0.39) | $ (0.36) | $ (0.42) | $ (0.47) |
| Net asset value — End of year | $14.11 | $ 14.34 | $17.96 | $17.36 | $ 17.10 |
| Total Return(2) | 2.44% | (18.20)% | 5.55% | 4.06% | 10.65% |
| Ratios/Supplemental Data | | | | | |
| Net assets, end of year (000’s omitted) | $ 5,402 | $ 5,613 | $ 8,218 | $ 9,655 | $11,623 |
| Ratios (as a percentage of average daily net assets):(3) | | | | | |
| Total expenses | 1.68% | 1.66% | 1.67% | 1.69% | 1.73% |
| Net expenses | 1.68% (4) | 1.66% (4) | 1.67% | 1.69% | 1.72% |
| Net investment income | 4.00% | 2.30% | 1.99% | 2.46% | 2.78% |
| Portfolio Turnover | 153% (5) | 51% (5) | 48% | 74% | 57% |
| (1) | Computed using average shares outstanding. |
| (2) | Returns are historical and are calculated by determining the percentage change in net asset value with all distributions reinvested and do not reflect the effect of sales charges, if any. |
| (3) | Total expenses do not reflect amounts reimbursed and/or waived by the adviser and certain of its affiliates, if applicable. Net expenses are net of all reductions and represent the net expenses paid by the Fund. |
| (4) | Includes a reduction by the investment adviser of a portion of its advisory fee due to the Fund’s investment in the Liquidity Fund (equal to less than 0.005% of average daily net assets for the years ended September 30, 2023 and 2022). |
| (5) | Includes the effect of To-Be-Announced (TBA) transactions. |
21
See Notes to Financial Statements.
Calvert
Income Fund
September 30, 2023
Financial Highlights — continued
| | Class I |
| | Year Ended September 30, |
| | 2023 | 2022 | 2021 | 2020 | 2019 |
| Net asset value — Beginning of year | $ 14.39 | $ 18.02 | $ 17.41 | $ 17.16 | $ 15.94 |
| Income (Loss) From Operations | | | | | |
| Net investment income(1) | $ 0.73 | $ 0.55 | $ 0.53 | $ 0.59 | $ 0.61 |
| Net realized and unrealized gain (loss) | (0.23) | (3.62) | 0.62 | 0.25 | 1.23 |
| Total income (loss) from operations | $ 0.50 | $ (3.07) | $ 1.15 | $ 0.84 | $ 1.84 |
| Less Distributions | | | | | |
| From net investment income | $ (0.74) | $ (0.56) | $ (0.54) | $ (0.57) | $ (0.62) |
| Tax return of capital | — | — | — | (0.02) | — |
| Total distributions | $ (0.74) | $ (0.56) | $ (0.54) | $ (0.59) | $ (0.62) |
| Net asset value — End of year | $ 14.15 | $ 14.39 | $ 18.02 | $ 17.41 | $ 17.16 |
| Total Return(2) | 3.40% | (17.36)% | 6.66% | 5.03% | 11.81% |
| Ratios/Supplemental Data | | | | | |
| Net assets, end of year (000’s omitted) | $529,174 | $463,602 | $502,756 | $351,345 | $267,226 |
| Ratios (as a percentage of average daily net assets):(3) | | | | | |
| Total expenses | 0.68% | 0.66% | 0.67% | 0.69% | 0.72% |
| Net expenses | 0.68% (4) | 0.66% (4) | 0.67% | 0.69% | 0.68% |
| Net investment income | 5.01% | 3.33% | 2.98% | 3.45% | 3.74% |
| Portfolio Turnover | 153% (5) | 51% (5) | 48% | 74% | 57% |
| (1) | Computed using average shares outstanding. |
| (2) | Returns are historical and are calculated by determining the percentage change in net asset value with all distributions reinvested and do not reflect the effect of sales charges, if any. |
| (3) | Total expenses do not reflect amounts reimbursed and/or waived by the adviser and certain of its affiliates, if applicable. Net expenses are net of all reductions and represent the net expenses paid by the Fund. |
| (4) | Includes a reduction by the investment adviser of a portion of its advisory fee due to the Fund’s investment in the Liquidity Fund (equal to less than 0.005% of average daily net assets for the years ended September 30, 2023 and 2022). |
| (5) | Includes the effect of To-Be-Announced (TBA) transactions. |
22
See Notes to Financial Statements.
Calvert
Income Fund
September 30, 2023
Financial Highlights — continued
| | Class R6 |
| | Period Ended
September 30,
2023(1) |
| |
| Net asset value — Beginning of period | $ 15.30 |
| Income (Loss) From Operations | |
| Net investment income(2) | $ 0.51 |
| Net realized and unrealized loss | (1.15) |
| Total loss from operations | $ (0.64) |
| Less Distributions | |
| From net investment income | $ (0.51) |
| Total distributions | $ (0.51) |
| Net asset value — End of period | $14.15 |
| Total Return(3) | (4.22)% (4) |
| Ratios/Supplemental Data | |
| Net assets, end of period (000’s omitted) | $ 48 |
| Ratios (as a percentage of average daily net assets):(5) | |
| Total expenses | 0.63% (6) |
| Net expenses | 0.63% (6)(7) |
| Net investment income | 5.22% (6) |
| Portfolio Turnover | 153% (8)(9) |
| (1) | For the period from the commencement of operations, February 1, 2023, to September 30, 2023. |
| (2) | Computed using average shares outstanding. |
| (3) | Returns are historical and are calculated by determining the percentage change in net asset value with all distributions reinvested and do not reflect the effect of sales charges, if any. |
| (4) | Not annualized. |
| (5) | Total expenses do not reflect amounts reimbursed and/or waived by the adviser and certain of its affiliates, if applicable. Net expenses are net of all reductions and represent the net expenses paid by the Fund. |
| (6) | Annualized. |
| (7) | Includes a reduction by the investment adviser of a portion of its advisory fee due to the Fund’s investment in the Liquidity Fund (equal to less than 0.005% of average daily net assets for the period ended September 30, 2023). |
| (8) | Includes the effect of To-Be-Announced (TBA) transactions. |
| (9) | For the year ended September 30, 2023. |
23
See Notes to Financial Statements.
Calvert
Income Fund
September 30, 2023
Notes to Financial Statements
1 Significant Accounting Policies
Calvert Income Fund (the Fund) is a diversified series of The Calvert Fund (the Trust). The Trust is a Massachusetts business trust registered under the Investment Company Act of 1940, as amended (the 1940 Act), as an open-end management investment company. The investment objective of the Fund is to seek to maximize income, to the extent consistent with preservation of capital, through investment in bonds and income-producing securities. The Fund invests primarily in investment grade, U.S. dollar-denominated debt securities.
The Fund offers four classes of shares. Class A shares are generally sold subject to a sales charge imposed at time of purchase. A contingent deferred sales charge of 0.75% may apply to certain redemptions of Class A shares for accounts for which no sales charge was paid, if redeemed within 12 months of purchase. Class C shares are sold without a front-end sales charge, and with certain exceptions, are charged a contingent deferred sales charge of 1% on shares redeemed within 12 months of purchase. Class C shares are only available for purchase through a financial intermediary. Effective November 5, 2020, Class C shares automatically convert to Class A shares eight years after their purchase as described in the Fund’s prospectus. Class I and Class R6 shares are sold at net asset value, are not subject to a sales charge and are sold only to certain eligible investors. Each class represents a pro rata interest in the Fund, but votes separately on class-specific matters and is subject to different expenses.
The Fund applies the accounting and reporting guidance in the Financial Accounting Standards Board (FASB) Accounting Standards Codification Topic 946, Financial Services – Investment Companies (ASC 946). Subsequent events, if any, through the date that the financial statements were issued have been evaluated in the preparation of the financial statements.
A Investment Valuation— Net asset value per share is determined every business day as of the close of the regular session of the New York Stock Exchange (generally 4:00 p.m. Eastern time). The Fund uses independent pricing services approved by the Board of Trustees (the Board) to value its investments wherever possible. Investments for which market quotations are not available or deemed not reliable are fair valued in good faith by the Board’s valuation designee.
U.S. generally accepted accounting principles (U.S. GAAP) establishes a disclosure hierarchy that categorizes the inputs to valuation techniques used to value assets and liabilities at measurement date. These inputs are summarized in the three broad levels listed below:
Level 1 - quoted prices in active markets for identical securities
Level 2 - other significant observable inputs (including quoted prices for similar securities, interest rates, prepayment speeds, credit risk, etc.)
Level 3 - significant unobservable inputs (including the Fund’s own assumptions in determining the fair value of investments)
The inputs or methodologies used for valuing securities are not necessarily an indication of the risk associated with investing in those securities.
Valuation techniques used to value the Fund’s investments by major category are as follows:
Equity Securities. Equity securities (including warrants and rights) listed on a U.S. securities exchange generally are valued at the last sale or closing price as reported by an independent pricing service on the primary market or exchange on which they are traded and are categorized as Level 1 in the hierarchy. Equity securities listed on the NASDAQ National Market System are valued at the NASDAQ official closing price and are categorized as Level 1 in the hierarchy. Unlisted or listed securities for which closing sales prices or closing quotations are not available are valued at the mean between the latest available bid and ask prices and are categorized as Level 2 in the hierarchy.
Debt Securities. Debt securities are generally valued based on valuations provided by third party pricing services, as derived from such services’ pricing models. Inputs to the models may include, but are not limited to, reported trades, executable bid and ask prices, broker/dealer quotations, prices or yields of securities with similar characteristics, interest rates, anticipated prepayments, benchmark curves or information pertaining to the issuer, as well as industry and economic events. Accordingly, debt securities are generally categorized as Level 2 in the hierarchy. Short-term debt securities with a remaining maturity at time of purchase of more than sixty days are valued based on valuations provided by a third party pricing service. Such securities are generally categorized as Level 2 in the hierarchy. Short-term debt securities of sufficient credit quality purchased with remaining maturities of sixty days or less for which a valuation from a third party pricing service is not readily available may be valued at amortized cost, which approximates fair value, and are categorized as Level 2 in the hierarchy.
Senior Floating-Rate Loans. Interests in senior floating-rate loans for which reliable market quotations are readily available are valued generally at the average mean of bid and ask quotations obtained from a third party pricing service, and are categorized as Level 2 in the hierarchy.
Other Securities. Investments in management investment companies (including money market funds) that do not trade on an exchange are valued at the net asset value as of the close of each business day and are categorized as Level 1 in the hierarchy.
Derivatives. Futures contracts are valued at unrealized appreciation (depreciation) based on the settlement price established each day by the board of trade or exchange on which they are traded and are categorized as Level 1 in the hierarchy. Forward foreign currency exchange contracts are generally valued at the mean of the average bid and average ask prices that are reported by currency dealers to a third party pricing service at the valuation time. Such third party pricing service valuations are supplied for specific settlement periods and the Fund's forward foreign currency exchange contracts are valued at an interpolated rate between the closest preceding and subsequent settlement period reported by the third party pricing service and are categorized as Level 2
Calvert
Income Fund
September 30, 2023
Notes to Financial Statements — continued
in the hierarchy. U.S. exchange-traded options are valued at the mean between the bid and ask prices at valuation time as reported by the Options Price Reporting Authority and are categorized as Level 1 in the hierarchy.
Fair Valuation. In connection with Rule 2a-5 of the 1940 Act, the Board has designated the Fund’s investment adviser as its valuation designee. Investments for which valuations or market quotations are not readily available or are deemed unreliable are valued by the investment adviser, as valuation designee, at fair value using methods that most fairly reflect the security’s “fair value”, which is the amount that the Fund might reasonably expect to receive for the security upon its current sale in the ordinary course. Each such determination is based on a consideration of relevant factors, which are likely to vary from one pricing context to another. These factors may include, but are not limited to, the type of security, the existence of any contractual restrictions on the security’s disposition, the price and extent of public trading in similar securities of the issuer or of comparable companies or entities, quotations or relevant information obtained from broker/dealers or other market participants, information obtained from the issuer, analysts, and/or the appropriate stock exchange (for exchange-traded securities), an analysis of the company’s or entity’s financial statements, and an evaluation of the forces that influence the issuer and the market(s) in which the security is purchased and sold.
The values assigned to fair value investments are based on available information and do not necessarily represent amounts that might ultimately be realized. Further, due to the inherent uncertainty of valuations of such investments, the fair values may differ significantly from the values that would have been used had an active market existed, and the differences could be material.
The following table summarizes the market value of the Fund's holdings as of September 30, 2023, based on the inputs used to value them:
| Asset Description | Level 1 | Level 2 | Level 3 | Total |
| Asset-Backed Securities | $ — | $ 94,357,303 | $ — | $ 94,357,303 |
| Collateralized Mortgage Obligations | — | 49,259,072 | — | 49,259,072 |
| Commercial Mortgage-Backed Securities | — | 49,470,626 | — | 49,470,626 |
| Corporate Bonds | — | 463,300,229 | — | 463,300,229 |
| High Social Impact Investments | — | 1,479,435 | — | 1,479,435 |
| Preferred Stocks | 6,955,645 | — | — | 6,955,645 |
| Senior Floating-Rate Loans | — | 1,161,168 | — | 1,161,168 |
| Taxable Municipal Obligations | — | 1,634,122 | — | 1,634,122 |
| U.S. Government Agency Mortgage-Backed Securities | — | 67,436,153 | — | 67,436,153 |
| U.S. Treasury Obligations | — | 31,541,281 | — | 31,541,281 |
| Short-Term Investments: | | | | |
| Affiliated Fund | 9,680,308 | — | — | 9,680,308 |
| Securities Lending Collateral | 11,027,720 | — | — | 11,027,720 |
| Purchased Call Options | 78,375 | — | — | 78,375 |
| Total Investments | $27,742,048 | $759,639,389 | $ — | $787,381,437 |
| Forward Foreign Currency Exchange Contracts | $ — | $ 150,250 | $ — | $ 150,250 |
| Futures Contracts | 533,931 | — | — | 533,931 |
| Total | $28,275,979 | $759,789,639 | $ — | $788,065,618 |
| Liability Description | | | | |
| Forward Foreign Currency Exchange Contracts | $ — | $ (69,081) | $ — | $ (69,081) |
| Futures Contracts | (4,305,557) | — | — | (4,305,557) |
| Total | $ (4,305,557) | $ (69,081) | $ — | $ (4,374,638) |
B Investment Transactions and Income— Investment transactions for financial statement purposes are accounted for on trade date. Realized gains and losses are recorded on an identified cost basis and may include proceeds from litigation. Dividend income is recorded on the ex-dividend date for dividends received in cash and/or securities. Non-cash dividends are recorded at the fair value of the securities received. Withholding taxes on foreign dividends and interest, if any, have been provided for in accordance with the Fund's understanding of the applicable country’s tax rules and rates. Distributions received that represent a return of capital are recorded as a reduction of cost of investments. Distributions received that represent a capital gain are recorded as a realized gain. Interest income, which includes amortization of premium and accretion of discount on debt securities, is accrued as earned. The Fund may earn certain fees in connection with its investments in senior floating-rate loans. These fees are in addition to interest payments earned and may include
Calvert
Income Fund
September 30, 2023
Notes to Financial Statements — continued
amendment fees, consent fees and prepayment fees, which are recorded to income as earned. Inflation adjustments to the principal amount of inflation-adjusted bonds and notes are reflected as interest income.
C Share Class Accounting— Realized and unrealized gains and losses are allocated daily to each class of shares based upon the relative net assets of each class to the total net assets of the Fund. Net investment income, other than class-specific expenses, is allocated daily to each class of shares based upon the ratio of the value of each class's paid shares to the total value of all paid shares. Expenses arising in connection with a specific class are charged directly to that class. Sub-accounting, recordkeeping and similar administrative fees payable to financial intermediaries, which are a component of transfer
agency fees and expenses on the Statement of Operations, are not allocated to Class R6 shares.
D Foreign Currency Transactions— The Fund’s accounting records are maintained in U.S. dollars. For valuation of assets and liabilities on each date of net asset value determination, foreign denominations are converted into U.S. dollars using the current exchange rate. Security transactions, income and expenses are translated at the prevailing rate of exchange on the date of the event. Recognized gains or losses on investment transactions attributable to changes in foreign currency exchange rates are recorded for financial statement purposes as net realized gains and losses on investments. That portion of unrealized gains and losses on investments that results from fluctuations in foreign currency exchange rates is not separately disclosed.
E Senior Floating-Rate Loans— The Fund may invest in direct debt instruments, which are interests in amounts owed to lenders or lending syndicates by corporate, governmental, or other borrowers. The Fund’s investment in loans may be in the form of participations in loans or assignments of all or a portion of loans from third parties. A loan is often administered by a bank or other financial institution (the lender) that acts as agent for all holders. The agent administers the terms of the loan, as specified in the loan agreement. The Fund may invest in multiple series or tranches of a loan, which may have varying terms and carry different associated risks. When the Fund purchases assignments from lenders, it acquires direct rights against the borrower of the loan. When investing in a loan participation, the Fund has the right to receive payments of principal, interest and any fees to which it is entitled only from the lender selling the loan agreement and only upon receipt of such payments by the lender from the borrower. The Fund generally has no right to enforce compliance by the borrower with the terms of the loan agreement. As a result, the Fund may be subject to the credit risk of both the borrower and the lender that is issuing the participation interest.
F Futures Contracts— The Fund may enter into futures contracts to buy or sell a financial instrument for a set price at a future date. Initial margin deposits of either cash or securities as required by the broker are made upon entering into the contract. While the contract is open, daily variation margin payments are made to or received from the broker reflecting the daily change in market value of the contract and are recorded for financial reporting purposes as unrealized gains or losses by the Fund. When a futures contract is closed, a realized gain or loss is recorded equal to the difference between the opening and closing value of the contract. The risks associated with entering into futures contracts may include the possible illiquidity of the secondary market which would limit the Fund’s ability to close out a futures contract prior to the settlement date, an imperfect correlation between the value of the contracts and the underlying financial instruments, or that the counterparty will fail to perform its obligations under the contracts’ terms. Futures contracts are designed by boards of trade, which are designated “contracts markets” by the Commodities Futures Trading Commission. Futures contracts trade on the contracts markets in a manner that is similar to the way a stock trades on a stock exchange, and the boards of trade, through their clearing corporations, guarantee the futures contracts against default. As a result, there is minimal counterparty credit risk to the Fund.
G Forward Foreign Currency Exchange Contracts— The Fund may enter into forward foreign currency exchange contracts for the purchase or sale of a specific foreign currency at a fixed price on a future date. The forward foreign currency exchange contracts are adjusted by the daily exchange rate of the underlying currency and any gains or losses are recorded as unrealized until such time as the contracts have been closed. Risks may arise upon entering these contracts from the potential inability of counterparties to meet the terms of their contracts and from movements in the value of a foreign currency relative to the U.S. dollar.
H Options Contracts— Upon the purchase of a call or put option, the premium paid by the Fund is included in the Statement of Assets and Liabilities as an investment. The amount of the investment is subsequently marked-to-market to reflect the current market value of the option purchased, in accordance with the Fund’s policies on investment valuations discussed above. Premiums paid for purchasing options that expire are treated as realized losses. Premiums paid for purchasing options that are exercised or closed are added to the amounts paid or offset against the proceeds on the underlying investment transaction to determine the realized gain or loss. An option on a futures contract gives the holder the right to enter into a specified futures contract. As the purchaser of an index option, the Fund has the right to receive a cash payment equal to any depreciation in the value of the index below the exercise price of the option (in the case of a put) or equal to any appreciation in the value of the index over the exercise price of the option (in the case of a call) as of the valuation date of the option. The risk associated with purchasing options is limited to the premium originally paid. Purchased options traded over-the-counter involve risk that the issuer or counterparty will fail to perform its contractual obligations.
I Restricted Securities— The Fund may invest in securities that are subject to legal or contractual restrictions on resale. Generally, these securities may only be sold publicly upon registration under the Securities Act of 1933 or in transactions exempt from such registration. Information regarding restricted securities (excluding Rule 144A securities) is included at the end of the Schedule of Investments.
J Distributions to Shareholders— Distributions to shareholders are recorded by the Fund on ex-dividend date. The Fund declares income distributions daily to shareholders of record at the time of declaration and generally pays them monthly. The Fund makes distributions of net realized capital gains, if any, at least annually. Distributions are declared separately for each class of shares. Distributions are determined in accordance with income tax regulations, which
Calvert
Income Fund
September 30, 2023
Notes to Financial Statements — continued
may differ from U.S. GAAP; accordingly, periodic reclassifications are made within the Fund’s capital accounts to reflect income and gains available for distribution under income tax regulations.
K Estimates— The preparation of financial statements in conformity with U.S. GAAP requires management to make estimates and assumptions that affect the reported amounts of assets and liabilities and disclosure of contingent assets and liabilities at the date of the financial statements and the reported amounts of increases and decreases in net assets from operations during the reporting period. Actual results could differ from those estimates.
L Indemnifications— Under the Trust’s organizational document, its officers and Trustees may be indemnified against certain liabilities and expenses arising out of the performance of their duties to the Fund. Under Massachusetts law, if certain conditions prevail, shareholders of a Massachusetts business trust (such as the Trust) could be deemed to have personal liability for the obligations of the Trust. However, the Trust’s Declaration of Trust contains an express disclaimer of liability on the part of Fund shareholders and provides that the Trust shall assume, upon request by the shareholder, the defense on behalf of any Fund shareholders or former shareholders. Additionally, in the normal course of business, the Fund enters into agreements with service providers that may contain indemnification clauses. The Fund’s maximum exposure under these arrangements is unknown as this would involve future claims that may be made against the Fund that have not yet occurred.
M Federal Income Taxes— No provision for federal income or excise tax is required since the Fund intends to continue to qualify as a regulated investment company under the Internal Revenue Code and to distribute substantially all of its taxable earnings.
Management has analyzed the Fund's tax positions taken for all open federal income tax years and has concluded that no provision for federal income tax is required in the Fund's financial statements. A Fund's federal tax return is subject to examination by the Internal Revenue Service for a period of three years from the date of filing.
N When-Issued Securities and Delayed Delivery Transactions— The Fund may purchase securities on a delayed delivery, when-issued or forward commitment basis, including TBA (To Be Announced) securities. Payment and delivery may take place after the customary settlement period for that security. At the time the transaction is negotiated, the price of the security that will be delivered is fixed. Securities purchased on a delayed delivery, when-issued or forward commitment basis are marked-to-market daily and begin earning interest on settlement date. Such security purchases are subject to the risk that when delivered they will be worth less than the agreed upon payment price. Losses may also arise if the counterparty does not perform under the contract. A forward purchase commitment may be closed by entering into an offsetting commitment. If an offsetting commitment is entered into, the Fund will realize a gain or loss on investments based on the price established when the Fund entered into the commitment.
2 Related Party Transactions
The investment advisory fee is earned by Calvert Research and Management (CRM), an indirect, wholly-owned subsidiary of Morgan Stanley, as compensation for investment advisory services rendered to the Fund. The investment advisory fee is computed at the following annual rates of the Fund’s average daily net assets as follows and is payable monthly:
| Average Daily Net Assets | Annual Fee
Rate |
| Up to and including $2 billion | 0.400% |
| Over $2 billion up to and including $7.5 billion | 0.375% |
| Over $7.5 billion up to and including $10 billion | 0.350% |
| Over $10 billion | 0.325% |
For the year ended September 30, 2023, the investment advisory fee amounted to $2,760,114 or 0.40% of the Fund's average daily net assets.
The Fund may invest in a money market fund, the Institutional Class of the Morgan Stanley Institutional Liquidity Funds - Government Portfolio (the “Liquidity Fund”), an open-end management investment company managed by Morgan Stanley Investment Management Inc., a wholly-owned subsidiary of Morgan Stanley. The investment advisory fee paid by the Fund is reduced by an amount equal to its pro rata share of the advisory and administration fees paid by the Fund due to its investment in the Liquidity Fund. For the year ended September 30, 2023, the investment advisory fee paid was reduced by $23,525 relating to the Fund’s investment in the Liquidity Fund.
CRM has agreed to reimburse the Fund’s operating expenses to the extent that total annual operating expenses (relating to ordinary operating expenses only and excluding expenses such as brokerage commissions, acquired fund fees and expenses of unaffiliated funds, borrowing costs, taxes or litigation expenses) exceed 0.95%, 1.70%, 0.70% and 0.65% for Class A, Class C, Class I and Class R6, respectively, of such class’s average daily net assets. The expense reimbursement agreement with CRM may be changed or terminated after February 1, 2025. For the year ended September 30, 2023, no expenses were waived or reimbursed by CRM.
Calvert
Income Fund
September 30, 2023
Notes to Financial Statements — continued
The administrative fee is earned by CRM as compensation for administrative services rendered to the Fund. The fee is computed at an annual rate of 0.12% of the Fund’s average daily net assets attributable to Class A, Class C, Class I and Class R6 and is payable monthly. For the year ended September 30, 2023, CRM was paid administrative fees of $828,034.
The Fund has in effect a distribution plan for Class A shares (Class A Plan) pursuant to Rule 12b-1 under the 1940 Act. Pursuant to the Class A Plan, the Fund pays Eaton Vance Distributors, Inc. (EVD), an affiliate of CRM and the Fund’s principal underwriter, a distribution and service fee of 0.25% per annum of its average daily net assets attributable to Class A shares for distribution services and facilities provided to the Fund by EVD, as well as for personal services and/or the maintenance of shareholder accounts. The Fund also has in effect a distribution plan for Class C shares (Class C Plan) pursuant to Rule 12b-1 under the 1940 Act. Pursuant to the Class C Plan, the Fund pays EVD amounts equal to 0.75% per annum of its average daily net assets attributable to Class C shares for providing ongoing distribution services and facilities to the Fund. In addition, pursuant to the Class C Plan, the Fund also makes payments of service fees to EVD, financial intermediaries and other persons in amounts equal to 0.25% per annum of its average daily net assets attributable to that class. Service fees paid or accrued are for personal services and/or the maintenance of shareholder accounts. Distribution and service fees paid or accrued for the year ended September 30, 2023 amounted to $488,861 and $58,168 for Class A shares and Class C shares, respectively.
The Fund was informed that EVD received $11,159 as its portion of the sales charge on sales of Class A shares for the year ended September 30, 2023. The Fund was also informed that EVD received $90 of contingent deferred sales charges (CDSC) paid by Class A shareholders and no CDSC paid by Class C shareholders for the same period.
Eaton Vance Management (EVM), an affiliate of CRM, provides sub-transfer agency and related services to the Fund pursuant to a Sub-Transfer Agency Support Services Agreement. For the year ended September 30, 2023, sub-transfer agency fees and expenses incurred to EVM amounted to $67,488 and are included in transfer agency fees and expenses on the Statement of Operations.
Each Trustee of the Fund who is not an employee of CRM or its affiliates receives an annual fee of $214,000, an annual Committee fee ranging from $8,500 to $16,500 depending on the Committee, and may receive a fee of $10,000 for special meetings. The Board chair receives an additional $40,000 ($30,000 prior to January 1, 2023) annual fee, Committee chairs receive an additional $15,000 ($6,000 prior to January 1, 2023) annual fee and the special equities liaison receives an additional $2,500 annual fee. Eligible Trustees may participate in a Deferred Compensation Plan (the Plan). Amounts deferred under the Plan are treated as though equal dollar amounts had been invested in shares of the Fund or other Calvert funds selected by the Trustees. The Fund purchases shares of the funds selected equal to the dollar amounts deferred under the Plan, resulting in an asset equal to the deferred compensation liability. Obligations of the Plan are paid solely from the Fund's assets. Trustees’ fees are allocated to each of the Calvert funds served. Salaries and fees of officers and Trustees of the Fund who are employees of CRM or its affiliates are paid by CRM.
3 Investment Activity
During the year ended September 30, 2023, the cost of purchases and proceeds from sales of investments, other than U.S. government and agency securities and short-term securities and including maturities, paydowns and principal repayments on senior floating-rate loans, were $498,404,783 and $467,837,202, respectively. Purchases and sales of U.S. government and agency securities, including paydowns and TBA transactions, were $657,158,712 and $607,999,220, respectively.
4 Distributions to Shareholders and Income Tax Information
The tax character of distributions declared for the years ended September 30, 2023 and September 30, 2022 was as follows:
| | Year Ended September 30, |
| | 2023 | 2022 |
| Ordinary income | $34,226,744 | $24,501,239 |
During the year ended September 30, 2023, accumulated loss was increased by $160,992 and paid-in capital was increased by $160,992 due to the Fund's use of equalization accounting. Tax equalization accounting allows the Fund to treat as a distribution that portion of redemption proceeds representing a redeeming shareholder’s portion of undistributed taxable income and net capital gains. These reclassifications had no effect on the net assets or net asset value per share of the Fund.
Calvert
Income Fund
September 30, 2023
Notes to Financial Statements — continued
As of September 30, 2023, the components of distributable earnings (accumulated loss) on a tax basis were as follows:
| Undistributed ordinary income | $ 89,167 |
| Deferred capital losses | (274,041,250) |
| Net unrealized depreciation | (81,758,631) |
| Distributions payable | (212,550) |
| Accumulated loss | $(355,923,264) |
At September 30, 2023, the Fund, for federal income tax purposes, had deferred capital losses of $274,041,250 which would reduce the Fund's taxable income arising from future net realized gains on investment transactions, if any, to the extent permitted by the Internal Revenue Code, and thus would reduce the amount of distributions to shareholders, which would otherwise be necessary to relieve the Fund of any liability for federal income or excise tax. The deferred capital losses are treated as arising on the first day of the Fund's next taxable year, can be carried forward for an unlimited period, and retain the same short-term or long-term character as when originally deferred. Of the deferred capital losses at September 30, 2023, $21,045,682 are short-term and $252,995,568 are long-term.
The cost and unrealized appreciation (depreciation) of investments, including open derivative contracts, of the Fund at September 30, 2023, as determined on a federal income tax basis, were as follows:
| Aggregate cost | $869,133,911 |
| Gross unrealized appreciation | $ 1,736,543 |
| Gross unrealized depreciation | (83,491,112) |
| Net unrealized depreciation | $ (81,754,569) |
5 Financial Instruments
The Fund may trade in financial instruments with off-balance sheet risk in the normal course of its investing activities. These financial instruments may include forward foreign currency exchange contracts and futures contracts and may involve, to a varying degree, elements of risk in excess of the amounts recognized for financial statement purposes. The notional or contractual amounts of these instruments represent the investment the Fund has in particular classes of financial instruments and do not necessarily represent the amounts potentially subject to risk. The measurement of the risks associated with these instruments is meaningful only when all related and offsetting transactions are considered. A summary of obligations under these financial instruments at September 30, 2023 is included in the Schedule of Investments. At September 30, 2023, the Fund had sufficient cash and/or securities to cover commitments under these contracts.
In the normal course of pursuing its investment objective, the Fund is subject to the following risks:
Foreign Exchange Risk: During the year ended September 30, 2023, the Fund entered into forward foreign currency exchange contracts to seek to hedge against the decline in the value of currencies in which its portfolio holdings are denominated against the U.S. dollar.
Interest Rate Risk: During the year ended September 30, 2023, the Fund used futures contracts and options on futures contracts to hedge interest rate risk and to manage duration.
The Fund enters into forward foreign currency exchange contracts that may contain provisions whereby the counterparty may terminate the contract under certain conditions, including but not limited to a decline in the Fund’s net assets below a certain level over a certain period of time, which would trigger a payment by the Fund for those derivatives in a liability position. At September 30, 2023, the fair value of derivatives with credit-related contingent features in a net liability position was $69,081. At September 30, 2023, there were no assets pledged by the Fund for such liability.
The over-the-counter (OTC) derivatives in which the Fund invests are subject to the risk that the counterparty to the contract fails to perform its obligations under the contract. To mitigate this risk, the Fund has entered into an International Swaps and Derivatives Association, Inc. Master Agreement (“ISDA Master Agreement”) with its derivative counterparties. The ISDA Master Agreement is a bilateral agreement between the Fund and a counterparty that governs certain OTC derivatives and typically contains, among other things, set-off provisions in the event of a default and/or termination event as defined under the relevant ISDA Master Agreement. Under the ISDA Master Agreement, the Fund may, under certain circumstances, offset with the counterparty certain derivative financial instruments’ payables and/or receivables with collateral held and/or posted and create one single net payment. The provisions of the ISDA Master Agreement typically permit a single net payment in the event of default including the bankruptcy or insolvency of the counterparty. However, bankruptcy or insolvency laws of a particular jurisdiction may impose restrictions on or prohibitions against the right of offset in bankruptcy or
Calvert
Income Fund
September 30, 2023
Notes to Financial Statements — continued
insolvency. Certain ISDA Master Agreements allow the counterparty to OTC derivatives to terminate derivative contracts prior to maturity in the event the Fund’s net assets decline by a stated percentage or the Fund fails to meet the terms of its ISDA Master Agreements, which would cause the counterparty to accelerate payment by the Fund of any net liability owed to it.
The collateral requirements for derivatives traded under the ISDA Master Agreement are governed by a Credit Support Annex to the ISDA Master Agreement. Collateral requirements are determined at the close of business each day and are typically based on changes in market values for each transaction under the ISDA Master Agreement and netted into one amount for such agreement. Generally, the amount of collateral due from or to a counterparty is subject to a minimum transfer threshold amount before a transfer is required. Collateral pledged for the benefit of the Fund and/or counterparty is held in segregated accounts by the Fund’s custodian and cannot be sold, re-pledged, assigned or otherwise used while pledged. The portion of such collateral representing cash, if any, is reflected as deposits for derivatives collateral and, in the case of cash pledged by a counterparty for the benefit of the Fund, a corresponding liability on the Statement of Assets and Liabilities. Securities pledged by the Fund as collateral, if any, are identified as such in the Schedule of Investments.
At September 30, 2023, the fair value of open derivative instruments (not considered to be hedging instruments for accounting disclosure purposes) by risk exposure was as follows:
| Risk | Derivative | Statement of Assets and Liabilities Caption | Assets | Liabilities |
| Foreign exchange | Forward foreign currency exchange contracts | Receivable/Payable for open forward foreign currency
exchange contracts | $ 150,250 | $ (69,081) |
| Interest rate | Futures contracts | Accumulated loss | 533,931 (1) | (4,305,557) (1) |
| Interest rate | Purchased options | Investments in securities of unaffiliated issuers, at value | 78,375 | — |
| Total | | | $762,556 | $(4,374,638) |
| Derivatives not subject to master netting agreements | $612,306 | $(4,305,557) |
| Total Derivatives subject to master netting agreements | $150,250 | $ (69,081) |
| (1) | Only the current day's variation margin is reported within the Statement of Assets and Liabilities as Receivable or Payable for variation margin on open futures contracts, as applicable. |
The Fund’s derivative assets and liabilities at fair value by risk, which are reported gross in the Statement of Assets and Liabilities, are presented in the table above. The following tables present the Fund’s derivative assets and liabilities by counterparty, net of amounts available for offset under a master netting agreement and net of the related collateral received by the Fund for such assets and pledged by the Fund for such liabilities as of September 30, 2023.
| Counterparty | Derivative
Assets Subject to
Master Netting
Agreement | Derivatives
Available
for Offset | Non-cash
Collateral
Received(a) | Cash
Collateral
Received(a) | Net Amount
of Derivative
Assets(b) |
| Citibank, N.A. | $ 39,105 | $ — | $ — | $ — | $ 39,105 |
| JPMorgan Chase Bank, N.A. | 101,351 | — | — | — | 101,351 |
| State Street Bank and Trust Company | 9,794 | (9,794) | — | — | — |
| | $150,250 | $(9,794) | $ — | $ — | $140,456 |
Calvert
Income Fund
September 30, 2023
Notes to Financial Statements — continued
| Counterparty | Derivative
Liabilities Subject to
Master Netting
Agreement | Derivatives
Available
for Offset | Non-cash
Collateral
Pledged(a) | Cash
Collateral
Pledged(a) | Net Amount
of Derivative
Liabilities(c) |
| State Street Bank and Trust Company | $(69,081) | $9,794 | $ — | $ — | $(59,287) |
| (a) | In some instances, the total collateral received and/or pledged may be more than the amount shown due to overcollateralization. |
| (b) | Net amount represents the net amount due from the counterparty in the event of default. |
| (c) | Net amount represents the net amount payable to the counterparty in the event of default. |
The effect of derivative instruments (not considered to be hedging instruments for accounting disclosure purposes) on the Statement of Operations by risk exposure for the year ended September 30, 2023 was as follows:
| Statement of Operations Caption | Foreign exchange | Interest rate | Total |
| Net realized gain (loss): | | | |
| Forward foreign currency exchange contracts | $ 39,225 | $ — | $ 39,225 |
| Futures contracts | — | (9,340,507) | (9,340,507) |
| Total | $ 39,225 | $(9,340,507) | $(9,301,282) |
| Change in unrealized appreciation (depreciation): | | | |
| Investment securities(1) | $ — | $ 2,095 | $ 2,095 |
| Forward foreign currency exchange contracts | (82,856) | — | (82,856) |
| Futures contracts | — | (378,931) | (378,931) |
| Total | $(82,856) | $ (376,836) | $ (459,692) |
| (1) | Relates to purchased options. |
The average notional cost of futures contracts and average notional amounts of other derivative contracts outstanding during the year ended September 30, 2023, which are indicative of the volume of these derivative types, were approximately as follows:
| Futures Contracts — Long | Futures Contracts — Short | Forward Foreign Currency Exchange Contracts* |
| $138,996,000 | $30,710,000 | $3,657,000 |
| * | The average notional amount for forward foreign currency exchange contracts is based on the absolute value of notional amounts of currency purchased and currency sold. |
The average number of purchased options contracts outstanding during the year ended September 30, 2023, which is indicative of the volume of this derivative type, was 12 contracts.
6 Securities Lending
To generate additional income, the Fund may lend its securities pursuant to a securities lending agency agreement with State Street Bank and Trust Company (SSBT), the securities lending agent. Security loans are subject to termination by the Fund at any time and, therefore, are not considered illiquid investments. The Fund requires that the loan be continuously collateralized by either cash or securities in an amount at least equal to the market value of the securities on loan. The market value of securities loaned is determined daily and any additional required collateral is delivered to the Fund on the next business day. Cash collateral is generally invested in a money market fund registered under the 1940 Act that is managed by an affiliate of SSBT. Any gain or loss in the market price of the loaned securities that might occur and any interest earned or dividends declared during the term of the loan would accrue to the account of the Fund. Income earned on the investment of collateral, net of broker rebates and other expenses incurred by the securities lending agent, is split between the Fund and the securities lending agent based on agreed upon contractual terms. Non-cash collateral, if any, is held by the lending agent on behalf of the Fund and cannot be sold or re-pledged by the Fund; accordingly, such collateral is not reflected in the Statement of Assets and Liabilities.
Calvert
Income Fund
September 30, 2023
Notes to Financial Statements — continued
The risks associated with lending portfolio securities include, but are not limited to, possible delays in receiving additional collateral or in the recovery of the loaned securities, possible loss of rights to the collateral should the borrower fail financially, as well as risk of loss in the value of the collateral or the value of the investments made with the collateral. The securities lending agent shall indemnify the Fund in the case of default of any securities borrower.
At September 30, 2023, the total value of securities on loan, including accrued interest, was $15,985,030 and the total value of collateral received was $16,186,412, comprised of cash of $11,027,720 and U.S. government and/or agencies securities of $5,158,692.
The following table provides a breakdown of securities lending transactions accounted for as secured borrowings, the obligations by class of collateral pledged, and the remaining contractual maturity of those transactions as of September 30, 2023.
| | Remaining Contractual Maturity of the Transactions |
| | Overnight and
Continuous | <30 days | 30 to 90 days | >90 days | Total |
| Corporate Bonds | $11,027,720 | $ — | $ — | $ — | $11,027,720 |
The carrying amount of the liability for deposits for securities loaned at September 30, 2023 approximated its fair value. If measured at fair value, such liability would have been considered as Level 2 in the fair value hierarchy (see Note 1A) at September 30, 2023.
7 Line of Credit
The Fund participates with other portfolios and funds managed by EVM and its affiliates, including CRM, in a $725 million unsecured revolving line of credit agreement with a group of banks, which is in effect through October 24, 2023. Borrowings are made by the Fund solely for temporary purposes related to redemptions and other short-term cash needs. Interest is charged to the Fund based on its borrowings at an amount above either the Secured Overnight Financing Rate (SOFR) or Federal Funds rate. In addition, a fee computed at an annual rate of 0.15% on the daily unused portion of the line of credit is allocated among the participating portfolios and funds at the end of each quarter. In connection with the renewal of the agreement in October 2022, an arrangement fee of $150,000 was incurred that was allocated to the participating portfolios and funds. Because the line of credit is not available exclusively to the Fund, it may be unable to borrow some or all of its requested amounts at any particular time.
The Fund had no borrowings outstanding pursuant to its line of credit at September 30, 2023. The Fund did not have any significant borrowings or allocated fees during the year ended September 30, 2023. Effective October 24, 2023, the Fund renewed its line of credit agreement, which expires October 22, 2024. In connection with the renewal, the borrowing limit was decreased to $650 million.
8 Affiliated Investments
The Fund has invested a portion of its assets in notes (the Notes) issued by Calvert Impact Capital, Inc. (CIC) pursuant to exemptive relief granted by the U.S. Securities and Exchange Commission (the SEC). There are certain potential points of affiliation between the Fund and CIC. CRM has licensed use of the Calvert name to CIC and provides other types of support. An officer of CRM's affiliate serves on the CIC Board. In addition, a director/trustee on the Fund Board serves as a director emeritus on the CIC Board.
At September 30, 2023, the value of the Fund’s investment in the Notes and in issuers and funds that may be deemed to be affiliated was $20,331,127, which represents 2.8% of the Fund’s net assets. Transactions in such investments by the Fund for the year ended September 30, 2023 were as follows:
| Name | Value,
beginning
of period | Purchases | Sales
proceeds | Net
realized
gain
(loss) | Change in
unrealized
appreciation
(depreciation) | Value,
end of
period | Interest/
Dividend
income | Principal amount/
Shares,
end of period |
| Commercial Mortgage-Backed Securities | | | | | | | | |
| Morgan Stanley Capital I Trust: | | | | | | | | |
| Series 2017-CLS, Class E, 4.768%, (1 mo. USD LIBOR + 1.95%), 11/15/34 | $ 1,412,823 | $ — | $ (1,426,000) | $ 1,101 | $ 12,076 | $ — | $ 2,644 | $ — |
| Series 2019-BPR, Class B, 8.022%, (1 mo. SOFR + 2.692%), 5/15/36 | 6,342,772 | — | — | — | (56,716) | 6,288,978 | 467,335 | 6,576,000 |
| Series 2019-BPR, Class C, 8.972%, (1 mo. SOFR + 3.642%), 5/15/36 | 2,894,266 | — | — | — | (11,860) | 2,882,406 | 244,374 | 3,045,000 |
Calvert
Income Fund
September 30, 2023
Notes to Financial Statements — continued
| Name | Value,
beginning
of period | Purchases | Sales
proceeds | Net
realized
gain
(loss) | Change in
unrealized
appreciation
(depreciation) | Value,
end of
period | Interest/
Dividend
income | Principal amount/
Shares,
end of period |
| High Social Impact Investments | | | | | | | | |
| Calvert Impact Capital, Inc., Community Investment Notes, 1.50%, 12/15/23(1) | $ 1,393,140 | $ — | $ — | $ — | $ 86,295 | $ 1,479,435 | $ 22,500 | $1,500,000 |
| Short-Term Investments | | | | | | |
| Liquidity Fund | 23,995,266 | 325,624,566 | (339,939,524) | — | — | 9,680,308 | 712,235 | 9,680,308 |
| Total | | | | $1,101 | $ 29,795 | $20,331,127 | $1,449,088 | |
9 Capital Shares
The Fund’s Declaration of Trust permits the Trustees to issue an unlimited number of full and fractional shares of beneficial interest (without par value). Such shares may be issued in a number of different series (such as the Fund) and classes.
Transactions in capital shares, including direct exchanges pursuant to share class conversions for all periods presented, were as follows:
| | Year Ended
September 30, 2023 | | Year Ended
September 30, 2022 |
| | Shares | Amount | | Shares | Amount |
| Class A | | | | | |
| Shares sold | 830,597 | $ 12,180,126 | | 860,201 | $ 14,387,645 |
| Reinvestment of distributions | 569,145 | 8,329,979 | | 403,870 | 6,544,659 |
| Shares redeemed | (2,026,205) | (29,645,980) | | (2,742,268) | (45,852,473) |
| Net decrease | (626,463) | $ (9,135,875) | | (1,478,197) | $ (24,920,169) |
| Class C | | | | | |
| Shares sold | 74,071 | $ 1,093,099 | | 54,120 | $ 905,728 |
| Reinvestment of distributions | 15,054 | 220,166 | | 9,435 | 152,326 |
| Shares redeemed | (97,563) | (1,428,200) | | (129,699) | (2,163,833) |
| Net decrease | (8,438) | $ (114,935) | | (66,144) | $ (1,105,779) |
| Class I | | | | | |
| Shares sold | 15,016,030 | $ 220,925,598 | | 14,787,849 | $ 244,049,817 |
| Reinvestment of distributions | 1,587,364 | 23,271,520 | | 1,019,673 | 16,515,161 |
| Shares redeemed | (11,432,431) | (168,394,137) | | (11,488,521) | (186,906,417) |
| Net increase | 5,170,963 | $ 75,802,981 | | 4,319,001 | $ 73,658,561 |
| Class R6(1) | | | | | |
| Shares sold | 3,268 | $ 50,000 | | — | $ — |
| Reinvestment of distributions | 116 | 1,708 | | — | — |
| Net increase | 3,384 | $ 51,708 | | — | $ — |
| (1) | For the period from the commencement of operations, February 1, 2023, to September 30, 2023. |
Calvert
Income Fund
September 30, 2023
Report of Independent Registered Public Accounting Firm
To the Board of Trustees of The Calvert Fund and Shareholders of Calvert Income Fund:
Opinion on the Financial Statements and Financial Highlights
We have audited the accompanying statement of assets and liabilities of Calvert Income Fund (the “Fund”) (one of the funds constituting The Calvert Fund), including the schedule of investments, as of September 30, 2023, the related statement of operations for the year then ended, the statements of changes in net assets for each of the two years in the period then ended, the financial highlights for each of the three years in the period then ended, and the related notes. In our opinion, the financial statements and financial highlights present fairly, in all material respects, the financial position of the Fund as of September 30, 2023, and the results of its operations for the year then ended, the changes in its net assets for each of the two years in the period then ended, and the financial highlights for each of the three years in the period then ended, in conformity with accounting principles generally accepted in the United States of America. The financial highlights for the years ended September 30, 2020 and 2019 were audited by other auditors whose report, dated November 20, 2020, expressed an unqualified opinion on those financial highlights.
Basis for Opinion
These financial statements and financial highlights are the responsibility of the Fund's management. Our responsibility is to express an opinion on the Fund's financial statements and financial highlights based on our audits. We are a public accounting firm registered with the Public Company Accounting Oversight Board (United States) (PCAOB) and are required to be independent with respect to the Fund in accordance with the U.S. federal securities laws and the applicable rules and regulations of the Securities and Exchange Commission and the PCAOB.
We conducted our audits in accordance with the standards of the PCAOB. Those standards require that we plan and perform the audit to obtain reasonable assurance about whether the financial statements and financial highlights are free of material misstatement, whether due to error or fraud. The Fund is not required to have, nor were we engaged to perform, an audit of its internal control over financial reporting. As part of our audits, we are required to obtain an understanding of internal control over financial reporting but not for the purpose of expressing an opinion on the effectiveness of the Fund’s internal control over financial reporting. Accordingly, we express no such opinion.
Our audits included performing procedures to assess the risks of material misstatement of the financial statements and financial highlights, whether due to error or fraud, and performing procedures that respond to those risks. Such procedures included examining, on a test basis, evidence regarding the amounts and disclosures in the financial statements and financial highlights. Our audits also included evaluating the accounting principles used and significant estimates made by management, as well as evaluating the overall presentation of the financial statements and financial highlights. Our procedures included confirmation of securities and senior loans owned as of September 30, 2023, by correspondence with the custodian, brokers and agent banks; when replies were not received from brokers and agent banks, we performed other auditing procedures. We believe that our audits provide a reasonable basis for our opinion.
/s/ Deloitte & Touche LLP
Boston, Massachusetts
November 22, 2023
We have served as the auditor of one or more Calvert investment companies since 2021.
Calvert
Income Fund
September 30, 2023
Federal Tax Information (Unaudited)
The Form 1099-DIV you receive in February 2024 will show the tax status of all distributions paid to your account in calendar year 2023. Shareholders are advised to consult their own tax adviser with respect to the tax consequences of their investment in the Fund. As required by the Internal Revenue Code and/or regulations, shareholders must be notified regarding the status of qualified dividend income for individuals and 163(j) interest dividends.
Qualified Dividend Income. For the fiscal year ended September 30, 2023, the Fund designates approximately $328,944, or up to the maximum amount of such dividends allowable pursuant to the Internal Revenue Code, as qualified dividend income eligible for the reduced tax rate of 15%.
163(j) Interest Dividends. For the fiscal year ended September 30, 2023, the Fund designates 92.91% of distributions from net investment income as a 163(j) interest dividend.
Calvert
Income Fund
September 30, 2023
Board of Trustees' Contract Approval
Overview of the Contract Review Process
The Investment Company Act of 1940, as amended, provides, in substance, that each investment advisory agreement between a fund and its investment adviser will continue in effect from year to year only if its continuation is approved at least annually by the fund’s board of directors, including by a vote of a majority of the directors who are not “interested persons” of the fund (“Independent Trustees”), cast in person at a meeting called for the purpose of considering such approval.
At an in-person meeting of the Boards of Trustees/Directors (each a “Board”) of the registered investment companies advised by Calvert Research and Management (“CRM” or the “Adviser”) (the “Calvert Funds”) held on June 12-13, 2023, the Board, including a majority of the Independent Trustees, voted to approve continuation of existing investment advisory and investment sub-advisory agreements for the Calvert Funds for an additional one-year period.
In evaluating the investment advisory and investment sub-advisory agreements for the Calvert Funds, the Board considered a variety of information relating to the Calvert Funds and various service providers, including the Adviser. The Independent Trustees reviewed a report prepared by the Adviser regarding various services provided to the Calvert Funds by the Adviser and its affiliates. Such report included, among other data, information regarding the Adviser’s personnel and the Adviser’s revenue and cost of providing services to the Calvert Funds, and a separate report prepared by an independent data provider, which compared each fund’s investment performance, fees and expenses to those of comparable funds as identified by such independent data provider (“comparable funds”).
The Independent Trustees were separately represented by independent legal counsel with respect to their consideration of the continuation of the investment advisory and investment sub-advisory agreements for the Calvert Funds. Prior to voting, the Independent Trustees reviewed the proposed continuation of the Calvert Funds’ investment advisory and investment sub-advisory agreements with management and also met in private sessions with their counsel at which time no representatives of management were present.
The information that the Board considered included, among other things, the following (for funds that invest through one or more affiliated underlying fund(s), references to “each fund” in this section may include information that was considered at the underlying fund-level):
Information about Fees, Performance and Expenses
| • | A report from an independent data provider comparing the advisory and related fees paid by each fund with fees paid by comparable funds; |
| • | A report from an independent data provider comparing each fund’s total expense ratio and its components to comparable funds; |
| • | A report from an independent data provider comparing the investment performance of each fund to the investment performance of comparable funds over various time periods; |
| • | Data regarding investment performance in comparison to benchmark indices; |
| • | For each fund, comparative information concerning the fees charged and the services provided by the Adviser in managing other accounts (including mutual funds, other collective investment funds and institutional accounts) using investment strategies and techniques similar to those used in managing such fund; |
| • | Profitability analyses for the Adviser with respect to each fund; |
Information about Portfolio Management and Trading
| • | Descriptions of the investment management services provided to each fund, including investment strategies and processes it employs; |
| • | Information about the Adviser’s policies and practices with respect to trading, including the Adviser’s processes for monitoring best execution of portfolio transactions; |
| • | Information about the allocation of brokerage transactions and the benefits received by the Adviser as a result of brokerage allocation, including information concerning the acquisition of research through client commission arrangements and policies with respect to “soft dollars”; |
Information about the Adviser
| • | Reports detailing the financial results and condition of CRM; |
| • | Descriptions of the qualifications, education and experience of the individual investment professionals whose responsibilities include portfolio management and investment research for the funds, and information relating to their compensation and responsibilities with respect to managing other mutual funds and investment accounts; |
| • | Policies and procedures relating to proxy voting and the handling of corporate actions and class actions; |
| • | A description of CRM’s procedures for overseeing sub-advisers, including with respect to regulatory and compliance issues, investment management and other matters; |
Calvert
Income Fund
September 30, 2023
Board of Trustees' Contract Approval — continued
Other Relevant Information
| • | Information concerning the nature, cost and character of the administrative and other non-investment advisory services provided by CRM and its affiliates; and |
| • | The terms of each investment advisory agreement. |
Over the course of the year, the Board and its committees held regular quarterly meetings. During these meetings, the Trustees participated in investment and performance reviews with the portfolio managers and other investment professionals of the Adviser relating to each fund and considered various investment and trading strategies used in pursuing each fund’s investment objective(s), such as the use of derivative instruments, as well as risk management techniques. The Board and its committees also evaluated issues pertaining to industry and regulatory developments, compliance procedures, corporate governance and other issues with respect to the funds and received and participated in reports and presentations provided by CRM and its affiliates with respect to such matters. In addition to the formal meetings of the Board and its committees, the Independent Trustees held regular video conferences in between meetings to discuss, among other topics, matters relating to the continuation of the Calvert Funds’ investment advisory and investment sub-advisory agreements.
For funds that invest through one or more affiliated underlying funds, the Board considered similar information about the underlying fund(s) when considering the approval of investment advisory agreements. In addition, in cases where the Adviser has engaged a sub-adviser, the Board considered similar information about the sub-adviser when considering the approval of any investment sub-advisory agreement.
The Independent Trustees were assisted throughout the contract review process by their independent legal counsel. The Independent Trustees relied upon the advice of such counsel and their own business judgment in determining the material factors to be considered in evaluating each investment advisory and investment sub-advisory agreement and the weight to be given to each such factor. The Board, including the Independent Trustees, did not identify any single factor as controlling, and each Trustee may have attributed different weight to various factors.
Results of the Contract Review Process
Based on its consideration of the foregoing, and such other information as it deemed relevant, including the factors and conclusions described below, the Board, including the Independent Trustees, concluded that the continuation of the investment advisory agreement of Calvert Income Fund (the “Fund”), including the fee payable under the agreement, is in the best interests of the Fund’s shareholders. Accordingly, the Board, including a majority of the Independent Trustees, voted to approve the continuation of the investment advisory agreement of the Fund.
Nature, Extent and Quality of Services
In considering the nature, extent and quality of the services provided by the Adviser under the investment advisory agreement, the Board reviewed information provided by the Adviser relating to its operations and personnel, including, among other information, biographical information on the Adviser’s investment personnel and descriptions of its organizational and management structure. The Board also took into account similar information provided periodically throughout the previous year by the Adviser as well as the Board’s familiarity with management through Board meetings, discussions and other reports. The Board considered the Adviser’s management style and its performance in employing its investment strategies as well as its current level of staffing and overall resources. The Board also noted that it reviewed on a quarterly basis information regarding the Adviser’s compliance with applicable policies and procedures, including those related to personal investing. The Board took into account, among other items, periodic reports received from the Adviser over the past year concerning the Adviser’s ongoing review and enhancement of certain processes, policies and procedures of the Calvert Funds and the Adviser. The Board concluded that it was satisfied with the nature, extent and quality of services provided to the Fund by the Adviser under the investment advisory agreement.
Fund Performance
In considering the Fund’s performance, the Board noted that it reviewed on a quarterly basis detailed information about the Fund’s performance results, portfolio composition and investment strategies. The Board compared the Fund’s investment performance to that of the Fund’s peer universe and its benchmark index. The Board’s review included comparative performance data for the one-, three- and five-year periods ended December 31, 2022. This performance data indicated that the Fund had outperformed the median of the Fund’s peer universe for the one-, three- and five-year periods ended December 31, 2022. This performance data also indicated that the Fund had underperformed its benchmark index for the one-year period ended December 31, 2022, while it had outperformed the three- and five-year periods ended December 31, 2022. Based upon its review, the Board concluded that the Fund’s performance was satisfactory relative to the performance of its peer universe and its benchmark index.
Calvert
Income Fund
September 30, 2023
Board of Trustees' Contract Approval — continued
Management Fees and Expenses
In considering the Fund’s fees and expenses, the Board compared the Fund’s fees and total expense ratio with those of comparable funds in its expense group. Among other findings, the data indicated that the Fund’s advisory and administrative fees (referred to collectively as “management fees”) and the Fund’s total expenses were each above the respective median of the Fund’s expense group. The Board took into account the Adviser’s current undertaking to maintain expense limitations for the Fund and that the Adviser was waiving and/or reimbursing a portion of the Fund’s expenses. Based upon its review, the Board concluded that the management fees were reasonable in view of the nature, extent and quality of services provided by the Adviser.
Profitability and Other “Fall-Out” Benefits
The Board reviewed the Adviser’s profitability in regard to the Fund and the Calvert Funds in the aggregate. In reviewing the overall profitability of the Fund to the Adviser, the Board also considered the fact that the Adviser and its affiliates provided sub-transfer agency support, administrative and distribution services to the Fund for which they received compensation. The information considered by the Board included the profitability of the Fund to the Adviser and its affiliates without regard to any marketing support or other payments by the Adviser and its affiliates to third parties in respect of distribution services. The Board also considered that the Adviser and its affiliates derived benefits to their reputation and other indirect benefits from their relationships with the Fund. Based upon its review, the Board concluded that the Adviser’s and its affiliates’ level of profitability from their relationships with the Fund was reasonable.
Economies of Scale
The Board considered the effect of the Fund’s current size and its potential growth on its performance and fees. The Board also took into account the breakpoints in the advisory fee schedule for the Fund that would reduce the advisory fee rate on assets above specific asset levels. The Board noted that if the Fund’s assets increased over time, the Fund might realize other economies of scale if assets increased proportionally more than certain other expenses.
Calvert
Income Fund
September 30, 2023
Liquidity Risk Management Program
The Fund has implemented a written liquidity risk management program (Program) and related procedures to manage its liquidity in accordance with Rule 22e-4 under the Investment Company Act of 1940, as amended (Liquidity Rule). The Liquidity Rule defines “liquidity risk” as the risk that a fund could not meet requests to redeem shares issued by the fund without significant dilution of the remaining investors’ interests in the fund. The Fund’s Board of Trustees/Directors has designated the investment adviser to serve as the administrator of the Program and the related procedures. The administrator has established a Liquidity Risk Management Oversight Committee (Committee) to perform the functions necessary to administer the Program. As part of the Program, the administrator is responsible for identifying illiquid investments and categorizing the relative liquidity of the Fund’s investments in accordance with the Liquidity Rule. Under the Program, the administrator assesses, manages, and periodically reviews the Fund’s liquidity risk, and is responsible for making certain reports to the Fund’s Board of Trustees/Directors and the Securities and Exchange Commission (SEC) regarding the liquidity of the Fund’s investments, and to notify the Board of Trustees/Directors and the SEC of certain liquidity events specified in the Liquidity Rule. The liquidity of the Fund’s portfolio investments is determined based on a number of factors including, but not limited to, relevant market, trading and investment-specific considerations under the Program.
At a meeting of the Fund’s Board of Trustees/Directors on June 13, 2023, the Committee provided a written report to the Fund’s Board of Trustees/ Directors pertaining to the operation, adequacy, and effectiveness of implementation of the Program, as well as the operation of the highly liquid investment minimum (if applicable) for the period January 1, 2022 through December 31, 2022 (Review Period). The Program operated effectively during the Review Period, supporting the administrator’s ability to assess, manage and monitor Fund liquidity risk, including during periods of market volatility and net redemptions. During the Review Period, the Fund met redemption requests on a timely basis.
There can be no assurance that the Program will achieve its objectives in the future. Please refer to the Fund’s prospectus for more information regarding the Fund’s exposure to liquidity risk and other principal risks to which an investment in the Fund may be subject.
Calvert
Income Fund
September 30, 2023
Management and Organization
Fund Management. The Trustees of The Calvert Fund (the Trust) are responsible for the overall management and supervision of the affairs of the Trust. The Board members and officers of the Trust are listed below. Except as indicated, each individual has held the office shown or other offices in the same company for the last five years. Board members hold indefinite terms of office. Each Board member holds office until his or her successor is elected and qualified, or until his or her earlier death, resignation, retirement, removal or disqualification. Under the terms of the Fund's current Board member retirement policy, an Independent Board member must retire at the end of the calendar year in which he or she turns 75. However, if such retirement would cause the Fund to be out of compliance with Section 16 of the 1940 Act or any other regulations or guidance of the SEC, then such retirement will not become effective until such time as action has been taken for the Fund to be in compliance therewith. The “noninterested Trustees” consist of those Trustees who are not “interested persons” of the Trust, as that term is defined under the 1940 Act. The business address of each Board member and the Chief Compliance Officer is 2050 M Street NW, Washington, DC 20036 and the business address of the Secretary, Vice President and Chief Legal Officer and the Treasurer is Two International Place, Boston, Massachusetts 02110. As used below, “CRM” refers to Calvert Research and Management and “Eaton Vance” refers to Eaton Vance Management. Each Trustee oversees 46 funds in the Calvert fund complex. Each of Eaton Vance and CRM are indirect, wholly owned subsidiaries of Morgan Stanley. Each officer affiliated with CRM may hold a position with other CRM affiliates that is comparable to his or her position with CRM listed below.
| Name and Year of Birth | Trust
Position(s) | Length of
Service | Principal Occupation(s) and Other Directorships
During Past Five Years and Other Relevant Experience |
| Interested Trustee | | | |
Theodore H. Eliopoulos(1)
1964 | Trustee and
President | Since 2022 | President and Chief Executive Officer of CRM and senior sponsor of Morgan Stanley Investment Management’s (MSIM) Diversity Council. Formerly, Vice Chairman & Head of Strategic Partnerships at MSIM (2019-2022). Former Chief Investment Officer and interim Chief Investment Officer (2014-2018) and Senior Investment Officer of Real Estate and Real Assets at California Public Employees’ Retirement System (CalPERS) (2007-2014). Former Chief Deputy Treasurer and Deputy Treasurer at the California State Treasurer's Office (2002-2006). Mr. Eliopoulos is an interested person because of his positions with CRM and certain affiliates.
Other Directorships. The Robert Toigo Foundation; Pacific Pension & Investment Institute (PPI). |
| Noninterested Trustees |
Richard L. Baird, Jr.(2)
1948 | Trustee | Since 1982 | Regional Disaster Recovery Lead, American Red Cross of Greater
Pennsylvania (since 2017). Volunteer, American Red Cross (since 2015).
Former President and CEO of Adagio Health Inc. (retired in 2014) in
Pittsburgh, PA.
Other Directorships. None. |
Alice Gresham Bullock
1950 | Chair and
Trustee | Since 2016 | Professor Emerita at Howard University School of Law. Dean Emerita of
Howard University School of Law and Deputy Director of the Association
of American Law Schools (1992-1994).
Other Directorships. None. |
Cari M. Dominguez
1949 | Trustee | Since 2016 | Former Chair of the U.S. Equal Employment Opportunity Commission.
Other Directorships. ManpowerGroup Inc. (workforce solutions company);
Triple S Management Corporation (managed care); National Association of Corporate Directors. |
Karen Fang(3)
1958 | Trustee | Since 2023 | Formerly, Managing Director, Wealth Management at GAMCO Asset Management (asset management firm) (2020-2023). Formerly, Managing Director, Senior Portfolio Manager of Fiduciary Trust Company International (wealth management firm) (1993-2019).
Other Directorships. None. |
John G. Guffey, Jr.(2)
1948 | Trustee | Since 1982 | President of Aurora Press Inc., a privately held publisher of trade paperbacks
(since January 1997).
Other Directorships. Calvert Impact Capital, Inc. (through December 31, 2018); Calvert Ventures, LLC. |
Miles D. Harper, III
1962 | Trustee | Since 2016 | Partner, Carr Riggs & Ingram (public accounting firm) since October 2014.
Partner, Gainer Donnelly & Desroches (public accounting firm) (now Carr
Riggs & Ingram) (November 1999 - September 2014).
Other Directorships. Bridgeway Funds (9) (asset management). |
Joy V. Jones
1950 | Trustee | Since 2016 | Attorney.
Other Directorships. Palm Management Corporation. |
Calvert
Income Fund
September 30, 2023
Management and Organization — continued
| Name and Year of Birth | Trust
Position(s) | Length of
Service | Principal Occupation(s) and Other Directorships
During Past Five Years and Other Relevant Experience |
| Noninterested Trustees (continued) |
Eddie Ramos(3)
1967 | Trustee | Since 2023 | Private investor (2022-present). Formerly, Head of External Advisors/Diversity Portfolio Management at the New Jersey Division of Investment (2020-2022). Formerly, Chief Investment Officer and Lead Portfolio Manager – Global Fundamental Equities at Cornerstone Capital Management (asset management firm) (2011-2017).
Other Directorships. Macquarie Optimum Funds (6) (asset management). |
Anthony A. Williams
1951 | Trustee | Since 2010 | CEO and Executive Director of the Federal City Council (July 2012 to
present); Senior Adviser and Independent Consultant for King and
Spalding LLP (September 2015 to present); Executive Director of Global
Government Practice at the Corporate Executive Board (January 2010 to
January 2012).
Other Directorships. Freddie Mac; Evoq Properties/Meruelo Maddux
Properties, Inc. (real estate management); Weston Solutions, Inc.
(environmental services); Bipartisan Policy Center’s Debt Reduction Task Force;
Chesapeake Bay Foundation; Catholic University of America; Urban Institute (research organization); The Howard Hughes Corporation (real estate development); Old Dominion National Bank. |
| Name and Year of Birth | Trust
Position(s) | Length of
Service | Principal Occupation(s)
During Past Five Years |
| Principal Officers who are not Trustees |
Hope L. Brown
1973 | Chief
Compliance
Officer | Since 2014 | Chief Compliance Officer of 46 registered investment companies advised
by CRM (since 2014). Vice President and Chief Compliance Officer,
Wilmington Funds (2012-2014). |
Deidre E. Walsh
1971 | Secretary,
Vice President
and Chief
Legal Officer | Since 2021 | Vice President of CRM and officer of 46 registered investment companies
advised by CRM (since 2021). Also Vice President of Eaton Vance and
certain of its affiliates and officer of 127 registered investment companies
advised or administered by Eaton Vance. |
James F. Kirchner
1967 | Treasurer | Since 2016 | Vice President of CRM and officer of 46 registered investment companies
advised by CRM (since 2016). Also Vice President of Eaton Vance and
certain of its affiliates and officer of 127 registered investment companies
advised or administered by Eaton Vance. |
| | | | |
| (1) Mr. Eliopoulos is an interested person of the Fund because of his positions with the Fund’s adviser and certain affiliates. |
| (2) Effective December 31, 2023, Richard L. Baird, Jr. and John G. Guffey, Jr. will retire from the Board of Trustees. |
| (3) Ms. Fang and Mr. Ramos began serving as Trustees effective October 30, 2023. |
The SAI for the Fund includes additional information about the Trustees and officers of the Fund and can be obtained without charge on Calvert’s website at www.calvert.com or by calling 1-800-368-2745.
| FACTS | WHAT DOES EATON VANCE DO WITH YOUR
PERSONAL INFORMATION? |
| Why? | Financial companies choose how they share your personal information. Federal law gives consumers the right to limit some but not all sharing. Federal law also requires us to tell you how we collect, share, and protect your personal information. Please read this notice carefully to understand what we do. |
| |
| What? | The types of personal information we collect and share depend on the product or service you have with us. This information can include:■ Social Security number and income
■
investment experience and risk tolerance
■
checking account number and wire transfer instructions |
| |
| How? | All financial companies need to share customers’ personal information to run their everyday business. In the section below, we list the reasons financial companies can share their customers’ personal information; the reasons Eaton Vance chooses to share; and whether you can limit this sharing. |
Reasons we can share your
personal information | Does Eaton Vance
share? | Can you limit
this sharing? |
| For our everyday business purposes — such as to process your transactions, maintain your account(s), respond to court orders and legal investigations, or report to credit bureaus | Yes | No |
| For our marketing purposes — to offer our products and services to you | Yes | No |
| For joint marketing with other financial companies | No | We don’t share |
| For our investment management affiliates’ everyday business purposes — information about your transactions, experiences, and creditworthiness | Yes | Yes |
| For our affiliates’ everyday business purposes — information about your transactions and experiences | Yes | No |
| For our affiliates’ everyday business purposes — information about your creditworthiness | No | We don’t share |
| For our investment management affiliates to market to you | Yes | Yes |
| For our affiliates to market to you | No | We don’t share |
| For nonaffiliates to market to you | No | We don’t share |
To limit our
sharing | Call toll-free 1-800-368-2745 or email: CRMPrivacy@calvert.comPlease note:If you are a new customer, we can begin sharing your information 30 days from the date we sent this notice. When you are no longer our customer, we continue to share your information as described in this notice. However, you can contact us at any time to limit our sharing. |
| Questions? | Call toll-free 1-800-368-2745 or email: CRMPrivacy@calvert.com |
| Privacy Notice — continued | April 2021 |
| Who we are |
| Who is providing this notice? | Eaton Vance Management, Eaton Vance Distributors, Inc., Eaton Vance Trust Company, Eaton Vance Management (International) Limited, Eaton Vance Advisers International Ltd., Eaton Vance Global Advisors Limited, Eaton Vance Management’s Real Estate Investment Group, Boston Management and Research, Calvert Research and Management, Eaton Vance and Calvert Fund Families and our investment advisory affiliates (“Eaton Vance”) (see Investment Management Affiliates definition below) |
| What we do |
How does Eaton Vance
protect my personal
information? | To protect your personal information from unauthorized access and use, we use security measures that comply with federal law. These measures include computer safeguards and secured files and buildings. We have policies governing the proper handling of customer information by personnel and requiring third parties that provide support to adhere to appropriate security standards with respect to such information. |
How does Eaton Vance
collect my personal
information? | We collect your personal information, for example, when you■ open an account or make deposits or withdrawals from your account
■
buy securities from us or make a wire transfer
■
give us your contact informationWe also collect your personal information from others, such as credit bureaus, affiliates, or other companies. |
| Why can’t I limit all sharing? | Federal law gives you the right to limit only■ sharing for affiliates’ everyday business purposes — information about your creditworthiness
■
affiliates from using your information to market to you
■
sharing for nonaffiliates to market to youState laws and individual companies may give you additional rights to limit sharing. See below for more on your rights under state law. |
| Definitions |
Investment Management
Affiliates | Eaton Vance Investment Management Affiliates include registered investment advisers, registered broker- dealers, and registered and unregistered funds. Investment Management Affiliates does not include entities associated with Morgan Stanley Wealth Management, such as Morgan Stanley Smith Barney LLC and Morgan Stanley & Co. |
| Affiliates | Companies related by common ownership or control. They can be financial and nonfinancial companies.■ Our affiliates include companies with a Morgan Stanley name and financial companies such as Morgan Stanley Smith Barney LLC and Morgan Stanley & Co. |
| Nonaffiliates | Companies not related by common ownership or control. They can be financial and nonfinancial companies.■ Eaton Vance does not share with nonaffiliates so they can market to you. |
| Joint marketing | A formal agreement between nonaffiliated financial companies that together market financial products or services to you.■ Eaton Vance doesn’t jointly market. |
| Other important information |
| Vermont: Except as permitted by law, we will not share personal information we collect about Vermont residents with Nonaffiliates unless you provide us with your written consent to share such information.California: Except as permitted by law, we will not share personal information we collect about California residents with Nonaffiliates and we will limit sharing such personal information with our Affiliates to comply with California privacy laws that apply to us. |
Delivery of Shareholder Documents. The Securities and Exchange Commission (SEC) permits funds to deliver only one copy of shareholder documents, including prospectuses, proxy statements and shareholder reports, to fund investors with multiple accounts at the same residential or post office box address. This practice is often called “householding” and it helps eliminate duplicate mailings to shareholders. Calvert funds, or your financial intermediary, may household the mailing of your documents indefinitely unless you instruct Calvert funds, or your financial intermediary, otherwise. If you would prefer that your Calvert fund documents not be householded, please contact Calvert funds at 1-800-368-2745, or contact your financial intermediary. Your instructions that householding not apply to delivery of your Calvert fund documents will typically be effective within 30 days of receipt by Calvert funds or your financial intermediary.
Portfolio Holdings. Each Calvert fund files a schedule of portfolio holdings on Part F to Form N-PORT with the SEC. Certain information filed on Form N-PORT may be viewed on the Calvert website at www.calvert.com, by calling Calvert at 1-800-368-2745 or in the EDGAR database on the SEC’s website at www.sec.gov.
Proxy Voting. The Proxy Voting Guidelines that each Calvert fund uses to determine how to vote proxies relating to portfolio securities is provided as an Appendix to the fund’s Statement of Additional Information. The Statement of Additional Information can be obtained free of charge by calling the Calvert funds at 1-800-368-2745, by visiting the Calvert funds’ website at www.calvert.com or visiting the SEC’s website at www.sec.gov. Information regarding how a Calvert fund voted proxies relating to portfolio securities during the most recent 12-month period ended June 30 is available by calling Calvert funds, by visiting the Calvert funds’ website at www.calvert.com or by visiting the SEC’s website at www.sec.gov.
Tailored Shareholder Reports. Effective January 24, 2023, the SEC adopted rule and form amendments to require open-end mutual funds and ETFs to transmit concise and visually engaging streamlined annual and semiannual reports to shareholders that highlight key information. Other information, including financial statements, will no longer appear in a streamlined shareholder report but must be available online, delivered free of charge upon request, and filed on a semiannual basis on Form N-CSR. The rule and form amendments have a compliance date of July 24, 2024. At this time, management is evaluating the impact of these amendments on the shareholder reports for the Calvert Funds.
Investment Adviser and Administrator
Calvert Research and Management
2050 M Street NW
Washington, DC 20036
Principal Underwriter*
Eaton Vance Distributors, Inc.
Two International Place
Boston, MA 02110
(617) 482-8260
Custodian
State Street Bank and Trust Company
One Congress Street, Suite 1
Boston, MA 02114-2016
Transfer Agent
SS&C Global Investor & Distribution Solutions, Inc.
2000 Crown Colony Drive
Quincy, MA 02169
Independent Registered Public Accounting Firm
Deloitte & Touche LLP
200 Berkeley Street
Boston, MA 02116-5022
Fund Offices
2050 M Street NW
Washington, DC 20036
* FINRA BrokerCheck. Investors may check the background of their Investment Professional by contacting the Financial Industry Regulatory Authority (FINRA). FINRA BrokerCheck is a free tool to help investors check the professional background of current and former FINRA-registered securities firms and brokers. FINRA BrokerCheck is available by calling 1-800-289-9999 and at www.FINRA.org. The FINRA BrokerCheck brochure describing this program is available to investors at www.FINRA.org.
Printed on recycled paper.
24177 9.30.23
Calvert
Core Bond Fund
Annual Report
September 30, 2023
Commodity Futures Trading Commission Registration. The Commodity Futures Trading Commission (“CFTC”) has adopted regulations that subject registered investment companies and advisers to regulation by the CFTC if a fund invests more than a prescribed level of its assets in certain CFTC-regulated instruments (including futures, certain options and swap agreements) or markets itself as providing investment exposure to such instruments. The adviser has claimed an exclusion from the definition of “commodity pool operator” under the Commodity Exchange Act with respect to its management of the Fund and the other funds it manages. Accordingly, neither the Fund nor the adviser is subject to CFTC regulation.
Fund shares are not insured by the FDIC and are not deposits or other obligations of, or guaranteed by, any depository institution. Shares are subject to investment risks, including possible loss of principal invested.
This report must be preceded or accompanied by a current summary prospectus or prospectus. Before investing, investors should consider carefully the investment objective, risks, and charges and expenses of a mutual fund. This and other important information is contained in the summary prospectus and prospectus, which can be obtained from a financial intermediary. Prospective investors should read the prospectus carefully before investing. For further information, please call 1-800-368-2745.
Choose Planet-friendly E-delivery!
Sign up now for on-line statements, prospectuses, and fund reports. In less than five minutes you can help reduce paper mail and lower fund costs.
Just go to www.calvert.com. If you already have an online account with the Calvert funds, click on Login to access your Account and select the documents you would like to receive via e-mail.
If you’re new to online account access, click on Login, then Register to create your user name and password. Once you’re in, click on the E-delivery sign-up on the Account Portfolio page and follow the quick, easy steps.
Note: If your shares are not held directly with the Calvert funds but through a brokerage firm, you must contact your broker for electronic delivery options available through their firm.
Annual Report September 30, 2023
Calvert
Core Bond Fund
Calvert
Core Bond Fund
September 30, 2023
Management's Discussion of Fund Performance†
Economic and Market Conditions
For fixed-income investors, the dominant event during the 12-month period ended September 30, 2023, was the series of U.S. Federal Reserve (Fed) interest rate hikes -- six during the period, and 11 in total -- that brought the federal funds rate to its highest level in 22 years.
But while the Fed’s campaign to tamp down inflation led to negative performance for government bonds, corporate bond returns were strongly positive during the period -- buoyed in part by the very factors that were fueling inflation: record low unemployment, strong job creation, and robust consumer spending.
By the summer of 2023, a majority of economists and market observers seemed to be coming around to the view that Jerome Powell’s Fed might be able to accomplish what had seldom, if ever, been done before: raise rates significantly to lower inflation and still bring the economy in for a soft landing without a recession.
One cloud that hung over fixed-income markets during the period, however, was fear that even after it finished raising rates, the Fed would leave rates higher for longer than investors had previously anticipated. During the final two months of the period -- and especially after the Fed’s September 2023 meeting -- longer-term interest rates rose dramatically, as investor expectations of how high rates would go -- and how long they would stay there -- seemed to get higher and longer.
Against the backdrop of the Fed’s aggressive monetary tightening campaign, U.S. Treasurys were the worst-performing major fixed-income asset class during the 12-month period, with the Bloomberg U.S. Treasury Index returning -0.81%.
In contrast, the strong U.S. economy and increasing confidence in a soft-landing scenario served as tailwinds for investment-grade corporate bonds. Even in a rising-rate environment, the Bloomberg U.S. Corporate Bond Index returned 3.65% during the period.
High yield bonds were the standout performer among major fixed-income asset classes, with the Bloomberg U.S. Corporate High Yield Index returning 10.28% during the period. With a strong U.S. economy helping keep bond defaults low, and a recession looking increasingly remote, investors gravitated toward riskier investments with greater yields.
Asset-backed securities -- including bonds backed by automobile and consumer loans -- benefited from strong consumer balance sheets and spending during the period, with the Bloomberg U.S. Asset-Backed Securities Index returning 2.81%.
Mortgage-backed securities (MBS), however, were dogged by two technical factors that depressed prices, causing the Bloomberg U.S. Mortgage-Backed Securities Index to return -0.17% during the period. As the Fed lowered its balance sheet, it sold off much of its MBS holdings. And several regional banks that had been significant buyers of MBS were forced by the banking crisis of March 2023 to liquidate their assets. The resulting release of a significant amount of MBS into the market led prices to fall and the asset class to deliver negative returns.
Fund Performance
For the 12-month period ended September 30, 2023, Calvert Core Bond Fund (the Fund) returned 0.76% for Class A shares at net asset value (NAV), outperforming its benchmark, the Bloomberg U.S. Aggregate Bond Index (the Index), which returned 0.64%.
Security selections were the leading contributor to performance relative to the Index during the period. Selections in commercial mortgage-backed securities (CMBS), investment-grade corporate securities, and asset-backed securities (ABS) were particularly beneficial to relative returns. The Fund’s duration contributed to relative returns, and a small out-of-Index allocation to high yield corporate bonds further enhanced performance during the period.
In contrast, while security selections were generally favorable to the Fund’s performance, selections in U.S. Treasurys detracted from relative returns. Overweight allocations to ABS and CMBS also weighed on returns relative to the Index during the period.
Derivatives had a large negative impact on the Fund’s total return during the period.
See Endnotes and Additional Disclosures in this report.
Past performance is no guarantee of future results. Returns are historical and are calculated by determining the percentage change in net asset value (NAV) or offering price (as applicable) with all distributions reinvested. Furthermore, returns do not reflect the deduction of taxes that shareholders may have to pay on Fund distributions or upon the redemption of Fund shares. Investment return and principal value will fluctuate so that shares, when redeemed, may be worth more or less than their original cost. Performance for periods less than or equal to one year is cumulative. Performance is for the stated time period only; due to market volatility, current Fund performance may be lower or higher than the quoted return. For performance as of the most recent month-end, please refer to www.calvert.com.
Calvert
Core Bond Fund
September 30, 2023
Performance
Portfolio Manager(s) Vishal Khanduja, CFA and Brian S. Ellis, CFA, each of Calvert Research and Management
| % Average Annual Total Returns1,2 | Class
Inception Date | Performance
Inception Date | One Year | Five Years | Ten Years |
| Class A at NAV | 12/31/2004 | 12/31/2004 | 0.76% | 2.92% | 3.70% |
| Class A with 3.25% Maximum Sales Charge | — | — | (2.49) | 2.24 | 3.36 |
| Class I at NAV | 01/30/2015 | 12/31/2004 | 1.09 | 3.20 | 4.02 |
| Class R6 at NAV | 06/30/2023 | 12/31/2004 | 1.03 | 3.19 | 2.23 |
|
| Bloomberg U.S. Aggregate Bond Index | — | — | 0.64% | 0.10% | 1.13% |
| % Total Annual Operating Expense Ratios3 | Class A | Class I | Class R6 |
| Gross | 0.91% | 0.66% | 0.63% |
| Net | 0.74 | 0.49 | 0.46 |
Growth of $10,000
This graph shows the change in value of a hypothetical investment of $10,000 in Class A of the Fund for the period indicated. For comparison, the same investment is shown in the indicated index.
| Growth of Investment2 | Amount Invested | Period Beginning | At NAV | With Maximum Sales Charge |
| Class I, at minimum investment | $1,000,000 | 09/30/2013 | $1,483,991 | N.A. |
| Class R6, at minimum investment | $5,000,000 | 09/30/2013 | $7,418,767 | N.A. |
See Endnotes and Additional Disclosures in this report.
Past performance is no guarantee of future results. Returns are historical and are calculated by determining the percentage change in net asset value (NAV) or offering price (as applicable) with all distributions reinvested. Furthermore, returns do not reflect the deduction of taxes that shareholders may have to pay on Fund distributions or upon the redemption of Fund shares. Investment return and principal value will fluctuate so that shares, when redeemed, may be worth more or less than their original cost. Performance for periods less than or equal to one year is cumulative. Performance is for the stated time period only; due to market volatility, current Fund performance may be lower or higher than the quoted return. For performance as of the most recent month-end, please refer to www.calvert.com.
Calvert
Core Bond Fund
September 30, 2023
Asset Allocation (% of total investments)
| Credit Quality (% of net assets)1 |
Footnotes:
| 1 | For purposes of the Fund’s rating restrictions, ratings are based on Moody’s Investors Service, Inc. (“Moody’s”), S&P Global Ratings (“S&P”) or Fitch Ratings (“Fitch”), or Kroll Bond Rating Agency, LLC (“Kroll”) for securitized debt instruments only (such as asset-backed securities (“ABS”) and mortgage-backed securities (“MBS”)), as applicable. If securities are rated differently by the ratings agencies, the highest rating is applied. Ratings, which are subject to change, apply to the creditworthiness of the issuers of the underlying securities and not to the Fund or its shares. Credit ratings measure the quality of an issuance based on the issuer’s creditworthiness, with ratings ranging from AAA, being the highest, to D, being the lowest based on S&P’s measures. Ratings of BBB or higher by S&P, Fitch or Kroll (Baa or higher by Moody’s) are considered to be investment-grade quality. Credit ratings are based largely on the ratings agency’s analysis at the time of rating. The rating assigned to any particular security is not necessarily a reflection of the issuer’s current financial condition and does not necessarily reflect its assessment of the volatility of a security’s market value or of the liquidity of an investment in the security. Holdings designated as “Not Rated” (if any) are not rated by the national ratings agencies stated above. |
Calvert
Core Bond Fund
September 30, 2023
Endnotes and Additional Disclosures
| † | The views expressed in this report are those of the portfolio manager(s) and are current only through the date stated at the top of this page. These views are subject to change at any time based upon market or other conditions, and Calvert and the Fund(s) disclaim any responsibility to update such views. These views may not be relied upon as investment advice and, because investment decisions are based on many factors, may not be relied upon as an indication of trading intent on behalf of any Calvert fund. This commentary may contain statements that are not historical facts, referred to as “forward-looking statements.” The Fund’s actual future results may differ significantly from those stated in any forward-looking statement, depending on factors such as changes in securities or financial markets or general economic conditions, the volume of sales and purchases of Fund shares, the continuation of investment advisory, administrative and service contracts, and other risks discussed from time to time in the Fund’s filings with the Securities and Exchange Commission. |
| | |
| 1 | Bloomberg U.S. Aggregate Bond Index is an unmanaged index of domestic investment-grade bonds, including corporate, government and mortgage-backed securities. Unless otherwise stated, index returns do not reflect the effect of any applicable sales charges, commissions, expenses, taxes or leverage, as applicable. It is not possible to invest directly in an index. |
| 2 | Total Returns at NAV do not include applicable sales charges. If sales charges were deducted, the returns would be lower. Total Returns shown with maximum sales charge reflect the stated maximum sales charge. Unless otherwise stated, performance does not reflect the deduction of taxes on Fund distributions or redemptions of Fund shares.Performance prior to the inception date of a class may be linked to the performance of an older class of the Fund. This linked performance is adjusted for any applicable sales charge, but is not adjusted for class expense differences. If adjusted for such differences, the performance would be different. The performance of Class I is linked to Class A and the performance of Class R6 is linked to Class I. Performance presented in the Financial Highlights included in the financial statements is not linked. Effective February 1, 2021, the Fund revised its name, objective and principal investment strategies and adopted a policy of investing at least 80% of its net assets in investment grade, U.S. dollar-denominated debt securities.Calvert Research and Management became the investment adviser to the Fund on December 31, 2016. Performance reflected prior to such date is that of the Fund’s former investment adviser. |
| 3 | Source: Fund prospectus. Net expense ratios reflect a contractual expense reimbursement that continues through 2/1/25. The expense ratios for the current reporting period can be found in the Financial Highlights section of this report. Performance reflects expenses waived and/or reimbursed, if applicable. Without such waivers and/or reimbursements, performance would have been lower. |
| Fund profile subject to change due to active management. |
| | Additional Information |
| | Bloomberg U.S. Treasury Index measures the performance of U.S. Treasuries with a maturity of one year or more. Bloomberg U.S. Corporate Bond Index measures the performance of investment-grade U.S. corporate securities with a maturity of one year or more. Bloomberg U.S. Corporate High Yield Index measures USD-denominated, non-investment grade corporate securities. Bloomberg U.S. Asset-Backed Securities Index tracks the performance of U.S. dollar denominated investment grade, fixed rate asset-backed securities publicly issued in the U.S. domestic market. Bloomberg U.S. Mortgage-Backed Securities Index measures agency mortgage-backed pass-through securities issued by Ginnie Mae (GNMA), Fannie Mae (FNMA), and Freddie Mac (FHLMC). |
| | Duration is a measure of the expected change in price of a bond — in percentage terms — given a one percent change in interest rates, all else being constant. Securities with lower durations tend to be less sensitive to interest rate changes. |
Calvert
Core Bond Fund
September 30, 2023
Example
As a Fund shareholder, you incur two types of costs: (1) transaction costs, including sales charges (loads) on purchases; and (2) ongoing costs, including management fees; distribution and/or service fees; and other Fund expenses. This Example is intended to help you understand your ongoing costs (in dollars) of Fund investing and to compare these costs with the ongoing costs of investing in other mutual funds. The Example is based on an investment of $1,000 invested at the beginning of the period and held for the entire period (April 1, 2023 to September 30, 2023).
Actual Expenses
The first section of the table below provides information about actual account values and actual expenses. You may use the information in this section, together with the amount you invested, to estimate the expenses that you paid over the period. Simply divide your account value by $1,000 (for example, an $8,600 account value divided by $1,000 = 8.6), then multiply the result by the number in the first section under the heading entitled “Expenses Paid During Period” to estimate the expenses you paid on your account during this period.
Hypothetical Example for Comparison Purposes
The second section of the table below provides information about hypothetical account values and hypothetical expenses based on the actual Fund expense ratio and an assumed rate of return of 5% per year (before expenses), which is not the actual Fund return. The hypothetical account values and expenses may not be used to estimate the actual ending account balance or expenses you paid for the period. You may use this information to compare the ongoing costs of investing in the Fund and other funds. To do so, compare this 5% hypothetical example with the 5% hypothetical examples that appear in the shareholder reports of the other funds.
Please note that the expenses shown in the table are meant to highlight your ongoing costs only and do not reflect any transactional costs, such as sales charges (loads). Therefore, the second section of the table is useful in comparing ongoing costs only, and will not help you determine the relative total costs of owning different funds. In addition, if these transactional costs were included, your costs would be higher.
| | Beginning
Account Value
(4/1/23) | Ending
Account Value
(9/30/23) | Expenses Paid
During Period
(4/1/23 – 9/30/23) | Annualized
Expense
Ratio |
| Actual * | | | | |
| Class A | $1,000.00 | $ 962.10 | $3.64 ** | 0.74% |
| Class I | $1,000.00 | $ 963.40 | $2.41 ** | 0.49% |
| Class R6 | $1,000.00 | $ 972.20 | $1.16 ** | 0.46% |
| Hypothetical *** | | | | |
| (5% return per year before expenses) | | | | |
| Class A | $1,000.00 | $1,021.36 | $3.75 ** | 0.74% |
| Class I | $1,000.00 | $1,022.61 | $2.48 ** | 0.49% |
| Class R6 | $1,000.00 | $1,022.76 | $2.33 ** | 0.46% |
| * | Class R6 had not commenced operations on April 1, 2023. Actual expenses are equal to the Fund’s annualized expense ratio for the indicated Class, multiplied by the average account value over the period, multiplied by 183/365 (to reflect the one-half year period); 93/365 for Class R6 (to reflect the period from the commencement of operations on June 30, 2023 to September 30, 2023). The Example assumes that the $1,000 was invested at the net asset value per share determined at the close of business on March 31, 2023 (June 30, 2023 for Class R6). |
| ** | Absent a waiver and/or reimbursement of expenses by affiliate(s), expenses would be higher. |
| *** | Hypothetical expenses are equal to the Fund’s annualized expense ratio for the indicated Class, multiplied by the average account value over the period, multiplied by 183/365 (to reflect the one-half year period). The Example assumes that the $1,000 was invested at the net asset value per share determined at the close of business on March 31, 2023 (June 30, 2023 for Class R6). |
Calvert
Core Bond Fund
September 30, 2023
| Asset-Backed Securities — 10.3% |
| Security | Principal
Amount
(000's omitted) | Value |
| Amur Equipment Finance Receivables XII, LLC, Series 2023-1A, Class A2, 6.09%, 12/20/29(1) | $ | 2,565 | $ 2,568,376 |
| Avis Budget Rental Car Funding AESOP, LLC, Series 2022-3A, Class A, 4.62%, 2/20/27(1) | | 643 | 623,585 |
| CarMax Auto Owner Trust, Series 2023-1, Class A2A, 5.23%, 1/15/26 | | 260 | 259,262 |
| Coinstar Funding, LLC, Series 2017-1A, Class A2, 5.216%, 4/25/47(1) | | 163 | 136,422 |
| Cologix Data Centers US Issuer, LLC, Series 2021-1A, Class A2, 3.30%, 12/26/51(1) | | 720 | 635,159 |
| Conn's Receivables Funding, LLC, Series 2023-A, Class A, 8.01%, 1/17/28(1) | | 1,561 | 1,563,783 |
| DataBank Issuer, Series 2021-2A, Class A2, 2.40%, 10/25/51(1) | | 1,105 | 953,521 |
| DB Master Finance, LLC, Series 2017-1A, Class A2II, 4.03%, 11/20/47(1) | | 402 | 366,012 |
| Diamond Infrastructure Funding, LLC, Series 2021-1A, Class A, 1.76%, 4/15/49(1) | | 852 | 729,336 |
| Diamond Issuer, Series 2021-1A, Class A, 2.305%, 11/20/51(1) | | 490 | 417,881 |
| Driven Brands Funding, LLC: | | | |
| Series 2019-1A, Class A2, 4.641%, 4/20/49(1) | | 638 | 603,323 |
| Series 2019-2A, Class A2, 3.981%, 10/20/49(1) | | 2,647 | 2,422,772 |
| Enterprise Fleet Financing, LLC, Series 2023-1, Class A2, 5.51%, 1/22/29(1) | | 3,175 | 3,150,176 |
| FMC GMSR Issuer Trust, Series 2021-GT2, Class A, 3.85%, 10/25/26(1)(2) | | 200 | 164,613 |
| FOCUS Brands Funding, LLC, Series 2017-1A, Class A2II, 5.093%, 4/30/47(1) | | 422 | 391,115 |
| GoodLeap Sustainable Home Solutions Trust, Series 2021-5CS, Class A, 2.31%, 10/20/48(1) | | 128 | 96,864 |
| JPMorgan Chase Bank, NA: | | | |
| Series 2021-2, Class B, 0.889%, 12/26/28(1) | | 71 | 68,816 |
| Series 2021-3, Class B, 0.76%, 2/26/29(1) | | 81 | 77,613 |
| LAD Auto Receivables Trust: | | | |
| Series 2023-1A, Class A2, 5.68%, 10/15/26(1) | | 890 | 887,778 |
| Series 2023-2A, Class A2, 5.93%, 6/15/27(1) | | 708 | 706,418 |
| Series 2023-3A, Class A2, 6.09%, 6/15/26(1) | | 2,574 | 2,573,161 |
| Marlette Funding Trust: | | | |
| Series 2023-1A, Class A, 6.07%, 4/15/33(1) | | 1,071 | 1,068,746 |
| Series 2023-1A, Class B, 6.50%, 4/15/33(1) | | 1,500 | 1,495,760 |
| Series 2023-3A, Class B, 6.71%, 9/15/33(1) | | 2,500 | 2,497,304 |
| Mosaic Solar Loan Trust: | | | |
| Series 2020-2A, Class C, 3.00%, 8/20/46(1) | | 860 | 769,461 |
| Series 2022-2A, Class C, 5.95%, 1/21/53(1) | | 850 | 744,099 |
| Series 2023-2A, Class B, 2.09%, 4/22/47(1) | | 1,392 | 1,000,886 |
| Mosaic Solar Loans, LLC: | | | |
| Series 2017-1A, Class A, 4.45%, 6/20/42(1) | | 455 | 426,688 |
| Series 2017-2A, Class A, 3.82%, 6/22/43(1) | | 1,553 | 1,392,863 |
| Security | Principal
Amount
(000's omitted) | Value |
| NRZ Excess Spread-Collateralized Notes, Series 2021-GNT1, Class A, 3.474%, 11/25/26(1) | $ | 246 | $ 222,199 |
| Octane Receivables Trust, Series 2023-1A, Class A, 5.87%, 5/21/29(1) | | 453 | 451,836 |
| OneMain Financial Issuance Trust: | | | |
| Series 2020-1A, Class B, 4.83%, 5/14/32(1) | | 3,009 | 2,990,265 |
| Series 2022-S1, Class A, 4.13%, 5/14/35(1) | | 1,025 | 984,614 |
| Oportun Funding XIII, LLC, Series 2019-A, Class A, 3.08%, 8/8/25(1) | | 1,356 | 1,345,032 |
| Oportun Funding XIV, LLC, Series 2021-A, Class B, 1.76%, 3/8/28(1) | | 65 | 62,029 |
| Oportun Funding, LLC, Series 2022-1, Class A, 3.25%, 6/15/29(1) | | 80 | 79,301 |
| Oportun Issuance Trust: | | | |
| Series 2021-B, Class A, 1.47%, 5/8/31(1) | | 278 | 254,017 |
| Series 2021-C, Class A, 2.18%, 10/8/31(1) | | 1,155 | 1,051,158 |
| Series 2022-2, Class A, 5.94%, 10/9/29(1) | | 72 | 72,021 |
| Series 2022-3, Class A, 7.451%, 1/8/30(1) | | 1,264 | 1,263,324 |
| Series 2022-3, Class B, 8.533%, 1/8/30(1) | | 2,970 | 3,000,027 |
| Pagaya AI Debt Selection Trust: | | | |
| Series 2021-3, Class A, 1.15%, 5/15/29(1) | | 40 | 40,204 |
| Series 2021-5, Class A, 1.53%, 8/15/29(1) | | 74 | 72,616 |
| Series 2021-HG1, Class A, 1.22%, 1/16/29(1) | | 54 | 52,414 |
| Series 2022-1, Class A, 2.03%, 10/15/29(1) | | 372 | 364,526 |
| Planet Fitness Master Issuer, LLC, Series 2019-1A, Class A2, 3.858%, 12/5/49(1) | | 602 | 503,151 |
| Retained Vantage Data Centers Issuer, LLC, Series 2023-1A, Class A2A, 5.00%, 9/15/48(1) | | 3,145 | 2,841,385 |
| SBA Tower Trust, Series 2014-2A, Class C, 3.869% to 10/15/23, 10/15/49(1)(3) | | 500 | 486,781 |
| ServiceMaster Funding, LLC, Series 2020-1, Class A2II, 3.337%, 1/30/51(1) | | 325 | 256,239 |
| SoFi Consumer Loan Program Trust: | | | |
| Series 2022-1S, Class A, 6.21%, 4/15/31(1) | | 572 | 571,707 |
| Series 2023-1S, Class A, 5.81%, 5/15/31(1) | | 242 | 241,038 |
| Stack Infrastructure Issuer, LLC: | | | |
| Series 2019-1A, Class A2, 4.54%, 2/25/44(1) | | 163 | 161,417 |
| Series 2019-2A, Class A2, 3.08%, 10/25/44(1) | | 1,080 | 1,035,817 |
| Series 2020-1A, Class A2, 1.893%, 8/25/45(1) | | 591 | 536,982 |
| Series 2021-1A, Class A2, 1.877%, 3/26/46(1) | | 1,450 | 1,277,886 |
| Sunnova Helios II Issuer, LLC: | | | |
| Series 2019-AA, Class A, 3.75%, 6/20/46(1) | | 1,124 | 992,785 |
| Series 2021-B, Class A, 1.62%, 7/20/48(1) | | 1,406 | 1,156,047 |
| Sunnova Helios IV Issuer, LLC, Series 2020-AA, Class A, 2.98%, 6/20/47(1) | | 249 | 222,271 |
| Sunnova Helios IX Issuer, LLC, Series 2022-B, Class A, 5.00%, 8/20/49(1) | | 378 | 355,122 |
| Sunnova Helios V Issuer, LLC, Series 2021-A, Class A, 1.80%, 2/20/48(1) | | 331 | 279,228 |
| Sunnova Helios VII Issuer, LLC, Series 2021-C, Class B, 2.33%, 10/20/48(1) | | 652 | 531,258 |
7
See Notes to Financial Statements.
Calvert
Core Bond Fund
September 30, 2023
Schedule of Investments — continued
| Security | Principal
Amount
(000's omitted) | Value |
| Sunnova Helios X Issuer, LLC, Series 2022-C, Class B, 5.60%, 11/22/49(1) | $ | 1,043 | $ 976,113 |
| Sunnova Helios XII Issuer, LLC: | | | |
| Series 2023-B, Class A, 5.30%, 8/22/50(1) | | 2,045 | 1,949,839 |
| Series 2023-B, Class B, 5.60%, 8/22/50(1) | | 2,069 | 1,921,279 |
| Sunnova Sol Issuer, LLC, Series 2020-1A, Class B, 5.54%, 2/1/55(1) | | 2,410 | 2,007,844 |
| Sunrun Demeter Issuer, LLC, Series 2021-2A, Class A, 2.27%, 1/30/57(1) | | 155 | 122,599 |
| Sunrun Jupiter Issuer, LLC, Series 2022-1A, Class A, 4.75%, 7/30/57(1) | | 584 | 509,113 |
| Tesla Auto Lease Trust, Series 2023-B, Class A3, 6.13%, 9/21/26(1) | | 2,154 | 2,154,364 |
| Theorem Funding Trust: | | | |
| Series 2022-1A, Class A, 1.85%, 2/15/28(1) | | 64 | 63,018 |
| Series 2022-3A, Class A, 7.60%, 4/15/29(1) | | 210 | 211,106 |
| Vantage Data Centers Issuer, LLC: | | | |
| Series 2019-1A, Class A2, 3.188%, 7/15/44(1) | | 4,115 | 3,997,479 |
| Series 2021-1A, Class A2, 2.165%, 10/15/46(1) | | 140 | 122,700 |
Total Asset-Backed Securities
(identified cost $68,005,889) | | | $ 66,581,944 |
| Collateralized Mortgage Obligations — 2.0% |
| Security | Principal
Amount
(000's omitted) | Value |
| Bellemeade Re, Ltd.: | | | |
| Series 2021-1A, Class M1A, 7.065%, (30-day average SOFR + 1.75%), 3/25/31(1)(4) | $ | 4 | $ 3,913 |
| Series 2021-2A, Class M1A, 6.515%, (30-day average SOFR + 1.20%), 6/25/31(1)(4) | | 109 | 109,129 |
| Series 2021-3A, Class A2, 6.315%, (30-day average SOFR + 1.00%), 9/25/31(1)(4) | | 150 | 148,786 |
| Cascade MH Asset Trust, Series 2022-MH1, Class A, 4.25% to 7/25/27, 8/25/54(1)(3) | | 472 | 415,490 |
| CHNGE Mortgage Trust: | | | |
| Series 2023-2, Class A3, 7.436% to 5/25/26, 6/25/58(1)(3) | | 851 | 836,795 |
| Series 2023-4, Class A1, 7.573% to 8/25/26, 9/25/58(1)(3) | | 2,204 | 2,215,443 |
| Federal Home Loan Mortgage Corp., Series 5324, Class MZ, 6.00%, 7/25/53 | | 112 | 103,548 |
| Federal Home Loan Mortgage Corp. Structured Agency Credit Risk Debt Notes: | | | |
| Series 2021-DNA3, Class M1, 6.065%, (30-day average SOFR + 0.75%), 10/25/33(1)(4) | | 41 | 40,540 |
| Series 2022-DNA1, Class M1A, 6.315%, (30-day average SOFR + 1.00%), 1/25/42(1)(4) | | 1,693 | 1,682,082 |
| Series 2022-DNA2, Class M1A, 6.615%, (30-day average SOFR + 1.30%), 2/25/42(1)(4) | | 164 | 164,292 |
| Federal National Mortgage Association Connecticut Avenue Securities, Series 2022-R07, Class 1M1, 8.265%, (30-day average SOFR + 2.95%), 6/25/42(1)(4) | | 1,500 | 1,544,356 |
| Security | Principal
Amount
(000's omitted) | Value |
| Government National Mortgage Association: | | | |
| Series 2023-84, Class DL, 6.00%, 6/20/53 | $ | 464 | $ 453,604 |
| Series 2023-84, Class MW, 6.00%, 6/20/53 | | 492 | 480,791 |
| PNMAC GMSR Issuer Trust: | | | |
| Series 2018-GT1, Class A, 9.284%, (1 mo. SOFR + 3.85%), 2/25/25(1)(4) | | 500 | 499,950 |
| Series 2018-GT2, Class A, 8.084%, (1 mo. SOFR + 2.65%), 8/25/25(1)(4) | | 1,000 | 1,000,039 |
| Series 2022-FT1, Class A, 9.505%, (30-day average SOFR + 4.19%), 6/25/27(1)(4) | | 2,499 | 2,503,027 |
| Series 2022-GT1, Class A, 9.565%, (30-day average SOFR + 4.25%), 5/25/27(1)(4) | | 500 | 501,378 |
Total Collateralized Mortgage Obligations
(identified cost $12,712,970) | | | $ 12,703,163 |
| Commercial Mortgage-Backed Securities — 10.0% |
| Security | Principal
Amount
(000's omitted) | Value |
| BPR Trust, Series 2022-SSP, Class A, 8.332%, (1 mo. SOFR + 3.00%), 5/15/39(1)(4) | $ | 1,230 | $ 1,229,229 |
| BX Commercial Mortgage Trust: | | | |
| Series 2019-XL, Class A, 6.367%, (1 mo. SOFR + 1.034%), 10/15/36(1)(4) | | 3,771 | 3,761,158 |
| Series 2019-XL, Class B, 6.527%, (1 mo. SOFR + 1.194%), 10/15/36(1)(4) | | 1,006 | 1,000,233 |
| Series 2021-VOLT, Class B, 6.397%, (1 mo. SOFR + 1.064%), 9/15/36(1)(4) | | 1,357 | 1,313,789 |
| Series 2021-VOLT, Class C, 6.547%, (1 mo. SOFR + 1.214%), 9/15/36(1)(4) | | 5,296 | 5,097,578 |
| Series 2021-VOLT, Class D, 7.097%, (1 mo. SOFR + 1.764%), 9/15/36(1)(4) | | 180 | 172,127 |
| CAMB Commercial Mortgage Trust: | | | |
| Series 2019-LIFE, Class B, 6.63%, (1 mo. SOFR + 1.30%), 12/15/37(1)(4) | | 1,852 | 1,839,964 |
| Series 2019-LIFE, Class D, 7.13%, (1 mo. SOFR + 1.80%), 12/15/37(1)(4) | | 1,000 | 990,659 |
| CSMC: | | | |
| Series 2018-SITE, Class A, 4.284%, 4/15/36(1) | | 1,050 | 1,026,237 |
| Series 2022-NWPT, Class A, 8.475%, (1 mo. SOFR + 3.143%), 9/9/24(1)(4) | | 1,891 | 1,911,098 |
| Extended Stay America Trust: | | | |
| Series 2021-ESH, Class A, 6.527%, (1 mo. SOFR + 1.194%), 7/15/38(1)(4) | | 3,809 | 3,779,960 |
| Series 2021-ESH, Class B, 6.827%, (1 mo. SOFR + 1.49%), 7/15/38(1)(4) | | 1,335 | 1,320,721 |
| Series 2021-ESH, Class C, 7.147%, (1 mo. SOFR + 1.814%), 7/15/38(1)(4) | | 1,243 | 1,226,468 |
| Federal Home Loan Mortgage Corp. Multifamily Structured Pass Through Certificates, Series KG08, Class A2, 4.134%, 5/25/33(2) | | 1,384 | 1,266,449 |
| Federal National Mortgage Association: | | | |
| Series 2017-M13, Class A2, 3.029%, 9/25/27(2) | | 2,981 | 2,749,126 |
| Series 2018-M4, Class A2, 3.166%, 3/25/28(2) | | 6,588 | 6,077,976 |
8
See Notes to Financial Statements.
Calvert
Core Bond Fund
September 30, 2023
Schedule of Investments — continued
| Security | Principal
Amount
(000's omitted) | Value |
| Federal National Mortgage Association: (continued) | | | |
| Series 2018-M13, Class A2, 3.866%, 9/25/30(2) | $ | 706 | $ 651,865 |
| Series 2019-M1, Class A2, 3.665%, 9/25/28(2) | | 2,770 | 2,591,423 |
| Series 2019-M22, Class A2, 2.522%, 8/25/29 | | 5,684 | 4,952,224 |
| Series 2020-M1, Class A2, 2.444%, 10/25/29 | | 4,000 | 3,439,338 |
| Series 2023-M1S, Class A2, 4.656%, 4/25/33(2) | | 3,414 | 3,228,853 |
| Hawaii Hotel Trust, Series 2019-MAUI, Class A, 6.529%, (1 mo. SOFR + 1.197%), 5/15/38(1)(4) | | 4,443 | 4,413,177 |
| JPMorgan Chase Commercial Mortgage Securities Trust, Series 2021-MHC, Class C, 6.747%, (1 mo. SOFR + 1.41%), 4/15/38(1)(4) | | 1,500 | 1,476,020 |
| Med Trust: | | | |
| Series 2021-MDLN, Class B, 6.897%, (1 mo. SOFR + 1.56%), 11/15/38(1)(4) | | 1,896 | 1,850,306 |
| Series 2021-MDLN, Class D, 7.447%, (1 mo. SOFR + 2.114%), 11/15/38(1)(4) | | 1,339 | 1,286,181 |
| MHC Commercial Mortgage Trust: | | | |
| Series 2021-MHC, Class A, 6.247%, (1 mo. SOFR + 0.915%), 4/15/38(1)(4) | | 3,727 | 3,686,505 |
| Series 2021-MHC, Class B, 6.547%, (1 mo. SOFR + 1.215%), 4/15/38(1)(4) | | 959 | 946,582 |
| Morgan Stanley Capital I Trust, Series 2019-BPR, Class A, 7.322%, (1 mo. SOFR + 1.992%), 5/15/36(1)(4)(5) | | 1,118 | 1,077,242 |
| VMC Finance, LLC, Series 2021-HT1, Class A, 7.095%, (1 mo. SOFR + 1.764%), 1/18/37(1)(4) | | 235 | 229,877 |
Total Commercial Mortgage-Backed Securities
(identified cost $65,824,148) | | | $ 64,592,365 |
| Security | Principal
Amount
(000’s omitted) | Value |
| Basic Materials — 0.5% | |
| Celanese U.S. Holdings, LLC: | | | |
| 6.35%, 11/15/28 | $ | 1,681 | $ 1,660,736 |
| 6.70%, 11/15/33 | | 1,545 | 1,505,059 |
| South32 Treasury, Ltd., 4.35%, 4/14/32(1) | | 204 | 172,232 |
| | | | $ 3,338,027 |
| Communications — 1.6% | |
| AT&T, Inc.: | | | |
| 3.55%, 9/15/55 | $ | 3,820 | $ 2,340,844 |
| 3.65%, 6/1/51 | | 2,464 | 1,589,925 |
| Charter Communications Operating, LLC/Charter Communications Operating Capital, 4.80%, 3/1/50 | | 3,947 | 2,762,846 |
| Comcast Corp., 1.95%, 1/15/31 | | 662 | 517,846 |
| Rogers Communications, Inc., 4.55%, 3/15/52 | | 3,484 | 2,543,976 |
| SES Global Americas Holdings GP, 5.30%, 3/25/44(1) | | 219 | 147,682 |
| SES S.A., 5.30%, 4/4/43(1) | | 130 | 87,661 |
| | | | $ 9,990,780 |
| Security | Principal
Amount
(000’s omitted) | Value |
| Consumer, Cyclical — 2.5% | |
| Aptiv PLC/Aptiv Corp., 3.25%, 3/1/32 | $ | 459 | $ 376,477 |
| Delta Air Lines, Inc./SkyMiles IP, Ltd.: | | | |
| 4.50%, 10/20/25(1) | | 656 | 636,746 |
| 4.75%, 10/20/28(1) | | 1,201 | 1,141,805 |
| Dick's Sporting Goods, Inc., 4.10%, 1/15/52 | | 2,420 | 1,471,586 |
| Ford Motor Co., 3.25%, 2/12/32 | | 1,178 | 908,996 |
| Ford Motor Credit Co., LLC, 7.35%, 11/4/27 | | 487 | 497,795 |
| General Motors Financial Co., Inc.: | | | |
| 4.30%, 4/6/29 | | 366 | 328,534 |
| 5.80%, 6/23/28 | | 1,860 | 1,818,120 |
| 5.85%, 4/6/30(6) | | 3,786 | 3,628,920 |
| Hyundai Capital America: | | | |
| 5.68%, 6/26/28(1) | | 1,400 | 1,369,572 |
| 5.80%, 6/26/25(1) | | 1,688 | 1,681,562 |
| WarnerMedia Holdings, Inc.: | | | |
| 5.05%, 3/15/42 | | 2,059 | 1,593,550 |
| 5.391%, 3/15/62 | | 886 | 654,979 |
| | | | $ 16,108,642 |
| Consumer, Non-cyclical — 1.5% | |
| Ashtead Capital, Inc., 4.25%, 11/1/29(1) | $ | 2,501 | $ 2,216,454 |
| Centene Corp.: | | | |
| 2.50%, 3/1/31 | | 2,432 | 1,871,153 |
| 4.625%, 12/15/29 | | 312 | 281,360 |
| Coca-Cola Femsa SAB de CV, 1.85%, 9/1/32 | | 220 | 163,848 |
| Conservation Fund (The), 3.474%, 12/15/29 | | 190 | 160,559 |
| CVS Health Corp.: | | | |
| 4.30%, 3/25/28 | | 136 | 128,753 |
| 5.25%, 1/30/31 | | 1,335 | 1,283,400 |
| 5.875%, 6/1/53 | | 2,129 | 1,970,477 |
| CVS Pass-Through Trust, 6.036%, 12/10/28 | | 134 | 132,905 |
| Ford Foundation (The), 2.415%, 6/1/50 | | 270 | 157,508 |
| Kaiser Foundation Hospitals, 3.15%, 5/1/27 | | 224 | 209,727 |
| Merck & Co., Inc., 2.45%, 6/24/50 | | 591 | 340,402 |
| Pfizer, Inc., 2.625%, 4/1/30 | | 460 | 393,088 |
| Smithfield Foods, Inc.: | | | |
| 2.625%, 9/13/31(1) | | 701 | 503,230 |
| 5.20%, 4/1/29(1) | | 150 | 137,173 |
| | | | $ 9,950,037 |
| Energy — 0.1% | |
| TerraForm Power Operating, LLC, 4.75%, 1/15/30(1) | $ | 544 | $ 465,476 |
| | | | $ 465,476 |
| Financial — 14.2% | |
| ABN AMRO Bank NV, 6.339% to 9/18/26, 9/18/27(1)(7) | $ | 1,300 | $ 1,297,306 |
| Affiliated Managers Group, Inc., 3.30%, 6/15/30 | | 244 | 202,948 |
| AIB Group PLC, 6.608% to 9/13/28, 9/13/29(1)(7) | | 2,251 | 2,243,103 |
| Ally Financial, Inc., 8.00%, 11/1/31 | | 1,807 | 1,825,973 |
9
See Notes to Financial Statements.
Calvert
Core Bond Fund
September 30, 2023
Schedule of Investments — continued
| Security | Principal
Amount
(000’s omitted) | Value |
| Financial (continued) | |
| American National Group, LLC, 6.144%, 6/13/32(1) | $ | 250 | $ 226,468 |
| Ameriprise Financial, Inc., 5.15%, 5/15/33 | | 1,678 | 1,586,804 |
| Andrew W. Mellon Foundation (The), 0.947%, 8/1/27 | | 300 | 257,150 |
| Australia & New Zealand Banking Group, Ltd., 2.95% to 7/22/25, 7/22/30(1)(7) | | 316 | 293,499 |
| Aviation Capital Group, LLC: | | | |
| 6.25%, 4/15/28(1) | | 693 | 678,338 |
| 6.375%, 7/15/30(1) | | 1,533 | 1,485,830 |
| Banco Santander S.A.: | | | |
| 1.722% to 9/14/26, 9/14/27(7) | | 1,000 | 874,881 |
| 4.175% to 3/24/27, 3/24/28(7) | | 200 | 184,762 |
| 5.294%, 8/18/27 | | 1,200 | 1,160,906 |
| 6.921%, 8/8/33 | | 1,600 | 1,530,987 |
| Bank of America Corp.: | | | |
| 1.734% to 7/22/26, 7/22/27(7) | | 2,425 | 2,149,588 |
| 2.299% to 7/21/31, 7/21/32(7) | | 697 | 528,477 |
| 2.572% to 10/20/31, 10/20/32(7) | | 227 | 174,541 |
| 3.824% to 1/20/27, 1/20/28(7) | | 3,987 | 3,704,356 |
| 3.846% to 3/8/32, 3/8/37(7) | | 1,040 | 846,676 |
| 4.571% to 4/27/32, 4/27/33(7) | | 2,452 | 2,178,186 |
| 5.819% to 9/15/28, 9/15/29(7) | | 2,710 | 2,677,865 |
| 5.872% to 9/15/33, 9/15/34(7) | | 2,034 | 1,980,513 |
| 6.204% to 11/10/27, 11/10/28(7) | | 840 | 844,106 |
| Bank of New York Mellon Corp. (The), 4.706% to 2/1/33, 2/1/34(7) | | 1,940 | 1,752,721 |
| BNP Paribas S.A., 7.75% to 8/16/29(1)(7)(8) | | 244 | 232,231 |
| Boston Properties, L.P., 2.45%, 10/1/33(6) | | 894 | 610,980 |
| Brookfield Finance, Inc., 4.70%, 9/20/47 | | 485 | 378,358 |
| CaixaBank S.A., 6.208% to 1/18/28, 1/18/29(1)(7) | | 1,550 | 1,517,567 |
| Capital One Financial Corp.: | | | |
| 3.273% to 3/1/29, 3/1/30(7) | | 197 | 164,906 |
| 3.75%, 7/28/26 | | 212 | 196,643 |
| 4.20%, 10/29/25 | | 1,000 | 953,757 |
| CBRE Services, Inc., 5.95%, 8/15/34 | | 1,205 | 1,138,021 |
| Charles Schwab Corp. (The): | | | |
| 2.45%, 3/3/27 | | 1,060 | 944,751 |
| 6.136% to 8/24/33, 8/24/34(7) | | 1,560 | 1,518,358 |
| CI Financial Corp.: | | | |
| 3.20%, 12/17/30 | | 501 | 380,398 |
| 4.10%, 6/15/51 | | 789 | 457,386 |
| Citigroup, Inc.: | | | |
| 2.572% to 6/3/30, 6/3/31(7) | | 1,287 | 1,026,776 |
| 4.00% to 12/10/25(7)(8) | | 415 | 364,059 |
| 5.316% to 3/26/40, 3/26/41(7) | | 647 | 584,888 |
| Corporate Office Properties, L.P., 2.90%, 12/1/33 | | 1,022 | 717,924 |
| EPR Properties, 4.95%, 4/15/28 | | 2,471 | 2,191,777 |
| Extra Space Storage, L.P.: | | | |
| 2.55%, 6/1/31 | | 1,375 | 1,071,756 |
| 5.50%, 7/1/30 | | 1,175 | 1,137,151 |
| Security | Principal
Amount
(000’s omitted) | Value |
| Financial (continued) | |
| F&G Annuities & Life, Inc., 7.40%, 1/13/28 | $ | 1,450 | $ 1,448,632 |
| Fifth Third Bancorp, 6.339% to 7/27/28, 7/27/29(7) | | 3,085 | 3,049,213 |
| GA Global Funding Trust, 2.25%, 1/6/27(1) | | 1,753 | 1,537,474 |
| Global Atlantic Fin Co., 3.125%, 6/15/31(1) | | 1,039 | 741,596 |
| HAT Holdings I, LLC/HAT Holdings II, LLC: | | | |
| 3.375%, 6/15/26(1) | | 1,254 | 1,115,945 |
| 3.75%, 9/15/30(1)(6) | | 2,300 | 1,762,960 |
| 6.00%, 4/15/25(1) | | 685 | 667,285 |
| HSBC Holdings PLC: | | | |
| 6.161% to 3/9/28, 3/9/29(7) | | 1,107 | 1,096,461 |
| 7.39% to 11/3/27, 11/3/28(7) | | 1,722 | 1,782,136 |
| Huntington National Bank (The), 5.699% to 11/18/24, 11/18/25(7) | | 438 | 428,298 |
| Intesa Sanpaolo SpA: | | | |
| 7.00%, 11/21/25(1) | | 400 | 405,034 |
| 8.248% to 11/21/32, 11/21/33(1)(7) | | 2,549 | 2,571,158 |
| Jefferies Financial Group, Inc., 5.875%, 7/21/28 | | 1,603 | 1,569,720 |
| JPMorgan Chase & Co.: | | | |
| 1.47% to 9/22/26, 9/22/27(7) | | 328 | 287,462 |
| 2.545% to 11/8/31, 11/8/32(7) | | 122 | 94,463 |
| 3.54% to 5/1/27, 5/1/28(7) | | 1,100 | 1,012,035 |
| 4.005% to 4/23/28, 4/23/29(7) | | 846 | 780,101 |
| 4.493% to 3/24/30, 3/24/31(7) | | 799 | 731,798 |
| 4.565% to 6/14/29, 6/14/30(7) | | 2,910 | 2,715,539 |
| KeyBank N.A., 5.85%, 11/15/27 | | 395 | 375,874 |
| KKR Group Finance Co. VII, LLC, 3.625%, 2/25/50(1) | | 695 | 443,111 |
| Macquarie Bank, Ltd., 6.798%, 1/18/33(1) | | 543 | 533,361 |
| Metropolitan Life Global Funding I, 5.15%, 3/28/33(1) | | 541 | 512,908 |
| Principal Financial Group, Inc., 4.625%, 9/15/42 | | 308 | 246,752 |
| Radian Group, Inc., 4.875%, 3/15/27 | | 1,270 | 1,188,009 |
| Societe Generale S.A.: | | | |
| 6.221% to 6/15/32, 6/15/33(1)(7) | | 255 | 231,245 |
| 9.375% to 11/22/27(1)(7)(8) | | 276 | 271,133 |
| Standard Chartered PLC, 1.822% to 11/23/24, 11/23/25(1)(7) | | 200 | 189,057 |
| Stifel Financial Corp., 4.00%, 5/15/30 | | 438 | 370,597 |
| Sun Communities Operating, L.P.: | | | |
| 4.20%, 4/15/32 | | 500 | 426,963 |
| 5.70%, 1/15/33 | | 445 | 421,385 |
| Swedbank AB: | | | |
| 5.337%, 9/20/27(1) | | 1,012 | 981,514 |
| 6.136%, 9/12/26(1) | | 2,031 | 2,023,839 |
| Synchrony Bank, 5.40%, 8/22/25 | | 500 | 482,102 |
| Synchrony Financial, 4.50%, 7/23/25 | | 1,600 | 1,524,082 |
| Synovus Bank/Columbus, GA: | | | |
| 4.00% to 10/29/25, 10/29/30(7) | | 373 | 301,333 |
| 5.625%, 2/15/28 | | 611 | 553,987 |
| Synovus Financial Corp., 5.90% to 2/7/24, 2/7/29(7) | | 365 | 339,749 |
| Toronto-Dominion Bank (The), 8.125% to 10/31/27, 10/31/82(7) | | 1,268 | 1,264,645 |
10
See Notes to Financial Statements.
Calvert
Core Bond Fund
September 30, 2023
Schedule of Investments — continued
| Security | Principal
Amount
(000’s omitted) | Value |
| Financial (continued) | |
| Truist Financial Corp.: | | | |
| 5.10% to 3/1/30(7)(8) | $ | 232 | $ 199,511 |
| 5.867% to 6/8/33, 6/8/34(7) | | 3,816 | 3,594,399 |
| U.S. Bancorp: | | | |
| 5.775% to 6/12/28, 6/12/29(7) | | 3,153 | 3,070,817 |
| 5.836% to 6/10/33, 6/12/34(7) | | 1,149 | 1,084,572 |
| UBS Group AG, 2.095% to 2/11/31, 2/11/32(1)(7) | | 745 | 551,647 |
| UniCredit SpA, 2.569% to 9/22/25, 9/22/26(1)(7) | | 447 | 409,693 |
| Westpac Banking Corp., 3.02% to 11/18/31, 11/18/36(7) | | 244 | 180,778 |
| | | | $ 91,844,044 |
| Government - Multinational — 1.5% | |
| Asian Development Bank: | | | |
| 2.375%, 8/10/27 | $ | 2,500 | $ 2,296,518 |
| 3.125%, 9/26/28 | | 291 | 270,413 |
| European Bank for Reconstruction & Development, 1.50%, 2/13/25 | | 305 | 289,316 |
| European Investment Bank: | | | |
| 1.625%, 5/13/31 | | 585 | 472,913 |
| 2.125%, 4/13/26 | | 1,166 | 1,088,790 |
| 2.375%, 5/24/27 | | 2,860 | 2,634,733 |
| 2.875%, 6/13/25(1) | | 1,942 | 1,867,928 |
| Inter-American Development Bank, 0.875%, 4/3/25(6) | | 241 | 225,524 |
| International Bank for Reconstruction & Development, 3.125%, 11/20/25 | | 861 | 826,389 |
| | | | $ 9,972,524 |
| Government - Regional — 0.4% | |
| Kommuninvest I Sverige AB, 0.375%, 6/19/24(1)(6) | $ | 2,600 | $ 2,503,108 |
| | | | $ 2,503,108 |
| Industrial — 0.3% | |
| Berry Global, Inc., 5.50%, 4/15/28(1) | $ | 385 | $ 372,167 |
| Penske Truck Leasing Co., L.P./PTL Finance Corp., 6.20%, 6/15/30(1) | | 1,510 | 1,489,277 |
| | | | $ 1,861,444 |
| Technology — 1.7% | |
| Apple, Inc., 3.45%, 2/9/45 | $ | 936 | $ 709,833 |
| Concentrix Corp.: | | | |
| 6.60%, 8/2/28 | | 2,977 | 2,874,553 |
| 6.65%, 8/2/26 | | 1,535 | 1,526,325 |
| Foundry JV Holdco, LLC, 5.875%, 1/25/34(1) | | 1,141 | 1,091,182 |
| Intel Corp., 5.70%, 2/10/53 | | 1,602 | 1,503,432 |
| Kyndryl Holdings, Inc.: | | | |
| 2.70%, 10/15/28 | | 895 | 736,322 |
| 3.15%, 10/15/31(6) | | 1,825 | 1,383,641 |
| Marvell Technology, Inc., 5.75%, 2/15/29 | | 745 | 738,477 |
| Micron Technology, Inc., 2.703%, 4/15/32 | | 405 | 309,483 |
| Security | Principal
Amount
(000’s omitted) | Value |
| Technology (continued) | |
| Seagate HDD Cayman, 5.75%, 12/1/34 | $ | 316 | $ 267,221 |
| | | | $ 11,140,469 |
| Utilities — 0.6% | |
| Consolidated Edison Co. of New York, Inc., 4.00%, 11/15/57 | $ | 420 | $ 294,729 |
| Enel Finance International N.V., 1.375%, 7/12/26(1) | | 201 | 177,607 |
| MidAmerican Energy Co.: | | | |
| 4.25%, 7/15/49 | | 1,016 | 795,596 |
| 5.35%, 1/15/34 | | 294 | 290,289 |
| New England Power Co., 5.936%, 11/25/52(1) | | 502 | 478,045 |
| NextEra Energy Capital Holdings, Inc., 1.90%, 6/15/28 | | 1,482 | 1,255,128 |
| Northern States Power Co., 2.60%, 6/1/51 | | 317 | 179,927 |
| Terraform Global Operating, LLC, 6.125%, 3/1/26(1) | | 225 | 221,007 |
| | | | $ 3,692,328 |
Total Corporate Bonds
(identified cost $169,830,482) | | | $160,866,879 |
| High Social Impact Investments — 0.0%(9) |
| Security | Principal
Amount
(000's omitted) | Value |
| Calvert Impact Capital, Inc., Community Investment Notes, 1.50%, 12/15/23(10)(11) | $ | 250 | $ 246,573 |
Total High Social Impact Investments
(identified cost $250,000) | | | $ 246,573 |
| Preferred Stocks — 0.0%(9) |
| Security | Shares | Value |
| Wireless Telecommunication Services — 0.0%(9) | |
| United States Cellular Corp.5.50% | | 16,250 | $ 267,475 |
Total Preferred Stocks
(identified cost $406,250) | | | $ 267,475 |
| Sovereign Government Bonds — 0.9% |
| Security | Principal
Amount
(000’s omitted) | Value |
| Kreditanstalt fuer Wiederaufbau: | | | |
| 1.00%, 10/1/26 | $ | 934 | $ 834,620 |
| 1.75%, 9/14/29 | | 2,635 | 2,240,950 |
| Nederlandse Waterschapsbank NV, 1.00%, 5/28/30(1) | | 3,400 | 2,657,285 |
Total Sovereign Government Bonds
(identified cost $6,130,589) | | | $ 5,732,855 |
11
See Notes to Financial Statements.
Calvert
Core Bond Fund
September 30, 2023
Schedule of Investments — continued
| Taxable Municipal Obligations — 0.3% |
| Security | Principal
Amount
(000's omitted) | Value |
| General Obligations — 0.2% | |
| Massachusetts, Green Bonds, 3.277%, 6/1/46 | $ | 1,300 | $ 962,455 |
| | | | $ 962,455 |
| Special Tax Revenue — 0.0%(9) | |
| California Health Facilities Financing Authority, (No Place Like Home Program): | | | |
| Social Bonds, 2.984%, 6/1/33 | $ | 155 | $ 126,717 |
| Social Bonds, 3.034%, 6/1/34 | | 110 | 88,408 |
| | | | $ 215,125 |
| Water and Sewer — 0.1% | |
| District of Columbia Water & Sewer Authority, Green Bonds, 4.814%, 10/1/2114 | $ | 555 | $ 474,342 |
| San Diego County Water Authority, CA, Green Bonds, 1.951%, 5/1/34 | | 185 | 134,884 |
| | | | $ 609,226 |
Total Taxable Municipal Obligations
(identified cost $2,399,808) | | | $ 1,786,806 |
| U.S. Government Agencies and Instrumentalities — 0.1% |
| Security | Principal
Amount
(000's omitted) | Value |
| U.S. Department of Housing and Urban Development: | | | |
| 3.435%, 8/1/34 | $ | 145 | $ 125,386 |
| 3.485%, 8/1/35 | | 85 | 71,585 |
| 3.585%, 8/1/37 | | 150 | 124,346 |
Total U.S. Government Agencies and Instrumentalities
(identified cost $411,152) | | | $ 321,317 |
| U.S. Government Agency Mortgage-Backed Securities — 22.0% |
| Security | Principal
Amount
(000's omitted) | Value |
| Federal Home Loan Mortgage Corp.: | | | |
| 3.00%, 4/1/51 | $ | 234 | $ 195,706 |
| 5.00%, 2/1/53 | | 1,640 | 1,549,523 |
| 5.50%, 7/1/53 | | 2,677 | 2,591,852 |
| 6.00%, with various maturities to 2053 | | 9,818 | 9,711,167 |
| 6.50%, 8/1/53 | | 4,358 | 4,388,448 |
| Federal National Mortgage Association: | | | |
| 2.00%, 4/1/51 | | 158 | 122,097 |
| 3.00%, 7/1/49 | | 132 | 110,272 |
| 4.00%, 30-Year, TBA(12) | | 25,812 | 22,996,868 |
| 4.50%, 30-Year, TBA(12) | | 14,454 | 13,277,913 |
| Security | Principal
Amount
(000's omitted) | Value |
| Federal National Mortgage Association: (continued) | | | |
| 4.50%, with various maturities to 2052 | $ | 4,292 | $ 3,950,364 |
| 5.00%, 7/1/53 | | 2,473 | 2,336,236 |
| 5.00%, 30-Year, TBA(12) | | 32,469 | 30,648,979 |
| 5.50%, 7/1/53 | | 4,002 | 3,873,210 |
| 5.50%, 30-Year, TBA(12) | | 26,333 | 25,460,733 |
| 6.00%, 30-Year, TBA(12) | | 17,275 | 17,057,029 |
| 7.00%, 6/1/53 | | 385 | 400,042 |
| Government National Mortgage Association II: | | | |
| 2.50%, with various maturities to 2051 | | 568 | 458,380 |
| 5.50%, 6/20/53 | | 1,660 | 1,617,317 |
| 6.00%, with various maturities to 2053 | | 384 | 382,562 |
| 7.00%, 6/20/53 | | 649 | 665,871 |
Total U.S. Government Agency Mortgage-Backed Securities
(identified cost $144,739,520) | | $141,794,569 |
| U.S. Treasury Obligations — 42.8% |
| Security | Principal
Amount
(000's omitted) | Value |
| U.S. Treasury Bonds: | | | |
| 1.375%, 8/15/50 | $ | 375 | $ 183,105 |
| 1.875%, 2/15/41 | | 1,340 | 864,980 |
| 1.875%, 11/15/51 | | 442 | 246,501 |
| 2.00%, 2/15/50 | | 355 | 207,245 |
| 2.00%, 8/15/51 | | 150 | 86,590 |
| 2.25%, 2/15/52 | | 1,115 | 684,737 |
| 2.875%, 5/15/43 | | 9,219 | 6,833,404 |
| 3.00%, 8/15/52 | | 244 | 177,863 |
| 3.25%, 5/15/42 | | 2,100 | 1,673,889 |
| 3.375%, 8/15/42 | | 850 | 688,882 |
| 3.625%, 2/15/53 | | 2,655 | 2,196,390 |
| 3.875%, 5/15/43 | | 35,724 | 31,063,134 |
| 4.00%, 11/15/52 | | 1,783 | 1,580,741 |
| U.S. Treasury Notes: | | | |
| 0.25%, 3/15/24 | | 7,515 | 7,343,727 |
| 0.25%, 5/15/24 | | 5,600 | 5,421,445 |
| 0.25%, 6/15/24 | | 4,765 | 4,594,101 |
| 0.375%, 12/31/25 | | 2,111 | 1,908,723 |
| 1.00%, 7/31/28 | | 2,066 | 1,743,107 |
| 1.25%, 3/31/28 | | 1,646 | 1,420,897 |
| 1.25%, 6/30/28 | | 5,325 | 4,560,779 |
| 1.50%, 1/31/27 | | 626 | 563,742 |
| 1.875%, 2/28/27 | | 100 | 91,031 |
| 2.00%, 4/30/24 | | 5,500 | 5,391,871 |
| 2.00%, 5/31/24 | | 5,500 | 5,376,638 |
| 2.125%, 3/31/24 | | 10,000 | 9,836,565 |
| 2.25%, 3/31/24 | | 5,400 | 5,315,542 |
| 2.25%, 4/30/24 | | 5,450 | 5,350,518 |
12
See Notes to Financial Statements.
Calvert
Core Bond Fund
September 30, 2023
Schedule of Investments — continued
| Security | Principal
Amount
(000's omitted) | Value |
| U.S. Treasury Notes: (continued) | | | |
| 2.50%, 4/30/24 | $ | 5,450 | $ 5,357,543 |
| 2.50%, 5/15/24 | | 5,550 | 5,450,654 |
| 2.75%, 8/15/32 | | 35,420 | 30,677,041 |
| 3.25%, 8/31/24 | | 1,900 | 1,862,305 |
| 3.375%, 5/15/33 | | 11,962 | 10,849,908 |
| 3.50%, 1/31/28 | | 7,893 | 7,533,807 |
| 3.625%, 3/31/28 | | 8,275 | 7,934,303 |
| 3.625%, 5/31/28 | | 36,427 | 34,917,272 |
| 3.875%, 3/31/25 | | 10,050 | 9,851,356 |
| 3.875%, 4/30/25 | | 10,855 | 10,635,144 |
| 3.875%, 11/30/27 | | 1,998 | 1,937,123 |
| 3.875%, 12/31/27 | | 5,265 | 5,103,348 |
| 4.00%, 2/29/28 | | 3,165 | 3,083,526 |
| 4.125%, 1/31/25 | | 4,350 | 4,283,221 |
| 4.125%, 7/31/28 | | 7,875 | 7,705,810 |
| 4.25%, 12/31/24 | | 4,950 | 4,883,774 |
| 4.25%, 5/31/25 | | 11,423 | 11,254,332 |
| 4.50%, 11/30/24 | | 5,767 | 5,709,893 |
| 4.75%, 7/31/25 | | 2,300 | 2,284,861 |
Total U.S. Treasury Obligations
(identified cost $285,997,971) | | | $276,721,368 |
| Short-Term Investments — 2.8% | | | |
| Affiliated Fund — 2.6% |
| Security | Shares | Value |
| Morgan Stanley Institutional Liquidity Funds - Government Portfolio, Institutional Class, 5.27%(13) | | 17,004,514 | $ 17,004,514 |
Total Affiliated Fund
(identified cost $17,004,514) | | | $ 17,004,514 |
| Securities Lending Collateral — 0.2% |
| Security | Shares | Value |
| State Street Navigator Securities Lending Government Money Market Portfolio, 5.36%(14) | | 1,432,130 | $ 1,432,130 |
Total Securities Lending Collateral
(identified cost $1,432,130) | | | $ 1,432,130 |
Total Short-Term Investments
(identified cost $18,436,644) | | | $ 18,436,644 |
Total Purchased Call Options — 0.0%(9)
(identified cost $67,247) | | | $ 69,094 |
Total Investments — 116.1%
(identified cost $775,212,670) | | | $750,121,052 |
| Other Assets, Less Liabilities — (16.1)% | | | $ (104,132,900) |
| Net Assets — 100.0% | | | $ 645,988,152 |
| The percentage shown for each investment category in the Schedule of Investments is based on net assets. |
| (1) | Security exempt from registration under Rule 144A of the Securities Act of 1933, as amended. These securities may be sold in certain transactions in reliance on an exemption from registration (normally to qualified institutional buyers). At September 30, 2023, the aggregate value of these securities is $159,963,514 or 24.8% of the Fund's net assets. |
| (2) | Weighted average fixed-rate coupon that changes/updates monthly. Rate shown is the rate at September 30, 2023. |
| (3) | Step coupon security. Interest rate represents the rate in effect at
September 30, 2023. |
| (4) | Variable rate security. The stated interest rate represents the rate in effect at September 30, 2023. |
| (5) | Represents an investment in an issuer that may be deemed to be an affiliate (see Note 8). |
| (6) | All or a portion of this security was on loan at September 30, 2023. The aggregate market value of securities on loan at September 30, 2023 was $4,731,471. |
| (7) | Security converts to variable rate after the indicated fixed-rate coupon period. |
| (8) | Perpetual security with no stated maturity date but may be subject to calls by the issuer. |
| (9) | Amount is less than 0.05%. |
13
See Notes to Financial Statements.
Calvert
Core Bond Fund
September 30, 2023
Schedule of Investments — continued
| (10) | May be deemed to be an affiliated company (see Note 8). |
| (11) | Restricted security. Total market value of restricted securities amounts to $246,573, which represents less than 0.05% of the net assets of the Fund as of September 30, 2023. |
| (12) | TBA (To Be Announced) securities are purchased on a forward commitment basis with an approximate principal amount and maturity date. The actual principal amount and maturity date are determined upon settlement. |
| (13) | May be deemed to be an affiliated investment company. The rate shown is the annualized seven-day yield as of September 30, 2023. |
| (14) | Represents investment of cash collateral received in connection with securities lending. |
Purchased Call Options (Exchange-Traded) — 0.0%(1)
| Description | Number of
Contracts | Notional
Amount | Exercise
Price | Expiration
Date | Value |
| U.S. 10-Year Treasury Note Futures 12/2023 | 134 | $14,480,375 | $110.00 | 11/24/23 | $ 69,094 |
| Total | | | | | $69,094 |
| (1) | Amount is less than 0.05%. |
Futures Contracts
| Description | Number of
Contracts | Position | Expiration
Date | Notional
Amount | Value/
Unrealized
Appreciation
(Depreciation) |
| Interest Rate Futures | | | | | |
| U.S. 2-Year Treasury Note | 533 | Long | 12/29/23 | $108,044,930 | $ (394,481) |
| U.S. 5-Year Treasury Note | 208 | Long | 12/29/23 | 21,914,750 | (128,650) |
| U.S. 10-Year Treasury Note | 44 | Long | 12/19/23 | 4,754,750 | (6,993) |
| U.S. Long Treasury Bond | 104 | Long | 12/19/23 | 11,833,250 | (491,757) |
| U.S. Ultra 10-Year Treasury Note | 26 | Long | 12/19/23 | 2,900,625 | 1,202 |
| U.S. Ultra-Long Treasury Bond | 41 | Long | 12/19/23 | 4,866,187 | (279,034) |
| | | | | | $(1,299,713) |
Restricted Securities
| Description | Acquisition Date | Cost |
| Calvert Impact Capital, Inc., Community Investment Notes, 1.50%, 12/15/23 | 12/14/20 | $250,000 |
| Abbreviations: |
| SOFR | – Secured Overnight Financing Rate |
| TBA | – To Be Announced |
| Currency Abbreviations: |
| USD | – United States Dollar |
14
See Notes to Financial Statements.
Calvert
Core Bond Fund
September 30, 2023
Statement of Assets and Liabilities
| | September 30, 2023 |
| Assets | |
Investments in securities of unaffiliated issuers, at value (identified cost $756,889,256) - including
$4,731,471 of securities on loan | $ 731,792,723 |
| Investments in securities of affiliated issuers, at value (identified cost $18,323,414) | 18,328,329 |
| Receivable for variation margin on open futures contracts | 150,511 |
| Cash | 1,311 |
| Deposits at broker for futures contracts | 1,674,241 |
| Deposits for forward commitment securities | 998,000 |
| Receivable for investments sold | 27,398,075 |
| Receivable for capital shares sold | 12,797,908 |
| Interest receivable | 5,696,443 |
| Dividends and interest receivable - affiliated | 59,472 |
| Securities lending income receivable | 3,570 |
| Receivable from affiliates | 80,256 |
| Trustees' deferred compensation plan | 58,475 |
| Prepaid expenses | 12,012 |
| Total assets | $799,051,326 |
| Liabilities | |
| Payable for investments purchased | $ 38,087,543 |
| Payable for forward commitment securities | 111,578,235 |
| Payable for capital shares redeemed | 1,513,140 |
| Distributions payable | 8,832 |
| Deposits for securities loaned | 1,432,130 |
| Payable to affiliates: | |
| Investment advisory fee | 153,812 |
| Administrative fee | 62,109 |
| Distribution and service fees | 11,743 |
| Sub-transfer agency fee | 3,693 |
| Trustees' deferred compensation plan | 58,475 |
| Accrued expenses | 153,462 |
| Total liabilities | $153,063,174 |
| Net Assets | $645,988,152 |
| Sources of Net Assets | |
| Paid-in capital | $ 691,589,342 |
| Accumulated loss | (45,601,190) |
| Net Assets | $645,988,152 |
| Class A Shares | |
| Net Assets | $ 59,234,600 |
| Shares Outstanding | 3,906,428 |
Net Asset Value and Redemption Price Per Share
(net assets ÷ shares of beneficial interest outstanding) | $ 15.16 |
Maximum Offering Price Per Share
(100 ÷ 96.75 of net asset value per share) | $ 15.67 |
| Class I Shares | |
| Net Assets | $ 586,704,939 |
| Shares Outstanding | 38,639,506 |
Net Asset Value, Offering Price and Redemption Price Per Share
(net assets ÷ shares of beneficial interest outstanding) | $ 15.18 |
15
See Notes to Financial Statements.
Calvert
Core Bond Fund
September 30, 2023
Statement of Assets and Liabilities — continued
| | September 30, 2023 |
| Class R6 Shares | |
| Net Assets | $ 48,613 |
| Shares Outstanding | 3,202 |
Net Asset Value, Offering Price and Redemption Price Per Share
(net assets ÷ shares of beneficial interest outstanding) | $ 15.18 |
| On sales of $100,000 or more, the offering price of Class A shares is reduced. |
16
See Notes to Financial Statements.
Calvert
Core Bond Fund
September 30, 2023
| | Year Ended |
| | September 30, 2023 |
| Investment Income | |
| Dividend income | $ 22,344 |
| Dividend income - affiliated issuers | 521,320 |
| Interest and other income | 16,406,790 |
| Interest income - affiliated issuers | 88,763 |
| Securities lending income, net | 25,196 |
| Total investment income | $ 17,064,413 |
| Expenses | |
| Investment advisory fee | $ 1,135,753 |
| Administrative fee | 454,301 |
| Distribution and service fees: | |
| Class A | 120,407 |
| Trustees' fees and expenses | 27,681 |
| Custodian fees | 18,190 |
| Transfer agency fees and expenses | 311,684 |
| Accounting fees | 88,836 |
| Professional fees | 54,763 |
| Registration fees | 85,708 |
| Reports to shareholders | 24,584 |
| Miscellaneous | 33,792 |
| Total expenses | $ 2,355,699 |
| Waiver and/or reimbursement of expenses by affiliates | $ (388,952) |
| Net expenses | $ 1,966,747 |
| Net investment income | $ 15,097,666 |
| Realized and Unrealized Gain (Loss) | |
| Net realized gain (loss): | |
| Investment securities | $ (13,700,402) |
| Investment securities - affiliated issuers | 18,188 |
| Futures contracts | (2,951,573) |
| Net realized loss | $(16,633,787) |
| Change in unrealized appreciation (depreciation): | |
| Investment securities | $ (8,032,328) |
| Investment securities - affiliated issuers | (6,905) |
| Futures contracts | (680,047) |
| Net change in unrealized appreciation (depreciation) | $ (8,719,280) |
| Net realized and unrealized loss | $(25,353,067) |
| Net decrease in net assets from operations | $(10,255,401) |
17
See Notes to Financial Statements.
Calvert
Core Bond Fund
September 30, 2023
Statements of Changes in Net Assets
| | Year Ended September 30, |
| | 2023 | 2022 |
| Increase (Decrease) in Net Assets | | |
| From operations: | | |
| Net investment income | $ 15,097,666 | $ 2,353,310 |
| Net realized loss | (16,633,787) | (2,541,718) |
| Net change in unrealized appreciation (depreciation) | (8,719,280) | (20,526,211) |
| Net decrease in net assets from operations | $ (10,255,401) | $ (20,714,619) |
| Distributions to shareholders: | | |
| Class A | $ (1,735,011) | $ (3,017,866) |
| Class I | (13,214,469) | (3,480,801) |
| Class R6(1) | (553) | — |
| Total distributions to shareholders | $ (14,950,033) | $ (6,498,667) |
| Capital share transactions: | | |
| Class A | $ 17,940,387 | $ 2,778,657 |
| Class I | 477,347,275 | 107,244,001 |
| Class R6(1) | 50,553 | — |
| Net increase in net assets from capital share transactions | $495,338,215 | $110,022,658 |
| Net increase in net assets | $470,132,781 | $ 82,809,372 |
| Net Assets | | |
| At beginning of year | $ 175,855,371 | $ 93,045,999 |
| At end of year | $645,988,152 | $175,855,371 |
| (1) | For the period from the commencement of operations, June 30, 2023, to September 30, 2023. |
18
See Notes to Financial Statements.
Calvert
Core Bond Fund
September 30, 2023
| | Class A |
| | Year Ended September 30, |
| | 2023 | 2022 | 2021 | 2020 | 2019 |
| Net asset value — Beginning of year | $ 15.59 | $ 19.49 | $ 19.97 | $ 18.45 | $ 16.07 |
| Income (Loss) From Operations | | | | | |
| Net investment income(1) | $ 0.57 | $ 0.29 | $ 0.30 | $ 0.51 | $ 0.56 |
| Net realized and unrealized gain (loss) | (0.44) | (3.03) | 0.06 | 1.53 | 2.39 |
| Total income (loss) from operations | $ 0.13 | $ (2.74) | $ 0.36 | $ 2.04 | $ 2.95 |
| Less Distributions | | | | | |
| From net investment income | $ (0.56) | $ (0.30) | $ (0.30) | $ (0.52) | $ (0.57) |
| From net realized gain | — | (0.86) | (0.54) | — | — |
| Total distributions | $ (0.56) | $ (1.16) | $ (0.84) | $ (0.52) | $ (0.57) |
| Net asset value — End of year | $ 15.16 | $ 15.59 | $ 19.49 | $ 19.97 | $ 18.45 |
| Total Return(2) | 0.76% | (14.78)% | 1.79% | 11.21% | 18.81% |
| Ratios/Supplemental Data | | | | | |
| Net assets, end of year (000’s omitted) | $59,235 | $43,106 | $50,647 | $52,965 | $51,709 |
| Ratios (as a percentage of average daily net assets):(3) | | | | | |
| Total expenses | 0.84% | 0.91% | 0.97% | 1.05% | 1.14% |
| Net expenses | 0.74% (4) | 0.74% (4) | 0.80% | 0.92% | 0.92% |
| Net investment income | 3.64% | 1.65% | 1.52% | 2.70% | 3.33% |
| Portfolio Turnover | 226% (5) | 175% (5) | 195% (5) | 52% | 43% |
| (1) | Computed using average shares outstanding. |
| (2) | Returns are historical and are calculated by determining the percentage change in net asset value with all distributions reinvested and do not reflect the effect of sales charges, if any. |
| (3) | Total expenses do not reflect amounts reimbursed and/or waived by the adviser and certain of its affiliates, if applicable. Net expenses are net of all reductions and represent the net expenses paid by the Fund. |
| (4) | Includes a reduction by the investment adviser of a portion of its advisory fee due to the Fund’s investment in the Liquidity Fund (equal to less than 0.005% of average daily net assets for the years ended September 30, 2023 and 2022). |
| (5) | Includes the effect of To Be Announced (TBA) transactions. |
19
See Notes to Financial Statements.
Calvert
Core Bond Fund
September 30, 2023
Financial Highlights — continued
| | Class I |
| | Year Ended September 30, |
| | 2023 | 2022 | 2021 | 2020 | 2019 |
| Net asset value — Beginning of year | $ 15.61 | $ 19.51 | $ 20.00 | $ 18.47 | $ 16.08 |
| Income (Loss) From Operations | | | | | |
| Net investment income(1) | $ 0.63 | $ 0.35 | $ 0.36 | $ 0.56 | $ 0.60 |
| Net realized and unrealized gain (loss) | (0.46) | (3.04) | 0.04 | 1.54 | 2.41 |
| Total income (loss) from operations | $ 0.17 | $ (2.69) | $ 0.40 | $ 2.10 | $ 3.01 |
| Less Distributions | | | | | |
| From net investment income | $ (0.60) | $ (0.35) | $ (0.35) | $ (0.57) | $ (0.62) |
| From net realized gain | — | (0.86) | (0.54) | — | — |
| Total distributions | $ (0.60) | $ (1.21) | $ (0.89) | $ (0.57) | $ (0.62) |
| Net asset value — End of year | $ 15.18 | $ 15.61 | $ 19.51 | $ 20.00 | $ 18.47 |
| Total Return(2) | 1.09% | (14.55)% | 1.99% | 11.53% | 19.14% |
| Ratios/Supplemental Data | | | | | |
| Net assets, end of year (000’s omitted) | $586,705 | $132,749 | $42,399 | $54,009 | $33,302 |
| Ratios (as a percentage of average daily net assets):(3) | | | | | |
| Total expenses | 0.59% | 0.66% | 0.72% | 0.80% | 0.87% |
| Net expenses | 0.49% (4) | 0.49% (4) | 0.55% | 0.67% | 0.63% |
| Net investment income | 4.02% | 2.07% | 1.81% | 2.93% | 3.53% |
| Portfolio Turnover | 226% (5) | 175% (5) | 195% (5) | 52% | 43% |
| (1) | Computed using average shares outstanding. |
| (2) | Returns are historical and are calculated by determining the percentage change in net asset value with all distributions reinvested and do not reflect the effect of sales charges, if any. |
| (3) | Total expenses do not reflect amounts reimbursed and/or waived by the adviser and certain of its affiliates, if applicable. Net expenses are net of all reductions and represent the net expenses paid by the Fund. |
| (4) | Includes a reduction by the investment adviser of a portion of its advisory fee due to the Fund’s investment in the Liquidity Fund (equal to less than 0.005% of average daily net assets for the years ended September 30, 2023 and 2022). |
| (5) | Includes the effect of To Be Announced (TBA) transactions. |
20
See Notes to Financial Statements.
Calvert
Core Bond Fund
September 30, 2023
Financial Highlights — continued
| | Class R6 |
| | Period Ended
September 30,
2023(1) |
| |
| Net asset value — Beginning of period | $ 15.79 |
| Income (Loss) From Operations | |
| Net investment income(2) | $ 0.17 |
| Net realized and unrealized loss | (0.61) |
| Total loss from operations | $ (0.44) |
| Less Distributions | |
| From net investment income | $ (0.17) |
| Total distributions | $ (0.17) |
| Net asset value — End of period | $15.18 |
| Total Return(3) | (2.78)% (4) |
| Ratios/Supplemental Data | |
| Net assets, end of period (000’s omitted) | $ 49 |
| Ratios (as a percentage of average daily net assets):(5) | |
| Total expenses | 0.56% (6) |
| Net expenses | 0.46% (6)(7) |
| Net investment income | 4.41% (6) |
| Portfolio Turnover | 226% (8)(9) |
| (1) | For the period from the commencement of operations, June 30, 2023, to September 30, 2023. |
| (2) | Computed using average shares outstanding. |
| (3) | Returns are historical and are calculated by determining the percentage change in net asset value with all distributions reinvested and do not reflect the effect of sales charges, if any. |
| (4) | Not annualized. |
| (5) | Total expenses do not reflect amounts reimbursed and/or waived by the adviser and certain of its affiliates, if applicable. Net expenses are net of all reductions and represent the net expenses paid by the Fund. |
| (6) | Annualized. |
| (7) | Includes a reduction by the investment adviser of a portion of its advisory fee due to the Fund’s investment in the Liquidity Fund (equal to less than 0.005% of average daily net assets for the period ended September 30, 2023). |
| (8) | For the year ended September 30, 2023. |
| (9) | Includes the effect of To Be Announced (TBA) transactions. |
21
See Notes to Financial Statements.
Calvert
Core Bond Fund
September 30, 2023
Notes to Financial Statements
1 Significant Accounting Policies
Calvert Core Bond Fund (the Fund) is a diversified series of The Calvert Fund (the Trust). The Trust is a Massachusetts business trust registered under the Investment Company Act of 1940, as amended (the 1940 Act), as an open-end management investment company. The investment objective of the Fund is to seek total return with an emphasis on income. The Fund invests primarily in investment grade, U.S. dollar denominated securities.
The Fund offers three classes of shares. Class A shares are generally sold subject to a sales charge imposed at time of purchase. A contingent deferred sales charge of 0.75% may apply to certain redemptions of Class A shares for accounts for which no sales charge was paid, if redeemed within 12 months of purchase. Class I and Class R6 shares are sold at net asset value, are not subject to a sales charge and are sold only to certain eligible investors. Each class represents a pro rata interest in the Fund, but votes separately on class-specific matters and is subject to different expenses.
The Fund applies the accounting and reporting guidance in the Financial Accounting Standards Board (FASB) Accounting Standards Codification Topic 946, Financial Services – Investment Companies (ASC 946). Subsequent events, if any, through the date that the financial statements were issued have been evaluated in the preparation of the financial statements.
A Investment Valuation— Net asset value per share is determined every business day as of the close of the regular session of the New York Stock Exchange (generally 4:00 p.m. Eastern time). The Fund uses independent pricing services approved by the Board of Trustees (the Board) to value its investments wherever possible. Investments for which market quotations are not available or deemed not reliable are fair valued in good faith by the Board’s valuation designee.
U.S. generally accepted accounting principles (U.S. GAAP) establishes a disclosure hierarchy that categorizes the inputs to valuation techniques used to value assets and liabilities at measurement date. These inputs are summarized in the three broad levels listed below:
Level 1 - quoted prices in active markets for identical securities
Level 2 - other significant observable inputs (including quoted prices for similar securities, interest rates, prepayment speeds, credit risk, etc.)
Level 3 - significant unobservable inputs (including the Fund’s own assumptions in determining the fair value of investments)
The inputs or methodologies used for valuing securities are not necessarily an indication of the risk associated with investing in those securities.
Valuation techniques used to value the Fund’s investments by major category are as follows:
Equity Securities. Equity securities (including warrants and rights) listed on a U.S. securities exchange generally are valued at the last sale or closing price as reported by an independent pricing service on the primary market or exchange on which they are traded and are categorized as Level 1 in the hierarchy. Equity securities listed on the NASDAQ National Market System are valued at the NASDAQ official closing price and are categorized as Level 1 in the hierarchy. Unlisted or listed securities for which closing sales prices or closing quotations are not available are valued at the mean between the latest available bid and ask prices and are categorized as Level 2 in the hierarchy.
Debt Securities. Debt securities are generally valued based on valuations provided by third party pricing services, as derived from such services’ pricing models. Inputs to the models may include, but are not limited to, reported trades, executable bid and ask prices, broker/dealer quotations, prices or yields of securities with similar characteristics, interest rates, anticipated prepayments, benchmark curves or information pertaining to the issuer, as well as industry and economic events. Accordingly, debt securities are generally categorized as Level 2 in the hierarchy. Short-term debt securities with a remaining maturity at time of purchase of more than sixty days are valued based on valuations provided by a third party pricing service. Such securities are generally categorized as Level 2 in the hierarchy. Short-term debt securities of sufficient credit quality purchased with remaining maturities of sixty days or less for which a valuation from a third party pricing service is not readily available may be valued at amortized cost, which approximates fair value, and are categorized as Level 2 in the hierarchy.
Other Securities. Investments in management investment companies (including money market funds) that do not trade on an exchange are valued at the net asset value as of the close of each business day and are categorized as Level 1 in the hierarchy.
Derivatives. Futures contracts are valued at unrealized appreciation (depreciation) based on the settlement price established each day by the board of trade or exchange on which they are traded and are categorized as Level 1 in the hierarchy. U.S. exchange-traded options are valued at the mean between the bid and ask prices at valuation time as reported by the Options Price Reporting Authority and are categorized as Level 1 in the hierarchy.
Fair Valuation. In connection with Rule 2a-5 of the 1940 Act, the Board has designated the Fund’s investment adviser as its valuation designee. Investments for which valuations or market quotations are not readily available or are deemed unreliable are valued by the investment adviser, as valuation designee, at fair value using methods that most fairly reflect the security’s “fair value”, which is the amount that the Fund might reasonably expect to receive for the security upon its current sale in the ordinary course. Each such determination is based on a consideration of relevant factors, which are likely to vary from one pricing context to another. These factors may include, but are not limited to, the type of security, the existence of any contractual restrictions on the security’s disposition, the price and extent of public trading in similar securities of the issuer or of comparable companies or entities, quotations or relevant information obtained from broker/dealers or other market participants, information obtained from the issuer, analysts, and/or the appropriate stock exchange (for exchange-traded securities), an analysis of the company’s or entity’s financial statements, and an evaluation of the forces that influence the issuer and the market(s) in which the security is purchased and sold.
Calvert
Core Bond Fund
September 30, 2023
Notes to Financial Statements — continued
The values assigned to fair value investments are based on available information and do not necessarily represent amounts that might ultimately be realized. Further, due to the inherent uncertainty of valuations of such investments, the fair values may differ significantly from the values that would have been used had an active market existed, and the differences could be material.
The following table summarizes the market value of the Fund's holdings as of September 30, 2023, based on the inputs used to value them:
| Asset Description | Level 1 | Level 2 | Level 3 | Total |
| Asset-Backed Securities | $ — | $ 66,581,944 | $ — | $ 66,581,944 |
| Collateralized Mortgage Obligations | — | 12,703,163 | — | 12,703,163 |
| Commercial Mortgage-Backed Securities | — | 64,592,365 | — | 64,592,365 |
| Corporate Bonds | — | 160,866,879 | — | 160,866,879 |
| High Social Impact Investments | — | 246,573 | — | 246,573 |
| Preferred Stocks | 267,475 | — | — | 267,475 |
| Sovereign Government Bonds | — | 5,732,855 | — | 5,732,855 |
| Taxable Municipal Obligations | — | 1,786,806 | — | 1,786,806 |
| U.S. Government Agencies and Instrumentalities | — | 321,317 | — | 321,317 |
| U.S. Government Agency Mortgage-Backed Securities | — | 141,794,569 | — | 141,794,569 |
| U.S. Treasury Obligations | — | 276,721,368 | — | 276,721,368 |
| Short-Term Investments: | | | | |
| Affiliated Fund | 17,004,514 | — | — | 17,004,514 |
| Securities Lending Collateral | 1,432,130 | — | — | 1,432,130 |
| Purchased Call Options | 69,094 | — | — | 69,094 |
| Total Investments | $18,773,213 | $731,347,839 | $ — | $750,121,052 |
| Futures Contracts | $ 1,202 | $ — | $ — | $ 1,202 |
| Total | $18,774,415 | $731,347,839 | $ — | $750,122,254 |
| Liability Description | | | | |
| Futures Contracts | $ (1,300,915) | $ — | $ — | $ (1,300,915) |
| Total | $ (1,300,915) | $ — | $ — | $ (1,300,915) |
B Investment Transactions and Income— Investment transactions for financial statement purposes are accounted for on trade date. Realized gains and losses are recorded on an identified cost basis and may include proceeds from litigation. Dividend income is recorded on the ex-dividend date for dividends received in cash and/or securities. Non-cash dividends are recorded at the fair value of the securities received. Distributions received that represent a return of capital are recorded as a reduction of cost of investments. Distributions received that represent a capital gain are recorded as a realized gain. Interest income, which includes amortization of premium and accretion of discount on debt securities, is accrued as earned.
C Share Class Accounting— Realized and unrealized gains and losses are allocated daily to each class of shares based upon the relative net assets of each class to the total net assets of the Fund. Net investment income, other than class-specific expenses, is allocated daily to each class of shares based upon the ratio of the value of each class's paid shares to the total value of all paid shares. Expenses arising in connection with a specific class are charged directly to that class. Sub-accounting, recordkeeping and similar administrative fees payable to financial intermediaries, which are a component of transfer agency fees and expenses on the Statement of Operations, are not allocated to Class R6 shares.
D Futures Contracts— The Fund may enter into futures contracts to buy or sell a financial instrument for a set price at a future date. Initial margin deposits of either cash or securities as required by the broker are made upon entering into the contract. While the contract is open, daily variation margin payments are made to or received from the broker reflecting the daily change in market value of the contract and are recorded for financial reporting purposes as unrealized gains or losses by the Fund. When a futures contract is closed, a realized gain or loss is recorded equal to the difference between the opening and closing value of the contract. The risks associated with entering into futures contracts may include the possible illiquidity of the secondary market which would limit the Fund’s ability to close out a futures contract prior to the settlement date, an imperfect correlation between the value of the contracts and the underlying financial instruments, or that the counterparty will fail to perform its obligations under the contracts’ terms. Futures contracts are designed by boards of trade, which are designated “contracts markets” by the Commodities Futures Trading Commission. Futures contracts trade on the contracts markets in a manner that is similar to the way a stock trades on a stock exchange, and the boards of trade, through their clearing corporations, guarantee the futures contracts against default. As a result, there is minimal counterparty credit risk to the Fund.
Calvert
Core Bond Fund
September 30, 2023
Notes to Financial Statements — continued
E Options Contracts— Upon the purchase of a call or put option, the premium paid by the Fund is included in the Statement of Assets and Liabilities as an investment. The amount of the investment is subsequently marked-to-market to reflect the current market value of the option purchased, in accordance with the Fund's policies on investment valuations discussed above. Premiums paid for purchasing options that expire are treated as realized losses. Premiums paid for purchasing options that are exercised or closed are added to the amounts paid or offset against the proceeds on the underlying investment transaction to determine the realized gain or loss. As the purchaser of an index option, the Fund has the right to receive a cash payment equal to any depreciation in the value of the index below the exercise price of the option (in the case of a put) or equal to any appreciation in the value of the index over the exercise price of the option (in the case of a call) as of the valuation date of the option. The risk associated with purchasing options is limited to the premium originally paid. Purchased options traded over-the-counter involve risk that the issuer or counterparty will fail to perform its contractual obligations.
F Restricted Securities— The Fund may invest in securities that are subject to legal or contractual restrictions on resale. Generally, these securities may only be sold publicly upon registration under the Securities Act of 1933 or in transactions exempt from such registration. Information regarding restricted securities (excluding Rule 144A securities) is included at the end of the Schedule of Investments.
G Distributions to Shareholders— Distributions to shareholders are recorded by the Fund on ex-dividend date. The Fund declares income distributions daily to shareholders of record at the time of declaration and generally pays them monthly. The Fund makes distributions of net realized capital gains, if any, at least annually. Distributions are declared separately for each class of shares. Distributions are determined in accordance with income tax regulations, which may differ from U.S. GAAP; accordingly, periodic reclassifications are made within the Fund’s capital accounts to reflect income and gains available for distribution under income tax regulations.
H Estimates— The preparation of financial statements in conformity with U.S. GAAP requires management to make estimates and assumptions that affect the reported amounts of assets and liabilities and disclosure of contingent assets and liabilities at the date of the financial statements and the reported amounts of increases and decreases in net assets from operations during the reporting period. Actual results could differ from those estimates.
I Indemnifications— Under the Trust’s organizational document, its officers and Trustees may be indemnified against certain liabilities and expenses arising out of the performance of their duties to the Fund. Under Massachusetts law, if certain conditions prevail, shareholders of a Massachusetts business trust (such as the Trust) could be deemed to have personal liability for the obligations of the Trust. However, the Trust’s Declaration of Trust contains an express disclaimer of liability on the part of Fund shareholders and provides that the Trust shall assume, upon request by the shareholder, the defense on behalf of any Fund shareholders or former shareholders. Additionally, in the normal course of business, the Fund enters into agreements with service providers that may contain indemnification clauses. The Fund’s maximum exposure under these arrangements is unknown as this would involve future claims that may be made against the Fund that have not yet occurred.
J Federal Income Taxes— No provision for federal income or excise tax is required since the Fund intends to continue to qualify as a regulated investment company under the Internal Revenue Code and to distribute substantially all of its taxable earnings.
Management has analyzed the Fund's tax positions taken for all open federal income tax years and has concluded that no provision for federal income tax is required in the Fund's financial statements. A Fund's federal tax return is subject to examination by the Internal Revenue Service for a period of three years from the date of filing.
K When-Issued Securities and Delayed Delivery Transactions— The Fund may purchase securities on a delayed delivery, when-issued or forward commitment basis, including TBA (To Be Announced) securities. Payment and delivery may take place after the customary settlement period for that security. At the time the transaction is negotiated, the price of the security that will be delivered is fixed. Securities purchased on a delayed delivery, when-issued or forward commitment basis are marked-to-market daily and begin earning interest on settlement date. Such security purchases are subject to the risk that when delivered they will be worth less than the agreed upon payment price. Losses may also arise if the counterparty does not perform under the contract. A forward purchase commitment may be closed by entering into an offsetting commitment. If an offsetting commitment is entered into, the Fund will realize a gain or loss on investments based on the price established when the Fund entered into the commitment.
2 Related Party Transactions
The investment advisory fee is earned by Calvert Research and Management (CRM), an indirect, wholly-owned subsidiary of Morgan Stanley, as compensation for investment advisory services rendered to the Fund. The investment advisory fee is computed at the annual rate of 0.30% of the Fund’s average daily net assets and is payable monthly. For the year ended September 30, 2023, the investment advisory fee amounted to $1,135,753.
The Fund may invest in a money market fund, the Institutional Class of the Morgan Stanley Institutional Liquidity Funds - Government Portfolio (the “Liquidity Fund”), an open-end management investment company managed by Morgan Stanley Investment Management Inc., a wholly-owned subsidiary of Morgan Stanley. The investment advisory fee paid by the Fund is reduced by an amount equal to its pro rata share of the advisory and administration fees paid by the Fund due to its investment in the Liquidity Fund. For the year ended September 30, 2023, the investment advisory fee paid was reduced by $17,446 relating to the Fund’s investment in the Liquidity Fund.
Calvert
Core Bond Fund
September 30, 2023
Notes to Financial Statements — continued
CRM has agreed to reimburse the Fund’s operating expenses to the extent that total annual operating expenses (relating to ordinary operating expenses only and excluding expenses such as brokerage commissions, acquired fund fees and expenses of unaffiliated funds, borrowing costs, taxes or litigation expenses) exceed 0.74%, 0.49% and 0.46% for Class A, Class I and Class R6, respectively, of such class's average daily net assets. The expense reimbursement agreement with CRM may be changed or terminated after February 1, 2025. For the year ended September 30, 2023, CRM waived or reimbursed expenses of $371,506.
The administrative fee is earned by CRM as compensation for administrative services rendered to the Fund. The fee is computed at an annual rate of 0.12% of the Fund’s average daily net assets attributable to Class A, Class I and Class R6 and is payable monthly. For the year ended September 30, 2023, CRM was paid administrative fees of $454,301.
The Fund has in effect a distribution plan for Class A shares (Class A Plan) pursuant to Rule 12b-1 under the 1940 Act. Pursuant to the Class A Plan, the Fund pays Eaton Vance Distributors, Inc. (EVD), an affiliate of CRM and the Fund’s principal underwriter, a distribution and service fee of 0.25% per annum of its average daily net assets attributable to Class A shares for distribution services and facilities provided to the Fund by EVD, as well as for personal services and/or the maintenance of shareholder accounts. Distribution and service fees paid or accrued for the year ended September 30, 2023 amounted to $120,407 for Class A shares.
The Fund was informed that EVD received $10,965 as its portion of the sales charge on sales of Class A shares and no contingent deferred sales charges paid by Fund shareholders for the year ended September 30, 2023.
Eaton Vance Management (EVM), an affiliate of CRM, provides sub-transfer agency and related services to the Fund pursuant to a Sub-Transfer Agency Support Services Agreement. For the year ended September 30, 2023, sub-transfer agency fees and expenses incurred to EVM amounted to $15,213 and are included in transfer agency fees and expenses on the Statement of Operations.
Each Trustee of the Fund who is not an employee of CRM or its affiliates receives an annual fee of $214,000, an annual Committee fee ranging from $8,500 to $16,500 depending on the Committee, and may receive a fee of $10,000 for special meetings. The Board chair receives an additional $40,000 ($30,000 prior to January 1, 2023) annual fee, Committee chairs receive an additional $15,000 ($6,000 prior to January 1, 2023) annual fee and the special equities liaison receives an additional $2,500 annual fee. Eligible Trustees may participate in a Deferred Compensation Plan (the Plan). Amounts deferred under the Plan are treated as though equal dollar amounts had been invested in shares of the Fund or other Calvert funds selected by the Trustees. The Fund purchases shares of the funds selected equal to the dollar amounts deferred under the Plan, resulting in an asset equal to the deferred compensation liability. Obligations of the Plan are paid solely from the Fund’s assets. Trustees’ fees are allocated to each of the Calvert funds served. Salaries and fees of officers and Trustees of the Fund who are employees of CRM or its affiliates are paid by CRM.
3 Investment Activity
During the year ended September 30, 2023, the cost of purchases and proceeds from sales of investments, other than U.S. government and agency securities and short-term securities and including paydowns, were $369,604,241 and $124,673,942, respectively. Purchases and sales of U.S. government and agency securities, including paydowns and TBA transactions, were $1,100,973,739 and $822,377,333, respectively.
4 Distributions to Shareholders and Income Tax Information
The tax character of distributions declared for the years ended September 30, 2023 and September 30, 2022 was as follows:
| | Year Ended September 30, |
| | 2023 | 2022 |
| Ordinary income | $14,950,033 | $2,791,091 |
| Long-term capital gains | $ — | $3,707,576 |
During the year ended September 30, 2023, accumulated loss was decreased by $1,400 and paid-in capital was decreased by $1,400 due to differences between book and tax accounting. These reclassifications had no effect on the net assets or net asset value per share of the Fund.
Calvert
Core Bond Fund
September 30, 2023
Notes to Financial Statements — continued
As of September 30, 2023, the components of distributable earnings (accumulated loss) on a tax basis were as follows:
| Deferred capital losses | $ (20,124,089) |
| Net unrealized depreciation | (25,468,269) |
| Distributions payable | (8,832) |
| Accumulated loss | $(45,601,190) |
At September 30, 2023, the Fund, for federal income tax purposes, had deferred capital losses of $20,124,089 which would reduce the Fund's taxable income arising from future net realized gains on investment transactions, if any, to the extent permitted by the Internal Revenue Code, and thus would reduce the amount of distributions to shareholders, which would otherwise be necessary to relieve the Fund of any liability for federal income or excise tax. The deferred capital losses are treated as arising on the first day of the Fund's next taxable year, can be carried forward for an unlimited period, and retain the same short-term or long-term character as when originally deferred. Of the deferred capital losses at September 30, 2023, $12,837,181 are short-term and $7,286,908 are long-term.
The cost and unrealized appreciation (depreciation) of investments, including open derivative contracts, of the Fund at September 30, 2023, as determined on a federal income tax basis, were as follows:
| Aggregate cost | $775,520,226 |
| Gross unrealized appreciation | $ 588,782 |
| Gross unrealized depreciation | (26,057,051) |
| Net unrealized depreciation | $ (25,468,269) |
5 Financial Instruments
A summary of futures contracts and options contracts outstanding at September 30, 2023 is included in the Schedule of Investments.
During the year ended September 30, 2023, the Fund used futures contracts and options on futures contracts to hedge interest rate risk and to manage duration.
At September 30, 2023, the fair value of open derivative instruments (not considered to be hedging instruments for accounting disclosure purposes) and whose primary underlying risk exposure is interest rate risk was as follows:
| Derivative | Statement of Assets and Liabilities Caption | Assets | Liabilities |
| Futures contracts | Accumulated loss | | $ 1,202(1) | $ (1,300,915)(1) |
| Purchased options | Investments in securities of unaffiliated issuers, at value | | 69,094 | — |
| Total | | | $70,296 | $(1,300,915) |
| (1) | Only the current day's variation margin is reported within the Statement of Assets and Liabilities as Receivable or Payable for variation margin on open futures contracts, as applicable. |
Calvert
Core Bond Fund
September 30, 2023
Notes to Financial Statements — continued
The effect of derivative instruments (not considered to be hedging instruments for accounting disclosure purposes) on the Statement of Operations by risk exposure for the year ended September 30, 2023 was as follows:
| Statement of Operations Caption | Interest rate |
| Net realized gain (loss): | |
| Futures contracts | $ (2,951,573) |
| Total | $(2,951,573) |
| Change in unrealized appreciation (depreciation): | |
| Investment securities(1) | $ 1,847 |
| Futures contracts | (680,047) |
| Total | $ (678,200) |
| (1) | Relates to purchased options. |
The average notional cost of futures contracts outstanding during the year ended September 30, 2023, which are indicative of the volume of these derivative types, were approximately as follows:
| Futures Contracts — Long | Futures Contracts — Short |
| $46,520,000 | $6,289,000 |
The average number of purchased options contracts outstanding during the year ended September 30, 2023, which is indicative of the volume of this derivative type, was 10 contracts.
6 Securities Lending
To generate additional income, the Fund may lend its securities pursuant to a securities lending agency agreement with State Street Bank and Trust Company (SSBT), the securities lending agent. Security loans are subject to termination by the Fund at any time and, therefore, are not considered illiquid investments. The Fund requires that the loan be continuously collateralized by either cash or securities in an amount at least equal to the market value of the securities on loan. The market value of securities loaned is determined daily and any additional required collateral is delivered to the Fund on the next business day. Cash collateral is generally invested in a money market fund registered under the 1940 Act that is managed by an affiliate of SSBT. Any gain or loss in the market price of the loaned securities that might occur and any interest earned or dividends declared during the term of the loan would accrue to the account of the Fund. Income earned on the investment of collateral, net of broker rebates and other expenses incurred by the securities lending agent, is split between the Fund and the securities lending agent based on agreed upon contractual terms. Non-cash collateral, if any, is held by the lending agent on behalf of the Fund and cannot be sold or re-pledged by the Fund; accordingly, such collateral is not reflected in the Statement of Assets and Liabilities.
The risks associated with lending portfolio securities include, but are not limited to, possible delays in receiving additional collateral or in the recovery of the loaned securities, possible loss of rights to the collateral should the borrower fail financially, as well as risk of loss in the value of the collateral or the value of the investments made with the collateral. The securities lending agent shall indemnify the Fund in the case of default of any securities borrower.
At September 30, 2023, the total value of securities on loan, including accrued interest, was $4,804,246 and the total value of collateral received was $4,903,010, comprised of cash of $1,432,130 and U.S. government and/or agencies securities of $3,470,880.
Calvert
Core Bond Fund
September 30, 2023
Notes to Financial Statements — continued
The following table provides a breakdown of securities lending transactions accounted for as secured borrowings, the obligations by class of collateral pledged, and the remaining contractual maturity of those transactions as of September 30, 2023.
| | Remaining Contractual Maturity of the Transactions |
| | Overnight and
Continuous | <30 days | 30 to 90 days | >90 days | Total |
| Corporate Bonds | $1,432,130 | $ — | $ — | $ — | $1,432,130 |
The carrying amount of the liability for deposits for securities loaned at September 30, 2023 approximated its fair value. If measured at fair value, such liability would have been considered as Level 2 in the fair value hierarchy (see Note 1A) at September 30, 2023.
7 Line of Credit
The Fund participates with other portfolios and funds managed by EVM and its affiliates, including CRM, in a $725 million unsecured revolving line of credit agreement with a group of banks, which is in effect through October 24, 2023. Borrowings are made by the Fund solely for temporary purposes related to redemptions and other short-term cash needs. Interest is charged to the Fund based on its borrowings at an amount above either the Secured Overnight Financing Rate (SOFR) or Federal Funds rate. In addition, a fee computed at an annual rate of 0.15% on the daily unused portion of the line of credit is allocated among the participating portfolios and funds at the end of each quarter. In connection with the renewal of the agreement in October 2022, an arrangement fee of $150,000 was incurred that was allocated to the participating portfolios and funds. Because the line of credit is not available exclusively to the Fund, it may be unable to borrow some or all of its requested amounts at any particular time.
The Fund had no borrowings outstanding pursuant to its line of credit at September 30, 2023. The Fund did not have any significant borrowings or allocated fees during the year ended September 30, 2023. Effective October 24, 2023, the Fund renewed its line of credit agreement, which expires October 22, 2024. In connection with the renewal, the borrowing limit was decreased to $650 million.
8 Affiliated Investments
The Fund has invested a portion of its assets in notes (the Notes) issued by Calvert Impact Capital, Inc. (CIC) pursuant to exemptive relief granted by the U.S. Securities and Exchange Commission (the SEC). There are certain potential points of affiliation between the Fund and CIC. CRM has licensed use of the Calvert name to CIC and provides other types of support. An officer of CRM's affiliate serves on the CIC Board. In addition, a director/trustee on the Fund Board serves as a director emeritus on the CIC Board.
At September 30, 2023, the value of the Fund's investment in the Notes and in issuers and funds that may be deemed to be affiliated was $18,328,329, which represents 2.8% of the Fund's net assets. Transactions in such investments by the Fund for the year ended September 30, 2023 were as follows:
| Name | Value,
beginning
of period | Purchases | Sales
proceeds | Net
realized
gain
(loss) | Change in
unrealized
appreciation
(depreciation) | Value,
end of
period | Interest/
Dividend
income | Principal amount/
Shares,
end of period |
| Commercial Mortgage-Backed Securities | | | | | | | | |
| Morgan Stanley Capital I Trust: | | | | | | | | |
| Series 2017-CLS, Class A, 3.518%, (1 mo. USD LIBOR + 0.70%), 11/15/34 | $ 189,873 | $ — | $ (191,000) | $ — | $ 1,127 | $ — | $ 261 | $ — |
| Series 2017-CLS, Class B, 3.668%, (1 mo. USD LIBOR + 0.85%), 11/15/34 | 635,861 | — | (640,000) | 4,393 | (256) | — | 914 | — |
| Series 2017-CLS, Class D, 4.218%, (1 mo. USD LIBOR + 1.40%), 11/15/34 | 1,101,652 | — | (1,110,000) | 13,795 | (5,452) | — | 1,825 | — |
| Series 2019-BPR, Class A, 7.322%, (1 mo. SOFR + 1.992%), 5/15/36 | 1,216,422 | — | (123,132) | — | (16,707) | 1,077,242 | 82,013 | 1,117,961 |
| High Social Impact Investments | | | | | | | | |
| Calvert Impact Capital, Inc., Community Investment Notes, 1.50%, 12/15/23(1) | 232,190 | — | — | — | 14,383 | 246,573 | 3,750 | 250,000 |
Calvert
Core Bond Fund
September 30, 2023
Notes to Financial Statements — continued
| Name | Value,
beginning
of period | Purchases | Sales
proceeds | Net
realized
gain
(loss) | Change in
unrealized
appreciation
(depreciation) | Value,
end of
period | Interest/
Dividend
income | Principal amount/
Shares,
end of period |
| Short-Term Investments | | | | | | |
| Liquidity Fund | $9,608,995 | $286,704,874 | $(279,309,355) | $ — | $ — | $ 17,004,514 | $ 521,320 | 17,004,514 |
| Total | | | | $18,188 | $ (6,905) | $18,328,329 | $610,083 | |
9 Capital Shares
The Fund’s Declaration of Trust permits the Trustees to issue an unlimited number of full and fractional shares of beneficial interest (without par value). Such shares may be issued in a number of different series (such as the Fund) and classes.
Transactions in capital shares were as follows:
| | Year Ended
September 30, 2023 | | Year Ended
September 30, 2022 |
| | Shares | Amount | | Shares | Amount |
| Class A | | | | | |
| Shares sold | 1,810,561 | $ 28,483,404 | | 756,941 | $ 13,071,927 |
| Reinvestment of distributions | 105,364 | 1,656,891 | | 158,443 | 2,874,105 |
| Shares redeemed | (775,109) | (12,199,908) | | (748,901) | (13,167,375) |
| Net increase | 1,140,816 | $ 17,940,387 | | 166,483 | $ 2,778,657 |
| Class I | | | | | |
| Shares sold | 35,769,030 | $ 566,118,084 | | 7,981,369 | $ 135,341,110 |
| Reinvestment of distributions | 840,411 | 13,207,704 | | 197,200 | 3,480,572 |
| Shares redeemed | (6,474,694) | (101,978,513) | | (1,846,851) | (31,577,681) |
| Net increase | 30,134,747 | $ 477,347,275 | | 6,331,718 | $107,244,001 |
| Class R6(1) | | | | | |
| Shares sold | 3,166 | $ 50,000 | | — | $ — |
| Reinvestment of distributions | 36 | 553 | | — | — |
| Net increase | 3,202 | $ 50,553 | | — | $ — |
| (1) | For the period from the commencement of operations, June 30, 2023, to September 30, 2023. |
Calvert
Core Bond Fund
September 30, 2023
Report of Independent Registered Public Accounting Firm
To the Board of Trustees of The Calvert Fund and Shareholders of Calvert Core Bond Fund:
Opinion on the Financial Statements and Financial Highlights
We have audited the accompanying statement of assets and liabilities of Calvert Core Bond Fund (the "Fund") (one of the funds constituting The Calvert Fund), including the schedule of investments, as of September 30, 2023, the related statement of operations for the year then ended, the statements of changes in net assets for each of the two years in the period then ended, the financial highlights for each of the three years in the period then ended, and the related notes. In our opinion, the financial statements and financial highlights present fairly, in all material respects, the financial position of the Fund as of September 30, 2023, and the results of its operations for the year then ended, the changes in its net assets for each of the two years in the period then ended, and the financial highlights for each of the three years in the period then ended, in conformity with accounting principles generally accepted in the United States of America. The financial highlights for the years ended September 30, 2020 and 2019 were audited by other auditors whose report, dated November 20, 2020, expressed an unqualified opinion on those financial highlights.
Basis for Opinion
These financial statements and financial highlights are the responsibility of the Fund's management. Our responsibility is to express an opinion on the Fund's financial statements and financial highlights based on our audits. We are a public accounting firm registered with the Public Company Accounting Oversight Board (United States) (PCAOB) and are required to be independent with respect to the Fund in accordance with the U.S. federal securities laws and the applicable rules and regulations of the Securities and Exchange Commission and the PCAOB.
We conducted our audits in accordance with the standards of the PCAOB. Those standards require that we plan and perform the audit to obtain reasonable assurance about whether the financial statements and financial highlights are free of material misstatement, whether due to error or fraud. The Fund is not required to have, nor were we engaged to perform, an audit of its internal control over financial reporting. As part of our audits, we are required to obtain an understanding of internal control over financial reporting but not for the purpose of expressing an opinion on the effectiveness of the Fund’s internal control over financial reporting. Accordingly, we express no such opinion.
Our audits included performing procedures to assess the risks of material misstatement of the financial statements and financial highlights, whether due to error or fraud, and performing procedures that respond to those risks. Such procedures included examining, on a test basis, evidence regarding the amounts and disclosures in the financial statements and financial highlights. Our audits also included evaluating the accounting principles used and significant estimates made by management, as well as evaluating the overall presentation of the financial statements and financial highlights. Our procedures included confirmation of securities owned as of September 30, 2023, by correspondence with the custodian and brokers; when replies were not received from brokers, we performed other auditing procedures. We believe that our audits provide a reasonable basis for our opinion.
/s/ Deloitte & Touche LLP
Boston, Massachusetts
November 22, 2023
We have served as the auditor of one or more Calvert investment companies since 2021.
Calvert
Core Bond Fund
September 30, 2023
Federal Tax Information (Unaudited)
The Form 1099-DIV you receive in February 2024 will show the tax status of all distributions paid to your account in calendar year 2023. Shareholders are advised to consult their own tax adviser with respect to the tax consequences of their investment in the Fund. As required by the Internal Revenue Code and/or regulations, shareholders must be notified regarding the status of qualified dividend income for individuals and 163(j) interest dividends.
Qualified Dividend Income. For the fiscal year ended September 30, 2023, the Fund designates approximately $22,344, or up to the maximum amount of such dividends allowable pursuant to the Internal Revenue Code, as qualified dividend income eligible for the reduced tax rate of 15%.
163(j) Interest Dividends. For the fiscal year ended September 30, 2023, the Fund designates 95.61% of distributions from net investment income as a 163(j) interest dividend.
Calvert
Core Bond Fund
September 30, 2023
Board of Trustees' Contract Approval
Overview of the Contract Review Process
The Investment Company Act of 1940, as amended, provides, in substance, that each investment advisory agreement between a fund and its investment adviser will continue in effect from year to year only if its continuation is approved at least annually by the fund’s board of directors, including by a vote of a majority of the directors who are not “interested persons” of the fund (“Independent Trustees”), cast in person at a meeting called for the purpose of considering such approval.
At an in-person meeting of the Boards of Trustees/Directors (each a “Board”) of the registered investment companies advised by Calvert Research and Management (“CRM” or the “Adviser”) (the “Calvert Funds”) held on June 12-13, 2023, the Board, including a majority of the Independent Trustees, voted to approve continuation of existing investment advisory and investment sub-advisory agreements for the Calvert Funds for an additional one-year period.
In evaluating the investment advisory and investment sub-advisory agreements for the Calvert Funds, the Board considered a variety of information relating to the Calvert Funds and various service providers, including the Adviser. The Independent Trustees reviewed a report prepared by the Adviser regarding various services provided to the Calvert Funds by the Adviser and its affiliates. Such report included, among other data, information regarding the Adviser’s personnel and the Adviser’s revenue and cost of providing services to the Calvert Funds, and a separate report prepared by an independent data provider, which compared each fund’s investment performance, fees and expenses to those of comparable funds as identified by such independent data provider (“comparable funds”).
The Independent Trustees were separately represented by independent legal counsel with respect to their consideration of the continuation of the investment advisory and investment sub-advisory agreements for the Calvert Funds. Prior to voting, the Independent Trustees reviewed the proposed continuation of the Calvert Funds’ investment advisory and investment sub-advisory agreements with management and also met in private sessions with their counsel at which time no representatives of management were present.
The information that the Board considered included, among other things, the following (for funds that invest through one or more affiliated underlying fund(s), references to “each fund” in this section may include information that was considered at the underlying fund-level):
Information about Fees, Performance and Expenses
| • | A report from an independent data provider comparing the advisory and related fees paid by each fund with fees paid by comparable funds; |
| • | A report from an independent data provider comparing each fund’s total expense ratio and its components to comparable funds; |
| • | A report from an independent data provider comparing the investment performance of each fund to the investment performance of comparable funds over various time periods; |
| • | Data regarding investment performance in comparison to benchmark indices; |
| • | For each fund, comparative information concerning the fees charged and the services provided by the Adviser in managing other accounts (including mutual funds, other collective investment funds and institutional accounts) using investment strategies and techniques similar to those used in managing such fund; |
| • | Profitability analyses for the Adviser with respect to each fund; |
Information about Portfolio Management and Trading
| • | Descriptions of the investment management services provided to each fund, including investment strategies and processes it employs; |
| • | Information about the Adviser’s policies and practices with respect to trading, including the Adviser’s processes for monitoring best execution of portfolio transactions; |
| • | Information about the allocation of brokerage transactions and the benefits received by the Adviser as a result of brokerage allocation, including information concerning the acquisition of research through client commission arrangements and policies with respect to “soft dollars”; |
Information about the Adviser
| • | Reports detailing the financial results and condition of CRM; |
| • | Descriptions of the qualifications, education and experience of the individual investment professionals whose responsibilities include portfolio management and investment research for the funds, and information relating to their compensation and responsibilities with respect to managing other mutual funds and investment accounts; |
| • | Policies and procedures relating to proxy voting and the handling of corporate actions and class actions; |
| • | A description of CRM’s procedures for overseeing sub-advisers, including with respect to regulatory and compliance issues, investment management and other matters; |
Calvert
Core Bond Fund
September 30, 2023
Board of Trustees' Contract Approval — continued
Other Relevant Information
| • | Information concerning the nature, cost and character of the administrative and other non-investment advisory services provided by CRM and its affiliates; and |
| • | The terms of each investment advisory agreement. |
Over the course of the year, the Board and its committees held regular quarterly meetings. During these meetings, the Trustees participated in investment and performance reviews with the portfolio managers and other investment professionals of the Adviser relating to each fund and considered various investment and trading strategies used in pursuing each fund’s investment objective(s), such as the use of derivative instruments, as well as risk management techniques. The Board and its committees also evaluated issues pertaining to industry and regulatory developments, compliance procedures, corporate governance and other issues with respect to the funds and received and participated in reports and presentations provided by CRM and its affiliates with respect to such matters. In addition to the formal meetings of the Board and its committees, the Independent Trustees held regular video conferences in between meetings to discuss, among other topics, matters relating to the continuation of the Calvert Funds’ investment advisory and investment sub-advisory agreements.
For funds that invest through one or more affiliated underlying funds, the Board considered similar information about the underlying fund(s) when considering the approval of investment advisory agreements. In addition, in cases where the Adviser has engaged a sub-adviser, the Board considered similar information about the sub-adviser when considering the approval of any investment sub-advisory agreement.
The Independent Trustees were assisted throughout the contract review process by their independent legal counsel. The Independent Trustees relied upon the advice of such counsel and their own business judgment in determining the material factors to be considered in evaluating each investment advisory and investment sub-advisory agreement and the weight to be given to each such factor. The Board, including the Independent Trustees, did not identify any single factor as controlling, and each Trustee may have attributed different weight to various factors.
Results of the Contract Review Process
Based on its consideration of the foregoing, and such other information as it deemed relevant, including the factors and conclusions described below, the Board, including the Independent Trustees, concluded that the continuation of the investment advisory agreement of Calvert Core Bond Fund (the “Fund”), including the fee payable under the agreement, is in the best interests of the Fund’s shareholders. Accordingly, the Board, including a majority of the Independent Trustees, voted to approve the continuation of the investment advisory agreement of the Fund.
Nature, Extent and Quality of Services
In considering the nature, extent and quality of the services provided by the Adviser under the investment advisory agreement, the Board reviewed information provided by the Adviser relating to its operations and personnel, including, among other information, biographical information on the Adviser’s investment personnel and descriptions of its organizational and management structure. The Board also took into account similar information provided periodically throughout the previous year by the Adviser as well as the Board’s familiarity with management through Board meetings, discussions and other reports. The Board considered the Adviser’s management style and its performance in employing its investment strategies as well as its current level of staffing and overall resources. The Board also noted that it reviewed on a quarterly basis information regarding the Adviser’s compliance with applicable policies and procedures, including those related to personal investing. The Board took into account, among other items, periodic reports received from the Adviser over the past year concerning the Adviser’s ongoing review and enhancement of certain processes, policies and procedures of the Calvert Funds and the Adviser. The Board concluded that it was satisfied with the nature, extent and quality of services provided to the Fund by the Adviser under the investment advisory agreement.
Fund Performance
In considering the Fund’s performance, the Board noted that it reviewed on a quarterly basis detailed information about the Fund’s performance results, portfolio composition and investment strategies. The Board compared the Fund’s investment performance to that of the Fund’s peer universe and its benchmark index. The Board’s review included comparative performance data for the one-, three- and five-year periods ended December 31, 2022. This performance data indicated that the Fund had outperformed the median of the Fund’s peer universe for the one-, three- and five-year periods ended December 31, 2022. This performance data also indicated that the Fund had underperformed its benchmark index for the one-year period ended December 31, 2022, while it had outperformed the benchmark index for the three- and five-year periods ended December 31, 2022. Based upon its review, the Board concluded that the Fund’s performance was satisfactory relative to the performance of its peer universe and its benchmark index.
Calvert
Core Bond Fund
September 30, 2023
Board of Trustees' Contract Approval — continued
Management Fees and Expenses
In considering the Fund’s fees and expenses, the Board compared the Fund’s fees and total expense ratio with those of comparable funds in its expense group. Among other findings, the data indicated that the Fund’s advisory and administrative fees (after taking into account waivers and/or reimbursements) (referred to collectively as “management fees”) and the Fund’s total expenses (net of waivers and/or reimbursements) were each below of the respective median of the Fund’s expense group. The Board took into account the Adviser’s current undertaking to maintain expense limitations for the Fund and that the Adviser was waiving and/or reimbursing a portion of the Fund’s expenses. Based upon its review, the Board concluded that the management fees were reasonable in view of the nature, extent and quality of services provided by the Adviser.
Profitability and Other “Fall-Out” Benefits
The Board reviewed the Adviser’s profitability in regard to the Fund and the Calvert Funds in the aggregate. In reviewing the overall profitability of the Fund to the Adviser, the Board also considered the fact that the Adviser and its affiliates provided sub-transfer agency support, administrative and distribution services to the Fund for which they received compensation. The information considered by the Board included the profitability of the Fund to the Adviser and its affiliates without regard to any marketing support or other payments by the Adviser and its affiliates to third parties in respect of distribution services. The Board also considered that the Adviser and its affiliates derived benefits to their reputation and other indirect benefits from their relationships with the Fund. Based upon its review, the Board concluded that the Adviser’s and its affiliates’ level of profitability from their relationships with the Fund was reasonable.
Economies of Scale
The Board considered the effect of the Fund’s current size and its potential growth on its performance and fees. The Board concluded that adding breakpoints to the advisory fee at specified asset levels would not be appropriate at this time. The Board noted that if the Fund’s assets increased over time, the Fund might realize other economies of scale if assets increased proportionally more than certain other expenses.
Calvert
Core Bond Fund
September 30, 2023
Liquidity Risk Management Program
The Fund has implemented a written liquidity risk management program (Program) and related procedures to manage its liquidity in accordance with Rule 22e-4 under the Investment Company Act of 1940, as amended (Liquidity Rule). The Liquidity Rule defines “liquidity risk” as the risk that a fund could not meet requests to redeem shares issued by the fund without significant dilution of the remaining investors’ interests in the fund. The Fund’s Board of Trustees/Directors has designated the investment adviser to serve as the administrator of the Program and the related procedures. The administrator has established a Liquidity Risk Management Oversight Committee (Committee) to perform the functions necessary to administer the Program. As part of the Program, the administrator is responsible for identifying illiquid investments and categorizing the relative liquidity of the Fund’s investments in accordance with the Liquidity Rule. Under the Program, the administrator assesses, manages, and periodically reviews the Fund’s liquidity risk, and is responsible for making certain reports to the Fund’s Board of Trustees/Directors and the Securities and Exchange Commission (SEC) regarding the liquidity of the Fund’s investments, and to notify the Board of Trustees/Directors and the SEC of certain liquidity events specified in the Liquidity Rule. The liquidity of the Fund’s portfolio investments is determined based on a number of factors including, but not limited to, relevant market, trading and investment-specific considerations under the Program.
At a meeting of the Fund’s Board of Trustees/Directors on June 13, 2023, the Committee provided a written report to the Fund’s Board of Trustees/ Directors pertaining to the operation, adequacy, and effectiveness of implementation of the Program, as well as the operation of the highly liquid investment minimum (if applicable) for the period January 1, 2022 through December 31, 2022 (Review Period). The Program operated effectively during the Review Period, supporting the administrator’s ability to assess, manage and monitor Fund liquidity risk, including during periods of market volatility and net redemptions. During the Review Period, the Fund met redemption requests on a timely basis.
There can be no assurance that the Program will achieve its objectives in the future. Please refer to the Fund’s prospectus for more information regarding the Fund’s exposure to liquidity risk and other principal risks to which an investment in the Fund may be subject.
Calvert
Core Bond Fund
September 30, 2023
Management and Organization
Fund Management. The Trustees of The Calvert Fund (the Trust) are responsible for the overall management and supervision of the affairs of the Trust. The Board members and officers of the Trust are listed below. Except as indicated, each individual has held the office shown or other offices in the same company for the last five years. Board members hold indefinite terms of office. Each Board member holds office until his or her successor is elected and qualified, or until his or her earlier death, resignation, retirement, removal or disqualification. Under the terms of the Fund's current Board member retirement policy, an Independent Board member must retire at the end of the calendar year in which he or she turns 75. However, if such retirement would cause the Fund to be out of compliance with Section 16 of the 1940 Act or any other regulations or guidance of the SEC, then such retirement will not become effective until such time as action has been taken for the Fund to be in compliance therewith. The “noninterested Trustees” consist of those Trustees who are not “interested persons” of the Trust, as that term is defined under the 1940 Act. The business address of each Board member and the Chief Compliance Officer is 2050 M Street NW, Washington, DC 20036 and the business address of the Secretary, Vice President and Chief Legal Officer and the Treasurer is Two International Place, Boston, Massachusetts 02110. As used below, “CRM” refers to Calvert Research and Management and “Eaton Vance” refers to Eaton Vance Management. Each Trustee oversees 46 funds in the Calvert fund complex. Each of Eaton Vance and CRM are indirect, wholly owned subsidiaries of Morgan Stanley. Each officer affiliated with CRM may hold a position with other CRM affiliates that is comparable to his or her position with CRM listed below.
| Name and Year of Birth | Trust
Position(s) | Length of
Service | Principal Occupation(s) and Other Directorships
During Past Five Years and Other Relevant Experience |
| Interested Trustee | | | |
Theodore H. Eliopoulos(1)
1964 | Trustee and
President | Since 2022 | President and Chief Executive Officer of CRM and senior sponsor of Morgan Stanley Investment Management’s (MSIM) Diversity Council. Formerly, Vice Chairman & Head of Strategic Partnerships at MSIM (2019-2022). Former Chief Investment Officer and interim Chief Investment Officer (2014-2018) and Senior Investment Officer of Real Estate and Real Assets at California Public Employees’ Retirement System (CalPERS) (2007-2014). Former Chief Deputy Treasurer and Deputy Treasurer at the California State Treasurer's Office (2002-2006). Mr. Eliopoulos is an interested person because of his positions with CRM and certain affiliates.
Other Directorships. The Robert Toigo Foundation; Pacific Pension & Investment Institute (PPI). |
| Noninterested Trustees |
Richard L. Baird, Jr.(2)
1948 | Trustee | Since 1982 | Regional Disaster Recovery Lead, American Red Cross of Greater
Pennsylvania (since 2017). Volunteer, American Red Cross (since 2015).
Former President and CEO of Adagio Health Inc. (retired in 2014) in
Pittsburgh, PA.
Other Directorships. None. |
Alice Gresham Bullock
1950 | Chair and
Trustee | Since 2016 | Professor Emerita at Howard University School of Law. Dean Emerita of
Howard University School of Law and Deputy Director of the Association
of American Law Schools (1992-1994).
Other Directorships. None. |
Cari M. Dominguez
1949 | Trustee | Since 2016 | Former Chair of the U.S. Equal Employment Opportunity Commission.
Other Directorships. ManpowerGroup Inc. (workforce solutions company);
Triple S Management Corporation (managed care); National Association of Corporate Directors. |
Karen Fang(3)
1958 | Trustee | Since 2023 | Formerly, Managing Director, Wealth Management at GAMCO Asset Management (asset management firm) (2020-2023). Formerly, Managing Director, Senior Portfolio Manager of Fiduciary Trust Company International (wealth management firm) (1993-2019).
Other Directorships. None. |
John G. Guffey, Jr.(2)
1948 | Trustee | Since 1982 | President of Aurora Press Inc., a privately held publisher of trade paperbacks
(since January 1997).
Other Directorships. Calvert Impact Capital, Inc. (through December 31, 2018); Calvert Ventures, LLC. |
Miles D. Harper, III
1962 | Trustee | Since 2016 | Partner, Carr Riggs & Ingram (public accounting firm) since October 2014.
Partner, Gainer Donnelly & Desroches (public accounting firm) (now Carr
Riggs & Ingram) (November 1999 - September 2014).
Other Directorships. Bridgeway Funds (9) (asset management). |
Joy V. Jones
1950 | Trustee | Since 2016 | Attorney.
Other Directorships. Palm Management Corporation. |
Calvert
Core Bond Fund
September 30, 2023
Management and Organization — continued
| Name and Year of Birth | Trust
Position(s) | Length of
Service | Principal Occupation(s) and Other Directorships
During Past Five Years and Other Relevant Experience |
| Noninterested Trustees (continued) |
Eddie Ramos(3)
1967 | Trustee | Since 2023 | Private investor (2022-present). Formerly, Head of External Advisors/Diversity Portfolio Management at the New Jersey Division of Investment (2020-2022). Formerly, Chief Investment Officer and Lead Portfolio Manager – Global Fundamental Equities at Cornerstone Capital Management (asset management firm) (2011-2017).
Other Directorships. Macquarie Optimum Funds (6) (asset management). |
Anthony A. Williams
1951 | Trustee | Since 2010 | CEO and Executive Director of the Federal City Council (July 2012 to
present); Senior Adviser and Independent Consultant for King and
Spalding LLP (September 2015 to present); Executive Director of Global
Government Practice at the Corporate Executive Board (January 2010 to
January 2012).
Other Directorships. Freddie Mac; Evoq Properties/Meruelo Maddux
Properties, Inc. (real estate management); Weston Solutions, Inc.
(environmental services); Bipartisan Policy Center’s Debt Reduction Task Force;
Chesapeake Bay Foundation; Catholic University of America; Urban Institute (research organization); The Howard Hughes Corporation (real estate development); Old Dominion National Bank. |
| Name and Year of Birth | Trust
Position(s) | Length of
Service | Principal Occupation(s)
During Past Five Years |
| Principal Officers who are not Trustees |
Hope L. Brown
1973 | Chief
Compliance
Officer | Since 2014 | Chief Compliance Officer of 46 registered investment companies advised
by CRM (since 2014). Vice President and Chief Compliance Officer,
Wilmington Funds (2012-2014). |
Deidre E. Walsh
1971 | Secretary,
Vice President
and Chief
Legal Officer | Since 2021 | Vice President of CRM and officer of 46 registered investment companies
advised by CRM (since 2021). Also Vice President of Eaton Vance and
certain of its affiliates and officer of 127 registered investment companies
advised or administered by Eaton Vance. |
James F. Kirchner
1967 | Treasurer | Since 2016 | Vice President of CRM and officer of 46 registered investment companies
advised by CRM (since 2016). Also Vice President of Eaton Vance and
certain of its affiliates and officer of 127 registered investment companies
advised or administered by Eaton Vance. |
| | | | |
| (1) Mr. Eliopoulos is an interested person of the Fund because of his positions with the Fund’s adviser and certain affiliates. |
| (2) Effective December 31, 2023, Richard L. Baird, Jr. and John G. Guffey, Jr. will retire from the Board of Trustees. |
| (3) Ms. Fang and Mr. Ramos began serving as Trustees effective October 30, 2023. |
The SAI for the Fund includes additional information about the Trustees and officers of the Fund and can be obtained without charge on Calvert’s website at www.calvert.com or by calling 1-800-368-2745.
| FACTS | WHAT DOES EATON VANCE DO WITH YOUR
PERSONAL INFORMATION? |
| Why? | Financial companies choose how they share your personal information. Federal law gives consumers the right to limit some but not all sharing. Federal law also requires us to tell you how we collect, share, and protect your personal information. Please read this notice carefully to understand what we do. |
| |
| What? | The types of personal information we collect and share depend on the product or service you have with us. This information can include:■ Social Security number and income
■
investment experience and risk tolerance
■
checking account number and wire transfer instructions |
| |
| How? | All financial companies need to share customers’ personal information to run their everyday business. In the section below, we list the reasons financial companies can share their customers’ personal information; the reasons Eaton Vance chooses to share; and whether you can limit this sharing. |
Reasons we can share your
personal information | Does Eaton Vance
share? | Can you limit
this sharing? |
| For our everyday business purposes — such as to process your transactions, maintain your account(s), respond to court orders and legal investigations, or report to credit bureaus | Yes | No |
| For our marketing purposes — to offer our products and services to you | Yes | No |
| For joint marketing with other financial companies | No | We don’t share |
| For our investment management affiliates’ everyday business purposes — information about your transactions, experiences, and creditworthiness | Yes | Yes |
| For our affiliates’ everyday business purposes — information about your transactions and experiences | Yes | No |
| For our affiliates’ everyday business purposes — information about your creditworthiness | No | We don’t share |
| For our investment management affiliates to market to you | Yes | Yes |
| For our affiliates to market to you | No | We don’t share |
| For nonaffiliates to market to you | No | We don’t share |
To limit our
sharing | Call toll-free 1-800-368-2745 or email: CRMPrivacy@calvert.comPlease note:If you are a new customer, we can begin sharing your information 30 days from the date we sent this notice. When you are no longer our customer, we continue to share your information as described in this notice. However, you can contact us at any time to limit our sharing. |
| Questions? | Call toll-free 1-800-368-2745 or email: CRMPrivacy@calvert.com |
| Privacy Notice — continued | April 2021 |
| Who we are |
| Who is providing this notice? | Eaton Vance Management, Eaton Vance Distributors, Inc., Eaton Vance Trust Company, Eaton Vance Management (International) Limited, Eaton Vance Advisers International Ltd., Eaton Vance Global Advisors Limited, Eaton Vance Management’s Real Estate Investment Group, Boston Management and Research, Calvert Research and Management, Eaton Vance and Calvert Fund Families and our investment advisory affiliates (“Eaton Vance”) (see Investment Management Affiliates definition below) |
| What we do |
How does Eaton Vance
protect my personal
information? | To protect your personal information from unauthorized access and use, we use security measures that comply with federal law. These measures include computer safeguards and secured files and buildings. We have policies governing the proper handling of customer information by personnel and requiring third parties that provide support to adhere to appropriate security standards with respect to such information. |
How does Eaton Vance
collect my personal
information? | We collect your personal information, for example, when you■ open an account or make deposits or withdrawals from your account
■
buy securities from us or make a wire transfer
■
give us your contact informationWe also collect your personal information from others, such as credit bureaus, affiliates, or other companies. |
| Why can’t I limit all sharing? | Federal law gives you the right to limit only■ sharing for affiliates’ everyday business purposes — information about your creditworthiness
■
affiliates from using your information to market to you
■
sharing for nonaffiliates to market to youState laws and individual companies may give you additional rights to limit sharing. See below for more on your rights under state law. |
| Definitions |
Investment Management
Affiliates | Eaton Vance Investment Management Affiliates include registered investment advisers, registered broker- dealers, and registered and unregistered funds. Investment Management Affiliates does not include entities associated with Morgan Stanley Wealth Management, such as Morgan Stanley Smith Barney LLC and Morgan Stanley & Co. |
| Affiliates | Companies related by common ownership or control. They can be financial and nonfinancial companies.■ Our affiliates include companies with a Morgan Stanley name and financial companies such as Morgan Stanley Smith Barney LLC and Morgan Stanley & Co. |
| Nonaffiliates | Companies not related by common ownership or control. They can be financial and nonfinancial companies.■ Eaton Vance does not share with nonaffiliates so they can market to you. |
| Joint marketing | A formal agreement between nonaffiliated financial companies that together market financial products or services to you.■ Eaton Vance doesn’t jointly market. |
| Other important information |
| Vermont: Except as permitted by law, we will not share personal information we collect about Vermont residents with Nonaffiliates unless you provide us with your written consent to share such information.California: Except as permitted by law, we will not share personal information we collect about California residents with Nonaffiliates and we will limit sharing such personal information with our Affiliates to comply with California privacy laws that apply to us. |
Delivery of Shareholder Documents. The Securities and Exchange Commission (SEC) permits funds to deliver only one copy of shareholder documents, including prospectuses, proxy statements and shareholder reports, to fund investors with multiple accounts at the same residential or post office box address. This practice is often called “householding” and it helps eliminate duplicate mailings to shareholders. Calvert funds, or your financial intermediary, may household the mailing of your documents indefinitely unless you instruct Calvert funds, or your financial intermediary, otherwise. If you would prefer that your Calvert fund documents not be householded, please contact Calvert funds at 1-800-368-2745, or contact your financial intermediary. Your instructions that householding not apply to delivery of your Calvert fund documents will typically be effective within 30 days of receipt by Calvert funds or your financial intermediary.
Portfolio Holdings. Each Calvert fund files a schedule of portfolio holdings on Part F to Form N-PORT with the SEC. Certain information filed on Form N-PORT may be viewed on the Calvert website at www.calvert.com, by calling Calvert at 1-800-368-2745 or in the EDGAR database on the SEC’s website at www.sec.gov.
Proxy Voting. The Proxy Voting Guidelines that each Calvert fund uses to determine how to vote proxies relating to portfolio securities is provided as an Appendix to the fund’s Statement of Additional Information. The Statement of Additional Information can be obtained free of charge by calling the Calvert funds at 1-800-368-2745, by visiting the Calvert funds’ website at www.calvert.com or visiting the SEC’s website at www.sec.gov. Information regarding how a Calvert fund voted proxies relating to portfolio securities during the most recent 12-month period ended June 30 is available by calling Calvert funds, by visiting the Calvert funds’ website at www.calvert.com or by visiting the SEC’s website at www.sec.gov.
Tailored Shareholder Reports. Effective January 24, 2023, the SEC adopted rule and form amendments to require open-end mutual funds and ETFs to transmit concise and visually engaging streamlined annual and semiannual reports to shareholders that highlight key information. Other information, including financial statements, will no longer appear in a streamlined shareholder report but must be available online, delivered free of charge upon request, and filed on a semiannual basis on Form N-CSR. The rule and form amendments have a compliance date of July 24, 2024. At this time, management is evaluating the impact of these amendments on the shareholder reports for the Calvert Funds.
Investment Adviser and Administrator
Calvert Research and Management
2050 M Street NW
Washington, DC 20036
Principal Underwriter*
Eaton Vance Distributors, Inc.
Two International Place
Boston, MA 02110
(617) 482-8260
Custodian
State Street Bank and Trust Company
One Congress Street, Suite 1
Boston, MA 02114-2016
Transfer Agent
SS&C Global Investor & Distribution Solutions, Inc.
2000 Crown Colony Drive
Quincy, MA 02169
Independent Registered Public Accounting Firm
Deloitte & Touche LLP
200 Berkeley Street
Boston, MA 02116-5022
Fund Offices
2050 M Street NW
Washington, DC 20036
* FINRA BrokerCheck. Investors may check the background of their Investment Professional by contacting the Financial Industry Regulatory Authority (FINRA). FINRA BrokerCheck is a free tool to help investors check the professional background of current and former FINRA-registered securities firms and brokers. FINRA BrokerCheck is available by calling 1-800-289-9999 and at www.FINRA.org. The FINRA BrokerCheck brochure describing this program is available to investors at www.FINRA.org.
Printed on recycled paper.
24181 9.30.23
Calvert
Short Duration Income Fund
Annual Report
September 30, 2023
Commodity Futures Trading Commission Registration. The Commodity Futures Trading Commission (“CFTC”) has adopted regulations that subject registered investment companies and advisers to regulation by the CFTC if a fund invests more than a prescribed level of its assets in certain CFTC-regulated instruments (including futures, certain options and swap agreements) or markets itself as providing investment exposure to such instruments. The adviser has claimed an exclusion from the definition of “commodity pool operator” under the Commodity Exchange Act with respect to its management of the Fund and the other funds it manages. Accordingly, neither the Fund nor the adviser is subject to CFTC regulation.
Fund shares are not insured by the FDIC and are not deposits or other obligations of, or guaranteed by, any depository institution. Shares are subject to investment risks, including possible loss of principal invested.
This report must be preceded or accompanied by a current summary prospectus or prospectus. Before investing, investors should consider carefully the investment objective, risks, and charges and expenses of a mutual fund. This and other important information is contained in the summary prospectus and prospectus, which can be obtained from a financial intermediary. Prospective investors should read the prospectus carefully before investing. For further information, please call 1-800-368-2745.
Choose Planet-friendly E-delivery!
Sign up now for on-line statements, prospectuses, and fund reports. In less than five minutes you can help reduce paper mail and lower fund costs.
Just go to www.calvert.com. If you already have an online account with the Calvert funds, click on Login to access your Account and select the documents you would like to receive via e-mail.
If you’re new to online account access, click on Login, then Register to create your user name and password. Once you’re in, click on the E-delivery sign-up on the Account Portfolio page and follow the quick, easy steps.
Note: If your shares are not held directly with the Calvert funds but through a brokerage firm, you must contact your broker for electronic delivery options available through their firm.
Annual Report September 30, 2023
Calvert
Short Duration Income Fund
Calvert
Short Duration Income Fund
September 30, 2023
Management's Discussion of Fund Performance†
Economic and Market Conditions
For fixed-income investors, the dominant event during the 12-month period ended September 30, 2023, was the series of U.S. Federal Reserve (Fed) interest rate hikes -- six during the period, and 11 in total -- that brought the federal funds rate to its highest level in 22 years.
But while the Fed’s campaign to tamp down inflation led to negative performance for government bonds, corporate bond returns were strongly positive during the period -- buoyed in part by the very factors that were fueling inflation: record low unemployment, strong job creation, and robust consumer spending.
By the summer of 2023, a majority of economists and market observers seemed to be coming around to the view that Jerome Powell’s Fed might be able to accomplish what had seldom, if ever, been done before: raise rates significantly to lower inflation and still bring the economy in for a soft landing without a recession.
One cloud that hung over fixed-income markets during the period, however, was fear that even after it finished raising rates, the Fed would leave rates higher for longer than investors had previously anticipated. During the final two months of the period -- and especially after the Fed’s September 2023 meeting -- longer-term interest rates rose dramatically, as investor expectations of how high rates would go -- and how long they would stay there -- seemed to get higher and longer.
Against the backdrop of the Fed’s aggressive monetary tightening campaign, U.S. Treasurys were the worst-performing major fixed-income asset class during the 12-month period, with the Bloomberg U.S. Treasury Index returning -0.81%.
In contrast, the strong U.S. economy and increasing confidence in a soft-landing scenario served as tailwinds for investment-grade corporate bonds. Even in a rising-rate environment, the Bloomberg U.S. Corporate Bond Index returned 3.65% during the period.
High yield bonds were the standout performer among major fixed-income asset classes, with the Bloomberg U.S. Corporate High Yield Index returning 10.28% during the period. With a strong U.S. economy helping keep bond defaults low, and a recession looking increasingly remote, investors gravitated toward riskier investments with greater yields.
Asset-backed securities -- including bonds backed by automobile and consumer loans -- benefited from strong consumer balance sheets and spending during the period, with the Bloomberg Asset-Backed Securities Index returning 2.81%.
Mortgage-backed securities (MBS), however, were dogged by two technical factors that depressed prices, causing the Bloomberg U.S. Mortgage-Backed Securities Index to return -0.17% during the period. As the Fed lowered its balance sheet, it sold off much of its MBS holdings. And several regional banks that had been significant buyers of MBS were forced by the banking crisis of March 2023 to liquidate their assets. The resulting release of a significant amount of MBS into the market led prices to fall and the asset class to deliver negative returns.
Fund Performance
For the 12-month period ended September 30, 2023, Calvert Short Duration Income Fund (the Fund) returned 5.15% for Class A shares at net asset value (NAV), outperforming its benchmark, the Bloomberg 1-5 Year U.S. Credit Index (the Index), which returned 3.72%.
Security selections within investment-grade corporate securities were the leading contributor to returns relative to the Index during the period. Sector allocations, especially out-of-Index allocations to high yield corporate bonds, asset-backed securities, and mortgage-backed securities, also contributed to relative returns during the period. An underweight exposure to government-related securities further enhanced relative returns.
The Fund’s slightly shorter-than-Index duration had a substantial positive impact as well.
In contrast, while sector allocations overall were positive, out-of-Index allocations to U.S. Treasurys, and an underweight exposure to investment-grade corporate securities detracted from returns relative to the Index during the period.
The Fund’s use of derivatives had a slight positive impact on total returns during the period.
See Endnotes and Additional Disclosures in this report.
Past performance is no guarantee of future results. Returns are historical and are calculated by determining the percentage change in net asset value (NAV) or offering price (as applicable) with all distributions reinvested. Furthermore, returns do not reflect the deduction of taxes that shareholders may have to pay on Fund distributions or upon the redemption of Fund shares. Investment return and principal value will fluctuate so that shares, when redeemed, may be worth more or less than their original cost. Performance for periods less than or equal to one year is cumulative. Performance is for the stated time period only; due to market volatility, current Fund performance may be lower or higher than the quoted return. For performance as of the most recent month-end, please refer to www.calvert.com.
Calvert
Short Duration Income Fund
September 30, 2023
Performance
Portfolio Manager(s) Vishal Khanduja, CFA and Brian S. Ellis, CFA, each of Calvert Research and Management
| % Average Annual Total Returns1,2 | Class
Inception Date | Performance
Inception Date | One Year | Five Years | Ten Years |
| Class A at NAV | 01/31/2002 | 01/31/2002 | 5.15% | 1.84% | 1.64% |
| Class A with 2.25% Maximum Sales Charge | — | — | 2.81 | 1.39 | 1.41 |
| Class C at NAV | 10/01/2002 | 01/31/2002 | 4.37 | 1.08 | 1.04 |
| Class C with 1% Maximum Deferred Sales Charge | — | — | 3.37 | 1.08 | 1.04 |
| Class I at NAV | 04/21/2006 | 01/31/2002 | 5.40 | 2.10 | 2.01 |
| Class R6 at NAV | 02/01/2019 | 01/31/2002 | 5.46 | 2.15 | 2.03 |
|
| Bloomberg 1-5 Year U.S. Credit Index | — | — | 3.72% | 1.60% | 1.67% |
| % Total Annual Operating Expense Ratios3 | Class A | Class C | Class I | Class R6 |
| | 0.76% | 1.51% | 0.51% | 0.44% |
Growth of $10,000
This graph shows the change in value of a hypothetical investment of $10,000 in Class A of the Fund for the period indicated. For comparison, the same investment is shown in the indicated index.
| Growth of Investment2 | Amount Invested | Period Beginning | At NAV | With Maximum Sales Charge |
| Class C | $10,000 | 09/30/2013 | $11,091 | N.A. |
| Class I, at minimum investment | $1,000,000 | 09/30/2013 | $1,220,095 | N.A. |
| Class R6, at minimum investment | $5,000,000 | 09/30/2013 | $6,115,645 | N.A. |
See Endnotes and Additional Disclosures in this report.
Past performance is no guarantee of future results. Returns are historical and are calculated by determining the percentage change in net asset value (NAV) or offering price (as applicable) with all distributions reinvested. Furthermore, returns do not reflect the deduction of taxes that shareholders may have to pay on Fund distributions or upon the redemption of Fund shares. Investment return and principal value will fluctuate so that shares, when redeemed, may be worth more or less than their original cost. Performance for periods less than or equal to one year is cumulative. Performance is for the stated time period only; due to market volatility, current Fund performance may be lower or higher than the quoted return. For performance as of the most recent month-end, please refer to www.calvert.com.
Calvert
Short Duration Income Fund
September 30, 2023
Asset Allocation (% of total investments)
| Credit Quality (% of net assets)1 |
Footnotes:
| 1 | For purposes of the Fund’s rating restrictions, ratings are based on Moody’s Investors Service, Inc. (“Moody’s”), S&P Global Ratings (“S&P”) or Fitch Ratings (“Fitch”), or Kroll Bond Rating Agency, LLC (“Kroll”) for securitized debt instruments only (such as asset-backed securities (“ABS”) and mortgage-backed securities (“MBS”)), as applicable. If securities are rated differently by the ratings agencies, the highest rating is applied. Ratings, which are subject to change, apply to the creditworthiness of the issuers of the underlying securities and not to the Fund or its shares. Credit ratings measure the quality of an issuance based on the issuer’s creditworthiness, with ratings ranging from AAA, being the highest, to D, being the lowest based on S&P’s measures. Ratings of BBB or higher by S&P, Fitch or Kroll (Baa or higher by Moody’s) are considered to be investment-grade quality. Credit ratings are based largely on the ratings agency’s analysis at the time of rating. The rating assigned to any particular security is not necessarily a reflection of the issuer’s current financial condition and does not necessarily reflect its assessment of the volatility of a security’s market value or of the liquidity of an investment in the security. Holdings designated as “Not Rated” (if any) are not rated by the national ratings agencies stated above. |
Calvert
Short Duration Income Fund
September 30, 2023
Endnotes and Additional Disclosures
| † | The views expressed in this report are those of the portfolio manager(s) and are current only through the date stated at the top of this page. These views are subject to change at any time based upon market or other conditions, and Calvert and the Fund(s) disclaim any responsibility to update such views. These views may not be relied upon as investment advice and, because investment decisions are based on many factors, may not be relied upon as an indication of trading intent on behalf of any Calvert fund. This commentary may contain statements that are not historical facts, referred to as “forward-looking statements.” The Fund’s actual future results may differ significantly from those stated in any forward-looking statement, depending on factors such as changes in securities or financial markets or general economic conditions, the volume of sales and purchases of Fund shares, the continuation of investment advisory, administrative and service contracts, and other risks discussed from time to time in the Fund’s filings with the Securities and Exchange Commission. |
| | |
| 1 | Bloomberg 1-5 Year U.S. Credit Index measures the performance of investment-grade U.S. corporate securities and government-related bonds with a maturity between one and five years. Unless otherwise stated, index returns do not reflect the effect of any applicable sales charges, commissions, expenses, taxes or leverage, as applicable. It is not possible to invest directly in an index. |
| 2 | Total Returns at NAV do not include applicable sales charges. If sales charges were deducted, the returns would be lower. Total Returns shown with maximum sales charge reflect the stated maximum sales charge. Unless otherwise stated, performance does not reflect the deduction of taxes on Fund distributions or redemptions of Fund shares.Performance prior to the inception date of a class may be linked to the performance of an older class of the Fund. This linked performance is adjusted for any applicable sales charge, but is not adjusted for class expense differences. If adjusted for such differences, the performance would be different. The performance of Class R6 is linked to Class I. Performance presented in the Financial Highlights included in the financial statements is not linked.Effective November 5, 2020, Class C shares automatically convert to Class A shares eight years after purchase. The average annual total returns listed for Class C reflect conversion to Class A shares after eight years. Prior to November 5, 2020, Class C shares automatically converted to Class A shares ten years after purchase.Calvert Research and Management became the investment adviser to the Fund on December 31, 2016. Performance reflected prior to such date is that of the Fund’s former investment adviser. |
| 3 | Source: Fund prospectus. The expense ratios for the current reporting period can be found in the Financial Highlights section of this report. Performance reflects expenses waived and/or reimbursed, if applicable. Without such waivers and/or reimbursements, performance would have been lower. |
| Fund profile subject to change due to active management. |
| | Additional Information |
| | Bloomberg U.S. Treasury Index measures the performance of U.S. Treasuries with a maturity of one year or more. Bloomberg U.S. Corporate Bond Index measures the performance of investment-grade U.S. corporate securities with a maturity of one year or more. Bloomberg U.S. Corporate High Yield Index measures USD-denominated, non- investment grade corporate securities. Bloomberg Asset-Backed Securities Index tracks the performance of U.S. dollar denominated investment grade, fixed rate asset-backed securities publicly issued in the U.S. domestic market. Bloomberg U.S. Mortgage-Backed Securities Index measures agency mortgage-backed pass-through securities issued by Ginnie Mae (GNMA), Fannie Mae (FNMA), and Freddie Mac (FHLMC). |
| | Duration is a measure of the expected change in price of a bond — in percentage terms — given a one percent change in interest rates, all else being constant. Securities with lower durations tend to be less sensitive to interest rate changes. |
Calvert
Short Duration Income Fund
September 30, 2023
Example
As a Fund shareholder, you incur two types of costs: (1) transaction costs, including sales charges (loads) on purchases; and (2) ongoing costs, including management fees; distribution and/or service fees; and other Fund expenses. This Example is intended to help you understand your ongoing costs (in dollars) of Fund investing and to compare these costs with the ongoing costs of investing in other mutual funds. The Example is based on an investment of $1,000 invested at the beginning of the period and held for the entire period (April 1, 2023 to September 30, 2023).
Actual Expenses
The first section of the table below provides information about actual account values and actual expenses. You may use the information in this section, together with the amount you invested, to estimate the expenses that you paid over the period. Simply divide your account value by $1,000 (for example, an $8,600 account value divided by $1,000 = 8.6), then multiply the result by the number in the first section under the heading entitled “Expenses Paid During Period” to estimate the expenses you paid on your account during this period.
Hypothetical Example for Comparison Purposes
The second section of the table below provides information about hypothetical account values and hypothetical expenses based on the actual Fund expense ratio and an assumed rate of return of 5% per year (before expenses), which is not the actual Fund return. The hypothetical account values and expenses may not be used to estimate the actual ending account balance or expenses you paid for the period. You may use this information to compare the ongoing costs of investing in the Fund and other funds. To do so, compare this 5% hypothetical example with the 5% hypothetical examples that appear in the shareholder reports of the other funds.
Please note that the expenses shown in the table are meant to highlight your ongoing costs only and do not reflect any transactional costs, such as sales charges (loads). Therefore, the second section of the table is useful in comparing ongoing costs only, and will not help you determine the relative total costs of owning different funds. In addition, if these transactional costs were included, your costs would be higher.
| | Beginning
Account Value
(4/1/23) | Ending
Account Value
(9/30/23) | Expenses Paid
During Period*
(4/1/23 – 9/30/23) | Annualized
Expense
Ratio |
| Actual | | | | |
| Class A | $1,000.00 | $1,013.30 | $3.84 ** | 0.76% |
| Class C | $1,000.00 | $1,008.90 | $7.60 ** | 1.51% |
| Class I | $1,000.00 | $1,014.00 | $2.57 ** | 0.51% |
| Class R6 | $1,000.00 | $1,014.30 | $2.27 ** | 0.45% |
| Hypothetical | | | | |
| (5% return per year before expenses) | | | | |
| Class A | $1,000.00 | $1,021.26 | $3.85 ** | 0.76% |
| Class C | $1,000.00 | $1,017.50 | $7.64 ** | 1.51% |
| Class I | $1,000.00 | $1,022.51 | $2.59 ** | 0.51% |
| Class R6 | $1,000.00 | $1,022.81 | $2.28 ** | 0.45% |
| * | Expenses are equal to the Fund's annualized expense ratio for the indicated Class, multiplied by the average account value over the period, multiplied by 183/365 (to reflect the one-half year period). The Example assumes that the $1,000 was invested at the net asset value per share determined at the close of business on March 31, 2023. |
| ** | Absent a waiver and/or reimbursement of expenses by affiliate(s), expenses would be higher. |
Calvert
Short Duration Income Fund
September 30, 2023
| Asset-Backed Securities — 21.9% |
| Security | Principal
Amount
(000's omitted) | Value |
| Amur Equipment Finance Receivables IX, LLC, Series 2021-1A, Class A2, 0.75%, 11/20/26(1) | $ | 775 | $ 760,623 |
| Avant Credit Card Master Trust, Series 21-1A, Class A, 1.37%, 4/15/27(1) | | 5,800 | 5,389,500 |
| BHG Securitization Trust: | | | |
| Series 2021-B, Class A, 0.90%, 10/17/34(1) | | 1,764 | 1,696,689 |
| Series 2021-B, Class B, 1.67%, 10/17/34(1) | | 4,500 | 4,010,283 |
| Series 2022-B, Class A, 3.75%, 6/18/35(1) | | 934 | 926,651 |
| Business Jet Securities, LLC, Series 2020-1A, Class A, 2.981%, 11/15/35(1) | | 1,302 | 1,221,701 |
| Chase Auto Credit Linked Notes, Series 2021-1, Class B, 0.875%, 9/25/28(1) | | 2,255 | 2,200,667 |
| Coinstar Funding, LLC, Series 2017-1A, Class A2, 5.216%, 4/25/47(1) | | 10,167 | 8,502,844 |
| Cologix Data Centers US Issuer, LLC: | | | |
| Series 2021-1A, Class A2, 3.30%, 12/26/51(1) | | 14,080 | 12,420,878 |
| Series 2021-1A, Class B, 3.79%, 12/26/51(1) | | 12,235 | 10,630,063 |
| Conn's Receivables Funding, LLC: | | | |
| Series 2021-A, Class C, 4.59%, 5/15/26(1) | | 4,882 | 4,870,846 |
| Series 2022-A, Class B, 9.52%, 12/15/26(1) | | 5,093 | 5,114,643 |
| Series 2022-A, Class C, 0.00%, 12/15/26(1) | | 9,400 | 8,027,948 |
| Consumer Loan Underlying Bond (CLUB) Credit Trust, Series 2020-P1, Class C, 4.61%, 3/15/28(1) | | 409 | 405,853 |
| DataBank Issuer, Series 2021-2A, Class A2, 2.40%, 10/25/51(1) | | 6,085 | 5,250,835 |
| Diamond Infrastructure Funding, LLC: | | | |
| Series 2021-1A, Class A, 1.76%, 4/15/49(1) | | 5,250 | 4,494,150 |
| Series 2021-1A, Class B, 2.355%, 4/15/49(1) | | 3,000 | 2,551,769 |
| Series 2021-1A, Class C, 3.475%, 4/15/49(1) | | 1,499 | 1,304,584 |
| Diamond Issuer, Series 2021-1A, Class A, 2.305%, 11/20/51(1) | | 13,011 | 11,096,011 |
| Driven Brands Funding, LLC: | | | |
| Series 2018-1A, Class A2, 4.739%, 4/20/48(1) | | 8,314 | 8,031,031 |
| Series 2019-2A, Class A2, 3.981%, 10/20/49(1) | | 6,223 | 5,695,716 |
| Enterprise Fleet Financing, LLC, Series 2023-1, Class A2, 5.51%, 1/22/29(1) | | 11,545 | 11,454,733 |
| ExteNet, LLC: | | | |
| Series 2019-1A, Class A2, 3.204%, 7/25/49(1) | | 5,465 | 5,255,674 |
| Series 2019-1A, Class B, 4.14%, 7/25/49(1) | | 5,431 | 5,213,696 |
| Series 2019-1A, Class C, 5.219%, 7/25/49(1) | | 2,000 | 1,899,238 |
| FMC GMSR Issuer Trust: | | | |
| Series 2021-GT1, Class A, 3.62%, 7/25/26(1)(2) | | 6,835 | 5,620,904 |
| Series 2021-GT2, Class A, 3.85%, 10/25/26(1)(2) | | 7,670 | 6,312,909 |
| Series 2022-GT1, Class A, 6.19%, 4/25/27(1) | | 4,447 | 4,134,795 |
| GoodLeap Sustainable Home Solutions Trust: | | | |
| Series 2021-5CS, Class A, 2.31%, 10/20/48(1) | | 1,605 | 1,210,801 |
| Series 2022-2CS, Class A, 4.00%, 4/20/49(1) | | 9,352 | 8,044,658 |
| Hardee's Funding, LLC, Series 2020-1A, Class A2, 3.981%, 12/20/50(1) | | 4,736 | 3,997,766 |
| Security | Principal
Amount
(000's omitted) | Value |
| Horizon Aircraft Finance II, Ltd., Series 2019-1, Class A, 3.721%, 7/15/39(1) | $ | 3,461 | $ 3,011,177 |
| Horizon Aircraft Finance III, Ltd., Series 2019-2, Class A, 3.425%, 11/15/39(1) | | 3,878 | 3,068,349 |
| JPMorgan Chase Bank, NA: | | | |
| Series 2021-2, Class B, 0.889%, 12/26/28(1) | | 1,523 | 1,479,031 |
| Series 2021-3, Class B, 0.76%, 2/26/29(1) | | 1,830 | 1,750,600 |
| Series 2021-3, Class C, 0.86%, 2/26/29(1) | | 840 | 803,163 |
| Series 2021-3, Class D, 1.009%, 2/26/29(1) | | 815 | 775,479 |
| Series 2021-3, Class E, 2.102%, 2/26/29(1) | | 520 | 494,199 |
| LAD Auto Receivables Trust: | | | |
| Series 2022-1A, Class A, 5.21%, 6/15/27(1) | | 4,973 | 4,936,555 |
| Series 2023-1A, Class A2, 5.68%, 10/15/26(1) | | 3,480 | 3,472,199 |
| Series 2023-2A, Class A2, 5.93%, 6/15/27(1) | | 3,591 | 3,582,223 |
| Lendingpoint Asset Securitization Trust, Series 2022-B, Class A, 4.77%, 10/15/29(1) | | 1,689 | 1,668,719 |
| LL ABS Trust: | | | |
| Series 2021-1A, Class A, 1.07%, 5/15/29(1) | | 449 | 441,559 |
| Series 2022-1A, Class A, 3.76%, 11/15/29(1) | | 1,880 | 1,863,115 |
| Lunar Aircraft, Ltd.: | | | |
| Series 2020-1A, Class B, 4.335%, 2/15/45(1) | | 700 | 499,743 |
| Series 2020-1A, Class C, 6.413%, 2/15/45(1) | | 540 | 123,006 |
| Marlette Funding Trust: | | | |
| Series 2019-4A, Class C, 3.76%, 12/17/29(1) | | 672 | 666,564 |
| Series 2023-1A, Class B, 6.50%, 4/15/33(1) | | 16,500 | 16,453,361 |
| Series 2023-3A, Class B, 6.71%, 9/15/33(1) | | 9,500 | 9,489,754 |
| Mosaic Solar Loan Trust: | | | |
| Series 2018-1A, Class B, 2.00%, 6/22/43(1) | | 3,338 | 2,774,027 |
| Series 2019-2A, Class B, 3.28%, 9/20/40(1) | | 1,959 | 1,692,994 |
| Series 2020-1A, Class B, 3.10%, 4/20/46(1) | | 708 | 605,282 |
| Series 2020-2A, Class A, 1.44%, 8/20/46(1) | | 3,552 | 2,870,283 |
| Series 2020-2A, Class B, 2.21%, 8/20/46(1) | | 2,714 | 2,112,850 |
| Series 2021-1A, Class B, 2.05%, 12/20/46(1) | | 3,642 | 2,759,876 |
| Series 2021-3A, Class A, 1.44%, 6/20/52(1) | | 5,275 | 4,076,034 |
| Series 2022-2A, Class C, 5.95%, 1/21/53(1) | | 9,530 | 8,342,667 |
| MVW, LLC, Series 2020-1A, Class A, 1.74%, 10/20/37(1) | | 382 | 351,582 |
| Neighborly Issuer, LLC, Series 2021-1A, Class A2, 3.584%, 4/30/51(1) | | 6,647 | 5,568,299 |
| Newtek Small Business Loan Trust, Series 2023-1, Class A, 8.00%, (USD Prime - 0.50%), 7/25/50(1)(3) | | 7,217 | 7,208,528 |
| NRZ Excess Spread-Collateralized Notes: | | | |
| Series 2021-FHT1, Class A, 3.104%, 7/25/26(1) | | 1,059 | 947,519 |
| Series 2021-GNT1, Class A, 3.474%, 11/25/26(1) | | 9,968 | 8,990,303 |
| Octane Receivables Trust: | | | |
| Series 2022-1, Class A2, 4.18%, 3/20/28(1) | | 3,014 | 2,969,757 |
| Series 2023-1A, Class A, 5.87%, 5/21/29(1) | | 3,389 | 3,377,836 |
| Oportun Funding, LLC, Series 2022-1, Class A, 3.25%, 6/15/29(1) | | 1,387 | 1,374,367 |
| Oportun Issuance Trust: | | | |
| Series 2021-B, Class A, 1.47%, 5/8/31(1) | | 2,279 | 2,082,393 |
| Series 2021-B, Class B, 1.96%, 5/8/31(1) | | 2,687 | 2,444,416 |
7
See Notes to Financial Statements.
Calvert
Short Duration Income Fund
September 30, 2023
Schedule of Investments — continued
| Security | Principal
Amount
(000's omitted) | Value |
| Oportun Issuance Trust: (continued) | | | |
| Series 2021-C, Class A, 2.18%, 10/8/31(1) | $ | 16,430 | $ 14,952,831 |
| Series 2021-C, Class B, 2.67%, 10/8/31(1) | | 11,238 | 10,106,777 |
| Series 2022-2, Class A, 5.94%, 10/9/29(1) | | 1,237 | 1,233,574 |
| Series 2022-3, Class B, 8.533%, 1/8/30(1) | | 6,090 | 6,151,571 |
| Pagaya AI Debt Selection Trust: | | | |
| Series 2021-2, 3.00%, 1/25/29(1) | | 2,258 | 2,181,690 |
| Series 2021-3, Class A, 1.15%, 5/15/29(1) | | 677 | 674,769 |
| Series 2021-3, Class B, 1.74%, 5/15/29(1) | | 14,249 | 13,924,570 |
| Series 2021-3, Class C, 3.27%, 5/15/29(1) | | 3,250 | 2,814,497 |
| Series 2021-5, Class B, 2.63%, 8/15/29(1) | | 8,642 | 8,336,609 |
| Series 2021-HG1, Class A, 1.22%, 1/16/29(1) | | 2,344 | 2,258,064 |
| Planet Fitness Master Issuer, LLC, Series 2018-1A, Class A2II, 4.666%, 9/5/48(1) | | 3,385 | 3,253,999 |
| Prodigy Finance CM DAC, Series 2021-1A, Class A, 6.684%, (1 mo. SOFR + 1.364%), 7/25/51(1)(3) | | 1,092 | 1,082,093 |
| Purchasing Power Funding, LLC, Series 2021-A, Class A, 1.57%, 10/15/25(1) | | 895 | 891,477 |
| Reach ABS Trust, Series 2023-1A, Class B, 7.33%, 2/18/31(1) | | 5,000 | 4,992,306 |
| Retained Vantage Data Centers Issuer, LLC, Series 2023-1A, Class A2A, 5.00%, 9/15/48(1) | | 10,490 | 9,477,306 |
| ServiceMaster Funding, LLC, Series 2020-1, Class A2I, 2.841%, 1/30/51(1) | | 3,012 | 2,554,869 |
| SERVPRO Master Issuer, LLC, Series 2019-1A, Class A2, 3.882%, 10/25/49(1) | | 13,715 | 12,574,137 |
| SoFi Consumer Loan Program Trust, Series 2023-1S, Class A, 5.81%, 5/15/31(1) | | 1,794 | 1,790,182 |
| SpringCastle America Funding, LLC, Series 2020-AA, Class A, 1.97%, 9/25/37(1) | | 11,364 | 10,322,525 |
| Stack Infrastructure Issuer, LLC: | | | |
| Series 2019-1A, Class A2, 4.54%, 2/25/44(1) | | 12,666 | 12,544,646 |
| Series 2019-2A, Class A2, 3.08%, 10/25/44(1) | | 2,720 | 2,608,724 |
| Series 2020-1A, Class A2, 1.893%, 8/25/45(1) | | 1,470 | 1,335,640 |
| Sunnova Helios II Issuer, LLC, Series 2021-B, Class B, 2.01%, 7/20/48(1) | | 7,605 | 6,127,286 |
| Sunnova Helios IV Issuer, LLC, Series 2020-AA, Class A, 2.98%, 6/20/47(1) | | 2,851 | 2,540,242 |
| Sunnova Helios IX Issuer, LLC, Series 2022-B, Class A, 5.00%, 8/20/49(1) | | 3,783 | 3,551,217 |
| Sunnova Helios V Issuer, LLC: | | | |
| Series 2021-A, Class A, 1.80%, 2/20/48(1) | | 1,035 | 871,735 |
| Series 2021-A, Class B, 3.15%, 2/20/48(1) | | 2,288 | 1,785,565 |
| Sunnova Helios X Issuer, LLC, Series 2022-C, Class B, 5.60%, 11/22/49(1) | | 5,785 | 5,412,989 |
| Sunnova Sol II Issuer, LLC, Series 2020-2A, Class B, 5.47%, 11/1/55(1) | | 7,845 | 6,228,409 |
| Sunrun Demeter Issuer, LLC, Series 2021-2A, Class A, 2.27%, 1/30/57(1) | | 1,820 | 1,442,342 |
| Theorem Funding Trust: | | | |
| Series 2021-1A, Class B, 1.84%, 12/15/27(1) | | 4,986 | 4,898,893 |
| Series 2022-1A, Class A, 1.85%, 2/15/28(1) | | 1,166 | 1,155,327 |
| Security | Principal
Amount
(000's omitted) | Value |
| Theorem Funding Trust: (continued) | | | |
| Series 2022-3A, Class A, 7.60%, 4/15/29(1) | $ | 2,420 | $ 2,432,666 |
| Upstart Securitization Trust: | | | |
| Series 2020-1, Class C, 4.899%, 4/22/30(1) | | 2,520 | 2,498,495 |
| Series 2020-3, Class C, 6.25%, 11/20/30(1) | | 3,462 | 3,442,123 |
| Series 2021-2, Class B, 1.75%, 6/20/31(1) | | 2,053 | 2,028,410 |
| Series 2021-3, Class A, 0.83%, 7/20/31(1) | | 80 | 79,419 |
| Vantage Data Centers Issuer, LLC: | | | |
| Series 2019-1A, Class A2, 3.188%, 7/15/44(1) | | 5,582 | 5,423,153 |
| Series 2020-2A, Class A2, 1.992%, 9/15/45(1) | | 10,045 | 8,414,477 |
| Series 2021-1A, Class A2, 2.165%, 10/15/46(1) | | 3,661 | 3,208,610 |
| Vivint Solar Financing VII, LLC, Series 2020-1A, Class A, 2.21%, 7/31/51(1) | | 6,372 | 5,004,443 |
| Willis Engine Structured Trust V: | | | |
| Series 2020-A, Class B, 4.212%, 3/15/45(1) | | 628 | 507,275 |
| Series 2020-A, Class C, 6.657%, 3/15/45(1) | | 869 | 627,112 |
Total Asset-Backed Securities
(identified cost $508,687,188) | | | $ 466,619,312 |
| Collateralized Mortgage Obligations — 4.6% |
| Security | Principal
Amount
(000's omitted) | Value |
| Bellemeade Re, Ltd.: | | | |
| Series 2021-1A, Class M1A, 7.065%, (30-day average SOFR + 1.75%), 3/25/31(1)(3) | $ | 62 | $ 62,478 |
| Series 2021-1A, Class M1B, 7.515%, (30-day average SOFR + 2.20%), 3/25/31(1)(3) | | 2,360 | 2,376,305 |
| Series 2021-1A, Class M1C, 8.265%, (30-day average SOFR + 2.95%), 3/25/31(1)(3) | | 670 | 682,872 |
| Series 2021-2A, Class M1A, 6.515%, (30-day average SOFR + 1.20%), 6/25/31(1)(3) | | 1,846 | 1,846,629 |
| Series 2021-2A, Class M1B, 6.815%, (30-day average SOFR + 1.50%), 6/25/31(1)(3) | | 4,750 | 4,752,498 |
| Series 2021-3A, Class A2, 6.315%, (30-day average SOFR + 1.00%), 9/25/31(1)(3) | | 5,245 | 5,202,569 |
| Series 2021-3A, Class M1A, 6.315%, (30-day average SOFR + 1.00%), 9/25/31(1)(3) | | 1,792 | 1,795,800 |
| CHNGE Mortgage Trust, Series 2023-4, Class A1, 7.573% to 8/25/26, 9/25/58(1)(4) | | 5,582 | 5,611,675 |
| Federal Home Loan Mortgage Corp. Structured Agency Credit Risk Debt Notes: | | | |
| Series 2019-DNA4, Class M2, 7.379%, (30-day average SOFR + 2.064%), 10/25/49(1)(3) | | 101 | 100,928 |
| Series 2019-HQA4, Class B1, 8.379%, (30-day average SOFR + 3.064%), 11/25/49(1)(3) | | 2,674 | 2,754,749 |
| Series 2020-HQA2, Class B1, 9.529%, (30-day average SOFR + 4.214%), 3/25/50(1)(3) | | 5,335 | 5,817,920 |
| Series 2021-DNA3, Class M1, 6.065%, (30-day average SOFR + 0.75%), 10/25/33(1)(3) | | 795 | 794,371 |
| Series 2022-DNA2, Class M1A, 6.615%, (30-day average SOFR + 1.30%), 2/25/42(1)(3) | | 4,389 | 4,388,088 |
8
See Notes to Financial Statements.
Calvert
Short Duration Income Fund
September 30, 2023
Schedule of Investments — continued
| Security | Principal
Amount
(000's omitted) | Value |
| Federal National Mortgage Association Connecticut Avenue Securities: | | | |
| Series 2018-R07, Class 1M2, 7.829%, (30-day average SOFR + 2.514%), 4/25/31(1)(3) | $ | 224 | $ 225,592 |
| Series 2019-R05, Class 1B1, 9.529%, (30-day average SOFR + 4.214%), 7/25/39(1)(3) | | 2,523 | 2,617,278 |
| Series 2019-R06, Class 2B1, 9.179%, (30-day average SOFR + 3.864%), 9/25/39(1)(3) | | 11,472 | 11,783,950 |
| Series 2019-R07, Class 1B1, 8.829%, (30-day average SOFR + 3.514%), 10/25/39(1)(3) | | 9,350 | 9,558,069 |
| Series 2020-R02, Class 2B1, 8.429%, (30-day average SOFR + 3.114%), 1/25/40(1)(3) | | 6,160 | 6,228,048 |
| Series 2021-R01, Class 1B2, 11.315%, (30-day average SOFR + 6.00%), 10/25/41(1)(3) | | 3,995 | 4,063,416 |
| Home Re, Ltd.: | | | |
| Series 2021-1, Class M1C, 7.734%, (30-day average SOFR + 2.414%), 7/25/33(1)(3) | | 3,576 | 3,598,626 |
| Series 2021-1, Class M2, 8.284%, (30-day average SOFR + 2.964%), 7/25/33(1)(3) | | 3,500 | 3,510,045 |
| JPMorgan Mortgage Trust, Series 2023-HE2, Class A1, 7.016%, (30-day average SOFR + 1.70%), 3/25/54(1)(3) | | 6,036 | 6,036,000 |
| LHOME Mortgage Trust, Series 2023-RTL3, Class A1, 8.00%, 8/25/28(1)(2) | | 2,500 | 2,500,433 |
| PNMAC GMSR Issuer Trust: | | | |
| Series 2022-FT1, Class A, 9.505%, (30-day average SOFR + 4.19%), 6/25/27(1)(3) | | 1,000 | 1,001,612 |
| Series 2022-GT1, Class A, 9.565%, (30-day average SOFR + 4.25%), 5/25/27(1)(3) | | 4,820 | 4,833,281 |
| Preston Ridge Partners Mortgage: | | | |
| Series 2021-RPL1, Class A1, 1.319% to 8/25/24, 7/25/51(1)(4) | | 2,743 | 2,402,385 |
| Series 2021-RPL2, Class A1, 1.455%, 10/25/51(1)(2) | | 1,707 | 1,492,801 |
| RESIMAC Premier Trust, Series 2020-1A, Class A1A, 6.492%, (1 mo. SOFR + 1.16%), 2/7/52(1)(3) | | 818 | 818,782 |
Total Collateralized Mortgage Obligations
(identified cost $96,066,444) | | | $ 96,857,200 |
| Commercial Mortgage-Backed Securities — 8.6% |
| Security | Principal
Amount
(000's omitted) | Value |
| BAMLL Commercial Mortgage Securities Trust: | | | |
| Series 2019-BPR, Class DNM, 3.843%, 11/5/32(1)(2) | $ | 10,820 | $ 6,771,472 |
| Series 2019-BPR, Class ENM, 3.843%, 11/5/32(1)(2) | | 6,285 | 2,079,262 |
| BPR Trust, Series 2022-SSP, Class A, 8.332%, (1 mo. SOFR + 3.00%), 5/15/39(1)(3) | | 4,485 | 4,482,189 |
| BX Commercial Mortgage Trust: | | | |
| Series 2019-XL, Class A, 6.367%, (1 mo. SOFR + 1.034%), 10/15/36(1)(3) | | 18,945 | 18,897,302 |
| Series 2019-XL, Class B, 6.527%, (1 mo. SOFR + 1.194%), 10/15/36(1)(3) | | 10,595 | 10,532,920 |
| Series 2021-VOLT, Class B, 6.397%, (1 mo. SOFR + 1.064%), 9/15/36(1)(3) | | 10,284 | 9,954,114 |
| Security | Principal
Amount
(000's omitted) | Value |
| BX Commercial Mortgage Trust: (continued) | | | |
| Series 2021-VOLT, Class C, 6.547%, (1 mo. SOFR + 1.214%), 9/15/36(1)(3) | $ | 3,122 | $ 3,005,091 |
| Series 2021-VOLT, Class D, 7.097%, (1 mo. SOFR + 1.764%), 9/15/36(1)(3) | | 9,322 | 8,912,263 |
| Credit Suisse Mortgage Trust, Series 2018-SITE, Class C, 4.941%, 4/15/36(1)(2) | | 5,000 | 4,835,748 |
| CSMC: | | | |
| Series 2018-SITE, Class A, 4.284%, 4/15/36(1) | | 4,875 | 4,764,671 |
| Series 2021-4SZN, Class A, 9.30%, (1 mo. SOFR + 3.967%), 11/15/23(1)(3) | | 6,457 | 6,262,974 |
| Series 2021-BPNY, Class A, 9.162%, (1 mo. SOFR + 3.829%), 8/15/26(1)(3) | | 1,840 | 1,616,570 |
| Series 2022-CNTR, Class A, 9.277%, (1 mo. SOFR + 3.944%), 1/15/24(1)(3) | | 1,014 | 871,444 |
| Series 2022-NWPT, Class A, 8.475%, (1 mo. SOFR + 3.143%), 9/9/24(1)(3) | | 5,027 | 5,080,427 |
| Extended Stay America Trust: | | | |
| Series 2021-ESH, Class A, 6.527%, (1 mo. SOFR + 1.194%), 7/15/38(1)(3) | | 3,616 | 3,588,462 |
| Series 2021-ESH, Class B, 6.827%, (1 mo. SOFR + 1.49%), 7/15/38(1)(3) | | 3,229 | 3,193,232 |
| Series 2021-ESH, Class C, 7.147%, (1 mo. SOFR + 1.814%), 7/15/38(1)(3) | | 5,845 | 5,765,711 |
| Series 2021-ESH, Class D, 7.697%, (1 mo. SOFR + 2.36%), 7/15/38(1)(3) | | 3,252 | 3,204,367 |
| Federal National Mortgage Association, Series 2017-M13, Class A2, 3.029%, 9/25/27(2) | | 4,295 | 3,961,174 |
| Federal National Mortgage Association Multifamily Connecticut Avenue Securities Trust: | | | |
| Series 2019-01, Class M10, 8.679%, (30-day average SOFR + 3.364%), 10/25/49(1)(3) | | 2,934 | 2,868,714 |
| Series 2020-01, Class M10, 9.179%, (30-day average SOFR + 3.864%), 3/25/50(1)(3) | | 3,537 | 3,459,254 |
| Hawaii Hotel Trust, Series 2019-MAUI, Class A, 6.529%, (1 mo. SOFR + 1.197%), 5/15/38(1)(3) | | 17,728 | 17,609,004 |
| JPMorgan Chase Commercial Mortgage Securities Trust: | | | |
| Series 2014-DSTY, Class B, 3.771%, 6/10/27(1) | | 4,200 | 615,195 |
| Series 2014-DSTY, Class C, 3.931%, 6/10/27(1)(2) | | 1,920 | 130,637 |
| Med Trust, Series 2021-MDLN, Class C, 7.247%, (1 mo. SOFR + 1.91%), 11/15/38(1)(3) | | 10,952 | 10,647,581 |
| Morgan Stanley Capital I Trust, Series 2019-BPR, Class A, 7.322%, (1 mo. SOFR + 1.992%), 5/15/36(1)(3)(5) | | 11,660 | 11,235,281 |
| Taubman Centers Commercial Mortgage Trust, Series 2022-DPM, Class A, 7.518%, (1 mo. SOFR + 2.186%), 5/15/37(1)(3) | | 2,250 | 2,200,050 |
| VMC Finance, LLC: | | | |
| Series 2021-HT1, Class A, 7.095%, (1 mo. SOFR + 1.764%), 1/18/37(1)(3) | | 18,103 | 17,712,197 |
| Series 2021-HT1, Class B, 9.945%, (1 mo. SOFR + 4.614%), 1/18/37(1)(3) | | 9,712 | 9,212,096 |
Total Commercial Mortgage-Backed Securities
(identified cost $199,735,168) | | | $ 183,469,402 |
9
See Notes to Financial Statements.
Calvert
Short Duration Income Fund
September 30, 2023
Schedule of Investments — continued
| Security | Principal
Amount
(000’s omitted) | Value |
| Basic Materials — 0.7% | |
| Celanese U.S. Holdings, LLC, 6.35%, 11/15/28 | $ | 14,034 | $ 13,864,830 |
| | | | $ 13,864,830 |
| Communications — 1.0% | |
| CCO Holdings, LLC/CCO Holdings Capital Corp.: | | | |
| 5.00%, 2/1/28(1) | $ | 2,733 | $ 2,484,934 |
| 5.125%, 5/1/27(1) | | 10,390 | 9,691,389 |
| Nokia Oyj, 4.375%, 6/12/27 | | 4,118 | 3,816,870 |
| Sprint, LLC: | | | |
| 7.125%, 6/15/24 | | 2,125 | 2,139,765 |
| 7.625%, 3/1/26 | | 4,000 | 4,113,972 |
| | | | $ 22,246,930 |
| Consumer, Cyclical — 5.1% | |
| American Airlines, Inc./AAdvantage Loyalty IP, Ltd., 5.50%, 4/20/26(1) | $ | 10,219 | $ 9,989,611 |
| Aptiv PLC/Aptiv Corp., 2.396%, 2/18/25 | | 10,692 | 10,177,559 |
| Brunswick Corp., 0.85%, 8/18/24 | | 7,728 | 7,372,283 |
| Delta Air Lines, Inc./SkyMiles IP, Ltd.: | | | |
| 4.50%, 10/20/25(1) | | 6,394 | 6,213,488 |
| 4.75%, 10/20/28(1) | | 10,953 | 10,413,150 |
| Ford Motor Credit Co., LLC, 7.35%, 11/4/27 | | 6,379 | 6,520,398 |
| General Motors Financial Co., Inc.: | | | |
| 4.30%, 4/6/29 | | 4,163 | 3,736,847 |
| 5.80%, 6/23/28 | | 8,255 | 8,069,131 |
| 5.85%, 4/6/30(6) | | 4,235 | 4,059,291 |
| 6.579%, (SOFR + 1.30%), 4/7/25(3) | | 5,092 | 5,103,920 |
| Hyundai Capital America: | | | |
| 5.68%, 6/26/28(1) | | 7,000 | 6,847,861 |
| 5.80%, 6/26/25(1) | | 7,040 | 7,013,149 |
| Lithia Motors, Inc., 4.625%, 12/15/27(1) | | 3,500 | 3,199,682 |
| Nordstrom, Inc., 2.30%, 4/8/24 | | 3,428 | 3,359,886 |
| WarnerMedia Holdings, Inc., 3.755%, 3/15/27 | | 17,500 | 16,163,918 |
| | | | $ 108,240,174 |
| Consumer, Non-cyclical — 1.4% | |
| Ashtead Capital, Inc.: | | | |
| 4.00%, 5/1/28(1) | $ | 8,545 | $ 7,777,488 |
| 4.25%, 11/1/29(1) | | 3,000 | 2,658,682 |
| Centene Corp., 4.25%, 12/15/27(6) | | 15,882 | 14,655,354 |
| CVS Pass-Through Trust, 6.036%, 12/10/28 | | 835 | 826,027 |
| Smithfield Foods, Inc., 2.625%, 9/13/31(1) | | 4,498 | 3,229,001 |
| | | | $ 29,146,552 |
| Financial — 28.1% | |
| ABN AMRO Bank NV, 6.339% to 9/18/26, 9/18/27(1)(7) | $ | 6,400 | $ 6,386,739 |
| Security | Principal
Amount
(000’s omitted) | Value |
| Financial (continued) | |
| AerCap Ireland Capital DAC/AerCap Global Aviation Trust: | | | |
| 1.65%, 10/29/24 | $ | 4,203 | $ 3,999,580 |
| 1.75%, 10/29/24 | | 7,000 | 6,675,760 |
| AIB Group PLC, 6.608% to 9/13/28, 9/13/29(1)(7) | | 6,675 | 6,651,582 |
| Ally Financial, Inc.: | | | |
| 3.875%, 5/21/24 | | 9,687 | 9,508,614 |
| 6.992% to 6/13/28, 6/13/29(7) | | 8,007 | 7,839,917 |
| American Assets Trust, L.P., 3.375%, 2/1/31 | | 4,301 | 3,225,208 |
| Assurant, Inc., 6.10%, 2/27/26 | | 3,776 | 3,759,793 |
| Australia & New Zealand Banking Group, Ltd., 2.95% to 7/22/25, 7/22/30(1)(7) | | 6,350 | 5,897,847 |
| Aviation Capital Group, LLC: | | | |
| 6.25%, 4/15/28(1) | | 6,205 | 6,073,723 |
| 6.375%, 7/15/30(1) | | 6,300 | 6,106,153 |
| Banco Santander S.A.: | | | |
| 4.175% to 3/24/27, 3/24/28(7) | | 1,000 | 923,812 |
| 5.147%, 8/18/25 | | 10,200 | 9,988,939 |
| 5.294%, 8/18/27 | | 6,000 | 5,804,529 |
| 5.588%, 8/8/28 | | 4,600 | 4,502,245 |
| 6.921%, 8/8/33 | | 3,400 | 3,253,348 |
| Bank of America Corp.: | | | |
| 4.376% to 4/27/27, 4/27/28(7) | | 16,876 | 15,939,964 |
| 5.08% to 1/20/26, 1/20/27(7) | | 10,000 | 9,776,777 |
| 5.819% to 9/15/28, 9/15/29(7) | | 28,176 | 27,841,889 |
| 6.204% to 11/10/27, 11/10/28(7) | | 18,132 | 18,220,638 |
| BNP Paribas S.A., 4.375%, 9/28/25(1) | | 3,000 | 2,888,507 |
| CaixaBank S.A., 6.208% to 1/18/28, 1/18/29(1)(7) | | 8,154 | 7,983,384 |
| Capital One Financial Corp., 3.75%, 7/28/26 | | 14,222 | 13,191,748 |
| Charles Schwab Corp. (The), 5.875%, 8/24/26 | | 5,227 | 5,211,829 |
| CI Financial Corp., 3.20%, 12/17/30 | | 3,788 | 2,876,140 |
| Citigroup, Inc.: | | | |
| 4.00% to 12/10/25(7)(8) | | 5,060 | 4,438,891 |
| 5.61% to 9/29/25, 9/29/26(7) | | 12,000 | 11,880,519 |
| Credit Agricole S.A., 1.247% to 1/26/26, 1/26/27(1)(7) | | 10,700 | 9,561,229 |
| Danske Bank A/S, 1.621% to 9/11/25, 9/11/26(1)(7) | | 4,647 | 4,235,302 |
| Discover Bank, 5.974%, 8/9/28 | | 5,732 | 5,250,295 |
| DNB Bank ASA, 1.535% to 5/25/26, 5/25/27(1)(7) | | 5,000 | 4,417,222 |
| EPR Properties, 4.50%, 6/1/27 | | 12,800 | 11,467,216 |
| Extra Space Storage L.P.: | | | |
| 3.90%, 4/1/29 | | 2,650 | 2,382,408 |
| 5.70%, 4/1/28 | | 1,612 | 1,594,623 |
| F&G Annuities & Life, Inc., 7.40%, 1/13/28 | | 15,421 | 15,406,454 |
| Federation des Caisses Desjardins du Quebec, 4.40%, 8/23/25(1) | | 10,783 | 10,440,289 |
| Fifth Third Bancorp, 6.339% to 7/27/28, 7/27/29(7) | | 9,434 | 9,324,561 |
| GA Global Funding Trust: | | | |
| 2.25%, 1/6/27(1) | | 11,545 | 10,125,580 |
| 6.644%, (SOFR + 1.36%), 4/11/25(1)(3) | | 10,000 | 9,894,530 |
| Goldman Sachs Group, Inc. (The), 2.64% to 2/24/27, 2/24/28(7) | | 17,120 | 15,272,036 |
10
See Notes to Financial Statements.
Calvert
Short Duration Income Fund
September 30, 2023
Schedule of Investments — continued
| Security | Principal
Amount
(000’s omitted) | Value |
| Financial (continued) | |
| HAT Holdings I, LLC/HAT Holdings II, LLC: | | | |
| 3.375%, 6/15/26(1) | $ | 13,807 | $ 12,286,964 |
| 6.00%, 4/15/25(1) | | 6,656 | 6,483,866 |
| HSBC Holdings PLC: | | | |
| 6.161% to 3/9/28, 3/9/29(7) | | 6,808 | 6,743,187 |
| 7.39% to 11/3/27, 11/3/28(7) | | 10,464 | 10,829,425 |
| Huntington National Bank (The), 5.699% to 11/18/24, 11/18/25(7) | | 7,687 | 7,516,735 |
| Intesa Sanpaolo SpA: | | | |
| 5.25%, 1/12/24 | | 4,300 | 4,284,265 |
| 7.00%, 11/21/25(1) | | 8,178 | 8,280,922 |
| Jefferies Financial Group, Inc., 5.875%, 7/21/28 | | 6,129 | 6,001,755 |
| JPMorgan Chase & Co.: | | | |
| 1.04% to 2/4/26, 2/4/27(7) | | 25,000 | 22,255,665 |
| 1.47% to 9/22/26, 9/22/27(7) | | 11,468 | 10,050,635 |
| 1.578% to 4/22/26, 4/22/27(7) | | 9,000 | 8,034,085 |
| 4.005% to 4/23/28, 4/23/29(7) | | 16,059 | 14,808,092 |
| KeyBank N.A.: | | | |
| 4.15%, 8/8/25 | | 6,600 | 6,218,028 |
| 5.85%, 11/15/27 | | 5,155 | 4,905,397 |
| KeyCorp, 4.789% to 6/1/32, 6/1/33(7) | | 2,250 | 1,876,826 |
| Macquarie Bank, Ltd., 3.624%, 6/3/30(1) | | 3,984 | 3,245,844 |
| Newmark Group, Inc., 6.125%, 11/15/23 | | 14,113 | 14,100,369 |
| OneMain Finance Corp.: | | | |
| 3.50%, 1/15/27 | | 7,159 | 6,137,089 |
| 7.125%, 3/15/26 | | 1,938 | 1,900,008 |
| Radian Group, Inc.: | | | |
| 4.875%, 3/15/27 | | 8,622 | 8,065,364 |
| 6.625%, 3/15/25 | | 6,300 | 6,268,563 |
| Santander UK Group Holdings PLC, 1.532% to 8/21/25, 8/21/26(7) | | 5,400 | 4,897,277 |
| Standard Chartered PLC, 1.822% to 11/23/24, 11/23/25(1)(7) | | 6,397 | 6,047,002 |
| Stifel Financial Corp., 4.25%, 7/18/24 | | 8,282 | 8,150,353 |
| Swedbank AB: | | | |
| 5.337%, 9/20/27(1) | | 6,688 | 6,486,527 |
| 6.136%, 9/12/26(1) | | 11,147 | 11,107,698 |
| Synchrony Bank: | | | |
| 5.40%, 8/22/25 | | 2,775 | 2,675,668 |
| 5.625%, 8/23/27 | | 970 | 905,963 |
| Synchrony Financial, 4.875%, 6/13/25 | | 1,561 | 1,497,205 |
| Synovus Bank/Columbus, GA: | | | |
| 4.00% to 10/29/25, 10/29/30(7) | | 2,946 | 2,379,967 |
| 5.625%, 2/15/28 | | 4,100 | 3,717,425 |
| Texas Capital Bancshares, Inc., 4.00% to 5/6/26, 5/6/31(6)(7) | | 3,909 | 3,246,300 |
| Truist Financial Corp., 6.047% to 6/8/26, 6/8/27(7) | | 16,795 | 16,618,140 |
| U.S. Bancorp, 5.775% to 6/12/28, 6/12/29(7) | | 15,564 | 15,158,322 |
| UBS Group AG: | | | |
| 4.703% to 8/5/26, 8/5/27(1)(7) | | 2,348 | 2,252,287 |
| Security | Principal
Amount
(000’s omitted) | Value |
| Financial (continued) | |
| UBS Group AG: (continued) | | | |
| 6.327% to 12/22/26, 12/22/27(1)(7) | $ | 10,000 | $ 9,988,139 |
| UniCredit SpA, 2.569% to 9/22/25, 9/22/26(1)(7) | | 13,997 | 12,828,797 |
| | | | $ 598,469,974 |
| Industrial — 2.1% | |
| Berry Global, Inc., 5.50%, 4/15/28(1) | $ | 2,590 | $ 2,503,669 |
| Mohawk Industries, Inc., 5.85%, 9/18/28(6) | | 6,875 | 6,827,638 |
| Penske Truck Leasing Co., L.P./PTL Finance Corp.: | | | |
| 5.75%, 5/24/26(1) | | 4,175 | 4,115,677 |
| 5.875%, 11/15/27(1) | | 7,850 | 7,721,606 |
| SMBC Aviation Capital Finance DAC, 3.55%, 4/15/24(1) | | 3,800 | 3,747,198 |
| TD SYNNEX Corp., 1.25%, 8/9/24 | | 6,500 | 6,211,796 |
| Teledyne Technologics, Inc., 0.95%, 4/1/24 | | 14,000 | 13,631,003 |
| | | | $ 44,758,587 |
| Technology — 1.7% | |
| Concentrix Corp.: | | | |
| 6.60%, 8/2/28 | $ | 11,333 | $ 10,943,000 |
| 6.65%, 8/2/26 | | 5,835 | 5,802,023 |
| Kyndryl Holdings, Inc., 2.70%, 10/15/28 | | 18,732 | 15,410,920 |
| Marvell Technology, Inc., 5.75%, 2/15/29 | | 4,254 | 4,216,752 |
| | | | $ 36,372,695 |
| Utilities — 1.2% | |
| AES Corp. (The), 1.375%, 1/15/26 | $ | 7,000 | $ 6,237,124 |
| Enel Finance International N.V., 1.375%, 7/12/26(1) | | 14,665 | 12,958,259 |
| NextEra Energy Operating Partners, L.P., 4.25%, 9/15/24(1) | | 779 | 748,701 |
| Niagara Mohawk Power Corp., 4.278%, 12/15/28(1) | | 6,500 | 6,035,176 |
| | | | $ 25,979,260 |
Total Corporate Bonds
(identified cost $923,776,750) | | | $ 879,079,002 |
| High Social Impact Investments — 0.2% |
| Security | Principal
Amount
(000's omitted) | Value |
| Calvert Impact Capital, Inc., Community Investment Notes, 1.50%, 12/15/23(9)(10) | $ | 4,000 | $ 3,945,160 |
Total High Social Impact Investments
(identified cost $4,000,000) | | | $ 3,945,160 |
11
See Notes to Financial Statements.
Calvert
Short Duration Income Fund
September 30, 2023
Schedule of Investments — continued
| Senior Floating-Rate Loans — 0.2%(11) |
| Borrower/Description | Principal
Amount
(000's omitted) | Value |
| Diversified Telecommunication Services — 0.2% | |
| CenturyLink, Inc., Term Loan, 7.681%, (SOFR + 2.25%), 3/15/27 | $ | 6,519 | $ 4,659,328 |
Total Senior Floating-Rate Loans
(identified cost $6,474,514) | | | $ 4,659,328 |
| Taxable Municipal Obligations — 0.5% |
| Security | Principal
Amount
(000's omitted) | Value |
| Special Tax Revenue — 0.3% | |
| California Health Facilities Financing Authority, (No Place Like Home Program): | | | |
| Social Bonds, 2.02%, 6/1/24 | $ | 2,500 | $ 2,442,450 |
| Social Bonds, 2.211%, 6/1/25 | | 4,450 | 4,222,783 |
| | | | $ 6,665,233 |
| Water and Sewer — 0.2% | |
| Narragansett Bay Commission, RI, Wastewater System Revenue, Green Bonds, 1.597%, 9/1/25 | $ | 2,350 | $ 2,187,592 |
| San Diego County Water Authority, CA, Green Bonds, Series A, 0.743%, 5/1/25 | | 1,500 | 1,397,085 |
| San Francisco City and County Public Utilities Commission, CA, Water Revenue, Green Bonds: | | | |
| 1.982%, 11/1/23 | | 700 | 698,033 |
| 2.082%, 11/1/24 | | 375 | 361,601 |
| (Escrowed to Maturity), 2.082%, 11/1/24 | | 125 | 120,286 |
| | | | $ 4,764,597 |
Total Taxable Municipal Obligations
(identified cost $12,000,000) | | | $ 11,429,830 |
| U.S. Government Agency Mortgage-Backed Securities — 4.6% |
| Security | Principal
Amount
(000's omitted) | Value |
| Federal National Mortgage Association: | | | |
| 5.00%, 30-Year, TBA(12) | $ | 48,900 | $ 46,158,955 |
| 5.50%, 30-Year, TBA(12) | | 5,500 | 5,317,815 |
| 6.00%, 30-Year, TBA(12) | | 45,700 | 45,123,371 |
Total U.S. Government Agency Mortgage-Backed Securities
(identified cost $97,985,293) | | $ 96,600,141 |
| U.S. Treasury Obligations — 18.5% |
| Security | Principal
Amount
(000's omitted) | Value |
| U.S. Treasury Floating Rate Notes: | | | |
| 5.44%, (3 mo. USTMMR + 0.037%), 7/31/24(3) | $ | 79,000 | $ 79,020,492 |
| 5.572%, (3 mo. USTMMR + 0.17%), 4/30/25(3) | | 10,400 | 10,405,232 |
| U.S. Treasury Notes: | | | |
| 4.125%, 7/31/28 | | 61,212 | 59,896,898 |
| 4.25%, 5/31/25 | | 10,000 | 9,852,344 |
| 4.25%, 10/15/25 | | 173,000 | 170,317,149 |
| 4.375%, 8/15/26 | | 10,080 | 9,955,575 |
| 4.375%, 8/31/28 | | 15,170 | 15,020,670 |
| 4.50%, 7/15/26 | | 4,600 | 4,557,953 |
| 4.625%, 9/15/26 | | 28,748 | 28,608,752 |
| 5.00%, 8/31/25 | | 5,600 | 5,589,062 |
Total U.S. Treasury Obligations
(identified cost $396,288,343) | | | $ 393,224,127 |
| Short-Term Investments — 3.2% | | | |
| Affiliated Fund — 2.5% |
| Security | Shares | Value |
| Morgan Stanley Institutional Liquidity Funds - Government Portfolio, Institutional Class, 5.27%(13) | | 53,606,159 | $ 53,606,159 |
Total Affiliated Fund
(identified cost $53,606,159) | | | $ 53,606,159 |
| Securities Lending Collateral — 0.7% |
| Security | Shares | Value |
| State Street Navigator Securities Lending Government Money Market Portfolio, 5.36%(14) | | 15,147,475 | $ 15,147,475 |
Total Securities Lending Collateral
(identified cost $15,147,475) | | | $ 15,147,475 |
Total Short-Term Investments
(identified cost $68,753,634) | | | $ 68,753,634 |
Total Investments — 103.6%
(identified cost $2,313,767,334) | | | $2,204,637,136 |
| Other Assets, Less Liabilities — (3.6)% | | | $ (76,498,098) |
| Net Assets — 100.0% | | | $ 2,128,139,038 |
12
See Notes to Financial Statements.
Calvert
Short Duration Income Fund
September 30, 2023
Schedule of Investments — continued
| The percentage shown for each investment category in the Schedule of Investments is based on net assets. |
| (1) | Security exempt from registration under Rule 144A of the Securities Act of 1933, as amended. These securities may be sold in certain transactions in reliance on an exemption from registration (normally to qualified institutional buyers). At September 30, 2023, the aggregate value of these securities is $1,020,003,594 or 47.9% of the Fund's net assets. |
| (2) | Weighted average fixed-rate coupon that changes/updates monthly. Rate shown is the rate at September 30, 2023. |
| (3) | Variable rate security. The stated interest rate represents the rate in effect at September 30, 2023. |
| (4) | Step coupon security. Interest rate represents the rate in effect at
September 30, 2023. |
| (5) | Represents an investment in an issuer that may be deemed to be an affiliate (see Note 8). |
| (6) | All or a portion of this security was on loan at September 30, 2023. The aggregate market value of securities on loan at September 30, 2023 was $20,720,548. |
| (7) | Security converts to variable rate after the indicated fixed-rate coupon period. |
| (8) | Perpetual security with no stated maturity date but may be subject to calls by the issuer. |
| (9) | May be deemed to be an affiliated company (see Note 8). |
| (10) | Restricted security. Total market value of restricted securities amounts to $3,945,160, which represents 0.2% of the net assets of the Fund as of September 30, 2023. |
| (11) | Senior floating-rate loans (Senior Loans) often require prepayments from excess cash flows or permit the borrowers to repay at their election. The degree to which borrowers repay, whether as a contractual requirement or at their election, cannot be predicted with accuracy. As a result, the actual remaining maturity may be substantially less than the stated maturities shown. However, Senior Loans will typically have an expected average life of approximately two to four years. Senior Loans typically have rates of interest which are redetermined periodically by reference to a base lending rate, plus a spread. These base lending rates are primarily the Secured Overnight Financing Rate (“SOFR”) (or the London Interbank Offered Rate (“LIBOR”) for those loans whose rates reset prior to the discontinuance of LIBOR on June 30, 2023) and secondarily, the prime rate offered by one or more major United States banks (the “Prime Rate”). Base lending rates may be subject to a floor, or minimum rate. Rates for SOFR are generally 1 or 3-month tenors and may also be subject to a credit spread adjustment. Senior Loans are generally subject to contractual restrictions that must be satisfied before they can be bought or sold. |
| (12) | TBA (To Be Announced) securities are purchased on a forward commitment basis with an approximate principal amount and maturity date. The actual principal amount and maturity date are determined upon settlement. |
| (13) | May be deemed to be an affiliated investment company. The rate shown is the annualized seven-day yield as of September 30, 2023. |
| (14) | Represents investment of cash collateral received in connection with securities lending. |
Futures Contracts
| Description | Number of
Contracts | Position | Expiration
Date | Notional
Amount | Value/
Unrealized
Appreciation
(Depreciation) |
| Interest Rate Futures | | | | | |
| U.S. 2-Year Treasury Note | 1,827 | Long | 12/29/23 | $ 370,352,884 | $(1,005,800) |
| U.S. 5-Year Treasury Note | 144 | Long | 12/29/23 | 15,171,750 | (54,055) |
| U.S. Ultra 10-Year Treasury Note | (973) | Short | 12/19/23 | (108,550,313) | 3,442,758 |
| | | | | | $ 2,382,903 |
Restricted Securities
| Description | Acquisition Date | Cost |
| Calvert Impact Capital, Inc., Community Investment Notes, 1.50%, 12/15/23 | 12/14/20 | $4,000,000 |
| Abbreviations: |
| SOFR | – Secured Overnight Financing Rate |
| TBA | – To Be Announced |
| USTMMR | – U.S. Treasury Money Market Rate |
| Currency Abbreviations: |
| USD | – United States Dollar |
13
See Notes to Financial Statements.
Calvert
Short Duration Income Fund
September 30, 2023
Statement of Assets and Liabilities
| | September 30, 2023 |
| Assets | |
Investments in securities of unaffiliated issuers, at value (identified cost $2,244,501,209) - including
$20,720,548 of securities on loan | $ 2,135,850,536 |
| Investments in securities of affiliated issuers, at value (identified cost $69,266,125) | 68,786,600 |
| Cash | 84,267 |
| Deposits at broker for futures contracts | 2,953,000 |
| Deposits for forward commitment securities | 673,000 |
| Receivable for investments sold | 10,490,404 |
| Receivable for capital shares sold | 30,861,025 |
| Interest receivable | 16,654,135 |
| Dividends and interest receivable - affiliated | 349,410 |
| Securities lending income receivable | 25,951 |
| Tax reclaims receivable | 68,965 |
| Trustees' deferred compensation plan | 1,097,226 |
| Total assets | $2,267,894,519 |
| Liabilities | |
| Payable for variation margin on open futures contracts | $ 14,005 |
| Payable for investments purchased | 18,873,708 |
| Payable for when-issued/delayed delivery/forward commitment securities | 98,153,028 |
| Payable for capital shares redeemed | 4,342,991 |
| Distributions payable | 882,118 |
| Deposits for securities loaned | 15,147,475 |
| Payable to affiliates: | |
| Investment advisory fee | 469,182 |
| Administrative fee | 206,810 |
| Distribution and service fees | 57,671 |
| Sub-transfer agency fee | 12,766 |
| Trustees' deferred compensation plan | 1,097,226 |
| Other | 27,115 |
| Accrued expenses | 471,386 |
| Total liabilities | $ 139,755,481 |
| Net Assets | $2,128,139,038 |
| Sources of Net Assets | |
| Paid-in capital | $ 2,315,814,241 |
| Accumulated loss | (187,675,203) |
| Net Assets | $2,128,139,038 |
| Class A Shares | |
| Net Assets | $ 232,643,469 |
| Shares Outstanding | 15,364,683 |
Net Asset Value and Redemption Price Per Share
(net assets ÷ shares of beneficial interest outstanding) | $ 15.14 |
Maximum Offering Price Per Share
(100 ÷ 97.75 of net asset value per share) | $ 15.49 |
| Class C Shares | |
| Net Assets | $ 11,701,776 |
| Shares Outstanding | 775,808 |
Net Asset Value and Offering Price Per Share*
(net assets ÷ shares of beneficial interest outstanding) | $ 15.08 |
14
See Notes to Financial Statements.
Calvert
Short Duration Income Fund
September 30, 2023
Statement of Assets and Liabilities — continued
| | September 30, 2023 |
| Class I Shares | |
| Net Assets | $ 1,670,416,159 |
| Shares Outstanding | 109,577,947 |
Net Asset Value, Offering Price and Redemption Price Per Share
(net assets ÷ shares of beneficial interest outstanding) | $ 15.24 |
| Class R6 Shares | |
| Net Assets | $ 213,377,634 |
| Shares Outstanding | 13,997,806 |
Net Asset Value, Offering Price and Redemption Price Per Share
(net assets ÷ shares of beneficial interest outstanding) | $ 15.24 |
| On sales of $100,000 or more, the offering price of Class A shares is reduced. |
| * | Redemption price per share is equal to the net asset value less any applicable contingent deferred sales charge. |
15
See Notes to Financial Statements.
Calvert
Short Duration Income Fund
September 30, 2023
| | Year Ended |
| | September 30, 2023 |
| Investment Income | |
| Dividend income | $ 95,313 |
| Dividend income - affiliated issuers | 2,285,399 |
| Interest and other income | 94,022,483 |
| Interest income - affiliated issuers | 890,353 |
| Securities lending income, net | 117,954 |
| Total investment income | $ 97,411,502 |
| Expenses | |
| Investment advisory fee | $ 6,125,244 |
| Administrative fee | 2,656,470 |
| Distribution and service fees: | |
| Class A | 611,625 |
| Class C | 134,743 |
| Trustees' fees and expenses | 148,214 |
| Custodian fees | 45,854 |
| Transfer agency fees and expenses | 1,452,774 |
| Accounting fees | 429,206 |
| Professional fees | 122,956 |
| Registration fees | 116,878 |
| Reports to shareholders | 116,363 |
| Miscellaneous | 118,630 |
| Total expenses | $ 12,078,957 |
| Waiver and/or reimbursement of expenses by affiliates | $ (213,414) |
| Net expenses | $ 11,865,543 |
| Net investment income | $ 85,545,959 |
| Realized and Unrealized Gain (Loss) | |
| Net realized gain (loss): | |
| Investment securities | $ (64,026,759) |
| Investment securities - affiliated issuers | 12,865 |
| Futures contracts | 4,787,256 |
| Net realized loss | $ (59,226,638) |
| Change in unrealized appreciation (depreciation): | |
| Investment securities | $ 96,710,610 |
| Investment securities - affiliated issuers | 300,844 |
| Futures contracts | (4,498,599) |
| Net change in unrealized appreciation (depreciation) | $ 92,512,855 |
| Net realized and unrealized gain | $ 33,286,217 |
| Net increase in net assets from operations | $118,832,176 |
16
See Notes to Financial Statements.
Calvert
Short Duration Income Fund
September 30, 2023
Statements of Changes in Net Assets
| | Year Ended September 30, |
| | 2023 | 2022 |
| Increase (Decrease) in Net Assets | | |
| From operations: | | |
| Net investment income | $ 85,545,959 | $ 51,036,772 |
| Net realized loss | (59,226,638) | (13,939,994) |
| Net change in unrealized appreciation (depreciation) | 92,512,855 | (216,994,807) |
| Net increase (decrease) in net assets from operations | $ 118,832,176 | $ (179,898,029) |
| Distributions to shareholders: | | |
| Class A | $ (9,011,417) | $ (7,159,231) |
| Class C | (392,857) | (358,445) |
| Class I | (68,240,543) | (56,270,476) |
| Class R6 | (8,684,264) | (4,538,867) |
| Total distributions to shareholders | $ (86,329,081) | $ (68,327,019) |
| Capital share transactions: | | |
| Class A | $ (31,763,776) | $ (13,310,965) |
| Class C | (4,152,735) | (5,345,187) |
| Class I | (261,503,616) | 180,322,501 |
| Class R6 | (12,111,139) | 122,012,212 |
| Net increase (decrease) in net assets from capital share transactions | $ (309,531,266) | $ 283,678,561 |
| Net increase (decrease) in net assets | $ (277,028,171) | $ 35,453,513 |
| Net Assets | | |
| At beginning of year | $ 2,405,167,209 | $ 2,369,713,696 |
| At end of year | $2,128,139,038 | $2,405,167,209 |
17
See Notes to Financial Statements.
Calvert
Short Duration Income Fund
September 30, 2023
| | Class A |
| | Year Ended September 30, |
| | 2023 | 2022 | 2021 | 2020 | 2019 |
| Net asset value — Beginning of year | $ 14.94 | $ 16.47 | $ 16.21 | $ 16.13 | $ 15.83 |
| Income (Loss) From Operations | | | | | |
| Net investment income(1) | $ 0.55 | $ 0.28 | $ 0.26 | $ 0.35 | $ 0.45 |
| Net realized and unrealized gain (loss) | 0.21 | (1.41) | 0.36 | 0.09 | 0.32 |
| Total income (loss) from operations | $ 0.76 | $ (1.13) | $ 0.62 | $ 0.44 | $ 0.77 |
| Less Distributions | | | | | |
| From net investment income | $ (0.56) | $ (0.29) | $ (0.27) | $ (0.36) | $ (0.47) |
| From net realized gain | — | (0.11) | (0.09) | — | — |
| Total distributions | $ (0.56) | $ (0.40) | $ (0.36) | $ (0.36) | $ (0.47) |
| Net asset value — End of year | $ 15.14 | $ 14.94 | $ 16.47 | $ 16.21 | $ 16.13 |
| Total Return(2) | 5.15% | (6.99)% | 3.87% | 2.80% | 4.94% |
| Ratios/Supplemental Data | | | | | |
| Net assets, end of year (000’s omitted) | $232,643 | $260,829 | $301,929 | $266,758 | $251,080 |
| Ratios (as a percentage of average daily net assets):(3) | | | | | |
| Total expenses | 0.77% | 0.76% | 0.76% | 0.77% | 0.81% |
| Net expenses | 0.76% (4) | 0.76% (4) | 0.76% | 0.76% | 0.79% |
| Net investment income | 3.65% | 1.77% | 1.57% | 2.18% | 2.80% |
| Portfolio Turnover | 121% (5) | 71% (5) | 89% (5) | 91% (5) | 68% |
| (1) | Computed using average shares outstanding. |
| (2) | Returns are historical and are calculated by determining the percentage change in net asset value with all distributions reinvested and do not reflect the effect of sales charges, if any. |
| (3) | Total expenses do not reflect amounts reimbursed and/or waived by the adviser and certain of its affiliates, if applicable. Net expenses are net of all reductions and represent the net expenses paid by the Fund. |
| (4) | Includes a reduction by the investment adviser of a portion of its advisory fee due to the Fund's investment in the Liquidity Fund (equal to less than 0.005% of average daily net assets for the years ended September 30, 2023 and 2022). |
| (5) | Includes the effect of To Be Announced (TBA) transactions. |
18
See Notes to Financial Statements.
Calvert
Short Duration Income Fund
September 30, 2023
Financial Highlights — continued
| | Class C |
| | Year Ended September 30, |
| | 2023 | 2022 | 2021 | 2020 | 2019 |
| Net asset value — Beginning of year | $ 14.88 | $ 16.40 | $ 16.15 | $ 16.07 | $ 15.77 |
| Income (Loss) From Operations | | | | | |
| Net investment income(1) | $ 0.44 | $ 0.16 | $ 0.14 | $ 0.23 | $ 0.33 |
| Net realized and unrealized gain (loss) | 0.21 | (1.40) | 0.35 | 0.09 | 0.32 |
| Total income (loss) from operations | $ 0.65 | $ (1.24) | $ 0.49 | $ 0.32 | $ 0.65 |
| Less Distributions | | | | | |
| From net investment income | $ (0.45) | $ (0.17) | $ (0.15) | $ (0.24) | $ (0.35) |
| From net realized gain | — | (0.11) | (0.09) | — | — |
| Total distributions | $ (0.45) | $ (0.28) | $ (0.24) | $ (0.24) | $ (0.35) |
| Net asset value — End of year | $ 15.08 | $ 14.88 | $ 16.40 | $ 16.15 | $ 16.07 |
| Total Return(2) | 4.37% | (7.67)% | 3.04% | 2.03% | 4.16% |
| Ratios/Supplemental Data | | | | | |
| Net assets, end of year (000’s omitted) | $11,702 | $15,646 | $22,935 | $32,087 | $48,326 |
| Ratios (as a percentage of average daily net assets):(3) | | | | | |
| Total expenses | 1.52% | 1.51% | 1.51% | 1.52% | 1.57% |
| Net expenses | 1.51% (4) | 1.51% (4) | 1.51% | 1.51% | 1.55% |
| Net investment income | 2.88% | 0.99% | 0.85% | 1.46% | 2.06% |
| Portfolio Turnover | 121% (5) | 71% (5) | 89% (5) | 91% (5) | 68% |
| (1) | Computed using average shares outstanding. |
| (2) | Returns are historical and are calculated by determining the percentage change in net asset value with all distributions reinvested and do not reflect the effect of sales charges, if any. |
| (3) | Total expenses do not reflect amounts reimbursed and/or waived by the adviser and certain of its affiliates, if applicable. Net expenses are net of all reductions and represent the net expenses paid by the Fund. |
| (4) | Includes a reduction by the investment adviser of a portion of its advisory fee due to the Fund's investment in the Liquidity Fund (equal to less than 0.005% of average daily net assets for the years ended September 30, 2023 and 2022). |
| (5) | Includes the effect of To Be Announced (TBA) transactions. |
19
See Notes to Financial Statements.
Calvert
Short Duration Income Fund
September 30, 2023
Financial Highlights — continued
| | Class I |
| | Year Ended September 30, |
| | 2023 | 2022 | 2021 | 2020 | 2019 |
| Net asset value — Beginning of year | $ 15.04 | $ 16.58 | $ 16.32 | $ 16.24 | $ 15.93 |
| Income (Loss) From Operations | | | | | |
| Net investment income(1) | $ 0.59 | $ 0.32 | $ 0.30 | $ 0.39 | $ 0.49 |
| Net realized and unrealized gain (loss) | 0.21 | (1.42) | 0.37 | 0.10 | 0.33 |
| Total income (loss) from operations | $ 0.80 | $ (1.10) | $ 0.67 | $ 0.49 | $ 0.82 |
| Less Distributions | | | | | |
| From net investment income | $ (0.60) | $ (0.33) | $ (0.32) | $ (0.41) | $ (0.51) |
| From net realized gain | — | (0.11) | (0.09) | — | — |
| Total distributions | $ (0.60) | $ (0.44) | $ (0.41) | $ (0.41) | $ (0.51) |
| Net asset value — End of year | $ 15.24 | $ 15.04 | $ 16.58 | $ 16.32 | $ 16.24 |
| Total Return(2) | 5.40% | (6.76)% | 4.11% | 3.05% | 5.24% |
| Ratios/Supplemental Data | | | | | |
| Net assets, end of year (000’s omitted) | $1,670,416 | $1,906,319 | $1,928,347 | $1,349,828 | $1,298,581 |
| Ratios (as a percentage of average daily net assets):(3) | | | | | |
| Total expenses | 0.52% | 0.51% | 0.51% | 0.52% | 0.56% |
| Net expenses | 0.51% (4) | 0.51% (4) | 0.51% | 0.51% | 0.51% |
| Net investment income | 3.89% | 2.03% | 1.81% | 2.43% | 3.06% |
| Portfolio Turnover | 121% (5) | 71% (5) | 89% (5) | 91% (5) | 68% |
| (1) | Computed using average shares outstanding. |
| (2) | Returns are historical and are calculated by determining the percentage change in net asset value with all distributions reinvested and do not reflect the effect of sales charges, if any. |
| (3) | Total expenses do not reflect amounts reimbursed and/or waived by the adviser and certain of its affiliates, if applicable. Net expenses are net of all reductions and represent the net expenses paid by the Fund. |
| (4) | Includes a reduction by the investment adviser of a portion of its advisory fee due to the Fund's investment in the Liquidity Fund (equal to less than 0.005% of average daily net assets for the years ended September 30, 2023 and 2022). |
| (5) | Includes the effect of To Be Announced (TBA) transactions. |
20
See Notes to Financial Statements.
Calvert
Short Duration Income Fund
September 30, 2023
Financial Highlights — continued
| | Class R6 |
| | Year Ended September 30, | Period Ended
September 30,
2019(1) |
| | 2023 | 2022 | 2021 | 2020 |
| Net asset value — Beginning of period | $ 15.04 | $ 16.58 | $ 16.32 | $ 16.24 | $ 15.90 |
| Income (Loss) From Operations | | | | | |
| Net investment income(2) | $ 0.60 | $ 0.35 | $ 0.30 | $ 0.40 | $ 0.33 |
| Net realized and unrealized gain (loss) | 0.21 | (1.44) | 0.37 | 0.09 | 0.34 |
| Total income (loss) from operations | $ 0.81 | $ (1.09) | $ 0.67 | $ 0.49 | $ 0.67 |
| Less Distributions | | | | | |
| From net investment income | $ (0.61) | $ (0.34) | $ (0.32) | $ (0.41) | $ (0.33) |
| From net realized gain | — | (0.11) | (0.09) | — | — |
| Total distributions | $ (0.61) | $ (0.45) | $ (0.41) | $ (0.41) | $ (0.33) |
| Net asset value — End of period | $ 15.24 | $ 15.04 | $ 16.58 | $ 16.32 | $ 16.24 |
| Total Return(3) | 5.46% | (6.70)% | 4.17% | 3.10% | 4.25% (4) |
| Ratios/Supplemental Data | | | | | |
| Net assets, end of period (000’s omitted) | $213,378 | $222,373 | $116,503 | $40,102 | $24,575 |
| Ratios (as a percentage of average daily net assets):(5) | | | | | |
| Total expenses | 0.45% | 0.44% | 0.45% | 0.46% | 0.49% (6) |
| Net expenses | 0.45% (7) | 0.44% (7) | 0.45% | 0.46% | 0.46% (6) |
| Net investment income | 3.96% | 2.20% | 1.84% | 2.46% | 3.11% (6) |
| Portfolio Turnover | 121% (8) | 71% (8) | 89% (8) | 91% (8) | 68% (9) |
| (1) | For the period from the commencement of operations, February 1, 2019, to September 30, 2019. |
| (2) | Computed using average shares outstanding. |
| (3) | Returns are historical and are calculated by determining the percentage change in net asset value with all distributions reinvested and do not reflect the effect of sales charges, if any. |
| (4) | Not annualized. |
| (5) | Total expenses do not reflect amounts reimbursed and/or waived by the adviser and certain of its affiliates, if applicable. Net expenses are net of all reductions and represent the net expenses paid by the Fund. |
| (6) | Annualized. |
| (7) | Includes a reduction by the investment adviser of a portion of its advisory fee due to the Fund's investment in the Liquidity Fund (equal to less than 0.005% of average daily net assets for the years ended September 30, 2023 and 2022). |
| (8) | Includes the effect of To Be Announced (TBA) transactions. |
| (9) | For the year ended September 30, 2019. |
21
See Notes to Financial Statements.
Calvert
Short Duration Income Fund
September 30, 2023
Notes to Financial Statements
1 Significant Accounting Policies
Calvert Short Duration Income Fund (the Fund) is a diversified series of The Calvert Fund (the Trust). The Trust is a Massachusetts business trust registered under the Investment Company Act of 1940, as amended (the 1940 Act), as an open-end management investment company. The investment objective of the Fund is to seek to maximize income, to the extent consistent with preservation of capital, through investment in short-term bonds and income- producing securities. The Fund invests primarily in investment grade, U.S. dollar denominated debt securities.
The Fund offers four classes of shares. Class A shares are generally sold subject to a sales charge imposed at time of purchase. A contingent deferred sales charge of 0.25% may apply to certain redemptions of Class A shares for accounts for which no sales charge was paid, if redeemed within 12 months of purchase. Class C shares are sold without a front-end sales charge, and with certain exceptions, are charged a contingent deferred sales charge of 1% on shares redeemed within 12 months of purchase. Class C shares are only available for purchase through a financial intermediary. Effective November 5, 2020, Class C shares automatically convert to Class A shares eight years after their purchase as described in the Fund's prospectus. Class I and Class R6 shares are sold at net asset value, are not subject to a sales charge and are sold only to certain eligible investors. Each class represents a pro rata interest in the Fund, but votes separately on class-specific matters and is subject to different expenses.
The Fund applies the accounting and reporting guidance in the Financial Accounting Standards Board (FASB) Accounting Standards Codification Topic 946, Financial Services – Investment Companies (ASC 946). Subsequent events, if any, through the date that the financial statements were issued have been evaluated in the preparation of the financial statements.
A Investment Valuation— Net asset value per share is determined every business day as of the close of the regular session of the New York Stock Exchange (generally 4:00 p.m. Eastern time). The Fund uses independent pricing services approved by the Board of Trustees (the Board) to value its investments wherever possible. Investments for which market quotations are not available or deemed not reliable are fair valued in good faith by the Board’s valuation designee.
U.S. generally accepted accounting principles (U.S. GAAP) establishes a disclosure hierarchy that categorizes the inputs to valuation techniques used to value assets and liabilities at measurement date. These inputs are summarized in the three broad levels listed below:
Level 1 - quoted prices in active markets for identical securities
Level 2 - other significant observable inputs (including quoted prices for similar securities, interest rates, prepayment speeds, credit risk, etc.)
Level 3 - significant unobservable inputs (including the Fund’s own assumptions in determining the fair value of investments)
The inputs or methodologies used for valuing securities are not necessarily an indication of the risk associated with investing in those securities.
Valuation techniques used to value the Fund’s investments by major category are as follows:
Equity Securities. Equity securities (including warrants and rights) listed on a U.S. securities exchange generally are valued at the last sale or closing price as reported by an independent pricing service on the primary market or exchange on which they are traded and are categorized as Level 1 in the hierarchy. Equity securities listed on the NASDAQ National Market System are valued at the NASDAQ official closing price and are categorized as Level 1 in the hierarchy. Unlisted or listed securities for which closing sales prices or closing quotations are not available are valued at the mean between the latest available bid and ask prices and are categorized as Level 2 in the hierarchy.
Debt Securities. Debt securities are generally valued based on valuations provided by third party pricing services, as derived from such services’ pricing models. Inputs to the models may include, but are not limited to, reported trades, executable bid and ask prices, broker/dealer quotations, prices or yields of securities with similar characteristics, interest rates, anticipated prepayments, benchmark curves or information pertaining to the issuer, as well as industry and economic events. Accordingly, debt securities are generally categorized as Level 2 in the hierarchy. Short-term debt securities with a remaining maturity at time of purchase of more than sixty days are valued based on valuations provided by a third party pricing service. Such securities are generally categorized as Level 2 in the hierarchy. Short-term debt securities of sufficient credit quality purchased with remaining maturities of sixty days or less for which a valuation from a third party pricing service is not readily available may be valued at amortized cost, which approximates fair value, and are categorized as Level 2 in the hierarchy.
Senior Floating-Rate Loans. Interests in senior floating-rate loans for which reliable market quotations are readily available are valued generally at the average mean of bid and ask quotations obtained from a third party pricing service, and are categorized as Level 2 in the hierarchy.
Other Securities. Investments in management investment companies (including money market funds) that do not trade on an exchange are valued at the net asset value as of the close of each business day and are categorized as Level 1 in the hierarchy.
Derivatives. Futures contracts are valued at unrealized appreciation (depreciation) based on the settlement price established each day by the board of trade or exchange on which they are traded and are categorized as Level 1 in the hierarchy.
Fair Valuation. In connection with Rule 2a-5 of the 1940 Act, the Board has designated the Fund’s investment adviser as its valuation designee. Investments for which valuations or market quotations are not readily available or are deemed unreliable are valued by the investment adviser, as valuation designee, at fair value using methods that most fairly reflect the security’s “fair value”, which is the amount that the Fund might reasonably expect to
Calvert
Short Duration Income Fund
September 30, 2023
Notes to Financial Statements — continued
receive for the security upon its current sale in the ordinary course. Each such determination is based on a consideration of relevant factors, which are likely to vary from one pricing context to another. These factors may include, but are not limited to, the type of security, the existence of any contractual restrictions on the security’s disposition, the price and extent of public trading in similar securities of the issuer or of comparable companies or entities, quotations or relevant information obtained from broker/dealers or other market participants, information obtained from the issuer, analysts, and/or the appropriate stock exchange (for exchange-traded securities), an analysis of the company’s or entity’s financial statements, and an evaluation of the forces that influence the issuer and the market(s) in which the security is purchased and sold.
The values assigned to fair value investments are based on available information and do not necessarily represent amounts that might ultimately be realized. Further, due to the inherent uncertainty of valuations of such investments, the fair values may differ significantly from the values that would have been used had an active market existed, and the differences could be material.
The following table summarizes the market value of the Fund's holdings as of September 30, 2023, based on the inputs used to value them:
| Asset Description | Level 1 | Level 2 | Level 3 | Total |
| Asset-Backed Securities | $ — | $ 466,619,312 | $ — | $ 466,619,312 |
| Collateralized Mortgage Obligations | — | 96,857,200 | — | 96,857,200 |
| Commercial Mortgage-Backed Securities | — | 183,469,402 | — | 183,469,402 |
| Corporate Bonds | — | 879,079,002 | — | 879,079,002 |
| High Social Impact Investments | — | 3,945,160 | — | 3,945,160 |
| Senior Floating-Rate Loans | — | 4,659,328 | — | 4,659,328 |
| Taxable Municipal Obligations | — | 11,429,830 | — | 11,429,830 |
| U.S. Government Agency Mortgage-Backed Securities | — | 96,600,141 | — | 96,600,141 |
| U.S. Treasury Obligations | — | 393,224,127 | — | 393,224,127 |
| Short-Term Investments: | | | | |
| Affiliated Fund | 53,606,159 | — | — | 53,606,159 |
| Securities Lending Collateral | 15,147,475 | — | — | 15,147,475 |
| Total Investments | $68,753,634 | $2,135,883,502 | $ — | $2,204,637,136 |
| Futures Contracts | $ 3,442,758 | $ — | $ — | $ 3,442,758 |
| Total | $72,196,392 | $2,135,883,502 | $ — | $2,208,079,894 |
| Liability Description | | | | |
| Futures Contracts | $ (1,059,855) | $ — | $ — | $ (1,059,855) |
| Total | $ (1,059,855) | $ — | $ — | $ (1,059,855) |
B Investment Transactions and Income— Investment transactions for financial statement purposes are accounted for on trade date. Realized gains and losses are recorded on an identified cost basis and may include proceeds from litigation. Dividend income is recorded on the ex-dividend date for dividends received in cash and/or securities. Non-cash dividends are recorded at the fair value of the securities received. Distributions received that represent a return of capital are recorded as a reduction of cost of investments. Distributions received that represent a capital gain are recorded as a realized gain. Interest income, which includes amortization of premium and accretion of discount on debt securities, is accrued as earned. The Fund may earn certain fees in connection with its investments in senior floating-rate loans. These fees are in addition to interest payments earned and may include amendment fees, consent fees and prepayment fees, which are recorded to income as earned. Inflation adjustments to the principal amount of inflation-adjusted bonds and notes are reflected as interest income. Deflation adjustments to the principal amount of an inflation-adjusted bond or note are reflected as reductions to interest income to the extent of interest income previously recorded on such bond or note.
C Share Class Accounting— Realized and unrealized gains and losses are allocated daily to each class of shares based upon the relative net assets of each class to the total net assets of the Fund. Net investment income, other than class-specific expenses, is allocated daily to each class of shares based upon the ratio of the value of each class’s paid shares to the total value of all paid shares. Expenses arising in connection with a specific class are charged directly to that class. Sub-accounting, recordkeeping and similar administrative fees payable to financial intermediaries, which are a component of transfer agency fees and expenses on the Statement of Operations, are not allocated to Class R6 shares.
D Senior Floating-Rate Loans— The Fund may invest in direct debt instruments, which are interests in amounts owed to lenders or lending syndicates by corporate, governmental, or other borrowers. The Fund’s investment in loans may be in the form of participations in loans or assignments of all or a portion of loans from third parties. A loan is often administered by a bank or other financial institution (the lender) that acts as agent for all holders. The agent
Calvert
Short Duration Income Fund
September 30, 2023
Notes to Financial Statements — continued
administers the terms of the loan, as specified in the loan agreement. The Fund may invest in multiple series or tranches of a loan, which may have varying terms and carry different associated risks. When the Fund purchases assignments from lenders, it acquires direct rights against the borrower of the loan. When investing in a loan participation, the Fund has the right to receive payments of principal, interest and any fees to which it is entitled only from the lender selling the loan agreement and only upon receipt of such payments by the lender from the borrower. The Fund generally has no right to enforce compliance by the borrower with the terms of the loan agreement. As a result, the Fund may be subject to the credit risk of both the borrower and the lender that is issuing the participation interest.
E Futures Contracts— The Fund may enter into futures contracts to buy or sell a financial instrument for a set price at a future date. Initial margin deposits of either cash or securities as required by the broker are made upon entering into the contract. While the contract is open, daily variation margin payments are made to or received from the broker reflecting the daily change in market value of the contract and are recorded for financial reporting purposes as unrealized gains or losses by the Fund. When a futures contract is closed, a realized gain or loss is recorded equal to the difference between the opening and closing value of the contract. The risks associated with entering into futures contracts may include the possible illiquidity of the secondary market which would limit the Fund’s ability to close out a futures contract prior to the settlement date, an imperfect correlation between the value of the contracts and the underlying financial instruments, or that the counterparty will fail to perform its obligations under the contracts’ terms. Futures contracts are designed by boards of trade, which are designated “contracts markets” by the Commodities Futures Trading Commission. Futures contracts trade on the contracts markets in a manner that is similar to the way a stock trades on a stock exchange, and the boards of trade, through their clearing corporations, guarantee the futures contracts against default. As a result, there is minimal counterparty credit risk to the Fund.
F Restricted Securities— The Fund may invest in securities that are subject to legal or contractual restrictions on resale. Generally, these securities may only be sold publicly upon registration under the Securities Act of 1933 or in transactions exempt from such registration. Information regarding restricted securities (excluding Rule 144A securities) is included at the end of the Schedule of Investments.
G Distributions to Shareholders— Distributions to shareholders are recorded by the Fund on ex-dividend date. The Fund declares income distributions daily to shareholders of record at the time of declaration and generally pays them monthly. The Fund makes distributions of net realized capital gains, if any, at least annually. Distributions are declared separately for each class of shares. Distributions are determined in accordance with income tax regulations, which may differ from U.S. GAAP; accordingly, periodic reclassifications are made within the Fund’s capital accounts to reflect income and gains available for distribution under income tax regulations.
H Estimates— The preparation of financial statements in conformity with U.S. GAAP requires management to make estimates and assumptions that affect the reported amounts of assets and liabilities and disclosure of contingent assets and liabilities at the date of the financial statements and the reported amounts of increases and decreases in net assets from operations during the reporting period. Actual results could differ from those estimates.
I Indemnifications— Under the Trust’s organizational document, its officers and Trustees may be indemnified against certain liabilities and expenses arising out of the performance of their duties to the Fund. Under Massachusetts law, if certain conditions prevail, shareholders of a Massachusetts business trust (such as the Trust) could be deemed to have personal liability for the obligations of the Trust. However, the Trust’s Declaration of Trust contains an express disclaimer of liability on the part of Fund shareholders and provides that the Trust shall assume, upon request by the shareholder, the defense on behalf of any Fund shareholders or former shareholders. Additionally, in the normal course of business, the Fund enters into agreements with service providers that may contain indemnification clauses. The Fund’s maximum exposure under these arrangements is unknown as this would involve future claims that may be made against the Fund that have not yet occurred.
J Federal Income Taxes— No provision for federal income or excise tax is required since the Fund intends to continue to qualify as a regulated investment company under the Internal Revenue Code and to distribute substantially all of its taxable earnings.
Management has analyzed the Fund's tax positions taken for all open federal income tax years and has concluded that no provision for federal income tax is required in the Fund's financial statements. A Fund's federal tax return is subject to examination by the Internal Revenue Service for a period of three years from the date of filing.
K When-Issued Securities and Delayed Delivery Transactions— The Fund may purchase securities on a delayed delivery, when-issued or forward commitment basis, including TBA (To Be Announced) securities. Payment and delivery may take place after the customary settlement period for that security. At the time the transaction is negotiated, the price of the security that will be delivered is fixed. Securities purchased on a delayed delivery, when-issued or forward commitment basis are marked-to-market daily and begin earning interest on settlement date. Such security purchases are subject to the risk that when delivered they will be worth less than the agreed upon payment price. Losses may also arise if the counterparty does not perform under the contract. A forward purchase commitment may be closed by entering into an offsetting commitment. If an offsetting commitment is entered into, the Fund will realize a gain or loss on investments based on the price established when the Fund entered into the commitment.
Calvert
Short Duration Income Fund
September 30, 2023
Notes to Financial Statements — continued
2 Related Party Transactions
The investment advisory fee is earned by Calvert Research and Management (CRM), an indirect, wholly-owned subsidiary of Morgan Stanley, as compensation for investment advisory services rendered to the Fund. The investment advisory fee is computed at an annual rate as a percentage of the Fund’s average daily net assets as follows and is payable monthly:
| Average Daily Net Assets | Annual Fee
Rate |
| Up to and including $750 million | 0.280% |
| Over $750 million | 0.275% |
For the year ended September 30, 2023, the investment advisory fee amounted to $6,125,244 or 0.28% of the Fund's average daily net assets.
The Fund may invest in a money market fund, the Institutional Class of the Morgan Stanley Institutional Liquidity Funds - Government Portfolio (the “Liquidity Fund”), an open-end management investment company managed by Morgan Stanley Investment Management Inc., a wholly-owned subsidiary of Morgan Stanley. The investment advisory fee paid by the Fund is reduced by an amount equal to its pro rata share of the advisory and administration fees paid by the Fund due to its investment in the Liquidity Fund. For the year ended September 30, 2023, the investment advisory fee paid was reduced by $74,698 relating to the Fund’s investment in the Liquidity Fund.
CRM has agreed to reimburse the Fund's operating expenses to the extent that total annual operating expenses (relating to ordinary operating expenses only and excluding expenses such as brokerage commissions, acquired fund fees and expenses of unaffiliated funds, borrowing costs, taxes or litigation expenses) exceed 0.76%, 1.51%, 0.51% and 0.46% for Class A, Class C, Class I and Class R6, respectively, of such class's average daily net assets. The expense reimbursement agreement with CRM may be changed or terminated after February 1, 2025. For the year ended September 30, 2023, CRM waived or reimbursed expenses of $138,716.
The administrative fee is earned by CRM as compensation for administrative services rendered to the Fund. The fee is computed at an annual rate of 0.12% of the Fund’s average daily net assets attributable to Class A, Class C, Class I and Class R6 and is payable monthly. For the year ended September 30, 2023, CRM was paid administrative fees of $2,656,470.
The Fund has in effect a distribution plan for Class A shares (Class A Plan) pursuant to Rule 12b-1 under the 1940 Act. Pursuant to the Class A Plan, the Fund pays Eaton Vance Distributors, Inc. (EVD), an affiliate of CRM and the Fund’s principal underwriter, a distribution and service fee of 0.25% per annum of its average daily net assets attributable to Class A shares for distribution services and facilities provided to the Fund by EVD, as well as for personal services and/or the maintenance of shareholder accounts. The Fund also has in effect a distribution plan for Class C shares (Class C Plan) pursuant to Rule 12b-1 under the 1940 Act. Pursuant to the Class C Plan, the Fund pays EVD amounts equal to 0.75% per annum of its average daily net assets attributable to Class C shares for providing ongoing distribution services and facilities to the Fund. In addition, pursuant to the Class C Plan, the Fund also makes payments of service fees to EVD, financial intermediaries and other persons in amounts equal to 0.25% per annum of its average daily net assets attributable to that class. Service fees paid or accrued are for personal services and/or the maintenance of shareholder accounts. Distribution and service fees paid or accrued for the year ended September 30, 2023 amounted to $611,625 and $134,743 for Class A shares and Class C shares, respectively.
The Fund was informed that EVD received $9,343 as its portion of the sales charge on sales of Class A shares for the year ended September 30, 2023. The Fund was also informed that EVD received $6,486 and $3,513 of contingent deferred sales charges paid by Class A and Class C shareholders, respectively, for the same period. The Fund was informed that Morgan Stanley affiliated broker-dealers, which may be deemed to be affiliates of CRM and EVD, also received a portion of the sales charge on sales of Class A shares for the year ended September 30, 2023 in the amount of $1,005.
Eaton Vance Management (EVM), an affiliate of CRM, provides sub-transfer agency and related services to the Fund pursuant to a Sub-Transfer Agency Support Services Agreement. For the year ended September 30, 2023, sub-transfer agency fees and expenses incurred to EVM amounted to $53,736 and are included in transfer agency fees and expenses on the Statement of Operations.
Each Trustee of the Fund who is not an employee of CRM or its affiliates receives an annual fee of $214,000, an annual Committee fee ranging from $8,500 to $16,500 depending on the Committee, and may receive a fee of $10,000 for special meetings. The Board chair receives an additional $40,000 ($30,000 prior to January 1, 2023) annual fee, Committee chairs receive an additional $15,000 ($6,000 prior to January 1, 2023) annual fee and the special equities liaison receives an additional $2,500 annual fee. Eligible Trustees may participate in a Deferred Compensation Plan (the Plan). Amounts deferred under the Plan are treated as though equal dollar amounts had been invested in shares of the Fund or other Calvert funds selected by the Trustees. The Fund purchases shares of the funds selected equal to the dollar amounts deferred under the Plan, resulting in an asset equal to the deferred compensation liability. Obligations of the Plan are paid solely from the Fund's assets. Trustees’ fees are allocated to each of the Calvert funds served. Salaries and fees of officers and Trustees of the Fund who are employees of CRM or its affiliates are paid by CRM.
Calvert
Short Duration Income Fund
September 30, 2023
Notes to Financial Statements — continued
3 Investment Activity
During the year ended September 30, 2023, the cost of purchases and proceeds from sales of investments, other than U.S. government and agency securities and short-term securities and including maturities, paydowns and principal repayments on senior floating-rate loans, were $984,754,387 and $1,396,493,128, respectively. Purchases and sales of U.S. government and agency securities, including maturities, paydowns and TBA transactions, were $1,629,409,719 and $1,492,250,065, respectively.
4 Distributions to Shareholders and Income Tax Information
The tax character of distributions declared for the years ended September 30, 2023 and September 30, 2022 was as follows:
| | Year Ended September 30, |
| | 2023 | 2022 |
| Ordinary income | $86,329,081 | $59,854,435 |
| Long-term capital gains | $ — | $ 8,472,584 |
During the year ended September 30, 2023, accumulated loss was increased by $79,317 and paid-in capital was increased by $79,317 due to the Fund's use of equalization accounting. Tax equalization accounting allows the Fund to treat as a distribution that portion of redemption proceeds representing a redeeming shareholder’s portion of undistributed taxable income and net capital gains. These reclassifications had no effect on the net assets or net asset value per share of the Fund.
As of September 30, 2023, the components of distributable earnings (accumulated loss) on a tax basis were as follows:
| Deferred capital losses | $ (76,337,290) |
| Net unrealized depreciation | (110,455,795) |
| Distributions payable | (882,118) |
| Accumulated loss | $(187,675,203) |
At September 30, 2023, the Fund, for federal income tax purposes, had deferred capital losses of $76,337,290 which would reduce the Fund’s taxable income arising from future net realized gains on investment transactions, if any, to the extent permitted by the Internal Revenue Code, and thus would reduce the amount of distributions to shareholders, which would otherwise be necessary to relieve the Fund of any liability for federal income or excise tax. The deferred capital losses are treated as arising on the first day of the Fund’s next taxable year, can be carried forward for an unlimited period, and retain the same short-term or long-term character as when originally deferred. Of the deferred capital losses at September 30, 2023, $31,361,735 are short-term and $44,975,555 are long-term.
The cost and unrealized appreciation (depreciation) of investments, including open derivative contracts, of the Fund at September 30, 2023, as determined on a federal income tax basis, were as follows:
| Aggregate cost | $2,315,092,931 |
| Gross unrealized appreciation | $ 3,441,328 |
| Gross unrealized depreciation | (113,897,123) |
| Net unrealized depreciation | $ (110,455,795) |
5 Financial Instruments
A summary of futures contracts outstanding at September 30, 2023 is included in the Schedule of Investments. During the year ended September 30, 2023, the Fund used futures contracts to hedge interest rate risk and to manage duration.
Calvert
Short Duration Income Fund
September 30, 2023
Notes to Financial Statements — continued
At September 30, 2023, the fair value of open derivative instruments (not considered to be hedging instruments for accounting disclosure purposes) and whose primary underlying risk exposure is interest rate risk was as follows:
| Derivative | Statement of Assets and Liabilities Caption | Assets | Liabilities |
| Futures contracts | Accumulated loss | | $3,442,758 (1) | $(1,059,855) (1) |
| (1) | Only the current day's variation margin is reported within the Statement of Assets and Liabilities as Receivable or Payable for variation margin on open futures contracts, as applicable. |
The effect of derivative instruments (not considered to be hedging instruments for accounting disclosure purposes) on the Statement of Operations and whose primary underlying risk exposure is interest rate risk for the year ended September 30, 2023 was as follows:
| | Statement of Operations Caption | |
| Derivative | Net realized gain (loss): Futures
contracts | Change in unrealized appreciation
(depreciation): Futures contracts |
| Futures contracts | $ 4,787,256 | $ (4,498,599) |
The average notional cost of futures contracts (long) and futures contracts (short) outstanding during the year ended September 30, 2023 was approximately $286,299,000 and $202,180,000, respectively.
6 Securities Lending
To generate additional income, the Fund may lend its securities pursuant to a securities lending agency agreement with State Street Bank and Trust Company (SSBT), the securities lending agent. Security loans are subject to termination by the Fund at any time and, therefore, are not considered illiquid investments. The Fund requires that the loan be continuously collateralized by either cash or securities in an amount at least equal to the market value of the securities on loan. The market value of securities loaned is determined daily and any additional required collateral is delivered to the Fund on the next business day. Cash collateral is generally invested in a money market fund registered under the 1940 Act that is managed by an affiliate of SSBT. Any gain or loss in the market price of the loaned securities that might occur and any interest earned or dividends declared during the term of the loan would accrue to the account of the Fund. Income earned on the investment of collateral, net of broker rebates and other expenses incurred by the securities lending agent, is split between the Fund and the securities lending agent based on agreed upon contractual terms. Non-cash collateral, if any, is held by the lending agent on behalf of the Fund and cannot be sold or re-pledged by the Fund; accordingly, such collateral is not reflected in the Statement of Assets and Liabilities.
The risks associated with lending portfolio securities include, but are not limited to, possible delays in receiving additional collateral or in the recovery of the loaned securities, possible loss of rights to the collateral should the borrower fail financially, as well as risk of loss in the value of the collateral or the value of the investments made with the collateral. The securities lending agent shall indemnify the Fund in the case of default of any securities borrower.
At September 30, 2023, the total value of securities on loan, including accrued interest, was $21,044,767 and the total value of collateral received was $21,418,551, comprised of cash of $15,147,475 and U.S. government and/or agencies securities of $6,271,076.
The following table provides a breakdown of securities lending transactions accounted for as secured borrowings, the obligations by class of collateral pledged, and the remaining contractual maturity of those transactions as of September 30, 2023.
| | Remaining Contractual Maturity of the Transactions |
| | Overnight and
Continuous | <30 days | 30 to 90 days | >90 days | Total |
| Corporate Bonds | $15,147,475 | $ — | $ — | $ — | $15,147,475 |
The carrying amount of the liability for deposits for securities loaned at September 30, 2023 approximated its fair value. If measured at fair value, such liability would have been considered as Level 2 in the fair value hierarchy (see Note 1A) at September 30, 2023.
Calvert
Short Duration Income Fund
September 30, 2023
Notes to Financial Statements — continued
7 Line of Credit
The Fund participates with other portfolios and funds managed by EVM and its affiliates, including CRM, in a $725 million unsecured revolving line of credit agreement with a group of banks, which is in effect through October 24, 2023. Borrowings are made by the Fund solely for temporary purposes related to redemptions and other short-term cash needs. Interest is charged to the Fund based on its borrowings at an amount above either the Secured Overnight Financing Rate (SOFR) or Federal Funds rate. In addition, a fee computed at an annual rate of 0.15% on the daily unused portion of the line of credit is allocated among the participating portfolios and funds at the end of each quarter. In connection with the renewal of the agreement in October 2022, an arrangement fee of $150,000 was incurred that was allocated to the participating portfolios and funds. Because the line of credit is not available exclusively to the Fund, it may be unable to borrow some or all of its requested amounts at any particular time.
The Fund had no borrowings outstanding pursuant to its line of credit at September 30, 2023. The Fund did not have any significant borrowings or allocated fees during the year ended September 30, 2023. Effective October 24, 2023, the Fund renewed its line of credit agreement, which expires October 22, 2024. In connection with the renewal, the borrowing limit was decreased to $650 million.
8 Affiliated Investments
The Fund has invested a portion of its assets in notes (the Notes) issued by Calvert Impact Capital, Inc. (CIC) pursuant to exemptive relief granted by the U.S. Securities and Exchange Commission (the SEC). There are certain potential points of affiliation between the Fund and CIC. CRM has licensed use of the Calvert name to CIC and provides other types of support. An officer of CRM's affiliate serves on the CIC Board. In addition, a director/trustee on the Fund Board serves as a director emeritus on the CIC Board.
At September 30, 2023, the value of the Fund's investment in the Notes and in issuers and funds that may be deemed to be affiliated was $68,786,600, which represents 3.2% of the Fund's net assets. Transactions in such investments by the Fund for the year ended September 30, 2023 were as follows:
| Name | Value,
beginning
of period | Purchases | Sales
proceeds | Net
realized
gain
(loss) | Change in
unrealized
appreciation
(depreciation) | Value,
end of
period | Interest/
Dividend
income | Principal amount/
Shares,
end of period |
| Commercial Mortgage-Backed Securities | | | | | | | | |
| Morgan Stanley Capital I Trust: | | | | | | | | |
| Series 2017-CLS, Class A, 3.518%, (1 mo. USD LIBOR + 0.70%), 11/15/34 | $ 8,974,746 | $ — | $ (9,028,000) | $ 7,903 | $ 45,348 | $ — | $ 12,354 | $ — |
| Series 2017-CLS, Class B, 3.668%, (1 mo. USD LIBOR + 0.85%), 11/15/34 | 5,901,587 | — | (5,940,000) | — | 38,413 | — | 8,473 | — |
| Series 2017-CLS, Class C, 3.818%, (1 mo. USD LIBOR + 1.00%), 11/15/34 | 5,714,507 | — | (5,755,000) | — | 40,493 | — | 8,545 | — |
| Series 2017-CLS, Class E, 4.768%, (1 mo. USD LIBOR + 1.95%), 11/15/34 | 6,367,609 | — | (6,427,000) | 4,962 | 54,427 | — | 11,919 | — |
| Series 2019-BPR, Class A, 7.322%, (1 mo. SOFR + 1.992%), 5/15/36 | 12,686,893 | — | (1,343,655) | — | (107,957) | 11,235,281 | 789,062 | 11,659,966 |
| High Social Impact Investments | | | | | | | | |
| Calvert Impact Capital, Inc., Community Investment Notes, 1.50%, 12/15/23(1) | 3,715,040 | — | — | — | 230,120 | 3,945,160 | 60,000 | 4,000,000 |
| Short-Term Investments | | | | | | |
| Liquidity Fund | 68,969,256 | 964,461,960 | (979,825,057) | — | — | 53,606,159 | 2,285,399 | 53,606,159 |
| Total | | | | $12,865 | $ 300,844 | $68,786,600 | $3,175,752 | |
9 Capital Shares
The Fund’s Declaration of Trust permits the Trustees to issue an unlimited number of full and fractional shares of beneficial interest (without par value). Such shares may be issued in a number of different series (such as the Fund) and classes.
Calvert
Short Duration Income Fund
September 30, 2023
Notes to Financial Statements — continued
Transactions in capital shares, including direct exchanges pursuant to share class conversions for all periods presented, were as follows:
| | Year Ended
September 30, 2023 | | Year Ended
September 30, 2022 |
| | Shares | Amount | | Shares | Amount |
| Class A | | | | | |
| Shares sold | 3,267,884 | $ 49,481,752 | | 5,504,226 | $ 87,083,426 |
| Reinvestment of distributions | 527,200 | 7,994,961 | | 519,090 | 8,162,658 |
| Shares redeemed | (5,890,995) | (89,240,489) | | (6,899,220) | (108,557,049) |
| Net decrease | (2,095,911) | $ (31,763,776) | | (875,904) | $ (13,310,965) |
| Class C | | | | | |
| Shares sold | 145,012 | $ 2,183,625 | | 209,882 | $ 3,325,642 |
| Reinvestment of distributions | 24,227 | 366,017 | | 21,036 | 331,714 |
| Shares redeemed | (444,857) | (6,702,377) | | (577,705) | (9,002,543) |
| Net decrease | (275,618) | $ (4,152,735) | | (346,787) | $ (5,345,187) |
| Class I | | | | | |
| Shares sold | 43,973,672 | $ 670,555,762 | | 71,451,368 | $ 1,137,346,532 |
| Reinvestment of distributions | 3,819,541 | 58,319,856 | | 2,968,649 | 47,050,074 |
| Shares redeemed | (64,969,093) | (990,379,234) | | (63,990,499) | (1,004,074,105) |
| Net increase (decrease) | (17,175,880) | $(261,503,616) | | 10,429,518 | $ 180,322,501 |
| Class R6 | | | | | |
| Shares sold | 4,739,177 | $ 72,320,103 | | 12,358,173 | $ 193,538,104 |
| Reinvestment of distributions | 554,533 | 8,467,087 | | 274,435 | 4,312,609 |
| Shares redeemed | (6,082,343) | (92,898,329) | | (4,874,840) | (75,838,501) |
| Net increase (decrease) | (788,633) | $ (12,111,139) | | 7,757,768 | $ 122,012,212 |
Calvert
Short Duration Income Fund
September 30, 2023
Report of Independent Registered Public Accounting Firm
To the Board of Trustees of The Calvert Fund and Shareholders of Calvert Short Duration Income Fund:
Opinion on the Financial Statements and Financial Highlights
We have audited the accompanying statement of assets and liabilities of Calvert Short Duration Income Fund (the "Fund") (one of the funds constituting The Calvert Fund), including the schedule of investments, as of September 30, 2023, the related statement of operations for the year then ended, the statements of changes in net assets for each of the two years in the period then ended, the financial highlights for each of the three years in the period then ended, and the related notes. In our opinion, the financial statements and financial highlights present fairly, in all material respects, the financial position of the Fund as of September 30, 2023, and the results of its operations for the year then ended, the changes in its net assets for each of the two years in the period then ended, and the financial highlights for each of the three years in the period then ended, in conformity with accounting principles generally accepted in the United States of America. The financial highlights for the years ended September 30, 2020 and 2019 were audited by other auditors whose report, dated November 20, 2020, expressed an unqualified opinion on those financial highlights.
Basis for Opinion
These financial statements and financial highlights are the responsibility of the Fund's management. Our responsibility is to express an opinion on the Fund's financial statements and financial highlights based on our audits. We are a public accounting firm registered with the Public Company Accounting Oversight Board (United States) (PCAOB) and are required to be independent with respect to the Fund in accordance with the U.S. federal securities laws and the applicable rules and regulations of the Securities and Exchange Commission and the PCAOB.
We conducted our audits in accordance with the standards of the PCAOB. Those standards require that we plan and perform the audit to obtain reasonable assurance about whether the financial statements and financial highlights are free of material misstatement, whether due to error or fraud. The Fund is not required to have, nor were we engaged to perform, an audit of its internal control over financial reporting. As part of our audits, we are required to obtain an understanding of internal control over financial reporting but not for the purpose of expressing an opinion on the effectiveness of the Fund’s internal control over financial reporting. Accordingly, we express no such opinion.
Our audits included performing procedures to assess the risks of material misstatement of the financial statements and financial highlights, whether due to error or fraud, and performing procedures that respond to those risks. Such procedures included examining, on a test basis, evidence regarding the amounts and disclosures in the financial statements and financial highlights. Our audits also included evaluating the accounting principles used and significant estimates made by management, as well as evaluating the overall presentation of the financial statements and financial highlights. Our procedures included confirmation of securities and senior loans owned as of September 30, 2023, by correspondence with the custodian, brokers and agent banks; when replies were not received from brokers and agent banks, we performed other auditing procedures. We believe that our audits provide a reasonable basis for our opinion.
/s/ Deloitte & Touche LLP
Boston, Massachusetts
November 22, 2023
We have served as the auditor of one or more Calvert investment companies since 2021.
Calvert
Short Duration Income Fund
September 30, 2023
Federal Tax Information (Unaudited)
The Form 1099-DIV you receive in February 2024 will show the tax status of all distributions paid to your account in calendar year 2023. Shareholders are advised to consult their own tax adviser with respect to the tax consequences of their investment in the Fund. As required by the Internal Revenue Code and/or regulations, shareholders must be notified regarding the status of qualified dividend income for individuals and 163(j) interest dividends.
Qualified Dividend Income. For the fiscal year ended September 30, 2023, the Fund designates approximately $95,227, or up to the maximum amount of such dividends allowable pursuant to the Internal Revenue Code, as qualified dividend income eligible for the reduced tax rate of 15%.
163(j) Interest Dividends. For the fiscal year ended September 30, 2023, the Fund designates 94.66% of distributions from net investment income as a 163(j) interest dividend.
Calvert
Short Duration Income Fund
September 30, 2023
Board of Trustees' Contract Approval
Overview of the Contract Review Process
The Investment Company Act of 1940, as amended, provides, in substance, that each investment advisory agreement between a fund and its investment adviser will continue in effect from year to year only if its continuation is approved at least annually by the fund’s board of directors, including by a vote of a majority of the directors who are not “interested persons” of the fund (“Independent Trustees”), cast in person at a meeting called for the purpose of considering such approval.
At an in-person meeting of the Boards of Trustees/Directors (each a “Board”) of the registered investment companies advised by Calvert Research and Management (“CRM” or the “Adviser”) (the “Calvert Funds”) held on June 12-13, 2023, the Board, including a majority of the Independent Trustees, voted to approve continuation of existing investment advisory and investment sub-advisory agreements for the Calvert Funds for an additional one-year period.
In evaluating the investment advisory and investment sub-advisory agreements for the Calvert Funds, the Board considered a variety of information relating to the Calvert Funds and various service providers, including the Adviser. The Independent Trustees reviewed a report prepared by the Adviser regarding various services provided to the Calvert Funds by the Adviser and its affiliates. Such report included, among other data, information regarding the Adviser’s personnel and the Adviser’s revenue and cost of providing services to the Calvert Funds, and a separate report prepared by an independent data provider, which compared each fund’s investment performance, fees and expenses to those of comparable funds as identified by such independent data provider (“comparable funds”).
The Independent Trustees were separately represented by independent legal counsel with respect to their consideration of the continuation of the investment advisory and investment sub-advisory agreements for the Calvert Funds. Prior to voting, the Independent Trustees reviewed the proposed continuation of the Calvert Funds’ investment advisory and investment sub-advisory agreements with management and also met in private sessions with their counsel at which time no representatives of management were present.
The information that the Board considered included, among other things, the following (for funds that invest through one or more affiliated underlying fund(s), references to “each fund” in this section may include information that was considered at the underlying fund-level):
Information about Fees, Performance and Expenses
| • | A report from an independent data provider comparing the advisory and related fees paid by each fund with fees paid by comparable funds; |
| • | A report from an independent data provider comparing each fund’s total expense ratio and its components to comparable funds; |
| • | A report from an independent data provider comparing the investment performance of each fund to the investment performance of comparable funds over various time periods; |
| • | Data regarding investment performance in comparison to benchmark indices; |
| • | For each fund, comparative information concerning the fees charged and the services provided by the Adviser in managing other accounts (including mutual funds, other collective investment funds and institutional accounts) using investment strategies and techniques similar to those used in managing such fund; |
| • | Profitability analyses for the Adviser with respect to each fund; |
Information about Portfolio Management and Trading
| • | Descriptions of the investment management services provided to each fund, including investment strategies and processes it employs; |
| • | Information about the Adviser’s policies and practices with respect to trading, including the Adviser’s processes for monitoring best execution of portfolio transactions; |
| • | Information about the allocation of brokerage transactions and the benefits received by the Adviser as a result of brokerage allocation, including information concerning the acquisition of research through client commission arrangements and policies with respect to “soft dollars”; |
Information about the Adviser
| • | Reports detailing the financial results and condition of CRM; |
| • | Descriptions of the qualifications, education and experience of the individual investment professionals whose responsibilities include portfolio management and investment research for the funds, and information relating to their compensation and responsibilities with respect to managing other mutual funds and investment accounts; |
| • | Policies and procedures relating to proxy voting and the handling of corporate actions and class actions; |
| • | A description of CRM’s procedures for overseeing sub-advisers, including with respect to regulatory and compliance issues, investment management and other matters; |
Calvert
Short Duration Income Fund
September 30, 2023
Board of Trustees' Contract Approval — continued
Other Relevant Information
| • | Information concerning the nature, cost and character of the administrative and other non-investment advisory services provided by CRM and its affiliates; and |
| • | The terms of each investment advisory agreement. |
Over the course of the year, the Board and its committees held regular quarterly meetings. During these meetings, the Trustees participated in investment and performance reviews with the portfolio managers and other investment professionals of the Adviser relating to each fund and considered various investment and trading strategies used in pursuing each fund’s investment objective(s), such as the use of derivative instruments, as well as risk management techniques. The Board and its committees also evaluated issues pertaining to industry and regulatory developments, compliance procedures, corporate governance and other issues with respect to the funds and received and participated in reports and presentations provided by CRM and its affiliates with respect to such matters. In addition to the formal meetings of the Board and its committees, the Independent Trustees held regular video conferences in between meetings to discuss, among other topics, matters relating to the continuation of the Calvert Funds’ investment advisory and investment sub-advisory agreements.
For funds that invest through one or more affiliated underlying funds, the Board considered similar information about the underlying fund(s) when considering the approval of investment advisory agreements. In addition, in cases where the Adviser has engaged a sub-adviser, the Board considered similar information about the sub-adviser when considering the approval of any investment sub-advisory agreement.
The Independent Trustees were assisted throughout the contract review process by their independent legal counsel. The Independent Trustees relied upon the advice of such counsel and their own business judgment in determining the material factors to be considered in evaluating each investment advisory and investment sub-advisory agreement and the weight to be given to each such factor. The Board, including the Independent Trustees, did not identify any single factor as controlling, and each Trustee may have attributed different weight to various factors.
Results of the Contract Review Process
Based on its consideration of the foregoing, and such other information as it deemed relevant, including the factors and conclusions described below, the Board, including the Independent Trustees, concluded that the continuation of the investment advisory agreement of Calvert Short Duration Income Fund (the “Fund”), including the fee payable under the agreement, is in the best interests of the Fund’s shareholders. Accordingly, the Board, including a majority of the Independent Trustees, voted to approve the continuation of the investment advisory agreement of the Fund.
Nature, Extent and Quality of Services
In considering the nature, extent and quality of the services provided by the Adviser under the investment advisory agreement, the Board reviewed information provided by the Adviser relating to its operations and personnel, including, among other information, biographical information on the Adviser’s investment personnel and descriptions of its organizational and management structure. The Board also took into account similar information provided periodically throughout the previous year by the Adviser as well as the Board’s familiarity with management through Board meetings, discussions and other reports. The Board considered the Adviser’s management style and its performance in employing its investment strategies as well as its current level of staffing and overall resources. The Board also noted that it reviewed on a quarterly basis information regarding the Adviser’s compliance with applicable policies and procedures, including those related to personal investing. The Board took into account, among other items, periodic reports received from the Adviser over the past year concerning the Adviser’s ongoing review and enhancement of certain processes, policies and procedures of the Calvert Funds and the Adviser. The Board concluded that it was satisfied with the nature, extent and quality of services provided to the Fund by the Adviser under the investment advisory agreement.
Fund Performance
In considering the Fund’s performance, the Board noted that it reviewed on a quarterly basis detailed information about the Fund’s performance results, portfolio composition and investment strategies. The Board compared the Fund’s investment performance to that of the Fund’s peer universe and its benchmark index. The Board’s review included comparative performance data for the one-, three- and five-year periods ended December 31, 2022. This performance data indicated that the Fund had underperformed the median of its peer universe for the one-year period ended December 31, 2022, while it had outperformed the median of its peer universe for the three- and five-year periods ended December 31, 2022. The data also indicated that the Fund had outperformed its benchmark index for the one- and three-year periods ended December 31, 2022, while it had underperformed its benchmark index for the five-year period ended December 31, 2022. Based upon its review, the Board concluded that the Fund’s performance was satisfactory relative to the performance of its peer universe and its benchmark index.
Calvert
Short Duration Income Fund
September 30, 2023
Board of Trustees' Contract Approval — continued
Management Fees and Expenses
In considering the Fund’s fees and expenses, the Board compared the Fund’s fees and total expense ratio with those of comparable funds in its expense group. Among other findings, the data indicated that the Fund’s advisory and administrative fees (referred to collectively as “management fees”) and the Fund’s total expenses were each above the respective median of the Fund’s expense group. The Board took into account the Adviser’s current undertaking to maintain expense limitations for the Fund and that the Adviser was waiving and/or reimbursing a portion of the Fund’s expenses. Based upon its review, the Board concluded that the management fees were reasonable in view of the nature, extent and quality of services provided by the Adviser.
Profitability and Other “Fall-Out” Benefits
The Board reviewed the Adviser’s profitability in regard to the Fund and the Calvert Funds in the aggregate. In reviewing the overall profitability of the Fund to the Adviser, the Board also considered the fact that the Adviser and its affiliates provided sub-transfer agency support, administrative and distribution services to the Fund for which they received compensation. The information considered by the Board included the profitability of the Fund to the Adviser and its affiliates without regard to any marketing support or other payments by the Adviser and its affiliates to third parties in respect of distribution services. The Board also considered that the Adviser and its affiliates derived benefits to their reputation and other indirect benefits from their relationships with the Fund. Based upon its review, the Board concluded that the Adviser’s and its affiliates’ level of profitability from their relationships with the Fund was reasonable.
Economies of Scale
The Board considered the effect of the Fund’s current size and its potential growth on its performance and fees. The Board also took into account the breakpoint in the advisory fee schedule for the Fund that would reduce the advisory fee rate on assets above a specific asset level. The Board noted that if the Fund’s assets increased over time, the Fund might realize other economies of scale if assets increased proportionally more than certain other expenses.
Calvert
Short Duration Income Fund
September 30, 2023
Liquidity Risk Management Program
The Fund has implemented a written liquidity risk management program (Program) and related procedures to manage its liquidity in accordance with Rule 22e-4 under the Investment Company Act of 1940, as amended (Liquidity Rule). The Liquidity Rule defines “liquidity risk” as the risk that a fund could not meet requests to redeem shares issued by the fund without significant dilution of the remaining investors’ interests in the fund. The Fund’s Board of Trustees/Directors has designated the investment adviser to serve as the administrator of the Program and the related procedures. The administrator has established a Liquidity Risk Management Oversight Committee (Committee) to perform the functions necessary to administer the Program. As part of the Program, the administrator is responsible for identifying illiquid investments and categorizing the relative liquidity of the Fund’s investments in accordance with the Liquidity Rule. Under the Program, the administrator assesses, manages, and periodically reviews the Fund’s liquidity risk, and is responsible for making certain reports to the Fund’s Board of Trustees/Directors and the Securities and Exchange Commission (SEC) regarding the liquidity of the Fund’s investments, and to notify the Board of Trustees/Directors and the SEC of certain liquidity events specified in the Liquidity Rule. The liquidity of the Fund’s portfolio investments is determined based on a number of factors including, but not limited to, relevant market, trading and investment-specific considerations under the Program.
At a meeting of the Fund’s Board of Trustees/Directors on June 13, 2023, the Committee provided a written report to the Fund’s Board of Trustees/ Directors pertaining to the operation, adequacy, and effectiveness of implementation of the Program, as well as the operation of the highly liquid investment minimum (if applicable) for the period January 1, 2022 through December 31, 2022 (Review Period). The Program operated effectively during the Review Period, supporting the administrator’s ability to assess, manage and monitor Fund liquidity risk, including during periods of market volatility and net redemptions. During the Review Period, the Fund met redemption requests on a timely basis.
There can be no assurance that the Program will achieve its objectives in the future. Please refer to the Fund’s prospectus for more information regarding the Fund’s exposure to liquidity risk and other principal risks to which an investment in the Fund may be subject.
Calvert
Short Duration Income Fund
September 30, 2023
Management and Organization
Fund Management. The Trustees of The Calvert Fund (the Trust) are responsible for the overall management and supervision of the affairs of the Trust. The Board members and officers of the Trust are listed below. Except as indicated, each individual has held the office shown or other offices in the same company for the last five years. Board members hold indefinite terms of office. Each Board member holds office until his or her successor is elected and qualified, or until his or her earlier death, resignation, retirement, removal or disqualification. Under the terms of the Fund's current Board member retirement policy, an Independent Board member must retire at the end of the calendar year in which he or she turns 75. However, if such retirement would cause the Fund to be out of compliance with Section 16 of the 1940 Act or any other regulations or guidance of the SEC, then such retirement will not become effective until such time as action has been taken for the Fund to be in compliance therewith. The “noninterested Trustees” consist of those Trustees who are not “interested persons” of the Trust, as that term is defined under the 1940 Act. The business address of each Board member and the Chief Compliance Officer is 2050 M Street NW, Washington, DC 20036 and the business address of the Secretary, Vice President and Chief Legal Officer and the Treasurer is Two International Place, Boston, Massachusetts 02110. As used below, “CRM” refers to Calvert Research and Management and “Eaton Vance” refers to Eaton Vance Management. Each Trustee oversees 46 funds in the Calvert fund complex. Each of Eaton Vance and CRM are indirect, wholly owned subsidiaries of Morgan Stanley. Each officer affiliated with CRM may hold a position with other CRM affiliates that is comparable to his or her position with CRM listed below.
| Name and Year of Birth | Trust
Position(s) | Length of
Service | Principal Occupation(s) and Other Directorships
During Past Five Years and Other Relevant Experience |
| Interested Trustee | | | |
Theodore H. Eliopoulos(1)
1964 | Trustee and
President | Since 2022 | President and Chief Executive Officer of CRM and senior sponsor of Morgan Stanley Investment Management’s (MSIM) Diversity Council. Formerly, Vice Chairman & Head of Strategic Partnerships at MSIM (2019-2022). Former Chief Investment Officer and interim Chief Investment Officer (2014-2018) and Senior Investment Officer of Real Estate and Real Assets at California Public Employees’ Retirement System (CalPERS) (2007-2014). Former Chief Deputy Treasurer and Deputy Treasurer at the California State Treasurer's Office (2002-2006). Mr. Eliopoulos is an interested person because of his positions with CRM and certain affiliates.
Other Directorships. The Robert Toigo Foundation; Pacific Pension & Investment Institute (PPI). |
| Noninterested Trustees |
Richard L. Baird, Jr.(2)
1948 | Trustee | Since 1982 | Regional Disaster Recovery Lead, American Red Cross of Greater
Pennsylvania (since 2017). Volunteer, American Red Cross (since 2015).
Former President and CEO of Adagio Health Inc. (retired in 2014) in
Pittsburgh, PA.
Other Directorships. None. |
Alice Gresham Bullock
1950 | Chair and
Trustee | Since 2016 | Professor Emerita at Howard University School of Law. Dean Emerita of
Howard University School of Law and Deputy Director of the Association
of American Law Schools (1992-1994).
Other Directorships. None. |
Cari M. Dominguez
1949 | Trustee | Since 2016 | Former Chair of the U.S. Equal Employment Opportunity Commission.
Other Directorships. ManpowerGroup Inc. (workforce solutions company);
Triple S Management Corporation (managed care); National Association of Corporate Directors. |
Karen Fang(3)
1958 | Trustee | Since 2023 | Formerly, Managing Director, Wealth Management at GAMCO Asset Management (asset management firm) (2020-2023). Formerly, Managing Director, Senior Portfolio Manager of Fiduciary Trust Company International (wealth management firm) (1993-2019).
Other Directorships. None. |
John G. Guffey, Jr.(2)
1948 | Trustee | Since 1982 | President of Aurora Press Inc., a privately held publisher of trade paperbacks
(since January 1997).
Other Directorships. Calvert Impact Capital, Inc. (through December 31, 2018); Calvert Ventures, LLC. |
Miles D. Harper, III
1962 | Trustee | Since 2016 | Partner, Carr Riggs & Ingram (public accounting firm) since October 2014.
Partner, Gainer Donnelly & Desroches (public accounting firm) (now Carr
Riggs & Ingram) (November 1999 - September 2014).
Other Directorships. Bridgeway Funds (9) (asset management). |
Joy V. Jones
1950 | Trustee | Since 2016 | Attorney.
Other Directorships. Palm Management Corporation. |
Calvert
Short Duration Income Fund
September 30, 2023
Management and Organization — continued
| Name and Year of Birth | Trust
Position(s) | Length of
Service | Principal Occupation(s) and Other Directorships
During Past Five Years and Other Relevant Experience |
| Noninterested Trustees (continued) |
Eddie Ramos(3)
1967 | Trustee | Since 2023 | Private investor (2022-present). Formerly, Head of External Advisors/Diversity Portfolio Management at the New Jersey Division of Investment (2020-2022). Formerly, Chief Investment Officer and Lead Portfolio Manager – Global Fundamental Equities at Cornerstone Capital Management (asset management firm) (2011-2017).
Other Directorships. Macquarie Optimum Funds (6) (asset management). |
Anthony A. Williams
1951 | Trustee | Since 2010 | CEO and Executive Director of the Federal City Council (July 2012 to
present); Senior Adviser and Independent Consultant for King and
Spalding LLP (September 2015 to present); Executive Director of Global
Government Practice at the Corporate Executive Board (January 2010 to
January 2012).
Other Directorships. Freddie Mac; Evoq Properties/Meruelo Maddux
Properties, Inc. (real estate management); Weston Solutions, Inc.
(environmental services); Bipartisan Policy Center’s Debt Reduction Task Force;
Chesapeake Bay Foundation; Catholic University of America; Urban Institute (research organization); The Howard Hughes Corporation (real estate development); Old Dominion National Bank. |
| Name and Year of Birth | Trust
Position(s) | Length of
Service | Principal Occupation(s)
During Past Five Years |
| Principal Officers who are not Trustees |
Hope L. Brown
1973 | Chief
Compliance
Officer | Since 2014 | Chief Compliance Officer of 46 registered investment companies advised
by CRM (since 2014). Vice President and Chief Compliance Officer,
Wilmington Funds (2012-2014). |
Deidre E. Walsh
1971 | Secretary,
Vice President
and Chief
Legal Officer | Since 2021 | Vice President of CRM and officer of 46 registered investment companies
advised by CRM (since 2021). Also Vice President of Eaton Vance and
certain of its affiliates and officer of 127 registered investment companies
advised or administered by Eaton Vance. |
James F. Kirchner
1967 | Treasurer | Since 2016 | Vice President of CRM and officer of 46 registered investment companies
advised by CRM (since 2016). Also Vice President of Eaton Vance and
certain of its affiliates and officer of 127 registered investment companies
advised or administered by Eaton Vance. |
| | | | |
| (1) Mr. Eliopoulos is an interested person of the Fund because of his positions with the Fund’s adviser and certain affiliates. |
| (2) Effective December 31, 2023, Richard L. Baird, Jr. and John G. Guffey, Jr. will retire from the Board of Trustees. |
| (3) Ms. Fang and Mr. Ramos began serving as Trustees effective October 30, 2023. |
The SAI for the Fund includes additional information about the Trustees and officers of the Fund and can be obtained without charge on Calvert’s website at www.calvert.com or by calling 1-800-368-2745.
| FACTS | WHAT DOES EATON VANCE DO WITH YOUR
PERSONAL INFORMATION? |
| Why? | Financial companies choose how they share your personal information. Federal law gives consumers the right to limit some but not all sharing. Federal law also requires us to tell you how we collect, share, and protect your personal information. Please read this notice carefully to understand what we do. |
| |
| What? | The types of personal information we collect and share depend on the product or service you have with us. This information can include:■ Social Security number and income
■
investment experience and risk tolerance
■
checking account number and wire transfer instructions |
| |
| How? | All financial companies need to share customers’ personal information to run their everyday business. In the section below, we list the reasons financial companies can share their customers’ personal information; the reasons Eaton Vance chooses to share; and whether you can limit this sharing. |
Reasons we can share your
personal information | Does Eaton Vance
share? | Can you limit
this sharing? |
| For our everyday business purposes — such as to process your transactions, maintain your account(s), respond to court orders and legal investigations, or report to credit bureaus | Yes | No |
| For our marketing purposes — to offer our products and services to you | Yes | No |
| For joint marketing with other financial companies | No | We don’t share |
| For our investment management affiliates’ everyday business purposes — information about your transactions, experiences, and creditworthiness | Yes | Yes |
| For our affiliates’ everyday business purposes — information about your transactions and experiences | Yes | No |
| For our affiliates’ everyday business purposes — information about your creditworthiness | No | We don’t share |
| For our investment management affiliates to market to you | Yes | Yes |
| For our affiliates to market to you | No | We don’t share |
| For nonaffiliates to market to you | No | We don’t share |
To limit our
sharing | Call toll-free 1-800-368-2745 or email: CRMPrivacy@calvert.comPlease note:If you are a new customer, we can begin sharing your information 30 days from the date we sent this notice. When you are no longer our customer, we continue to share your information as described in this notice. However, you can contact us at any time to limit our sharing. |
| Questions? | Call toll-free 1-800-368-2745 or email: CRMPrivacy@calvert.com |
| Privacy Notice — continued | April 2021 |
| Who we are |
| Who is providing this notice? | Eaton Vance Management, Eaton Vance Distributors, Inc., Eaton Vance Trust Company, Eaton Vance Management (International) Limited, Eaton Vance Advisers International Ltd., Eaton Vance Global Advisors Limited, Eaton Vance Management’s Real Estate Investment Group, Boston Management and Research, Calvert Research and Management, Eaton Vance and Calvert Fund Families and our investment advisory affiliates (“Eaton Vance”) (see Investment Management Affiliates definition below) |
| What we do |
How does Eaton Vance
protect my personal
information? | To protect your personal information from unauthorized access and use, we use security measures that comply with federal law. These measures include computer safeguards and secured files and buildings. We have policies governing the proper handling of customer information by personnel and requiring third parties that provide support to adhere to appropriate security standards with respect to such information. |
How does Eaton Vance
collect my personal
information? | We collect your personal information, for example, when you■ open an account or make deposits or withdrawals from your account
■
buy securities from us or make a wire transfer
■
give us your contact informationWe also collect your personal information from others, such as credit bureaus, affiliates, or other companies. |
| Why can’t I limit all sharing? | Federal law gives you the right to limit only■ sharing for affiliates’ everyday business purposes — information about your creditworthiness
■
affiliates from using your information to market to you
■
sharing for nonaffiliates to market to youState laws and individual companies may give you additional rights to limit sharing. See below for more on your rights under state law. |
| Definitions |
Investment Management
Affiliates | Eaton Vance Investment Management Affiliates include registered investment advisers, registered broker- dealers, and registered and unregistered funds. Investment Management Affiliates does not include entities associated with Morgan Stanley Wealth Management, such as Morgan Stanley Smith Barney LLC and Morgan Stanley & Co. |
| Affiliates | Companies related by common ownership or control. They can be financial and nonfinancial companies.■ Our affiliates include companies with a Morgan Stanley name and financial companies such as Morgan Stanley Smith Barney LLC and Morgan Stanley & Co. |
| Nonaffiliates | Companies not related by common ownership or control. They can be financial and nonfinancial companies.■ Eaton Vance does not share with nonaffiliates so they can market to you. |
| Joint marketing | A formal agreement between nonaffiliated financial companies that together market financial products or services to you.■ Eaton Vance doesn’t jointly market. |
| Other important information |
| Vermont: Except as permitted by law, we will not share personal information we collect about Vermont residents with Nonaffiliates unless you provide us with your written consent to share such information.California: Except as permitted by law, we will not share personal information we collect about California residents with Nonaffiliates and we will limit sharing such personal information with our Affiliates to comply with California privacy laws that apply to us. |
Delivery of Shareholder Documents. The Securities and Exchange Commission (SEC) permits funds to deliver only one copy of shareholder documents, including prospectuses, proxy statements and shareholder reports, to fund investors with multiple accounts at the same residential or post office box address. This practice is often called “householding” and it helps eliminate duplicate mailings to shareholders. Calvert funds, or your financial intermediary, may household the mailing of your documents indefinitely unless you instruct Calvert funds, or your financial intermediary, otherwise. If you would prefer that your Calvert fund documents not be householded, please contact Calvert funds at 1-800-368-2745, or contact your financial intermediary. Your instructions that householding not apply to delivery of your Calvert fund documents will typically be effective within 30 days of receipt by Calvert funds or your financial intermediary.
Portfolio Holdings. Each Calvert fund files a schedule of portfolio holdings on Part F to Form N-PORT with the SEC. Certain information filed on Form N-PORT may be viewed on the Calvert website at www.calvert.com, by calling Calvert at 1-800-368-2745 or in the EDGAR database on the SEC’s website at www.sec.gov.
Proxy Voting. The Proxy Voting Guidelines that each Calvert fund uses to determine how to vote proxies relating to portfolio securities is provided as an Appendix to the fund’s Statement of Additional Information. The Statement of Additional Information can be obtained free of charge by calling the Calvert funds at 1-800-368-2745, by visiting the Calvert funds’ website at www.calvert.com or visiting the SEC’s website at www.sec.gov. Information regarding how a Calvert fund voted proxies relating to portfolio securities during the most recent 12-month period ended June 30 is available by calling Calvert funds, by visiting the Calvert funds’ website at www.calvert.com or by visiting the SEC’s website at www.sec.gov.
Tailored Shareholder Reports. Effective January 24, 2023, the SEC adopted rule and form amendments to require open-end mutual funds and ETFs to transmit concise and visually engaging streamlined annual and semiannual reports to shareholders that highlight key information. Other information, including financial statements, will no longer appear in a streamlined shareholder report but must be available online, delivered free of charge upon request, and filed on a semiannual basis on Form N-CSR. The rule and form amendments have a compliance date of July 24, 2024. At this time, management is evaluating the impact of these amendments on the shareholder reports for the Calvert Funds.
Investment Adviser and Administrator
Calvert Research and Management
2050 M Street NW
Washington, DC 20036
Principal Underwriter*
Eaton Vance Distributors, Inc.
Two International Place
Boston, MA 02110
(617) 482-8260
Custodian
State Street Bank and Trust Company
One Congress Street, Suite 1
Boston, MA 02114-2016
Transfer Agent
SS&C Global Investor & Distribution Solutions, Inc.
2000 Crown Colony Drive
Quincy, MA 02169
Independent Registered Public Accounting Firm
Deloitte & Touche LLP
200 Berkeley Street
Boston, MA 02116-5022
Fund Offices
2050 M Street NW
Washington, DC 20036
* FINRA BrokerCheck. Investors may check the background of their Investment Professional by contacting the Financial Industry Regulatory Authority (FINRA). FINRA BrokerCheck is a free tool to help investors check the professional background of current and former FINRA-registered securities firms and brokers. FINRA BrokerCheck is available by calling 1-800-289-9999 and at www.FINRA.org. The FINRA BrokerCheck brochure describing this program is available to investors at www.FINRA.org.
Printed on recycled paper.
24179 9.30.23
Calvert
Ultra-Short Duration Income Fund
Annual Report
September 30, 2023
Commodity Futures Trading Commission Registration. The Commodity Futures Trading Commission (“CFTC”) has adopted regulations that subject registered investment companies and advisers to regulation by the CFTC if a fund invests more than a prescribed level of its assets in certain CFTC-regulated instruments (including futures, certain options and swap agreements) or markets itself as providing investment exposure to such instruments. The adviser has claimed an exclusion from the definition of “commodity pool operator” under the Commodity Exchange Act with respect to its management of the Fund and the other funds it manages. Accordingly, neither the Fund nor the adviser is subject to CFTC regulation.
Fund shares are not insured by the FDIC and are not deposits or other obligations of, or guaranteed by, any depository institution. Shares are subject to investment risks, including possible loss of principal invested.
This report must be preceded or accompanied by a current summary prospectus or prospectus. Before investing, investors should consider carefully the investment objective, risks, and charges and expenses of a mutual fund. This and other important information is contained in the summary prospectus and prospectus, which can be obtained from a financial intermediary. Prospective investors should read the prospectus carefully before investing. For further information, please call 1-800-368-2745.
Choose Planet-friendly E-delivery!
Sign up now for on-line statements, prospectuses, and fund reports. In less than five minutes you can help reduce paper mail and lower fund costs.
Just go to www.calvert.com. If you already have an online account with the Calvert funds, click on Login to access your Account and select the documents you would like to receive via e-mail.
If you’re new to online account access, click on Login, then Register to create your user name and password. Once you’re in, click on the E-delivery sign-up on the Account Portfolio page and follow the quick, easy steps.
Note: If your shares are not held directly with the Calvert funds but through a brokerage firm, you must contact your broker for electronic delivery options available through their firm.
Annual Report September 30, 2023
Calvert
Ultra-Short Duration Income Fund
Calvert
Ultra-Short Duration Income Fund
September 30, 2023
Management's Discussion of Fund Performance†
Economic and Market Conditions
For fixed-income investors, the dominant event during the 12-month period ended September 30, 2023, was the series of U.S. Federal Reserve (Fed) interest rate hikes -- six during the period, and 11 in total -- that brought the federal funds rate to its highest level in 22 years.
But while the Fed’s campaign to tamp down inflation led to negative performance for government bonds, corporate bond returns were strongly positive during the period -- buoyed in part by the very factors that were fueling inflation: record low unemployment, strong job creation, and robust consumer spending.
By the summer of 2023, a majority of economists and market observers seemed to be coming around to the view that Jerome Powell’s Fed might be able to accomplish what had seldom, if ever, been done before: raise rates significantly to lower inflation and still bring the economy in for a soft landing without a recession.
One cloud that hung over fixed-income markets during the period, however, was fear that even after it finished raising rates, the Fed would leave rates higher for longer than investors had previously anticipated. During the final two months of the period -- and especially after the Fed’s September 2023 meeting -- longer-term interest rates rose dramatically, as investor expectations of how high rates would go -- and how long they would stay there -- seemed to get higher and longer.
Against the backdrop of the Fed’s aggressive monetary tightening campaign, U.S. Treasurys were the worst-performing major fixed-income asset class during the 12-month period, with the Bloomberg U.S. Treasury Index returning -0.81%.
In contrast, the strong U.S. economy and increasing confidence in a soft-landing scenario served as tailwinds for investment-grade corporate bonds. Even in a rising-rate environment, the Bloomberg U.S. Corporate Bond Index returned 3.65% during the period.
High yield bonds were the standout performer among major fixed-income asset classes, with the Bloomberg U.S. Corporate High Yield Index returning 10.28% during the period. With a strong U.S. economy helping keep bond defaults low, and a recession looking increasingly remote, investors gravitated toward riskier investments with greater yields.
Asset-backed securities -- including bonds backed by automobile and consumer loans -- benefited from strong consumer balance sheets and spending during the period, with the Bloomberg U.S. Asset-Backed Securities Index returning 2.81%.
Mortgage-backed securities (MBS), however, were dogged by two technical factors that depressed prices, causing the Bloomberg U.S. Mortgage-Backed Securities Index to return -0.17% during the period. As the Fed lowered its balance sheet, it sold off much of its MBS holdings. And several regional banks that had been significant buyers of MBS were forced by the banking crisis of March 2023 to liquidate their assets. The resulting release of a significant amount of MBS into the market led prices to fall and the asset class to deliver negative returns.
Fund Performance
For the 12-month period ended September 30, 2023, Calvert Ultra-Short Duration Income Fund (the Fund) returned 5.39% for Class A shares at net asset value (NAV), outperforming its benchmark, the Bloomberg 9-12 Months Short Treasury Index (the Index), which returned 3.95%.
Sector allocations in the Fund were the leading contributor to performance relative to the Index during the period. Out-of-Index allocations to investment-grade corporate securities, asset-backed securities, and commercial mortgage-backed securities made especially strong contributions. Out-of-Index allocations to mortgage-backed securities and high yield corporate bonds were also beneficial. The Fund’s slightly shorter-than-Index duration enhanced relative returns during the period.
In contrast, the Fund’s small out-of-Index allocation to bank loans detracted from relative performance during the period. Security selections within U.S. Treasurys also had a slight negative impact.
The Fund’s use of derivatives had no impact on total returns during the period.
See Endnotes and Additional Disclosures in this report.
Past performance is no guarantee of future results. Returns are historical and are calculated by determining the percentage change in net asset value (NAV) or offering price (as applicable) with all distributions reinvested. Furthermore, returns do not reflect the deduction of taxes that shareholders may have to pay on Fund distributions or upon the redemption of Fund shares. Investment return and principal value will fluctuate so that shares, when redeemed, may be worth more or less than their original cost. Performance for periods less than or equal to one year is cumulative. Performance is for the stated time period only; due to market volatility, current Fund performance may be lower or higher than the quoted return. For performance as of the most recent month-end, please refer to www.calvert.com.
Calvert
Ultra-Short Duration Income Fund
September 30, 2023
Performance
Portfolio Manager(s) Vishal Khanduja, CFA and Brian S. Ellis, CFA, each of Calvert Research and Management
| % Average Annual Total Returns1,2 | Class
Inception Date | Performance
Inception Date | One Year | Five Years | Ten Years |
| Class A at NAV | 10/31/2006 | 10/31/2006 | 5.39% | 1.61% | 1.37% |
| Class I at NAV | 01/31/2014 | 10/31/2006 | 5.54 | 1.87 | 1.65 |
| Class R6 at NAV | 10/03/2017 | 10/31/2006 | 5.59 | 1.89 | 1.67 |
|
| Bloomberg 9-12 Months Short Treasury Index | — | — | 3.95% | 1.60% | 1.10% |
| % Total Annual Operating Expense Ratios3 | Class A | Class I | Class R6 |
| Gross | 0.75% | 0.50% | 0.46% |
| Net | 0.72 | 0.47 | 0.43 |
Growth of $10,000
This graph shows the change in value of a hypothetical investment of $10,000 in Class A of the Fund for the period indicated. For comparison, the same investment is shown in the indicated index.
| Growth of Investment2 | Amount Invested | Period Beginning | At NAV | With Maximum Sales Charge |
| Class I, at minimum investment | $1,000,000 | 09/30/2013 | $1,178,172 | N.A. |
| Class R6, at minimum investment | $5,000,000 | 09/30/2013 | $5,899,358 | N.A. |
See Endnotes and Additional Disclosures in this report.
Past performance is no guarantee of future results. Returns are historical and are calculated by determining the percentage change in net asset value (NAV) or offering price (as applicable) with all distributions reinvested. Furthermore, returns do not reflect the deduction of taxes that shareholders may have to pay on Fund distributions or upon the redemption of Fund shares. Investment return and principal value will fluctuate so that shares, when redeemed, may be worth more or less than their original cost. Performance for periods less than or equal to one year is cumulative. Performance is for the stated time period only; due to market volatility, current Fund performance may be lower or higher than the quoted return. For performance as of the most recent month-end, please refer to www.calvert.com.
Calvert
Ultra-Short Duration Income Fund
September 30, 2023
Asset Allocation (% of total investments)
| Credit Quality (% of net assets)1 |
Footnotes:
| 1 | For purposes of the Fund’s rating restrictions, ratings are based on Moody’s Investors Service, Inc. (“Moody’s”), S&P Global Ratings (“S&P”) or Fitch Ratings (“Fitch”), or Kroll Bond Rating Agency, LLC (“Kroll”) for securitized debt instruments only (such as asset-backed securities (“ABS”) and mortgage-backed securities (“MBS”)), as applicable. If securities are rated differently by the ratings agencies, the highest rating is applied. Ratings, which are subject to change, apply to the creditworthiness of the issuers of the underlying securities and not to the Fund or its shares. Credit ratings measure the quality of an issuance based on the issuer’s creditworthiness, with ratings ranging from AAA, being the highest, to D, being the lowest based on S&P’s measures. Ratings of BBB or higher by S&P, Fitch or Kroll (Baa or higher by Moody’s) are considered to be investment-grade quality. Credit ratings are based largely on the ratings agency’s analysis at the time of rating. The rating assigned to any particular security is not necessarily a reflection of the issuer’s current financial condition and does not necessarily reflect its assessment of the volatility of a security’s market value or of the liquidity of an investment in the security. Holdings designated as “Not Rated” (if any) are not rated by the national ratings agencies stated above. |
Calvert
Ultra-Short Duration Income Fund
September 30, 2023
Endnotes and Additional Disclosures
| † | The views expressed in this report are those of the portfolio manager(s) and are current only through the date stated at the top of this page. These views are subject to change at any time based upon market or other conditions, and Calvert and the Fund(s) disclaim any responsibility to update such views. These views may not be relied upon as investment advice and, because investment decisions are based on many factors, may not be relied upon as an indication of trading intent on behalf of any Calvert fund. This commentary may contain statements that are not historical facts, referred to as “forward-looking statements.” The Fund’s actual future results may differ significantly from those stated in any forward-looking statement, depending on factors such as changes in securities or financial markets or general economic conditions, the volume of sales and purchases of Fund shares, the continuation of investment advisory, administrative and service contracts, and other risks discussed from time to time in the Fund’s filings with the Securities and Exchange Commission. |
| | |
| 1 | Bloomberg 9-12 Months Short Treasury Index measures the performance of U.S. Treasury bills, notes, and bonds with a maturity between nine and twelve months. Unless otherwise stated, index returns do not reflect the effect of any applicable sales charges, commissions, expenses, taxes or leverage, as applicable. It is not possible to invest directly in an index. |
| 2 | Class A, Class I and Class R6 shares are offered at net asset value (NAV). Returns are historical and are calculated by determining the percentage change in NAV with all distributions reinvested. Unless otherwise stated, performance does not reflect the deduction of taxes on Fund distributions or redemptions of Fund shares.Performance prior to the inception date of a class may be linked to the performance of an older class of the Fund. This linked performance is adjusted for any applicable sales charge, but is not adjusted for class expense differences. If adjusted for such differences, the performance would be different. The performance of Class I is linked to Class A and the performance of Class R6 is linked to Class I. Performance presented in the Financial Highlights included in the financial statements is not linked.Calvert Research and Management became the investment adviser to the Fund on December 31, 2016. Performance reflected prior to such date is that of the Fund’s former investment adviser. |
| 3 | Source: Fund prospectus. Net expense ratios reflect a contractual expense reimbursement that continues through 1/31/24. The expense ratios for the current reporting period can be found in the Financial Highlights section of this report. Performance reflects expenses waived and/or reimbursed, if applicable. Without such waivers and/or reimbursements, performance would have been lower. |
| | Fund profile subject to change due to active management. |
| Additional Information |
| | Bloomberg U.S. Treasury Index measures the performance of U.S. Treasuries with a maturity of one year or more. Bloomberg U.S. Corporate Bond Index measures the performance of investment-grade U.S. corporate securities with a maturity of one year or more. Bloomberg U.S. Corporate High Yield Index measures USD-denominated, non- investment grade corporate securities. Bloomberg U.S. Asset-Backed Securities Index tracks the performance of U.S. dollar denominated investment grade, fixed rate asset-backed securities publicly issued in the U.S. domestic market. Bloomberg U.S. Mortgage-Backed Securities Index measures agency mortgage-backed pass-through securities issued by Ginnie Mae (GNMA), Fannie Mae (FNMA), and Freddie Mac (FHLMC). |
| | Duration is a measure of the expected change in price of a bond — in percentage terms — given a one percent change in interest rates, all else being constant. Securities with lower durations tend to be less sensitive to interest rate changes. |
Calvert
Ultra-Short Duration Income Fund
September 30, 2023
Example
As a Fund shareholder, you incur two types of costs: (1) transaction costs, including sales charges (loads) on purchases; and (2) ongoing costs, including management fees; distribution and/or service fees; and other Fund expenses. This Example is intended to help you understand your ongoing costs (in dollars) of Fund investing and to compare these costs with the ongoing costs of investing in other mutual funds. The Example is based on an investment of $1,000 invested at the beginning of the period and held for the entire period (April 1, 2023 to September 30, 2023).
Actual Expenses
The first section of the table below provides information about actual account values and actual expenses. You may use the information in this section, together with the amount you invested, to estimate the expenses that you paid over the period. Simply divide your account value by $1,000 (for example, an $8,600 account value divided by $1,000 = 8.6), then multiply the result by the number in the first section under the heading entitled “Expenses Paid During Period” to estimate the expenses you paid on your account during this period.
Hypothetical Example for Comparison Purposes
The second section of the table below provides information about hypothetical account values and hypothetical expenses based on the actual Fund expense ratio and an assumed rate of return of 5% per year (before expenses), which is not the actual Fund return. The hypothetical account values and expenses may not be used to estimate the actual ending account balance or expenses you paid for the period. You may use this information to compare the ongoing costs of investing in the Fund and other funds. To do so, compare this 5% hypothetical example with the 5% hypothetical examples that appear in the shareholder reports of the other funds.
Please note that the expenses shown in the table are meant to highlight your ongoing costs only and do not reflect any transactional costs, such as sales charges (loads). Therefore, the second section of the table is useful in comparing ongoing costs only, and will not help you determine the relative total costs of owning different funds. In addition, if these transactional costs were included, your costs would be higher.
| | Beginning
Account Value
(4/1/23) | Ending
Account Value
(9/30/23) | Expenses Paid
During Period*
(4/1/23 – 9/30/23) | Annualized
Expense
Ratio |
| Actual | | | | |
| Class A | $1,000.00 | $1,028.40 | $3.66 ** | 0.72% |
| Class I | $1,000.00 | $1,029.70 | $2.39 ** | 0.47% |
| Class R6 | $1,000.00 | $1,028.90 | $2.19 ** | 0.43% |
| Hypothetical | | | | |
| (5% return per year before expenses) | | | | |
| Class A | $1,000.00 | $1,021.46 | $3.65 ** | 0.72% |
| Class I | $1,000.00 | $1,022.71 | $2.38 ** | 0.47% |
| Class R6 | $1,000.00 | $1,022.91 | $2.18 ** | 0.43% |
| * | Expenses are equal to the Fund's annualized expense ratio for the indicated Class, multiplied by the average account value over the period, multiplied by 183/365 (to reflect the one-half year period). The Example assumes that the $1,000 was invested at the net asset value per share determined at the close of business on March 31, 2023. |
| ** | Absent a waiver and/or reimbursement of expenses by affiliate(s), expenses would be higher. |
Calvert
Ultra-Short Duration Income Fund
September 30, 2023
| Asset-Backed Securities — 18.5% |
| Security | Principal
Amount
(000's omitted) | Value |
| Amur Equipment Finance Receivables IX, LLC, Series 2021-1A, Class A2, 0.75%, 11/20/26(1) | $ | 884 | $ 868,286 |
| Amur Equipment Finance Receivables XII, LLC, Series 2023-1A, Class A2, 6.09%, 12/20/29(1) | | 7,215 | 7,224,496 |
| Avant Loans Funding Trust, Series 2021-REV1, Class B, 1.64%, 7/15/30(1) | | 4,310 | 4,173,467 |
| BHG Securitization Trust: | | | |
| Series 2021-B, Class A, 0.90%, 10/17/34(1) | | 2,789 | 2,682,909 |
| Series 2022-B, Class A, 3.75%, 6/18/35(1) | | 623 | 617,767 |
| CarMax Auto Owner Trust, Series 2023-1, Class A2A, 5.23%, 1/15/26 | | 1,040 | 1,037,047 |
| Chesapeake Funding II, LLC, Series 2020-1A, Class A2, 6.078%, (30-day average SOFR + 0.76%), 8/15/32(1)(2) | | 186 | 185,891 |
| Coinstar Funding, LLC, Series 2017-1A, Class A2, 5.216%, 4/25/47(1) | | 3,439 | 2,875,835 |
| Conn's Receivables Funding, LLC: | | | |
| Series 2021-A, Class C, 4.59%, 5/15/26(1) | | 5,076 | 5,063,907 |
| Series 2023-A, Class A, 8.01%, 1/17/28(1) | | 3,939 | 3,944,643 |
| Consumer Loan Underlying Bond (CLUB) Credit Trust, Series 2020-P1, Class C, 4.61%, 3/15/28(1) | | 208 | 206,017 |
| Dell Equipment Finance Trust, Series 2023-2, Class A2, 5.84%, 1/22/29(1) | | 1,800 | 1,798,694 |
| Donlen Fleet Lease Funding 2, LLC, Series 2021-2, Class A1, 5.757%, (1 mo. SOFR + 0.33%), 12/11/34(1)(2) | | 1,023 | 1,021,798 |
| Driven Brands Funding, LLC, Series 2018-1A, Class A2, 4.739%, 4/20/48(1) | | 4,738 | 4,576,086 |
| Enterprise Fleet Financing, LLC, Series 2023-1, Class A1, 5.33%, 3/20/24(1) | | 2,155 | 2,153,909 |
| Ford Credit Auto Lease Trust, Series 2023-A, Class A2A, 5.19%, 6/15/25 | | 636 | 634,662 |
| Ford Credit Auto Owner Trust, Series 2022-C, Class A2A, 4.52%, 4/15/25 | | 857 | 855,095 |
| GM Financial Automobile Leasing Trust, Series 2023-2, Class A2A, 5.44%, 10/20/25 | | 1,260 | 1,255,545 |
| GM Financial Consumer Automobile Receivables Trust, Series 2023-3, Class A2A, 5.74%, 9/16/26 | | 3,926 | 3,924,883 |
| Hilton Grand Vacations Trust, Series 2020-AA, Class A, 2.74%, 2/25/39(1) | | 585 | 547,944 |
| Hyundai Auto Lease Securitization Trust, Series 2023-B, Class A2A, 5.47%, 9/15/25(1) | | 2,100 | 2,093,840 |
| JPMorgan Chase Bank, NA: | | | |
| Series 2021-2, Class B, 0.889%, 12/26/28(1) | | 475 | 461,170 |
| Series 2021-3, Class B, 0.76%, 2/26/29(1) | | 795 | 760,318 |
| Series 2021-3, Class C, 0.86%, 2/26/29(1) | | 888 | 849,140 |
| Series 2021-3, Class D, 1.009%, 2/26/29(1) | | 355 | 337,662 |
| LAD Auto Receivables Trust: | | | |
| Series 2022-1A, Class A, 5.21%, 6/15/27(1) | | 7,125 | 7,072,501 |
| Series 2023-1A, Class A2, 5.68%, 10/15/26(1) | | 2,353 | 2,347,680 |
| Series 2023-2A, Class A2, 5.93%, 6/15/27(1) | | 3,988 | 3,978,729 |
| Series 2023-3A, Class A2, 6.09%, 6/15/26(1) | | 4,325 | 4,323,590 |
| Security | Principal
Amount
(000's omitted) | Value |
| Lendingpoint Asset Securitization Trust, Series 2022-C, Class A, 6.56%, 2/15/30(1) | $ | 4,139 | $ 4,133,395 |
| LL ABS Trust: | | | |
| Series 2021-1A, Class A, 1.07%, 5/15/29(1) | | 201 | 197,270 |
| Series 2022-1A, Class A, 3.76%, 11/15/29(1) | | 2,914 | 2,887,829 |
| Marlette Funding Trust: | | | |
| Series 2019-4A, Class C, 3.76%, 12/17/29(1) | | 617 | 611,017 |
| Series 2020-1A, Class D, 3.54%, 3/15/30(1) | | 2,832 | 2,790,963 |
| Series 2023-1A, Class A, 6.07%, 4/15/33(1) | | 4,003 | 3,996,445 |
| Series 2023-3A, Class A, 6.49%, 9/15/33(1) | | 11,393 | 11,398,859 |
| MVW, LLC, Series 2020-1A, Class A, 1.74%, 10/20/37(1) | | 133 | 122,620 |
| New Residential Mortgage, LLC, Series 2020-FNT2, Class A, 5.437%, 7/25/25(1) | | 5,373 | 5,161,521 |
| Newtek Small Business Loan Trust, Series 2023-1, Class A, 8.00%, (USD Prime - 0.50%), 7/25/50(1)(2) | | 3,257 | 3,253,215 |
| Octane Receivables Trust: | | | |
| Series 2021-2A, Class A, 1.21%, 9/20/28(1) | | 939 | 909,319 |
| Series 2023-1A, Class A, 5.87%, 5/21/29(1) | | 1,185 | 1,180,603 |
| OneMain Financial Issuance Trust, Series 2020-1A, Class B, 4.83%, 5/14/32(1) | | 1,991 | 1,978,603 |
| Oportun Funding XIV, LLC, Series 2021-A, Class D, 5.40%, 3/8/28(1) | | 3,886 | 3,766,190 |
| Oportun Funding, LLC, Series 2022-1, Class A, 3.25%, 6/15/29(1) | | 2,358 | 2,336,424 |
| Oportun Issuance Trust: | | | |
| Series 2022-3, Class A, 7.451%, 1/8/30(1) | | 2,399 | 2,398,486 |
| Series 2022-3, Class B, 8.533%, 1/8/30(1) | | 4,150 | 4,191,957 |
| Oscar U.S. Funding XV, LLC, Series 2023-1A, Class A2, 6.07%, 9/10/26(1) | | 9,850 | 9,838,363 |
| Pagaya AI Debt Selection Trust: | | | |
| Series 2020-3, Class C, 6.43%, 5/17/27(1) | | 1,571 | 1,565,836 |
| Series 2021-2, 3.00%, 1/25/29(1) | | 992 | 958,921 |
| Series 2021-3, Class A, 1.15%, 5/15/29(1) | | 432 | 430,725 |
| Series 2021-5, Class A, 1.53%, 8/15/29(1) | | 740 | 730,541 |
| Series 2021-HG1, Class A, 1.22%, 1/16/29(1) | | 1,031 | 993,038 |
| Prodigy Finance CM DAC, Series 2021-1A, Class A, 6.684%, (1 mo. SOFR + 1.364%), 7/25/51(1)(2) | | 1,578 | 1,563,275 |
| Prosper Marketplace Issuance Trust: | | | |
| Series 2019-4A, Class C, 4.95%, 2/17/26(1) | | 332 | 331,717 |
| Series 2023-1A, Class A, 7.06%, 7/16/29(1) | | 5,729 | 5,733,848 |
| Purchasing Power Funding, LLC, Series 2021-A, Class A, 1.57%, 10/15/25(1) | | 662 | 659,418 |
| Reach ABS Trust, Series 2023-1A, Class A, 7.05%, 2/18/31(1) | | 1,863 | 1,867,922 |
| SoFi Consumer Loan Program Trust: | | | |
| Series 2022-1S, Class A, 6.21%, 4/15/31(1) | | 2,607 | 2,604,441 |
| Series 2023-1S, Class A, 5.81%, 5/15/31(1) | | 2,364 | 2,358,924 |
| SpringCastle America Funding, LLC, Series 2020-AA, Class A, 1.97%, 9/25/37(1) | | 1,864 | 1,693,164 |
| Stack Infrastructure Issuer, LLC: | | | |
| Series 2019-1A, Class A2, 4.54%, 2/25/44(1) | | 10 | 9,905 |
| Series 2020-1A, Class A2, 1.893%, 8/25/45(1) | | 952 | 864,986 |
7
See Notes to Financial Statements.
Calvert
Ultra-Short Duration Income Fund
September 30, 2023
Schedule of Investments — continued
| Security | Principal
Amount
(000's omitted) | Value |
| Theorem Funding Trust: | | | |
| Series 2022-3A, Class A, 7.60%, 4/15/29(1) | $ | 4,320 | $ 4,343,090 |
| Series 2023-1A, Class A, 7.58%, 4/15/29(1) | | 2,657 | 2,667,811 |
| Upstart Pass-Through Trust, Series 2020-ST2, Class A, 3.50%, 3/20/28(1) | | 1,923 | 1,898,434 |
| Upstart Securitization Trust: | | | |
| Series 2020-1, Class C, 4.899%, 4/22/30(1) | | 647 | 641,634 |
| Series 2021-3, Class A, 0.83%, 7/20/31(1) | | 29 | 28,910 |
| Series 2021-4, Class A, 0.84%, 9/20/31(1) | | 679 | 672,203 |
| Series 2021-5, Class A, 1.31%, 11/20/31(1) | | 242 | 238,444 |
| Vantage Data Centers Issuer, LLC: | | | |
| Series 2019-1A, Class A2, 3.188%, 7/15/44(1) | | 5,444 | 5,288,972 |
| Series 2020-2A, Class A2, 1.992%, 9/15/45(1) | | 4,955 | 4,150,695 |
Total Asset-Backed Securities
(identified cost $173,099,758) | | | $171,323,444 |
| Collateralized Mortgage Obligations — 2.2% |
| Security | Principal
Amount
(000's omitted) | Value |
| Bellemeade Re, Ltd.: | | | |
| Series 2021-1A, Class M1A, 7.065%, (30-day average SOFR + 1.75%), 3/25/31(1)(2) | $ | 124 | $ 124,799 |
| Series 2021-1A, Class M1B, 7.515%, (30-day average SOFR + 2.20%), 3/25/31(1)(2) | | 1,500 | 1,510,363 |
| Series 2021-2A, Class M1A, 6.515%, (30-day average SOFR + 1.20%), 6/25/31(1)(2) | | 2,046 | 2,046,851 |
| Series 2021-3A, Class M1A, 6.315%, (30-day average SOFR + 1.00%), 9/25/31(1)(2) | | 1,792 | 1,795,800 |
| Federal Home Loan Mortgage Corp. Structured Agency Credit Risk Debt Notes: | | | |
| Series 2019-DNA4, Class M2, 7.379%, (30-day average SOFR + 2.064%), 10/25/49(1)(2) | | 51 | 51,011 |
| Series 2021-DNA3, Class M1, 6.065%, (30-day average SOFR + 0.75%), 10/25/33(1)(2) | | 370 | 369,246 |
| Series 2022-DNA2, Class M1A, 6.615%, (30-day average SOFR + 1.30%), 2/25/42(1)(2) | | 3,520 | 3,518,834 |
| Series 2022-HQA1, Class M1A, 7.415%, (30-day average SOFR + 2.10%), 3/25/42(1)(2) | | 1,581 | 1,599,006 |
| Federal National Mortgage Association Connecticut Avenue Securities: | | | |
| Series 2014-C03, Class 2M2, 8.329%, (30-day average SOFR + 3.014%), 7/25/24(2) | | 17 | 17,239 |
| Series 2019-R06, Class 2B1, 9.179%, (30-day average SOFR + 3.864%), 9/25/39(1)(2) | | 1,589 | 1,632,438 |
| JPMorgan Mortgage Trust, Series 2023-HE2, Class A1, 7.016%, (30-day average SOFR + 1.70%), 3/25/54(1)(2) | | 2,640 | 2,640,000 |
| PNMAC GMSR Issuer Trust, Series 2018-GT1, Class A, 9.284%, (1 mo. SOFR + 3.85%), 2/25/25(1)(2) | | 2,628 | 2,627,737 |
| RESIMAC Bastille Trust, Series 2021-2NCA, Class A1B, 6.062%, (SOFR + 0.74%), 2/3/53(1)(2) | | 2,068 | 2,054,748 |
| Security | Principal
Amount
(000's omitted) | Value |
| RESIMAC Premier Trust, Series 2020-1A, Class A1A, 6.492%, (1 mo. SOFR + 1.16%), 2/7/52(1)(2) | $ | 545 | $ 545,855 |
Total Collateralized Mortgage Obligations
(identified cost $20,501,294) | | | $ 20,533,927 |
| Commercial Mortgage-Backed Securities — 7.1% |
| Security | Principal
Amount
(000's omitted) | Value |
| BX Commercial Mortgage Trust: | | | |
| Series 2019-XL, Class A, 6.367%, (1 mo. SOFR + 1.034%), 10/15/36(1)(2) | $ | 9,468 | $ 9,443,627 |
| Series 2021-VOLT, Class B, 6.397%, (1 mo. SOFR + 1.064%), 9/15/36(1)(2) | | 4,129 | 3,996,745 |
| Series 2021-VOLT, Class C, 6.547%, (1 mo. SOFR + 1.214%), 9/15/36(1)(2) | | 1,908 | 1,835,887 |
| Series 2021-VOLT, Class D, 7.097%, (1 mo. SOFR + 1.764%), 9/15/36(1)(2) | | 1,427 | 1,364,587 |
| CAMB Commercial Mortgage Trust, Series 2019-LIFE, Class A, 6.45%, (1 mo. SOFR + 1.11%), 12/15/37(1)(2) | | 2,650 | 2,643,569 |
| Extended Stay America Trust: | | | |
| Series 2021-ESH, Class A, 6.527%, (1 mo. SOFR + 1.194%), 7/15/38(1)(2) | | 7,213 | 7,159,001 |
| Series 2021-ESH, Class B, 6.827%, (1 mo. SOFR + 1.49%), 7/15/38(1)(2) | | 3,045 | 3,010,869 |
| Hawaii Hotel Trust, Series 2019-MAUI, Class A, 6.529%, (1 mo. SOFR + 1.197%), 5/15/38(1)(2) | | 7,467 | 7,416,879 |
| JPMorgan Chase Commercial Mortgage Securities Trust, Series 2021-MHC, Class B, 6.497%, (1 mo. SOFR + 1.16%), 4/15/38(1)(2) | | 900 | 889,112 |
| Med Trust, Series 2021-MDLN, Class B, 6.897%, (1 mo. SOFR + 1.56%), 11/15/38(1)(2) | | 5,041 | 4,919,581 |
| MHC Commercial Mortgage Trust, Series 2021-MHC, Class A, 6.247%, (1 mo. SOFR + 0.915%), 4/15/38(1)(2) | | 7,887 | 7,801,887 |
| Morgan Stanley Capital I Trust, Series 2019-BPR, Class A, 7.322%, (1 mo. SOFR + 1.992%), 5/15/36(1)(2)(3) | | 5,047 | 4,863,496 |
| Taubman Centers Commercial Mortgage Trust, Series 2022-DPM, Class A, 7.518%, (1 mo. SOFR + 2.186%), 5/15/37(1)(2) | | 1,000 | 977,800 |
| VMC Finance, LLC, Series 2021-HT1, Class A, 7.095%, (1 mo. SOFR + 1.764%), 1/18/37(1)(2) | | 9,362 | 9,160,047 |
Total Commercial Mortgage-Backed Securities
(identified cost $65,971,893) | | | $ 65,483,087 |
| Security | Principal
Amount
(000’s omitted) | Value |
| Communications — 3.5% | |
| AT&T, Inc., 0.90%, 3/25/24 | $ | 9,500 | $ 9,278,997 |
8
See Notes to Financial Statements.
Calvert
Ultra-Short Duration Income Fund
September 30, 2023
Schedule of Investments — continued
| Security | Principal
Amount
(000’s omitted) | Value |
| Communications (continued) | |
| CCO Holdings, LLC/CCO Holdings Capital Corp., 5.125%, 5/1/27(1) | $ | 4,010 | $ 3,740,373 |
| Rogers Communications, Inc., 4.10%, 10/1/23 | | 7,500 | 7,500,000 |
| Sprint, LLC, 7.125%, 6/15/24 | | 11,649 | 11,729,937 |
| | | | $ 32,249,307 |
| Consumer, Cyclical — 7.3% | |
| Brunswick Corp., 0.85%, 8/18/24 | $ | 3,575 | $ 3,410,444 |
| Daimler Trucks Finance North America, LLC: | | | |
| 1.125%, 12/14/23(1) | | 3,775 | 3,738,211 |
| 5.945%, (SOFR + 0.60%), 12/14/23(1)(2) | | 7,500 | 7,502,829 |
| Delta Air Lines, Inc./SkyMiles IP, Ltd., 4.50%, 10/20/25(1) | | 6,741 | 6,550,191 |
| General Motors Financial Co., Inc.: | | | |
| 5.92%, (SOFR + 0.62%), 10/15/24(2) | | 11,698 | 11,664,187 |
| 6.579%, (SOFR + 1.30%), 4/7/25(2) | | 1,908 | 1,912,466 |
| Hyatt Hotels Corp., 1.80%, 10/1/24 | | 7,600 | 7,293,861 |
| Hyundai Capital America, 5.80%, 6/26/25(1) | | 3,344 | 3,331,246 |
| Lennar Corp., 4.875%, 12/15/23 | | 5,000 | 4,983,345 |
| Marriott International, Inc., 3.60%, 4/15/24 | | 7,000 | 6,914,850 |
| Nordstrom, Inc., 2.30%, 4/8/24(4) | | 1,572 | 1,540,764 |
| WarnerMedia Holdings, Inc., 6.412%, 3/15/26 | | 8,659 | 8,661,161 |
| | | | $ 67,503,555 |
| Consumer, Non-cyclical — 4.0% | |
| Baxter International, Inc.: | | | |
| 5.604%, (SOFR + 0.26%), 12/1/23(2) | $ | 3,000 | $ 2,997,730 |
| 5.784%, (SOFR + 0.44%), 11/29/24(2) | | 3,000 | 2,981,705 |
| Becton Dickinson and Co., 3.363%, 6/6/24 | | 5,000 | 4,912,746 |
| Centene Corp., 4.25%, 12/15/27(4) | | 3,500 | 3,229,677 |
| CVS Health Corp., 4.00%, 12/5/23 | | 5,000 | 4,981,042 |
| JDE Peet's NV, 0.80%, 9/24/24(1) | | 8,519 | 8,088,077 |
| Revvity, Inc., 0.85%, 9/15/24 | | 6,017 | 5,719,353 |
| Zimmer Biomet Holdings, Inc., 1.45%, 11/22/24 | | 4,200 | 3,990,219 |
| | | | $ 36,900,549 |
| Financial — 35.6% | |
| AerCap Ireland Capital DAC/AerCap Global Aviation Trust, 1.75%, 10/29/24 | $ | 3,000 | $ 2,861,040 |
| Affiliated Managers Group, Inc., 4.25%, 2/15/24 | | 11,712 | 11,609,957 |
| Ally Financial, Inc.: | | | |
| 1.45%, 10/2/23 | | 2,009 | 2,009,000 |
| 5.125%, 9/30/24(4) | | 10,000 | 9,848,269 |
| Assurant, Inc., 6.10%, 2/27/26 | | 1,425 | 1,418,884 |
| Aviation Capital Group, LLC, 4.375%, 1/30/24(1) | | 5,000 | 4,956,770 |
| Avolon Holdings Funding, Ltd., 5.25%, 5/15/24(1) | | 4,860 | 4,814,477 |
| Banco Santander S.A.: | | | |
| 3.892%, 5/24/24 | | 6,600 | 6,502,478 |
| 5.147%, 8/18/25 | | 3,000 | 2,937,923 |
| Security | Principal
Amount
(000’s omitted) | Value |
| Financial (continued) | |
| Bank of America Corp.: | | | |
| 1.843% to 2/4/24, 2/4/25(5) | $ | 14,200 | $ 13,968,654 |
| 6.062%, (SOFR + 0.73%), 10/24/24(2) | | 13,800 | 13,805,947 |
| Bank of Ireland Group PLC, 2.029% to 9/30/26, 9/30/27(1)(5) | | 8,000 | 7,019,086 |
| Bank of Montreal: | | | |
| Series E, 3.30%, 2/5/24 | | 2,500 | 2,476,650 |
| 5.694%, (SOFR + 0.35%), 12/8/23(2) | | 4,200 | 4,200,080 |
| 6.054%, (SOFR + 0.71%), 3/8/24(2) | | 4,000 | 4,005,386 |
| Bank of Nova Scotia (The), 5.745%, (SOFR + 0.45%), 4/15/24(2) | | 5,000 | 4,999,234 |
| BBVA Bancomer S.A./Texas, 1.875%, 9/18/25(1) | | 1,718 | 1,577,190 |
| Boston Properties, L.P., 3.80%, 2/1/24 | | 1,300 | 1,288,172 |
| BPCE S.A., 5.868%, (SOFR + 0.57%), 1/14/25(1)(2) | | 4,000 | 3,984,290 |
| Brookfield Finance, Inc., 4.00%, 4/1/24 | | 4,800 | 4,747,884 |
| Capital One Financial Corp., 6.034%, (SOFR + 0.69%), 12/6/24(2) | | 12,000 | 11,867,149 |
| Charles Schwab Corp. (The), 5.845%, (SOFR + 0.50%), 3/18/24(2) | | 8,297 | 8,287,705 |
| Citigroup, Inc.: | | | |
| 6.01%, (SOFR + 0.67%), 5/1/25(2) | | 4,618 | 4,612,119 |
| 6.019%, (SOFR + 0.69%), 1/25/26(2) | | 2,778 | 2,767,707 |
| Credit Suisse AG, 3.625%, 9/9/24 | | 10,000 | 9,736,288 |
| Discover Bank, 2.45%, 9/12/24 | | 10,000 | 9,614,166 |
| Fifth Third Bancorp, 3.65%, 1/25/24 | | 3,260 | 3,228,998 |
| Five Corners Funding Trust, 4.419%, 11/15/23(1) | | 3,000 | 2,992,301 |
| GA Global Funding Trust: | | | |
| 5.844%, (SOFR + 0.50%), 9/13/24(1)(2) | | 5,000 | 4,932,427 |
| 6.644%, (SOFR + 1.36%), 4/11/25(1)(2) | | 5,000 | 4,947,265 |
| Goldman Sachs Group, Inc. (The): | | | |
| 5.808%, (SOFR + 0.49%), 10/21/24(2) | | 8,000 | 7,979,900 |
| 6.734%, (SOFR + 1.39%), 3/15/24(2) | | 10,200 | 10,237,122 |
| HAT Holdings I, LLC/HAT Holdings II, LLC, 6.00%, 4/15/25(1) | | 3,000 | 2,922,415 |
| HSBC Holdings PLC, 0.976% to 5/24/24, 5/24/25(5) | | 9,530 | 9,183,130 |
| Intesa Sanpaolo SpA, 5.25%, 1/12/24 | | 11,600 | 11,557,552 |
| JPMorgan Chase & Co., 3.845% to 6/14/24, 6/14/25(5) | | 20,650 | 20,289,490 |
| KeyBank NA, 5.664%, (SOFR + 0.32%), 6/14/24(2) | | 4,750 | 4,674,340 |
| Marsh & McLennan Cos., Inc., 3.875%, 3/15/24 | | 2,500 | 2,476,754 |
| National Bank of Canada, 0.55% to 11/15/23, 11/15/24(5) | | 2,352 | 2,334,639 |
| Nationwide Building Society, 0.55%, 1/22/24(1) | | 7,000 | 6,885,431 |
| Newmark Group, Inc., 6.125%, 11/15/23 | | 4,550 | 4,545,928 |
| PNC Financial Services Group, Inc. (The), 3.90%, 4/29/24 | | 3,300 | 3,259,356 |
| Radian Group, Inc.: | | | |
| 4.50%, 10/1/24 | | 2,000 | 1,944,900 |
| 6.625%, 3/15/25 | | 4,100 | 4,079,541 |
| Societe Generale S.A., 3.875%, 3/28/24(1) | | 5,000 | 4,937,866 |
| Standard Chartered PLC, 6.273%, (SOFR + 0.93%), 11/23/25(1)(2) | | 4,000 | 3,985,963 |
| State Street Corp., 3.70%, 11/20/23 | | 4,875 | 4,859,061 |
| Stifel Financial Corp., 4.25%, 7/18/24 | | 7,589 | 7,468,369 |
| Synchrony Bank, 5.40%, 8/22/25 | | 3,975 | 3,832,713 |
9
See Notes to Financial Statements.
Calvert
Ultra-Short Duration Income Fund
September 30, 2023
Schedule of Investments — continued
| Security | Principal
Amount
(000’s omitted) | Value |
| Financial (continued) | |
| Synchrony Financial: | | | |
| 4.25%, 8/15/24 | $ | 3,000 | $ 2,930,526 |
| 4.875%, 6/13/25 | | 3,574 | 3,427,937 |
| Toronto-Dominion Bank (The): | | | |
| 3.25%, 3/11/24 | | 3,700 | 3,657,602 |
| 5.532%, 7/17/26 | | 3,172 | 3,149,869 |
| Truist Bank, 3.20%, 4/1/24 | | 2,325 | 2,290,451 |
| Truist Financial Corp., 5.744%, (SOFR + 0.40%), 6/9/25(2) | | 9,440 | 9,233,138 |
| UniCredit SpA, 7.83%, 12/4/23(1) | | 11,650 | 11,664,663 |
| Wells Fargo & Co., 2.406% to 10/30/24, 10/30/25(5) | | 3,400 | 3,259,390 |
| | | | $329,085,542 |
| Industrial — 2.0% | |
| Parker-Hannifin Corp., 3.65%, 6/15/24 | $ | 3,300 | $ 3,249,496 |
| SMBC Aviation Capital Finance DAC, 3.55%, 4/15/24(1) | | 7,035 | 6,937,247 |
| TD SYNNEX Corp., 1.25%, 8/9/24 | | 5,178 | 4,948,413 |
| Teledyne Technologics, Inc., 0.95%, 4/1/24 | | 3,300 | 3,213,022 |
| | | | $ 18,348,178 |
| Technology — 3.1% | |
| Broadcom Corp./Broadcom Cayman Finance, Ltd., 3.625%, 1/15/24 | $ | 5,570 | $ 5,529,622 |
| Concentrix Corp., 6.65%, 8/2/26 | | 4,775 | 4,748,013 |
| Fidelity National Information Services, Inc., 0.60%, 3/1/24 | | 5,625 | 5,497,730 |
| Hewlett Packard Enterprise Co., 5.90%, 10/1/24 | | 3,545 | 3,543,100 |
| Kyndryl Holdings, Inc., 2.05%, 10/15/26 | | 1,703 | 1,487,285 |
| NXP B.V./NXP Funding, LLC, 4.875%, 3/1/24 | | 4,566 | 4,543,635 |
| SK Hynix, Inc., 1.50%, 1/19/26(1) | | 4,000 | 3,595,027 |
| Take-Two Interactive Software, Inc., 3.30%, 3/28/24 | | 269 | 265,369 |
| | | | $ 29,209,781 |
| Utilities — 2.3% | |
| CMS Energy Corp., 3.875%, 3/1/24 | $ | 5,000 | $ 4,955,821 |
| Eversource Energy, 4.20%, 6/27/24 | | 3,500 | 3,453,671 |
| NextEra Energy Capital Holdings, Inc.: | | | |
| 5.741%, (SOFR + 0.40%), 11/3/23(2) | | 10,000 | 9,999,727 |
| 6.051%, 3/1/25 | | 2,998 | 3,003,607 |
| | | | $ 21,412,826 |
Total Corporate Bonds
(identified cost $538,764,916) | | | $534,709,738 |
| High Social Impact Investments — 0.1% |
| Security | Principal
Amount
(000's omitted) | Value |
| Calvert Impact Capital, Inc., Community Investment Notes, 1.50%, 12/15/23(6)(7) | $ | 1,000 | $ 986,290 |
Total High Social Impact Investments
(identified cost $1,000,000) | | | $ 986,290 |
| Senior Floating-Rate Loans — 0.1%(8) |
| Borrower/Description | Principal
Amount
(000's omitted) | Value |
| Diversified Telecommunication Services — 0.1% | |
| CenturyLink, Inc., Term Loan, 7.681%, (SOFR + 2.25%), 3/15/27 | $ | 1,959 | $ 1,400,143 |
Total Senior Floating-Rate Loans
(identified cost $1,944,744) | | | $ 1,400,143 |
| U.S. Treasury Obligations — 9.0% |
| Security | Principal
Amount
(000's omitted) | Value |
| U.S. Treasury Floating Rate Notes, 5.603%, (3 mo. USTMMR + 0.20%), 1/31/25(2) | $ | 30,000 | $ 30,045,933 |
| U.S. Treasury Notes: | | | |
| 2.50%, 5/31/24 | | 18,250 | 17,897,695 |
| 3.00%, 6/30/24 | | 35,659 | 35,011,160 |
Total U.S. Treasury Obligations
(identified cost $82,991,956) | | | $ 82,954,788 |
| Short-Term Investments — 6.8% | | | |
| Affiliated Fund — 3.2% |
| Security | Shares | Value |
| Morgan Stanley Institutional Liquidity Funds - Government Portfolio, Institutional Class, 5.27%(9) | | 30,103,914 | $ 30,103,914 |
Total Affiliated Fund
(identified cost $30,103,914) | | | $ 30,103,914 |
| Commercial Paper — 3.1% |
| Security | Principal
Amount
(000's omitted) | Value |
| Aviation Capital Group, LLC, 6.214%, 10/16/23(1)(10)(11) | $ | 9,550 | $ 9,524,962 |
| HSBC USA, Inc., 5.483%, 10/24/23(1)(10)(11) | | 4,900 | 4,881,594 |
| Jabil, Inc.: | | | |
| 6.186%, 10/20/23(1)(10)(11) | | 5,000 | 4,981,771 |
10
See Notes to Financial Statements.
Calvert
Ultra-Short Duration Income Fund
September 30, 2023
Schedule of Investments — continued
| Commercial Paper (continued) |
| Security | Principal
Amount
(000's omitted) | Value |
| Jabil, Inc.: (continued) | | | |
| 6.197%, 10/6/23(1)(10)(11) | $ | 9,105 | $ 9,094,121 |
Total Commercial Paper
(identified cost $28,490,702) | | | $ 28,482,448 |
| Securities Lending Collateral — 0.5% |
| Security | Shares | Value |
| State Street Navigator Securities Lending Government Money Market Portfolio, 5.36%(12) | | 4,602,670 | $ 4,602,670 |
Total Securities Lending Collateral
(identified cost $4,602,670) | | | $ 4,602,670 |
Total Short-Term Investments
(identified cost $63,197,286) | | | $ 63,189,032 |
Total Investments — 101.6%
(identified cost $947,471,847) | | | $940,580,449 |
| Other Assets, Less Liabilities — (1.6)% | | | $ (15,127,439) |
| Net Assets — 100.0% | | | $ 925,453,010 |
| The percentage shown for each investment category in the Schedule of Investments is based on net assets. |
| (1) | Security exempt from registration under Rule 144A of the Securities Act of 1933, as amended. These securities may be sold in certain transactions in reliance on an exemption from registration (normally to qualified institutional buyers). At September 30, 2023, the aggregate value of these securities is $387,201,780 or 41.8% of the Fund's net assets. |
| (2) | Variable rate security. The stated interest rate represents the rate in effect at September 30, 2023. |
| (3) | Represents an investment in an issuer that may be deemed to be an affiliate (see Note 8). |
| (4) | All or a portion of this security was on loan at September 30, 2023. The aggregate market value of securities on loan at September 30, 2023 was $4,455,763. |
| (5) | Security converts to variable rate after the indicated fixed-rate coupon period. |
| (6) | May be deemed to be an affiliated company (see Note 8). |
| (7) | Restricted security. Total market value of restricted securities amounts to $986,290, which represents 0.1% of the net assets of the Fund as of September 30, 2023. |
| (8) | Senior floating-rate loans (Senior Loans) often require prepayments from excess cash flows or permit the borrowers to repay at their election. The degree to which borrowers repay, whether as a contractual requirement or at their election, cannot be predicted with accuracy. As a result, the actual remaining maturity may be substantially less than the stated maturities shown. However, Senior Loans will typically have an expected average life of approximately two to four years. Senior Loans typically have rates of interest which are redetermined periodically by reference to a base lending rate, plus a spread. These base lending rates are primarily the Secured Overnight Financing Rate (“SOFR”) (or the London Interbank Offered Rate (“LIBOR”) for those loans whose rates reset prior to the discontinuance of LIBOR on June 30, 2023) and secondarily, the prime rate offered by one or more major United States banks (the “Prime Rate”). Base lending rates may be subject to a floor, or minimum rate. Rates for SOFR are generally 1 or 3-month tenors and may also be subject to a credit spread adjustment. Senior Loans are generally subject to contractual restrictions that must be satisfied before they can be bought or sold. |
| (9) | May be deemed to be an affiliated investment company. The rate shown is the annualized seven-day yield as of September 30, 2023. |
| (10) | Security exempt from registration under Section 4(2) of the Securities Act of 1933, as amended. Such securities may be sold in transactions exempt from registration only to dealers in that program or other “accredited investors”. At September 30, 2023, the aggregate value of these securities is $28,482,448 representing 3.1% of the Fund’s net assets. |
| (11) | Rate shown is the discount rate at date of purchase. |
| (12) | Represents investment of cash collateral received in connection with securities lending. |
Futures Contracts
| Description | Number of
Contracts | Position | Expiration
Date | Notional
Amount | Value/
Unrealized
Appreciation
(Depreciation) |
| Interest Rate Futures | | | | | |
| U.S. 2-Year Treasury Note | 14 | Long | 12/29/23 | $ 2,837,953 | $ (8,992) |
| U.S. 5-Year Treasury Note | (58) | Short | 12/29/23 | (6,110,844) | 66,510 |
| | | | | | $57,518 |
11
See Notes to Financial Statements.
Calvert
Ultra-Short Duration Income Fund
September 30, 2023
Schedule of Investments — continued
Restricted Securities
| Description | Acquisition Date | Cost |
| Calvert Impact Capital, Inc., Community Investment Notes, 1.50%, 12/15/23 | 12/14/20 | $1,000,000 |
| Abbreviations: |
| SOFR | – Secured Overnight Financing Rate |
| USTMMR | – U.S. Treasury Money Market Rate |
| Currency Abbreviations: |
| USD | – United States Dollar |
12
See Notes to Financial Statements.
Calvert
Ultra-Short Duration Income Fund
September 30, 2023
Statement of Assets and Liabilities
| | September 30, 2023 |
| Assets | |
Investments in securities of unaffiliated issuers, at value (identified cost $911,323,049) - including
$4,455,763 of securities on loan | $ 904,626,749 |
| Investments in securities of affiliated issuers, at value (identified cost $36,148,798) | 35,953,700 |
| Cash | 24,987 |
| Deposits at broker for futures contracts | 125,000 |
| Receivable for capital shares sold | 5,139,962 |
| Interest receivable | 6,325,307 |
| Dividends and interest receivable - affiliated | 100,941 |
| Securities lending income receivable | 649 |
| Receivable from affiliates | 85,716 |
| Trustees' deferred compensation plan | 742,909 |
| Total assets | $953,125,920 |
| Liabilities | |
| Payable for variation margin on open futures contracts | $ 7,602 |
| Payable for investments purchased | 19,402,258 |
| Payable for capital shares redeemed | 2,176,541 |
| Distributions payable | 141,508 |
| Deposits for securities loaned | 4,602,670 |
| Payable to affiliates: | |
| Investment advisory fee | 194,112 |
| Administrative fee | 90,371 |
| Distribution and service fees | 46,958 |
| Sub-transfer agency fee | 17,613 |
| Trustees' deferred compensation plan | 742,909 |
| Accrued expenses | 250,368 |
| Total liabilities | $ 27,672,910 |
| Net Assets | $925,453,010 |
| Sources of Net Assets | |
| Paid-in capital | $ 954,896,375 |
| Accumulated loss | (29,443,365) |
| Net Assets | $925,453,010 |
| Class A Shares | |
| Net Assets | $ 228,164,911 |
| Shares Outstanding | 23,312,088 |
Net Asset Value, Offering Price and Redemption Price Per Share
(net assets ÷ shares of beneficial interest outstanding) | $ 9.79 |
| Class I Shares | |
| Net Assets | $ 470,263,035 |
| Shares Outstanding | 48,041,840 |
Net Asset Value, Offering Price and Redemption Price Per Share
(net assets ÷ shares of beneficial interest outstanding) | $ 9.79 |
13
See Notes to Financial Statements.
Calvert
Ultra-Short Duration Income Fund
September 30, 2023
Statement of Assets and Liabilities — continued
| | September 30, 2023 |
| Class R6 Shares | |
| Net Assets | $ 227,025,064 |
| Shares Outstanding | 23,206,937 |
Net Asset Value, Offering Price and Redemption Price Per Share
(net assets ÷ shares of beneficial interest outstanding) | $ 9.78 |
14
See Notes to Financial Statements.
Calvert
Ultra-Short Duration Income Fund
September 30, 2023
| | Year Ended |
| | September 30, 2023 |
| Investment Income | |
| Dividend income - affiliated issuers | $ 766,367 |
| Interest and other income | 42,729,432 |
| Interest income - affiliated issuers | 390,202 |
| Securities lending income, net | 6,687 |
| Total investment income | $43,892,688 |
| Expenses | |
| Investment advisory fee | $ 2,329,483 |
| Administrative fee | 1,075,192 |
| Distribution and service fees: | |
| Class A | 627,797 |
| Trustees' fees and expenses | 61,363 |
| Custodian fees | 17,790 |
| Transfer agency fees and expenses | 610,640 |
| Accounting fees | 203,317 |
| Professional fees | 67,974 |
| Registration fees | 144,080 |
| Reports to shareholders | 57,920 |
| Miscellaneous | 52,047 |
| Total expenses | $ 5,247,603 |
| Waiver and/or reimbursement of expenses by affiliates | $ (488,152) |
| Net expenses | $ 4,759,451 |
| Net investment income | $39,133,237 |
| Realized and Unrealized Gain (Loss) | |
| Net realized gain (loss): | |
| Investment securities | $ (3,885,897) |
| Investment securities - affiliated issuers | 2,632 |
| Futures contracts | 293,467 |
| Net realized loss | $ (3,589,798) |
| Change in unrealized appreciation (depreciation): | |
| Investment securities | $ 12,539,370 |
| Investment securities - affiliated issuers | 155,270 |
| Futures contracts | (317,784) |
| Net change in unrealized appreciation (depreciation) | $12,376,856 |
| Net realized and unrealized gain | $ 8,787,058 |
| Net increase in net assets from operations | $47,920,295 |
15
See Notes to Financial Statements.
Calvert
Ultra-Short Duration Income Fund
September 30, 2023
Statements of Changes in Net Assets
| | Year Ended September 30, |
| | 2023 | 2022 |
| Increase (Decrease) in Net Assets | | |
| From operations: | | |
| Net investment income | $ 39,133,237 | $ 10,585,216 |
| Net realized loss | (3,589,798) | (2,393,516) |
| Net change in unrealized appreciation (depreciation) | 12,376,856 | (21,973,959) |
| Net increase (decrease) in net assets from operations | $ 47,920,295 | $ (13,782,259) |
| Distributions to shareholders: | | |
| Class A | $ (10,271,866) | $ (3,441,541) |
| Class I | (21,676,783) | (6,839,678) |
| Class R6 | (6,926,869) | (1,286,476) |
| Total distributions to shareholders | $ (38,875,518) | $ (11,567,695) |
| Capital share transactions: | | |
| Class A | $ (56,486,722) | $ (40,932,392) |
| Class I | (21,967,326) | (105,082,655) |
| Class R6 | 140,365,504 | 4,708,653 |
| Net increase (decrease) in net assets from capital share transactions | $ 61,911,456 | $ (141,306,394) |
| Net increase (decrease) in net assets | $ 70,956,233 | $ (166,656,348) |
| Net Assets | | |
| At beginning of year | $ 854,496,777 | $1,021,153,125 |
| At end of year | $925,453,010 | $ 854,496,777 |
16
See Notes to Financial Statements.
Calvert
Ultra-Short Duration Income Fund
September 30, 2023
| | Class A |
| | Year Ended September 30, |
| | 2023 | 2022 | 2021 | 2020 | 2019 |
| Net asset value — Beginning of year | $ 9.68 | $ 9.94 | $ 9.86 | $ 9.98 | $ 9.99 |
| Income (Loss) From Operations | | | | | |
| Net investment income(1) | $ 0.40 | $ 0.09 | $ 0.06 | $ 0.15 | $ 0.24 |
| Net realized and unrealized gain (loss) | 0.11 | (0.24) | 0.09 | (0.12) | — (2) |
| Total income (loss) from operations | $ 0.51 | $ (0.15) | $ 0.15 | $ 0.03 | $ 0.24 |
| Less Distributions | | | | | |
| From net investment income | $ (0.40) | $ (0.11) | $ (0.07) | $ (0.15) | $ (0.25) |
| Total distributions | $ (0.40) | $ (0.11) | $ (0.07) | $ (0.15) | $ (0.25) |
| Net asset value — End of year | $ 9.79 | $ 9.68 | $ 9.94 | $ 9.86 | $ 9.98 |
| Total Return(3) | 5.39% | (1.56)% | 1.55% | 0.35% | 2.46% |
| Ratios/Supplemental Data | | | | | |
| Net assets, end of year (000’s omitted) | $228,165 | $281,960 | $331,648 | $296,786 | $311,980 |
| Ratios (as a percentage of average daily net assets):(4) | | | | | |
| Total expenses | 0.77% | 0.75% | 0.76% | 0.76% | 0.79% |
| Net expenses | 0.72% (5) | 0.72% (5) | 0.72% | 0.72% | 0.74% |
| Net investment income | 4.12% | 0.93% | 0.58% | 1.48% | 2.44% |
| Portfolio Turnover | 70% | 78% | 92% (6) | 128% (6) | 85% |
| (1) | Computed using average shares outstanding. |
| (2) | Amount is less than $0.005. |
| (3) | Returns are historical and are calculated by determining the percentage change in net asset value with all distributions reinvested and do not reflect the effect of sales charges, if any. |
| (4) | Total expenses do not reflect amounts reimbursed and/or waived by the adviser and certain of its affiliates, if applicable. Net expenses are net of all reductions and represent the net expenses paid by the Fund. |
| (5) | Includes a reduction by the investment adviser of a portion of its advisory fee due to the Fund's investment in the Liquidity Fund (equal to less than 0.005% of average daily net assets for the years ended September 30, 2023 and 2022). |
| (6) | Includes the effect of To Be Announced (TBA) transactions. |
17
See Notes to Financial Statements.
Calvert
Ultra-Short Duration Income Fund
September 30, 2023
Financial Highlights — continued
| | Class I |
| | Year Ended September 30, |
| | 2023 | 2022 | 2021 | 2020 | 2019 |
| Net asset value — Beginning of year | $ 9.69 | $ 9.94 | $ 9.86 | $ 9.98 | $ 9.99 |
| Income (Loss) From Operations | | | | | |
| Net investment income(1) | $ 0.43 | $ 0.12 | $ 0.08 | $ 0.17 | $ 0.27 |
| Net realized and unrealized gain (loss) | 0.10 | (0.24) | 0.10 | (0.11) | — (2) |
| Total income (loss) from operations | $ 0.53 | $ (0.12) | $ 0.18 | $ 0.06 | $ 0.27 |
| Less Distributions | | | | | |
| From net investment income | $ (0.43) | $ (0.13) | $ (0.10) | $ (0.18) | $ (0.28) |
| Total distributions | $ (0.43) | $ (0.13) | $ (0.10) | $ (0.18) | $ (0.28) |
| Net asset value — End of year | $ 9.79 | $ 9.69 | $ 9.94 | $ 9.86 | $ 9.98 |
| Total Return(3) | 5.54% | (1.21)% | 1.80% | 0.60% | 2.75% |
| Ratios/Supplemental Data | | | | | |
| Net assets, end of year (000’s omitted) | $470,263 | $487,115 | $605,831 | $490,798 | $576,065 |
| Ratios (as a percentage of average daily net assets):(4) | | | | | |
| Total expenses | 0.52% | 0.51% | 0.51% | 0.51% | 0.54% |
| Net expenses | 0.47% (5) | 0.47% (5) | 0.47% | 0.47% | 0.48% |
| Net investment income | 4.40% | 1.19% | 0.82% | 1.75% | 2.70% |
| Portfolio Turnover | 70% | 78% | 92% (6) | 128% (6) | 85% |
| (1) | Computed using average shares outstanding. |
| (2) | Amount is less than $0.005. |
| (3) | Returns are historical and are calculated by determining the percentage change in net asset value with all distributions reinvested and do not reflect the effect of sales charges, if any. |
| (4) | Total expenses do not reflect amounts reimbursed and/or waived by the adviser and certain of its affiliates, if applicable. Net expenses are net of all reductions and represent the net expenses paid by the Fund. |
| (5) | Includes a reduction by the investment adviser of a portion of its advisory fee due to the Fund's investment in the Liquidity Fund (equal to less than 0.005% of average daily net assets for the years ended September 30, 2023 and 2022). |
| (6) | Includes the effect of To Be Announced (TBA) transactions. |
18
See Notes to Financial Statements.
Calvert
Ultra-Short Duration Income Fund
September 30, 2023
Financial Highlights — continued
| | Class R6 |
| | Year Ended September 30, |
| | 2023 | 2022 | 2021 | 2020 | 2019 |
| Net asset value — Beginning of year | $ 9.68 | $ 9.93 | $ 9.86 | $ 9.98 | $ 9.99 |
| Income (Loss) From Operations | | | | | |
| Net investment income(1) | $ 0.45 | $ 0.12 | $ 0.08 | $ 0.18 | $ 0.27 |
| Net realized and unrealized gain (loss) | 0.08 | (0.24) | 0.09 | (0.12) | — (2) |
| Total income (loss) from operations | $ 0.53 | $ (0.12) | $ 0.17 | $ 0.06 | $ 0.27 |
| Less Distributions | | | | | |
| From net investment income | $ (0.43) | $ (0.13) | $ (0.10) | $ (0.18) | $ (0.28) |
| Total distributions | $ (0.43) | $ (0.13) | $ (0.10) | $ (0.18) | $ (0.28) |
| Net asset value — End of year | $ 9.78 | $ 9.68 | $ 9.93 | $ 9.86 | $ 9.98 |
| Total Return(3) | 5.59% | (1.17)% | 1.75% | 0.64% | 2.76% |
| Ratios/Supplemental Data | | | | | |
| Net assets, end of year (000’s omitted) | $227,025 | $85,422 | $83,675 | $34,944 | $50,650 |
| Ratios (as a percentage of average daily net assets):(4) | | | | | |
| Total expenses | 0.48% | 0.46% | 0.46% | 0.47% | 0.50% |
| Net expenses | 0.43% (5) | 0.43% (5) | 0.43% | 0.43% | 0.44% |
| Net investment income | 4.66% | 1.22% | 0.82% | 1.85% | 2.72% |
| Portfolio Turnover | 70% | 78% | 92% (6) | 128% (6) | 85% |
| (1) | Computed using average shares outstanding. |
| (2) | Amount is less than $0.005. |
| (3) | Returns are historical and are calculated by determining the percentage change in net asset value with all distributions reinvested and do not reflect the effect of sales charges, if any. |
| (4) | Total expenses do not reflect amounts reimbursed and/or waived by the adviser and certain of its affiliates, if applicable. Net expenses are net of all reductions and represent the net expenses paid by the Fund. |
| (5) | Includes a reduction by the investment adviser of a portion of its advisory fee due to the Fund's investment in the Liquidity Fund (equal to less than 0.005% of average daily net assets for the years ended September 30, 2023 and 2022). |
| (6) | Includes the effect of To Be Announced (TBA) transactions. |
19
See Notes to Financial Statements.
Calvert
Ultra-Short Duration Income Fund
September 30, 2023
Notes to Financial Statements
1 Significant Accounting Policies
Calvert Ultra-Short Duration Income Fund (the Fund) is a diversified series of The Calvert Fund (the Trust). The Trust is a Massachusetts business trust registered under the Investment Company Act of 1940, as amended (the 1940 Act), as an open-end management investment company. The investment objective of the Fund is to seek to maximize income, to the extent consistent with preservation of capital, through investment in short-term bonds and income-producing securities. The Fund invests primarily in investment grade, U.S. dollar denominated debt securities.
The Fund offers three classes of shares. Class A shares are sold at net asset value and are not subject to a sales charge. Class I and Class R6 shares are sold at net asset value, are not subject to a sales charge and are sold only to certain eligible investors. Each class represents a pro rata interest in the Fund, but votes separately on class-specific matters and is subject to different expenses.
The Fund applies the accounting and reporting guidance in the Financial Accounting Standards Board (FASB) Accounting Standards Codification Topic 946, Financial Services – Investment Companies (ASC 946). Subsequent events, if any, through the date that the financial statements were issued have been evaluated in the preparation of the financial statements.
A Investment Valuation— Net asset value per share is determined every business day as of the close of the regular session of the New York Stock Exchange (generally 4:00 p.m. Eastern time). The Fund uses independent pricing services approved by the Board of Trustees (the Board) to value its investments wherever possible. Investments for which market quotations are not available or deemed not reliable are fair valued in good faith by the Board’s valuation designee.
U.S. generally accepted accounting principles (U.S. GAAP) establishes a disclosure hierarchy that categorizes the inputs to valuation techniques used to value assets and liabilities at measurement date. These inputs are summarized in the three broad levels listed below:
Level 1 - quoted prices in active markets for identical securities
Level 2 - other significant observable inputs (including quoted prices for similar securities, interest rates, prepayment speeds, credit risk, etc.)
Level 3 - significant unobservable inputs (including the Fund’s own assumptions in determining the fair value of investments)
The inputs or methodologies used for valuing securities are not necessarily an indication of the risk associated with investing in those securities.
Valuation techniques used to value the Fund’s investments by major category are as follows:
Debt Securities. Debt securities are generally valued based on valuations provided by third party pricing services, as derived from such services’ pricing models. Inputs to the models may include, but are not limited to, reported trades, executable bid and ask prices, broker/dealer quotations, prices or yields of securities with similar characteristics, interest rates, anticipated prepayments, benchmark curves or information pertaining to the issuer, as well as industry and economic events. Accordingly, debt securities are generally categorized as Level 2 in the hierarchy. Short-term debt securities with a remaining maturity at time of purchase of more than sixty days are valued based on valuations provided by a third party pricing service. Such securities are generally categorized as Level 2 in the hierarchy. Short-term debt securities of sufficient credit quality purchased with remaining maturities of sixty days or less for which a valuation from a third party pricing service is not readily available may be valued at amortized cost, which approximates fair value, and are categorized as Level 2 in the hierarchy.
Senior Floating-Rate Loans. Interests in senior floating-rate loans for which reliable market quotations are readily available are valued generally at the average mean of bid and ask quotations obtained from a third party pricing service, and are categorized as Level 2 in the hierarchy.
Other Securities. Investments in management investment companies (including money market funds) that do not trade on an exchange are valued at the net asset value as of the close of each business day and are categorized as Level 1 in the hierarchy.
Derivatives. Futures contracts are valued at unrealized appreciation (depreciation) based on the settlement price established each day by the board of trade or exchange on which they are traded and are categorized as Level 1 in the hierarchy.
Fair Valuation. In connection with Rule 2a-5 of the 1940 Act, the Board has designated the Fund’s investment adviser as its valuation designee. Investments for which valuations or market quotations are not readily available or are deemed unreliable are valued by the investment adviser, as valuation designee, at fair value using methods that most fairly reflect the security’s “fair value”, which is the amount that the Fund might reasonably expect to receive for the security upon its current sale in the ordinary course. Each such determination is based on a consideration of relevant factors, which are likely to vary from one pricing context to another. These factors may include, but are not limited to, the type of security, the existence of any contractual restrictions on the security’s disposition, the price and extent of public trading in similar securities of the issuer or of comparable companies or entities, quotations or relevant information obtained from broker/dealers or other market participants, information obtained from the issuer, analysts, and/or the appropriate stock exchange (for exchange-traded securities), an analysis of the company’s or entity’s financial statements, and an evaluation of the forces that influence the issuer and the market(s) in which the security is purchased and sold.
The values assigned to fair value investments are based on available information and do not necessarily represent amounts that might ultimately be realized. Further, due to the inherent uncertainty of valuations of such investments, the fair values may differ significantly from the values that would have been used had an active market existed, and the differences could be material.
Calvert
Ultra-Short Duration Income Fund
September 30, 2023
Notes to Financial Statements — continued
The following table summarizes the market value of the Fund's holdings as of September 30, 2023, based on the inputs used to value them:
| Asset Description | Level 1 | Level 2 | Level 3 | Total |
| Asset-Backed Securities | $ — | $ 171,323,444 | $ — | $ 171,323,444 |
| Collateralized Mortgage Obligations | — | 20,533,927 | — | 20,533,927 |
| Commercial Mortgage-Backed Securities | — | 65,483,087 | — | 65,483,087 |
| Corporate Bonds | — | 534,709,738 | — | 534,709,738 |
| High Social Impact Investments | — | 986,290 | — | 986,290 |
| Senior Floating-Rate Loans | — | 1,400,143 | — | 1,400,143 |
| U.S. Treasury Obligations | — | 82,954,788 | — | 82,954,788 |
| Short-Term Investments: | | | | |
| Affiliated Fund | 30,103,914 | — | — | 30,103,914 |
| Commercial Paper | — | 28,482,448 | — | 28,482,448 |
| Securities Lending Collateral | 4,602,670 | — | — | 4,602,670 |
| Total Investments | $34,706,584 | $905,873,865 | $ — | $940,580,449 |
| Futures Contracts | $ 66,510 | $ — | $ — | $ 66,510 |
| Total | $34,773,094 | $905,873,865 | $ — | $940,646,959 |
| Liability Description | | | | |
| Futures Contracts | $ (8,992) | $ — | $ — | $ (8,992) |
| Total | $ (8,992) | $ — | $ — | $ (8,992) |
B Investment Transactions and Income— Investment transactions for financial statement purposes are accounted for on trade date. Realized gains and losses are recorded on an identified cost basis and may include proceeds from litigation. Dividend income is recorded on the ex-dividend date for dividends received in cash and/or securities. Non-cash dividends are recorded at the fair value of the securities received. Distributions received that represent a return of capital are recorded as a reduction of cost of investments. Distributions received that represent a capital gain are recorded as a realized gain. Interest income, which includes amortization of premium and accretion of discount on debt securities, is accrued as earned. The Fund may earn certain fees in connection with its investments in senior floating-rate loans. These fees are in addition to interest payments earned and may include amendment fees, consent fees and prepayment fees, which are recorded to income as earned.
C Share Class Accounting— Realized and unrealized gains and losses are allocated daily to each class of shares based upon the relative net assets of each class to the total net assets of the Fund. Net investment income, other than class-specific expenses, is allocated daily to each class of shares based upon the ratio of the value of each class’s paid shares to the total value of all paid shares. Expenses arising in connection with a specific class are charged directly to that class. Sub-accounting, recordkeeping and similar administrative fees payable to financial intermediaries, which are a component of transfer agency fees and expenses on the Statement of Operations, are not allocated to Class R6 shares.
D Senior Floating-Rate Loans— The Fund may invest in direct debt instruments, which are interests in amounts owed to lenders or lending syndicates by corporate, governmental, or other borrowers. The Fund’s investment in loans may be in the form of participations in loans or assignments of all or a portion of loans from third parties. A loan is often administered by a bank or other financial institution (the lender) that acts as agent for all holders. The agent administers the terms of the loan, as specified in the loan agreement. The Fund may invest in multiple series or tranches of a loan, which may have varying terms and carry different associated risks. When the Fund purchases assignments from lenders, it acquires direct rights against the borrower of the loan. When investing in a loan participation, the Fund has the right to receive payments of principal, interest and any fees to which it is entitled only from the lender selling the loan agreement and only upon receipt of such payments by the lender from the borrower. The Fund generally has no right to enforce compliance by the borrower with the terms of the loan agreement. As a result, the Fund may be subject to the credit risk of both the borrower and the lender that is issuing the participation interest.
E Futures Contracts— The Fund may enter into futures contracts to buy or sell a financial instrument for a set price at a future date. Initial margin deposits of either cash or securities as required by the broker are made upon entering into the contract. While the contract is open, daily variation margin payments are made to or received from the broker reflecting the daily change in market value of the contract and are recorded for financial reporting purposes as unrealized gains or losses by the Fund. When a futures contract is closed, a realized gain or loss is recorded equal to the difference between the opening and closing value of the contract. The risks associated with entering into futures contracts may include the possible illiquidity of the secondary market which would limit the Fund’s ability to close out a futures contract prior to the settlement date, an imperfect correlation between the value of the contracts and the underlying financial instruments, or that the counterparty will fail to perform its obligations under the contracts’ terms. Futures contracts are
Calvert
Ultra-Short Duration Income Fund
September 30, 2023
Notes to Financial Statements — continued
designed by boards of trade, which are designated “contracts markets” by the Commodities Futures Trading Commission. Futures contracts trade on the contracts markets in a manner that is similar to the way a stock trades on a stock exchange, and the boards of trade, through their clearing corporations, guarantee the futures contracts against default. As a result, there is minimal counterparty credit risk to the Fund.
F Restricted Securities— The Fund may invest in securities that are subject to legal or contractual restrictions on resale. Generally, these securities may only be sold publicly upon registration under the Securities Act of 1933 or in transactions exempt from such registration. Information regarding restricted securities (excluding Rule 144A securities) is included at the end of the Schedule of Investments.
G Distributions to Shareholders— Distributions to shareholders are recorded by the Fund on ex-dividend date. The Fund declares income distributions daily to shareholders of record at the time of declaration and generally pays them monthly. The Fund makes distributions of net realized capital gains, if any, at least annually. Distributions are declared separately for each class of shares. Distributions are determined in accordance with income tax regulations, which may differ from U.S. GAAP; accordingly, periodic reclassifications are made within the Fund’s capital accounts to reflect income and gains available for distribution under income tax regulations.
H Estimates— The preparation of financial statements in conformity with U.S. GAAP requires management to make estimates and assumptions that affect the reported amounts of assets and liabilities and disclosure of contingent assets and liabilities at the date of the financial statements and the reported amounts of increases and decreases in net assets from operations during the reporting period. Actual results could differ from those estimates.
I Indemnifications— Under the Trust’s organizational document, its officers and Trustees may be indemnified against certain liabilities and expenses arising out of the performance of their duties to the Fund. Under Massachusetts law, if certain conditions prevail, shareholders of a Massachusetts business trust (such as the Trust) could be deemed to have personal liability for the obligations of the Trust. However, the Trust’s Declaration of Trust contains an express disclaimer of liability on the part of Fund shareholders and provides that the Trust shall assume, upon request by the shareholder, the defense on behalf of any Fund shareholders or former shareholders. Additionally, in the normal course of business, the Fund enters into agreements with service providers that may contain indemnification clauses. The Fund’s maximum exposure under these arrangements is unknown as this would involve future claims that may be made against the Fund that have not yet occurred.
J Federal Income Taxes— No provision for federal income or excise tax is required since the Fund intends to continue to qualify as a regulated investment company under the Internal Revenue Code and to distribute substantially all of its taxable earnings.
Management has analyzed the Fund's tax positions taken for all open federal income tax years and has concluded that no provision for federal income tax is required in the Fund's financial statements. A Fund's federal tax return is subject to examination by the Internal Revenue Service for a period of three years from the date of filing.
2 Related Party Transactions
The investment advisory fee is earned by Calvert Research and Management (CRM), an indirect, wholly-owned subsidiary of Morgan Stanley, as compensation for investment advisory services rendered to the Fund. The investment advisory fee is computed at an annual rate as a percentage of the Fund’s average daily net assets as follows and is payable monthly:
| Average Daily Net Assets | Annual Fee
Rate |
| Up to and including $1 billion | 0.260% |
| Over $1 billion | 0.250% |
For the year ended September 30, 2023, the investment advisory fee amounted to $2,329,483 or 0.26% of the Fund’s average daily net assets.
The Fund may invest in a money market fund, the Institutional Class of the Morgan Stanley Institutional Liquidity Funds - Government Portfolio (the “Liquidity Fund”), an open-end management investment company managed by Morgan Stanley Investment Management Inc., a wholly-owned subsidiary of Morgan Stanley. The investment advisory fee paid by the Fund is reduced by an amount equal to its pro rata share of the advisory and administration fees paid by the Fund due to its investment in the Liquidity Fund. For the year ended September 30, 2023, the investment advisory fee paid was reduced by $26,181 relating to the Fund’s investment in the Liquidity Fund.
CRM has agreed to reimburse the Fund’s operating expenses to the extent that total annual operating expenses (relating to ordinary operating expenses only and excluding expenses such as brokerage commissions, acquired fund fees and expenses of unaffiliated funds, borrowing costs, taxes or litigation expenses) exceed 0.72%, 0.47% and 0.43% for Class A, Class I and Class R6, respectively, of such class's average daily net assets. The expense reimbursement agreement with CRM may be changed or terminated after January 31, 2024. For the year ended September 30, 2023, CRM waived or reimbursed expenses of $461,971.
Calvert
Ultra-Short Duration Income Fund
September 30, 2023
Notes to Financial Statements — continued
The administrative fee is earned by CRM as compensation for administrative services rendered to the Fund. The fee is computed at an annual rate of 0.12% of the Fund’s average daily net assets attributable to Class A, Class I and Class R6 and is payable monthly. For the year ended September 30, 2023, CRM was paid administrative fees of $1,075,192.
The Fund has in effect a distribution plan for Class A shares (Class A Plan) pursuant to Rule 12b-1 under the 1940 Act. Pursuant to the Class A Plan, the Fund pays Eaton Vance Distributors, Inc. (EVD), an affiliate of CRM and the Fund’s principal underwriter, a distribution and service fee of 0.25% per annum of its average daily net assets attributable to Class A shares for distribution services and facilities provided to the Fund by EVD, as well as for personal services and/or the maintenance of shareholder accounts. Distribution and service fees paid or accrued for the year ended September 30, 2023 amounted to $627,797 for Class A shares.
Eaton Vance Management (EVM), an affiliate of CRM, provides sub-transfer agency and related services to the Fund pursuant to a Sub-Transfer Agency Support Services Agreement. For the year ended September 30, 2023, sub-transfer agency fees and expenses incurred to EVM amounted to $55,014 and are included in transfer agency fees and expenses on the Statement of Operations.
Each Trustee of the Fund who is not an employee of CRM or its affiliates receives an annual fee of $214,000, an annual Committee fee ranging from $8,500 to $16,500 depending on the Committee, and may receive a fee of $10,000 for special meetings. The Board chair receives an additional $40,000 ($30,000 prior to January 1, 2023) annual fee, Committee chairs receive an additional $15,000 ($6,000 prior to January 1, 2023) annual fee and the special equities liaison receives an additional $2,500 annual fee. Eligible Trustees may participate in a Deferred Compensation Plan (the Plan). Amounts deferred under the Plan are treated as though equal dollar amounts had been invested in shares of the Fund or other Calvert funds selected by the Trustees. The Fund purchases shares of the funds selected equal to the dollar amounts deferred under the Plan, resulting in an asset equal to the deferred compensation liability. Obligations of the Plan are paid solely from the Fund's assets. Trustees’ fees are allocated to each of the Calvert funds served. Salaries and fees of officers and Trustees of the Fund who are employees of CRM or its affiliates are paid by CRM.
3 Investment Activity
During the year ended September 30, 2023, the cost of purchases and proceeds from sales of investments, other than U.S. government and agency securities and short-term securities and including maturities, paydowns and principal repayments on senior floating-rate loans, were $399,445,491 and $487,445,829, respectively. Purchases and sales of U.S. government and agency securities, including paydowns, were $30,055,180 and $10,336,143, respectively.
4 Distributions to Shareholders and Income Tax Information
The tax character of distributions declared for the years ended September 30, 2023 and September 30, 2022 was as follows:
| | Year Ended September 30, |
| | 2023 | 2022 |
| Ordinary income | $38,875,518 | $11,567,695 |
As of September 30, 2023, the components of distributable earnings (accumulated loss) on a tax basis were as follows:
| Undistributed ordinary income | $ 101,166 |
| Deferred capital losses | (22,266,931) |
| Net unrealized depreciation | (7,136,092) |
| Distributions payable | (141,508) |
| Accumulated loss | $(29,443,365) |
At September 30, 2023, the Fund, for federal income tax purposes, had deferred capital losses of $22,266,931 which would reduce the Fund's taxable income arising from future net realized gains on investment transactions, if any, to the extent permitted by the Internal Revenue Code, and thus would reduce the amount of distributions to shareholders, which would otherwise be necessary to relieve the Fund of any liability for federal income or excise tax. The deferred capital losses are treated as arising on the first day of the Fund's next taxable year, can be carried forward for an unlimited period, and retain the same short-term or long-term character as when originally deferred. Of the deferred capital losses at September 30, 2023, $12,288,815 are short-term and $9,978,116 are long-term.
Calvert
Ultra-Short Duration Income Fund
September 30, 2023
Notes to Financial Statements — continued
The cost and unrealized appreciation (depreciation) of investments, including open derivative contracts, of the Fund at September 30, 2023, as determined on a federal income tax basis, were as follows:
| Aggregate cost | $947,716,541 |
| Gross unrealized appreciation | $ 1,046,803 |
| Gross unrealized depreciation | (8,182,895) |
| Net unrealized depreciation | $ (7,136,092) |
5 Financial Instruments
A summary of futures contracts outstanding at September 30, 2023 is included in the Schedule of Investments. During the year ended September 30, 2023, the Fund used futures contracts to hedge interest rate risk and to manage duration.
At September 30, 2023, the fair value of open derivative instruments (not considered to be hedging instruments for accounting disclosure purposes) and whose primary underlying risk exposure is interest rate risk was as follows:
| Derivative | Statement of Assets and Liabilities Caption | Assets | Liabilities |
| Futures contracts | Accumulated loss | | $66,510 (1) | $(8,992) (1) |
| (1) | Only the current day's variation margin is reported within the Statement of Assets and Liabilities as Receivable or Payable for variation margin on open futures contracts, as applicable. |
The effect of derivative instruments (not considered to be hedging instruments for accounting disclosure purposes) on the Statement of Operations and whose primary underlying risk exposure is interest rate risk for the year ended September 30, 2023 was as follows:
| | Statement of Operations Caption | |
| Derivative | Net realized gain (loss): Futures
contracts | Change in unrealized appreciation
(depreciation): Futures contracts |
| Futures contracts | $ 293,467 | $ (317,784) |
The average notional cost of futures contracts (long) and futures contracts (short) outstanding during the year ended September 30, 2023 was approximately $2,105,000 and $7,103,000, respectively.
6 Securities Lending
To generate additional income, the Fund may lend its securities pursuant to a securities lending agency agreement with State Street Bank and Trust Company (SSBT), the securities lending agent. Security loans are subject to termination by the Fund at any time and, therefore, are not considered illiquid investments. The Fund requires that the loan be continuously collateralized by either cash or securities in an amount at least equal to the market value of the securities on loan. The market value of securities loaned is determined daily and any additional required collateral is delivered to the Fund on the next business day. Cash collateral is generally invested in a money market fund registered under the 1940 Act that is managed by an affiliate of SSBT. Any gain or loss in the market price of the loaned securities that might occur and any interest earned or dividends declared during the term of the loan would accrue to the account of the Fund. Income earned on the investment of collateral, net of broker rebates and other expenses incurred by the securities lending agent, is split between the Fund and the securities lending agent based on agreed upon contractual terms. Non-cash collateral, if any, is held by the lending agent on behalf of the Fund and cannot be sold or re-pledged by the Fund; accordingly, such collateral is not reflected in the Statement of Assets and Liabilities.
The risks associated with lending portfolio securities include, but are not limited to, possible delays in receiving additional collateral or in the recovery of the loaned securities, possible loss of rights to the collateral should the borrower fail financially, as well as risk of loss in the value of the collateral or the value of the investments made with the collateral. The securities lending agent shall indemnify the Fund in the case of default of any securities borrower.
At September 30, 2023, the total value of securities on loan, including accrued interest, was $4,528,283 and the total value of collateral received was $4,602,670, comprised of cash.
Calvert
Ultra-Short Duration Income Fund
September 30, 2023
Notes to Financial Statements — continued
The following table provides a breakdown of securities lending transactions accounted for as secured borrowings, the obligations by class of collateral pledged, and the remaining contractual maturity of those transactions as of September 30, 2023.
| | Remaining Contractual Maturity of the Transactions |
| | Overnight and
Continuous | <30 days | 30 to 90 days | >90 days | Total |
| Corporate Bonds | $4,602,670 | $ — | $ — | $ — | $4,602,670 |
The carrying amount of the liability for deposits for securities loaned at September 30, 2023 approximated its fair value. If measured at fair value, such liability would have been considered as Level 2 in the fair value hierarchy (see Note 1A) at September 30, 2023.
7 Line of Credit
The Fund participates with other portfolios and funds managed by EVM and its affiliates, including CRM, in a $725 million unsecured revolving line of credit agreement with a group of banks, which is in effect through October 24, 2023. Borrowings are made by the Fund solely for temporary purposes related to redemptions and other short-term cash needs. Interest is charged to the Fund based on its borrowings at an amount above either the Secured Overnight Financing Rate (SOFR) or Federal Funds rate. In addition, a fee computed at an annual rate of 0.15% on the daily unused portion of the line of credit is allocated among the participating portfolios and funds at the end of each quarter. In connection with the renewal of the agreement in October 2022, an arrangement fee of $150,000 was incurred that was allocated to the participating portfolios and funds. Because the line of credit is not available exclusively to the Fund, it may be unable to borrow some or all of its requested amounts at any particular time.
The Fund had no borrowings outstanding pursuant to its line of credit at September 30, 2023. The Fund did not have any significant borrowings or allocated fees during the year ended September 30, 2023. Effective October 24, 2023, the Fund renewed its line of credit agreement, which expires October 22, 2024. In connection with the renewal, the borrowing limit was decreased to $650 million.
8 Affiliated Investments
The Fund has invested a portion of its assets in notes (the Notes) issued by Calvert Impact Capital, Inc. (CIC) pursuant to exemptive relief granted by the U.S. Securities and Exchange Commission (the SEC). There are certain potential points of affiliation between the Fund and CIC. CRM has licensed use of the Calvert name to CIC and provides other types of support. An officer of CRM's affiliate serves on the CIC Board. In addition, a director/trustee on the Fund Board serves as a director emeritus on the CIC Board.
At September 30, 2023, the value of the Fund's investment in the Notes and in issuers and funds that may be deemed to be affiliated was $35,953,700, which represents 3.9% of the Fund's net assets. Transactions in such investments by the Fund for the year ended September 30, 2023 were as follows:
| Name | Value,
beginning
of period | Purchases | Sales
proceeds | Net
realized
gain
(loss) | Change in
unrealized
appreciation
(depreciation) | Value,
end of
period | Interest/
Dividend
income | Principal amount/
Shares,
end of period |
| Commercial Mortgage-Backed Securities | | | | | | | | |
| Morgan Stanley Capital I Trust: | | | | | | | | |
| Series 2017-CLS, Class A, 3.518%, (1 mo. USD LIBOR + 0.70%), 11/15/34 | $12,102,189 | $ — | $ (12,174,000) | $ 2,632 | $ 69,179 | $ — | $ 16,656 | $ — |
| Series 2017-CLS, Class B, 3.668%, (1 mo. USD LIBOR + 0.85%), 11/15/34 | 11,614,402 | — | (11,690,000) | — | 75,598 | — | 16,675 | — |
| Series 2019-BPR, Class A, 7.322%, (1 mo. SOFR + 1.992%), 5/15/36 | 5,491,866 | — | (581,637) | — | (47,037) | 4,863,496 | 341,871 | 5,047,332 |
| High Social Impact Investments | | | | | | | | |
| Calvert Impact Capital, Inc., Community Investment Notes, 1.50%, 12/15/23(1) | 928,760 | — | — | — | 57,530 | 986,290 | 15,000 | 1,000,000 |
Calvert
Ultra-Short Duration Income Fund
September 30, 2023
Notes to Financial Statements — continued
| Name | Value,
beginning
of period | Purchases | Sales
proceeds | Net
realized
gain
(loss) | Change in
unrealized
appreciation
(depreciation) | Value,
end of
period | Interest/
Dividend
income | Principal amount/
Shares,
end of period |
| Short-Term Investments | | | | | | |
| Liquidity Fund | $27,008,480 | $712,891,203 | $(709,795,769) | $ — | $ — | $ 30,103,914 | $ 766,367 | 30,103,914 |
| Total | | | | $2,632 | $155,270 | $35,953,700 | $1,156,569 | |
9 Capital Shares
The Fund’s Declaration of Trust permits the Trustees to issue an unlimited number of full and fractional shares of beneficial interest (without par value). Such shares may be issued in a number of different series (such as the Fund) and classes.
Transactions in capital shares were as follows:
| | Year Ended
September 30, 2023 | | Year Ended
September 30, 2022 |
| | Shares | Amount | | Shares | Amount |
| Class A | | | | | |
| Shares sold | 1,827,261 | $ 17,802,545 | | 8,198,319 | $ 81,004,552 |
| Reinvestment of distributions | 1,003,735 | 9,787,686 | | 336,021 | 3,279,876 |
| Shares redeemed | (8,633,310) | (84,076,953) | | (12,793,212) | (125,216,820) |
| Net decrease | (5,802,314) | $ (56,486,722) | | (4,258,872) | $ (40,932,392) |
| Class I | | | | | |
| Shares sold | 29,254,440 | $ 285,067,922 | | 29,346,462 | $ 288,147,742 |
| Reinvestment of distributions | 2,105,763 | 20,540,873 | | 631,345 | 6,168,815 |
| Shares redeemed | (33,607,092) | (327,576,121) | | (40,642,405) | (399,399,212) |
| Net decrease | (2,246,889) | $ (21,967,326) | | (10,664,598) | $(105,082,655) |
| Class R6 | | | | | |
| Shares sold | 35,494,292 | $ 346,224,495 | | 13,364,970 | $ 131,340,157 |
| Reinvestment of distributions | 697,380 | 6,806,208 | | 131,759 | 1,286,331 |
| Shares redeemed | (21,809,319) | (212,665,199) | | (13,098,207) | (127,917,835) |
| Net increase | 14,382,353 | $ 140,365,504 | | 398,522 | $ 4,708,653 |
Calvert
Ultra-Short Duration Income Fund
September 30, 2023
Report of Independent Registered Public Accounting Firm
To the Board of Trustees of The Calvert Fund and Shareholders of Calvert Ultra-Short Duration Income Fund:
Opinion on the Financial Statements and Financial Highlights
We have audited the accompanying statement of assets and liabilities of Calvert Ultra-Short Duration Income Fund (the "Fund") (one of the funds constituting The Calvert Fund), including the schedule of investments, as of September 30, 2023, the related statement of operations for the year then ended, the statements of changes in net assets for each of the two years in the period then ended, the financial highlights for each of the three years in the period then ended, and the related notes. In our opinion, the financial statements and financial highlights present fairly, in all material respects, the financial position of the Fund as of September 30, 2023, and the results of its operations for the year then ended, the changes in its net assets for each of the two years in the period then ended, and the financial highlights for each of the three years in the period then ended, in conformity with accounting principles generally accepted in the United States of America. The financial highlights for the years ended September 30, 2020 and 2019 were audited by other auditors whose report, dated November 20, 2020, expressed an unqualified opinion on those financial highlights.
Basis for Opinion
These financial statements and financial highlights are the responsibility of the Fund's management. Our responsibility is to express an opinion on the Fund's financial statements and financial highlights based on our audits. We are a public accounting firm registered with the Public Company Accounting Oversight Board (United States) (PCAOB) and are required to be independent with respect to the Fund in accordance with the U.S. federal securities laws and the applicable rules and regulations of the Securities and Exchange Commission and the PCAOB.
We conducted our audits in accordance with the standards of the PCAOB. Those standards require that we plan and perform the audit to obtain reasonable assurance about whether the financial statements and financial highlights are free of material misstatement, whether due to error or fraud. The Fund is not required to have, nor were we engaged to perform, an audit of its internal control over financial reporting. As part of our audits, we are required to obtain an understanding of internal control over financial reporting but not for the purpose of expressing an opinion on the effectiveness of the Fund’s internal control over financial reporting. Accordingly, we express no such opinion.
Our audits included performing procedures to assess the risks of material misstatement of the financial statements and financial highlights, whether due to error or fraud, and performing procedures that respond to those risks. Such procedures included examining, on a test basis, evidence regarding the amounts and disclosures in the financial statements and financial highlights. Our audits also included evaluating the accounting principles used and significant estimates made by management, as well as evaluating the overall presentation of the financial statements and financial highlights. Our procedures included confirmation of securities and senior loans owned as of September 30, 2023, by correspondence with the custodian, brokers and agent banks; when replies were not received from brokers and agent banks, we performed other auditing procedures. We believe that our audits provide a reasonable basis for our opinion.
/s/ Deloitte & Touche LLP
Boston, Massachusetts
November 22, 2023
We have served as the auditor of one or more Calvert investment companies since 2021.
Calvert
Ultra-Short Duration Income Fund
September 30, 2023
Federal Tax Information (Unaudited)
The Form 1099-DIV you receive in February 2024 will show the tax status of all distributions paid to your account in calendar year 2023. Shareholders are advised to consult their own tax adviser with respect to the tax consequences of their investment in the Fund. As required by the Internal Revenue Code and/or regulations, shareholders must be notified regarding the status of 163(j) interest dividends.
163(j) Interest Dividends. For the fiscal year ended September 30, 2023, the Fund designates 97.09% of distributions from net investment income as a 163(j) interest dividend.
Calvert
Ultra-Short Duration Income Fund
September 30, 2023
Board of Trustees' Contract Approval
Overview of the Contract Review Process
The Investment Company Act of 1940, as amended, provides, in substance, that each investment advisory agreement between a fund and its investment adviser will continue in effect from year to year only if its continuation is approved at least annually by the fund’s board of directors, including by a vote of a majority of the directors who are not “interested persons” of the fund (“Independent Trustees”), cast in person at a meeting called for the purpose of considering such approval.
At an in-person meeting of the Boards of Trustees/Directors (each a “Board”) of the registered investment companies advised by Calvert Research and Management (“CRM” or the “Adviser”) (the “Calvert Funds”) held on June 12-13, 2023, the Board, including a majority of the Independent Trustees, voted to approve continuation of existing investment advisory and investment sub-advisory agreements for the Calvert Funds for an additional one-year period.
In evaluating the investment advisory and investment sub-advisory agreements for the Calvert Funds, the Board considered a variety of information relating to the Calvert Funds and various service providers, including the Adviser. The Independent Trustees reviewed a report prepared by the Adviser regarding various services provided to the Calvert Funds by the Adviser and its affiliates. Such report included, among other data, information regarding the Adviser’s personnel and the Adviser’s revenue and cost of providing services to the Calvert Funds, and a separate report prepared by an independent data provider, which compared each fund’s investment performance, fees and expenses to those of comparable funds as identified by such independent data provider (“comparable funds”).
The Independent Trustees were separately represented by independent legal counsel with respect to their consideration of the continuation of the investment advisory and investment sub-advisory agreements for the Calvert Funds. Prior to voting, the Independent Trustees reviewed the proposed continuation of the Calvert Funds’ investment advisory and investment sub-advisory agreements with management and also met in private sessions with their counsel at which time no representatives of management were present.
The information that the Board considered included, among other things, the following (for funds that invest through one or more affiliated underlying fund(s), references to “each fund” in this section may include information that was considered at the underlying fund-level):
Information about Fees, Performance and Expenses
| • | A report from an independent data provider comparing the advisory and related fees paid by each fund with fees paid by comparable funds; |
| • | A report from an independent data provider comparing each fund’s total expense ratio and its components to comparable funds; |
| • | A report from an independent data provider comparing the investment performance of each fund to the investment performance of comparable funds over various time periods; |
| • | Data regarding investment performance in comparison to benchmark indices; |
| • | For each fund, comparative information concerning the fees charged and the services provided by the Adviser in managing other accounts (including mutual funds, other collective investment funds and institutional accounts) using investment strategies and techniques similar to those used in managing such fund; |
| • | Profitability analyses for the Adviser with respect to each fund; |
Information about Portfolio Management and Trading
| • | Descriptions of the investment management services provided to each fund, including investment strategies and processes it employs; |
| • | Information about the Adviser’s policies and practices with respect to trading, including the Adviser’s processes for monitoring best execution of portfolio transactions; |
| • | Information about the allocation of brokerage transactions and the benefits received by the Adviser as a result of brokerage allocation, including information concerning the acquisition of research through client commission arrangements and policies with respect to “soft dollars”; |
Information about the Adviser
| • | Reports detailing the financial results and condition of CRM; |
| • | Descriptions of the qualifications, education and experience of the individual investment professionals whose responsibilities include portfolio management and investment research for the funds, and information relating to their compensation and responsibilities with respect to managing other mutual funds and investment accounts; |
| • | Policies and procedures relating to proxy voting and the handling of corporate actions and class actions; |
| • | A description of CRM’s procedures for overseeing sub-advisers, including with respect to regulatory and compliance issues, investment management and other matters; |
Calvert
Ultra-Short Duration Income Fund
September 30, 2023
Board of Trustees' Contract Approval — continued
Other Relevant Information
| • | Information concerning the nature, cost and character of the administrative and other non-investment advisory services provided by CRM and its affiliates; and |
| • | The terms of each investment advisory agreement. |
Over the course of the year, the Board and its committees held regular quarterly meetings. During these meetings, the Trustees participated in investment and performance reviews with the portfolio managers and other investment professionals of the Adviser relating to each fund and considered various investment and trading strategies used in pursuing each fund’s investment objective(s), such as the use of derivative instruments, as well as risk management techniques. The Board and its committees also evaluated issues pertaining to industry and regulatory developments, compliance procedures, corporate governance and other issues with respect to the funds and received and participated in reports and presentations provided by CRM and its affiliates with respect to such matters. In addition to the formal meetings of the Board and its committees, the Independent Trustees held regular video conferences in between meetings to discuss, among other topics, matters relating to the continuation of the Calvert Funds’ investment advisory and investment sub-advisory agreements.
For funds that invest through one or more affiliated underlying funds, the Board considered similar information about the underlying fund(s) when considering the approval of investment advisory agreements. In addition, in cases where the Adviser has engaged a sub-adviser, the Board considered similar information about the sub-adviser when considering the approval of any investment sub-advisory agreement.
The Independent Trustees were assisted throughout the contract review process by their independent legal counsel. The Independent Trustees relied upon the advice of such counsel and their own business judgment in determining the material factors to be considered in evaluating each investment advisory and investment sub-advisory agreement and the weight to be given to each such factor. The Board, including the Independent Trustees, did not identify any single factor as controlling, and each Trustee may have attributed different weight to various factors.
Results of the Contract Review Process
Based on its consideration of the foregoing, and such other information as it deemed relevant, including the factors and conclusions described below, the Board, including the Independent Trustees, concluded that the continuation of the investment advisory agreement of Calvert Ultra-Short Duration Income Fund (the “Fund”), including the fee payable under the agreement, is in the best interests of the Fund’s shareholders. Accordingly, the Board, including a majority of the Independent Trustees, voted to approve the continuation of the investment advisory agreement of the Fund.
Nature, Extent and Quality of Services
In considering the nature, extent and quality of the services provided by the Adviser under the investment advisory agreement, the Board reviewed information provided by the Adviser relating to its operations and personnel, including, among other information, biographical information on the Adviser’s investment personnel and descriptions of its organizational and management structure. The Board also took into account similar information provided periodically throughout the previous year by the Adviser as well as the Board’s familiarity with management through Board meetings, discussions and other reports. The Board considered the Adviser’s management style and its performance in employing its investment strategies as well as its current level of staffing and overall resources. The Board also noted that it reviewed on a quarterly basis information regarding the Adviser’s compliance with applicable policies and procedures, including those related to personal investing. The Board took into account, among other items, periodic reports received from the Adviser over the past year concerning the Adviser’s ongoing review and enhancement of certain processes, policies and procedures of the Calvert Funds and the Adviser. The Board concluded that it was satisfied with the nature, extent and quality of services provided to the Fund by the Adviser under the investment advisory agreement.
Fund Performance
In considering the Fund’s performance, the Board noted that it reviewed on a quarterly basis detailed information about the Fund’s performance results, portfolio composition and investment strategies. The Board compared the Fund’s investment performance to that of the Fund’s peer universe and its benchmark index. The Board’s review included comparative performance data for the one-, three- and five-year periods ended December 31, 2022. This performance data indicated that the Fund had outperformed the median of its peer universe and its benchmark index for the one-year period ended December 31, 2022, while it had underperformed the median of its peer universe and its benchmark index for the three- and five-year periods ended December 31, 2022. Based upon its review, the Board concluded that the Fund’s performance was satisfactory relative to the performance of its peer universe and its benchmark index.
Management Fees and Expenses
In considering the Fund’s fees and expenses, the Board compared the Fund’s fees and total expense ratio with those of comparable funds in its expense group. Among other findings, the data indicated that the Fund’s advisory and administrative fees (after taking into account waivers and/or reimbursements) (referred to collectively as “management fees”) and the Fund’s total expenses (net of waivers and/or reimbursements) were each above the respective
Calvert
Ultra-Short Duration Income Fund
September 30, 2023
Board of Trustees' Contract Approval — continued
median of the Fund’s expense group. The Board took into account the Adviser’s current undertaking to maintain expense limitations for the Fund and that the Adviser was waiving and/or reimbursing a portion of the Fund’s expenses. Based upon its review, the Board concluded that the management fees were reasonable in view of the nature, extent and quality of services provided by the Adviser.
Profitability and Other “Fall-Out” Benefits
The Board reviewed the Adviser’s profitability in regard to the Fund and the Calvert Funds in the aggregate. In reviewing the overall profitability of the Fund to the Adviser, the Board also considered the fact that the Adviser and its affiliates provided sub-transfer agency support, administrative and distribution services to the Fund for which they received compensation. The information considered by the Board included the profitability of the Fund to the Adviser and its affiliates without regard to any marketing support or other payments by the Adviser and its affiliates to third parties in respect of distribution services. The Board also considered that the Adviser and its affiliates derived benefits to their reputation and other indirect benefits from their relationships with the Fund. Based upon its review, the Board concluded that the Adviser’s and its affiliates’ level of profitability from their relationships with the Fund was reasonable.
Economies of Scale
The Board considered the effect of the Fund’s current size and its potential growth on its performance and fees. The Board also took into account the breakpoint in the advisory fee schedule for the Fund that would reduce the advisory fee rate on assets above a specific asset level. The Board noted that if the Fund’s assets increased over time, the Fund might realize other economies of scale if assets increased proportionally more than certain other expenses.
Calvert
Ultra-Short Duration Income Fund
September 30, 2023
Liquidity Risk Management Program
The Fund has implemented a written liquidity risk management program (Program) and related procedures to manage its liquidity in accordance with Rule 22e-4 under the Investment Company Act of 1940, as amended (Liquidity Rule). The Liquidity Rule defines “liquidity risk” as the risk that a fund could not meet requests to redeem shares issued by the fund without significant dilution of the remaining investors’ interests in the fund. The Fund’s Board of Trustees/Directors has designated the investment adviser to serve as the administrator of the Program and the related procedures. The administrator has established a Liquidity Risk Management Oversight Committee (Committee) to perform the functions necessary to administer the Program. As part of the Program, the administrator is responsible for identifying illiquid investments and categorizing the relative liquidity of the Fund’s investments in accordance with the Liquidity Rule. Under the Program, the administrator assesses, manages, and periodically reviews the Fund’s liquidity risk, and is responsible for making certain reports to the Fund’s Board of Trustees/Directors and the Securities and Exchange Commission (SEC) regarding the liquidity of the Fund’s investments, and to notify the Board of Trustees/Directors and the SEC of certain liquidity events specified in the Liquidity Rule. The liquidity of the Fund’s portfolio investments is determined based on a number of factors including, but not limited to, relevant market, trading and investment-specific considerations under the Program.
At a meeting of the Fund’s Board of Trustees/Directors on June 13, 2023, the Committee provided a written report to the Fund’s Board of Trustees/ Directors pertaining to the operation, adequacy, and effectiveness of implementation of the Program, as well as the operation of the highly liquid investment minimum (if applicable) for the period January 1, 2022 through December 31, 2022 (Review Period). The Program operated effectively during the Review Period, supporting the administrator’s ability to assess, manage and monitor Fund liquidity risk, including during periods of market volatility and net redemptions. During the Review Period, the Fund met redemption requests on a timely basis.
There can be no assurance that the Program will achieve its objectives in the future. Please refer to the Fund’s prospectus for more information regarding the Fund’s exposure to liquidity risk and other principal risks to which an investment in the Fund may be subject.
Calvert
Ultra-Short Duration Income Fund
September 30, 2023
Management and Organization
Fund Management. The Trustees of The Calvert Fund (the Trust) are responsible for the overall management and supervision of the affairs of the Trust. The Board members and officers of the Trust are listed below. Except as indicated, each individual has held the office shown or other offices in the same company for the last five years. Board members hold indefinite terms of office. Each Board member holds office until his or her successor is elected and qualified, or until his or her earlier death, resignation, retirement, removal or disqualification. Under the terms of the Fund's current Board member retirement policy, an Independent Board member must retire at the end of the calendar year in which he or she turns 75. However, if such retirement would cause the Fund to be out of compliance with Section 16 of the 1940 Act or any other regulations or guidance of the SEC, then such retirement will not become effective until such time as action has been taken for the Fund to be in compliance therewith. The “noninterested Trustees” consist of those Trustees who are not “interested persons” of the Trust, as that term is defined under the 1940 Act. The business address of each Board member and the Chief Compliance Officer is 2050 M Street NW, Washington, DC 20036 and the business address of the Secretary, Vice President and Chief Legal Officer and the Treasurer is Two International Place, Boston, Massachusetts 02110. As used below, “CRM” refers to Calvert Research and Management and “Eaton Vance” refers to Eaton Vance Management. Each Trustee oversees 46 funds in the Calvert fund complex. Each of Eaton Vance and CRM are indirect, wholly owned subsidiaries of Morgan Stanley. Each officer affiliated with CRM may hold a position with other CRM affiliates that is comparable to his or her position with CRM listed below.
| Name and Year of Birth | Trust
Position(s) | Length of
Service | Principal Occupation(s) and Other Directorships
During Past Five Years and Other Relevant Experience |
| Interested Trustee | | | |
Theodore H. Eliopoulos(1)
1964 | Trustee and
President | Since 2022 | President and Chief Executive Officer of CRM and senior sponsor of Morgan Stanley Investment Management’s (MSIM) Diversity Council. Formerly, Vice Chairman & Head of Strategic Partnerships at MSIM (2019-2022). Former Chief Investment Officer and interim Chief Investment Officer (2014-2018) and Senior Investment Officer of Real Estate and Real Assets at California Public Employees’ Retirement System (CalPERS) (2007-2014). Former Chief Deputy Treasurer and Deputy Treasurer at the California State Treasurer's Office (2002-2006). Mr. Eliopoulos is an interested person because of his positions with CRM and certain affiliates.
Other Directorships. The Robert Toigo Foundation; Pacific Pension & Investment Institute (PPI). |
| Noninterested Trustees |
Richard L. Baird, Jr.(2)
1948 | Trustee | Since 1982 | Regional Disaster Recovery Lead, American Red Cross of Greater
Pennsylvania (since 2017). Volunteer, American Red Cross (since 2015).
Former President and CEO of Adagio Health Inc. (retired in 2014) in
Pittsburgh, PA.
Other Directorships. None. |
Alice Gresham Bullock
1950 | Chair and
Trustee | Since 2016 | Professor Emerita at Howard University School of Law. Dean Emerita of
Howard University School of Law and Deputy Director of the Association
of American Law Schools (1992-1994).
Other Directorships. None. |
Cari M. Dominguez
1949 | Trustee | Since 2016 | Former Chair of the U.S. Equal Employment Opportunity Commission.
Other Directorships. ManpowerGroup Inc. (workforce solutions company);
Triple S Management Corporation (managed care); National Association of Corporate Directors. |
Karen Fang(3)
1958 | Trustee | Since 2023 | Formerly, Managing Director, Wealth Management at GAMCO Asset Management (asset management firm) (2020-2023). Formerly, Managing Director, Senior Portfolio Manager of Fiduciary Trust Company International (wealth management firm) (1993-2019).
Other Directorships. None. |
John G. Guffey, Jr.(2)
1948 | Trustee | Since 1982 | President of Aurora Press Inc., a privately held publisher of trade paperbacks
(since January 1997).
Other Directorships. Calvert Impact Capital, Inc. (through December 31, 2018); Calvert Ventures, LLC. |
Miles D. Harper, III
1962 | Trustee | Since 2016 | Partner, Carr Riggs & Ingram (public accounting firm) since October 2014.
Partner, Gainer Donnelly & Desroches (public accounting firm) (now Carr
Riggs & Ingram) (November 1999 - September 2014).
Other Directorships. Bridgeway Funds (9) (asset management). |
Joy V. Jones
1950 | Trustee | Since 2016 | Attorney.
Other Directorships. Palm Management Corporation. |
Calvert
Ultra-Short Duration Income Fund
September 30, 2023
Management and Organization — continued
| Name and Year of Birth | Trust
Position(s) | Length of
Service | Principal Occupation(s) and Other Directorships
During Past Five Years and Other Relevant Experience |
| Noninterested Trustees (continued) |
Eddie Ramos(3)
1967 | Trustee | Since 2023 | Private investor (2022-present). Formerly, Head of External Advisors/Diversity Portfolio Management at the New Jersey Division of Investment (2020-2022). Formerly, Chief Investment Officer and Lead Portfolio Manager – Global Fundamental Equities at Cornerstone Capital Management (asset management firm) (2011-2017).
Other Directorships. Macquarie Optimum Funds (6) (asset management). |
Anthony A. Williams
1951 | Trustee | Since 2010 | CEO and Executive Director of the Federal City Council (July 2012 to
present); Senior Adviser and Independent Consultant for King and
Spalding LLP (September 2015 to present); Executive Director of Global
Government Practice at the Corporate Executive Board (January 2010 to
January 2012).
Other Directorships. Freddie Mac; Evoq Properties/Meruelo Maddux
Properties, Inc. (real estate management); Weston Solutions, Inc.
(environmental services); Bipartisan Policy Center’s Debt Reduction Task Force;
Chesapeake Bay Foundation; Catholic University of America; Urban Institute (research organization); The Howard Hughes Corporation (real estate development); Old Dominion National Bank. |
| Name and Year of Birth | Trust
Position(s) | Length of
Service | Principal Occupation(s)
During Past Five Years |
| Principal Officers who are not Trustees |
Hope L. Brown
1973 | Chief
Compliance
Officer | Since 2014 | Chief Compliance Officer of 46 registered investment companies advised
by CRM (since 2014). Vice President and Chief Compliance Officer,
Wilmington Funds (2012-2014). |
Deidre E. Walsh
1971 | Secretary,
Vice President
and Chief
Legal Officer | Since 2021 | Vice President of CRM and officer of 46 registered investment companies
advised by CRM (since 2021). Also Vice President of Eaton Vance and
certain of its affiliates and officer of 127 registered investment companies
advised or administered by Eaton Vance. |
James F. Kirchner
1967 | Treasurer | Since 2016 | Vice President of CRM and officer of 46 registered investment companies
advised by CRM (since 2016). Also Vice President of Eaton Vance and
certain of its affiliates and officer of 127 registered investment companies
advised or administered by Eaton Vance. |
| | | | |
| (1) Mr. Eliopoulos is an interested person of the Fund because of his positions with the Fund’s adviser and certain affiliates. |
| (2) Effective December 31, 2023, Richard L. Baird, Jr. and John G. Guffey, Jr. will retire from the Board of Trustees. |
| (3) Ms. Fang and Mr. Ramos began serving as Trustees effective October 30, 2023. |
The SAI for the Fund includes additional information about the Trustees and officers of the Fund and can be obtained without charge on Calvert’s website at www.calvert.com or by calling 1-800-368-2745.
| FACTS | WHAT DOES EATON VANCE DO WITH YOUR
PERSONAL INFORMATION? |
| Why? | Financial companies choose how they share your personal information. Federal law gives consumers the right to limit some but not all sharing. Federal law also requires us to tell you how we collect, share, and protect your personal information. Please read this notice carefully to understand what we do. |
| |
| What? | The types of personal information we collect and share depend on the product or service you have with us. This information can include:■ Social Security number and income
■
investment experience and risk tolerance
■
checking account number and wire transfer instructions |
| |
| How? | All financial companies need to share customers’ personal information to run their everyday business. In the section below, we list the reasons financial companies can share their customers’ personal information; the reasons Eaton Vance chooses to share; and whether you can limit this sharing. |
Reasons we can share your
personal information | Does Eaton Vance
share? | Can you limit
this sharing? |
| For our everyday business purposes — such as to process your transactions, maintain your account(s), respond to court orders and legal investigations, or report to credit bureaus | Yes | No |
| For our marketing purposes — to offer our products and services to you | Yes | No |
| For joint marketing with other financial companies | No | We don’t share |
| For our investment management affiliates’ everyday business purposes — information about your transactions, experiences, and creditworthiness | Yes | Yes |
| For our affiliates’ everyday business purposes — information about your transactions and experiences | Yes | No |
| For our affiliates’ everyday business purposes — information about your creditworthiness | No | We don’t share |
| For our investment management affiliates to market to you | Yes | Yes |
| For our affiliates to market to you | No | We don’t share |
| For nonaffiliates to market to you | No | We don’t share |
To limit our
sharing | Call toll-free 1-800-368-2745 or email: CRMPrivacy@calvert.comPlease note:If you are a new customer, we can begin sharing your information 30 days from the date we sent this notice. When you are no longer our customer, we continue to share your information as described in this notice. However, you can contact us at any time to limit our sharing. |
| Questions? | Call toll-free 1-800-368-2745 or email: CRMPrivacy@calvert.com |
| Privacy Notice — continued | April 2021 |
| Who we are |
| Who is providing this notice? | Eaton Vance Management, Eaton Vance Distributors, Inc., Eaton Vance Trust Company, Eaton Vance Management (International) Limited, Eaton Vance Advisers International Ltd., Eaton Vance Global Advisors Limited, Eaton Vance Management’s Real Estate Investment Group, Boston Management and Research, Calvert Research and Management, Eaton Vance and Calvert Fund Families and our investment advisory affiliates (“Eaton Vance”) (see Investment Management Affiliates definition below) |
| What we do |
How does Eaton Vance
protect my personal
information? | To protect your personal information from unauthorized access and use, we use security measures that comply with federal law. These measures include computer safeguards and secured files and buildings. We have policies governing the proper handling of customer information by personnel and requiring third parties that provide support to adhere to appropriate security standards with respect to such information. |
How does Eaton Vance
collect my personal
information? | We collect your personal information, for example, when you■ open an account or make deposits or withdrawals from your account
■
buy securities from us or make a wire transfer
■
give us your contact informationWe also collect your personal information from others, such as credit bureaus, affiliates, or other companies. |
| Why can’t I limit all sharing? | Federal law gives you the right to limit only■ sharing for affiliates’ everyday business purposes — information about your creditworthiness
■
affiliates from using your information to market to you
■
sharing for nonaffiliates to market to youState laws and individual companies may give you additional rights to limit sharing. See below for more on your rights under state law. |
| Definitions |
Investment Management
Affiliates | Eaton Vance Investment Management Affiliates include registered investment advisers, registered broker- dealers, and registered and unregistered funds. Investment Management Affiliates does not include entities associated with Morgan Stanley Wealth Management, such as Morgan Stanley Smith Barney LLC and Morgan Stanley & Co. |
| Affiliates | Companies related by common ownership or control. They can be financial and nonfinancial companies.■ Our affiliates include companies with a Morgan Stanley name and financial companies such as Morgan Stanley Smith Barney LLC and Morgan Stanley & Co. |
| Nonaffiliates | Companies not related by common ownership or control. They can be financial and nonfinancial companies.■ Eaton Vance does not share with nonaffiliates so they can market to you. |
| Joint marketing | A formal agreement between nonaffiliated financial companies that together market financial products or services to you.■ Eaton Vance doesn’t jointly market. |
| Other important information |
| Vermont: Except as permitted by law, we will not share personal information we collect about Vermont residents with Nonaffiliates unless you provide us with your written consent to share such information.California: Except as permitted by law, we will not share personal information we collect about California residents with Nonaffiliates and we will limit sharing such personal information with our Affiliates to comply with California privacy laws that apply to us. |
Delivery of Shareholder Documents. The Securities and Exchange Commission (SEC) permits funds to deliver only one copy of shareholder documents, including prospectuses, proxy statements and shareholder reports, to fund investors with multiple accounts at the same residential or post office box address. This practice is often called “householding” and it helps eliminate duplicate mailings to shareholders. Calvert funds, or your financial intermediary, may household the mailing of your documents indefinitely unless you instruct Calvert funds, or your financial intermediary, otherwise. If you would prefer that your Calvert fund documents not be householded, please contact Calvert funds at 1-800-368-2745, or contact your financial intermediary. Your instructions that householding not apply to delivery of your Calvert fund documents will typically be effective within 30 days of receipt by Calvert funds or your financial intermediary.
Portfolio Holdings. Each Calvert fund files a schedule of portfolio holdings on Part F to Form N-PORT with the SEC. Certain information filed on Form N-PORT may be viewed on the Calvert website at www.calvert.com, by calling Calvert at 1-800-368-2745 or in the EDGAR database on the SEC’s website at www.sec.gov.
Proxy Voting. The Proxy Voting Guidelines that each Calvert fund uses to determine how to vote proxies relating to portfolio securities is provided as an Appendix to the fund’s Statement of Additional Information. The Statement of Additional Information can be obtained free of charge by calling the Calvert funds at 1-800-368-2745, by visiting the Calvert funds’ website at www.calvert.com or visiting the SEC’s website at www.sec.gov. Information regarding how a Calvert fund voted proxies relating to portfolio securities during the most recent 12-month period ended June 30 is available by calling Calvert funds, by visiting the Calvert funds’ website at www.calvert.com or by visiting the SEC’s website at www.sec.gov.
Tailored Shareholder Reports. Effective January 24, 2023, the SEC adopted rule and form amendments to require open-end mutual funds and ETFs to transmit concise and visually engaging streamlined annual and semiannual reports to shareholders that highlight key information. Other information, including financial statements, will no longer appear in a streamlined shareholder report but must be available online, delivered free of charge upon request, and filed on a semiannual basis on Form N-CSR. The rule and form amendments have a compliance date of July 24, 2024. At this time, management is evaluating the impact of these amendments on the shareholder reports for the Calvert Funds.
This Page Intentionally Left Blank
This Page Intentionally Left Blank
This Page Intentionally Left Blank
Investment Adviser and Administrator
Calvert Research and Management
2050 M Street NW
Washington, DC 20036
Principal Underwriter*
Eaton Vance Distributors, Inc.
Two International Place
Boston, MA 02110
(617) 482-8260
Custodian
State Street Bank and Trust Company
One Congress Street, Suite 1
Boston, MA 02114-2016
Transfer Agent
SS&C Global Investor & Distribution Solutions, Inc.
2000 Crown Colony Drive
Quincy, MA 02169
Independent Registered Public Accounting Firm
Deloitte & Touche LLP
200 Berkeley Street
Boston, MA 02116-5022
Fund Offices
2050 M Street NW
Washington, DC 20036
* FINRA BrokerCheck. Investors may check the background of their Investment Professional by contacting the Financial Industry Regulatory Authority (FINRA). FINRA BrokerCheck is a free tool to help investors check the professional background of current and former FINRA-registered securities firms and brokers. FINRA BrokerCheck is available by calling 1-800-289-9999 and at www.FINRA.org. The FINRA BrokerCheck brochure describing this program is available to investors at www.FINRA.org.
Printed on recycled paper.
24183 9.30.23
Item 2. Code of Ethics
The registrant has adopted a code of ethics applicable to its Principal Executive Officer, Principal Financial Officer and Principal Accounting Officer. The registrant undertakes to provide a copy of such code of ethics to any person upon request, without charge, by calling 1-800-368-2745. The registrant has not amended the code of ethics as described in Form N-CSR during the period covered by this report. The registrant has not granted any waiver, including an implicit waiver, from a provision of the code of ethics as described in Form N-CSR during the period covered by this report.
Item 3. Audit Committee Financial Expert
The registrant’s Board of Trustees has determined that Miles D. Harper III, an “independent” Trustee serving on the registrant’s audit committee, is an “audit committee financial expert,” as defined in Item 3 of Form N-CSR. Under applicable securities laws, a person who is determined to be an audit committee financial expert will not be deemed an “expert” for any purpose, including without limitation for the purposes of Section 11 of the Securities Act of 1933, as a result of being designated or identified as an audit committee financial expert. The
designation or identification of a person as an audit committee financial expert does not impose on such person any duties, obligations, or liabilities that are greater than the duties, obligations, and liabilities imposed on such person as a member of the audit committee and Board of Trustees in the absence of such designation or identification.
Item 4. Principal Accountant Fees and Services
(a) –(d)
The following table presents the aggregate fees billed to the registrant for the registrant’s fiscal years ended September 30, 2022 and September 30, 2023 by its principal accountant for professional services rendered for the audit of the registrant’s annual financial statements and fees billed for other services rendered by its principal accountant during such periods.
| | | | | | | | | | | | | | | | |
Fiscal Years Ended | | 9/30/22 | | | %* | | | 9/30/23 | | | %* | |
Audit Fees | | $ | 163,000 | | | | 0 | % | | $ | 178,800 | | | | 0 | % |
Audit-Related Fees(1) | | $ | 0 | | | | 0 | % | | $ | 0 | | | | 0 | % |
Tax Fees(2) | | $ | 0 | | | | 0 | % | | $ | 0 | | | | 0 | % |
All Other Fees(3) | | $ | 0 | | | | 0 | % | | $ | 0 | | | | 0 | % |
| | | | | | | | | | | | | | | | |
Total | | $ | 163,000 | | | | 0 | % | | $ | 178,800 | | | | 0 | % |
| | | | | | | | | | | | | | | | |
| * | Percentage of fees approved by the Audit Committee pursuant to (c)(7)(i)(C) of Rule 2-01 of Reg. S-X (statutory de minimis waiver of Committee’s requirement to pre-approve). |
| (1) | Audit-related fees consist of the aggregate fees billed for assurance and related services that are reasonably related to the performance of the audit of the registrant’s financial statements and are not reported under the category of audit fees. |
| (2) | Tax fees consist of the aggregate fees billed for professional services rendered by the principal accountant relating to tax compliance, tax advice, and tax planning and specifically include fees for tax return preparation and other related tax compliance/planning matters. |
| (3) | All other fees consist of the aggregate fees billed for products and services provided by the principal accountant other than audit, audit-related, and tax services. |
(e) The Audit Committee is required to pre-approve all audit and non-audit services provided to the registrant by the auditors, and to the registrant’s investment adviser, and any entity controlling, controlled by, or under common control with the adviser that provides ongoing services to the registrant. In determining whether to pre-approve non-audit services, the Audit Committee considers whether the services are consistent with maintaining the independence of the auditors. The Committee may delegate its authority to pre-approve certain matters to one or more of its members. In this regard, the Committee has delegated authority jointly to the Audit Committee Chair together with another Committee member with respect to non-audit services not exceeding $25,000 in each instance. In addition, the Committee has pre-approved the retention of the auditors to provide tax-related services related to the tax treatment and tax accounting of newly acquired securities, upon request by the investment adviser in each instance.
(f) Not applicable.
(g) Aggregate non-audit fees billed by the registrant’s principal accountant for services rendered to the registrant, and rendered to the registrant’s investment adviser, and any entity controlling, controlled by, or under common control with the adviser that provides ongoing services to the registrant for each of the last two fiscal years of the registrant:
| | | | | | |
Fiscal Year ended 9/30/22 | | Fiscal Year ended 9/30/23 |
$ | | %* | | $ | | %* |
| $0 | | 0% | | $0 | | 0% |
| * | Percentage of fees approved by the Audit Committee pursuant to (c)(7)(i)(C) of Rule 2-01 of Reg. S-X (statutory de minimis waiver of Committee’s requirement to pre-approve). |
(h) The registrant’s audit committee has considered whether the provision by the registrant’s principal accountant of non-audit services to the registrant’s investment adviser and any entity controlling, controlled by, or under common control with the adviser that provides ongoing services to the registrant that were not pre-approved pursuant to Rule 2-01(c)(7)(ii) of Regulation S-X is compatible with maintaining the principal accountant’s independence.
(i) Not applicable.
(j) Not applicable.
Item 5. Audit Committee of Listed Registrants
Not applicable.
Item 6. Schedule of Investments
Please see schedule of investments contained in the Report to Stockholders included under Item 1 of this Form N-CSR.
Item 7. Disclosure of Proxy Voting Policies and Procedures for Closed-End Management Investment Companies
Not applicable.
Item 8. Portfolio Managers of Closed-End Management Investment Companies
Not applicable.
Item 9. Purchases of Equity Securities by Closed-End Management Investment Company and Affiliated Purchasers
Not applicable.
Item 10. Submission of Matters to a Vote of Security Holders
No material changes.
Item 11. Controls and Procedures
(a) The registrant’s principal executive and principal financial officers have concluded that the registrant’s disclosure controls and procedures (as defined in Rule 30a-3(c) under the Investment Company Act of 1940 Act, as amended (the “1940 Act”) are effective, based on the evaluation of these controls and procedures required by Rule 30a-3(b) under the 1940 Act and Rules 13a-15(b) or 15d-15(b) under the Securities Exchange Act of 1934 (“Exchange Act”), as of a date within 90 days of the filing date of this report.
(b) There was no change in the registrant’s internal control over financial reporting (as defined in Rule 30a-3(d) under the 1940 Act) that occurred during the period covered by this report that has materially affected, or is reasonably likely to materially affect, the registrant’s internal control over financial reporting.
Item 12. Disclosure of Securities Lending Activities for Closed-End Management Investment Companies
Not applicable.
Item 13. Exhibits
Signatures
Pursuant to the requirements of the Securities Exchange Act of 1934 and the Investment Company Act of 1940, the registrant has duly caused this report to be signed on its behalf by the undersigned, thereunto duly authorized.
| | |
| THE CALVERT FUND |
| |
| By: | | /s/ Theodore H. Eliopoulos |
| | Theodore H. Eliopoulos |
| | President |
Date: November 22, 2023
Pursuant to the requirements of the Securities Exchange Act of 1934 and the Investment Company Act of 1940, this report has been signed below by the following persons on behalf of the registrant and in the capacities and on the dates indicated.
| | |
| By: | | /s/ James F. Kirchner |
| | James F. Kirchner |
| | Treasurer |
Date: November 22, 2023
| | |
| By: | | /s/ Theodore H. Eliopoulos |
| | Theodore H. Eliopoulos |
| | President |
Date: November 22, 2023