UNITED STATES
SECURITIES AND EXCHANGE COMMISSION
Washington, D.C. 20549
FORM N-CSR
CERTIFIED SHAREHOLDER REPORT OF REGISTERED
MANAGEMENT INVESTMENT COMPANIES
| | |
| Investment Company Act file number: | | 811-03422 |
| Exact name of registrant as specified in charter: | | The Prudential Variable Contract Account-11 |
| |
| Address of principal executive offices: | | Gateway Center 3, 100 Mulberry Street, Newark, New Jersey 07102 |
| |
| Name and address of agent for service: | | Deborah A. Docs Gateway Center 3, 100 Mulberry Street, Newark, New Jersey 07102 |
| |
| Registrant’s telephone number, including area code: | | 973-367-7521 |
| |
| Date of fiscal year end: | | 12/31/2009 |
| |
| Date of reporting period: | | 12/31/2009 |
Item 1 – Reports to Stockholders

Prudential
MEDLEY Program
Annual report to participants
December 31, 2009
This report is not authorized for distribution to prospective investors unless preceded or accompanied by a current prospectus for The MEDLEY Program. Investors should consider the contract and the underlying portfolios’ investment objectives, risks, charges and expenses carefully before investing. This and other important information is contained in the prospectuses that can be obtained from your financial professional. You should read the prospectuses carefully before investing.
The report is for the information of persons participating in The Prudential Variable Contract Account-10 (VCA-10), The Prudential Variable Contract Account-11 (VCA-11), and The Prudential Variable Contract Account-24 (VCA-24) (Collectively known as the “Accounts”) of The MEDLEY Program. VCA-10, VCA-11, and VCA-24 are group annuity insurance products issued by The Prudential Insurance Company of America, 751 Broad Street, Newark, NJ 07102-3777, and is distributed by Prudential Investment Management Services LLC (PIMS), member SIPC, Three Gateway Center, 14th Floor, Newark, NJ 07102-4077. Both are Prudential Financial companies.
All are Prudential Financial companies and each is solely responsible for its financial condition and contractual obligations.
Pru, Prudential, Prudential Financial, Rock Solid, “The Rock”, the Rock Logo and the Rock Prudential Logo are registered service marks of The Prudential Insurance Company of America, Newark, NJ, and its affiliates.
This report includes the financial statements of VCA-10, VCA-11, and the portfolios of The Prudential Series Fund (the “Funds”) available through VCA-24.
This report does not include separate account financials for the VCA-24 Subaccounts. If you would like separate account financial statements as of December 31, 2008, please call the telephone number on the inside back cover of this report.
Annuity contracts contain exclusions, limitations, reductions of benefits, and terms for keeping them in force. Your plan sponsor or licensed financial professional can provide you with costs and complete details. Contract guarantees are based on the claims-paying ability of the issuing company.
A description of the Account’s proxy voting policies and procedures is available without charge, upon request. MEDLEY participants should call 888-778-2888 to obtain a description of the Account’s proxy voting policies and procedures. The description is also available on the website of the Securities and Exchange Commission (the “Commission”) at www.sec.gov. Information regarding how the Account’s voted proxies relating to portfolio securities during the most recent 12-month period ended June 30 is available on the website of the Commission at www.sec.gov and on the Account’s website.
The Accounts Statement of Additional Information contains additional information about the Account’s Committee Members and is available without charge upon request by calling 800-458-6333.
Each Account files with the Commission a complete listing of portfolio holdings as of the end of the first and third quarters on Form N-Q. Form N-Q is available on the Commission’s website at www.sec.gov or by visiting the Commission’s Public Reference Room. For more information on the Commission’s Public Reference Room, please visit the Commission’s website or call 1-800-732-0330. MEDLEY participants may obtain copies of Form N-Q filings by calling 800-458-6333.
| | | | |
The Prudential MEDLEY Program Table of Contents | | Annual Report | | December 31, 2009 |
| n | | VCA-10 CAPITAL GROWTH ACCOUNT |
Financial Statements
| n | | VCA-11 MONEY MARKET ACCOUNT |
Financial Statements
| n | | VCA-24 THE PRUDENTIAL SERIES FUND PORTFOLIOS |
Conservative Balanced Portfolio
Diversified Bond Portfolio
Equity Portfolio
Flexible Managed Portfolio
Global Portfolio
Government Income Portfolio
Stock Index Portfolio
| | |
The Prudential MEDLEY Program Letter to Participants | | December 31, 2009 |
Our primary focus at Prudential is to help investors achieve and maintain long-term financial success. MEDLEY Program annual report outlines our efforts to reach this goal. We hope you find it informative and useful.
Prudential has been building on a heritage of success for more than 130 years, and the quality of our businesses and risk diversification has enabled us to manage effectively through volatile markets. We believe the array of our products provides a highly attractive value proposition to clients like you who are focused on financial security.
Your financial professional is your best resource to make the most informed investment decisions to help meet your needs. Together, you can build a diversified investment portfolio that aligns with your long-term financial goals. Diversification does not assure a profit or protect against loss in declining markets.
Thank you for selecting Prudential as one of your financial partners. We value your trust and appreciate the opportunity to help you achieve financial security.
Sincerely,
| | |
 | | 
|
Stephen Pelletier President, The Prudential Series Fund | | Judy A. Rice, President, Variable Contract Accounts 10 & 11 |
January 29, 2010
| | |
Prudential Variable Contract Account-10 (VCA-10) & Variable Contract Account-24 (VCA-24) Presentation of Portfolio Holdings — unaudited | | December 31, 2009 |
| | |
| Conservative Balanced | | |
| Five Largest Holdings (% of Net Assets) |
| Exxon Mobil Corp. | | 1.6% |
| Federal National Mortgage Association, 6.000%, TBA 30 YR | | 1.5% |
U.S. Treasury Notes,
2.625%, 12/31/14 | | 1.5% |
| Microsoft Corp. | | 1.2% |
Apple, Inc. | | 0.9% |
| | |
| Diversified Bond | | |
| Allocation (% of Net Assets) |
| Corporate Bonds | | 47.2% |
| Commercial Mortgage-Backed Securities | | 15.6% |
| U.S. Government Mortgage-Backed Securities | | 12.7% |
| Asset-Backed Securities | | 5.2% |
| Residential Mortgage-Backed Securities | | 3.7% |
| | |
| Equity | | |
| Five Largest Holdings (% of Net Assets) |
| Occidental Petroleum Corp. | | 2.9% |
Google, Inc. (Class A Stock) | | 2.9% |
Goldman Sachs Group, Inc. (The) | | 2.7% |
| Apple, Inc. | | 2.7% |
Amazon.com, Inc. | | 2.4% |
| | |
| Flexible Managed | | |
| Five Largest Holdings (% of Net Assets) |
| Exxon Mobil Corp. | | 2.1% |
| Apple, Inc. | | 1.4% |
Microsoft Corp. | | 1.3% |
Procter & Gamble Co. (The) | | 1.3% |
JPMorgan Chase & Co. | | 1.3% |
| | |
| Global | | |
| Top Five Countries (% of Net Assets) |
| United States | | 41.5% |
| United Kingdom | | 9.5% |
Japan | | 8.1% |
France | | 5.1% |
Switzerland | | 4.5% |
| | |
| Government Income | | |
| Allocation (% of Net Assets) |
| Mortgage-Backed Securities | | 42.5% |
| U.S. Treasury Securities | | 28.7% |
| U.S. Government Agency Obligations | | 8.8% |
| Commercial Mortgage-Backed Securities | | 8.5% |
| Collateralized Mortgage Obligations | | 3.7% |
| | |
| Stock Index | | |
| Five Largest Holdings (% of Net Assets) |
| Exxon Mobil Corp. | | 3.2% |
| Microsoft Corp. | | 2.3% |
| Apple, Inc. | | 1.9% |
| Johnson & Johnson | | 1.8% |
| Procter & Gamble Co. (The) | | 1.8% |
| | |
| VCA-10 | | |
| Five Largest Holdings (% of Net Assets) |
| Occidental Petroleum Corp. | | 2.6% |
| Advanced Micro Devices, Inc. | | 2.4% |
| H & R Block, Inc. | | 2.3% |
| Google, Inc. Cl. A | | 2.3% |
| NII Holdings, Inc. | | 2.2% |
For a complete listing of holdings, refer to the Schedule of Investments section of this report. Holdings reflect only long-term investments. Holdings/Issues/Industries/Sectors are subject to change.
| | |
The Prudential MEDLEY Program — VCA-10 Capital Growth Account Subadvised by: Jennison Associates LLC | | December 31, 2009 |
Investment Managers’ Report - As of December 31, 2009
Average Annual Total Return Percentages
| | | | | | | | | |
| | | 1-Year | | | 5-Year | | | 10-Year | |
Capital Growth Acct. (VCA-10)1 | | 47.75 | % | | 3.80 | % | | 2.88 | % |
S&P 500 Index2 | | 26.47 | | | 0.42 | | | -0.95 | |
Capital Growth Account inception: 5/13/1983.
Past performance does not guarantee future returns. Portfolio performance is net of investment fees and fund expenses. The investment return and principal value of an investment will fluctuate, so that an investor’s shares, when redeemed, may be worth more or less than their original cost. Current performance may be lower or higher than the past performance data quoted.
$10,000 INVESTED OVER 10 YEARS
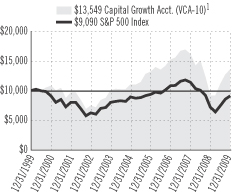
For the year ended December 31, 2009, the VCA-10 Capital Growth Account rose 47.75%.
Every sector in the benchmark, the S&P 500 Index (the Index), had positive returns for the year ended December 31, 2009. Likewise, every sector in the VCA-10 Account (the Portfolio) advanced. Stock selection across the board, with the one exception of industrials, benefited the Portfolio’s relative return. The Portfolio significantly outperformed the Index.
Energy positions made the most meaningful positive impact on relative performance. Jennison prefers energy companies that are best positioned to gain from rising oil and gas prices. Jennison remains bullish on the long-term supply/demand imbalances for copper and gold, which should result in higher prices for these commodities and ultimately the Portfolio’s copper and gold mining stocks. Industrialization of the developing world and difficulty in increasing supply will most likely create upward pressure on prices. Growth in global money supply should also push up gold prices. Security selection and an underweight stance in financials made a sizable contribution to relative performance.
From the depths of their March lows, equity markets have posted impressive rebounds, with most indexes gaining 50% or more through year-end. Corporate profits, which have been much better than were thought possible at the beginning of 2009, largely due to workforce and inventory reductions, have provided much of the fuel for this recovery in equities. Favorable interest rate and liquidity conditions have been instrumental in spurring the rally, as well. With these tailwinds in place, there is reason to be optimistic that further gains lie ahead in 2010. Yet significant challenges remain, including high unemployment, still-weak housing markets, and probable increases in tax rates. Against this backdrop, Jennison remains cautiously optimistic.
Prudential Investments LLC (PI), an indirect, wholly owned subsidiary of Prudential Financial, Inc., serves as the investment manager for the Account.
| 1. | The Account performance results are after the deduction of all expenses and contract charges, including investment management and administrative fees but not including the effect of any sales charges. All total returns are for the periods indicated and are calculated based on changes in unit values. |
| 2. | The S&P 500 Index is an unmanaged, market value-weighted index of 500 stocks generally representative of the broad stock market. Investors cannot invest directly in an index. |
For a complete list of holdings please see the Statement of Net Assets sections of this report.
FINANCIAL STATEMENTS OF VCA-10
December 31, 2009
| | | | | |
| LONG-TERM INVESTMENTS — 98.7% | | |
| COMMON STOCKS — 97.3% | | Shares
| | Value
(Note 2)
|
Aerospace & Defense — 1.1% | | | | | |
Precision Castparts Corp. | | 17,800 | | $ | 1,964,230 |
| | | | |
|
|
Auto Components — 2.0% | | | | | |
Goodyear Tire & Rubber Co. (The)(a) | | 172,100 | | | 2,426,610 |
Lear Corp.(a) | | 18,200 | | | 1,231,048 |
| | | | |
|
|
| | | | | | 3,657,658 |
| | | | |
|
|
Biotechnology — 2.3% | | | | | |
Celgene Corp.(a) | | 43,400 | | | 2,416,512 |
Gilead Sciences, Inc.(a) | | 41,100 | | | 1,778,808 |
| | | | |
|
|
| | | | | | 4,195,320 |
| | | | |
|
|
Capital Markets — 5.1% | | | | | |
Bank of New York Mellon Corp. (The) | | 54,200 | | | 1,515,974 |
Goldman, Sachs Group, Inc. (The) | | 17,400 | | | 2,937,816 |
Morgan Stanley | | 89,100 | | | 2,637,360 |
TD Ameritrade Holding Corp.(a) | | 114,700 | | | 2,222,886 |
| | | | |
|
|
| | | | | | 9,314,036 |
| | | | |
|
|
Chemicals — 1.4% | | | | | |
Dow Chemical Co. (The) | | 94,600 | | | 2,613,798 |
| | | | |
|
|
Commercial Banks — 0.8% | | | | | |
Keycorp | | 247,800 | | | 1,375,290 |
| | | | |
|
|
Commercial Services & Supplies — 1.7% | | | | | |
Waste Management, Inc. | | 92,900 | | | 3,140,949 |
| | | | |
|
|
Communications Equipment — 1.6% | | | | | |
QUALCOMM, Inc. | | 62,300 | | | 2,881,998 |
| | | | |
|
|
Computers & Peripherals — 1.1% | | | | | |
Apple, Inc.(a) | | 9,900 | | | 2,087,514 |
| | | | |
|
|
Consumer Finance — 1.7% | | | | | |
SLM Corp.(a) | | 277,600 | | | 3,128,552 |
| | | | |
|
|
Diversified Consumer Services — 3.7% | | | | | |
Career Education Corp.(a) | | 110,500 | | | 2,575,755 |
H & R Block, Inc. | | 187,400 | | | 4,238,988 |
| | | | |
|
|
| | | | | | 6,814,743 |
| | | | |
|
|
Diversified Financial Services — 1.0% | | | | | |
JPMorgan Chase & Co. | | 42,800 | | | 1,783,476 |
| | | | |
|
|
Electric Utilities — 1.2% | | | | | |
Entergy Corp. | | 27,500 | | | 2,250,600 |
| | | | |
|
|
Electronic Equipment & Instruments — 1.2% | | | |
Flextronics International, Ltd.(a) | | 287,900 | | | 2,104,549 |
| | | | |
|
|
Energy Equipment & Services — 1.1% | | | | | |
National Oilwell Varco, Inc. | | 44,500 | | | 1,962,005 |
| | | | |
|
|
Food & Staples Retailing — 3.9% | | | | | |
CVS Caremark Corp. | | 60,300 | | | 1,942,263 |
Kroger Co. (The) | | 137,100 | | | 2,814,663 |
Wal-Mart Stores, Inc. | | 42,500 | | | 2,271,625 |
| | | | |
|
|
| | | | | | 7,028,551 |
| | | | |
|
|
| | | | | |
| COMMON STOCKS | | |
| (continued) | | Shares
| | Value
(Note 2)
|
Food Products — 4.4% | | | | | |
Bunge, Ltd. | | 39,400 | | $ | 2,514,902 |
ConAgra Foods, Inc. | | 130,800 | | | 3,014,940 |
Tyson Foods, Inc. Cl. A | | 207,100 | | | 2,541,117 |
| | | | |
|
|
| | | | | | 8,070,959 |
| | | | |
|
|
Health Care Equipment & Supplies — 1.5% | | | | | |
Alcon, Inc. | | 16,800 | | | 2,761,080 |
| | | | |
|
|
Health Care Providers & Services — 6.0% | | | | | |
Aetna, Inc. | | 37,200 | | | 1,179,240 |
Medco Health Solutions, Inc.(a) | | 48,600 | | | 3,106,026 |
Omnicare, Inc. | | 150,600 | | | 3,643,014 |
Wellpoint, Inc.(a) | | 52,300 | | | 3,048,567 |
| | | | |
|
|
| | | | | | 10,976,847 |
| | | | |
|
|
Hotels, Restaurants & Leisure — 1.0% | | | | | |
Yum Brands, Inc, | | 51,000 | | | 1,783,470 |
| | | | |
|
|
Independent Power Producers & Energy Traders — 1.4% | | | | | |
NRG Energy, Inc.(a) | | 104,100 | | | 2,457,801 |
| | | | |
|
|
Insurance — 2.2% | | | | | |
Arch Capital Group, Ltd.(a) | | 3,900 | | | 279,045 |
Axis Capital Holdings, Ltd. | | 65,900 | | | 1,872,219 |
Travelers Cos., Inc. (The) | | 35,400 | | | 1,765,044 |
| | | | |
|
|
| | | | | | 3,916,308 |
| | | | |
|
|
Internet Software & Services — 4.3% | | | | | |
Google, Inc. Cl. A(a) | | 6,800 | | | 4,215,864 |
IAC/InterActiveCorp.(a) | | 175,850 | | | 3,601,408 |
| | | | |
|
|
| | | | | | 7,817,272 |
| | | | |
|
|
Media — 3.2% | | | | | |
Comcast Corp. | | 177,800 | | | 2,997,708 |
Liberty Global, Inc. Ser. C (a) | | 125,405 | | | 2,740,099 |
| | | | |
|
|
| | | | | | 5,737,807 |
| | | | |
|
|
Metals & Mining — 3.1% | | | | | |
Freeport-McMoRan Copper & Gold, Inc.(a) | | 37,200 | | | 2,986,788 |
Kinross Gold Corp. | | 145,600 | | | 2,679,040 |
| | | | |
|
|
| | | | | | 5,665,828 |
| | | | |
|
|
Multi-Utilities — 1.9% | | | | | |
Sempra Energy | | 62,800 | | | 3,515,544 |
| | | | |
|
|
Oil, Gas & Consumable Fuels — 17.8% | | | | | |
Anadarko Petroleum Corp. | | 41,200 | | | 2,571,704 |
Apache Corp. | | 33,400 | | | 3,445,878 |
Canadian Natural Resources, Ltd. | | 40,800 | | | 2,935,560 |
EOG Resources, Inc. | | 33,200 | | | 3,230,360 |
Hess Corp. | | 19,000 | | | 1,149,500 |
Noble Energy, Inc. | | 29,000 | | | 2,065,380 |
Occidental Petroleum Corp. | | 58,700 | | | 4,775,245 |
Petroleo Brasileiro SA ADR (Brazil) | | 78,100 | | | 3,723,808 |
Suncor Energy, Inc. | | 94,200 | | | 3,326,202 |
Williams Cos, Inc. | | 164,200 | | | 3,461,336 |
XTO Energy, Inc. | | 39,100 | | | 1,819,323 |
| | | | |
|
|
| | | | | | 32,504,296 |
| | | | |
|
|
SEE NOTES TO FINANCIAL STATEMENTS.
FINANCIAL STATEMENTS OF VCA-10
December 31, 2009
| | | | | |
| COMMON STOCKS | | |
| (continued) | | Shares
| | Value
(Note 2)
|
Pharmaceuticals — 6.5% | | | | | |
Mylan, Inc.(a) | | 103,300 | | $ | 1,903,819 |
Novartis AG ADR (Switzerland) | | 46,900 | | | 2,552,767 |
Pfizer, Inc. | | 119,200 | | | 2,168,248 |
Sanofi-Aventis SA ADR (France) | | 69,200 | | | 2,717,484 |
Shire PLC ADR (Ireland) | | 41,800 | | | 2,453,660 |
| | | | |
|
|
| | | | | | 11,795,978 |
| | | | |
|
|
Road & Rail — 1.5% | | | | | |
Union Pacific Corp. | | 43,600 | | | 2,786,040 |
| | | | |
|
|
Semiconductors & Semiconductor Equipment — 2.4% |
Advanced Micro Devices, Inc.(a) | | 446,800 | | | 4,325,024 |
| | | | |
|
|
Software — 6.3% | | | | | |
Adobe Systems, Inc.(a) | | 71,600 | | | 2,633,448 |
CA, Inc. | | 159,073 | | | 3,572,780 |
Nuance Communications, Inc.(a) | | 118,000 | | | 1,833,720 |
Symantec Corp.(a) | | 193,500 | | | 3,461,715 |
| | | | |
|
|
| | | | | | 11,501,663 |
| | | | |
|
|
Thrifts & Mortgage Finance — 0.7% | | | |
People's United Financial, Inc. | | 73,130 | | | 1,221,271 |
| | | | |
|
|
Wireless Telecommunication Services — 2.2% | | | |
NII Holdings, Inc.(a) | | 117,299 | | | 3,938,900 |
| | | | |
|
|
TOTAL COMMON STOCKS
(Cost: $141,600,057) | | | | | 177,079,357 |
| | | | |
|
|
| PREFERRED STOCK — 1.4% | | | |
Diversified Financial Services | | | | | |
Bank of America Corp.
(cost $2,535,759) | | 168,700 | | | 2,517,004 |
| | | | |
|
|
| CORPORATE BOND — 0.7% | | | |
| | | Principal
Amount
(000)
| | |
Oil, Gas & Consumable Fuels | | | | | |
Trident Resources., Unsec'd Note, (Canada), Private Placement, due 8/12/12(a)(b)(c)(f) (Cost: $3,588,714; purchased 8/20/07) | | CAD 3,589 | | | — |
| | | | |
|
|
| | | | | | |
| WARRANT | | | |
| | | Units
| | Value
(Note 2)
| |
Oil, Gas & Consumable Fuels | | | | | | |
Trident Resources Corp. (Canada), Expiring 1/01/15(a)(b)(c)(f)
(Cost: $0; purchased 8/20/07) | | 309,661 | | $ | — | |
| | | | |
|
|
|
TOTAL LONG-TERM INVESTMENTS
(Cost: $147,724,530) | | | | $ | 179,596,361 | |
| | | | |
|
|
|
| SHORT-TERM INVESTMENTS — 1.2% | |
| | | Shares
| | | |
Affiliated Money Market Mutual Fund | | | | |
Dryden Core Investment Fund- Taxable Money Market Series(e)
(Cost: $2,335,845) | | 2,335,845 | | | 2,335,845 | |
| | | | |
|
|
|
TOTAL INVESTMENTS(d) — 99.9%
(Cost: $150,060,375) | | $ | 181,932,206 | |
| | | | |
|
|
|
OTHER ASSETS, LESS LIABILITIES | | | | | | |
Receivable for Securities Sold | | $ | 1,728,353 | |
Dividends Receivable | | | 174,379 | |
Payable for Pending Capital Transactions | | | (218,896 | ) |
Payable for Securities Purchased | | | (1,596,670 | ) |
| | | | |
|
|
|
OTHER ASSETS IN EXCESS OF
LIABILITIES — 0.1% | | | 87,166 | |
| | | | |
|
|
|
NET ASSETS — 100% | | $ | 182,019,372 | |
| | | | |
|
|
|
NET ASSETS, representing: | | | | | | |
Equity of Participants —
20,072,004 Accumulation Units at an Accumulation Unit Value of $9.0708 | | $ | 182,069,260 | |
Equity of The Prudential Insurance Company of America | | | (49,888 | ) |
| | | | |
|
|
|
| | | | | $ | 182,019,372 | |
| | | | |
|
|
|
| (a) | Non-income producing security. |
| (b) | Indicates an illiquid security. |
| (c) | Indicates a security restricted to resale. The aggregate cost of such securities is $3,588,714. The aggregate value of $0 is approximately 0% of net assets. |
| (d) | As of December 31, 2009, two securities valued at $0 and representing 0% of the total market value of the portfolio were fair valued in accordance with the policies adopted by the Committee Members. |
| (e) | The Prudential Investments LLC, the Manager of the Account, also serves as Manager of the Dryden Core Investment Fund—Taxable Money Market Series. |
| (f) | The issuer has filed for bankruptcy and has defaulted in the payment of interest on the debt Security. The Security has been fair valued at zero. |
| | |
| ADR | | American Depository Receipt |
| CAD | | Canadian Dollar |
SEE NOTES TO FINANCIAL STATEMENTS.
FINANCIAL STATEMENTS OF VCA-10
December 31, 2009
Various inputs are used in determining the value of the Account’s investments. These inputs are summarized in the three broad levels listed below.
Level 1—quoted prices in active markets for identical securities
Level 2—other significant observable inputs (including quoted prices for similar securities, interest rates, prepayment speeds, credit risk, etc.)
Level 3—significant unobservable inputs (including the Fund’s own assumptions in determining the fair value of investments)
The following is a summary of the inputs used as of December 31, 2009 in valuing the Account's assets carried at fair value:
| | | | | | | | | |
Investments in Securities
| | Level 1
| | Level 2
| | Level 3
|
Common Stocks | | $ | 177,079,357 | | $ | — | | $ | — |
Corporate Bond | | | — | | | — | | | — |
Preferred Stocks | | | 2,517,004 | | | — | | | — |
Warrants | | | — | | | — | | | — |
Affiliated Mutual Funds | | | 2,335,845 | | | — | | | — |
| | |
|
| |
|
| |
|
|
| | | | 181,932,206 | | | — | | | — |
Other Financial Instruments* | | | — | | | — | | | — |
| | |
|
| |
|
| |
|
|
Total | | $ | 181,932,206 | | $ | — | | $ | — |
| | |
|
| |
|
| |
|
|
| * | Other financial instruments are derivative instruments not reflected in the Schedule of Investments, such as futures, forwards and swap contracts, which are valued at the unrealized appreciation/depreciation on the instrument. |
The following is a reconciliation of assets in which significant unobservable inputs (Level 3) were used in determining fair value:
| | | | |
| | | Corporate Bond
| |
Balance as of 12/31/08 | | $ | 993,565 | |
Realized gain (loss) | | | — | |
Change in unrealized appreciation (depreciation) | | | (1,140,133 | ) |
Earned amortization/accretion | | | — | |
Net purchases (sales) | | | 146,568 | |
Transfers in and/or out of Level 3 | | | — | |
| | |
|
|
|
Balance as of 12/31/09 | | $ | — | |
| | |
|
|
|
SEE NOTES TO FINANCIAL STATEMENTS.
FINANCIAL STATEMENTS OF VCA-10
December 31, 2009
The industry classification of portfolio holdings and other assets in excess of liabilities shown as a percentage of net assets as of December 31, 2009 were as follows:
| | | |
Oil, Gas & Consumable Fuels | | 17.8 | % |
Pharmaceuticals | | 6.5 | |
Software | | 6.3 | |
Health Care Providers & Services | | 6.0 | |
Capital Markets | | 5.1 | |
Food Products | | 4.4 | |
Internet Software & Services | | 4.3 | |
Food & Staples Retailing | | 3.9 | |
Diversified Consumer Services | | 3.7 | |
Media | | 3.2 | |
Metals & Mining | | 3.1 | |
Diversified Financial Services | | 2.4 | |
Semiconductors & Semiconductor Equipment | | 2.4 | |
Biotechnology | | 2.3 | |
Insurance | | 2.2 | |
Wireless Telecommunication Services | | 2.2 | |
Auto Components | | 2.0 | |
Multi-Utilities | | 1.9 | |
Commercial Services & Supplies | | 1.7 | |
Consumer Finance | | 1.7 | |
Communications Equipment | | 1.6 | |
Road & Rail | | 1.5 | |
Health Care Equipment & Supplies | | 1.5 | |
Chemicals | | 1.4 | |
Independent Power Producers & Energy Traders | | 1.4 | |
Affiliated Money Market Mutual Fund | | 1.2 | |
Electric Utilities | | 1.2 | |
Electronic Equipment & Instruments | | 1.2 | |
Aerospace & Defense | | 1.1 | |
Computers and Peripherals | | 1.1 | |
Energy Equipment & Services | | 1.1 | |
Hotels, Restaurants & Leisure | | 1.0 | |
Commercial Banks | | 0.8 | |
Thrifts & Mortgage Finance | | 0.7 | |
| | |
|
|
| | | 99.9 | |
Other Assets in Excess of Liabilities | | 0.1 | |
| | |
|
|
| | | 100.0 | % |
| | |
|
|
The Account invested in derivative instruments during the reporting period. The primary types of risk associated with derivative instruments are commodity risk, credit risk, equity risk, foreign exchange risk and interest rate risk. The effect of such derivative instruments on the Account’s financial position and financial performance as reflected in the Statement of Assets and Liabilities and Statement of Operations is presented in the summary below.
Fair values of derivative instruments as of December 31, 2009 as presented in the Statement of Assets and Liabilities: (Unaudited)
| | | | | | | | | | | |
Derivatives not designated as hedging
instruments, carried at fair value
| | Asset Derivatives
| | | Liability Derivatives
|
| | Balance Sheet Location
| | Fair Value
| | | Balance Sheet Location
| | Fair Value
|
Equity contracts | | Unaffiliated investments | | $ | — | * | | — | | $ | — |
| * | Includes one security with a fair value of $0. |
For the year ended December 31, 2009, the Account did not have any realized gain or (loss) on derivatives recognized in income.
For the year ended December 31, 2009, the Account did not have any unrealized appreciation or (depreciation) on derivatives recognized in income.
SEE NOTES TO FINANCIAL STATEMENTS.
FINANCIAL STATEMENTS OF VCA-10
Year Ended December 31, 2009
| | | | |
| | | | |
INVESTMENT INCOME | | | | |
Unaffiliated Dividend Income (net of $20,294 foreign withholding tax) | | $ | 2,359,024 | |
Affiliated Dividend Income | | | 11,625 | |
Unaffiliated Interest Income | | | 144,592 | |
Total Income | | | 2,515,241 | |
EXPENSES | | | | |
Fees Charged to Participants for Investment Management Services | | | (387,308 | ) |
Fees Charged to Participants for Administrative Expenses | | | (1,150,503 | ) |
Total Expenses . | | | (1,537,811 | ) |
NET INVESTMENT INCOME | | | 977,430 | |
REALIZED AND UNREALIZED LOSS ON INVESTMENTS | | | | |
Net Realized Loss on Investment Transactions | | | (17,836,135 | ) |
Net Change in Unrealized Appreciation (Depreciation) on Investments | | | 77,235,232 | |
NET GAIN ON INVESTMENTS | | | 59,399,097 | |
NET INCREASE IN NET ASSETS RESULTING FROM OPERATIONS | | $ | 60,376,527 | |
| | | | | | |
| | | STATEMENT OF CHANGES IN NET ASSETS | | |
| | | | | | | | |
| | | Year Ended December 31,
| |
| | | 2009 | | | 2008 | |
OPERATIONS | | | | | | | | |
Net Investment Income | | $ | 977,430 | | | $ | 1,695,945 | |
Net Realized Loss on Investment Transactions | | | (17,836,135 | ) | | | (34,268,066 | ) |
Net Change In Unrealized Appreciation (Depreciation) on Investments | | | 77,235,232 | | | | (78,535,921 | ) |
NET INCREASE (DECREASE) IN NET ASSETS RESULTING FROM OPERATIONS | | | 60,376,527 | | | | (111,108,042 | ) |
CAPITAL TRANSACTIONS | | | | | | | | |
Purchase Payments and Transfers In | | | 5,901,161 | | | | 8,918,960 | |
Withdrawals and Transfers Out | | | (16,978,866 | ) | | | (37,777,985 | ) |
Annual Account Charges Deducted from Participants’ Accounts | | | (28,544 | ) | | | (32,968 | ) |
NET DECREASE IN NET ASSETS RESULTING FROM CAPITAL TRANSACTIONS | | | (11,106,249 | ) | | | (28,891,993 | ) |
NET DECREASE IN NET ASSETS RESULTING FROM SURPLUS TRANSFERS | | | (111,802 | ) | | | (145,649 | ) |
TOTAL INCREASE (DECREASE) IN NET ASSETS | | | 49,158,476 | | | | (140,145,684 | ) |
NET ASSETS | | | | | | | | |
Beginning of year | | | 132,860,896 | | | | 273,006,580 | |
End of year | | $ | 182,019,372 | | | $ | 132,860,896 | |
SEE NOTES TO FINANCIAL STATEMENTS.
FINANCIAL HIGHLIGHTS FOR VCA-10
| | | | | | |
| | | INCOME AND CAPITAL CHANGES PER ACCUMULATION UNIT* | | |
(For an Accumulation Unit outstanding throughout the year)
| | | | | | | | | | | | | | | | | | | | |
| | | Year Ended December 31,
| |
| | | 2009 | | | 2008 | | | 2007 | | | 2006 | | | 2005 | |
Investment Income | | $ | .1215 | | | $ | .1628 | | | $ | .1753 | | | $ | .1539 | | | $ | .1061 | |
Expenses | | | | | | | | | | | | | | | | | | | | |
Investment management fee | | | (.0186 | ) | | | (.0226 | ) | | | (.0274 | ) | | | (.0237 | ) | | | (.0193 | ) |
Administrative expenses | | | (.0557 | ) | | | (.0677 | ) | | | (.0821 | ) | | | (.0710 | ) | | | (.0600 | ) |
Net Investment Income | | | .0472 | | | | .0725 | | | | .0658 | | | | .0592 | | | | .0268 | |
Capital Changes | | | | | | | | | | | | | | | | | | | | |
Net realized gain (loss) on investment transactions | | | (.8411 | ) | | | (1.5104 | ) | | | 1.8696 | | | | 1.6855 | | | | .8647 | |
Net change in unrealized appreciation (depreciation) on investments | | | 3.7265 | | | | (3.3558 | ) | | | (1.3347 | ) | | | (.4319 | ) | | | .6037 | |
Net Increase (Decrease) in Accumulation Unit Value | | | 2.9326 | | | | (4.7937 | ) | | | .6007 | | | | 1.3128 | | | | 1.4952 | |
Accumulation Unit Value | | | | | | | | | | | | | | | | | | | | |
Beginning of year | | | 6.1382 | | | | 10.9319 | | | | 10.3312 | | | | 9.0184 | | | | 7.5232 | |
End of year | | $ | 9.0708 | | | $ | 6.1382 | | | $ | 10.9319 | | | $ | 10.3312 | | | $ | 9.0184 | |
Total Return** | | | 47.78 | % | | | (43.85 | )% | | | 5.81 | % | | | 14.56 | % | | | 19.87 | % |
Ratio of Expenses To Average Net Assets*** | | | 1.00 | % | | | 1.00 | % | | | 1.00 | % | | | 1.00 | % | | | 1.00 | % |
Ratio of Net Investment Income To Average Net Assets*** | | | 1.00 | % | | | 1.01 | % | | | .60 | % | | | .62 | % | | | .32 | % |
Portfolio Turnover Rate | | | 62 | % | | | 81 | % | | | 65 | % | | | 60 | % | | | 51 | % |
Number of Accumulation Units Outstanding
For Participants at end of year (000’s omitted) | | | 20,072 | | | | 21,633 | | | | 24,945 | | | | 27,921 | | | | 33,107 | |
| * | Calculated by accumulating the actual per unit amounts daily. |
| ** | Total return does not consider the effects of sales loads. Total return is calculated assuming a purchase of a share on the first day and a sale on the last day of each year reported. Total returns may reflect adjustments to conform to generally accepted accounting principles. |
| *** | These calculations exclude PICA’s equity in VCA-10. |
The above table does not reflect the annual administration charge, which does not affect the Accumulation Unit Value. This charge is made by reducing Participants’ Accumulation Accounts by a number of Accumulation Units equal in value to the charge.
SEE NOTES TO FINANCIAL STATEMENTS.
NOTES TO THE FINANCIAL STATEMENTS OF
VCA-10
The Prudential Variable Contract Account-10 (“VCA-10” or the “Account”) was established on March 1, 1982 by The Prudential Insurance Company of America (“PICA”) under the laws of the State of New Jersey and is registered as an open-end, diversified management investment company under the Investment Company Act of 1940, as amended. VCA-10 has been designed for use by employers (“Contract-holders”) in making retirement arrangements on behalf of their employees (“Participants”). The investment objective of the Account is long-term growth of capital. The Account’s investments are composed primarily of common stocks. Although variable annuity payments differ according to the investment performance of the Account, they are not affected by mortality or expense experience because PICA assumes the expense risk and the mortality risk under the contracts.
| Note 2: | | Summary of Significant Accounting Policies |
Securities Valuation: Securities listed on a securities exchange are valued at the last sale price on such exchange on the day of valuation or, if there was no sale on such day, at the mean between the last reported bid and ask prices, or at the last bid price on such day in the absence of an asked price. Securities traded via Nasdaq are valued at the official closing price provided by Nasdaq. Securities that are actively traded in the over-the-counter market, including listed securities for which the primary market is believed by Prudential Investments LLC (“PI” or “Manager”), in consultation with the subadviser(s), to be over-the-counter, are valued by an independent pricing agent or principal market maker. Securities for which market quotations are not readily available, or whose values have been affected by events occurring after the close of the security’s foreign market and before the Account’s normal pricing time, are valued at fair value in accordance with the Accounts’ Committee Members approved fair valuation procedures. When determining the fair valuation of securities some of the factors influencing the valuation include, the nature of any restrictions on disposition of the securities; assessment of the general liquidity of the securities; the issuer’s financial condition and the markets in which it does business; the cost of the investment; the size of the holding and the capitalization of issuer; the prices of any recent transactions or bids/offers for such securities or any comparable securities; any available analyst media or other reports or information deemed reliable by the investment adviser regarding the issuer or the markets or industry in which it operates. Using fair value to price securities may result in a value that is different from a security’s most recent closing price and from the price used by other mutual funds to calculate their net asset values.
Investments in mutual funds are valued at their net asset value as of the close of the New York Stock Exchange on the date of valuation.
Short-term investments which mature in more than 60 days are valued based on current market quotations. Short-term investments having maturities of 60 days or less and of sufficient credit quality are valued at amortized cost which approximates fair value. Amortized cost is computed using the cost on the date of purchase, adjusted for constant accretion of discount or amortization of premium to maturity.
Warrants and Rights: The Account may hold warrants and rights acquired either through a direct purchase, including as part of private placement, or pursuant to corporate actions. Warrants and rights entitle the holder to buy a proportionate amount of common stock at a specific price and time through the expiration dates. Such warrants and rights are held as long positions by the Account until exercised, sold or expired. Warrants and rights are valued at fair value in accordance with the Committee Members’ approved fair valuation procedures.
Securities Transactions and Net Investment Income: Securities transactions are recorded on the trade date. Realized and unrealized gains or losses on sales of securities are calculated on the identified cost basis. Dividend income is recorded on the ex-dividend date and interest income is recorded on the accrual basis. Net investment income and realized and unrealized gain or losses (other than administrative fees) are allocated to the Participants and PICA on a daily basis in proportion to their respective ownership in VCA-10.
Estimates: The preparation of the financial statements requires management to make estimates and assumptions that affect the reported amounts and disclosures in the financial statements. Actual results could differ from those estimates.
Federal Income Taxes: The operations of VCA-10 are part of, and are taxed with, the operations of PICA. Under the current provisions of the Internal Revenue Code, PICA does not expect to incur federal income taxes on earnings of VCA-10 to the extent the earnings are credited under the Contracts. As a result, the Unit Value of VCA-10 has not been reduced by federal income taxes.
| Note 3: | | Investment Management Agreement and Charges |
The Account has a management agreement with PI. Pursuant to this agreement, PI has responsibility for all investment advisory services and supervises the subadvisers’ performance of such services. PI has entered into a subadvisory agreement with Jennison Associates LLC (“Jennison”). The subadvisory agreement provides that Jennison will furnish investment advisory services in connection with the management of the Account. PI pays for the services of Jennison.
A daily charge, at an effective annual rate of up to 1.00% of the current value of the Participant’s equity in VCA-10, is charged to the Account. Up to three quarters of the charge (0.75%) paid to PICA, is for administrative expenses not provided by the annual account charge, and one quarter (0.25%), paid to PI, is for investment management services. PICA may impose a reduced Administrative Fee where warranted by economies of scale and the expense characteristics of the employer, association or trust to which Prudential has issued a Contract.
PICA, PI and Jennison are indirect, wholly-owned subsidiaries of Prudential Financial, Inc. (“Prudential”).
An annual account charge of not more than $30 is deducted from the account of each Participant, if applicable, at the time of withdrawal of the value of all of the Participant’s accounts or at the end of the fiscal year by canceling Units.
A deferred sales charge is imposed upon that portion of certain withdrawals which represents a return of contributions. The charge is designed to compensate PICA for sales and other marketing expenses. The maximum deferred sales charge is 7% on contributions withdrawn from an account during the first year of participation. After the first year of participation, the maximum deferred sales charge declines by 1% in each subsequent year until it reaches 0% after seven years. No deferred sales charge is imposed upon contributions withdrawn for any reason after seven years. Effective October 1, 2009, there is no longer a deferred sales charge on this Account. For the years ended December 31, 2009 and December 31, 2008, PICA has advised the Account that it has received deferred sales charges of $552 and $2,060 respectively, imposed upon certain withdrawals from the Account.
| Note 4: | | Purchases and Sales of Portfolio Securities |
For the year ended December 31, 2009, the aggregate cost of purchases and the proceeds from sales of securities, excluding short-term investments, were $93,556,918 and $128,230,455, respectively.
Investment in the Core Fund: The Account invests in the Taxable Money Market Series (the “Series”), a portfolio of Dryden Core Investment Fund. The Series is a money market mutual fund registered under the Investment Company Act of 1940, as amended, and managed by PI. During the year ended December 31, 2009, the Account earned $11,625, by investing its excess cash in the Series.
| Note 5: | | Unit Transactions |
The number of Accumulation Units issued and redeemed for the years ended December 31, 2009 and December 31, 2008, respectively, are as follows:
| | | | | | |
| | | Year Ended December 31,
| |
| | | 2009 | | | 2008 | |
Units issued | | 785,793 | | | 979,281 | |
Units redeemed | | (2,346,692 | ) | | (4,291,698 | ) |
Net decrease | | (1,560,899 | ) | | (3,312,417 | ) |
| Note 6: | | Net Increase (Decrease) In Net Assets Resulting from Surplus Transfers |
The increase (decrease) in net assets resulting from surplus transfers represents the net increase to/(reductions from) PICA’s investment in the Account. This increase (decrease) includes reserve adjustments for mortality and expense risks assumed by PICA.
| Note 7: | | Participant Loans |
Loans are considered to be withdrawals from the Account from which the loan amount was deducted, though they are not considered a withdrawal from the MEDLEY Program. Therefore, no deferred sales charge is imposed upon them. The principal portion of any loan repayment, however, will be treated as a contribution to the receiving Account for purposes of calculating any deferred sales charge imposed upon any subsequent withdrawal. If the Participant defaults on the loan, for example by failing to make required payments, the outstanding balance of the loan will be treated as a withdrawal for purposes of the deferred sales charge. The deferred sales charge will be withdrawn from the same Accumulation Accounts, and in the same proportions, as the loan amount was withdrawn. If sufficient funds do not remain in those Accumulation Accounts, the deferred sales charge will be withdrawn from the Participant’s other Accumulation Accounts as well.
Withdrawals, transfers and loans from VCA-10 are considered to be withdrawals of contributions until all of the Participant’s contributions to the Account have been withdrawn, transferred or borrowed. No deferred sales charge is imposed upon withdrawals of any amount in excess of contributions.
For the year ended December 31, 2009, $231,953 in participant loans were withdrawn from VCA-10 and $218,403 of principal and interest was repaid to VCA-10. For the year ended December 31, 2008, $215,460 in participant loans were withdrawn from VCA-10 and $260,400 of principal and interest was repaid to VCA-10. Loan repayments are invested in Participant’s account(s) as chosen by the Participant, which may not necessarily be VCA-10. The initial loan proceeds which are being repaid may not necessarily have originated solely from VCA-10. During the year ended December 31, 2009, PICA has advised the Account that it received $2,578 in loan origination fees. The participant loan principal and interest repayments are included in purchase payments and transfers in within the Statement of Changes in Net Assets.
| Note 8: | | New Accounting Pronouncement |
In January 2010, the Financial Accounting Standards Board (“FASB”) issued Accounting Standards Update (“ASU”) No. 2010-06 “Improving Disclosures about Fair Value Measurements”. ASU 2010-06 will require reporting entities to make new disclosures about amount and reasons for significant transfers in and out of Level 1 and Level 2 fair value measurements and input and valuation techniques used to measure fair value for both recurring and nonrecurring fair value measurements that fall in either Level 2 or Level 3, and information on purchases, sales, issuances, and settlements in the roll forward of activity in Level 3 fair value measurements. The new and revised disclosures are effective for interim and annual reporting periods beginning after December 15, 2009 except for the disclosures about purchases, sales, issuances, and settlements in the roll forward of activity in Level 3 fair value measurements, which are effective for interim and annual reporting periods beginning after December 15, 2010. At this time, management is evaluating the implications of ASU No. 2010-06 and its impact on the financial statements has not been determined.
| Note 9: | | Subsequent Events |
Management has evaluated the impact of all subsequent events on the Fund through February 25, 2010, the date the financial statements were issued, and has been determined that, except for the following, there were no subsequent events requiring recognition or disclosure in the financial statements.
REPORT OF INDEPENDENT REGISTERED PUBLIC ACCOUNTING FIRM
THE COMMITTEE AND PARTICIPANTS OF THE PRUDENTIAL VARIABLE CONTRACT ACCOUNT-10:
We have audited the accompanying statement of net assets of The Prudential Variable Contract Account-10 (the “Account”) as of December 31, 2009, and the related statement of operations for the year then ended, the statement of changes in net assets for each of the years in the two-year period then ended, and the financial highlights for each of the years in the five-year period then ended. These financial statements and financial highlights are the responsibility of the Account’s management. Our responsibility is to express an opinion on these financial statements and financial highlights based on our audits.
We conducted our audits in accordance with the standards of the Public Company Accounting Oversight Board (United States). Those standards require that we plan and perform the audit to obtain reasonable assurance about whether the financial statements and financial highlights are free of material misstatement. An audit includes examining, on a test basis, evidence supporting the amounts and disclosures in the financial statements. Our procedures included confirmation of securities owned as of December 31, 2009, by correspondence with the custodian and brokers, or by other appropriate auditing procedures where replies from brokers were not received. An audit also includes assessing the accounting principles used and significant estimates made by management, as well as evaluating the overall financial statement presentation. We believe that our audits provide a reasonable basis for our opinion.
In our opinion, the financial statements and financial highlights referred to above present fairly, in all material respects, the financial position of the Account as of December 31, 2009, and the results of its operations, the changes in its net assets and the financial highlights for the periods described in the first paragraph above, in conformity with U.S. generally accepted accounting principles.
New York, New York
February 25, 2010
| | |
The Prudential MEDLEY Program — VCA-11 Money Market Account Subadvised by: Prudential Investment Management | | December 31, 2009 |
Investment Manager’s Report - As of December 31, 2009
Average Annual Total Return Percentages
| | | | | | | | | | | | |
| | | 7-Day Current Net Yield | | | 1-Year | | | 5-Year | | | 10-Year | |
VCA-11 Money Market Acct.1 | | -0.64 | % | | -0.29 | % | | 2.52 | % | | 2.33 | % |
Citigroup 3-Month Treasury Bill Index2 | | N/A | | | 0.16 | | | 2.88 | | | 2.84 | |
Portfolio inception: 5/13/1983.
Past performance does not guarantee future returns. Portfolio performance is net of investment fees and fund expenses. The investment return and principal value of an investment will fluctuate, so that an investor’s shares, when redeemed, may be worth more or less than their original cost. Current performance may be lower or higher than the past performance data quoted.
MONEY MARKET ACCOUNT
ONE-YEAR TOTAL RETURN FOR THE
PAST 10 YEARS
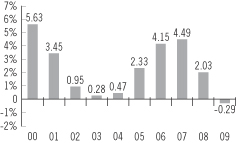
The yield quotation more closely reflects the current earnings of the Portfolio than the total return quotation.
For the year ended December 31, 2009, VCA-11 Money Market Account (the Account) declined 0.29%.
The U.S. government and the Federal Reserve took steps to steady the nation’s financial system and stimulate the economy. Both had been hurt by a protracted credit crisis. Improvement in the financial system began slowly, then accelerated as liquidity returned to the markets, boosting investor confidence. Meanwhile, key initiatives aimed at stimulating consumer spending aided the economic recovery.
Money market yields declined to historically low levels in 2009 as the Federal Open Market Committee kept its target for the overnight bank lending rate at a record low range of zero to 0.25%, and reiterated its desire for short-term rates to remain low for an extended period of time to boost economic growth. The decline in money market yields was further exacerbated by an enormous amount of cash that needed to be invested at a time when issuers were decreasing their reliance on short-term financing and issuing fewer eligible money market securities.
The Account underperformed the Citigroup Three-Month Treasury Bill Index in 2009. The unit value of the Account declined reflecting primarily the impact of fees, which are deducted directly from the assets of the Account. The 7-day current net yield more closely reflects the current earnings of the Account than the total return. On December 29, 2009, the Account’s 7-day current net yield was -0.64%, down from 0.42% on December 30, 2008.
Due to the uncertainty in the credit markets, the Account continued to employ a conservative strategy. It invested primarily in money market securities of highly rated corporate issuers, highly rated banks, and government agencies. Additionally, the Account also invested in overnight repurchase agreements, contracts in which a seller of securities agrees to buy them back the next day at a specified price. This prudent approach resulted in a high level of liquidity in the Account.
Prudential Investments LLC (PI), an indirect, wholly owned subsidiary of Prudential Financial, Inc., serves as the investment manager for the Account.
| 1. | The Account performance results are after the deduction of all expenses and contract charges, including investment management and administrative fees but not including the effect of any sales charges. All total returns are for the periods indicated and are calculated based on changes in unit values. |
| 2. | The Citigroup 3-Month Treasury Bill Index is an index whereby equal dollar amounts of three-month Treasury bills are purchased at the beginning of each of three consecutive months. As each bill matures, all proceeds are rolled over and reinvested in a new three-month bill. The income used to calculate the monthly return is derived by subtracting the original amount invested from the maturity value. |
For current yields on the Money Market Account, please call (800) 458-6333. An investment in the Account is not insured or guaranteed by the Federal Deposit Insurance Corporation or any other government agency. It is possible to lose money by investing in the Account.
For a complete list of holdings, refer to the Statement of Net Assets section of this report.
FINANCIAL STATEMENTS OF VCA-11
December 31, 2009
| | | | | | |
SHORT TERM
INVESTMENTS — 100.0% | | Principal
Amount
(000)
| | Value
(Note 2)
|
Certificates of Deposit — 31.3% | | | | | | |
Bank of America, NA
0.35%, 1/28/2010 | | $ | 2,000 | | $ | 2,000,000 |
Bank of Tokyo-Mitsubishi UFJ, Ltd.
0.24%, 2/17/2010 | | | 2,000 | | | 2,000,000 |
BNP Paribas
0.24%, 1/15/2010 | | | 1,000 | | | 1,000,000 |
0.71%, 3/18/2010 | | | 1,000 | | | 1,000,000 |
Chase Bank USA, NA
0.19%, 2/10/2010 | | | 2,000 | | | 2,000,000 |
Royal Bank of Scotland
0.833%, 1/19/2010(b) | | | 1,500 | | | 1,500,000 |
State Street Bank & Trust Co.
0.21%, 2/12/2010 | | | 2,000 | | | 2,000,000 |
Sumitomo Mitsui Banking Corp./New York
0.21%, 1/15/2010 | | | 2,000 | | | 2,000,000 |
UBS AG
0.66%, 1/29/2010 | | | 2,000 | | | 2,000,000 |
| | | | | |
|
|
| | | | | | | 15,500,000 |
| | | | | |
|
|
Commercial Paper — 43.2% | | | | | | |
Banco Bilbao Vizcaya Argentaria SA, 144A(a)
0.35%, 5/20/2010 | | | 1,000 | | | 998,648 |
BPCE SA, 144A(a)
0.27%, 2/16/2010 | | | 2,000 | | | 1,999,310 |
DNB Norbank ASA, 144A(a)
0.33%, 3/10/2010 | | | 2,172 | | | 2,170,646 |
E.ON AG, 144A(a)
0.25%, 1/12/2010 | | | 1,000 | | | 999,924 |
0.27%, 1/19/2010 | | | 1,000 | | | 999,865 |
GDF Suez, 144A(a)
0.20%, 1/13/2010 | | | 1,000 | | | 999,937 |
Prudential PLC, 144A(a)
0.25%, 2/1/2010 | | | 1,000 | | | 999,785 |
RaboBank USA Financial Corp.(a)
0.31%, 2/18/2010 | | | 2,500 | | | 2,498,967 |
Societe Generale North America, Inc.(a)
0.24%, 2/5/2010 | | | 1,250 | | | 1,249,708 |
0.25%, 4/1/2010 | | | 1,000 | | | 999,375 |
Straight-A Funding LLC, 144A(a)
0.20%, 2/1/2010 | | | 1,000 | | | 999,828 |
0.20%, 2/8/2010 | | | 1,000 | | | 999,789 |
SwedBank AB, 144A(a) (Guaranteed by the Kingdom of Sweden)
0.85%, 2/11/2010 | | | 1,500 | | | 1,498,548 |
0.82%, 2/17/2010 | | | 1,000 | | | 998,929 |
Total Capital Canada, Ltd., 144A(a)
0.00%, 1/14/2010 | | | 1,000 | | | 999,928 |
Unicredit Delaware, Inc., 144A(a)
0.32%, 1/14/2010 | | | 1,000 | | | 999,884 |
US Bancorp(a)
0.17%, 3/22/2010 | | | 1,000 | | | 999,622 |
| | | | | |
|
|
| | | | | | | 21,412,693 |
| | | | | |
|
|
| | | | | | |
SHORT TERM INVESTMENTS (continued) | | Principal
Amount
(000)
| | Value
(Note 2)
| |
Other Corporate Obligations — 14.1% | | | | | | |
Bank of America NA Gtd.(b)(c)
0.331%, 1/29/2010 | | 1,000 | | | 1,000,000 | |
Barclays Bank PLC NY
0.482%, 1/19/2010(b) | | 1,000 | | | 1,000,000 | |
Citigroup Funding Inc.,MTN(b)(c)
0.381%, 1/29/2010 | | 1,000 | | | 1,000,000 | |
Goldman Sachs Group, MTN
0.40%, 2/3/2010 | | 1,000 | | | 1,000,000 | |
Morgan Stanley, MTN
0.374%, 1/15/2010(b) | | 1,129 | | | 1,128,989 | |
4.00%, 1/15/2010 | | 1,000 | | | 1,001,360 | |
National Australia Bank, Ltd., MTN, 144A(b)
0.725%, 2/8/2010 | | 300 | | | 300,000 | |
Westpac Banking Corp., MTN, 144A(b)
0.532%, 1/25/2010 | | 565 | | | 565,000 | |
| | | | |
|
|
|
| | | | | | 6,995,349 | |
| | | | |
|
|
|
US Government Agencies — 10.1% | | | | | | |
Fannie Mae
0.174%, 1/13/2010(b) | | 2,000 | | | 1,999,287 | |
Federal Home Loan Bank
0.183%, 1/19/2010(b) | | 1,000 | | | 999,901 | |
Freddie Mac
0.242%, 2/24/2010(b) | | 1,000 | | | 999,875 | |
0.219%, 3/24/2010(b) | | 1,000 | | | 999,855 | |
| | | | |
|
|
|
| | | | | | 4,998,918 | |
| | | | |
|
|
|
Repurchase Agreement(d) — 1.3% | | | | | | |
Bank of America Securities, LLC
0.03%, dated 12/31/2009, due 1/4/2010 in the amount of $643,002 (cost $643,000; the value of the collateral including accrued interest was $655,861) | | 643 | | | 643,000 | |
| | | | |
|
|
|
TOTAL INVESTMENTS — 100.0%
(Cost: $49,549,960) | | | | $ | 49,549,960 | |
| | | | |
|
|
|
OTHER ASSETS, LESS LIABILITIES | | | | | | |
Interest Receivable | | | | $ | 36,892 | |
Cash | | | | | 17 | |
Payable for Pending Capital Transactions | | | | | (26,985 | ) |
| | | | |
|
|
|
OTHER LIABILITIES IN EXCESS OF ASSETS | | | | | 9,924 | |
| | | | |
|
|
|
NET ASSETS — 100% | | | | $ | 49,559,884 | |
| | | | |
|
|
|
NET ASSETS, representing: | | | | | | |
Equity of Participants —
14,777,411 Accumulation Units at an Accumulation Value of 3.3520 | | | | $ | 49,534,614 | |
Equity of The Prudential Insurance Company of America | | | | | 25,270 | |
| | | | |
|
|
|
| | | | | $ | 49,559,884 | |
| | | | |
|
|
|
SEE NOTES TO FINANCIAL STATEMENTS.
FINANCIAL STATEMENTS OF VCA-11
December 31, 2009
| | |
| 144A | | Security was purchased pursuant to Rule 144A under the Act of 1933 and may not be resold subject to that rule except to qualified institutional buyers. Unless otherwise noted, 144A securities are deemed to be liquid. |
| MTN | | Medium Term Note |
| (a) | Percentage quoted represents yield-to-maturity as of the purchase date. |
| (b) | Indicates a variable rate instrument. The maturity date presented for these instruments is the later of the next date on which the security can be redeemed at par or the next date on which the rate of interest is adjusted. The interest rate shown reflects the rate in effect is as of December 31, 2009. |
| (c) | FDIC-Guarantee issued under temporary liquidity guarantee program. |
| (d) | Repurchase agreement is collateralized by federal agency obligations. |
Various inputs are used in determining the value of the Account’s investments. These inputs are summarized in the three broad levels listed below.
Level 1—quoted prices in active markets for identical securities
Level 2—other significant observable inputs (including quoted prices for similar securities, interest rates, prepayment speeds, credit risk, etc.)
Level 3—significant unobservable inputs (including the Account's own assumptions in determining the fair value of investments)
The following is a summary of the inputs used as of December 31, 2009 in valuing the Account’s assets carried at fair value:
| | | | | | | | | |
Investments in Securities
| | Level 1
| | Level 2
| | Level 3
|
Certificates of Deposit | | $ | — | | $ | 15,500,000 | | $ | — |
Commercial Paper | | | — | | | 21,412,693 | | | — |
Other Corporate Obligations | | | — | | | 6,995,349 | | | — |
Repurchase Agreements | | | — | | | 643,000 | | | — |
US Government Agencies | | | — | | | 4,998,918 | | | — |
| | |
|
| |
|
| |
|
|
| | | | — | | | 49,549,960 | | | — |
Other Financial Instruments* | | | — | | | — | | | — |
| | |
|
| |
|
| |
|
|
Total | | $ | — | | $ | 49,549,960 | | $ | — |
| | |
|
| |
|
| |
|
|
| * | Other financial instruments are derivative instruments not reflected in the Statement of Net Assets, such as futures, forwards and swap contracts, which are valued at the unrealized appreciation/depreciation on the instrument. |
As of December 31, 2008 and December 31, 2009, the Account did not use any significant unobservable inputs (Level 3) in determining the value of investments.
The industry classification of portfolio holdings and other assets in excess of liabilities shown as a percentage on net assets as of December 31, 2009 were as follows:
| | | |
Commercial Paper | | 43.2 | % |
Certificates of Deposit | | 31.3 | |
Other Corporate Obligations | | 14.1 | |
US Government Agencies | | 10.1 | |
Repurchase Agreement | | 1.3 | |
| | |
|
|
| | | 100.0 | |
Other assets in excess of liabilities | | 0.0 | |
| | |
|
|
| | | 100.0 | % |
| | |
|
|
SEE NOTES TO FINANCIAL STATEMENTS.
FINANCIAL STATEMENTS OF VCA-11
Year Ended December 31, 2009
| | | | |
| | | | |
INVESTMENT INCOME | | | | |
Unaffiliated Interest Income | | $ | 379,366 | |
Total | | | 379,366 | |
EXPENSES | | | | |
Fees Charged to Participants for Investment Management Services | | | (131,382 | ) |
Fees Charged to Participants for Administrative Expenses | | | (397,372 | ) |
Total Expenses | | | (528,754 | ) |
NET INVESTMENT LOSS | | | (149,388 | ) |
Realized Gain on Investment Transactions | | | 3,705 | |
NET DECREASE IN NET ASSETS FROM OPERATIONS | | $ | (145,683 | ) |
| | | | | | |
| | | STATEMENT OF CHANGES IN NET ASSETS | | |
| | | | | | | | |
| | | Year Ended December 31,
| |
| | | 2009 | | | 2008 | |
OPERATIONS | | | | | | | | |
Net Investment Income (Loss) | | $ | (149,388 | ) | | $ | 1,134,677 | |
Net Realized Gain on Investment Transactions | | | 3,705 | | | | 4,786 | |
NET INCREASE (DECREASE) IN NET ASSETS RESULTING FROM OPERATIONS | | | (145,683 | ) | | | 1,139,463 | |
CAPITAL TRANSACTIONS | | | | | | | | |
Purchase Payments and Transfers In | | | 7,058,635 | | | | 12,925,119 | |
Withdrawals and Transfers Out | | | (13,612,962 | ) | | | (12,465,465 | ) |
Annual Account Charges Deducted from Participants’ Accounts | | | (24,191 | ) | | | (27,772 | ) |
NET INCREASE (DECREASE) IN NET ASSETS RESULTING FROM CAPITAL TRANSACTIONS | | | (6,578,518 | ) | | | 431,882 | |
NET DECREASE IN NET ASSETS RESULTING FROM SURPLUS TRANSFERS | | | (48,332 | ) | | | (648,067 | ) |
TOTAL INCREASE (DECREASE) IN NET ASSETS | | | (6,772,533 | ) | | | 923,278 | |
NET ASSETS | | | | | | | | |
Beginning of year | | | 56,332,417 | | | | 55,409,139 | |
End of year | | $ | 49,559,884 | | | $ | 56,332,417 | |
SEE NOTES TO FINANCIAL STATEMENTS.
FINANCIAL HIGHLIGHTS FOR VCA-11
| | | | | | |
| | | INCOME PER ACCUMULATION UNIT* | | |
(For an Accumulation Unit outstanding throughout the year)
| | | | | | | | | | | | | | | | | | | | |
| | | Year Ended December 31,
| |
| | | 2009 | | | 2008 | | | 2007 | | | 2006 | | | 2005 | |
Investment Income | | $ | .0239 | | | $ | .1010 | | | $ | .1735 | | | $ | .1561 | | | $ | .0985 | |
Expenses | | | | | | | | | | | | | | | | | | | | |
Investment management fee | | | (.0084 | ) | | | (.0083 | ) | | | (.0080 | ) | | | (.0077 | ) | | | (.0071 | ) |
Administrative expenses | | | (.0251 | ) | | | (.0250 | ) | | | (.0235 | ) | | | (.0228 | ) | | | (.0223 | ) |
Net Increase (Decrease) in Accumulation Unit Value | | | (.0096 | ) | | | .0677 | | | | .1420 | | | | .1256 | | | | .0691 | |
Accumulation Unit Value | | | | | | | | | | | | | | | | | | | | |
Beginning of year | | | 3.3616 | | | | 3.2939 | | | | 3.1519 | | | | 3.0263 | | | | 2.9572 | |
End of year | | $ | 3.3520 | | | $ | 3.3616 | | | $ | 3.2939 | | | $ | 3.1519 | | | $ | 3.0263 | |
Total Return** | | | (.29 | )% | | | 2.06 | % | | | 4.51 | % | | | 4.15 | % | | | 2.33 | % |
Ratio Of Expenses To Average Net Assets*** | | | 1.00 | % | | | 1.00 | % | | | 1.00 | % | | | 1.00 | % | | | 1.00 | % |
Ratio Of Net Investment Income (Loss) To Average Net Assets*** | | | (.30 | )% | | | 2.00 | % | | | 4.39 | % | | | 4.06 | % | | | 2.30 | % |
Number of Accumulation Units Outstanding
For Participants at end of year (000’s omitted) | | | 14,777 | | | | 16,736 | | | | 16,560 | | | | 18,183 | | | | 20,822 | |
| * | Calculated by accumulating the actual per unit amounts daily. |
| ** | Total return does not consider the effects of sales loads. Total return is calculated assuming a purchase of a share on the first day and a sale on the last day of each year reported. Total returns may reflect adjustments to conform to generally accepted accounting principles. |
| *** | These calculations exclude PICA’s equity in VCA-11. |
The above table does not reflect the annual administration charge, which does not affect the Accumulation Unit Value. This charge is made by reducing Participants’ Accumulation Accounts by a number of Units equal in value to the charge.
SEE NOTES TO FINANCIAL STATEMENTS.
NOTES TO THE FINANCIAL STATEMENTS OF
VCA-11
The Prudential Variable Contract Account-11 (VCA-11 or the Account) was established on March 1, 1982 by The Prudential Insurance Company of America (“PICA”) under the laws of the State of New Jersey and is registered as an open-end, diversified management investment company under the Investment Company Act of 1940, as amended. VCA-11 has been designed for use by employers (Contract-holders) in making retirement arrangements on behalf of their employees (Participants). The investment objective of the Account is to realize a high level of current income as is consistent with the preservation of capital and liquidity. Its investments are primarily composed of short-term securities. The ability of the issuers of the securities held by the Account to meet their obligations may be affected by economic developments in a specific state, industry or region. Although variable annuity payments differ according to the investment performance of the Account, they are not affected by mortality or expense experience because PICA assumes the expense risk and the mortality risk under the contracts.
| Note 2: | | Summary of Significant Accounting Policies |
Securities Valuation: Portfolio securities of VCA-11 are valued at amortized cost, which approximates fair value. The amortized cost method involves valuing a security at its cost on the date of purchase and thereafter assuming a constant amortization to maturity of any discount or premium. If the amortized cost method is determined not to represent fair value, the fair value shall be determined by or under the direction of the Accounts’ Committee Members.
Securities Transactions and Net Investment Income: Securities transactions are recorded on the trade date. Realized gains or losses from security transactions are calculated on the identified cost basis. Interest income is recorded on the accrual basis. Net investment income (other than administration fees) is allocated to the Participants and PICA on a daily basis in proportion to their respective ownership or investment in VCA-11.
Estimates: The preparation of the financial statements requires management to make estimates and assumptions that affect the reported amounts and disclosures in the financial statements. Actual results could differ from those amounts.
Federal Income Taxes: The operations of VCA-11 are part of, and are taxed with, the operations of PICA. Under the current provisions of the Internal Revenue Code, PICA does not expect to incur federal income taxes on earnings of VCA-11 to the extent the earnings are credited under the Contracts. As a result, the Unit Value of VCA-11 has not been reduced by federal income taxes.
Repurchase Agreements: In connection with transactions in repurchase agreements with United States financial institutions, it is the Account’s policy that its custodian or designated subcustodians under triparty repurchase agreements, as the case may be, take possession of the underlying collateral securities, the value of which exceeds the principal amount of the repurchase transaction, including accrued interest. To the extent that any repurchase agreement exceeds one business day, the value of collateral is marked-to-market on a daily basis to ensure adequacy of the collateral. If the seller defaults and the value of the collateral declines or if bankruptcy proceedings are commenced with respect to the seller of the security, realization of the collateral by the Account may be delayed or limited.
| Note 3: | | Investment Management Agreement and Charges |
The Account has a management agreement with Prudential Investments LLC (“PI”). Pursuant to this agreement, PI has responsibility for all investment advisory services and supervises the subadvisers’ performance of such services. PI has entered into a subadvisory agreement with Prudential Investment Management, Inc. (“PIM”). The subadvisory agreement provides that PIM will furnish investment advisory services in connection with management of the Account. PI pays for the services of PIM.
A daily charge, at an effective annual rate of up to 1.00% of the current value of the Participant’s equity in VCA-11, is charged to the Account. Up to three quarters of the charge (0.75%), paid to PICA, is for administrative expenses not provided by the annual account charge, and one quarter (0.25%), paid to PI, is for investment management services. PICA may impose a reduced Administrative Fee where warranted by
economies of scale and the expense characteristics of the employer, association or trust to which PICA has issued a contract.
PICA, PI and PIM are indirect, wholly-owned subsidiaries of Prudential Financial, Inc. (“Prudential”).
An annual account charge of not more than $30 is deducted from the account of each Participant, if applicable, at the time of withdrawal of the value of all of the Participant’s accounts or at the end of the fiscal year by cancelling Units.
A deferred sales charge is imposed upon that portion of certain withdrawals which represents a return of contributions. The charge is designed to compensate PICA for sales and other marketing expenses. The maximum deferred sales charge is 7% on contributions withdrawn from an account during the first year of participation. After the first year of participation, the maximum deferred sales charge declines by 1% in each subsequent year until it reaches 0% after seven years. No deferred sales charge is imposed upon contributions withdrawn for any reason after seven years. Effective October 1, 2009, there is no longer a deferred sales charge on this Account. For the years ended December 31, 2009 and December 31, 2008, PICA has advised the Account that it received deferred sales charges of $862 and $2,484, respectively, imposed upon certain withdrawals from the Account, respectively.
| Note 4: | | Unit Transactions |
The number of Accumulation Units issued and redeemed for the years ended December 31, 2009 and December 31, 2008, are as follows:
| | | | | | |
| | | Year Ended December 31,
| |
| | | 2009 | | | 2008 | |
Units issued | | 2,100,106 | | | 3,923,407 | |
Units redeemed | | (4,058,934 | ) | | (3,746,725 | ) |
Net Increase (Decrease) | | (1,958,828 | ) | | 176,682 | |
| Note 5: | | Net Increase (Decrease) In Net Assets Resulting From Surplus Transfers |
The increase (decrease) in net assets from surplus transfers represents the net increases to/(reductions from) PICA’s investment in the Account. This increase (decrease) includes reserve adjustments for mortality and expense risks assumed by PICA.
| Note 6: | | Participant Loans |
Loans are considered to be withdrawals from the Account from which the loan amount was deducted, though they are not considered a withdrawal from the MEDLEY Program. Therefore, no deferred sales charge is imposed upon them. The principal portion of any loan repayment, however, will be treated as a contribution to the receiving Account for purposes of calculating any deferred sales charge imposed upon any subsequent withdrawal. If the Participant defaults on the loan, for example by failing to make required payments, the outstanding balance of the loan will be treated as a withdrawal for purposes of the deferred sales charge. The deferred sales charge will be withdrawn from the same Accumulation Accounts, and in the same proportions, as the loan amount was withdrawn. If sufficient funds do not remain in those Accumulation Accounts, the deferred sales charge will be withdrawn from the Participant’s other Accumulation Accounts as well.
Withdrawals, transfers and loans from VCA-11 are considered to be withdrawals of contributions until all of the Participant’s contributions to the Account have been withdrawn, transferred or borrowed. No deferred sales charge is imposed upon withdrawals of any amount in excess of contributions.
For the year ended December 31, 2009, $195,772 in participant loans were withdrawn from VCA-11 and $128,388 of principal and interest was repaid to VCA-11. For the year ended December 31, 2008, $267,555 in participant loans were withdrawn from VCA-11 and $118,451 of principal and interest was repaid to VCA-11. Loan repayments are invested in Participant’s account(s) as chosen by the Participant, which may not necessarily be VCA-11. The initial loan proceeds which are being repaid may not necessarily have originated solely from VCA-11. During the year ended December 31, 2009, PICA has advised the Account that it received $3,006 in loan origination fees. The participant loan principal and interest repayments are included in purchase payments and transfers in within the Statement of Changes in Net Assets.
| Note 7: | | New Accounting Pronouncement |
In January 2010, the Financial Accounting Standards Board (“FASB”) issued Accounting Standards Update (“ASU”) No. 2010-06 “Improving Disclosures about Fair Value Measurements”. ASU 2010-06 will require reporting entities to make new disclosures about amount and reasons for significant transfers in and out of Level 1 and Level 2 fair value measurements and input and valuation techniques used to measure fair value for both recurring and nonrecurring fair value measurements that fall in either Level 2 or Level 3, and information on purchases, sales, issuances, and settlements in the roll forward of activity in Level 3 fair value measurements. The new and revised disclosures are effective for interim and annual reporting periods beginning after December 15, 2009 except for the disclosures about purchases, sales, issuances, and settlements in the roll forward of activity in Level 3 fair value measurements, which are effective for interim and annual reporting periods beginning after December 15, 2010. At this time, management is evaluating the implications of ASU No. 2010-06 and its impact on the financial statements has not been determined.
| Note 8: | | Subsequent Events |
Management has evaluated the impact of all subsequent events on the Fund through February 25, 2010, the date the financial statements were issued, and has been determined that, except for the following, there were no subsequent events requiring recognition or disclosure in the financial statements.
REPORT OF INDEPENDENT REGISTERED PUBLIC ACCOUNTING FIRM
THE COMMITTEE AND PARTICIPANTS OF THE PRUDENTIAL VARIABLE CONTRACT ACCOUNT-11:
We have audited the accompanying statement of net assets of The Prudential Variable Contract Account-11 (the “Account”) as of December 31, 2009, and the related statement of operations for the year then ended, the statement of changes in net assets for each of the years in the two-year period then ended, and the financial highlights for each of the years in the five-year period then ended. These financial statements and financial highlights are the responsibility of the Account’s management. Our responsibility is to express an opinion on these financial statements and financial highlights based on our audits.
We conducted our audits in accordance with the standards of the Public Company Accounting Oversight Board (United States). Those standards require that we plan and perform the audit to obtain reasonable assurance about whether the financial statements and financial highlights are free of material misstatement. An audit includes examining, on a test basis, evidence supporting the amounts and disclosures in the financial statements. Our procedures included confirmation of securities owned as of December 31, 2009, by correspondence with the custodian and brokers. An audit also includes assessing the accounting principles used and significant estimates made by management, as well as evaluating the overall financial statement presentation. We believe that our audits provide a reasonable basis for our opinion.
In our opinion, the financial statements and financial highlights referred to above present fairly, in all material respects, the financial position of the Account as of December 31, 2009, and the results of its operations, the changes in its net assets and the financial highlights for the periods described in the first paragraph above, in conformity with U.S. generally accepted accounting principles.
New York, New York
February 25, 2010
MANAGEMENT OF VCA 10 AND VCA 11 (Unaudited)
VCA 10 and VCA 11 are managed by The Prudential Variable Contract Account 10 Committee and The Prudential Variable Contract Account 11 Committees (the VCA Committees). The members of the VCA Committees are elected by the persons having voting rights in respect of the VCA 10 Account and the VCA 11 Account. The affairs of the Accounts are conducted in accordance with the Rules and Regulations of the Accounts.
Information pertaining to the Committee Members of VCA 10 and VCA 11 (hereafter referred to as Board Members) is set forth below. Board Members who are not deemed to be “interested persons” of VCA 10 and VCA 11 as defined in the 1940 Act, as amended (the Investment Company Act or the 1940 Act) are referred to as “Independent Board Members.” Board Members who are deemed to be “interested persons” of VCA 10 and VCA 11 are referred to as “Interested Board Members.” “Fund Complex” consists of VCA 10 and VCA 11 and any other investment companies managed by PI. VCA 10 and VCA 11 are also referred to as “Funds.”
| | | | |
Independent Board Members (1) | | | | |
Name, Address, Age Position(s) Portfolios Overseen | | Principal Occupation(s) During Past Five Years | | Other Directorships Held |
Kevin J. Bannon (57) Board Member Portfolios Overseen: 57 | | Managing Director (since April 2008) and Chief Investment Officer (since October 2008) of Highmount Capital LLC (registered investment adviser); formerly Executive Vice President and Chief Investment Officer (April 1993-August 2007) of Bank of New York Company; President (May 2003-May 2007) of BNY Hamilton Family of Mutual Funds. | | Director of Urstadt Biddle Properties (since September 2008). |
| | | |
Linda W. Bynoe (57) Board Member Portfolios Overseen: 57 | | President and Chief Executive Officer (since March 1995) of Telemat Ltd. (management consulting); formerly Vice President at Morgan Stanley & Co (broker-dealer). | | Director of Simon Property Group, Inc. (retail real estate) (since May 2003); Anixter International (communication products distributor) (since January 2006); Director of Northern Trust Corporation (financial services) (since April 2006); Director of Equity Residential (residential real estate) (since December 2009); formerly Director of Dynegy Inc. (power generation) (September 2002-May 2006), CitiStreet Funds, Inc (mutual funds) (May 1993-February 2005), AM- CH, Inc. (restaurant holding company) (November 2004-February 2005). |
| | | |
Michael S. Hyland, CFA (64) Board Member Portfolios Overseen: 57 | | Independent Consultant (since February 2005); formerly Senior Managing Director (July 2001-February 2005) of Bear Stearns & Co, Inc.; Global Partner, INVESCO (1999-2001); Managing Director and President Salomon Brothers Asset Management (1989-1999). | | None. |
| | | |
Douglas H. McCorkindale (70) Board Member Portfolios Overseen: 57 | | Formerly Chairman (February 2001-June 2006), Chief Executive Officer (June 2000-July 2005), President (September 1997-July 2005) and Vice Chairman (March 1984-May 2000) of Gannett Co. Inc. (publishing and media). | | Director of Continental Airlines, Inc. (since May 1993); Director of Lockheed Martin Corp. (aerospace and defense) (since May 2001). |
| | | |
Stephen P. Munn (67) Board Member Portfolios Overseen: 57 | | Lead Director (since 2007) and formerly Chairman (1993-2007) of Carlisle Companies Incorporated (manufacturer of industrial products). | | None. |
| | | |
Richard A. Redeker (66) Board Member Portfolios Overseen: 57 | | Retired Mutual Fund Executive (36 years); Management Consultant; Director of Penn Tank Lines, Inc. (since 1999). | | None. |
| | | |
Robin B. Smith (70) Board Member & Independent Chair Portfolios Overseen: 57 | | Chairman of the Board (since January 2003) of Publishers Clearing House (direct marketing); formerly Chairman and Chief Executive Officer (August 1996-January 2003) of Publishers Clearing House. | | Formerly Director of BellSouth Corporation (telecommunications) (1992-2006). |
| | | |
Stephen G. Stoneburn (66) Board Member Portfolios Overseen: 57 | | President and Chief Executive Officer (since June 1996) of Quadrant Media Corp. (publishing company); formerly President (June 1995- June 1996) of Argus Integrated Media, Inc.; Senior Vice President and Managing Director (January 1993-1995) of Cowles Business Media; Senior Vice President of Fairchild Publications, Inc (1975-1989). | | None. |
| | | | |
Interested Board Member (1) | | | | |
Judy A. Rice (62) Board Member & President Portfolios Overseen: 57 | | President, Chief Executive Officer, Chief Operating Officer and Officer-In-Charge (since February 2003) of Prudential Investments LLC; President, Chief Executive Officer and Officer-In-Charge (since April 2003) of Prudential Mutual Fund Services LLC; Executive Vice President (since December 2008) of Prudential Investment Management Services LLC; formerly Vice President (February 1999- April 2006) of Prudential Investment Management Services LLC; formerly President, Chief Executive Officer, Chief Operating Officer and Officer-In-Charge (May 2003-June 2005) and Director (May 2003-March 2006) and Executive Vice President (June 2005-March 2006) of AST Investment Services, Inc.; Member of Board of Governors of the Investment Company Institute. | | None. |
| (1) | The year in which each individual joined the Fund’s Board is as follows: Kevin J. Bannon, 2008; Linda W. Bynoe, 2005; Michael S. Hyland, 2008; Douglas H. McCorkindale, 2003, Stephen P. Munn, 2008; Richard A. Redeker, 2003; Robin B. Smith, 2003; Stephen G. Stoneburn, 2003; Kevin J. Bannon, 2008; Michael S. Hyland, 2008; Stephen P. Munn, 2008; Judy A. Rice, Board Member and President since 2003. |
| | |
Fund Officers (a)(1) | | |
Name, Address and Age Position with Fund | | Principal Occupation(s) During Past Five Years |
Scott E. Benjamin (36) Vice President | | Executive Vice President (since June 2009) of Prudential Investments LLC and Prudential Investment Management Services LLC; Senior Vice President Product Development and Marketing, Prudential Investments (since February 2006); Vice President Product Development and Product Management, Prudential Investments (2003-2006). |
| | |
Kathryn L. Quirk (57) Chief Legal Officer | | Vice President and Corporate Counsel (since September 2004) of Prudential; Executive Vice President, Chief Legal Officer and Secretary (since July 2005) of PI and Prudential Mutual Fund Services LLC; Vice President and Corporate Counsel (since June 2005) and Secretary (since February 2006) of AST Investment Services, Inc.; formerly Senior Vice President and Assistant Secretary (November 2004-August 2005) of PI; formerly Assistant Secretary (June 2005-February 2006) of AST Investment Services, Inc.; formerly Managing Director, General Counsel, Chief Compliance Officer, Chief Risk Officer and Corporate Secretary (1997-2002) of Zurich Scudder Investments, Inc. |
| | |
Deborah A. Docs (52) Secretary | | Vice President and Corporate Counsel (since January 2001) of Prudential; Vice President (since December 1996) and Assistant Secretary (since March 1999) of PI; formerly Vice President and Assistant Secretary (May 2003-June 2005) of AST Investment Services, Inc. |
| | |
Jonathan D. Shain (51) Assistant Secretary | | Vice President and Corporate Counsel (since August 1998) of Prudential; Vice President and Assistant Secretary (since May 2001) of PI; Vice President and Assistant Secretary (since February 2001) of PMFS; formerly Vice President and Assistant Secretary (May 2003-June 2005) of AST Investment Services, Inc. |
| | |
Claudia DiGiacomo (35) Assistant Secretary | | Vice President and Corporate Counsel (since January 2005) of Prudential; Vice President and Assistant Secretary of PI (since December 2005); Associate at Sidley Austin Brown & Wood LLP (1999-2004). |
| | |
John P. Schwartz (38) Assistant Secretary | | Vice President and Corporate Counsel (since April 2005) of Prudential; Vice President and Assistant Secretary of PI (since December 2005); Associate at Sidley Austin Brown & Wood LLP (1997-2005). |
| | |
Andrew R. French (47) Assistant Secretary | | Vice President and Corporate Counsel (since February 2010) of Prudential; formerly Director and Corporate Counsel (2006-2010) of Prudential; Vice President and Assistant Secretary (since January 2007) of PI; Vice President and Assistant Secretary (since January 2007) of PMFS; formerly Senior Legal Analyst of Prudential Mutual Fund Law Department (1997-2006). |
| | |
Timothy J. Knierim (51) Chief Compliance Officer | | Chief Compliance Officer of Prudential Investment Management, Inc. (since July 2007); formerly Chief Risk Officer of PIM and PI (2002-2007) and formerly Chief Ethics Officer of PIM and PI (2006-2007). |
| | |
Valerie M. Simpson (51) Deputy Chief Compliance Officer | | Chief Compliance Officer (since April 2007) of PI and AST Investment Services, Inc.; formerly Vice President-Financial Reporting (June 1999-March 2006) for Prudential Life and Annuities Finance. |
| | |
Theresa C. Thompson (47) Deputy Chief Compliance Officer | | Vice President, Compliance, PI (since April 2004); and Director, Compliance, PI (2001-2004). |
| | |
Noreen M. Fierro (45) Anti-Money Laundering Compliance Officer | | Vice President, Corporate Compliance (since May 2006) of Prudential; formerly Corporate Vice President, Associate General Counsel (April 2002-May 2005) of UBS Financial Services, Inc., in their Money Laundering Prevention Group; Senior Manager (May 2005-May 2006) of Deloitte Financial Advisory Services, LLP, in their Forensic and Dispute Services, Anti-Money Laundering Group. |
| | |
Grace C. Torres (50) Treasurer and Principal Financial and Accounting Officer | | Assistant Treasurer (since March 1999) and Senior Vice President (since September 1999) of PI; Assistant Treasurer (since May 2003) and Vice President (since June 2005) of AST Investment Services, Inc.; Senior Vice President and Assistant Treasurer (since May 2003) of Prudential Annuities Advisory Services, Inc.; formerly Senior Vice President (May 2003-June 2005) of AST Investment Services, Inc. |
| | |
M. Sadiq Peshimam (46) Assistant Treasurer | | Vice President (since 2005) of Prudential Investments LLC. |
| | |
Peter Parrella (51) Assistant Treasurer | | Vice President (since 2007) and Director (2004-2007) within Prudential Mutual Fund Administration; formerly Tax Manager at SSB Citi Fund Management LLC (1997-2004). |
| (a) | Excludes Ms. Rice, an interested Board Member who also serves as President. |
| (1) | The year that each individual became a Fund officer is as follows: Scott E. Benjamin, 2009; Kathryn L. Quirk, 2005; Deborah A. Docs, 2005; Jonathan D. Shain, 2005; Claudia DiGiacomo, 2005; John P. Schwartz, 2006; Andrew R. French, 2006; Timothy J. Knierim, 2007; Grace C. Torres, 1997; Valerie Simpson, 2007; Peter Parrella, 2007, M. Sadiq Peshimam, 2006; Noreen M. Fierro, 2006; Theresa C. Thompson, 2008. |
Explanatory Notes to Tables:
| • | | Board Members are deemed to be “Interested,” as defined in the 1940 Act, by reason of their affiliation with Prudential Investments LLC and/or an affiliate of Prudential Investments LLC. |
| • | | Unless otherwise noted, the address of all Board Members and Officers is c/o Prudential Investments LLC, Gateway Center Three, 100 Mulberry Street, Newark, New Jersey 07102-4077. |
| • | | There is no set term of office for Board Members or Officers. The Board Members have adopted a retirement policy, which calls for the retirement of Board Members on December 31 of the year in which they reach the age of 75. |
| • | | “Other Directorships Held” includes only directorships of companies required to register or file reports with the Commission under the Securities Exchange Act of 1934, as amended (the “Exchange Act”) (that is, “public companies”) or other investment companies registered under the 1940 Act. |
| • | | “Portfolios Overseen” includes all investment companies managed by Prudential Investments LLC. The investment companies for which PI serves as manager include the Prudential Investments Mutual Funds, The Prudential Variable Contract Accounts, Target Mutual Funds, The Prudential Series Fund, Prudential’s Gibraltar Fund, Inc. and the Advanced Series Trust. |
The Prudential Series Fund
The following pages represent information on the Prudential Series Fund Portfolios. Returns are at the Portfolio level, not at the Subaccount level.
Each Subaccount of VCA-24 will invest in the corresponding portfolio of the Prudential Series Fund (the “Fund”). Of the portfolios comprising the Fund, seven portfolios are presently available to The MEDLEY Program. The Diversified Bond Subaccount invests in the Diversified Bond Portfolio, the Government Income Subaccount in the Government Income Portfolio, the Conservative Balanced Subaccount in the Conservative Balanced Portfolio, the Flexible Managed Subaccount in the Flexible Managed Portfolio, the Stock Index Subaccount in the Stock Index Portfolio, the Equity Subaccount invests in the Equity Portfolio, and the Global Subaccount in the Global Portfolio.
There is no assurance that the investment objective of the portfolios will be attained, nor is there any guarantee that the amount available to a Participant will equal or exceed the total contributions made on that Participant’s behalf. The value of the investments held in each account may fluctuate daily and is subject to the risks of both changing economic conditions and the selection of investments necessary to meet the Subaccounts’ or Portfolios’ objectives.
Important Note
This information supplements the financial statements and other information included in this Report to Participants in The MEDLEY Program. It highlights the investment performance of the seven portfolios of the Prudential Series Fund which are available through the Prudential Variable Contract Account-24. The rates of return quoted on the following pages reflect deduction of investment management fees and portfolio expenses, but not product charges. They reflect the reinvestment of dividend and capital gains distributions. They are not an estimate or a guarantee of future performance.
Contract unit values increase or decrease based on the performance of the portfolio and when redeemed, may be worth more or less than original cost. Changes in contract values depend not only on the investment performance of the Portfolio but also on the insurance, administrative charges and applicable sales charges, if any, under a contract. These contract charges effectively reduce the dollar amount of any net gains and increase the dollar amount of any net losses.
| | |
The Prudential Series Fund, Conservative Balanced Portfolio Subadvised by: Prudential Investment Management, Inc., Quantitative Management Associates LLC | | December 31, 2009 |
Investment Manager’s Report - As of December 31, 2009
Average Annual Total Return Percentages
| | | | | | | | | |
| | | 1-Year | | | 5-Year | | | 10-Year | |
Portfolio | | 20.01 | % | | 2.72 | % | | 2.68 | % |
Blended Index | | 15.72 | | | 2.77 | | | 2.63 | |
S&P 500 Index | | 26.47 | | | 0.42 | | | -0.95 | |
Past performance does not guarantee future returns. The investment return and principal value of an investment will fluctuate, so that an investor’s shares, when redeemed, may be worth more or less than their original cost. Current performance may be lower or higher than the past performance data quoted.
$10,000 INVESTED OVER 10 YEARS
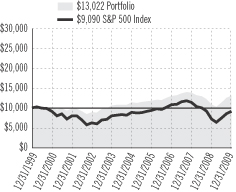
Portfolio inception: 5/13/1983. Portfolio performance is net of investment fees and fund expenses, but not product charges, which, if included, would significantly lower the performance quoted. Performance figures may reflect fee waivers and/or expense reimbursements. In the absence of such fee waivers and/or expense reimbursements, total returns would be lower.
For the year ended December 31, 2009, the Conservative Balanced Portfolio rose 20.01%.
Quantitative Management Associates, LLC runs the Portfolio whose objective is total return consistent with a conservatively managed diversified portfolio. The Portfolio is diversified across a combination of equity and equity-related securities, debt obligations, and money market instruments.
A scorching broad-based rally in global equity markets began in March 2009 and continued during the year as global economic conditions improved. Developed market equities outperformed the U.S. stock market partially due to a weakening greenback. In the United States, mid-cap stocks and the growth style of investing led gains. Emerging market stocks were the stars, returning nearly 79% overall in U.S. dollar terms as investors increasingly sought riskier assets in pursuit of higher returns.
In the fixed-income markets, yield-hungry investors favored riskier debt securities encouraged by improving global economic conditions and the low interest-rate environment, among other factors. This preference for riskier assets, supply pressures that emerged as a flood of U.S. Treasury securities were issued to fund the federal deficit and stimulus programs, and renewed inflation fears pressured the U.S. Treasury market, which ended the year in the red.
The Portfolio outperformed the blended index because it maintained a slightly larger exposure to equities than the guideline weight of 50%. The Portfolio also benefited from a fixed-income strategy that emphasized investment-grade corporate bonds, commercial mortgage-backed securities, emerging market bonds, and certain other types of debt securities that carry greater credit risk than ultra safe U.S. Treasuries, which are backed by the federal government. These riskier bond markets posted strong gains in 2009 that easily outperformed the Barclays Capital U.S. Aggregate Bond Index.
Prudential Investments LLC (PI), an indirect, wholly owned subsidiary of Prudential Financial, Inc., serves as the investment manager for the Fund.
Blended Index consists of S&P 500 Index (50%), Barclays Capital U.S. Aggregate Bond Index (40%), an unmanaged index comprised of more than 5,000 government and corporate bonds, and 3-Month T-Bill Index (10%), an unmanaged market value-weighted index of investment grade fixed rate public obligations of the U.S. Treasury with maturities of 3 months, excluding zero coupon strips. S&P 500 Index is an unmanaged, market value-weighted index of 500 stocks generally representative of the broad stock market. These returns do not include the effect of any investment management expenses. These returns would have been lower if they included the effect of these expenses. Investors cannot invest directly in a market index. For a complete list of holdings refer to the Schedule of Investments section of this report.
| | |
The Prudential Series Fund, Diversified Bond Portfolio Subadvised by: Prudential Investment Management, Inc. | | December 31, 2009 |
Investment Manager’s Report - As of December 31, 2009
Average Annual Total Return Percentages
| | | | | | | | | |
| | | 1-Year | | | 5-Year | | | 10-Year | |
Portfolio | | 20.51 | % | | 5.92 | % | | 6.64 | % |
Barclays Capital U.S. Aggregate Bond Index | | 5.93 | | | 4.97 | | | 6.33 | |
Past performance does not guarantee future returns. The investment return and principal value of an investment will fluctuate, so that an investor’s shares, when redeemed, may be worth more or less than their original cost. Current performance may be lower or higher than the past performance data quoted.
$10,000 INVESTED OVER 10 YEARS
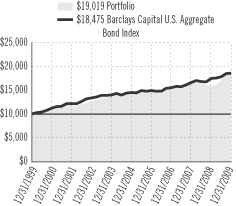
Portfolio inception: 5/13/1983. Portfolio performance is net of investment fees and fund expenses, but not product charges, which, if included, would significantly lower the performance quoted. Performance figures may reflect fee waivers and/or expense reimbursements. In the absence of such fee waivers and/or expense reimbursements, total returns would be lower.
For the year ended December 31, 2009, the Diversified Bond Portfolio rose 20.51%.
The U.S. government and the Federal Reserve took steps to steady the nation’s financial system and stimulate the economy. Both had been hurt by a protracted credit crisis. The financial system began to heal in 2009 and the economy began to tentatively emerge from the so-called “Great Recession,” even though job losses continued to climb. The favorable developments boosted investor confidence in bonds with greater credit risk than U.S. Treasury securities. Riskier bonds were also sought for their attractive yields in the low interest-rate environment. Most notably, prices soared on high yield corporate “junk” bonds, while the Treasury market ended 2009 in the red.
Prudential Fixed Income, which is part of Prudential Investment Management, Inc., runs the Portfolio, which outperformed the Barclays Capital U.S. Aggregate Bond Index (the Index) primarily because it had a larger exposure than the Index to investment-grade corporate bonds, commercial mortgage-backed securities, and asset-backed securities. Each of these markets beat the Index in 2009. In addition to support provided by generally improving economic conditions, corporate bonds gained as many firms strengthened their balance sheets. One initiative that aided the financial system was the Term Asset Backed Securities Loan Facility (TALF), which provides loans on favorable terms to investors who buy high-quality bonds backed by cash flows from credit cards, commercial mortgages, or certain other types of loans and leases. Sales of these bonds help keep credit flowing to businesses and consumers. TALF and a related initiative encouraged a rally in asset-backed securities, residential mortgage-backed securities not guaranteed by federal agencies, and commercial mortgage-backed securities.
The Portfolio had smaller exposures than the Index to Treasury securities, federal agency debt securities, and mortgage-backed securities guaranteed by Ginnie Mae, Fannie Mae, and Freddie Mac. This worked well because each of these markets trailed the Index in 2009. The Portfolio had a larger exposure than the Index to emerging market bonds, which also worked well as this market outperformed the Index.
The Portfolio benefited from its exposure to two riskier markets not included in the Index. It held high yield corporate bonds and leveraged bank loans, both of which beat the Index. Leveraged bank loans are generally considered a more conservative type of investment than high yield bonds because, in most cases, a bankrupt firm will pay off its leveraged loan before it pays off its high yield bonds.
Prudential Investments LLC (PI), an indirect, wholly owned subsidiary of Prudential Financial, Inc., serves as the investment manager for the Fund.
Barclays Capital U.S. Aggregate Bond Index is an unmanaged index comprised of more than 5,000 government and corporate bonds. These returns do not include the effect of any investment management expenses. These returns would have been lower if they included the effect of these expenses. Investors cannot invest directly in a market index. For a complete list of holdings refer to the Schedule of Investments section of this report.
| | |
The Prudential Series Fund, Equity Portfolio Subadvised by: Jennison Associates LLC | | December 31, 2009 |
Investment Manager’s Report - As of December 31, 2009
Average Annual Total Return Percentages
| | | | | | | | | |
| | | 1-Year | | | 5-Year | | | 10-Year | |
Portfolio: Class I | | 38.17 | % | | 3.23 | % | | 1.91 | % |
Portfolio: Class II | | 37.58 | | | 2.82 | | | 1.50 | |
Russell 1000® Index | | 28.43 | | | 0.79 | | | -0.49 | |
S&P 500 Index | | 26.47 | | | 0.42 | | | -0.95 | |
Past performance does not guarantee future returns. The investment return and principal value of an investment will fluctuate, so that an investor’s shares, when redeemed, may be worth more or less than their original cost. Current performance may be lower or higher than the past performance data quoted.
$10,000 INVESTED OVER 10 YEARS1
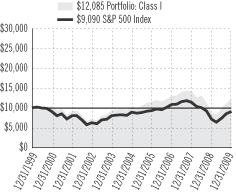
Portfolio (Class I) inception: 5/13/1983. Portfolio (Class II) inception: 5/4/1999. Portfolio performance is net of investment fees and fund expenses, but not product charges, which, if included, would significantly lower the performance quoted.
The Russell 1000® Index is a trademark/service mark of the Frank Russell Company. Russell® is a trademark of the Frank Russell Company. Performance figures may reflect fee waivers and/or expense reimbursements. In the absence of such fee waivers and/or expense reimbursements, total returns would be lower.
For the year ended December 31, 2009, the Equity Portfolio Class I shares rose 38.17%, while the Class II shares rose 37.58%, significantly outperforming the S&P 500 Index (the Index). The investment objective of this Portfolio is long-term growth of capital.
Every sector was a source of positive relative performance, and stock selection nearly across the board drove the Portfolio’s strong performance. The top 10 contributors came from seven different sectors.
Positions in information technology benefited absolute performance most. An overweight stance in the sector was the primary driver of outperformance. Energy positions also bolstered overall performance. Jennison remains bullish on the long-term supply/demand imbalances for oil and natural gas, and prefers exploration and production companies with organic production and reserve growth because they have the highest leverage to rising oil/gas prices. The investment team also seeks exploration and production companies with low per-barrel operating costs. The Portfolio substantially outperformed in financials and its underweight stance also added to performance relative to its benchmark, the S&P 500 Index.
Industrials was the one sector that detracted from absolute return. However, the Portfolio’s smaller exposure to the sector resulted in positive relative performance.
From the depths of their March lows, equity markets have posted impressive rebounds, with most indexes gaining 50% or more through year-end. Corporate profits, which have been much better than were thought possible at the beginning of 2009, largely due to workforce and inventory reductions, have provided much of the fuel for this recovery in equities. Favorable interest rate and liquidity conditions have been instrumental in spurring the rally, as well. With these tailwinds in place, there is reason to be optimistic that further gains lie ahead in 2010. Yet significant challenges remain, including high unemployment, still-weak housing markets, and probable increases in tax rates. Against this backdrop, Jennison remains cautiously optimistic.
Prudential Investments LLC (PI), an indirect, wholly owned subsidiary of Prudential Financial, Inc., serves as the investment manager for the Fund.
| 1 | The graph is based on the performance of Class I shares. Performance of Class II shares will be lower due to differences in the fee structure. Class II shares have associated 12b-1 and administrative fees at an annual rate of 0.25% and 0.15%, respectively, of the average daily net assets of the Class II shares. |
Russell 1000® Index is a market cap-weighted index that measures the performance of the 1,000 largest companies in the Russell 3000 Index, which represents approximately 92% of the total market. S&P 500 Index is an unmanaged, market value-weighted index of 500 stocks generally representative of the broad stock market. These returns do not include the effect of any investment management expenses. These returns would have been lower if they included the effect of these expenses. Investors cannot invest directly in a market index. For a complete list of holdings, refer to the Schedule of Investments section of this report.
| | |
The Prudential Series Fund, Flexible Managed Portfolio Subadvised by: Prudential Investment Management, Inc., Quantitative Management Associates, LLC | | December 31, 2009 |
Investment Manager’s Report - As of December 31, 2009
Average Annual Total Return Percentages
| | | | | | | | | |
| | | 1-Year | | | 5-Year | | | 10-Year | |
Portfolio | | 19.95 | % | | 2.30 | % | | 2.22 | % |
Blended Index | | 18.08 | | | 2.42 | | | 2.07 | |
S&P 500 Index | | 26.47 | | | 0.42 | | | -0.95 | |
Past performance does not guarantee future returns. The investment return and principal value of an investment will fluctuate, so that an investor’s shares, when redeemed, may be worth more or less than their original cost. Current performance may be lower or higher than the past performance data quoted.
$10,000 INVESTED OVER 10 YEARS
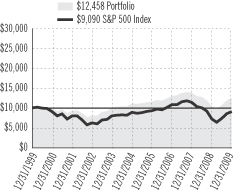
Portfolio inception: 5/13/1983. Portfolio performance is net of investment fees and fund expenses, but not product charges, which, if included, would significantly lower the performance quoted. Performance figures may reflect fee waivers and/or expense reimbursements. In the absence of such fee waivers and/or expense reimbursements, total returns would be lower.
For the year ended December 31, 2009, the Flexible Managed Portfolio rose 19.95%.
Quantitative Management Associates, LLC runs the Portfolio whose objective is total return consistent with an aggressively managed diversified portfolio. The Portfolio is diversified across a combination of equity and equity-related securities, debt obligations, and money market instruments.
A scorching broad-based rally in global equity markets began in March 2009 and continued during the year as global economic conditions improved. Developed market equities outperformed the U.S. stock market partially due to a weakening greenback. In the United States, mid-cap stocks and the growth style of investing led gains. Emerging market stocks were the stars, returning nearly 79% overall in U.S. dollar terms as investors increasingly sought riskier assets in pursuit of higher returns.
In the fixed-income markets, yield-hungry investors snapped up riskier debt securities encouraged by improving global economic conditions and the low interest-rate environment, among other factors. This preference for riskier assets, supply pressures that emerged as a flood of U.S. Treasuries were issued, and renewed inflation fears pressured the U.S. Treasury market, which ended the year in the red.
The Portfolio outperformed the blended index because it maintained a slightly larger exposure to equities than the guideline weight of 60%. The Portfolio also benefited from a fixed-income strategy that emphasized investment-grade corporate bonds, commercial mortgage-backed securities, emerging market bonds, and certain other types of debt securities that carry greater credit risk than ultra-safe U.S. Treasury securities, which are backed by the federal government. These riskier bond markets posted strong gains in 2009 that easily outperformed the Barclays Capital U.S. Aggregate Bond Index.
Prudential Investments LLC (PI), an indirect, wholly owned subsidiary of Prudential Financial, Inc., serves as the investment manager for the Fund.
Blended Index consists of S&P 500 Index (60%), Barclays Capital U.S. Aggregate Bond Index (35%), an unmanaged index comprised of more than 5,000 government and corporate bonds, and 3-Month T-Bill Index (5%), an unmanaged market value-weighted index of investment grade fixed rate public obligations of the U.S. Treasury with maturities of 3 months, excluding zero coupon strips. S&P 500 Index is an unmanaged, market value-weighted index of 500 stocks generally representative of the broad stock market. These returns do not include the effect of any investment management expenses. These returns would have been lower if they included the effect of these expenses. Investors cannot invest directly in a market index. For a complete list of holdings refer to the Schedule of Investments section of this report.
| | |
The Prudential Series Fund, Global Portfolio Subadvised by: LSV Asset Management, Marsico Capital Management, LLC, Quantitative Management Associates LLC, T. Rowe Price
Associates, Inc., William Blair & Company LLC | | December 31, 2009 |
Investment Manager’s Report - As of December 31, 2009
Average Annual Total Return Percentages
| | | | | | | | | |
| | | 1-Year | | | 5-Year | | | 10-Year | |
Portfolio | | 31.39 | % | | 2.85 | % | | -1.52 | % |
MSCI World Index (GD) | | 30.79 | | | 2.57 | | | 0.23 | |
Past performance does not guarantee future returns. The investment return and principal value of an investment will fluctuate, so that an investor’s shares, when redeemed, may be worth more or less than their original cost. Current performance may be lower or higher than the past performance data quoted.
$10,000 INVESTED OVER 10 YEARS
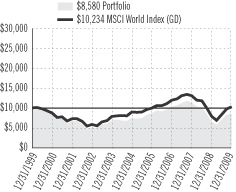
Portfolio inception: 9/19/1988. Portfolio performance is net of investment fees and fund expenses, but not product charges, which, if included, would significantly lower the performance quoted. Performance figures may reflect fee waivers and/or expense reimbursements. In the absence of such fee waivers and/or expense reimbursements, total returns would be lower.
For the year ended December 31, 2009, the Global Portfolio rose 31.39%.
The Portfolio is co-managed by four specialist firms: Marsico Capital Management (Marsico), T. Rowe Price Associates, Inc. (T. Rowe Price), William Blair & Company, LLC (William Blair), and LSV Asset Management (LSV). The Portfolio seeks growth of capital over the long term by investing in growth and value stocks of large companies in the United States and abroad.
A scorching broad-based rally in global equity markets began in March 2009 and continued during the year as global economic conditions improved. Developed market equities outperformed the U.S. stock market due partially to a weakening greenback. In the United States, mid-cap stocks and the growth style of investing led gains. Emerging market stocks were the stars, returning nearly 79% overall in U.S. dollar terms as investors increasingly sought riskier assets in pursuit of higher returns.
The Portfolio outperformed the MSCI World Index due to the strong relative performances of three of its portions versus their respective style-specific benchmark indexes. The U.S. large-cap value portion managed by T. Rowe Price outperformed its style-specific benchmark index driven by stock selection in the financials and industrials sectors. The T. Rowe Price portion also benefited from an overweight in the technology sector. An overweight in consumer discretionary and an underweight in utilities also aided relative results.
The LSV portion, which invests in international large-cap value stocks, outperformed its style-specific benchmark index largely because the attributes of its “deep value” investment style, including low price-to-earnings (P/E) and price-to-book (P/B) ratios and high dividend-yield stocks, were rewarded in 2009. The LSV portion also benefitted from strong stock selection in the industrials, consumer discretionary, and technology sectors.
The portion managed by William Blair, which invests in international mid- and large-cap growth stocks, outperformed its style-specific benchmark index largely due to country allocations. Exposure to emerging markets nations Brazil and South Africa boosted performance as they returned more than 100% and 50% respectively in U.S. dollar terms. An underweight in Japanese stocks also benefited performance as Japan was the worst performing developed market.
The Marsico portion, which invests in U.S. large-cap growth stocks, was the only one that underperformed its style-specific benchmark index. Most of its underperformance was driven by sector exposures, notably an overweight position in the financials sector, banks in particular, and an underweight to technology.
Prudential Investments LLC (PI), an indirect, wholly owned subsidiary of Prudential Financial, Inc., serves as the investment manager for the Fund.
MSCI World Index (GD) - The Morgan Stanley Capital International World Index is an unmanaged capitalization weighted index which includes the equity markets of Australia, Austria, Belgium, Canada, Denmark, Finland, France, Germany, Hong Kong, Ireland, Italy, Japan, Malaysia, Netherlands, New Zealand, Norway, Singapore, Spain, Sweden, Switzerland, United Kingdom and United States. The GD version does not reflect the impact of withholding taxes on reinvested dividends. These returns do not include the effect of any investment management expenses. These returns would have been lower if they included the effect of these expenses. Investors cannot invest directly in a market index. For a complete list of holdings, refer to the Schedule of Investments section of this report.
| | |
The Prudential Series Fund, Government Income Portfolio Subadvised by: Prudential Investment Management, Inc. | | December 31, 2009 |
Investment Manager’s Report - As of December 31, 2009
Average Annual Total Return Percentages
| | | | | | | | | |
| | | 1-Year | | | 5-Year | | | 10-Year | |
Portfolio | | 7.71 | % | | 4.78 | % | | 6.18 | % |
Barclays Capital Government Bond Index | | -2.20 | | | 4.87 | | | 6.17 | |
Past performance does not guarantee future returns. The investment return and principal value of an investment will fluctuate, so that an investor’s shares, when redeemed, may be worth more or less than their original cost. Current performance may be lower or higher than the past performance data quoted.
$10,000 INVESTED OVER 10 YEARS
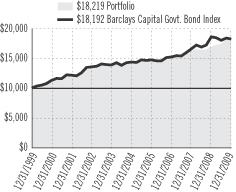
Portfolio inception: 5/1/1989. Portfolio performance is net of investment fees and fund expenses, but not product charges, which, if included, would significantly lower the performance quoted. Performance figures may reflect fee waivers and/or expense reimbursements. In the absence of such fee waivers and/or expense reimbursements, total returns would be lower.
For the year ended December 31, 2009, the Government Income Portfolio rose 7.71%.
The U.S. government and the Federal Reserve took steps to steady the nation’s financial system and stimulate the economy. Both had been hurt by a protracted credit crisis. The financial system began to heal in 2009 and the economy began to tentatively emerge from the so-called “Great Recession,” even though job losses continued to climb. The favorable developments boosted investor confidence in bonds with greater credit risk than U.S. Treasury securities. Riskier bonds were also sought for their attractive yields in the low interest-rate environment. Therefore, prices climbed on debt securities such as corporate bonds, while the U.S. Treasury market ended 2009 in the red.
Prudential Fixed Income which is part of Prudential Investment Management, Inc., runs the Portfolio, which outperformed the Barclays Capital U.S. Government Bond Index (the Index) because it had exposure to commercial mortgage-backed securities as well as good security selection within that market, which easily outperformed the Index in 2009. Commercial mortgage-backed securities gained sharply after the Fed launched the Term Asset Backed Securities Loan Facility (TALF), which provides loans at favorable terms to investors who buy high-quality bonds backed by cash flows from pools of credit cards, auto loans, commercial mortgages, or certain other types of loans. Sales of these debt securities help keep credit flowing to businesses and consumers.
The Portfolio also benefited from taking advantage of pricing inefficiencies within in the U.S. Treasury market between STRIPS (Separate Trading of Registered Interest and Principal of Securities) and TIPS (Treasury Inflation Protected Securities) and between newly issued Treasury securities and those issued earlier with higher coupons.
Another positive was the Portfolio’s favorable security selection among residential mortgage-backed securities guaranteed by Ginnie Mae, Fannie Mae, and Freddie Mac. The Portfolio emphasized mortgage-backed securities with higher coupons that benefited from a decrease in the rate of expected prepayments on the securities and from a program in which the Fed purchased the securities to help support the housing market and mortgage industry. Additionally, the Portfolio held shares of the Dryden Core Investment Fund—Short Term Bond Series, which gained in value amid the environment that favored riskier assets.
On a negative note, the Portfolio’s strategies for managing its duration (sensitivity to changes in the level of interest rates) and its positioning on the yield curve subtracted slightly from its performance in 2009.
Prudential Investments LLC (PI), an indirect, wholly owned subsidiary of Prudential Financial, Inc., serves as the investment manager for the Fund.
Barclays Capital Government Bond Index is a weighted index comprised of securities issued or backed by the U.S. Government, its agencies and instrumentalities with a remaining maturity of one to thirty years. These returns do not include the effect of any investment management expenses. These returns would have been lower if they included the effect of these expenses. Investors cannot invest directly in a market index. For a complete list of holdings refer to the Schedule of Investments section of this report.
| | |
The Prudential Series Fund, Stock Index Portfolio Subadvised by: Quantitative Management Associates LLC | | December 31, 2009 |
Investment Manager’s Report - As of December 31, 2009
Average Annual Total Return Percentages
| | | | | | | | | |
| | | 1-Year | | | 5-Year | | | 10-Year | |
Portfolio | | 26.07 | % | | 0.18 | % | | -1.16 | % |
S&P 500 Index | | 26.47 | | | 0.42 | | | -0.95 | |
Past performance does not guarantee future returns. The investment return and principal value of an investment will fluctuate, so that an investor’s shares, when redeemed, may be worth more or less than their original cost. Current performance may be lower or higher than the past performance data quoted.
$10,000 INVESTED OVER 10 YEARS
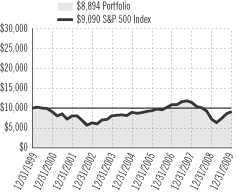
Portfolio inception: 10/19/1987. Portfolio performance is net of investment fees and fund expenses, but not product charges, which, if included, would significantly lower the performance quoted. Performance figures may reflect fee waivers and/or expense reimbursements. In the absence of such fee waivers and/or expense reimbursements, total returns would be lower.
For the year ended December 31, 2009, the Stock Index Portfolio rose 26.07%.
Quantitative Management Associates, LLC runs the Portfolio, which is an index fund that uses a quantitative approach to approximate the holdings and weights of the S&P 500 Index, except for shares of Prudential Financial, Inc. The Portfolio cannot hold these shares because of compliance restrictions.
The Portfolio performed in line with the S&P 500 Index in 2009. Income the Portfolio earned from lending its securities to others offset the negative impact from the restriction on holding shares of Prudential Financial.
The U.S. government and the Federal Reserve took steps to steady the nation’s financial system and stimulate the economy. Both had been hurt by a protracted credit crisis. The financial system began to heal in 2009 and the economy began to tentatively emerge from the so-called “Great Recession,” even though job losses continued to climb. The favorable developments helped boost investor confidence in stocks and a powerful rally in the U.S. stock market that began in March 2009 continued during the year.
All sectors of the S&P 500 Index benefited from the rally. The largest contributions came from more economically sensitive stocks, the cyclicals, including top contributors information technology, materials and consumer discretionary, which stand to benefit from a global economic rebound. Information technology benefited from strong balance sheets and the anticipation that companies would upgrade their technology in order to increase efficiencies. The materials sector was attractive for its exposure to companies tied to commodities. Consumer discretionary scored attractive returns based on stronger-than-anticipated consumer spending in light of tighter credit conditions and higher unemployment. The less economically sensitive utilities and telecommunications services sectors posted the worst, although still positive, returns of any sectors.
Prudential Investments LLC (PI), an indirect, wholly owned subsidiary of Prudential Financial, Inc., serves as the investment manager for the Fund.
S&P 500 Index is an unmanaged, market value-weighted index of 500 stocks generally representative of the broad stock market. These returns do not include the effect of any investment management expenses. These returns would have been lower if they included the effect of these expenses. Investors cannot invest directly in a market index. For a complete list of holdings refer to the Schedule of Investments section of this report.
| | |
The Prudential Series Fund Fees and Expenses — unaudited | | December 31, 2009 |
As a contract owner investing in Portfolios of the Fund through a variable annuity or variable life contract, you incur ongoing costs, including management fees, and other Portfolio expenses. This example is intended to help you understand your ongoing costs (in dollars) of investing in the Fund and to compare these costs with the ongoing costs of investing in other investment options. This example does not reflect fees and charges under your variable annuity or variable life contract. If contract charges were included, the costs shown below would be higher. Please consult the prospectus for your contract for more information about contract fees and charges.
The example is based on an investment of $1,000 invested at the beginning of the period and held for the entire period July 1, 2009 through December 31, 2009.
Actual Expenses
The first line of the table below provides information about actual account values and actual expenses. You may use this information, together with the amount you invested, to estimate the Portfolio expenses that you paid over the period. Simply divide your account value by $1,000 (for example, an $8,600 account value divided by $1,000 = 8.6), then multiply the result by the number in the first line under the heading entitled “Expenses Paid During Period” to estimate the Portfolio expenses you paid on your account during this period. As noted above, the table does not reflect variable contract fees and charges.
Hypothetical Example for Comparison Purposes
The second line of the table below provides information about hypothetical account values and hypothetical expenses based on the Portfolio’s actual expense ratio and an assumed rate of return of 5% per year before expenses, which is not the Portfolio’s actual return. The hypothetical account values and expenses may not be used to estimate the actual ending account balance or expenses you paid for the period. You may use this information to compare the ongoing costs of investing in the Portfolio and other investment options. To do so, compare this 5% hypothetical example with the 5% hypothetical examples that appear in the shareholder reports of the other investment options.
Please note that the expenses shown in the table are meant to highlight your ongoing Portfolio costs only and do not reflect any contract fees and charges, such as sales charges (loads), insurance charges or administrative charges. Therefore the second line of the table is useful to compare ongoing investment option costs only, and will not help you determine the relative total costs of owning different contracts. In addition, if these contract fee and charges were included, your costs would have been higher.
| | | | | | | | | | | | | | |
| The Prudential Series Fund Portfolios | | Beginning
Account Value
July 1, 2009 | | Ending
Account Value
December 31, 2009 | | Annualized Expense
Ratio based on the
Six-Month period | | | Expenses Paid
During the
Six-Month period |
| | | | | | | | | | | | | | | |
| Conservative Balanced (Class I) | | Actual | | $ | 1,000.00 | | $ | 1,150.80 | | 0.57 | % | | $ | 3.09 |
| | | Hypothetical | | $ | 1,000.00 | | $ | 1,022.33 | | 0.57 | % | | $ | 2.91 |
| Diversified Bond (Class I) | | Actual | | $ | 1,000.00 | | $ | 1,112.40 | | 0.42 | % | | $ | 2.24 |
| | | Hypothetical | | $ | 1,000.00 | | $ | 1,023.09 | | 0.42 | % | | $ | 2.14 |
| Equity (Class I) | | Actual | | $ | 1,000.00 | | $ | 1,241.00 | | 0.48 | % | | $ | 2.71 |
| | | Hypothetical | | $ | 1,000.00 | | $ | 1,022.79 | | 0.48 | % | | $ | 2.45 |
| Equity (Class II) | | Actual | | $ | 1,000.00 | | $ | 1,238.10 | | 0.88 | % | | $ | 4.96 |
| | | Hypothetical | | $ | 1,000.00 | | $ | 1,020.77 | | 0.88 | % | | $ | 4.48 |
| Flexible Managed (Class I) | | Actual | | $ | 1,000.00 | | $ | 1,161.90 | | 0.62 | % | | $ | 3.38 |
| | | Hypothetical | | $ | 1,000.00 | | $ | 1,022.08 | | 0.62 | % | | $ | 3.16 |
| Global (Class I) | | Actual | | $ | 1,000.00 | | $ | 1,222.90 | | 0.83 | % | | $ | 4.65 |
| | | Hypothetical | | $ | 1,000.00 | | $ | 1,021.02 | | 0.83 | % | | $ | 4.23 |
| Government Income (Class I) | | Actual | | $ | 1,000.00 | | $ | 1,046.90 | | 0.46 | % | | $ | 2.37 |
| | | Hypothetical | | $ | 1,000.00 | | $ | 1,022.89 | | 0.46 | % | | $ | 2.35 |
| Stock Index (Class I) | | Actual | | $ | 1,000.00 | | $ | 1,223.20 | | 0.36 | % | | $ | 2.02 |
| | | Hypothetical | | $ | 1,000.00 | | $ | 1,023.39 | | 0.36 | % | | $ | 1.84 |
Portfolio expenses (net of fee waivers or subsidies, if any) for each share class are equal to the annualized expense ratio for each share class (provided in the table), multiplied by the average account value over the period, multiplied by the 184 days in the six-month period ended December 31, 2009, and divided by the 365 days in the Portfolio’s fiscal year ended December 31, 2009 (to reflect the six-month period). Expenses presented in the table include the expenses of any underlying portfolios in which the Portfolio may invest.
| | | | | | |
| | | CONSERVATIVE BALANCED PORTFOLIO | | |
| |
| SCHEDULE OF INVESTMENTS | | December 31, 2009 |
| | | | | |
| LONG-TERM INVESTMENTS — 91.2% | | |
| COMMON STOCKS — 49.5% | | Shares
| | Value
(Note 2)
|
| | | | | | |
Aerospace & Defense — 1.4% | | | | | |
Boeing Co. (The) | | 77,000 | | $ | 4,168,010 |
General Dynamics Corp. | | 41,500 | | | 2,829,055 |
Goodrich Corp. | | 13,700 | | | 880,225 |
Honeywell International, Inc. | | 80,912 | | | 3,171,750 |
ITT Corp. | | 20,100 | | | 999,774 |
L-3 Communications Holdings, Inc. | | 11,900 | | | 1,034,705 |
Lockheed Martin Corp. | | 34,100 | | | 2,569,435 |
Northrop Grumman Corp. | | 33,662 | | | 1,880,023 |
Precision Castparts Corp. | | 13,900 | | | 1,533,865 |
Raytheon Co. | | 41,800 | | | 2,153,536 |
Rockwell Collins, Inc. | | 16,600 | | | 918,976 |
United Technologies Corp. | | 100,900 | | | 7,003,469 |
| | | | |
|
|
| | | | | | 29,142,823 |
| | | | |
|
|
Air Freight & Logistics — 0.5% | | | | | |
C.H. Robinson Worldwide, Inc. | | 18,800 | | | 1,104,124 |
Expeditors International of Washington, Inc. | | 22,700 | | | 788,371 |
FedEx Corp. | | 33,900 | | | 2,828,955 |
United Parcel Service, Inc. (Class B Stock) | | 107,000 | | | 6,138,590 |
| | | | |
|
|
| | | | | | 10,860,040 |
| | | | |
|
|
Airlines | | | | | |
Southwest Airlines Co. | | 79,300 | | | 906,399 |
| | | | |
|
|
Auto Components — 0.1% | | | | | |
Goodyear Tire & Rubber Co. (The)(a) | | 25,600 | | | 360,960 |
Johnson Controls, Inc. | | 70,600 | | | 1,923,144 |
| | | | |
|
|
| | | | | | 2,284,104 |
| | | | |
|
|
Automobiles — 0.2% | | | | | |
Ford Motor Co.(a)(b) | | 347,685 | | | 3,476,850 |
Harley-Davidson, Inc. | | 25,000 | | | 630,000 |
| | | | |
|
|
| | | | | | 4,106,850 |
| | | | |
|
|
Beverages — 1.3% | | | | | |
Brown-Forman Corp. (Class B Stock) | | 11,900 | | | 637,483 |
Coca-Cola Co. (The) | | 245,600 | | | 13,999,200 |
Coca-Cola Enterprises, Inc. | | 35,100 | | | 744,120 |
Constellation Brands, Inc. (Class A Stock)(a) | | 19,400 | | | 309,042 |
Dr Pepper Snapple Group, Inc. | | 27,800 | | | 786,740 |
Molson Coors Brewing Co. (Class B Stock) | | 17,100 | | | 772,236 |
Pepsi Bottling Group, Inc. | | 15,000 | | | 562,500 |
PepsiCo, Inc. | | 167,230 | | | 10,167,584 |
| | | | |
|
|
| | | | | | 27,978,905 |
| | | | |
|
|
Biotechnology — 0.8% | | | | | |
Amgen, Inc.(a) | | 108,920 | | | 6,161,604 |
Biogen Idec, Inc.(a)(b) | | 30,390 | | | 1,625,865 |
Celgene Corp.(a) | | 48,400 | | | 2,694,912 |
Cephalon, Inc.(a) | | 8,600 | | | 536,726 |
Genzyme Corp.(a) | | 26,400 | | | 1,293,864 |
Gilead Sciences, Inc.(a) | | 96,400 | | | 4,172,192 |
| | | | |
|
|
| | | | | | 16,485,163 |
| | | | |
|
|
Building Products | | | | | |
Masco Corp. | | 35,500 | | | 490,255 |
| | | | |
|
|
| | | | | |
COMMON STOCKS
(continued) | | Shares
| | Value
(Note 2)
|
| | | | | | |
Capital Markets — 1.4% | | | | | |
Ameriprise Financial, Inc. | | 28,720 | | $ | 1,114,911 |
Bank of New York Mellon Corp. (The) | | 130,058 | | | 3,637,722 |
Charles Schwab Corp. (The) | | 100,150 | | | 1,884,823 |
E*Trade Financial Corp.(a) | | 127,000 | | | 222,250 |
Federated Investors, Inc. (Class B Stock)(b) | | 10,800 | | | 297,000 |
Franklin Resources, Inc. | | 16,400 | | | 1,727,740 |
Goldman Sachs Group, Inc. (The) | | 55,700 | | | 9,404,388 |
Invesco Ltd. | | 48,300 | | | 1,134,567 |
Janus Capital Group, Inc.(b) | | 18,600 | | | 250,170 |
Legg Mason, Inc. | | 17,800 | | | 536,848 |
Morgan Stanley | | 146,980 | | | 4,350,608 |
Northern Trust Corp. | | 26,200 | | | 1,372,880 |
State Street Corp. | | 53,700 | | | 2,338,098 |
T. Rowe Price Group, Inc.(b) | | 27,800 | | | 1,480,350 |
| | | | |
|
|
| | | | | | 29,752,355 |
| | | | |
|
|
Chemicals — 1.0% | | | | | |
Air Products & Chemicals, Inc. | | 22,800 | | | 1,848,168 |
Airgas, Inc. | | 7,600 | | | 361,760 |
CF Industries Holdings, Inc. | | 5,700 | | | 517,446 |
Dow Chemical Co. (The) | | 121,731 | | | 3,363,428 |
E.I. du Pont de Nemours & Co. | | 95,320 | | | 3,209,424 |
Eastman Chemical Co. | | 7,800 | | | 469,872 |
Ecolab, Inc. | | 25,800 | | | 1,150,164 |
FMC Corp. | | 8,100 | | | 451,656 |
International Flavors & Fragrances, Inc. | | 9,600 | | | 394,944 |
Monsanto Co. | | 57,194 | | | 4,675,609 |
PPG Industries, Inc. | | 18,200 | | | 1,065,428 |
Praxair, Inc. | | 32,200 | | | 2,585,982 |
Sigma-Aldrich Corp. | | 12,200 | | | 616,466 |
| | | | |
|
|
| | | | | | 20,710,347 |
| | | | |
|
|
Commercial Banks — 1.4% | | | | | |
BB&T Corp.(b) | | 72,500 | | | 1,839,325 |
Comerica, Inc. | | 19,200 | | | 567,744 |
Fifth Third Bancorp | | 89,021 | | | 867,955 |
First Horizon National Corp.(a) | | 26,880 | | | 360,192 |
Huntington Bancshares, Inc. | | 77,936 | | | 284,466 |
KeyCorp | | 92,300 | | | 512,265 |
M&T Bank Corp.(b) | | 9,000 | | | 602,010 |
Marshall & Ilsley Corp. | | 48,500 | | | 264,325 |
PNC Financial Services Group, Inc. | | 50,033 | | | 2,641,242 |
Regions Financial Corp. | | 129,603 | | | 685,600 |
SunTrust Banks, Inc. | | 57,100 | | | 1,158,559 |
U.S. Bancorp | | 206,385 | | | 4,645,726 |
Wells Fargo & Co. | | 537,864 | | | 14,516,949 |
Zions Bancorporation(b) | | 13,550 | | | 173,847 |
| | | | |
|
|
| | | | | | 29,120,205 |
| | | | |
|
|
Commercial Services & Supplies — 0.3% | | | |
Avery Dennison Corp. | | 11,500 | | | 419,635 |
Cintas Corp. | | 14,600 | | | 380,330 |
Iron Mountain, Inc.(a)(b) | | 20,800 | | | 473,408 |
Matsuda Sangyo Co. Ltd. (Japan) | | 30 | | | 516 |
Pitney Bowes, Inc. | | 20,700 | | | 471,132 |
Republic Services, Inc. (Class A Stock) | | 35,065 | | | 992,690 |
SEE NOTES TO FINANCIAL STATEMENTS.
A1
| | | | | | |
| | | CONSERVATIVE BALANCED PORTFOLIO (continued) | | |
| |
| SCHEDULE OF INVESTMENTS | | December 31, 2009 |
| | | | | |
COMMON STOCKS
(continued) | | Shares
| | Value
(Note 2)
|
| | | | | | |
Commercial Services & Supplies (continued) | | | |
RR Donnelley & Sons Co. | | 21,400 | | $ | 476,578 |
Stericycle, Inc.(a)(b) | | 8,800 | | | 485,496 |
Waste Management, Inc.(b) | | 51,642 | | | 1,746,016 |
| | | | |
|
|
| | | | | | 5,445,801 |
| | | | |
|
|
Communications Equipment — 1.3% | | | |
Cisco Systems, Inc.(a) | | 617,600 | | | 14,785,344 |
Harris Corp. | | 14,200 | | | 675,210 |
JDS Uniphase Corp.(a) | | 21,475 | | | 177,169 |
Juniper Networks, Inc.(a)(b) | | 58,000 | | | 1,546,860 |
Motorola, Inc. | | 248,425 | | | 1,927,778 |
QUALCOMM, Inc. | | 175,600 | | | 8,123,256 |
Tellabs, Inc.(a) | | 45,800 | | | 260,144 |
| | | | |
|
|
| | | | | | 27,495,761 |
| | | | |
|
|
Computers & Peripherals — 3.0% | | | |
Apple, Inc.(a) | | 96,300 | | | 20,305,818 |
Dell, Inc.(a) | | 182,500 | | | 2,620,700 |
EMC Corp.(a) | | 218,950 | | | 3,825,057 |
Hewlett-Packard Co. | | 253,648 | | | 13,065,408 |
International Business Machines Corp. | | 140,700 | | | 18,417,630 |
Lexmark International, Inc. (Class A Stock)(a) | | 9,833 | | | 255,461 |
NetApp, Inc.(a) | | 35,700 | | | 1,227,723 |
QLogic Corp.(a)(b) | | 12,100 | | | 228,327 |
SanDisk Corp.(a)(b) | | 24,500 | | | 710,255 |
Sun Microsystems, Inc.(a) | | 79,275 | | | 742,807 |
Teradata Corp.(a) | | 19,300 | | | 606,599 |
Western Digital Corp.(a) | | 26,400 | | | 1,165,560 |
| | | | |
|
|
| | | | | | 63,171,345 |
| | | | |
|
|
Construction & Engineering — 0.1% | | | |
Fluor Corp. | | 19,100 | | | 860,264 |
Jacobs Engineering Group, Inc.(a)(b) | | 12,700 | | | 477,647 |
Quanta Services, Inc.(a) | | 20,100 | | | 418,884 |
| | | | |
|
|
| | | | | | 1,756,795 |
| | | | |
|
|
Construction Materials | | | | | |
Vulcan Materials Co. | | 13,400 | | | 705,778 |
| | | | |
|
|
Consumer Finance — 0.4% | | | | | |
American Express Co. | | 129,100 | | | 5,231,132 |
Capital One Financial Corp. | | 49,161 | | | 1,884,833 |
Discover Financial Services | | 60,540 | | | 890,543 |
SLM Corp.(a) | | 60,200 | | | 678,454 |
| | | | |
|
|
| | | | | | 8,684,962 |
| | | | |
|
|
Containers & Packaging — 0.1% | | | | | |
Ball Corp. | | 10,100 | | | 522,170 |
Bemis Co., Inc. | | 11,300 | | | 335,045 |
Owens-Illinois, Inc.(a) | | 17,500 | | | 575,225 |
Pactiv Corp.(a) | | 15,100 | | | 364,514 |
Sealed Air Corp. | | 17,100 | | | 373,806 |
| | | | |
|
|
| | | | | | 2,170,760 |
| | | | |
|
|
Distributors | | | | | |
Genuine Parts Co. | | 17,700 | | | 671,892 |
| | | | |
|
|
Diversified Consumer Services — 0.1% |
Apollo Group, Inc. (Class A Stock)(a)(b) | | 13,500 | | | 817,830 |
| | | | | |
COMMON STOCKS
(continued) | | Shares
| | Value
(Note 2)
|
| | | | | | |
Diversified Consumer Services (continued) |
DeVry, Inc. | | 6,300 | | $ | 357,399 |
H&R Block, Inc. | | 35,600 | | | 805,272 |
| | | | |
|
|
| | | | | | 1,980,501 |
| | | | |
|
|
Diversified Financial Services — 2.1% | | | | | |
Bank of America Corp. | | 1,061,121 | | | 15,980,482 |
Citigroup, Inc. | | 2,040,458 | | | 6,753,916 |
CME Group, Inc. (Class A Stock) | | 7,240 | | | 2,432,278 |
IntercontinentalExchange, Inc.(a)(b) | | 8,800 | | | 988,240 |
JPMorgan Chase & Co. | | 423,745 | | | 17,657,454 |
Leucadia National Corp.(a) | | 19,700 | | | 468,663 |
Moody’s Corp.(b) | | 23,600 | | | 632,480 |
Nasdaq OMX Group, Inc. (The)(a) | | 16,600 | | | 329,012 |
NYSE Euronext | | 30,500 | | | 771,650 |
| | | | |
|
|
| | | | | | 46,014,175 |
| | | | |
|
|
Diversified Telecommunication Services — 1.4% | | | |
AT&T, Inc. | | 632,368 | | | 17,725,275 |
CenturyTel, Inc.(b) | | 32,007 | | | 1,158,974 |
Frontier Communications Corp. | | 32,100 | | | 250,701 |
Qwest Communications International, Inc. | | 174,057 | | | 732,780 |
Verizon Communications, Inc. | | 305,476 | | | 10,120,420 |
Windstream Corp. | | 46,057 | | | 506,166 |
| | | | |
|
|
| | | | | | 30,494,316 |
| | | | |
|
|
Electric Utilities — 1.0% | | | | | |
Allegheny Energy, Inc. | | 16,800 | | | 394,464 |
American Electric Power Co., Inc. | | 51,860 | | | 1,804,209 |
Duke Energy Corp. | | 140,424 | | | 2,416,697 |
Edison International | | 36,400 | | | 1,265,992 |
Entergy Corp. | | 20,900 | | | 1,710,456 |
Exelon Corp. | | 70,574 | | | 3,448,951 |
FirstEnergy Corp. | | 32,601 | | | 1,514,317 |
FPL Group, Inc. | | 44,500 | | | 2,350,490 |
Northeast Utilities | | 18,200 | | | 469,378 |
Pepco Holdings, Inc. | | 23,800 | | | 401,030 |
Pinnacle West Capital Corp. | | 9,600 | | | 351,168 |
PPL Corp. | | 38,600 | | | 1,247,166 |
Progress Energy, Inc. | | 29,683 | | | 1,217,300 |
Southern Co. | | 84,500 | | | 2,815,540 |
| | | | |
|
|
| | | | | | 21,407,158 |
| | | | |
|
|
Electrical Equipment — 0.2% | | | | | |
Emerson Electric Co. | | 81,700 | | | 3,480,420 |
First Solar, Inc.(a)(b) | | 4,700 | | | 636,380 |
Rockwell Automation, Inc. | | 15,300 | | | 718,794 |
Roper Industries, Inc. | | 6,700 | | | 350,879 |
| | | | |
|
|
| | | | | | 5,186,473 |
| | | | |
|
|
Electronic Equipment & Instruments — 0.3% | | | |
Agilent Technologies, Inc.(a)(b) | | 35,614 | | | 1,106,527 |
Amphenol Corp. (Class A Stock) | | 18,700 | | | 863,566 |
Corning, Inc. | | 169,000 | | | 3,263,390 |
FLIR Systems, Inc.(a) | | 14,900 | | | 487,528 |
Jabil Circuit, Inc. | | 23,600 | | | 409,932 |
Molex, Inc. | | 15,000 | | | 323,250 |
| | | | |
|
|
| | | | | | 6,454,193 |
| | | | |
|
|
SEE NOTES TO FINANCIAL STATEMENTS.
A2
| | | | | | |
| | | CONSERVATIVE BALANCED PORTFOLIO (continued) | | |
| |
| SCHEDULE OF INVESTMENTS | | December 31, 2009 |
| | | | | |
COMMON STOCKS
(continued) | | Shares
| | Value
(Note 2)
|
| | | | | | |
Energy Equipment & Services — 0.9% | | | | | |
Baker Hughes, Inc.(b) | | 33,650 | | $ | 1,362,152 |
BJ Services Co. | | 28,600 | | | 531,960 |
Cameron International Corp.(a) | | 24,600 | | | 1,028,280 |
Diamond Offshore Drilling, Inc. | | 7,800 | | | 767,676 |
FMC Technologies, Inc.(a) | | 13,500 | | | 780,840 |
Halliburton Co. | | 95,200 | | | 2,864,568 |
Nabors Industries Ltd. (Bermuda)(a) | | 27,700 | | | 606,353 |
National Oilwell Varco, Inc. | | 45,500 | | | 2,006,095 |
Rowan Cos., Inc.(a) | | 13,200 | | | 298,848 |
Schlumberger Ltd. | | 128,300 | | | 8,351,047 |
Smith International, Inc. | | 23,600 | | | 641,212 |
| | | | |
|
|
| | | | | | 19,239,031 |
| | | | |
|
|
Food & Staples Retailing — 1.3% | | | | | |
Costco Wholesale Corp. | | 46,600 | | | 2,757,322 |
CVS Caremark Corp. | | 146,748 | | | 4,726,753 |
Kroger Co. (The) | | 65,746 | | | 1,349,766 |
Safeway, Inc. | | 45,400 | | | 966,566 |
SUPERVALU, Inc. | | 22,310 | | | 283,560 |
SYSCO Corp. | | 64,200 | | | 1,793,748 |
Walgreen Co. | | 105,500 | | | 3,873,960 |
Wal-Mart Stores, Inc. | | 229,700 | | | 12,277,465 |
Whole Foods Market, Inc.(a)(b) | | 16,200 | | | 444,690 |
| | | | |
|
|
| | | | | | 28,473,830 |
| | | | |
|
|
Food Products — 0.8% | | | | | |
Archer-Daniels-Midland Co. | | 69,426 | | | 2,173,728 |
Campbell Soup Co. | | 20,400 | | | 689,520 |
ConAgra Foods, Inc. | | 45,100 | | | 1,039,555 |
Dean Foods Co.(a)(b) | | 20,800 | | | 375,232 |
General Mills, Inc. | | 34,700 | | | 2,457,107 |
H.J. Heinz Co. | | 34,300 | | | 1,466,668 |
Hershey Co. (The)(b) | | 17,600 | | | 629,904 |
Hormel Foods Corp. | | 8,600 | | | 330,670 |
J.M. Smucker Co. (The) | | 12,500 | | | 771,875 |
Kellogg Co. | | 27,100 | | | 1,441,720 |
Kraft Foods, Inc. (Class A Stock) | | 156,353 | | | 4,249,675 |
McCormick & Co., Inc. | | 12,800 | | | 462,464 |
Sara Lee Corp. | | 75,800 | | | 923,244 |
Tyson Foods, Inc. (Class A Stock) | | 33,400 | | | 409,818 |
| | | | |
|
|
| | | | | | 17,421,180 |
| | | | |
|
|
Gas Utilities — 0.1% | | | | | |
EQT Corp. | | 13,700 | | | 601,704 |
Nicor, Inc. | | 4,700 | | | 197,870 |
Questar Corp. | | 16,800 | | | 698,376 |
| | | | |
|
|
| | | | | | 1,497,950 |
| | | | |
|
|
Healthcare Equipment & Supplies — 1.0% |
Baxter International, Inc. | | 64,000 | | | 3,755,520 |
Becton Dickinson And Co. | | 24,600 | | | 1,939,956 |
Boston Scientific Corp.(a) | | 160,467 | | | 1,444,203 |
C.R. Bard, Inc. | | 10,800 | | | 841,320 |
Carefusion Corp.(a) | | 19,475 | | | 487,070 |
DENTSPLY International, Inc. | | 16,200 | | | 569,754 |
Hospira, Inc.(a) | | 17,460 | | | 890,460 |
Intuitive Surgical, Inc.(a) | | 4,100 | | | 1,243,612 |
Medtronic, Inc. | | 117,600 | | | 5,172,048 |
St. Jude Medical, Inc.(a) | | 36,000 | | | 1,324,080 |
| | | | | |
COMMON STOCKS
(continued) | | Shares
| | Value
(Note 2)
|
| | | | | | |
Healthcare Equipment & Supplies (continued) |
Stryker Corp. | | 29,200 | | $ | 1,470,804 |
Varian Medical Systems, Inc.(a)(b) | | 13,100 | | | 613,735 |
Zimmer Holdings, Inc.(a) | | 23,000 | | | 1,359,530 |
| | | | |
|
|
| | | | | | 21,112,092 |
| | | | |
|
|
Healthcare Providers & Services — 1.1% |
Aetna, Inc. | | 45,400 | | | 1,439,180 |
AmerisourceBergen Corp. (Class A Stock) | | 33,700 | | | 878,559 |
Cardinal Health, Inc. | | 37,750 | | | 1,217,060 |
CIGNA Corp. | | 28,400 | | | 1,001,668 |
Coventry Health Care, Inc.(a) | | 17,050 | | | 414,145 |
DaVita, Inc.(a) | | 10,600 | | | 622,644 |
Express Scripts, Inc.(a) | | 28,900 | | | 2,498,405 |
Humana, Inc.(a) | | 16,700 | | | 732,963 |
Laboratory Corp. of America Holdings(a)(b) | | 11,400 | | | 853,176 |
McKesson Corp. | | 28,230 | | | 1,764,375 |
Medco Health Solutions, Inc.(a) | | 50,698 | | | 3,240,109 |
Patterson Cos., Inc.(a)(b) | | 9,000 | | | 251,820 |
Quest Diagnostics, Inc. | | 17,300 | | | 1,044,574 |
Tenet Healthcare Corp.(a) | | 44,600 | | | 240,394 |
UnitedHealth Group, Inc. | | 123,700 | | | 3,770,376 |
WellPoint, Inc.(a) | | 51,500 | | | 3,001,935 |
| | | | |
|
|
| | | | | | 22,971,383 |
| | | | |
|
|
Healthcare Technology | | | | | |
IMS Health, Inc. | | 21,800 | | | 459,108 |
| | | | |
|
|
Hotels, Restaurants & Leisure — 0.7% | | | | | |
Carnival Corp.(a) | | 46,300 | | | 1,467,247 |
Darden Restaurants, Inc. | | 13,950 | | | 489,227 |
International Game Technology | | 28,200 | | | 529,314 |
Marriott International, Inc. (Class A Stock) | | 25,228 | | | 687,463 |
McDonald’s Corp. | | 116,000 | | | 7,243,040 |
Starbucks Corp.(a)(b) | | 79,300 | | | 1,828,658 |
Starwood Hotels & Resorts Worldwide, Inc.(b) | | 18,200 | | | 665,574 |
Wyndham Worldwide Corp. | | 21,520 | | | 434,058 |
Wynn Resorts Ltd. | | 6,700 | | | 390,141 |
Yum! Brands, Inc. | | 50,200 | | | 1,755,494 |
| | | | |
|
|
| | | | | | 15,490,216 |
| | | | |
|
|
Household Durables — 0.2% | | | | | |
Black & Decker Corp. | | 6,900 | | | 447,327 |
D.R. Horton, Inc. | | 31,100 | | | 338,057 |
Fortune Brands, Inc. | | 16,600 | | | 717,120 |
Harman International Industries, Inc. | | 6,400 | | | 225,792 |
Leggett & Platt, Inc. | | 18,400 | | | 375,360 |
Lennar Corp. (Class A Stock) | | 17,200 | | | 219,644 |
Newell Rubbermaid, Inc. | | 32,914 | | | 494,039 |
Pulte Homes, Inc.(b) | | 35,522 | | | 355,220 |
Whirlpool Corp.(b) | | 7,926 | | | 639,311 |
| | | | |
|
|
| | | | | | 3,811,870 |
| | | | |
|
|
Household Products — 1.3% | | | | | |
Clorox Co.(b) | | 15,200 | | | 927,200 |
Colgate-Palmolive Co. | | 53,000 | | | 4,353,950 |
Kimberly-Clark Corp. | | 43,500 | | | 2,771,385 |
SEE NOTES TO FINANCIAL STATEMENTS.
A3
| | | | | | |
| | | CONSERVATIVE BALANCED PORTFOLIO (continued) | | |
| |
| SCHEDULE OF INVESTMENTS | | December 31, 2009 |
| | | | | |
COMMON STOCKS
(continued) | | Shares
| | Value
(Note 2)
|
| | | | | | |
Household Products (continued) | | | | | |
Procter & Gamble Co. (The) | | 312,225 | | $ | 18,930,202 |
| | | | |
|
|
| | | | | | 26,982,737 |
| | | | |
|
|
Independent Power Producers & Energy Traders — 0.1% |
AES Corp. (The)(a) | | 74,500 | | | 991,595 |
Constellation Energy Group, Inc. | | 21,200 | | | 745,604 |
| | | | |
|
|
| | | | | | 1,737,199 |
| | | | |
|
|
Industrial Conglomerates — 1.1% | | | | | |
3M Co. | | 75,600 | | | 6,249,852 |
General Electric Co. | | 1,131,000 | | | 17,112,030 |
Textron, Inc. | | 26,300 | | | 494,703 |
| | | | |
|
|
| | | | | | 23,856,585 |
| | | | |
|
|
Insurance — 1.1% | | | | | |
Aflac, Inc. | | 50,800 | | | 2,349,500 |
Allstate Corp. (The) | | 58,300 | | | 1,751,332 |
American International Group, Inc.(a)(b) | | 15,339 | | | 459,863 |
AON Corp. | | 30,100 | | | 1,154,034 |
Assurant, Inc. | | 15,600 | | | 459,888 |
Chubb Corp. | | 38,300 | | | 1,883,594 |
Cincinnati Financial Corp. | | 19,737 | | | 517,899 |
Genworth Financial, Inc. (Class A Stock)(a) | | 51,200 | | | 581,120 |
Hartford Financial Services Group, Inc. | | 41,000 | | | 953,660 |
Lincoln National Corp. | | 32,018 | | | 796,608 |
Loews Corp. | | 39,275 | | | 1,427,646 |
Marsh & McLennan Cos., Inc. | | 56,800 | | | 1,254,144 |
MetLife, Inc. | | 89,000 | | | 3,146,150 |
Principal Financial Group, Inc. | | 35,800 | | | 860,632 |
Progressive Corp. (The)(a) | | 74,100 | | | 1,333,059 |
Torchmark Corp. | | 10,000 | | | 439,500 |
Travelers Cos., Inc. (The) | | 61,135 | | | 3,048,191 |
Unum Group | | 39,010 | | | 761,475 |
XL Capital Ltd. (Class A Stock) | | 42,200 | | | 773,526 |
| | | | |
|
|
| | | | | | 23,951,821 |
| | | | |
|
|
Internet & Catalog Retail — 0.3% | | | | | |
Amazon.com, Inc.(a) | | 35,600 | | | 4,788,912 |
Expedia, Inc.(a) | | 23,300 | | | 599,043 |
priceline.com, Inc.(a) | | 4,200 | | | 917,700 |
| | | | |
|
|
| | | | | | 6,305,655 |
| | | | |
|
|
Internet Software & Services — 1.0% | | | | | |
Akamai Technologies, Inc.(a)(b) | | 18,300 | | | 463,539 |
eBay, Inc.(a) | | 119,300 | | | 2,808,322 |
Google, Inc. (Class A Stock)(a) | | 25,750 | | | 15,964,485 |
Verisign, Inc.(a)(b) | | 19,800 | | | 479,952 |
Yahoo!, Inc.(a) | | 128,000 | | | 2,147,840 |
| | | | |
|
|
| | | | | | 21,864,138 |
| | | | |
|
|
IT Services — 0.8% | | | | | |
Affiliated Computer Services, Inc. (Class A Stock)(a) | | 9,800 | | | 584,962 |
Automatic Data Processing, Inc. | | 53,400 | | | 2,286,588 |
Cognizant Technology Solutions Corp. (Class A Stock)(a) | | 30,200 | | | 1,368,060 |
Computer Sciences Corp.(a) | | 16,400 | | | 943,492 |
| | | | | |
COMMON STOCKS
(continued) | | Shares
| | Value
(Note 2)
|
| | | | | | |
IT Services (continued) | | | | | |
Fidelity National Information Services, Inc. | | 34,000 | | $ | 796,960 |
Fiserv, Inc.(a) | | 17,000 | | | 824,160 |
Mastercard, Inc. (Class A Stock) | | 10,100 | | | 2,585,398 |
Paychex, Inc. | | 33,100 | | | 1,014,184 |
SAIC, Inc.(a) | | 22,700 | | | 429,938 |
Total System Services, Inc. | | 19,096 | | | 329,788 |
Visa, Inc. (Class A Stock) | | 46,600 | | | 4,075,636 |
Western Union Co. (The) | | 76,010 | | | 1,432,788 |
| | | | |
|
|
| | | | | | 16,671,954 |
| | | | |
|
|
Leisure Equipment & Products — 0.1% | | | | | |
Eastman Kodak Co.(a)(b) | | 20,000 | | | 84,400 |
Hasbro, Inc. | | 12,200 | | | 391,132 |
Mattel, Inc. | | 38,251 | | | 764,255 |
| | | | |
|
|
| | | | | | 1,239,787 |
| | | | |
|
|
Life Sciences Tools & Services — 0.2% | | | | | |
Life Technologies Corp.(a)(b) | | 18,201 | | | 950,638 |
Millipore Corp.(a) | | 6,100 | | | 441,335 |
PerkinElmer, Inc. | | 12,600 | | | 259,434 |
Thermo Fisher Scientific, Inc.(a) | | 45,900 | | | 2,188,971 |
Waters Corp.(a)(b) | | 11,100 | | | 687,756 |
| | | | |
|
|
| | | | | | 4,528,134 |
| | | | |
|
|
Machinery — 0.8% | | | | | |
Caterpillar, Inc.(b) | | 65,900 | | | 3,755,641 |
Cummins, Inc. | | 22,400 | | | 1,027,264 |
Danaher Corp. | | 27,700 | | | 2,083,040 |
Deere & Co. | | 45,300 | | | 2,450,277 |
Dover Corp. | | 19,800 | | | 823,878 |
Eaton Corp. | | 18,400 | | | 1,170,608 |
Flowserve Corp. | | 6,500 | | | 614,445 |
Illinois Tool Works, Inc. | | 40,600 | | | 1,948,394 |
PACCAR, Inc. | | 36,943 | | | 1,339,923 |
Pall Corp. | | 12,000 | | | 434,400 |
Parker Hannifin Corp. | | 17,265 | | | 930,238 |
Snap-On, Inc. | | 7,000 | | | 295,820 |
Stanley Works (The)(b) | | 8,100 | | | 417,231 |
| | | | |
|
|
| | | | | | 17,291,159 |
| | | | |
|
|
Media — 1.4% | | | | | |
CBS Corp. (Class B Stock) | | 73,734 | | | 1,035,963 |
Comcast Corp. (Class A Stock) | | 308,690 | | | 5,204,513 |
DIRECTV (Class A Stock)(a) | | 98,300 | | | 3,278,305 |
Gannett Co., Inc. | | 22,500 | | | 334,125 |
Interpublic Group of Cos., Inc.(a) | | 49,500 | | | 365,310 |
McGraw-Hill Cos., Inc. (The) | | 34,600 | | | 1,159,446 |
Meredith Corp. | | 4,000 | | | 123,400 |
New York Times Co. (The) (Class A Stock)(a) | | 10,000 | | | 123,600 |
News Corp. (Class A Stock)(b) | | 241,100 | | | 3,300,659 |
Omnicom Group, Inc. | | 32,200 | | | 1,260,630 |
Scripps Networks Interactive, Inc. (Class A Stock) | | 9,600 | | | 398,400 |
Time Warner Cable, Inc. | | 37,314 | | | 1,544,427 |
Time Warner, Inc. | | 126,766 | | | 3,693,961 |
Viacom, Inc. (Class B Stock)(a) | | 65,934 | | | 1,960,218 |
Walt Disney Co. (The) | | 198,400 | | | 6,398,400 |
SEE NOTES TO FINANCIAL STATEMENTS.
A4
| | | | | | |
| | | CONSERVATIVE BALANCED PORTFOLIO (continued) | | |
| |
| SCHEDULE OF INVESTMENTS | | December 31, 2009 |
| | | | | |
COMMON STOCKS
(continued) | | Shares
| | Value
(Note 2)
|
| | | | | | |
Media (continued) | | | | | |
Washington Post Co. (The)
(Class B Stock) | | 600 | | $ | 263,760 |
| | | | |
|
|
| | | | | | 30,445,117 |
| | | | |
|
|
Metals & Mining — 0.5% |
AK Steel Holding Corp. | | 11,900 | | | 254,065 |
Alcoa, Inc. | | 102,240 | | | 1,648,109 |
Allegheny Technologies, Inc. | | 10,200 | | | 456,654 |
Cliffs Natural Resources, Inc. | | 10,000 | | | 460,900 |
Freeport-McMoRan Copper & Gold, Inc.(a) | | 44,794 | | | 3,596,510 |
Newmont Mining Corp. | | 52,800 | | | 2,497,968 |
Nucor Corp. | | 34,000 | | | 1,586,100 |
Titanium Metals Corp.(a) | | 4,000 | | | 50,080 |
United States Steel Corp. | | 15,600 | | | 859,872 |
| | | | |
|
|
| | | | | | 11,410,258 |
| | | | |
|
|
Multiline Retail — 0.4% |
Big Lots, Inc.(a)(b) | | 9,200 | | | 266,616 |
Family Dollar Stores, Inc. | | 14,300 | | | 397,969 |
J.C. Penney Co., Inc. | | 23,800 | | | 633,318 |
Kohl’s Corp.(a) | | 31,900 | | | 1,720,367 |
Macy’s, Inc. | | 44,874 | | | 752,088 |
Nordstrom, Inc.(b) | | 15,800 | | | 593,764 |
Sears Holdings Corp.(a)(b) | | 5,042 | | | 420,755 |
Target Corp. | | 80,000 | | | 3,869,600 |
| | | | |
|
|
| | | | | | 8,654,477 |
| | | | |
|
|
Multi-Utilities — 0.7% |
Ameren Corp. | | 24,500 | | | 684,775 |
CenterPoint Energy, Inc. | | 41,800 | | | 606,518 |
CMS Energy Corp.(b) | | 28,800 | | | 451,008 |
Consolidated Edison, Inc. | | 29,100 | | | 1,322,013 |
Dominion Resources, Inc. | | 62,932 | | | 2,449,313 |
DTE Energy Co. | | 16,600 | | | 723,594 |
Integrys Energy Group, Inc. | | 8,120 | | | 340,959 |
NiSource, Inc. | | 28,000 | | | 430,640 |
PG&E Corp. | | 38,600 | | | 1,723,490 |
Public Service Enterprise Group, Inc. | | 53,400 | | | 1,775,550 |
SCANA Corp. | | 11,300 | | | 425,784 |
Sempra Energy | | 25,619 | | | 1,434,152 |
TECO Energy, Inc. | | 20,500 | | | 332,510 |
Wisconsin Energy Corp. | | 12,300 | | | 612,909 |
Xcel Energy, Inc. | | 49,310 | | | 1,046,358 |
| | | | |
|
|
| | | | | | 14,359,573 |
| | | | |
|
|
Office Electronics |
Xerox Corp. | | 97,300 | | | 823,158 |
| | | | |
|
|
Oil, Gas & Consumable Fuels — 4.8% |
Anadarko Petroleum Corp. | | 52,654 | | | 3,286,663 |
Apache Corp. | | 36,014 | | | 3,715,564 |
Cabot Oil & Gas Corp. | | 11,500 | | | 501,285 |
Chesapeake Energy Corp. | | 68,300 | | | 1,767,604 |
Chevron Corp. | | 214,922 | | | 16,546,845 |
ConocoPhillips | | 159,177 | | | 8,129,169 |
Consol Energy, Inc. | | 18,600 | | | 926,280 |
Denbury Resources, Inc.(a)(b) | | 25,500 | | | 377,400 |
Devon Energy Corp. | | 48,300 | | | 3,550,050 |
El Paso Corp. | | 75,136 | | | 738,587 |
| | | | | |
COMMON STOCKS
(continued) | | Shares
| | Value
(Note 2)
|
| | | | | | |
Oil, Gas & Consumable Fuels (continued) |
EOG Resources, Inc. | | 27,200 | | $ | 2,646,560 |
Exxon Mobil Corp. | | 506,940 | | | 34,568,238 |
Hess Corp. | | 30,900 | | | 1,869,450 |
Marathon Oil Corp. | | 76,982 | | | 2,403,378 |
Massey Energy Co. | | 8,800 | | | 369,688 |
Murphy Oil Corp. | | 19,900 | | | 1,078,580 |
Noble Energy, Inc. | | 18,600 | | | 1,324,692 |
Occidental Petroleum Corp. | | 86,200 | | | 7,012,370 |
Peabody Energy Corp. | | 27,900 | | | 1,261,359 |
Pioneer Natural Resources Co. | | 11,000 | | | 529,870 |
Range Resources Corp. | | 16,900 | | | 842,465 |
Southwestern Energy Co.(a) | | 37,000 | | | 1,783,400 |
Spectra Energy Corp. | | 70,962 | | | 1,455,431 |
Sunoco, Inc. | | 10,300 | | | 268,830 |
Tesoro Corp.(b) | | 15,000 | | | 203,250 |
Valero Energy Corp. | | 61,400 | | | 1,028,450 |
Williams Cos., Inc. (The) | | 63,600 | | | 1,340,688 |
XTO Energy, Inc. | | 62,241 | | | 2,896,074 |
| | | | |
|
|
| | | | | | 102,422,220 |
| | | | |
|
|
Paper & Forest Products — 0.1% |
International Paper Co. | | 46,973 | | | 1,257,937 |
MeadWestvaco Corp. | | 16,514 | | | 472,796 |
Weyerhaeuser Co. | | 23,000 | | | 992,220 |
| | | | |
|
|
| | | | | | 2,722,953 |
| | | | |
|
|
Personal Products — 0.1% |
Avon Products, Inc. | | 45,700 | | | 1,439,550 |
Estee Lauder Cos., Inc. (The) (Class A Stock) | | 12,500 | | | 604,500 |
Mead Johnson Nutrition Co. (Class A Stock) | | 17,867 | | | 780,788 |
| | | | |
|
|
| | | | | | 2,824,838 |
| | | | |
|
|
Pharmaceuticals — 3.2% |
Abbott Laboratories | | 166,100 | | | 8,967,739 |
Allergan, Inc. | | 33,500 | | | 2,110,835 |
Bristol-Myers Squibb Co.(b) | | 186,270 | | | 4,703,317 |
Eli Lilly & Co. | | 107,100 | | | 3,824,541 |
Forest Laboratories, Inc.(a) | | 31,100 | | | 998,621 |
Johnson & Johnson | | 295,348 | | | 19,023,365 |
King Pharmaceuticals, Inc.(a) | | 23,866 | | | 292,836 |
Merck & Co., Inc. | | 327,333 | | | 11,960,748 |
Mylan, Inc.(a)(b) | | 30,900 | | | 569,487 |
Pfizer, Inc. | | 864,670 | | | 15,728,347 |
Watson Pharmaceuticals, Inc.(a)(b) | | 12,400 | | | 491,164 |
| | | | |
|
|
| | | | | | 68,671,000 |
| | | | |
|
|
Professional Services — 0.1% |
Dun & Bradstreet Corp. | | 5,800 | | | 489,346 |
Equifax, Inc. | | 12,700 | | | 392,303 |
Monster Worldwide, Inc.(a) | | 16,200 | | | 281,880 |
Robert Half International, Inc.(b) | | 15,700 | | | 419,661 |
| | | | |
|
|
| | | | | | 1,583,190 |
| | | | |
|
|
Real Estate Investment Trusts — 0.6% |
Apartment Investment & Management Co. (Class A Stock) | | 15,633 | | | 248,877 |
AvalonBay Communities, Inc.(b) | | 9,675 | | | 794,414 |
Boston Properties, Inc. | | 15,100 | | | 1,012,757 |
SEE NOTES TO FINANCIAL STATEMENTS.
A5
| | | | | | |
| | | CONSERVATIVE BALANCED PORTFOLIO (continued) | | |
| |
| SCHEDULE OF INVESTMENTS | | December 31, 2009 |
| | | | | |
COMMON STOCKS
(continued) | | Shares
| | Value
(Note 2)
|
| | | | | | |
Real Estate Investment Trusts (continued) |
Equity Residential(b) | | 31,000 | | $ | 1,047,180 |
HCP, Inc. | | 31,500 | | | 962,010 |
Health Care REIT, Inc. | | 13,300 | | | 589,456 |
Host Hotels & Resorts, Inc.(b) | | 66,782 | | | 779,346 |
Kimco Realty Corp.(b) | | 39,000 | | | 527,670 |
Plum Creek Timber Co., Inc.(b) | | 19,400 | | | 732,544 |
ProLogis(b) | | 48,600 | | | 665,334 |
Public Storage | | 14,400 | | | 1,172,880 |
Simon Property Group, Inc.(b) | | 30,643 | | | 2,445,311 |
Ventas, Inc. | | 17,200 | | | 752,328 |
Vornado Realty Trust(b) | | 18,025 | | | 1,260,669 |
| | | | |
|
|
| | | | | | 12,990,776 |
| | | | |
|
|
Real Estate Management & Development |
CB Richard Ellis Group, Inc. (Class A Stock)(a)(b) | | 28,100 | | | 381,317 |
| | | | |
|
|
Road & Rail — 0.5% |
Burlington Northern Santa Fe Corp. | | 28,200 | | | 2,781,084 |
CSX Corp. | | 42,600 | | | 2,065,674 |
Norfolk Southern Corp. | | 38,500 | | | 2,018,170 |
Ryder System, Inc. | | 4,900 | | | 201,733 |
Union Pacific Corp. | | 53,200 | | | 3,399,480 |
| | | | |
|
|
| | | | | | 10,466,141 |
| | | | |
|
|
Semiconductors & Semiconductor Equipment — 1.3% |
Advanced Micro Devices, Inc.(a) | | 68,800 | | | 665,984 |
Altera Corp.(b) | | 30,800 | | | 697,004 |
Analog Devices, Inc. | | 29,700 | | | 937,926 |
Applied Materials, Inc. | | 145,000 | | | 2,021,300 |
Broadcom Corp. (Class A Stock)(a) | | 46,450 | | | 1,460,853 |
Intel Corp. | | 596,100 | | | 12,160,440 |
KLA-Tencor Corp. | | 19,100 | | | 690,656 |
Linear Technology Corp. | | 23,300 | | | 711,582 |
LSI Corp.(a) | | 72,800 | | | 437,528 |
MEMC Electronic Materials, Inc.(a)(b) | | 25,400 | | | 345,948 |
Microchip Technology, Inc. | | 19,700 | | | 572,482 |
Micron Technology, Inc.(a)(b) | | 89,600 | | | 946,176 |
National Semiconductor Corp. | | 21,700 | | | 333,312 |
Novellus Systems, Inc.(a) | | 10,400 | | | 242,736 |
NVIDIA Corp.(a)(b) | | 58,450 | | | 1,091,846 |
Teradyne, Inc.(a)(b) | | 23,500 | | | 252,155 |
Texas Instruments, Inc. | | 138,000 | | | 3,596,280 |
Xilinx, Inc.(b) | | 27,900 | | | 699,174 |
| | | | |
|
|
| | | | | | 27,863,382 |
| | | | |
|
|
Software — 2.2% |
Adobe Systems, Inc.(a) | | 56,300 | | | 2,070,714 |
Autodesk, Inc.(a)(b) | | 23,700 | | | 602,217 |
BMC Software, Inc.(a) | | 19,900 | | | 797,990 |
CA, Inc. | | 43,364 | | | 973,956 |
Citrix Systems, Inc.(a)(b) | | 20,500 | | | 853,005 |
Compuware Corp.(a) | | 21,200 | | | 153,276 |
Electronic Arts, Inc.(a)(b) | | 33,000 | | | 585,750 |
Intuit, Inc.(a) | | 35,500 | | | 1,090,205 |
McAfee, Inc.(a)(b) | | 16,400 | | | 665,348 |
Microsoft Corp. | | 825,300 | | | 25,163,397 |
Novell, Inc.(a) | | 35,200 | | | 146,080 |
Oracle Corp. | | 417,300 | | | 10,240,542 |
Red Hat, Inc.(a) | | 18,800 | | | 580,920 |
| | | | | |
COMMON STOCKS
(continued) | | Shares
| | Value
(Note 2)
|
| | | | | | |
Software (continued) |
Salesforce.com, Inc.(a) | | 10,800 | | $ | 796,716 |
Symantec Corp.(a) | | 88,978 | | | 1,591,816 |
| | | | |
|
|
| | | | | | 46,311,932 |
| | | | |
|
|
Specialty Retail — 1.0% |
Abercrombie & Fitch Co. (Class A Stock) | | 8,700 | | | 303,195 |
AutoNation, Inc.(a)(b) | | 11,474 | | | 219,727 |
AutoZone, Inc.(a)(b) | | 3,300 | | | 521,631 |
Bed Bath & Beyond, Inc.(a)(b) | | 28,800 | | | 1,112,544 |
Best Buy Co., Inc. | | 35,925 | | | 1,417,600 |
GameStop Corp. (Class A Stock)(a)(b) | | 19,400 | | | 425,636 |
Gap, Inc. (The) | | 53,800 | | | 1,127,110 |
Home Depot, Inc. (The) | | 180,650 | | | 5,226,205 |
Limited Brands, Inc. | | 31,106 | | | 598,479 |
Lowe’s Cos., Inc. | | 157,400 | | | 3,681,586 |
Office Depot, Inc.(a) | | 27,800 | | | 179,310 |
O’Reilly Automotive, Inc.(a) | | 11,200 | | | 426,944 |
RadioShack Corp. | | 11,900 | | | 232,050 |
Ross Stores, Inc. | | 8,300 | | | 354,493 |
Sherwin-Williams Co. (The)(b) | | 10,300 | | | 634,995 |
Staples, Inc. | | 77,849 | | | 1,914,307 |
Tiffany & Co. | | 14,400 | | | 619,200 |
TJX Cos., Inc. | | 45,000 | | | 1,644,750 |
| | | | |
|
|
| | | | | | 20,639,762 |
| | | | |
|
|
Textiles, Apparel & Luxury Goods — 0.2% |
Coach, Inc. | | 35,500 | | | 1,296,815 |
NIKE, Inc. (Class B Stock) | | 41,700 | | | 2,755,119 |
Polo Ralph Lauren Corp. (Class A Stock) | | 6,500 | | | 526,370 |
VF Corp. | | 9,200 | | | 673,808 |
| | | | |
|
|
| | | | | | 5,252,112 |
| | | | |
|
|
Thrifts & Mortgage Finance — 0.1% |
Hudson City Bancorp, Inc.(b) | | 58,500 | | | 803,205 |
People’s United Financial, Inc. | | 42,300 | | | 706,410 |
| | | | |
|
|
| | | | | | 1,509,615 |
| | | | |
|
|
Tobacco — 0.8% |
Altria Group, Inc. | | 219,500 | | | 4,308,785 |
Lorillard, Inc. | | 17,047 | | | 1,367,681 |
Philip Morris International, Inc. | | 205,300 | | | 9,893,407 |
Reynolds American, Inc. | | 17,800 | | | 942,866 |
| | | | |
|
|
| | | | | | 16,512,739 |
| | | | |
|
|
Trading Companies & Distributors — 0.1% | | | |
Fastenal Co.(b) | | 14,700 | | | 612,108 |
W.W. Grainger, Inc. | | 6,900 | | | 668,127 |
| | | | |
|
|
| | | | | | 1,280,235 |
| | | | |
|
|
Wireless Telecommunication Services — 0.1% |
American Tower Corp. (Class A Stock)(a) | | 43,100 | | | 1,862,351 |
MetroPCS Communications, Inc.(a) | | 26,000 | | | 198,380 |
Sprint Nextel Corp.(a) | | 312,277 | | | 1,142,934 |
| | | | |
|
|
| | | | | | 3,203,665 |
| | | �� | |
|
|
TOTAL COMMON STOCKS
(cost $824,429,851) | | | 1,058,711,645 |
| | | | |
|
|
SEE NOTES TO FINANCIAL STATEMENTS.
A6
| | | | | | |
| | | CONSERVATIVE BALANCED PORTFOLIO (continued) | | |
| |
| SCHEDULE OF INVESTMENTS | | December 31, 2009 |
| | | | | | | | | | | | |
| ASSET-BACKED SECURITIES — 0.7% | | Moody’s
Rating
(Unaudited)†
| | Interest
Rate
| | Maturity
Date
| | Principal
Amount
(000)
| | Value
(Note 2)
|
| | | | | | | | | | | | | |
ARES CLO Funds (Cayman Islands), Ser. 2003-7AW, Class A1A, 144A(d) | | A2 | | 0.625% | | 05/08/15 | | $ | 2,460 | | $ | 2,318,943 |
Ballyrock CDO Ltd. (Cayman Islands), Ser. 2003-2A, Class A, 144A(d) | | Aa2 | | 0.799% | | 11/20/15 | | | 2,771 | | | 2,577,114 |
Bank of America Credit Card Trust, Ser. 2006-C5, Class C5(d) | | Baa1 | | 0.633% | | 01/15/16 | | | 4,159 | | | 3,584,655 |
Chatham Light CLO Ltd. (Cayman Islands), Ser. 2005-2A, Class A1, 144A(d) | | Aa1 | | 0.531% | | 08/03/19 | | | 495 | | | 450,560 |
Citibank Credit Card Issuance Trust, Ser. 2006-C1, Class C1(d) | | Baa2 | | 0.633% | | 02/20/15 | | | 1,500 | | | 1,371,253 |
Granite Ventures Ltd. (Cayman Islands), Ser. 2005-2A, Class A1, 144A(d) | | Aaa | | 0.544% | | 12/15/17 | | | 3,200 | | | 2,992,000 |
Mountain Capital CLO Ltd. (Cayman Islands), Ser. 2004-3A, Class A1LA, 144A(d) | | Aaa | | 0.688% | | 02/15/16 | | | 2,336 | | | 2,219,029 |
SVO VOI Mortgage Corp., Ser. 2005-AA, Class A, 144A | | Aaa | | 5.250% | | 02/20/21 | | | 477 | | | 440,041 |
| | | | | | | | | | | |
|
|
TOTAL ASSET-BACKED SECURITIES
(cost $16,652,160) | | | 15,953,595 |
| | | | | | | | | | | |
|
|
| BANK LOANS — 0.7% | | | | | | | | | | | | |
Automotive | | | | | | | | | | | | |
Oshkosh Truck Corp.(d)(e) | | B2 | | 6.269% | | 12/06/13 | | | 211 | | | 210,446 |
| | | | | | | | | | | |
|
|
Cable | | | | | | | | | | | | |
Insight Midwest Holding LLC(d)(e) | | B1 | | 1.790% | | 10/06/13 | | | 1,005 | | | 943,627 |
| | | | | | | | | | | |
|
|
Consumer | | | | | | | | | | | | |
Pilot Travel Centers LLC(d)(e) | | Ba2 | | TBA | | 12/31/15 | | | 300 | | | 301,197 |
| | | | | | | | | | | |
|
|
Electric — 0.1% | | | | | | | | | | | | |
NRG Energy(d)(e) | | Baa3 | | 0.151% | | 02/01/13 | | | 177 | | | 168,299 |
NRG Energy(d)(e) | | Baa3 | | 1.996% | | 02/01/13 | | | 301 | | | 285,544 |
Texas Competitive Electric Holdings Co. LLC(d)(e) | | B1 | | 3.735% | | 10/10/14 | | | 978 | | | 794,219 |
| | | | | | | | | | | |
|
|
| | | | | | | | | | | | | 1,248,062 |
| | | | | | | | | | | |
|
|
Healthcare & Pharmaceutical — 0.3% | | | | | | | | | | | | |
DaVita, Inc.(d)(e) | | Ba1 | | 1.748% | | 10/05/12 | | | 1,200 | | | 1,161,667 |
HCA, Inc.(d)(e) | | Ba3 | | 2.501% | | 11/18/13 | | | 1,481 | | | 1,412,592 |
Health Management Associates, Inc. Term B(d)(e) | | B1 | | 2.001% | | 02/28/14 | | | 1,104 | | | 1,026,794 |
Warner Chilcott Corp.(d)(e) | | B1 | | 5.500% | | 10/30/14 | | | 979 | | | 979,572 |
Warner Chilcott Corp.(d)(e) | | B1 | | 5.750% | | 04/30/15 | | | 1,077 | | | 1,077,530 |
Warner Chilcott Corp.(d)(e) | | B1 | | 5.750% | | 04/30/15 | | | 489 | | | 489,786 |
| | | | | | | | | | | |
|
|
| | | | | | | | | | | | | 6,147,941 |
| | | | | | | | | | | |
|
|
Media & Entertainment — 0.1% | | | | | | | | | | | | |
Discovery Communications, Inc.(d)(e) | | Baa3 | | 5.250% | | 05/14/14 | | | 953 | | | 960,541 |
| | | | | | | | | | | |
|
|
Paper | | | | | | | | | | | | |
Domtar, Inc.(d)(e) | | Baa3 | | 1.608% | | 03/05/14 | | | 523 | | | 507,854 |
| | | | | | | | | | | |
|
|
Pipelines & Other | | | | | | | | | | | | |
Enterprise GP Holdings LP(d)(e) | | Ba2 | | 2.514% | | 11/08/14 | | | 980 | | | 934,675 |
| | | | | | | | | | | |
|
|
Technology — 0.2% | | | | | | | | | | | | |
Fidelity National Information Services, Inc.(d)(e) | | Ba1 | | 4.481% | | 01/18/12 | | | 119 | | | 118,711 |
First Data Corp.(d)(e) | | B1 | | 2.983% | | 09/24/14 | | | 1,075 | | | 952,492 |
First Data Corp.(d)(e) | | B1 | | 2.999% | | 09/24/14 | | | 1,466 | | | 1,296,715 |
Flextronics International Ltd. (Singapore)(d)(e) | | Ba1 | | 2.514% | | 10/01/14 | | | 759 | | | 701,727 |
Flextronics International Ltd. (Singapore)(d)(e) | | Ba1 | | 2.534% | | 10/01/14 | | | 218 | | | 201,646 |
Sensata Technologies (Netherlands)(d)(e) | | B2 | | 2.031% | | 04/27/13 | | | 335 | | | 297,216 |
| | | | | | | | | | | |
|
|
| | | | | | | | | | | | | 3,568,507 |
| | | | | | | | | | | |
|
|
TOTAL BANK LOANS
(cost $15,512,638) | | | 14,822,850 |
| | | | | | | | | | | |
|
|
| COLLATERALIZED MORTGAGE OBLIGATIONS — 0.5% | | | | | | | | | | | | |
Banc of America Alternative Loan Trust, Ser. 2005-12, Class 3CB1 | | B3 | | 6.000% | | 01/25/36 | | | 3,139 | | | 2,382,756 |
Banc of America Mortgage Securities, Inc., Ser. 2005-A, Class 2A1(d) | | Ba1 | | 4.439% | | 02/25/35 | | | 848 | | | 651,136 |
SEE NOTES TO FINANCIAL STATEMENTS.
A7
| | | | | | |
| | | CONSERVATIVE BALANCED PORTFOLIO (continued) | | |
| |
| SCHEDULE OF INVESTMENTS | | December 31, 2009 |
| | | | | | | | | | | | |
COLLATERALIZED MORTGAGE OBLIGATIONS
(continued) | | Moody’s
Rating
(Unaudited)†
| | Interest
Rate
| | Maturity
Date
| | Principal
Amount
(000)
| | Value
(Note 2)
|
| | | | | | | | | | | | | |
Banc of America Mortgage Securities, Inc., Ser. 2005-B, Class 2A1(d) | | Ba2 | | 4.375% | | 03/25/35 | | $ | 834 | | $ | 660,569 |
Chase Mortgage Finance Corp., Ser. 2007-A1, Class 1A5(d) | | Ba2 | | 3.899% | | 02/25/37 | | | 2,347 | | | 2,168,044 |
Countrywide Alternative Loan Trust, Ser. 2004-18CB, Class 3A1 | | A1 | | 5.250% | | 09/25/19 | | | 1,289 | | | 1,247,205 |
JPMorgan Mortgage Trust, Ser. 2007-A1, Class 4A1(d) | | B1 | | 4.067% | | 07/25/35 | | | 1,483 | | | 1,333,000 |
Master Alternative Loans Trust, Ser. 2004-4, Class 4A1 | | Aaa | | 5.000% | | 04/25/19 | | | 351 | | | 331,413 |
Structured Adjustable Rate Mortgage Loan Trust, Ser. 2004-1, Class 4A3(d) | | A1 | | 3.586% | | 02/25/34 | | | 822 | | | 680,196 |
Washington Mutual Alternative Mortgage Pass-Thru Certificates, Ser. 2005-1, Class 3A | | AAA(f) | | 5.000% | | 03/25/20 | | | 841 | | | 644,645 |
| | | | | | | | | | | |
|
|
TOTAL COLLATERALIZED MORTGAGE OBLIGATIONS
(cost $11,907,535) | | | 10,098,964 |
| | | | | | | | | | | |
|
|
| COMMERCIAL MORTGAGE-BACKED SECURITIES — 4.8% | | | | | | |
Banc of America Commercial Mortgage, Inc., Ser. 2004-2, Class A4 | | Aaa | | 4.153% | | 11/10/38 | | | 3,680 | | | 3,666,890 |
Banc of America Commercial Mortgage, Inc., Ser. 2005-1, Class ASB(d) | | AAA(f) | | 4.965% | | 11/10/42 | | | 834 | | | 856,127 |
Banc of America Commercial Mortgage, Inc., Ser. 2006-4, Class A3A | | Aaa | | 5.600% | | 07/10/46 | | | 2,000 | | | 2,031,327 |
Banc of America Commercial Mortgage, Inc., Ser. 2007-3, Class A2(d) | | Aaa | | 5.658% | | 06/10/49 | | | 5,730 | | | 5,829,967 |
Bear Stearns Commercial Mortgage Securities, Ser. 2005-T18, Class AAB(d) | | Aaa | | 4.823% | | 02/13/42 | | | 2,250 | | | 2,271,335 |
Bear Stearns Commercial Mortgage Securities, Ser. 2005-T20, Class AAB(d) | | Aaa | | 5.133% | | 10/12/42 | | | 3,000 | | | 3,076,364 |
Bear Stearns Commercial Mortgage Securities, Ser. 2006-PW11, Class A4(d) | | AAA(f) | | 5.456% | | 03/11/39 | | | 1,200 | | | 1,172,916 |
Commercial Mortgage Acceptance Corp., Ser. 1998-C2, Class F, 144A(d) | | A-(f) | | 5.440% | | 09/15/30 | | | 890 | | | 847,827 |
Commercial Mortgage Loan Trust, Ser. 2008-LS1, Class A2(d) | | Aaa | | 6.019% | | 12/10/49 | | | 2,100 | | | 2,154,120 |
Commercial Mortgage Pass-Thru Certificates, Ser. 2006-C7, Class A4(d) | | AAA(f) | | 5.768% | | 06/10/46 | | | 4,000 | | | 3,922,356 |
Commercial Mortgage Pass-Thru Certificate, Ser. 2004-LB2A, Class X2, I/O, 144A(d) | | AAA(f) | | 0.862% | | 03/10/39 | | | 10,893 | | | 97,658 |
Commercial Mortgage Pass-Thru Certificate, Ser. 2006-C8, Class A2B | | Aaa | | 5.248% | | 12/10/46 | | | 3,740 | | | 3,755,383 |
Credit Suisse Mortgage Capital Certificates, Ser. 2006-C1, Class A4(d) | | AAA(f) | | 5.548% | | 02/15/39 | | | 4,330 | | | 4,265,238 |
CS First Boston Mortgage Securities Corp., Ser. 2004-C4, Class A4 | | Aaa | | 4.283% | | 10/15/39 | | | 1,500 | | | 1,501,399 |
CS First Boston Mortgage Securities Corp., Ser. 2005-C5, Class A4(d) | | AAA(f) | | 5.100% | | 08/15/38 | | | 3,000 | | | 2,890,196 |
CW Capital Cobalt Ltd., Ser. 2007-C3, Class A3(d) | | AAA(f) | | 5.820% | | 05/15/46 | | | 2,100 | | | 2,033,124 |
DLJ Commercial Mortgage Corp., Ser. 2000-CF1, Class A1B | | AAA(f) | | 7.620% | | 06/10/33 | | | 674 | | | 675,487 |
GE Commercial Mortgage Corp., Ser. 2004-C2, Class X2, I/O, 144A(d) | | Aaa | | 0.598% | | 03/10/40 | | | 20,836 | | | 148,871 |
GMAC Commercial Mortgage Securities, Inc., Ser. 2005-C1, Class A5 | | AAA(f) | | 4.697% | | 05/10/43 | | | 2,610 | | | 2,546,133 |
Greenwich Capital Commercial Funding Corp., Ser. 2005-GG5, Class A5(d) | | Aaa | | 5.224% | | 04/10/37 | | | 1,400 | | | 1,326,094 |
Greenwich Capital Commercial Funding Corp., Ser. 2007-GG9, Class A2 | | Aaa | | 5.381% | | 03/10/39 | | | 4,000 | | | 4,052,193 |
JPMorgan Chase Commercial Mortgage Securities Corp., Ser. 2005-LDP1, Class ASB(d) | | Aaa | | 4.853% | | 03/15/46 | | | 3,571 | | | 3,628,680 |
JPMorgan Chase Commercial Mortgage Securities Corp.,
Ser. 2005-LDP2, Class ASB | | Aaa | | 4.659% | | 07/15/42 | | | 6,380 | | | 6,446,264 |
JPMorgan Chase Commercial Mortgage Securities Corp.,
Ser. 2005-LDP5, Class A4(d) | | Aaa | | 5.179% | | 12/15/44 | | | 3,630 | | | 3,593,597 |
JPMorgan Chase Commercial Mortgage Securities Corp.,
Ser. 2006-CB16, Class ASB | | Aaa | | 5.523% | | 05/12/45 | | | 2,000 | | | 1,979,266 |
JPMorgan Chase Commercial Mortgage Securities Corp.,
Ser. 2006-LDP6, Class A4(d) | | Aaa | | 5.475% | | 04/15/43 | | | 2,436 | | | 2,343,960 |
SEE NOTES TO FINANCIAL STATEMENTS.
A8
| | | | | | |
| | | CONSERVATIVE BALANCED PORTFOLIO (continued) | | |
| |
| SCHEDULE OF INVESTMENTS | | December 31, 2009 |
| | | | | | | | | | | | |
COMMERCIAL MORTGAGE-BACKED SECURITIES
(continued) | | Moody’s
Rating
(Unaudited)†
| | Interest
Rate
| | Maturity
Date
| | Principal
Amount
(000)
| | Value
(Note 2)
|
| | | | | | | | | | | | | |
JPMorgan Chase Commercial Mortgage Securities Corp.,
Ser. 2006-LDP6, Class X2, I/O(d) | | Aaa | �� | 0.066% | | 04/15/43 | | $ | 131,659 | | $ | 388,025 |
JPMorgan Chase Commercial Mortgage Securities Corp.,
Ser. 2007-LD11, Class A2(d) | | Aaa | | 5.803% | | 06/15/49 | | | 2,000 | | | 2,053,856 |
LB-UBS Commercial Mortgage Trust, Ser. 2004-C6, Class A5(d) | | AAA(f) | | 4.826% | | 08/15/29 | | | 5,000 | | | 4,771,222 |
LB-UBS Commercial Mortgage Trust, Ser. 2005-C3, Class A5 | | Aaa | | 4.739% | | 07/15/30 | | | 695 | | | 672,340 |
LB-UBS Commercial Mortgage Trust, Ser. 2006-C6, Class AAB | | Aaa | | 5.341% | | 09/15/39 | | | 4,280 | | | 4,219,426 |
Merrill Lynch Mortgage Trust, Ser. 2004-KEY2, Class A3 | | Aaa | | 4.615% | | 08/12/39 | | | 1,900 | | | 1,867,012 |
Merrill Lynch Mortgage Trust, Ser. 2006-C1, Class A4(d) | | AAA(f) | | 5.656% | | 05/12/39 | | | 3,400 | | | 3,322,772 |
Merrill Lynch/Countrywide Commercial Mortgage Trust, Ser. 2006-2, Class A4(d) | | Aaa | | 5.909% | | 06/12/46 | | | 2,210 | | | 2,169,588 |
Merrill Lynch/Countrywide Commercial Mortgage Trust, Ser. 2007-5, Class A3 | | Aaa | | 5.364% | | 08/12/48 | | | 440 | | | 405,514 |
Morgan Stanley Capital I, Ser. 2006-IQ11, Class A4(d) | | AAA(f) | | 5.770% | | 10/15/42 | | | 2,600 | | | 2,572,110 |
Morgan Stanley Capital I, Ser. 2007-HQ11, Class AAB | | Aaa | | 5.444% | | 02/12/44 | | | 4,400 | | | 4,249,671 |
Morgan Stanley Capital I, Ser. 2007-T27, Class AAB(d) | | AAA(f) | | 5.650% | | 06/11/42 | | | 1,040 | | | 1,037,485 |
Wachovia Bank Commercial Mortgage Trust, Ser. 2006-C25, Class A3(d) | | Aaa | | 5.705% | | 05/15/43 | | | 2,000 | | | 2,012,176 |
Wachovia Bank Commercial Mortgage Trust, Ser. 2006-C25, Class A4(d) | | Aaa | | 5.740% | | 05/15/43 | | | 5,188 | | | 5,111,173 |
| | | | | | | | | | | |
|
|
TOTAL COMMERCIAL MORTGAGE-BACKED SECURITIES
(cost $98,363,723) | | | 101,965,142 |
| | | | | | | | | | | |
|
|
| CORPORATE BONDS — 13.5% | | | | | | | | | | | | |
Aerospace & Defense — 0.2% | | | | | | | | | | | | |
BAE Systems Holdings, Inc., Gtd. Notes, 144A | | Baa2 | | 4.750% | | 08/15/10 | | | 2,000 | | | 2,030,348 |
BAE Systems Holdings, Inc., Gtd. Notes, 144A | | Baa2 | | 6.375% | | 06/01/19 | | | 600 | | | 645,401 |
Boeing Capital Corp., Sr. Unsec’d. Notes | | A2 | | 6.100% | | 03/01/11 | | | 975 | | | 1,030,604 |
Goodrich Corp., Sr. Unsec’d. Notes | | Baa2 | | 6.800% | | 07/01/36 | | | 711 | | | 762,265 |
| | | | | | | | | | | |
|
|
| | | | | | | | | | | | | 4,468,618 |
| | | | | | | | | | | |
|
|
Airlines — 0.2% | | | | | | | | | | | | |
American Airlines Pass-Through Trust 2001-01, Pass-Thru Certs., Ser. 01-1 | | B2 | | 6.817% | | 05/23/11 | | | 2,420 | | | 2,323,200 |
Continental Airlines, Inc., Pass-Thru Certs., Ser. 981A | | Baa2 | | 6.648% | | 09/15/17 | | | 245 | | | 236,752 |
Continental Airlines, Inc., Pass-Thru Certs., Ser. 01A1(e) | | Baa2 | | 6.703% | | 06/15/21 | | | 142 | | | 131,982 |
Continental Airlines, Inc., Pass-Thru Certs., Ser. A(b) | | Baa2 | | 7.250% | | 11/10/19 | | | 725 | | | 737,687 |
Delta Air Lines, Inc., Pass-thru Certs., Ser. 071A | | Baa1 | | 6.821% | | 08/10/22 | | | 438 | | | 417,981 |
Southwest Airlines Co., Sr. Unsec’d. Notes | | Baa3 | | 6.500% | | 03/01/12 | | | 965 | | | 1,026,828 |
| | | | | | | | | | | |
|
|
| | | | | | | | | | | | | 4,874,430 |
| | | | | | | | | | | |
|
|
Automotive | | | | | | | | | | | | |
Harley-Davidson Funding Corp., Gtd. Notes, 144A, MTN | | Baa1 | | 5.750% | | 12/15/14 | | | 495 | | | 502,558 |
Johnson Controls, Inc., Sr. Unsec’d. Notes | | Baa2 | | 5.500% | | 01/15/16 | | | 235 | | | 239,012 |
| | | | | | | | | | | |
|
|
| | | | | | | | | | | | | 741,570 |
| | | | | | | | | | | |
|
|
Banking — 2.7% | | | | | | | | | | | | |
American Express Co., Sr. Unsec’d. Notes | | A3 | | 8.125% | | 05/20/19 | | | 4,015 | | | 4,758,020 |
Banco Bradesco SA (Cayman Islands), Sub. Notes | | A2 | | 8.750% | | 10/24/13 | | | 1,690 | | | 1,977,300 |
Bank of America Corp., Jr. Sub. Notes(d) | | Ba3 | | 8.000% | | 12/29/49 | | | 2,100 | | | 2,021,754 |
Bank of America Corp., Sr. Unsec’d. Notes | | A2 | | 7.625% | | 06/01/19 | | | 1,400 | | | 1,619,586 |
Bank of America NA, Sub. Notes | | A1 | | 5.300% | | 03/15/17 | | | 850 | | | 833,076 |
Bank of America NA, Sub. Notes | | A1 | | 6.000% | | 10/15/36 | | | 1,300 | | | 1,256,222 |
Bank One Corp., Sub. Notes | | A1 | | 7.875% | | 08/01/10 | | | 2,500 | | | 2,606,475 |
Bear Stearns Cos., Inc. (The), Sr. Unsec’d. Notes | | Aa3 | | 5.300% | | 10/30/15 | | | 550 | | | 581,712 |
Bear Stearns Cos., Inc. (The), Sr. Unsec’d. Notes | | Aa3 | | 6.400% | | 10/02/17 | | | 270 | | | 294,322 |
Bear Stearns Cos., Inc. (The), Sr. Unsec’d. Notes | | Aa3 | | 7.250% | | 02/01/18 | | | 1,135 | | | 1,302,813 |
Capital One Bank Corp., Sub. Notes | | A3 | | 6.500% | | 06/13/13 | | | 10 | | | 10,750 |
Capital One Capital V, Gtd. Notes | | Baa2 | | 10.250% | | 08/15/39 | | | 555 | | | 645,188 |
Capital One Capital VI, Gtd. Notes | | Baa2 | | 8.875% | | 05/15/40 | | | 1,130 | | | 1,203,450 |
SEE NOTES TO FINANCIAL STATEMENTS.
A9
| | | | | | |
| | | CONSERVATIVE BALANCED PORTFOLIO (continued) | | |
| |
| SCHEDULE OF INVESTMENTS | | December 31, 2009 |
| | | | | | | | | | | | |
CORPORATE BONDS
(continued) | | Moody’s
Rating
(Unaudited)†
| | Interest
Rate
| | Maturity
Date
| | Principal
Amount
(000)
| | Value
(Note 2)
|
| | | | | | | | | | | | | |
Banking (continued) | | | | | | | | | | | | |
Capital One Financial Corp., Sr. Unsec’d. Notes, MTN | | Baa1 | | 5.700% | | 09/15/11 | | $ | 570 | | $ | 598,711 |
Citigroup, Inc., Sub. Notes | | Baa1 | | 5.625% | | 08/27/12 | | | 1,900 | | | 1,954,281 |
Citigroup, Inc., Sub. Notes | | Baa1 | | 6.125% | | 08/25/36 | | | 725 | | | 621,756 |
Citigroup, Inc., Sr. Unsec’d. Notes | | A3 | | 6.875% | | 03/05/38 | | | 790 | | | 788,434 |
Citigroup, Inc., Sr. Unsec’d. Notes(b) | | A3 | | 8.125% | | 07/15/39 | | | 415 | | | 468,389 |
Citigroup, Inc., Unsec’d. Notes | | A3 | | 8.500% | | 05/22/19 | | | 600 | | | 692,852 |
Countrywide Financial Corp., Gtd. Notes, MTN | | A2 | | 5.800% | | 06/07/12 | | | 1,160 | | | 1,231,353 |
DEPFA ACS Bank (Ireland), Covered Notes, 144A | | Aa2 | | 5.125% | | 03/16/37 | | | 1,325 | | | 973,849 |
Discover Bank/Greenwood DE, Sub. Notes | | Ba1 | | 8.700% | | 11/18/19 | | | 900 | | | 964,219 |
Goldman Sachs Group, Inc. (The), Sr. Unsec’d. Notes | | A1 | | 5.450% | | 11/01/12 | | | 580 | | | 623,604 |
Goldman Sachs Group, Inc. (The), Sub. Notes | | A2 | | 5.625% | | 01/15/17 | | | 765 | | | 781,340 |
Goldman Sachs Group, Inc. (The), Sub. Notes | | A2 | | 6.450% | | 05/01/36 | | | 1,770 | | | 1,743,356 |
Goldman Sachs Group, Inc. (The), Sub. Notes | | A2 | | 6.750% | | 10/01/37 | | | 113 | | | 116,151 |
Goldman Sachs Group, Inc. (The), Sr. Unsec’d. Notes(b) | | A1 | | 7.500% | | 02/15/19 | | | 2,400 | | | 2,797,927 |
ICICI Bank Ltd. (India), Bonds, 144A(d) | | Baa2 | | 0.824% | | 01/12/10 | | | 1,880 | | | 1,876,302 |
ICICI Bank Ltd. (Singapore), Notes, 144A | | Baa2 | | 5.750% | | 11/16/10 | | | 1,670 | | | 1,705,280 |
JPMorgan Chase & Co., Jr. Sub. Notes, Ser. 1(d) | | Baa1 | | 7.900% | | 04/29/49 | | | 2,000 | | | 2,062,920 |
JPMorgan Chase & Co., Sr. Unsec’d. Notes | | Aa3 | | 4.600% | | 01/17/11 | | | 175 | | | 181,052 |
JPMorgan Chase Capital XXVI(Capital Security, fixed to floating preferred) | | A2 | | 8.000% | | 05/15/48 | | | 28 | | | 752,080 |
JPMorgan Chase Capital XXVII, Gtd. Notes, Ser. AA(b) | | A2 | | 7.000% | | 11/01/39 | | | 1,500 | | | 1,512,770 |
Merrill Lynch & Co., Inc., Sr. Unsec’d. Notes, Ser. C, MTN | | A2 | | 4.250% | | 02/08/10 | | | 1,470 | | | 1,475,085 |
Merrill Lynch & Co., Inc., Sr. Unsec’d. Notes | | A2 | | 4.790% | | 08/04/10 | | | 375 | | | 382,750 |
Merrill Lynch & Co., Inc., Sr. Unsec’d. Notes, Ser. C, MTN | | A2 | | 5.000% | | 01/15/15 | | | 190 | | | 193,235 |
Merrill Lynch & Co., Inc., Sr. Unsec’d. Notes, MTN | | A2 | | 5.770% | | 07/25/11 | | | 355 | | | 375,284 |
Merrill Lynch & Co., Inc., Notes, MTN | | A2 | | 6.875% | | 04/25/18 | | | 1,230 | | | 1,325,249 |
Morgan Stanley, Sr. Unsec’d. Notes | | A2 | | 5.300% | | 03/01/13 | | | 30 | | | 31,620 |
Morgan Stanley, Sr. Unsec’d. Notes, Ser. E | | A2 | | 5.450% | | 01/09/17 | | | 2,530 | | | 2,557,111 |
Morgan Stanley, Sr. Unsec’d. Notes, MTN | | A2 | | 5.625% | | 09/23/19 | | | 2,110 | | | 2,125,424 |
Morgan Stanley, Sr. Unsec’d. Notes, MTN | | A2 | | 5.950% | | 12/28/17 | | | 600 | | | 618,864 |
MUFG Capital Finance Corp. Ltd. (Cayman Islands), Gtd. Notes.(d) | | A2 | | 6.346% | | 07/25/49 | | | 800 | | | 728,117 |
PNC Funding Corp., Gtd. Notes.(b) | | A3 | | 6.700% | | 06/10/19 | | | 885 | | | 990,294 |
Royal Bank of Scotland Group PLC (United Kingdom), Sr. Unsec’d. Notes, MTN | | A1 | | 6.400% | | 10/21/19 | | | 1,775 | | | 1,769,302 |
Santander Central Hispano Issuances Ltd. (Cayman Islands), Gtd. Notes. | | Aa3 | | 7.625% | | 09/14/10 | | | 805 | | | 843,848 |
USB Capital XIII Trust, Gtd. Notes | | A2 | | 6.625% | | 12/15/39 | | | 755 | | | 767,337 |
Wells Fargo Bank NA, Sub. Notes | | Aa3 | | 6.450% | | 02/01/11 | | | 90 | | | 95,044 |
Wells Fargo Capital XIII, Gtd. Notes, Ser. G, MTN(d) | | Ba1 | | 7.700% | | 12/29/49 | | | 1,000 | | | 970,000 |
| | | | | | | | | | | |
|
|
| | | | | | | | | | | | | 56,805,858 |
| | | | | | | | | | | |
|
|
Brokerage | | | | | | | | | | | | |
Lehman Brothers Holdings, Inc., Sr. Unsec’d. Notes, MTN(h) | | NR | | 5.250% | | 02/06/12 | | | 1,850 | | | 360,750 |
Lehman Brothers Holdings, Inc., Sr. Unsec’d. Notes, MTN(h) | | NR | | 6.875% | | 05/02/18 | | | 700 | | | 145,250 |
| | | | | | | | | | | |
|
|
| | | | | | | | | | | | | 506,000 |
| | | | | | | | | | | |
|
|
Building Materials & Construction — 0.1% | | | | | | | | | | | | |
Hanson Ltd. (United Kingdom), Gtd. Notes(b) | | B1 | | 7.875% | | 09/27/10 | | | 1,270 | | | 1,316,012 |
Lafarge SA (France), Sr. Unsec’d. Notes | | Baa3 | | 6.150% | | 07/15/11 | | | 1,100 | | | 1,146,291 |
| | | | | | | | | | | |
|
|
| | | | | | | | | | | | | 2,462,303 |
| | | | | | | | | | | |
|
|
Cable — 0.5% | | | | | | | | | | | | |
Comcast Cable Communications Holdings, Inc., Gtd. Notes | | Baa1 | | 9.455% | | 11/15/22 | | | 115 | | | 147,907 |
Comcast Cable Holdings LLC, Sr. Unsec’d. Notes | | Baa1 | | 9.875% | | 06/15/22 | | | 1,440 | | | 1,754,313 |
Comcast Corp., Gtd. Notes | | Baa1 | | 6.400% | | 05/15/38 | | | 310 | | | 318,998 |
Comcast Corp., Gtd. Notes | | Baa1 | | 6.950% | | 08/15/37 | | | 290 | | | 316,069 |
COX Communications, Inc., Sr. Unsec’d. Notes | | Baa3 | | 6.750% | | 03/15/11 | | | 1,195 | | | 1,256,475 |
DIRECTV Holdings LLC / DIRECTV Financing Co., Inc., Gtd. Notes, 144A | | Ba2 | | 4.750% | | 10/01/14 | | | 1,940 | | | 1,977,512 |
SEE NOTES TO FINANCIAL STATEMENTS.
A10
| | | | | | |
| | | CONSERVATIVE BALANCED PORTFOLIO (continued) | | |
| |
| SCHEDULE OF INVESTMENTS | | December 31, 2009 |
| | | | | | | | | | | | |
CORPORATE BONDS
(continued) | | Moody’s
Rating
(Unaudited)†
| | Interest
Rate
| | Maturity
Date
| | Principal
Amount
(000)
| | Value
(Note 2)
|
| | | | | | | | | | | | | |
Cable (continued) | | | | | | | | | | | | |
DISH DBS Corp., Gtd. Notes | | Ba3 | | 6.375% | | 10/01/11 | | $ | 1,000 | | $ | 1,032,500 |
Time Warner Cable, Inc., Gtd. Notes | | Baa2 | | 5.400% | | 07/02/12 | | | 2,410 | | | 2,574,914 |
Time Warner Cable, Inc., Gtd. Notes(b) | | Baa2 | | 6.750% | | 06/15/39 | | | 1,340 | | | 1,403,389 |
| | | | | | | | | | | |
|
|
| | | | | | | | | | | | | 10,782,077 |
| | | | | | | | | | | |
|
|
Capital Goods — 0.2% | | | | | | | | | | | | |
Erac USA Finance Co., Gtd. Notes, 144A
(original cost $459,646; purchased 10/10/07)(e)(i) | | Baa2 | | 5.800% | | 10/15/12 | | | 460 | | | 482,332 |
Erac USA Finance Co., Gtd. Notes, 144A
(original cost $1,195,904; purchased 10/10/07)(e)(i) | | Baa2 | | 6.375% | | 10/15/17 | | | 1,198 | | | 1,210,060 |
Erac USA Finance Co., Gtd. Notes, 144A
(original cost $386,623; purchased 10/10/07)(e)(i) | | Baa2 | | 7.000% | | 10/15/37 | | | 390 | | | 381,735 |
FedEx Corp., Gtd. Notes | | Baa2 | | 7.250% | | 02/15/11 | | | 480 | | | 508,389 |
General Electric Co., Sr. Unsec’d. Notes | | Aa2 | | 5.250% | | 12/06/17 | | | 320 | | | 326,997 |
Trane US, Inc., Gtd. Notes(b) | | BBB+(f) | | 7.625% | | 02/15/10 | | | 1,000 | | | 1,006,004 |
United Technologies Corp., Sr. Unsec’d. Notes | | A2 | | 5.375% | | 12/15/17 | | | 515 | | | 548,809 |
| | | | | | | | | | | |
|
|
| | | | | | | | | | | | | 4,464,326 |
| | | | | | | | | | | |
|
|
Chemicals — 0.3% | | | | | | | | | | | | |
Dow Chemical Co. (The), Sr. Unsec’d. Notes | | Baa3 | | 6.125% | | 02/01/11 | | | 690 | | | 719,303 |
Dow Chemical Co. (The), Sr. Unsec’d. Notes | | Baa3 | | 7.600% | | 05/15/14 | | | 1,600 | | | 1,820,627 |
Dow Chemical Co. (The), Sr. Unsec’d. Notes | | Baa3 | | 8.550% | | 05/15/19 | | | 1,000 | | | 1,193,145 |
Dow Chemical Co. (The), Sr. Unsec’d. Notes | | Baa3 | | 9.400% | | 05/15/39 | | | 40 | | | 52,886 |
ICI Wilmington, Inc., Gtd. Notes | | Baa1 | | 5.625% | | 12/01/13 | | | 780 | | | 814,118 |
PPG Industries, Inc., Sr. Unsec’d. Notes | | Baa1 | | 5.750% | | 03/15/13 | | | 1,500 | | | 1,601,533 |
Union Carbide Corp., Sr. Unsec’d. Notes | | Ba2 | | 7.500% | | 06/01/25 | | | 500 | | | 459,719 |
| | | | | | | | | | | |
|
|
| | | | | | | | | | | | | 6,661,331 |
| | | | | | | | | | | |
|
|
Consumer — 0.3% | | | | | | | | | | | | |
Avon Products, Inc., Sr. Unsec’d. Notes | | A2 | | 5.750% | | 03/01/18 | | | 1,400 | | | 1,502,431 |
Fortune Brands, Inc., Sr. Unsec’d. Notes(b) | | Baa3 | | 6.375% | | 06/15/14 | | | 2,190 | | | 2,345,391 |
Newell Rubbermaid, Inc., Sr. Unsec’d. Notes | | Baa3 | | 6.250% | | 04/15/18 | | | 1,600 | | | 1,580,965 |
Whirlpool Corp., Sr. Unsec’d. Notes | | Baa3 | | 6.125% | | 06/15/11 | | | 1,045 | | | 1,086,092 |
| | | | | | | | | | | |
|
|
| | | | | | | | | | | | | 6,514,879 |
| | | | | | | | | | | |
|
|
Electric — 1.2% | | | | | | | | | | | | |
Appalachian Power Co., Sr. Unsec’d. Notes, Ser. J | | Baa2 | | 4.400% | | 06/01/10 | | | 790 | | | 798,840 |
Arizona Public Service Co., Sr. Unsec’d. Notes | | Baa2 | | 6.250% | | 08/01/16 | | | 170 | | | 179,731 |
Arizona Public Service Co., Sr. Unsec’d. Notes | | Baa2 | | 6.375% | | 10/15/11 | | | 1,250 | | | 1,338,110 |
Baltimore Gas & Electric Co., Sr. Unsec’d. Notes | | Baa2 | | 6.350% | | 10/01/36 | | | 530 | | | 544,395 |
Carolina Power & Light Co., First Mtge. Bonds | | A1 | | 5.250% | | 12/15/15 | | | 660 | | | 721,722 |
CenterPoint Energy Houston Electric LLC, Genl. Ref. Mtge., Ser. J2 | | Baa1 | | 5.700% | | 03/15/13 | | | 1,070 | | | 1,137,349 |
CenterPoint Energy Houston Electric LLC, Genl. Ref. Mtge., Ser. K2 | | Baa1 | | 6.950% | | 03/15/33 | | | 300 | | | 331,749 |
Consolidated Edison Co. of NY, Inc., Sr. Unsec’d. Notes, Ser. 05-C | | A3 | | 5.375% | | 12/15/15 | | | 820 | | | 886,148 |
Consolidated Edison Co. of NY, Inc., Sr. Unsec’d. Notes, Ser. 08-B(b) | | A3 | | 6.750% | | 04/01/38 | | | 130 | | | 148,211 |
Consumers Energy Co., First Mtge. Bonds, Ser. D | | A3 | | 5.375% | | 04/15/13 | | | 435 | | | 467,075 |
Duke Energy Carolinas LLC, First Mtge. Bonds | | A1 | | 6.050% | | 04/15/38 | | | 530 | | | 564,305 |
Duke Energy Carolinas LLC, Sr. Unsec’d. Notes | | A3 | | 6.100% | | 06/01/37 | | | 920 | | | 965,270 |
E.ON International Finance BV (Netherlands), Gtd. Notes, 144A | | A2 | | 6.650% | | 04/30/38 | | | 930 | | | 1,057,495 |
El Paso Electric Co., Sr. Unsec’d. Notes | | Baa2 | | 6.000% | | 05/15/35 | | | 845 | | | 759,902 |
Empresa Nacional de Electricidad S.A. (Chile), Unsub. Notes | | Baa3 | | 8.625% | | 08/01/15 | | | 1,160 | | | 1,374,969 |
ENEL Finance International SA (Luxembourg), Gtd. Notes, 144A | | A2 | | 6.000% | | 10/07/39 | | | 1,260 | | | 1,266,669 |
Energy East Corp., Sr. Unsec’d. Notes | | A3 | | 6.750% | | 09/15/33 | | | 140 | | | 146,075 |
Exelon Corp., Sr. Unsec’d. Notes | | Baa1 | | 4.900% | | 06/15/15 | | | 195 | | | 201,162 |
Exelon Generation Co. LLC, Sr. Unsec’d. Notes | | A3 | | 6.250% | | 10/01/39 | | | 1,375 | | | 1,400,893 |
FirstEnergy Solutions Corp., Gtd. Notes | | Baa2 | | 6.050% | | 08/15/21 | | | 620 | | | 625,460 |
Florida Power & Light Co., First Mtge. Bonds | | Aa2 | | 5.950% | | 10/01/33 | | | 380 | | | 397,770 |
Georgia Power Co., Sr. Unsec’d. Notes, Ser. B | | A2 | | 5.700% | | 06/01/17 | | | 470 | | | 509,987 |
Indiana Michigan Power Co., Sr. Unsec’d. Notes, Ser. INDF | | Baa2 | | 5.050% | | 11/15/14 | | | 575 | | | 596,427 |
SEE NOTES TO FINANCIAL STATEMENTS.
A11
| | | | | | |
| | | CONSERVATIVE BALANCED PORTFOLIO (continued) | | |
| |
| SCHEDULE OF INVESTMENTS | | December 31, 2009 |
| | | | | | | | | | | | |
CORPORATE BONDS
(continued) | | Moody’s
Rating
(Unaudited)†
| | Interest
Rate
| | Maturity
Date
| | Principal
Amount
(000)
| | Value
(Note 2)
|
| | | | | | | | | | | | | |
Electric (continued) | | | | | | | | | | | | |
Korea Hydro & Nuclear Power Co. Ltd. (South Korea), Sr. Unsec’d. Notes, 144A(b) | | A2 | | 6.250% | | 06/17/14 | | $ | 1,555 | | $ | 1,696,674 |
Midamerican Energy Holdings Co., Sr. Unsec’d. Notes | | Baa1 | | 5.750% | | 04/01/18 | | | 210 | | | 221,334 |
Midamerican Energy Holdings Co., Sr. Unsec’d. Notes | | Baa1 | | 5.950% | | 05/15/37 | | | 325 | | | 325,364 |
Nevada Power Co., Genl. Ref. Mtge., Ser. O | | Baa3 | | 6.500% | | 05/15/18 | | | 1,210 | | | 1,294,871 |
Niagara Mohawk Power Corp., Sr. Unsec’d. Notes, 144A | | A3 | | 4.881% | | 08/15/19 | | | 545 | | | 540,358 |
NiSource Finance Corp., Gtd. Notes | | Baa3 | | 5.450% | | 09/15/20 | | | 500 | | | 484,850 |
NSTAR | | A2 | | 4.500% | | 11/15/19 | | | 605 | | | 591,634 |
Oncor Electric Delivery Co. LLC, Sr. Sec’d. Notes | | Baa1 | | 6.375% | | 01/15/15 | | | 465 | | | 507,240 |
Oncor Electric Delivery Co. LLC, Sr. Sec’d. Notes | | Baa1 | | 7.000% | | 09/01/22 | | | 545 | | | 605,958 |
Pacific Gas & Electric Co., Sr. Unsec’d. Notes | | A3 | | 6.050% | | 03/01/34 | | | 1,610 | | | 1,680,895 |
Public Service Co. of New Mexico, Sr. Unsec’d. Notes | | Baa3 | | 7.950% | | 05/15/18 | | | 135 | | | 141,318 |
Public Service Electric & Gas Co., Sec’d. Notes, MTN | | A2 | | 5.800% | | 05/01/37 | | | 515 | | | 529,936 |
Southern California Edison Co., Ser. 04-F | | A1 | | 4.650% | | 04/01/15 | | | 610 | | | 644,973 |
Xcel Energy, Inc., Sr. Unsec’d. Notes | | Baa1 | | 5.613% | | 04/01/17 | | | 263 | | | 271,168 |
Xcel Energy, Inc., Sr. Unsec’d. Notes | | Baa1 | | 6.500% | | 07/01/36 | | | 445 | | | 468,777 |
| | | | | | | | | | | |
|
|
| | | | | | | | | | | | | 26,425,064 |
| | | | | | | | | | | |
|
|
Energy – Integrated — 0.2% | | | | | | | | | | | | |
Cenovus Energy, Inc. (Canada), Sr. Notes, 144A | | Baa2 | | 6.750% | | 11/15/39 | | | 975 | | | 1,062,803 |
Hess Corp., Sr. Unsec’d. Notes | | Baa2 | | 6.000% | | 01/15/40 | | | 390 | | | 386,196 |
Husky Energy, Inc. (Canada), Sr. Unsec’d. Notes | | Baa2 | | 7.250% | | 12/15/19 | | | 300 | | | 346,680 |
TNK-BP Finance SA (Luxembourg), Gtd. Notes, 144A | | Baa2 | | 7.500% | | 07/18/16 | | | 1,365 | | | 1,399,125 |
| | | | | | | | | | | |
|
|
| | | | | | | | | | | | | 3,194,804 |
| | | | | | | | | | | |
|
|
Energy – Other — 0.3% | | | | | | | | | | | | |
Devon Financing Corp. ULC (Canada), Gtd. Notes | | Baa1 | | 7.875% | | 09/30/31 | | | 280 | | | 350,815 |
Dolphin Energy Ltd. (United Arab Emirates), Sr. Sec’d. Notes, 144A | | Aa3 | | 5.888% | | 06/15/19 | | | 843 | | | 851,915 |
Halliburton Co., Sr. Unsec’d. Notes | | A2 | | 5.500% | | 10/15/10 | | | 200 | | | 208,137 |
Nexen, Inc. (Canada), Sr. Unsec’d. Notes | | Baa3 | | 6.400% | | 05/15/37 | | | 195 | | | 196,466 |
Pioneer Natural Resources Co., Sr. Unsec’d. Notes | | Ba1 | | 6.875% | | 05/01/18 | | | 1,450 | | | 1,434,659 |
Questar Market Resources, Inc., Sr. Unsec’d. Notes(b) | | Baa3 | | 6.800% | | 03/01/20 | | | 735 | | | 766,094 |
Valero Energy Corp., Gtd. Notes | | Baa2 | | 6.625% | | 06/15/37 | | | 250 | | | 234,583 |
Weatherford International Ltd. (Bermuda), Gtd. Notes | | Baa1 | | 6.500% | | 08/01/36 | | | 25 | | | 23,876 |
Woodside Finance Ltd. (Australia), Gtd. Notes, 144A | | Baa1 | | 5.000% | | 11/15/13 | | | 1,660 | | | 1,698,271 |
XTO Energy, Inc., Sr. Unsec’d. Notes | | Baa2 | | 6.250% | | 08/01/17 | | | 565 | | | 639,770 |
| | | | | | | | | | | |
|
|
| | | | | | | | | | | | | 6,404,586 |
| | | | | | | | | | | |
|
|
Foods — 0.7% | | | | | | | | | | | | |
Anheuser-Busch InBev Worldwide, Inc., Gtd. Notes, 144A | | Baa2 | | 5.375% | | 01/15/20 | | | 1,100 | | | 1,122,285 |
Anheuser-Busch InBev Worldwide, Inc., Gtd. Notes, 144A | | Baa2 | | 6.875% | | 11/15/19 | | | 1,100 | | | 1,228,022 |
Anheuser-Busch InBev Worldwide, Inc., Gtd. Notes, 144A | | Baa2 | | 8.000% | | 11/15/39 | | | 1,160 | | | 1,444,103 |
Anheuser-Busch InBev Worldwide, Inc., Gtd. Notes, 144A | | Baa2 | | 8.200% | | 01/15/39 | | | 230 | | | 290,835 |
Bunge Ltd. Finance Corp., Gtd. Notes(b) | | Baa2 | | 5.350% | | 04/15/14 | | | 1,000 | | | 1,022,270 |
Bunge Ltd. Finance Corp., Gtd. Notes | | Baa2 | | 8.500% | | 06/15/19 | | | 860 | | | 980,320 |
Cargill, Inc., Sr. Unsec’d. Notes, 144A
(original cost $646,913; purchased 11/19/07)(e)(i) | | A2 | | 6.000% | | 11/27/17 | | | 650 | | | 692,792 |
ConAgra Foods, Inc., Sr. Unsec’d. Notes | | Baa2 | | 7.875% | | 09/15/10 | | | 62 | | | 64,904 |
Delhaize America, Inc., Gtd. Notes | | Baa3 | | 9.000% | | 04/15/31 | | | 660 | | | 844,999 |
Delhaize Group (Belgium), Gtd. Notes | | Baa3 | | 6.500% | | 06/15/17 | | | 460 | | | 499,575 |
General Mills, Inc., Sr. Unsec’d. Notes | | Baa1 | | 6.000% | | 02/15/12 | | | 975 | | | 1,052,684 |
H.J. Heinz Finance Co., Gtd. Notes, 144A | | Baa2 | | 7.125% | | 08/01/39 | | | 405 | | | 457,868 |
Kroger Co. (The), Gtd. Notes | | Baa2 | | 6.750% | | 04/15/12 | | | 215 | | | 234,824 |
Kroger Co. (The), Gtd. Notes | | Baa2 | | 6.800% | | 04/01/11 | | | 575 | | | 610,586 |
McDonald’s Corp., Sr. Unsec’d. Notes, MTN | | A3 | | 6.300% | | 03/01/38 | | | 1,140 | | | 1,257,485 |
Ralcorp Holdings, Inc., Sr. Notes, 144A | | Baa3 | | 6.625% | | 08/15/39 | | | 800 | | | 780,194 |
Tyson Foods, Inc., Gtd. Notes | | Ba3 | | 7.850% | | 04/01/16 | | | 785 | | | 804,625 |
Yum! Brands, Inc., Sr. Unsec’d. Notes | | Baa3 | | 8.875% | | 04/15/11 | | | 235 | | | 254,287 |
| | | | | | | | | | | |
|
|
| | | | | | | | | | | | | 13,642,658 |
| | | | | | | | | | | |
|
|
SEE NOTES TO FINANCIAL STATEMENTS.
A12
| | | | | | |
| | | CONSERVATIVE BALANCED PORTFOLIO (continued) | | |
| |
| SCHEDULE OF INVESTMENTS | | December 31, 2009 |
| | | | | | | | | | | | |
CORPORATE BONDS
(continued) | | Moody’s
Rating
(Unaudited)†
| | Interest
Rate
| | Maturity
Date
| | Principal
Amount
(000)
| | Value
(Note 2)
|
| | | | | | | | | | | | | |
Healthcare & Pharmaceutical — 0.7% | | | | | | | | | | | | |
Abbott Laboratories, Sr. Unsec’d. Notes | | A1 | | 5.875% | | 05/15/16 | | $ | 1,100 | | $ | 1,213,288 |
AmerisourceBergen Corp., Gtd. Notes | | Baa3 | | 5.625% | | 09/15/12 | | | 915 | | | 974,249 |
AstraZeneca PLC (United Kingdom), Sr. Unsec’d. Notes | | A1 | | 6.450% | | 09/15/37 | | | 480 | | | 540,621 |
Boston Scientific Corp., Sr. Unsec’d. Notes | | Ba1 | | 4.500% | | 01/15/15 | | | 885 | | | 886,806 |
Boston Scientific Corp., Sr. Unsec’d. Notes | | Ba1 | | 6.000% | | 01/15/20 | | | 570 | | | 582,413 |
CareFusion Corp., Sr. Unsec’d. Notes, 144A | | Baa3 | | 6.375% | | 08/01/19 | | | 320 | | | 342,567 |
Genentech, Inc., Sr. Unsec’d. Notes | | AA-(f) | | 4.750% | | 07/15/15 | | | 270 | | | 288,974 |
GlaxoSmithKline Capital, Inc., Gtd. Notes | | A1 | | 6.375% | | 05/15/38 | | | 840 | | | 930,616 |
HCA, Inc., Sec’d. Notes | | B2 | | 9.250% | | 11/15/16 | | | 1,925 | | | 2,066,969 |
Laboratory Corp. of America Holdings, Sr. Unsec’d. Notes | | Baa3 | | 5.625% | | 12/15/15 | | | 560 | | | 585,503 |
Merck & Co., Inc., Gtd. Notes | | Aa3 | | 6.000% | | 09/15/17 | | | 842 | | | 935,247 |
Merck & Co., Inc., Gtd. Notes | | Aa3 | | 6.550% | | 09/15/37 | | | 330 | | | 374,783 |
Merck & Co., Inc., Sr. Unsec’d. Notes | | Aa3 | | 5.750% | | 11/15/36 | | | 280 | | | 286,957 |
Merck & Co., Inc., Sr. Unsec’d. Notes | | Aa3 | | 5.950% | | 12/01/28 | | | 205 | | | 216,034 |
Watson Pharmaceuticals, Inc., Sr. Unsec’d. Notes | | Ba1 | | 6.125% | | 08/15/19 | | | 440 | | | 453,989 |
Wyeth, Gtd. Notes | | A1 | | 5.500% | | 03/15/13 | | | 1,165 | | | 1,266,690 |
Wyeth, Gtd. Notes | | A1 | | 5.950% | | 04/01/37 | | | 1,645 | | | 1,715,370 |
Wyeth, Gtd. Notes | | A1 | | 6.450% | | 02/01/24 | | | 60 | | | 66,842 |
| | | | | | | | | | | |
|
|
| | | | | | | | | | | | | 13,727,918 |
| | | | | | | | | | | |
|
|
Healthcare Insurance — 0.3% | | | | | | | | | | | | |
Aetna, Inc., Sr. Unsec’d. Notes | | A3 | | 5.750% | | 06/15/11 | | | 430 | | | 450,944 |
Aetna, Inc., Sr. Unsec’d. Notes | | A3 | | 6.625% | | 06/15/36 | | | 480 | | | 492,191 |
CIGNA Corp., Sr. Unsec’d. Notes | | Baa2 | | 6.150% | | 11/15/36 | | | 640 | | | 571,727 |
Coventry Health Care, Inc., Sr. Unsec’d. Notes | | Ba1 | | 6.125% | | 01/15/15 | | | 1,200 | | | 1,146,252 |
UnitedHealth Group, Inc., Sr. Unsec’d. Notes | | Baa1 | | 5.250% | | 03/15/11 | | | 1,470 | | | 1,523,226 |
UnitedHealth Group, Inc., Sr. Unsec’d. Notes | | Baa1 | | 6.000% | | 06/15/17 | | | 115 | | | 120,355 |
UnitedHealth Group, Inc., Sr. Unsec’d. Notes | | Baa1 | | 6.500% | | 06/15/37 | | | 400 | | | 394,439 |
UnitedHealth Group, Inc., Sr. Unsec’d. Notes | | Baa1 | | 6.625% | | 11/15/37 | | | 410 | | | 410,734 |
WellPoint, Inc., Sr. Unsec’d. Notes(b) | | Baa1 | | 5.000% | | 12/15/14 | | | 1,085 | | | 1,128,746 |
WellPoint, Inc., Sr. Unsec’d. Notes | | Baa1 | | 5.250% | | 01/15/16 | | | 335 | | | 338,156 |
| | | | | | | | | | | |
|
|
| | | | | | | | | | | | | 6,576,770 |
| | | | | | | | | | | |
|
|
Insurance — 0.5% | | | | | | | | | | | | |
American International Group, Inc., Sr. Unsec’d. Notes | | A3 | | 4.250% | | 05/15/13 | | | 655 | | | 605,028 |
AXA SA (France), Sub. Notes | | A3 | | 8.600% | | 12/15/30 | | | 230 | | | 267,274 |
Berkshire Hathaway Finance Corp., Gtd. Notes | | Aa2 | | 4.750% | | 05/15/12 | | | 425 | | | 453,078 |
Liberty Mutual Group, Inc., Bonds, 144A | | Baa2 | | 7.000% | | 03/15/34 | | | 910 | | | 779,726 |
Lincoln National Corp., Sr. Unsec’d. Notes | | Baa2 | | 6.300% | | 10/09/37 | | | 476 | | | 435,926 |
Lincoln National Corp., Sr. Unsec’d. Notes | | Baa2 | | 8.750% | | 07/01/19 | | | 505 | | | 577,015 |
Marsh & McLennan Cos., Inc., Sr. Unsec’d. Notes | | Baa2 | | 5.150% | | 09/15/10 | | | 335 | | | 343,427 |
MetLife, Inc., Sr. Unsec’d. Notes | | A3 | | 5.700% | | 06/15/35 | | | 1,185 | | | 1,170,281 |
MetLife, Inc., Sr. Unsec’d. Notes | | A3 | | 6.125% | | 12/01/11 | | | 435 | | | 467,637 |
MetLife, Inc., Sr. Unsec’d. Notes | | A3 | | 6.375% | | 06/15/34 | | | 85 | | | 90,834 |
MetLife, Inc., Sr. Unsec’d. Notes | | A3 | | 6.750% | | 06/01/16 | | | 270 | | | 302,357 |
New York Life Insurance Co., Sub. Notes, 144A | | Aa2 | | 6.750% | | 11/15/39 | | | 650 | | | 664,736 |
Pacific Life Insurance Co., Sub. Notes, 144A
(original cost $869,582; purchased 06/16/09)(i) | | A3 | | 9.250% | | 06/15/39 | | | 870 | | | 1,004,620 |
Teachers Insurance & Annuity Association of America, Notes, 144A | | Aa2 | | 6.850% | | 12/16/39 | | | 1,430 | | | 1,478,246 |
Travelers Cos., Inc. (The), Sr. Unsec’d. Notes | | A2 | | 6.750% | | 06/20/36 | | | 740 | | | 816,821 |
W.R. Berkley Corp., Sr. Unsec’d. Notes | | Baa2 | | 5.600% | | 05/15/15 | | | 705 | | | 697,311 |
W.R. Berkley Corp., Sr. Unsec’d. Notes | | Baa2 | | 6.150% | | 08/15/19 | | | 575 | | | 545,791 |
XL Capital Ltd. (Cayman Islands), Sr. Unsec’d. Notes | | Baa2 | | 5.250% | | 09/15/14 | | | 110 | | | 107,725 |
| | | | | | | | | | | |
|
|
| | | | | | | | | | | | | 10,807,833 |
| | | | | | | | | | | |
|
|
Lodging — 0.2% | | | | | | | | | | | | |
Starwood Hotels & Resorts Worldwide, Inc., Sr. Unsec’d. Notes(b) | | Ba1 | | 6.250% | | 02/15/13 | | | 1,585 | | | 1,634,531 |
Starwood Hotels & Resorts Worldwide, Inc., Sr. Unsec’d. Notes(b) | | Ba1 | | 6.750% | | 05/15/18 | | | 2,700 | | | 2,706,750 |
| | | | | | | | | | | |
|
|
| | | | | | | | | | | | | 4,341,281 |
| | | | | | | | | | | |
|
|
SEE NOTES TO FINANCIAL STATEMENTS.
A13
| | | | | | |
| | | CONSERVATIVE BALANCED PORTFOLIO (continued) | | |
| |
| SCHEDULE OF INVESTMENTS | | December 31, 2009 |
| | | | | | | | | | | | |
CORPORATE BONDS
(continued) | | Moody’s
Rating
(Unaudited)†
| | Interest
Rate
| | Maturity
Date
| | Principal
Amount
(000)
| | Value
(Note 2)
|
| | | | | | | | | | | | | |
Media & Entertainment — 0.4% | | | | | | | | | | | | |
Gannett Co., Inc., Sr. Unsec’d. Notes | | Ba2 | | 6.375% | | 04/01/12 | | $ | 2,500 | | $ | 2,500,000 |
News America, Inc., Gtd. Notes | | Baa1 | | 7.625% | | 11/30/28 | | | 1,265 | | | 1,351,983 |
News America, Inc., Gtd. Notes, 144A(b) | | Baa1 | | 6.900% | | 08/15/39 | | | 325 | | | 354,534 |
Time Warner, Inc., Gtd. Notes | | Baa2 | | 6.750% | | 04/15/11 | | | 725 | | | 768,138 |
Time Warner, Inc., Gtd. Notes | | Baa2 | | 7.250% | | 10/15/17 | | | 745 | | | 834,342 |
Time Warner, Inc., Sr. Unsec’d. Notes | | Baa2 | | 9.150% | | 02/01/23 | | | 625 | | | 754,271 |
Viacom, Inc., Sr. Unsec’d. Notes(b) | | Baa2 | | 6.750% | | 10/05/37 | | | 420 | | | 433,304 |
Viacom, Inc., Sr. Unsec’d. Notes | | Baa2 | | 6.875% | | 04/30/36 | | | 620 | | | 670,410 |
| | | | | | | | | | | |
|
|
| | | | | | | | | | | | | 7,666,982 |
| | | | | | | | | | | |
|
|
Metals — 0.3% | | | | | | | | | | | | |
ArcelorMittal USA Partnership (Canada), Gtd. Notes | | Baa3 | | 9.750% | | 04/01/14 | | | 1,720 | | | 1,806,000 |
Newmont Mining Corp., Gtd. Notes | | Baa2 | | 6.250% | | 10/01/39 | | | 865 | | | 866,034 |
Rio Tinto Alcan, Inc. (Canada), Sr. Unsec’d. Notes | | BBB+(f) | | 4.500% | | 05/15/13 | | | 255 | | | 261,840 |
Rio Tinto Alcan, Inc. (Canada), Sr. Unsec’d. Notes | | BBB+(f) | | 5.000% | | 06/01/15 | | | 755 | | | 775,124 |
Rio Tinto Finance USA Ltd. (Australia), Gtd. Notes | | Baa1 | | 5.875% | | 07/15/13 | | | 500 | | | 539,518 |
Southern Copper Corp., Sr. Unsec’d. Notes | | Baa3 | | 7.500% | | 07/27/35 | | | 120 | | | 118,901 |
United States Steel Corp., Sr. Unsec’d. Notes | | Ba3 | | 5.650% | | 06/01/13 | | | 2,540 | | | 2,527,320 |
| | | | | | | | | | | |
|
|
| | | | | | | | | | | | | 6,894,737 |
| | | | | | | | | | | |
|
|
Non Captive Finance — 0.5% | | | | | | | | | | | | |
General Electric Capital Corp., Sr. Unsec’d. Notes, MTN(c). | | Aa2 | | 5.550% | | 05/04/20 | | | 1,555 | | | 1,541,216 |
General Electric Capital Corp., Sr. Unsec’d. Notes, MTN | | Aa2 | | 5.875% | | 01/14/38 | | | 970 | | | 898,107 |
General Electric Capital Corp., Sr. Unsec’d. Notes, Ser. G, MTN(c) | | Aa2 | | 6.000% | | 08/07/19 | | | 3,010 | | | 3,124,443 |
HSBC Finance Corp., Sr. Unsec’d. Notes | | A3 | | 5.700% | | 06/01/11 | | | 585 | | | 611,158 |
International Lease Finance Corp., Sr. Unsec’d. Notes | | B1 | | 6.375% | | 03/25/13 | | | 1,750 | | | 1,438,815 |
SLM Corp., Sr. Unsec’d. Notes, MTN | | Ba1 | | 8.450% | | 06/15/18 | | | 2,825 | | | 2,787,577 |
| | | | | | | | | | | |
|
|
| | | | | | | | | | | | | 10,401,316 |
| | | | | | | | | | | |
|
|
Packaging | | | | | | | | | | | | |
Sealed Air Corp., Sr. Unsec’d. Notes, 144A | | Baa3 | | 6.875% | | 07/15/33 | | | 450 | | | 423,363 |
| | | | | | | | | | | |
|
|
Paper — 0.1% | | | | | | | | | | | | |
International Paper Co., Sr. Unsec’d. Notes | | Baa3 | | 7.300% | | 11/15/39 | | | 1,080 | | | 1,145,730 |
International Paper Co., Sr. Unsec’d. Notes | | Baa3 | | 7.500% | | 08/15/21 | | | 460 | | | 515,417 |
| | | | | | | | | | | |
|
|
| | | | | | | | | | | | | 1,661,147 |
| | | | | | | | | | | |
|
|
Pipelines & Other — 0.3% | | | | | | | | | | | | |
DCP Midstream LLC, Sr. Unsec’d. Notes | | Baa2 | | 7.875% | | 08/16/10 | | | 1,830 | | | 1,902,512 |
Kinder Morgan Energy Partners LP, Sr. Unsec’d. Notes(b) | | Baa2 | | 6.500% | | 09/01/39 | | | 650 | | | 655,077 |
ONEOK Partners LP, Gtd. Notes | | Baa2 | | 6.650% | | 10/01/36 | | | 405 | | | 413,069 |
Sempra Energy, Sr. Unsec’d. Notes | | Baa1 | | 6.000% | | 02/01/13 | | | 80 | | | 85,307 |
Spectra Energy Capital LLC, Gtd. Notes | | Baa2 | | 6.200% | | 04/15/18 | | | 3,310 | | | 3,515,266 |
Spectra Energy Capital LLC, Sr. Unsec’d. Notes | | Baa2 | | 6.250% | | 02/15/13 | | | 205 | | | 220,418 |
| | | | | | | | | | | |
|
|
| | | | | | | | | | | | | 6,791,649 |
| | | | | | | | | | | |
|
|
Railroads — 0.1% | | | | | | | | | | | | |
Burlington Northern Santa Fe Corp., Sr. Unsec’d. Notes | | Baa1 | | 6.700% | | 08/01/28 | | | 735 | | | 787,815 |
CSX Corp., Sr. Unsec’d. Notes(b) | | Baa3 | | 6.150% | | 05/01/37 | | | 690 | | | 699,094 |
Norfolk Southern Corp., Sr. Unsec’d. Notes | | Baa1 | | 5.590% | | 05/17/25 | | | 630 | | | 612,441 |
Norfolk Southern Corp., Sr. Unsec’d. Notes | | Baa1 | | 7.800% | | 05/15/27 | | | 24 | | | 28,850 |
Union Pacific Corp., Sr. Unsec’d. Notes | | Baa2 | | 6.650% | | 01/15/11 | | | 760 | | | 801,627 |
| | | | | | | | | | | |
|
|
| | | | | | | | | | | | | 2,929,827 |
| | | | | | | | | | | |
|
|
Real Estate Investment Trusts — 0.3% | | | | | | | | | | | | |
Brandywine Operating Partnership LP, Gtd. Notes | | Baa3 | | 5.750% | | 04/01/12 | | | 391 | | | 398,545 |
Mack-Cali Realty LP, Sr. Unsec’d. Notes | | Baa2 | | 7.750% | | 08/15/19 | | | 685 | | | 708,807 |
Post Apartment Homes LP, Sr. Unsec’d. Notes | | Baa3 | | 5.450% | | 06/01/12 | | | 545 | | | 540,774 |
Post Apartment Homes LP, Sr. Unsec’d. Notes | | Baa3 | | 6.300% | | 06/01/13 | | | 650 | | | 646,260 |
Simon Property Group LP, Sr. Unsec’d. Notes | | A3 | | 5.750% | | 05/01/12 | | | 1,625 | | | 1,707,056 |
Simon Property Group LP, Sr. Unsec’d. Notes | | A3 | | 6.125% | | 05/30/18 | | | 2,700 | | | 2,743,168 |
| | | | | | | | | | | |
|
|
| | | | | | | | | | | | | 6,744,610 |
| | | | | | | | | | | |
|
|
SEE NOTES TO FINANCIAL STATEMENTS.
A14
| | | | | | |
| | | CONSERVATIVE BALANCED PORTFOLIO (continued) | | |
| |
| SCHEDULE OF INVESTMENTS | | December 31, 2009 |
| | | | | | | | | | | | |
CORPORATE BONDS
(continued) | | Moody’s
Rating
(Unaudited)†
| | Interest
Rate
| | Maturity
Date
| | Principal
Amount
(000)
| | Value
(Note 2)
|
| | | | | | | | | | | | | |
Retailers — 0.8% | | | | | | | | | | | | |
CVS Caremark Corp., Sr. Unsec’d. Notes | | Baa2 | | 5.750% | | 08/15/11 | | $ | 1,240 | | $ | 1,320,445 |
CVS Caremark Corp., Sr. Unsec’d. Notes | | Baa2 | | 5.750% | | 06/01/17 | | | 1,580 | | | 1,667,554 |
CVS Caremark Corp., Sr. Unsec’d. Notes | | Baa2 | | 6.125% | | 09/15/39 | | | 725 | | | 718,547 |
GameStop Corp./GameStop, Inc., Gtd. Notes | | Ba1 | | 8.000% | | 10/01/12 | | | 980 | | | 1,015,525 |
Home Depot, Inc. (The) Sr. Unsec’d. Notes | | Baa1 | | 5.875% | | 12/16/36 | | | 315 | | | 304,056 |
Kohl’s Corp., Sr. Unsec’d. Notes | | Baa1 | | 6.875% | | 12/15/37 | | | 1,000 | | | 1,134,152 |
Lowe’s Cos., Inc., Sr. Unsec’d. Notes | | A1 | | 6.500% | | 03/15/29 | | | 345 | | | 379,391 |
Macy’s Retail Holdings, Inc., Gtd. Notes | | Ba2 | | 5.350% | | 03/15/12 | | | 330 | | | 337,013 |
Macy’s Retail Holdings, Inc., Gtd. Notes | | Ba2 | | 5.875% | | 01/15/13 | | | 2,000 | | | 2,055,000 |
Nordstrom, Inc., Sr. Unsec’d. Notes(b) | | Baa2 | | 6.250% | | 01/15/18 | | | 4,500 | | | 4,871,115 |
Target Corp., Sr. Unsec’d. Notes | | A2 | | 7.000% | | 01/15/38 | | | 1,655 | | | 1,930,968 |
Wal-Mart Stores, Inc., Sr. Unsec’d. Notes | | Aa2 | | 5.250% | | 09/01/35 | | | 235 | | | 231,080 |
| | | | | | | | | | | |
|
|
| | | | | | | | | | | | | 15,964,846 |
| | | | | | | | | | | |
|
|
Technology — 0.5% | | | | | | | | | | | | |
Cisco Systems, Inc., Sr. Unsec’d. Notes | | A1 | | 4.450% | | 01/15/20 | | | 1,665 | | | 1,633,338 |
Computer Sciences Corp., Sr. Unsec’d. Notes, Ser. WI | | Baa1 | | 6.500% | | 03/15/18 | | | 1,700 | | | 1,855,207 |
Electronic Data Systems Corp., Sr. Unsec’d. Notes | | A2 | | 7.450% | | 10/15/29 | | | 120 | | | 141,996 |
Fiserv, Inc., Gtd. Notes | | Baa2 | | 6.125% | | 11/20/12 | | | 960 | | | 1,045,316 |
Intuit, Inc., Sr. Unsec’d. Notes | | Baa2 | | 5.400% | | 03/15/12 | | | 575 | | | 610,882 |
Motorola, Inc., Sr. Unsec’d. Notes | | Baa3 | | 8.000% | | 11/01/11 | | | 48 | | | 51,335 |
Oracle Corp., Sr. Unsec’d. Notes(b) | | A2 | | 6.125% | | 07/08/39 | | | 1,085 | | | 1,139,288 |
Seagate Technology HDD Holdings (Cayman Islands), Gtd. Notes | | Ba3 | | 6.375% | | 10/01/11 | | | 985 | | | 1,002,238 |
Xerox Corp., Sr. Unsec’d. Notes(b) | | Baa2 | | 4.250% | | 02/15/15 | | | 2,650 | | | 2,631,527 |
| | | | | | | | | | | |
|
|
| | | | | | | | | | | | | 10,111,127 |
| | | | | | | | | | | |
|
|
Telecommunications — 1.3% | | | | | | | | | | | | |
America Movil SAB de CV (Mexico), Gtd. Notes(b) | | A3 | | 6.375% | | 03/01/35 | | | 630 | | | 650,341 |
AT&T Corp., Gtd. Notes | | A2 | | 8.000% | | 11/15/31 | | | 505 | | | 616,362 |
AT&T, Inc., Sr. Unsec’d. Notes | | A2 | | 5.300% | | 11/15/10 | | | 1,180 | | | 1,226,661 |
Cellco Partnership/Verizon Wireless Capital LLC, Sr. Unsec’d. Notes | | A2 | | 8.500% | | 11/15/18 | | | 2,400 | | | 2,976,917 |
Deutsche Telekom International Finance BV (Netherlands), Gtd. Notes | | Baa1 | | 8.750% | | 06/15/30 | | | 345 | | | 443,708 |
Embarq Corp., Sr. Unsec’d. Notes
(original cost $349,979; purchased date 05/12/06)(e)(i) | | Baa3 | | 7.082% | | 06/01/16 | | | 350 | | | 386,602 |
Embarq Corp., Sr. Unsec’d. Notes
(original cost $1,667,844; purchased date 05/12/06-04/01/07)(e)(i) | | Baa3 | | 7.995% | | 06/01/36 | | | 1,645 | | | 1,769,523 |
France Telecom SA (France), Sr. Unsec’d. Notes | | A3 | | 8.500% | | 03/01/31 | | | 360 | | | 479,093 |
Koninklijke (Royal) KPN NV (Netherlands), Sr. Unsec’d. Notes | | Baa2 | | 8.000% | | 10/01/10 | | | 645 | | | 677,250 |
New Cingular Wireless Services, Inc., Gtd. Notes | | A2 | | 8.125% | | 05/01/12 | | | 800 | | | 903,946 |
New Cingular Wireless Services, Inc., Sr. Unsec’d. Notes | | A2 | | 8.750% | | 03/01/31 | | | 1,235 | | | 1,596,002 |
PCCW HKT Capital Ltd. (U.S. Virgin Islands), Gtd. Notes, 144A | | Baa2 | | 8.000% | | 11/15/11 | | | 2,275 | | | 2,452,222 |
Qwest Capital Funding, Inc., Gtd. Notes | | B1 | | 7.250% | | 02/15/11 | | | 720 | | | 730,800 |
Qwest Corp., Sr. Unsec’d. Notes | | Ba1 | | 8.875% | | 03/15/12 | | | 2,000 | | | 2,150,000 |
Telecom Italia Capital SA (Luxembourg), Gtd. Notes | | Baa2 | | 5.250% | | 11/15/13 | | | 170 | | | 178,804 |
Telecom Italia Capital SA (Luxembourg), Gtd. Notes | | Baa2 | | 7.175% | | 06/18/19 | | | 3,405 | | | 3,796,109 |
Telefonica Emisiones SAU (Spain), Gtd. Notes | | Baa1 | | 5.877% | | 07/15/19 | | | 640 | | | 685,971 |
Telefonica Emisiones SAU (Spain), Gtd. Notes | | Baa1 | | 7.045% | | 06/20/36 | | | 210 | | | 239,799 |
Telefonos de Mexico SAB de CV (Mexico), Sr. Unsec’d. Notes, 144A(b) | | A3 | | 5.500% | | 11/15/19 | | | 255 | | | 248,309 |
TELUS Corp. (Canada), Sr. Unsec’d. Notes | | Baa1 | | 8.000% | | 06/01/11 | | | 1,041 | | | 1,126,990 |
US Cellular Corp., Sr. Unsec’d. Notes | | Baa2 | | 6.700% | | 12/15/33 | | | 255 | | | 250,779 |
Verizon Communications, Inc., Sr. Unsec’d. Notes | | A3 | | 6.100% | | 04/15/18 | | | 3,500 | | | 3,804,181 |
Verizon Communications, Inc., Sr. Unsec’d. Notes | | A3 | | 6.400% | | 02/15/38 | | | 105 | | | 109,768 |
Vodafone Group PLC (United Kingdom), Sr. Unsec’d. Notes | | Baa1 | | 7.750% | | 02/15/10 | | | 950 | | | 957,581 |
| | | | | | | | | | | |
|
|
| | | | | | | | | | | | | 28,457,718 |
| | | | | | | | | | | |
|
|
SEE NOTES TO FINANCIAL STATEMENTS.
A15
| | | | | | |
| | | CONSERVATIVE BALANCED PORTFOLIO (continued) | | |
| |
| SCHEDULE OF INVESTMENTS | | December 31, 2009 |
| | | | | | | | | | | | |
CORPORATE BONDS
(continued) | | Moody’s
Rating
(Unaudited)†
| | Interest
Rate
| | Maturity
Date
| | Principal
Amount
(000)
| | Value
(Note 2)
|
| | | | | | | | | | | | | |
Tobacco — 0.3% | | | | | | | | | | | | |
Altria Group, Inc., Gtd. Notes | | Baa1 | | 9.250% | | 08/06/19 | | $ | 1,995 | | $ | 2,431,163 |
Altria Group, Inc., Gtd. Notes(b) | | Baa1 | | 9.700% | | 11/10/18 | | | 900 | | | 1,112,550 |
Altria Group, Inc., Gtd. Notes | | Baa1 | | 9.950% | | 11/10/38 | | | 130 | | | 169,456 |
Altria Group, Inc., Gtd. Notes | | Baa1 | | 10.200% | | 02/06/39 | | | 850 | | | 1,133,932 |
Lorillard Tobacco Co., Sr. Unsec’d. Notes(b) | | Baa2 | | 8.125% | | 06/23/19 | | | 670 | | | 736,589 |
Philip Morris International, Inc., Sr. Unsec’d. Notes | | A2 | | 4.875% | | 05/16/13 | | | 830 | | | 876,195 |
Reynolds American, Inc., Gtd. Notes | | Baa3 | | 7.250% | | 06/15/37 | | | 285 | | | 287,017 |
| | | | | | | | | | | |
|
|
| | | | | | | | | | | | | 6,746,902 |
| | | | | | | | | | | |
|
|
TOTAL CORPORATE BONDS
(cost $279,108,374) | | | 288,196,530 |
| | | | | | | | | | | |
|
|
| FOREIGN AGENCIES — 0.4% | | | | | | | | | | | | |
Commonwealth Bank of Australia (Australia), 144A | | Aaa | | 2.700% | | 11/25/14 | | | 7,220 | | | 7,076,040 |
Pemex Project Funding Master Trust, Gtd. Notes | | Baa1 | | 8.625% | | 12/01/23 | | | 350 | | | 422,625 |
RSHB Capital SA For OJSC Russian Agricultural Bank (Luxembourg), Sr. Sec’d. Notes, 144A | | Baa1 | | 6.299% | | 05/15/17 | | | 2,100 | | | 2,114,700 |
| | | | | | | | | | | |
|
|
TOTAL FOREIGN AGENCIES
(cost $9,724,479) | | | 9,613,365 |
| | | | | | | | | | | |
|
|
| FOREIGN LOCAL GOVERNMENT | | | | | | | | | | | | |
Qatar Government International Bond (Qatar), 144A
(cost $728,430)(b) | | Aa2 | | 6.400% | | 01/20/40 | | | 730 | | | 733,650 |
| | | | | | | | | | | |
|
|
| MORTGAGE-BACKED SECURITIES — 13.7% | | | | | | | | | | | | |
Federal Home Loan Mortgage Corp. | | | | 4.500% | | 02/01/19-07/01/20 | | | 5,097 | | | 5,293,808 |
Federal Home Loan Mortgage Corp. | | | | 4.500% | | TBA 15 YR | | | 1,400 | | | 1,438,500 |
Federal Home Loan Mortgage Corp. | | | | 4.500% | | TBA 30 YR | | | 2,000 | | | 1,995,000 |
Federal Home Loan Mortgage Corp. | | | | 5.000% | | 07/01/18-05/01/34 | | | 9,584 | | | 10,016,475 |
Federal Home Loan Mortgage Corp. | | | | 5.000% | | TBA 30 YR | | | 8,000 | | | 8,202,496 |
Federal Home Loan Mortgage Corp.(d) | | | | 5.214% | | 12/01/35 | | | 2,570 | | | 2,703,669 |
Federal Home Loan Mortgage Corp. | | | | 5.500% | | 12/01/33-05/01/38 | | | 10,718 | | | 11,267,331 |
Federal Home Loan Mortgage Corp.(d) | | | | 5.548% | | 06/01/36 | | | 1,980 | | | 2,086,992 |
Federal Home Loan Mortgage Corp. | | | | 6.000% | | 03/01/32-12/01/33 | | | 2,266 | | | 2,436,973 |
Federal Home Loan Mortgage Corp. | | | | 6.500% | | 12/01/14-09/01/16 | | | 257 | | | 276,185 |
Federal Home Loan Mortgage Corp. | | | | 7.000% | | 05/01/31-09/01/33 | | | 3,987 | | | 4,390,792 |
Federal Home Loan Mortgage Corp. | | | | 5.500% | | TBA 30 YR | | | 13,500 | | | 14,141,250 |
Federal National Mortgage Association(d) | | | | 3.233% | | 07/01/33 | | | 903 | | | 930,416 |
Federal National Mortgage Association | | | | 4.000% | | 06/01/19 | | | 1,828 | | | 1,868,235 |
Federal National Mortgage Association | | | | 4.000% | | TBA 15 YR | | | 7,000 | | | 7,016,408 |
Federal National Mortgage Association | | | | 4.500% | | 11/01/18-01/01/35 | | | 11,780 | | | 12,073,425 |
Federal National Mortgage Association | | | | 4.500% | | TBA 30 YR | | | 16,000 | | | 15,970,000 |
Federal National Mortgage Association | | | | 5.000% | | 10/01/18-05/01/36 | | | 14,879 | | | 15,363,504 |
Federal National Mortgage Association | | | | 5.000% | | TBA 30 YR | | | 9,500 | | | 9,747,893 |
Federal National Mortgage Association | | | | 5.500% | | 03/01/16-01/01/38 | | | 46,713 | | | 49,118,521 |
Federal National Mortgage Association | | | | 5.500% | | TBA 15 YR | | | 3,000 | | | 3,172,500 |
Federal National Mortgage Association | | | | 5.500% | | TBA 30 YR | | | 10,750 | | | 11,252,229 |
Federal National Mortgage Association(d) | | | | 5.904% | | 07/01/37 | | | 3,972 | | | 4,223,324 |
Federal National Mortgage Association(d) | | | | 5.921% | | 06/01/37 | | | 4,162 | | | 4,425,781 |
Federal National Mortgage Association | | | | 6.000% | | 04/01/13-06/01/38 | | | 25,917 | | | 27,643,791 |
Federal National Mortgage Association | | | | 6.000% | | TBA 30 YR | | | 30,500 | | | 32,301,391 |
Federal National Mortgage Association | | | | 6.500% | | 07/01/17-01/01/37 | | | 9,377 | | | 10,090,440 |
Federal National Mortgage Association | | | | 7.000% | | 08/01/11-07/01/32 | | | 767 | | | 851,320 |
Federal National Mortgage Association | | | | 7.500% | | 05/01/12-05/01/32 | | | 423 | | | 463,783 |
Government National Mortgage Association | | | | 4.500% | | TBA 30 YR | | | 6,000 | | | 6,052,697 |
Government National Mortgage Association | | | | 5.500% | | 08/15/33-04/15/36 | | | 7,882 | | | 8,306,009 |
Government National Mortgage Association | | | | 6.000% | | 11/15/23-07/15/34 | | | 2,540 | | | 2,705,582 |
Government National Mortgage Association | | | | 6.500% | | 10/15/23-09/15/36 | | | 4,922 | | | 5,279,363 |
SEE NOTES TO FINANCIAL STATEMENTS.
A16
| | | | | | |
| | | CONSERVATIVE BALANCED PORTFOLIO (continued) | | |
| |
| SCHEDULE OF INVESTMENTS | | December 31, 2009 |
| | | | | | | | | | | | |
MORTGAGE-BACKED SECURITIES
(continued) | | Moody’s
Rating
(Unaudited)†
| | Interest
Rate
| | Maturity
Date
| | Principal
Amount
(000)
| | Value
(Note 2)
|
| | | | | | | | | | | | | |
Government National Mortgage Association | | | | 7.000% | | 09/15/31 | | $ | 110 | | $ | 122,463 |
Government National Mortgage Association | | | | 8.000% | | 01/15/24-
04/15/25 | | | 79 | | | 90,427 |
| | | | | | | | | | | |
|
|
TOTAL MORTGAGE-BACKED SECURITIES
(cost $285,605,910) | | | 293,318,973 |
| | | | | | | | | | | |
|
|
| MUNICIPAL BONDS — 0.2% | | | | | | | | | | | | |
Bay Area Toll Authority | | Aa3 | | 6.263% | | 04/01/49 | | | 1,305 | | | 1,251,508 |
New Jersey State Turnpike Authority, BABs | | A3 | | 7.414% | | 01/01/40 | | | 395 | | | 445,244 |
New York City Transitional Finance Authority | | Aa2 | | 5.767% | | 08/01/36 | | | 1,100 | | | 1,066,087 |
State of California | | Baa1 | | 7.300% | | 10/01/39 | | | 1,250 | | | 1,181,350 |
State of California, BABs(b) | | Baa1 | | 7.550% | | 04/01/39 | | | 245 | | | 240,708 |
State of Washington | | Aa1 | | 5.481% | | 08/01/39 | | | 345 | | | 333,760 |
| | | | | | | | | | | |
|
|
TOTAL MUNICIPAL BONDS
(cost $4,653,616) | | | 4,518,657 |
| | | | | | | | | | | |
|
|
| RESIDENTIAL MORTGAGE-BACKED SECURITIES — 0.5% | | | | | | | | |
CDC Mortgage Capital Trust, Ser. 2002-HE3, Class M1(d) | | Baa2 | | 1.881% | | 03/25/33 | | | 690 | | | 440,466 |
CDC Mortgage Capital Trust, Ser. 2003-HE1, Class M2(d) | | Baa2 | | 3.156% | | 08/25/33 | | | 53 | | | 19,415 |
Centex Home Equity, Ser. 2005-A, Class M2(d) | | Aa3 | | 0.731% | | 01/25/35 | | | 2,250 | | | 1,687,112 |
Credit-Based Asset Servicing And Securitization LLC, Ser. 2005-CB6, Class A3 | | A3 | | 5.120% | | 07/25/35 | | | 667 | | | 557,365 |
Equity One ABS, Inc., Ser. 2004-3, Class M1 | | Aa2 | | 5.700% | | 07/25/34 | | | 1,028 | | | 782,090 |
First Franklin Mortgage Loan Trust, Ser. 2005-FFH1, Class M2(d) | | Ba3 | | 0.751% | | 06/25/36 | | | 1,800 | | | 195,370 |
HFC Home Equity Loan Trust, Ser. 2005-2, Class M2(d) | | Aa1 | | 0.723% | | 01/20/35 | | | 523 | | | 431,430 |
Long Beach Mortgage Loan Trust, Ser. 2004-2, Class M1(d) | | Aa2 | | 0.761% | | 06/25/34 | | | 1,250 | | | 864,264 |
Morgan Stanley ABS Capital I, Ser. 2004-NC1, Class M1(d) | | Aa2 | | 0.931% | | 12/25/33 | | | 1,468 | | | 1,082,074 |
Morgan Stanley Dean Witter Capital I, Ser. 2002-HE1, Class M1(d) | | B3 | | 1.131% | | 07/25/32 | | | 1,156 | | | 772,714 |
Morgan Stanley Dean Witter Capital I, Ser. 2002-NC4, Class M1(d) | | A2 | | 1.506% | | 09/25/32 | | | 1,156 | | | 824,596 |
Saxon Asset Securities Trust, Ser. 2005-2, Class M2(d) | | A2 | | 0.671% | | 10/25/35 | | | 1,480 | | | 427,849 |
Securitized Asset Backed Receivables LLC, Ser. 2004-OP1, Class M1(d) | | Aa2 | | 0.996% | | 02/25/34 | | | 1,660 | | | 1,247,911 |
Securitized Asset Backed Receivables LLC, Ser. 2006-FR3, Class A3(d) | | Caa1 | | 0.481% | | 05/25/36 | | | 1,400 | | | 463,740 |
| | | | | | | | | | | |
|
|
TOTAL RESIDENTIAL MORTGAGE-BACKED SECURITIES
(cost $15,737,981) | | | 9,796,396 |
| | | | | | | | | | | |
|
|
| U.S. GOVERNMENT AGENCY OBLIGATIONS — 1.0% | | | | | | | | | | | | |
Western Corporate Federal Credit Union, Gtd. Notes. | | | | 1.750% | | 11/02/12 | | | 4,550 | | | 4,529,570 |
Federal Farm Credit Bank(b) | | | | 4.875% | | 01/17/17 | | | 845 | | | 899,186 |
Federal Home Loan Banks | | | | 5.000% | | 11/17/17 | | | 420 | | | 454,322 |
Federal Home Loan Banks | | | | 5.625% | | 06/11/21 | | | 2,320 | | | 2,525,499 |
Federal Home Loan Mortgage Corp.(b) | | | | 3.750% | | 03/27/19 | | | 3,040 | | | 2,980,480 |
Federal National Mortgage Association(b) | | | | 2.625% | | 11/20/14 | | | 2,620 | | | 2,599,684 |
Federal National Mortgage Association | | | | 5.000% | | 02/13/17 | | | 1,955 | | | 2,122,147 |
Federal National Mortgage Association(b) | | | | 6.625% | | 11/15/30 | | | 2,010 | | | 2,415,634 |
Resolution Funding Corp. Interest Strip(j) | | | | 4.980% | | 04/15/18 | | | 2,645 | | | 1,864,569 |
Tennessee Valley Authority | | | | 4.500% | | 04/01/18 | | | 1,390 | | | 1,414,532 |
Tennessee Valley Authority | | | | 5.880% | | 04/01/36 | | | 85 | | | 90,792 |
Tennessee Valley Authority, Ser. E | | | | 6.250% | | 12/15/17 | | | 360 | | | 410,616 |
| | | | | | | | | | | |
|
|
TOTAL U.S. GOVERNMENT AGENCY OBLIGATIONS
(cost $22,486,354) | | | 22,307,031 |
| | | | | | | | | | | |
|
|
| U.S. TREASURY SECURITIES — 5.7% | | | | | | | | | | | | |
U.S. Treasury Bonds(b) | | | | 4.500% | | 08/15/39 | | | 2,595 | | | 2,536,208 |
U.S. Treasury Bonds | | | | 4.500% | | 02/15/36 | | | 3,070 | | | 3,023,950 |
U.S. Treasury Bonds | | | | 6.250% | | 08/15/23 | | | 6,140 | | | 7,333,463 |
U.S. Treasury Inflation Index | | | | 1.625% | | 01/15/15 | | | 13,857 | | | 14,411,307 |
SEE NOTES TO FINANCIAL STATEMENTS.
A17
| | | | | | |
| | | CONSERVATIVE BALANCED PORTFOLIO (continued) | | |
| |
| SCHEDULE OF INVESTMENTS | | December 31, 2009 |
| | | | | | | | | | | | | |
U.S. TREASURY SECURITIES
(continued) | | | | Interest
Rate
| | Maturity
Date
| | Principal
Amount
(000)
| | Value
(Note 2)
| |
| | | | | | | | | | | | | | |
U.S. Treasury Inflation Index | | | | 3.500% | | 01/15/11 | | $ | 3,832 | | $ | 3,974,485 | |
U.S. Treasury Notes(b) | | | | 0.750% | | 11/30/11 | | | 2,500 | | | 2,483,693 | |
U.S. Treasury Notes(b) | | | | 2.125% | | 11/30/14 | | | 16,875 | | | 16,475,569 | |
U.S. Treasury Notes | | | | 2.625% | | 12/31/14 | | | 31,530 | | | 31,438,878 | |
U.S. Treasury Notes(b) | | | | 3.375% | | 11/15/19 | | | 1,645 | | | 1,582,293 | |
U.S. Treasury Strips Coupon(m) | | | | 4.830% | | 11/15/24 | | | 14,565 | | | 7,108,419 | |
U.S. Treasury Strips Coupon(m) | | | | 4.840% | | 05/15/24 | | | 3,985 | | | 2,004,403 | |
U.S. Treasury Strips Coupon(m) | | | | 4.860% | | 08/15/24 | | | 12,545 | | | 6,218,105 | |
U.S. Treasury Strips Coupon(m) | | | | 5.270% | | 05/15/20 | | | 9,010 | | | 5,794,763 | |
U.S. Treasury Strips Coupon(m) | | | | 7.450% | | 05/15/26 | | | 5,000 | | | 2,234,300 | |
U.S. Treasury Strips Principal(b)(m) | | | | 4.750% | | 08/15/23 | | | 6,000 | | | 3,186,918 | |
U.S. Treasury Strips Principal(b)(m) | | | | 4.800% | | 11/15/24 | | | 5,000 | | | 2,468,395 | |
U.S. Treasury Strips Principal(m) | | | | 6.260% | | 02/15/23 | | | 16,780 | | | 9,151,443 | |
| | | | | | | | | | | |
|
|
|
TOTAL U.S. TREASURY SECURITIES
(cost $122,702,297) | | | 121,426,592 | |
| | | | | | | | | | | |
|
|
|
TOTAL LONG-TERM INVESTMENTS
(cost $1,707,613,348) | | | 1,951,463,390 | |
| | | | | | | | | | | |
|
|
|
| SHORT-TERM INVESTMENTS — 19.5% | | | | | | | | | | | | | |
U.S. TREASURY SECURITIES — 0.4% | | | | | | | | | | | | | |
U.S. Treasury Bill(g) | | | | 0.040% | | 03/18/10 | | | 3,000 | | | 2,999,697 | |
U.S. Treasury Bill(g) | | | | 0.157% | | 06/17/10 | | | 4,700 | | | 4,695,996 | |
| | | | | | | | | | | |
|
|
|
TOTAL U.S. TREASURY SECURITIES
(cost $7,696,367) | | | 7,695,693 | |
| | | | | | | | | | | |
|
|
|
| | | | | | | | | Shares
| | | |
AFFILIATED MUTUAL FUNDS — 19.1% | | | | | | | | | | | | | |
Dryden Core Investment Fund — Short-Term Bond Series (Note 4)(k) | | | 15,417,258 | | | 131,971,730 | |
Dryden Core Investment Fund — Taxable Money Market Series
(includes $122,857,073 of cash collateral received for securities on loan)(Note 4)(k)(l) | | | 277,211,474 | | | 277,211,474 | |
| | | | | | | | | | | |
|
|
|
TOTAL AFFILIATED MUTUAL FUNDS
(cost $427,520,895) | | | 409,183,204 | |
| | | | | | | | | | | |
|
|
|
TOTAL SHORT-TERM INVESTMENTS
(cost $435,217,262) | | | 416,878,897 | |
| | | | | | | | | | | |
|
|
|
TOTAL INVESTMENTS(n) — 110.7%
(cost $2,142,830,610) | | | 2,368,342,287 | |
LIABILITIES IN EXCESS OF OTHER ASSETS(o) — (10.7)% | | | (229,610,222 | ) |
| | | | | | | | | | | |
|
|
|
NET ASSETS — 100.0% | | $ | 2,138,732,065 | |
| | | | | | | | | | | |
|
|
|
The following abbreviations are used in portfolio descriptions:
| | |
| 144A | | Security was purchased pursuant to Rule 144A under the Securities Act of 1933 and may not be resold subject to that rule except to qualified institutional buyers. Unless otherwise noted, 144A securities are deemed to be liquid. |
| BABs | | Build America Bonds |
| I/O | | Interest Only |
| MTN | | Medium Term Note |
| NR | | Not Rated by Moody’s or Standard & Poor’s |
| TBA | | To Be Announced |
| ULC | | Unlimited Liability Corporation |
| † | The ratings reflected are as of December 31, 2009. Ratings of certain bonds may have changed subsequent to that date. |
| (a) | Non-income producing security. |
| (b) | All or a portion of security is on loan. The aggregate market value of such securities is $118,672,517; cash collateral of $122,857,073 (included in liabilities) was received with which the Portfolio purchased highly liquid short-term investments. |
| (c) | Security segregated as collateral for futures contracts. |
| (d) | Indicates a variable rate security. The maturity date presented for these instruments is the latter of the next date on which the security can be redeemed at par or the next date on which the rate of interest is adjusted. The interest rate shown reflects the rate in effect at December 31, 2009. |
SEE NOTES TO FINANCIAL STATEMENTS.
A18
| | | | | | |
| | | CONSERVATIVE BALANCED PORTFOLIO (continued) | | |
| |
| SCHEDULE OF INVESTMENTS | | December 31, 2009 |
| (e) | Indicates a security that has been deemed illiquid. |
| (f) | Standard & Poor’s Rating |
| (g) | Rate quoted represents yield-to-maturity as of purchase date. |
| (h) | Represents issuer in default on interest payments and/or principal repayment; non-income producing security. |
| (i) | Indicates a restricted security; the aggregate original cost of such securities is $5,576,491. The aggregate value of $5,927,664 is approximately 0.3% of net assets. |
| (j) | Represents zero coupon bond. Rate shown reflects the effective yield at December 31, 2009. |
| (k) | Prudential Investments LLC, the manager of the Portfolio, also serves as manager of the Dryden Core Investment Fund—Taxable Money Market Series and the Dryden Core Investment Fund—Short-Term Bond Series. |
| (l) | Represents security, or a portion thereof, purchased with cash collateral received for securities on loan. |
| (m) | Rate shown reflects the effective yield at December 31, 2009. |
| (n) | As of December 31, 2009, 2 securities representing $2,219,545 and 0.1% of the net assets were fair valued in accordance with the policies adopted by the Board of Trustees. |
| (o) | Liabilities in excess of other assets include net unrealized appreciation (depreciation) on financial futures contracts, interest rate and credit default swap agreements as follows: |
Open futures contracts outstanding at December 31, 2009:
| | | | | | | | | | | | | | |
Number of
Contracts
| | Type
| | Expiration
Date
| | Value at
Trade Date
| | Value at
December 31, 2009
| | Unrealized
Appreciation/
(Depreciation)
| |
| Long Positions: | | | | | | | | | | | | | | |
| 419 | | U.S. Treasury 2 Yr. Notes | | Mar. 2010 | | $ | 91,079,553 | | $ | 90,615,297 | | $ | (464,256 | ) |
| 796 | | U.S. Treasury 5 Yr. Notes | | Mar. 2010 | | | 92,172,583 | | | 91,048,719 | | | (1,123,864 | ) |
| 246 | | S&P 500 Index | | Mar. 2010 | | | 67,377,913 | | | 68,308,050 | | | 930,137 | |
| | | | | | | | | | | | |
|
|
|
| | | | | | | | | | | | | | (657,983 | ) |
| | | | | | | | | | | | |
|
|
|
| Short Positions: | | | | | | | | | | | | | | |
| 67 | | U.S. Treasury 10 Yr. Notes | | Mar. 2010 | | | 8,026,839 | | | 7,735,359 | | | 291,480 | |
| 309 | | U.S. Long Bond | | Mar. 2010 | | | 37,163,452 | | | 35,650,875 | | | 1,512,577 | |
| | | | | | | | | | | | |
|
|
|
| | | | | | | | | | | | | | 1,804,057 | |
| | | | | | | | | | | | |
|
|
|
| | | | | | | | | | | | | $ | 1,146,074 | |
| | | | | | | | | | | | |
|
|
|
Interest rate swap agreements outstanding at December 31, 2009:
| | | | | | | | | | | | | | | | | | | | |
Counterparty
| | Termination
Date
| | Notional
Amount
(000)#
| | Fixed
Rate
| | Floating Rate
| | Fair
Value
| | | Upfront
Premiums
Paid/
(Received)
| | Unrealized
Appreciation/
(Depreciation)
| |
Deutsche Bank AG(a) | | 05/31/2014 | | $ | 11,895 | | 2.355% | | 3 month LIBOR | | $ | (253,855 | ) | | $ | — | | $ | (253,855 | ) |
Morgan Stanley Capital Services, Inc.(b) | | 02/15/2036 | | | 2,985 | | 4.128% | | 3 month LIBOR | | | 167,792 | | | | — | | | 167,792 | |
| | | | | | | | | | | |
|
|
| |
|
| |
|
|
|
| | | | | | | | | | | | $ | (86,063 | ) | | $ | — | | $ | (86,063 | ) |
| | | | | | | | | | | |
|
|
| |
|
| |
|
|
|
| (a) | Portfolio pays the floating rate and receives the fixed rate. |
| (b) | Portfolio pays the fixed rate and receives the floating rate. |
| # | Notional amount is shown in U.S. dollars unless otherwise stated. |
Credit default swap agreements outstanding at December 31, 2009:
| | | | | | | | | | | | | | | | | | | | |
Counterparty
| | Termination
Date
| | Notional
Amount
(000)#(4)
| | Fixed
Rate
| | Reference Entity/Obligation
| | Fair
Value
| | | Upfront
Premiums
Paid/
(Received)
| | Unrealized
Appreciation/
(Depreciation)
| |
Credit Default Swaps on Corporate Issues—Buy Protection(1): | | | | | | | | |
Barclays Bank PLC | | 09/20/2012 | | $ | 2,800 | | 0.595% | | Fortune Brands, Inc.,
5.375%, 01/15/16 | | $ | 12,830 | | | $ | — | | $ | 12,830 | |
Barclays Bank PLC | | 03/20/2018 | | | 1,700 | | 1.220% | | Computer Sciences Corp.,
5.000%, 02/15/13 | | | (75,690 | ) | | | — | | | (75,690 | ) |
Citibank NA | | 09/20/2012 | | | 3,200 | | 0.320% | | Altria Group, Inc.,
7.000%, 11/04/13 | | | 35,999 | | | | — | | | 35,999 | |
Credit Suisse International | | 06/20/2018 | | | 3,500 | | 0.970% | | Verizon Communications, Inc., 4.900%, 09/15/15 | | | (33,357 | ) | | | — | | | (33,357 | ) |
SEE NOTES TO FINANCIAL STATEMENTS.
A19
| | | | | | |
| | | CONSERVATIVE BALANCED PORTFOLIO (continued) | | |
| |
| SCHEDULE OF INVESTMENTS | | December 31, 2009 |
| | | | | | | | | | | | | | | | | | | | | |
Counterparty
| | Termination
Date
| | Notional
Amount
(000)#(4)
| | Fixed
Rate
| | Reference Entity/Obligation
| | Fair
Value
| | | Upfront
Premiums
Paid/
(Received)
| | | Unrealized
Appreciation/
(Depreciation)
| |
Credit Default Swaps on Corporate Issues—Buy Protection(1) (continued): | | | | | |
Deutsche Bank AG | | 09/20/2011 | | $ | 1,000 | | 1.000% | | Dish DBS Corp.,
6.625%, 10/01/14 | | $ | (404 | ) | | $ | 13,678 | | | $ | (14,082 | ) |
Deutsche Bank AG | | 03/20/2012 | | | 2,000 | | 5.000% | | Gannett Co., Inc.,
6.375%, 04/01/12 | | | (128,921 | ) | | | (48,739 | ) | | | (80,182 | ) |
Deutsche Bank AG | | 12/20/2012 | | | 2,000 | | 1.000% | | Macys Retail Holdings, Inc.,
8.000%, 07/15/12 | | | 22,348 | | | | 74,480 | | | | (52,132 | ) |
Deutsche Bank AG | | 06/20/2013 | | | 1,750 | | 2.000% | | International Lease Finance Corp.,
4.150%, 01/20/15 | | | 320,259 | | | | — | | | | 320,259 | |
Deutsche Bank AG | | 06/20/2013 | | | 2,000 | | 1.000% | | United States Steel Corp.,
6.650%, 06/01/37 | | | 86,634 | | | | 113,706 | | | | (27,072 | ) |
Deutsche Bank AG | | 03/20/2014 | | | 1,585 | | 7.050% | | Starwood Hotels & Resorts Worldwide, Inc.,
7.875%, 05/01/12 | | | (360,821 | ) | | | — | | | | (360,821 | ) |
Deutsche Bank AG | | 03/20/2018 | | | 4,500 | | 0.990% | | Nordstrom, Inc.,
6.950%, 03/15/28 | | | 29,111 | | | | — | | | | 29,111 | |
Deutsche Bank AG | | 06/20/2018 | | | 2,800 | | 1.150% | | Spectra Energy Capital LLC,
6.250%, 02/15/13 | | | (74,782 | ) | | | — | | | | (74,782 | ) |
JPMorgan Chase Bank | | 06/20/2014 | | | 1,110 | | 0.650% | | Bunge Ltd. Finance Corp.,
5.350%, 04/15/14 | | | 24,937 | | | | — | | | | 24,937 | |
Merrill Lynch Capital Services, Inc. | | 09/20/2016 | | | 785 | | 1.730% | | Tyson Foods, Inc.,
7.850%, 04/01/16 | | | 33,442 | | | | — | | | | 33,442 | |
Merrill Lynch Capital Services, Inc. | | 06/20/2018 | | | 1,800 | | 3.050% | | SLM Corp.,
5.125%, 08/27/12 | | | 210,897 | | | | — | | | | 210,897 | |
Merrill Lynch Capital Services, Inc. | | 06/20/2018 | | | 2,700 | | 1.450% | | Starwood Hotels & Resorts Worldwide, Inc.,
6.750, 05/15/18 | | | 69,820 | | | | — | | | | 69,820 | |
Morgan Stanley Capital Services, Inc. | | 03/20/2012 | | | 500 | | 5.000% | | Gannett Co., Inc.,
6.375%, 04/01/12 | | | (32,230 | ) | | | (17,617 | ) | | | (14,613 | ) |
Morgan Stanley Capital Services, Inc. | | 03/20/2018 | | | 1,400 | | 0.700% | | Avon Products, Inc.,
6.500%, 03/01/19 | | | (28,252 | ) | | | — | | | | (28,252 | ) |
Morgan Stanley Capital Services, Inc. | | 06/20/2018 | | | 1,600 | | 1.000% | | Newell Rubbermaid, Inc.,
0.000%, 07/15/28 | | | 43,146 | | | | — | | | | 43,146 | |
Morgan Stanley Capital Services, Inc. | | 06/20/2018 | | | 2,700 | | 0.970% | | Simon Property Group LP,
5.250%, 12/01/16 | | | 101,340 | | | | — | | | | 101,340 | |
| | | | | | | | | | | |
|
|
| |
|
|
| |
|
|
|
| | | | | | | | | | | | $ | 256,306 | | | $ | 135,508 | | | $ | 120,798 | |
| | | | | | | | | | | |
|
|
| |
|
|
| |
|
|
|
| | | | | | | |
Counterparty
| | Termination
Date
| | Notional
Amount
(000)#(4)
| | Fixed
Rate
| | Reference Entity/Obligation
| | Fair
Value
| | | Upfront
Premiums
Paid/
(Received)
| | | Unrealized
Appreciation/
(Depreciation)
| |
Credit Default Swaps on Asset-Backed Issues—Buy Protection(1): | | | | | |
Merrill Lynch Capital Services, Inc. | | 03/25/2036 | | $ | 842 | | 3.720% | | AmeriQuest Mortgage Securities, Inc., 2.731%, 03/25/36 | | $ | 814,732 | | | $ | — | | | $ | 814,732 | |
| | | | | | | | | | | |
|
|
| |
|
|
| |
|
|
|
| | | | | | | |
Counterparty
| | Termination
Date
| | Notional
Amount
(000)#(4)
| | Fixed
Rate
| | Reference Entity/Obligation
| | Fair
Value(3)
| | | Upfront
Premiums
Paid/
(Received)
| | | Unrealized
Appreciation/
(Depreciation)
| |
Credit Default Swaps on Asset-Backed Issues—Sell Protection(2): | | | | | | | | | |
Merrill Lynch Capital Services, Inc. | | 03/25/2036 | | $ | 842 | | 9.000% | | AmeriQuest Mortgage Securities, Inc., 2.731%, 03/25/36 | | $ | (790,816 | ) | | $ | — | | | $ | (790,816 | ) |
| | | | | | | | | | | |
|
|
| |
|
|
| |
|
|
|
The Portfolio entered into credit default swaps as the protection seller on asset-backed issues to take an active short position with respect to the likelihood of a particular issuer’s default.
| (1) | If the Portfolio is a buyer of protection, it pays the fixed rate. When a credit event occurs, as defined under the terms of that particular swap agreement, the Portfolio will either (i) receive from the seller of protection an amount equal to the notional amount of the swap and make delivery |
SEE NOTES TO FINANCIAL STATEMENTS.
A20
| | | | | | |
| | | CONSERVATIVE BALANCED PORTFOLIO (continued) | | |
| |
| SCHEDULE OF INVESTMENTS | | December 31, 2009 |
| | of the referenced obligation or underlying securities comprising the referenced index or (ii) receive a net settlement amount in the form of cash or securities equal to the notional amount of the swap less the recovery value of the referenced obligation or underlying securities comprising the referenced index. |
| (2) | If the Portfolio is a seller of protection, it receives the fixed rate. When a credit event occurs, as defined under the terms of that particular swap agreement, the Portfolio will either (i) pay to the buyer of protection an amount equal to the notional amount of the swap and take delivery of the referenced obligation or underlying securities comprising the referenced index or (ii) pay a net settlement amount in the form of cash or securities equal to the notional amount of the swap less the recovery value of the referenced obligation or underlying securities comprising the referenced index. |
| (3) | The fair value of credit default swap agreements on asset-backed securities serve as an indicator of the current status of the payment/performance risk and represent the likelihood of an expected liability (or profit) for the credit derivative should the notional amount of the swap agreement be closed/sold as of the reporting date. Increasing fair value in absolute terms, represents a deterioration of the referenced entity’s credit soundness and a greater likelihood of risk of default or other credit event occuring as defined under the terms of the agreement. |
| (4) | Notional amount represents the maximum potential amount the Portfolio could be required to pay as a seller of credit protection or receive as a buyer of credit protection if a credit event occurs as defined under the terms of that particular swap agreement. |
| # | Notional amount is shown in U.S. dollars unless otherwise stated. |
Various inputs are used in determining the value of the Portfolio’s investments. These inputs are summarized in the three broad levels listed below.
Level 1—quoted prices in active markets for identical securities
Level 2—other significant observable inputs (including quoted prices for similar securities, interest rates, prepayment speeds, credit risk, etc.)
Level 3—significant unobservable inputs (including the Portfolio’s own assumptions in determining the fair value of investments)
The following is a summary of the inputs used as of December 31, 2009 in valuing the Portfolio’s assets carried at fair value:
| | | | | | | | | |
| | | Level 1
| | Level 2
| | Level 3
|
Investments in Securities | | | | | | | | | |
Asset-Backed Securities | | $ | — | | $ | 13,734,566 | | $ | 2,219,029 |
Bank Loans | | | — | | | 14,822,850 | | | — |
Collateralized Mortgage Obligations | | | — | | | 10,098,964 | | | — |
Commercial Mortgage-Backed Securities | | | — | | | 101,965,142 | | | — |
Corporate Bonds | | | — | | | 288,196,530 | | | — |
Common Stocks | | | 1,058,711,129 | | | 516 | | | — |
Foreign Agencies | | | — | | | 9,613,365 | | | — |
Foreign Local Government | | | — | | | 733,650 | | | — |
Mortgage-Backed Securities | | | — | | | 293,318,973 | | | — |
Municipal Bonds | | | — | | | 4,518,657 | | | — |
Residential Mortgage-Backed Securities | | | — | | | 9,796,396 | | | — |
U.S. Government Agency Obligations | | | — | | | 22,307,031 | | | — |
U.S. Treasury Securities | | | — | | | 129,122,285 | | | — |
Affiliated Mutual Funds | | | 409,183,204 | | | — | | | — |
| | |
|
| |
|
| |
|
|
| | | | 1,467,894,333 | | | 898,228,925 | | | 2,219,029 |
Other Financial Instruments* | | | 1,146,074 | | | 34,735 | | | 23,916 |
| | |
|
| |
|
| |
|
|
Total | | $ | 1,469,040,407 | | $ | 898,263,660 | | $ | 2,242,945 |
| | |
|
| |
|
| |
|
|
The following is a reconciliation of assets in which significant unobservable inputs (Level 3) were used in determining fair value:
| | | | | | | | |
| | | Asset-Backed
Security
| | | Other Financial
Instruments*
| |
Balance as of 12/31/08 | | $ | — | | | $ | 1,511,232 | |
Realized gain (loss) | | | — | | | | — | ** |
Change in unrealized appreciation (depreciation) | | | (933 | ) | | | (1,487,316 | ) |
Earned accretion/amortization | | | 933 | | | | — | |
Net purchases (sales) | | | 2,219,029 | | | | — | |
Transfers in and/or out of Level 3 | | | — | | | | — | |
| | |
|
|
| |
|
|
|
Balance as of 12/31/09 | | $ | 2,219,029 | | | $ | 23,916 | |
| | |
|
|
| |
|
|
|
| * | Other financial instruments are derivative instruments not reflected in the Schedule of Investments, such as futures, forwards and swap contracts, which are valued at the unrealized appreciation/depreciation on the instrument. |
| ** | The realized gain earned during the period for other financial instruments was $1,580,515. |
SEE NOTES TO FINANCIAL STATEMENTS.
A21
| | | | | | |
| | | CONSERVATIVE BALANCED PORTFOLIO (continued) | | |
| |
| SCHEDULE OF INVESTMENTS | | December 31, 2009 |
The industry classification of portfolio holdings and liabilities in excess of other assets shown as a percentage of net assets as of December 31, 2009 was as follows:
| | | |
Affiliated Mutual Fund (including 5.7% of collateral received for securities on loan) | | 19.1 | % |
Mortgage-Backed Securities | | 13.7 | |
U.S. Treasury Securities | | 6.1 | |
Commercial Mortgage-Backed Securities | | 4.8 | |
Oil, Gas & Consumable Fuels | | 4.8 | |
Pharmaceuticals | | 3.2 | |
Computers & Peripherals | | 3.0 | |
Banking | | 2.7 | |
Software | | 2.2 | |
Diversified Financial Services | | 2.1 | |
Aerospace & Defense | | 1.6 | |
Insurance | | 1.6 | |
Capital Markets | | 1.4 | |
Commercial Banks | | 1.4 | |
Diversified Telecommunication Services | | 1.4 | |
Media | | 1.4 | |
Beverages | | 1.3 | |
Chemicals | | 1.3 | |
Communications Equipment | | 1.3 | |
Electric | | 1.3 | |
Food & Staples Retailing | | 1.3 | |
Household Products | | 1.3 | |
Semiconductors & Semiconductor Equipment | | 1.3 | |
Telecommunications | | 1.3 | |
Healthcare Providers & Services | | 1.1 | |
Industrial Conglomerates | | 1.1 | |
Tobacco | | 1.1 | |
Electric Utilities | | 1.0 | |
Healthcare & Pharmaceutical | | 1.0 | |
Healthcare Equipment & Supplies | | 1.0 | |
Internet Software & Services | | 1.0 | |
Specialty Retail | | 1.0 | |
U.S. Government Agency Obligations | | 1.0 | |
Energy Equipment & Services | | 0.9 | |
Real Estate Investment Trusts | | 0.9 | |
Biotechnology | | 0.8 | |
Food Products | | 0.8 | |
IT Services | | 0.8 | |
Machinery | | 0.8 | |
Retailers | | 0.8 | |
Asset-Backed Securities | | 0.7 | |
Foods | | 0.7 | |
Hotels, Restaurants & Leisure | | 0.7 | |
Multi-Utilities | | 0.7 | |
Technology | | 0.7 | |
| | | |
Air Freight & Logistics | | 0.5 | % |
Cable | | 0.5 | |
Collateralized Mortgage Obligations | | 0.5 | |
Media & Entertainment | | 0.5 | |
Metals & Mining | | 0.5 | |
Non Captive Finance | | 0.5 | |
Residential Mortgage-Backed Securities | | 0.5 | |
Road & Rail | | 0.5 | |
Consumer Finance | | 0.4 | |
Foreign Agencies | | 0.4 | |
Multiline Retail | | 0.4 | |
Commercial Services & Supplies | | 0.3 | |
Consumer | | 0.3 | |
Electronic Equipment & Instruments | | 0.3 | |
Energy – Other | | 0.3 | |
Healthcare Insurance | | 0.3 | |
Internet & Catalog Retail | | 0.3 | |
Metals | | 0.3 | |
Pipelines & Other | | 0.3 | |
Airlines | | 0.2 | |
Automobiles | | 0.2 | |
Capital Goods | | 0.2 | |
Electrical Equipment | | 0.2 | |
Energy – Integrated | | 0.2 | |
Household Durables | | 0.2 | |
Life Sciences Tools & Services | | 0.2 | |
Lodging | | 0.2 | |
Municipal Bonds | | 0.2 | |
Textiles, Apparel & Luxury Goods | | 0.2 | |
Auto Components | | 0.1 | |
Building Materials & Construction | | 0.1 | |
Construction & Engineering | | 0.1 | |
Containers & Packaging | | 0.1 | |
Diversified Consumer Services | | 0.1 | |
Gas Utilities | | 0.1 | |
Independent Power Producers & Energy Traders | | 0.1 | |
Leisure Equipment & Products | | 0.1 | |
Paper | | 0.1 | |
Paper & Forest Products | | 0.1 | |
Personal Products | | 0.1 | |
Professional Services | | 0.1 | |
Railroads | | 0.1 | |
Thrifts & Mortgage Finance | | 0.1 | |
Trading Companies & Distributors | | 0.1 | |
Wireless Telecommunication Services | | 0.1 | |
| | |
|
|
| | | 110.7 | |
Liabilities in excess of other assets | | (10.7 | ) |
| | |
|
|
| | | 100.0 | % |
| | |
|
|
SEE NOTES TO FINANCIAL STATEMENTS.
A22
| | | | | | |
| | | CONSERVATIVE BALANCED PORTFOLIO (continued) | | |
| |
| SCHEDULE OF INVESTMENTS | | December 31, 2009 |
The Portfolio invested in derivative instruments during the reporting period. The primary types of risk associated with these derivative instruments are commodity risk, credit risk, equity risk, foreign exchange risk and interest rate risk. The effect of such derivative instruments on the Portfolio’s financial position and financial performance as reflected in the Statement of Assets and Liabilities and Statement of Operations is presented in the summary below.
Fair values of derivative Instruments as of December 31, 2009 as presented in the Statement of Assets and Liabilities:
| | | | | | | | | | | | |
Derivatives not designated as
hedging instruments, carried at
fair value
| | Asset Derivatives
| | | Liability Derivatives
| |
| | Balance Sheet Location
| | Fair
Value
| | | Balance Sheet Location
| | Fair
Value
| |
Credit contracts | | Premium paid for swaps agreements | | $ | 201,864 | | | Premium received for swaps agreements | | $ | 66,356 | |
Credit contracts | | Unrealized appreciation on swaps | | | 1,696,513 | | | Unrealized depreciation on swaps | | | 1,551,799 | |
Equity contracts | | Due to broker—variation margin | | | 930,137 | * | | — | | | — | |
Interest rate contracts | | Due to broker—variation margin | | | 1,804,057 | * | | Due to broker—variation margin | | | 1,588,120 | * |
Interest rate contracts | | Unrealized appreciation on swaps | | | 167,792 | | | Unrealized depreciation on swaps | | | 253,855 | |
| | | | |
|
|
| | | |
|
|
|
Total | | | | $ | 4,800,363 | | | | | $ | 3,460,130 | |
| | | | |
|
|
| | | |
|
|
|
| * | Includes cumulative appreciation/depreciation on futures contracts as reported in Schedule of Investments. Only unsettled variation margin receivable (payable) is reported within the Statement of Assets and Liabilities. |
The effects of derivative instruments on the Statement of Operations for the year ended December 31, 2009 are as follows:
| | | | | | | | | | | | | | | | |
Amount of Realized Gain or (Loss) on Derivatives Recognized in Income
|
Derivatives not designated as hedging
instruments, carried at fair value
| | Futures
| | Swaps
| | Purchased
Options
| | | Written
Options
| | Total
|
Credit contracts | | $ | — | | $ | 916,506 | | $ | — | | | $ | — | | $ | 916,506 |
Equity contracts | | | 16,217,169 | | | — | | | — | | | | — | | | 16,217,169 |
Interest rate contracts | | | 5,098,976 | | | 192,226 | | | (113,446 | ) | | | 39,538 | | | 5,217,294 |
| | |
|
| |
|
| |
|
|
| |
|
| |
|
|
Total | | $ | 21,316,145 | | $ | 1,108,732 | | $ | (113,446 | ) | | $ | 39,538 | | $ | 22,350,969 |
| | |
|
| |
|
| |
|
|
| |
|
| |
|
|
| | | | | | | | | | | | |
Change in Unrealized Appreciation or (Depreciation) on Derivatives Recognized in Income
| |
Derivatives not designated as hedging
instruments, carried at fair value
| | Futures
| | | Swaps
| | | Total
| |
Credit contracts | | $ | — | | | $ | (5,614,260 | ) | | $ | (5,614,260 | ) |
Equity contracts | | | 619,788 | | | | — | | | | 619,788 | |
Interest rate contracts | | | (2,547,298 | ) | | | 20,922 | | | | (2,526,376 | ) |
| | |
|
|
| |
|
|
| |
|
|
|
Total | | $ | (1,927,510 | ) | | $ | (5,593,338 | ) | | $ | (7,520,848 | ) |
| | |
|
|
| |
|
|
| |
|
|
|
For the year ended December 31, 2009, the Portfolio’s average volume of derivative activities is as follows:
| | | | | | |
Purchased Options
(Cost)
| | Written Options
(Premium Received)
| | Futures
Long Position
(Value at Trade Date)
| | Futures
Short Position
(Value at Trade Date)
|
$7,100 | | $2,899 | | $193,146,186 | | $14,597,723 |
| | | | |
Interest Rate Swaps
(Notional Amount in USD (000))
| | Credit Default
Swaps as Buyer
(Notional Amount in USD (000))
| | Credit Default
Swaps as Writer
(Notional Amount in USD (000))
|
$11,697 | | $38,723 | | $968 |
SEE NOTES TO FINANCIAL STATEMENTS.
A23
| | | | | | |
| | | CONSERVATIVE BALANCED PORTFOLIO (continued) | | |
STATEMENT OF ASSETS AND LIABILITIES December 31, 2009
| | | |
| ASSETS | | | |
Investments, at value including securities on loan of $118,672,517: | | | |
Unaffiliated investments (cost $1,715,309,715) | | $ | 1,959,159,083 |
Affiliated investments (cost $427,520,895) | | | 409,183,204 |
Foreign currency, at value (cost $9,325) | | | 9,323 |
Receivable for investments sold | | | 53,436,700 |
Dividends and interest receivable | | | 7,981,069 |
Unrealized appreciation on swaps | | | 1,864,305 |
Foreign tax reclaim receivable | | | 318,199 |
Premium paid for swaps agreements | | | 201,864 |
Receivable for Series shares sold | | | 34,088 |
Prepaid expenses | | | 22,474 |
| | |
|
|
Total Assets | | | 2,432,210,309 |
| | |
|
|
| LIABILITIES | | | |
Payable for investments purchased | | | 139,648,338 |
Collateral for securities on loan | | | 122,857,073 |
Payable to custodian | | | 26,943,962 |
Unrealized depreciation on swaps | | | 1,805,654 |
Management fee payable | | | 1,000,526 |
Due to broker-variation margin | | | 769,898 |
Accrued expenses and other liabilities | | | 268,240 |
Payable for Series shares repurchased | | | 117,602 |
Premium received for swaps agreements | | | 66,356 |
Affiliated transfer agent fee payable | | | 595 |
| | |
|
|
Total Liabilities | | | 293,478,244 |
| | |
|
|
| NET ASSETS | | $ | 2,138,732,065 |
| | |
|
|
Net assets were comprised of: | | | |
Paid-in capital | | $ | 2,004,241,267 |
Retained earnings | | | 134,490,798 |
| | |
|
|
Net assets, December 31, 2009 | | $ | 2,138,732,065 |
| | |
|
|
Net asset value and redemption price per share, $2,138,732,065 / 145,958,929 outstanding shares of beneficial interest | | $ | 14.65 |
| | |
|
|
STATEMENT OF OPERATIONS
Year Ended December 31, 2009
| | | | |
| INVESTMENT INCOME | | | | |
Interest | | $ | 37,092,927 | |
Unaffiliated dividend income (net of foreign withholding taxes of $124) | | | 22,885,291 | |
Affiliated dividend income | | | 3,023,297 | |
Affiliated income from securities loaned, net | | | 1,252,718 | |
| | |
|
|
|
| | | | 64,254,233 | |
| | |
|
|
|
| EXPENSES | | | | |
Management fee | | | 10,805,389 | |
Shareholders’ reports | | | 280,000 | |
Custodian’s fees and expenses | | | 267,000 | |
Audit fee | | | 41,000 | |
Insurance expenses | | | 41,000 | |
Trustees’ fees | | | 36,000 | |
Commitment fee on syndicated credit agreement | | | 15,000 | |
Legal fees and expenses | | | 15,000 | |
Transfer agent’s fee and expenses (including affiliated expense of $3,600) (Note 4) | | | 10,000 | |
Miscellaneous | | | 20,859 | |
| | |
|
|
|
Total expenses | | | 11,531,248 | |
| | |
|
|
|
| NET INVESTMENT INCOME | | | 52,722,985 | |
| | |
|
|
|
| NET REALIZED AND UNREALIZED GAIN (LOSS) ON INVESTMENTS, SWAPS AND FOREIGN CURRENCIES | | | | |
Net realized gain (loss) on: | | | | |
Investment transactions (including affiliated: $(2,250,188)) | | | (63,813,497 | ) |
Futures transactions | | | 21,316,145 | |
Swap agreement transactions | | | 1,108,732 | |
Foreign currency transactions | | | 1,626 | |
Written options transactions | | | 39,538 | |
| | |
|
|
|
| | | | (41,347,456 | ) |
| | |
|
|
|
Net change in unrealized appreciation (depreciation) on: | | | | |
Investments (including affiliated: $19,799,375) | | | 360,490,601 | |
Futures | | | (1,927,510 | ) |
Swaps | | | (5,593,338 | ) |
Foreign currencies | | | 8,220 | |
| | |
|
|
|
| | | | 352,977,973 | |
| | |
|
|
|
| NET GAIN ON INVESTMENTS, SWAPS AND FOREIGN CURRENCIES | | | 311,630,517 | |
| | |
|
|
|
| NET INCREASE IN NET ASSETS RESULTING FROM OPERATIONS | | $ | 364,353,502 | |
| | |
|
|
|
STATEMENT OF CHANGES IN NET ASSETS
| | | | | | | | |
| | | Year Ended December 31,
| |
| | | 2009
| | | 2008
| |
| INCREASE (DECREASE) IN NET ASSETS | | | | | | | | |
| OPERATIONS: | | | | | | | | |
Net investment income | | $ | 52,722,985 | | | $ | 74,151,854 | |
Net realized loss on investments, swaps and foreign currencies | | | (41,347,456 | ) | | | (65,065,328 | ) |
Net change in unrealized appreciation (depreciation) on investments, swaps and foreign currencies | | | 352,977,973 | | | | (563,716,770 | ) |
| | |
|
|
| |
|
|
|
NET INCREASE (DECREASE) IN NET ASSETS RESULTING FROM OPERATIONS | | | 364,353,502 | | | | (554,630,244 | ) |
| | |
|
|
| |
|
|
|
| DISTRIBUTIONS | | | (74,120,351 | ) | | | (81,811,715 | ) |
| | |
|
|
| |
|
|
|
| SERIES SHARE TRANSACTIONS: | | | | | | | | |
Series shares sold [1,049,111 and 1,194,754 shares, respectively] | | | 13,537,729 | | | | 16,824,187 | |
Series shares issued in reinvestment of dividends and distributions [5,781,619 and 5,295,257 shares, respectively] | | | 74,120,351 | | | | 81,811,715 | |
Series shares repurchased [15,167,586 and 15,304,061 shares, respectively] | | | (196,684,797 | ) | | | (226,520,392 | ) |
| | |
|
|
| |
|
|
|
NET DECREASE IN NET ASSETS RESULTING FROM SERIES SHARE TRANSACTIONS | | | (109,026,717 | ) | | | (127,884,490 | ) |
| | |
|
|
| |
|
|
|
| TOTAL INCREASE (DECREASE) IN NET ASSETS | | | 181,206,434 | | | | (764,326,449 | ) |
| NET ASSETS: | | | | | | | | |
Beginning of year | | | 1,957,525,631 | | | | 2,721,852,080 | |
| | |
|
|
| |
|
|
|
End of year | | $ | 2,138,732,065 | | | $ | 1,957,525,631 | |
| | |
|
|
| |
|
|
|
SEE NOTES TO FINANCIAL STATEMENTS.
A24
| | | | | | |
| | | DIVERSIFIED BOND PORTFOLIO | | |
| |
| SCHEDULE OF INVESTMENTS | | December 31, 2009 |
| | | | | | | | | | | | |
LONG-TERM INVESTMENTS — 91.7%
ASSET-BACKED SECURITIES — 5.2% | |
Moody’s
Rating
(Unaudited)†
| | Interest
Rate
| | Maturity
Date
| | Principal
Amount
(000)#
| | Value
(Note 2)
|
| | | | | | | | | | | | | |
Alfa Diversified Payment Rights Finance Co. (Russia), Ser. 1A, Class A, 144A(a) | | Ba1 | | 1.854% | | 03/15/11 | | $ | 954 | | $ | 858,375 |
Ballyrock Cdo Ltd. (Cayman Islands), Ser. 2003-2A, Class A, 144A(a) | | Aa2 | | 0.799% | | 11/20/15 | | | 5,542 | | | 5,154,228 |
Bank of America Credit Card Trust
Ser. 2006-C5, Class C5(a) | | Baa1 | | 0.633% | | 01/15/16 | | | 5,750 | | | 4,955,943 |
Ser. 2007-A3, Class A3(a) | | Aaa | | 0.253% | | 11/15/16 | | | 1,000 | | | 954,474 |
Bank One Issuance Trust
Ser. 2004-A3, Class A3(a) | | Aaa | | 0.403% | | 02/15/17 | | | 5,100 | | | 4,976,066 |
Ser. 2004-C2, Class C2(a) | | Baa2 | | 1.033% | | 02/15/17 | | | 2,100 | | | 1,946,647 |
Chase Issuance Trust, Ser. 2008-A13, Class A13(a) | | Aaa | | 1.754% | | 09/15/15 | | | 1,000 | | | 1,029,390 |
Chatham Light CLO Ltd. (Cayman Islands), Ser. 2005-2A, Class A1, 144A(a) | | Aa1 | | 0.531% | | 08/03/19 | | | 4,951 | | | 4,505,602 |
Citibank Credit Card Issuance Trust
Ser. 2003-C4, Class C4 | | Baa2 | | 5.000% | | 06/10/15 | | | 6,500 | | | 6,387,152 |
Ser. 2005-C3, Class C3(a) | | Baa2 | | 0.643% | | 07/15/14 | | | 3,780 | | | 3,523,873 |
Ser. 2006-A7, Class A7(a) | | Aaa | | 0.314% | | 12/15/18 | | | 6,000 | | | 5,651,543 |
Ser. 2006-C1, Class C1(a) | | Baa2 | | 0.633% | | 02/20/15 | | | 2,200 | | | 2,011,170 |
Ford Credit Auto Owner Trust, Ser. 2006-B, Class C | | Aaa | | 5.680% | | 06/15/12 | | | 2,100 | | | 2,192,933 |
Granite Ventures Ltd. (Cayman Islands), Ser. 2005-2A, Class A1, 144A(a) | | Aaa | | 0.544% | | 12/15/17 | | | 4,200 | | | 3,927,000 |
Katonah Ltd., Ser. 2005-7A, Class A2, 144A(a) | | A2 | | 0.533% | | 11/15/17 | | | 3,385 | | | 3,088,410 |
MBNA Credit Card Master Note Trust
Ser. 2002-C3, Class C3(a) | | Baa1 | | 1.583% | | 10/15/14 | | | 1,900 | | | 1,782,933 |
Ser. 2004-C2, Class C2(a) | | Baa1 | | 1.133% | | 11/15/16 | | | 1,500 | | | 1,274,295 |
Ser. 2005-A10, Class A10(a) | | Aaa | | 0.293% | | 11/15/15 | | | 2,400 | | | 2,322,634 |
Ser. 2005-A2, Class A2(a) | | Aaa | | 0.313% | | 10/15/14 | | | 2,100 | | | 2,057,307 |
Ser. 2006-A2, Class A2(a) | | Aaa | | 0.293% | | 06/15/15 | | | 1,000 | | | 972,096 |
Ser. 2006-A5, Class A5(a) | | Aaa | | 0.293% | | 10/15/15 | | | 1,250 | | | 1,210,882 |
Ser. 2006-C1, Class C1(a) | | Baa1 | | 0.653% | | 07/15/15 | | | 5,000 | | | 4,446,850 |
Mountain Capital CLO Ltd. (Cayman Islands), Ser. 2004-3A,
Class A1LA, 144A(a) | | Aaa | | 0.688% | | 02/15/16 | | | 3,550 | | | 3,372,924 |
Railcar Leasing LLC, Ser. 1997-1, Class A2, 144A | | Aa2 | | 7.125% | | 01/15/13 | | | 2,332 | | | 2,410,407 |
| | | | | | | | | | | |
|
|
TOTAL ASSET-BACKED SECURITIES
(cost $66,290,504) | | | 71,013,134 |
| | | | | | | | | | | |
|
|
| BANK LOANS — 2.8% | | | | | | | | | | | | |
Automotive — 0.1% | | | | | | | | | | | | |
Oshkosh Truck Corp.(a)(b) | | B2 | | 6.269% | | 12/06/13 | | | 1,144 | | | 1,141,009 |
| | | | | | | | | | | |
|
|
Cable — 0.3% | | | | | | | | | | | | |
Discovery Communications, Inc.(a)(b) | | Baa3 | | 5.250% | | 05/14/14 | | | 1,302 | | | 1,312,740 |
Insight Midwest Holding LLC(a)(b) | | B1 | | 1.790% | | 10/06/13 | | | 2,653 | | | 2,490,126 |
| | | | | | | | | | | |
|
|
| | | | | | | | | | | | | 3,802,866 |
| | | | | | | | | | | |
|
|
Capital Goods — 0.1% | | | | | | | | | | | | |
Capital Safety Group Ltd.(a)(b) | | B2 | | 2.723% | | 07/20/15 | | | 409 | | | 339,676 |
Capital Safety Group Ltd.(a)(b) | | B2 | | 2.981% | | 07/20/16 | | | 1,091 | | | 905,324 |
| | | | | | | | | | | |
|
|
| | | | | | | | | | | | | 1,245,000 |
| | | | | | | | | | | |
|
|
Consumer — 0.1% | | | | | | | | | | | | |
Huish Detergents, Inc.(a)(b) | | Ba2 | | 2.010% | | 04/26/14 | | | 206 | | | 192,471 |
Pilot Travel Centers LLC(b) | | Ba2 | | TBA | | 12/31/15 | | | 1,125 | | | 1,129,489 |
| | | | | | | | | | | |
|
|
| | | | | | | | | | | | | 1,321,960 |
| | | | | | | | | | | |
|
|
Electric — 0.3% | | | | | | | | | | | | |
NRG Energy, Inc.(a)(b) | | Baa3 | | 0.151% | | 02/01/13 | | | 1,171 | | | 1,112,508 |
NRG Energy, Inc.(a)(b) | | Baa3 | | 1.996% | | 02/01/13 | | | 1,991 | | | 1,891,124 |
Texas Competitive Electric Holdings Co. LLC(a)(b) | | B1 | | 3.735% | | 10/10/14 | | | 1,955 | | | 1,588,438 |
| | | | | | | | | | | |
|
|
| | | | | | | | | | | | | 4,592,070 |
| | | | | | | | | | | |
|
|
Gaming — 0.1% | | | | | | | | | | | | |
MotorCity Casino Hotel(b) | | B3 | | 8.500% | | 07/13/12 | | | 1,641 | | | 1,595,558 |
| | | | | | | | | | | |
|
|
SEE NOTES TO FINANCIAL STATEMENTS.
A25
| | | | | | |
| | | DIVERSIFIED BOND PORTFOLIO (continued) | | |
| |
| SCHEDULE OF INVESTMENTS | | December 31, 2009 |
| | | | | | | | | | | | |
BANK LOANS
(continued) | |
Moody’s
Rating
(Unaudited)†
| | Interest
Rate
| | Maturity
Date
| | Principal
Amount
(000)#
| | Value
(Note 2)
|
| | | | | | | | | | | | | |
Healthcare & Pharmaceutical — 1.3% | | | | | | | | | | | | |
HCA, Inc.(a)(b) | | Ba3 | | 2.501% | | 11/18/13 | | $ | 1,851 | | $ | 1,765,740 |
Health Management Associates Term B(a)(b) | | B1 | | 2.001% | | 02/28/14 | | | 1,880 | | | 1,748,650 |
Inverness Medical Innovations(a)(b) | | Ba2 | | 3.131% | | 06/26/14 | | | 2,925 | | | 2,756,812 |
PTS Acquisitions Corp.(a)(b) | | Ba3 | | 2.481% | | 04/10/14 | | | 3,803 | | | 3,220,242 |
Royalty Pharma Finance Trust(b) | | Baa3 | | 7.750% | | 05/15/15 | | | 4,000 | | | 3,720,000 |
Warner Chilcott Corp.(a)(b) | | B1 | | 5.500% | | 10/30/14 | | | 1,544 | | | 1,545,689 |
Warner Chilcott Corp.(a)(b) | | B1 | | 5.750% | | 04/30/15 | | | 1,699 | | | 1,700,257 |
Warner Chilcott Corp.(a)(b) | | B1 | | 5.750% | | 04/30/15 | | | 772 | | | 772,844 |
| | | | | | | | | | | |
|
|
| | | | | | | | | | | | | 17,230,234 |
| | | | | | | | | | | |
|
|
Paper | | | | | | | | | | | | |
Domtar, Inc.(a)(b) | | Baa3 | | 1.608% | | 03/05/14 | | | 840 | | | 816,375 |
| | | | | | | | | | | |
|
|
Pipelines & Other — 0.1% | | | | | | | | | | | | |
Enterprise GP Holdings LP(a)(b) | | Ba2 | | 2.514% | | 11/08/14 | | | 1,504 | | | 1,434,726 |
| | | | | | | | | | | |
|
|
Technology — 0.4% | | | | | | | | | | | | |
Fidelity National Information Services, Inc.(b) | | Ba1 | | 4.481% | | 01/18/12 | | | 298 | | | 296,779 |
First Data Corp.(a)(b) | | B1 | | 2.983% | | 09/24/14 | | | 1,026 | | | 909,197 |
First Data Corp.(a)(b) | | B1 | | 2.999% | | 09/24/14 | | | 1,955 | | | 1,728,953 |
Flextronics International Ltd. (Singapore)(a)(b) | | Ba1 | | 2.514% | | 10/01/14 | | | 2,278 | | | 2,105,182 |
Flextronics International Ltd. (Singapore)(a)(b) | | Ba1 | | 2.534% | | 10/01/14 | | | 655 | | | 604,938 |
| | | | | | | | | | | |
|
|
| | | | | | | | | | | | | 5,645,049 |
| | | | | | | | | | | |
|
|
TOTAL BANK LOANS
(cost $41,352,990) | | | 38,824,847 |
| | | | | | | | | | | |
|
|
| COLLATERALIZED MORTGAGE OBLIGATIONS — 0.4% | | | | | | | | | | | | |
Countrywide Alternative Loan Trust, Ser. 2004-18CB, Class 3A1 | | A1 | | 5.250% | | 09/25/19 | | | 1,594 | | | 1,542,596 |
Master Alternative Loans Trust, Ser. 2004-4, Class 4A1 | | Aaa | | 5.000% | | 04/25/19 | | | 351 | | | 331,412 |
Structured Adjustable Rate Mortgage Loan Trust, Ser. 2004-1, Class 4A3(a) | | A1 | | 3.586% | | 02/25/34 | | | 2,302 | | | 1,904,549 |
Washington Mutual Alternative Mortgage Pass-Through Certificates, Ser. 2005-1, Class 3A | | AAA(c) | | 5.000% | | 03/25/20 | | | 1,291 | | | 988,944 |
| | | | | | | | | | | |
|
|
TOTAL COLLATERALIZED MORTGAGE OBLIGATIONS
(cost $5,593,458) | | | 4,767,501 |
| | | | | | | | | | | |
|
|
| COMMERCIAL MORTGAGE-BACKED SECURITIES — 15.6% | | | | | | | | | | | | |
Banc of America Commercial Mortgage, Inc.
Ser. 2005-1, Class ASB(a) | | AAA(c) | | 4.965% | | 11/10/42 | | | 4,512 | | | 4,630,871 |
Ser. 2007-1, Class A2 | | Aaa | | 5.381% | | 01/15/49 | | | 5,000 | | | 5,093,416 |
Ser. 2007-4, Class A3(a) | | AAA(c) | | 5.811% | | 02/10/51 | | | 6,460 | | | 6,338,273 |
Ser. 2007-5, Class A3 | | AAA(c) | | 5.620% | | 02/10/51 | | | 2,445 | | | 2,372,995 |
Bear Stearns Commercial Mortgage Securities
Ser. 2005-T18, Class AAB(a) | | Aaa | | 4.823% | | 02/13/42 | | | 2,475 | | | 2,498,469 |
Ser. 2005-T20, Class AAB(a) | | Aaa | | 5.134% | | 10/12/42 | | | 3,400 | | | 3,486,546 |
Ser. 2006-PW11, Class A4(a) | | AAA(c) | | 5.456% | | 03/11/39 | | | 2,000 | | | 1,954,859 |
Ser. 2006-PW13, Class A3 | | AAA(c) | | 5.518% | | 09/11/41 | | | 4,024 | | | 4,015,491 |
Citigroup Commercial Mortgage Trust
Ser. 2006-C5, Class A2 | | Aaa | | 5.378% | | 10/15/49 | | | 7,000 | | | 7,112,874 |
Ser. 2008-C7, Class A2A | | Aaa | | 6.034% | | 12/10/49 | | | 3,620 | | | 3,769,770 |
Citigroup/Deutsche Bank Commercial Mortgage Trust, Ser. 2006-CD2, Class AAB(a) | | Aaa | | 5.393% | | 01/15/46 | | | 3,000 | | | 3,035,411 |
Commercial Mortgage Loan Trust, Ser. 2008-LS1, Class A2(a) | | Aaa | | 6.019% | | 12/10/49 | | | 3,000 | | | 3,077,314 |
Commercial Mortgage Loan Trust, Pass-Through Certificates, Ser. 2006-C7,
Class A3(a) | | AAA(c) | | 5.706% | | 06/10/46 | | | 1,598 | | | 1,605,750 |
Credit Suisse First Boston Mortgage Securities Corp., Ser. 2001-CP4, Class B | | AAA(c) | | 6.330% | | 12/15/35 | | | 1,400 | | | 1,432,952 |
Credit Suisse Mortgage Capital Certificates
Ser. 2006-C1, Class A4(a) | | AAA(c) | | 5.548% | | 02/15/39 | | | 4,400 | | | 4,334,191 |
Ser. 2006-C4, Class A2 | | Aaa | | 5.361% | | 09/15/39 | | | 460 | | | 466,342 |
SEE NOTES TO FINANCIAL STATEMENTS.
A26
| | | | | | |
| | | DIVERSIFIED BOND PORTFOLIO (continued) | | |
| |
| SCHEDULE OF INVESTMENTS | | December 31, 2009 |
| | | | | | | | | | | | |
COMMERCIAL MORTGAGE-BACKED SECURITIES
(continued) | | Moody’s
Rating
(Unaudited)†
| | Interest
Rate
| | Maturity
Date
| | Principal
Amount
(000)#
| | Value
(Note 2)
|
| | | | | | | | | | | | | |
Ser. 2006-C5, Class A2 | | Aaa | | 5.246% | | 12/15/39 | | $ | 3,810 | | $ | 3,877,044 |
Ser. 2007-C1, Class A2 | | Aaa | | 5.268% | | 02/15/40 | | | 7,430 | | | 7,473,817 |
CS First Boston Mortgage Securities Corp.
Ser. 2005-C3, Class A3 | | Aaa | | 4.645% | | 07/15/37 | | | 3,950 | | | 3,965,086 |
Ser. 2005-C5, Class A4(a) | | AAA(c) | | 5.100% | | 08/15/38 | | | 2,400 | | | 2,312,157 |
GE Capital Commercial Mortgage Corp., Ser. 2006-C1, Class A4(a) | | AAA(c) | | 5.336% | | 03/10/44 | | | 4,300 | | | 4,101,564 |
Greenwich Capital Commercial Funding Corp.
Ser. 2005-GG5, Class A5(a) | | Aaa | | 5.224% | | 04/10/37 | | | 4,900 | | | 4,641,329 |
Ser. 2007-GG9, Class A2 | | Aaa | | 5.381% | | 03/10/39 | | | 6,010 | | | 6,088,420 |
GS Mortgage Securities Corp. II, Ser. 2007-GG10, Class A2(a) | | Aaa | | 5.778% | | 08/10/45 | | | 6,920 | | | 7,087,677 |
JPMorgan Chase Commercial Mortgage Securities Corp.
Ser. 2005-LDP2, Class ASB | | Aaa | | 4.659% | | 07/15/42 | | | 9,300 | | | 9,396,592 |
Ser. 2006-CB14, Class A4(a) | | Aaa | | 5.481% | | 12/12/44 | | | 5,000 | | | 4,816,066 |
Ser. 2006-LDP6, Class A4(a) | | Aaa | | 5.475% | | 04/15/43 | | | 900 | | | 865,995 |
Ser. 2006-LDP7, Class A2(a) | | Aaa | | 5.861% | | 04/15/45 | | | 4,500 | | | 4,612,079 |
Ser. 2006-LDP9, Class A2 | | Aaa | | 5.134% | | 05/15/47 | | | 2,435 | | | 2,328,443 |
Ser. 2007-CB19, Class A2(a) | | Aaa | | 5.746% | | 02/12/49 | | | 656 | | | 673,152 |
Ser. 2007-LD11, Class A2(a) | | Aaa | | 5.803% | | 06/15/49 | | | 4,190 | | | 4,302,828 |
Ser. 2007-LDPX, Class A2 | | Aaa | | 5.434% | | 01/15/49 | | | 4,285 | | | 4,003,031 |
LB-UBS Commercial Mortgage Trust
Ser. 2004-C8, Class A6(a) | | Aaa | | 4.799% | | 12/15/29 | | | 4,200 | | | 3,882,842 |
Ser. 2006-C6, Class AAB | | Aaa | | 5.341% | | 09/15/39 | | | 7,126 | | | 7,025,147 |
Ser. 2007-C1, Class A2 | | AAA(c) | | 5.318% | | 02/15/40 | | | 6,000 | | | 6,109,477 |
Merrill Lynch Mortgage Trust
Ser. 2005-CIP1, Class A4(a) | | Aaa | | 5.047% | | 07/12/38 | | | 3,100 | | | 3,012,781 |
Ser. 2006-C1, Class A4(a) | | AAA(c) | | 5.656% | | 05/12/39 | | | 7,920 | | | 7,740,105 |
Merrill Lynch/Countrywide Commercial Mortgage Trust
Ser. 2006-2, Class A4(a) | | Aaa | | 5.909% | | 06/12/46 | | | 2,625 | | | 2,576,999 |
Ser. 2006-3, Class ASB(a) | | Aaa | | 5.382% | | 07/12/46 | | | 2,095 | | | 2,065,439 |
Ser. 2007-7, Class A2(a) | | Aaa | | 5.693% | | 06/12/50 | | | 347 | | | 355,508 |
Ser. 2007-8, Class A2(a) | | AAA(c) | | 5.920% | | 08/12/49 | | | 4,400 | | | 4,310,061 |
Ser. 2007-9, Class A2 | | AAA(c) | | 5.590% | | 09/12/49 | | | 5,415 | | | 5,472,896 |
Morgan Stanley Capital Group, Inc.
Ser. 2006-IQ12, Class AAB | | AAA(c) | | 5.325% | | 12/15/43 | | | 1,400 | | | 1,395,121 |
Ser. 2006-T23, Class A3(a) | | AAA(c) | | 5.807% | | 08/12/41 | | | 1,318 | | | 1,335,215 |
Ser. 2006-T23, Class A4(a) | | AAA(c) | | 5.810% | | 08/12/41 | | | 6,100 | | | 6,146,798 |
Morgan Stanley Capital I, Ser. 2006-IQ12, Class ANM | | AAA(c) | | 5.310% | | 12/15/43 | | | 5,500 | | | 5,575,506 |
Wachovia Bank Commercial Mortgage Trust
Ser. 2003-C9, Class A3 | | AAA(c) | | 4.608% | �� | 12/15/35 | | | 3,991 | | | 4,076,101 |
Ser. 2005-C18, Class APB | | Aaa | | 4.807% | | 04/15/42 | | | 1,500 | | | 1,513,945 |
Ser. 2005-C22, Class A3(a) | | Aaa | | 5.285% | | 12/15/44 | | | 2,800 | | | 2,812,914 |
Ser. 2006-C24, Class A3(a) | | Aaa | | 5.558% | | 03/15/45 | | | 2,050 | | | 2,003,723 |
Ser. 2006-C25, Class A4(a) | | Aaa | | 5.740% | | 05/15/43 | | | 6,000 | | | 5,911,719 |
Ser. 2006-C27, Class A2 | | Aaa | | 5.624% | | 07/15/45 | | | 5,000 | | | 5,118,811 |
Ser. 2007-C33, Class A2(a) | | Aaa | | 5.857% | | 02/15/51 | | | 5,000 | | | 5,117,400 |
Ser. 2007-C34, Class A2 | | Aaa | | 5.569% | | 05/15/46 | | | 3,600 | | | 3,668,610 |
| | | | | | | | | | | |
|
|
TOTAL COMMERCIAL MORTGAGE-BACKED SECURITIES
(cost $191,573,107) | | | 212,997,922 |
| | | | | | | | | | | |
|
|
| CORPORATE BONDS — 47.2% | | | | | | | | | | | | |
Aerospace & Defense — 0.1% | | | | | | | | | | | | |
BAE Systems Holdings, Inc., Gtd. Notes, 144A | | Baa2 | | 6.375% | | 06/01/19 | | | 1,350 | | | 1,452,153 |
| | | | | | | | | | | |
|
|
Airlines — 1.2% | | | | | | | | | | | | |
American Airlines Pass-Through Trust 2001-01, Pass-thru Certs., Ser. 01-1(d) | | B2 | | 6.817% | | 05/23/11 | | | 2,750 | | | 2,640,000 |
Continental Airlines, Inc., Pass-thru Certs.
Ser. 2000-1, Class A-1(b) | | Baa2 | | 7.487% | | 10/02/10 | | | 7,954 | | | 7,914,230 |
Ser. 2000-1, Class A-1(b) | | Baa2 | | 6.703% | | 06/15/21 | | | 3 | | | 2,490 |
SEE NOTES TO FINANCIAL STATEMENTS.
A27
| | | | | | |
| | | DIVERSIFIED BOND PORTFOLIO (continued) | | |
| |
| SCHEDULE OF INVESTMENTS | | December 31, 2009 |
| | | | | | | | | | | | |
CORPORATE BONDS
(continued) | | Moody’s
Rating
(Unaudited)†
| | Interest
Rate
| | Maturity
Date
| | Principal
Amount
(000)#
| | Value
(Note 2)
|
| | | | | | | | | | | | | |
Airlines (continued) | | | | | | | | | | | | |
Ser. 2001-1, Class A-1 | | Ba1 | | 7.373% | | 12/15/15 | | $ | 1,022 | | $ | 904,634 |
Ser. A(d) | | Baa1 | | 5.983% | | 04/19/22 | | | 1,850 | | | 1,785,250 |
Delta Air Lines, Inc., Pass-thru Certs., Ser. 071A | | Baa1 | | 6.821% | | 08/10/22 | | | 1,624 | | | 1,550,708 |
United Airlines, Inc., Pass-thru Certs., Ser. 2007-1, Class A(d) | | Ba1 | | 6.636% | | 07/02/22 | | | 1,183 | | | 1,005,827 |
| | | | | | | | | | | |
|
|
| | | | | | | | | | | | | 15,803,139 |
| | | | | | | | | | | |
|
|
Automotive — 0.5% | | | | | | | | | | | | |
Ford Motor Credit Co. LLC, Sr. Unsec’d. Notes | | B3 | | 7.875% | | 06/15/10 | | | 5,615 | | | 5,699,826 |
Harley-Davidson Funding Corp., Gtd. Notes, 144A, MTN | | Baa1 | | 5.750% | | 12/15/14 | | | 660 | | | 670,077 |
| | | | | | | | | | | |
|
|
| | | | | | | | | | | | | 6,369,903 |
| | | | | | | | | | | |
|
|
Banking — 6.5% | | | | | | | | | | | | |
Alfa MTN Markets Ltd. for ABH Financial Ltd. (Cyprus), Notes, 144A, MTN | | Ba1 | | 8.200% | | 06/25/12 | | | 1,500 | | | 1,500,000 |
American Express Co., Sr. Unsec’d. Notes | | A3 | | 8.125% | | 05/20/19 | | | 2,785 | | | 3,300,395 |
Bank of America, Sub. Notes | | A1 | | 5.300% | | 03/15/17 | | | 790 | | | 774,271 |
Bank of America Corp., Jr. Sub. Notes(a) | | Ba3 | | 8.000% | | 12/29/49 | | | 3,500 | | | 3,369,590 |
Bank of America Corp., Sr. Unsec’d. Notes | | A2 | | 6.000% | | 09/01/17 | | | 1,495 | | | 1,551,696 |
Barclays Bank PLC (United Kingdom), Sr. Unsec’d. Notes(d) | | Aa3 | | 6.750% | | 05/22/19 | | | 1,600 | | | 1,784,691 |
Bear Stearns Cos., Inc. (The), Sr. Unsec’d. Notes | | Aa3 | | 7.250% | | 02/01/18 | | | 1,575 | | | 1,807,868 |
Capital One Financial Corp., Sub. Notes | | Baa2 | | 6.150% | | 09/01/16 | | | 700 | | | 703,161 |
Chuo Mitsui Trust & Banking Co. Ltd. (Japan), Jr. Sub. Notes, 144A(a) | | A2 | | 5.506% | | 12/29/49 | | | 3,050 | | | 2,799,653 |
Citigroup, Inc., Sr. Unsec’d. Notes | | A3 | | 6.125% | | 11/21/17 | | | 2,050 | | | 2,066,349 |
Citigroup, Inc., Sr. Unsec’d. Notes(d) | | A3 | | 8.125% | | 07/15/39 | | | 4,120 | | | 4,650,026 |
Citigroup, Inc. | | A3 | | 8.500% | | 05/22/19 | | | 1,375 | | | 1,587,785 |
Countrywide Financial Corp., Gtd. Notes, MTN | | A2 | | 5.800% | | 06/07/12 | | | 3,670 | | | 3,895,745 |
Depfa ACS Bank (Ireland), Covered Notes, 144A | | Aa2 | | 5.125% | | 03/16/37 | | | 3,065 | | | 2,252,714 |
Goldman Sachs Group, Inc. (The), Sr. Unsec’d. Notes | | A1 | | 5.950% | | 01/18/18 | | | 1,550 | | | 1,636,758 |
Goldman Sachs Group, Inc. (The), Sr. Unsec’d. Notes(d) | | A1 | | 6.150% | | 04/01/18 | | | 1,900 | | | 2,033,948 |
Goldman Sachs Group, Inc. (The), Sr. Unsec’d. Notes | | A1 | | 6.250% | | 09/01/17 | | | 3,195 | | | 3,426,363 |
Goldman Sachs Group, Inc. (The), Sub. Notes | | A2 | | 6.750% | | 10/01/37 | | | 440 | | | 452,270 |
HSBC Holdings PLC (United Kingdom), Sub. Notes | | A1 | | 6.500% | | 05/02/36 | | | 995 | | | 1,043,580 |
HSBC Holdings PLC (United Kingdom), Sub. Notes | | A1 | | 6.500% | | 09/15/37 | | | 2,255 | | | 2,356,006 |
HSBC Holdings PLC (United Kingdom), Sub. Notes | | A1 | | 6.800% | | 06/01/38 | | | 2,035 | | | 2,208,526 |
HSBK Europe BV (Netherlands), Gtd. Notes., 144A | | Ba2 | | 7.250% | | 05/03/17 | | | 2,230 | | | 2,029,300 |
ICICI Bank Ltd. (India), Jr. Sub. Notes, 144A(a) | | Ba1 | | 7.250% | | 08/29/49 | | | 2,380 | | | 1,995,861 |
ICICI Bank Ltd. (Singapore), Notes, 144A | | Baa2 | | 5.750% | | 11/16/10 | | | 2,500 | | | 2,552,815 |
JPMorgan Chase & Co., Jr. Sub. Notes, Ser. 1(a) | | Baa1 | | 7.900% | | 04/29/49 | | | 2,180 | | | 2,248,583 |
JPMorgan Chase & Co., Sr. Unsec’d. Notes(e) | | Aa3 | | 6.300% | | 04/23/19 | | | 3,250 | | | 3,575,250 |
KBC Bank Funding Trust III, Gtd. Notes, 144A(a) | | Caa1 | | 4.331% | | 11/29/49 | | | 5,000 | | | 3,350,000 |
Krung Thai Bank PCL (Thailand), Sub. Notes(a) | | Baa3 | | 7.378% | | 10/29/49 | | | 1,590 | | | 1,393,357 |
Merrill Lynch & Co., Inc., Notes, MTN | | A2 | | 6.875% | | 04/25/18 | | | 2,860 | | | 3,081,472 |
Merrill Lynch & Co., Inc., Sr. Unsec’d. Notes | | A2 | | 6.050% | | 08/15/12 | | | 1,500 | | | 1,606,848 |
Merrill Lynch & Co., Inc., Sub. Notes | | A3 | | 6.110% | | 01/29/37 | | | 1,785 | | | 1,645,631 |
Morgan Stanley, Sr. Unsec’d. Notes, Ser. E | | A2 | | 5.450% | | 01/09/17 | | | 4,035 | | | 4,078,239 |
Morgan Stanley, Sr. Unsec’d. Notes, MTN | | A2 | | 5.625% | | 09/23/19 | | | 2,635 | | | 2,654,262 |
Royal Bank of Scotland Group PLC (United Kingdom), Sr. Unsec’d. Notes, MTN | | A1 | | 6.400% | | 10/21/19 | | | 1,525 | | | 1,520,105 |
Sumitomo Mitsui Banking Corp. (Japan), Sub. Notes, 144A(a) | | Aa3 | | 5.625% | | 07/29/49 | | | 6,380 | | | 6,081,831 |
USB Capital Xiii Trust, Gtd. Notes | | A2 | | 6.625% | | 12/15/39 | | | 1,975 | | | 2,007,272 |
Wachovia Bank NA, Sub. Notes(d) | | Aa3 | | 6.600% | | 01/15/38 | | | 1,300 | | | 1,372,123 |
Woori Bank (South Korea), Notes, 144A(d) | | A2 | | 7.000% | | 02/02/15 | | | 1,965 | | | 2,153,508 |
| | | | | | | | | | | |
|
|
| | | | | | | | | | | | | 88,547,852 |
| | | | | | | | | | | |
|
|
Brokerage — 0.1% | | | | | | | | | | | | |
Blackstone Holdings Finance Co. LLC, Gtd. Notes, 144A | | A(c) | | 6.625% | | 08/15/19 | | | 1,360 | | | 1,331,127 |
Lehman Brothers Holdings, Inc., Sr. Unsec’d. Notes, MTN(f) | | NR | | 6.875% | | 05/02/18 | | | 2,740 | | | 568,550 |
| | | | | | | | | | | |
|
|
| | | | | | | | | | | | | 1,899,677 |
| | | | | | | | | | | |
|
|
SEE NOTES TO FINANCIAL STATEMENTS.
A28
| | | | | | |
| | | DIVERSIFIED BOND PORTFOLIO (continued) | | |
| |
| SCHEDULE OF INVESTMENTS | | December 31, 2009 |
| | | | | | | | | | | | |
CORPORATE BONDS
(continued) | | Moody’s
Rating
(Unaudited)†
| | Interest
Rate
| | Maturity
Date
| | Principal
Amount
(000)#
| | Value
(Note 2)
|
| | | | | | | | | | | | | |
Building Materials & Construction — 1.1% | | | | | | | | | | | | |
Centex Corp., Sr. Unsec’d. Notes | | B1 | | 5.700% | | 05/15/14 | | $ | 2,500 | | $ | 2,550,000 |
Interline Brands, Inc., Gtd. Notes | | B3 | | 8.125% | | 06/15/14 | | | 1,685 | | | 1,693,425 |
KB Home, Gtd. Notes | | B1 | | 6.375% | | 08/15/11 | | | 447 | | | 447,000 |
Lennar Corp., Gtd. Notes, Ser. B | | B3 | | 5.950% | | 10/17/11 | | | 3,060 | | | 3,082,950 |
Masco Corp., Sr. Unsec’d. Notes | | Ba2 | | 7.125% | | 08/15/13 | | | 2,600 | | | 2,706,262 |
Toll Brothers Finance Corp., Gtd. Notes | | Ba1 | | 5.150% | | 05/15/15 | | | 4,695 | | | 4,492,448 |
| | | | | | | | | | | |
|
|
| | | | | | | | | | | | | 14,972,085 |
| | | | | | | | | | | |
|
|
Cable — 1.5% | | | | | | | | | | | | |
Comcast Cable Communications Holdings, Inc., Gtd. Notes | | Baa1 | | 9.455% | | 11/15/22 | | | 1,065 | | | 1,369,744 |
British Sky Broadcasting Group PLC (United Kingdom), Gtd. Notes, 144A | | Baa1 | | 6.100% | | 02/15/18 | | | 210 | | | 222,461 |
Cablevision Systems Corp., Sr. Notes, 144A | | B1 | | 8.625% | | 09/15/17 | | | 3,175 | | | 3,305,969 |
COX Communications, Inc., Sr. Unsec’d. Notes, 144A
(original cost $1,892,647; purchased date 02/12/09)(g) | | Baa3 | | 8.375% | | 03/01/39 | | | 1,900 | | | 2,365,840 |
DIRECTV Holdings LLC / DIRECTV Financing Co., Inc., Gtd. Notes, 144A | | Ba2 | | 4.750% | | 10/01/14 | | | 3,100 | | | 3,159,942 |
TCI Communications, Inc., Sr. Unsec’d. Notes | | Baa1 | | 7.875% | | 02/15/26 | | | 750 | | | 840,707 |
Time Warner Cable, Inc., Gtd. Notes | | Baa2 | | 5.850% | | 05/01/17 | | | 1,420 | | | 1,491,957 |
Time Warner Cable, Inc., Gtd. Notes | | Baa2 | | 6.750% | | 07/01/18 | | | 5,520 | | | 6,064,068 |
Time Warner Cable, Inc., Gtd. Notes | | Baa2 | | 8.250% | | 02/14/14 | | | 1,115 | | | 1,303,151 |
| | | | | | | | | | | |
|
|
| | | | | | | | | | | | | 20,123,839 |
| | | | | | | | | | | |
|
|
Capital Goods — 1.7% | | | | | | | | | | | | |
Ashtead Holdings PLC (United Kingdom), Sec’d. Notes, 144A(d) | | B2 | | 8.625% | | 08/01/15 | | | 1,300 | | | 1,306,500 |
Hutchison Whampoa International 09/16 Ltd. (Cayman Islands), Gtd. Notes, 144A(d) | | A3 | | 4.625% | | 09/11/15 | | | 4,960 | | | 5,004,590 |
Noble Group Ltd. (Bermuda), Sr. Unsec’d. Notes, 144A | | Baa3 | | 6.750% | | 01/29/20 | | | 2,860 | | | 2,935,075 |
Rockwell Automation, Inc., Sr. Unsec’d. Notes | | A3 | | 5.200% | | 01/15/98 | | | 6,500 | | | 4,874,200 |
Textron, Inc., Sr. Unsec’d. Notes | | Baa3 | | 7.250% | | 10/01/19 | | | 2,350 | | | 2,432,415 |
Trane U.S., Inc., Gtd. Notes | | BBB+(c) | | 7.625% | | 02/15/10 | | | 3,800 | | | 3,822,813 |
Waste Management, Inc., Sr. Unsec’d. Notes | | Baa3 | | 7.650% | | 03/15/11 | | | 2,100 | | | 2,224,977 |
| | | | | | | | | | | |
|
|
| | | | | | | | | | | | | 22,600,570 |
| | | | | | | | | | | |
|
|
Chemicals — 0.9% | | | | | | | | | | | | |
Dow Chemical Co. (The), Sr. Unsec’d. Notes | | Baa3 | | 5.900% | | 02/15/15 | | | 750 | | | 805,932 |
Dow Chemical Co. (The), Sr. Unsec’d. Notes | | Baa3 | | 7.600% | | 05/15/14 | | | 2,050 | | | 2,332,679 |
Dow Chemical Co. (The), Sr. Unsec’d. Notes | | Baa3 | | 8.550% | | 05/15/19 | | | 2,450 | | | 2,923,205 |
Dow Chemical Co. (The), Sr. Unsec’d. Notes | | Baa3 | | 9.400% | | 05/15/39 | | | 1,450 | | | 1,917,119 |
Nova Chemicals Corp. (Canada), Sr. Unsec’d. Notes | | B1 | | 6.500% | | 01/15/12 | | | 1,440 | | | 1,447,200 |
Union Carbide Chemical & Plastics Co., Gtd. Notes | | Ba2 | | 7.875% | | 04/01/23 | | | 3,058 | | | 2,730,922 |
| | | | | | | | | | | |
|
|
| | | | | | | | | | | | | 12,157,057 |
| | | | | | | | | | | |
|
|
Consumer — 0.3% | | | | | | | | | | | | |
Realogy Corp., Gtd. Notes, PIK | | Ca | | 11.000% | | 04/15/14 | | | 2,374 | | | 1,958,232 |
Visant Holding Corp., Sr. Notes | | B3 | | 8.750% | | 12/01/13 | | | 2,445 | | | 2,512,237 |
| | | | | | | | | | | |
|
|
| | | | | | | | | | | | | 4,470,469 |
| | | | | | | | | | | |
|
|
Electric — 4.1% | | | | | | | | | | | | |
AES Corp. (The), Sr. Sec’d. Notes, 144A | | Ba3 | | 8.750% | | 05/15/13 | | | 5,007 | | | 5,132,175 |
CenterPoint Energy Houston Electric LLC, Genl. Ref. Mtge., Ser. J2 | | Baa1 | | 5.700% | | 03/15/13 | | | 2,950 | | | 3,135,682 |
Consumers Energy Co., First Mtge. Bonds, Ser. D | | A3 | | 5.375% | | 04/15/13 | | | 1,000 | | | 1,073,736 |
Duke Energy Corp., Sr. Unsec’d. Notes | | Baa2 | | 6.300% | | 02/01/14 | | | 3,400 | | | 3,738,705 |
EDP Finance BV (Netherlands), Sr. Unsec’d. Notes, 144A | | A3 | | 6.000% | | 02/02/18 | | | 600 | | | 640,945 |
El Paso Electric Co., Sr. Unsec’d. Notes | | Baa2 | | 6.000% | | 05/15/35 | | | 2,325 | | | 2,090,854 |
Empresa Nacional de Electricidad SA (Chile), Unsub. Notes(d) | | Baa3 | | 8.350% | | 08/01/13 | | | 625 | | | 723,517 |
ENEL Finance International SA (Luxembourg), Gtd. Notes, 144A | | A2 | | 6.000% | | 10/07/39 | | | 3,200 | | | 3,216,938 |
Energy East Corp., Sr. Unsec’d. Notes | | A3 | | 6.750% | | 06/15/12 | | | 750 | | | 819,709 |
Energy East Corp., Sr. Unsec’d. Notes | | A3 | | 6.750% | | 09/15/33 | | | 1,150 | | | 1,199,902 |
Enersis SA (Chile), Sr. Unsec’d. Notes | | Baa3 | | 7.375% | | 01/15/14 | | | 3,700 | | | 4,124,593 |
SEE NOTES TO FINANCIAL STATEMENTS.
A29
| | | | | | |
| | | DIVERSIFIED BOND PORTFOLIO (continued) | | |
| |
| SCHEDULE OF INVESTMENTS | | December 31, 2009 |
| | | | | | | | | | | | |
CORPORATE BONDS
(continued) | | Moody’s
Rating
(Unaudited)†
| | Interest
Rate
| | Maturity
Date
| | Principal
Amount
(000)#
| | Value
(Note 2)
|
| | | | | | | | | | | | | |
Electric (continued) | | | | | | | | | | | | |
Exelon Corp., Sr. Unsec’d. Notes | | Baa1 | | 4.900% | | 06/15/15 | | $ | 500 | | $ | 515,800 |
Exelon Generation Co. LLC, Sr. Unsec’d. Notes | | A3 | | 6.200% | | 10/01/17 | | | 1,930 | | | 2,068,844 |
Exelon Generation Co. LLC, Sr. Unsec’d. Notes | | A3 | | 6.250% | | 10/01/39 | | | 1,900 | | | 1,935,779 |
FirstEnergy Solutions Corp., Gtd. Notes | | Baa2 | | 6.050% | | 08/15/21 | | | 1,750 | | | 1,765,411 |
Korea Hydro & Nuclear Power Co. Ltd. (South Korea), Sr. Unsec’d. Notes, 144A(d) | | A2 | | 6.250% | | 06/17/14 | | | 5,295 | | | 5,777,422 |
Mirant Americas Generation LLC, Sr. Unsec’d. Notes | | B3 | | 8.300% | | 05/01/11 | | | 2,655 | | | 2,721,375 |
Mirant MID Atlantic Pass-Through Trust A, Pass-thru Certs., Ser. A | | Ba1 | | 8.625% | | 06/30/12 | | | 2,770 | | | 2,828,380 |
NiSource Finance Corp., Gtd. Notes | | Baa3 | | 5.450% | | 09/15/20 | | | 1,345 | | | 1,304,248 |
North American Energy Alliance LLC / North American Energy Alliance Finance Corp., Sr. Sec’d. Notes, 144A (original cost $1,563,824; purchased date 09/22/09)(g) | | Ba3 | | 10.875% | | 06/01/16 | | | 1,600 | | | 1,700,000 |
Oncor Electric Delivery Co. LLC, First Mtge. Bonds | | Baa1 | | 6.800% | | 09/01/18 | | | 1,460 | | | 1,621,737 |
Orion Power Holdings, Inc., Sr. Unsec’d. Notes | | Ba3 | | 12.000% | | 05/01/10 | | | 3,535 | | | 3,623,375 |
Transalta Corp. (Canada), Sr. Unsec’d. Notes(d) | | Baa2 | | 6.650% | | 05/15/18 | | | 1,953 | | | 2,036,210 |
Xcel Energy, Inc., Sr. Unsec’d. Notes | | Baa1 | | 5.613% | | 04/01/17 | | | 1,947 | | | 2,007,470 |
| | | | | | | | | | | |
|
|
| | | | | | | | | | | | | 55,802,807 |
| | | | | | | | | | | |
|
|
Energy - Integrated — 0.5% | | | | | | | | | | | | |
Cenovus Energy, Inc. (Canada), Sr. Notes, 144A(d) | | Baa2 | | 6.750% | | 11/15/39 | | | 3,325 | | | 3,624,430 |
Hess Corp., Sr. Unsec’d. Notes | | Baa2 | | 6.000% | | 01/15/40 | | | 615 | | | 609,002 |
Hess Corp., Sr. Unsec’d. Notes(d) | | Baa2 | | 8.125% | | 02/15/19 | | | 500 | | | 602,978 |
Western Oil Sand, Inc. (Canada), Gtd. Notes | | Baa1 | | 8.375% | | 05/01/12 | | | 1,900 | | | 2,126,767 |
| | | | | | | | | | | |
|
|
| | | | | | | | | | | | | 6,963,177 |
| | | | | | | | | | | |
|
|
Energy - Other — 1.1% | | | | | | | | | | | | |
Dolphin Energy Ltd. (Uae), Sr. Sec’d. Notes, 144A | | Aa3 | | 5.888% | | 06/15/19 | | | 3,846 | | | 3,884,612 |
GS Caltex Corp. (South Korea), Sr. Unsec’d. Notes, 144A | | Baa2 | | 7.750% | | 07/25/11 | | | 3,000 | | | 3,186,432 |
Halliburton Co., Sr. Unsec’d. Notes | | A2 | | 7.450% | | 09/15/39 | | | 1,500 | | | 1,855,882 |
Pioneer Natural Resources Co., Sr. Unsec’d. Notes | | Ba1 | | 6.875% | | 05/01/18 | | | 1,750 | | | 1,731,485 |
XTO Energy, Inc., Sr. Unsec’d. Notes | | Baa2 | | 6.250% | | 04/15/13 | | | 4,107 | | | 4,523,302 |
| | | | | | | | | | | |
|
|
| | | | | | | | | | | | | 15,181,713 |
| | | | | | | | | | | |
|
|
Foods — 1.7% | | | | | | | | | | | | |
Anheuser-Busch InBev Worldwide, Inc., Gtd. Notes, 144A | | Baa2 | | 4.125% | | 01/15/15 | | | 2,975 | | | 3,020,669 |
Anheuser-Busch InBev Worldwide, Inc., Gtd. Notes, 144A | | Baa2 | | 6.875% | | 11/15/19 | | | 2,200 | | | 2,456,045 |
Anheuser-Busch InBev Worldwide, Inc., Gtd. Notes, 144A | | Baa2 | | 7.750% | | 01/15/19 | | | 1,640 | | | 1,920,104 |
Constellation Brands, Inc., Gtd. Notes, Ser. B(d) | | B2 | | 8.125% | | 01/15/12 | | | 2,678 | | | 2,688,043 |
Kraft Foods, Inc., Sr. Unsec’d. Notes | | Baa2 | | 6.125% | | 02/01/18 | | | 2,770 | | | 2,912,771 |
Mead Johnson Nutrition Co., Gtd. Notes, 144A | | Baa1 | | 3.500% | | 11/01/14 | | | 1,285 | | | 1,270,355 |
Ralcorp Holdings, Inc., Sr. Notes, 144A | | Baa3 | | 6.625% | | 08/15/39 | | | 2,825 | | | 2,755,062 |
Stater Brothers Holdings, Gtd. Notes | | B2 | | 8.125% | | 06/15/12 | | | 1,250 | | | 1,262,500 |
Tyson Foods, Inc., Gtd. Notes | | Ba3 | | 7.850% | | 04/01/16 | | | 1,000 | | | 1,025,000 |
Tyson Foods, Inc., Sr. Unsec’d. Notes | | B2 | | 8.250% | | 10/01/11 | | | 2,050 | | | 2,193,500 |
Yum! Brands, Inc., Sr. Unsec’d. Notes | | Baa3 | | 8.875% | | 04/15/11 | | | 1,705 | | | 1,844,934 |
| | | | | | | | | | | |
|
|
| | | | | | | | | | | | | 23,348,983 |
| | | | | | | | | | | |
|
|
Gaming — 0.3% | | | | | | | | | | | | |
MGM Mirage, Sr. Sec’d. Notes, 144A | | B1 | | 10.375% | | 05/15/14 | | | 1,115 | | | 1,209,775 |
MGM Mirage, Sr. Sec’d. Notes, 144A | | B1 | | 11.125% | | 11/15/17 | | | 1,115 | | | 1,234,863 |
Peninsula Gaming LLC, Sr. Sec’d. Notes, 144A | | Ba2 | | 8.375% | | 08/15/15 | | | 945 | | | 942,637 |
Peninsula Gaming LLC, Sr. Unsec’d. Notes, 144A | | B3 | | 10.750% | | 08/15/17 | | | 945 | | | 949,725 |
| | | | | | | | | | | |
|
|
| | | | | | | | | | | | | 4,337,000 |
| | | | | | | | | | | |
|
|
Healthcare & Pharmaceutical — 1.3% | | | | | | | | | | | | |
Apria Healthcare Group, Inc., Sr. Sec’d. Notes, 144A | | B1 | | 12.375% | | 11/01/14 | | | 1,650 | | | 1,815,000 |
Carefusion Corp., Sr. Unsec’d. Notes, 144A | | Baa3 | | 6.375% | | 08/01/19 | | | 1,525 | | | 1,632,545 |
Express Scripts, Inc., Gtd. Notes | | Baa3 | | 6.250% | | 06/15/14 | | | 3,450 | | | 3,764,398 |
HCA, Inc., Sr. Unsec’d. Notes, MTN | | Caa1 | | 8.700% | | 02/10/10 | | | 1,700 | | | 1,703,683 |
Hospira, Inc., Sr. Unsec’d. Notes | | Baa3 | | 5.550% | | 03/30/12 | | | 2,500 | | | 2,664,665 |
SEE NOTES TO FINANCIAL STATEMENTS.
A30
| | | | | | |
| | | DIVERSIFIED BOND PORTFOLIO (continued) | | |
| |
| SCHEDULE OF INVESTMENTS | | December 31, 2009 |
| | | | | | | | | | | | |
CORPORATE BONDS
(continued) | |
Moody’s
Rating
(Unaudited)†
| | Interest
Rate
| | Maturity
Date
| | Principal
Amount
(000)#
| | Value
(Note 2)
|
| | | | | | | | | | | | | |
Healthcare & Pharmaceutical (continued) | | | | | | | | | | | | |
McKesson Corp., Sr. Unsec’d. Notes | | Baa3 | | 6.500% | | 02/15/14 | | $ | 2,800 | | $ | 3,097,259 |
Senior Housing Properties Trust, Sr. Unsec’d. Notes | | Ba1 | | 8.625% | | 01/15/12 | | | 2,500 | | | 2,587,500 |
| | | | | | | | | | | |
|
|
| | | | | | | | | | | | | 17,265,050 |
| | | | | | | | | | | |
|
|
Healthcare Insurance — 1.0% | | | | | | | | | | | | |
Aetna, Inc., Sr. Unsec’d. Notes | | A3 | | 6.750% | | 12/15/37 | | | 1,900 | | | 1,981,185 |
Cigna Corp., Sr. Unsec’d. Notes | | Baa2 | | 5.375% | | 03/15/17 | | | 2,125 | | | 2,045,281 |
Coventry Health Care, Inc., Sr. Unsec’d. Notes | | Ba1 | | 6.125% | | 01/15/15 | | | 4,025 | | | 3,844,720 |
UnitedHealth Group, Inc., Sr. Unsec’d. Notes | | Baa1 | | 6.000% | | 06/15/17 | | | 2,610 | | | 2,731,540 |
UnitedHealth Group, Inc., Sr. Unsec’d. Notes | | Baa1 | | 6.500% | | 06/15/37 | | | 760 | | | 749,434 |
UnitedHealth Group, Inc., Sr. Unsec’d. Notes | | Baa1 | | 6.625% | | 11/15/37 | | | 195 | | | 195,349 |
UnitedHealth Group, Inc., Sr. Unsec’d. Notes | | Baa1 | | 6.875% | | 02/15/38 | | | 2,000 | | | 2,067,102 |
| | | | | | | | | | | |
|
|
| | | | | | | | | | | | | 13,614,611 |
| | | | | | | | | | | |
|
|
Insurance — 2.0% | | | | | | | | | | | | |
Allied World Assurance Co. Holdings Ltd. (Bermuda), Sr. Unsec’d. Notes | | Baa1 | | 7.500% | | 08/01/16 | | | 2,475 | | | 2,642,911 |
American International Group, Inc., Sr. Unsec’d. Notes | | A3 | | 4.250% | | 05/15/13 | | | 1,820 | | | 1,681,147 |
American International Group, Inc., Sr. Unsec’d. Notes | | A3 | | 5.050% | | 10/01/15 | | | 315 | | | 262,790 |
American International Group, Inc., Sr. Unsec’d. Notes, MTN | | A3 | | 5.850% | | 01/16/18 | | | 3,700 | | | 3,035,957 |
Axis Capital Holdings Ltd. (Bermuda), Sr. Unsec’d. Notes | | Baa1 | | 5.750% | | 12/01/14 | | | 3,350 | | | 3,372,077 |
Lincoln National Corp., Sr. Unsec’d. Notes | | Baa2 | | 8.750% | | 07/01/19 | | | 1,265 | | | 1,445,394 |
Massachusetts Mutual Life Insurance Co., Sub. Notes, 144A | | A1 | | 8.875% | | 06/01/39 | | | 1,200 | | | 1,471,739 |
MetLife, Inc., Sr. Unsec’d. Notes(d) | | A3 | | 7.717% | | 02/15/19 | | | 2,000 | | | 2,350,270 |
Teachers Insurance & Annuity Association of America, Notes, 144A | | Aa2 | | 6.850% | | 12/16/39 | | | 2,310 | | | 2,387,935 |
XL Capital Finance Europe PLC (United Kingdom), Gtd. Notes | | Baa2 | | 6.500% | | 01/15/12 | | | 6,820 | | | 7,057,704 |
XL Capital Ltd. (Cayman Islands), Jr. Sub. Notes, Ser. E(a) | | Ba1 | | 6.500% | | 12/31/49 | | | 1,880 | | | 1,419,400 |
XL Capital Ltd. (Cayman Islands), Sr. Unsec’d. Notes | | Baa2 | | 5.250% | | 09/15/14 | | | 140 | | | 137,105 |
| | | | | | | | | | | |
|
|
| | | | | | | | | | | | | 27,264,429 |
| | | | | | | | | | | |
|
|
Lodging — 0.5% | | | | | | | | | | | | |
Felcor Lodging LP, Sr. Sec’d. Notes, 144A(d) | | B2 | | 10.000% | | 10/01/14 | | | 2,350 | | | 2,370,563 |
Starwood Hotels & Resorts Worldwide, Inc., Gtd. Notes | | Ba1 | | 7.875% | | 05/01/12 | | | 3,060 | | | 3,300,975 |
Starwood Hotels & Resorts Worldwide, Inc., Sr. Unsec’d. Notes(d) | | Ba1 | | 6.250% | | 02/15/13 | | | 980 | | | 1,010,625 |
| | | | | | | | | | | |
|
|
| | | | | | | | | | | | | 6,682,163 |
| | | | | | | | | | | |
|
|
Media & Entertainment — 2.6% | | | | | | | | | | | | |
CBS Corp., Gtd. Notes(d) | | Baa3 | | 8.200% | | 05/15/14 | | | 4,800 | | | 5,456,726 |
Gannett Co., Inc., Sr. Unsec’d. Notes(d) | | Ba2 | | 5.750% | | 06/01/11 | | | 2,240 | | | 2,245,600 |
Gannett Co., Inc., Sr. Unsec’d. Notes | | Ba2 | | 6.375% | | 04/01/12 | | | 1,100 | | | 1,100,000 |
Historic TW, Inc., Gtd. Notes | | Baa2 | | 6.625% | | 05/15/29 | | | 225 | | | 234,608 |
News America, Inc., Gtd. Notes, 144A(d) | | Baa1 | | 6.900% | | 08/15/39 | | | 600 | | | 654,524 |
News America, Inc., Gtd. Notes | | Baa1 | | 7.625% | | 11/30/28 | | | 1,415 | | | 1,512,297 |
RR Donnelley & Sons Co., Sr. Unsec’d. Notes | | Baa3 | | 4.950% | | 04/01/14 | | | 7,000 | | | 7,002,121 |
RR Donnelley & Sons Co., Sr. Unsec’d. Notes | | Baa3 | | 8.600% | | 08/15/16 | | | 4,750 | | | 5,170,893 |
Time Warner Cos., Inc., Gtd. Notes | | Baa2 | | 6.950% | | 01/15/28 | | | 2,153 | | | 2,316,746 |
Time Warner Cos., Inc., Gtd. Notes | | Baa2 | | 7.250% | | 10/15/17 | | | 1,440 | | | 1,612,688 |
Viacom, Inc., Sr. Unsec’d. Notes | | Baa2 | | 4.250% | | 09/15/15 | | | 2,795 | | | 2,816,938 |
Viacom, Inc., Sr. Unsec’d. Notes | | Baa2 | | 4.375% | | 09/15/14 | | | 860 | | | 886,884 |
Viacom, Inc., Sr. Unsec’d. Notes(d) | | Baa2 | | 6.750% | | 10/05/37 | | | 1,240 | | | 1,279,278 |
Viacom, Inc., Sr. Unsec’d. Notes | | Baa2 | | 6.875% | | 04/30/36 | | | 580 | | | 627,158 |
Vivendi SA (France), Sr. Unsec’d. Notes, 144A | | Baa2 | | 5.750% | | 04/04/13 | | | 2,000 | | | 2,102,694 |
| | | | | | | | | | | |
|
|
| | | | | | | | | | | | | 35,019,155 |
| | | | | | | | | | | |
|
|
Metals — 2.0% | | | | | | | | | | | | |
AK Steel Corp., Gtd. Notes(d) | | Ba3 | | 7.750% | | 06/15/12 | | | 4,195 | | | 4,236,950 |
Arcelormittal (Luxembourg), Sr. Unsec’d. Notes(d) | | Baa3 | | 6.125% | | 06/01/18 | | | 1,550 | | | 1,599,346 |
Freeport-McMoRan Copper & Gold, Inc., Sr. Unsec’d. Notes | | Ba2 | | 8.375% | | 04/01/17 | | | 2,095 | | | 2,294,025 |
Newmont Mining Corp., Gtd. Notes | | Baa2 | | 6.250% | | 10/01/39 | | | 2,025 | | | 2,027,420 |
Rio Tinto Finance USA Ltd. (Australia), Gtd. Notes(d) | | Baa1 | | 9.000% | | 05/01/19 | | | 5,785 | | | 7,321,427 |
Teck Resources Ltd. (Canada), Sr. Sec’d. Notes | | Ba2 | | 10.250% | | 05/15/16 | | | 500 | | | 582,500 |
SEE NOTES TO FINANCIAL STATEMENTS.
A31
| | | | | | |
| | | DIVERSIFIED BOND PORTFOLIO (continued) | | |
| |
| SCHEDULE OF INVESTMENTS | | December 31, 2009 |
| | | | | | | | | | | | |
CORPORATE BONDS
(continued) | | Moody’s
Rating
(Unaudited)†
| | Interest
Rate
| | Maturity
Date
| | Principal
Amount
(000)#
| | Value
(Note 2)
|
| | | | | | | | | | | | | |
Metals (continued) | | | | | | | | | | | | |
Teck Resources Ltd. (Canada), Sr. Sec’d. Notes | | Ba2 | | 10.750% | | 05/15/19 | | $ | 1,800 | | $ | 2,151,000 |
United States Steel Corp., Sr. Unsec’d. Notes(d) | | Ba3 | | 7.000% | | 02/01/18 | | | 2,000 | | | 1,958,988 |
Vale Overseas Ltd. (Cayman Islands), Gtd. Notes | | Baa2 | | 6.875% | | 11/21/36 | | | 815 | | | 814,316 |
Vale Overseas Ltd. (Cayman Islands), Gtd. Notes | | Baa2 | | 6.875% | | 11/10/39 | | | 1,275 | | | 1,283,573 |
Xstrata Finance Canada Ltd. (Canada), Gtd. Notes, 144A | | Baa2 | | 5.500% | | 11/16/11 | | | 3,430 | | | 3,600,059 |
| | | | | | | | | | | |
|
|
| | | | | | | | | | | | | 27,869,604 |
| | | | | | | | | | | |
|
|
Non-Captive Finance — 2.6% | | | | | | | | | | | | |
Block Financial LLC, Gtd. Notes | | Baa1 | | 7.875% | | 01/15/13 | | | 5,700 | | | 6,350,005 |
Bosphorus Financial Services Ltd. (Cayman Islands), Sr. Sec’d. Notes, MTN(a)(b) | | A3 | | 2.073% | | 02/15/12 | | | 1,252 | | | 1,194,366 |
GATX Corp., Sr. Unsec’d. Notes | | Baa1 | | 4.750% | | 10/01/12 | | | 1,500 | | | 1,531,707 |
General Electric Capital Australia Funding Pty Ltd. (Australia), Gtd. Notes, MTN | | Aa2 | | 6.000% | | 04/15/15 | | | AUD 4,440 | | | 3,689,394 |
General Electric Capital Corp., Sr. Unsec’d. Notes, MTN | | Aa2 | | 5.875% | | 01/14/38 | | | 1,675 | | | 1,550,854 |
General Electric Capital Corp., Sr. Unsec’d. Notes, Ser. G, MTN(e)(h) | | Aa2 | | 6.000% | | 08/07/19 | | | 7,275 | | | 7,551,603 |
Nelnet, Inc., Jr. Sub. Notes(a) | | Ba2 | | 7.400% | | 09/29/36 | | | 6,500 | | | 4,734,022 |
Preferred Term Securities X (Cayman Islands), Sr. Sec’d. Notes, 144A(a)(b) | | A2 | | 1.003% | | 07/03/33 | | | 3,102 | | | 1,504,523 |
SLM Corp., Sr. Unsec’d. Notes, MTN | | Ba1 | | 5.050% | | 11/14/14 | | | 4,150 | | | 3,743,213 |
SLM Corp., Sr. Unsec’d. Notes, MTN | | Ba1 | | 8.450% | | 06/15/18 | | | 3,200 | | | 3,157,609 |
| | | | | | | | | | | |
|
|
| | | | | | | | | | | | | 35,007,296 |
| | | | | | | | | | | |
|
|
Packaging — 1.0% | | | | | | | | | | | | |
Ball Corp., Gtd. Notes(d) | | Ba1 | | 7.125% | | 09/01/16 | | | 1,320 | | | 1,353,000 |
Greif, Inc., Sr. Unsec’d. Notes | | Ba2 | | 7.750% | | 08/01/19 | | | 3,505 | | | 3,575,100 |
Reynolds Group Issuer, Inc. , Sr. Sec’d. Notes, 144A | | B1 | | 7.750% | | 10/15/16 | | | 1,600 | | | 1,636,000 |
Sealed Air Corp., Sr. Unsec’d. Notes, 144A(d) | | Baa3 | | 5.625% | | 07/15/13 | | | 6,600 | | | 6,978,589 |
| | | | | | | | | | | |
|
|
| | | | | | | | | | | | | 13,542,689 |
| | | | | | | | | | | |
|
|
Paper — 1.3% | | | | | | | | | | | | |
Cascades, Inc. (Canada), Sr. Notes, 144A | | Ba3 | | 7.750% | | 12/15/17 | | | 2,150 | | | 2,171,500 |
Georgia-Pacific LLC, Sr. Unsec’d. Notes(d) | | B2 | | 8.125% | | 05/15/11 | | | 3,965 | | | 4,163,250 |
Graphic Packaging International, Inc., Gtd. Notes | | B3 | | 9.500% | | 06/15/17 | | | 1,750 | | | 1,855,000 |
International Paper Co., Sr. Unsec’d. Notes | | Baa3 | | 7.300% | | 11/15/39 | | | 1,000 | | | 1,060,861 |
International Paper Co., Sr. Unsec’d. Notes | | Baa3 | | 7.500% | | 08/15/21 | | | 1,650 | | | 1,848,777 |
MeadWestvaco Corp., Sr. Unsec’d. Notes | | Ba1 | | 7.375% | | 09/01/19 | | | 4,400 | | | 4,833,383 |
Rock-Tenn Co., Sr. Sec’d. Notes | | Ba2 | | 8.200% | | 08/15/11 | | | 2,000 | | | 2,122,500 |
| | | | | | | | | | | |
|
|
| | | | | | | | | | | | | 18,055,271 |
| | | | | | | | | | | |
|
|
Pipelines & Other — 0.6% | | | | | | | | | | | | |
Kinder Morgan Energy Partners LP, Sr. Unsec’d. Notes(d) | | Baa2 | | 6.500% | | 09/01/39 | | | 1,545 | | | 1,557,068 |
Kinder Morgan Energy Partners LP, Sr. Unsec’d. Notes | | Baa2 | | 7.300% | | 08/15/33 | | | 1,550 | | | 1,690,542 |
Sempra Energy, Sr. Unsec’d. Notes(d) | | Baa1 | | 6.500% | | 06/01/16 | | | 2,275 | | | 2,467,258 |
Sonat, Inc., Sr. Unsec’d. Notes | | Ba3 | | 7.625% | | 07/15/11 | | | 2,240 | | | 2,308,770 |
| | | | | | | | | | | |
|
|
| | | | | | | | | | | | | 8,023,638 |
| | | | | | | | | | | |
|
|
Railroads — 0.1% | | | | | | | | | | | | |
Union Pacific Corp., Sr. Unsec’d. Notes(d) | | Baa2 | | 5.750% | | 11/15/17 | | | 1,450 | | | 1,529,889 |
| | | | | | | | | | | |
|
|
Real Estate Investment Trusts — 1.4% | | | | | | | | | | | | |
Country Garden Holdings Co. (Cayman Islands), Sr. Notes, 144A | | Ba3 | | 11.750% | | 09/10/14 | | | 1,220 | | | 1,220,000 |
Hospitality Properties Trust, Sr. Unsec’d. Notes | | Baa2 | | 7.875% | | 08/15/14 | | | 2,900 | | | 2,993,867 |
Post Apartment Homes LP, Sr. Unsec’d. Notes | | Baa3 | | 5.450% | | 06/01/12 | | | 2,300 | | | 2,282,166 |
ProLogis, Sr. Unsec’d. Notes | | Baa2 | | 7.375% | | 10/30/19 | | | 1,650 | | | 1,627,568 |
Realty Income Corp., Sr. Unsec’d. Notes(d) | | Baa1 | | 6.750% | | 08/15/19 | | | 1,545 | | | 1,512,887 |
Simon Property Group LP, Sr. Unsec’d. Notes | | A3 | | 5.300% | | 05/30/13 | | | 3,400 | | | 3,508,137 |
Simon Property Group LP, Sr. Unsec’d. Notes | | A3 | | 10.350% | | 04/01/19 | | | 1,685 | | | 2,116,473 |
WEA Finance LLC , Gtd. Notes, 144A | | A2 | | 5.750% | | 09/02/15 | | | 4,000 | | | 4,217,760 |
| | | | | | | | | | | |
|
|
| | | | | | | | | | | | | 19,478,858 |
| | | | | | | | | | | |
|
|
SEE NOTES TO FINANCIAL STATEMENTS.
A32
| | | | | | |
| | | DIVERSIFIED BOND PORTFOLIO (continued) | | |
| |
| SCHEDULE OF INVESTMENTS | | December 31, 2009 |
| | | | | | | | | | | |
CORPORATE BONDS
(continued) | |
Moody’s
Rating
(Unaudited)†
| | Interest
Rate
| | Maturity
Date
| | Principal
Amount
(000)#
| | Value
(Note 2)
|
| | | | | | | | | | | | |
Retailers — 1.4% | | | | | | | | | | | |
CVS Caremark Corp., Sr. Unsec’d. Notes | | Baa2 | | 6.125% | | 09/15/39 | | AUD 3,350 | | $ | 3,320,182 |
GameStop Corp., Gtd. Notes | | Ba1 | | 8.000% | | 10/01/12 | | $ 3,325 | | | 3,445,531 |
Macy’s Retail Holdings, Inc., Gtd. Notes | | Ba2 | | 5.350% | | 03/15/12 | | 1,800 | | | 1,838,250 |
Macy’s Retail Holdings, Inc., Gtd. Notes | | Ba2 | | 5.875% | | 01/15/13 | | 7,800 | | | 8,014,500 |
Target Corp., Sr. Unsec’d. Notes | | A2 | | 6.500% | | 10/15/37 | | 800 | | | 877,228 |
Target Corp., Sr. Unsec’d. Notes | | A2 | | 7.000% | | 01/15/38 | | 1,870 | | | 2,181,819 |
| | | | | | | | | | |
|
|
| | | | | | | | | | | | 19,677,510 |
| | | | | | | | | | |
|
|
Structured Notes — 1.3% | | | | | | | | | | | |
Dow Jones CDX North America High Yield, Pass-thru Certs., 144A
Ser. 5-T3 | | Caa3 | | 8.250% | | 12/29/10 | | 7,488 | | | 7,834,398 |
Ser. 6-T1 | | Caa3 | | 8.625% | | 06/29/11 | | 8,570 | | | 9,426,450 |
| | | | | | | | | | |
|
|
| | | | | | | | | | | | 17,260,848 |
| | | | | | | | | | |
|
|
Technology — 2.6% | | | | | | | | | | | |
Advanced Micro Devices, Inc., Sr. Unsec’d. Notes, 144A(d) | | B2 | | 8.125% | | 12/15/17 | | 1,530 | | | 1,524,263 |
Affiliated Computer Services, Inc., Sr. Unsec’d. Notes | | Ba2 | | 4.700% | | 06/01/10 | | 5,785 | | | 5,835,619 |
Amphenol Corp., Sr. Unsec’d. Notes | | Baa3 | | 4.750% | | 11/15/14 | | 2,475 | | | 2,475,869 |
Arrow Electronics, Inc., Sr. Unsec’d. Notes | | Baa3 | | 6.000% | | 04/01/20 | | 3,400 | | | 3,363,834 |
Cisco Systems, Inc., Sr. Unsec’d. Notes | | A1 | | 4.450% | | 01/15/20 | | 4,650 | | | 4,561,576 |
FISERV, Inc., Gtd. Notes | | Baa2 | | 6.125% | | 11/20/12 | | 1,600 | | | 1,742,194 |
Motorola, Inc., Sr. Unsec’d. Notes | | Baa3 | | 8.000% | | 11/01/11 | | 121 | | | 129,408 |
Oracle Corp., Sr. Unsec’d. Notes(d) | | A2 | | 6.125% | | 07/08/39 | | 1,100 | | | 1,155,038 |
Seagate Technology HDD Holdings (Cayman Islands), Gtd. Notes | | Ba3 | | 6.375% | | 10/01/11 | | 2,115 | | | 2,152,012 |
Sensata Technologies BV (Netherlands), Gtd. Notes | | Caa2 | | 8.000% | | 05/01/14 | | 4,370 | | | 4,282,600 |
Stats ChipPAC Ltd. (Singapore), Gtd. Notes | | Ba1 | | 6.750% | | 11/15/11 | | 2,500 | | | 2,515,625 |
SunGard Data Systems, Inc., Gtd. Notes(d) | | Caa1 | | 10.250% | | 08/15/15 | | 2,610 | | | 2,779,650 |
Xerox Corp., Sr. Unsec’d. Notes | | Baa2 | | 4.250% | | 02/15/15 | | 2,000 | | | 1,986,058 |
Xerox Corp., Sr. Unsec’d. Notes | | Baa2 | | 5.500% | | 05/15/12 | | 870 | | | 919,433 |
| | | | | | | | | | |
|
|
| | | | | | | | | | | | 35,423,179 |
| | | | | | | | | | |
|
|
Telecommunications — 3.2% | | | | | | | | | | | |
AT&T Corp., Gtd. Notes | | A2 | | 8.000% | | 11/15/31 | | 3,915 | | | 4,778,328 |
British Telecommunications PLC (United Kingdom), Sr. Unsec’d. Notes | | Baa2 | | 9.625% | | 12/15/30 | | 328 | | | 417,943 |
CC Holdings GS V LLC, Sr. Sec’d. Notes, 144A | | Baa3 | | 7.750% | | 05/01/17 | | 3,000 | | | 3,195,000 |
Cellco Partnership/Verizon Wireless Capital LLC, Sr. Unsec’d. Notes | | A2 | | 8.500% | | 11/15/18 | | 2,960 | | | 3,671,531 |
CenturyTel, Inc., Sr. Unsec’d. Notes, Ser. P(d) | | Baa3 | | 7.600% | | 09/15/39 | | 1,250 | | | 1,281,046 |
Embarq Corp., Sr. Unsec’d. Notes (original cost $8,523,664; purchased date 05/12/06-01/12/09)(b)(g) | | Baa3 | | 7.082% | | 06/01/16 | | 9,000 | | | 9,941,202 |
Qwest Capital Funding, Inc., Gtd. Notes | | B1 | | 7.250% | | 02/15/11 | | 1,925 | | | 1,953,875 |
Qwest Corp., Sr. Unsec’d. Notes | | Ba1 | | 8.375% | | 05/01/16 | | 1,100 | | | 1,179,750 |
Qwest Corp., Sr. Unsec’d. Notes | | Ba1 | | 8.875% | | 03/15/12 | | 3,300 | | | 3,547,500 |
Sprint Capital Corp., Gtd. Notes(d) | | Ba3 | | 7.625% | | 01/30/11 | | 5,235 | | | 5,359,331 |
Telecom Italia Capital SA (Luxembourg), Gtd. Notes | | Baa2 | | 4.875% | | 10/01/10 | | 3,400 | | | 3,479,890 |
Telefonica Emisiones Sau (Spain), Gtd. Notes | | Baa1 | | 7.045% | | 06/20/36 | | 5 | | | 5,709 |
Verizon Communications, Inc., Sr. Unsec’d. Notes | | A3 | | 6.350% | | 04/01/19 | | 900 | | | 992,907 |
Windstream Corp., Gtd. Notes, 144A | | Ba3 | | 7.875% | | 11/01/17 | | 3,750 | | | 3,703,125 |
| | | | | | | | | | |
|
|
| | | | | | | | | | | | 43,507,137 |
| | | | | | | | | | |
|
|
Tobacco — 0.7% | | | | | | | | | | | |
Altria Group, Inc., Gtd. Notes(e) | | Baa1 | | 9.950% | | 11/10/38 | | 6,005 | | | 7,827,578 |
Lorillard Tobacco Co., Sr. Unsec’d. Notes(d) | | Baa2 | | 8.125% | | 06/23/19 | | 2,075 | | | 2,281,226 |
| | | | | | | | | | |
|
|
| | | | | | | | | | | | 10,108,804 |
| | | | | | | | | | |
|
|
TOTAL CORPORATE BONDS
(cost $622,143,084) | | | 643,360,555 |
| | | | | | | | | | |
|
|
| FOREIGN AGENCIES — 1.7% | | | | | | | | | | | |
DP World Ltd. (United Arab Emirates), Sr. Unsec’d. Notes, MTN, Reg.- S. | | Ba1 | | 6.850% | | 07/02/37 | | 4,470 | | | 3,352,500 |
SEE NOTES TO FINANCIAL STATEMENTS.
A33
| | | | | | |
| | | DIVERSIFIED BOND PORTFOLIO (continued) | | |
| |
| SCHEDULE OF INVESTMENTS | | December 31, 2009 |
| | | | | | | | | | | | |
FOREIGN AGENCIES
(continued) | | Moody’s
Rating
(Unaudited)†
| | Interest
Rate
| | Maturity
Date
| | Principal
Amount
(000)#
| | Value
(Note 2)
|
| | | | | | | | | | | | | |
DP World Ltd. (United Arab Emirates), Sr. Unsec’d. Notes, 144A | | Ba1 | | 6.850% | | 07/02/37 | | $ | 190 | | $ | 146,152 |
Export-Import Bank of Korea (South Korea) | | A2 | | 5.875% | | 01/14/15 | | | 2,230 | | | 2,393,040 |
Export-Import Bank of Korea (South Korea) | | A2 | | 8.125% | | 01/21/14 | | | 820 | | | 951,928 |
GAZ Capital SA (Luxembourg), Sr. Unsec’d. Notes, 144A | | Baa1 | | 6.510% | | 03/07/22 | | | 4,740 | | | 4,348,950 |
GAZ Capital SA (Luxembourg), Sr. Unsec’d. Notes, 144A | | Baa1 | | 8.125% | | 07/31/14 | | | 2,810 | | | 2,978,600 |
GAZ Capital SA (Luxembourg), Sr. Unsec’d. Notes, Reg. - S. | | Baa1 | | 9.250% | | 04/23/19 | | | 2,055 | | | 2,291,325 |
GAZ Capital SA For Gazprom (Luxembourg), Sr. Unsec’d. Notes, Reg. - S. | | Baa1 | | 8.125% | | 07/31/14 | | | 600 | | | 640,500 |
Gazprom International SA (Luxembourg), Gtd. Notes, 144A | | BBB+(c) | | 7.201% | | 02/01/20 | | | 1,671 | | | 1,702,697 |
Korea Expressway Corp. (South Korea), 144A | | A2 | | 4.500% | | 03/23/15 | | | 2,825 | | | 2,878,336 |
National Power Corp. (Philippines), Gtd. Notes., 144A(a) | | BB-(c) | | 4.517% | | 08/23/11 | | | 1,530 | | | 1,591,200 |
| | | | | | | | | | | |
|
|
TOTAL FOREIGN AGENCIES
(cost $21,684,839) | | | 23,275,228 |
| | | | | | | | | | | |
|
|
| MUNICIPAL BONDS — 0.7% | | | | | | | | | | | | |
New Jersey State Turnpike Authority, Build America Bonds | | A3 | | 7.414% | | 01/01/40 | | | 2,050 | | | 2,310,760 |
State of California, Buid America Bonds | | Baa1 | �� | 7.300% | | 10/01/39 | | | 3,500 | | | 3,307,780 |
State of California, Build America Bonds(d) | | Baa1 | | 7.550% | | 04/01/39 | | | 2,205 | | | 2,166,368 |
University of California Rev., Build America Bonds | | Aa1 | | 5.770% | | 05/15/43 | | | 1,400 | | | 1,367,492 |
| | | | | | | | | | | |
|
|
TOTAL MUNICIPAL BONDS
(cost $9,020,462) | | | 9,152,400 |
| | | | | | | | | | | |
|
|
| RESIDENTIAL MORTGAGE-BACKED SECURITIES — 3.7% | | | | | | | | | | |
ACE Securities Corp., Ser. 2004-FM1, Class M1(a) | | Aa2 | | 1.131% | | 09/25/33 | | | 2,267 | | | 1,777,488 |
Ameriquest Mortgage Securities, Inc.
Ser. 2001-2, Class M3(a) | | Baa2 | | 3.156% | | 10/25/31 | | | 702 | | | 399,457 |
Ser. 2003-AR3, Class M6(a)(b) | | Ba3 | | 5.380% | | 10/25/33 | | | 1,600 | | | 205,536 |
Ser. 2004-R8, Class M1(a) | | Aa1 | | 0.871% | | 09/25/34 | | | 950 | | | 697,341 |
Amortizing Residential Collateral Trust, Ser. 2002-BC7, Class M2(a) | | CC(c) | | 1.581% | | 10/25/32 | | | 134 | | | 10,211 |
Argent Securities, Inc., Ser. 2003-W2, Class M4(a) | | Baa1 | | 5.169% | | 09/25/33 | | | 2,400 | | | 1,157,494 |
Asset Backed Funding Certificates, Ser. 2004-OPT1, Class M1(a) | | Aa2 | | 1.281% | | 08/25/33 | | | 2,592 | | | 1,895,056 |
Asset Backed Securities Corp. Home Equity, Ser. 2003-HE3, Class M1(a) | | Aa3 | | 1.478% | | 06/15/33 | | | 1,994 | | | 1,497,424 |
CDC Mortgage Capital Trust, Ser. 2002-HE3, Class M2(a) | | Ca | | 3.606% | | 03/25/33 | | | 348 | | | 23,714 |
Centex Home Equity, Ser. 2004-B, Class AF6 | | Aaa | | 4.186% | | 03/25/34 | | | 1,300 | | | 1,150,044 |
Citigroup Mortgage Loan Trust, Inc., Ser. 2004-RES1, Class M3(a) | | A3 | | 1.311% | | 11/25/34 | | | 239 | | | 106,018 |
Countrywide Asset-Backed Certificates, Ser. 2004-12, Class MV3(a) | | Aa3 | | 0.891% | | 03/25/35 | | | 2,670 | | | 1,679,610 |
CS First Boston Mortgage Securities Corp., Ser. 2002-HE4, Class M2(a) | | B2 | | 2.481% | | 08/25/32 | | | 159 | | | 28,423 |
Equity One ABS, Inc., Ser. 2004-3, Class M1 | | Aa2 | | 5.700% | | 07/25/34 | | | 1,300 | | | 989,391 |
FBR Securitization Trust, Ser. 2005-2, Class M1(a) | | A1 | | 0.711% | | 09/25/35 | | | 3,600 | | | 2,469,547 |
First Franklin Mortgage Loan Asset Backed Certificates, Ser. 2005-FF6, Class M2(a) | | A1 | | 0.671% | | 05/25/36 | | | 2,575 | | | 855,882 |
Fremont Home Loan Trust, Ser. 2003-B, Class M1(a) | | Aa3 | | 1.281% | | 12/25/33 | | | 382 | | | 283,038 |
GSAMP Trust, Ser. 2004-FM1, Class M1(a) | | Aaa | | 1.206% | | 11/25/33 | | | 4,075 | | | 3,341,532 |
HFC Home Equity Loan Asset Backed Certificates
Ser. 2004-1, Class A(a) | | Aaa | | 0.583% | | 09/20/33 | | | 2,114 | | | 1,884,176 |
Ser. 2004-1, Class M(a) | | Aa2 | | 0.753% | | 09/20/33 | | | 1,916 | | | 1,637,328 |
Ser. 2006-1, Class M1(a) | | Aa1 | | 0.513% | | 01/20/36 | | | 1,227 | | | 1,054,245 |
Ser. 2006-2, Class A1(a) | | Aaa | | 0.383% | | 03/20/36 | | | 340 | | | 299,019 |
Ser. 2006-2, Class A2(a) | | Aaa | | 0.413% | | 03/20/36 | | | 413 | | | 363,705 |
IXIS Real Estate Capital Trust, Ser. 2006-HE1, Class A4(a) | | Caa2 | | 0.531% | | 03/25/36 | | | 3,200 | | | 1,066,212 |
Long Beach Mortgage Loan Trust, Ser. 2004-1, Class M1(a) | | Aa1 | | 0.731% | | 02/25/34 | | | 4,250 | | | 2,999,566 |
Merrill Lynch Mortgage Investors, Inc., Ser. 2004-OPT1, Class A1A(a) | | AAA(c) | | 0.491% | | 06/25/35 | | | 3,249 | | | 2,538,626 |
Morgan Stanley ABS Capital I
Ser. 2002-NC6, Class M2(a) | | B3 | | 3.381% | | 11/25/32 | | | 174 | | | 36,801 |
Ser. 2003-HE1, Class M1(a) | | Aa2 | | 1.431% | | 05/25/33 | | | 2,141 | | | 1,639,566 |
Ser. 2004-NC1, Class M1(a) | | Aa2 | | 0.931% | | 12/25/33 | | | 1,193 | | | 879,185 |
Ser. 2004-OP1, Class M1(a) | | Aa1 | | 0.811% | | 11/25/34 | | | 3,688 | | | 2,817,759 |
SEE NOTES TO FINANCIAL STATEMENTS.
A34
| | | | | | |
| | | DIVERSIFIED BOND PORTFOLIO (continued) | | |
| |
| SCHEDULE OF INVESTMENTS | | December 31, 2009 |
| | | | | | | | | | | | |
RESIDENTIAL��MORTGAGE-BACKED SECURITIES
(continued) | | Moody’s
Rating
(Unaudited)†
| | Interest
Rate
| | Maturity
Date
| | Principal
Amount
(000)#
| | Value
(Note 2)
|
| | | | | | | | | | | | | |
Ser. 2004-WMC1, Class M1(a) | | Aa1 | | 1.161% | | 06/25/34 | | $ | 3,176 | | $ | 2,251,742 |
Ser. 2004-WMC2, Class M1(a) | | Aa1 | | 1.146% | | 07/25/34 | | | 3,299 | | | 2,504,376 |
New Century Home Equity Loan Trust
Ser. 2003-4, Class M1(a) | | Aa2 | | 1.356% | | 10/25/33 | | | 5,016 | | | 3,716,162 |
Ser. 2004-4, Class M1(a) | | Aa1 | | 0.741% | | 02/25/35 | | | 3,524 | | | 3,103,478 |
Residential Asset Mortgage Products, Inc., Ser. 2004-RS12, Class MII2(a)(b) | | Aa3 | | 1.031% | | 12/25/34 | | | 1,546 | | | 1,411,189 |
Residential Asset Securities Corp., Ser. 2004-KS1, Class AI5 | | Aaa | | 5.221% | | 02/25/34 | | | 1,000 | | | 753,782 |
Saxon Asset Securities Trust, Ser. 2002-3, Class M1(a) | | Aaa | | 1.356% | | 12/25/32 | | | 849 | | | 680,655 |
Securitized Asset Backed Receivables LLC Trust, Ser. 2006-FR1, Class M1(a) | | Caa1 | | 0.631% | | 11/25/35 | | | 2,000 | | | 111,957 |
Structured Asset Securities Corp., Ser. 2002-HF2, Class M3(a)(b) | | CC(c) | | 3.231% | | 07/25/32 | | | 1,345 | | | 658,838 |
| | | | | | | | | | | |
|
|
TOTAL RESIDENTIAL MORTGAGE-BACKED SECURITIES
(cost $62,613,783) | | | 50,975,573 |
| | | | | | | | | | | |
|
|
| SOVEREIGNS — 1.1% | | | | | | | | | | | | |
Government of Hungary (Hungary), Ser. 15/A | | Baa1 | | 8.000% | | 02/12/15 | | | HUF 693,400 | | | 3,720,364 |
Government of Jamaica (Jamaica) | | Caa1 | | 11.000% | | 07/27/12 | | | EUR 620 | | | 799,920 |
Peru Government International Bond (Cayman Islands), Sr. Sec’d. Notes, 144A(i) | | Ba1 | | 6.350% | | 05/31/18 | | | 1,647 | | | 1,257,692 |
Poland Government International Bond (Poland) | | A2 | | 6.375% | | 07/15/19 | | | 1,550 | | | 1,685,909 |
Qatar Government International Bond (Qatar), 144A(d) | | Aa2 | | 6.400% | | 01/20/40 | | | 2,445 | | | 2,457,225 |
Republic of Poland (Poland), Ser. 1015 | | A2 | | 6.250% | | 10/24/15 | | | PLN 9,910 | | | 3,506,060 |
South Africa Government International Bond (South Africa) | | A3 | | 7.375% | | 04/25/12 | | | 600 | | | 658,500 |
Ukraine Government International Bond (Ukraine) | | B2 | | 6.385% | | 06/26/12 | | | 1,340 | | | 1,139,000 |
| | | | | | | | | | | |
|
|
TOTAL SOVEREIGNS
(cost $15,455,016) | | | 15,224,670 |
| | | | | | | | | | | |
|
|
| U.S. GOVERNMENT AGENCY OBLIGATION — 0.1% | | | | | | | | | | |
Federal National Mortgage Association (cost $1,332,952)(d) | | 2.625% | | 11/20/14 | | | 1,340 | | | 1,329,610 |
| | | | | | | | | | | |
|
|
| U.S. GOVERNMENT MORTGAGE-BACKED SECURITIES — 12.7% | | | | | | | | |
Federal Home Loan Mortgage Corporation | | | | 4.500% | | 02/01/19 | | | 1,287 | | | 1,340,508 |
Federal Home Loan Mortgage Corporation | | | | 5.000% | | 07/01/19-12/01/19 | | | 3,001 | | | 3,162,119 |
Federal Home Loan Mortgage Corporation | | | | 5.500% | | 10/01/33-06/01/34 | | | 4,008 | | | 4,255,662 |
Federal Home Loan Mortgage Corporation | | | | 5.500% | | TBA 30 YR | | | 23,000 | | | 24,092,500 |
Federal Home Loan Mortgage Corporation | | | | 6.000% | | 11/01/33-06/01/34 | | | 4,548 | | | 4,857,367 |
Federal Home Loan Mortgage Corporation | | | | 6.500% | | 07/01/32-09/01/32 | | | 2,140 | | | 2,311,162 |
Federal Home Loan Mortgage Corporation | | | | 7.000% | | 10/01/32-11/01/33 | | | 3,850 | | | 4,238,653 |
Federal National Mortgage Association | | | | 4.000% | | 05/01/19 | | | 960 | | | 980,658 |
Federal National Mortgage Association | | | | 4.500% | | 06/01/18-02/01/35 | | | 10,417 | | | 10,841,873 |
Federal National Mortgage Association | | | | 5.000% | | 01/01/19-01/01/20 | | | 5,759 | | | 6,064,903 |
Federal National Mortgage Association(a) | | | | 5.198% | | 10/01/37 | | | 8,332 | | | 8,742,220 |
Federal National Mortgage Association | | | | 5.500% | | 12/01/16-09/01/34 | | | 18,004 | | | 19,012,184 |
Federal National Mortgage Association | | | | 6.000% | | 09/01/17-03/01/38 | | | 16,532 | | | 17,674,615 |
Federal National Mortgage Association | | | | 6.000% | | TBA 30 YR | | | 25,500 | | | 27,006,081 |
Federal National Mortgage Association | | | | 6.500% | | 12/01/14-10/01/37 | | | 17,231 | | | 18,521,831 |
Federal National Mortgage Association | | | | 7.000% | | 05/01/32-06/01/32 | | | 415 | | | 458,304 |
Government National Mortgage Association | | | | 5.500% | | 01/15/33-01/15/36 | | | 7,461 | | | 7,869,918 |
Government National Mortgage Association | | | | 6.000% | | 12/15/32-11/15/34 | | | 6,304 | | | 6,722,953 |
Government National Mortgage Association | | | | 6.500% | | 09/15/32-11/15/33 | | | 4,050 | | | 4,351,102 |
Government National Mortgage Association | | | | 7.500% | | 10/15/25-02/15/26 | | | 140 | | | 157,180 |
| | | | | | | | | | | |
|
|
TOTAL U.S. GOVERNMENT MORTGAGE-BACKED SECURITIES
(cost $167,680,884) | | | 172,661,793 |
| | | | | | | | | | | |
|
|
SEE NOTES TO FINANCIAL STATEMENTS.
A35
| | | | | | |
| | | DIVERSIFIED BOND PORTFOLIO (continued) | | |
| |
| SCHEDULE OF INVESTMENTS | | December 31, 2009 |
| | | | | | | | | | | | | |
| U.S. GOVERNMENT TREASURY SECURITIES — 0.5% | | | | Interest
Rate
| | Maturity
Date
| | Principal
Amount
(000)#
| | Value
(Note 2)
| |
| | | | | | | | | | | | | | |
U.S. Treasury Notes(d) | | 0.750% | | 11/30/11 | | $ | 3,000 | | $ | 2,980,431 | |
U.S. Treasury Notes(d) | | 3.375% | | 11/15/19 | | | 2,860 | | | 2,750,977 | |
U.S. Treasury Strips Coupon(i) | | 4.860% | | 08/15/24 | | | 1,000 | | | 495,664 | |
| | | | | | | | | | | |
|
|
|
TOTAL U.S. GOVERNMENT TREASURY SECURITIES
(cost $6,356,338) | | | 6,227,072 | |
| | | | | | | | | | | |
|
|
|
TOTAL LONG-TERM INVESTMENTS
(cost $1,211,097,417) | | | 1,249,810,305 | |
| | | | | | | | | | | |
|
|
|
| | | | | |
| | | | | | | | | Shares
| | | |
| SHORT-TERM INVESTMENTS — 16.2% | | | | | | | | | | | | | |
| AFFILIATED MUTUAL FUNDS | | | | | | | | | | | | | |
Dryden Core Investment Fund — Short-Term Bond Series(j)
(cost $164,700,915) | | | 16,649,555 | | | 142,520,193 | |
Dryden Core Investment Fund — Taxable Money Market Series(j)(k)
(cost $78,783,202; includes $67,999,531 of cash collateral received for securities on loan) | | | 78,783,202 | | | 78,783,202 | |
| | | | | | | | | | | |
|
|
|
TOTAL SHORT-TERM INVESTMENTS
(cost $243,484,117) | | | 221,303,395 | |
| | | | | | | | | | | |
|
|
|
TOTAL INVESTMENTS (l) — 107.9%
(cost $1,454,581,534) | | | 1,471,113,700 | |
LIABILITIES IN EXCESS OF OTHER ASSETS(m) (7.9)% | | | (107,644,681 | ) |
| | | | | | | | | | | |
|
|
|
NET ASSETS — 100.0% | | $ | 1,363,469,019 | |
| | | | | | | | | | | |
|
|
|
The following abbreviations are used in portfolio descriptions:
| | |
| 144A | | Security was purchased pursuant to Rule 144A under the Securities Act of 1933 and may not be resold subject to that rule except to qualified institutional buyers. Unless otherwise noted, 144A securities are deemed to be liquid. |
| AUD | | Australian Dollar |
| CAD | | Canadian Dollar |
| EUR | | Euro |
| GBP | | British Pound |
| HUF | | Hungarian Forint |
| MTN | | Medium Term Note |
| NR | | Not Rated by Moody’s or Standard & Poor’s |
| NOK | | Norwegian Krone |
| NZD | | New Zealand Dollar |
| PIK | | Payment in Kind |
| PLN | | Polish Zloty |
| SEK | | Swedish Krona |
| TBA | | To Be Announced |
| † | The ratings reflected are as of December 31, 2009. Ratings of certain bonds may have changed subsequent to that date. |
| # | Principal amount shown in U.S. dollars unless otherwise stated. |
| (a) | Indicates a variable rate security. The maturity date presented for these instruments is the latter of the next date on which the security can be redeemed at par or the next date on which the rate of interest is adjusted. The interest rate shown reflects the rate in effect at December 31, 2009. |
| (b) | Indicates a security that has been deemed illiquid. |
| (c) | Standard & Poor’s Rating |
| (d) | All or a portion of security is on loan. The aggregate market value of such securities is $66,383,884; cash collateral of $67,999,531 (included in liabilities) was received with which the Portfolio purchased highly liquid short-term investments. |
| (e) | Security segregated as collateral for swap contracts. |
| (f) | Represents issuer in default on interest payments and/or principal repayment; non-income producing security. |
| (g) | Indicates a restricted security; the aggregate original cost of such securities is $11,980,135. The aggregate value of $14,007,042 is approximately 1.0% of net assets. |
| (h) | Security segregated as collateral for futures contracts. |
SEE NOTES TO FINANCIAL STATEMENTS.
A36
| | | | | | |
| | | DIVERSIFIED BOND PORTFOLIO (continued) | | |
| |
| SCHEDULE OF INVESTMENTS | | December 31, 2009 |
| (i) | Represents zero coupon bond. Rate shown reflects the effective yield at December 31, 2009. |
| (j) | Prudential Investments LLC, the manager of the Fund, also serves as manager of the Dryden Core Investment Fund—Taxable Money Market Series and the Dryden Core Investment Fund—Short-Term Bond Series. |
| (k) | Represents security, or a portion thereof, purchased with cash collateral received for securities on loan. |
| (l) | As of December 31, 2009, 1 security representing $3,372,924 and 0.2% of the net assets was fair valued in accordance with the policies adopted by the Board of Trustees. |
| (m) | Liabilities in excess of other assets include net unrealized appreciation (depreciation) on futures contracts, forward foreign currency exchange contracts, interest rate and credit default swap agreements as follows: |
Open futures contracts outstanding at December 31, 2009:
| | | | | | | | | | | | | | |
Number of
Contracts
| | Type
| | Expiration
Date
| | Value at
Trade Date
| | Value at
December 31, 2009
| | Unrealized
Appreciation/
(Depreciation)
| |
| Long Positions: | | | | | | | | | | | | | | |
| 11 | | Euro 10 Yrs. Bonds | | Mar. 2010 | | $ | 1,941,065 | | $ | 1,911,048 | | $ | (30,017 | ) |
| 235 | | U.S. Treasury 10 Yrs. Notes | | Mar. 2010 | | | 27,209,692 | | | 27,131,484 | | | (78,208 | ) |
| 340 | | U.S. Treasury 2 Yrs. Notes | | Mar. 2010 | | | 73,777,543 | | | 73,530,313 | | | (247,230 | ) |
| 425 | | U.S. Treasury 5 Yrs. Notes | | Mar. 2010 | | | 48,643,413 | | | 48,612,695 | | | (30,718 | ) |
| 507 | | U.S. Long Bonds | | Mar. 2010 | | | 59,445,617 | | | 58,495,125 | | | (950,492 | ) |
| | | | | | | | | | | | |
|
|
|
| | | | | | | | | | | | | | (1,336,665 | ) |
| | | | | | | | | | | | |
|
|
|
| Short Position: | | | | | | | | | | | | | | |
| 20 | | Australian 10 Yrs. Bonds | | Mar. 2010 | | | 1,855,897 | | | 1,828,925 | | | 26,972 | |
| | | | | | | | | | | | |
|
|
|
| | | | | | | | | | | | | $ | (1,309,693 | ) |
| | | | | | | | | | | | |
|
|
|
Forward foreign currency exchange contracts outstanding at December 31, 2009:
| | | | | | | | | | | | | | |
Foreign Currency Contract
| | Counterparty
| | Notional
Amount (000)
| | Payable at
Settlement Date
| | Value at
December 31, 2009
| | Unrealized
Appreciation/
(Depreciation)
| |
Purchased: | | | | | | | | | | | | | | |
Australian Dollar
expiring 01/20/10 | | JPMorgan Chase & Co. | | AUD 759 | | $ | 680,900 | | $ | 681,027 | | $ | 127 | |
British Pound
expiring 01/22/10 | | Citibank N.A. | | GBP 841 | | | 1,363,700 | | | 1,357,669 | | | (6,031 | ) |
Canadian Dollar
expiring 01/19/10 | | Morgan Stanley | | CAD 2,785 | | | 2,623,615 | | | 2,662,905 | | | 39,290 | |
Euro expiring 01/22/10 | | Citibank N.A. | | EUR 119 | | | 170,383 | | | 170,146 | | | (237 | ) |
Hungarian Forint
expiring 01/21/10 | | JPMorgan Chase & Co. | | HUF 129,681 | | | 680,900 | | | 687,718 | | | 6,818 | |
Hungarian Forint
expiring 01/21/10 | | Citibank N.A. | | HUF 257,125 | | | 1,363,700 | | | 1,363,570 | | | (130 | ) |
New Zealand Dollar
expiring 01/21/10 | | Deutsche Bank Securities Corp. | | NZD 1,666 | | | 1,198,424 | | | 1,207,874 | | | 9,450 | |
New Zealand Dollar
expiring 01/21/10 | | JPMorgan Chase & Co. | | NZD 1,326 | | | 953,300 | | | 961,132 | | | 7,832 | |
New Zealand Dollar
expiring 01/21/10 | | JPMorgan Chase & Co. | | NZD 1,879 | | | 1,363,700 | | | 1,362,259 | | | (1,441 | ) |
Norwegian Krone
expiring 01/21/10 | | Morgan Stanley | | NOK 18,708 | | | 3,170,775 | | | 3,228,149 | | | 57,374 | |
Swedish Krona
expiring 01/21/10 | | Morgan Stanley | | SEK 13,844 | | | 1,893,905 | | | 1,935,232 | | | 41,327 | |
Swedish Krona
expiring 01/21/10 | | Citibank N.A. | | SEK 4,876 | | | 680,900 | | | 681,629 | | | 729 | |
Swedish Krona
expiring 01/21/10 | | Citibank N.A. | | SEK 9,716 | | | 1,363,700 | | | 1,358,116 | | | (5,584 | ) |
| | | | | | |
|
| |
|
| |
|
|
|
| | | | | | | $ | 17,507,902 | | $ | 17,657,426 | | | 149,524 | |
| | | | | | |
|
| |
|
| |
|
|
|
SEE NOTES TO FINANCIAL STATEMENTS.
A37
| | | | | | |
| | | DIVERSIFIED BOND PORTFOLIO (continued) | | |
| |
| SCHEDULE OF INVESTMENTS | | December 31, 2009 |
| | | | | | | | | | | | | | |
Foreign Currency Contract
| | Counterparty
| | Notional
Amount (000)
| | Payable at
Settlement Date
| | Value at
December 31, 2009
| | Unrealized
Appreciation/
(Depreciation)
| |
Sold: | | | | | | | | | | | | | | |
Australian Dollar
expiring 01/20/10 | | JPMorgan Chase & Co. | | AUD 1,556 | | $ | 1,395,378 | | $ | 1,394,706 | | $ | 672 | |
Australian Dollar
expiring 01/20/10 | | JPMorgan Chase & Co. | | AUD 1,289 | | | 1,156,900 | | | 1,155,856 | | | 1,044 | |
Australian Dollar
expiring 01/20/10 | | Citibank N.A. | | AUD 1,288 | | | 1,137,100 | | | 1,154,288 | | | (17,188 | ) |
British Pound
expiring 01/22/10 | | Citibank N.A. | | GBP 2 | | | 3,088 | | | 3,096 | | | (8 | ) |
Hungarian Forint
expiring 01/21/10 | | Citibank N.A. | | HUF 212,185 | | | 1,088,800 | | | 1,125,247 | | | (36,447 | ) |
Hungarian Forint
expiring 01/21/10 | | Citibank N.A. | | HUF 549,626 | | | 2,819,752 | | | 2,914,741 | | | (94,989 | ) |
New Zealand Dollar
expiring 01/21/10 | | UBS Securities LLC | | NZD 1,958 | | | 1,365,800 | | | 1,419,260 | | | (53,460 | ) |
Norwegian Krone
expiring 01/21/10 | | JPMorgan Chase & Co. | | NOK 9,607 | | | 1,634,700 | | | 1,657,736 | | | (23,036 | ) |
Swedish Krona
expiring 01/21/10 | | JPMorgan Chase & Co. | | SEK 13,712 | | | 1,905,500 | | | 1,916,761 | | | (11,261 | ) |
Polish Zloty
expiring 01/21/10 | | Citibank N.A. | | PLN 4,170 | | | 1,417,249 | | | 1,454,304 | | | (37,055 | ) |
| | | | | | |
|
| |
|
| |
|
|
|
| | | | | | | $ | 13,924,267 | | $ | 14,195,995 | | | (271,728 | ) |
| | | | | | |
|
| |
|
| |
|
|
|
| | | | | | | | | | | | | $ | (122,204 | ) |
| | | | | | | | | | | | |
|
|
|
Interest rate swap agreements outstanding at December 31, 2009:
| | | | | | | | | | | | | | | | | | | | |
Counterparty
| | Termination
Date
| | Notional
Amount
(000)#
| | Fixed
Rate
| | Floating
Rate
| | Fair
Value
| | | Upfront
Premiums
Paid/
(Received)
| | Unrealized
Depreciation
| |
Deutsche Bank, AG(a) | | 5/31/2014 | | $ | 33,230 | | 2.355% | | 3 month LIBOR | | $ | (709,172 | ) | | $ | — | | $ | (709,172 | ) |
| | | | | | | | | | | |
|
|
| |
|
| |
|
|
|
| (a) | Portfolio pays the floating rate and receives the fixed rate. |
| # | Notional amount is shown in U.S. dollars unless otherwise stated. |
Credit default swap agreements outstanding as of December 31, 2009:
| | | | | | | | | | | | | | | | | | | | | |
Counterparty
| | Termination
Date
| | Notional
Amount
(000)#(3)
| | Fixed
Rate
| | Reference Entity/Obligation
| | Fair
Value
| | | Upfront
Premiums
Paid/
(Received)
| | | Unrealized
Appreciation/
(Depreciation)
| |
Credit default swaps on Corporate Issues—Buy Protections(1): | | | | | |
Barclays Bank PLC | | 6/20/2011 | | $ | 2,240 | | 5.000% | | Gannett Co., Inc.
6.375%, due 04/01/2012 | | $ | (111,953 | ) | | $ | (51,117 | ) | | $ | (60,836 | ) |
Citibank, N.A. | | 3/20/2012 | | | 6,900 | | 5.000% | | XL Capital Ltd.
5.250%, due 09/15/2014 | | | (656,264 | ) | | | (310,054 | ) | | | (346,210 | ) |
Citibank, N.A. | | 6/20/2014 | | | 5,000 | | 0.700% | | United Parcel Service, Inc.
8.375%, due 04/1/2030 | | | (84,951 | ) | | | — | | | | (84,951 | ) |
Citibank, N.A. | | 6/20/2014 | | | 4,800 | | 1.000% | | CBS Corp.
4.625%, due 05/15/2018 | | | 4,038 | | | | 337,097 | | | | (333,059 | ) |
Credit Suisse International | | 12/20/2012 | | | 1,500 | | 1.000% | | Gatx Corp.
5.500%, due 2/15/2012 | | | (13,068 | ) | | | 14,931 | | | | (27,999 | ) |
Credit Suisse International | | 6/20/2014 | | | 2,500 | | 1.000% | | Centex Corp.
5.250%, due 06/15/2015 | | | (11,196 | ) | | | (15,568 | ) | | | 4,372 | |
Credit Suisse International | | 3/20/2015 | | | 4,695 | | 1.000% | | Toll Brothers Financial Corp.
5.150%, due 05/15/2015 | | | 97,460 | | | | 38,252 | | | | 59,208 | |
Deutsche Bank, AG | | 3/20/2012 | | | 1,100 | | 5.000% | | Gannett Co., Inc.
6.375%, due 04/01/2012 | | | (70,906 | ) | | | (26,806 | ) | | | (44,100 | ) |
Deutsche Bank, AG | | 6/20/2012 | | | 3,060 | | 5.000% | | Starwood Hotels & Resorts Holdings, Inc. 7.875%, due 05/01/2012 | | | (308,811 | ) | | | (80,523 | ) | | | (228,288 | ) |
Deutsche Bank, AG | | 12/20/2012 | | | 4,400 | | 1.000% | | Block Financial LLC
5.125%, due 10/30/2014 | | | (79,315 | ) | | | (50,272 | ) | | | (29,043 | ) |
SEE NOTES TO FINANCIAL STATEMENTS.
A38
| | | | | | |
| | | DIVERSIFIED BOND PORTFOLIO (continued) | | |
| |
| SCHEDULE OF INVESTMENTS | | December 31, 2009 |
| | | | | | | | | | | | | | | | | | | | | |
Counterparty
| | Termination
Date
| | Notional
Amount
(000)#(3)
| | Fixed
Rate
| | Reference Entity/Obligation
| | Fair
Value
| | | Upfront
Premiums
Paid/
(Received)
| | | Unrealized
Appreciation/
(Depreciation)
| |
Deutsche Bank, AG | | 12/20/2012 | | $ | 7,800 | | 1.000% | | Macy’s Retail Holdings, Inc.
8.000%, due 07/15/2012 | | $ | 87,158 | | | $ | 293,476 | | | $ | (206,318 | ) |
Deutsche Bank, AG | | 6/20/2013 | | | 6,600 | | 1.000% | | Sealed Air Corp.
5.625%, due 07/15/2013 | | | (60,653 | ) | | | 97,851 | | | | (158,504 | ) |
Deutsche Bank, AG | | 9/20/2013 | | | 2,600 | | 1.000% | | Masco Corp.
6.125%, due 10/03/2016 | | | 60,759 | | | | 91,457 | | | | (30,698 | ) |
Deutsche Bank, AG | | 3/20/2014 | | | 980 | | 7.050% | | Starwood Hotels & Resorts Holdings, Inc.
7.875%, due 05/01/2012 | | | (223,095 | ) | | | — | | | | (223,095 | ) |
Deutsche Bank, AG | | 6/20/2014 | | | 7,000 | | 1.000% | | R.R. Donnelley & Sons Co.
4.950%, due 04/01/2014 | | | 123,313 | | | | 504,077 | | | | (380,764 | ) |
Deutsche Bank, AG | | 3/20/2018 | | | 3,700 | | 3.700% | | American International Group, Inc. 6.250%, due 05/01/2036 | | | 425,861 | | | | — | | | | 425,861 | |
Goldman Sachs International, Inc. | | 12/20/2011 | | | 3,060 | | 1.000% | | Lennar Corp.
6.500%, due 04/15/2016 | | | 74,717 | | | | 110,642 | | | | (35,925 | ) |
Goldman Sachs International, Inc. | | 3/20/2014 | | | 3,400 | | 6.600% | | Simon Propery Group L.P.
5.250%, due 12/01/2016 | | | (733,686 | ) | | | — | | | | (733,686 | ) |
Goldman Sachs International, Inc. | | 3/20/2014 | | | 3,400 | | 0.700% | | Duke Energy Corp.
5.650%, due 06/15/2013 | | | (48,971 | ) | | | — | | | | (48,971 | ) |
JPMorgan Chase Bank | | 6/20/2014 | | | 4,150 | | 5.000% | | SLM Corp.
5.125%, due 08/27/2012 | | | 2,467 | | | | 723,700 | | | | (721,233 | ) |
JPMorgan Chase Bank | | 6/20/2016 | | | 3,400 | | 1.500% | | Embarq Holdings Co. LLC
7.082%, due 06/01/2016 | | | (150,541 | ) | | | — | | | | (150,541 | ) |
JPMorgan Chase Bank | | 9/20/2016 | | | 4,750 | | 1.000% | | R.R. Donnelley & Sons Co.
4.950%, due 04/01/2014 | | | 212,873 | | | | 567,562 | | | | (354,689 | ) |
JPMorgan Chase Bank | | 9/20/2019 | | | 4,400 | | 1.000% | | MeadWestvaco Corp.
7.950%, due 02/15/2031 | | | 137,144 | | | | 84,164 | | | | 52,980 | |
Merrill Lynch Capital Services, Inc. | | 9/20/2016 | | | 1,000 | | 1.730% | | Tyson Foods, Inc.
7.850%, due 04/01/2016 | | | 42,602 | | | | — | | | | 42,602 | |
Morgan Stanley Capital Services, Inc. | | 6/20/2013 | | | 3,700 | | 1.650% | | Itraxx Euro zero,
due 06/20/2013 | | | (174,401 | ) | | | (117,396 | ) | | | (57,005 | ) |
Morgan Stanley Capital Services, Inc. | | 12/20/2019 | | | 3,400 | | 1.000% | | Arrow Electronics, Inc.
6.875%, due 06/01/2018 | | | 47,483 | | | | (27,003 | ) | | | 74,486 | |
| | | | | | | | | | | |
|
|
| |
|
|
| |
|
|
|
| | | | | | | | | | | | $ | (1,411,936 | ) | | $ | 2,184,470 | | | $ | (3,596,406 | ) |
| | | | | | | | | | | |
|
|
| |
|
|
| |
|
|
|
| | | | | | | | | | | | | | | | | | |
Counterparty
| | Termination
Date
| | Notional
Amount
(000)#(3)
| | Fixed
Rate
| | Reference Entity/Obligation
| | Fair
Value
| | Upfront
Premiums
Paid/
(Received)
| | Unrealized
Appreciation
|
Credit default swaps on Asset-Backed Issues—Buy Protections(1): | | | |
Merrill Lynch Capital Services, Inc. | | 3/25/2036 | | $ | 842 | | 3.720% | | AmeriQuest Mortgage Securities, Inc. Ser. 2006-R1, Class M9,
2.731%, due 03/25/2036 | | $ | 814,732 | | $ | — | | $ | 814,732 |
| | | | | | | | | | | |
|
| |
|
| |
|
|
| | | | | | | | | | | | | | | | | | | | | |
Counterparty
| | Termination
Date
| | Implied
Credit Spread at
December 31, 2009(4)
| | Notional
Amount
(000)#(3)
| | Fixed Rate
| | Reference Entity/Obligation
| | Fair
Value
| | Upfront
Premiums
Paid/
(Received)
| | | Unrealized
Appreciation
|
Credit default swaps on Corporate Issues—Sell Protections(2): | | | | |
Deutsche Bank, AG | | 3/20/2010 | | 0.275% | | $ | 2,500 | | 5.000% | | Arcelor Mittal Co.
6.125%, due 06/01/2018 | | $ | 30,059 | | $ | (115,762 | ) | | $ | 145,821 |
| | | | | | | | | | | | | |
|
| |
|
|
| |
|
|
| | | | | | | | | | | | | | | | | | | | |
Counterparty
| | Termination
Date
| | Notional
Amount
(000)#(3)
| | Fixed
Rate
| | Reference Entity/Obligation
| | Fair
Value(5)
| | | Upfront
Premiums
Paid/
(Received)
| | Unrealized
Depreciation
| |
Credit default swaps on Asset-Backed Issues—Sell Protections(2): | | | | |
Merrill Lynch Capital Services, Inc. | | 3/25/2036 | | $ | 842 | | 9.000% | | AmeriQuest Mortgage Securities, Inc. Ser. 2006-R1, Class M9,
2.731%, due 03/25/2036 | | $ | (790,816 | ) | | $ | — | | $ | (790,816 | ) |
| | | | | | | | | | | |
|
|
| |
|
| |
|
|
|
SEE NOTES TO FINANCIAL STATEMENTS.
A39
| | | | | | |
| | | DIVERSIFIED BOND PORTFOLIO (continued) | | |
| |
| SCHEDULE OF INVESTMENTS | | December 31, 2009 |
The Portfolio entered into credit default swaps as the protection seller on corporate issues and asset-backed issues to take an active short position with respect to the likelihood of a particular issuer’s default.
| (1) | If the Portfolio is a buyer of protection, it pays the fixed rate. When a credit event occurs, as defined under the terms of that particular swap agreement, the Portfolio will either (i) receive from the seller of protection an amount up to the notional amount of the swap and make delivery of the referenced obligation or underlying securities comprising the referenced index or (ii) receive a net settlement amount in the form of cash or securities up to the notional amount of the swap less the recovery value of the referenced obligation or underlying securities comprising the referenced index. |
| (2) | If the Portfolio is a seller of protection, it receives the fixed rate. When a credit event occurs, as defined under the terms of that particular swap agreement, the Portfolio will either (i) pay to the buyer of protection an amount equal to the notional amount of the swap and take delivery of the referenced obligation or underlying securities comprising the referenced index or (ii) pay a net settlement amount in the form of cash or securities equal to the notional amount of the swap less the recovery value of the referenced obligation or underlying securities comprising the referenced index. |
| (3) | Notional amount represents the maximum potential amount the Portfolio could be required to pay as a seller of credit protection or receive as a buyer of credit protection if a credit event occurs as defined under the terms of that particular swap agreement. |
| (4) | Implied credit spreads, represented in absolute terms, utilized in determining the market value of credit default swap agreements on corporate issues or sovereign issues of an emerging country as of the reporting date serve as an indicator of the current status of the payment/performance risk and represent the likelihood of risk of default for the credit derivative. The implied credit spread of a particular referenced entity reflects the cost of buying/selling protection and may include up-front payments required to be made to enter into the agreement. Wider credit spreads represent a deterioration of the referenced entity’s credit soundness and a greater likelihood of risk of default or other credit event occurring as defined under the terms of the agreement. |
| (5) | The fair value of credit default swap agreements on asset-backed securities serve as an indicator of the current status of the payment/performance risk and represents the likelihood of an expected liability (or profit) for the credit derivative should the notional amount of the swap agreement be closed/sold as of the reporting date. Increasing fair value in absolute terms, represents a deterioration of the referenced entity’s credit soundness and a greater likelihood of risk of default or other credit event occuring as defined under the terms of the agreement. |
| # | Notional amount is shown in U.S. dollars unless otherwise stated. |
Various inputs are used in determining the value of the Portfolio’s investments. These inputs are summarized in the three broad levels listed below.
Level 1—quoted prices in active markets for identical securities
Level 2—other significant observable inputs (including quoted prices for similar securities, interest rates, prepayment speeds, credit risk, etc.)
Level 3—significant unobservable inputs (including the Portfolio’s own assumptions in determining the fair value of investments)
The following is a summary of the inputs used as of December 31, 2009 in valuing the Portfolio’s assets carried at fair value:
| | | | | | | | | | | |
| | | Level 1
| | | Level 2
| | | Level 3
|
Investments in Securities | | | | | | | | | | | |
Asset-Backed Securities | | $ | — | | | $ | 67,640,210 | | | $ | 3,372,924 |
Bank Loans | | | — | | | | 38,824,847 | | | | — |
Collateralized Mortgage Obligations | | | — | | | | 4,767,501 | | | | — |
Commercial Mortgage-Backed Securities | | | — | | | | 212,997,922 | | | | — |
Corporate Bonds | | | — | | | | 643,360,555 | | | | — |
Foreign Agencies | | | — | | | | 23,275,228 | | | | — |
Municipal Bonds | | | — | | | | 9,152,400 | | | | — |
Residential Mortgage-Backed Securities | | | — | | | | 50,975,573 | | | | — |
Sovereigns | | | — | | | | 15,224,670 | | | | — |
U.S. Government Agency Obligation | | | — | | | | 1,329,610 | | | | — |
U.S. Government Mortgage-Backed Securities | | | — | | | | 172,661,793 | | | | — |
U.S. Government Treasury Securities | | | — | | | | 6,227,072 | | | | — |
Affiliated Mutual Funds | | | 221,303,395 | | | | — | | | | — |
| | |
|
|
| |
|
|
| |
|
|
| | | | 221,303,395 | | | | 1,246,437,381 | | | | 3,372,924 |
Other Financial Instruments* | | | (1,309,693 | ) | | | (4,281,961 | ) | | | 23,916 |
| | |
|
|
| |
|
|
| |
|
|
Total | | $ | 219,993,702 | | | $ | 1,242,155,420 | | | $ | 3,396,840 |
| | |
|
|
| |
|
|
| |
|
|
SEE NOTES TO FINANCIAL STATEMENTS.
A40
| | | | | | |
| | | DIVERSIFIED BOND PORTFOLIO (continued) | | |
| |
| SCHEDULE OF INVESTMENTS | | December 31, 2009 |
The following is a reconciliation of assets in which significant unobservable inputs (Level 3) were used in determining fair value:
| | | | | | | | | | | | |
| | | Corporate
Bonds
| | | Asset-Backed
Securities
| | | Other Financial
Instruments*
| |
Balance as of 12/31/08 | | $ | 2,023,560 | | | $ | — | | | $ | 2,641,021 | |
Realized gain (loss) | | | (1,642,574 | ) | | | — | | | | — | ** |
Change in unrealized appreciation (depreciation) | | | 578,234 | | | | (1,418 | ) | | | (2,617,105 | ) |
Earned amortization/accretion | | | — | | | | 1,418 | | | | — | |
Net purchases (sales) | | | (959,220 | ) | | | 3,372,924 | | | | — | |
Transfers in and/or out of Level 3 | | | — | | | | — | | | | — | |
| | |
|
|
| |
|
|
| |
|
|
|
Balance as of 12/31/09 | | $ | — | | | $ | 3,372,924 | | | $ | 23,916 | |
| | |
|
|
| |
|
|
| |
|
|
|
| * | Other financial instruments are derivative instruments not reflected in the Schedule of Investments, such as futures, forwards and swap contracts, which are valued at the unrealized appreciation/depreciation on the instrument. |
| ** | The realized gain earned during the period for other financial instruments was $2,612,480. |
The industry classification of portfolio holdings and liabilities in excess of other assets shown as a percentage of net assets as of December 31, 2009 was as follows:
| | | |
Affiliated Mutual Funds (including 5.0% of collateral received for securities on loan) | | 16.2 | % |
Commercial Mortgage-Backed Securities | | 15.6 | |
U.S. Government Mortgage-Backed Securities | | 12.7 | |
Banking | | 6.5 | |
Asset-Backed Securities | | 5.2 | |
Electric | | 4.4 | |
Residential Mortgage-Backed Securities | | 3.7 | |
Telecommunications | | 3.2 | |
Technology | | 3.0 | |
Healthcare & Pharmaceutical | | 2.6 | |
Media & Entertainment | | 2.6 | |
Non-Captive Finance | | 2.6 | |
Insurance | | 2.0 | |
Metals | | 2.0 | |
Capital Goods | | 1.8 | |
Cable | | 1.8 | |
Foods | | 1.7 | |
Foreign Agencies | | 1.7 | |
Real Estate Investment Trusts | | 1.4 | |
Retailers | | 1.4 | |
Paper | | 1.3 | |
Structured Notes | | 1.3 | |
Airlines | | 1.2 | |
Energy – Other | | 1.1 | |
Sovereigns | | 1.1 | |
Building Materials & Construction | | 1.1 | |
Healthcare Insurance | | 1.0 | |
Packaging | | 1.0 | |
Chemicals | | 0.9 | |
Municipal Bonds | | 0.7 | |
Pipelines & Other | | 0.7 | |
Tobacco | | 0.7 | |
Automotive | | 0.6 | |
Energy – Integrated | | 0.5 | |
Lodging | | 0.5 | |
U.S. Government Treasury Securities | | 0.5 | |
Collateralized Mortgage Obligations | | 0.4 | |
Consumer | | 0.4 | |
Gaming | | 0.4 | |
Aerospace & Defense | | 0.1 | |
Brokerage | | 0.1 | |
Railroads | | 0.1 | |
U.S. Government Agency Obligation | | 0.1 | |
| | |
|
|
| | | 107.9 | |
Liabilities in excess of other assets | | (7.9 | ) |
| | |
|
|
| | | 100.0 | % |
| | |
|
|
SEE NOTES TO FINANCIAL STATEMENTS.
A41
| | | | | | |
| | | DIVERSIFIED BOND PORTFOLIO (continued) | | |
| |
| SCHEDULE OF INVESTMENTS | | December 31, 2009 |
The Portfolio invested in derivative instruments during the reporting period. The primary types of risk associated with these derivative instruments are commodity risk, credit risk, equity risk, foreign exchange risk and interest rate risk. The effect of such derivative instruments on the Portfolio’s financial position and financial performance as reflected in the Statement of Assets and Liabilities and Statement of Operations is presented in the summary below.
Fair values of derivative Instruments as of December 31, 2009 as presented in the Statement of Assets and Liabilities:
| | | | | | | | | | | | |
Derivatives not designated as
hedging instruments, carried at
fair value
| | Asset Derivatives
| | | Liability Derivatives
| |
| | Balance Sheet Location
| | Fair
Value
| | | Balance Sheet Location
| | Fair
Value
| |
Credit contracts | | Premium paid for swaps agreements | | $ | 2,863,209 | | | Premium received for swaps agreements | | $ | 794,501 | |
Credit contracts | | Unrealized appreciation on swaps | | | 1,620,062 | | | Unrealized depreciation on swaps | | | 5,046,731 | |
Foreign exchange contracts | | Unrealized appreciation on forward
foreign currency exchange contracts | | | 164,663 | | | Unrealized depreciation on forward
foreign currency exchange contracts | | | 286,867 | |
Interest rate contracts | | Due to broker—variation margin | | | 26,972 | * | | Due to broker—variation margin | | | 1,336,665 | * |
Interest rate contracts | | — | | | — | | | Unrealized depreciation on swaps | | | 709,172 | |
| | | | |
|
|
| | | |
|
|
|
Total | | | | $ | 4,674,906 | | | | | $ | 8,173,936 | |
| | | | |
|
|
| | | |
|
|
|
| * | Includes cumulative appreciation/depreciation on futures contracts as reported in Schedule of Investments. Only unsettled variation margin receivable (payable) is reported within the Statement of Assets and Liabilities. |
The effects of derivative instruments on the Statement of Operations for the year ended December 31, 2009 are as follows:
| | | | | | | | | | | | | | | | | | | | | | | |
Amount of Realized Gain or (Loss) on Derivatives Recognized in Income
| |
Derivatives not designated as hedging
instruments, carried at fair value
| | Futures
| | Forward
Contracts
| | | Swaps
| | | Purchased
Options
| | | Written
Options
| | | Total
| |
Credit contracts | | $ | — | | $ | — | | | $ | 644,799 | | | $ | — | | | $ | — | | | $ | 644,799 | |
Foreign exchange contracts | | | — | | | (452,416 | ) | | | — | | | | — | | | | — | | | | (452,416 | ) |
Interest rate contracts | | | 5,789,315 | | | — | | | | 1,809,990 | | | | (187,350 | ) | | | 79,190 | | | | 7,491,145 | |
| | |
|
| |
|
|
| |
|
|
| |
|
|
| |
|
|
| |
|
|
|
Total | | $ | 5,789,315 | | $ | (452,416 | ) | | $ | 2,454,789 | | | $ | (187,350 | ) | | $ | 79,190 | | | $ | 7,683,528 | |
| | |
|
| |
|
|
| |
|
|
| |
|
|
| |
|
|
| |
|
|
|
|
Change in Unrealized Appreciation or (Depreciation) on Derivatives Recognized in Income
| |
Derivatives not designated as hedging
instruments, carried at fair value
| | | | | | | Futures
| | | Forward
Contracts
| | | Swaps
| | | Total
| |
Credit contracts | | | $ | — | | | $ | — | | | $ | (4,777,247 | ) | | $ | (4,777,247 | ) |
Foreign exchange contracts | | | | — | | | | (293,111 | ) | | | — | | | | (293,111 | ) |
Interest rate contracts | | | | (7,834,730 | ) | | | — | | | | (449,477 | ) | | | (8,284,207 | ) |
| | | | | | | | | |
|
|
| |
|
|
| |
|
|
| |
|
|
|
Total | | | $ | (7,834,730 | ) | | $ | (293,111 | ) | | $ | (5,226,724 | ) | | $ | (13,354,565 | ) |
| | | | | | | | | |
|
|
| |
|
|
| |
|
|
| |
|
|
|
For the year ended December 31, 2009, the Portfolio’s average volume of derivative activities is as follows:
| | | | | | | | | | | | | | |
Purchased Options
(Cost)
| | Written Options
(Premium Received)
| | Futures
Long Position
(Value at Trade Date)
| | Futures
Short Position
(Value at Trade Date)
| | Forward Currency
Contracts—Purchased
(Value at Settlement
Date Payable)
| | Forward Currency
Contracts—Sold
(Value at Settlement
Date Receivable)
|
| $9,203 | | $3,757 | | $ | 161,547,212 | | $ | 28,971,015 | | $ | 8,255,159 | | $ | 11,426,539 |
| | | | | |
Interest Rate Swaps
(Notional Amount in USD (000))
| | Credit Default
Swaps as Buyer
(Notional Amount in USD (000))
| | Credit Default
Swaps as Writer
(Notional Amount in USD (000))
|
| $52,763 | | $54,719 | | $ | 7,724 |
SEE NOTES TO FINANCIAL STATEMENTS.
A42
| | | | | | |
| | | DIVERSIFIED BOND PORTFOLIO (continued) | | |
STATEMENT OF ASSETS AND LIABILITIES
December 31, 2009
| | | |
| ASSETS | | | |
Investments, at value including securities on loan of $66,383,884: | | | |
Unaffiliated investments (cost $1,211,097,417) | | $ | 1,249,810,305 |
Affiliated investments (cost $243,484,117) | | | 221,303,395 |
Cash | | | 1,301,596 |
Receivable for investments sold | | | 23,624,548 |
Dividends and interest receivable | | | 13,658,667 |
Premium paid for swaps agreements | | | 2,863,209 |
Unrealized appreciation on swaps | | | 1,620,062 |
Unrealized appreciation on forward foreign currency exchange contracts | | | 164,663 |
Receivable for Series shares sold | | | 40,810 |
Prepaid expenses | | | 13,633 |
| | |
|
|
Total Assets | | | 1,514,400,888 |
| | |
|
|
| LIABILITIES | | | |
Payable for investments purchased | | | 74,976,408 |
Collateral for securities on loan | | | 67,999,531 |
Unrealized depreciation on swaps | | | 5,755,903 |
Premium received for swaps agreements | | | 794,501 |
Management fee payable | | | 462,592 |
Due to broker—variation margin | | | 407,874 |
Unrealized depreciation on forward foreign currency exchange contracts | | | 286,867 |
Accrued expenses and other liabilities | | | 132,384 |
Payable for Series shares repurchased | | | 108,981 |
Deferred trustees’ fees | | | 6,233 |
Affiliated transfer agent fee payable | | | 595 |
| | |
|
|
Total Liabilities | | | 150,931,869 |
| | |
|
|
| NET ASSETS | | $ | 1,363,469,019 |
| | |
|
|
Net assets were comprised of: | | | |
Paid-in capital | | $ | 1,329,937,441 |
Retained earnings | | | 33,531,578 |
| | |
|
|
Net assets, December 31, 2009 | | $ | 1,363,469,019 |
| | |
|
|
Net asset value and redemption price per share, $1,363,469,019 / 122,149,049 outstanding shares of beneficial interest | | $ | 11.16 |
| | |
|
|
STATEMENT OF OPERATIONS
Year Ended December 31, 2009
| | | | |
| INVESTMENT INCOME | | | | |
Interest | | $ | 60,004,476 | |
Affiliated dividend income | | | 2,659,194 | |
Affiliated income from securities loaned, net | | | 197,592 | |
| | |
|
|
|
| | | | 62,861,262 | |
| | |
|
|
|
| EXPENSES | | | | |
Management fee | | | 4,808,368 | |
Custodian’s fees and expenses | | | 190,000 | |
Shareholders’ reports | | | 120,000 | |
Audit fee | | | 33,000 | |
Trustees’ fees | | | 22,000 | |
Insurance expenses | | | 21,000 | |
Commitment fee on syndicated credit agreement | | | 10,000 | |
Legal fees and expenses | | | 10,000 | |
Transfer agent’s fee and expenses (including affiliated expense of $3,600) (Note 4) | | | 10,000 | |
Loan interest expense (Note 8) | | | 21 | |
Miscellaneous | | | 11,811 | |
| | |
|
|
|
Total expenses | | | 5,236,200 | |
| | |
|
|
|
| NET INVESTMENT INCOME | | | 57,625,062 | |
| | |
|
|
|
| NET REALIZED AND UNREALIZED GAIN (LOSS) ON INVESTMENTS, SWAPS AND FOREIGN CURRENCIES | | | | |
Net realized gain (loss) on: | | | | |
Investment transactions (including affiliated: $(72,467)) | | | 9,716,123 | |
Futures transactions | | | 5,789,315 | |
Swap agreement transactions | | | 2,454,789 | |
Foreign currency transactions | | | 270,625 | |
Written options transactions | | | 79,190 | |
| | |
|
|
|
| | | | 18,310,042 | |
| | |
|
|
|
Net change in unrealized appreciation (depreciation) on: | | | | |
Investments (including affiliated: $20,049,476) | | | 161,506,328 | |
Futures | | | (7,834,730 | ) |
Swaps | | | (5,226,724 | ) |
Foreign currencies | | | (265,100 | ) |
| | |
|
|
|
| | | | 148,179,774 | |
| | |
|
|
|
| NET GAIN ON INVESTMENTS, SWAPS AND FOREIGN CURRENCIES | | | 166,489,816 | |
| | |
|
|
|
| NET INCREASE IN NET ASSETS RESULTING FROM OPERATIONS | | $ | 224,114,878 | |
| | |
|
|
|
STATEMENT OF CHANGES IN NET ASSETS
| | | | | | | | |
| | | Year Ended December 31,
| |
| | | 2009
| | | 2008
| |
INCREASE (DECREASE) IN NET ASSETS
OPERATIONS: | | | | | | | | |
Net investment income | | $ | 57,625,062 | | | $ | 60,447,814 | |
Net realized gain on investments, swaps and foreign currencies | | | 18,310,042 | | | | 20,953,008 | |
Net change in unrealized appreciation (depreciation) on investments, swaps and foreign currencies | | | 148,179,774 | | | | (123,991,687 | ) |
| | |
|
|
| |
|
|
|
NET INCREASE (DECREASE) IN NET ASSETS RESULTING FROM OPERATIONS | | | 224,114,878 | | | | (42,590,865 | ) |
| | |
|
|
| |
|
|
|
| DISTRIBUTIONS | | | (77,854,926 | ) | | | (72,614,494 | ) |
| | |
|
|
| |
|
|
|
| SERIES SHARE TRANSACTIONS: | | | | | | | | |
Series shares sold [10,352,324 and 9,801,318 shares, respectively] | | | 113,677,834 | | | | 102,899,591 | |
Series shares issued in reinvestment of dividends and distributions [7,526,024 and 7,018,378 shares, respectively] | | | 77,854,926 | | | | 72,614,494 | |
Series shares repurchased [10,529,843 and 13,831,055 shares, respectively] | | | (109,159,405 | ) | | | (143,763,704 | ) |
| | |
|
|
| |
|
|
|
NET INCREASE IN NET ASSETS RESULTING FROM SERIES SHARE TRANSACTIONS | | | 82,373,355 | | | | 31,750,381 | |
| | |
|
|
| |
|
|
|
| TOTAL INCREASE (DECREASE) IN NET ASSETS | | | 228,633,307 | | | | (83,454,978 | ) |
| NET ASSETS: | | | | | | | | |
Beginning of year | | | 1,134,835,712 | | | | 1,218,290,690 | |
| | |
|
|
| |
|
|
|
End of year | | $ | 1,363,469,019 | | | $ | 1,134,835,712 | |
| | |
|
|
| |
|
|
|
SEE NOTES TO FINANCIAL STATEMENTS.
A43
| | | | | | |
| | | EQUITY PORTFOLIO | | |
| |
| SCHEDULE OF INVESTMENTS | | December 31, 2009 |
| | | | | |
| LONG-TERM INVESTMENTS — 98.2% |
| COMMON STOCKS — 97.5% | | Shares
| | Value
(Note 2)
|
| | | | | | |
Aerospace & Defense — 1.1% | | | |
Precision Castparts Corp. | | 192,000 | | $ | 21,187,200 |
United Technologies Corp. | | 191,800 | | | 13,312,838 |
| | | | |
|
|
| | | | | | 34,500,038 |
| | | | |
|
|
Auto Components — 0.9% | | | |
Goodyear Tire & Rubber Co. (The)* | | 1,936,800 | | | 27,308,880 |
| | | | |
|
|
Beverages — 0.7% | | | |
PepsiCo, Inc. | | 378,358 | | | 23,004,166 |
| | | | |
|
|
Biotechnology — 2.1% | | | |
Celgene Corp.* | | 545,320 | | | 30,363,418 |
Gilead Sciences, Inc.* | | 842,400 | | | 36,459,072 |
| | | | |
|
|
| | | | | | 66,822,490 |
| | | | |
|
|
Capital Markets — 5.9% | | | |
Bank of New York Mellon Corp. (The) | | 814,878 | | | 22,792,138 |
Charles Schwab Corp. (The) | | 1,506,530 | | | 28,352,894 |
Goldman Sachs Group, Inc. (The) | | 516,231 | | | 87,160,442 |
Morgan Stanley | | 1,056,700 | | | 31,278,320 |
TD Ameritrade Holding Corp.*(a) | | 1,000,100 | | | 19,381,938 |
| | | | |
|
|
| | | | | | 188,965,732 |
| | | | |
|
|
Chemicals — 1.0% | | | |
Dow Chemical Co. (The) | | 1,123,600 | | | 31,045,068 |
| | | | |
|
|
Commercial Banks — 0.6% | | | |
KeyCorp | | 3,305,300 | | | 18,344,415 |
| | | | |
|
|
Commercial Services & Supplies — 1.2% | | | |
Waste Management, Inc. | | 1,131,800 | | | 38,266,158 |
| | | | |
|
|
Communications Equipment — 3.5% | | | |
Cisco Systems, Inc.* | | 1,572,569 | | | 37,647,302 |
Juniper Networks, Inc.*(a) | | 481,400 | | | 12,838,938 |
QUALCOMM, Inc. | | 1,331,170 | | | 61,579,924 |
| | | | |
|
|
| | | | | | 112,066,164 |
| | | | |
|
|
Computers & Peripherals — 5.6% | | | |
Apple, Inc.* | | 412,466 | | | 86,972,581 |
Hewlett-Packard Co. | | 1,047,760 | | | 53,970,117 |
NetApp, Inc.*(a) | | 1,116,600 | | | 38,399,874 |
| | | | |
|
|
| | | | | | 179,342,572 |
| | | | |
|
|
Consumer Finance — 1.1% | | | |
SLM Corp.* | | 3,138,700 | | | 35,373,149 |
| | | | |
|
|
Diversified Consumer Services — 2.4% | | | |
Career Education Corp.*(a) | | 1,301,400 | | | 30,335,634 |
H&R Block, Inc. | | 1,981,200 | | | 44,814,744 |
| | | | |
|
|
| | | | | | 75,150,378 |
| | | | |
|
|
Diversified Financial Services — 1.3% | | | |
Bank of America Corp. | | 1,604,400 | | | 24,162,264 |
JPMorgan Chase & Co. | | 450,900 | | | 18,789,003 |
| | | | |
|
|
| | | | | | 42,951,267 |
| | | | |
|
|
Electronic Components — 0.6% | | | |
Flextronics International Ltd. (Singapore)* | | 2,521,342 | | | 18,431,010 |
| | | | |
|
|
| | | | | |
COMMON STOCKS
(continued) | | Shares
| | Value
(Note 2)
|
| | | | | | |
Energy Equipment & Services — 2.3% | | | |
National Oilwell Varco, Inc. | | 584,090 | | $ | 25,752,528 |
Schlumberger Ltd. (Netherlands) | | 749,400 | | | 48,778,446 |
| | | | |
|
|
| | | | | | 74,530,974 |
| | | | |
|
|
Food & Staples Retailing — 2.6% | | | |
Costco Wholesale Corp. | | 486,200 | | | 28,768,454 |
CVS Caremark Corp. | | 774,900 | | | 24,959,529 |
Kroger Co. (The) | | 1,420,500 | | | 29,162,865 |
| | | | |
|
|
| | | | | | 82,890,848 |
| | | | |
|
|
Food Products — 4.0% | | | |
Bunge Ltd. (Bermuda)(a) | | 493,500 | | | 31,500,105 |
ConAgra Foods, Inc. | | 1,409,500 | | | 32,488,975 |
Tyson Foods, Inc. (Class A Stock) | | 2,664,600 | | | 32,694,642 |
Unilever PLC (United Kingdom) | | 928,700 | | | 29,769,757 |
| | | | |
|
|
| | | | | | 126,453,479 |
| | | | |
|
|
Healthcare Equipment & Supplies — 2.9% | | | |
Alcon, Inc. (Switzerland)(a) | | 357,000 | | | 58,672,950 |
Baxter International, Inc. | | 572,300 | | | 33,582,564 |
| | | | |
|
|
| | | | | | 92,255,514 |
| | | | |
|
|
Healthcare Providers & Services — 5.1% | | | |
Aetna, Inc. | | 707,800 | | | 22,437,260 |
Express Scripts, Inc.* | | 66,700 | | | 5,766,215 |
Medco Health Solutions, Inc.* | | 904,300 | | | 57,793,813 |
Omnicare, Inc. | | 1,590,900 | | | 38,467,962 |
WellPoint, Inc.* | | 663,300 | | | 38,663,757 |
| | | | |
|
|
| | | | | | 163,129,007 |
| | | | |
|
|
Hotels, Restaurants & Leisure — 0.6% | | | |
Yum! Brands, Inc. | | 550,600 | | | 19,254,482 |
| | | | |
|
|
Household Products — 0.7% | | | |
Colgate-Palmolive Co. | | 290,800 | | | 23,889,220 |
| | | | |
|
|
Independent Power Producers & Energy Traders — 0.9% |
NRG Energy, Inc.*(a) | | 1,248,800 | | | 29,484,168 |
| | | | |
|
|
Insurance — 0.7% | | | |
Travelers Cos., Inc. (The) | | 464,400 | | | 23,154,984 |
| | | | |
|
|
Internet & Catalog Retail — 2.4% | | | |
Amazon.com, Inc.* | | 575,500 | | | 77,416,260 |
| | | | |
|
|
Internet Software & Services — 4.8% | | | |
Baidu, Inc., ADR (Cayman Islands)*(a) | | 54,732 | | | 22,507,440 |
Google, Inc. (Class A Stock)* | | 149,900 | | | 92,935,002 |
IAC/InterActiveCorp*(a) | | 1,824,050 | | | 37,356,544 |
| | | | |
|
|
| | | | | | 152,798,986 |
| | | | |
|
|
IT Services — 3.2% | | | |
MasterCard, Inc. (Class A Stock)(a) | | 177,100 | | | 45,334,058 |
Visa, Inc. (Class A Stock)(a) | | 637,230 | | | 55,732,136 |
| | | | |
|
|
| | | | | | 101,066,194 |
| | | | |
|
|
Media — 3.4% | | | | | |
Comcast Corp. (Class A Stock) | | 2,299,820 | | | 38,774,965 |
Liberty Global, Inc.
(Class C Stock)*(a) | | 1,386,250 | | | 30,289,563 |
Walt Disney Co. (The) | | 1,244,180 | | | 40,124,805 |
| | | | |
|
|
| | | | | | 109,189,333 |
| | | | |
|
|
SEE NOTES TO FINANCIAL STATEMENTS.
A44
| | | | | | |
| | | EQUITY PORTFOLIO (continued) | | |
| |
| SCHEDULE OF INVESTMENTS | | December 31, 2009 |
| | | | | |
COMMON STOCKS
(continued) | | Shares
| | Value
(Note 2)
|
| | | | | | |
Metals & Mining — 2.1% | | | | | |
Freeport-McMoRan Copper & Gold, Inc.* | | 420,360 | | $ | 33,750,705 |
Kinross Gold Corp. (Canada)(a) | | 1,846,600 | | | 33,977,440 |
| | | | |
|
|
| | | | | | 67,728,145 |
| | | | |
|
|
Multi-Line Retail — 0.9% | | | | | |
Kohl’s Corp.* | | 513,700 | | | 27,703,841 |
| | | | |
|
|
Multi-Utilities — 1.1% | | | | | |
Sempra Energy | | 629,986 | | | 35,266,616 |
| | | | |
|
|
Oil, Gas & Consumable Fuels — 11.7% | | | | | |
Apache Corp. | | 467,100 | | | 48,190,707 |
Canadian Natural Resources Ltd. (Canada) | | 469,500 | | | 33,780,525 |
EOG Resources, Inc. | | 342,900 | | | 33,364,170 |
Hess Corp. | | 166,600 | | | 10,079,300 |
Noble Energy, Inc. | | 307,100 | | | 21,871,662 |
Occidental Petroleum Corp. | | 1,146,900 | | | 93,300,315 |
Petroleo Brasileiro SA, ADR (Brazil) | | 964,000 | | | 45,963,520 |
Suncor Energy, Inc. (XNYS) (Canada) | | 157,500 | | | 5,561,325 |
Suncor Energy, Inc. (XTSE) (Canada) | | 922,547 | | | 32,823,038 |
Williams Cos., Inc. (The) | | 1,607,100 | | | 33,877,668 |
XTO Energy, Inc. | | 341,478 | | | 15,888,971 |
| | | | |
|
|
| | | | | | 374,701,201 |
| | | | |
|
|
Pharmaceuticals — 5.2% | | | | | |
Abbott Laboratories | | 460,305 | | | 24,851,867 |
Novartis AG, ADR (Switzerland)(a) | | 546,400 | | | 29,740,552 |
Pfizer, Inc. | | 1,304,400 | | | 23,727,036 |
Sanofi-Aventis SA, ADR (France)(a) | | 828,400 | | | 32,531,268 |
Shire PLC, ADR (United Kingdom)(a) | | 335,500 | | | 19,693,850 |
Teva Pharmaceutical Industries Ltd., ADR (Israel) | | 611,700 | | | 34,365,306 |
| | | | |
|
|
| | | | | | 164,909,879 |
| | | | |
|
|
Road & Rail — 1.9% | | | | | |
Union Pacific Corp. | | 933,900 | | | 59,676,210 |
| | | | |
|
|
Semiconductors & Semiconductor Equipment — 2.4% |
Advanced Micro Devices, Inc.*(a) | | 5,177,400 | | | 50,117,232 |
Intel Corp. | | 1,346,900 | | | 27,476,760 |
| | | | |
|
|
| | | | | | 77,593,992 |
| | | | |
|
|
Software — 7.6% | | | | | |
Adobe Systems, Inc.* | | 1,359,400 | | | 49,998,732 |
CA, Inc. | | 2,123,100 | | | 47,684,826 |
Microsoft Corp. | | 2,275,600 | | | 69,383,044 |
Symantec Corp.* | | 2,860,400 | | | 51,172,556 |
VMware, Inc. (Class A Stock)*(a) | | 611,700 | | | 25,923,846 |
| | | | |
|
|
| | | | | | 244,163,004 |
| | | | |
|
|
Textiles, Apparel & Luxury Goods — 1.9% | | | |
Coach, Inc. | | 699,100 | | | 25,538,123 |
NIKE, Inc. (Class B Stock)(a) | | 533,030 | | | 35,217,292 |
| | | | |
|
|
| | | | | | 60,755,415 |
| | | | |
|
|
| | | | | | |
COMMON STOCKS
(continued) | | Shares
| | Value
(Note 2)
| |
| | | | | | | |
Wireless Telecommunication Services — 1.1% | | | | |
NII Holdings, Inc.* | | 1,045,985 | | $ | 35,124,176 | |
| | | | |
|
|
|
TOTAL COMMON STOCKS
(cost $2,367,080,432) | | | 3,114,707,415 | |
| | | | |
|
|
|
| PREFERRED STOCK — 0.7% | | | | | | |
Diversified Financial Services | | | | | | |
Bank of America Corp. Common Equivalent Securities, 10.00%, CVT (cost $22,599,752) | | 1,502,000 | | | 22,409,840 | |
| | | | |
|
|
|
TOTAL LONG-TERM INVESTMENTS
(cost $2,389,680,184) | | | 3,137,117,255 | |
| | | | |
|
|
|
| SHORT-TERM INVESTMENT — 10.4% | | | | |
AFFILIATED MONEY MARKET MUTUAL FUND | | | | |
Dryden Core Investment Fund — Taxable Money Market Series (cost $332,803,820; includes $256,064,708 of cash collateral for securities on loan)(b)(w) (Note 4) | | 332,803,820 | | | 332,803,820 | |
| | | | |
|
|
|
TOTAL INVESTMENTS(o) — 108.6%
(cost $2,722,484,004) | | | 3,469,921,075 | |
LIABILITIES IN EXCESS OF
OTHER ASSETS — (8.6)% | | | (274,381,071 | ) |
| | | | |
|
|
|
NET ASSETS — 100.0% | | $ | 3,195,540,004 | |
| | | | |
|
|
|
The following abbreviations are used in Portfolio descriptions:
| | |
| ADR | | American Depositary Receipt |
| CVT | | Convertible Security |
| XNYS | | New York Stock Exchange |
| XTSE | | Toronto Stock Exchange |
| * | Non-income producing security. |
| (a) | All or a portion of security is on loan. The aggregate market value of such securities is $248,151,005; cash collateral of $256,064,708 (included with liabilities) was received with which the Portfolio purchased highly liquid short-term investments. |
| (b) | Represents security, or a portion thereof, purchased with cash collateral received for securities on loan. |
| (o) | As of December 31, 2009, one security representing $29,769,757 and 0.9% of net assets was fair valued in accordance with the policies adopted by the Board of Trustees. |
| (w) | Prudential Investments LLC, the manager of the Portfolio, also serves as manager of the Dryden Core Investment Fund-Taxable Money Market Series. |
SEE NOTES TO FINANCIAL STATEMENTS.
A45
| | | | | | |
| | | EQUITY PORTFOLIO (continued) | | |
| |
| SCHEDULE OF INVESTMENTS | | December 31, 2009 |
Various inputs are used in determining the value of the Portfolio’s investments. These inputs are summarized in the three broad levels listed below.
Level 1—quoted prices in active markets for identical securities
Level 2—other significant observable inputs (including quoted prices for similar securities, interest rates, prepayment speeds, credit risk, etc.)
Level 3—significant unobservable inputs (including the Portfolio’s own assumptions in determining the fair value of investments)
The following is a summary of the inputs used as of December 31, 2009 in valuing the Portfolio’s assets carried at fair value:
| | | | | | | | | |
Investments in Securities
| | Level 1
| | Level 2
| | Level 3
|
Common Stocks | | $ | 3,084,937,658 | | $ | 29,769,757 | | $ | — |
Preferred Stock | | | 22,409,840 | | | — | | | — |
Affiliated Money Market Mutual Fund | | | 332,803,820 | | | — | | | — |
| | |
|
| |
|
| |
|
|
| | | | 3,440,151,318 | | | 29,769,757 | | | — |
Other Financial Instruments* | | | — | | | — | | | — |
| | |
|
| |
|
| |
|
|
Total | | $ | 3,440,151,318 | | $ | 29,769,757 | | $ | — |
| | |
|
| |
|
| |
|
|
| * | Other financial instruments are derivative instruments not reflected in the Schedule of Investments, such as futures, forwards and swap contracts, which are valued at the unrealized appreciation/depreciation on the instrument. |
As of December 31, 2009 and 2008, the Portfolio did not use any significant unobservable inputs (Level 3) in determining the value of investments.
The industry classification of investments and liabilities in excess of other assets shown as a percentage of net assets as of December 31, 2009 were as follows:
| | | |
Oil, Gas & Consumable Fuels | | 11.7 | % |
Affiliated Money Market Mutual Fund (8.0% represents investments purchased with collateral from securities on loan) | | 10.4 | |
Software | | 7.6 | |
Capital Markets | | 5.9 | |
Computers & Peripherals | | 5.6 | |
Pharmaceuticals | | 5.2 | |
Healthcare Providers & Services | | 5.1 | |
Internet Software & Services | | 4.8 | |
Food Products | | 4.0 | |
Communications Equipment | | 3.5 | |
Media | | 3.4 | |
IT Services | | 3.2 | |
Healthcare Equipment & Supplies | | 2.9 | |
Food & Staples Retailing | | 2.6 | |
Semiconductors & Semiconductor Equipment | | 2.4 | |
Internet & Catalog Retail | | 2.4 | |
Diversified Consumer Services | | 2.4 | |
Energy Equipment & Services | | 2.3 | |
Metals & Mining | | 2.1 | |
Biotechnology | | 2.1 | |
Diversified Financial Services | | 2.0 | |
Textiles, Apparel & Luxury Goods | | 1.9 | |
Road & Rail | | 1.9 | |
Commercial Services & Supplies | | 1.2 | |
Consumer Finance | | 1.1 | |
Multi-Utilities | | 1.1 | |
Wireless Telecommunication Services | | 1.1 | |
Aerospace & Defense | | 1.1 | |
Chemicals | | 1.0 | |
Independent Power Producers & Energy Traders | | 0.9 | |
| | | |
Multi-Line Retail | | 0.9 | % |
Auto Components | | 0.9 | |
Household Products | | 0.7 | |
Insurance | | 0.7 | |
Beverages | | 0.7 | |
Hotels, Restaurants & Leisure | | 0.6 | |
Electronic Components | | 0.6 | |
Commercial Banks | | 0.6 | |
| | |
|
|
| | | 108.6 | |
Liabilities in excess of other assets | | (8.6 | ) |
| | |
|
|
| | | 100.0 | % |
| | |
|
|
SEE NOTES TO FINANCIAL STATEMENTS.
A46
| | | | | | |
| | | EQUITY PORTFOLIO (continued) | | |
STATEMENT OF ASSETS AND LIABILITIES December 31, 2009
| | | | |
| ASSETS | | | | |
Investments at value, including securities on loan of $248,151,005: | | | | |
Unaffiliated investments (cost $2,389,680,184) | | $ | 3,137,117,255 | |
Affiliated investments (cost $332,803,820) | | | 332,803,820 | |
Cash | | | 5,231,674 | |
Receivable for investments sold | | | 39,648,244 | |
Dividends receivable | | | 3,072,746 | |
Receivable for Series shares sold | | | 24,929 | |
Prepaid expenses | | | 26,956 | |
| | |
|
|
|
Total Assets | | | 3,517,925,624 | |
| | |
|
|
|
| LIABILITIES | | | | |
Collateral for securities on loan | | | 256,064,708 | |
Payable for investments purchased | | | 64,415,500 | |
Management fee payable | | | 1,209,469 | |
Payable for Series shares repurchased | | | 367,292 | |
Accrued expenses and other liabilities | | | 313,161 | |
Payable to custodian | | | 13,177 | |
Deferred trustees’ fees | | | 1,577 | |
Affiliated transfer agent fees payable | | | 595 | |
Distribution fee payable | | | 88 | |
Administration fee payable | | | 53 | |
| | |
|
|
|
Total Liabilities | | | 322,385,620 | |
| | |
|
|
|
| NET ASSETS | | $ | 3,195,540,004 | |
| | |
|
|
|
Net assets were comprised of: | | | | |
Paid-in capital | | $ | 3,238,063,916 | |
Retained earnings | | | (42,523,912 | ) |
| | |
|
|
|
Net assets, December 31, 2009 | | $ | 3,195,540,004 | |
| | |
|
|
|
| Class I: | | | | |
Net asset value and redemption price per share, $3,195,121,901 / 143,295,948 outstanding shares of beneficial interest | | $ | 22.30 | |
| | |
|
|
|
| Class II: | | | | |
Net asset value and redemption price per share, $418,103 / 18,616 outstanding shares of beneficial interest | | $ | 22.46 | |
| | |
|
|
|
STATEMENT OF OPERATIONS
Year Ended December 31, 2009
| | | | |
| INVESTMENT INCOME | | | | |
Unaffiliated dividend income (net of $958,775 foreign withholding tax) | | $ | 35,882,300 | |
Affiliated income from securities lending, net | | | 1,212,345 | |
Affiliated dividend income | | | 398,941 | |
| | |
|
|
|
| | | | 37,493,586 | |
| | |
|
|
|
| EXPENSES | | | | |
Management fee | | | 12,194,789 | |
Distribution fee—Class II | | | 891 | |
Administration fee—Class II | | | 535 | |
Custodian’s fees and expenses | | | 397,000 | |
Shareholders’ reports | | | 310,000 | |
Insurance expenses | | | 55,000 | |
Trustees’ fees | | | 43,000 | |
Commitment fee on syndicated credit agreement | | | 22,000 | |
Audit fee | | | 20,000 | |
Legal fees and expenses | | | 19,000 | |
Transfer agent’s fees and expenses (including affiliated expense of $3,600) (Note 4) | | | 10,000 | |
Miscellaneous | | | 18,793 | |
| | |
|
|
|
Total expenses | | | 13,091,008 | |
| | |
|
|
|
| NET INVESTMENT INCOME | | | 24,402,578 | |
| | |
|
|
|
| NET REALIZED AND UNREALIZED GAIN (LOSS) ON INVESTMENTS AND FOREIGN CURRENCIES | | | | |
Net realized loss on: | | | | |
Investment transactions | | | (316,965,250 | ) |
Foreign currency transactions | | | (169,716 | ) |
| | |
|
|
|
| | | | (317,134,966 | ) |
| | |
|
|
|
Net change in unrealized appreciation (depreciation) on: | | | | |
Investments | | | 1,193,076,920 | |
Foreign currencies | | | (9,550 | ) |
| | |
|
|
|
| | | | 1,193,067,370 | |
| | |
|
|
|
| NET GAIN ON INVESTMENTS AND FOREIGN CURRENCIES | | | 875,932,404 | |
| | |
|
|
|
| NET INCREASE IN NET ASSETS RESULTING FROM OPERATIONS | | $ | 900,334,982 | |
| | |
|
|
|
STATEMENT OF CHANGES IN NET ASSETS
| | | | | | | | |
| | | Year Ended December 31,
| |
| | | 2009
| | | 2008
| |
| INCREASE (DECREASE) IN NET ASSETS | | | | | | | | |
| OPERATIONS: | | | | | | | | |
Net investment income | | $ | 24,402,578 | | | $ | 43,413,611 | |
Net realized loss on investment and foreign currency transactions | | | (317,134,966 | ) | | | (413,360,852 | ) |
Net change in unrealized appreciation (depreciation) on investments and foreign currencies | | | 1,193,067,370 | | | | (1,236,215,453 | ) |
| | |
|
|
| |
|
|
|
NET INCREASE (DECREASE) IN NET ASSETS RESULTING FROM OPERATIONS | | | 900,334,982 | | | | (1,606,162,694 | ) |
| | |
|
|
| |
|
|
|
| DISTRIBUTIONS | | | | | | | | |
Class I | | | (43,394,722 | ) | | | (436,963,357 | ) |
Class II | | | (3,037 | ) | | | (63,526 | ) |
| | |
|
|
| |
|
|
|
TOTAL DISTRIBUTIONS | | | (43,397,759 | ) | | | (437,026,883 | ) |
| | |
|
|
| |
|
|
|
| SERIES SHARE TRANSACTIONS (NOTE 7): | | | | | | | | |
Series shares sold | | | 26,713,318 | | | | 31,235,697 | |
Series shares issued in reinvestment of distributions | | | 43,397,759 | | | | 437,026,883 | |
Series shares repurchased | | | (252,864,006 | ) | | | (328,918,685 | ) |
| | |
|
|
| |
|
|
|
INCREASE (DECREASE) IN NET ASSETS RESULTING FROM SERIES SHARE TRANSACTIONS | | | (182,752,929 | ) | | | 139,343,895 | |
| | |
|
|
| |
|
|
|
| TOTAL INCREASE (DECREASE) IN NET ASSETS | | | 674,184,294 | | | | (1,903,845,682 | ) |
| NET ASSETS: | | | | | | | | |
Beginning of year | | | 2,521,355,710 | | | | 4,425,201,392 | |
| | |
|
|
| |
|
|
|
End of year | | $ | 3,195,540,004 | | | $ | 2,521,355,710 | |
| | |
|
|
| |
|
|
|
SEE NOTES TO FINANCIAL STATEMENTS.
A47
| | | | | | |
| | | FLEXIBLE MANAGED PORTFOLIO | | |
| |
| SCHEDULE OF INVESTMENTS | | December 31, 2009 |
| | | | | |
| LONG-TERM INVESTMENTS — 93.6% |
| COMMON STOCKS — 62.3% | | Shares
| | Value
(Note 2)
|
| | | | | | |
Aerospace & Defense — 2.2% | | | | | |
Alliant Techsystems, Inc.(a)(b) | | 53,700 | | $ | 4,740,099 |
Dyncorp International, Inc. (Class A Stock)(b) | | 11,900 | | | 170,765 |
General Dynamics Corp. | | 210,300 | | | 14,336,151 |
ITT Corp. | | 32,800 | | | 1,631,472 |
L-3 Communications Holdings, Inc. | | 67,600 | | | 5,877,820 |
Lockheed Martin Corp. | | 37,600 | | | 2,833,160 |
Northrop Grumman Corp. | | 235,400 | | | 13,147,090 |
Raytheon Co. | | 267,600 | | | 13,786,752 |
United Technologies Corp. | | 94,800 | | | 6,580,068 |
| | | | |
|
|
| | | | | | 63,103,377 |
| | | | |
|
|
Air Freight & Logistics — 1.0% | | | | | |
C.H. Robinson Worldwide, Inc. | | 126,600 | | | 7,435,218 |
FedEx Corp. | | 108,500 | | | 9,054,325 |
United Parcel Service, Inc. (Class B Stock) | | 240,900 | | | 13,820,433 |
| | | | |
|
|
| | | | | | 30,309,976 |
| | | | |
|
|
Airlines | | | | | |
Alaska Air Group, Inc.(b) | | 32,200 | | | 1,112,832 |
| | | | |
|
|
Auto Components — 0.3% | | | | | |
Cooper Tire & Rubber Co. | | 40,100 | | | 804,005 |
Johnson Controls, Inc. | | 89,300 | | | 2,432,532 |
TRW Automotive Holdings Corp.(a)(b) | | 197,300 | | | 4,711,524 |
| | | | |
|
|
| | | | | | 7,948,061 |
| | | | |
|
|
Automobiles — 0.5% | | | | | |
Ford Motor Co.(a)(b) | | 1,377,100 | | | 13,771,000 |
Thor Industries, Inc. | | 14,700 | | | 461,580 |
| | | | |
|
|
| | | | | | 14,232,580 |
| | | | |
|
|
Beverages — 1.5% | | | | | |
Coca-Cola Co. (The)(a) | | 275,100 | | | 15,680,700 |
Coca-Cola Enterprises, Inc. | | 261,500 | | | 5,543,800 |
Dr. Pepper Snapple Group, Inc. | | 113,700 | | | 3,217,710 |
Molson Coors Brewing Co. (Class B Stock) | | 24,900 | | | 1,124,484 |
PepsiCo, Inc. | | 304,920 | | | 18,539,136 |
| | | | |
|
|
| | | | | | 44,105,830 |
| | | | |
|
|
Biotechnology — 0.7% | | | | | |
Amgen, Inc.(b) | | 253,008 | | | 14,312,663 |
Biogen Idec, Inc.(a)(b) | | 95,200 | | | 5,093,200 |
Gilead Sciences, Inc.(b) | | 35,600 | | | 1,540,768 |
| | | | |
|
|
| | | | | | 20,946,631 |
| | | | |
|
|
Building Products — 0.1% | | | | | |
Owens Corning(b) | | 57,100 | | | 1,464,044 |
| | | | |
|
|
Capital Markets — 1.7% | | | | | |
Ameriprise Financial, Inc. | | 45,400 | | | 1,762,428 |
Bank of New York Mellon Corp. (The) | | 109,700 | | | 3,068,309 |
Franklin Resources, Inc. | | 17,700 | | | 1,864,695 |
Goldman Sachs Group, Inc. (The) | | 142,300 | | | 24,025,932 |
Invesco Ltd. | | 58,900 | | | 1,383,561 |
Morgan Stanley | | 261,890 | | | 7,751,944 |
State Street Corp. | | 95,300 | | | 4,149,362 |
T. Rowe Price Group, Inc.(a) | | 94,100 | | | 5,010,825 |
| | | | |
|
|
| | | | | | 49,017,056 |
| | | | |
|
|
| | | | | |
COMMON STOCKS
(continued) | | Shares
| | Value
(Note 2)
|
| | | | | | |
Chemicals — 0.8% | | | | | |
Air Products & Chemicals, Inc. | | 39,500 | | $ | 3,201,870 |
E.I. du Pont de Nemours & Co. | | 158,600 | | | 5,340,062 |
Ecolab, Inc. | | 129,500 | | | 5,773,110 |
Koppers Holdings, Inc. | | 18,600 | | | 566,184 |
Lubrizol Corp. | | 32,200 | | | 2,348,990 |
Nalco Holding Co. | | 21,000 | | | 535,710 |
NewMarket Corp. | | 26,100 | | | 2,995,497 |
Praxair, Inc. | | 29,100 | | | 2,337,021 |
Scotts Miracle-Gro Co. (The) (Class A Stock) | | 17,500 | | | 687,925 |
| | | | |
|
|
| | | | | | 23,786,369 |
| | | | |
|
|
Commercial Banks — 1.3% | | | | | |
Community Bank System, Inc. | | 43,400 | | | 838,054 |
FNB Corp. | | 30,000 | | | 203,700 |
Fulton Financial Corp. | | 86,200 | | | 751,664 |
Huntington Bancshares, Inc. | | 910,000 | | | 3,321,500 |
International Bancshares Corp.(a) | | 20,100 | | | 380,493 |
KeyCorp | | 141,200 | | | 783,660 |
Regions Financial Corp. | | 1,067,600 | | | 5,647,604 |
Susquehanna Bancshares, Inc.(a) | | 176,000 | | | 1,036,640 |
U.S. Bancorp | | 145,332 | | | 3,271,423 |
Webster Financial Corp. | | 28,200 | | | 334,734 |
Wells Fargo & Co. | | 757,612 | | | 20,447,948 |
| | | | |
|
|
| | | | | | 37,017,420 |
| | | | |
|
|
Commercial Services & Supplies — 0.2% | | | |
Avery Dennison Corp. | | 100,200 | | | 3,656,298 |
RR Donnelley & Sons Co. | | 78,300 | | | 1,743,741 |
Waste Management, Inc.(a) | | 42,800 | | | 1,447,068 |
| | | | |
|
|
| | | | | | 6,847,107 |
| | | | |
|
|
Communications Equipment — 1.2% | | | | | |
Arris Group, Inc.(b) | | 37,100 | | | 424,053 |
Cisco Systems, Inc.(b) | | 1,176,700 | | | 28,170,198 |
Harris Corp. | | 14,600 | | | 694,230 |
JDS Uniphase Corp.(b) | | 34,400 | | | 283,800 |
Juniper Networks, Inc.(a)(b) | | 56,000 | | | 1,493,520 |
QUALCOMM, Inc. | | 93,500 | | | 4,325,310 |
| | | | |
|
|
| | | | | | 35,391,111 |
| | | | |
|
|
Computers & Peripherals — 4.2% | | | | | |
Apple, Inc.(b) | | 197,400 | | | 41,623,764 |
Dell, Inc.(b) | | 259,300 | | | 3,723,548 |
EMC Corp.(b) | | 405,900 | | | 7,091,073 |
Hewlett-Packard Co. | | 443,465 | | | 22,842,882 |
International Business Machines Corp. | | 234,600 | | | 30,709,140 |
Novatel Wireless, Inc.(a)(b) | | 12,100 | | | 96,437 |
Seagate Technology(a) | | 273,300 | | | 4,971,327 |
Teradata Corp.(b) | | 21,600 | | | 678,888 |
Western Digital Corp.(b) | | 210,100 | | | 9,275,915 |
| | | | |
|
|
| | | | | | 121,012,974 |
| | | | |
|
|
Consumer Finance — 0.9% | | | | | |
American Express Co. | | 319,400 | | | 12,942,088 |
Capital One Financial Corp.(a) | | 296,100 | | | 11,352,474 |
First Cash Financial Services, Inc.(a)(b) | | 16,700 | | | 370,573 |
| | | | |
|
|
| | | | | | 24,665,135 |
| | | | |
|
|
SEE NOTES TO FINANCIAL STATEMENTS.
A48
| | | | | | |
| | | FLEXIBLE MANAGED PORTFOLIO (continued) | | |
| |
| SCHEDULE OF INVESTMENTS | | December 31, 2009 |
| | | | | |
COMMON STOCKS
(continued) | | Shares
| | Value
(Note 2)
|
| | | | | | |
Containers & Packaging — 0.3% | | | | | |
Owens-Illinois, Inc.(b) | | 96,200 | | $ | 3,162,094 |
Pactiv Corp.(b) | | 214,500 | | | 5,178,030 |
Rock-Tenn Co. (Class A Stock) | | 6,200 | | | 312,542 |
| | | | |
|
|
| | | | | | 8,652,666 |
| | | | |
|
|
Distributors | | | | | |
Genuine Parts Co. | | 10,900 | | | 413,764 |
| | | | |
|
|
Diversified Consumer Services — 0.1% | | | | | |
DeVry, Inc. | | 23,900 | | | 1,355,847 |
Regis Corp. | | 23,500 | | | 365,895 |
Strayer Education, Inc. | | 2,000 | | | 424,980 |
| | | | |
|
|
| | | | | | 2,146,722 |
| | | | |
|
|
Diversified Financial Services — 3.1% | | | | | |
Bank of America Corp. | | 2,418,182 | | | 36,417,821 |
Citigroup, Inc. | | 3,776,900 | | | 12,501,539 |
CME Group, Inc. | | 6,400 | | | 2,150,080 |
JPMorgan Chase & Co. | | 909,694 | | | 37,906,949 |
NASDAQ OMX Group, Inc. (The)(b) | | 40,700 | | | 806,674 |
NYSE Euronext | | 26,600 | | | 672,980 |
| | | | |
|
|
| | | | | | 90,456,043 |
| | | | |
|
|
Diversified Telecommunication Services — 2.2% | | | |
AT&T, Inc. | | 1,239,647 | | | 34,747,305 |
CenturyTel, Inc.(a) | | 66,800 | | | 2,418,828 |
Verizon Communications, Inc. | | 838,288 | | | 27,772,482 |
| | | | |
|
|
| | | | | | 64,938,615 |
| | | | |
|
|
Electrical Equipment — 0.1% | | | | | |
A.O. Smith Corp. | | 9,700 | | | 420,883 |
Emerson Electric Co. | | 74,500 | | | 3,173,700 |
| | | | |
|
|
| | | | | | 3,594,583 |
| | | | |
|
|
Electrical Utilities — 0.8% | | | | | |
Allegheny Energy, Inc. | | 98,800 | | | 2,319,824 |
American Electric Power Co., Inc. | | 82,300 | | | 2,863,217 |
DPL, Inc. | | 34,300 | | | 946,680 |
Edison International | | 144,300 | | | 5,018,754 |
Exelon Corp. | | 17,600 | | | 860,112 |
FPL Group, Inc. | | 220,400 | | | 11,641,528 |
NV Energy, Inc. | | 32,200 | | | 398,636 |
| | | | |
|
|
| | | | | | 24,048,751 |
| | | | |
|
|
Electronic Equipment & Instruments — 0.5% | | | |
Corning, Inc. | | 473,500 | | | 9,143,285 |
Jabil Circuit, Inc. | | 296,200 | | | 5,144,994 |
Tech Data Corp.(b) | | 15,800 | | | 737,228 |
| | | | |
|
|
| | | | | | 15,025,507 |
| | | | |
|
|
Energy Equipment & Services — 0.7% | | | | | |
Cal Dive International, Inc.(b) | | 197,900 | | | 1,496,124 |
CARBO Ceramics, Inc.(a) | | 3,300 | | | 224,961 |
Dresser-Rand Group, Inc.(b) | | 62,300 | | | 1,969,303 |
FMC Technologies, Inc.(b) | | 98,800 | | | 5,714,592 |
Helix Energy Solutions Group, Inc.(b) | | 75,800 | | | 890,650 |
Schlumberger Ltd. | | 146,100 | | | 9,509,649 |
| | | | |
|
|
| | | | | | 19,805,279 |
| | | | |
|
|
| | | | | |
COMMON STOCKS
(continued) | | Shares
| | Value
(Note 2)
|
| | | | | | |
Food & Staples Retailing — 1.2% | | | | | |
Costco Wholesale Corp. | | 88,700 | | $ | 5,248,379 |
SUPERVALU, Inc. | | 76,800 | | | 976,128 |
Wal-Mart Stores, Inc. | | 493,400 | | | 26,372,230 |
Whole Foods Market, Inc.(a)(b) | | 102,200 | | | 2,805,390 |
| | | | |
|
|
| | | | | | 35,402,127 |
| | | | |
|
|
Food Products — 1.1% | | | | | |
Archer-Daniels-Midland Co. | | 256,000 | | | 8,015,360 |
Chiquita Brands International, Inc.(a)(b) | | 43,300 | | | 781,132 |
Dean Foods Co.(a)(b) | | 107,400 | | | 1,937,496 |
General Mills, Inc. | | 8,300 | | | 587,723 |
Kellogg Co. | | 83,300 | | | 4,431,560 |
Kraft Foods, Inc. (Class A Stock) | | 425,300 | | | 11,559,654 |
Lancaster Colony Corp. | | 13,800 | | | 685,860 |
Sanderson Farms, Inc. | | 54,400 | | | 2,293,504 |
Tyson Foods, Inc. (Class A Stock) | | 190,700 | | | 2,339,889 |
| | | | |
|
|
| | | | | | 32,632,178 |
| | | | |
|
|
Gas Utilities — 0.1% | | | | | |
AGL Resources, Inc. | | 10,000 | | | 364,700 |
UGI Corp. | | 53,700 | | | 1,299,003 |
| | | | |
|
|
| | | | | | 1,663,703 |
| | | | |
|
|
Healthcare Equipment & Supplies — 1.5% | | | |
American Medical Systems Holdings, Inc.(a)(b) | | 109,200 | | | 2,106,468 |
Baxter International, Inc. | | 123,700 | | | 7,258,716 |
Carefusion Corp.(b) | | 206,800 | | | 5,172,068 |
Hospira, Inc.(b) | | 74,700 | | | 3,809,700 |
Intuitive Surgical, Inc.(a)(b) | | 36,800 | | | 11,162,176 |
Medtronic, Inc. | | 321,900 | | | 14,157,162 |
Meridian Bioscience, Inc. | | 24,000 | | | 517,200 |
Quidel Corp.(b) | | 54,100 | | | 745,498 |
Sirona Dental Systems, Inc.(b) | | 9,000 | | | 285,660 |
| | | | |
|
|
| | | | | | 45,214,648 |
| | | | |
|
|
Healthcare Providers & Services — 1.2% | | | | | |
Laboratory Corp. of America Holdings(a)(b) | | 33,500 | | | 2,507,140 |
Medco Health Solutions, Inc.(b) | | 83,000 | | | 5,304,530 |
Quest Diagnostics, Inc. | | 140,500 | | | 8,483,390 |
UnitedHealth Group, Inc. | | 67,900 | | | 2,069,592 |
WellPoint, Inc.(b) | | 260,700 | | | 15,196,203 |
| | | | |
|
|
| | | | | | 33,560,855 |
| | | | |
|
|
Hotels, Restaurants & Leisure — 0.5% | | | | | |
McDonald’s Corp. | | 132,100 | | | 8,248,324 |
Texas Roadhouse, Inc. (Class A Stock)(a)(b) | | 48,900 | | | 549,147 |
Yum! Brands, Inc. | | 201,300 | | | 7,039,461 |
| | | | |
|
|
| | | | | | 15,836,932 |
| | | | |
|
|
Household Durables — 0.4% | | | | | |
American Greetings Corp. (Class A Stock) | | 25,200 | | | 549,108 |
Leggett & Platt, Inc. | | 251,500 | | | 5,130,600 |
Newell Rubbermaid, Inc. | | 182,400 | | | 2,737,824 |
Tempur-Pedic International, Inc.(b) | | 79,100 | | | 1,869,133 |
SEE NOTES TO FINANCIAL STATEMENTS.
A49
| | | | | | |
| | | FLEXIBLE MANAGED PORTFOLIO (continued) | | |
| |
| SCHEDULE OF INVESTMENTS | | December 31, 2009 |
| | | | | |
COMMON STOCKS
(continued) | | Shares
| | Value
(Note 2)
|
| | | | | | |
Household Durables (continued) | | | | | |
Tupperware Brands Corp. | | 9,900 | | $ | 461,043 |
Whirlpool Corp. | | 26,200 | | | 2,113,292 |
| | | | |
|
|
| | | | | | 12,861,000 |
| | | | |
|
|
Household Products — 1.8% | | | | | |
Clorox Co.(a) | | 40,000 | | | 2,440,000 |
Colgate-Palmolive Co. | | 58,600 | | | 4,813,990 |
Kimberly-Clark Corp. | | 118,100 | | | 7,524,151 |
Procter & Gamble Co. (The) | | 635,005 | | | 38,500,353 |
| | | | |
|
|
| | | | | | 53,278,494 |
| | | | |
|
|
Independent Power Producers & Energy Traders — 0.3% |
AES Corp. (The)(b) | | 9,500 | | | 126,445 |
Constellation Energy Group, Inc. | | 234,300 | | | 8,240,331 |
Mirant Corp.(b) | | 98,700 | | | 1,507,149 |
| | | | |
|
|
| | | | | | 9,873,925 |
| | | | |
|
|
Industrial Conglomerates — 1.4% | | | | | |
3M Co. | | 218,700 | | | 18,079,929 |
General Electric Co. | | 1,398,300 | | | 21,156,279 |
McDermott International, Inc. (Panama)(b) | | 24,300 | | | 583,443 |
| | | | |
|
|
| | | | | | 39,819,651 |
| | | | |
|
|
Insurance — 1.0% | | | | | |
Aflac, Inc., | | 99,500 | | | 4,601,875 |
Allied World Assurance Co. Holdings, Ltd. (Bermuda) | | 39,500 | | | 1,819,765 |
Argo Group International Holdings Ltd. (Bermuda)(b) | | 15,200 | | | 442,928 |
Axis Capital Holdings Ltd. | | 14,600 | | | 414,786 |
Chubb Corp. (The) | | 74,500 | | | 3,663,910 |
Endurance Specialty Holdings Ltd. (Bermuda) | | 95,100 | | | 3,540,573 |
Lincoln National Corp. | | 92,300 | | | 2,296,424 |
MetLife, Inc. | | 154,200 | | | 5,450,970 |
PartnerRe Ltd. (Bermuda) | | 18,800 | | | 1,403,608 |
Travelers Cos., Inc. (The) | | 70,800 | | | 3,530,088 |
Unum Group | | 167,300 | | | 3,265,696 |
| | | | |
|
|
| | | | | | 30,430,623 |
| | | | |
|
|
Internet & Catalog Retail | | | | | |
PetMed Express, Inc.(a) | | 45,800 | | | 807,454 |
| | | | |
|
|
Internet Software & Services — 1.1% | | | | | |
DealerTrack Holdings, Inc.(a)(b) | | 10,200 | | | 191,658 |
EarthLink, Inc. | | 42,900 | | | 356,499 |
Google, Inc. (Class A Stock)(b) | | 46,100 | | | 28,581,078 |
IAC/InterActiveCorp(b) | | 88,100 | | | 1,804,288 |
j2 Global Communications, Inc.(b) | | 16,000 | | | 325,600 |
| | | | |
|
|
| | | | | | 31,259,123 |
| | | | |
|
|
IT Services — 1.2% | | | | | |
Convergys Corp.(b) | | 37,800 | | | 406,350 |
DST Systems, Inc.(b) | | 14,800 | | | 644,540 |
Fidelity National Information Services, Inc. | | 113,500 | | | 2,660,440 |
Fiserv, Inc.(b) | | 16,600 | | | 804,768 |
Mastercard, Inc. (Class A Stock)(a) | | 20,200 | | | 5,170,796 |
Visa, Inc. (Class A Stock) | | 156,800 | | | 13,713,728 |
Western Union Co. (The) | | 532,100 | | | 10,030,085 |
| | | | |
|
|
| | | | | | 33,430,707 |
| | | | |
|
|
| | | | | |
COMMON STOCKS
(continued) | | Shares
| | Value
(Note 2)
|
| | | | | | |
Leisure Equipment & Products — 0.1% | | | | | |
Hasbro, Inc. | | 49,700 | | $ | 1,593,382 |
Smith & Wesson Holding Corp.(a)(b) | | 132,700 | | | 542,743 |
| | | | |
|
|
| | | | | | 2,136,125 |
| | | | |
|
|
Life Sciences Tools & Services — 0.7% | | | | | |
Bruker Corp.(b) | | 37,900 | | | 457,074 |
Mettler-Toledo International, Inc.(b) | | 20,300 | | | 2,131,297 |
Millipore Corp.(b) | | 59,000 | | | 4,268,650 |
Thermo Fisher Scientific, Inc.(b) | | 248,900 | | | 11,870,041 |
Waters Corp.(a)(b) | | 23,400 | | | 1,449,864 |
| | | | |
|
|
| | | | | | 20,176,926 |
| | | | |
|
|
Machinery — 0.7% | | | | | |
Dover Corp. | | 80,200 | | | 3,337,122 |
Flowserve Corp. | | 30,600 | | | 2,892,618 |
Illinois Tool Works, Inc. | | 134,000 | | | 6,430,660 |
Joy Global, Inc. | | 46,400 | | | 2,393,776 |
Oshkosh Corp. | | 98,700 | | | 3,654,861 |
Toro Co. | | 17,700 | | | 740,037 |
| | | | |
|
|
| | | | | | 19,449,074 |
| | | | |
|
|
Media — 1.6% | | | | | |
Comcast Corp. (Class A Stock) | | 1,100,973 | | | 18,562,405 |
Gannett Co., Inc. | | 471,700 | | | 7,004,745 |
Scholastic Corp. | | 7,800 | | | 232,674 |
Time Warner Cable, Inc. | | 20,000 | | | 827,800 |
Time Warner, Inc. | | 198,366 | | | 5,780,385 |
Viacom, Inc. (Class B Stock)(b) | | 320,500 | | | 9,528,465 |
Walt Disney Co. (The) | | 162,800 | | | 5,250,300 |
| | | | |
|
|
| | | | | | 47,186,774 |
| | | | |
|
|
Metals & Mining — 0.9% | | | | | |
Freeport-McMoRan Copper & Gold, Inc.(b) | | 203,900 | | | 16,371,131 |
Nucor Corp. | | 98,400 | | | 4,590,360 |
Southern Copper Corp.(a) | | 163,200 | | | 5,370,912 |
Walter Energy, Inc. | | 4,600 | | | 346,426 |
| | | | |
|
|
| | | | | | 26,678,829 |
| | | | |
|
|
Multiline Retail — 0.8% | | | | | |
99 Cents Only Stores(b) | | 34,400 | | | 449,608 |
Dollar Tree, Inc.(b) | | 25,800 | | | 1,246,140 |
Family Dollar Stores, Inc. | | 179,000 | | | 4,981,570 |
Target Corp. | | 342,100 | | | 16,547,377 |
| | | | |
|
|
| | | | | | 23,224,695 |
| | | | |
|
|
Multi-Utilities — 0.6% | | | | | |
Dominion Resources, Inc. | | 117,700 | | | 4,580,884 |
Public Service Enterprise Group, Inc. | | 214,100 | | | 7,118,825 |
Sempra Energy | | 92,900 | | | 5,200,542 |
TECO Energy, Inc. | | 27,300 | | | 442,806 |
Xcel Energy, Inc. | | 49,000 | | | 1,039,780 |
| | | | |
|
|
| | | | | | 18,382,837 |
| | | | |
|
|
Office Electronics — 0.1% | | | | | |
Xerox Corp. | | 313,600 | | | 2,653,056 |
| | | | |
|
|
Oil, Gas & Consumable Fuels — 6.1% | | | | | |
Anadarko Petroleum Corp. | | 92,900 | | | 5,798,818 |
Apache Corp. | | 22,300 | | | 2,300,691 |
SEE NOTES TO FINANCIAL STATEMENTS.
A50
| | | | | | |
| | | FLEXIBLE MANAGED PORTFOLIO (continued) | | |
| |
| SCHEDULE OF INVESTMENTS | | December 31, 2009 |
| | | | | |
COMMON STOCKS
(continued) | | Shares
| | Value
(Note 2)
|
| | | | | | |
Oil, Gas & Consumable Fuels (continued) | | | |
Chesapeake Energy Corp. | | 193,700 | | $ | 5,012,956 |
Chevron Corp. | | 484,056 | | | 37,267,472 |
ConocoPhillips | | 405,434 | | | 20,705,514 |
Devon Energy Corp. | | 120,100 | | | 8,827,350 |
El Paso Corp. | | 159,900 | | | 1,571,817 |
Exxon Mobil Corp. | | 880,416 | | | 60,035,567 |
Hess Corp. | | 9,000 | | | 544,500 |
Marathon Oil Corp. | | 313,500 | | | 9,787,470 |
Murphy Oil Corp. | | 111,600 | | | 6,048,720 |
Occidental Petroleum Corp. | | 124,500 | | | 10,128,075 |
Spectra Energy Corp. | | 339,700 | | | 6,967,247 |
Stone Energy Corp.(a)(b) | | 10,200 | | | 184,110 |
Western Refining, Inc.(a)(b) | | 83,800 | | | 394,698 |
World Fuel Services Corp. | | 12,700 | | | 340,233 |
| | | | |
|
|
| | | | | | 175,915,238 |
| | | | |
|
|
Personal Products | | | | | |
Avon Products, Inc. | | 32,900 | | | 1,036,350 |
| | | | |
|
|
Pharmaceuticals — 4.2% | | | | | |
Abbott Laboratories | | 178,500 | | | 9,637,215 |
Allergan, Inc. | | 160,500 | | | 10,113,105 |
Bristol-Myers Squibb Co.(a) | | 696,100 | | | 17,576,525 |
Eli Lilly & Co. | | 249,700 | | | 8,916,787 |
ENDO Pharmaceuticals Holdings, Inc.(b) | | 17,200 | | | 352,772 |
Johnson & Johnson | | 526,998 | | | 33,943,941 |
Merck & Co., Inc. | | 332,400 | | | 12,145,896 |
Par Pharmaceutical Cos., Inc.(b) | | 34,800 | | | 941,688 |
Perrigo Co. | | 7,800 | | | 310,752 |
Pfizer, Inc. | | 1,326,797 | | | 24,134,438 |
Valeant Pharmaceuticals International(a)(b) | | 102,700 | | | 3,264,833 |
| | | | |
|
|
| | | | | | 121,337,952 |
| | | | |
|
|
Professional Services — 0.3% | | | | | |
Equifax, Inc. | | 175,800 | | | 5,430,462 |
Robert Half International, Inc.(a) | | 29,600 | | | 791,208 |
Watson Wyatt Worldwide, Inc. (Class A Stock) | | 30,900 | | | 1,468,368 |
| | | | |
|
|
| | | | | | 7,690,038 |
| | | | |
|
|
Real Estate Investment Trusts — 0.5% | | | | | |
Annaly Capital Management, Inc. | | 437,800 | | | 7,595,830 |
Anworth Mortgage Asset Corp. | | 86,500 | | | 605,500 |
Brandywine Realty Trust(a) | | 50,100 | | | 571,140 |
CBL & Associates Properties, Inc. | | 101,700 | | | 983,439 |
Chimera Investment Corp. | | 546,900 | | | 2,121,972 |
MFA Financial, Inc. | | 552,900 | | | 4,063,815 |
| | | | |
|
|
| | | | | | 15,941,696 |
| | | | |
|
|
Road & Rail — 0.3% | | | | | |
Avis Budget Group, Inc.(b) | | 163,300 | | | 2,142,496 |
CSX Corp. | | 35,300 | | | 1,711,697 |
Dollar Thrifty Automotive Group, Inc.(b) | | 50,700 | | | 1,298,427 |
Ryder System, Inc. | | 79,100 | | | 3,256,547 |
Werner Enterprises, Inc. | | 11,500 | | | 227,585 |
| | | | |
|
|
| | | | | | 8,636,752 |
| | | | |
|
|
| | | | | |
COMMON STOCKS
(continued) | | Shares
| | Value
(Note 2)
|
| | | | | | |
Semiconductors & Semiconductor Equipment — 2.1% |
Broadcom Corp. (Class A Stock)(a)(b) | | 164,600 | | $ | 5,176,670 |
Intel Corp. | | 1,484,000 | | | 30,273,600 |
LSI Corp.(b) | | 203,800 | | | 1,224,838 |
Marvell Technology Group Ltd.(b) | | 49,600 | | | 1,029,200 |
Micron Technology, Inc.(b) | | 356,100 | | | 3,760,416 |
National Semiconductor Corp. | | 103,900 | | | 1,595,904 |
PMC — Sierra, Inc.(b) | | 71,200 | | | 616,592 |
Semtech Corp.(b) | | 32,600 | | | 554,526 |
Texas Instruments, Inc. | | 619,000 | | | 16,131,140 |
Zoran Corp.(b) | | 21,300 | | | 235,365 |
| | | | |
|
|
| | | | | | 60,598,251 |
| | | | |
|
|
Software — 2.6% | | | | | |
Adobe Systems, Inc.(b) | | 161,700 | | | 5,947,326 |
BMC Software, Inc.(b) | | 68,300 | | | 2,738,830 |
CA, Inc. | | 34,900 | | | 783,854 |
Intuit, Inc.(b) | | 96,700 | | | 2,969,657 |
McAfee, Inc.(a)(b) | | 132,000 | | | 5,355,240 |
Microsoft Corp. | | 1,264,400 | | | 38,551,556 |
Novell, Inc.(b) | | 93,100 | | | 386,365 |
Oracle Corp. | | 302,900 | | | 7,433,166 |
Pegasystems, Inc. | | 20,000 | | | 680,000 |
Symantec Corp.(b) | | 517,700 | | | 9,261,653 |
| | | | |
|
|
| | | | | | 74,107,647 |
| | | | |
|
|
Specialty Retail — 1.5% | | | | | |
AutoNation, Inc.(a)(b) | | 17,600 | | | 337,040 |
Best Buy Co., Inc. | | 255,000 | | | 10,062,300 |
Chico’s FAS, Inc.(b) | | 465,400 | | | 6,538,870 |
Gap, Inc. (The) | | 208,200 | | | 4,361,790 |
Home Depot, Inc. (The) | | 118,250 | | | 3,420,972 |
Rent-A-Center, Inc. (Class A Stock)(b) | | 10,000 | | | 177,200 |
Ross Stores, Inc. | | 194,200 | | | 8,294,282 |
Sally Beauty Holdings, Inc.(a)(b) | | 85,600 | | | 654,840 |
Sonic Automotive, Inc. (Class A Stock)(b) | | 113,600 | | | 1,180,304 |
TJX Cos., Inc. | | 227,500 | | | 8,315,125 |
| | | | |
|
|
| | | | | | 43,342,723 |
| | | | |
|
|
Textiles, Apparel & Luxury Goods — 0.6% | | | |
Carter’s, Inc.(b) | | 30,900 | | | 811,125 |
Coach, Inc. | | 360,700 | | | 13,176,371 |
Jones Apparel Group, Inc. | | 85,400 | | | 1,371,524 |
Phillips-Van Heusen Corp. | | 27,600 | | | 1,122,768 |
| | | | |
|
|
| | | | | | 16,481,788 |
| | | | |
|
|
Tobacco — 1.1% | | | | | |
Altria Group, Inc. | | 504,700 | | | 9,907,261 |
Lorillard, Inc. | | 6,800 | | | 545,564 |
Philip Morris International, Inc. (Switzerland) | | 284,400 | | | 13,705,236 |
Reynolds American, Inc. | | 142,600 | | | 7,553,522 |
| | | | |
|
|
| | | | | | 31,711,583 |
| | | | |
|
|
Trading Companies & Distributors — 0.2% | | | |
W.W. Grainger, Inc.(a) | | 70,000 | | | 6,778,100 |
| | | | |
|
|
Wireless Telecommunication Services — 0.1% | | | |
Sprint Nextel Corp.(b) | | 482,800 | | | 1,767,048 |
| | | | |
|
|
TOTAL COMMON STOCKS
(cost $1,512,480,744) | | | 1,811,347,335 |
| | | | |
|
|
SEE NOTES TO FINANCIAL STATEMENTS.
A51
| | | | | | |
| | | FLEXIBLE MANAGED PORTFOLIO (continued) | | |
| |
| SCHEDULE OF INVESTMENTS | | December 31, 2009 |
| | | | | | | | | | | | |
| ASSET-BACKED SECURITIES — 0.5% | | Moody’s
Rating
(Unaudited)†
| | Interest
Rate
| | Maturity
Date
| | Principal
Amount
(000)#
| | Value
(Note 2)
|
| | | | | | | | | | | | | |
ARES CLO Funds (Cayman Islands), Ser. 2003-7AW,
Class A1A, 144A(c) | | A2 | | 0.625% | | 05/08/15 | | $ | 2,498 | | $ | 2,354,674 |
Ballyrock CDO Ltd. (Cayman Islands), Ser. 2003-2A, Class A, 144A(c) | | Aa2 | | 0.799% | | 11/20/15 | | | 2,771 | | | 2,577,114 |
Bank of America Credit Card Trust, Ser. 2006-C5, Class C5(c) | | Baa1 | | 0.633% | | 01/15/16 | | | 3,209 | | | 2,765,847 |
Chatham Light CLO Ltd. (Cayman Islands), Ser. 2005-2A,
Class A1, 144A(c) | | Aa1 | | 0.531% | | 08/03/19 | | | 495 | | | 450,560 |
Citibank Credit Card Issuance Trust, Ser. 2006-C1, Class C1(c) | | Baa2 | | 0.633% | | 02/20/15 | | | 1,350 | | | 1,234,127 |
Granite Ventures Ltd. (Cayman Islands), Ser. 2005-2A, Class A1, 144A(c) | | Aaa | | 0.544% | | 12/15/17 | | | 3,200 | | | 2,992,000 |
Mountain Capital CLO Ltd. (Cayman Islands), Ser. 2004-3A,
Class A1LA, 144A(c) | | Aaa | | 0.688% | | 02/15/16 | | | 2,336 | | | 2,219,029 |
SVO VOI Mortgage Corp., Ser. 2005-AA, Class A, 144A | | Aaa | | 5.250% | | 02/20/21 | | | 382 | | | 352,033 |
| | | | | | | | | | | |
|
|
TOTAL ASSET-BACKED SECURITIES
(cost $15,492,437) | | | 14,945,384 |
| | | | | | | | | | | |
|
|
| BANK LOANS — 0.5% | | | | | | | | | | | | |
Automotive | | | | | | | | | | | | |
Oshkosh Truck Corp.(c)(d) | | B2 | | 6.269% | | 12/06/13 | | | 211 | | | 210,446 |
| | | | | | | | | | | |
|
|
Cable | | | | | | | | | | | | |
Insight Midwest Holdings LLC(c)(d) | | B1 | | 1.790% | | 10/06/13 | | | 1,005 | | | 943,627 |
| | | | | | | | | | | |
|
|
Consumer | | | | | | | | | | | | |
Pilot Travel Centers LLC(c)(d) | | Ba2 | | TBA | | 12/31/15 | | | 300 | | | 301,197 |
| | | | | | | | | | | |
|
|
Electric — 0.1% | | | | | | | | | | | | |
NRG Energy, Inc.(c)(d) | | Baa3 | | 0.151% | | 02/01/13 | | | 177 | | | 168,299 |
NRG Energy, Inc.(c)(d) | | Baa3 | | 1.996% | | 02/01/13 | | | 301 | | | 285,544 |
Texas Competitive Electric Holdings Co. LLC(c)(d) | | B1 | | 3.735% | | 10/10/14 | | | 978 | | | 794,219 |
| | | | | | | | | | | |
|
|
| | | | | | | | | | | | | 1,248,062 |
| | | | | | | | | | | |
|
|
Healthcare & Pharmaceutical — 0.2% | | | | | | | | | | | | |
DaVita, Inc.(c)(d) | | Ba1 | | 1.748% | | 10/05/12 | | | 1,200 | | | 1,161,667 |
HCA, Inc.(c)(d) | | Ba3 | | 2.501% | | 11/18/13 | | | 1,481 | | | 1,412,592 |
Health Management Association(c)(d) | | B1 | | 2.001% | | 02/28/14 | | | 1,104 | | | 1,026,794 |
Warner Chilcott Corp.(c)(d) | | B1 | | 5.500% | | 10/30/14 | | | 979 | | | 979,572 |
Warner Chilcott Corp.(c)(d) | | B1 | | 5.750% | | 04/30/15 | | | 1,077 | | | 1,077,530 |
Warner Chilcott Corp.(c)(d) | | B1 | | 5.750% | | 04/30/15 | | | 489 | | | 489,786 |
| | | | | | | | | | | |
|
|
| | | | | | | | | | | | | 6,147,941 |
| | | | | | | | | | | |
|
|
Media & Entertainment — 0.1% | | | | | | | | | | | | |
Discovery Communications, Inc.(c)(d) | | Baa3 | | 5.250% | | 05/14/14 | | | 1,056 | | | 1,064,600 |
| | | | | | | | | | | |
|
|
Paper | | | | | | | | | | | | |
Domtar Corp.(c)(d) | | Baa3 | | 1.608% | | 03/05/14 | | | 523 | | | 507,854 |
| | | | | | | | | | | |
|
|
Pipelines & Other | | | | | | | | | | | | |
Enterprise GP Holdings LP(c)(d) | | Ba2 | | 2.514% | | 11/08/14 | | | 980 | | | 934,675 |
| | | | | | | | | | | |
|
|
Technology — 0.1% | | | | | | | | | | | | |
Fidelity National Information Services, Inc.(c)(d) | | Ba1 | | 4.481% | | 01/18/12 | | | 119 | | | 118,712 |
First Data Corp.(c)(d) | | B1 | | 2.983% | | 09/24/14 | | | 1,173 | | | 1,039,082 |
First Data Corp.(c)(d) | | B1 | | 2.999% | | 09/24/14 | | | 1,466 | | | 1,296,715 |
Flextronics International Ltd. (Singapore)(c)(d) | | Ba1 | | 2.514% | | 10/01/14 | | | 987 | | | 912,245 |
Flextronics International Ltd. (Singapore)(c)(d) | | Ba1 | | 2.534% | | 10/01/14 | | | 284 | | | 262,139 |
Sensata Technologies (Netherlands)(c)(d) | | B2 | | 2.031% | | 04/27/13 | | | 335 | | | 297,216 |
| | | | | | | | | | | |
|
|
| | | | | | | | | | | | | 3,926,109 |
| | | | | | | | | | | |
|
|
TOTAL BANK LOANS
(cost $16,000,310) | | | 15,284,511 |
| | | | | | | | | | | |
|
|
| COLLATERALIZED MORTGAGE OBLIGATIONS — 0.4% | | | | | | | | | | | | |
Banc of America Alternative Loan Trust, Ser. 2005-12, Class 3CB1 | | B3 | | 6.000% | | 01/25/36 | | | 3,767 | | | 2,859,307 |
Banc of America Mortgage Securities, Inc., Ser. 2005-A, Class 2A1(c) | | Ba1 | | 4.439% | | 02/25/35 | | | 928 | | | 711,909 |
SEE NOTES TO FINANCIAL STATEMENTS.
A52
| | | | | | |
| | | FLEXIBLE MANAGED PORTFOLIO (continued) | | |
| |
| SCHEDULE OF INVESTMENTS | | December 31, 2009 |
| | | | | | | | | | | | |
COLLATERALIZED MORTGAGE OBLIGATIONS
(continued) | | Moody’s
Rating
(Unaudited)†
| | Interest
Rate
| | Maturity
Date
| | Principal
Amount
(000)#
| | Value
(Note 2)
|
| | | | | | | | | | | | | |
Banc of America Mortgage Securities, Inc., Ser. 2005-B, Class 2A1(c) | | Ba2 | | 4.375% | | 03/25/35 | | $ | 689 | | $ | 546,071 |
Chase Mortgage Finance Corp., Ser. 2007-A1, Class 1A5(c) | | Ba2 | | 3.899% | | 02/25/37 | | | 2,431 | | | 2,245,474 |
Countrywide Alternative Loan Trust, Ser. 2004-18CB, Class 3A1 | | A1 | | 5.250% | | 09/25/19 | | | 1,018 | | | 984,636 |
JPMorgan Mortgage Trust, Ser. 2007-A1, Class 4A1(c) | | B1 | | 4.067% | | 07/25/35 | | | 1,601 | | | 1,438,720 |
Master Alternative Loans Trust, Ser. 2004-4, Class 4A1 | | Aaa | | 5.000% | | 04/25/19 | | | 351 | | | 331,412 |
Structured Adjustable Rate Mortgage Loan Trust, Ser. 2004-1, Class 4A3(c) | | A1 | | 3.586% | | 02/25/34 | | | 658 | | | 544,157 |
Washington Mutual Alternative Mortgage Pass-Through Certificates, Ser. 2005-1, Class 3A | | AAA(e) | | 5.000% | | 03/25/20 | | | 430 | | | 329,648 |
| | | | | | | | | | | |
|
|
TOTAL COLLATERALIZED MORTGAGE OBLIGATIONS
(cost $11,505,565) | | | 9,991,334 |
| | | | | | | | | | | |
|
|
| COMMERCIAL MORTGAGE-BACKED SECURITIES — 3.8% | | | | | | | | | | |
Banc of America Commercial Mortgage, Inc., Ser. 2004-2, Class A4 | | Aaa | | 4.153% | | 11/10/38 | | | 2,800 | | | 2,790,025 |
Banc of America Commercial Mortgage, Inc., Ser. 2005-1, Class ASB(c) | | AAA(e) | | 4.965% | | 11/10/42 | | | 683 | | | 700,468 |
Banc of America Commercial Mortgage, Inc., Ser. 2006-4, Class A3A | | Aaa | | 5.600% | | 07/10/46 | | | 3,700 | | | 3,757,954 |
Banc of America Commercial Mortgage, Inc., Ser. 2007-3, Class A2(c) | | Aaa | | 5.658% | | 06/10/49 | | | 5,900 | | | 6,002,933 |
Banc of America Commercial Mortgage, Inc., Ser. 2007-5, Class A3 | | AAA(e) | | 5.620% | | 02/10/51 | | | 1,920 | | | 1,863,457 |
Bear Stearns Commercial Mortgage Securities, Ser. 2005-T18,
Class AAB(c) | | Aaa | | 4.823% | | 02/13/42 | | | 1,775 | | | 1,791,832 |
Bear Stearns Commercial Mortgage Securities, Ser. 2005-T20,
Class AAB(c) | | Aaa | | 5.134% | | 10/12/42 | | | 2,400 | | | 2,461,091 |
Commercial Mortgage Acceptance Corp., Ser. 1998-C2, Class F, 144A(c) | | A-(e) | | 5.440% | | 09/15/30 | | | 890 | | | 847,827 |
Commercial Mortgage Loan Trust, Ser. 2008-LS1, Class A2(c) | | Aaa | | 6.019% | | 12/10/49 | | | 2,200 | | | 2,256,697 |
Commercial Mortgage Pass-Through Certificates, Ser. 2004-LB2A,
Class X2, I/O, 144A(c) | | AAA(e) | | 0.862% | | 03/10/39 | | | 8,370 | | | 75,040 |
Commercial Mortgage Pass-Through Certificates, Ser. 2006-C8,
Class A2B | | Aaa | | 5.248% | | 12/10/46 | | | 1,000 | | | 1,004,113 |
Commercial Mortgage Pass-Thru Certificates, Ser. 2006-C7, Class A4(c) | | AAA(e) | | 5.768% | | 06/10/46 | | | 1,500 | | | 1,470,883 |
CS First Boston Mortgage Securities Corp., Ser. 2004-C3, Class A4 | | Aaa | | 4.835% | | 07/15/36 | | | 880 | | | 881,729 |
CS First Boston Mortgage Securities Corp., Ser. 2004-C4, Class A4 | | Aaa | | 4.283% | | 10/15/39 | | | 1,400 | | | 1,401,306 |
CS First Boston Mortgage Securities Corp., Ser. 2005-C5, Class A4(c) | | AAA(e) | | 5.100% | | 08/15/38 | | | 6,800 | | | 6,551,110 |
CS Mortgage Capital Certificate Corp., Ser. 2006-C1, Class A4(c) | | AAA(e) | | 5.548% | | 02/15/39 | | | 2,700 | | | 2,659,617 |
CW Capital Cobalt Ltd., Ser. 2007-C2, Class A2 | | Aaa | | 5.334% | | 04/15/47 | | | 750 | | | 754,020 |
CW Capital Cobalt Ltd., Ser. 2007-C3, Class A3(c) | | AAA(e) | | 5.820% | | 05/15/46 | | | 2,200 | | | 2,129,939 |
DLJ Commercial Mortgage Corp., Ser. 2000-CF1, Class A1B | | AAA(e) | | 7.620% | | 06/10/33 | | | 571 | | | 572,053 |
GE Capital Commercial Mortgage Corp., Ser. 2004-C2, Class X2, I/O, 144A(c) | | Aaa | | 0.597% | | 03/10/40 | | | 16,209 | | | 115,815 |
GMAC Commercial Mortgage Securities, Inc., Ser. 2005-C1, Class A5 | | AAA(e) | | 4.697% | | 05/10/43 | | | 2,720 | | | 2,653,441 |
Greenwich Capital Commercial Funding Corp., Ser. 2005-GG5, Class A5(c) | | Aaa | | 5.224% | | 04/10/37 | | | 8,050 | | | 7,625,041 |
Greenwich Capital Commercial Funding Corp., Ser. 2007-GG9, Class A2 | | Aaa | | 5.381% | | 03/10/39 | | | 4,000 | | | 4,052,193 |
GS Mortgage Securities Corp. II, Ser. 2006-GG6, Class AAB(c) | | AAA(e) | | 5.587% | | 04/10/38 | | | 6,650 | | | 6,613,854 |
JPMorgan Chase Commercial Mortgage Securities Corp.,
Ser. 2005-LDP1, Class ASB(c) | | Aaa | | 4.853% | | 03/15/46 | | | 3,749 | | | 3,810,114 |
JPMorgan Chase Commercial Mortgage Securities Corp.,
Ser. 2005-LDP2, Class ASB | | Aaa | | 4.659% | | 07/15/42 | | | 6,350 | | | 6,415,952 |
JPMorgan Chase Commercial Mortgage Securities Corp.,
Ser. 2006-CB16, Class ASB | | Aaa | | 5.523% | | 05/12/45 | | | 3,900 | | | 3,859,570 |
JPMorgan Chase Commercial Mortgage Securities Corp.,
Ser. 2006-LDP6, Class X2, I/O(c) | | Aaa | | 0.066% | | 04/15/43 | | | 119,690 | | | 352,750 |
SEE NOTES TO FINANCIAL STATEMENTS.
A53
| | | | | | |
| | | FLEXIBLE MANAGED PORTFOLIO (continued) | | |
| |
| SCHEDULE OF INVESTMENTS | | December 31, 2009 |
| | | | | | | | | | | | |
COMMERCIAL MORTGAGE-BACKED SECURITIES
(continued) | | Moody’s
Rating
(Unaudited)†
| | Interest
Rate
| | Maturity
Date
| | Principal
Amount
(000)#
| | Value
(Note 2)
|
| | | | | | | | | | | | | |
JPMorgan Chase Commercial Mortgage Securities Corp.,
Ser. 2006-LDP7, Class A3A(c) | | Aaa | | 5.875% | | 04/15/45 | | $ | 563 | | $ | 561,446 |
JPMorgan Chase Commercial Mortgage Securities Corp.,
Ser. 2007-LD12, Class A2 | | Aaa | | 5.827% | | 02/15/51 | | | 2,050 | | | 2,101,978 |
LB-UBS Commercial Mortgage Trust, Ser. 2004-C6, Class A5(c) | | AAA(e) | | 4.826% | | 08/15/29 | | | 3,910 | | | 3,731,096 |
LB-UBS Commercial Mortgage Trust, Ser. 2006-C6, Class AAB | | Aaa | | 5.341% | | 09/15/39 | | | 3,580 | | | 3,529,333 |
Merrill Lynch Mortgage Trust, Ser. 2004-KEY2, Class A3 | | Aaa | | 4.615% | | 08/12/39 | | | 2,000 | | | 1,965,275 |
Merrill Lynch Mortgage Trust, Ser. 2008-C1, Class A2 | | Aaa | | 5.425% | | 02/12/51 | | | 150 | | | 149,783 |
Merrill Lynch/Countrywide Commercial Mortgage Trust, Ser. 2006-2, Class A4(c) | | Aaa | | 5.909% | | 06/12/46 | | | 1,795 | | | 1,762,177 |
Morgan Stanley Capital I, Ser. 2006-IQ11, Class A4(c) | | AAA(e) | | 5.770% | | 10/15/42 | | | 2,600 | | | 2,572,110 |
Morgan Stanley Capital I, Ser. 2007-HQ11, Class AAB | | Aaa | | 5.444% | | 02/12/44 | | | 4,600 | | | 4,442,838 |
Morgan Stanley Capital I, Ser. 2007-T27, Class AAB(c) | | AAA(e) | | 5.650% | | 06/11/42 | | | 1,105 | | | 1,102,328 |
Wachovia Bank Commercial Mortgage Trust, Ser. 2006-C23, Class A4(c) | | Aaa | | 5.418% | | 01/15/45 | | | 2,500 | | | 2,394,716 |
Wachovia Bank Commercial Mortgage Trust, Ser. 2006-C25, Class A3(c) | | Aaa | | 5.705% | | 05/15/43 | | | 5,000 | | | 5,030,440 |
Wachovia Bank Commercial Mortgage Trust, Ser. 2006-C25, Class A4(c) | | Aaa | | 5.740% | | 05/15/43 | | | 1,000 | | | 985,286 |
Wachovia Bank Commercial Mortgage Trust, Ser. 2006-C27, Class A2 | | Aaa | | 5.624% | | 07/15/45 | | | 3,000 | | | 3,071,287 |
| | | | | | | | | | | |
|
|
TOTAL COMMERCIAL MORTGAGE-BACKED SECURITIES
(cost $105,476,171) | | | 108,870,917 |
| | | | | | | | | | | |
|
|
| CORPORATE BONDS — 9.6% | | | | | | | | | | | | |
Aerospace & Defense — 0.2% | | | | | | | | | | | | |
BAE Systems Holdings, Inc., Gtd. Notes, 144A | | Baa2 | | 4.750% | | 08/15/10 | | | 2,150 | | | 2,182,624 |
BAE Systems Holdings, Inc., Gtd. Notes, 144A | | Baa2 | | 6.375% | | 06/01/19 | | | 725 | | | 779,860 |
Boeing Capital Corp., Sr. Unsec’d. Notes | | A2 | | 6.100% | | 03/01/11 | | | 925 | | | 977,753 |
Goodrich Corp., Sr. Unsec’d. Notes | | Baa2 | | 6.800% | | 07/01/36 | | | 743 | | | 796,572 |
| | | | | | | | | | | |
|
|
| | | | | | | | | | | | | 4,736,809 |
| | | | | | | | | | | |
|
|
Airlines — 0.2% | | | | | | | | | | | | |
American Airlines, Inc., Pass-thru Certs., Ser. 01-1 | | B2 | | 6.817% | | 05/23/11 | | | 2,520 | | | 2,419,200 |
Continental Airlines, Inc., Pass-thru Certs., Ser. 981A | | Baa2 | | 6.648% | | 09/15/17 | | | 269 | | | 259,421 |
Continental Airlines, Inc., Pass-thru Certs., Ser. A(a) | | Baa2 | | 7.250% | | 11/10/19 | | | 790 | | | 803,825 |
Delta Air Lines, Inc., Pass-thru Certs., Ser. 071A(a) | | Baa1 | | 6.821% | | 08/10/22 | | | 455 | | | 434,700 |
Southwest Airlines Co., Sr. Unsec’d. Notes | | Baa3 | | 6.500% | | 03/01/12 | | | 1,005 | | | 1,069,390 |
| | | | | | | | | | | |
|
|
| | | | | | | | | | | | | 4,986,536 |
| | | | | | | | | | | |
|
|
Automotive | | | | | | | | | | | | |
Harley-Davidson Funding Corp., Gtd. Notes, 144A, MTN | | Baa1 | | 5.750% | | 12/15/14 | | | 500 | | | 507,634 |
Johnson Controls, Inc., Sr. Unsec’d. Notes | | Baa2 | | 5.500% | | 01/15/16 | | | 245 | | | 249,183 |
| | | | | | | | | | | |
|
|
| | | | | | | | | | | | | 756,817 |
| | | | | | | | | | | |
|
|
Banking — 1.9% | | | | | | | | | | | | |
American Express Co., Sr. Unsec’d. Notes | | A3 | | 8.125% | | 05/20/19 | | | 1,925 | | | 2,281,242 |
Banco Bradesco SA (Cayman Islands), Sub. Notes | | A2 | | 8.750% | | 10/24/13 | | | 1,760 | | | 2,059,200 |
Bank of America Corp., Sub. Notes | | A3 | | 5.750% | | 08/15/16 | | | 1,775 | | | 1,786,582 |
Bank of America Corp., Jr. Sub. Notes(c) | | Ba3 | | 8.000% | | 12/29/49 | | | 2,200 | | | 2,118,028 |
Bank of America NA, Sub. Notes | | A1 | | 5.300% | | 03/15/17 | | | 930 | | | 911,484 |
Bank of America NA, Sub. Notes | | A1 | | 6.000% | | 10/15/36 | | | 410 | | | 396,193 |
Bank One Corp., Sub. Notes | | A1 | | 7.875% | | 08/01/10 | | | 2,250 | | | 2,345,828 |
Bear Stearns Cos. LLC (The), Sr. Unsec’d. Notes | | Aa3 | | 5.300% | | 10/30/15 | | | 515 | | | 544,694 |
Bear Stearns Cos. LLC (The), Sr. Unsec’d. Notes | | Aa3 | | 6.400% | | 10/02/17 | | | 330 | | | 359,727 |
Bear Stearns Cos. LLC (The), Sr. Unsec’d. Notes | | Aa3 | | 7.250% | | 02/01/18 | | | 1,175 | | | 1,348,727 |
Capital One Bank USA NA., Sub. Notes | | A3 | | 6.500% | | 06/13/13 | | | 20 | | | 21,501 |
Capital One Capital V, Gtd. Notes | | Baa2 | | 10.250% | | 08/15/39 | | | 620 | | | 720,750 |
Capital One Capital VI, Gtd. Notes | | Baa2 | | 8.875% | | 05/15/40 | | | 1,080 | | | 1,150,200 |
SEE NOTES TO FINANCIAL STATEMENTS.
A54
| | | | | | |
| | | FLEXIBLE MANAGED PORTFOLIO (continued) | | |
| |
| SCHEDULE OF INVESTMENTS | | December 31, 2009 |
| | | | | | | | | | | | |
CORPORATE BONDS
(continued) | | Moody’s
Rating
(Unaudited)†
| | Interest
Rate
| | Maturity
Date
| | Principal
Amount
(000)#
| | Value
(Note 2)
|
| | | | | | | | | | | | | |
Banking (continued) | | | | | | | | | | | | |
Capital One Financial Corp., Sr. Unsec’d. Notes, MTN | | Baa1 | | 5.700% | | 09/15/11 | | $ | 600 | | $ | 630,223 |
Citigroup, Inc., Sub. Notes | | Baa1 | | 5.000% | | 09/15/14 | | | 454 | | | 437,667 |
Citigroup, Inc., Sub. Notes | | Baa1 | | 5.625% | | 08/27/12 | | | 2,800 | | | 2,879,993 |
Citigroup, Inc., Sub. Notes | | Baa1 | | 6.125% | | 08/25/36 | | | 570 | | | 488,829 |
Citigroup, Inc., Sr. Unsec’d. Notes | | A3 | | 6.875% | | 03/05/38 | | | 520 | | | 518,969 |
Citigroup, Inc., Sr. Unsec’d. Notes(a) | | A3 | | 8.125% | | 07/15/39 | | | 430 | | | 485,318 |
Citigroup, Inc., Unsec’d. Notes | | A3 | | 8.500% | | 05/22/19 | | | 975 | | | 1,125,884 |
Countrywide Financial Corp., Gtd. Notes, MTN | | A2 | | 5.800% | | 06/07/12 | | | 1,190 | | | 1,263,198 |
DEPFA ACS Bank (Ireland), Covered Notes, 144A | | Aa2 | | 5.125% | | 03/16/37 | | | 1,380 | | | 1,014,272 |
Discover Bank, Sub. Notes | | Ba1 | | 8.700% | | 11/18/19 | | | 900 | | | 964,219 |
Goldman Sachs Group, Inc. (The), Sr. Unsec’d. Notes | | A1 | | 5.450% | | 11/01/12 | | | 600 | | | 645,107 |
Goldman Sachs Group, Inc. (The), Sub. Notes | | A2 | | 5.625% | | 01/15/17 | | | 1,190 | | | 1,215,418 |
Goldman Sachs Group, Inc. (The), Sub. Notes | | A2 | | 6.450% | | 05/01/36 | | | 1,615 | | | 1,590,689 |
Goldman Sachs Group, Inc. (The), Sub. Notes | | A2 | | 6.750% | | 10/01/37 | | | 104 | | | 106,900 |
Goldman Sachs Group, Inc. (The), Sr. Unsec’d. Notes(a) | | A1 | | 7.500% | | 02/15/19 | | | 1,500 | | | 1,748,705 |
ICICI Bank Ltd. (India), Bonds, 144A(c) | | Baa2 | | 0.824% | | 01/12/10 | | | 2,385 | | | 2,380,308 |
ICICI Bank, Ltd. (Singapore), Notes, 144A | | Baa2 | | 5.750% | | 11/16/10 | | | 1,410 | | | 1,439,788 |
JPMorgan Chase & Co., Jr. Sub. Notes, Ser. 1(c) | | Baa1 | | 7.900% | | 04/29/49 | | | 2,000 | | | 2,062,920 |
JPMorgan Chase Capital XXVI (Capital Security, fixed to floating preferred)(c) | | A2 | | 8.000% | | 05/15/48 | | | 28 | | | 752,080 |
JPMorgan Chase Capital XXVII, Gtd. Notes, Ser. AA | | A2 | | 7.000% | | 11/01/39 | | | 1,500 | | | 1,512,770 |
Merrill Lynch & Co., Inc., Sr. Unsec’d. Notes, Ser. C, MTN | | A2 | | 4.250% | | 02/08/10 | | | 1,170 | | | 1,174,048 |
Merrill Lynch & Co., Inc., Sr. Unsec’d. Notes | | A2 | | 4.790% | | 08/04/10 | | | 295 | | | 301,096 |
Merrill Lynch & Co., Inc., Sr. Unsec’d. Notes, Ser. C, MTN | | A2 | | 5.000% | | 01/15/15 | | | 615 | | | 625,472 |
Merrill Lynch & Co., Inc., Sr. Unsec’d. Notes, MTN | | A2 | | 5.770% | | 07/25/11 | | | 520 | | | 549,712 |
Merrill Lynch & Co., Inc., Sr. Unsec’d. Notes | | A2 | | 6.400% | | 08/28/17 | | | 35 | | | 36,833 |
Merrill Lynch & Co., Inc., Notes, MTN | | A2 | | 6.875% | | 04/25/18 | | | 980 | | | 1,055,889 |
Morgan Stanley, Sr. Unsec’d. Notes | | A2 | | 5.300% | | 03/01/13 | | | 265 | | | 279,309 |
Morgan Stanley, Sr. Unsec’d. Notes, Ser. E | | A2 | | 5.450% | | 01/09/17 | | | 2,345 | | | 2,370,129 |
Morgan Stanley, Sr. Unsec’d. Notes, MTN | | A2 | | 5.625% | | 09/23/19 | | | 1,415 | | | 1,425,344 |
Morgan Stanley, Sr. Unsec’d. Notes, MTN | | A2 | | 5.950% | | 12/28/17 | | | 620 | | | 639,493 |
MUFG Capital Finance 1 Ltd. (Cayman Islands), Gtd. Notes.(c) | | A2 | | 6.346% | | 07/25/49 | | | 800 | | | 728,117 |
PNC Funding Corp., Gtd. Notes.(a) | | A3 | | 6.700% | | 06/10/19 | | | 1,000 | | | 1,118,976 |
Royal Bank of Scotland Group PLC (United Kingdom), Sr. Unsec’d. Notes, MTN | | A1 | | 6.400% | | 10/21/19 | | | 1,775 | | | 1,769,302 |
Santander Central Hispano Issuances Ltd. (Cayman Islands), Gtd. Notes. | | Aa3 | | 7.625% | | 09/14/10 | | | 695 | | | 728,539 |
USB Capital XIII Trust, Gtd. Notes | | A2 | | 6.625% | | 12/15/39 | | | 775 | | | 787,664 |
Wachovia Bank NA, Sub. Notes(a) | | Aa3 | | 7.800% | | 08/18/10 | | | 2,100 | | | 2,191,291 |
Wells Fargo Bank NA, Sub. Notes, Ser. AI | | Aa3 | | 4.750% | | 02/09/15 | | | 585 | | | 596,520 |
Wells Fargo Bank NA, Sub. Notes | | Aa3 | | 6.450% | | 02/01/11 | | | 65 | | | 68,643 |
Wells Fargo Capital XIII, Gtd. Notes, Ser. G, MTN(c) | | Ba1 | | 7.700% | | 12/29/49 | | | 1,000 | | | 970,000 |
| | | | | | | | | | | |
|
|
| | | | | | | | | | | | | 56,723,790 |
| | | | | | | | | | | |
|
|
Brokerage | | | | | | | | | | | | |
Lehman Brothers Holdings, Inc., Sr. Unsec’d. Notes, MTN(f) | | NR | | 5.250% | | 02/06/12 | | | 1,715 | | | 334,425 |
Lehman Brothers Holdings, Inc., Sr. Unsec’d. Notes, MTN(f) | | NR | | 6.875% | | 05/02/18 | | | 700 | | | 145,250 |
| | | | | | | | | | | |
|
|
| | | | | | | | | | | | | 479,675 |
| | | | | | | | | | | |
|
|
Building Materials & Construction — 0.1% | | | | | | | | | | | | |
Hanson Ltd. (United Kingdom), Gtd. Notes | | B1 | | 7.875% | | 09/27/10 | | | 1,000 | | | 1,036,230 |
Lafarge SA (France), Sr. Unsec’d. Notes | | Baa3 | | 6.150% | | 07/15/11 | | | 910 | | | 948,296 |
| | | | | | | | | | | |
|
|
| | | | | | | | | | | | | 1,984,526 |
| | | | | | | | | | | |
|
|
Cable — 0.4% | | | | | | | | | | | | |
Comcast Cable Communications Holdings, Inc., Gtd. Notes | | Baa1 | | 9.455% | | 11/15/22 | | | 255 | | | 327,967 |
Comcast Corp., Gtd. Notes | | Baa1 | | 6.400% | | 05/15/38 | | | 570 | | | 586,546 |
Comcast Corp., Gtd. Notes | | Baa1 | | 6.450% | | 03/15/37 | | | 155 | | | 159,816 |
SEE NOTES TO FINANCIAL STATEMENTS.
A55
| | | | | | |
| | | FLEXIBLE MANAGED PORTFOLIO (continued) | | |
| |
| SCHEDULE OF INVESTMENTS | | December 31, 2009 |
| | | | | | | | | | | | | |
CORPORATE BONDS
(continued) | | Moody’s
Rating
(Unaudited)†
| | | Interest
Rate
| | Maturity
Date
| | Principal
Amount
(000)#
| | Value
(Note 2)
|
| | | | | | | | | | | | | | |
Cable (continued) | | | | | | | | | | | | | |
Comcast Corp., Gtd. Notes | | Baa1 | | | 6.500% | | 11/15/35 | | $ | 450 | | $ | 466,587 |
Comcast Corp., Gtd. Notes | | Baa1 | | | 6.950% | | 08/15/37 | | | 605 | | | 659,385 |
Cox Communications, Inc., Sr. Unsec’d. Notes | | Baa3 | | | 6.750% | | 03/15/11 | | | 950 | | | 998,872 |
DIRECTV Holdings LLC / DIRECTV Financing Co., Inc., Gtd. Notes, 144A | | Ba2 | | | 4.750% | | 10/01/14 | | | 1,940 | | | 1,977,512 |
DISH DBS Corp., Gtd. Notes | | Ba3 | | | 6.375% | | 10/01/11 | | | 1,000 | | | 1,032,500 |
Time Warner Cable, Inc., Gtd. Notes | | Baa2 | | | 5.400% | | 07/02/12 | | | 2,510 | | | 2,681,757 |
Time Warner Cable, Inc., Gtd. Notes(a) | | Baa2 | | | 6.750% | | 06/15/39 | | | 1,575 | | | 1,649,505 |
| | | | | | | | | | | | |
|
|
| | | | | | | | | | | | | | 10,540,447 |
| | | | | | | | | | | | |
|
|
Capital Goods — 0.1% | | | | | | | | | | | | | |
ERAC USA Finance Co., Gtd. Notes, 144A (original cost $459,646; purchased 10/10/07)(d)(g) | | Baa2 | | | 5.800% | | 10/15/12 | | | 460 | | | 482,332 |
ERAC USA Finance Co., Gtd. Notes, 144A (original cost $1,299,722; purchased 10/10/07)(d)(g) | | Baa2 | | | 6.375% | | 10/15/17 | | | 1,302 | | | 1,315,107 |
ERAC USA Finance Co., Gtd. Notes, 144A (original cost $376,709; purchased 10/10/07)(d)(g) | | Baa2 | | | 7.000% | | 10/15/37 | | | 380 | | | 371,947 |
FedEx Corp., Gtd. Notes | | Baa2 | | | 7.250% | | 02/15/11 | | | 400 | | | 423,657 |
General Electric Co., Sr. Unsec’d. Notes | | Aa2 | | | 5.250% | | 12/06/17 | | | 200 | | | 204,373 |
Trane US, Inc., Gtd. Notes(a) | | BBB+ | (e) | | 7.625% | | 02/15/10 | | | 770 | | | 774,623 |
| | | | | | | | | | | | |
|
|
| | | | | | | | | | | | | | 3,572,039 |
| | | | | | | | | | | | |
|
|
Chemicals — 0.2% | | | | | | | | | | | | | |
Dow Chemical Co. (The), Sr. Unsec’d. Notes | | Baa3 | | | 6.125% | | 02/01/11 | | | 685 | | | 714,091 |
Dow Chemical Co. (The), Sr. Unsec’d. Notes | | Baa3 | | | 7.600% | | 05/15/14 | | | 1,800 | | | 2,048,206 |
Dow Chemical Co. (The), Sr. Unsec’d. Notes | | Baa3 | | | 9.400% | | 05/15/39 | | | 500 | | | 661,075 |
ICI Wilmington, Inc., Gtd. Notes | | Baa1 | | | 5.625% | | 12/01/13 | | | 720 | | | 751,494 |
PPG Industries, Inc., Sr. Unsec’d. Notes | | Baa1 | | | 5.750% | | 03/15/13 | | | 1,500 | | | 1,601,533 |
Union Carbide Corp., Sr. Unsec’d. Notes | | Ba2 | | | 7.500% | | 06/01/25 | | | 460 | | | 422,941 |
| | | | | | | | | | | | |
|
|
| | | | | | | | | | | | | | 6,199,340 |
| | | | | | | | | | | | |
|
|
Consumer — 0.2% | | | | | | | | | | | | | |
Avon Products, Inc., Sr. Unsec’d. Notes | | A2 | | | 5.750% | | 03/01/18 | | | 1,500 | | | 1,609,747 |
Fortune Brands, Inc., Sr. Unsec’d. Notes(a) | | Baa3 | | | 6.375% | | 06/15/14 | | | 2,250 | | | 2,409,649 |
Newell Rubbermaid, Inc., Sr. Unsec’d. Notes | | Baa3 | | | 6.250% | | 04/15/18 | | | 1,700 | | | 1,679,775 |
Whirlpool Corp., Sr. Unsec’d. Notes | | Baa3 | | | 6.125% | | 06/15/11 | | | 965 | | | 1,002,946 |
| | | | | | | | | | | | |
|
|
| | | | | | | | | | | | | | 6,702,117 |
| | | | | | | | | | | | |
|
|
Electric — 0.9% | | | | | | | | | | | | | |
Appalachian Power Co., Sr. Unsec’d. Notes, Ser. J | | Baa2 | | | 4.400% | | 06/01/10 | | | 620 | | | 626,938 |
Arizona Public Service Co., Sr. Unsec’d. Notes | | Baa2 | | | 6.250% | | 08/01/16 | | | 175 | | | 185,018 |
Arizona Public Service Co., Sr. Unsec’d. Notes | | Baa2 | | | 6.375% | | 10/15/11 | | | 1,305 | | | 1,396,987 |
Baltimore Gas & Electric Co., Sr. Unsec’d. Notes | | Baa2 | | | 6.350% | | 10/01/36 | | | 550 | | | 564,938 |
Carolina Power & Light Co., First Mtge. Bonds | | A1 | | | 5.250% | | 12/15/15 | | | 525 | | | 574,097 |
CenterPoint Energy Houston Electric LLC, Genl. Ref. Mtge., Ser. J2 | | Baa1 | | | 5.700% | | 03/15/13 | | | 740 | | | 786,578 |
CenterPoint Energy Houston Electric LLC, Genl. Ref. Mtge., Ser. K2 | | Baa1 | | | 6.950% | | 03/15/33 | | | 590 | | | 652,440 |
Consolidated Edison Co. of New York, Inc., Sr. Unsec’d. Notes,
Ser. 05-C | | A3 | | | 5.375% | | 12/15/15 | | | 730 | | | 788,888 |
Consolidated Edison Co. of New York, Inc., Sr. Unsec’d. Notes,
Ser. 08-B(a) | | A3 | | | 6.750% | | 04/01/38 | | | 200 | | | 228,017 |
Consumers Energy Co., First Mtge. Bonds, Ser. D | | A3 | | | 5.375% | | 04/15/13 | | | 325 | | | 348,964 |
Duke Energy Carolinas LLC, First Mtge. Bonds | | A1 | | | 6.050% | | 04/15/38 | | | 550 | | | 585,600 |
Duke Energy Carolinas LLC, Sr. Unsec’d. Notes | | A3 | | | 6.100% | | 06/01/37 | | | 960 | | | 1,007,239 |
E.ON International Finance BV (Netherlands), Gtd. Notes, 144A | | A2 | | | 6.650% | | 04/30/38 | | | 890 | | | 1,012,011 |
El Paso Electric Co., Sr. Unsec’d. Notes | | Baa2 | | | 6.000% | | 05/15/35 | | | 670 | | | 602,526 |
Empresa Nacional de Electricidad S.A. (Chile), Unsub. Notes | | Baa3 | | | 8.625% | | 08/01/15 | | | 1,295 | | | 1,534,987 |
ENEL Finance International SA (Luxembourg), Gtd. Notes, 144A(a) | | A2 | | | 6.000% | | 10/07/39 | | | 1,280 | | | 1,286,775 |
Energy East Corp., Sr. Unsec’d. Notes | | A3 | | | 6.750% | | 09/15/33 | | | 145 | | | 151,292 |
Exelon Corp., Sr. Unsec’d. Notes | | Baa1 | | | 4.900% | | 06/15/15 | | | 155 | | | 159,898 |
SEE NOTES TO FINANCIAL STATEMENTS.
A56
| | | | | | |
| | | FLEXIBLE MANAGED PORTFOLIO (continued) | | |
| |
| SCHEDULE OF INVESTMENTS | | December 31, 2009 |
| | | | | | | | | | | | |
CORPORATE BONDS
(continued) | | Moody’s
Rating
(Unaudited)†
| | Interest
Rate
| | Maturity
Date
| | Principal
Amount
(000)#
| | Value
(Note 2)
|
| | | | | | | | | | | | | |
Electric (continued) | | | | | | | | | | | | |
Exelon Generation Co. LLC, Sr. Unsec’d. Notes | | A3 | | 6.250% | | 10/01/39 | | $ | 1,425 | | $ | 1,451,834 |
FirstEnergy Solutions Corp., Gtd. Notes | | Baa2 | | 6.050% | | 08/15/21 | | | 695 | | | 701,120 |
Florida Power & Light Co., First Mtge. Bonds | | Aa2 | | 5.950% | | 10/01/33 | | | 295 | | | 308,795 |
Georgia Power Co., Sr. Unsec’d. Notes, Ser. B | | A2 | | 5.700% | | 06/01/17 | | | 495 | | | 537,114 |
Indiana Michigan Power Co., Sr. Unsec’d. Notes, Ser. INDF | | Baa2 | | 5.050% | | 11/15/14 | | | 460 | | | 477,141 |
Korea Hydro & Nuclear Power Co. Ltd. (South Korea), Sr. Unsec’d. Notes, 144A(a) | | A2 | | 6.250% | | 06/17/14 | | | 1,770 | | | 1,931,263 |
Midamerican Energy Holdings Co., Sr. Unsec’d. Notes | | Baa1 | | 5.750% | | 04/01/18 | | | 205 | | | 216,064 |
Midamerican Energy Holdings Co., Sr. Unsec’d. Notes | | Baa1 | | 5.950% | | 05/15/37 | | | 300 | | | 300,336 |
National Rural Utilities Cooperative Finance Corp., Sr. Unsec’d. Notes,
Ser. C, MTN | | A2 | | 7.250% | | 03/01/12 | | | 90 | | | 98,931 |
Nevada Power Co., Genl. Ref. Mtge., Ser. O | | Baa3 | | 6.500% | | 05/15/18 | | | 1,260 | | | 1,348,378 |
Niagara Mohawk Power Corp., Sr. Unsec’d. Notes, 144A | | A3 | | 4.881% | | 08/15/19 | | | 610 | | | 604,805 |
NiSource Finance Corp., Gtd. Notes | | Baa3 | | 5.250% | | 09/15/17 | | | 245 | | | 240,976 |
NiSource Finance Corp., Gtd. Notes | | Baa3 | | 5.450% | | 09/15/20 | | | 350 | | | 339,395 |
NSTAR | | A2 | | 4.500% | | 11/15/19 | | | 615 | | | 601,413 |
Oncor Electric Delivery Co. LLC, Sr. Sec’d. Notes | | Baa1 | | 6.375% | | 01/15/15 | | | 345 | | | 376,339 |
Oncor Electric Delivery Co. LLC, Sr. Sec’d. Notes | | Baa1 | | 7.000% | | 09/01/22 | | | 475 | | | 528,128 |
Pacific Gas & Electric Co., Sr. Unsec’d. Notes | | A3 | | 6.050% | | 03/01/34 | | | 1,550 | | | 1,618,253 |
Public Service Co. of New Mexico, Sr. Unsec’d. Notes | | Baa3 | | 7.950% | | 05/15/18 | | | 140 | | | 146,552 |
Public Service Electric & Gas Co., Sec’d. Notes, MTN | | A2 | | 5.800% | | 05/01/37 | | | 535 | | | 550,516 |
Southern California Edison Co., Ser. 04-F | | A1 | | 4.650% | | 04/01/15 | | | 470 | | | 496,946 |
Xcel Energy, Inc., Sr. Unsec’d. Notes | | Baa1 | | 5.613% | | 04/01/17 | | | 199 | | | 205,181 |
Xcel Energy, Inc., Sr. Unsec’d. Notes | | Baa1 | | 6.500% | | 07/01/36 | | | 445 | | | 468,777 |
| | | | | | | | | | | |
|
|
| | | | | | | | | | | | | 26,041,450 |
| | | | | | | | | | | |
|
|
Energy – Integrated — 0.1% | | | | | | | | | | | | |
Cenovus Energy, Inc. (Canada), Sr. Notes, 144A | | Baa2 | | 6.750% | | 11/15/39 | | | 975 | | | 1,062,802 |
Hess Corp., Sr. Unsec’d. Notes | | Baa2 | | 6.000% | | 01/15/40 | | | 400 | | | 396,099 |
Marathon Oil Canada Corp. (Canada), Gtd. Notes | | Baa1 | | 8.375% | | 05/01/12 | | | 360 | | | 402,966 |
Husky Energy, Inc. (Canada), Sr. Unsec’d. Notes | | Baa2 | | 7.250% | | 12/15/19 | | | 325 | | | 375,570 |
TNK-BP Finance SA (Luxembourg), Gtd. Notes, 144A | | Baa2 | | 7.500% | | 07/18/16 | | | 1,425 | | | 1,460,625 |
| | | | | | | | | | | |
|
|
| | | | | | | | | | | | | 3,698,062 |
| | | | | | | | | | | |
|
|
Energy – Other — 0.2% | | | | | | | | | | | | |
Devon Financing Corp. ULC (Canada), Gtd. Notes | | Baa1 | | 7.875% | | 09/30/31 | | | 225 | | | 281,905 |
Dolphin Energy Ltd. (United Arab Emirates), Sr. Sec’d. Notes, 144A | | Aa3 | | 5.888% | | 06/15/19 | | | 936 | | | 944,906 |
Halliburton Co., Sr. Unsec’d. Notes | | A2 | | 5.500% | �� | 10/15/10 | | | 150 | | | 156,103 |
Nexen, Inc. (Canada), Sr. Unsec’d. Notes | | Baa3 | | 6.400% | | 05/15/37 | | | 200 | | | 201,503 |
Pioneer Natural Resources Co., Sr. Unsec’d. Notes | | Ba1 | | 6.875% | | 05/01/18 | | | 1,500 | | | 1,484,130 |
Questar Market Resources, Inc., Sr. Unsec’d. Notes(a) | | Baa3 | | 6.800% | | 03/01/20 | | | 745 | | | 776,517 |
Valero Energy Corp., Gtd. Notes | | Baa2 | | 6.625% | | 06/15/37 | | | 255 | | | 239,275 |
Woodside Finance Ltd. (Australia), Gtd. Notes, 144A | | Baa1 | | 5.000% | | 11/15/13 | | | 1,315 | | | 1,345,317 |
XTO Energy, Inc., Sr. Unsec’d. Notes | | Baa2 | | 6.250% | | 08/01/17 | | | 585 | | | 662,417 |
| | | | | | | | | | | |
|
|
| | | | | | | | | | | | | 6,092,073 |
| | | | | | | | | | | |
|
|
Foods — 0.4% | | | | | | | | | | | | |
Anheuser-Busch InBev Worldwide, Inc., Gtd. Notes, 144A | | Baa2 | | 5.375% | | 01/15/20 | | | 1,800 | | | 1,836,466 |
Anheuser-Busch InBev Worldwide, Inc., Gtd. Notes, 144A | | Baa2 | | 8.000% | | 11/15/39 | | | 1,285 | | | 1,599,717 |
Anheuser-Busch InBev Worldwide, Inc., Gtd. Notes, 144A | | Baa2 | | 8.200% | | 01/15/39 | | | 250 | | | 316,125 |
Bunge Ltd. Finance Corp., Gtd. Notes(a) | | Baa2 | | 5.350% | | 04/15/14 | | | 1,040 | | | 1,063,161 |
Bunge Ltd. Finance Corp., Gtd. Notes | | Baa2 | | 8.500% | | 06/15/19 | | | 985 | | | 1,122,809 |
Cargill, Inc., Sr. Unsec’d. Notes, 144A (original cost $666,818; purchased 11/19/07)(d)(g) | | A2 | | 6.000% | | 11/27/17 | | | 670 | | | 714,108 |
ConAgra Foods, Inc., Sr. Unsec’d. Notes | | Baa2 | | 7.875% | | 09/15/10 | | | 46 | | | 48,154 |
Delhaize America, Inc., Gtd. Notes | | Baa3 | | 9.000% | | 04/15/31 | | | 752 | | | 962,787 |
Delhaize Group SA (Belgium), Gtd. Notes | | Baa3 | | 6.500% | | 06/15/17 | | | 480 | | | 521,295 |
General Mills, Inc., Sr. Unsec’d. Notes | | Baa1 | | 6.000% | | 02/15/12 | | | 1,050 | | | 1,133,660 |
SEE NOTES TO FINANCIAL STATEMENTS.
A57
| | | | | | |
| | | FLEXIBLE MANAGED PORTFOLIO (continued) | | |
| |
| SCHEDULE OF INVESTMENTS | | December 31, 2009 |
| | | | | | | | | | | | |
CORPORATE BONDS
(continued) | | Moody’s
Rating
(Unaudited)†
| | Interest
Rate
| | Maturity
Date
| | Principal
Amount
(000)#
| | Value
(Note 2)
|
| | | | | | | | | | | | | |
Foods (continued) | | | | | | | | | | | | |
H.J. Heinz Finance Co., Gtd. Notes, 144A | | Baa2 | | 7.125% | | 08/01/39 | | $ | 450 | | $ | 508,742 |
Kroger Co. (The), Gtd. Notes | | Baa2 | | 6.750% | | 04/15/12 | | | 45 | | | 49,149 |
Kroger Co. (The), Gtd. Notes | | Baa2 | | 6.800% | | 04/01/11 | | | 670 | | | 711,466 |
McDonald’s Corp., Sr. Unsec’d. Notes, MTN | | A3 | | 6.300% | | 03/01/38 | | | 685 | | | 755,594 |
Ralcorp Holdings, Inc., Sr. Notes, 144A | | Baa3 | | 6.625% | | 08/15/39 | | | 875 | | | 853,338 |
Tyson Foods, Inc., Gtd. Notes | | Ba3 | | 7.850% | | 04/01/16 | | | 735 | | | 753,375 |
Yum! Brands, Inc., Sr. Unsec’d. Notes | | Baa3 | | 8.875% | | 04/15/11 | | | 180 | | | 194,773 |
| | | | | | | | | | | |
|
|
| | | | | | | | | | | | | 13,144,719 |
| | | | | | | | | | | |
|
|
Healthcare & Pharmaceutical — 0.5% | | | | | | | | | | | | |
Abbott Laboratories, Sr. Unsec’d. Notes | | A1 | | 5.875% | | 05/15/16 | | | 1,145 | | | 1,262,922 |
AmerisourceBergen Corp., Gtd. Notes | | Baa3 | | 5.625% | | 09/15/12 | | | 915 | | | 974,249 |
Boston Scientific Corp., Sr. Unsec’d. Notes | | Ba1 | | 4.500% | | 01/15/15 | | | 910 | | | 911,857 |
Boston Scientific Corp., Sr. Unsec’d. Notes | | Ba1 | | 6.000% | | 01/15/20 | | | 565 | | | 577,304 |
Carefusion Corp., Sr. Unsec’d. Notes, 144A | | Baa3 | | 6.375% | | 08/01/19 | | | 355 | | | 380,035 |
Genentech, Inc., Sr. Unsec’d. Notes | | AA-(e) | | 4.750% | | 07/15/15 | | | 280 | | | 299,676 |
GlaxoSmithKline Capital, Inc., Gtd. Notes | | A1 | | 6.375% | | 05/15/38 | | | 870 | | | 963,852 |
HCA, Inc., Sec’d. Notes | | B2 | | 9.250% | | 11/15/16 | | | 1,925 | | | 2,066,969 |
Laboratory Corp. of America Holdings, Sr. Unsec’d. Notes | | Baa3 | | 5.625% | | 12/15/15 | | | 580 | | | 606,414 |
Merck & Co., Inc., Sr. Unsec’d. Notes | | Aa3 | | 5.750% | | 11/15/36 | | | 110 | | | 112,733 |
Merck & Co., Inc., Sr. Unsec’d. Notes | | Aa3 | | 5.850% | | 06/30/39 | | | 265 | | | 278,879 |
Merck & Co., Inc., Sr. Unsec’d. Notes | | Aa3 | | 5.950% | | 12/01/28 | | | 165 | | | 173,881 |
Schering-Plough Corp., Gtd. Notes(a) | | Aa3 | | 6.000% | | 09/15/17 | | | 884 | | | 981,899 |
Schering-Plough Corp., Gtd. Notes | | Aa3 | | 6.550% | | 09/15/37 | | | 340 | | | 386,140 |
Watson Pharmaceuticals, Inc., Sr. Unsec’d. Notes | | Ba1 | | 6.125% | | 08/15/19 | | | 445 | | | 459,148 |
Wyeth, Gtd. Notes | | A1 | | 5.500% | | 03/15/13 | | | 1,210 | | | 1,315,619 |
Wyeth, Gtd. Notes | | A1 | | 5.950% | | 04/01/37 | | | 1,715 | | | 1,788,364 |
Wyeth, Gtd. Notes | | A1 | | 6.450% | | 02/01/24 | | | 60 | | | 66,843 |
| | | | | | | | | | | |
|
|
| | | | | | | | | | | | | 13,606,784 |
| | | | | | | | | | | |
|
|
Healthcare Insurance — 0.2% | | | | | | | | | | | | |
Aetna, Inc., Sr. Unsec’d. Notes | | A3 | | 5.750% | | 06/15/11 | | | 390 | | | 408,995 |
Aetna, Inc., Sr. Unsec’d. Notes | | A3 | | 6.625% | | 06/15/36 | | | 515 | | | 528,080 |
Cigna Corp., Sr. Unsec’d. Notes | | Baa2 | | 6.150% | | 11/15/36 | | | 670 | | | 598,527 |
Coventry Health Care, Inc., Sr. Unsec’d. Notes | | Ba1 | | 6.125% | | 01/15/15 | | | 1,290 | | | 1,232,221 |
UnitedHealth Group, Inc., Sr. Unsec’d. Notes | | Baa1 | | 5.250% | | 03/15/11 | | | 1,350 | | | 1,398,881 |
UnitedHealth Group, Inc., Sr. Unsec’d. Notes | | Baa1 | | 6.000% | | 06/15/17 | | | 195 | | | 204,081 |
UnitedHealth Group, Inc., Sr. Unsec’d. Notes | | Baa1 | | 6.500% | | 06/15/37 | | | 420 | | | 414,161 |
UnitedHealth Group, Inc., Sr. Unsec’d. Notes | | Baa1 | | 6.625% | | 11/15/37 | | | 420 | | | 420,751 |
WellPoint, Inc., Sr. Unsec’d. Notes(a) | | Baa1 | | 5.000% | | 12/15/14 | | | 860 | | | 894,674 |
| | | | | | | | | | | |
|
|
| | | | | | | | | | | | | 6,100,371 |
| | | | | | | | | | | |
|
|
Insurance — 0.4% | | | | | | | | | | | | |
American International Group, Inc., Sr. Unsec’d. Notes | | A3 | | 4.250% | | 05/15/13 | | | 580 | | | 535,750 |
AXA SA (France), Sub. Notes | | A3 | | 8.600% | | 12/15/30 | | | 155 | | | 180,119 |
Berkshire Hathaway Finance Corp., Gtd. Notes | | Aa2 | | 4.750% | | 05/15/12 | | | 440 | | | 469,069 |
Liberty Mutual Group, Inc., Bonds, 144A | | Baa2 | | 7.000% | | 03/15/34 | | | 850 | | | 728,316 |
Lincoln National Corp., Sr. Unsec’d. Notes | | Baa2 | | 6.300% | | 10/09/37 | | | 492 | | | 450,579 |
Lincoln National Corp., Sr. Unsec’d. Notes | | Baa2 | | 8.750% | | 07/01/19 | | | 605 | | | 691,276 |
Marsh & McLennan Cos., Inc., Sr. Unsec’d. Notes | | Baa2 | | 5.150% | | 09/15/10 | | | 265 | | | 271,666 |
MetLife, Inc., Sr. Unsec’d. Notes | | A3 | | 5.700% | | 06/15/35 | | | 1,020 | | | 1,007,331 |
MetLife, Inc., Sr. Unsec’d. Notes | | A3 | | 6.125% | | 12/01/11 | | | 335 | | | 360,134 |
MetLife, Inc., Sr. Unsec’d. Notes | | A3 | | 6.375% | | 06/15/34 | | | 400 | | | 427,454 |
MetLife, Inc., Sr. Unsec’d. Notes | | A3 | | 6.750% | | 06/01/16 | | | 430 | | | 481,532 |
New York Life Insurance Co., Sub. Notes, 144A | | Aa2 | | 6.750% | | 11/15/39 | | | 660 | | | 674,962 |
Pacific Life Insurance Co., Sub. Notes, 144A (original cost $994,522; purchased 6/16/09)(g) | | A3 | | 9.250% | | 06/15/39 | | | 995 | | | 1,148,962 |
Teachers Insurance & Annuity Association of America, Notes, 144A | | Aa2 | | 6.850% | | 12/16/39 | | | 1,450 | | | 1,498,920 |
SEE NOTES TO FINANCIAL STATEMENTS.
A58
| | | | | | |
| | | FLEXIBLE MANAGED PORTFOLIO (continued) | | |
| |
| SCHEDULE OF INVESTMENTS | | December 31, 2009 |
| | | | | | | | | | | | |
CORPORATE BONDS
(continued) | | Moody’s
Rating
(Unaudited)†
| | Interest
Rate
| | Maturity
Date
| | Principal
Amount
(000)#
| | Value
(Note 2)
|
| | | | | | | | | | | | | |
Insurance (continued) | | | | | | | | | | | | |
Travelers Cos., Inc. (The), Sr. Unsec’d. Notes | | A2 | | 6.750% | | 06/20/36 | | $ | 685 | | $ | 756,111 |
W.R. Berkley Corp., Sr. Unsec’d. Notes | | Baa2 | | 5.600% | | 05/15/15 | | | 555 | | | 548,947 |
W.R. Berkley Corp., Sr. Unsec’d. Notes | | Baa2 | | 6.150% | | 08/15/19 | | | 460 | | | 436,633 |
XL Capital Ltd. (Cayman Islands), Sr. Unsec’d. Notes | | Baa2 | | 5.250% | | 09/15/14 | | | 85 | | | 83,242 |
| | | | | | | | | | | |
|
|
| | | | | | | | | | | | | 10,751,003 |
| | | | | | | | | | | |
|
|
Lodging — 0.2% | | | | | | | | | | | | |
Starwood Hotels & Resorts Worldwide, Inc., Sr. Unsec’d. Notes | | Ba1 | | 6.250% | | 02/15/13 | | | 1,645 | | | 1,696,406 |
Starwood Hotels & Resorts Worldwide, Inc., Sr. Unsec’d. Notes(a) | | Ba1 | | 6.750% | | 05/15/18 | | | 2,800 | | | 2,807,000 |
| | | | | | | | | | | |
|
|
| | | | | | | | | | | | | 4,503,406 |
| | | | | | | | | | | |
|
|
Media & Entertainment — 0.2% | | | | | | | | | | | | |
Gannett Co., Inc., Sr. Unsec’d. Notes | | Ba2 | | 6.375% | | 04/01/12 | | | 2,500 | | | 2,500,000 |
Historic TW, Inc., Sr. Unsec’d. Notes | | Baa2 | | 9.150% | | 02/01/23 | | | 505 | | | 609,451 |
News America, Inc., Gtd. Notes, 144A(a) | | Baa1 | | 6.900% | | 08/15/39 | | | 800 | | | 872,699 |
Time Warner, Inc., Gtd. Notes | | Baa2 | | 6.750% | | 04/15/11 | | | 640 | | | 678,081 |
Time Warner Cos., Inc., Gtd. Notes | | Baa2 | | 7.250% | | 10/15/17 | | | 790 | | | 884,738 |
Viacom, Inc., Sr. Unsec’d. Notes(a) | | Baa2 | | 6.750% | | 10/05/37 | | | 430 | | | 443,621 |
Viacom, Inc., Sr. Unsec’d. Notes | | Baa2 | | 6.875% | | 04/30/36 | | | 625 | | | 675,816 |
| | | | | | | | | | | |
|
|
| | | | | | | | | | | | | 6,664,406 |
| | | | | | | | | | | |
|
|
Metals — 0.2% | | | | | | | | | | | | |
Alcan, Inc. (Canada), Sr. Unsec’d. Notes | | BBB+(e) | | 4.500% | | 05/15/13 | | | 115 | | | 118,084 |
Alcan, Inc. (Canada), Sr. Unsec’d. Notes | | BBB+(e) | | 5.000% | | 06/01/15 | | | 600 | | | 615,993 |
Ispat Inland ULC (Canada), Gtd. Notes | | Baa3 | | 9.750% | | 04/01/14 | | | 1,745 | | | 1,832,250 |
Newmont Mining Corp., Gtd. Notes | | Baa2 | | 6.250% | | 10/01/39 | | | 880 | | | 881,052 |
Rio Tinto Finance USA Ltd. (Australia), Gtd. Notes | | Baa1 | | 5.875% | | 07/15/13 | | | 1,000 | | | 1,079,037 |
Southern Copper Corp., Sr. Unsec’d. Notes | | Baa3 | | 7.500% | | 07/27/35 | | | 125 | | | 123,855 |
United States Steel Corp., Sr. Unsec’d. Notes | | Ba3 | | 5.650% | | 06/01/13 | | | 2,580 | | | 2,567,121 |
| | | | | | | | | | | |
|
|
| | | | | | | | | | | | | 7,217,392 |
| | | | | | | | | | | |
|
|
Non-Captive Finance — 0.4% | | | | | | | | | | | | |
General Electric Capital Corp., Notes, MTN(a) | | Aa2 | | 3.500% | | 08/13/12 | | | 1,990 | | | 2,031,062 |
General Electric Capital Corp., Sr. Unsec’d. Notes, MTN | | Aa2 | | 5.550% | | 05/04/20 | | | 985 | | | 976,269 |
General Electric Capital Corp., Sr. Unsec’d. Notes, MTN | | Aa2 | | 5.875% | | 01/14/38 | | | 1,060 | | | 981,436 |
General Electric Capital Corp., Sr. Unsec’d. Notes, Ser. A, MTN | | Aa2 | | 6.125% | | 02/22/11 | | | 950 | | | 1,003,863 |
General Electric Capital Corp., Sr. Unsec’d. Notes, Ser. G, MTN | | Aa2 | | 6.000% | | 08/07/19 | | | 920 | | | 954,979 |
HSBC Finance Corp., Sr. Unsec’d. Notes | | A3 | | 5.700% | | 06/01/11 | | | 440 | | | 459,674 |
International Lease Finance Corp., Sr. Unsec’d. Notes | | B1 | | 6.375% | | 03/25/13 | | | 1,850 | | | 1,521,033 |
SLM Corp., Sr. Unsec’d. Notes, MTN | | Ba1 | | 8.450% | | 06/15/18 | | | 2,870 | | | 2,831,981 |
| | | | | | | | | | | |
|
|
| | | | | | | | | | | | | 10,760,297 |
| | | | | | | | | | | |
|
|
Packaging | | | | | | | | | | | | |
Sealed Air Corp., Sr. Unsec’d. Notes, 144A | | Baa3 | | 6.875% | | 07/15/33 | | | 515 | | | 484,516 |
| | | | | | | | | | | |
|
|
Paper — 0.1% | | | | | | | | | | | | |
International Paper Co., Sr. Unsec’d. Notes | | Baa3 | | 7.300% | | 11/15/39 | | | 1,080 | | | 1,145,730 |
International Paper Co., Sr. Unsec’d. Notes | | Baa3 | | 7.500% | | 08/15/21 | | | 510 | | | 571,440 |
| | | | | | | | | | | |
|
|
| | | | | | | | | | | | | 1,717,170 |
| | | | | | | | | | | |
|
|
Pipelines & Other — 0.2% | | | | | | | | | | | | |
DCP Midstream LLC, Sr. Unsec’d. Notes | | Baa2 | | 7.875% | | 08/16/10 | | | 1,760 | | | 1,829,738 |
Kinder Morgan Energy Partners LP, Sr. Unsec’d. Notes(a) | | Baa2 | | 6.500% | | 09/01/39 | | | 675 | | | 680,272 |
Oneok Partners LP, Gtd. Notes | | Baa2 | | 6.650% | | 10/01/36 | | | 420 | | | 428,368 |
Sempra Energy, Sr. Unsec’d. Notes | | Baa1 | | 6.000% | | 02/01/13 | | | 90 | | | 95,970 |
Spectra Energy Capital LLC, Gtd. Notes | | Baa2 | | 6.200% | | 04/15/18 | | | 3,190 | | | 3,387,825 |
Spectra Energy Capital LLC, Sr. Unsec’d. Notes | | Baa2 | | 6.250% | | 02/15/13 | | | 235 | | | 252,675 |
| | | | | | | | | | | |
|
|
| | | | | | | | | | | | | 6,674,848 |
| | | | | | | | | | | |
|
|
SEE NOTES TO FINANCIAL STATEMENTS.
A59
| | | | | | |
| | | FLEXIBLE MANAGED PORTFOLIO (continued) | | |
| |
| SCHEDULE OF INVESTMENTS | | December 31, 2009 |
| | | | | | | | | | | | |
CORPORATE BONDS
(continued) | | Moody’s
Rating
(Unaudited)†
| | Interest
Rate
| | Maturity
Date
| | Principal
Amount
(000)#
| | Value
(Note 2)
|
| | | | | | | | | | | | | |
Railroads — 0.1% | | | | | | | | | | | | |
Burlington Northern Santa Fe Corp., Sr. Unsec’d. Notes | | Baa1 | | 6.700% | | 08/01/28 | | $ | 670 | | $ | 718,144 |
CSX Corp., Sr. Unsec’d. Notes(a) | | Baa3 | | 6.150% | | 05/01/37 | | | 715 | | | 724,423 |
Norfolk Southern Corp., Sr. Unsec’d. Notes | | Baa1 | | 5.590% | | 05/17/25 | | | 525 | | | 510,367 |
Norfolk Southern Corp., Sr. Unsec’d. Notes | | Baa1 | | 7.800% | | 05/15/27 | | | 18 | | | 21,638 |
Union Pacific Corp., Sr. Unsec’d. Notes | | Baa2 | | 6.650% | | 01/15/11 | | | 750 | | | 791,080 |
| | | | | | | | | | | |
|
|
| | | | | | | | | | | | | 2,765,652 |
| | | | | | | | | | | |
|
|
Real Estate Investment Trusts — 0.2% | | | | | | | | | | | | |
Brandywine Operating Partnership LP, Gtd. Notes | | Baa3 | | 5.750% | | 04/01/12 | | | 361 | | | 367,966 |
Mack-Cali Realty LP, Sr. Unsec’d. Notes | | Baa2 | | 7.750% | | 08/15/19 | | | 765 | | | 791,588 |
Post Apartment Homes LP, Sr. Unsec’d. Notes | | Baa3 | | 5.450% | | 06/01/12 | | | 435 | | | 431,627 |
Post Apartment Homes LP, Sr. Unsec’d. Notes | | Baa3 | | 6.300% | | 06/01/13 | | | 660 | | | 656,202 |
Simon Property Group LP, Sr. Unsec’d. Notes | | A3 | | 5.750% | | 05/01/12 | | | 1,500 | | | 1,575,744 |
Simon Property Group LP, Sr. Unsec’d. Notes | | A3 | | 6.125% | | 05/30/18 | | | 2,800 | | | 2,844,766 |
| | | | | | | | | | | |
|
|
| | | | | | | | | | | | | 6,667,893 |
| | | | | | | | | | | |
|
|
Retailers — 0.6% | | | | | | | | | | | | |
CVS Caremark Corp., Sr. Unsec’d. Notes | | Baa2 | | 5.750% | | 08/15/11 | | | 1,000 | | | 1,064,875 |
CVS Caremark Corp., Sr. Unsec’d. Notes | | Baa2 | | 5.750% | | 06/01/17 | | | 1,640 | | | 1,730,879 |
CVS Caremark Corp., Sr. Unsec’d. Notes | | Baa2 | | 6.125% | | 09/15/39 | | | 750 | | | 743,324 |
Gamestop Corp. / Gamestop, Inc., Gtd. Notes | | Ba1 | | 8.000% | | 10/01/12 | | | 1,115 | | | 1,155,419 |
Home Depot, Inc. (The), Sr. Unsec’d. Notes | | Baa1 | | 5.875% | | 12/16/36 | | | 325 | | | 313,709 |
Kohl’s Corp., Sr. Unsec’d. Notes | | Baa1 | | 6.875% | | 12/15/37 | | | 1,015 | | | 1,151,164 |
Lowe’s Cos., Inc., Sr. Unsec’d. Notes | | A1 | | 6.500% | | 03/15/29 | | | 385 | | | 423,379 |
Macy’s Retail Holdings, Inc., Gtd. Notes | | Ba2 | | 5.350% | | 03/15/12 | | | 390 | | | 398,287 |
Macy’s Retail Holdings, Inc., Gtd. Notes | | Ba2 | | 5.875% | | 01/15/13 | | | 2,000 | | | 2,055,000 |
Nordstrom, Inc., Sr. Unsec’d. Notes(a) | | Baa2 | | 6.250% | | 01/15/18 | | | 4,500 | | | 4,871,115 |
Target Corp., Sr. Unsec’d. Notes | | A2 | | 7.000% | | 01/15/38 | | | 1,835 | | | 2,140,983 |
Wal-Mart Stores, Inc., Sr. Unsec’d. Notes | | Aa2 | | 5.250% | | 09/01/35 | | | 245 | | | 240,913 |
Wal-Mart Stores, Inc., Sr. Unsec’d. Notes | | Aa2 | | 6.200% | | 04/15/38 | | | 500 | | | 551,397 |
| | | | | | | | | | | |
|
|
| | | | | | | | | | | | | 16,840,444 |
| | | | | | | | | | | |
|
|
Technology — 0.4% | | | | | | | | | | | | |
Cisco Systems, Inc., Sr. Unsec’d. Notes | | A1 | | 4.450% | | 01/15/20 | | | 1,690 | | | 1,657,863 |
Computer Sciences Corp., Sr. Unsec’d. Notes, Ser. WI | | Baa1 | | 6.500% | | 03/15/18 | | | 1,800 | | | 1,964,336 |
Electronic Data Systems LLC., Sr. Unsec’d. Notes | | A2 | | 7.450% | | 10/15/29 | | | 120 | | | 141,996 |
Fiserv, Inc., Gtd. Notes | | Baa2 | | 6.125% | | 11/20/12 | | | 1,000 | | | 1,088,871 |
Intuit, Inc., Sr. Unsec’d. Notes | | Baa2 | | 5.400% | | 03/15/12 | | | 600 | | | 637,442 |
Motorola, Inc., Sr. Unsec’d. Notes | | Baa3 | | 8.000% | | 11/01/11 | | | 49 | | | 52,405 |
Oracle Corp., Sr. Unsec’d. Notes | | A2 | | 6.125% | | 07/08/39 | | | 1,215 | | | 1,275,793 |
Seagate Technology HDD Holdings (Cayman Islands), Gtd. Notes | | Ba3 | | 6.375% | | 10/01/11 | | | 1,000 | | | 1,017,500 |
Xerox Corp., Sr. Unsec’d. Notes(a) | | Baa2 | | 4.250% | | 02/15/15 | | | 2,720 | | | 2,701,039 |
| | | | | | | | | | | |
|
|
| | | | | | | | | | | | | 10,537,245 |
| | | | | | | | | | | |
|
|
Telecommunications — 0.8% | | | | | | | | | | | | |
America Movil SAB de CV (Mexico), Gtd. Notes(a) | | A3 | | 6.375% | | 03/01/35 | | | 580 | | | 598,726 |
AT&T Corp., Gtd. Notes | | A2 | | 8.000% | | 11/15/31 | | | 260 | | | 317,335 |
AT&T, Inc., Sr. Unsec’d. Notes | | A2 | | 5.300% | | 11/15/10 | | | 1,260 | | | 1,309,824 |
AT&T Mobility LLC, Sr. Unsec’d. Notes | | A2 | | 7.125% | | 12/15/31 | | | 505 | | | 564,429 |
Deutsche Telekom International Finance BV (Netherlands), Gtd. Notes | | Baa1 | | 8.750% | | 06/15/30 | | | 295 | | | 379,402 |
Embarq Corp., Sr. Unsec’d. Notes (original cost $349,979; purchased 05/12/06)(d)(g) | | Baa3 | | 7.082% | | 06/01/16 | | | 350 | | | 386,602 |
Embarq Corp., Sr. Unsec’d. Notes (original cost $1,626,279; purchased 05/12/06-04/10/07)(d)(g) | | Baa3 | | 7.995% | | 06/01/36 | | | 1,600 | | | 1,721,117 |
France Telecom SA (France), Sr. Unsec’d. Notes | | A3 | | 8.500% | | 03/01/31 | | | 375 | | | 499,055 |
Koninklijke KPN NV (Netherlands), Sr. Unsec’d. Notes | | Baa2 | | 8.000% | | 10/01/10 | | | 530 | | | 556,500 |
New Cingular Wireless Services, Inc., Gtd. Notes | | A2 | | 8.125% | | 05/01/12 | | | 640 | | | 723,157 |
New Cingular Wireless Services, Inc., Sr. Unsec’d. Notes | | A2 | | 8.750% | | 03/01/31 | | | 1,339 | | | 1,730,402 |
SEE NOTES TO FINANCIAL STATEMENTS.
A60
| | | | | | |
| | | FLEXIBLE MANAGED PORTFOLIO (continued) | | |
| |
| SCHEDULE OF INVESTMENTS | | December 31, 2009 |
| | | | | | | | | | | | |
CORPORATE BONDS
(continued) | | Moody’s
Rating
(Unaudited)†
| | Interest
Rate
| | Maturity
Date
| | Principal
Amount
(000)#
| | Value
(Note 2)
|
| | | | | | | | | | | | | |
Telecommunications (continued) | | | | | | | | | | | | |
PCCW-HKT Capital Ltd. (Virgin Islands (US)), Gtd. Notes, 144A | | Baa2 | | 8.000% | | 11/15/11 | | $ | 2,370 | | $ | 2,554,623 |
Qwest Capital Funding, Inc., Gtd. Notes | | B1 | | 7.250% | | 02/15/11 | | | 700 | | | 710,500 |
Qwest Corp., Sr. Unsec’d. Notes | | Ba1 | | 8.875% | | 03/15/12 | | | 2,000 | | | 2,150,000 |
Telecom Italia Capital SA (Luxembourg), Gtd. Notes | | Baa2 | | 5.250% | | 11/15/13 | | | 320 | | | 336,573 |
Telecom Italia Capital SA (Luxembourg), Gtd. Notes | | Baa2 | | 7.175% | | 06/18/19 | | | 2,095 | | | 2,335,638 |
Telefonica Emisiones SAU (Spain), Gtd. Notes | | Baa1 | | 5.877% | | 07/15/19 | | | 780 | | | 836,027 |
Telefonica Emisiones SAU (Spain), Gtd. Notes | | Baa1 | | 7.045% | | 06/20/36 | | | 210 | | | 239,799 |
Telefonos de Mexico SAB de CV (Mexico), Sr. Unsec’d. Notes, 144A(a) | | A3 | | 5.500% | | 11/15/19 | | | 255 | | | 248,309 |
TELUS Corp. (Canada), Sr. Unsec’d. Notes | | Baa1 | | 8.000% | | 06/01/11 | | | 899 | | | 973,260 |
United States Cellular Corp., Sr. Unsec’d. Notes | | Baa2 | | 6.700% | | 12/15/33 | | | 275 | | | 270,449 |
Verizon Communications, Inc., Sr. Unsec’d. Notes | | A3 | | 6.100% | | 04/15/18 | | | 3,400 | | | 3,695,491 |
Vodafone Group PLC (United Kingdom), Sr. Unsec’d. Notes | | Baa1 | | 7.750% | | 02/15/10 | | | 800 | | | 806,384 |
| | | | | | | | | | | |
|
|
| | | | | | | | | | | | | 23,943,602 |
| | | | | | | | | | | |
|
|
Tobacco — 0.2% | | | | | | | | | | | | |
Altria Group, Inc., Gtd. Notes | | Baa1 | | 9.250% | | 08/06/19 | | | 215 | | | 262,005 |
Altria Group, Inc., Gtd. Notes(a) | | Baa1 | | 9.700% | | 11/10/18 | | | 985 | | | 1,217,625 |
Altria Group, Inc., Gtd. Notes | | Baa1 | | 9.950% | | 11/10/38 | | | 140 | | | 182,491 |
Altria Group, Inc., Gtd. Notes | | Baa1 | | 10.200% | | 02/06/39 | | | 790 | | | 1,053,890 |
Lorillard Tobacco Co., Sr. Unsec’d. Notes(a) | | Baa2 | | 8.125% | | 06/23/19 | | | 765 | | | 841,030 |
Philip Morris International, Inc., Sr. Unsec’d. Notes | | A2 | | 4.875% | | 05/16/13 | | | 860 | | | 907,864 |
Reynolds American, Inc., Gtd. Notes | | Baa3 | | 7.250% | | 06/15/37 | | | 320 | | | 322,265 |
| | | | | | | | | | | |
|
|
| | | | | | | | | | | | | 4,787,170 |
| | | | | | | | | | | |
|
|
TOTAL CORPORATE BONDS
(cost $270,471,604) | | | 279,680,599 |
| | | | | | | | | | | |
|
|
| MORTGAGE-BACKED SECURITIES — 10.6% | | | | | | | | | | |
Federal Home Loan Mortgage Corporation | | | | 4.500% | | 02/01/19-07/01/20 | | | 4,342 | | | 4,508,231 |
Federal Home Loan Mortgage Corporation | | | | 5.000% | | 07/01/18-05/01/34 | | | 7,762 | | | 8,110,347 |
Federal Home Loan Mortgage Corporation | | | | 5.000% | | TBA 30 YR | | | 5,000 | | | 5,126,560 |
Federal Home Loan Mortgage Corporation(c) | | | | 5.214% | | 12/01/35 | | | 2,387 | | | 2,511,410 |
Federal Home Loan Mortgage Corporation | | | | 5.500% | | 12/01/33-05/01/38 | | | 10,490 | | | 11,024,532 |
Federal Home Loan Mortgage Corporation | | | | 5.500% | | TBA 30 YR | | | 18,000 | | | 18,855,000 |
Federal Home Loan Mortgage Corporation(c) | | | | 5.548% | | 06/01/36 | | | 2,970 | | | 3,130,489 |
Federal Home Loan Mortgage Corporation | | | | 6.000% | | 03/01/32-12/01/33 | | | 2,266 | | | 2,436,973 |
Federal Home Loan Mortgage Corporation | | | | 6.500% | | 12/01/14 | | | 194 | | | 208,892 |
Federal Home Loan Mortgage Corporation | | | | 7.000% | | 01/01/31-11/01/33 | | | 2,850 | | | 3,138,417 |
Federal National Mortgage Association(c) | | | | 3.233% | | 07/01/33 | | | 740 | | | 762,375 |
Federal National Mortgage Association | | | | 4.000% | | 06/01/19 | | | 1,371 | | | 1,401,176 |
Federal National Mortgage Association | | | | 4.000% | | TBA 15 YR | | | 6,000 | | | 6,014,064 |
Federal National Mortgage Association | | | | 4.500% | | 11/01/18-01/01/35 | | | 10,774 | | | 11,062,329 |
Federal National Mortgage Association | | | | 4.500% | | TBA 30 YR | | | 10,000 | | | 9,981,250 |
Federal National Mortgage Association | | | | 5.000% | | 10/01/18-05/01/36 | | | 29,419 | | | 30,315,867 |
Federal National Mortgage Association | | | | 5.000% | | TBA 30 YR | | | 2,000 | | | 2,052,188 |
Federal National Mortgage Association | | | | 5.500% | | 03/01/16-06/01/38 | | | 46,704 | | | 49,100,986 |
Federal National Mortgage Association | | | | 5.500% | | TBA 15 YR | | | 6,000 | | | 6,345,000 |
Federal National Mortgage Association | | | | 5.500% | | TBA 30 YR | | | 25,250 | | | 26,429,655 |
Federal National Mortgage Association(c) | | | | 5.921% | | 06/01/37 | | | 7,740 | | | 8,230,697 |
Federal National Mortgage Association | | | | 6.000% | | 04/01/13-08/01/38 | | | 25,264 | | | 26,923,258 |
Federal National Mortgage Association | | | | 6.000% | | TBA 30 YR | | | 30,500 | | | 32,301,391 |
Federal National Mortgage Association | | | | 6.500% | | 07/01/17-09/01/37 | | | 10,131 | | | 10,891,434 |
Federal National Mortgage Association | | | | 7.000% | | 08/01/11-07/01/32 | | | 714 | | | 793,668 |
Federal National Mortgage Association | | | | 7.500% | | 06/01/12-05/01/32 | | | 315 | | | 344,769 |
Government National Mortgage Association | | | | 4.500% | | TBA 30 YR | | | 8,000 | | | 8,070,284 |
SEE NOTES TO FINANCIAL STATEMENTS.
A61
| | | | | | |
| | | FLEXIBLE MANAGED PORTFOLIO (continued) | | |
| |
| SCHEDULE OF INVESTMENTS | | December 31, 2009 |
| | | | | | | | | | | | |
MORTGAGE-BACKED SECURITIES
(continued) | | Moody’s
Rating
(Unaudited)†
| | Interest
Rate
| | Maturity
Date
| | Principal
Amount
(000)#
| | Value
(Note 2)
|
| | | | | | | | | | | | | |
Government National Mortgage Association | | | | 5.500% | | 11/15/32-02/15/36 | | $ | 9,603 | | $ | 10,123,962 |
Government National Mortgage Association | | | | 6.000% | | 02/15/33-10/15/34 | | | 3,885 | | | 4,138,827 |
Government National Mortgage Association | | | | 6.500% | | 10/15/23-07/15/35 | | | 4,231 | | | 4,540,112 |
Government National Mortgage Association | | | | 8.000% | | 01/15/24-04/15/25 | | | 98 | | | 112,188 |
| | | | | | | | | | | |
|
|
TOTAL MORTGAGE-BACKED SECURITIES
(cost $301,109,630) | | | 308,986,331 |
| | | | | | | | | | | |
|
|
| MUNICIPAL BONDS — 0.2% | | | | | | | | | | | | |
Bay Area Toll Authority, BABs | | Aa3 | | 6.263% | | 04/01/49 | | | 1,325 | | | 1,270,689 |
New Jersey State Turnpike Authority, BABs | | A3 | | 7.414% | | 01/01/40 | | | 450 | | | 507,240 |
New York City Transitional Finance Authority, BABs | | Aa2 | | 5.767% | | 08/01/36 | | | 1,130 | | | 1,095,162 |
State of California, BABs | | Baa1 | | 7.300% | | 10/01/39 | | | 1,270 | | | 1,200,252 |
State of California, BABs(a) | | Baa1 | | 7.550% | | 04/01/39 | | | 245 | | | 240,707 |
State of Washington, BABs | | Aa1 | | 5.481% | | 08/01/39 | | | 355 | | | 343,434 |
| | | | | | | | | | | |
|
|
TOTAL MUNICIPAL BONDS
(cost $4,788,780) | | | 4,657,484 |
| | | | | | | | | | | |
|
|
| NON-CORPORATE FOREIGN AGENCIES — 0.3% | | | | | | | | | | | | |
Commonwealth Bank of Australia (Australia), 144A | | Aaa | | 2.700% | | 11/25/14 | | | 7,435 | | | 7,286,754 |
Pemex Project Funding Master Trust, Gtd. Notes | | Baa1 | | 8.625% | | 12/01/23 | | | 350 | | | 422,625 |
RSHB Capital SA For OJSC Russian Agricultural Bank (Luxembourg), Sr. Sec’d. Notes, 144A | | Baa1 | | 6.299% | | 05/15/17 | | | 2,190 | | | 2,205,330 |
| | | | | | | | | | | |
|
|
TOTAL NON-CORPORATE FOREIGN AGENCIES
(cost $10,029,329) | | | 9,914,709 |
| | | | | | | | | | | |
|
|
| NON-CORPORATE SOVEREIGN | | | | | | | | | | | | |
Qatar Government International Bond (Qatar), 144A (cost $738,409)(a) | | Aa2 | | 6.400% | | 01/20/40 | | | 740 | | | 743,700 |
| | | | | | | | | | | |
|
|
| RESIDENTIAL MORTGAGE-BACKED SECURITIES —0.3% | | | | | | | | |
Amortizing Residential Collateral Trust, Ser. 2002-BC7, Class M2(c) | | CC(e) | | 1.581% | | 10/25/32 | | | 107 | | | 8,139 |
CDC Mortgage Capital Trust, Ser. 2002-HE3, Class M1(c) | | Baa2 | | 1.881% | | 03/25/33 | | | 547 | | | 349,620 |
Centex Home Equity, Ser. 2005-A, Class M2(c) | | Aa3 | | 0.731% | | 01/25/35 | | | 1,790 | | | 1,342,191 |
Credit-Based Asset Servicing And Securitization LLC, Ser. 2005-CB6, Class A3 | | A3 | | 5.120% | | 07/25/35 | | | 536 | | | 448,455 |
Equity One ABS, Inc., Ser. 2004-3, Class M1 | | Aa2 | | 5.700% | | 07/25/34 | | | 793 | | | 603,058 |
First Franklin Mortgage Loan Trust, Ser. 2005-FFH1, Class M2(c) | | Ba3 | | 0.751% | | 06/25/36 | | | 1,450 | | | 157,382 |
HFC Home Equity Loan, Ser. 2005-2, Class M2(c) | | Aa1 | | 0.723% | | 01/20/35 | | | 422 | | | 348,462 |
Long Beach Mortgage Loan Trust, Ser. 2004-2, Class M1(c) | | Aa2 | | 0.761% | | 06/25/34 | | | 1,250 | | | 864,264 |
Morgan Stanley ABS Capital I, Ser. 2004-NC1, Class M1(c) | | Aa2 | | 0.931% | | 12/25/33 | | | 1,193 | | | 879,185 |
Morgan Stanley Dean Witter Capital I, Ser. 2002-HE1, Class M1(c) | | B3 | | 1.131% | | 07/25/32 | | | 1,065 | | | 711,711 |
Morgan Stanley Dean Witter Capital I, Ser. 2002-NC4, Class M1(c) | | A2 | | 1.506% | | 09/25/32 | | | 881 | | | 628,263 |
Morgan Stanley Dean Witter Capital I, Ser. 2002-NC2, Class M2, 144A(c) | | NR | | 2.556% | | 04/25/32 | | | 351 | | | 104,888 |
Saxon Asset Securities Trust, Ser. 2005-2, Class M2(c) | | A2 | | 0.671% | | 10/25/35 | | | 1,170 | | | 338,232 |
Securitized Asset Backed Receivables LLC Trust, Ser. 2004-OP1, Class M1(c) | | Aa2 | | 0.996% | | 02/25/34 | | | 1,325 | | | 995,484 |
Securitized Asset Backed Receivables LLC Trust, Ser. 2006-FR3, Class A3(c) | | Caa1 | | 0.481% | | 05/25/36 | | | 1,100 | | | 364,367 |
| | | | | | | | | | | |
|
|
TOTAL RESIDENTIAL MORTGAGE-BACKED SECURITIES
(cost $13,221,757) | | | 8,143,701 |
| | | | | | | | | | | |
|
|
SEE NOTES TO FINANCIAL STATEMENTS.
A62
| | | | | | |
| | | FLEXIBLE MANAGED PORTFOLIO (continued) | | |
| |
| SCHEDULE OF INVESTMENTS | | December 31, 2009 |
| | | | | | | | | | | | | |
| U.S. GOVERNMENT AGENCY OBLIGATIONS — 0.8% | | | | Interest
Rate
| | Maturity
Date
| | Principal
Amount
(000)#
| | Value
(Note 2)
| |
| | | | | | | | | | | | | | |
Western Corporate Federal Credit Union, US Gov’t. Gtd. Notes | | | | 1.750% | | 11/02/12 | | $ | 2,610 | | $ | 2,598,281 | |
Federal Farm Credit Bank(a) | | | | 4.875% | | 01/17/17 | | | 855 | | | 909,828 | |
Federal Home Loan Bank | | | | 5.000% | | 11/17/17 | | | 635 | | | 686,892 | |
Federal Home Loan Bank | | | | 5.625% | | 06/11/21 | | | 2,390 | | | 2,601,699 | |
Federal Home Loan Mortgage Corporation(a) | | | | 3.750% | | 03/27/19 | | | 4,835 | | | 4,740,335 | |
Federal National Mortgage Association | | | | 0.875% | | 01/12/12 | | | 115 | | | 114,114 | |
Federal National Mortgage Association(a) | | | | 2.625% | | 11/20/14 | | | 2,640 | | | 2,619,529 | |
Federal National Mortgage Association | | | | 5.000% | | 02/13/17 | | | 3,070 | | | 3,332,476 | |
Federal National Mortgage Association(a) | | | | 6.625% | | 11/15/30 | | | 2,245 | | | 2,698,059 | |
Resolution Funding Corp. Interest Strip(h) | | | | 4.980% | | 04/15/18 | | | 2,615 | | | 1,843,421 | |
Tennessee Valley Authority | | | | 4.500% | | 04/01/18 | | | 1,445 | | | 1,470,503 | |
Tennessee Valley Authority, Ser. E | | | | 6.250% | | 12/15/17 | | | 560 | | | 638,735 | |
| | | | | | | | | | | |
|
|
|
TOTAL U.S. GOVERNMENT AGENCY OBLIGATIONS
(cost $24,465,153) | | | 24,253,872 | |
| | | | | | | | | | | |
|
|
|
| U.S. GOVERNMENT TREASURY OBLIGATIONS — 4.3% | | | | | | | | | | | | | |
U.S. Treasury Bonds | | | | 4.500% | | 02/15/36 | | | 3,150 | | | 3,102,750 | |
U.S. Treasury Bonds(a) | | | | 4.500% | | 08/15/39 | | | 2,470 | | | 2,414,040 | |
U.S. Treasury Bonds | | | | 6.250% | | 08/15/23 | | | 10,495 | | | 12,534,966 | |
U.S. Treasury Bonds | | | | 7.125% | | 02/15/23 | | | 8,200 | | | 10,516,500 | |
U.S. Treasury Bonds(i) | | | | 8.875% | | 08/15/17 | | | 5,505 | | | 7,504,003 | |
U.S. Treasury Inflation Index Notes | | | | 1.625% | | 01/15/15 | | | 19,087 | | | 19,850,869 | |
U.S. Treasury Inflation Index Notes | | | | 3.500% | | 01/15/11 | | | 5,279 | | | 5,475,385 | |
U.S. Treasury Notes(a) | | | | 0.750% | | 11/30/11 | | | 3,155 | | | 3,134,420 | |
U.S. Treasury Notes(a) | | | | 2.125% | | 11/30/14 | | | 3,835 | | | 3,744,225 | |
U.S. Treasury Notes | | | | 2.625% | | 12/31/14 | | | 10,560 | | | 10,529,482 | |
U.S. Treasury Notes(a) | | | | 3.375% | | 11/15/19 | | | 9,110 | | | 8,762,727 | |
U.S. Treasury Strips Coupon(n) | | | | 3.980% | | 11/15/18 | | | 1,230 | | | 864,437 | |
U.S. Treasury Strips Coupon(n) | | | | 4.830% | | 11/15/24 | | | 10,880 | | | 5,309,962 | |
U.S. Treasury Strips Coupon(n) | | | | 4.840% | | 05/15/24 | | | 4,045 | | | 2,034,582 | |
U.S. Treasury Strips Coupon(n) | | | | 4.860% | | 08/15/24 | | | 6,980 | | | 3,459,735 | |
U.S. Treasury Strips Coupon(n) | | | | 5.270% | | 05/15/20 | | | 4,565 | | | 2,935,971 | |
U.S. Treasury Strips Coupon(n) | | | | 7.140% | | 05/15/25 | | | 9,500 | | | 4,493,500 | |
U.S. Treasury Strips Coupon(n) | | | | 7.450% | | 05/15/26 | | | 5,000 | | | 2,234,300 | |
U.S. Treasury Strips Principal(a)(h) | | | | 4.070% | | 02/15/19 | | | 4,295 | | | 2,984,110 | |
U.S. Treasury Strips Principal(a)(h) | | | | 4.800% | | 11/15/24 | | | 13,500 | | | 6,664,666 | |
U.S. Treasury Strips Principal(h) | | | | 6.260% | | 02/15/23 | | | 10,900 | | | 5,944,620 | |
| | | | | | | | | | | |
|
|
|
TOTAL U.S. GOVERNMENT TREASURY OBLIGATIONS
(cost $124,995,757) | | | 124,495,250 | |
| | | | | | | | | | | |
|
|
|
TOTAL LONG-TERM INVESTMENTS
(cost $2,410,775,646) | | | 2,721,315,127 | |
| | | | | | | | | | | |
|
|
|
| SHORT-TERM INVESTMENTS — 15.6% | | | | | | | | | | | | | |
U.S. GOVERNMENT TREASURY OBLIGATION — 0.2% | | | | | | | | | | | | | |
U.S. Treasury Bill (cost $4,396,836)(j) | | | | 0.157% | | 06/17/10 | | | 4,400 | | | 4,396,251 | |
| | | | | | | | | | | |
|
|
|
| | | | | |
| | | | | | | | | Shares
| | | |
AFFILIATED MUTUAL FUNDS — 15.4% | | | | | | | | | | | | | |
Dryden Core Investment Fund — Short-Term Bond Series
(cost $167,366,748) (Note 4)(k) | | | 16,901,556 | | | 144,677,318 | |
Dryden Core Investment Fund — Taxable Money Market Series
(cost $302,386,487; includes $156,084,644 of cash collateral received for securities on loan) (Note 4)(k)(l) | | | 302,386,487 | | | 302,386,487 | |
| | | | | | | | | | | |
|
|
|
TOTAL AFFILIATED MUTUAL FUNDS
(cost $469,753,234) | | | 447,063,805 | |
| | | | | | | | | | | |
|
|
|
TOTAL SHORT-TERM INVESTMENTS
(cost $474,150,070) | | | 451,460,056 | |
| | | | | | | | | | | |
|
|
|
TOTAL INVESTMENTS(m) — 109.2%
(cost $2,884,925,716) | | | 3,172,775,183 | |
LIABILITIES IN EXCESS OF OTHER ASSETS(o) — (9.2)% | | | (266,782,405 | ) |
| | | | | | | | | | | |
|
|
|
NET ASSETS — 100.0% | | $ | 2,905,992,778 | |
| | | | | | | | | | | |
|
|
|
SEE NOTES TO FINANCIAL STATEMENTS.
A63
| | | | | | |
| | | FLEXIBLE MANAGED PORTFOLIO (continued) | | |
| |
| SCHEDULE OF INVESTMENTS | | December 31, 2009 |
The following abbreviations are used in portfolio descriptions:
| | |
| 144A | | Security was purchased pursuant to Rule 144A under the Securities Act of 1933 and may not be resold subject to that rule except to qualified institutional buyers. Unless otherwise noted, 144A securities are deemed to be liquid. |
| BABs | | Build America Bonds |
| CDO | | Collateralized Debt Obligation |
| I/O | | Interest Only |
| MTN | | Medium Term Note |
| NR | | Not Rated by Moody’s or Standard & Poor’s |
| TBA | | To Be Announced |
| ULC | | Unlimited Liability Corporation |
| # | Principal amount shown in U.S. dollars unless otherwise stated. |
| † | The rating reflected is as of December 31, 2009. Ratings of certain bonds may have changed subsequent to that date. |
| (a) | All or a portion of security is on loan. The aggregate market value of such securities is $149,443,792; cash collateral of $156,084,644 (included in liabilities) was received with which the Portfolio purchased highly liquid short-term investments. |
| (b) | Non-income producing security. |
| (c) | Indicates a variable rate security. The maturity date presented for these instruments is the latter of the next date on which the security can be redeemed at par or the next date on which the rate of interest is adjusted. The interest rate shown reflects the rate in effect at December 31, 2009. |
| (d) | Indicates a security that has been deemed illiquid. |
| (e) | Standard & Poor’s Rating. |
| (f) | Represents issuer in default on interest payments and/or principal repayment; non-income producing security. |
| (g) | Indicates a restricted security; the aggregate original cost of such securities is $5,773,675. The aggregate value of $6,140,175 is approximately 0.2% of net assets. |
| (h) | Represents zero-coupon bond. Rate shown reflects the effective yield at December 31, 2009. |
| (i) | Security segregated as collateral for futures contracts. |
| (j) | Rate quoted represents yield-to-maturity as of purchase date. |
| (k) | Prudential Investments LLC, the manager of the Portfolio, also serves as manager of the Dryden Core Investment Fund—Taxable Money Market Series and the Dryden Core Investment Fund—Short-Term Bond Series. |
| (l) | Represents security, or a portion thereof, purchased with cash collateral received for securities on loan. |
| (m) | As of December 31, 2009, one security representing $2,219,029 and 0.08% of net assets was fair valued in accordance with the policies adopted by the Board of Trustees. |
| (n) | Rate shown reflects the effective yield at December 31, 2009. |
| (o) | Liabilities in excess of other assets includes net unrealized appreciation (depreciation) on futures contracts, interest rate and credit default swap agreements as follows: |
Open futures contracts outstanding at December 31, 2009:
| | | | | | | | | | | | | | |
Number of
Contracts
| | Type
| | Expiration
Date
| | Value at
Trade Date
| | Value at
December 31, 2009
| | Unrealized
Appreciation
(Depreciation)
| |
| Long Positions: | | | | | | | | | | | | | | |
| 123 | | U.S. Treasury 10 Yr. Notes | | Mar. 2010 | | $ | 14,262,634 | | $ | 14,200,735 | | $ | (61,899 | ) |
| 365 | | U.S. Treasury 2 Yr. Notes | | Mar. 2010 | | | 79,336,237 | | | 78,936,953 | | | (399,284 | ) |
| 805 | | U.S. Treasury 5 Yr. Notes | | Mar. 2010 | | | 93,365,192 | | | 92,078,164 | | | (1,287,028 | ) |
| 175 | | S&P 500 Index | | Mar. 2010 | | | 47,801,762 | | | 48,593,125 | | | 791,363 | |
| | | | | | | | | | | | |
|
|
|
| | | | | | | | | | | | | $ | (956,848 | ) |
| | | | | | | | | | | | |
|
|
|
| Short Position: | | | | | | | | | | | | | | |
| 378 | | U.S. Long Bond | | Mar. 2010 | | | 45,507,295 | | | 43,611,750 | | | 1,895,545 | |
| | | | | | | | | | | | |
|
|
|
| | | | | | | | | | | | | $ | 938,697 | |
| | | | | | | | | | | | |
|
|
|
SEE NOTES TO FINANCIAL STATEMENTS.
A64
| | | | | | |
| | | FLEXIBLE MANAGED PORTFOLIO (continued) | | |
| |
| SCHEDULE OF INVESTMENTS | | December 31, 2009 |
Interest rate swap agreements outstanding at December 31, 2009:
| | | | | | | | | | | | | | | | | | | | |
Counterparty
| | Termination
Date
| | Notional
Amount
(000)#
| | Fixed
Rate
| | Floating Rate
| | Fair
Value
| | | Upfront
Premiums
Paid/(Received)
| | Unrealized
Appreciation/
(Depreciation)
| |
Deutsche Bank AG(b) | | 5/31/2014 | | $ | 12,200 | | 2.355% | | 3 Month LIBOR | | $ | (260,364 | ) | | $ | — | | $ | (260,364 | ) |
Morgan Stanley Capital Services, Inc.(a) | | 2/15/2036 | | | 3,060 | | 4.128% | | 3 Month LIBOR | | | 172,008 | | | | — | | | 172,008 | |
| | | | | | | | | | | |
|
|
| |
|
| |
|
|
|
| | | | | | | | | | | | $ | (88,356 | ) | | $ | — | | $ | (88,356 | ) |
| | | | | | | | | | | |
|
|
| |
|
| |
|
|
|
| (a) | Portfolio pays the fixed rate and receives the floating rate. |
| (b) | Portfolio pays the floating rate and receives the fixed rate. |
| # | Notional amount is shown in U.S. dollars unless otherwise stated. |
Credit default swap agreements outstanding at December 31, 2009:
| | | | | | | | | | | | | | | | | | | | | |
Counterparty
| | Termination
Date
| | Notional
Amount
(000)#(4)
| | Fixed
Rate
| | Reference Entity/Obligation
| | Fair
Value
| | | Upfront
Premiums
Paid/
(Received)
| | | Unrealized
Appreciation/
(Depreciation)
| |
Credit Default Swaps on Corporate Issues—Buy protection(1) | | | | | | | | | | | | |
Barclays Bank PLC | | 9/20/2012 | | $ | 2,900 | | 0.595% | | Fortune Brands, Inc.,
5.375%, 01/15/16 | | $ | 13,288 | | | $ | — | | | $ | 13,288 | |
Barclays Bank PLC | | 3/20/2018 | | | 1,800 | | 1.220% | | Computer Sciences Corp.,
5.000%, 02/15/13 | | | (80,143 | ) | | | — | | | | (80,143 | ) |
Citibank NA | | 9/20/2012 | | | 3,200 | | 0.320% | | Altria Group, Inc.,
7.000%, 11/04/13 | | | 35,999 | | | | — | | | | 35,999 | |
Credit Suisse International | | 6/20/2018 | | | 3,400 | | 0.970% | | Verizon Communications, Inc.,
4.900%, 09/15/15 | | | (32,404 | ) | | | — | | | | (32,404 | ) |
Deutsche Bank AG | | 9/20/2011 | | | 1,000 | | 1.000% | | Dish DBS Corp.,
6.625%, 10/01/14 | | | (405 | ) | | | 11,828 | | | | (12,233 | ) |
Deutsche Bank AG | | 3/20/2012 | | | 2,000 | | 5.000% | | Gannett Co., Inc.,
6.375%, 4/01/12 | | | (128,921 | ) | | | (68,315 | ) | | | (60,606 | ) |
Deutsche Bank AG | | 12/20/2012 | | | 2,000 | | 1.000% | | Macy’s Retail Holdings, Inc.,
8.000%, 7/15/12 | | | 22,348 | | | | 70,988 | | | | (48,640 | ) |
Deutsche Bank AG | | 6/20/2013 | | | 1,850 | | 2.000% | | International Lease Finance Corp., 4.150%, 01/20/15 | | | 338,559 | | | | — | | | | 338,559 | |
Deutsche Bank AG | | 6/20/2013 | | | 2,000 | | 1.000% | | US Steel Corp.,
6.650%, 6/01/37 | | | 86,635 | | | | 109,913 | | | | (23,278 | ) |
Deutsche Bank AG | | 3/20/2014 | | | 1,645 | | 7.050% | | Starwood Hotels & Resorts Worldwide,
7.875%, 05/01/12 | | | (374,480 | ) | | | — | | | | (374,480 | ) |
Deutsche Bank AG | | 3/20/2018 | | | 4,500 | | 0.990% | | Nordstrom, Inc.,
6.950%, 03/15/28 | | | 29,111 | | | | — | | | | 29,111 | |
Deutsche Bank AG | | 6/20/2018 | | | 2,200 | | 1.150% | | Spectra Energy Capital LLC,
6.250%, 02/15/13 | | | (58,757 | ) | | | — | | | | (58,757 | ) |
JPMorgan Chase Bank | | 6/20/2014 | | | 1,150 | | 0.650% | | Bunge Ltd. Finance Corp.,
5.350%, 04/15/14 | | | 25,835 | | | | — | | | | 25,835 | |
Merrill Lynch Capital Services, Inc. | | 9/20/2016 | | | 735 | | 1.730% | | Tyson Foods, Inc.,
7.850%, 04/01/16 | | | 31,312 | | | | — | | | | 31,312 | |
Merrill Lynch Capital Services, Inc. | | 6/20/2018 | | | 1,800 | | 3.050% | | SLM Corp.,
5.125%, 08/27/12 | | | 210,897 | | | | — | | | | 210,897 | |
Merrill Lynch Capital Services, Inc. | | 6/20/2018 | | | 500 | | 1.130% | | Spectra Energy Capital LLC,
6.250%, 02/15/13 | | | (12,623 | ) | | | — | | | | (12,623 | ) |
Merrill Lynch Capital Services, Inc. | | 6/20/2018 | | | 2,800 | | 1.450% | | Starwood Hotels & Resorts Worldwide, Inc.,
6.750%, 05/15/18 | | | 72,406 | | | | — | | | | 72,406 | |
Morgan Stanley Capital Services, Inc. | | 3/20/2012 | | | 500 | | 5.000% | | Gannett Co., Inc.,
6.375%, 04/01/12 | | | (32,230 | ) | | | (17,617 | ) | | | (14,613 | ) |
Morgan Stanley Capital Services, Inc. | | 3/20/2018 | | | 1,500 | | 0.700% | | Avon Products, Inc.,
6.500%, 03/01/19 | | | (30,270 | ) | | | — | | | | (30,270 | ) |
SEE NOTES TO FINANCIAL STATEMENTS.
A65
| | | | | | |
| | | FLEXIBLE MANAGED PORTFOLIO (continued) | | |
| |
| SCHEDULE OF INVESTMENTS | | December 31, 2009 |
Credit default swap agreements outstanding at December 31, 2009 (continued):
| | | | | | | | | | | | | | | | | | |
Counterparty
| | Termination
Date
| | Notional
Amount
(000)#(4)
| | Fixed
Rate
| | Reference Entity/Obligation
| | Fair
Value
| | Upfront
Premiums
Paid/
(Received)
| | Unrealized
Appreciation/
(Depreciation)
|
Credit Default Swaps on Corporate Issues—Buy protection(1) (continued) | | | | | | | | | |
Morgan Stanley Capital Services, Inc. | | 6/20/2018 | | $ | 1,700 | | 1.000% | | Newell Rubbermaid, Inc.,
0.000%, 07/15/28 | | $ | 45,843 | | $ | — | | $ | 45,843 |
Morgan Stanley Capital Services, Inc. | | 6/20/2018 | | | 2,800 | | 0.970% | | Simon Property Group L.P.,
5.250%, 12/01/16 | | | 105,094 | | | — | | | 105,094 |
| | | | | | | | | | | |
|
| |
|
| |
|
|
| | | | | | | | | | | | $ | 267,094 | | $ | 106,797 | | $ | 160,297 |
| | | | | | | | | | | |
|
| |
|
| |
|
|
| | | | | | | | | | | | | | | | | | |
Counterparty
| | Termination
Date
| | Notional
Amount
(000)#(4)
| | Fixed
Rate
| | Reference Entity/Obligation
| | Fair
Value
| | Upfront
Premiums
Paid/
(Received)
| | Unrealized
Appreciation
|
Credit Default Swaps on Asset-Backed Issues—Buy protection(1) | | | | | | | | | |
Merrill Lynch Capital Services, Inc. | | 3/25/2036 | | $ | 842 | | 3.720% | | Ameriquest Mortgage Securities, Inc., Ser. 2006-R1, Class M9,
2.731%, 03/25/36 | | $ | 814,732 | | $ | — | | $ | 814,732 |
| | | | | | | | | | | |
|
| |
|
| |
|
|
| | | | | | | | | | | | | | | | | | | | |
Counterparty
| | Termination
Date
| | Notional
Amount
(000)#(4)
| | Fixed
Rate
| | Reference Entity/Obligation
| | Fair
Value(3)
| | | Upfront
Premiums
Paid/
(Received)
| | Unrealized
Depreciation
| |
Credit Default Swaps on Asset-Backed Issues—Sell protection(2) | | | | | | | | | | | |
Merrill Lynch Capital Services, Inc. | | 3/25/2036 | | $ | 842 | | 9.000% | | Ameriquest Mortgage Securities, Inc., Ser. 2006-R1, Class M9,
2.731%, 03/25/36 | | $ | (790,816 | ) | | $ | — | | $ | (790,816 | ) |
| | | | | | | | | | | |
|
|
| |
|
| |
|
|
|
The Portfolio entered into credit default swaps as the protection seller on asset-backed issues to take an active short position with respect to the likelihood of a particular issuer’s default.
| (1) | If the Portfolio is a buyer of protection, it pays the fixed rate. When a credit event occurs, as defined under the terms of that particular swap agreement, the Portfolio will either (i) receive from the seller of protection an amount equal to the notional amount of the swap and make delivery of the referenced obligation or underlying securities comprising the referenced index or (ii) receive a net settlement amount in the form of cash or securities equal to the notional amount of the swap less the recovery value of the referenced obligation or underlying securities comprising the referenced index. |
| (2) | If the Portfolio is a seller of protection, it receives the fixed rate. When a credit event occurs, as defined under the terms of that particular swap agreement, the Portfolio will either (i) pay to the buyer of protection an amount equal to the notional amount of the swap and take delivery of the referenced obligation or underlying securities comprising the referenced index or (ii) pay a net settlement amount in the form of cash or securities equal to the notional amount of the swap less the recovery value of the referenced obligation or underlying securities comprising the referenced index. |
| (3) | The fair value of credit default swap agreements on asset-backed securities serve as an indicator of the current status of the payment/performance risk and represent the likelihood of an expected liability (or profit) for the credit derivative should the notional amount of the swap agreement be closed/sold as of the reporting date. |
| (4) | Notional amount represents the maximum potential amount the Portfolio could be required to pay as a seller of credit protection or receive as a buyer of credit protection if a credit event occurs as defined under the terms of that particular swap agreement. |
| # | Notional amount is shown in U.S. dollars unless otherwise stated. |
Various inputs are used in determining the value of the Portfolio’s investments. These inputs are summarized in the three broad levels listed below.
Level 1—quoted prices in active markets for identical securities
Level 2—other significant observable inputs (including quoted prices for similar securities, interest rates, prepayment speeds, credit risk, etc.)
Level 3—significant unobservable inputs (including the Portfolio’s own assumptions in determining the fair value of investments)
SEE NOTES TO FINANCIAL STATEMENTS.
A66
| | | | | | |
| | | FLEXIBLE MANAGED PORTFOLIO (continued) | | |
| |
| SCHEDULE OF INVESTMENTS | | December 31, 2009 |
The following is a summary of the inputs used as of December 31, 2009 in valuing the Portfolio’s assets carried at fair value:
| | | | | | | | | |
| | | Level 1
| | Level 2
| | Level 3
|
Investments in Securities | | | | | | | | | |
Asset-Backed Securities | | $ | — | | $ | 12,726,355 | | $ | 2,219,029 |
Bank Loans | | | — | | | 15,284,511 | | | — |
Collateralized Mortgage Obligations | | | — | | | 9,991,334 | | | — |
Commercial Mortgage-Backed Securities | | | — | | | 108,870,917 | | | — |
Corporate Bonds | | | — | | | 279,680,599 | | | — |
Common Stocks | | | 1,811,347,335 | | | — | | | — |
Mortgage-Backed Securities | | | — | | | 308,986,331 | | | — |
Municipal Bonds | | | — | | | 4,657,484 | | | — |
Non-Corporate Foreign Agencies | | | — | | | 9,914,709 | | | — |
Non-Corporate Sovereign | | | — | | | 743,700 | | | — |
Residential Mortgage-Backed Securities | | | — | | | 8,143,701 | | | — |
U.S. Government Agency Obligations | | | — | | | 24,253,872 | | | — |
U.S. Government Treasury Obligations | | | — | | | 128,891,501 | | | — |
Affiliated Mutual Funds | | | 447,063,805 | | | — | | | — |
| | |
|
| |
|
| |
|
|
| | | | 2,258,411,140 | | | 912,145,014 | | | 2,219,029 |
Other Financial Instruments* | | | 938,697 | | | 71,941 | | | 23,916 |
| | |
|
| |
|
| |
|
|
Total | | $ | 2,259,349,837 | | $ | 912,216,955 | | $ | 2,242,945 |
| | |
|
| |
|
| |
|
|
The following is a reconciliation of assets in which significant unobservable inputs (Level 3) were used in determining fair value:
| | | | | | | | |
| | | Asset-Backed
Securities
| | | Other Financial
Instruments*
| |
Balance as of 12/31/08 | | $ | — | | | $ | 1,511,232 | |
Realized gain (loss) | | | — | | | | — | ** |
Change in unrealized appreciation (depreciation) | | | (933 | ) | | | (1,487,316 | ) |
Earned accretion/amortization | | | 933 | | | | — | |
Net purchases (sales) | | | 2,219,029 | | | | — | |
Transfers in and/or out of Level 3 | | | — | | | | — | |
| | |
|
|
| |
|
|
|
Balance as of 12/31/09 | | $ | 2,219,029 | | | $ | 23,916 | |
| | |
|
|
| |
|
|
|
| * | Other financial instruments are derivative instruments not reflected in the Schedule of Investments, such as futures, forwards and swap contracts, which are valued at the unrealized appreciation/depreciation on the instrument. |
| ** | The realized gain earned during the period for other financial instruments was $1,580,082. |
SEE NOTES TO FINANCIAL STATEMENTS.
A67
| | | | | | |
| | | FLEXIBLE MANAGED PORTFOLIO (continued) | | |
| |
| SCHEDULE OF INVESTMENTS | | December 31, 2009 |
The industry classification of portfolio holdings and liabilities in excess of other assets shown as a percentage of net assets as of December 31, 2009 was as follows:
| | | |
Affiliated Mutual Funds (including 5.4% of collateral received for securities on loan) | | 15.4 | % |
Mortgage-Backed Securities | | 10.6 | |
Oil, Gas & Consumable Fuels | | 6.1 | |
U.S. Government Treasury Obligations | | 4.5 | |
Computers & Peripherals | | 4.2 | |
Pharmaceuticals | | 4.2 | |
Commercial Mortgage-Backed Securities | | 3.8 | |
Diversified Financial Services | | 3.1 | |
Software | | 2.6 | |
Aerospace & Defense | | 2.4 | |
Diversified Telecommunication Services | | 2.2 | |
Semiconductors & Semiconductor Equipment | | 2.1 | |
Banking | | 1.9 | |
Household Products | | 1.8 | |
Capital Markets | | 1.7 | |
Media | | 1.6 | |
Beverages | | 1.5 | |
Healthcare Equipment & Supplies | | 1.5 | |
Specialty Retail | | 1.5 | |
Industrial Conglomerates | | 1.4 | |
Insurance | | 1.4 | |
Commercial Banks | | 1.3 | |
Tobacco | | 1.3 | |
Communications Equipment | | 1.2 | |
Food & Staples Retailing | | 1.2 | |
Healthcare Providers & Services | | 1.2 | |
IT Services | | 1.2 | |
Food Products | | 1.1 | |
Internet Software & Services | | 1.1 | |
Air Freight & Logistics | | 1.0 | |
Chemicals | | 1.0 | |
Electric | | 1.0 | |
Consumer Finance | | 0.9 | |
Metals & Mining | | 0.9 | |
Electrical Utilities | | 0.8 | |
Multiline Retail | | 0.8 | |
Telecommunications | | 0.8 | |
U.S. Government Agency Obligations | | 0.8 | |
Biotechnology | | 0.7 | |
Energy Equipment & Services | | 0.7 | |
Healthcare & Pharmaceutical | | 0.7 | |
Life Sciences Tools & Services | | 0.7 | |
Machinery | | 0.7 | |
Real Estate Investment Trusts | | 0.7 | |
| | | |
Multi-Utilities | | 0.6 | % |
Retailers | | 0.6 | |
Textiles, Apparel & Luxury Goods | | 0.6 | |
Asset-Backed Securities | | 0.5 | |
Automobiles | | 0.5 | |
Electronic Equipment & Instruments | | 0.5 | |
Hotels, Restaurants & Leisure | | 0.5 | |
Technology | | 0.5 | |
Cable | | 0.4 | |
Collateralized Mortgage Obligations | | 0.4 | |
Foods | | 0.4 | |
Household Durables | | 0.4 | |
Non-Captive Finance | | 0.4 | |
Auto Components | | 0.3 | |
Containers & Packaging | | 0.3 | |
Independent Power Producers & Energy Traders | | 0.3 | |
Media & Entertainment | | 0.3 | |
Non-Corporate Foreign Agencies | | 0.3 | |
Professional Services | | 0.3 | |
Residential Mortgage-Backed Securities | | 0.3 | |
Road & Rail | | 0.3 | |
Airlines | | 0.2 | |
Commercial Services & Supplies | | 0.2 | |
Consumer | | 0.2 | |
Energy – Other | | 0.2 | |
Healthcare Insurance | | 0.2 | |
Lodging | | 0.2 | |
Metals | | 0.2 | |
Municipal Bonds | | 0.2 | |
Pipelines & Other | | 0.2 | |
Trading Companies & Distributors | | 0.2 | |
Building Materials & Construction | | 0.1 | |
Building Products | | 0.1 | |
Capital Goods | | 0.1 | |
Diversified Consumer Services | | 0.1 | |
Electrical Equipment | | 0.1 | |
Energy – Integrated | | 0.1 | |
Gas Utilities | | 0.1 | |
Leisure Equipment & Products | | 0.1 | |
Office Electronics | | 0.1 | |
Paper | | 0.1 | |
Railroads | | 0.1 | |
Wireless Telecommunication Services | | 0.1 | |
| | |
|
|
| | | 109.2 | |
Liabilities in excess of other assets | | (9.2 | ) |
| | |
|
|
| | | 100.0 | % |
| | |
|
|
SEE NOTES TO FINANCIAL STATEMENTS.
A68
| | | | | | |
| | | FLEXIBLE MANAGED PORTFOLIO (continued) | | |
| |
| SCHEDULE OF INVESTMENTS | | December 31, 2009 |
The Portfolio invested in derivative instruments during the reporting period. The primary types of risk associated with these derivative instruments are commodity risk, credit risk, equity risk, foreign exchange risk and interest rate risk. The effect of such derivative instruments on the Portfolio’s financial position and financial performance as reflected in the Statement of Assets and Liabilities and Statement of Operations is presented in the summary below.
Fair values of derivative Instruments as of December 31, 2009 as presented in the Statement of Assets and Liabilities:
| | | | | | | | | | | | |
Derivatives not designated as
hedging instruments, carried at
fair value
| | Asset Derivatives
| | | Liability Derivatives
| |
| | Balance Sheet Location
| | Fair
Value
| | | Balance Sheet Location
| | Fair
Value
| |
Credit contracts | | Premium paid for swap agreements | | $ | 192,729 | | | Premium received for swap agreements | | $ | 85,932 | |
Credit contracts | | Unrealized appreciation on swaps | | | 1,723,076 | | | Unrealized depreciation on swaps | | | 1,538,863 | |
Equity contracts | | Due to broker—variation margin | | | 791,363 | * | | — | | | — | |
Interest rate contracts | | Due to broker—variation margin | | | 1,895,545 | * | | Due to broker—variation margin | | | 1,748,211 | * |
Interest rate contracts | | Unrealized appreciation on swaps | | | 172,008 | | | Unrealized depreciation on swaps | | | 260,364 | |
| | | | |
|
|
| | | |
|
|
|
Total | | | | $ | 4,774,721 | | | | | $ | 3,633,370 | |
| | | | |
|
|
| | | |
|
|
|
| * | Includes cumulative appreciation/depreciation on futures contracts as reported in Schedule of Investments. Only unsettled variation margin receivable (payable) is reported within the Statement of Assets and Liabilities. |
The effects of derivative instruments on the Statement of Operations for the year ended December 31, 2009 are as follows:
| | | | | | | | | | | | | | | |
| Amount of Realized Gain or (Loss) on Derivatives Recognized in Income |
Derivatives not designated as hedging
instruments, carried at fair value
| | Futures
| | Swaps
| | Purchased
Options
| | | Written
Options
| | Total
|
Credit contracts | | $ | — | | $ 882,749 | | $ | — | | | $ | — | | $ | 882,749 |
Equity contracts | | | 9,211,850 | | — | | | — | | | | — | | | 9,211,850 |
Interest rate contracts | | | 4,606,026 | | 270,773 | | | (119,911 | ) | | | 43,436 | | | 4,800,324 |
| | |
|
| |
| |
|
|
| |
|
| |
|
|
Total | | $ | 13,817,876 | | $1,153,522 | | $ | (119,911 | ) | | $ | 43,436 | | $ | 14,894,923 |
| | |
|
| |
| |
|
|
| |
|
| |
|
|
| | | | | | | | | | | | |
|
| Change in Unrealized Appreciation or (Depreciation) on Derivatives Recognized in Income | |
Derivatives not designated as hedging
instruments, carried at fair value
| | Futures
| | | Swaps
| | | Total
| |
Credit contracts | | $ | — | | | $ | (5,660,170 | ) | | $ | (5,660,170 | ) |
Equity contracts | | | 708,263 | | | | — | | | | 708,263 | |
Interest rate contracts | | | (2,524,923 | ) | | | 27,961 | | | | (2,496,962 | ) |
| | |
|
|
| |
|
|
| |
|
|
|
Total | | $ | (1,816,660 | ) | | $ | (5,632,209 | ) | | $ | (7,448,869 | ) |
| | |
|
|
| |
|
|
| |
|
|
|
For the year ended December 31, 2009, the Portfolio’s average volume of derivative activities is as follows:
| | | | | | |
Purchased Options
(Cost)
| | Written Options
(Premium Received)
| | Futures
Long Position
(Value at Trade Date)
| | Futures
Short Position
(Value at Trade Date)
|
$7,889 | | $3,221 | | $165,681,351 | | $10,767,010 |
| | | | |
Interest Rate Swaps
(Notional Amount in USD (000))
| | Credit Default
Swaps as Buyer
(Notional Amount in USD (000))
| | Credit Default
Swaps as Writer
(Notional Amount in USD (000))
|
$12,686 | | $39,281 | | $968 |
SEE NOTES TO FINANCIAL STATEMENTS.
A69
| | | | | | |
| | | FLEXIBLE MANAGED PORTFOLIO (continued) | | |
STATEMENT OF ASSETS AND LIABILITIES
December 31, 2009
| | | | |
| ASSETS | | | | |
Investments, at value including securities on loan of $149,443,792: | | | | |
Unaffiliated investments (cost $2,415,172,482) | | $ | 2,725,711,378 | |
Affiliated investments (cost $469,753,234) | | | 447,063,805 | |
Receivable for investments sold | | | 110,554,208 | |
Dividends and interest receivable | | | 10,181,644 | |
Unrealized appreciation on swaps | | | 1,895,084 | |
Foreign tax reclaim receivable | | | 512,246 | |
Premium paid for swap agreements | | | 192,729 | |
Receivable for Series shares sold | | | 1,735 | |
Prepaid expenses | | | 36,816 | |
| | |
|
|
|
Total Assets | | | 3,296,149,645 | |
| | |
|
|
|
| LIABILITIES | | | | |
Payable for investments purchased | | | 224,009,915 | |
Collateral for securities on loan | | | 156,084,644 | |
Payable to custodian | | | 5,636,062 | |
Unrealized depreciation on swaps | | | 1,799,227 | |
Management fee payable | | | 1,478,287 | |
Due to broker-variation margin | | | 594,568 | |
Accrued expenses and other liabilities | | | 265,490 | |
Payable for Series shares repurchased | | | 202,147 | |
Premium received for swap agreements | | | 85,932 | |
Affiliated transfer agent fee payable | | | 595 | |
| | |
|
|
|
Total Liabilities | | | 390,156,867 | |
| | |
|
|
|
| NET ASSETS | | $ | 2,905,992,778 | |
| | |
|
|
|
Net assets were comprised of: | | | | |
Paid-in capital | | $ | 3,135,070,544 | |
Retained earnings | | | (229,077,766 | ) |
| | |
|
|
|
Net assets, December 31, 2009 | | $ | 2,905,992,778 | |
| | |
|
|
|
Net asset value and redemption price per share, $2,905,992,778 / 203,489,907 outstanding shares of beneficial interest | | $ | 14.28 | |
| | |
|
|
|
STATEMENT OF OPERATIONS
Year Ended December 31, 2009
| | | | |
| INVESTMENT INCOME | | | | |
Unaffiliated dividend income (net of foreign withholding taxes of $253) | | $ | 39,107,636 | |
Unaffiliated interest | | | 38,949,481 | |
Affiliated dividend income | | | 3,332,189 | |
Affiliated income from securities loaned, net | | | 936,691 | |
| | |
|
|
|
| | | | 82,325,997 | |
| | |
|
|
|
| EXPENSES | | | | |
Management fee | | | 15,765,657 | |
Shareholders’ reports | | | 295,000 | |
Custodian’s fees and expenses | | | 280,000 | |
Insurance expenses | | | 49,000 | |
Trustees’ fees | | | 43,000 | |
Audit fee | | | 41,000 | |
Commitment fee on syndicated credit agreement | | | 22,000 | |
Legal fees and expenses | | | 18,000 | |
Transfer agent’s fee and expenses (including affiliated expense of $3,600) (Note 4) | | | 10,000 | |
Miscellaneous | | | 23,669 | |
| | |
|
|
|
Total expenses | | | 16,547,326 | |
| | |
|
|
|
| NET INVESTMENT INCOME | | | 65,778,671 | |
| | |
|
|
|
| NET REALIZED AND UNREALIZED GAIN (LOSS) ON INVESTMENTS, SWAPS AND FOREIGN CURRENCIES | | | | |
Net realized gain (loss) on: | | | | |
Investment transactions (including affiliated: $(1,632,891)) | | | (222,070,573 | ) |
Futures transactions | | | 13,817,876 | |
Swap agreement transactions | | | 1,153,522 | |
Foreign currency transactions | | | 1,607 | |
Written options transactions | | | 43,436 | |
| | |
|
|
|
| | | | (207,054,132 | ) |
| | |
|
|
|
Net change in unrealized appreciation (depreciation) on: | | | | |
Investments (including affiliated: $21,958,534) | | | 636,736,075 | |
Futures | | | (1,816,660 | ) |
Swaps | | | (5,632,209 | ) |
Foreign currencies | | | 13,970 | |
| | |
|
|
|
| | | | 629,301,176 | |
| | |
|
|
|
| NET GAIN ON INVESTMENTS, SWAPS AND FOREIGN CURRENCIES | | | 422,247,044 | |
| | |
|
|
|
| NET INCREASE IN NET ASSETS RESULTING FROM OPERATIONS | | $ | 488,025,715 | |
| | |
|
|
|
STATEMENT OF CHANGES IN NET ASSETS
| | | | | | | | |
| | | Year Ended December 31,
| |
| | | 2009
| | | 2008
| |
| INCREASE (DECREASE) IN NET ASSETS | | | | | | | | |
| OPERATIONS: | | | | | | | | |
Net investment income | | $ | 65,778,671 | | | $ | 91,569,165 | |
Net realized loss on investments, swaps and foreign currencies | | | (207,054,132 | ) | | | (353,630,781 | ) |
Net change in unrealized appreciation (depreciation) on investments, swaps and foreign currencies | | | 629,301,176 | | | | (627,558,587 | ) |
| | |
|
|
| |
|
|
|
NET INCREASE (DECREASE) IN NET ASSETS RESULTING FROM OPERATIONS | | | 488,025,715 | | | | (889,620,203 | ) |
| | |
|
|
| |
|
|
|
| DISTRIBUTIONS | | | (91,535,531 | ) | | | (353,573,797 | ) |
| | |
|
|
| |
|
|
|
| SERIES SHARE TRANSACTIONS: | | | | | | | | |
Series shares sold [1,203,125 and 1,347,523 shares, respectively] | | | 15,189,643 | | | | 19,045,784 | |
Series shares issued in reinvestment of dividends and distributions [7,405,787 and 22,635,967 shares, respectively] | | | 91,535,531 | | | | 353,573,797 | |
Series shares repurchased [17,489,813 and 14,641,462 shares, respectively] | | | (218,829,963 | ) | | | (224,142,062 | ) |
| | |
|
|
| |
|
|
|
NET INCREASE (DECREASE) IN NET ASSETS RESULTING FROM SERIES SHARE TRANSACTIONS | | | (112,104,789 | ) | | | 148,477,519 | |
| | |
|
|
| |
|
|
|
| TOTAL INCREASE (DECREASE) IN NET ASSETS | | | 284,385,395 | | | | (1,094,716,481 | ) |
| NET ASSETS: | | | | | | | | |
Beginning of year | | | 2,621,607,383 | | | | 3,716,323,864 | |
| | |
|
|
| |
|
|
|
End of year | | $ | 2,905,992,778 | | | $ | 2,621,607,383 | |
| | |
|
|
| |
|
|
|
SEE NOTES TO FINANCIAL STATEMENTS.
A70
| | | | | | |
| | | GLOBAL PORTFOLIO | | |
| |
| SCHEDULE OF INVESTMENTS | | December 31, 2009 |
| | | | | |
| LONG-TERM INVESTMENTS — 96.6% |
| COMMON STOCKS — 96.5% | | Shares
| | Value
(Note 2)
|
| | | | | | |
Australia — 2.9% | | | |
Amcor Ltd. | | 182,500 | | $ | 1,016,039 |
AWB Ltd.(a) | | 543,000 | | | 547,789 |
BHP Billiton Ltd., ADR(b) | | 22,684 | | | 1,737,141 |
BHP Billiton PLC, ADR | | 59,100 | | | 3,773,535 |
BlueScope Steel Ltd. | | 218,400 | | | 601,772 |
Challenger Financial Services Group, Ltd. | | 343,900 | | | 1,294,419 |
Downer EDI Ltd. | | 215,400 | | | 1,793,865 |
Goodman Fielder Ltd. | | 443,900 | | | 646,407 |
Macquarie Group Ltd. | | 21,200 | | | 908,338 |
Metcash Ltd. | | 216,600 | | | 868,512 |
Pacific Brands Ltd.(a) | | 460,600 | | | 464,618 |
Qantas Airways Ltd.(a) | | 308,500 | | | 823,107 |
TABCORP Holdings Ltd. | | 119,400 | | | 740,797 |
Woolworths Ltd. | | 52,868 | | | 1,325,970 |
WorleyParsons Ltd. | | 53,665 | | | 1,393,439 |
| | | | |
|
|
| | | | | | 17,935,748 |
| | | | |
|
|
Austria — 0.1% | | | |
Voestalpine AG | | 9,500 | | | 347,068 |
| | | | |
|
|
Belgium — 1.0% | | | |
AGFA-Gevaert NV(a) | | 62,200 | | | 400,949 |
Anheuser-Busch InBev NV | | 80,028 | | | 4,142,818 |
Delhaize Group SA | | 18,500 | | | 1,415,236 |
| | | | |
|
|
| | | | | | 5,959,003 |
| | | | |
|
|
Brazil — 2.1% | | | |
BM&F Bovespa SA | | 276,812 | | | 1,947,701 |
Itau Unibanco Holding SA, ADR(a) | | 119,800 | | | 2,736,232 |
Petroleo Brasileiro SA | | 98,036 | | | 2,066,020 |
Petroleo Brasileiro SA, ADR | | 108,798 | | | 5,187,489 |
Weg SA | | 117,200 | | | 1,238,645 |
| | | | |
|
|
| | | | | | 13,176,087 |
| | | | |
|
|
Canada — 1.9% | | | |
Brookfield Asset Management, Inc. (Class A Stock) | | 74,206 | | | 1,645,889 |
Canadian National Railway Co. | | 49,574 | | | 2,694,843 |
Goldcorp, Inc. | | 46,087 | | | 1,813,063 |
Potash Corp. of Saskatchewan, Inc. | | 16,880 | | | 1,831,480 |
Research In Motion Ltd.(a) | | 16,862 | | | 1,138,860 |
Royal Bank of Canada | | 30,230 | | | 1,630,226 |
Tim Hortons, Inc. | | 31,032 | | | 953,347 |
| | | | |
|
|
| | | | | | 11,707,708 |
| | | | |
|
|
China — 2.0% | | | |
Baidu, Inc., ADR(a) | | 9,599 | | | 3,947,397 |
China Life Insurance Co. Ltd. (Class H Stock) | | 407,000 | | | 1,991,563 |
China Overseas Land & Investment Ltd. | | 754,000 | | | 1,579,846 |
China Railway Construction Corp. Ltd. (Class H Stock) | | 1,081,500 | | | 1,378,105 |
CNOOC Ltd. | | 1,170,000 | | | 1,822,792 |
Li Ning Co. Ltd. | | 442,000 | | | 1,675,982 |
| | | | |
|
|
| | | | | | 12,395,685 |
| | | | |
|
|
| | | | | |
COMMON STOCKS
(continued) | | Shares
| | Value
(Note 2)
|
| | | | | | |
Denmark — 0.7% | | | |
Danisco A/S | | 14,500 | | $ | 967,431 |
Danske Bank A/S(a) | | 23,900 | | | 536,541 |
H Lundbeck A/S | | 49,400 | | | 892,519 |
Novo Nordisk A/S (Class B Stock) | | 33,566 | | | 2,142,911 |
| | | | |
|
|
| | | | | | 4,539,402 |
| | | | |
|
|
Finland — 0.5% | | | |
Nokia Oyj | | 83,800 | | | 1,083,532 |
Rautaruukki Oyj | | 22,300 | | | 515,833 |
Tieto Oyj | | 56,200 | | | 1,167,707 |
| | | | |
|
|
| | | | | | 2,767,072 |
| | | | |
|
|
France — 5.1% | | | |
Alstom SA | | 34,180 | | | 2,390,405 |
AXA SA | | 107,610 | | | 2,526,571 |
BNP Paribas | | 19,800 | | | 1,570,496 |
Casino Guichard Perrachon SA | | 14,200 | | | 1,265,150 |
Credit Agricole SA | | 29,400 | | | 515,965 |
France Telecom SA | | 42,900 | | | 1,071,996 |
Iliad SA | | 14,445 | | | 1,726,234 |
Lagardere SCA | | 14,000 | | | 566,798 |
Rallye SA | | 13,400 | | | 468,098 |
Safran SA | | 72,500 | | | 1,416,598 |
Sanofi-Aventis SA | | 43,600 | | | 3,428,824 |
Schneider Electric SA | | 19,669 | | | 2,286,965 |
SCOR SE | | 28,000 | | | 703,417 |
Thales SA | | 22,500 | | | 1,156,393 |
Total SA | | 27,900 | | | 1,792,014 |
Total SA, ADR(a) | | 68,700 | | | 4,399,548 |
Vinci SA | | 39,660 | | | 2,231,709 |
Vivendi SA | | 65,800 | | | 1,952,924 |
| | | | |
|
|
| | | | | | 31,470,105 |
| | | | |
|
|
Germany — 3.5% | | | |
Aurubis AG | | 10,300 | | | 441,075 |
BASF SE | | 32,400 | | | 2,018,176 |
Deutsche Bank AG | | 11,600 | | | 822,891 |
Deutsche Lufthansa AG | | 51,700 | | | 874,106 |
E.ON AG | | 110,270 | | | 4,609,475 |
Hannover Rueckversicherung AG(a) | | 11,800 | | | 553,322 |
MAN SE | | 22,984 | | | 1,781,084 |
MTU Aero Engines Holding AG | | 28,100 | | | 1,522,921 |
Muenchener Rueckversicherungs AG | | 12,000 | | | 1,872,555 |
Rheinmetall AG | | 11,800 | | | 744,144 |
RWE AG | | 9,300 | | | 906,079 |
SAP AG | | 47,182 | | | 2,254,765 |
Suedzucker AG | | 21,000 | | | 437,846 |
Thomas Cook Group PLC | | 164,000 | | | 605,845 |
ThyssenKrupp AG | | 45,900 | | | 1,737,248 |
Vossloh AG | | 4,300 | | | 427,493 |
| | | | |
|
|
| | | | | | 21,609,025 |
| | | | |
|
|
Greece | | | |
Alpha Bank A.E.(a) | | 13,000 | | | 151,700 |
| | | | |
|
|
Hong Kong — 1.0% | | | |
Chaoda Modern Agriculture Holdings Ltd. | | 966,070 | | | 1,028,374 |
Li & Fung Ltd. | | 432,000 | | | 1,786,077 |
Noble Group Ltd. | | 1,586,000 | | | 3,637,890 |
| | | | |
|
|
| | | | | | 6,452,341 |
| | | | |
|
|
SEE NOTES TO FINANCIAL STATEMENTS.
A71
| | | | | | |
| | | GLOBAL PORTFOLIO (continued) | | |
| |
| SCHEDULE OF INVESTMENTS | | December 31, 2009 |
| | | | | |
COMMON STOCKS
(continued) | | Shares
| | Value
(Note 2)
|
| | | | | | |
India — 1.0% | | | |
HDFC Bank, Ltd., ADR(b) | | 7,809 | | $ | 1,015,795 |
Infosys Technologies Ltd., ADR | | 43,025 | | | 2,377,992 |
Vedanta Resources PLC | | 60,069 | | | 2,512,433 |
| | | | |
|
|
| | | | | | 5,906,220 |
| | | | |
|
|
Indonesia — 0.2% | | | |
Bank Rakyat Indonesia | | 1,825,000 | | | 1,466,813 |
| | | | |
|
|
Ireland — 0.8% | | | |
Allied Irish Banks PLC(a) | | 42,100 | | | 72,030 |
Bank of Ireland (Governor & Co.)(a) | | 83,300 | | | 157,650 |
CRH PLC(a) | | 82,774 | | | 2,250,575 |
Irish Life & Permanent PLC(a) | | 51,300 | | | 225,878 |
Ryanair Holdings PLC, ADR(a) | | 73,855 | | | 1,980,791 |
| | | | |
|
|
| | | | | | 4,686,924 |
| | | | |
|
|
Israel — 0.6% | | | |
Teva Pharmaceutical Industries Ltd., ADR(a) | | 66,065 | | | 3,711,532 |
| | | | |
|
|
Italy — 1.4% | | | |
Banco Popolare SC(a) | | 38,200 | | | 286,163 |
Ciments Francais SA | | 5,200 | | | 550,929 |
Enel SpA | | 184,700 | | | 1,069,299 |
ENI SpA | | 89,300 | | | 2,274,094 |
Finmeccanica SpA | | 20,900 | | | 334,627 |
Fondiaria-Sai SpA | | 19,900 | | | 316,358 |
Saipem SpA | | 80,132 | | | 2,765,388 |
Telecom Italia SpA | | 796,300 | | | 1,242,184 |
| | | | |
|
|
| | | | | | 8,839,042 |
| | | | |
|
|
Japan — 8.3% | | | | | |
Aeon Credit Service Co. Ltd. | | 16,100 | | | 155,430 |
Alpine Electronics, Inc.(a) | | 41,600 | | | 441,189 |
Aoyama Trading Co. Ltd. | | 52,100 | | | 665,023 |
Astellas Pharma, Inc. | | 41,200 | | | 1,537,125 |
Canon, Inc. | | 58,100 | | | 2,471,485 |
Circle K Sunkus Co. Ltd. | | 46,900 | | | 578,546 |
COMSYS Holdings Corp. | | 72,800 | | | 765,831 |
Daikin Industries Ltd. | | 41,400 | | | 1,635,185 |
Fast Retailing Co. Ltd. | | 7,200 | | | 1,353,164 |
Fukuoka Financial Group, Inc. | | 158,000 | | | 550,630 |
Hitachi Capital Corp. | | 49,400 | | | 600,621 |
Honda Motor Co. Ltd. | | 79,400 | | | 2,693,938 |
Hoya Corp. | | 64,100 | | | 1,710,350 |
Itochu Techno-Solutions Corp. | | 26,200 | | | 703,561 |
Jupiter Telecommunications Co. Ltd. | | 1,674 | | | 1,656,465 |
KDDI Corp. | | 200 | | | 1,059,343 |
Keihin Corp. | | 78,900 | | | 1,179,469 |
Keyence Corp. | | 10,400 | | | 2,158,454 |
Konami Corp. | | 10,300 | | | 183,900 |
Kurabo Industries Ltd. | | 173,100 | | | 263,779 |
Kurita Water Industries Ltd. | | 69,400 | | | 2,180,377 |
Kyoei Steel Ltd. | | 42,800 | | | 788,790 |
Kyowa Exeo Corp. | | 56,000 | | | 476,489 |
Marubeni Corp. | | 271,000 | | | 1,496,998 |
Mitsubishi Corp. | | 135,400 | | | 3,372,623 |
Mitsui & Co. Ltd. | | 66,000 | | | 936,284 |
Mizuho Financial Group, Inc. | | 198,100 | | | 356,244 |
Nifco, Inc. | | 31,000 | | | 619,261 |
| | | | | |
COMMON STOCKS
(continued) | | Shares
| | Value
(Note 2)
|
| | | | | | |
Japan (continued) | | | | | |
Nippon Electric Glass Co., Ltd. | | 107,000 | | $ | 1,472,735 |
Nippon Express Co. Ltd. | | 160,000 | | | 660,761 |
Nippon Light Metal Co. Ltd.(a) | | 195,000 | | | 168,094 |
Nippon Oil Corp. | | 240,600 | | | 1,115,448 |
Nippon Shokubai Co. Ltd. | | 161,000 | | | 1,384,011 |
Nippon Telegraph & Telephone Corp. | | 37,000 | | | 1,461,614 |
Nissan Motor Co. Ltd.(a) | | 53,400 | | | 469,275 |
NTT DoCoMo, Inc. | | 1,100 | | | 1,535,037 |
Ricoh Co. Ltd. | | 52,000 | | | 745,096 |
Sankyu, Inc. | | 210,000 | | | 1,080,201 |
Sanwa Holdings Corp. | | 281,000 | | | 720,042 |
Seiko Epson Corp., | | 17,100 | | | 276,343 |
Seino Holdings Corp. | | 65,000 | | | 412,586 |
Shimachu Co. Ltd. | | 30,700 | | | 605,048 |
Sumitomo Corp. | | 115,400 | | | 1,175,089 |
Sumitomo Mitsui Financial Group, Inc. | | 59,300 | | | 1,701,636 |
Sumitomo Trust & Banking Co. Ltd. (The) | | 67,000 | | | 328,972 |
Takeda Pharmaceutical Co. Ltd. | | 39,900 | | | 1,643,930 |
Terumo Corp. | | 27,500 | | | 1,657,422 |
Yokohama Rubber Co. Ltd. (The) | | 59,600 | | | 263,481 |
| | | | |
|
|
| | | | | | 51,467,375 |
| | | | |
|
|
Liechtenstein | | | | | |
Verwaltungs- und Privat-Bank AG | | 2,578 | | | 253,289 |
| | | | |
|
|
Mexico — 0.1% | | | | | |
Wal-Mart de Mexico SAB de CV, Ser. V | | 90,700 | | | 404,205 |
| | | | |
|
|
Netherlands — 2.5% | | | | | |
Aegon NV(a) | | 56,800 | | | 363,724 |
ASM Pacific Technology Ltd. | | 85,900 | | | 812,155 |
Brit Insurance Holdings NV | | 227,200 | | | 717,535 |
CSM | | 32,790 | | | 861,283 |
European Aeronautic Defence and Space Co. NV | | 41,900 | | | 842,237 |
ING Groep NV(a) | | 62,700 | | | 603,825 |
Koninklijke DSM NV | | 31,100 | | | 1,528,050 |
Nutreco Holding NV | | 9,400 | | | 528,376 |
OCE NV(a) | | 53,300 | | | 653,473 |
QIAGEN NV(a) | | 76,936 | | | 1,731,528 |
Royal Dutch Shell PLC, ADR(b) | | 35,150 | | | 2,112,866 |
Royal Dutch Shell PLC (Class B Stock) | | 162,200 | | | 4,723,777 |
| | | | |
|
|
| | | | | | 15,478,829 |
| | | | |
|
|
New Zealand — 0.1% | | | | | |
Air New Zealand Ltd. | | 737,900 | | | 647,599 |
Fisher & Paykel Appliances Holdings Ltd. | | 85,100 | | | 35,706 |
| | | | |
|
|
| | | | | | 683,305 |
| | | | |
|
|
Norway — 0.4% | | | | | |
DnB NOR ASA(a) | | 67,200 | | | 725,473 |
Norsk Hydro ASA(a) | | 54,500 | | | 457,823 |
Statoil ASA | | 45,100 | | | 1,124,777 |
| | | | |
|
|
| | | | | | 2,308,073 |
| | | | |
|
|
Portugal — 0.2% | | | | | |
Banco Espirito Santo SA | | 43,600 | | | 283,966 |
Portugal Telecom SGPS SA | | 89,600 | | | 1,093,306 |
| | | | |
|
|
| | | | | | 1,377,272 |
| | | | |
|
|
SEE NOTES TO FINANCIAL STATEMENTS.
A72
| | | | | | |
| | | GLOBAL PORTFOLIO (continued) | | |
| |
| SCHEDULE OF INVESTMENTS | | December 31, 2009 |
| | | | | |
COMMON STOCKS
(continued) | | Shares
| | Value
(Note 2)
|
| | | | | | |
Singapore — 0.7% | | | | | |
CapitaLand Ltd. | | 666,000 | | $ | 1,975,730 |
MobileOne Ltd. | | 390,330 | | | 524,738 |
Singapore Airlines Ltd.(a) | | 72,000 | | | 762,550 |
Wilmar International Ltd. | | 183,000 | | | 832,103 |
| | | | |
|
|
| | | | | | 4,095,121 |
| | | | |
|
|
South Africa — 0.4% | | | | | |
Naspers Ltd. (Class N Stock) | | 60,800 | | | 2,460,586 |
| | | | |
|
|
Spain — 2.8% | | | | | |
Banco Bilbao Vizcaya Argentaria SA | | 114,000 | | | 2,077,651 |
Banco Espanol de Credito SA | | 71,978 | | | 881,738 |
Banco Santander SA | | 371,208 | | | 6,134,083 |
Inditex SA | | 40,797 | | | 2,547,872 |
Repsol YPF SA | | 66,100 | | | 1,773,765 |
Telefonica SA | | 144,788 | | | 4,052,474 |
| | | | |
|
|
| | | | | | 17,467,583 |
| | | | |
|
|
Sweden — 0.3% | | | | | |
Svenska Handelsbanken AB (Class A Stock) | | 73,200 | | | 2,085,454 |
| | | | |
|
|
Switzerland — 4.5% | | | | | |
ABB Ltd.(a) | | 102,769 | | | 1,980,290 |
Actelion Ltd.(a) | | 28,971 | | | 1,547,353 |
Baloise-Holding AG | | 14,600 | | | 1,212,199 |
Clariant AG(a) | | 103,700 | | | 1,226,264 |
Credit Suisse Group AG | | 86,887 | | | 4,304,501 |
Georg Fischer AG(a) | | 2,000 | | | 499,077 |
Julius Baer Group Ltd. | | 25,075 | | | 881,849 |
Nestle SA | | 45,532 | | | 2,209,833 |
Novartis AG | | 36,200 | | | 1,976,855 |
Philip Morris International, Inc. | | 22,500 | | | 1,084,275 |
Rieter Holding AG(a) | | 2,200 | | | 496,916 |
Roche Holding AG | | 16,639 | | | 2,845,483 |
Sonova Holding AG | | 7,442 | | | 901,599 |
Swiss Reinsurance Co. Ltd. | | 18,700 | | | 895,817 |
Swisscom AG | | 6,200 | | | 2,367,858 |
Zurich Financial Services AG | | 17,068 | | | 3,731,470 |
| | | | |
|
|
| | | | | | 28,161,639 |
| | | | |
|
|
Taiwan — 0.5% | | | | | |
MediaTek, Inc. | | 95,190 | | | 1,653,884 |
Taiwan Semiconductor Manufacturing Co. Ltd. | | 769,294 | | | 1,550,493 |
| | | | |
|
|
| | | | | | 3,204,377 |
| | | | |
|
|
Turkey — 0.2% | | | | | |
Turkiye Garanti Bankasi AS | | 341,048 | | | 1,452,833 |
| | | | |
|
|
United Kingdom — 9.5% | | | | | |
AMEC PLC | | 93,814 | | | 1,195,234 |
Amlin PLC | | 139,217 | | | 803,852 |
AstraZeneca PLC | | 71,500 | | | 3,360,296 |
Autonomy Corp. PLC(a) | | 88,272 | | | 2,143,630 |
Aviva PLC | | 118,200 | | | 751,886 |
Barclays PLC | | 753,129 | | | 3,318,626 |
Beazley PLC | | 360,794 | | | 580,742 |
BG Group PLC | | 178,982 | | | 3,231,744 |
BP PLC | | 472,900 | | | 4,566,397 |
British Sky Broadcasting Group PLC | | 317,999 | | | 2,872,420 |
| | | | | |
COMMON STOCKS
(continued) | | Shares
| | Value
(Note 2)
|
| | | | | | |
United Kingdom (continued) | | | | | |
BT Group PLC | | 602,100 | | $ | 1,311,269 |
Cairn Energy PLC(a) | | 257,990 | | | 1,381,093 |
Capita Group PLC (The) | | 124,631 | | | 1,506,973 |
Centrica PLC | | 88,100 | | | 399,052 |
Davis Service Group PLC | | 24,300 | | | 155,882 |
Drax Group PLC | | 94,500 | | | 630,015 |
DS Smith PLC | | 230,900 | | | 472,265 |
Experian PLC | | 130,380 | | | 1,287,853 |
GlaxoSmithKline PLC | | 118,600 | | | 2,515,014 |
HSBC Holdings PLC | | 142,465 | | | 1,620,531 |
HSBC Holdings PLC, ADR | | 52,000 | | | 2,968,680 |
IMI PLC | | 145,600 | | | 1,214,492 |
Legal & General Group PLC | | 624,000 | | | 802,758 |
Lloyds Banking Group PLC(a) | | 381,679 | | | 307,090 |
Marston’s PLC | | 339,130 | | | 480,020 |
Meggitt PLC | | 216,200 | | | 905,082 |
Northern Foods PLC | | 211,500 | | | 226,859 |
Old Mutual PLC(a) | | 527,200 | | | 923,229 |
Petrofac Ltd. | | 84,242 | | | 1,410,203 |
Reckitt Benckiser Group PLC | | 55,975 | | | 3,029,927 |
Rolls-Royce Group PLC(a) | | 332,964 | | | 2,592,927 |
Rolls-Royce Group PLC (Class C Stock)(a) | | 19,241,880 | | | 31,079 |
Rotork PLC | | 43,573 | | | 832,595 |
Royal Bank of Scotland Group PLC(a) | | 263,527 | | | 122,332 |
RSA Insurance Group PLC | | 300,200 | | | 583,222 |
Spectris PLC | | 98,200 | | | 1,168,025 |
Standard Chartered PLC | | 70,424 | | | 1,777,914 |
Tate & Lyle PLC | | 127,900 | | | 889,597 |
Tomkins PLC | | 201,400 | | | 625,855 |
Tullow Oil PLC | | 92,806 | | | 1,947,106 |
Vodafone Group PLC | | 751,500 | | | 1,740,254 |
| | | | |
|
|
| | | | | | 58,684,020 |
| | | | |
|
|
United States — 41.2% | | | | | |
3M Co. | | 30,050 | | | 2,484,234 |
Abbott Laboratories | | 92,880 | | | 5,014,591 |
Adobe Systems, Inc.(a) | | 47,969 | | | 1,764,300 |
Alcoa, Inc. | | 45,800 | | | 738,296 |
Altria Group, Inc. | | 48,100 | | | 944,203 |
Amazon.com, Inc.(a) | | 24,679 | | | 3,319,819 |
American Express Co. | | 123,225 | | | 4,993,077 |
American Tower Corp. (Class A Stock)(a) | | 59,275 | | | 2,561,273 |
Ameriprise Financial, Inc. | | 52,800 | | | 2,049,696 |
Amgen, Inc.(a) | | 25,750 | | | 1,456,677 |
Analog Devices, Inc., | | 41,500 | | | 1,310,570 |
Apple, Inc.(a)(b) | | 33,504 | | | 7,064,653 |
AT&T, Inc. | | 143,900 | | | 4,033,517 |
Avon Products, Inc. | | 23,900 | | | 752,850 |
Baker Hughes, Inc.(b) | | 55,450 | | | 2,244,616 |
Bank of America Corp. | | 304,400 | | | 4,584,264 |
Bank of New York Mellon Corp. (The) | | 29,800 | | | 833,506 |
Cablevision Systems Corp. (Class A Stock) | | 95,300 | | | 2,460,646 |
CenterPoint Energy, Inc. | | 35,400 | | | 513,654 |
Chevron Corp. | | 58,150 | | | 4,476,969 |
SEE NOTES TO FINANCIAL STATEMENTS.
A73
| | | | | | |
| | | GLOBAL PORTFOLIO (continued) | | |
| |
| SCHEDULE OF INVESTMENTS | | December 31, 2009 |
| | | | | |
COMMON STOCKS
(continued) | | Shares
| | Value
(Note 2)
|
| | | | | | |
United States (continued) | | | | | |
Citigroup, Inc. | | 172,200 | | $ | 569,982 |
Coca-Cola Co. (The)(b) | | 12,850 | | | 732,450 |
Covidien PLC | | 49,500 | | | 2,370,555 |
Dell, Inc.(a) | | 125,600 | | | 1,803,616 |
DIRECTV (Class A Stock)(a) | | 36,374 | | | 1,213,073 |
Dow Chemical Co. (The) | | 193,073 | | | 5,334,607 |
E.I. du Pont de Nemours & Co., | | 47,200 | | | 1,589,224 |
Eli Lilly & Co. | | 10,600 | | | 378,526 |
Entergy Corp. | | 26,950 | | | 2,205,588 |
EOG Resources, Inc., | | 28,079 | | | 2,732,087 |
Exxon Mobil Corp. | | 61,800 | | | 4,214,142 |
Fifth Third Bancorp | | 93,900 | | | 915,525 |
Fortune Brands, Inc. | | 42,350 | | | 1,829,520 |
General Dynamics Corp., | | 79,103 | | | 5,392,452 |
General Electric Co. | | 192,200 | | | 2,907,986 |
Gilead Sciences, Inc.(a) | | 67,568 | | | 2,924,343 |
Goldman Sachs Group, Inc. (The) | | 35,559 | | | 6,003,781 |
Google, Inc. (Class A Stock)(a) | | 12,466 | | | 7,728,671 |
H&R Block, Inc. | | 62,200 | | | 1,406,964 |
Home Depot, Inc. | | 123,800 | | | 3,581,534 |
Honeywell International, Inc. | | 31,900 | | | 1,250,480 |
Illinois Tool Works, Inc. | | 52,650 | | | 2,526,674 |
International Business Machines Corp. | | 57,718 | | | 7,555,286 |
International Paper Co. | | 85,300 | | | 2,284,334 |
Johnson & Johnson | | 97,263 | | | 6,264,710 |
JPMorgan Chase & Co. | | 218,723 | | | 9,114,187 |
KeyCorp, | | 189,600 | | | 1,052,280 |
Kraft Foods, Inc. (Class A Stock) | | 31,500 | | | 856,170 |
Liberty Media Corp. — Starz, Ser. Z(a) | | 15,750 | | | 726,863 |
Lockheed Martin Corp. | | 11,100 | | | 836,385 |
Marsh & McLennan Cos., Inc. | | 99,400 | | | 2,194,752 |
Mastercard, Inc. (Class A Stock) | | 16,353 | | | 4,186,041 |
McDonald’s Corp. | | 93,280 | | | 5,824,403 |
Merck & Co., Inc. | | 206,017 | | | 7,527,861 |
Microsoft Corp. | | 148,200 | | | 4,518,618 |
Morgan Stanley | | 39,100 | | | 1,157,360 |
Murphy Oil Corp. | | 40,750 | | | 2,208,650 |
National Oilwell Varco, Inc.(a) | | 38,010 | | | 1,675,861 |
Newell Rubbermaid, Inc. | | 87,100 | | | 1,307,371 |
NiSource, Inc., | | 64,600 | | | 993,548 |
Nordstrom, Inc.,(b) | | 27,195 | | | 1,021,988 |
Norfolk Southern Corp. | | 33,515 | | | 1,756,856 |
NRG Energy, Inc.(a) | | 30,300 | | | 715,383 |
Pfizer, Inc. | | 153,300 | | | 2,788,527 |
Pinnacle West Capital Corp. | | 25,000 | | | 914,500 |
PPG Industries, Inc. | | 38,166 | | | 2,234,238 |
Praxair, Inc. | | 56,606 | | | 4,546,028 |
priceline.com, Inc.(a) | | 5,011 | | | 1,094,904 |
Procter & Gamble Co. (The) | | 27,150 | | | 1,646,104 |
QUALCOMM, Inc. | | 98,758 | | | 4,568,545 |
Qwest Communications International, Inc. | | 133,800 | | | 563,298 |
Raytheon Co. | | 34,050 | | | 1,754,256 |
Schlumberger Ltd. | | 12,300 | | | 800,607 |
SLM Corp.(a) | | 102,000 | | | 1,149,540 |
Southwest Airlines Co. | | 273,800 | | | 3,129,534 |
| | | | | | |
COMMON STOCKS
(continued) | | Shares
| | Value
(Note 2)
| |
| | | | | | | |
United States (continued) | | | | | | |
Spectra Energy Corp. | | 101,400 | | $ | 2,079,714 | |
Sprint Nextel Corp.,(a) | | 340,900 | | | 1,247,694 | |
St Joe Co. (The)(a)(b) | | 48,500 | | | 1,401,165 | |
State Street Corp. | | 43,400 | | | 1,889,636 | |
Sunoco, Inc. | | 26,600 | | | 694,260 | |
Time Warner Cable, Inc. | | 36,800 | | | 1,523,152 | |
Time Warner, Inc. | | 89,700 | | | 2,613,858 | |
Transocean Ltd.(a) | | 68,376 | | | 5,661,533 | |
Tyco Electronics Ltd. | | 76,600 | | | 1,880,530 | |
Tyco International Ltd. | | 48,200 | | | 1,719,776 | |
U.S. Bancorp | | 179,359 | | | 4,037,371 | |
Union Pacific Corp. | | 116,691 | | | 7,456,555 | |
Verizon Communications, Inc. | | 27,100 | | | 897,823 | |
Visa, Inc. (Class A Stock)(b) | | 47,922 | | | 4,191,258 | |
Wal-Mart Stores, Inc. | | 39,350 | | | 2,103,257 | |
Waste Management, Inc.(b) | | 39,300 | | | 1,328,733 | |
Wells Fargo & Co. | | 189,948 | | | 5,126,697 | |
Western Union Co. (The) | | 89,700 | | | 1,690,845 | |
Weyerhaeuser Co. | | 55,150 | | | 2,379,171 | |
Wynn Resorts Ltd.(a) | | 30,288 | | | 1,763,670 | |
Yahoo!, Inc.(a) | | 85,202 | | | 1,429,689 | |
| | | | |
|
|
|
| | | | | | 255,298,566 | |
| | | | |
|
|
|
TOTAL COMMON STOCKS
(cost $542,348,854) | | | 598,004,002 | |
| | | | |
|
|
|
| PREFERRED STOCKS — 0.1% | | | | | | |
United States | | | | | | |
Bank of America Corp | | 8,300 | | | 123,836 | |
Wells Fargo & Co. | | 23,175 | | | 595,598 | |
| | | | |
|
|
|
TOTAL PREFERRED STOCKS
(cost $569,801) | | | 719,434 | |
| | | | |
|
|
|
TOTAL LONG-TERM INVESTMENTS
(cost $542,918,655) | | | 598,723,436 | |
| | | | |
|
|
|
| SHORT-TERM INVESTMENT — 6.3% | |
Affiliated Money Market Mutual Fund | | | | |
Dryden Core Investment Fund — Taxable Money Market Series
(cost $38,613,062; includes $23,197,723 of cash collateral
received for securities on
loan) (Note 4)(c)(d) | | 38,613,062 | | | 38,613,062 | |
| | | | |
|
|
|
TOTAL INVESTMENTS(e) — 102.9%
(cost $581,531,717) | | | 637,336,498 | |
LIABILITIES IN EXCESS OF
OTHER ASSETS — (2.9)% | | | (17,805,028 | ) |
| | | | |
|
|
|
NET ASSETS — 100.0% | | $ | 619,531,470 | |
| | | | |
|
|
|
The following abbreviation is used in portfolio descriptions:
| | |
| ADR | | American Depositary Receipt |
SEE NOTES TO FINANCIAL STATEMENTS.
A74
| | | | | | |
| | | GLOBAL PORTFOLIO (continued) | | |
| |
| SCHEDULE OF INVESTMENTS | | December 31, 2009 |
| (a) | Non-income producing security. |
| (b) | All or a portion of security is on loan. The aggregate market value of such securities is $22,543,645; cash collateral of $23,197,723 (included in liabilities) was received with which the Portfolio purchased highly liquid short-term investments. |
| (c) | Represents security, or a portion thereof, purchased with cash collateral received for securities on loan. |
| (d) | Prudential Investments LLC, the manager of the Portfolio, also serves as manager of the Dryden Core Investment Fund-Taxable Money Market Series. |
| (e) | As of December 31, 2009, 215 securities representing $287,394,956 and 46.4% of the net assets were fair valued in accordance with the policies adopted by the Board of Trustees. |
Various inputs are used in determining the value of the Portfolio’s investments. These inputs are summarized in the three broad levels listed below.
Level 1—quoted prices in active markets for identical securities
Level 2—other significant observable inputs (including quoted prices for similar securities, interest rates, prepayment speeds, credit risk, etc.)
Level 3—significant unobservable inputs (including the Portfolio’s own assumptions in determining the fair value of investments)
The following is a summary of the inputs used as of December 31, 2009 in valuing the Portfolio’s assets carried at fair value:
| | | | | | | | | |
Investments in Securities
| | Level 1
| | Level 2
| | Level 3
|
Common Stocks | | | | | | | | | |
Australia | | $ | 5,510,676 | | $ | 12,425,072 | | $ | — |
Austria | | | — | | | 347,068 | | | — |
Belgium | | | — | | | 5,959,003 | | | — |
Brazil | | | 13,176,087 | | | — | | | — |
Canada | | | 11,707,708 | | | — | | | — |
China | | | 3,947,397 | | | 8,448,288 | | | — |
Denmark | | | — | | | 4,539,402 | | | — |
Finland | | | — | | | 2,767,072 | | | — |
France | | | 4,399,548 | | | 27,070,557 | | | — |
Germany | | | — | | | 21,609,025 | | | — |
Greece | | | — | | | 151,700 | | | — |
Hong Kong | | | — | | | 6,452,341 | | | — |
India | | | 3,393,787 | | | 2,512,433 | | | — |
Indonesia | | | — | | | 1,466,813 | | | — |
Ireland | | | 1,980,791 | | | 2,706,133 | | | — |
Israel | | | 3,711,532 | | | — | | | — |
Italy | | | — | | | 8,839,042 | | | — |
Japan | | | — | | | 51,467,375 | | | — |
Liechtenstein | | | — | | | 253,289 | | | — |
Mexico | | | 404,205 | | | — | | | — |
Netherlands | | | 2,112,866 | | | 13,365,963 | | | — |
New Zealand | | | — | | | 683,305 | | | — |
Norway | | | — | | | 2,308,073 | | | — |
Portugal | | | — | | | 1,377,272 | | | — |
Singapore | | | — | | | 4,095,121 | | | — |
South Africa | | | — | | | 2,460,586 | | | — |
Spain | | | — | | | 17,467,583 | | | — |
Sweden | | | — | | | 2,085,454 | | | — |
Switzerland | | | 1,966,124 | | | 26,195,515 | | | — |
Taiwan | | | — | | | 3,204,377 | | | — |
Turkey | | | — | | | 1,452,833 | | | — |
United Kingdom | | | 2,968,680 | | | 55,715,340 | | | — |
United States | | | 255,298,566 | | | — | | | — |
Preferred Stock | | | | | | | | | |
United States | | | 719,434 | | | — | | | — |
Affiliated Money Market Mutual Fund | | | 38,613,062 | | | — | | | — |
| | |
|
| |
|
| |
|
|
| | | | 349,910,463 | | | 287,426,035 | | | — |
Other Financial Instruments* | | | — | | | — | | | — |
| | |
|
| |
|
| |
|
|
Total | | $ | 349,910,463 | | $ | 287,426,035 | | $ | — |
| | |
|
| |
|
| |
|
|
| * | Other financial instruments are derivative instruments not reflected in the Schedule of Investments, such as futures, forwards and swap contracts, which are valued at the unrealized appreciation/depreciation on the instrument. |
SEE NOTES TO FINANCIAL STATEMENTS.
A75
| | | | | | |
| | | GLOBAL PORTFOLIO (continued) | | |
| |
| SCHEDULE OF INVESTMENTS | | December 31, 2009 |
The following is a reconciliation of assets in which significant unobservable inputs (Level 3) were used in determining fair value:
| | | | | | | | |
| | | Common Stock
| | | Preferred Stock
| |
Balance as of 12/31/08 | | $ | 102,852 | | | $ | 295,558 | |
Realized gain (loss) | | | — | | | | — | |
Change in unrealized appreciation (depreciation) | | | — | | | | — | |
Net purchases (sales) | | | — | | | | — | |
Transfers in and/or out of Level 3 | | | (102,852 | ) | | | (295,558 | ) |
| | |
|
|
| |
|
|
|
Balance as of 12/31/09 | | $ | — | | | $ | — | |
| | |
|
|
| |
|
|
|
The industry classification of portfolio holdings and liabilities in excess of other assets shown as a percentage of net assets as of December 31, 2009 was as follows:
| | | |
Oil, Gas & Consumable Fuels | | 9.0 | % |
Commercial Banks | | 7.7 | |
Pharmaceuticals | | 7.4 | |
Affiliated Money Market Mutual Fund (including 3.7% of collateral received for securities on loan) | | 6.2 | |
Chemicals | | 3.6 | |
Insurance | | 3.5 | |
Diversified Telecommunication | | 3.2 | |
Capital Markets | | 3.1 | |
Diversified Financial Services | | 3.1 | |
Aerospace & Defense | | 2.9 | |
Media | | 2.9 | |
Energy Equipment & Services | | 2.8 | |
Computers & Peripherals | | 2.7 | |
IT Services | | 2.3 | |
Road & Rail | | 2.3 | |
Metals & Mining | | 2.2 | |
Internet Software & Services | | 2.1 | |
Food Products | | 1.7 | |
Hotels, Restaurants & Leisure | | 1.7 | |
Software | | 1.7 | |
Trading Companies & Distributors | | 1.7 | |
Machinery | | 1.6 | |
Electronic Equipment & Instruments | | 1.5 | |
Electric Utilities | | 1.4 | |
Industrial Conglomerates | | 1.4 | |
Wireless Telecommunication Services | | 1.4 | |
Airlines | | 1.3 | |
Food & Staples Retailing | | 1.3 | |
Specialty Retail | | 1.3 | |
Communications Equipment | | 1.1 | |
Consumer Finance | | 1.1 | |
| | | |
Electrical Equipment | | 1.1 | % |
Real Estate Management & Development | | 1.1 | |
Biotechnology | | 1.0 | |
Semiconductors & Semiconductor Equipment | | 0.9 | |
Beverages | | 0.8 | |
Construction & Engineering | | 0.8 | |
Healthcare Equipment & Supplies | | 0.8 | |
Household Products | | 0.8 | |
Commercial Services & Supplies | | 0.7 | |
Internet & Catalog Retail | | 0.7 | |
Paper & Forest Products | | 0.7 | |
Household Durables | | 0.6 | |
Office Electronics | | 0.6 | |
Automobiles | | 0.5 | |
Building Products | | 0.5 | |
Multi-Utilities | | 0.5 | |
Construction Materials | | 0.4 | |
Distributors | | 0.4 | |
Auto Components | | 0.3 | |
Gold | | 0.3 | |
Life Sciences Tools & Services | | 0.3 | |
Textiles, Apparel & Luxury Goods | | 0.3 | |
Tobacco | | 0.3 | |
Containers & Packaging | | 0.2 | |
Diversified Consumer Services | | 0.2 | |
Independent Power Producers & Energy Traders | | 0.2 | |
Multiline Retail | | 0.2 | |
Professional Services | | 0.2 | |
Healthcare Technology | | 0.1 | |
Personal Products | | 0.1 | |
| | |
|
|
| | | 102.8 | |
Liabilities in excess of other assets | | (2.8 | ) |
| | |
|
|
| | | 100.0 | % |
| | |
|
|
SEE NOTES TO FINANCIAL STATEMENTS.
A76
| | | | | | |
| | | GLOBAL PORTFOLIO (continued) | | |
| |
| SCHEDULE OF INVESTMENTS | | December 31, 2009 |
The Portfolio invested in various derivative instruments during the reporting period. The primary types of risk associated with derivative instruments are commodity risk, credit risk, equity risk, foreign exchange risk and interest rate risk. The effect of such derivative instruments on the Portfolio’s financial position and financial performance as reflected in the Statement of Assets and Liabilities and Statement of Operations is presented in the summary below.
The Portfolio did not hold any derivative instruments as of December 31, 2009, accordingly no derivative positions were presented in the Statement of Assets and Liabilities.
The effects of derivative instruments on the Statement of Operations for the year ended December 31, 2009 are as follows:
| | | | | | | | | | | | | | | | | |
| Amount of Realized Gain or (Loss) on Derivatives Recognized in Income | |
Derivatives not designated as hedging
instruments, carried at fair value
| | Warrant
| | Rights
| | | Forward
Contracts
| | Futures
| | Total
| |
Foreign exchange contracts | | $ | — | | $ | — | | | $ | 139,834 | | $ | — | | $ | 139,834 | |
Equity contracts | | | 14,588 | | | (1,962,957 | ) | | | — | | | 65,736 | | | (1,882,633 | ) |
| | |
|
| |
|
|
| |
|
| |
|
| |
|
|
|
Total | | $ | 14,588 | | $ | (1,962,957 | ) | | $ | 139,834 | | $ | 65,736 | | $ | (1,742,799 | ) |
| | |
|
| |
|
|
| |
|
| |
|
| |
|
|
|
| | | |
Change in Unrealized Appreciation or (Depreciation) on Derivatives Recognized in Income
|
Derivatives not designated as hedging
instruments, carried at fair value
| | Forward
Contracts
|
Foreign exchange contracts | | $ | 31,520 |
For the year ended December 31, 2009, the Portfolio’s average value at settlement date payable for forward foreign currency exchange purchase contracts was $2,313,902 and the average value at settlement date receivable for forward foreign currency exchange sale contracts was $2,310,645.
SEE NOTES TO FINANCIAL STATEMENTS.
A77
| | | | | | |
| | | GLOBAL PORTFOLIO (continued) | | |
STATEMENT OF ASSETS AND LIABILITIES
December 31, 2009
| | | | |
| ASSETS | | | | |
Investments, at value including securities on loan of $22,543,645: | | | | |
Unaffiliated investments (cost $542,918,655) | | $ | 598,723,436 | |
Affiliated investments (cost $38,613,062) | | | 38,613,062 | |
Foreign currency, at value (cost $5,010,415) | | | 4,937,937 | |
Cash | | | 7,020 | |
Receivable for investments sold | | | 1,550,569 | |
Foreign tax reclaim receivable | | | 1,153,373 | |
Dividends and interest receivable | | | 545,529 | |
Prepaid expenses | | | 6,078 | |
Receivable for Series shares sold | | | 29 | |
| | |
|
|
|
Total Assets | | | 645,537,033 | |
| | |
|
|
|
| LIABILITIES | | | | |
Collateral for securities on loan | | | 23,197,723 | |
Payable for investments purchased | | | 2,041,960 | |
Management fee payable | | | 393,904 | |
Payable for Series shares repurchased | | | 200,300 | |
Accrued expenses and other liabilities | | | 171,081 | |
Affiliated transfer agent fee payable | | | 595 | |
| | |
|
|
|
Total Liabilities | | | 26,005,563 | |
| | |
|
|
|
| NET ASSETS | | $ | 619,531,470 | |
| | |
|
|
|
Net assets were comprised of: | | | | |
Paid-in capital | | $ | 723,324,781 | |
Retained earnings | | | (103,793,311 | ) |
| | |
|
|
|
Net assets, December 31, 2009 | | $ | 619,531,470 | |
| | |
|
|
|
Net asset value and redemption price per share, $619,531,470 / 37,149,452 outstanding shares of beneficial interest | | $ | 16.68 | |
| | |
|
|
|
STATEMENT OF OPERATIONS
Year Ended December 31, 2009
| | | | |
| INVESTMENT INCOME | | | | |
Unaffiliated dividend income (net of foreign withholding taxes of $724,051) | | $ | 13,689,206 | |
Affiliated income from securities loaned, net | | | 227,558 | |
Affiliated dividend income | | | 88,164 | |
Interest | | | 5,442 | |
| | |
|
|
|
| | | | 14,010,370 | |
| | |
|
|
|
| EXPENSES | | | | |
Management fee | | | 4,006,515 | |
Custodian’s fees and expenses | | | 238,000 | |
Shareholders’ reports | | | 152,000 | |
Audit fee | | | 36,000 | |
Trustees’ fees | | | 15,000 | |
Insurance expenses | | | 13,000 | |
Transfer agent’s fee and expenses (including affiliated expense of $3,600) (Note 4) | | | 10,000 | |
Legal fees and expenses | | | 9,000 | |
Commitment fee on syndicated credit agreement | | | 2,000 | |
Miscellaneous | | | 47,866 | |
| | |
|
|
|
Total expenses | | | 4,529,381 | |
| | |
|
|
|
| NET INVESTMENT INCOME | | | 9,480,989 | |
| | |
|
|
|
| NET REALIZED AND UNREALIZED GAIN (LOSS) ON INVESTMENTS AND FOREIGN CURRENCIES | | | | |
Net realized gain (loss) on: | | | | |
Investment transactions | | | (62,900,316 | ) |
Futures transactions | | | 65,736 | |
Foreign currency transactions | | | (1,578,682 | ) |
| | |
|
|
|
| | | | (64,413,262 | ) |
| | |
|
|
|
Net change in unrealized appreciation (depreciation) on: | | | | |
Investments | | | 204,101,309 | |
Foreign currencies | | | 27,225 | |
| | |
|
|
|
| | | | 204,128,534 | |
| | |
|
|
|
| NET GAIN ON INVESTMENTS AND FOREIGN CURRENCIES | | | 139,715,272 | |
| | |
|
|
|
| NET INCREASE IN NET ASSETS RESULTING FROM OPERATIONS | | $ | 149,196,261 | |
| | |
|
|
|
STATEMENT OF CHANGES IN NET ASSETS
| | | | | | | | |
| | | Year Ended December 31,
| |
| | | 2009
| | | 2008
| |
| INCREASE (DECREASE) IN NET ASSETS | | | | | | | | |
| OPERATIONS: | | | | | | | | |
Net investment income | | $ | 9,480,989 | | | $ | 15,477,187 | |
Net realized loss on investments and foreign currencies | | | (64,413,262 | ) | | | (101,996,224 | ) |
Net change in unrealized appreciation (depreciation) on investments and foreign currencies | | | 204,128,534 | | | | (316,326,272 | ) |
| | |
|
|
| |
|
|
|
NET INCREASE (DECREASE) IN NET ASSETS RESULTING FROM OPERATIONS | | | 149,196,261 | | | | (402,845,309 | ) |
| | |
|
|
| |
|
|
|
| DISTRIBUTIONS | | | (15,473,292 | ) | | | (61,349,073 | ) |
| | |
|
|
| |
|
|
|
| SERIES SHARE TRANSACTIONS: | | | | | | | | |
Series shares sold [944,130 and 1,400,663 shares, respectively] | | | 13,276,492 | | | | 27,172,912 | |
Series shares issued in reinvestment of dividends and distributions [1,100,519 and 2,931,155 shares, respectively] | | | 15,473,292 | | | | 61,349,073 | |
Series shares repurchased [4,117,959 and 5,123,305 shares, respectively] | | | (55,673,306 | ) | | | (96,604,973 | ) |
| | |
|
|
| |
|
|
|
NET DECREASE IN NET ASSETS RESULTING FROM SERIES SHARE TRANSACTIONS | | | (26,923,522 | ) | | | (8,082,988 | ) |
| | |
|
|
| |
|
|
|
| TOTAL INCREASE (DECREASE) IN NET ASSETS | | | 106,799,447 | | | | (472,277,370 | ) |
| NET ASSETS: | | | | | | | | |
Beginning of year | | | 512,732,023 | | | | 985,009,393 | |
| | |
|
|
| |
|
|
|
End of year | | $ | 619,531,470 | | | $ | 512,732,023 | |
| | |
|
|
| |
|
|
|
SEE NOTES TO FINANCIAL STATEMENTS.
A78
| | | | | | |
| | | GOVERNMENT INCOME PORTFOLIO | | |
| |
| SCHEDULE OF INVESTMENTS | | December 31, 2009 |
| | | | | | | | | | | | |
| LONG-TERM INVESTMENTS — 94.8% | | | | Interest
Rate
| | Maturity
Date
| | Principal
Amount
(000)#
| | Value
(Note 2)
|
| | | | | | | | | | | | | |
Asset-Backed Securities — 2.1% | | | | | | | | | | | | |
Citibank Credit Card Issuance Trust, | | | | | | | | | | | | |
Ser. 2007-A8, Class A8 | | | | 5.650% | | 09/20/19 | | $ | 1,500 | | $ | 1,624,771 |
Small Business Administration Participation Certificates, | | | | | | | | | | | | |
Ser. 1996-20J, Class 1 | | | | 7.200% | | 10/01/16 | | | 1,895 | | | 2,053,713 |
Ser. 1997-20A, Class 1 | | | | 7.150% | | 01/01/17 | | | 1,512 | | | 1,649,675 |
Ser. 1997-20G, Class 1 | | | | 6.850% | | 07/01/17 | | | 677 | | | 721,576 |
Ser. 1998-20I, Class 1 | | | | 6.000% | | 09/01/18 | | | 1,529 | | | 1,639,058 |
| | | | | | | | | | | |
|
|
| | | | | | | | | | | | | 7,688,793 |
| | | | | | | | | | | |
|
|
Collateralized Mortgage Obligations — 3.7% | | | | | | | | | | | | |
Federal Home Loan Mortgage Corp., | | | | | | | | | | | | |
Ser. 2002-2496, Class PM | | | | 5.500% | | 09/15/17 | | | 2,775 | | | 2,938,133 |
Ser. 2002-2501, Class MC | | | | 5.500% | | 09/15/17 | | | 1,076 | | | 1,144,635 |
Ser. 2002-2513, Class HC | | | | 5.000% | | 10/15/17 | | | 2,339 | | | 2,476,624 |
Ser. 2002-2518, Class PV | | | | 5.500% | | 06/15/19 | | | 1,920 | | | 2,028,261 |
Federal National Mortgage Association, | | | | | | | | | | | | |
Ser. 2002-18, Class PC | | | | 5.500% | | 04/25/17 | | | 3,487 | | | 3,673,382 |
Ser. 2002-57, Class ND | | | | 5.500% | | 09/25/17 | | | 1,178 | | | 1,251,461 |
Merrill Lynch Mortgage Investors, Inc., | | | | | | | | | | | | |
Ser. 2003-E, Class A1(a) | | | | 0.541% | | 10/25/28 | | | 112 | | | 96,085 |
Structured Adjustable Rate Mortgage Loan Trust, | | | | | | | | | | | | |
Ser. 2004-1, Class 4A3(a) | | | | 3.586% | | 02/25/34 | | | 378 | | | 312,890 |
| | | | | | | | | | | |
|
|
| | | | | | | | | | | | | 13,921,471 |
| | | | | | | | | | | |
|
|
Commercial Mortgage-Backed Securities — 8.5% | | | | | | | | | | | | |
Bear Stearns Commercial Mortgage Securities, Inc., | | | | | | | | | | | | |
Ser. 2004-T16, Class A5 | | | | 4.600% | | 02/13/46 | | | 4,200 | | | 4,096,276 |
Ser. 2006-PW11, Class A4(a) | | | | 5.456% | | 03/11/39 | | | 860 | | | 840,589 |
Ser. 2006-T22, Class A4(a) | | | | 5.463% | | 04/12/38 | | | 2,825 | | | 2,844,214 |
Commercial Mortgage Loan Trust, | | | | | | | | | | | | |
Ser. 2008-LS1, Class A2(a) | | | | 6.019% | | 12/10/49 | | | 1,230 | | | 1,261,699 |
CW Capital Cobalt Ltd., | | | | | | | | | | | | |
Ser. 2007-C3, Class A3(a) | | | | 5.820% | | 05/15/46 | | | 1,300 | | | 1,258,600 |
Greenwich Capital Commercial Funding Corp., | | | | | | | | | | | | |
Ser. 2007-GG9, Class A2 | | | | 5.381% | | 03/10/39 | | | 2,415 | | | 2,446,512 |
Merrill Lynch Mortgage Trust, | | | | | | | | | | | | |
Ser. 2006-C1, Class ASB(a) | | | | 5.656% | | 05/12/39 | | | 1,500 | | | 1,504,155 |
Merrill Lynch/Countrywide Commercial Mortgage Trust, | | | | | | | | | | | | |
Ser. 2007-9, Class A2 | | | | 5.590% | | 09/12/49 | | | 3,000 | | | 3,032,075 |
Morgan Stanley Capital I, | | | | | | | | | | | | |
Ser. 2005-IQ9, Class AAB | | | | 4.510% | | 07/15/56 | | | 2,500 | | | 2,523,433 |
Ser. 2005-T19, Class AAB | | | | 4.852% | | 06/12/47 | | | 1,375 | | | 1,393,552 |
Ser. 2006-IQ11, Class A4(a) | | | | 5.770% | | 10/15/42 | | | 2,800 | | | 2,769,964 |
Wachovia Bank Commercial Mortgage Trust, | | | | | | | | | | | | |
Ser. 2006-C25, Class A4(a) | | | | 5.740% | | 05/15/43 | | | 2,000 | | | 1,970,573 |
Ser. 2006-C27, Class A2 | | | | 5.624% | | 07/15/45 | | | 3,000 | | | 3,071,287 |
Ser. 2007-C33, Class A3(a) | | | | 5.902% | | 02/15/51 | | | 3,000 | | | 2,950,483 |
| | | | | | | | | | | |
|
|
| | | | | | | | | | | | | 31,963,412 |
| | | | | | | | | | | |
|
|
Corporate Bond — 0.3% | | | | | | | | | | | | |
DEPFA ACS Bank (Ireland), Covered Notes, 144A | | | | 5.125% | | 03/16/37 | | | 1,520 | | | 1,117,170 |
| | | | | | | | | | | |
|
|
Mortgage-Backed Securities — 42.5% | | | | | | | | | | | | |
Federal Home Loan Mortgage Corp.(a) | | | | 2.761% | | 05/01/34 | | | 1,046 | | | 1,072,362 |
Federal Home Loan Mortgage Corp.(h) | | | | 4.500% | | TBA 15 Year | | | 3,500 | | | 3,596,250 |
Federal Home Loan Mortgage Corp. | | | | 5.000% | | 06/01/33-05/01/34 | | | 7,725 | | | 7,949,480 |
Federal Home Loan Mortgage Corp.(h) | | | | 5.000% | | TBA 30 Year | | | 9,500 | | | 9,740,464 |
Federal Home Loan Mortgage Corp. | | | | 5.500% | | 05/01/37-05/01/38 | | | 3,816 | | | 4,002,669 |
Federal Home Loan Mortgage Corp.(h) | | | | 5.500% | | TBA 30 Year | | | 9,000 | | | 9,427,500 |
SEE NOTES TO FINANCIAL STATEMENTS.
A79
| | | | | | |
| | | GOVERNMENT INCOME PORTFOLIO (continued) | | |
| |
| SCHEDULE OF INVESTMENTS | | December 31, 2009 |
| | | | | | | | | | | | |
| | | | | Interest
Rate
| | Maturity
Date
| | Principal
Amount
(000)#
| | Value
(Note 2)
|
| | | | | | | | | | | | | |
Mortgage-Backed Securities (continued) | | | | | | | | | | |
Federal Home Loan Mortgage Corp. | | | | 6.000% | | 09/01/34 | | $ | 498 | | $ | 531,593 |
Federal Home Loan Mortgage Corp. | | | | 6.500% | | 01/01/11-09/01/32 | | | 355 | | | 379,153 |
Federal Home Loan Mortgage Corp. | | | | 7.000% | | 08/01/11-10/01/32 | | | 142 | | | 151,763 |
Federal National Mortgage Association(a) | | | | 2.602% | | 07/01/33 | | | 2,920 | | | 3,000,816 |
Federal National Mortgage Association(a) | | | | 2.764% | | 06/01/34 | | | 907 | | | 929,779 |
Federal National Mortgage Association(a) | | | | 3.673% | | 04/01/34 | | | 842 | | | 871,392 |
Federal National Mortgage Association(a) | | | | 3.680% | | 04/01/34 | | | 384 | | | 397,096 |
Federal National Mortgage Association(h) | | | | 4.000% | | TBA 15 Year | | | 500 | | | 501,172 |
Federal National Mortgage Association(h) | | | | 4.000% | | TBA 30 Year | | | 2,000 | | | 1,930,624 |
Federal National Mortgage Association(a) | | | | 4.029% | | 08/01/33 | | | 1,868 | | | 1,900,612 |
Federal National Mortgage Association(h) | | | | 4.500% | | TBA 30 Year | | | 2,000 | | | 1,996,250 |
Federal National Mortgage Association | | | | 5.000% | | 07/01/18-05/01/36 | | | 12,554 | | | 13,055,092 |
Federal National Mortgage Association(h) | | | | 5.000% | | TBA 30 Year | | | 13,000 | | | 13,339,222 |
Federal National Mortgage Association | | | | 5.500% | | 01/01/17-05/01/37 | | | 29,053 | | | 30,536,409 |
Federal National Mortgage Association(h) | | | | 5.500% | | TBA 15 Year | | | 4,500 | | | 4,758,750 |
Federal National Mortgage Association | | | | 6.000% | | 11/01/14-05/01/38 | | | 11,234 | | | 11,951,070 |
Federal National Mortgage Association(h) | | | | 6.000% | | TBA 30 Year | | | 14,000 | | | 14,826,868 |
Federal National Mortgage Association | | | | 6.260% | | 03/01/11 | | | 1,108 | | | 1,149,048 |
Federal National Mortgage Association | | | | 6.500% | | 01/01/15-10/01/37 | | | 5,177 | | | 5,576,501 |
Federal National Mortgage Association | | | | 7.000% | | 02/01/12-01/01/36 | | | 1,073 | | | 1,180,286 |
Federal National Mortgage Association | | | | 7.500% | | 05/01/10-10/01/12 | | | 50 | | | 52,910 |
Federal National Mortgage Association | | | | 8.000% | | 03/01/22-02/01/26 | | | 31 | | | 35,234 |
Federal National Mortgage Association | | | | 9.000% | | 02/01/25-04/01/25 | | | 165 | | | 191,019 |
Government National Mortgage Association(h) | | | | 4.500% | | TBA 30 Year | | | 3,500 | | | 3,496,727 |
Government National Mortgage Association | | | | 5.000% | | 07/15/33-04/15/34 | | | 3,082 | | | 3,193,397 |
Government National Mortgage Association | | | | 5.500% | | 03/15/34-03/15/36 | | | 2,729 | | | 2,875,030 |
Government National Mortgage Association(h) | | | | 6.000% | | TBA 30 Year | | | 2,000 | | | 2,113,124 |
Government National Mortgage Association | | | | 6.500% | | 07/15/32-08/15/32 | | | 616 | | | 663,642 |
Government National Mortgage Association | | | | 7.000% | | 03/15/23-08/15/28 | | | 1,394 | | | 1,545,736 |
Government National Mortgage Association | | | | 7.500% | | 12/15/25-02/15/26 | | | 267 | | | 300,467 |
Government National Mortgage Association | | | | 8.500% | | 09/15/24-04/15/25 | | | 285 | | | 328,699 |
| | | | | | | | | | | |
|
|
| | | | | | | | | | | | | 159,548,206 |
| | | | | | | | | | | |
|
|
Municipal Bond — 0.2% | | | | | | | | | | | | |
State of Utah, Build America Bonds, Ser. D | | | | 4.554% | | 07/01/24 | | | 630 | | | 616,581 |
| | | | | | | | | | | |
|
|
U.S. Government Agency Obligations — 8.8% | | | | | | | | | | | | |
Federal Farm Credit Bank(c) | | | | 4.875% | | 01/17/17 | | | 980 | | | 1,042,843 |
Federal Home Loan Banks(b) | | | | 5.000% | | 11/17/17 | | | 1,285 | | | 1,390,009 |
Federal Home Loan Banks | | | | 5.625% | | 06/11/21 | | | 2,015 | | | 2,193,483 |
Federal Home Loan Mortgage Corp.(c) | | | | 3.750% | | 03/27/19 | | | 1,950 | | | 1,911,821 |
Federal National Mortgage Association(c) | | | | 2.625% | | 11/20/14 | | | 3,005 | | | 2,981,699 |
Federal National Mortgage Association(c) | | | | 5.000% | | 05/11/17 | | | 4,370 | | | 4,746,698 |
Federal National Mortgage Association(c) | | | | 6.625% | | 11/15/30 | | | 1,230 | | | 1,478,224 |
Financing Corp. FICO, | | | | | | | | | | | | |
Ser. 1P(d) | | | | 4.570% | | 05/11/18 | | | 4,000 | | | 2,753,748 |
Ser. 2P(d) | | | | 5.190% | | 11/30/17 | | | 2,940 | | | 2,075,081 |
Ser. 3P(d) | | | | 5.190% | | 11/30/17 | | | 3,640 | | | 2,569,149 |
Tennessee Valley Authority | | | | 4.500% | | 04/01/18 | | | 805 | | | 819,207 |
Tennessee Valley Authority | | | | 5.250% | | 09/15/39 | | | 870 | | | 862,044 |
Tennessee Valley Authority | | | | 5.500% | | 06/15/38 | | | 465 | | | 472,314 |
GMAC, Inc., FDIC Gtd. Notes | | | | 1.750% | | 10/30/12 | | | 4,415 | | | 4,386,258 |
Western Corporate Federal Credit Union, Gtd. Notes. | | | | 1.750% | | 11/02/12 | | | 3,405 | | | 3,389,712 |
| | | | | | | | | | | |
|
|
| | | | | | | | | | | | | 33,072,290 |
| | | | | | | | | | | |
|
|
U.S. Treasury Securities — 28.7% | | | | | | | | | | | | |
U.S. Treasury Bonds | | | | 3.500% | | 02/15/39 | | | 690 | | | 565,153 |
U.S. Treasury Bonds(c) | | | | 4.375% | | 11/15/39 | | | 4,545 | | | 4,350,419 |
U.S. Treasury Bonds | | | | 4.500% | | 02/15/36 | | | 2,510 | | | 2,472,350 |
U.S. Treasury Bonds(c) | | | | 4.500% | | 08/15/39 | | | 11,015 | | | 10,765,444 |
SEE NOTES TO FINANCIAL STATEMENTS.
A80
| | | | | | |
| | | GOVERNMENT INCOME PORTFOLIO (continued) | | |
| |
| SCHEDULE OF INVESTMENTS | | December 31, 2009 |
| | | | | | | | | | | | | |
| | | | | Interest
Rate
| | Maturity
Date
| | Principal
Amount
(000)#
| | Value
(Note 2)
| |
| | | | | | | | | | | | | | |
U.S. Treasury Securities (continued) | | | | | | | | | | | |
U.S. Treasury Bonds | | | | 6.250% | | 08/15/23 | | $ | 9,555 | | $ | 11,412,253 | |
U.S. Treasury Bonds | | | | 6.875% | | 08/15/25 | | | 15,000 | | | 19,038,285 | |
U.S. Treasury Bonds | | | | 7.125% | | 02/15/23 | | | 630 | | | 807,975 | |
U.S. Treasury Bonds | | | | 8.875% | | 08/15/17 | | | 9,900 | | | 13,494,938 | |
U.S. Treasury Notes | | | | 2.375% | | 08/31/14 | | | 40,560 | | | 40,262,127 | |
U.S. Treasury Strips Coupon(g) | | | | 4.830% | | 11/15/24 | | | 890 | | | 434,363 | |
U.S. Treasury Strips Coupon(g) | | | | 4.860% | | 08/15/24 | | | 1,095 | | | 542,752 | |
U.S. Treasury Strips Coupon(g) | | | | 5.270% | | 05/15/20 | | | 1,055 | | | 678,521 | |
U.S. Treasury Strips Principal(g) | | | | 6.260% | | 02/15/23 | | | 5,540 | | | 3,021,394 | |
| | | | | | | | | | | |
|
|
|
| | | | | | | | | | | | | 107,845,974 | |
| | | | | | | | | | | |
|
|
|
TOTAL LONG-TERM INVESTMENTS
(cost $349,490,039) | | | 355,773,897 | |
| | | | | | | | | | | |
|
|
|
| | | | | |
| | | | | | | | | Shares
| | | |
| SHORT-TERM INVESTMENTS — 26.4% | | | | | | | | | | | | | |
AFFILIATED MUTUAL FUNDS | | | | | | | | | | | | | |
Dryden Core Investment Fund — Short-Term Bond Series (Note 4)(e)
(cost $52,856,631) | | | 5,353,208 | | | 45,823,462 | |
Dryden Core Investment Fund — Taxable Money Market Series
(cost $53,269,210; includes $15,593,648 of cash collateral received for securities on loan)(Note 4)(e)(f) | | | 53,269,210 | | | 53,269,210 | |
| | | | | | | | | | | |
|
|
|
TOTAL AFFILIATED MUTUAL FUNDS
(cost $106,125,841) | | | 99,092,672 | |
| | | | | | | | | | | |
|
|
|
TOTAL INVESTMENTS, BEFORE SECURITY SOLD SHORT —121.2%
(cost $455,615,880) | | | 454,866,569 | |
| | | | | | | | | | | |
|
|
|
| | | | | |
| | | | | | | | | Principal
Amount
(000)#
| | | |
| SECURITY SOLD SHORT — (1.7)% | | | | | | | | | | | | | |
Mortgage-Backed Security | | | | | | | | | | | |
Federal National Mortgage Association
(proceeds $6,332,852) | | | | 5.500% | | TBA 30 Year | | $ | 6,000 | | | (6,280,314 | ) |
| | | | | | | | | | | |
|
|
|
TOTAL INVESTMENTS, NET OF SECURITY SOLD SHORT — 119.5%
(cost $449,283,028) | | | 448,586,255 | |
LIABILITIES IN EXCESS OF OTHER ASSETS(i) — (19.5)% | | | (73,195,863 | ) |
| | | | | | | | | | | |
|
|
|
NET ASSETS — 100.0% | | $ | 375,390,392 | |
| | | | | | | | | | | |
|
|
|
The following abbreviations are used in portfolio descriptions:
| | |
| 144A | | Security was purchased pursuant to Rule 144A under the Securities Act of 1933 and may not be resold subject to that rule except to qualified institutional buyers. Unless otherwise noted, 144A securities are deemed to be liquid. |
| FDIC | | Federal Deposit Insurance Corporation |
| FICO | | Financing Corporation |
| TBA | | To Be Announced |
| # | Principal amount shown in U.S. dollars unless otherwise stated. |
| (a) | Indicates a variable rate security. The maturity date presented for these instruments is the later of the next date on which the security can be redeemed at par or the next date on which the rate of interest is adjusted. The interest rate shown reflects the rate in effect at December 31, 2009. |
| (b) | Security segregated as collateral for futures contracts. |
| (c) | All or a portion of security is on loan. The aggregate market value of such securities is $15,162,729; cash collateral of $15,593,648 (included in liabilities) was received with which the Portfolio purchased highly liquid short-term investments. |
| (d) | Represents zero coupon bond. Rate shown reflects the effective yield at December 31, 2009. |
| (e) | Prudential Investments LLC, the manager of the Portfolio, also serves as manager of the Dryden Core Investment Fund—Taxable Money Market Series and the Dryden Core Investment Fund—Short-Term Bond Series. |
SEE NOTES TO FINANCIAL STATEMENTS.
A81
| | | | | | |
| | | GOVERNMENT INCOME PORTFOLIO (continued) | | |
| |
| SCHEDULE OF INVESTMENTS | | December 31, 2009 |
| (f) | Represents security, or a portion thereof, purchased with cash collateral received for securities on loan. |
| (g) | Rate shown reflects the effective yield at December 31, 2009. |
| (h) | All or partial principal amount totaling $57,500,000 represents to-be-announced (“TBA”) securities acquired under mortgage dollar roll agreement. |
| (i) | Liabilities in excess of other assets include net unrealized appreciation (depreciation) on financial futures contracts and interest rate swap agreements as follows: |
Open futures contracts outstanding at December 31, 2009:
| | | | | | | | | | | | | | |
Number of
Contracts
| | Type
| | Expiration
Date
| | Value at
Trade Date
| | Value at
December 31, 2009
| | Unrealized
Appreciation
(Depreciation)
| |
| Long Positions: | | | | | | | | | | | | | | |
| 96 | | U.S. Treasury 10 Yr. Notes | | Mar. 2010 | | $ | 11,076,868 | | $ | 11,083,500 | | $ | 6,632 | |
| 232 | | U.S. Treasury 2 Yr. Notes | | Mar. 2010 | | | 50,442,160 | | | 50,173,625 | | | (268,535 | ) |
| 17 | | U.S. Treasury 5 Yr. Notes | | Mar. 2010 | | | 1,948,115 | | | 1,944,508 | | | (3,607 | ) |
| | | | | | | | | | | | |
|
|
|
| | | | | | | | | | | | | | (265,510 | ) |
| | | | | | | | | | | | |
|
|
|
| Short Position: | | | | | | | | | | | | | | |
| 334 | | U.S. Long Bond | | Mar. 2010 | | | 39,305,840 | | | 38,535,250 | | | 770,590 | |
| | | | | | | | | | | | |
|
|
|
| | | | | | | | | | | | | $ | 505,080 | |
| | | | | | | | | | | | |
|
|
|
Interest rate swap agreements outstanding at December 31, 2009:
| | | | | | | | | | | | | | | | | | | | |
Counterparty
| | Termination
Date
| | Notional
Amount
(000)
| | Fixed
Rate
| | Floating Rate
| | Fair
value
| | | Upfront
Premium
Paid/
(Receivable)
| | Unrealized
Appreciation/
(Depreciation)
| |
Deutsche Bank AG(a) | | 5/31/2014 | | $ | 4,660 | | 2.355% | | 3 month LIBOR | | $ | (99,451 | ) | | $ | — | | $ | (99,451 | ) |
Morgan Stanley Capital Services(b) | | 2/15/2036 | | | 2,445 | | 4.128% | | 3 month LIBOR | | | 137,438 | | | | — | | | 137,438 | |
| | | | | | | | | | | |
|
|
| |
|
| |
|
|
|
| | | | | | | | | | | | $ | 37,987 | | | $ | — | | $ | 37,987 | |
| | | | | | | | | | | |
|
|
| |
|
| |
|
|
|
LIBOR—London Interbank Offered Rate
| (a) | Portfolio pays the floating rate and receives the fixed rate. |
| (b) | Portfolio pays the fixed rate and receives the floating rate. |
Various inputs are used in determining the value of the Portfolio’s investments. These inputs are summarized in the three broad levels listed below.
Level 1—quoted prices in active markets for identical securities
Level 2—other significant observable inputs (including quoted prices for similar securities, interest rates, prepayment speeds, credit risk, etc.)
Level 3—significant unobservable inputs (including the Portfolio’s own assumptions in determining the fair value of investments)
The following is a summary of the inputs used as of December 31, 2009 in valuing the Portfolio’s assets carried at fair value:
| | | | | | | | | | |
Investments in Securities
| | Level 1
| | Level 2
| | | Level 3
|
Asset-Backed Securities | | $ | — | | $ | 7,688,793 | | | $ | — |
Collateralized Mortgage Obligations | | | — | | | 13,921,471 | | | | — |
Commercial Mortgage-Backed Securities | | | — | | | 31,963,412 | | | | — |
Corporate Bond | | | — | | | 1,117,170 | | | | — |
Mortgage-Backed Securities | | | — | | | 159,548,206 | | | | — |
Municipal Bond | | | — | | | 616,581 | | | | — |
U.S. Government Agency Obligations | | | — | | | 33,072,290 | | | | — |
U.S. Treasury Securities | | | — | | | 107,845,974 | | | | — |
Affiliated Mutual Funds | | | 99,092,672 | | | — | | | | — |
Security Sold Short | | | — | | | (6,280,314 | ) | | | — |
| | |
|
| |
|
|
| |
|
|
| | | | 99,092,672 | | | 349,493,583 | | | | — |
Other Financial Instruments* | | | 505,080 | | | 37,987 | | | | — |
| | |
|
| |
|
|
| |
|
|
Total | | $ | 99,597,752 | | $ | 349,531,570 | | | $ | — |
| | |
|
| |
|
|
| |
|
|
| * | Other financial instruments are derivative instruments not reflected in the Schedule of Investments, such as futures, forwards and swap contracts, which are valued at the unrealized appreciation/depreciation on the instrument. |
As of December 31, 2009 and 2008, the Portfolio did not use any significant unobservable inputs (Level 3) in determining the value of investments.
SEE NOTES TO FINANCIAL STATEMENTS.
A82
| | | | | | |
| | | GOVERNMENT INCOME PORTFOLIO (continued) | | |
| |
| SCHEDULE OF INVESTMENTS | | December 31, 2009 |
The industry classification of portfolio holdings and liabilities in excess of other assets shown as a percentage of net assets as of December 31, 2009 was as follows:
| | | |
Mortgage-Backed Securities | | 42.5 | % |
U.S. Treasury Securities | | 28.7 | |
Affiliated Mutual Funds (including 4.2% of collateral received for securities on loan) | | 26.4 | |
U.S. Government Agency Obligations | | 8.8 | |
Commercial Mortgage-Backed Securities | | 8.5 | |
Collateralized Mortgage Obligations | | 3.7 | |
Asset-Backed Securities | | 2.1 | |
Corporate Bond | | 0.3 | |
Municipal Bond | | 0.2 | |
| | |
|
|
| | | 121.2 | |
Security Sold Short | | (1.7 | ) |
Liabilities in excess of other assets | | (19.5 | ) |
| | |
|
|
| | | 100.0 | % |
| | |
|
|
The Portfolio invested in derivative instruments during the reporting period. The primary types of risk associated with these derivative instruments are commodity risk, credit risk, equity risk, foreign exchange risk and interest rate risk. The effect of such derivative instruments on the Portfolio’s financial position and financial performance as reflected in the Statement of Assets and Liabilities and Statement of Operations is presented in the summary below.
Fair values of derivative Instruments as of December 31, 2009 as presented in the Statement of Assets and Liabilities:
| | | | | | | | | | | | |
Derivatives not designated as
hedging instruments, carried at
fair value
| | Asset Derivatives
| | | Liability Derivatives
| |
| | Balance Sheet Location
| | Fair
Value
| | | Balance Sheet Location
| | Fair
Value
| |
Interest rate contracts | | Due from broker—variation margin | | $ | 777,222 | * | | Due from broker—variation margin | | $ | 272,142 | * |
Interest rate contracts | | Unrealized appreciation on swaps | | | 137,438 | | | Unrealized depreciation on swaps | | | 99,451 | |
| | | | |
|
|
| | | |
|
|
|
Total | | | | $ | 914,660 | | | | | $ | 371,593 | |
| | | | |
|
|
| | | |
|
|
|
| * | Includes cumulative appreciation/depreciation on futures contracts as reported in Schedule of Investments. Only unsettled variation margin receivable (payable) is reported within the Statement of Assets and Liabilities. |
The effects of derivative instruments on the Statement of Operations for the year ended December 31, 2009 are as follows:
| | | | | | | | | | | | | | | | | | | | | |
| Amount of Realized Gain or (Loss) on Derivatives Recognized in Income | |
Derivatives not designated as hedging
instruments, carried at fair value
| | Futures
| | Forward
Contracts
| | | Swaps
| | Purchased
Options
| | | Written
Options
| | Total
| |
Foreign exchange contracts | | $ | — | | $ | (90,336 | ) | | $ | — | | $ | (49,981 | ) | | $ | — | | $ | (140,317 | ) |
Interest rate contracts | | | 3,982,348 | | | — | | | | 287,251 | | | (66,398 | ) | | | 12,250 | | | 4,215,451 | |
| | |
|
| |
|
|
| |
|
| |
|
|
| |
|
| |
|
|
|
Total | | $ | 3,982,348 | | $ | (90,336 | ) | | $ | 287,251 | | $ | (116,379 | ) | | $ | 12,250 | | $ | 4,075,134 | |
| | |
|
| |
|
|
| |
|
| |
|
|
| |
|
| |
|
|
|
|
| Change in Unrealized Appreciation or (Depreciation) on Derivatives Recognized in Income | |
Derivatives not designated as hedging
instruments, carried at fair value
| | | | | | | Futures
| | Forward
Contracts
| | | Swaps
| | Total
| |
Foreign exchange contracts | | | $ | — | | $ | 88,182 | | | $ | — | | $ | — | |
Interest rate contracts | | | | 290,928 | | | — | | | | 246,857 | | | 625,967 | |
| | | |
|
| |
|
|
| |
|
| |
|
|
|
Total | | | $ | 290,928 | | $ | 88,182 | | | $ | 246,857 | | $ | 625,967 | |
| | | |
|
| |
|
|
| |
|
| |
|
|
|
For the year ended December 31, 2009, the Portfolio’s average volume of derivative activities is as follows:
| | | | | | | | | | | | | | | | | | |
Purchased Options
(Cost)
| | Written Options
(Premium
Received)
| | Futures
Long Position
(Value at
Trade Date)
| | Futures
Short Position
(Value at
Trade Date)
| | Forward Currency
Contracts—Purchased
(Value at Settlement
Date Payable)
| | Forward Currency
Contracts—Sold
(Value at Settlement
Date Receivable)
| | Interest Rate Swaps
(Notional Amount in
USD (000))
|
| $12,889 | | $ | 1,181 | | $ | 40,653,521 | | $ | 26,139,070 | | $ | 66,132 | | $ | 20,299 | | $ | 25,467 |
| |
|
| |
|
| |
|
| |
|
| |
|
| |
|
|
SEE NOTES TO FINANCIAL STATEMENTS.
A83
| | | | | | |
| | | GOVERNMENT INCOME PORTFOLIO (continued) | | |
STATEMENT OF ASSETS AND LIABILITIES
December 31, 2009
| | | |
| ASSETS | | | |
Investments, at value including securities on loan of $15,162,729: | | | |
Unaffiliated investments (cost $349,490,039) | | $ | 355,773,897 |
Affiliated investments (cost $106,125,841) | | | 99,092,672 |
Cash | | | 24,343 |
Receivable for investments sold | | | 41,909,015 |
Dividends and interest receivable | | | 2,649,138 |
Unrealized appreciation on swaps | | | 137,438 |
Due from broker—variation margin | | | 126,924 |
Receivable for Series shares sold | | | 83,315 |
Prepaid expenses | | | 4,292 |
| | |
|
|
Total Assets | | | 499,801,034 |
| | |
|
|
| LIABILITIES | | | |
Payable for investments purchased | | | 102,146,806 |
Collateral for securities on loan | | | 15,593,648 |
Securities sold short, at value (proceeds received $6,332,852) | | | 6,280,314 |
Management fee payable | | | 128,816 |
Unrealized depreciation on swaps | | | 99,451 |
Accrued expenses and other liabilities | | | 94,726 |
Payable for Series shares repurchased | | | 65,312 |
Deferred trustees’ fees | | | 974 |
Affiliated transfer agent fee payable | | | 595 |
| | |
|
|
Total Liabilities | | | 124,410,642 |
| | |
|
|
| NET ASSETS | | $ | 375,390,392 |
| | |
|
|
Net assets were comprised of: | | | |
Paid-in capital | | $ | 365,116,986 |
Retained earnings | | | 10,273,406 |
| | |
|
|
Net assets, December 31, 2009 | | $ | 375,390,392 |
| | |
|
|
Net asset value and redemption price per share, $375,390,392 / 31,642,071 outstanding shares of beneficial interest | | $ | 11.86 |
| | |
|
|
STATEMENT OF OPERATIONS
Year Ended December 31, 2009
| | | | |
| INVESTMENT INCOME | | | | |
Interest | | $ | 12,196,732 | |
Affiliated dividend income | | | 1,067,749 | |
Affiliated income from securities loaned, net | | | 118,955 | |
| | |
|
|
|
| | | | 13,383,436 | |
| | |
|
|
|
| EXPENSES | | | | |
Management fee | | | 1,493,853 | |
Shareholders’ reports | | | 115,000 | |
Custodian’s fees and expenses | | | 76,000 | |
Audit fee | | | 28,000 | |
Trustees’ fees | | | 12,000 | |
Transfer agent’s fee and expenses (including affiliated expense of $3,600) (Note 4) | | | 10,000 | |
Interest expense (Note 8) | | | 7,925 | |
Insurance expenses | | | 6,000 | |
Legal fees and expenses | | | 6,000 | |
Commitment fee on syndicated credit agreement | | | 4,000 | |
Miscellaneous | | | 7,628 | |
| | |
|
|
|
Total expenses | | | 1,766,406 | |
| | |
|
|
|
| NET INVESTMENT INCOME | | | 11,617,030 | |
| | |
|
|
|
| NET REALIZED AND UNREALIZED GAIN (LOSS) ON INVESTMENTS, SWAPS AND FOREIGN CURRENCIES | | | | |
Net realized gain (loss) on: | | | | |
Investment transactions (including affiliated: $(23,213)) | | | 5,653,782 | |
Short sale transactions | | | (55,859 | ) |
Futures transactions | | | 3,982,348 | |
Swap agreement transactions | | | 287,251 | |
Foreign currency transactions | | | (90,591 | ) |
Written options transactions | | | 12,250 | |
| | |
|
|
|
| | | | 9,789,181 | |
| | |
|
|
|
Net change in unrealized appreciation (depreciation) on: | | | | |
Investments (including affiliated: $6,446,272) | | | 5,582,273 | |
Securities sold short | | | 52,538 | |
Futures | | | 290,928 | |
Swaps | | | 246,857 | |
Foreign currencies | | | 88,182 | |
| | |
|
|
|
| | | | 6,260,778 | |
| | |
|
|
|
| NET GAIN ON INVESTMENTS, SWAPS AND FOREIGN CURRENCIES | | | 16,049,959 | |
| | |
|
|
|
| NET INCREASE IN NET ASSETS RESULTING FROM OPERATIONS | | $ | 27,666,989 | |
| | |
|
|
|
STATEMENT OF CHANGES IN NET ASSETS
| | | | | | | | |
| | | Year Ended December 31,
| |
| | | 2009
| | | 2008
| |
| INCREASE (DECREASE) IN NET ASSETS | | | | | | | | |
| OPERATIONS: | | | | | | | | |
Net investment income | | $ | 11,617,030 | | | $ | 13,906,867 | |
Net realized gain on investments, swaps and foreign currencies | | | 9,789,181 | | | | 8,180,834 | |
Net change in unrealized appreciation (depreciation) on investments, swaps and foreign currencies | | | 6,260,778 | | | | (7,237,091 | ) |
| | |
|
|
| |
|
|
|
NET INCREASE IN NET ASSETS RESULTING FROM OPERATIONS | | | 27,666,989 | | | | 14,850,610 | |
| | |
|
|
| |
|
|
|
| DISTRIBUTIONS | | | (12,874,743 | ) | | | (14,159,429 | ) |
| | |
|
|
| |
|
|
|
| SERIES SHARE TRANSACTIONS: | | | | | | | | |
Series shares sold [1,335,219 and 3,779,508 shares, respectively] | | | 15,539,947 | | | | 43,082,961 | |
Series shares issued in reinvestment of dividends and distributions [1,112,755 and 1,259,137 shares, respectively] | | | 12,874,743 | | | | 14,159,429 | |
Series shares repurchased [3,294,616 and 2,453,088 shares, respectively] | | | (38,329,997 | ) | | | (27,727,532 | ) |
| | |
|
|
| |
|
|
|
NET INCREASE (DECREASE) IN NET ASSETS RESULTING FROM SERIES SHARE TRANSACTIONS | | | (9,915,307 | ) | | | 29,514,858 | |
| | |
|
|
| |
|
|
|
| TOTAL INCREASE IN NET ASSETS | | | 4,876,939 | | | | 30,206,039 | |
| NET ASSETS: | | | | | | | | |
Beginning of year | | | 370,513,453 | | | | 340,307,414 | |
| | |
|
|
| |
|
|
|
End of year | | $ | 375,390,392 | | | $ | 370,513,453 | |
| | |
|
|
| |
|
|
|
SEE NOTES TO FINANCIAL STATEMENTS.
A84
| | | | | | |
| | | STOCK INDEX PORTFOLIO | | |
| |
| SCHEDULE OF INVESTMENTS | | December 31, 2009 |
| | | | | |
| LONG-TERM INVESTMENTS — 98.5% |
| COMMON STOCKS — 98.5% | | Shares
| | Value
(Note 2)
|
| | | | | | |
Aerospace & Defense — 2.7% | | | | | |
Boeing Co. (The) | | 148,836 | | $ | 8,056,493 |
General Dynamics Corp. | | 82,800 | | | 5,644,476 |
Goodrich Corp. | | 22,900 | | | 1,471,325 |
Honeywell International, Inc. | | 156,650 | | | 6,140,680 |
ITT Corp. | | 37,600 | | | 1,870,224 |
L-3 Communications Holdings, Inc. | | 24,600 | | | 2,138,970 |
Lockheed Martin Corp. | | 68,598 | | | 5,168,859 |
Northrop Grumman Corp. | | 70,826 | | | 3,955,632 |
Precision Castparts Corp. | | 28,000 | | | 3,089,800 |
Raytheon Co. | | 85,718 | | | 4,416,191 |
Rockwell Collins, Inc. | | 30,600 | | | 1,694,016 |
United Technologies Corp. | | 196,100 | | | 13,611,301 |
| | | | |
|
|
| | | | | | 57,257,967 |
| | | | |
|
|
Air Freight & Logistics — 1.0% | | | | | |
C.H. Robinson Worldwide, Inc. | | 38,200 | | | 2,243,486 |
Expeditors International of Washington, Inc. | | 41,600 | | | 1,444,768 |
FedEx Corp. | | 64,740 | | | 5,402,553 |
United Parcel Service, Inc. (Class B Stock) | | 209,400 | | | 12,013,278 |
| | | | |
|
|
| | | | | | 21,104,085 |
| | | | |
|
|
Airlines — 0.1% | | | | | |
Southwest Airlines Co. | | 164,137 | | | 1,876,086 |
| | | | |
|
|
Auto Components — 0.2% | | | | | |
Goodyear Tire & Rubber Co. (The)(a) | | 49,600 | | | 699,360 |
Johnson Controls, Inc. | | 141,300 | | | 3,849,012 |
| | | | |
|
|
| | | | | | 4,548,372 |
| | | | |
|
|
Automobiles — 0.4% | | | | | |
Ford Motor Co.(a)(b) | | 670,659 | | | 6,706,590 |
Harley-Davidson, Inc. | | 48,300 | | | 1,217,160 |
| | | | |
|
|
| | | | | | 7,923,750 |
| | | | |
|
|
Beverages — 2.6% | | | | | |
Brown-Forman Corp. (Class B Stock) | | 20,500 | | | 1,098,185 |
Coca-Cola Co. (The)(b) | | 482,400 | | | 27,496,800 |
Coca-Cola Enterprises, Inc. | | 69,000 | | | 1,462,800 |
Constellation Brands, Inc. (Class A Stock)(a) | | 43,200 | | | 688,176 |
Dr. Pepper Snapple Group, Inc. | | 50,600 | | | 1,431,980 |
Molson Coors Brewing Co. (Class B Stock) | | 31,100 | | | 1,404,476 |
Pepsi Bottling Group, Inc. | | 28,600 | | | 1,072,500 |
PepsiCo, Inc. | | 323,640 | | | 19,677,312 |
| | | | |
|
|
| | | | | | 54,332,229 |
| | | | |
|
|
Biotechnology — 1.5% | | | | | |
Amgen, Inc.(a) | | 211,364 | | | 11,956,861 |
Biogen Idec, Inc.(a)(b) | | 61,225 | | | 3,275,538 |
Celgene Corp.(a) | | 92,900 | | | 5,172,672 |
Cephalon, Inc.(a) | | 15,400 | | | 961,114 |
Genzyme Corp.(a) | | 51,900 | | | 2,543,619 |
Gilead Sciences, Inc.(a) | | 189,600 | | | 8,205,888 |
| | | | |
|
|
| | | | | | 32,115,692 |
| | | | |
|
|
Building Products — 0.1% | | | | | |
Masco Corp. | | 81,300 | | | 1,122,753 |
| | | | |
|
|
| | | | | |
COMMON STOCKS
(continued) | | Shares
| | Value
(Note 2)
|
| | | | | | |
Capital Markets — 2.8% | | | | | |
Ameriprise Financial, Inc. | | 51,600 | | $ | 2,003,112 |
Bank of New York Mellon Corp. (The) | | 254,989 | | | 7,132,042 |
Charles Schwab Corp. (The) | | 196,600 | | | 3,700,012 |
E*Trade Financial Corp.(a)(b) | | 252,400 | | | 441,700 |
Federated Investors, Inc. (Class B Stock)(b) | | 22,600 | | | 621,500 |
Franklin Resources, Inc. | | 33,100 | | | 3,487,085 |
Goldman Sachs Group, Inc. (The) | | 108,500 | | | 18,319,140 |
Invesco Ltd. | | 91,400 | | | 2,146,986 |
Janus Capital Group, Inc.(b) | | 39,000 | | | 524,550 |
Legg Mason, Inc. | | 32,600 | | | 983,216 |
Morgan Stanley | | 288,110 | | | 8,528,056 |
Northern Trust Corp. | | 51,000 | | | 2,672,400 |
State Street Corp. | | 104,900 | | | 4,567,346 |
T. Rowe Price Group, Inc.(b) | | 57,000 | | | 3,035,250 |
| | | | |
|
|
| | | | | | 58,162,395 |
| | | | |
|
|
Chemicals — 1.9% | | | | | |
Air Products & Chemicals, Inc. | | 44,700 | | | 3,623,382 |
Airgas, Inc. | | 14,400 | | | 685,440 |
CF Industries Holdings, Inc., | | 10,000 | | | 907,800 |
Dow Chemical Co. (The) | | 232,061 | | | 6,411,845 |
E.I. du Pont de Nemours & Co. | | 184,391 | | | 6,208,445 |
Eastman Chemical Co. | | 15,800 | | | 951,792 |
Ecolab, Inc. | | 50,000 | | | 2,229,000 |
FMC Corp. | | 15,300 | | | 853,128 |
International Flavors & Fragrances, Inc. | | 16,100 | | | 662,354 |
Monsanto Co. | | 111,596 | | | 9,122,973 |
PPG Industries, Inc. | | 35,800 | | | 2,095,732 |
Praxair, Inc. | | 64,300 | | | 5,163,933 |
Sigma-Aldrich Corp. | | 25,700 | | | 1,298,621 |
| | | | |
|
|
| | | | | | 40,214,445 |
| | | | |
|
|
Commercial Banks — 2.7% | | | | | |
BB&T Corp.(b) | | 142,200 | | | 3,607,614 |
Comerica, Inc. | | 36,450 | | | 1,077,827 |
Fifth Third Bancorp | | 163,649 | | | 1,595,578 |
First Horizon National Corp.(a) | | 49,979 | | | 669,721 |
Huntington Bancshares, Inc. | | 130,775 | | | 477,329 |
KeyCorp | | 174,700 | | | 969,585 |
M&T Bank Corp.(b) | | 16,300 | | | 1,090,307 |
Marshall & Ilsley Corp. | | 105,998 | | | 577,689 |
PNC Financial Services Group, Inc. | | 98,993 | | | 5,225,840 |
Regions Financial Corp. | | 252,212 | | | 1,334,202 |
SunTrust Banks, Inc. | | 103,000 | | | 2,089,870 |
U.S. Bancorp | | 407,481 | | | 9,172,397 |
Wells Fargo & Co. | | 1,058,686 | | | 28,573,935 |
Zions Bancorporation(b) | | 30,300 | | | 388,749 |
| | | | |
|
|
| | | | | | 56,850,643 |
| | | | |
|
|
Commercial Services & Supplies — 0.5% | | | |
Avery Dennison Corp. | | 25,400 | | | 926,846 |
Cintas Corp. | | 26,500 | | | 690,325 |
Iron Mountain, Inc.(a) | | 39,200 | | | 892,192 |
Pitney Bowes, Inc. | | 43,500 | | | 990,060 |
Republic Services, Inc. | | 65,410 | | | 1,851,757 |
SEE NOTES TO FINANCIAL STATEMENTS.
A85
| | | | | | |
| | | STOCK INDEX PORTFOLIO (continued) | | |
| |
| SCHEDULE OF INVESTMENTS | | December 31, 2009 |
| | | | | |
COMMON STOCKS
(continued) | | Shares
| | Value
(Note 2)
|
| | | | | | |
Commercial Services & Supplies (continued) | | | |
RR Donnelley & Sons Co. | | 46,600 | | $ | 1,037,782 |
Stericycle, Inc.(a)(b) | | 19,300 | | | 1,064,781 |
Waste Management, Inc.(b) | | 103,530 | | | 3,500,349 |
| | | | |
|
|
| | | | | | 10,954,092 |
| | | | |
|
|
Communications Equipment — 2.6% | | | | | |
Cisco Systems, Inc.(a) | | 1,207,500 | | | 28,907,550 |
Harris Corp. | | 28,200 | | | 1,340,910 |
JDS Uniphase Corp.(a) | | 45,587 | | | 376,093 |
Juniper Networks, Inc.(a)(b) | | 111,200 | | | 2,965,704 |
Motorola, Inc.(a) | | 487,795 | | | 3,785,289 |
QUALCOMM, Inc. | | 342,800 | | | 15,857,928 |
Tellabs, Inc.(a) | | 88,000 | | | 499,840 |
| | | | |
|
|
| | | | | | 53,733,314 |
| | | | |
|
|
Computers & Peripherals — 5.9% | | | | | |
Apple, Inc.(a)(b) | | 188,700 | | | 39,789,282 |
Dell, Inc.(a) | | 365,900 | | | 5,254,324 |
EMC Corp.(a)(b) | | 434,874 | | | 7,597,249 |
Hewlett-Packard Co. | | 496,316 | | | 25,565,237 |
International Business Machines Corp. | | 274,600 | | | 35,945,140 |
Lexmark International, Inc., (Class A Stock)(a) | | 15,514 | | | 403,054 |
NetApp, Inc.(a) | | 72,000 | | | 2,476,080 |
QLogic Corp.(a)(b) | | 27,700 | | | 522,699 |
SanDisk Corp.(a)(b) | | 47,900 | | | 1,388,621 |
Sun Microsystems, Inc.(a) | | 155,950 | | | 1,461,251 |
Teradata Corp.(a) | | 38,200 | | | 1,200,626 |
Western Digital Corp.(a) | | 45,900 | | | 2,026,485 |
| | | | |
|
|
| | | | | | 123,630,048 |
| | | | |
|
|
Construction & Engineering — 0.2% | | | |
Fluor Corp. | | 38,000 | | | 1,711,520 |
Jacobs Engineering Group, Inc.(a)(b) | | 25,700 | | | 966,577 |
Quanta Services, Inc.(a) | | 38,000 | | | 791,920 |
| | | | |
|
|
| | | | | | 3,470,017 |
| | | | |
|
|
Construction Materials — 0.1% | | | |
Vulcan Materials Co. | | 23,700 | | | 1,248,279 |
| | | | |
|
|
Consumer Finance — 0.8% | | | |
American Express Co. | | 252,100 | | | 10,215,092 |
Capital One Financial Corp. | | 96,169 | | | 3,687,119 |
Discover Financial Services | | 120,505 | | | 1,772,629 |
SLM Corp.(a) | | 99,000 | | | 1,115,730 |
| | | | |
|
|
| | | | | | 16,790,570 |
| | | | |
|
|
Containers & Packaging — 0.2% | | | |
Ball Corp. | | 20,400 | | | 1,054,680 |
Bemis Co., Inc. | | 21,300 | | | 631,545 |
Owens-Illinois, Inc.(a) | | 37,100 | | | 1,219,477 |
Pactiv Corp.(a) | | 29,300 | | | 707,302 |
Sealed Air Corp. | | 33,020 | | | 721,817 |
| | | | |
|
|
| | | | | | 4,334,821 |
| | | | |
|
|
Distributors — 0.1% | | | |
Genuine Parts Co. | | 33,025 | | | 1,253,629 |
| | | | |
|
|
| | | | | |
COMMON STOCKS
(continued) | | Shares
| | Value
(Note 2)
|
| | | | | | |
Diversified Consumer Services — 0.2% | | | |
Apollo Group, Inc. (Class A Stock)(a)(b) | | 26,900 | | $ | 1,629,602 |
DeVry, Inc. | | 13,700 | | | 777,201 |
H&R Block, Inc. | | 71,000 | | | 1,606,020 |
| | | | |
|
|
| | | | | | 4,012,823 |
| | | | |
|
|
Diversified Financial Services — 4.3% | | | |
Bank of America Corp.(b) | | 2,076,232 | | | 31,268,054 |
Citigroup, Inc. | | 4,020,676 | | | 13,308,438 |
CME Group, Inc. | | 14,070 | | | 4,726,816 |
IntercontinentalExchange, Inc.(a)(b) | | 16,000 | | | 1,796,800 |
JPMorgan Chase & Co. | | 827,545 | | | 34,483,800 |
Leucadia National Corp.(a) | | 38,900 | | | 925,431 |
Moody’s Corp.(b) | | 42,120 | | | 1,128,816 |
Nasdaq OMX Group, Inc. (The)(a) | | 25,700 | | | 509,374 |
NYSE Euronext | | 56,700 | | | 1,434,510 |
| | | | |
|
|
| | | | | | 89,582,039 |
| | | | |
|
|
Diversified Telecommunication Services — 2.9% | | | |
AT&T, Inc. | | 1,237,811 | | | 34,695,842 |
CenturyTel, Inc.(b) | | 63,130 | | | 2,285,937 |
Frontier Communications Corp. | | 77,200 | | | 602,932 |
Qwest Communications International, Inc. | | 322,047 | | | 1,355,818 |
Verizon Communications, Inc. | | 600,838 | | | 19,905,763 |
Windstream Corp. | | 90,665 | | | 996,409 |
| | | | |
|
|
| | | | | | 59,842,701 |
| | | | |
|
|
Electric Utilities — 2.0% | | | |
Allegheny Energy, Inc. | | 32,600 | | | 765,448 |
American Electric Power Co., Inc. | | 98,140 | | | 3,414,291 |
Duke Energy Corp. | | 272,082 | | | 4,682,531 |
Edison International | | 68,100 | | | 2,368,518 |
Entergy Corp. | | 38,800 | | | 3,175,392 |
Exelon Corp. | | 135,950 | | | 6,643,877 |
FirstEnergy Corp. | | 61,336 | | | 2,849,057 |
FPL Group, Inc. | | 86,300 | | | 4,558,366 |
Northeast Utilities | | 31,100 | | | 802,069 |
Pepco Holdings, Inc. | | 47,400 | | | 798,690 |
Pinnacle West Capital Corp. | | 20,900 | | | 764,522 |
PPL Corp. | | 78,500 | | | 2,536,335 |
Progress Energy, Inc. | | 58,414 | | | 2,395,558 |
Southern Co. | | 164,100 | | | 5,467,812 |
| | | | |
|
|
| | | | | | 41,222,466 |
| | | | |
|
|
Electrical Equipment — 0.5% | | | |
Emerson Electric Co. | | 159,600 | | | 6,798,960 |
First Solar, Inc.(a)(b) | | 8,500 | | | 1,150,900 |
Rockwell Automation, Inc. | | 30,300 | | | 1,423,494 |
Roper Industries, Inc. | | 14,900 | | | 780,313 |
| | | | |
|
|
| | | | | | 10,153,667 |
| | | | |
|
|
Electronic Equipment & Instruments — 0.6% | | | |
Agilent Technologies, Inc.(a)(b) | | 71,582 | | | 2,224,053 |
Amphenol Corp. (Class A Stock) | | 33,100 | | | 1,528,558 |
Corning, Inc. | | 326,500 | | | 6,304,715 |
FLIR Systems, Inc.(a) | | 30,700 | | | 1,004,504 |
Jabil Circuit, Inc. | | 44,000 | | | 764,280 |
Molex, Inc. | | 26,600 | | | 573,230 |
| | | | |
|
|
| | | | | | 12,399,340 |
| | | | |
|
|
SEE NOTES TO FINANCIAL STATEMENTS.
A86
| | | | | | |
| | | STOCK INDEX PORTFOLIO (continued) | | |
| |
| SCHEDULE OF INVESTMENTS | | December 31, 2009 |
| | | | | |
COMMON STOCKS
(continued) | | Shares
| | Value
(Note 2)
|
| | | | | | |
Energy Equipment & Services — 1.8% | | | |
Baker Hughes, Inc.(b) | | 61,130 | | $ | 2,474,542 |
BJ Services Co. | | 54,300 | | | 1,009,980 |
Cameron International Corp.(a) | | 48,100 | | | 2,010,580 |
Diamond Offshore Drilling, Inc. | | 13,600 | | | 1,338,512 |
FMC Technologies, Inc.(a) | | 24,500 | | | 1,417,080 |
Halliburton Co. | | 183,000 | | | 5,506,470 |
Nabors Industries Ltd. (Bermuda)(a) | | 60,800 | | | 1,330,912 |
National Oilwell Varco, Inc. | | 88,200 | | | 3,888,738 |
Rowan Cos., Inc.(a) | | 24,100 | | | 545,624 |
Schlumberger Ltd. | | 250,600 | | | 16,311,554 |
Smith International, Inc. | | 44,200 | | | 1,200,914 |
| | | | |
|
|
| | | | | | 37,034,906 |
| | | | |
|
|
Food & Staples Retailing — 2.6% | | | |
Costco Wholesale Corp. | | 88,232 | | | 5,220,687 |
CVS Caremark Corp. | | 289,238 | | | 9,316,356 |
Kroger Co. (The) | | 138,700 | | | 2,847,511 |
Safeway, Inc. | | 88,100 | | | 1,875,649 |
SUPERVALU, Inc. | | 47,508 | | | 603,827 |
Sysco Corp. | | 123,700 | | | 3,456,178 |
Walgreen Co. | | 206,400 | | | 7,579,008 |
Wal-Mart Stores, Inc. | | 441,500 | | | 23,598,175 |
Whole Foods Market, Inc.(a)(b) | | 28,300 | | | 776,835 |
| | | | |
|
|
| | | | | | 55,274,226 |
| | | | |
|
|
Food Products — 1.6% | | | |
Archer-Daniels-Midland Co. | | 135,238 | | | 4,234,302 |
Campbell Soup Co. | | 39,300 | | | 1,328,340 |
ConAgra Foods, Inc. | | 94,500 | | | 2,178,225 |
Dean Foods Co.(a)(b) | | 38,800 | | | 699,952 |
General Mills, Inc. | | 69,000 | | | 4,885,890 |
H.J. Heinz Co. | | 65,950 | | | 2,820,022 |
Hershey Co. (The)(b) | | 35,800 | | | 1,281,282 |
Hormel Foods Corp. | | 15,500 | | | 595,975 |
J.M. Smucker Co. (The) | | 25,700 | | | 1,586,975 |
Kellogg Co. | | 54,200 | | | 2,883,440 |
Kraft Foods, Inc. (Class A Stock) | | 308,311 | | | 8,379,893 |
McCormick & Co., Inc. | | 27,600 | | | 997,188 |
Sara Lee Corp. | | 151,100 | | | 1,840,398 |
Tyson Foods, Inc. (Class A Stock) | | 66,600 | | | 817,182 |
| | | | |
|
|
| | | | | | 34,529,064 |
| | | | |
|
|
Gas Utilities — 0.1% | | | |
EQT Corp. | | 25,100 | | | 1,102,392 |
Nicor, Inc. | | 10,200 | | | 429,420 |
Questar Corp. | | 33,200 | | | 1,380,124 |
| | | | |
|
|
| | | | | | 2,911,936 |
| | | | |
|
|
Healthcare Equipment & Supplies — 2.0% | | | |
Baxter International, Inc. | | 126,400 | | | 7,417,152 |
Becton, Dickinson & Co. | | 49,400 | | | 3,895,684 |
Boston Scientific Corp.(a) | | 313,199 | | | 2,818,791 |
C.R. Bard, Inc. | | 21,000 | | | 1,635,900 |
CareFusion Corp.(a) | | 36,237 | | | 906,287 |
DENTSPLY International, Inc. | | 31,700 | | | 1,114,889 |
Hospira, Inc.(a) | | 35,420 | | | 1,806,420 |
Intuitive Surgical, Inc.(a) | | 8,100 | | | 2,456,892 |
Medtronic, Inc. | | 231,900 | | | 10,198,962 |
St. Jude Medical, Inc.(a) | | 68,800 | | | 2,530,464 |
| | | | | |
COMMON STOCKS
(continued) | | Shares
| | Value
(Note 2)
|
| | | | | | |
Healthcare Equipment & Supplies (continued) | | | |
Stryker Corp. | | 59,500 | | $ | 2,997,015 |
Varian Medical Systems, Inc.(a)(b) | | 23,300 | | | 1,091,605 |
Zimmer Holdings, Inc.(a) | | 43,986 | | | 2,600,013 |
| | | | |
|
|
| | | | | | 41,470,074 |
| | | | |
|
|
Healthcare Providers & Services — 2.1% | | | |
Aetna, Inc. | | 91,748 | | | 2,908,412 |
AmerisourceBergen Corp. | | 61,300 | | | 1,598,091 |
Cardinal Health, Inc. | | 72,475 | | | 2,336,594 |
CIGNA Corp. | | 59,200 | | | 2,087,984 |
Coventry Health Care, Inc.(a) | | 32,750 | | | 795,497 |
DaVita, Inc.(a) | | 22,100 | | | 1,298,154 |
Express Scripts, Inc.(a) | | 55,800 | | | 4,823,910 |
Humana, Inc.(a) | | 36,100 | | | 1,584,429 |
Laboratory Corp. of America Holdings(a)(b) | | 22,300 | | | 1,668,932 |
McKesson Corp. | | 55,707 | | | 3,481,687 |
Medco Health Solutions, Inc.(a) | | 98,992 | | | 6,326,579 |
Patterson Cos., Inc.(a)(b) | | 17,100 | | | 478,458 |
Quest Diagnostics, Inc. | | 34,800 | | | 2,101,224 |
Tenet Healthcare Corp.(a) | | 90,000 | | | 485,100 |
UnitedHealth Group, Inc. | | 238,000 | | | 7,254,240 |
WellPoint, Inc.(a) | | 100,400 | | | 5,852,316 |
| | | | |
|
|
| | | | | | 45,081,607 |
| | | | |
|
|
Healthcare Technology | | | |
IMS Health, Inc. | | 36,820 | | | 775,429 |
| | | | |
|
|
Hotels, Restaurants & Leisure — 1.4% | | | |
Carnival Corp.(a) | | 89,100 | | | 2,823,579 |
Darden Restaurants, Inc.(b) | | 30,850 | | | 1,081,909 |
International Game Technology | | 56,700 | | | 1,064,259 |
Marriott International, Inc. (Class A Stock)(b) | | 48,703 | | | 1,327,157 |
McDonald’s Corp. | | 222,900 | | | 13,917,876 |
Starbucks Corp.(a)(b) | | 151,100 | | | 3,484,366 |
Starwood Hotels & Resorts Worldwide, Inc.(b) | | 36,000 | | | 1,316,520 |
Wyndham Worldwide Corp. | | 41,363 | | | 834,292 |
Wynn Resorts Ltd. | | 12,000 | | | 698,760 |
Yum! Brands, Inc. | | 99,300 | | | 3,472,521 |
| | | | |
|
|
| | | | | | 30,021,239 |
| | | | |
|
|
Household Durables — 0.3% | | | |
Black & Decker Corp. (The) | | 11,400 | | | 739,062 |
D.R. Horton, Inc. | | 55,200 | | | 600,024 |
Fortune Brands, Inc. | | 31,900 | | | 1,378,080 |
Harman International Industries, Inc. | | 14,100 | | | 497,448 |
Leggett & Platt, Inc. | | 36,800 | | | 750,720 |
Lennar Corp. (Class A Stock) | | 25,500 | | | 325,635 |
Newell Rubbermaid, Inc. | | 64,649 | | | 970,381 |
Pulte Homes, Inc.(a)(b) | | 53,485 | | | 534,850 |
Whirlpool Corp.(b) | | 14,607 | | | 1,178,201 |
| | | | |
|
|
| | | | | | 6,974,401 |
| | | | |
|
|
Household Products — 2.5% | | | |
Clorox Co.(b) | | 28,700 | | | 1,750,700 |
Colgate-Palmolive Co. | | 104,500 | | | 8,584,675 |
Kimberly-Clark Corp. | | 87,988 | | | 5,605,716 |
Procter & Gamble Co. (The) | | 610,981 | | | 37,043,778 |
| | | | |
|
|
| | | | | | 52,984,869 |
| | | | |
|
|
SEE NOTES TO FINANCIAL STATEMENTS.
A87
| | | | | | |
| | | STOCK INDEX PORTFOLIO (continued) | | |
| |
| SCHEDULE OF INVESTMENTS | | December 31, 2009 |
| | | | | |
COMMON STOCKS
(continued) | | Shares
| | Value
(Note 2)
|
| | | | | | |
Independent Power Producers & Energy Traders — 0.2% |
AES Corp. (The)(a) | | 145,300 | | $ | 1,933,943 |
Constellation Energy Group, Inc. | | 43,950 | | | 1,545,722 |
| | | | |
|
|
| | | | | | 3,479,665 |
| | | | |
|
|
Industrial Conglomerates — 2.2% | | | |
3M Co. | | 147,600 | | | 12,202,092 |
General Electric Co. | | 2,214,000 | | | 33,497,820 |
Textron, Inc. | | 48,400 | | | 910,404 |
| | | | |
|
|
| | | | | | 46,610,316 |
| | | | |
|
|
Insurance — 2.2% | | | |
Aflac, Inc. | | 101,900 | | | 4,712,875 |
Allstate Corp. (The) | | 118,388 | | | 3,556,376 |
American International Group, Inc.(a)(b) | | 25,229 | | | 756,365 |
Aon Corp. | | 57,125 | | | 2,190,173 |
Assurant, Inc. | | 24,500 | | | 722,260 |
Chubb Corp. (The), | | 75,000 | | | 3,688,500 |
Cincinnati Financial Corp. | | 39,028 | | | 1,024,095 |
Genworth Financial, Inc. (Class A Stock)(a) | | 105,200 | | | 1,194,020 |
Hartford Financial Services Group, Inc. | | 79,000 | | | 1,837,540 |
Lincoln National Corp. | | 62,963 | | | 1,566,519 |
Loews Corp. | | 73,226 | | | 2,661,765 |
Marsh & McLennan Cos., Inc. | | 114,700 | | | 2,532,576 |
MetLife, Inc. | | 175,000 | | | 6,186,250 |
Principal Financial Group, Inc. | | 65,500 | | | 1,574,620 |
Progressive Corp. (The)(a) | | 134,000 | | | 2,410,660 |
Torchmark Corp. | | 21,300 | | | 936,135 |
Travelers Cos., Inc. (The) | | 119,498 | | | 5,958,170 |
Unum Group | | 75,756 | | | 1,478,757 |
XL Capital Ltd. (Class A Stock) | | 74,300 | | | 1,361,919 |
| | | | |
|
|
| | | | | | 46,349,575 |
| | | | |
|
|
Internet & Catalog Retail — 0.6% | | | |
Amazon.com, Inc.(a) | | 69,300 | | | 9,322,236 |
Expedia, Inc.(a)(b) | | 44,900 | | | 1,154,379 |
priceline.com, Inc.(a) | | 8,700 | | | 1,900,950 |
| | | | |
|
|
| | | | | | 12,377,565 |
| | | | |
|
|
Internet Software & Services — 2.0% | | | |
Akamai Technologies, Inc.(a)(b) | | 36,100 | | | 914,413 |
eBay, Inc.(a) | | 229,900 | | | 5,411,846 |
Google, Inc. (Class A Stock)(a) | | 50,600 | | | 31,370,988 |
VeriSign, Inc.(a)(b) | | 41,300 | | | 1,001,112 |
Yahoo!, Inc.(a) | | 248,200 | | | 4,164,796 |
| | | | |
|
|
| | | | | | 42,863,155 |
| | | | |
|
|
IT Services — 1.6% | | | |
Affiliated Computer Services, Inc. (Class A Stock)(a) | | 19,700 | | | 1,175,893 |
Automatic Data Processing, Inc. | | 106,000 | | | 4,538,920 |
Cognizant Technology Solutions Corp. (Class A Stock)(a) | | 58,400 | | | 2,645,520 |
Computer Sciences Corp.(a) | | 31,900 | | | 1,835,207 |
Fidelity National Information Services, Inc. | | 63,600 | | | 1,490,784 |
Fiserv, Inc.(a) | | 33,000 | | | 1,599,840 |
| | | | | |
COMMON STOCKS
(continued) | | Shares
| | Value
(Note 2)
|
| | | | | | |
IT Services (continued) | | | |
Mastercard, Inc. (Class A Stock)(b) | | 20,200 | | $ | 5,170,796 |
Paychex, Inc. | | 63,250 | | | 1,937,980 |
SAIC, Inc.(a) | | 50,600 | | | 958,364 |
Total System Services, Inc. | | 41,593 | | | 718,311 |
Visa, Inc. (Class A Stock) | | 92,000 | | | 8,046,320 |
Western Union Co. (The) | | 153,704 | | | 2,897,321 |
| | | | |
|
|
| | | | | | 33,015,256 |
| | | | |
|
|
Leisure Equipment & Products — 0.1% | | | |
Eastman Kodak Co.(a)(b) | | 30,000 | | | 126,600 |
Hasbro, Inc. | | 27,150 | | | 870,429 |
Mattel, Inc. | | 73,281 | | | 1,464,154 |
| | | | |
|
|
| | | | | | 2,461,183 |
| | | | |
|
|
Life Sciences Tools & Services — 0.4% | | | |
Life Technologies Corp.(a)(b) | | 37,430 | | | 1,954,969 |
Millipore Corp.(a) | | 12,500 | | | 904,375 |
PerkinElmer, Inc. | | 27,200 | | | 560,048 |
Thermo Fisher Scientific, Inc.(a) | | 89,100 | | | 4,249,179 |
Waters Corp.(a)(b) | | 20,000 | | | 1,239,200 |
| | | | |
|
|
| | | | | | 8,907,771 |
| | | | |
|
|
Machinery — 1.6% | | | |
Caterpillar, Inc.(b) | | 128,600 | | | 7,328,914 |
Cummins, Inc. | | 40,600 | | | 1,861,916 |
Danaher Corp. | | 55,500 | | | 4,173,600 |
Deere & Co. | | 85,800 | | | 4,640,922 |
Dover Corp. | | 39,400 | | | 1,639,434 |
Eaton Corp. | | 34,500 | | | 2,194,890 |
Flowserve Corp. | | 12,000 | | | 1,134,360 |
Illinois Tool Works, Inc. | | 82,400 | | | 3,954,376 |
PACCAR, Inc. | | 73,328 | | | 2,659,607 |
Pall Corp. | | 26,200 | | | 948,440 |
Parker Hannifin Corp. | | 31,487 | | | 1,696,519 |
Snap-On, Inc. | | 12,700 | | | 536,702 |
Stanley Works (The)(b) | | 17,500 | | | 901,425 |
| | | | |
|
|
| | | | | | 33,671,105 |
| | | | |
|
|
Media — 2.8% | | | |
CBS Corp. (Class B Stock) | | 146,668 | | | 2,060,685 |
Comcast Corp. (Class A Stock) | | 600,846 | | | 10,130,264 |
DIRECTV (Class A Stock)(a) | | 192,700 | | | 6,426,545 |
Gannett Co., Inc. | | 56,300 | | | 836,055 |
Interpublic Group of Cos., Inc.(a) | | 90,900 | | | 670,842 |
McGraw-Hill Cos., Inc. (The) | | 67,800 | | | 2,271,978 |
Meredith Corp. | | 7,200 | | | 222,120 |
New York Times Co. (The) (Class A Stock)(a) | | 13,200 | | | 163,152 |
News Corp. (Class A Stock)(b) | | 465,800 | | | 6,376,802 |
Omnicom Group, Inc. | | 67,200 | | | 2,630,880 |
Scripps Networks Interactive, Inc. (Class A Stock) | | 20,300 | | | 842,450 |
Time Warner Cable, Inc. | | 75,826 | | | 3,138,438 |
Time Warner, Inc. | | 245,840 | | | 7,163,778 |
Viacom, Inc. (Class B Stock)(a) | | 128,568 | | | 3,822,327 |
Walt Disney Co. (The) | | 383,701 | | | 12,374,357 |
Washington Post Co. (The) (Class B Stock) | | 1,200 | | | 527,520 |
| | | | |
|
|
| | | | | | 59,658,193 |
| | | | |
|
|
SEE NOTES TO FINANCIAL STATEMENTS.
A88
| | | | | | |
| | | STOCK INDEX PORTFOLIO (continued) | | |
| |
| SCHEDULE OF INVESTMENTS | | December 31, 2009 |
| | | | | |
COMMON STOCKS
(continued) | | Shares
| | Value
(Note 2)
|
| | | | | | |
Metals & Mining — 1.1% | | | |
AK Steel Holding Corp. | | 23,900 | | $ | 510,265 |
Alcoa, Inc. | | 204,576 | | | 3,297,765 |
Allegheny Technologies, Inc. | | 18,440 | | | 825,559 |
Cliffs Natural Resources, Inc. | | 22,200 | | | 1,023,198 |
Freeport-McMoRan Copper & Gold, Inc.(a) | | 88,806 | | | 7,130,233 |
Newmont Mining Corp. | | 102,003 | | | 4,825,762 |
Nucor Corp. | | 65,000 | | | 3,032,250 |
Titanium Metals Corp.(a) | | 6,000 | | | 75,120 |
United States Steel Corp.(b) | | 27,340 | | | 1,506,981 |
| | | | |
|
|
| | | | | | 22,227,133 |
| | | | |
|
|
Multiline Retail — 0.8% | | | |
Big Lots, Inc.(a)(b) | | 16,900 | | | 489,762 |
Family Dollar Stores, Inc. | | 27,100 | | | 754,193 |
J.C. Penney Co., Inc. | | 48,900 | | | 1,301,229 |
Kohl’s Corp.(a) | | 64,900 | | | 3,500,057 |
Macy’s, Inc. | | 91,720 | | | 1,537,227 |
Nordstrom Inc.(b) | | 35,700 | | | 1,341,606 |
Sears Holdings Corp.(a)(b) | | 8,312 | | | 693,637 |
Target Corp. | | 162,568 | | | 7,863,414 |
| | | | |
|
|
| | | | | | 17,481,125 |
| | | | |
|
|
Multi-Utilities — 1.4% | | | |
Ameren Corp. | | 48,500 | | | 1,355,575 |
CenterPoint Energy, Inc. | | 79,010 | | | 1,146,435 |
CMS Energy Corp.(b) | | 48,100 | | | 753,246 |
Consolidated Edison, Inc.(b) | | 59,600 | | | 2,707,628 |
Dominion Resources, Inc. | | 126,084 | | | 4,907,189 |
DTE Energy Co. | | 35,600 | | | 1,551,804 |
Integrys Energy Group, Inc. | | 17,750 | | | 745,323 |
NiSource, Inc. | | 57,000 | | | 876,660 |
PG&E Corp. | | 78,800 | | | 3,518,420 |
Public Service Enterprise Group, Inc. | | 110,600 | | | 3,677,450 |
SCANA Corp. | | 22,200 | | | 836,496 |
Sempra Energy | | 52,554 | | | 2,941,973 |
TECO Energy, Inc. | | 48,200 | | | 781,804 |
Wisconsin Energy Corp. | | 22,600 | | | 1,126,158 |
Xcel Energy, Inc. | | 96,695 | | | 2,051,868 |
| | | | |
|
|
| | | | | | 28,978,029 |
| | | | |
|
|
Office Electronics — 0.1% | | | |
Xerox Corp. | | 191,692 | | | 1,621,714 |
| | | | |
|
|
Oil, Gas & Consumable Fuels — 9.5% | | | |
Anadarko Petroleum Corp. | | 102,726 | | | 6,412,157 |
Apache Corp. | | 70,750 | | | 7,299,278 |
Cabot Oil & Gas Corp. | | 19,000 | | | 828,210 |
Chesapeake Energy Corp. | | 134,000 | | | 3,467,920 |
Chevron Corp. | | 421,392 | | | 32,442,970 |
ConocoPhillips | | 311,679 | | | 15,917,447 |
Consol Energy, Inc. | | 37,300 | | | 1,857,540 |
Denbury Resources, Inc.(a)(b) | | 43,900 | | | 649,720 |
Devon Energy Corp. | | 94,000 | | | 6,909,000 |
El Paso Corp. | | 150,911 | | | 1,483,455 |
EOG Resources, Inc. | | 51,900 | | | 5,049,870 |
Exxon Mobil Corp. | | 989,370 | | | 67,465,140 |
Hess Corp. | | 62,000 | | | 3,751,000 |
Marathon Oil Corp. | | 150,494 | | | 4,698,423 |
| | | | | |
COMMON STOCKS
(continued) | | Shares
| | Value
(Note 2)
|
| | | | | | |
Oil, Gas & Consumable Fuels (continued) | | | |
Massey Energy Co. | | 17,500 | | $ | 735,175 |
Murphy Oil Corp. | | 40,600 | | | 2,200,520 |
Noble Energy, Inc. | | 35,900 | | | 2,556,798 |
Occidental Petroleum Corp. | | 168,100 | | | 13,674,935 |
Peabody Energy Corp. | | 56,400 | | | 2,549,844 |
Pioneer Natural Resources Co. | | 21,600 | | | 1,040,472 |
Range Resources Corp. | | 32,200 | | | 1,605,170 |
Southwestern Energy Co.(a) | | 72,500 | | | 3,494,500 |
Spectra Energy Corp. | | 137,542 | | | 2,820,986 |
Sunoco, Inc. | | 27,000 | | | 704,700 |
Tesoro Corp.(b) | | 31,500 | | | 426,825 |
Valero Energy Corp. | | 112,600 | | | 1,886,050 |
Williams Cos., Inc. (The) | | 124,400 | | | 2,622,352 |
XTO Energy, Inc. | | 121,800 | | | 5,667,354 |
| | | | |
|
|
| | | | | | 200,217,811 |
| | | | |
|
|
Paper & Forest Products — 0.3% | | | |
International Paper Co. | | 87,867 | | | 2,353,078 |
MeadWestvaco Corp. | | 38,689 | | | 1,107,666 |
Weyerhaeuser Co. | | 45,400 | | | 1,958,556 |
| | | | |
|
|
| | | | | | 5,419,300 |
| | | | |
|
|
Personal Products — 0.3% | | | |
Avon Products, Inc. | | 91,000 | | | 2,866,500 |
Estee Lauder Cos., Inc. (The) (Class A Stock) | | 22,900 | | | 1,107,444 |
Mead Johnson Nutrition Co., Inc. (Class A Stock) | | 34,493 | | | 1,507,344 |
| | | | |
|
|
| | | | | | 5,481,288 |
| | | | |
|
|
Pharmaceuticals — 6.4% | | | |
Abbott Laboratories | | 320,100 | | | 17,282,199 |
Allergan, Inc. | | 64,900 | | | 4,089,349 |
Bristol-Myers Squibb Co.(b) | | 366,540 | | | 9,255,135 |
Eli Lilly & Co. | | 213,300 | | | 7,616,943 |
Forest Laboratories, Inc.(a) | | 64,300 | | | 2,064,673 |
Johnson & Johnson | | 578,171 | | | 37,239,994 |
King Pharmaceuticals, Inc. (a) | | 45,233 | | | 555,009 |
Merck & Co., Inc. | | 636,104 | | | 23,243,234 |
Mylan, Inc.(a)(b) | | 59,200 | | | 1,091,056 |
Pfizer, Inc. | | 1,685,273 | | | 30,655,116 |
Watson Pharmaceuticals, Inc.(a)(b) | | 20,400 | | | 808,044 |
| | | | |
|
|
| | | | | | 133,900,752 |
| | | | |
|
|
Professional Services — 0.1% | | | |
Dun & Bradstreet Corp. | | 11,300 | | | 953,381 |
Equifax, Inc. | | 29,100 | | | 898,899 |
Monster Worldwide, Inc.(a)(b) | | 25,200 | | | 438,480 |
Robert Half International, Inc.(b) | | 32,500 | | | 868,725 |
| | | | |
|
|
| | | | | | 3,159,485 |
| | | | |
|
|
Real Estate Investment Trusts — 1.2% | | | |
Apartment Investment & Management Co., REIT (Class A Stock)(b) | | 34,974 | | | 556,786 |
AvalonBay Communities, Inc.(b) | | 16,918 | | | 1,389,137 |
Boston Properties, Inc. | | 28,100 | | | 1,884,667 |
Equity Residential(b) | | 57,500 | | | 1,942,350 |
HCP, Inc. | | 57,600 | | | 1,759,104 |
Health Care REIT, Inc.(b) | | 22,900 | | | 1,014,928 |
SEE NOTES TO FINANCIAL STATEMENTS.
A89
| | | | | | |
| | | STOCK INDEX PORTFOLIO (continued) | | |
| |
| SCHEDULE OF INVESTMENTS | | December 31, 2009 |
| | | | | |
COMMON STOCKS
(continued) | | Shares
| | Value
(Note 2)
|
| | | | | | |
Real Estate Investment Trusts (continued) | | | |
Host Hotels & Resorts, Inc.(a)(b) | | 131,726 | | $ | 1,537,242 |
Kimco Realty Corp.(b) | | 76,400 | | | 1,033,692 |
Plum Creek Timber Co., Inc.(b) | | 35,000 | | | 1,321,600 |
ProLogis(b) | | 91,500 | | | 1,252,635 |
Public Storage | | 27,600 | | | 2,248,020 |
Simon Property Group, Inc.(b) | | 59,001 | | | 4,708,280 |
Ventas, Inc. | | 32,600 | | | 1,425,924 |
Vornado Realty Trust(b) | | 33,557 | | | 2,346,977 |
| | | | |
|
|
| | | | | | 24,421,342 |
| | | | |
|
|
Real Estate Management & Development | | | |
CB Richard Ellis Group, Inc. (Class A Stock)(a)(b) | | 51,100 | | | 693,427 |
| | | | |
|
|
Road & Rail — 1.0% | | | |
Burlington Northern Santa Fe Corp. | | 54,626 | | | 5,387,216 |
CSX Corp. | | 82,424 | | | 3,996,740 |
Norfolk Southern Corp. | | 76,300 | | | 3,999,646 |
Ryder System, Inc. | | 12,800 | | | 526,976 |
Union Pacific Corp. | | 104,800 | | | 6,696,720 |
| | | | |
|
|
| | | | | | 20,607,298 |
| | | | |
|
|
Semiconductors & Semiconductor Equipment — 2.6% |
Advanced Micro Devices, Inc.(a) | | 115,600 | | | 1,119,008 |
Altera Corp.(b) | | 62,500 | | | 1,414,375 |
Analog Devices, Inc. | | 61,900 | | | 1,954,802 |
Applied Materials, Inc. | | 270,100 | | | 3,765,194 |
Broadcom Corp. (Class A Stock)(a)(b) | | 92,450 | | | 2,907,552 |
Intel Corp. | | 1,160,600 | | | 23,676,240 |
KLA-Tencor Corp. | | 32,000 | | | 1,157,120 |
Linear Technology Corp. | | 48,700 | | | 1,487,298 |
LSI Corp.(a) | | 141,700 | | | 851,617 |
MEMC Electronic Materials, Inc.(a)(b) | | 39,700 | | | 540,714 |
Microchip Technology, Inc. | | 38,900 | | | 1,130,434 |
Micron Technology, Inc.(a)(b) | | 167,700 | | | 1,770,912 |
National Semiconductor Corp. | | 40,500 | | | 622,080 |
Novellus Systems, Inc.(a)(b) | | 22,400 | | | 522,816 |
NVIDIA Corp.(a)(b) | | 116,650 | | | 2,179,022 |
Teradyne, Inc.(a)(b) | | 31,800 | | | 341,214 |
Texas Instruments, Inc. | | 270,200 | | | 7,041,412 |
Xilinx, Inc.(b) | | 54,900 | | | 1,375,794 |
| | | | |
|
|
| | | | | | 53,857,604 |
| | | | |
|
|
Software — 4.3% | | | |
Adobe Systems, Inc.(a) | | 108,200 | | | 3,979,596 |
Autodesk, Inc.(a)(b) | | 48,200 | | | 1,224,762 |
BMC Software, Inc.(a) | | 40,100 | | | 1,608,010 |
CA, Inc. | | 85,873 | | | 1,928,707 |
Citrix Systems, Inc.(a) | | 37,300 | | | 1,552,053 |
Compuware Corp.(a) | | 57,500 | | | 415,725 |
Electronic Arts, Inc.(a)(b) | | 58,700 | | | 1,041,925 |
Intuit, Inc.(a) | | 66,900 | | | 2,054,499 |
McAfee, Inc.(a) | | 34,200 | | | 1,387,494 |
Microsoft Corp. | | 1,612,000 | | | 49,149,880 |
Novell, Inc.(a) | | 73,100 | | | 303,365 |
Oracle Corp. | | 809,620 | | | 19,868,075 |
Red Hat, Inc.(a) | | 36,400 | | | 1,124,760 |
| | | | | |
COMMON STOCKS
(continued) | | Shares
| | Value
(Note 2)
|
| | | | | | |
Software (continued) | | | |
Salesforce.com, Inc.(a) | | 21,000 | | $ | 1,549,170 |
Symantec Corp.(a)(b) | | 178,311 | | | 3,189,984 |
| | | | |
|
|
| | | | | | 90,378,005 |
| | | | |
|
|
Specialty Retail — 1.9% | | | |
Abercrombie & Fitch Co. (Class A Stock) | | 15,500 | | | 540,175 |
AutoNation, Inc.(a)(b) | | 20,489 | | | 392,364 |
AutoZone, Inc.(a) | | 6,800 | | | 1,074,876 |
Bed Bath & Beyond, Inc.(a)(b) | | 52,900 | | | 2,043,527 |
Best Buy Co., Inc. | | 72,225 | | | 2,849,998 |
GameStop Corp. (Class A Stock)(a)(b) | | 33,800 | | | 741,572 |
Gap, Inc. (The), | | 101,187 | | | 2,119,868 |
Home Depot, Inc. | | 353,519 | | | 10,227,305 |
Limited Brands, Inc. | | 59,796 | | | 1,150,475 |
Lowe’s Cos., Inc. | | 301,400 | | | 7,049,746 |
Office Depot, Inc.(a) | | 44,900 | | | 289,605 |
O’Reilly Automotive, Inc.(a) | | 25,400 | | | 968,248 |
RadioShack Corp. | | 26,560 | | | 517,920 |
Ross Stores, Inc. | | 26,000 | | | 1,110,460 |
Sherwin-Williams Co. (The)(b) | | 18,400 | | | 1,134,360 |
Staples, Inc. | | 151,400 | | | 3,722,926 |
Tiffany & Co. | | 25,800 | | | 1,109,400 |
TJX Cos., Inc. | | 89,800 | | | 3,282,190 |
| | | | |
|
|
| | | | | | 40,325,015 |
| | | | |
|
|
Textiles, Apparel & Luxury Goods — 0.5% | | | |
Coach, Inc. | | 72,100 | | | 2,633,813 |
NIKE, Inc. (Class B Stock) | | 78,900 | | | 5,212,923 |
Polo Ralph Lauren Corp. (Class A Stock) | | 10,500 | | | 850,290 |
V.F. Corp. | | 19,336 | | | 1,416,169 |
| | | | |
|
|
| | | | | | 10,113,195 |
| | | | |
|
|
Thrifts & Mortgage Finance — 0.1% | | | |
Hudson City Bancorp, Inc.(b) | | 113,600 | | | 1,559,728 |
People’s United Financial, Inc. | | 71,900 | | | 1,200,730 |
| | | | |
|
|
| | | | | | 2,760,458 |
| | | | |
|
|
Tobacco — 1.5% | | | |
Altria Group, Inc. | | 424,900 | | | 8,340,787 |
Lorillard, Inc. | | 32,431 | | | 2,601,939 |
Philip Morris International, Inc. (Switzerland) | | 402,600 | | | 19,401,294 |
Reynolds American, Inc. | | 38,100 | | | 2,018,157 |
| | | | |
|
|
| | | | | | 32,362,177 |
| | | | |
|
|
Trading Companies & Distributors — 0.1% | | | |
Fastenal Co.(b) | | 24,200 | | | 1,007,688 |
W.W. Grainger, Inc.(b) | | 12,400 | | | 1,200,692 |
| | | | |
|
|
| | | | | | 2,208,380 |
| | | | |
|
|
Wireless Telecommunication Services — 0.3% | | | |
American Tower Corp. (Class A Stock)(a) | | 79,500 | | | 3,435,195 |
MetroPCS Communications, Inc.(a) | | 39,500 | | | 301,385 |
Sprint Nextel Corp.(a) | | 610,722 | | | 2,235,243 |
| | | | |
|
|
| | | | | | 5,971,823 |
| | | | |
|
|
TOTAL LONG-TERM INVESTMENTS
(cost $1,341,165,006) | | | 2,066,773,119 |
| | | | |
|
|
SEE NOTES TO FINANCIAL STATEMENTS.
A90
| | | | | | |
| | | STOCK INDEX PORTFOLIO (continued) | | |
| |
| SCHEDULE OF INVESTMENTS | | December 31, 2009 |
| | | | | |
SHORT-TERM
INVESTMENTS — 8.7% | | Shares
| | Value
(Note 2)
|
| | | | | | |
Affiliated Money Market Mutual Fund — 8.5% | | | |
Dryden Core Investment Fund — Taxable Money Market Series
(cost $177,953,852; includes $155,266,293 of cash collateral received for securities on loan) (Note 4)(c)(d) | | 177,953,832 | | $ | 177,953,832 |
| | | | |
|
|
| | | | | | | |
| | | Principal
Amount
(000)
| | Value
(Note 2)
| |
| | | | | | | | |
U.S. Government Obligation — 0.2% | | | | |
U.S. Treasury Bill,
0.04%, 03/18/2010
(cost $4,699,603) | | $ | 4,700 | | $ | 4,699,525 | |
| | | | | |
|
|
|
TOTAL SHORT-TERM INVESTMENTS
(cost $182,653,435) | | | 182,653,357 | |
| | | | | |
|
|
|
TOTAL INVESTMENTS — 107.2%
(cost $1,523,818,441) | | | 2,249,426,476 | |
LIABILITIES IN EXCESS OF
OTHER ASSETS(e) — (7.2)% | | | (151,367,182 | ) |
| | | | | |
|
|
|
NET ASSETS — 100.0% | | $ | 2,098,059,294 | |
| | | | | |
|
|
|
The following abbreviations are used in portfolio descriptions:
| (a) | Non-income producing security. |
| (b) | All or a portion of security is on loan. The aggregate market value of such securities is $149,549,726; cash collateral of $155,266,293 (included in liabilities) was received with which the Portfolio purchased highly liquid short-term investments. |
| (c) | Represents security, or a portion thereof, purchased with cash collateral received for securities on loan. |
| (d) | Prudential Investments LLC, the manager of the Portfolio, also serves as manager of the Dryden Core Investment Fund-Taxable Money Market Series. |
| (e) | Liabilities in excess of other assets include net unrealized appreciation (depreciation) on financial futures contracts as follows: |
Open futures contracts outstanding at December 31, 2009:
| | | | | | | | | | | | | |
Number of
Contracts
| | Type
| | Expiration
Date
| | Value at
Trade Date
| | Value at
December 31, 2009
| | Unrealized
Appreciation
|
| Long Position: | | | | | | | | | | | | | |
| 109 | | S&P 500 Index | | Mar. 2010 | | $ | 30,086,386 | | $ | 30,266,575 | | $ | 180,189 |
| | | | | | | | | | | | |
|
|
Various inputs are used in determining the value of the Portfolio’s investments. These inputs are summarized in the three broad levels listed below.
Level 1—quoted prices in active markets for identical securities
Level 2—other significant observable inputs (including quoted prices for similar securities, interest rates, prepayment speeds, credit risk, etc.)
Level 3—significant unobservable inputs (including the Portfolio’s own assumptions in determining the fair value of investments)
The following is a summary of the inputs used as of December 31, 2009 in valuing the Portfolio’s assets carried at fair value:
| | | | | | | | | |
| | | Level 1
| | Level 2
| | Level 3
|
Investments in Securities | | | | | | |
Common Stocks | | $ | 2,066,773,119 | | $ | — | | $ | — |
U.S. Government Obligations | | | — | | | 4,699,525 | | | — |
Affiliated Money Market Mutual Fund | | | 177,953,832 | | | — | | | — |
| | |
|
| |
|
| |
|
|
| | | | 2,244,726,951 | | | 4,699,525 | | | — |
Other Financial Instruments* | | | 180,189 | | | — | | | — |
| | |
|
| |
|
| |
|
|
Total | | $ | 2,244,907,140 | | $ | 4,699,525 | | $ | — |
| | |
|
| |
|
| |
|
|
| * | Other financial instruments are derivative instruments not reflected in the Schedule of Investments, such as futures, forwards and swap contracts, which are valued at the unrealized appreciation/depreciation on the instrument. |
As of December 31, 2009 and 2008, the Portfolio did not use any significant unobservable inputs (Level 3) in determining the value of investments.
SEE NOTES TO FINANCIAL STATEMENTS.
A91
| | | | | | |
| | | STOCK INDEX PORTFOLIO (continued) | | |
| |
| SCHEDULE OF INVESTMENTS | | December 31, 2009 |
The industry classification of portfolio holdings and liabilities in excess of other assets shown as a percentage of net assets as of December 31, 2009 was as follows:
| | | |
Oil, Gas & Consumable Fuels | | 9.5 | % |
Affiliated Money Market Mutual Fund (including 7.4% of collateral received for securities on loan) | | 8.5 | |
Pharmaceuticals | | 6.4 | |
Computers & Peripherals | | 5.9 | |
Diversified Financial Services | | 4.3 | |
Software | | 4.3 | |
Diversified Telecommunication Services | | 2.9 | |
Capital Markets | | 2.8 | |
Media | | 2.8 | |
Aerospace & Defense | | 2.7 | |
Commercial Banks | | 2.7 | |
Beverages | | 2.6 | |
Communications Equipment | | 2.6 | |
Food & Staples Retailing | | 2.6 | |
Semiconductors & Semiconductor Equipment | | 2.6 | |
Household Products | | 2.5 | |
Industrial Conglomerates | | 2.2 | |
Insurance | | 2.2 | |
Healthcare Providers & Services | | 2.1 | |
Electric Utilities | | 2.0 | |
Healthcare Equipment & Supplies | | 2.0 | |
Internet Software & Services | | 2.0 | |
Chemicals | | 1.9 | |
Specialty Retail | | 1.9 | |
Energy Equipment & Services | | 1.8 | |
Food Products | | 1.6 | |
IT Services | | 1.6 | |
Machinery | | 1.6 | |
Biotechnology | | 1.5 | |
Tobacco | | 1.5 | |
Hotels, Restaurants & Leisure | | 1.4 | |
Multi-Utilities | | 1.4 | |
| | | |
Real Estate Investment Trusts | | 1.2 | % |
Metals & Mining | | 1.1 | |
Air Freight & Logistics | | 1.0 | |
Road & Rail | | 1.0 | |
Consumer Finance | | 0.8 | |
Multiline Retail | | 0.8 | |
Electronic Equipment & Instruments | | 0.6 | |
Internet & Catalog Retail | | 0.6 | |
Commercial Services & Supplies | | 0.5 | |
Electrical Equipment | | 0.5 | |
Textiles, Apparel & Luxury Goods | | 0.5 | |
Automobiles | | 0.4 | |
Life Sciences Tools & Services | | 0.4 | |
Household Durables | | 0.3 | |
Paper & Forest Products | | 0.3 | |
Personal Products | | 0.3 | |
Wireless Telecommunication Services | | 0.3 | |
Auto Components | | 0.2 | |
Construction & Engineering | | 0.2 | |
Containers & Packaging | | 0.2 | |
Diversified Consumer Services | | 0.2 | |
Independent Power Producers & Energy Traders | | 0.2 | |
U.S. Government Obligation | | 0.2 | |
Airlines | | 0.1 | |
Building Products | | 0.1 | |
Construction Materials | | 0.1 | |
Distributors | | 0.1 | |
Gas Utilities | | 0.1 | |
Leisure Equipment & Products | | 0.1 | |
Office Electronics | | 0.1 | |
Professional Services | | 0.1 | |
Thrifts & Mortgage Finance | | 0.1 | |
Trading Companies & Distributors | | 0.1 | |
| | |
|
|
| | | 107.2 | |
Liabilities in excess of other assets | | (7.2 | ) |
| | |
|
|
| | | 100.0 | % |
| | |
|
|
The Portfolio invested in derivative instruments during the reporting period. The primary types of risk associated with derivative instruments are commodity risk, credit risk, equity risk, foreign exchange risk and interest rate risk. The effect of such derivative instruments on the Portfolio’s financial position and financial performance as reflected in the Statement of Assets and Liabilities and Statement of Operations is presented in the summary below.
Fair values of derivative instruments as of December 31, 2009 as presented in the Statement of Assets and Liabilities:
| | | | | | | | | | | |
Derivatives not designated as
hedging instruments, carried at
fair value
| | Asset Derivatives
| | | Liability Derivatives
|
| | Balance Sheet Location
| | Fair
Value
| | | Balance Sheet Location
| | Fair
Value
|
Equity contracts | | Due to broker—variation margin | | $ | 180,189 | * | | — | | $ | — |
| | | | |
|
|
| | | |
|
|
| * | Includes cumulative appreciation/depreciation on futures contracts as reported in the Schedule of Investments. Only unsettled variation margin receivable (payable) is reported within the Statement of Assets and Liabilities. |
SEE NOTES TO FINANCIAL STATEMENTS.
A92
| | | | | | |
| | | STOCK INDEX PORTFOLIO (continued) | | |
| |
| SCHEDULE OF INVESTMENTS | | December 31, 2009 |
The effects of derivative instruments on the Statement of Operations for the year ended December 31, 2009 are as follows:
| | | |
Amount of Realized Gain or (Loss) on Derivatives Recognized in Income
|
Derivatives not designated as hedging
instruments, carried at fair value
| | Futures
|
Equity contracts | | $ | 10,307,032 |
| | |
|
|
| | | | |
Change in Unrealized Appreciation or (Depreciation) on Derivatives Recognized in Income
| |
Derivatives not designated as hedging
instruments, carried at fair value
| | Futures
| |
Equity contracts | | $ | (379,818 | ) |
| | |
|
|
|
For the year ended December 31, 2009, the average value at trade date for futures long position was $36,988,610.
SEE NOTES TO FINANCIAL STATEMENTS.
A93
| | | | | | |
| | | STOCK INDEX PORTFOLIO (continued) | | |
STATEMENT OF ASSETS AND LIABILITIES
December 31, 2009
| | | |
| ASSETS | | | |
Investments, at value including securities on loan of $149,549,726: | | | |
Unaffiliated investments (cost $1,345,864,609) | | $ | 2,071,472,644 |
Affiliated investments (cost $177,953,832) | | | 177,953,832 |
Cash | | | 49,130 |
Receivable for investments sold | | | 6,314,127 |
Dividends and interest receivable | | | 2,854,527 |
Receivable for Series shares sold | | | 78,019 |
Prepaid expenses | | | 20,750 |
| | |
|
|
Total Assets | | | 2,258,743,029 |
| | |
|
|
| LIABILITIES | | | |
Collateral for securities on loan | | | 155,266,293 |
Payable for investments purchased | | | 4,066,123 |
Management fee payable | | | 622,119 |
Due to broker-variation margin | | | 310,650 |
Payable for Series shares repurchased | | | 277,366 |
Accrued expenses and other liabilities | | | 140,589 |
Affiliated transfer agent fee payable | | | 595 |
| | |
|
|
Total Liabilities | | | 160,683,735 |
| | |
|
|
| NET ASSETS | | $ | 2,098,059,294 |
| | |
|
|
Net assets were comprised of: | | | |
Paid-in capital | | $ | 1,435,013,755 |
Retained earnings | | | 663,045,539 |
| | |
|
|
Net assets, December 31, 2009 | | $ | 2,098,059,294 |
| | |
|
|
Net asset value and redemption price per share, $2,098,059,294 / 75,231,986 outstanding shares of beneficial interest | | $ | 27.89 |
| | |
|
|
STATEMENT OF OPERATIONS
Year Ended December 31, 2009
| | | | |
| INVESTMENT INCOME | | | | |
Unaffiliated dividend income | | $ | 42,565,351 | |
Affiliated income from securities loaned, net | | | 1,769,831 | |
Affiliated dividend income | | | 174,319 | |
Interest | | | 4,546 | |
| | |
|
|
|
| | | | 44,514,047 | |
| | |
|
|
|
| EXPENSES | | | | |
Management fee | | | 6,408,612 | |
Custodian’s fees and expenses | | | 163,000 | |
Shareholders’ reports | | | 50,000 | |
Insurance expenses | | | 43,000 | |
Trustees’ fees | | | 33,000 | |
Audit fee | | | 17,000 | |
Legal fees and expenses | | | 15,000 | |
Commitment fee on syndicated credit agreement | | | 12,000 | |
Transfer agent’s fee and expenses (including affiliated expense of $3,600) (Note 4) | | | 10,000 | |
Miscellaneous | | | 15,956 | |
| | |
|
|
|
Total expenses | | | 6,767,568 | |
| | |
|
|
|
| NET INVESTMENT INCOME | | | 37,746,479 | |
| | |
|
|
|
| NET REALIZED AND UNREALIZED GAIN (LOSS) ON INVESTMENTS | | | | |
Net realized gain (loss) on: | | | | |
Investment transactions | | | (22,151,368 | ) |
Futures transactions | | | 10,307,032 | |
| | |
|
|
|
| | | | (11,844,336 | ) |
| | |
|
|
|
Net change in unrealized appreciation (depreciation) on: | | | | |
Investments | | | 414,349,079 | |
Futures | | | (379,818 | ) |
| | |
|
|
|
| | | | 413,969,261 | |
| | |
|
|
|
| NET GAIN ON INVESTMENTS | | | 402,124,925 | |
| | |
|
|
|
| NET INCREASE IN NET ASSETS RESULTING FROM OPERATIONS | | $ | 439,871,404 | |
| | |
|
|
|
STATEMENT OF CHANGES IN NET ASSETS
| | | | | | | | |
| | | Year Ended December 31,
| |
| | | 2009
| | | 2008
| |
INCREASE (DECREASE) IN NET ASSETS
OPERATIONS: | | | | | | | | |
Net investment income | | $ | 37,746,479 | | | $ | 51,604,331 | |
Net realized loss on investments | | | (11,844,336 | ) | | | (28,775,151 | ) |
Net change in unrealized appreciation (depreciation) on investments | | | 413,969,261 | | | | (1,123,541,103 | ) |
| | |
|
|
| |
|
|
|
NET INCREASE (DECREASE) IN NET ASSETS RESULTING FROM OPERATIONS | | | 439,871,404 | | | | (1,100,711,923 | ) |
| | |
|
|
| |
|
|
|
| DISTRIBUTIONS | | | (51,594,261 | ) | | | (56,959,943 | ) |
| | |
|
|
| |
|
|
|
| SERIES SHARE TRANSACTIONS: | | | | | | | | |
Series shares sold [2,119,324 and 2,142,562 shares, respectively] | | | 48,926,542 | | | | 63,864,986 | |
Series shares issued in reinvestment of dividends and distributions [2,201,121 and 1,689,203 shares, respectively] | | | 51,594,261 | | | | 56,959,943 | |
Series shares repurchased [8,851,247 and 8,835,363 shares, respectively] | | | (206,536,067 | ) | | | (269,751,865 | ) |
| | |
|
|
| |
|
|
|
NET DECREASE IN NET ASSETS RESULTING FROM SERIES SHARE TRANSACTIONS | | | (106,015,264 | ) | | | (148,926,936 | ) |
| | |
|
|
| |
|
|
|
| TOTAL INCREASE (DECREASE) IN NET ASSETS | | | 282,261,879 | | | | (1,306,598,802 | ) |
| NET ASSETS: | | | | | | | | |
Beginning of year | | | 1,815,797,415 | | | | 3,122,396,217 | |
| | |
|
|
| |
|
|
|
End of year | | $ | 2,098,059,294 | | | $ | 1,815,797,415 | |
| | |
|
|
| |
|
|
|
SEE NOTES TO FINANCIAL STATEMENTS.
A94
NOTES TO THE FINANCIAL STATEMENTS OF THE PRUDENTIAL SERIES FUND
The Prudential Series Fund (“Series Fund”), organized as a Delaware statutory trust, is a diversified open-end management investment company registered under the Investment Company Act of 1940, as amended. On January 2, 2006, each Portfolio of the Series Fund changed its federal income tax status from a regulated investment company to a partnership. As a result of that conversion, the Series Fund was reorganized from a Maryland corporation to a Delaware statutory trust. Pursuant to this reorganization, the Series Fund has been renamed “The Prudential Series Fund.” The Series Fund is composed of twenty-two Portfolios (“Portfolio” or “Portfolios”), each with separate series shares. The information presented in these financial statements pertains to seven Portfolios which are listed below along with each Portfolio’s investment objective.
Conservative Balanced Portfolio: Total investment return consistent with a conservatively managed diversified portfolio by investing in a mix of equity-related securities, debt obligations and money market instruments.
Diversified Bond Portfolio: High level of income over a longer term while providing reasonable safety of capital by investing in intermediate and long-term debt obligations that are rated investment grade and high quality money market instruments. The types of debt obligations in which the Portfolio can invest include U.S. government securities, mortgage-related securities and corporate bonds.
Equity Portfolio: Capital appreciation by investing primarily in stocks of major, established corporations as well as small companies.
Flexible Managed Portfolio: High total return consistent with an aggressively managed diversified portfolio by investing in a mix of equity and equity-related securities, debt obligations and money market instruments.
Global Portfolio: Long-term growth of capital by investing primarily in equity and equity-related securities of foreign and U.S. companies.
Government Income Portfolio: High level of income over the long-term consistent with the preservation of capital by investing primarily in intermediate and long-term U.S. government securities, including U.S. treasuries, government agency and mortgage-related securities.
Stock Index Portfolio: Investment results that generally correspond to the price and yield performance of the S&P 500 Index by investing primarily in stocks in the S&P 500 Index.
The ability of issuers of debt securities (other than those issued or guaranteed by the U.S. Government) held by the Portfolios to meet their obligations may be affected by the economic or political developments in a specific industry, region or country.
Foreign security and currency transactions may involve certain considerations and risks not typically associated with those of domestic origin as a result of, among other factors, the possibility of political and economic instability or the level of governmental supervision and regulation of foreign securities markets.
| Note 2: | | Accounting Policies |
The following is a summary of significant accounting policies followed by the Series Fund and the Portfolios in preparation of their financial statements.
Securities Valuation: Securities listed on a securities exchange are valued at the last sale price on such exchange on the day of valuation or, if there was no sale on such day, at the mean between the last reported bid and asked prices, or at the last bid price on such day in the absence of an asked price. Securities traded via NASDAQ are valued at the NASDAQ official closing price (“NOCP”) on the day of valuation, or if there was no NOCP, at the last sale price. Securities that are actively traded in the over-the-counter market, including listed securities for which the primary market is believed by Prudential Investments LLC (“PI” or “Manager”) in consultation with the subadvisors, to be over-the-counter, are valued at market value using prices provided by an independent pricing agent or principal market maker. Options on securities and indices traded on an exchange are valued at the last sale price as of the close of trading on the applicable exchange or, if there was no sale, at the mean between the most recently quoted bid and asked prices on such exchange, or at the last bid price in the absence of an asked price. Futures contracts and options thereon traded on a
B1
commodities exchange or board of trade are valued at the last sale price at the close of trading on such exchange or board of trade or, if there was no sale on the applicable commodities exchange or board of trade on such day, at the mean between the most recently quoted bid and asked prices on such exchange or board of trade or at the last bid price in the absence of an asked price. Prices may be obtained from independent pricing services which use information provided by market makers or estimates of market values obtained from yield data relating to investments or securities with similar characteristics. Securities for which reliable market quotations are not readily available, or whose values have been affected by events occurring after the close of the security’s foreign market and before the Series Fund’s normal pricing time, are valued at fair value in accordance with Board of Trustees approved fair valuation procedures. When determining the fair value of securities, some of the factors influencing the valuation include, the nature of any restrictions on disposition of the securities; assessment of the general liquidity of the securities; the issuer’s financial condition and the markets in which it does business; the cost of the investment; the size of the holding and the capitalization of the issuer; the prices of any recent transactions or bids/offers for such securities or any comparable securities; any available analyst media or other reports or information deemed reliable by the investment advisor regarding the issuer or the markets or industry in which it operates. Using fair value to price securities may result in a value that is different from a security’s most recent closing price and from the price used by other mutual funds to calculate their net asset values.
Investments in mutual funds are valued at their net asset value as of the close of the New York Stock Exchange on the date of valuation.
Short-term debt securities that are held in the Portfolios which mature in more than 60 days are valued at fair value and those short-term debt securities of sufficient credit quality which mature in 60 days or less are valued at amortized cost which approximates fair value. The amortized cost method involves valuing a security at its cost at the time of purchase and thereafter assumes a constant amortization to maturity of any discount or premium.
Each Portfolio may hold up to 15% of its net assets in illiquid securities, including those which are restricted as to disposition under securities law (“restricted securities”). Restricted securities, including private placements, are valued pursuant to the valuation procedures noted above.
Repurchase Agreements: In connection with transactions in repurchase agreements with United States financial institutions, it is the Series Fund’s policy that its custodian or designated subcustodians, as the case may be, under triparty repurchase agreements, take possession of the underlying collateral securities, the value of which exceeds the principal amount of the repurchase transaction, including accrued interest. To the extent that any repurchase transaction exceeds one business day, the value of the collateral is marked to market on a daily basis to ensure the adequacy of the collateral. If the seller defaults and the value of the collateral declines, or if bankruptcy proceedings are commenced with respect to the seller of the security, realization of the collateral by the Series Fund may by delayed or limited.
Foreign Currency Translation: The books and records of the Series Fund are maintained in U.S. dollars. Foreign currency amounts are translated into U.S. dollars on the following basis:
(i) market value of investment securities, other assets and liabilities at the current daily rates of exchange.
(ii) purchases and sales of investment securities, income and expenses at the rates of exchange prevailing on the respective dates of such transactions.
Although the net assets of the Series Fund are presented at the foreign exchange rates and market values at the close of the period, the Series Fund does not isolate that portion of the results of operations arising as a result of changes in the foreign exchange rates from the fluctuations arising from changes in the market prices of securities held at the end of the period. Similarly, the Series Fund does not isolate the effect of changes in foreign exchange rates from the fluctuations arising from changes in the market prices of portfolio securities sold during the period. Accordingly, these realized foreign currency gains (losses) are included in the reported net realized gains (losses) on investment transactions.
Net realized gains (losses) on foreign currency transactions represent net foreign exchange gains (losses) from the holding of foreign currencies, currency gains (losses) realized between the trade date and settlement date on securities transactions, and the difference between the amounts of dividends, interest and foreign withholding taxes recorded on the Series Fund’s books and the U.S. dollar equivalent amounts actually received or paid. Net unrealized currency gains (losses) from valuing foreign currency denominated assets
B2
and liabilities (other than investments) at period end exchange rates are reflected as a component of net unrealized appreciation (depreciation) on investments and foreign currencies.
Forward Currency Contracts: A forward currency contract is a commitment to purchase or sell a foreign currency at a future date at a negotiated forward rate between two parties. Certain Portfolios of the Series Fund entered into forward currency contracts in order to hedge their exposure to changes in foreign currency exchange rates on their foreign portfolio holdings or specific receivables and payables denominated in a foreign currency and to gain exposure to certain currencies. The contracts are valued daily at current exchange rates and any unrealized gain or loss is included in net unrealized appreciation or depreciation on foreign currencies. Gain or loss is realized on the settlement date of the contract equal to the difference between the settlement value of the original and renegotiated forward contracts. This gain or loss, if any, is included in net realized gain (loss) on foreign currency transactions. Risks may arise upon entering into these contracts from the potential inability of the counterparties to meet the terms of their contracts. Forward currency contracts involve risks from currency exchange rate and credit risk in excess of the amounts reflected on the Statement of Assets and Liabilities. The Portfolio’s maximum risk of loss from counterparty credit risk is the net value of the cash flows to be received from the counterparty at the end of the contract’s life. This risk may be mitigated by having a master netting arrangement between the Portfolio and the counterparty which may permit the Portfolio to offset amounts payable by the Portfolio to the same counterparty against amounts to be received; and by the receipt of collateral from the counterparty by the Portfolio to cover the Portfolio’s exposure to the counterparty. However, there is no assurance that such mitigating factors are easily enforceable.
Short Sales: Certain Portfolios of the Series Fund may sell a security it does not own in anticipation of a decline in the market value of that security (short sale). When a Portfolio makes a short sale, it must borrow the security sold short and deliver it to the broker-dealer through which it made the short sale as collateral for its obligation to deliver the security upon conclusion of the transaction. The Portfolio may have to pay a fee to borrow the particular security and may be obligated to remit any interest or dividends received on such borrowed securities. Dividends declared on short positions open are recorded on the ex-date and interest payable is accrued daily on fixed income securities sold short, both of which are recorded as an expense. A gain, limited to the price at which the Portfolio sold the security short, or a loss, unlimited in magnitude, will be recognized upon the termination of a short sale if the market price at termination is less than or greater than, respectively, the proceeds originally received.
Financial Futures Contracts: A financial futures contract is an agreement to purchase (long) or sell (short) an agreed amount of securities at a set price for delivery on a future date. Upon entering into a financial futures contract, the Portfolio is required to pledge to the broker an amount of cash and/or other assets equal to a certain percentage of the contract amount. This amount is known as the “initial margin.” Subsequent payments, known as “variation margin,” are made or received by the Portfolio each day, depending on the daily fluctuations in the value of the underlying security. Such variation margin is recorded for financial statement purposes on a daily basis as unrealized gain (loss). When the contract expires or is closed, the gain (loss) is realized and is presented in the Statement of Operations as net realized gain (loss) on financial futures contracts.
Certain Portfolios of the Series Fund entered into financial futures contracts in order to hedge their existing portfolio securities, or securities the Portfolio intends to purchase, against fluctuations in value caused by changes in prevailing interest rates and to manage yield curve duration. Certain Portfolios entered into equity index futures contracts to gain market exposure. The Portfolio may not achieve the anticipated benefits of the financial futures contracts and may realize a loss. The use of futures transactions involves the risk of imperfect correlation in movements in the price of futures contracts, interest rates and the underlying hedged assets. Financial futures contracts involve elements of risk in excess of the amounts reflected on the Statement of Assets and Liabilities.
Options: Certain Portfolios of the Series Fund purchased or wrote options in order to hedge against adverse market movements or fluctuations in value caused by changes in prevailing interest rates and foreign currency exchange rates, with respect to securities which the Portfolio currently owns or intends to purchase. Certain Portfolios also used purchased options to gain exposure to certain securities and foreign currencies. The Portfolios’ principal reason for writing options is to realize, through receipt of premiums, a greater current return than would be realized on the underlying security alone. When the Portfolio purchases an option, it pays a premium and an amount equal to that premium is recorded as an asset. When the Portfolio writes an option, it receives a premium and an amount equal to that premium is recorded as a liability. The asset or liability is
B3
adjusted daily to reflect the current market value of the option. If an option expires unexercised, the Portfolio realizes a gain or loss to the extent of the premium received or paid. If an option is exercised, the premium received or paid is recorded as an adjustment to the proceeds from the sale or the cost of the purchase in determining whether the Portfolio has realized a gain or loss. The difference between the premium and the amount received or paid on at a closing purchase or sale transaction is also treated as a realized gain or loss. Gain or loss on purchased options is included in net realized gain or loss on investment transactions. Gain or loss on written options is presented separately as net realized gain or loss on options written. The Portfolio, as writer of an option, may have no control over whether the underlying securities may be sold (called) or purchased (put). As a result, the Portfolio bears the market risk of an unfavorable change in the price of the security underlying the written option. The Portfolio, as purchaser of an over-the-counter option, bears the risk of the potential inability of the counterparties to meet the terms of their contracts.
With exchange-traded futures and options contracts, there is minimal counterparty credit risk to the Portfolio since the exchanges’ clearinghouse acts as counterparty to all exchange traded futures and options, and guarantees the futures and options contracts against default.
Swap Agreements: Certain Portfolios of the Series Fund may enter into credit default, interest rate, total return and other forms of swap agreements. A swap agreement is an agreement to exchange the return generated by one instrument for the return generated by another instrument. The swap agreements are valued daily at current market value and any change in value is included in the net unrealized appreciation or depreciation on investments. Payments received or paid by the Portfolio are recorded as realized gains or losses upon termination or maturity of the swap. Risk of loss may exceed amounts recognized on the Statements of Assets and Liabilities. Swap agreements outstanding at period end, if any, are listed on the Schedule of Investments.
Interest Rate Swaps: Interest rate swaps represent agreements between counterparties to exchange cash flows based on the difference between two interest rates, applied to a notional principal amount for a specified period. The Portfolio is subject to interest rate risk exposure in the normal course of pursuing its investment objectives. Certain Portfolios used interest rate swaps to generate steady cash flow by receiving a stream of fixed rate payments and to increase exposure to prevailing market rates by receiving floating rate payments. The Portfolio’s maximum risk of loss from counterparty credit risk is the discounted net value of the cash flows to be received from the counterparty over the contract’s remaining life. This risk may be mitigated by having a master netting arrangement between the Portfolio and the counterparty which may permit the Portfolio to offset amounts payable by the Portfolio to the same counterparty against amounts to be received; and by the receipt of collateral from the counterparty by the Portfolio to cover the Portfolio’s exposure to the counterparty. However, there is no assurance that such mitigating factors are easily enforceable.
Credit Default Swaps: Credit default swaps involve one party (the protection buyer) making a stream of payments to another party (the protection seller) in exchange for the right to receive a specified payment in the event of a default or as a result of a default (“credit event”) for the referenced party, typically corporate issues or sovereign issues of an emerging country, on its obligation; or in the event of a write-down, principal shortfall, interest shortfall or default of all or part of the referenced entities comprising a credit index.
The Portfolio is subject to credit risk in the normal course of pursuing its investment objectives. Certain Portfolios purchased credit default swaps to provide a measure of protection against defaults of the issuers. Certain Portfolios in the Series Fund used credit default swaps on credit indices to hedge a portfolio of credit default swaps or bonds, which is less expensive than it would be to buy many credit default swaps to achieve a similar effect. Certain Portfolios took an active short position with respect to the likelihood of particular issuer’s default by selling credit default swaps. The Portfolios’ maximum risk of loss from counterparty credit risk for purchased credit default swaps is the notional value of a credit default swap agreement. A master netting arrangement between the Portfolio and the counterparty that permits the Portfolio to offset amounts payable by the Portfolio to the same counterparty against amounts to be received; and by the receipt of collateral from the counterparty by the Portfolio to cover the Portfolio’s exposure to the counterparty. However, there is no assurance that such mitigating factors are easily enforceable.
As a seller of protection on credit default swap agreements, a Portfolio will generally receive from the buyer of protection an agreed upon payment throughout the term of the swap provided that there is no credit event. As the seller, a Portfolio would effectively increase investment risk to its portfolio because, in addition to its total net assets, a Portfolio may be subject to investment exposure on the notional amount of the swap.
B4
The maximum amount of the payment that a Portfolio as a seller of protection could be required to make under a credit default swap agreement would be equal the notional amount of the underlying security or index contract as a result of a credit event. These potential amounts will be partially offset by any recovery values of the respective referenced obligations, or net amounts received from the settlement of buy protection credit default swap agreements entered into by the Portfolio for the same referenced entity or index. As a buyer of protection, the Portfolio generally receives an amount up to the notional value of the swap if a credit event occurs.
Implied credit spreads, represented in absolute terms, utilized in determining the market value of credit default swap agreements on corporate issues or sovereign issues of an emerging country as of period end are disclosed in the footnotes to the Schedules of Investments and serve as an indicator of the current status of the payment/performance risk and represent the likelihood or risk of default for the credit derivative. The implied credit spread of a particular referenced entity reflects the cost of buying/selling protection and may include upfront payments required to enter into the agreement. For credit default swap agreements on asset- backed securities and credit indices, the quoted market prices and resulting values serve as the indicator of the current status of the payment and/or performance risk. Wider credit spreads and increasing market value in absolute terms, when compared to the notional amount of the swap, represent a deterioration of the referenced entity’s credit soundness and a greater likelihood or risk of default or other credit event occurring as defined under the terms of the agreement.
In addition to each instrument’s primary underlying risk exposure (e.g. interest rate, credit, equity or foreign exchange, etc.), swap agreements involve, to varying degrees, elements of credit, market and documentation risk. Such risks involve the possibility that there will be no liquid market for these agreements, that the counterparty to the agreement may default on its obligation to perform or disagree as to the meaning of the contractual terms in the agreement, and that there will be unfavorable changes in net interest rates. In connection with these agreements, securities in the portfolio may be identified as collateral or received as collateral from the counterparty in accordance with the terms of the respective swap agreements to provide or receive assets of value and serve as recourse in the event of default or bankruptcy/insolvency of either party. Such over-the-counter derivative agreements include conditions which when materialized, give the counterparty the right to cause an early termination of the transactions under those agreements. Any election by the counterparty for early termination of the contract(s) may impact the amounts reported on financial statements.
As of December 31, 2009, none of the Portfolios have met conditions under such agreements, which give the counterparty the right to call for an early termination.
Forward currency contracts, written options, short sales, swaps and financial futures contracts involve elements of both market and credit risk in excess of the amounts reflected on the Statement of Assets and Liabilities.
Securities Lending: Each Portfolio of the Series Fund may lend its portfolio securities to broker-dealers. The loans are secured by collateral at least equal at all times to the market value of the securities loaned. Loans are subject to termination at the option of the borrower or the Portfolio. Upon termination of the loan, the borrower will return to the Portfolio securities identical to the loaned securities. Should the borrower of the securities fail financially, the Portfolio has the right to repurchase the securities using the collateral in the open market. The Portfolio recognizes income, net of any rebate and securities lending agent fees, for lending its securities in the form of fees or interest on the investment of any cash received as collateral. The Portfolio also continues to receive interest and dividends or amounts equivalent thereto on the securities loaned and recognizes any unrealized gain or loss in the market price of the securities loaned that may occur during the term of the loan.
Dollar Rolls: Certain Portfolios of the Series Fund enter into mortgage dollar rolls in which the Portfolio sells mortgage securities for delivery in the current month, realizing a gain (loss), and simultaneously contracts to repurchase somewhat similar (same type, coupon and maturity) securities on a specified future date. During the roll period, the Portfolio forgoes principal and interest paid on the securities. The Portfolio is compensated by the interest earned on the cash proceeds of the initial sale and by the lower repurchase price at the future date. The difference between the sales proceeds and the lower repurchase price is recorded as a realized gain. The Portfolio maintains a segregated account, the dollar value of which is at least equal to its obligations, with respect to dollar rolls.
When-Issued/Delayed Delivery Securities: Securities purchased or sold on a when-issued or delayed delivery basis may be settled a month or more after trade date; interest income is not accrued until settlement
B5
date. At the time a Portfolio enters into such transactions, it instructs the custodian to segregate assets with a current value at least equal to the amount of its when-issued or delayed-delivery purchase commitments.
Securities Transactions and Net Investment Income: Securities transactions are recorded on the trade date. Realized gains (losses) on sales of securities are calculated on the identified cost basis. Dividend income is recorded on the ex-dividend date; interest income, which is comprised of four elements: stated coupon, original issue discount, market discount and market premium, is recorded on the accrual basis. Expenses are recorded on the accrual basis. The Series Fund’s expenses are allocated to the respective Portfolios on the basis of relative net assets except for Portfolio specific expenses which are attributable directly to a Portfolio or class level.
For Portfolios with multiple classes of shares, net investment income (loss) (other than administration and distribution fees, which are charged to the respective class) and unrealized and realized gains (losses) are allocated daily to each class of shares based upon the relative proportion of net assets of each class at the beginning of the day.
Taxes: For federal income tax purposes, each Portfolio in the Series Fund is treated as a separate taxpaying entity. The Portfolios are treated as partnerships for tax purposes. No provision has been made in the financial statements for U.S. federal, state, or local taxes, as any tax liability arising from operations of the Portfolios is the responsibility of their partners. The Portfolios are not generally subject to entity-level taxation. Partners of each Portfolio are subject to taxes on their distributive share of partnership items.
Withholding taxes on foreign dividends, interest and capital gains have been provided for in accordance with the Series Fund’s understanding of the applicable country’s tax rules and regulations.
Distributions: Distributions from each Portfolio are made in cash and automatically reinvested in additional shares of the same Portfolio. The Diversified Bond and Government Income Portfolios make distributions, if any, quarterly. All other Portfolios’ distributions are generally made on an annual basis. Distributions are recorded on the ex-date.
Estimates: The preparation of financial statements requires management to make estimates and assumptions that affect the reported amounts and disclosures in the financial statements. Actual results could differ from these estimates.
The Series Fund has a management agreement with PI. Pursuant to this agreement PI has responsibility for all investment advisory services and supervises the subadvisors performance of such services. PI has entered into subadvisory agreements with Prudential Investment Management, Inc. (“PIM”), Jennison Associates LLC (“Jennison”), LSV Asset Management (“LSV”), Marsico Capital Management, LLC (“Marsico”), Quantitative Management Associates LLC (“QMA”), T. Rowe Price Associates, Inc. (“T. Rowe”) and William Blair & Company, L.L.C. (“William Blair”) (collectively, the “Subadvisors”), under which each provides investment advisory services for certain Portfolios of the Series Fund. PI pays for the services of the Subadvisors, compensation of officers of the Series Fund, occupancy and certain clerical and administrative expenses of the Series Fund. The Portfolios bear all other costs and expenses.
The management fee paid to PI is computed daily and payable monthly, at the annual rates specified below, of the value of each of the Portfolio’s average daily net assets.
| | | | | |
Portfolio
| | Management Fee
| | Effective
Management Fee
| |
Conservative Balanced Portfolio | | 0.55% | | 0.55 | % |
Diversified Bond Portfolio | | 0.40 | | 0.40 | |
Equity Portfolio | | 0.45 | | 0.45 | |
Flexible Managed Portfolio | | 0.60 | | 0.60 | |
Global Portfolio | | 0.75 | | 0.75 | |
Government Income Portfolio | | 0.40 | | 0.40 | |
Stock Index Portfolio | | 0.35% up to $4 billion | | | |
| | | 0.30% over $4 billion | | 0.35 | |
B6
At December 31, 2009, the Subadvisors that provide investment advisory services to the Portfolios are as follows.
Where more than one Subadvisor is listed, each Subadvisor provides services to a segment of the Portfolio:
| | |
Portfolio
| | Subadvisor(s)
|
Conservative Balanced Portfolio | | PIM, QMA |
Diversified Bond Portfolio | | PIM |
Equity Portfolio | | Jennison |
Flexible Managed Portfolio | | PIM, QMA |
Global Portfolio | | LSV, Marsico, QMA, T. Rowe & William Blair |
Government Income Portfolio | | PIM |
Stock Index Portfolio | | QMA |
The Series Fund has a distribution agreement with Prudential Investment Management Services LLC (“PIMS”), which acts as the distributor of the Class I and Class II shares of the Series Fund. The Series Fund compensates PIMS for distributing and servicing the Series Fund’s Class II shares pursuant to a plan of distribution (the “Class II Plan”), regardless of expenses actually incurred by PIMS. The distribution fees are accrued daily and payable monthly. No distribution or service fees are paid to PIMS as distributor of the Class I shares of the Series Fund. Pursuant to the Class II Plan, the Class II shares of each Portfolio compensate PIMS for distribution-related activities at an annual rate of 0.25% of the average daily net assets of the Class II shares.
The Series Fund has an administration agreement with PI, which acts as the administrator of the Class II shares of the Series Fund. The administration fee paid to PI is accrued daily and payable monthly, at the annual rate of 0.15% of the average daily net assets of the Class II shares.
PI has voluntarily agreed to reimburse each of the following Portfolios the portion of the management fee for that Portfolio equal to the amount that the aggregate annual ordinary operating expenses (excluding interest, taxes, and brokerage commissions) exceed the percentage stated below.
| | | | | |
Portfolio
| | Class I
Expense Limit
| | | Class II
Expense Limit
|
Government Income Portfolio | | 0.75 | *% | | N/A |
Stock Index Portfolio | | 0.75 | ** | | N/A |
| | * Effective | July 1, 2009, the expense limitation has been removed. |
| | ** Effective | July 1, 2009, the expense limitation has been renewed. |
| | N/A—Not | applicable—There are no Class II shares outstanding for this Portfolio. |
PIMS, PI, PIM, QMA and Jennison are indirect, wholly-owned subsidiaries of Prudential Financial, Inc. (“Prudential”).
| Note 4: | | Other Transactions with Affiliates |
Prudential Mutual Fund Services LLC (“PMFS”), an affiliate of PI and an indirect, wholly-owned subsidiary of Prudential, serves as the Series Fund’s transfer agent. Transfer agent’s fees and expenses in the Statement of Operations include certain out-of-pocket expenses paid to non-affiliates, where applicable. PIM also serves as the Series Fund’s security lending agent. For the year ended December 31, 2009, PIM was compensated as follows for these services by the Series Fund Portfolios:
| | | |
Portfolio
| | PIM
|
Conservative Balanced Portfolio | | $ | 517,880 |
Diversified Bond Portfolio | | | 81,331 |
Equity Portfolio | | | 498,901 |
Flexible Managed Portfolio | | | 389,114 |
Global Portfolio | | | 95,348 |
Government Income Portfolio | | | 49,525 |
Stock Index Portfolio | | | 730,418 |
B7
For the year ended December 31, 2009, Wells Fargo Advisors, LLC (“Wells Fargo”), an affiliate of PI, earned brokerage commissions from transactions executed on behalf of the Series Fund Portfolios as follows:
| | | |
Portfolio
| | Wells Fargo
|
Equity Portfolio | | $ | 25,193 |
Certain Portfolios invest in the Short-Term Bond Series, pursuant to an exemptive order received from the Securities and Exchange Commission and in the Taxable Money Market Series, each a portfolio of the Dryden Core Investment Fund registered under the Investment Company Act of 1940, as amended, and managed by PI.
| Note 5: | | Portfolio Securities |
The aggregate cost of purchases and the proceeds from the sales of securities (excluding government securities and short-term issues) for the year ended December 31, 2009 were as follows:
| | | | | | |
Portfolio
| | Cost of Purchases
| | Proceeds from Sales
|
Conservative Balanced Portfolio | | $ | 3,472,864,979 | | $ | 3,622,098,710 |
Diversified Bond Portfolio | | | 3,416,474,438 | | | 3,397,509,296 |
Equity Portfolio | | | 2,585,967,605 | | | 2,784,347,808 |
Flexible Managed Portfolio | | | 5,094,802,384 | | | 5,231,291,236 |
Global Portfolio | | | 255,890,614 | | | 296,331,457 |
Government Income Portfolio | | | 2,562,157,425 | | | 2,619,410,508 |
Stock Index Portfolio | | | 86,802,275 | | | 185,978,605 |
The Conservative Balanced, Diversified Bond, Flexible Managed and Government Income Portfolios’ written options activity for the year ended December 31, 2009 were as follows:
| | | | | | | |
| Conservative Balanced Portfolio | | | | | | | |
| | | Contracts
| | | Premiums
| |
Balance as of December 31, 2008 | | — | | | $ | — | |
Options written | | 134 | | | | 94,675 | |
Options terminated in closing purchase transactions | | (134 | ) | | | (94,675 | ) |
Options expired | | — | | | | — | |
| | |
|
| |
|
|
|
Balance as of December 31, 2009 | | — | | | $ | — | |
| | |
|
| |
|
|
|
| | |
| Diversified Bond Portfolio | | | | | | | |
| | | Contracts
| | | Premiums
| |
Balance as of December 31, 2008 | | — | | | $ | — | |
Options written | | 243 | | | | 209,267 | |
Options terminated in closing purchase transactions | | (243 | ) | | | (209,267 | ) |
Options expired | | — | | | | — | |
| | |
|
| |
|
|
|
Balance as of December 31, 2009 | | — | | | $ | — | |
| | |
|
| |
|
|
|
| | |
| Flexible Managed Portfolio | | | | | | | |
| | | Contracts
| | | Premiums
| |
Balance as of December 31, 2008 | | — | | | $ | — | |
Options written | | 149 | | | | 105,195 | |
Options terminated in closing purchase transactions | | (149 | ) | | | (105,195 | ) |
Options expired | | — | | | | — | |
| | |
|
| |
|
|
|
Balance as of December 31, 2009 | | — | | | $ | — | |
| | |
|
| |
|
|
|
B8
| | | | | | | |
| Government Income Portfolio | | | | | | | |
| | | Contracts/
Notional
Amount
| | | Premiums
| |
Balance as of December 31, 2008 | | — | | | $ | — | |
Options written | | 17,400,080 | | | | 791,853 | |
Options terminated in closing purchase transactions | | (17,400,080 | ) | | | (791,853 | ) |
Options expired | | — | | | | — | |
| | |
|
| |
|
|
|
Balance as of December 31, 2009 | | — | | | $ | — | |
| | |
|
| |
|
|
|
After January 2, 2006, all Portfolios are treated as partnerships for tax purposes. The character of the cash distributions made by the partnerships is generally classified as return of capital nontaxable distributions. After each fiscal year each partner will receive information regarding their distributive allocable share of the partnership’s income, gains, losses and deductions.
Prior to January 2, 2006, each Portfolio, which was incorporated as of that date, qualified as a regulated investment company under the Internal Revenue Code and distributed all of its taxable income, including any net realized gains on investments, to shareholders.
With respect to the Portfolios, book cost of assets differs from tax cost of assets as a result of each Portfolio’s adoption of a mark to market method of accounting for tax purposes. Under this method, tax cost of assets will approximate its fair market value.
Management has analyzed the Portfolios’ tax positions taken on federal income tax returns for all open tax years and has concluded that as of December 31, 2009, no provision for income tax would be required in the Portfolios’ financial statements. The Portfolios’ federal and state income tax returns for tax years for which the applicable statutes of limitations have not expired are subject to examination by the Internal Revenue Service and state departments of revenue.
The Series Fund offers Class I and Class II shares. Neither Class I nor Class II shares of a Portfolio are subject to any sales charge or redemption charge and are sold at the net asset value of the Portfolio. Class I shares are sold only to certain separate accounts of Prudential to fund benefits under certain variable life insurance and variable annuity contracts (“contracts”). Class II shares are sold only to separate accounts of non-Prudential insurance companies as investment options under certain contracts. The separate accounts invest in shares of the Series Fund through subaccounts that correspond to the Portfolios. The separate accounts will redeem shares of the Series Fund to the extent necessary to provide benefits under the contracts or for such other purposes as may be consistent with the contracts. As of December 31, 2009, the Equity Portfolio has Class II shares outstanding.
Transactions in shares of beneficial interest of the Equity Portfolio were as follows:
| | | | | | | |
| Equity Portfolio: | | | | | | | |
Class I
| | Shares
| | | Amount
| |
Year ended December 31, 2009: | | | | | | | |
Series shares sold | | 1,441,609 | | | $ | 26,628,310 | |
Series shares issued in reinvestment of distributions | | 2,358,409 | | | | 43,394,722 | |
Series shares repurchased | | (14,177,442 | ) | | | (252,716,612 | ) |
| | |
|
| |
|
|
|
Net increase (decrease) in shares outstanding | | (10,377,424 | ) | | $ | (182,693,580 | ) |
| | |
|
| |
|
|
|
Year ended December 31, 2008: | | | | | | | |
Series shares sold | | 1,436,949 | | | $ | 31,146,917 | |
Series shares issued in reinvestment of distributions | | 17,082,227 | | | | 436,963,357 | |
Series shares repurchased | | (13,934,724 | ) | | | (328,218,745 | ) |
| | |
|
| |
|
|
|
Net increase (decrease) in shares outstanding | �� | 4,584,452 | | | $ | 139,891,529 | |
| | |
|
| |
|
|
|
B9
| | | | | | | |
Class II
| | Shares
| | | Amount
| |
Year ended December 31, 2009: | | | | | | | |
Series shares sold | | 4,210 | | | $ | 85,008 | |
Series shares issued in reinvestment of distributions | | 164 | | | | 3,037 | |
Series shares repurchased | | (8,224 | ) | | | (147,394 | ) |
| | |
|
| |
|
|
|
Net increase (decrease) in shares outstanding | | (3,850 | ) | | $ | (59,349 | ) |
| | |
|
| |
|
|
|
Year ended December 31, 2008: | | | | | | | |
Series shares sold | | 3,868 | | | $ | 88,780 | |
Series shares issued in reinvestment of distributions | | 2,468 | | | | 63,526 | |
Series shares repurchased | | (26,501 | ) | | | (699,940 | ) |
| | |
|
| |
|
|
|
Net increase (decrease) in shares outstanding | | (20,165 | ) | | $ | (547,634 | ) |
| | |
|
| |
|
|
|
| Note 8: | | Borrowings and Overdrafts |
The Portfolios, along with other affiliated registered investment companies (the “Funds”), are a party to a Syndicated Credit Agreement (“SCA”) with two banks. The SCA provides for a commitment of $500 million. Interest on any borrowings under the SCA is incurred at contracted market rates and a commitment fee for the unused amount is accrued daily and paid quarterly. Effective October 22, 2009, the Funds renewed the SCA with the banks. The commitment under the renewed SCA continues to be $500 million. The Funds pay a commitment fee of .15 of 1% of the unused portion of the renewed SCA. For the period from October 24, 2008 through October 21, 2009, the Portfolios paid a commitment fee of .13 of 1% of the unused portion of the agreement. The expiration date of the renewed SCA will be October 20, 2010. The purpose of the SCA is to provide an alternative source of temporary funding for capital share redemptions.
The following Portfolio utilized the line of credit during the year ended December 31, 2009. The average balance outstanding is for the number of days the Portfolio had utilized the credit facility.
| | | | | | | | | | | |
Portfolio
| | Approximate
Average
Balance
Outstanding
| | Number of
Days
Outstanding
| | Weighted
Average
Interest
Rates
| | | Amount
Outstanding at
December 31,
2009
|
Diversified Bond Portfolio | | $ | 648,000 | | 1 | | 1.19 | % | | $ | — |
The average balance and weighted average interest rate on temporary overdrawn balances during the year ended December 31, 2009 were as follows:
| | | | | | |
Portfolio
| | Approximate
Average
Balance
Outstanding
| | Weighted
Average
Interest
Rates
| |
Government Income Portfolio | | $ | 3,964,644 | | 2.25 | % |
| Note 9: | | Ownership and Affiliates |
As of December 31, 2009, all of Class I shares of each Portfolio were owned of record by the Prudential Insurance Company of America (“PICA”) on behalf of the owners of the variable insurance products issued by PICA.
| Note 10: | | New Accounting Pronouncement |
In January 2010, the Financial Accounting Standards Board (“FASB”) issued Accounting Standards Update (“ASU”) No. 2010-06 “Improving Disclosures about Fair Value Measurements”. ASU 2010-06 will require reporting entities to make new disclosures about amounts and reasons for significant transfers in and out of Level 1 and Level 2 fair value measurements and input and valuation techniques used to measure fair value for both recurring and nonrecurring fair value measurements that fall in either Level 2 or Level 3, and information on purchases, sales, issuances, and settlements in the roll forward of activity in Level 3 fair value measurements. The new and revised disclosures are effective for interim and annual reporting periods beginning after December 15, 2009 except for the disclosures about purchases, sales, issuances, and settlements in the roll forward of activity in Level 3 fair value measurements, which are effective for interim and annual reporting periods beginning after December 15, 2010. At this time, management is evaluating the implications of ASU No. 2010-06 and its impact on the financial statements has not been determined.
B10
| Note 11: | | Subsequent Events |
Management has evaluated the impact of all subsequent events on the Portfolios through February 16, 2010, the date the financial statements were issued, and has determined that there were no subsequent events requiring recognition or disclosure in the financial statements.
B11
Financial Highlights
| | | | | | | | | | | | | | | | | | | | |
| | | Conservative Balanced Portfolio
| |
| | | Year Ended December 31,
| |
| | | 2009
| | | 2008
| | | 2007(a)
| | | 2006
| | | 2005
| |
Per Share Operating Performance: | | | | | | | | | | | | | | | | | | | | |
Net Asset Value, beginning of year | | $ | 12.69 | | | $ | 16.69 | | | $ | 16.21 | | | $ | 15.09 | | | $ | 15.10 | |
| | |
|
|
| |
|
|
| |
|
|
| |
|
|
| |
|
|
|
Income (Loss) From Investment Operations: | | | | | | | | | | | | | | | | | | | | |
Net investment income | | | 0.39 | | | | 0.50 | | | | 0.50 | | | | 0.48 | | | | 0.38 | |
Net realized and unrealized gain (loss) on investments | | | 2.08 | | | | (3.98 | ) | | | 0.49 | | | | 1.06 | | | | 0.11 | |
| | |
|
|
| |
|
|
| |
|
|
| |
|
|
| |
|
|
|
Total from investment operations | | | 2.47 | | | | (3.48 | ) | | | 0.99 | | | | 1.54 | | | | 0.49 | |
| | |
|
|
| |
|
|
| |
|
|
| |
|
|
| |
|
|
|
Less Dividends and Distributions: | | | | | | | | | | | | | | | | | | | | |
Dividends from net investment income | | | — | | | | — | | | | — | | | | — | | | | (0.35 | ) |
Distributions from net realized gains | | | — | | | | — | | | | — | | | | — | | | | (0.15 | ) |
Distributions | | | (0.51 | ) | | | (0.52 | ) | | | (0.51 | ) | | | (0.42 | ) | | | — | |
| | |
|
|
| |
|
|
| |
|
|
| |
|
|
| |
|
|
|
Total dividends and distributions | | | (0.51 | ) | | | (0.52 | ) | | | (0.51 | ) | | | (0.42 | ) | | | (0.50 | ) |
| | |
|
|
| |
|
|
| |
|
|
| |
|
|
| |
|
|
|
Net Asset Value, end of year | | $ | 14.65 | | | $ | 12.69 | | | $ | 16.69 | | | $ | 16.21 | | | $ | 15.09 | |
| | |
|
|
| |
|
|
| |
|
|
| |
|
|
| |
|
|
|
Total Return(b): | | | 20.01 | % | | | (21.41 | )% | | | 6.12 | % | | | 10.44 | % | | | 3.43 | % |
Ratios/Supplemental Data: | | | | | | | | | | | | | | | | | | | | |
Net assets, end of year (in millions) | | $ | 2,138.7 | | | $ | 1,957.5 | | | $ | 2,721.9 | | | $ | 2,770.6 | | | $ | 2,749.8 | |
Ratios to average net assets(c): | | | | | | | | | | | | | | | | | | | | |
Expenses | | | 0.59 | % | | | 0.59 | % | | | 0.59 | % | | | 0.57 | % | | | 0.58 | % |
Net investment income | | | 2.68 | % | | | 3.12 | % | | | 2.95 | % | | | 2.97 | % | | | 2.45 | % |
Portfolio turnover rate | | | 250 | % | | | 336 | % | | | 178 | % | | | 114 | % | | | 110 | % |
| (a) | Calculated based upon average shares outstanding during the year. |
| (b) | Total return is calculated assuming a purchase of a share on the first day and a sale on the last day of each year reported and includes reinvestment of dividends and distributions and does not reflect the effect of insurance contract charges. Total return does not reflect expenses associated with the separate account such as administrative fees, account charges and surrender charges which, if reflected, would reduce the total returns for all years shown. Performance figures may reflect voluntary fee waivers and/or expense reimbursements. In the absence of voluntary fee waivers and/or expense reimbursements, the total return would be lower. Past performance is no guarantee of future results. Total returns may reflect adjustments to conform to generally accepted accounting principles. |
| (c) | Does not include expenses of the underlying portfolios in which the Portfolio invests. |
| | | | | | | | | | | | | | | | | | | | |
| | | Diversified Bond Portfolio
| |
| | | Year Ended December 31,
| |
| | | 2009
| | | 2008
| | | 2007
| | | 2006
| | | 2005
| |
Per Share Operating Performance: | | | | | | | | | | | | | | | | | | | | |
Net Asset Value, beginning of year | | $ | 9.89 | | | $ | 10.90 | | | $ | 10.85 | | | $ | 10.96 | | | $ | 11.28 | |
| | |
|
|
| |
|
|
| |
|
|
| |
|
|
| |
|
|
|
Income (Loss) From Investment Operations: | | | | | | | | | | | | | | | | | | | | |
Net investment income | | | 0.50 | | | | 0.54 | | | | 0.58 | | | | 0.57 | | | | 0.55 | |
Net realized and unrealized gain (loss) on investments | | | 1.46 | | | | (0.90 | ) | | | 0.02 | | | | (0.05 | ) | | | (0.20 | ) |
| | |
|
|
| |
|
|
| |
|
|
| |
|
|
| |
|
|
|
Total from investment operations | | | 1.96 | | | | (0.36 | ) | | | 0.60 | | | | 0.52 | | | | 0.35 | |
| | |
|
|
| |
|
|
| |
|
|
| |
|
|
| |
|
|
|
Less Dividends and Distributions: | | | | | | | | | | | | | | | | | | | | |
Dividends from net investment income | | | — | | | | — | | | | — | | | | — | | | | (0.59 | ) |
Distributions from net realized gains | | | — | | | | — | | | | — | | | | — | | | | (0.08 | ) |
Distributions | | | (0.69 | ) | | | (0.65 | ) | | | (0.55 | ) | | | (0.63 | ) | | | — | |
| | |
|
|
| |
|
|
| |
|
|
| |
|
|
| |
|
|
|
Total dividends and distributions | | | (0.69 | ) | | | (0.65 | ) | | | (0.55 | ) | | | (0.63 | ) | | | (0.67 | ) |
| | |
|
|
| |
|
|
| |
|
|
| |
|
|
| |
|
|
|
Net Asset Value, end of year | | $ | 11.16 | | | $ | 9.89 | | | $ | 10.90 | | | $ | 10.85 | | | $ | 10.96 | |
| | |
|
|
| |
|
|
| |
|
|
| |
|
|
| |
|
|
|
Total Return(a): | | | 20.51 | % | | | (3.46 | )% | | | 5.71 | % | | | 4.98 | % | | | 3.28 | % |
Ratios/Supplemental Data: | | | | | | | | | | | | | | | | | | | | |
Net assets, end of year (in millions) | | $ | 1,363.5 | | | $ | 1,134.8 | | | $ | 1,218.3 | | | $ | 1,150.4 | | | $ | 1,230.6 | |
Ratios to average net assets(b): | | | | | | | | | | | | | | | | | | | | |
Expenses | | | 0.44 | % | | | 0.44 | % | | | 0.44 | % | | | 0.45 | % | | | 0.45 | % |
Net investment income | | | 4.79 | % | | | 5.07 | % | | | 5.39 | % | | | 5.18 | % | | | 4.81 | % |
Portfolio turnover rate | | | 401 | % | | | 723 | % | | | 476 | % | | | 393 | % | | | 278 | % |
| (a) | Total return is calculated assuming a purchase of a share on the first day and a sale on the last day of each year reported and includes reinvestment of dividends and distributions and does not reflect the effect of insurance contract charges. Total return does not reflect expenses associated with the separate account such as administrative fees, account charges and surrender charges which, if reflected, would reduce the total returns for all years shown. Performance figures may reflect voluntary fee waivers and/or expense reimbursements. In the absence of voluntary fee waivers and/or expense reimbursements, the total return would be lower. Past performance is no guarantee of future results. Total returns may reflect adjustments to conform to generally accepted accounting principles. |
| (b) | Does not include expenses of the underlying portfolios in which the Portfolio invests. |
SEE NOTES TO FINANCIAL STATEMENTS.
C1
Financial Highlights
| | | | | | | | | | | | | | | | | | | | |
| | | Equity Portfolio
| |
| | | Class I
| |
| | | Year Ended December 31,
| |
| | | 2009
| | | 2008(c)
| | | 2007
| | | 2006
| | | 2005
| |
Per Share Operating Performance: | | | | | | | | | | | | | | | | | | | | |
Net Asset Value, beginning of year | | $ | 16.40 | | | $ | 29.67 | | | $ | 27.45 | | | $ | 24.64 | | | $ | 22.31 | |
| | |
|
|
| |
|
|
| |
|
|
| |
|
|
| |
|
|
|
Income (Loss) From Investment Operations: | | | | | | | | | | | | | | | | | | | | |
Net investment income | | | .16 | | | | .29 | | | | .35 | | | | .30 | | | | .24 | |
Net realized and unrealized gain (loss) on investments | | | 6.04 | | | | (10.52 | ) | | | 2.21 | | | | 2.80 | | | | 2.32 | |
| | |
|
|
| |
|
|
| |
|
|
| |
|
|
| |
|
|
|
Total from investment operations | | | 6.20 | | | | (10.23 | ) | | | 2.56 | | | | 3.10 | | | | 2.56 | |
| | |
|
|
| |
|
|
| |
|
|
| |
|
|
| |
|
|
|
Less Dividends and Distributions: | | | | | | | | | | | | | | | | | | | | |
Dividends from net investment income | | | — | | | | — | | | | — | | | | — | | | | (.23 | ) |
Distributions | | | (.30 | ) | | | (3.04 | ) | | | (.34 | ) | | | (.29 | ) | | | — | |
| | |
|
|
| |
|
|
| |
|
|
| |
|
|
| |
|
|
|
Total dividends and distributions | | | (.30 | ) | | | (3.04 | ) | | | (.34 | ) | | | (.29 | ) | | | (.23 | ) |
| | |
|
|
| |
|
|
| |
|
|
| |
|
|
| |
|
|
|
Net Asset Value, end of year | | $ | 22.30 | | | $ | 16.40 | | | $ | 29.67 | | | $ | 27.45 | | | $ | 24.64 | |
| | |
|
|
| |
|
|
| |
|
|
| |
|
|
| |
|
|
|
Total Return(a) | | | 38.17 | % | | | (38.16 | )% | | | 9.32 | % | | | 12.57 | % | | | 11.47 | % |
Ratios/Supplemental Data: | | | | | | | | | | | | | | | | | | | | |
Net assets, end of year (in millions) | | $ | 3,195.1 | | | $ | 2,521.0 | | | $ | 4,423.9 | | | $ | 4,402.7 | | | $ | 4,283.9 | |
Ratios to average net assets(b): | | | | | | | | | | | | | | | | | | | | |
Expenses | | | .48 | % | | | .48 | % | | | .47 | % | | | .47 | % | | | .47 | % |
Net investment income | | | .90 | % | | | 1.21 | % | | | 1.16 | % | | | 1.10 | % | | | 1.01 | % |
Portfolio turnover rate | | | 98 | % | | | 67 | % | | | 57 | % | | | 60 | % | | | 77 | % |
| |
| | | Equity Portfolio
| |
| | | Class II
| |
| | | Year Ended December 31,
| |
| | | 2009
| | | 2008(c)
| | | 2007
| | | 2006
| | | 2005
| |
Per Share Operating Performance: | | | | | | | | | | | | | | | | | | | | |
Net Asset Value, beginning of year | | $ | 16.47 | | | $ | 29.81 | | | $ | 27.52 | | | $ | 24.69 | | | $ | 22.34 | |
| | |
|
|
| |
|
|
| |
|
|
| |
|
|
| |
|
|
|
Income (Loss) From Investment Operations: | | | | | | | | | | | | | | | | | | | | |
Net investment income | | | .09 | | | | .19 | | | | .28 | | | | .19 | | | | .12 | |
Net realized and unrealized gain (loss) on investments | | | 6.07 | | | | (10.61 | ) | | | 2.20 | | | | 2.80 | | | | 2.35 | |
| | |
|
|
| |
|
|
| |
|
|
| |
|
|
| |
|
|
|
Total from investment operations | | | 6.16 | | | | (10.42 | ) | | | 2.48 | | | | 2.99 | | | | 2.47 | |
| | |
|
|
| |
|
|
| |
|
|
| |
|
|
| |
|
|
|
Less Dividends and Distributions: | | | | | | | | | | | | | | | | | | | | |
Dividends from net investment income | | | — | | | | — | | | | — | | | | — | | | | (.12 | ) |
Distributions | | | (.17 | ) | | | (2.92 | ) | | | (.19 | ) | | | (.16 | ) | | | — | |
| | |
|
|
| |
|
|
| |
|
|
| |
|
|
| |
|
|
|
Total dividends and distributions | | | (.17 | ) | | | (2.92 | ) | | | (.19 | ) | | | (.16 | ) | | | (.12 | ) |
| | |
|
|
| |
|
|
| |
|
|
| |
|
|
| |
|
|
|
Net Asset Value, end of year | | $ | 22.46 | | | $ | 16.47 | | | $ | 29.81 | | | $ | 27.52 | | | $ | 24.69 | |
| | |
|
|
| |
|
|
| |
|
|
| |
|
|
| |
|
|
|
Total Return(a) | | | 37.58 | % | | | (38.47 | )% | | | 8.91 | % | | | 12.13 | % | | | 11.04 | % |
Ratios/Supplemental Data: | | | | | | | | | | | | | | | | | | | | |
Net assets, end of year (in millions) | | $ | 0.4 | | | $ | 0.4 | | | $ | 1.3 | | | $ | 1.9 | | | $ | 2.1 | |
Ratios to average net assets(b): | | | | | | | | | | | | | | | | | | | | |
Expenses | | | .88 | % | | | .88 | % | | | .87 | % | | | .87 | % | | | .87 | % |
Net investment income | | | .52 | % | | | .78 | % | | | .74 | % | | | .71 | % | | | .64 | % |
Portfolio turnover rate | | | 98 | % | | | 67 | % | | | 57 | % | | | 60 | % | | | 77 | % |
| (a) | Total return is calculated assuming a purchase of a share on the first day and a sale on the last day of each year reported and includes reinvestment of dividends and distributions and does not reflect the effect of insurance contract charges. Total return does not reflect expenses associated with the separate account such as administrative fees, account charges and surrender charges which, if reflected, would reduce the total returns for all years shown. Performance figures may reflect voluntary fee waivers and/or expense reimbursements. In the absence of voluntary fee waivers and/or expense reimbursements, the total return would be lower. Past performance is no guarantee of future results. Total returns may reflect adjustments to conform to generally accepted accounting principles. |
| (b) | Does not include expenses of the underlying portfolio in which the Portfolio invests. |
| (c) | Calculation based on average shares outstanding during the year. |
SEE NOTES TO FINANCIAL STATEMENTS.
C2
Financial Highlights
| | | | | | | | | | | | | | | | | | | | |
| | | Flexible Managed Portfolio
| |
| | | Year Ended December 31,
| |
| | | 2009
| | | 2008
| | | 2007
| | | 2006
| | | 2005(a)
| |
Per Share Operating Performance: | | | | | | | | | | | | | | | | | | | | |
Net Asset Value, beginning of year | | $ | 12.34 | | | $ | 18.30 | | | $ | 18.36 | | | $ | 16.92 | | | $ | 16.58 | |
| | |
|
|
| |
|
|
| |
|
|
| |
|
|
| |
|
|
|
Income (Loss) From Investment Operations: | | | | | | | | | | | | | | | | | | | | |
Net investment income | | | 0.34 | | | | 0.45 | | | | 0.50 | | | | 0.44 | | | | 0.32 | |
Net realized and unrealized gain (loss) on investments | | | 2.05 | | | | (4.62 | ) | | | 0.65 | | | | 1.59 | | | | 0.34 | |
| | |
|
|
| |
|
|
| |
|
|
| |
|
|
| |
|
|
|
Total from investment operations | | | 2.39 | | | | (4.17 | ) | | | 1.15 | | | | 2.03 | | | | 0.66 | |
| | |
|
|
| |
|
|
| |
|
|
| |
|
|
| |
|
|
|
Less Dividends and Distributions: | | | | | | | | | | | | | | | | | | | | |
Dividends from net investment income | | | — | | | | — | | | | — | | | | — | | | | (0.32 | ) |
Distributions | | | (0.45 | ) | | | (1.79 | ) | | | (1.21 | ) | | | (0.59 | ) | | | — | |
| | |
|
|
| |
|
|
| |
|
|
| |
|
|
| |
|
|
|
Total dividends and distributions | | | (0.45 | ) | | | (1.79 | ) | | | (1.21 | ) | | | (0.59 | ) | | | (0.32 | ) |
| | |
|
|
| |
|
|
| |
|
|
| |
|
|
| |
|
|
|
Net Asset Value, end of year | | $ | 14.28 | | | $ | 12.34 | | | $ | 18.30 | | | $ | 18.36 | | | $ | 16.92 | |
| | |
|
|
| |
|
|
| |
|
|
| |
|
|
| |
|
|
|
Total Return(b): | | | 19.95 | % | | | (24.82 | )% | | | 6.30 | % | | | 12.17 | % | | | 4.16 | % |
Ratios/Supplemental Data: | | | | | | | | | | | | | | | | | | | | |
Net assets, end of year (in millions) | | $ | 2,906.0 | | | $ | 2,621.6 | | | $ | 3,716.3 | | | $ | 3,723.6 | | | $ | 3,543.9 | |
Ratios to average net assets(c): | | | | | | | | | | | | | | | | | | | | |
Expenses | | | 0.63 | % | | | 0.64 | % | | | 0.63 | % | | | 0.62 | % | | | 0.63 | % |
Net investment income | | | 2.50 | % | | | 2.85 | % | | | 2.53 | % | | | 2.48 | % | | | 1.95 | % |
Portfolio turnover rate | | | 248 | % | | | 321 | % | | | 212 | % | | | 153 | % | | | 126 | % |
| (a) | Calculated based upon average shares outstanding during the year. |
| (b) | Total return is calculated assuming a purchase of a share on the first day and a sale on the last day of each year reported and includes reinvestment of dividends and distributions and does not reflect the effect of insurance contract charges. Total return does not reflect expenses associated with the separate account such as administrative fees, account charges and surrender charges which, if reflected, would reduce the total returns for all years shown. Performance figures may reflect voluntary fee waivers and/or expense reimbursements. In the absence of voluntary fee waivers and/or expense reimbursements, the total return would be lower. Past performance is no guarantee of future results. Total returns may reflect adjustments to conform to generally accepted accounting principles. |
| (c) | Does not include expenses of the underlying portfolios in which the Portfolio invests. |
| | | | | | | | | | | | | | | | | | | | |
| | | Global Portfolio
| |
| | | Year Ended December 31,
| |
| | | 2009
| | | 2008
| | | 2007
| | | 2006
| | | 2005
| |
Per Share Operating Performance: | | | | | | | | | | | | | | | | | | | | |
Net Asset Value, beginning of year | | $ | 13.07 | | | $ | 24.62 | | | $ | 22.53 | | | $ | 18.96 | | | $ | 16.43 | |
| | |
|
|
| |
|
|
| |
|
|
| |
|
|
| |
|
|
|
Income (Loss) From Investment Operations: | | | | | | | | | | | | | | | | | | | | |
Net investment income | | | 0.28 | | | | 0.40 | | | | 0.36 | | | | 0.26 | | | | 0.13 | |
Net realized and unrealized gain (loss) on investments | | | 3.75 | | | | (10.38 | ) | | | 2.00 | | | | 3.44 | | | | 2.50 | |
| | |
|
|
| |
|
|
| |
|
|
| |
|
|
| |
|
|
|
Total from investment operations | | | 4.03 | | | | (9.98 | ) | | | 2.36 | | | | 3.70 | | | | 2.63 | |
| | |
|
|
| |
|
|
| |
|
|
| |
|
|
| |
|
|
|
Less Dividends and Distributions: | | | | | | | | | | | | | | | | | | | | |
Dividends from net investment income | | | — | | | | — | | | | — | | | | — | | | | (0.10 | ) |
Distributions | | | (0.42 | ) | | | (1.57 | ) | | | (0.27 | ) | | | (0.13 | ) | | | — | |
| | |
|
|
| |
|
|
| |
|
|
| |
|
|
| |
|
|
|
Total dividends and distributions | | | (0.42 | ) | | | (1.57 | ) | | | (0.27 | ) | | | (0.13 | ) | | | (0.10 | ) |
| | |
|
|
| |
|
|
| |
|
|
| |
|
|
| |
|
|
|
Net Asset Value, end of year | | $ | 16.68 | | | $ | 13.07 | | | $ | 24.62 | | | $ | 22.53 | | | $ | 18.96 | |
| | |
|
|
| |
|
|
| |
|
|
| |
|
|
| |
|
|
|
Total Return(a): | | | 31.39 | % | | | (42.92 | )% | | | 10.48 | % | | | 19.65 | % | | | 16.06 | % |
Ratios/Supplemental Data: | | | | | | | | | | | | | | | | | | | | |
Net assets, end of year (in millions) | | $ | 619.5 | | | $ | 512.7 | | | $ | 985.0 | | | $ | 932.9 | | | $ | 814.1 | |
Ratios to average net assets(b): | | | | | | | | | | | | | | | | | | | | |
Expenses | | | 0.85 | % | | | 0.84 | % | | | 0.81 | % | | | 0.84 | % | | | 0.82 | % |
Net investment income | | | 1.77 | % | | | 2.01 | % | | | 1.43 | % | | | 1.24 | % | | | 0.77 | % |
Portfolio turnover rate | | | 50 | % | | | 65 | % | | | 48 | % | | | 50 | % | | | 155 | % |
| (a) | Total return is calculated assuming a purchase of a share on the first day and a sale on the last day of each year reported and includes reinvestment of dividends and distributions and does not reflect the effect of insurance contract charges. Total return does not reflect expenses associated with the separate account such as administrative fees, account charges and surrender charges which, if reflected, would reduce the total returns for all years shown. Performance figures may reflect voluntary fee waivers and/or expense reimbursements. In the absence of voluntary fee waivers and/or expense reimbursements, the total return would be lower. Past performance is no guarantee of future results. Total returns may reflect adjustments to conform to generally accepted accounting principles. |
| (b) | Does not include expenses of the underlying portfolios in which the Portfolio invests. |
SEE NOTES TO FINANCIAL STATEMENTS.
C3
Financial Highlights
| | | | | | | | | | | | | | | | | | | | |
| | | Government Income Portfolio
| |
| | | Year Ended December 31,
| |
| | | 2009
| | | 2008
| | | 2007
| | | 2006
| | | 2005
| |
Per Share Operating Performance: | | | | | | | | | | | | | | | | | | | | |
Net Asset Value, beginning of year | | $ | 11.40 | | | $ | 11.38 | | | $ | 11.26 | | | $ | 11.40 | | | $ | 11.65 | |
| | |
|
|
| |
|
|
| |
|
|
| |
|
|
| |
|
|
|
Income (Loss) From Investment Operations: | | | | | | | | | | | | | | | | | | | | |
Net investment income | | | 0.37 | | �� | | 0.45 | | | | 0.53 | | | | 0.54 | | | | 0.49 | |
Net realized and unrealized gain (loss) on investments | | | 0.49 | | | | 0.03 | | | | 0.10 | | | | (0.13 | ) | | | (0.20 | ) |
| | |
|
|
| |
|
|
| |
|
|
| |
|
|
| |
|
|
|
Total from investment operations | | | 0.86 | | | | 0.48 | | | | 0.63 | | | | 0.41 | | | | 0.29 | |
| | |
|
|
| |
|
|
| |
|
|
| |
|
|
| |
|
|
|
Less Dividends and Distributions: | | | | | | | | | | | | | | | | | | | | |
Dividends from net investment income | | | — | | | | — | | | | — | | | | — | | | | (0.54 | ) |
Distributions | | | (0.40 | ) | | | (0.46 | ) | | | (0.51 | ) | | | (0.55 | ) | | | — | |
| | |
|
|
| |
|
|
| |
|
|
| |
|
|
| |
|
|
|
Total dividends and distributions | | | (0.40 | ) | | | (0.46 | ) | | | (0.51 | ) | | | (0.55 | ) | | | (0.54 | ) |
| | |
|
|
| |
|
|
| |
|
|
| |
|
|
| |
|
|
|
Net Asset Value, end of year | | $ | 11.86 | | | $ | 11.40 | | | $ | 11.38 | | | $ | 11.26 | | | $ | 11.40 | |
| | |
|
|
| |
|
|
| |
|
|
| |
|
|
| |
|
|
|
Total Return(a): | | | 7.71 | % | | | 4.30 | % | | | 5.70 | % | | | 3.74 | % | | | 2.51 | % |
Ratios/Supplemental Data: | | | | | | | | | | | | | | | | | | | | |
Net assets, end of year (in millions) | | $ | 375.4 | | | $ | 370.5 | | | $ | 340.3 | | | $ | 354.3 | | | $ | 378.2 | |
Ratios to average net assets(b): | | | | | | | | | | | | | | | | | | | | |
Expenses | | | 0.47 | % | | | 0.52 | %(c) | | | 0.52 | % | | | 0.50 | % | | | 0.47 | % |
Net investment income | | | 3.11 | % | | | 3.98 | %(c) | | | 4.62 | % | | | 4.75 | % | | | 4.16 | % |
Portfolio turnover rate | | | 1179 | % | | | 2707 | % | | | 2377 | % | | | 734 | % | | | 507 | % |
| (a) | Total return is calculated assuming a purchase of a share on the first day and a sale on the last day of each year reported and includes reinvestment of dividends and distributions and does not reflect the effect of insurance contract charges. Total return does not reflect expenses associated with the separate account such as administrative fees, account charges and surrender charges which, if reflected, would reduce the total returns for all years shown. Performance figures may reflect voluntary fee waivers and/or expense reimbursements. In the absence of voluntary fee waivers and/or expense reimbursements, the total return would be lower. Past performance is no guarantee of future results. Total returns may reflect adjustments to conform to generally accepted accounting principles. |
| (b) | Does not include expenses of the underlying portfolios in which the Portfolio invests. |
| (c) | Includes interest expense of 0.03%. |
| | | | | | | | | | | | | | | | | | | | |
| | | Stock Index Portfolio
| |
| | | Year Ended December 31,
| |
| | | 2009
| | | 2008
| | | 2007
| | | 2006
| | | 2005
| |
Per Share Operating Performance: | | | | | | | | | | | | | | | | | | | | |
Net Asset Value, beginning of year | | $ | 22.76 | | | $ | 36.84 | | | $ | 35.64 | | | $ | 31.41 | | | $ | 31.29 | |
| | |
|
|
| |
|
|
| |
|
|
| |
|
|
| |
|
|
|
Income (Loss) From Investment Operations: | | | | | | | | | | | | | | | | | | | | |
Net investment income | | | 0.49 | | | | 0.64 | | | | 0.68 | | | | 0.56 | | | | 0.48 | |
Net realized and unrealized gain (loss) on investments | | | 5.32 | | | | (14.02 | ) | | | 1.14 | | | | 4.31 | | | | 0.88 | |
| | |
|
|
| |
|
|
| |
|
|
| |
|
|
| |
|
|
|
Total from investment operations | | | 5.81 | | | | (13.38 | ) | | | 1.82 | | | | 4.87 | | | | 1.36 | |
| | |
|
|
| |
|
|
| |
|
|
| |
|
|
| |
|
|
|
Less Dividends and Distributions: | | | | | | | | | | | | | | | | | | | | |
Dividends from net investment income | | | — | | | | — | | | | — | | | | — | | | | (0.47 | ) |
Distributions from net realized gains | | | — | | | | — | | | | — | | | | — | | | | (0.77 | ) |
Distributions | | | (0.68 | ) | | | (0.70 | ) | | | (0.62 | ) | | | (0.64 | ) | | | — | |
| | |
|
|
| |
|
|
| |
|
|
| |
|
|
| |
|
|
|
Total dividends and distributions | | | (0.68 | ) | | | (0.70 | ) | | | (0.62 | ) | | | (0.64 | ) | | | (1.24 | ) |
| | |
|
|
| |
|
|
| |
|
|
| |
|
|
| |
|
|
|
Net Asset Value, end of year | | $ | 27.89 | | | $ | 22.76 | | | $ | 36.84 | | | $ | 35.64 | | | $ | 31.41 | |
| | |
|
|
| |
|
|
| |
|
|
| |
|
|
| |
|
|
|
Total Return(a): | | | 26.07 | % | | | (36.94 | )% | | | 5.10 | % | | | 15.54 | % | | | 4.54 | % |
Ratios/Supplemental Data: | | | | | | | | | | | | | | | | | | | | |
Net assets, end of year (in millions) | | $ | 2,098.1 | | | $ | 1,815.8 | | | $ | 3,122.4 | | | $ | 3,306.4 | | | $ | 3,212.7 | |
Ratios to average net assets(b): | | | | | | | | | | | | | | | | | | | | |
Expenses | | | 0.37 | % | | | 0.37 | % | | | 0.37 | % | | | 0.37 | % | | | 0.38 | % |
Net investment income | | | 2.06 | % | | | 2.04 | % | | | 1.73 | % | | | 1.61 | % | | | 1.52 | % |
Portfolio turnover rate | | | 5 | % | | | 4 | % | | | 3 | % | | | 3 | % | | | 7 | % |
| (a) | Total return is calculated assuming a purchase of a share on the first day and a sale on the last day of each year reported and includes reinvestment of dividends and distributions and does not reflect the effect of insurance contract charges. Total return does not reflect expenses associated with the separate account such as administrative fees, account charges and surrender charges which, if reflected, would reduce the total returns for all years shown. Performance figures may reflect voluntary fee waivers and/or expense reimbursements. In the absence of voluntary fee waivers and/or expense reimbursements, the total return would be lower. Past performance is no guarantee of future results. Total returns may reflect adjustments to conform to generally accepted accounting principles. |
| (b) | Does not include expenses of the underlying portfolios in which the Portfolio invests. |
SEE NOTES TO FINANCIAL STATEMENTS.
C4
REPORT OF INDEPENDENT REGISTERED PUBLIC ACCOUNTING FIRM
THE BOARD OF TRUSTEES AND SHAREHOLDERS
THE PRUDENTIAL SERIES FUND:
We have audited the accompanying statements of assets and liabilities of The Prudential Series Fund (comprised of Conservative Balanced Portfolio, Diversified Bond Portfolio, Equity Portfolio, Flexible Managed Portfolio, Global Portfolio, Government Income Portfolio, and Stock Index Portfolio), hereafter referred to as the “Funds”, including the portfolios of investments, as of December 31, 2009, and the related statements of operations for the year then ended, the statements of changes in net assets for each of the years in the two-year period then ended and the financial highlights for each of the years in the five-year period then ended. These financial statements and financial highlights are the responsibility of the Funds’ management. Our responsibility is to express an opinion on these financial statements and financial highlights based on our audits.
We conducted our audits in accordance with the standards of the Public Company Accounting Oversight Board (United States). Those standards require that we plan and perform the audit to obtain reasonable assurance about whether the financial statements and financial highlights are free of material misstatement. An audit includes examining, on a test basis, evidence supporting the amounts and disclosures in the financial statements. Our procedures included confirmation of securities owned as of December 31, 2009, by correspondence with the custodian, transfer agent and brokers or by other appropriate auditing procedures where replies from brokers were not received. An audit also includes assessing the accounting principles used and significant estimates made by management, as well as evaluating the overall financial statement presentation. We believe that our audits provide a reasonable basis for our opinion.
In our opinion, the financial statements and financial highlights referred to above present fairly, in all material respects, the financial position of the Funds as of December 31, 2009, and the results of their operations, the changes in their net assets and the financial highlights for the periods described in the first paragraph above, in conformity with U.S. generally accepted accounting principles.
New York, New York
February 16, 2010
D1
INFORMATION ABOUT TRUSTEES AND OFFICERS (Unaudited)
Information about the Trustees and the Officers of the Fund is set forth below. Trustees who are not deemed to be “interested persons” of the Fund, as defined in the 1940 Act, are referred to as “Independent Trustees.” Trustees who are deemed to be “interested persons” of the Fund are referred to as “Interested Trustees.” The Trustees are responsible for the overall supervision of the operations of the Fund and perform the various duties imposed on the directors of investment companies by the 1940 Act.
| | | | |
Independent Trustees (1) | | | | |
Name, Address, Age No. of Portfolios Overseen | | Principal Occupation(s) During Past Five Years | | Other Directorships Held |
Saul K. Fenster, Ph.D. (76) No. of Portfolios Overseen: 83 | | Currently President Emeritus of New Jersey Institute of Technology (since 2002); formerly President (1978-2002) of New Jersey Institute of Technology; Commissioner (1998-2002) of the Middle States Association Commission on Higher Education; Commissioner (1985-2002) of the New Jersey Commission on Science and Technology; formerly Director (1998-2005) of Society of Manufacturing Engineering Education Foundation; formerly Director of Prosperity New Jersey; formerly a director or trustee of Liberty Science Center, Research and Development Council of New Jersey, New Jersey State Chamber of Commerce, and National Action Council for Minorities in Engineering. | | Member (since 2006), Board of The Ridgefield Foundation and The Leir Foundation. |
| | | |
Delayne Dedrick Gold (71) No. of Portfolios Overseen: 83 | | Marketing Consultant (1982-present); formerly Senior Vice President and Member of the Board of Directors, Prudential Bache Securities, Inc. | | None |
| | | |
W. Scott McDonald, Jr. (72) No. of Portfolios Overseen: 83 | | Formerly Management Consultant (1997-2004) and of Counsel (2004-2005) at Kaludis Consulting Group, Inc. (company serving higher education); Formerly principal (1995-1997), Scott McDonald Associates; Chief Operating Officer (1991-1995), Fairleigh Dickinson University; Executive Vice President and Chief Operating Officer (1975-1991), Drew University; interim President (1988-1990), Drew University; formerly Director of School, College and University Underwriters Ltd. | | None |
| | | |
Thomas T. Mooney (68) No. of Portfolios Overseen: 83 | | Formerly Chief Executive Officer, Excell Partners, Inc.; formerly President of the Greater Rochester Metro Chamber of Commerce, Rochester City Manager; formerly Deputy Monroe County Executive. | | None |
| | | |
Thomas M. O’Brien (59) No. of Portfolios Overseen: 83 | | President and COO (since November 2006) and CEO (since April 2007) of State Bancorp, Inc. and State Bank; Vice Chairman (January 1997-April 2000) of North Fork Bank; President and Chief Executive Officer (December 1984-December 1996) of North Side Savings Bank; formerly President and Chief Executive Officer (May 2000-June 2006) Atlantic Bank of New York. | | Formerly Director (December 1996-May 2000) of North Fork Bancorporation, Inc.; Formerly Director (May 2000-April 2006) of Atlantic Bank of New York; Director (since November 2006) of State Bancorp, Inc. (NASDAQ: STBC) and State Bank of Long Island. |
| | | |
F. Don Schwartz (74) No. of Portfolios Overseen: 83 | | Management Consultant (since April 1985). | | None |
| | | | |
Interested Trustee (1) | | | | |
Robert F. Gunia (63) No. of Portfolios Overseen: 83 | | Independent Consultant; formerly Chief Administrative Officer (September 1999-September 2009) and Executive Vice President (December 1996-September 2009) of Prudential Investments LLC; Executive Vice President (March 1999-September 2009) and Treasurer (May 2000-September 2009) of Prudential Mutual Fund Services LLC; President (April 1999-December 2008) and Executive Vice President and Chief Operating Officer (December 2008- December 2009) of Prudential Investment Management Services LLC; Chief Administrative Officer, Executive Vice President and Director (May 2003-September 2009) of AST Investment Services, Inc. | | Director (since May 1989) of The Asia Pacific Fund, Inc. |
| 1 | The year that each Trustee joined the Fund’s Board is as follows: Saul K. Fenster, 1983; Delayne Dedrick Gold, 2001; Robert F. Gunia, 2001; W. Scott McDonald, Jr., 1983; Thomas T. Mooney, 2001; Thomas M. O’Brien, 2003; F. Don Schwartz, 2003. |
E1
| | |
Fund Officers 1 | | |
Name, Address and Age Position with the Fund | | Principal Occupation(s) During the Past Five Years |
Steve Pelletier (56) President and Principal Executive Officer | | President of Prudential Annuities (since September 2008); Chairman and CEO, International Investments, Prudential Financial (since January 1998). |
| | |
Timothy S. Cronin (44) Vice President | | Chief Investment Officer and Strategist of Prudential Annuities (since January 2004); Director of Investment & Research Strategy (since February 1998); President of AST Investment Services, Inc. (since June 2005). |
| | |
Kathryn L. Quirk (57) Chief Legal Officer | | Vice President and Corporate Counsel (since September 2004) of Prudential; Executive Vice President, Chief Legal Officer and Secretary (since July 2005) of Prudential Investments LLC (PI) and Prudential Mutual Fund Services LLC (PMFS); Vice President and Corporate Counsel (since June 2005) and Secretary (since February 2006) of AST Investment Services, Inc.; formerly Senior Vice President and Assistant Secretary (November 2004-August 2005) of PI; formerly Assistant Secretary (June 2005-February 2006) of AST Investment Services, Inc.; formerly Managing Director, General Counsel, Chief Compliance Officer, Chief Risk Officer and Corporate Secretary (1997-2002) of Zurich Scudder Investments, Inc. |
| | |
Deborah A. Docs (52) Secretary | | Vice President and Corporate Counsel (since January 2001) of Prudential; Vice President (since December 1996) and Assistant Secretary (since March 1999) of PI; formerly Vice President and Assistant Secretary (May 2003-June 2005) of AST Investment Services, Inc. |
| | |
Jonathan D. Shain (51) Assistant Secretary | | Vice President and Corporate Counsel (since August 1998) of Prudential; Vice President and Assistant Secretary (since May 2001) of PI; Vice President and Assistant Secretary (since February 2001) of PMFS; formerly Vice President and Assistant Secretary (May 2003-June 2005) of AST Investment Services, Inc. |
| | |
Claudia DiGiacomo (35) Assistant Secretary | | Vice President and Corporate Counsel (since January 2005) of Prudential; Vice President and Assistant Secretary of PI (since December 2005); Associate at Sidley Austin Brown & Wood LLP (1999-2004). |
| | |
John P. Schwartz (38) Assistant Secretary | | Vice President and Corporate Counsel (since April 2005) of Prudential; Vice President and Assistant Secretary of PI (since December 2005); Associate at Sidley Austin Brown & Wood LLP (1997-2005). |
| | |
Andrew R. French (47) Assistant Secretary | | Director and Corporate Counsel (since May 2006) of Prudential; Vice President and Assistant Secretary (since January 2007) of PI; Vice President and Assistant Secretary (since January 2007) of PMFS; formerly Senior Legal Analyst of Prudential Mutual Fund Law Department (1997-2006). |
| | |
Timothy J. Knierim (51) Chief Compliance Officer | | Chief Compliance Officer of Prudential Investment Management, Inc.(PIM) (since July 2007); formerly Chief Risk Officer of PIM and PI (2002-2007) and formerly Chief Ethics Officer of PIM and PI (2006-2007). |
| | |
Valerie M. Simpson (51) Deputy Chief Compliance Officer | | Chief Compliance Officer (since April 2007) of PI and AST Investment Services, Inc.; formerly Vice President-Financial Reporting (June 1999-March 2006) for Prudential Life and Annuities Finance. |
| | |
Theresa C. Thompson (47) Deputy Chief Compliance Officer | | Vice President, Compliance, PI (since April 2004); and Director, Compliance, PI (2001 - 2004). |
| | |
Noreen M. Fierro (45) Anti-Money Laundering Compliance Officer | | Vice President, Corporate Compliance (since May 2006) of Prudential; formerly Corporate Vice President, Associate General Counsel (April 2002-May 2005) of UBS Financial Services, Inc., in their Money Laundering Prevention Group; Senior Manager (May 2005-May 2006) of Deloitte Financial Advisory Services, LLP, in their Forensic and Dispute Services, Anti-Money Laundering Group. |
| | |
Grace C. Torres (50) Treasurer and Principal Financial and Accounting Officer | | Assistant Treasurer (since March 1999) and Senior Vice President (since September 1999) of PI; Assistant Treasurer (since May 2003) and Vice President (since June 2005) of AST Investment Services, Inc.; Senior Vice President and Assistant Treasurer (since May 2003) of Prudential Annuities Advisory Services, Inc.; formerly Senior Vice President (May 2003-June 2005) of AST Investment Services, Inc. |
| | |
M. Sadiq Peshimam (46) Assistant Treasurer | | Vice President (since 2005) of Prudential Investments LLC. |
| | |
Peter Parrella (51) Assistant Treasurer | | Vice President (since 2007) and Director (2004-2007) within Prudential Mutual Fund Administration; formerly Tax Manager at SSB Citi Fund Management LLC (1997-2004). |
| | |
Alan Fu (52) Assistant Treasurer | | Vice President and Corporate Counsel - Tax, Prudential Financial, Inc. (since October 2003). |
| 1 | The year in which each individual became an Officer of the Fund is as follows: Stephen Pelletier, 2008; Timothy S. Cronin, 2009; Kathryn L. Quirk, 2005; Deborah A. Docs, 2005; Jonathan D. Shain, 2005; Claudia DiGiacomo, 2005; John P. Schwartz, 2006; Andrew R. French, 2006; Timothy J. Knierim, 2007; Valerie M. Simpson, 2007; Theresa C. Thompson, 2008; Noreen M. Fierro, 2006; Grace C. Torres, 1997; Peter Parrella, 2007; M. Sadiq Peshimam, 2006; Alan Fu, 2006. |
Explanatory Notes to Tables:
Trustees are deemed to be “Interested”, as defined in the 1940 Act, by reason of their affiliation with Prudential Investments LLC and/or an affiliate of Prudential Investments LLC. Robert F. Gunia will be considered an Interested Trustee for at least two years after his retirement from employment by the Manager and its affiliates (which was on or about October 21, 2009). He will also be an Interested Trustee as long as he holds a beneficial interest in securities issued by the Manager or its affiliates.
Unless otherwise noted, the address of all Trustees and Officers is c/o Prudential Investments LLC, Gateway Center Three, 100 Mulberry Street, Newark, New Jersey 07102.
There is no set term of office for Trustees or Officers. The Independent Trustees have adopted a retirement policy, which calls for the retirement of Trustees on December 31 of the year in which they reach the age of 75.
“Other Directorships Held” includes only directorships of companies required to register or file reports with the SEC under the Securities Exchange Act of 1934 (that is, “public companies”) or other investment companies registered under the 1940 Act.
“No. of Portfolios Overseen” includes all investment companies managed by Prudential Investments LLC. The investment companies for which PI serves as manager include the Prudential Investments Funds, The Prudential Variable Contract Accounts, The Target Portfolio Trust, The Prudential Series Fund, Advanced Series Trust and Prudential’s Gibraltar Fund, Inc.
E2
The toll-free number shown below can be used to make transfers and reallocations, review how your premiums are being allocated, and receive current investment option values in your contract. Unit values for each investment option are available to all participants from the toll-free number. The phone lines are open each business day during the hours shown. Please be sure to have your contract number available when you call.
800-458-6333
8 a.m. — 8 p.m. Eastern time

The Prudential Insurance Company of America
751 Broad Street
Newark NJ 07102-3777
Presorted
Standard
U.S. Postage
PAID
Prudential
In the past, participants who held several variable contracts at the same address received multiple copies of annual and semiannual reports. In an effort to lessen waste and reduce expenses of postage and printing, we will attempt to mail only one copy of this report, based on our current records for participants with the same last name and same address. No action on your part is necessary. Upon request, we will furnish you with additional reports. The toll-free number listed on the inside back cover should be used to request additional copies. Proxy material and tax information will continue to be sent for each account of record.
Prudential Retirement, Prudential Financial, PRU, Prudential and the Rock logo are registered service marks of The Prudential Insurance Company of America, Newark, NJ and its affiliates.
0172931-00001-00 MD.RS.011

Item 2 – Code of Ethics – See Exhibit (a)
As of the end of the period covered by this report, the registrant has adopted a code of ethics (the “Section 406 Standards for Investment Companies – Ethical Standards for Principal Executive and Financial Officers”) that applies to the registrant’s Principal Executive Officer and Principal Financial Officer; the registrant’s Principal Financial Officer also serves as the Principal Accounting Officer.
The registrant hereby undertakes to provide any person, without charge, upon request, a copy of the code of ethics. To request a copy of the code of ethics, contact the registrant 973-367-7521, and ask for a copy of the Section 406 Standards for Investment
Companies – Ethical Standards for Principal Executive and Financial Officers.
Item 3 – Audit Committee Financial Expert –
The registrant’s Board has determined that Mr. Stephen P. Munn, member of the Board’s Audit Committee is an “audit committee financial expert,” and that he is “independent,” for purposes of this Item.
Item 4 – Principal Accountant Fees and Services –
(a) Audit Fees
For the fiscal years ended December 31, 2009 and December 31, 2008, KPMG LLP (“KPMG”), the Registrant’s principal accountant, billed the Registrant $16,745 and $16,745, respectively, for professional services rendered for the audit of the Registrant’s annual financial statements or services that are normally provided in connection with statutory and regulatory filings.
(b) Audit-Related Fees
None.
(c) Tax Fees
None.
(d) All Other Fees
None.
(e) (1) Audit Committee Pre-Approval Policies and Procedures
THE PRUDENTIAL MUTUAL FUNDS
AUDIT COMMITTEE POLICY
on
Pre-Approval of Services Provided by the Independent Accountants
The Audit Committee of each Prudential Mutual Fund is charged with the responsibility to monitor the independence of the Fund’s independent accountants. As part of this responsibility, the Audit Committee must pre-approve any independent accounting firm’s engagement to render audit and/or permissible non-audit services, as required by law. In evaluating a proposed engagement of the independent accountants, the Audit Committee will assess the effect that the engagement might reasonably be expected to have on the accountant’s independence. The Committee’s evaluation will be based on:
| | • | | a review of the nature of the professional services expected to be provided, |
| | • | | a review of the safeguards put into place by the accounting firm to safeguard independence, and |
| | • | | periodic meetings with the accounting firm. |
Policy for Audit and Non-Audit Services Provided to the Funds
On an annual basis, the scope of audits for each Fund, audit fees and expenses, and audit-related and non-audit services (and fees proposed in respect thereof) proposed to be performed by the Fund’s independent accountants will be presented by the Treasurer and the independent accountants to the Audit Committee for review and, as appropriate, approval prior to the initiation of such services. Such presentation shall be accompanied by confirmation by both the Treasurer and the independent accountants that the proposed services will not adversely affect the independence of the independent accountants. Proposed services shall be described in sufficient detail to enable the Audit Committee to assess the appropriateness of such services and fees, and the compatibility of the provision of such services with the auditor’s independence. The Committee shall receive periodic reports on the progress of the audit and other services which are approved by the Committee or by the Committee Chair pursuant to authority delegated in this Policy.
The categories of services enumerated under “Audit Services”, “Audit-related Services”, and “Tax Services” are intended to provide guidance to the Treasurer and the independent accountants as to those categories of services which the Committee believes are generally consistent with the independence of the independent accountants and which the Committee (or the Committee Chair) would expect upon the presentation of specific proposals to pre-approve. The enumerated categories are not intended as an exclusive list of audit, audit-related or tax services, which the Committee (or the Committee Chair) would consider for pre-approval.
Audit Services
The following categories of audit services are considered to be consistent with the role of the Fund’s independent accountants:
| | • | | Annual Fund financial statement audits |
| | • | | Seed audits (related to new product filings, as required) |
| | • | | SEC and regulatory filings and consents |
Audit-related Services
The following categories of audit-related services are considered to be consistent with the role of the Fund’s independent accountants:
| | • | | Accounting consultations |
| | • | | Fund merger support services |
| | • | | Agreed Upon Procedure Reports |
| | • | | Other Internal Control Reports |
Individual audit-related services that fall within one of these categories and are not presented to the Audit Committee as part of the annual pre-approval process will be subject to pre-approval by the Committee Chair (or any other Committee member on whom this responsibility has been delegated) so long as the estimated fee for those services does not exceed $50,000.
Tax Services
The following categories of tax services are considered to be consistent with the role of the Fund’s independent accountants:
| | • | | Tax compliance services related to the filing or amendment of the following: |
| | • | | Federal, state and local income tax compliance; and, |
| | • | | Sales and use tax compliance |
| | • | | Timely RIC qualification reviews |
| | • | | Tax distribution analysis and planning |
| | • | | Tax authority examination services |
| | • | | Tax appeals support services |
| | • | | Accounting methods studies |
| | • | | Fund merger support services |
| | • | | Tax consulting services and related projects |
Individual tax services that fall within one of these categories and are not presented to the Audit Committee as part of the annual pre-approval process will be subject to pre-approval by the Committee Chair (or any other Committee member on whom this responsibility has been delegated) so long as the estimated fee for those services does not exceed $50,000.
Other Non-audit Services
Certain non-audit services that the independent accountants are legally permitted to render will be subject to pre-approval by the Committee or by one or more Committee members to whom the Committee has delegated this authority and who will report to the full Committee any pre-approval decisions made pursuant to this Policy. Non-audit services presented for pre-approval pursuant to this paragraph will be accompanied by a confirmation from both the Treasurer and the independent accountants that the proposed services will not adversely affect the independence of the independent accountants.
Proscribed Services
The Fund’s independent accountants will not render services in the following categories of non-audit services:
| | • | | Bookkeeping or other services related to the accounting records or financial statements of the Fund |
| | • | | Financial information systems design and implementation |
| | • | | Appraisal or valuation services, fairness opinions, or contribution-in-kind reports |
| | • | | Internal audit outsourcing services |
| | • | | Management functions or human resources |
| | • | | Broker or dealer, investment adviser, or investment banking services |
| | • | | Legal services and expert services unrelated to the audit |
| | • | | Any other service that the Public Company Accounting Oversight Board determines, by regulation, is impermissible. |
Pre-approval of Non-Audit Services Provided to Other Entities Within the Prudential Fund Complex
Certain non-audit services provided to Prudential Investments LLC or any of its affiliates that also provide ongoing services to the Prudential Mutual Funds will be subject to pre-approval by the Audit Committee. The only non-audit services provided to these entities that will require pre-approval are those related directly to the operations and financial reporting of the Funds. Individual projects that are not presented to the Audit Committee as part of the annual pre-approval process will be subject to pre-approval by the Committee Chair (or any other Committee member on whom this responsibility has been delegated) so long as the estimated fee for those services does not exceed $50,000. Services presented for pre-approval pursuant to this paragraph will be accompanied by a confirmation from both the Treasurer and the independent accountants that the proposed services will not adversely affect the independence of the independent accountants.
Although the Audit Committee will not pre-approve all services provided to Prudential Investments LLC and its affiliates, the Committee will receive an annual report from the Fund’s independent accounting firm showing the aggregate fees for all services provided to Prudential Investments and its affiliates.
(e) (2) Percentage of services referred to in 4(b) – 4(d) that were approved by the audit committee –
Not applicable.
(f) Percentage of hours expended attributable to work performed by other than full time employees of principal accountant if greater than 50%.
The percentage of hours expended on the principal accountant’s engagement to audit the registrant’s financial statements for the most recent fiscal year that were attributed to work performed by persons other than the principal accountant’s full-time, permanent employees was 0%.
(g) Non-Audit Fees
Not applicable to Registrant for the fiscal years 2009 and 2008. The aggregate non-audit fees billed by KPMG for services rendered to the registrant’s investment adviser and any entity controlling, controlled by, or under common control with the investment adviser that provides ongoing services to the registrant for the fiscal years 2009 and 2008 was $0 and $0, respectively.
(h) Principal Accountant’s Independence
Not applicable as KPMG has not provided non-audit services to the registrant’s investment adviser and any entity controlling, controlled by, or under common control with the investment adviser that provides ongoing services to the registrant that were not pre-approved pursuant to Rule 2-01(c)(7)(ii) of Regulation S-X.
Item 5 – Audit Committee of Listed Registrants – Not applicable.
Item 6 – Schedule of Investments – The schedule is included as part of the report to shareholders filed under Item 1 of this Form.
Item 7 – Disclosure of Proxy Voting Policies and Procedures for Closed-End Management Investment Companies – Not applicable.
Item 8 – Portfolio Managers of Closed-End Management Investment Companies – Not applicable.
Item 9 – Purchases of Equity Securities by Closed-End Management Investment Company and Affiliated Purchasers – Not applicable.
Item 10 – Submission of Matters to a Vote of Security Holders – Not applicable.
Item 11 – Controls and Procedures
| | (a) | It is the conclusion of the registrant’s principal executive officer and principal financial officer that the effectiveness of the registrant’s current disclosure controls and procedures (such disclosure controls and procedures having been evaluated within 90 days of the date of this filing) provide reasonable assurance that the information required to be disclosed by the registrant has been recorded, processed, summarized and reported within the time period specified in the Commission’s rules and forms and that the information required to be disclosed by the registrant has been accumulated and communicated to the registrant’s principal executive officer and principal financial officer in order to allow timely decisions regarding required disclosure. |
| | (b) | There has been no significant change in the registrant’s internal control over financial reporting that occurred during the registrant’s most recent fiscal quarter of the period covered by this report that has materially affected, or is likely to materially affect, the registrant’s internal control over financial reporting. |
Item 12 – Exhibits
| | (a) | (1) Code of Ethics – Attached hereto as Exhibit EX-99.CODE-ETH |
(2) Certifications pursuant to Section 302 of the Sarbanes-Oxley Act – Attached hereto as Exhibit EX-99.CERT.
(3) Any written solicitation to purchase securities under Rule 23c-1. – Not applicable.
| | (b) | Certifications pursuant to Section 906 of the Sarbanes-Oxley Act – Attached hereto as Exhibit EX-99.906CERT. |
SIGNATURES
Pursuant to the requirements of the Securities Exchange Act of 1934 and the Investment Company Act of 1940, the registrant has duly caused this report to be signed on its behalf by the undersigned, thereunto duly authorized.
| | | | |
(Registrant) The Prudential Variable Contract Account-11 | | |
| | |
| By (Signature and Title)* | | /S/ DEBORAH A. DOCS | | |
| | Deborah A. Docs | | |
| | Secretary | | |
Date February 22, 2010 | | | | |
Pursuant to the requirements of the Securities Exchange Act of 1934 and the Investment Company Act of 1940, this report has been signed below by the following persons on behalf of the registrant and in the capacities and on the dates indicated.
| | | | |
| | |
| By (Signature and Title)* | | /S/ JUDY A. RICE | | |
| | Judy A. Rice | | |
| | President and Principal Executive Officer | | |
Date February 22, 2010 | | | | |
| | |
| By (Signature and Title)* | | /S/ GRACE C. TORRES | | |
| | Grace C. Torres | | |
| | Treasurer and Principal Financial Officer | | |
Date February 22, 2010 | | | | |
| * | Print the name and title of each signing officer under his or her signature. |