UNITED STATES
SECURITIES AND EXCHANGE COMMISSION
Washington, D.C. 20549
FORM N-CSR
CERTIFIED SHAREHOLDER REPORT OF REGISTERED
MANAGEMENT INVESTMENT COMPANIES
| | |
| Investment Company Act file number: | | 811-03421 |
| |
| Exact name of registrant as specified in charter: | | The Prudential Variable |
| | Contract Account-10 |
| |
| Address of principal executive offices: | | 655 Broad Street, 17th Floor |
| | Newark, New Jersey 07102 |
| |
| Name and address of agent for service: | | Deborah A. Docs |
| | 655 Broad Street, 17th Floor |
| | Newark, New Jersey 07102 |
| |
| Registrant’s telephone number, including area code: | | 973-367-7521 |
| |
| Date of fiscal year end: | | 12/31/2016 |
| |
| Date of reporting period: | | 12/31/2016 |
Item 1 – Reports to Stockholders
The MEDLEY Program
| | |
| ANNUAL REPORT | | December 31, 2016 |

The report is for the information of persons participating in The Prudential Variable Contract Account-10 (VCA-10), The Prudential Variable Contract Account-11 (VCA-11), and The Prudential Variable Contract Account-24 (VCA-24) (Collectively known as the “Accounts”) of The MEDLEY Program. VCA-10, VCA-11, and VCA-24 are group annuity insurance products issued by The Prudential Insurance Company of America, 751 Broad Street, Newark, NJ 07102-3777, and are distributed by Prudential Investment Management Services LLC (PIMS), member SIPC, 655 Broad Street, 19th Floor, Newark, NJ 07102. Both are Prudential Financial companies.
The views expressed in this report and information about the Accounts’ portfolio holdings are for the period covered by this report and are subject to change thereafter.
All are Prudential Financial companies and each is solely responsible for its financial condition and contractual obligations.
Please note that this document may include prospectus supplements that are separate from and not a part of this report.

| | | | |
The Prudential MEDLEY Program Table of Contents | | Annual Report | | December 31, 2016 |
| ∎ | | REPORT OF THE INVESTMENT MANAGER |
Financial Statements
Financial Statements
| ∎ | | VCA-24 THE PRUDENTIAL SERIES FUND PORTFOLIOS |
Conservative Balanced Portfolio
Diversified Bond Portfolio
Equity Portfolio
Flexible Managed Portfolio
Global Portfolio
Government Income Portfolio
Stock Index Portfolio
| | |
The Prudential MEDLEY Program Letter to Participants | | December 31, 2016 |
At Prudential, our primary objective is to help investors achieve and maintain long-term financial success. This MEDLEYProgram annual report outlines our efforts to achieve this goal. We hope you find it informative and useful.
Prudential has been building on a heritage of success for more than 135 years. We believe the array of our products provides a highly attractive value proposition to clients like you who are focused on financial security.
Your financial professional is the best resource to help you make the most informed investment decisions. Together, you can build a diversified investment portfolio that aligns with your long-term financial goals. Please keep in mind that diversification and asset allocation strategies do not assure a profit or protect against loss in declining markets.
Thank you for selecting Prudential as one of your financial partners. We value your trust and appreciate the opportunity to help you achieve financial security.
Sincerely,
| | |
 | |  |
Stuart Parker President, The Prudential Variable Contract Accounts 10 & 11 | | Timothy S. Cronin President, The Prudential Series Fund |
January 31, 2017
| | | | |
| Market Overview — unaudited | | Annual Report | | December 31, 2016 |
Equity Market Overview
US Equities lifted by post-election optimism
In a year of surprises, US equities left no surprise regarding investor sentiment. After a powerful fourth quarter of 2016, the S&P 500, including dividends, returned 3.82% for the quarter and 11.94% for the year.
The year began on a down note. US stocks entered into a correction in January, jolted by a steep decline in manufacturing in China, followed by a massive selloff in China’s equity markets, which spilled over to all global markets. Market woes continued roughly through the first half of February, as stocks performed poorly, but then turned upward. In March, a strong rally powered stocks in the S&P 500 to rise by one of the largest gains in any single month in recent history. Continued low interest rates and a stabilization in oil prices helped stocks to rebound.
One of the biggest surprises took place in late June. The UK’s vote to leave the European Union, known as “Brexit,” briefly increased market volatility, although the macroeconomic fallout appeared manageable, if not limited. Volatility was generally kept in check during the third quarter. Also, riskier equities, such as companies in the technology and financial sectors, outperformed.
In the fourth quarter, the presidential election delivered the year’s biggest surprise as Donald Trump was elected the 45th president of the US. Stocks, especially financials, surged on the news, as Trump’s US-focus on a growth-friendly agenda was also seen as a boon for the US financial sector. In December, to no one’s surprise, the Fed raised interest rates by 0.25%.
Sector performance reflects strength in the economy
Sector performance was positive except for health care. Cyclical stocks, which are more sensitive to developments in the economy, outpaced most of their defensive counterparts. Energy led all sectors with a 27.36% gain, as oil prices climbed. The defensive, but dividend-paying, telecommunications sector rose by 23.49%, as the search for yield continues. Financials, were boosted by the election results, shot up 22.80%, with banks and diversified financial companies achieving impressive returns. Industrials churned out an 18.86% gain, led by construction and engineering companies. Materials turned in a strong performance, rising by 16.69%, as metals & mining and construction materials industries surged.
Utilities gained 16.29%, as independent power and renewable energy producers charge forward. Information technology clicked up by 13.85% on strength in the semi-conductor & semi-conductor equipment industry. The media industry and Internet catalogue & retail industries boosted consumer discretionary, which rose by 6.03%. Consumer staples rang up a 5.38% return on gains in the tobacco and food industries. Real estate posted a gain of 3.39%, on concerns over rising interest rates. Health care stumbled to a -2.69% return on weakness in the health care technology and biotechnology industries.
Small-caps show leadership in Russell Indexes
The Russell US Indexes, which measure equity performance with respect to stock-specific styles (value and growth) and capitalization levels (small-, mid-, and large-cap), were all in positive territory. Small-cap stocks, as measured by the Russell 2000® Index, gained 21.31% against their larger counterparts, which also reflected stronger business activity. The Russell Midcap® Index returned 13.80%. In large-cap stocks, the Russell 1000® Value Index gained 17.34% against the 7.08% return of the Russell 1000® Growth Index.
International and emerging markets mixed
The MSCI-EAFE Index, which measures the performance of developed markets excluding the United States and Canada, eked out a positive return of 1.0% net of dividends, for the year.
A lackluster fourth quarter hindered market performance for the year, especially in Europe which was fraught with political uncertainty. Most heavily weighted countries in Europe turned in a moderate performance. Germany returned 2.28%, France rose by 4.88%, and the UK fell by -0.10%. Austria gained 11.26% to lead the region, while Belgium lagged the region, falling to a -15.77% return.
Countries in the Pacific region generally gained. Hong Kong rose by 2.26%. Singapore gained 1.42%. Japan was positive with a 2.37% gain. Australia rose by 11.44% and New Zealand gained 18.37% on low interest rates and strong dividend-paying companies.
The MSCI Emerging Markets Index generally recorded solid gains, rising by 11.19%. The Brazil, Russia, India, and China (BRIC) group rose by 12.12%. Brazil rose by a whopping 66.24%, as a result of its new, pro-growth leadership. Re-energized Russian markets posted a huge 54.82% gain on rising oil prices. India dipped into negative territory with a -1.43% return, and China was slightly positive, returning 0.93%.
| | | | |
| Market Overview — unaudited | | Annual Report | | December 31, 2016 |
Fixed Income Market Overview
Bond Market Review
According to the Bloomberg Barclays bond indexes, the US Aggregate Bond Index returned 2.68%, US Treasury securities returned 1.04%, and US investment-grade corporate bonds returned 6.11% and US corporate high yield bonds returned 17.13% for the fourth quarter of 2016.
Between the Brexit vote and the Trump sweep, 2016 was certainly a year of surprises and bumps, but it was a generally productive year for the bond market, even after subtracting out the fourth-quarter setback.
Bonds took a hit during the fourth quarter as US interest rates rose and the Federal Reserve hiked its benchmark rate by 0.25% in December. This comes in the wake of the US economy presumably approaching full employment and fiscal policy seemingly about to turn stimulative. While the US economy may be reasonably solid, it nonetheless has to fit within a larger global puzzle — which is perhaps best characterized as having plenty of excess capacity, but not enough growth.
The US elections resulted in an upset Republican sweep. The market’s immediate reaction was a flight to quality, presumably driven by fears of trade wars. After the initial lapse in confidence, however, the markets have seemingly come to the firm conclusion that the prevailing outcome of the new political landscape could be a stronger US economy as evidenced by the rise in Treasury yields and the US dollar.
US and European Corporate Bonds
US corporate bond spreads (the extra yield investors receive to compensate for the risk between investment-grade corporate bonds and US Treasuries with similar maturities) tightened in the fourth quarter of 2016 but not by enough to overcome the run-up in interest rates following the November presidential election. For the year, US corporate bonds delivered a respectable return. Long-term corporate bonds were the clear winner.
European corporate bonds were also volatile in the fourth quarter with yields first rising over concerns that the European Central Bank (ECB) may begin tapering its quantitative easing program. Yields then tightened again in early/mid December. Also, concerns over rising populism and the duration of the ECB’s quantitative easing program dominated sentiment in the European corporate bond markets.
Global Leveraged Finance
In global leveraged bond markets, high yield spreads (the extra yield investors receive to compensate for the risk between non-investment grade and investment-grade bonds) drifted wider in the run-up to the US elections, and while the surprise victory by president-elect Trump prompted a substantial selloff — which led to further spread widening — the tone of the market improved on the prospects for faster economic growth, less regulation, tax reform, and increased fiscal spending. High yield spreads tightened sharply and the high yield bonds had the strongest annual return since 2009.
Emerging Markets Debt
It was a year of recovery for the emerging markets debt sector. The Emerging Market Foreign Exchange just posted its third consecutive year of negative returns, Emerging Market local yields rose to levels last seen during 2013’s taper tantrum. Brazil faced a political and confidence crisis not seen in recent decades, and concerns mounted about China’s growth outlook.
Mortgages
Agency mortgage-backed securities underperformed US Treasuries in the fourth quarter as rates rose sharply following the November presidential election. Mortgages posted a moderate return in 2016. Mortgage-backed securities (MBS) benefitted from strong demand from the Federal Reserve, as well as US. and overseas investors.
| | |
Prudential Variable Contract Account-10 (VCA-10) Presentation of Portfolio Holdings — unaudited | | December 31, 2016 |
| | | | |
| VCA-10 | |
| Five Largest Holdings | | | (% of Net Assets | ) |
| Goldman Sachs Group, Inc. (The) | | | 3.4% | |
| JPMorgan Chase & Co. | | | 3.3% | |
| Microsoft Corp. | | | 2.8% | |
| Alphabet, Inc. (Class A Stock) | | | 2.5% | |
| Shire PLC, ADR | | | 2.4% | |
For a complete listing of holdings, refer to the Schedule of Investments section of this report. Holdings reflect only long-term investments. Holdings/Issues/Industries/Sectors are subject to change.
| | |
| The Prudential MEDLEY Program — VCA-10 | | December 31, 2016 |
Report of the Investment Manager - As of December 31, 2016 (Unaudited)
| | | | | | | | | | | | | | | | |
Average Annual
Total Returns | | 1-Year | | | 5-Year | | | 10-Year | | | Since
Inception | |
VCA-101—Standard Contract | | | 6.22 | % | | | 11.21 | % | | | 4.42 | % | | | — | |
VCA-101—0.50% Contract | | | 6.75 | | | | 11.76 | | | | 4.94 | | | | — | |
VCA-101—0.45% Contract | | | 6.80 | | | | 11.81 | | | | — | | | | 9.11 | % |
S&P 500 Index | | | 11.94 | | | | 14.65 | | | | 6.94 | | | | 11.90 | |
Past performance does not guarantee future returns. Account performance is net of investment fees and fund expenses. The investment return and principal value of an investment will fluctuate, so that an investor’s shares, when redeemed, may be worth more or less than their original cost. Current performance may be lower or higher than the past performance data quoted.
0.45% Contract inception: 4/1/2011. Unless noted otherwise, Index since inception returns reflect performance beginning the closest month-end date to the Account’s inception of the 0.45% contract.
$10,000 INVESTED OVER 10 YEARS

For the year ended December 31, 2016, the value of the standard contract for the Prudential Variable Contract Account 10 (“VCA-10” or the “Account”) returned 6.22%, the value of a contract with annual expenses of 0.50% returned 6.75%, and the value of a contract with annual expenses of 0.45% returned 6.80%.
The Account’s investment objective is long-term growth of capital. The Account is subadvised by Jennison Associates LLC.
What were market conditions during the reporting period?
2016 was a year of volatility and surprises. Among the contributing factors were decelerating economic growth in China; the negative effect of lower energy prices on industrial sectors; fears of slowing US economic growth; uncertainty about future Federal Reserve monetary tightening; Brexit, the UK’s decision to leave the European Union; and anxiety about the highly unconventional US presidential election. US dollar strength persisted throughout the reporting period, as strong US economic growth fueled investors’ preference for the US dollar and US-dollar-denominated assets.
The S&P 500 Index (the Index) returned 11.94% during the period. Among sectors, energy, telecommunication services, and financials generated the largest gains in the Index. Health care was the only sector to record negative returns. Value stocks significantly outperformed growth stocks across market capitalizations, while small-cap companies generally outpaced large-cap and mid-cap stocks.
What strategies or holdings affected the Account’s performance?
The Account underperformed the Index during the period, with positions in health care detracting from returns. After several acquisitions, Allergan has grown in size and scope, and could become a growth leader in global pharmaceuticals. Allergan’s development pipeline could be considerably more productive than investors assume and its balance sheet should allow for significant strategic capital deployment. Uncertainty around mergers and acquisitions activity in the pharmaceuticals industry caused volatility in Teva’s share price. Near period end, the US Federal Trade Commission approved its acquisition of Allergan’s generics business and subadviser exited the Account’s position because of a lowered outlook on Teva’s generics division. Alexion’s flagship product, Soliris, treats two rare genetic, and potentially life-threatening, blood disorders. The company is aggressively pursuing expansion opportunities for the drug in other autoimmune and inflammatory disease settings. Given heightened volatility in the health care sector and Alexion’s realization of pipeline milestones, the Account eliminated the position during the period.
In the consumer discretionary sector, the Account’s underperformance was driven by Netflix, which suffered from weaker-than-expected subscriber growth. Although the subadviser believes the company’s long-term competitive positioning is strong, the Account sold the position due to near-term headwinds.
Despite positive performance from Texas Instruments, the Account’s exposure to information technology detracted overall. Strong demand across Texas Instruments’ end-markets led to improved results. The subadviser likes Texas Instruments’ focus on free cash flow margins and capital returns, as well as its product mix, dominant share in analog products, and strong channel relationships. LinkedIn, a leading global online professional network, was mostly responsible for the Account’s shortfall in the information technology sector. The Account eliminated the position as recent high growth rates started to decelerate.
Stock selection and overweight positions in the financials and energy sectors added to performance. An improved outlook for fiscal-spending stimulus, higher interest rates, better economic growth, and regulatory relief benefited many financial companies. Goldman Sachs, JP Morgan Chase, and SLM were standouts in both the sector and the Account. In the energy sector, as crude oil prices rebounded due to falling US shale production, the market rewarded stronger energy companies such as Halliburton and Chevron.
| 1 | The Account performance results are after the deduction of all expenses and contract charges, but not including the effect of any sales charges. The standard VCA-10 contract has total annual expenses (as a percentage of net assets) of 1.00%. Certain VCA-10 contracts include reduced administrative fees and have total annual expenses of either 0.50% or 0.45%. Performance of the VCA-10 contracts with reduced expenses will be higher than the performance of the standard VCA-10 contract. All total returns are for the periods indicated and are calculated based on changes in unit values. |
| 2 | The graph is based on the performance of the Standard Contract. Performance of the 0.50% Contract and the 0.45% Contract will be higher due to a lower fee structure. |
The S&P 500 Index is an unmanaged, market value-weighted index of 500 stocks generally representative of the broad stock market. Investors cannot invest directly in an index.
For a complete list of holdings please see the Statement of Net Assets sections of this report.
1
FINANCIAL STATEMENTS OF VCA-10
December 31, 2016
| | | | | | | | |
| LONG-TERM INVESTMENTS — 98.3% | |
| | |
| COMMON STOCKS | | Shares
| | | Value
(Note 2)
| |
Aerospace & Defense — 3.1% | | | | | | | | |
Boeing Co. (The) | | | 10,186 | | | $ | 1,585,756 | |
TransDigm Group, Inc. | | | 5,712 | | | | 1,422,060 | |
United Technologies Corp. | | | 15,431 | | | | 1,691,546 | |
| | | | | | |
|
|
|
| | | | | | | | 4,699,362 | |
| | | | | | |
|
|
|
Banks — 11.1% | | | | | | | | |
Bank of America Corp. | | | 147,486 | | | | 3,259,441 | |
BB&T Corp. | | | 39,898 | | | | 1,876,004 | |
Citigroup, Inc. | | | 45,527 | | | | 2,705,670 | |
JPMorgan Chase & Co. | | | 56,643 | | | | 4,887,724 | |
PNC Financial Services Group, Inc. | | | 17,629 | | | | 2,061,888 | |
Wells Fargo & Co. | | | 34,242 | | | | 1,887,077 | |
| | | | | | |
|
|
|
| | | | | | | | 16,677,804 | |
| | | | | | |
|
|
|
Biotechnology — 4.3% | | | | | | | | |
Celgene Corp.(a) | | | 24,237 | | | | 2,805,433 | |
Shire PLC, ADR | | | 21,274 | | | | 3,624,664 | |
| | | | | | |
|
|
|
| | | | | | | | 6,430,097 | |
| | | | | | |
|
|
|
Capital Markets — 3.4% | | | | | | | | |
Goldman Sachs Group, Inc. (The) | | | 21,263 | | | | 5,091,425 | |
| | | | | | |
|
|
|
Chemicals — 1.9% | | | | | | | | |
Dow Chemicals Co. (The) | | | 24,336 | | | | 1,392,506 | |
FMC Corp. | | | 25,381 | | | | 1,435,549 | |
| | | | | | |
|
|
|
| | | | | | | | 2,828,055 | |
| | | | | | |
|
|
|
Communications Equipment — 1.1% | | | | | | | | |
Brocade Communications Systems, Inc. | | | 131,427 | | | | 1,641,523 | |
| | | | | | |
|
|
|
Consumer Finance — 2.8% | | | | | | | | |
Capital One Financial Corp. | | | 23,924 | | | | 2,087,130 | |
SLM Corp.(a) | | | 190,072 | | | | 2,094,593 | |
| | | | | | |
|
|
|
| | | | | | | | 4,181,723 | |
| | | | | | |
|
|
|
Diversified Financial Services — 0.7% | | | | | | | | |
Voya Financial, Inc. | | | 27,846 | | | | 1,092,120 | �� |
| | | | | | |
|
|
|
Electric Utilities — 2.4% | | | | | | | | |
Exelon Corp. | | | 22,608 | | | | 802,358 | |
PG&E Corp. | | | 46,387 | | | | 2,818,938 | |
| | | | | | |
|
|
|
| | | | | | | | 3,621,296 | |
| | | | | | |
|
|
|
Electrical Equipment — 0.9% | | | | | | | | |
Eaton Corp. PLC | | | 20,798 | | | | 1,395,338 | |
| | | | | | |
|
|
|
Electronic Equipment, Instruments & Components — 1.1% | |
Flex Ltd.(a) | | | 111,500 | | | | 1,602,255 | |
| | | | | | |
|
|
|
Energy Equipment & Services — 1.5% | | | | | | | | |
Halliburton Co. | | | 41,521 | | | | 2,245,871 | |
| | | | | | |
|
|
|
Equity Real Estate Investment Trust (REITs) — 0.9% | |
American Tower Corp. | | | 12,225 | | | | 1,291,938 | |
| | | | | | |
|
|
|
Food & Staples Retailing — 1.0% | | | | | | | | |
Wal-Mart Stores, Inc. | | | 21,496 | | | | 1,485,804 | |
| | | | | | |
|
|
|
| | | | | | | | |
| COMMON STOCKS | |
| | |
| (continued) | | Shares
| | | Value
(Note 2)
| |
Food Products — 2.3% | | | | | | | | |
ConAgra Foods, Inc. | | | 45,981 | | | $ | 1,818,549 | |
Mondelez International, Inc. (Class A Stock) | | | 37,777 | | | | 1,674,654 | |
| | | | | | |
|
|
|
| | | | | | | | 3,493,203 | |
| | | | | | |
|
|
|
Health Care Equipment & Supplies — 0.9% | |
Zimmer Biomet Holdings, Inc. | | | 13,039 | | | | 1,345,625 | |
| | | | | | |
|
|
|
Health Care Providers & Services — 2.0% | |
Cigna Corp. | | | 11,734 | | | | 1,565,198 | |
Laboratory Corp. of America Holdings(a) | | | 11,113 | | | | 1,426,687 | |
| | | | | | |
|
|
|
| | | | | | | | 2,991,885 | |
| | | | | | |
|
|
|
Hotels, Restaurants & Leisure — 2.6% | | | | | | | | |
Carnival Corp. | | | 25,737 | | | | 1,339,868 | |
Hyatt Hotels Corp. (Class A Stock)(a) | | | 28,112 | | | | 1,553,469 | |
McDonald's Corp. | | | 8,559 | | | | 1,041,801 | |
| | | | | | |
|
|
|
| | | | | | | | 3,935,138 | |
| | | | | | |
|
|
|
Household Products — 1.6% | | | | | | | | |
Procter & Gamble Co. (The) | | | 27,985 | | | | 2,352,979 | |
| | | | | | |
|
|
|
Industrial Conglomerates — 1.5% | | | | | | | | |
General Electric Co. | | | 73,512 | | | | 2,322,979 | |
| | | | | | |
|
|
|
Insurance — 2.5% | | | | | | | | |
Chubb Ltd. (Switzerland) | | | 15,715 | | | | 2,076,266 | |
MetLife, Inc. | | | 29,856 | | | | 1,608,940 | |
| | | | | | |
|
|
|
| | | | | | | | 3,685,206 | |
| | | | | | |
|
|
|
Internet & Direct Marketing Retail — 1.9% | | | | | | | | |
Amazon.com, Inc.(a) | | | 3,804 | | | | 2,852,505 | |
| | | | | | |
|
|
|
Internet Software & Services — 9.0% | | | | | | | | |
Alibaba Group Holding Ltd. (China), ADR(a) | | | 26,320 | | | | 2,311,159 | |
Alphabet, Inc. (Class A Stock)(a) | | | 4,678 | | | | 3,707,081 | |
Alphabet, Inc. (Class C Stock)(a) | | | 1,903 | | | | 1,468,773 | |
eBay, Inc.(a) | | | 45,285 | | | | 1,344,512 | |
Facebook, Inc. (Class A Stock)(a) | | | 19,997 | | | | 2,300,655 | |
Tencent Holdings Ltd. (China), ADR | | | 99,109 | | | | 2,400,420 | |
| | | | | | |
|
|
|
| | | | | | | | 13,532,600 | |
| | | | | | |
|
|
|
IT Services — 1.4% | | | | | | | | |
Mastercard, Inc. | | | 20,616 | | | | 2,128,602 | |
| | | | | | |
|
|
|
Media — 3.9% | | | | | | | | |
Charter Communications, Inc.(a) | | | 5,131 | | | | 1,477,318 | |
Comcast Corp. (Class A Stock) | | | 31,729 | | | | 2,190,887 | |
Liberty Global PLC (Series C) (United Kingdom)(a) | | | 17,119 | | | | 508,434 | |
Twenty-First Century Fox, Inc. (Class A Stock) | | | 27,965 | | | | 784,139 | |
Viacom, Inc. (Class B Stock) | | | 25,107 | | | | 881,256 | |
| | | | | | |
|
|
|
| | | | | | | | 5,842,034 | |
| | | | | | |
|
|
|
Oil, Gas & Consumable Fuels — 8.3% | | | | | | | | |
Anadarko Petroleum Corp. | | | 21,170 | | | | 1,476,184 | |
Chevron Corp. | | | 20,568 | | | | 2,420,854 | |
SEE NOTES TO FINANCIAL STATEMENTS.
FINANCIAL STATEMENTS OF VCA-10
December 31, 2016
| | | | | | | | |
| | |
COMMON STOCKS (continued) | | Shares
| | | Value
(Note 2)
| |
Oil, Gas & Consumable Fuels (continued) | |
EOG Resources, Inc. | | | 8,068 | | | $ | 815,675 | |
Hess Corp. | | | 20,639 | | | | 1,285,603 | |
Noble Energy, Inc. | | | 31,096 | | | | 1,183,514 | |
Occidental Petroleum Corp. | | | 23,542 | | | | 1,676,897 | |
Royal Dutch Shell PLC (Netherlands) (Class A Stock), ADR | | | 37,777 | | | | 2,054,313 | |
Suncor Energy, Inc. (Canada) | | | 49,278 | | | | 1,610,898 | |
| | | | | | |
|
|
|
| | | | | | | | 12,523,938 | |
| | | | | | |
|
|
|
Pharmaceuticals — 4.6% | | | | | | | | |
Allergan PLC(a) | | | 6,782 | | | | 1,424,288 | |
Eli Lilly & Co. | | | 11,459 | | | | 842,809 | |
Merck & Co., Inc. | | | 41,195 | | | | 2,425,150 | |
Pfizer, Inc. | | | 69,442 | | | | 2,255,476 | |
| | | | | | |
|
|
|
| | | | | | | | 6,947,723 | |
| | | | | | |
|
|
|
Road & Rail — 1.7% | | | | | | | | |
Ryder Systems, Inc. | | | 12,831 | | | | 955,140 | |
Union Pacific Corp. | | | 15,421 | | | | 1,598,849 | |
| | | | | | |
|
|
|
| | | | | | | | 2,553,989 | |
| | | | | | |
|
|
|
Semiconductors & Semiconductor Equipment — 4.6% | |
NVIDIA Corp. | | | 19,189 | | | | 2,048,234 | |
QUALCOMM, Inc. | | | 50,985 | | | | 3,324,222 | |
Texas Instruments, Inc. | | | 21,661 | | | | 1,580,603 | |
| | | | | | |
|
|
|
| | | | | | | | 6,953,059 | |
| | | | | | |
|
|
|
Software — 6.6% | | | | | | | | |
Adobe Systems, Inc.(a) | | | 20,377 | | | | 2,097,812 | |
Microsoft Corp. | | | 66,475 | | | | 4,130,756 | |
PTC, Inc.(a) | | | 35,284 | | | | 1,632,591 | |
salesforce.com, Inc.(a) | | | 28,803 | | | | 1,971,853 | |
| | | | | | |
|
|
|
| | | | | | | | 9,833,012 | |
| | | | | | |
|
|
|
Specialty Retail — 2.5% | | | | | | | | |
Industria de Diseno Textil SA (Spain) | | | 56,729 | | | | 1,936,383 | |
O’ Reilly Automotive, Inc.(a) | | | 6,307 | | | | 1,755,932 | |
| | | | | | |
|
|
|
| | | | | | | | 3,692,315 | |
| | | | | | |
|
|
|
Technology Hardware, Storage & Peripherals — 1.0% | |
Apple, Inc. | | | 12,400 | | | | 1,436,168 | |
| | | | | | |
|
|
|
Textiles, Apparel & Luxury Goods — 2.4% | |
adidas AG (Germany), ADR | | | 26,885 | | | | 2,111,817 | |
Coach, Inc. | | | 42,750 | | | | 1,497,105 | |
| | | | | | |
|
|
|
| | | | | | | | 3,608,922 | |
| | | | | | |
|
|
|
Wireless Telecommunication Services — 0.8% | |
Vodafone Group PLC (United Kingdom), ADR | | | 48,179 | | | | 1,177,013 | |
| | | | | | |
|
|
|
TOTAL COMMON STOCKS | | | | | | | | |
(cost $110,431,054) | | | | 147,493,506 | |
| | | | | | |
|
|
|
| | | | | | | | |
| | |
SHORT-TERM INVESTMENT — 1.7% | | Shares
| | | Value
(Note 2)
| |
AFFILIATED MUTUAL FUND | | | | | | | | |
Prudential Investment Portfolios 2 — Prudential Core Ultra Short Bond Fund
(cost $2,542,529)(b) (Note 4) | | | 2,542,529 | | | $ | 2,542,529 | |
| | | | | | |
|
|
|
TOTAL INVESTMENTS — 100.0% | | | | | | | | |
(cost $112,973,583) | | | | 150,036,035 | |
| | | | | | |
|
|
|
LIABILITIES LESS, OTHER ASSETS | | | | | | | | |
Dividends Receivable | | | | 193,669 | |
Tax Reclaim Receivable | | | | 33,618 | |
Payable for Securities Purchased | | | | (113,056 | ) |
Payable Pending Capital Transactions | | | | (122,633 | ) |
| | | | | | |
|
|
|
LIABILITIES IN EXCESS OF OTHER ASSETS | | | | (8,402 | ) |
| | | | | | |
|
|
|
NET ASSETS — 100% | | | $ | 150,027,633 | |
| | | | | | |
|
|
|
Net Assets, representing: | | | | | | | | |
Equity of Participants — | | | $ | 150,045,495 | |
Equity of The Prudential Insurance Company of America | | | | (17,862 | ) |
| | | | | | |
|
|
|
| | | | | | | $ | 150,027,633 | |
| | | | | | |
|
|
|
The following abbreviation is used in the annual report:
| | |
| ADR | | American Depositary Receipt |
| (a) | Non-income producing security. |
| (b) | Prudential Investments LLC, the Manager of the Account, also serves as Manager of the Prudential Investment Portfolios 2 — Prudential Core Ultra Short Bond Fund. |
SEE NOTES TO FINANCIAL STATEMENTS.
FINANCIAL STATEMENTS OF VCA-10
December 31, 2016
Various inputs are used in determining the value of the Account’s investments. These inputs are summarized in the three broad levels listed below.
| Level 1— | quoted prices generally in active markets for identical securities. |
| Level 2— | quoted prices for similar securities, interest rates and yield curves, prepayment speeds, foreign currency exchange rates, and other observable inputs. |
| Level 3— | unobservable inputs for securities valued in accordance with the Account’s Committee approved fair valuation procedures. |
The following is a summary of the inputs used as of December 31, 2016 in valuing such portfolio securities:
| | | | | | | | | | | | |
| | | Level 1
| | | Level 2
| | | Level 3
| |
Investments in Securities | |
Common Stocks | | | | | | | | | | | | |
Aerospace & Defense | | $ | 4,699,362 | | | $ | — | | | $ | — | |
Banks | | | 16,677,804 | | | | — | | | | — | |
Biotechnology | | | 6,430,097 | | | | — | | | | — | |
Capital Markets | | | 5,091,425 | | | | — | | | | — | |
Chemicals | | | 2,828,055 | | | | — | | | | — | |
Communications Equipment | | | 1,641,523 | | | | — | | | | — | |
Consumer Finance | | | 4,181,723 | | | | — | | | | — | |
Diversified Financial Services | | | 1,092,120 | | | | — | | | | — | |
Electric Utilities | | | 3,621,296 | | | | — | | | | — | |
Electrical Equipment | | | 1,395,338 | | | | — | | | | — | |
Electronic Equipment, Instruments & Components | | | 1,602,255 | | | | — | | | | — | |
Energy Equipment & Services | | | 2,245,871 | | | | — | | | | — | |
Equity Real Estate Investment Trust (REITs) | | | 1,291,938 | | | | — | | | | — | |
Food & Staples Retailing | | | 1,485,804 | | | | — | | | | — | |
Food Products | | | 3,493,203 | | | | — | | | | — | |
Health Care Equipment & Supplies | | | 1,345,625 | | | | — | | | | — | |
Health Care Providers & Services | | | 2,991,885 | | | | — | | | | — | |
Hotels, Restaurants & Leisure | | | 3,935,138 | | | | — | | | | — | |
Household Products | | | 2,352,979 | | | | — | | | | — | |
Industrial Conglomerates | | | 2,322,979 | | | | — | | | | — | |
Insurance | | | 3,685,206 | | | | — | | | | — | |
Internet & Direct Marketing Retail | | | 2,852,505 | | | | — | | | | — | |
Internet Software & Services | | | 13,532,600 | | | | — | | | | — | |
IT Services | | | 2,128,602 | | | | — | | | | — | |
Media | | | 5,842,034 | | | | — | | | | — | |
Oil, Gas & Consumable Fuels | | | 12,523,938 | | | | — | | | | — | |
Pharmaceuticals | | | 6,947,723 | | | | — | | | | — | |
Road & Rail | | | 2,553,989 | | | | — | | | | — | |
Semiconductors & Semiconductor Equipment | | | 6,953,059 | | | | — | | | | — | |
Software | | | 9,833,012 | | | | — | | | | — | |
Specialty Retail | | | 1,755,932 | | | | 1,936,383 | | | | — | |
Technology Hardware, Storage & Peripherals | | | 1,436,168 | | | | — | | | | — | |
Textiles, Apparel & Luxury Goods | | | 3,608,922 | | | | — | | | | — | |
Wireless Telecommunication Services | | | 1,177,013 | | | | — | | | | — | |
Affiliated Mutual Fund | | | 2,542,529 | | | | — | | | | — | |
| | |
|
|
| |
|
|
| |
|
|
|
Total | | $ | 148,099,652 | | | $ | 1,936,383 | | | $ | — | |
| | |
|
|
| |
|
|
| |
|
|
|
During the period, there were no transfers between Level 1 and Level 2 to report.
SEE NOTES TO FINANCIAL STATEMENTS.
FINANCIAL STATEMENTS OF VCA-10
December 31, 2016
The industry classification of investments and liabilities in excess of other assets shown as a percentage of net assets as of December 31, 2016 were as follows (Unaudited):
| | | | |
Banks | | | 11.1 | % |
Internet Software & Services | | | 9.0 | |
Oil, Gas & Consumable Fuels | | | 8.3 | |
Software | | | 6.6 | |
Semiconductors & Semiconductor Equipment | | | 4.6 | |
Pharmaceuticals | | | 4.6 | |
Biotechnology | | | 4.3 | |
Media | | | 3.9 | |
Capital Markets | | | 3.4 | |
Aerospace & Defense | | | 3.1 | |
Consumer Finance | | | 2.8 | |
Hotels, Restaurants & Leisure | | | 2.6 | |
Specialty Retail | | | 2.5 | |
Insurance | | | 2.5 | |
Textiles, Apparel & Luxury Goods | | | 2.4 | |
Electric Utilities | | | 2.4 | |
Food Products | | | 2.3 | |
Health Care Providers & Services | | | 2.0 | |
Internet & Direct Marketing Retail | | | 1.9 | |
Chemicals | | | 1.9 | |
| | | | |
Road & Rail | | | 1.7 | % |
Affiliated Mutual Fund | | | 1.7 | |
Household Products | | | 1.6 | |
Industrial Conglomerates | | | 1.5 | |
Energy Equipment & Services | | | 1.5 | |
IT Services | | | 1.4 | |
Communications Equipment | | | 1.1 | |
Electronic Equipment, Instruments & Components | | | 1.1 | |
Technology Hardware, Storage & Peripherals | | | 1.0 | |
Food & Staples Retailing | | | 1.0 | |
Electrical Equipment | | | 0.9 | |
Equity Real Estate Investment Trust (REITs) | | | 0.9 | |
Health Care Equipment & Supplies | | | 0.9 | |
Wireless Telecommunications Services | | | 0.8 | |
Diversified Financial Services | | | 0.7 | |
| | |
|
|
|
| | | | 100.0 | |
Liabilities in excess of other assets | | | — | * |
| | |
|
|
|
| | | | 100.0 | % |
| | |
|
|
|
SEE NOTES TO FINANCIAL STATEMENTS.
FINANCIAL STATEMENTS OF VCA-10
Year Ended December 31, 2016
| | | | |
| | | | |
INVESTMENT INCOME | | | | |
Unaffiliated Dividend Income (net of $15,276 foreign withholding tax) | | $ | 2,710,017 | |
Affiliated Dividend Income | | | 22,594 | |
Total Income | | | 2,732,611 | |
EXPENSES | | | | |
Fees Charged to Participants for Investment Management Services | | | (374,578 | ) |
Fees Charged to Participants for Administrative Expenses: | | | | |
Standard Contract | | | (1,009,026 | ) |
0.50% Contract | | | (8,778 | ) |
0.45% Contract | | | (18,513 | ) |
Total Expenses | | | (1,410,895 | ) |
NET INVESTMENT INCOME | | | 1,321,716 | |
REALIZED AND UNREALIZED GAIN (LOSS) ON INVESTMENT AND FOREIGN CURRENCY TRANSACTIONS | | | | |
Net Realized Gain (Loss) on: | | | | |
Investment Transactions | | | 4,634,082 | |
Foreign Currency Transactions | | | (1,779 | ) |
| | | | 4,632,303 | |
Net Change in Unrealized Appreciation (Depreciation) on Investments | | | 2,703,381 | |
NET GAIN ON INVESTMENT AND FOREIGN CURRENCY TRANSACTIONS | | | 7,335,684 | |
NET INCREASE IN NET ASSETS RESULTING FROM OPERATIONS | | $ | 8,657,400 | |
| | | | | | |
| | | STATEMENT OF CHANGES IN NET ASSETS | | |
| | | | | | | | |
| | | Year Ended December 31,
| |
| | | 2016 | | | 2015 | |
OPERATIONS | | | | | | | | |
Net Investment Income | | $ | 1,321,716 | | | $ | 1,046,235 | |
Net Realized Gain on Investment and Foreign Currency Transactions | | | 4,632,303 | | | | 7,365,457 | |
Net Change In Unrealized Appreciation (Depreciation) on Investments | | | 2,703,381 | | | | (11,020,024 | ) |
NET INCREASE (DECREASE) IN NET ASSETS RESULTING FROM OPERATIONS | | | 8,657,400 | | | | (2,608,332 | ) |
CAPITAL TRANSACTIONS | | | | | | | | |
Purchase Payments and Transfers In | | | 1,076,649 | | | | 1,785,014 | |
Withdrawals and Transfers Out | | | (17,277,918 | ) | | | (19,074,873 | ) |
NET DECREASE IN NET ASSETS RESULTING FROM CAPITAL TRANSACTIONS | | | (16,201,269 | ) | | | (17,289,859 | ) |
NET INCREASE (DECREASE) IN NET ASSETS RESULTING FROM SURPLUS TRANSFERS | | | 4,298 | | | | (2,870 | ) |
TOTAL DECREASE IN NET ASSETS | | | (7,539,571 | ) | | | (19,901,061 | ) |
NET ASSETS | | | | | | | | |
Beginning of year | | | 157,567,204 | | | | 177,468,265 | |
End of year | | $ | 150,027,633 | | | $ | 157,567,204 | |
Accumulation Unit Values and Equity of Participants as of December 31, 2016
| | | | |
Standard Contract: | | | | |
Accumulation Unit Value and Equity of Participants, $137,067,345 / 8,605,567 Accumulation Units | | $ | 15.9278 | |
| | |
|
|
|
| |
0.50% Contract: | | | | |
Accumulation Unit Value and Equity of Participants, $3,748,289 / 212,438 Accumulation Units | | $ | 17.6442 | |
| | |
|
|
|
| |
0.45% Contract: | | | | |
Accumulation Unit Value and Equity of Participants, $9,229,861 / 521,571 Accumulation Units | | $ | 17.6963 | |
| | |
|
|
|
SEE NOTES TO FINANCIAL STATEMENTS.
FINANCIAL HIGHLIGHTS FOR VCA-10
| | | | | | |
| | | INCOME AND CAPITAL CHANGES PER ACCUMULATION UNIT* | | |
(For an Accumulation Unit outstanding throughout the year)
| | | | | | | | | | | | | | | | | | | | | | | | |
| | | Year Ended December 31, 2016
| | | Year Ended December 31, 2015
| |
| | | Standard
Contract | | | 0.50%
Contract | | | 0.45%
Contract | | | Standard
Contract | | | 0.50%
Contract | | | 0.45%
Contract | |
Investment Income | | $ | .2736 | | | $ | .3019 | | | $ | .3027 | | | $ | .2397 | | | $ | .2631 | | | $ | .2637 | |
Expenses | | | | | | | | | | | | | | | | | | | | | | | | |
Investment management fee | | | (.0369 | ) | | | (.0407 | ) | | | (.0408 | ) | | | (.0384 | ) | | | (.0422 | ) | | | (.0423 | ) |
Administrative expenses | | | (.1103 | ) | | | (.0407 | ) | | | (.0327 | ) | | | (.1149 | ) | | | (.0422 | ) | | | (.0339 | ) |
Net Investment Income | | | .1264 | | | | .2205 | | | | .2292 | | | | .0864 | | | | .1787 | | | | .1875 | |
Capital Changes | | | | | | | | | | | | | | | | |
Net realized and unrealized gain (loss) on investment and foreign currency transactions | | | .8068 | | | | .8955 | | | | .8983 | | | | (.3479 | ) | | | (.3837 | ) | | | (.3847 | ) |
Net Increase (Decrease) in Accumulation Unit Value | | | .9332 | | | | 1.1160 | | | | 1.1275 | | | | (.2615 | ) | | | (.2050 | ) | | | (.1972 | ) |
Accumulation Unit Value | | | | | | | | | | | | | | | | |
Beginning of year | | | 14.9946 | | | | 16.5282 | | | | 16.5688 | | | | 15.2561 | | | | 16.7332 | | | | 16.7660 | |
End of year | | $ | 15.9278 | | | $ | 17.6442 | | | $ | 17.6963 | | | $ | 14.9946 | | | $ | 16.5282 | | | $ | 16.5688 | |
Total Return** | | | 6.22 | % | | | 6.75 | % | | | 6.80 | % | | | (1.71 | %) | | | (1.23 | %) | | | (1.18 | %) |
Ratio of Expenses To Average Net Assets*** | | | 1.00 | % | | | .50 | % | | | .45 | % | | | 1.00 | % | | | .50 | % | | | .45 | % |
Ratio of Net Investment Income To Average Net Assets*** | | | .85 | % | | | 1.34 | % | | | 1.39 | % | | | .57 | % | | | 1.06 | % | | | 1.11 | % |
Portfolio Turnover Rate | | | 42 | % | | | 42 | % | | | 42 | % | | | 47 | % | | | 47 | % | | | 47 | % |
Number of Accumulation Units Outstanding
For Participants at end of year (000’s omitted) | | | 8,606 | | | | 212 | | | | 522 | | | | 9,595 | | | | 219 | | | | 609 | |
| * | Calculated by accumulating the actual per unit amounts daily. |
| ** | Total return does not consider the effects of sales loads. Total return is calculated assuming a purchase of a share on the first day and a sale on the last day of each year reported. Total returns may reflect adjustments to conform to generally accepted accounting principles. |
| *** | These calculations exclude PICA’s equity in VCA-10. |
The above table does not reflect the annual administration charge, which does not affect the Accumulation Unit Value. This charge is made by reducing Participants’ Accumulation Accounts by a number of Accumulation Units equal in value to the charge.
SEE NOTES TO FINANCIAL STATEMENTS.
FINANCIAL HIGHLIGHTS FOR VCA-10
| | | | | | |
| | | INCOME AND CAPITAL CHANGES PER ACCUMULATION UNIT* | | |
(For an Accumulation Unit outstanding throughout the year)
| | | | | | | | | | | | | | | | | | | | | | | | |
| | | Year Ended December 31, 2014
| | | Year Ended December 31, 2013
| |
| | | Standard
Contract | | | 0.50%
Contract | | | 0.45%
Contract | | | Standard
Contract | | | 0.50%
Contract | | | 0.45%
Contract | |
Investment Income | | $ | .1871 | | | $ | .2046 | | | $ | .2049 | | | $ | .1792 | | �� | $ | .1950 | | | $ | .1952 | |
Expenses | | | | | | | | | | | | | | | | | | | | | | | | |
Investment management fee | | | (.0362 | ) | | | (.0397 | ) | | | (.0398 | ) | | | (.0303 | ) | | | (.0330 | ) | | | (.0330 | ) |
Administrative expenses | | | (.1086 | ) | | | (.0397 | ) | | | (.0318 | ) | | | (.0906 | ) | | | (.0330 | ) | | | (.0264 | ) |
Net Investment Income | | | .0423 | | | | .1252 | | | | .1333 | | | | .0583 | | | | .1290 | | | | .1358 | |
Capital Changes | | | | | | | | | | | | | | | | | | | | | | | | |
Net realized and unrealized gain (loss) on investment and foreign currency transactions | | | 1.4515 | | | | 1.5879 | | | | 1.5907 | | | | 3.1834 | | | | 3.4658 | | | | 3.4700 | |
Net Increase (Decrease) in Accumulation Unit Value | | | 1.4938 | | | | 1.7131 | | | | 1.7240 | | | | 3.2417 | | | | 3.5948 | | | | 3.6058 | |
Accumulation Unit Value | | | | | | | | | | | | | | | | | | | | | | | | |
Beginning of year | | | 13.7623 | | | | 15.0201 | | | | 15.0420 | | | | 10.5206 | | | | 11.4253 | | | | 11.4362 | |
End of year | | $ | 15.2561 | | | $ | 16.7332 | | | $ | 16.7660 | | | $ | 13.7623 | | | $ | 15.0201 | | | $ | 15.0420 | |
Total Return** | | | 10.85 | % | | | 11.41 | % | | | 11.46 | % | | | 30.81 | % | | | 31.46 | % | | | 31.53 | % |
Ratio of Expenses To Average Net Assets*** | | | 1.00 | % | | | .50 | % | | | .45 | % | | | 1.00 | % | | | .50 | % | | | .45 | % |
Ratio of Net Investment Income To Average Net Assets*** | | | .29 | % | | | .78 | % | | | .83 | % | | | .48 | % | | | .98 | % | | | 1.03 | % |
Portfolio Turnover Rate | | | 70 | % | | | 70 | % | | | 70 | % | | | 69 | % | | | 69 | % | | | 69 | % |
Number of Accumulation Units Outstanding
For Participants at end of year (000’s omitted) | | | 10,646 | | | | 242 | | | | 657 | | | | 11,720 | | | | 224 | | | | 751 | |
| * | Calculated by accumulating the actual per unit amounts daily. |
| ** | Total return does not consider the effects of sales loads. Total return is calculated assuming a purchase of a share on the first day and a sale on the last day of each year reported. Total returns may reflect adjustments to conform to generally accepted accounting principles. |
| *** | These calculations exclude PICA’s equity in VCA-10. |
The above table does not reflect the annual administration charge, which does not affect the Accumulation Unit Value. This charge is made by reducing Participants’ Accumulation Accounts by a number of Accumulation Units equal in value to the charge.
SEE NOTES TO FINANCIAL STATEMENTS.
FINANCIAL HIGHLIGHTS FOR VCA-10
| | | | | | |
| | | INCOME AND CAPITAL CHANGES PER ACCUMULATION UNIT* | | |
(For an Accumulation Unit outstanding throughout the year)
| | | | | | | | | | | | |
| | | Year Ended December 31, 2012
| |
| | | Standard
Contract | | | 0.50%
Contract | | | 0.45%
Contract | |
Investment Income | | $ | .1825 | | | $ | .1975 | | | $ | .1976 | |
Expenses | | | | | | | | | | | | |
Investment management fee | | | (.0251 | ) | | | (.0272 | ) | | | (.0272 | ) |
Administrative expenses | | | (.0752 | ) | | | (.0272 | ) | | | (.0218 | ) |
Net Investment Income | | | .0822 | | | | .1431 | | | | .1486 | |
Capital Changes | | | | | | | | | | | | |
Net realized and unrealized gain (loss) on investment and foreign currency transactions | | | 1.0786 | | | | 1.1677 | | | | 1.1686 | |
Net Increase (Decrease) in Accumulation Unit Value | | | 1.1608 | | | | 1.3108 | | | | 1.3172 | |
Accumulation Unit Value | | | | | | | | | | | | |
Beginning of year | | | 9.3598 | | | | 10.1145 | | | | 10.1190 | |
End of year | | $ | 10.5206 | | | $ | 11.4253 | | | $ | 11.4362 | |
Total Return** | | | 12.40 | % | | | 12.96 | % | | | 13.02 | % |
Ratio of Expenses To Average Net Assets*** | | | 1.00 | % | | | .50 | % | | | .45 | % |
Ratio of Net Investment Income To Average Net Assets*** | | | .82 | % | | | 1.32 | % | | | 1.37 | % |
Portfolio Turnover Rate | | | 44 | % | | | 44 | % | | | 44 | % |
Number of Accumulation Units Outstanding
For Participants at end of year (000’s omitted) | | | 13,204 | | | | 205 | | | | 891 | |
| * | Calculated by accumulating the actual per unit amounts daily. |
| ** | Total return does not consider the effects of sales loads. Total return is calculated assuming a purchase of a share on the first day and a sale on the last day of each year reported. Total returns may reflect adjustments to conform to generally accepted accounting principles. |
| *** | These calculations exclude PICA’s equity in VCA-10. |
The above table does not reflect the annual administration charge, which does not affect the Accumulation Unit Value. This charge is made by reducing Participants’ Accumulation Accounts by a number of Accumulation Units equal in value to the charge.
SEE NOTES TO FINANCIAL STATEMENTS.
NOTES TO THE FINANCIAL STATEMENTS OF
VCA-10
The Prudential Variable Contract Account-10 (“VCA-10” or the “Account”) was established on March 1, 1982 by The Prudential Insurance Company of America (“PICA”) under the laws of the State of New Jersey and is registered as an open-end, diversified management investment company under the Investment Company Act of 1940 (“1940 Act”), as amended. VCA-10 has been designed for use by employers (“Contract-holders”) in making retirement arrangements on behalf of their employees (“Participants”). The investment objective of the Account is long-term growth of capital. The Account’s investments are composed primarily of common stocks. Although variable annuity payments differ according to the investment performance of the Account, they are not affected by mortality or expense experience because PICA assumes the expense risk and the mortality risk under the contracts.
PICA issues standard VCA-10 contracts (the “Standard Contracts”), with total annual expenses of 1.00% (as a percentage of net assets). It also issues contracts with lower administrative expenses where warranted by economies of scale and the expense characteristics of the Contract-holder’s retirement arrangement. Prior to January 1, 2011, PICA issued standard contracts and contracts with annual expenses of 0.50% (as a percentage of net assets) (the “0.50% contracts”). The Accumulation Units Values were previously shown on a combined basis. During 2011, PICA issued VCA-10 contract with annual expenses of 0.45% (as a percentage of net assets) (the “0.45% contracts”). The financial statements now show separate Accumulation Units Values for each type of contract.
| Note 2: | | Accounting Policies |
The Account follows investment company accounting and reporting guidance of the Financial Accounting Standards Board (“FASB”) Accounting Standard Codification Topic 946 Financial Services-Investment Companies. The following accounting policies conform to U.S. generally accepted accounting principles. The Account consistently follows such policies in the preparation of its financial statements.
Securities Valuation: The Account holds securities and other assets that are fair valued at the close of each day (generally, 4:00 PM Eastern time) the New York Stock Exchange (“NYSE”) is open for trading. Fair value is the price that would be received to sell an asset or paid to transfer a liability in an orderly transaction between market participants on the measurement date. The Account’s Committee Members (the “Committee”) has adopted Valuation Procedures for security valuation under which fair valuation responsibilities have been delegated to Prudential Investments LLC (“PI” or “Manager”). Under the current Valuation Procedures, the established Valuation Committee is responsible for supervising the valuation of portfolio securities and other assets. The Valuation Procedures permit the Account to utilize independent pricing vendor services, quotations from market makers, and alternative valuation methods when market quotations are either not readily available or not deemed representative of fair value. A record of the Valuation Committee’s actions is subject to the Committee’s review, approval, and ratification at its next regularly-scheduled quarterly meeting.
Various inputs determine how the Account’s investments are valued, all of which are categorized according to the three broad levels (Level 1, 2, or 3) detailed in the table following the Account’s Statement of Net Assets.
Common and preferred stocks, exchange-traded funds, and derivative instruments such as futures or options that are traded on a national securities exchange are valued at the last sale price as of the close of trading on the applicable exchange where the security principally trades. Securities traded via NASDAQ are valued at the NASDAQ official closing price. To the extent these securities are valued at the last sale price or NASDAQ official closing price, they are classified as Level 1 in the fair value hierarchy.
In the event that no sale or official closing price on valuation date exists, these securities are generally valued at the mean between the last reported bid and ask prices, or at the last bid price in the absence of an ask price. These securities are classified as Level 2 in the fair value hierarchy.
Common and preferred stocks traded on foreign securities exchanges are valued using pricing vendor services that provide model prices derived using adjustment factors based on information such as local closing price, relevant general and sector indices, currency fluctuations, depositary receipts, and futures, as applicable. Securities valued using such model prices are classified as Level 2 in the fair value hierarchy. The models generate an evaluated adjustment factor for each security, which can be applied to the local closing
price to adjust it for post closing market movements. Utilizing that evaluated adjustment factor, the vendor provides an evaluated price for each security. If the vendor does not provide an evaluated price, securities are valued in accordance with exchange-traded common and preferred stocks discussed above.
Participatory notes (“P-notes”) are generally valued based upon the value of a related underlying security that trades actively in the market and are classified as Level 2 in the fair value hierarchy.
Investments in open-end, non-exchange-traded mutual funds are valued at their net asset values as of the close of the NYSE on the date of valuation. These securities are classified as Level 1 in the fair value hierarchy since they may be purchased or sold at their net asset values on the date of valuation.
Account securities and other assets that cannot be priced according to the methods described above are valued based on pricing methodologies approved by the Committee. In the event that unobservable inputs are used when determining such valuations, the securities will be classified as Level 3 in the fair value hierarchy.
When determining the fair value of securities, some of the factors influencing the valuation include: the nature of any restrictions on disposition of the securities; assessment of the general liquidity of the securities; the issuer’s financial condition and the markets in which it does business; the cost of the investment; the size of the holding and the capitalization of the issuer; the prices of any recent transactions or bids/offers for such securities or any comparable securities; any available analyst media or other reports or information deemed reliable by the investment adviser regarding the issuer or the markets or industry in which it operates. Using fair value to price securities may result in a value that is different from a security’s most recent closing price and from the price used by other mutual funds to calculate their net asset values.
Rights: The Account may hold rights acquired either through a direct purchase, including as part of private placement, or pursuant to corporate actions. Rights entitle the holder to buy a proportionate amount of common stock at a specific price and time through the expiration dates. Such rights are held as long positions by the Account until exercised, sold or expired. Rights are valued at fair value in accordance with the Committee Members’ approved fair valuation procedures.
Restricted and Illiquid Securities: Subject to guidelines adopted by the Committee, the Account may invest up to 15% of its net assets in illiquid securities, including those which are restricted as to disposition under securities law (“restricted securities”). Restricted securities are valued pursuant to the valuation procedures noted above. Illiquid securities are those that, because of the absence of a readily available market or due to legal or contractual restrictions on resale, cannot be sold within seven days in the ordinary course of business at approximately the amount at which the Account has valued the investment. Therefore, the Account may find it difficult to sell illiquid securities at the time considered most advantageous by its subadviser and may incur expenses that would not be incurred in the sale of securities that were freely marketable. Certain securities that would otherwise be considered illiquid because of legal restrictions on resale to the general public may be traded among qualified institutional buyers under Rule 144A of the Securities Act of 1933. These Rule 144A securities, as well as commercial paper that is sold in private placements under Section 4(2) of the Securities Act, may be deemed liquid by the Account’s subadviser under the guidelines adopted by the Committee Members of the Account. However, the liquidity of the Account’s investments in Rule 144A securities could be impaired if trading does not develop or declines.
Foreign Currency Translation: The books and records of the Account are maintained in U.S. dollars. Foreign currency amounts are translated into U.S. dollars on the following basis:
(i) market value of investment securities, other assets and liabilities — at the current rates of exchange;
(ii) purchases and sales of investment securities, income and expenses — at the rates of exchange prevailing on the respective dates of such transactions.
Although the net assets of the Account are presented at the foreign exchange rates and market values at the close of the period, the Account does not generally isolate that portion of the results of operations arising as a result of changes in the foreign exchange rates from the fluctuations arising from changes in the market prices of long-term portfolio securities held at the end of the period. Similarly, the Account does not isolate the effect of changes in foreign exchange rates from the fluctuations arising from changes in the market prices of long-term portfolio securities sold during the period. Accordingly, holding period realized foreign currency gains (losses) are included in the reported net realized gains (losses) on investment transactions. Notwithstanding the above, the Account does isolate the effect of fluctuations in foreign currency exchange rates when determining the gain (loss) upon the sale or maturity of foreign currency denominated debt obligations; such amounts are included in net realized gains (losses) on foreign currency transactions.
Additionally net realized gains (losses) on foreign currency transactions represent net foreign exchange gains (losses) from holdings of foreign currencies, currency gains (losses) realized between the trade and settlement dates on securities transactions, and the difference between the amounts of interest, dividends and foreign withholding taxes recorded on the Account’s books and the U.S. dollar equivalent amounts actually received or paid. Net unrealized currency gains (losses) from valuing foreign currency denominated assets and liabilities (other than investments) at period end exchange rates are reflected as a component of net unrealized appreciation (depreciation) on foreign currencies.
Concentration of Risk: Foreign security and currency transactions may involve certain considerations and risks not typically associated with those of domestic origin as a result of, among other factors, the possibility of political and economic instability or the level of governmental supervision and regulation of foreign securities markets.
Securities Transactions and Net Investment Income: Securities transactions are recorded on the trade date. Realized gains (losses) from investment and currency transactions are calculated on the specific identification method. Dividend income is recorded on the ex-dividend date. Interest income, including amortization of premium and accretion of discount on debt securities, as required, is recorded on the accrual basis. Expenses are recorded on the accrual basis, which may require the use of certain estimates by management that may differ from actual. Net investment income and realized and unrealized gain (losses) (other than administrative fees) are allocated to the Participants and PICA on a daily basis in proportion to their respective ownership in VCA-10.
Estimates: The preparation of the financial statements requires management to make estimates and assumptions that affect the reported amounts and disclosures in the financial statements. Actual results could differ from those estimates.
Federal Income Taxes: The operations of VCA-10 are part of, and are taxed with, the operations of PICA. Under the current provisions of the Internal Revenue Code, PICA does not expect to incur federal income taxes on earnings of VCA-10 to the extent the earnings are credited under the Contracts. As a result, the Unit Value of VCA-10 has not been reduced by federal income taxes.
| Note 3: | | Investment Management Agreement and Charges |
The Account has a management agreement with PI. Pursuant to this agreement, PI has responsibility for all investment advisory services and supervises the subadviser’s performance of such services. PI has entered into a subadvisory agreement with Jennison Associates LLC (“Jennison”). The subadvisory agreement provides that Jennison will furnish investment advisory services in connection with the management of the Account. PI pays for the services of Jennison.
VCA-10 is subject to fees for investment management and administration services. PICA may impose a reduced Administrative Fee where warranted by economies of scale and the expense characteristics of the employer, association or trust to which Prudential has issued a Contract.
Standard contracts have an effective annual rate of up to 1.00% of the current value of the Participant’s equity of which 0.75% is paid to PICA for administrative expenses not provided by the annual account charge, and 0.25% is paid to PI, for investment management services. The 0.50% contracts have an effective annual rate of up to 0.50% of the current value of the Participant’s equity of which 0.25% is paid to PICA for administrative expenses not provided by the annual account charge, and 0.25% is paid to PI, is for investment management services. The 0.45% contracts have an effective annual rate of up to 0.45% of the current value of the Participant’s equity of which 0.20% is paid to PICA for administrative expenses not provided by the annual account charge, and 0.25% is paid to PI, for investment management services.
PICA, PI and Jennison are indirect, wholly-owned subsidiaries of Prudential Financial, Inc. (“Prudential”).
An annual account charge of not more than $30 is deducted from the account of each Participant, if applicable, at the time of withdrawal of the value of all of the Participant’s accounts or at the year ended by cancelling Units.
| Note 4: | | Other Transactions with Affiliates |
The Account may enter into certain securities purchase or sale transactions under Board approved Rule 17a-7 procedures. Rule 17a-7 is an exemptive rule under the 1940 Act, that permits purchase and sale transactions among affiliated investment companies, or between an investment company and a person
that is affiliated solely by reason of having a common (or affiliated) investment adviser, common directors, and/or common officers. Such transactions are subject to ratification by the Account’s Committee.
For the year ended December 31, 2016, the Account invested in the Prudential Core Ultra Short Bond Fund (the “Core Fund”), a portfolio of the Prudential Investment Portfolios 2, registered under the 1940 Act, and managed by PI. Earnings from the Core Fund are disclosed on the Statement of Operations as affiliated dividend income.
| Note 5: | | Purchases and Sales of Portfolio Securities |
For the year ended December 31, 2016, the aggregate cost of purchases and the proceeds from sales of securities, excluding short-term investments, were $60,273,308 and $71,966,295, respectively.
| Note 6: | | Unit Transactions |
The number of Accumulation Units issued and redeemed for the year ended December 31, 2016 and the year ended December 31, 2015, respectively, are as follows:
| | | | | | | | |
Standard Contracts
| | Units
| | | Amount
| |
Year ended December 31, 2016: | | | | | | | | |
Account units issued | | | 73,142 | | | $ | 1,076,402 | |
Account units redeemed | | | (1,062,336 | ) | | | (15,742,006 | ) |
| | |
|
|
| |
|
|
|
Net increase (decrease) in units outstanding | | | (989,194 | ) | | $ | (14,665,604 | ) |
| | |
|
|
| |
|
|
|
Year ended December 31, 2015: | | | | | | | | |
Account units issued | | | 107,010 | | | $ | 1,648,237 | |
Account units redeemed | | | (1,158,432 | ) | | | (17,720,977 | ) |
| | |
|
|
| |
|
|
|
Net increase (decrease) in units outstanding | | | (1,051,422 | ) | | $ | (16,072,740 | ) |
| | |
|
|
| |
|
|
|
| | |
0.50 % Contracts
| | Units
| | | Amount
| |
Year ended December 31, 2016: | | | | | | | | |
Account units issued | | | 15 | | | $ | 247 | |
Account units redeemed | | | (6,770 | ) | | | (109,172 | ) |
| | |
|
|
| |
|
|
|
Net increase (decrease) in units outstanding | | | (6,755 | ) | | $ | (108,925 | ) |
| | |
|
|
| |
|
|
|
Year ended December 31, 2015: | | | | | | | | |
Account units issued | | | 8,078 | | | $ | 136,777 | |
Account units redeemed | | | (31,049 | ) | | | (527,491 | ) |
| | |
|
|
| |
|
|
|
Net increase (decrease) in units outstanding | | | (22,971 | ) | | $ | (390,714 | ) |
| | |
|
|
| |
|
|
|
| | |
0.45 % Contracts
| | Units
| | | Amount
| |
Year ended December 31, 2016: | | | | | | | | |
Account units issued | | | — | | | $ | — | |
Account units redeemed | | | (87,732 | ) | | | (1,426,740 | ) |
| | |
|
|
| |
|
|
|
Net increase (decrease) in units outstanding | | | (87,732 | ) | | $ | (1,426,740 | ) |
| | |
|
|
| |
|
|
|
Year ended December 31, 2015: | | | | | | | | |
Account units issued | | | — | | | $ | — | |
Account units redeemed | | | (47,645 | ) | | | (804,689 | ) |
| | |
|
|
| |
|
|
|
Net increase (decrease) in units outstanding | | | (47,645 | ) | | $ | (804,689 | ) |
| | |
|
|
| |
|
|
|
| Note 7: | | Net Increase (Decrease) In Net Assets Resulting From Surplus Transfers |
The increase (decrease) in net assets resulting from surplus transfers represents the net increase to/(reductions from) PICA’s investment in the Account. This increase (decrease) includes reserve adjustments for mortality and expense risks assumed by PICA.
| Note 8: | | Participant Loans |
Loans are considered to be withdrawals from the Account from which the loan amount was deducted, though they are not considered a withdrawal from the MEDLEY Program. Withdrawals, transfers and loans from VCA-10 are considered to be withdrawals of contributions until all of the Participant’s contributions to the Account have been withdrawn, transferred or borrowed.
For the year ended December 31, 2016, $85,662 in participant loans were withdrawn from VCA-10 and $80,871 of principal and interest was repaid to VCA-10. For the year ended December 31, 2015, $100,361 in participant loans were withdrawn from VCA-10 and $172,795 of principal and interest was repaid to VCA-10. Loan repayments are invested in Participant’s account(s) as chosen by the Participant, which may not necessarily be VCA-10. The initial loan proceeds which are being repaid may not necessarily have originated solely from VCA-10. During the year ended December 31, 2016, PICA has advised the Account that it received $674 in loan origination fees. The participant loan principal and interest repayments are included in Purchase Payments and Transfers In within the Statement of Changes in Net Assets.
| Note 9: | | Recent Accounting Pronouncements and Reporting Updates |
In December 2016, the FASB released an Accounting Standards Update (“ASU”) that makes technical changes to various sections of the Accounting Standards Codification (“ASC”), including Topic 820, Fair Value Measurement. The changes to Topic 820 are intended to clarify the difference between a valuation approach and a valuation technique. The changes to ASC 820-10-50-2 require a reporting entity to disclose, for Level 2 and Level 3 fair value measurements, a change in either or both a valuation approach and a valuation technique and the reason(s) for the change. The changes to Topic 820 are effective for fiscal years, and interim periods within those fiscal years, beginning after December 15, 2016. At this time, management is evaluating the implications of the ASU and its impact on the financial statements and disclosures has not yet been determined.
On October 13, 2016, the Securities and Exchange Commission (the “SEC”) adopted new rules and forms and amended existing rules and forms which are intended to modernize and enhance the reporting and disclosure of information by registered investment companies and to improve the quality of information that funds provide to investors, including modifications to Regulation S-X which would require standardized, enhanced disclosure about derivatives in investment company financial statements. The new rules also enhance disclosure regarding fund liquidity and redemption practices. Also under the new rules, the SEC will permit open-end funds, with the exception of money market funds, to offer swing pricing, subject to board approval and review. The compliance dates of the modifications to Regulation S-X are August 1, 2017 and other amendments and rules are generally June 1, 2018 and December 1, 2018. Management is currently evaluating the impacts to the financial statement disclosures, if any.
REPORT OF INDEPENDENT REGISTERED PUBLIC ACCOUNTING FIRM
THE COMMITTEE AND PARTICIPANTS OF
THE PRUDENTIAL VARIABLE CONTRACT ACCOUNT-10:
We have audited the accompanying statement of net assets of The Prudential Variable Contract Account-10 (the “Account”) as of December 31, 2016, and the related statement of operations for the year then ended, the statements of changes in net assets for each of the years in the two-year period then ended, and the financial highlights for each of the years in the five-year period then ended. These financial statements and financial highlights are the responsibility of the Account’s management. Our responsibility is to express an opinion on these financial statements and financial highlights based on our audits.
We conducted our audits in accordance with the standards of the Public Company Accounting Oversight Board (United States). Those standards require that we plan and perform the audit to obtain reasonable assurance about whether the financial statements and financial highlights are free of material misstatement. An audit includes examining, on a test basis, evidence supporting the amounts and disclosures in the financial statements. Our procedures included confirmation of securities owned as of December 31, 2016, by correspondence with the custodian and brokers or by other appropriate auditing procedures where replies from brokers were not received. An audit also includes assessing the accounting principles used and significant estimates made by management, as well as evaluating the overall financial statement presentation. We believe that our audits provide a reasonable basis for our opinion.
In our opinion, the financial statements and financial highlights referred to above present fairly, in all material respects, the financial position of the Account as of December 31, 2016, the results of its operations for the year then ended, the changes in its net assets for each of the years in the two-year period then ended and the financial highlights for each of the years in the five-year period then ended, in conformity with U.S. generally accepted accounting principles.
New York, New York
February 16, 2017
| | |
| The Prudential MEDLEY Program — VCA-11 | | December 31, 2016 |
Report of the Investment Manager - As of December 31, 2016 (Unaudited)
| | | | | | | | | | | | | | | | | | | | |
Average Annual
Total Returns | | 7-Day Current Net Yield | | | 1-Year | | | 5-Year | | | 10-Year | | | Since
Inception | |
VCA-11
Money Market
Account1—
Standard
Contract | | | -0.20 | % | | | -0.38 | % | | | -0.71 | % | | | 0.11 | | | | — | |
VCA-11
Money Market
Account1—
0.50% Contract | | | 0.30 | | | | 0.12 | | | | -0.22 | | | | 0.60 | | | | — | |
VCA-11
Money Market
Account1—
0.45% Contract | | | 0.35 | | | | 0.17 | | | | -0.17 | | | | — | | | | -0.18 | % |
Citigroup
3-Month
Treasury
Bill Index | | | — | | | | 0.27 | | | | 0.09 | | | | 0.73 | | | | 0.09 | |
Past performance does not guarantee future returns. Account performance is net of investment fees and fund expenses. The investment return and principal value of an investment will fluctuate, so that an investor’s shares, when redeemed, may be worth more or less than their original cost. Current performance may be lower or higher than the past performance data quoted.
The yield quotation more closely reflects the current earnings of the Account than the total return quotation. 0.45% contract inception: 4/1/2011. Unless noted otherwise, Index since inception returns reflect performance beginning the closest month-end date to the Account’s inception of the 0.45% contract.
VCA-11
ONE-YEAR TOTAL RETURN FOR THE
PAST 10 YEARS2
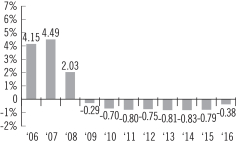
For the year ended December 31, 2016, the value of the standard contract for the Prudential Variable Contract Account 11 (“VCA-11” or the “Account”) returned -0.38%, the value of a contract with annual expenses of 0.50% returned 0.12%, and the value of a contract with annual expenses of 0.45% returned 0.17%.
The Account’s investment objective is to seek high current income and maintain high levels of liquidity. The Account is subadvised by PGIM Fixed Income.
What were market conditions during the reporting period?
2016 was a turbulent year, marked by a sharp sell-off in equities and other riskier asset classes during the first quarter, the UK’s vote to leave the European Union (commonly known as Brexit), continued geopolitical risk worldwide, and the election of Donald Trump as US president.
After raising the targeted fed funds rate in December 2015, the Federal Reserve eased its expected pace of 2016 rate hikes during the first quarter, citing uncertainty about the sustainability of US economic growth, as well as concerns about tightening US financial conditions and rising international vulnerabilities. Mid-year, as the negative interest rate policies and aggressive bond-buying programs of the Bank of Japan and the European Central Bank powered ahead, Japanese, German, and UK government bonds staged spectacular rallies, thanks in part to economic slowdown fears brought on by Brexit. US yields also fell, following the global trend of low short-term rates and based on some evidence of moderating US growth, which kept the Fed at bay. In December, the Fed raised the fed funds rate 0.25% to a range of between 0.50% and 0.75%. As the move was well communicated, the markets had priced in the rate hike ahead of the announcement.
What strategies or holdings affected the Account’s performance?
Early in the period, the Account maintained a weighted average maturity (WAM) in line with its peers. It kept its weighted average life longer than its peers through the addition of longer-maturity corporate and bank securities in anticipation of the SEC’s regulatory changes, which the subadviser believed would dampen yields on government paper. The Account maintained this strategy through the middle of the period as the peer group continued to increase liquidity ahead of the regulatory changes. In addition, as credit spreads widened, the Account added LIBOR-based floating rate paper. (Credit spreads are the amount of extra yield that corporate bonds provide over similar-duration Treasuries.)
Through the second half of the reporting period, the Account maintained a relatively longer WAM than its peers as money market funds continued to position themselves for the final implementation of SEC regulations in October. As credit spreads widened, the subadviser took advantage of the more attractive spreads and reduced the Account’s exposure to US government securities in favor of corporate bonds, particularly those issued by foreign corporations. As December approached, in advance of the widely anticipated fed funds rate hike, the subadviser shortened the Account’s WAM.
| 1 | The Account performance results are after the deduction of all expenses and contract charges, but not including the effect of any sales charges. The standard VCA-11 contract has total annual expenses (as a percentage of net assets) of 1.00%. Certain VCA-11 contracts include reduced administrative fees and have total annual expenses of either 0.50% or 0.45%. Performance of the VCA-11 contracts with reduced expenses will be higher than the performance of the standard VCA-11 contract. All total returns are for the periods indicated and are calculated based on changes in unit values. |
| 2 | The graph is based on the performance of the Standard Contract. Performance of the 0.50% Contract and the 0.45% Contract will be higher due to a lower fee structure. |
The Citigroup 3-Month Treasury Bill Index is an index whereby equal dollar amounts of three-month Treasury bills are purchased at the beginning of each of three consecutive months. As each bill matures, all proceeds are rolled over and reinvested in a new three-month bill. The income used to calculate the monthly return is derived by subtracting the original amount invested from the maturity value. Investors cannot invest directly in an index.
London Interbank Offered Rate (LIBOR). The LIBOR is an interest rate at which banks can borrow funds, in marketable size, from other banks in the London interbank market. The LIBOR is fixed on a daily basis by the British Bankers’ Association.
For current yields on the Money Market Account, please call (800) 458-6333. An investment in the Account is not insured or guaranteed by the Federal Deposit Insurance Corporation or any other government agency. It is possible to lose money by investing in the Account.
For a complete list of holdings, refer to the Statement of Net Assets section of this report.
2
FINANCIAL STATEMENTS OF VCA-11
December 31, 2016
| | | | | | | | |
SHORT-TERM
INVESTMENTS — 99.9% | | Principal
Amount
(000)#
| | | Value
(Note 2)
| |
Certificates of Deposit — 22.9% | | | | | | | | |
Bank of Montreal | | | | | | | | |
1.035%, 01/05/2017(b) | | $ | 234 | | | $ | 234,017 | |
1.284%, 03/10/2017(b) | | | 300 | | | | 300,327 | |
Bank of Tokyo-Mitsubishi UFJ Ltd. | | | | | | | | |
0.900%, 01/23/2017(a) | | | 600 | | | | 600,143 | |
Branch Banking and Trust Co. | | | | | | | | |
0.710%, 02/01/2017(a) | | | 600 | | | | 599,996 | |
Canadian Imperial Bank of Commerce | | | | | | | | |
1.237%, 02/09/2017(b) | | | 250 | | | | 250,148 | |
Citibank NA | | | | | | | | |
0.900%, 02/13/2017(a) | | | 250 | | | | 250,067 | |
1.100%, 05/01/2017(a) | | | 350 | | | | 349,949 | |
Credit Agricole Corporate | | | | | | | | |
1.280%, 01/17/2017(b) | | | 195 | | | | 195,063 | |
Nordea Bank Finland | | | | | | | | |
1.281%, 04/21/2017(b) | | | 250 | | | | 250,323 | |
Norinchukin Bank NY | | | | | | | | |
0.880%, 01/27/2017(a) | | | 250 | | | | 250,030 | |
Skandinaviska Enskilda Banken NY | | | | | | | | |
1.216%, 04/18/2017(b) | | | 300 | | | | 300,270 | |
State Street Bank & Trust Co. | | | | | | | | |
1.332%, 04/18/2017(b) | | | 300 | | | | 300,428 | |
Sumitomo Mitsui Banking Corp. | | | | | | | | |
0.860%, 01/26/2017(a) | | | 250 | | | | 250,043 | |
0.970%, 03/06/2017(a) | | | 300 | | | | 300,103 | |
Svenska Handelsbanken AB | | | | | | | | |
1.105%, 02/09/2017(b) | | | 300 | | | | 300,204 | |
Toronto-Dominion Bank (The) | | | | | | | | |
1.311%, 05/19/2017(b) | | | 200 | | | | 200,242 | |
Wells Fargo Bank NA | | | | | | | | |
1.010%, 01/18/2017(a) | | | 500 | | | | 500,107 | |
| | | | | | |
|
|
|
| | | | | | | | 5,431,460 | |
| | | | | | |
|
|
|
Commercial Paper — 45.6% | | | | | | | | |
ABN AMRO Funding USA LLC, 144A | | | | | | | | |
0.894%, 02/16/2017(a) | | | 300 | | | | 299,736 | |
Apple Inc., 144A | | | | | | | | |
0.700%, 02/07/2017(a) | | | 560 | | | | 559,679 | |
Caisse Centrale Desjardins du
Quebec, 144A | | | | | | | | |
0.884%, 01/04/2017(a) | | | 450 | | | | 449,957 | |
Cargill, Inc., 144A | | | | | | | | |
0.720%, 01/03/2017(a) | | | 500 | | | | 499,975 | |
CDP Financial, Inc., 144A | | | | | | | | |
0.832%, 02/17/2017(a) | | | 250 | | | | 249,785 | |
1.275%, 03/13/2017(a) | | | 300 | | | | 299,513 | |
Commonwealth Bank of Australia, 144A | | | | | | | | |
1.271%, 04/20/2017(b) | | | 250 | | | | 250,306 | |
CPPIB Capital, Inc., 144A | | | | | | | | |
0.711%, 01/19/2017(a) | | | 250 | | | | 249,927 | |
DNB Bank ASA, 144A | | | | | | | | |
1.284%, 04/26/2017(b) | | | 250 | | | | 250,321 | |
1.284%, 03/10/2017(b) | | | 300 | | | | 300,327 | |
General Electric Co. | | | | | | | | |
0.608%, 01/06/2017(a) | | | 500 | | | | 499,940 | |
| | | | | | | | |
SHORT-TERM INVESTMENTS
(continued) | | Principal
Amount
(000)#
| | | Value
(Note 2)
| |
Commercial Paper (continued) | | | | | | | | |
HSBC Bank PLC, 144A | | | | | | | | |
1.281%, 02/06/2017(b) | | $ | 200 | | | $ | 200,121 | |
ING US Funding LLC | | | | | | | | |
1.205%, 05/03/2017(b) | | | 300 | | | | 300,349 | |
JPMorgan Securities LLC, 144A | | | | | | | | |
1.037%, 02/02/2017(b) | | | 250 | | | | 250,140 | |
KFW, 144A | | | | | | | | |
0.813%, 01/10/2017(a) | | | 475 | | | | 474,902 | |
0.823%, 02/01/2017(a) | | | 260 | | | | 259,821 | |
Microsoft Corp., 144A | | | | | | | | |
0.721%, 01/25/2017(a) | | | 350 | | | | 349,867 | |
0.843%, 02/21/2017(a) | | | 400 | | | | 399,636 | |
Novartis Corp., 144A | | | | | | | | |
0.730%, 01/09/2017(a) | | | 500 | | | | 499,933 | |
Ontario (Province of) | | | | | | | | |
0.639%, 02/01/2017(a) | | | 250 | | | | 249,867 | |
0.751%, 03/01/2017(a) | | | 400 | | | | 399,539 | |
Ontario Teachers’ Financial Trust, 144A | | | | | | | | |
0.979%, 03/06/2017(b) | | | 300 | | | | 300,262 | |
1.255%, 05/26/2017(a) | | | 250 | | | | 248,598 | |
Toyota Motor Credit Corp., Sr. Unsec’d. Notes, MTN | | | | | | | | |
0.928%, 02/01/2017(b) | | | 250 | | | | 250,118 | |
1.153%, 09/06/2017(b) | | | 250 | | | | 249,940 | |
PSP Capital Inc., 144A | | | | | | | | |
0.925%, 03/06/2017(a) | | | 600 | | | | 599,197 | |
Roche Holdings, Inc., 144A | | | | | | | | |
0.649%, 01/4/2017(a) | | | 580 | | | | 579,963 | |
Siemens Capital Co. LLC, 144A | | | | | | | | |
0.925%, 03/27/2017(a) | | | 400 | | | | 399,091 | |
Sumitomo Mitsui Banking Co., 144A | | | | | | | | |
0.966%, 01/04/2017(a) | | | 300 | | | | 299,977 | |
Total Capital Canada, 144A | | | | | | | | |
0.761%, 01/17/2017(a) | | | 600 | | | | 599,845 | |
| | | | | | |
|
|
|
| | | | | | | | 10,820,632 | |
| | | | | | |
|
|
|
Other Corporate Obligations — 1.7% | | | | | | | | |
Bank of America NA | | | | | | | | |
1.372%, 02/14/2017(b) | | | 250 | | | | 250,119 | |
Caisse Centrale Desjardins du
Quebec, 144A | | | | | | | | |
1.397%, 03/27/2017(b) | | | 160 | | | | 159,993 | |
| | | | | | |
|
|
|
| | | | | | | | 410,112 | |
| | | | | | |
|
|
|
Repurchase Agreement(c) — 2.7% | | | | | | | | |
BNP Paribas SA | | | | | | | | |
0.500%, dated 12/30/2016, due 01/03/2017 in the amount of $637,035
(cost $637,000) | | | 637 | | | | 637,000 | |
| | | | | | |
|
|
|
U.S. Government Agency Obligations — 21.7% | |
Federal Home Loan Bank | | | | | | | | |
0.406%, 01/13/2017(a) | | | 500 | | | | 499,947 | |
0.446%, 01/11/2017(a) | | | 500 | | | | 499,958 | |
0.456%, 01/18/2017(a) | | | 750 | | | | 749,882 | |
0.462%, 01/27/2017(a) | | | 500 | | | | 499,875 | |
0.497%, 01/17/2017(a) | | | 300 | | | | 299,956 | |
SEE NOTES TO FINANCIAL STATEMENTS.
FINANCIAL STATEMENTS OF VCA-11
December 31, 2016
| | | | | | | | |
SHORT-TERM INVESTMENTS
(continued) | | Principal
Amount
(000)#
| | | Value
(Note 2)
| |
U.S. Government Agency Obligations (continued) | |
0.502%, 01/17/2017(a) | | $ | 700 | | | $ | 699,896 | |
0.502%, 01/18/2017(a) | | | 300 | | | | 299,926 | |
0.507%, 01/11/2017(a) | | | 1,000 | | | | 999,916 | |
0.507%, 01/24/2017(a) | | | 300 | | | | 299,953 | |
Federal Home Loan Mortgage Corporation | | | | | | | | |
0.796%, 04/27/2017(b) | | | 300 | | | | 300,171 | |
| | | | | | |
|
|
|
| | | | | | | | 5,149,480 | |
| | | | | | |
|
|
|
U.S. Treasury Obligations — 5.3% | | | | | | | | |
U.S. Treasury Bills | | | | | | | | |
0.406%, 01/12/2017(a) | | | 250 | | | | 249,975 | |
0.438%, 01/19/2017(a) | | | 250 | | | | 249,954 | |
0.489%, 01/12/2017(a) | | | 500 | | | | 499,950 | |
U.S. Treasury Note | | | | | | | | |
0.875%, 02/28/2017(a) | | | 250 | | | | 250,168 | |
| | | | | | |
|
|
|
| | | | | | | | 1,250,047 | |
| | | | | | |
|
|
|
TOTAL INVESTMENTS — 99.9%
(cost $23,693,014) | | | | 23,698,731 | |
| | | | | | |
|
|
|
OTHER ASSETS, LESS LIABILITIES — 0.1% | | | | | |
Interest Receivable | | | | 13,891 | |
Receivable Pending Capital Transactions | | | | 13,121 | |
Cash | | | | 164 | |
| | | | | | |
|
|
|
OTHER ASSETS IN EXCESS OF LIABILITIES | | | | 27,176 | |
| | | | | | |
|
|
|
NET ASSETS — 100.0% | | | $ | 23,725,907 | |
| | | | | | |
|
|
|
NET ASSETS, representing: | | | | | | | | |
Equity of Participants | | | $ | 23,725,775 | |
Equity of The Prudential Insurance Company of America | | | | 132 | |
| | | | | | |
|
|
|
| | | | | | | $ | 23,725,907 | |
| | | | | | |
|
|
|
The following abbreviations are used in the semiannual report:
| | |
| 144A | | Security was purchased pursuant to Rule 144A under the Act of 1933 and may not be resold subject to that rule except to qualified institutional buyers. Unless otherwise noted, 144A securities are deemed to be liquid. |
| MTN | | MediumTerm Note |
| # | Principal amount is shown in U.S. dollars unless otherwise stated. |
| (a) | Rate quoted represents yield-to-maturity as of the purchase date. |
| (b) | Variable rate instrument. The interest rate shown reflects the rate in effect at December 31, 2016. |
| (c) | Repurchase agreements are collaterized by U.S. Treasury Securities (coupon rates 0.000%-0.125%, maturity dates 01/05/2017-01/15/2022), with the aggregate value, including accrued interest, of $649,752. Repurchase agreements are subject to contractual netting arrangements. For further detail on individual repurchase agreements and the corresponding counterparty, see the Statement of Net Assets. |
Various inputs are used in determining the value of the Account’s investments. These inputs are summarized in the three broad levels listed below.
| Level 1— | quoted prices generally in active markets for identical securities. |
| Level 2— | quoted prices for similar securities, interest rates and yield curves, prepayment speeds, foreign currency exchange rates, and other observable inputs. |
| Level 3— | unobservable inputs for securities valued in accordance with the Account’s Committee approved fair valuation procedures. |
The following is a summary of the inputs used as of December 31, 2016 in valuing such portfolio securities:
| | | | | | | | | | | | |
| | | Level 1
| | | Level 2
| | | Level 3
| |
Investments in Securities | | | | | | | | | | | | |
Certificates of Deposit | | $ | — | | | $ | 5,431,460 | | | $ | — | |
Commercial Paper | | | — | | | | 10,820,632 | | | | — | |
Other Corporate Obligations | | | — | | | | 410,112 | | | | — | |
Repurchase Agreement | | | — | | | | 637,000 | | | | — | |
U.S. Government Agency Obligations | | | — | | | | 5,149,480 | | | | — | |
U.S. Treasury Obligations | | | — | | | | 1,250,047 | | | | — | |
| | |
|
|
| |
|
|
| |
|
|
|
Total | | $ | — | | | $ | 23,698,731 | | | $ | — | |
| | |
|
|
| |
|
|
| |
|
|
|
During the period, there were no transfers between Level 1 and Level 2 to report.
SEE NOTES TO FINANCIAL STATEMENTS.
FINANCIAL STATEMENTS OF VCA-11
December 31, 2016
The industry classification of investments and other assets in excess of liabilities shown as a percentage on net assets as of December 31, 2016 were as follows (Unaudited):
| | | | |
Commercial Paper | | | 45.6 | % |
Certificates of Deposit | | | 22.9 | |
U.S. Government Agency Obligations | | | 21.7 | |
Repurchase Agreement | | | 2.7 | |
U.S. Treasury Obligations | | | 5.3 | |
| | | | |
Other Corporate Obligations | | | 1.7 | % |
| | |
|
|
|
| | | | 99.9 | |
Other assets in excess of liabilities | | | 0.1 | |
| | |
|
|
|
| | | | 100.0 | % |
| | |
|
|
|
Offsetting of financial instrument assets and liabilities:
The Account invested in financial instruments during the reporting period that are either offset in accordance with current requirements or are subject to enforceable master netting arrangements or similar agreements that permit offsetting. The information about offsetting and related netting arrangements for financial instruments, where the legal right to set-off exists, is presented in the summary below.
| | | | | | | | | | | | |
Description
| | Gross
Amounts of
Recognized
Assets(1)
| | | Collateral
Received
| | | Net
Amount
| |
Repurchase Agreements | | $ | 637,000 | | | $ | 637,000 | | | $ | — | |
| | |
|
|
| | | | | | | | |
| (1) | Amount represents market value. |
SEE NOTES TO FINANCIAL STATEMENTS.
FINANCIAL STATEMENTS OF VCA-11
Year Ended December 31, 2016
| | | | |
| | | | |
INVESTMENT INCOME | | | | |
Interest Income | | $ | 144,532 | |
EXPENSES | | | | |
Fees Charged to Participants for Investment Management Services | | | (61,358 | ) |
Fees Charged to Participants for Administrative Expenses: | | | | |
Standard Contract | | | (164,536 | ) |
0.50% Contract | | | (3,833 | ) |
0.45% Contract | | | (2,143 | ) |
Total Expenses | | | (231,870 | ) |
NET INVESTMENT LOSS | | | (87,338 | ) |
REALIZED AND UNREALIZED GAIN (LOSS) ON INVESTMENT TRANSACTIONS | | | | |
Net Realized Gain on Investment Transactions | | | 613 | |
Net Change in Unrealized Appreciation on Investments | | | 5,717 | |
NET GAIN ON INVESTMENT TRANSACTIONS | | | 6,330 | |
NET DECREASE IN NET ASSETS RESULTING FROM OPERATIONS | | $ | (81,008 | ) |
| | | | | | |
| | | STATEMENT OF CHANGES IN NET ASSETS | | |
| | | | | | | | |
| | | Year Ended December 31,
| |
| | | 2016 | | | 2015 | |
OPERATIONS | | | | | | | | |
Net Investment Loss | | $ | (87,338 | ) | | $ | (194,100 | ) |
Net Realized Gain on Investment Transactions | | | 613 | | | | 316 | |
Net Change in Unrealized Appreciation (Depreciation) on Investments | | | 5,717 | | | | — | |
NET DECREASE IN NET ASSETS RESULTING FROM OPERATIONS | | | (81,008 | ) | | | (193,784 | ) |
CAPITAL TRANSACTIONS | | | | | | | | |
Purchase Payments and Transfers In | | | 1,731,599 | | | | 1,843,959 | |
Withdrawals and Transfers Out | | | (3,241,840 | ) | | | (3,770,747 | ) |
NET DECREASE IN NET ASSETS RESULTING FROM CAPITAL TRANSACTIONS | | | (1,510,241 | ) | | | (1,926,788 | ) |
NET INCREASE IN NET ASSETS RESULTING FROM SURPLUS TRANSFERS | | | 134 | | | | 18 | |
TOTAL DECREASE IN NET ASSETS | | | (1,591,115 | ) | | | (2,120,554 | ) |
NET ASSETS | | | | | | | | |
Beginning of year | | | 25,317,022 | | | | 27,437,576 | |
End of year | | $ | 23,725,907 | | | $ | 25,317,022 | |
Accumulation Unit Values and Equity of Participants as of December 31, 2016
| | | | |
Standard Contract: | | | | |
Accumulation Unit Value and Equity of Participants, $21,195,640 / 6,656,050 outstanding Accumulation Units | | $ | 3.1844 | |
| | |
|
|
|
| |
0.50% Contract: | | | | |
Accumulation Unit Value and Equity of Participants, $1,486,524 / 424,967 outstanding Accumulation Units | | $ | 3.4980 | |
| | |
|
|
|
| |
0.45% Contract: | | | | |
Accumulation Unit Value and Equity of Participants, $1,043,611 / 297,468 outstanding Accumulation Units | | $ | 3.5083 | |
| | |
|
|
|
SEE NOTES TO FINANCIAL STATEMENTS.
FINANCIAL HIGHLIGHTS FOR VCA-11
| | | | | | |
| | | INCOME AND CAPITAL CHANGES PER ACCUMULATION UNIT* | | |
(For an Accumulation Unit outstanding throughout the year)
| | | | | | | | | | | | | | | | | | | | | | | | |
| | | Year Ended December 31, 2016
| | | Year Ended December 31, 2015
| |
| | | Standard
Contract | | | 0.50%
Contract | | | 0.45% Contract | | | Standard Contract | | | 0.50% Contract | | | 0.45% Contract | |
Investment Income | | $ | .0189 | | | $ | .0206 | | | $ | .0207 | | | $ | .0066 | | | $ | .0071 | | | $ | .0071 | |
Expenses | | | | | | | | | | | | | | | | | | | | | | | | |
Investment management fee | | | (.0080 | ) | | | (.0087 | ) | | | (.0088 | ) | | | (.0080 | ) | | | (.0087 | ) | | | (.0088 | ) |
Administrative expenses | | | (.0239 | ) | | | (.0087 | ) | | | (.0070 | ) | | | (.0239 | ) | | | (.0087 | ) | | | (.0069 | ) |
Net Investment Income (Loss) | | | (.0130 | ) | | | (.0032 | ) | | | .0049 | | | | (.0253 | ) | | | (.0103 | ) | | | (.0086 | ) |
Capital Changes | | | | | | | | | | | | | | | | | | | | | | | | |
Net realized and unrealized gain (loss) on investment transactions | | | .0008 | | | | .0009 | | | | .0009 | | | | .0000 | †† | | | .0000 | †† | | | .0000 | †† |
Net Increase (Decrease) in Accumulation Unit Value | | | (.0122 | ) | | | .0041 | | | | .0058 | | | | (.0253 | ) | | | (.0103 | ) | | | (.0086 | ) |
Accumulation Unit Value | | | | | | | | | | | | | | | | | | | | | | | | |
Beginning of year | | | 3.1966 | | | | 3.4939 | | | | 3.5025 | | | | 3.2219 | | | | 3.5042 | | | | 3.5111 | |
End of year | | $ | 3.1844 | | | $ | 3.4980 | | | $ | 3.5083 | | | $ | 3.1966 | | | $ | 3.4939 | | | $ | 3.5025 | |
Total Return** | | | (.38 | %) | | | .12 | % | | | .17 | % | | | (.79 | %) | | | (.29 | %) | | | (.24 | %) |
Ratio of Expenses To Average Net Assets*** | | | 1.00 | % | | | .50 | % | | | .45 | % | | | 1.00 | % | | | .50 | % | | | .45 | % |
Ratio of Net Investment Income (Loss) To Average Net Assets*** | | | (.41 | %) | | | .09 | % | | | .14 | % | | | (.79 | %) | | | (.29 | %) | | | (.24 | %) |
Number of Accumulation Units Outstanding
For Participants at end of year (000’s omitted) | | | 6,656 | | | | 425 | | | | 297 | | | | 7,077 | | | | 456 | | | | 314 | |
| * | Calculated by accumulating the actual per unit amounts daily. |
| ** | Total return does not consider the effects of sales loads. Total return is calculated assuming a purchase of a share on the first day and a sale on the last day of each year reported. Total returns may reflect adjustments to conform to generally accepted accounting principles. |
| *** | These calculations exclude PICA’s equity in VCA-11. |
The above table does not reflect the annual administration charge, which does not affect the Accumulation Unit Value. This charge is made by reducing Participants’ Accumulation Accounts by a number of Units equal in value to the charge.
SEE NOTES TO FINANCIAL STATEMENTS.
FINANCIAL HIGHLIGHTS FOR VCA-11
| | | | | | |
| | | INCOME PER ACCUMULATION UNIT* | | |
(For an Accumulation Unit outstanding throughout the year)
| | | | | | | | | | | | | | | | | | | | | | | | |
| | | Year Ended December 31, 2014
| | | Year Ended December 31, 2013
| |
| | | Standard
Contract | | | 0.50%
Contract | | | 0.45%
Contract | | | Standard
Contract | | | 0.50%
Contract | | | 0.45%
Contract | |
Investment Income | | $ | .0052 | | | $ | .0056 | | | $ | .0056 | | | $ | .0060 | | | $ | .0063 | | | $ | .0064 | |
Expenses | | | | | | | | | | | | | | | | | | | | | | | | |
Investment management fee | | | (.0081 | ) | | | (.0088 | ) | | | (.0088 | ) | | | (.0081 | ) | | | (.0087 | ) | | | (.0087 | ) |
Administrative expenses | | | (.0242 | ) | | | (.0088 | ) | | | (.0070 | ) | | | (.0244 | ) | | | (.0087 | ) | | | (.0071 | ) |
Net Investment Loss | | | (.0271 | ) | | | (.0120 | ) | | | (.0102 | ) | | | (.0265 | ) | | | (.0111 | ) | | | (.0094 | ) |
Capital Changes | | | | | | | | | | | | | | | | | | | | | | | | |
Net realized and unrealized gain (loss) on investment transactions | | | .0000 | †† | | | .0000 | †† | | | .0000 | †† | | | .0001 | | | | .0001 | | | | .0001 | |
Net Increase (Decrease) in Accumulation Unit Value | | | (.0271 | ) | | | (.0120 | ) | | | (.0102 | ) | | | (.0264 | ) | | | (.0110 | ) | | | (.0093 | ) |
Accumulation Unit Value | | | | | | | | | | | | | | | | | | | | | | | | |
Beginning of year | | | 3.2490 | | | | 3.5162 | | | | 3.5213 | | | | 3.2754 | | | | 3.5272 | | | | 3.5306 | |
End of year | | $ | 3.2219 | | | $ | 3.5042 | | | $ | 3.5111 | | | $ | 3.2490 | | | $ | 3.5162 | | | $ | 3.5213 | |
Total Return** | | | (.83 | %) | | | (.34 | %) | | | (.29 | %) | | | (.81 | %) | | | (.31 | %) | | | (.26 | %) |
Ratio of Expenses To Average Net Assets*** | | | 1.00 | % | | | .50 | % | | | .45 | % | | | 1.00 | % | | | .50 | % | | | .45 | % |
Ratio of Net Investment Income (Loss) To Average Net Assets*** | | | (.84 | %) | | | (.34 | %) | | | (.29 | %) | | | (.81 | %) | | | (.32 | %) | | | (.27 | %) |
Number of Accumulation Units Outstanding
For Participants at end of year (000’s omitted) | | | 7,653 | | | | 458 | | | | 335 | | | | 8,446 | | | | 502 | | | | 393 | |
| * | Calculated by accumulating the actual per unit amounts daily. |
| ** | Total return does not consider the effects of sales loads. Total return is calculated assuming a purchase of a share on the first day and a sale on the last day of each year reported. Total returns may reflect adjustments to conform to generally accepted accounting principles. |
| *** | These calculations exclude PICA’s equity in VCA-11. |
The above table does not reflect the annual administration charge, which does not affect the Accumulation Unit Value. This charge is made by reducing Participants’ Accumulation Accounts by a number of Units equal in value to the charge.
SEE NOTES TO FINANCIAL STATEMENTS.
FINANCIAL HIGHLIGHTS FOR VCA-11
| | | | | | |
| | | INCOME PER ACCUMULATION UNIT* | | |
(For an Accumulation Unit outstanding throughout the year)
| | | | | | | | | | | | |
| | | Year Ended December 31, 2012
| |
| | | Standard
Contract | | | 0.50%
Contract | | | 0.45%
Contract | |
Investment Income | | $ | .0081 | | | $ | .0085 | | | $ | .0086 | |
Expenses | | | | | | | | | | | | |
Investment management fee | | | (.0083 | ) | | | (.0088 | ) | | | (.0088 | ) |
Administrative expenses | | | (.0246 | ) | | | (.0088 | ) | | | (.0071 | ) |
Net Investment Loss | | | (.0248 | ) | | | (.0091 | ) | | | (.0073 | ) |
Capital Changes | | | | | | | | | | | | |
Net realized and unrealized gain (loss) on investment transactions | | | .0001 | | | | .0001 | | | | .0001 | |
Net Increase (Decrease) in Accumulation Unit Value | | | (.0247 | ) | | | (.0090 | ) | | | (.0072 | ) |
Accumulation Unit Value | | | | | | | | | | | | |
Beginning of year | | | 3.3001 | | | | 3.5362 | | | | 3.5378 | |
End of year | | $ | 3.2754 | | | $ | 3.5272 | | | $ | 3.5306 | |
Total Return** | | | (.75 | %) | | | (.25 | %) | | | (.20 | %) |
Ratio of Expenses To Average Net Assets*** | | | 1.00 | % | | | .50 | % | | | .45 | % |
Ratio of Net Investment Income (Loss) To Average Net Assets*** | | | (.75 | %) | | | (.26 | %) | | | (.21 | %) |
Number of Accumulation Units Outstanding
For Participants at end of year (000’s omitted) | | | 9,435 | | | | 500 | | | | 433 | |
| * | Calculated by accumulating the actual per unit amounts daily. |
| ** | Total return does not consider the effects of sales loads. Total return is calculated assuming a purchase of a share on the first day and a sale on the last day of each year reported. Total returns may reflect adjustments to conform to generally accepted accounting principles. |
| *** | These calculations exclude PICA’s equity in VCA-11. |
The above table does not reflect the annual administration charge, which does not affect the Accumulation Unit Value. This charge is made by reducing Participants’ Accumulation Accounts by a number of Units equal in value to the charge.
SEE NOTES TO FINANCIAL STATEMENTS.
NOTES TO THE FINANCIAL STATEMENTS OF
VCA-11
The Prudential Variable Contract Account-11 (VCA-11 or the Account) was established on March 1, 1982 by The Prudential Insurance Company of America (“PICA”) under the laws of the State of New Jersey and is registered as an open-end, diversified management investment company under the Investment Company Act of 1940, as amended. VCA-11 has been designed for use by employers (Contract-holders) in making retirement arrangements on behalf of their employees (Participants). The investment objective of the Account is to realize a high level of current income as is consistent with the preservation of capital and liquidity. Its investments are primarily composed of short-term securities. The ability of the issuers of the securities held by the Account to meet their obligations may be affected by economic developments in a specific state, industry or region. Although variable annuity payments differ according to the investment performance of the Account, they are not affected by mortality or expense experience because PICA assumes the expense risk and the mortality risk under the contracts.
PICA issues standard VCA-11 contracts (the “Standard Contracts”), with total annual expenses of 1.00% (as a percentage of net assets). It also issues contracts with lower administrative expenses where warranted by economies of scale and the expense characteristics of the Contract-holder’s retirement arrangement. Prior to January 1, 2011, PICA issued standard contracts and contracts with annual expenses of 0.50% (as a percentage of net assets) (the “0.50% contracts”). The Accumulation Units Values were previously shown on a combined basis. During 2011, PICA issued VCA-11 contract with annual expenses of 0.45% (as a percentage of net assets) (the “0.45% contracts”). The financial statements now show separate Accumulation Units Values for each type of contract.
| Note 2: | | Accounting Policies |
The Account follows investment company accounting and reporting guidance of the Financial Accounting Standards Board (FASB) Accounting Standard Codification Topic 946 Financial Services-Investment Companies. The following accounting policies conform to U.S. generally accepted accounting principles. The Account consistently follows such policies in the preparation of its financial statements.
Securities Valuation: The Account holds securities and other assets that are fair valued at the close of each day (generally, 4:00 PM Eastern time) the New York Stock Exchange (“NYSE”) is open for trading. Fair value is the price that would be received to sell an asset or paid to transfer a liability in an orderly transaction between market participants on the measurement date. The Account’s Committee Members (the “Committee”) have adopted Valuation Procedures for security valuation under which fair valuation responsibilities have been delegated to Prudential Investments LLC (“PI” or “Manager”). Under the current Valuation Procedures, the established Valuation Committee is responsible for supervising the valuation of portfolio securities and other assets. The Valuation Procedures permit the Account to utilize independent pricing vendor services, quotations from market makers, and alternative valuation methods when market quotations are either not readily available or not deemed representative of fair value. A record of the Valuation Committee’s actions is subject to the Committee’s action is subject to the Board’s review, approval, and ratification at its next regularly-scheduled quarterly meeting.
Various inputs determine how the Account’s investments are valued, all of which are categorized according to the three broad levels (Level 1, 2, or 3) detailed in the table following the Statement of Net Assets.
Effective March 30, 2016, the Account has amended its valuation policy for fixed income securities as follows. Fixed income securities traded in the over-the-counter (“OTC”) market are generally valued at prices provided by approved independent pricing vendors. The pricing vendors provide these prices after evaluating observable inputs including, but not limited to yield curves, yield spreads, credit ratings, deal terms, tranche level attributes, default rates, cash flows, prepayment speeds, broker/dealer quotations, and reported trades. Securities valued using such vendor prices are classified as Level 2 in the fair value hierarchy.
Through March 29, 2016, the Account valued all of its securities of sufficient credit quality, at amortized cost, which approximates fair value. The amortized cost method involves valuing a security at its cost at the time of purchase and thereafter assuming a constant amortization to maturity of the difference between the principal amount due at maturity and cost.
When determining the fair value of securities, some of the factors influencing the valuation include: the nature of any restrictions on disposition of the securities; assessment of the general liquidity of the securities; the
issuer’s financial condition and the markets in which it does business; the cost of the investment; the size of the holding and the capitalization of the issuer; the prices of any recent transactions or bids/offers for such securities or any comparable securities; any available analyst media or other reports or information deemed reliable by the investment adviser regarding the issuer or the markets or industry in which it operates. Using fair value to price securities may result in a value that is different from a security’s most recent closing price and from the price used by other mutual funds to calculate their net asset values.
Loan Participations: The Account may invest in loan participations. When the Account purchases a loan participation, the Account typically enters into a contractual relationship with the lender or third party selling such participations (“Selling Participant”), but not the borrower. As a result, the Account assumes the credit risk of the borrower, the Selling Participant and any other persons positioned between the Account and the borrower. The Account may not directly benefit from the collateral supporting the senior loan in which it has purchased the loan participation.
Restricted and Illiquid Securities: The Account may hold up to 5% of its net assets in illiquid securities, including those that are restricted as to disposition under securities law (“restricted securities”). Restricted securities, sometimes referred to as private placements, are valued pursuant to the valuation procedures noted above.
Repurchase Agreements: In connection with transactions in repurchase agreements with United States financial institutions, it is the Account’s policy that its custodian or designated subcustodians under triparty repurchase agreements, as the case may be, take possession of the underlying collateral securities, the value of which exceeds the principal amount of the repurchase transaction, including accrued interest. To the extent that any repurchase agreement exceeds one business day, the value of collateral is marked-to-market on a daily basis to ensure adequacy of the collateral. If the seller defaults and the value of the collateral declines or if bankruptcy proceedings are commenced with respect to the seller of the security, realization of the collateral by the Account may be delayed or limited.
Master Netting Arrangements: The Account may be subject to various Master Agreements, or netting arrangements, with select counterparties. A master netting arrangement between the Account and the counterparty permits the Account to offset amounts payable by the Account to the same counterparty against amounts to be received; and by the receipt of collateral from the counterparty by the Account to cover the Account’s exposure to the counterparty. However, there is no assurance that such mitigating factors are easily enforcable. The right to set-off exists when all the conditions are met such that each of the parties owes the other determinable amounts, the reporting party has the right to set-off the amount owed with the amount owed by the other party, the reporting party intends to set-off and the right to set-off is enforceable by law. During the reporting period, there was no intention to settle on a net basis and all amounts are presented on a gross basis on the Statement of Assets and Liabilities.
Securities Transactions and Net Investment Income: Securities transactions are recorded on the trade date. Realized gains (losses) from security transactions are calculated on the specific identification method. Interest income, including amortization of premium and accretion of discount on debt securities, as required, is recorded on the accrual basis. Net investment income (other than administration fees) is allocated to the Participants and PICA on a daily basis in proportion to their respective ownership or investment in VCA-11.
Estimates: The preparation of the financial statements requires management to make estimates and assumptions that affect the reported amounts and disclosures in the financial statements. Actual results could differ from those estimates.
Federal Income Taxes: The operations of VCA-11 are part of, and are taxed with, the operations of PICA. Under the current provisions of the Internal Revenue Code, PICA does not expect to incur federal income taxes on earnings of VCA-11 to the extent the earnings are credited under the Contracts. As a result, the Unit Value of VCA-11 has not been reduced by federal income taxes.
| Note 3: | | Investment Management Agreement and Charges |
The Account has a management agreement with Prudential Investments LLC (“PI”). Pursuant to this agreement, PI has responsibility for all investment advisory services and supervises the subadviser’s performance of such services. PI has entered into a subadvisory agreement with PGIM, Inc. The subadvisory agreement provides that PGIM, Inc. will furnish investment advisory services in connection with management of the Account. PI pays for the services of PGIM, Inc. Prior to January 4, 2016, PGIM, Inc. was known as Prudential Investment Management, Inc. (“PIM”).
VCA-11 is subject to fees for investment management and administration services. PICA may impose a reduced Administrative Fee where warranted by economies of scale and the expense characteristics of the employer, association or trust to which Prudential has issued a Contract.
Standard contracts have an effective annual rate of up to 1.00% of the current value of the Participant’s equity of which 0.75% is paid to PICA for administrative expenses not provided by the annual account charge, and 0.25% is paid to PI, for investment management services. The 0.50% contracts have an effective annual rate of up to 0.50% of the current value of the Participant’s equity of which 0.25% is paid to PICA for administrative expenses not provided by the annual account charge, and 0.25% is paid to PI, is for investment management services. The 0.45% contracts have an effective annual rate of up to 0.45% of the current value of the Participant’s equity of which 0.20% is paid to PICA for administrative expenses not provided by the annual account charge, and 0.25% is paid to PI, for investment management services.
PICA, PI and PGIM, Inc. are indirect, wholly-owned subsidiaries of Prudential Financial, Inc. (“Prudential”).
An annual account charge of not more than $30 is deducted from the account of each Participant, if applicable, at the time of withdrawal of the value of all of the Participant’s accounts or at the end of the fiscal year by cancelling Units.
| Note 4: | | Unit Transactions |
The number of Accumulation Units issued and redeemed for the year ended December 31, 2016 and the year ended December 31, 2015, respectively, are as follows:
| | | | | | | | |
Standard Contract
| | Units
| | | Amount
| |
Year ended December 31, 2016: | | | | | | | | |
Account units issued | | | 515,713 | | | $ | 1,645,625 | |
Account units redeemed | | | (936,855 | ) | | | (2,988,387 | ) |
| | |
|
|
| |
|
|
|
Net increase (decrease) in units outstanding | | | (421,142 | ) | | $ | (1,342,762 | ) |
| | |
|
|
| |
|
|
|
Year ended December 31, 2015: | | | | | | | | |
Account units issued | | | 524,714 | | | $ | 1,683,743 | |
Account units redeemed | | | (1,100,210 | ) | | | (3,531,497 | ) |
| | |
|
|
| |
|
|
|
Net increase (decrease) in units outstanding | | | (575,496 | ) | | $ | (1,847,754 | ) |
| | |
|
|
| |
|
|
|
0.50% Contract
| | | | | | |
Year ended December 31, 2016: | | | | | | | | |
Account units issued | | | 24,604 | | | $ | 85,974 | |
Account units redeemed | | | (56,073 | ) | | | (195,951 | ) |
| | |
|
|
| |
|
|
|
Net increase (decrease) in units outstanding | | | (31,469 | ) | | $ | (109,977 | ) |
| | |
|
|
| |
|
|
|
Year ended December 31, 2015: | | | | | | | | |
Account units issued | | | 45,777 | | | $ | 160,216 | |
Account units redeemed | | | (47,326 | ) | | | (165,489 | ) |
| | |
|
|
| |
|
|
|
Net increase (decrease) in units outstanding | | | (1,549 | ) | | $ | (5,273 | ) |
| | |
|
|
| |
|
|
|
0.45% Contract
| | | | | | |
Year ended December 31, 2016: | | | | | | | | |
Account units issued | | | — | | | $ | — | |
Account units redeemed | | | (16,407 | ) | | | (57,502 | ) |
| | |
|
|
| |
|
|
|
Net increase (decrease) in units outstanding | | | (16,407 | ) | | $ | (57,502 | ) |
| | |
|
|
| |
|
|
|
Year ended December 31, 2015: | | | | | | | | |
Account units issued | | | — | | | $ | — | |
Account units redeemed | | | (21,034 | ) | | | (73,761 | ) |
| | |
|
|
| |
|
|
|
Net increase (decrease) in units outstanding | | | (21,034 | ) | | $ | (73,761 | ) |
| | |
|
|
| |
|
|
|
| Note 5: | | Net Increase (Decrease) In Net Assets Resulting From Surplus Transfers |
The increase (decrease) in net assets from surplus transfers represents the net increases to/(reductions from) PICA’s investment in the Account. This increase (decrease) includes reserve adjustments for mortality and expense risks assumed by PICA.
| Note 6: | | Participant Loans |
Loans are considered to be withdrawals from the Account from which the loan amount was deducted, though they are not considered a withdrawal from the MEDLEY Program. Withdrawals, transfers and loans from VCA-11 are considered to be withdrawals of contributions until all of the Participant’s contributions to the Account have been withdrawn, transferred or borrowed.
For the year ended December 31, 2016, $15,491 in participant loans were withdrawn from VCA-11 and $24,387 of principal and interest was repaid to VCA-11. For the year ended December 31, 2015, $28,071 in participant loans were withdrawn from VCA-11 and $44,121 of principal and interest was repaid to VCA-11. Loan repayments are invested in Participant’s account(s) as chosen by the Participant, which may not necessarily be VCA-11. The initial loan proceeds which are being repaid may not necessarily have originated solely from VCA-11. During the year ended December 31, 2016, PICA has advised the Account that it received $317 in loan origination fees. The participant loan principal and interest repayments are included in purchase payments and transfers in within the Statement of Changes in Net Assets.
| Note 7: | | Recent Accounting Pronouncements and Reporting Updates |
In December 2016, the FASB released an Accounting Standards Update (“ASU”) that makes technical changes to various sections of the Accounting Standards Codification (“ASC”), including Topic 820, Fair Value Measurement. The changes to Topic 820 are intended to clarify the difference between a valuation approach and a valuation technique. The changes to ASC 820-10-50-2 require a reporting entity to disclose, for Level 2 and Level 3 fair value measurements, a change in either or both a valuation approach and a valuation technique and the reason(s) for the change. The changes to Topic 820 are effective for fiscal years, and interim periods within those fiscal years, beginning after December 15, 2016. At this time, management is evaluating the implications of the ASU and its impact on the financial statements and disclosures has not yet been determined.
On October 13, 2016, the Securities and Exchange Commission (the “SEC”) adopted new rules and forms and amended existing rules and forms which are intended to modernize and enhance the reporting and disclosure of information by registered investment companies and to improve the quality of information that funds provide to investors, including modifications to Regulation S-X which would require standardized, enhanced disclosure about derivatives in investment company financial statements. The new rules also enhance disclosure regarding fund liquidity and redemption practices. Also under the new rules, the SEC will permit open-end funds, with the exception of money market funds, to offer swing pricing, subject to board approval and review. The compliance dates of the modifications to Regulation S-X are August 1, 2017 and other amendments and rules are generally June 1, 2018 and December 1, 2018. Management is currently evaluating the impacts to the financial statement disclosures, if any.
On September 22, 2016, the Committee approved and on January 27, 2017, the contractholders and participants having voting rights in VCA 11 approved the Agreement and Plan of Reorganization, which provides for the transfer of the assets and liabilities of VCA 11 to the Government Money Market Portfolio (“Government Money Market Portfolio”), a series of The Prudential Series Fund, in exchange for Class I shares of the Government Money Market Portfolio having an aggregate value equal to the net asset value of VCA 11, and the restructuring of VCA 11 into a unit investment trust under the Investment Company Act of 1940, as amended (“1940 Act”). The reorganization will take place on or about April 28, 2017.
REPORT OF INDEPENDENT REGISTERED PUBLIC ACCOUNTING FIRM
THE COMMITTEE AND PARTICIPANTS OF
THE PRUDENTIAL VARIABLE CONTRACT ACCOUNT-11:
We have audited the accompanying statement of net assets of The Prudential Variable Contract Account-11 (the “Account”) as of December 31, 2016, and the related statement of operations for the year then ended, the statements of changes in net assets for each of the years in the two-year period then ended, and the financial highlights for each of the years in the five-year period then ended. These financial statements and financial highlights are the responsibility of the Account’s management. Our responsibility is to express an opinion on these financial statements and financial highlights based on our audits.
We conducted our audits in accordance with the standards of the Public Company Accounting Oversight Board (United States). Those standards require that we plan and perform the audit to obtain reasonable assurance about whether the financial statements and financial highlights are free of material misstatement. An audit includes examining, on a test basis, evidence supporting the amounts and disclosures in the financial statements. Our procedures included confirmation of securities owned as of December 31, 2016, by correspondence with the custodian and brokers or by other appropriate auditing procedures where replies from brokers were not received. An audit also includes assessing the accounting principles used and significant estimates made by management, as well as evaluating the overall financial statement presentation. We believe that our audits provide a reasonable basis for our opinion.
In our opinion, the financial statements and financial highlights referred to above present fairly, in all material respects, the financial position of the Account as of December 31, 2016, the results of its operations for the year then ended, the changes in its net assets for each of the years in the two-year period then ended and the financial highlights for each of the years in the five-year period then ended, in conformity with U.S. generally accepted accounting principles.
New York, New York
February 16, 2017
INFORMATION ABOUT COMMITTEE MEMBERS AND OFFICERS
VCA 10 and VCA 11 are managed by the VCA 10 Committee and the VCA 11 Committee, respectively. The members of each Committee are elected by the persons having voting rights in respect of the VCA 10 Account or the VCA 11 Account. The affairs of VCA 10 and VCA 11 are conducted in accordance with the Rules and Regulations of VCA 10 and VCA 11, respectively. Information pertaining to the members of the VCA 10 Committee and the VCA 11 Committee (hereafter referred to as “Committee Members”) is set forth below. Committee Members who are not deemed to be “interested persons” of VCA 10 or VCA 11 as defined in the Investment Company Act of 1940, as amended (the 1940 Act) are referred to as “Independent Committee Members.” Committee Members who are deemed to be “interested persons” of VCA10 or VCA 11 are referred to as “Independent Committee Members.” Information pertaining to the Officers of VCA 10 and VCA 11 is also set forth below.
| | | | |
| Independent Committee Members(1) |
Name, Address, Age
Position(s)
Portfolios Overseen | | Principal Occupation(s) During Past Five Years | | Other Directorships Held During Past Five Years |
Ellen S. Alberding (58)
Committee Member
Portfolios Overseen: 88 | | President and Board Member, The Joyce Foundation (charitable foundation) (since 2002); Vice Chair, City Colleges of Chicago (community college system) (since 2011); Trustee, Skills for America’s Future (national initiative to connect employers to community colleges) (since 2011); Trustee, National Park Foundation (charitable foundation for national park system) (since 2009); Trustee, Economic Club of Chicago (since 2009). | | None. |
Kevin J. Bannon (64)
Committee Member
Portfolios Overseen: 88 | | Managing Director (April 2008-May 2015) and Chief Investment Officer (October 2008-November 2013) of Highmount Capital LLC (registered investment adviser); formerly Executive Vice President and Chief Investment Officer (April 1993-August 2007) of Bank of New York Company; President (May 2003-May 2007) of BNY Hamilton Family of Mutual Funds. | | Director of Urstadt Biddle Properties (equity real estate investment trust) (since September 2008). |
Linda W. Bynoe (64)
Committee Member
Portfolios Overseen: 88 | | President and Chief Executive Officer (since March 1995) and formerly Chief Operating Officer (December 1989-February 1995) of Telemat Ltd. (management consulting); formerly Vice President (January 1985-June 1989) at Morgan Stanley & Co. (broker-dealer). | | Director of Simon Property Group, Inc. (retail real estate) (May 2003-May 2012); Director of Anixter International, Inc. (communication products distributor) (since January 2006); Director of Northern Trust Corporation (financial services) (since April 2006); Trustee of Equity Residential (residential real estate) (since December 2009). |
Keith F. Hartstein (60)
Committee Member & Independent Chair Portfolios Overseen: 88 | | Retired; Member (since November 2014) of the Governing Council of the Independent Directors Council (organization of independent mutual fund directors); formerly President and Chief Executive Officer (2005-2012), Senior Vice President (2004-2005), Senior Vice President of Sales and Marketing (1997-2004), and various executive management positions (1990-1997), John Hancock Funds, LLC (asset management); Chairman, Investment Company Institute’s Sales Force Marketing Committee (2003-2008). | | None. |
Michael S. Hyland, CFA (71)
Committee Member
Portfolios Overseen: 88 | | Retired (since February 2005); formerly Senior Managing Director (July 2001-February 2005) of Bear Stearns & Co, Inc.; Global Partner, INVESCO (1999-2001); Managing Director and President of Salomon Brothers Asset Management (1989-1999). | | None. |
Richard A. Redeker (73)
Committee Member & Independent Vice Chair Portfolios Overseen: 88 | | Retired Mutual Fund Senior Executive (47 years); Management Consultant; Director, Mutual Fund Directors Forum (since 2014); Independent Directors Council (organization of independent mutual fund directors)-Executive Committee, Chair of Policy Steering Committee, Governing Council. | | None. |
Stephen G. Stoneburn (73)
Committee Member
Portfolios Overseen: 88 | | Chairman (since July 2011), President and Chief Executive Officer (since June 1996) of Frontline Medical Communications (publishing company); formerly President (June 1995-June 1996) of Argus Integrated Media, Inc.; Senior Vice President and Managing Director (January 1993-1995) of Cowles Business Media; Senior Vice President of Fairchild Publications, Inc. (1975-1989). | | None. |
| | | | |
| Interested Committee Members(1) |
Name, Address, Age
Position(s)
Portfolios Overseen | | Principal Occupation(s) During Past Five Years | | Other Directorships Held During Past Five Years |
Stuart S. Parker (54)
Committee Member & President
Portfolios Overseen: 88 | | President of Prudential Investments LLC (since January 2012); Executive Vice President of Prudential Investment Management Services LLC (since December 2012); Executive Vice President of Jennison Associates LLC and Head of Retail Distribution of Prudential Investments LLC (June 2005-December 2011). | | None. |
| | | | |
| Interested Committee Members(1) |
Name, Address, Age
Position(s) Portfolios
Overseen | | Principal Occupation(s) During Past Five Years | | Other Directorships Held During Past Five Years |
Scott E. Benjamin (43)
Committee Member & Vice President Portfolios Overseen: 88 | | Executive Vice President (since June 2009) of Prudential Investments LLC; Executive Vice President (June 2009-June 2012) and Vice President (since June 2012) of Prudential Investment Management Services LLC; Executive Vice President (since September 2009) of AST Investment Services, Inc.; Senior Vice President of Product Development and Marketing, Prudential Investments (since February 2006); Vice President of Product Development and Product Management, Prudential Investments (2003-2006). | | None. |
Grace C. Torres* (57)
Committee Member
Portfolios Overseen: 86 | | Retired; formerly Treasurer and Principal Financial and Accounting Officer of the Prudential Investments Funds, Target Funds, Advanced Series Trust, Prudential Variable Contract Accounts and The Prudential Series Fund (1998-June 2014); Assistant Treasurer (March 1999-June 2014) and Senior Vice President (September 1999-June 2014) of Prudential Investments LLC; Assistant Treasurer (May 2003-June 2014) and Vice President (June 2005-June 2014) of AST Investment Services, Inc.; Senior Vice President and Assistant Treasurer (May 2003-June 2014) of Prudential Annuities Advisory Services, Inc. | | Director (since July 2015) of Sun Bancorp, Inc. N.A. |
* Note: Prior to her retirement in 2014, Ms. Torres was employed by Prudential Investments LLC. Due to her prior employment, she is considered to be an “interested person” under the 1940 Act. Ms. Torres is a Non-Management Interested Committee Member.
(1) The year that each Committee Member joined the VCA 10 and VCA 11 Committees is as follows: Ellen S. Alberding, 2013; Kevin J. Bannon, 2008; Linda W. Bynoe, 2008; Keith F. Hartstein, 2013; Michael S. Hyland, 2008; Richard A. Redeker, 2008; Stephen G. Stoneburn, 2008; Grace C. Torres, 2015; Stuart S. Parker, Committee Member since 2015 and President since 2012; Scott E. Benjamin, Committee Member since 2010 and Vice President since 2009.
| | | | |
| VCA 10/11 Officers(a) |
Name, Address and Age
Position with VCA 10/11 | | Principal Occupation(s) During Past Five Years | | Length of Service as VCA10/11 Officer |
Raymond A. O’Hara (61)
Chief Legal Officer | | Vice President and Corporate Counsel (since July 2010) of Prudential Insurance Company of America (Prudential); Vice President (March 2011-Present) of Pruco Life Insurance Company and Pruco Life Insurance Company of New Jersey; Vice President and Corporate Counsel (March 2011-Present) of Prudential Annuities Life Assurance Corporation; Chief Legal Officer of Prudential Investments LLC (since June 2012); Chief Legal Officer of Prudential Mutual Fund Services LLC (since June 2012) and Corporate Counsel of AST Investment Services, Inc. (since June 2012); formerly Assistant Vice President and Corporate Counsel (September 2008-July 2010) of The Hartford Financial Services Group, Inc.; formerly Associate (September 1980-December 1987) and Partner (January 1988–August 2008) of Blazzard & Hasenauer, P.C. (formerly, Blazzard, Grodd & Hasenauer, P.C.). | | Since 2012 |
Chad A. Earnst (41)
Chief Compliance Officer | | Chief Compliance Officer (September 2014-Present) of Prudential Investments LLC; Chief Compliance Officer (September 2014-Present) of the Prudential Investments Funds, Target Funds, Advanced Series Trust, The Prudential Series Fund, Prudential’s Gibraltar Fund, Inc., Prudential Global Short Duration High Yield Income Fund, Inc., Prudential Short Duration High Yield Fund, Inc. and Prudential Jennison MLP Income Fund, Inc.; formerly Assistant Director (March 2010-August 2014) of the Asset Management Unit, Division of Enforcement, US Securities & Exchange Commission; Assistant Regional Director (January 2010-August 2014), Branch Chief (June 2006-December 2009) and Senior Counsel (April 2003-May 2006) of the Miami Regional Office, Division of Enforcement, US Securities & Exchange Commission. | | Since 2014 |
Deborah A. Docs (59)
Secretary | | Vice President and Corporate Counsel (since January 2001) of Prudential; Vice President (since December 1996) and Assistant Secretary (since March 1999) of Prudential Investments LLC; formerly Vice President and Assistant Secretary (May 2003-June 2005) of AST Investment Services, Inc. | | Since 2004 |
| | | | |
| VCA 10/11 Officers(a) |
Name, Address and Age
Position with VCA 10/11 | | Principal Occupation(s) During Past Five Years | | Length of Service as VCA10/11 Officer |
Jonathan D. Shain (58)
Assistant Secretary | | Vice President and Corporate Counsel (since August 1998) of Prudential; Vice President and Assistant Secretary (since May 2001) of Prudential Investments LLC; Vice President and Assistant Secretary (since February 2001) of Prudential Mutual Fund Services LLC; formerly Vice President and Assistant Secretary (May 2003-June 2005) of AST Investment Services, Inc. | | Since 2005 |
Claudia DiGiacomo (42)
Assistant Secretary | | Vice President and Corporate Counsel (since January 2005) of Prudential; Vice President and Assistant Secretary of Prudential Investments LLC (since December 2005); Associate at Sidley Austin Brown & Wood LLP (1999-2004). | | Since 2005 |
Andrew R. French (54)
Assistant Secretary | | Vice President and Corporate Counsel (since February 2010) of Prudential; formerly Director and Corporate Counsel (2006-2010) of Prudential; Vice President and Assistant Secretary (since January 2007) of Prudential Investments LLC; Vice President and Assistant Secretary (since January 2007) of Prudential Mutual Fund Services LLC. | | Since 2006 |
Theresa C. Thompson (54)
Deputy Chief Compliance Officer | | Vice President, Compliance, Prudential Investments LLC (since April 2004); and Director, Compliance, Prudential Investments LLC (2001-2004). | | Since 2008 |
Charles H. Smith (43)
Anti-Money Laundering Compliance Officer | | Vice President, Corporate Compliance, Anti-Money Laundering Unit (since January 2015) of Prudential; committee member of the American Council of Life Insurers Anti-Money Laundering and Critical Infrastructure Committee (since January 2016); formerly Global Head of Economic Sanctions Compliance at AIG Property Casualty (February 2007-December 2014); Assistant Attorney General at the New York State Attorney General’s Office, Division of Public Advocacy. (August 1998-January 2007). | | Since 2016 |
M. Sadiq Peshimam (53)
Treasurer and Principal Financial and Accounting Officer | | Vice President (since 2005) of Prudential Investments LLC; formerly Assistant Treasurer of funds in the Prudential Mutual Fund Complex (2006-2014). | | Since 2006 |
Peter Parrella (58)
Assistant Treasurer | | Vice President (since 2007) and Director (2004-2007) within Prudential Mutual Fund Administration; formerly Tax Manager at SSB Citi Fund Management LLC (1997-2004). | | Since 2007 |
Lana Lomuti (49)
Assistant Treasurer | | Vice President (since 2007) and Director (2005-2007), within Prudential Mutual Fund Administration; formerly Assistant Treasurer (December 2007-February 2014) of The Greater China Fund, Inc. | | Since 2014 |
Linda McMullin (55)
Assistant Treasurer | | Vice President (since 2011) and Director (2008-2011) within Prudential Mutual Fund Administration. | | Since 2014 |
Kelly A. Coyne (48)
Assistant Treasurer | | Director, Investment Operations of Prudential Mutual Fund Services LLC (since 2010). | | Since 2015 |
(a) Excludes Mr. Parker and Mr. Benjamin, interested Committee Members who also serve as President and Vice President, respectively.
Explanatory Notes to Tables:
Committee Members are deemed to be “Interested,” as defined in the 1940 Act, by reason of their affiliation with Prudential Investments LLC and/or an affiliate of Prudential Investments LLC.
Unless otherwise noted, the address of all Committee Members and Officers is c/o Prudential Investments LLC, 655 Broad Street, Newark, New Jersey 07102-4410.
There is no set term of office for Committee Members or Officers. The Committee Members have adopted a retirement policy, which calls for the retirement of Committee Members on December 31 of the year in which they reach the age of 75.
“Other Directorships Held” includes only directorships of companies required to register or file reports with the SEC under the 1934 Act (that is, “public companies”) or other investment companies registered under the 1940 Act.
“Portfolios Overseen” includes all investment companies managed by Prudential Investments LLC. The investment companies for which Prudential Investments LLC serves as manager include the Prudential Investments Mutual Funds, The Prudential Variable Contract Accounts, Target Mutual Funds, Prudential Short Duration High Yield Fund, Inc., Prudential Global Short Duration High Yield Fund, Inc., The Prudential Series Fund, Prudential’s Gibraltar Fund, Inc. and the Advanced Series Trust.
The Prudential Series Fund
The following pages represent information on the Prudential Series Fund Portfolios. Returns are at the Portfolio level, not at the Subaccount level.
Each Subaccount of VCA-24 will invest in the corresponding Portfolio of the Prudential Series Fund (the “Fund”). Of the Portfolios comprising the Fund, seven Portfolios are presently available to The MEDLEY Program. The Diversified Bond Subaccount invests in the Diversified Bond Portfolio, the Government Income Subaccount in the Government Income Portfolio, the Conservative Balanced Subaccount in the Conservative Balanced Portfolio, the Flexible Managed Subaccount in the Flexible Managed Portfolio, the Stock Index Subaccount in the Stock Index Portfolio, the Equity Subaccount invests in the Equity Portfolio, and the Global Subaccount in the Global Portfolio.
There is no assurance that the investment objective of the Portfolios will be attained, nor is there any guarantee that the amount available to a Participant will equal or exceed the total contributions made on that Participant’s behalf. The value of the investments held in each account may fluctuate daily and is subject to the risks of both changing economic conditions and the selection of investments necessary to meet the Subaccounts’ or Portfolios’ objectives.
Important Note
This information supplements the financial statements and other information included in this Report to Participants in The MEDLEY Program. It highlights the investment performance of the seven portfolios of the Fund which are available through the Prudential Variable Contract Account-24. The rates of return quoted on the following pages reflect deduction of investment management fees and portfolio expenses, but not product charges. They reflect the reinvestment of dividend and capital gains distributions. They are not an estimate or a guarantee of future performance.
Contract unit values increase or decrease based on the performance of each corresponding Portfolio and when redeemed, may be worth more or less than original cost. Changes in contract values depend not only on the investment performance of each Portfolio but also on the insurance, administrative charges and applicable sales charges, if any, under a contract. These contract charges effectively reduce the dollar amount of any net gains and increase the dollar amount of any net losses.
| | |
The Prudential Series Fund, Conservative Balanced Portfolio | | December 31, 2016 |
Report of the Investment Manager - As of December 31, 2016 (Unaudited)
| | | | | | | | | | | | |
| Average Annual Total Returns | | 1-Year | | | 5-Year | | | 10-Year | |
Portfolio | | | 7.28 | % | | | 8.64 | % | | | 5.88 | % |
Blended Index | | | 7.11 | | | | 8.21 | | | | 5.58 | |
S&P 500 Index | | | 11.94 | | | | 14.65 | | | | 6.94 | |
Past performance does not guarantee future returns. The investment return and principal value of an investment will fluctuate, so that an investor’s shares, when redeemed, may be worth more or less than their original cost. Current performance may be lower or higher than the past performance data quoted.
Portfolio performance is net of investment fees and fund expenses, but not contract charges, which, if included, would significantly lower the performance quoted. Performance figures may reflect fee waivers and/or expense reimbursements. In the absence of such fee waivers and/or expense reimbursements, total returns would be lower.
$10,000 INVESTED OVER 10 YEARS
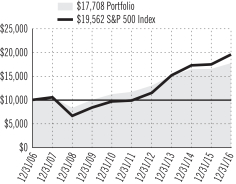
For the year ended December 31, 2016, the Conservative Balanced Portfolio returned 7.28%.
The net assets of the Portfolio at December 31, 2016 were $2,473.2 million.
The Portfolio’s investment objective is total investment return consistent with a conservatively managed diversified portfolio.
The Portfolio’s subadvisers are PGIM Fixed Income and Quantitative Management Associates LLC.
What were market conditions during the reporting period?
Following a global market sell-off from January through mid-February and after the UK’s June referendum to leave the European Union, 2016 culminated in Donald Trump’s victory in the November US presidential election. The election results had an immediate effect on global markets as investors looked to a reflationary environment and fiscal spending to boost economic growth. In December, the Federal Reserve raised short-term interest rates, only the second rate hike in the last decade. These two fourth-quarter events worked together to push interest rates higher, spark a rally in the US dollar, and provide a tailwind for US equity markets. The rise in interest rates had a negative impact on fixed income, while the strengthening US dollar weighed on international equity prices. Value stocks, however, had one of their best periods of the past few years, as did the small-cap segment of the US stock market.
What strategies or holdings affected the Portfolio’s performance?
The Portfolio benefited from asset allocation decisions throughout the reporting period. In the middle of the period, the Portfolio’s higher allocation to international equities was reduced in favor of US equities and maintained a smaller allocation to international equities through the fourth quarter when the asset class lagged US equities. In addition, the Portfolio shifted away from fixed income and into US equities early in the fourth quarter, which resulted in positive returns as bonds underperformed and US stocks outperformed through end of the period. The Portfolio’s cash position was kept below benchmark levels throughout the period, as investments in both fixed income and equities consistently seemed more attractive from a fundamental standpoint. At the close of the period, the portfolio was positioned with a slight overweight in equities, a slight underweight in fixed income, and a position in cash that was within guidelines.
Did the Portfolio use derivatives, and how did they affect performance?
The Portfolio used interest rate swaps to help manage duration and yield curve exposure. The use of interest rate swaps had a positive impact on performance during the reporting period. The Portfolio used futures to manage interest rate risk, which is a more efficient way of managing interest rate risk than through the purchase and sale of cash bonds. The use of futures had no material impact on the Portfolio’s performance during the reporting period. The Portfolio used credit default swaps to hedge credit risk of the portfolio in order to increase or decrease credit risk. Credit default swaps establish exposure to a desired credit or index within the letter and spirit of the investment guidelines. The use of credit default swaps had no material impact on performance in 2016. In addition, the Portfolio traded foreign exchange derivatives, which had no material impact on performance during the reporting period.
The Blended Index consists of the S&P 500 Index (50%), the Bloomberg Barclays US Aggregate Bond Index (40%), an unmanaged index comprised of more than 5,000 government and corporate bonds, and the 3-Month T-Bill Index (10%), an unmanaged market value-weighted index of investment grade fixed rate public obligations of the US Treasury with maturities of three months, excluding zero coupon strips. The S&P 500 Index is an unmanaged, market value-weighted index of over 500 stocks generally representative of the broad stock market. These returns do not include the effect of any investment management expenses. These returns would have been lower if they included the effect of these expenses. Investors cannot invest directly in a market index. For a complete list of holdings, refer to the Schedule of Investments section of this report.
1
| | |
| The Prudential Series Fund, Diversified Bond Portfolio | | December 31, 2016 |
Report of the Investment Manager - As of December 31, 2016 (Unaudited)
| | | | | | | | | | | | |
| Average Annual Total Returns | | 1-Year | | | 5-Year | | | 10-Year | |
Portfolio | | | 5.59 | % | | | 4.39 | % | | | 6.12 | % |
Bloomberg Barclays U.S. Aggregate Bond Index | | | 2.65 | | | | 2.23 | | | | 4.34 | |
Past performance does not guarantee future returns. The investment return and principal value of an investment will fluctuate, so that an investor’s shares, when redeemed, may be worth more or less than their original cost. Current performance may be lower or higher than the past performance data quoted.
Portfolio performance is net of investment fees and fund expenses, but not contract charges, which, if included, would significantly lower the performance quoted. Performance figures may reflect fee waivers and/or expense reimbursements. In the absence of such fee waivers and/or expense reimbursements, total returns would be lower.
$10,000 INVESTED OVER 10 YEARS
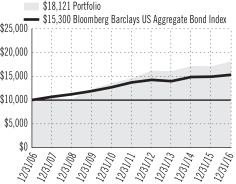
For the year ended December 31, 2016, the Diversified Bond Portfolio returned 5.59%.
The net assets of the Portfolio at December 31, 2016 were $1,104.6 million.
The Portfolio’s investment objective is a high level of income over a longer term while providing reasonable safety of capital. The Portfolio’s subadviser is PGIM Fixed Income.
What were market conditions during the reporting period?
The broad fixed income market generated positive returns during 2016, in spite of setbacks during February and the fourth quarter. The gain came amid a number of surprises, including a commodity price decline and rebound, Britain’s decision to leave the European Union (commonly called Brexit), and the Republican sweep of Congress and the White House.
Investment-grade corporate bonds began the reporting period under pressure, as commodity price weakness, global growth concerns, and a stronger US dollar caused credit spreads to widen. (Credit spreads are the amount of extra yield that corporate bonds provide over similar-duration Treasuries.) Spreads then tightened at the beginning of the second quarter as commodity prices stabilized and were buoyed by strong investor demand. During the rest of the reporting period, despite political uncertainty, a pickup in mergers and acquisitions activity, and hawkishness from central bank officials, investment-grade corporate bonds advanced. They generally benefited from improved economic data, supportive central bank policies, and Donald Trump’s surprise victory in the US election, even during a calendar year of record issuance.
What strategies or holdings affected the Portfolio’s performance?
During the period, security selection was a large positive contributor to the Portfolio’s performance, highlighted by positions in non-agency mortgage-backed securities, investment-grade corporate bonds, emerging markets debt, collateralized loan obligations, and commercial mortgage-backed securities (CMBS). Security selection in high yield corporate bonds detracted from results. Within its holdings of corporate bonds, the Portfolio benefited from positions in upstream energy and consumer non-cyclical names and was hurt by positions in health care & pharmaceutical, midstream energy, and banking bonds. Investments in non-US, non-corporate bonds added to performance. At the sector level, the Portfolio’s exposure to high yield corporate bonds, CMBS, investment-grade corporate bonds, bank loans, and emerging markets debt added to returns. The combined impact of the Portfolio’s duration and yield curve strategies was negative during the period. Duration is a measure of a bond’s price sensitivity to interest rates over time.
Did the Portfolio use derivatives, and how did they affect performance?
During the period, the Portfolio used interest rate swaps to help manage duration and yield curve exposure. The use of interest rate swaps had a positive impact on performance during the reporting period. The Portfolio used futures to manage interest rate risk, which is a more efficient way of managing interest rate risk than through the purchase and sale of cash bonds. The use of futures had no material impact on the Portfolio’s performance during the reporting period. In addition, the Portfolio traded foreign exchange derivatives, which had no material impact on performance during the reporting period. The Portfolio used interest rate swaps to help manage duration and yield curve exposure. The use of interest rate swaps had a positive impact on performance during the reporting period. The Portfolio used futures to manage interest rate risk, which is a more efficient way of managing interest rate risk than through the purchase and sale of cash bonds. The use of futures had no material impact on the Portfolio’s performance during the reporting period. The Portfolio used credit default swaps to hedge credit risk of the portfolio in order to increase or decrease credit risk. Credit default swaps establish exposure to a desired credit or index within the letter and spirit of the investment guidelines. The use of credit default swaps had no material impact on performance in 2016. In addition, the Portfolio traded foreign exchange derivatives, which had no material impact on performance during the reporting period.
The Bloomberg Barclays US Aggregate Bond Index is an unmanaged index comprised of more than 5,000 government and corporate bonds. These returns do not include the effect of any investment management expenses. These returns would have been lower if they included the effect of these expenses. Investors cannot invest directly in a market index. For a complete list of holdings, refer to the Schedule of Investments section of this report.
2
| | |
| The Prudential Series Fund, Equity Portfolio | | December 31, 2016 |
Report of the Investment Manager - As of December 31, 2016 (Unaudited)
| | | | | | | | | | | | |
| Average Annual Total Returns | | 1-Year | | | 5-Year | | | 10-Year | |
Portfolio: Class I | | | 3.78 | % | | | 11.67 | % | | | 5.77 | % |
Portfolio: Class II | | | 3.35 | | | | 11.23 | | | | 5.35 | |
Russell 1000® Index | | | 12.05 | | | | 14.69 | | | | 7.08 | |
S&P 500 Index | | | 11.94 | | | | 14.65 | | | | 6.94 | |
Past performance does not guarantee future returns. The investment return and principal value of an investment will fluctuate, so that an investor’s shares, when redeemed, may be worth more or less than their original cost. Current performance may be lower or higher than the past performance data quoted.
Portfolio performance is net of investment fees and fund expenses, but not contract charges, which, if included, would significantly lower the performance quoted. Performance figures may reflect fee waivers and/or expense reimbursements. In the absence of such fee waivers and/or expense reimbursements, total returns would be lower.
$10,000 INVESTED OVER 10 YEARS1
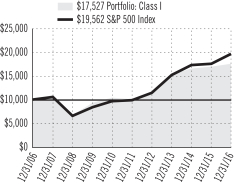
The Russell 1000® Index is a trademark/service mark of the Frank Russell Company. Russell® is a trademark of the Frank Russell Company.
For the year ended December 31, 2016, Equity Portfolio Class I shares returned 3.78% and Class II shares returned 3.35%.
The net assets of the Portfolio at December 31, 2016 were $3,743.4 million.
The Portfolio’s investment objective is long-term growth of capital. The Portfolio’s subadviser is Jennison Associates LLC.
What were market conditions during the reporting period?
2016 was a year of volatility and surprises. China’s decelerating economic growth; the negative effect of lower energy prices on industrials; fears of slowing US economic growth; uncertainty about the course of Federal Reserve monetary tightening; the United Kingdom’s vote to leave the European Union; and anxiety about the unconventional US presidential election contributed to volatility. US dollar strength persisted throughout 2016, as superior US economic growth drove a strong preference for the dollar and dollar-denominated assets.
What strategies or holdings affected the Portfolio’s performance?
There was significant disparity among market segments during the year. Value significantly outperformed growth across capitalizations and small outperformed large and midcaps.
The Portfolio underperformed the Russell 1000 Index. Health care positions, especially those in pharmaceuticals and biotechnology, detracted from absolute and relative returns. Many health care companies faced concerns about drug pricing. Biotechnology companies that sell innovative, high-priced drugs lost ground, including Alexion Pharmaceuticals and Regeneron Pharmaceuticals. Jennison believes that the long-term fundamentals of the Portfolio’s biotechnology holdings remain intact and that current valuations underestimate the potential of pipeline drugs.
Allergan has grown in size and scope and appears to be on track to be a leader in global growth pharmaceuticals. Although Allergan’s development pipeline could be meaningfully more productive than investors currently assume, and its strong balance sheet should allow for significant capital deployment, the company has hit bumps in the road that may indicate that its transition is still in progress.
Shire — with product franchises in neuroscience, gastrointestinal, and rare diseases — has been transforming itself into a leading orphan disease company. The stock’s recent weakness may have been related to news that Roche expects to release clinical trial data for a developmental hemophilia treatment that could potentially compete with Shire hemophilia drugs.
Uncertainty around mergers and acquisitions for Teva, and pharmaceutical companies in general, caused volatility in its share price. The US Federal Trade Commission approved its acquisition to acquire Allergan’s generics business. The position was eliminated due to a reduced outlook on its generics business.
Stock selection in information technology also detracted from performance. LinkedIn is a leading global online professional network that provides what is considered unique access to a job candidate database. While its long-term potential is attractive, the position was eliminated due to decelerating growth.
Semiconductor maker NVIDIA posted a substantial gain in the period. Jennison believes it is uniquely positioned in its markets, potentially driving several years of strong growth.
Financials were the largest source of absolute and relative gain as a better outlook for a fiscal spending stimulus, higher rates, better economic growth, and regulatory relief benefited many positions in the sector. Goldman Sachs, JP Morgan, and SLM were standouts in the sector and the overall Portfolio.
| 1 | The graph is based on the performance of Class I shares. Performance of Class II shares will be lower due to differences in the fee structure. Class II shares have associated 12b-1 and administrative fees at an annual rate of 0.25% and 0.15%, respectively, of the average daily net assets of the Class II shares. |
The Russell 1000® Index is an unmanaged market cap-weighted index that measures the performance of the 1,000 largest companies in the Russell 3000 Index, which represents approximately 92% of the total market. The S&P 500 Index is an unmanaged, market value-weighted index of over 500 stocks generally representative of the broad stock market. These returns do not include the effect of any investment management expenses. These returns would have been lower if they included the effect of these expenses. Investors cannot invest directly in a market index. For a complete list of holdings, refer to the Schedule of Investments section of this report.
Jennison Associates LLC is a registered investment adviser and a Prudential Financial company.
3
| | |
| The Prudential Series Fund, Flexible Managed Portfolio | | December 31, 2016 |
Report of the Investment Manager - As of December 31, 2016 (Unaudited)
| | | | | | | | | | | | |
| Average Annual Total Returns | | 1-Year | | | 5-Year | | | 10-Year | |
Portfolio | | | 8.52 | % | | | 10.64 | % | | | 6.40 | % |
Blended Index | | | 8.16 | | | | 9.56 | | | | 6.02 | |
S&P 500 Index | | | 11.94 | | | | 14.65 | | | | 6.94 | |
Past performance does not guarantee future returns. The investment return and principal value of an investment will fluctuate, so that an investor’s shares, when redeemed, may be worth more or less than their original cost. Current performance may be lower or higher than the past performance data quoted.
Portfolio performance is net of investment fees and fund expenses, but not contract charges, which, if included, would significantly lower the performance quoted. Performance figures may reflect fee waivers and/or expense reimbursements. In the absence of such fee waivers and/or expense reimbursements, total returns would be lower.
$10,000 INVESTED OVER 10 YEARS
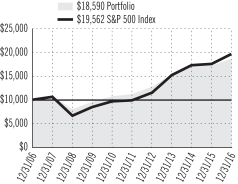
For the year ending December 31, 2016, the Flexible Managed Portfolio returned 8.52%.
The net assets of the Portfolio at December 31, 2016 were $3,889.8 million.
The Portfolio’s investment objective is total investment return consistent with an aggressively managed diversified portfolio.
The Portfolio’s subadvisers are PGIM, Inc. and Quantitative Management Associates LLC.
What were market conditions during the reporting period?
Following a global market sell-off from January through mid-February and the leave result in the UK’s June referendum about membership in the European Union, 2016 culminated in Donald Trump’s victory in the November US presidential election. The election results had an immediate effect on global markets, as investors looked to a reflationary environment and fiscal spending to boost economic growth. In December, the Federal Reserve raised short-term interest rates, only the second rate hike in the last decade. These two fourth-quarter events worked together to push up interest rates, spark a rally in the US dollar, and provide a tailwind for US equity markets. The rise in interest rates had a negative impact on fixed income, while the strengthening US dollar weighed on international equity prices. However, value stocks had one of their best periods of the past few years, as did the small-cap segment of the US stock market.
What strategies or holdings affected the Portfolio’s performance?
The Portfolio benefited from our asset allocation decisions throughout the reporting period. In the middle of the period, we reduced the Portfolio’s higher allocation to international equities in favor of cash and maintained a smaller allocation to international equities through the fourth quarter when the asset class lagged US equities. After keeping the Portfolio at a guideline weight in fixed income for most of the year, we shifted it away from fixed income and into US equities early in the fourth quarter, which resulted in positive returns as bonds underperformed and US stocks outperformed through the end of the period. The Portfolio’s cash position slightly below benchmark levels throughout the period, as investments in both fixed income and equities consistently seemed more attractive from a fundamental standpoint. At the close of the period, the Portfolio was positioned with a slight overweight in equities, a slight underweight in fixed income, and a position in cash that was within guidelines.
Did the Portfolio use derivatives, and how did they affect performance?
Derivatives, in the form of international futures contracts, were used during the year to gain exposure to international equity markets. The impact on the Portfolio was immaterial to performance. The Portfolio used interest rate swaps to help manage duration and yield curve exposure. The use of interest rate swaps had a positive impact on performance during the reporting period. The Portfolio used futures to manage interest rate risk, which is a more efficient way of managing interest rate risk than through the purchase and sale of cash bonds. The use of futures had no material impact on the Portfolio’s performance during the reporting period. The Portfolio used options to buy or sell a specific amount of a given security, at a specific price during a specific period of time. Options are used as an efficient and cost effective way to gain exposure to a particular security. They are also used to manage risk and portfolio volatility. The use of options had no material impact on performance in 2016. The Portfolio also used credit default swaps to hedge credit risk of the portfolio in order to increase or decrease credit risk. Credit default swaps establish exposure to a desired credit or index within the letter and spirit of the investment guidelines. The use of credit default swaps had no material impact on performance in 2016. In addition, the Portfolio traded foreign exchange derivatives, which had no material impact on performance during the reporting period.
The Blended Index consists of the S&P 500 Index (60%), the Bloomberg Barclays U.S. Aggregate Bond Index (35%), an unmanaged index comprised of more than 5,000 government and corporate bonds, and the 3-Month T-Bill Index (5%), an unmanaged market value-weighted index of investment grade fixed rate public obligations of the U.S. Treasury with maturities of three months, excluding zero coupon strips. The S&P 500 Index is an unmanaged, market value-weighted index of over 500 stocks generally representative of the broad stock market. These returns do not include the effect of any investment management expenses. These returns would have been lower if they included the effect of these expenses. Investors cannot invest directly in a market index. For a complete list of holdings, refer to the Schedule of Investments section of this report.
PGIM, Inc., and Quantitative Management Associates LLC are registered investment advisers and are Prudential Financial companies.
4
| | |
| The Prudential Series Fund, Global Portfolio | | December 31, 2016 |
Report of the Investment Manager - As of December 31, 2016 (Unaudited)
| | | | | | | | | | | | |
| Average Annual Total Returns | | 1-Year | | | 5-Year | | | 10-Year | |
Portfolio | | | 4.44 | % | | | 10.55 | % | | | 3.68 | % |
MSCI World Index (GD) | | | 8.15 | | | | 11.04 | | | | 4.41 | |
Past performance does not guarantee future returns. The investment return and principal value of an investment will fluctuate, so that an investor’s shares, when redeemed, may be worth more or less than their original cost. Current performance may be lower or higher than the past performance data quoted.
Portfolio performance is net of investment fees and fund expenses, but not contract charges, which, if included, would significantly lower the performance quoted. Performance figures may reflect fee waivers and/or expense reimbursements. In the absence of such fee waivers and/or expense reimbursements, total returns would be lower.
$10,000 INVESTED OVER 10 YEARS
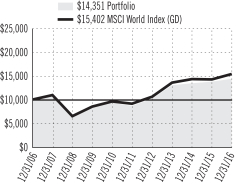
For the year ended December 31, 2016, the Global Portfolio returned 4.44%.
The net assets of the Portfolio at December 31, 2016 were $955.4 million.
The Portfolio’s investment objective is long-term growth of capital. The Portfolio’s subadvisers are: Brown Advisory (Brown), LLC, (US growth stocks), T. Rowe Price Associates, Inc. (US value stocks), William Blair & Company LLC (international growth stocks), LSV Asset Management (international value stocks), and Quantitative Management Associates LLC.
What were market conditions during the reporting period?
In a difficult environment for active managers, investors moved between buying and selling high-dividend-yielding stocks, as speculation swirled around the timing and magnitude of Federal Reserve rate hikes. In addition, volatility surrounding the UK’s vote to leave the European Union (commonly known as Brexit) and the US elections caused many managers to underperform, as markets tended to move against consensus expectations for these events.
What strategies or holdings affected the Portfolio’s performance?
All of the Portfolio’s subadvisers underperformed their respective style-specific indices in this challenging environment for active managers. Furthermore, only one of the Portfolio’s four subadvisers was able to outperform the Portfolio’s benchmark index. The large-cap value portion of the Portfolio was the only positive contributor to overall relative performance, driven primarily by strong absolute returns in US large-cap value stocks relative to other areas of the global equity markets. The Portfolio was hurt by its underexposure to dividend-paying stocks, as these higher-quality stocks were strongly rewarded in the first half of the reporting period.
The MSCI World Index (GD) - The Morgan Stanley Capital International World Index is an unmanaged capitalization weighted index which includes the equity markets of Australia, Austria, Belgium, Canada, Denmark, Finland, France, Germany, Hong Kong, Ireland, Italy, Japan, Malaysia, Netherlands, New Zealand, Norway, Singapore, Spain, Sweden, Switzerland, United Kingdom, and United States. The GD version does not reflect the impact of withholding taxes on reinvested dividends. These returns do not include the effect of any investment management expenses. These returns would have been lower if they included the effect of these expenses. Investors cannot invest directly in a market index. For a complete list of holdings, refer to the Schedule of Investments section of this report.
5
| | |
| The Prudential Series Fund, Government Income Portfolio | | December 31, 2016 |
Report of the Investment Manager - As of December 31, 2016 (Unaudited)
| | | | | | | | | | | | |
| Average Annual Total Returns | | 1-Year | | | 5-Year | | | 10-Year | |
Portfolio | | | 2.17 | % | | | 1.96 | % | | | 4.18 | % |
Bloomberg Barclays Government Bond Index | | | 1.05 | | | | 1.22 | | | | 3.86 | |
Past performance does not guarantee future returns. The investment return and principal value of an investment will fluctuate, so that an investor’s shares, when redeemed, may be worth more or less than their original cost. Current performance may be lower or higher than the past performance data quoted.
Portfolio performance is net of investment fees and fund expenses, but not contract charges, which, if included, would significantly lower the performance quoted. Performance figures may reflect fee waivers and/or expense reimbursements. In the absence of such fee waivers and/or expense reimbursements, total returns would be lower.
$10,000 INVESTED OVER 10 YEARS
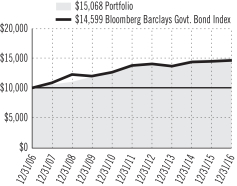
For the year ended December 31, 2016, the Government Income Portfolio returned 2.17%.
The net assets of the Portfolio at December 31, 2016 were $226.3 million.
The Portfolio’s investment objective is a high level of income over the long term consistent with the preservation of capital. The Portfolio’s subadviser is PGIM Fixed Income.
What were market conditions during the reporting period?
The broad fixed income market generated positive returns during 2016, in spite of a setback during the fourth quarter. The gain came amid a number of surprises, including a commodity price decline and rebound, Britain’s decision to leave the European Union (commonly called Brexit), and the Republican sweep of Congress and the White House.
Interest rates in most developed countries encountered steady headwinds in late 2016 amid expectations for expanded fiscal policies in the US, signs of policy restraint or tightening from major central banks, and firming inflation prospects as oil prices rose.
The Federal Reserve (Fed) raised short-term rates in December, as widely expected, but its hawkish trajectory for rate hikes in 2017 was a surprise. The Fed’s “dot plot,” which shows the projections of the 16 members of the Fed’s rate-setting body, anticipated three rate increases in 2017 — an increase from the prior projection of two hikes — and three increases in 2018 and 2019, respectively. Nevertheless, long-term Fed fund futures, which are used by investors to hedge against or speculate on changes in Fed monetary policy, remained stable at the end of the reporting period.
What strategies or holdings affected the Portfolio’s performance?
During the period, security selection was a strong driver of the Portfolio’s outperformance, highlighted by positions among interest rate swaps, collateralized loan obligations, and agency securities. Security selection in commercial mortgage-backed securities (CMBS) hurt performance.
Sector allocations also added to performance, with the Portfolio’s overweight in CMBS the largest positive contributor to returns. The Portfolio’s positioning for a flatter US yield curve detracted from performance, while its tactical long duration position bolstered results. Yield curves are single line graphs that illustrate the relationship between the yields and maturities of fixed income securities. They are created by plotting the yields of different maturities for the same type of bonds. Duration measures the approximate price change of a bond portfolio for a given change in interest rates.
Did the Portfolio use derivatives, and how did they affect performance?
During the period, the Portfolio used interest rate swaps to help manage duration and yield curve exposure. The use of interest rate swaps had a positive impact on performance during the reporting period. The Portfolio used futures to manage the Portfolio’s interest rate risk, which is a more efficient way of managing interest rate risk than through the purchases and sales of cash bonds. The use of futures had no material impact on the Portfolio’s performance during the reporting period.
The Bloomberg Barclays Government Bond Index is a weighted unmanaged index comprised of securities issued or backed by the US Government, its agencies, and instrumentalities with a remaining maturity of one to 30 years. These returns do not include the effect of any investment management expenses. These returns would have been lower if they included the effect of these expenses. Investors cannot invest directly in a market index. For a complete list of holdings, refer to the Schedule of Investments section of this report.
6
| | |
| The Prudential Series Fund, Stock Index Portfolio | | December 31, 2016 |
Report of the Investment Manager - As of December 31, 2016 (Unaudited)
| | | | | | | | | | | | |
| Average Annual Total Returns | | 1-Year | | | 5-Year | | | 10-Year | |
Portfolio | | | 11.83 | % | | | 14.36 | % | | | 6.68 | % |
S&P 500 Index | | | 11.94 | | | | 14.65 | | | | 6.94 | |
Past performance does not guarantee future returns. The investment return and principal value of an investment will fluctuate, so that an investor’s shares, when redeemed, may be worth more or less than their original cost. Current performance may be lower or higher than the past performance data quoted.
Portfolio performance is net of investment fees and fund expenses, but not contract charges, which, if included, would significantly lower the performance quoted. Performance figures may reflect fee waivers and/or expense reimbursements. In the absence of such fee waivers and/or expense reimbursements, total returns would be lower.
$10,000 INVESTED OVER 10 YEARS
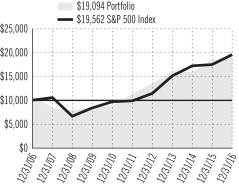
For the year ended December 31, 2016, the Stock Index Portfolio returned 11.83%.
The net assets of the Portfolio at December 31, 2016 were $3,305.1 million.
The Portfolio’s investment objective is to achieve investment results that generally correspond to the performance of publicly traded common stocks.
The Portfolio’s subadviser is Quantitative Management Associates LLC (QMA).
What were market conditions during the reporting period?
Following a global market sell-off from January through mid-February and the UK’s vote to leave the European Union in June, 2016 culminated in Donald Trump’s victory in the November US presidential election. The election results had an immediate effect on global markets, as investors looked to a reflationary environment and fiscal spending to boost economic growth. In December, the Federal Reserve raised short-term interest rates, only the second rate hike in the last decade. These two fourth-quarter events worked together to push up interest rates, spark a rally in the US dollar, and provide a tailwind for US equity markets. The rise in interest rates had a negative impact on fixed income, while the strengthening US dollar weighed on international equity returns. However, value stocks had one of their best periods of the past few years, as did the small-cap segment of the US stock market.
What strategies or holdings affected the Portfolio’s performance?
Potential tracking error differences (the difference between the return of the Portfolio and the return of the benchmark), brokerage costs, and other costs and expenses of the Portfolio may cause its return to be lower than that of the S&P 500 Index. The Portfolio slightly underperformed the Index during the reporting period.
Did the Portfolio’s use of derivatives affect performance?
During the period, the Portfolio had a small exposure to derivative instruments to help enhance its liquidity, but the position did not have a material impact on its performance.
The S&P 500 Index is an unmanaged, market value-weighted index of over 500 stocks generally representative of the broad stock market. These returns do not include the effect of any investment management expenses. These returns would have been lower if they included the effect of these expenses. Investors cannot invest directly in a market index. For a complete list of holdings, refer to the Schedule of Investments section of this report.
7
| | |
The Prudential Series Fund Fees and Expenses — unaudited | | December 31, 2016 |
As a contract owner investing in Portfolios of the Fund through a variable annuity or variable life contract, you incur ongoing costs, including management fees, and other Portfolio expenses. This example is intended to help you understand your ongoing costs (in dollars) of investing in the Fund and to compare these costs with the ongoing costs of investing in other investment options. This example does not reflect fees and charges under your variable annuity or variable life contract. If contract charges were included, the costs shown below would be higher. Please consult the prospectus for your contract for more information about contract fees and charges.
The example is based on an investment of $1,000 invested at the beginning of the period and held for the entire period July 1, 2016 through December 31, 2016.
Actual Expenses
The first line of the table below provides information about actual account values and actual expenses. You may use this information, together with the amount you invested, to estimate the Portfolio expenses that you paid over the period. Simply divide your account value by $1,000 (for example, an $8,600 account value divided by $1,000 = 8.6), then multiply the result by the number in the first line under the heading entitled “Expenses Paid During the Six-Month Period” to estimate the Portfolio expenses you paid on your account during this period. As noted above, the table does not reflect variable contract fees and charges.
Hypothetical Example for Comparison Purposes
The second line of the table below provides information about hypothetical account values and hypothetical expenses based on the Portfolio’s actual expense ratio and an assumed rate of return of 5% per year before expenses, which is not the Portfolio’s actual return. The hypothetical account values and expenses may not be used to estimate the actual ending account balance or expenses you paid for the period. You may use this information to compare the ongoing costs of investing in the Portfolio and other investment options. To do so, compare this 5% hypothetical example with the 5% hypothetical examples that appear in the shareholder reports of the other investment options.
Please note that the expenses shown in the table are meant to highlight your ongoing Portfolio costs only and do not reflect any contract fees and charges, such as sales charges (loads), insurance charges or administrative charges. Therefore the second line of the table is useful to compare ongoing investment option costs only, and will not help you determine the relative total costs of owning different contracts. In addition, if these contract fee and charges were included, your costs would have been higher.
| | | | | | | | | | | | | | | | | | |
| The Prudential Series Fund Portfolios | | Beginning
Account Value
July 1, 2016 | | | Ending
Account Value
December 31, 2016 | | | Annualized Expense
Ratio based on the
Six-Month period | | | Expenses Paid
During the
Six-Month period* | |
| Conservative Balanced (Class I) | | Actual | | $ | 1,000.00 | | | $ | 1,029.40 | | | | 0.58 | % | | $ | 2.96 | |
| | | Hypothetical | | $ | 1,000.00 | | | $ | 1,022.22 | | | | 0.58 | % | | $ | 2.95 | |
| Diversified Bond (Class I) | | Actual | | $ | 1,000.00 | | | $ | 986.30 | | | | 0.42 | % | | $ | 2.10 | |
| | | Hypothetical | | $ | 1,000.00 | | | $ | 1,023.03 | | | | 0.42 | % | | $ | 2.14 | |
| Equity (Class I) | | Actual | | $ | 1,000.00 | | | $ | 1,092.60 | | | | 0.47 | % | | $ | 2.47 | |
| | | Hypothetical | | $ | 1,000.00 | | | $ | 1,022.77 | | | | 0.47 | % | | $ | 2.39 | |
| Equity (Class II) | | Actual | | $ | 1,000.00 | | | $ | 1,090.20 | | | | 0.87 | % | | $ | 4.57 | |
| | | Hypothetical | | $ | 1,000.00 | | | $ | 1,020.76 | | | | 0.87 | % | | $ | 4.42 | |
| Flexible Managed (Class I) | | Actual | | $ | 1,000.00 | | | $ | 1,048.40 | | | | 0.63 | % | | $ | 3.24 | |
| | | Hypothetical | | $ | 1,000.00 | | | $ | 1,021.97 | | | | 0.63 | % | | $ | 3.20 | |
| Global (Class I) | | Actual | | $ | 1,000.00 | | | $ | 1,051.20 | | | | 0.79 | % | | $ | 4.07 | |
| | | Hypothetical | | $ | 1,000.00 | | | $ | 1,021.17 | | | | 0.79 | % | | $ | 4.01 | |
| Government Income (Class I) | | Actual | | $ | 1,000.00 | | | $ | 973.00 | | | | 0.52 | % | | $ | 2.58 | |
| | | Hypothetical | | $ | 1,000.00 | | | $ | 1,022.52 | | | | 0.52 | % | | $ | 2.64 | |
| Stock Index (Class I) | | Actual | | $ | 1,000.00 | | | $ | 1,076.20 | | | | 0.32 | % | | $ | 1.67 | |
| | | Hypothetical | | $ | 1,000.00 | | | $ | 1,023.53 | | | | 0.32 | % | | $ | 1.63 | |
* Portfolio expenses (net of fee waivers or subsidies, if any) for each share class are equal to the annualized expense ratio, multiplied by the average account value over the period, multiplied by the 184 days in the six-month period ended December 31, 2016, and divided by the 366 days in the Portfolio's fiscal year ended December 31, 2016 (to reflect the six-month period). Expenses presented in the table include the expenses of any underlying portfolios in which the Portfolio may invest.
| | | | | | |
| | | CONSERVATIVE BALANCED PORTFOLIO | | |
| |
| SCHEDULE OF INVESTMENTS | | as of December 31, 2016 |
| | | | | | | | |
| LONG-TERM INVESTMENTS — 87.8% | | | Value
(Note 2)
| |
| COMMON STOCKS — 50.5% | | Shares
| | |
Aerospace & Defense — 1.1% | |
Arconic, Inc. | | | 26,980 | | | $ | 500,209 | |
BAE Systems PLC (United Kingdom) | | | 6,267 | | | | 45,583 | |
Boeing Co. (The) | | | 37,150 | | | | 5,783,512 | |
General Dynamics Corp. | | | 18,300 | | | | 3,159,678 | |
L3 Technologies, Inc. | | | 5,100 | | | | 775,761 | |
Lockheed Martin Corp. | | | 16,300 | | | | 4,074,022 | |
Northrop Grumman Corp. | | | 11,362 | | | | 2,642,574 | |
Raytheon Co. | | | 18,800 | | | | 2,669,600 | |
Rockwell Collins, Inc. | | | 8,200 | | | | 760,632 | |
Safran SA (France) | | | 568 | | | | 40,853 | |
Textron, Inc. | | | 17,100 | | | | 830,376 | |
Thales SA (France) | | | 1,785 | | | | 172,933 | |
TransDigm Group, Inc.(a) | | | 3,400 | | | | 846,464 | |
United Technologies Corp. | | | 49,300 | | | | 5,404,266 | |
| | | | | | |
|
|
|
| | | | | | | | 27,706,463 | |
| | | | | | |
|
|
|
Air Freight & Logistics — 0.4% | |
C.H. Robinson Worldwide, Inc.(a) | | | 9,200 | | | | 673,992 | |
Deutsche Post AG (Germany) | | | 1,764 | | | | 57,851 | |
Expeditors International of Washington, Inc.(a) | | | 11,000 | | | | 582,560 | |
FedEx Corp. | | | 15,700 | | | | 2,923,340 | |
United Parcel Service, Inc. (Class B Stock) | | | 43,800 | | | | 5,021,232 | |
| | | | | | |
|
|
|
| | | | | | | | 9,258,975 | |
| | | | | | |
|
|
|
Airlines — 0.3% | |
Alaska Air Group, Inc. | | | 8,000 | | | | 709,840 | |
American Airlines Group, Inc.(a) | | | 33,100 | | | | 1,545,439 | |
Delta Air Lines, Inc.(a) | | | 48,500 | | | | 2,385,715 | |
Deutsche Lufthansa AG (Germany) | | | 11,224 | | | | 144,686 | |
International Consolidated Airlines Group SA (United Kingdom) | | | 3,186 | | | | 17,164 | |
Singapore Airlines Ltd. (Singapore) | | | 3,300 | | | | 21,984 | |
Southwest Airlines Co. | | | 39,600 | | | | 1,973,664 | |
United Continental Holdings, Inc.* | | | 19,200 | | | | 1,399,296 | |
| | | | | | |
|
|
|
| | | | | | | | 8,197,788 | |
| | | | | | |
|
|
|
Auto Components — 0.1% | |
Aisin Seiki Co. Ltd. (Japan) | | | 3,600 | | | | 155,770 | |
BorgWarner, Inc. | | | 14,000 | | | | 552,160 | |
Cie Generale des Etablissements Michelin (France) | | | 997 | | | | 110,826 | |
Delphi Automotive PLC | | | 16,900 | | | | 1,138,215 | |
Goodyear Tire & Rubber Co. (The) | | | 16,300 | | | | 503,181 | |
Koito Manufacturing Co. Ltd. (Japan) | | | 400 | | | | 21,124 | |
Valeo SA (France) | | | 1,685 | | | | 96,732 | |
| | | | | | |
|
|
|
| | | | | | | | 2,578,008 | |
| | | | | | |
|
|
|
Automobiles — 0.3% | |
Bayerische Motoren Werke AG (Germany) | | | 541 | | | | 50,387 | |
Ferrari NV (Italy) | | | 218 | | | | 12,692 | |
Fiat Chrysler Automobiles NV (United Kingdom) | | | 3,504 | | | | 31,875 | |
Ford Motor Co. | | | 244,185 | | | | 2,961,964 | |
Fuji Heavy Industries Ltd. (Japan) | | | 1,000 | | | | 40,744 | |
| | | | | | | | |
COMMON STOCKS
(continued) | | Shares
| | | Value
(Note 2)
| |
| | |
Automobiles (continued) | |
General Motors Co. | | | 88,000 | | | $ | 3,065,920 | |
Harley-Davidson, Inc. | | | 11,000 | | | | 641,740 | |
Honda Motor Co. Ltd. (Japan) | | | 3,300 | | | | 96,345 | |
Mazda Motor Corp. (Japan) | | | 2,200 | | | | 35,825 | |
Mitsubishi Motors Corp. (Japan) | | | 1,400 | | | | 7,959 | |
Nissan Motor Co. Ltd. (Japan) | | | 4,400 | | | | 44,137 | |
Peugeot SA (France)* | | | 974 | | | | 15,864 | |
Renault SA (France) | | | 342 | | | | 30,375 | |
Suzuki Motor Corp. (Japan) | | | 5,000 | | | | 175,544 | |
Toyota Motor Corp. (Japan) | | | 4,400 | | | | 257,965 | |
Volkswagen AG (Germany) | | | 123 | | | | 17,654 | |
| | | | | | |
|
|
|
| | | | | | | | 7,486,990 | |
| | | | | | |
|
|
|
Banks — 3.5% | |
Aozora Bank Ltd. (Japan) | | | 2,000 | | | | 7,066 | |
Bank Hapoalim BM (Israel) | | | 27,327 | | | | 162,200 | |
Bank of America Corp. | | | 649,121 | | | | 14,345,574 | |
BB&T Corp. | | | 52,100 | | | | 2,449,742 | |
Bendigo & Adelaide Bank Ltd. (Australia) | | | 18,079 | | | | 165,383 | |
BNP Paribas SA (France) | | | 4,997 | | | | 318,000 | |
BOC Hong Kong Holdings Ltd. (Hong Kong) | | | 46,000 | | | | 163,832 | |
Citigroup, Inc. | | | 183,685 | | | | 10,916,400 | |
Citizens Financial Group, Inc. | | | 31,700 | | | | 1,129,471 | |
Comerica, Inc. | | | 11,000 | | | | 749,210 | |
Commonwealth Bank of Australia (Australia) | | | 882 | | | | 52,324 | |
Concordia Financial Group Ltd. (Japan) | | | 4,700 | | | | 22,617 | |
Credit Agricole SA (France) | | | 19,000 | | | | 235,196 | |
DBS Group Holdings Ltd. (Singapore) | | | 3,900 | | | | 46,530 | |
DNB ASA (Norway) | | | 1,430 | | | | 21,229 | |
Erste Group Bank AG (Austria) | | | 607 | | | | 17,747 | |
Fifth Third Bancorp | | | 47,021 | | | | 1,268,156 | |
Fukuoka Financial Group, Inc. (Japan) | | | 13,000 | | | | 57,655 | |
HSBC Holdings PLC (United Kingdom) | | | 58,862 | | | | 474,938 | |
Huntington Bancshares, Inc. | | | 64,236 | | | | 849,200 | |
ING Groep NV (Netherlands) | | | 22,342 | | | | 314,549 | |
Intesa Sanpaolo SpA (Italy) | | | 22,976 | | | | 58,202 | |
Intesa Sanpaolo SpA, RSP (Italy) | | | 10,665 | | | | 24,980 | |
JPMorgan Chase & Co. | | | 229,245 | | | | 19,781,551 | |
KeyCorp. | | | 65,500 | | | | 1,196,685 | |
M&T Bank Corp.(a) | | | 10,100 | | | | 1,579,943 | |
Mediobanca SpA (Italy) | | | 7,358 | | | | 59,924 | |
Mitsubishi UFJ Financial Group, Inc. (Japan) | | | 2,100 | | | | 12,951 | |
Mizuho Financial Group, Inc. (Japan) | | | 47,500 | | | | 85,240 | |
National Australia Bank Ltd. (Australia) | | | 5,302 | | | | 117,113 | |
People’s United Financial, Inc. | | | 19,100 | | | | 369,776 | |
PNC Financial Services Group, Inc. (The) | | | 31,433 | | | | 3,676,404 | |
Regions Financial Corp. | | | 78,203 | | | | 1,122,995 | |
SEE NOTES TO FINANCIAL STATEMENTS.
A1
| | | | | | |
| | | CONSERVATIVE BALANCED PORTFOLIO (continued) | | |
| |
| SCHEDULE OF INVESTMENTS | | as of December 31, 2016 |
| | | | | | | | |
COMMON STOCKS
(continued) | | Shares
| | | Value
(Note 2)
| |
| | |
Banks (continued) | |
Resona Holdings, Inc. (Japan) | | | 8,700 | | | $ | 44,588 | |
Societe Generale SA (France) | | | 5,693 | | | | 280,021 | |
Sumitomo Mitsui Financial Group, Inc. (Japan) | | | 4,400 | | | | 167,565 | |
SunTrust Banks, Inc. | | | 31,800 | | | | 1,744,230 | |
Svenska Handelsbanken AB (Sweden) (Class A Stock) | | | 3,046 | | | | 42,188 | |
Swedbank AB (Sweden) (Class A Stock) | | | 1,840 | | | | 44,334 | |
U.S. Bancorp | | | 102,085 | | | | 5,244,106 | |
UniCredit SpA (Italy) | | | 10,217 | | | | 29,341 | |
Wells Fargo & Co. | | | 287,964 | | | | 15,869,696 | |
Westpac Banking Corp. (Australia) | | | 410 | | | | 9,624 | |
Zions Bancorporation(a) | | | 12,850 | | | | 553,064 | |
| | | | | | |
|
|
|
| | | | | | | | 85,881,540 | |
| | | | | | |
|
|
|
Beverages — 1.0% | |
Anheuser-Busch InBev SA/NV (Belgium) | | | 255 | | | | 26,990 | |
Asahi Group Holdings Ltd. (Japan) | | | 600 | | | | 18,891 | |
Brown-Forman Corp.
(Class B Stock)(a) | | | 12,500 | | | | 561,500 | |
Coca-Cola Amatil Ltd. (Australia) | | | 20,856 | | | | 152,103 | |
Coca-Cola Co. (The) | | | 245,201 | | | | 10,166,033 | |
Coca-Cola European Partners PLC (United Kingdom) | | | 850 | | | | 26,827 | |
Constellation Brands, Inc. (Class A Stock) | | | 11,100 | | | | 1,701,741 | |
Diageo PLC (United Kingdom) | | | 10,771 | | | | 279,508 | |
Dr. Pepper Snapple Group, Inc. | | | 12,000 | | | | 1,088,040 | |
Molson Coors Brewing Co. (Class B Stock) | | | 11,700 | | | | 1,138,527 | |
Monster Beverage Corp.* | | | 26,700 | | | | 1,183,878 | |
PepsiCo, Inc. | | | 90,907 | | | | 9,511,599 | |
| | | | | | |
|
|
|
| | | | | | | | 25,855,637 | |
| | | | | | |
|
|
|
Biotechnology — 1.4% | |
AbbVie, Inc. | | | 103,300 | | | | 6,468,646 | |
Actelion Ltd. (Switzerland) | | | 761 | | | | 164,459 | |
Alexion Pharmaceuticals, Inc.* | | | 14,300 | | | | 1,749,605 | |
Amgen, Inc. | | | 47,737 | | | | 6,979,627 | |
Biogen, Inc.* | | | 14,060 | | | | 3,987,135 | |
Celgene Corp.* | | | 49,500 | | | | 5,729,625 | |
Gilead Sciences, Inc. | | | 83,800 | | | | 6,000,918 | |
Regeneron Pharmaceuticals, Inc.* | | | 5,040 | | | | 1,850,133 | |
Shire PLC | | | 1,045 | | | | 59,669 | |
Vertex Pharmaceuticals, Inc.* | | | 15,900 | | | | 1,171,353 | |
| | | | | | |
|
|
|
| | | | | | | | 34,161,170 | |
| | | | | | |
|
|
|
Building Products — 0.2% | |
Allegion PLC | | | 6,433 | | | | 411,712 | |
Asahi Glass Co. Ltd. (Japan) | | | 4,000 | | | | 27,139 | |
Cie de Saint-Gobain (France) | | | 865 | | | | 40,238 | |
Daikin Industries Ltd. (Japan) | | | 500 | | | | 45,804 | |
Fortune Brands Home & Security, Inc. | | | 9,700 | | | | 518,562 | |
Johnson Controls International PLC | | | 59,522 | | | | 2,451,711 | |
Masco Corp. | | | 21,400 | | | | 676,668 | |
| | | | | | |
|
|
|
| | | | | | | | 4,171,834 | |
| | | | | | |
|
|
|
| | | | | | | | |
COMMON STOCKS
(continued) | | Shares
| | | Value
(Note 2)
| |
| | |
Capital Markets — 1.5% | |
3i Group PLC (United Kingdom) | | | 22,175 | | | $ | 191,824 | |
Affiliated Managers Group, Inc.* | | | 3,500 | | | | 508,550 | |
Ameriprise Financial, Inc. | | | 10,820 | | | | 1,200,371 | |
ASX Ltd. (Australia) | | | 541 | | | | 19,381 | |
Bank of New York Mellon Corp. (The) | | | 67,358 | | | | 3,191,422 | |
BlackRock, Inc. | | | 8,000 | | | | 3,044,320 | |
Charles Schwab Corp. (The) | | | 75,650 | | | | 2,985,905 | |
CME Group, Inc. | | | 21,600 | | | | 2,491,560 | |
E*TRADE Financial Corp.* | | | 17,520 | | | | 607,068 | |
Franklin Resources, Inc. | | | 22,900 | | | | 906,382 | |
Goldman Sachs Group, Inc. (The) | | | 24,100 | | | | 5,770,745 | |
Intercontinental Exchange, Inc. | | | 38,355 | | | | 2,163,989 | |
Invesco Ltd. | | | 25,400 | | | | 770,636 | |
London Stock Exchange Group PLC (United Kingdom) | | | 630 | | | | 22,517 | |
Macquarie Group Ltd. (Australia) | | | 3,592 | | | | 225,011 | |
Moody’s Corp. | | | 10,900 | | | | 1,027,543 | |
Morgan Stanley | | | 95,080 | | | | 4,017,130 | |
Nasdaq, Inc. | | | 7,700 | | | | 516,824 | |
Northern Trust Corp. | | | 13,600 | | | | 1,211,080 | |
Partners Group Holding AG (Switzerland) | | | 66 | | | | 30,897 | |
S&P Global, Inc. | | | 17,000 | | | | 1,828,180 | |
SBI Holdings, Inc. (Japan) | | | 300 | | | | 3,812 | |
State Street Corp. | | | 24,200 | | | | 1,880,824 | |
T. Rowe Price Group, Inc. | | | 15,900 | | | | 1,196,634 | |
UBS Group AG (Switzerland) | | | 7,305 | | | | 114,217 | |
| | | | | | |
|
|
|
| | | | | | | | 35,926,822 | |
| | | | | | |
|
|
|
Chemicals — 1.1% | |
Air Products & Chemicals, Inc. | | | 13,700 | | | | 1,970,334 | |
Albemarle Corp. | | | 7,400 | | | | 636,992 | |
Asahi Kasei Corp. (Japan) | | | 4,000 | | | | 34,805 | |
BASF SE (Germany) | | | 1,846 | | | | 171,081 | |
CF Industries Holdings, Inc.(a) | | | 13,400 | | | | 421,832 | |
Croda International PLC (United Kingdom) | | | 513 | | | | 20,176 | |
Daicel Corp. (Japan) | | | 12,700 | | | | 139,624 | |
Dow Chemical Co. (The) | | | 71,031 | | | | 4,064,394 | |
E.I. du Pont de Nemours & Co. | | | 55,420 | | | | 4,067,828 | |
Eastman Chemical Co. | | | 9,300 | | | | 699,453 | |
Ecolab, Inc. | | | 16,700 | | | | 1,957,574 | |
FMC Corp. | | | 8,200 | | | | 463,792 | |
Givaudan SA (Switzerland) | | | 19 | | | | 34,773 | |
Hitachi Chemical Co. Ltd. (Japan) | | | 400 | | | | 9,979 | |
International Flavors & Fragrances, Inc.(a) | | | 5,000 | | | | 589,150 | |
JSR Corp. (Japan) | | | 400 | | | | 6,296 | |
K+S AG (Germany) | | | 389 | | | | 9,266 | |
Kuraray Co. Ltd. (Japan) | | | 1,300 | | | | 19,494 | |
LyondellBasell Industries NV (Class A Stock) | | | 21,700 | | | | 1,861,426 | |
Mitsubishi Chemical Holdings Corp. (Japan) | | | 5,300 | | | | 34,268 | |
Mitsubishi Gas Chemical Co., Inc. (Japan) | | | 6,200 | | | | 105,645 | |
Mitsui Chemicals, Inc. (Japan) | | | 1,000 | | | | 4,481 | |
Monsanto Co. | | | 27,494 | | | | 2,892,644 | |
SEE NOTES TO FINANCIAL STATEMENTS.
A2
| | | | | | |
| | | CONSERVATIVE BALANCED PORTFOLIO (continued) | | |
| |
| SCHEDULE OF INVESTMENTS | | as of December 31, 2016 |
| | | | | | | | |
COMMON STOCKS
(continued) | | Shares
| | | Value
(Note 2)
| |
| | |
Chemicals (continued) | |
Mosaic Co. (The)(a) | | | 21,900 | | | $ | 642,327 | |
PPG Industries, Inc. | | | 17,300 | | | | 1,639,348 | |
Praxair, Inc. | | | 18,200 | | | | 2,132,858 | |
Sherwin-Williams Co. (The) | | | 5,000 | | | | 1,343,700 | |
Shin-Etsu Chemical Co. Ltd. (Japan) | | | 600 | | | | 46,433 | |
Sika AG (Switzerland) | | | 3 | | | | 14,394 | |
Solvay SA (Belgium) | | | 135 | | | | 15,783 | |
Sumitomo Chemical Co. Ltd. (Japan) | | | 6,000 | | | | 28,442 | |
Teijin Ltd. (Japan) | | | 600 | | | | 12,123 | |
Toray Industries, Inc. (Japan) | | | 4,000 | | | | 32,302 | |
Yara International ASA (Norway) | | | 4,830 | | | | 190,008 | |
| | | | | | |
|
|
|
| | | | | | | | 26,313,025 | |
| | | | | | |
|
|
|
Commercial Services & Supplies — 0.2% | |
Cintas Corp. | | | 5,400 | | | | 624,024 | |
Pitney Bowes, Inc. | | | 9,400 | | | | 142,786 | |
Republic Services, Inc. | | | 15,465 | | | | 882,279 | |
Stericycle, Inc.* | | | 5,600 | | | | 431,424 | |
Waste Management, Inc. | | | 26,242 | | | | 1,860,820 | |
| | | | | | |
|
|
|
| | | | | | | | 3,941,333 | |
| | | | | | |
|
|
|
Communications Equipment — 0.5% | |
Cisco Systems, Inc. | | | 318,500 | | | | 9,625,070 | |
F5 Networks, Inc.* | | | 4,500 | | | | 651,240 | |
Harris Corp. | | | 8,000 | | | | 819,760 | |
Juniper Networks, Inc. | | | 23,200 | | | | 655,632 | |
Motorola Solutions, Inc. | | | 11,089 | | | | 919,167 | |
| | | | | | |
|
|
|
| | | | | | | | 12,670,869 | |
| | | | | | |
|
|
|
Construction & Engineering — 0.1% | |
Fluor Corp. | | | 8,800 | | | | 462,176 | |
Jacobs Engineering Group, Inc.* | | | 7,700 | | | | 438,900 | |
Kajima Corp. (Japan) | | | 22,000 | | | | 151,956 | |
Obayashi Corp. (Japan) | | | 16,500 | | | | 157,531 | |
Quanta Services, Inc.* | | | 8,400 | | | | 292,740 | |
Shimizu Corp. (Japan) | | | 2,000 | | | | 18,256 | |
Taisei Corp. (Japan) | | | 13,000 | | | | 90,779 | |
| | | | | | |
|
|
|
| | | | | | | | 1,612,338 | |
| | | | | | |
|
|
|
Construction Materials — 0.1% | |
Fletcher Building Ltd. (New Zealand) | | | 1,253 | | | | 9,207 | |
HeidelbergCement AG (Germany) | | | 328 | | | | 30,530 | |
Martin Marietta Materials, Inc. | | | 4,000 | | | | 886,120 | |
Vulcan Materials Co. | | | 8,600 | | | | 1,076,290 | |
| | | | | | |
|
|
|
| | | | | | | | 2,002,147 | |
| | | | | | |
|
|
|
Consumer Finance — 0.4% | |
American Express Co. | | | 50,500 | | | | 3,741,040 | |
Capital One Financial Corp. | | | 31,761 | | | | 2,770,830 | |
Discover Financial Services | | | 26,440 | | | | 1,906,060 | |
Navient Corp. | | | 18,300 | | | | 300,669 | |
Synchrony Financial | | | 52,172 | | | | 1,892,278 | |
| | | | | | |
|
|
|
| | | | | | | | 10,610,877 | |
| | | | | | |
|
|
|
Containers & Packaging — 0.2% | |
Avery Dennison Corp. | | | 5,400 | | | | 379,188 | |
Ball Corp.(a) | | | 10,500 | | | | 788,235 | |
International Paper Co. | | | 26,273 | | | | 1,394,045 | |
| | | | | | | | |
COMMON STOCKS
(continued) | | Shares
| | | Value
(Note 2)
| |
| | |
Containers & Packaging (continued) | |
Sealed Air Corp. | | | 12,000 | | | $ | 544,080 | |
WestRock Co. | | | 15,544 | | | | 789,169 | |
| | | | | | |
|
|
|
| | | | | | | | 3,894,717 | |
| | | | | | |
|
|
|
Distributors — 0.1% | |
Genuine Parts Co. | | | 9,600 | | | | 917,184 | |
Jardine Cycle & Carriage Ltd. (Singapore) | | | 2,200 | | | | 62,480 | |
LKQ Corp.* | | | 18,300 | | | | 560,895 | |
| | | | | | |
|
|
|
| | | | | | | | 1,540,559 | |
| | | | | | |
|
|
|
Diversified Consumer Services | |
H&R Block, Inc.(a) | | | 12,800 | | | | 294,272 | |
| | | | | | |
|
|
|
Diversified Financial Services — 0.8% | |
Berkshire Hathaway, Inc. (Class B Stock)* | | | 120,800 | | | | 19,687,984 | |
Challenger Ltd. (Australia) | | | 5,328 | | | | 43,050 | |
Investor AB (Sweden) (Class B Stock) | | | 916 | | | | 34,130 | |
Leucadia National Corp. | | | 18,600 | | | | 432,450 | |
Mitsubishi UFJ Lease & Finance Co. Ltd. (Japan) | | | 900 | | | | 4,642 | |
ORIX Corp. (Japan) | | | 11,600 | | | | 180,545 | |
| | | | | | |
|
|
|
| | | | | | | | 20,382,801 | |
| | | | | | |
|
|
|
Diversified Telecommunication Services — 1.3% | |
AT&T, Inc. | | | 389,738 | | | | 16,575,557 | |
CenturyLink, Inc.(a) | | | 33,336 | | | | 792,730 | |
Deutsche Telekom AG (Germany) | | | 5,933 | | | | 101,794 | |
Frontier Communications Corp.(a) | | | 66,190 | | | | 223,722 | |
HKT Trust & HKT Ltd. (Hong Kong) | | | 4,000 | | | | 4,900 | |
Level 3 Communications, Inc.* | | | 17,800 | | | | 1,003,208 | |
Nippon Telegraph & Telephone Corp. (Japan) | | | 4,800 | | | | 202,057 | |
Orange SA (France) | | | 3,659 | | | | 55,485 | |
Spark New Zealand Ltd. (New Zealand) | | | 3,575 | | | | 8,459 | |
Telecom Italia SpA (Italy)* | | | 149,299 | | | | 131,823 | |
Telecom Italia SpA, RSP (Italy) | | | 210,856 | | | | 153,038 | |
Telefonica SA (Spain) | | | 8,048 | | | | 74,302 | |
Verizon Communications, Inc. | | | 258,376 | | | | 13,792,111 | |
| | | | | | |
|
|
|
| | | | | | | | 33,119,186 | |
| | | | | | |
|
|
|
Electric Utilities — 1.0% | |
Alliant Energy Corp. | | | 13,700 | | | | 519,093 | |
American Electric Power Co., Inc. | | | 30,760 | | | | 1,936,650 | |
Cheung Kong Infrastructure Holdings Ltd. (Hong Kong) | | | 2,000 | | | | 15,885 | |
Chubu Electric Power Co., Inc. (Japan) | | | 2,400 | | | | 33,397 | |
Chugoku Electric Power Co., Inc. (The) (Japan) | | | 500 | | | | 5,852 | |
CLP Holdings Ltd. (Hong Kong) | | | 7,000 | | | | 64,196 | |
Duke Energy Corp. | | | 43,761 | | | | 3,396,729 | |
Edison International | | | 21,200 | | | | 1,526,188 | |
EDP-Energias de Portugal SA (Portugal) | | | 30,232 | | | | 92,013 | |
Electricite de France SA (France) | | | 1,013 | | | | 10,307 | |
Enel SpA (Italy) | | | 51,672 | | | | 227,135 | |
SEE NOTES TO FINANCIAL STATEMENTS.
A3
| | | | | | |
| | | CONSERVATIVE BALANCED PORTFOLIO (continued) | | |
| |
| SCHEDULE OF INVESTMENTS | | as of December 31, 2016 |
| | | | | | | | |
COMMON STOCKS
(continued) | | Shares
| | | Value
(Note 2)
| |
| | |
Electric Utilities (continued) | |
Entergy Corp. | | | 11,400 | | | $ | 837,558 | |
Eversource Energy | | | 19,600 | | | | 1,082,508 | |
Exelon Corp. | | | 57,613 | | | | 2,044,685 | |
FirstEnergy Corp. | | | 25,806 | | | | 799,212 | |
Hokuriku Electric Power Co. (Japan) | | | 300 | | | | 3,356 | |
Iberdrola SA (Spain) | | | 10,270 | | | | 67,247 | |
Kansai Electric Power Co., Inc. (The) (Japan)* | | | 2,700 | | | | 29,434 | |
Kyushu Electric Power Co., Inc. (Japan) | | | 1,600 | | | | 17,334 | |
NextEra Energy, Inc. | | | 29,700 | | | | 3,547,962 | |
PG&E Corp. | | | 31,700 | | | | 1,926,409 | |
Pinnacle West Capital Corp. | | | 7,400 | | | | 577,422 | |
PPL Corp. | | | 42,100 | | | | 1,433,505 | |
Shikoku Electric Power Co., Inc. (Japan) | | | 300 | | | | 3,032 | |
Southern Co. (The) | | | 61,300 | | | | 3,015,347 | |
SSE PLC (United Kingdom) | | | 1,852 | | | | 35,362 | |
Tohoku Electric Power Co., Inc. (Japan) | | | 1,700 | | | | 21,430 | |
Tokyo Electric Power Co. Holdings, Inc. (Japan)* | | | 5,600 | | | | 22,538 | |
Xcel Energy, Inc. | | | 32,110 | | | | 1,306,877 | |
| | | | | | |
|
|
|
| | | | | | | | 24,598,663 | |
| | | | | | |
|
|
|
Electrical Equipment — 0.3% | |
ABB Ltd. (Switzerland) | | | 2,564 | | | | 53,951 | |
Acuity Brands, Inc.(a) | | | 2,900 | | | | 669,494 | |
AMETEK, Inc. | | | 14,900 | | | | 724,140 | |
Eaton Corp. PLC | | | 29,137 | | | | 1,954,801 | |
Emerson Electric Co. | | | 40,100 | | | | 2,235,575 | |
Nidec Corp. (Japan) | | | 500 | | | | 43,045 | |
Rockwell Automation, Inc. | | | 8,500 | | | | 1,142,400 | |
Vestas Wind Systems A/S (Denmark) | | | 2,563 | | | | 165,992 | |
| | | | | | |
|
|
|
| | | | | | | | 6,989,398 | |
| | | | | | |
|
|
|
Electronic Equipment, Instruments & Components — 0.2% | |
Amphenol Corp. (Class A Stock) | | | 19,500 | | | | 1,310,400 | |
Corning, Inc. | | | 64,500 | | | | 1,565,415 | |
FLIR Systems, Inc. | | | 8,800 | | | | 318,472 | |
Hitachi High-Technologies Corp. (Japan) | | | 3,700 | | | | 148,816 | |
Hitachi Ltd. (Japan) | | | 9,000 | | | | 48,529 | |
TDK Corp. (Japan) | | | 2,400 | | | | 164,564 | |
TE Connectivity Ltd. | | | 22,500 | | | | 1,558,800 | |
| | | | | | |
|
|
|
| | | | | | | | 5,114,996 | |
| | | | | | |
|
|
|
Energy Equipment & Services — 0.6% | |
Baker Hughes, Inc. | | | 27,398 | | | | 1,780,048 | |
FMC Technologies, Inc.* | | | 14,300 | | | | 508,079 | |
Halliburton Co. | | | 54,100 | | | | 2,926,269 | |
Helmerich & Payne, Inc.(a) | | | 6,700 | | | | 518,580 | |
National Oilwell Varco, Inc.(a) | | | 22,700 | | | | 849,888 | |
Schlumberger Ltd. | | | 87,724 | | | | 7,364,430 | |
Transocean Ltd.*(a) | | | 20,500 | | | | 302,170 | |
| | | | | | |
|
|
|
| | | | | | | | 14,249,464 | |
| | | | | | |
|
|
|
| | | | | | | | |
COMMON STOCKS
(continued) | | Shares
| | | Value
(Note 2)
| |
| | |
Equity Real Estate Investment Trusts (REITs) — 1.4% | |
American Tower Corp. | | | 27,100 | | | $ | 2,863,928 | |
Apartment Investment & Management Co. (Class A Stock) | | | 9,533 | | | | 433,275 | |
AvalonBay Communities, Inc. | | | 8,875 | | | | 1,572,206 | |
Boston Properties, Inc. | | | 9,800 | | | | 1,232,644 | |
Crown Castle International Corp. | | | 22,900 | | | | 1,987,033 | |
Dexus Property Group (Australia) | �� | | 6,477 | | | | 44,932 | |
Digital Realty Trust, Inc.(a) | | | 9,500 | | | | 933,470 | |
Equinix, Inc. | | | 4,494 | | | | 1,606,201 | |
Equity Residential(a) | | | 22,800 | | | | 1,467,408 | |
Essex Property Trust, Inc.(a) | | | 4,150 | | | | 964,875 | |
Extra Space Storage, Inc.(a) | | | 8,000 | | | | 617,920 | |
Federal Realty Investment Trust | | | 4,500 | | | | 639,495 | |
General Growth Properties, Inc. | | | 35,800 | | | | 894,284 | |
Goodman Group (Australia) | | | 6,830 | | | | 35,076 | |
GPT Group (The) (Australia) | | | 7,268 | | | | 26,351 | |
HCP, Inc.(a) | | | 28,800 | | | | 855,936 | |
Host Hotels & Resorts, Inc.(a) | | | 45,582 | | | | 858,765 | |
Iron Mountain, Inc. | | | 14,902 | | | | 484,017 | |
Kimco Realty Corp. | | | 25,600 | | | | 644,096 | |
Land Securities Group PLC (United Kingdom) | | | 2,906 | | | | 38,177 | |
Link REIT (Hong Kong) | | | 4,500 | | | | 29,174 | |
Macerich Co. (The)(a) | | | 8,100 | | | | 573,804 | |
Mid-America Apartment Communities, Inc. | | | 6,600 | | | | 646,272 | |
Mirvac Group (Australia) | | | 96,402 | | | | 148,044 | |
Prologis, Inc. | | | 32,877 | | | | 1,735,577 | |
Public Storage | | | 9,500 | | | | 2,123,250 | |
Realty Income Corp. | | | 16,100 | | | | 925,428 | |
Simon Property Group, Inc. | | | 19,693 | | | | 3,498,855 | |
SL Green Realty Corp. | | | 6,400 | | | | 688,320 | |
UDR, Inc. | | | 15,900 | | | | 580,032 | |
Unibail-Rodamco SE (France) | | | 196 | | | | 46,708 | |
Ventas, Inc.(a) | | | 22,218 | | | | 1,389,069 | |
Vornado Realty Trust | | | 11,425 | | | | 1,192,427 | |
Welltower, Inc. | | | 22,800 | | | | 1,526,004 | |
Weyerhaeuser Co. | | | 46,818 | | | | 1,408,754 | |
| | | | | | |
|
|
|
| | | | | | | | 34,711,807 | |
| | | | | | |
|
|
|
Food & Staples Retailing — 1.0% | |
Carrefour SA (France) | | | 1,094 | | | | 26,339 | |
Casino Guichard Perrachon SA (France) | | | 488 | | | | 23,382 | |
Costco Wholesale Corp. | | | 27,400 | | | | 4,387,014 | |
CVS Health Corp. | | | 67,548 | | | | 5,330,213 | |
ICA Gruppen AB (Sweden) | | | 5,153 | | | | 156,846 | |
J. Sainsbury PLC (United Kingdom) | | | 58,582 | | | | 180,050 | |
Kroger Co. (The) | | | 60,292 | | | | 2,080,677 | |
METRO AG (Germany) | | | 5,220 | | | | 173,499 | |
Sysco Corp. | | | 32,800 | | | | 1,816,136 | |
Wal-Mart Stores, Inc. | | | 96,100 | | | | 6,642,432 | |
Walgreens Boots Alliance, Inc. | | | 54,700 | | | | 4,526,972 | |
Whole Foods Market, Inc.(a) | | | 19,000 | | | | 584,440 | |
| | | | | | |
|
|
|
| | | | | | | | 25,928,000 | |
| | | | | | |
|
|
|
Food Products — 0.8% | |
Archer-Daniels-Midland Co. | | | 36,726 | | | | 1,676,542 | |
Campbell Soup Co. | | | 11,700 | | | | 707,499 | |
SEE NOTES TO FINANCIAL STATEMENTS.
A4
| | | | | | |
| | | CONSERVATIVE BALANCED PORTFOLIO (continued) | | |
| |
| SCHEDULE OF INVESTMENTS | | as of December 31, 2016 |
| | | | | | | | |
COMMON STOCKS
(continued) | | Shares
| | | Value
(Note 2)
| |
| | |
Food Products (continued) | |
Conagra Brands, Inc. | | | 26,900 | | | $ | 1,063,895 | |
General Mills, Inc. | | | 37,800 | | | | 2,334,906 | |
Hershey Co. (The) | | | 9,200 | | | | 951,556 | |
Hormel Foods Corp. | | | 16,800 | | | | 584,808 | |
J.M. Smucker Co. (The) | | | 7,500 | | | | 960,450 | |
Kellogg Co. | | | 15,800 | | | | 1,164,618 | |
Kraft Heinz Co. (The) | | | 37,917 | | | | 3,310,912 | |
Marine Harvest ASA (Norway) | | | 8,837 | | | | 159,777 | |
McCormick & Co., Inc.(a) | | | 7,500 | | | | 699,975 | |
Mead Johnson Nutrition Co. | | | 11,967 | | | | 846,785 | |
MEIJI Holdings Co. Ltd. (Japan) | | | 400 | | | | 31,291 | |
Mondelez International, Inc. (Class A Stock) | | | 97,553 | | | | 4,324,525 | |
Nestle SA (Switzerland) | | | 4,224 | | | | 302,597 | |
Orkla ASA (Norway) | | | 1,982 | | | | 17,935 | |
Tate & Lyle PLC (United Kingdom) | | | 3,149 | | | | 27,405 | |
Tyson Foods, Inc. (Class A Stock) | | | 19,400 | | | | 1,196,592 | |
WH Group Ltd. (Hong Kong), 144A | | | 220,500 | | | | 177,744 | |
Wilmar International Ltd. (Singapore) | | | 3,800 | | | | 9,388 | |
| | | | | | |
|
|
|
| | | | | | | | 20,549,200 | |
| | | | | | |
|
|
|
Gas Utilities | |
Gas Natural SDG SA (Spain) | | | 1,629 | | | | 30,647 | |
Tokyo Gas Co. Ltd. (Japan) | | | 7,000 | | | | 31,599 | |
| | | | | | |
|
|
|
| | | | | | | | 62,246 | |
| | | | | | |
|
|
|
Health Care Equipment & Supplies — 1.2% | |
Abbott Laboratories | | | 92,300 | | | | 3,545,243 | |
Baxter International, Inc. | | | 31,900 | | | | 1,414,446 | |
Becton, Dickinson & Co. | | | 13,778 | | | | 2,280,948 | |
Boston Scientific Corp.* | | | 84,467 | | | | 1,827,021 | |
C.R. Bard, Inc. | | | 4,700 | | | | 1,055,902 | |
Cooper Cos., Inc. (The) | | | 2,800 | | | | 489,804 | |
Danaher Corp. | | | 38,900 | | | | 3,027,976 | |
DENTSPLY SIRONA, Inc. | | | 14,400 | | | | 831,312 | |
Edwards Lifesciences Corp.* | | | 13,700 | | | | 1,283,690 | |
Hologic, Inc.* | | | 17,500 | | | | 702,100 | |
Intuitive Surgical, Inc.* | | | 2,450 | | | | 1,553,716 | |
Medtronic PLC | | | 88,490 | | | | 6,303,143 | |
St. Jude Medical, Inc. | | | 17,800 | | | | 1,427,382 | |
Stryker Corp. | | | 20,000 | | | | 2,396,200 | |
Varian Medical Systems, Inc.* | | | 6,200 | | | | 556,636 | |
Zimmer Biomet Holdings, Inc. | | | 12,600 | | | | 1,300,320 | |
| | | | | | |
|
|
|
| | | | | | | | 29,995,839 | |
| | | | | | |
|
|
|
Health Care Providers & Services — 1.3% | |
Aetna, Inc. | | | 22,269 | | | | 2,761,579 | |
Alfresa Holdings Corp. (Japan) | | | 5,800 | | | | 95,798 | |
AmerisourceBergen Corp. | | | 11,600 | | | | 907,004 | |
Anthem, Inc. | | | 16,800 | | | | 2,415,336 | |
Cardinal Health, Inc. | | | 20,650 | | | | 1,486,181 | |
Centene Corp.* | | | 11,000 | | | | 621,610 | |
Cigna Corp. | | | 16,600 | | | | 2,214,274 | |
DaVita, Inc.* | | | 10,700 | | | | 686,940 | |
Envision Healthcare Corp.* | | | 6,500 | | | | 411,385 | |
Express Scripts Holding Co.* | | | 40,649 | | | | 2,796,245 | |
Fresenius SE & Co. KGaA (Germany) | | | 756 | | | | 58,976 | |
| | | | | | | | |
COMMON STOCKS
(continued) | | Shares
| | | Value
(Note 2)
| |
| | |
Health Care Providers & Services (continued) | |
HCA Holdings, Inc.* | | | 18,800 | | | $ | 1,391,576 | |
Henry Schein, Inc.* | | | 5,300 | | | | 804,063 | |
Humana, Inc. | | | 9,600 | | | | 1,958,688 | |
Laboratory Corp. of America Holdings* | | | 6,700 | | | | 860,146 | |
McKesson Corp. | | | 14,330 | | | | 2,012,649 | |
Medipal Holdings Corp. (Japan) | | | 10,500 | | | | 165,397 | |
Patterson Cos., Inc.(a) | | | 5,400 | | | | 221,562 | |
Quest Diagnostics, Inc. | | | 9,300 | | | | 854,670 | |
Ramsay Health Care Ltd. (Australia) | | | 540 | | | | 26,550 | |
Sonic Healthcare Ltd. (Australia) | | | 1,516 | | | | 23,331 | |
Suzuken Co. Ltd. (Japan) | | | 210 | | | | 6,859 | |
UnitedHealth Group, Inc. | | | 60,600 | | | | 9,698,424 | |
Universal Health Services, Inc. (Class B Stock) | | | 5,700 | | | | 606,366 | |
| | | | | | |
|
|
|
| | | | | | | | 33,085,609 | |
| | | | | | |
|
|
|
Health Care Technology | |
Cerner Corp.* | | | 18,700 | | | | 885,819 | |
| | | | | | |
|
|
|
Hotels, Restaurants & Leisure — 0.8% | |
Aristocrat Leisure Ltd. (Australia) | | | 15,595 | | | | 173,988 | |
Carnival Corp. | | | 27,600 | | | | 1,436,856 | |
Chipotle Mexican Grill, Inc.*(a) | | | 1,950 | | | | 735,774 | |
Compass Group PLC (United Kingdom) | | | 11,699 | | | | 216,217 | |
Darden Restaurants, Inc.(a) | | | 8,450 | | | | 614,484 | |
Marriott International, Inc. (Class A Stock) | | | 20,568 | | | | 1,700,562 | |
McDonald’s Corp. | | | 54,000 | | | | 6,572,880 | |
Paddy Power Betfair PLC (Ireland) | | | 716 | | | | 76,188 | |
Royal Caribbean Cruises Ltd. | | | 10,800 | | | | 886,032 | |
Starbucks Corp. | | | 92,600 | | | | 5,141,152 | |
TUI AG (Germany) | | | 1,957 | | | | 28,019 | |
Wyndham Worldwide Corp. | | | 7,520 | | | | 574,302 | |
Wynn Resorts Ltd.(a) | | | 5,300 | | | | 458,503 | |
Yum! Brands, Inc. | | | 23,400 | | | | 1,481,922 | |
| | | | | | |
|
|
|
| | | | | | | | 20,096,879 | |
| | | | | | |
|
|
|
Household Durables — 0.2% | |
D.R. Horton, Inc. | | | 20,200 | | | | 552,066 | |
Electrolux AB (Sweden) (Class B Stock) | | | 5,844 | | | | 144,704 | |
Garmin Ltd.(a) | | | 7,000 | | | | 339,430 | |
Harman International Industries, Inc. | | | 4,700 | | | | 522,452 | |
Iida Group Holdings Co. Ltd. (Japan) | | | 7,500 | | | | 142,179 | |
Leggett & Platt, Inc. | | | 8,400 | | | | 410,592 | |
Lennar Corp. (Class A Stock) | | | 11,700 | | | | 502,281 | |
Mohawk Industries, Inc.* | | | 4,200 | | | | 838,656 | |
Newell Brands, Inc. | | | 29,414 | | | | 1,313,335 | |
Panasonic Corp. (Japan) | | | 4,000 | | | | 40,569 | |
PulteGroup, Inc. | | | 18,222 | | | | 334,920 | |
Sekisui House Ltd. (Japan) | | | 2,300 | | | | 38,213 | |
Sony Corp. (Japan) | | | 2,600 | | | | 72,649 | |
Whirlpool Corp.(a) | | | 4,926 | | | | 895,399 | |
| | | | | | |
|
|
|
| | | | | | | | 6,147,445 | |
| | | | | | |
|
|
|
Household Products — 0.9% | |
Church & Dwight Co., Inc. | | | 16,400 | | | | 724,716 | |
Clorox Co. (The) | | | 8,600 | | | | 1,032,172 | |
SEE NOTES TO FINANCIAL STATEMENTS.
A5
| | | | | | |
| | | CONSERVATIVE BALANCED PORTFOLIO (continued) | | |
| |
| SCHEDULE OF INVESTMENTS | | as of December 31, 2016 |
| | | | | | | | |
COMMON STOCKS
(continued) | | Shares
| | | Value
(Note 2)
| |
| | |
Household Products (continued) | |
Colgate-Palmolive Co. | | | 56,600 | | | $ | 3,703,904 | |
Henkel AG & Co. KGaA (Germany) | | | 191 | | | | 19,878 | |
Kimberly-Clark Corp. | | | 23,000 | | | | 2,624,760 | |
Procter & Gamble Co. (The) | | | 169,525 | | | | 14,253,662 | |
Reckitt Benckiser Group PLC (United Kingdom) | | | 1,179 | | | | 99,872 | |
Svenska Cellulosa AB SCA (Sweden) (Class B Stock) | | | 1,127 | | | | 31,721 | |
| | | | | | |
|
|
|
| | | | | | | | 22,490,685 | |
| | | | | | |
|
|
|
Independent Power & Renewable Electricity Producers | |
AES Corp. | | | 39,500 | | | | 458,990 | |
Electric Power Development Co. Ltd. (Japan) | | | 500 | | | | 11,476 | |
NRG Energy, Inc. | | | 18,200 | | | | 223,132 | |
| | | | | | |
|
|
|
| | | | | | | | 693,598 | |
| | | | | | |
|
|
|
Industrial Conglomerates — 1.3% | |
3M Co. | | | 38,200 | | | | 6,821,374 | |
CK Hutchison Holdings Ltd. (Hong Kong) | | | 3,916 | | | | 44,206 | |
DCC PLC (United Kingdom) | | | 163 | | | | 12,116 | |
General Electric Co. | | | 566,730 | | | | 17,908,668 | |
Honeywell International, Inc. | | | 48,012 | | | | 5,562,190 | |
Jardine Matheson Holdings Ltd. (Hong Kong) | | | 500 | | | | 27,625 | |
Roper Technologies, Inc. | | | 6,600 | | | | 1,208,328 | |
Siemens AG (Germany) | | | 2,072 | | | | 253,696 | |
Toshiba Corp. (Japan)* | | | 15,000 | | | | 36,233 | |
| | | | | | |
|
|
|
| | | | | | | | 31,874,436 | |
| | | | | | |
|
|
|
Insurance — 1.3% | |
Aflac, Inc. | | | 26,000 | | | | 1,809,600 | |
AIA Group Ltd. (Hong Kong) | | | 23,800 | | | | 133,324 | |
Allianz SE (Germany) | | | 517 | | | | 85,325 | |
Allstate Corp. (The) | | | 23,400 | | | | 1,734,408 | |
American International Group, Inc. | | | 64,139 | | | | 4,188,918 | |
Aon PLC | | | 17,200 | | | | 1,918,316 | |
Arthur J. Gallagher & Co. | | | 10,700 | | | | 555,972 | |
Assicurazioni Generali SpA (Italy) | | | 2,322 | | | | 34,418 | |
Assurant, Inc. | | | 4,300 | | | | 399,298 | |
AXA SA (France) | | | 3,864 | | | | 97,407 | |
Chubb Ltd. | | | 29,286 | | | | 3,869,266 | |
Cincinnati Financial Corp.(a) | | | 9,237 | | | | 699,703 | |
Hartford Financial Services Group, Inc. (The) | | | 24,000 | | | | 1,143,600 | |
Legal & General Group PLC (United Kingdom) | | | 64,188 | | | | 195,542 | |
Lincoln National Corp. | | | 14,918 | | | | 988,616 | |
Loews Corp. | | | 17,075 | | | | 799,622 | |
Marsh & McLennan Cos., Inc. | | | 32,700 | | | | 2,210,193 | |
MetLife, Inc. | | | 68,700 | | | | 3,702,243 | |
MS&AD Insurance Group Holdings, Inc. (Japan) | | | 1,000 | | | | 30,967 | |
Muenchener Rueckversicherungs-Gesellschaft AG in Muenchen (Germany) | | | 322 | | | | 60,819 | |
NN Group NV (Netherlands) | | | 4,229 | | | | 143,163 | |
Principal Financial Group, Inc. | | | 17,000 | | | | 983,620 | |
| | | | | | | | |
COMMON STOCKS
(continued) | | Shares
| | | Value
(Note 2)
| |
| | |
Insurance (continued) | |
Progressive Corp. (The) | | | 36,300 | | | $ | 1,288,650 | |
QBE Insurance Group Ltd. (Australia) | | | 2,802 | | | | 25,035 | |
St. James’s Place PLC (United Kingdom) | | | 6,542 | | | | 81,604 | |
Swiss Life Holding AG (Switzerland) | | | 613 | | | | 173,160 | |
Swiss Re AG (Switzerland) | | | 675 | | | | 63,864 | |
Tokio Marine Holdings, Inc. (Japan) | | | 1,400 | | | | 57,320 | |
Torchmark Corp. | | | 6,925 | | | | 510,788 | |
Travelers Cos., Inc. (The) | | | 18,335 | | | | 2,244,571 | |
Unum Group | | | 15,310 | | | | 672,568 | |
Willis Towers Watson PLC | | | 8,700 | | | | 1,063,836 | |
XL Group Ltd. (Ireland) | | | 18,000 | | | | 670,680 | |
| | | | | | |
|
|
|
| | | | | | | | 32,636,416 | |
| | | | | | |
|
|
|
Internet & Direct Marketing Retail — 1.1% | |
Amazon.com, Inc.* | | | 25,020 | | | | 18,761,747 | |
Expedia, Inc. | | | 7,650 | | | | 866,592 | |
Netflix, Inc.* | | | 27,350 | | | | 3,385,930 | |
Priceline Group, Inc. (The)* | | | 3,180 | | | | 4,662,071 | |
TripAdvisor, Inc.* | | | 7,350 | | | | 340,820 | |
| | | | | | |
|
|
|
| | | | | | | | 28,017,160 | |
| | | | | | |
|
|
|
Internet Software & Services — 2.1% | |
Akamai Technologies, Inc.* | | | 11,000 | | | | 733,480 | |
Alphabet, Inc. (Class A Stock)* | | | 18,860 | | | | 14,945,607 | |
Alphabet, Inc. (Class C Stock)* | | | 18,903 | | | | 14,589,713 | |
eBay, Inc.* | | | 66,500 | | | | 1,974,385 | |
Facebook, Inc. (Class A Stock)* | | | 148,700 | | | | 17,107,935 | |
VeriSign, Inc.*(a) | | | 6,400 | | | | 486,848 | |
Yahoo!, Inc.* | | | 55,300 | | | | 2,138,451 | |
| | | | | | |
|
|
|
| | | | | | | | 51,976,419 | |
| | | | | | |
|
|
|
IT Services — 1.9% | |
Accenture PLC (Class A Stock) | | | 39,800 | | | | 4,661,774 | |
Alliance Data Systems Corp. | | | 3,840 | | | | 877,440 | |
Amadeus IT Group SA (Spain) | | | 1,801 | | | | 81,683 | |
Atos SE (France) | | | 1,247 | | | | 131,432 | |
Automatic Data Processing, Inc. | | | 29,200 | | | | 3,001,176 | |
Cognizant Technology Solutions Corp. (Class A Stock)* | | | 38,200 | | | | 2,140,346 | |
CSRA, Inc. | | | 8,700 | | | | 277,008 | |
Fidelity National Information Services, Inc. | | | 20,300 | | | | 1,535,492 | |
Fiserv, Inc.* | | | 14,300 | | | | 1,519,804 | |
Fujitsu Ltd. (Japan) | | | 24,000 | | | | 132,901 | |
Global Payments, Inc. | | | 9,800 | | | | 680,218 | |
International Business Machines Corp. | | | 55,600 | | | | 9,229,044 | |
Mastercard, Inc. (Class A Stock) | | | 61,500 | | | | 6,349,875 | |
Paychex, Inc.(a) | | | 20,300 | | | | 1,235,864 | |
PayPal Holdings, Inc.* | | | 69,700 | | | | 2,751,059 | |
Teradata Corp.* | | | 8,400 | | | | 228,228 | |
Total System Services, Inc. | | | 11,096 | | | | 544,037 | |
Visa, Inc. (Class A Stock)(a) | | | 119,800 | | | | 9,346,796 | |
Western Union Co. (The)(a) | | | 30,410 | | | | 660,505 | |
Worldpay Group PLC (United Kingdom), 144A | | | 12,018 | | | | 39,901 | |
Xerox Corp. | | | 58,163 | | | | 507,763 | |
| | | | | | |
|
|
|
| | | | | | | | 45,932,346 | |
| | | | | | |
|
|
|
SEE NOTES TO FINANCIAL STATEMENTS.
A6
| | | | | | |
| | | CONSERVATIVE BALANCED PORTFOLIO (continued) | | |
| |
| SCHEDULE OF INVESTMENTS | | as of December 31, 2016 |
| | | | | | | | |
COMMON STOCKS
(continued) | | Shares
| | | Value
(Note 2)
| |
| | |
Leisure Products | |
Bandai Namco Holdings, Inc. (Japan) | | | 2,700 | | | $ | 74,317 | |
Hasbro, Inc. | | | 7,000 | | | | 544,530 | |
Mattel, Inc. | | | 21,351 | | | | 588,220 | |
| | | | | | |
|
|
|
| | | | | | | | 1,207,067 | |
| | | | | | |
|
|
|
Life Sciences Tools & Services — 0.3% | |
Agilent Technologies, Inc. | | | 20,714 | | | | 943,730 | |
Illumina, Inc.* | | | 9,500 | | | | 1,216,380 | |
Mettler-Toledo International, Inc.* | | | 1,700 | | | | 711,552 | |
PerkinElmer, Inc. | | | 6,600 | | | | 344,190 | |
QIAGEN NV* | | | 406 | | | | 11,377 | |
Thermo Fisher Scientific, Inc. | | | 25,000 | | | | 3,527,500 | |
Waters Corp.* | | | 5,200 | | | | 698,828 | |
| | | | | | |
|
|
|
| | | | | | | | 7,453,557 | |
| | | | | | |
|
|
|
Machinery — 0.8% | |
Amada Holdings Co. Ltd. (Japan) | | | 600 | | | | 6,684 | |
Atlas Copco AB (Sweden) (Class A Stock) | | | 6,396 | | | | 194,033 | |
Atlas Copco AB (Sweden) (Class B Stock) | | | 1,000 | | | | 27,187 | |
Caterpillar, Inc.(a) | | | 37,100 | | | | 3,440,654 | |
Cummins, Inc. | | | 10,000 | | | | 1,366,700 | |
Deere & Co.(a) | | | 19,200 | | | | 1,978,368 | |
Dover Corp. | | | 10,100 | | | | 756,793 | |
Flowserve Corp.(a) | | | 8,300 | | | | 398,815 | |
Fortive Corp. | | | 18,750 | | | | 1,005,563 | |
Illinois Tool Works, Inc. | | | 20,500 | | | | 2,510,430 | |
Ingersoll-Rand PLC | | | 16,400 | | | | 1,230,656 | |
Kone OYJ (Finland) (Class B Stock) | | | 680 | | | | 30,385 | |
PACCAR, Inc. | | | 22,043 | | | | 1,408,548 | |
Parker-Hannifin Corp. | | | 8,765 | | | | 1,227,100 | |
Pentair PLC (United Kingdom) | | | 11,577 | | | | 649,122 | |
Sandvik AB (Sweden) | | | 2,161 | | | | 26,658 | |
Schindler Holding AG (Switzerland) | | | 270 | | | | 47,128 | |
Snap-on, Inc. | | | 3,900 | | | | 667,953 | |
Stanley Black & Decker, Inc. | | | 9,697 | | | | 1,112,149 | |
Volvo AB (Sweden) (Class B Stock) | | | 652 | | | | 7,591 | |
Xylem, Inc. | | | 11,600 | | | | 574,432 | |
| | | | | | |
|
|
|
| | | | | | | | 18,666,949 | |
| | | | | | |
|
|
|
Marine | |
A.P. Moeller-Maersk A/S (Denmark) (Class A Stock) | | | 6 | | | | 9,055 | |
| | | | | | |
|
|
|
Media — 1.5% | |
CBS Corp. (Class B Stock) | | | 25,934 | | | | 1,649,921 | |
Charter Communications, Inc. (Class A Stock)* | | | 13,550 | | | | 3,901,316 | |
Comcast Corp. (Class A Stock) | | | 152,090 | | | | 10,501,814 | |
Discovery Communications, Inc. (Class A Stock)*(a) | | | 8,500 | | | | 232,985 | |
Discovery Communications, Inc. (Class C Stock)*(a) | | | 13,100 | | | | 350,818 | |
Interpublic Group of Cos., Inc. (The) | | | 23,131 | | | | 541,497 | |
News Corp. (Class A Stock) | | | 21,475 | | | | 246,103 | |
News Corp. (Class B Stock) | | | 4,800 | | | | 56,640 | |
Omnicom Group, Inc.(a) | | | 15,300 | | | | 1,302,183 | |
RTL Group SA (Luxembourg) | | | 287 | | | | 21,027 | |
| | | | | | | | |
COMMON STOCKS
(continued) | | Shares
| | | Value
(Note 2)
| |
| | |
Media (continued) | |
Scripps Networks Interactive, Inc. (Class A Stock)(a) | | | 6,100 | | | $ | 435,357 | |
TEGNA, Inc. | | | 11,400 | | | | 243,846 | |
Time Warner, Inc. | | | 49,466 | | | | 4,774,953 | |
Twenty-First Century Fox, Inc. (Class A Stock) | | | 67,800 | | | | 1,901,112 | |
Twenty-First Century Fox, Inc. (Class B Stock) | | | 29,400 | | | | 801,150 | |
Viacom, Inc. (Class B Stock) | | | 21,334 | | | | 748,823 | |
Walt Disney Co. (The) | | | 93,900 | | | | 9,786,258 | |
WPP PLC (United Kingdom) | | | 9,878 | | | | 219,821 | |
| | | | | | |
|
|
|
| | | | | | | | 37,715,624 | |
| | | | | | |
|
|
|
Metals & Mining — 0.2% | |
Anglo American PLC (United Kingdom)* | | | 2,378 | | | | 33,599 | |
BHP Billiton Ltd. (Australia) | | | 5,784 | | | | 103,619 | |
Boliden AB (Sweden) | | | 5,128 | | | | 133,200 | |
Fortescue Metals Group Ltd. (Australia) | | | 41,517 | | | | 173,500 | |
Freeport-McMoRan, Inc.* | | | 82,088 | | | | 1,082,741 | |
Mitsubishi Materials Corp. (Japan) | | | 900 | | | | 27,528 | |
Newmont Mining Corp. | | | 33,800 | | | | 1,151,566 | |
Nucor Corp. | | | 20,400 | | | | 1,214,208 | |
Rio Tinto PLC (United Kingdom) | | | 2,246 | | | | 85,748 | |
voestalpine AG (Austria) | | | 3,347 | | | | 130,879 | |
| | | | | | |
|
|
|
| | | | | | | | 4,136,588 | |
| | | | | | |
|
|
|
Multi-Utilities — 0.5% | |
Ameren Corp. | | | 15,100 | | | | 792,146 | |
CenterPoint Energy, Inc. | | | 25,300 | | | | 623,392 | |
CMS Energy Corp. | | | 17,200 | | | | 715,864 | |
Consolidated Edison, Inc.(a) | | | 19,800 | | | | 1,458,864 | |
Dominion Resources, Inc.(a) | | | 38,932 | | | | 2,981,802 | |
DTE Energy Co. | | | 11,700 | | | | 1,152,567 | |
National Grid PLC (United Kingdom) | | | 8,921 | | | | 104,231 | |
NiSource, Inc. | | | 19,600 | | | | 433,944 | |
Public Service Enterprise Group, Inc. | | | 31,600 | | | | 1,386,608 | |
SCANA Corp. | | | 9,600 | | | | 703,488 | |
Sempra Energy(a) | | | 15,419 | | | | 1,551,768 | |
WEC Energy Group, Inc. | | | 19,913 | | | | 1,167,898 | |
| | | | | | |
|
|
|
| | | | | | | | 13,072,572 | |
| | | | | | |
|
|
|
Multiline Retail — 0.3% | |
Dollar General Corp. | | | 17,200 | | | | 1,274,004 | |
Dollar Tree, Inc.*(a) | | | 14,765 | | | | 1,139,563 | |
Harvey Norman Holdings Ltd. (Australia) | | | 2,314 | | | | 8,574 | |
Kohl’s Corp.(a) | | | 11,700 | | | | 577,746 | |
Macy’s, Inc. | | | 19,474 | | | | 697,364 | |
Nordstrom, Inc.(a) | | | 8,600 | | | | 412,198 | |
Target Corp.(a) | | | 37,000 | | | | 2,672,510 | |
| | | | | | |
|
|
|
| | | | | | | | 6,781,959 | |
| | | | | | |
|
|
|
Oil, Gas & Consumable Fuels — 3.2% | |
Anadarko Petroleum Corp. | | | 34,654 | | | | 2,416,423 | |
Apache Corp. | | | 23,914 | | | | 1,517,822 | |
BP PLC (United Kingdom) | | | 54,358 | | | | 340,469 | |
Cabot Oil & Gas Corp. | | | 27,700 | | | | 647,072 | |
Chesapeake Energy Corp.* | | | 38,100 | | | | 267,462 | |
SEE NOTES TO FINANCIAL STATEMENTS.
A7
| | | | | | |
| | | CONSERVATIVE BALANCED PORTFOLIO (continued) | | |
| |
| SCHEDULE OF INVESTMENTS | | as of December 31, 2016 |
| | | | | | | | |
COMMON STOCKS
(continued) | | Shares
| | | Value
(Note 2)
| |
| | |
Oil, Gas & Consumable Fuels (continued) | |
Chevron Corp. | | | 119,722 | | | $ | 14,091,279 | |
Cimarex Energy Co. | | | 6,200 | | | | 842,580 | |
Concho Resources, Inc.*(a) | | | 9,000 | | | | 1,193,400 | |
ConocoPhillips | | | 78,577 | | | | 3,939,851 | |
Devon Energy Corp. | | | 33,400 | | | | 1,525,378 | |
EOG Resources, Inc. | | | 36,200 | | | | 3,659,820 | |
EQT Corp. | | | 11,200 | | | | 732,480 | |
Exxon Mobil Corp. | | | 263,899 | | | | 23,819,524 | |
Galp Energia SGPS SA (Portugal) | | | 13,233 | | | | 197,281 | |
Hess Corp. | | | 17,100 | | | | 1,065,159 | |
Kinder Morgan, Inc. | | | 119,298 | | | | 2,470,662 | |
Marathon Oil Corp. | | | 51,882 | | | | 898,077 | |
Marathon Petroleum Corp. | | | 33,082 | | | | 1,665,679 | |
Murphy Oil Corp.(a) | | | 10,200 | | | | 317,526 | |
Neste Oyj (Finland) | | | 4,433 | | | | 169,641 | |
Newfield Exploration Co.* | | | 12,100 | | | | 490,050 | |
Noble Energy, Inc. | | | 26,300 | | | | 1,000,978 | |
Occidental Petroleum Corp. | | | 48,300 | | | | 3,440,409 | |
ONEOK, Inc.(a) | | | 12,900 | | | | 740,589 | |
Phillips 66 | | | 29,338 | | | | 2,535,097 | |
Pioneer Natural Resources Co. | | | 10,450 | | | | 1,881,731 | |
Range Resources Corp. | | | 10,300 | | | | 353,908 | |
Royal Dutch Shell PLC (Netherlands) (Class A Stock) | | | 8,689 | | | | 239,849 | |
Royal Dutch Shell PLC (Netherlands) (Class B Stock) | | | 6,920 | | | | 198,826 | |
Southwestern Energy Co.* | | | 28,800 | | | | 311,616 | |
Spectra Energy Corp. | | | 43,762 | | | | 1,798,181 | |
Statoil ASA (Norway) | | | 450 | | | | 8,213 | |
Tesoro Corp.(a) | | | 7,800 | | | | 682,110 | |
TOTAL SA (France) | | | 4,090 | | | | 209,785 | |
Valero Energy Corp. | | | 30,100 | | | | 2,056,432 | |
Williams Cos., Inc. (The) | | | 42,500 | | | | 1,323,450 | |
| | | | | | |
|
|
|
| | | | | | | | 79,048,809 | |
| | | | | | |
|
|
|
Paper & Forest Products | |
Mondi PLC (South Africa) | | | 2,108 | | | | 43,050 | |
Stora Enso OYJ (Finland) (Class R Stock) | | | 2,120 | | | | 22,678 | |
UPM-Kymmene OYJ (Finland) | | | 5,941 | | | | 145,291 | |
| | | | | | |
|
|
|
| | | | | | | | 211,019 | |
| | | | | | |
|
|
|
Personal Products — 0.1% | |
Coty, Inc. (Class A Stock) | | | 26,800 | | | | 490,708 | |
Estee Lauder Cos., Inc. (The) (Class A Stock) | | | 13,900 | | | | 1,063,211 | |
Kao Corp. (Japan) | | | 900 | | | | 42,601 | |
Unilever NV (United Kingdom), CVA | | | 3,257 | | | | 133,794 | |
Unilever PLC (United Kingdom) | | | 2,044 | | | | 82,660 | |
| | | | | | |
|
|
|
| | | | | | | | 1,812,974 | |
| | | | | | |
|
|
|
Pharmaceuticals — 2.6% | |
Allergan PLC*(a) | | | 24,375 | | | | 5,118,994 | |
Astellas Pharma, Inc. (Japan) | | | 9,100 | | | | 126,248 | |
AstraZeneca PLC (United Kingdom) | | | 2,302 | | | | 125,708 | |
Bayer AG (Germany) | | | 3,107 | | | | 323,699 | |
Bristol-Myers Squibb Co. | | | 105,070 | | | | 6,140,291 | |
Daiichi Sankyo Co. Ltd. (Japan) | | | 1,200 | | | | 24,503 | |
Eli Lilly & Co. | | | 61,400 | | | | 4,515,970 | |
| | | | | | | | |
COMMON STOCKS
(continued) | | Shares
| | | Value
(Note 2)
| |
| | |
Pharmaceuticals (continued) | |
Endo International PLC* | | | 12,500 | | | $ | 205,875 | |
GlaxoSmithKline PLC (United Kingdom) | | | 9,498 | | | | 182,443 | |
Johnson & Johnson | | | 173,248 | | | | 19,959,902 | |
Mallinckrodt PLC* | | | 6,900 | | | | 343,758 | |
Merck & Co., Inc. | | | 175,133 | | | | 10,310,080 | |
Mitsubishi Tanabe Pharma Corp. (Japan) | | | 5,200 | | | | 101,815 | |
Mylan NV* | | | 28,400 | | | | 1,083,460 | |
Novartis AG (Switzerland) | | | 4,229 | | | | 307,548 | |
Novo Nordisk A/S (Denmark) (Class B Stock) | | | 3,450 | | | | 123,759 | |
Perrigo Co. PLC(a) | | | 9,300 | | | | 774,039 | |
Pfizer, Inc. | | | 386,170 | | | | 12,542,802 | |
Roche Holding AG (Switzerland) | | | 1,659 | | | | 378,173 | |
Sanofi (France) | | | 2,160 | | | | 174,669 | |
Shionogi & Co. Ltd. (Japan) | | | 500 | | | | 23,896 | |
Teva Pharmaceutical Industries Ltd. (Israel) | | | 3,561 | | | | 128,222 | |
Zoetis, Inc. | | | 31,300 | | | | 1,675,489 | |
| | | | | | |
|
|
|
| | | | | | | | 64,691,343 | |
| | | | | | |
|
|
|
Professional Services — 0.1% | |
Adecco Group AG (Switzerland) | | | 1,874 | | | | 122,329 | |
Dun & Bradstreet Corp. (The) | | | 2,300 | | | | 279,036 | |
Equifax, Inc. | | | 7,500 | | | | 886,725 | |
Intertek Group PLC (United Kingdom) | | | 322 | | | | 13,800 | |
Nielsen Holdings PLC | | | 21,200 | | | | 889,340 | |
Randstad Holding NV (Netherlands) | | | 3,016 | | | | 163,370 | |
RELX PLC (United Kingdom) | | | 5,807 | | | | 103,484 | |
Robert Half International, Inc. | | | 8,400 | | | | 409,752 | |
Verisk Analytics, Inc.* | | | 10,000 | | | | 811,700 | |
Wolters Kluwer NV (Netherlands) | | | 593 | | | | 21,449 | |
| | | | | | |
|
|
|
| | | | | | | | 3,700,985 | |
| | | | | | |
|
|
|
Real Estate Management & Development | |
CBRE Group, Inc. (Class A Stock)* | | | 18,200 | | | | 573,118 | |
Cheung Kong Property Holdings Ltd. (Hong Kong) | | | 5,500 | | | | 33,589 | |
Daito Trust Construction Co. Ltd. (Japan) | | | 1,100 | | | | 165,372 | |
Daiwa House Industry Co. Ltd. (Japan) | | | 1,000 | | | | 27,270 | |
Kerry Properties Ltd. (Hong Kong) | | | 5,000 | | | | 13,521 | |
Mitsubishi Estate Co. Ltd. (Japan) | | | 2,000 | | | | 39,729 | |
Mitsui Fudosan Co. Ltd. (Japan) | | | 2,000 | | | | 46,301 | |
Sun Hung Kai Properties Ltd. (Hong Kong) | | | 13,000 | | | | 163,702 | |
Wharf Holdings Ltd. (The) (Hong Kong) | | | 3,000 | | | | 19,872 | |
Wheelock & Co. Ltd. (Hong Kong) | | | 3,000 | | | | 16,837 | |
| | | | | | |
|
|
|
| | | | | | | | 1,099,311 | |
| | | | | | |
|
|
|
Road & Rail — 0.5% | |
CSX Corp. | | | 59,200 | | | | 2,127,056 | |
East Japan Railway Co. (Japan) | | | 600 | | | | 51,731 | |
JB Hunt Transport Services, Inc. | | | 6,000 | | | | 582,420 | |
Kansas City Southern | | | 6,900 | | | | 585,465 | |
SEE NOTES TO FINANCIAL STATEMENTS.
A8
| | | | | | |
| | | CONSERVATIVE BALANCED PORTFOLIO (continued) | | |
| |
| SCHEDULE OF INVESTMENTS | | as of December 31, 2016 |
| | | | | | | | |
COMMON STOCKS
(continued) | | Shares
| | | Value
(Note 2)
| |
| | |
Road & Rail (continued) | |
Norfolk Southern Corp. | | | 18,700 | | | $ | 2,020,909 | |
Ryder System, Inc. | | | 3,600 | | | | 267,984 | |
Union Pacific Corp. | | | 52,900 | | | | 5,484,672 | |
| | | | | | |
|
|
|
| | | | | | | | 11,120,237 | |
| | | | | | |
|
|
|
Semiconductors & Semiconductor Equipment — 1.7% | |
Analog Devices, Inc. | | | 19,600 | | | | 1,423,352 | |
Applied Materials, Inc. | | | 67,700 | | | | 2,184,679 | |
Broadcom Ltd. (Singapore) | | | 25,080 | | | | 4,433,392 | |
First Solar, Inc.*(a) | | | 5,100 | | | | 163,659 | |
Intel Corp. | | | 300,300 | | | | 10,891,881 | |
KLA-Tencor Corp. | | | 10,000 | | | | 786,800 | |
Lam Research Corp.(a) | | | 10,250 | | | | 1,083,732 | |
Linear Technology Corp. | | | 14,900 | | | | 929,015 | |
Microchip Technology, Inc.(a) | | | 13,600 | | | | 872,440 | |
Micron Technology, Inc.* | | | 63,300 | | | | 1,387,536 | |
NVIDIA Corp.(a) | | | 33,850 | | | | 3,613,149 | |
Qorvo, Inc.*(a) | | | 7,707 | | | | 406,390 | |
QUALCOMM, Inc. | | | 94,000 | | | | 6,128,800 | |
Skyworks Solutions, Inc. | | | 12,100 | | | | 903,386 | |
Texas Instruments, Inc. | | | 64,000 | | | | 4,670,080 | |
Tokyo Electron Ltd. (Japan) | | | 300 | | | | 28,215 | |
Xilinx, Inc. | | | 16,200 | | | | 977,994 | |
| | | | | | |
|
|
|
| | | | | | | | 40,884,500 | |
| | | | | | |
|
|
|
Software — 2.2% | |
Activision Blizzard, Inc. | | | 42,200 | | | | 1,523,842 | |
Adobe Systems, Inc.* | | | 31,500 | | | | 3,242,925 | |
Autodesk, Inc.* | | | 13,700 | | | | 1,013,937 | |
CA, Inc. | | | 18,864 | | | | 599,309 | |
Check Point Software Technologies Ltd. (Israel)* | | | 900 | | | | 76,014 | |
Citrix Systems, Inc.* | | | 9,900 | | | | 884,169 | |
Electronic Arts, Inc.* | | | 19,400 | | | | 1,527,944 | |
Intuit, Inc. | | | 16,400 | | | | 1,879,604 | |
Konami Holdings Corp. (Japan) | | | 3,200 | | | | 129,147 | |
Microsoft Corp. | | | 494,700 | | | | 30,740,658 | |
Oracle Corp. | | | 191,200 | | | | 7,351,640 | |
Red Hat, Inc.* | | | 11,400 | | | | 794,580 | |
Sage Group PLC (The) (United Kingdom) | | | 4,244 | | | | 34,211 | |
salesforce.com, inc.* | | | 40,200 | | | | 2,752,092 | |
SAP SE (Germany) | | | 1,214 | | | | 105,018 | |
Symantec Corp. | | | 38,178 | | | | 912,072 | |
| | | | | | |
|
|
|
| | | | | | | | 53,567,162 | |
| | | | | | |
|
|
|
Specialty Retail — 1.3% | |
Advance Auto Parts, Inc. | | | 4,800 | | | | 811,776 | |
AutoNation, Inc.* | | | 4,674 | | | | 227,390 | |
AutoZone, Inc.* | | | 1,950 | | | | 1,540,090 | |
Bed Bath & Beyond, Inc.(a) | | | 9,400 | | | | 382,016 | |
Best Buy Co., Inc.(a) | | | 18,025 | | | | 769,127 | |
CarMax, Inc.*(a) | | | 12,100 | | | | 779,119 | |
Foot Locker, Inc. | | | 8,900 | | | | 630,921 | |
Gap, Inc. (The)(a) | | | 13,300 | | | | 298,452 | |
Home Depot, Inc. (The) | | | 78,450 | | | | 10,518,576 | |
Industria de Diseno Textil SA (Spain) | | | 5,306 | | | | 180,755 | |
Kingfisher PLC (United Kingdom) | | | 8,899 | | | | 38,341 | |
| | | | | | | | |
COMMON STOCKS
(continued) | | Shares
| | | Value
(Note 2)
| |
| | |
Specialty Retail (continued) | |
L Brands, Inc. | | | 15,806 | | | $ | 1,040,667 | |
Lowe’s Cos., Inc. | | | 55,800 | | | | 3,968,496 | |
O’Reilly Automotive, Inc.*(a) | | | 6,200 | | | | 1,726,142 | |
Ross Stores, Inc. | | | 25,700 | | | | 1,685,920 | |
Signet Jewelers Ltd.(a) | | | 5,200 | | | | 490,152 | |
Staples, Inc. | | | 37,049 | | | | 335,293 | |
Tiffany & Co.(a) | | | 7,400 | | | | 572,982 | |
TJX Cos., Inc. (The) | | | 42,000 | | | | 3,155,460 | |
Tractor Supply Co. | | | 8,800 | | | | 667,128 | |
Ulta Salon Cosmetics & Fragrance, Inc.* | | | 4,000 | | | | 1,019,760 | |
Urban Outfitters, Inc.* | | | 4,300 | | | | 122,464 | |
| | | | | | |
|
|
|
| | | | | | | | 30,961,027 | |
| | | | | | |
|
|
|
Technology Hardware, Storage & Peripherals — 1.9% | |
Apple, Inc. | | | 340,590 | | | | 39,447,134 | |
Brother Industries Ltd. (Japan) | | | 9,200 | | | | 165,392 | |
FUJIFILM Holdings Corp. (Japan) | | | 900 | | | | 34,079 | |
Hewlett Packard Enterprise Co. | | | 104,448 | | | | 2,416,927 | |
HP, Inc. | | | 106,548 | | | | 1,581,172 | |
NEC Corp. (Japan) | | | 11,000 | | | | 29,094 | |
NetApp, Inc. | | | 17,800 | | | | 627,806 | |
Seagate Technology PLC(a) | | | 18,800 | | | | 717,596 | |
Western Digital Corp. | | | 17,803 | | | | 1,209,714 | |
| | | | | | |
|
|
|
| | | | | | | | 46,228,914 | |
| | | | | | |
|
|
|
Textiles, Apparel & Luxury Goods — 0.4% | |
adidas AG (Germany) | | | 372 | | | | 58,671 | |
Coach, Inc. | | | 17,300 | | | | 605,846 | |
Hanesbrands, Inc. | | | 23,600 | | | | 509,052 | |
Hermes International (France) | | | 52 | | | | 21,331 | |
LVMH Moet Hennessy Louis Vuitton SE (France) | | | 548 | | | | 104,489 | |
Michael Kors Holdings Ltd.* | | | 10,700 | | | | 459,886 | |
NIKE, Inc. (Class B Stock)(a) | | | 84,400 | | | | 4,290,052 | |
PVH Corp. | | | 5,300 | | | | 478,272 | |
Ralph Lauren Corp.(a) | | | 3,800 | | | | 343,216 | |
Swatch Group AG (The) (Switzerland) | | | 363 | | | | 22,153 | |
Under Armour, Inc. (Class A Stock)*(a) | | | 11,900 | | | | 345,695 | |
Under Armour, Inc. (Class C Stock)*(a) | | | 12,074 | | | | 303,903 | |
VF Corp. | | | 21,300 | | | | 1,136,355 | |
| | | | | | |
|
|
|
| | | | | | | | 8,678,921 | |
| | | | | | |
|
|
|
Tobacco — 0.8% | |
Altria Group, Inc. | | | 123,100 | | | | 8,324,022 | |
British American Tobacco PLC (United Kingdom) | | | 5,979 | | | | 338,864 | |
Japan Tobacco, Inc. (Japan) | | | 3,800 | | | | 124,730 | |
Philip Morris International, Inc. | | | 98,700 | | | | 9,030,063 | |
Reynolds American, Inc. | | | 51,638 | | | | 2,893,794 | |
| | | | | | |
|
|
|
| | | | | | | | 20,711,473 | |
| | | | | | |
|
|
|
Trading Companies & Distributors — 0.1% | |
Ashtead Group PLC (United Kingdom) | | | 1,960 | | | | 38,103 | |
Fastenal Co.(a) | | | 18,200 | | | | 855,036 | |
ITOCHU Corp. (Japan) | | | 13,700 | | | | 181,399 | |
SEE NOTES TO FINANCIAL STATEMENTS.
A9
| | | | | | |
| | | CONSERVATIVE BALANCED PORTFOLIO (continued) | | |
| |
| SCHEDULE OF INVESTMENTS | | as of December 31, 2016 |
| | | | | | | | |
COMMON STOCKS
(continued) | | Shares
| | | Value
(Note 2)
| |
| | |
Trading Companies & Distributors (continued) | |
Mitsubishi Corp. (Japan) | | | 5,300 | | | $ | 112,565 | |
Mitsui & Co. Ltd. (Japan) | | | 16,000 | | | | 219,237 | |
United Rentals, Inc.* | | | 6,000 | | | | 633,480 | |
W.W. Grainger, Inc. | | | 3,800 | | | | 882,550 | |
| | | | | | |
|
|
|
| | | | | | | | 2,922,370 | |
| | | | | | |
|
|
|
Transportation Infrastructure | |
Abertis Infraestructuras SA (Spain) | | | 2,121 | | | | 29,633 | |
Aena SA (Spain), 144A, RegS | | | 782 | | | | 106,541 | |
Atlantia SpA (Italy) | | | 757 | | | | 17,711 | |
Auckland International Airport Ltd. (New Zealand) | | | 3,721 | | | | 16,140 | |
Sydney Airport (Australia) | | | 4,183 | | | | 18,056 | |
| | | | | | |
|
|
|
| | | | | | | | 188,081 | |
| | | | | | |
|
|
|
Water Utilities | |
American Water Works Co., Inc. | | | 11,100 | | | | 803,196 | |
| | | | | | |
|
|
|
Wireless Telecommunication Services | |
KDDI Corp. (Japan) | | | 3,500 | | | | 88,386 | |
NTT DOCOMO, Inc. (Japan) | | | 2,700 | | | | 61,412 | |
SoftBank Group Corp. (Japan) | | | 2,300 | | | | 152,200 | |
Vodafone Group PLC (United Kingdom) | | | 48,846 | | | | 120,205 | |
| | | | | | |
|
|
|
| | | | | | | | 422,203 | |
| | | | | | |
|
|
|
TOTAL COMMON STOCKS
(cost $504,126,534) | | | | | | | 1,249,739,672 | |
| | | | | | |
|
|
|
| | | | | | | | |
PREFERRED STOCKS — 0.1% | | Shares
| | | Value
(Note 2)
| |
| | |
Automobiles | |
Bayerische Motoren Werke AG (Germany) (PRFC) | | | 212 | | | $ | 16,191 | |
Volkswagen AG (Germany) (PRFC) | | | 1,519 | | | | 212,535 | |
| | | | | | |
|
|
|
| | | | | | | | 228,726 | |
| | | | | | |
|
|
|
Banks | |
Citigroup Capital XIII 7.257%, (Capital Security, fixed to floating preferred) | | | 20,000 | | | | 516,400 | |
| | | | | | |
|
|
|
Capital Markets — 0.1% | |
State Street Corp. 5.350%, (Capital Security, fixed to floating preferred) | | | 30,000 | | | | 750,600 | |
| | | | | | |
|
|
|
Household Products | |
Henkel AG & Co. KGaA (Germany) (PRFC) | | | 355 | | | | 42,259 | |
| | | | | | |
|
|
|
TOTAL PREFERRED STOCKS
(cost $1,488,613) | | | | | | | 1,537,985 | |
| | | | | | |
|
|
|
UNAFFILIATED EXCHANGE TRADED FUND | |
iShares MSCI EAFE ETF(a) (cost $177,380) | | | 3,226 | | | | 186,237 | |
| | | | | | |
|
|
|
| | | | | | | | | | | | | | |
| ASSET-BACKED SECURITIES — 5.2% | | Interest
Rate
| | | Maturity
Date
| | Principal
Amount
(000)#
| | | | |
Collateralized Loan Obligations — 1.7% | |
ACAS CLO Ltd. (Cayman Islands), Series 2013-1A, Class A, 144A | | | 2.061% | (b) | | 04/20/25 | | | 2,100 | | | | 2,097,629 | |
Anchorage Capital CLO Ltd. (Cayman Islands), Series 2014-3A, Class A1R, 144A | | | 2.288% | (b) | | 04/28/26 | | | 400 | | | | 400,839 | |
Anchorage Capital CLO Ltd. (Cayman Islands), Series 2014-5A, Class A, 144A | | | 2.480% | (b) | | 10/15/26 | | | 2,000 | | | | 2,005,078 | |
Arrowpoint CLO Ltd. (Cayman Islands), Series 2015-4A, Class A, 144A | | | 2.432% | (b) | | 04/18/27 | | | 1,000 | | | | 1,001,456 | |
Atlas Senior Loan Fund Ltd. (Cayman Islands), Series 2014-6A, Class A, 144A | | | 2.420% | (b) | | 10/15/26 | | | 600 | | | | 600,633 | |
Battalion CLO Ltd. (Cayman Islands), Series 2014-7A, Class A1, 144A | | | 2.480% | (b) | | 10/17/26 | | | 250 | | | | 250,353 | |
Battalion CLO Ltd. (Cayman Islands), Series 2015-8A, Class A1, 144A | | | 2.412% | (b) | | 04/18/27 | | | 1,000 | | | | 1,000,365 | |
Benefit Street Partners CLO Ltd. (Cayman Islands), Series 2013-IIA, Class A1, 144A | | | 2.080% | (b) | | 07/15/24 | | | 1,000 | | | | 996,275 | |
Brookside Mill CLO Ltd. (Cayman Islands), Series 2013-1A, Class A1, 144A | | | 2.030% | (b) | | 04/17/25 | | | 2,200 | | | | 2,197,045 | |
Catamaran CLO Ltd. (Cayman Islands), Series 2014-1A, Class A1, 144A | | | 2.431% | (b) | | 04/20/26 | | | 1,650 | | | | 1,652,202 | |
Flatiron CLO Ltd. (Cayman Islands), Series 2013-1A, Class A1, 144A | | | 2.280% | (b) | | 01/17/26 | | | 250 | | | | 249,917 | |
Galaxy CLO Ltd. (Cayman Islands), Series 2014-18A, Class A, 144A | | | 2.350% | (b) | | 10/15/26 | | | 750 | | | | 751,482 | |
Highbridge Loan Management Ltd. (Cayman Islands), Series 2015-6A, Class A, 144A | | | 2.331% | (b) | | 05/05/27 | | | 250 | | | | 249,807 | |
ICG US CLO Ltd. (Cayman Islands), Series 2014-3A, Class A1B, 144A(c) | | | 3.280% | | | 01/25/27 | | | 750 | | | | 740,510 | |
Jackson Mill CLO Ltd. (Cayman Islands), Series 2015-1A, Class A, 144A | | | 2.420% | (b) | | 04/15/27 | | | 250 | | | | 250,167 | |
KVK CLO Ltd. (Cayman Islands), Series 2014-1A, Class A1, 144A | | | 2.496% | (b) | | 05/15/26 | | | 250 | | | | 250,312 | |
Magnetite Ltd. (Cayman Islands), Series 2014-9A, Class A1, 144A(c) | | | 2.302% | (b) | | 07/25/26 | | | 2,000 | | | | 2,003,305 | |
Magnetite Ltd. (Cayman Islands), Series 2014-11A, Class A1, 144A(c) | | | 2.332% | (b) | | 01/18/27 | | | 500 | | | | 500,992 | |
Mill Creek CLO Ltd. (Cayman Islands), Series 2016-1A, Class A, 144A | | | 2.631% | (b) | | 04/20/28 | | | 1,250 | | | | 1,252,214 | |
OZLM Funding Ltd. (Cayman Islands), Series 2013-4A, Class A1, 144A | | | 2.032% | (b) | | 07/22/25 | | | 1,000 | | | | 1,000,421 | |
Race Point CLO Ltd. (Cayman Islands), Series 2011-5A, Class AR, 144A | | | 2.263% | (b) | | 12/15/22 | | | 201 | | | | 201,327 | |
Race Point CLO Ltd. (Cayman Islands), Series 2013-8A, Class A, 144A | | | 2.161% | (b) | | 02/20/25 | | | 250 | | | | 250,103 | |
Regatta Funding Ltd. (Cayman Islands), Series 2014-1A, Class A1, 144A | | | 2.292% | (b) | | 07/25/26 | | | 1,250 | | | | 1,250,768 | |
SEE NOTES TO FINANCIAL STATEMENTS.
A10
| | | | | | |
| | | CONSERVATIVE BALANCED PORTFOLIO (continued) | | |
| |
| SCHEDULE OF INVESTMENTS | | as of December 31, 2016 |
| | | | | | | | | | | | | | |
ASSET-BACKED SECURITIES
(continued) | | Interest
Rate
| | | Maturity
Date
| | Principal
Amount
(000)#
| | | Value
(Note 2)
| |
Collateralized Loan Obligations (continued) | |
Seneca Park CLO Ltd. (Cayman Islands), Series 2014-1A, Class A, 144A | | | 2.360% | (b) | | 07/17/26 | | | 500 | | | $ | 500,775 | |
Shackleton CLO Ltd. (Cayman Islands), Series 2014-5A, Class A, 144A | | | 2.381% | (b) | | 05/07/26 | | | 2,500 | | | | 2,508,290 | |
Shackleton CLO Ltd. (Cayman Islands), Series 2014-6A, Class A1, 144A | | | 2.360% | (b) | | 07/17/26 | | | 1,500 | | | | 1,502,361 | |
Sheridan Square CLO Ltd. (Cayman Islands), Series 2013-1A, Class A1, 144A | | | 1.930% | (b) | | 04/15/25 | | | 2,600 | | | | 2,595,427 | |
Slater Mill Loan Fund LP (Cayman Islands), Series 2012-1A, Class B, 144A | | | 3.556% | (b) | | 08/17/22 | | | 500 | | | | 499,007 | |
Sound Point CLO Ltd. (Cayman Islands), Series 2012-1A, Class B, 144A | | | 3.581% | (b) | | 10/20/23 | | | 900 | | | | 901,435 | |
THL Credit Wind River CLO Ltd. (Cayman Islands), Series 2014-3A, Class A, 144A | | | 2.502% | (b) | | 01/22/27 | | | 1,750 | | | | 1,749,695 | |
TIAA CLO Ltd. (Cayman Islands), Series 2016-1A, Class A, 144A | | | 2.581% | (b) | | 07/20/28 | | | 1,750 | | | | 1,752,682 | |
Trinitas CLO Ltd (Cayman Islands), Series 2016-5A, Class A, 144A | | | 2.434% | (b) | | 10/25/28 | | | 2,500 | | | | 2,499,437 | |
Tyron Park CLO Ltd. (Cayman Islands), Series 2013-1A, Class A1, 144A | | | 2.000% | (b) | | 07/15/25 | | | 2,200 | | | | 2,200,936 | |
Voya CLO Ltd. (Cayman Islands), Series 2013-1A, Class A1, 144A | | | 2.020% | (b) | | 04/15/24 | | | 1,500 | | | | 1,500,594 | |
Washington Mill CLO Ltd. (Cayman Islands), Series 2014-1A, Class A1, 144A | | | 2.381% | (b) | | 04/20/26 | | | 1,300 | | | | 1,298,873 | |
Washington Mill CLO Ltd. (Cayman Islands), Series 2014-1A, Class B2, 144A | | | 4.250% | | | 04/20/26 | | | 500 | | | | 504,026 | |
| | | | | | | | | | | | |
|
|
|
| | | | | | | | | | | | | | 41,166,738 | |
| | | | | | | | | | | | |
|
|
|
Non-Residential Mortgage-Backed Securities — 2.7% | |
American Express Credit Account Secured Note Trust, Series 2012-4, Class C, 144A | | | 1.504% | (b) | | 05/15/20 | | | 2,700 | | | | 2,698,349 | |
AmeriCredit Automobile Receivables Trust, Series 2015-4, Class A2B | | | 1.399% | (b) | | 04/08/19 | | | 1,383 | | | | 1,384,203 | |
AmeriCredit Automobile Receivables Trust, Series 2016-2, Class A2B | | | 1.349% | (b) | | 10/08/19 | | | 2,494 | | | | 2,499,589 | |
AmeriCredit Automobile Receivables Trust, Series 2016-3, Class A2B | | | 1.209% | (b) | | 11/08/19 | | | 800 | | | | 800,863 | |
AmeriCredit Automobile Receivables Trust, Series 2016-4, Class C | | | 2.410% | | | 07/08/22 | | | 800 | | | | 792,720 | |
Avis Budget Rental Car Funding AESOP LLC, Series 2013-1A, Class A, 144A | | | 1.920% | | | 09/20/19 | | | 1,475 | | | | 1,467,584 | |
Avis Budget Rental Car Funding AESOP LLC, Series 2015-1A, Class A, 144A | | | 2.500% | | | 07/20/21 | | | 4,800 | | | | 4,763,482 | |
Avis Budget Rental Car Funding AESOP LLC, Series 2015-2A, Class A, 144A | | | 2.630% | | | 12/20/21 | | | 3,800 | | | | 3,753,520 | |
Chase Issuance Trust, Series 2007-C1, Class C1 | | | 1.164% | (b) | | 04/15/19 | | | 6,200 | | | | 6,199,487 | |
Enterprise Fleet Financing LLC, Series 2016-2, Class A2, 144A | | | 1.740% | | | 02/22/22 | | | 2,100 | | | | 2,094,055 | |
Ford Credit Auto Owner Trust, Series 2014-1, Class A, 144A | | | 2.260% | | | 11/15/25 | | | 2,325 | | | | 2,344,846 | |
Ford Credit Auto Owner Trust, Series 2014-2, Class A, 144A | | | 2.310% | | | 04/15/26 | | | 2,400 | | | | 2,420,072 | |
Ford Credit Auto Owner Trust, Series 2016-1, Class A, 144A | | | 2.310% | | | 08/15/27 | | | 4,100 | | | | 4,092,039 | |
Ford Credit Auto Owner Trust, Series 2016-2, Class A, 144A | | | 2.030% | | | 12/15/27 | | | 2,500 | | | | 2,458,700 | |
GMF Floorplan Owner Revolving Trust, Series 2015-1, Class A2, 144A(c) | | | 1.038% | (b) | | 05/15/20 | | | 1,600 | | | | 1,600,697 | |
GMF Floorplan Owner Revolving Trust, Series 2016-1, Class A2, 144A(c) | | | 1.554% | (b) | | 05/17/21 | | | 1,700 | | | | 1,708,954 | |
Hertz Vehicle Financing II LP, Series 2015-1A, Class A, 144A | | | 2.730% | | | 03/25/21 | | | 4,200 | | | | 4,169,749 | |
Hertz Vehicle Financing II LP, Series 2015-3A, Class A, 144A | | | 2.670% | | | 09/25/21 | | | 2,500 | | | | 2,460,149 | |
Hertz Vehicle Financing LLC, Series 2016-1A, Class A, 144A | | | 2.320% | | | 03/25/20 | | | 2,400 | | | | 2,384,166 | |
OneMain Direct Auto Receivables Trust, Series 2016-1A, Class A, 144A | | | 2.040% | | | 01/15/21 | | | 854 | | | | 855,442 | |
OneMain Financial Issuance Trust, Series 2015-2A, Class A, 144A | | | 2.570% | | | 07/18/25 | | | 3,800 | | | | 3,800,133 | |
Santander Drive Auto Receivables Trust, Series 2015-4, Class A2B | | | 1.404% | (b) | | 12/17/18 | | | 115 | | | | 114,988 | |
Santander Drive Auto Receivables Trust, Series 2015-5, Class A2B | | | 1.454% | (b) | | 12/17/18 | | | 329 | | | | 328,768 | |
Sierra Timeshare Receivables Funding LLC, Series 2013-3A, Class A, 144A | | | 2.200% | | | 10/20/30 | | | 1,118 | | | | 1,118,067 | |
Sierra Timeshare Receivables Funding LLC, Series 2015-3A, Class A, 144A | | | 2.580% | | | 09/20/32 | | | 1,116 | | | | 1,110,274 | |
Sierra Timeshare Receivables Funding LLC, Series 2016-1A, Class A, 144A | | | 3.080% | | | 03/21/33 | | | 2,080 | | | | 2,100,043 | |
SpringCastle America Funding LLC, Series 2016-AA, Class A, 144A | | | 3.050% | | | 04/25/29 | | | 2,259 | | | | 2,270,367 | |
Springleaf Funding Trust, Series 2015-AA, Class A, 144A | | | 3.160% | | | 11/15/24 | | | 4,665 | | | | 4,701,854 | |
SVO VOI Mortgage LLC, Series 2012-AA, Class A, 144A | | | 2.000% | | | 09/20/29 | | | 527 | | | | 517,955 | |
Synchrony Credit Card Master Note Trust, Series 2015-3, Class A | | | 1.740% | | | 09/15/21 | | | 1,200 | | | | 1,200,638 | |
| | | | | | | | | | | | |
|
|
|
| | | | | | | | | | | | | | 68,211,753 | |
| | | | | | | | | | | | |
|
|
|
Residential Mortgage-Backed Securities — 0.8% | |
CDC Mortgage Capital Trust, Series 2002-HE3, Class M1 | | | 2.406% | (b) | | 03/25/33 | | | 208 | | | | 199,914 | |
Credit Suisse Mortgage Trust, Series 2016-RPL1, Class A1, 144A | | | 3.767% | (b) | | 12/26/46 | | | 4,132 | | | | 4,116,755 | |
Credit Suisse Mortgage Trust, Series 2016-12R, Class 1A1, 144A(d) | | | 3.239% | (b) | | 02/28/47 | | | 2,820 | | | | 2,820,000 | |
Credit-Based Asset Servicing & Securitization LLC, Series 2005-CB6, Class A3 | | | 3.765% | (b) | | 07/25/35 | | | 368 | | | | 351,484 | |
CWABS, Inc., Asset-Backed Certificates, Series 2004-1, Class M1 | | | 1.506% | (b) | | 03/25/34 | | | 1,626 | | | | 1,568,842 | |
SEE NOTES TO FINANCIAL STATEMENTS.
A11
| | | | | | |
| | | CONSERVATIVE BALANCED PORTFOLIO (continued) | | |
| |
| SCHEDULE OF INVESTMENTS | | as of December 31, 2016 |
| | | | | | | | | | | | | | | | |
ASSET-BACKED SECURITIES
(continued) | | Interest
Rate
| | | Maturity
Date
| | | Principal
Amount
(000)#
| | | Value
(Note 2)
| |
Residential Mortgage-Backed Securities (continued) | |
Equity One Mortgage Pass-Through Trust, Series 2004-3, Class M1 | | | 4.792% | | | | 07/25/34 | | | | 346 | | | $ | 328,474 | |
Fremont Home Loan Trust, Series 2004-2, Class M1 | | | 1.611% | (b) | | | 07/25/34 | | | | 506 | | | | 463,032 | |
Long Beach Mortgage Loan Trust, Series 2004-2, Class M1 | | | 1.379% | (b) | | | 06/25/34 | | | | 424 | | | | 411,392 | |
Morgan Stanley ABS Capital I, Inc. Trust, Series 2003-HE1, Class M1 | | | 1.956% | (b) | | | 05/25/33 | | | | 113 | | | | 109,627 | |
Morgan Stanley ABS Capital I, Inc. Trust, Series 2004-NC1, Class M1 | | | 1.806% | (b) | | | 12/27/33 | | | | 674 | | | | 656,551 | |
Morgan Stanley Dean Witter Capital I, Inc. Trust, Series 2002-HE1, Class M1 | | | 1.656% | (b) | | | 07/25/32 | | | | 245 | | | | 236,978 | |
Morgan Stanley Dean Witter Capital I, Inc. Trust, Series 2002-NC4, Class M1 | | | 2.031% | (b) | | | 09/25/32 | | | | 2,619 | | | | 2,517,865 | |
Securitized Asset-Backed Receivables LLC Trust, Series 2004-OP1, Class M1 | | | 1.521% | (b) | | | 02/25/34 | | | | 772 | | | | 722,364 | |
VOLT XLIV LLC, Series 2016-NPL4, Class A1, 144A | | | 4.250% | | | | 04/25/46 | | | | 1,647 | | | | 1,659,019 | |
VOLT XXXI LLC, Series 2015-NPL2, Class A1, 144A | | | 3.375% | | | | 02/25/55 | | | | 694 | | | | 695,612 | |
VOLT XXXVII LLC, Series 2015-NP11, Class A1, 144A | | | 3.625% | | | | 07/25/45 | | | | 2,139 | | | | 2,137,155 | |
| | | | | | | | | | | | | | |
|
|
|
| | | | | | | | | | | | | | | | 18,995,064 | |
| | | | | | | | | | | | | | |
|
|
|
TOTAL ASSET-BACKED SECURITIES
(cost $127,913,777) | | | | 128,373,555 | |
| | | | | | | | | | | | | | |
|
|
|
| BANK LOANS(b) — 0.3% | |
Food | |
Aramark Corp. | | | 3.430% | | | | 02/24/21 | | | | 381 | | | | 384,233 | |
| | | | | | | | | | | | | | |
|
|
|
Media & Entertainment | |
Nielsen Finance LLC | | | 3.442% | | | | 10/04/23 | | | | 672 | | | | 676,917 | |
| | | | | | | | | | | | | | |
|
|
|
Pharmaceuticals — 0.1% | |
RPI Finance Trust | | | 3.498% | | | | 10/14/22 | | | | 1,006 | | | | 1,016,854 | |
| | | | | | | | | | | | | | |
|
|
|
Technology — 0.2% | |
Avago Technologies Cayman Finance Ltd. (Singapore) | | | 3.881% | | | | 02/01/23 | | | | 727 | | | | 736,638 | |
Dell International LLC | | | 2.998% | | | | 12/31/18 | | | | 500 | | | | 499,219 | |
Dell International LLC | | | 4.020% | | | | 09/07/23 | | | | 610 | | | | 619,913 | |
First Data Corp. | | | 3.998% | | | | 03/24/21 | | | | 940 | | | | 948,981 | |
Trans Union LLC | | | 3.520% | | | | 04/09/21 | | | | 389 | | | | 391,436 | |
Western Digital Corp. | | | 4.748% | | | | 04/29/23 | | | | 700 | | | | 709,361 | |
| | | | | | | | | | | | | | |
|
|
|
| | | | | | | | | | | | | | | | 3,905,548 | |
| | | | | | | | | | | | | | |
|
|
|
Telecommunications | |
T-Mobile USA, Inc. | | | 3.707% | | | | 11/09/22 | | | | 733 | | | | 740,188 | |
| | | | | | | | | | | | | | |
|
|
|
TOTAL BANK LOANS
(cost $6,595,334) | | | | 6,723,740 | |
| | | | | | | | | | | | | | |
|
|
|
| COMMERCIAL MORTGAGE-BACKED SECURITIES — 4.6% | |
Assurant Commercial Mortgage Trust, Series 2016-1A, Class AS, 144A | | | 3.172% | | | | 05/15/49 | | | | 3,100 | | | | 3,052,396 | |
Banc of America Commercial Mortgage Trust, Series 2007-2, Class A1A | | | 5.587% | (b) | | | 04/10/49 | | | | 2,191 | | | | 2,201,715 | |
CFCRE Commercial Mortgage Trust, Series 2016-C4, Class A3 | | | 3.014% | | | | 05/10/58 | | | | 2,500 | | | | 2,431,497 | |
Citigroup Commercial Mortgage Trust, Series 2007-C6, Class A4 | | | 5.711% | (b) | | | 12/10/49 | | | | 800 | | | | 806,936 | |
Citigroup Commercial Mortgage Trust, Series 2013-GC11, Class A3 | | | 2.815% | | | | 04/10/46 | | | | 900 | | | | 905,278 | |
Citigroup Commercial Mortgage Trust, Series 2014-GC21, Class A4 | | | 3.575% | | | | 05/10/47 | | | | 2,090 | | | | 2,164,670 | |
Citigroup Commercial Mortgage Trust, Series 2016-C1, Class A3 | | | 2.944% | | | | 05/10/49 | | | | 2,700 | | | | 2,640,788 | |
Commercial Mortgage Trust, Series 2012-CR5, Class A3 | | | 2.540% | | | | 12/10/45 | | | | 1,000 | | | | 994,960 | |
Commercial Mortgage Trust, Series 2013-CR7, Class A3 | | | 2.929% | | | | 03/10/46 | | | | 1,400 | | | | 1,415,034 | |
Commercial Mortgage Trust, Series 2014-CR15, Class A2 | | | 2.928% | | | | 02/10/47 | | | | 2,000 | | | | 2,042,116 | |
Commercial Mortgage Trust, Series 2014-CR18, Class A4 | | | 3.550% | | | | 07/15/47 | | | | 2,100 | | | | 2,168,950 | |
Commercial Mortgage Trust, Series 2014-LC17, Class A4 | | | 3.648% | | | | 10/10/47 | | | | 5,000 | | | | 5,185,823 | |
Commercial Mortgage Trust, Series 2014-UBS3, Class A2 | | | 2.844% | | | | 06/10/47 | | | | 1,700 | | | | 1,733,196 | |
CSAIL Commercial Mortgage Trust, Series 2015-C4, Class A3 | | | 3.544% | | | | 11/15/48 | | | | 2,500 | | | | 2,558,252 | |
Eleven Madison Mortgage Trust, Series 2015-11MD, Class A, 144A | | | 3.555% | (b) | | | 09/10/35 | | | | 1,100 | | | | 1,131,841 | |
Fannie Mae-Aces, Series 2014-M2, Class A2 | | | 3.513% | (b) | | | 12/25/23 | | | | 1,925 | | | | 2,005,234 | |
Fannie Mae-Aces, Series 2015-M8, Class AB2 | | | 2.829% | (b) | | | 01/25/25 | | | | 4,100 | | | | 4,066,914 | |
Fannie Mae-Aces, Series 2015-M17, Class A2 | | | 2.940% | (b) | | | 11/25/25 | | | | 3,000 | | | | 3,013,884 | |
Fannie Mae-Aces, Series 2016-M7, Class AB2 | | | 2.385% | | | | 09/25/26 | | | | 1,800 | | | | 1,669,215 | |
SEE NOTES TO FINANCIAL STATEMENTS.
A12
| | | | | | |
| | | CONSERVATIVE BALANCED PORTFOLIO (continued) | | |
| |
| SCHEDULE OF INVESTMENTS | | as of December 31, 2016 |
| | | | | | | | | | | | | | |
COMMERCIAL MORTGAGE-BACKED SECURITIES
(continued) | | Interest
Rate
| | | Maturity
Date
| | Principal
Amount
(000)#
| | | Value
(Note 2)
| |
FHLMC Multifamily Structured Pass-Through Certificates, Series K020, Class X1, IO | | | 1.442% | (b) | | 05/25/22 | | | 20,259 | | | $ | 1,274,814 | |
FHLMC Multifamily Structured Pass-Through Certificates, Series K021, Class X1, IO | | | 1.481% | (b) | | 06/25/22 | | | 5,603 | | | | 368,576 | |
FHLMC Multifamily Structured Pass-Through Certificates, Series K045, Class A2 | | | 3.023% | | | 01/25/25 | | | 4,965 | | | | 5,045,286 | |
FHLMC Multifamily Structured Pass-Through Certificates, Series K048, Class A2 | | | 3.284% | (b) | | 06/25/25 | | | 3,650 | | | | 3,771,258 | |
FHLMC Multifamily Structured Pass-Through Certificates, Series K055, Class X1,IO | | | 1.369% | (b) | | 03/25/26 | | | 9,331 | | | | 916,951 | |
FHLMC Multifamily Structured Pass-Through Certificates, Series K710, Class X1, IO | | | 1.759% | (b) | | 05/25/19 | | | 15,802 | | | | 526,934 | |
FHLMC Multifamily Structured Pass-Through Certificates, Series K711, Class X1, IO | | | 1.692% | (b) | | 07/25/19 | | | 16,616 | | | | 562,502 | |
FHLMC Multifamily Structured Pass-Through Certificates, Series KS03, Class A4 | | | 3.161% | (b) | | 05/25/25 | | | 1,900 | | | | 1,921,057 | |
GS Mortgage Securities Trust, Series 2015-GC28, Class A4 | | | 3.136% | | | 02/10/48 | | | 3,000 | | | | 3,002,028 | |
GS Mortgage Securities Trust, Series 2015-GC34, Class A3 | | | 3.244% | | | 10/10/48 | | | 4,800 | | | | 4,808,330 | |
GS Mortgage Securities Trust, Series 2016-GS4, Class A3 | | | 3.178% | | | 11/10/49 | | | 4,000 | | | | 3,993,376 | |
JPMBB Commercial Mortgage Securities Trust, Series 2014-C25, Class A4A1 | | | 3.408% | | | 11/15/47 | | | 1,100 | | | | 1,127,553 | |
JPMBB Commercial Mortgage Securities Trust, Series 2015-C27, Class A3A1 | | | 2.920% | | | 02/15/48 | | | 5,000 | | | | 4,932,718 | |
JPMDB Commercial Mortgage Securities Trust, Series 2016-C2, Class A3A | | | 2.881% | | | 06/15/49 | | | 2,500 | | | | 2,441,701 | |
JPMorgan Chase Commercial Mortgage Securities Trust, Series 2012-CBX, Class A3 | | | 3.139% | | | 06/15/45 | | | 792 | | | | 805,773 | |
JPMorgan Chase Commercial Mortgage Securities Trust, Series 2012-LC9, Class A4 | | | 2.611% | | | 12/15/47 | | | 1,500 | | | | 1,502,230 | |
JPMorgan Chase Commercial Mortgage Securities Trust, Series 2013-C10, Class A4 | | | 2.875% | | | 12/15/47 | | | 3,200 | | | | 3,235,584 | |
JPMorgan Chase Commercial Mortgage Securities Trust, Series 2013-C16, Class A2 | | | 3.070% | | | 12/15/46 | | | 1,219 | | | | 1,243,755 | |
JPMorgan Chase Commercial Mortgage Securities Trust, Series 2013-LC11, Class A4 | | | 2.694% | | | 04/15/46 | | | 1,100 | | | | 1,112,004 | |
LB-UBS Commercial Mortgage Trust, Series 2007-C6, Class AM | | | 6.114% | (b) | | 07/15/40 | | | 2,500 | | | | 2,565,752 | |
Morgan Stanley Bank of America Merrill Lynch Trust, Series 2013-C8, Class A3 | | | 2.863% | | | 12/15/48 | | | 1,200 | | | | 1,210,809 | |
Morgan Stanley Capital I Trust, Series 2015-UBS8, Class A3 | | | 3.540% | | | 12/15/48 | | | 5,000 | | | | 5,135,655 | |
Morgan Stanley Capital I Trust, Series 2016-UB11, Class A3 | | | 2.531% | | | 08/15/49 | | | 6,300 | | | | 5,959,370 | |
UBS-Barclays Commercial Mortgage Trust, Series 2012-C4, Class A4 | | | 2.792% | | | 12/10/45 | | | 1,400 | | | | 1,411,029 | |
UBS-Barclays Commercial Mortgage Trust, Series 2013-C5, Class A3 | | | 2.920% | | | 03/10/46 | | | 3,200 | | | | 3,218,562 | |
UBS-Barclays Commercial Mortgage Trust, Series 2013-C6, Class A3 | | | 2.971% | | | 04/10/46 | | | 1,500 | | | | 1,513,070 | |
Wachovia Bank Commercial Mortgage Trust, Series 2007-C34, Class A1A | | | 5.608% | (b) | | 05/15/46 | | | 3,838 | | | | 3,897,378 | |
Wells Fargo Commercial Mortgage Trust, Series 2016-BNK1, Class XB, IO | | | 1.343% | (b) | | 08/15/49 | | | 9,000 | | | | 948,935 | |
Wells Fargo Commercial Mortgage Trust, Series 2016-NXS6, Class A3 | | | 2.642% | | | 11/15/49 | | | 4,500 | | | | 4,266,067 | |
| | | | | | | | | | | | |
|
|
|
TOTAL COMMERCIAL MORTGAGE-BACKED SECURITIES
(cost $117,304,605) | | | | 114,907,756 | |
| | | | | | | | | | | | |
|
|
|
| CORPORATE BONDS — 10.7% | |
Agriculture — 0.2% | |
Altria Group, Inc., Gtd. Notes | | | 4.000% | | | 01/31/24 | | | 1,585 | | | | 1,674,738 | |
Bunge Ltd. Finance Corp., Gtd. Notes | | | 8.500% | | | 06/15/19 | | | 690 | | | | 790,501 | |
Imperial Brands Finance PLC (United Kingdom), Gtd. Notes, 144A | | | 2.050% | | | 02/11/18 | | | 1,680 | | | | 1,681,559 | |
Reynolds American, Inc., Gtd. Notes | | | 8.125% | | | 06/23/19 | | | 290 | | | | 330,843 | |
| | | | | | | | | | | | |
|
|
|
| | | | | | | | | | | | | | 4,477,641 | |
| | | | | | | | | | | | |
|
|
|
Airlines — 0.2% | |
American Airlines, Inc., Pass-Through Trust, Pass-Through Certificates, Series 2015-1, Class A | | | 3.375% | | | 11/01/28 | | | 2,449 | | | | 2,411,785 | |
Continental Airlines, Inc., Pass-Through Trust, Pass-Through Certificates, Series 1998-1, Class A | | | 6.648% | | | 03/15/19 | | | 34 | | | | 34,604 | |
SEE NOTES TO FINANCIAL STATEMENTS.
A13
| | | | | | |
| | | CONSERVATIVE BALANCED PORTFOLIO (continued) | | |
| |
| SCHEDULE OF INVESTMENTS | | as of December 31, 2016 |
| | | | | | | | | | | | | | |
CORPORATE BONDS
(continued) | | Interest
Rate
| | | Maturity
Date
| | Principal
Amount
(000)#
| | | Value
(Note 2)
| |
Airlines (continued) | |
Continental Airlines, Inc., Pass-Through Trust, Pass-Through Certificates, Series 2001-1, Class A-1 | | | 6.703% | | | 12/15/22 | | | 30 | | | $ | 31,582 | |
Continental Airlines, Inc., Pass-Through Trust, Pass-Through Certificates, Series 2009-2, Class A | | | 7.250% | | | 05/10/21 | | | 487 | | | | 544,139 | |
Continental Airlines, Inc., Pass-Through Trust, Pass-Through Certificates, Series 2010-1, Class A | | | 4.750% | | | 07/12/22 | | | 509 | | | | 537,294 | |
Continental Airlines, Inc., Pass-Through Trust, Pass-Through Certificates, Series 2012-2, Class A | | | 4.000% | | | 04/29/26 | | | 343 | | | | 350,836 | |
Delta Air Lines, Inc., Pass-Through Trust, Pass-Through Certificates, Series 2007-1, Class A | | | 6.821% | | | 02/10/24 | | | 264 | | | | 303,256 | |
Delta Air Lines, Inc., Pass-Through Trust, Pass-Through Certificates, Series 2010-2, Class A | | | 4.950% | | | 11/23/20 | | | 311 | | | | 325,410 | |
Delta Air Lines, Inc., Pass-Through Trust, Pass-Through Certificates, Series 2011-1, Class A | | | 5.300% | | | 10/15/20 | | | 593 | | | | 625,692 | |
| | | | | | | | | | | | |
|
|
|
| | | | | | | | | | | | | | 5,164,598 | |
| | | | | | | | | | | | |
|
|
|
Auto Manufacturers — 0.3% | |
Ford Motor Co., Sr. Unsec’d. Notes | | | 4.750% | | | 01/15/43 | | | 1,090 | | | | 1,034,854 | |
Ford Motor Credit Co. LLC, Sr. Unsec’d. Notes, GMTN | | | 4.389% | | | 01/08/26 | | | 1,240 | | | | 1,256,709 | |
General Motors Co., Sr. Unsec’d. Notes | | | 6.250% | | | 10/02/43 | | | 1,065 | | | | 1,177,335 | |
General Motors Co., Sr. Unsec’d. Notes | | | 6.600% | | | 04/01/36 | | | 585 | | | | 668,659 | |
Harley-Davidson Financial Services, Inc., Gtd. Notes, 144A, MTN | | | 2.700% | | | 03/15/17 | | | 380 | | | | 380,888 | |
Harley-Davidson Financial Services, Inc., Gtd. Notes, 144A, MTN | | | 2.850% | | | 01/15/21 | | | 2,300 | | | | 2,309,752 | |
| | | | | | | | | | | | |
|
|
|
| | | | | | | | | | | | | | 6,828,197 | |
| | | | | | | | | | | | |
|
|
|
Banks — 2.9% | |
Bank of America Corp., Jr. Sub. Notes | | | 6.300% | (b) | | 12/29/49 | | | 275 | | | | 287,375 | |
Bank of America Corp., Jr. Sub. Notes | | | 8.000% | (b) | | 07/29/49 | | | 2,100 | | | | 2,157,750 | |
Bank of America Corp., Sr. Unsec’d. Notes | | | 5.700% | | | 01/24/22 | | | 1,290 | | | | 1,448,977 | |
Bank of America Corp., Sr. Unsec’d. Notes | | | 6.000% | | | 09/01/17 | | | 1,330 | | | | 1,368,542 | |
Bank of America Corp., Sr. Unsec’d. Notes, GMTN | | | 3.300% | | | 01/11/23 | | | 360 | | | | 361,202 | |
Bank of America Corp., Sr. Unsec’d. Notes, GMTN | | | 3.500% | | | 04/19/26 | | | 4,770 | | | | 4,706,425 | |
Bank of America Corp., Sr. Unsec’d. Notes, MTN | | | 4.000% | | | 04/01/24 | | | 745 | | | | 768,348 | |
Bank of America Corp., Sr. Unsec’d. Notes, MTN | | | 5.650% | | | 05/01/18 | | | 105 | | | | 110,015 | |
Bank of America Corp., Sub. Notes, MTN | | | 4.000% | | | 01/22/25 | | | 1,700 | | | | 1,702,135 | |
Bank of America NA, Sub. Notes | | | 5.300% | | | 03/15/17 | | | 850 | | | | 856,583 | |
Bank of America NA, Sub. Notes | | | 6.000% | | | 10/15/36 | | | 805 | | | | 971,212 | |
Barclays PLC (United Kingdom), Sr. Unsec’d. Notes | | | 4.375% | | | 01/12/26 | | | 1,205 | | | | 1,220,451 | |
Capital One Financial Corp., Sr. Unsec’d. Notes | | | 3.750% | | | 04/24/24 | | | 3,325 | | | | 3,368,291 | |
Citigroup, Inc., Jr. Sub. Notes | | | 5.950% | (b) | | 12/29/49 | | | 1,590 | | | | 1,613,770 | |
Citigroup, Inc., Jr. Sub. Notes | | | 6.125% | (b) | | 12/29/49 | | | 945 | | | | 978,075 | |
Citigroup, Inc., Jr. Sub. Notes | | | 6.250% | (b) | | 12/29/49 | | | 640 | | | | 658,560 | |
Citigroup, Inc., Sr. Unsec’d. Notes | | | 3.700% | | | 01/12/26 | | | 1,610 | | | | 1,601,712 | |
Citigroup, Inc., Sr. Unsec’d. Notes | | | 4.500% | | | 01/14/22 | | | 1,125 | | | | 1,199,448 | |
Citigroup, Inc., Sr. Unsec’d. Notes | | | 8.125% | | | 07/15/39 | | | 850 | | | | 1,263,044 | |
Citigroup, Inc., Sub. Notes | | | 4.450% | | | 09/29/27 | | | 1,485 | | | | 1,508,531 | |
Compass Bank, Sr. Unsec’d. Notes | | | 1.850% | | | 09/29/17 | | | 1,050 | | | | 1,047,617 | |
Deutsche Bank AG (Germany), Sr. Unsec’d. Notes, GMTN | | | 3.375% | | | 05/12/21 | | | 1,240 | | | | 1,227,461 | |
Discover Bank, Sr. Unsec’d. Notes | | | 4.250% | | | 03/13/26 | | | 595 | | | | 606,141 | |
Discover Bank, Sub. Notes | | | 7.000% | | | 04/15/20 | | | 485 | | | | 538,533 | |
Goldman Sachs Group, Inc. (The), Jr. Sub. Notes | | | 5.300% | (b) | | 12/29/49 | | | 560 | | | | 536,900 | |
Goldman Sachs Group, Inc. (The), Jr. Sub. Notes | | | 5.375% | (b) | | 12/29/49 | | | 1,800 | | | | 1,818,000 | |
Goldman Sachs Group, Inc. (The), Sr. Unsec’d. Notes | | | 3.750% | | | 02/25/26 | | | 1,165 | | | | 1,168,423 | |
Goldman Sachs Group, Inc. (The), Sr. Unsec’d. Notes | | | 5.250% | | | 07/27/21 | | | 2,305 | | | | 2,526,257 | |
Goldman Sachs Group, Inc. (The), Sr. Unsec’d. Notes | | | 5.750% | | | 01/24/22 | | | 1,250 | | | | 1,405,269 | |
Goldman Sachs Group, Inc. (The), Sr. Unsec’d. Notes | | | 6.250% | | | 02/01/41 | | | 220 | | | | 272,705 | |
Goldman Sachs Group, Inc. (The), Sub. Notes | | | 6.750% | | | 10/01/37 | | | 1,100 | | | | 1,358,332 | |
HSBC Holdings PLC (United Kingdom), Sr. Unsec’d. Notes | | | 4.875% | | | 01/14/22 | | | 1,230 | | | | 1,327,832 | |
HSBC Holdings PLC (United Kingdom), Sr. Unsec’d. Notes | | | 5.100% | | | 04/05/21 | | | 920 | | | | 994,250 | |
SEE NOTES TO FINANCIAL STATEMENTS.
A14
| | | | | | |
| | | CONSERVATIVE BALANCED PORTFOLIO (continued) | | |
| |
| SCHEDULE OF INVESTMENTS | | as of December 31, 2016 |
| | | | | | | | | | | | | | |
CORPORATE BONDS
(continued) | | Interest
Rate
| | | Maturity
Date
| | Principal
Amount
(000)#
| | | Value
(Note 2)
| |
Banks (continued) | |
JPMorgan Chase & Co., Jr. Sub. Notes | | | 6.100% | (b) | | 10/29/49 | | | 1,175 | | | $ | 1,188,953 | |
JPMorgan Chase & Co., Jr. Sub. Notes | | | 7.900% | (b) | | 12/29/49 | | | 2,000 | | | | 2,071,000 | |
JPMorgan Chase & Co., Sr. Unsec’d. Notes | | | 4.250% | | | 10/15/20 | | | 1,660 | | | | 1,756,672 | |
JPMorgan Chase & Co., Sub. Notes | | | 3.875% | | | 09/10/24 | | | 3,525 | | | | 3,566,725 | |
JPMorgan Chase & Co., Sub. Notes | | | 4.950% | | | 06/01/45 | | | 195 | | | | 207,930 | |
Lloyds Bank PLC (United Kingdom), Gtd. Notes, 144A, MTN | | | 5.800% | | | 01/13/20 | | | 1,770 | | | | 1,930,150 | |
Manufacturers & Traders Trust Co., Sr. Unsec’d. Notes | | | 2.900% | | | 02/06/25 | | | 2,385 | | | | 2,323,686 | |
Morgan Stanley, Jr. Sub. Notes | | | 5.450% | (b) | | 07/29/49 | | | 640 | | | | 633,600 | |
Morgan Stanley, Sr. Unsec’d. Notes, GMTN | | | 3.750% | | | 02/25/23 | | | 605 | | | | 621,422 | |
Morgan Stanley, Sr. Unsec’d. Notes, GMTN | | | 5.450% | | | 01/09/17 | | | 1,530 | | | | 1,530,753 | |
Morgan Stanley, Sr. Unsec’d. Notes, GMTN | | | 5.500% | | | 07/28/21 | | | 840 | | | | 930,835 | |
Morgan Stanley, Sr. Unsec’d. Notes, GMTN | | | 6.625% | | | 04/01/18 | | | 100 | | | | 105,753 | |
Morgan Stanley, Sr. Unsec’d. Notes, MTN | | | 6.375% | | | 07/24/42 | | | 640 | | | | 822,507 | |
Morgan Stanley, Sub. Notes, GMTN | | | 4.350% | | | 09/08/26 | | | 3,050 | | | | 3,125,481 | |
National City Corp., Sub. Notes | | | 6.875% | | | 05/15/19 | | | 2,687 | | | | 2,957,541 | |
Nordea Bank AB (Sweden), Sr. Unsec’d. Notes, 144A, MTN | | | 1.875% | | | 09/17/18 | | | 1,590 | | | | 1,589,216 | |
PNC Bank NA, Sr. Unsec’d. Notes | | | 1.950% | | | 03/04/19 | | | 455 | | | | 455,480 | |
PNC Bank NA, Sub. Notes | | | 3.800% | | | 07/25/23 | | | 480 | | | | 494,908 | |
Sumitomo Mitsui Banking Corp. (Japan), Gtd. Notes | | | 2.450% | | | 01/10/19 | | | 925 | | | | 930,063 | |
US Bancorp, Sub. Notes, MTN | | | 2.950% | | | 07/15/22 | | | 915 | | | | 920,423 | |
| | | | | | | | | | | | |
|
|
|
| | | | | | | | | | | | | | 71,141,264 | |
| | | | | | | | | | | | |
|
|
|
Beverages — 0.1% | |
Anheuser-Busch InBev Finance, Inc. (Belgium), Gtd. Notes | | | 4.700% | | | 02/01/36 | | | 2,005 | | | | 2,108,995 | |
| | | | | | | | | | | | |
|
|
|
Biotechnology — 0.1% | |
Amgen, Inc., Sr. Unsec’d. Notes, 144A | | | 4.663% | | | 06/15/51 | | | 1,527 | | | | 1,467,612 | |
Gilead Sciences, Inc., Sr. Unsec’d. Notes | | | 4.150% | | | 03/01/47 | | | 30 | | | | 28,494 | |
Gilead Sciences, Inc., Sr. Unsec’d. Notes | | | 5.650% | | | 12/01/41 | | | 110 | | | | 127,141 | |
| | | | | | | | | | | | |
|
|
|
| | | | | | | | | | | | | | 1,623,247 | |
| | | | | | | | | | | | |
|
|
|
Building Materials | |
Standard Industries, Inc., Sr. Unsec’d. Notes, 144A(c) | | | 5.375% | | | 11/15/24 | | | 1,135 | | | | 1,166,212 | |
| | | | | | | | | | | | |
|
|
|
Chemicals — 0.2% | |
Celanese US Holdings LLC, Gtd. Notes | | | 5.875% | | | 06/15/21 | | | 1,160 | | | | 1,288,193 | |
CF Industries, Inc., Gtd. Notes | | | 5.375% | | | 03/15/44 | | | 445 | | | | 367,263 | |
Dow Chemical Co. (The), Sr. Unsec’d. Notes | | | 4.625% | | | 10/01/44 | | | 5 | | | | 5,017 | |
Dow Chemical Co. (The), Sr. Unsec’d. Notes | | | 9.400% | | | 05/15/39 | | | 30 | | | | 46,545 | |
LyondellBasell Industries NV, Sr. Unsec’d. Notes | | | 4.625% | | | 02/26/55 | | | 955 | | | | 887,428 | |
LyondellBasell Industries NV, Sr. Unsec’d. Notes | | | 5.000% | | | 04/15/19 | | | 800 | | | | 845,322 | |
Mosaic Co. (The), Sr. Unsec’d. Notes(a) | | | 5.450% | | | 11/15/33 | | | 265 | | | | 262,829 | |
Mosaic Co. (The), Sr. Unsec’d. Notes | | | 5.625% | | | 11/15/43 | | | 860 | | | | 828,778 | |
Union Carbide Corp., Sr. Unsec’d. Notes | | | 7.500% | | | 06/01/25 | | | 500 | | | | 601,944 | |
Westlake Chemical Corp., Gtd. Notes, 144A | | | 4.625% | | | 02/15/21 | | | 750 | | | | 776,250 | |
| | | | | | | | | | | | |
|
|
|
| | | | | | | | | | | | | | 5,909,569 | |
| | | | | | | | | | | | |
|
|
|
Commercial Services — 0.1% | |
ERAC USA Finance LLC, Gtd. Notes, 144A(c) | | | 6.375% | | | 10/15/17 | | | 1,198 | | | | 1,241,302 | |
ERAC USA Finance LLC, Gtd. Notes, 144A(c) | | | 7.000% | | | 10/15/37 | | | 390 | | | | 494,152 | |
United Rentals North America, Inc., Gtd. Notes | | | 5.875% | | | 09/15/26 | | | 400 | | | | 411,500 | |
| | | | | | | | | | | | |
|
|
|
| | | | | | | | | | | | | | 2,146,954 | |
| | | | | | | | | | | | |
|
|
|
Computers — 0.2% | |
Diamond 1 Finance Corp./Diamond 2 Finance Corp., Sr. Sec’d. Notes, 144A | | | 3.480% | | | 06/01/19 | | | 825 | | | | 842,165 | |
Diamond 1 Finance Corp./Diamond 2 Finance Corp., Sr. Sec’d. Notes, 144A | | | 4.420% | | | 06/15/21 | | | 700 | | | | 724,322 | |
Hewlett Packard Enterprise Co., Sr. Unsec’d. Notes | | | 2.450% | (b) | | 10/05/17 | | | 2,915 | | | | 2,931,207 | |
Hewlett Packard Enterprise Co., Sr. Unsec’d. Notes | | | 2.850% | (b) | | 10/05/18 | | | 545 | | | | 550,271 | |
Seagate HDD Cayman, Gtd. Notes | | | 3.750% | | | 11/15/18 | | | 455 | | | | 466,204 | |
| | | | | | | | | | | | |
|
|
|
| | | | | | | | | | | | | | 5,514,169 | |
| | | | | | | | | | | | |
|
|
|
SEE NOTES TO FINANCIAL STATEMENTS.
A15
| | | | | | |
| | | CONSERVATIVE BALANCED PORTFOLIO (continued) | | |
| |
| SCHEDULE OF INVESTMENTS | | as of December 31, 2016 |
| | | | | | | | | | | | | | | | |
CORPORATE BONDS
(continued) | | Interest
Rate
| | | Maturity
Date
| | | Principal
Amount
(000)#
| | | Value
(Note 2)
| |
Diversified Financial Services — 0.3% | | | | | | | | | | | | | | | | |
AerCap Ireland Capital Ltd./AerCap Global Aviation Trust (Netherlands), Gtd. Notes | | | 3.750% | | | | 05/15/19 | | | | 600 | | | $ | 611,250 | |
Bear Stearns Cos. LLC (The), Gtd. Notes | | | 6.400% | | | | 10/02/17 | | | | 270 | | | | 279,706 | |
Bear Stearns Cos. LLC (The), Gtd. Notes | | | 7.250% | | | | 02/01/18 | | | | 1,135 | | | | 1,201,100 | |
Discover Financial Services, Sr. Unsec’d. Notes | | | 3.850% | | | | 11/21/22 | | | | 900 | | | | 913,710 | |
GE Capital International Funding Co., Gtd. Notes | | | 4.418% | | | | 11/15/35 | | | | 922 | | | | 966,170 | |
Jefferies Group LLC, Sr. Unsec’d. Notes | | | 6.500% | | | | 01/20/43 | | | | 465 | | | | 478,480 | |
Lehman Brothers Holdings, Inc., Sr. Unsec’d. Notes, MTN(e) | | | 5.250% | | | | 02/06/12 | | | | 1,850 | | | | 106,375 | |
Lehman Brothers Holdings, Inc., Sr. Unsec’d. Notes, MTN(e) | | | 6.875% | | | | 05/02/18 | | | | 700 | | | | 41,370 | |
Navient Corp., Sr. Unsec’d. Notes, MTN | | | 8.450% | | | | 06/15/18 | | | | 295 | | | | 317,863 | |
Private Export Funding Corp., U.S. Gov’t. Gtd. Notes | | | 1.875% | | | | 07/15/18 | | | | 55 | | | | 55,426 | |
Private Export Funding Corp., U.S. Gov’t. Gtd. Notes | | | 2.450% | | | | 07/15/24 | | | | 285 | | | | 277,625 | |
Private Export Funding Corp., U.S. Gov’t. Gtd. Notes | | | 3.250% | | | | 06/15/25 | | | | 895 | | | | 924,511 | |
Synchrony Financial, Sr. Unsec’d. Notes | | | 2.700% | | | | 02/03/20 | | | | 2,175 | | | | 2,168,551 | |
| | | | | | | | | | | | | | |
|
|
|
| | | | | | | | | | | | | | | | 8,342,137 | |
| | | | | | | | | | | | | | |
|
|
|
Electric — 0.6% | | | | | | | | | | | | | | | | |
Baltimore Gas & Electric Co., Sr. Unsec’d. Notes | | | 6.350% | | | | 10/01/36 | | | | 530 | | | | 672,831 | |
Berkshire Hathaway Energy Co., Sr. Unsec’d. Notes | | | 6.125% | | | | 04/01/36 | | | | 340 | | | | 424,619 | |
Black Hills Corp., Sr. Unsec’d. Notes | | | 2.500% | | | | 01/11/19 | | | | 950 | | | | 953,788 | |
CenterPoint Energy Houston Electric LLC, Gen. Ref. Mtge. | | | 6.950% | | | | 03/15/33 | | | | 300 | | | | 399,483 | |
Consolidated Edison Co. of New York, Inc., Sr. Unsec’d. Notes | | | 5.500% | | | | 12/01/39 | | | | 145 | | | | 170,731 | |
Dominion Resources, Inc., Jr. Sub. Notes | | | 4.104% | | | | 04/01/21 | | | | 2,470 | | | | 2,572,920 | |
Duke Energy Carolinas LLC, First Mortgage | | | 6.050% | | | | 04/15/38 | | | | 530 | | | | 668,515 | |
Dynegy, Inc., Gtd. Notes | | | 6.750% | | | | 11/01/19 | | | | 345 | | | | 351,037 | |
Dynegy, Inc., Gtd. Notes | | | 7.375% | | | | 11/01/22 | | | | 255 | | | | 243,525 | |
El Paso Electric Co., Sr. Unsec’d. Notes | | | 6.000% | | | | 05/15/35 | | | | 845 | | | | 974,330 | |
Emera U.S. Finance LP (Canada), Gtd. Notes, 144A | | | 3.550% | | | | 06/15/26 | | | | 745 | | | | 732,357 | |
Eversource Energy, Sr. Unsec’d. Notes | | | 4.500% | | | | 11/15/19 | | | | 605 | | | | 642,164 | |
Exelon Generation Co. LLC, Sr. Unsec’d. Notes | | | 6.250% | | | | 10/01/39 | | | | 1,375 | | | | 1,384,441 | |
FirstEnergy Transmission LLC, Sr. Unsec’d. Notes, 144A | | | 5.450% | | | | 07/15/44 | | | | 265 | | | | 281,315 | |
Florida Power & Light Co., First Mortgage | | | 5.950% | | | | 10/01/33 | | | | 380 | | | | 473,883 | |
Iberdrola International BV (Spain), Gtd. Notes | | | 6.750% | | | | 09/15/33 | | | | 140 | | | | 160,410 | |
Niagara Mohawk Power Corp., Sr. Unsec’d. Notes, 144A | | | 4.881% | | | | 08/15/19 | | | | 545 | | | | 581,597 | |
NRG Energy, Inc., Gtd. Notes, 144A | | | 7.250% | | | | 05/15/26 | | | | 685 | | | | 681,575 | |
Public Service Co. of New Mexico, Sr. Unsec’d. Notes | | | 7.950% | | | | 05/15/18 | | | | 135 | | | | 145,739 | |
Public Service Electric & Gas Co., Sr. Sec’d. Notes, MTN | | | 5.800% | | | | 05/01/37 | | | | 515 | | | | 638,104 | |
Southern California Edison Co., First Mortgage | | | 3.600% | | | | 02/01/45 | | | | 690 | | | | 652,671 | |
Xcel Energy, Inc., Sr. Unsec’d. Notes | | | 4.800% | | | | 09/15/41 | | | | 480 | | | | 511,441 | |
| | | | | | | | | | | | | | |
|
|
|
| | | | | | | | | | | | | | | | 14,317,476 | |
| | | | | | | | | | | | | | |
|
|
|
Entertainment | | | | | | | | | | | | | | | | |
GLP Capital LP/GLP Financing II, Inc., Gtd. Notes | | | 4.875% | | | | 11/01/20 | | | | 800 | | | | 840,000 | |
| | | | | | | | | | | | | | |
|
|
|
Food — 0.1% | | | | | | | | | | | | | | | | |
Kraft Heinz Foods Co., Gtd. Notes | | | 3.000% | | | | 06/01/26 | | | | 1,510 | | | | 1,417,644 | |
Kraft Heinz Foods Co., Gtd. Notes | | | 4.375% | | | | 06/01/46 | | | | 360 | | | | 338,752 | |
Lamb Weston Holdings, Inc., Gtd. Notes, 144A | | | 4.875% | | | | 11/01/26 | | | | 715 | | | | 707,403 | |
| | | | | | | | | | | | | | |
|
|
|
| | | | | | | | | | | | | | | | 2,463,799 | |
| | | | | | | | | | | | | | |
|
|
|
Forest Products & Paper — 0.1% | | | | | | | | | | | | | | | | |
Georgia-Pacific LLC, Gtd. Notes, 144A(c) | | | 5.400% | | | | 11/01/20 | | | | 275 | | | | 302,329 | |
International Paper Co., Sr. Unsec’d. Notes | | | 6.000% | | | | 11/15/41 | | | | 1,270 | | | | 1,426,225 | |
International Paper Co., Sr. Unsec’d. Notes | | | 7.950% | | | | 06/15/18 | | | | 304 | | | | 329,985 | |
| | | | | | | | | | | | | | |
|
|
|
| | | | | | | | | | | | | | | | 2,058,539 | |
| | | | | | | | | | | | | | |
|
|
|
Gas | | | | | | | | | | | | | | | | |
Dominion Gas Holdings LLC, Sr. Unsec’d. Notes | | | 4.800% | | | | 11/01/43 | | | | 45 | | | | 46,629 | |
NiSource Finance Corp., Gtd. Notes | | | 5.450% | | | | 09/15/20 | | | | 500 | | | | 545,994 | |
| | | | | | | | | | | | | | |
|
|
|
| | | | | | | | | | | | | | | | 592,623 | |
| | | | | | | | | | | | | | |
|
|
|
SEE NOTES TO FINANCIAL STATEMENTS.
A16
| | | | | | |
| | | CONSERVATIVE BALANCED PORTFOLIO (continued) | | |
| |
| SCHEDULE OF INVESTMENTS | | as of December 31, 2016 |
| | | | | | | | | | | | | | | | |
CORPORATE BONDS
(continued) | | Interest
Rate
| | | Maturity
Date
| | | Principal
Amount
(000)#
| | | Value
(Note 2)
| |
Healthcare-Products — 0.3% | | | | | | | | | | | | | | | | |
Becton Dickinson & Co., Sr. Unsec’d. Notes | | | 3.734% | | | | 12/15/24 | | | | 372 | | | $ | 380,415 | |
Medtronic, Inc., Gtd. Notes | | | 3.500% | | | | 03/15/25 | | | | 2,515 | | | | 2,589,731 | |
Medtronic, Inc., Gtd. Notes | | | 4.375% | | | | 03/15/35 | | | | 997 | | | | 1,054,754 | |
St. Jude Medical, Inc., Sr. Unsec’d. Notes | | | 2.000% | | | | 09/15/18 | | | | 3,700 | | | | 3,705,221 | |
| | | | | | | | | | | | | | |
|
|
|
| | | | | | | | | | | | | | | | 7,730,121 | |
| | | | | | | | | | | | | | |
|
|
|
Healthcare-Services — 0.4% | | | | | | | | | | | | | | | | |
Aetna, Inc., Sr. Unsec’d. Notes | | | 6.625% | | | | 06/15/36 | | | | 480 | | | | 610,650 | |
Aetna, Inc., Sr. Unsec’d. Notes | | | 6.750% | | | | 12/15/37 | | | | 1,050 | | | | 1,364,592 | |
Anthem, Inc., Sr. Unsec’d. Notes | | | 4.625% | | | | 05/15/42 | | | | 330 | | | | 331,574 | |
Anthem, Inc., Sr. Unsec’d. Notes | | | 4.650% | | | | 01/15/43 | | | | 260 | | | | 261,013 | |
CHS/Community Health Systems, Inc., Sr. Sec’d. Notes(a) | | | 5.125% | | | | 08/15/18 | | | | 181 | | | | 177,380 | |
Cigna Corp., Sr. Unsec’d. Notes | | | 5.875% | | | | 03/15/41 | | | | 540 | | | | 620,726 | |
Cigna Corp., Sr. Unsec’d. Notes | | | 6.150% | | | | 11/15/36 | | | | 640 | | | | 742,113 | |
Fresenius Medical Care U.S. Finance II, Inc. (Germany), Gtd. Notes, 144A | | | 4.125% | | | | 10/15/20 | | | | 1,235 | | | | 1,278,225 | |
HCA, Inc., Sr. Sec’d. Notes | | | 5.000% | | | | 03/15/24 | | | | 900 | | | | 925,875 | |
HCA, Inc., Sr. Sec’d. Notes | | | 5.250% | | | | 04/15/25 | | | | 350 | | | | 365,312 | |
HCA, Inc., Sr. Sec’d. Notes | | | 5.250% | | | | 06/15/26 | | | | 700 | | | | 723,625 | |
Laboratory Corp. of America Holdings, Sr. Unsec’d. Notes | | | 3.200% | | | | 02/01/22 | | | | 160 | | | | 161,329 | |
New York & Presbyterian Hospital (The), Unsec’d. Notes | | | 4.024% | | | | 08/01/45 | | | | 340 | | | | 329,994 | |
UnitedHealth Group, Inc., Sr. Unsec’d. Notes | | | 3.950% | | | | 10/15/42 | | | | 440 | | | | 428,498 | |
UnitedHealth Group, Inc., Sr. Unsec’d. Notes | | | 6.000% | | | | 06/15/17 | | | | 115 | | | | 117,368 | |
UnitedHealth Group, Inc., Sr. Unsec’d. Notes | | | 6.625% | | | | 11/15/37 | | | | 410 | | | | 536,306 | |
| | | | | | | | | | | | | | |
|
|
|
| | | | | | | | | | | | | | | | 8,974,580 | |
| | | | | | | | | | | | | | |
|
|
|
Home Builders | | | | | | | | | | | | | | | | |
D.R. Horton, Inc., Gtd. Notes | | | 3.625% | | | | 02/15/18 | | | | 375 | | | | 378,750 | |
| | | | | | | | | | | | | | |
|
|
|
Housewares — 0.1% | | | | | | | | | | | | | | | | |
Newell Brands, Inc., Sr. Unsec’d. Notes | | | 4.200% | | | | 04/01/26 | | | | 610 | | | | 636,706 | |
Newell Brands, Inc., Sr. Unsec’d. Notes | | | 6.250% | | | | 04/15/18 | | | | 1,600 | | | | 1,683,841 | |
| | | | | | | | | | | | | | |
|
|
|
| | | | | | | | | | | | | | | | 2,320,547 | |
| | | | | | | | | | | | | | |
|
|
|
Insurance — 0.7% | | | | | | | | | | | | | | | | |
Allied World Assurance Co. Holdings Ltd., Gtd. Notes | | | 5.500% | | | | 11/15/20 | | | | 480 | | | | 517,790 | |
American International Group, Inc., Sr. Unsec’d. Notes(a) | | | 4.500% | | | | 07/16/44 | | | | 1,910 | | | | 1,883,403 | |
AXIS Specialty Finance LLC, Gtd. Notes | | | 5.875% | | | | 06/01/20 | | | | 990 | | | | 1,085,165 | |
Berkshire Hathaway, Inc., Sr. Unsec’d. Notes | | | 3.125% | | | | 03/15/26 | | | | 1,350 | | | | 1,341,232 | |
Chubb Corp. (The), Gtd. Notes | | | 6.375%(b) | | | | 03/29/67 | | | | 1,260 | | | | 1,184,400 | |
Chubb INA Holdings, Inc., Gtd. Notes(a) | | | 3.350% | | | | 05/03/26 | | | | 705 | | | | 714,102 | |
Chubb INA Holdings, Inc., Gtd. Notes | | | 4.350% | | | | 11/03/45 | | | | 100 | | | | 105,630 | |
Hartford Financial Services Group, Inc. (The), Sr. Unsec’d. Notes | | | 5.125% | | | | 04/15/22 | | | | 635 | | | | 704,333 | |
Liberty Mutual Group, Inc., Gtd. Notes, 144A | | | 6.500% | | | | 05/01/42 | | | | 215 | | | | 254,911 | |
Liberty Mutual Group, Inc., Gtd. Notes, 144A | | | 7.000% | | | | 03/15/34 | | | | 910 | | | | 1,080,492 | |
Lincoln National Corp., Sr. Unsec’d. Notes | | | 6.300% | | | | 10/09/37 | | | | 701 | | | | 825,639 | |
Markel Corp., Sr. Unsec’d. Notes | | | 5.000% | | | | 03/30/43 | | | | 165 | | | | 167,352 | |
New York Life Insurance Co., Sub. Notes, 144A | | | 6.750% | | | | 11/15/39 | | | | 650 | | | | 854,948 | |
Northwestern Mutual Life Insurance Co. (The), Sub. Notes, 144A | | | 6.063% | | | | 03/30/40 | | | | 350 | | | | 430,985 | |
Ohio National Financial Services, Inc., Sr. Unsec’d. Notes, 144A | | | 6.375% | | | | 04/30/20 | | | | 640 | | | | 703,689 | |
Pacific Life Insurance Co., Sub. Notes, 144A | | | 9.250% | | | | 06/15/39 | | | | 695 | | | | 1,026,601 | |
Principal Financial Group, Inc., Gtd. Notes | | | 4.625% | | | | 09/15/42 | | | | 105 | | | | 108,749 | |
Progressive Corp. (The), Jr. Sub. Notes | | | 6.700%(b) | | | | 06/15/67 | | | | 715 | | | | 698,913 | |
Progressive Corp. (The), Sr. Unsec’d. Notes | | | 3.700% | | | | 01/26/45 | | | | 570 | | | | 531,975 | |
Teachers Insurance & Annuity Association of America, Sub. Notes, 144A | | | 6.850% | | | | 12/16/39 | | | | 1,430 | | | | 1,855,745 | |
Travelers Cos., Inc. (The), Sr. Unsec’d. Notes | | | 4.300% | | | | 08/25/45 | | | | 660 | | | | 683,665 | |
Unum Group, Sr. Unsec’d. Notes | | | 5.625% | | | | 09/15/20 | | | | 315 | | | | 343,037 | |
W.R. Berkley Corp., Sr. Unsec’d. Notes | | | 6.150% | | | | 08/15/19 | | | | 575 | | | | 626,352 | |
| | | | | | | | | | | | | | |
|
|
|
| | | | | | | | | | | | | | | | 17,729,108 | |
| | | | | | | | | | | | | | |
|
|
|
SEE NOTES TO FINANCIAL STATEMENTS.
A17
| | | | | | |
| | | CONSERVATIVE BALANCED PORTFOLIO (continued) | | |
| |
| SCHEDULE OF INVESTMENTS | | as of December 31, 2016 |
| | | | | | | | | | | | | | | | |
CORPORATE BONDS
(continued) | | Interest
Rate
| | | Maturity
Date
| | | Principal
Amount
(000)#
| | | Value
(Note 2)
| |
Lodging — 0.2% | | | | | | | | | | | | | | | | |
Choice Hotels International, Inc., Gtd. Notes | | | 5.750% | | | | 07/01/22 | | | | 555 | | | $ | 592,463 | |
Marriott International, Inc., Sr. Unsec’d. Notes | | | 3.000% | | | | 03/01/19 | | | | 490 | | | | 498,574 | |
Marriott International, Inc., Sr. Unsec’d. Notes | | | 3.250% | | | | 09/15/22 | | | | 805 | | | | 811,740 | |
Marriott International, Inc., Sr. Unsec’d. Notes | | | 6.750% | | | | 05/15/18 | | | | 2,700 | | | | 2,878,240 | |
Wyndham Worldwide Corp., Sr. Unsec’d. Notes | | | 2.500% | | | | 03/01/18 | | | | 405 | | | | 408,409 | |
| | | | | | | | | | | | | | |
|
|
|
| | | | | | | | | | | | | | | | 5,189,426 | |
| | | | | | | | | | | | | | |
|
|
|
Machinery-Diversified — 0.1% | | | | | | | | | | | | | | | | |
Case New Holland Industrial, Inc. (United Kingdom), Gtd. Notes | | | 7.875% | | | | 12/01/17 | | | | 1,100 | | | | 1,156,375 | |
Xylem, Inc., Sr. Unsec’d. Notes | | | 4.875% | | | | 10/01/21 | | | | 1,060 | | | | 1,144,346 | |
| | | | | | | | | | | | | | |
|
|
|
| | | | | | | | | | | | | | | | 2,300,721 | |
| | | | | | | | | | | | | | |
|
|
|
Media — 0.6% | | | | | | | | | | | | | | | | |
21st Century Fox America, Inc., Gtd. Notes | | | 6.150% | | | | 03/01/37 | | | | 250 | | | | 292,566 | |
21st Century Fox America, Inc., Gtd. Notes | | | 6.900% | | | | 08/15/39 | | | | 35 | | | | 43,951 | |
21st Century Fox America, Inc., Gtd. Notes | | | 7.625% | | | | 11/30/28 | | | | 1,265 | | | | 1,621,611 | |
AMC Networks, Inc., Gtd. Notes | | | 5.000% | | | | 04/01/24 | | | | 1,225 | | | | 1,231,125 | |
Cablevision Systems Corp., Sr. Unsec’d. Notes | | | 8.625% | | | | 09/15/17 | | | | 900 | | | | 936,000 | |
CCO Holdings LLC/CCO Holdings Capital Corp., Sr. Unsec’d. Notes, 144A | | | 5.375% | | | | 05/01/25 | | | | 720 | | | | 741,600 | |
Charter Communications Operating LLC/Charter Communications Operating Capital, Sr. Sec’d. Notes | | | 6.384% | | | | 10/23/35 | | | | 630 | | | | 719,354 | |
Charter Communications Operating LLC/Charter Communications Operating Capital, Sr. Sec’d. Notes | | | 6.484% | | | | 10/23/45 | | | | 1,000 | | | | 1,156,079 | |
Comcast Cable Holdings LLC, Gtd. Notes | | | 9.875% | | | | 06/15/22 | | | | 1,440 | | | | 1,859,639 | |
Historic TW, Inc., Gtd. Notes | | | 9.150% | | | | 02/01/23 | | | | 625 | | | | 801,530 | |
Myriad International Holdings BV (South Africa), Gtd. Notes, RegS | | | 6.375% | | | | 07/28/17 | | | | 750 | | | | 764,820 | |
Time Warner Cable, Inc., Sr. Sec’d. Notes | | | 5.850% | | | | 05/01/17 | | | | 1,240 | | | | 1,257,597 | |
Time Warner, Inc., Gtd. Notes | | | 3.800% | | | | 02/15/27 | | | | 585 | | | | 581,678 | |
Time Warner, Inc., Gtd. Notes | | | 6.200% | | | | 03/15/40 | | | | 175 | | | | 202,009 | |
Time Warner, Inc., Gtd. Notes | | | 6.250% | | | | 03/29/41 | | | | 495 | | | | 577,557 | |
Viacom, Inc., Sr. Unsec’d. Notes | | | 4.500% | | | | 02/27/42 | | | | 50 | | | | 41,449 | |
Viacom, Inc., Sr. Unsec’d. Notes | | | 4.875% | | | | 06/15/43 | | | | 150 | | | | 130,038 | |
Viacom, Inc., Sr. Unsec’d. Notes | | | 5.250% | | | | 04/01/44 | | | | 340 | | | | 309,312 | |
Videotron Ltd. (Canada), Gtd. Notes | | | 5.000% | | | | 07/15/22 | | | | 850 | | | | 871,250 | |
| | | | | | | | | | | | | | |
|
|
|
| | | | | | | | | | | | | | | | 14,139,165 | |
| | | | | | | | | | | | | | |
|
|
|
Mining — 0.1% | | | | | | | | | | | | | | | | |
BHP Billiton Finance USA Ltd. (Australia), Gtd. Notes | | | 5.000% | | | | 09/30/43 | | | | 700 | | | | 781,872 | |
BHP Billiton Finance USA Ltd. (Australia), Gtd. Notes, 144A(a) | | | 6.250% | (b) | | | 10/19/75 | | | | 845 | | | | 914,882 | |
Southern Copper Corp. (Peru), Sr. Unsec’d. Notes | | | 5.875% | | | | 04/23/45 | | | | 400 | | | | 392,690 | |
Southern Copper Corp. (Peru), Sr. Unsec’d. Notes | | | 6.750% | | | | 04/16/40 | | | | 300 | | | | 323,672 | |
| | | | | | | | | | | | | | |
|
|
|
| | | | | | | | | | | | | | | | 2,413,116 | |
| | | | | | | | | | | | | | |
|
|
|
Miscellaneous Manufacturing — 0.1% | | | | | | | | | | | | | | | | |
Actuant Corp., Gtd. Notes | | | 5.625% | | | | 06/15/22 | | | | 1,040 | | | | 1,066,000 | |
Koppers, Inc., Gtd. Notes | | | 7.875% | | | | 12/01/19 | | | | 1,050 | | | | 1,064,437 | |
| | | | | | | | | | | | | | |
|
|
|
| | | | | | | | | | | | | | | | 2,130,437 | |
| | | | | | | | | | | | | | |
|
|
|
Multi-National — 0.1% | | | | | | | | | | | | | | | | |
Corp. Andina de Fomento (Supranational Bank), Sr. Unsec’d. Notes | | | 2.000% | | | | 05/10/19 | | | | 1,065 | | | | 1,058,059 | |
North American Development Bank (Supranational Bank), Sr. Unsec’d. Notes | | | 2.400% | | | | 10/26/22 | | | | 855 | | | | 830,001 | |
North American Development Bank (Supranational Bank), Sr. Unsec’d. Notes | | | 4.375% | | | | 02/11/20 | | | | 800 | | | | 851,156 | |
| | | | | | | | | | | | | | |
|
|
|
| | | | | | | | | | | | | | | | 2,739,216 | |
| | | | | | | | | | | | | | |
|
|
|
Oil & Gas — 0.6% | | | | | | | | | | | | | | | | |
Anadarko Petroleum Corp., Sr. Unsec’d. Notes | | | 4.677% | (f) | | | 10/10/36 | | | | 1,000 | | | | 404,312 | |
Anadarko Petroleum Corp., Sr. Unsec’d. Notes | | | 6.450% | | | | 09/15/36 | | | | 1,040 | | | | 1,237,773 | |
Anadarko Petroleum Corp., Sr. Unsec’d. Notes | | | 6.600% | | | | 03/15/46 | | | | 195 | | | | 240,505 | |
ConocoPhillips Co., Gtd. Notes | | | 4.950% | | | | 03/15/26 | | | | 1,700 | | | | 1,876,803 | |
Devon Energy Corp., Sr. Unsec’d. Notes | | | 5.000% | | | | 06/15/45 | | | | 85 | | | | 83,498 | |
SEE NOTES TO FINANCIAL STATEMENTS.
A18
| | | | | | |
| | | CONSERVATIVE BALANCED PORTFOLIO (continued) | | |
| |
| SCHEDULE OF INVESTMENTS | | as of December 31, 2016 |
| | | | | | | | | | | | | | | | |
CORPORATE BONDS
(continued) | | Interest
Rate
| | | Maturity
Date
| | | Principal
Amount
(000)#
| | | Value
(Note 2)
| |
Oil & Gas (continued) | | | | | | | | | | | | | | | | |
Devon Energy Corp., Sr. Unsec’d. Notes | | | 5.600% | | | | 07/15/41 | | | | 225 | | | $ | 231,749 | |
Devon Financing Co. LLC, Gtd. Notes | | | 7.875% | | | | 09/30/31 | | | | 1,350 | | | | 1,712,939 | |
EOG Resources, Inc., Sr. Unsec’d. Notes | | | 3.900% | | | | 04/01/35 | | | | 830 | | | | 786,036 | |
Helmerich & Payne International Drilling Co., Gtd. Notes | | | 4.650% | | | | 03/15/25 | | | | 1,555 | | | | 1,606,738 | |
Hess Corp., Sr. Unsec’d. Notes | | | 4.300% | | | | 04/01/27 | | | | 780 | | | | 776,429 | |
Nabors Industries, Inc., Gtd. Notes | | | 4.625% | | | | 09/15/21 | | | | 890 | | | | 904,703 | |
Noble Energy, Inc., Sr. Unsec’d. Notes | | | 5.050% | | | | 11/15/44 | | | | 925 | | | | 927,727 | |
Occidental Petroleum Corp., Sr. Unsec’d. Notes | | | 3.000% | | | | 02/15/27 | | | | 415 | | | | 401,544 | |
Phillips 66, Gtd. Notes | | | 2.950% | | | | 05/01/17 | | | | 415 | | | | 417,315 | |
Pioneer Natural Resources Co., Sr. Unsec’d. Notes | | | 6.875% | | | | 05/01/18 | | | | 1,450 | | | | 1,539,366 | |
Reliance Holding USA, Inc. (India), Gtd. Notes, 144A | | | 5.400% | | | | 02/14/22 | | | | 400 | | | | 432,441 | |
Valero Energy Corp., Sr. Unsec’d. Notes(a) | | | 4.900% | | | | 03/15/45 | | | | 225 | | | | 224,222 | |
| | | | | | | | | | | | | | |
|
|
|
| | | | | | | | | | | | | | | | 13,804,100 | |
| | | | | | | | | | | | | | |
|
|
|
Oil & Gas Services — 0.1% | | | | | | | | | | | | | | | | |
Schlumberger Holdings Corp., Sr. Unsec’d. Notes, 144A | | | 4.000% | | | | 12/21/25 | | | | 2,170 | | | | 2,274,138 | |
| | | | | | | | | | | | | | |
|
|
|
Packaging & Containers — 0.1% | | | | | | | | | | | | | | | | |
Ball Corp., Gtd. Notes | | | 4.375% | | | | 12/15/20 | | | | 465 | | | | 485,925 | |
WestRock RKT Co., Gtd. Notes | | | 4.900% | | | | 03/01/22 | | | | 675 | | | | 732,738 | |
| | | | | | | | | | | | | | |
|
|
|
| | | | | | | | | | | | | | | | 1,218,663 | |
| | | | | | | | | | | | | | |
|
|
|
Pharmaceuticals — 0.3% | | | | | | | | | | | | | | | | |
AbbVie, Inc., Sr. Unsec’d. Notes | | | 3.600% | | | | 05/14/25 | | | | 950 | | | | 940,964 | |
AbbVie, Inc., Sr. Unsec’d. Notes | | | 4.500% | | | | 05/14/35 | | | | 1,595 | | | | 1,567,130 | |
Actavis Funding SCS, Gtd. Notes | | | 3.800% | | | | 03/15/25 | | | | 805 | | | | 805,948 | |
Actavis Funding SCS, Gtd. Notes | | | 4.550% | | | | 03/15/35 | | | | 1,625 | | | | 1,608,412 | |
Actavis Funding SCS, Gtd. Notes | | | 4.750% | | | | 03/15/45 | | | | 230 | | | | 225,799 | |
Actavis, Inc., Gtd. Notes | | | 6.125% | | | | 08/15/19 | | | | 440 | | | | 480,713 | |
Merck & Co., Inc., Sr. Unsec’d. Notes(a) | | | 2.750% | | | | 02/10/25 | | | | 340 | | | | 333,833 | |
Merck & Co., Inc., Sr. Unsec’d. Notes | | | 3.700% | | | | 02/10/45 | | | | 1,105 | | | | 1,053,664 | |
Novartis Capital Corp. (Switzerland), Gtd. Notes | | | 4.400% | | | | 05/06/44 | | | | 700 | | | | 754,908 | |
Teva Pharmaceutical Finance Netherlands III BV (Israel), Gtd. Notes(a) | | | 3.150% | | | | 10/01/26 | | | | 460 | | | | 424,086 | |
Teva Pharmaceutical Finance Netherlands III BV (Israel), Gtd. Notes | | | 4.100% | | | | 10/01/46 | | | | 145 | | | | 124,245 | |
Zoetis, Inc., Sr. Unsec’d. Notes | | | 4.700% | | | | 02/01/43 | | | | 90 | | | | 87,604 | |
| | | | | | | | | | | | | | |
|
|
|
| | | | | | | | | | | | | | | | 8,407,306 | |
| | | | | | | | | | | | | | |
|
|
|
Pipelines — 0.2% | |
DCP Midstream LLC, Sr. Unsec’d. Notes, 144A | | | 5.350% | | | | 03/15/20 | | | | 473 | | | | 490,738 | |
Energy Transfer Partners LP, Sr. Unsec’d. Notes(a) | | | 4.650% | | | | 06/01/21 | | | | 610 | | | | 633,344 | |
Energy Transfer Partners LP, Sr. Unsec’d. Notes | | | 4.900% | | | | 03/15/35 | | | | 200 | | | | 186,906 | |
Enterprise Products Operating LLC, Gtd. Notes(a) | | | 3.700% | | | | 02/15/26 | | | | 550 | | | | 551,994 | |
Enterprise Products Operating LLC, Gtd. Notes(a) | | | 3.750% | | | | 02/15/25 | | | | 1,055 | | | | 1,071,945 | |
Enterprise Products Operating LLC, Gtd. Notes(a) | | | 3.950% | | | | 02/15/27 | | | | 810 | | | | 829,758 | |
Kinder Morgan Energy Partners LP, Gtd. Notes | | | 5.950% | | | | 02/15/18 | | | | 530 | | | | 552,854 | |
MPLX LP, Sr. Unsec’d. Notes | | | 4.000% | | | | 02/15/25 | | | | 1,140 | | | | 1,108,086 | |
ONEOK Partners LP, Gtd. Notes | | | 6.650% | | | | 10/01/36 | | | | 130 | | | | 147,474 | |
| | | | | | | | | | | | | | |
|
|
|
| | | | | | | | | | | | | | | | 5,573,099 | |
| | | | | | | | | | | | | | |
|
|
|
Real Estate | |
Prologis LP, Gtd. Notes | | | 6.875% | | | | 03/15/20 | | | | 68 | | | | 76,279 | |
| | | | | | | | | | | | | | |
|
|
|
Real Estate Investment Trusts (REITs) | |
Select Income REIT, Sr. Unsec’d. Notes | | | 2.850% | | | | 02/01/18 | | | | 550 | | | | 552,350 | |
Simon Property Group LP, Sr. Unsec’d. Notes | | | 3.375% | | | | 03/15/22 | | | | 190 | | | | 196,434 | |
| | | | | | | | | | | | | | |
|
|
|
| | | | | | | | | | | | | | | | 748,784 | |
| | | | | | | | | | | | | | |
|
|
|
Retail — 0.3% | |
CVS Health Corp., Sr. Unsec’d. Notes | | | 5.125% | | | | 07/20/45 | | | | 590 | | | | 657,524 | |
CVS Health Corp., Sr. Unsec’d. Notes | | | 5.300% | | | | 12/05/43 | | | | 170 | | | | 192,624 | |
Home Depot, Inc. (The), Sr. Unsec’d. Notes | | | 3.000% | | | | 04/01/26 | | | | 585 | | | | 583,877 | |
SEE NOTES TO FINANCIAL STATEMENTS.
A19
| | | | | | |
| | | CONSERVATIVE BALANCED PORTFOLIO (continued) | | |
| |
| SCHEDULE OF INVESTMENTS | | as of December 31, 2016 |
| | | | | | | | | | | | | | | | |
CORPORATE BONDS
(continued) | | Interest
Rate
| | | Maturity
Date
| | | Principal
Amount
(000)#
| | | Value
(Note 2)
| |
Retail (continued) | |
Home Depot, Inc. (The), Sr. Unsec’d. Notes | | | 4.400% | | | | 03/15/45 | | | | 565 | | | $ | 602,118 | |
L Brands, Inc., Gtd. Notes | | | 5.625% | | | | 02/15/22 | | | | 1,300 | | | | 1,387,750 | |
Lowe’s Cos., Inc., Sr. Unsec’d. Notes | | | 6.500% | | | | 03/15/29 | | | | 345 | | | | 445,650 | |
Macy’s Retail Holdings, Inc., Gtd. Notes | | | 3.875% | | | | 01/15/22 | | | | 300 | | | | 307,268 | |
McDonald’s Corp., Sr. Unsec’d. Notes, MTN | | | 3.700% | | | | 01/30/26 | | | | 1,925 | | | | 1,959,837 | |
Sally Holdings LLC/Sally Capital, Inc., Gtd. Notes | | | 5.625% | | | | 12/01/25 | | | | 1,020 | | | | 1,060,800 | |
Target Corp., Sr. Unsec’d. Notes | | | 3.500% | | | | 07/01/24 | | | | 265 | | | | 275,266 | |
| | | | | | | | | | | | | | |
|
|
|
| | | | | | | | | | | | | | | | 7,472,714 | |
| | | | | | | | | | | | | | |
|
|
|
Savings & Loans | |
People’s United Financial, Inc., Sr. Unsec’d. Notes | | | 3.650% | | | | 12/06/22 | | | | 1,195 | | | | 1,201,718 | |
| | | | | | | | | | | | | | |
|
|
|
Semiconductors — 0.1% | |
NXP BV/NXP Funding LLC (Netherlands), Gtd. Notes, 144A | | | 5.750% | | | | 03/15/23 | | | | 1,200 | | | | 1,266,000 | |
| | | | | | | | | | | | | | |
|
|
|
Software — 0.2% | |
Fidelity National Information Services, Inc., Sr. Unsec’d. Notes | | | 2.850% | | | | 10/15/18 | | | | 1,225 | | | | 1,246,306 | |
Fidelity National Information Services, Inc., Sr. Unsec’d. Notes | | | 3.625% | | | | 10/15/20 | | | | 1,640 | | | | 1,697,840 | |
Microsoft Corp., Sr. Unsec’d. Notes | | | 4.000% | | | | 02/12/55 | | | | 360 | | | | 340,481 | |
Oracle Corp., Sr. Unsec’d. Notes | | | 4.300% | | | | 07/08/34 | | | | 700 | | | | 723,789 | |
| | | | | | | | | | | | | | |
|
|
|
| | | | | | | | | | | | | | | | 4,008,416 | |
| | | | | | | | | | | | | | |
|
|
|
Telecommunications — 0.6% | |
AT&T Corp., Gtd. Notes | | | 8.250% | (b) | | | 11/15/31 | | | | 10 | | | | 13,901 | |
AT&T, Inc., Sr. Unsec’d. Notes | | | 3.400% | | | | 05/15/25 | | | | 3,130 | | | | 3,016,766 | |
AT&T, Inc., Sr. Unsec’d. Notes | | | 4.500% | | | | 05/15/35 | | | | 350 | | | | 338,158 | |
AT&T, Inc., Sr. Unsec’d. Notes | | | 4.500% | | | | 03/09/48 | | | | 12 | | | | 10,783 | |
AT&T, Inc., Sr. Unsec’d. Notes | | | 4.550% | | | | 03/09/49 | | | | 1,174 | | | | 1,060,434 | |
AT&T, Inc., Sr. Unsec’d. Notes | | | 4.750% | | | | 05/15/46 | | | | 560 | | | | 530,555 | |
AT&T, Inc., Sr. Unsec’d. Notes | | | 4.800% | | | | 06/15/44 | | | | 305 | | | | 288,199 | |
AT&T, Inc., Sr. Unsec’d. Notes | | | 5.150% | | | | 03/15/42 | | | | 520 | | | | 518,009 | |
AT&T, Inc., Sr. Unsec’d. Notes | | | 5.350% | | | | 09/01/40 | | | | 113 | | | | 116,051 | |
British Telecommunications PLC (United Kingdom), Sr. Unsec’d. Notes | | | 9.125% | (b) | | | 12/15/30 | | | | 350 | | | | 533,988 | |
Sprint Spectrum Co. LLC/Sprint Spectrum Co. II LLC/Sprint Spectrum Co. III LLC, Sr. Sec’d. Notes, 144A | | | 3.360% | | | | 03/20/23 | | | | 1,400 | | | | 1,402,618 | |
Verizon Communications, Inc., Sr. Unsec’d. Notes | | | 4.522% | | | | 09/15/48 | | | | 1,827 | | | | 1,751,932 | |
Verizon Communications, Inc., Sr. Unsec’d. Notes | | | 4.672% | | | | 03/15/55 | | | | 2,288 | | | | 2,148,684 | |
Verizon Communications, Inc., Sr. Unsec’d. Notes | | | 5.012% | | | | 08/21/54 | | | | 2,349 | | | | 2,336,696 | |
| | | | | | | | | | | | | | |
|
|
|
| | | | | | | | | | | | | | | | 14,066,774 | |
| | | | | | | | | | | | | | |
|
|
|
Transportation — 0.1% | |
Burlington Northern Santa Fe LLC, Sr. Unsec’d. Notes | | | 3.450% | | | | 09/15/21 | | | | 1,180 | | | | 1,232,346 | |
Burlington Northern Santa Fe LLC, Sr. Unsec’d. Notes | | | 6.700% | | | | 08/01/28 | | | | 735 | | | | 936,190 | |
CSX Corp., Sr. Unsec’d. Notes | | | 6.150% | | | | 05/01/37 | | | | 690 | | | | 847,635 | |
Norfolk Southern Corp., Sr. Unsec’d. Notes | | | 5.590% | | | | 05/17/25 | | | | 120 | | | | 137,265 | |
| | | | | | | | | | | | | | |
|
|
|
| | | | | | | | | | | | | | | | 3,153,436 | |
| | | | | | | | | | | | | | |
|
|
|
TOTAL CORPORATE BONDS
(cost $256,743,437) | | | | 264,012,034 | |
| | | | | | | | | | | | | | |
|
|
|
| MUNICIPAL BONDS — 0.6% | |
Alabama | |
Alabama Economic Settlement Authority, Revenue Bonds, BABs | | | 4.263% | | | | 09/15/32 | | | | 180 | | | | 185,000 | |
| | | | | | | | | | | | | | |
|
|
|
California — 0.3% | |
Bay Area Toll Authority, Revenue Bonds, BABs | | | 6.263% | | | | 04/01/49 | | | | 1,305 | | | | 1,772,869 | |
California Educational Facilities Authority, Revenue Bonds, BABs | | | 5.000% | | | | 06/01/46 | | | | 550 | | | | 704,352 | |
Central Puget Sound Regional Transit Authority, Revenue Bonds, BABs | | | 5.000% | | | | 11/01/46 | | | | 700 | | | | 888,846 | |
State of California, GO, BABs | | | 7.300% | | | | 10/01/39 | | | | 1,250 | | | | 1,765,487 | |
State of California, GO, BABs | | | 7.500% | | | | 04/01/34 | | | | 350 | | | | 492,331 | |
State of California, GO, BABs | | | 7.550% | | | | 04/01/39 | | | | 245 | | | | 363,827 | |
State of California, GO, BABs | | | 7.625% | | | | 03/01/40 | | | | 205 | | | | 301,211 | |
| | | | | | | | | | | | | | |
|
|
|
| | | | | | | | | | | | | | | | 6,288,923 | |
| | | | | | | | | | | | | | |
|
|
|
SEE NOTES TO FINANCIAL STATEMENTS.
A20
| | | | | | |
| | | CONSERVATIVE BALANCED PORTFOLIO (continued) | | |
| |
| SCHEDULE OF INVESTMENTS | | as of December 31, 2016 |
| | | | | | | | | | | | | | | | |
MUNICIPAL BONDS
(continued) | | Interest
Rate
| | | Maturity
Date
| | | Principal
Amount
(000)#
| | | Value
(Note 2)
| |
Colorado | |
Regional Transportation District, Revenue Bonds, Series 2010-B, BABs | | | 5.844% | | | | 11/01/50 | | | | 565 | | | $ | 732,336 | |
| | | | | | | | | | | | | | |
|
|
|
Illinois — 0.1% | |
Chicago O’Hare International Airport, Revenue Bonds, BABs | | | 6.395% | | | | 01/01/40 | | | | 970 | | | | 1,266,093 | |
| | | | | | | | | | | | | | |
|
|
|
New Jersey — 0.1% | |
New Jersey State Turnpike Authority, Revenue Bonds, Series F, BABs | | | 7.414% | | | | 01/01/40 | | | | 1,000 | | | | 1,440,530 | |
| | | | | | | | | | | | | | |
|
|
|
New York — 0.1% | | | | | | | | | | | | | | | | |
New York City Transitional Finance Authority, Revenue Bonds, BABs | | | 5.767% | | | | 08/01/36 | | | | 1,100 | | | | 1,360,898 | |
| | | | | | | | | | | | | | |
|
|
|
Ohio | | | | | | | | | | | | | | | | |
Ohio State University (The), Revenue Bonds, BABs | | | 4.910% | | | | 06/01/40 | | | | 415 | | | | 474,801 | |
Ohio State Water Development Authority, Revenue Bonds, BABs | | | 4.879% | | | | 12/01/34 | | | | 275 | | | | 309,477 | |
| | | | | | | | | | | | | | |
|
|
|
| | | | | | | | | | | | | | | | 784,278 | |
| | | | | | | | | | | | | | |
|
|
|
Oregon | | | | | | | | | | | | | | | | |
Oregon State Department of Transportation Highway, Revenue Bonds, Series A, BABs | | | 5.834% | | | | 11/15/34 | | | | 425 | | | | 535,122 | |
| | | | | | | | | | | | | | |
|
|
|
Pennsylvania | | | | | | | | | | | | | | | | |
Pennsylvania Turnpike Commission, Revenue Bonds, Series B, BABs | | | 5.511% | | | | 12/01/45 | | | | 505 | | | | 606,631 | |
| | | | | | | | | | | | | | |
|
|
|
Tennessee | | | | | | | | | | | | | | | | |
Metropolitan Government of Nashville & Davidson County Convention Center Authority, Revenue Bonds, BABs | | | 6.731% | | | | 07/01/43 | | | | 945 | | | | 1,222,159 | |
| | | | | | | | | | | | | | |
|
|
|
TOTAL MUNICIPAL BONDS
(cost $11,452,714) | | | | 14,421,970 | |
| | | | | | | | | | | | | | |
|
|
|
| NON-CORPORATE FOREIGN AGENCIES — 0.8% | | | | | | | | | | | | | | | | |
Bank Nederlandse Gemeenten NV (Netherlands), Sr. Unsec’d. Notes, 144A | | | 2.625% | | | | 04/28/21 | | | | 2,086 | | | | 2,117,753 | |
CDP Financial, Inc. (Canada), Sr. Unsec’d. Notes, 144A | | | 3.150% | | | | 07/24/24 | | | | 1,300 | | | | 1,318,447 | |
Comision Federal de Electricidad (Mexico), Sr. Unsec’d. Notes, 144A | | | 4.750% | | | | 02/23/27 | | | | 355 | | | | 340,800 | |
Comision Federal de Electricidad (Mexico), Sr. Unsec’d. Notes, 144A | | | 4.875% | | | | 01/15/24 | | | | 490 | | | | 486,938 | |
Dexia Credit Local SA (France), Gov’t. Liq. Gtd. Notes, 144A | | | 1.875% | | | | 09/15/21 | | | | 1,000 | | | | 965,013 | |
Export-Import Bank of Korea (South Korea), Sr. Unsec’d. Notes | | | 5.125% | | | | 06/29/20 | | | | 265 | | | | 286,836 | |
Finnvera OYJ (Finland), Gov’t. Gtd. Notes, 144A, MTN | | | 2.375% | | | | 06/04/25 | | | | 400 | | | | 382,736 | |
Gazprom OAO Via Gaz Capital SA (Russia), Sr. Unsec’d. Notes, 144A | | | 4.950% | | | | 07/19/22 | | | | 255 | | | | 262,387 | |
Gazprom OAO Via Gaz Capital SA (Russia), Sr. Unsec’d. Notes, 144A | | | 6.510% | | | | 03/07/22 | | | | 440 | | | | 485,373 | |
Japan Bank for International Cooperation (Japan), Gov’t. Gtd. Notes | | | 1.500% | | | | 07/21/21 | | | | 600 | | | | 575,267 | |
Japan Finance Organization for Municipalities (Japan), Sr. Unsec’d. Notes, 144A, MTN | | | 2.125% | | | | 04/13/21 | | | | 600 | | | | 586,865 | |
Japan Finance Organization for Municipalities (Japan), Sr. Unsec’d. Notes, 144A, MTN | | | 2.125% | | | | 10/25/23 | | | | 1,000 | | | | 951,284 | |
Kommunalbanken AS (Norway), Sr. Unsec’d. Notes, 144A | | | 1.125% | | | | 05/23/18 | | | | 2,634 | | | | 2,623,617 | |
Petroleos Mexicanos (Mexico), Gtd. Notes | | | 5.500% | | | | 01/21/21 | | | | 795 | | | | 817,856 | |
Petroleos Mexicanos (Mexico), Gtd. Notes | | | 6.500% | | | | 06/02/41 | | | | 955 | | | | 894,405 | |
Petroleos Mexicanos (Mexico), Gtd. Notes | | | 8.625% | (b) | | | 12/01/23 | | | | 350 | | | | 379,750 | |
Petroleos Mexicanos (Mexico), Gtd. Notes, 144A | | | 5.375% | | | | 03/13/22 | | | | 330 | | | | 337,913 | |
Russian Agricultural Bank OJSC via RSHB Capital SA (Russia), Sr. Unsec’d. Notes, 144A | | | 6.299% | | | | 05/15/17 | | | | 560 | | | | 566,729 | |
Sinopec Group Overseas Development 2014 Ltd. (China), Gtd. Notes, 144A | | | 1.750% | | | | 04/10/17 | | | | 1,035 | | | | 1,034,661 | |
Sinopec Group Overseas Development 2015 Ltd. (China), Gtd. Notes, 144A | | | 2.500% | | | | 04/28/20 | | | | 1,000 | | | | 993,371 | |
State Grid Overseas Investment 2014 Ltd. (China), Gtd. Notes, 144A | | | 2.750% | | | | 05/07/19 | | | | 500 | | | | 506,517 | |
Svensk Exportkredit AB (Sweden), Sr. Unsec’d. Notes, GMTN | | | 1.750% | | | | 03/10/21 | | | | 2,385 | | | | 2,340,560 | |
| | | | | | | | | | | | | | |
|
|
|
TOTAL NON-CORPORATE FOREIGN AGENCIES
(cost $19,560,945) | | | | 19,255,078 | |
| | | | | | | | | | | | | | |
|
|
|
| RESIDENTIAL MORTGAGE-BACKED SECURITIES — 1.7% | | | | | | | | | | | | | | | | |
Alternative Loan Trust, Series 2004-18CB, Class 3A1 | | | 5.250% | | | | 09/25/19 | | | | 163 | | | | 163,464 | |
Banc of America Alternative Loan Trust, Series 2005-12, Class 3CB1 | | | 6.000% | | | | 01/25/36 | | | | 1,026 | | | | 872,011 | |
Banc of America Funding Trust, Series 2015-R4, Class 4A1, 144A | | | 3.500% | (b) | | | 07/26/36 | | | | 1,430 | | | | 1,430,580 | |
SEE NOTES TO FINANCIAL STATEMENTS.
A21
| | | | | | |
| | | CONSERVATIVE BALANCED PORTFOLIO (continued) | | |
| |
| SCHEDULE OF INVESTMENTS | | as of December 31, 2016 |
| | | | | | | | | | | | | | | | |
RESIDENTIAL MORTGAGE-BACKED SECURITIES
(continued) | | Interest
Rate
| | | Maturity
Date
| | | Principal
Amount
(000)#
| | | Value
(Note 2)
| |
Banc of America Funding Trust, Series 2015-R6, Class 1A1, 144A | | | 0.739% | (b) | | | 08/26/36 | | | | 790 | | | $ | 744,886 | |
Banc of America Mortgage Trust, Series 2005-A, Class 2A1 | | | 2.961% | (b) | | | 02/25/35 | | | | 236 | | | | 235,128 | |
Banc of America Mortgage Trust, Series 2005-B, Class 2A1 | | | 3.063% | (b) | | | 03/25/35 | | | | 268 | | | | 241,340 | |
Bayview Opportunity Master Fund Trust, Series 2016-CRT1, Class M1, 144A | | | 2.511% | (b) | | | 10/27/27 | | | | 511 | | | | 509,664 | |
Chase Mortgage Finance Trust, Series 2007-A1, Class 1A5 | | | 3.167% | (b) | | | 02/25/37 | | | | 500 | | | | 479,429 | |
Fannie Mae Connecticut Avenue Securities, Series 2014-C04, Class 1M1(g) | | | 2.706% | (b) | | | 11/25/24 | | | | 623 | | | | 624,422 | |
Fannie Mae Connecticut Avenue Securities, Series 2015-C02, Class 1M1(g) | | | 1.906% | (b) | | | 05/25/25 | | | | 252 | | | | 251,845 | |
Fannie Mae Connecticut Avenue Securities, Series 2016-C02, Class 1M1(g) | | | 2.906% | (b) | | | 09/25/28 | | | | 1,080 | | | | 1,090,938 | |
Fannie Mae Connecticut Avenue Securities, Series 2016-C03, Class 2M1(g) | | | 2.956% | (b) | | | 10/25/28 | | | | 1,379 | | | | 1,392,873 | |
Fannie Mae Connecticut Avenue Securities, Series 2016-C04, Class 1M1(g) | | | 2.206% | (b) | | | 01/25/29 | | | | 1,308 | | | | 1,316,324 | |
Freddie Mac Structured Agency Credit Risk Debt Notes, Series 2015-DNA1, Class M1(g) | | | 1.656% | (b) | | | 10/25/27 | | | | 3,785 | | | | 3,787,735 | |
Freddie Mac Structured Agency Credit Risk Debt Notes, Series 2015-DNA3, Class M1(g) | | | 2.106% | (b) | | | 04/25/28 | | | | 305 | | | | 305,592 | |
Freddie Mac Structured Agency Credit Risk Debt Notes, Series 2016-DNA1, Class M1(g) | | | 2.206% | (b) | | | 07/25/28 | | | | 1,967 | | | | 1,974,558 | |
Freddie Mac Structured Agency Credit Risk Debt Notes, Series 2016-DNA3, Class M2(g) | | | 2.756% | (b) | | | 12/25/28 | | | | 1,425 | | | | 1,438,264 | |
Freddie Mac Structured Agency Credit Risk Debt Notes, Series 2016-DNA4, Class M2(g) | | | 2.056% | (b) | | | 03/25/29 | | | | 1,040 | | | | 1,038,022 | |
Freddie Mac Structured Agency Credit Risk Debt Notes, Series 2016-HQA2, Class M2(g) | | | 3.006% | (b) | | | 11/25/28 | | | | 1,200 | | | | 1,224,645 | |
JPMorgan Mortgage Trust, Series 2007-A1, Class 4A1 | | | 3.182% | (b) | | | 07/25/35 | | | | 259 | | | | 258,137 | |
LSTAR Securities Investment Ltd. (Cayman Islands), Series 2015-6, Class A, 144A(d) | | | 2.533% | (b) | | | 05/01/20 | | | | 3,951 | | | | 3,896,453 | |
LSTAR Securities Investment Ltd. (Cayman Islands), Series 2015-7, Class A, 144A(d) | | | 2.533% | (b) | | | 07/01/20 | | | | 1,557 | | | | 1,547,018 | |
LSTAR Securities Investment Ltd. (Cayman Islands), Series 2015-8, Class A1, 144A | | | 2.617% | (b) | | | 08/01/20 | | | | 1,147 | | | | 1,145,391 | |
LSTAR Securities Investment Ltd. (Cayman Islands), Series 2015-10, Class A1, 144A(d) | | | 2.617% | (b) | | | 11/01/20 | | | | 402 | | | | 398,704 | |
LSTAR Securities Investment Ltd. (Cayman Islands), Series 2016-1, Class A1, 144A | | | 2.617% | (b) | | | 01/01/21 | | | | 1,738 | | | | 1,707,624 | |
LSTAR Securities Investment Ltd. (Cayman Islands), Series 2016-3, Class A, 144A(d) | | | 2.617% | (b) | | | 09/01/21 | | | | 1,934 | | | | 1,910,279 | |
LSTAR Securities Investment Ltd. (Cayman Islands), Series 2016-6, Class A, 144A | | | 2.635% | (b) | | | 11/01/21 | | | | 1,250 | | | | 1,232,583 | |
MASTR Alternative Loan Trust, Series 2004-4, Class 4A1 | | | 5.000% | | | | 04/25/19 | | | | 32 | | | | 32,464 | |
Mortgage Repurchase Agreement Financing Trust, Series 2016-3, Class A1, 144A(d) | | | 1.664% | (b) | | | 11/10/18 | | | | 1,770 | | | | 1,770,000 | |
Mortgage Repurchase Agreement Financing Trust, Series 2016-4, Class A1, 144A(d) | | | 1.737% | (b) | | | 05/10/19 | | | | 7,380 | | | | 7,363,963 | |
Mortgage Repurchase Agreement Financing Trust, Series 2016-5, Class A, 144A(d) | | | 1.871% | (b) | | | 06/10/19 | | | | 1,300 | | | | 1,300,000 | |
Structured Adjustable Rate Mortgage Loan Trust, Series 2004-1, Class 4A3 | | | 3.093% | (b) | | | 02/25/34 | | | | 326 | | | | 326,423 | |
Washington Mutual Mortgage Pass-Through Certificates, Series 2005-1, Class 3A | | | 5.000% | | | | 03/25/20 | | | | 113 | | | | 113,604 | |
| | | | | | | | | | | | | | |
|
|
|
TOTAL RESIDENTIAL MORTGAGE-BACKED SECURITIES
(cost $42,229,167) | | | | 42,124,363 | |
| | | | | | | | | | | | | | |
|
|
|
| SOVEREIGN BONDS — 0.6% | | | | | | | | | | | | | | | | |
Belgium Government International Bond (Belgium), Sr. Unsec’d. Notes, 144A, RegS, EMTN | | | 1.125% | | | | 08/03/19 | | | | 1,200 | | | | 1,181,266 | |
Colombia Government International Bond (Colombia), Sr. Unsec’d. Notes | | | 4.000% | | | | 02/26/24 | | | | 220 | | | | 222,200 | |
Colombia Government International Bond (Colombia), Sr. Unsec’d. Notes | | | 4.375% | | | | 07/12/21 | | | | 400 | | | | 419,000 | |
Hungary Government International Bond (Hungary), Sr. Unsec’d. Notes | | | 4.000% | | | | 03/25/19 | | | | 392 | | | | 405,720 | |
Hungary Government International Bond (Hungary), Sr. Unsec’d. Notes | | | 6.375% | | | | 03/29/21 | | | | 1,760 | | | | 1,970,778 | |
Hungary Government International Bond (Hungary), Sr. Unsec’d. Notes | | | 7.625% | | | | 03/29/41 | | | | 688 | | | | 961,308 | |
SEE NOTES TO FINANCIAL STATEMENTS.
A22
| | | | | | |
| | | CONSERVATIVE BALANCED PORTFOLIO (continued) | | |
| |
| SCHEDULE OF INVESTMENTS | | as of December 31, 2016 |
| | | | | | | | | | | | | | | | |
SOVEREIGN BONDS
(continued) | | Interest
Rate
| | | Maturity
Date
| | | Principal
Amount
(000)#
| | | Value
(Note 2)
| |
Indonesia Government International Bond (Indonesia), Sr. Unsec’d. Notes, 144A | | | 5.250% | | | | 01/08/47 | | | | 705 | | | $ | 702,971 | |
Indonesia Government International Bond (Indonesia), Sr. Unsec’d. Notes, 144A(a) | | | 5.875% | | | | 03/13/20 | | | | 770 | | | | 840,373 | |
Indonesia Government International Bond (Indonesia), Sr. Unsec’d. Notes, 144A, MTN | | | 5.875% | | | | 01/15/24 | | | | 750 | | | | 827,478 | |
Indonesia Government International Bond (Indonesia), Sr. Unsec’d. Notes, RegS | | | 4.875% | | | | 05/05/21 | | | | 750 | | | | 793,958 | |
Mexico Government International Bond (Mexico), Sr. Unsec’d. Notes | | | 4.000% | | | | 10/02/23 | | | | 438 | | | | 439,051 | |
Mexico Government International Bond (Mexico), Sr. Unsec’d. Notes, MTN | | | 4.750% | | | | 03/08/44 | | | | 766 | | | | 696,524 | |
Panama Government International Bond (Panama), Sr. Unsec’d. Notes | | | 3.750% | | | | 03/16/25 | | | | 490 | | | | 486,325 | |
Panama Government International Bond (Panama), Sr. Unsec’d. Notes | | | 4.000% | | | | 09/22/24 | | | | 395 | | | | 401,912 | |
Panama Government International Bond (Panama), Sr. Unsec’d. Notes | | | 5.200% | | | | 01/30/20 | | | | 375 | | | | 402,750 | |
Province of Alberta (Canada), Sr. Unsec’d. Notes | | | 1.900% | | | | 12/06/19 | | | | 800 | | | | 801,225 | |
Romanian Government International Bond (Romania), Sr. Unsec’d. Notes, RegS, MTN | | | 6.125% | | | | 01/22/44 | | | | 350 | | | | 408,537 | |
Saudi Government International Bond (Saudi Arabia), Sr. Unsec’d. Notes, 144A, MTN | | | 2.375% | | | | 10/26/21 | | | | 980 | | | | 951,517 | |
Turkey Government International Bond (Turkey), Sr. Unsec’d. Notes | | | 7.000% | | | | 06/05/20 | | | | 1,260 | | | | 1,352,890 | |
| | | | | | | | | | | | | | |
|
|
|
TOTAL SOVEREIGN BONDS
(cost $14,356,096) | | | | 14,265,783 | |
| | | | | | | | | | | | | | |
|
|
|
| U.S. GOVERNMENT AGENCY OBLIGATIONS — 10.3% | | | | | | | | | | | | | | | | |
Federal Home Loan Banks(h) | | | 5.500% | | | | 07/15/36 | | | | 850 | | | | 1,114,973 | |
Federal Home Loan Mortgage Corp. | | | 2.500% | | | | TBA | | | | 5,000 | | | | 5,008,985 | |
Federal Home Loan Mortgage Corp. | | | 2.500% | | | | 03/01/30 | | | | 804 | | | | 806,911 | |
Federal Home Loan Mortgage Corp. | | | 2.665% | (b) | | | 12/01/35 | | | | 296 | | | | 312,204 | |
Federal Home Loan Mortgage Corp. | | | 2.875% | (b) | | | 06/01/36 | | | | 278 | | | | 294,489 | |
Federal Home Loan Mortgage Corp. | | | 3.000% | | | | 10/01/28 | | | | 700 | | | | 719,846 | |
Federal Home Loan Mortgage Corp. | | | 3.000% | | | | 06/01/29 | | | | 1,331 | | | | 1,368,856 | |
Federal Home Loan Mortgage Corp. | | | 3.000% | | | | 06/01/42 | | | | 523 | | | | 523,173 | |
Federal Home Loan Mortgage Corp. | | | 3.000% | | | | 10/01/42 | | | | 873 | | | | 872,993 | |
Federal Home Loan Mortgage Corp. | | | 3.000% | | | | 01/01/43 | | | | 1,088 | | | | 1,087,500 | |
Federal Home Loan Mortgage Corp. | | | 3.000% | | | | 07/01/43 | | | | 2,847 | | | | 2,841,618 | |
Federal Home Loan Mortgage Corp. | | | 3.000% | | | | 12/01/44 | | | | 1,233 | | | | 1,226,620 | |
Federal Home Loan Mortgage Corp. | | | 3.000% | | | | 03/01/45 | | | | 957 | | | | 951,906 | |
Federal Home Loan Mortgage Corp. | | | 3.000% | | | | 03/01/45 | | | | 1,375 | | | | 1,367,877 | |
Federal Home Loan Mortgage Corp. | | | 3.000% | | | | 04/01/45 | | | | 939 | | | | 936,477 | |
Federal Home Loan Mortgage Corp. | | | 3.500% | | | | TBA | | | | 15,000 | | | | 15,359,144 | |
Federal Home Loan Mortgage Corp. | | | 3.500% | | | | 08/01/26 | | | | 936 | | | | 981,269 | |
Federal Home Loan Mortgage Corp. | | | 3.500% | | | | 06/01/42 | | | | 530 | | | | 545,465 | |
Federal Home Loan Mortgage Corp. | | | 4.000% | | | | TBA | | | | 7,500 | | | | 7,877,490 | |
Federal Home Loan Mortgage Corp. | | | 4.000% | | | | 06/01/26 | | | | 923 | | | | 971,610 | |
Federal Home Loan Mortgage Corp. | | | 4.000% | | | | 09/01/26 | | | | 340 | | | | 358,179 | |
Federal Home Loan Mortgage Corp. | | | 4.000% | | | | 10/01/39 | | | | 894 | | | | 943,534 | |
Federal Home Loan Mortgage Corp. | | | 4.000% | | | | 12/01/40 | | | | 626 | | | | 661,004 | |
Federal Home Loan Mortgage Corp. | | | 4.000% | | | | 10/01/41 | | | | 799 | | | | 839,389 | |
Federal Home Loan Mortgage Corp. | | | 4.000% | | | | 01/01/42 | | | | 232 | | | | 244,758 | |
Federal Home Loan Mortgage Corp. | | | 4.000% | | | | 10/01/45 | | | | 1,224 | | | | 1,286,650 | |
Federal Home Loan Mortgage Corp. | | | 4.500% | | | | 02/01/19 | | | | 24 | | | | 24,745 | |
Federal Home Loan Mortgage Corp. | | | 4.500% | | | | 07/01/19 | | | | 174 | | | | 179,011 | |
Federal Home Loan Mortgage Corp. | | | 4.500% | | | | 07/01/20 | | | | 95 | | | | 98,086 | |
Federal Home Loan Mortgage Corp. | | | 4.500% | | | | 02/01/39 | | | | 142 | | | | 152,069 | |
Federal Home Loan Mortgage Corp. | | | 4.500% | | | | 09/01/39 | | | | 244 | | | | 263,301 | |
Federal Home Loan Mortgage Corp. | | | 4.500% | | | | 10/01/39 | | | | 2,224 | | | | 2,393,632 | |
Federal Home Loan Mortgage Corp. | | | 4.500% | | | | 12/01/39 | | | | 220 | | | | 236,759 | |
Federal Home Loan Mortgage Corp. | | | 4.500% | | | | 07/01/41 | | | | 325 | | | | 350,675 | |
Federal Home Loan Mortgage Corp. | | | 4.500% | | | | 07/01/41 | | | | 2,447 | | | | 2,641,927 | |
Federal Home Loan Mortgage Corp. | | | 4.500% | | | | 08/01/41 | | | | 804 | | | | 863,964 | |
SEE NOTES TO FINANCIAL STATEMENTS.
A23
| | | | | | |
| | | CONSERVATIVE BALANCED PORTFOLIO (continued) | | |
| |
| SCHEDULE OF INVESTMENTS | | as of December 31, 2016 |
| | | | | | | | | | | | | | |
U.S. GOVERNMENT AGENCY OBLIGATIONS
(continued) | | Interest
Rate
| | | Maturity
Date
| | Principal
Amount
(000)#
| | | Value
(Note 2)
| |
Federal Home Loan Mortgage Corp. | | | 4.500% | | | 08/01/41 | | | 243 | | | $ | 261,354 | |
Federal Home Loan Mortgage Corp. | | | 4.500% | | | 08/01/41 | | | 175 | | | | 188,059 | |
Federal Home Loan Mortgage Corp. | | | 4.500% | | | 10/01/41 | | | 674 | | | | 727,706 | |
Federal Home Loan Mortgage Corp. | | | 5.000% | | | 07/01/18 | | | 95 | | | | 97,165 | |
Federal Home Loan Mortgage Corp. | | | 5.000% | | | 12/01/18 | | | 55 | | | | 56,019 | |
Federal Home Loan Mortgage Corp. | | | 5.000% | | | 07/01/19 | | | 116 | | | | 118,961 | |
Federal Home Loan Mortgage Corp. | | | 5.000% | | | 07/01/19 | | | 130 | | | | 134,041 | |
Federal Home Loan Mortgage Corp. | | | 5.000% | | | 12/01/19 | | | 24 | | | | 24,498 | |
Federal Home Loan Mortgage Corp. | | | 5.000% | | | 05/01/34 | | | 30 | | | | 32,600 | |
Federal Home Loan Mortgage Corp. | | | 5.000% | | | 05/01/34 | | | 501 | | | | 548,905 | |
Federal Home Loan Mortgage Corp. | | | 5.000% | | | 10/01/35 | | | 12 | | | | 13,161 | |
Federal Home Loan Mortgage Corp. | | | 5.000% | | | 07/01/37 | | | 837 | | | | 915,559 | |
Federal Home Loan Mortgage Corp. | | | 5.000% | | | 05/01/39 | | | 114 | | | | 124,582 | |
Federal Home Loan Mortgage Corp. | | | 5.500% | | | 12/01/33 | | | 156 | | | | 173,161 | |
Federal Home Loan Mortgage Corp. | | | 5.500% | | | 01/01/34 | | | 65 | | | | 73,577 | |
Federal Home Loan Mortgage Corp. | | | 5.500% | | | 06/01/34 | | | 106 | | | | 118,710 | |
Federal Home Loan Mortgage Corp. | | | 5.500% | | | 07/01/34 | | | 342 | | | | 383,567 | |
Federal Home Loan Mortgage Corp. | | | 5.500% | | | 05/01/37 | | | 97 | | | | 107,987 | |
Federal Home Loan Mortgage Corp. | | | 5.500% | | | 02/01/38 | | | 783 | | | | 873,204 | |
Federal Home Loan Mortgage Corp. | | | 5.500% | | | 05/01/38 | | | 82 | | | | 91,863 | |
Federal Home Loan Mortgage Corp. | | | 5.500% | | | 07/01/38 | | | 203 | | | | 225,746 | |
Federal Home Loan Mortgage Corp. | | | 6.000% | | | 03/01/32 | | | 336 | | | | 386,900 | |
Federal Home Loan Mortgage Corp. | | | 6.000% | | | 12/01/33 | | | 110 | | | | 123,832 | |
Federal Home Loan Mortgage Corp. | | | 6.000% | | | 11/01/36 | | | 98 | | | | 111,113 | |
Federal Home Loan Mortgage Corp. | | | 6.000% | | | 01/01/37 | | | 86 | | | | 97,352 | |
Federal Home Loan Mortgage Corp. | | | 6.000% | | | 05/01/37 | | | 46 | | | | 51,931 | |
Federal Home Loan Mortgage Corp. | | | 6.000% | | | 02/01/38 | | | 8 | | | | 8,963 | |
Federal Home Loan Mortgage Corp. | | | 6.000% | | | 08/01/39 | | | 112 | | | | 128,228 | |
Federal Home Loan Mortgage Corp.(i) | | | 6.750% | | | 03/15/31 | | | 550 | | | | 775,163 | |
Federal Home Loan Mortgage Corp. | | | 7.000% | | | 05/01/31 | | | 23 | | | | 25,629 | |
Federal Home Loan Mortgage Corp. | | | 7.000% | | | 06/01/31 | | | 15 | | | | 16,203 | |
Federal Home Loan Mortgage Corp. | | | 7.000% | | | 06/01/31 | | | 12 | | | | 12,102 | |
Federal Home Loan Mortgage Corp. | | | 7.000% | | | 08/01/31 | | | 179 | | | | 200,496 | |
Federal Home Loan Mortgage Corp. | | | 7.000% | | | 10/01/31 | | | 7 | | | | 7,841 | |
Federal National Mortgage Assoc. | | | 1.875% | | | 09/24/26 | | | 200 | | | | 183,745 | |
Federal National Mortgage Assoc. | | | 2.000% | | | 08/01/31 | | | 1,180 | | | | 1,149,838 | |
Federal National Mortgage Assoc. | | | 2.432% | (b) | | 07/01/33 | | | 315 | | | | 330,047 | |
Federal National Mortgage Assoc. | | | 2.500% | | | TBA | | | 1,500 | | | | 1,427,025 | |
Federal National Mortgage Assoc. | | | 2.500% | | | 01/01/28 | | | 1,230 | | | | 1,234,133 | |
Federal National Mortgage Assoc. | | | 2.500% | | | 10/01/43 | | | 875 | | | | 837,351 | |
Federal National Mortgage Assoc. | | | 2.560% | (b) | | 06/01/37 | | | 74 | | | | 74,420 | |
Federal National Mortgage Assoc. | | | 2.678% | (b) | | 07/01/37 | | | 401 | | | | 420,267 | |
Federal National Mortgage Assoc. | | | 3.000% | | | 02/01/27 | | | 2,832 | | | | 2,913,009 | |
Federal National Mortgage Assoc. | | | 3.000% | | | 08/01/30 | | | 1,721 | | | | 1,767,998 | |
Federal National Mortgage Assoc. | | | 3.000% | | | 02/01/31 | | | 3,728 | | | | 3,828,482 | |
Federal National Mortgage Assoc. | | | 3.000% | | | 05/01/31 | | | 2,179 | | | | 2,237,787 | |
Federal National Mortgage Assoc. | | | 3.000% | | | 11/01/36 | | | 2,977 | | | | 3,016,224 | |
Federal National Mortgage Assoc. | | | 3.000% | | | 12/01/42 | | | 2,457 | | | | 2,456,033 | |
Federal National Mortgage Assoc. | | | 3.000% | | | 04/01/43 | | | 7,418 | | | | 7,416,241 | |
Federal National Mortgage Assoc. | | | 3.000% | | | 07/01/43 | | | 1,781 | | | | 1,780,322 | |
Federal National Mortgage Assoc. | | | 3.000% | | | 08/01/43 | | | 4,787 | | | | 4,785,151 | |
Federal National Mortgage Assoc. | | | 3.500% | | | 07/01/27 | | | 2,039 | | | | 2,129,128 | |
Federal National Mortgage Assoc. | | | 3.500% | | | 06/01/39 | | | 791 | | | | 812,471 | |
Federal National Mortgage Assoc. | | | 3.500% | | | 01/01/42 | | | 6,448 | | | | 6,649,302 | |
Federal National Mortgage Assoc. | | | 3.500% | | | 05/01/42 | | | 3,357 | | | | 3,462,275 | |
Federal National Mortgage Assoc. | | | 3.500% | | | 06/01/42 | | | 1,329 | | | | 1,370,954 | |
Federal National Mortgage Assoc. | | | 3.500% | | | 07/01/42 | | | 1,229 | | | | 1,267,377 | |
Federal National Mortgage Assoc. | | | 3.500% | | | 08/01/42 | | | 1,489 | | | | 1,535,690 | |
Federal National Mortgage Assoc. | | | 3.500% | | | 08/01/42 | | | 485 | | | | 499,936 | |
SEE NOTES TO FINANCIAL STATEMENTS.
A24
| | | | | | |
| | | CONSERVATIVE BALANCED PORTFOLIO (continued) | | |
| |
| SCHEDULE OF INVESTMENTS | | as of December 31, 2016 |
| | | | | | | | | | | | | | |
U.S. GOVERNMENT AGENCY OBLIGATIONS
(continued) | | Interest
Rate
| | | Maturity
Date
| | Principal
Amount
(000)#
| | | Value
(Note 2)
| |
Federal National Mortgage Assoc. | | | 3.500% | | | 09/01/42 | | | 2,382 | | | $ | 2,456,004 | |
Federal National Mortgage Assoc. | | | 3.500% | | | 09/01/42 | | | 615 | | | | 633,745 | |
Federal National Mortgage Assoc. | | | 3.500% | | | 11/01/42 | | | 452 | | | | 465,614 | |
Federal National Mortgage Assoc. | | | 3.500% | | | 03/01/43 | | | 3,784 | | | | 3,900,900 | |
Federal National Mortgage Assoc. | | | 3.500% | | | 04/01/43 | | | 860 | | | | 886,798 | |
Federal National Mortgage Assoc. | | | 3.500% | | | 04/01/43 | | | 1,304 | | | | 1,343,383 | |
Federal National Mortgage Assoc. | | | 3.500% | | | 01/01/46 | | | 2,651 | | | | 2,719,044 | |
Federal National Mortgage Assoc. | | | 4.000% | | | TBA | | | 25,000 | | | | 26,282,715 | |
Federal National Mortgage Assoc. | | | 4.000% | | | 10/01/41 | | | 3,528 | | | | 3,725,786 | |
Federal National Mortgage Assoc. | | | 4.000% | | | 09/01/44 | | | 4,296 | | | | 4,516,928 | |
Federal National Mortgage Assoc. | | | 4.500% | | | TBA | | | 1,000 | | | | 1,075,586 | |
Federal National Mortgage Assoc. | | | 4.500% | | | 11/01/18 | | | 120 | | | | 123,484 | |
Federal National Mortgage Assoc. | | | 4.500% | | | 01/01/19 | | | 91 | | | | 93,534 | |
Federal National Mortgage Assoc. | | | 4.500% | | | 01/01/19 | | | 66 | | | | 67,904 | |
Federal National Mortgage Assoc. | | | 4.500% | | | 06/01/19 | | | 19 | | | | 19,724 | |
Federal National Mortgage Assoc. | | | 4.500% | | | 07/01/33 | | | 90 | | | | 97,126 | |
Federal National Mortgage Assoc. | | | 4.500% | | | 08/01/33 | | | 83 | | | | 89,640 | |
Federal National Mortgage Assoc. | | | 4.500% | | | 09/01/33 | | | 176 | | | | 189,411 | |
Federal National Mortgage Assoc. | | | 4.500% | | | 10/01/33 | | | 16 | | | | 16,858 | |
Federal National Mortgage Assoc. | | | 4.500% | | | 10/01/33 | | | 47 | | | | 51,448 | |
Federal National Mortgage Assoc. | | | 4.500% | | | 10/01/33 | | | 215 | | | | 232,321 | |
Federal National Mortgage Assoc. | | | 4.500% | | | 01/01/35 | | | 2 | | | | 2,461 | |
Federal National Mortgage Assoc. | | | 4.500% | | | 07/01/39 | | | 1,379 | | | | 1,492,488 | |
Federal National Mortgage Assoc. | | | 4.500% | | | 08/01/39 | | | 2,192 | | | | 2,377,167 | |
Federal National Mortgage Assoc. | | | 4.500% | | | 03/01/41 | | | 761 | | | | 824,570 | |
Federal National Mortgage Assoc. | | | 5.000% | | | TBA | | | 6,500 | | | | 7,080,938 | |
Federal National Mortgage Assoc. | | | 5.000% | | | 10/01/18 | | | 31 | | | | 31,904 | |
Federal National Mortgage Assoc. | | | 5.000% | | | 01/01/19 | | | 108 | | | | 111,102 | |
Federal National Mortgage Assoc. | | | 5.000% | | | 03/01/34 | | | 411 | | | | 448,189 | |
Federal National Mortgage Assoc. | | | 5.000% | | | 06/01/35 | | | 154 | | | | 168,551 | |
Federal National Mortgage Assoc. | | | 5.000% | | | 07/01/35 | | | 213 | | | | 232,965 | |
Federal National Mortgage Assoc. | | | 5.000% | | | 09/01/35 | | | 140 | | | | 154,102 | |
Federal National Mortgage Assoc. | | | 5.000% | | | 11/01/35 | | | 137 | | | | 150,751 | |
Federal National Mortgage Assoc. | | | 5.000% | | | 02/01/36 | | | 197 | | | | 215,206 | |
Federal National Mortgage Assoc. | | | 5.000% | | | 05/01/36 | | | 100 | | | | 109,223 | |
Federal National Mortgage Assoc. | | | 5.500% | | | 12/01/17 | | | 22 | | | | 22,287 | |
Federal National Mortgage Assoc. | | | 5.500% | | | 02/01/18 | | | 11 | | | | 11,597 | |
Federal National Mortgage Assoc. | | | 5.500% | | | 05/01/20 | | | 49 | | | | 50,922 | |
Federal National Mortgage Assoc. | | | 5.500% | | | 05/01/21 | | | 112 | | | | 118,341 | |
Federal National Mortgage Assoc. | | | 5.500% | | | 09/01/33 | | | 475 | | | | 530,010 | |
Federal National Mortgage Assoc. | | | 5.500% | | | 10/01/33 | | | 120 | | | | 134,210 | |
Federal National Mortgage Assoc. | | | 5.500% | | | 12/01/33 | | | 84 | | | | 94,689 | |
Federal National Mortgage Assoc. | | | 5.500% | | | 01/01/34 | | | 2 | | | | 2,374 | |
Federal National Mortgage Assoc. | | | 5.500% | | | 12/01/34 | | | 339 | | | | 380,237 | |
Federal National Mortgage Assoc. | | | 5.500% | | | 10/01/35 | | | 1,264 | | | | 1,417,926 | |
Federal National Mortgage Assoc. | | | 5.500% | | | 03/01/36 | | | 229 | | | | 255,432 | |
Federal National Mortgage Assoc. | | | 5.500% | | | 05/01/36 | | | 174 | | | | 194,220 | |
Federal National Mortgage Assoc. | | | 5.500% | | | 04/01/37 | | | 182 | | | | 203,229 | |
Federal National Mortgage Assoc. | | | 6.000% | | | 09/01/17 | | | 3 | | | | 2,570 | |
Federal National Mortgage Assoc. | | | 6.000% | | | 05/01/21 | | | 89 | | | | 94,915 | |
Federal National Mortgage Assoc. | | | 6.000% | | | 08/01/22 | | | 73 | | | | 77,551 | |
Federal National Mortgage Assoc. | | | 6.000% | | | 04/01/33 | | | 32 | | | | 36,392 | |
Federal National Mortgage Assoc. | | | 6.000% | | | 06/01/33 | | | 7 | | | | 8,079 | |
Federal National Mortgage Assoc. | | | 6.000% | | | 10/01/33 | | | 551 | | | | 638,992 | |
Federal National Mortgage Assoc. | | | 6.000% | | | 11/01/33 | | | 10 | | | | 11,577 | |
Federal National Mortgage Assoc. | | | 6.000% | | | 11/01/33 | | | 76 | | | | 86,388 | |
Federal National Mortgage Assoc. | | | 6.000% | | | 11/01/33 | | | 32 | | | | 36,393 | |
Federal National Mortgage Assoc. | | | 6.000% | | | 12/01/33 | | | 42 | | | | 47,729 | |
Federal National Mortgage Assoc. | | | 6.000% | | | 01/01/34 | | | 494 | | | | 564,156 | |
SEE NOTES TO FINANCIAL STATEMENTS.
A25
| | | | | | |
| | | CONSERVATIVE BALANCED PORTFOLIO (continued) | | |
| |
| SCHEDULE OF INVESTMENTS | | as of December 31, 2016 |
| | | | | | | | | | | | | | |
U.S. GOVERNMENT AGENCY OBLIGATIONS
(continued) | | Interest
Rate
| | | Maturity
Date
| | Principal
Amount
(000)#
| | | Value
(Note 2)
| |
Federal National Mortgage Assoc. | | | 6.000% | | | 02/01/34 | | | 114 | | | $ | 131,300 | |
Federal National Mortgage Assoc. | | | 6.000% | | | 03/01/34 | | | 123 | | | | 141,154 | |
Federal National Mortgage Assoc. | | | 6.000% | | | 03/01/34 | | | 79 | | | | 89,380 | |
Federal National Mortgage Assoc. | | | 6.000% | | | 07/01/34 | | | 271 | | | | 308,229 | |
Federal National Mortgage Assoc. | | | 6.000% | | | 08/01/34 | | | 1 | | | | 938 | |
Federal National Mortgage Assoc. | | | 6.000% | | | 10/01/34 | | | 7 | | | | 8,099 | |
Federal National Mortgage Assoc. | | | 6.000% | | | 11/01/34 | | | 6 | | | | 7,340 | |
Federal National Mortgage Assoc. | | | 6.000% | | | 11/01/34 | | | 64 | | | | 72,883 | |
Federal National Mortgage Assoc. | | | 6.000% | | | 12/01/34 | | | 25 | | | | 28,575 | |
Federal National Mortgage Assoc. | | | 6.000% | | | 01/01/35 | | | 97 | | | | 112,044 | |
Federal National Mortgage Assoc. | | | 6.000% | | | 01/01/35 | | | 327 | | | | 375,524 | |
Federal National Mortgage Assoc. | | | 6.000% | | | 02/01/35 | | | 6 | | | | 6,885 | |
Federal National Mortgage Assoc. | | | 6.000% | | | 02/01/35 | | | 139 | | | | 156,869 | |
Federal National Mortgage Assoc. | | | 6.000% | | | 02/01/35 | | | 377 | | | | 435,303 | |
Federal National Mortgage Assoc. | | | 6.000% | | | 03/01/35 | | | 4 | | | | 4,756 | |
Federal National Mortgage Assoc. | | | 6.000% | | | 04/01/35 | | | 1 | | | | 1,718 | |
Federal National Mortgage Assoc. | | | 6.000% | | | 07/01/36 | | | 76 | | | | 86,698 | |
Federal National Mortgage Assoc. | | | 6.000% | | | 02/01/37 | | | 133 | | | | 151,073 | |
Federal National Mortgage Assoc. | | | 6.000% | | | 05/01/37 | | | 51 | | | | 57,456 | |
Federal National Mortgage Assoc. | | | 6.000% | | | 06/01/37 | | | 1 | | | | 1,566 | |
Federal National Mortgage Assoc. | | | 6.000% | | | 08/01/37 | | | 35 | | | | 39,270 | |
Federal National Mortgage Assoc. | | | 6.000% | | | 08/01/37 | | | 1 | | | | 636 | |
Federal National Mortgage Assoc. | | | 6.000% | | | 09/01/37 | | | 1 | | | | 953 | |
Federal National Mortgage Assoc. | | | 6.000% | | | 10/01/37 | | | 53 | | | | 59,546 | |
Federal National Mortgage Assoc. | | | 6.000% | | | 05/01/38 | | | 126 | | | | 143,050 | |
Federal National Mortgage Assoc. | | | 6.000% | | | 06/01/38 | | | 3 | | | | 3,534 | |
Federal National Mortgage Assoc.(h) | | | 6.250% | | | 05/15/29 | | | 1,245 | | | | 1,650,261 | |
Federal National Mortgage Assoc. | | | 6.500% | | | 07/01/17 | | | 1 | | | | 1,350 | |
Federal National Mortgage Assoc. | | | 6.500% | | | 09/01/17 | | | 10 | | | | 10,119 | |
Federal National Mortgage Assoc. | | | 6.500% | | | 07/01/32 | | | 62 | | | | 70,385 | |
Federal National Mortgage Assoc. | | | 6.500% | | | 07/01/32 | | | 2 | | | | 2,794 | |
Federal National Mortgage Assoc. | | | 6.500% | | | 09/01/32 | | | 92 | | | | 103,708 | |
Federal National Mortgage Assoc. | | | 6.500% | | | 09/01/32 | | | 15 | | | | 17,334 | |
Federal National Mortgage Assoc. | | | 6.500% | | | 09/01/32 | | | 103 | | | | 116,576 | |
Federal National Mortgage Assoc. | | | 6.500% | | | 09/01/32 | | | 85 | | | | 96,063 | |
Federal National Mortgage Assoc. | | | 6.500% | | | 09/01/32 | | | 11 | | | | 12,869 | |
Federal National Mortgage Assoc. | | | 6.500% | | | 04/01/33 | | | 161 | | | | 187,664 | |
Federal National Mortgage Assoc. | | | 6.500% | | | 11/01/33 | | | 98 | | | | 111,142 | |
Federal National Mortgage Assoc. | | | 6.500% | | | 01/01/34 | | | 82 | | | | 92,248 | |
Federal National Mortgage Assoc. | | | 6.500% | | | 09/01/34 | | | 98 | | | | 110,834 | |
Federal National Mortgage Assoc. | | | 6.500% | | | 10/01/34 | | | 217 | | | | 245,859 | |
Federal National Mortgage Assoc. | | | 6.500% | | | 09/01/36 | | | 104 | | | | 117,314 | |
Federal National Mortgage Assoc. | | | 6.500% | | | 10/01/36 | | | 54 | | | | 62,334 | |
Federal National Mortgage Assoc. | | | 6.500% | | | 11/01/36 | | | 46 | | | | 51,564 | |
Federal National Mortgage Assoc. | | | 6.500% | | | 01/01/37 | | | 43 | | | | 48,325 | |
Federal National Mortgage Assoc. | | | 6.500% | | | 01/01/37 | | | 121 | | | | 137,158 | |
Federal National Mortgage Assoc.(i) | | | 6.625% | | | 11/15/30 | | | 480 | | | | 667,721 | |
Federal National Mortgage Assoc. | | | 7.000% | | | 02/01/32 | | | 41 | | | | 46,667 | |
Federal National Mortgage Assoc. | | | 7.000% | | | 03/01/32 | | | 3 | | | | 2,937 | |
Federal National Mortgage Assoc. | | | 7.000% | | | 05/01/32 | | | 23 | | | | 26,922 | |
Federal National Mortgage Assoc. | | | 7.000% | | | 06/01/32 | | | 25 | | | | 28,583 | |
Federal National Mortgage Assoc. | | | 7.000% | | | 07/01/32 | | | 75 | | | | 84,620 | |
Federal National Mortgage Assoc.(h)(i) | | | 7.125% | | | 01/15/30 | | | 3,195 | | | | 4,559,156 | |
Federal National Mortgage Assoc. | | | 7.500% | | | 05/01/32 | | | 18 | | | | 18,141 | |
Government National Mortgage Assoc. | | | 3.000% | | | TBA | | | 15,500 | | | | 15,694,052 | |
Government National Mortgage Assoc. | | | 3.000% | | | 03/15/45 | | | 1,643 | | | | 1,662,172 | |
Government National Mortgage Assoc. | | | 3.500% | | | TBA | | | 12,500 | | | | 12,993,896 | |
Government National Mortgage Assoc. | | | 3.500% | | | 05/20/43 | | | 651 | | | | 679,592 | |
Government National Mortgage Assoc. | | | 3.500% | | | 04/20/45 | | | 3,166 | | | | 3,294,462 | |
SEE NOTES TO FINANCIAL STATEMENTS.
A26
| | | | | | |
| | | CONSERVATIVE BALANCED PORTFOLIO (continued) | | |
| |
| SCHEDULE OF INVESTMENTS | | as of December 31, 2016 |
| | | | | | | | | | | | | | |
U.S. GOVERNMENT AGENCY OBLIGATIONS
(continued) | | Interest
Rate
| | | Maturity
Date
| | Principal
Amount
(000)#
| | | Value
(Note 2)
| |
Government National Mortgage Assoc. | | | 4.000% | | | TBA | | | 3,000 | | | $ | 3,185,918 | |
Government National Mortgage Assoc. | | | 4.000% | | | 06/15/40 | | | 155 | | | | 164,731 | |
Government National Mortgage Assoc. | | | 4.000% | | | 05/20/41 | | | 121 | | | | 128,848 | |
Government National Mortgage Assoc. | | | 4.500% | | | TBA | | | 1,000 | | | | 1,081,367 | |
Government National Mortgage Assoc. | | | 4.500% | | | 04/15/40 | | | 1,179 | | | | 1,279,507 | |
Government National Mortgage Assoc. | | | 4.500% | | | 01/20/41 | | | 861 | | | | 929,067 | |
Government National Mortgage Assoc. | | | 4.500% | | | 02/20/41 | | | 1,471 | | | | 1,584,368 | |
Government National Mortgage Assoc. | | | 4.500% | | | 03/20/41 | | | 736 | | | | 793,721 | |
Government National Mortgage Assoc. | | | 5.000% | | | 10/20/37 | | | 192 | | | | 212,203 | |
Government National Mortgage Assoc. | | | 5.000% | | | 04/20/45 | | | 1,246 | | | | 1,341,449 | |
Government National Mortgage Assoc. | | | 5.500% | | | 08/15/33 | | | 274 | | | | 305,952 | |
Government National Mortgage Assoc. | | | 5.500% | | | 08/15/33 | | | 308 | | | | 344,997 | |
Government National Mortgage Assoc. | | | 5.500% | | | 09/15/33 | | | 88 | | | | 98,618 | |
Government National Mortgage Assoc. | | | 5.500% | | | 12/15/33 | | | 57 | | | | 64,087 | |
Government National Mortgage Assoc. | | | 5.500% | | | 03/15/34 | | | 206 | | | | 232,218 | |
Government National Mortgage Assoc. | | | 5.500% | | | 12/15/34 | | | 470 | | | | 534,309 | |
Government National Mortgage Assoc. | | | 5.500% | | | 07/15/35 | | | 124 | | | | 139,515 | |
Government National Mortgage Assoc. | | | 5.500% | | | 04/15/36 | | | 173 | | | | 195,574 | |
Government National Mortgage Assoc. | | | 6.000% | | | 11/15/23 | | | 1 | | | | 717 | |
Government National Mortgage Assoc. | | | 6.000% | | | 05/15/32 | | | 1 | | | | 647 | |
Government National Mortgage Assoc. | | | 6.000% | | | 04/15/33 | | | 14 | | | | 16,137 | |
Government National Mortgage Assoc. | | | 6.000% | | | 12/15/33 | | | 159 | | | | 181,565 | |
Government National Mortgage Assoc. | | | 6.000% | | | 01/15/34 | | | 65 | | | | 73,336 | |
Government National Mortgage Assoc. | | | 6.000% | | | 01/15/34 | | | 96 | | | | 110,689 | |
Government National Mortgage Assoc. | | | 6.000% | | | 01/15/34 | | | 53 | | | | 63,149 | |
Government National Mortgage Assoc. | | | 6.000% | | | 06/20/34 | | | 173 | | | | 200,905 | |
Government National Mortgage Assoc. | | | 6.000% | | | 07/15/34 | | | 125 | | | | 142,563 | |
Government National Mortgage Assoc. | | | 6.500% | | | 10/15/23 | | | 2 | | | | 1,752 | |
Government National Mortgage Assoc. | | | 6.500% | | | 12/15/23 | | | 7 | | | | 8,490 | |
Government National Mortgage Assoc. | | | 6.500% | | | 01/15/24 | | | 29 | | | | 33,522 | |
Government National Mortgage Assoc. | | | 6.500% | | | 01/15/24 | | | 84 | | | | 95,676 | |
Government National Mortgage Assoc. | | | 6.500% | | | 01/15/24 | | | 30 | | | | 34,241 | |
Government National Mortgage Assoc. | | | 6.500% | | | 01/15/24 | | | 54 | | | | 61,811 | |
Government National Mortgage Assoc. | | | 6.500% | | | 01/15/24 | | | — | (j) | | | 237 | |
Government National Mortgage Assoc. | | | 6.500% | | | 01/15/24 | | | 2 | | | | 2,530 | |
Government National Mortgage Assoc. | | | 6.500% | | | 01/15/24 | | | 2 | | | | 1,736 | |
Government National Mortgage Assoc. | | | 6.500% | | | 01/15/24 | | | 5 | | | | 5,276 | |
Government National Mortgage Assoc. | | | 6.500% | | | 01/15/24 | | | 15 | | | | 17,605 | |
Government National Mortgage Assoc. | | | 6.500% | | | 01/15/24 | | | 3 | | | | 2,924 | |
Government National Mortgage Assoc. | | | 6.500% | | | 02/15/24 | | | 10 | | | | 11,976 | |
Government National Mortgage Assoc. | | | 6.500% | | | 02/15/24 | | | 33 | | | | 37,870 | |
Government National Mortgage Assoc. | | | 6.500% | | | 02/15/24 | | | 32 | | | | 36,444 | |
Government National Mortgage Assoc. | | | 6.500% | | | 02/15/24 | | | 10 | | | | 11,946 | |
Government National Mortgage Assoc. | | | 6.500% | | | 02/15/24 | | | 12 | | | | 13,290 | |
Government National Mortgage Assoc. | | | 6.500% | | | 02/15/24 | | | 4 | | | | 4,750 | |
Government National Mortgage Assoc. | | | 6.500% | | | 03/15/24 | | | 3 | | | | 3,179 | |
Government National Mortgage Assoc. | | | 6.500% | | | 03/15/24 | | | 5 | | | | 5,911 | |
Government National Mortgage Assoc. | | | 6.500% | | | 03/15/24 | | | 5 | | | | 5,937 | |
Government National Mortgage Assoc. | | | 6.500% | | | 04/15/24 | | | 2 | | | | 2,188 | |
Government National Mortgage Assoc. | | | 6.500% | | | 04/15/24 | | | 1 | | | | 1,172 | |
Government National Mortgage Assoc. | | | 6.500% | | | 04/15/24 | | | 7 | | | | 7,555 | |
Government National Mortgage Assoc. | | | 6.500% | | | 04/15/24 | | | 4 | | | | 4,541 | |
Government National Mortgage Assoc. | | | 6.500% | | | 04/15/24 | | | 9 | | | | 10,658 | |
Government National Mortgage Assoc. | | | 6.500% | | | 04/15/24 | | | 22 | | | | 24,945 | |
Government National Mortgage Assoc. | | | 6.500% | | | 04/15/24 | | | 5 | | | | 5,730 | |
Government National Mortgage Assoc. | | | 6.500% | | | 04/15/24 | | | 3 | | | | 3,939 | |
Government National Mortgage Assoc. | | | 6.500% | | | 05/15/24 | | | 5 | | | | 6,158 | |
Government National Mortgage Assoc. | | | 6.500% | | | 05/15/24 | | | 9 | | | | 10,355 | |
Government National Mortgage Assoc. | | | 6.500% | | | 05/15/24 | | | 40 | | | | 45,847 | |
SEE NOTES TO FINANCIAL STATEMENTS.
A27
| | | | | | |
| | | CONSERVATIVE BALANCED PORTFOLIO (continued) | | |
| |
| SCHEDULE OF INVESTMENTS | | as of December 31, 2016 |
| | | | | | | | | | | | | | |
U.S. GOVERNMENT AGENCY OBLIGATIONS
(continued) | | Interest
Rate
| | | Maturity
Date
| | Principal
Amount
(000)#
| | | Value
(Note 2)
| |
Government National Mortgage Assoc. | | | 6.500% | | | 10/15/24 | | | 36 | | | $ | 40,539 | |
Government National Mortgage Assoc. | | | 6.500% | | | 11/15/28 | | | 9 | | | | 9,844 | |
Government National Mortgage Assoc. | | | 6.500% | | | 08/15/31 | | | 8 | | | | 9,353 | |
Government National Mortgage Assoc. | | | 6.500% | | | 12/15/31 | | | 15 | | | | 16,656 | |
Government National Mortgage Assoc. | | | 6.500% | | | 01/15/32 | | | 29 | | | | 33,332 | |
Government National Mortgage Assoc. | | | 6.500% | | | 02/15/32 | | | 57 | | | | 64,713 | |
Government National Mortgage Assoc. | | | 6.500% | | | 06/15/32 | | | 26 | | | | 29,854 | |
Government National Mortgage Assoc. | | | 6.500% | | | 07/15/32 | | | 52 | | | | 59,599 | |
Government National Mortgage Assoc. | | | 6.500% | | | 08/15/32 | | | 9 | | | | 9,713 | |
Government National Mortgage Assoc. | | | 6.500% | | | 08/15/32 | | | 11 | | | | 12,493 | |
Government National Mortgage Assoc. | | | 6.500% | | | 08/15/32 | | | 9 | | | | 10,609 | |
Government National Mortgage Assoc. | | | 6.500% | | | 08/15/32 | | | 43 | | | | 48,866 | |
Government National Mortgage Assoc. | | | 6.500% | | | 08/15/32 | | | 285 | | | | 328,790 | |
Government National Mortgage Assoc. | | | 6.500% | | | 08/15/34 | | | 31 | | | | 35,286 | |
Government National Mortgage Assoc. | | | 6.500% | | | 06/15/35 | | | 61 | | | | 71,071 | |
Government National Mortgage Assoc. | | | 6.500% | | | 09/15/36 | | | 63 | | | | 75,251 | |
Government National Mortgage Assoc. | | | 8.000% | | | 01/15/24 | | | 13 | | | | 13,035 | |
Government National Mortgage Assoc. | | | 8.000% | | | 07/15/24 | | | 1 | | | | 919 | |
Hashemite Kingdom of Jordan, USAID Bond, U.S. Gov’t. Gtd. Notes | | | 2.578% | | | 06/30/22 | | | 2,835 | | | | 2,883,856 | |
Hashemite Kingdom of Jordan, USAID Bond, U.S. Gov’t. Gtd. Notes | | | 3.000% | | | 06/30/25 | | | 915 | | | | 933,337 | |
Israel Government USAID Bond, U.S. Gov’t. Gtd. Notes | | | 5.500% | | | 12/04/23 | | | 190 | | | | 226,030 | |
Israel Government USAID Bond, U.S. Gov’t. Gtd. Notes | | | 5.500% | | | 04/26/24 | | | 500 | | | | 599,375 | |
Residual Funding Corp. Strips Principal, Unsec’d. Notes, PO | | | 2.804% | (f) | | 01/15/30 | | | 870 | | | | 568,667 | |
Residual Funding Corp. Strips Principal, Unsec’d. Notes, PO | | | 2.962% | (f) | | 04/15/30 | | | 1,705 | | | | 1,104,192 | |
Tennessee Valley Authority, Sr. Unsec’d. Notes | | | 7.125% | | | 05/01/30 | | | 950 | | | | 1,353,311 | |
Tunisia Government, USAID Bonds, U.S. Gov’t. Gtd. Notes | | | 1.416% | | | 08/05/21 | | | 600 | | | | 579,985 | |
Ukraine Government, USAID Bonds, U.S. Gov’t. Gtd. Notes | | | 1.471% | | | 09/29/21 | | | 800 | | | | 780,995 | |
| | | | | | | | | | | | |
|
|
|
TOTAL U.S. GOVERNMENT AGENCY OBLIGATIONS
(cost $252,904,818) | | | | 254,191,879 | |
| | | | | | | | | | | | |
|
|
|
| U.S. TREASURY OBLIGATIONS — 2.4% | | | | | | | | | | | | | | |
U.S. Treasury Bonds | | | 2.250% | | | 08/15/46 | | | 540 | | | | 454,043 | |
U.S. Treasury Bonds | | | 2.875% | | | 11/15/46 | | | 1,125 | | | | 1,086,153 | |
U.S. Treasury Bonds | | | 4.250% | | | 11/15/40 | | | 440 | | | | 534,187 | |
U.S. Treasury Inflation Indexed Bonds, TIPS | | | 2.375% | | | 01/15/25 | | | 30,058 | | | | 34,512,833 | |
U.S. Treasury Notes(a) | | | 1.750% | | | 11/30/21 | | | 5,855 | | | | 5,811,316 | |
U.S. Treasury Notes | | | 2.000% | | | 11/15/26 | | | 1,320 | | | | 1,270,035 | |
U.S. Treasury Notes(a) | | | 2.125% | | | 11/30/23 | | | 5,030 | | | | 4,996,596 | |
U.S. Treasury Notes | | | 2.125% | | | 05/15/25 | | | 2,150 | | | | 2,107,671 | |
U.S. Treasury Strips Coupon | | | 2.184% | (f) | | 02/15/28 | | | 2,115 | | | | 1,564,628 | |
U.S. Treasury Strips Coupon | | | 2.241% | (f) | | 05/15/28 | | | 1,055 | | | | 772,773 | |
U.S. Treasury Strips Coupon | | | 2.280% | (f) | | 02/15/29 | | | 1,055 | | | | 753,730 | |
U.S. Treasury Strips Coupon | | | 2.384% | (f) | | 05/15/29 | | | 2,175 | | | | 1,543,156 | |
U.S. Treasury Strips Coupon | | | 2.519% | (f) | | 08/15/25 | | | 1,930 | | | | 1,553,478 | |
U.S. Treasury Strips Coupon | | | 2.783% | (f) | | 08/15/29 | | | 1,000 | | | | 703,671 | |
U.S. Treasury Strips Coupon | | | 2.878% | (f) | | 05/15/31 | | | 1,000 | | | | 662,633 | |
U.S. Treasury Strips Coupon | | | 3.042% | (f) | | 11/15/35 | | | 2,000 | | | | 1,132,774 | |
U.S. Treasury Strips Coupon | | | 3.202% | (f) | | 08/15/40 | | | 2,000 | | | | 944,778 | |
| | | | | | | | | | | | |
|
|
|
TOTAL U.S. TREASURY OBLIGATIONS
(cost $61,359,375) | | | | 60,404,455 | |
| | | | | | | | | | | | |
|
|
|
TOTAL LONG-TERM INVESTMENTS
(cost $1,416,212,795) | | | | 2,170,144,507 | |
| | | | | | | | | | | | |
|
|
|
SEE NOTES TO FINANCIAL STATEMENTS.
A28
| | | | | | |
| | | CONSERVATIVE BALANCED PORTFOLIO (continued) | | |
| |
| SCHEDULE OF INVESTMENTS | | as of December 31, 2016 |
| | | | | | | | | | | | | | |
| | | | | | | | Shares
| | | Value
(Note 2)
| |
| SHORT-TERM INVESTMENTS — 19.4% | | | | | | | | | | | | | | |
AFFILIATED MUTUAL FUNDS — 19.2% | | | | | | | | | | | | | | |
Prudential Investment Portfolios 2 — Prudential Core Short-Term Bond Fund(k) | | | 10,793,450 | | | $ | 100,055,283 | |
Prudential Investment Portfolios 2 — Prudential Core Ultra Short Bond Fund(k) | | | 288,393,616 | | | | 288,393,616 | |
Prudential Investment Portfolios 2 — Prudential Institutional Money Market Fund
(cost $86,646,816; includes $86,591,303 of cash collateral for securities on loan)(k)(l) | | | 86,646,351 | | | | 86,663,681 | |
| | | | | | | | | | | | |
|
|
|
TOTAL AFFILIATED MUTUAL FUNDS
(cost $478,326,417)(Note 4) | | | | 475,112,580 | |
| | | | | | | | | | | | |
|
|
|
| | | | |
| | | Interest
Rate
| | | Maturity
Date
| | Principal
Amount
(000)#
| | | | |
U.S. TREASURY OBLIGATION — 0.2% | | | | | | | | | | | | | | |
U.S. Treasury Bills(h)
(cost $5,189,963) | | | 0.480% | (m) | | 03/16/17 | | | 5,195,000 | | | | 5,189,805 | |
| | | | | | | | | | | | |
|
|
|
TOTAL SHORT-TERM INVESTMENTS
(cost $483,516,380) | | | | 480,302,385 | |
| | | | | | | | | | | | |
|
|
|
TOTAL INVESTMENTS — 107.2%
(cost $1,899,729,175) | | | | 2,650,446,892 | |
LIABILITIES IN EXCESS OF OTHER ASSETS(n) — (7.2)% | | | | (177,219,891 | ) |
| | | | | | | | | | | | |
|
|
|
NET ASSETS — 100.0% | | | $ | 2,473,227,001 | |
| | | | | | | | | | | | |
|
|
|
See the Glossary for abbreviations used in the annual report.
| * | Non-income producing security. |
| # | Principal or notional amount is shown in U.S. dollars unless otherwise stated. |
| (a) | All or a portion of security is on loan. The aggregate market value of such securities, including those sold and pending settlement, is $84,452,982; cash collateral of $86,591,303 (included in liabilities) was received with which the Portfolio purchased highly liquid short-term investments. Securities on loan are subject to contractual netting arrangements. |
| (b) | Variable rate instrument. The interest rate shown reflects the rate in effect at December 31, 2016. |
| (c) | Indicates a security that has been deemed illiquid. (unaudited) |
| (d) | Indicates a Level 3 security. The aggregate value of Level 3 securities is $21,006,417 and 0.8% of net assets. |
| (e) | Represents issuer in default on interest payments and/or principal re-payments; non-income producing security. Such securities may be post maturity. |
| (f) | Represents zero coupon bond or principal only security. Rate represents yield to maturity at purchase date. |
| (g) | Represents CAS issued by Fannie Mae or STACR securities issued by Freddie Mac. |
| (h) | Represents security, or a portion thereof, segregated as collateral for futures contracts. |
| (i) | Represents security, or a portion thereof, segregated as collateral for centrally cleared swap agreements. |
| (k) | Prudential Investments LLC, the manager of the Portfolio, also serves as manager of the Prudential Investment Portfolios 2 — Prudential Core Short-Term Bond Fund, the Prudential Investment Portfolios 2 — Prudential Core Ultra Short Bond Fund and the Prudential Investment Portfolios 2 — Prudential Institutional Money Market Fund. |
| (l) | Represents security purchased with cash collateral received for securities on loan and includes dividend reinvestment. |
| (m) | Rate quoted represents yield-to-maturity as of purchase date. |
| (n) | Includes net unrealized appreciation (depreciation) on the following derivative contracts held at reporting period end: |
SEE NOTES TO FINANCIAL STATEMENTS.
A29
| | | | | | |
| | | CONSERVATIVE BALANCED PORTFOLIO (continued) | | |
| |
| SCHEDULE OF INVESTMENTS | | as of December 31, 2016 |
Futures contracts outstanding at December 31, 2016:
| | | | | | | | | | | | | | | | | | | | | | |
Number of
Contracts
| | | Type
| | | Expiration
Date
| | | Value at
Trade Date
| | | Value at
December 31, 2016
| | | Unrealized
Appreciation
(Depreciation)
| |
| | Long Positions: | | | | | | | | | | | | | | | | | | | | | |
| | 582 | | | | 2 Year U.S. Treasury Notes | | | | Mar. 2017 | | | $ | 126,082,732 | | | $ | 126,112,125 | | | $ | 29,393 | |
| | 1,039 | | | | 5 Year U.S. Treasury Notes | | | | Mar. 2017 | | | | 122,578,326 | | | | 122,252,961 | | | | (325,365 | ) |
| | 499 | | | | 10 Year U.S. Treasury Notes | | | | Mar. 2017 | | | | 62,021,376 | | | | 62,016,343 | | | | (5,033 | ) |
| | 321 | | | | 30 Year U.S. Ultra Treasury Bonds | | | | Mar. 2017 | | | | 51,751,616 | | | | 51,440,250 | | | | (311,366 | ) |
| | 9 | | | | Mini MSCI EAFE Index | | | | Mar. 2017 | | | | 758,539 | | | | 754,020 | | | | (4,519 | ) |
| | 98 | | | | S&P 500 E-Mini Index | | | | Mar. 2017 | | | | 11,081,081 | | | | 10,957,380 | | | | (123,701 | ) |
| | 61 | | | | S&P 500 Index | | | | Mar. 2017 | | | | 34,395,968 | | | | 34,102,050 | | | | (293,918 | ) |
| | | | | | | | | | | | | | | | | | | | |
|
|
|
| | | | | | | | | | | | | | | | | | | | | | (1,034,509 | ) |
| | | | | | | | | | | | | | | | | | | | |
|
|
|
| | Short Position: | | | | | | | | | | | | | | | | | | | | | |
| | 212 | | | | 20 Year U.S. Treasury Bonds | | | | Mar. 2017 | | | | 31,997,134 | | | | 31,939,125 | | | | 58,009 | |
| | | | | | | | | | | | | | | | | | | | |
|
|
|
| | | | | | | | | | | | | | | | | | | | | $ | (976,500 | ) |
| | | | | | | | | | | | | | | | | | | | |
|
|
|
A U.S. Treasury Obligation with a market value of $5,189,805 has been segregated with Goldman Sachs & Co. and U.S. Government Agency Obligations with a combined market value of $3,595,449 have been segregated with Citigroup Global Markets to cover requirements for open futures contracts at December 31, 2016.
Credit default swap agreements outstanding at December 31, 2016:
| | | | | | | | | | | | | | | | | | | | | | | | |
Reference Entity/ Obligation
| | Termination
Date
| | | Fixed
Rate
| | | Notional
Amount
(000)#(3)
| | | Value at
Trade
Date
| | | Value at
December 31,
2016(4)
| | | Unrealized
Appreciation
(Depreciation)
| |
Centrally cleared credit default swap on credit indices—Buy Protection(1): | |
CDX.NA.IG.24.V1 | | | 06/20/20 | | | | 1.000% | | | | 53,000 | | | $ | (997,536 | ) | | $ | (886,257 | ) | | $ | 111,279 | |
| | | | | | | | | | | | | | |
|
|
| |
|
|
| |
|
|
|
The Portfolio entered into credit default swaps (“CDS”) to provide a measure of protection against defaults or to take an active long or short position with respect to the likelihood of a particular issuer’s default or the reference entity’s credit soundness. CDS contracts generally trade based on a spread which represents the cost a protection buyer has to pay the protection seller. The protection buyer is said to be short the credit as the value of the contract rises the more credit deteriorates. The value of the CDS contract increases for the protection buyer if the spread increases.
| (1) | If the Portfolio is a buyer of protection, it pays the fixed rate. When a credit event occurs, as defined under the terms of that particular swap agreement, the Portfolio will either (i) receive from the seller of protection an amount equal to the notional amount of the swap and make delivery of the referenced obligation or underlying securities comprising the referenced index or (ii) receive a net settlement amount in the form of cash or securities equal to the notional amount of the swap less the recovery value of the referenced obligation or underlying securities comprising the referenced index. |
| (2) | If the Portfolio is a seller of protection, it receives the fixed rate. When a credit event occurs, as defined under the terms of that particular swap agreement, the Portfolio will either (i) pay to the buyer of protection an amount equal to the notional amount of the swap and take delivery of the referenced obligation or underlying securities comprising the referenced index or (ii) pay a net settlement amount in the form of cash or securities equal to the notional amount of the swap less the recovery value of the referenced obligation or underlying securities comprising the referenced index. |
| (3) | Notional amount represents the maximum potential amount the Portfolio could be required to pay as a seller of credit protection or receive as a buyer of credit protection if a credit event occurs as defined under the terms of that particular swap agreement. |
| (4) | The fair value of credit default swap agreements on credit indices, asset-backed securities and centrally cleared corporate and/or sovereign issues serves as an indicator of the current status of the payment/performance risk and represents the likelihood of an expected liability (or profit) for the credit derivative should the notional amount of the swap agreement be closed/sold as of the reporting date. Increasing fair value in absolute terms, when compared to the notional amount of the swap, represents a deterioration of the referenced entity’s credit soundness and a greater likelihood of risk of default or other credit event occurring as defined under the terms of the agreement. |
| (5) | Implied credit spreads, represented in absolute terms, utilized in determining the fair value of OTC credit default swap agreements on corporate issues or sovereign issues of an emerging country as of the reporting date serve as an indicator of the current status of the payment/performance risk and represent the likelihood of risk of default for the credit derivative. The implied credit spread of a particular referenced entity reflects the cost of buying/selling protection and may include up-front payments required to be made to enter into the agreement. Wider credit spreads represent a deterioration of the referenced entity’s credit soundness and a greater likelihood of risk of default or other credit event occurring as defined under the terms of the agreement. |
SEE NOTES TO FINANCIAL STATEMENTS.
A30
| | | | | | |
| | | CONSERVATIVE BALANCED PORTFOLIO (continued) | | |
| |
| SCHEDULE OF INVESTMENTS | | as of December 31, 2016 |
Interest rate swap agreements outstanding at December 31, 2016:
| | | | | | | | | | | | | | | | | | | | | | | | |
Notional
Amount
(000)#
| | | Termination
Date
| | | Fixed
Rate
| | | Floating Rate
| | Value at
Trade Date
| | | Value at
December 31, 2016
| | | Unrealized
Appreciation
(Depreciation)
| |
| | Centrally cleared swap agreements: | | | | | |
| | 115,305 | | | | 09/09/17 | | | | 0.539% | | | 1 Day USOIS(1) | | $ | 404 | | | $ | 144,058 | | | $ | 143,654 | |
| | 94,515 | | | | 10/18/17 | | | | 0.607% | | | 1 Day USOIS(1) | | | 235 | | | | 109,392 | | | | 109,157 | |
| | 52,530 | | | | 11/09/17 | | | | 0.626% | | | 1 Day USOIS(1) | | | 268 | | | | 69,806 | | | | 69,538 | |
| | 2,270 | | | | 07/11/18 | | | | 0.947% | | | 3 Month LIBOR(1) | | | 155 | | | | 13,085 | | | | 12,930 | |
| | 7,060 | | | | 05/31/22 | | | | 2.200% | | | 3 Month LIBOR(1) | | | (14,313 | ) | | | (70,337 | ) | | | (56,024 | ) |
| | 20,465 | | | | 11/30/22 | | | | 1.850% | | | 3 Month LIBOR(1) | | | 261 | | | | 239,580 | | | | 239,319 | |
| | 6,240 | | | | 11/30/22 | | | | 1.982% | | | 3 Month LIBOR(1) | | | 184 | | | | 26,396 | | | | 26,212 | |
| | 1,900 | | | | 12/31/22 | | | | 1.405% | | | 3 Month LIBOR(1) | | | 160 | | | | 71,750 | | | | 71,590 | |
| | 1,500 | | | | 12/31/22 | | | | 1.406% | | | 3 Month LIBOR(1) | | | 158 | | | | 56,519 | | | | 56,361 | |
| | 2,900 | | | | 12/31/22 | | | | 1.409% | | | 3 Month LIBOR(1) | | | 166 | | | | 108,857 | | | | 108,691 | |
| | 700 | | | | 12/31/22 | | | | 1.412% | | | 3 Month LIBOR(1) | | | 154 | | | | 26,168 | | | | 26,014 | |
| | 1,000 | | | | 12/31/22 | | | | 1.495% | | | 3 Month LIBOR(1) | | | 156 | | | | 32,600 | | | | 32,444 | |
| | 2,080 | | | | 05/31/23 | | | | 1.203% | | | 3 Month LIBOR(1) | | | 161 | | | | 114,318 | | | | 114,157 | |
| | 1,785 | | | | 05/31/23 | | | | 1.399% | | | 3 Month LIBOR(1) | | | (32,437 | ) | | | 76,817 | | | | 109,254 | |
| | 8,410 | | | | 08/02/23 | | | | —(3) | | | —(3) | | | (2,727 | ) | | | 22,891 | | | | 25,618 | |
| | 12,748 | | | | 08/02/23 | | | | —(4) | | | —(4) | | | 1,092 | | | | 36,772 | | | | 35,680 | |
| | 3,245 | | | | 08/03/23 | | | | —(5) | | | —(5) | | | (1,211 | ) | | | 9,120 | | | | 10,331 | |
| | 6,160 | | | | 08/19/23 | | | | 0.898% | | | 1 Day USOIS(1) | | | 183 | | | | 330,150 | | | | 329,967 | |
| | 8,025 | | | | 10/27/23 | | | | 1.073% | | | 1 Day USOIS(1) | | | 193 | | | | 363,519 | | | | 363,326 | |
| | 5,570 | | | | 09/04/25 | | | | 2.214% | | | 3 Month LIBOR(1) | | | 190 | | | | 21,803 | | | | 21,613 | |
| | 22,150 | | | | 01/08/26 | | | | 2.210% | | | 3 Month LIBOR(1) | | | 238 | | | | 136,895 | | | | 136,657 | |
| | 140 | | | | 05/15/26 | | | | 1.652% | | | 3 Month LIBOR(1) | | | 6 | | | | 7,814 | | | | 7,808 | |
| | 1,670 | | | | 05/15/37 | | | | 2.726% | | | 3 Month LIBOR(2) | | | 177 | | | | 38,069 | | | | 37,892 | |
| | 2,190 | | | | 11/15/41 | | | | 1.869% | | | 3 Month LIBOR(1) | | | 8,538 | | | | 301,372 | | | | 292,834 | |
| | | | | | | | | | | | | | |
|
|
| |
|
|
| |
|
|
|
| | | | | | | | | | | | | | | $ | (37,609 | ) | | $ | 2,287,414 | | | $ | 2,325,023 | |
| | | | | | | | | | | | | | |
|
|
| |
|
|
| |
|
|
|
U.S. Government Agency Obligations with a combined market value of $4,149,973 have been segregated with Citigroup Global Markets to cover requirements for open centrally cleared credit default and interest rate swap contracts at December 31, 2016.
| (1) | The Portfolio pays the fixed rate and receives the floating rate. |
| (2) | The Portfolio pays the floating rate and receives the fixed rate. |
| (3) | The Portfolio pays the floating rate of 3 Month LIBOR and receives the floating rate of 1 Day USOIS plus 38.25 bps. |
| (4) | The Portfolio pays the floating rate of 3 Month LIBOR and receives the floating rate of 1 Day USOIS plus 38.50 bps. |
| (5) | The Portfolio pays the floating rate of 3 Month LIBOR and receives the floating rate of 1 Day USOIS plus 38.375 bps. |
Various inputs are used in determining the value of the Portfolio’s investments. These inputs are summarized in the three broad levels listed below.
| Level 1— | quoted prices generally in active markets for identical securities. |
| Level 2— | quoted prices for similar securities, interest rates and yield curves, prepayment speeds, foreign currency exchange rates and other observable inputs. |
| Level 3— | unobservable inputs for securities valued in accordance with Board approved fair valuation procedures. |
SEE NOTES TO FINANCIAL STATEMENTS.
A31
| | | | | | |
| | | CONSERVATIVE BALANCED PORTFOLIO (continued) | | |
| |
| SCHEDULE OF INVESTMENTS | | as of December 31, 2016 |
The following is a summary of the inputs used as of December 31, 2016 in valuing such portfolio securities:
| | | | | | | | | | | | |
| | | Level 1
| | | Level 2
| | | Level 3
| |
Investments in Securities | |
Common Stocks | | $ | 1,225,848,357 | | | $ | 23,891,315 | | | $ | — | |
Preferred Stocks | | | 1,267,000 | | | | 270,985 | | | | — | |
Unaffiliated Exchange Traded Fund | | | 186,237 | | | | — | | | | — | |
Asset-Backed Securities | |
Collateralized Loan Obligations | | | — | | | | 41,166,738 | | | | — | |
Non-Residential Mortgage-Backed Securities | | | — | | | | 68,211,753 | | | | — | |
Residential Mortgage-Backed Securities | | | — | | | | 16,175,064 | | | | 2,820,000 | |
Bank Loans | | | — | | | | 6,723,740 | | | | — | |
Commercial Mortgage-Backed Securities | | | — | | | | 114,907,756 | | | | — | |
Corporate Bonds | | | — | | | | 264,012,034 | | | | — | |
Municipal Bonds | | | — | | | | 14,421,970 | | | | — | |
Non-Corporate Foreign Agencies | | | — | | | | 19,255,078 | | | | — | |
Residential Mortgage-Backed Securities | | | — | | | | 23,937,946 | | | | 18,186,417 | |
Sovereign Bonds | | | — | | | | 14,265,783 | | | | — | |
U.S. Government Agency Obligations | | | — | | | | 254,191,879 | | | | — | |
U.S. Treasury Obligations | | | — | | | | 65,594,260 | | | | — | |
Affiliated Mutual Funds | | | 475,112,580 | | | | — | | | | — | |
Other Financial Instruments* | |
Futures Contracts | | | (976,500 | ) | | | — | | | | — | |
Centrally Cleared Credit Default Swap Agreement | | | — | | | | 111,279 | | | | — | |
Centrally Cleared Interest Rate Swap Agreements | | | — | | | | 2,325,023 | | | | — | |
| | |
|
|
| |
|
|
| |
|
|
|
Total | | $ | 1,701,437,674 | | | $ | 929,462,603 | | | $ | 21,006,417 | |
| | |
|
|
| |
|
|
| |
|
|
|
| * | Other financial instruments are derivative instruments not reflected in the Schedule of Investments, such as futures, forwards and centrally cleared swap contracts, which are recorded at the unrealized appreciation (depreciation) on the instrument, and OTC swap contracts which are recorded at fair value. |
During the period, there were no transfers between Level 1 and Level 2 to report.
The industry classification of investments and liabilities in excess of other assets shown as a percentage of net assets as of December 31, 2016 were as follows (unaudited):
| | | | |
Affiliated Mutual Funds (including 3.5% of collateral for securities on loan) | | | 19.2 | % |
U.S. Government Agency Obligations | | | 10.3 | |
Banks | | | 6.4 | |
Commercial Mortgage-Backed Securities | | | 4.6 | |
Oil, Gas & Consumable Fuels | | | 3.2 | |
Pharmaceuticals | | | 3.0 | |
Non-Residential Mortgage-Backed Securities | | | 2.7 | |
U.S. Treasury Obligations | | | 2.6 | |
Residential Mortgage-Backed Securities | | | 2.5 | |
Software | | | 2.4 | |
Internet Software & Services | | | 2.1 | |
Media | | | 2.1 | |
Insurance | | | 2.0 | |
Technology Hardware, Storage & Peripherals | | | 1.9 | |
IT Services | | | 1.9 | |
Collateralized Loan Obligations | | | 1.7 | |
Semiconductors & Semiconductor Equipment | | | 1.7 | |
Capital Markets | | | 1.6 | |
Biotechnology | | | 1.5 | |
Equity Real Estate Investment Trusts (REITs) | | | 1.4 | |
Diversified Telecommunication Services | | | 1.3 | |
Health Care Providers & Services | | | 1.3 | |
Chemicals | | | 1.3 | |
Industrial Conglomerates | | | 1.3 | |
| | | | |
Specialty Retail | | | 1.3 | % |
Health Care Equipment & Supplies | | | 1.2 | |
Diversified Financial Services | | | 1.1 | |
Internet & Direct Marketing Retail | | | 1.1 | |
Beverages | | | 1.1 | |
Aerospace & Defense | | | 1.1 | |
Food & Staples Retailing | | | 1.0 | |
Electric Utilities | | | 1.0 | |
Household Products | | | 0.9 | |
Tobacco | | | 0.8 | |
Food Products | | | 0.8 | |
Hotels, Restaurants & Leisure | | | 0.8 | |
Non-Corporate Foreign Agencies | | | 0.8 | |
Machinery | | | 0.8 | |
Telecommunications | | | 0.6 | |
Municipal Bonds | | | 0.6 | |
Electric | | | 0.6 | |
Sovereign Bonds | | | 0.6 | |
Energy Equipment & Services | | | 0.6 | |
Oil & Gas | | | 0.6 | |
Airlines | | | 0.5 | |
Multi-Utilities | | | 0.5 | |
Communications Equipment | | | 0.5 | |
Road & Rail | | | 0.5 | |
Consumer Finance | | | 0.4 | |
SEE NOTES TO FINANCIAL STATEMENTS.
A32
| | | | | | |
| | | CONSERVATIVE BALANCED PORTFOLIO (continued) | | |
| |
| SCHEDULE OF INVESTMENTS | | as of December 31, 2016 |
| | | | |
Industry table (cont.)
| |
| |
Air Freight & Logistics | | | 0.4 | % |
Healthcare-Services | | | 0.4 | |
Textiles, Apparel & Luxury Goods | | | 0.4 | |
Healthcare-Products | | | 0.3 | |
Automobiles | | | 0.3 | |
Retail | | | 0.3 | |
Life Sciences Tools & Services | | | 0.3 | |
Electrical Equipment | | | 0.3 | |
Auto Manufacturers | | | 0.3 | |
Multiline Retail | | | 0.3 | |
Household Durables | | | 0.2 | |
Pipelines | | | 0.2 | |
Computers | | | 0.2 | |
Lodging | | | 0.2 | |
Electronic Equipment, Instruments & Components | | | 0.2 | |
Agriculture | | | 0.2 | |
Building Products | | | 0.2 | |
Metals & Mining | | | 0.2 | |
Commercial Services & Supplies | | | 0.2 | |
Technology | | | 0.2 | |
Containers & Packaging | | | 0.2 | |
Professional Services | | | 0.1 | |
| | | | |
Transportation | | | 0.1 | % |
Trading Companies & Distributors | | | 0.1 | |
Food | | | 0.1 | |
Multi-National | | | 0.1 | |
Auto Components | | | 0.1 | |
Mining | | | 0.1 | |
Housewares | | | 0.1 | |
Machinery-Diversified | | | 0.1 | |
Oil & Gas Services | | | 0.1 | |
Commercial Services | | | 0.1 | |
Miscellaneous Manufacturing | | | 0.1 | |
Forest Products & Paper | | | 0.1 | |
Construction Materials | | | 0.1 | |
Personal Products | | | 0.1 | |
Construction & Engineering | | | 0.1 | |
Distributors | | | 0.1 | |
Semiconductors | | | 0.1 | |
Packaging & Containers | | | 0.1 | |
| | |
|
|
|
| | | | 107.2 | |
Liabilities in excess of other assets | | | (7.2 | ) |
| | |
|
|
|
| | | | 100.0 | % |
| | |
|
|
|
The Portfolio invested in derivative instruments during the reporting period. The primary types of risk associated with these derivative instruments are credit risk, equity risk and interest rate risk. The effect of such derivative instruments on the Portfolio’s financial position and financial performance as reflected in the Statement of Assets and Liabilities and Statement of Operations is presented in the summary below.
Fair values of derivative instruments as of December 31, 2016 as presented in the Statement of Assets and Liabilities:
| | | | | | | | | | | | |
Derivatives not designated as hedging
instruments, carried at fair value
| | Asset Derivatives
| | | Liability Derivatives
| |
| | Balance Sheet Location
| | Fair Value
| | | Balance Sheet Location
| | Fair Value
| |
Credit contracts | | Due from/to broker — variation margin swaps | | $ | 111,279 | * | | — | | $ | — | |
Equity contracts | | — | | | — | | | Due from/to broker — variation margin futures | | | 422,138 | * |
Interest rate contracts | | Due from/to broker — variation margin futures | | | 87,402 | * | | Due from/to broker — variation margin futures | | | 641,764 | * |
Interest rate contracts | | Due from/to broker — variation margin swaps | | | 2,381,047 | * | | Due from/to broker — variation margin swaps | | | 56,024 | * |
| | | | |
|
|
| | | |
|
|
|
Total | | | | $ | 2,579,728 | | | | | $ | 1,119,926 | |
| | | | |
|
|
| | | |
|
|
|
| * | Includes cumulative appreciation (depreciation) as reported in the schedule of open futures and centrally cleared swap contracts. Only unsettled variation margin receivable (payable) is reported within the Statement of Assets and Liabilities. |
The effects of derivative instruments on the Statement of Operations for the year ended December 31, 2016 are as follows:
| | | | | | | | | | | | | | | | | | | | | | | | | | | | |
Amount of Realized Gain (Loss) on Derivatives Recognized in Income
| |
Derivatives not accounted for as hedging
instruments, carried at fair value
| | Rights*
| | | Options
Purchased*
| | | Options
Written
| | | Futures
| | | Forward
Rate
Agreements
| | | Swaps
| | | Total
| |
Credit contracts | | $ | — | | | $ | — | | | $ | — | | | $ | — | | | $ | — | | | $ | (631,785 | ) | | $ | (631,785 | ) |
Equity contracts | | | 22 | | | | — | | | | — | | | | 7,279,186 | | | | — | | | | — | | | | 7,279,208 | |
Interest rate contracts | | | — | | | | (745,107 | ) | | | (403,265 | ) | | | (4,915,630 | ) | | | 17,708 | | | | (1,501,249 | ) | | | (7,547,543 | ) |
| | |
|
|
| |
|
|
| |
|
|
| |
|
|
| |
|
|
| |
|
|
| |
|
|
|
Total | | $ | 22 | | | $ | (745,107 | ) | | $ | (403,265 | ) | | $ | 2,363,556 | | | $ | 17,708 | | | $ | (2,133,034 | ) | | $ | (900,120 | ) |
| | |
|
|
| |
|
|
| |
|
|
| |
|
|
| |
|
|
| |
|
|
| |
|
|
|
* Included in net realized gain (loss) on investment transactions in the Statement of Operations. | |
SEE NOTES TO FINANCIAL STATEMENTS.
A33
| | | | | | |
| | | CONSERVATIVE BALANCED PORTFOLIO (continued) | | |
| |
| SCHEDULE OF INVESTMENTS | | as of December 31, 2016 |
| | | | | | | | | | | | | | | | | | | | | | | | | | |
|
Change in Unrealized Appreciation (Depreciation) on Derivatives Recognized in Income
| |
Derivatives not accounted for as hedging
instruments, carried at fair value
| | Rights*
| | | Options
Purchased*
| | | Options
Written
| | | Futures
| | | Swaps
| | | Total
| |
Credit contracts | | $ | — | | | $ | — | | | $ | — | | | $ | — | | | $ | (457,392 | ) | | $ | (457,392 | ) |
Equity contracts | | | (34 | ) | | | — | | | | — | | | | (687,841 | ) | | | — | | | | (687,875 | ) |
Interest rate contracts | | | — | | | | 300,971 | | | | (177,697 | ) | | | (846,024 | ) | | | 3,558,589 | | | | 2,835,839 | |
| | | | |
|
|
| |
|
|
| |
|
|
| |
|
|
| |
|
|
| |
|
|
|
Total | | $ | (34 | ) | | $ | 300,971 | | | $ | (177,697 | ) | | $ | (1,533,865 | ) | | $ | 3,101,197 | | | $ | 1,690,572 | |
| | | | |
|
|
| |
|
|
| |
|
|
| |
|
|
| |
|
|
| |
|
|
|
| * | Included in net change in unrealized appreciation (depreciation) on investments in the Statement of Operations. |
For the year ended December 31, 2016, the Portfolio’s average volume of derivative activities is as follows:
| | | | | | |
Options Purchased(1)
| | Options Written(2)
| | Futures Contracts—
Long Positions(3)
| | Futures Contracts—
Short Positions(3)
|
| $87,742 | | $192,260,000 | | $338,657,642 | | $71,509,435 |
| | | |
Interest Rate Swap
Agreements(2)
| | Credit Default
Swap Agreements—Buy
Protection(2)
| | Credit Default
Swap Agreements—Sell
Protection(2)
| | Total Return Swap
Agreements(2)
|
| $221,572,800 | | $53,000,000 | | $2,554,000 | | $3,600,000 |
| (2) | Notional Amount in USD. |
The Portfolio entered into financial transactions during the reporting period that are either offset in accordance with current requirements or are subject to enforceable master netting arrangements or similar agreements that permit offsetting. The information about offsetting and related netting arrangements for financial transactions, where the legal right to set-off exists, is presented in the summary below.
Offsetting of financial transactions assets and liabilities:
| | | | | | | | | | | | |
Description
| | Gross Amounts of
Recognized Assets(1)
| | | Collateral
Received
| | | Net Amount
| |
Securities on Loan | | $ | 84,452,982 | | | $ | (84,452,982 | ) | | $ | — | |
| | |
|
|
| | | | | | | | |
| (1) | Amount represents market value. |
SEE NOTES TO FINANCIAL STATEMENTS.
A34
| | | | | | |
| | | CONSERVATIVE BALANCED PORTFOLIO (continued) | | |
STATEMENT OF ASSETS & LIABILITIES
as of December 31, 2016
| | | | |
| ASSETS | |
Investments at value, including securities on loan of $84,452,982: | | | | |
Unaffiliated investments (cost $1,421,402,758) | | $ | 2,175,334,312 | |
Affiliated investments (cost $478,326,417) | | | 475,112,580 | |
Cash | | | 12,645 | |
Foreign currency, at value (cost $63,940) | | | 62,765 | |
Receivable for investments sold | | | 20,829,142 | |
Dividends and interest receivable | | | 7,438,828 | |
Tax reclaim receivable | | | 527,213 | |
Due from broker—variation margin futures | | | 522,380 | |
Receivable for Series shares sold | | | 109,157 | |
Prepaid expenses | | | 19,144 | |
Receivable from affiliate | | | 2,300 | |
| | |
|
|
|
Total Assets | | | 2,679,970,466 | |
| | |
|
|
|
| LIABILITIES | |
Payable for investments purchased | | | 118,254,831 | |
Payable to broker for collateral for securities on loan | | | 86,591,303 | |
Management fee payable | | | 1,154,093 | |
Accrued expenses and other liabilities | | | 273,082 | |
Due to broker—variation margin futures | | | 176,950 | |
Payable for Series shares repurchased | | | 148,408 | |
Due to broker—variation margin swaps | | | 143,818 | |
Affiliated transfer agent fee payable | | | 980 | |
| | |
|
|
|
Total Liabilities | | | 206,743,465 | |
| | |
|
|
|
| NET ASSETS | | $ | 2,473,227,001 | |
| | |
|
|
|
Net assets were comprised of: | |
Paid-in capital | | $ | 1,153,785,703 | |
Retained earnings | | | 1,319,441,298 | |
| | |
|
|
|
Net assets, December 31, 2016 | | $ | 2,473,227,001 | |
| | |
|
|
|
Net asset value and redemption price per share
$2,473,227,001 / 102,270,972 outstanding shares of beneficial interest | | $ | 24.18 | |
| | |
|
|
|
STATEMENT OF OPERATIONS
Year Ended December 31, 2016
| | | | |
| NET INVESTMENT INCOME (LOSS) | |
| INCOME | |
Unaffiliated dividend income (net) (foreign withholding tax of $291,761, of which $24,389 is reimbursable by an affiliate) | | $ | 27,766,840 | |
Interest income | | | 27,279,906 | |
Affiliated dividend income | | | 3,662,538 | |
Income from securities lending, net (including affiliated income of $319,996) | | | 346,200 | |
| | |
|
|
|
Total income | | | 59,055,484 | |
| | |
|
|
|
| EXPENSES | |
Management fee | | | 13,680,400 | |
Custodian and accounting fees (net of $17,100 fee credit) | | | 383,000 | |
Shareholders’ reports | | | 254,000 | |
Audit fee | | | 53,000 | |
Trustees’ fees | | | 33,000 | |
Insurance expenses | | | 30,000 | |
Legal fees and expenses | | | 15,000 | |
Transfer agent’s fees and expenses (including affiliated expense of $5,900) | | | 12,000 | |
Commitment fee on syndicated credit agreement | | | 5,000 | |
Miscellaneous | | | 46,221 | |
| | |
|
|
|
Total expenses | | | 14,511,621 | |
| | |
|
|
|
| NET INVESTMENT INCOME (LOSS) | | | 44,543,863 | |
| | |
|
|
|
| REALIZED AND UNREALIZED GAIN (LOSS) ON INVESTMENT AND FOREIGN CURRENCY TRANSACTIONS | | | | |
Net realized gain (loss) on: | |
Investment transactions (including affiliated of $2,284) | | | 28,856,570 | |
Futures transactions | | | 2,363,556 | |
Options written transactions | | | (403,265 | ) |
Swap agreement transactions | | | (2,133,034 | ) |
Forward rate agreement transactions | | | 17,708 | |
Foreign currency transactions | | | (43,231 | ) |
| | |
|
|
|
| | | | 28,658,304 | |
| | |
|
|
|
Net change in unrealized appreciation (depreciation) on: | | | | |
Investments (including affiliated of $13,988) | | | 97,179,829 | |
Futures | | | (1,533,865 | ) |
Options written | | | (177,697 | ) |
Swap agreements | | | 3,101,197 | |
Foreign currencies | | | (5,477 | ) |
| | |
|
|
|
| | | | 98,563,987 | |
| | |
|
|
|
| NET GAIN (LOSS) ON INVESTMENT AND FOREIGN CURRENCY TRANSACTIONS | | | 127,222,291 | |
| | |
|
|
|
| NET INCREASE (DECREASE) IN NET ASSETS RESULTING FROM OPERATIONS | | $ | 171,766,154 | |
| | |
|
|
|
STATEMENT OF CHANGES IN NET ASSETS
| | | | | | | | |
| | | Year Ended December 31,
| |
| | | 2016
| | | 2015
| |
| INCREASE (DECREASE) IN NET ASSETS | | | | | | | | |
| OPERATIONS | | | | | | | | |
Net investment income (loss) | | $ | 44,543,863 | | | $ | 42,958,646 | |
Net realized gain (loss) on investment and foreign currency transactions | | | 28,658,304 | | | | 125,966,448 | |
Net change in unrealized appreciation (depreciation) on investments and foreign currencies | | | 98,563,987 | | | | (158,615,573 | ) |
| | |
|
|
| |
|
|
|
NET INCREASE (DECREASE) IN NET ASSETS RESULTING FROM OPERATIONS | | | 171,766,154 | | | | 10,309,521 | |
| | |
|
|
| |
|
|
|
| SERIES SHARE TRANSACTIONS | | | | | | | | |
Series shares sold [338,782 and 6,321,083 shares, respectively] | | | 7,843,814 | | | | 143,898,043 | |
Series shares repurchased [11,378,786 and 7,700,902 shares, respectively] | | | (262,953,434 | ) | | | (174,291,543 | ) |
| | |
|
|
| |
|
|
|
NET INCREASE (DECREASE) IN NET ASSETS FROM SERIES SHARE TRANSACTIONS | | | (255,109,620 | ) | | | (30,393,500 | ) |
| | |
|
|
| |
|
|
|
| CAPITAL CONTRIBUTIONS (Note 4) | | | 2,299,220 | | | | — | |
| | |
|
|
| |
|
|
|
| TOTAL INCREASE (DECREASE) | | | (81,044,246 | ) | | | (20,083,979 | ) |
| NET ASSETS: | | | | | | | | |
Beginning of year | | | 2,554,271,247 | | | | 2,574,355,226 | |
| | |
|
|
| |
|
|
|
End of year | | $ | 2,473,227,001 | | | $ | 2,554,271,247 | |
| | |
|
|
| |
|
|
|
SEE NOTES TO FINANCIAL STATEMENTS.
A35
| | | | | | |
| | | DIVERSIFIED BOND PORTFOLIO | | |
| |
| SCHEDULE OF INVESTMENTS | | as of December 31, 2016 |
| | | | | | | | | | | | | | | | | | |
LONG-TERM INVESTMENTS — 89.3% ASSET-BACKED SECURITIES — 13.9% | | Interest
Rate
| | | Maturity
Date
| | Principal
Amount
(000)#
| | | Value
(Note 2)
| |
Collateralized Loan Obligations — 4.7% | |
A Voce CLO Ltd. (Cayman Islands), Series 2014-1A, Class A1A, 144A | | | 2.330% | (a) | | 07/15/26 | | | | | | | 500 | | | $ | 498,930 | |
ACAS CLO Ltd. (Cayman Islands), Series 2013-1A, Class A, 144A | | | 2.061% | (a) | | 04/20/25 | | | | | | | 3,300 | | | | 3,296,274 | |
Anchorage Capital CLO Ltd. (Cayman Islands), Series 2014-5A, Class A, 144A | | | 2.480% | (a) | | 10/15/26 | | | | | | | 1,750 | | | | 1,754,443 | |
Avery Point V CLO Ltd. (Cayman Islands), Series 2014-5A, Class A, 144A | | | 2.340% | (a) | | 07/17/26 | | | | | | | 1,000 | | | | 1,001,649 | |
Battalion CLO IV Ltd. (Cayman Islands), Series 2013-4A, Class A1, 144A | | | 2.282% | (a) | | 10/22/25 | | | | | | | 1,300 | | | | 1,305,265 | |
Battalion CLO VII Ltd. (Cayman Islands), Series 2014-7A, Class A1, 144A | | | 2.480% | (a) | | 10/17/26 | | | | | | | 2,750 | | | | 2,753,886 | |
Benefit Street Partners CLO II Ltd. (Cayman Islands), Series 2013-IIA, Class A1, 144A | | | 2.080% | (a) | | 07/15/24 | | | | | | | 900 | | | | 896,647 | |
Benefit Street Partners CLO Ltd. (Cayman Islands), Series 2012-IA, Class A2R, 144A | | | 3.132% | (a) | | 10/15/25 | | | | | | | 1,000 | | | | 1,004,015 | |
Benefit Street Partners CLO V Ltd. (Cayman Islands), Series 2014-VA, Class A, 144A | | | 2.481% | (a) | | 10/20/26 | | | | | | | 1,250 | | | | 1,255,938 | |
Blue Hill CLO Ltd. (Cayman Islands), Series 2013-1A, Class A, 144A | | | 2.360% | (a) | | 01/15/26 | | | | | | | 700 | | | | 701,123 | |
Brookside Mill CLO Ltd. (Cayman Islands), Series 2013-1A, Class A1, 144A | | | 2.030% | (a) | | 04/17/25 | | | | | | | 2,600 | | | | 2,596,508 | |
Carlyle Global Market Strategies CLO Ltd. (Cayman Islands), Series 2014-3A, Class A1A, 144A | | | 2.346% | (a) | | 07/27/26 | | | | | | | 250 | | | | 250,428 | |
ECP CLO Ltd. (Cayman Islands), Series 2014-6A, Class A1A, 144A | | | 2.330% | (a) | | 07/15/26 | | | | | | | 1,500 | | | | 1,497,755 | |
Flagship VII CLO Ltd. (Cayman Islands), Series 2013-7A, Class A1, 144A | | | 2.351% | (a) | | 01/20/26 | | | | | | | 2,500 | | | | 2,504,840 | |
Flatiron CLO Ltd. (Cayman Islands), Series 2013-1A, Class A1, 144A | | | 2.280% | (a) | | 01/17/26 | | | | | | | 1,250 | | | | 1,249,586 | |
Jackson Mill CLO Ltd. (Cayman Islands), Series 2015-1A, Class A, 144A | | | 2.420% | (a) | | 04/15/27 | | | | | | | 2,250 | | | | 2,251,500 | |
KVK CLO Ltd. (Cayman Islands), Series 2014-2A, Class A, 144A | | | 2.430% | (a) | | 07/15/26 | | | | | | | 250 | | | | 250,012 | |
Palmer Square CLO Ltd. (Cayman Islands), Series 2015-2A, Class A1A, 144A | | | 2.381% | (a) | | 07/20/27 | | | | | | | 1,000 | | | | 1,001,794 | |
Regatta V Funding Ltd. (Cayman Islands), Series 2014-1A, Class A1A, 144A | | | 2.442% | (a) | | 10/25/26 | | | | | | | 4,375 | | | | 4,386,720 | |
Shackleton III CLO Ltd. (Cayman Islands), Series 2013-3A, Class B2, 144A | | | 3.440% | | | 04/15/25 | | | | | | | 700 | | | | 699,499 | |
Shackleton V CLO Ltd. (Cayman Islands), Series 2014-5A, Class A, 144A | | | 2.381% | (a) | | 05/07/26 | | | | | | | 1,250 | | | | 1,254,145 | |
Sheridan Square CLO Ltd. (Cayman Islands), Series 2013-1A, Class A1, 144A | | | 1.930% | (a) | | 04/15/25 | | | | | | | 7,300 | | | | 7,287,160 | |
Sound Point CLO VI Ltd. (Cayman Islands), Series 2014-2A, Class A1, 144A | | | 2.241% | (a) | | 10/20/26 | | | | | | | 750 | | | | 748,767 | |
THL Credit Wind River CLO Ltd. (Cayman Islands), Series 2013-2A, Class A1, 144A | | | 2.332% | (a) | | 01/18/26 | | | | | | | 3,300 | | | | 3,305,675 | |
Trinitas CLO V Ltd. (Cayman Islands), Series 2016-5A, Class A, 144A | | | 2.434% | (a) | | 10/25/28 | | | | | | | 3,250 | | | | 3,249,268 | |
Tyron Park CLO Ltd. (Cayman Islands), Series 2013-1A, Class A1, 144A | | | 2.000% | (a) | | 07/15/25 | | | | | | | 300 | | | | 300,128 | |
Voya CLO Ltd. (Cayman Islands), Series 2013-1A, Class A1, 144A | | | 2.020% | (a) | | 04/15/24 | | | | | | | 4,200 | | | | 4,201,663 | |
| | | | | | | | | | | | | | | | |
|
|
|
| | | | | | | | | | | | | | | | | | 51,503,618 | |
| | | | | | | | | | | | | | | | |
|
|
|
Non-Residential Mortgage-Backed Securities — 3.1% | |
Avis Budget Rental Car Funding AESOP LLC, Series 2016-1A, Class A, 144A | | | 2.990% | | | 06/20/22 | | | | | | | 2,500 | | | | 2,494,619 | |
Earnest Student Loan Program LLC, Series 2016-D, Class A1, 144A | | | 2.156% | (a) | | 01/25/41 | | | | | | | 689 | | | | 690,637 | |
Hertz Vehicle Financing II LP, Series 2015-1A, Class A, 144A | | | 2.730% | | | 03/25/21 | | | | | | | 3,200 | | | | 3,176,951 | |
Hertz Vehicle Financing LLC, Series 2016-2A, Class A, 144A | | | 2.950% | | | 03/25/22 | | | | | | | 1,600 | | | | 1,581,454 | |
Lendmark Funding Trust, Series 2016-2A, Class A, 144A | | | 3.260% | | | 04/21/25 | | | | | | | 700 | | | | 695,488 | |
Marriott Vacation Club Owner Trust, Series 2010-1A, Class A, 144A | | | 3.540% | | | 10/20/32 | | | | | | | 1,155 | | | | 1,166,859 | |
SEE NOTES TO FINANCIAL STATEMENTS.
A36
| | | | | | |
| | | DIVERSIFIED BOND PORTFOLIO (continued) | | |
| |
| SCHEDULE OF INVESTMENTS | | as of December 31, 2016 |
| | | | | | | | | | | | | | | | | | |
ASSET-BACKED SECURITIES
(continued) | | Interest
Rate
| | | Maturity
Date
| | Principal
Amount
(000)#
| | | Value
(Note 2)
| |
Non-Residential Mortgage-Backed Securities (continued) | |
OneMain Direct Auto Receivables Trust, Series 2016-1A, Class C, 144A | | | 4.580% | | | 09/15/21 | | | | | | | 1,600 | | | $ | 1,609,740 | |
OneMain Financial Issuance Trust, Series 2015-1A, Class A, 144A | | | 3.190% | | | 03/18/26 | | | | | | | 1,000 | | | | 1,007,097 | |
OneMain Financial Issuance Trust, Series 2015-2A, Class A, 144A | | | 2.570% | | | 07/18/25 | | | | | | | 4,100 | | | | 4,100,144 | |
OneMain Financial Issuance Trust, Series 2015-2A, Class C, 144A | | | 4.320% | | | 07/18/25 | | | | | | | 1,100 | | | | 1,084,873 | |
OneMain Financial Issuance Trust, Series 2016-1A, Class A, 144A | | | 3.660% | | | 02/20/29 | | | | | | | 2,500 | | | | 2,527,491 | |
OneMain Financial Issuance Trust, Series 2016-2A, Class A, 144A | | | 4.100% | | | 03/20/28 | | | | | | | 2,600 | | | | 2,650,690 | |
Oportun Funding IV LLC, Series 2016-C, Class A, 144A | | | 3.280% | | | 11/08/21 | | | | | | | 2,300 | | | | 2,284,218 | |
SpringCastle America Funding LLC, Series 2016-AA, Class A, 144A | | | 3.050% | | | 04/25/29 | | | | | | | 4,048 | | | | 4,067,741 | |
Springleaf Funding Trust, Series 2015-AA, Class A, 144A | | | 3.160% | | | 11/15/24 | | | | | | | 5,200 | | | | 5,241,081 | |
| | | | | | | | | | | | | | | | |
|
|
|
| | | | | | | | | | | | | | | | | | 34,379,083 | |
| | | | | | | | | | | | | | | | |
|
|
|
Residential Mortgage-Backed Securities — 6.1% | |
ABFC Trust, Series 2004-OPT1, Class M1 | | | 1.806% | (a) | | 08/25/33 | | | | | | | 1,054 | | | | 1,008,219 | |
ACE Securities Corp. Home Equity Loan Trust, Series 2004-FM1, Class M1 | | | 1.656% | (a) | | 09/25/33 | | | | | | | 1,081 | | | | 1,013,397 | |
Ameriquest Mortgage Securities, Inc. Asset-Backed Pass-Through Certificates, Series 2003-AR1, Class M3 | | | 5.092% | (a) | | 01/25/33 | | | | | | | 1,892 | | | | 1,863,484 | |
Ameriquest Mortgage Securities, Inc. Asset-Backed Pass-Through Certificates, Series 2004-R8, Class M1 | | | 1.716% | (a) | | 09/25/34 | | | | | | | 595 | | | | 592,576 | |
Ameriquest Mortgage Securities, Inc. Floating Rate Mortgage Pass-Through Certificates, Series 2001-2, Class M3 | | | 3.681% | (a) | | 10/25/31 | | | | | | | 329 | | | | 328,367 | |
Argent Securities, Inc. Asset-Backed Pass-Through Certificates,
Series 2003-W2, Class M4 | | | 3.878% | (a) | | 09/25/33 | | | | | | | 2,400 | | | | 2,241,970 | |
Argent Securities, Inc. Asset-Backed Pass-Through Certificates, Series 2004-W10, Class A2 | | | 1.364% | (a) | | 10/25/34 | | | | | | | 1,589 | | | | 1,551,477 | |
Argent Securities, Inc. Asset-Backed Pass-Through Certificates, Series 2004-W6, Class M1 | | | 1.581% | (a) | | 05/25/34 | | | | | | | 856 | | | | 821,539 | |
Asset-Backed Securities Corp. Home Equity Loan Trust, Series 2003-HE3, Class M1 | | | 1.949% | (a) | | 06/15/33 | | | | | | | 948 | | | | 912,475 | |
Asset-Backed Securities Corp. Home Equity Loan Trust, Series 2004-HE1, Class M1 | | | 1.754% | (a) | | 01/15/34 | | | | | | | 981 | | | | 951,553 | |
Asset-Backed Securities Corp. Home Equity Loan Trust, Series 2004-HE5, Class M1 | | | 1.484% | (a) | | 08/25/34 | | | | | | | 1,336 | | | | 1,282,367 | |
Bayview Opportunity Master Fund IIIa Trust, Series 2016-RN3, Class A1, 144A | | | 3.598% | | | 09/29/31 | | | | | | | 1,003 | | | | 998,969 | |
Bayview Opportunity Master Fund lIIb NPL Trust, Series 2015-NPLA, Class A, 144A | | | 3.721% | | | 07/28/35 | | | | | | | 3,125 | | | | 3,124,726 | |
Bear Stearns Asset-Backed Securities Trust, Series 2004-HE2, Class M1 | | | 1.484% | (a) | | 03/25/34 | | | | | | | 2,993 | | | | 2,879,517 | |
Bear Stearns Asset-Backed Securities Trust, Series 2004-HE3, Class M2 | | | 2.309% | (a) | | 04/25/34 | | | | | | | 1,935 | | | | 1,810,422 | |
Centex Home Equity Loan Trust, Series 2004-B, Class AF6 | | | 4.686% | | | 03/25/34 | | | | | | | 747 | | | | 766,740 | |
Credit Suisse First Boston Mortgage Securities Corp., Series 2002-HE4, Class M2 | | | 3.006% | (a) | | 08/25/32 | | | | | | | 37 | | | | 33,880 | |
Credit Suisse Mortgage Trust, Series 16-RPL1, Class A1, 144A | | | 3.767% | (a) | | 12/26/46 | | | | | | | 5,051 | | | | 5,032,684 | |
Credit Suisse Mortgage Trust, Series 2016-12R, Class 1A1, 144A(b) | | | 3.239% | | | 02/28/47 | | | | | | | 3,440 | | | | 3,440,000 | |
Equity One Mortgage Pass-Through Trust, Series 2004-3, Class M1 | | | 4.792% | | | 07/25/34 | | | | | | | 438 | | | | 415,540 | |
FBR Securitization Trust, Series 2005-2, Class M1 | | | 1.304% | (a) | | 09/25/35 | | | | | | | 1,762 | | | | 1,748,580 | |
Fremont Home Loan Trust, Series 2003-B, Class M1 | | | 1.806% | (a) | | 12/25/33 | | | | | | | 157 | | | | 148,976 | |
GSAMP Trust, Series 2004-FM1, Class M1 | | | 1.731% | (a) | | 11/25/33 | | | | | | | 1,408 | | | | 1,330,903 | |
Long Beach Mortgage Loan Trust, Series 2004-1, Class M1 | | | 1.506% | (a) | | 02/25/34 | | | | | | | 2,774 | | | | 2,676,289 | |
MASTR Asset-Backed Securities Trust, Series 2004-WMC1, Class M1 | | | 1.536% | (a) | | 02/25/34 | | | | | | | 1,556 | | | | 1,495,857 | |
Merrill Lynch Mortgage Investors Trust, Series 2004-HE2, Class M1 | | | 1.956% | (a) | | 08/25/35 | | | | | | | 439 | | | | 419,443 | |
Merrill Lynch Mortgage Investors Trust, Series 2004-OPT1, Class A1A | | | 1.276% | (a) | | 06/25/35 | | | | | | | 1,242 | | | | 1,199,060 | |
Morgan Stanley ABS Capital I, Inc. Trust, Series 2003-HE1, Class M1 | | | 1.956% | (a) | | 05/25/33 | | | | | | | 839 | | | | 816,719 | |
SEE NOTES TO FINANCIAL STATEMENTS.
A37
| | | | | | |
| | | DIVERSIFIED BOND PORTFOLIO (continued) | | |
| |
| SCHEDULE OF INVESTMENTS | | as of December 31, 2016 |
| | | | | | | | | | | | | | | | | | | | |
ASSET-BACKED SECURITIES
(continued) | | Interest
Rate
| | | Maturity
Date
| | | Principal
Amount
(000)#
| | | Value
(Note 2)
| |
Residential Mortgage-Backed Securities (continued) | |
Morgan Stanley ABS Capital I, Inc. Trust, Series 2003-HE3, Class M1 | | | 1.776% | (a) | | | 10/25/33 | | | | | | | | 631 | | | $ | 595,407 | |
Morgan Stanley ABS Capital I, Inc. Trust, Series 2004-NC1, Class M1 | | | 1.806% | (a) | | | 12/27/33 | | | | | | | | 548 | | | | 533,448 | |
Morgan Stanley ABS Capital I, Inc. Trust, Series 2004-OP1, Class M1 | | | 1.626% | (a) | | | 11/25/34 | | | | | | | | 3,688 | | | | 3,431,654 | |
Morgan Stanley ABS Capital I, Inc. Trust, Series 2004-WMC1, Class M1 | | | 1.686% | (a) | | | 06/25/34 | | | | | | | | 1,510 | | | | 1,469,215 | |
Morgan Stanley ABS Capital I, Inc. Trust, Series 2004-WMC2, Class M1 | | | 1.671% | (a) | | | 07/25/34 | | | | | | | | 1,236 | | | | 1,181,640 | |
New Century Home Equity Loan Trust, Series 2003-4, Class M1 | | | 1.881% | (a) | | | 10/25/33 | | | | | | | | 2,245 | | | | 2,166,044 | |
New Century Home Equity Loan Trust, Series 2004-4, Class M1 | | | 1.521% | (a) | | | 02/25/35 | | | | | | | | 2,540 | | | | 2,363,623 | |
Residential Asset Securities Corp., Series 2004-KS1, Class AI5 | | | 5.721% | | | | 02/25/34 | | | | | | | | 882 | | | | 906,329 | |
Securitized Asset-Backed Receivables LLC Trust, Series 2004-NC1, Class M1 | | | 1.536% | (a) | | | 02/25/34 | | | | | | | | 2,448 | | | | 2,302,385 | |
Specialty Underwriting & Residential Finance Trust, Series 2004-BC1, Class M1 | | | 1.521% | (a) | | | 02/25/35 | | | | | | | | 1,038 | | | | 969,807 | |
Structured Asset Investment Loan Trust, Series 2004-2, Class A4 | | | 1.461% | (a) | | | 03/25/34 | | | | | | | | 2,020 | | | | 1,862,064 | |
Structured Asset Investment Loan Trust, Series 2004-7, Class A8 | | | 1.956% | (a) | | | 08/25/34 | | | | | | | | 1,400 | | | | 1,259,116 | |
VOLT LI LLC, Series 2016-NP11, Class A1, 144A | | | 3.500% | | | | 10/25/46 | | | | | | | | 1,504 | | | | 1,500,332 | |
VOLT XLIV LLC, Series 2016-NPL4, Class A1, 144A | | | 4.250% | | | | 04/25/46 | | | | | | | | 2,290 | | | | 2,306,037 | |
VOLT XXXVII LLC, Series 2015-NP11, Class A1, 144A | | | 3.625% | | | | 07/25/45 | | | | | | | | 3,862 | | | | 3,858,752 | |
| | | | | | | | | | | | | | | | | | |
|
|
|
| | | | | | | | | | | | | | | | | | | | 67,611,582 | |
| | | | | | | | | | | | | | | | | | |
|
|
|
TOTAL ASSET-BACKED SECURITIES
(cost $147,406,576) | | | | 153,494,283 | |
| | | | | | | | | | | | | | | | | | |
|
|
|
| BANK LOANS(a) — 2.9% | |
Aerospace & Defense — 0.2% | |
TransDigm, Inc. | | | 3.845% | | | | 05/14/22 | | | | | | | | 1,967 | | | | 1,978,052 | |
| | | | | | | | | | | | | | | | | | |
|
|
|
Automotive — 0.1% | |
Chrysler Group LLC | | | 3.270% | | | | 12/31/18 | | | | | | | | 406 | | | | 407,183 | |
Chrysler Group LLC | | | 3.500% | | | | 05/24/17 | | | | | | | | 778 | | | | 779,657 | |
| | | | | | | | | | | | | | | | | | |
|
|
|
| | | | | | | | | | | | | | | | | | | | 1,186,840 | |
| | | | | | | | | | | | | | | | | | |
|
|
|
Chemicals — 0.1% | |
Axalta Coating Systems US Holding | | | 3.453% | | | | 02/01/23 | | | | | | | | 509 | | | | 513,982 | |
MacDermid, Inc. | | | 4.500% | | | | 06/07/20 | | | | | | | | 611 | | | | 617,959 | |
| | | | | | | | | | | | | | | | | | |
|
|
|
| | | | | | | | | | | | | | | | | | | | 1,131,941 | |
| | | | | | | | | | | | | | | | | | |
|
|
|
Consumer — 0.1% | |
Generac Power Systems, Inc. | | | 3.748% | | | | 05/31/23 | | | | | | | | 876 | | | | 882,258 | |
| | | | | | | | | | | | | | | | | | |
|
|
|
Diversified Manufacturing — 0.1% | |
CeramTec GmbH (Germany) | | | 3.750% | | | | 08/30/20 | | | | EUR | | | | 900 | | | | 953,310 | |
| | | | | | | | | | | | | | | | | | |
|
|
|
Gaming — 0.1% | |
CCM Merger, Inc.(b) | | | 4.020% | | | | 08/06/21 | | | | | | | | 1,494 | | | | 1,509,078 | |
| | | | | | | | | | | | | | | | | | |
|
|
|
Health Care & Pharmaceutical — 0.1% | |
RPI Finance Trust | | | 3.498% | | | | 10/14/22 | | | | | | | | 1,010 | | | | 1,021,041 | |
| | | | | | | | | | | | | | | | | | |
|
|
|
Healthcare & Pharmaceutical — 0.3% | |
Mallinckrodt International Finance (Luxembourg) | | | 3.748% | | | | 03/19/21 | | | | | | | | 993 | | | | 994,651 | |
Select Med Corp. | | | 6.000% | | | | 03/03/21 | | | | | | | | 941 | | | | 956,680 | |
Valeant Pharmaceuticals International, Inc. | | | 5.500% | | | | 04/01/22 | | | | | | | | 1,078 | | | | 1,078,349 | |
| | | | | | | | | | | | | | | | | | |
|
|
|
| | | | | | | | | | | | | | | | | | | | 3,029,680 | |
| | | | | | | | | | | | | | | | | | |
|
|
|
IT Services — 0.1% | |
Vantiv LLC | | | 2.704% | | | | 10/14/21 | | | | | | | | 1,331 | | | | 1,324,261 | |
| | | | | | | | | | | | | | | | | | |
|
|
|
Retailers — 0.2% | |
Euro Garages (United Kingdom) | | | 5.761% | | | | 01/30/23 | | | | GBP | | | | 1,000 | | | | 1,199,177 | |
Rite Aid Corp. | | | 4.875% | | | | 06/21/21 | | | | | | | | 1,375 | | | | 1,377,864 | |
| | | | | | | | | | | | | | | | | | |
|
|
|
| | | | | | | | | | | | | | | | | | | | 2,577,041 | |
| | | | | | | | | | | | | | | | | | |
|
|
|
SEE NOTES TO FINANCIAL STATEMENTS.
A38
| | | | | | |
| | | DIVERSIFIED BOND PORTFOLIO (continued) | | |
| |
| SCHEDULE OF INVESTMENTS | | as of December 31, 2016 |
| | | | | | | | | | | | | | | | | | |
BANK LOANS(a)
(continued) | | Interest
Rate
| | | Maturity
Date
| | | Principal
Amount
(000)#
| | | Value
(Note 2)
| |
Supermarkets — 0.1% | |
Albertsons LLC | | | 4.000% | | | | 08/25/21 | | | | | | 856 | | | $ | 864,567 | |
| | | | | | | | | | | | | | | | |
|
|
|
Technology — 1.0% | |
Action Nederland BV(c) | | | 4.250% | | | | 02/25/22 | | | EUR | | | 1,100 | | | | 1,169,981 | |
Avago Technologies Cayman Finance Ltd. (Singapore) | | | 3.881% | | | | 02/01/23 | | | | | | 1,170 | | | | 1,186,090 | |
BMC Software Finance, Inc. | | | 5.000% | | | | 09/10/20 | | | | | | 487 | | | | 485,225 | |
Dell International LLC | | | 2.998% | | | | 12/31/18 | | | | | | 2,800 | | | | 2,795,626 | |
Dell International LLC | | | 4.020% | | | | 09/07/23 | | | | | | 800 | | | | 813,000 | |
First Data Corp. | | | 3.998% | | | | 03/24/21 | | | | | | 2,328 | | | | 2,349,521 | |
ON Semiconductor Corp. | | | 4.248% | | | | 03/31/23 | | | | | | 574 | | | | 579,935 | |
TransUnion LLC | | | 3.520% | | | | 04/09/21 | | | | | | 442 | | | | 444,721 | |
Western Digital Corp. | | | 4.000% | | | | 04/28/23 | | | EUR | | | 821 | | | | 875,389 | |
Western Digital Corp. | | | 4.748% | | | | 04/29/23 | | | | | | 776 | | | | 785,940 | |
| | | | | | | | | | | | | | | | |
|
|
|
| | | | | | | | | | | | | | | | | | 11,485,428 | |
| | | | | | | | | | | | | | | | |
|
|
|
Telecommunications — 0.2% | |
LTS Buyer LLC | | | 4.207% | | | | 04/13/20 | | | | | | 814 | | | | 819,835 | |
SBA Senior Finance II LLC | | | 3.270% | | | | 03/24/21 | | | | | | 1,121 | | | | 1,123,878 | |
| | | | | | | | | | | | �� | | | | |
|
|
|
| | | | | | | | | | | | | | | | | | 1,943,713 | |
| | | | | | | | | | | | | | | | |
|
|
|
Transportation Services — 0.2% | |
Scandlines GmbH (Germany) | | | 4.250% | | | | 12/03/20 | | | EUR | | | 1,675 | | | | 1,782,255 | |
| | | | | | | | | | | | | | | | |
|
|
|
TOTAL BANK LOANS
(cost $32,274,293) | | | | 31,669,465 | |
| | | | | | | | | | | | | | | | |
|
|
|
| COMMERCIAL MORTGAGE-BACKED SECURITIES — 12.9% | |
Banc of America Commercial Mortgage Trust, Series 2007-2, Class A1A | | | 5.650% | (a) | | | 04/10/49 | | | | | | 993 | | | | 998,111 | |
Banc of America Commercial Mortgage Trust, Series 2016-UB10, Class A3 | | | 2.903% | | | | 07/15/49 | | | | | | 2,300 | | | | 2,236,886 | |
BBCMS Mortgage Trust, Series 2016-ETC, Class A, 144A | | | 2.937% | | | | 08/14/36 | | | | | | 1,170 | | | | 1,131,356 | |
BBCMS Mortgage Trust, Series 2016-ETC, Class B, 144A | | | 3.189% | | | | 08/14/36 | | | | | | 510 | | | | 495,953 | |
BBCMS Mortgage Trust, Series 2016-ETC, Class C, 144A | | | 3.391% | | | | 08/14/36 | | | | | | 430 | | | | 422,138 | |
BBCMS Mortgage Trust, Series 2016-ETC, Class D, 144A | | | 3.609% | (a) | | | 08/14/36 | | | | | | 1,560 | | | | 1,510,456 | |
CDGJ Commercial Mortgage Trust, Series 2014-BXCH, Class B, 144A | | | 2.389% | (a) | | | 12/15/27 | | | | | | 5,000 | | | | 5,006,276 | |
Citigroup Commercial Mortgage Trust, Series 2014-GC21, Class A4 | | | 3.575% | | | | 05/10/47 | | | | | | 3,200 | | | | 3,314,328 | |
Citigroup Commercial Mortgage Trust, Series 2016-C1, Class A4 | | | 3.209% | | | | 05/10/49 | | | | | | 3,500 | | | | 3,487,139 | |
Citigroup Commercial Mortgage Trust, Series 2016-C2, Class A4 | | | 2.832% | | | | 08/10/49 | | | | | | 2,500 | | | | 2,406,691 | |
Citigroup Commercial Mortgage Trust, Series 2016-GC37, Class A4 | | | 3.314% | | | | 04/10/49 | | | | | | 100 | | | | 100,171 | |
Cityline Commercial Mortgage Trust, Series 2016-CLNE, Class B, 144A | | | 2.778% | (a) | | | 11/10/31 | | | | | | 2,400 | | | | 2,331,615 | |
Cityline Commercial Mortgage Trust, Series 2016-CLNE, Class C, 144A | | | 2.778% | (a) | | | 11/10/31 | | | | | | 900 | | | | 853,706 | |
COMM Mortgage Trust, Series 2012-CR5, Class A3 | | | 2.540% | | | | 12/10/45 | | | | | | 2,000 | | | | 1,989,920 | |
COMM Mortgage Trust, Series 2013-CR7, Class A3 | | | 2.929% | | | | 03/10/46 | | | | | | 3,900 | | | | 3,941,881 | |
COMM Mortgage Trust, Series 2014-UBS4, Class A4 | | | 3.420% | | | | 08/10/47 | | | | | | 3,200 | | | | 3,258,035 | |
COMM Mortgage Trust, Series 2014-UBS5, Class A4 | | | 3.838% | | | | 09/10/47 | | | | | | 3,600 | | | | 3,759,994 | |
COMM Mortgage Trust, Series 2015-CR26, Class A4 | | | 3.630% | | | | 10/10/48 | | | | | | 1,700 | | | | 1,749,788 | |
COMM Mortgage Trust, Series 2015-DC1, Class A4 | | | 3.078% | | | | 02/10/48 | | | | | | 5,000 | | | | 4,964,032 | |
COMM Mortgage Trust, Series 2015-LC21, Class A4 | | | 3.708% | | | | 07/10/48 | | | | | | 2,600 | | | | 2,699,422 | |
COMM Mortgage Trust, Series 2015-PC1, Class A5 | | | 3.902% | | | | 07/10/50 | | | | | | 2,100 | | | | 2,194,452 | |
COMM Mortgage Trust, Series 2016-COR1, Class A3 | | | 2.826% | | | | 10/10/49 | | | | | | 2,500 | | | | 2,416,514 | |
COMM Mortgage Trust, Series 2016-DC2, Class A5 | | | 3.765% | | | | 02/10/49 | | | | | | 600 | | | | 622,571 | |
DBWF Mortgage Trust, Series 2016-85T, Class D, 144A
(original cost $1,317,944; purchased 12/09/16)(c)(d) | | | 3.808% | (a) | | | 12/10/36 | | | | | | 1,400 | | | | 1,334,142 | |
Eleven Madison Trust Mortgage Trust, Series 2015-11MD, Class C, 144A | | | 3.555% | (a) | | | 09/10/35 | | | | | | 3,000 | | | | 2,964,363 | |
SEE NOTES TO FINANCIAL STATEMENTS.
A39
| | | | | | |
| | | DIVERSIFIED BOND PORTFOLIO (continued) | | |
| |
| SCHEDULE OF INVESTMENTS | | as of December 31, 2016 |
| | | | | | | | | | | | | | | | |
COMMERCIAL MORTGAGE-BACKED SECURITIES
(continued) | | Interest
Rate
| | | Maturity
Date
| | Principal
Amount
(000)#
| | | Value
(Note 2)
| |
FHLMC Multifamily Structured Pass-Through Certificates, Series K008, Class X1, IO | | | 1.621% | (a) | | 06/25/20 | | | | | 8,902 | | | $ | 362,707 | |
FHLMC Multifamily Structured Pass-Through Certificates, Series K020, Class X1, IO | | | 1.442% | (a) | | 05/25/22 | | | | | 27,797 | | | | 1,749,164 | |
FHLMC Multifamily Structured Pass-Through Certificates, Series K021, Class X1, IO | | | 1.481% | (a) | | 06/25/22 | | | | | 15,860 | | | | 1,043,257 | |
FHLMC Multifamily Structured Pass-Through Certificates, Series K025, Class X1, IO | | | 0.883% | (a) | | 10/25/22 | | | | | 10,914 | | | | 450,646 | |
FHLMC Multifamily Structured Pass-Through Certificates, Series K027, Class X1, IO | | | 0.819% | (a) | | 01/25/23 | | | | | 136,713 | | | | 5,352,500 | |
FHLMC Multifamily Structured Pass-Through Certificates, Series K044, Class X1, IO | | | 0.755% | (a) | | 01/25/25 | | | | | 83,596 | | | | 4,073,037 | |
FHLMC Multifamily Structured Pass-Through Certificates, Series K053, Class X1, IO | | | 0.893% | (a) | | 12/25/25 | | | | | 89,764 | | | | 5,769,357 | |
FHLMC Multifamily Structured Pass-Through Certificates, Series K055, Class X1, IO | | | 1.369% | (a) | | 03/25/26 | | | | | 27,993 | | | | 2,750,854 | |
FHLMC Multifamily Structured Pass-Through Certificates, Series K710, Class X1, IO | | | 1.759% | (a) | | 05/25/19 | | | | | 21,843 | | | | 728,408 | |
FHLMC Multifamily Structured Pass-Through Certificates, Series K711, Class X1, IO | | | 1.692% | (a) | | 07/25/19 | | | | | 26,586 | | | | 900,004 | |
GS Mortgage Securities Trust, Series 2013-GC12, Class A3 | | | 2.860% | | | 06/10/46 | | | | | 1,430 | | | | 1,438,017 | |
JPMBB Commercial Mortgage Securities Trust, Series 2014-C21, Class A4 | | | 3.493% | | | 08/15/47 | | | | | 3,200 | | | | 3,297,657 | |
JPMorgan Chase Commercial Mortgage Securities Corp., Series 2012-LC9, Class A4 | | | 2.611% | | | 12/15/47 | | | | | 2,000 | | | | 2,002,974 | |
JPMorgan Chase Commercial Mortgage Securities Trust, Series 2013-C10, Class A4 | | | 2.875% | | | 12/15/47 | | | | | 4,600 | | | | 4,651,152 | |
JPMorgan Chase Commercial Mortgage Securities Trust, Series 2013-LC11, Class A4 | | | 2.694% | | | 04/15/46 | | | | | 4,600 | | | | 4,650,199 | |
JPMorgan Chase Commercial Mortgage Securities Trust, Series 2016-JP2, Class A3 | | | 2.559% | | | 08/15/49 | | | | | 2,900 | | | | 2,761,907 | |
Morgan Stanley Bank of America Merrill Lynch Trust, Series 2012-C5,
Class XA, IO, 144A | | | 1.718% | (a) | | 08/15/45 | | | | | 49,340 | | | | 2,650,339 | |
Morgan Stanley Bank of America Merrill Lynch Trust, Series 2013-C10, Class A3 | | | 3.969% | (a) | | 07/15/46 | | | | | 4,800 | | | | 5,096,163 | |
Morgan Stanley Bank of America Merrill Lynch Trust, Series 2013-C13, Class A3 | | | 3.766% | | | 11/15/46 | | | | | 4,000 | | | | 4,176,582 | |
Morgan Stanley Bank of America Merrill Lynch Trust, Series 2013-C8, Class A3 | | | 2.863% | | | 12/15/48 | | | | | 1,700 | | | | 1,715,313 | |
Morgan Stanley Bank of America Merrill Lynch Trust, Series 2013-C9, Class A3 | | | 2.834% | | | 05/15/46 | | | | | 2,300 | | | | 2,306,204 | |
Morgan Stanley Bank of America Merrill Lynch Trust, Series 2016-C30, Class A5 | | | 2.860% | | | 09/15/49 | | | | | 3,100 | | | | 2,969,375 | |
Shops at Crystals Trust, Series 2016-CSTL, Class A, 144A | | | 3.126% | | | 07/05/36 | | | | | 2,900 | | | | 2,831,281 | |
UBS-Barclays Commercial Mortgage Trust, Series 2013-C5, Class A3 | | | 2.920% | | | 03/10/46 | | | | | 4,600 | | | | 4,626,682 | |
UBS-Barclays Commercial Mortgage Trust, Series 2013-C6, Class A3 | | | 2.971% | | | 04/10/46 | | | | | 3,800 | | | | 3,833,110 | |
Wachovia Bank Commercial Mortgage Trust, Series 2007-C31, Class A4 | | | 5.509% | | | 04/15/47 | | | | | 3,480 | | | | 3,486,986 | |
Wachovia Bank Commercial Mortgage Trust, Series 2007-C32, Class A1A | | | 5.707% | (a) | | 06/15/49 | | | | | 1,844 | | | | 1,858,289 | |
Wells Fargo Commercial Mortgage Trust, Series 2014-LC16, Class A4 | | | 3.548% | | | 08/15/50 | | | | | 4,300 | | | | 4,432,308 | |
Wells Fargo Commercial Mortgage Trust, Series 2016-C35, Class A3 | | | 2.674% | | | 07/15/48 | | | | | 4,600 | | | | 4,383,291 | |
| | | | | | | | | | | | | | |
|
|
|
TOTAL COMMERCIAL MORTGAGE-BACKED SECURITIES
(cost $145,419,549) | | | | 142,537,703 | |
| | | | | | | | | | | | | | |
|
|
|
| CORPORATE BONDS — 42.7% | |
Aerospace & Defense — 0.1% | |
United Technologies Corp., Sr. Unsec’d. Notes | | | 1.125% | | | 12/15/21 | | EUR | | | 700 | | | | 762,738 | |
| | | | | | | | | | | | | | |
|
|
|
SEE NOTES TO FINANCIAL STATEMENTS.
A40
| | | | | | |
| | | DIVERSIFIED BOND PORTFOLIO (continued) | | |
| |
| SCHEDULE OF INVESTMENTS | | as of December 31, 2016 |
| | | | | | | | | | | | | | | | | | | | |
CORPORATE BONDS
(continued) | | Interest
Rate
| | | Maturity
Date
| | | Principal
Amount
(000)#
| | | Value
(Note 2)
| |
Agriculture — 0.3% | |
Imperial Brands Finance PLC (United Kingdom), Gtd. Notes, 144A | | | 2.050% | | | | 02/11/18 | | | | | | | | 2,375 | | | $ | 2,377,204 | |
Reynolds American, Inc., Gtd. Notes | | | 8.125% | | | | 06/23/19 | | | | | | | | 895 | | | | 1,021,048 | |
| | | | | | | | | | | | | | | | | | |
|
|
|
| | | | | | | | | | | | | | | | | | | | 3,398,252 | |
| | | | | | | | | | | | | | | | | | |
|
|
|
Airlines — 0.6% | |
American Airlines, Pass-Through Trust, Pass-Through Certificates, Series 2016-1, Class AA | | | 3.575% | | | | 07/15/29 | | | | | | | | 1,831 | | | | 1,830,504 | |
Continental Airlines, Inc., Pass-Through Trust, Pass-Through Certificates, Series 2001-1, Class A-1 | | | 6.703% | | | | 12/15/22 | | | | | | | | 1 | | | | 596 | |
Continental Airlines, Inc., Pass-Through Trust, Pass-Through Certificates, Series 2007-1, Class A | | | 5.983% | | | | 10/19/23 | | | | | | | | 1,396 | | | | 1,542,282 | |
Continental Airlines, Inc., Pass-Through Trust, Pass-Through Certificates, Series 2010-1, Class A | | | 4.750% | | | | 07/12/22 | | | | | | | | 388 | | | | 409,367 | |
Delta Air Lines, Inc., Pass-Through Trust, Pass-Through Certificates, Series 2007-1 Class A | | | 6.821% | | | | 02/10/24 | | | | | | | | 978 | | | | 1,125,080 | |
Delta Air Lines, Inc., Pass-Through Trust, Pass-Through Certificates, Series 2010-2, Class A | | | 4.950% | | | | 11/23/20 | | | | | | | | 360 | | | | 376,914 | |
Delta Air Lines, Inc., Pass-Through Trust, Pass-Through Certificates, Series 2011-1, Class A | | | 5.300% | | | | 10/15/20 | | | | | | | | 442 | | | | 466,524 | |
United Airlines, Pass-Through Trust, Pass-Through Certificates, Series 2007-071A, Class A | | | 6.636% | | | | 01/02/24 | | | | | | | | 736 | | | | 792,977 | |
| | | | | | | | | | | | | | | | | | |
|
|
|
| | | | | | | | | | | | | | | | | | | | 6,544,244 | |
| | | | | | | | | | | | | | | | | | |
|
|
|
Apparel — 0.1% | |
Hanesbrands Finance Luxembourg SCA, Gtd. Notes, 144A | | | 3.500% | | | | 06/15/24 | | | | EUR | | | | 575 | | | | 631,303 | |
| | | | | | | | | | | | | | | | | | |
|
|
|
Auto Manufacturers — 0.8% | |
Ford Motor Co., Sr. Unsec’d. Notes | | | 4.750% | | | | 01/15/43 | | | | | | | | 1,755 | | | | 1,666,209 | |
Ford Motor Credit Co. LLC, Sr. Unsec’d. Notes | | | 2.375% | | | | 01/16/18 | | | | | | | | 2,225 | | | | 2,234,935 | |
Ford Motor Credit Co. LLC, Sr. Unsec’d. Notes, GMTN(e) | | | 4.389% | | | | 01/08/26 | | | | | | | | 1,095 | | | | 1,109,755 | |
General Motors Co., Sr. Unsec’d. Notes | | | 4.875% | | | | 10/02/23 | | | | | | | | 1,350 | | | | 1,415,167 | |
General Motors Co., Sr. Unsec’d. Notes | | | 6.250% | | | | 10/02/43 | | | | | | | | 1,885 | | | | 2,083,828 | |
General Motors Co., Sr. Unsec’d. Notes | | | 6.600% | | | | 04/01/36 | | | | | | | | 210 | | | | 240,032 | |
| | | | | | | | | | | | | | | | | | |
|
|
|
| | | | | | | | | | | | | | | | | | | | 8,749,926 | |
| | | | | | | | | | | | | | | | | | |
|
|
|
Auto Parts & Equipment — 0.4% | |
Adient Global Holdings Ltd., Gtd. Notes, 144A | | | 3.500% | | | | 08/15/24 | | | | EUR | | | | 701 | | | | 748,610 | |
IHO Verwaltungs GmbH (Germany), 1st Lien, 144A | | | 3.750% | | | | 09/15/26 | | | | EUR | | | | 1,050 | | | | 1,104,623 | |
IHO Verwaltungs GmbH (Germany), Sr. Sec’d. Notes, PIK, 144A | | | 3.250% | | | | 09/15/23 | | | | EUR | | | | 1,075 | | | | 1,165,551 | |
LKQ Italia Bondco SpA, Gtd. Notes, 144A | | | 3.875% | | | | 04/01/24 | | | | EUR | | | | 1,275 | | | | 1,426,688 | |
| | | | | | | | | | | | | | | | | | |
|
|
|
| | | | | | | | | | | | | | | | | | | | 4,445,472 | |
| | | | | | | | | | | | | | | | | | |
|
|
|
Banks — 10.2% | |
Bank of America Corp., Jr. Sub. Notes, Series K | | | 8.000% | (a) | | | 07/29/49 | | | | | | | | 3,500 | | | | 3,596,250 | |
Bank of America Corp., Sr. Unsec’d. Notes, GMTN | | | 3.300% | | | | 01/11/23 | | | | | | | | 4,275 | | | | 4,289,278 | |
Bank of America Corp., Sr. Unsec’d. Notes, MTN | | | 4.000% | | | | 04/01/24 | | | | | | | | 1,150 | | | | 1,186,040 | |
Bank of America Corp., Sr. Unsec’d. Notes, MTN | | | 4.125% | | | | 01/22/24 | | | | | | | | 3,750 | | | | 3,897,191 | |
Bank of America Corp., Sr. Unsec’d. Notes | | | 5.700% | | | | 01/24/22 | | | | | | | | 1,775 | | | | 1,993,747 | |
Bank of America Corp., Sr. Unsec’d. Notes | | | 6.000% | | | | 09/01/17 | | | | | | | | 4,590 | | | | 4,723,014 | |
Bank of America Corp., Sub. Notes, MTN | | | 4.450% | | | | 03/03/26 | | | | | | | | 1,735 | | | | 1,787,983 | |
Bank of America NA, Sub. Notes | | | 5.300% | | | | 03/15/17 | | | | | | | | 790 | | | | 796,119 | |
Barclays PLC (United Kingdom), Sr. Unsec’d. Notes | | | 4.375% | | | | 01/12/26 | | | | | | | | 1,290 | | | | 1,306,540 | |
Branch Banking & Trust Co., Sr. Unsec’d. Notes | | | 2.850% | | | | 04/01/21 | | | | | | | | 3,700 | | | | 3,756,647 | |
Capital One Financial Corp., Sr. Unsec’d. Notes | | | 3.750% | | | | 04/24/24 | | | | | | | | 2,400 | | | | 2,431,248 | |
Citigroup, Inc., Jr. Sub. Notes, Series Q | | | 5.950% | (a) | | | 12/29/49 | | | | | | | | 1,355 | | | | 1,375,257 | |
Citigroup, Inc., Jr. Sub. Notes, Series R(e) | | | 6.125% | (a) | | | 12/29/49 | | | | | | | | 1,085 | | | | 1,122,975 | |
Citigroup, Inc., Sr. Unsec’d. Notes | | | 8.125% | | | | 07/15/39 | | | | | | | | 2,995 | | | | 4,450,372 | |
Citigroup, Inc., Sub. Notes | | | 4.450% | | | | 09/29/27 | | | | | | | | 2,630 | | | | 2,671,675 | |
Credit Suisse/New York NY (Switzerland), Sr. Unsec’d. Notes, MTN | | | 3.625% | | | | 09/09/24 | | | | | | | | 1,050 | | | | 1,057,015 | |
Deutsche Bank AG (Germany), Sr. Unsec’d. Notes, GMTN | | | 3.375% | | | | 05/12/21 | | | | | | | | 900 | | | | 890,899 | |
SEE NOTES TO FINANCIAL STATEMENTS.
A41
| | | | | | |
| | | DIVERSIFIED BOND PORTFOLIO (continued) | | |
| |
| SCHEDULE OF INVESTMENTS | | as of December 31, 2016 |
| | | | | | | | | | | | | | | | |
CORPORATE BONDS
(continued) | | Interest
Rate
| | | Maturity
Date
| | Principal
Amount
(000)#
| | | Value
(Note 2)
| |
Banks (continued) | |
Deutsche Bank AG (Germany), Sr. Unsec’d. Notes, MTN | | | 3.700% | | | 05/30/24 | | | | | 159 | | | $ | 154,617 | |
Discover Bank, Sr. Unsec’d. Notes | | | 3.450% | | | 07/27/26 | | | | | 280 | | | | 270,371 | |
Discover Bank, Sr. Unsec’d. Notes | | | 4.250% | | | 03/13/26 | | | | | 1,150 | | | | 1,171,533 | |
Discover Bank, Sub. Notes | | | 7.000% | | | 04/15/20 | | | | | 2,005 | | | | 2,226,308 | |
Fifth Third Bank, Sr. Unsec’d. Notes | | | 2.375% | | | 04/25/19 | | | | | 425 | | | | 428,195 | |
Goldman Sachs Group, Inc. (The), Jr. Sub. Notes, Series M | | | 5.375% | (a) | | 12/29/49 | | | | | 1,950 | | | | 1,969,500 | |
Goldman Sachs Group, Inc. (The), Sr. Unsec’d. Notes | | | 3.750% | | | 02/25/26 | | | | | 125 | | | | 125,367 | |
Goldman Sachs Group, Inc. (The), Sr. Unsec’d. Notes | | | 5.750% | | | 01/24/22 | | | | | 4,200 | | | | 4,721,703 | |
Goldman Sachs Group, Inc. (The), Sr. Unsec’d. Notes | | | 6.150% | | | 04/01/18 | | | | | 1,355 | | | | 1,425,345 | |
Goldman Sachs Group, Inc. (The), Sr. Unsec’d. Notes | | | 6.250% | | | 02/01/41 | | | | | 2,195 | | | | 2,720,850 | |
Goldman Sachs Group, Inc. (The), Sr. Unsec’d. Notes, Series D, MTN | | | 6.000% | | | 06/15/20 | | | | | 2,420 | | | | 2,683,637 | |
Goldman Sachs Group, Inc. (The), Sub. Notes | | | 6.750% | | | 10/01/37 | | | | | 440 | | | | 543,333 | |
HSBC Holdings PLC (United Kingdom), Sub. Notes | | | 4.375% | | | 11/23/26 | | | | | 270 | | | | 272,004 | |
JPMorgan Chase & Co., Jr. Sub. Notes, Series 1 | | | 7.900% | (a) | | 12/29/49 | | | | | 6,130 | | | | 6,347,615 | |
JPMorgan Chase & Co., Jr. Sub. Notes, Series X | | | 6.100% | (a) | | 10/29/49 | | | | | 1,450 | | | | 1,467,219 | |
JPMorgan Chase & Co., Sr. Unsec’d. Notes | | | 2.750% | | | 06/23/20 | | | | | 5,400 | | | | 5,448,838 | |
JPMorgan Chase & Co., Sr. Unsec’d. Notes | | | 2.950% | | | 10/01/26 | | | | | 1,740 | | | | 1,660,809 | |
JPMorgan Chase & Co., Sr. Unsec’d. Notes | | | 3.200% | | | 06/15/26 | | | | | 3,020 | | | | 2,955,834 | |
JPMorgan Chase & Co., Sr. Unsec’d. Notes | | | 3.250% | | | 09/23/22 | | | | | 500 | | | | 505,645 | |
JPMorgan Chase & Co., Sr. Unsec’d. Notes | | | 4.250% | | | 10/15/20 | | | | | 600 | | | | 634,942 | |
JPMorgan Chase & Co., Sub. Notes | | | 4.250% | | | 10/01/27 | | | | | 420 | | | | 431,520 | |
JPMorgan Chase & Co., Sub. Notes | | | 4.950% | | | 06/01/45 | | | | | 715 | | | | 762,411 | |
KeyCorp, Sr. Unsec’d. Notes, MTN | | | 5.100% | | | 03/24/21 | | | | | 1,155 | | | | 1,263,032 | |
Lloyds Bank PLC (United Kingdom), Gtd. Notes, 144A, MTN | | | 5.800% | | | 01/13/20 | | | | | 2,650 | | | | 2,889,772 | |
Mizuho Bank Ltd. (Japan), Gtd. Notes, 144A | | | 1.850% | | | 03/21/18 | | | | | 1,125 | | | | 1,123,040 | |
Morgan Stanley, Jr. Sub. Notes, Series H | | | 5.450% | (a) | | 07/29/49 | | | | | 975 | | | | 965,250 | |
Morgan Stanley, Sr. Unsec’d. Notes, MTN | | | 3.125% | | | 07/27/26 | | | | | 2,725 | | | | 2,603,400 | |
Morgan Stanley, Sr. Unsec’d. Notes, GMTN | | | 3.750% | | | 02/25/23 | | | | | 1,535 | | | | 1,576,666 | |
Morgan Stanley, Sr. Unsec’d. Notes, GMTN | | | 5.450% | | | 01/09/17 | | | | | 4,035 | | | | 4,036,985 | |
Morgan Stanley, Sr. Unsec’d. Notes, GMTN | | | 5.500% | | | 07/28/21 | | | | | 2,080 | | | | 2,304,925 | |
Morgan Stanley, Sr. Unsec’d. Notes, MTN | | | 5.625% | | | 09/23/19 | | | | | 2,635 | | | | 2,856,235 | |
Morgan Stanley, Sr. Unsec’d. Notes | | | 5.750% | | | 01/25/21 | | | | | 1,920 | | | | 2,130,386 | |
Morgan Stanley, Sub. Notes, GMTN | | | 4.350% | | | 09/08/26 | | | | | 750 | | | | 768,561 | |
Northern Trust Corp., Sub. Notes | | | 3.950% | | | 10/30/25 | | | | | 2,725 | | | | 2,857,691 | |
People’s United Bank, Sub. Notes | | | 4.000% | | | 07/15/24 | | | | | 550 | | | | 541,779 | |
PNC Financial Services Group, Inc. (The), Sub. Notes | | | 3.900% | | | 04/29/24 | | | | | 975 | | | | 999,474 | |
Santander UK Group Holdings PLC (United Kingdom), Sr. Unsec’d. Notes | | | 2.875% | | | 10/16/20 | | | | | 1,550 | | | | 1,536,036 | |
State Street Corp., Jr. Sub. Notes | | | 4.956% | | | 03/15/18 | | | | | 3,025 | | | | 3,125,191 | |
Sumitomo Mitsui Banking Corp. (Japan), Gtd. Notes | | | 2.450% | | | 01/10/19 | | | | | 625 | | | | 628,421 | |
| | | | | | | | | | | | | | |
|
|
|
| | | | | | | | | | | | | | | | 112,466,690 | |
| | | | | | | | | | | | | | |
|
|
|
Beverages — 0.1% | |
Coca-Cola Icecek A/S (Turkey), Sr. Unsec’d. Notes, 144A | | | 4.750% | | | 10/01/18 | | | | | 375 | | | | 385,929 | |
Cott Beverages, Inc. (Canada), Gtd. Notes | | | 6.750% | | | 01/01/20 | | | | | 1,250 | | | | 1,295,312 | |
| | | | | | | | | | | | | | |
|
|
|
| | | | | | | | | | | | | | | | 1,681,241 | |
| | | | | | | | | | | | | | |
|
|
|
Biotechnology — 0.3% | |
Amgen, Inc., Sr. Unsec’d. Notes, 144A | | | 4.663% | | | 06/15/51 | | | | | 2,948 | | | | 2,833,346 | |
| | | | | | | | | | | | | | |
|
|
|
Building Materials — 0.5% | |
Cemex Finance LLC (Mexico), Sr. Sec’d. Notes, 144A | | | 9.375% | | | 10/12/22 | | | | | 1,200 | | | | 1,308,000 | |
Cemex SAB de CV (Mexico), Sr. Sec’d. Notes, 144A | | | 4.750% | | | 01/11/22 | | EUR | | | 900 | | | | 981,968 | |
Standard Industries, Inc., Sr. Unsec’d. Notes, 144A(c) | | | 5.375% | | | 11/15/24 | | | | | 3,000 | | | | 3,082,500 | |
US Concrete, Inc., Gtd. Notes | | | 6.375% | | | 06/01/24 | | | | | 600 | | | | 634,500 | |
| | | | | | | | | | | | | | |
|
|
|
| | | | | | | | | | | | | | | | 6,006,968 | |
| | | | | | | | | | | | | | |
|
|
|
Chemicals — 1.5% | |
Agrium, Inc. (Canada), Sr. Unsec’d. Notes | | | 4.900% | | | 06/01/43 | | | | | 870 | | | | 866,718 | |
Agrium, Inc. (Canada), Sr. Unsec’d. Notes | | | 5.250% | | | 01/15/45 | | | | | 420 | | | | 437,378 | |
SEE NOTES TO FINANCIAL STATEMENTS.
A42
| | | | | | |
| | | DIVERSIFIED BOND PORTFOLIO (continued) | | |
| |
| SCHEDULE OF INVESTMENTS | | as of December 31, 2016 |
| | | | | | | | | | | | | | | | |
CORPORATE BONDS
(continued) | | Interest
Rate
| | | Maturity
Date
| | Principal
Amount
(000)#
| | | Value
(Note 2)
| |
Chemicals (continued) | |
Agrium, Inc. (Canada), Sr. Unsec’d. Notes | | | 6.125% | | | 01/15/41 | | | | | 450 | | | $ | 511,278 | |
Ashland, Inc., Gtd. Notes | | | 6.875% | | | 05/15/43 | | | | | 3,000 | | | | 3,097,500 | |
CF Industries, Inc., Gtd. Notes | | | 4.950% | | | 06/01/43 | | | | | 675 | | | | 551,812 | |
CF Industries, Inc., Gtd. Notes | | | 5.375% | | | 03/15/44 | | | | | 700 | | | | 577,717 | |
CF Industries, Inc., Gtd. Notes | | | 6.875% | | | 05/01/18 | | | | | 380 | | | | 400,003 | |
CF Industries, Inc., Gtd. Notes(e) | | | 7.125% | | | 05/01/20 | | | | | 300 | | | | 327,000 | |
Dow Chemical Co. (The), Sr. Unsec’d. Notes | | | 4.625% | | | 10/01/44 | | | | | 125 | | | | 125,429 | |
Dow Chemical Co. (The), Sr. Unsec’d. Notes | | | 9.400% | | | 05/15/39 | | | | | 1,002 | | | | 1,554,614 | |
LyondellBasell Industries NV, Sr. Unsec’d. Notes | | | 6.000% | | | 11/15/21 | | | | | 3,550 | | | | 4,025,945 | |
Mosaic Co. (The), Sr. Unsec’d. Notes(e) | | | 5.450% | | | 11/15/33 | | | | | 465 | | | | 461,190 | |
Mosaic Co. (The), Sr. Unsec’d. Notes | | | 5.625% | | | 11/15/43 | | | | | 155 | | | | 149,373 | |
Union Carbide Corp., Sr. Unsec’d. Notes | | | 7.875% | | | 04/01/23 | | | | | 3,058 | | | | 3,686,817 | |
| | | | | | | | | | | | | | |
|
|
|
| | | | | | | | | | | | | | | | 16,772,774 | |
| | | | | | | | | | | | | | |
|
|
|
Commercial Services — 0.8% | |
Ashtead Capital, Inc. (United Kingdom), Sec’d. Notes, 144A | | | 6.500% | | | 07/15/22 | | | | | 1,375 | | | | 1,440,312 | |
Avis Budget Car Rental LLC/Avis Budget Finance, Inc., Gtd. Notes, 144A | | | 6.375% | | | 04/01/24 | | | | | 650 | | | | 649,188 | |
ERAC USA Finance LLC, Gtd. Notes, 144A(c) | | | 6.700% | | | 06/01/34 | | | | | 920 | | | | 1,115,746 | |
ERAC USA Finance LLC, Gtd. Notes, 144A(c) | | | 7.000% | | | 10/15/37 | | | | | 770 | | | | 975,633 | |
Hertz Corp. (The), Gtd. Notes(e) | | | 6.750% | | | 04/15/19 | | | | | 632 | | | | 632,000 | |
Service Corp. International, Sr. Unsec’d. Notes | | | 7.625% | | | 10/01/18 | | | | | 2,000 | | | | 2,185,000 | |
United Rentals North America, Inc., Gtd. Notes | | | 5.500% | | | 07/15/25 | | | | | 650 | | | | 663,000 | |
United Rentals North America, Inc., Gtd. Notes | | | 5.500% | | | 05/15/27 | | | | | 450 | | | | 446,625 | |
United Rentals North America, Inc., Gtd. Notes | | | 7.625% | | | 04/15/22 | | | | | 920 | | | | 968,300 | |
| | | | | | | | | | | | | | |
|
|
|
| | | | | | | | | | | | | | | | 9,075,804 | |
| | | | | | | | | | | | | | |
|
|
|
Computers — 0.5% | |
Diamond 1 Finance Corp./Diamond 2 Finance Corp., Sr. Sec’d. Notes, 144A | | | 3.480% | | | 06/01/19 | | | | | 905 | | | | 923,829 | |
Diamond 1 Finance Corp./Diamond 2 Finance Corp., Sr. Sec’d. Notes, 144A | | | 4.420% | | | 06/15/21 | | | | | 770 | | | | 796,754 | |
Hewlett Packard Enterprise Co., Sr. Unsec’d. Notes | | | 2.450% | | | 10/05/17 | | | | | 3,360 | | | | 3,378,681 | |
Hewlett Packard Enterprise Co., Sr. Unsec’d. Notes | | | 2.850% | | | 10/05/18 | | | | | 630 | | | | 636,093 | |
| | | | | | | | | | | | | | |
|
|
|
| | | | | | | | | | | | | | | | 5,735,357 | |
| | | | | | | | | | | | | | |
|
|
|
Diversified Financial Services — 1.1% | |
Ally Financial, Inc., Sr. Unsec’d. Notes | | | 4.125% | (a) | | 02/13/22 | | | | | 3,000 | | | | 2,973,750 | |
CIT Group, Inc., Sr. Unsec’d. Notes | | | 5.000% | | | 08/15/22 | | | | | 1,350 | | | | 1,407,375 | |
CIT Group, Inc., Sr. Unsec’d. Notes, 144A | | | 5.500% | | | 02/15/19 | | | | | 4,000 | | | | 4,220,000 | |
GE Capital International Funding Co. Unlimited Co., Gtd. Notes | | | 4.418% | | | 11/15/35 | | | | | 354 | | | | 370,959 | |
HSBC Finance Corp., Sub. Notes | | | 6.676% | | | 01/15/21 | | | | | 295 | | | | 331,592 | |
International Lease Finance Corp., Sr. Unsec’d. Notes | | | 6.250% | | | 05/15/19 | | | | | 1,400 | | | | 1,505,000 | |
Jefferies Group LLC, Sr. Unsec’d. Notes | | | 6.500% | | | 01/20/43 | | | | | 650 | | | | 668,843 | |
Lehman Brothers Holdings, Inc., Sr. Unsec’d. Notes(f) | | | 6.875% | | | 05/02/18 | | | | | 2,740 | | | | 161,934 | |
Preferred Term Securities X Ltd./Preferred Term Securities X, Inc. (Cayman Islands), Sr. Sec’d. Notes, 144A(c) | | | 1.717% | (a) | | 07/03/33 | | | | | 373 | | | | 320,723 | |
| | | | | | | | | | | | | | |
|
|
|
| | | | | | | | | | | | | | | | 11,960,176 | |
| | | | | | | | | | | | | | |
|
|
|
Electric — 3.5% | |
AES Corp., Sr. Unsec’d. Notes | | | 5.500% | | | 04/15/25 | | | | | 5,000 | | | | 5,000,000 | |
Baltimore Gas & Electric Co., Sr. Unsec’d. Notes | | | 3.350% | | | 07/01/23 | | | | | 550 | | | | 563,011 | |
Calpine Corp., Sr. Unsec’d. Notes | | | 5.500% | | | 02/01/24 | | | | | 1,500 | | | | 1,447,500 | |
Calpine Corp., Sr. Unsec’d. Notes(e) | | | 5.375% | | | 01/15/23 | | | | | 800 | | | | 782,000 | |
Calpine Corp., Sr. Unsec’d. Notes(e) | | | 5.750% | | | 01/15/25 | | | | | 1,350 | | | | 1,302,750 | |
Consolidated Edison Co. of New York, Inc., Sr. Unsec’d. Notes(e) | | | 4.300% | | | 12/01/56 | | | | | 235 | | | | 234,677 | |
ContourGlobal Power Holdings SA (France), Sr. Sec’d. Notes, 144A(c) | | | 5.125% | | | 06/15/21 | | EUR | | | 1,350 | | | | 1,487,873 | |
Dominion Resources Inc., Jr. Sub. Notes | | | 4.104% | | | 04/01/21 | | | | | 2,710 | | | | 2,822,920 | |
SEE NOTES TO FINANCIAL STATEMENTS.
A43
| | | | | | |
| | | DIVERSIFIED BOND PORTFOLIO (continued) | | |
| |
| SCHEDULE OF INVESTMENTS | | as of December 31, 2016 |
| | | | | | | | | | | | | | | | | | |
CORPORATE BONDS
(continued) | | Interest
Rate
| | | Maturity
Date
| | Principal
Amount
(000)#
| | | Value
(Note 2)
| |
Electric (continued) | | | | | | | | | | | | | | | | | | |
Dynegy, Inc., Gtd. Notes | | | 5.875% | | | 06/01/23 | | | | | | | 2,400 | | | $ | 2,082,000 | |
Dynegy, Inc., Gtd. Notes | | | 7.375% | | | 11/01/22 | | | | | | | 2,500 | | | | 2,387,500 | |
El Paso Electric Co., Sr. Unsec’d. Notes | | | 6.000% | | | 05/15/35 | | | | | | | 2,325 | | | | 2,680,848 | |
Emera US Finance LP (Canada), Gtd. Notes, 144A | | | 3.550% | | | 06/15/26 | | | | | | | 820 | | | | 806,085 | |
Enel Finance International NV (Italy), Gtd. Notes, 144A | | | 6.000% | | | 10/07/39 | | | | | | | 1,450 | | | | 1,619,911 | |
Enersis Americas SA (Chile), Sr. Unsec’d. Notes | | | 4.000% | | | 10/25/26 | | | | | | | 235 | | | | 224,350 | |
Exelon Generation Co. LLC, Sr. Unsec’d. Notes | | | 6.200% | | | 10/01/17 | | | | | | | 1,930 | | | | 1,994,813 | |
Exelon Generation Co. LLC, Sr. Unsec’d. Notes | | | 6.250% | | | 10/01/39 | | | | | | | 1,900 | | | | 1,913,045 | |
FirstEnergy Corp., Sr. Unsec’d. Notes, Series A | | | 2.750% | | | 03/15/18 | | | | | | | 1,800 | | | | 1,816,351 | |
FirstEnergy Transmission LLC, Sr. Unsec’d. Notes, 144A | | | 5.450% | | | 07/15/44 | | | | | | | 400 | | | | 424,627 | |
Iberdrola International BV (Spain), Gtd. Notes | | | 6.750% | | | 09/15/33 | | | | | | | 1,150 | | | | 1,317,650 | |
NRG Energy, Inc., Gtd. Notes | | | 6.625% | | | 03/15/23 | | | | | | | 3,263 | | | | 3,271,158 | |
Pacific Gas & Electric Co., Sr. Unsec’d. Notes | | | 4.600% | | | 06/15/43 | | | | | | | 1,950 | | | | 2,056,874 | |
South Carolina Electric & Gas Co., First Mortgage | | | 4.600% | | | 06/15/43 | | | | | | | 2,025 | | | | 2,128,393 | |
| | | | | | | | | | | | | | | | |
|
|
|
| | | | | | | | | | | | | | | | | | 38,364,336 | |
| | | | | | | | | | | | | | | | |
|
|
|
Electronics — 0.1% | | | | | | | | | | | | | | | | | | |
Honeywell International, Inc., Sr. Unsec’d. Notes | | | 0.650% | | | 02/21/20 | | | EUR | | | | 900 | | | | 962,348 | |
| | | | | | | | | | | | | | | | |
|
|
|
Entertainment — 0.3% | | | | | | | | | | | | | | | | | | |
Cedar Fair LP/Canada’s Wonderland Co./Magnum Management Corp., Gtd. Notes | | | 5.375% | | | 06/01/24 | | | | | | | 425 | | | | 437,750 | |
Cinemark USA, Inc., Gtd. Notes | | | 4.875% | | | 06/01/23 | | | | | | | 1,508 | | | | 1,526,850 | |
CPUK Finance Ltd. (United Kingdom), Sr. Sec’d. Notes, RegS | | | 7.000% | | | 02/28/42 | | | GBP | | | | 1,100 | | | | 1,431,772 | |
| | | | | | | | | | | | | | | | |
|
|
|
| | | | | | | | | | | | | | | | | | 3,396,372 | |
| | | | | | | | | | | | | | | | |
|
|
|
Food — 1.1% | | | | | | | | | | | | | | | | | | |
Albertsons Cos LLC/Safeway, Inc./New Albertson’s, Inc./Albertson’s LLC, Sr. Unsec’d. Notes, 144A | | | 5.750% | (a) | | 03/15/25 | | | | | | | 225 | | | | 222,750 | |
B&G Foods, Inc., Gtd. Notes | | | 4.625% | | | 06/01/21 | | | | | | | 2,000 | | | | 2,040,000 | |
Ingles Markets, Inc., Sr. Unsec’d. Notes | | | 5.750% | | | 06/15/23 | | | | | | | 1,925 | | | | 1,977,938 | |
JBS USA LLC/JBS USA Finance, Inc. (Brazil), Gtd. Notes, 144A(c) | | | 5.750% | | | 06/15/25 | | | | | | | 2,025 | | | | 2,050,312 | |
JBS USA LLC/JBS USA Finance, Inc. (Brazil), Gtd. Notes, 144A(c) | | | 7.250% | | | 06/01/21 | | | | | | | 1,330 | | | | 1,376,563 | |
Kraft Heinz Foods Co., Gtd. Notes | | | 3.000% | | | 06/01/26 | | | | | | | 1,360 | | | | 1,276,818 | |
Kraft Heinz Foods Co., Gtd. Notes | | | 4.375% | | | 06/01/46 | | | | | | | 400 | | | | 376,392 | |
Kraft Heinz Foods Co., Gtd. Notes | | | 5.000% | | | 07/15/35 | | | | | | | 725 | | | | 760,597 | |
Minerva Luxembourg SA (Brazil), Gtd. Notes, 144A | | | 12.250% | | | 02/10/22 | | | | | | | 725 | | | | 779,375 | |
Post Holdings, Inc., Gtd. Notes, 144A | | | 6.000% | | | 12/15/22 | | | | | | | 1,500 | | | | 1,565,625 | |
| | | | | | | | | | | | | | | | |
|
|
|
| | | | | | | | | | | | | | | | | | 12,426,370 | |
| | | | | | | | | | | | | | | | |
|
|
|
Forest Products & Paper — 0.3% | | | | | | | | | | | | | | | | | | |
International Paper Co., Sr. Unsec’d. Notes | | | 6.000% | | | 11/15/41 | | | | | | | 675 | | | | 758,033 | |
International Paper Co., Sr. Unsec’d. Notes | | | 7.300% | | | 11/15/39 | | | | | | | 1,000 | | | | 1,274,218 | |
International Paper Co., Sr. Unsec’d. Notes | | | 7.950% | | | 06/15/18 | | | | | | | 922 | | | | 1,000,810 | |
| | | | | | | | | | | | | | | | |
|
|
|
| | | | | | | | | | | | | | | | | | 3,033,061 | |
| | | | | | | | | | | | | | | | |
|
|
|
Gas — 0.2% | | | | | | | | | | | | | | | | | | |
NiSource Finance Corp., Gtd. Notes | | | 4.800% | | | 02/15/44 | | | | | | | 300 | | | | 315,838 | |
NiSource Finance Corp., Gtd. Notes | | | 5.450% | | | 09/15/20 | | | | | | | 1,345 | | | | 1,468,724 | |
Southern Co. Gas Capital Corp., Gtd. Notes | | | 4.400% | | | 06/01/43 | | | | | | | 1,050 | | | | 1,038,259 | |
| | | | | | | | | | | | | | | | |
|
|
|
| | | | | | | | | | | | | | | | | | 2,822,821 | |
| | | | | | | | | | | | | | | | |
|
|
|
Healthcare-Products — 0.7% | | | | | | | | | | | | | | | | | | |
Abbott Laboratories, Sr. Unsec’d. Notes | | | 2.900% | | | 11/30/21 | | | | | | | 2,780 | | | | 2,772,077 | |
Medtronic, Inc., Gtd. Notes | | | 3.500% | | | 03/15/25 | | | | | | | 3,435 | | | | 3,537,068 | |
Medtronic, Inc., Gtd. Notes | | | 4.375% | | | 03/15/35 | | | | | | | 1,358 | | | | 1,436,666 | |
| | | | | | | | | | | | | | | | |
|
|
|
| | | | | | | | | | | | | | | | | | 7,745,811 | |
| | | | | | | | | | | | | | | | |
|
|
|
Healthcare-Services — 2.5% | | | | | | | | | | | | | | | | | | |
Aetna, Inc., Sr. Unsec’d. Notes | | | 6.750% | | | 12/15/37 | | | | | | | 1,900 | | | | 2,469,261 | |
Anthem, Inc., Sr. Unsec’d. Notes | | | 4.650% | | | 01/15/43 | | | | | | | 385 | | | | 386,499 | |
SEE NOTES TO FINANCIAL STATEMENTS.
A44
| | | | | | |
| | | DIVERSIFIED BOND PORTFOLIO (continued) | | |
| |
| SCHEDULE OF INVESTMENTS | | as of December 31, 2016 |
| | | | | | | | | | | | | | | | | | | | |
CORPORATE BONDS
(continued) | | Interest
Rate
| | | Maturity
Date
| | | Principal
Amount
(000)#
| | | Value
(Note 2)
| |
Healthcare-Services (continued) | | | | | | | | | | | | | | | | | | | | |
CHS/Community Health Systems, Inc., Gtd. Notes(e) | | | 7.125% | | | | 07/15/20 | | | | | | | | 750 | | | $ | 570,225 | |
CHS/Community Health Systems, Inc., Gtd. Notes(e) | | | 8.000% | | | | 11/15/19 | | | | | | | | 3,400 | | | | 2,822,000 | |
Cigna Corp., Sr. Unsec’d. Notes | | | 4.375% | | | | 12/15/20 | | | | | | | | 745 | | | | 791,977 | |
Cigna Corp., Sr. Unsec’d. Notes | | | 5.375% | | | | 03/15/17 | | | | | | | | 2,125 | | | | 2,141,203 | |
Cigna Corp., Sr. Unsec’d. Notes | | | 5.875% | | | | 03/15/41 | | | | | | | | 750 | | | | 862,120 | |
DaVita, Inc., Gtd. Notes | | | 5.000% | | | | 05/01/25 | | | | | | | | 500 | | | | 491,875 | |
Fresenius Medical Care U.S. Finance II, Inc. (Germany), Gtd. Notes, 144A | | | 4.125% | | | | 10/15/20 | | | | | | | | 2,705 | | | | 2,799,675 | |
HCA, Inc., Gtd. Notes | | | 5.375% | | | | 02/01/25 | | | | | | | | 5,025 | | | | 5,037,562 | |
HCA, Inc., Gtd. Notes | | | 5.875% | | | | 02/15/26 | | | | | | | | 725 | | | | 746,750 | |
HealthSouth Corp., Gtd. Notes | | | 5.125% | | | | 03/15/23 | | | | | | | | 300 | | | | 297,000 | |
Laboratory Corp. of America Holdings, Sr. Unsec’d. Notes | | | 3.200% | | | | 02/01/22 | | | | | | | | 240 | | | | 241,994 | |
Select Medical Corp., Gtd. Notes | | | 6.375% | | | | 06/01/21 | | | | | | | | 2,600 | | | | 2,600,000 | |
Synlab Bondco PLC (United Kingdom), Sr. Sec’d. Notes, RegS | | | 6.250% | | | | 07/01/22 | | | | EUR | | | | 1,100 | | | | 1,262,132 | |
Tenet Healthcare Corp., Sr. Unsec’d. Notes | | | 6.750% | | | | 02/01/20 | | | | | | | | 500 | | | | 481,250 | |
Tenet Healthcare Corp., Sr. Unsec’d. Notes | | | 8.000% | | | | 08/01/20 | | | | | | | | 1,570 | | | | 1,550,532 | |
UnitedHealth Group, Inc., Sr. Unsec’d. Notes | | | 3.950% | | | | 10/15/42 | | | | | | | | 1,260 | | | | 1,227,064 | |
UnitedHealth Group, Inc., Sr. Unsec’d. Notes | | | 6.500% | | | | 06/15/37 | | | | | | | | 760 | | | | 976,731 | |
UnitedHealth Group, Inc., Sr. Unsec’d. Notes | | | 6.625% | | | | 11/15/37 | | | | | | | | 195 | | | | 255,072 | |
| | | | | | | | | | | | | | | | | | |
|
|
|
| | | | | | | | | | | | | | | | | | | | 28,010,922 | |
| | | | | | | | | | | | | | | | | | |
|
|
|
Home Builders — 1.0% | | | | | | | | | | | | | | | | | | | | |
Brookfield Residential Properties, Inc./Brookfield Residential US Corp. (Canada), Gtd. Notes, 144A | | | 6.125% | | | | 07/01/22 | | | | | | | | 2,000 | | | | 2,010,000 | |
CalAtlantic Group, Inc., Gtd. Notes | | | 6.250% | | | | 12/15/21 | | | | | | | | 3,500 | | | | 3,771,250 | |
PulteGroup, Inc., Gtd. Notes | | | 5.000% | | | | 01/15/27 | | | | | | | | 975 | | | | 926,250 | |
Taylor Morrison Communities, Inc./Monarch Communities, Inc., Gtd. Notes, 144A | | | 5.250% | | | | 04/15/21 | | | | | | | | 2,175 | | | | 2,229,375 | |
William Lyon Homes, Inc., Gtd. Notes | | | 8.500% | | | | 11/15/20 | | | | | | | | 2,000 | | | | 2,090,000 | |
| | | | | | | | | | | | | | | | | | |
|
|
|
| | | | | | | | | | | | | | | | | | | | 11,026,875 | |
| | | | | | | | | | | | | | | | | | |
|
|
|
Home Furnishings — 0.1% | | | | | | | | | | | | | | | | | | | | |
Tempur Sealy International, Inc., Gtd. Notes | | | 5.500% | | | | 06/15/26 | | | | | | | | 650 | | | | 653,250 | |
| | | | | | | | | | | | | | | | | | |
|
|
|
Housewares — 0.1% | | | | | | | | | | | | | | | | | | | | |
Newell Brands, Inc., Sr. Unsec’d. Notes | | | 4.200% | | | | 04/01/26 | | | | | | | | 670 | | | | 699,333 | |
| | | | | | | | | | | | | | | | | | |
|
|
|
Insurance — 2.1% | | | | | | | | | | | | | | | | | | | | |
Allied World Assurance Co. Holdings Ltd., Gtd. Notes | | | 5.500% | (a) | | | 11/15/20 | | | | | | | | 430 | | | | 463,853 | |
American International Group, Inc., Sr. Unsec’d. Notes | | | 3.900% | | | | 04/01/26 | | | | | | | | 2,120 | | | | 2,157,274 | |
American International Group, Inc., Sr. Unsec’d. Notes | | | 4.500% | | | | 07/16/44 | | | | | | | | 1,075 | | | | 1,060,031 | |
Berkshire Hathaway, Inc., Sr. Unsec’d. Notes | | | 2.750% | | | | 03/15/23 | | | | | | | | 4,760 | | | | 4,742,131 | |
Chubb Corp. (The), Gtd. Notes | | | 6.375% | (a) | | | 04/15/37 | | | | | | | | 1,775 | | | | 1,668,500 | |
Chubb INA Holdings, Inc., Gtd. Notes | | | 4.350% | | | | 11/03/45 | | | | | | | | 115 | | | | 121,475 | |
Endurance Specialty Holdings Ltd., Sr. Unsec’d. Notes | | | 7.000% | | | | 07/15/34 | | | | | | | | 1,350 | | | | 1,630,857 | |
Hartford Financial Services Group, Inc., Sr. Unsec’d. Notes | | | 5.125% | | | | 04/15/22 | | | | | | | | 500 | | | | 554,592 | |
Liberty Mutual Group, Inc., Gtd. Notes, 144A | | | 6.500% | | | | 03/15/35 | | | | | | | | 1,030 | | | | 1,230,677 | |
Lincoln National Corp., Sr. Unsec’d. Notes | | | 7.000% | | | | 06/15/40 | | | | | | | | 405 | | | | 511,334 | |
Lincoln National Corp., Sr. Unsec’d. Notes | | | 8.750% | | | | 07/01/19 | | | | | | | | 388 | | | | 446,426 | |
Markel Corp., Sr. Unsec’d. Notes | | | 5.000% | | | | 03/30/43 | | | | | | | | 350 | | | | 354,989 | |
Nippon Life Insurance Co. (Japan), Sub. Notes, 144A | | | 5.100% | (a) | | | 10/16/44 | | | | | | | | 565 | | | | 582,656 | |
Northwestern Mutual Life Insurance Co. (The), Sub. Notes, 144A | | | 6.063% | | | | 03/30/40 | | | | | | | | 500 | | | | 615,693 | |
Ohio National Financial Services, Inc., Sr. Unsec’d. Notes, 144A | | | 6.375% | | | | 04/30/20 | | | | | | | | 850 | | | | 934,587 | |
Principal Financial Group, Inc., Gtd. Notes | | | 4.625% | | | | 09/15/42 | | | | | | | | 150 | | | | 155,356 | |
Progressive Corp. (The), Jr. Sub. Notes | | | 6.700% | (a) | | | 06/15/37 | | | | | | | | 1,015 | | | | 992,162 | |
Teachers Insurance & Annuity Association of America, Sub. Notes, 144A | | | 6.850% | | | | 12/16/39 | | | | | | | | 2,310 | | | | 2,997,742 | |
Unum Group, Sr. Unsec’d. Notes | | | 5.625% | | | | 09/15/20 | | | | | | | | 500 | | | | 544,503 | |
XLIT Ltd. (Ireland), Gtd. Notes, Series E | | | 6.500% | (a) | | | 10/29/49 | | | | | | | | 1,880 | | | | 1,466,400 | |
| | | | | | | | | | | | | | | | | | |
|
|
|
| | | | | | | | | | | | | | | | | | | | 23,231,238 | |
| | | | | | | | | | | | | | | | | | |
|
|
|
SEE NOTES TO FINANCIAL STATEMENTS.
A45
| | | | | | |
| | | DIVERSIFIED BOND PORTFOLIO (continued) | | |
| |
| SCHEDULE OF INVESTMENTS | | as of December 31, 2016 |
| | | | | | | | | | | | | | | | | | |
CORPORATE BONDS
(continued) | | Interest
Rate
| | | Maturity
Date
| | Principal
Amount
(000)#
| | | Value
(Note 2)
| |
Iron/Steel — 0.1% | | | | | | | | | | | | | | | | | | |
Vale Overseas Ltd. (Brazil), Gtd. Notes(e) | | | 6.250% | | | 08/10/26 | | | | | | | 580 | | | $ | 603,200 | |
| | | | | | | | | | | | | | | | |
|
|
|
Leisure Time — 0.1% | | | | | | | | | | | | | | | | | | |
Viking Cruises Ltd., Sr. Unsec’d. Notes, 144A(c) | | | 8.500% | | | 10/15/22 | | | | | | | 1,225 | | | | 1,270,937 | |
| | | | | | | | | | | | | | | | |
|
|
|
Lodging — 0.4% | | | | | | | | | | | | | | | | | | |
Boyd Gaming Corp., Gtd. Notes, 144A | | | 6.375% | | | 04/01/26 | | | | | | | 575 | | | | 619,275 | |
Marriott International, Inc., Sr. Unsec’d. Notes | | | 3.250% | | | 09/15/22 | | | | | | | 1,325 | | | | 1,336,094 | |
MGM Resorts International, Gtd. Notes | | | 6.625% | | | 12/15/21 | | | | | | | 2,525 | | | | 2,821,688 | |
| | | | | | | | | | | | | | | | |
|
|
|
| | | | | | | | | | | | | | | | | | 4,777,057 | |
| | | | | | | | | | | | | | | | |
|
|
|
Machinery-Diversified — 0.4% | | | | | | | | | | | | | | | | | | |
CNH Industrial Capital LLC, Gtd. Notes | | | 4.875% | | | 04/01/21 | | | | | | | 1,050 | | | | 1,092,000 | |
Rockwell Automation, Inc., Sr. Unsec’d. Notes | | | 5.200% | | | 01/15/98 | | | | | | | 1,100 | | | | 1,091,231 | |
Xylem, Inc., Sr. Unsec’d. Notes | | | 4.875% | | | 10/01/21 | | | | | | | 1,960 | | | | 2,115,961 | |
| | | | | | | | | | | | | | | | |
|
|
|
| | | | | | | | | | | | | | | | | | 4,299,192 | |
| | | | | | | | | | | | | | | | |
|
|
|
Media — 3.5% | | | | | | | | | | | | | | | | | | |
21st Century Fox America, Inc., Gtd. Notes | | | 6.900% | | | 08/15/39 | | | | | | | 65 | | | | 81,624 | |
21st Century Fox America, Inc., Gtd. Notes | | | 7.625% | | | 11/30/28 | | | | | | | 1,415 | | | | 1,813,897 | |
Cablevision Systems Corp., Sr. Unsec’d. Notes | | | 8.625% | | | 09/15/17 | | | | | | | 2,000 | | | | 2,080,000 | |
CCO Holdings LLC/CCO Holdings Capital Corp., Sr. Unsec’d. Notes, 144A | | | 5.500% | | | 05/01/26 | | | | | | | 3,300 | | | | 3,366,000 | |
CCO Holdings LLC/CCO Holdings Capital Corp., Sr. Unsec’d. Notes, 144A(e) | | | 5.875% | | | 04/01/24 | | | | | | | 800 | | | | 854,000 | |
CCO Holdings LLC/CCO Holdings Capital Corp., Sr. Unsec’d. Notes, 144A | | | 5.875% | | | 05/01/27 | | | | | | | 1,000 | | | | 1,037,500 | |
Cequel Communications Holdings I LLC/Cequel Capital Corp., Sr. Sec’d. Notes, 144A | | | 7.750% | (a) | | 07/15/25 | | | | | | | 1,500 | | | | 1,650,000 | |
Cequel Communications Holdings I LLC/Cequel Capital Corp., Sr. Unsec’d. Notes, 144A | | | 5.125% | | | 12/15/21 | | | | | | | 1,425 | | | | 1,449,937 | |
Cequel Communications Holdings I LLC/Cequel Capital Corp., Sr. Unsec’d. Notes, 144A | | | 6.375% | | | 09/15/20 | | | | | | | 950 | | | | 978,500 | |
Charter Communications Operating LLC/Charter Communications Operating Capital, Sr. Sec’d. Notes | | | 6.384% | | | 10/23/35 | | | | | | | 710 | | | | 810,701 | |
Charter Communications Operating LLC/Charter Communications Operating Capital, Sr. Sec’d. Notes | | | 6.484% | | | 10/23/45 | | | | | | | 855 | | | | 988,448 | |
Charter Communications Operating LLC/Charter Communications Operating Capital, Sr. Sec’d. Notes | | | 6.834% | | | 10/23/55 | | | | | | | 225 | | | | 263,772 | |
Comcast Corp., Gtd. Notes | | | 3.150% | | | 03/01/26 | | | | | | | 1,190 | | | | 1,174,141 | |
DISH DBS Corp., Gtd. Notes | | | 4.250% | | | 04/01/18 | | | | | | | 2,850 | | | | 2,922,304 | |
Grupo Televisa SAB (Mexico), Sr. Unsec’d. Notes | | | 6.125% | | | 01/31/46 | | | | | | | 495 | | | | 491,231 | |
Historic TW, Inc., Gtd. Notes | | | 6.625% | | | 05/15/29 | | | | | | | 690 | | | | 843,866 | |
Liberty Interactive LLC, Sr. Unsec’d. Notes(e) | | | 8.250% | | | 02/01/30 | | | | | | | 2,250 | | | | 2,396,250 | |
Myriad International Holdings BV (South Africa), Gtd. Notes, 144A | | | 6.375% | | | 07/28/17 | | | | | | | 1,035 | | | | 1,055,452 | |
NBCUniversal Media LLC, Gtd. Notes | | | 4.450% | | | 01/15/43 | | | | | | | 290 | | | | 296,341 | |
Nielsen Finance LLC/Nielsen Finance Co., Gtd. Notes, 144A | | | 5.000% | | | 04/15/22 | | | | | | | 1,500 | | | | 1,528,125 | |
Sinclair Television Group, Inc., Gtd. Notes, 144A | | | 5.875% | | | 03/15/26 | | | | | | | 775 | | | | 776,938 | |
Sky PLC (United Kingdom), Gtd. Notes, 144A | | | 6.100% | | | 02/15/18 | | | | | | | 210 | | | | 219,110 | |
TCI Communications, Inc., Sr. Unsec’d. Notes | | | 7.875% | | | 02/15/26 | | | | | | | 750 | | | | 1,006,701 | |
TEGNA, Inc., Gtd. Notes, 144A | | | 4.875% | | | 09/15/21 | | | | | | | 475 | | | | 483,313 | |
Time Warner Cable, Inc., Sr. Sec’d. Notes | | | 6.750% | | | 07/01/18 | | | | | | | 2,620 | | | | 2,797,164 | |
Time Warner Cos., Inc., Gtd. Notes | | | 7.250% | | | 10/15/17 | | | | | | | 1,440 | | | | 1,504,557 | |
Unitymedia Hessen GmbH & Co. KG/Unitymedia NRW GmbH (Germany), Sr. Sec’d. Notes, RegS | | | 4.000% | | | 01/15/25 | | | EUR | | | | 1,100 | | | | 1,204,236 | |
Univision Communications, Inc., Sr. Sec’d. Notes, 144A(c) | | | 5.125% | | | 02/15/25 | | | | | | | 1,175 | | | | 1,123,594 | |
UPCB Finance IV Ltd. (Netherlands), Sr. Sec’d. Notes, 144A | | | 5.375% | | | 01/15/25 | | | | | | | 1,140 | | | | 1,148,550 | |
Viacom, Inc., Sr. Unsec’d. Notes | | | 4.875% | | | 06/15/43 | | | | | | | 475 | | | | 411,785 | |
Viacom, Inc., Sr. Unsec’d. Notes | | | 4.500% | | | 02/27/42 | | | | | | | 95 | | | | 78,753 | |
SEE NOTES TO FINANCIAL STATEMENTS.
A46
| | | | | | |
| | | DIVERSIFIED BOND PORTFOLIO (continued) | | |
| |
| SCHEDULE OF INVESTMENTS | | as of December 31, 2016 |
| | | | | | | | | | | | | | | | | | |
CORPORATE BONDS
(continued) | | Interest
Rate
| | | Maturity
Date
| | Principal
Amount
(000)#
| | | Value
(Note 2)
| |
Media (continued) | | | | | | | | | | | | | | | | | | |
Virgin Media Secured Finance PLC (United Kingdom), Sr. Sec’d. Notes, 144A | | | 6.000% | | | 04/15/21 | | | GBP | | | | 611 | | | $ | 783,004 | |
Ziggo Secured Finance BV (Netherlands), Sr. Sec’d. Notes, RegS | | | 3.750% | | | 01/15/25 | | | EUR | | | | 1,000 | | | | 1,065,180 | |
| | | | | | | | | | | | | | | | |
|
|
|
| | | | | | | | | | | | | | | | | | 38,684,974 | |
| | | | | | | | | | | | | | | | |
|
|
|
Mining — 0.4% | | | | | | | | | | | | | | | | | | |
BHP Billiton Finance USA Ltd. (Australia), Gtd. Notes, 144A | | | 6.750% | (a) | | 10/19/75 | | | | | | | 1,730 | | | | 1,941,925 | |
Goldcorp, Inc. (Canada), Sr. Unsec’d. Notes | | | 3.625% | | | 06/09/21 | | | | | | | 825 | | | | 838,123 | |
Southern Copper Corp. (Peru), Sr. Unsec’d. Notes | | | 5.875% | | | 04/23/45 | | | | | | | 820 | | | | 805,015 | |
Southern Copper Corp. (Peru), Sr. Unsec’d. Notes | | | 6.750% | | | 04/16/40 | | | | | | | 990 | | | | 1,068,118 | |
| | | | | | | | | | | | | | | | |
|
|
|
| | | | | | | | | | | | | | | | | | 4,653,181 | |
| | | | | | | | | | | | | | | | |
|
|
|
Miscellaneous Manufacturing — 0.4% | | | | | | | | | | | | | | | | | | |
General Electric Co., Sr. Unsec’d. Notes | | | 4.125% | | | 10/09/42 | | | | | | | 500 | | | | 504,425 | |
General Electric Co., Sub. Notes, MTN | | | 5.300% | | | 02/11/21 | | | | | | | 340 | | | | 377,080 | |
Ingersoll-Rand Global Holding Co. Ltd., Gtd. Notes | | | 5.750% | | | 06/15/43 | | | | | | | 425 | | | | 502,895 | |
Pentair Finance SA (United Kingdom), Gtd. Notes | | | 1.875% | | | 09/15/17 | | | | | | | 625 | | | | 625,932 | |
Textron, Inc., Sr. Unsec’d. Notes | | | 7.250% | | | 10/01/19 | | | | | | | 2,350 | | | | 2,641,196 | |
| | | | | | | | | | | | | | | | |
|
|
|
| | | | | | | | | | | | | | | | | | 4,651,528 | |
| | | | | | | | | | | | | | | | |
|
|
|
Multi-National — 0.2% | | | | | | | | | | | | | | | | | | |
Corp. Andina de Fomento (Supranational Bank), Sr. Unsec’d. Notes | | | 2.000% | | | 05/10/19 | | | | | | | 1,180 | | | | 1,172,310 | |
Corp. Andina de Fomento (Supranational Bank), Sr. Unsec’d. Notes | | | 2.125% | | | 09/27/21 | | | | | | | 1,060 | | | | 1,026,260 | |
| | | | | | | | | | | | | | | | |
|
|
|
| | | | | | | | | | | | | | | | | | 2,198,570 | |
| | | | | | | | | | | | | | | | |
|
|
|
Office/Business Equipment — 0.1% | | | | | | | | | | | | | | | | | | |
CDW LLC/CDW Finance Corp., Gtd. Notes | | | 5.000% | | | 09/01/23 | | | | | | | 1,150 | | | | 1,151,437 | |
| | | | | | | | | | | | | | | | |
|
|
|
Oil & Gas — 1.4% | | | | | | | | | | | | | | | | | | |
Anadarko Petroleum Corp., Sr. Unsec’d. Notes | | | 4.677% | (g) | | 10/10/36 | | | | | | | 2,000 | | | | 808,624 | |
Anadarko Petroleum Corp., Sr. Unsec’d. Notes | | | 6.450% | | | 09/15/36 | | | | | | | 945 | | | | 1,124,707 | |
Anadarko Petroleum Corp., Sr. Unsec’d. Notes | | | 6.600% | | | 03/15/46 | | | | | | | 165 | | | | 203,504 | |
Apache Corp., Sr. Unsec’d. Notes | | | 5.100% | | | 09/01/40 | | | | | | | 650 | | | | 680,018 | |
Devon Energy Corp., Sr. Unsec’d. Notes | | | 5.600% | | | 07/15/41 | | | | | | | 1,650 | | | | 1,699,493 | |
Lukoil International Finance BV (Russia), Gtd. Notes, 144A | | | 6.125% | | | 11/09/20 | | | | | | | 600 | | | | 650,100 | |
Nabors Industries, Inc., Gtd. Notes | | | 4.625% | | | 09/15/21 | | | | | | | 1,650 | | | | 1,677,258 | |
Noble Energy, Inc., Sr. Unsec’d. Notes | | | 6.000% | | | 03/01/41 | | | | | | | 1,530 | | | | 1,698,788 | |
Occidental Petroleum Corp., Sr. Unsec’d. Notes | | | 3.000% | | | 02/15/27 | | | | | | | 470 | | | | 454,760 | |
Pioneer Natural Resources Co., Sr. Unsec’d. Notes | | | 6.875% | | | 05/01/18 | | | | | | | 1,750 | | | | 1,857,856 | |
Reliance Holding USA, Inc. (India), Gtd. Notes, 144A | | | 5.400% | | | 02/14/22 | | | | | | | 510 | | | | 551,362 | |
Sasol Financing International PLC (South Africa), Gtd. Notes | | | 4.500% | | | 11/14/22 | | | | | | | 1,525 | | | | 1,513,563 | |
Sunoco LP/Sunoco Finance Corp., Gtd. Notes | | | 6.250% | | | 04/15/21 | | | | | | | 2,100 | | | | 2,139,375 | |
| | | | | | | | | | | | | | | | |
|
|
|
| | | | | | | | | | | | | | | | | | 15,059,408 | |
| | | | | | | | | | | | | | | | |
|
|
|
Oil & Gas Services — 0.1% | | | | | | | | | | | | | | | | | | |
Cameron International Corp., Gtd. Notes | | | 7.000% | | | 07/15/38 | | | | | | | 450 | | | | 561,928 | |
| | | | | | | | | | | | | | | | |
|
|
|
Packaging & Containers — 0.6% | | | | | | | | | | | | | | | | | | |
Ball Corp., Gtd. Notes | | | 4.375% | | | 12/15/23 | | | EUR | | | | 1,125 | | | | 1,308,012 | |
Greif Nevada Holdings, Sr. Unsec’d. Notes, 144A, MTN | | | 7.375% | | | 07/15/21 | | | EUR | | | | 1,470 | | | | 1,875,481 | |
Greif, Inc., Sr. Unsec’d. Notes | | | 7.750% | | | 08/01/19 | | | | | | | 1,815 | | | | 2,014,650 | |
WestRock RKT Co., Gtd. Notes | | | 4.450% | | | 03/01/19 | | | | | | | 1,165 | | | | 1,215,646 | |
| | | | | | | | | | | | | | | | |
|
|
|
| | | | | | | | | | | | | | | | | | 6,413,789 | |
| | | | | | | | | | | | | | | | |
|
|
|
Pharmaceuticals — 1.0% | | | | | | | | | | | | | | | | | | |
AbbVie, Inc., Sr. Unsec’d. Notes | | | 3.600% | | | 05/14/25 | | | | | | | 1,020 | | | | 1,010,298 | |
AbbVie, Inc., Sr. Unsec’d. Notes | | | 4.500% | | | 05/14/35 | | | | | | | 1,715 | | | | 1,685,034 | |
Actavis Funding SCS, Gtd. Notes | | | 3.800% | | | 03/15/25 | | | | | | | 875 | | | | 876,031 | |
Actavis Funding SCS, Gtd. Notes | | | 4.550% | | | 03/15/35 | | | | | | | 1,850 | | | | 1,831,115 | |
Actavis Funding SCS, Gtd. Notes | | | 4.750% | | | 03/15/45 | | | | | | | 250 | | | | 245,434 | |
Endo Ltd./Endo Finance LLC/Endo Finco, Inc., Gtd. Notes, 144A | | | 6.000% | | | 07/15/23 | | | | | | | 625 | | | | 547,656 | |
SEE NOTES TO FINANCIAL STATEMENTS.
A47
| | | | | | |
| | | DIVERSIFIED BOND PORTFOLIO (continued) | | |
| |
| SCHEDULE OF INVESTMENTS | | as of December 31, 2016 |
| | | | | | | | | | | | | | | | | | |
CORPORATE BONDS
(continued) | | Interest
Rate
| | | Maturity
Date
| | Principal
Amount
(000)#
| | | Value
(Note 2)
| |
Pharmaceuticals (continued) | | | | | | | | | | | | | | | | | | |
Merck & Co, Inc., Sr. Unsec’d. Notes | | | 4.150% | | | 05/18/43 | | | | | | | 2,075 | | | $ | 2,131,390 | |
Pfizer, Inc., Sr. Unsec’d. Notes | | | 4.125% | | | 12/15/46 | | | | | | | 1,690 | | | | 1,719,173 | |
Teva Pharmaceutical Finance Netherlands III BV (Israel), Gtd. Notes(e) | | | 3.150% | | | 10/01/26 | | | | | | | 505 | | | | 465,573 | |
Teva Pharmaceutical Finance Netherlands Ill BV (Israel), Gtd. Notes | | | 4.100% | | | 10/01/46 | | | | | | | 160 | | | | 137,098 | |
Valeant Pharmaceuticals International, Inc., Gtd. Notes, 144A | | | 6.125% | | | 04/15/25 | | | | | | | 450 | | | | 338,062 | |
| | | | | | | | | | | | | | | | |
|
|
|
| | | | | | | | | | | | | | | | | | 10,986,864 | |
| | | | | | | | | | | | | | | | |
|
|
|
Pipelines — 0.3% | | | | | | | | | | | | | | | | | | |
Enterprise Products Operating LLC, Gtd. Notes | | | 4.900% | | | 05/15/46 | | | | | | | 2,110 | | | | 2,165,917 | |
Fermaca Enterprises S de RL de CV (Mexico), Sr. Sec’d. Notes, 144A(c) | | | 6.375% | | | 03/30/38 | | | | | | | 415 | | | | 408,642 | |
ONEOK Partners LP, Gtd. Notes | | | 2.000% | | | 10/01/17 | | | | | | | 750 | | | | 752,072 | |
Western Gas Partners LP, Sr. Unsec’d. Notes | | | 5.450% | | | 04/01/44 | | | | | | | 575 | | | | 592,229 | |
| | | | | | | | | | | | | | | | |
|
|
|
| | | | | | | | | | | | | | | | | | 3,918,860 | |
| | | | | | | | | | | | | | | | |
|
|
|
Real Estate | | | | | | | | | | | | | | | | | | |
ProLogis LP, Gtd. Notes | | | 6.875% | | | 03/15/20 | | | | | | | 8 | | | | 8,974 | |
| | | | | | | | | | | | | | | | |
|
|
|
Real Estate Investment Trusts (REITs) — 0.3% | | | | | | | | | | | | | | | | | | |
DuPont Fabros Technology LP, Gtd. Notes | | | 5.875% | | | 09/15/21 | | | | | | | 2,000 | | | | 2,092,500 | |
Simon Property Group LP, Sr. Unsec’d. Notes | | | 3.375% | | | 03/15/22 | | | | | | | 325 | | | | 336,006 | |
Trust F/1401 (Mexico), Sr. Unsec’d. Notes, 144A | | | 5.250% | | | 12/15/24 | | | | | | | 1,235 | | | | 1,208,756 | |
| | | | | | | | | | | | | | | | |
|
|
|
| | | | | | | | | | | | | | | | | | 3,637,262 | |
| | | | | | | | | | | | | | | | |
|
|
|
Retail — 0.7% | | | | | | | | | | | | | | | | | | |
CVS Health Corp., Sr. Unsec’d. Notes | | | 5.125% | | | 07/20/45 | | | | | | | 765 | | | | 852,552 | |
Dufry Finance SCA (Switzerland), Gtd. Notes, 144A | | | 4.500% | | | 08/01/23 | | | EUR | | | | 1,425 | | | | 1,605,034 | |
Limited Brands, Inc., Gtd. Notes | | | 5.625% | | | 02/15/22 | | | | | | | 2,200 | | | | 2,348,500 | |
PVH Corp., Sr. Unsec’d. Notes, 144A | | | 3.625% | | | 07/15/24 | | | EUR | | | | 1,250 | | | | 1,388,107 | |
Tops Holding LLC/Tops Markets II Corp., Sr. Sec’d. Notes, 144A(c) | | | 8.000% | | | 06/15/22 | | | | | | | 1,350 | | | | 1,161,000 | |
| | | | | | | | | | | | | | | | |
|
|
|
| | | | | | | | | | | | | | | | | | 7,355,193 | |
| | | | | | | | | | | | | | | | |
|
|
|
Savings & Loans — 0.1% | |
People’s United Financial, Inc., Sr. Unsec’d. Notes | | | 3.650% | | | 12/06/22 | | | | | | | 1,675 | | | | 1,684,417 | |
| | | | | | | | | | | | | | | | |
|
|
|
Semiconductors — 0.6% | |
NXP BV/NXP Funding LLC (Netherlands), Gtd. Notes, 144A | | | 3.750% | | | 06/01/18 | | | | | | | 1,925 | | | | 1,953,875 | |
NXP BV/NXP Funding LLC (Netherlands), Gtd. Notes, 144A | | | 4.625% | | | 06/01/23 | | | | | | | 2,975 | | | | 3,123,750 | |
Sensata Technologies BV, Gtd. Notes, 144A | | | 5.000% | | | 10/01/25 | | | | | | | 1,750 | | | | 1,715,000 | |
| | | | | | | | | | | | | | | | |
|
|
|
| | | | | | | | | | | | | | | | | | 6,792,625 | |
| | | | | | | | | | | | | | | | |
|
|
|
Software — 0.9% | |
Fidelity National Information Services, Inc., Sr. Unsec’d. Notes | | | 3.000% | | | 08/15/26 | | | | | | | 1,050 | | | | 985,878 | |
Fidelity National Information Services, Inc., Sr. Unsec’d. Notes | | | 4.500% | | | 10/15/22 | | | | | | | 2,355 | | | | 2,505,152 | |
First Data Corp., Gtd. Notes, 144A | | | 7.000% | | | 12/01/23 | | | | | | | 2,225 | | | | 2,369,625 | |
Infor US, Inc., Gtd. Notes(c) | | | 6.500% | | | 05/15/22 | | | | | | | 950 | | | | 990,375 | |
Infor US, Inc., Sr. Sec’d. Notes, 144A(c) | | | 5.750% | | | 08/15/20 | | | | | | | 1,350 | | | | 1,414,125 | |
Microsoft Corp., Sr. Unsec’d. Notes | | | 4.000% | | | 02/12/55 | | | | | | | 435 | | | | 411,415 | |
Oracle Corp., Sr. Unsec’d. Notes | | | 4.300% | | | 07/08/34 | | | | | | | 1,070 | | | | 1,106,363 | |
| | | | | | | | | | | | | | | | |
|
|
|
| | | | | | | | | | | | | | | | | | 9,782,933 | |
| | | | | | | | | | | | | | | | |
|
|
|
Telecommunications — 1.7% | |
AT&T Corp., Gtd. Notes | | | 8.250% | | | 11/15/31 | | | | | | | 55 | | | | 76,457 | |
AT&T, Inc., Sr. Unsec’d. Notes | | | 3.400% | | | 05/15/25 | | | | | | | 2,320 | | | | 2,236,069 | |
AT&T, Inc., Sr. Unsec’d. Notes | | | 4.500% | | | 05/15/35 | | | | | | | 300 | | | | 289,850 | |
AT&T, Inc., Sr. Unsec’d. Notes | | | 4.500% | | | 03/09/48 | | | | | | | 74 | | | | 66,494 | |
AT&T, Inc., Sr. Unsec’d. Notes | | | 4.550% | | | 03/09/49 | | | | | | | 499 | | | | 450,730 | |
AT&T, Inc., Sr. Unsec’d. Notes | | | 4.750% | | | 05/15/46 | | | | | | | 850 | | | | 805,306 | |
AT&T, Inc., Sr. Unsec’d. Notes | | | 4.800% | | | 06/15/44 | | | | | | | 1,515 | | | | 1,431,545 | |
AT&T, Inc., Sr. Unsec’d. Notes | | | 5.350% | | | 09/01/40 | | | | | | | 49 | | | | 50,323 | |
SEE NOTES TO FINANCIAL STATEMENTS.
A48
| | | | | | |
| | | DIVERSIFIED BOND PORTFOLIO (continued) | | |
| |
| SCHEDULE OF INVESTMENTS | | as of December 31, 2016 |
| | | | | | | | | | | | | | | | | | |
CORPORATE BONDS
(continued) | | Interest
Rate
| | | Maturity
Date
| | Principal
Amount
(000)#
| | | Value
(Note 2)
| |
Telecommunications (continued) | |
Bharti Airtel International Netherlands BV (India), Gtd. Notes, 144A | | | 5.125% | | | 03/11/23 | | | | | | | 1,305 | | | $ | 1,360,128 | |
Bharti Airtel International Netherlands BV (India), Gtd. Notes, 144A | | | 5.350% | | | 05/20/24 | | | | | | | 690 | | | | 722,730 | |
Sprint Capital Corp., Gtd. Notes | | | 6.900% | | | 05/01/19 | | | | | | | 1,300 | | | | 1,376,375 | |
Sprint Corp., Gtd. Notes(c)(e) | | | 7.625% | | | 02/15/25 | | | | | | | 500 | | | | 525,625 | |
T-Mobile USA, Inc., Gtd. Notes | | | 6.500% | | | 01/15/26 | | | | | | | 1,675 | | | | 1,811,094 | |
Telecom Italia SpA (Italy), Sr. Unsec’d. Notes, EMTN | | | 6.375% | | | 06/24/19 | | | GBP | | | | 950 | | | | 1,280,230 | |
Verizon Communications, Inc., Sr. Unsec’d. Notes | | | 4.672% | | | 03/15/55 | | | | | | | 2,796 | | | | 2,625,752 | |
Verizon Communications, Inc., Sr. Unsec’d. Notes | | | 4.750% | | | 11/01/41 | | | | | | | 745 | | | | 735,646 | |
Verizon Communications, Inc., Sr. Unsec’d. Notes | | | 5.012% | | | 08/21/54 | | | | | | | 2,517 | | | | 2,503,816 | |
Vimpel Communications Via VIP Finance Ireland Ltd. OJSC (Russia), Sr. Unsec’d. Notes, 144A | | | 9.125% | | | 04/30/18 | | | | | | | 200 | | | | 215,248 | |
| | | | | | | | | | | | | | | | |
|
|
|
| | | | | | | | | | | | | | | | | | 18,563,418 | |
| | | | | | | | | | | | | | | | |
|
|
|
Textiles | |
Mohawk Industries, Inc., Sr. Unsec’d. Notes | | | 3.850% | | | 02/01/23 | | | | | | | 294 | | | | 300,412 | |
| | | | | | | | | | | | | | | | |
|
|
|
Transportation — 0.1% | |
Silk Bidco AS (Norway), Sr. Sec’d. Notes, RegS | | | 7.500% | | | 02/01/22 | | | EUR | | | | 1,300 | | | | 1,446,862 | |
| | | | | | | | | | | | | | | | |
|
|
|
TOTAL CORPORATE BONDS
(cost $460,425,565) | | | | 472,240,049 | |
| | | | | | | | | | | | | | | | |
|
|
|
| NON-CORPORATE FOREIGN AGENCIES — 1.7% | |
CITIC Ltd. (China), Sr. Unsec’d. Notes, RegS, EMTN | | | 6.875% | | | 01/21/18 | | | | | | | 1,100 | | | | 1,149,986 | |
CNOOC Finance 2013 Ltd. (China), Gtd. Notes | | | 3.000% | | | 05/09/23 | | | | | | | 750 | | | | 723,900 | |
Gazprom OAO Via Gaz Capital SA (Russia), Sr. Unsec’d. Notes, 144A | | | 6.510% | | | 03/07/22 | | | | | | | 1,665 | | | | 1,836,695 | |
Gazprom OAO Via Gaz Capital SA (Russia), Sr. Unsec’d. Notes, RegS | | | 4.950% | | | 07/19/22 | | | | | | | 390 | | | | 401,298 | |
KazMunayGas National Co. JSC (Kazakhstan), Sr. Unsec’d. Notes, 144A, MTN | | | 9.125% | | | 07/02/18 | | | | | | | 1,610 | | | | 1,749,426 | |
Korea Development Bank (The) (South Korea), Sr. Unsec’d. Notes | | | 4.625% | | | 11/16/21 | | | | | | | 600 | | | | 649,945 | |
Korea Gas Corp. (South Korea), Sr. Unsec’d. Notes, RegS | | | 4.250% | | | 11/02/20 | | | | | | | 1,750 | | | | 1,856,409 | |
Korea Hydro & Nuclear Power Co. Ltd. (South Korea), Sr. Unsec’d. Notes, 144A | | | 4.750% | | | 07/13/21 | | | | | | | 250 | | | | 270,103 | |
Majapahit Holding BV (Indonesia), Gtd. Notes, RegS | | | 7.750% | | | 01/20/20 | | | | | | | 1,500 | | | | 1,683,750 | |
Petrobras Global Finance BV (Brazil), Gtd. Notes | | | 8.375% | | | 05/23/21 | | | | | | | 2,475 | | | | 2,666,812 | |
Petroleos Mexicanos (Mexico), Gtd. Notes | | | 4.875% | | | 01/24/22 | | | | | | | 1,100 | | | | 1,103,300 | |
Petroleos Mexicanos (Mexico), Gtd. Notes, 144A | | | 5.375% | | | 03/13/22 | | | | | | | 405 | | | | 414,712 | |
Provincia de Buenos Aires (Argentina), Sr. Unsec’d. Notes, 144A | | | 9.950% | | | 06/09/21 | | | | | | | 440 | | | | 496,100 | |
Provincia de Buenos Aires (Argentina), Sr. Unsec’d. Notes, 144A | | | 9.950% | | | 06/09/21 | | | | | | | 1,500 | | | | 1,691,250 | |
Sinopec Group Overseas Development 2015 Ltd. (China), Gtd. Notes, 144A | | | 2.500% | | | 04/28/20 | | | | | | | 1,250 | | | | 1,241,714 | |
YPF SA (Argentina), Sr. Unsec’d. Notes, 144A | | | 8.500% | | | 03/23/21 | | | | | | | 1,000 | | | | 1,072,600 | |
| | | | | | | | | | | | | | | | |
|
|
|
TOTAL NON-CORPORATE FOREIGN AGENCIES
(cost $18,601,593) | | | | 19,008,000 | |
| | | | | | | | | | | | | | | | |
|
|
|
| MUNICIPAL BONDS — 1.8% | |
California — 0.7% | |
Bay Area Toll Authority, Revenue Bonds, BABs | | | 6.907% | | | 10/01/50 | | | | | | | 1,125 | | | | 1,579,163 | |
State of California, General Obligation Unlimited, BABs | | | 7.300% | | | 10/01/39 | | | | | | | 2,280 | | | | 3,220,249 | |
State of California, General Obligation Unlimited, BABs | | | 7.625% | | | 03/01/40 | | | | | | | 725 | | | | 1,065,257 | |
University of California, Revenue Bonds, BABs | | | 5.770% | | | 05/15/43 | | | | | | | 1,400 | | | | 1,711,724 | |
| | | | | | | | | | | | | | | | |
|
|
|
| | | | | | | | | | | | | | | | | | 7,576,393 | |
| | | | | | | | | | | | | | | | |
|
|
|
Colorado — 0.1% | |
Regional Transportation District, Revenue Bonds, Series 2010-B, BABs | | | 5.844% | | | 11/01/50 | | | | | | | 770 | | | | 998,051 | |
| | | | | | | | | | | | | | | | |
|
|
|
Illinois — 0.2% | |
Chicago O’Hare International Airport, Revenue Bonds, BABs | | | 6.395% | | | 01/01/40 | | | | | | | 1,380 | | | | 1,801,245 | |
| | | | | | | | | | | | | | | | |
|
|
|
SEE NOTES TO FINANCIAL STATEMENTS.
A49
| | | | | | |
| | | DIVERSIFIED BOND PORTFOLIO (continued) | | |
| |
| SCHEDULE OF INVESTMENTS | | as of December 31, 2016 |
| | | | | | | | | | | | | | | | | | | | |
MUNICIPAL BONDS
(continued) | | Interest
Rate
| | | Maturity
Date
| | | Principal
Amount
(000)#
| | | Value
(Note 2)
| |
New Jersey — 0.4% | |
New Jersey State Turnpike Authority, Revenue Bonds, Series A, BABs | | | 7.102% | | | | 01/01/41 | | | | | | | | 1,175 | | | $ | 1,641,499 | |
New Jersey State Turnpike Authority, Revenue Bonds, Series F, BABs | | | 7.414% | | | | 01/01/40 | | | | | | | | 2,050 | | | | 2,953,086 | |
| | | | | | | | | | | | | | | | | | |
|
|
|
| | | | | | | | | | | | | | | | | | | | 4,594,585 | |
| | | | | | | | | | | | | | | | | | |
|
|
|
Ohio — 0.1% | |
Ohio State University (The), Revenue Bonds, BABs | | | 4.910% | | | | 06/01/40 | | | | | | | | 695 | | | | 795,149 | |
Ohio State Water Development Authority Water Pollution Control Loan Fund, Revenue Bonds, BABs | | | 4.879% | | | | 12/01/34 | | | | | | | | 450 | | | | 506,417 | |
| | | | | | | | | | | | | | | | | | |
|
|
|
| | | | | | | | | | | | | | | | | | | | 1,301,566 | |
| | | | | | | | | | | | | | | | | | |
|
|
|
Oregon — 0.1% | |
Oregon State Department of Transportation, Revenue Bonds, Series A, BABs | | | 5.834% | | | | 11/15/34 | | | | | | | | 615 | | | | 774,352 | |
| | | | | | | | | | | | | | | | | | |
|
|
|
Pennsylvania — 0.1% | |
Pennsylvania Turnpike Commission, Revenue Bonds, Series B, BABs | | | 5.511% | | | | 12/01/45 | | | | | | | | 800 | | | | 961,000 | |
| | | | | | | | | | | | | | | | | | |
|
|
|
Tennessee — 0.1% | |
Metropolitan Government of Nashville & Davidson County Convention Center Authority, Revenue Bonds, BABs | | | 6.731% | | | | 07/01/43 | | | | | | | | 1,375 | | | | 1,778,274 | |
| | | | | | | | | | | | | | | | | | |
|
|
|
TOTAL MUNICIPAL BONDS
(cost $14,872,896) | | | | 19,785,466 | |
| | | | | | | | | | | | | | | | | | |
|
|
|
| RESIDENTIAL MORTGAGE-BACKED SECURITIES — 6.4% | |
Alternative Loan Trust, Series 2004-18CB, Class 3A1 | | | 5.250% | | | | 09/25/19 | | | | | | | | 201 | | | | 202,179 | |
Banc of America Funding Trust, Series 2015-R6, Class 1A1, 144A | | | 0.739% | (a) | | | 08/26/36 | | | | | | | | 2,765 | | | | 2,607,100 | |
Bayview Opportunity Master Fund IVb Trust, Series 2016-CRT1, Class M1, 144A | | | 2.511% | (a) | | | 10/27/27 | | | | | | | | 579 | | | | 578,272 | |
Citigroup Mortgage Loan Trust, Series 2011-12, Class 3A2, 144A | | | 3.130% | (a) | | | 09/25/47 | | | | | | | | 1,152 | | | | 1,041,481 | |
Fannie Mae Connecticut Avenue Securities, Series 2016-C04, Class 1M1(h) | | | 2.206% | (a) | | | 01/25/29 | | | | | | | | 1,435 | | | | 1,444,027 | |
Freddie Mac Structured Agency Credit Risk Debt Notes, Series 2014-DN4,
Class M3(h) | | | 5.306% | (a) | | | 10/25/24 | | | | | | | | 660 | | | | 706,185 | |
Freddie Mac Structured Agency Credit Risk Debt Notes, Series 2016-DNA3,
Class M2(h) | | | 2.756% | (a) | | | 12/25/28 | | | | | | | | 1,550 | | | | 1,564,428 | |
Freddie Mac Structured Agency Credit Risk Debt Notes, Series 2016-HQA2,
Class M2(h) | | | 3.006% | (a) | | | 11/25/28 | | | | | | | | 1,450 | | | | 1,479,779 | |
Freddie Mac Structured Agency Credit Risk Debt Notes, Series 2016-HQA3,
Class M2(h) | | | 2.106% | (a) | | | 03/25/29 | | | | | | | | 760 | | | | 758,044 | |
Freddie Mac Structured Agency Credit Risk Debt Notes, Series 2016-HQA4,
Class M2(h) | | | 2.056% | (a) | | | 04/25/29 | | | | | | | | 1,740 | | | | 1,727,485 | |
GSMSC Resecuritization Trust, Series 2015-3R, Class 1A1, 144A | | | 0.732% | (a) | | | 01/26/37 | | | | | | | | 3,264 | | | | 3,142,113 | |
GSMSC Resecuritization Trust, Series 2015-3R, Class 1A2, 144A | | | 0.732% | (a) | | | 01/26/37 | | | | | | | | 1,400 | | | | 1,154,169 | |
GSMSC Resecuritization Trust, Series 2015-4R, Class A1, 144A | | | 0.730% | (a) | | | 03/26/37 | | | | | | | | 2,701 | | | | 2,573,767 | |
GSMSC Resecuritization Trust, Series 2015-4R, Class A2, 144A | | | 0.730% | (a) | | | 03/26/37 | | | | | | | | 700 | | | | 550,570 | |
Harborview Mortgage Loan Trust, Series 2007-4, Class 2A1 | | | 0.956% | (a) | | | 07/19/47 | | | | | | | | 2,306 | | | | 1,927,827 | |
LSTAR Securities Investment Ltd. (Cayman Islands), Series 2015-6, Class A, 144A(b) | | | 2.530% | (a) | | | 05/01/20 | | | | | | | | 5,675 | | | | 5,596,929 | |
LSTAR Securities Investment Ltd. (Cayman Islands), Series 2015-7, Class A, 144A(b) | | | 2.530% | (a) | | | 07/01/20 | | | | | | | | 3,892 | | | | 3,867,545 | |
LSTAR Securities Investment Ltd. (Cayman Islands), Series 2015-8, Class A1, 144A | | | 2.620% | (a) | | | 08/01/20 | | | | | | | | 2,724 | | | | 2,720,303 | |
LSTAR Securities Investment Ltd. (Cayman Islands), Series 2015-9, Class A1,
144A(b) | | | 2.620% | (a) | | | 10/01/20 | | | | | | | | 4,243 | | | | 4,226,425 | |
LSTAR Securities Investment Ltd. (Cayman Islands), Series 2015-10, Class A2,
144A(b) | | | 4.120% | (a) | | | 11/01/20 | | | | | | | | 1,500 | | | | 1,488,750 | |
SEE NOTES TO FINANCIAL STATEMENTS.
A50
| | | | | | |
| | | DIVERSIFIED BOND PORTFOLIO (continued) | | |
| |
| SCHEDULE OF INVESTMENTS | | as of December 31, 2016 |
| | | | | | | | | | | | | | | | | | |
RESIDENTIAL MORTGAGE-BACKED SECURITIES
(continued) | | Interest
Rate
| | | Maturity
Date
| | Principal
Amount
(000)#
| | | Value
(Note 2)
| |
LSTAR Securities Investment Ltd. (Cayman Islands), Series 2016-1,
Class A1, 144A | | | 2.620% | (a) | | 01/01/21 | | | | | | | 3,776 | | | $ | 3,710,090 | |
LSTAR Securities Investment Ltd. (Cayman Islands), Series 2016-2,
Class A, 144A | | | 2.620% | (a) | | 03/01/21 | | | | | | | 2,129 | | | | 2,117,357 | |
LSTAR Securities Investment Ltd. (Cayman Islands), Series 2016-3,
Class A, 144A(b) | | | 2.620% | (a) | | 09/01/21 | | | | | | | 2,031 | | | | 2,005,793 | |
LSTAR Securities Investment Trust (Cayman Islands), Series 2016-5,
Class A1, 144A | | | 2.620% | (a) | | 11/01/21 | | | | | | | 2,103 | | | | 2,079,840 | |
LSTAR Securities Investment Ltd. (Cayman Islands), Series 2016-6,
Class A, 144A | | | 2.630% | (a) | | 11/01/21 | | | | | | | 3,820 | | | | 3,766,226 | |
MASTR Alternative Loan Trust, Series 2004-4, Class 4A1 | | | 5.000% | | | 04/25/19 | | | | | | | 32 | | | | 32,464 | |
Mortgage Repurchase Agreement Financing Trust, Series 2016-3,
Class A1, 144A(b) | | | 1.664% | (a) | | 11/10/18 | | | | | | | 1,510 | | | | 1,510,000 | |
Mortgage Repurchase Agreement Financing Trust, Series 2016-4,
Class A1, 144A(b) | | | 1.737% | (a) | | 05/10/19 | | | | | | | 6,310 | | | | 6,296,288 | |
Mortgage Repurchase Agreement Financing Trust, Series 2016-5,
Class A, 144A(b) | | | 1.872% | (a) | | 06/10/19 | | | | | | | 1,100 | | | | 1,100,000 | |
Structured Adjustable Rate Mortgage Loan Trust, Series 2004-1, Class 4A3 | | | 3.093% | (a) | | 02/25/34 | | | | | | | 912 | | | | 913,988 | |
Structured Adjustable Rate Mortgage Loan Trust, Series 2004-18, Class 3A1 | | | 3.258% | (a) | | 12/25/34 | | | | | | | 4,911 | | | | 4,756,202 | |
Structured Asset Securities Corp. Mortgage Pass-Through Certificates, Series 2002-HF2, Class M3 | | | 3.756% | (a) | | 07/25/32 | | | | | | | 537 | | | | 521,483 | |
Towd Point Mortgage Funding PLC (United Kingdom), Series 2016-V1A, Class A1, 144A | | | 1.538% | (a) | | 02/20/54 | | | GBP | | | | 2,200 | | | | 2,687,797 | |
Washington Mutual Mortgage Pass-Through Certificates, Series 2005-1, Class 3A | | | 5.000% | | | 03/25/20 | | | | | | | 174 | | | | 174,279 | |
| | | | | | | | | | | | | | | | |
|
|
|
TOTAL RESIDENTIAL MORTGAGE-BACKED SECURITIES
(cost $70,619,842) | | | | 71,029,185 | |
| | | | | | | | | | | | | | | | |
|
|
|
| SOVEREIGN BONDS — 3.7% | |
Argentine Republic Government International Bond (Argentina), Sr. Unsec’d. Notes, 144A | | | 6.875% | | | 04/22/21 | | | | | | | 1,175 | | | | 1,251,375 | |
Brazilian Government International Bond (Brazil), Unsec’d. Notes | | | 11.000% | | | 06/26/17 | | | EUR | | | | 2,200 | | | | 2,427,411 | |
Colombia Government International Bond (Colombia), Sr. Unsec’d. Notes | | | 4.000% | | | 02/26/24 | | | | | | | 250 | | | | 252,500 | |
Dominican Republic International Bond (Dominican Republic), Sr. Unsec’d. Notes, 144A | | | 6.850% | | | 01/27/45 | | | | | | | 600 | | | | 566,832 | |
Dominican Republic International Bond (Dominican Republic), Sr. Unsec’d. Notes, 144A | | | 7.450% | | | 04/30/44 | | | | | | | 290 | | | | 292,900 | |
Dominican Republic International Bond (Dominican Republic), Sr. Unsec’d. Notes, 144A | | | 7.500% | | | 05/06/21 | | | | | | | 600 | | | | 651,204 | |
Dominican Republic International Bond (Dominican Republic), Sr. Unsec’d. Notes, RegS | | | 7.500% | | | 05/06/21 | | | | | | | 2,250 | | | | 2,442,015 | |
Hellenic Republic Government International Bond (Greece), Sr. Unsec’d. Notes(c) | | | 3.800% | | | 08/08/17 | | | JPY | | | | 680,000 | | | | 5,658,182 | |
Hungary Government International Bond (Hungary), Sr. Unsec’d. Notes | | | 6.375% | | | 03/29/21 | | | | | | | 2,776 | | | | 3,108,454 | |
Hungary Government International Bond (Hungary), Sr. Unsec’d. Notes | | | 4.125% | | | 02/19/18 | | | | | | | 2,020 | | | | 2,066,504 | |
Hungary Government International Bond (Hungary), Sr. Unsec’d. Notes | | | 5.375% | | | 02/21/23 | | | | | | | 436 | | | | 472,559 | |
Hungary Government International Bond (Hungary), Sr. Unsec’d. Notes | | | 5.375% | | | 03/25/24 | | | | | | | 290 | | | | 316,100 | |
Hungary Government International Bond (Hungary), Sr. Unsec’d. Notes | | | 5.750% | | | 11/22/23 | | | | | | | 2,300 | | | | 2,550,125 | |
Hungary Government International Bond (Hungary), Sr. Unsec’d. Notes, RegS | | | 6.000% | | | 01/11/19 | | | EUR | | | | 715 | | | | 842,953 | |
SEE NOTES TO FINANCIAL STATEMENTS.
A51
| | | | | | |
| | | DIVERSIFIED BOND PORTFOLIO (continued) | | |
| |
| SCHEDULE OF INVESTMENTS | | as of December 31, 2016 |
| | | | | | | | | | | | | | | | | | |
SOVEREIGN BONDS
(Continued) | | Interest
Rate
| | | Maturity
Date
| | Principal
Amount
(000)#
| | | Value
(Note 2)
| |
Indonesia Government International Bond (Indonesia), Sr. Unsec’d. Notes, 144A, MTN | | | 2.875% | | | 07/08/21 | | | EUR | | | | 825 | | | $ | 905,891 | |
Indonesia Government International Bond (Indonesia), Sr. Unsec’d. Notes, 144A | | | 3.375% | | | 07/30/25 | | | EUR | | | | 1,625 | | | | 1,751,544 | |
Indonesia Government International Bond (Indonesia), Sr. Unsec’d. Notes, 144A | | | 5.250% | | | 01/08/47 | | | | | | | 1,280 | | | | 1,276,316 | |
Indonesia Government International Bond (Indonesia), Sr. Unsec’d. Notes, RegS, EMTN, RegS | | | 3.750% | | | 06/14/28 | | | EUR | | | | 500 | | | | 535,107 | |
Italy Government International Bond (Italy), Sr. Unsec’d. Notes, RegS | | | 3.450% | | | 03/24/17 | | | JPY | | | | 170,000 | | | | 1,468,131 | |
Mexico Government International Bond (Mexico), Sr. Unsec’d. Notes | | | 4.600% | | | 01/23/46 | | | | | | | 700 | | | | 628,250 | |
Mexico Government International Bond (Mexico), Sr. Unsec’d. Notes, MTN | | | 4.750% | | | 03/08/44 | | | | | | | 462 | | | | 420,097 | |
Panama Government International Bond (Panama), Sr. Unsec’d. Notes | | | 3.750% | | | 03/16/25 | | | | | | | 450 | | | | 446,625 | |
Peru Enhanced Pass-Through Finance Ltd. (Peru), Pass-Through Certificates, 144A | | | 3.974% | (g) | | 05/31/18 | | | | | | | 296 | | | | 288,325 | |
Philippine Government International Bond (Philippines), Sr. Unsec’d. Notes | | | 9.500% | | | 02/02/30 | | | | | | | 450 | | | | 709,065 | |
Portugal Government International Bond (Portugal), Sr. Unsec’d. Notes, RegS, RegS, MTN | | | 5.125% | | | 10/15/24 | | | | | | | 2,100 | | | | 2,031,750 | |
Romanian Government International Bond (Romania), Sr. Unsec’d. Notes, 144A, MTN | | | 3.875% | | | 10/29/35 | | | EUR | | | | 945 | | | | 1,045,739 | |
Romanian Government International Bond (Romania), Sr. Unsec’d. Notes, RegS, MTN | | | 3.875% | | | 10/29/35 | | | EUR | | | | 1,000 | | | | 1,106,602 | |
Saudi Government International Bond (Saudi Arabia), Sr. Unsec’d. Notes, 144A | | | 3.250% | | | 10/26/26 | | | | | | | 1,450 | | | | 1,374,635 | |
Slovenia Government International Bond (Slovenia), Sr. Unsec’d. Notes, RegS | | | 5.250% | | | 02/18/24 | | | | | | | 600 | | | | 657,300 | |
Slovenia Government International Bond (Slovenia), Sr. Unsec’d. Notes, RegS | | | 5.500% | | | 10/26/22 | | | | | | | 1,300 | | | | 1,436,469 | |
Slovenia Government International Bond (Slovenia), Sr. Unsec’d. Notes, RegS | | | 5.850% | | | 05/10/23 | | | | | | | 200 | | | | 225,285 | |
Turkey Government International Bond (Turkey), Sr. Unsec’d. Notes | | | 5.625% | | | 03/30/21 | | | | | | | 500 | | | | 512,700 | |
Turkey Government International Bond (Turkey), Sr. Unsec’d. Notes | | | 7.000% | | | 06/05/20 | | | | | | | 1,510 | | | | 1,621,320 | |
| | | | | | | | | | | | | | | | |
|
|
|
TOTAL SOVEREIGN BONDS
(cost $44,204,128) | | | | 41,340,265 | |
| | | | | | | | | | | | | | | | |
|
|
|
| U.S. GOVERNMENT AGENCY OBLIGATIONS — 1.5% | |
Federal Home Loan Mortgage Corp. | | | 5.500% | | | 10/01/33 | | | | | | | 854 | | | | 976,144 | |
Federal Home Loan Mortgage Corp. | | | 5.500% | | | 06/01/34 | | | | | | | 14 | | | | 16,147 | |
Federal Home Loan Mortgage Corp. | | | 6.000% | | | 11/01/33 | | | | | | | 297 | | | | 342,699 | |
Federal Home Loan Mortgage Corp. | | | 6.000% | | | 05/01/34 | | | | | | | 145 | | | | 163,986 | |
Federal Home Loan Mortgage Corp. | | | 6.000% | | | 06/01/34 | | | | | | | 165 | | | | 186,926 | |
Federal Home Loan Mortgage Corp.(i) | | | 6.250% | | | 07/15/32 | | | | | | | 830 | | | | 1,142,196 | |
Federal Home Loan Mortgage Corp. | | | 6.500% | | | 07/01/32 | | | | | | | 33 | | | | 37,256 | |
Federal Home Loan Mortgage Corp. | | | 6.500% | | | 07/01/32 | | | | | | | 35 | | | | 38,967 | |
Federal Home Loan Mortgage Corp. | | | 6.500% | | | 08/01/32 | | | | | | | 79 | | | | 89,708 | |
Federal Home Loan Mortgage Corp. | | | 6.500% | | | 08/01/32 | | | | | | | 80 | | | | 90,094 | |
Federal Home Loan Mortgage Corp. | | | 6.500% | | | 08/01/32 | | | | | | | 67 | | | | 77,620 | |
Federal Home Loan Mortgage Corp. | | | 6.500% | | | 09/01/32 | | | | | | | 184 | | | | 207,706 | |
Federal Home Loan Mortgage Corp. | | | 6.500% | | | 09/01/32 | | | | | | | 66 | | | | 74,453 | |
Federal Home Loan Mortgage Corp.(i) | | | 6.750% | | | 03/15/31 | | | | | | | 600 | | | | 845,633 | |
Federal National Mortgage Assoc. | | | 5.500% | | | 02/01/33 | | | | | | | 33 | | | | 37,468 | |
Federal National Mortgage Assoc. | | | 5.500% | | | 02/01/33 | | | | | | | 27 | | | | 29,722 | |
Federal National Mortgage Assoc. | | | 5.500% | | | 03/01/33 | | | | | | | 95 | | | | 107,008 | |
Federal National Mortgage Assoc. | | | 5.500% | | | 03/01/33 | | | | | | | 84 | | | | 93,756 | |
Federal National Mortgage Assoc. | | | 5.500% | | | 03/01/33 | | | | | | | 40 | | | | 45,044 | |
Federal National Mortgage Assoc. | | | 5.500% | | | 04/01/33 | | | | | | | 54 | | | | 60,248 | |
Federal National Mortgage Assoc. | | | 5.500% | | | 04/01/33 | | | | | | | 59 | | | | 66,412 | |
SEE NOTES TO FINANCIAL STATEMENTS.
A52
| | | | | | |
| | | DIVERSIFIED BOND PORTFOLIO (continued) | | |
| |
| SCHEDULE OF INVESTMENTS | | as of December 31, 2016 |
| | | | | | | | | | | | | | | | | | |
U.S. GOVERNMENT AGENCY OBLIGATIONS
(Continued) | | Interest
Rate
| | | Maturity
Date
| | Principal
Amount
(000)#
| | | Value
(Note 2)
| |
Federal National Mortgage Assoc. | | | 5.500% | | | 04/01/33 | | | | | | | 12 | | | $ | 13,632 | |
Federal National Mortgage Assoc. | | | 5.500% | | | 04/01/33 | | | | | | | 43 | | | | 47,472 | |
Federal National Mortgage Assoc. | | | 5.500% | | | 07/01/33 | | | | | | | 63 | | | | 70,833 | |
Federal National Mortgage Assoc. | | | 5.500% | | | 07/01/33 | | | | | | | 64 | | | | 71,795 | |
Federal National Mortgage Assoc. | | | 5.500% | | | 08/01/33 | | | | | | | 20 | | | | 22,752 | |
Federal National Mortgage Assoc. | | | 5.500% | | | 02/01/34 | | | | | | | 49 | | | | 55,382 | |
Federal National Mortgage Assoc. | | | 5.500% | | | 04/01/34 | | | | | | | 61 | | | | 68,921 | |
Federal National Mortgage Assoc. | | | 5.500% | | | 06/01/34 | | | | | | | 44 | | | | 49,159 | |
Federal National Mortgage Assoc. | | | 6.000% | | | 10/01/33 | | | | | | | 393 | | | | 456,184 | |
Federal National Mortgage Assoc. | | | 6.000% | | | 10/01/33 | | | | | | | 4 | | | | 4,442 | |
Federal National Mortgage Assoc. | | | 6.000% | | | 03/01/34 | | | | | | | 165 | | | | 188,205 | |
Federal National Mortgage Assoc. | | | 6.000% | | | 02/01/35 | | | | | | | 310 | | | | 357,792 | |
Federal National Mortgage Assoc. | | | 6.000% | | | 11/01/36 | | | | | | | 99 | | | | 112,602 | |
Federal National Mortgage Assoc.(i) | | | 6.250% | | | 05/15/29 | | | | | | | 1,090 | | | | 1,444,807 | |
Federal National Mortgage Assoc. | | | 6.500% | | | 08/01/32 | | | | | | | 184 | | | | 209,059 | |
Federal National Mortgage Assoc. | | | 6.500% | | | 09/01/32 | | | | | | | 153 | | | | 172,846 | |
Federal National Mortgage Assoc. | | | 6.500% | | | 09/01/32 | | | | | | | 286 | | | | 332,290 | |
Federal National Mortgage Assoc. | | | 6.500% | | | 10/01/32 | | | | | | | 125 | | | | 141,882 | |
Federal National Mortgage Assoc. | | | 6.500% | | | 04/01/33 | | | | | | | 273 | | | | 317,399 | |
Federal National Mortgage Assoc. | | | 6.500% | | | 11/01/33 | | | | | | | 8 | | | | 9,138 | |
Federal National Mortgage Assoc.(i) | | | 6.625% | | | 11/15/30 | | | | | | | 530 | | | | 737,276 | |
Federal National Mortgage Assoc. | | | 7.000% | | | 05/01/32 | | | | | | | 125 | | | | 135,297 | |
Federal National Mortgage Assoc. | | | 7.000% | | | 06/01/32 | | | | | | | 10 | | | | 11,502 | |
Federal National Mortgage Assoc.(i) | | | 7.125% | | | 01/15/30 | | | | | | | 785 | | | | 1,120,168 | |
Government National Mortgage Assoc. | | | 5.500% | | | 01/15/33 | | | | | | | 110 | | | | 124,110 | |
Government National Mortgage Assoc. | | | 5.500% | | | 02/15/33 | | | | | | | 87 | | | | 98,584 | |
Government National Mortgage Assoc. | | | 5.500% | | | 05/15/33 | | | | | | | 206 | | | | 230,139 | |
Government National Mortgage Assoc. | | | 5.500% | | | 05/15/33 | | | | | | | 151 | | | | 167,891 | |
Government National Mortgage Assoc. | | | 5.500% | | | 06/15/33 | | | | | | | 236 | | | | 268,507 | |
Government National Mortgage Assoc. | | | 5.500% | | | 09/15/33 | | | | | | | 159 | | | | 179,673 | |
Government National Mortgage Assoc. | | | 5.500% | | | 07/15/35 | | | | | | | 124 | | | | 139,515 | |
Government National Mortgage Assoc. | | | 6.000% | | | 12/15/32 | | | | | | | 190 | | | | 225,511 | |
Government National Mortgage Assoc. | | | 6.000% | | | 11/15/33 | | | | | | | 92 | | | | 106,842 | |
Government National Mortgage Assoc. | | | 6.000% | | | 01/15/34 | | | | | | | 17 | | | | 19,843 | |
Government National Mortgage Assoc. | | | 6.000% | | | 06/20/34 | | | | | | | 518 | | | | 602,715 | |
Government National Mortgage Assoc. | | | 6.000% | | | 11/15/34 | | | | | | | 851 | | | | 1,002,213 | |
Government National Mortgage Assoc. | | | 6.500% | | | 09/15/32 | | | | | | | 246 | | | | 281,318 | |
Government National Mortgage Assoc. | | | 6.500% | | | 09/15/32 | | | | | | | 270 | | | | 308,222 | |
Government National Mortgage Assoc. | | | 6.500% | | | 09/15/32 | | | | | | | 128 | | | | 145,853 | |
Government National Mortgage Assoc. | | | 6.500% | | | 11/15/33 | | | | | | | 223 | | | | 254,226 | |
Tennessee Valley Authority, Sr. Unsec’d. Notes | | | 7.125% | | | 05/01/30 | | | | | | | 950 | | | | 1,353,311 | |
| | | | | | | | | | | | | | | | |
|
|
|
TOTAL U.S. GOVERNMENT AGENCY OBLIGATIONS
(cost $15,842,436) | | | | 16,388,501 | |
| | | | | | | | | | | | | | | | |
|
|
|
| U.S. TREASURY OBLIGATIONS — 1.6% | |
U.S. Treasury Bonds(j) | | | 2.250% | | | 08/15/46 | | | | | | | 1,680 | | | | 1,412,578 | |
U.S. Treasury Bonds(i)(j) | | | 2.500% | | | 05/15/46 | | | | | | | 2,105 | | | | 1,870,654 | |
U.S. Treasury Bonds(i)(j) | | | 2.875% | | | 05/15/43 | | | | | | | 3,955 | | | | 3,820,126 | |
U.S. Treasury Bonds(j) | | | 4.250% | | | 11/15/40 | | | | | | | 2,350 | | | | 2,853,046 | |
U.S. Treasury Notes(i) | | | 1.375% | | | 04/30/21 | | | | | | | 285 | | | | 279,578 | |
U.S. Treasury Notes | | | 2.000% | | | 11/15/26 | | | | | | | 2,120 | | | | 2,039,754 | |
U.S. Treasury Notes(i) | | | 2.250% | | | 07/31/21 | | | | | | | 805 | | | | 817,609 | |
U.S. Treasury Strips Coupon, IO(j) | | | 2.783% | (g) | | 08/15/29 | | | | | | | 1,200 | | | | 844,405 | |
U.S. Treasury Strips Coupon, IO(j) | | | 2.878% | (g) | | 05/15/31 | | | | | | | 1,200 | | | | 795,160 | |
U.S. Treasury Strips Coupon, IO(i)(j) | | | 3.042% | (g) | | 11/15/35 | | | | | | | 2,400 | | | | 1,359,329 | |
U.S. Treasury Strips Coupon, IO(i) | | | 3.202% | (g) | | 08/15/40 | | | | | | | 2,400 | | | | 1,133,734 | |
| | | | | | | | | | | | | | | | |
|
|
|
TOTAL U.S. TREASURY OBLIGATIONS
(cost $17,909,144) | | | | 17,225,973 | |
| | | | | | | | | | | | | | | | |
|
|
|
SEE NOTES TO FINANCIAL STATEMENTS.
A53
| | | | | | |
| | | DIVERSIFIED BOND PORTFOLIO (continued) | | |
| |
| SCHEDULE OF INVESTMENTS | | as of December 31, 2016 |
| | | | | | | | | | | | | | | | |
| PREFERRED STOCKS — 0.2% | | | | | | Principal
Amount
(000)#
| | | Value
(Note 2)
| |
Banking | |
Citigroup Capital XIII, 7.257%, (Capital Security, fixed to floating preferred)(a) | | | | | | | 45,000 | | | $ | 1,161,900 | |
State Street Corp., 5.35%(a) | | | | | | | 35,000 | | | | 875,700 | |
| | | | | | | | | | | | | | |
|
|
|
TOTAL PREFERRED STOCKS
(cost $2,000,000) | | | | 2,037,600 | |
| | | | | | | | | | | | | | |
|
|
|
TOTAL LONG-TERM INVESTMENTS
(cost $969,576,022) | | | | 986,756,490 | |
| | | | | | | | | | | | | | |
|
|
|
| | | | |
| | | | | | | Shares
| | | | |
| SHORT-TERM INVESTMENTS — 9.1% | |
AFFILIATED MUTUAL FUNDS | |
Prudential Investment Portfolios 2 — Prudential Core Short-Term Bond Fund(k) | | | | | | | 8,928,002 | | | | 82,762,575 | |
Prudential Investment Portfolios 2 — Prudential Core Ultra Short Bond Fund(k) | | | | | | | 7,204,262 | | | | 7,204,262 | |
Prudential Investment Portfolios 2 — Prudential Institutional Money Market Fund
(cost $10,072,615; includes $10,066,753 of cash collateral for securities on loan)(k)(l) | | | | | | | 10,071,571 | | | | 10,073,585 | |
| | | | | | | | | | | | | | |
|
|
|
TOTAL SHORT-TERM INVESTMENTS
(cost $103,890,836) (Note 4) | | | | 100,040,422 | |
| | | | | | | | | | | | | | |
|
|
|
TOTAL INVESTMENTS — 98.4%
(cost $1,073,466,858) | | | | 1,086,796,912 | |
OTHER ASSETS IN EXCESS OF LIABILITIES(m) — 1.6% | | | | 17,781,706 | |
| | | | | | | | | | | | | | |
|
|
|
NET ASSETS — 100.0% | | | $ | 1,104,578,618 | |
| | | | | | | | | | | | | | |
|
|
|
See the Glossary for abbreviations used in the annual report.
| # | Principal or notional amount is shown in U.S. dollars unless otherwise stated. |
| (a) | Variable rate instrument. The interest rate shown reflects the rate in effect at December 31, 2016. |
| (b) | Indicates a Level 3 security. The aggregate value of Level 3 securities is $31,059,799 and 2.8% of net assets. |
| (c) | Indicates a security or securities that have been deemed illiquid. (unaudited) |
| (d) | Indicates a restricted security; the aggregate original cost of such securities is $1,317,944. The aggregate value, $1,334,142, is approximately 0.1% of net assets. |
| (e) | All or a portion of security is on loan. The aggregate market value of such securities, including those sold and pending settlement, is $9,861,400; cash collateral of $10,066,753 (included in liabilities) was received with which the Portfolio purchased highly liquid short-term investments. Securities on loan are subject to contractual netting arrangements. |
| (f) | Represents issuer in default on interest payments. Non-income producing security. |
| (g) | Represents zero coupon bond or principal only securities. Rate represents yield to maturity at purchase date. |
| (h) | Represents CAS issued by Fannie Mae or a STACR securities issued by Freddie Mac. |
| (i) | Represents security, or a portion thereof, segregated as collateral for centrally cleared swap agreements. |
| (j) | Represents security, or a portion thereof, segregated as collateral for futures contracts. |
| (k) | Prudential Investments LLC, the manager of the Portfolio, also serves as manager of the Prudential Investment Portfolios 2 — Prudential Core Short-Term Bond Fund, the Prudential Investment Portfolios 2 — Prudential Core Ultra Short Bond Fund and the Prudential Investment Portfolios 2 — Prudential Institutional Money Market Fund. |
| (l) | Represents security purchased with cash collateral received for securities on loan and includes dividend reinvestment. |
| (m) | Includes net unrealized appreciation (depreciation) on the following derivative contracts held at reporting period end: |
SEE NOTES TO FINANCIAL STATEMENTS.
A54
| | | | | | |
| | | DIVERSIFIED BOND PORTFOLIO (continued) | | |
| |
| SCHEDULE OF INVESTMENTS | | as of December 31, 2016 |
Futures contracts outstanding at December 31, 2016:
| | | | | | | | | | | | | | | | | | | | | | |
Number of
Contracts
| | | Type
| | | Expiration
Date
| | | Value at
Trade Date
| | | Value at
December 31, 2016
| | | Unrealized
Appreciation
(Depreciation)
| |
| | Long Positions: | | | | | | | | | | | | | | | | | | | | | |
| | 4,694 | | | | 5 Year U.S. Treasury Notes | | | Mar. | 2017 | | | $ | 555,006,605 | | | $ | 552,315,109 | | | $ | (2,691,496 | ) |
| | 2,272 | | | | 10 Year U.S. Treasury Notes | | | Mar. | 2017 | | | | 283,201,306 | | | | 282,367,000 | | | | (834,306 | ) |
| | 81 | | | | 20 Year U.S. Treasury Bonds | | | Mar. | 2017 | | | | 12,056,975 | | | | 12,203,156 | | | | 146,181 | |
| | 487 | | | | 30 Year U.S. Ultra Treasury Bonds | | | Mar. | 2017 | | | | 78,712,591 | | | | 78,041,750 | | | | (670,841 | ) |
| | | | | | | | | | | | | | | | | | | | |
|
|
|
| | | | | | | | | | | | | | | | | | | | | | (4,050,462 | ) |
| | | | | | | | | | | | | | | | | | | | |
|
|
|
| | Short Position: | | | | | | | | | | | | | | | | | | | | | |
| | 342 | | | | 2 Year U.S. Treasury Notes | | | Mar. | 2017 | | | | 74,027,194 | | | | 74,107,125 | | | | (79,931 | ) |
| | | | | | | | | | | | | | | | | | | | |
|
|
|
| | | | | | | | | | | | | | | | | | | | | $ | (4,130,393 | ) |
| | | | | | | | | | | | | | | | | | | | |
|
|
|
Cash of $3,010,000 and U.S. Treasury Obligations with a combined market value of $7,967,406 have been segregated with Citigroup Global Markets to cover requirements for open futures contracts at December 31, 2016.
Forward foreign currency exchange contracts outstanding at December 31, 2016:
| | | | | | | | | | | | | | | | | | |
Purchase Contracts
| | Counterparty
| | Notional
Amount
(000)
| | | Value at
Settlement
Date
| | | Current
Value
| | | Unrealized
Appreciation
(Depreciation)
| |
OTC forward foreign currency exchange contracts: | |
Mexican Peso, | | | | | | | | | | | | | | | | | | |
Expiring 01/24/17 | | Goldman Sachs & Co. | | MXN | 24,824 | | | $ | 1,211,100 | | | $ | 1,192,981 | | | $ | (18,119 | ) |
| | | | | | | | |
|
|
| |
|
|
| |
|
|
|
| | | | | |
Sale Contracts
| | Counterparty
| | Notional
Amount
(000)
| | | Value at
Settlement Date
| | | Current
Value
| | | Unrealized
Appreciation
(Depreciation)
| |
OTC forward foreign currency exchange contracts: | | | | | | | | | | | | | |
Australian Dollar, | | | | | | | | | | | | | | | | | | |
Expiring 01/13/17 | | BNP Paribas | | AUD | 559 | | | $ | 421,860 | | | $ | 403,519 | | | $ | 18,341 | |
British Pound, | | | | | | | | | | | | | | | | | | |
Expiring 01/27/17 | | Goldman Sachs & Co. | | GBP | 2,078 | | | | 2,640,357 | | | | 2,562,526 | | | | 77,831 | |
Expiring 01/27/17 | | UBS AG | | GBP | 3,839 | | | | 4,666,257 | | | | 4,734,507 | | | | (68,250 | ) |
Euro, | | | | | | | | | | | | | | | | | | |
Expiring 01/27/17 | | Goldman Sachs & Co. | | EUR | 16,967 | | | | 18,548,092 | | | | 17,887,230 | | | | 660,862 | |
Expiring 01/27/17 | | JPMorgan Chase | | EUR | 419 | | | | 458,859 | | | | 442,089 | | | | 16,770 | |
Hungarian Forint, | | | | | | | | | | | | | | | | | | |
Expiring 01/25/17 | | Citigroup Global Markets | | HUF | 219,665 | | | | 786,908 | | | | 748,329 | | | | 38,579 | |
Israeli Shekel, | | | | | | | | | | | | | | | | | | |
Expiring 01/19/17 | | Citigroup Global Markets | | ILS | 400 | | | | 104,693 | | | | 104,008 | | | | 685 | |
Japanese Yen, | | | | | | | | | | | | | | | | | | |
Expiring 01/27/17 | | UBS AG | | JPY | 45,193 | | | | 435,024 | | | | 387,300 | | | | 47,724 | |
Mexican Peso, | | | | | | | | | | | | | | | | | | |
Expiring 01/24/17 | | Goldman Sachs & Co. | | MXN | 16,772 | | | | 892,322 | | | | 805,993 | | | | 86,329 | |
Polish Zloty, | | | | | | | | | | | | | | | | | | |
Expiring 01/25/17 | | Goldman Sachs & Co. | | PLN | 2,314 | | | | 587,203 | | | | 552,682 | | | | 34,521 | |
South African Rand, | | | | | | | | | | | | | | | | | | |
Expiring 01/13/17 | | Toronto Dominion | | ZAR | 9,060 | | | | 618,700 | | | | 657,916 | | | | (39,216 | ) |
| | | | | | | | |
|
|
| |
|
|
| |
|
|
|
| | | | | | | | | $ | 30,160,275 | | | $ | 29,286,099 | | | | 874,176 | |
| | | | | | | | |
|
|
| |
|
|
| |
|
|
|
| | | | | | | | | | | | | | | | | $ | 856,057 | |
| | | | | | | | | | | | | | | | |
|
|
|
SEE NOTES TO FINANCIAL STATEMENTS.
A55
| | | | | | |
| | | DIVERSIFIED BOND PORTFOLIO (continued) | | |
| |
| SCHEDULE OF INVESTMENTS | | as of December 31, 2016 |
| | | | | | | | | | | | | | | | | | | | | | | | |
Credit default swap agreements outstanding at December 31, 2016: | |
Reference Entity/
Obligation
| | Termination
Date
| | | Fixed
Rate
| | | Notional
Amount
(000)#(3)
| | | Value at
Trade
Date
| | | Value at
December 31,
2016(4)
| | | Unrealized
Appreciation
(Depreciation)
| |
Centrally cleared credit default swap on credit indices—Buy Protection(1): | | | | | | | | | | | | | |
CDX.NA.HY.27.V1 | | | 12/20/21 | | | | 5.000% | | | | 13,900 | | | $ | (484,261 | ) | | $ | (860,521 | ) | | $ | (376,260 | ) |
| | | | | | | | | | | | | | |
|
|
| |
|
|
| |
|
|
|
| | | | | | |
Reference Entity/
Obligation
| | Termination
Date
| | | Fixed
Rate
| | | Notional
Amount
(000)#(3)
| | | Value at
Trade
Date
| | | Value at
December 31,
2016(4)
| | | Unrealized
Appreciation
(Depreciation)
| |
Centrally cleared credit default swaps on corporate and/or sovereign issues—Sell Protection(2): | |
CIT Group, Inc. | | | 06/20/18 | | | | 5.000% | | | | 5,350 | | | $ | 341,964 | | | $ | 347,123 | | | $ | 5,159 | |
General Motors Co. | | | 06/20/19 | | | | 5.000% | | | | 1,925 | | | | 216,698 | | | | 197,218 | | | | (19,480 | ) |
| | | | | | | | | | | | | | |
|
|
| |
|
|
| |
|
|
|
| | | | | | | | | | | | | | | $ | 558,662 | | | $ | 544,341 | | | $ | (14,321 | ) |
| | | | | | | | | | | | | | |
|
|
| |
|
|
| |
|
|
|
| | | | | | | | | | | | | | | | | | | | | | | | | | |
Reference Entity/
Obligation
| | Termination
Date
| | | Fixed
Rate
| | | Notional
Amount
(000)#(3)
| | | Fair
Value(4)
| | | Upfront
Premiums
Paid
(Received)
| | | Unrealized
Appreciation
(Depreciation)
| | | Counterparty
|
OTC credit default swaps on asset-backed securities—Sell Protection(2)(b): |
Ameriquest Home Equity | | | 01/30/17 | | | | 1.500% | | | | 261 | | | $ | 380 | | | $ | — | | | $ | 380 | | | Goldman Sachs & Co. |
Ameriquest Home Equity | | | 01/30/17 | | | | 1.500% | | | | 110 | | | | 160 | | | | — | | | | 160 | | | Goldman Sachs & Co. |
Ameriquest Home Equity | | | 01/30/17 | | | | 1.500% | | | | 172 | | | | 251 | | | | — | | | | 251 | | | Goldman Sachs & Co. |
Ameriquest Home Equity | | | 01/30/17 | | | | 1.500% | | | | 178 | | | | 259 | | | | — | | | | 259 | | | Goldman Sachs & Co. |
Ameriquest Home Equity | | | 01/30/17 | | | | 1.500% | | | | 137 | | | | 199 | | | | — | | | | 199 | | | Goldman Sachs & Co. |
Ameriquest Home Equity | | | 01/30/17 | | | | 1.500% | | | | 220 | | | | 320 | | | | — | | | | 320 | | | Goldman Sachs & Co. |
Ameriquest Home Equity | | | 01/30/17 | | | | 1.500% | | | | 273 | | | | 398 | | | | — | | | | 398 | | | Goldman Sachs & Co. |
Bank of America Prime Mortgage | | | 01/30/17 | | | | 1.500% | | | | 595 | | | | 867 | | | | — | | | | 867 | | | Goldman Sachs & Co. |
Bear Stearns Asset Backed Securities Trust | | | 01/30/17 | | | | 1.500% | | | | 422 | | | | 53 | | | | — | | | | 53 | | | Goldman Sachs & Co. |
Bear Stearns Asset Backed Securities Trust | | | 01/30/17 | | | | 1.500% | | | | 116 | | | | 170 | | | | — | | | | 170 | | | Goldman Sachs & Co. |
Chase Mortgage | | | 01/30/17 | | | | 1.500% | | | | 161 | | | | 234 | | | | — | | | | 234 | | | Goldman Sachs & Co. |
Chase Mortgage | | | 01/30/17 | | | | 1.500% | | | | 414 | | | | 604 | | | | — | | | | 604 | | | Goldman Sachs & Co. |
Chase Mortgage | | | 01/30/17 | | | | 1.500% | | | | 414 | | | | 603 | | | | — | | | | 603 | | | Goldman Sachs & Co. |
Citigroup Commercial Mortgage Trust | | | 01/23/17 | | | | 1.500% | | | | 92 | | | | 134 | | | | — | | | | 134 | | | Goldman Sachs & Co. |
Citigroup Mortgage Loan Trust | | | 01/30/17 | | | | 1.500% | | | | 143 | | | | 208 | | | | — | | | | 208 | | | Goldman Sachs & Co. |
Citigroup Mortgage Loan Trust | | | 01/30/17 | | | | 1.500% | | | | 170 | | | | 248 | | | | — | | | | 248 | | | Goldman Sachs & Co. |
COMM Mortgage Trust | | | 01/23/17 | | | | 1.500% | | | | 61 | | | | 89 | | | | — | | | | 89 | | | Goldman Sachs & Co. |
COMM Mortgage Trust | | | 01/23/17 | | | | 1.500% | | | | 380 | | | | 554 | | | | — | | | | 554 | | | Goldman Sachs & Co. |
COMM Mortgage Trust | | | 01/23/17 | | | | 1.500% | | | | 411 | | | | 599 | | | | — | | | | 599 | | | Goldman Sachs & Co. |
COMM Mortgage Trust | | | 01/23/17 | | | | 1.500% | | | | 205 | | | | 299 | | | | — | | | | 299 | | | Goldman Sachs & Co. |
COMM Mortgage Trust | | | 01/23/17 | | | | 1.500% | | | | 49 | | | | 71 | | | | — | | | | 71 | | | Goldman Sachs & Co. |
COMM Mortgage Trust | | | 01/23/17 | | | | 1.500% | | | | 45 | | | | 66 | | | | — | | | | 66 | | | Goldman Sachs & Co. |
COMM Mortgage Trust | | | 01/23/17 | | | | 1.500% | | | | 104 | | | | 152 | | | | — | | | | 152 | | | Goldman Sachs & Co. |
Commercial Mortgage Pass Through Certificate | | | 01/23/17 | | | | 1.500% | | | | 88 | | | | 128 | | | | — | | | | 128 | | | Goldman Sachs & Co. |
Countrywide Home Equity | | | 01/30/17 | | | | 1.500% | | | | 154 | | | | 225 | | | | — | | | | 225 | | | Goldman Sachs & Co. |
Countrywide Home Equity | | | 01/30/17 | | | | 1.500% | | | | 217 | | | | 316 | | | | — | | | | 316 | | | Goldman Sachs & Co. |
Countrywide Home Equity | | | 01/30/17 | | | | 1.500% | | | | 173 | | | | 252 | | | | — | | | | 252 | | | Goldman Sachs & Co. |
Federal Home Loan Mortgage Corp. | | | 01/03/17 | | | | 1.500% | | | | 79 | | | | 16 | | | | — | | | | 16 | | | Goldman Sachs & Co. |
Federal Home Loan Mortgage Corp. | | | 01/03/17 | | | | 1.500% | | | | 920 | | | | 190 | | | | — | | | | 190 | | | Goldman Sachs & Co. |
Federal Home Loan Mortgage Corp. | | | 01/03/17 | | | | 1.500% | | | | 314 | | | | 62 | | | | — | | | | 62 | | | Goldman Sachs & Co. |
GS Mortgage Securities Trust | | | 01/23/17 | | | | 1.500% | | | | 100 | | | | 146 | | | | — | | | | 146 | | | Goldman Sachs & Co. |
GS Mortgage Securities Trust | | | 01/23/17 | | | | 1.500% | | | | 380 | | | | 554 | | | | — | | | | 554 | | | Goldman Sachs & Co. |
GS Mortgage Securities Trust | | | 01/23/17 | | | | 1.500% | | | | 143 | | | | 208 | | | | — | | | | 208 | | | Goldman Sachs & Co. |
GS Mortgage Securities Trust | | | 01/23/17 | | | | 1.500% | | | | 80 | | | | 117 | | | | — | | | | 117 | | | Goldman Sachs & Co. |
GS Mortgage Securities Trust | | | 01/23/17 | | | | 1.500% | | | | 84 | | | | 122 | | | | — | | | | 122 | | | Goldman Sachs & Co. |
GS Mortgage Securities Trust | | | 01/23/17 | | | | 1.500% | | | | 162 | | | | 236 | | | | — | | | | 236 | | | Goldman Sachs & Co. |
GS Mortgage Securities Trust | | | 01/23/17 | | | | 1.500% | | | | 139 | | | | 203 | | | | — | | | | 203 | | | Goldman Sachs & Co. |
GS Mortgage Securities Trust | | | 01/23/17 | | | | 1.500% | | | | 53 | | | | 77 | | | | — | | | | 77 | | | Goldman Sachs & Co. |
SEE NOTES TO FINANCIAL STATEMENTS.
A56
| | | | | | |
| | | DIVERSIFIED BOND PORTFOLIO (continued) | | |
| |
| SCHEDULE OF INVESTMENTS | | as of December 31, 2016 |
Credit default swap agreements outstanding at December 31, 2016 (continued):
| | | | | | | | | | | | | | | | | | | | | | | | | | |
Reference Entity/
Obligation
| | Termination
Date
| | | Fixed
Rate
| | | Notional
Amount
(000)#(3)
| | |
Fair
Value(4)
| | | Upfront
Premiums
Paid
(Received)
| | | Unrealized
Appreciation
(Depreciation)
| | | Counterparty
|
OTC credit default swaps on asset-backed securities—Sell Protection(2)(b) (continued): |
GS Mortgage Securities Trust | | | 01/23/17 | | | | 1.500% | | | | 150 | | | $ | 219 | | | $ | — | | | $ | 219 | | | Goldman Sachs & Co. |
GSAMP Home Equity | | | 01/30/17 | | | | 1.500% | | | | 175 | | | | 254 | | | | — | | | | 254 | | | Goldman Sachs & Co. |
GSAMP Home Equity | | | 01/30/17 | | | | 1.500% | | | | 265 | | | | 386 | | | | — | | | | 386 | | | Goldman Sachs & Co. |
Indymac Subprime Mortgage | | | 01/30/17 | | | | 1.500% | | | | 144 | | | | 187 | | | | — | | | | 187 | | | Goldman Sachs & Co. |
Indymac Subprime Mortgage | | | 01/30/17 | | | | 1.500% | | | | 389 | | | | (193 | ) | | | — | | | | (193 | ) | | Goldman Sachs & Co. |
JPMBB Commercial Mortgage Securities Trust | | | 01/23/17 | | | | 1.500% | | | | 193 | | | | 281 | | | | — | | | | 281 | | | Goldman Sachs & Co. |
JPMBB Commercial Mortgage Securities Trust | | | 01/23/17 | | | | 1.500% | | | | 57 | | | | 83 | | | | — | | | | 83 | | | Goldman Sachs & Co. |
JPMorgan Chase Commercial Mortgage | | | 01/23/17 | | | | 1.500% | | | | 53 | | | | 77 | | | | — | | | | 77 | | | Goldman Sachs & Co. |
Lehman Home Equity | | | 01/30/17 | | | | 1.500% | | | | 330 | | | | 481 | | | | — | | | | 481 | | | Goldman Sachs & Co. |
LNR CDO Ltd. | | | 01/11/17 | | | | 1.500% | | | | 1,560 | | | | 2,143 | | | | — | | | | 2,143 | | | Goldman Sachs & Co. |
Long Beach Home Equity | | | 01/30/17 | | | | 1.500% | | | | 310 | | | | 452 | | | | — | | | | 452 | | | Goldman Sachs & Co. |
Morgan Stanley BAML Trust | | | 01/23/17 | | | | 1.500% | | | | 395 | | | | 576 | | | | — | | | | 576 | | | Goldman Sachs & Co. |
Morgan Stanley BAML Trust | | | 01/23/17 | | | | 1.500% | | | | 57 | | | | 83 | | | | — | | | | 83 | | | Goldman Sachs & Co. |
Morgan Stanley BAML Trust | | | 01/23/17 | | | | 1.500% | | | | 73 | | | | 106 | | | | — | | | | 106 | | | Goldman Sachs & Co. |
Morgan Stanley BAML Trust | | | 01/23/17 | | | | 1.500% | | | | 88 | | | | 128 | | | | — | | | | 128 | | | Goldman Sachs & Co. |
Morgan Stanley Home Equity | | | 01/30/17 | | | | 1.500% | | | | 134 | | | | 195 | | | | — | | | | 195 | | | Goldman Sachs & Co. |
New Century Home Equity | | | 01/30/17 | | | | 1.500% | | | | 339 | | | | 493 | | | | — | | | | 493 | | | Goldman Sachs & Co. |
New Century Home Equity | | | 01/30/17 | | | | 1.500% | | | | 300 | | | | 438 | | | | — | | | | 438 | | | Goldman Sachs & Co. |
New Century Home Equity | | | 01/30/17 | | | | 1.500% | | | | 153 | | | | 223 | | | | — | | | | 223 | | | Goldman Sachs & Co. |
New Century Home Equity | | | 01/30/17 | | | | 1.500% | | | | 179 | | | | 260 | | | | — | | | | 260 | | | Goldman Sachs & Co. |
New Century Home Equity | | | 01/30/17 | | | | 1.500% | | | | 184 | | | | 268 | | | | — | | | | 268 | | | Goldman Sachs & Co. |
Option One Home Equity | | | 01/30/17 | | | | 1.500% | | | | 564 | | | | 822 | | | | — | | | | 822 | | | Goldman Sachs & Co. |
Option One Home Equity | | | 01/30/17 | | | | 1.500% | | | | 318 | | | | 463 | | | | — | | | | 463 | | | Goldman Sachs & Co. |
UBS-Barclays Commercial Mortgage Trust | | | 01/23/17 | | | | 1.500% | | | | 42 | | | | 61 | | | | — | | | | 61 | | | Goldman Sachs & Co. |
Wells Fargo Home Equity | | | 01/30/17 | | | | 1.500% | | | | 116 | | | | 169 | | | | — | | | | 169 | | | Goldman Sachs & Co. |
WF-RBS Commercial Mortgage Trust | | | 01/23/17 | | | | 1.500% | | | | 49 | | | | 71 | | | | — | | | | 71 | | | Goldman Sachs & Co. |
WF-RBS Commercial Mortgage Trust | | | 01/23/17 | | | | 1.500% | | | | 57 | | | | 83 | | | | — | | | | 83 | | | Goldman Sachs & Co. |
WFCG Chase Commercial Mortgage | | | 01/23/17 | | | | 1.500% | | | | 283 | | | | 412 | | | | — | | | | 412 | | | Goldman Sachs & Co. |
| | | | | | | | | | | | | | |
|
|
| |
|
|
| |
|
|
| | |
| | | | | | | | | | | | | | | $ | 18,991 | | | $ | — | | | $ | 18,991 | | | |
| | | | | | | | | | | | | | |
|
|
| |
|
|
| |
|
|
| | |
| | | | | | | | | | | | | | | | | | | | | | | | | | | | |
Reference Entity/Obligation
| | Termination
Date
| | | Fixed
Rate
| | | Notional
Amount
(000)#(3)
| | | Implied
Credit
Spread at
December 31,
2016(5)
| | | Fair
Value
| | | Upfront
Premiums
Paid
(Received)
| | | Unrealized
Appreciation
(Depreciation)
| | Counterparty
|
OTC credit default swaps on corporate and/or sovereign Issues — Sell Protection(2): |
Petroleo Brasileriro SA | | | 06/20/18 | | | | 1.000% | | | | 2,250 | | | | 2.166 | % | | $ | (37,270 | ) | | $ | (172,518 | ) | | $ 135,248 | | Morgan Stanley |
Republic of Italy | | | 09/20/20 | | | | 1.000% | | | | 9,680 | | | | 1.421 | % | | | (140,432 | ) | | | 44,911 | | | (185,343) | | JPMorgan Chase |
Republic of Italy | | | 09/20/20 | | | | 1.000% | | | | 2,000 | | | | 1.421 | % | | | (29,014 | ) | | | 5,762 | | | (34,776) | | JPMorgan Chase |
| | | | | | | | | | | | | | | | | | |
|
|
| |
|
|
| |
| | |
| | | | | | | | | | | | | | | | | | | $ | (206,716 | ) | | $ | (121,845 | ) | | $ (84,871) | | |
| | | | | | | | | | | | | | | | | | |
|
|
| |
|
|
| |
| | |
The Portfolio entered into credit default swaps (“CDS”) to provide a measure of protection against defaults or to take an active long or short position with respect to the likelihood of a particular issuer’s default or the reference entity’s credit soundness. CDS contracts generally trade based on a spread which represents the cost a protection buyer has to pay the protection seller. The protection buyer is said to be short the credit as the value of the contract rises the more credit deteriorates. The value of the CDS contract increases for the protection buyer if the spread increases.
| (1) | If the Portfolio is a buyer of protection, it pays the fixed rate. When a credit event occurs, as defined under the terms of that particular swap agreement, the Portfolio will either (i) receive from the seller of protection an amount equal to the notional amount of the swap and make delivery of the referenced obligation or underlying securities comprising the referenced index or (ii) receive a net settlement amount in the form of cash or securities equal to the notional amount of the swap less the recovery value of the referenced obligation or underlying securities comprising the referenced index. |
SEE NOTES TO FINANCIAL STATEMENTS.
A57
| | | | | | |
| | | DIVERSIFIED BOND PORTFOLIO (continued) | | |
| |
| SCHEDULE OF INVESTMENTS | | as of December 31, 2016 |
| (2) | If the Portfolio is a seller of protection, it receives the fixed rate. When a credit event occurs, as defined under the terms of that particular swap agreement, the Portfolio will either (i) pay to the buyer of protection an amount equal to the notional amount of the swap and take delivery of the referenced obligation or underlying securities comprising the referenced index or (ii) pay a net settlement amount in the form of cash or securities equal to the notional amount of the swap less the recovery value of the referenced obligation or underlying securities comprising the referenced index. |
| (3) | Notional amount represents the maximum potential amount the Portfolio could be required to pay as a seller of credit protection or receive as a buyer of credit protection if a credit event occurs as defined under the terms of that particular swap agreement. |
| (4) | The fair value of credit default swap agreements on credit indices, asset-backed securities and centrally cleared corporate and/or sovereign issues serves as an indicator of the current status of the payment/performance risk and represents the likelihood of an expected liability (or profit) for the credit derivative should the notional amount of the swap agreement be closed/sold as of the reporting date. Increasing fair value in absolute terms, when compared to the notional amount of the swap, represents a deterioration of the referenced entity’s credit soundness and a greater likelihood of risk of default or other credit event occurring as defined under the terms of the agreement. |
| (5) | Implied credit spreads, represented in absolute terms, utilized in determining the fair value of OTC credit default swap agreements on corporate issues or sovereign issues of an emerging country as of the reporting date serve as an indicator of the current status of the payment/performance risk and represent the likelihood of risk of default for the credit derivative. The implied credit spread of a particular referenced entity reflects the cost of buying/selling protection and may include up-front payments required to be made to enter into the agreement. Wider credit spreads represent a deterioration of the referenced entity’s credit soundness and a greater likelihood of risk of default or other credit event occurring as defined under the terms of the agreement. |
Currency swap agreements outstanding at December 31, 2016:
| | | | | | | | | | | | | | | | | | | | | | | | | | | | | | |
Notional
Amount
(000)#
| | | Fund
Receives
| | | Notional
Amount
(000)#
| | Fund Pays
| | Counterparty
| | Termination
Date
| | Fair
Value
| | | Upfront
Premiums
Paid
(Received)
| | | Unrealized
Appreciation
(Depreciation)
| |
| | OTC currency swap agreements: | |
| | 278 | | | | 3 Month LIBOR | | | | EUR | | | 240 | | 3 Month EURIBOR
minus 24.50 bps | | Citigroup Global Markets | | 01/16/17 | | $ | 26,630 | | | $ | — | | | $ | 26,630 | |
| | 1,541 | | |
| 3 Month LIBOR
plus 432 bps |
| | | JPY | | | 120,000 | | 3.450% | | Citigroup Global Markets | | 03/24/17 | | | 492,834 | | | | 37,018 | | | | 455,816 | |
| | 5,882 | | | | 3 Month LIBOR | | | | JPY | | | 600,000 | | 3 Month JPY
LIBOR minus
31.25 bps | | Deutsche Bank AG | | 05/14/17 | | | 741,412 | | | | — | | | | 741,412 | |
| | 1,157 | | | | 3 Month LIBOR | | | | EUR | | | 900 | | 3 Month EURIBOR
minus 31.75 bps | | Hong Kong & Shanghai Bank | | 09/28/17 | | | 209,463 | | | | — | | | | 209,463 | |
| | 13,099 | | | | 3 Month LIBOR | | | | EUR | | | 11,400 | | 3 Month EURIBOR
minus 26.95 bps | | JPMorgan Chase | | 02/17/17 | | | 1,117,404 | | | | — | | | | 1,117,404 | |
| | 1,003 | | | | 3 Month LIBOR | | | | EUR | | | 900 | | (0.613)% | | JPMorgan Chase | | 02/22/20 | | | 60,611 | | | | — | | | | 60,611 | |
| | 719 | | | | 3 Month LIBOR | | | | EUR | | | 640 | | (0.443)% | | JPMorgan Chase | | 08/22/21 | | | 44,423 | | | | — | | | | 44,423 | |
| | | | | | | | | | | | | | | | | | | | |
|
|
| |
|
|
| |
|
|
|
| | | | | | | | | | | | | | | | | | | | | $ | 2,692,777 | | | $ | 37,018 | | | $ | 2,655,759 | |
| | | | | | | | | | | | | | | | | | | | |
|
|
| |
|
|
| |
|
|
|
Interest rate swap agreements outstanding at December 31, 2016:
| | | | | | | | | | | | | | | | | | | | | | | | |
Notional
Amount
(000)#
| | | Termination
Date
| | | Fixed
Rate
| | | Floating Rate
| | Value at
Trade Date
| | | Value at
December 31, 2016
| | | Unrealized
Appreciation
(Depreciation)
| |
| | Centrally cleared swap agreements: | | | | | | | | | | | | |
| AUD | 2,490 | | | | 10/26/18 | | | | 1.765% | | | 3 Month BBSW(1) | | $ | 119 | | | $ | 6,967 | | | $ | 6,848 | |
| AUD | 3,630 | | | | 10/27/18 | | | | 1.793% | | | 3 Month BBSW(1) | | | 120 | | | | 8,992 | | | | 8,872 | |
| AUD | 15,895 | | | | 11/29/18 | | | | 1.900% | | | 3 Month BBSW(1) | | | 138 | | | | 20,336 | | | | 20,198 | |
| AUD | 2,020 | | | | 10/26/21 | | | | 2.115% | | | 6 Month BBSW(2) | | | 121 | | | | (32,819 | ) | | | (32,940 | ) |
| AUD | 2,990 | | | | 10/27/21 | | | | 2.125% | | | 6 Month BBSW(2) | | | 123 | | | | (47,742 | ) | | | (47,865 | ) |
| AUD | 9,570 | | | | 10/27/21 | | | | 2.173% | | | 6 Month BBSW(2) | | | (1,730 | ) | | | (137,754 | ) | | | (136,024 | ) |
| AUD | 19,585 | | | | 11/29/21 | | | | 2.458% | | | 6 Month BBSW(2) | | | (284 | ) | | | (105,810 | ) | | | (105,526 | ) |
| AUD | 790 | | | | 10/27/26 | | | | 2.355% | | | 6 Month BBSW(1) | | | 119 | | | | 31,338 | | | | 31,219 | |
| AUD | 3,490 | | | | 11/29/26 | | | | 2.823% | | | 6 Month BBSW(1) | | | 131 | | | | 36,893 | | | | 36,762 | |
| CAD | 15,470 | | | | 10/26/18 | | | | 0.904% | | | 3 Month Canadian Banker’s Acceptance(2) | | | 104 | | | | (34,962 | ) | | | (35,066 | ) |
| EUR | 8,000 | | | | 08/01/19 | | | | 0.346% | | | 1 Day EUROIS(1) | | | (131,181 | ) | | | (171,557 | ) | | | (40,376 | ) |
| EUR | 1,255 | | | | 10/06/21 | | | | (0.385%) | | | 1 Day EONIA(1) | | | 173 | | | | 13,017 | | | | 12,844 | |
| EUR | 1,150 | | | | 06/20/24 | | | | (0.050%) | | | 1 Day EUROIS(1) | | | 99 | | | | 15,413 | | | | 15,314 | |
| EUR | 1,380 | | | | 09/13/24 | | | | (0.104%) | | | 1 Day EUROIS(1) | | | 180 | | | | 29,845 | | | | 29,665 | |
SEE NOTES TO FINANCIAL STATEMENTS.
A58
| | | | | | |
| | | DIVERSIFIED BOND PORTFOLIO (continued) | | |
| |
| SCHEDULE OF INVESTMENTS | | as of December 31, 2016 |
| | | | | | | | | | | | | | | | | | | | | | | | |
Notional
Amount
(000)#
| | | Termination
Date
| | | Fixed
Rate
| | | Floating Rate
| | Value at
Trade Date
| | | Value at
December 31, 2016
| | | Unrealized
Appreciation
(Depreciation)
| |
| | Centrally cleared swap agreements (continued): | | | | | | | | | | | | |
| EUR | 2,000 | | | | 07/28/25 | | | | 0.780% | | | 1 Day EUROIS(1) | | $ | 180 | | | $ | (102,007 | ) | | $ | (102,187 | ) |
| EUR | 3,900 | | | | 02/23/26 | | | | 0.324% | | | 1 Day EUROIS(1) | | | (2,798 | ) | | | (13,412 | ) | | | (10,614 | ) |
| EUR | 705 | | | | 03/04/36 | | | | 0.865% | | | 1 Day EUROIS(1) | | | (798 | ) | | | 12,772 | | | | 13,570 | |
| EUR | 550 | | | | 04/11/36 | | | | 0.962% | | | 6 Month EURIBOR(1) | | | 179 | | | | 21,519 | | | | 21,340 | |
| GBP | 1,950 | | | | 02/23/21 | | | | 0.639% | | | 1 Day GBP OIS(1) | | | 222 | | | | (25,222 | ) | | | (25,444 | ) |
| MXN | 48,200 | | | | 05/25/22 | | | | 6.370% | | | 28 Day Mexican Interbank Rate(2) | | | 29 | | | | (135,629 | ) | | | (135,658 | ) |
| MXN | 38,000 | | | | 08/13/24 | | | | 6.120% | | | 28 Day Mexican Interbank Rate(2) | | | 25 | | | | (185,054 | ) | | | (185,079 | ) |
| MXN | 38,100 | | | | 12/27/24 | | | | 5.795% | | | 28 Day Mexican Interbank Rate(2) | | | 26 | | | | (231,827 | ) | | | (231,853 | ) |
| MXN | 69,000 | | | | 10/15/26 | | | | 6.445% | | | 28 Day Mexican Interbank Rate(2) | | | 38 | | | | (352,890 | ) | | | (352,928 | ) |
| MXN | 37,560 | | | | 12/09/26 | | | | 7.780% | | | 28 Day Mexican Interbank Rate(2) | | | (148 | ) | | | (19,665 | ) | | | (19,517 | ) |
| MXN | 13,900 | | | | 07/27/34 | | | | 6.720% | | | 28 Day Mexican Interbank Rate(2) | | | 18 | | | | (105,582 | ) | | | (105,600 | ) |
| NOK | 28,010 | | | | 11/01/26 | | | | 1.650% | | | 6 Month NIBOR(2) | | | 43 | | | | (83,274 | ) | | | (83,317 | ) |
| NZD | 21,750 | | | | 12/15/17 | | | | 2.125% | | | 3 Month New Zealand Bank Bill(2) | | | 122 | | | | (8,021 | ) | | | (8,143 | ) |
| NZD | 6,340 | | | | 11/01/26 | | | | 2.835% | | | 3 Month New Zealand Bank Bill(2) | | | (16,628 | ) | | | (243,737 | ) | | | (227,109 | ) |
| | 118,285 | | | | 02/18/17 | | | | 0.466% | | | 1 Day USOIS(1) | | | 256 | | | | 17,094 | | | | 16,838 | |
| | 57,350 | | | | 08/19/17 | | | | 0.524% | | | 1 Day USOIS(1) | | | 202 | | | | 62,731 | | | | 62,529 | |
| | 231,530 | | | | 09/09/17 | | | | 0.539% | | | 1 Day USOIS(1) | | | 31,678 | | | | 289,266 | | | | 257,588 | |
| | 56,750 | | | | 10/21/17 | | | | 0.590% | | | 1 Day USOIS(1) | | | 202 | | | | 79,334 | | | | 79,132 | |
| | 55,860 | | | | 11/01/17 | | | | 0.639% | | | 1 Day USOIS(1) | | | 276 | | | | 59,554 | | | | 59,278 | |
| | 110,140 | | | | 11/14/17 | | | | 0.675% | | | 1 Day USOIS(1) | | | (9,329 | ) | | | 102,156 | | | | 111,485 | |
| | 54,980 | | | | 11/22/17 | | | | 0.716% | | | 1 Day USOIS(1) | | | 274 | | | | 36,311 | | | | 36,037 | |
| | 45,150 | | | | 09/30/18 | | | | 0.655% | | | 1 Day USOIS(1) | | | 252 | | | | 315,200 | | | | 314,948 | |
| | 22,510 | | | | 09/30/18 | | | | 0.747% | | | 1 Day USOIS(1) | | | 200 | | | | 121,102 | | | | 120,902 | |
| | 55,120 | | | | 11/17/18 | | | | 1.080% | | | 1 Day USOIS(1) | | | 274 | | | | 144,915 | | | | 144,641 | |
| | 82,865 | | | | 11/18/18 | | | | 0.911% | | | 1 Day USOIS(1) | | | (4,269 | ) | | | 242,942 | | | | 247,211 | |
| | 35,980 | | | | 11/22/18 | | | | 1.297% | | | 3 Month LIBOR(1) | | | 232 | | | | 85,503 | | | | 85,271 | |
| | 1,575 | | | | 03/11/20 | | | | 1.824% | | | 3 Month LIBOR(1) | | | 28 | | | | (5,006 | ) | | | (5,034 | ) |
| | 107,735 | | | | 12/31/21 | | | | 1.787% | | | 3 Month LIBOR(1) | | | (140,427 | ) | | | 923,418 | | | | 1,063,845 | |
| | 17,000 | | | | 12/31/21 | | | | 1.850% | | | 3 Month LIBOR(1) | | | 242 | | | | 93,717 | | | | 93,475 | |
| | 51,250 | | | | 05/31/22 | | | | 1.741% | | | 3 Month LIBOR(1) | | | 375,423 | | | | 711,374 | | | | 335,951 | |
| | 29,120 | | | | 05/31/22 | | | | 2.237% | | | 3 Month LIBOR(1) | | | (77,973 | ) | | | (345,497 | ) | | | (267,524 | ) |
| | 22,700 | | | | 08/31/22 | | | | 1.788% | | | 3 Month LIBOR(1) | | | 273 | | | | 298,045 | | | | 297,772 | |
| | 87,900 | | | | 08/31/22 | | | | 2.013% | | | 3 Month LIBOR(1) | | | (161,643 | ) | | | 80,676 | | | | 242,319 | |
| | 12,360 | | | | 11/30/22 | | | | 1.982% | | | 3 Month LIBOR(1) | | | 217 | | | | 52,284 | | | | 52,067 | |
| | 5,800 | | | | 12/31/22 | | | | 1.405% | | | 3 Month LIBOR(1) | | | 181 | | | | 219,026 | | | | 218,845 | |
| | 4,400 | | | | 12/31/22 | | | | 1.406% | | | 3 Month LIBOR(1) | | | 174 | | | | 165,788 | | | | 165,614 | |
| | 8,700 | | | | 12/31/22 | | | | 1.409% | | | 3 Month LIBOR(1) | | | 197 | | | | 326,572 | | | | 326,375 | |
| | 2,400 | | | | 12/31/22 | | | | 1.412% | | | 3 Month LIBOR(1) | | | 163 | | | | 89,718 | | | | 89,555 | |
| | 12,100 | | | | 12/31/22 | | | | 1.416% | | | 3 Month LIBOR(1) | | | 216 | | | | 449,280 | | | | 449,064 | |
| | 4,850 | | | | 12/31/22 | | | | 1.495% | | | 3 Month LIBOR(1) | | | 177 | | | | 158,106 | | | | 157,929 | |
| | 10,495 | | | | 05/31/23 | | | | 1.394% | | | 3 Month LIBOR(1) | | | 207 | | | | 454,777 | | | | 454,570 | |
| | 10,495 | | | | 05/31/23 | | | | 1.395% | | | 3 Month LIBOR(1) | | | 208 | | | | 454,081 | | | | 453,873 | |
| | 10,290 | | | | 05/31/23 | | | | 1.513% | | | 3 Month LIBOR(1) | | | 206 | | | | 371,269 | | | | 371,063 | |
| | 8,910 | | | | 05/31/23 | | | | 1.578% | | | 3 Month LIBOR(1) | | | (16,958 | ) | | | 285,974 | | | | 302,932 | |
| | 3,950 | | | | 05/31/23 | | | | 1.584% | | | 3 Month LIBOR(1) | | | 172 | | | | 125,448 | | | | 125,276 | |
| | 38,325 | | | | 08/02/23 | | | | —(3) | | | —(3) | | | (14,022 | ) | | | 104,320 | | | | 118,342 | |
| | 58,445 | | | | 08/02/23 | | | | —(4) | | | —(4) | | | 2,858 | | | | 168,597 | | | | 165,739 | |
| | 18,580 | | | | 08/03/23 | | | | —(5) | | | —(5) | | | (13,138 | ) | | | 52,220 | | | | 65,358 | |
| | 10,920 | | | | 08/15/23 | | | | 1.459% | | | 3 Month LIBOR(2) | | | 130 | | | | (454,659 | ) | | | (454,789 | ) |
| | 7,400 | | | | 05/15/37 | | | | 2.726% | | | 3 Month LIBOR(2) | | | 271 | | | | 168,688 | | | | 168,417 | |
| | 14,685 | | | | 11/15/41 | | | | 1.869% | | | 3 Month LIBOR(1) | | | 46,940 | | | | 2,020,844 | | | | 1,973,904 | |
| | 2,905 | | | | 02/15/42 | | | | 1.369% | | | 1 Day USOIS(1) | | | 202 | | | | 466,733 | | | | 466,531 | |
| | 1,835 | | | | 09/27/46 | | | | 1.380% | | | 1 Day USOIS(1) | | | 183 | | | | 323,497 | | | | 323,314 | |
| | | | | | | | | | | | | | |
|
|
| |
|
|
| |
|
|
|
| | | | | | | | | | | | | | | $ | (126,503 | ) | | $ | 7,475,526 | | | $ | 7,602,029 | |
| | | | | | | | | | | | | | |
|
|
| |
|
|
| |
|
|
|
Cash of $8,748,000, U.S. Government Agency Obligations, and U.S. Treasury Obligations with a combined market value of $12,484,612 have been segregated with Citigroup Global Markets to cover requirements for open centrally cleared credit default and interest rate swap contracts at December 31, 2016.
SEE NOTES TO FINANCIAL STATEMENTS.
A59
| | | | | | |
| | | DIVERSIFIED BOND PORTFOLIO (continued) | | |
| |
| SCHEDULE OF INVESTMENTS | | as of December 31, 2016 |
| (1) | The Portfolio pays the fixed rate and receives the floating rate. |
| (2) | The Portfolio pays the floating rate and receives the fixed rate. |
| (3) | The Portfolio pays the floating rate of 3 Month LIBOR and receives the floating rate of 1 Day USOIS plus 38.25 bps. |
| (4) | The Portfolio pays the floating rate of 3 Month LIBOR and receives the floating rate of 1 Day USOIS plus 38.50 bps. |
| (5) | The Portfolio pays the floating rate of 3 Month LIBOR and receives the floating rate of 1 Day USOIS plus 38.375 bps. |
Total return swap agreements outstanding at December 31, 2016:
| | | | | | | | | | | | | | | | | | | | | | |
Counterparty
| | Termination
Date
| | | Long (Short)
Notional
Amount
(000)#
| | | Description
| | Fair
Value
| | | Upfront
Premiums
Paid
(Received)
| | | Unrealized
Appreciation
(Depreciation)(1)
| |
OTC total return swap agreements: | | | | | | | | | | | | | | | |
| Credit Suisse First Boston Corp. | | | 01/12/41 | | | | 5,231 | | | Pay variable payments based on 1 Month LIBOR and receive fixed payments based on the IOS.FN30.450.10 Index | | $ | (4,157 | ) | | $ | (15,649 | ) | | $ | 11,492 | |
| | | | | | | | | | | | |
|
|
| |
|
|
| |
|
|
|
| (1) | Upfront/recurring fees or commissions, as applicable, are included in the net unrealized appreciation (depreciation). |
Various inputs are used in determining the value of the Portfolio’s investments. These inputs are summarized in the three broad levels listed below.
| Level 1— | quoted prices generally in active markets for identical securities. |
| Level 2— | quoted prices for similar securities, interest rates and yield curves, prepayment speeds, foreign currency exchange rates and other observable inputs. |
| Level 3— | unobservable inputs for securities valued in accordance with Board approved fair valuation procedures. |
The following is a summary of the inputs used as of December 31, 2016 in valuing such portfolio securities:
| | | | | | | | | | | | |
| | | Level 1
| | | Level 2
| | | Level 3
| |
Investments in Securities | |
Asset-Backed Securities | | | | | | | | | | | | |
Collateralized Loan Obligations | | $ | — | | | $ | 51,503,618 | | | $ | — | |
Non-Residential Mortgage-Backed Securities | | | — | | | | 34,379,083 | | | | — | |
Residential Mortgage-Backed Securities | | | — | | | | 64,171,582 | | | | 3,440,000 | |
Bank Loans | | | — | | | | 30,160,387 | | | | 1,509,078 | |
Commercial Mortgage-Backed Securities | | | — | | | | 142,537,703 | | | | — | |
Corporate Bonds | | | — | | | | 472,240,049 | | | | — | |
Non-Corporate Foreign Agencies | | | — | | | | 19,008,000 | | | | — | |
Municipal Bonds | | | — | | | | 19,785,466 | | | | — | |
Residential Mortgage-Backed Securities | | | — | | | | 44,937,455 | | | | 26,091,730 | |
Sovereign Bonds | | | — | | | | 41,340,265 | | | | — | |
U.S. Government Agency Obligations | | | — | | | | 16,388,501 | | | | — | |
U.S. Treasury Obligations | | | — | | | | 17,225,973 | | | | — | |
Preferred Stocks | | | 2,037,600 | | | | — | | | | — | |
Affiliated Mutual Funds | | | 100,040,422 | | | | — | | | | — | |
Other Financial Instruments* | | | | | | | | | | | | |
Futures Contracts | | | (4,130,393 | ) | | | — | | | | — | |
OTC Forward Foreign Currency Exchange Contracts | | | — | | | | 856,057 | | | | — | |
Centrally Cleared Credit Default Swap Agreements | | | — | | | | (390,581 | ) | | | — | |
OTC Credit Default Swap Agreements | | | — | | | | (206,716 | ) | | | 18,991 | |
OTC Currency Swap Agreements | | | — | | | | 2,692,777 | | | | — | |
Centrally Cleared Interest Rate Swap Agreements | | | — | | | | 7,602,029 | | | | — | |
OTC Total Return Swap Agreement | | | — | | | | (4,157 | ) | | | — | |
| | |
|
|
| |
|
|
| |
|
|
|
Total | | $ | 97,947,629 | | | $ | 964,227,491 | | | $ | 31,059,799 | |
| | |
|
|
| |
|
|
| |
|
|
|
SEE NOTES TO FINANCIAL STATEMENTS.
A60
| | | | | | |
| | | DIVERSIFIED BOND PORTFOLIO (continued) | | |
| |
| SCHEDULE OF INVESTMENTS | | as of December 31, 2016 |
The following is a reconciliation of assets in which unobservable inputs (Level 3) were used in determining fair value:
| | | | | | | | | | | | |
| | | Bank
Loans
| | | Residential
Mortgage-Backed
Securities***
| | | Credit
Default
Swaps
| |
Balance as of 12/31/15 | | $ | — | | | $ | 18,076,943 | | | $ | 2,839 | |
Realized gain (loss) | | | 5,824 | | | | 75,982 | | | | — | |
Change in unrealized appreciation (depreciation)** | | | 20,740 | | | | 112,441 | | | | 16,152 | |
Purchases / Exchanges / Issuances | | | — | | | | 16,094,369 | | | | — | |
Sales/Paydowns | | | (669,422 | ) | | | (9,505,952 | ) | | | — | |
Accrued discount/premium | | | — | | | | 51,082 | | | | — | |
Transfers into Level 3 | | | 2,151,936 | | | | 4,626,865 | | | | — | |
Transfers out of Level 3 | | | — | | | | — | | | | — | |
| | |
|
|
| |
|
|
| |
|
|
|
Balance as of 12/31/16 | | $ | 1,509,078 | | | $ | 29,531,730 | | | $ | 18,991 | |
| | |
|
|
| |
|
|
| |
|
|
|
| * | Other financial instruments are derivative instruments not reflected in the Schedule of Investments, such as futures, forwards and centrally cleared swap contracts, which are recorded at the unrealized appreciation (depreciation) on the instrument, and OTC swap contracts which are recorded at fair value. |
| ** | Of which, $152,709 was relating to securities held at the reporting period end. |
| *** | Residential Mortgage-Backed and Asset-Backed Residential Mortgage-Backed Level 3 securities rollforward. |
During the period, there were no transfers between Level 1 and Level 2 to report.
Level 3 securities as presented in the table above are being fair valued using pricing methodologies approved by Board, which contain unobservable inputs as follows:
| | | | | | | | | | |
Level 3 Securities
| | Fair Value as of
December 31, 2016
| | | Valuation
Methodology
| | | Unobservable Inputs
|
Bank Loans | | $ | 1,509,078 | | | | Market Approach | | | Single Broker Indicative Quote |
Residential Mortgage-Backed Securities | | | 29,531,730 | | | | Market Approach | | | Single Broker Indicative Quote |
Credit Default Swap Agreements | | | 18,991 | | | | Market Approach | | | Single Broker Indicative Quote |
| | |
|
|
| | | | | | |
| | | $ | 31,059,799 | | | | | | | |
| | |
|
|
| | | | | | |
It is the Portfolio’s policy to recognize transfers in and transfers out at the fair value as of the beginning of period. Securities transferred levels as follows:
| | | | | | | | | | |
Investments in Securities
| | Amount
Transferred
| | | Level
Transfer
| | | Logic
|
Bank Loans | | $ | 2,151,936 | | | | L2 to L3 | | | Multiple Broker Quotes to Single Broker Indicative Quote |
Residential Mortgage-Backed Securities | | $ | 4,626,865 | | | | L2 to L3 | | | Evaluated Bid to Single Broker Indicative Quote |
The industry classification of investments and other assets in excess of liabilities shown as a percentage of net assets as of December 31, 2016 were as follows (unaudited):
| | | | |
Commercial Mortgage-Backed Securities | | | 12.9 | % |
Residential Mortgage-Backed Securities | | | 12.5 | |
Banks | | | 10.2 | |
Affiliated Mutual Funds (including 0.9% of collateral for securities on loan) | | | 9.1 | |
Collateralized Loan Obligations | | | 4.7 | |
Sovereign Bonds | | | 3.7 | |
Media | | | 3.5 | |
Electric | | | 3.5 | |
Non-Residential Mortgage-Backed Securities | | | 3.1 | |
Healthcare-Services | | | 2.5 | |
Insurance | | | 2.1 | |
Telecommunications | | | 1.9 | |
Municipal Bonds | | | 1.8 | |
Non-Corporate Foreign Agencies | | | 1.7 | |
Chemicals | | | 1.6 | |
U.S. Treasury Obligations | | | 1.6 | |
| | | | |
U.S. Government Agency Obligations | | | 1.5 | % |
Oil & Gas | | | 1.4 | |
Food | | | 1.1 | |
Diversified Financial Services | | | 1.1 | |
Technology | | | 1.0 | |
Home Builders | | | 1.0 | |
Pharmaceuticals | | | 1.0 | |
Software | | | 0.9 | |
Commercial Services | | | 0.8 | |
Auto Manufacturers | | | 0.8 | |
Healthcare-Products | | | 0.7 | |
Retail | | | 0.7 | |
Semiconductors | | | 0.6 | |
Airlines | | | 0.6 | |
Packaging & Containers | | | 0.6 | |
Building Materials | | | 0.5 | |
Computers | | | 0.5 | |
SEE NOTES TO FINANCIAL STATEMENTS.
A61
| | | | | | |
| | | DIVERSIFIED BOND PORTFOLIO (continued) | | |
| |
| SCHEDULE OF INVESTMENTS | | as of December 31, 2016 |
| | | | |
Industry table (cont.)
| |
| |
Lodging | | | 0.4 | % |
Mining | | | 0.4 | |
Miscellaneous Manufacturing | | | 0.4 | |
Auto Parts & Equipment | | | 0.4 | |
Machinery-Diversified | | | 0.4 | |
Pipelines | | | 0.3 | |
Real Estate Investment Trusts (REITs) | | | 0.3 | |
Agriculture | | | 0.3 | |
Entertainment | | | 0.3 | |
Forest Products & Paper | | | 0.3 | |
Healthcare & Pharmaceutical | | | 0.3 | |
Biotechnology | | | 0.3 | |
Aerospace & Defense | | | 0.3 | |
Gas | | | 0.2 | |
Retailers | | | 0.2 | |
Multi-National | | | 0.2 | |
Banking | | | 0.2 | |
Transportation Services | | | 0.2 | |
Savings & Loans | | | 0.1 | |
Beverages | | | 0.1 | |
| | | | |
Gaming | | | 0.1 | % |
Transportation | | | 0.1 | |
IT Services | | | 0.1 | |
Leisure Time | | | 0.1 | |
Automotive | | | 0.1 | |
Office/Business Equipment | | | 0.1 | |
Health Care & Pharmaceutical | | | 0.1 | |
Electronics | | | 0.1 | |
Diversified Manufacturing | | | 0.1 | |
Consumer | | | 0.1 | |
Supermarkets | | | 0.1 | |
Housewares | | | 0.1 | |
Home Furnishings | | | 0.1 | |
Apparel | | | 0.1 | |
Iron/Steel | | | 0.1 | |
Oil & Gas Services | | | 0.1 | |
| | |
|
|
|
| | | | 98.4 | |
Other assets in excess of liabilities | | | 1.6 | |
| | |
|
|
|
| | | | 100.0 | % |
| | |
|
|
|
The Portfolio invested in derivative instruments during the reporting period. The primary types of risk associated with these derivative instruments are credit risk, foreign exchange risk and interest rate risk. The effect of such derivative instruments on the Portfolio’s financial position and financial performance as reflected in the Statement of Assets and Liabilities and Statement of Operations is presented in the summary below.
Fair values of derivative instruments as of December 31, 2016 as presented in the Statement of Assets and Liabilities:
| | | | | | | | | | | | |
Derivatives not accounted for as hedging
instruments, carried at fair value
| | Asset Derivatives
| | | Liability Derivatives
| |
| | Balance Sheet Location
| | Fair Value
| | | Balance Sheet Location
| | Fair Value
| |
Credit contracts | | Due from/to broker—variation margin swaps | | $ | 5,159 | * | | Due from/to broker—variation margin swaps | | $ | 395,740 | * |
Credit contracts | | Premiums paid for OTC swap agreements | | | 50,673 | | | Premiums received for OTC swap agreements | | | 172,518 | |
Credit contracts | | Unrealized appreciation on OTC swap agreements | | | 154,432 | | | Unrealized depreciation on OTC swap agreements | | | 220,312 | |
Foreign exchange contracts | | Unrealized appreciation on OTC forward foreign currency exchange contracts | | | 981,642 | | | Unrealized depreciation on OTC forward foreign currency exchange contracts | | | 125,585 | |
Interest rate contracts | | Due from/to broker—variation margin futures | | | 146,181 | * | | Due from/to broker—variation margin futures | | | 4,276,574 | * |
Interest rate contracts | | Due from/to broker—variation margin swaps | | | 10,214,622 | * | | Due from/to broker—variation margin swaps | | | 2,612,593 | * |
Interest rate contracts | | Premiums paid for OTC swap agreements | | | 37,018 | | | Premiums received for OTC swap agreements | | | 15,649 | |
Interest rate contracts | | Unrealized appreciation on OTC swap agreements | | | 2,667,251 | | | — | | | — | |
| | | | |
|
|
| | | |
|
|
|
Total | | | | $ | 14,256,978 | | | | | $ | 7,818,971 | |
| | | | |
|
|
| | | |
|
|
|
| * | Includes cumulative appreciation (depreciation) as reported in the schedule of open futures contracts and centrally cleared swap contracts. Only unsettled variation margin receivable (payable) is reported within the Statement of Assets and Liabilities. |
SEE NOTES TO FINANCIAL STATEMENTS.
A62
| | | | | | |
| | | DIVERSIFIED BOND PORTFOLIO (continued) | | |
| |
| SCHEDULE OF INVESTMENTS | | as of December 31, 2016 |
The effects of derivative instruments on the Statement of Operations for the year ended December 31, 2016 are as follows:
| | | | | | | | | | | | | | | | | | | | | | | | | | | | |
Amount of Realized Gain (Loss) on Derivatives Recognized in Income
| |
Derivatives not designated as hedging
instruments, carried at fair value
| | Options
Purchased*
| | | Options
Written
| | | Futures
| | | Forward Rate
Agreements
| | | Forward
Contracts**
| | | Swaps
| | | Total
| |
Credit contracts | | $ | (518,630 | ) | | $ | 265,120 | | | $ | — | | | $ | — | | | $ | — | | | $ | (1,631,610 | ) | | $ | (1,885,120 | ) |
Foreign exchange contracts | | | — | | | | — | | | | — | | | | — | | | | 1,522,976 | | | | — | | | | 1,522,976 | |
Interest rate contracts | | | (434,072 | ) | | | (134,313 | ) | | | 3,369,998 | | | | 128,858 | | | | — | | | | (6,278,412 | ) | | | (3,347,941 | ) |
| | |
|
|
| |
|
|
| |
|
|
| |
|
|
| |
|
|
| |
|
|
| |
|
|
|
Total | | $ | (952,702 | ) | | $ | 130,807 | | | $ | 3,369,998 | | | $ | 128,858 | | | $ | 1,522,976 | | | $ | (7,910,022 | ) | | $ | (3,710,085 | ) |
| | |
|
|
| |
|
|
| |
|
|
| |
|
|
| |
|
|
| |
|
|
| |
|
|
|
| * | Included in net realized gain (loss) on investment transactions in the Statement of Operations. |
| ** | Included in net realized gain (loss) on foreign currency transactions in the Statement of Operations. |
| | | | | | | | | | | | | | | | | | | | | | | | |
Change in Unrealized Appreciation (Depreciation) on Derivatives Recognized in Income
| |
Derivatives not designated as hedging
instruments, carried at fair value
| | Options
Purchased*
| | | Options
Written
| | | Futures
| | | Forward
Contracts**
| | | Swaps
| | | Total
| |
Credit contracts | | $ | 357,855 | | | $ | (209,859 | ) | | $ | — | | | $ | — | | | $ | 944,847 | | | $ | 1,092,843 | |
Foreign exchange contracts | | | — | | | | — | | | | — | | | | 493,771 | | | | — | | | | 493,771 | |
Interest rate contracts | | | 428,204 | | | | (284,376 | ) | | | (3,552,236 | ) | | | — | | | | 9,331,414 | | | | 5,923,006 | |
| | |
|
|
| |
|
|
| |
|
|
| |
|
|
| |
|
|
| |
|
|
|
Total | | $ | 786,059 | | | $ | (494,235 | ) | | $ | (3,552,236 | ) | | $ | 493,771 | | | $ | 10,276,261 | | | $ | 7,509,620 | |
| | |
|
|
| |
|
|
| |
|
|
| |
|
|
| |
|
|
| |
|
|
|
| * | Included in net unrealized appreciation (depreciation) on investment transactions in the Statement of Operations. |
| ** | Included in net unrealized appreciation (depreciation) on foreign currency transactions in the Statement of Operations. |
For the year ended December 31, 2016, the Portfolio’s average volume of derivative activities is as follows:
| | | | | | | | |
Options
Purchased(1)
| | Options
Written(4)
| | Futures
Contracts
Long Positions(2)
| | Futures
Contracts
Short Positions(2)
| | Forward Foreign
Currency Exchange
Contracts—Purchased(3)
|
| $527,430 | | $148,946,000 | | $823,350,509 | | $103,673,248 | | $4,509,743 |
| | | | |
Forward Foreign
Currency Exchange
Contracts—Sold(3)
| | Interest Rate
Swap Agreements(4)
| | Credit Default
Swap Agreements
Buy Protection(4)
| | Credit Default
Swap Agreements
Sell Protection(4)
| | Currency
Swap Agreements(4)
|
| $26,204,359 | | $978,491,000 | | $18,970,000 | | $52,294,000 | | $45,268,000 |
| | | | |
| | | | | Total
Return
Swap Agreements(4)
| | | | |
| | | | | $17,779,000 | | | | |
| (3) | Value at Settlement Date. |
| (4) | Notional Amount in USD. |
The Portfolio invested in OTC derivatives and entered into other financial transactions during the reporting period that are either offset in accordance with current requirements or are subject to enforceable master netting arrangements or similar agreements that permit offsetting. The information about offsetting and related netting arrangements for OTC derivatives and other financial transactions, where the legal right to set-off exists, is presented in the summary below.
Offsetting of financial transactions assets and liabilities:
| | | | | | | | | | | | |
Description
| | Gross Amounts of
Recognized Assets(3)
| | | Collateral
Received
| | | Net Amount
| |
Securities on Loan | | $ | 9,861,400 | | | $ | (9,861,400 | ) | | $ | — | |
| | |
|
|
| | | | | | | | |
SEE NOTES TO FINANCIAL STATEMENTS.
A63
| | | | | | |
| | | DIVERSIFIED BOND PORTFOLIO (continued) | | |
| |
| SCHEDULE OF INVESTMENTS | | as of December 31, 2016 |
Offsetting of OTC derivative assets and liabilities:
| | | | | | | | | | | | | | | | |
Counterparty
| | Gross amounts of
recognized assets(1)
| | | Gross amounts
available for offset
| | | Collateral
Received
| | | Net Amount
| |
BNP Paribas | | $ | 18,341 | | | $ | — | | | $ | — | | | $ | 18,341 | |
Citigroup Global Markets | | | 558,728 | | | | — | | | | (424,000 | ) | | | 134,728 | |
Credit Suisse First Boston Corp. | | | 11,492 | | | | (11,492 | ) | | | — | | | | — | |
Deutsche Bank AG | | | 741,412 | | | | — | | | | (700,918 | ) | | | 40,494 | |
Goldman Sachs & Co. | | | 878,727 | | | | (18,312 | ) | | | — | | | | 860,415 | |
Hong Kong & Shanghai Bank | | | 209,463 | | | | — | | | | — | | | | 209,463 | |
JPMorgan Chase | | | 1,289,881 | | | | (220,119 | ) | | | (1,042,052 | ) | | | 27,710 | |
Morgan Stanley | | | 135,248 | | | | (135,248 | ) | | | — | | | | — | |
Toronto Dominion | | | — | | | | — | | | | — | | | | — | |
UBS AG | | | 47,724 | | | | (47,724 | ) | | | — | | | | — | |
| | |
|
|
| | | | | | | | | | | | |
| | | $ | 3,891,016 | | | | | | | | | | | | | |
| | |
|
|
| | | | | | | | | | | | |
| | | | | | | | | | | | | | | | |
Counterparty
| | Gross amounts of
recognized liabilities(2)
| | | Gross amounts
available for offset
| | | Collateral
Pledged
| | | Net Amount
| |
BNP Paribas | | $ | — | | | $ | — | | | $ | — | | | $ | — | |
Citigroup Global Markets | | | — | | | | — | | | | — | | | | — | |
Credit Suisse First Boston Corp. | | | (15,649 | ) | | | 11,492 | | | | — | | | | (4,157 | ) |
Deutsche Bank AG | | | — | | | | — | | | | — | | | | — | |
Goldman Sachs & Co. | | | (18,312 | ) | | | 18,312 | | | | — | | | | — | |
Hong Kong & Shanghai Bank | | | — | | | | — | | | | — | | | | — | |
JPMorgan Chase | | | (220,119 | ) | | | 220,119 | | | | — | | | | — | |
Morgan Stanley | | | (172,518 | ) | | | 135,248 | | | | — | | | | (37,270 | ) |
Toronto Dominion | | | (39,216 | ) | | | — | | | | — | | | | (39,216 | ) |
UBS AG | | | (68,250 | ) | | | 47,724 | | | | — | | | | (20,526 | ) |
| | |
|
|
| | | | | | | | | | | | |
| | | $ | (534,064 | ) | | | | | | | | | | | | |
| | |
|
|
| | | | | | | | | | | | |
| (1) | Includes unrealized appreciation on swaps and forwards, premiums paid on swap agreements and market value of purchased options. |
| (2) | Includes unrealized depreciation on swaps and forwards, premiums received on swap agreements and market value of written options. |
| (3) | Amount represents market value. |
SEE NOTES TO FINANCIAL STATEMENTS.
A64
| | | | | | |
| | | DIVERSIFIED BOND PORTFOLIO (continued) | | |
STATEMENT OF ASSETS & LIABILITIES
as of December 31, 2016
| | | | |
| ASSETS | | | | |
Investments at value, including securities on loan of $9,861,400: | | | | |
Unaffiliated investments (cost $969,576,022) | | $ | 986,756,490 | |
Affiliated investments (cost $103,890,836) | | | 100,040,422 | |
Cash | | | 1,815,642 | |
Foreign currency, at value (cost $181,085) | | | 182,192 | |
Dividends and interest receivable | | | 9,032,117 | |
Deposit with broker for centrally cleared swaps | | | 8,748,000 | |
Deposit with broker for futures | | | 3,010,000 | |
Unrealized appreciation on OTC swap agreements | | | 2,821,683 | |
Due from broker—variation margin futures | | | 2,053,122 | |
Unrealized appreciation on OTC forward foreign currency exchange contracts | | | 981,642 | |
Receivable for investments sold | | | 487,002 | |
Premiums paid for OTC swap agreements | | | 87,691 | |
Tax reclaim receivable | | | 51,758 | |
Receivable for Series shares sold | | | 48,410 | |
Prepaid expenses | | | 8,794 | |
| | |
|
|
|
Total Assets | | | 1,116,124,965 | |
| | |
|
|
|
| LIABILITIES | | | | |
Payable to broker for collateral for securities on loan | | | 10,066,753 | |
Management fee payable | | | 372,267 | |
Due to broker—variation margin swaps | | | 289,026 | |
Unrealized depreciation on OTC swap agreements | | | 220,312 | |
Premium received for OTC swap agreements | | | 188,167 | |
Unrealized depreciation on OTC forward foreign currency exchange contracts | | | 125,585 | |
Accrued expenses and other liabilities | | | 121,294 | |
Payable for investments purchased | | | 120,961 | |
Payable for Series shares repurchased | | | 39,804 | |
Deferred trustees’ fees | | | 1,047 | |
Affiliated transfer agent fee payable | | | 980 | |
Loan interest payable | | | 151 | |
| | |
|
|
|
Total Liabilities | | | 11,546,347 | |
| | |
|
|
|
| NET ASSETS | | $ | 1,104,578,618 | |
| | |
|
|
|
Net assets were comprised of: | | | | |
Paid-in capital | | $ | 946,610,460 | |
Retained earnings | | | 157,968,158 | |
| | |
|
|
|
Net assets, December 31, 2016 | | $ | 1,104,578,618 | |
| | |
|
|
|
Net asset value and redemption price per share $1,104,578,618 / 89,941,589 outstanding shares of beneficial interest | | $ | 12.28 | |
| | |
|
|
|
STATEMENT OF OPERATIONS
Year Ended December 31, 2016
| | | | |
| NET INVESTMENT INCOME (LOSS) | | | | |
| INCOME | | | | |
Interest income (net of foreign withholding taxes of $4,383) | | $ | 42,468,723 | |
Affiliated dividend income | | | 1,683,782 | |
Unaffiliated dividend income | | | 111,476 | |
Income from securities lending, net (including affiliated of $93,198) | | | 99,115 | |
| | |
|
|
|
Total income | | | 44,363,096 | |
| | |
|
|
|
| EXPENSES | | | | |
Management fee | | | 4,482,241 | |
Custodian and accounting fees (net of $8,800 fee credit) | | | 184,000 | |
Shareholders’ reports | | | 106,000 | |
Audit fee | | | 58,000 | |
Trustees’ fees | | | 21,000 | |
Insurance expenses | | | 13,000 | |
Transfer agent’s fees and expenses (including affiliated expense of $5,900) | | | 12,000 | |
Legal fees and expenses | | | 10,000 | |
Loan interest expense | | | 160 | |
Miscellaneous | | | 10,997 | |
| | |
|
|
|
Total expenses | | | 4,897,398 | |
| | |
|
|
|
| NET INVESTMENT INCOME (LOSS) | | | 39,465,698 | |
| | |
|
|
|
| REALIZED AND UNREALIZED GAIN (LOSS) ON INVESTMENTS AND FOREIGN CURRENCY TRANSACTIONS | | | | |
Net realized gain (loss) on: | | | | |
Investment transactions (including affiliated of $(394,871)) | | | (817,002 | ) |
Futures transactions | | | 3,369,998 | |
Options written transactions | | | 130,807 | |
Forward rate agreement transactions | | | 128,858 | |
Swap agreement transactions | | | (7,910,022 | ) |
Foreign currency transactions | | | 1,749,403 | |
| | |
|
|
|
| | | | (3,347,958 | ) |
| | |
|
|
|
Net change in unrealized appreciation (depreciation) on: | | | | |
Investments (including affiliated of $393,515) | | | 16,997,966 | |
Futures | | | (3,552,236 | ) |
Options written | | | (494,235 | ) |
Swap agreements | | | 10,276,261 | |
Foreign currencies | | | 366,248 | |
| | |
|
|
|
| | | | 23,594,004 | |
| | |
|
|
|
| NET GAIN (LOSS) ON INVESTMENT AND FOREIGN CURRENCY TRANSACTIONS | | | 20,246,046 | |
| | |
|
|
|
| NET INCREASE (DECREASE) IN NET ASSETS RESULTING FROM OPERATIONS | | $ | 59,711,744 | |
| | |
|
|
|
STATEMENT OF CHANGES IN NET ASSETS
| | | | | | | | |
| | | Year Ended December 31,
| |
| | | 2016
| | | 2015
| |
| INCREASE (DECREASE) IN NET ASSETS | | | | | | | | |
| OPERATIONS | | | | | | | | |
Net investment income (loss) | | $ | 39,465,698 | | | $ | 37,422,495 | |
Net realized gain (loss) on investment and foreign currency transactions | | | (3,347,958 | ) | | | 6,161,154 | |
Net change in unrealized appreciation (depreciation) on investments and foreign currencies | | | 23,594,004 | | | | (45,769,143 | ) |
| | |
|
|
| |
|
|
|
NET INCREASE (DECREASE) IN NET ASSETS RESULTING FROM OPERATIONS | | | 59,711,744 | | | | (2,185,494 | ) |
| | |
|
|
| |
|
|
|
| SERIES SHARE TRANSACTIONS | | | | | | | | |
Series shares sold [2,764,375 and 8,670,539 shares, respectively] | | | 34,011,481 | | | | 101,626,083 | |
Series shares repurchased [6,055,908 and 7,014,473 shares, respectively] | | | (74,059,176 | ) | | | (82,418,630 | ) |
| | |
|
|
| |
|
|
|
NET INCREASE (DECREASE) IN NET ASSETS FROM SERIES SHARE TRANSACTIONS | | | (40,047,695 | ) | | | 19,207,453 | |
| | |
|
|
| |
|
|
|
| CAPITAL CONTRIBUTIONS (Note 4) | | | 20,597 | | | | — | |
| | |
|
|
| |
|
|
|
| TOTAL INCREASE (DECREASE) | | | 19,684,646 | | | | 17,021,959 | |
| NET ASSETS: | | | | | | | | |
Beginning of year | | | 1,084,893,972 | | | | 1,067,872,013 | |
| | |
|
|
| |
|
|
|
End of year | | $ | 1,104,578,618 | | | $ | 1,084,893,972 | |
| | |
|
|
| |
|
|
|
SEE NOTES TO FINANCIAL STATEMENTS.
A65
| | | | | | |
| | | EQUITY PORTFOLIO | | |
| |
| SCHEDULE OF INVESTMENTS | | as of December 31, 2016 |
| | | | | | | | |
| LONG-TERM INVESTMENTS — 98.1% | | | | |
| COMMON STOCKS | | Shares
| | | Value
(Note 2)
| |
Aerospace & Defense — 2.0% | |
Boeing Co. (The) | | | 223,500 | | | $ | 34,794,480 | |
United Technologies Corp. | | | 353,316 | | | | 38,730,500 | |
| | | | | | |
|
|
|
| | | | | | | | 73,524,980 | |
| | | | | | |
|
|
|
Air Freight & Logistics — 0.7% | |
FedEx Corp. | | | 137,552 | | | | 25,612,182 | |
| | | | | | |
|
|
|
Automobiles — 0.5% | | | | | | | | |
Tesla Motors, Inc.*(a) | | | 88,564 | | | | 18,925,241 | |
| | | | | | |
|
|
|
Banks — 9.3% | |
Bank of America Corp. | | | 2,675,677 | | | | 59,132,462 | |
BB&T Corp. | | | 783,808 | | | | 36,854,652 | |
Citigroup, Inc. | | | 920,153 | | | | 54,684,693 | |
JPMorgan Chase & Co. | | | 1,348,342 | | | | 116,348,431 | |
PNC Financial Services Group, Inc. (The) | | | 396,938 | | | | 46,425,868 | |
Wells Fargo & Co. | | | 628,123 | | | | 34,615,859 | |
| | | | | | |
|
|
|
| | | | | | | | 348,061,965 | |
| | | | | | |
|
|
|
Beverages — 0.6% | | | | | | | | |
Monster Beverage Corp.* | | | 503,201 | | | | 22,311,932 | |
| | | | | | |
|
|
|
Biotechnology — 5.6% | | | | | | | | |
Alexion Pharmaceuticals, Inc.* | | | 252,458 | | | | 30,888,236 | |
BioMarin Pharmaceutical, Inc.* | | | 247,779 | | | | 20,526,012 | |
Celgene Corp.* | | | 523,807 | | | | 60,630,660 | |
Regeneron Pharmaceuticals, Inc.* | | | 85,688 | | | | 31,455,208 | |
Shire PLC, ADR | | | 394,262 | | | | 67,174,360 | |
| | | | | | |
|
|
|
| | | | | | | | 210,674,476 | |
| | | | | | |
|
|
|
Capital Markets — 2.8% | | | | | | | | |
Goldman Sachs Group, Inc. (The) | | | 432,367 | | | | 103,530,278 | |
| | | | | | |
|
|
|
Chemicals — 1.5% | | | | | | | | |
Dow Chemical Co. (The) | | | 450,936 | | | | 25,802,558 | |
FMC Corp. | | | 553,391 | | | | 31,299,795 | |
| | | | | | |
|
|
|
| | | | | | | | 57,102,353 | |
| | | | | | |
|
|
|
Communications Equipment — 0.5% | |
Palo Alto Networks, Inc.*(a) | | | 155,722 | | | | 19,473,036 | |
| | | | | | |
|
|
|
Consumer Finance — 2.0% | |
Capital One Financial Corp. | | | 441,465 | | | | 38,513,407 | |
SLM Corp.* | | | 3,430,362 | | | | 37,802,589 | |
| | | | | | |
|
|
|
| | | | | | | | 76,315,996 | |
| | | | | | |
|
|
|
Diversified Financial Services — 0.5% | |
Voya Financial, Inc. | | | 492,407 | | | | 19,312,203 | |
| | | | | | |
|
|
|
Electric Utilities — 1.8% | | | | | | | | |
Exelon Corp. | | | 408,139 | | | | 14,484,853 | |
PG&E Corp. | | | 855,791 | | | | 52,006,419 | |
| | | | | | |
|
|
|
| | | | | | | | 66,491,272 | |
| | | | | | |
|
|
|
Electrical Equipment — 0.8% | | | | | | | | |
Eaton Corp. PLC | | | 450,412 | | | | 30,218,141 | |
| | | | | | |
|
|
|
Electronic Equipment, Instruments & Components — 1.0% | |
Flex Ltd.* | | | 2,489,691 | | | | 35,776,860 | |
| | | | | | |
|
|
|
Energy Equipment & Services — 2.3% | |
Halliburton Co.(a) | | | 1,602,068 | | | | 86,655,858 | |
| | | | | | |
|
|
|
Equity Real Estate Investment Trusts (REITs) — 0.6% | |
American Tower Corp. | | | 220,753 | | | | 23,329,177 | |
| | | | | | |
|
|
|
| | | | | | | | |
COMMON STOCKS (continued) | | Shares
| | | Value
(Note 2)
| |
Food & Staples Retailing — 1.6% | |
Costco Wholesale Corp. | | | 200,370 | | | $ | 32,081,241 | |
Wal-Mart Stores, Inc. | | | 395,129 | | | | 27,311,316 | |
| | | | | | |
|
|
|
| | | | | | | | 59,392,557 | |
| | | | | | |
|
|
|
Food Products — 1.6% | |
ConAgra Foods, Inc. | | | 813,870 | | | | 32,188,559 | |
Mondelez International, Inc. (Class A Stock) | | | 645,395 | | | | 28,610,360 | |
| | | | | | |
|
|
|
| | | | | | | | 60,798,919 | |
| | | | | | |
|
|
|
Health Care Equipment & Supplies — 0.7% | |
Zimmer Biomet Holdings, Inc. | | | 245,413 | | | | 25,326,622 | |
| | | | | | |
|
|
|
Health Care Providers & Services — 1.5% | |
Cigna Corp. | | | 215,116 | | | | 28,694,323 | |
Laboratory Corp. of America Holdings* | | | 219,616 | | | | 28,194,302 | |
| | | | | | |
|
|
|
| | | | | | | | 56,888,625 | |
| | | | | | |
|
|
|
Hotels, Restaurants & Leisure — 4.0% | |
Carnival Corp. | | | 706,022 | | | | 36,755,505 | |
Marriott International, Inc. (Class A Stock) | | | 644,583 | | | | 53,294,122 | |
McDonald’s Corp. | | | 215,586 | | | | 26,241,128 | |
Starbucks Corp. | | | 619,749 | | | | 34,408,465 | |
| | | | | | |
|
|
|
| | | | | | | | 150,699,220 | |
| | | | | | |
|
|
|
Household Products — 1.2% | |
Procter & Gamble Co. (The) | | | 531,330 | | | | 44,674,226 | |
| | | | | | |
|
|
|
Industrial Conglomerates — 1.1% | | | | | | | | |
General Electric Co. | | | 1,349,085 | | | | 42,631,086 | |
| | | | | | |
|
|
|
Insurance — 2.1% | |
Chubb Ltd. | | | 371,411 | | | | 49,070,821 | |
MetLife, Inc. | | | 545,414 | | | | 29,392,361 | |
| | | | | | |
|
|
|
| | | | | | | | 78,463,182 | |
| | | | | | |
|
|
|
Internet & Direct Marketing Retail — 4.9% | |
Amazon.com, Inc.* | | | 145,893 | | | | 109,400,784 | |
Netflix, Inc.* | | | 317,159 | | | | 39,264,284 | |
Priceline Group, Inc. (The)* | | | 24,342 | | | | 35,686,833 | |
| | | | | | |
|
|
|
| | | | | | | | 184,351,901 | |
| | | | | | |
|
|
|
Internet Software & Services — 9.9% | |
Alibaba Group Holding Ltd. (China), ADR*(a) | | | 630,950 | | | | 55,403,720 | |
Alphabet, Inc. (Class A Stock)* | | | 102,514 | | | | 81,237,219 | |
Alphabet, Inc. (Class C Stock)* | | | 74,674 | | | | 57,634,887 | |
eBay, Inc.* | | | 1,105,186 | | | | 32,812,972 | |
Facebook, Inc. (Class A Stock)* | | | 716,002 | | | | 82,376,030 | |
Tencent Holdings Ltd. (China) | | | 2,467,503 | | | | 59,829,827 | |
| | | | | | |
|
|
|
| | | | | | | | 369,294,655 | |
| | | | | | |
|
|
|
IT Services — 2.9% | |
MasterCard, Inc. (Class A Stock) | | | 529,693 | | | | 54,690,802 | |
Visa, Inc. (Class A Stock)(a) | | | 688,476 | | | | 53,714,898 | |
| | | | | | |
|
|
|
| | | | | | | | 108,405,700 | |
| | | | | | |
|
|
|
Machinery — 0.3% | |
Parker-Hannifin Corp. | | | 78,533 | | | | 10,994,620 | |
| | | | | | |
|
|
|
SEE NOTES TO FINANCIAL STATEMENTS.
A66
| | | | | | |
| | | EQUITY PORTFOLIO (continued) | | |
| |
| SCHEDULE OF INVESTMENTS | | as of December 31, 2016 |
| | | | | | | | |
COMMON STOCKS (continued) | | Shares
| | | Value
(Note 2)
| |
Media — 2.0% | |
Charter Communications, Inc. (Class A Stock)* | | | 74,965 | | | $ | 21,583,923 | |
Comcast Corp. (Class A Stock) | | | 567,743 | | | | 39,202,654 | |
Twenty-First Century Fox, Inc. (Class A Stock) | | | 508,040 | | | | 14,245,442 | |
| | | | | | |
|
|
|
| | | | | | | | 75,032,019 | |
| | | | | | |
|
|
|
Oil, Gas & Consumable Fuels — 6.5% | |
Anadarko Petroleum Corp. | | | 277,508 | | | | 19,350,633 | |
Chevron Corp. | | | 571,052 | | | | 67,212,820 | |
Concho Resources, Inc.* | | | 265,393 | | | | 35,191,112 | |
EOG Resources, Inc. | | | 170,952 | | | | 17,283,247 | |
Noble Energy, Inc. | | | 679,410 | | | | 25,858,345 | |
Occidental Petroleum Corp. | | | 566,880 | | | | 40,378,862 | |
Suncor Energy, Inc. (Canada) | | | 1,158,063 | | | | 37,864,645 | |
| | | | | | |
|
|
|
| | | | | | | | 243,139,664 | |
| | | | | | |
|
|
|
Pharmaceuticals — 4.5% | |
Allergan PLC*(a) | | | 134,022 | | | | 28,145,960 | |
Bristol-Myers Squibb Co. | | | 639,148 | | | | 37,351,809 | |
Eli Lilly & Co. | | | 206,804 | | | | 15,210,434 | |
Merck & Co., Inc. | | | 758,760 | | | | 44,668,201 | |
Pfizer, Inc. | | | 1,316,280 | | | | 42,752,775 | |
| | | | | | |
|
|
|
| | | | | | | | 168,129,179 | |
| | | | | | |
|
|
|
Road & Rail — 0.5% | |
Ryder System, Inc. | | | 237,420 | | | | 17,673,545 | |
| | | | | | |
|
|
|
Semiconductors & Semiconductor Equipment — 5.0% | |
Analog Devices, Inc. | | | 249,110 | | | | 18,090,368 | |
NVIDIA Corp.(a) | | | 596,128 | | | | 63,630,703 | |
QUALCOMM, Inc. | | | 1,092,542 | | | | 71,233,738 | |
Texas Instruments, Inc. | | | 481,631 | | | | 35,144,614 | |
| | | | | | |
|
|
|
| | | | | | | | 188,099,423 | |
| | | | | | |
|
|
|
Software — 8.0% | |
Adobe Systems, Inc.* | | | 519,900 | | | | 53,523,705 | |
Microsoft Corp. | | | 1,921,311 | | | | 119,390,266 | |
PTC, Inc.* | | | 740,007 | | | | 34,240,124 | |
salesforce.com, Inc.* | | | 640,315 | | | | 43,835,965 | |
Splunk, Inc.*(a) | | | 449,988 | | | | 23,016,886 | |
Workday, Inc. (Class A Stock)*(a) | | | 362,801 | | | | 23,977,518 | |
| | | | | | |
|
|
|
| | | | | | | | 297,984,464 | |
| | | | | | |
|
|
|
Specialty Retail — 2.1% | |
Industria de Diseno Textil SA (Spain), ADR | | | 2,693,274 | | | | 45,704,860 | |
O’Reilly Automotive, Inc.*(a) | | | 116,650 | | | | 32,476,526 | |
| | | | | | |
|
|
|
| | | | | | | | 78,181,386 | |
| | | | | | |
|
|
|
Technology Hardware, Storage & Peripherals — 2.4% | |
Apple, Inc. | | | 781,905 | | | | 90,560,237 | |
| | | | | | |
|
|
|
Textiles, Apparel & Luxury Goods — 2.0% | |
adidas AG (Germany), ADR(a) | | | 534,382 | | | | 41,975,706 | |
Coach, Inc. | | | 888,793 | | | | 31,125,531 | |
| | | | | | |
|
|
|
| | | | | | | | 73,101,237 | |
| | | | | | |
|
|
|
| | | | | | | | |
COMMON STOCKS (continued) | | Shares
| | | Value
(Note 2)
| |
Wireless Telecommunication Services — 0.8% | |
Vodafone Group PLC (United Kingdom), ADR | | | 1,172,370 | | | $ | 28,640,999 | |
| | | | | | |
|
|
|
TOTAL LONG-TERM INVESTMENTS
(cost $2,709,437,236) | | | | 3,669,779,416 | |
| | | | | | |
|
|
|
| SHORT-TERM INVESTMENTS — 11.3% | |
AFFILIATED MUTUAL FUNDS | | | | | | | | |
Prudential Investment Portfolios 2 — Prudential Core Ultra Short Bond Fund(b) | | | 83,702,783 | | | | 83,702,783 | |
Prudential Investment Portfolios 2 — Prudential Institutional Money Market Fund
(cost $340,087,956; includes $339,889,748 of cash collateral for securities on loan)(b)(c) | | | 340,076,342 | | | | 340,144,358 | |
| | | | | | |
|
|
|
TOTAL SHORT-TERM INVESTMENTS
(cost $423,790,739)(Note 4) | | | | 423,847,141 | |
| | | | | | |
|
|
|
TOTAL INVESTMENTS — 109.4%
(cost $3,133,227,975) | | | | 4,093,626,557 | |
LIABILITIES IN EXCESS OF
OTHER ASSETS — (9.4)% | | | | (350,235,586 | ) |
| | | | | | |
|
|
|
NET ASSETS — 100.0% | | | $ | 3,743,390,971 | |
| | | | | | |
|
|
|
See the Glossary for abbreviations used in the annual report.
| * | Non-income producing security. |
| (a) | All or a portion of security is on loan. The aggregate market value of such securities, including those sold and pending settlement, is $329,720,861; cash collateral of $339,889,748 (included in liabilities) was received with which the Portfolio purchased highly liquid short-term investments. Securities on loan are subject to contractual netting arrangements. |
| (b) | Prudential Investments LLC, the manager of the Portfolio, also serves as manager of the Prudential Investment Portfolios 2 — Prudential Core Ultra Short Bond Fund and the Prudential Investment Portfolios 2 — Prudential Institutional Money Market Fund. |
| (c) | Represents security purchased with cash collateral received for securities on loan and includes dividend reinvestment. |
Various inputs are used in determining the value of the Portfolio’s investments. These inputs are summarized in the three broad levels listed below.
| Level 1— | quoted prices generally in active markets for identical securities. |
| Level 2— | quoted prices for similar securities, interest rates and yield curves, prepayment speeds, foreign currency exchange rates and other observable inputs. |
| Level 3— | unobservable inputs for securities valued in accordance with Board approved fair valuation procedures. |
SEE NOTES TO FINANCIAL STATEMENTS.
A67
| | | | | | |
| | | EQUITY PORTFOLIO (continued) | | |
| |
| SCHEDULE OF INVESTMENTS | | as of December 31, 2016 |
The following is a summary of the inputs used as of December 31, 2016 in valuing such portfolio securities:
| | | | | | | | | | | | |
| | | Level 1
| | | Level 2
| | | Level 3
| |
Investments in Securities | | | | | | | | | | | | |
Common Stocks | | | | | | | | | | | | |
Aerospace & Defense | | $ | 73,524,980 | | | $ | — | | | $ | — | |
Air Freight & Logistics | | | 25,612,182 | | | | — | | | | — | |
Automobiles | | | 18,925,241 | | | | — | | | | — | |
Banks | | | 348,061,965 | | | | — | | | | — | |
Beverages | | | 22,311,932 | | | | — | | | | — | |
Biotechnology | | | 210,674,476 | | | | — | | | | — | |
Capital Markets | | | 103,530,278 | | | | — | | | | — | |
Chemicals | | | 57,102,353 | | | | — | | | | — | |
Communications Equipment | | | 19,473,036 | | | | — | | | | — | |
Consumer Finance | | | 76,315,996 | | | | — | | | | — | |
Diversified Financial Services | | | 19,312,203 | | | | — | | | | — | |
Electric Utilities | | | 66,491,272 | | | | — | | | | — | |
Electrical Equipment | | | 30,218,141 | | | | — | | | | — | |
Electronic Equipment, Instruments & Components | | | 35,776,860 | | | | — | | | | — | |
Energy Equipment & Services | | | 86,655,858 | | | | — | | | | — | |
Equity Real Estate Investment Trusts (REITs) | | | 23,329,177 | | | | — | | | | — | |
Food & Staples Retailing | | | 59,392,557 | | | | — | | | | — | |
Food Products | | | 60,798,919 | | | | — | | | | — | |
Health Care Equipment & Supplies | | | 25,326,622 | | | | — | | | | — | |
Health Care Providers & Services | | | 56,888,625 | | | | — | | | | — | |
Hotels, Restaurants & Leisure | | | 150,699,220 | | | | — | | | | — | |
Household Products | | | 44,674,226 | | | | — | | | | — | |
Industrial Conglomerates | | | 42,631,086 | | | | — | | | | — | |
Insurance | | | 78,463,182 | | | | — | | | | — | |
Internet & Direct Marketing Retail | | | 184,351,901 | | | | — | | | | — | |
Internet Software & Services | | | 309,464,828 | | | | 59,829,827 | | | | — | |
IT Services | | | 108,405,700 | | | | — | | | | — | |
Machinery | | | 10,994,620 | | | | — | | | | — | |
Media | | | 75,032,019 | | | | — | | | | — | |
Oil, Gas & Consumable Fuels | | | 243,139,664 | | | | — | | | | — | |
Pharmaceuticals | | | 168,129,179 | | | | — | | | | — | |
Road & Rail | | | 17,673,545 | | | | — | | | | — | |
Semiconductors & Semiconductor Equipment | | | 188,099,423 | | | | — | | | | — | |
Software | | | 297,984,464 | | | | — | | | | — | |
Specialty Retail | | | 78,181,386 | | | | — | | | | — | |
Technology Hardware, Storage & Peripherals | | | 90,560,237 | | | | — | | | | — | |
Textiles, Apparel & Luxury Goods | | | 73,101,237 | | | | — | | | | — | |
Wireless Telecommunication Services | | | 28,640,999 | | | | — | | | | — | |
Affiliated Mutual Funds | | | 423,847,141 | | | | — | | | | — | |
| | |
|
|
| |
|
|
| |
|
|
|
Total | | $ | 4,033,796,730 | | | $ | 59,829,827 | | | $ | — | |
| | |
|
|
| |
|
|
| |
|
|
|
During the period, there were no transfers between Level 1 and Level 2 to report.
The industry classification of investments and liabilities in excess of other assets shown as a percentage of net assets as of December 31, 2016 were as follows (unaudited):
| | | | |
Affiliated Mutual Funds (including 9.1% of collateral for securities on loan) | | | 11.3 | % |
Internet Software & Services | | | 9.9 | |
Banks | | | 9.3 | |
Software | | | 8.0 | |
Oil, Gas & Consumable Fuels | | | 6.5 | |
Biotechnology | | | 5.6 | |
Semiconductors & Semiconductor Equipment | | | 5.0 | |
Internet & Direct Marketing Retail | | | 4.9 | |
Pharmaceuticals | | | 4.5 | |
Hotels, Restaurants & Leisure | | | 4.0 | |
IT Services | | | 2.9 | |
| | | | |
Capital Markets | | | 2.8 | % |
Technology Hardware, Storage & Peripherals | | | 2.4 | |
Energy Equipment & Services | | | 2.3 | |
Insurance | | | 2.1 | |
Specialty Retail | | | 2.1 | |
Consumer Finance | | | 2.0 | |
Media | | | 2.0 | |
Aerospace & Defense | | | 2.0 | |
Textiles, Apparel & Luxury Goods | | | 2.0 | |
Electric Utilities | | | 1.8 | |
Food Products | | | 1.6 | |
Food & Staples Retailing | | | 1.6 | |
SEE NOTES TO FINANCIAL STATEMENTS.
A68
| | | | | | |
| | | EQUITY PORTFOLIO (continued) | | |
| |
| SCHEDULE OF INVESTMENTS | | as of December 31, 2016 |
| | | | |
Industry table (cont.)
| | | |
Chemicals | | | 1.5 | % |
Health Care Providers & Services | | | 1.5 | |
Household Products | | | 1.2 | |
Industrial Conglomerates | | | 1.1 | |
Electronic Equipment, Instruments & Components | | | 1.0 | |
Electrical Equipment | | | 0.8 | |
Wireless Telecommunication Services | | | 0.8 | |
Air Freight & Logistics | | | 0.7 | |
Health Care Equipment & Supplies | | | 0.7 | |
Equity Real Estate Investment Trusts (REITs) | | | 0.6 | |
| | | | |
Beverages | | | 0.6 | % |
Communications Equipment | | | 0.5 | |
Diversified Financial Services | | | 0.5 | |
Automobiles | | | 0.5 | |
Road & Rail | | | 0.5 | |
Machinery | | | 0.3 | |
| | |
|
|
|
| | | | 109.4 | |
Liabilities in excess of other assets | | | (9.4 | ) |
| | |
|
|
|
| | | | 100.0 | % |
| | |
|
|
|
The Portfolio entered into financial transactions during the reporting period that are either offset in accordance with current requirements or are subject to enforceable master netting arrangements or similar agreements that permit offsetting. The information about offsetting and related netting arrangements for financial transactions, where the legal right to set-off exists, is presented in the summary below.
Offsetting of financial transactions assets and liabilities:
| | | | | | | | | | | | |
Description
| | Gross Amounts of
Recognized Assets(1)
| | | Collateral
Received
| | | Net
Amount
| |
Securities on Loan | | $ | 329,720,861 | | | $ | (329,720,861 | ) | | $ | — | |
| | |
|
|
| | | | | | | | |
| (1) | Amount represents market value. |
SEE NOTES TO FINANCIAL STATEMENTS.
A69
| | | | | | |
| | | EQUITY PORTFOLIO (continued) | | |
STATEMENT OF ASSETS & LIABILITIES
as of December 31, 2016
| | | | |
| ASSETS | | | | |
Investments at value, including securities on loan of $329,720,861: | | | | |
Unaffiliated investments (cost $2,709,437,236) | | $ | 3,669,779,416 | |
Affiliated investments (cost $423,790,739) | | | 423,847,141 | |
Dividends receivable | | | 3,624,376 | |
Tax reclaim receivable | | | 1,551,067 | |
Receivable for Series shares sold | | | 11,787 | |
Prepaid expenses | | | 27,382 | |
| | |
|
|
|
Total assets | | | 4,098,841,169 | |
| | |
|
|
|
| LIABILITIES | | | | |
Payable to broker for collateral for securities on loan | | | 339,889,748 | |
Payable for investments purchased | | | 13,180,477 | |
Management fee payable | | | 1,435,010 | |
Payable for Series shares repurchased | | | 595,536 | |
Accrued expenses and other liabilities | | | 347,514 | |
Affiliated transfer agent fee payable | | | 980 | |
Distribution fee payable | | | 391 | |
Administration fee payable | | | 311 | |
Deferred trustees’ fees | | | 231 | |
| | |
|
|
|
Total liabilities | | | 355,450,198 | |
| | |
|
|
|
| NET ASSETS | | $ | 3,743,390,971 | |
| | |
|
|
|
Net assets were comprised of: | | | | |
Paid-in capital | | $ | 1,656,568,389 | |
Retained earnings | | | 2,086,822,582 | |
| | |
|
|
|
Net assets, December 31, 2016 | | $ | 3,743,390,971 | |
| | |
|
|
|
| Class I: | | | | |
Net asset value and redemption price per share
$3,741,686,294 / 91,346,503 outstanding shares of beneficial interest | | $ | 40.96 | |
| | |
|
|
|
| Class II: | | | | |
Net asset value and redemption price per share
$1,704,677 / 41,838 outstanding shares of beneficial interest | | $ | 40.74 | |
| | |
|
|
|
STATEMENT OF OPERATIONS
Year Ended December 31, 2016
| | | | |
| NET INVESTMENT INCOME (LOSS) | | | | |
| INCOME | | | | |
Unaffiliated dividend income (net of foreign withholding taxes of $696,529) | | $ | 50,864,127 | |
Income from securities lending, net (including affiliated: $1,491,131) | | | 2,172,835 | |
Affiliated dividend income | | | 444,656 | |
| | |
|
|
|
Total income | | | 53,481,618 | |
| | |
|
|
|
| EXPENSES | | | | |
Management fee | | | 16,276,223 | |
Distribution fee—Class II | | | 4,541 | |
Administration fee—Class II | | | 2,710 | |
Custodian and accounting fees | | | 426,000 | |
Shareholders’ reports | | | 263,000 | |
Insurance expenses | | | 46,000 | |
Trustees’ fees | | | 42,000 | |
Audit fee | | | 27,000 | |
Legal fees and expenses | | | 15,000 | |
Transfer agent’s fees and expenses (including affiliated expense of $5,900) | | | 12,000 | |
Commitment fee on syndicated credit agreement | | | 6,000 | |
Miscellaneous | | | 17,761 | |
| | |
|
|
|
Total expenses | | | 17,138,235 | |
| | |
|
|
|
| NET INVESTMENT INCOME (LOSS) | | | 36,343,383 | |
| | |
|
|
|
| REALIZED AND UNREALIZED GAIN (LOSS) ON INVESTMENTS AND FOREIGN CURRENCY TRANSACTIONS | | | | |
Net realized gain (loss) on: | | | | |
Investment transactions (including affiliated of $14,839) | | | 217,865,740 | |
Foreign currency transactions | | | 10,656 | |
| | |
|
|
|
| | | | 217,876,396 | |
| | |
|
|
|
Net change in unrealized appreciation (depreciation) on: | | | | |
Investments (including affiliated of $56,402) | | | (128,105,402 | ) |
Foreign currencies | | | 7,087 | |
| | |
|
|
|
| | | | (128,098,315 | ) |
| | |
|
|
|
| NET GAIN (LOSS) ON INVESTMENT AND FOREIGN CURRENCY TRANSACTIONS | | | 89,778,081 | |
| | |
|
|
|
| NET INCREASE (DECREASE) IN NET ASSETS RESULTING FROM OPERATIONS | | $ | 126,121,464 | |
| | |
|
|
|
STATEMENT OF CHANGES IN NET ASSETS
| | | | | | | | |
| | | Year Ended December 31,
| |
| | | 2016
| | | 2015
| |
| INCREASE (DECREASE) IN NET ASSETS | | | | | | | | |
| OPERATIONS | | | | | | | | |
Net investment income (loss) | | $ | 36,343,383 | | | $ | 34,018,287 | |
Net realized gain (loss) on investment and foreign currency transactions | | | 217,876,396 | | | | 164,739,137 | |
Net change in unrealized appreciation (depreciation) on investments and foreign currencies | | | (128,098,315 | ) | | | (104,802,733 | ) |
| | |
|
|
| |
|
|
|
NET INCREASE (DECREASE) IN NET ASSETS RESULTING FROM OPERATIONS | | | 126,121,464 | | | | 93,954,691 | |
| | |
|
|
| |
|
|
|
| SERIES SHARE TRANSACTIONS (Note 7) | | | | | | | | |
Series shares sold | | | 9,112,648 | | | | 11,599,955 | |
Series shares repurchased | | | (243,276,531 | ) | | | (277,235,158 | ) |
| | |
|
|
| |
|
|
|
NET INCREASE (DECREASE) IN NET ASSETS FROM SERIES SHARE TRANSACTIONS | | | (234,163,883 | ) | | | (265,635,203 | ) |
| | |
|
|
| |
|
|
|
| CAPITAL CONTRIBUTIONS (Note 4) | | | 3,315,979 | | | | — | |
| TOTAL INCREASE (DECREASE) | | | (104,726,440 | ) | | | (171,680,512 | ) |
| NET ASSETS: | | | | | | | | |
Beginning of year | | | 3,848,117,411 | | | | 4,019,797,923 | |
| | |
|
|
| |
|
|
|
End of year | | $ | 3,743,390,971 | | | $ | 3,848,117,411 | |
| | |
|
|
| |
|
|
|
SEE NOTES TO FINANCIAL STATEMENTS.
A70
| | | | | | |
| | | FLEXIBLE MANAGED PORTFOLIO | | |
| |
| SCHEDULE OF INVESTMENTS | | as of December 31, 2016 |
| | | | | | | | |
| LONG-TERM INVESTMENTS — 93.9% | | | Value
(Note 2)
| |
| COMMON STOCKS — 62.2% | | Shares
| | |
Aerospace & Defense — 1.9% | | | | | | | | |
BAE Systems PLC (United Kingdom) | | | 9,581 | | | $ | 69,688 | |
Boeing Co. (The) | | | 78,800 | | | | 12,267,584 | |
BWX Technologies, Inc. | | | 87,200 | | | | 3,461,840 | |
General Dynamics Corp. | | | 56,500 | | | | 9,755,290 | |
Huntington Ingalls Industries, Inc. | | | 68,300 | | | | 12,580,177 | |
Lockheed Martin Corp. | | | 59,200 | | | | 14,796,448 | |
Northrop Grumman Corp. | | | 42,500 | | | | 9,884,650 | |
Spirit AeroSystems Holdings, Inc. (Class A Stock) | | | 129,300 | | | | 7,544,655 | |
Textron, Inc. | | | 4,900 | | | | 237,944 | |
Thales SA (France) | | | 2,763 | | | | 267,683 | |
United Technologies Corp. | | | 15,700 | | | | 1,721,034 | |
| | | | | | |
|
|
|
| | | | | | | | 72,586,993 | |
| | | | | | |
|
|
|
Air Freight & Logistics — 0.5% | | | | | | | | |
Deutsche Post AG (Germany) | | | 6,890 | | | | 225,959 | |
FedEx Corp. | | | 97,600 | | | | 18,173,120 | |
| | | | | | |
|
|
|
| | | | | | | | 18,399,079 | |
| | | | | | |
|
|
|
Airlines — 0.5% | | | | | | | | |
Deutsche Lufthansa AG (Germany) | | | 17,155 | | | | 221,141 | |
International Consolidated Airlines Group SA (United Kingdom) | | | 2,273 | | | | 12,245 | |
Singapore Airlines Ltd. (Singapore) | | | 2,100 | | | | 13,990 | |
Southwest Airlines Co. | | | 390,800 | | | | 19,477,472 | |
United Continental Holdings, Inc.* | | | 21,200 | | | | 1,545,056 | |
| | | | | | |
|
|
|
| | | | | | | | 21,269,904 | |
| | | | | | |
|
|
|
Auto Components — 0.4% | | | | | | | | |
Aisin Seiki Co. Ltd. (Japan) | | | 1,300 | | | | 56,250 | |
Cie Generale des Etablissements Michelin (France) | | | 2,598 | | | | 288,792 | |
Continental AG (Germany) | | | 330 | | | | 63,577 | |
Cooper-Standard Holding, Inc.* | | | 29,400 | | | | 3,039,372 | |
Dana Holding Corp. | | | 81,400 | | | | 1,544,972 | |
GKN PLC (United Kingdom) | | | 8,424 | | | | 34,335 | |
Koito Manufacturing Co. Ltd. (Japan) | | | 300 | | | | 15,843 | |
Lear Corp. | | | 78,300 | | | | 10,364,571 | |
Valeo SA (France) | | | 715 | | | | 41,047 | |
| | | | | | |
|
|
|
| | | | | | | | 15,448,759 | |
| | | | | | |
|
|
|
Automobiles — 0.3% | | | | | | | | |
Bayerische Motoren Werke AG (Germany) | | | 1,277 | | | | 118,935 | |
Ferrari NV (Italy) | | | 347 | | | | 20,203 | |
Fiat Chrysler Automobiles NV (United Kingdom) | | | 2,674 | | | | 24,325 | |
Ford Motor Co. | | | 919,300 | | | | 11,151,109 | |
Fuji Heavy Industries Ltd. (Japan) | | | 1,900 | | | | 77,414 | |
Honda Motor Co. Ltd. (Japan) | | | 5,000 | | | | 145,977 | |
Mazda Motor Corp. (Japan) | | | 1,600 | | | | 26,054 | |
Mitsubishi Motors Corp. (Japan) | | | 5,300 | | | | 30,128 | |
Nissan Motor Co. Ltd. (Japan) | | | 7,600 | | | | 76,237 | |
Peugeot SA (France)* | | | 13,902 | | | | 226,425 | |
Suzuki Motor Corp. (Japan) | | | 7,700 | | | | 270,338 | |
Thor Industries, Inc. | | | 10,000 | | | | 1,000,500 | |
Toyota Motor Corp. (Japan) | | | 7,000 | | | | 410,399 | |
Volkswagen AG (Germany) | | | 91 | | | | 13,061 | |
| | | | | | |
|
|
|
| | | | | | | | 13,591,105 | |
| | | | | | |
|
|
|
| | | | | | | | |
COMMON STOCKS
(continued) | | Shares
| | | Value
(Note 2)
| |
Banks — 4.8% | | | | | | | | |
Abn Amro Group NV (Netherlands), 144A | | | 850 | | | $ | 18,821 | |
Aozora Bank Ltd. (Japan) | | | 4,000 | | | | 14,133 | |
Bank Hapoalim BM (Israel) | | | 34,253 | | | | 203,309 | |
Bank of America Corp. | | | 2,072,500 | | | | 45,802,250 | |
Bendigo & Adelaide Bank Ltd. (Australia) | | | 27,922 | | | | 255,424 | |
BNP Paribas SA (France) | | | 7,735 | | | | 492,241 | |
BOC Hong Kong Holdings Ltd. (Hong Kong) | | | 76,500 | | | | 272,459 | |
Chiba Bank Ltd. (The) (Japan) | | | 2,000 | | | | 12,260 | |
Citigroup, Inc. | | | 616,100 | | | | 36,614,823 | |
Commonwealth Bank of Australia (Australia) | | | 1,398 | | | | 82,935 | |
Concordia Financial Group Ltd. (Japan) | | | 3,400 | | | | 16,361 | |
Credit Agricole SA (France) | | | 28,051 | | | | 347,236 | |
DBS Group Holdings Ltd. (Singapore) | | | 5,400 | | | | 64,427 | |
DNB ASA (Norway) | | | 3,003 | | | | 44,581 | |
Erste Group Bank AG (Austria) | | | 928 | | | | 27,132 | |
Fukuoka Financial Group, Inc. (Japan) | | | 22,000 | | | | 97,570 | |
Hiroshima Bank Ltd. (The) (Japan) | | | 2,000 | | | | 9,320 | |
HSBC Holdings PLC (United Kingdom) | | | 90,563 | | | | 730,722 | |
ING Groep NV , CVA (Netherlands) | | | 32,794 | | | | 461,700 | |
Intesa Sanpaolo SpA (Italy) | | | 36,407 | | | | 92,224 | |
Intesa Sanpaolo SpA, RSP (Italy) | | | 2,701 | | | | 6,326 | |
JPMorgan Chase & Co. | | | 619,894 | | | | 53,490,653 | |
KBC Groep NV (Belgium) | | | 202 | | | | 12,481 | |
Kyushu Financial Group, Inc. (Japan) | | | 1,100 | | | | 7,453 | |
Lloyds Banking Group PLC (United Kingdom) | | | 195,417 | | | | 150,057 | |
Mebuki Financial Group, Inc. (Japan) | | | 2,850 | | | | 10,533 | |
Mediobanca SpA (Italy) | | | 24,619 | | | | 200,500 | |
Mitsubishi UFJ Financial Group, Inc. (Japan) | | | 2,800 | | | | 17,269 | |
Mizuho Financial Group, Inc. (Japan) | | | 71,600 | | | | 128,489 | |
National Australia Bank Ltd. (Australia) | | | 1,107 | | | | 24,452 | |
PNC Financial Services Group, Inc. (The) | | | 181,800 | | | | 21,263,328 | |
Resona Holdings, Inc. (Japan) | | | 6,800 | | | | 34,850 | |
Societe Generale SA (France) | | | 8,701 | | | | 427,976 | |
Sumitomo Mitsui Financial Group, Inc. (Japan) | | | 4,000 | | | | 152,332 | |
SunTrust Banks, Inc. | | | 71,200 | | | | 3,905,320 | |
Svenska Handelsbanken AB (Sweden) (Class A Stock) | | | 4,656 | | | | 64,488 | |
Swedbank AB (Sweden) (Class A Stock) | | | 2,767 | | | | 66,670 | |
UniCredit SpA (Italy) | | | 15,629 | | | | 44,883 | |
Wells Fargo & Co. | | | 346,112 | | | | 19,074,232 | |
Westpac Banking Corp. (Australia) | | | 650 | | | | 15,258 | |
| | | | | | |
|
|
|
| | | | | | | | 184,757,478 | |
| | | | | | |
|
|
|
SEE NOTES TO FINANCIAL STATEMENTS.
A71
| | | | | | |
| | | FLEXIBLE MANAGED PORTFOLIO (continued) | | |
| |
| SCHEDULE OF INVESTMENTS | | as of December 31, 2016 |
| | | | | | | | |
COMMON STOCKS
(continued) | | Shares
| | | Value
(Note 2)
| |
Beverages — 1.3% | | | | | | | | |
Anheuser-Busch InBev SA/NV (Belgium) | | | 390 | | | $ | 41,279 | |
Asahi Group Holdings Ltd. (Japan) | | | 1,100 | | | | 34,634 | |
Coca-Cola Amatil Ltd. (Australia) | | | 32,744 | | | | 238,801 | |
Coca-Cola European Partners PLC (United Kingdom) | | | 644 | | | | 20,326 | |
Diageo PLC (United Kingdom) | | | 16,817 | | | | 436,401 | |
Dr. Pepper Snapple Group, Inc. | | | 162,900 | | | | 14,770,143 | |
PepsiCo, Inc. | | | 320,120 | | | | 33,494,156 | |
| | | | | | |
|
|
|
| | | | | | | | 49,035,740 | |
| | | | | | |
|
|
|
Biotechnology — 2.0% | | | | | | | | |
Actelion Ltd. (Switzerland) | | | 299 | | | | 64,616 | |
Amgen, Inc. | | | 153,408 | | | | 22,429,784 | |
Biogen Idec, Inc.* | | | 49,000 | | | | 13,895,420 | |
Celgene Corp.* | | | 201,200 | | | | 23,288,900 | |
Gilead Sciences, Inc. | | | 267,700 | | | | 19,169,997 | |
| | | | | | |
|
|
|
| | | | | | | | 78,848,717 | |
| | | | | | |
|
|
|
Building Products — 0.1% | | | | | | | | |
Asahi Glass Co. Ltd. (Japan) | | | 43,000 | | | | 291,740 | |
Continental Building Products, Inc.* | | | 54,600 | | | | 1,261,260 | |
Daikin Industries Ltd. (Japan) | | | 700 | | | | 64,126 | |
Universal Forest Products, Inc. | | | 24,800 | | | | 2,534,064 | |
| | | | | | |
|
|
|
| | | | | | | | 4,151,190 | |
| | | | | | |
|
|
|
Capital Markets — 1.5% | | | | | | | | |
3i Group PLC (United Kingdom) | | | 35,139 | | | | 303,968 | |
Aberdeen Asset Management PLC (United Kingdom) | | | 2,747 | | | | 8,685 | |
Ameriprise Financial, Inc. | | | 45,100 | | | | 5,003,394 | |
ASX Ltd. (Australia) | | | 600 | | | | 21,495 | |
BlackRock, Inc. | | | 9,100 | | | | 3,462,914 | |
Goldman Sachs Group, Inc. (The) | | | 121,100 | | | | 28,997,395 | |
Invesco Ltd. | | | 66,500 | | | | 2,017,610 | |
Macquarie Group Ltd. (Australia) | | | 5,349 | | | | 335,073 | |
Morgan Stanley | | | 139,400 | | | | 5,889,650 | |
Partners Group Holding AG (Switzerland) | | | 106 | | | | 49,623 | |
Raymond James Financial, Inc. | | | 116,400 | | | | 8,063,028 | |
Schroders PLC (United Kingdom) | | | 406 | | | | 14,912 | |
State Street Corp. | | | 47,200 | | | | 3,668,384 | |
UBS Group AG (Switzerland) | | | 11,166 | | | | 174,586 | |
| | | | | | |
|
|
|
| | | | | | | | 58,010,717 | |
| | | | | | |
|
|
|
Chemicals — 0.9% | | | | | | | | |
AdvanSix, Inc.* | | | 7,116 | | | | 157,548 | |
Arkema SA (France) | | | 201 | | | | 19,648 | |
Asahi Kasei Corp. (Japan) | | | 3,000 | | | | 26,104 | |
BASF SE (Germany) | | | 2,815 | | | | 260,885 | |
Celanese Corp. Series A | | | 64,100 | | | | 5,047,234 | |
Chemours Co. (The) | | | 163,400 | | | | 3,609,506 | |
Covestro AG (Germany), 144A | | | 551 | | | | 37,715 | |
Croda International PLC (United Kingdom) | | | 401 | | | | 15,771 | |
Daicel Corp. (Japan) | | | 17,900 | | | | 196,794 | |
Evonik Industries AG (Germany) | | | 625 | | | | 18,631 | |
GCP Applied Technologies, Inc.* | | | 26,600 | | | | 711,550 | |
Givaudan SA (Switzerland) | | | 35 | | | | 64,056 | |
| | | | | | | | |
COMMON STOCKS
(continued) | | Shares
| | | Value
(Note 2)
| |
Chemicals (continued) | | | | | | | | |
Hitachi Chemical Co. Ltd. (Japan) | | | 300 | | | $ | 7,484 | |
Johnson Matthey PLC (United Kingdom) | | | 594 | | | | 23,242 | |
K+S AG (Germany) | | | 585 | | | | 13,935 | |
Kuraray Co. Ltd. (Japan) | | | 1,000 | | | | 14,996 | |
LyondellBasell Industries NV (Class A Stock) | | | 200,100 | | | | 17,164,578 | |
Mitsubishi Chemical Holdings Corp. (Japan) | | | 3,600 | | | | 23,276 | |
Mitsubishi Gas Chemical Co., Inc. (Japan) | | | 11,700 | | | | 199,361 | |
Mitsui Chemicals, Inc. (Japan) | | | 2,000 | | | | 8,961 | |
PPG Industries, Inc. | | | 53,000 | | | | 5,022,280 | |
Shin-Etsu Chemical Co. Ltd. (Japan) | | | 1,200 | | | | 92,867 | |
Sika AG (Switzerland) | | | 5 | | | | 23,989 | |
Solvay SA (Belgium) | | | 214 | | | | 25,018 | |
Teijin Ltd. (Japan) | | | 400 | | | | 8,082 | |
Toray Industries, Inc. (Japan) | | | 4,000 | | | | 32,302 | |
Trinseo SA | | | 5,000 | | | | 296,500 | |
Westlake Chemical Corp. | | | 45,700 | | | | 2,558,743 | |
Yara International ASA (Norway) | | | 5,105 | | | | 200,826 | |
| | | | | | |
|
|
|
| | | | | | | | 35,881,882 | |
| | | | | | |
|
|
|
Commercial Services & Supplies — 0.1% | |
Brink’s Co. (The) | | | 20,400 | | | | 841,500 | |
Herman Miller, Inc. | | | 25,900 | | | | 885,780 | |
Steelcase, Inc. (Class A Stock) | | | 169,600 | | | | 3,035,840 | |
| | | | | | |
|
|
|
| | | | | | | | 4,763,120 | |
| | | | | | |
|
|
|
Communications Equipment — 0.6% | | | | | |
Cisco Systems, Inc. | | | 609,800 | | | | 18,428,156 | |
F5 Networks, Inc.* | | | 38,400 | | | | 5,557,248 | |
| | | | | | |
|
|
|
| | | | | | | | 23,985,404 | |
| | | | | | |
|
|
|
Construction & Engineering — 0.2% | | | | | |
Argan, Inc. | | | 27,200 | | | | 1,918,960 | |
Eiffage SA (France) | | | 182 | | | | 12,677 | |
EMCOR Group, Inc. | | | 53,100 | | | | 3,757,356 | |
Kajima Corp. (Japan) | | | 35,000 | | | | 241,749 | |
MasTec, Inc.* | | | 40,300 | | | | 1,541,475 | |
Obayashi Corp. (Japan) | | | 26,200 | | | | 250,140 | |
Shimizu Corp. (Japan) | | | 6,000 | | | | 54,768 | |
Skanska AB (Sweden) (Class B Stock) | | | 1,065 | | | | 25,075 | |
Taisei Corp. (Japan) | | | 11,000 | | | | 76,813 | |
| | | | | | |
|
|
|
| | | | | | | | 7,879,013 | |
| | | | | | |
|
|
|
Construction Materials | | | | | | | | |
Fletcher Building Ltd. (New Zealand) | | | 1,986 | | | | 14,593 | |
HeidelbergCement AG (Germany) | | | 406 | | | | 37,790 | |
| | | | | | |
|
|
|
| | | | | | | | 52,383 | |
| | | | | | |
|
|
|
Consumer Finance — 0.6% | | | | | | | | |
Capital One Financial Corp. | | | 56,200 | | | | 4,902,888 | |
Discover Financial Services | | | 42,100 | | | | 3,034,989 | |
Synchrony Financial | | | 446,600 | | | | 16,198,182 | |
| | | | | | |
|
|
|
| | | | | | | | 24,136,059 | |
| | | | | | |
|
|
|
SEE NOTES TO FINANCIAL STATEMENTS.
A72
| | | | | | |
| | | FLEXIBLE MANAGED PORTFOLIO (continued) | | |
| |
| SCHEDULE OF INVESTMENTS | | as of December 31, 2016 |
| | | | | | | | |
COMMON STOCKS
(continued) | | Shares
| | | Value
(Note 2)
| |
Containers & Packaging — 0.2% | | | | | | | | |
Amcor Ltd. (Australia) | | | 3,536 | | | $ | 38,057 | |
Greif, Inc. (Class A Stock) | | | 37,400 | | | | 1,918,994 | |
Owens-Illinois, Inc.* | | | 232,900 | | | | 4,054,789 | |
| | | | | | |
|
|
|
| | | | | | | | 6,011,840 | |
| | | | | | |
|
|
|
Distributors | | | | | | | | |
Jardine Cycle & Carriage Ltd. (Singapore) | | | 4,100 | | | | 116,440 | |
| | | | | | |
|
|
|
Diversified Financial Services — 0.7% | |
Berkshire Hathaway, Inc. (Class B Stock)* | | | 160,900 | | | | 26,223,482 | |
Challenger Ltd. (Australia) | | | 8,862 | | | | 71,604 | |
Investor AB (Sweden) (Class B Stock) | | | 4,787 | | | | 178,364 | |
Mitsubishi UFJ Lease & Finance Co. Ltd. (Japan) | | | 1,400 | | | | 7,221 | |
ORIX Corp. (Japan) | | | 17,300 | | | | 269,262 | |
| | | | | | |
|
|
|
| | | | | | | | 26,749,933 | |
| | | | | | |
|
|
|
Diversified Telecommunication Services — 2.1% | |
AT&T, Inc. | | | 1,014,520 | | | | 43,147,536 | |
Deutsche Telekom AG (Germany) | | | 10,156 | | | | 174,249 | |
Nippon Telegraph & Telephone Corp. (Japan) | | | 7,700 | | | | 324,133 | |
Orange SA (France) | | | 5,798 | | | | 87,921 | |
Telecom Italia SpA (Italy)* | | | 65,746 | | | | 58,050 | |
Telecom Italia SpA (Italy) | | | 353,674 | | | | 256,695 | |
Telefonica SA (Spain) | | | 13,765 | | | | 127,084 | |
Verizon Communications, Inc. | | | 731,488 | | | | 39,046,829 | |
| | | | | | |
|
|
|
| | | | | | | | 83,222,497 | |
| | | | | | |
|
|
|
Electric Utilities — 1.6% | | | | | | | | |
American Electric Power Co., Inc. | | | 254,400 | | | | 16,017,024 | |
AusNet Services (Australia) | | | 5,286 | | | | 6,018 | |
Cheung Kong Infrastructure Holdings Ltd. (Hong Kong) | | | 1,000 | | | | 7,942 | |
Chubu Electric Power Co., Inc. (Japan) | | | 1,900 | | | | 26,439 | |
Chugoku Electric Power Co., Inc. (The) (Japan) | | | 800 | | | | 9,364 | |
CLP Holdings Ltd. (Hong Kong) | | | 8,000 | | | | 73,367 | |
Duke Energy Corp. | | | 196,900 | | | | 15,283,378 | |
EDP-Energias de Portugal SA (Portugal) | | | 46,235 | | | | 140,719 | |
Electricite de France (France) | | | 763 | | | | 7,763 | |
Enel SpA (Italy) | | | 81,879 | | | | 359,917 | |
Exelon Corp. | | | 289,100 | | | | 10,260,159 | |
FirstEnergy Corp. | | | 215,700 | | | | 6,680,229 | |
Hokuriku Electric Power Co. (Japan) | | | 400 | | | | 4,474 | |
Iberdrola SA (Spain) | | | 16,274 | | | | 106,561 | |
Kansai Electric Power Co., Inc. (The) (Japan)* | | | 2,000 | | | | 21,803 | |
Kyushu Electric Power Co., Inc. (Japan) | | | 1,200 | | | | 13,000 | |
PPL Corp. | | | 394,300 | | | | 13,425,915 | |
Red Electrica Corp. SA (Spain) | | | 1,262 | | | | 23,776 | |
Shikoku Electric Power Co., Inc. (Japan) | | | 1,200 | | | | 12,127 | |
| | | | | | | | |
COMMON STOCKS
(continued) | | Shares
| | | Value
(Note 2)
| |
Electric Utilities (continued) | | | | | | | | |
SSE PLC (United Kingdom) | | | 2,935 | | | $ | 56,041 | |
Terna Rete Elettrica Nazionale SpA (Italy) | | | 4,613 | | | | 21,097 | |
Tohoku Electric Power Co., Inc. (Japan) | | | 1,300 | | | | 16,388 | |
Tokyo Electric Power Co., Inc. (Japan)* | | | 4,200 | | | | 16,904 | |
| | | | | | |
|
|
|
| | | | | | | | 62,590,405 | |
| | | | | | |
|
|
|
Electrical Equipment — 0.3% | | | | | | | | |
Emerson Electric Co. | | | 140,600 | | | | 7,838,450 | |
EnerSys | | | 22,600 | | | | 1,765,060 | |
Nidec Corp. (Japan) | | | 700 | | | | 60,263 | |
Regal Beloit Corp. | | | 500 | | | | 34,625 | |
Vestas Wind Systems A/S (Denmark) | | | 3,917 | | | | 253,683 | |
| | | | | | |
|
|
|
| | | | | | | | 9,952,081 | |
| | | | | | |
|
|
|
Electronic Equipment, Instruments & Components | |
Hitachi High-Technologies Corp. (Japan) | | | 5,700 | | | | 229,256 | |
Hitachi Ltd. (Japan) | | | 15,000 | | | | 80,882 | |
TDK Corp. (Japan) | | | 3,500 | | | | 239,989 | |
| | | | | | |
|
|
|
| | | | | | | | 550,127 | |
| | | | | | |
|
|
|
Energy Equipment & Services — 0.3% | | | | | | | | |
Ensco PLC (Class A Stock) | | | 810,700 | | | | 7,880,004 | |
McDermott International, Inc.* | | | 144,800 | | | | 1,070,072 | |
Unit Corp.* | | | 67,300 | | | | 1,808,351 | |
| | | | | | |
|
|
|
| | | | | | | | 10,758,427 | |
| | | | | | |
|
|
|
Equity Real Estate Investment Trusts (REITs) — 1.3% | |
Apple Hospitality REIT, Inc. | | | 24,100 | | | | 481,518 | |
CoreCivic, Inc. | | | 55,200 | | | | 1,350,192 | |
Crown Castle International Corp. | | | 109,800 | | | | 9,527,346 | |
Dexus Property Group (Australia) | | | 4,998 | | | | 34,672 | |
Forest City Realty Trust, Inc. (Class A Stock) | | | 161,000 | | | | 3,355,240 | |
Franklin Street Properties Corp. | | | 82,100 | | | | 1,064,016 | |
GEO Group, Inc. (The)(a) | | | 168,900 | | | | 6,068,577 | |
HCP, Inc.(a) | | | 95,900 | | | | 2,850,148 | |
Land Securities Group PLC (United Kingdom) | | | 2,407 | | | | 31,621 | |
Link REIT (The) (Hong Kong) | | | 7,000 | | | | 45,382 | |
Mirvac Group (Australia) | | | 154,867 | | | | 237,829 | |
Prologis, Inc. | | | 196,600 | | | | 10,378,514 | |
Ryman Hospitality Properties, Inc. | | | 44,800 | | | | 2,822,848 | |
Simon Property Group, Inc. | | | 34,700 | | | | 6,165,149 | |
Unibail-Rodamco SE (France) | | | 309 | | | | 73,636 | |
VEREIT, Inc. | | | 451,100 | | | | 3,816,306 | |
WP Carey, Inc. | | | 20,000 | | | | 1,181,800 | |
| | | | | | |
|
|
|
| | | | | | | | 49,484,794 | |
| | | | | | |
|
|
|
Food & Staples Retailing — 1.2% | | | | | | | | |
Carrefour SA (France) | | | 1,445 | | | | 34,790 | |
Distribuidora Internacional de Alimentacion SA (Spain) | | | 1,871 | | | | 9,176 | |
ICA Gruppen AB (Sweden) | | | 8,166 | | | | 248,556 | |
J. Sainsbury PLC (United Kingdom) | | | 92,828 | | | | 285,304 | |
Kroger Co. (The) | | | 338,900 | | | | 11,695,439 | |
SEE NOTES TO FINANCIAL STATEMENTS.
A73
| | | | | | |
| | | FLEXIBLE MANAGED PORTFOLIO (continued) | | |
| |
| SCHEDULE OF INVESTMENTS | | as of December 31, 2016 |
| | | | | | | | |
COMMON STOCKS
(continued) | | Shares
| | | Value
(Note 2)
| |
Food & Staples Retailing (continued) | | | | | | | | |
METRO AG (Germany) | | | 7,879 | | | $ | 261,876 | |
Wal-Mart Stores, Inc. | | | 362,600 | | | | 25,062,912 | |
Walgreens Boots Alliance, Inc. | | | 97,400 | | | | 8,060,824 | |
Wesfarmers Ltd. (Australia) | | | 408 | | | | 12,384 | |
| | | | | | |
|
|
|
| | | | | | | | 45,671,261 | |
| | | | | | |
|
|
|
Food Products — 1.4% | | | | | | | | |
Archer-Daniels-Midland Co. | | | 46,000 | | | | 2,099,900 | |
Bunge Ltd. | | | 108,800 | | | | 7,859,712 | |
ConAgra Foods, Inc. | | | 256,000 | | | | 10,124,800 | |
Fresh Del Monte Produce, Inc. | | | 5,300 | | | | 321,339 | |
General Mills, Inc. | | | 189,900 | | | | 11,730,123 | |
J.M. Smucker Co. (The) | | | 16,600 | | | | 2,125,796 | |
Marine Harvest ASA (Norway) | | | 16,965 | | | | 306,736 | |
MEIJI Holdings Co. Ltd. (Japan) | | | 300 | | | | 23,468 | |
Nestle SA (Switzerland) | | | 7,545 | | | | 540,506 | |
Sanderson Farms, Inc.(a) | | | 56,100 | | | | 5,286,864 | |
Tate & Lyle PLC (United Kingdom) | | | 1,387 | | | | 12,071 | |
Tyson Foods, Inc. (Class A Stock) | | | 246,300 | | | | 15,191,784 | |
WH Group Ltd. (Hong Kong), 144A | | | 334,000 | | | | 269,236 | |
Wilmar International Ltd. (Singapore) | | | 17,300 | | | | 42,739 | |
| | | | | | |
|
|
|
| | | | | | | | 55,935,074 | |
| | | | | | |
|
|
|
Gas Utilities — 0.1% | | | | | | | | |
Enagas SA (Spain) | | | 691 | | | | 17,512 | |
Gas Natural SDG SA (Spain) | | | 1,223 | | | | 23,009 | |
Tokyo Gas Co. Ltd. (Japan) | | | 2,000 | | | | 9,028 | |
UGI Corp. | | | 117,000 | | | | 5,391,360 | |
| | | | | | |
|
|
|
| | | | | | | | 5,440,909 | |
| | | | | | |
|
|
|
Health Care Equipment & Supplies — 2.0% | |
Abbott Laboratories | | | 414,800 | | | | 15,932,468 | |
Baxter International, Inc. | | | 310,900 | | | | 13,785,306 | |
Becton Dickinson and Co. | | | 38,200 | | | | 6,324,010 | |
Boston Scientific Corp.* | | | 340,100 | | | | 7,356,363 | |
C.R. Bard, Inc. | | | 38,300 | | | | 8,604,478 | |
Cochlear Ltd. (Australia) | | | 175 | | | | 15,446 | |
Danaher Corp. | | | 159,200 | | | | 12,392,128 | |
Hologic, Inc.* | | | 297,000 | | | | 11,915,640 | |
| | | | | | |
|
|
|
| | | | | | | | 76,325,839 | |
| | | | | | |
|
|
|
Health Care Providers & Services — 1.7% | |
Alfresa Holdings Corp. (Japan) | | | 12,800 | | | | 211,417 | |
Anthem, Inc. | | | 87,200 | | | | 12,536,744 | |
Express Scripts Holding Co.* | | | 248,500 | | | | 17,094,315 | |
Fresenius SE & Co. KGaA (Germany) | | | 244 | | | | 19,035 | |
McKesson Corp. | | | 39,300 | | | | 5,519,685 | |
Medipal Holdings Corp. (Japan) | | | 16,700 | | | | 263,060 | |
Ramsay Health Care Ltd. (Australia) | | | 417 | | | | 20,503 | |
Ryman Healthcare Ltd. (New Zealand) | | | 1,106 | | | | 6,228 | |
Sonic Healthcare Ltd. (Australia) | | | 4,962 | | | | 76,365 | |
UnitedHealth Group, Inc. | | | 199,400 | | | | 31,911,976 | |
| | | | | | |
|
|
|
| | | | | | | | 67,659,328 | |
| | | | | | |
|
|
|
Health Care Technology — 0.1% | | | | | | | | |
Cerner Corp.* | | | 56,500 | | | | 2,676,405 | |
| | | | | | |
|
|
|
| | | | | | | | |
COMMON STOCKS
(continued) | | Shares
| | | Value
(Note 2)
| |
Hotels, Restaurants & Leisure — 0.7% | | | | | | | | |
Aristocrat Leisure Ltd. (Australia) | | | 24,712 | | | $ | 275,702 | |
Compass Group PLC (United Kingdom) | | | 5,038 | | | | 93,110 | |
Domino’s Pizza Enterprises Ltd. (Australia) | | | 1,113 | | | | 52,048 | |
Extended Stay America, Inc. | | | 147,300 | | | | 2,378,895 | |
Galaxy Entertainment Group Ltd. (Hong Kong) | | | 7,000 | | | | 30,318 | |
McDonald’s Corp. | | | 203,400 | | | | 24,757,848 | |
Paddy Power Betfair PLC (Ireland) | | | 2,421 | | | | 257,612 | |
Tui AG (Germany) | | | 1,434 | | | | 20,531 | |
| | | | | | |
|
|
|
| | | | | | | | 27,866,064 | |
| | | | | | |
|
|
|
Household Durables — 0.4% | | | | | | | | |
D.R. Horton, Inc. | | | 457,600 | | | | 12,506,208 | |
Electrolux AB (Sweden) (Class B Stock) | | | 714 | | | | 17,679 | |
Iida Group Holdings Co. Ltd. (Japan) | | | 4,100 | | | | 77,725 | |
Lennar Corp. (Class A Stock) | | | 22,800 | | | | 978,804 | |
Nikon Corp. (Japan) | | | 1,000 | | | | 15,530 | |
Panasonic Corp. (Japan) | | | 6,400 | | | | 64,910 | |
Persimmon PLC (United Kingdom) | | | 951 | | | | 20,749 | |
Sekisui House Ltd. (Japan) | | | 1,700 | | | | 28,244 | |
Sony Corp. (Japan) | | | 3,900 | | | | 108,974 | |
Taylor Wimpey PLC (United Kingdom) | | | 9,768 | | | | 18,423 | |
TRI Pointe Group, Inc.* | | | 210,200 | | | | 2,413,096 | |
| | | | | | |
|
|
|
| | | | | | | | 16,250,342 | |
| | | | | | |
|
|
|
Household Products — 0.9% | | | | | | | | |
Colgate-Palmolive Co. | | | 266,400 | | | | 17,433,216 | |
Henkel AG & Co. KGaA (Germany) | | | 304 | | | | 31,639 | |
Kimberly-Clark Corp. | | | 84,800 | | | | 9,677,376 | |
Procter & Gamble Co. (The) | | | 70,905 | | | | 5,961,692 | |
Reckitt Benckiser Group PLC (United Kingdom) | | | 2,034 | | | | 172,297 | |
Svenska Cellulosa AB SCA (Sweden) (Class B Stock) | | | 1,865 | | | | 52,493 | |
| | | | | | |
|
|
|
| | | | | | | | 33,328,713 | |
| | | | | | |
|
|
|
Independent Power & Renewable Electricity Producers — 0.3% | |
AES Corp. | | | 900,000 | | | | 10,458,000 | |
Electric Power Development Co. Ltd. (Japan) | | | 400 | | | | 9,181 | |
| | | | | | |
|
|
|
| | | | | | | | 10,467,181 | |
| | | | | | |
|
|
|
Industrial Conglomerates — 1.2% | | | | | | | | |
3M Co. | | | 89,800 | | | | 16,035,586 | |
Carlisle Cos., Inc. | | | 35,700 | | | | 3,937,353 | |
CK Hutchison Holdings Ltd. (Hong Kong) | | | 8,000 | | | | 90,308 | |
DCC PLC (United Kingdom) | | | 259 | | | | 19,252 | |
General Electric Co. | | | 387,592 | | | | 12,247,907 | |
Honeywell International, Inc. | | | 136,700 | | | | 15,836,695 | |
Jardine Matheson Holdings Ltd. (Hong Kong) | | | 800 | | | | 44,200 | |
NWS Holdings Ltd. (Hong Kong) | | | 5,000 | | | | 8,128 | |
SEE NOTES TO FINANCIAL STATEMENTS.
A74
| | | | | | |
| | | FLEXIBLE MANAGED PORTFOLIO (continued) | | |
| |
| SCHEDULE OF INVESTMENTS | | as of December 31, 2016 |
| | | | | | | | |
COMMON STOCKS
(continued) | | Shares
| | | Value
(Note 2)
| |
Industrial Conglomerates (continued) | |
Siemens AG (Germany) | | | 2,411 | | | $ | 295,204 | |
Toshiba Corp. (Japan)* | | | 12,000 | | | | 28,986 | |
| | | | | | |
|
|
|
| | | | | | | | 48,543,619 | |
| | | | | | |
|
|
|
Insurance — 1.3% | | | | | | | | |
Aflac, Inc. | | | 154,600 | | | | 10,760,160 | |
AIA Group Ltd. (Hong Kong) | | | 36,400 | | | | 203,907 | |
Alleghany Corp.* | | | 2,300 | | | | 1,398,676 | |
Allianz SE (Germany) | | | 456 | | | | 75,258 | |
Allstate Corp. (The) | | | 213,400 | | | | 15,817,208 | |
Aon PLC | | | 14,100 | | | | 1,572,573 | |
Assicurazioni Generali SpA (Italy) | | | 3,595 | | | | 53,287 | |
AXA SA (France) | | | 5,568 | | | | 140,363 | |
Hannover Rueck SE (Germany) | | | 183 | | | | 19,769 | |
Hanover Insurance Group, Inc. (The) | | | 13,500 | | | | 1,228,635 | |
Legal & General Group PLC (United Kingdom) | | | 109,099 | | | | 332,359 | |
Mapfre SA (Spain) | | | 3,284 | | | | 10,003 | |
MetLife, Inc. | | | 66,900 | | | | 3,605,241 | |
MS&AD Insurance Group Holdings, Inc. (Japan) | | | 3,100 | | | | 95,999 | |
Muenchener Rueckversicherungs-Gesellschaft AG in Muenchen (Germany) | | | 184 | | | | 34,754 | |
NN Group NV (Netherlands) | | | 4,426 | | | | 149,832 | |
QBE Insurance Group Ltd. (Australia) | | | 4,283 | | | | 38,268 | |
RSA Insurance Group PLC (United Kingdom) | | | 3,056 | | | | 22,038 | |
St. James’s Place PLC (United Kingdom) | | | 9,947 | | | | 124,077 | |
Suncorp Group Ltd. (Australia) | | | 3,650 | | | | 35,541 | |
Swiss Life Holding AG (Switzerland) | | | 971 | | | | 274,287 | |
Swiss Re AG (Switzerland) | | | 1,017 | | | | 96,221 | |
Tokio Marine Holdings, Inc. (Japan) | | | 2,100 | | | | 85,980 | |
Unum Group | | | 122,500 | | | | 5,381,425 | |
XL Group Ltd. (Ireland) | | | 265,900 | | | | 9,907,434 | |
| | | | | | |
|
|
|
| | | | | | | | 51,463,295 | |
| | | | | | |
|
|
|
Internet & Direct Marketing Retail — 1.0% | |
Amazon.com, Inc.* | | | 17,800 | | | | 13,347,686 | |
HSN, Inc. | | | 67,000 | | | | 2,298,100 | |
Liberty TripAdvisor Holdings, Inc. (Class A Stock)* | | | 94,500 | | | | 1,422,225 | |
Netflix, Inc.* | | | 156,000 | | | | 19,312,800 | |
Shutterfly, Inc.* | | | 22,500 | | | | 1,129,050 | |
| | | | | | |
|
|
|
| | | | | | | | 37,509,861 | |
| | | | | | |
|
|
|
Internet Software & Services — 3.0% | |
Alphabet, Inc. (Class A Stock)* | | | 35,800 | | | | 28,369,710 | |
Alphabet, Inc. (Class C Stock)* | | | 51,682 | | | | 39,889,201 | |
eBay, Inc.* | | | 169,400 | | | | 5,029,486 | |
Facebook, Inc. (Class A Stock)* | | | 388,300 | | | | 44,673,915 | |
| | | | | | |
|
|
|
| | | | | | | | 117,962,312 | |
| | | | | | |
|
|
|
IT Services — 1.8% | | | | | | | | |
Accenture PLC (Class A Stock) | | | 177,100 | | | | 20,743,723 | |
Amadeus IT Holding SA (Spain) (Class A Stock) | | | 5,242 | | | | 237,747 | |
| | | | | | | | |
COMMON STOCKS
(continued) | | Shares
| | | Value
(Note 2)
| |
IT Services (continued) | | | | | | | | |
Atos SE (France) | | | 1,132 | | | $ | 119,311 | |
Booz Allen Hamilton Holding Corp. | | | 103,400 | | | | 3,729,638 | |
Cardtronics PLC (Class A Stock)*(a) | | | 60,700 | | | | 3,312,399 | |
Cognizant Technology Solutions Corp. (Class A Stock)* | | | 300,800 | | | | 16,853,824 | |
CoreLogic, Inc.* | | | 26,600 | | | | 979,678 | |
Fujitsu Ltd. (Japan) | | | 38,000 | | | | 210,427 | |
MasterCard, Inc. (Class A Stock) | | | 218,600 | | | | 22,570,450 | |
Travelport Worldwide Ltd. (United Kingdom) | | | 58,000 | | | | 817,800 | |
Worldpay Group PLC (United Kingdom), 144A | | | 7,202 | | | | 23,911 | |
| | | | | | |
|
|
|
| | | | | | | | 69,598,908 | |
| | | | | | |
|
|
|
Leisure Products — 0.1% | | | | | | | | |
Bandai Namco Holdings, Inc. (Japan) | | | 8,000 | | | | 220,200 | |
Sega Sammy Holdings, Inc. (Japan) | | | 1,100 | | | | 16,346 | |
Smith & Wesson Holding Corp.*(a) | | | 229,800 | | | | 4,844,184 | |
| | | | | | |
|
|
|
| | | | | | | | 5,080,730 | |
| | | | | | |
|
|
|
Life Sciences Tools & Services — 0.3% | |
Lonza Group AG (Switzerland) | | | 161 | | | | 27,826 | |
QIAGEN NV* | | | 644 | | | | 18,047 | |
Thermo Fisher Scientific, Inc. | | | 90,100 | | | | 12,713,110 | |
VWR Corp.* | | | 25,900 | | | | 648,277 | |
| | | | | | |
|
|
|
| | | | | | | | 13,407,260 | |
| | | | | | |
|
|
|
Machinery — 1.2% | | | | | | | | |
Atlas Copco AB (Sweden) (Class A Stock) | | | 9,901 | | | | 300,362 | |
Atlas Copco AB (Sweden) (Class B Stock) | | | 1,137 | | | | 30,912 | |
Fortive Corp. | | | 169,000 | | | | 9,063,470 | |
Illinois Tool Works, Inc. | | | 50,300 | | | | 6,159,738 | |
Ingersoll-Rand PLC(a) | | | 190,500 | | | | 14,295,120 | |
JTEKT Corp. (Japan) | | | 700 | | | | 11,162 | |
Kone OYJ (Finland) (Class B Stock) | | | 1,037 | | | | 46,337 | |
Minebea Co. Ltd. (Japan) | | | 1,000 | | | | 9,331 | |
Sandvik AB (Sweden) | | | 3,138 | | | | 38,711 | |
Schindler Holding AG (Switzerland) | | | 539 | | | | 94,082 | |
Schindler Holding AG (Switzerland) (Part. Cert.) | | | 136 | | | | 23,951 | |
SKF AB (Sweden) (Class B Stock) | | | 754 | | | | 13,826 | |
Stanley Black & Decker, Inc. | | | 112,400 | | | | 12,891,156 | |
Sumitomo Heavy Industries Ltd. (Japan) | | | 2,000 | | | | 12,842 | |
Wabash National Corp.*(a) | | | 160,300 | | | | 2,535,946 | |
| | | | | | |
|
|
|
| | | | | | | | 45,526,946 | |
| | | | | | |
|
|
|
Marine | | | | | | | | |
A.P. Moeller – Maersk A/S (Denmark) (Class A Stock) | | | 10 | | | | 15,091 | |
| | | | | | |
|
|
|
Media — 1.4% | | | | | | | | |
Altice NV (Netherlands), (Class A Stock)* | | | 1,125 | | | | 22,264 | |
CBS Corp. (Class B Stock) | | | 172,300 | | | | 10,961,726 | |
Cinemark Holdings, Inc. | | | 75,000 | | | | 2,877,000 | |
Comcast Corp. (Class A Stock) | | | 283,273 | | | | 19,560,000 | |
SEE NOTES TO FINANCIAL STATEMENTS.
A75
| | | | | | |
| | | FLEXIBLE MANAGED PORTFOLIO (continued) | | |
| |
| SCHEDULE OF INVESTMENTS | | as of December 31, 2016 |
| | | | | | | | |
COMMON STOCKS
(continued) | | Shares
| | | Value
(Note 2)
| |
Media (continued) | | | | | | | | |
Discovery Communications, Inc. (Class C Stock)* | | | 79,500 | | | $ | 2,129,010 | |
RTL Group SA (Luxembourg) | | | 111 | | | | 8,132 | |
TEGNA, Inc. | | | 232,600 | | | | 4,975,314 | |
Toho Co. Ltd. (Japan) | | | 300 | | | | 8,463 | |
Twenty-First Century Fox, Inc. (Class A Stock) | | | 131,600 | | | | 3,690,064 | |
Twenty-First Century Fox, Inc. (Class B Stock) | | | 219,700 | | | | 5,986,825 | |
Walt Disney Co. (The) | | | 52,700 | | | | 5,492,394 | |
WPP PLC (United Kingdom) | | | 15,653 | | | | 348,335 | |
| | | | | | |
|
|
|
| | | | | | | | 56,059,527 | |
| | | | | | |
|
|
|
Metals & Mining — 0.7% | | | | | | | | |
Anglo American PLC (United Kingdom)* | | | 4,642 | | | | 65,586 | |
BHP Billiton Ltd. (Australia) | | | 9,166 | | | | 164,208 | |
Boliden AB (Sweden) | | | 11,368 | | | | 295,284 | |
Fortescue Metals Group Ltd. (Australia) | | | 63,457 | | | | 265,188 | |
Mitsubishi Materials Corp. (Japan) | | | 300 | | | | 9,176 | |
Newmont Mining Corp. | | | 435,600 | | | | 14,840,892 | |
Norsk Hydro ASA (Norway) | | | 4,020 | | | | 19,186 | |
Rio Tinto PLC (United Kingdom) | | | 2,275 | | | | 86,855 | |
Steel Dynamics, Inc. | | | 279,100 | | | | 9,930,378 | |
Voestalpine AG (Austria) | | | 4,296 | | | | 167,988 | |
| | | | | | |
|
|
|
| | | | | | | | 25,844,741 | |
| | | | | | |
|
|
|
Mortgage Real Estate Investment Trusts (REITs) — 0.1% | |
Chimera Investment Corp. | | | 229,400 | | | | 3,904,388 | |
| | | | | | |
|
|
|
Multi-Utilities — 0.4% | | | | | | | | |
National Grid PLC (United Kingdom) | | | 13,495 | | | | 157,673 | |
Public Service Enterprise Group, Inc. | | | 355,600 | | | | 15,603,728 | |
| | | | | | |
|
|
|
| | | | | | | | 15,761,401 | |
| | | | | | |
|
|
|
Multiline Retail — 0.8% | | | | | | | | |
Harvey Norman Holdings Ltd. (Australia) | | | 1,628 | | | | 6,032 | |
Kohl’s Corp.(a) | | | 136,200 | | | | 6,725,556 | |
Macy’s, Inc. | | | 387,600 | | | | 13,879,956 | |
Target Corp.(a) | | | 120,900 | | | | 8,732,607 | |
| | | | | | |
|
|
|
| | | | | | | | 29,344,151 | |
| | | | | | |
|
|
|
Multi-Utilities | | | | | | | | |
DUET Group (Australia) | | | 7,448 | | | | 14,709 | |
Engie SA (France) | | | 817 | | | | 10,400 | |
Innogy SE (Germany), 144A* | | | 431 | | | | 14,976 | |
| | | | | | |
|
|
|
| | | | | | | | 40,085 | |
| | | | | | |
|
|
|
Oil, Gas & Consumable Fuels — 4.4% | | | | | | | | |
Anadarko Petroleum Corp. | | | 218,200 | | | | 15,215,086 | |
BP PLC (United Kingdom) | | | 72,956 | | | | 456,957 | |
Chevron Corp. | | | 110,100 | | | | 12,958,770 | |
ConocoPhillips | | | 419,900 | | | | 21,053,786 | |
Devon Energy Corp. | | | 149,500 | | | | 6,827,665 | |
Energen Corp.* | | | 31,300 | | | | 1,805,071 | |
EOG Resources, Inc. | | | 135,800 | | | | 13,729,380 | |
Exxon Mobil Corp. | | | 351,116 | | | | 31,691,730 | |
| | | | | | | | |
COMMON STOCKS
(continued) | | Shares
| | | Value
(Note 2)
| |
Oil, Gas & Consumable Fuels (continued) | |
Galp Energia SGPS SA (Portugal) | | | 20,128 | | | $ | 300,074 | |
Kinder Morgan, Inc. | | | 693,500 | | | | 14,362,385 | |
Neste OYJ (Finland) | | | 6,813 | | | | 260,718 | |
Newfield Exploration Co.* | | | 303,200 | | | | 12,279,600 | |
Phillips 66 | | | 209,000 | | | | 18,059,690 | |
Rice Energy, Inc.* | | | 98,400 | | | | 2,100,840 | |
Royal Dutch Shell PLC (Netherlands) (Class A Stock) | | | 13,069 | | | | 360,753 | |
Royal Dutch Shell PLC (Netherlands) (Class B Stock) | | | 11,445 | | | | 328,839 | |
Statoil ASA (Norway) | | | 3,433 | | | | 62,658 | |
Tesoro Corp.(a) | | | 59,700 | | | | 5,220,765 | |
Total SA (France) | | | 6,482 | | | | 332,476 | |
Valero Energy Corp. | | | 104,300 | | | | 7,125,776 | |
Williams Cos., Inc. (The) | | | 162,100 | | | | 5,047,794 | |
| | | | | | |
|
|
|
| | | | | | | | 169,580,813 | |
| | | | | | |
|
|
|
Paper & Forest Products | | | | | | | | |
Mondi PLC (South Africa) | | | 4,276 | | | | 87,326 | |
Stora Enso OYJ (Finland) (Class R Stock) | | | 1,619 | | | | 17,319 | |
UPM-Kymmene OYJ (Finland) | | | 10,502 | | | | 256,833 | |
| | | | | | |
|
|
|
| | | | | | | | 361,478 | |
| | | | | | |
|
|
|
Personal Products | | | | | | | | |
Avon Products, Inc.* | | | 257,500 | | | | 1,297,800 | |
Kao Corp. (Japan) | | | 1,500 | | | | 71,002 | |
Unilever NV (United Kingdom) | | | 5,045 | | | | 207,244 | |
Unilever PLC (United Kingdom) | | | 2,617 | | | | 105,832 | |
| | | | | | |
|
|
|
| | | | | | | | 1,681,878 | |
| | | | | | |
|
|
|
Pharmaceuticals — 2.8% | | | | | | | | |
Allergan PLC*(a) | | | 107,900 | | | | 22,660,079 | |
Astellas Pharma, Inc. (Japan) | | | 20,200 | | | | 280,242 | |
AstraZeneca PLC (United Kingdom) | | | 3,648 | | | | 199,210 | |
Bayer AG (Germany) | | | 4,923 | | | | 512,897 | |
Bristol-Myers Squibb Co. | | | 36,300 | | | | 2,121,372 | |
Daiichi Sankyo Co. Ltd. (Japan) | | | 1,800 | | | | 36,755 | |
GlaxoSmithKline PLC (United Kingdom) | | | 14,610 | | | | 280,638 | |
Jazz Pharmaceuticals PLC* | | | 41,700 | | | | 4,546,551 | |
Johnson & Johnson | | | 369,398 | | | | 42,558,344 | |
Mallinckrodt PLC* | | | 199,200 | | | | 9,924,144 | |
Merck & Co., Inc. | | | 43,000 | | | | 2,531,410 | |
Mitsubishi Tanabe Pharma Corp. (Japan) | | | 4,100 | | | | 80,278 | |
Novartis AG (Switzerland) | | | 6,701 | | | | 487,320 | |
Novo Nordisk A/S (Denmark) (Class B Stock) | | | 4,357 | | | | 156,295 | |
Otsuka Holdings Co. Ltd. (Japan) | | | 500 | | | | 21,780 | |
Pfizer, Inc. | | | 624,497 | | | | 20,283,663 | |
Roche Holding AG (Switzerland) | | | 3,009 | | | | 685,909 | |
Sanofi (France) | | | 3,424 | | | | 276,883 | |
Shionogi & Co. Ltd. (Japan) | | | 800 | | | | 38,234 | |
Taro Pharmaceutical Industries Ltd.* | | | 100 | | | | 10,527 | |
Teva Pharmaceutical Industries Ltd. (Israel) | | | 6,209 | | | | 223,569 | |
| | | | | | |
|
|
|
| | | | | | | | 107,916,100 | |
| | | | | | |
|
|
|
SEE NOTES TO FINANCIAL STATEMENTS.
A76
| | | | | | |
| | | FLEXIBLE MANAGED PORTFOLIO (continued) | | |
| |
| SCHEDULE OF INVESTMENTS | | as of December 31, 2016 |
| | | | | | | | |
COMMON STOCKS
(continued) | | Shares
| | | Value
(Note 2)
| |
Professional Services — 0.1% | | | | | | | | |
Adecco Group AG (Switzerland) | | | 3,495 | | | $ | 228,142 | |
Insperity, Inc. | | | 20,700 | | | | 1,468,665 | |
Intertek Group PLC (United Kingdom) | | | 493 | | | | 21,129 | |
Randstad Holding NV (Netherlands) | | | 4,182 | | | | 226,530 | |
RELX PLC (United Kingdom) | | | 15,162 | | | | 270,196 | |
Wolters Kluwer NV (Netherlands) | | | 913 | | | | 33,023 | |
| | | | | | |
|
|
|
| | | | | | | | 2,247,685 | |
| | | | | | |
|
|
|
Real Estate Management & Development — 0.2% | |
Daito Trust Construction Co. Ltd. (Japan) | | | 1,600 | | | | 240,540 | |
Daiwa House Industry Co. Ltd. (Japan) | | | 1,600 | | | | 43,633 | |
Hulic Co. Ltd. (Japan) | | | 1,800 | | | | 15,970 | |
Jones Lang LaSalle, Inc. | | | 64,800 | | | | 6,547,392 | |
Kerry Properties Ltd. (Hong Kong) | | | 7,000 | | | | 18,930 | |
Mitsubishi Estate Co. Ltd. (Japan) | | | 4,000 | | | | 79,459 | |
Sun Hung Kai Properties Ltd. (Hong Kong) | | | 21,000 | | | | 264,442 | |
Wharf Holdings Ltd. (The) (Hong Kong) | | | 4,000 | | | | 26,496 | |
Wheelock & Co. Ltd. (Hong Kong) | | | 6,000 | | | | 33,673 | |
| | | | | | |
|
|
|
| | | | | | | | 7,270,535 | |
| | | | | | |
|
|
|
Real Estate Management & Development | |
Cheung Kong Property Holdings Ltd. (Hong Kong) | | | 8,000 | | | | 48,856 | |
LendLease Group (Australia) | | | 1,738 | | | | 18,264 | |
Mitsui Fudosan Co. Ltd. (Japan) | | | 3,000 | | | | 69,451 | |
| | | | | | |
|
|
|
| | | | | | | | 136,571 | |
| | | | | | |
|
|
|
Road & Rail — 0.1% | | | | | | | | |
CSX Corp. | | | 33,300 | | | | 1,196,469 | |
East Japan Railway Co. (Japan) | | | 1,000 | | | | 86,219 | |
Landstar System, Inc. | | | 12,500 | | | | 1,066,250 | |
MTR Corp. Ltd. (Hong Kong) | | | 4,500 | | | | 21,817 | |
Nippon Express Co. Ltd. (Japan) | | | 3,000 | | | | 16,108 | |
Tokyu Corp. (Japan) | | | 3,000 | | | | 22,014 | |
Union Pacific Corp. | | | 13,500 | | | | 1,399,680 | |
| | | | | | |
|
|
|
| | | | | | | | 3,808,557 | |
| | | | | | |
|
|
|
Semiconductors & Semiconductor Equipment — 2.4% | |
Applied Materials, Inc. | | | 525,200 | | | | 16,948,204 | |
Infineon Technologies AG (Germany) | | | 1,733 | | | | 29,976 | |
Intel Corp. | | | 886,800 | | | | 32,164,236 | |
QUALCOMM, Inc. | | | 363,100 | | | | 23,674,120 | |
Texas Instruments, Inc. | | | 284,900 | | | | 20,789,153 | |
Tokyo Electron Ltd. (Japan) | | | 400 | | | | 37,620 | |
| | | | | | |
|
|
|
| | | | | | | | 93,643,309 | |
| | | | | | |
|
|
|
Software — 3.0% | | | | | | | | |
Adobe Systems, Inc.* | | | 151,300 | | | | 15,576,335 | |
Check Point Software Technologies Ltd. (Israel)* | | | 1,900 | | | | 160,474 | |
Citrix Systems, Inc.* | | | 131,100 | | | | 11,708,541 | |
Electronic Arts, Inc.* | | | 71,800 | | | | 5,654,968 | |
Intuit, Inc. | | | 137,300 | | | | 15,735,953 | |
Konami Holdings Corp. (Japan) | | | 5,900 | | | | 238,114 | |
| | | | | | | | |
COMMON STOCKS
(continued) | | Shares
| | | Value
(Note 2)
| |
Software (continued) | | | | | | | | |
Microsoft Corp. | | | 649,800 | | | $ | 40,378,572 | |
Oracle Corp. | | | 666,300 | | | | 25,619,235 | |
Sage Group PLC (The) (United Kingdom) | | | 8,348 | | | | 67,294 | |
SAP SE (Germany) | | | 664 | | | | 57,439 | |
| | | | | | |
|
|
|
| | | | | | | | 115,196,925 | |
| | | | | | |
|
|
|
Specialty Retail — 1.8% | | | | | | | | |
Bed Bath & Beyond, Inc.(a) | | | 61,600 | | | | 2,503,424 | |
Best Buy Co., Inc.(a) | | | 336,200 | | | | 14,345,654 | |
Express, Inc.* | | | 326,300 | | | | 3,510,988 | |
Francesca’s Holdings Corp.*(a) | | | 173,100 | | | | 3,120,993 | |
GameStop Corp. (Class A Stock)(a) | | | 129,000 | | | | 3,258,540 | |
GNC Holdings, Inc. (Class A Stock) | | | 800 | | | | 8,832 | |
Home Depot, Inc. (The) | | | 216,200 | | | | 28,988,096 | |
Industria de Diseno Textil SA (Spain) | | | 8,614 | | | | 293,445 | |
Kingfisher PLC (United Kingdom) | | | 6,911 | | | | 29,776 | |
Penske Automotive Group, Inc.(a) | | | 13,400 | | | | 694,656 | |
Ross Stores, Inc. | | | 231,400 | | | | 15,179,840 | |
| | | | | | |
|
|
|
| | | | | | | | 71,934,244 | |
| | | | | | |
|
|
|
Technology Hardware, Storage & Peripherals — 2.3% | |
Apple, Inc. | | | 552,300 | | | | 63,967,386 | |
Brother Industries Ltd. (Japan) | | | 14,100 | | | | 253,482 | |
FUJIFILM Holdings Corp. (Japan) | | | 1,300 | | | | 49,226 | |
Hewlett Packard Enterprise Co. | | | 728,300 | | | | 16,852,862 | |
HP, Inc. | | | 639,900 | | | | 9,496,116 | |
NEC Corp. (Japan) | | | 8,000 | | | | 21,159 | |
| | | | | | |
|
|
|
| | | | | | | | 90,640,231 | |
| | | | | | |
|
|
|
Textiles, Apparel & Luxury Goods | | | | | | | | |
adidas AG (Germany) | | | 569 | | | | 89,742 | |
Hermes International (France) | | | 80 | | | | 32,818 | |
LVMH Moet Hennessy Louis Vuitton SE (France) | | | 853 | | | | 162,643 | |
PVH Corp. | | | 400 | | | | 36,096 | |
Swatch Group AG (The) (Switzerland) | | | 140 | | | | 8,544 | |
| | | | | | |
|
|
|
| | | | | | | | 329,843 | |
| | | | | | |
|
|
|
Tobacco — 0.8% | | | | | | | | |
Altria Group, Inc. | | | 436,300 | | | | 29,502,606 | |
British American Tobacco PLC (United Kingdom) | | | 9,597 | | | | 543,917 | |
Japan Tobacco, Inc. (Japan) | | | 6,500 | | | | 213,354 | |
| | | | | | |
|
|
|
| | | | | | | | 30,259,877 | |
| | | | | | |
|
|
|
Trading Companies & Distributors | | | | | | | | |
Ashtead Group PLC (United Kingdom) | | | 1,439 | | | | 27,975 | |
ITOCHU Corp. (Japan) | | | 22,600 | | | | 299,241 | |
Mitsubishi Corp. (Japan) | | | 6,700 | | | | 142,299 | |
Mitsui & Co. Ltd. (Japan) | | | 21,600 | | | | 295,970 | |
Sumitomo Corp. (Japan) | | | 3,700 | | | | 43,436 | |
| | | | | | |
|
|
|
| | | | | | | | 808,921 | |
| | | | | | |
|
|
|
Transportation Infrastructure | | | | | | | | |
Abertis Infraestructuras SA (Spain) | | | 1,866 | | | | 26,071 | |
Aena SA (Spain), 144A | | | 196 | | | | 26,703 | |
SEE NOTES TO FINANCIAL STATEMENTS.
A77
| | | | | | |
| | | FLEXIBLE MANAGED PORTFOLIO (continued) | | |
| |
| SCHEDULE OF INVESTMENTS | | as of December 31, 2016 |
| | | | | | | | |
COMMON STOCKS (continued) | | Shares
| | | Value
(Note 2)
| |
Transportation Infrastructure (continued) | |
Atlantia SpA (Italy) | | | 1,200 | | | $ | 28,076 | |
Auckland International Airport Ltd. (New Zealand) | | | 2,752 | | | | 11,937 | |
Sydney Airport (Australia) | | | 3,216 | | | | 13,881 | |
| | | | | | |
|
|
|
| | | | | | | | 106,668 | |
| | | | | | |
|
|
|
Wireless Telecommunication Services | | | | | | | | |
KDDI Corp. (Japan) | | | 8,300 | | | | 209,600 | |
NTT DOCOMO, Inc. (Japan) | | | 4,200 | | | | 95,530 | |
SoftBank Corp. (Japan) | | | 4,100 | | | | 271,313 | |
Vodafone Group PLC (United Kingdom) | | | 82,153 | | | | 202,170 | |
| | | | | | |
|
|
|
| | | | | | | | 778,613 | |
| | | | | | |
|
|
|
TOTAL COMMON STOCKS
(cost $1,915,035,972) | | | | 2,420,619,766 | |
| | | | | | |
|
|
|
| UNAFFILIATED EXCHANGE TRADED FUND | |
iShares MSCI EAFE Index
Fund(a)
(cost $208,821) | | | 3,850 | | | | 222,260 | |
| | | | | | |
|
|
|
| | | | | | | | |
| PREFERRED STOCKS | | Shares
| | | Value
(Note 2)
| |
Automobiles | | | | | | | | |
Bayerische Motoren Werke AG (Germany) (PRFC) | | | 155 | | | $ | 11,837 | |
Volkswagen AG (Germany) (PRFC) | | | 2,408 | | | | 336,922 | |
| | | | | | |
|
|
|
| | | | | | | | 348,759 | |
| | | | | | |
|
|
|
Banks | | | | | | | | |
Citigroup Capital XIII, 7.1215%, (Capital Security, fixed to floating preferred)(b) | | | 22,000 | | | | 568,040 | |
| | | | | | |
|
|
|
Household Products | | | | | | | | |
Henkel AG & Co. KGaA (Germany) (PRFC) | | | 541 | | | | 64,401 | |
| | | | | | |
|
|
|
TOTAL PREFERRED STOCKS
(cost $908,689) | | | | 981,200 | |
| | | | | | |
|
|
|
| | | | | | | | | | | | | | | | |
| ASSET-BACKED SECURITIES — 4.1% | | Interest
Rate
| | | Maturity
Date
| | | Principal
Amount
(000)#
| | | Value
(Note 2)
| |
Collateralized Loan Obligations — 1.4% | | | | | | | | | | | | | | | | |
ACAS CLO Ltd. (Cayman Islands), Series 2013-1A, Class A, 144A | | | 2.061% | (b) | | | 04/20/25 | | | | 2,550 | | | | 2,547,120 | |
AIMCO CLO (Cayman Islands), Series 2015-AA, Class A1, 144A | | | 2.580% | (b) | | | 01/15/28 | | | | 2,500 | | | | 2,493,804 | |
Anchorage Capital CLO 3 Ltd. (Cayman Islands), Series 2014-3A, Class A1R, 144A | | | 2.288% | (b) | | | 04/28/26 | | | | 1,500 | | | | 1,503,147 | |
Anchorage Capital CLO Ltd. (Cayman Islands), Series 2014-5A, Class A, 144A | | | 2.480% | (b) | | | 10/15/26 | | | | 2,500 | | | | 2,506,347 | |
Arrowpoint CLO Ltd. (Cayman Islands), Series 2015-4A, Class A, 144A | | | 2.432% | (b) | | | 04/18/27 | | | | 1,000 | | | | 1,001,456 | |
Atlas Senior Loan Fund VI Ltd. (Cayman Islands), Series 2014-6A, Class A, 144A | | | 2.420% | (b) | | | 10/15/26 | | | | 750 | | | | 750,791 | |
Battalion CLO VII Ltd. (Cayman Islands), Series 2014-7A, Class A1, 144A | | | 2.480% | (b) | | | 10/17/26 | | | | 250 | | | | 250,353 | |
Battalion CLO VIII Ltd. (Cayman Islands), Series 2015-8A, Class A1, 144A | | | 2.412% | (b) | | | 04/18/27 | | | | 1,250 | | | | 1,250,456 | |
Benefit Street Partners CLO II Ltd. (Cayman Islands), Series 2013-IIA, Class A1, 144A | | | 2.080% | (b) | | | 07/15/24 | | | | 1,200 | | | | 1,195,530 | |
Benefit Street Partners CLO VII Ltd. (Cayman Islands), Series 2015-VIIA, Class A1A, 144A | | | 2.412% | (b) | | | 07/18/27 | | | | 750 | | | | 752,240 | |
Brookside Mill CLO Ltd. (Cayman Islands), Series 2013-1A, Class A1, 144A | | | 2.030% | (b) | | | 04/17/25 | | | | 2,100 | | | | 2,097,180 | |
Catamaran CLO Ltd. (Cayman Islands), Series 2014-1A, Class A1, 144A | | | 2.431% | (b) | | | 04/20/26 | | | | 2,200 | | | | 2,202,937 | |
Catamaran CLO Ltd. (Cayman Islands), Series 2014-1A, Class A2, 144A | | | 2.681% | (b) | | | 04/20/26 | | | | 450 | | | | 441,760 | |
Catamaran CLO Ltd. (Cayman Islands), Series 2014-2, Class A1R, 144A | | | 2.108% | (b) | | | 10/18/26 | | | | 500 | | | | 499,616 | |
Flagship VII Ltd. (Cayman Islands), Series 2013-7A, Class A1, 144A | | | 2.351% | (b) | | | 01/20/26 | | | | 2,300 | | | | 2,304,453 | |
Flatiron CLO Ltd. (Cayman Islands), Series 2013-1A, Class A1, 144A | | | 2.280% | (b) | | | 01/17/26 | | | | 500 | | | | 499,834 | |
Galaxy XVIII CLO Ltd. (Cayman Islands), Series 2014-18A, Class A, 144A | | | 2.350% | (b) | | | 10/15/26 | | | | 1,250 | | | | 1,252,471 | |
Highbridge Loan Management Ltd. (Cayman Islands), Series 2015-6A, Class A, 144A | | | 2.331% | (b) | | | 05/05/27 | | | | 250 | | | | 249,807 | |
ICG U.S. CLO Ltd. (Cayman Islands), Series 2014-3A, Class A1B, 144A(c) | | | 3.280% | | | | 01/25/27 | | | | 1,000 | | | | 987,346 | |
Jackson Mill CLO Ltd. (Cayman Islands), Series 2015-1A, Class A, 144A | | | 2.420% | (b) | | | 04/15/27 | | | | 500 | | | | 500,333 | |
KVK CLO Ltd. (Cayman Islands), Series 2014-1A, Class A1, 144A | | | 2.496% | (b) | | | 05/15/26 | | | | 300 | | | | 300,375 | |
Limerock CLO II Ltd. (Cayman Islands), Series 2014-2A, Class A, 144A | | | 2.382% | (b) | | | 04/18/26 | | | | 750 | | | | 750,815 | |
Magnetite IX Ltd. (Cayman Islands), Series 2014-9A, Class A1, 144A(c) | | | 2.302% | (b) | | | 07/25/26 | | | | 3,000 | | | | 3,004,957 | |
Magnetite XI Ltd. (Cayman Islands), Series 2014-11A, Class A1, 144A(c) | | | 2.332% | (b) | | | 01/18/27 | | | | 500 | | | | 500,992 | |
OZLM Funding IV Ltd. (Cayman Islands), Series 2013-4A, Class A1, 144A | | | 2.032% | (b) | | | 07/22/25 | | | | 1,200 | | | | 1,200,506 | |
Race Point V CLO Ltd. (Cayman Islands), Series 2011-5AR, Class AR, 144A | | | 2.263% | (b) | | | 12/15/22 | | | | 201 | | | | 201,327 | |
Race Point VIII CLO Ltd. (Cayman Islands), Series 2013-8A, Class A, 144A | | | 2.161% | (b) | | | 02/20/25 | | | | 250 | | | | 250,103 | |
SEE NOTES TO FINANCIAL STATEMENTS.
A78
| | | | | | |
| | | FLEXIBLE MANAGED PORTFOLIO (continued) | | |
| |
| SCHEDULE OF INVESTMENTS | | as of December 31, 2016 |
| | | | | | | | | | | | | | | | |
ASSET-BACKED SECURITIES (continued) | | Interest
Rate
| | | Maturity
Date
| | | Principal
Amount
(000)#
| | | Value
(Note 2)
| |
Collateralized Loan Obligations (continued) | | | | | | | | | | | | | | | | |
Regatta IV Funding Ltd. (Cayman Islands), Series 2014-1A, Class A1, 144A | | | 2.292% | (b) | | | 07/25/26 | | | | 1,000 | | | $ | 1,000,614 | |
Seneca Park CLO Ltd. (Cayman Islands), Series 2014-1A, Class A, 144A | | | 2.360% | (b) | | | 07/17/26 | | | | 800 | | | | 801,241 | |
Shackleton CLO V Ltd. (Cayman Islands), Series 2014-5A, Class A, 144A | | | 2.381% | (b) | | | 05/07/26 | | | | 1,250 | | | | 1,254,145 | |
Sheridan Square CLO Ltd. (Cayman Islands), Series 2013-1A, Class A1, 144A | | | 1.930% | (b) | | | 04/15/25 | | | | 3,200 | | | | 3,194,371 | |
Slater Mill Loan Fund LP (Cayman Islands), Series 2012-1A, Class B, 144A | | | 3.556% | (b) | | | 08/17/22 | | | | 500 | | | | 499,007 | |
Sound Point CLO Ltd. (Cayman Islands), Series 2012-1A, Class B, 144A | | | 3.581% | (b) | | | 10/20/23 | | | | 1,100 | | | | 1,101,754 | |
THL Credit Wind River CLO Ltd. (Cayman Islands), Series 2014-3A, Class A, 144A | | | 2.502% | (b) | | | 01/22/27 | | | | 2,250 | | | | 2,249,608 | |
Trinitas CLO V Ltd. (Cayman Islands), Series 2016-5A, Class A, 144A | | | 2.434% | (b) | | | 10/25/28 | | | | 3,250 | | | | 3,249,268 | |
Tyron Park CLO Ltd. (Cayman Islands), Series 2013-1A, Class A1, 144A | | | 2.000% | (b) | | | 07/15/25 | | | | 2,700 | | | | 2,701,148 | |
Voya CLO Ltd. (Cayman Islands), Series 2013-1A, Class A1, 144A | | | 2.020% | (b) | | | 04/15/24 | | | | 1,850 | | | | 1,850,733 | |
Washington Mill CLO Ltd. (Cayman Islands), Series 2014-1A, Class A1, 144A | | | 2.381% | (b) | | | 04/20/26 | | | | 1,850 | | | | 1,848,397 | |
Washington Mill CLO Ltd. (Cayman Islands), Series 2014-1A, Class B2, 144A | | | 4.250% | | | | 04/20/26 | | | | 500 | | | | 504,026 | |
| | | | | | | | | | | | | | |
|
|
|
| | | | | | | | | | | | | | | | 51,750,368 | |
| | | | | | | | | | | | | | |
|
|
|
Non-Residential Mortgage-Backed Securities — 2.2% | | | | | | | | | | | | | | | | |
American Express Credit Account Secured Note Trust, Series 2012-4, Class C, 144A | | | 1.504% | (b) | | | 05/15/20 | | �� | | 3,900 | | | | 3,897,615 | |
AmeriCredit Automobile Receivables Trust, Series 2015-4, Class A2B | | | 1.399% | (b) | | | 04/08/19 | | | | 1,843 | | | | 1,845,604 | |
AmeriCredit Automobile Receivables Trust, Series 2016-2, Class A2B | | | 1.349% | (b) | | | 10/08/19 | | | | 3,243 | | | | 3,249,465 | |
AmeriCredit Automobile Receivables Trust, Series 2016-3, Class A2B | | | 1.209% | (b) | | | 11/08/19 | | | | 1,000 | | | | 1,001,079 | |
Americredit Automobile Receivables Trust, Series 2016-4, Class C | | | 2.410% | | | | 07/08/22 | | | | 1,000 | | | | 990,900 | |
Avis Budget Rental Car Funding AESOP LLC, Series 2013-1A, Class A, 144A | | | 1.920% | | | | 09/20/19 | | | | 1,700 | | | | 1,691,452 | |
Avis Budget Rental Car Funding AESOP LLC, Series 2015-1A, Class A, 144A | | | 2.500% | | | | 07/20/21 | | | | 6,000 | | | | 5,954,352 | |
Avis Budget Rental Car Funding AESOP LLC, Series 2015-2A, Class A, 144A | | | 2.630% | | | | 12/20/21 | | | | 4,700 | | | | 4,642,511 | |
Chase Issuance Trust, Series 2007-C1, Class C1 | | | 1.164% | (b) | | | 04/15/19 | | | | 8,300 | | | | 8,299,314 | |
Enterprise Fleet Financing LLC, Series 2016-2, Class A2, 144A | | | 1.740% | | | | 02/22/22 | | | | 2,700 | | | | 2,692,357 | |
Ford Credit Auto Owner Trust, Series 2014-1, Class A, 144A | | | 2.260% | | | | 11/15/25 | | | | 2,000 | | | | 2,017,072 | |
Ford Credit Auto Owner Trust, Series 2014-2, Class A, 144A | | | 2.310% | | | | 04/15/26 | | | | 3,200 | | | | 3,226,763 | |
Ford Credit Auto Owner Trust, Series 2016-1, Class A, 144A | | | 2.310% | | | | 08/15/27 | | | | 5,400 | | | | 5,389,515 | |
Ford Credit Auto Owner Trust, Series 2016-2, Class A, 144A | | | 2.030% | | | | 12/15/27 | | | | 3,300 | | | | 3,245,485 | |
GMF Floorplan Owner Revolving Trust, Series 2015-1, Class A2, 144A(c) | | | 1.038% | (b) | | | 05/15/20 | | | | 1,800 | | | | 1,800,784 | |
GMF Floorplan Owner Revolving Trust, Series 2016-1, Class A2, 144A(c) | | | 1.554% | (b) | | | 05/17/21 | | | | 2,300 | | | | 2,312,114 | |
Hertz Vehicle Financing II LP, Series 2015-1A, Class A, 144A | | | 2.730% | | | | 03/25/21 | | | | 4,300 | | | | 4,269,028 | |
Hertz Vehicle Financing II LP, Series 2015-3A, Class A, 144A | | | 2.670% | | | | 09/25/21 | | | | 3,400 | | | | 3,345,802 | |
Hertz Vehicle Financing LLC, Series 2016-1A, Class A, 144A | | | 2.320% | | | | 03/25/20 | | | | 3,000 | | | | 2,980,208 | |
OneMain Direct Auto Receivables Trust, Series 2016-1A, Class A, 144A | | | 2.040% | | | | 01/15/21 | | | | 1,182 | | | | 1,184,458 | |
OneMain Financial Issuance Trust, Series 2015-2A, Class A, 144A | | | 2.570% | | | | 07/18/25 | | | | 4,700 | | | | 4,700,165 | |
Santander Drive Auto Receivables Trust, Series 2015-4, Class A2B | | | 1.404% | (b) | | | 12/17/18 | | | | 153 | | | | 153,317 | |
Santander Drive Auto Receivables Trust, Series 2015-5, Class A2B | | | 1.454% | (b) | | | 12/17/18 | | | | 452 | | | | 452,057 | |
Sierra Timeshare Receivables Funding LLC, Series 2015-3A, Class A, 144A | | | 2.580% | | | | 09/20/32 | | | | 1,522 | | | | 1,514,010 | |
Sierra Timeshare Receivables Funding LLC, Series 2016-1A, Class A, 144A | | | 3.080% | | | | 03/21/33 | | | | 2,647 | | | | 2,672,782 | |
Sierra Timeshare Receivables Funding LLC, Series 2013-3A, Class A, 144A | | | 2.200% | | | | 10/20/30 | | | | 1,423 | | | | 1,422,994 | |
SpringCastle America Funding LLC, Series 2016-AA. Class A, 144A | | | 3.050% | | | | 04/25/29 | | | | 2,918 | | | | 2,932,557 | |
Springleaf Funding Trust, Series 2015-AA, Class A, 144A | | | 3.160% | | | | 11/15/24 | | | | 5,795 | | | | 5,840,781 | |
SVO VOI Mortgage LLC, Series 2012-AA, Class A, 144A | | | 2.000% | | | | 09/20/29 | | | | 638 | | | | 626,999 | |
Synchrony Credit Card Master Note Trust, Series 2015-3, Class A | | | 1.740% | | | | 09/15/21 | | | | 1,700 | | | | 1,700,903 | |
| | | | | | | | | | | | | | |
|
|
|
| | | | | | | | | | | | | | | | 86,052,443 | |
| | | | | | | | | | | | | | |
|
|
|
SEE NOTES TO FINANCIAL STATEMENTS.
A79
| | | | | | |
| | | FLEXIBLE MANAGED PORTFOLIO (continued) | | |
| |
| SCHEDULE OF INVESTMENTS | | as of December 31, 2016 |
| | | | | | | | | | | | | | | | |
ASSET-BACKED SECURITIES (continued) | | Interest
Rate
| | | Maturity
Date
| | | Principal
Amount
(000)#
| | | Value
(Note 2)
| |
Residential Mortgage-Backed Securities — 0.5% | | | | | | | | | | | | | | | | |
Banc of America Funding Trust, Series 2015-R6, Class 1A1, 144A | | | 0.739% | (b) | | | 08/26/36 | | | | 1,185 | | | $ | 1,117,329 | |
CDC Mortgage Capital Trust, Series 2002-HE3, Class M1 | | | 2.406% | (b) | | | 03/25/33 | | | | 165 | | | | 158,682 | |
Credit Suisse Mortgage Trust, Series 16-RPL1, Class A1, 144A | | | 3.767% | (b) | | | 12/26/46 | | | | 5,595 | | | | 5,574,362 | |
Credit-Based Asset Servicing & Securitization LLC, Series 2005-CB6, Class A3 | | | 3.765% | (b) | | | 07/25/35 | | | | 296 | | | | 282,803 | |
Equity One Mortgage Pass-Through Trust, Series 2004-3, Class M1 | | | 4.792% | (b) | | | 07/25/34 | | | | 267 | | | | 253,281 | |
GSAMP Trust, Series 2004-HE2, Class A3C | | | 1.916% | (b) | | | 09/25/34 | | | | 389 | | | | 386,071 | |
Long Beach Mortgage Loan Trust, Series 2004-2, Class M1 | | | 1.379% | (b) | | | 06/25/34 | | | | 424 | | | | 411,392 | |
Morgan Stanley ABS Capital I, Inc. Trust, Series 2003-HE1, Class M1 | | | 1.956% | (b) | | | 05/25/33 | | | | 282 | | | | 274,067 | |
Morgan Stanley ABS Capital I, Inc. Trust, Series 2004-HE5, Class M1 | | | 1.701% | (b) | | | 06/25/34 | | | | 659 | | | | 626,890 | |
Morgan Stanley ABS Capital I, Inc. Trust, Series 2004-NC1, Class M1 | | | 1.806% | (b) | | | 12/27/33 | | | | 548 | | | | 533,448 | |
Morgan Stanley Dean Witter Capital I, Inc. Trust, Series 2002-HE1, Class M1 | | | 1.656% | (b) | | | 07/25/32 | | | | 225 | | | | 218,270 | |
Morgan Stanley Dean Witter Capital I, Inc. Trust, Series 2002-NC4, Class M1 | | | 2.031% | (b) | | | 09/25/32 | | | | 3,375 | | | | 3,245,223 | |
Securitized Asset-Backed Receivables LLC Trust, Series 2004-OP1, Class M1 | | | 1.521% | (b) | | | 02/25/34 | | | | 616 | | | | 576,245 | |
VOLT XLIV LLC, Series 2016-NPL4, Class A1, 144A | | | 4.250% | | | | 04/25/46 | | | | 2,059 | | | | 2,073,774 | |
VOLT XXXI LLC, Series 2015-NPL2, Class A1, 144A | | | 3.375% | | | | 02/25/55 | | | | 1,041 | | | | 1,043,418 | |
VOLT XXXVII LLC, Series 2015-NP11, Class A1, 144A | | | 3.625% | | | | 07/25/45 | | | | 3,149 | | | | 3,146,367 | |
| | | | | | | | | | | | | | |
|
|
|
| | | | | | | | | | | | | | | | 19,921,622 | |
| | | | | | | | | | | | | | |
|
|
|
TOTAL ASSET-BACKED SECURITIES
(cost $157,336,121) | | | | 157,724,433 | |
| | | | | | | | | | | | | | |
|
|
|
| BANK LOANS(b) — 0.2% | | | | | | | | | | | | | | | | |
Food | | | | | | | | | | | | | | | | |
ARAMARK Corp. | | | 3.430% | | | | 02/24/21 | | | | 466 | | | | 469,619 | |
| | | | | | | | | | | | | | |
|
|
|
Health Care & Pharmaceutical — 0.1% | | | | | | | | | | | | | | | | |
RPI Finance Trust | | | 3.498% | | | | 10/14/22 | | | | 1,325 | | | | 1,338,972 | |
| | | | | | | | | | | | | | |
|
|
|
Media & Entertainment | | | | | | | | | | | | | | | | |
Nielsen Finance LLC | | | 3.442% | | | | 10/04/23 | | | | 751 | | | | 757,144 | |
| | | | | | | | | | | | | | |
|
|
|
Technology — 0.1% | | | | | | | | | | | | | | | | |
Avago Technologies Cayman Finance Ltd. (Singapore) | | | 3.881% | | | | 02/01/23 | | | | 905 | | | | 917,387 | |
Dell International LLC | | | 2.998% | | | | 12/31/18 | | | | 600 | | | | 599,063 | |
Dell International LLC | | | 4.020% | | | | 09/07/23 | | | | 815 | | | | 828,244 | |
First Data Corp. | | | 3.998% | | | | 03/24/21 | | | | 1,020 | | | | 1,029,108 | |
TransUnion LLC | | | 3.520% | | | | 04/09/21 | | | | 486 | | | | 489,295 | |
Western Digital Corp. | | | 4.748% | | | | 04/29/23 | | | | 872 | | | | 882,671 | |
| | | | | | | | | | | | | | |
|
|
|
| | | | | | | | | | | | | | | | 4,745,768 | |
| | | | | | | | | | | | | | |
|
|
|
Telecommunications | | | | | | | | | | | | | | | | |
T-Mobile USA, Inc. | | | 3.707% | | | | 11/09/22 | | | | 1,025 | | | | 1,035,262 | |
| | | | | | | | | | | | | | |
|
|
|
TOTAL BANK LOANS
(cost $8,188,699) | | | | 8,346,765 | |
| | | | | | | | | | | | | | |
|
|
|
| COMMERCIAL MORTGAGE-BACKED SECURITIES — 4.0% | | | | | | | | | | | | | | | | |
Assurant Commercial Mortgage Trust, Series 2016-1A, Class AS, 144A | | | 3.172% | | | | 05/15/49 | | | | 4,000 | | | | 3,938,576 | |
Banc of America Commercial Mortgage Trust, Series 2007-2, Class A1A | | | 5.587% | (b) | | | 04/10/49 | | | | 3,857 | | | | 3,875,019 | |
Citigroup Commercial Mortgage Trust, Series 2007-C6, Class A4 | | | 5.711% | (b) | | | 12/10/49 | | | | 1,000 | | | | 1,008,670 | |
Citigroup Commercial Mortgage Trust, Series 2013-GC11, Class A3 | | | 2.815% | | | | 04/10/46 | | | | 1,100 | | | | 1,106,451 | |
Citigroup Commercial Mortgage Trust, Series 2014-GC21, Class A4 | | | 3.575% | | | | 05/10/47 | | | | 2,750 | | | | 2,848,250 | |
Citigroup Commercial Mortgage Trust, Series 2014-GC23, Class A3 | | | 3.356% | | | | 07/10/47 | | | | 2,800 | | | | 2,857,492 | |
Citigroup Commercial Mortgage Trust, Series 2016-C1, Class A3 | | | 2.944% | | | | 05/10/49 | | | | 5,000 | | | | 4,890,348 | |
Citigroup Commercial Mortgage Trust, Series 2016-GC37, Class A3 | | | 3.050% | | | | 04/10/49 | | | | 6,500 | | | | 6,391,947 | |
Citigroup Deutsche Bank Commercial Mortgage Trust, Series 2007-CD4, Class AMFX | | | 5.366% | (b) | | | 12/11/49 | | | | 6,000 | | | | 6,006,033 | |
Commercial Mortgage Trust, Series 2015-CR27, Class A3 | | | 3.349% | | | | 10/10/48 | | | | 6,100 | | | | 6,180,028 | |
SEE NOTES TO FINANCIAL STATEMENTS.
A80
| | | | | | |
| | | FLEXIBLE MANAGED PORTFOLIO (continued) | | |
| |
| SCHEDULE OF INVESTMENTS | | as of December 31, 2016 |
| | | | | | | | | | | | | | |
COMMERCIAL MORTGAGE-BACKED SECURITIES (continued) | | Interest
Rate
| | | Maturity
Date
| | Principal
Amount
(000)#
| | | Value
(Note 2)
| |
Commercial Mortgage Trust, Series 2012-CR5, Class A3 | | | 2.540% | | | 12/10/45 | | | 1,000 | | | $ | 994,960 | |
Commercial Mortgage Trust, Series 2013-CR7, Class A3 | | | 2.929% | | | 03/10/46 | | | 1,700 | | | | 1,718,256 | |
Commercial Mortgage Trust, Series 2014-CR15, Class A2 | | | 2.928% | | | 02/10/47 | | | 2,700 | | | | 2,756,857 | |
Commercial Mortgage Trust, Series 2014-CR18, Class A4 | | | 3.550% | | | 07/15/47 | | | 2,800 | | | | 2,891,933 | |
Commercial Mortgage Trust, Series 2014-CR20, Class A3 | | | 3.326% | | | 11/10/47 | | | 5,000 | | | | 5,090,328 | |
Commercial Mortgage Trust, Series 2014-UBS3, Class A2 | | | 2.844% | | | 06/10/47 | | | 2,300 | | | | 2,344,913 | |
CSAIL Commercial Mortgage Trust, Series 2015-C4, Class A3 | | | 3.544% | | | 11/15/48 | | | 3,000 | | | | 3,069,902 | |
Eleven Madison Mortgage Trust, Series 2015-11MD, Class A, 144A | | | 3.555% | (b) | | 09/10/35 | | | 1,100 | | | | 1,131,841 | |
Fannie Mae-Aces, Series 2014-M2, Class A2 | | | 3.513% | (b) | | 12/25/23 | | | 2,515 | | | | 2,619,825 | |
Fannie Mae-Aces, Series 2015-M17, Class A2 | | | 2.940% | (b) | | 11/25/25 | | | 3,900 | | | | 3,918,050 | |
Fannie Mae-Aces, Series 2016-M7, Class AB2 | | | 2.385% | | | 09/25/26 | | | 2,400 | | | | 2,225,619 | |
FHLMC Multifamily Structured Pass-Through Certificates, Series K017, Class A2 | | | 2.873% | | | 12/25/21 | | | 3,500 | | | | 3,590,313 | |
FHLMC Multifamily Structured Pass-Through Certificates, Series K020, Class A2 | | | 2.373% | | | 05/25/22 | | | 2,000 | | | | 2,003,526 | |
FHLMC Multifamily Structured Pass-Through Certificates, Series K020, Class X1, IO | | | 1.442% | (b) | | 05/25/22 | | | 24,499 | | | | 1,541,636 | |
FHLMC Multifamily Structured Pass-Through Certificates, Series K021, Class X1, IO | | | 1.481% | (b) | | 06/25/22 | | | 6,933 | | | | 456,034 | |
FHLMC Multifamily Structured Pass-Through Certificates, Series K029, Class A2 | | | 3.320% | (b) | | 02/25/23 | | | 5,800 | | | | 6,072,692 | |
FHLMC Multifamily Structured Pass-Through Certificates, Series K034, Class A2 | | | 3.531% | (b) | | 07/25/23 | | | 2,400 | | | | 2,542,343 | |
FHLMC Multifamily Structured Pass-Through Certificates, Series K055, Class X1, IO | | | 1.369% | (b) | | 03/25/26 | | | 27,988 | | | | 2,750,364 | |
FHLMC Multifamily Structured Pass-Through Certificates, Series K710, Class X1, IO | | | 1.759% | (b) | | 05/25/19 | | | 18,590 | | | | 619,922 | |
FHLMC Multifamily Structured Pass-Through Certificates, Series K711, Class X1, IO | | | 1.692% | (b) | | 07/25/19 | | | 19,940 | | | | 675,003 | |
FHLMC Multifamily Structured Pass-Through Certificates, Series KS03, Class A4 | | | 3.161% | (b) | | 05/25/25 | | | 2,500 | | | | 2,527,706 | |
GS Mortgage Securities Trust, Series 2015-GC28, Class A4 | | | 3.136% | | | 02/10/48 | | | 4,000 | | | | 4,002,704 | |
GS Mortgage Securities Trust, Series 2015-GC32, Class A3 | | | 3.498% | | | 07/10/48 | | | 5,800 | | | | 5,955,613 | |
GS Mortgage Securities Trust, Series GS4, Class A3 | | | 3.178% | | | 11/10/49 | | | 5,500 | | | | 5,490,891 | |
JPMBB Commercial Mortgage Securities Trust, Series 2014-C25, Class A4A1 | | | 3.408% | | | 11/15/47 | | | 1,400 | | | | 1,435,067 | |
JPMBB Commercial Mortgage Securities Trust, Series 2015-C27, Class A3A1 | | | 2.920% | | | 02/15/48 | | | 6,000 | | | | 5,919,262 | |
JPMorgan Chase Commercial Mortgage Securities Trust, Series 2012-CBX, Class A3 | | | 3.139% | | | 06/15/45 | | | 924 | | | | 940,069 | |
JPMorgan Chase Commercial Mortgage Securities Trust, Series 2012-LC9, Class A4 | | | 2.611% | | | 12/15/47 | | | 1,700 | | | | 1,702,528 | |
JPMorgan Chase Commercial Mortgage Securities Trust, Series 2013-C10, Class A4 | | | 2.875% | | | 12/15/47 | | | 3,900 | | | | 3,943,368 | |
JPMorgan Chase Commercial Mortgage Securities Trust, Series 2013-C16, Class A2 | | | 3.070% | | | 12/15/46 | | | 1,936 | | | | 1,975,376 | |
JPMorgan Chase Commercial Mortgage Securities Trust, Series 2013-LC11, Class A4 | | | 2.694% | | | 04/15/46 | | | 1,400 | | | | 1,415,278 | |
Morgan Stanley Bank of America Merrill Lynch Trust, Series 2013-C8, Class A3 | | | 2.863% | | | 12/15/48 | | | 1,500 | | | | 1,513,512 | |
Morgan Stanley Capital I Trust, Series 2016-UB11, Class A3 | | | 2.531% | | | 08/15/49 | | | 10,400 | | | | 9,837,691 | |
UBS-Barclays Commercial Mortgage Trust, Series 2012-C4, Class A4 | | | 2.792% | | | 12/10/45 | | | 1,700 | | | | 1,713,392 | |
UBS-Barclays Commercial Mortgage Trust, Series 2013-C5, Class A3 | | | 2.920% | | | 03/10/46 | | | 3,900 | | | | 3,922,622 | |
UBS-Barclays Commercial Mortgage Trust, Series 2013-C6, Class A3 | | | 2.971% | | | 04/10/46 | | | 1,800 | | | | 1,815,684 | |
Wachovia Bank Commercial Mortgage Trust, Series 2007-C31, Class A4 | | | 5.509% | | | 04/15/47 | | | 3,041 | | | | 3,046,881 | |
Wachovia Bank Commercial Mortgage Trust, Series 2007-C34, Class A1A | | | 5.608% | (b) | | 05/15/46 | | | 1,204 | | | | 1,222,707 | |
Wells Fargo Commercial Mortgage Trust, Series 2016-NXS6, Class A3 | | | 2.642% | | | 11/15/49 | | | 8,000 | | | | 7,584,119 | |
| | | | | | | | | | | | |
|
|
|
TOTAL COMMERCIAL MORTGAGE-BACKED SECURITIES
(cost $156,544,305) | | | | 154,081,601 | |
| | | | | | | | | | | | |
|
|
|
SEE NOTES TO FINANCIAL STATEMENTS.
A81
| | | | | | |
| | | FLEXIBLE MANAGED PORTFOLIO (continued) | | |
| |
| SCHEDULE OF INVESTMENTS | | as of December 31, 2016 |
| | | | | | | | | | | | | | | | |
| CORPORATE BONDS — 9.4% | | Interest
Rate
| | | Maturity
Date
| | | Principal
Amount
(000)#
| | | Value
(Note 2)
| |
Agriculture — 0.1% | | | | | | | | | | | | | | | | |
Altria Group, Inc., Gtd. Notes | | | 4.000% | | | | 01/31/24 | | | | 1,500 | | | $ | 1,584,926 | |
Bunge Ltd. Finance Corp., Gtd. Notes | | | 8.500% | | | | 06/15/19 | | | | 930 | | | | 1,065,458 | |
Imperial Brands Finance PLC (United Kingdom), Gtd. Notes, 144A | | | 2.050% | | | | 02/11/18 | | | | 2,050 | | | | 2,051,902 | |
Reynolds American, Inc., Gtd. Notes | | | 8.125% | | | | 06/23/19 | | | | 325 | | | | 370,772 | |
| | | | | | | | | | | | | | |
|
|
|
| | | | | | | | | | | | | | | | 5,073,058 | |
| | | | | | | | | | | | | | |
|
|
|
Airlines — 0.2% | |
American Airlines, Inc. Pass-Through Trust, Pass-Through Certificates, Series 2015-1, Class A | | | 3.375% | | | | 11/01/28 | | | | 3,029 | | | | 2,983,840 | |
Continental Airlines, Inc., Pass-Through Trust, Pass-Through Certificates, Series 1998-1, Class A | | | 6.648% | | | | 03/15/19 | | | | 37 | | | | 37,917 | |
Continental Airlines, Inc., Pass-Through Trust, Pass-Through Certificates, Series 2009-2, Class A | | | 7.250% | | | | 05/10/21 | | | | 531 | | | | 592,924 | |
Continental Airlines, Inc., Pass-Through Trust, Pass-Through Certificates, Series 2010-1, Class A | | | 4.750% | | | | 07/12/22 | | | | 592 | | | | 625,016 | |
Continental Airlines, Inc., Pass-Through Trust, Pass-Through Certificates, Series 2012-2, Class A | | | 4.000% | | | | 04/29/26 | | | | 597 | | | | 610,715 | |
Delta Air Lines, Inc., Pass-Through Trust, Pass-Through Certificates, Series 2007-1 Class A | | | 6.821% | | | | 02/10/24 | | | | 274 | | | | 315,386 | |
Delta Air Lines, Inc., Pass-Through Trust, Pass-Through Certificates, Series 2010-2, Class A | | | 4.950% | | | | 11/23/20 | | | | 342 | | | | 358,185 | |
Delta Air Lines, Inc., Pass-Through Trust, Pass-Through Certificates, Series 2011-1, Class A | | | 5.300% | | | | 10/15/20 | | | | 773 | | | | 815,046 | |
| | | | | | | | | | | | | | |
|
|
|
| | | | | | | | | | | | | | | | 6,339,029 | |
| | | | | | | | | | | | | | |
|
|
|
Auto Manufacturers — 0.3% | |
Ford Motor Co., Sr. Unsec’d. Notes | | | 4.750% | | | | 01/15/43 | | | | 1,430 | | | | 1,357,652 | |
Ford Motor Credit Co. LLC, Sr. Unsec’d. Notes(a) | | | 4.134% | | | | 08/04/25 | | | | 390 | | | | 390,469 | |
Ford Motor Credit Co. LLC, Sr. Unsec’d. Notes, GMTN | | | 4.389% | | | | 01/08/26 | | | | 1,255 | | | | 1,271,911 | |
General Motors Co., Sr. Unsec’d. Notes | | | 6.250% | | | | 10/02/43 | | | | 1,395 | | | | 1,542,143 | |
General Motors Co., Sr. Unsec’d. Notes | | | 6.600% | | | | 04/01/36 | | | | 760 | | | | 868,686 | |
Harley-Davidson Financial Services, Inc., Gtd. Notes, 144A, MTN | | | 2.700% | | | | 03/15/17 | | | | 450 | | | | 451,051 | |
Harley-Davidson Financial Services, Inc., Gtd. Notes, 144A, MTN | | | 2.850% | | | | 01/15/21 | | | | 4,705 | | | | 4,724,949 | |
Jaguar Land Rover Automotive PLC (United Kingdom), Gtd. Notes, 144A | | | 4.250% | | | | 11/15/19 | | | | 715 | | | | 739,131 | |
| | | | | | | | | | | | | | |
|
|
|
| | | | | | | | | | | | | | | | 11,345,992 | |
| | | | | | | | | | | | | | |
|
|
|
Banks — 2.6% | |
Bank of America Corp., Jr. Sub. Notes | | | 6.300% | (b) | | | 12/29/49 | | | | 445 | | | | 465,025 | |
Bank of America Corp., Sr. Unsec’d. Notes | | | 5.700% | | | | 01/24/22 | | | | 2,330 | | | | 2,617,145 | |
Bank of America Corp., Sr. Unsec’d. Notes | | | 6.000% | | | | 09/01/17 | | | | 1,075 | | | | 1,106,152 | |
Bank of America Corp., Sr. Unsec’d. Notes, GMTN | | | 3.300% | | | | 01/11/23 | | | | 780 | | | | 782,605 | |
Bank of America Corp., Sr. Unsec’d. Notes, MTN | | | 4.000% | | | | 04/01/24 | | | | 975 | | | | 1,005,556 | |
Bank of America Corp., Sr. Unsec’d. Notes, MTN | | | 4.125% | | | | 01/22/24 | | | | 3,820 | | | | 3,969,939 | |
Bank of America Corp., Sub. Notes, MTN | | | 4.450% | | | | 03/03/26 | | | | 3,880 | | | | 3,998,487 | |
Bank of America Corp., Sub. Notes, MTN | | | 4.000% | | | | 01/22/25 | | | | 2,000 | | | | 2,002,512 | |
Bank of America Corp., Series K, Jr. Sub. Notes | | | 8.000% | (b) | | | 07/29/49 | | | | 2,200 | | | | 2,260,500 | |
Bank of America NA, Sub. Notes | | | 5.300% | | | | 03/15/17 | | | | 930 | | | | 937,203 | |
Bank of America NA, Sub. Notes | | | 6.000% | | | | 10/15/36 | | | | 410 | | | | 494,654 | |
Barclays PLC (United Kingdom), Sr. Unsec’d. Notes | | | 4.375% | | | | 01/12/26 | | | | 1,590 | | | | 1,610,387 | |
Capital One Financial Corp., Sr. Unsec’d. Notes | | | 3.750% | | | | 04/24/24 | | | | 4,560 | | | | 4,619,371 | |
Citigroup, Inc., Jr. Sub. Notes(a) | | | 6.125% | (b) | | | 12/29/49 | | | | 1,375 | | | | 1,423,125 | |
Citigroup, Inc., Jr. Sub. Notes | | | 6.250% | (b) | | | 12/29/49 | | | | 625 | | | | 643,125 | |
Citigroup, Inc., Jr. Sub. Notes | | | 5.950% | (b) | | | 12/29/49 | | | | 2,205 | | | | 2,237,965 | |
Citigroup, Inc., Sr. Unsec’d. Notes | | | 3.700% | | | | 01/12/26 | | | | 2,440 | | | | 2,427,439 | |
Citigroup, Inc., Sr. Unsec’d. Notes(a) | | | 4.500% | | | | 01/14/22 | | | | 2,450 | | | | 2,612,131 | |
Citigroup, Inc., Sr. Unsec’d. Notes | | | 8.125% | | | | 07/15/39 | | | | 710 | | | | 1,055,013 | |
Citigroup, Inc., Sub. Notes(a) | | | 4.450% | | | | 09/29/27 | | | | 1,965 | | | | 1,996,137 | |
Compass Bank, Sr. Unsec’d. Notes | | | 1.850% | | | | 09/29/17 | | | | 1,270 | | | | 1,267,117 | |
Deutsche Bank AG (Germany), Sr. Unsec’d. Notes, GMTN | | | 3.375% | | | | 05/12/21 | | | | 1,640 | | | | 1,623,416 | |
SEE NOTES TO FINANCIAL STATEMENTS.
A82
| | | | | | |
| | | FLEXIBLE MANAGED PORTFOLIO (continued) | | |
| |
| SCHEDULE OF INVESTMENTS | | as of December 31, 2016 |
| | | | | | | | | | | | | | | | |
CORPORATE BONDS (continued) | | Interest
Rate
| | | Maturity
Date
| | | Principal
Amount
(000)#
| | | Value
(Note 2)
| |
Banks (continued) | | | | | | | | | | | | | | | | |
Dexia Credit Local SA (France), Govt. Liquid Gtd. Notes, 144A | | | 1.875% | | | | 09/15/21 | | | | 1,250 | | | $ | 1,206,266 | |
Discover Bank, Sr. Unsec’d. Notes | | | 4.250% | | | | 03/13/26 | | | | 970 | | | | 988,162 | |
Discover Bank, Sub. Notes | | | 7.000% | | | | 04/15/20 | | | | 570 | | | | 632,916 | |
Goldman Sachs Group, Inc. (The), Jr. Sub. Notes | | | 5.300% | (b) | | | 12/29/49 | | | | 740 | | | | 709,475 | |
Goldman Sachs Group, Inc. (The), Jr. Sub. Notes | | | 5.375% | (b) | | | 12/29/49 | | | | 2,215 | | | | 2,237,150 | |
Goldman Sachs Group, Inc. (The), Sr. Unsec’d. Notes | | | 3.500% | | | | 01/23/25 | | | | 4,100 | | | | 4,045,466 | |
Goldman Sachs Group, Inc. (The), Sr. Unsec’d. Notes | | | 3.750% | | | | 02/25/26 | | | | 1,010 | | | | 1,012,967 | |
Goldman Sachs Group, Inc. (The), Sr. Unsec’d. Notes | | | 5.250% | | | | 07/27/21 | | | | 2,055 | | | | 2,252,260 | |
Goldman Sachs Group, Inc. (The), Sr. Unsec’d. Notes | | | 5.750% | | | | 01/24/22 | | | | 3,620 | | | | 4,069,658 | |
Goldman Sachs Group, Inc. (The), Sr. Unsec’d. Notes | | | 6.250% | | | | 02/01/41 | | | | 270 | | | | 334,683 | |
Goldman Sachs Group, Inc. (The), Sub. Notes | | | 6.750% | | | | 10/01/37 | | | | 104 | | | | 128,424 | |
HSBC Holdings PLC (United Kingdom), Sr. Unsec’d. Notes | | | 4.875% | | | | 01/14/22 | | | | 1,910 | | | | 2,061,918 | |
HSBC Holdings PLC (United Kingdom), Sr. Unsec’d. Notes | | | 5.100% | | | | 04/05/21 | | | | 1,025 | | | | 1,107,724 | |
JPMorgan Chase & Co., Jr. Sub. Notes(a) | | | 6.100% | (b) | | | 10/29/49 | | | | 1,275 | | | | 1,290,141 | |
JPMorgan Chase & Co., Jr. Sub. Notes | | | 7.900% | (b) | | | 12/29/49 | | | | 2,000 | | | | 2,071,000 | |
JPMorgan Chase & Co., Sr. Unsec’d. Notes | | | 4.250% | | | | 10/15/20 | | | | 2,930 | | | | 3,100,632 | |
JPMorgan Chase & Co., Sub. Notes | | | 4.950% | | | | 06/01/45 | | | | 515 | | | | 549,149 | |
JPMorgan Chase & Co., Sub. Notes | | | 3.875% | | | | 09/10/24 | | | | 3,775 | | | | 3,819,685 | |
Lloyds Bank PLC (United Kingdom), Gtd. Notes, 144A, MTN | | | 5.800% | | | | 01/13/20 | | | | 1,870 | | | | 2,039,198 | |
Manufacturers & Traders Trust Co., Sr. Unsec’d. Notes | | | 2.900% | | | | 02/06/25 | | | | 3,080 | | | | 3,000,819 | |
Merrill Lynch & Co., Inc., Sr. Unsec’d. Notes, GMTN | | | 6.400% | | | | 08/28/17 | | | | 20 | | | | 20,613 | |
Morgan Stanley, Jr. Sub. Notes(a) | | | 5.450% | (b) | | | 07/29/49 | | | | 840 | | | | 831,600 | |
Morgan Stanley, Sr. Unsec’d. Notes | | | 5.750% | | | | 01/25/21 | | | | 1,400 | | | | 1,553,406 | |
Morgan Stanley, Sr. Unsec’d. Notes, GMTN | | | 3.750% | | | | 02/25/23 | | | | 940 | | | | 965,515 | |
Morgan Stanley, Sr. Unsec’d. Notes, GMTN | | | 5.450% | | | | 01/09/17 | | | | 1,345 | | | | 1,345,662 | |
Morgan Stanley, Sr. Unsec’d. Notes, GMTN | | | 5.500% | | | | 07/28/21 | | | | 1,290 | | | | 1,429,497 | |
Morgan Stanley, Sr. Unsec’d. Notes, GMTN | | | 6.625% | | | | 04/01/18 | | | | 105 | | | | 111,040 | |
Morgan Stanley, Sr. Unsec’d. Notes, MTN | | | 5.625% | | | | 09/23/19 | | | | 1,415 | | | | 1,533,803 | |
Morgan Stanley, Sr. Unsec’d. Notes, MTN | | | 6.375% | | | | 07/24/42 | | | | 780 | | | | 1,002,430 | |
Morgan Stanley, Sub. Notes, GMTN | | | 4.350% | | | | 09/08/26 | | | | 3,825 | | | | 3,919,661 | |
National City Corp., Sub. Notes | | | 6.875% | | | | 05/15/19 | | | | 3,370 | | | | 3,709,309 | |
Nordea Bank AB (Sweden), Sr. Unsec’d. Notes, 144A, MTN | | | 1.875% | | | | 09/17/18 | | | | 2,110 | | | | 2,108,960 | |
People’s United Bank, Sub. Notes | | | 4.000% | | | | 07/15/24 | | | | 465 | | | | 458,049 | |
PNC Bank NA, Sr. Unsec’d. Notes | | | 1.950% | | | | 03/04/19 | | | | 515 | | | | 515,543 | |
PNC Bank NA, Sub. Notes | | | 3.800% | | | | 07/25/23 | | | | 270 | | | | 278,386 | |
Sumitomo Mitsui Banking Corp. (Japan), Gtd. Notes | | | 2.450% | | | | 01/10/19 | | | | 1,210 | | | | 1,216,624 | |
US Bancorp, Sub. Notes, MTN | | | 2.950% | | | | 07/15/22 | | | | 1,120 | | | | 1,126,638 | |
| | | | | | | | | | | | | | |
|
|
|
| | | | | | | | | | | | | | | | 99,939,433 | |
| | | | | | | | | | | | | | |
|
|
|
Beverages — 0.1% | |
Anheuser-Busch InBev Finance, Inc. (Belgium), Gtd. Notes | | | 4.700% | | | | 02/01/36 | | | | 855 | | | | 899,347 | |
Anheuser-Busch InBev Finance, Inc. (Belgium), Gtd. Notes | | | 4.900% | | | | 02/01/46 | | | | 225 | | | | 243,196 | |
Anheuser-Busch InBev Worldwide, Inc. (Belgium), Gtd. Notes | | | 8.000% | | | | 11/15/39 | | | | 1,285 | | | | 1,889,753 | |
Anheuser-Busch InBev Worldwide, Inc. (Belgium), Gtd. Notes | | | 8.200% | | | | 01/15/39 | | | | 250 | | | | 375,973 | |
Constellation Brands, Inc., Gtd. Notes | | | 4.250% | | | | 05/01/23 | | | | 1,400 | | | | 1,451,646 | |
| | | | | | | | | | | | | | |
|
|
|
| | | | | | | | | | | | | | | | 4,859,915 | |
| | | | | | | | | | | | | | |
|
|
|
Biotechnology — 0.1% | |
Amgen, Inc., Sr. Unsec’d. Notes, 144A | | | 4.663% | | | | 06/15/51 | | | | 1,834 | | | | 1,762,672 | |
Gilead Sciences, Inc., Sr. Unsec’d. Notes | | | 3.500% | | | | 02/01/25 | | | | 1,460 | | | | 1,476,146 | |
Gilead Sciences, Inc., Sr. Unsec’d. Notes | | | 4.150% | | | | 03/01/47 | | | | 40 | | | | 37,992 | |
Gilead Sciences, Inc., Sr. Unsec’d. Notes | | | 5.650% | | | | 12/01/41 | | | | 145 | | | | 167,596 | |
| | | | | | | | | | | | | | |
|
|
|
| | | | | | | | | | | | | | | | 3,444,406 | |
| | | | | | | | | | | | | | |
|
|
|
Building Materials — 0.1% | |
Owens Corning, Inc., Gtd. Notes | | | 4.200% | | | | 12/15/22 | | | | 775 | | | | 804,865 | |
Standard Industries, Inc., Sr. Unsec’d. Notes, 144A(c) | | | 5.375% | | | | 11/15/24 | | | | 1,400 | | | | 1,438,500 | |
| | | | | | | | | | | | | | |
|
|
|
| | | | | | | | | | | | | | | | 2,243,365 | |
| | | | | | | | | | | | | | |
|
|
|
SEE NOTES TO FINANCIAL STATEMENTS.
A83
| | | | | | |
| | | FLEXIBLE MANAGED PORTFOLIO (continued) | | |
| |
| SCHEDULE OF INVESTMENTS | | as of December 31, 2016 |
| | | | | | | | | | | | | | | | |
CORPORATE BONDS (continued) | | Interest
Rate
| | | Maturity
Date
| | | Principal
Amount
(000)#
| | | Value
(Note 2)
| |
Chemicals — 0.2% | |
Agrium, Inc. (Canada), Sr. Unsec’d. Notes | | | 3.150% | | | | 10/01/22 | | | | 780 | | | $ | 775,467 | |
Celanese US Holdings LLC, Gtd. Notes(a) | | | 5.875% | | | | 06/15/21 | | | | 1,500 | | | | 1,665,767 | |
CF Industries, Inc., Gtd. Notes | | | 5.375% | | | | 03/15/44 | | | | 585 | | | | 482,806 | |
Dow Chemical Co. (The), Sr. Unsec’d. Notes | | | 4.625% | | | | 10/01/44 | | | | 45 | | | | 45,154 | |
Dow Chemical Co. (The), Sr. Unsec’d. Notes | | | 9.400% | | | | 05/15/39 | | | | 347 | | | | 538,374 | |
LyondellBasell Industries NV, Sr. Unsec’d. Notes | | | 4.625% | | | | 02/26/55 | | | | 1,185 | | | | 1,101,154 | |
LyondellBasell Industries NV, Sr. Unsec’d. Notes | | | 5.000% | | | | 04/15/19 | | | | 1,000 | | | | 1,056,652 | |
Mosaic Co. (The), Sr. Unsec’d. Notes(a) | | | 5.450% | | | | 11/15/33 | | | | 345 | | | | 342,173 | |
Mosaic Co. (The), Sr. Unsec’d. Notes | | | 5.625% | | | | 11/15/43 | | | | 1,135 | | | | 1,093,794 | |
Union Carbide Corp., Sr. Unsec’d. Notes | | | 7.500% | | | | 06/01/25 | | | | 460 | | | | 553,789 | |
Westlake Chemical Corp., Gtd. Notes, 144A | | | 4.625% | | | | 02/15/21 | | | | 950 | | | | 983,250 | |
| | | | | | | | | | | | | | |
|
|
|
| | | | | | | | | | | | | | | | 8,638,380 | |
| | | | | | | | | | | | | | |
|
|
|
Commercial Services — 0.1% | |
ERAC USA Finance LLC, Gtd. Notes, 144A(c) | | | 6.375% | | | | 10/15/17 | | | | 1,302 | | | | 1,349,061 | |
ERAC USA Finance LLC, Gtd. Notes, 144A(c) | | | 6.700% | | | | 06/01/34 | | | | 420 | | | | 509,362 | |
ERAC USA Finance LLC, Gtd. Notes, 144A(c) | | | 7.000% | | | | 10/15/37 | | | | 380 | | | | 481,481 | |
United Rentals North America, Inc., Gtd. Notes | | | 5.875% | | | | 09/15/26 | | | | 485 | | | | 498,944 | |
| | | | | | | | | | | | | | |
|
|
|
| | | | | | | | | | | | | | | | 2,838,848 | |
| | | | | | | | | | | | | | |
|
|
|
Computers — 0.2% | |
Apple, Inc., Sr. Unsec’d. Notes | | | 3.450% | | | | 02/09/45 | | | | 890 | | | | 785,557 | |
Diamond 1 Finance Corp./Diamond 2 Finance Corp., Sr. Sec’d. Notes, 144A | | | 3.480% | | | | 06/01/19 | | | | 1,085 | | | | 1,107,575 | |
Diamond 1 Finance Corp./Diamond 2 Finance Corp., Sr. Sec’d. Notes, 144A | | | 4.420% | | | | 06/15/21 | | | | 920 | | | | 951,965 | |
Hewlett Packard Enterprise Co., Sr. Unsec’d. Notes | | | 2.450% | (b) | | | 10/05/17 | | | | 3,925 | | | | 3,946,823 | |
Hewlett Packard Enterprise Co., Sr. Unsec’d. Notes | | | 2.850% | (b) | | | 10/05/18 | | | | 735 | | | | 742,108 | |
Seagate HDD Cayman, Gtd. Notes | | | 3.750% | | | | 11/15/18 | | | | 605 | | | | 619,898 | |
| | | | | | | | | | | | | | |
|
|
|
| | | | | | | | | | | | | | | | 8,153,926 | |
| | | | | | | | | | | | | | |
|
|
|
Diversified Financial Services — 0.3% | |
AerCap Ireland Capital Ltd./AerCap Global Aviation Trust (Netherlands), Gtd. Notes | | | 3.750% | | | | 05/15/19 | | | | 775 | | | | 789,531 | |
Bear Stearns Cos. LLC, Sr. Unsec’d. Notes | | | 6.400% | | | | 10/02/17 | | | | 330 | | | | 341,862 | |
Bear Stearns Cos. LLC, Sr. Unsec’d. Notes | | | 7.250% | | | | 02/01/18 | | | | 1,175 | | | | 1,243,430 | |
Capital One Bank USA NA, Sub. Notes | | | 3.375% | | | | 02/15/23 | | | | 1,560 | | | | 1,545,355 | |
Discover Financial Services, Sr. Unsec’d. Notes | | | 3.850% | | | | 11/21/22 | | | | 900 | | | | 913,710 | |
GE Capital International Funding Co., Gtd. Notes | | | 2.342% | | | | 11/15/20 | | | | 766 | | | | 765,635 | |
GE Capital International Funding Co., Gtd. Notes | | | 4.418% | | | | 11/15/35 | | | | 760 | | | | 796,409 | |
Jefferies Group LLC, Sr. Unsec’d. Notes | | | 6.500% | | | | 01/20/43 | | | | 560 | | | | 576,234 | |
Lehman Brothers Holdings, Inc., Sr. Unsec’d. Notes | | | 6.875% | (f) | | | 02/06/12 | | | | 1,715 | | | | 98,613 | |
Lehman Brothers Holdings, Inc., Sr. Unsec’d. Notes | | | 6.875% | (f) | | | 05/02/18 | | | | 700 | | | | 41,370 | |
Navient Corp., Sr. Unsec’d. Notes, MTN | | | 8.450% | | | | 06/15/18 | | | | 240 | | | | 258,600 | |
Private Export Funding Corp., U.S. Gov’t. Gtd. Notes | | | 2.450% | | | | 07/15/24 | | | | 475 | | | | 462,709 | |
Private Export Funding Corp., U.S. Gov’t. Gtd. Notes | | | 3.250% | | | | 06/15/25 | | | | 1,155 | | | | 1,193,084 | |
Synchrony Financial, Sr. Unsec’d. Notes | | | 2.700% | | | | 02/03/20 | | | | 2,700 | | | | 2,691,994 | |
| | | | | | | | | | | | | | |
|
|
|
| | | | | | | | | | | | | | | | 11,718,536 | |
| | | | | | | | | | | | | | |
|
|
|
Electric — 0.5% | |
Baltimore Gas & Electric Co., Sr. Unsec’d. Notes | | | 6.350% | | | | 10/01/36 | | | | 550 | | | | 698,221 | |
Berkshire Hathaway Energy Co., Sr. Unsec’d. Notes | | | 6.125% | | | | 04/01/36 | | | | 310 | | | | 387,153 | |
Black Hills Corp., Sr. Unsec’d. Notes | | | 2.500% | | | | 01/11/19 | | | | 1,245 | | | | 1,249,964 | |
CenterPoint Energy Houston Electric LLC, Gen. Ref. Mtge. | | | 6.950% | | | | 03/15/33 | | | | 590 | | | | 785,649 | |
Comision Federal De Electricidad (Mexico), Sr. Unsec’d. Notes, 144A | | | 4.750% | | | | 02/23/27 | | | | 480 | | | | 460,800 | |
Consolidated Edison Co. of New York, Inc., Sr. Unsec’d. Notes | | | 5.500% | | | | 12/01/39 | | | | 220 | | | | 259,041 | |
Dominion Resources, Inc., Jr. Sub. Notes | | | 4.104% | | | | 04/01/21 | | | | 3,210 | | | | 3,343,754 | |
Duke Energy Carolinas LLC, First Mortgage | | | 6.050% | | | | 04/15/38 | | | | 550 | | | | 693,742 | |
Duke Energy Carolinas LLC, First Ref. Mortgage | | | 4.000% | | | | 09/30/42 | | | | 570 | | | | 566,066 | |
SEE NOTES TO FINANCIAL STATEMENTS.
A84
| | | | | | |
| | | FLEXIBLE MANAGED PORTFOLIO (continued) | | |
| |
| SCHEDULE OF INVESTMENTS | | as of December 31, 2016 |
| | | | | | | | | | | | | | | | |
CORPORATE BONDS (continued) | | Interest
Rate
| | | Maturity
Date
| | | Principal
Amount
(000)#
| | | Value
(Note 2)
| |
Electric (continued) | | | | | | | | | | | | | | | | |
Dynegy, Inc., Gtd. Notes | | | 6.750% | | | | 11/01/19 | | | | 455 | | | $ | 462,963 | |
Dynegy, Inc., Gtd. Notes | | | 7.375% | | | | 11/01/22 | | | | 345 | | | | 329,475 | |
El Paso Electric Co., Sr. Unsec’d. Notes | | | 6.000% | | | | 05/15/35 | | | | 670 | | | | 772,546 | |
Emera US Finance LP (Canada), Gtd. Notes, 144A | | | 3.550% | | | | 06/15/26 | | | | 990 | | | | 973,200 | |
Eversource Energy, Sr. Unsec’d. Notes | | | 4.500% | | | | 11/15/19 | | | | 615 | | | | 652,778 | |
Exelon Generation Co. LLC, Sr. Unsec’d. Notes | | | 6.250% | | | | 10/01/39 | | | | 1,425 | | | | 1,434,784 | |
FirstEnergy Transmission LLC, Sr. Unsec’d. Notes, 144A | | | 5.450% | | | | 07/15/44 | | | | 355 | | | | 376,856 | |
Florida Power & Light Co., First Mortgage | | | 5.950% | | | | 10/01/33 | | | | 295 | | | | 367,883 | |
Iberdrola International BV (Spain), Gtd. Notes | | | 6.750% | | | | 09/15/33 | | | | 145 | | | | 166,139 | |
Nevada Power Co., Gen. Ref. Mtge. | | | 6.500% | | | | 05/15/18 | | | | 1,260 | | | | 1,343,965 | |
Niagara Mohawk Power Corp., Sr. Unsec’d. Notes, 144A | | | 4.881% | | | | 08/15/19 | | | | 610 | | | | 650,962 | |
NRG Energy, Inc., Gtd. Notes, 144A | | | 7.250% | | | | 05/15/26 | | | | 895 | | | | 890,525 | |
Public Service Co. of New Mexico, Sr. Unsec’d. Notes | | | 7.950% | | | | 05/15/18 | | | | 140 | | | | 151,137 | |
Public Service Electric & Gas Co., Sr. Sec’d. Notes, MTN | | | 5.800% | | | | 05/01/37 | | | | 535 | | | | 662,884 | |
Southern California Edison Co., First Mortgage | | | 3.600% | | | | 02/01/45 | | | | 860 | | | | 813,474 | |
Xcel Energy, Inc., Sr. Unsec’d. Notes | | | 4.800% | | | | 09/15/41 | | | | 480 | | | | 511,441 | |
| | | | | | | | | | | | | | |
|
|
|
| | | | | | | | | | | | | | | | 19,005,402 | |
| | | | | | | | | | | | | | |
|
|
|
Entertainment | |
GLP Capital LP/GLP Financing II, Inc., Gtd. Notes | | | 4.375% | | | | 11/01/18 | | | | 1,000 | | | | 1,034,690 | |
| | | | | | | | | | | | | | |
|
|
|
Food — 0.1% | |
Kraft Heinz Foods Co., Gtd. Notes | | | 3.000% | | | | 06/01/26 | | | | 1,630 | | | | 1,530,304 | |
Kraft Heinz Foods Co., Gtd. Notes | | | 4.375% | | | | 06/01/46 | | | | 475 | | | | 446,965 | |
Kraft Heinz Foods Co., Gtd. Notes | | | 5.000% | | | | 07/15/35 | | | | 815 | | | | 855,016 | |
Lamb Weston Holdings, Inc., Gtd. Notes, 144A | | | 4.875% | | | | 11/01/26 | | | | 980 | | | | 969,587 | |
Smithfield Foods, Inc., Sr. Unsec’d. Notes | | | 6.625% | | | | 08/15/22 | | | | 1,600 | | | | 1,686,000 | |
| | | | | | | | | | | | | | |
|
|
|
| | | | | | | | | | | | | | | | 5,487,872 | |
| | | | | | | | | | | | | | |
|
|
|
Forest & Paper Products — 0.1% | |
Georgia-Pacific LLC, Gtd. Notes, 144A(c) | | | 5.400% | | | | 11/01/20 | | | | 290 | | | | 318,820 | |
International Paper Co., Sr. Unsec’d. Notes | | | 6.000% | | | | 11/15/41 | | | | 1,595 | | | | 1,791,204 | |
International Paper Co., Sr. Unsec’d. Notes | | | 7.950% | | | | 06/15/18 | | | | 286 | | | | 310,446 | |
| | | | | | | | | | | | | | |
|
|
|
| | | | | | | | | | | | | | | | 2,420,470 | |
| | | | | | | | | | | | | | |
|
|
|
Gas | |
Dominion Gas Holdings LLC, Sr. Unsec’d. Notes | | | 4.800% | | | | 11/01/43 | | | | 65 | | | | 67,352 | |
NiSource Finance Corp., Gtd. Notes | | | 5.450% | | | | 09/15/20 | | | | 350 | | | | 382,196 | |
| | | | | | | | | | | | | | |
|
|
|
| | | | | | | | | | | | | | | | 449,548 | |
| | | | | | | | | | | | | | |
|
|
|
Healthcare-Products — 0.3% | |
Becton Dickinson and Co., Sr. Unsec’d. Notes | | | 3.734% | | | | 12/15/24 | | | | 474 | | | | 484,723 | |
Medtronic, Inc., Gtd. Notes | | | 3.500% | | | | 03/15/25 | | | | 3,205 | | | | 3,300,233 | |
Medtronic, Inc., Gtd. Notes | | | 4.375% | | | | 03/15/35 | | | | 1,269 | | | | 1,342,511 | |
St Jude Medical, Inc., Sr. Unsec’d. Notes | | | 2.000% | | | | 09/15/18 | | | | 4,910 | | | | 4,916,928 | |
| | | | | | | | | | | | | | |
|
|
|
| | | | | | | | | | | | | | | | 10,044,395 | |
| | | | | | | | | | | | | | |
|
|
|
Healthcare-Services — 0.4% | |
Aetna, Inc., Sr. Unsec’d. Notes | | | 6.625% | | | | 06/15/36 | | | | 515 | | | | 655,176 | |
Aetna, Inc., Sr. Unsec’d. Notes | | | 6.750% | | | | 12/15/37 | | | | 1,380 | | | | 1,793,463 | |
Anthem, Inc., Sr. Unsec’d. Notes | | | 4.625% | | | | 05/15/42 | | | | 390 | | | | 391,860 | |
Anthem, Inc., Sr. Unsec’d. Notes | | | 4.650% | | | | 01/15/43 | | | | 360 | | | | 361,402 | |
CHS/Community Health Systems, Inc., Sr. Sec’d. Notes(a) | | | 5.125% | | | | 08/15/18 | | | | 221 | | | | 216,580 | |
Cigna Corp., Sr. Unsec’d. Notes | | | 5.875% | | | | 03/15/41 | | | | 650 | | | | 747,170 | |
Cigna Corp., Sr. Unsec’d. Notes | | | 6.150% | | | | 11/15/36 | | | | 670 | | | | 776,899 | |
Fresenius Medical Care U.S. Finance II, Inc. (Germany), Gtd. Notes, 144A | | | 4.125% | | | | 10/15/20 | | | | 1,665 | | | | 1,723,275 | |
HCA, Inc., Sr. Sec’d. Notes | | | 4.250% | | | | 10/15/19 | | | | 555 | | | | 577,200 | |
HCA, Inc., Sr. Sec’d. Notes | | | 5.000% | | | | 03/15/24 | | | | 1,100 | | | | 1,131,625 | |
HCA, Inc., Sr. Sec’d. Notes | | | 5.250% | | | | 04/15/25 | | | | 400 | | | | 417,500 | |
Laboratory Corp. of America Holdings, Sr. Unsec’d. Notes | | | 3.200% | | | | 02/01/22 | | | | 190 | | | | 191,578 | |
SEE NOTES TO FINANCIAL STATEMENTS.
A85
| | | | | | |
| | | FLEXIBLE MANAGED PORTFOLIO (continued) | | |
| |
| SCHEDULE OF INVESTMENTS | | as of December 31, 2016 |
| | | | | | | | | | | | | | | | |
CORPORATE BONDS (continued) | | Interest
Rate
| | | Maturity
Date
| | | Principal
Amount
(000)#
| | | Value
(Note 2)
| |
Healthcare-Services (continued) | | | | | | | | | | | | | | | | |
New York & Presbyterian Hospital (The), Unsec’d. Notes | | | 4.024% | | | | 08/01/45 | | | | 445 | | | $ | 431,904 | |
Roche Holdings, Inc. (Switzerland), Gtd. Notes, 144A | | | 2.875% | | | | 09/29/21 | | | | 5,305 | | | | 5,396,151 | |
UnitedHealth Group, Inc., Sr. Unsec’d. Notes | | | 3.950% | | | | 10/15/42 | | | | 720 | | | | 701,179 | |
UnitedHealth Group, Inc., Sr. Unsec’d. Notes | | | 6.000% | | | | 06/15/17 | | | | 195 | | | | 199,016 | |
UnitedHealth Group, Inc., Sr. Unsec’d. Notes | | | 6.625% | | | | 11/15/37 | | | | 420 | | | | 549,387 | |
| | | | | | | | | | | | | | |
|
|
|
| | | | | | | | | | | | | | | | 16,261,365 | |
| | | | | | | | | | | | | | |
|
|
|
Home Builders | | | | | | | | | | | | | | | | |
D.R. Horton, Inc., Gtd. Notes | | | 3.625% | | | | 02/15/18 | | | | 450 | | | | 454,500 | |
| | | | | | | | | | | | | | |
|
|
|
Housewares — 0.1% | | | | | | | | | | | | | | | | |
Newell Rubbermaid, Inc., Sr. Unsec’d. Notes | | | 4.200% | | | | 04/01/26 | | | | 795 | | | | 829,805 | |
Newell Rubbermaid, Inc., Sr. Unsec’d. Notes | | | 6.250% | | | | 04/15/18 | | | | 1,700 | | | | 1,789,082 | |
| | | | | | | | | | | | | | |
|
|
|
| | | | | | | | | | | | | | | | 2,618,887 | |
| | | | | | | | | | | | | | |
|
|
|
Insurance — 0.6% | | | | | | | | | | | | | | | | |
Allied World Assurance Co. Holdings Ltd., Gtd. Notes | | | 5.500% | | | | 11/15/20 | | | | 525 | | | | 566,332 | |
American International Group, Inc., Sr. Unsec’d. Notes | | | 4.500% | | | | 07/16/44 | | | | 1,980 | | | | 1,952,428 | |
Axis Specialty Finance LLC, Gtd. Notes | | | 5.875% | | | | 06/01/20 | | | | 1,030 | | | | 1,129,010 | |
Berkshire Hathaway, Inc., Sr. Unsec’d. Notes | | | 3.125% | | | | 03/15/26 | | | | 2,455 | | | | 2,439,055 | |
Chubb Corp. (The), Gtd. Notes | | | 6.375% | (b) | | | 03/29/67 | | | | 1,300 | | | | 1,222,000 | |
Chubb INA Holdings, Inc., Gtd. Notes | | | 3.350% | | | | 05/03/26 | | | | 945 | | | | 957,201 | |
Chubb INA Holdings, Inc., Gtd. Notes | | | 4.350% | | | | 11/03/45 | | | | 130 | | | | 137,319 | |
Hartford Financial Services Group, Inc., Sr. Unsec’d. Notes | | | 5.125% | | | | 04/15/22 | | | | 755 | | | | 837,435 | |
Liberty Mutual Group, Inc., Gtd. Notes, 144A | | | 6.500% | | | | 05/01/42 | | | | 365 | | | | 432,756 | |
Liberty Mutual Group, Inc., Sr. Unsec’d. Notes, 144A | | | 7.000% | | | | 03/15/34 | | | | 850 | | | | 1,009,251 | |
Lincoln National Corp., Sr. Unsec’d. Notes | | | 6.300% | | | | 10/09/37 | | | | 772 | | | | 909,262 | |
Lincoln National Corp., Sr. Unsec’d. Notes | | | 8.750% | | | | 07/01/19 | | | | 186 | | | | 214,008 | |
Markel Corp., Sr. Unsec’d. Notes | | | 5.000% | | | | 03/30/43 | | | | 200 | | | | 202,851 | |
New York Life Global Funding, Sec’d. Notes, 144A | | | 1.950% | | | | 02/11/20 | | | | 3,030 | | | | 3,008,108 | |
New York Life Insurance Co., Sub. Notes, 144A | | | 6.750% | | | | 11/15/39 | | | | 660 | | | | 868,101 | |
Northwestern Mutual Life Insurance Co. (The), Sub. Notes, 144A | | | 6.063% | | | | 03/30/40 | | | | 370 | | | | 455,613 | |
Ohio National Financial Services, Inc., Sr. Unsec’d. Notes, 144A | | | 6.375% | | | | 04/30/20 | | | | 680 | | | | 747,670 | |
Pacific Life Insurance Co., Sub. Notes, 144A | | | 9.250% | | | | 06/15/39 | | | | 910 | | | | 1,344,183 | |
Principal Financial Group, Inc., Gtd. Notes | | | 4.625% | | | | 09/15/42 | | | | 130 | | | | 134,642 | |
Progressive Corp. (The), Jr. Sub. Notes | | | 6.700% | (b) | | | 06/15/67 | | | | 735 | | | | 718,462 | |
Progressive Corp. (The), Sr. Unsec’d. Notes | | | 3.700% | | | | 01/26/45 | | | | 710 | | | | 662,636 | |
Teachers Insurance & Annuity Association of America, Sub. Notes, 144A | | | 6.850% | | | | 12/16/39 | | | | 1,450 | | | | 1,881,700 | |
Travelers Cos., Inc. (The), Sr. Unsec’d. Notes | | | 4.300% | | | | 08/25/45 | | | | 885 | | | | 916,733 | |
Unum Group, Sr. Unsec’d. Notes | | | 5.625% | | | | 09/15/20 | | | | 350 | | | | 381,152 | |
W.R. Berkley Corp., Sr. Unsec’d. Notes | | | 6.150% | | | | 08/15/19 | | | | 460 | | | | 501,082 | |
| | | | | | | | | | | | | | |
|
|
|
| | | | | | | | | | | | | | | | 23,628,990 | |
| | | | | | | | | | | | | | |
|
|
|
Lodging — 0.1% | | | | | | | | | | | | | | | | |
Choice Hotels International, Inc., Gtd. Notes | | | 5.750% | | | | 07/01/22 | | | | 450 | | | | 480,375 | |
Marriott International, Inc., Sr. Unsec’d. Notes | | | 3.000% | | | | 03/01/19 | | | | 580 | | | | 590,148 | |
Marriott International, Inc., Sr. Unsec’d. Notes | | | 3.250% | | | | 09/15/22 | | | | 980 | | | | 988,206 | |
Marriott International, Inc., Sr. Unsec’d. Notes | | | 6.750% | | | | 05/15/18 | | | | 2,800 | | | | 2,984,842 | |
Wyndham Worldwide Corp., Sr. Unsec’d. Notes | | | 2.500% | | | | 03/01/18 | | | | 490 | | | | 494,125 | |
| | | | | | | | | | | | | | |
|
|
|
| | | | | | | | | | | | | | | | 5,537,696 | |
| | | | | | | | | | | | | | |
|
|
|
Machinery-Diversified — 0.1% | | | | | | | | | | | | | | | | |
Case New Holland Industrial, Inc. (United Kingdom), Gtd. Notes | | | 7.875% | | | | 12/01/17 | | | | 1,255 | | | | 1,319,319 | |
Xylem, Inc., Sr. Unsec’d. Notes | | | 4.875% | | | | 10/01/21 | | | | 1,260 | | | | 1,360,260 | |
| | | | | | | | | | | | | | |
|
|
|
| | | | | | | | | | | | | | | | 2,679,579 | |
| | | | | | | | | | | | | | |
|
|
|
Media — 0.4% | | | | | | | | | | | | | | | | |
21st Century Fox America, Inc., Gtd. Notes | | | 6.150% | | | | 03/01/37 | | | | 515 | | | | 602,686 | |
21st Century Fox America, Inc., Gtd. Notes | | | 6.900% | | | | 08/15/39 | | | | 90 | | | | 113,018 | |
AMC Networks, Inc., Gtd. Notes | | | 5.000% | | | | 04/01/24 | | | | 1,520 | | | | 1,527,600 | |
SEE NOTES TO FINANCIAL STATEMENTS.
A86
| | | | | | |
| | | FLEXIBLE MANAGED PORTFOLIO (continued) | | |
| |
| SCHEDULE OF INVESTMENTS | | as of December 31, 2016 |
| | | | | | | | | | | | | | | | |
CORPORATE BONDS (continued) | | Interest
Rate
| | | Maturity
Date
| | | Principal
Amount
(000)#
| | | Value
(Note 2)
| |
Media (continued) | | | | | | | | | | | | | | | | |
Cablevision Systems Corp., Sr. Unsec’d. Notes | | | 8.625% | | | | 09/15/17 | | | | 1,000 | | | $ | 1,040,000 | |
CCO Holdings LLC/CCO Holdings Capital Corp., Sr. Unsec’d. Notes, 144A | | | 5.375% | | | | 05/01/25 | | | | 880 | | | | 906,400 | |
Charter Communications Operating LLC/Charter Communications Operating Capital, Sr. Sec’d. Notes | | | 6.384% | | | | 10/23/35 | | | | 875 | | | | 999,103 | |
Charter Communications Operating LLC/Charter Communications Operating Capital, Sr. Sec’d. Notes | | | 6.484% | | | | 10/23/45 | | | | 1,386 | | | | 1,602,326 | |
Comcast Cable Communications Holdings, Inc., Gtd. Notes | | | 9.455% | | | | 11/15/22 | | | | 255 | | | | 345,143 | |
Comcast Corp., Gtd. Notes | | | 6.400% | | | | 05/15/38 | | | | 530 | | | | 678,665 | |
Historic TW, Inc., Gtd. Notes | | | 9.150% | | | | 02/01/23 | | | | 505 | | | | 647,636 | |
Myriad International Holdings BV (South Africa), Gtd. Notes, RegS | | | 6.375% | | | | 07/28/17 | | | | 1,300 | | | | 1,325,688 | |
Time Warner Cable, Inc., Sr. Sec’d. Notes | | | 5.850% | | | | 05/01/17 | | | | 1,710 | | | | 1,734,267 | |
Time Warner, Inc., Gtd. Notes | | | 3.800% | | | | 02/15/27 | | | | 385 | | | | 382,814 | |
Time Warner, Inc., Gtd. Notes | | | 6.200% | | | | 03/15/40 | | | | 210 | | | | 242,411 | |
Time Warner, Inc., Gtd. Notes | | | 6.250% | | | | 03/29/41 | | | | 1,465 | | | | 1,709,334 | |
Viacom, Inc., Sr. Unsec’d. Notes | | | 4.875% | | | | 06/15/43 | | | | 200 | | | | 173,383 | |
Viacom, Inc., Sr. Unsec’d. Notes | | | 4.500% | | | | 02/27/42 | | | | 50 | | | | 41,449 | |
Viacom, Inc., Sr. Unsec’d. Notes | | | 5.250% | | | | 04/01/44 | | | | 450 | | | | 409,383 | |
Videotron Ltd. (Canada), Gtd. Notes | | | 5.000% | | | | 07/15/22 | | | | 1,040 | | | | 1,066,000 | |
| | | | | | | | | | | | | | |
|
|
|
| | | | | | | | | | | | | | | | 15,547,306 | |
| | | | | | | | | | | | | | |
|
|
|
Mining — 0.1% | | | | | | | | | | | | | | | | |
BHP Billiton Finance USA Ltd. (Australia), Gtd. Notes, 144A(a) | | | 6.250% | (b) | | | 10/19/75 | | | | 1,135 | | | | 1,228,865 | |
BHP Billiton Finance USA Ltd. (Australia), Gtd. Notes | | | 5.000% | | | | 09/30/43 | | | | 920 | | | | 1,027,603 | |
Southern Copper Corp. (Peru), Sr. Unsec’d. Notes | | | 5.875% | | | | 04/23/45 | | | | 530 | | | | 520,315 | |
Southern Copper Corp. (Peru), Sr. Unsec’d. Notes | | | 6.750% | | | | 04/16/40 | | | | 425 | | | | 458,535 | |
| | | | | | | | | | | | | | |
|
|
|
| | | | | | | | | | | | | | | | 3,235,318 | |
| | | | | | | | | | | | | | |
|
|
|
Miscellaneous Manufacturing — 0.1% | | | | | | | | | | | | | | | | |
Actuant Corp., Gtd. Notes | | | 5.625% | | | | 06/15/22 | | | | 1,205 | | | | 1,235,125 | |
General Electric Co., Sr. Unsec’d. Notes | | | 4.125% | | | | 10/09/42 | | | | 190 | | | | 191,682 | |
General Electric Co., Sr. Unsec’d. Notes, GMTN | | | 6.000% | | | | 08/07/19 | | | | 264 | | | | 291,684 | |
Koppers, Inc., Gtd. Notes | | | 7.875% | | | | 12/01/19 | | | | 1,300 | | | | 1,317,875 | |
| | | | | | | | | | | | | | |
|
|
|
| | | | | | | | | | | | | | | | 3,036,366 | |
| | | | | | | | | | | | | | |
|
|
|
Multi-National — 0.1% | | | | | | | | | | | �� | | | | | |
Corp. Andina de Fomento (Supranational Bank), Sr. Unsec’d. Notes | | | 2.000% | | | | 05/10/19 | | | | 1,410 | | | | 1,400,811 | |
Corp. Andina de Fomento (Supranational Bank), Sr. Unsec’d. Notes | | | 2.125% | | | | 09/27/21 | | | | 1,260 | | | | 1,219,894 | |
North American Development Bank (Supranational Bank),
Sr. Unsec’d. Notes | | | 2.400% | | | | 10/26/22 | | | | 1,095 | | | | 1,062,984 | |
North American Development Bank (Supranational Bank),
Sr. Unsec’d. Notes | | | 4.375% | | | | 02/11/20 | | | | 1,000 | | | | 1,063,945 | |
| | | | | | | | | | | | | | |
|
|
|
| | | | | | | | | | | | | | | | 4,747,634 | |
| | | | | | | | | | | | | | |
|
|
|
Oil & Gas — 0.5% | | | | | | | | | | | | | | | | |
Anadarko Petroleum Corp., Sr. Unsec’d. Notes | | | 6.600% | | | | 03/15/46 | | | | 225 | | | | 277,506 | |
Anadarko Petroleum Corp., Sr. Unsec’d. Notes | | | 4.677% | (g) | | | 10/10/36 | | | | 2,000 | | | | 808,624 | |
Anadarko Petroleum Corp., Sr. Unsec’d. Notes | | | 6.450% | | | | 09/15/36 | | | | 1,155 | | | | 1,374,642 | |
Apache Corp., Sr. Unsec’d. Notes | | | 5.100% | | | | 09/01/40 | | | | 325 | | | | 340,009 | |
ConocoPhillips Co., Gtd. Notes | | | 4.950% | | | | 03/15/26 | | | | 2,250 | | | | 2,484,004 | |
Devon Energy Corp., Sr. Unsec’d. Notes | | | 5.600% | | | | 07/15/41 | | | | 300 | | | | 308,999 | |
Devon Energy Corp., Sr. Unsec’d. Notes | | | 5.000% | | | | 06/15/45 | | | | 110 | | | | 108,057 | |
Devon Financing Corp. LLC, Gtd. Notes | | | 7.875% | | | | 09/30/31 | | | | 1,700 | | | | 2,157,035 | |
EOG Resources, Inc., Sr. Unsec’d. Notes | | | 3.900% | | | | 04/01/35 | | | | 1,020 | | | | 965,972 | |
Helmerich & Payne International Drilling Co., Gtd. Notes | | | 4.650% | | | | 03/15/25 | | | | 1,995 | | | | 2,061,378 | |
Hess Corp., Sr. Unsec’d. Notes | | | 4.300% | | | | 04/01/27 | | | | 1,055 | | | | 1,050,170 | |
Nabors Industries, Inc., Gtd. Notes | | | 4.625% | | | | 09/15/21 | | | | 1,070 | | | | 1,087,676 | |
Noble Energy, Inc., Sr. Unsec’d. Notes | | | 5.050% | | | | 11/15/44 | | | | 1,200 | | | | 1,203,537 | |
Occidental Petroleum Corp., Sr. Unsec’d. Notes | | | 3.000% | | | | 02/15/27 | | | | 555 | | | | 537,004 | |
Petroleos Mexicanos (Mexico), Gtd. Notes | | | 6.500% | | | | 06/02/41 | | | | 1,255 | | | | 1,175,370 | |
SEE NOTES TO FINANCIAL STATEMENTS.
A87
| | | | | | |
| | | FLEXIBLE MANAGED PORTFOLIO (continued) | | |
| |
| SCHEDULE OF INVESTMENTS | | as of December 31, 2016 |
| | | | | | | | | | | | | | | | |
CORPORATE BONDS (continued) | | Interest
Rate
| | | Maturity
Date
| | | Principal
Amount
(000)#
| | | Value
(Note 2)
| |
Oil & Gas (continued) | | | | | | | | | | | | | | | | |
Petroleos Mexicanos (Mexico), Gtd. Notes, 144A | | | 5.375% | | | | 03/13/22 | | | | 450 | | | $ | 460,791 | |
Phillips 66, Gtd. Notes | | | 2.950% | | | | 05/01/17 | | | | 490 | | | | 492,733 | |
Pioneer Natural Resources Co., Sr. Unsec’d. Notes | | | 6.875% | | | | 05/01/18 | | | | 1,500 | | | | 1,592,448 | |
Reliance Holding USA, Inc. (India), Gtd. Notes, 144A | | | 5.400% | | | | 02/14/22 | | | | 550 | | | | 594,606 | |
| | | | | | | | | | | | | | |
|
|
|
| | | | | | | | | | | | | | | | 19,080,561 | |
| | | | | | | | | | | | | | |
|
|
|
Oil & Gas Services — 0.1% | | | | | | | | | | | | | | | | |
Cameron International Corp., Sr. Unsec’d. Notes | | | 4.500% | | | | 06/01/21 | | | | 2,200 | | | | 2,274,505 | |
Schlumberger Holdings Corp., Sr. Unsec’d. Notes, 144A | | | 4.000% | | | | 12/21/25 | | | | 2,845 | | | | 2,981,532 | |
| | | | | | | | | | | | | | |
|
|
|
| | | | | | | | | | | | | | | | 5,256,037 | |
| | | | | | | | | | | | | | |
|
|
|
Packaging & Containers | | | | | | | | | | | | | | | | |
Ball Corp., Gtd. Notes | | | 4.375% | | | | 12/15/20 | | | | 630 | | | | 658,350 | |
WestRock RKT Co., Gtd. Notes | | | 4.900% | | | | 03/01/22 | | | | 800 | | | | 868,430 | |
| | | | | | | | | | | | | | |
|
|
|
| | | | | | | | | | | | | | | | 1,526,780 | |
| | | | | | | | | | | | | | |
|
|
|
Pharmaceuticals — 0.3% | | | | | | | | | | | | | | | | |
AbbVie, Inc., Sr. Unsec’d. Notes | | | 3.600% | | | | 05/14/25 | | | | 1,175 | | | | 1,163,823 | |
AbbVie, Inc., Sr. Unsec’d. Notes | | | 4.500% | | | | 05/14/35 | | | | 1,910 | | | | 1,876,627 | |
Actavis Funding SCS, Gtd. Notes | | | 3.800% | | | | 03/15/25 | | | | 1,000 | | | | 1,001,178 | |
Actavis Funding SCS, Gtd. Notes | | | 4.550% | | | | 03/15/35 | | | | 2,010 | | | | 1,989,482 | |
Actavis Funding SCS, Gtd. Notes | | | 4.750% | | | | 03/15/45 | | | | 285 | | | | 279,794 | |
Actavis, Inc., Gtd. Notes | | | 6.125% | | | | 08/15/19 | | | | 445 | | | | 486,175 | |
Merck & Co., Inc., Sr. Unsec’d. Notes(a) | | | 2.750% | | | | 02/10/25 | | | | 420 | | | | 412,382 | |
Merck & Co., Inc., Sr. Unsec’d. Notes | | | 3.700% | | | | 02/10/45 | | | | 1,380 | | | | 1,315,888 | |
Novartis Capital Corp. (Switzerland), Gtd. Notes | | | 4.400% | | | | 05/06/44 | | | | 1,325 | | | | 1,428,933 | |
Teva Pharmaceutical Finance Netherlands III BV (Netherlands), Gtd. Notes(a) | | | 3.150% | | | | 10/01/26 | | | | 610 | | | | 562,376 | |
Teva Pharmaceutical Finance Netherlands III BV (Israel), Gtd. Notes(a) | | | 4.100% | | | | 10/01/46 | | | | 195 | | | | 167,088 | |
Wyeth LLC, Gtd. Notes | | | 6.450% | | | | 02/01/24 | | | | 60 | | | | 73,058 | |
Zoetis, Inc., Sr. Unsec’d. Notes | | | 4.700% | | | | 02/01/43 | | | | 120 | | | | 116,805 | |
| | | | | | | | | | | | | | |
|
|
|
| | | | | | | | | | | | | | | | 10,873,609 | |
| | | | | | | | | | | | | | |
|
|
|
Pipelines — 0.2% | | | | | | | | | | | | | | | | |
DCP Midstream LLC, Sr. Unsec’d. Notes, 144A | | | 5.350% | | | | 03/15/20 | | | | 717 | | | | 743,887 | |
Energy Transfer Partners LP, Sr. Unsec’d. Notes(a) | | | 4.650% | | | | 06/01/21 | | | | 675 | | | | 700,831 | |
Energy Transfer Partners LP, Sr. Unsec’d. Notes | | | 4.900% | | | | 03/15/35 | | | | 250 | | | | 233,633 | |
Enterprise Products Operating LLC, Gtd. Notes(a) | | | 3.950% | | | | 02/15/27 | | | | 1,080 | | | | 1,106,344 | |
Enterprise Products Operating LLC, Gtd. Notes(a) | | | 3.700% | | | | 02/15/26 | | | | 690 | | | | 692,502 | |
Enterprise Products Operating LLC, Gtd. Notes(a) | | | 3.750% | | | | 02/15/25 | | | | 1,345 | | | | 1,366,603 | |
Kinder Morgan Energy Partners LP, Gtd. Notes | | | 5.950% | | | | 02/15/18 | | | | 510 | | | | 531,992 | |
MPLX LP, Sr. Unsec’d. Notes | | | 4.000% | | | | 02/15/25 | | | | 1,430 | | | | 1,389,967 | |
ONEOK Partners LP, Gtd. Notes | | | 6.650% | | | | 10/01/36 | | | | 145 | | | | 164,490 | |
| | | | | | | | | | | | | | |
|
|
|
| | | | | | | | | | | | | | | | 6,930,249 | |
| | | | | | | | | | | | | | |
|
|
|
Real Estate | | | | | | | | | | | | | | | | |
ProLogis LP, Gtd. Notes | | | 6.875% | | | | 03/15/20 | | | | 72 | | | | 80,766 | |
| | | | | | | | | | | | | | |
|
|
|
Real Estate Investment Trusts (REITs) | | | | | | | | | | | | | | | | |
Select Income REIT, Sr. Unsec’d. Notes | | | 2.850% | | | | 02/01/18 | | | | 715 | | | | 718,055 | |
Simon Property Group LP, Sr. Unsec’d. Notes | | | 3.375% | | | | 03/15/22 | | | | 230 | | | | 237,789 | |
| | | | | | | | | | | | | | |
|
|
|
| | | | | | | | | | | | | | | | 955,844 | |
| | | | | | | | | | | | | | |
|
|
|
Retail — 0.2% | | | | | | | | | | | | | | | | |
CVS Health Corp., Sr. Unsec’d. Notes | | | 5.125% | | | | 07/20/45 | | | | 820 | | | | 913,847 | |
CVS Health Corp., Sr. Unsec’d. Notes | | | 5.300% | | | | 12/05/43 | | | | 225 | | | | 254,944 | |
Home Depot, Inc. (The), Sr. Unsec’d. Notes | | | 3.000% | | | | 04/01/26 | | | | 730 | | | | 728,599 | |
Home Depot, Inc. (The), Sr. Unsec’d. Notes | | | 4.400% | | | | 03/15/45 | | | | 755 | | | | 804,601 | |
L Brands, Inc., Gtd. Notes | | | 5.625% | | | | 02/15/22 | | | | 1,450 | | | | 1,547,875 | |
Lowe’s Cos., Inc., Sr. Unsec’d. Notes | | | 6.500% | | | | 03/15/29 | | | | 385 | | | | 497,319 | |
Macy’s Retail Holdings, Inc., Gtd. Notes | | | 3.875% | | | | 01/15/22 | | | | 360 | | | | 368,721 | |
SEE NOTES TO FINANCIAL STATEMENTS.
A88
| | | | | | |
| | | FLEXIBLE MANAGED PORTFOLIO (continued) | | |
| |
| SCHEDULE OF INVESTMENTS | | as of December 31, 2016 |
| | | | | | | | | | | | | | | | |
CORPORATE BONDS (continued) | | Interest
Rate
| | | Maturity
Date
| | | Principal
Amount
(000)#
| | | Value
(Note 2)
| |
Retail (continued) | | | | | | | | | | | | | | | | |
McDonald’s Corp., Sr. Unsec’d. Notes, MTN | | | 3.700% | | | | 01/30/26 | | | | 2,620 | | | $ | 2,667,414 | |
Sally Holdings LLC/Sally Capital, Inc., Gtd. Notes | | | 5.625% | | | | 12/01/25 | | | | 1,375 | | | | 1,430,000 | |
Target Corp., Sr. Unsec’d. Notes | | | 3.500% | | | | 07/01/24 | | | | 345 | | | | 358,365 | |
| | | | | | | | | | | | | | |
|
|
|
| | | | | | | | | | | | | | | | 9,571,685 | |
| | | | | | | | | | | | | | |
|
|
|
Savings & Loans | | | | | | | | | | | | | | | | |
People’s United Financial, Inc., Sr. Unsec’d. Notes | | | 3.650% | | | | 12/06/22 | | | | 1,455 | | | | 1,463,180 | |
| | | | | | | | | | | | | | |
|
|
|
Semiconductors | | | | | | | | | | | | | | | | |
NXP BV/NXP Funding LLC (Netherlands), Gtd. Notes, 144A | | | 5.750% | | | | 03/15/23 | | | | 1,500 | | | | 1,582,500 | |
| | | | | | | | | | | | | | |
|
|
|
Software — 0.2% | | | | | | | | | | | | | | | | |
Fidelity National Information Services, Inc., Sr. Unsec’d. Notes | | | 2.850% | | | | 10/15/18 | | | | 1,650 | | | | 1,678,699 | |
Fidelity National Information Services, Inc., Sr. Unsec’d. Notes | | | 3.625% | | | | 10/15/20 | | | | 2,210 | | | | 2,287,942 | |
Microsoft Corp., Sr. Unsec’d. Notes | | | 2.375% | | | | 02/12/22 | | | | 3,085 | | | | 3,072,583 | |
Microsoft Corp., Sr. Unsec’d. Notes(a) | | | 3.125% | | | | 11/03/25 | | | | 1,380 | | | | 1,395,413 | |
Oracle Corp., Sr. Unsec’d. Notes | | | 4.300% | | | | 07/08/34 | | | | 920 | | | | 951,265 | |
| | | | | | | | | | | | | | |
|
|
|
| | | | | | | | | | | | | | | | 9,385,902 | |
| | | | | | | | | | | | | | |
|
|
|
Telecommunications — 0.5% | | | | | | | | | | | | | | | | |
AT&T Corp., Gtd. Notes | | | 8.250% | (b) | | | 11/15/31 | | | | 4 | | | | 5,561 | |
AT&T, Inc., Sr. Unsec’d. Notes | | | 3.400% | | | | 05/15/25 | | | | 3,460 | | | | 3,334,828 | |
AT&T, Inc., Sr. Unsec’d. Notes | | | 4.500% | | | | 05/15/35 | | | | 430 | | | | 415,451 | |
AT&T, Inc., Sr. Unsec’d. Notes | | | 4.500% | | | | 03/09/48 | | | | 4 | | | | 3,594 | |
AT&T, Inc., Sr. Unsec’d. Notes | | | 4.550% | | | | 03/09/49 | | | | 844 | | | | 762,356 | |
AT&T, Inc., Sr. Unsec’d. Notes | | | 4.750% | | | | 05/15/46 | | | | 875 | | | | 828,992 | |
AT&T, Inc., Sr. Unsec’d. Notes | | | 4.800% | | | | 06/15/44 | | | | 1,000 | | | | 944,914 | |
AT&T, Inc., Sr. Unsec’d. Notes | | | 5.150% | | | | 03/15/42 | | | | 860 | | | | 856,708 | |
AT&T, Inc., Sr. Unsec’d. Notes | | | 5.350% | | | | 09/01/40 | | | | 82 | | | | 84,214 | |
British Telecommunications PLC (United Kingdom), Sr. Unsec’d. Notes | | | 9.125% | (b) | | | 12/15/30 | | | | 400 | | | | 610,272 | |
Sprint Spectrum Co. LLC/Sprint Spectrum Co. II LLC/Sprint Spectrum Co. III LLC, Sr. Sec’d. Notes, 144A | | | 3.360% | | | | 03/20/23 | | | | 2,000 | | | | 2,003,740 | |
Verizon Communications, Inc., Sr. Unsec’d. Notes | | | 4.522% | | | | 09/15/48 | | | | 2,025 | | | | 1,941,797 | |
Verizon Communications, Inc., Sr. Unsec’d. Notes | | | 4.672% | | | | 03/15/55 | | | | 2,056 | | | | 1,930,810 | |
Verizon Communications, Inc., Sr. Unsec’d. Notes | | | 4.862% | | | | 08/21/46 | | | | 1,256 | | | | 1,272,697 | |
Verizon Communications, Inc., Sr. Unsec’d. Notes | | | 5.012% | | | | 08/21/54 | | | | 3,127 | | | | 3,110,621 | |
| | | | | | | | | | | | | | |
|
|
|
| | | | | | | | | | | | | | | | 18,106,555 | |
| | | | | | | | | | | | | | |
|
|
|
Transportation — 0.1% | | | | | | | | | | | | | | | | |
Burlington Northern Santa Fe LLC, Sr. Unsec’d. Notes | | | 6.700% | | | | 08/01/28 | | | | 670 | | | | 853,398 | |
CSX Corp., Sr. Unsec’d. Notes | | | 6.150% | | | | 05/01/37 | | | | 715 | | | | 878,346 | |
Norfolk Southern Corp., Sr. Unsec’d. Notes | | | 5.590% | | | | 05/17/25 | | | | 100 | | | | 114,387 | |
| | | | | | | | | | | | | | |
|
|
|
| | | | | | | | | | | | | | | | 1,846,131 | |
| | | | | | | | | | | | | | |
|
|
|
TOTAL CORPORATE BONDS
(cost $358,101,890) | | | | 367,444,705 | |
| | | | | | | | | | | | | | |
|
|
|
| MUNICIPAL BONDS — 0.4% | | | | | | | | | | | | | | | | |
Alabama | | | | | | | | | | | | | | | | |
Alabama Economic Settlement Authority | | | 4.263% | | | | 09/15/32 | | | | 240 | | | | 246,667 | |
| | | | | | | | | | | | | | |
|
|
|
California — 0.2% | | | | | | | | | | | | | | | | |
Bay Area Toll Authority, Revenue Bonds, BABs | | | 6.263% | | | | 04/01/49 | | | | 1,325 | | | | 1,800,039 | |
California Educational Facilities Authority | | | 5.000% | | | | 06/01/46 | | | | 750 | | | | 960,480 | |
State of California, GO, BABs | | | 7.300% | | | | 10/01/39 | | | | 1,270 | | | | 1,793,735 | |
State of California, GO, BABs | | | 7.500% | | | | 04/01/34 | | | | 475 | | | | 668,164 | |
State of California, GO, BABs | | | 7.550% | | | | 04/01/39 | | | | 245 | | | | 363,827 | |
State of California, GO, BABs | | | 7.625% | | | | 03/01/40 | | | | 215 | | | | 315,904 | |
| | | | | | | | | | | | | | |
|
|
|
| | | | | | | | | | | | | | | | 5,902,149 | |
| | | | | | | | | | | | | | |
|
|
|
Colorado | | | | | | | | | | | | | | | | |
Regional Transportation District, Revenue Bonds, Series 2010-B, BABs | | | 5.844% | | | | 11/01/50 | | | | 680 | | | | 881,396 | |
| | | | | | | | | | | | | | |
|
|
|
SEE NOTES TO FINANCIAL STATEMENTS.
A89
| | | | | | |
| | | FLEXIBLE MANAGED PORTFOLIO (continued) | | |
| |
| SCHEDULE OF INVESTMENTS | | as of December 31, 2016 |
| | | | | | | | | | | | | | | | |
MUNICIPAL BONDS (continued) | | Interest
Rate
| | | Maturity
Date
| | | Principal
Amount
(000)#
| | | Value
(Note 2)
| |
Illinois | | | | | | | | | | | | | | | | |
Chicago O’Hare International Airport, Revenue Bonds, BABs | | | 6.395% | | | | 01/01/40 | | | | 1,030 | | | $ | 1,344,407 | |
| | | | | | | | | | | | | | |
|
|
|
New Jersey — 0.1% | | | | | | | | | | | | | | | | |
New Jersey State Turnpike Authority, Revenue Bonds, Series F, BABs | | | 7.414% | | | | 01/01/40 | | | | 1,070 | | | | 1,541,367 | |
| | | | | | | | | | | | | | |
|
|
|
New York — 0.1% | | | | | | | | | | | | | | | | |
New York City Transitional Finance Authority, Revenue Bonds, BABs | | | 5.767% | | | | 08/01/36 | | | | 1,130 | | | | 1,398,013 | |
| | | | | | | | | | | | | | |
|
|
|
Ohio | | | | | | | | | | | | | | | | |
Ohio State University (The), Revenue Bonds, BABs | | | 4.910% | | | | 06/01/40 | | | | 455 | | | | 520,566 | |
Ohio State Water Development Authority, Revenue Bonds, BABs | | | 4.879% | | | | 12/01/34 | | | | 300 | | | | 337,611 | |
| | | | | | | | | | | | | | |
|
|
|
| | | | | | | | | | | | | | | | 858,177 | |
| | | | | | | | | | | | | | |
|
|
|
Oregon | | | | | | | | | | | | | | | | |
Oregon State Department of Transportation Highway, Revenue Bonds, Series A, BABs | | | 5.834% | | | | 11/15/34 | | | | 445 | | | | 560,304 | |
| | | | | | | | | | | | | | |
|
|
|
Pennsylvania | | | | | | | | | | | | | | | | |
Pennsylvania Turnpike Commission, Revenue Bonds, Series B, BABs | | | 5.511% | | | | 12/01/45 | | | | 550 | | | | 660,688 | |
| | | | | | | | | | | | | | |
|
|
|
Tennessee | | | | | | | | | | | | | | | | |
Metropolitan Government of Nashville & Davidson County Convention Center Authority, Revenue Bonds, BABs | | | 6.731% | | | | 07/01/43 | | | | 1,000 | | | | 1,293,290 | |
| | | | | | | | | | | | | | |
|
|
|
Washington | | | | | | | | | | | | | | | | |
Central Puget Sound Regional Transit Authority | | | 5.000% | | | | 11/01/46 | | | | 950 | | | | 1,206,291 | |
| | | | | | | | | | | | | | |
|
|
|
TOTAL MUNICIPAL BONDS
(cost $12,722,447) | | | | 15,892,749 | |
| | | | | | | | | | | | | | |
|
|
|
| NON-CORPORATE FOREIGN AGENCIES — 0.5% | | | | | | | | | | | | | | | | |
Bank Nederlandse Gemeenten NV (Netherlands), Sr. Unsec’d. Notes, 144A | | | 2.625% | | | | 04/28/21 | | | | 2,570 | | | | 2,609,121 | |
CDP Financial, Inc. (Canada), Sr. Unsec’d. Notes, 144A | | | 3.150% | | | | 07/24/24 | | | | 800 | | | | 811,352 | |
Comision Federal de Electricidad (Mexico), Sr. Unsec’d. Notes, 144A | | | 4.875% | | | | 01/15/24 | | | | 645 | | | | 640,969 | |
Export-Import Bank of Korea (South Korea), Sr. Unsec’d. Notes | | | 5.125% | | | | 06/29/20 | | | | 400 | | | | 432,960 | |
Finnvera OYJ (Finland), Gov’t. Gtd. Notes, 144A, MTN | | | 2.375% | | | | 06/04/25 | | | | 400 | | | | 382,736 | |
Gazprom OAO Via Gaz Capital SA (Russia), Sr. Unsec’d. Notes, 144A | | | 4.950% | | | | 07/19/22 | | | | 350 | | | | 360,139 | |
Gazprom OAO Via Gaz Capital SA (Russia), Sr. Unsec’d. Notes, 144A | | | 6.510% | | | | 03/07/22 | | | | 580 | | | | 639,810 | |
Japan Bank for International Cooperation (Japan), Gov’t. Gtd. Notes | | | 1.500% | | | | 07/21/21 | | | | 600 | | | | 575,267 | |
Japan Finance Organization for Municipalities (Japan), Sr. Unsec’d. Notes, 144A, MTN | | | 2.125% | | | | 04/13/21 | | | | 800 | | | | 782,486 | |
Japan Finance Organization for Municipalities (Japan), Sr. Unsec’d. Notes, 144A, MTN | | | 2.125% | | | | 10/25/23 | | | | 1,400 | | | | 1,331,798 | |
Kommunalbanken AS (Norway), Sr. Unsec’d. Notes, 144A | | | 1.125% | | | | 05/23/18 | | | | 3,158 | | | | 3,145,551 | |
Petroleos Mexicanos (Mexico), Gtd. Notes | | | 8.625% | (b) | | | 12/01/23 | | | | 350 | | | | 379,750 | |
Petroleos Mexicanos (Mexico), Gtd. Notes | | | 5.500% | | | | 01/21/21 | | | | 1,110 | | | | 1,141,912 | |
Russian Agricultural Bank OJSC via RSHB Capital SA (Russia), Sr. Unsec’d. Notes, 144A | | | 6.299% | | | | 05/15/17 | | | | 1,030 | | | | 1,042,376 | |
Sinopec Group Overseas Development 2014 Ltd. (China), Gtd. Notes, 144A | | | 1.750% | | | | 04/10/17 | | | | 1,620 | | | | 1,619,469 | |
Sinopec Group Overseas Development 2015 Ltd. (China), Gtd. Notes, 144A | | | 2.500% | | | | 04/28/20 | | | | 1,250 | | | | 1,241,714 | |
State Grid Overseas Investment 2014 Ltd. (China), Gtd. Notes, 144A | | | 2.750% | | | | 05/07/19 | | | | 665 | | | | 673,667 | |
Svensk Exportkredit AB (Sweden), Sr. Unsec’d. Notes, GMTN | | | 1.750% | | | | 03/10/21 | | | | 3,100 | | | | 3,042,238 | |
| | | | | | | | | | | | | | |
|
|
|
TOTAL NON-CORPORATE FOREIGN AGENCIES
(cost $21,063,796) | | | | 20,853,315 | |
| | | | | | | | | | | | | | |
|
|
|
| RESIDENTIAL MORTGAGE-BACKED SECURITIES — 1.7% | | | | | | | | | | | | | | | | |
Alternative Loan Trust, Series 2004-18CB, Class 3A1 | | | 5.250% | | | | 09/25/19 | | | | 129 | | | | 129,050 | |
Banc of America Alternative Loan Trust, Series 2005-12, Class 3CB1 | | | 6.000% | | | | 01/25/36 | | | | 1,231 | | | | 1,046,413 | |
Banc of America Funding Trust, Series 2015-R4, Class 4A1, 144A | | | 3.500% | (b) | | | 07/26/36 | | | | 1,755 | | | | 1,755,711 | |
Bank of America Mortgage Trust, Series 2005-A, Class 2A1 | | | 2.961% | (b) | | | 02/25/35 | | | | 638 | | | | 636,412 | |
Bank of America Mortgage Trust, Series 2005-B, Class 2A1 | | | 3.063% | (b) | | | 03/25/35 | | | | 221 | | | | 199,507 | |
Bayview Opportunity Master Fund Trust, Series 2016-CRT1, Class M1, 144A | | | 2.511% | (b) | | | 10/27/27 | | | | 697 | | | | 695,887 | |
SEE NOTES TO FINANCIAL STATEMENTS.
A90
| | | | | | |
| | | FLEXIBLE MANAGED PORTFOLIO (continued) | | |
| |
| SCHEDULE OF INVESTMENTS | | as of December 31, 2016 |
| | | | | | | | | | | | | | |
RESIDENTIAL MORTGAGE-BACKED SECURITIES (continued) | | Interest
Rate
| | | Maturity
Date
| | Principal
Amount
(000)#
| | | Value
(Note 2)
| |
Chase Mortgage Finance Trust, Series 2007-A1, Class 1A5 | | | 3.167% | (b) | | 02/25/37 | | | 518 | | | $ | 496,551 | |
Credit Suisse Mortgage Trust, Series 2016-12R, Class 1A1, 144A(d) | | | 3.239% | | | 02/28/47 | | | 3,820 | | | | 3,820,000 | |
Fannie Mae Connecticut Avenue Securities, Series 2014-CO4, Class 1M1(h) | | | 2.706% | (b) | | 11/25/24 | | | 779 | | | | 780,527 | |
Fannie Mae Connecticut Avenue Securities, Series 2015-C02, Class 1M1(h) | | | 1.906% | (b) | | 05/25/25 | | | 302 | | | | 302,214 | |
Fannie Mae Connecticut Avenue Securities, Series 2016-C02, Class 1M1(h) | | | 2.906% | (b) | | 09/25/28 | | | 1,402 | | | | 1,416,305 | |
Fannie Mae Connecticut Avenue Securities, Series 2016-C03, Class 2M1(h) | | | 2.956% | (b) | | 10/25/28 | | | 1,854 | | | | 1,873,174 | |
Fannie Mae Connecticut Avenue Securities, Series 2016-C04, Class 1M1(h) | | | 2.206% | (b) | | 01/25/29 | | | 1,718 | | | | 1,728,904 | |
Freddie Mac Structured Agency Credit Risk Debt Notes, Series 2015-DNA1, Class M1(h) | | | 1.656% | (b) | | 10/25/27 | | | 5,241 | | | | 5,244,556 | |
Freddie Mac Structured Agency Credit Risk Debt Notes, Series 2015-DNA3, Class M1(h) | | | 2.106% | (b) | | 04/25/28 | | | 382 | | | | 381,990 | |
Freddie Mac Structured Agency Credit Risk Debt Notes, Series 2016-DNA1, Class M1(h) | | | 2.206% | (b) | | 07/25/28 | | | 2,589 | | | | 2,598,463 | |
Freddie Mac Structured Agency Credit Risk Debt Notes, Series 2016-DNA3, Class M2(h) | | | 2.756% | (b) | | 12/25/28 | | | 1,725 | | | | 1,741,057 | |
Freddie Mac Structured Agency Credit Risk Debt Notes, Series 2016-DNA4 M2(h) | | | 2.056% | (b) | | 03/25/29 | | | 1,430 | | | | 1,427,281 | |
Freddie Mac Structured Agency Credit Risk Debt Notes, Series 2016-HQA2, Class M2(h) | | | 3.006% | (b) | | 11/25/28 | | | 1,600 | | | | 1,632,860 | |
Freddie Mac Structured Agency Credit Risk Debt Notes, Series 2016-HQA4, Class M2(h) | | | 2.056% | (b) | | 04/25/29 | | | 2,050 | | | | 2,035,255 | |
JPMorgan Mortgage Trust, Series 2007-A1, Class 4A1 | | | 3.182% | (b) | | 07/25/35 | | | 279 | | | | 278,611 | |
LSTAR Securities Investment Trust, Series 2015-3, Class A, 144A | | | 2.617% | (b) | | 03/01/20 | | | 2,695 | | | | 2,691,795 | |
LSTAR Securities Investment Trust, Series 2015-4, Class A1, 144A(d) | | | 2.617% | (b) | | 04/01/20 | | | 619 | | | | 618,102 | |
LSTAR Securities Investment Trust, Series 2015-6, Class A, 144A(d) | | | 2.771% | (b) | | 05/01/20 | | | 4,876 | | | | 4,808,629 | |
LSTAR Securities Investment Trust, Series 2015-7, Class A, 144A(d) | | | 2.771% | (b) | | 07/01/20 | | | 1,557 | | | | 1,547,018 | |
LSTAR Securities Investment Trust, Series 2015-8, Class A1, 144A | | | 2.771% | (b) | | 08/01/20 | | | 1,577 | | | | 1,574,912 | |
LSTAR Securities Investment Trust, Series 2015-9, Class A1, 144A(d) | | | 2.771% | (b) | | 10/01/20 | | | 1,748 | | | | 1,741,287 | |
LSTAR Securities Investment Trust, Series 2015-10, Class A1, 144A(d) | | | 2.771% | (b) | | 11/01/20 | | | 584 | | | | 579,580 | |
LSTAR Securities Investment Trust, Series 2016-1, Class A1, 144A | | | 2.771% | (b) | | 01/01/21 | | | 2,375 | | | | 2,334,163 | |
LSTAR Securities Investment Ltd., Series 2016-3, Class A, 144A(d) | | | 2.771% | (b) | | 09/01/21 | | | 2,321 | | | | 2,292,335 | |
LSTAR Securities Investment Ltd. (Cayman Islands), Series 2016-6, Class A, 144A | | | 2.630% | (b) | | 11/01/21 | | | 1,687 | | | | 1,663,009 | |
MASTR Alternative Loan Trust, Series 2004-4, Class 4A1 | | | 5.000% | | | 04/25/19 | | | 32 | | | | 32,464 | |
Mortgage Repurchase Agreement Financing Trust 2016-3, 3, Class A1, 144A(d) | | | 1.664% | (b) | | 11/10/18 | | | 2,390 | | | | 2,390,000 | |
Mortgage Repurchase Agreement Financing Trust 2016-4, 4, Class A1, 144A(d) | | | 1.737% | (b) | | 05/10/19 | | | 9,990 | | | | 9,968,292 | |
Mortgage Repurchase Agreement Financing Trust 2016-5, 5, Class A, 144A(d) | | | 1.872% | (b) | | 06/10/19 | | | 1,700 | | | | 1,700,000 | |
Structured Adjustable Rate Mortgage Loan Trust, Series 2004-1, Class 4A3 | | | 3.093% | (b) | | 02/25/34 | | | 261 | | | | 261,139 | |
Washington Mutual Mortgage Pass-Through Certificates, Series 2005-1, Class 3A | | | 5.000% | | | 03/25/20 | | | 58 | | | | 58,093 | |
| | | | | | | | | | | | |
|
|
|
TOTAL RESIDENTIAL MORTGAGE-BACKED SECURITIES
(cost $64,486,569) | | | | 64,481,546 | |
| | | | | | | | | | | | |
|
|
|
| SOVEREIGN BONDS — 0.5% | | | | | | | | | | | | | | |
Belgium Government International Bond (Belgium), Sr. Unsec’d. Notes, 144A, RegS, EMTN | | | 1.125% | | | 08/03/19 | | | 1,600 | | | | 1,575,021 | |
Colombia Government International Bond (Colombia), Sr. Unsec’d. Notes | | | 4.000% | | | 02/26/24 | | | 175 | | | | 176,750 | |
Colombia Government International Bond (Colombia), Sr. Unsec’d. Notes | | | 4.375% | | | 07/12/21 | | | 500 | | | | 523,750 | |
Hungary Government International Bond (Hungary), Sr. Unsec’d. Notes | | | 4.000% | | | 03/25/19 | | | 580 | | | | 600,300 | |
SEE NOTES TO FINANCIAL STATEMENTS.
A91
| | | | | | |
| | | FLEXIBLE MANAGED PORTFOLIO (continued) | | |
| |
| SCHEDULE OF INVESTMENTS | | as of December 31, 2016 |
| | | | | | | | | | | | | | |
SOVEREIGN BONDS (continued) | | Interest
Rate
| | | Maturity
Date
| | Principal
Amount
(000)#
| | | Value
(Note 2)
| |
Hungary Government International Bond (Hungary), Sr. Unsec’d. Notes | | | 6.375% | | | 03/29/21 | | | 2,280 | | | $ | 2,553,053 | |
Hungary Government International Bond (Hungary), Sr. Unsec’d. Notes | | | 7.625% | | | 03/29/41 | | | 880 | | | | 1,229,580 | |
Indonesia Government International Bond (Indonesia), Sr. Unsec’d. Notes, | | | 4.875% | | | 05/05/21 | | | 1,120 | | | | 1,185,644 | |
Indonesia Government International Bond (Indonesia), Sr. Unsec’d. Notes, 144A | | | 5.875% | | | 03/13/20 | | | 1,135 | | | | 1,238,731 | |
Indonesia Government International Bond (Indonesia), Sr. Unsec’d. Notes, 144A, MTN | | | 5.875% | | | 01/15/24 | | | 950 | | | | 1,048,139 | |
Indonesia Government International Bond (Indonesia), Series 20470108, Sr. Unsec’d. Notes, 144A | | | 5.250% | | | 01/08/47 | | | 570 | | | | 568,360 | |
Mexico Government International Bond (Mexico), Sr. Unsec’d. Notes | | | 4.000% | | | 10/02/23 | | | 566 | | | | 567,358 | |
Mexico Government International Bond (Mexico), Sr. Unsec’d. Notes, MTN | | | 4.750% | | | 03/08/44 | | | 1,006 | | | | 914,756 | |
Panama Government International Bond (Panama), Sr. Unsec’d. Notes | | | 3.750% | | | 03/16/25 | | | 600 | | | | 595,500 | |
Panama Government International Bond (Panama), Sr. Unsec’d. Notes | | | 4.000% | | | 09/22/24 | | | 515 | | | | 524,012 | |
Panama Government International Bond (Panama), Sr. Unsec’d. Notes | | | 5.200% | | | 01/30/20 | | | 620 | | | | 665,880 | |
Province Of Alberta Canada (Canada), Sr. Unsec’d. Notes | | | 1.900% | | | 12/06/19 | | | 1,000 | | | | 1,001,531 | |
Province of Manitoba (Canada), Sr. Unsec’d. Notes | | | 2.125% | | | 06/22/26 | | | 200 | | | | 186,570 | |
Republic Of Indonesia | | | 4.750% | | | 01/08/26 | | | 700 | | | | 722,599 | |
Romanian Government International Bond (Romania), Sr. Unsec’d. Notes, RegS, EMTN | | | 6.125% | | | 01/22/44 | | | 400 | | | | 466,900 | |
Saudi Government International Bond (Saudi Arabia), Sr. Unsec’d. Notes, 144A, MTN | | | 2.375% | | | 10/26/21 | | | 1,325 | | | | 1,286,490 | |
Turkey Government International Bond (Turkey), Sr. Unsec’d. Notes | | | 7.000% | | | 06/05/20 | | | 1,710 | | | | 1,836,065 | |
| | | | | | | | | | | | |
|
|
|
TOTAL SOVEREIGN BONDS
(cost $19,564,944) | | | | 19,466,989 | |
| | | | | | | | | | | | |
|
|
|
| U.S. GOVERNMENT AGENCY OBLIGATIONS — 8.7% | | | | | | | | | | | | | | |
Federal Home Loan Banks(i) | | | 5.500% | | | 07/15/36 | | | 1,080 | | | | 1,416,672 | |
Federal Home Loan Mortgage Corp. | | | 3.000% | | | TBA | | | 1,000 | | | | 1,026,099 | |
Federal Home Loan Mortgage Corp. | | | 3.000% | | | 06/01/45 | | | 1,352 | | | | 1,347,410 | |
Federal Home Loan Mortgage Corp. | | | 3.000% | | | 06/01/45 | | | 5,524 | | | | 5,496,087 | |
Federal Home Loan Mortgage Corp. | | | 4.000% | | | 10/01/41 | | | 799 | | | | 839,389 | |
Federal Home Loan Mortgage Corp. | | | 4.000% | | | 01/01/42 | | | 251 | | | | 263,910 | |
Federal Home Loan Mortgage Corp. | | | 3.000% | | | 07/01/43 | | | 2,847 | | | | 2,841,618 | |
Federal Home Loan Mortgage Corp. | | | 2.500% | | | 01/20/30 | | | 7,500 | | | | 7,513,477 | |
Federal Home Loan Mortgage Corp. | | | 2.500% | | | 03/01/30 | | | 804 | | | | 806,911 | |
Federal Home Loan Mortgage Corp. | | | 2.665% | (b) | | 12/01/35 | | | 275 | | | | 290,003 | |
Federal Home Loan Mortgage Corp. | | | 2.875% | (b) | | 06/01/36 | | | 418 | | | | 441,733 | |
Federal Home Loan Mortgage Corp. | | | 3.000% | | | 10/01/28 | | | 700 | | | | 719,846 | |
Federal Home Loan Mortgage Corp. | | | 3.000% | | | 06/01/29 | | | 1,664 | | | | 1,711,071 | |
Federal Home Loan Mortgage Corp. | | | 3.000% | | | 01/01/43 | | | 1,451 | | | | 1,450,000 | |
Federal Home Loan Mortgage Corp. | | | 3.500% | | | 12/01/25 | | | 686 | | | | 719,624 | |
Federal Home Loan Mortgage Corp. | | | 3.500% | | | 08/01/26 | | | 1,247 | | | | 1,308,358 | |
Federal Home Loan Mortgage Corp. | | | 3.500% | | | 06/01/42 | | | 530 | | | | 545,465 | |
Federal Home Loan Mortgage Corp. | | | 3.500% | | | TBA | | | 21,000 | | | | 21,502,801 | |
Federal Home Loan Mortgage Corp. | | | 4.000% | | | 06/01/26 | | | 1,077 | | | | 1,133,545 | |
Federal Home Loan Mortgage Corp. | | | 4.000% | | | 09/01/26 | | | 574 | | | | 603,536 | |
Federal Home Loan Mortgage Corp. | | | 4.000% | | | 10/01/39 | | | 1,192 | | | | 1,258,045 | |
Federal Home Loan Mortgage Corp. | | | 4.000% | | | 12/01/40 | | | 626 | | | | 661,004 | |
Federal Home Loan Mortgage Corp. | | | 4.000% | | | TBA | | | 11,000 | | | | 11,553,652 | |
Federal Home Loan Mortgage Corp. | | | 4.000% | | | 10/01/45 | | | 1,633 | | | | 1,715,533 | |
Federal Home Loan Mortgage Corp. | | | 4.500% | | | 02/01/19 | | | 4 | | | | 4,502 | |
Federal Home Loan Mortgage Corp. | | | 4.500% | | | 07/01/19 | | | 158 | | | | 162,478 | |
Federal Home Loan Mortgage Corp. | | | 4.500% | | | 07/01/20 | | | 95 | | | | 98,252 | |
Federal Home Loan Mortgage Corp. | | | 4.500% | | | 09/01/39 | | | 488 | | | | 526,602 | |
Federal Home Loan Mortgage Corp. | | | 4.500% | | | 10/01/39 | | | 2,830 | | | | 3,046,440 | |
Federal Home Loan Mortgage Corp. | | | 4.500% | | | 12/01/39 | | | 880 | | | | 947,035 | |
Federal Home Loan Mortgage Corp. | | | 4.500% | | | 07/01/41 | | | 341 | | | | 367,922 | |
Federal Home Loan Mortgage Corp. | | | 4.500% | | | 07/01/41 | | | 2,567 | | | | 2,771,858 | |
Federal Home Loan Mortgage Corp. | | | 4.500% | | | 08/01/41 | | | 844 | | | | 906,455 | |
SEE NOTES TO FINANCIAL STATEMENTS.
A92
| | | | | | |
| | | FLEXIBLE MANAGED PORTFOLIO (continued) | | |
| |
| SCHEDULE OF INVESTMENTS | | as of December 31, 2016 |
| | | | | | | | | | | | | | |
U.S. GOVERNMENT AGENCY OBLIGATIONS (continued) | | Interest
Rate
| | | Maturity
Date
| | Principal
Amount
(000)#
| | | Value
(Note 2)
| |
Federal Home Loan Mortgage Corp. | | | 4.500% | | | 08/01/41 | | | 255 | | | $ | 274,208 | |
Federal Home Loan Mortgage Corp. | | | 4.500% | | | 08/01/41 | | | 184 | | | | 197,308 | |
Federal Home Loan Mortgage Corp. | | | 4.500% | | | 10/01/41 | | | 674 | | | | 727,706 | |
Federal Home Loan Mortgage Corp. | | | 5.000% | | | 07/01/18 | | | 82 | | | | 83,570 | |
Federal Home Loan Mortgage Corp. | | | 5.000% | | | 12/01/18 | | | 44 | | | | 44,815 | |
Federal Home Loan Mortgage Corp. | | | 5.000% | | | 07/01/19 | | | 66 | | | | 68,307 | |
Federal Home Loan Mortgage Corp. | | | 5.000% | | | 07/01/19 | | | 130 | | | | 134,041 | |
Federal Home Loan Mortgage Corp. | | | 5.000% | | | 12/01/19 | | | 24 | | | | 24,884 | |
Federal Home Loan Mortgage Corp. | | | 5.000% | | | 05/01/34 | | | 40 | | | | 44,340 | |
Federal Home Loan Mortgage Corp. | | | 5.000% | | | 05/01/34 | | | 401 | | | | 439,124 | |
Federal Home Loan Mortgage Corp. | | | 5.000% | | | 08/01/35 | | | 44 | | | | 47,822 | |
Federal Home Loan Mortgage Corp. | | | 5.000% | | | 09/01/35 | | | 63 | | | | 68,603 | |
Federal Home Loan Mortgage Corp. | | | 5.000% | | | 10/01/36 | | | 65 | | | | 70,569 | |
Federal Home Loan Mortgage Corp. | | | 5.000% | | | 05/01/37 | | | 43 | | | | 47,277 | |
Federal Home Loan Mortgage Corp. | | | 5.000% | | | 07/01/37 | | | 871 | | | | 951,816 | |
Federal Home Loan Mortgage Corp. | | | 5.000% | | | 09/01/38 | | | 120 | | | | 130,602 | |
Federal Home Loan Mortgage Corp. | | | 5.000% | | | 09/01/38 | | | 101 | | | | 109,572 | |
Federal Home Loan Mortgage Corp. | | | 5.000% | | | 09/01/38 | | | 105 | | | | 114,234 | |
Federal Home Loan Mortgage Corp. | | | 5.000% | | | 02/01/39 | | | 41 | | | | 44,722 | |
Federal Home Loan Mortgage Corp. | | | 5.000% | | | 06/01/39 | | | 108 | | | | 117,532 | |
Federal Home Loan Mortgage Corp. | | | 5.500% | | | 02/01/34 | | | 38 | | | | 42,405 | |
Federal Home Loan Mortgage Corp. | | | 5.500% | | | 04/01/34 | | | 347 | | | | 385,876 | |
Federal Home Loan Mortgage Corp. | | | 5.500% | | | 06/01/34 | | | 218 | | | | 245,022 | |
Federal Home Loan Mortgage Corp. | | | 5.500% | | | 06/01/34 | | | 236 | | | | 265,609 | |
Federal Home Loan Mortgage Corp. | | | 5.500% | | | 05/01/37 | | | 97 | | | | 107,987 | |
Federal Home Loan Mortgage Corp. | | | 5.500% | | | 02/01/38 | | | 783 | | | | 873,204 | |
Federal Home Loan Mortgage Corp. | | | 5.500% | | | 05/01/38 | | | 137 | | | | 153,105 | |
Federal Home Loan Mortgage Corp. | | | 5.500% | | | 07/01/38 | | | 670 | | | | 744,961 | |
Federal Home Loan Mortgage Corp. | | | 6.000% | | | 03/01/32 | | | 336 | | | | 386,900 | |
Federal Home Loan Mortgage Corp. | | | 6.000% | | | 12/01/33 | | | 110 | | | | 123,832 | |
Federal Home Loan Mortgage Corp. | | | 6.000% | | | 07/01/36 | | | 7 | | | | 7,613 | |
Federal Home Loan Mortgage Corp. | | | 6.000% | | | 12/01/36 | | | 16 | | | | 18,345 | |
Federal Home Loan Mortgage Corp. | | | 6.000% | | | 05/01/37 | | | 25 | | | | 28,585 | |
Federal Home Loan Mortgage Corp. | | | 6.000% | | | 12/01/37 | | | 66 | | | | 74,607 | |
Federal Home Loan Mortgage Corp. | | | 6.000% | | | 01/01/38 | | | 15 | | | | 17,254 | |
Federal Home Loan Mortgage Corp. | | | 6.000% | | | 01/01/38 | | | 533 | | | | 603,506 | |
Federal Home Loan Mortgage Corp. | | | 6.000% | | | 01/01/38 | | | 27 | | | | 30,987 | |
Federal Home Loan Mortgage Corp. | | | 6.000% | | | 10/01/38 | | | 115 | | | | 131,823 | |
Federal Home Loan Mortgage Corp. | | | 6.000% | | | 08/01/39 | | | 78 | | | | 89,313 | |
Federal Home Loan Mortgage Corp. | | | 6.750% | | | 03/15/31 | | | 700 | | | | 986,572 | |
Federal Home Loan Mortgage Corp. | | | 7.000% | | | 01/01/31 | | | 37 | | | | 41,816 | |
Federal Home Loan Mortgage Corp. | | | 7.000% | | | 06/01/31 | | | 34 | | | | 38,128 | |
Federal Home Loan Mortgage Corp. | | | 7.000% | | | 09/01/31 | | | 5 | | | | 6,261 | |
Federal Home Loan Mortgage Corp. | | | 7.000% | | | 10/01/31 | | | 70 | | | | 78,346 | |
Federal Home Loan Mortgage Corp. | | | 7.000% | | | 10/01/32 | | | 34 | | | | 35,911 | |
Federal National Mortgage Assoc. | | | 2.000% | | | 08/01/31 | | | 1,966 | | | | 1,916,397 | |
Federal National Mortgage Assoc. | | | 3.000% | | | 08/01/30 | | | 1,721 | | | | 1,767,998 | |
Federal National Mortgage Assoc. | | | 3.000% | | | 02/01/31 | | | 5,125 | | | | 5,264,163 | |
Federal National Mortgage Assoc. | | | 3.000% | | | 05/01/31 | | | 3,379 | | | | 3,470,895 | |
Federal National Mortgage Assoc. | | | 3.000% | | | 04/01/43 | | | 9,600 | | | | 9,597,488 | |
Federal National Mortgage Assoc. | | | 3.000% | | | 07/01/43 | | | 4,452 | | | | 4,450,804 | |
Federal National Mortgage Assoc. | | | 3.500% | | | 04/01/43 | | | 860 | | | | 886,798 | |
Federal National Mortgage Assoc. | | | 3.500% | | | 04/01/43 | | | 2,173 | | | | 2,238,972 | |
Federal National Mortgage Assoc. | | | 1.875% | | | 09/24/26 | | | 300 | | | | 275,618 | |
Federal National Mortgage Assoc. | | | 2.432% | (b) | | 07/01/33 | | | 258 | | | | 270,438 | |
Federal National Mortgage Assoc. | | | 2.500% | | | 01/01/28 | | | 1,846 | | | | 1,851,199 | |
Federal National Mortgage Assoc. | | | 2.500% | | | 10/01/43 | | | 1,313 | | | | 1,256,027 | |
Federal National Mortgage Assoc. | | | 2.500% | | | TBA | | | 2,500 | | | | 2,378,376 | |
Federal National Mortgage Assoc. | | | 2.560% | (b) | | 06/01/37 | | | 138 | | | | 138,399 | |
SEE NOTES TO FINANCIAL STATEMENTS.
A93
| | | | | | |
| | | FLEXIBLE MANAGED PORTFOLIO (continued) | | |
| |
| SCHEDULE OF INVESTMENTS | | as of December 31, 2016 |
| | | | | | | | | | | | | | |
U.S. GOVERNMENT AGENCY OBLIGATIONS (continued) | | Interest
Rate
| | | Maturity
Date
| | Principal
Amount
(000)#
| | | Value
(Note 2)
| |
Federal National Mortgage Assoc. | | | 3.000% | | | 02/01/27 | | | 3,133 | | | $ | 3,222,836 | |
Federal National Mortgage Assoc. | | | 3.000% | | | 11/01/36 | | | 3,970 | | | | 4,021,632 | |
Federal National Mortgage Assoc. | | | 3.000% | | | 12/01/42 | | | 1,757 | | | | 1,756,411 | |
Federal National Mortgage Assoc. | | | 3.000% | | | 12/01/42 | | | 2,948 | | | | 2,947,240 | |
Federal National Mortgage Assoc. | | | 3.000% | | | 08/01/43 | | | 5,744 | | | | 5,742,111 | |
Federal National Mortgage Assoc. | | | 3.500% | | | 07/01/27 | | | 2,379 | | | | 2,483,983 | |
Federal National Mortgage Assoc. | | | 3.500% | | | 06/01/39 | | | 989 | | | | 1,015,589 | |
Federal National Mortgage Assoc. | | | 3.500% | | | 01/01/42 | | | 9,482 | | | | 9,778,385 | |
Federal National Mortgage Assoc. | | | 3.500% | | | 05/01/42 | | | 4,699 | | | | 4,846,797 | |
Federal National Mortgage Assoc. | | | 3.500% | | | 06/01/42 | | | 1,329 | | | | 1,370,954 | |
Federal National Mortgage Assoc. | | | 3.500% | | | 07/01/42 | | | 1,229 | | | | 1,267,377 | |
Federal National Mortgage Assoc. | | | 3.500% | | | 08/01/42 | | | 1,489 | | | | 1,535,690 | |
Federal National Mortgage Assoc. | | | 3.500% | | | 08/01/42 | | | 485 | | | | 499,936 | |
Federal National Mortgage Assoc. | | | 3.500% | | | 09/01/42 | | | 1,230 | | | | 1,267,489 | |
Federal National Mortgage Assoc. | | | 3.500% | | | 09/01/42 | | | 2,281 | | | | 2,351,774 | |
Federal National Mortgage Assoc. | | | 3.500% | | | 11/01/42 | | | 903 | | | | 931,229 | |
Federal National Mortgage Assoc. | | | 3.500% | | | 03/01/43 | | | 4,816 | | | | 4,964,783 | |
Federal National Mortgage Assoc. | | | 3.500% | | | 07/01/43 | | | 423 | | | | 436,528 | |
Federal National Mortgage Assoc. | | | 4.000% | | | TBA | | | 34,500 | | | | 36,270,147 | |
Federal National Mortgage Assoc. | | | 4.000% | | | 10/01/41 | | | 4,410 | | | | 4,657,232 | |
Federal National Mortgage Assoc. | | | 4.000% | | | 09/01/44 | | | 4,909 | | | | 5,162,203 | |
Federal National Mortgage Assoc. | | | 4.500% | | | 11/01/18 | | | 88 | | | | 90,025 | |
Federal National Mortgage Assoc. | | | 4.500% | | | 01/01/19 | | | 105 | | | | 108,229 | |
Federal National Mortgage Assoc. | | | 4.500% | | | 01/01/19 | | | 31 | | | | 32,195 | |
Federal National Mortgage Assoc. | | | 4.500% | | | 02/01/19 | | | 63 | | | | 64,956 | |
Federal National Mortgage Assoc. | | | 4.500% | | | 05/01/19 | | | 51 | | | | 52,724 | |
Federal National Mortgage Assoc. | | | 4.500% | | | 07/01/33 | | | 90 | | | | 97,126 | |
Federal National Mortgage Assoc. | | | 4.500% | | | 08/01/33 | | | 25 | | | | 27,318 | |
Federal National Mortgage Assoc. | | | 4.500% | | | 09/01/33 | | | 76 | | | | 81,688 | |
Federal National Mortgage Assoc. | | | 4.500% | | | 10/01/33 | | | 215 | | | | 232,321 | |
Federal National Mortgage Assoc. | | | 4.500% | | | 03/01/34 | | | 61 | | | | 65,686 | |
Federal National Mortgage Assoc. | | | 4.500% | | | 01/01/35 | | | 4 | | | | 4,397 | |
Federal National Mortgage Assoc. | | | 4.500% | | | TBA | | | 5,500 | | | | 5,915,722 | |
Federal National Mortgage Assoc. | | | 4.500% | | | 07/01/39 | | | 1,379 | | | | 1,492,488 | |
Federal National Mortgage Assoc. | | | 4.500% | | | 08/01/39 | | | 1,096 | | | | 1,188,584 | |
Federal National Mortgage Assoc. | | | 4.500% | | | 09/01/39 | | | 827 | | | | 890,735 | |
Federal National Mortgage Assoc. | | | 4.500% | | | 12/01/39 | | | 9 | | | | 9,487 | |
Federal National Mortgage Assoc. | | | 4.500% | | | 03/01/41 | | | 2,664 | | | | 2,885,995 | |
Federal National Mortgage Assoc. | | | 4.500% | | | 07/01/42 | | | 228 | | | | 246,011 | |
Federal National Mortgage Assoc. | | | 5.000% | | | 10/01/18 | | | 31 | | | | 31,904 | |
Federal National Mortgage Assoc. | | | 5.000% | | | 01/01/19 | | | 72 | | | | 74,068 | |
Federal National Mortgage Assoc. | | | 5.000% | | | 03/01/34 | | | 411 | | | | 448,189 | |
Federal National Mortgage Assoc. | | | 5.000% | | | 01/01/35 | | | 7,000 | | | | 7,625,625 | |
Federal National Mortgage Assoc. | | | 5.000% | | | 04/01/35 | | | 986 | | | | 1,082,325 | |
Federal National Mortgage Assoc. | | | 5.000% | | | 06/01/35 | | | 244 | | | | 267,744 | |
Federal National Mortgage Assoc. | | | 5.000% | | | 07/01/35 | | | 256 | | | | 279,558 | |
Federal National Mortgage Assoc. | | | 5.000% | | | 07/01/35 | | | 176 | | | | 191,940 | |
Federal National Mortgage Assoc. | | | 5.000% | | | 09/01/35 | | | 154 | | | | 169,513 | |
Federal National Mortgage Assoc. | | | 5.000% | | | 11/01/35 | | | 151 | | | | 165,826 | |
Federal National Mortgage Assoc. | | | 5.000% | | | 02/01/36 | | | 141 | | | | 154,421 | |
Federal National Mortgage Assoc. | | | 5.500% | | | 12/01/17 | | | 22 | | | | 22,287 | |
Federal National Mortgage Assoc. | | | 5.500% | | | 02/01/18 | | | 11 | | | | 11,597 | |
Federal National Mortgage Assoc. | | | 5.500% | | | 05/01/20 | | | 49 | | | | 50,922 | |
Federal National Mortgage Assoc. | | | 5.500% | | | 01/01/21 | | | 169 | | | | 178,334 | |
Federal National Mortgage Assoc. | | | 5.500% | | | 02/01/33 | | | 278 | | | | 311,180 | |
Federal National Mortgage Assoc. | | | 5.500% | | | 08/01/33 | | | 312 | | | | 354,169 | |
Federal National Mortgage Assoc. | | | 5.500% | | | 10/01/33 | | | 80 | | | | 89,473 | |
Federal National Mortgage Assoc. | | | 5.500% | | | 12/01/33 | | | 84 | | | | 94,689 | |
Federal National Mortgage Assoc. | | | 5.500% | | | 12/01/34 | | | 271 | | | | 304,189 | |
SEE NOTES TO FINANCIAL STATEMENTS.
A94
| | | | | | |
| | | FLEXIBLE MANAGED PORTFOLIO (continued) | | |
| |
| SCHEDULE OF INVESTMENTS | | as of December 31, 2016 |
| | | | | | | | | | | | | | |
U.S. GOVERNMENT AGENCY OBLIGATIONS (continued) | | Interest
Rate
| | | Maturity
Date
| | Principal
Amount
(000)#
| | | Value
(Note 2)
| |
Federal National Mortgage Assoc. | | | 5.500% | | | 10/01/35 | | | 1,138 | | | $ | 1,276,134 | |
Federal National Mortgage Assoc. | | | 5.500% | | | 03/01/36 | | | 161 | | | | 178,357 | |
Federal National Mortgage Assoc. | | | 5.500% | | | 04/01/36 | | | 196 | | | | 219,871 | |
Federal National Mortgage Assoc. | | | 5.500% | | | 01/01/37 | | | 122 | | | | 136,086 | |
Federal National Mortgage Assoc. | | | 5.500% | | | 04/01/37 | | | 69 | | | | 77,328 | |
Federal National Mortgage Assoc. | | | 5.500% | | | 05/01/37 | | | 407 | | | | 457,719 | |
Federal National Mortgage Assoc. | | | 5.500% | | | 08/01/37 | | | 485 | | | | 544,598 | |
Federal National Mortgage Assoc. | | | 6.000% | | | 09/01/17 | | | 3 | | | | 2,570 | |
Federal National Mortgage Assoc. | | | 6.000% | | | 05/01/21 | | | 145 | | | | 155,272 | |
Federal National Mortgage Assoc. | | | 6.000% | | | 10/01/33 | | | 472 | | | | 547,707 | |
Federal National Mortgage Assoc. | | | 6.000% | | | 11/01/33 | | | 48 | | | | 54,758 | |
Federal National Mortgage Assoc. | | | 6.000% | | | 11/01/33 | | | 51 | | | | 58,530 | |
Federal National Mortgage Assoc. | | | 6.000% | | | 12/01/33 | | | 21 | | | | 23,865 | |
Federal National Mortgage Assoc. | | | 6.000% | | | 01/01/34 | | | 432 | | | | 493,637 | |
Federal National Mortgage Assoc. | | | 6.000% | | | 02/01/34 | | | 183 | | | | 210,443 | |
Federal National Mortgage Assoc. | | | 6.000% | | | 03/01/34 | | | 4 | | | | 4,041 | |
Federal National Mortgage Assoc. | | | 6.000% | | | 03/01/34 | | | 82 | | | | 94,102 | |
Federal National Mortgage Assoc. | | | 6.000% | | | 03/01/34 | | | 34 | | | | 37,950 | |
Federal National Mortgage Assoc. | | | 6.000% | | | 11/01/34 | | | 88 | | | | 99,411 | |
Federal National Mortgage Assoc. | | | 6.000% | | | 01/01/35 | | | 245 | | | | 281,643 | |
Federal National Mortgage Assoc. | | | 6.000% | | | 01/01/35 | | | 98 | | | | 113,419 | |
Federal National Mortgage Assoc. | | | 6.000% | | | 02/01/35 | | | 5 | | | | 5,497 | |
Federal National Mortgage Assoc. | | | 6.000% | | | 02/01/35 | | | 326 | | | | 376,383 | |
Federal National Mortgage Assoc. | | | 6.000% | | | 02/01/35 | | | 249 | | | | 282,418 | |
Federal National Mortgage Assoc. | | | 6.000% | | | 04/01/35 | | | 31 | | | | 35,461 | |
Federal National Mortgage Assoc. | | | 6.000% | | | 12/01/35 | | | 317 | | | | 359,280 | |
Federal National Mortgage Assoc. | | | 6.000% | | | 05/01/36 | | | 72 | | | | 82,010 | |
Federal National Mortgage Assoc. | | | 6.000% | | | 06/01/36 | | | 37 | | | | 41,732 | |
Federal National Mortgage Assoc. | | | 6.000% | | | 02/01/37 | | | 133 | | | | 151,073 | |
Federal National Mortgage Assoc. | | | 6.000% | | | 06/01/37 | | | 89 | | | | 101,320 | |
Federal National Mortgage Assoc. | | | 6.000% | | | 05/01/38 | | | 366 | | | | 415,162 | |
Federal National Mortgage Assoc.(i)(j) | | | 6.250% | | | 05/15/29 | | | 1,935 | | | | 2,564,864 | |
Federal National Mortgage Assoc. | | | 6.500% | | | 07/01/17 | | | 1 | | | | 1,012 | |
Federal National Mortgage Assoc. | | | 6.500% | | | 09/01/17 | | | 8 | | | | 7,589 | |
Federal National Mortgage Assoc. | | | 6.500% | | | 09/01/32 | | | 61 | | | | 69,139 | |
Federal National Mortgage Assoc. | | | 6.500% | | | 09/01/32 | | | 15 | | | | 17,081 | |
Federal National Mortgage Assoc. | | | 6.500% | | | 09/01/32 | | | 10 | | | | 11,556 | |
Federal National Mortgage Assoc. | | | 6.500% | | | 09/01/32 | | | 52 | | | | 58,582 | |
Federal National Mortgage Assoc. | | | 6.500% | | | 09/01/32 | | | 8 | | | | 8,579 | |
Federal National Mortgage Assoc. | | | 6.500% | | | 10/01/32 | | | 73 | | | | 82,680 | |
Federal National Mortgage Assoc. | | | 6.500% | | | 04/01/33 | | | 106 | | | | 123,415 | |
Federal National Mortgage Assoc. | | | 6.500% | | | 11/01/33 | | | 98 | | | | 111,142 | |
Federal National Mortgage Assoc. | | | 6.500% | | | 01/01/34 | | | 82 | | | | 92,248 | |
Federal National Mortgage Assoc. | | | 6.500% | | | 09/01/34 | | | 81 | | | | 91,895 | |
Federal National Mortgage Assoc. | | | 6.500% | | | 10/01/34 | | | 145 | | | | 163,906 | |
Federal National Mortgage Assoc. | | | 6.500% | | | 09/01/36 | | | 229 | | | | 259,030 | |
Federal National Mortgage Assoc. | | | 6.500% | | | 10/01/36 | | | 78 | | | | 89,451 | |
Federal National Mortgage Assoc. | | | 6.500% | | | 11/01/36 | | | 81 | | | | 91,495 | |
Federal National Mortgage Assoc. | | | 6.500% | | | 01/01/37 | | | 43 | | | | 48,325 | |
Federal National Mortgage Assoc. | | | 6.500% | | | 01/01/37 | | | 121 | | | | 137,158 | |
Federal National Mortgage Assoc. | | | 6.500% | | | 09/01/37 | | | 33 | | | | 37,748 | |
Federal National Mortgage Assoc.(j) | | | 6.625% | | | 11/15/30 | | | 630 | | | | 876,384 | |
Federal National Mortgage Assoc. | | | 7.000% | | | 02/01/32 | | | 41 | | | | 46,667 | |
Federal National Mortgage Assoc. | | | 7.000% | | | 03/01/32 | | | 2 | | | | 2,098 | |
Federal National Mortgage Assoc. | | | 7.000% | | | 05/01/32 | | | 23 | | | | 26,922 | |
Federal National Mortgage Assoc. | | | 7.000% | | | 06/01/32 | | | 18 | | | | 20,417 | |
Federal National Mortgage Assoc. | | | 7.000% | | | 07/01/32 | | | 75 | | | | 84,620 | |
Federal National Mortgage Assoc.(i)(j) | | | 7.125% | | | 01/15/30 | | | 4,210 | | | | 6,007,527 | |
Federal National Mortgage Assoc. | | | 7.500% | | | 05/01/32 | | | 18 | | | | 18,141 | |
SEE NOTES TO FINANCIAL STATEMENTS.
A95
| | | | | | |
| | | FLEXIBLE MANAGED PORTFOLIO (continued) | | |
| |
| SCHEDULE OF INVESTMENTS | | as of December 31, 2016 |
| | | | | | | | | | | | | | |
U.S. GOVERNMENT AGENCY OBLIGATIONS (continued) | | Interest
Rate
| | | Maturity
Date
| | Principal
Amount
(000)#
| | | Value
(Note 2)
| |
Government National Mortgage Assoc. | | | 3.000% | | | TBA | | | 20,500 | | | $ | 20,756,650 | |
Government National Mortgage Assoc. | | | 3.000% | | | 03/15/45 | | | 2,053 | | | | 2,077,714 | |
Government National Mortgage Assoc. | | | 3.500% | | | TBA | | | 13,500 | | | | 14,033,408 | |
Government National Mortgage Assoc. | | | 3.500% | | | 05/20/43 | | | 651 | | | | 679,592 | |
Government National Mortgage Assoc. | | | 3.500% | | | 03/20/45 | | | 3,188 | | | | 3,317,160 | |
Government National Mortgage Assoc. | | | 3.500% | | | 04/20/45 | | | 4,523 | | | | 4,706,374 | |
Government National Mortgage Assoc. | | | 4.000% | | | 06/15/40 | | | 315 | | | | 335,792 | |
Government National Mortgage Assoc. | | | 4.000% | | | TBA | | | 4,000 | | | | 4,247,890 | |
Government National Mortgage Assoc. | | | 4.000% | | | 05/20/41 | | | 541 | | | | 577,901 | |
Government National Mortgage Assoc. | | | 4.500% | | | TBA | | | 2,000 | | | | 2,162,734 | |
Government National Mortgage Assoc. | | | 4.500% | | | 04/15/40 | | | 1,474 | | | | 1,599,383 | |
Government National Mortgage Assoc. | | | 4.500% | | | 01/20/41 | | | 2,344 | | | | 2,528,442 | |
Government National Mortgage Assoc. | | | 4.500% | | | 02/20/41 | | | 1,527 | | | | 1,644,501 | |
Government National Mortgage Assoc. | | | 5.000% | | | 10/20/37 | | | 253 | | | | 279,601 | |
Government National Mortgage Assoc. | | | 5.000% | | | 04/20/45 | | | 1,647 | | | | 1,772,179 | |
Government National Mortgage Assoc. | | | 5.500% | | | 11/15/32 | | | 121 | | | | 137,002 | |
Government National Mortgage Assoc. | | | 5.500% | | | 02/15/33 | | | 104 | | | | 117,208 | |
Government National Mortgage Assoc. | | | 5.500% | | | 08/15/33 | | | 181 | | | | 201,729 | |
Government National Mortgage Assoc. | | | 5.500% | | | 08/15/33 | | | 175 | | | | 198,590 | |
Government National Mortgage Assoc. | | | 5.500% | | | 09/15/33 | | | 112 | | | | 124,415 | |
Government National Mortgage Assoc. | | | 5.500% | | | 09/15/33 | | | 86 | | | | 95,543 | |
Government National Mortgage Assoc. | | | 5.500% | | | 10/15/33 | | | 141 | | | | 161,451 | |
Government National Mortgage Assoc. | | | 5.500% | | | 12/15/33 | | | 28 | | | | 32,044 | |
Government National Mortgage Assoc. | | | 5.500% | | | 02/15/34 | | | 48 | | | | 53,142 | |
Government National Mortgage Assoc. | | | 5.500% | | | 04/15/34 | | | 528 | | | | 602,117 | |
Government National Mortgage Assoc. | | | 5.500% | | | 07/15/35 | | | 124 | | | | 139,515 | |
Government National Mortgage Assoc. | | | 5.500% | | | 02/15/36 | | | 165 | | | | 187,404 | |
Government National Mortgage Assoc. | | | 6.000% | | | 02/15/33 | | | 4 | | | | 4,635 | |
Government National Mortgage Assoc. | | | 6.000% | | | 04/15/33 | | | 25 | | | | 28,764 | |
Government National Mortgage Assoc. | | | 6.000% | | | 09/15/33 | | | 34 | | | | 38,936 | |
Government National Mortgage Assoc. | | | 6.000% | | | 12/15/33 | | | 159 | | | | 181,565 | |
Government National Mortgage Assoc. | | | 6.000% | | | 12/15/33 | | | 53 | | | | 61,619 | |
Government National Mortgage Assoc. | | | 6.000% | | | 01/15/34 | | | 30 | | | | 35,176 | |
Government National Mortgage Assoc. | | | 6.000% | | | 01/15/34 | | | 53 | | | | 63,149 | |
Government National Mortgage Assoc. | | | 6.000% | | | 06/20/34 | | | 115 | | | | 133,937 | |
Government National Mortgage Assoc. | | | 6.000% | | | 07/15/34 | | | 249 | | | | 285,126 | |
Government National Mortgage Assoc. | | | 6.000% | | | 10/15/34 | | | 218 | | | | 250,850 | |
Government National Mortgage Assoc. | | | 6.500% | | | 10/15/23 | | | 2 | | | | 1,752 | |
Government National Mortgage Assoc. | | | 6.500% | | | 12/15/23 | | | 7 | | | | 8,490 | |
Government National Mortgage Assoc. | | | 6.500% | | | 01/15/24 | | | 29 | | | | 33,522 | |
Government National Mortgage Assoc. | | | 6.500% | | | 01/15/24 | | | 84 | | | | 95,676 | |
Government National Mortgage Assoc. | | | 6.500% | | | 01/15/24 | | | 8 | | | | 9,385 | |
Government National Mortgage Assoc. | | | 6.500% | | | 01/15/24 | | | 30 | | | | 34,402 | |
Government National Mortgage Assoc. | | | 6.500% | | | 01/15/24 | | | 2 | | | | 2,633 | |
Government National Mortgage Assoc. | | | 6.500% | | | 01/15/24 | | | 3 | | | | 3,508 | |
Government National Mortgage Assoc. | | | 6.500% | | | 01/15/24 | | | 2 | | | | 2,823 | |
Government National Mortgage Assoc. | | | 6.500% | | | 01/15/24 | | | 7 | | | | 7,920 | |
Government National Mortgage Assoc. | | | 6.500% | | | 02/15/24 | | | 7 | | | | 7,619 | |
Government National Mortgage Assoc. | | | 6.500% | | | 02/15/24 | | | 33 | | | | 37,870 | |
Government National Mortgage Assoc. | | | 6.500% | | | 02/15/24 | | | 40 | | | | 46,168 | |
Government National Mortgage Assoc. | | | 6.500% | | | 02/15/24 | | | 32 | | | | 36,444 | |
Government National Mortgage Assoc. | | | 6.500% | | | 02/15/24 | | | 6 | | | | 6,649 | |
Government National Mortgage Assoc. | | | 6.500% | | | 02/15/24 | | | 6 | | | | 6,428 | |
Government National Mortgage Assoc. | | | 6.500% | | | 02/15/24 | | | 1 | | | | 964 | |
Government National Mortgage Assoc. | | | 6.500% | | | 02/15/24 | | | 1 | | | | 772 | |
Government National Mortgage Assoc. | | | 6.500% | | | 02/15/24 | | | 19 | | | | 21,375 | |
Government National Mortgage Assoc. | | | 6.500% | | | 02/15/24 | | | 27 | | | | 30,320 | |
Government National Mortgage Assoc. | | | 6.500% | | | 02/15/24 | | | 8 | | | | 9,035 | |
Government National Mortgage Assoc. | | | 6.500% | | | 03/15/24 | | | 11 | | | | 12,946 | |
SEE NOTES TO FINANCIAL STATEMENTS.
A96
| | | | | | |
| | | FLEXIBLE MANAGED PORTFOLIO (continued) | | |
| |
| SCHEDULE OF INVESTMENTS | | as of December 31, 2016 |
| | | | | | | | | | | | | | |
U.S. GOVERNMENT AGENCY OBLIGATIONS (continued) | | Interest
Rate
| | | Maturity
Date
| | Principal
Amount
(000)#
| | | Value
(Note 2)
| |
Government National Mortgage Assoc. | | | 6.500% | | | 04/15/24 | | | 3 | | | $ | 3,815 | |
Government National Mortgage Assoc. | | | 6.500% | | | 04/15/24 | | | 8 | | | | 9,562 | |
Government National Mortgage Assoc. | | | 6.500% | | | 04/15/24 | | | 13 | | | | 14,737 | |
Government National Mortgage Assoc. | | | 6.500% | | | 04/15/24 | | | 1 | | | | 1,655 | |
Government National Mortgage Assoc. | | | 6.500% | | | 04/15/24 | | | 7 | | | | 7,704 | |
Government National Mortgage Assoc. | | | 6.500% | | | 04/15/24 | | | 22 | | | | 24,945 | |
Government National Mortgage Assoc. | | | 6.500% | | | 04/15/24 | | | 3 | | | | 3,939 | |
Government National Mortgage Assoc. | | | 6.500% | | | 04/15/24 | | | 4 | | | | 4,261 | |
Government National Mortgage Assoc. | | | 6.500% | | | 05/15/24 | | | — | (k) | | | 566 | |
Government National Mortgage Assoc. | | | 6.500% | | | 05/15/24 | | | 21 | | | | 23,919 | |
Government National Mortgage Assoc. | | | 6.500% | | | 05/15/24 | | | 23 | | | | 26,004 | |
Government National Mortgage Assoc. | | | 6.500% | | | 10/15/24 | | | 36 | | | | 40,539 | |
Government National Mortgage Assoc. | | | 6.500% | | | 12/15/30 | | | 12 | | | | 13,821 | |
Government National Mortgage Assoc. | | | 6.500% | | | 01/15/32 | | | 27 | | | | 30,746 | |
Government National Mortgage Assoc. | | | 6.500% | | | 02/15/32 | | | 26 | | | | 29,606 | |
Government National Mortgage Assoc. | | | 6.500% | | | 07/15/32 | | | 56 | | | | 63,725 | |
Government National Mortgage Assoc. | | | 6.500% | | | 08/15/32 | | | 9 | | | | 10,263 | |
Government National Mortgage Assoc. | | | 6.500% | | | 08/15/32 | | | 12 | | | | 13,268 | |
Government National Mortgage Assoc. | | | 6.500% | | | 08/15/32 | | | 45 | | | | 51,893 | |
Government National Mortgage Assoc. | | | 6.500% | | | 08/15/32 | | | 303 | | | | 349,222 | |
Government National Mortgage Assoc. | | | 6.500% | | | 06/15/35 | | | 60 | | | | 69,614 | |
Government National Mortgage Assoc. | | | 6.500% | | | 06/15/35 | | | 6 | | | | 6,535 | |
Government National Mortgage Assoc. | | | 6.500% | | | 07/15/35 | | | 8 | | | | 8,797 | |
Government National Mortgage Assoc. | | | 8.000% | | | 01/15/24 | | | 13 | | | | 13,035 | |
Government National Mortgage Assoc. | | | 8.000% | | | 04/15/25 | | | 11 | | | | 12,609 | |
Hashemite Kingdom of Jordan Government USAID Bond, U.S. Gov’t. Gtd. Notes | | | 2.578% | | | 06/30/22 | | | 3,948 | | | | 4,016,036 | |
Israel Government USAID Bond, U.S. Gov’t. Gtd. Notes | | | 5.500% | | | 12/04/23 | | | 250 | | | | 297,409 | |
Israel Government USAID Bond, U.S. Gov’t. Gtd. Notes | | | 5.500% | | | 04/26/24 | | | 1,090 | | | | 1,306,636 | |
Residual Funding Corp. Strips Principal, Unsec’d. Notes, PO | | | 2.804% | (g) | | 01/15/30 | | | 950 | | | | 620,958 | |
Residual Funding Corp. Strips Principal, Unsec’d. Notes, PO | | | 2.967% | (g) | | 04/15/30 | | | 2,100 | | | | 1,360,002 | |
Tennessee Valley Authority, Sr. Unsec’d. Notes | | | 7.125% | | | 05/01/30 | | | 1,310 | | | | 1,866,145 | |
Tunisia Government AID Bonds, U.S. Gov’t. Gtd. Notes | | | 1.416% | | | 08/05/21 | | | 1,000 | | | | 966,642 | |
Ukraine Government AID Bonds, U.S. Gov’t. Gtd. Notes | | | 1.471% | | | 09/29/21 | | | 1,200 | | | | 1,171,493 | |
| | | | | | | | | | | | |
|
|
|
TOTAL U.S. GOVERNMENT AGENCY OBLIGATIONS
(cost $336,284,090) | | | | 337,721,379 | |
| | | | | | | | | | | | |
|
|
|
| U.S. TREASURY OBLIGATIONS — 2.2% | | | | | | | | | | | | | | |
U.S. Treasury Bonds | | | 2.250% | | | 08/15/46 | | | 720 | | | | 605,390 | |
U.S. Treasury Bonds | | | 2.875% | | | 11/15/46 | | | 1,520 | | | | 1,467,513 | |
U.S. Treasury Inflation Indexed Bonds, TIPS | | | 2.375% | | | 01/15/25 | | | 22,672 | | | | 26,031,864 | |
U.S. Treasury Notes | | | 1.375% | | | 12/15/19 | | | 145 | | | | 144,655 | |
U.S. Treasury Notes | | | 1.625% | | | 04/30/23 | | | 3,955 | | | | 3,825,229 | |
U.S. Treasury Notes(a) | | | 1.750% | | | 11/30/21 | | | 8,915 | | | | 8,848,485 | |
U.S. Treasury Notes(a) | | | 2.000% | | | 11/15/26 | | | 2,081 | | | | 2,002,230 | |
U.S. Treasury Notes(a) | | | 2.125% | | | 11/30/23 | | | 9,380 | | | | 9,317,707 | |
U.S. Treasury Notes | | | 2.125% | | | 05/15/25 | | | 12,560 | | | | 12,312,719 | |
U.S. Treasury Notes | | | 2.250% | | | 12/31/23 | | | 3,390 | | | | 3,391,590 | |
U.S. Treasury Strips Coupon | | | 2.184% | (g) | | 02/15/28 | | | 5,465 | | | | 4,042,881 | |
U.S. Treasury Strips Coupon(i) | | | 2.241% | (g) | | 05/15/28 | | | 2,735 | | | | 2,003,349 | |
U.S. Treasury Strips Coupon | | | 2.280% | (g) | | 02/15/29 | | | 2,735 | | | | 1,953,983 | |
U.S. Treasury Strips Coupon | | | 2.384% | (g) | | 05/15/29 | | | 5,640 | | | | 4,001,563 | |
U.S. Treasury Strips Coupon | | | 2.783% | (g) | | 08/15/29 | | | 1,400 | | | | 985,139 | |
U.S. Treasury Strips Coupon | | | 2.878% | (g) | | 05/15/31 | | | 1,400 | | | | 927,686 | |
U.S. Treasury Strips Coupon | | | 3.042% | (g) | | 11/15/35 | | | 2,800 | | | | 1,585,884 | |
U.S. Treasury Strips Coupon | | | 3.202% | (g) | | 08/15/40 | | | 2,800 | | | | 1,322,689 | |
| | | | | | | | | | | | |
|
|
|
TOTAL U.S. TREASURY OBLIGATIONS
(cost $86,102,462) | | | | 84,770,556 | |
| | | | | | | | | | | | |
|
|
|
TOTAL LONG-TERM INVESTMENTS
(cost $3,136,548,806) | | | | 3,652,607,264 | |
| | | | | | | | | | | | |
|
|
|
SEE NOTES TO FINANCIAL STATEMENTS.
A97
| | | | | | |
| | | FLEXIBLE MANAGED PORTFOLIO (continued) | | |
| |
| SCHEDULE OF INVESTMENTS | | as of December 31, 2016 |
| | | | | | | | | | | | | | | | |
| SHORT-TERM INVESTMENTS — 12.3% | | | | | | | | | | | | | | | | |
| | | | |
| AFFILIATED MUTUAL FUNDS — 12.2% | | | | | | | | Shares
| | | Value
(Note 2)
| |
Prudential Investment Portfolios 2 — Prudential Core Short-Term Bond Fund(l) | | | | 14,048,305 | | | $ | 130,227,786 | |
Prudential Investment Portfolios 2 — Prudential Core Ultra Short Bond Fund(l) | | | | 232,009,632 | | | | 232,009,632 | |
Prudential Investment Portfolios 2 — Prudential Institutional Money Market Fund
(cost $113,103,987; includes $113,030,605 of cash collateral for securities on loan)(l)(m) | | | | 113,089,176 | | | | 113,111,794 | |
| | | | | | | | | | | | | | |
|
|
|
TOTAL AFFILIATED MUTUAL FUNDS
(cost $483,006,410)(Note 4) | | | | 475,349,212 | |
| | | | | | | | | | | | | | |
|
|
|
| | | | |
| | | Interest
Rate
| | | Maturity
Date
| | | Principal
Amount
(000)#
| | | | |
| U.S. TREASURY OBLIGATION — 0.1% | | | | | | | | | | | | | | | | |
U.S. Treasury Bills
(cost $4,146,241)(i) | | | 0.448% | (e) | | | 03/16/17 | | | | 4,150 | | | | 4,145,850 | |
| | | | | | | | | | | | | | |
|
|
|
TOTAL SHORT-TERM INVESTMENTS
(cost $487,152,651) | | | | 479,495,062 | |
| | | | | | | | | | | | | | |
|
|
|
TOTAL INVESTMENTS — 106.2%
(cost $3,623,701,457) | | | | 4,132,102,326 | |
LIABILITIES IN EXCESS OF OTHER ASSETS(n) — (6.2)% | | | | (242,269,102 | ) |
| | | | | | | | | | | | | | |
|
|
|
NET ASSETS — 100.0% | | | $ | 3,889,833,224 | |
| | | | | | | | | | | | | | |
|
|
|
See Glossary for abbreviations used in the annual report.
| # | Principal amount is shown in U.S. dollars unless otherwise stated. |
| * | Non-income producing security. |
| (a) | All or a portion of security is on loan. The aggregate market value of such securities, including those sold and pending settlement, is $110,460,076; cash collateral of $113,030,605 (included in liabilities) was received with which the Portfolio purchased highly liquid short-term investments. Securities on loan are subject to contractual netting arrangements. |
| (b) | Variable rate instrument. The interest rate shown reflects the rate in effect at December 31, 2016. |
| (c) | Indicates a security or securities that have been deemed illiquid (unaudited). |
| (d) | Indicates a Level 3 security. The aggregate value of Level 3 securities is $29,465,243 and 0.8% of net assets. |
| (e) | Rate quoted represents yield-to-maturity as of purchase date. |
| (f) | Represents issuer in default on interest payments. Non-income producing security. Such securities may be post maturity. |
| (g) | Represents zero coupon bond or principal only securities. Rate represents yield to maturity at purchase date. |
| (h) | Represents CAS issued by Fannie Mae or STACR security issued by Freddie Mac. |
| (i) | Represents security, or a portion thereof, segregated as collateral for futures contracts. |
| (j) | Represents security, or a portion thereof, segregated as collateral for centrally cleared swap agreements. |
| (k) | Principal amount is less than $500 par. |
| (l) | Prudential Investments LLC, the manager of the Portfolio, also serves as manager of the Prudential Investment Portfolios 2 — Prudential Core Short-Term Bond Fund, the Prudential Investment Portfolios 2 — Prudential Core Ultra Short Bond Fund and the Prudential Investment Portfolios 2 — Prudential Institutional Money Market Fund. |
| (m) | Represents security purchased with cash collateral received for securities on loan and includes dividend reinvestment. |
| (n) | Includes net unrealized appreciation (depreciation) on the following derivative contracts held at reporting period end: |
SEE NOTES TO FINANCIAL STATEMENTS.
A98
| | | | | | |
| | | FLEXIBLE MANAGED PORTFOLIO (continued) | | |
| |
| SCHEDULE OF INVESTMENTS | | as of December 31, 2016 |
Futures contracts outstanding at December 31, 2016:
| | | | | | | | | | | | | | | | | | | | | | |
Number of
Contracts
| | | Type
| | | Expiration
Date
| | | Value at
Trade Date
| | | Value at
December 31, 2016
| | | Unrealized
Appreciation
(Depreciation)
| |
| | Long Positions: | | | | | | | | | | | | | | | | | | | | | |
| | 972 | | | | 2 Year U.S. Treasury Notes | | | | Mar. 2017 | | | $ | 210,591,224 | | | $ | 210,620,250 | | | $ | 29,026 | |
| | 1,366 | | | | 5 Year U.S. Treasury Notes | | | | Mar. 2017 | | | | 161,126,649 | | | | 160,729,109 | | | | (397,540 | ) |
| | 375 | | | | 10 Year U.S. Treasury Notes | | | | Mar. 2017 | | | | 46,501,197 | | | | 46,605,469 | | | | 104,272 | |
| | 474 | | | | 30 Year U.S. Ultra Treasury Bonds | | | | Mar. 2017 | | | | 76,454,617 | | | | 75,958,500 | | | | (496,117 | ) |
| | 12 | | | | Mini MSCI EAFE Index | | | | Mar. 2017 | | | | 1,011,385 | | | | 1,005,360 | | | | (6,025 | ) |
| | | | | | | | | | | | | | | | | | | | |
|
|
|
| | | | | | | | | | | | | | | | | | | | | | (766,384 | ) |
| | | | | | | | | | | | | | | | | | | | |
|
|
|
| | Short Position: | | | | | | | | | | | | | | | | | | | | | |
| | 247 | | | | 20 Year U.S. Treasury Bonds | | | | Mar. 2017 | | | | 37,259,984 | | | | 37,212,094 | | | | 47,890 | |
| | | | | | | | | | | | | | | | | | | | |
|
|
|
| | | | | | | | | | | | | | | | | | | | | $ | (718,494 | ) |
| | | | | | | | | | | | | | | | | | | | |
|
|
|
| | A U.S. Treasury Obligation with a market value of $4,145,850 has been segregated with Goldman Sachs & Co. and U.S. Government Agency Obligations and a U.S. Treasury Obligation with a combined market value of $4,834,200 have been segregated with Citigroup Global Markets to cover requirements for open futures contracts at December 31, 2016. |
| | | | | | | | | | | | | | | | | | | | | | | | |
Credit default swap agreements outstanding at December 31, 2016: | |
Reference Entity/Obligation
| | Termination
Date
| | | Fixed
Rate
| | | Notional
Amount
(000)#(3)
| | | Value at
Trade
Date
| | | Value at
December 31,
2016(4)
| | |
Unrealized
Appreciation
(Depreciation)
| |
Centrally cleared credit default swap on credit indices—Buy Protection(1): | |
CDX.NA.IG.24.V1 | | | 06/20/20 | | | | 1.000% | | | | 51,500 | | | $ | (969,274 | ) | | $ | (861,175 | ) | | $ | 108,099 | |
| | | | | | | | | | | | | | |
|
|
| |
|
|
| |
|
|
|
The Portfolio entered into credit default swaps (“CDS”) to provide a measure of protection against defaults or to take an active long or short position with respect to the likelihood of a particular issuer’s default or the reference entity’s credit soundness. CDS contracts generally trade based on a spread which represents the cost a protection buyer has to pay the protection seller. The protection buyer is said to be short the credit as the value of the contract rises the more credit deteriorates. The value of the CDS contract increases for the protection buyer if the spread increases.
| (1) | If the Portfolio is a buyer of protection, it pays the fixed rate. When a credit event occurs, as defined under the terms of that particular swap agreement, the Portfolio will either (i) receive from the seller of protection an amount equal to the notional amount of the swap and make delivery of the referenced obligation or underlying securities comprising the referenced index or (ii) receive a net settlement amount in the form of cash or securities equal to the notional amount of the swap less the recovery value of the referenced obligation or underlying securities comprising the referenced index. |
| (2) | If the Portfolio is a seller of protection, it receives the fixed rate. When a credit event occurs, as defined under the terms of that particular swap agreement, the Portfolio will either (i) pay to the buyer of protection an amount equal to the notional amount of the swap and take delivery of the referenced obligation or underlying securities comprising the referenced index or (ii) pay a net settlement amount in the form of cash or securities equal to the notional amount of the swap less the recovery value of the referenced obligation or underlying securities comprising the referenced index. |
| (3) | Notional amount represents the maximum potential amount the Portfolio could be required to pay as a seller of credit protection or receive as a buyer of credit protection if a credit event occurs as defined under the terms of that particular swap agreement. |
| (4) | The fair value of credit default swap agreements on credit indices, asset-backed securities and centrally cleared corporate and/or sovereign issues serves as an indicator of the current status of the payment/performance risk and represents the likelihood of an expected liability (or profit) for the credit derivative should the notional amount of the swap agreement be closed/sold as of the reporting date. Increasing fair value in absolute terms, when compared to the notional amount of the swap, represents a deterioration of the referenced entity’s credit soundness and a greater likelihood of risk of default or other credit event occurring as defined under the terms of the agreement. |
| (5) | Implied credit spreads, represented in absolute terms, utilized in determining the fair value of OTC credit default swap agreements on corporate issues or sovereign issues of an emerging country as of the reporting date serve as an indicator of the current status of the payment/performance risk and represent the likelihood of risk of default for the credit derivative. The implied credit spread of a particular referenced entity reflects the cost of buying/selling protection and may include up-front payments required to be made to enter into the agreement. Wider credit spreads represent a deterioration of the referenced entity’s credit soundness and a greater likelihood of risk of default or other credit event occurring as defined under the terms of the agreement. |
SEE NOTES TO FINANCIAL STATEMENTS.
A99
| | | | | | |
| | | FLEXIBLE MANAGED PORTFOLIO (continued) | | |
| |
| SCHEDULE OF INVESTMENTS | | as of December 31, 2016 |
Interest rate swap agreements outstanding at December 31, 2016:
| | | | | | | | | | | | | | | | | | | | | | | | |
Notional
Amount
(000)#
| | | Termination
Date
| | | Fixed
Rate
| | | Floating Rate
| | Value at
Trade Date
| | | Value at
December 31, 2016
| | | Unrealized
Appreciation
(Depreciation)
| |
| | Centrally cleared swap agreements: | | | | | |
| | 152,125 | | | | 09/09/17 | | | | 0.539% | | | 1 Day USOIS(1) | | $ | 437 | | | $ | 190,060 | | | $ | 189,623 | |
| | 127,920 | | | | 10/18/17 | | | | 0.607% | | | 1 Day USOIS(1) | | | 265 | | | | 148,055 | | | | 147,790 | |
| | 71,095 | | | | 11/09/17 | | | | 0.626% | | | 1 Day USOIS(1) | | | 310 | | | | 94,476 | | | | 94,166 | |
| | 2,720 | | | | 07/11/18 | | | | 0.947% | | | 3 Month LIBOR(1) | | | 156 | | | | 15,679 | | | | 15,523 | |
| | 11,300 | | | | 05/31/22 | | | | 2.200% | | | 3 Month LIBOR(1) | | | (22,921 | ) | | | (112,579 | ) | | | (89,658 | ) |
| | 26,415 | | | | 11/30/22 | | | | 1.850% | | | 3 Month LIBOR(1) | | | 293 | | | | 309,236 | | | | 308,943 | |
| | 8,160 | | | | 11/30/22 | | | | 1.982% | | | 3 Month LIBOR(1) | | | 195 | | | | 34,518 | | | | 34,323 | |
| | 2,300 | | | | 12/31/22 | | | | 1.405% | | | 3 Month LIBOR(1) | | | 162 | | | | 86,854 | | | | 86,692 | |
| | 1,600 | | | | 12/31/22 | | | | 1.406% | | | 3 Month LIBOR(1) | | | 159 | | | | 60,286 | | | | 60,127 | |
| | 3,400 | | | | 12/31/22 | | | | 1.409% | | | 3 Month LIBOR(1) | | | 169 | | | | 127,626 | | | | 127,457 | |
| | 900 | | | | 12/31/22 | | | | 1.412% | | | 3 Month LIBOR(1) | | | 155 | | | | 33,644 | | | | 33,489 | |
| | 1,350 | | | | 12/31/22 | | | | 1.495% | | | 3 Month LIBOR(1) | | | 157 | | | | 44,009 | | | | 43,852 | |
| | 2,730 | | | | 05/31/23 | | | | 1.203% | | | 3 Month LIBOR(2) | | | 165 | | | | 150,043 | | | | 149,878 | |
| | 2,470 | | | | 05/31/23 | | | | 1.399% | | | 3 Month LIBOR(1) | | | (44,914 | ) | | | 106,296 | | | | 151,210 | |
| | 11,115 | | | | 08/02/23 | | | | —(3) | | | —(3) | | | (3,748 | ) | | | 30,255 | | | | 34,003 | |
| | 4,285 | | | | 08/03/23 | | | | —(4) | | | —(4) | | | (1,695 | ) | | | 12,043 | | | | 13,738 | |
| | 16,870 | | | | 08/02/23 | | | | —(5) | | | —(5) | | | 1,251 | | | | 48,664 | | | | 47,413 | |
| | 8,140 | | | | 08/19/23 | | | | 0.898% | | | 1 Day USOIS(1) | | | 194 | | | | 436,270 | | | | 436,076 | |
| | 10,850 | | | | 10/27/23 | | | | 1.073% | | | 1 Day USOIS(1) | | | 209 | | | | 491,486 | | | | 491,277 | |
| | 7,420 | | | | 09/04/25 | | | | 2.214% | | | 3 Month LIBOR(1) | | | 203 | | | | 29,044 | | | | 28,841 | |
| | 28,775 | | | | 01/08/26 | | | | 2.210% | | | 3 Month LIBOR(1) | | | 292 | | | | 177,840 | | | | 177,548 | |
| | 330 | | | | 05/15/26 | | | | 1.652% | | | 3 Month LIBOR(1) | | | 11 | | | | 18,420 | | | | 18,409 | |
| | 2,150 | | | | 05/15/37 | | | | 2.726% | | | 3 Month LIBOR(2) | | | 185 | | | | 49,011 | | | | 48,826 | |
| | 2,970 | | | | 11/15/41 | | | | 1.869% | | | 3 Month LIBOR(1) | | | 11,525 | | | | 408,710 | | | | 397,185 | |
| | | | | | | | | | | | | | |
|
|
| |
|
|
| |
|
|
|
| | | | | | | | | | | | | | | $ | (56,785 | ) | | $ | 2,989,946 | | | $ | 3,046,731 | |
| | | | | | | | | | | | | | |
|
|
| |
|
|
| |
|
|
|
U.S. Government Agency Obligations with a combined market value of $5,474,675 have been segregated with Citigroup Global Markets to cover requirements for open centrally cleared credit default and interest rate swap contracts at December 31, 2016.
| (1) | The Portfolio pays the fixed rate and receives the floating rate. |
| (2) | The Portfolio pays the floating rate and receives the fixed rate. |
| (3) | The Portfolio pays the floating rate of 3 Month LIBOR and receives the floating rate of 1 Day USOIS plus 38.25 bps. |
| (4) | The Portfolio pays the floating rate of 3 Month LIBOR and receives the floating rate of 1 Day USOIS plus 38.375 bps. |
| (5) | The Portfolio pays the floating rate of 3 Month LIBOR and receives the floating rate of 1 Day USOIS plus 38.50 bps. |
Various inputs are used in determining the value of the Portfolio’s investments. These inputs are summarized in the three broad levels listed below.
| Level 1—quoted | prices generally in active markets for identical securities. |
| Level 2—quoted | prices for similar securities, interest rates and yield curves, prepayment speeds, foreign currency exchange ratesand other observable inputs. |
| Level 3—unobservable | inputs for securities valued in accordance with Board approved fair valuation procedures. |
SEE NOTES TO FINANCIAL STATEMENTS.
A100
| | | | | | |
| | | FLEXIBLE MANAGED PORTFOLIO (continued) | | |
| |
| SCHEDULE OF INVESTMENTS | | as of December 31, 2016 |
The following is a summary of the inputs used as of December 31, 2016 in valuing such portfolio securities:
| | | | | | | | | | | | |
| | | Level 1
| | | Level 2
| | | Level 3
| |
Investments in Securities | | | | | | | | | | | | |
Common Stocks | | $ | 2,384,111,305 | | | $ | 36,508,461 | | | $ | — | |
Unaffiliated Exchange Traded Fund | | | 222,260 | | | | — | | | | — | |
Preferred Stocks | | | 568,040 | | | | 413,160 | | | | — | |
Asset-Backed Securities | | | | | | | | | | | | |
Collateralized Loan Obligations | | | — | | | | 51,750,368 | | | | — | |
Non-Residential Mortgage-Backed Securities | | | — | | | | 86,052,443 | | | | — | |
Residential Mortgage-Backed Securities | | | — | | | | 19,921,622 | | | | — | |
Bank Loans | | | — | | | | 8,346,765 | | | | — | |
Commercial Mortgage-Backed Securities | | | — | | | | 154,081,601 | | | | — | |
Corporate Bonds | | | — | | | | 367,444,705 | | | | — | |
Municipal Bonds | | | — | | | | 15,892,749 | | | | — | |
Non-Corporate Foreign Agencies | | | — | | | | 20,853,315 | | | | — | |
Residential Mortgage-Backed Securities | | | — | | | | 35,016,303 | | | | 29,465,243 | |
Sovereign Bonds | | | — | | | | 19,466,989 | | | | — | |
U.S. Government Agency Obligations | | | — | | | | 337,721,379 | | | | — | |
U.S. Treasury Obligations | | | — | | | | 88,916,406 | | | | — | |
Affiliated Mutual Funds | | | 475,349,212 | | | | — | | | | — | |
Other Financial Instruments* | | | | | | | | | | | | |
Futures Contracts | | | (718,494 | ) | | | — | | | | — | |
Centrally Cleared Credit Default Swap Agreement | | | — | | | | 108,099 | | | | — | |
Centrally Cleared Interest Rate Swap Agreements | | | — | | | | 3,046,731 | | | | — | |
| | |
|
|
| |
|
|
| |
|
|
|
Total | | $ | 2,859,532,323 | | | $ | 1,245,541,096 | | | $ | 29,465,243 | |
| | |
|
|
| |
|
|
| |
|
|
|
| * | Other financial instruments are derivative instruments not reflected in the Schedule of Investments, such as futures, forwards and centrally cleared swap contracts, which are recorded at the unrealized appreciation (depreciation) on the instrument, and OTC swap contracts which are recorded at fair value. |
During the period, there were no transfers between Level 1 and Level 2 to report.
The industry classification of investments and liabilities in excess of other assets shown as a percentage of net assets as of December 31, 2016 were as follows (unaudited):
| | | | |
Affiliated Mutual Funds (including 2.9% of collateral for securities on loan) | | | 12.2 | % |
U.S. Government Agency Obligations | | | 8.7 | |
Banks | | | 7.4 | |
Oil, Gas & Consumable Fuels | | | 4.4 | |
Commercial Mortgage-Backed Securities | | | 4.0 | |
Software | | | 3.2 | |
Pharmaceuticals | | | 3.1 | |
Internet Software & Services | | | 3.0 | |
Semiconductors & Semiconductor Equipment | | | 2.4 | |
Technology Hardware, Storage & Peripherals | | | 2.3 | |
U.S. Treasury Obligations | | | 2.3 | |
Non-Residential Mortgage-Backed Securities | | | 2.2 | |
Residential Mortgage-Backed Securities | | | 2.2 | |
Diversified Telecommunication Services | | | 2.1 | |
Biotechnology | | | 2.1 | |
Health Care Equipment & Supplies | | | 2.0 | |
Insurance | | | 1.9 | |
Aerospace & Defense | | | 1.9 | |
Specialty Retail | | | 1.8 | |
Media | | | 1.8 | |
IT Services | | | 1.8 | |
Health Care Providers & Services | | | 1.7 | |
Electric Utilities | | | 1.6 | |
| | | | |
Capital Markets | | | 1.5 | % |
Food Products | | | 1.4 | |
Beverages | | | 1.4 | |
Collateralized Loan Obligations | | | 1.4 | |
Equity Real Estate Investment Trusts (REITs) | | | 1.3 | |
Industrial Conglomerates | | | 1.2 | |
Food & Staples Retailing | | | 1.2 | |
Machinery | | | 1.2 | |
Chemicals | | | 1.1 | |
Diversified Financial Services | | | 1.0 | |
Internet & Direct Marketing Retail | | | 1.0 | |
Household Products | | | 0.9 | |
Tobacco | | | 0.8 | |
Multiline Retail | | | 0.8 | |
Hotels, Restaurants & Leisure | | | 0.7 | |
Airlines | | | 0.7 | |
Metals & Mining | | | 0.7 | |
Consumer Finance | | | 0.6 | |
Communications Equipment | | | 0.6 | |
Non-Corporate Foreign Agencies | | | 0.5 | |
Sovereign Bonds | | | 0.5 | |
Telecommunications | | | 0.5 | �� |
Oil & Gas | | | 0.5 | |
Electric | | | 0.5 | |
SEE NOTES TO FINANCIAL STATEMENTS.
A101
| | | | | | |
| | | FLEXIBLE MANAGED PORTFOLIO (continued) | | |
| |
| SCHEDULE OF INVESTMENTS | | as of December 31, 2016 |
| | | | |
Industry table (cont.)
| | | |
Air Freight & Logistics | | | 0.5 | % |
Healthcare-Services | | | 0.4 | |
Household Durables | | | 0.4 | |
Municipal Bonds | | | 0.4 | |
Multi-Utilities | | | 0.4 | |
Auto Components | | | 0.4 | |
Automobiles | | | 0.3 | |
Life Sciences Tools & Services | | | 0.3 | |
Auto Manufacturers | | | 0.3 | |
Energy Equipment & Services | | | 0.3 | |
Independent Power & Renewable Electricity Producers | | | 0.3 | |
Healthcare-Products | | | 0.3 | |
Electrical Equipment | | | 0.3 | |
Retail | | | 0.2 | |
Computers | | | 0.2 | |
Construction & Engineering | | | 0.2 | |
Real Estate Management & Development | | | 0.2 | |
Pipelines | | | 0.2 | |
Containers & Packaging | | | 0.2 | |
Food | | | 0.1 | |
Lodging | | | 0.1 | |
Gas Utilities | | | 0.1 | |
Oil & Gas Services | | | 0.1 | |
| | | | |
Leisure Products | | | 0.1 | % |
Agriculture | | | 0.1 | |
Commercial Services & Supplies | | | 0.1 | |
Multi-National | | | 0.1 | |
Technology | | | 0.1 | |
Building Products | | | 0.1 | |
Mortgage Real Estate Investment Trusts (REITs) | | | 0.1 | |
Road & Rail | | | 0.1 | |
Mining | | | 0.1 | |
Miscellaneous Manufacturing | | | 0.1 | |
Commercial Services | | | 0.1 | |
Machinery-Diversified | | | 0.1 | |
Health Care Technology | | | 0.1 | |
Housewares | | | 0.1 | |
Forest & Paper Products | | | 0.1 | |
Professional Services | | | 0.1 | |
Building Materials | | | 0.1 | |
Transportation | | | 0.1 | |
Health Care & Pharmaceutical | | | 0.1 | |
| | |
|
|
|
| | | | 106.2 | |
Liabilities in excess of other assets | | | (6.2 | ) |
| | |
|
|
|
| | | | 100.0 | % |
| | |
|
|
|
The Portfolio invested in derivative instruments during the reporting period. The primary types of risk associated with these derivative instruments are credit risk, equity risk and interest rate risk. The effect of such derivative instruments on the Portfolio’s financial position and financial performance as reflected in the Statement of Assets and Liabilities and Statement of Operations is presented in the summary below.
Fair values of derivative instruments as of December 31, 2016 as presented in the Statement of Assets and Liabilities:
| | | | | | | | | | | | |
| | | Asset Derivatives
| | | Liability Derivatives
| |
Derivatives not designated as hedging
instruments, carried at fair value
| | Balance Sheet Location
| | Fair Value
| | | Balance Sheet Location
| | Fair Value
| |
Credit contracts | | Due from/to broker — variation margin swaps | | $ | 108,099 | * | | — | | $ | — | |
Equity contracts | | — | | | — | | | Due from/to broker — variation margin futures | | | 6,025 | * |
Interest rate contracts | | Due from/to broker — variation margin futures | | | 181,188 | * | | Due from/to broker — variation margin futures | | | 893,657 | * |
Interest rate contracts | | Due from/to broker — variation margin swaps | | | 3,136,389 | * | | Due from/to broker — variation margin swaps | | | 89,658 | * |
| | | | |
|
|
| | | |
|
|
|
Total | | | | $ | 3,425,676 | | | | | $ | 989,340 | |
| | | | |
|
|
| | | |
|
|
|
| * | Includes cumulative appreciation (depreciation) as reported in the schedule of open futures and centrally cleared swap contracts. Only unsettled variation margin receivable (payable) is reported within the Statement of Assets and Liabilities. |
The effects of derivative instruments on the Statement of Operations for the year ended December 31, 2016 are as follows:
| | | | | | | | | | | | | | | | | | | | | | | | | | | | |
Amount of Realized Gain (Loss) on Derivatives Recognized in Income
| |
Derivatives not accounted for as hedging
instruments, carried at fair value
| | Rights*
| | | Options
Purchased*
| | | Options
Written
| | | Futures
| | | Forward Rate
Agreements
| | | Swaps
| | | Total
| |
Credit contracts | | $ | — | | | $ | — | | | $ | — | | | $ | — | | | $ | — | | | $ | (637,192 | ) | | $ | (637,192 | ) |
Equity contracts | | | 51 | | | | — | | | | — | | | | 2,921,649 | | | | — | | | | — | | | | 2,921,700 | |
Interest rate contracts | | | — | | | | (999,424 | ) | | | (515,972 | ) | | | (4,431,718 | ) | | | 23,986 | | | | (2,067,055 | ) | | | (7,990,183 | ) |
| | |
|
|
| |
|
|
| |
|
|
| |
|
|
| |
|
|
| |
|
|
| |
|
|
|
Total | | $ | 51 | | | $ | (999,424 | ) | | $ | (515,972 | ) | | $ | (1,510,069 | ) | | $ | 23,986 | | | $ | (2,704,247 | ) | | $ | (5,705,675 | ) |
| | |
|
|
| |
|
|
| |
|
|
| |
|
|
| |
|
|
| |
|
|
| |
|
|
|
| * | Included in net realized gain (loss) on investment transactions in the Statement of Operations. |
SEE NOTES TO FINANCIAL STATEMENTS.
A102
| | | | | | |
| | | FLEXIBLE MANAGED PORTFOLIO (continued) | | |
| |
| SCHEDULE OF INVESTMENTS | | as of December 31, 2016 |
| | | | | | | | | | | | | | | | | | | | | | | | |
Change in Unrealized Appreciation (Depreciation) on Derivatives Recognized in Income
| |
Derivatives not accounted for as hedging
instruments, carried at fair value
| | Rights*
| | | Options
Purchased*
| | | Options
Written
| | | Futures
| | | Swaps
| | | Total
| |
Credit contracts | | $ | — | | | $ | — | | | $ | — | | | $ | — | | | $ | (419,113 | ) | | $ | (419,113 | ) |
Equity contracts | | | (32 | ) | | | — | | | | — | | | | (41,298 | ) | | | — | | | | (41,330 | ) |
Interest rate contracts | | | — | | | | 409,545 | | | | (241,909 | ) | | | (1,180,112 | ) | | | 4,756,378 | | | | 3,743,902 | |
| | |
|
|
| |
|
|
| |
|
|
| |
|
|
| |
|
|
| |
|
|
|
Total | | $ | (32 | ) | | $ | 409,545 | | | $ | (241,909 | ) | | $ | (1,221,410 | ) | | $ | 4,337,265 | | | $ | 3,283,459 | |
| | |
|
|
| |
|
|
| |
|
|
| |
|
|
| |
|
|
| |
|
|
|
| * | Included in net change in unrealized appreciation (depreciation) on investment transactions in the Statement of Operations. |
For the year ended December 31, 2016, the Portfolio’s average volume of derivative activities is as follows:
| | | | | | |
Options Purchased(1)
| | Options Written(2)
| | Futures Contracts—
Long Positions(3)
| | Futures Contracts—
Short Positions(3)
|
| $119,463 | | $259,640,000 | | $394,987,234 | | $89,008,014 |
| | | |
Interest Rate Swap
Agreements(2)
| | Credit Default
Swap Agreements—Buy
Protection(2)
| | Credit Default
Swap Agreements—Sell
Protection(2)
| | Total Return Swap
Agreements(2)
|
| $296,221,000 | | $51,500,000 | | $3,210,000 | | $5,040,000 |
| (2) | Notional Amount in USD. |
The Portfolio entered into financial transactions during the reporting period that are either offset in accordance with current requirements or are subject to enforceable master netting arrangements or similar agreements that permit offsetting. The information about offsetting and related netting arrangements for financial transactions, where the legal right to set-off exists, is presented in the summary below.
Offsetting of financial transactions assets and liabilities:
| | | | | | | | | | | | |
Description
| | Gross Amounts of
Recognized Assets(1)
| | | Collateral
Received
| | | Net
Amount
| |
Securities on Loan | | $ | 110,460,076 | | | $ | (110,460,076 | ) | | $ | — | |
| | |
|
|
| | | | | | | | |
| (1) | Amount represents market value. |
SEE NOTES TO FINANCIAL STATEMENTS.
A103
| | | | | | |
| | | FLEXIBLE MANAGED PORTFOLIO (continued) | | |
STATEMENT OF ASSETS & LIABILITIES
as of December 31, 2016
| | | | |
| ASSETS | | | | |
Investments at value, including securities on loan of $110,460,076: | | | | |
Unaffiliated investments (cost $3,140,695,047) | | $ | 3,656,753,114 | |
Affiliated investments (cost $483,006,410) | | | 475,349,212 | |
Cash | | | 15,775 | |
Foreign currency, at value (cost $89,390) | | | 88,260 | |
Receivable for investments sold | | | 29,199,700 | |
Dividends and interest receivable | | | 10,065,318 | |
Due from broker—variation margin futures | | | 681,988 | |
Tax reclaim receivable | | | 589,907 | |
Receivable for Series shares sold | | | 31,875 | |
Prepaid expenses | | | 29,451 | |
Receivable from affiliate | | | 2,990 | |
| | |
|
|
|
Total Assets | | | 4,172,807,590 | |
| | |
|
|
|
| LIABILITIES | | | | |
Payable for investments purchased | | | 167,331,586 | |
Payable to broker for collateral for securities on loan | | | 113,030,605 | |
Management fee payable | | | 1,982,403 | |
Accrued expenses and other liabilities | | | 330,165 | |
Due to broker—variation margin swaps | | | 186,376 | |
Payable for Series shares repurchased | | | 112,251 | |
Affiliated transfer agent fee payable | | | 980 | |
| | |
|
|
|
Total Liabilities | | | 282,974,366 | |
| | |
|
|
|
| NET ASSETS | | $ | 3,889,833,224 | |
| | |
|
|
|
Net assets were comprised of: | | | | |
Paid-in capital | | $ | 2,048,324,617 | |
Retained earnings | | | 1,841,508,607 | |
| | |
|
|
|
Net assets, December 31, 2016 | | $ | 3,889,833,224 | |
| | |
|
|
|
Net asset value and redemption price per share $3,889,833,224 / 149,668,676 outstanding shares of beneficial interest | | $ | 25.99 | |
| | |
|
|
|
STATEMENT OF OPERATIONS
Year Ended December 31, 2016
| | | | |
| INVESTMENT INCOME (LOSS) | | | | |
| INCOME | | | | |
Unaffiliated dividend income (net) (foreign withholding tax $449,375, of which $35,507 is reimbursable by an affiliate) | | $ | 51,876,687 | |
Interest income (net) (foreign withholding tax $6,552) | | | 35,374,745 | |
Affiliated dividend income | | | 3,891,974 | |
Income from securities lending, net (including affiliated income of $358,638) | | | 394,648 | |
| | |
|
|
|
Total income | | | 91,538,054 | |
| | |
|
|
|
| EXPENSES | | | | |
Management fee | | | 22,795,712 | |
Custodian and accounting fees (net of $25,300 fee credit) | | | 552,000 | |
Shareholders’ reports | | | 248,000 | |
Audit fee | | | 50,000 | |
Insurance expenses | | | 47,000 | |
Trustees’ fees | | | 43,000 | |
Legal fees and expenses | | | 18,000 | |
Transfer agent’s fees and expenses (including affiliated expense of $5,900) | | | 12,000 | |
Commitment fee on syndicated credit agreement | | | 7,000 | |
Miscellaneous | | | 53,612 | |
| | |
|
|
|
Total expenses | | | 23,826,324 | |
| | |
|
|
|
| NET INVESTMENT INCOME (LOSS) | | | 67,711,730 | |
| | |
|
|
|
| REALIZED AND UNREALIZED GAIN (LOSS) ON INVESTMENTS AND FOREIGN CURRENCY TRANSACTIONS | | | | |
Net realized gain (loss) on: | | | | |
Investment transactions (including affiliated of $6,390) | | | 134,161,861 | |
Futures transactions | | | (1,510,069 | ) |
Forward rate agreement transactions | | | 23,986 | |
Options written transactions | | | (515,972 | ) |
Short sales transactions | | | (22,015 | ) |
Swap agreement transactions | | | (2,704,247 | ) |
Foreign currency transactions | | | (6,249 | ) |
| | |
|
|
|
| | | | 129,427,295 | |
| | |
|
|
|
Net change in unrealized appreciation (depreciation) on: | | | | |
Investments (including affiliated of $4,062) | | | 108,639,367 | |
Futures | | | (1,221,410 | ) |
Options written | | | (241,909 | ) |
Swap agreements | | | 4,337,265 | |
Foreign currencies | | | (15,803 | ) |
| | |
|
|
|
| | | | 111,497,510 | |
| | |
|
|
|
| NET GAIN (LOSS) ON INVESTMENT AND FOREIGN CURRENCY TRANSACTIONS | | | 240,924,805 | |
| | |
|
|
|
| NET INCREASE (DECREASE) IN NET ASSETS RESULTING FROM OPERATIONS | | $ | 308,636,535 | |
| | |
|
|
|
STATEMENT OF CHANGES IN NET ASSETS
| | | | | | | | |
| | | Year Ended December 31,
| |
| | | 2016
| | | 2015
| |
| INCREASE (DECREASE) IN NET ASSETS | | | | | | | | |
| OPERATIONS | | | | | | | | |
Net investment income (loss) | | $ | 67,711,730 | | | $ | 67,622,207 | |
Net realized gain (loss) on investment and foreign currency transactions | | | 129,427,295 | | | | 227,213,152 | |
Net change in unrealized appreciation (depreciation) on investments and foreign currencies | | | 111,497,510 | | | | (255,176,199 | ) |
| | |
|
|
| |
|
|
|
NET INCREASE (DECREASE) IN NET ASSETS RESULTING FROM OPERATIONS | | | 308,636,535 | | | | 39,659,160 | |
| | |
|
|
| |
|
|
|
| SERIES SHARE TRANSACTIONS | | | | | | | | |
Series shares sold [950,649 and 441,580 shares, respectively] | | | 23,434,776 | | | | 10,576,788 | |
Series shares repurchased [8,662,738 and 9,397,959 shares, respectively] | | | (214,255,950 | ) | | | (225,231,619 | ) |
| | |
|
|
| |
|
|
|
NET INCREASE (DECREASE) IN NET ASSETS FROM SERIES SHARE TRANSACTIONS | | | (190,821,174 | ) | | | (214,654,831 | ) |
| | |
|
|
| |
|
|
|
| CAPITAL CONTRIBUTIONS (Note 4) | | | 3,201,924 | | | | — | |
| | |
|
|
| |
|
|
|
| TOTAL INCREASE (DECREASE) | | | 121,017,285 | | | | (174,995,671 | ) |
| NET ASSETS: | | | | | | | | |
Beginning of year | | | 3,768,815,939 | | | | 3,943,811,610 | |
| | |
|
|
| |
|
|
|
End of year | | $ | 3,889,833,224 | | | $ | 3,768,815,939 | |
| | |
|
|
| |
|
|
|
SEE NOTES TO FINANCIAL STATEMENTS.
A104
| | | | | | |
| | | GLOBAL PORTFOLIO | | |
| |
| SCHEDULE OF INVESTMENTS | | as of December 31, 2016 |
| | | | | | | | |
| LONG-TERM INVESTMENTS — 97.1% | |
| COMMON STOCKS — 96.9% | | Shares
| | | Value
(Note 2)
| |
Australia — 1.5% | |
Arrium Ltd.*(a) | | | 894,400 | | | $ | 14,105 | |
Asaleo Care Ltd. | | | 733,400 | | | | 781,852 | |
Ausdrill Ltd.* | | | 123,200 | | | | 111,754 | |
Bendigo & Adelaide Bank Ltd. | | | 158,500 | | | | 1,449,923 | |
Bradken Ltd.* | | | 98,900 | | | | 229,355 | |
Caltex Australia Ltd. | | | 26,000 | | | | 570,068 | |
Challenger Ltd. | | | 8,400 | | | | 67,871 | |
CSR Ltd. | | | 452,900 | | | | 1,505,744 | |
Downer EDI Ltd. | | | 182,200 | | | | 797,801 | |
Fortescue Metals Group Ltd. | | | 129,900 | | | | 542,854 | |
Harvey Norman Holdings Ltd. | | | 168,800 | | | | 625,447 | |
LendLease Group | | | 124,300 | | | | 1,306,216 | |
Macquarie Group Ltd. | | | 48,800 | | | | 3,056,939 | |
Metcash Ltd.* | | | 412,500 | | | | 678,387 | |
Mineral Resources Ltd. | | | 49,900 | | | | 434,342 | |
Myer Holdings Ltd. | | | 567,600 | | | | 564,261 | |
National Australia Bank Ltd. | | | 33,588 | | | | 741,910 | |
Primary Health Care Ltd. | | | 139,400 | | | | 409,486 | |
Qantas Airways Ltd. | | | 387,619 | | | | 928,556 | |
| | | | | | |
|
|
|
| | | | | | | | 14,816,871 | |
| | | | | | |
|
|
|
Austria — 0.3% | |
OMV AG | | | 36,200 | | | | 1,276,187 | |
Voestalpine AG | | | 28,800 | | | | 1,126,176 | |
| | | | | | |
|
|
|
| | | | | | | | 2,402,363 | |
| | | | | | |
|
|
|
Belgium — 0.1% | |
AGFA-Gevaert NV* | | | 86,100 | | | | 332,288 | |
Bekaert NV | | | 13,500 | | | | 545,665 | |
| | | | | | |
|
|
|
| | | | | | | | 877,953 | |
| | | | | | |
|
|
|
Brazil — 0.2% | |
Cielo SA | | | 209,800 | | | | 1,797,807 | |
| | | | | | |
|
|
|
Canada — 2.3% | |
Alimentation Couche-Tard, Inc. (Class B Stock) | | | 55,431 | | | | 2,513,417 | |
Brookfield Asset Management, Inc. (Class A Stock) | | | 115,957 | | | | 3,827,740 | |
Canadian Natural Resources Ltd. | | | 75,750 | | | | 2,414,910 | |
Canadian Pacific Railway Ltd. | | | 18,400 | | | | 2,626,968 | |
Constellation Software, Inc. | | | 6,507 | | | | 2,956,877 | |
Suncor Energy, Inc. | | | 99,479 | | | | 3,252,618 | |
Toronto-Dominion Bank (The) | | | 69,858 | | | | 3,445,423 | |
TransCanada Corp.(b) | | | 24,252 | | | | 1,094,978 | |
| | | | | | |
|
|
|
| | | | | | | | 22,132,931 | |
| | | | | | |
|
|
|
China — 1.0% | |
Alibaba Group Holding Ltd., ADR*(b) | | | 40,468 | | | | 3,553,495 | |
China Overseas Land & Investment Ltd. | | | 486,000 | | | | 1,278,739 | |
NetEase, Inc., ADR | | | 12,081 | | | | 2,601,522 | |
Tencent Holdings Ltd. | | | 91,600 | | | | 2,221,036 | |
Universal Health International Group Holding Ltd.* | | | 2,473,000 | | | | 113,012 | |
| | | | | | |
|
|
|
| | | | | | | | 9,767,804 | |
| | | | | | |
|
|
|
Denmark — 0.2% | |
Danske Bank A/S | | | 61,200 | | | | 1,851,530 | |
| | | | | | |
|
|
|
| | | | | | | | |
COMMON STOCKS (continued) | | Shares
| | | Value
(Note 2)
| |
Finland — 0.7% | |
Kone OYJ (Class B Stock) | | | 48,286 | | | $ | 2,157,599 | |
Sampo OYJ (Class A Stock) | | | 62,726 | | | | 2,804,028 | |
Tieto OYJ | | | 18,100 | | | | 492,499 | |
UPM-Kymmene OYJ | | | 57,300 | | | | 1,401,308 | |
| | | | | | |
|
|
|
| | | | | | | | 6,855,434 | |
| | | | | | |
|
|
|
France — 4.4% | |
Arkema SA | | | 34,521 | | | | 3,374,464 | |
Atos SE | | | 15,600 | | | | 1,644,208 | |
AXA SA | | | 46,300 | | | | 1,167,171 | |
BNP Paribas SA | | | 82,959 | | | | 5,279,355 | |
Carrefour SA | | | 47,800 | | | | 1,150,835 | |
Cie Generale des Etablissements Michelin | | | 12,000 | | | | 1,333,910 | |
CNP Assurances | | | 46,700 | | | | 864,388 | |
Credit Agricole SA | | | 78,500 | | | | 971,730 | |
Electricite de France SA(b) | | | 61,800 | | | | 628,809 | |
Engie SA | | | 35,200 | | | | 448,061 | |
Orange SA | | | 79,700 | | | | 1,208,573 | |
Renault SA | | | 12,300 | | | | 1,092,450 | |
Sanofi | | | 44,400 | | | | 3,590,426 | |
SCOR SE | | | 22,000 | | | | 759,239 | |
Societe Generale SA | | | 28,600 | | | | 1,406,748 | |
Total SA | | | 110,316 | | | | 5,658,358 | |
Total SA, ADR | | | 118,650 | | | | 6,047,591 | |
Valeo SA | | | 85,854 | | | | 4,928,707 | |
Vinci SA | | | 12,619 | | | | 858,406 | |
| | | | | | |
|
|
|
| | | | | | | | 42,413,429 | |
| | | | | | |
|
|
|
Germany — 2.6% | |
Allianz SE | | | 9,800 | | | | 1,617,377 | |
Aurubis AG | | | 14,200 | | | | 817,248 | |
BASF SE | | | 18,900 | | | | 1,751,590 | |
Bayer AG | | | 19,100 | | | | 1,989,911 | |
Bayerische Motoren Werke AG | | | 12,200 | | | | 1,136,263 | |
Daimler AG | | | 27,600 | | | | 2,048,358 | |
Deutsche Bank AG* | | | 27,100 | | | | 491,578 | |
Deutsche Lufthansa AG | | | 54,200 | | | | 698,680 | |
Deutsche Post AG | | | 45,000 | | | | 1,475,782 | |
E.ON SE | | | 46,000 | | | | 323,609 | |
Evonik Industries AG | | | 36,500 | | | | 1,088,025 | |
Hannover Rueck SE | | | 4,500 | | | | 486,125 | |
Metro AG | | | 46,000 | | | | 1,528,913 | |
Muenchener Rueckversicherungs AG | | | 6,800 | | | | 1,284,374 | |
Rational AG | | | 2,354 | | | | 1,049,870 | |
Rheinmetall AG | | | 13,300 | | | | 892,576 | |
Siemens AG | | | 40,611 | | | | 4,972,426 | |
STADA Arzneimittel AG | | | 8,800 | | | | 454,626 | |
Uniper SE* | | | 4,600 | | | | 63,317 | |
Volkswagen AG | | | 7,400 | | | | 1,062,088 | |
| | | | | | |
|
|
|
| | | | | | | | 25,232,736 | |
| | | | | | |
|
|
|
Hong Kong — 1.2% | |
AIA Group Ltd. | | | 609,400 | | | | 3,413,762 | |
China Resources Cement Holdings Ltd. | | | 886,000 | | | | 342,582 | |
Huabao International Holdings Ltd.* | | | 1,045,000 | | | | 442,122 | |
Kingboard Chemical Holdings Ltd. | | | 216,000 | | | | 652,337 | |
SEE NOTES TO FINANCIAL STATEMENTS.
A105
| | | | | | |
| | | GLOBAL PORTFOLIO (continued) | | |
| |
| SCHEDULE OF INVESTMENTS | | as of December 31, 2016 |
| | | | | | | | |
COMMON STOCKS (continued) | | Shares
| | | Value
(Note 2)
| |
Hong Kong (continued) | | | | | | | | |
Lee & Man Paper Manufacturing Ltd. | | | 1,244,000 | | | $ | 959,232 | |
PCCW Ltd. | | | 870,000 | | | | 470,307 | |
Sands China Ltd. | | | 316,400 | | | | 1,365,005 | |
Singamas Container Holdings Ltd.* | | | 2,676,000 | | | | 288,800 | |
Skyworth Digital Holdings Ltd. | | | 1,072,000 | | | | 608,172 | |
WH Group Ltd. | | | 1,914,500 | | | | 1,543,273 | |
Wheelock & Co. Ltd. | | | 97,000 | | | | 544,388 | |
Yue Yuen Industrial Holdings Ltd. | | | 220,500 | | | | 799,248 | |
| | | | | | |
|
|
|
| | | | | | | | 11,429,228 | |
| | | | | | |
|
|
|
India — 0.8% | |
HDFC Bank Ltd., ADR | | | 76,217 | | | | 4,624,847 | |
Tata Motors Ltd., ADR | | | 74,679 | | | | 2,568,211 | |
| | | | | | |
|
|
|
| | | | | | | | 7,193,058 | |
| | | | | | |
|
|
|
Ireland — 2.1% | |
Experian PLC | | | 179,529 | | | | 3,475,996 | |
Johnson Controls International PLC | | | 113,948 | | | | 4,693,518 | |
Kingspan Group PLC | | | 98,407 | | | | 2,660,190 | |
Paddy Power Betfair PLC | | | 17,203 | | | | 1,830,523 | |
Ryanair Holdings PLC, ADR* | | | 38,703 | | | | 3,222,412 | |
Smurfit Kappa Group PLC | | | 35,200 | | | | 806,161 | |
XL Group Ltd. | | | 97,502 | | | | 3,632,924 | |
| | | | | | |
|
|
|
| | | | | | | | 20,321,724 | |
| | | | | | |
|
|
|
Israel — 0.3% | |
Bank Hapoalim BM | | | 200,200 | | | | 1,188,290 | |
Elbit Systems Ltd. | | | 6,400 | | | | 646,522 | |
Teva Pharmaceutical Industries Ltd. | | | 16,300 | | | | 586,918 | |
| | | | | | |
|
|
|
| | | | | | | | 2,421,730 | |
| | | | | | |
|
|
|
Italy — 0.7% | |
A2A SpA | | | 420,800 | | | | 543,457 | |
Astaldi SpA(b) | | | 62,200 | | | | 353,478 | |
Enel SpA | | | 348,600 | | | | 1,532,346 | |
Luxottica Group SpA | | | 63,307 | | | | 3,402,538 | |
Mediobanca SpA | | | 87,600 | | | | 713,425 | |
| | | | | | |
|
|
|
| | | | | | | | 6,545,244 | |
| | | | | | |
|
|
|
Japan — 8.4% | |
Aisan Industry Co. Ltd. | | | 68,400 | | | | 584,225 | |
Aoyama Trading Co. Ltd. | | | 9,900 | | | | 344,022 | |
Aozora Bank Ltd. | | | 156,000 | | | | 551,188 | |
Asahi Kasei Corp. | | | 103,000 | | | | 896,231 | |
Astellas Pharma, Inc. | | | 75,600 | | | | 1,048,826 | |
Calsonic Kansei Corp. | | | 105,000 | | | | 1,609,375 | |
Concordia Financial Group Ltd. | | | 121,000 | | | | 582,267 | |
Daikin Industries Ltd. | | | 39,300 | | | | 3,600,230 | |
Daito Trust Construction Co. Ltd. | | | 14,400 | | | | 2,164,865 | |
Dowa Holdings Co. Ltd. | | | 75,000 | | | | 570,334 | |
Enplas Corp. | | | 18,500 | | | | 544,566 | |
FANUC Corp. | | | 19,000 | | | | 3,178,595 | |
Fuji Electric Co. Ltd. | | | 131,000 | | | | 676,445 | |
Fuji Heavy Industries Ltd. | | | 85,274 | | | | 3,474,439 | |
Fujikura Ltd. | | | 254,000 | | | | 1,375,500 | |
Fujitec Co. Ltd. | | | 77,100 | | | | 901,854 | |
Heiwa Corp. | | | 34,800 | | | | 795,053 | |
Hoya Corp. | | | 44,300 | | | | 1,857,473 | |
Isuzu Motors Ltd. | | | 78,200 | | | | 988,802 | |
| | | | | | | | |
COMMON STOCKS (continued) | | Shares
| | | Value
(Note 2)
| |
Japan (continued) | | | | | | | | |
ITOCHU Corp. | | | 37,100 | | | $ | 491,232 | |
Japan Airlines Co. Ltd. | | | 28,000 | | | | 817,062 | |
Kaneka Corp. | | | 74,000 | | | | 601,910 | |
KDDI Corp. | | | 44,800 | | | | 1,131,333 | |
Keihin Corp. | | | 54,300 | | | | 949,023 | |
Keyence Corp. | | | 4,700 | | | | 3,215,973 | |
Komori Corp. | | | 40,000 | | | | 522,580 | |
Konica Minolta, Inc. | | | 129,600 | | | | 1,284,427 | |
Kureha Corp. | | | 25,500 | | | | 957,097 | |
KYORIN Holdings, Inc. | | | 37,400 | | | | 800,332 | |
Kyowa Exeo Corp. | | | 66,900 | | | | 960,990 | |
Lintec Corp. | | | 30,000 | | | | 652,763 | |
Makita Corp. | | | 38,100 | | | | 2,545,800 | |
Marubeni Corp. | | | 109,700 | | | | 620,472 | |
Matsumotokiyoshi Holdings Co. Ltd. | | | 15,400 | | | | 757,618 | |
Mitsubishi Gas Chemical Co., Inc. | | | 117,000 | | | | 1,993,613 | |
Mitsubishi UFJ Financial Group, Inc. | | | 755,200 | | | | 4,657,563 | |
Mizuho Financial Group, Inc. | | | 597,700 | | | | 1,072,594 | |
NEC Corp. | | | 213,000 | | | | 563,369 | |
Nippon Prologis REIT, Inc. | | | 903 | | | | 1,846,519 | |
Nippon Telegraph & Telephone Corp. | | | 62,800 | | | | 2,643,576 | |
Nishi-Nippon Financial Holdings, Inc.* | | | 48,600 | | | | 508,559 | |
Nissan Motor Co. Ltd. | | | 161,600 | | | | 1,621,033 | |
Nisshinbo Holdings, Inc. | | | 81,000 | | | | 779,937 | |
Nitori Holdings Co. Ltd. | | | 22,600 | | | | 2,576,739 | |
NTT DOCOMO, Inc. | | | 39,300 | | | | 893,889 | |
ORIX Corp. | | | 213,400 | | | | 3,321,412 | |
Park24 Co. Ltd. | | | 30,300 | | | | 820,505 | |
Resona Holdings, Inc. | | | 416,800 | | | | 2,136,108 | |
Sankyu, Inc. | | | 126,000 | | | | 760,291 | |
Sawai Pharmaceutical Co. Ltd. | | | 9,200 | | | | 493,159 | |
Seino Holdings Co. Ltd. | | | 52,600 | | | | 582,832 | |
Shimachu Co. Ltd. | | | 30,700 | | | | 816,894 | |
SKY Perfect JSAT Holdings, Inc. | | | 151,000 | | | | 693,741 | |
Sumitomo Heavy Industries Ltd. | | | 116,000 | | | | 744,854 | |
Sumitomo Mitsui Financial Group, Inc. | | | 33,900 | | | | 1,291,013 | |
Sumitomo Osaka Cement Co. Ltd. | | | 184,500 | | | | 695,167 | |
T-Gaia Corp. | | | 39,000 | | | | 633,657 | |
Toagosei Co. Ltd. | | | 73,500 | | | | 721,427 | |
Toho Holdings Co. Ltd. | | | 36,900 | | | | 735,423 | |
Towa Pharmaceutical Co. Ltd. | | | 9,400 | | | | 367,900 | |
Toyo Tire & Rubber Co. Ltd. | | | 35,200 | | | | 437,206 | |
Toyoda Gosei Co. Ltd. | | | 33,200 | | | | 774,861 | |
Toyota Motor Corp. | | | 15,730 | | | | 922,225 | |
Tsubakimoto Chain Co. | | | 85,000 | | | | 689,215 | |
Tsumura & Co. | | | 15,700 | | | | 432,120 | |
Ube Industries Ltd. | | | 301,000 | | | | 628,971 | |
Yokohama Rubber Co. Ltd. (The) | | | 45,000 | | | | 804,387 | |
| | | | | | |
|
|
|
| | | | | | | | 80,713,661 | |
| | | | | | |
|
|
|
Liechtenstein | |
VP Bank AG | | | 1,765 | | | | 187,093 | |
| | | | | | |
|
|
|
Mexico — 0.1% | |
Wal-Mart de Mexico SAB de CV | | | 419,400 | | | | 750,603 | |
| | | | | | |
|
|
|
Netherlands — 3.0% | |
ABN AMRO Group NV | | | 28,800 | | | | 637,685 | |
Aegon NV | | | 95,000 | | | | 521,898 | |
SEE NOTES TO FINANCIAL STATEMENTS.
A106
| | | | | | |
| | | GLOBAL PORTFOLIO (continued) | | |
| |
| SCHEDULE OF INVESTMENTS | | as of December 31, 2016 |
| | | | | | | | |
COMMON STOCKS (continued) | | Shares
| | | Value
(Note 2)
| |
Netherlands (continued) | | | | | | | | |
ING Groep NV , CVA | | | 75,400 | | | $ | 1,061,542 | |
Koninklijke Ahold Delhaize NV | | | 70,500 | | | | 1,484,946 | |
Koninklijke Philips NV | | | 89,883 | | | | 2,747,905 | |
NN Group NV | | | 46,800 | | | | 1,584,304 | |
NXP Semiconductors NV* | | | 118,962 | | | | 11,659,466 | |
Royal Dutch Shell PLC (Class A Stock) | | | 137,501 | | | | 3,750,434 | |
Royal Dutch Shell PLC (Class A Stock), ADR | | | 79,650 | | | | 4,331,367 | |
Royal Dutch Shell PLC (Class B Stock) | | | 36,900 | | | | 1,060,214 | |
| | | | | | |
|
|
|
| | | | | | | | 28,839,761 | |
| | | | | | |
|
|
|
New Zealand — 0.2% | |
Air New Zealand Ltd. | | | 606,600 | | | | 923,800 | |
Fletcher Building Ltd. | | | 88,500 | | | | 650,276 | |
| | | | | | |
|
|
|
| | | | | | | | 1,574,076 | |
| | | | | | |
|
|
|
Norway — 0.3% | |
DNB ASA | | | 68,200 | | | | 1,012,450 | |
Salmar ASA | | | 18,100 | | | | 540,482 | |
Statoil ASA | | | 37,300 | | | | 680,788 | |
Yara International ASA | | | 23,200 | | | | 912,666 | |
| | | | | | |
|
|
|
| | | | | | | | 3,146,386 | |
| | | | | | |
|
|
|
Singapore — 0.2% | |
DBS Group Holdings Ltd. | | | 81,200 | | | | 968,784 | |
Wilmar International Ltd. | | | 302,500 | | | | 747,314 | |
| | | | | | |
|
|
|
| | | | | | | | 1,716,098 | |
| | | | | | |
|
|
|
South Africa — 0.3% | |
Bid Corp. Ltd. | | | 89,464 | | | | 1,585,665 | |
Mondi PLC | | | 52,500 | | | | 1,072,174 | |
| | | | | | |
|
|
|
| | | | | | | | 2,657,839 | |
| | | | | | |
|
|
|
Spain — 1.1% | |
Amadeus IT Holding SA (Class A Stock) | | | 49,623 | | | | 2,250,616 | |
Banco Santander SA | | | 137,900 | | | | 717,396 | |
Distribuidora Internacional de Alimentacion SA | | | 175,100 | | | | 858,795 | |
Gas Natural SDG SA | | | 47,300 | | | | 889,872 | |
Iberdrola SA | | | 150,200 | | | | 983,495 | |
Industria de Diseno Textil SA | | | 90,645 | | | | 3,087,920 | |
Mapfre SA | | | 219,300 | | | | 668,012 | |
Repsol SA | | | 73,100 | | | | 1,027,288 | |
| | | | | | |
|
|
|
| | | | | | | | 10,483,394 | |
| | | | | | |
|
|
|
Sweden — 0.8% | |
Atlas Copco AB (Class A Stock) | | | 76,482 | | | | 2,320,201 | |
Boliden AB | | | 36,700 | | | | 953,283 | |
Hexagon AB (Class B Stock) | | | 60,971 | | | | 2,171,540 | |
Nordea Bank AB | | | 83,600 | | | | 926,340 | |
Swedbank AB (Class A Stock) | | | 29,700 | | | | 715,606 | |
Telia Co. AB | | | 196,000 | | | | 787,370 | |
| | | | | | |
|
|
|
| | | | | | | | 7,874,340 | |
| | | | | | |
|
|
|
Switzerland — 3.5% | |
Actelion Ltd.* | | | 17,841 | | | | 3,855,593 | |
Aryzta AG | | | 18,700 | | | | 822,357 | |
| | | | | | | | |
COMMON STOCKS (continued) | | Shares
| | | Value
(Note 2)
| |
Switzerland (continued) | | | | | | | | |
Baloise Holding AG | | | 10,300 | | | $ | 1,296,100 | |
Bucher Industries AG | | | 2,800 | | | | 688,783 | |
Cembra Money Bank AG | | | 12,000 | | | | 872,914 | |
Credit Suisse Group AG | | | 113,100 | | | | 1,616,316 | |
Geberit AG | | | 6,944 | | | | 2,780,077 | |
Georg Fischer AG | | | 1,100 | | | | 899,608 | |
Helvetia Holding AG | | | 1,800 | | | | 968,492 | |
Lonza Group AG | | | 11,540 | | | | 1,994,449 | |
Partners Group Holding AG | | | 5,036 | | | | 2,357,543 | |
Roche Holding AG | | | 6,300 | | | | 1,436,101 | |
Swiss Life Holding AG* | | | 7,200 | | | | 2,033,848 | |
Swiss Re AG | | | 25,500 | | | | 2,412,629 | |
TE Connectivity Ltd. | | | 38,350 | | | | 2,656,888 | |
UBS Group AG | | | 66,800 | | | | 1,044,449 | |
Wolseley PLC | | | 52,266 | | | | 3,190,659 | |
Zurich Insurance Group AG | | | 8,400 | | | | 2,308,486 | |
| | | | | | |
|
|
|
| | | | | | | | 33,235,292 | |
| | | | | | |
|
|
|
Taiwan — 0.5% | |
Taiwan Semiconductor Manufacturing Co. Ltd. | | | 788,000 | | | | 4,413,790 | |
| | | | | | |
|
|
|
United Kingdom — 5.7% | |
3i Group PLC | | | 120,600 | | | | 1,043,244 | |
Ashtead Group PLC | | | 35,000 | | | | 680,417 | |
AstraZeneca PLC | | | 11,300 | | | | 617,071 | |
Aviva PLC | | | 129,800 | | | | 773,175 | |
BAE Systems PLC | | | 709,374 | | | | 5,159,697 | |
Barclays PLC | | | 266,300 | | | | 730,824 | |
Barratt Developments PLC | | | 109,300 | | | | 621,387 | |
Beazley PLC | | | 129,500 | | | | 618,982 | |
Bellway PLC | | | 25,400 | | | | 774,266 | |
Berkeley Group Holdings PLC | | | 25,300 | | | | 874,597 | |
Bovis Homes Group PLC | | | 66,300 | | | | 669,176 | |
BP PLC | | | 385,500 | | | | 2,414,566 | |
BT Group PLC | | | 100,400 | | | | 453,239 | |
Carillion PLC(b) | | | 145,900 | | | | 423,336 | |
Centrica PLC | | | 289,000 | | | | 832,338 | |
Compass Group PLC | | | 214,216 | | | | 3,959,069 | |
Crest Nicholson Holdings PLC | | | 143,814 | | | | 800,727 | |
Debenhams PLC | | | 301,400 | | | | 212,721 | |
easyJet PLC | | | 25,500 | | | | 315,422 | |
GKN PLC | | | 188,200 | | | | 767,088 | |
GlaxoSmithKline PLC | | | 130,000 | | | | 2,497,121 | |
Go-Ahead Group PLC | | | 15,200 | | | | 418,506 | |
HSBC Holdings PLC | | | 196,000 | | | | 1,581,458 | |
IG Group Holdings PLC | | | 176,211 | | | | 1,070,917 | |
Imperial Brands PLC | | | 10,600 | | | | 461,956 | |
Intermediate Capital Group | | | 53,155 | | | | 457,644 | |
Interserve PLC | | | 82,200 | | | | 346,128 | |
J. Sainsbury PLC | | | 536,900 | | | | 1,650,145 | |
Johnson Matthey PLC | | | 68,451 | | | | 2,678,316 | |
Keller Group PLC | | | 48,200 | | | | 503,254 | |
Kingfisher PLC | | | 160,800 | | | | 692,793 | |
Lloyds Banking Group PLC | | | 1,133,000 | | | | 870,011 | |
Man Group PLC | | | 308,300 | | | | 448,578 | |
Meggitt PLC | | | 115,600 | | | | 652,819 | |
Micro Focus International PLC | | | 63,295 | | | | 1,699,864 | |
Mitie Group PLC | | | 247,100 | | | | 682,305 | |
SEE NOTES TO FINANCIAL STATEMENTS.
A107
| | | | | | |
| | | GLOBAL PORTFOLIO (continued) | | |
| |
| SCHEDULE OF INVESTMENTS | | as of December 31, 2016 |
| | | | | | | | |
COMMON STOCKS (continued) | | Shares
| | | Value
(Note 2)
| |
United Kingdom (continued) | | | | | | | | |
National Express Group PLC | | | 197,400 | | | $ | 860,217 | |
Old Mutual PLC | | | 274,800 | | | | 700,736 | |
Paragon Group Cos. PLC (The) | | | 105,900 | | | | 539,649 | |
Premier Foods PLC* | | | 357,756 | | | | 206,525 | |
QinetiQ Group PLC | | | 214,000 | | | | 692,775 | |
Relx PLC | | | 158,509 | | | | 2,824,728 | |
Rio Tinto PLC | | | 81,768 | | | | 3,121,758 | |
Royal Mail PLC | | | 120,900 | | | | 687,247 | |
St. James’s Place PLC | | | 153,379 | | | | 1,913,228 | |
Vesuvius PLC | | | 81,100 | | | | 394,332 | |
WM Morrison Supermarkets PLC | | | 30,600 | | | | 86,913 | |
WPP PLC | | | 139,811 | | | | 3,111,292 | |
| | | | | | |
|
|
|
| | | | | | | | 54,592,557 | |
| | | | | | |
|
|
|
United States — 54.4% | |
A.O. Smith Corp. | | | 70,704 | | | | 3,347,834 | |
Adient PLC* | | | 25,694 | | | | 1,505,668 | |
Adobe Systems, Inc.* | | | 88,012 | | | | 9,060,835 | |
AES Corp. | | | 252,470 | | | | 2,933,701 | |
Aetna, Inc. | | | 36,550 | | | | 4,532,565 | |
Akamai Technologies, Inc.* | | | 107,134 | | | | 7,143,695 | |
Alexion Pharmaceuticals, Inc.*(b) | | | 70,735 | | | | 8,654,427 | |
Alphabet, Inc. (Class A Stock)* | | | 4,892 | | | | 3,876,665 | |
Alphabet, Inc. (Class C Stock)* | | | 11,088 | | | | 8,557,940 | |
Amazon.com, Inc.* | | | 16,097 | | | | 12,070,657 | |
American Express Co. | | | 55,500 | | | | 4,111,440 | |
Ameriprise Financial, Inc. | | | 37,900 | | | | 4,204,626 | |
Amgen, Inc. | | | 4,900 | | | | 716,429 | |
Amphenol Corp. (Class A Stock) | | | 154,610 | | | | 10,389,792 | |
ANSYS, Inc.* | | | 54,232 | | | | 5,015,918 | |
Apache Corp. | | | 49,400 | | | | 3,135,418 | |
Apple, Inc. | | | 29,250 | | | | 3,387,735 | |
Applied Materials, Inc. | | | 73,150 | | | | 2,360,551 | |
Bank of America Corp. | | | 142,550 | | | | 3,150,355 | |
Bank of New York Mellon Corp. (The) | | | 122,050 | | | | 5,782,729 | |
Boeing Co. (The) | | | 28,600 | | | | 4,452,448 | |
Bunge Ltd. | | | 37,400 | | | | 2,701,776 | |
Carnival Corp. | | | 52,450 | | | | 2,730,547 | |
Cisco Systems, Inc. | | | 171,350 | | | | 5,178,197 | |
Citigroup, Inc. | | | 83,450 | | | | 4,959,433 | |
Cognizant Technology Solutions Corp. (Class A Stock)* | | | 135,691 | | | | 7,602,767 | |
Comcast Corp. (Class A Stock) | | | 74,400 | | | | 5,137,320 | |
Costco Wholesale Corp.(b) | | | 67,261 | | | | 10,769,159 | |
Coty, Inc. (Class A Stock) | | | 67,830 | | | | 1,241,967 | |
Cummins, Inc. | | | 16,100 | | | | 2,200,387 | |
Danaher Corp. | | | 133,195 | | | | 10,367,899 | |
DaVita, Inc.* | | | 97,801 | | | | 6,278,824 | |
DexCom, Inc.*(b) | | | 104,745 | | | | 6,253,276 | |
E.I. du Pont de Nemours & Co. | | | 49,300 | | | | 3,618,620 | |
Ecolab, Inc. | | | 86,209 | | | | 10,105,419 | |
Entergy Corp. | | | 19,950 | | | | 1,465,727 | |
EQT Corp. | | | 24,100 | | | | 1,576,140 | |
Estee Lauder Cos., Inc. (The) (Class A Stock) | | | 115,801 | | | | 8,857,618 | |
Exelon Corp. | | | 127,200 | | | | 4,514,328 | |
Exxon Mobil Corp. | | | 72,000 | | | | 6,498,720 | |
Facebook, Inc. (Class A Stock)* | | | 100,963 | | | | 11,615,793 | |
| | | | | | | | |
COMMON STOCKS (continued) | | Shares
| | | Value
(Note 2)
| |
United States (continued) | | | | | | | | |
Fifth Third Bancorp | | | 193,900 | | | $ | 5,229,483 | |
FirstEnergy Corp. | | | 59,821 | | | | 1,852,656 | |
FleetCor Technologies, Inc.* | | | 45,553 | | | | 6,446,661 | |
Fortive Corp. | | | 142,873 | | | | 7,662,279 | |
General Electric Co. | | | 213,600 | | | | 6,749,760 | |
General Motors Co. | | | 41,850 | | | | 1,458,054 | |
Genpact Ltd.* | | | 258,037 | | | | 6,280,621 | |
Gilead Sciences, Inc. | | | 22,650 | | | | 1,621,967 | |
Hess Corp. | | | 45,700 | | | | 2,846,653 | |
Hologic, Inc.* | | | 64,750 | | | | 2,597,770 | |
Illinois Tool Works, Inc. | | | 27,350 | | | | 3,349,281 | |
International Paper Co. | | | 42,800 | | | | 2,270,968 | |
Intuitive Surgical, Inc.* | | | 15,069 | | | | 9,556,308 | |
Invesco Ltd. | | | 67,050 | | | | 2,034,297 | |
Johnson & Johnson | | | 49,200 | | | | 5,668,332 | |
JPMorgan Chase & Co. | | | 130,200 | | | | 11,234,958 | |
Kohl’s Corp.(b) | | | 39,850 | | | | 1,967,793 | |
Las Vegas Sands Corp. | | | 40,000 | | | | 2,136,400 | |
Loews Corp. | | | 72,150 | | | | 3,378,785 | |
Lowe’s Cos., Inc. | | | 45,850 | | | | 3,260,852 | |
Marsh & McLennan Cos., Inc. | | | 55,430 | | | | 3,746,514 | |
Mattel, Inc.(b) | | | 86,900 | | | | 2,394,095 | |
Mead Johnson Nutrition Co. | | | 103,981 | | | | 7,357,696 | |
Medtronic PLC | | | 71,571 | | | | 5,098,002 | |
Merck & Co., Inc. | | | 77,350 | | | | 4,553,594 | |
MetLife, Inc. | | | 114,900 | | | | 6,191,961 | |
Microsoft Corp. | | | 127,200 | | | | 7,904,208 | |
Morgan Stanley | | | 180,800 | | | | 7,638,800 | |
News Corp. (Class A Stock) | | | 148,200 | | | | 1,698,372 | |
Occidental Petroleum Corp. | | | 53,400 | | | | 3,803,682 | |
PayPal Holdings, Inc. | | | 200,276 | | | | 7,904,894 | |
PepsiCo, Inc. | | | 42,250 | | | | 4,420,617 | |
Pfizer, Inc. | | | 249,250 | | | | 8,095,640 | |
PG&E Corp. | | | 136,650 | | | | 8,304,220 | |
Philip Morris International, Inc. | | | 57,650 | | | | 5,274,398 | |
Procter & Gamble Co. (The) | | | 41,446 | | | | 3,484,780 | |
QUALCOMM, Inc. | | | 59,300 | | | | 3,866,360 | |
Raytheon Co. | | | 13,850 | | | | 1,966,700 | |
Roper Technologies, Inc. | | | 48,621 | | | | 8,901,533 | |
salesforce.com, inc.* | | | 111,469 | | | | 7,631,168 | |
SBA Communications Corp. (Class A Stock)* | | | 75,230 | | | | 7,768,250 | |
Shire PLC | | | 51,554 | | | | 2,943,712 | |
Southwest Airlines Co. | | | 61,250 | | | | 3,052,700 | |
Starbucks Corp. | | | 209,837 | | | | 11,650,150 | |
Stericycle, Inc.* | | | 18,370 | | | | 1,415,225 | |
T-Mobile U.S., Inc.* | | | 21,850 | | | | 1,256,594 | |
Texas Instruments, Inc. | | | 34,750 | | | | 2,535,708 | |
Thermo Fisher Scientific, Inc. | | | 25,650 | | | | 3,619,215 | |
TripAdvisor, Inc.*(b) | | | 145,673 | | | | 6,754,857 | |
Twenty-First Century Fox (Class B Stock) | | | 163,550 | | | | 4,456,737 | |
Tyson Foods, Inc. (Class A Stock) | | | 53,900 | | | | 3,324,552 | |
U.S. Bancorp | | | 47,300 | | | | 2,429,801 | |
Under Armour, Inc. (Class A Stock)*(b) | | | 70,259 | | | | 2,041,024 | |
Under Armour, Inc. (Class C Stock)*(b) | | | 145,504 | | | | 3,662,336 | |
SEE NOTES TO FINANCIAL STATEMENTS.
A108
| | | | | | |
| | | GLOBAL PORTFOLIO (continued) | | |
| |
| SCHEDULE OF INVESTMENTS | | as of December 31, 2016 |
| | | | | | | | |
COMMON STOCKS (continued) | | Shares
| | | Value
(Note 2)
| |
United States (continued) | | | | | | | | |
United Technologies Corp. | | | 32,650 | | | $ | 3,579,093 | |
VEREIT, Inc. | | | 207,745 | | | | 1,757,523 | |
Verizon Communications, Inc. | | | 55,450 | | | | 2,959,921 | |
Visa, Inc. (Class A Stock)(b) | | | 157,627 | | | | 12,298,059 | |
Vulcan Materials Co. | | | 19,650 | | | | 2,459,198 | |
Wabtec Corp.(b) | | | 87,757 | | | | 7,285,586 | |
Wal-Mart Stores, Inc. | | | 40,050 | | | | 2,768,256 | |
Wells Fargo & Co. | | | 113,500 | | | | 6,254,985 | |
Weyerhaeuser Co. | | | 59,150 | | | | 1,779,824 | |
Yum China Holdings, Inc.* | | | 64,995 | | | | 1,697,669 | |
| | | | | | |
|
|
|
| | | | | | | | 519,657,432 | |
| | | | | | |
|
|
|
TOTAL COMMON STOCKS
(cost $779,396,328) | | | | 925,902,164 | |
| | | | | | |
|
|
|
PREFERRED STOCKS — 0.2%
| |
Electric Utilities | |
NextEra Energy, Inc.
(cost $2,218,570)(b) | | | 45,298 | | | | 2,218,696 | |
| | | | | | |
|
|
|
| | |
| | | Units
| | | | |
| RIGHTS* | | | | | | | | |
Spain | | | | | | | | |
Repsol SA, expiring 01/06/17(b)
(cost $25,470) | | | 73,100 | | | | 27,086 | |
| | | | | | |
|
|
|
TOTAL LONG-TERM INVESTMENTS
(cost $781,640,368) | | | | | | | 928,147,946 | |
| | | | | | |
|
|
|
| SHORT-TERM INVESTMENTS — 7.0% | |
| | |
| | | Shares
| | | | |
AFFILIATED MUTUAL FUNDS | | | | | | | | |
Prudential Investment Portfolios 2 — Prudential Core Ultra Short Bond Fund(c) | | | 23,423,919 | | | | 23,423,919 | |
Prudential Investment Portfolios 2 — Prudential Institutional Money Market Fund
(cost $43,410,440; includes $43,374,675 of cash collateral for securities on loan)(c)(d) | | | 43,410,036 | | | | 43,418,718 | |
| | | | | | |
|
|
|
TOTAL SHORT-TERM INVESTMENTS
(cost $66,834,359)(Note 4) | | | | 66,842,637 | |
| | | | | | |
|
|
|
TOTAL INVESTMENTS — 104.1%
(cost $848,474,727) | | | | 994,990,583 | |
LIABILITIES IN EXCESS OF
OTHER ASSETS — (4.1)% | | | | (39,628,975 | ) |
| | | | | | |
|
|
|
NET ASSETS — 100.0% | | | $ | 955,361,608 | |
| | | | | | |
|
|
|
See Glossary for abbreviations used in the annual report.
| * | Non-income producing security. |
| (a) | Indicates a Level 3 security. The aggregate value of Level 3 securities is $14,105 and 0.0% of net assets. |
| (b) | All or a portion of security is on loan. The aggregate market value of such securities, including those sold and pending settlement, is $42,176,630; cash collateral of $43,374,675 (included in liabilities) was received with which the Portfolio purchased highly liquid short-term investments. Securities on loan are subject to contractual netting arrangements. |
| (c) | Prudential Investments LLC, the manager of the Portfolio, also serves as manager of the Prudential Investment Portfolios 2 — Prudential Core Ultra Short Bond Fund and the Prudential Investment Portfolios 2 — Prudential Institutional Money Market Fund. |
| (d) | Represents security purchased with cash collateral received for securities on loan and includes dividend reinvestment. |
Various inputs are used in determining the value of the Portfolio’s investments. These inputs are summarized in the three broad levels listed below.
| Level 1— | quoted prices generally in active markets for identical securities. |
| Level 2— | quoted prices for similar securities, interest rates and yield curves, prepayment speeds, foreign currency exchange rates and other observable inputs. |
| Level 3— | unobservable inputs for securities valued in accordance with Board approved fair valuation procedures. |
SEE NOTES TO FINANCIAL STATEMENTS.
A109
| | | | | | |
| | | GLOBAL PORTFOLIO (continued) | | |
| |
| SCHEDULE OF INVESTMENTS | | as of December 31, 2016 |
The following is a summary of the inputs used as of December 31, 2016 in valuing such portfolio securities:
| | | | | | | | | | | | |
| | | Level 1
| | | Level 2
| | | Level 3
| |
Investments in Securities | | | | | | | | | | | | |
Common Stocks | | | | | | | | | | | | |
Australia | | $ | — | | | $ | 14,802,766 | | | $ | 14,105 | |
Austria | | | — | | | | 2,402,363 | | | | — | |
Belgium | | | — | | | | 877,953 | | | | — | |
Brazil | | | 1,797,807 | | | | — | | | | — | |
Canada | | | 22,132,931 | | | | — | | | | — | |
China | | | 6,155,017 | | | | 3,612,787 | | | | — | |
Denmark | | | — | | | | 1,851,530 | | | | — | |
Finland | | | — | | | | 6,855,434 | | | | — | |
France | | | 6,047,591 | | | | 36,365,838 | | | | — | |
Germany | | | — | | | | 25,232,736 | | | | — | |
Hong Kong | | | — | | | | 11,429,228 | | | | — | |
India | | | 7,193,058 | | | | — | | | | — | |
Ireland | | | 11,548,854 | | | | 8,772,870 | | | | — | |
Israel | | | — | | | | 2,421,730 | | | | — | |
Italy | | | — | | | | 6,545,244 | | | | — | |
Japan | | | 508,559 | | | | 80,205,102 | | | | — | |
Liechtenstein | | | — | | | | 187,093 | | | | — | |
Mexico | | | 750,603 | | | | — | | | | — | |
Netherlands | | | 15,990,833 | | | | 12,848,928 | | | | — | |
New Zealand | | | — | | | | 1,574,076 | | | | — | |
Norway | | | — | | | | 3,146,386 | | | | — | |
Singapore | | | — | | | | 1,716,098 | | | | — | |
South Africa | | | — | | | | 2,657,839 | | | | — | |
Spain | | | — | | | | 10,483,394 | | | | — | |
Sweden | | | — | | | | 7,874,340 | | | | — | |
Switzerland | | | 2,656,888 | | | | 30,578,404 | | | | — | |
Taiwan | | | — | | | | 4,413,790 | | | | — | |
United Kingdom | | | — | | | | 54,592,557 | | | | — | |
United States | | | 516,713,720 | | | | 2,943,712 | | | | — | |
Preferred Stocks | | | 2,218,696 | | | | — | | | | — | |
Rights – Spain | | | 27,086 | | | | — | | | | — | |
Affiliated Mutual Funds | | | 66,842,637 | | | | — | | | | — | |
| | |
|
|
| |
|
|
| |
|
|
|
Total | | $ | 660,584,280 | | | $ | 334,392,198 | | | $ | 14,105 | |
| | |
|
|
| |
|
|
| |
|
|
|
During the period, there were no transfers between Level 1 and Level 2 to report.
The industry classification of investments and liabilities in excess of other assets shown as a percentage of net assets as of December 31, 2016 were as follows (unaudited):
| | | | |
Banks | | | 8.0 | % |
Affiliated Mutual Funds (including 4.5% of collateral for securities on loan) | | | 7.0 | |
Oil, Gas & Consumable Fuels | | | 5.3 | |
IT Services | | | 5.0 | |
Insurance | | | 5.0 | |
Internet Software & Services | | | 4.1 | |
Health Care Equipment & Supplies | | | 3.8 | |
Machinery | | | 3.7 | |
Capital Markets | | | 3.5 | |
Software | | | 3.5 | |
Pharmaceuticals | | | 3.4 | |
Chemicals | | | 3.4 | |
Food & Staples Retailing | | | 2.9 | |
Hotels, Restaurants & Leisure | | | 2.6 | |
Industrial Conglomerates | | | 2.6 | |
Semiconductors & Semiconductor Equipment | | | 2.6 | |
| | | | |
Electric Utilities | | | 2.4 | % |
Electronic Equipment, Instruments & Components | | | 2.1 | |
Internet & Direct Marketing Retail | | | 2.0 | |
Biotechnology | | | 1.9 | |
Aerospace & Defense | | | 1.9 | |
Food Products | | | 1.8 | |
Building Products | | | 1.7 | |
Automobiles | | | 1.6 | |
Media | | | 1.6 | |
Diversified Telecommunication Services | | | 1.5 | |
Auto Components | | | 1.4 | |
Health Care Providers & Services | | | 1.3 | |
Specialty Retail | | | 1.1 | |
Personal Products | | | 1.1 | |
Airlines | | | 1.0 | |
Textiles, Apparel & Luxury Goods | | | 1.0 | |
Metals & Mining | | | 0.9 | |
SEE NOTES TO FINANCIAL STATEMENTS.
A110
| | | | | | |
| | | GLOBAL PORTFOLIO (continued) | | |
| |
| SCHEDULE OF INVESTMENTS | | as of December 31, 2016 |
| | | | |
Industry table (cont.)
| | | |
Professional Services | | | 0.6 | % |
Construction Materials | | | 0.6 | |
Life Sciences Tools & Services | | | 0.6 | |
Equity Real Estate Investment Trusts (REITs) | | | 0.6 | |
Road & Rail | | | 0.6 | |
Technology Hardware, Storage & Peripherals | | | 0.6 | |
Trading Companies & Distributors | | | 0.6 | |
Household Durables | | | 0.6 | |
Tobacco | | | 0.5 | |
Real Estate Management & Development | | | 0.5 | |
Communications Equipment | | | 0.5 | |
Consumer Finance | | | 0.5 | |
Beverages | | | 0.5 | |
Commercial Services & Supplies | | | 0.4 | |
Household Products | | | 0.4 | |
Multiline Retail | | | 0.4 | |
| | | | |
Construction & Engineering | | | 0.3 | % |
Paper & Forest Products | | | 0.3 | |
Diversified Financial Services | | | 0.3 | |
Wireless Telecommunication Services | | | 0.3 | |
Leisure Products | | | 0.3 | |
Containers & Packaging | | | 0.3 | |
Independent Power & Renewable Electricity Producers | | | 0.3 | |
Air Freight & Logistics | | | 0.2 | |
Multi-Utilities | | | 0.2 | |
Electrical Equipment | | | 0.2 | |
Gas Utilities | | | 0.1 | |
Thrifts & Mortgage Finance | | | 0.1 | |
| | |
|
|
|
| | | | 104.1 | |
Liabilities in excess of other assets | | | (4.1 | ) |
| | |
|
|
|
| | | | 100.0 | % |
| | |
|
|
|
The Portfolio invested in derivative instruments during the reporting period. The primary type of risk associated with these derivative instruments is equity risk. The effect of such derivative instruments on the Portfolio’s financial position and financial performance as reflected in the Statement of Assets and Liabilities and Statement of Operations is presented in the summary below.
Fair values of derivative instruments as of December 31, 2016 as presented in the Statement of Assets and Liabilities:
| | | | | | | | | | | | |
Derivatives not designated for as hedging
instruments, carried at fair value
| | Asset Derivatives
| | | Liability Derivatives
| |
| | Balance Sheet Location
| | Fair Value
| | | Balance Sheet Location
| | Fair Value
| |
Equity contracts | | Unaffiliated investments | | $ | 27,086 | | | — | | $ | — | |
| | | | |
|
|
| | | |
|
|
|
The effects of derivative instruments on the Statement of Operations for the year ended December 31, 2016 are as follows:
For the year ended December 31, 2016, the Portfolio did not have any realized gain (loss) on derivatives recognized in income.
| | | | |
Change in Unrealized Appreciation (Depreciation) on Derivatives Recognized in Income
| |
Derivatives not accounted for as hedging instruments, carried at fair value
| | Rights*
| |
Equity contracts | | $ | 2,193 | |
| | |
|
|
|
| * | Included in net change in unrealized appreciation (depreciation) on investments in the Statement of Operations. |
The Portfolio entered into financial transactions during the reporting period that are either offset in accordance with current requirements or are subject to enforceable master netting arrangements or similar agreements that permit offsetting. The information about offsetting and related netting arrangements for financial transactions, where the legal right to set-off exists, is presented in the summary below.
Offsetting of financial transactions assets and liabilities:
| | | | | | | | | | | | |
Description
| | Gross Amounts of
Recognized Assets(1)
| | | Collateral
Received
| | | Net Amount
| |
Securities on Loan | | $ | 42,176,630 | | | $ | (42,176,630 | ) | | $ | — | |
| | |
|
|
| | | | | | | | |
| (1) | Amount represents market value. |
SEE NOTES TO FINANCIAL STATEMENTS.
A111
| | | | | | |
| | | GLOBAL PORTFOLIO (continued) | | |
STATEMENT OF ASSETS & LIABILITIES
as of December 31, 2016
| | | | |
| ASSETS | |
Investments at value, including securities on loan of $42,176,630: | | | | |
Unaffiliated investments (cost $781,640,368) | | $ | 928,147,946 | |
Affiliated investments (cost $66,834,359) | | | 66,842,637 | |
Foreign currency, at value (cost $2,905,990) | | | 2,893,109 | |
Receivable for investments sold | | | 1,896,524 | |
Tax reclaim receivable | | | 1,451,095 | |
Dividends and interest receivable | | | 1,089,961 | |
Receivable from affiliate | | | 23,845 | |
Receivable for Series shares sold | | | 3,620 | |
Prepaid expenses | | | 7,229 | |
| | |
|
|
|
Total Assets | | | 1,002,355,966 | |
| | |
|
|
|
| LIABILITIES | |
Payable to broker for collateral for securities on loan | | | 43,374,675 | |
Payable for investments purchased | | | 2,808,029 | |
Management fee payable | | | 592,220 | |
Accrued expenses and other liabilities | | | 181,287 | |
Payable for Series shares repurchased | | | 37,167 | |
Affiliated transfer agent fee payable | | | 980 | |
| | |
|
|
|
Total Liabilities | | | 46,994,358 | |
| | |
|
|
|
| NET ASSETS | | $ | 955,361,608 | |
| | |
|
|
|
Net assets were comprised of: | |
Paid-in capital | | $ | 706,818,283 | |
Retained earnings | | | 248,543,325 | |
| | |
|
|
|
Net assets, December 31, 2016 | | $ | 955,361,608 | |
| | |
|
|
|
Net asset value and redemption price per share $955,361,608 / 34,741,496 outstanding shares of beneficial interest | | $ | 27.50 | |
| | |
|
|
|
STATEMENT OF OPERATIONS
Year Ended December 31, 2016
| | | | |
| NET INVESTMENT INCOME (LOSS) | |
| INCOME | |
Unaffiliated dividend income (net) ( foreign withholding tax $1,509,894, of which $99,518 is reimbursable by an affiliate) | | $ | 19,041,634 | |
Income from securities lending, net (including affiliated income of $326,597) | | | 424,539 | |
Affiliated dividend income | | | 175,000 | |
| | |
|
|
|
Total income | | | 19,641,173 | |
| | |
|
|
|
| EXPENSES | |
Management fee | | | 7,065,842 | |
Custodian and accounting fees (net of $41,400 fee credit) | | | 337,000 | |
Shareholders’ reports | | | 102,000 | |
Audit fee | | | 33,000 | |
Trustees’ fees | | | 18,000 | |
Transfer agent’s fees and expenses (including affiliated expense of $5,900) | | | 12,000 | |
Legal fees and expenses | | | 12,000 | |
Insurance expenses | | | 10,000 | |
Miscellaneous | | | 48,786 | |
| | |
|
|
|
Total expenses | | | 7,638,628 | |
Less: Management fee waiver | | | (126,009 | ) |
| | |
|
|
|
Net expenses | | | 7,512,619 | |
| | |
|
|
|
| NET INVESTMENT INCOME (LOSS) | | | 12,128,554 | |
| | |
|
|
|
REALIZED AND UNREALIZED GAIN (LOSS) ON
INVESTMENT AND FOREIGN CURRENCY TRANSACTIONS | |
Net realized gain (loss) on: | |
Investment transactions (including affiliated of $5,373) | | | 7,321,891 | |
Foreign currency transactions | | | (353,587 | ) |
| | |
|
|
|
| | | | 6,968,304 | |
| | |
|
|
|
Net change in unrealized appreciation (depreciation) on: | |
Investments (including affiliated of $8,278) | | | 20,940,203 | |
Foreign currencies | | | 12,039 | |
| | |
|
|
|
| | | | 20,952,242 | |
| | |
|
|
|
| NET GAIN (LOSS) ON INVESTMENT AND FOREIGN CURRENCY TRANSACTIONS | | | 27,920,546 | |
| | |
|
|
|
| NET INCREASE (DECREASE) IN NET ASSETS RESULTING FROM OPERATIONS | | $ | 40,049,100 | |
| | |
|
|
|
STATEMENT OF CHANGES IN NET ASSETS
| | | | | | | | |
| | | Year Ended December 31,
| |
| | | 2016
| | | 2015
| |
| INCREASE (DECREASE) IN NET ASSETS | |
| OPERATIONS | |
Net investment income (loss) | | $ | 12,128,554 | | | $ | 10,401,170 | |
Net realized gain (loss) on investment and foreign currency transactions | | | 6,968,304 | | | | 30,378,029 | |
Net change in unrealized appreciation (depreciation) on investments and foreign currencies | | | 20,952,242 | | | | (12,947,986 | ) |
| | |
|
|
| |
|
|
|
NET INCREASE (DECREASE) IN NET ASSETS RESULTING FROM OPERATIONS | | | 40,049,100 | | | | 27,831,213 | |
| | |
|
|
| |
|
|
|
| SERIES SHARE TRANSACTIONS | |
Series shares sold [177,123 and 10,575,719 shares, respectively] | | | 4,692,671 | | | | 267,851,761 | |
Series shares repurchased [2,096,896 and 1,878,916 shares, respectively] | | | (55,475,254 | ) | | | (49,569,010 | ) |
| | |
|
|
| |
|
|
|
NET INCREASE (DECREASE) IN NET ASSETS FROM SERIES SHARE TRANSACTIONS | | | (50,782,583 | ) | | | 218,282,751 | |
| | |
|
|
| |
|
|
|
| CAPITAL CONTRIBUTIONS (Note 4) | | | 808,056 | | | | — | |
| | |
|
|
| |
|
|
|
| TOTAL INCREASE (DECREASE) | | | (9,925,427 | ) | | | 246,113,964 | |
| NET ASSETS: | |
Beginning of year | | | 965,287,035 | | | | 719,173,071 | |
| | |
|
|
| |
|
|
|
End of year | | $ | 955,361,608 | | | $ | 965,287,035 | |
| | |
|
|
| |
|
|
|
SEE NOTES TO FINANCIAL STATEMENTS.
A112
| | | | | | |
| | | GOVERNMENT INCOME PORTFOLIO | | |
| |
| SCHEDULE OF INVESTMENTS | | as of December 31, 2016 |
| | | | | | | | | | | | | | | | |
| LONG-TERM INVESTMENTS — 98.7% | |
| ASSET-BACKED SECURITIES — 5.4% | | Interest
Rate
| | | Maturity
Date
| | | Principal
Amount
(000)#
| | | Value
(Note 2)
| |
Collateralized Loan Obligations — 5.3% | |
Anchorage Capital CLO Ltd. (Cayman Islands), Series 2014-5A, Class A, 144A | | | 2.480% | (a) | | | 10/15/26 | | | | 750 | | | $ | 751,904 | |
Battalion CLO Ltd. (Cayman Islands), Series 2014-7A, Class A1, 144A | | | 2.480% | (a) | | | 10/17/26 | | | | 750 | | | | 751,060 | |
Battalion CLO Ltd. (Cayman Islands), Series 2015-8A, Class A1, 144A | | | 2.412% | (a) | | | 04/18/27 | | | | 500 | | | | 500,182 | |
Blue Hill CLO Ltd. (Cayman Islands), Series 2013-1A, Class A, 144A | | | 2.360% | (a) | | | 01/15/26 | | | | 600 | | | | 600,963 | |
BlueMountain CLO Ltd. (Cayman Islands), Series 2015-1A, Class A1R, 144A | | | 2.065% | (a) | | | 04/13/27 | | | | 1,750 | | | | 1,750,000 | |
Flatiron CLO Ltd. (Cayman Islands), Series 2013-1A, Class A1, 144A | | | 2.280% | (a) | | | 01/17/26 | | | | 250 | | | | 249,917 | |
Galaxy CLO Ltd. (Cayman Islands), Series 2014-18A, Class A, 144A | | | 2.350% | (a) | | | 10/15/26 | | | | 3,250 | | | | 3,256,424 | |
OZLM Funding Ltd. (Cayman Islands), Series 2012-1A, Class A1R, 144A | | | 2.402% | (a) | | | 07/22/27 | | | | 500 | | | | 500,081 | |
Regatta Funding Ltd. (Cayman Islands), Series 2014-1A, Class A1, 144A | | | 2.292% | (a) | | | 07/25/26 | | | | 250 | | | | 250,154 | |
Shackleton CLO Ltd. (Cayman Islands), Series 2014-5A, Class A, 144A | | | 2.381% | (a) | | | 05/07/26 | | | | 750 | | | | 752,487 | |
Silver Spring CLO Ltd. (Cayman Islands), Series 2014-1A, Class A, 144A | | | 2.330% | (a) | | | 10/15/26 | | | | 1,489 | | | | 1,481,770 | |
Sound Point CLO Ltd. (Cayman Islands), Series 2015-2A, Class A, 144A | | | 2.401% | (a) | | | 07/20/27 | | | | 750 | | | | 750,760 | |
Trinitas CLO Ltd. (Cayman Islands), Series 2016-5A, Class A, 144A | | | 2.434% | (a) | | | 10/25/28 | | | | 500 | | | | 499,887 | |
| | | | | | | | | | | | | | |
|
|
|
| | | | | | | | | | | | | | | | 12,095,589 | |
| | | | | | | | | | | | | | |
|
|
|
Non-Residential Mortgage-Backed Securities — 0.1% | |
Small Business Administration Participation Certificates, Series 1997-20A, Class 1 | | | 7.150% | | | | 01/01/17 | | | | 31 | | | | 30,749 | |
Small Business Administration Participation Certificates, Series 1997-20G, Class 1 | | | 6.850% | | | | 07/01/17 | | | | 25 | | | | 25,066 | |
Small Business Administration Participation Certificates, Series 1998-20I, Class 1 | | | 6.000% | | | | 09/01/18 | | | | 118 | | | | 120,162 | |
| | | | | | | | | | | | | | |
|
|
|
| | | | | | | | | | | | | | | | 175,977 | |
| | | | | | | | | | | | | | |
|
|
|
TOTAL ASSET-BACKED SECURITIES
(cost $12,232,857) | | | | 12,271,566 | |
| | | | | | | | | | | | | | |
|
|
|
| COMMERCIAL MORTGAGE-BACKED SECURITIES — 27.2% | |
Citigroup Commercial Mortgage Trust, Series 2015-GC33, Class A3 | | | 3.515% | | | | 09/10/58 | | | | 700 | | | | 716,626 | |
Commercial Mortgage Trust, Series 2012-CR5, Class A3 | | | 2.540% | | | | 12/10/45 | | | | 1,000 | | | | 994,960 | |
Commercial Mortgage Trust, Series 2015-CR24, Class A3 | | | 3.214% | | | | 08/10/48 | | | | 1,600 | | | | 1,620,352 | |
Commercial Mortgage Trust, Series 2015-CR25, Class A3 | | | 3.505% | | | | 08/10/48 | | | | 1,000 | | | | 1,026,280 | |
Fannie Mae-Aces, Series 2012-M2, Class A2 | | | 2.717% | | | | 02/25/22 | | | | 200 | | | | 201,623 | |
Fannie Mae-Aces, Series 2012-M13, Class A2 | | | 2.377% | | | | 05/25/22 | | | | 1,850 | | | | 1,837,631 | |
Fannie Mae-Aces, Series 2014-M2, Class A2 | | | 3.513% | (a) | | | 12/25/23 | | | | 2,650 | | | | 2,760,452 | |
Fannie Mae-Aces, Series 2015-M1, Class AB2 | | | 2.465% | | | | 09/25/24 | | | | 550 | | | | 533,869 | |
Fannie Mae-Aces, Series 2015-M3, Class AB2 | | | 2.625% | | | | 10/25/24 | | | | 2,730 | | | | 2,682,857 | |
Fannie Mae-Aces, Series 2015-M8, Class AB2 | | | 2.829% | (a) | | | 01/25/25 | | | | 1,600 | | | | 1,587,088 | |
Fannie Mae-Aces, Series 2015-M10, Class A2 | | | 3.092% | (a) | | | 04/25/27 | | | | 1,600 | | | | 1,603,547 | |
Fannie Mae-Aces, Series 2015-M17, Class A2 | | | 2.940% | (a) | | | 11/25/25 | | | | 1,500 | | | | 1,506,942 | |
Fannie Mae-Aces, Series 2016-M11, Class A2 | | | 2.369% | (a) | | | 07/25/26 | | | | 1,200 | | | | 1,138,492 | |
Fannie Mae-Aces, Series 2016-M13, Class A2 | | | 2.477% | (a) | | | 09/25/26 | | | | 2,100 | | | | 1,983,371 | |
FHLMC Multifamily Structured Pass-Through Certificates, Series K003, Class A5 | | | 5.085% | | | | 03/25/19 | | | | 250 | | | | 265,312 | |
FHLMC Multifamily Structured Pass-Through Certificates, Series K008, Class X1, IO | | | 1.621% | (a) | | | 06/25/20 | | | | 17,805 | | | | 725,414 | |
FHLMC Multifamily Structured Pass-Through Certificates, Series K019, Class X1, IO | | | 1.693% | (a) | | | 03/25/22 | | | | 17,556 | | | | 1,256,054 | |
FHLMC Multifamily Structured Pass-Through Certificates, Series K020, Class X1, IO | | | 1.442% | (a) | | | 05/25/22 | | | | 8,952 | | | | 563,290 | |
FHLMC Multifamily Structured Pass-Through Certificates, Series K021, Class X1, IO | | | 1.480% | (a) | | | 06/25/22 | | | | 9,497 | | | | 624,705 | |
FHLMC Multifamily Structured Pass-Through Certificates, Series K024, Class A2 | | | 2.573% | | | | 09/25/22 | | | | 2,000 | | | | 2,016,457 | |
FHLMC Multifamily Structured Pass-Through Certificates, Series K025, Class X1, IO | | | 0.883% | (a) | | | 10/25/22 | | | | 26,946 | | | | 1,112,657 | |
FHLMC Multifamily Structured Pass-Through Certificates, Series K032, Class A2 | | | 3.310% | (a) | | | 05/25/23 | | | | 2,730 | | | | 2,858,878 | |
SEE NOTES TO FINANCIAL STATEMENTS.
A113
| | | | | | |
| | | GOVERNMENT INCOME PORTFOLIO (continued) | | |
| |
| SCHEDULE OF INVESTMENTS | | as of December 31, 2016 |
| | | | | | | | | | | | | | | | |
COMMERCIAL MORTGAGE-BACKED SECURITIES (continued) | | Interest
Rate
| | | Maturity
Date
| | | Principal
Amount
(000)#
| | | Value
(Note 2)
| |
FHLMC Multifamily Structured Pass-Through Certificates, Series K033, Class A2 | | | 3.060% | (a) | | | 07/25/23 | | | | 3,600 | | | $ | 3,715,499 | |
FHLMC Multifamily Structured Pass-Through Certificates, Series K038, Class A2 | | | 3.389% | | | | 03/25/24 | | | | 3,200 | | | | 3,352,491 | |
FHLMC Multifamily Structured Pass-Through Certificates, Series K041, Class A2 | | | 3.171% | | | | 10/25/24 | | | | 4,000 | | | | 4,117,131 | |
FHLMC Multifamily Structured Pass-Through Certificates, Series K044, Class A2 | | | 2.811% | | | | 01/25/25 | | | | 3,200 | | | | 3,208,472 | |
FHLMC Multifamily Structured Pass-Through Certificates, Series K045, Class A2 | | | 3.023% | | | | 01/25/25 | | | | 4,000 | | | | 4,064,681 | |
FHLMC Multifamily Structured Pass-Through Certificates, Series K060, Class AM | | | 3.300% | | | | 10/25/26 | | | | 1,930 | | | | 1,967,786 | |
FHLMC Multifamily Structured Pass-Through Certificates, Series K151, Class A3 | | | 3.511% | | | | 04/25/30 | | | | 400 | | | | 410,651 | |
FHLMC Multifamily Structured Pass-Through Certificates, Series K710, Class X1, IO | | | 1.759% | (a) | | | 05/25/19 | | | | 7,901 | | | | 263,467 | |
FHLMC Multifamily Structured Pass-Through Certificates, Series K711, Class X1, IO | | | 1.692% | (a) | | | 07/25/19 | | | | 7,596 | | | | 257,144 | |
FHLMC Multifamily Structured Pass-Through Certificates, Series KS03, Class A4 | | | 3.161% | (a) | | | 05/25/25 | | | | 2,600 | | | | 2,628,814 | |
JPMBB Commercial Mortgage Securities Trust, Series 2013-C17, Class A2 | | | 3.003% | | | | 01/15/47 | | | | 1,700 | | | | 1,734,134 | |
JPMBB Commercial Mortgage Securities Trust, Series 2015-C30, Class A3 | | | 3.322% | | | | 07/15/48 | | | | 1,600 | | | | 1,625,715 | |
JPMorgan Chase Commercial Mortgage Securities Trust, Series 2013-LC11, Class A4 | | | 2.694% | | | | 04/15/46 | | | | 1,700 | | | | 1,718,552 | |
Morgan Stanley Bank of America Merrill Lynch Trust, Series 2015-C23, Class A3 | | | 3.451% | | | | 07/15/50 | | | | 1,600 | | | | 1,635,450 | |
Wachovia Bank Commercial Mortgage Trust, Series 2006-C27, Class AM | | | 5.795% | (a) | | | 07/15/45 | | | | 155 | | | | 154,442 | |
Wells Fargo Commercial Mortgage Trust, Series 2016-C37, Class A4 | | | 3.525% | | | | 12/15/49 | | | | 1,100 | | | | 1,115,880 | |
| | | | | | | | | | | | | | |
|
|
|
TOTAL COMMERCIAL MORTGAGE-BACKED SECURITIES
(cost $61,544,163) | | | | 61,587,166 | |
| | | | | | | | | | | | | | |
|
|
|
| CORPORATE BOND — 1.1% | |
Diversified Financial Services | | | | | | | | | | | | | | | | |
Private Export Funding Corp., U.S. Gov’t. Gtd. Notes
(cost $2,414,101) | | | 4.300% | | | | 12/15/21 | | | | 2,160 | | | | 2,377,158 | |
| | | | | | | | | | | | | | |
|
|
|
| MUNICIPAL BONDS — 0.4% | |
California — 0.2% | |
California Educational Facilities Authority, Revenue Bonds, BABs | | | 5.000% | | | | 06/01/46 | | | | 125 | | | | 160,080 | |
Central Puget Sound Regional Transit Authority, Revenue Bonds, BABs | | | 5.000% | | | | 11/01/46 | | | | 180 | | | | 228,560 | |
| | | | | | | | | | | | | | |
|
|
|
| | | | | | | | | | | | | | | | 388,640 | |
| | | | | | | | | | | | | | |
|
|
|
Pennsylvania — 0.2% | | | | | | | | | | | | | | | | |
Pennsylvania Turnpike Commission, Revenue Bonds, BABs | | | 5.000% | | | | 12/01/46 | | | | 500 | | | | 550,450 | |
| | | | | | | | | | | | | | |
|
|
|
TOTAL MUNICIPAL BONDS
(cost $921,886) | | | | 939,090 | |
| | | | | | | | | | | | | | |
|
|
|
| NON-CORPORATE FOREIGN AGENCY — 0.4% | | | | | | | | | | | | | | | | |
CDP Financial, Inc. (Canada), Sr. Unsec’d. Notes, 144A
(cost $816,933) | | | 3.150% | | | | 07/24/24 | | | | 820 | | | | 831,636 | |
| | | | | | | | | | | | | | |
|
|
|
| RESIDENTIAL MORTGAGE-BACKED SECURITIES — 0.1% | | | | | | | | | | | | | | | | |
Federal Home Loan Mortgage Corp., REMICS, Series 2002-2496, Class PM | | | 5.500% | | | | 09/15/17 | | | | 40 | | | | 40,734 | |
Federal Home Loan Mortgage Corp., REMICS, Series 2002-2501, Class MC | | | 5.500% | | | | 09/15/17 | | | | 2 | | | | 1,925 | |
Federal Home Loan Mortgage Corp., REMICS, Series 2002-2513, Class HC | | | 5.000% | | | | 10/15/17 | | | | 95 | | | | 95,887 | |
Federal National Mortgage Assoc., REMICS, Series 2002-57, Class ND | | | 5.500% | | | | 09/25/17 | | | | 3 | | | | 2,692 | |
Merrill Lynch Mortgage Investors Trust, Series 2003-E, Class A1 | | | 1.376% | (a) | | | 10/25/28 | | | | 31 | | | | 29,467 | |
Structured Adjustable Rate Mortgage Loan Trust, Series 2004-1, Class 4A3 | | | 3.093% | (a) | | | 02/25/34 | | | | 150 | | | | 150,155 | |
| | | | | | | | | | | | | | |
|
|
|
TOTAL RESIDENTIAL MORTGAGE-BACKED SECURITIES
(cost $320,050) | | | | 320,860 | |
| | | | | | | | | | | | | | |
|
|
|
SEE NOTES TO FINANCIAL STATEMENTS.
A114
| | | | | | |
| | | GOVERNMENT INCOME PORTFOLIO (continued) | | |
| |
| SCHEDULE OF INVESTMENTS | | as of December 31, 2016 |
| | | | | | | | | | | | | | |
| U.S. GOVERNMENT AGENCY OBLIGATIONS — 43.4% | | Interest
Rate
| | | Maturity
Date
| | Principal
Amount
(000)#
| | | Value
(Note 2)
| |
Federal Home Loan Mortgage Corp. | | | 2.500% | | | TBA | | | 500 | | | $ | 500,898 | |
Federal Home Loan Mortgage Corp. | | | 2.500% | | | 03/01/30 | | | 804 | | | | 806,911 | |
Federal Home Loan Mortgage Corp. | | | 2.745% | (a) | | 05/01/34 | | | 242 | | | | 253,484 | |
Federal Home Loan Mortgage Corp. | | | 3.000% | | | TBA | | | 3,500 | | | | 3,475,410 | |
Federal Home Loan Mortgage Corp. | | | 3.000% | | | 06/01/29 | | | 666 | | | | 684,428 | |
Federal Home Loan Mortgage Corp. | | | 3.000% | | | 06/01/45 | | | 858 | | | | 853,725 | |
Federal Home Loan Mortgage Corp. | | | 3.500% | | | TBA | | | 4,500 | | | | 4,607,743 | |
Federal Home Loan Mortgage Corp. | | | 3.500% | | | 08/01/26 | | | 312 | | | | 327,090 | |
Federal Home Loan Mortgage Corp. | | | 3.500% | | | 01/01/27 | | | 328 | | | | 344,029 | |
Federal Home Loan Mortgage Corp. | | | 3.500% | | | 07/01/42 | | | 874 | | | | 900,130 | |
Federal Home Loan Mortgage Corp. | | | 3.500% | | | 10/01/42 | | | 1,438 | | | | 1,480,891 | |
Federal Home Loan Mortgage Corp. | | | 3.500% | | | 08/01/43 | | | 1,163 | | | | 1,197,242 | |
Federal Home Loan Mortgage Corp. | | | 4.000% | | | TBA | | | 2,250 | | | | 2,363,247 | |
Federal Home Loan Mortgage Corp. | | | 4.000% | | | 06/01/26 | | | 113 | | | | 118,645 | |
Federal Home Loan Mortgage Corp. | | | 4.000% | | | 09/01/26 | | | 382 | | | | 402,357 | |
Federal Home Loan Mortgage Corp. | | | 4.000% | | | 09/01/40 | | | 572 | | | | 604,154 | |
Federal Home Loan Mortgage Corp. | | | 4.000% | | | 12/01/40 | | | 584 | | | | 614,953 | |
Federal Home Loan Mortgage Corp. | | | 4.000% | | | 12/01/40 | | | 626 | | | | 661,004 | |
Federal Home Loan Mortgage Corp. | | | 4.000% | | | 10/01/45 | | | 408 | | | | 428,883 | |
Federal Home Loan Mortgage Corp. | | | 4.500% | | | 09/01/39 | | | 2,196 | | | | 2,369,710 | |
Federal Home Loan Mortgage Corp. | | | 5.000% | | | 06/01/33 | | | 483 | | | | 531,739 | |
Federal Home Loan Mortgage Corp. | | | 5.000% | | | 05/01/34 | | | 487 | | | | 533,825 | |
Federal Home Loan Mortgage Corp. | | | 5.500% | | | 05/01/37 | | | 97 | | | | 107,987 | |
Federal Home Loan Mortgage Corp. | | | 5.500% | | | 02/01/38 | | | 335 | | | | 374,230 | |
Federal Home Loan Mortgage Corp. | | | 5.500% | | | 05/01/38 | | | 137 | | | | 153,105 | |
Federal Home Loan Mortgage Corp. | | | 6.000% | | | 09/01/34 | | | 78 | | | | 87,767 | |
Federal Home Loan Mortgage Corp. | | | 6.000% | | | 01/01/37 | | | 158 | | | | 179,724 | |
Federal Home Loan Mortgage Corp. | | | 6.000% | | | 09/01/38 | | | 93 | | | | 105,604 | |
Federal Home Loan Mortgage Corp. | | | 6.000% | | | 08/01/39 | | | 112 | | | | 128,228 | |
Federal Home Loan Mortgage Corp. | | | 6.500% | | | 09/01/32 | | | 58 | | | | 65,899 | |
Federal National Mortgage Assoc. | | | 1.000% | | | 10/24/19 | | | 2,300 | | | | 2,268,205 | |
Federal National Mortgage Assoc. | | | 2.000% | | | 08/01/31 | | | 393 | | | | 383,279 | |
Federal National Mortgage Assoc. | | | 2.500% | | | TBA | | | 1,000 | | | | 951,350 | |
Federal National Mortgage Assoc. | | | 2.500% | | | 06/01/28 | | | 2,829 | | | | 2,838,696 | |
Federal National Mortgage Assoc. | | | 2.539% | (a) | | 07/01/33 | | | 715 | | | | 756,345 | |
Federal National Mortgage Assoc. | | | 2.617% | (a) | | 04/01/34 | | | 125 | | | | 131,258 | |
Federal National Mortgage Assoc. | | | 2.636% | (a) | | 06/01/34 | | | 259 | | | | 274,915 | |
Federal National Mortgage Assoc. | | | 2.755% | (a) | | 04/01/34 | | | 214 | | | | 226,100 | |
Federal National Mortgage Assoc. | | | 2.893% | (a) | | 08/01/33 | | | 524 | | | | 551,554 | |
Federal National Mortgage Assoc. | | | 3.000% | | | 08/01/28 | | | 1,465 | | | | 1,504,767 | |
Federal National Mortgage Assoc. | | | 3.000% | | | 02/01/31 | | | 1,864 | | | | 1,914,241 | |
Federal National Mortgage Assoc. | | | 3.000% | | | 11/01/36 | | | 992 | | | | 1,005,408 | |
Federal National Mortgage Assoc. | | | 3.500% | | | TBA | | | 8,750 | | | | 8,968,067 | |
Federal National Mortgage Assoc. | | | 3.500% | | | 03/01/27 | | | 660 | | | | 689,546 | |
Federal National Mortgage Assoc. | | | 3.500% | | | 06/01/39 | | | 396 | | | | 406,236 | |
Federal National Mortgage Assoc. | | | 4.000% | | | TBA | | | 10,500 | | | | 11,038,740 | |
Federal National Mortgage Assoc. | | | 4.000% | | | 09/01/40 | | | 2,128 | | | | 2,236,383 | |
Federal National Mortgage Assoc. | | | 4.000% | | | 09/01/44 | | | 1,227 | | | | 1,290,551 | |
Federal National Mortgage Assoc. | | | 4.500% | | | 05/01/40 | | | 2,926 | | | | 3,173,811 | |
Federal National Mortgage Assoc. | | | 5.000% | | | 07/01/18 | | | 8 | | | | 8,525 | |
Federal National Mortgage Assoc. | | | 5.000% | | | 08/01/18 | | | 36 | | | | 36,929 | |
Federal National Mortgage Assoc. | | | 5.000% | | | 01/01/19 | | | 126 | | | | 129,619 | |
Federal National Mortgage Assoc. | | | 5.000% | | | 02/01/19 | | | 90 | | | | 92,045 | |
Federal National Mortgage Assoc. | | | 5.000% | | | 11/01/19 | | | 63 | | | | 64,991 | |
Federal National Mortgage Assoc. | | | 5.000% | | | 12/01/31 | | | 30 | | | | 32,813 | |
Federal National Mortgage Assoc. | | | 5.000% | | | 03/01/34 | | | 548 | | | | 597,586 | |
Federal National Mortgage Assoc. | | | 5.000% | | | 06/01/35 | | | 244 | | | | 267,744 | |
Federal National Mortgage Assoc. | | | 5.000% | | | 07/01/35 | | | 128 | | | | 139,779 | |
SEE NOTES TO FINANCIAL STATEMENTS.
A115
| | | | | | |
| | | GOVERNMENT INCOME PORTFOLIO (continued) | | |
| |
| SCHEDULE OF INVESTMENTS | | as of December 31, 2016 |
| | | | | | | | | | | | | | |
U.S. GOVERNMENT AGENCY OBLIGATIONS (continued) | | Interest
Rate
| | | Maturity
Date
| | Principal
Amount
(000)#
| | | Value
(Note 2)
| |
Federal National Mortgage Assoc. | | | 5.000% | | | 05/01/36 | | | 172 | | | $ | 187,739 | |
Federal National Mortgage Assoc. | | | 5.500% | | | 02/01/17 | | | — | (b) | | | 15 | |
Federal National Mortgage Assoc. | | | 5.500% | | | 04/01/17 | | | — | (b) | | | 394 | |
Federal National Mortgage Assoc. | | | 5.500% | | | 10/01/18 | | | 22 | | | | 22,223 | |
Federal National Mortgage Assoc. | | | 5.500% | | | 10/01/18 | | | 23 | | | | 23,775 | |
Federal National Mortgage Assoc. | | | 5.500% | | | 11/01/18 | | | 23 | | | | 23,521 | |
Federal National Mortgage Assoc. | | | 5.500% | | | 02/01/34 | | | 319 | | | | 358,355 | |
Federal National Mortgage Assoc. | | | 5.500% | | | 09/01/34 | | | 349 | | | | 394,570 | |
Federal National Mortgage Assoc. | | | 5.500% | | | 02/01/35 | | | 400 | | | | 452,620 | |
Federal National Mortgage Assoc. | | | 5.500% | | | 06/01/35 | | | 220 | | | | 246,272 | |
Federal National Mortgage Assoc. | | | 5.500% | | | 06/01/35 | | | 172 | | | | 191,787 | |
Federal National Mortgage Assoc. | | | 5.500% | | | 09/01/35 | | | 285 | | | | 318,544 | |
Federal National Mortgage Assoc. | | | 5.500% | | | 09/01/35 | | | 95 | | | | 105,659 | |
Federal National Mortgage Assoc. | | | 5.500% | | | 10/01/35 | | | 376 | | | | 420,042 | |
Federal National Mortgage Assoc. | | | 5.500% | | | 11/01/35 | | | 678 | | | | 764,265 | |
Federal National Mortgage Assoc. | | | 5.500% | | | 11/01/35 | | | 526 | | | | 587,548 | |
Federal National Mortgage Assoc. | | | 5.500% | | | 11/01/35 | | | 615 | | | | 690,997 | |
Federal National Mortgage Assoc. | | | 6.000% | | | 05/01/21 | | | 48 | | | | 51,757 | |
Federal National Mortgage Assoc. | | | 6.000% | | | 12/01/33 | | | 12 | | | | 13,339 | |
Federal National Mortgage Assoc. | | | 6.000% | | | 02/01/34 | | | 183 | | | | 210,446 | |
Federal National Mortgage Assoc. | | | 6.000% | | | 08/01/34 | | | 1 | | | | 1,073 | |
Federal National Mortgage Assoc. | | | 6.000% | | | 10/01/34 | | | 56 | | | | 63,285 | |
Federal National Mortgage Assoc. | | | 6.000% | | | 11/01/34 | | | 1 | | | | 1,235 | |
Federal National Mortgage Assoc. | | | 6.000% | | | 11/01/34 | | | 1 | | | | 1,124 | |
Federal National Mortgage Assoc. | | | 6.000% | | | 12/01/34 | | | 1 | | | | 1,164 | |
Federal National Mortgage Assoc. | | | 6.000% | | | 01/01/35 | | | 38 | | | | 43,175 | |
Federal National Mortgage Assoc. | | | 6.000% | | | 01/01/36 | | | 214 | | | | 241,632 | |
Federal National Mortgage Assoc. | | | 6.000% | | | 05/01/38 | | | 80 | | | | 90,704 | |
Federal National Mortgage Assoc. | | | 6.500% | | | 07/01/32 | | | 336 | | | | 380,631 | |
Federal National Mortgage Assoc. | | | 6.500% | | | 08/01/32 | | | 131 | | | | 148,681 | |
Federal National Mortgage Assoc. | | | 6.500% | | | 10/01/32 | | | 360 | | | | 406,914 | |
Federal National Mortgage Assoc. | | | 6.500% | | | 10/01/37 | | | 241 | | | | 272,628 | |
Federal National Mortgage Assoc. | | | 7.000% | | | 12/01/31 | | | 100 | | | | 114,635 | |
Federal National Mortgage Assoc. | | | 7.000% | | | 12/01/31 | | | 1 | | | | 616 | |
Federal National Mortgage Assoc. | | | 7.000% | | | 11/01/33 | | | 11 | | | | 11,912 | |
Federal National Mortgage Assoc. | | | 7.000% | | | 01/01/36 | | | 34 | | | | 38,338 | |
Federal National Mortgage Assoc. | | | 8.000% | | | 10/01/23 | | | — | (b) | | | 343 | |
Federal National Mortgage Assoc. | | | 8.000% | | | 09/01/24 | | | 1 | | | | 1,331 | |
Federal National Mortgage Assoc. | | | 8.000% | | | 11/01/24 | | | 1 | | | | 1,460 | |
Federal National Mortgage Assoc. | | | 8.000% | | | 01/01/26 | | | 1 | | | | 678 | |
Federal National Mortgage Assoc. | | | 8.000% | | | 02/01/26 | | | 2 | | | | 2,249 | |
Federal National Mortgage Assoc. | | | 9.000% | | | 02/01/25 | | | 15 | | | | 16,779 | |
Federal National Mortgage Assoc. | | | 9.000% | | | 04/01/25 | | | 8 | | | | 8,906 | |
Government National Mortgage Assoc. | | | 3.000% | | | TBA | | | 4,000 | | | | 4,050,078 | |
Government National Mortgage Assoc. | | | 3.000% | | | 03/15/45 | | | 2,464 | | | | 2,493,257 | |
Government National Mortgage Assoc. | | | 3.500% | | | TBA | | | 500 | | | | 519,756 | |
Government National Mortgage Assoc. | | | 3.500% | | | 03/20/45 | | | 1,594 | | | | 1,658,580 | |
Government National Mortgage Assoc. | | | 3.500% | | | 04/20/45 | | | 1,355 | | | | 1,410,029 | |
Government National Mortgage Assoc. | | | 4.000% | | | 06/15/40 | | | 321 | | | | 342,121 | |
Government National Mortgage Assoc. | | | 4.500% | | | 02/20/41 | | | 882 | | | | 950,621 | |
Government National Mortgage Assoc. | | | 4.500% | | | 03/20/41 | | | 748 | | | | 806,347 | |
Government National Mortgage Assoc. | | | 5.000% | | | 07/15/33 | | | 229 | | | | 255,133 | |
Government National Mortgage Assoc. | | | 5.000% | | | 09/15/33 | | | 302 | | | | 333,999 | |
Government National Mortgage Assoc. | | | 5.000% | | | 04/15/34 | | | 89 | | | | 96,897 | |
Government National Mortgage Assoc. | | | 5.500% | | | 03/15/34 | | | 439 | | | | 494,634 | |
Government National Mortgage Assoc. | | | 5.500% | | | 03/15/36 | | | 97 | | | | 109,690 | |
Government National Mortgage Assoc. | | | 6.500% | | | 07/15/32 | | | 23 | | | | 26,132 | |
Government National Mortgage Assoc. | | | 6.500% | | | 08/15/32 | | | 4 | | | | 4,215 | |
SEE NOTES TO FINANCIAL STATEMENTS.
A116
| | | | | | |
| | | GOVERNMENT INCOME PORTFOLIO (continued) | | |
| |
| SCHEDULE OF INVESTMENTS | | as of December 31, 2016 |
| | | | | | | | | | | | | | |
U.S. GOVERNMENT AGENCY OBLIGATIONS (continued) | | Interest
Rate
| | | Maturity
Date
| | Principal
Amount
(000)#
| | | Value
(Note 2)
| |
Government National Mortgage Assoc. | | | 6.500% | | | 08/15/32 | | | 5 | | | $ | 5,472 | |
Government National Mortgage Assoc. | | | 6.500% | | | 08/15/32 | | | 19 | | | | 21,622 | |
Government National Mortgage Assoc. | | | 6.500% | | | 08/15/32 | | | 125 | | | | 143,649 | |
Government National Mortgage Assoc. | | | 7.000% | | | 03/15/23 | | | 2 | | | | 2,037 | |
Government National Mortgage Assoc. | | | 7.000% | | | 05/15/23 | | | 8 | | | | 8,984 | |
Government National Mortgage Assoc. | | | 7.000% | | | 06/15/23 | | | 2 | | | | 1,674 | |
Government National Mortgage Assoc. | | | 7.000% | | | 06/15/23 | | | 6 | | | | 5,780 | |
Government National Mortgage Assoc. | | | 7.000% | | | 06/15/23 | | | 2 | | | | 1,528 | |
Government National Mortgage Assoc. | | | 7.000% | | | 06/15/23 | | | 22 | | | | 24,057 | |
Government National Mortgage Assoc. | | | 7.000% | | | 07/15/23 | | | 16 | | | | 16,159 | |
Government National Mortgage Assoc. | | | 7.000% | | | 07/15/23 | | | — | (b) | | | 1 | |
Government National Mortgage Assoc. | | | 7.000% | | | 07/15/23 | | | 1 | | | | 1,075 | |
Government National Mortgage Assoc. | | | 7.000% | | | 08/15/23 | | | 12 | | | | 12,408 | |
Government National Mortgage Assoc. | | | 7.000% | | | 08/15/23 | | | 8 | | | | 8,725 | |
Government National Mortgage Assoc. | | | 7.000% | | | 08/15/23 | | | 2 | | | | 1,518 | |
Government National Mortgage Assoc. | | | 7.000% | | | 09/15/23 | | | 2 | | | | 1,665 | |
Government National Mortgage Assoc. | | | 7.000% | | | 10/15/23 | | | 6 | | | | 5,986 | |
Government National Mortgage Assoc. | | | 7.000% | | | 10/15/23 | | | — | (b) | | | 112 | |
Government National Mortgage Assoc. | | | 7.000% | | | 10/15/23 | | | 6 | | | | 6,635 | |
Government National Mortgage Assoc. | | | 7.000% | | | 11/15/23 | | | 6 | | | | 6,423 | |
Government National Mortgage Assoc. | | | 7.000% | | | 11/15/23 | | | 12 | | | | 12,780 | |
Government National Mortgage Assoc. | | | 7.000% | | | 11/15/23 | | | 1 | | | | 803 | |
Government National Mortgage Assoc. | | | 7.000% | | | 01/15/24 | | | 82 | | | | 88,579 | |
Government National Mortgage Assoc. | | | 7.000% | | | 05/15/24 | | | 80 | | | | 85,828 | |
Government National Mortgage Assoc. | | | 7.000% | | | 08/15/28 | | | 63 | | | | 72,148 | |
Government National Mortgage Assoc. | | | 7.500% | | | 12/15/25 | | | 40 | | | | 44,543 | |
Government National Mortgage Assoc. | | | 7.500% | | | 12/15/25 | | | 9 | | | | 10,034 | |
Government National Mortgage Assoc. | | | 7.500% | | | 02/15/26 | | | 10 | | | | 10,856 | |
Government National Mortgage Assoc. | | | 8.500% | | | 09/15/24 | | | 102 | | | | 112,573 | |
Government National Mortgage Assoc. | | | 8.500% | | | 04/15/25 | | | 10 | | | | 11,380 | |
Hashemite Kingdom of Jordan, USAID Bond, U.S. Gov’t. Gtd. Notes | | | 2.578% | | | 06/30/22 | | | 1,520 | | | | 1,546,194 | |
Hashemite Kingdom of Jordan, USAID Bond, U.S. Gov’t. Gtd. Notes | | | 3.000% | | | 06/30/25 | | | 1,380 | | | | 1,407,655 | |
Israel Government, USAID Bond, U.S. Gov’t. Gtd. Notes | | | 5.500% | | | 09/18/23 | | | 1,300 | | | | 1,538,648 | |
Residual Funding Corp. Strips Principal, Unsec’d. Notes, PO | | | 2.194% | (c) | | 01/15/21 | | | 643 | | | | 591,177 | |
Residual Funding Corp. Strips Principal, Unsec’d. Notes, PO | | | 3.001% | (c) | | 04/15/30 | | | 635 | | | | 411,239 | |
Tennessee Valley Authority, Sr. Unsec’d. Notes | | | 6.750% | | | 11/01/25 | | | 510 | | | | 667,665 | |
Tennessee Valley Authority, Sr. Unsec’d. Notes | | | 7.125% | | | 05/01/30 | | | 980 | | | | 1,396,047 | |
Ukraine Government, USAID Bonds, U.S. Gov’t. Gtd. Notes | | | 1.471% | | | 09/29/21 | | | 2,200 | | | | 2,147,737 | |
| | | | | | | | | | | | |
|
|
|
TOTAL U.S. GOVERNMENT AGENCY OBLIGATIONS
(cost $97,037,859) | | | | 98,138,771 | |
| | | | | | | | | | | | |
|
|
|
| U.S. TREASURY OBLIGATIONS — 20.7% | | | | | | | | | | | | | | |
U.S. Treasury Bonds | | | 2.500% | | | 02/15/45 | | | 195 | | | | 173,695 | |
U.S. Treasury Bonds | | | 2.500% | | | 05/15/46 | | | 570 | | | | 506,543 | |
U.S. Treasury Bonds | | | 2.875% | | | 11/15/46 | | | 570 | | | | 550,317 | |
U.S. Treasury Bonds | | | 3.000% | | | 05/15/45 | | | 950 | | | | 937,160 | |
U.S. Treasury Bonds | | | 4.250% | | | 11/15/40 | | | 3,995 | | | | 4,850,178 | |
U.S. Treasury Bonds | | | 4.750% | | | 02/15/41 | | | 1,710 | | | | 2,229,412 | |
U.S. Treasury Bonds | | | 8.125% | | | 08/15/21 | | | 455 | | | | 579,467 | |
U.S. Treasury Notes | | | 0.750% | | | 02/28/18 | | | 570 | | | | 568,664 | |
U.S. Treasury Notes(d) | | | 1.000% | | | 03/15/18 | | | 100 | | | | 100,047 | |
U.S. Treasury Notes | | | 1.375% | | | 12/15/19 | | | 1,065 | | | | 1,062,462 | |
U.S. Treasury Notes | | | 1.375% | | | 04/30/21 | | | 10,200 | | | | 10,005,965 | |
U.S. Treasury Notes | | | 1.625% | | | 04/30/23 | | | 860 | | | | 831,782 | |
U.S. Treasury Notes | | | 1.750% | | | 11/30/21 | | | 515 | | | | 511,158 | |
U.S. Treasury Notes | | | 2.125% | | | 09/30/21 | | | 9,850 | | | | 9,937,340 | |
U.S. Treasury Notes | | | 2.125% | | | 12/31/21 | | | 425 | | | | 428,636 | |
U.S. Treasury Notes | | | 2.125% | | | 06/30/22 | | | 380 | | | | 381,336 | |
U.S. Treasury Notes(d) | | | 2.125% | | | 12/31/22 | | | 505 | | | | 504,724 | |
SEE NOTES TO FINANCIAL STATEMENTS.
A117
| | | | | | |
| | | GOVERNMENT INCOME PORTFOLIO (continued) | | |
| |
| SCHEDULE OF INVESTMENTS | | as of December 31, 2016 |
| | | | | | | | | | | | | | |
U.S. TREASURY OBLIGATIONS (continued) | | Interest
Rate
| | | Maturity
Date
| | Principal
Amount
(000)#
| | | Value
(Note 2)
| |
U.S. Treasury Notes(e) | | | 2.125% | | | 11/30/23 | | | 2,630 | | | $ | 2,612,534 | |
U.S. Treasury Notes | | | 2.250% | | | 12/31/23 | | | 850 | | | | 850,399 | |
U.S. Treasury Strips Coupon | | | 2.037% | (c) | | 02/15/22 | | | 1,690 | | | | 1,519,212 | |
U.S. Treasury Strips Coupon | | | 2.184% | (c) | | 02/15/28 | | | 550 | | | | 406,877 | |
U.S. Treasury Strips Coupon | | | 2.384% | (c) | | 05/15/29 | | | 565 | | | | 400,866 | |
U.S. Treasury Strips Coupon(d)(f) | | | 2.404% | (c) | | 08/15/21 | | | 2,525 | | | | 2,302,560 | |
U.S. Treasury Strips Coupon | | | 2.783% | (c) | | 08/15/29 | | | 500 | | | | 351,835 | |
U.S. Treasury Strips Coupon | | | 2.878% | (c) | | 05/15/31 | | | 500 | | | | 331,316 | |
U.S. Treasury Strips Coupon | | | 3.042% | (c) | | 11/15/35 | | | 1,000 | | | | 566,387 | |
U.S. Treasury Strips Coupon | | | 3.202% | (c) | | 08/15/40 | | | 1,000 | | | | 472,389 | |
U.S. Treasury Strips Coupon | | | 4.138% | (c) | | 02/15/42 | | | 3,725 | | | | 1,662,605 | |
U.S. Treasury Strips Principal, PO | | | 2.351% | (c) | | 05/15/43 | | | 595 | | | | 259,982 | |
U.S. Treasury Strips Principal, PO | | | 2.543% | (c) | | 02/15/45 | | | 515 | | | | 212,647 | |
U.S. Treasury Strips Principal, PO | | | 2.952% | (c) | | 05/15/45 | | | 800 | | | | 327,513 | |
U.S. Treasury Strips Principal, PO | | | 3.005% | (c) | | 11/15/44 | | | 715 | | | | 297,573 | |
| | | | | | | | | | | | |
|
|
|
TOTAL U.S. TREASURY OBLIGATIONS
(cost $48,066,122) | | | | 46,733,581 | |
| | | | | | | | | | | | |
|
|
|
TOTAL LONG-TERM INVESTMENTS
(cost $223,353,971) | | | | 223,199,828 | |
| | | | | | | | | | | | |
|
|
|
| | | | |
| SHORT-TERM INVESTMENTS — 18.6% | | | | | | | Shares
| | | | |
AFFILIATED MUTUAL FUNDS | | | | | | | | | | | | | | |
Prudential Investment Portfolios 2 — Prudential Core Short-Term Bond Fund(g) | | | 4,100,294 | | | | 38,009,726 | |
Prudential Investment Portfolios 2 — Prudential Core Ultra Short Bond Fund(g) | | | 1,765,750 | | | | 1,765,750 | |
Prudential Investment Portfolios 2 — Prudential Institutional Money Market Fund
(cost $2,424,821; includes $2,424,720 of cash collateral for securities on loan)(g)(h) | | | 2,424,336 | | | | 2,424,821 | |
| | | | | | | | | | | | |
|
|
|
TOTAL SHORT-TERM INVESTMENTS
(cost $44,186,145)(Note 4) | | | | 42,200,297 | |
| | | | | | | | | | | | |
|
|
|
TOTAL INVESTMENTS — 117.3%
(cost $267,540,116) | | | | 265,400,125 | |
LIABILITIES IN EXCESS OF OTHER ASSETS(i) — (17.3)% | | | | (39,082,060 | ) |
| | | | | | | | | | | | |
|
|
|
NET ASSETS — 100.0% | | | $ | 226,318,065 | |
| | | | | | | | | | | | |
|
|
|
See the Glossary for abbreviations used in the annual report.
| # | Principal or notional amount shown in U.S. dollars unless otherwise stated. |
| (a) | Variable rate instrument. The interest rate shown reflects the rate in effect at December 31, 2016. |
| (c) | Represents zero coupon bond or principal only securities. Rate represents yield to maturity at purchase date. |
| (d) | Represents security, or a portion thereof, segregated as collateral for centrally cleared swap agreements. |
| (e) | All or a portion of security is on loan. The aggregate market value of such securities, including those sold and pending settlement, is $2,384,062; cash collateral of $2,424,720 (included in liabilities) was received with which the Portfolio purchased highly liquid short-term investments. Securities on loan are subject to contractual netting arrangements. |
| (f) | Represents security, or a portion thereof, segregated as collateral for futures contracts. |
| (g) | Prudential Investments LLC, the manager of the Portfolio, also serves as manager of the Prudential Investment Portfolios 2 — Prudential Core Short-Term Bond Fund, the Prudential Investment Portfolios 2 — Prudential Core Ultra Short Bond Fund and the Prudential Investment Portfolios 2 — Prudential Institutional Money Market Fund. |
| (h) | Represents security purchased with cash collateral received for securities on loan and includes dividend reinvestment. |
| (i) | Includes net unrealized appreciation (depreciation) on the following derivative contracts held at reporting period end: |
SEE NOTES TO FINANCIAL STATEMENTS.
A118
| | | | | | |
| | | GOVERNMENT INCOME PORTFOLIO (continued) | | |
| |
| SCHEDULE OF INVESTMENTS | | as of December 31, 2016 |
Futures contracts outstanding at December 31, 2016:
| | | | | | | | | | | | | | | | | | | | |
Number of
Contracts
| | Type
| | | Expiration
Date
| | | Value at
Trade Date
| | | Value at
December 31, 2016
| | | Unrealized
Appreciation
(Depreciation)
| |
| Long Positions: | | | | | | | | | | | | | | | | | | | | |
| 311 | | | 2 Year U.S. Treasury Notes | | | | Mar. 2017 | | | $ | 67,376,004 | | | $ | 67,389,813 | | | $ | 13,809 | |
| 213 | | | 5 Year U.S. Treasury Notes | | | | Mar. 2017 | | | | 25,041,238 | | | | 25,062,445 | | | | 21,207 | |
| 69 | | | 10 Year U.S. Treasury Notes | | | | Mar. 2017 | | | | 8,506,499 | | | | 8,575,407 | | | | 68,908 | |
| 49 | | | 30 Year U.S. Ultra Treasury Bonds | | | | Mar. 2017 | | | | 7,873,712 | | | | 7,852,250 | | | | (21,462 | ) |
| | | | | | | | | | | | | | | | | | |
|
|
|
| | | | | | | | | 82,462 | |
| | | | | | | | | | | | | | | | | | |
|
|
|
| Short Position: | | | | | | | | | | | | | | | | | | | | |
| 51 | | | 20 Year U.S. Treasury Bonds | | | | Mar. 2017 | | | | 7,668,519 | | | | 7,683,469 | | | | (14,950 | ) |
| | | | | | | | | | | | | | | | | | |
|
|
|
| | | | | | | | $ | 67,512 | |
| | | | | | | | | | | | | | | | | | |
|
|
|
A U.S. Treasury Obligation with a market value of $897,314 has been segregated with Citigroup Global Markets to cover requirements for open futures contracts at December 31, 2016.
Interest rate swap agreements outstanding at December 31, 2016:
| | | | | | | | | | | | | | | | | | | | | | | | |
Notional
Amount
(000)#
| | | Termination
Date
| | | Fixed
Rate
| | | Floating Rate
| | Value at
Trade Date
| | | Value at
December 31, 2016
| | | Unrealized
Appreciation
(Depreciation)
| |
| | Centrally cleared swap agreements: | |
| | 52,560 | | | | 09/09/17 | | | | 0.539% | | | 1 Day USOIS(1) | | $ | 348 | | | $ | 65,668 | | | $ | 65,320 | |
| | 45,065 | | | | 10/18/17 | | | | 0.607% | | | 1 Day USOIS(1) | | | 191 | | | | 52,159 | | | | 51,968 | |
| | 24,905 | | | | 11/09/17 | | | | 0.626% | | | 1 Day USOIS(1) | | | 206 | | | | 33,096 | | | | 32,890 | |
| | 4,250 | | | | 01/13/22 | | | | 2.351% | | | 3 Month LIBOR(1) | | | 151 | | | | (75,922 | ) | | | (76,073 | ) |
| | 1,710 | | | | 01/22/22 | | | | 2.467% | | | 3 Month LIBOR(1) | | | 160 | | | | (40,143 | ) | | | (40,303 | ) |
| | 8,330 | | | | 11/30/22 | | | | 1.850% | | | 3 Month LIBOR(1) | | | 151 | | | | 97,518 | | | | 97,367 | |
| | 3,445 | | | | 08/02/23 | | | | —(3) | | | —(3) | | | (858 | ) | | | 9,377 | | | | 10,235 | |
| | 5,183 | | | | 08/02/23 | | | | —(4) | | | —(4) | | | 800 | | | | 14,950 | | | | 14,150 | |
| | 1,335 | | | | 08/03/23 | | | | —(5) | | | —(5) | | | (322 | ) | | | 3,752 | | | | 4,074 | |
| | 2,805 | | | | 08/19/23 | | | | 0.898% | | | 1 Day USOIS(1) | | | 165 | | | | 150,336 | | | | 150,171 | |
| | 3,805 | | | | 10/27/23 | | | | 1.073% | | | 1 Day USOIS(1) | | | 171 | | | | 172,360 | | | | 172,189 | |
| | 8,720 | | | | 12/20/23 | | | | 2.932% | | | 3 Month LIBOR(1) | | | 220 | | | | (439,537 | ) | | | (439,757 | ) |
| | 5,290 | | | | 09/17/24 | | | | 2.732% | | | 3 Month LIBOR(1) | | | 111 | | | | (194,698 | ) | | | (194,809 | ) |
| | 1,860 | | | | 09/04/25 | | | | 2.214% | | | 3 Month LIBOR(1) | | | 164 | | | | 7,282 | | | | 7,118 | |
| | 130 | | | | 01/08/26 | | | | 2.210% | | | 3 Month LIBOR(1) | | | 2 | | | | 803 | | | | 801 | |
| | 715 | | | | 05/15/37 | | | | 2.726% | | | 3 Month LIBOR(2) | | | 162 | | | | 16,299 | | | | 16,137 | |
| | 1,405 | | | | 11/15/41 | | | | 1.869% | | | 3 Month LIBOR(1) | | | 5,531 | | | | 193,346 | | | | 187,815 | |
| | | | | | | | | | | | | | |
|
|
| |
|
|
| |
|
|
|
| | | | | | | | | | | | | | | $ | 7,353 | | | $ | 66,646 | | | $ | 59,293 | |
| | | | | | | | | | | | | | |
|
|
| |
|
|
| |
|
|
|
U.S. Treasury Obligations with a combined market value of $1,732,140 have been segregated with Citigroup Global Markets to cover requirements for open centrally cleared interest rate swap contracts at December 31, 2016.
| (1) | The Portfolio pays the fixed rate and receives the floating rate. |
| (2) | The Portfolio pays the floating rate and receives the fixed rate. |
| (3) | The Portfolio pays the floating rate of 3 Month LIBOR and receives the floating rate of 1 Day USOIS plus 38.25 bps. |
| (4) | The Portfolio pays the floating rate of 3 Month LIBOR and receives the floating rate of 1 Day USOIS plus 38.50 bps. |
| (5) | The Portfolio pays the floating rate of 3 Month LIBOR and receives the floating rate of 1 Day USOIS plus 38.375 bps. |
SEE NOTES TO FINANCIAL STATEMENTS.
A119
| | | | | | |
| | | GOVERNMENT INCOME PORTFOLIO (continued) | | |
| |
| SCHEDULE OF INVESTMENTS | | as of December 31, 2016 |
Various inputs are used in determining the value of the Portfolio’s investments. These inputs are summarized in the three broad levels listed below.
| Level 1— | quoted prices generally in active markets for identical securities. |
| Level 2— | quoted prices for similar securities, interest rates and yield curves, prepayment speeds, foreign currency exchange ratesand other observable inputs. |
| Level 3— | unobservable inputs for securities valued in accordance with Board approved fair valuation procedures. |
The following is a summary of the inputs used as of December 31, 2016 in valuing such portfolio securities:
| | | | | | | | | | | | |
| | | Level 1
| | | Level 2
| | | Level 3
| |
Investments in Securities | |
Asset-Backed Securities | |
Collateralized Loan Obligations | | $ | — | | | $ | 12,095,589 | | | $ | — | |
Non-Residential Mortgage-Backed Securities | | | — | | | | 175,977 | | | | — | |
Commercial Mortgage-Backed Securities | | | — | | | | 61,587,166 | | | | — | |
Corporate Bond | | | — | | | | 2,377,158 | | | | — | |
Municipal Bonds | | | — | | | | 939,090 | | | | — | |
Non-Corporate Foreign Agency | | | — | | | | 831,636 | | | | — | |
Residential Mortgage-Backed Securities | | | — | | | | 320,860 | | | | — | |
U.S. Government Agency Obligations | | | — | | | | 98,138,771 | | | | — | |
U.S. Treasury Obligations | | | — | | | | 46,733,581 | | | | — | |
Affiliated Mutual Funds | | | 42,200,297 | | | | — | | | | — | |
Other Financial Instruments* | |
Futures Contracts | | | 67,512 | | | | — | | | | — | |
Centrally Cleared Interest Rate Swap Agreements | | | — | | | | 59,293 | | | | — | |
| | |
|
|
| |
|
|
| |
|
|
|
Total | | $ | 42,267,809 | | | $ | 223,259,121 | | | $ | — | |
| | |
|
|
| |
|
|
| |
|
|
|
| * | Other financial instruments are derivative instruments not reflected in the Schedule of Investments, such as futures, forwards and centrally cleared swap contracts, which are recorded at the unrealized appreciation (depreciation) on the instrument, and OTC swap contracts which are recorded at fair value. |
During the period, there were no transfers between Level 1 and Level 2 to report.
The industry classification of investments and liabilities in excess of other assets shown as a percentage of net assets as of December 31, 2016 were as follows (unaudited):
| | | | |
U.S. Government Agency Obligations | | | 43.4 | % |
Commercial Mortgage-Backed Securities | | | 27.2 | |
U.S. Treasury Obligations | | | 20.7 | |
Affiliated Mutual Funds (including 1.1% of collateral for securities on loan) | | | 18.6 | |
Collateralized Loan Obligations | | | 5.3 | |
Diversified Financial Services | | | 1.1 | |
Municipal Bonds | | | 0.4 | |
| | | | |
Non-Corporate Foreign Agency | | | 0.4 | % |
Residential Mortgage-Backed Securities | | | 0.1 | |
Non-Residential Mortgage-Backed Securities | | | 0.1 | |
| | |
|
|
|
| | | | 117.3 | |
Liabilities in excess of other assets | | | (17.3 | ) |
| | |
|
|
|
| | | | 100.0 | % |
| | |
|
|
|
The Portfolio invested in derivative instruments during the reporting period. The primary types of risk associated with these derivative instruments is interest rate risk. The effect of such derivative instruments on the Portfolio’s financial position and financial performance as reflected in the Statement of Assets and Liabilities and Statement of Operations is presented in the summary below.
Fair values of derivative instruments as of December 31, 2016 as presented in the Statement of Assets and Liabilities:
| | | | | | | | | | | | |
Derivatives not designated as hedging
instruments, carried at fair value
| | Asset Derivatives
| | | Liability Derivatives
| |
| | Balance Sheet Location
| | Fair Value
| | | Balance Sheet Location
| | Fair Value
| |
Interest rate contracts | | Due from/to broker — variation margin futures | | $ | 103,924 | * | | Due from/to broker — variation margin futures | | $ | 36,412 | * |
Interest rate contracts | | Due from/to broker — variation margin swaps | | | 810,235 | * | | Due from/to broker — variation margin swaps | | | 750,942 | * |
| | | | |
|
|
| | | |
|
|
|
Total | | | | $ | 914,159 | | | | | $ | 787,354 | |
| | | | |
|
|
| | | |
|
|
|
| * | Includes cumulative appreciation (depreciation) as reported in the schedule of open futures and centrally cleared swap contracts. Only unsettled variation margin receivable (payable) is reported within the Statement of Assets and Liabilities. |
SEE NOTES TO FINANCIAL STATEMENTS.
A120
| | | | | | |
| | | GOVERNMENT INCOME PORTFOLIO (continued) | | |
| |
| SCHEDULE OF INVESTMENTS | | as of December 31, 2016 |
The effects of derivative instruments on the Statement of Operations for the year ended December 31, 2016 are as follows:
| | | | | | | | | | | | | | | | | | | | | | | | |
Amount of Realized Gain (Loss) on Derivatives Recognized in Income
| |
Derivatives not accounted for as hedging
instruments, carried at fair value
| | Options
Purchased*
| | | Options
Written
| | | Futures
| | | Forward Rate
Agreements
| | | Swaps
| | | Total
| |
Interest rate contracts | | $ | (443,759 | ) | | $ | (134,785 | ) | | $ | 615,042 | | | $ | 8,789 | | | $ | (369,488 | ) | | $ | (324,201 | ) |
| | |
|
|
| |
|
|
| |
|
|
| |
|
|
| |
|
|
| |
|
|
|
| * | Included in net realized gain (loss) on investment transactions in the Statement of Operations. |
| | | | | | | | | | | | | | | | | | | | |
Change in Unrealized Appreciation (Depreciation) on Derivatives Recognized in Income
| |
Derivatives not accounted for as hedging
instruments, carried at fair value
| | Options
Purchased*
| | | Options
Written
| | | Futures
| | | Swaps
| | | Total
| |
Interest rate contracts | | $ | 214,775 | | | $ | (127,080 | ) | | $ | (101,531 | ) | | $ | 892,061 | | | $ | 878,225 | |
| | |
|
|
| |
|
|
| |
|
|
| |
|
|
| |
|
|
|
| * | Included in net change in unrealized appreciation (depreciation) on investment transactions in the Statement of Operations. |
For the year ended December 31, 2016, the Portfolio’s average volume of derivative activities is as follows:
| | | | | | | | |
Options Purchased(1)
| | Options Written(2)
| | Futures Contracts— Long Positions(3)
| | Futures Contracts— Short Position(3)
| | Interest Rate
Swap Agreements(2)
|
| $62,788 | | $132,192,000 | | $92,034,345 | | $28,397,987 | | $120,316,200 |
|
Total Return Swap Agreements(2)
|
| $1,800,000 |
| (2) | Notional Amount in USD. |
The Portfolio entered into financial transactions during the reporting period that are either offset in accordance with current requirements or are subject to enforceable master netting arrangements or similar agreements that permit offsetting. The information about offsetting and related netting arrangements for financial transactions, where the legal right to set-off exists, is presented in the summary below.
Offsetting of financial transactions assets and liabilities:
| | | | | | | | | | | | |
Description
| | Gross Amounts of
Recognized Assets(1)
| | | Collateral
Received
| | | Net
Amount
| |
Securities on Loan | | $ | 2,384,062 | | | $ | (2,384,062 | ) | | $ | — | |
| | |
|
|
| | | | | | | | |
| (1) | Amount represents market value. |
SEE NOTES TO FINANCIAL STATEMENTS.
A121
| | | | | | |
| | | GOVERNMENT INCOME PORTFOLIO (continued) | | |
STATEMENT OF ASSETS & LIABILITIES
as of December 31, 2016
| | | | |
| ASSETS | | | | |
Investments at value, including securities on loan of $2,384,062: | | | | |
Unaffiliated investments (cost $223,353,971) | | $ | 223,199,828 | |
Affiliated investments (cost $44,186,145) | | | 42,200,297 | |
Receivable for investments sold | | | 20,295,599 | |
Dividends and interest receivable | | | 833,956 | |
Due from broker—variation margin futures | | | 88,009 | |
Receivable for Series shares sold | | | 5,741 | |
Prepaid expenses | | | 1,853 | |
| | |
|
|
|
Total Assets | | | 286,625,283 | |
| | |
|
|
|
| LIABILITIES | | | | |
Payable for investments purchased | | | 57,645,317 | |
Payable to broker for collateral for securities on loan | | | 2,424,720 | |
Management fee payable | | | 76,814 | |
Accrued expenses and other liabilities | | | 70,652 | |
Due to broker—variation margin swaps | | | 56,546 | |
Payable for Series shares repurchased | | | 31,817 | |
Affiliated transfer agent fee payable | | | 980 | |
Deferred trustees’ fees | | | 372 | |
| | |
|
|
|
Total Liabilities | | | 60,307,218 | |
| | |
|
|
|
| NET ASSETS | | $ | 226,318,065 | |
| | |
|
|
|
Net assets were comprised of: | | | | |
Paid-in capital | | $ | 205,832,135 | |
Retained earnings | | | 20,485,930 | |
| | |
|
|
|
Net assets, December 31, 2016 | | $ | 226,318,065 | |
| | |
|
|
|
Net asset value and redemption price per share
$226,318,065 / 18,465,529 outstanding shares of beneficial interest | | $ | 12.26 | |
| | |
|
|
|
STATEMENT OF OPERATIONS
Year Ended December 31, 2016
| | | | |
| NET INVESTMENT INCOME (LOSS) | | | | |
| INCOME | | | | |
Interest income | | $ | 4,199,903 | |
Affiliated dividend income | | | 789,114 | |
Income from securities lending, net (including affiliated income of $2,048) | | | 2,306 | |
| | |
|
|
|
Total income | | | 4,991,323 | |
| | |
|
|
|
| EXPENSES | | | | |
Management fee | | | 943,112 | |
Shareholders’ reports | | | 99,000 | |
Custodian and accounting fees (net of $4,500 fee credit) | | | 76,000 | |
Audit fee | | | 40,000 | |
Transfer agent’s fees and expenses (including affiliated expense of $5,900) | | | 12,000 | |
Trustees’ fees | | | 11,000 | |
Legal fees and expenses | | | 9,000 | |
Commitment fee on syndicated credit agreement | | | 7,000 | |
Insurance expenses | | | 4,000 | |
Loan interest expense | | | 38 | |
Miscellaneous | | | 7,776 | |
| | |
|
|
|
Total expenses | | | 1,208,926 | |
| | |
|
|
|
| NET INVESTMENT INCOME (LOSS) | | | 3,782,397 | |
| | |
|
|
|
| REALIZED AND UNREALIZED GAIN (LOSS) ON INVESTMENTS | | | | |
Net realized gain (loss) on: | | | | |
Investment transactions | | | 2,109,254 | |
Futures transactions | | | 615,042 | |
Options written transactions | | | (134,785 | ) |
Forward rate agreement transactions | | | 8,789 | |
Swap agreement transactions | | | (369,488 | ) |
| | |
|
|
|
| | | | 2,228,812 | |
| | |
|
|
|
Net change in unrealized appreciation (depreciation) on: | | | | |
Investments (including affiliated of $(1,093)) | | | (1,672,056 | ) |
Futures | | | (101,531 | ) |
Options written | | | (127,080 | ) |
Swap agreements | | | 892,061 | |
| | |
|
|
|
| | | | (1,008,606 | ) |
| | |
|
|
|
| NET GAIN (LOSS) ON INVESTMENT TRANSACTIONS | | | 1,220,206 | |
| | |
|
|
|
| NET INCREASE (DECREASE) IN NET ASSETS RESULTING FROM OPERATIONS | | $ | 5,002,603 | |
| | |
|
|
|
STATEMENT OF CHANGES IN NET ASSETS
| | | | | | | | |
| | | Year Ended December 31,
| |
| | | 2016
| | | 2015
| |
| INCREASE (DECREASE) IN NET ASSETS | | | | | | | | |
| OPERATIONS | | | | | | | | |
Net investment income (loss) | | $ | 3,782,397 | | | $ | 4,806,869 | |
Net realized gain (loss) on investment transactions | | | 2,228,812 | | | | 1,519,137 | |
Net change in unrealized appreciation (depreciation) on investments | | | (1,008,606 | ) | | | (3,732,049 | ) |
| | |
|
|
| |
|
|
|
NET INCREASE (DECREASE) IN NET ASSETS RESULTING FROM OPERATIONS | | | 5,002,603 | | | | 2,593,957 | |
| | |
|
|
| |
|
|
|
| SERIES SHARE TRANSACTIONS | | | | | | | | |
Series shares sold [942,340 and 446,808 shares, respectively] | | | 11,729,036 | | | | 5,381,539 | |
Series shares repurchased [1,792,349 and 9,585,972 shares, respectively] | | | (22,240,242 | ) | | | (115,358,336 | ) |
| | |
|
|
| |
|
|
|
NET INCREASE (DECREASE) IN NET ASSETS FROM SERIES SHARE TRANSACTIONS | | | (10,511,206 | ) | | | (109,976,797 | ) |
| | |
|
|
| |
|
|
|
| CAPITAL CONTRIBUTIONS (Note 4) | | | 28,977 | | | | — | |
| | |
|
|
| |
|
|
|
| TOTAL INCREASE (DECREASE) | | | (5,479,626 | ) | | | (107,382,840 | ) |
| NET ASSETS: | | | | | | | | |
Beginning of year | | | 231,797,691 | | | | 339,180,531 | |
| | |
|
|
| |
|
|
|
End of year | | $ | 226,318,065 | | | $ | 231,797,691 | |
| | |
|
|
| |
|
|
|
SEE NOTES TO FINANCIAL STATEMENTS.
A122
| | | | | | |
| | | STOCK INDEX PORTFOLIO | | |
| |
| SCHEDULE OF INVESTMENTS | | as of December 31, 2016 |
| | | | | | | | |
| LONG-TERM INVESTMENTS — 97.4% | |
| COMMON STOCKS | | Shares
| | | Value
(Note 2)
| |
Aerospace & Defense — 2.2% | |
Arconic, Inc. | | | 73,192 | | | $ | 1,356,980 | |
Boeing Co. (The) | | | 96,436 | | | | 15,013,156 | |
General Dynamics Corp. | | | 48,200 | | | | 8,322,212 | |
Lockheed Martin Corp. | | | 42,298 | | | | 10,571,962 | |
L-3 Communications Holdings, Inc. | | | 13,000 | | | | 1,977,430 | |
Northrop Grumman Corp. | | | 30,126 | | | | 7,006,705 | |
Raytheon Co. | | | 49,718 | | | | 7,059,956 | |
Rockwell Collins, Inc. | | | 22,100 | | | | 2,049,996 | |
Textron, Inc. | | | 45,400 | | | | 2,204,624 | |
TransDigm Group, Inc.(a) | | | 8,500 | | | | 2,116,160 | |
United Technologies Corp. | | | 129,100 | | | | 14,151,942 | |
| | | | | | |
|
|
|
| | | | | | | | 71,831,123 | |
| | | | | | |
|
|
|
Air Freight & Logistics — 0.7% | |
C.H. Robinson Worldwide, Inc.(a) | | | 24,100 | | | | 1,765,566 | |
Expeditors International of Washington, Inc. | | | 30,300 | | | | 1,604,688 | |
FedEx Corp. | | | 41,240 | | | | 7,678,888 | |
United Parcel Service, Inc. (Class B Stock) | | | 115,600 | | | | 13,252,384 | |
| | | | | | |
|
|
|
| | | | | | | | 24,301,526 | |
| | | | | | |
|
|
|
Airlines — 0.6% | |
Alaska Air Group, Inc. | | | 20,600 | | | | 1,827,838 | |
American Airlines Group, Inc.(a) | | | 87,400 | | | | 4,080,706 | |
Delta Air Lines, Inc. | | | 125,300 | | | | 6,163,507 | |
Southwest Airlines Co. | | | 104,537 | | | | 5,210,124 | |
United Continental Holdings, Inc.* | | | 49,600 | | | | 3,614,848 | |
| | | | | | |
|
|
|
| | | | | | | | 20,897,023 | |
| | | | | | |
|
|
|
Auto Components — 0.2% | |
BorgWarner, Inc. | | | 34,800 | | | | 1,372,512 | |
Delphi Automotive PLC | | | 45,500 | | | | 3,064,425 | |
Goodyear Tire & Rubber Co. (The) | | | 44,300 | | | | 1,367,541 | |
| | | | | | |
|
|
|
| | | | | | | | 5,804,478 | |
| | | | | | |
|
|
|
Automobiles — 0.5% | |
Ford Motor Co. | | | 649,559 | | | | 7,879,151 | |
General Motors Co. | | | 234,400 | | | | 8,166,496 | |
Harley-Davidson, Inc.(a) | | | 30,800 | | | | 1,796,872 | |
| | | | | | |
|
|
|
| | | | | | | | 17,842,519 | |
| | | | | | |
|
|
|
Banks — 6.6% | |
Bank of America Corp. | | | 1,693,982 | | | | 37,437,002 | |
BB&T Corp. | | | 136,100 | | | | 6,399,422 | |
Citigroup, Inc. | | | 479,122 | | | | 28,474,220 | |
Citizens Financial Group, Inc. | | | 88,500 | | | | 3,153,255 | |
Comerica, Inc. | | | 29,150 | | | | 1,985,407 | |
Fifth Third Bancorp | | | 130,749 | | | | 3,526,301 | |
Huntington Bancshares, Inc. | | | 171,075 | | | | 2,261,612 | |
JPMorgan Chase & Co. | | | 599,645 | | | | 51,743,367 | |
KeyCorp | | | 172,500 | | | | 3,151,575 | |
M&T Bank Corp.(a) | | | 26,400 | | | | 4,129,752 | |
People’s United Financial, Inc.(a) | | | 50,700 | | | | 981,552 | |
| | | | | | | | |
COMMON STOCKS
(continued) | | Shares
| | | Value
(Note 2)
| |
Banks (continued) | |
PNC Financial Services Group, Inc. (The) | | | 82,393 | | | $ | 9,636,685 | |
Regions Financial Corp. | | | 214,512 | | | | 3,080,392 | |
SunTrust Banks, Inc. | | | 84,600 | | | | 4,640,310 | |
U.S. Bancorp | | | 269,681 | | | | 13,853,513 | |
Wells Fargo & Co. | | | 757,336 | | | | 41,736,787 | |
Zions Bancorporation(a) | | | 33,800 | | | | 1,454,752 | |
| | | | | | |
|
|
|
| | | | | | | | 217,645,904 | |
| | | | | | |
|
|
|
Beverages — 2.0% | |
Brown-Forman Corp. (Class B Stock) | | | 30,500 | | | | 1,370,060 | |
Coca-Cola Co. (The) | | | 648,450 | | | | 26,884,737 | |
Constellation Brands, Inc. (Class A Stock) | | | 29,100 | | | | 4,461,321 | |
Dr. Pepper Snapple Group, Inc. | | | 31,800 | | | | 2,883,306 | |
Molson Coors Brewing Co. (Class B Stock) | | | 30,500 | | | | 2,967,955 | |
Monster Beverage Corp.* | | | 67,800 | | | | 3,006,252 | |
PepsiCo, Inc. | | | 240,364 | | | | 25,149,285 | |
| | | | | | |
|
|
|
| | | | | | | | 66,722,916 | |
| | | | | | |
|
|
|
Biotechnology — 2.7% | |
AbbVie, Inc. | | | 270,700 | | | | 16,951,234 | |
Alexion Pharmaceuticals, Inc.* | | | 37,100 | | | | 4,539,185 | |
Amgen, Inc. | | | 125,494 | | | | 18,348,478 | |
Biogen, Inc.* | | | 36,775 | | | | 10,428,654 | |
Celgene Corp.* | | | 130,000 | | | | 15,047,500 | |
Gilead Sciences, Inc. | | | 221,100 | | | | 15,832,971 | |
Regeneron Pharmaceuticals, Inc.* | | | 12,710 | | | | 4,665,714 | |
Vertex Pharmaceuticals, Inc.* | | | 41,200 | | | | 3,035,204 | |
| | | | | | |
|
|
|
| | | | | | | | 88,848,940 | |
| | | | | | |
|
|
|
Building Products — 0.3% | |
Allegion PLC | | | 15,833 | | | | 1,013,312 | |
Fortune Brands Home & Security, Inc. | | | 23,800 | | | | 1,272,348 | |
Johnson Controls International PLC | | | 158,215 | | | | 6,516,876 | |
Masco Corp. | | | 55,400 | | | | 1,751,748 | |
| | | | | | |
|
|
|
| | | | | | | | 10,554,284 | |
| | | | | | |
|
|
|
Capital Markets — 2.8% | |
Affiliated Managers Group, Inc.* | | | 9,300 | | | | 1,351,290 | |
Ameriprise Financial, Inc. | | | 27,400 | | | | 3,039,756 | |
Bank of New York Mellon Corp. (The) | | | 179,089 | | | | 8,485,237 | |
BlackRock, Inc. | | | 20,530 | | | | 7,812,486 | |
Charles Schwab Corp. (The) | | | 200,900 | | | | 7,929,523 | |
CME Group, Inc. | | | 56,500 | | | | 6,517,275 | |
E*TRADE Financial Corp.* | | | 47,310 | | | | 1,639,292 | |
Franklin Resources, Inc. | | | 60,300 | | | | 2,386,674 | |
Goldman Sachs Group, Inc. (The) | | | 62,400 | | | | 14,941,680 | |
Intercontinental Exchange, Inc. | | | 99,990 | | | | 5,641,436 | |
Invesco Ltd. | | | 70,600 | | | | 2,142,004 | |
Moody’s Corp. | | | 28,420 | | | | 2,679,153 | |
Morgan Stanley | | | 243,910 | | | | 10,305,197 | |
SEE NOTES TO FINANCIAL STATEMENTS.
A123
| | | | | | |
| | | STOCK INDEX PORTFOLIO (continued) | | |
| |
| SCHEDULE OF INVESTMENTS | | as of December 31, 2016 |
| | | | | | | | |
COMMON STOCKS
(continued) | | Shares
| | | Value
(Note 2)
| |
Capital Markets (continued) | |
Nasdaq, Inc. | | | 19,600 | | | $ | 1,315,552 | |
Northern Trust Corp. | | | 36,100 | | | | 3,214,705 | |
S&P Global, Inc. | | | 44,000 | | | | 4,731,760 | |
State Street Corp. | | | 61,925 | | | | 4,812,811 | |
T. Rowe Price Group, Inc. | | | 41,500 | | | | 3,123,290 | |
| | | | | | |
|
|
|
| | | | | | | | 92,069,121 | |
| | | | | | |
|
|
|
Chemicals — 2.0% | |
Air Products & Chemicals, Inc. | | | 36,300 | | | | 5,220,666 | |
Albemarle Corp. | | | 17,600 | | | | 1,515,008 | |
CF Industries Holdings, Inc. | | | 39,100 | | | | 1,230,868 | |
Dow Chemical Co. (The) | | | 187,011 | | | | 10,700,770 | |
E.I. du Pont de Nemours & Co. | | | 145,991 | | | | 10,715,739 | |
Eastman Chemical Co. | | | 24,700 | | | | 1,857,687 | |
Ecolab, Inc. | | | 43,800 | | | | 5,134,236 | |
FMC Corp. | | | 22,500 | | | | 1,272,600 | |
International Flavors & Fragrances, Inc.(a) | | | 13,300 | | | | 1,567,139 | |
LyondellBasell Industries NV (Class A Stock) | | | 57,000 | | | | 4,889,460 | |
Monsanto Co. | | | 72,496 | | | | 7,627,304 | |
Mosaic Co. (The)(a) | | | 56,200 | | | | 1,648,346 | |
PPG Industries, Inc. | | | 44,700 | | | | 4,235,772 | |
Praxair, Inc. | | | 47,800 | | | | 5,601,682 | |
Sherwin-Williams Co. (The) | | | 13,300 | | | | 3,574,242 | |
| | | | | | |
|
|
|
| | | | | | | | 66,791,519 | |
| | | | | | |
|
|
|
Commercial Services & Supplies — 0.3% | |
Cintas Corp. | | | 14,500 | | | | 1,675,620 | |
Pitney Bowes, Inc. | | | 32,200 | | | | 489,118 | |
Republic Services, Inc. | | | 39,635 | | | | 2,261,177 | |
Stericycle, Inc.* | | | 14,500 | | | | 1,117,080 | |
Waste Management, Inc. | | | 68,930 | | | | 4,887,826 | |
| | | | | | |
|
|
|
| | | | | | | | 10,430,821 | |
| | | | | | |
|
|
|
Communications Equipment — 1.0% | |
Cisco Systems, Inc. | | | 840,575 | | | | 25,402,177 | |
F5 Networks, Inc.* | | | 11,700 | | | | 1,693,224 | |
Harris Corp. | | | 20,900 | | | | 2,141,623 | |
Juniper Networks, Inc. | | | 60,000 | | | | 1,695,600 | |
Motorola Solutions, Inc. | | | 26,527 | | | | 2,198,823 | |
| | | | | | |
|
|
|
| | | | | | | | 33,131,447 | |
| | | | | | |
|
|
|
Construction & Engineering — 0.1% | |
Fluor Corp. | | | 23,700 | | | | 1,244,724 | |
Jacobs Engineering Group, Inc.* | | | 20,900 | | | | 1,191,300 | |
Quanta Services, Inc.* | | | 26,200 | | | | 913,070 | |
| | | | | | |
|
|
|
| | | | | | | | 3,349,094 | |
| | | | | | |
|
|
|
Construction Materials — 0.2% | |
Martin Marietta Materials, Inc. | | | 10,800 | | | | 2,392,524 | |
Vulcan Materials Co. | | | 22,400 | | | | 2,803,360 | |
| | | | | | |
|
|
|
| | | | | | | | 5,195,884 | |
| | | | | | |
|
|
|
Consumer Finance — 0.8% | |
American Express Co. | | | 129,800 | | | | 9,615,584 | |
Capital One Financial Corp. | | | 81,969 | | | | 7,150,976 | |
Discover Financial Services | | | 68,205 | | | | 4,916,898 | |
| | | | | | | | |
COMMON STOCKS
(continued) | | Shares
| | | Value
(Note 2)
| |
Consumer Finance (continued) | |
Navient Corp. | | | 56,600 | | | $ | 929,938 | |
Synchrony Financial | | | 134,630 | | | | 4,883,030 | |
| | | | | | |
|
|
|
| | | | | | | | 27,496,426 | |
| | | | | | |
|
|
|
Containers & Packaging — 0.3% | |
Avery Dennison Corp. | | | 15,000 | | | | 1,053,300 | |
Ball Corp. | | | 27,300 | | | | 2,049,411 | |
International Paper Co. | | | 69,167 | | | | 3,670,001 | |
Sealed Air Corp. | | | 33,420 | | | | 1,515,263 | |
WestRock Co. | | | 42,761 | | | | 2,170,976 | |
| | | | | | |
|
|
|
| | | | | | | | 10,458,951 | |
| | | | | | |
|
|
|
Distributors — 0.1% | |
Genuine Parts Co. | | | 25,025 | | | | 2,390,889 | |
LKQ Corp.* | | | 49,300 | | | | 1,511,045 | |
| | | | | | |
|
|
|
| | | | | | | | 3,901,934 | |
| | | | | | |
|
|
|
Diversified Consumer Services | |
H&R Block, Inc.(a) | | | 37,500 | | | | 862,125 | |
| | | | | | |
|
|
|
Diversified Financial Services — 1.6% | |
Berkshire Hathaway, Inc. (Class B Stock)* | | | 316,600 | | | | 51,599,468 | |
Leucadia National Corp. | | | 54,500 | | | | 1,267,125 | |
| | | | | | |
|
|
|
| | | | | | | | 52,866,593 | |
| | | | | | |
|
|
|
Diversified Telecommunication Services — 2.6% | |
AT&T, Inc. | | | 1,026,335 | | | | 43,650,028 | |
CenturyLink, Inc. | | | 90,985 | | | | 2,163,623 | |
Frontier Communications Corp.(a) | | | 191,916 | | | | 648,676 | |
Level 3 Communications, Inc.* | | | 48,400 | | | | 2,727,824 | |
Verizon Communications, Inc. | | | 680,038 | | | | 36,300,428 | |
| | | | | | |
|
|
|
| | | | | | | | 85,490,579 | |
| | | | | | |
|
|
|
Electric Utilities — 1.9% | |
Alliant Energy Corp. | | | 34,000 | | | | 1,288,260 | |
American Electric Power Co., Inc. | | | 82,340 | | | | 5,184,126 | |
Duke Energy Corp. | | | 115,048 | | | | 8,930,026 | |
Edison International | | | 54,700 | | | | 3,937,853 | |
Entergy Corp. | | | 30,200 | | | | 2,218,794 | |
Eversource Energy | | | 53,200 | | | | 2,938,236 | |
Exelon Corp. | | | 154,173 | | | | 5,471,600 | |
FirstEnergy Corp. | | | 70,980 | | | | 2,198,251 | |
NextEra Energy, Inc. | | | 77,075 | | | | 9,207,379 | |
PG&E Corp. | | | 82,300 | | | | 5,001,371 | |
Pinnacle West Capital Corp. | | | 19,000 | | | | 1,482,570 | |
PPL Corp. | | | 112,600 | | | | 3,834,030 | |
Southern Co. (The) | | | 162,800 | | | | 8,008,132 | |
Xcel Energy, Inc. | | | 85,095 | | | | 3,463,367 | |
| | | | | | |
|
|
|
| | | | | | | | 63,163,995 | |
| | | | | | |
|
|
|
Electrical Equipment — 0.5% | |
Acuity Brands, Inc.(a) | | | 7,000 | | | | 1,616,020 | |
AMETEK, Inc. | | | 39,500 | | | | 1,919,700 | |
Eaton Corp. PLC | | | 76,861 | | | | 5,156,605 | |
Emerson Electric Co. | | | 107,700 | | | | 6,004,275 | |
Rockwell Automation, Inc. | | | 22,100 | | | | 2,970,240 | |
| | | | | | |
|
|
|
| | | | | | | | 17,666,840 | |
| | | | | | |
|
|
|
SEE NOTES TO FINANCIAL STATEMENTS.
A124
| | | | | | |
| | | STOCK INDEX PORTFOLIO (continued) | | |
| |
| SCHEDULE OF INVESTMENTS | | as of December 31, 2016 |
| | | | | | | | |
COMMON STOCKS
(continued) | | Shares
| | | Value
(Note 2)
| |
Electronic Equipment, Instruments & Components — 0.4% | |
Amphenol Corp. (Class A Stock) | | | 51,800 | | | $ | 3,480,960 | |
Corning, Inc. | | | 161,700 | | | | 3,924,459 | |
FLIR Systems, Inc. | | | 23,000 | | | | 832,370 | |
TE Connectivity Ltd. | | | 59,600 | | | | 4,129,088 | |
| | | | | | |
|
|
|
| | | | | | | | 12,366,877 | |
| | | | | | |
|
|
|
Energy Equipment & Services — 1.1% | |
Baker Hughes, Inc. | | | 72,548 | | | | 4,713,444 | |
FMC Technologies, Inc.* | | | 37,900 | | | | 1,346,587 | |
Halliburton Co. | | | 142,500 | | | | 7,707,825 | |
Helmerich & Payne, Inc. | | | 18,100 | | | | 1,400,940 | |
National Oilwell Varco, Inc.(a) | | | 63,100 | | | | 2,362,464 | |
Schlumberger Ltd. | | | 232,098 | | | | 19,484,627 | |
Transocean Ltd.*(a) | | | 56,000 | | | | 825,440 | |
| | | | | | |
|
|
|
| | | | | | | | 37,841,327 | |
| | | | | | |
|
|
|
Equity Real Estate Investment Trusts (REITs) — 2.7% | |
American Tower Corp. | | | 71,000 | | | | 7,503,280 | |
Apartment Investment & Management Co. (Class A Stock) | | | 26,274 | | | | 1,194,153 | |
AvalonBay Communities, Inc. | | | 23,018 | | | | 4,077,639 | |
Boston Properties, Inc.(a) | | | 25,800 | | | | 3,245,124 | |
Crown Castle International Corp. | | | 58,500 | | | | 5,076,045 | |
Digital Realty Trust, Inc.(a) | | | 25,000 | | | | 2,456,500 | |
Equinix, Inc. | | | 11,755 | | | | 4,201,355 | |
Equity Residential(a) | | | 61,100 | | | | 3,932,396 | |
Essex Property Trust, Inc.(a) | | | 11,100 | | | | 2,580,750 | |
Extra Space Storage, Inc.(a) | | | 20,700 | | | | 1,598,868 | |
Federal Realty Investment Trust(a) | | | 11,100 | | | | 1,577,421 | |
General Growth Properties, Inc.(a) | | | 97,600 | | | | 2,438,048 | |
HCP, Inc.(a) | | | 78,000 | | | | 2,318,160 | |
Host Hotels & Resorts, Inc.(a) | | | 124,626 | | | | 2,347,954 | |
Iron Mountain, Inc. | | | 39,930 | | | | 1,296,926 | |
Kimco Realty Corp. | | | 69,600 | | | | 1,751,136 | |
Macerich Co. (The)(a) | | | 20,800 | | | | 1,473,472 | |
Mid-America Apartment Communities, Inc. | | | 17,800 | | | | 1,742,976 | |
Prologis, Inc. | | | 87,928 | | | | 4,641,719 | |
Public Storage | | | 24,700 | | | | 5,520,450 | |
Realty Income Corp. | | | 41,900 | | | | 2,408,412 | |
Simon Property Group, Inc. | | | 51,761 | | | | 9,196,377 | |
SL Green Realty Corp.(a) | | | 17,100 | | | | 1,839,105 | |
UDR, Inc.(a) | | | 42,900 | | | | 1,564,992 | |
Ventas, Inc.(a) | | | 57,704 | | | | 3,607,654 | |
Vornado Realty Trust | | | 28,957 | | | | 3,022,242 | |
Welltower, Inc. | | | 59,400 | | | | 3,975,642 | |
Weyerhaeuser Co. | | | 123,830 | | | | 3,726,045 | |
| | | | | | |
|
|
|
| | | | | | | | 90,314,841 | |
| | | | | | |
|
|
|
Food & Staples Retailing — 2.0% | |
Costco Wholesale Corp. | | | 73,322 | | | | 11,739,585 | |
CVS Health Corp. | | | 178,338 | | | | 14,072,652 | |
Kroger Co. (The) | | | 159,500 | | | | 5,504,345 | |
Sysco Corp. | | | 85,600 | | | | 4,739,672 | |
| | | | | | | | |
COMMON STOCKS
(continued) | | Shares
| | | Value
(Note 2)
| |
Food & Staples Retailing (continued) | |
Wal-Mart Stores, Inc. | | | 253,200 | | | $ | 17,501,184 | |
Walgreens Boots Alliance, Inc. | | | 142,800 | | | | 11,818,128 | |
Whole Foods Market, Inc. | | | 54,400 | | | | 1,673,344 | |
| | | | | | |
|
|
|
| | | | | | | | 67,048,910 | |
| | | | | | |
|
|
|
Food Products — 1.6% | |
Archer-Daniels-Midland Co. | | | 98,338 | | | | 4,489,130 | |
Campbell Soup Co. | | | 30,100 | | | | 1,820,147 | |
Conagra Foods, Inc. | | | 71,300 | | | | 2,819,915 | |
General Mills, Inc. | | | 99,400 | | | | 6,139,938 | |
Hershey Co. (The) | | | 24,100 | | | | 2,492,663 | |
Hormel Foods Corp. | | | 45,400 | | | | 1,580,374 | |
J.M. Smucker Co. (The) | | | 20,100 | | | | 2,574,006 | |
Kellogg Co. | | | 42,300 | | | | 3,117,933 | |
Kraft Heinz Co. (The) | | | 99,337 | | | | 8,674,107 | |
McCormick & Co., Inc. (Non-Voting Shares)(a) | | | 19,500 | | | | 1,819,935 | |
Mead Johnson Nutrition Co. | | | 31,193 | | | | 2,207,217 | |
Mondelez International, Inc. (Class A Stock) | | | 259,911 | | | | 11,521,854 | |
Tyson Foods, Inc. (Class A Stock) | | | 49,600 | | | | 3,059,328 | |
| | | | | | |
|
|
|
| | | | | | | | 52,316,547 | |
| | | | | | |
|
|
|
Health Care Equipment & Supplies — 2.4% | |
Abbott Laboratories | | | 246,950 | | | | 9,485,350 | |
Baxter International, Inc. | | | 83,600 | | | | 3,706,824 | |
Becton, Dickinson & Co. | | | 35,354 | | | | 5,852,855 | |
Boston Scientific Corp.* | | | 225,499 | | | | 4,877,543 | |
C.R. Bard, Inc. | | | 12,500 | | | | 2,808,250 | |
Cooper Cos., Inc. (The) | | | 7,800 | | | | 1,364,454 | |
Danaher Corp. | | | 100,000 | | | | 7,784,000 | |
DENTSPLY SIRONA, Inc. | | | 38,500 | | | | 2,222,605 | |
Edwards Lifesciences Corp.* | | | 35,800 | | | | 3,354,460 | |
Hologic, Inc.* | | | 43,500 | | | | 1,745,220 | |
Intuitive Surgical, Inc.* | | | 6,340 | | | | 4,020,638 | |
Medtronic PLC | | | 231,528 | | | | 16,491,739 | |
St. Jude Medical, Inc. | | | 47,400 | | | | 3,801,006 | |
Stryker Corp. | | | 52,500 | | | | 6,290,025 | |
Varian Medical Systems, Inc.* | | | 15,800 | | | | 1,418,524 | |
Zimmer Biomet Holdings, Inc. | | | 32,586 | | | | 3,362,875 | |
| | | | | | |
|
|
|
| | | | | | | | 78,586,368 | |
| | | | | | |
|
|
|
Health Care Providers & Services — 2.6% | |
Aetna, Inc. | | | 58,457 | | | | 7,249,253 | |
AmerisourceBergen Corp.(a) | | | 28,600 | | | | 2,236,234 | |
Anthem, Inc. | | | 43,800 | | | | 6,297,126 | |
Cardinal Health, Inc. | | | 53,875 | | | | 3,877,384 | |
Centene Corp.* | | | 28,600 | | | | 1,616,186 | |
Cigna Corp. | | | 42,800 | | | | 5,709,092 | |
DaVita, Inc.* | | | 27,500 | | | | 1,765,500 | |
Envision Healthcare Corp* | | | 17,700 | | | | 1,120,233 | |
Express Scripts Holding Co.* | | | 105,126 | | | | 7,231,617 | |
HCA Holdings, Inc.* | | | 50,100 | | | | 3,708,402 | |
Henry Schein, Inc.* | | | 13,800 | | | | 2,093,598 | |
Humana, Inc. | | | 24,900 | | | | 5,080,347 | |
Laboratory Corp. of America Holdings* | | | 17,000 | | | | 2,182,460 | |
McKesson Corp. | | | 38,107 | | | | 5,352,128 | |
SEE NOTES TO FINANCIAL STATEMENTS.
A125
| | | | | | |
| | | STOCK INDEX PORTFOLIO (continued) | | |
| |
| SCHEDULE OF INVESTMENTS | | as of December 31, 2016 |
| | | | | | | | |
COMMON STOCKS
(continued) | | Shares
| | | Value
(Note 2)
| |
Health Care Providers & Services (continued) | |
Patterson Cos., Inc.(a) | | | 14,200 | | | $ | 582,626 | |
Quest Diagnostics, Inc. | | | 23,800 | | | | 2,187,220 | |
UnitedHealth Group, Inc. | | | 159,300 | | | | 25,494,372 | |
Universal Health Services, Inc. (Class B Stock) | | | 15,100 | | | | 1,606,338 | |
| | | | | | |
|
|
|
| | | | | | | | 85,390,116 | |
| | | | | | |
|
|
|
Health Care Technology — 0.1% | |
Cerner Corp.* | | | 51,200 | | | | 2,425,344 | |
| | | | | | |
|
|
|
Hotels, Restaurants & Leisure — 1.5% | |
Carnival Corp. | | | 71,500 | | | | 3,722,290 | |
Chipotle Mexican Grill, Inc.*(a) | | | 4,920 | | | | 1,856,414 | |
Darden Restaurants, Inc.(a) | | | 19,250 | | | | 1,399,860 | |
Marriott International, Inc. (Class A Stock) | | | 52,923 | | | | 4,375,674 | |
McDonald’s Corp. | | | 139,700 | | | | 17,004,284 | |
Royal Caribbean Cruises Ltd. | | | 28,800 | | | | 2,362,752 | |
Starbucks Corp. | | | 244,700 | | | | 13,585,744 | |
Wyndham Worldwide Corp. | | | 18,563 | | | | 1,417,656 | |
Wynn Resorts Ltd.(a) | | | 12,900 | | | | 1,115,979 | |
Yum! Brands, Inc. | | | 58,900 | | | | 3,730,137 | |
| | | | | | |
|
|
|
| | | | | | | | 50,570,790 | |
| | | | | | |
|
|
|
Household Durables — 0.5% | |
D.R. Horton, Inc. | | | 55,000 | | | | 1,503,150 | |
Garmin Ltd.(a) | | | 19,300 | | | | 935,857 | |
Harman International Industries, Inc. | | | 11,700 | | | | 1,300,572 | |
Leggett & Platt, Inc. | | | 22,700 | | | | 1,109,576 | |
Lennar Corp. (Class A Stock) | | | 30,100 | | | | 1,292,193 | |
Mohawk Industries, Inc.* | | | 10,700 | | | | 2,136,576 | |
Newell Brands, Inc. | | | 77,549 | | | | 3,462,563 | |
PulteGroup, Inc. | | | 52,585 | | | | 966,512 | |
Whirlpool Corp.(a) | | | 12,807 | | | | 2,327,929 | |
| | | | | | |
|
|
|
| | | | | | | | 15,034,928 | |
| | | | | | |
|
|
|
Household Products — 1.8% | |
Church & Dwight Co., Inc. | | | 44,000 | | | | 1,944,360 | |
Clorox Co. (The) | | | 21,700 | | | | 2,604,434 | |
Colgate-Palmolive Co. | | | 149,500 | | | | 9,783,280 | |
Kimberly-Clark Corp. | | | 60,488 | | | | 6,902,891 | |
Procter & Gamble Co. (The) | | | 445,406 | | | | 37,449,736 | |
| | | | | | |
|
|
|
| | | | | | | | 58,684,701 | |
| | | | | | |
|
|
|
Independent Power & Renewable Electricity Producers — 0.1% | |
AES Corp. | | | 110,400 | | | | 1,282,848 | |
NRG Energy, Inc. | | | 51,300 | | | | 628,938 | |
| | | | | | |
|
|
|
| | | | | | | | 1,911,786 | |
| | | | | | |
|
|
|
Industrial Conglomerates — 2.5% | |
3M Co. | | | 100,700 | | | | 17,981,999 | |
General Electric Co. | | | 1,480,847 | | | | 46,794,765 | |
Honeywell International, Inc. | | | 127,350 | | | | 14,753,498 | |
Roper Technologies, Inc. | | | 16,900 | | | | 3,094,052 | |
| | | | | | |
|
|
|
| | | | | | | | 82,624,314 | |
| | | | | | |
|
|
|
Insurance — 2.5% | |
Aflac, Inc. | | | 69,400 | | | | 4,830,240 | |
Allstate Corp. (The) | | | 62,988 | | | | 4,668,670 | |
| | | | | | | | |
COMMON STOCKS
(continued) | | Shares
| | | Value
(Note 2)
| |
Insurance (continued) | |
American International Group, Inc. | | | 164,829 | | | $ | 10,764,982 | |
Aon PLC | | | 44,325 | | | | 4,943,567 | |
Arthur J. Gallagher & Co. | | | 26,900 | | | | 1,397,724 | |
Assurant, Inc. | | | 10,000 | | | | 928,600 | |
Chubb Ltd. | | | 77,090 | | | | 10,185,131 | |
Cincinnati Financial Corp.(a) | | | 25,228 | | | | 1,911,021 | |
Hartford Financial Services Group, Inc. (The) | | | 65,400 | | | | 3,116,310 | |
Lincoln National Corp. | | | 39,863 | | | | 2,641,721 | |
Loews Corp. | | | 44,626 | | | | 2,089,836 | |
Marsh & McLennan Cos., Inc. | | | 87,100 | | | | 5,887,089 | |
MetLife, Inc. | | | 183,600 | | | | 9,894,204 | |
Principal Financial Group, Inc. | | | 45,700 | | | | 2,644,202 | |
Progressive Corp. (The) | | | 98,000 | | | | 3,479,000 | |
Torchmark Corp. | | | 18,875 | | | | 1,392,220 | |
Travelers Cos., Inc. (The) | | | 48,498 | | | | 5,937,125 | |
Unum Group | | | 40,956 | | | | 1,799,197 | |
Willis Towers Watson PLC | | | 22,000 | | | | 2,690,160 | |
XL Group Ltd. (Ireland) | | | 47,400 | | | | 1,766,124 | |
| | | | | | |
|
|
|
| | | | | | | | 82,967,123 | |
| | | | | | |
|
|
|
Internet & Direct Marketing Retail — 2.2% | |
Amazon.com, Inc.* | | | 65,710 | | | | 49,273,958 | |
Expedia, Inc. | | | 19,500 | | | | 2,208,960 | |
Netflix, Inc.* | | | 71,690 | | | | 8,875,222 | |
Priceline Group, Inc. (The)* | | | 8,320 | | | | 12,197,619 | |
TripAdvisor, Inc.* | | | 19,400 | | | | 899,578 | |
| | | | | | |
|
|
|
| | | | | | | | 73,455,337 | |
| | | | | | |
|
|
|
Internet Software & Services — 4.1% | |
Akamai Technologies, Inc.* | | | 29,400 | | | | 1,960,392 | |
Alphabet, Inc. (Class A Stock)* | | | 49,335 | | | | 39,095,521 | |
Alphabet, Inc. (Class C Stock)* | | | 49,530 | | | | 38,228,244 | |
eBay, Inc.* | | | 177,600 | | | | 5,272,944 | |
Facebook, Inc. (Class A Stock)* | | | 390,200 | | | | 44,892,510 | |
VeriSign, Inc.*(a) | | | 15,700 | | | | 1,194,299 | |
Yahoo!, Inc.* | | | 145,700 | | | | 5,634,219 | |
| | | | | | |
|
|
|
| | | | | | | | 136,278,129 | |
| | | | | | |
|
|
|
IT Services — 3.6% | |
Accenture PLC (Class A Stock) | | | 104,200 | | | | 12,204,946 | |
Alliance Data Systems Corp. | | | 9,900 | | | | 2,262,150 | |
Automatic Data Processing, Inc. | | | 76,000 | | | | 7,811,280 | |
Cognizant Technology Solutions Corp. (Class A Stock)* | | | 102,000 | | | | 5,715,060 | |
CSRA, Inc. | | | 22,600 | | | | 719,584 | |
Fidelity National Information Services, Inc. | | | 52,900 | | | | 4,001,356 | |
Fiserv, Inc.* | | | 36,900 | | | | 3,921,732 | |
Global Payments, Inc. | | | 23,700 | | | | 1,645,017 | |
International Business Machines Corp. | | | 144,925 | | | | 24,056,100 | |
Mastercard, Inc. (Class A Stock) | | | 159,800 | | | | 16,499,350 | |
Paychex, Inc.(a) | | | 53,850 | | | | 3,278,388 | |
PayPal Holdings, Inc.* | | | 184,600 | | | | 7,286,162 | |
Teradata Corp.*(a) | | | 23,000 | | | | 624,910 | |
Total System Services, Inc. | | | 28,293 | | | | 1,387,206 | |
SEE NOTES TO FINANCIAL STATEMENTS.
A126
| | | | | | |
| | | STOCK INDEX PORTFOLIO (continued) | | |
| |
| SCHEDULE OF INVESTMENTS | | as of December 31, 2016 |
| | | | | | | | |
COMMON STOCKS
(continued) | | Shares
| | | Value
(Note 2)
| |
IT Services (continued) | |
Visa, Inc. (Class A Stock)(a) | | | 312,600 | | | $ | 24,389,052 | |
Western Union Co. (The)(a) | | | 81,104 | | | | 1,761,579 | |
Xerox Corp. | | | 146,011 | | | | 1,274,676 | |
| | | | | | |
|
|
|
| | | | | | | | 118,838,548 | |
| | | | | | |
|
|
|
Leisure Products — 0.1% | |
Hasbro, Inc. | | | 19,150 | | | | 1,489,678 | |
Mattel, Inc.(a) | | | 57,181 | | | | 1,575,337 | |
| | | | | | |
|
|
|
| | | | | | | | 3,065,015 | |
| | | | | | |
|
|
|
Life Sciences Tools & Services — 0.6% | |
Agilent Technologies, Inc. | | | 54,782 | | | | 2,495,868 | |
Illumina, Inc.* | | | 24,000 | | | | 3,072,960 | |
Mettler-Toledo International, Inc.* | | | 4,150 | | | | 1,737,024 | |
PerkinElmer, Inc. | | | 18,600 | | | | 969,990 | |
Thermo Fisher Scientific, Inc. | | | 66,200 | | | | 9,340,820 | |
Waters Corp.* | | | 13,700 | | | | 1,841,143 | |
| | | | | | |
|
|
|
| | | | | | | | 19,457,805 | |
| | | | | | |
|
|
|
Machinery — 1.4% | |
Caterpillar, Inc.(a) | | | 97,200 | | | | 9,014,328 | |
Cummins, Inc. | | | 26,100 | | | | 3,567,087 | |
Deere & Co.(a) | | | 48,450 | | | | 4,992,288 | |
Dover Corp. | | | 26,400 | | | | 1,978,152 | |
Flowserve Corp.(a) | | | 21,800 | | | | 1,047,490 | |
Fortive Corp. | | | 50,000 | | | | 2,681,500 | |
Illinois Tool Works, Inc. | | | 53,675 | | | | 6,573,041 | |
Ingersoll-Rand PLC | | | 43,100 | | | | 3,234,224 | |
PACCAR, Inc. | | | 59,328 | | | | 3,791,059 | |
Parker-Hannifin Corp. | | | 22,787 | | | | 3,190,180 | |
Pentair PLC (United Kingdom) | | | 28,807 | | | | 1,615,208 | |
Snap-on, Inc. | | | 10,000 | | | | 1,712,700 | |
Stanley Black & Decker, Inc. | | | 25,135 | | | | 2,882,733 | |
Xylem, Inc. | | | 30,400 | | | | 1,505,408 | |
| | | | | | |
|
|
|
| | | | | | | | 47,785,398 | |
| | | | | | |
|
|
|
Media — 3.0% | |
CBS Corp. (Class B Non-Voting Stock) | | | 67,968 | | | | 4,324,124 | |
Charter Communications, Inc. (Class A Stock)* | | | 36,000 | | | | 10,365,120 | |
Comcast Corp. (Class A Stock) | | | 399,246 | | | | 27,567,936 | |
Discovery Communications, Inc. (Class A Stock)*(a) | | | 24,500 | | | | 671,545 | |
Discovery Communications, Inc. (Class C Stock)*(a) | | | 39,900 | | | | 1,068,522 | |
Interpublic Group of Cos., Inc. (The) | | | 67,762 | | | | 1,586,308 | |
News Corp. (Class A Stock) | | | 63,025 | | | | 722,267 | |
News Corp. (Class B Stock) | | | 18,100 | | | | 213,580 | |
Omnicom Group, Inc. | | �� | 40,100 | | | | 3,412,911 | |
Scripps Networks Interactive, Inc. (Class A Stock)(a) | | | 16,400 | | | | 1,170,468 | |
TEGNA, Inc. | | | 37,000 | | | | 791,430 | |
Time Warner, Inc. | | | 129,315 | | | | 12,482,777 | |
Twenty-First Century Fox, Inc. (Class A Stock) | | | 178,600 | | | | 5,007,944 | |
Twenty-First Century Fox, Inc. (Class B Stock) | | | 77,100 | | | | 2,100,975 | |
| | | | | | | | |
COMMON STOCKS
(continued) | | Shares
| | | Value
(Note 2)
| |
Media (continued) | |
Viacom, Inc. (Class B Stock) | | | 57,843 | | | $ | 2,030,289 | |
Walt Disney Co. (The) | | | 245,276 | | | | 25,562,665 | |
| | | | | | |
|
|
|
| | | | | | | | 99,078,861 | |
| | | | | | |
|
|
|
Metals & Mining — 0.3% | |
Freeport-McMoRan, Inc.* | | | 209,812 | | | | 2,767,421 | |
Newmont Mining Corp. | | | 88,803 | | | | 3,025,518 | |
Nucor Corp. | | | 53,600 | | | | 3,190,272 | |
| | | | | | |
|
|
|
| | | | | | | | 8,983,211 | |
| | | | | | |
|
|
|
Multi-Utilities — 1.0% | |
Ameren Corp. | | | 40,900 | | | | 2,145,614 | |
CenterPoint Energy, Inc. | | | 70,910 | | | | 1,747,222 | |
CMS Energy Corp. | | | 46,600 | | | | 1,939,492 | |
Consolidated Edison, Inc.(a) | | | 49,200 | | | | 3,625,056 | |
Dominion Resources, Inc. | | | 102,684 | | | | 7,864,568 | |
DTE Energy Co. | | | 30,100 | | | | 2,965,151 | |
NiSource, Inc. | | | 52,900 | | | | 1,171,206 | |
Public Service Enterprise Group, Inc. | | | 84,900 | | | | 3,725,412 | |
SCANA Corp. | | | 24,300 | | | | 1,780,704 | |
Sempra Energy | | | 40,454 | | | | 4,071,291 | |
WEC Energy Group, Inc. | | | 52,976 | | | | 3,107,042 | |
| | | | | | |
|
|
|
| | | | | | | | 34,142,758 | |
| | | | | | |
|
|
|
Multiline Retail — 0.5% | |
Dollar General Corp. | | | 43,500 | | | | 3,222,045 | |
Dollar Tree, Inc.* | | | 39,447 | | | | 3,044,519 | |
Kohl’s Corp.(a) | | | 31,200 | | | | 1,540,656 | |
Macy’s, Inc. | | | 52,920 | | | | 1,895,065 | |
Nordstrom, Inc.(a) | | | 20,100 | | | | 963,393 | |
Target Corp.(a) | | | 96,168 | | | | 6,946,215 | |
| | | | | | |
|
|
|
| | | | | | | | 17,611,893 | |
| | | | | | |
|
|
|
Oil, Gas & Consumable Fuels — 6.2% | |
Anadarko Petroleum Corp. | | | 91,426 | | | | 6,375,135 | |
Apache Corp. | | | 63,350 | | | | 4,020,825 | |
Cabot Oil & Gas Corp. | | | 76,700 | | | | 1,791,712 | |
Chesapeake Energy Corp.* | | | 106,600 | | | | 748,332 | |
Chevron Corp. | | | 314,142 | | | | 36,974,513 | |
Cimarex Energy Co. | | | 16,000 | | | | 2,174,400 | |
Concho Resources, Inc.* | | | 23,200 | | | | 3,076,320 | |
ConocoPhillips | | | 207,029 | | | | 10,380,434 | |
Devon Energy Corp. | | | 84,600 | | | | 3,863,682 | |
EOG Resources, Inc. | | | 95,100 | | | | 9,614,610 | |
EQT Corp. | | | 28,400 | | | | 1,857,360 | |
Exxon Mobil Corp. | | | 691,404 | | | | 62,406,125 | |
Hess Corp.(a) | | | 43,875 | | | | 2,732,974 | |
Kinder Morgan, Inc. | | | 314,543 | | | | 6,514,186 | |
Marathon Oil Corp. | | | 134,694 | | | | 2,331,553 | |
Marathon Petroleum Corp. | | | 89,394 | | | | 4,500,988 | |
Murphy Oil Corp.(a) | | | 27,700 | | | | 862,301 | |
Newfield Exploration Co.* | | | 32,900 | | | | 1,332,450 | |
Noble Energy, Inc. | | | 71,400 | | | | 2,717,484 | |
Occidental Petroleum Corp. | | | 127,700 | | | | 9,096,071 | |
ONEOK, Inc.(a) | | | 35,340 | | | | 2,028,869 | |
Phillips 66 | | | 75,064 | | | | 6,486,280 | |
Pioneer Natural Resources Co. | | | 27,800 | | | | 5,005,946 | |
Range Resources Corp. | | | 27,300 | | | | 938,028 | |
SEE NOTES TO FINANCIAL STATEMENTS.
A127
| | | | | | |
| | | STOCK INDEX PORTFOLIO (continued) | | |
| |
| SCHEDULE OF INVESTMENTS | | as of December 31, 2016 |
| | | | | | | | |
COMMON STOCKS
(continued) | | Shares
| | | Value
(Note 2)
| |
Oil, Gas & Consumable Fuels (continued) | |
Southwestern Energy Co.* | | | 72,400 | | | $ | 783,368 | |
Spectra Energy Corp. | | | 114,442 | | | | 4,702,422 | |
Tesoro Corp. | | | 20,000 | | | | 1,749,000 | |
Valero Energy Corp. | | | 78,100 | | | | 5,335,792 | |
Williams Cos., Inc. (The) | | | 114,400 | | | | 3,562,416 | |
| | | | | | |
|
|
|
| | | | | | | | 203,963,576 | |
| | | | | | |
|
|
|
Personal Products — 0.1% | |
Coty, Inc. (Class A Stock) | | | 72,800 | | | | 1,332,968 | |
Estee Lauder Cos., Inc. (The) (Class A Stock) | | | 37,400 | | | | 2,860,726 | |
| | | | | | |
|
|
|
| | | | | | | | 4,193,694 | |
| | | | | | |
|
|
|
Pharmaceuticals — 5.0% | |
Allergan PLC*(a) | | | 62,906 | | | | 13,210,889 | |
Bristol-Myers Squibb Co. | | | 278,540 | | | | 16,277,877 | |
Eli Lilly & Co. | | | 163,000 | | | | 11,988,650 | |
Endo International PLC* | | | 34,900 | | | | 574,803 | |
Johnson & Johnson | | | 455,796 | | | | 52,512,257 | |
Mallinckrodt PLC* | | | 19,200 | | | | 956,544 | |
Merck & Co., Inc. | | | 462,103 | | | | 27,204,004 | |
Mylan NV* | | | 73,200 | | | | 2,792,580 | |
Perrigo Co. PLC(a) | | | 24,300 | | | | 2,022,489 | |
Pfizer, Inc. | | | 1,011,423 | | | | 32,851,019 | |
Zoetis, Inc. | | | 82,900 | | | | 4,437,637 | |
| | | | | | |
|
|
|
| | | | | | | | 164,828,749 | |
| | | | | | |
|
|
|
Professional Services — 0.3% | |
Dun & Bradstreet Corp. (The) | | | 6,200 | | | | 752,184 | |
Equifax, Inc. | | | 20,200 | | | | 2,388,246 | |
Nielsen Holdings PLC | | | 57,100 | | | | 2,395,345 | |
Robert Half International, Inc. | | | 22,000 | | | | 1,073,160 | |
Verisk Analytics, Inc.* | | | 25,100 | | | | 2,037,367 | |
| | | | | | |
|
|
|
| | | | | | | | 8,646,302 | |
| | | | | | |
|
|
|
Real Estate Management & Development — 0.1% | |
CBRE Group, Inc. (Class A Stock)* | | | 48,800 | | | | 1,536,712 | |
| | | | | | |
|
|
|
Road & Rail — 0.9% | |
CSX Corp. | | | 159,672 | | | | 5,737,015 | |
J.B. Hunt Transport Services, Inc. | | | 14,900 | | | | 1,446,343 | |
Kansas City Southern | | | 18,500 | | | | 1,569,725 | |
Norfolk Southern Corp. | | | 49,200 | | | | 5,317,044 | |
Ryder System, Inc. | | | 9,100 | | | | 677,404 | |
Union Pacific Corp. | | | 138,600 | | | | 14,370,048 | |
| | | | | | |
|
|
|
| | | | | | | | 29,117,579 | |
| | | | | | |
|
|
|
Semiconductors & Semiconductor Equipment — 3.3% | |
Analog Devices, Inc. | | | 51,500 | | | | 3,739,930 | |
Applied Materials, Inc. | | | 182,900 | | | | 5,902,183 | |
Broadcom Ltd. (Singapore) | | | 65,860 | | | | 11,642,072 | |
First Solar, Inc.*(a) | | | 13,200 | | | | 423,588 | |
Intel Corp. | | | 790,200 | | | | 28,660,554 | |
KLA-Tencor Corp. | | | 26,300 | | | | 2,069,284 | |
Lam Research Corp.(a) | | | 26,750 | | | | 2,828,277 | |
Linear Technology Corp. | | | 40,600 | | | | 2,531,410 | |
Microchip Technology, Inc.(a) | | | 34,300 | | | | 2,200,345 | |
Micron Technology, Inc.* | | | 169,300 | | | | 3,711,056 | |
| | | | | | | | |
COMMON STOCKS
(continued) | | Shares
| | | Value
(Note 2)
| |
Semiconductors & Semiconductor Equipment (continued) | |
NVIDIA Corp.(a) | | | 88,850 | | | $ | 9,483,849 | |
Qorvo, Inc.*(a) | | | 21,886 | | | | 1,154,049 | |
QUALCOMM, Inc. | | | 245,350 | | | | 15,996,820 | |
Skyworks Solutions, Inc. | | | 32,000 | | | | 2,389,120 | |
Texas Instruments, Inc. | | | 168,600 | | | | 12,302,742 | |
Xilinx, Inc. | | | 42,300 | | | | 2,553,651 | |
| | | | | | |
|
|
|
| | | | | | | | 107,588,930 | |
| | | | | | |
|
|
|
Software — 4.2% | |
Activision Blizzard, Inc. | | | 110,900 | | | | 4,004,599 | |
Adobe Systems, Inc.* | | | 83,675 | | | | 8,614,341 | |
Autodesk, Inc.* | | | 33,400 | | | | 2,471,934 | |
CA, Inc. | | | 49,273 | | | | 1,565,403 | |
Citrix Systems, Inc.* | | | 26,300 | | | | 2,348,853 | |
Electronic Arts, Inc.* | | | 50,300 | | | | 3,961,628 | |
Intuit, Inc. | | | 41,600 | | | | 4,767,776 | |
Microsoft Corp. | | | 1,299,100 | | | | 80,726,074 | |
Oracle Corp. | | | 503,295 | | | | 19,351,693 | |
Red Hat, Inc.* | | | 30,900 | | | | 2,153,730 | |
salesforce.com, Inc.* | | | 105,300 | | | | 7,208,838 | |
Symantec Corp. | | | 103,711 | | | | 2,477,656 | |
| | | | | | |
|
|
|
| | | | | | | | 139,652,525 | |
| | | | | | |
|
|
|
Specialty Retail — 2.4% | |
Advance Auto Parts, Inc.(a) | | | 12,400 | | | | 2,097,088 | |
AutoNation, Inc.* | | | 12,589 | | | | 612,455 | |
AutoZone, Inc.* | | | 4,940 | | | | 3,901,563 | |
Bed Bath & Beyond, Inc.(a) | | | 25,800 | | | | 1,048,512 | |
Best Buy Co., Inc.(a) | | | 47,225 | | | | 2,015,091 | |
CarMax, Inc.*(a) | | | 32,800 | | | | 2,111,992 | |
Foot Locker, Inc. | | | 21,100 | | | | 1,495,779 | |
Gap, Inc. (The)(a) | | | 37,187 | | | | 834,476 | |
Home Depot, Inc. (The) | | | 204,069 | | | | 27,361,571 | |
L. Brands, Inc. | | | 40,196 | | | | 2,646,505 | |
Lowe’s Cos., Inc. | | | 146,325 | | | | 10,406,634 | |
O’Reilly Automotive, Inc.*(a) | | | 16,100 | | | | 4,482,401 | |
Ross Stores, Inc. | | | 67,400 | | | | 4,421,440 | |
Signet Jewelers Ltd.(a) | | | 12,100 | | | | 1,140,546 | |
Staples, Inc. | | | 105,000 | | | | 950,250 | |
Tiffany & Co. | | | 17,900 | | | | 1,385,997 | |
TJX Cos., Inc. (The) | | | 110,400 | | | | 8,294,352 | |
Tractor Supply Co. | | | 22,700 | | | | 1,720,887 | |
Ulta Salon Cosmetics & Fragrance, Inc.* | | | 9,800 | | | | 2,498,412 | |
Urban Outfitters, Inc.* | | | 15,600 | | | | 444,288 | |
| | | | | | |
|
|
|
| | | | | | | | 79,870,239 | |
| | | | | | |
|
|
|
Technology Hardware, Storage & Peripherals — 3.7% | |
Apple, Inc. | | | 891,605 | | | | 103,265,691 | |
Hewlett Packard Enterprise Co. | | | 278,466 | | | | 6,443,703 | |
HP, Inc. | | | 289,966 | | | | 4,303,095 | |
NetApp, Inc. | | | 49,000 | | | | 1,728,230 | |
Seagate Technology PLC(a) | | | 50,400 | | | | 1,923,768 | |
Western Digital Corp. | | | 46,968 | | | | 3,191,476 | |
| | | | | | |
|
|
|
| | | | | | | | 120,855,963 | |
| | | | | | |
|
|
|
Textiles, Apparel & Luxury Goods — 0.7% | |
Coach, Inc. | | | 46,800 | | | | 1,638,936 | |
Hanesbrands, Inc. | | | 62,700 | | | | 1,352,439 | |
SEE NOTES TO FINANCIAL STATEMENTS.
A128
| | | | | | |
| | | STOCK INDEX PORTFOLIO (continued) | | |
| |
| SCHEDULE OF INVESTMENTS | | as of December 31, 2016 |
| | | | | | | | |
COMMON STOCKS
(continued) | | Shares
| | | Value
(Note 2)
| |
Textiles, Apparel & Luxury Goods (continued) | |
Michael Kors Holdings Ltd.* | | | 29,500 | | | $ | 1,267,910 | |
NIKE, Inc. (Class B Stock) | | | 222,800 | | | | 11,324,924 | |
PVH Corp. | | | 13,900 | | | | 1,254,336 | |
Ralph Lauren Corp.(a) | | | 9,800 | | | | 885,136 | |
Under Armour, Inc. (Class A Stock)*(a) | | | 28,800 | | | | 836,640 | |
Under Armour, Inc. (Class C Stock)*(a) | | | 29,003 | | | | 730,006 | |
VF Corp. | | | 55,744 | | | | 2,973,942 | |
| | | | | | |
|
|
|
| | | | | | | | 22,264,269 | |
| | | | | | |
|
|
|
Tobacco — 1.6% | |
Altria Group, Inc. | | | 325,500 | | | | 22,010,310 | |
Philip Morris International, Inc. | | | 258,600 | | | | 23,659,314 | |
Reynolds American, Inc. | | | 138,984 | | | | 7,788,663 | |
| | | | | | |
|
|
|
| | | | | | | | 53,458,287 | |
| | | | | | |
|
|
|
Trading Companies & Distributors — 0.2% | |
Fastenal Co. | | | 48,600 | | | | 2,283,228 | |
United Rentals, Inc.* | | | 15,100 | | | | 1,594,258 | |
W.W. Grainger, Inc.(a) | | | 9,400 | | | | 2,183,150 | |
| | | | | | |
|
|
|
| | | | | | | | 6,060,636 | |
| | | | | | |
|
|
|
Water Utilities — 0.1% | |
American Water Works Co., Inc. | | | 28,900 | | | | 2,091,204 | |
| | | | | | |
|
|
|
TOTAL LONG-TERM INVESTMENTS
(cost $1,119,677,815) | | | | 3,218,233,634 | |
| | | | | | |
|
|
|
| | | | | | | | |
| SHORT-TERM INVESTMENTS — 7.4% | |
| | | Shares
| | | Value
(Note 2)
| |
AFFILIATED MUTUAL FUNDS — 7.3% | |
Prudential Investment Portfolios 2 — Prudential Core Ultra Short Bond Fund(b) | | | 79,402,987 | | | $ | 79,402,987 | |
Prudential Investment Portfolios 2 — Prudential Institutional Money Market Fund
(cost $161,274,644; includes $161,168,710 of cash collateral for securities on loan)(b)(c) | | | 161,271,929 | | | | 161,304,184 | |
| | | | | | |
|
|
|
TOTAL AFFILIATED MUTUAL FUNDS
(cost $240,677,631) (Note 4) | | | | 240,707,171 | |
| | | | | | |
|
|
|
| | |
| | | Principal
Amount
(000)#
| | | | |
U.S. TREASURY OBLIGATION — 0.1% | |
U.S. Treasury Bills,
0.529%, 03/16/17
(cost $3,995,724)(d)(e) | | | 4,000 | | | | 3,996,000 | |
| | | | | | |
|
|
|
TOTAL SHORT-TERM INVESTMENTS
(cost $244,673,355) | | | | 244,703,171 | |
| | | | | | |
|
|
|
TOTAL INVESTMENTS — 104.8%
(cost $1,364,351,170) | | | | 3,462,936,805 | |
LIABILITIES IN EXCESS OF OTHER ASSETS(f) — (4.8)% | | | | (157,811,531 | ) |
| | | | | | |
|
|
|
NET ASSETS — 100.0% | | | $ | 3,305,125,274 | |
| | | | | | |
|
|
|
| See | the Glossary for abbreviations used in the annual report. |
| # | Principal amount shown in U.S. dollars unless otherwise stated. |
| * | Non-income producing security. |
| (a) | All or a portion of security is on loan. The aggregate market value of such securities, including those sold and pending settlement, is $157,096,727; cash collateral of $161,168,710 (included in liabilities) was received with which the Portfolio purchased highly liquid short-term investments. Securities on loan are subject to contractual netting arrangements. |
| (b) | Prudential Investments LLC, the manager of the Portfolio, also serves as manager of the Prudential Investment Portfolios 2 — Prudential Core Ultra Short Bond Fund and the Prudential Investment Portfolios 2 — Prudential Institutional Money Market Fund. |
| (c) | Represents security purchased with cash collateral received for securities on loan and includes dividend reinvestment. |
| (d) | Rate quoted represents yield-to-maturity as of purchase date. |
| (e) | Represents security, or a portion thereof, segregated as collateral for futures contracts. |
| (f) | Includes net unrealized appreciation (depreciation) on the following derivative contracts held at reporting period end: |
Futures contracts outstanding at December 31, 2016:
| | | | | | | | | | | | | | | | | | | | |
Number of
Contracts
| | Type
| | | Expiration
Date
| | | Value at
Trade Date
| | | Value at
December 31, 2016
| | | Unrealized
Appreciation
(Depreciation)
| |
| Long Positions: | | | | | | | | | | | | | | | | | | | | |
| 40 | | | S&P 500 E-Mini | | | | Mar. 2017 | | | $ | 4,536,910 | | | $ | 4,472,400 | | | $ | (64,510 | ) |
| 148 | | | S&P 500 Index | | | | Mar. 2017 | | | | 83,470,440 | | | | 82,739,400 | | | | (731,040 | ) |
| | | | | | | | | | | | | | | | | | |
|
|
|
| | | | | | | | | | | | | | | | | | | $ | (795,550 | ) |
| | | | | | | | | | | | | | | | | | |
|
|
|
A U.S. Treasury Obligation with a market value of $3,996,000 has been segregated with UBS AG to cover requirements for open future contracts at December 31, 2016.
SEE NOTES TO FINANCIAL STATEMENTS.
A129
| | | | | | |
| | | STOCK INDEX PORTFOLIO (continued) | | |
| |
| SCHEDULE OF INVESTMENTS | | as of December 31, 2016 |
Various inputs are used in determining the value of the Portfolio’s investments. These inputs are summarized in the three broad levels listed below.
| Level 1— | quoted prices generally in active markets for identical securities. |
| Level 2— | quoted prices for similar securities, interest rates and yield curves, prepayment speeds, foreign currency exchange rates and other observable inputs. |
| Level 3— | unobservable inputs for securities valued in accordance with Board approved fair valuation procedures. |
The following is a summary of the inputs used as of December 31, 2016 in valuing such portfolio securities:
| | | | | | | | | | | | |
| | | Level 1
| | | Level 2
| | | Level 3
| |
Investments in Securities | | | | | | | | | | | | |
Common Stocks | | | | | | | | | | | | |
Aerospace & Defense | | $ | 71,831,123 | | | $ | — | | | $ | — | |
Air Freight & Logistics | | | 24,301,526 | | | | — | | | | — | |
Airlines | | | 20,897,023 | | | | — | | | | — | |
Auto Components | | | 5,804,478 | | | | — | | | | — | |
Automobiles | | | 17,842,519 | | | | — | | | | — | |
Banks | | | 217,645,904 | | | | — | | | | — | |
Beverages | | | 66,722,916 | | | | — | | | | — | |
Biotechnology | | | 88,848,940 | | | | — | | | | — | |
Building Products | | | 10,554,284 | | | | — | | | | — | |
Capital Markets | | | 92,069,121 | | | | — | | | | — | |
Chemicals | | | 66,791,519 | | | | — | | | | — | |
Commercial Services & Supplies | | | 10,430,821 | | | | — | | | | — | |
Communications Equipment | | | 33,131,447 | | | | — | | | | — | |
Construction & Engineering | | | 3,349,094 | | | | — | | | | — | |
Construction Materials | | | 5,195,884 | | | | — | | | | — | |
Consumer Finance | | | 27,496,426 | | | | — | | | | — | |
Containers & Packaging | | | 10,458,951 | | | | — | | | | — | |
Distributors | | | 3,901,934 | | | | — | | | | — | |
Diversified Consumer Services | | | 862,125 | | | | — | | | | — | |
Diversified Financial Services | | | 52,866,593 | | | | — | | | | — | |
Diversified Telecommunication Services | | | 85,490,579 | | | | — | | | | — | |
Electric Utilities | | | 63,163,995 | | | | — | | | | — | |
Electrical Equipment | | | 17,666,840 | | | | — | | | | — | |
Electronic Equipment, Instruments & Components | | | 12,366,877 | | | | — | | | | — | |
Energy Equipment & Services | | | 37,841,327 | | | | — | | | | — | |
Equity Real Estate Investment Trusts (REITs) | | | 90,314,841 | | | | — | | | | — | |
Food & Staples Retailing | | | 67,048,910 | | | | — | | | | — | |
Food Products | | | 52,316,547 | | | | — | | | | — | |
Health Care Equipment & Supplies | | | 78,586,368 | | | | — | | | | — | |
Health Care Providers & Services | | | 85,390,116 | | | | — | | | | — | |
Health Care Technology | | | 2,425,344 | | | | — | | | | — | |
Hotels, Restaurants & Leisure | | | 50,570,790 | | | | — | | | | — | |
Household Durables | | | 15,034,928 | | | | — | | | | — | |
Household Products | | | 58,684,701 | | | | — | | | | — | |
Independent Power & Renewable Electricity Producers | | | 1,911,786 | | | | — | | | | — | |
Industrial Conglomerates | | | 82,624,314 | | | | — | | | | — | |
Insurance | | | 82,967,123 | | | | — | | | | — | |
Internet & Direct Marketing Retail | | | 73,455,337 | | | | — | | | | — | |
Internet Software & Services | | | 136,278,129 | | | | — | | | | — | |
IT Services | | | 118,838,548 | | | | — | | | | — | |
Leisure Products | | | 3,065,015 | | | | — | | | | — | |
Life Sciences Tools & Services | | | 19,457,805 | | | | — | | | | — | |
Machinery | | | 47,785,398 | | | | — | | | | — | |
Media | | | 99,078,861 | | | | — | | | | — | |
Metals & Mining | | | 8,983,211 | | | | — | | | | — | |
Multi-Utilities | | | 34,142,758 | | | | — | | | | — | |
Multiline Retail | | | 17,611,893 | | | | — | | | | — | |
Oil, Gas & Consumable Fuels | | | 203,963,576 | | | | — | | | | — | |
Personal Products | | | 4,193,694 | | | | — | | | | — | |
Pharmaceuticals | | | 164,828,749 | | | | — | | | | — | |
SEE NOTES TO FINANCIAL STATEMENTS.
A130
| | | | | | |
| | | STOCK INDEX PORTFOLIO (continued) | | |
| |
| SCHEDULE OF INVESTMENTS | | as of December 31, 2016 |
| | | | | | | | | | | | |
| | | Level 1
| | | Level 2
| | | Level 3
| |
Investments in Securities (continued) | | | | | | | | | | | | |
Common Stocks (continued) | | | | | | | | | | | | |
Professional Services | | $ | 8,646,302 | | | $ | — | | | $ | — | |
Real Estate Management & Development | | | 1,536,712 | | | | — | | | | — | |
Road & Rail | | | 29,117,579 | | | | — | | | | — | |
Semiconductors & Semiconductor Equipment | | | 107,588,930 | | | | — | | | | — | |
Software | | | 139,652,525 | | | | — | | | | — | |
Specialty Retail | | | 79,870,239 | | | | — | | | | — | |
Technology Hardware, Storage & Peripherals | | | 120,855,963 | | | | — | | | | — | |
Textiles, Apparel & Luxury Goods | | | 22,264,269 | | | | — | | | | — | |
Tobacco | | | 53,458,287 | | | | — | | | | — | |
Trading Companies & Distributors | | | 6,060,636 | | | | — | | | | — | |
Water Utilities | | | 2,091,204 | | | | — | | | | — | |
Affiliated Mutual Funds | | | 240,707,171 | | | | — | | | | — | |
U.S. Treasury Obligation | | | — | | | | 3,996,000 | | | | — | |
Other Financial Instruments* | | | | | | | | | | | | |
Futures Contracts | | | (795,550 | ) | | | — | | | | — | |
| | |
|
|
| |
|
|
| |
|
|
|
Total | | $ | 3,458,145,255 | | | $ | 3,996,000 | | | $ | — | |
| | |
|
|
| |
|
|
| |
|
|
|
| * | Other financial instruments are derivative instruments not reflected in the Schedule of Investments, such as futures, forwards and centrally cleared swap contracts, which are recorded at the unrealized appreciation (depreciation) on the instrument, and OTC swap contracts which are recorded at fair value. |
During the period, there were no transfers between Level 1 and Level 2 to report.
The industry classification of investments and liabilities in excess of other assets shown as a percentage of net assets as of December 31, 2016 were as follows (unaudited):
| | | | |
Affiliated Mutual Funds (including 4.9% of collateral for securities on loan) | | | 7.3 | % |
Banks | | | 6.6 | |
Oil, Gas & Consumable Fuels | | | 6.2 | |
Pharmaceuticals | | | 5.0 | |
Software | | | 4.2 | |
Internet Software & Services | | | 4.1 | |
Technology Hardware, Storage & Peripherals | | | 3.7 | |
IT Services | | | 3.6 | |
Semiconductors & Semiconductor Equipment | | | 3.3 | |
Media | | | 3.0 | |
Capital Markets | | | 2.8 | |
Equity Real Estate Investment Trusts (REITs) | | | 2.7 | |
Biotechnology | | | 2.7 | |
Diversified Telecommunication Services | | | 2.6 | |
Health Care Providers & Services | | | 2.6 | |
Insurance | | | 2.5 | |
Industrial Conglomerates | | | 2.5 | |
Specialty Retail | | | 2.4 | |
Health Care Equipment & Supplies | | | 2.4 | |
Internet & Direct Marketing Retail | | | 2.2 | |
Aerospace & Defense | | | 2.2 | |
Food & Staples Retailing | | | 2.0 | |
Chemicals | | | 2.0 | |
Beverages | | | 2.0 | |
Electric Utilities | | | 1.9 | |
Household Products | | | 1.8 | |
Tobacco | | | 1.6 | |
Diversified Financial Services | | | 1.6 | |
Food Products | | | 1.6 | |
Hotels, Restaurants & Leisure | | | 1.5 | |
Machinery | | | 1.4 | |
Energy Equipment & Services | | | 1.1 | |
Multi-Utilities | | | 1.0 | |
| | | | |
Communications Equipment | | | 1.0 | % |
Road & Rail | | | 0.9 | |
Consumer Finance | | | 0.8 | |
Air Freight & Logistics | | | 0.7 | |
Textiles, Apparel & Luxury Goods | | | 0.7 | |
Airlines | | | 0.6 | |
Life Sciences Tools & Services | | | 0.6 | |
Automobiles | | | 0.5 | |
Electrical Equipment | | | 0.5 | |
Multiline Retail | | | 0.5 | |
Household Durables | | | 0.5 | |
Electronic Equipment, Instruments & Components | | | 0.4 | |
Building Products | | | 0.3 | |
Containers & Packaging | | | 0.3 | |
Commercial Services & Supplies | | | 0.3 | |
Metals & Mining | | | 0.3 | |
Professional Services | | | 0.3 | |
Trading Companies & Distributors | | | 0.2 | |
Auto Components | | | 0.2 | |
Construction Materials | | | 0.2 | |
Personal Products | | | 0.1 | |
U.S. Treasury Obligation | | | 0.1 | |
Distributors | | | 0.1 | |
Construction & Engineering | | | 0.1 | |
Leisure Products | | | 0.1 | |
Health Care Technology | | | 0.1 | |
Water Utilities | | | 0.1 | |
Independent Power & Renewable Electricity Producers | | | 0.1 | |
Real Estate Management & Development | | | 0.1 | |
| | |
|
|
|
| | | | 104.8 | |
Liabilities in excess of other assets | | | (4.8 | ) |
| | |
|
|
|
| | | | 100.0 | % |
| | |
|
|
|
SEE NOTES TO FINANCIAL STATEMENTS.
A131
| | | | | | |
| | | STOCK INDEX PORTFOLIO (continued) | | |
| |
| SCHEDULE OF INVESTMENTS | | as of December 31, 2016 |
The Portfolio invested in derivative instruments during the reporting period. The primary type of risk associated with these derivative instruments is equity risk. The effect of such derivative instruments on the Portfolio’s financial position and financial performance as reflected in the Statement of Assets and Liabilities and Statement of Operations is presented in the summary below.
Fair values of derivative instruments as of December 31, 2016 as presented in the Statement of Assets and Liabilities:
| | | | | | | | | | | | |
Derivatives not accounted for as hedging
instruments, carried at fair value
| | Asset Derivatives
| | | Liability Derivatives
| |
| | Balance Sheet Location
| | Fair Value
| | | Balance Sheet Location
| | Fair Value
| |
Equity contracts | | | | $ | — | | | Due from/to broker — variation margin futures | | $ | 795,550 | * |
| | | | |
|
|
| | | |
|
|
|
| * | Includes cumulative appreciation (depreciation) as reported in schedule of open futures and centrally cleared swap contracts. Only unsettled variation margin receivable (payable) is reported within the Statement of Assets and Liabilities. |
The effects of derivative instruments on the Statement of Operations for the year ended December 31, 2016 are as follows:
| | | | |
Amount of Realized Gain (Loss) on Derivatives Recognized in Income
| |
Derivatives not accounted for as hedging instruments, carried at fair value
| | Futures
| |
Equity contracts | | $ | 12,284,561 | |
| | |
|
|
|
|
Change in Unrealized Appreciation (Depreciation) on Derivatives Recognized in Income
| |
Derivatives not accounted for as hedging instruments, carried at fair value
| | Futures
| |
Equity contracts | | $ | (1,191,963 | ) |
| | |
|
|
|
For the year ended December 31, 2016, the Portfolio’s average value at trade date for futures long positions was $90,251,210.
The Portfolio entered into financial transactions during the reporting period that are either offset in accordance with current requirements or are subject to enforceable master netting arrangements or similar agreements that permit offsetting. The information about offsetting and related netting arrangements for financial transactions, where the legal right to set-off exists, is presented in the summary below.
Offsetting of financial transactions assets and liabilities:
| | | | | | | | | | | | |
Description
| | Gross Amounts of
Recognized Assets(1)
| | | Collateral Received
| | | Net Amount
| |
Securities on Loan | | $ | 157,096,727 | | | $ | (157,096,727 | ) | | $ | — | |
| | |
|
|
| | | | | | | | |
| (1) | Amount represents market value. |
SEE NOTES TO FINANCIAL STATEMENTS.
A132
| | | | | | |
| | | STOCK INDEX PORTFOLIO (continued) | | |
STATEMENT OF ASSETS & LIABILITIES
as of December 31, 2016
| | | | |
| ASSETS | |
Investments at value, including securities on loan of $157,096,727: | | | | |
Unaffiliated investments (cost $1,123,673,539) | | $ | 3,222,229,634 | |
Affiliated investments (cost $240,677,631) | | | 240,707,171 | |
Dividends and interest receivable | | | 4,175,404 | |
Receivable for investments sold | | | 1,621,489 | |
Receivable for Series shares sold | | | 75,653 | |
Tax reclaim receivable | | | 494 | |
Prepaid expenses | | | 24,314 | |
| | |
|
|
|
Total Assets | | | 3,468,834,159 | |
| | |
|
|
|
| LIABILITIES | |
Payable to broker for collateral for securities on loan | | | 161,168,710 | |
Payable for Series shares repurchased | | | 1,003,204 | |
Management fee payable | | | 843,309 | |
Due to broker—variation margin futures | | | 347,100 | |
Accrued expenses and other liabilities | | | 202,730 | |
Payable for investments purchased | | | 142,852 | |
Affiliated transfer agent fee payable | | | 980 | |
| | |
|
|
|
Total Liabilities | | | 163,708,885 | |
| | |
|
|
|
| NET ASSETS | | $ | 3,305,125,274 | |
| | |
|
|
|
Net assets were comprised of: | |
Paid-in capital | | $ | 1,127,461,833 | |
Retained earnings | | | 2,177,663,441 | |
| | |
|
|
|
Net assets, December 31, 2016 | | $ | 3,305,125,274 | |
| | |
|
|
|
Net asset value and redemption price per share
$3,305,125,274 / 65,187,820 outstanding shares of beneficial interest | | $ | 50.70 | |
| | |
|
|
|
STATEMENT OF OPERATIONS
Year Ended December 31, 2016
| | | | |
| NET INVESTMENT INCOME (LOSS) | |
Income | | | | |
Unaffiliated dividend income (net of foreign withholding taxes of $1,872) | | $ | 66,397,111 | |
Income from securities lending, net (including affiliated income of $505,664) | | | 564,159 | |
Affiliated dividend income | | | 502,761 | |
Interest income | | | 14,714 | |
| | |
|
|
|
Total income | | | 67,478,745 | |
| | |
|
|
|
| EXPENSES | |
Management fee | | | 10,114,576 | |
Custodian and accounting fees (net of $18,400 fee credit) | | | 288,000 | |
Shareholders’ reports | | | 107,000 | |
Insurance expenses | | | 41,000 | |
Trustees’ fees | | | 37,000 | |
Audit fee | | | 30,000 | |
Legal fees and expenses | | | 14,000 | |
Transfer agent’s fees and expenses (including affiliated expense of $5,900) | | | 12,000 | |
Miscellaneous | | | 13,533 | |
| | |
|
|
|
Total expenses | | | 10,657,109 | |
Less: Management fee waiver | | | (748,698 | ) |
| | |
|
|
|
Net expenses | | | 9,908,411 | |
| | |
|
|
|
| NET INVESTMENT INCOME (LOSS) | | | 57,570,334 | |
| | |
|
|
|
| REALIZED AND UNREALIZED GAIN (LOSS) ON INVESTMENTS | | | | |
Net realized gain (loss) on: | |
Investment transactions (including affiliated of $2,236) | | | 59,761,702 | |
Futures transactions | | | 12,284,561 | |
| | |
|
|
|
| | | | 72,046,263 | |
| | |
|
|
|
Net change in unrealized appreciation (depreciation) on: | |
Investments (including affiliated of $29,540) | | | 230,179,800 | |
Futures | | | (1,191,963 | ) |
| | |
|
|
|
| | | | 228,987,837 | |
| | |
|
|
|
| NET GAIN (LOSS) ON INVESTMENT TRANSACTIONS | | | 301,034,100 | |
| | |
|
|
|
| NET INCREASE (DECREASE) IN NET ASSETS RESULTING FROM OPERATIONS | | $ | 358,604,434 | |
| | |
|
|
|
STATEMENT OF CHANGES IN NET ASSETS
| | | | | | | | |
| | | Year Ended December 31,
| |
| | | 2016
| | | 2015
| |
| INCREASE (DECREASE) IN NET ASSETS | |
| OPERATIONS | |
Net investment income (loss) | | $ | 57,570,334 | | | $ | 57,514,806 | |
Net realized gain (loss) on investment transactions | | | 72,046,263 | | | | 152,884,259 | |
Net change in unrealized appreciation (depreciation) on investments | | | 228,987,837 | | | | (187,558,369 | ) |
| | |
|
|
| |
|
|
|
NET INCREASE (DECREASE) IN NET ASSETS RESULTING FROM OPERATIONS | | | 358,604,434 | | | | 22,840,696 | |
| | |
|
|
| |
|
|
|
| DISTRIBUTIONS | | | (210,338,581 | ) | | | (93,414,310 | ) |
| | |
|
|
| |
|
|
|
| SERIES SHARE TRANSACTIONS | |
Series shares sold [2,976,732 and 4,544,250 shares, respectively] | | | 136,335,898 | | | | 225,562,519 | |
Series shares issued in reinvestment of distributions [4,481,009 and 1,896,737 shares, respectively] | | | 210,338,581 | | | | 93,414,310 | |
Series shares repurchased [4,217,650 and 11,644,330 shares, respectively] | | | (204,352,773 | ) | | | (550,998,022 | ) |
| | |
|
|
| |
|
|
|
NET INCREASE (DECREASE) IN NET ASSETS FROM SERIES SHARE TRANSACTIONS | | | 142,321,706 | | | | (232,021,193 | ) |
| | |
|
|
| |
|
|
|
| CAPITAL CONTRIBUTIONS (Note 4) | | | 4,458,724 | | | | — | |
| | |
|
|
| |
|
|
|
| TOTAL INCREASE (DECREASE) | | | 295,046,283 | | | | (302,594,807 | ) |
| NET ASSETS: | |
Beginning of year | | | 3,010,078,991 | | | | 3,312,673,798 | |
| | |
|
|
| |
|
|
|
End of year | | $ | 3,305,125,274 | | | $ | 3,010,078,991 | |
| | |
|
|
| |
|
|
|
SEE NOTES TO FINANCIAL STATEMENTS.
A133
| | | | | | |
| | | GLOSSARY | | |
| |
| SCHEDULE OF INVESTMENTS | | as of December 31, 2016 |
The following abbreviations are used in the preceding Portfolios’ descriptions:
Currency
| | |
| AUD | | Australian Dollar |
| CAD | | Canadian Dollar |
| EUR | | Euro |
| GBP | | British Pound |
| HUF | | Hungarian Forint |
| ILS | | Israeli Shekel |
| JPY | | Japanese Yen |
| MXN | | Mexican Peso |
| NOK | | Norwegian Krone |
| NZD | | New Zealand Dollar |
| PLN | | Polish Zloty |
| SEK | | Swedish Krona |
| ZAR | | South African Rand |
Index
| | |
| CDX | | Credit Derivative Index |
Other
| | |
| 144A | | Security was purchased pursuant to Rule 144A under the Securities Act of 1933 and may not be resold subject to that rule except to qualified institutional buyers. Unless otherwise noted, 144A securities are deemed to be liquid. |
| RegS | | Regulation S. Security was purchased pursuant to Regulation S and may not be offered, sold or delivered within the United States or to, or for the account or benefit of, U.S. persons, except pursuant to an exemption from, or in a transaction not subject to, the registration requirements of the Securities Act of 1933. |
| ABS | | Asset-Backed Security |
| Aces | | Alternative Credit Enhancements Securities |
| ADR | | American Depositary Receipt |
| BABs | | Build America Bonds |
| BBSW | | Australian Bank Bill Swap Reference Rate |
| bps | | Basis Points |
| CAS | | Connecticut Avenue Securities |
| CDO | | Collateralized Debt Obligation |
| CLO | | Collateralized Loan Obligation |
| CMBS | | Collateralized Mortgage-Backed Security |
| CVA | | Certificate Van Aandelen (Bearer) |
| EAFE | | Europe, Australasia and Far East |
| ETF | | Exchange Traded Fund |
| EMTN | | Euro Medium Term Note |
| EONIA | | Euro Overnight Index Average |
| EURIBOR | | Euro Interbank Offered Rate |
| EUROIS | | Euro Overnight Index Swap |
| FHLMC | | Federal Home Loan Mortgage Corp. |
| GMTN | | Global Medium Term Note |
| GO | | General Obligation |
| IO | | Interest Only (Principal amount represents notional) |
| LIBOR | | London Interbank Offered Rate |
| MSCI | | Morgan Stanley Capital International |
| MTN | | Medium Term Note |
| NIBOR | | Norwegian Interbank Offered Rate |
| OTC | | Over-the-counter |
| PIK | | Payment-in-Kind |
| PO | | Principal Only |
| PRFC | | Preference Shares |
| REIT | | Real Estate Investment Trust |
| REMICS | | Real Estate Mortgage Investment Conduit Security |
| RSP | | Risparimo (Savings Shares) |
| STACR | | Structured Agency Credit Risk |
SEE NOTES TO FINANCIAL STATEMENTS.
A134
| | | | | | |
| | | GLOSSARY (continued) | | |
| |
| SCHEDULE OF INVESTMENTS | | as of December 31, 2016 |
| | |
| STRIPS | | Separate Trading of Registered Interest and Principle of Securities |
| TBA | | To Be Announced |
| TIPS | | Treasury Inflation-Protected Securities |
| USAID | | United States Agency for International Development |
| USOIS | | United States Overnight Index Swap |
SEE NOTES TO FINANCIAL STATEMENTS.
A135
NOTES TO THE FINANCIAL STATEMENTS OF
THE PRUDENTIAL SERIES FUND
The Prudential Series Fund (“Series Fund”), organized as a Delaware statutory trust, is a diversified open-end management investment company registered under the Investment Company Act of 1940, as amended (“1940 Act”). The Series Fund is composed of seventeen Portfolios (“Portfolio” or “Portfolios”), each with separate series shares. The information presented in these financial statements pertains to the seven Portfolios which are listed below along with each Portfolio’s investment objective.
Conservative Balanced Portfolio: Total investment return consistent with a conservatively managed diversified portfolio.
Diversified Bond Portfolio: High level of income over a longer term while providing reasonable safety of capital.
Equity Portfolio: Long-term growth of capital.
Flexible Managed Portfolio: Total return consistent with an aggressively managed diversified portfolio.
Global Portfolio: Long-term growth of capital.
Government Income Portfolio: High level of income over the long-term consistent with the preservation of capital.
Stock Index Portfolio: Achieve investment results that generally correspond to the performance of publicly traded common stocks.
| Note 2: | | Accounting Policies |
The Series Fund follows investment company accounting and reporting guidance of the Financial Accounting Standards Board (“FASB”) Accounting Standard Codification Topic 946 Financial Services — Investment Companies. The following accounting policies conform to U.S. generally accepted accounting principles. The Series Fund and the Portfolios consistently follow such policies in the preparation of their financial statements.
Securities Valuation: Each Portfolio holds securities and other assets that are fair valued at the close of each day (generally, 4:00 PM Eastern time) the New York Stock Exchange (“NYSE”) is open for trading. Fair value is the price that would be received to sell an asset or paid to transfer a liability in an orderly transaction between market participants on the measurement date. The Board of Trustees (the “Board”) has adopted Valuation Procedures for security valuation under which fair valuation responsibilities have been delegated to Prudential Investments LLC (“PI” or “Manager”). Under the current Valuation Procedures, the established Valuation Committee is responsible for supervising the valuation of portfolio securities and other assets. The Valuation Procedures permit a Portfolio to utilize independent pricing vendor services, quotations from market makers, and alternative valuation methods when market quotations are either not readily available or not deemed representative of fair value. A record of the Valuation Committee’s actions is subject to the Board’s review, approval, and ratification at its next regularly-scheduled quarterly meeting.
Various inputs determine how each Portfolio’s investments are valued, all of which are categorized according to the three broad levels (Level 1, 2, or 3) detailed in the table following each Portfolio’s Schedule of Investments.
Common and preferred stocks, exchange-traded funds, and derivative instruments, such as futures or options, that are traded on a national securities exchange are valued at the last sale price as of the close of trading on the applicable exchange where the security principally trades. Securities traded via NASDAQ are valued at the NASDAQ official closing price. To the extent these securities are valued at the last sale price or NASDAQ official closing price, they are classified as Level 1 in the fair value hierarchy.
In the event that no sale or official closing price on valuation date exists, these securities are generally valued at the mean between the last reported bid and ask prices, or at the last bid price in the absence of an ask price. These securities are classified as Level 2 in the fair value hierarchy.
B1
Common and preferred stocks traded on foreign securities exchanges are valued using pricing vendor services that provide model prices derived using adjustment factors based on information such as local closing price, relevant general and sector indices, currency fluctuations, depositary receipts, and futures, as applicable. Securities valued using such model prices are classified as Level 2 in the fair value hierarchy. The models generate an evaluated adjustment factor for each security, which is applied to the local closing price to adjust it for post closing market movements. Utilizing that evaluated adjustment factor, the vendor provides an evaluated price for each security. If the vendor does not provide an evaluated price, securities are valued in accordance with exchange-traded common and preferred stocks discussed above.
Participatory notes (“P-notes”) are generally valued based upon the value of a related underlying security that trades actively in the market and are classified as Level 2 in the fair value hierarchy.
Investments in open-end, non-exchange-traded mutual funds are valued at their net asset values as of the close of the NYSE on the date of valuation. These securities are classified as Level 1 in the fair value hierarchy since they may be purchased or sold at their net asset values on the date of valuation.
Fixed income securities traded in the OTC market are generally valued at prices provided by approved independent pricing vendors. The pricing vendors provide these prices after evaluating observable inputs including, but not limited to yield curves, yield spreads, credit ratings, deal terms, tranche level attributes, default rates, cash flows, prepayment speeds, broker/dealer quotations, and reported trades. Securities valued using such vendor prices are classified as Level 2 in the fair value hierarchy.
Bank loans are generally valued at prices provided by approved independent pricing vendors. The pricing vendors utilize broker/dealer quotations and provide prices based on the average of such quotations. Bank loans valued using such vendor prices are generally classified as Level 2 in the fair value hierarchy.
OTC derivative instruments are generally valued using pricing vendor services, which derive the valuation based on inputs such as underlying asset prices, indices, spreads, interest rates, and exchange rates. These instruments are categorized as Level 2 in the fair value hierarchy.
Centrally cleared swaps listed or traded on a multilateral or trade facility platform, such as a registered exchange, are generally valued at the daily settlement price determined by the respective exchange. These securities are classified as Level 2 in the fair value hierarchy, as the daily settlement price is not public.
Securities and other assets that cannot be priced according to the methods described above are valued based on pricing methodologies approved by the Board. In the event that unobservable inputs are used when determining such valuations, the securities will be classified as Level 3 in the fair value hierarchy.
When determining the fair value of securities, some of the factors influencing the valuation include: the nature of any restrictions on disposition of the securities; assessment of the general liquidity of the securities; the issuer’s financial condition and the markets in which it does business; the cost of the investment; the size of the holding and the capitalization of the issuer; the prices of any recent transactions or bids/offers for such securities or any comparable securities; any available analyst media or other reports or information deemed reliable by the investment adviser regarding the issuer or the markets or industry in which it operates. Using fair value to price securities may result in a value that is different from a security’s most recent closing price and from the price used by other mutual funds to calculate their net asset values.
Restricted and Illiquid Securities: Subject to guidelines adopted by the Board, each Portfolio may invest up to 15% of their net assets in illiquid securities, including those which are restricted as to disposition under securities law (“restricted securities”). Restricted securities are valued pursuant to the valuation procedures noted above. Illiquid securities are those that, because of the absence of a readily available market or due to legal or contractual restrictions on resale, cannot be sold within seven days in the ordinary course of business at approximately the amount at which the Portfolio has valued the investment. Therefore, a Portfolio may find it difficult to sell illiquid securities at the time considered most advantageous by its Subadviser and may incur expenses that would not be incurred in the sale of securities that were freely marketable. Certain securities that would otherwise be considered illiquid because of legal restrictions on resale to the general public may be traded among qualified institutional buyers under Rule 144A of the Securities Act of 1933. These Rule 144A securities, as well as commercial paper that is sold in private placements under Section 4(2) of the Securities Act, may be deemed liquid by the Portfolio’s Subadviser under the guidelines adopted by the Board of the Portfolio. However, the liquidity of a Portfolio’s investments in Rule 144A securities could be impaired if trading does not develop or declines.
B2
CAS and STACR: The Portfolios purchased government controlled Fannie Mae and Freddie Mac securities that transfer most of the cost of defaults to private investors including the Portfolios. These are insurance-like products that are called CAS by Fannie Mae and STACR securities by Freddie Mac. Payments on the securities are based primarily on the performance of a reference pool of underlying mortgages. With such securities, the Portfolios could lose some or all of their principal if the underlying mortgages experience credit defaults.
Repurchase Agreements: In connection with transactions in repurchase agreements with United States financial institutions, it is each Portfolio’s policy that its custodian or designated subcustodians, as the case may be, under triparty repurchase agreements, take possession of the underlying collateral securities, the value of which exceeds the principal amount of the repurchase transaction, including accrued interest. To the extent that any repurchase transaction exceeds one business day, the value of the collateral is marked to market on a daily basis to ensure the adequacy of the collateral. If the seller defaults or the value of the collateral declines, or if bankruptcy proceedings are commenced with respect to the seller of the security, realization of the collateral by the Portfolio may be delayed or limited.
Foreign Currency Translation: The books and records of the Portfolios are maintained in U.S. dollars. Foreign currency amounts are translated into U.S. dollars on the following basis:
(i) market value of investment securities, other assets and liabilities — at the current daily rates of exchange;
(ii) purchases and sales of investment securities, income and expenses — at the rates of exchange prevailing on the respective dates of such transactions.
Although the net assets of the Portfolios are presented at the foreign exchange rates and market values at the close of the period, the Portfolios do not generally isolate that portion of the results of operations arising as a result of changes in the foreign exchange rates from the fluctuations arising from changes in the market prices of long-term portfolio securities held at the end of the period. Similarly, the Portfolios do not isolate the effect of changes in foreign exchange rates from the fluctuations arising from changes in the market prices of long-term portfolio securities sold during the period. Accordingly, holding period realized foreign currency gains (losses) are included in the reported net realized gains (losses) on investment transactions. Notwithstanding the above, the Portfolios do isolate the effect of fluctuations in foreign currency exchange rates when determining the gain (loss) upon the sale or maturity of foreign currency denominated debt obligations; such amounts are included in net realized gains (losses) on foreign currency transactions.
Additionally, net realized gains (losses) on foreign currency transactions represent net foreign exchange gains (losses) from holdings of foreign currencies, forward currency contracts, disposition of foreign currencies, currency gains (losses) realized between the trade and settlement dates on securities transactions, and the difference between the amounts of interest, dividends and foreign withholding taxes recorded on the Portfolios’ books and the U.S. dollar equivalent amounts actually received or paid. Net unrealized currency gains (losses) from valuing foreign currency denominated assets and liabilities (other than investments) at period end exchange rates are reflected as a component of net unrealized appreciation (depreciation) on foreign currency transactions.
P-notes: The Series Fund may gain exposure to securities in certain foreign markets through investments in P-notes. The Series Fund may purchase P-notes due to restrictions applicable to foreign investors when investing directly in a foreign market. P-notes are generally issued by banks or broker-dealers and are designed to offer a return linked to a particular underlying security. P-notes involve transaction costs, which may be higher than those applicable to the equity securities. An investment in a P-note may involve risks, including counterparty risk, beyond those normally associated with a direct investment in the underlying security. The Series Fund must rely on the creditworthiness of the counterparty and would have no rights against the issuer of the underlying security. Furthermore, the P-note’s performance may differ from that of the underlying security. The holder of the P-note is entitled to receive from the bank or broker-dealer, an amount equal to dividends paid by the issuer of the underlying security; however, the holder is not entitled to the same rights (e.g., dividends, voting rights) as an owner of the underlying security. There is also no assurance that there will be a secondary trading market for a P-note or that the trading price of a P-note will equal the value of the underlying security.
Forward Currency Contracts: A forward currency contract is a commitment to purchase or sell a foreign currency at a future date at a negotiated forward rate. Certain Portfolios, as defined in the prospectus, entered into forward currency contracts in order to hedge their exposure to changes in foreign currency
B3
exchange rates on their foreign portfolio holdings or on specific receivables and payables denominated in a foreign currency and to gain exposures to certain currencies. The contracts are valued daily at current forward exchange rates and any unrealized gain (loss) is included in net unrealized appreciation or depreciation on investments and foreign currencies. Gain (loss) is realized on the settlement date of the contract equal to the difference between the settlement value of the original and negotiated forward contracts. This gain (loss), if any, is included in net realized gain (loss) on foreign currency transactions. Risks may arise upon entering into these contracts from the potential inability of the counterparties to meet the terms of their contracts. Forward currency contracts involve risks from currency exchange rate and credit risk in excess of the amounts reflected on the Statement of Assets and Liabilities. A Portfolio’s maximum risk of loss from counterparty credit risk is the net value of the cash flows to be received from the counterparty at the end of the contract’s life.
Cross Currency Exchange Contracts: A cross currency contract is a forward contract where a specified amount of one foreign currency will be exchanged for a specified amount of another foreign currency.
Short Sales: Certain Portfolios may sell a security they do not own in anticipation of a decline in the market value of that security (short sale). When the Portfolio makes a short sale, it must borrow the security sold short and deliver it to the broker-dealer through which it made the short sale as collateral for its obligation to deliver the security upon conclusion of the transaction. The Portfolio may have to pay a fee to borrow the particular security and may be obligated to return any interest or dividends received on such borrowed securities. Dividends declared on short positions open are recorded on the ex-date and the interest payable is accrued daily on fixed income securities sold short, both of which are recorded as an expense. A gain, limited to the price at which the Portfolio sold the security short, or a loss, unlimited in magnitude, will be recognized upon the termination of a short sale if the market price at termination is less than or greater than, respectively, the proceeds originally received.
Loan Participations: Certain Portfolios may invest in loan participations. When the Portfolio purchases a loan participation, the Portfolio typically enters into a contractual relationship with the lender or third party selling such participations (“Selling Participant”), but not the borrower. As a result, the Portfolio assumes the credit risk of the borrower, the Selling Participant and any other persons interpositioned between the Portfolio and the borrower. The Portfolio may not directly benefit from the collateral supporting the senior loan in which it has purchased the loan participation.
Financial Futures Contracts: A financial futures contract is an agreement to purchase (long) or sell (short) an agreed amount of securities at a set price for delivery on a future date. Upon entering into a financial futures contract, the Portfolio is required to pledge to the broker an amount of cash and/or other assets equal to a certain percentage of the contract amount. This amount is known as the “initial margin.” Subsequent payments known as “variation margin,” are made or received by the Portfolio each day, depending on the daily fluctuations in the value of the underlying security. Such variation margin is recorded for financial statement purposes on a daily basis as unrealized gain (loss). When the contract expires or is closed, the gain (loss) is realized and is presented in the Statement of Operations as net realized gain (loss) on futures transactions.
Certain Portfolios invested in financial futures contracts in order to hedge their existing portfolio securities, or securities the Portfolios intend to purchase, against fluctuations in value caused by changes in prevailing interest rates, value of equities or foreign currency exchange rates. Portfolios may also use futures to gain additional market exposure. Should interest rates move unexpectedly, the Portfolio may not achieve the anticipated benefits of the financial futures contracts and may realize a loss. The use of futures transactions involves the risk of imperfect correlation in movements in the price of futures contracts, interest rates and the underlying hedged assets. Financial futures contracts involve elements of risk in excess of the amounts reflected on the Statement of Assets and Liabilities. With exchange-traded futures contracts, there is minimal counterparty credit risk to the Portfolios since the exchanges’ clearinghouse acts as counterparty to all exchange-traded futures and guarantees the futures contracts against default.
Options: Certain Portfolios purchased or wrote options in order to hedge against adverse market movements or fluctuations in value caused by changes in prevailing interest rates, value of equities or foreign currency exchange rates with respect to securities or financial instruments which the Portfolio currently owns or intends to purchase. Portfolios may also use options to gain additional market exposure. The Portfolio’s principal reason for writing options is to realize, through receipt of premiums, a greater current return than would be realized on the underlying security alone. When the Portfolio purchases an option, it pays a
B4
premium and an amount equal to that premium is recorded as an asset. When the Portfolio writes an option, it receives a premium and an amount equal to that premium is recorded as a liability. The asset or liability is adjusted daily to reflect the current market value of the option. If an option expires unexercised, the Portfolio realizes a gain (loss) to the extent of the premium received or paid. If an option is exercised, the premium received or paid is recorded as an adjustment to the proceeds from the sale or the cost basis of the purchase. The difference between the premium and the amount received or paid on effecting a closing purchase or sale transaction is also treated as a realized gain (loss). Gain (loss) on purchased options is included in net realized gain (loss) on investment transactions. Gain (loss) on written options is presented separately as net realized gain (loss) on options written transactions.
The Portfolio, as writer of an option, may have no control over whether the underlying securities or financial instruments may be sold (called) or purchased (put). As a result, the Portfolio bears the market risk of an unfavorable change in the price of the security or financial instrument underlying the written option. OTC options also involve the risk of the potential inability of the counterparties to meet the terms of their contracts. With exchange-traded options contracts, there is minimal counterparty credit risk to the Portfolio since the exchanges’ clearinghouse acts as counterparty to all exchange-traded options and guarantees the options contracts against default.
When a Portfolio writes an option on a swap, an amount equal to any premium received by the Portfolio is recorded as a liability and is subsequently adjusted to the current market value of the written option on the swap. If a call option on a swap is exercised, the Portfolio becomes obligated to pay a fixed interest rate (noted as the strike price) and receive a variable interest rate on a notional amount. If a put option on a swap is exercised, the Portfolio becomes obligated to pay a variable interest rate and receive a fixed interest rate (noted as the strike price) on a notional amount. Premiums received from writing options on swaps that expire or are exercised are treated as realized gains upon the expiration or exercise of such options on swaps. The risk associated with writing put and call options on swaps is that the Portfolio will be obligated to be party to a swap agreement if an option on a swap is exercised.
Forward Rate Agreements: Forward rate agreements represent an agreement between counterparties to exchange cash flows based on the difference between two interest rates, applied to a notional principal amount on a fixed future date. Certain Portfolio entered into forward rate agreements to gain yield exposure based on anticipated market conditions at the specified termination date of the agreement.
Swap Agreements: Certain Portfolios may enter into credit default, interest rate, total return and other forms of swap agreements. A swap agreement is an agreement to exchange the return generated by one instrument for the return generated by another instrument. Swap agreements are negotiated in the OTC market and may be executed either directly with a counterparty (“OTC-traded”) or through a central clearing facility, such as a registered commodities exchange. Swap agreements are valued daily at current market value and any change in value is included in the net unrealized appreciation or depreciation on investments. Centrally cleared swaps pay or receive an amount, known as “variation margin”, based on the daily changes in valuation of the swap contract. Payments received or paid by the Portfolio are recorded as realized gains (losses) upon termination or maturity of the swap. Risk of loss may exceed amounts recognized on the Statement of Assets and Liabilities. Swap agreements outstanding at period end, if any, are listed on the Schedule of Investments.
Interest Rate Swaps: Interest rate swaps represent agreements between counterparties to exchange cash flows based on the difference between two interest rates, applied to a notional principal amount for a specified period. Certain Portfolios are subject to interest rate risk exposure in the normal course of pursuing their investment objectives. Certain Portfolios used interest rate swaps to either maintain their ability to generate steady cash flow by receiving a stream of fixed rate payments or to increase exposure to prevailing market rates by receiving floating rate payments using interest rate swap contracts. A Portfolio’s maximum risk of loss from counterparty credit risk is the discounted net value of the cash flows to be received from the counterparty over the contract’s remaining life.
Credit Default Swaps (“CDS”): CDS involve one party (the protection buyer) making a stream of payments to another party (the protection seller) in exchange for the right to receive a specified payment in the event of a default or as a result of a default (collectively a “credit event”) for the referenced entity (typically corporate issues or sovereign issues of an emerging country) on its obligation; or in the event of a write-down, principal shortfall, interest shortfall or default of all or part of the referenced entities comprising a credit index. Certain Portfolios are subject to credit risk in the normal course of pursuing their investment objectives. Certain Portfolios entered into CDS contracts to provide a measure of protection against defaults or take an active long or short position with respect to the likelihood of a particular issuer’s default or the reference entity’s credit soundness. CDS contracts generally trade based on a spread which represents the cost a protection buyer has to pay the protection seller.
B5
The protection buyer is said to be short the credit as the value of the contract rises the more the credit deteriorates. The value of the CDS contract increases for the protection buyer if the spread increases. A Portfolio’s maximum risk of loss from counterparty credit risk for purchased credit default swaps is the inability of the counterparty to honor the contract up to the notional value based on a credit event.
As a seller of protection on credit default swap agreements, the Portfolio generally receives an agreed upon payment from the buyer of protection throughout the term of the swap, provided no credit event occurs. As the seller, the Portfolio effectively increases its investment risk because, in addition to its total net assets, the Portfolio may be subject to investment exposure on the notional amount of the swap.
The maximum amount of the payment that the Portfolio, as a seller of protection, could be required to make under a credit default swap agreement would be equal to the notional amount of the underlying security or index contract as a result of a credit event. This potential amount will be partially offset by any recovery values of the respective referenced obligations, or net amounts received from the settlement of buy protection credit default swap agreements which the Portfolio entered into for the same referenced entity or index. As a buyer of protection, the Portfolio generally receives an amount up to the notional value of the swap if a credit event occurs.
Implied credit spreads, represented in absolute terms, utilized in determining the market value of credit default swap agreements on corporate or sovereign issues of an emerging country as of period end are disclosed in the footnotes to the Schedule of Investments, if applicable. These spreads serve as indicators of the current status of the payment/performance risk and represent the likelihood of default risk for the credit derivative. The implied credit spread of a particular referenced entity reflects the cost of buying/selling protection and may include upfront payments required to enter into the agreement. For credit default swap agreements on asset-backed securities and credit indices, the quoted market prices and resulting values serve as indicators of the current status of the payment/performance risk. Wider credit spreads and increased market value in absolute terms, when compared to the notional amount of the swap, represent a deterioration of the referenced entity’s credit soundness and a greater likelihood of risk of default or other credit event occurring as defined under the terms of the agreement.
Currency Swaps: Certain Portfolios entered into currency swap agreements primarily to gain yield exposure on foreign bonds. Currency swap agreements involve two parties exchanging two different currencies with an agreement to reverse the exchange at a later date at specified exchange rates.
Total Return Swaps: In a total return swap, one party would receive payments based on the market value of the security or the commodity involved, or total return of a specific referenced asset, such as an equity, index or bond, and in return pay a fixed amount. Certain Portfolios are subject to risk exposures associated with the referenced asset in the normal course of pursuing their investment objectives. Certain Portfolios entered into total return swaps to manage their exposure to a security or an index. A Portfolio’s maximum risk of loss from counterparty credit risk is the change in the value of the security, in the Portfolio’s favor, from the point of entering into the contract.
Master Netting Arrangements: Certain Portfolios are subject to various Master Agreements, or netting arrangements, with select counterparties. These are agreements which a subadviser may have negotiated and entered into on behalf of the Portfolio. For multi-sleeve Portfolios, different subadvisers who manage their respective sleeve, may enter into such agreements with the same counterparty and are disclosed separately for each sleeve when presenting information about offsetting and related netting arrangements for OTC derivatives. A master netting arrangement between the Portfolio and the counterparty permits the Portfolio to offset amounts payable by the Portfolio to the same counterparty against amounts to be received; and by the receipt of collateral from the counterparty by the Portfolio to cover the Portfolio’s exposure to the counterparty. However, there is no assurance that such mitigating factors are easily enforceable. In addition to master netting arrangements, the right to set-off exists when all the conditions are met such that each of the parties owes the other determinable amounts, the reporting party has the right to set-off the amount owed with the amount owed by the other party, the reporting party intends to set-off, and the right of set-off is enforceable by law. During the reporting period, there was no intention to settle on a net basis and all amounts are presented on a gross basis on the Statement of Assets and Liabilities.
Certain Portfolios are parties to ISDA (International Swaps and Derivatives Association, Inc.) Master Agreements with certain counterparties that govern OTC derivative and foreign exchange contracts entered into from time to time. The Master Agreements may contain provisions regarding, among other things, the parties’ general obligations, representations, agreements, collateral requirements, events of default and early
B6
termination. With respect to certain counterparties, in accordance with the terms of the Master Agreements, collateral posted to the Portfolio is held in a segregated account by the Portfolio’s custodian and with respect to those amounts which can be sold or re-pledged, are presented in the Schedule of Investments. Collateral pledged by the Portfolio is segregated by the Portfolio’s custodian and identified in the Schedule of Investments. Collateral can be in the form of cash or debt securities issued by the U.S. Government or related agencies or other securities as agreed to by the Portfolio and the applicable counterparty. Collateral requirements are determined based on the Portfolio’s net position with each counterparty. Termination events applicable to the Portfolio may occur upon a decline in the Portfolio’s net assets below a specified threshold over a certain period of time. Termination events applicable to counterparties may occur upon a decline in the counterparty’s long-term and short-term credit ratings below a specified level. In each case, upon occurrence, the other party may elect to terminate early and cause settlement of all derivative and foreign exchange contracts outstanding, including the payment of any losses and costs resulting from such early termination, as reasonably determined by the terminating party. Any decision by one or more of the Portfolio’s counterparties to elect early termination could impact the Portfolio’s future derivative activity.
In addition to each instrument’s primary underlying risk exposure (e.g. interest rate, credit, equity or foreign exchange, etc.), swap agreements involve, to varying degrees, elements of credit, market and documentation risk. Such risks involve the possibility that no liquid market for these agreements will exist, the counterparty to the agreement may default on its obligation to perform or disagree on the contractual terms of the agreement, and changes in net interest rates will be unfavorable. In connection with these agreements, securities in the portfolio may be identified or received as collateral from the counterparty in accordance with the terms of the respective swap agreements to provide or receive assets of value and to serve as recourse in the event of default or bankruptcy/insolvency of either party. Such OTC derivative agreements include conditions which, when materialized, give the counterparty the right to cause an early termination of the transactions under those agreements. Any election by the counterparty for early termination of the contract(s) may impact the amounts reported on financial statements.
As of December 31, 2016, none of the Portfolios have met conditions under such agreements which give the counterparty the right to call for an early termination.
Forward currency contracts, forward rate agreements, written options, short sales, swaps and financial futures contracts involve elements of both market and credit risk in excess of the amounts reflected on the Statement of Assets and Liabilities. Such risks may be mitigated by engaging in master netting arrangements.
Warrants and Rights: Certain Portfolios may hold warrants and rights acquired either through a direct purchase, included as part of a private placement, or pursuant to corporate actions. Warrants and rights entitle the holder to buy a proportionate amount of common stock, or such other security that the issuer may specify, at a specific price and time through the expiration dates. The Portfolio holds such warrants and rights as long positions by the Portfolio until exercised, sold or expired. Warrants and rights are valued at fair value in accordance with the Board approved fair valuation procedures.
PIK Securities: Certain fixed income Portfolios may invest in the open market or receive pursuant to debt restructuring, securities that pay in kind the interest due on such debt instruments. The PIK interest, computed at the contractual rate specified, is added to the existing principal balance of the debt when issued bonds have same terms as the bond or recorded as a separate bond when terms are different from the existing debt, and is recorded as interest income.
Delayed-Delivery Transactions: Certain Portfolios may purchase or sell securities on a when-issued or delayed-delivery basis. These transactions involve a commitment by the Portfolio to purchase or sell securities for a predetermined price or yield, with payment and delivery taking place beyond the customary settlement period. When delayed-delivery purchases are outstanding, the Portfolio will set aside and maintain an amount of liquid assets sufficient to meet the purchase price in a segregated account until the settlement date. When purchasing a security on a delayed-delivery basis, the Portfolio assumes the rights and risks of ownership of the security, including the risk of price and yield fluctuations, and takes such fluctuations into account when determining its net asset value. The Portfolio may dispose of or renegotiate a delayed-delivery transaction subsequent to establishment, and may sell when-issued securities before they are delivered, which may result in a capital gain (loss). When selling a security on a delayed-delivery basis, the Portfolio forfeits its eligibility to realize future gains (losses) with respect to the security.
Securities Lending: The Portfolios may lend their portfolio securities to banks and broker-dealers. The loans are secured by collateral at least equal to the market value of the securities loaned. Collateral pledged by each
B7
borrower is invested in an affiliated money market fund and is marked to market daily, based on the previous day’s market value, such that the value of the collateral exceeds the value of the loaned securities. Pursuant to the repositioning of the money market fund as an ultra-short bond fund, for the period March 31, 2016 through July 18, 2016 the collateral was invested in an ultra-short bond fund. Loans are subject to termination at the option of the borrower or the Portfolio. Upon termination of the loan, the borrower will return to the Portfolios securities identical to the loaned securities. Should the borrower of the securities fail financially, the Portfolio has the right to repurchase the securities in the open market using the collateral. The Portfolios recognize income, net of any rebate and securities lending agent fees, for lending its securities in the form of fees or interest on the investment of any cash received as collateral. The borrower receives all interest and dividends from the securities loaned and such payments are passed back to the lender in amounts equivalent thereto. The Portfolios also continue to recognize any unrealized gain (loss) in the market price of the securities loaned and on the change in the value of the collateral invested that may occur during the term of the loan. In addition, realized gain (loss) is recognized on changes in the value of the collateral invested that may occur during the term of the loan.
Dollar Rolls: Certain Portfolios may enter into mortgage dollar rolls in which the Portfolios sell mortgage securities for delivery in the current month, realizing a gain (loss), and simultaneously enter into contracts to repurchase somewhat similar (same type, coupon and maturity) securities on a specified future date. During the roll period, the Portfolios forgo principal and interest paid on the securities. The Portfolios are compensated by the interest earned on the cash proceeds of the initial sale and by the lower repurchase price at the future date. The difference between the sale proceeds and the lower repurchase price is recorded as a realized gain on investment transactions. The Portfolios maintain a segregated account, the dollar value of which is at least equal to its obligations, with respect to dollar rolls.
Concentration of Risk: The ability of debt securities issuers (other than those issued or guaranteed by the U.S. Government) held by the Portfolios to meet their obligations may be affected by the economic or political developments in a specific industry, region or country. Foreign security and currency transactions may involve certain considerations and risks not typically associated with those of domestic origin as a result of, among other factors, the possibility of political and economic instability or the level of the governmental supervision and regulation of foreign securities markets.
Securities Transactions and Net Investment Income: Securities transactions are recorded on the trade date. Realized gains (losses) from investment and currency transactions are calculated on the specific identification method. Dividend income is recorded on the ex-date. Interest income, including amortization of premium and accretion of discount on debt securities, as required, is recorded on the accrual basis. Expenses are recorded on the accrual basis, which may require the use of certain estimates by management that may differ from actual.
For Portfolios with multiple classes of shares, net investment income or loss (other than administration and distribution fees, which are charged directly to the respective class) and unrealized and realized gains (losses) are allocated daily to each class of shares based upon the relative proportion of adjusted net assets of each class at the beginning of the day.
REITs: Certain Portfolios invest in REITs, which report information on the source of their distributions annually. Based on current and historical information, a portion of distributions received from REITs during the period is estimated to be dividend income, capital gain or return of capital and recorded accordingly. These estimates are adjusted periodically when the actual source of distributions is disclosed by the REITs.
Taxes: For federal income tax purposes, each Portfolio is treated as a separate taxpaying entity. The Portfolios are treated as partnerships for tax purposes. No provision has been made in the financial statements for U.S. federal, state, or local taxes, as any tax liability arising from operations of the Portfolios is the responsibility of the Portfolios’ shareholders (Participating Insurance Companies). The Portfolios are not generally subject to entity-level taxation. Shareholders of each Portfolio are subject to taxes on their distributive share of partnership items.
Withholding taxes on foreign dividends, interest and foreign capital gains are accrued in accordance with the Portfolio’s understanding of the applicable country’s tax rules and rates. Such taxes are accrued net of reclaimable amounts, at the time the related income/gain is recorded.
Each Portfolio generally attempts to manage their diversification in a manner that supports the diversification requirements of the underlying separate accounts.
B8
Distributions: Distributions, if any, from each Portfolio are made in cash and automatically reinvested in additional shares of the Portfolio. Distributions are recorded on the ex-date.
Estimates: The preparation of financial statements requires management to make estimates and assumptions that affect the reported amounts and disclosures in the financial statements. Actual results could differ from those estimates.
The Series Fund has a management agreement with PI on behalf of the Portfolios. Pursuant to this agreement PI has responsibility for all investment advisory services and supervises the subadvisers’ performance of such services. PI has entered into subadvisory agreements with PGIM, Inc., which provides subadvisory services to the Portfolios through its PGIM Fixed Income (“PFI”) unit, Jennison Associates LLC (“Jennison”), Brown Advisory, LLC (“Brown”), LSV Asset Management (“LSV”), Quantitative Management Associates LLC (“QMA”), T. Rowe Price Associates, Inc. (“T. Rowe”) and William Blair & Co. LLC (“William Blair”) (collectively, the “Subadvisers”), under which each provides investment advisory services for certain Portfolios of the Series Fund. PI pays for the services of the Subadvisers, cost of compensation of officers of the Series Fund, occupancy and certain clerical and administrative expenses of the Series Fund. The Portfolios bear all other costs and expenses.
The management fee paid to PI is accrued daily and payable monthly, using the value of each of the Portfolio’s average daily net assets, at the respective annual rates specified below.
| | | | | | | | |
Portfolio
| | Management Fee
through June 30, 2016
| | Management Fee
effective July 1, 2016
| | Effective
Management Fee
| |
Conservative Balanced Portfolio | | 0.55% | | 0.55% | | | 0.55 | % |
Diversified Bond Portfolio | | 0.40 | | 0.40 | | | 0.40 | |
Equity Portfolio | | 0.45 | | 0.45 | | | 0.45 | |
Flexible Managed Portfolio | | 0.60 | | 0.60 | | | 0.60 | |
Global Portfolio | | 0.75 | | 0.75 | | | 0.74 | * |
Government Income Portfolio | | 0.40 | | 0.40 | | | 0.40 | |
Stock Index Portfolio | | 0.35% up to $4 billion
0.30% over $4 billion | | 0.30% up to $4 billion
0.25% over $4 billion | | | 0.30 | %** |
| | * | Effective October 17, 2016, PI has contractually agreed, through June 30, 2017, to waive a portion of its management fee equal to an annual rate of 0.022% of the average daily net assets of the Portfolio. Prior to October 17, 2016, PI had contractually agreed to waive a portion of its management fee equal to an annual rate of 0.011% of the average daily net assets of the Portfolio. |
| | ** | PI had contractually agreed, through June 30, 2016, to waive a portion of its management fee equal to an annual rate of 0.05% of the average daily net assets of the Portfolio. |
At December 31, 2016, the Subadvisers that provide investment advisory services to the Portfolios are listed directly below. Where more than one Subadviser is listed, each Subadviser provides services to a segment of the Portfolio:
| | |
Portfolio
| | Subadviser(s)
|
Conservative Balanced Portfolio | | PFI, QMA |
Diversified Bond Portfolio | | PFI |
Equity Portfolio | | Jennison |
Flexible Managed Portfolio | | PFI, QMA |
Global Portfolio | | Brown, LSV, QMA, T. Rowe & William Blair |
Government Income Portfolio | | PFI |
Stock Index Portfolio | | QMA |
The Series Fund has a distribution agreement, pursuant to Rule 12b-1 under the 1940 Act, with Prudential Investment Management Services LLC (“PIMS”), which acts as the distributor of the Class I and Class II shares of the Series Fund. The Series Fund compensates PIMS for distributing and servicing the Series Fund’s Class II shares pursuant to a plan of distribution (the “Class II Plan”), regardless of expenses actually incurred by PIMS. The distribution fees are accrued daily and payable monthly. No distribution or service fees
B9
are paid to PIMS as distributor of the Class I shares of the Series Fund. Pursuant to the Class II Plan, the Class II shares of each Portfolio compensate PIMS for distribution-related activities at an annual rate of 0.25% of the average daily net assets of the Class II shares.
The Series Fund has an administration agreement with PI, which acts as the administrator of the Class II shares of the Series Fund. The administration fee paid to PI is accrued daily and payable monthly, at the annual rate of 0.15% of the average daily net assets of the Class II shares.
PIMS, PI, PGIM, Inc., QMA and Jennison are indirect, wholly-owned subsidiaries of Prudential Financial, Inc. (“Prudential”).
The Series Fund has entered into a brokerage commission recapture agreement with certain registered broker-dealers with respect to certain Portfolios. Under the brokerage commission recapture program, a portion of the commission is returned to the Portfolio on whose behalf the trades were made. Commission recapture is paid solely to those Portfolios generating the applicable trades. Such amounts are included with realized gain (loss) on investment transactions presented in the Statement of Operations. For the year ended December 31, 2016, brokerage commission recaptured under these agreements was as follows:
| | | | |
Portfolio
| | Amount
| |
Equity Portfolio | | $ | 229,241 | |
Global Portfolio | | | 40,187 | |
| Note 4: | | Other Transactions with Affiliates |
Prudential Mutual Fund Services LLC (“PMFS”), an affiliate of PI and an indirect, wholly-owned subsidiary of Prudential, serves as the Series Fund’s transfer agent. The transfer agent’s fees and expenses in the Statement of Operations include certain out-of-pocket expenses paid to non-affiliates, where applicable.
Prior to July 7, 2016, PGIM, Inc. was the Series Fund’s securities lending agent. Net earnings from securities lending are disclosed on the Statement of Operations as “Income from securities lending, net”. For the period January 1, 2016 through February 4, 2016, PGIM, Inc. had been compensated as follows for these services (PGIM, Inc. had not received any compensation for the period February 5, 2016 through July 6, 2016):
| | | | |
Portfolio
| | Amount
| |
Conservative Balanced Portfolio | | $ | 1,586 | |
Diversified Bond Portfolio | | | 974 | |
Equity Portfolio | | | 19,858 | |
Flexible Managed Portfolio | | | 3,536 | |
Global Portfolio | | | 2,073 | |
In February 2016, Prudential, the parent company of the Investment Manager (PI) self reported to the Securities and Exchange Commission (SEC) and certain other regulators that, in some cases, it failed to maximize securities lending income for certain Portfolios of Prudential Series Fund due to a long-standing restriction benefitting Prudential. The Board was not notified of the restriction until after it had been removed. Prudential paid each of the affected Portfolios an amount equal to the estimated loss associated with the unauthorized restriction. At the Board’s direction, this payment occurred on June 30, 2016. The estimated opportunity loss was calculated by an independent consultant hired by Prudential whose calculation methodology was subsequently reviewed by a consultant retained by the independent trustees of the Series Fund. The amount of opportunity loss payment to each of the Portfolios is disclosed in the respective Portfolios’ “Statement of Changes in Net Assets” and “Financial Highlights” as “Capital Contributions”.
In addition to the above, Prudential has paid and continues to directly pay certain legal, audit and other charges in connection with the matter on behalf of the Portfolios.
The SEC Staff and other regulators are currently reviewing the matter.
Effective July 7, 2016, the Board replaced PGIM, Inc. as securities lending agent with a third party agent (Goldman Sachs Agency Lending).
The Portfolios may enter into certain securities purchase or sale transactions under Board approved Rule 17a-7 procedures. Rule 17a-7 is an exemptive rule under the 1940 Act, that permits purchase and sale
B10
transactions among affiliated investment companies, or between an investment company and a person that is affiliated solely by reason of having a common (or affiliated) investment adviser, common directors, and/or common officers. Such transactions are subject to ratification by the Board.
Certain Portfolios invest their overnight sweep cash in the Prudential Core Ultra Short Bond Fund (the ”Core Fund”) and its securities lending cash collateral in the Prudential Institutional Money Market Fund (the “Money Market Fund”), each a series of Prudential Investment Portfolios 2, registered under the 1940 Act and managed by PI. Certain Portfolios also invest in the Prudential Core Short-Term Bond Fund, pursuant to an exemptive order received from the SEC, a series of Prudential Investment Portfolios 2 (together with Prudential Core Ultra Short Bond Fund, the “Core Funds”), registered under the 1940 Act and managed by PI. Earnings from the Core Funds and the Money Market Fund are disclosed on the Statement of Operations as “Affiliated dividend income” and “Income from securities lending, net”, respectively.
The following Portfolios are reimbursed by Prudential for foreign withholding taxes for certain countries due to the Portfolios’ status as partnerships for tax purposes.
| | | | | | | | |
Portfolio
| | 2015 Withholding Tax
| | | 2016 Withholding Tax
| |
Conservative Balanced Portfolio | | $ | 44,001 | * | | $ | 24,389 | |
Flexible Managed Portfolio | | | 53,512 | * | | | 35,507 | |
Global Portfolio | | | 118,399 | * | | | 99,518 | |
| | * | Includes amounts from December 2015 reimbursed in 2016. |
| Note 5: | | Portfolio Securities |
The cost of purchases and the proceeds from sales of portfolio securities (excluding U.S. Treasury securities and short-term issues) for the year ended December 31, 2016 were as follows:
| | | | | | | | |
Portfolio
| | Cost of Purchases
| | | Proceeds from Sales
| |
Conservative Balanced Portfolio | | $ | 3,744,867,249 | | | $ | 3,800,701,759 | |
Diversified Bond Portfolio | | | 334,420,542 | | | | 284,706,899 | |
Equity Portfolio | | | 1,399,988,400 | | | | 1,543,945,875 | |
Flexible Managed Portfolio | | | 6,890,727,464 | | | | 6,910,310,794 | |
Global Portfolio | | | 364,879,525 | | | | 398,140,778 | |
Government Income Portfolio | | | 1,663,564,752 | | | | 1,663,132,464 | |
Stock Index Portfolio | | | 158,983,199 | | | | 141,372,856 | |
Options written transactions, during the year ended December 31, 2016, were as follows:
| | | | | | | | |
Conservative Balanced Portfolio
| | Notional
Amount
(000)
| | | Premiums
| |
Balance at beginning of year | | | 736,300 | | | $ | 178,078 | |
Written options | | | 363,400 | | | | 323,993 | |
Expired options | | | (943,800 | ) | | | (352,033 | ) |
Closed options | | | (155,900 | ) | | | (150,038 | ) |
| | |
|
|
| |
|
|
|
Balance at end of year | | | — | | | $ | — | |
| | |
|
|
| |
|
|
|
| | | | | | | | |
Diversified Bond Portfolio
| | Notional
Amount
(000)
| | | Premiums
| |
Balance at beginning of year | | | 362,120 | | | $ | 818,728 | |
Written options | | | 1,055,190 | | | | 1,142,289 | |
Expired options | | | (608,295 | ) | | | (1,154,594 | ) |
Closed options | | | (809,015 | ) | | | (806,423 | ) |
| | |
|
|
| |
|
|
|
Balance at end of year | | | — | | | $ | — | |
| | |
|
|
| |
|
|
|
B11
| | | | | | | | |
Flexible Managed Portfolio
| | Notional
Amount
(000)
| | | Premiums
| |
Balance at beginning of year | | | 994,900 | | | $ | 242,423 | |
Written options | | | 479,380 | | | | 425,892 | |
Expired options | | | (1,270,280 | ) | | | (472,028 | ) |
Closed options | | | (204,000 | ) | | | (196,287 | ) |
| | |
|
|
| |
|
|
|
Balance at end of year | | | — | | | $ | — | |
| | |
|
|
| |
|
|
|
| | | | | | | | |
Government Income Portfolio
| | Notional
Amount
(000)
| | | Premiums
| |
Balance at beginning of year | | | 507,660 | | | $ | 127,340 | |
Written options | | | 170,720 | | | | 150,093 | |
Expired options | | | (607,380 | ) | | | (209,100 | ) |
Closed options | | | (71,000 | ) | | | (68,333 | ) |
| | |
|
|
| |
|
|
|
Balance at end of year | | | — | | | $ | — | |
| | |
|
|
| |
|
|
|
All Portfolios are treated as partnerships for tax purposes. The character of the cash distributions, if any, made by the partnerships is generally classified as return of capital nontaxable distributions. After each fiscal year each shareholder of record will receive information regarding their distributive allocable share of the partnership’s income, gains, losses and deductions.
With respect to the Portfolios, book cost of assets differs from tax cost of assets as a result of each Portfolio’s adoption of a mark to market method of accounting for tax purposes. Under this method, tax cost of assets will approximate fair market value.
Management has analyzed the Portfolios’ tax positions taken on federal, state and local income tax returns for all open tax years and has concluded that no provision for income tax is required in the Portfolios’ financial statements for the current reporting period. The Portfolios’ federal, state and local income tax returns for tax years for which the applicable statutes of limitations have not expired are subject to examination by the Internal Revenue Service and state departments of revenue.
The Series Fund offers Class I and Class II shares. Neither Class I nor Class II shares of a Portfolio are subject to any sales charge or redemption charge and are sold at the net asset value of the Portfolio. Class I shares are sold only to certain separate accounts of Prudential to fund benefits under certain variable life insurance and variable annuity contracts (“contracts”). Class II shares are sold only to separate accounts of non-Prudential insurance companies as investment options under certain contracts. Class I shares are also offered to separate accounts of non-affiliated insurers for which Prudential or its affiliates administer and/or reinsure the variable life insurance or variable annuity contracts issued in connection with the separate accounts. The separate accounts invest in shares of the Series Fund through subaccounts that correspond to the Portfolios. The separate accounts will redeem shares of the Series Fund to the extent necessary to provide benefits under the contracts or for such other purposes as may be consistent with the contracts. As of December 31, 2016, the Equity Portfolio has Class II shares outstanding.
B12
Transactions in shares of beneficial interest of the Equity Portfolio were as follows:
Equity Portfolio:
| | | | | | | | |
Class I
| | Shares
| | | Amount
| |
Year ended December 31, 2016: | | | | | | | | |
Series shares sold | | | 239,387 | | | $ | 9,099,174 | |
Series shares repurchased | | | (6,334,813 | ) | | | (242,961,824 | ) |
Capital contributions | | | — | | | | 3,314,283 | |
| | |
|
|
| |
|
|
|
Net increase (decrease) in shares outstanding | | | (6,095,426 | ) | | $ | (230,548,367 | ) |
| | |
|
|
| |
|
|
|
Year ended December 31, 2015: | | | | | | | | |
Series shares sold | | | 293,271 | | | $ | 11,456,660 | |
Series shares repurchased | | | (7,053,688 | ) | | | (276,805,403 | ) |
| | |
|
|
| |
|
|
|
Net increase (decrease) in shares outstanding | | | (6,760,417 | ) | | $ | (265,348,743 | ) |
| | |
|
|
| |
|
|
|
| | |
Class II
| | | | | | |
Year ended December 31, 2016: | | | | | | | | |
Series shares sold | | | 398 | | | $ | 13,474 | |
Series shares repurchased | | | (8,058 | ) | | | (314,707 | ) |
Capital contributions | | | — | | | | 1,696 | |
| | |
|
|
| |
|
|
|
Net increase (decrease) in shares outstanding | | | (7,660 | ) | | $ | (299,537 | ) |
| | |
|
|
| |
|
|
|
Year ended December 31, 2015: | | | | | | | | |
Series shares sold | | | 3,613 | | | $ | 143,295 | |
Series shares repurchased | | | (11,130 | ) | | | (429,755 | ) |
| | |
|
|
| |
|
|
|
Net increase (decrease) in shares outstanding | | | (7,517 | ) | | $ | (286,460 | ) |
| | |
|
|
| |
|
|
|
The Portfolios, along with other affiliated registered investment companies (the “Funds”), are a party to a Syndicated Credit Agreement (“SCA”) with a group of banks. The purpose of the SCA is to provide an alternative source of temporary funding for capital share redemptions. The SCA provides for a commitment of $900 million for the period October 6, 2016 through October 5, 2017. The Funds pay an annualized commitment fee of .15% of the unused portion of the SCA. The interest rate on borrowings under the SCA is paid monthly and at a per annum rate based upon the higher of 0%, the effective federal funds rate, or the One-Month LIBOR rate, plus a contractual spread. Prior to October 6, 2016, the Funds had another SCA that provided a commitment of $900 million and the Funds paid an annualized commitment fee of .11% of the unused portion of the SCA. The interest rate on borrowings was substantially the same. Each Portfolio’s portion of the commitment fee for the unused amount is accrued daily and paid quarterly.
The following Portfolios utilized the SCA during the year ended December 31, 2016. The average balance outstanding is for the number of days the Portfolios had utilized the credit facility.
| | | | | | | | | | | | | | | | | | | | |
Portfolio
| | Average
Balance
Outstanding
| | | Number of
Days
Outstanding
| | | Weighted
Average
Interest
Rates
| | | Maximum
Balance
Outstanding
| | | Balance
Outstanding at
December 31,
2016
| |
Diversified Bond Portfolio | | $ | 596,800 | | | | 5 | | | | 1.93 | % | | $ | 1,602,000 | | | | — | |
Government Income Portfolio | | | 275,000 | | | | 3 | | | | 1.67 | % | | | 275,000 | | | | — | |
| Note 9: | | Ownership and Affiliates |
As of December 31, 2016, all of Class I shares of record of each Portfolio were owned by the Prudential Insurance Company of America (“PICA”), or subsidiaries thereof, on behalf of the owners of the variable insurance products issued by PICA. PICA is an indirect, wholly-owned subsidiary of Prudential.
B13
| Note 10: | | Recent Accounting Pronouncements and Reporting Updates |
In December 2016, the FASB released an Accounting Standards Update (“ASU”) that makes technical changes to various sections of the Accounting Standards Codification (“ASC”), including Topic 820, Fair Value Measurement. The changes to Topic 820 are intended to clarify the difference between a valuation approach and a valuation technique. The changes to ASC 820-10-50-2 require a reporting entity to disclose, for Level 2 and Level 3 fair value measurements, a change in either or both a valuation approach and a valuation technique and the reason(s) for the change. The changes to Topic 820 are effective for fiscal years, and interim periods within those fiscal years, beginning after December 15, 2016. At this time, management is evaluating the implications of the ASU and its impact on the financial statements and disclosures has not yet been determined.
On October 13, 2016, the SEC adopted new rules and forms and amended existing rules and forms which are intended to modernize and enhance the reporting and disclosure of information by registered investment companies and to improve the quality of information that funds provide to investors, including modifications to Regulation S-X which would require standardized, enhanced disclosure about derivatives in investment company financial statements. The new rules also enhance disclosure regarding fund liquidity and redemption practices. Also under the new rules, the SEC will permit open-end funds, with the exception of money market funds, to offer swing pricing, subject to board approval and review. The compliance dates of the modifications to Regulation S-X are August 1, 2017 and other amendments and rules are generally June 1, 2018 and December 1, 2018. Management is currently evaluating the impacts to the financial statement disclosures, if any.
B14
Financial Highlights
| | | | | | | | | | | | | | | | | | | | |
| | | Conservative Balanced Portfolio
| |
| | | Year Ended December 31,
| |
| | | 2016(a)
| | | 2015(a)
| | | 2014(a)
| | | 2013(a)
| | | 2012
| |
Per Share Operating Performance: | | | | | | | | | | | | | | | | | | | | |
Net Asset Value, beginning of year | | $ | 22.54 | | | $ | 22.45 | | | $ | 20.63 | | | $ | 17.77 | | | $ | 16.32 | |
| | |
|
|
| |
|
|
| |
|
|
| |
|
|
| |
|
|
|
Income (Loss) From Investment Operations: | | | | | | | | | | | | | | | | | | | | |
Net investment income (loss) | | | .42 | | | | .39 | | | | .36 | | | | .35 | | | | .38 | |
Net realized and unrealized gain (loss) on investments | | | 1.20 | | | | (.30 | ) | | | 1.46 | | | | 2.51 | | | | 1.43 | |
| | |
|
|
| |
|
|
| |
|
|
| |
|
|
| |
|
|
|
Total from investment operations | | | 1.62 | | | | .09 | | | | 1.82 | | | | 2.86 | | | | 1.81 | |
| | |
|
|
| |
|
|
| |
|
|
| |
|
|
| |
|
|
|
Less Distributions | | | — | | | | — | | | | — | | | | — | | | | (.36 | ) |
Capital Contributions(f)(Note 4) | | | .02 | | | | — | | | | — | | | | — | | | | — | |
| | |
|
|
| |
|
|
| |
|
|
| |
|
|
| |
|
|
|
Net Asset Value, end of year | | $ | 24.18 | | | $ | 22.54 | | | $ | 22.45 | | | $ | 20.63 | | | $ | 17.77 | |
| | |
|
|
| |
|
|
| |
|
|
| |
|
|
| |
|
|
|
Total Return(b) | | | 7.28 | %(g) | | | .40 | % | | | 8.82 | % | | | 16.09 | % | | | 11.23 | % |
Ratios/Supplemental Data: | | | | | | | | | | | | | | | | | | | | |
Net assets, end of year (in millions) | | $ | 2,473.2 | | | $ | 2,554.3 | | | $ | 2,574.4 | | | $ | 2,504.4 | | | $ | 2,287.0 | |
Ratios to average net assets(c): | | | | | | | | | | | | | | | | | | | | |
Expenses after waivers and/or expense reimbursement | | | .58 | % | | | .58 | % | | | .58 | % | | | .58 | % | | | .58 | % |
Expenses before waivers and/or expense reimbursement | | | .58 | % | | | .58 | % | | | .58 | % | | | .58 | % | | | .58 | % |
Net investment income (loss) | | | 1.79 | % | | | 1.70 | % | | | 1.66 | % | | | 1.84 | % | | | 2.11 | % |
Portfolio turnover rate(d) | | | 185 | % | | | 208 | % | | | 134 | % | | | 196 | % | | | 188 | % |
| |
| | | Diversified Bond Portfolio
| |
| | | Year Ended December 31,
| |
| | | 2016(a)
| | | 2015(a)
| | | 2014(a)
| | | 2013
| | | 2012(a)
| |
Per Share Operating Performance: | | | | | | | | | | | | | | | | | | | | |
Net Asset Value, beginning of year | | $ | 11.64 | | | $ | 11.66 | | | $ | 11.01 | | | $ | 11.88 | | | $ | 11.74 | |
| | |
|
|
| |
|
|
| |
|
|
| |
|
|
| |
|
|
|
Income (Loss) From Investment Operations: | | | | | | | | | | | | | | | | | | | | |
Net investment income (loss) | | | .43 | | | | .41 | | | | .43 | | | | .48 | | | | .54 | |
Net realized and unrealized gain (loss) on investments | | | .21 | | | | (.43 | ) | | | .34 | | | | (.56 | ) | | | .66 | |
| | |
|
|
| |
|
|
| |
|
|
| |
|
|
| |
|
|
|
Total from investment operations | | | .64 | | | | (.02 | ) | | | .77 | | | | (.08 | ) | | | 1.20 | |
| | |
|
|
| |
|
|
| |
|
|
| |
|
|
| |
|
|
|
Less Distributions | | | — | | | | — | | | | (.12 | ) | | | (.79 | ) | | | (1.06 | ) |
Capital Contributions(f)(Note 4) | | | — | (e) | | | — | | | | — | | | | — | | | | — | |
| | |
|
|
| |
|
|
| |
|
|
| |
|
|
| |
|
|
|
Net Asset Value, end of year | | $ | 12.28 | | | $ | 11.64 | | | $ | 11.66 | | | $ | 11.01 | | | $ | 11.88 | |
| | |
|
|
| |
|
|
| |
|
|
| |
|
|
| |
|
|
|
Total Return(b) | | | 5.50 | %(h) | | | (.17 | )% | | | 7.09 | % | | | (.71 | )% | | | 10.68 | % |
Ratios/Supplemental Data: | | | | | | | | | | | | | | | | | | | | |
Net assets, end of year (in millions) | | $ | 1,104.6 | | | $ | 1,084.9 | | | $ | 1,067.9 | | | $ | 1,197.5 | | | $ | 1,305.9 | |
Ratios to average net assets(c): | | | | | | | | | | | | | | | | | | | | |
Expenses after waivers and/or expense reimbursement | | | .44 | % | | | .46 | % | | | .44 | % | | | .44 | % | | | .44 | % |
Expenses before waivers and/or expense reimbursement | | | .44 | % | | | .46 | % | | | .44 | % | | | .44 | % | | | .44 | % |
Net investment income (loss) | | | 3.52 | % | | | 3.48 | % | | | 3.73 | % | | | 4.10 | % | | | 4.57 | % |
Portfolio turnover rate | | | 49 | % | | | 81 | % | | | 50 | % | | | 111 | % | | | 144 | % |
| (a) | Calculated based on average shares outstanding during the year. |
| (b) | Total return is calculated assuming a purchase of a share on the first day and a sale on the last day of each year reported and includes reinvestment of distributions, if any, and does not reflect the effect of insurance contract charges. Total return does not reflect expenses associated with the separate account such as administrative fees, account charges and surrender charges which, if reflected, would reduce the total returns for all years shown. Performance figures may reflect fee waivers and/or expense reimbursements. In the absence of fee waivers and/or expense reimbursements, the total return would be lower. Past performance is no guarantee of future results. Total returns may reflect adjustments to conform to generally accepted accounting principles. |
| (c) | Does not include expenses of the underlying portfolios in which the Portfolio invests. |
| (d) | The Portfolio accounts for mortgage dollar roll transactions as purchases and sales which, as a result, can increase its portfolio turnover. |
| (e) | Less than $.005 per share. |
| (f) | Represents payment received by the Portfolio, from Prudential, in connection with the failure to maximize securities lending income due to a restriction that benefited Prudential. |
| (g) | Total return for the year includes the impact of the capital contribution. Excluding the capital contribution, the total return would have been 7.19%. |
| (h) | Total return for the year includes the impact of the capital contribution, which was not material to the total return. |
SEE NOTES TO FINANCIAL STATEMENTS.
C1
Financial Highlights
| | | | | | | | | | | | | | | | | | | | |
| | | Equity Portfolio
| |
| | | Class I
| |
| | | Year Ended December 31,
| |
| | | 2016(c)
| | | 2015(c)
| | | 2014(c)
| | | 2013
| | | 2012(c)
| |
Per Share Operating Performance: | | | | | | | | | | | | | | | | | | | | |
Net Asset Value, beginning of year | | $ | 39.47 | | | $ | 38.56 | | | $ | 35.81 | | | $ | 26.81 | | | $ | 23.73 | |
| | |
|
|
| |
|
|
| |
|
|
| |
|
|
| |
|
|
|
Income (Loss) From Investment Operations: | | | | | | | | | | | | | | | | | | | | |
Net investment income (loss) | | | .38 | | | | .34 | | | | .19 | | | | .27 | | | | .27 | |
Net realized and unrealized gain (loss) on investments | | | 1.07 | | | | .57 | | | | 2.56 | | | | 8.73 | | | | 2.96 | |
| | |
|
|
| |
|
|
| |
|
|
| |
|
|
| |
|
|
|
Total from investment operations | | | 1.45 | | | | .91 | | | | 2.75 | | | | 9.00 | | | | 3.23 | |
| | |
|
|
| |
|
|
| |
|
|
| |
|
|
| |
|
|
|
Less Distributions: | | | — | | | | — | | | | — | | | | — | | | | (.15 | ) |
Capital Contributions(d)(Note 4) | | | .04 | | | | — | | | | — | | | | — | | | | — | |
| | |
|
|
| |
|
|
| |
|
|
| |
|
|
| |
|
|
|
Net Asset Value, end of year | | $ | 40.96 | | | $ | 39.47 | | | $ | 38.56 | | | $ | 35.81 | | | $ | 26.81 | |
| | |
|
|
| |
|
|
| |
|
|
| |
|
|
| |
|
|
|
Total Return(a) | | | 3.78 | %(e) | | | 2.36 | % | | | 7.68 | % | | | 33.57 | % | | | 13.69 | % |
Ratios/Supplemental Data: | | | | | | | | | | | | | | | | | | | | |
Net assets, end of year (in millions) | | $ | 3,741.7 | | | $ | 3,846.2 | | | $ | 4,017.6 | | | $ | 3,970.9 | | | $ | 3,167.0 | |
Ratios to average net assets(b): | | | | | | | | | | | | | | | | | | | | |
Expenses after waivers and/or expense reimbursement | | | .47 | % | | | .47 | % | | | .47 | % | | | .47 | % | | | .47 | % |
Expenses before waivers and/or expense reimbursement | | | .47 | % | | | .47 | % | | | .47 | % | | | .47 | % | | | .47 | % |
Net investment income (loss) | | | 1.01 | % | | | .86 | % | | | .52 | % | | | .86 | % | | | 1.04 | % |
Portfolio turnover rate | | | 39 | % | | | 37 | % | | | 51 | % | | | 45 | % | | | 48 | % |
| |
| | | Equity Portfolio
| |
| | | Class II
| |
| | | Year Ended December 31,
| |
| | | 2016(c)
| | | 2015(c)
| | | 2014(c)
| | | 2013
| | | 2012(c)
| |
Per Share Operating Performance: | | | | | | | | | | | | | | | | | | | | |
Net Asset Value, beginning of year | | $ | 39.42 | | | $ | 38.66 | | | $ | 36.05 | | | $ | 27.10 | | | $ | 23.99 | |
| | |
|
|
| |
|
|
| |
|
|
| |
|
|
| |
|
|
|
Income (Loss) From Investment Operations: | | | | | | | | | | | | | | | | | | | | |
Net investment income (loss) | | | .23 | | | | .18 | | | | .04 | | | | .13 | | | | .17 | |
Net realized and unrealized gain (loss) on investments | | | 1.05 | | | | .58 | | | | 2.57 | | | | 8.82 | | | | 3.00 | |
| | |
|
|
| |
|
|
| |
|
|
| |
|
|
| |
|
|
|
Total from investment operations | | | 1.28 | | | | .76 | | | | 2.61 | | | | 8.95 | | | | 3.17 | |
| | |
|
|
| |
|
|
| |
|
|
| |
|
|
| |
|
|
|
Less Distributions: | | | — | | | | — | | | | — | | | | — | | | | (.06 | ) |
Capital Contributions(d)(Note 4) | | | .04 | | | | — | | | | — | | | | — | | | | — | |
| | |
|
|
| |
|
|
| |
|
|
| |
|
|
| |
|
|
|
Net Asset Value, end of year | | $ | 40.74 | | | $ | 39.42 | | | $ | 38.66 | | | $ | 36.05 | | | $ | 27.10 | |
| | |
|
|
| |
|
|
| |
|
|
| |
|
|
| |
|
|
|
Total Return(a) | | | 3.35 | %(e) | | | 1.97 | % | | | 7.24 | % | | | 33.03 | % | | | 13.23 | % |
Ratios/Supplemental Data: | | | | | | | | | | | | | | | | | | | | |
Net assets, end of year (in millions) | | $ | 1.7 | | | $ | 2.0 | | | $ | 2.2 | | | $ | 2.3 | | | $ | 1.8 | |
Ratios to average net assets(b): | | | | | | | | | | | | | | | | | | | | |
Expenses after waivers and/or expense reimbursement | | | .87 | % | | | .87 | % | | | .87 | % | | | .87 | % | | | .87 | % |
Expenses before waivers and/or expense reimbursement | | | .87 | % | | | .87 | % | | | .87 | % | | | .87 | % | | | .87 | % |
Net investment income (loss) | | | .61 | % | | | .46 | % | | | .11 | % | | | .47 | % | | | .63 | % |
Portfolio turnover rate | | | 39 | % | | | 37 | % | | | 51 | % | | | 45 | % | | | 48 | % |
| (a) | Total return is calculated assuming a purchase of a share on the first day and a sale on the last day of each year reported and includes reinvestment of distributions, if any, and does not reflect the effect of insurance contract charges. Total return does not reflect expenses associated with the separate account such as administrative fees, account charges and surrender charges which, if reflected, would reduce the total return for all years shown. Performance figures may reflect fee waivers and/or expense reimbursements. In the absence of fee waivers and/or expense reimbursements, the total return would be lower. Past performance is no guarantee of future results. Total returns may reflect adjustments to conform to generally accepted accounting principles. |
| (b) | Does not include expenses of the underlying portfolio in which the Portfolio invests. |
| (c) | Calculated based on average shares outstanding during the year. |
| (d) | Represents payment received by the Portfolio, from Prudential, in connection with the failure to maximize securities lending income due to a restriction that benefited Prudential. |
| (e) | Total return for the year includes the impact of the capital contribution. Excluding the capital contribution, the total return for Class I and Class II would have been 3.68% and 3.25%, respectively. |
SEE NOTES TO FINANCIAL STATEMENTS.
C2
Financial Highlights
| | | | | | | | | | | | | | | | | | | | |
| | | Flexible Managed Portfolio
| |
| | | Year Ended December 31,
| |
| | | 2016(a)
| | | 2015(a)
| | | 2014(a)
| | | 2013(a)
| | | 2012
| |
Per Share Operating Performance: | | | | | | | | | | | | | | | | | | | | |
Net Asset Value, beginning of year | | $ | 23.95 | | | $ | 23.71 | | | $ | 21.35 | | | $ | 17.77 | | | $ | 15.99 | |
| | |
|
|
| |
|
|
| |
|
|
| |
|
|
| |
|
|
|
Income (Loss) From Investment Operations: | | | | | | | | | | | | | | | | | | | | |
Net investment income (loss) | | | .44 | | | | .42 | | | | .37 | | | | .36 | | | | .37 | |
Net realized and unrealized gain (loss) on investments | | | 1.58 | | | | (.18 | ) | | | 1.99 | | | | 3.22 | | | | 1.74 | |
| | |
|
|
| |
|
|
| |
|
|
| |
|
|
| |
|
|
|
Total from investment operations | | | 2.02 | | | | .24 | | | | 2.36 | | | | 3.58 | | | | 2.11 | |
| | |
|
|
| |
|
|
| |
|
|
| |
|
|
| |
|
|
|
Less Distributions | | | — | | | | — | | | | — | | | | — | | | | (.33 | ) |
Capital Contributions(e)(Note 4) | | | .02 | | | | — | | | | — | | | | — | | | | — | |
| | |
|
|
| |
|
|
| |
|
|
| |
|
|
| |
|
|
|
Net Asset Value, end of year | | $ | 25.99 | | | $ | 23.95 | | | $ | 23.71 | | | $ | 21.35 | | | $ | 17.77 | |
| | |
|
|
| |
|
|
| |
|
|
| |
|
|
| |
|
|
|
Total Return(b) | | | 8.52 | %(f) | | | 1.01 | % | | | 11.05 | % | | | 20.15 | % | | | 13.37 | % |
Ratios/Supplemental Data: | | | | | | | | | | | | | | | | | | | | |
Net assets, end of year (in millions) | | $ | 3,889.8 | | | $ | 3,768.8 | | | $ | 3,943.8 | | | $ | 3,730.6 | | | $ | 3,265.8 | |
Ratios to average net assets(c): | | | | | | | | | | | | | | | | | | | | |
Expenses after waivers and/or expense reimbursement | | | .63 | % | | | .63 | % | | | .63 | % | | | .63 | % | | | .63 | % |
Expenses before waivers and/or expense reimbursement | | | .63 | % | | | .63 | % | | | .63 | % | | | .63 | % | | | .63 | % |
Net investment income (loss) | | | 1.78 | % | | | 1.74 | % | | | 1.66 | % | | | 1.86 | % | | | 2.05 | % |
Portfolio turnover rate(d) | | | 203 | % | | | 213 | % | | | 161 | % | | | 210 | % | | | 214 | % |
| |
| | | Global Portfolio
| |
| | | Year Ended December 31,
| |
| | | 2016(a)
| | | 2015(a)
| | | 2014(a)
| | | 2013
| | | 2012
| |
Per Share Operating Performance: | | | | | | | | | | | | | | | | | | | | |
Net Asset Value, beginning of year | | $ | 26.33 | | | $ | 25.72 | | | $ | 24.91 | | | $ | 19.57 | | | $ | 16.94 | |
| | |
|
|
| |
|
|
| |
|
|
| |
|
|
| |
|
|
|
Income (Loss) From Investment Operations: | | | | | | | | | | | | | | | | | | | | |
Net investment income (loss) | | | .34 | | | | .34 | | | | .37 | | | | .31 | | | | .36 | |
Net realized and unrealized gain (loss) on investments | | | .81 | | | | .27 | | | | .44 | | | | 5.03 | | | | 2.57 | |
| | |
|
|
| |
|
|
| |
|
|
| |
|
|
| |
|
|
|
Total from investment operations | | | 1.15 | | | | .61 | | | | .81 | | | | 5.34 | | | | 2.93 | |
| | |
|
|
| |
|
|
| |
|
|
| |
|
|
| |
|
|
|
Less Distributions | | | — | | | | — | | | | — | | | | — | | | | (.30 | ) |
Capital Contributions(e)(Note 4) | | | .02 | | | | — | | | | — | | | | — | | | | — | |
| | |
|
|
| |
|
|
| |
|
|
| |
|
|
| |
|
|
|
Net Asset Value, end of year | | $ | 27.50 | | | $ | 26.33 | | | $ | 25.72 | | | $ | 24.91 | | | $ | 19.57 | |
| | |
|
|
| |
|
|
| |
|
|
| |
|
|
| |
|
|
|
Total Return(b) | | | 4.44 | %(g) | | | 2.37 | % | | | 3.25 | % | | | 27.29 | % | | | 17.52 | % |
Ratios/Supplemental Data: | | | | | | | | | | | | | | | | | | | | |
Net assets, end of year (in millions) | | $ | 955.4 | | | $ | 965.3 | | | $ | 719.2 | | | $ | 744.5 | | | $ | 611.2 | |
Ratios to average net assets(c): | | | | | | | | | | | | | | | | | | | | |
Expenses after waivers and/or expense reimbursements | | | .80 | % | | | .81 | % | | | .81 | % | | | .84 | % | | | .84 | % |
Expenses before waivers and/or expense reimbursements | | | .81 | % | | | .82 | % | | | .82 | % | | | .84 | % | | | .84 | % |
Net investment income (loss) | | | 1.29 | % | | | 1.28 | % | | | 1.45 | % | | | 1.29 | % | | | 1.82 | % |
Portfolio turnover rate | | | 40 | % | | | 33 | % | | | 37 | % | | | 70 | % | | | 57 | % |
| (a) | Calculated based on average shares outstanding during the year. |
| (b) | Total return is calculated assuming a purchase of a share on the first day and a sale on the last day of each year reported and includes reinvestment of distributions, if any, and does not reflect the effect of insurance contract charges. Total return does not reflect expenses associated with the separate account such as administrative fees, account charges and surrender charges which, if reflected, would reduce the total returns for all years shown. Performance figures may reflect fee waivers and/or expense reimbursements. In the absence of fee waivers and/or expense reimbursements, the total return would be lower. Past performance is no guarantee of future results. Total returns may reflect adjustments to conform to generally accepted accounting principles. |
| (c) | Does not include expenses of the underlying portfolios in which the Portfolio invests. |
| (d) | The Portfolio accounts for mortgage dollar roll transactions as purchases and sales which, as a result, can increase its portfolio turnover rate. |
| (e) | Represents payment received by the Portfolio, from Prudential, in connection with the failure to maximize securities lending income due to a restriction that benefited Prudential. |
| (f) | Total return for the year includes the impact of the capital contribution. Excluding the capital contribution, the total return would have been 8.44%. |
| (g) | Total return for the year includes the impact of the capital contribution. Excluding the capital contribution, the total return would have been 4.36%. |
SEE NOTES TO FINANCIAL STATEMENTS.
C3
Financial Highlights
| | | | | | | | | | | | | | | | | | | | |
| | | Government Income Portfolio
| |
| | | Year Ended December 31,
| |
| | | 2016(d)
| | | 2015(d)
| | | 2014
| | | 2013
| | | 2012
| |
Per Share Operating Performance: | | | | | | | | | | | | | | | | | | | | |
Net Asset Value, beginning of year | | $ | 12.00 | | | $ | 11.92 | | | $ | 11.30 | | | $ | 12.15 | | | $ | 12.37 | |
| | |
|
|
| |
|
|
| |
|
|
| |
|
|
| |
|
|
|
Income (Loss) From Investment Operations: | | | | | | | | | | | | | | | | | | | | |
Net investment income (loss) | | | .20 | | | | .18 | | | | .21 | | | | .21 | | | | .25 | |
Net realized and unrealized gain (loss) on investments | | | .06 | | | | (.10 | ) | | | .45 | | | | (.49 | ) | | | .19 | |
| | |
|
|
| |
|
|
| |
|
|
| |
|
|
| |
|
|
|
Total from investment operations | | | .26 | | | | .08 | | | | .66 | | | | (.28 | ) | | | .44 | |
| | |
|
|
| |
|
|
| |
|
|
| |
|
|
| |
|
|
|
Less Distributions | | | — | | | | — | | | | (.04 | ) | | | (.57 | ) | | | (.66 | ) |
Capital Contributions(e)(Note 4) | | | — | (f) | | | — | | | | — | | | | — | | | | — | |
| | |
|
|
| |
|
|
| |
|
|
| |
|
|
| |
|
|
|
Net Asset Value, end of year | | $ | 12.26 | | | $ | 12.00 | | | $ | 11.92 | | | $ | 11.30 | | | $ | 12.15 | |
| | |
|
|
| |
|
|
| |
|
|
| |
|
|
| |
|
|
|
Total Return(a) | | | 2.17 | %(g) | | | .67 | % | | | 5.86 | % | | | (2.34 | )% | | | 3.63 | % |
Ratios/Supplemental Data: | | | | | | | | | | | | | | | | | | | | |
Net assets, end of year (in millions) | | $ | 226.3 | | | $ | 231.8 | | | $ | 339.2 | | | $ | 341.1 | | | $ | 382.9 | |
Ratios to average net assets(b): | | | | | | | | | | | | | | | | | | | | |
Expenses after waivers and/or expense reimbursements | | | .51 | % | | | .48 | % | | | .47 | % | | | .49 | % | | | .48 | % |
Expenses before waivers and/or expense reimbursement | | | .51 | % | | | .48 | % | | | .47 | % | | | .49 | % | | | .48 | % |
Net investment income (loss) | | | 1.60 | % | | | 1.48 | % | | | 1.73 | % | | | 1.78 | % | | | 1.96 | % |
Portfolio turnover rate(c) | | | 705 | % | | | 746 | % | | | 830 | % | | | 1135 | % | | | 1154 | % |
| |
| | | Stock Index Portfolio
| |
| | | Year Ended December 31,
| |
| | | 2016(d)
| | | 2015(d)
| | | 2014(d)
| | | 2013(d)
| | | 2012
| |
Per Share Operating Performance: | | | | | | | | | | | | | | | | | | | | |
Net Asset Value, beginning of year | | $ | 48.59 | | | $ | 49.33 | | | $ | 47.02 | | | $ | 35.65 | | | $ | 31.47 | |
| | |
|
|
| |
|
|
| |
|
|
| |
|
|
| |
|
|
|
Income (Loss) From Investment Operations: | | | | | | | | | | | | | | | | | | | | |
Net investment income (loss) | | | .89 | | | | .86 | | | | .79 | | | | .73 | | | | .68 | |
Net realized and unrealized gain (loss) on investments | | | 4.52 | | | | (.26 | ) | | | 5.20 | | | | 10.64 | | | | 4.19 | |
| | |
|
|
| |
|
|
| |
|
|
| |
|
|
| |
|
|
|
Total from investment operations | | | 5.41 | | | | .60 | | | | 5.99 | | | | 11.37 | | | | 4.87 | |
| | |
|
|
| |
|
|
| |
|
|
| |
|
|
| |
|
|
|
Less Distributions | | | (3.37 | ) | | | (1.34 | ) | | | (3.68 | ) | | | — | | | | (.69 | ) |
Capital Contributions(e)(Note 4) | | | .07 | | | | — | | | | — | | | | — | | | | — | |
| | |
|
|
| |
|
|
| |
|
|
| |
|
|
| |
|
|
|
Net Asset Value, end of year | | $ | 50.70 | | | $ | 48.59 | | | $ | 49.33 | | | $ | 47.02 | | | $ | 35.65 | |
| | |
|
|
| |
|
|
| |
|
|
| |
|
|
| |
|
|
|
Total Return(a) | | | 11.83 | %(h) | | | 1.18 | % | | | 13.31 | % | | | 31.89 | % | | | 15.68 | % |
Ratios/Supplemental Data: | | | | | | | | | | | | | | | | | | | | |
Net assets, end of year (in millions) | | $ | 3,305.1 | | | $ | 3,010.1 | | | $ | 3,312.7 | | | $ | 2,890.5 | | | $ | 2,340.3 | |
Ratios to average net assets(b): | | | | | | | | | | | | | | | | | | | | |
Expenses after waivers and/or expense reimbursement | | | .32 | % | | | .32 | % | | | .32 | % | | | .32 | % | | | .32 | % |
Expenses before waivers and/or expense reimbursement | | | .34 | % | | | .37 | % | | | .37 | % | | | .37 | % | | | .37 | % |
Net investment income (loss) | | | 1.84 | % | | | 1.74 | % | | | 1.67 | % | | | 1.77 | % | | | 1.97 | % |
Portfolio turnover rate | | | 5 | % | | | 9 | % | | | 5 | % | | | 3 | % | | | 2 | % |
| (a) | Total return is calculated assuming a purchase of a share on the first day and a sale on the last day of each year reported and includes reinvestment of distributions, if any, and does not reflect the effect of insurance contract charges. Total return does not reflect expenses associated with the separate account such as administrative fees, account charges and surrender charges which, if reflected, would reduce the total returns for all years shown. Performance figures may reflect fee waivers and/or expense reimbursements. In the absence of fee waivers and/or expense reimbursements, the total return would be lower. Past performance is no guarantee of future results. Total returns may reflect adjustments to conform to generally accepted accounting principles. |
| (b) | Does not include expenses of the underlying portfolios in which the Portfolio invests. |
| (c) | The Portfolio accounts for mortgage dollar roll transactions as purchases and sales which, as a result, can increase its portfolio turnover rate. |
| (d) | Calculated based on average shares outstanding during the year. |
| (e) | Represents payment received by the Portfolio, from Prudential, in connection with the failure to maximize securities lending income due to a restriction that benefited Prudential. |
| (f) | Less than $0.005 per share. |
| (g) | Total return for the year includes the impact of the capital contribution, which was not material to the total return. |
| (h) | Total return for the year includes the impact of the capital contribution. Excluding the capital contribution, the total return would have been 11.69%. |
SEE NOTES TO FINANCIAL STATEMENTS.
C4
REPORT OF INDEPENDENT REGISTERED PUBLIC ACCOUNTING FIRM
THE BOARD OF TRUSTEES AND SHAREHOLDERS
THE PRUDENTIAL SERIES FUND:
We have audited the accompanying statements of assets and liabilities of Conservative Balanced Portfolio, Diversified Bond Portfolio, Equity Portfolio, Flexible Managed Portfolio, Global Portfolio, Government Income Portfolio, and Stock Index Portfolio (the “Portfolios”), each a portfolio of The Prudential Series Fund, including their respective schedules of investments, as of December 31, 2016, and their respective related statements of operations for the year then ended, statements of changes in net assets for each of the years in the two-year period then ended, and financial highlights for each of the years in the five-year period then ended. These financial statements and financial highlights are the responsibility of the Portfolios’ management. Our responsibility is to express an opinion on these financial statements and financial highlights based on our audits.
We conducted our audits in accordance with the standards of the Public Company Accounting Oversight Board (United States). Those standards require that we plan and perform the audit to obtain reasonable assurance about whether the financial statements and financial highlights are free of material misstatement. An audit includes examining, on a test basis, evidence supporting the amounts and disclosures in the financial statements. Our procedures included confirmation of securities owned as of December 31, 2016, by correspondence with the custodian, transfer agent and brokers or by other appropriate auditing procedures when replies from brokers were not received. An audit also includes assessing the accounting principles used and significant estimates made by management, as well as evaluating the overall financial statement presentation. We believe that our audits provide a reasonable basis for our opinion.
In our opinion, the financial statements and financial highlights referred to above present fairly, in all material respects, the financial position of the Portfolios as of December 31, 2016, and the results of their operations, the changes in their net assets and their financial highlights for the periods described in the first paragraph above, in conformity with U.S. generally accepted accounting principles.
New York, New York
February 14, 2017
D1
INFORMATION ABOUT TRUSTEES AND OFFICERS (Unaudited)
Information about the Trustees and the Officers of the Fund is set forth below. Trustees who are not deemed to be “interested persons” of the Fund, as defined in the Investment Company Act of 1940, are referred to as “Independent Trustees.” Trustees who are deemed to be “interested persons” of the Fund are referred to as “Interested Trustees.” The Trustees are responsible for the overall supervision of the operations of the Fund and perform the various duties imposed on the directors of investment companies by the Investment Company Act of 1940.
| | | | |
| Independent Trustees | | | | |
Name, Age Position with the Fund Number of Portfolios in Fund Complex†
Overseen by Trustee | | Principal Occupation(s) During Past 5 Years | | Other Directorships Held by Trustee** |
Susan Davenport Austin* (Age: 49) Trustee Since 2011 Overseen by Trustee: 112 | | Senior Managing Director of Brock Capital (since 2014); Vice Chairman of Sheridan Broadcasting Corporation (since 2013); Formerly Senior Vice President and Chief Financial Officer (2007-2012) and Vice President of Strategic Planning and Treasurer (2002-2007) of Sheridan Broadcasting Corporation; Formerly President of Sheridan Gospel Network (2004-2014); Vice President, Goldman, Sachs & Co. (2000-2001); Associate Director, Bear, Stearns & Co. Inc (1997-2000); Vice President, Salomon Brothers Inc (1993-1997); President of the Board, The MacDowell Colony (Since 2010); Formerly Chairman of the Board of Directors, Broadcast Music, Inc. (2011-2014); Presiding Director of the Board of Directors, Broadcast Music, Inc. (since 2014); Member of the Board of Directors, Hubbard Radio, LLC (Since 2011); President, Candide Business Advisors, Inc. (since 2011); formerly Member of the Board of Directors, National Association of Broadcasters (2004-2010). | | Director of NextEra Energy Partners, LP (NYSE:NEP) (February 2015-Present). |
Sherry S. Barrat* (Age: 67) Trustee Since 2013 Overseen by Trustee: 112 | | Formerly, Vice Chairman of Northern Trust Corporation (financial services and banking institution) (2011-June 2012); formerly President, Personal Financial Services, Northern Trust Corporation (2006-2010); formerly Chairman & CEO, Western US Region, Northern Trust Corporation (1999-2005); formerly President & CEO, Palm Beach/Martin County Region, Northern Trust. | | Director of NextEra Energy, Inc. (NYSE: NEE) (1998-Present); Director of Arthur J. Gallagher & Company (Since July 2013). |
Jessica M. Bibliowicz* (Age: 57) Trustee Since 2014 Overseen by Trustee: 112 | | Senior Adviser (Since 2013) of Bridge Growth Partners (private equity firm); formerly Chief Executive Officer (1999-2013) of National Financial Partners (independent distributor of financial services products. | | Director (since 2006) The Asia-Pacific Fund, Inc.; Sotheby’s (since 2014) (auction house and art-related finance). |
Kay Ryan Booth* (Age: 66) Trustee Since 2013 Overseen by Trustee: 112 | | Partner, Trinity Private Equity Group (Since September 2014); formerly, Managing Director of Cappello Waterfield & Co. LLC (2011-2014); formerly Vice Chair, Global Research, J.P. Morgan (financial services and investment banking institution) (June 2008-January 2009); formerly Global Director of Equity Research, Bear Stearns & Co., Inc. (financial services and investment banking institution) (1995-2008); formerly Associate Director of Equity Research, Bear Stearns & Co., Inc. (1987-1995). | | None. |
Delayne Dedrick Gold* (Age: 78) Trustee Since 2003 Overseen by Trustee: 112 | | Marketing Consultant (1982-present); formerly Senior Vice President and Member of the Board of Directors, Prudential Bache Securities, Inc. | | None. |
Robert F. Gunia* (Age: 70) Trustee Since 2003 Overseen by Trustee: 112 | | Independent Consultant (Since October 2009); formerly Chief Administrative Officer (September 1999-September 2009) and Executive Vice President (December 1996-September 2009) of Prudential Investments LLC; formerly Executive Vice President (March 1999-September 2009) and Treasurer (May 2000-September 2009) of Prudential Mutual Fund Services LLC; formerly President (April 1999-December 2008) and Executive Vice President and Chief Operating Officer (December 2008-December 2009) of Prudential Investment Management Services LLC; formerly Chief Administrative Officer, Executive Vice President and Director (May 2003-September 2009) of AST Investment Services, Inc. | | Director (Since May 1989) of The Asia-Pacific Fund, Inc. |
Thomas T. Mooney* (Age: 75) Trustee Since 2003 Independent Chair Since 2003 Overseen by Trustee: 112 | | Formerly Chief Executive Officer, Excell Partners, Inc. (2005-2007); founding partner of High Technology of Rochester and the Lennox Technology Center; formerly President of the Greater Rochester Metro Chamber of Commerce (1976-2004) formerly Rochester City Manager (1973); formerly Deputy Monroe County Executive (1974-1976). | | None. |
E1
| | | | |
| Independent Trustees | | | | |
Name, Age Position with the Fund Number of Portfolios in Fund Complex†
Overseen by Trustee | | Principal Occupation(s) During Past 5 Years | | Other Directorships Held by Trustee** |
Thomas M. O’Brien* (Age: 66) Trustee Since 2003 Overseen by Trustee: 112 | | Director, President and CEO Sun Bancorp, Inc. N.A. (NASDAQ: SNBC) and Sun National Bank (Since July 2014); formerly Consultant, Valley National Bancorp, Inc. and Valley National Bank (January 2012-June 2012); formerly President and COO (November 2006-December 2011) and CEO (April 2007-December 2011) of State Bancorp, Inc. and State Bank; formerly Vice Chairman (January 1997-April 2000) of North Fork Bank; formerly President and Chief Executive Officer (December 1984-December 1996) of North Side Savings Bank; formerly President and Chief Executive Officer (May 2000-June 2006) Atlantic Bank of New York. | | Formerly Director, BankUnited, Inc. and BankUnited N.A. (NYSE: BKU) (May 2012-April 2014); formerly Director (April 2008-January 2012) of Federal Home Loan Bank of New York; formerly Director (December 1996-May 2000) of North Fork Bancorporation, Inc.; formerly Director (May 2000-April 2006) of Atlantic Bank of New York; Director (November 2006- January 2012) of State Bancorp, Inc. (NASDAQ: STBC) and State Bank of Long Island. |
| Interested Trustee | | | | |
Timothy S. Cronin* (Age: 51) Trustee Since 2009 Overseen by Trustee: 113 | | President of Prudential Annuities (Since June 2015); Chief Investment Officer and Strategist of Prudential Annuities (Since January 2004); Director of Investment & Research Strategy (Since February 1998); President of AST Investment Services, Inc. (Since June 2005). | | None. |
* The address of each Trustee is c/o Prudential Investments LLC, 655 Broad Street, Newark, New Jersey 07102.
** Includes only directorships of companies required to register or file reports with the Securities and Exchange Commission (SEC) under the Securities Exchange Act of 1934 (that is, “public companies”) or other investment companies registered under the Investment Company Act of 1940.
† The Fund Complex consists of all investment companies managed by Prudential Investments LLC. The Funds for which Prudential Investments LLC serves as manager include the Prudential Investments Mutual Funds, Target Mutual Funds, The Prudential Variable Contract Accounts 2, 10 and 11, Prudential Short Duration High Yield Fund, Inc., Prudential Global Short Duration High Yield Fund, Inc., The Prudential Series Fund, Advanced Series Trust, and Prudential’s Gibraltar Fund, Inc.
| | |
| Trust Officers(1) | | |
Name, Age Position with the Fund | | Principal Occupation(s) During Past 5 Years |
Raymond A. O’Hara* (61) Chief Legal Officer Since 2012 | | Vice President and Corporate Counsel (since July 2010) of Prudential Insurance Company of America (Prudential); Vice President (March 2011-Present) of Pruco Life Insurance Company and Pruco Life Insurance Company of New Jersey; Vice President and Corporate Counsel (March 2011-Present) of Prudential Annuities Life Assurance Corporation; Chief Legal Officer of Prudential Investments LLC (since June 2012); Chief Legal Officer of Prudential Mutual Fund Services LLC (since June 2012) and Corporate Counsel of AST Investment Services, Inc. (since June 2012); formerly Assistant Vice President and Corporate Counsel (September 2008-July 2010) of The Hartford Financial Services Group, Inc.; formerly Associate (September 1980-December 1987) and Partner (January 1988-August 2008) of Blazzard & Hasenauer, P.C. (formerly, Blazzard, Grodd & Hasenauer, P.C.). |
Chad A. Earnst* (41) Chief Compliance Officer Since 2014 | | Chief Compliance Officer (September 2014-Present) of Prudential Investments LLC; Chief Compliance Officer (September 2014-Present) of the Prudential Investments Funds, Target Funds, Advanced Series Trust, The Prudential Series Fund, Prudential’s Gibraltar Fund, Inc., Prudential Global Short Duration High Yield Income Fund, Inc., Prudential Short Duration High Yield Fund, Inc. and Prudential Jennison MLP Income Fund, Inc.; formerly Assistant Director (March 2010-August 2014) of the Asset Management Unit, Division of Enforcement, U.S. Securities & Exchange Commission; Assistant Regional Director (January 2010-August 2014), Branch Chief (June 2006-December 2009) and Senior Counsel (April 2003-May 2006) of the Miami Regional Office, Division of Enforcement, U.S. Securities & Exchange Commission. |
Deborah A. Docs* (58) Secretary Since 2005 | | Vice President and Corporate Counsel (since January 2001) of Prudential; Vice President (since December 1996) and Assistant Secretary (since March 1999) of Prudential Investments LLC; formerly Vice President and Assistant Secretary (May 2003-June 2005) of AST Investment Services, Inc. |
Jonathan D. Shain* (58) Assistant Secretary Since 2005 | | Vice President and Corporate Counsel (since August 1998) of Prudential; Vice President and Assistant Secretary (since May 2001) of Prudential Investments LLC; Vice President and Assistant Secretary (since February 2001) of Prudential Mutual Fund Services LLC; formerly Vice President and Assistant Secretary (May 2003-June 2005) of AST Investment Services, Inc. |
Claudia DiGiacomo* (42) Assistant Secretary Since 2005 | | Vice President and Corporate Counsel (since January 2005) of Prudential; Vice President and Assistant Secretary of Prudential Investments LLC (since December 2005); Associate at Sidley Austin Brown & Wood LLP (1999-2004). |
Andrew R. French* (53) Assistant Secretary Since 2006 | | Vice President and Corporate Counsel (since February 2010) of Prudential; formerly Director and Corporate Counsel (2006-2010) of Prudential; Vice President and Assistant Secretary (since January 2007) of Prudential Investments LLC; Vice President and Assistant Secretary (since January 2007) of Prudential Mutual Fund Services LLC. |
Kathleen DeNicholas* (42) Assistant Secretary Since 2013 | | Vice President and Corporate Counsel (since May 2013) of Prudential; Managing Counsel at The Bank of New York Mellon Corporation (2011-2013); formerly Senior Counsel (2007-2011) and Assistant General Counsel (2001-2007) of The Dreyfus Corporation; Chief Legal Officer and Secretary of MBSC Securities Corporation (2011-2013); Vice President and Assistant Secretary of The Dreyfus Family of Funds (2010-2012). |
E2
| | |
| Trust Officers(1) | | |
Name, Age Position with the Fund | | Principal Occupation(s) During Past 5 Years |
M. Sadiq Peshimam* (53) Treasurer and Principal Financial & Accounting Officer Since 2014 | | Assistant Treasurer of funds in the Prudential Mutual Fund Complex (2006-2014); Vice President (since 2005) of Prudential Investments LLC. |
Peter Parrella* (58) Assistant Treasurer Since 2007 | | Vice President (since 2007) and Director (2004-2007) within Prudential Mutual Fund Administration; formerly Tax Manager at SSB Citi Fund Management LLC (1997-2004). |
Lana Lomuti* (49) Assistant Treasurer Since 2014 | | Vice President (since 2007) and Director (2005-2007), within Prudential Mutual Fund Administration; formerly Assistant Treasurer (December 2007-February 2014) of The Greater China Fund, Inc. |
Linda McMullin* (55) Assistant Treasurer Since 2014 | | Vice President (since 2011) and Director (2008-2011) within Prudential Mutual Fund Administration. |
Theresa C. Thompson* (54) Deputy Chief Compliance Officer Since 2008 | | Vice President, Compliance, Prudential Investments LLC (since April 2004); and Director, Compliance, Prudential Investments LLC (2001-2004). |
Charles H. Smith* (44) Anti-Money Laundering Compliance Officer Since 2016 | | Vice President, Corporate Compliance, Anti-Money Laundering Unit (since January 2015) of Prudential; committee member of the American Council of Life Insurers Anti-Money Laundering and Critical Infrastructure Committee (since January 2016); formerly Global Head of Economic Sanctions Compliance at AIG Property Casualty (February 2007-December 2014); Assistant Attorney General at the New York State Attorney General’s Office, Division of Public Advocacy. (August 1998-January 2007). |
* The address for each officer is c/o Prudential Investments LLC, 655 Broad Street, Newark, New Jersey 07102.
(1) Excludes Mr. Cronin, an Interested Trustee who serves as President. Biographical and other information with respect to Mr. Cronin appears under “Interested Trustee,” above.
E3
The toll-free number shown below can be used to make transfers and reallocations, review how your premiums are being allocated, and receive current investment option values in your contract. Unit values for each investment option are available to all participants from the toll-free number. Please be sure to have your contract number available when you call.
(800) 458-6333
This report is not authorized for distribution to prospective investors unless preceded or accompanied by a current prospectus for The MEDLEY Program. Investors should consider the contract and the underlying portfolios’ investment objectives, risks, charges and expenses carefully before investing. This and other important information is contained in the prospectuses that can be obtained from your financial professional. You should read the prospectuses carefully before investing.
This report includes the financial statements of VCA-10, VCA-11, and the portfolios of The Prudential Series Fund (the “Funds”) available through VCA-24.
This report does not include separate account financials for the VCA-24 Subaccounts. If you would like separate account financial statements, please call the telephone number on the inside back cover of this report.
Annuity contracts contain exclusions, limitations, reductions of benefits, and terms for keeping them in force. Your plan sponsor or licensed financial professional can provide you with costs and complete details. Contract guarantees are based on the claims-paying ability of the issuing company.
A description of VCA-10’s and VCA-11’s proxy voting policies and procedures is available without charge, upon request. MEDLEY participants should call 800-458-6333 to obtain a description of the VCA-10’s and VCA-11’s proxy voting policies and procedures. Information regarding how the VCA-10 and VCA-11 voted proxies relating to portfolio securities during the most recent 12-month period ended June 30 is available on the website of the Securities and Exchange Commission (the “Commission”) at www.sec.gov and on the VCA-10’s and VCA-11’s website.
The MEDLEY Program Statement of Additional Information contains additional information about the Committee Members of VCA-10 and VCA-11 and is available without charge upon request by calling 800-458-6333.
VCA-10 and VCA-11 file with the Commission a complete listing of portfolio holdings as of the end of the first and third quarters on Form N-Q. Form N-Q is available on the Commission’s website at www.sec.gov or by visiting the Commission’s Public Reference Room. For more information on the Commission’s Public Reference Room, please visit the Commission’s website or call 1-800-732-0330. MEDLEY participants may obtain copies of Form N-Q filings by calling 800-458-6333.
The Prudential Insurance Company of America
751 Broad Street
Newark, NJ 07102-3777
Presorted
Standard
U.S. Postage
PAID
Prudential
©2017 Prudential Financial, Inc. and its related entities. Prudential Investments, the Prudential logo, the Rock symbol, and Bring Your Challenges are service marks of Prudential Financial, Inc. and its related entities, registered in many jurisdictions worldwide.
MD.RS.011
Item 2 – Code of Ethics — See Exhibit (a)
As of the end of the period covered by this report, the registrant has adopted a code of ethics (the “Section 406 Standards for Investment Companies – Ethical Standards for Principal Executive and Financial Officers”) that applies to the registrant’s Principal Executive Officer and Principal Financial Officer; the registrant’s Principal Financial Officer also serves as the Principal Accounting Officer.
The registrant hereby undertakes to provide any person, without charge, upon request, a copy of the code of ethics. To request a copy of the code of ethics, contact the registrant 973-367-7521, and ask for a copy of the Section 406 Standards for Investment Companies - Ethical Standards for Principal Executive and Financial Officers.
Item 3 – Audit Committee Financial Expert –
The registrant’s Board has determined that Mr. Kevin J. Bannon, member of the Board’s Audit Committee is an “audit committee financial expert,” and that he is “independent,” for purposes of this Item.
Item 4 – Principal Accountant Fees and Services –
(a) Audit Fees
For the fiscal years ended December 31, 2016 and December 31, 2015, KPMG LLP (“KPMG”), the Registrant’s principal accountant, billed the Registrant $19,961 and $19,570, respectively, for professional services rendered for the audit of the Registrant’s annual financial statements or services that are normally provided in connection with statutory and regulatory filings.
(b) Audit-Related Fees
For the fiscal years ended December 31, 2016 and December 31, 2015: none.
(c) Tax Fees
For the fiscal years ended December 31, 2016 and December 31, 2015: none.
(d) All Other Fees
For the fiscal years ended December 31, 2016 and December 31, 2015: none.
(e) (1) Audit Committee Pre-Approval Policies and Procedures
THE PRUDENTIAL MUTUAL FUNDS
AUDIT COMMITTEE POLICY
on
Pre-Approval of Services Provided by the Independent Accountants
The Audit Committee of each Prudential Mutual Fund is charged with the responsibility to monitor the independence of the Fund’s independent accountants. As part of this responsibility, the Audit Committee must pre-approve the independent accounting firm’s engagement to render audit and/or permissible non-audit services, as required by law. In evaluating a proposed engagement of the independent accountants, the Audit Committee will assess the effect that the engagement might reasonably be expected to have on the accountant’s independence. The Committee’s evaluation will be based on:
| | • | | a review of the nature of the professional services expected to be provided, |
| | • | | a review of the safeguards put into place by the accounting firm to safeguard independence, and |
| | • | | periodic meetings with the accounting firm. |
Policy for Audit and Non-Audit Services Provided to the Funds
On an annual basis, the scope of audits for each Fund, audit fees and expenses, and audit-related and non-audit services (and fees proposed in respect thereof) proposed to be performed by the Fund’s independent accountants will be presented by the Treasurer and the independent accountants to the Audit Committee for review and, as appropriate, approval prior to the initiation of such services. Such presentation shall be accompanied by confirmation by both the Treasurer and the independent accountants that the proposed non-audit services will not adversely affect the independence of the independent accountants. Such proposed non-audit services shall be described in sufficient detail to enable the Audit Committee to assess the appropriateness of such services and fees, and the compatibility of the provision of such services with the auditor’s independence. The Committee shall receive periodic reports on the progress of the audit and other services which are approved by the Committee or by the Committee Chair pursuant to authority delegated in this Policy.
The categories of services enumerated under “Audit Services”, “Audit-related Services”, and “Tax Services” are intended to provide guidance to the Treasurer and the independent accountants as to those categories of services which the Committee believes are generally consistent with the independence of the independent accountants and which the Committee (or the Committee Chair) would expect upon the presentation of specific proposals to pre-approve. The enumerated categories are not intended as an exclusive list of audit, audit-related or tax services, which the Committee (or the Committee Chair) would consider for pre-approval.
Audit Services
The following categories of audit services are considered to be consistent with the role of the Fund’s independent accountants:
| | • | | Annual Fund financial statement audits |
| | • | | Seed audits (related to new product filings, as required) |
| | • | | SEC and regulatory filings and consents |
Audit-related Services
The following categories of audit-related services are considered to be consistent with the role of the Fund’s independent accountants:
| | • | | Accounting consultations |
| | • | | Fund merger support services |
| | • | | Agreed Upon Procedure Reports |
| | • | | Other Internal Control Reports |
Individual audit-related services that fall within one of these categories (except for fund merger support services) and are not presented to the Audit Committee as part of the annual pre-approval process are subject to an authorized pre-approval by the Audit Committee so long as the estimated fee for those services does not exceed $30,000. Any services provided under such pre-approval will be reported to the Audit Committee at its next regular meeting. Should the amount of such services exceed $30,000 any additional fees will be subject to pre-approval by the Committee Chair (or any other Committee member on whom this responsibility has been delegated). Fees related to fund merger support services are subject to a separate authorized pre-approval by the Audit Committee with fees determined on a per occurrence and merger complexity basis.
Tax Services
The following categories of tax services are considered to be consistent with the role of the Fund’s independent accountants:
| | • | | Tax compliance services related to the filing or amendment of the following: |
| | • | | Federal, state and local income tax compliance; and, |
| | • | | Sales and use tax compliance |
| | • | | Timely RIC qualification reviews |
| | • | | Tax distribution analysis and planning |
| | • | | Tax authority examination services |
| | • | | Tax appeals support services |
| | • | | Accounting methods studies |
| | • | | Fund merger support services |
| | • | | Tax consulting services and related projects |
Individual tax services that fall within one of these categories and are not presented to the Audit
Committee as part of the annual pre-approval process are subject to an authorized pre-approval by the Audit Committee so long as the estimated fee for those services does not exceed $30,000. Any services provided under such pre-approval will be reported to the Audit Committee at its next regular meeting. Should the amount of such services exceed $30,000 any additional fees will be subject to pre-approval by the Committee Chair (or any other Committee member on whom this responsibility has been delegated).
Other Non-Audit Services
Certain non-audit services that the independent accountants are legally permitted to render will be subject to pre-approval by the Committee or by one or more Committee members to whom the Committee has delegated this authority and who will report to the full Committee any pre-approval decisions made pursuant to this Policy. Non-audit services presented for pre-approval pursuant to this paragraph will be accompanied by a confirmation from both the Treasurer and the independent accountants that the proposed services will not adversely affect the independence of the independent accountants.
Proscribed Services
The Fund’s independent accountants will not render services in the following categories of non-audit services:
| | • | | Bookkeeping or other services related to the accounting records or financial statements of the Fund |
| | • | | Financial information systems design and implementation |
| | • | | Appraisal or valuation services, fairness opinions, or contribution-in-kind reports |
| | • | | Internal audit outsourcing services |
| | • | | Management functions or human resources |
| | • | | Broker or dealer, investment adviser, or investment banking services |
| | • | | Legal services and expert services unrelated to the audit |
| | • | | Any other service that the Public Company Accounting Oversight Board determines, by regulation, is impermissible. |
Pre-approval of Non-Audit Services Provided to Other Entities Within the Prudential Fund Complex
Certain non-audit services provided to Prudential Investments LLC or any of its affiliates that also provide ongoing services to the Prudential Mutual Funds will be subject to pre-approval by the Audit Committee. The only non-audit services provided to these entities that will require pre-approval are those related directly to the operations and financial reporting of the Funds. Individual projects that are not presented to the Audit Committee as part of the annual pre-approval process will be subject to pre-approval by the Committee Chair (or any other Committee member on whom this responsibility has been delegated) so long as the estimated fee for those services does not exceed $30,000. Services presented for pre-approval pursuant to this paragraph will be accompanied by a confirmation from both the Treasurer and the independent accountants that the proposed services will not adversely affect the independence of the independent accountants.
Although the Audit Committee will not pre-approve all services provided to Prudential Investments LLC and its affiliates, the Committee will receive an annual report from the Fund’s independent accounting firm showing the aggregate fees for all services provided to Prudential Investments and its affiliates.
(e) (2) Percentage of services referred to in 4(b) – 4(d) that were approved by the audit committee –
For the fiscal years ended December 31, 2016 and December 31, 2015: none.
| (f) | Percentage of hours expended attributable to work performed by other than full time employees of principal accountant if greater than 50%. |
The percentage of hours expended on the principal accountant’s engagement to audit the registrant’s financial statements for the most recent fiscal year that were attributed to work performed by persons other than the principal accountant’s full-time, permanent employees was 0%.
(g) Non-Audit Fees
The aggregate non-audit fees billed by KPMG for services rendered to the registrant’s investment adviser and any entity controlling, controlled by, or under common control with the investment adviser that provides ongoing services to the registrant for the fiscal years ended December 31, 2016 and December 31, 2015 was $0 and $0, respectively.
(h) Principal Accountant’s Independence
Not applicable as KPMG has not provided non-audit services to the registrant’s investment adviser and any entity controlling, controlled by, or under common control with the investment adviser that provides ongoing services to the registrant that were not pre-approved pursuant to Rule 2-01(c)(7)(ii) of Regulation S-X.
| Item 5 – | Audit Committee of Listed Registrants – Not applicable. |
| Item 6 – | Schedule of Investments – The schedule is included as part of the report to shareholders filed under Item 1 of this Form. |
| Item 7 – | Disclosure of Proxy Voting Policies and Procedures for Closed-End Management Investment Companies – Not applicable. |
| Item 8 – | Portfolio Managers of Closed-End Management Investment Companies – Not applicable. |
| Item 9 – | Purchases of Equity Securities by Closed-End Management Investment Company and Affiliated Purchasers – Not applicable. |
| Item 10 – | Submission of Matters to a Vote of Security Holders – Not applicable. |
| Item 11 – | Controls and Procedures |
| | (a) | It is the conclusion of the registrant’s principal executive officer and principal financial officer that the effectiveness of the registrant’s current disclosure controls and procedures (such disclosure controls and procedures having been evaluated within 90 days of the date of this filing) provide reasonable assurance that the information required to be disclosed by the registrant has been recorded, processed, summarized and reported within the time period specified in the Commission’s rules and forms and that the information required to be disclosed by the registrant has been accumulated and communicated to the registrant’s principal executive officer and principal financial officer in order to allow timely decisions regarding required disclosure. |
| | (b) | There has been no significant change in the registrant’s internal control over financial reporting that occurred during the registrant’s most recent fiscal quarter of the period covered by this report that has materially affected, or is likely to materially affect, the registrant’s internal control over financial reporting. |
| | (a) | (1) Code of Ethics – Attached hereto as Exhibit EX-99.CODE-ETH |
| | (2) | Certifications pursuant to Section 302 of the Sarbanes-Oxley Act – Attached hereto as Exhibit EX-99.CERT. |
| | (3) | Any written solicitation to purchase securities under Rule 23c-1. – Not applicable. |
| | (b) | Certifications pursuant to Section 906 of the Sarbanes-Oxley Act – Attached hereto as Exhibit EX-99.906CERT. |
SIGNATURES
Pursuant to the requirements of the Securities Exchange Act of 1934 and the Investment Company Act of 1940, the registrant has duly caused this report to be signed on its behalf by the undersigned, thereunto duly authorized.
Registrant: The Prudential Variable Contract Account-10
| | |
| By: | | /s/ Deborah A. Docs |
| | Deborah A. Docs |
| | Secretary |
| |
| Date: | | February 17, 2017 |
Pursuant to the requirements of the Securities Exchange Act of 1934 and the Investment Company Act of 1940, this report has been signed below by the following persons on behalf of the registrant and in the capacities and on the dates indicated.
| | |
| By: | | /s/ Stuart S. Parker |
| | Stuart S. Parker |
| | President and Principal Executive Officer |
| |
| Date: | | February 17, 2017 |
| |
| By: | | /s/ M. Sadiq Peshimam |
| | M. Sadiq Peshimam |
| | Treasurer and Principal Financial and Accounting Officer |