UNITED STATES
SECURITIES AND EXCHANGE COMMISSION
Washington, D.C. 20549
FORM N-CSR
CERTIFIED SHAREHOLDER REPORT OF REGISTERED MANAGEMENT
INVESTMENT COMPANIES
| | |
| Investment Company Act file number: | | 811-03421 |
| |
| Exact name of registrant as specified in charter: | | The Prudential Variable |
| | Contract Account-10 |
| |
| Address of principal executive offices: | | 655 Broad Street, 17th Floor |
| | Newark, New Jersey 07102 |
| |
| Name and address of agent for service: | | Deborah A. Docs |
| | 655 Broad Street, 17th Floor |
| | Newark, New Jersey 07102 |
| |
| Registrant’s telephone number, including area code: | | 973-367-7521 |
| |
| Date of fiscal year end: | | 12/31/2017 |
| |
| Date of reporting period: | | 12/31/2017 |
Item 1 – Reports to Stockholders
The MEDLEY Program
| | |
| ANNUAL REPORT | | December 31, 2017 |

The report is for the information of persons participating in The Prudential Variable Contract Account-10 (VCA-10), The Prudential Variable Contract Account-11 (VCA-11), and The Prudential Variable Contract Account-24 (VCA-24) (Collectively known as the “Accounts”) of The MEDLEY Program. VCA-10, VCA-11, and VCA-24 are group annuity insurance products issued by The Prudential Insurance Company of America, 751 Broad Street, Newark, NJ 07102-3777, and are distributed by Prudential Investment Management Services LLC (PIMS), member SIPC, 655 Broad Street, 19th Floor, Newark, NJ 07102. Both are Prudential Financial companies.
The views expressed in this report and information about the Accounts’ portfolio holdings are for the period covered by this report and are subject to change thereafter.
Please note that this document may include prospectus supplements that are separate from and not a part of this report.

| | | | |
The Prudential MEDLEY Program Table of Contents | | Annual Report | | December 31, 2017 |
| ∎ | | REPORT OF THE INVESTMENT MANAGER |
Financial Statements
| ∎ | | VCA-11 AND VCA-24 THE PRUDENTIAL SERIES FUND PORTFOLIOS |
Conservative Balanced Portfolio
Diversified Bond Portfolio
Equity Portfolio
Flexible Managed Portfolio
Global Portfolio
Government Income Portfolio
Government Money Market Portfolio
Stock Index Portfolio
| | |
The Prudential MEDLEY Program Letter to Participants | | December 31, 2017 |
At Prudential, our primary objective is to help investors achieve and maintain long-term financial success. This MEDLEY Program annual report outlines our efforts to achieve this goal. We hope you find it informative and useful.
Prudential has been building on a heritage of success for more than 135 years. We believe the array of our products provides a highly attractive value proposition to clients like you who are focused on financial security.
Your financial professional is the best resource to help you make the most informed investment decisions. Together, you can build a diversified investment portfolio that aligns with your long-term financial goals. Please keep in mind that diversification and asset allocation strategies do not assure a profit or protect against loss in declining markets.
Thank you for selecting Prudential as one of your financial partners. We value your trust and appreciate the opportunity to help you achieve financial security.
Sincerely,
| | |
 | |  |
Stuart Parker President, The Prudential Variable Contract Account 10 | | Timothy S. Cronin President, The Prudential Series Fund |
January 31, 2018
| | | | |
| Market Overview — unaudited | | Annual Report | | December 31, 2017 |
Equity Market Overview
Stocks markets around the world rallied in 2017 bolstered by reports of accelerating global economic growth. Equities in emerging markets posted the best returns. In the United States, the S&P 500® Index rose 21.82% and generated positive returns every month of the period.
Market and economic highlights
U.S. stocks performed well in the first quarter driven by investors’ hopes for tax cuts, a rise in consumer spending and corporate profits, and regulatory reforms. Positive economic news abroad also increased appetite for equities. In March, the Federal Reserve raised its target for the short-term federal funds rate by 0.25%, and would proceed to do so again in June and December. Central banks in several other countries scaled back their quantitative-easing efforts.
Second-quarter corporate profits were strong. In August, stocks retreated in reaction to mounting tensions between the U.S. and North Korea, but the pullback was short-lived. During the fourth quarter, stocks advanced again on positive corporate earnings, and in anticipation of tax reform. Corporate earnings rose at double-digit levels in Europe and Japan in the third quarter.
In late December, President Donald J. Trump signed the Tax Cuts and Jobs Act into law, reducing the corporate tax rate from 35% to 21% (effective 2018).
Following a sluggish first quarter, Gross Domestic Product (GDP) growth rose above 3% in the second and third quarters, yet inflation remained tame. The unemployment rate fell to 4.1% — its lowest level since 2000, and investment by businesses picked up. Unemployment also dropped in many other nations including Germany, the United Kingdom, and Japan. The U.S. dollar closed the year sharply lower against other major currencies.
Information technology stocks soar
For the 12 months, nine of the S&P 500’s 11 sectors turned in double-digit returns, and only two ended in negative territory. Information technology led with a return of 38.83%. Demand for cyclical stocks was strong. The materials sector was the second-best performer, rising 23.84%, followed by consumer discretionary, up 22.98%. Next in line was the financial sector, which gained 22.18%. Rising interest rates, which increase lenders’ profit margins; solid earnings, and a loosening of regulations boosted demand for this group. Investors snapped up health care stocks, which rose 22.08% in anticipation of health care reform. The industrials and consumer staples sectors followed, returning 21.03% and 13.49%, respectively.
Despite their favorable dividends, the defensive utilities and real estate sectors lagged but returned an impressive 12.11% and 10.85%, respectively. Telecommunications stocks, facing competitive pressures from cable companies, ended down 1.25%. Energy stocks finished down 1.01%. Their prices fell sharply during the first half of the year as oil prices tumbled, although both the sector and oil prices rebounded later in the year.
Growth and large-cap stocks outperform in Russell Indexes
The Russell US indexes, which measure equity performance with respect to stock-specific styles (value and growth) and capitalization levels (small-, mid-, and large-cap), ended 2017 higher. For the year, the Russell 1000 Growth Index returned 30.21%, more than doubling the Russell 1000 Value Index’s 13.66% return. Growth outperformed due in part to huge gains of large-cap tech stocks. By contrast, the energy sector detracted from value stocks’ performance. Large-cap equities, as measured by the Russell 1000® Index, gained 21.69%. The sector was bolstered by a pickup in economic activity abroad, U.S. dollar weakness, and rising short-term rates The Russell Midcap® Index returned 18.52%. Small-caps, as measured by the Russell 2000® Index, returned 14.65%.
Emerging markets lead international markets
Equities trading in emerging markets, particularly technology and financial issues, soared on reports of improving earnings and fundamentals. The MSCI Emerging Markets Index, net of dividends, rose 37.28% in U.S. dollars and 30.55% in local-currency terms. In U.S. dollars, Far East and Asian stocks rallied 43.53% and 42.83%, respectively. The Brazil, Russia, India, and China (BRIC) group advanced 41.75%, EMEA returned 24.54%. Latin America rose 23.74%, and Europe returned 20.54%.
On a country basis, Poland led with a return of 54.72%. China followed posting a return of 54.07%, and South Korea advanced 47.30%. Conversely, Pakistan, in contrast to its stellar performance in 2016, finished down 24.44%. Qatar dropped 11.51%.
The MSCI-EAFE Index, which measures the performance of developed markets excluding the United States and Canada, returned (net of dividends) 25.03% in U.S dollars and 15.23% in local-currency terms. In U.S. dollars, the best-performing markets were Austria, which returned 58.31%; Hong Kong, which rose 36.17%, and Denmark, which advanced 34.69%.
In the Pacific region, Singapore followed Hong Kong with a gain of 35.57%. Japan rose 23.99% driven by reports of explosive corporate earnings, increased trade, and monetary stimulus. Eurozone equities benefitted from a rise in consumer confidence and diminishing political uncertainty. “Heavy weights” in this group that performed well included France, which rose 28.75%; Italy, which advanced 28.43%; Germany, which returned 27.70%; and the United Kingdom, which gained 22.30%. Israel bucked the trend, returning merely 2.06%.
| | | | |
| Market Overview — unaudited | | Annual Report | | December 31, 2017 |
Fixed Income Market Overview
Bond markets in many developed and emerging markets advanced in 2017 despite interest rate hikes and other reductions in economic stimulus by central banks, broad-based global economic expansion, rising commodity prices, and geopolitical concerns.
Over the 12-month period, based on the performance of Bloomberg Barclays bond indexes, U.S. investment-grade bonds returned 3.54%. Corporate high-yield bonds returned 7.50%. Investment-grade corporate bonds followed with a gain of 6.42%. Treasury Inflation Protected Securities (TIPS) advanced 3.01%. Agency mortgage-backed securities returned 2.47%, closing marginally higher than U.S. Treasury securities, which returned 2.30%.
Municipal bonds advanced 5.45% and global investment-grade bonds gained 7.40%, according to Bloomberg Barclays bond index returns. Emerging markets, as measured by the J.P. Morgan EMBI Global Diversified Index, outperformed with a return of 10.26%.
Central banks react to global economic growth
Following a sluggish first quarter, Gross Domestic Product (GDP) growth in the U.S. rose above 3% in the second and third quarters. The unemployment rate fell to 4.1% — its lowest level since 2000, and investment by businesses picked up. Unemployment also dropped in many other nations including Germany, the United Kingdom, and Japan, which benefited from its aggressive stimulus campaign. Oil prices dropped in the first half of the year but rallied later, particularly in the final quarter, to close the period higher. In contrast to the euro, the U.S. dollar closed the year sharply lower against other major currencies.
Despite low inflation, the Federal Reserve raised its target for the short-term federal funds interbank-lending rate three times during the year, each time by a quarter of a percentage point. Central banks in several other countries scaled back their quantitative-easing efforts.
During the period, the European Central Bank (ECB) trimmed its bond purchases and said that it would further reduce them in 2018. Central banks, including the Bank of England and the People’s Bank of China, raised interest rates.
In late December, President Donald J. Trump signed the Tax Cuts and Jobs Act into law, reducing the corporate tax rate from 35% to 21% (effective January 2018).
U.S. Treasury yield curve flattens
The gap between yields on two-year and 10-year U.S. treasuries narrowed considerably as the Fed raised short-term rates, although the bond markets took the incremental rate hikes in stride thanks to the central bank’s forward guidance. Over the 12 months, long-term treasury bonds in particular posted sizeable gains. The yield on the 10-year U.S. Treasury, which moves opposite to price, ended the period at 2.40%.
Corporate bonds advance
Investors’ favorable reception to U.S. tax reforms, solid corporate earnings, and positive global economic growth drove U.S. corporate bond prices higher over the year.
In the investment-grade arena, long-term U.S. corporate bonds performed especially well. European bonds trailed their U.S. peers by a wide margin but outperformed U.S. Treasuries.
In the U.S. high-yield category, the lowest-rated credits performed best. Bonds rated CCC returned 10.6% for the year, according to Bloomberg Barclays data. Returns of U.S. high-yield bonds were more modest in the final quarter of the year due in part to uncertainties regarding tax reform, global growth, and other factors.
Emerging market bonds and currencies rally
Emerging markets overall generated impressive returns despite political uncertainties and rising short-term interest rates in developed markets. The returns were fueled by global economic expansion; a rise in commodity prices such as oil, which retreated during the first half of the year but rebounded to close the year higher at about $60 per barrel; a weaker U.S. dollar (in contrast to the strong performance of currencies of many emerging markets); and relatively tame inflation. Economic growth in countries including Russia, Brazil, and Argentina, expanded in 2017 after contracting the prior year.
TIPS advance as year comes to a close
Although some bond categories like U.S. high-yield bonds lost momentum in the final month of the period, inflation-linked U.S. TIPS rose 0.92% that month — accounting for nearly one-third of their return for the 12 months.
| | |
Prudential Variable Contract Account-10 (VCA-10) & Variable Contract Account-24 (VCA-24) Presentation of Portfolio Holdings — unaudited | | December 31, 2017 |
| | | | |
| Conservative Balanced | |
| Five Largest Holdings | | | (% of Net Assets | ) |
Apple, Inc. | | | 1.9% | |
Microsoft Corp. | | | 1.4% | |
U.S. Treasury Inflation Indexed Bonds | | | 1.3% | |
Amazon.com, Inc. | | | 1.0% | |
Facebook, Inc. (Class A Stock) | | | 0.9% | |
| | | | |
| Diversified Bond | |
| Fund Composition | | | (% of Net Assets | ) |
Corporate Bonds | | | 40.2% | |
Asset-Backed Securities | | | 20.0% | |
Commercial Mortgage-Backed Securities | | | 15.5% | |
Sovereign Bonds | | | 4.9% | |
Residential Mortgage-Backed Securities | | | 4.5% | |
| | | | |
| Equity | |
| Five Largest Holdings | | | (% of Net Assets | ) |
JPMorgan Chase & Co. | | | 4.8% | |
Apple, Inc. | | | 3.9% | |
Microsoft Corp. | | | 3.3% | |
Boeing Co. (The) | | | 2.6% | |
Alibaba Group Holding Ltd. (China), ADR | | | 2.3% | |
| | | | |
| Flexible Managed | |
| Five Largest Holdings | | | (% of Net Assets | ) |
Apple, Inc. | | | 2.2% | |
Microsoft Corp. | | | 1.7% | |
JPMorgan Chase & Co. | | | 1.4% | |
Facebook, Inc. | | | 1.4% | |
Alphabet, Inc. | | | 1.2% | |
| | | | |
| Global | |
| Top Five Countries | | | (% of Net Assets | ) |
United States | | | 54.0% | |
Japan | | | 8.3% | |
United Kingdom | | | 5.4% | |
France | | | 5.2% | |
Switzerland | | | 3.1% | |
| | | | |
| Government Income | |
| Fund Composition | | | (% of Net Assets | ) |
U.S. Government Agency Obligations | | | 41.5% | |
U.S. Treasury Obligations | | | 22.7% | |
Commercial Mortgage-Backed Securities | | | 20.9% | |
Collateralized Loan Obligations | | | 10.3% | |
Corporate Bonds | | | 1.3% | |
| | | | |
| Stock Index | |
| Five Largest Holdings | | | (% of Net Assets | ) |
| Apple, Inc. | | | 3.7% | |
| Microsoft Corp. | | | 2.8% | |
| Amazon.com, Inc. | | | 2.0% | |
| Facebook, Inc. | | | 1.8% | |
| Berkshire Hathaway, Inc. | | | 1.6% | |
| | | | |
| VCA-10 | |
| Five Largest Holdings | | | (% of Net Assets | ) |
JPMorgan Chase & Co. | | | 3.5% | |
Boeing Co. (The) | | | 3.2% | |
Apple, Inc. | | | 2.9% | |
Goldman Sachs Group, Inc. (The) | | | 2.8% | |
Microsoft Corp. | | | 2.8% | |
For a complete listing of holdings, refer to the Schedule of Investments section of this report for the Prudential Series Fund and refer to the Statement of Net Assets section for the Prudential MEDLEY Program — VCA-10. Holdings reflect only long-term investments. Holdings/Issues/Industries/Sectors are subject to change.
| | |
The Prudential MEDLEY Program — VCA-10 | | December 31, 2017 |
Report of the Investment Manager - As of December 31, 2017 (Unaudited)
| | | | | | | | | | | | | | | | |
Average Annual
Total Returns | | 1-Year | | | 5-Years | | | 10-Years | | | Since
Inception | |
VCA-101—Standard Contract | | | 22.31 | % | | | 13.11 | % | | | 5.95 | % | | | — | |
VCA-101—0.50% Contract | | | 22.92 | | | | 13.67 | | | | 6.47 | | | | — | |
VCA-101—0.45% Contract | | | 22.98 | | | | 13.73 | | | | — | | | | 10.99 | % |
S&P 500 Index | | | 21.82 | | | | 15.78 | | | | 8.49 | | | | 13.32 | |
Past performance does not guarantee future returns. Account performance is net of investment fees and fund expenses. The investment return and principal value of an investment will fluctuate, so that an investor’s shares, when redeemed, may be worth more or less than their original cost. Current performance may be lower or higher than the past performance data quoted.
0.45% Contract inception: 4/1/2011. Unless noted otherwise, Index since inception returns reflect performance beginning the closest month-end date to the Account’s inception of the 0.45% contract.
$10,000 INVESTED OVER 10 YEARS

For the year ended December 31, 2017, the value of the standard contract for the Prudential Variable Contract Account 10 (“VCA-10” or the “Account”) returned 22.31%, the value of a contract with annual expenses of 0.50% returned 22.92%, and the value of a contract with annual expenses of 0.45% returned 22.98%.
The Account’s investment objective is long-term growth of capital. The Account is subadvised by Jennison Associates LLC.
What were market conditions during the reporting period?
Equity markets posted a solid finish to a strong 2017. Gains were broad, but particularly notable among companies with above-average earnings growth. US GDP expansion accelerated, surpassing 3% for the second quarter in a row, and most leading economic indicators and sentiment gauges reflected expectations for economic activity to continue to strengthen. Short-term interest rates continued to push higher after the Fed raised interest rates three times. Longer-term US yields rallied, leaving the Treasury yield curve at its flattest level in more than a decade. US dollar weakness continued as global growth expanded and accelerated.
Major tax legislation was the most significant win for the Trump administration’s inaugural year. The tax package includes a substantial reduction in the tax rate paid by corporations on domestically earned income. Abroad, Europe’s economic recovery continued, and emerging markets posted the best annual performance since the aftermath of the financial crisis.
What strategies or holdings affected the Account’s performance?
The S&P 500 (the Index) returned 21.82% in 2017, led by information technology, materials, consumer discretionary, and financials. Telecom services and energy were the only negative sectors, both declining less than 2.0%. While value names performed well, growth names outperformed value.
The Account outperformed the Index. Positions in information technology were the primary drivers of overall return, specifically within the Internet software and services industry and software providers. Positions in consumer discretionary, industrials, and financials also positively contributed as the Fed raised interest rates.
Notable holdings were Alibaba, one of the world’s largest e-commerce companies, where the company reported September-quarter financial results that beat consensus expectations on most key metrics. Tencent, China’s largest and most visited Internet service portal, continues to perform well, its fundamentals driven by a dominant position in China’s online gaming and instant messaging markets, and growing advertising and payment service efforts. Among the industrials sector, Boeing Company, the world’s largest aerospace firm, performed well following a renewed focus on free cash flow (FCF) and capital returns (increasing dividends and returning 100% of FCF to shareholders). The company appears to be exceeding FCF expectations despite some pricing pressures and declining 777 aircraft production.
The Account’s allocations to the energy sector detracted from both relative and absolute performance as oil prices fell during the first half of 2017, hitting a one-year low before rebounding over 40% in the second half. Oil and gas exploration and production (E&P) company Hess detracted from the Account’s overall performance. The management team initially favored Hess after its two-year restructuring, believing that its balance sheet would allow it to develop its interests in offshore Guyana, possibly the premier oil discovery for some time to come. The development could provide upwardly revised volume guidance and deliver meaningful cash flow to the bottom line. However, despite oil prices rebounding, E&P names lagged commodity performance and did not participate in the upside as was expected. The position was eliminated in order to reduce overall energy sector allocation and to deploy capital in more favorable areas.
Shares of General Electric (GE) underperformed as the multi-industry company exited its GE Capital business as part of efforts to simplify the company’s business model. Former CEO Immelt lost credibility with overly aggressive targets, weak free cash flow, and poorly timed mergers and acquisitions. New CEO John Flannery focused on cost reductions, improved cash flow, and shaping the product portfolio. The stock subsequently lagged in anticipation of the impact of these changes on EPS and cash flow. The Account no longer holds the position.
Consumer discretionary company Newell Brands underperformed. The company lowered its fiscal year 2017 earnings guidance following resin supply disruptions following Hurricane Harvey in August. Supply of a specific type of resin used in the company’s food saver and consumer and commercial Rubbermaid products comes from the affected area, and it is anticipated that resin prices will rise and supply will be curtailed. However, in the management team’s opinion, cost reduction initiatives and the recently completed acquisition of Jarden should generate over $1 billion of savings and could help fuel a solid earnings growth profile over the coming years.
| 1 | The Account performance results is net of all contract charges but not including the effect of any sales charges. The standard VCA-10 contract has total annual expenses (as a percentage of net assets) of 1.00%. Certain VCA-10 contracts include reduced administrative fees and have total annual expenses of either 0.50% or 0.45%. Performance of the VCA-10 contracts with reduced expenses will be higher than the performance of the standard VCA-10 contract. All total returns are for the periods indicated and are calculated based on changes in unit values. |
| 2 | The graph is based on the performance of the Standard Contract. Performance of the 0.50% Contract and the 0.45% Contract will be higher due to a lower fee structure. |
For a complete list of holdings please see the Statement of Net Assets sections of this report.
1
FINANCIAL STATEMENTS OF VCA-10
December 31, 2017
| | | | | | | | |
| LONG-TERM INVESTMENTS — 99.5% | |
| COMMON STOCKS | | Shares | | | Value | |
Aerospace & Defense — 4.4% | | | | | | | | |
Boeing Co. (The) | | | 17,840 | | | $ | 5,261,194 | |
United Technologies Corp. | | | 15,677 | | | | 1,999,915 | |
| | | | | | | | |
| | | | | | | 7,261,109 | |
| | | | | | | | |
Air Freight & Logistics — 0.9% | | | | | | | | |
Fedex Corp. | | | 6,146 | | | | 1,533,673 | |
| | | | | | | | |
Banks — 11.6% | | | | | | | | |
Bank of America Corp. | | | 136,232 | | | | 4,021,569 | |
BB&T Corp. | | | 43,954 | | | | 2,185,393 | |
Citigroup, Inc. | | | 40,292 | | | | 2,998,128 | |
JPMorgan Chase & Co. | | | 54,388 | | | | 5,816,253 | |
PNC Financial Services
Group, Inc. (The) | | | 17,436 | | | | 2,515,840 | |
Wells Fargo & Co. | | | 26,801 | | | | 1,626,017 | |
| | | | | | | | |
| | | | | | | 19,163,200 | |
| | | | | | | | |
Biotechnology — 1.3% | | | | | | | | |
Shire PLC, ADR | | | 8,111 | | | | 1,258,178 | |
Vertex Pharmaceuticals, Inc.* | | | 5,836 | | | | 874,583 | |
| | | | | | | | |
| | | | | | | 2,132,761 | |
| | | | | | | | |
Building Products — 0.7% | | | | | | | | |
Johnson Controls International PLC | | | 30,719 | | | | 1,170,701 | |
| | | | | | | | |
Capital Markets — 2.8% | | | | | | | | |
Goldman Sachs Group, Inc. (The) | | | 18,498 | | | | 4,712,550 | |
| | | | | | | | |
Chemicals — 2.3% | | | | | | | | |
DowDuPont, Inc. | | | 27,461 | | | | 1,955,772 | |
FMC Corp. | | | 18,681 | | | | 1,768,343 | |
| | | | | | | | |
| | | | | | | 3,724,115 | |
| | | | | | | | |
Communications Equipment — 1.1% | | | | | |
Cisco Systems, Inc. | | | 48,356 | | | | 1,852,035 | |
| | | | | | | | |
Consumer Finance — 2.5% | | | | | | | | |
Capital One Financial Corp. | | | 23,662 | | | | 2,356,262 | |
SLM Corp.* | | | 153,732 | | | | 1,737,172 | |
| | | | | | | | |
| | | | | | | 4,093,434 | |
| | | | | | | | |
Containers & Packaging — 0.9% | | | | | | | | |
Sealed Air Corp. | | | 30,256 | | | | 1,491,621 | |
| | | | | | | | |
Electric Utilities — 2.3% | | | | | | | | |
American Electric Power Co., Inc. | | | 21,915 | | | | 1,612,287 | |
Exelon Corp. | | | 54,900 | | | | 2,163,609 | |
| | | | | | | | |
| | | | | | | 3,775,896 | |
| | | | | | | | |
Electrical Equipment — 1.0% | | | | | | | | |
Eaton Corp. PLC | | | 20,570 | | | | 1,625,236 | |
| | | | | | | | |
Electronic Equipment, Instruments & Components — 1.1% | |
Flex Ltd.* | | | 101,156 | | | | 1,819,796 | |
| | | | | | | | |
Energy Equipment & Services — 1.2% | | | | | |
Halliburton Co. | | | 40,649 | | | | 1,986,517 | |
| | | | | | | | |
Equity Real Estate Investment Trust (REITs) — 1.0% | |
American Tower Corp. | | | 12,091 | | | | 1,725,023 | |
| | | | | | | | |
Food & Staples Retailing — 2.7% | | | | | | | | |
Costco Wholesale Corp. | | | 10,713 | | | | 1,993,904 | |
| | | | | | | | |
| COMMON STOCKS | |
| (continued) | | Shares | | | Value | |
Food & Staples Retailing (continued) | | | | | |
Wal-Mart Stores, Inc. | | | 24,826 | | | $ | 2,451,567 | |
| | | | | | | | |
| | | | | | | 4,445,471 | |
| | | | | | | | |
Food Products — 1.8% | | | | | | | | |
Conagra Brands, Inc. | | | 47,284 | | | | 1,781,188 | |
Mondelez International, Inc.
(Class A Stock) | | | 26,896 | | | | 1,151,149 | |
| | | | | | | | |
| | | | | | | 2,932,337 | |
| | | | | | | | |
Health Care Equipment & Supplies — 1.1% | | | | | |
Zimmer Biomet Holdings, Inc. | | | 14,737 | | | | 1,778,314 | |
| | | | | | | | |
Health Care Providers & Services — 3.2% | | | | | |
Cigna Corp. | | | 8,290 | | | | 1,683,616 | |
Laboratory Corp. of America Holdings* | | | 10,556 | | | | 1,683,788 | |
UnitedHealth Group, Inc. | | | 8,777 | | | | 1,934,977 | |
| | | | | | | | |
| | | | | | | 5,302,381 | |
| | | | | | | | |
Hotels, Restaurants & Leisure — 4.2% | | | | | |
Carnival Corp. | | | 18,237 | | | | 1,210,390 | |
Hyatt Hotels Corp.
(Class A Stock)* | | | 29,645 | | | | 2,180,093 | |
Marriott International, Inc.
(Class A Stock) | | | 15,796 | | | | 2,143,991 | |
McDonald’s Corp. | | | 8,465 | | | | 1,456,996 | |
| | | | | | | | |
| | | | | | | 6,991,470 | |
| | | | | | | | |
Household Durables — 0.5% | | | | | | | | |
Newell Brands, Inc. | | | 27,810 | | | | 859,329 | |
| | | | | | | | |
Household Products — 1.6% | | | | | | | | |
Procter & Gamble Co. (The) | | | 29,459 | | | | 2,706,693 | |
| | | | | | | | |
Insurance — 3.1% | | | | | | | | |
Brighthouse Financial, Inc.* | | | 13,818 | | | | 810,288 | |
Chubb Ltd. (Switzerland) | | | 15,543 | | | | 2,271,299 | |
MetLife, Inc. | | | 36,995 | | | | 1,870,467 | |
| | | | | | | | |
| | | | | | | 4,952,054 | |
| | | | | | | | |
Internet & Direct Marketing Retail — 2.5% | | | | | |
Amazon.com, Inc.* | | | 2,027 | | | | 2,370,516 | |
Netflix, Inc.* | | | 9,507 | | | | 1,824,964 | |
| | | | | | | | |
| | | | | | | 4,195,480 | |
| | | | | | | | |
Internet Software & Services — 7.2% | | | | | |
Alibaba Group Holding Ltd. (China), ADR* | | | 14,950 | | | | 2,577,828 | |
Alphabet, Inc. (Class A Stock)* | | | 3,762 | | | | 3,962,891 | |
eBay, Inc.* | | | 28,385 | | | | 1,071,250 | |
Facebook, Inc. (Class A Stock)* | | | 13,939 | | | | 2,459,676 | |
Tencent Holdings Ltd. (China), ADR | | | 35,532 | | | | 1,844,821 | |
| | | | | | | | |
| | | | | | | 11,916,466 | |
| | | | | | | | |
IT Services — 3.8% | | | | | | | | |
DXC Technology Co. | | | 14,057 | | | | 1,334,009 | |
PayPal Holdings, Inc.* | | | 32,611 | | | | 2,400,822 | |
Visa, Inc. (Class A Stock) | | | 21,681 | | | | 2,472,068 | |
| | | | | | | | |
| | | | | | | 6,206,899 | |
| | | | | | | | |
SEE NOTES TO FINANCIAL STATEMENTS.
FINANCIAL STATEMENTS OF VCA-10
December 31, 2017
| | | | | | | | |
| COMMON STOCKS | |
| (continued) | | Shares | | | Value | |
Media — 2.9% | | | | | | | | |
Comcast Corp. (Class A Stock) | | | 54,105 | | | $ | 2,166,905 | |
Liberty Global PLC (United Kingdom) (Class C Stock)* | | | 38,694 | | | | 1,309,405 | |
Twenty-First Century Fox, Inc.
(Class A Stock) | | | 40,121 | | | | 1,385,378 | |
| | | | | | | | |
| | | | | | | 4,861,688 | |
| | | | | | | | |
Oil, Gas & Consumable Fuels — 5.9% | | | | | |
Anadarko Petroleum Corp. | | | 16,452 | | | | 882,485 | |
Chevron Corp. | | | 24,054 | | | | 3,011,320 | |
Noble Energy, Inc. | | | 29,340 | | | | 854,968 | |
Royal Dutch Shell PLC (Netherlands) (Class A Stock), ADR | | | 47,798 | | | | 3,188,575 | |
Suncor Energy, Inc. (Canada) | | | 48,738 | | | | 1,789,659 | |
| | | | | | | | |
| | | | | | | 9,727,007 | |
Pharmaceuticals — 5.6% | | | | | | | | |
Allergan PLC | | | 8,696 | | | | 1,422,492 | |
Bristol-Myers Squibb Co. | | | 36,678 | | | | 2,247,628 | |
Eli Lilly & Co. | | | 19,553 | | | | 1,651,446 | |
Merck & Co., Inc. | | | 26,992 | | | | 1,518,840 | |
Pfizer, Inc. | | | 68,681 | | | | 2,487,626 | |
| | | | | | | | |
| | | | | | | 9,328,032 | |
| | | | | | | | |
Road & Rail — 1.2% | | | | | | | | |
Union Pacific Corp. | | | 15,252 | | | | 2,045,293 | |
| | | | | | | | |
Semiconductors & Semiconductor Equipment — 3.9% | |
Broadcom Ltd. | | | 9,009 | | | | 2,314,412 | |
Texas Instruments, Inc. | | | 38,889 | | | | 4,061,567 | |
| | | | | | | | |
| | | | | | | 6,375,979 | |
| | | | | | | | |
Software — 7.0% | | | | | | | | |
Adobe Systems, Inc.* | | | 14,803 | | | | 2,594,078 | |
Microsoft Corp. | | | 53,435 | | | | 4,570,830 | |
PTC, Inc.* | | | 27,165 | | | | 1,650,817 | |
salesforce.com, Inc.* | | | 27,488 | | | | 2,810,098 | |
| | | | | | | | |
| | | | | | | 11,625,823 | |
| | | | | | | | |
Specialty Retail — 1.2% | | | | | | | | |
Home Depot, Inc. | | | 10,565 | | | | 2,002,384 | |
| | | | | | | | |
Technology Hardware, Storage & Peripherals — 2.9% | |
Apple, Inc. | | | 28,830 | | | | 4,878,901 | |
| | | | | | | | |
Textiles, Apparel & Luxury Goods — 0.9% | |
Tapestry, Inc. | | | 35,219 | | | | 1,557,736 | |
| | | | | | | | |
Wireless Telecommunication Services — 1.2% | |
Vodafone Group PLC
(United Kingdom), ADR | | | 62,298 | | | | 1,987,306 | |
| | | | | | | | |
TOTAL COMMON STOCKS
(cost $111,758,728) | | | | | | | 164,744,710 | |
| | | | | | | | |
| | | | | | | | |
SHORT-TERM INVESTMENT — 1.8% | | Shares | | | Value | |
AFFILIATED MUTUAL FUND | | | | | | | | |
Prudential Investment Portfolios 2 — Prudential Core Ultra Short Bond Fund
(cost $2,928,819)(a) | | | 2,928,819 | | | $ | 2,928,819 | |
| | | | | | | | |
TOTAL INVESTMENTS — 101.3%
(cost $114,687,547) | | | | 167,673,529 | |
| | | | | | | | |
LIABILITIES IN EXCESS OF OTHER ASSETS — (1.3)% | | | | | | | | |
Dividends Receivable | | | | 121,793 | |
Tax Reclaim Receivable | | | | 21,296 | |
Payable for Securities Purchased | | | | (237,139 | ) |
Payable Pending Capital Transactions | | | | (2,086,104 | ) |
| | | | | | | | |
LIABILITIES IN EXCESS OF OTHER ASSETS | | | | (2,180,154 | ) |
| | | | | | | | |
NET ASSETS — 100% | | | $ | 165,493,375 | |
| | | | | | | | |
NET ASSETS, representing: | | | | | | | | |
Equity of Participants — | | | $ | 165,515,136 | |
Equity of The Prudential Insurance Company of America | | | | (21,761 | ) |
| | | | | | | | |
| | | | | | $ | 165,493,375 | |
| | | | | | | | |
The following abbreviations is used in the annual report:
| | |
| ADR | | American Depositary Receipt |
| * | Non-income producing security. |
| (a) | PGIM Investments LLC, the manager of the Account, also serves as manager of the Prudential Investment Portfolios 2 — Prudential Core Ultra Short Bond Fund. |
SEE NOTES TO FINANCIAL STATEMENTS.
FINANCIAL STATEMENTS OF VCA-10
December 31, 2017
Fair value measurements:
Various inputs are used in determining the value of the Account’s investments. These inputs are summarized in the three broad levels listed below.
| Level 1— | unadjusted quoted prices generally in active markets for identical securities. |
| Level 2— | quoted prices for similar securities, interest rates and yield curves, prepayment speeds, foreign currency exchange rates, and other observable inputs. |
| Level 3— | unobservable inputs for securities valued in accordance with the Account’s Committee approved fair valuation procedures. |
The following is a summary of the inputs used as of December 31, 2017 in valuing such portfolio securities:
| | | | | | | | | | | | |
| | | Level 1 | | | Level 2 | | | Level 3 | |
Investments in Securities | | | | | | | | | | | | |
Common Stocks | | | | | | | | | | | | |
Aerospace & Defense | | $ | 7,261,109 | | | $ | — | | | $ | — | |
Affiliated Mutual Fund | | | 2,928,819 | | | | — | | | | — | |
Air Freight & Logistics | | | 1,533,673 | | | | — | | | | — | |
Banks | | | 19,163,200 | | | | — | | | | — | |
Biotechnology | | | 2,132,761 | | | | — | | | | — | |
Building Products | | | 1,170,701 | | | | — | | | | — | |
Capital Markets | | | 4,712,550 | | | | — | | | | — | |
Chemicals | | | 3,724,115 | | | | — | | | | — | |
Communications Equipment | | | 1,852,035 | | | | — | | | | — | |
Consumer Finance | | | 4,093,434 | | | | — | | | | — | |
Containers & Packaging | | | 1,491,621 | | | | — | | | | — | |
Electric Utilities | | | 3,775,896 | | | | — | | | | — | |
Electrical Equipment | | | 1,625,236 | | | | — | | | | — | |
Electronic Equipment, Instruments & Components | | | 1,819,796 | | | | — | | | | — | |
Energy Equipment & Services | | | 1,986,517 | | | | — | | | | — | |
Equity Real Estate Investment Trust (REITs) | | | 1,725,023 | | | | — | | | | — | |
Food & Staples Retailing | | | 4,445,471 | | | | — | | | | — | |
Food Products | | | 2,932,337 | | | | — | | | | — | |
Health Care Equipment & Supplies | | | 1,778,314 | | | | — | | | | — | |
Health Care Providers & Services | | | 5,302,381 | | | | — | | | | — | |
Hotels, Restaurants & Leisure | | | 6,991,470 | | | | — | | | | — | |
Household Durables | | | 859,329 | | | | — | | | | — | |
Household Products | | | 2,706,693 | | | | — | | | | — | |
Insurance | | | 4,952,054 | | | | — | | | | — | |
Internet & Direct Marketing Retail | | | 4,195,480 | | | | — | | | | — | |
Internet Software & Services | | | 11,916,466 | | | | — | | | | — | |
IT Services | | | 6,206,899 | | | | — | | | | — | |
Media | | | 4,861,688 | | | | — | | | | — | |
Oil, Gas & Consumable Fuels | | | 9,727,007 | | | | — | | | | — | |
Pharmaceuticals | | | 9,328,032 | | | | — | | | | — | |
Road & Rail | | | 2,045,293 | | | | — | | | | — | |
Semiconductors & Semiconductor Equipment | | | 6,375,979 | | | | — | | | | — | |
Software | | | 11,625,823 | | | | — | | | | — | |
Specialty Retail | | | 2,002,384 | | | | — | | | | — | |
Technology Hardware, Storage & Peripherals | | | 4,878,901 | | | | — | | | | — | |
Textiles, Apparel & Luxury Goods | | | 1,557,736 | | | | — | | | | — | |
Wireless Telecommunications Services | | | 1,987,306 | | | | — | | | | — | |
| | | | | | | | | | | | |
Total | | $ | 167,673,529 | | | $ | — | | | $ | — | |
| | | | | | | | | | | | |
During the period, there were no transfers between Level 1, Level 2 and Level 3 to report
SEE NOTES TO FINANCIAL STATEMENTS.
FINANCIAL STATEMENTS OF VCA-10
December 31, 2017
Industry Classification:
The industry classification of investments and liabilities in excess of other assets shown as a percentage of net assets as of December 31, 2017 were as follows (unaudited):
| | | | |
Banks | | | 11.6 | % |
Internet Software & Services | | | 7.2 | |
Software | | | 7.0 | |
Oil, Gas & Consumable Fuels | | | 5.9 | |
Pharmaceuticals | | | 5.6 | |
Aerospace & Defense | | | 4.4 | |
Hotels, Restaurants & Leisure | | | 4.2 | |
Semiconductors & Semiconductor Equipment | | | 3.9 | |
IT Services | | | 3.8 | |
Health Care Providers & Services | | | 3.2 | |
Insurance | | | 3.1 | |
Media | | | 2.9 | |
Technology Hardware, Storage & Peripherals | | | 2.9 | |
Capital Markets | | | 2.8 | |
Food & Staples Retailing | | | 2.7 | |
Consumer Finance | | | 2.5 | |
Internet & Direct Marketing Retail | | | 2.5 | |
Chemicals | | | 2.3 | |
Electric Utilities | | | 2.3 | |
Affiliated Mutual Fund | | | 1.8 | |
Food Products | | | 1.8 | |
| | | | |
Household Products | | | 1.6 | % |
Biotechnology | | | 1.3 | |
Energy Equipment & Services | | | 1.2 | |
Road & Rail | | | 1.2 | |
Specialty Retail | | | 1.2 | |
Wireless Telecommunications Services | | | 1.2 | |
Communications Equipment | | | 1.1 | |
Electronic Equipment, Instruments & Components | | | 1.1 | |
Health Care Equipment & Supplies | | | 1.1 | |
Electrical Equipment | | | 1.0 | |
Equity Real Estate Investment Trust (REITs) | | | 1.0 | |
Air Freight & Logistics | | | 0.9 | |
Containers & Packaging | | | 0.9 | |
Textiles, Apparel & Luxury Goods | | | 0.9 | |
Building Products | | | 0.7 | |
Household Durables | | | 0.5 | |
| | | | |
| | | 101.3 | |
| | | (1.3 | ) |
| | | | |
Liabilities in excess of other assets | | | 100.0 | % |
| | | | |
SEE NOTES TO FINANCIAL STATEMENTS.
FINANCIAL STATEMENTS OF VCA-10
Year Ended December 31, 2017
| | | | |
| | | | |
INVESTMENT INCOME | | | | |
Unaffiliated Dividend Income (net of $243 foreign withholding tax) | | $ | 2,561,405 | |
Affiliated Dividend Income | | | 34,254 | |
Total Income | | | 2,595,659 | |
EXPENSES | | | | |
Fees Charged to Participants for Investment Management Services | | | (399,987 | ) |
Fees Charged to Participants for Administrative Expenses: | | | | |
Standard Contract | | | (1,078,964 | ) |
0.50% Contract | | | (9,763 | ) |
0.45% Contract | | | (19,567 | ) |
Total Expenses | | | (1,508,281 | ) |
NET INVESTMENT INCOME | | | 1,087,378 | |
REALIZED AND UNREALIZED GAIN (LOSS) ON INVESTMENT AND FOREIGN CURRENCY TRANSACTIONS | | | | |
Net Realized Gain (Loss) on: | | | | |
Investment Transactions | | | 14,830,287 | |
Foreign Currency Transactions | | | 676 | |
| | | | 14,830,963 | |
Net Change in Unrealized Appreciation (Depreciation) on: | | | | |
Investments | | | 15,923,530 | |
Foreign Currencies | | | 203 | |
| | | | 15,923,733 | |
NET GAIN ON INVESTMENT AND FOREIGN CURRENCY TRANSACTIONS | | | 30,754,696 | |
NET INCREASE IN NET ASSETS RESULTING FROM OPERATIONS | | $ | 31,842,074 | |
| | | | | | |
| | STATEMENTS OF CHANGES IN NET ASSETS | | |
| | | | | | | | |
| | | Year Ended
December 31, 2017 | | | Year Ended
December 31, 2016 | |
OPERATIONS | | | | | | | | |
Net Investment Income | | $ | 1,087,378 | | | $ | 1,321,716 | |
Net Realized Gain on Investment and Foreign Currency Transactions | | | 14,830,963 | | | | 4,632,303 | |
Net Change In Unrealized Appreciation (Depreciation) on Investments and Foreign Currencies | | | 15,923,733 | | | | 2,703,381 | |
NET INCREASE IN NET ASSETS RESULTING FROM OPERATIONS | | | 31,842,074 | | | | 8,657,400 | |
CAPITAL TRANSACTIONS | | | | | | | | |
Purchase Payments and Transfers In | | | 1,305,515 | | | | 1,076,649 | |
Withdrawals and Transfers Out | | | (17,682,984 | ) | | | (17,277,918 | ) |
NET DECREASE IN NET ASSETS RESULTING FROM CAPITAL TRANSACTIONS | | | (16,377,469 | ) | | | (16,201,269 | ) |
NET INCREASE (DECREASE) IN NET ASSETS RESULTING FROM SURPLUS TRANSFERS | | | 1,137 | | | | 4,298 | |
TOTAL INCREASE (DECREASE) IN NET ASSETS | | | 15,465,742 | | | | (7,539,571 | ) |
NET ASSETS | | | | | | | | |
Beginning of year | | | 150,027,633 | | | | 157,567,204 | |
End of year | | $ | 165,493,375 | | | $ | 150,027,633 | |
Accumulation Unit Values and Equity of Participants as of December 31, 2017
| | | | |
Standard Contract: | | | | |
Accumulation Unit Value and Equity of Participants, $151,088,937 / 7,755,386 Accumulation Units | | $ | 19.4818 | |
| | | | |
| |
0.50% Contract: | | | | |
Accumulation Unit Value and Equity of Participants, $4,112,248 / 189,604 Accumulation Units | | $ | 21.6886 | |
| | | | |
| |
0.45% Contract: | | | | |
Accumulation Unit Value and Equity of Participants, $10,313,951 / 473,911 Accumulation Units | | $ | 21.7635 | |
| | | | |
SEE NOTES TO FINANCIAL STATEMENTS.
FINANCIAL HIGHLIGHTS FOR VCA-10
| | | | | | |
| | INCOME AND CAPITAL CHANGES PER ACCUMULATION UNIT* | | |
(For an Accumulation Unit outstanding throughout the year)
| | | | | | | | | | | | | | | | | | | | | | | | |
| | | Year Ended December 31, 2017 | | | Year Ended December 31, 2016 | |
| | | Standard
Contract | | | 0.50%
Contract | | | 0.45%
Contract | | | Standard
Contract | | | 0.50%
Contract | | | 0.45%
Contract | |
Investment Income (Loss) | | $ | 0.2909 | | | $ | 0.3229 | | | $ | 0.3239 | | | $ | 0.2736 | | | $ | 0.3019 | | | $ | 0.3027 | |
Expenses | | | | | | | | | | | | | | | | | | | | | | | | |
Investment management fee | | | (0.0440 | ) | | | (0.0489 | ) | | | (0.0491 | ) | | | (0.0369 | ) | | | (0.0407 | ) | | | (0.0408 | ) |
Administrative expenses | | | (0.1318 | ) | | | (0.0489 | ) | | | (0.0392 | ) | | | (0.1103 | ) | | | (0.0407 | ) | | | (0.0327 | ) |
Net Investment Income | | | 0.1151 | | | | 0.2251 | | | | 0.2356 | | | | 0.1264 | | | | 0.2205 | | | | 0.2292 | |
Capital Changes | | | | | | | | | | | | | | | | | | | | | | | | |
Net realized and unrealized gain (loss) on investment and foreign currency transactions | | | 3.4389 | | | | 3.8193 | | | | 3.8316 | | | | 0.8068 | | | | 0.8955 | | | | 0.8983 | |
Net Increase (Decrease) in Accumulation Unit Value | | | 3.5540 | | | | 4.0444 | | | | 4.0672 | | | | 0.9332 | | | | 1.1160 | | | | 1.1275 | |
Accumulation Unit Value | | | | | | | | | | | | | | | | | | | | | | | | |
Beginning of year | | | 15.9278 | | | | 17.6442 | | | | 17.6963 | | | | 14.9946 | | | | 16.5282 | | | | 16.5688 | |
End of year | | $ | 19.4818 | | | $ | 21.6886 | | | $ | 21.7635 | | | $ | 15.9278 | | | $ | 17.6442 | | | $ | 17.6963 | |
Total Return** | | | 22.31 | % | | | 22.92 | % | | | 22.98 | % | | | 6.22 | % | | | 6.75 | % | | | 6.80 | % |
Ratio of Expenses To Average Net Assets*** | | | 1.00 | % | | | 0.50 | % | | | 0.45 | % | | | 1.00 | % | | | 0.50 | % | | | 0.45 | % |
Ratio of Net Investment Income To Average Net Assets*** | | | 0.65 | % | | | 1.15 | % | | | 1.20 | % | | | 0.85 | % | | | 1.34 | % | | | 1.39 | % |
Portfolio Turnover Rate | | | 49 | % | | | 49 | % | | | 49 | % | | | 42 | % | | | 42 | % | | | 42 | % |
Number of Accumulation Units Outstanding
For Participants at end of year (000’s omitted) | | | 7,755 | | | | 190 | | | | 474 | | | | 8,606 | | | | 212 | | | | 522 | |
| * | Calculated by accumulating the actual per unit amounts daily. |
| ** | Total return does not consider the effects of sales loads. Total return is calculated assuming a purchase of a share on the first day and a sale on the last day of each year reported. Total returns may reflect adjustments to conform to generally accepted accounting principles. |
| *** | These calculations exclude PICA’s equity in VCA-10. |
The above table does not reflect the annual administration charge, which does not affect the Accumulation Unit Value. This charge is made by reducing Participants’ Accumulation Accounts by a number of Accumulation Units equal in value to the charge.
SEE NOTES TO FINANCIAL STATEMENTS.
FINANCIAL HIGHLIGHTS FOR VCA-10
| | | | | | |
| | INCOME AND CAPITAL CHANGES PER ACCUMULATION UNIT* | | |
(For an Accumulation Unit outstanding throughout the year)
| | | | | | | | | | | | | | | | | | | | | | | | |
| | | Year Ended December 31, 2015 | | | Year Ended December 31, 2014 | |
| | | Standard
Contract | | | 0.50%
Contract | | | 0.45%
Contract | | | Standard
Contract | | | 0.50%
Contract | | | 0.45%
Contract | |
Investment Income | | $ | 0.2397 | | | $ | 0.2631 | | | $ | 0.2637 | | | $ | 0.1871 | | | $ | 0.2046 | | | $ | 0.2049 | |
Expenses | | | | | | | | | | | | | | | | | | | | | | | | |
Investment management fee | | | (0.0384 | ) | | | (0.0422 | ) | | | (0.0423 | ) | | | (0.0362 | ) | | | (0.0397 | ) | | | (0.0398 | ) |
Administrative expenses | | | (0.1149 | ) | | | (0.0422 | ) | | | (0.0339 | ) | | | (0.1086 | ) | | | (0.0397 | ) | | | (0.0318 | ) |
Net Investment Income | | | 0.0864 | | | | 0.1787 | | | | 0.1875 | | | | 0.0423 | | | | 0.1252 | | | | 0.1333 | |
Capital Changes | | | | | | | | | | | | | | | | |
Net realized and unrealized gain (loss) on investment and foreign currency transactions | | | (0.3479 | ) | | | (0.3837 | ) | | | (0.3847 | ) | | | 1.4515 | | | | 1.5879 | | | | 1.5907 | |
Net Increase (Decrease) in Accumulation Unit Value | | | (0.2615 | ) | | | (0.2050 | ) | | | (0.1972 | ) | | | 1.4938 | | | | 1.7131 | | | | 1.7240 | |
Accumulation Unit Value | | | | | | | | | | | | | | | | |
Beginning of year | | | 15.2561 | | | | 16.7332 | | | | 16.7660 | | | | 13.7623 | | | | 15.0201 | | | | 15.0420 | |
End of year | | $ | 14.9946 | | | $ | 16.5282 | | | $ | 16.5688 | | | $ | 15.2561 | | | $ | 16.7332 | | | $ | 16.7660 | |
Total Return** | | | (1.71 | )% | | | (1.23 | )% | | | (1.18 | )% | | | 10.85 | % | | | 11.41 | % | | | 11.46 | % |
Ratio of Expenses To Average Net Assets*** | | | 1.00 | % | | | 0.50 | % | | | 0.45 | % | | | 1.00 | % | | | 0.50 | % | | | 0.45 | % |
Ratio of Net Investment Income To Average Net Assets*** | | | 0.57 | % | | | 1.06 | % | | | 1.11 | % | | | 0.29 | % | | | 0.78 | % | | | 0.83 | % |
Portfolio Turnover Rate | | | 47 | % | | | 47 | % | | | 47 | % | | | 70 | % | | | 70 | % | | | 70 | % |
Number of Accumulation Units Outstanding
For Participants at end of year (000’s omitted) | | | 9,595 | | | | 219 | | | | 609 | | | | 10,646 | | | | 242 | | | | 657 | |
| * | Calculated by accumulating the actual per unit amounts daily. |
| ** | Total return does not consider the effects of sales loads. Total return is calculated assuming a purchase of a share on the first day and a sale on the last day of each period reported. Total returns may reflect adjustments to conform to generally accepted accounting principles. |
| *** | These calculations exclude PICA’s equity in VCA-10. |
The above table does not reflect the annual administration charge, which does not affect the Accumulation Unit Value. This charge is made by reducing Participants’ Accumulation Accounts by a number of Accumulation Units equal in value to the charge.
SEE NOTES TO FINANCIAL STATEMENTS.
FINANCIAL HIGHLIGHTS FOR VCA-10
| | | | | | |
| | INCOME AND CAPITAL CHANGES PER ACCUMULATION UNIT* | | |
(For an Accumulation Unit outstanding throughout the year)
| | | | | | | | | | | | |
| | | Year Ended December 31, 2013 | |
| | | Standard
Contract | | | 0.50%
Contract | | | 0.45%
Contract | |
Investment Income | | $ | 0.1792 | | | $ | 0.1950 | | | $ | 0.1952 | |
Expenses | | | | | | | | | | | | |
Investment management fee | | | (0.0303 | ) | | | (0.0330 | ) | | | (0.0330 | ) |
Administrative expenses | | | (0.0906 | ) | | | (0.0330 | ) | | | (0.0264 | ) |
Net Investment Income | | | 0.0583 | | | | 0.1290 | | | | 0.1358 | |
Capital Changes | | | | | | | | | | | | |
Net realized and unrealized gain (loss) on investment and foreign currency transactions | | | 3.1834 | | | | 3.4658 | | | | 3.4700 | |
Net Increase (Decrease) in Accumulation Unit Value | | | 3.2417 | | | | 3.5948 | | | | 3.6058 | |
Accumulation Unit Value | | | | | | | | | | | | |
Beginning of year | | | 10.5206 | | | | 11.4253 | | | | 11.4362 | |
End of year | | $ | 13.7623 | | | $ | 15.0201 | | | $ | 15.0420 | |
Total Return** | | | 30.81 | % | | | 31.46 | % | | | 31.53 | % |
Ratio of Expenses To Average Net Assets*** | | | 1.00 | % | | | 0.50 | % | | | 0.45 | % |
Ratio of Net Investment Income To Average Net Assets*** | | | 0.48 | % | | | 0.98 | % | | | 1.03 | % |
Portfolio Turnover Rate | | | 69 | % | | | 69 | % | | | 69 | % |
Number of Accumulation Units Outstanding
For Participants at end of year (000’s omitted) | | | 11,720 | | | | 224 | | | | 751 | |
| * | Calculated by accumulating the actual per unit amounts daily. |
| ** | Total return does not consider the effects of sales loads. Total return is calculated assuming a purchase of a share on the first day and a sale on the last day of each period reported. Total returns may reflect adjustments to conform to generally accepted accounting principles. Total returns for periods of less than one full year are not annualized. |
| *** | These calculations exclude PICA’s equity in VCA-10. |
The above table does not reflect the annual administration charge, which does not affect the Accumulation Unit Value. This charge is made by reducing Participants’ Accumulation Accounts by a number of Accumulation Units equal in value to the charge.
SEE NOTES TO FINANCIAL STATEMENTS.
NOTES TO FINANCIAL STATEMENTS OF
VCA-10
The Prudential Variable Contract Account-10 (“VCA-10” or the “Account”) was established on March 1, 1982 by The Prudential Insurance Company of America (“PICA”) under the laws of the State of New Jersey and is registered as an open-end, diversified management investment company under the Investment Company Act of 1940 (“1940 Act”), as amended. VCA-10 has been designed for use by employers (“Contract-holders”) in making retirement arrangements on behalf of their employees (“Participants”). The investment objective of the Account is long-term growth of capital. The Account’s investments are composed primarily of common stocks. Variable annuity payments differ according to the investment performance of the Account.
PICA issues standard VCA-10 contracts with annual expenses of 1.00%, as a percentage of net assets, (the “Standard Contracts”), contracts with annual expenses of 0.50%, as a percentage of net assets, (the “0.50% contracts”), and contracts with annual expenses of 0.45%, as a percentage of net asset, (the “0.45% contracts”). The financial statements show separate Accumulation Units Values for each type of contract.
| Note 2: | | Accounting Policies |
The Account follows investment company accounting and reporting guidance of the Financial Accounting Standards Board (“FASB”) Accounting Standard Codification Topic 946 Financial Services-Investment Companies. The following accounting policies conform to U.S. generally accepted accounting principles. The Account consistently follows such policies in the preparation of its financial statements.
Securities Valuation: The Account holds securities and other assets and liabilities that are fair valued at the close of each day (generally, 4:00 PM Eastern time) the New York Stock Exchange (“NYSE”) is open for trading. Fair value is the price that would be received to sell an asset or paid to transfer a liability in an orderly transaction between market participants on the measurement date. The Account’s Committee Members (the “Committee”) has adopted valuation procedures for security valuation under which fair valuation responsibilities have been delegated to PGIM Investments LLC (“PGIM Investments” or “the Manager”) (formerly known as Prudential Investments LLC). Under the current valuation procedures, the Valuation Committee is responsible for supervising the valuation of portfolio securities and other assets and liabilities. The valuation procedures permit the Account to utilize independent pricing vendor services, quotations from market makers, and alternative valuation methods when market quotations are either not readily available or not deemed representative of fair value. A record of the Valuation Committee’s actions is subject to the Committee’s review, approval, and ratification at its next regularly-scheduled quarterly meeting.
Various inputs determine how the Account’s investments are valued, all of which are categorized according to the three broad levels (Level 1, 2, or 3) detailed in the table following the Account’s Statement of Net Assets.
Common and preferred stocks, exchange-traded funds, and derivative instruments such as futures or options that are traded on a national securities exchange are valued at the last sale price as of the close of trading on the applicable exchange where the security principally trades. Securities traded via NASDAQ are valued at the NASDAQ official closing price. To the extent these securities are valued at the last sale price or NASDAQ official closing price, they are classified as Level 1 in the fair value hierarchy. In the event that no sale or official closing price on valuation date exists, these securities are generally valued at the mean between the last reported bid and asked prices, or at the last bid price in the absence of an ask price. These securities are classified as Level 2 in the fair value hierarchy.
Foreign equities traded on foreign securities exchanges are valued using pricing vendor services that provide model prices derived using adjustment factors based on information such as local closing price, relevant general and sector indices, currency fluctuations, depositary receipts, and futures, as applicable. Securities valued using such model prices are classified as Level 2 in the fair value hierarchy. The models generate an evaluated adjustment factor for each security, which is applied to the local closing price to adjust it for post closing market movements. Utilizing that evaluated adjustment factor, the vendor provides an evaluated price for each security. If the vendor does not provide an evaluated price, securities are valued in accordance with exchange-traded common and preferred stock valuation policies discussed above.
Investments in open-end, non-exchange-traded mutual funds are valued at their net asset values as of the close of the NYSE on the date of valuation. These securities are classified as Level 1 in the fair value hierarchy since they may be purchased or sold at their net asset values on the date of valuation.
Account securities and other assets that cannot be priced according to the methods described above are valued based on pricing methodologies approved by the Committee. In the event that significant unobservable inputs are used when determining such valuations, the securities will be classified as Level 3 in the fair value hierarchy.
When determining the fair value of securities, some of the factors influencing the valuation include: the nature of any restrictions on disposition of the securities; assessment of the general liquidity of the securities; the issuer’s financial condition and the markets in which it does business; the cost of the investment; the size of the holding and the capitalization of the issuer; the prices of any recent transactions or bids/offers for such securities or any comparable securities; any available analyst media or other reports or information deemed reliable by the investment adviser regarding the issuer or the markets or industry in which it operates. Using fair value to price securities may result in a value that is different from a security’s most recent closing price and from the price used by other mutual funds to calculate their net asset values.
Restricted and Illiquid Securities: Subject to guidelines adopted by the Committee, the Account may invest up to 15% of its net assets in illiquid securities, including those which are restricted as to disposition under securities law (“restricted securities”). Restricted securities are valued pursuant to the valuation procedures noted above. Illiquid securities are those that, because of the absence of a readily available market or due to legal or contractual restrictions on resale, cannot be sold within seven days in the ordinary course of business at approximately the amount at which the Account has valued the investment. Therefore, the Account may find it difficult to sell illiquid securities at the time considered most advantageous by its subadviser and may incur expenses that would not be incurred in the sale of securities that were freely marketable. Certain securities that would otherwise be considered illiquid because of legal restrictions on resale to the general public may be traded among qualified institutional buyers under Rule 144A of the Securities Act of 1933. These Rule 144A securities, as well as commercial paper that is sold in private placements under Section 4(2) of the Securities Act, may be deemed liquid by the Account’s subadviser under the guidelines adopted by the Committee Members of the Account. However, the liquidity of the Account’s investments in Rule 144A securities could be impaired if trading does not develop or declines.
Foreign Currency Translation: The books and records of the Account are maintained in U.S. dollars. Foreign currency amounts are translated into U.S. dollars on the following basis:
(i) market value of investment securities, other assets and liabilities — at the current rates of exchange;
(ii) purchases and sales of investment securities, income and expenses — at the rates of exchange prevailing on the respective dates of such transactions.
Although the net assets of the Account are presented at the foreign exchange rates and market values at the close of the period, the Account does not generally isolate that portion of the results of operations arising as a result of changes in the foreign exchange rates from the fluctuations arising from changes in the market prices of long-term portfolio securities held at the end of the period. Similarly, the Account does not isolate the effect of changes in foreign exchange rates from the fluctuations arising from changes in the market prices of long-term portfolio securities sold during the period. Accordingly, holding period realized foreign currency gains (losses) are included in the reported net realized gains (losses) on investment transactions.
Net realized gains (losses) on foreign currency transactions represent net foreign exchange gains (losses) from holdings of foreign currencies, currency gains (losses) realized between the trade and settlement dates on securities transactions, and the difference between the amounts of interest, dividends and foreign withholding taxes recorded on the Account’s books and the U.S. dollar equivalent amounts actually received or paid. Net unrealized currency gains (losses) from valuing foreign currency denominated assets and liabilities (other than investments) at period end exchange rates are reflected as a component of net unrealized appreciation (depreciation) on foreign currencies.
Securities Transactions and Net Investment Income: Securities transactions are recorded on the trade date. Realized gains (losses) from investment and currency transactions are calculated on the identified cost basis. Dividend income is recorded on the ex-dividend date. Interest income, including amortization of premium and accretion of discount on debt securities, as required, is recorded on the accrual basis. Expenses are recorded on the accrual basis, which may require the use of certain estimates by management that may differ from
actual. Net investment income and realized and unrealized gain (losses) (other than administrative fees) are allocated to the Participants and PICA on a daily basis in proportion to their respective ownership in VCA-10.
Estimates: The preparation of the financial statements requires management to make estimates and assumptions that affect the reported amounts and disclosures in the financial statements. Actual results could differ from those estimates.
Federal Income Taxes: The operations of VCA-10 are part of, and are taxed with, the operations of PICA. Under the current provisions of the Internal Revenue Code, PICA does not expect to incur federal income taxes on earnings of VCA-10 to the extent the earnings are credited under the Contracts. As a result, the Unit Value of VCA-10 has not been reduced by federal income taxes.
| Note 3: | | Investment Management Agreement and Charges |
The Account has a management agreement with PGIM Investments. Pursuant to this agreement, PGIM Investments has responsibility for all investment advisory services and supervises the subadviser’s performance of such services. PGIM Investments has entered into a subadvisory agreement with Jennison Associates LLC (“Jennison”). The subadvisory agreement provides that Jennison will furnish investment advisory services in connection with the management of the Account. PGIM Investments pays for the services of Jennison.
VCA-10 is subject to fees for investment management and administration services. PICA may impose a reduced Administrative Fee where warranted by economies of scale and the expense characteristics of the employer, association or trust to which Prudential has issued a Contract.
Standard contracts have an effective annual rate of up to 1.00% of the current value of the Participant’s equity of which 0.75% is paid to PICA for administrative expenses not provided by the annual account charge, and 0.25% is paid to PGIM Investments, for investment management services. The 0.50% contracts have an effective annual rate of up to 0.50% of the current value of the Participant’s equity of which 0.25% is paid to PICA for administrative expenses not provided by the annual account charge, and 0.25% is paid to PGIM Investments, for investment management services. The 0.45% contracts have an effective annual rate of up to 0.45% of the current value of the Participant’s equity of which 0.20% is paid to PICA for administrative expenses not provided by the annual account charge, and 0.25% is paid to PGIM Investments, for investment management services.
An annual account charge of not more than $30 is deducted from the account of each Participant, if applicable, at the time of withdrawal of the value of all of the Participant’s accounts or on the last business day of each calendar year such amounts are reflected as a withdrawal on the Statements of Changes in Net Assets.
PICA, PGIM Investments and Jennison are indirect, wholly-owned subsidiaries of Prudential Financial, Inc. (“Prudential”).
| Note 4: | | Other Transactions with Affiliates |
The Account may enter into certain securities purchase or sale transactions under Committee approved Rule 17a-7 procedures. Rule 17a-7 is an exemptive rule under the 1940 Act, that permits purchase and sale transactions among affiliated investment companies, or between an investment company and a person that is affiliated solely by reason of having a common (or affiliated) investment adviser, common directors, and/or common officers. Such transactions are subject to ratification by the Committee. For the year ended December 31, 2017 no such transactions were entered into by the Account.
During the year ended December 31, 2017, the Account invested in the Prudential Core Ultra Short Bond Fund (the “Core Fund”), a portfolio of the Prudential Investment Portfolios 2, registered under the 1940 Act, and managed by PGIM Investments. Earnings from the Core Fund are disclosed on the Statement of Operations as “Affiliated dividend income”.
| Note 5: | | Purchases and Sales of Portfolio Securities |
For the year ended December 31, 2017, the aggregate cost of purchases and the proceeds from sales of securities, excluding short-term investments, were $74,952,292 and $88,454,092, respectively.
| Note 6: | | Unit Transactions |
The number of Accumulation Units issued and redeemed for the year ended December 31, 2017 and the year ended December 31, 2016, respectively, are as follows:
| | | | | | | | |
Standard Contracts | | Units | | | Amount | |
Year ended December 31, 2017: | | | | | | | | |
Account units issued | | | 74,595 | | | $ | 1,305,515 | |
Account units redeemed | | | (924,776 | ) | | | (16,317,915 | ) |
| | | | | | | | |
Net increase (decrease) in units outstanding | | | (850,181 | ) | | $ | (15,012,400 | ) |
| | | | | | | | |
Year ended December 31, 2016: | | | | | | | | |
Account units issued | | | 73,142 | | | $ | 1,076,402 | |
Account units redeemed | | | (1,062,336 | ) | | | (15,742,006 | ) |
| | | | | | | | |
Net increase (decrease) in units outstanding | | | (989,194 | ) | | $ | (14,665,604 | ) |
| | | | | | | | |
| | |
0.50 % Contracts | | Units | | | Amount | |
Year ended December 31, 2017: | | | | | | | | |
Account units issued | | | — | | | $ | — | |
Account units redeemed | | | (22,834 | ) | | | (433,904 | ) |
| | | | | | | | |
Net increase (decrease) in units outstanding | | | (22,834 | ) | | $ | (433,904 | ) |
| | | | | | | | |
Year ended December 31, 2016: | | | | | | | | |
Account units issued | | | 15 | | | $ | 247 | |
Account units redeemed | | | (6,770 | ) | | | (109,172 | ) |
| | | | | | | | |
Net increase (decrease) in units outstanding | | | (6,755 | ) | | $ | (108,925 | ) |
| | | | | | | | |
| | |
0.45 % Contracts | | Units | | | Amount | |
Year ended December 31, 2017: | | | | | | | | |
Account units issued | | | — | | | $ | — | |
Account units redeemed | | | (47,660 | ) | | | (931,165 | ) |
| | | | | | | | |
Net increase (decrease) in units outstanding | | | (47,660 | ) | | $ | (931,165 | ) |
| | | | | | | | |
Year ended December 31, 2016: | | | | | | | | |
Account units issued | | | — | | | $ | — | |
Account units redeemed | | | (87,732 | ) | | | (1,426,740 | ) |
| | | | | | | | |
Net increase (decrease) in units outstanding | | | (87,732 | ) | | $ | (1,426,740 | ) |
| | | | | | | | |
| Note 7: | | Net Increase (Decrease) In Net Assets Resulting From Surplus Transfers |
The increase (decrease) in net assets resulting from surplus transfers represents the net increase to/(reductions from) PICA’s investment in the Account.
| Note 8: | | Participant Loans |
Loans are considered to be withdrawals from the Account from which the loan amount was deducted, though they are not considered a withdrawal from the MEDLEY Program. Withdrawals, transfers and loans from VCA-10 are considered to be withdrawals of contributions until all of the Participant’s contributions to the Account have been withdrawn, transferred or borrowed.
For the year ended December 31, 2017, $75,791 in participant loans were withdrawn from VCA-10 and $66,116 of principal and interest was repaid to VCA-10. For the year ended December 31, 2016, $85,662 in participant loans were withdrawn from VCA-10 and $80,871 of principal and interest was repaid to VCA-10. Loan repayments are invested in Participant’s account(s) as chosen by the Participant, which may not necessarily be VCA-10. The initial loan proceeds which are being repaid may not necessarily have originated solely from VCA-10. During the year ended December 31, 2017, PICA has advised the Account that it received $517 in loan origination fees. The participant loan principal and interest repayments are included in purchase payments and transfers in within the Statement of Changes in Net Assets.
REPORT OF INDEPENDENT REGISTERED PUBLIC ACCOUNTING FIRM
TO THE COMMITTEE AND PARTICIPANTS OF
THE PRUDENTIAL VARIABLE CONTRACT ACCOUNT-10:
Opinion on the Financial Statements
We have audited the accompanying statement of net assets of The Prudential Variable Contract Account-10 (the “Account”), as of December 31, 2017, the related statement of operations for the year then ended, the statements of changes in net assets for each of the years in the two-year period then ended, and the related notes (collectively, the “financial statements”) and the financial highlights for accumulation units (the “financial highlights”) for each of the years in the five-year period then ended. In our opinion, the financial statements and financial highlights referred to above present fairly, in all material respects, the financial position of the Account as of December 31, 2017, the results of its operations for the year then ended, the changes in its net assets for each of the years in the two-year period then ended, and the financial highlights for each of the years in the five-year period then ended, in conformity with U.S. generally accepted accounting principles.
Basis for Opinion
These financial statements and financial highlights are the responsibility of the Account’s management. Our responsibility is to express an opinion on these financial statements and financial highlights based on our audits. We are a public accounting firm registered with the Public Company Accounting Oversight Board (United States) (“PCAOB”) and are required to be independent with respect to the Account in accordance with the U.S. federal securities laws and the applicable rules and regulations of the Securities and Exchange Commission and the PCAOB.
We conducted our audits in accordance with the standards of the PCAOB. Those standards require that we plan and perform the audit to obtain reasonable assurance about whether the financial statements and financial highlights are free of material misstatement, whether due to error or fraud. Our audits included performing procedures to assess the risks of material misstatement of the financial statements and financial highlights, whether due to error or fraud, and performing procedures that respond to those risks. Such procedures included examining, on a test basis, evidence supporting the amounts and disclosures in the financial statements and financial highlights. Such procedures also included confirmation of securities owned as of December 31, 2017, by correspondence with the custodian, transfer agent and brokers or by other appropriate auditing procedures when replies from brokers were not received. Our audits also included evaluating the accounting principles used and significant estimates made by management, as well as evaluating the overall presentation of the financial statements and financial highlights. We believe that our audits provide a reasonable basis for our opinion.
We have served as the auditor of one or more Prudential Variable Contract Accounts since 2003.
New York, New York
February 20, 2018
INFORMATION ABOUT COMMITTEE MEMBERS AND OFFICERS
VCA 10 is managed by the VCA 10 Committee. The members of the VCA 10 Committee are elected by the persons having voting rights in respect of the VCA 10 Account. The affairs of VCA 10 are conducted in accordance with the Rules and Regulations of VCA 10. Information pertaining to the members of the VCA 10 Committee (hereafter referred to as “Committee Members”) is set forth below. Committee Members who are not deemed to be “interested persons” of VCA 10 as defined in the Investment Company Act of 1940, as amended (the 1940 Act) are referred to as “Independent Committee Members.” Committee Members who are deemed to be “interested persons” of VCA 10 are referred to as “Independent Committee Members.” Information pertaining to the Officers of VCA 10 is also set forth below.
| | | | | | |
| Independent Committee Members |
Name, Address, Age
Position(s)
Portfolios Overseen | | Principal Occupation(s)
During Past Five Years | | Other Directorships
Held During Past Five Years | | Length of Committee Service |
Ellen S. Alberding (59)
Committee Member
Portfolios Overseen: 90 | | President and Board Member, The Joyce Foundation (charitable foundation) (since 2002); Vice Chair, City Colleges of Chicago (community college system) (since 2011); Trustee, Skills for America’s Future (national initiative to connect employers to community colleges) (since 2011); Trustee, National Park Foundation (charitable foundation for national park system) (since 2009); Trustee, Economic Club of Chicago (since 2009). | | None. | | Since September 2013 |
Kevin J. Bannon (65)
Committee Member
Portfolios Overseen: 90 | | Retired; Managing Director (April 2008-May 2015) and Chief Investment Officer (October 2008-November 2013) of Highmount Capital LLC (registered investment adviser); formerly Executive Vice President and Chief Investment Officer (April 1993-August 2007) of Bank of New York Company; President (May 2003-May 2007) of BNY Hamilton Family of Mutual Funds. | | Director of Urstadt Biddle Properties (equity real estate investment trust) (since September 2008). | | Since July 2008 |
Linda W. Bynoe (65)
Committee Member
Portfolios Overseen: 90 | | President and Chief Executive Officer (since March 1995) and formerly Chief Operating Officer (December 1989-February 1995) of Telemat Ltd. (management consulting); formerly Vice President (January 1985-June 1989) at Morgan Stanley & Co. (broker-dealer). | | Director of Simon Property Group, Inc. (retail real estate) (May 2003-May 2012); Director of Anixter International, Inc. (communication products distributor) (since January 2006); Director of Northern Trust Corporation (financial services) (since April 2006); Trustee of Equity Residential (residential real estate) (since December 2009). | | Since March 2005 |
Keith F. Hartstein (61)
Committee Member & Independent Chair
Portfolios Overseen: 90 | | Retired; Member (since November 2014) of the Governing Council of the Independent Directors Council (organization of independent mutual fund directors); formerly President and Chief Executive Officer (2005-2012), Senior Vice President (2004-2005), Senior Vice President of Sales and Marketing (1997-2004), and various executive management positions (1990-1997), John Hancock Funds, LLC (asset management); Chairman, Investment Company Institute’s Sales Force Marketing Committee (2003-2008). | | None. | | Since September 2013 |
Michael S. Hyland, CFA (72)
Committee Member
Portfolios Overseen: 90 | | Retired (since February 2005); formerly Senior Managing Director (July 2001-February 2005) of Bear Stearns & Co, Inc.; Global Partner, INVESCO (1999-2001); Managing Director and President of Salomon Brothers Asset Management (1989-1999). | | None. | | Since July 2008 |
| | | | | | |
| Independent Committee Members |
Name, Address, Age
Position(s)
Portfolios Overseen | | Principal Occupation(s)
During Past Five Years | | Other Directorships
Held During Past Five Years | | Length of Committee Service |
Richard A. Redeker (74)
Committee Member & Independent Vice Chair
Portfolios Overseen: 90 | | Retired Mutual Fund Senior Executive (47 years); Management Consultant; Director, Mutual Fund Directors Forum (since 2014); Independent Directors Council (organization of independent mutual fund directors)-Executive Committee, Chair of Policy Steering Committee, Governing Council. | | None. | | Since October 1993 |
Stephen G. Stoneburn (74)
Committee Member
Portfolios Overseen: 90 | | Chairman (since July 2011), President and Chief Executive Officer (since June 1996) of Frontline Medical Communications (publishing company); formerly President (June 1995-June 1996) of Argus Integrated Media, Inc.; Senior Vice President and Managing Director (January 1993-1995) of Cowles Business Media; Senior Vice President of Fairchild Publications, Inc. (1975-1989). | | None. | | Since July 2003 |
| | | | | | |
| Interested Committee Members |
Name, Address, Age
Position(s)
Portfolios Overseen | | Principal Occupation(s)
During Past Five Years | | Other Directorships
Held During Past Five Years | | Length of Committee Service |
Stuart S. Parker (55)
Committee Member & President
Portfolios Overseen: 90 | | President of PGIM Investments LLC (formerly known as Prudential Investments LLC) (since January 2012); Executive Vice President of Prudential Investment Management Services LLC (since December 2012); Executive Vice President of Jennison Associates LLC and Head of Retail Distribution of PGIM Investments LLC (June 2005-December 2011). | | None. | | Since January 2012 |
Scott E. Benjamin (44)
Committee Member & Vice President
Portfolios Overseen: 90 | | Executive Vice President (since June 2009) of PGIM Investments LLC; Executive Vice President (June 2009-June 2012) and Vice President (since June 2012) of Prudential Investment Management Services LLC; Executive Vice President (since September 2009) of AST Investment Services, Inc.; Senior Vice President of Product Development and Marketing, PGIM Investments (since February 2006); Vice President of Product Development and Product Management, PGIM Investments LLC (2003-2006). | | None. | | Since March 2010 |
| | | | |
| VCA 10 Officers(a) |
Name, Address and Age
Position with VCA 10 | | Principal Occupation(s) During Past Five Years | | Length of Service as VCA 10 Officer |
Raymond A. O’Hara (62)
Chief Legal Officer | | Vice President and Corporate Counsel (since July 2010) of Prudential Insurance Company of America (Prudential); Vice President (March 2011-Present) of Pruco Life Insurance Company and Pruco Life Insurance Company of New Jersey; Vice President and Corporate Counsel (March 2011-Present) of Prudential Annuities Life Assurance Corporation; Chief Legal Officer of PGIM Investments LLC (since June 2012); Chief Legal Officer of Prudential Mutual Fund Services LLC (since June 2012) and Corporate Counsel of AST Investment Services, Inc. (since June 2012); formerly Assistant Vice President and Corporate Counsel (September 2008-July 2010) of The Hartford Financial Services Group, Inc.; formerly Associate (September 1980-December 1987) and Partner (January 1988–August 2008) of Blazzard & Hasenauer, P.C. (formerly, Blazzard, Grodd & Hasenauer, P.C.). | | Since June 2012 |
Chad A. Earnst (42)
Chief Compliance Officer | | Chief Compliance Officer (September 2014-Present) of PGIM Investments LLC; Chief Compliance Officer (September 2014-Present) of the Prudential Funds, Target Funds, Advanced Series Trust, The Prudential Series Fund, Prudential’s Gibraltar Fund, Inc., Prudential Global Short Duration High Yield Income Fund, Inc., Prudential Short Duration High Yield Fund, Inc. and Prudential Jennison MLP Income Fund, Inc.; formerly Assistant Director (March 2010-August 2014) of the Asset Management Unit, Division of Enforcement, US Securities & Exchange Commission; Assistant Regional Director (January 2010-August 2014), Branch Chief (June 2006–December 2009) and Senior Counsel (April 2003-May 2006) of the Miami Regional Office, Division of Enforcement, US Securities & Exchange Commission. | | Since September 2014 |
Deborah A. Docs (60)
Secretary | | Vice President and Corporate Counsel (since January 2001) of Prudential; Vice President (since December 1996) and Assistant Secretary (since March 1999) of PGIM Investments LLC; formerly Vice President and Assistant Secretary (May 2003-June 2005) of AST Investment Services, Inc. | | Since May 2004 |
Jonathan D. Shain (59)
Assistant Secretary | | Vice President and Corporate Counsel (since August 1998) of Prudential; Vice President and Assistant Secretary (since May 2001) of PGIM Investments LLC; Vice President and Assistant Secretary (since February 2001) of Prudential Mutual Fund Services LLC; formerly Vice President and Assistant Secretary (May 2003-June 2005) of AST Investment Services, Inc. | | Since May 2005 |
Claudia DiGiacomo (43)
Assistant Secretary | | Vice President and Corporate Counsel (since January 2005) of Prudential; Vice President and Assistant Secretary of PGIM Investments LLC (since December 2005); Associate at Sidley Austin Brown & Wood LLP (1999-2004). | | Since December 2005 |
Andrew R. French (55)
Assistant Secretary | | Vice President and Corporate Counsel (since February 2010) of Prudential; formerly Director and Corporate Counsel (2006-2010) of Prudential; Vice President and Assistant Secretary (since January 2007) of PGIM Investments LLC; Vice President and Assistant Secretary (since January 2007) of Prudential Mutual Fund Services LLC. | | Since October 2006 |
Charles H. Smith (45)
Anti-Money Laundering
Compliance Officer | | Vice President, Corporate Compliance, Anti-Money Laundering Unit (since January 2015) of Prudential; committee member of the American Council of Life Insurers Anti-Money Laundering and Critical Infrastructure Committee (since January 2016); formerly Global Head of Economic Sanctions Compliance at AIG Property Casualty (February 2007 – December 2014); Assistant Attorney General at the New York State Attorney General’s Office, Division of Public Advocacy. (August 1998 —January 2007). | | Since January 2017 |
M. Sadiq Peshimam (54)
Treasurer and Principal Financial
and Accounting Officer | | Vice President (since 2005) of PGIM Investments LLC; formerly Assistant Treasurer of funds in the Prudential Mutual Fund Complex (2006-2014). | | Since February 2006 |
| | | | |
| VCA 10 Officers(a) |
Name, Address and Age
Position with VCA 10 | | Principal Occupation(s) During Past Five Years | | Length of Service as VCA 10 Officer |
Peter Parrella (59)
Assistant Treasurer | | Vice President (since 2007) and Director (2004-2007) within Prudential Mutual Fund Administration; formerly Tax Manager at SSB Citi Fund Management LLC (1997-2004). | | Since June 2007 |
Lana Lomuti (50)
Assistant Treasurer | | Vice President (since 2007) and Director (2005-2007), within Prudential Mutual Fund Administration; formerly Assistant Treasurer (December 2007-February 2014) of The Greater China Fund, Inc. | | Since April 2014 |
Linda McMullin (56)
Assistant Treasurer | | Vice President (since 2011) and Director (2008-2011) within Prudential Mutual Fund Administration. | | Since April 2014 |
Kelly A. Coyne (49)
Assistant Treasurer | | Director, Investment Operations of Prudential Mutual Fund Services LLC (since 2010). | | Since March 2015 |
(a) Excludes Mr. Parker and Mr. Benjamin, interested Committee Members who also serve as President and Vice President, respectively.
Explanatory Notes to Tables:
Committee Members are deemed to be “Interested,” as defined in the 1940 Act, by reason of their affiliation with PGIM Investments LLC and/or an affiliate of PGIM Investments LLC.
Unless otherwise noted, the address of all Committee Members and Officers is c/o PGIM Investments LLC, 655 Broad Street, Newark, New Jersey 07102.
There is no set term of office for Committee Members or Officers. The Committee Members have adopted a retirement policy, which calls for the retirement of Committee Members on December 31 of the year in which they reach the age of 75.
“Other Directorships Held” includes only directorships of companies required to register or file reports with the SEC under the Securities and Exchange Act of 1934 (that is, “public companies”) or other investment companies registered under the 1940 Act.
“Portfolios Overseen” includes all investment companies managed by PGIM Investments LLC. The investment companies for which PGIM Investments LLC serves as manager include the Prudential Mutual Funds, The Prudential Variable Contract Accounts, Target Mutual Funds, Prudential Short Duration High Yield Fund, Inc., Prudential Global Short Duration High Yield Fund, Inc., The Prudential Series Fund, Prudential’s Gibraltar Fund, Inc. and the Advanced Series Trust.
The Prudential Series Fund
The following pages represent information on the Prudential Series Fund Portfolios. Returns are at the Portfolio level, not at the Subaccount level.
Each Subaccount of VCA-11 and VCA-24 will invest in the corresponding Portfolio of the Prudential Series Fund (the “Fund”). Of the Portfolios comprising the Fund, eight Portfolios are presently available to The MEDLEY Program. The Conservative Balanced Subaccount in the Conservative Balanced Portfolio, the Diversified Bond Subaccount invests in the Diversified Bond Portfolio, the Equity Subaccount invests in the Equity Portfolio, the Flexible Managed Subaccount in the Flexible Managed Portfolio, the Global Subaccount in the Global Portfolio, the Government Income Subaccount in the Government Income Portfolio, the Government Money Market Subaccount in the Government Money Market Portfolio, and the Stock Index Subaccount in the Stock Index Portfolio.
There is no assurance that the investment objective of the Portfolios will be attained, nor is there any guarantee that the amount available to a Participant will equal or exceed the total contributions made on that Participant’s behalf. The value of the investments held in each account may fluctuate daily and is subject to the risks of both changing economic conditions and the selection of investments necessary to meet the Subaccounts’ or Portfolios’ objectives.
Important Note
This information supplements the financial statements and other information included in this Report to Participants in The MEDLEY Program. It highlights the investment performance of the eight portfolios of the Fund which are available through the Prudential Variable Contract Accounts 11 and 24. The rates of return quoted on the following pages reflect deduction of investment management fees and portfolio expenses, but not product charges. They reflect the reinvestment of dividend and capital gains distributions. They are not an estimate or a guarantee of future performance.
Contract unit values increase or decrease based on the performance of each corresponding Portfolio and when redeemed, may be worth more or less than original cost. Changes in contract values depend not only on the investment performance of each Portfolio but also on the insurance, administrative charges and applicable sales charges, if any, under a contract. These contract charges effectively reduce the dollar amount of any net gains and increase the dollar amount of any net losses.
| | |
The Prudential Series Fund, Conservative Balanced Portfolio | | December 31, 2017 |
Report of the Investment Manager - As of December 31, 2017 (Unaudited)
| | | | | | | | | | | | |
| Average Annual Total Returns | | 1-Year | | | 5-Years | | | 10-Years | |
Portfolio | | | 12.37 | % | | | 8.86 | % | | | 6.49 | % |
Blended Index | | | 12.08 | | | | 8.68 | | | | 6.16 | |
S&P 500 Index | | | 21.82 | | | | 15.78 | | | | 8.49 | |
Past performance does not guarantee future returns. The investment return and principal value of an investment will fluctuate, so that an investor’s shares, when redeemed, may be worth more or less than their original cost. Current performance may be lower or higher than the past performance data quoted.
Portfolio performance is net of investment fees and fund expenses, but not contract charges, which, if included, would significantly lower the performance quoted. Performance figures may reflect fee waivers and/or expense reimbursements. In the absence of such fee waivers and/or expense reimbursements, total returns would be lower.
$10,000 INVESTED OVER 10 YEARS
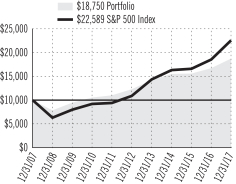
For the year ended December 31, 2017, the Conservative Balanced Portfolio returned 12.37%.
The net assets of the Portfolio at December 31, 2017 were $2,594.7 million.
The Portfolio’s investment objective is total investment return consistent with a conservatively managed diversified portfolio.
The Portfolio is subadvised by PGIM Fixed Income and Quantitative Management Associates LLC.
What were market conditions during the reporting period?
2017 was a year hallmarked by synchronized, strong global growth and incredibly low volatility, and most asset classes posted positive absolute returns. In the US, the corporate earnings recovery that began in late 2016 not only continued, but strengthened, providing a tailwind for risk assets. Expectations for pro-growth policies, which materialized into corporate tax cuts, further fueled market gains. Foreign stock markets saw even larger returns, catalyzed by robust and synchronized global economic growth. Developed economies showed several reflationary signs that ignited strong returns, which in turn were supported by accommodative monetary policies. In the fixed income markets, the US Federal Reserve continued along the path of interest rate normalization, hiking short-term rates three times, and initiated policy to unwind the balance sheet. Despite these actions, long bond yields remained low, as inflation expectations were subdued throughout most of the year. This resulted in a flattening of the yield curve and tepid returns for most fixed income investors.
What strategies or holdings affected the Portfolio’s performance?
The Portfolio benefited from a variety of asset allocation decisions. An out-of-benchmark allocation to international equities was increased early in the year in lieu of US equities, and allowed to appreciate through the end of the period. This was additive to returns as international equities outpaced domestic. Furthermore, the Portfolio benefited when bonds were moved from an overweight (holding more securities than the Index) to an underweight (holding fewer securities than the Index) in the last quarter of the year, a time when equity returns accelerated and those of fixed income remained only mildly positive.
In addition, an out-of-benchmark fixed income fulfillment using Treasury inflation-protected securities (TIPS) was a positive contributor, as it outpaced the fixed income benchmark within the Blended Index. Cash was generally kept below Index levels, as investments in both fixed income and equities consistently seemed more attractive from a fundamental standpoint. At year-end, the Portfolio was positioned with a slight overweight to equities and a slight underweight to cash and fixed income.
For a complete list of holdings, refer to the Schedule of Investments section of this report.
1
| | |
| The Prudential Series Fund, Diversified Bond Portfolio | | December 31, 2017 |
Report of the Investment Manager - As of December 31, 2017 (Unaudited)
| | | | | | | | | | | | |
| Average Annual Total Returns | | 1-Year | | | 5-Years | | | 10-Years | |
Portfolio | | | 7.00 | % | | | 3.68 | % | | | 6.25 | % |
Bloomberg Barclays U.S. Aggregate Bond Index | | | 3.54 | | | | 2.10 | | | | 4.01 | |
Past performance does not guarantee future returns. The investment return and principal value of an investment will fluctuate, so that an investor’s shares, when redeemed, may be worth more or less than their original cost. Current performance may be lower or higher than the past performance data quoted.
Portfolio performance is net of investment fees and fund expenses, but not contract charges, which, if included, would significantly lower the performance quoted. Performance figures may reflect fee waivers and/or expense reimbursements. In the absence of such fee waivers and/or expense reimbursements, total returns would be lower.
$10,000 INVESTED OVER 10 YEARS
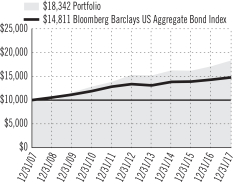
For the year ended December 31, 2017, the Diversified Bond Portfolio returned 7.00%.
The net assets of the Portfolio at December 31, 2017 were $1,145.1 million.
The Portfolio’s investment objective is a high level of income over a longer term while providing reasonable safety of capital. The Portfolio is subadvised by PGIM Fixed Income.
What were market conditions during the reporting period?
2017 was not expected to be a good year for bonds. There was so much for bond investors to fear. European and Japanese interest rates had risen as the European Central Bank (ECB) and Bank of Japan (BoJ) began to taper their asset purchases. Political uncertainties had emerged in Europe. The US had seen a Republican sweep, which brought with it expectations for pro-cyclical fiscal stimuli and upside risks to forecasts for Federal Reserve rate hikes. These factors were expected to finally torpedo the decades-old bull market in bonds.
While European political fears turned out to be overblown, if not a bit misguided, all the other fears were grounded in reality in some fashion. The ECB and BoJ continued to reduce their asset purchases, fiscal stimulus in the US appeared to be on the way, and the global economy generally continued to improve. But thanks to positively sloping yield curves that provided some yield and to selling bonds before they mature, a strategy known as roll-down advantages, bonds were able to outperform. Also, relative to cash, combined with additional spread tightening, bonds generally outperformed cash during the period, confounding many of the initial expectations. (Spreads are differences in yield between government bonds and debt securities of comparable maturity but lower credit quality.) As a result, 2017 turned out to be another solid year for fixed income, with the higher-yielding sectors turning in particularly impressive performances.
US economic growth accelerated from 1.5% in 2016 to an estimated 2.3% in 2017. Encouragingly, the source of growth rotated somewhat toward stronger business investment, a trend US tax legislation is likely to foster further in 2018. A rebound in corporate profits, a weakening US dollar, and broad-based, synchronized economic growth among US trading partners contributed to the improvement. Strong consumer spending, meanwhile, has been supported by a drop in the household savings rate over the past two years and a modest pickup in borrowing.
US corporate bonds closed 2017 on a positive note, supported by tailwinds from US tax legislation, ongoing investor demand, robust earnings, and positive global economic growth. For the year, US credit spreads narrowed by 30 basis points and corporate bonds outperformed similar-maturity US Treasuries. (A basis point is 1/100th of a percent.)
Structured products performed strongly in 2017. Spreads tightened across all sectors, with legacy non-agency residential mortgage-backed securities narrowing by 70 basis points, AAA-rated commercial mortgage-backed securities (CMBS) narrowing by 28 basis points, and AAA-rated collateralized loan obligations (CLOs) narrowing by 34 basis points.
For a complete list of holdings, refer to the Schedule of Investments section of this report.
2
| | |
| The Prudential Series Fund, Diversified Bond Portfolio | | December 31, 2017 |
Report of the Investment Manager - As of December 31, 2017 (Unaudited) (Continued)
What strategies or holdings affected the Portfolio’s performance?
During the reporting period, sector allocation contributed positively to the Portfolio’s performance, with exposure to non-Treasury sectors, including high yield corporate bonds, CMBS, emerging markets debt, investment-grade corporate bonds, and municipal securities, bolstering results. An underweight to mortgage-backed securities, meaning the Portfolio held fewer of them than the Bloomberg Barclays US Aggregate Bond Index, detracted from returns. Individual issue selection added to performance, highlighted by positioning in non-agency mortgage-backed securities, investment-grade corporate bonds, emerging markets debt, sovereign government bonds, CMBS, CLOs, and high yield corporate bonds. Within its holdings of corporate bonds, the Portfolio benefited from positions in the electric & water and banking sectors, while positions in the cable & satellite and consumer non-cyclical sectors weighed on results. The combined impact of the Portfolio’s duration and yield curve strategies added significantly to performance, as the Portfolio was appropriately positioned for a flattening of the yield curve. Duration is a measure of a bond’s price sensitivity to interest rate changes over time.
During the period, the Portfolio used interest rate swaps to help manage duration and yield curve exposure, which had a positive impact on performance. The Portfolio used futures and options to manage interest rate risk, a more efficient way of managing interest rate risk than through the purchase and sale of cash bonds. The use of futures and options collectively detracted from performance. The Portfolio also traded foreign exchange derivatives, which had no material impact on performance. The Portfolio used credit default swaps to hedge credit risk or to increase or decrease credit risk. Credit default swaps establish exposure to a desired credit security or index. The use of credit default swaps had a negligible impact on performance during the reporting period. For additional information regarding the Portfolio’s derivative exposures, please refer to the Portfolio’s Financial Statements.
For a complete list of holdings, refer to the Schedule of Investments section of this report.
3
| | |
| The Prudential Series Fund, Equity Portfolio | | December 31, 2017 |
Report of the Investment Manager - As of December 31, 2017 (Unaudited)
| | | | | | | | | | | | |
| Average Annual Total Returns | | 1-Year | | | 5-Years | | | 10-Years | |
Portfolio: Class I | | | 25.78 | % | | | 13.96 | % | | | 7.27 | % |
Portfolio: Class II | | | 25.28 | | | | 13.50 | | | | 6.83 | |
Russell 1000® Index | | | 21.69 | | | | 15.71 | | | | 8.59 | |
S&P 500 Index | | | 21.82 | | | | 15.78 | | | | 8.49 | |
Past performance does not guarantee future returns. The investment return and principal value of an investment will fluctuate, so that an investor’s shares, when redeemed, may be worth more or less than their original cost. Current performance may be lower or higher than the past performance data quoted.
Portfolio performance is net of investment fees and fund expenses, but not contract charges, which, if included, would significantly lower the performance quoted. Performance figures may reflect fee waivers and/or expense reimbursements. In the absence of such fee waivers and/or expense reimbursements, total returns would be lower.
$10,000 INVESTED OVER 10 YEARS1
The Russell 1000® Index is a trademark/service mark of the Frank Russell Company. Russell® is a trademark of the Frank Russell Company.
For the year ended December 31, 2017, Equity Portfolio Class I shares returned 25.78% and Class II shares returned 25.28%.
The net assets of the Portfolio at December 31, 2017 were $4,417.3 million.
The Portfolio’s investment objective is long-term growth of capital. The Portfolio is subadvised by Jennison Associates LLC.
What were market conditions during the reporting period?
Equity markets posted a solid finish to a strong 2017. Gains were broad but particularly notable among companies with above-average earnings growth. US GDP expansion accelerated, surpassing 3% for the second quarter in a row, and most leading economic indicators and sentiment gauges reflected expectations for ongoing and strengthening economic activity. Short-term interest rates continued to push higher, with the Federal Reserve raising the federal funds rate by 25 basis points three times during the year; longer-term US yields rallied, leaving the Treasury yield curve at its flattest level in more than a decade. US dollar weakness continued as global growth expanded and accelerated.
Major tax legislation, passed and signed into law in late December, was easily the most significant win for the Trump administration in its inaugural year. It includes a substantial reduction in the tax rate paid by corporations on domestically earned income.
Europe’s economic recovery proceeded, and equity emerging markets had their best annual performance since the aftermath of the financial crisis.
What strategies or holdings affected the Portfolio’s performance?
The S&P 500 Index (the Index) returned 21.82% in 2017. Information technology, materials, consumer discretionary, and financials generated the largest gains in the index; telecom services and energy were the only negative sectors, both declining less than 2.0%.
The Portfolio outperformed during the period. On an absolute performance basis, positions in information technology were the primary drivers of overall return, specifically within internet software & services and the software industries. Our consumer discretionary and financials holdings also positively contributed.
Among the top absolute contributors included Alibaba, one of the world’s largest e-commerce companies, where the Company recently reported September-quarter financial results that beat consensus expectations on most key metrics. Revenue advanced more than 60% year over year, the highest growth rate since the company’s initial public offering, and the number of annual active customers grew by 22 million quarter over quarter to 488 million. Tencent, China’s largest and most visited internet service portal, continues to perform well fundamentally driven by its dominant position in China’s online gaming and instant messaging markets and its growing advertising and payment service efforts. Apple’s September-quarter financial results were solid, as iPad, Mac, and services results exceeded expectations, offsetting a slight shortfall in iPhone revenue and average
| 1 | The graph is based on the performance of Class I shares. Performance of Class II shares will be lower due to differences in the fee structure. Class II shares have associated 12b-1 and administrative fees at an annual rate of 0.25% and 0.15%, respectively, of the average daily net assets of the Class II shares. |
For a complete list of holdings, refer to the Schedule of Investments section of this report.
Jennison Associates LLC is a registered investment adviser and a Prudential Financial company.
4
| | |
| The Prudential Series Fund, Equity Portfolio | | December 31, 2017 |
Report of the Investment Manager - As of December 31, 2017 (Unaudited) (Continued)
selling price in a transitional quarter. Apple’s fundamental strength reflects the proliferation of the iOS platform across the global mobile phone, tablet, and personal device landscape as well as the financial power related to the attractive margin profile of its hardware products.
Overall stock selection in healthcare, specifically within biotechnology were among the primary detractors during the period. Additionally, stock selection in the financials sector hurt relative performance, while positions within the energy sector detracted the most from absolute performance.
Shares of cellphone chipmaker Qualcomm detracted from the Portfolio during the period as new and ongoing antitrust litigation sent shares down in the beginning of the year. Despite having rebounded on news that the Company could be a potential takeover target, which sent shares higher towards the end of 2017, given the uncertainty on antitrust litigation, shares were sold and the Portfolio no longer holds a position. Shares of General Electric (GE) underperformed as the multi-industry company exited its GE Capital business, as part of its efforts to simplify the company’s business model. Former GE CEO Immelt lost credibility with overly aggressive targets, weak free cash flow, and poorly timed mergers and acquisitions. New CEO John Flannery focused on cost reductions, improved cash flow, and shaping the product portfolio. The stock subsequently lagged in anticipation of the impact of these changes on earnings per share (EPS) and cash flow. The Portfolio no longer holds a position in GE. As a result, the Portfolio no longer holds a position in General Electric. Shares of Newell Brands underperformed during the period as the Company lowered its FY17 earnings guidance following supply disruptions for resin due to Hurricane Harvey, which made US landfall on August 25th. The Company’s supply of a specific type of resin for its food saver and consumer & commercial Rubbermaid products comes from the affected area and expects resin prices to increase and supply to be curtailed. Jennison believes cost reduction initiatives and the recently completed acquisition of Jarden (JAH) should generate over $1 billion of savings and could help fuel a solid earnings growth profile over the coming years.
For a complete list of holdings, refer to the Schedule of Investments section of this report.
5
| | |
| The Prudential Series Fund, Flexible Managed Portfolio | | December 31, 2017 |
Report of the Investment Manager - As of December 31, 2017 (Unaudited)
| | | | | | | | | | | | |
| Average Annual Total Returns | | 1-Year | | | 5-Years | | | 10-Years | |
Portfolio | | | 14.97 | % | | | 10.95 | % | | | 7.23 | % |
Blended Index | | | 14.06 | | | | 10.15 | | | | 6.79 | |
S&P 500 Index | | | 21.82 | | | | 15.78 | | | | 8.49 | |
Past performance does not guarantee future returns. The investment return and principal value of an investment will fluctuate, so that an investor’s shares, when redeemed, may be worth more or less than their original cost. Current performance may be lower or higher than the past performance data quoted.
Portfolio performance is net of investment fees and fund expenses, but not contract charges, which, if included, would significantly lower the performance quoted. Performance figures may reflect fee waivers and/or expense reimbursements. In the absence of such fee waivers and/or expense reimbursements, total returns would be lower.
$10,000 INVESTED OVER 10 YEARS
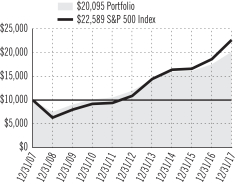
For the year ended December 31, 2017, the Flexible Managed Portfolio returned 14.97%.
The net assets of the Portfolio at December 31, 2017 were $4,229.7 million.
The Portfolio’s investment objective is total investment return consistent with an aggressively managed diversified portfolio.
The Portfolio is subadvised by PGIM Fixed Income and Quantitative Management Associates LLC.
What were market conditions during the reporting period?
2017 was a year hallmarked by synchronized, strong global growth and incredibly low volatility, and most asset classes posted positive absolute returns. In the US, the corporate earnings recovery that began in late 2016 not only continued, but strengthened, providing a tailwind for risk assets. Expectations for pro-growth policies, which materialized into corporate tax cuts, further fueled market gains. Foreign stock markets saw even larger returns, catalyzed by robust and synchronized global economic growth. Developed economies showed several reflationary signs that ignited strong returns, which were in turn supported by accommodative monetary policies.
In fixed income markets, the US Federal Reserve continued along the path of interest rate normalization, hiking short-term rates three times, and initiated policy to unwind the balance sheet. Despite these actions, long bond yields remained low as inflation expectations were subdued throughout most of the year. This resulted in a flattening of the yield curve and tepid returns for most fixed income investors.
What strategies or holdings affected the Portfolio’s performance?
The Portfolio benefited from a variety of asset allocation decisions. An out-of-the-Blended Index (the Index) allocation to international equities was increased early in the year in lieu of US equities, and allowed to appreciate through the end of the period. This was additive to returns, as international equities outpaced domestic.
Furthermore, the Portfolio benefited when bonds were moved from an overweight (holding more securities than the Index) to an underweight (holding fewer securities than the Index) in the last quarter of the year, a time when equity returns accelerated and those of fixed income remained only mildly positive. In addition, an out-of-Index fixed income addition using Treasury inflation-protected securities (TIPS) was a positive contributor, as it outpaced the Portfolio’s fixed income benchmark. Cash was generally kept below Index level, as investments in both fixed income and equities consistently seemed more attractive from a fundamental standpoint. At year-end, the Portfolio was positioned with an overweight to equities and underweights to fixed income and cash.
For a complete list of holdings, refer to the Schedule of Investments section of this report.
PGIM, Inc., and Quantitative Management Associates LLC are registered investment advisers and are Prudential Financial companies.
6
| | |
| The Prudential Series Fund, Global Portfolio | | December 31, 2017 |
Report of the Investment Manager - As of December 31, 2017 (Unaudited)
| | | | | | | | | | | | |
| Average Annual Total Returns | | 1-Year | | | 5-Years | | | 10-Years | |
Portfolio | | | 24.84 | % | | | 11.90 | % | | | 4.95 | % |
MSCI World Index (GD) | | | 23.07 | | | | 12.26 | | | | 5.63 | |
Past performance does not guarantee future returns. The investment return and principal value of an investment will fluctuate, so that an investor’s shares, when redeemed, may be worth more or less than their original cost. Current performance may be lower or higher than the past performance data quoted.
Portfolio performance is net of investment fees and fund expenses, but not contract charges, which, if included, would significantly lower the performance quoted. Performance figures may reflect fee waivers and/or expense reimbursements. In the absence of such fee waivers and/or expense reimbursements, total returns would be lower.
$10,000 INVESTED OVER 10 YEARS
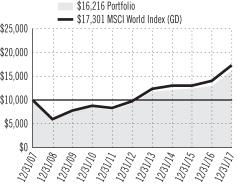
For the year ended December 31, 2017, the Global Portfolio returned 24.84%.
The net assets of the Portfolio at December 31, 2017 were $1,132.9 million.
The Portfolio’s investment objective is long-term growth of capital. The Portfolio is subadvised by: Brown Advisory (Brown), LLC, (US growth stocks), T. Rowe Price Associates, Inc. (US value stocks), William Blair & Company LLC (international growth stocks), LSV Asset Management (international value stocks), and Quantitative Management Associates LLC.
What were market conditions during the reporting period?
Global equities posted robust returns during 2017, fueled by continued economic growth, strong corporate earnings, and ongoing accommodative central bank monetary policy as inflation remained subdued. In the US, stocks benefited from accelerating economic growth and increased employment, rising consumer and business confidence, solid corporate profits, and a decline in regulation. The passage of tax legislation provided an additional boost for US stocks, as it included a reduction in the corporate tax rate.
What strategies or holdings affected the Portfolio’s performance?
Manager allocation contributed positively to results as many active managers were helped by strengthening corporate earnings. Domestically, the T. Rowe Price Large Cap Value sleeve outperformed the Russell 1000 Value for the year. Performance was mainly driven by underweights to the Energy and Telecommunications sectors and positive stock selection in the Technology sector. Negative stock selection in the Financial and Materials sectors detracted. Internationally, the William Blair International Growth sleeve added value by outperforming the MSCI EAFE Index in 2017. This performance was driven by an overweight the Technology sector and positive stock selection in the Financials sector. Weak stock selection within the Industrials sector detracted from performance.
None of the four subadvisors use derivative instruments as a principal investment strategy. The types of derivatives employed most often during the period were stock futures contracts (to help manage cash flows in the Portfolio) and currency forwards and futures contracts (to hedge a portion of the Portfolio’s currency exposure). The use of these derivatives had no significant impact on the Portfolio’s performance. For additional information regarding the Portfolio’s derivative exposures, please refer to the Portfolio’s Financial Statements.
For a complete list of holdings, refer to the Schedule of Investments section of this report.
7
| | |
| The Prudential Series Fund, Government Income Portfolio | | December 31, 2017 |
Report of the Investment Manager - As of December 31, 2017 (Unaudited)
| | | | | | | | | | | | |
| Average Annual Total Returns | | 1-Year | | | 5-Years | | | 10-Years | |
Portfolio | | | 2.94 | % | | | 1.82 | % | | | 3.91 | % |
Bloomberg Barclays Government Bond Index | | | 2.30 | | | | 1.28 | | | | 3.23 | |
Past performance does not guarantee future returns. The investment return and principal value of an investment will fluctuate, so that an investor’s shares, when redeemed, may be worth more or less than their original cost. Current performance may be lower or higher than the past performance data quoted.
Portfolio performance is net of investment fees and fund expenses, but not contract charges, which, if included, would significantly lower the performance quoted. Performance figures may reflect fee waivers and/or expense reimbursements. In the absence of such fee waivers and/or expense reimbursements, total returns would be lower.
$10,000 INVESTED OVER 10 YEARS
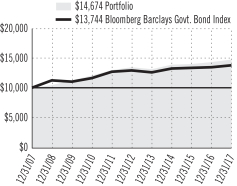
For the year ended December 31, 2017, the Government Income Portfolio returned 2.94%.
The net assets of the Portfolio at December 31, 2017 were $244.1 million.
The Portfolio’s investment objective is a high level of income over the long-term consistent with the preservation of capital. The Portfolio is subadvised by PGIM Fixed Income.
What were market conditions during the reporting period?
2017 was not expected to be a good year for bonds. There was so much for bond investors to fear. European and Japanese interest rates had risen as the European Central Bank (ECB) and Bank of Japan (BoJ) began to taper their asset purchases. The US had seen a Republican sweep, which brought with it expectations for pro-cyclical fiscal stimuli and upside risks to forecasts for Federal Reserve rate hikes. Consensus year-end forecasts for 10-year Treasury and German government bond yields rose to as high as 3.0% and 75 basis points, respectively. (A basis point is 1/100th of a percent.) All told, these factors were expected to finally torpedo the decades-old bull market in bonds.
While European political fears turned out to be overblown, if not a bit misguided, all the other fears were grounded in reality in some fashion. The ECB and BoJ continued to reduce their asset purchases, fiscal stimulus in the US appeared to be on the way, and the global economy generally continued to improve. But thanks to positively sloping yield curves, bonds were able to outperform from a strategy known as roll-down. Also, relative to cash, combined with additional spread tightening, bonds generally outperformed cash during the period, confounding many of the initial expectations. (Spreads are differences in yield between government bonds and debt securities of comparable maturity but lower credit quality.) As a result, 2017 turned out to be another solid year for fixed income, with the higher-yielding sectors putting in particularly impressive performances.
The newly passed US tax package will continue to pressure future budget deficits, which will heighten the need for international deficit financing via increased Treasury issuance. This could offset the positive effects of potential regulatory reform and pause the widening in long-dated swap spreads. While the front end of the US swap spreads curve may be affected by increased corporate issuance to start the year, this technical factor should fade shortly.
Mortgage-backed securities outperformed US Treasury securities. Overall, prepayment speeds were contained, as mortgage interest rates remained range-bound, ending 2017 at an average of 3.83%. With primary mortgage rates remaining relatively sticky, it is not anticipated that there will be an increase in prepayments unless primary rates decline by at least 25 basis points from current levels. Structured products overall performed strongly. Spreads tightened across all sectors, with legacy non-agency residential mortgage-backed securities narrowing by 70 basis points, AAA-rated commercial mortgage-backed securities (CMBS) narrowing by 28 basis points, and AAA-rated collateralized loan obligations (CLOs) narrowing by 34 basis points.
What strategies or holdings affected the Portfolio’s performance?
During the reporting period, security selection was a strong driver of the Portfolio’s performance, highlighted by positions among CLOs, US Treasury securities, interest rate swaps, and mortgage-backed securities. Security selection among municipal bonds detracted modestly from results. The Portfolio also benefited from its sector allocations, with an overweight to CMBS securities, as it held more than those held in the Bloomberg Barclays Government Bond Index, which was the largest positive contributor. In addition, the Portfolio’s positioning for a flatter US yield curve and its tactical long duration position bolstered returns during the period. Duration is a measure of a bond’s price sensitivity to interest rate changes over time.
During the period, the Portfolio used interest rate swaps to help manage duration and yield curve exposure. The use of interest rate swaps had a positive impact on performance. The Portfolio used futures and options to manage interest rate risk, which is a more efficient way of managing interest rate risk than through the purchases and sales of cash bonds. The use of futures and options collectively added to the Portfolio’s performance during the reporting period. For additional information regarding the Portfolio’s derivative exposures, please refer to the Portfolio’s Financial Statements.
For a complete list of holdings, refer to the Schedule of Investments section of this report.
8
| | |
| The Prudential Series Fund, Government Money Market Portfolio | | December 31, 2017 |
Report of the Investment Manager - As of December 31, 2017 (Unaudited)
| | | | | | | | | | | | | | | | |
Average Annual Total
Returns | | 7-Day*
Current
Net Yield | | | 1-Year | | | 5-Years | | | 10-Years | |
Portfolio | | | 0.86 | % | | | 0.56 | % | | | 0.13 | % | | | 0.37 | % |
Lipper (VIP) Money Market Funds Average | | | N/A | | | | 0.39 | | | | 0.09 | | | | 0.31 | |
Lipper US Government Money Market Index | | | N/A | | | | 0.36 | | | | 0.08 | | | | 0.24 | |
Past performance does not guarantee future returns. The investment return and principal value of an investment will fluctuate, so that an investor’s shares, when redeemed, may be worth more or less than their original cost. Current performance may be lower or higher than the past performance data quoted.
The yield quotation more closely reflects the current earnings of the Portfolio than the total return quotation. Portfolio performance is net of investment fees and fund expenses, but not contract charges, which, if included, would significantly lower the performance quoted. Performance figures may reflect fee waivers and/or expense reimbursements. In the absence of such fee waivers and/or expense reimbursements, total returns would be lower.
7-DAY CURRENT NET YIELD*
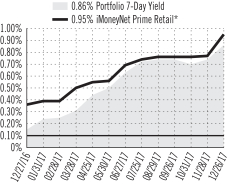
For the year ended December 31, 2017, the Government Money Market Portfolio returned 0.56%.
The net assets of the Portfolio at December 31, 2017 were $559.6 million.
The Portfolio’s investment objective is to seek maximum current income consistent with the stability of capital and maintenance of liquidity. The Portfolio is subadvised by PGIM Fixed Income.
What were market conditions during the reporting period?
2017 was not expected to be a good year for bonds. There was so much for bond investors to fear. European and Japanese interest rates had risen as the European Central Bank and Bank of Japan began to taper their asset purchases. The US had seen a Republican sweep, which brought with it expectations for pro-cyclical fiscal stimuli and upside risks to forecasts for Federal Reserve (Fed) rate hikes. Consensus year-end forecasts for 10-year Treasury and German government bond yields rose to as high as 3.0% and 75 basis points, respectively. (A basis point is 1/100th of a percent.) All told, these factors were expected to finally torpedo the decades-old bull market in bonds.
In December, the Federal Reserve (Fed) increased the federal funds rate to a range between 1.25% and 1.50%, marking its third interest rate hike in 2017 and the fifth in its current tightening cycle. During 2017, economic growth picked up to an annualized pace above 3%, while inflation remained generally muted around 2%, allowing the Fed to continue increasing the federal funds rate gradually and also pulling the London Interbank Offered Rate (LIBOR) and money market mutual fund yields higher.
At the short end of the yield curve, a key theme for 2017 was spread tightening among credit securities versus government securities. (Spreads are differences in yield between government bonds and debt securities of comparable maturity but lower credit quality.) Because of 2016’s money market fund reforms, credit sectors in the short end of the yield curve experienced significant spread widening as Rule 2a-7 money market investors flooded to the government sector of the market. Non-Rule 2a-7 investors took advantage of the wider spreads, driving them tighter. Supply-and-demand dynamics also created pockets of opportunity, as floating-rate spreads widened due to bouts of oversupply, making them less attractive relative to fixed-rate securities despite the rising interest rate environment.
What strategies or holdings affected the Portfolio’s performance?
Throughout the year, with the Fed’s rate hikes generally anticipated and broadcast, the Portfolio’s weighted average maturity and weighted average life were shortened ahead of the hikes, thus allowing the proceeds to be reinvested after the rate increases at higher levels in longer maturities.
At different times during 2017, the Portfolio took advantage of wider floating rate spreads and increased its positions in LIBOR floaters. Floaters are bonds or other types of debt whose coupon rate changes with short-term interest rates.
Additionally, the Portfolio’s position in agency discount notes versus repurchase agreements and US Treasuries was shifted tactically based on relative value between the sectors.
| * | Source: iMoneyNet, Inc. based on 105 funds in the iMoneyNet Prime Retail universe. Weekly 7-day current net yields of the Government Money Market Portfolio and the iMoneyNet Prime Retail universe as of 12/26/2017. |
For a complete list of holdings, refer to the Schedule of Investments section of this report.
An investment in the Government Money Market Portfolio is not insured or guaranteed by the Federal Deposit Insurance Corporation or any other government agency. Although the Portfolio seeks to preserve the value of your investment at $10.00 per share, it is possible to lose money by investing in the Portfolio.
9
| | |
| The Prudential Series Fund, Stock Index Portfolio | | December 31, 2017 |
Report of the Investment Manager - As of December 31, 2017 (Unaudited)
| | | | | | | | | | | | |
| Average Annual Total Returns | | 1-Year | | | 5-Years | | | 10-Years | |
Portfolio | | | 21.46 | % | | | 15.48 | % | | | 8.24 | % |
S&P 500 Index | | | 21.82 | | | | 15.78 | | | | 8.49 | |
Past performance does not guarantee future returns. The investment return and principal value of an investment will fluctuate, so that an investor’s shares, when redeemed, may be worth more or less than their original cost. Current performance may be lower or higher than the past performance data quoted.
Portfolio performance is net of investment fees and fund expenses, but not contract charges, which, if included, would significantly lower the performance quoted. Performance figures may reflect fee waivers and/or expense reimbursements. In the absence of such fee waivers and/or expense reimbursements, total returns would be lower.
$10,000 INVESTED OVER 10 YEARS
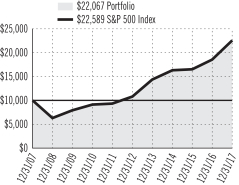
For the year ended December 31, 2017, the Stock Index Portfolio returned 21.46%.
The net assets of the Portfolio at December 31, 2017 were $3,928.3 million.
The Portfolio’s investment objective is to achieve investment results that generally correspond to the performance of publicly traded common stocks.
The Portfolio is subadvised by Quantitative Management Associates LLC (QMA).
What were market conditions during the reporting period?
With corporate earnings growth at a record high, US equity markets maintained their strong ascent throughout 2017. Investor concerns about the ability of the new administration to deliver on its widely hyped, pro-growth agenda, increasing geopolitical uncertainties, and low inflation echoed in the markets for much of the year. But as November unfolded, the markets increasingly focused on developments in Washington, DC and the likelihood of the tax bill being passed into legislation. The new tax changes are expected to have a more meaningful impact on larger-cap stocks, which outperformed mid-cap and small-cap stocks in 2017.
What strategies or holdings affected the Portfolio’s performance?
Potential tracking error differences (the difference between the return of the Portfolio and the return of the benchmark), brokerage costs, and other costs and expenses caused the Portfolio’s return to be slightly lower than that of the S&P 500 Index (the Index).
Information technology was the largest sector in both the Portfolio and the Index, and the sector posted the largest returns, led by companies including Facebook, Amazon.com, and Apple.
The Portfolio had a small exposure to derivative instruments to help enhance liquidity, but the position did not have a material impact on performance. For additional information regarding the Portfolio’s derivative exposures, please refer to the Portfolio’s Financial Statements.
For a complete list of holdings, refer to the Schedule of Investments section of this report.
10
| | |
The Prudential MEDLEY Program Benchmark Glossary — unaudited | | December 31, 2017 |
The indexes are unmanaged and include reinvestment of any income or distributions. They do not reflect any fees, expenses or sales charges. Investors cannot invest directly in a market index.
For Russell Indexes: Russell Investment Group is the source and owner of the trademarks, service marks and copyrights related to the Russell Indexes. Russell® is a trademark of Russell Investment Group.
Bloomberg Barclays Government Bond Index is a weighted unmanaged index comprised of securities issued or backed by the US Government, its agencies, and instrumentalities with a remaining maturity of one to 30 years.
Bloomberg Barclays US Aggregate Bond Index is an unmanaged index comprised of more than 5,000 government and corporate bonds.
Lipper US Government Money Market Index invests principally in financial instruments issued or guaranteed by the US government, its agencies, or its instrumentalities, with dollar-weighted average maturities of less than 90 days.
Lipper Variable Insurance Products (VIP) Funds Average is calculated by Lipper Analytical Services, Inc., and reflects the investment return of certain portfolios underlying variable life and annuity products. Returns for the Lipper Average reflect the deduction of operating expenses.
PSF Conservative Balanced Portfolio Blended Index consists of the S&P 500 Index (50%), the Bloomberg Barclays US Aggregate Bond Index (40%), an unmanaged index comprised of more than 5,000 government and corporate bonds, and the 3-Month T-Bill Index (10%), an unmanaged market value-weighted index of investment grade fixed rate public obligations of the US Treasury with maturities of three months, excluding zero coupon strips.
PSF Flexible Managed Portfolio Blended Index consists of the S&P 500 Index (60%), the Bloomberg Barclays U.S. Aggregate Bond Index (35%), an unmanaged index comprised of more than 5,000 government and corporate bonds, and the 3-Month T-Bill Index (5%), an unmanaged market value-weighted index of investment grade fixed rate public obligations of the U.S. Treasury with maturities of three months, excluding zero coupon strips.
MSCI World Index (GD) — The Morgan Stanley Capital International World Index is an unmanaged capitalization weighted index which includes the equity markets of Australia, Austria, Belgium, Canada, Denmark, Finland, France, Germany, Hong Kong, Ireland, Italy, Japan, Malaysia, Netherlands, New Zealand, Norway, Singapore, Spain, Sweden, Switzerland, United Kingdom, and United States. The GD version does not reflect the impact of withholding taxes on reinvested dividends.
Russell 1000® Index is an unmanaged market cap-weighted index that measures the performance of the 1,000 largest companies in the Russell 3000 Index, which represents approximately 92% of the total market.
S&P 500 Index is an unmanaged, market value-weighted index of over 500 stocks generally representative of the broad stock market.
| | |
The Prudential Series Fund Fees and Expenses — unaudited | | December 31, 2017 |
As a contract owner investing in Portfolios of the Fund through a variable annuity or variable life contract, you incur ongoing costs, including management fees, and other Portfolio expenses. This example is intended to help you understand your ongoing costs (in dollars) of investing in the Fund and to compare these costs with the ongoing costs of investing in other investment options. This example does not reflect fees and charges under your variable annuity or variable life contract. If contract charges were included, the costs shown below would be higher. Please consult the prospectus for your contract for more information about contract fees and charges.
The example is based on an investment of $1,000 invested at the beginning of the period and held for the entire period July 1, 2017 through December 31, 2017.
Actual Expenses
The first line of the table below provides information about actual account values and actual expenses. You may use this information, together with the amount you invested, to estimate the Portfolio expenses that you paid over the period. Simply divide your account value by $1,000 (for example, an $8,600 account value divided by $1,000 = 8.6), then multiply the result by the number in the first line under the heading entitled “Expenses Paid During the Six-Month Period” to estimate the Portfolio expenses you paid on your account during this period. As noted above, the table does not reflect variable contract fees and charges.
Hypothetical Example for Comparison Purposes
The second line of the table below provides information about hypothetical account values and hypothetical expenses based on the Portfolio’s actual expense ratio and an assumed rate of return of 5% per year before expenses, which is not the Portfolio’s actual return. The hypothetical account values and expenses may not be used to estimate the actual ending account balance or expenses you paid for the period. You may use this information to compare the ongoing costs of investing in the Portfolio and other investment options. To do so, compare this 5% hypothetical example with the 5% hypothetical examples that appear in the shareholder reports of the other investment options.
Please note that the expenses shown in the table are meant to highlight your ongoing Portfolio costs only and do not reflect any contract fees and charges, such as sales charges (loads), insurance charges or administrative charges. Therefore the second line of the table is useful to compare ongoing investment option costs only, and will not help you determine the relative total costs of owning different contracts. In addition, if these contract fee and charges were included, your costs would have been higher.
| | | | | | | | | | | | | | | | | | |
| The Prudential Series Fund Portfolios | | Beginning
Account Value
July 1, 2017 | | | Ending
Account Value
December 31, 2017 | | | Annualized Expense
Ratio based on the
Six-Month period | | | Expenses Paid
During the
Six-Month period* | |
| Conservative Balanced (Class I) | | Actual | | $ | 1,000.00 | | | $ | 1,061.70 | | | | 0.59 | % | | $ | 3.07 | |
| | | Hypothetical | | $ | 1,000.00 | | | $ | 1,022.23 | | | | 0.59 | % | | $ | 3.01 | |
| Diversified Bond (Class I) | | Actual | | $ | 1,000.00 | | | $ | 1,025.00 | | | | 0.45 | % | | $ | 2.30 | |
| | | Hypothetical | | $ | 1,000.00 | | | $ | 1,022.94 | | | | 0.45 | % | | $ | 2.29 | |
| Equity (Class I) | | Actual | | $ | 1,000.00 | | | $ | 1,128.80 | | | | 0.47 | % | | $ | 2.52 | |
| | | Hypothetical | | $ | 1,000.00 | | | $ | 1,022.84 | | | | 0.47 | % | | $ | 2.40 | |
| Equity (Class II) | | Actual | | $ | 1,000.00 | | | $ | 1,126.50 | | | | 0.87 | % | | $ | 4.66 | |
| | | Hypothetical | | $ | 1,000.00 | | | $ | 1,020.82 | | | | 0.87 | % | | $ | 4.43 | |
| Flexible Managed (Class I) | | Actual | | $ | 1,000.00 | | | $ | 1,085.40 | | | | 0.62 | % | | $ | 3.26 | |
| | | Hypothetical | | $ | 1,000.00 | | | $ | 1,022.08 | | | | 0.62 | % | | $ | 3.16 | |
| Global (Class I) | | Actual | | $ | 1,000.00 | | | $ | 1,109.60 | | | | 0.79 | % | | $ | 4.20 | |
| | | Hypothetical | | $ | 1,000.00 | | | $ | 1,021.22 | | | | 0.79 | % | | $ | 4.02 | |
| Government Income (Class I) | | Actual | | $ | 1,000.00 | | | $ | 1,008.00 | | | | 0.57 | % | | $ | 2.88 | |
| | | Hypothetical | | $ | 1,000.00 | | | $ | 1,022.33 | | | | 0.57 | % | | $ | 2.91 | |
| Government Money Market (Class I) | | Actual | | $ | 1,000.00 | | | $ | 1,003.80 | | | | 0.36 | % | | $ | 1.82 | |
| | | Hypothetical | | $ | 1,000.00 | | | $ | 1,023.39 | | | | 0.36 | % | | $ | 1.84 | |
| Stock Index (Class I) | | Actual | | $ | 1,000.00 | | | $ | 1,112.40 | | | | 0.32 | % | | $ | 1.70 | |
| | | Hypothetical | | $ | 1,000.00 | | | $ | 1,023.59 | | | | 0.32 | % | | $ | 1.63 | |
* Portfolio expenses (net of fee waivers or subsidies, if any) for each share class are equal to the annualized expense ratio for each share class (provided in the table), multiplied by the average account value over the period, multiplied by the 184 days in the six-month period ended December 31, 2017, and divided by the 365 days in the Portfolio's fiscal year ended December 31, 2017 (to reflect the six-month period). Expenses presented in the table include the expenses of any underlying portfolios in which the Portfolio may invest.
| | | | | | |
| | CONSERVATIVE BALANCED PORTFOLIO | | |
| |
| SCHEDULE OF INVESTMENTS | | as of December 31, 2017 |
| | | | | | | | |
| LONG-TERM INVESTMENTS — 89.0% | | | | |
| COMMON STOCKS — 51.0% | | Shares | | | Value | |
Aerospace & Defense — 1.3% | |
Arconic, Inc. | | | 21,480 | | | $ | 585,330 | |
Boeing Co. (The) | | | 31,050 | | | | 9,156,956 | |
General Dynamics Corp. | | | 15,500 | | | | 3,153,475 | |
L3 Technologies, Inc. | | | 4,500 | | | | 890,325 | |
Lockheed Martin Corp. | | | 13,900 | | | | 4,462,595 | |
MTU Aero Engines AG (Germany) | | | 1,966 | | | | 351,313 | |
Northrop Grumman Corp. | | | 9,662 | | | | 2,965,364 | |
Raytheon Co. | | | 16,100 | | | | 3,024,385 | |
Rockwell Collins, Inc. | | | 9,200 | | | | 1,247,704 | |
Safran SA (France) | | | 1,136 | | | | 117,173 | |
Textron, Inc. | | | 14,900 | | | | 843,191 | |
Thales SA (France) | | | 379 | | | | 40,788 | |
TransDigm Group, Inc.(a) | | | 2,700 | | | | 741,474 | |
United Technologies Corp. | | | 41,200 | | | | 5,255,884 | |
| | | | | | | | |
| | | | | | | 32,835,957 | |
| | | | | | | | |
Air Freight & Logistics — 0.4% | |
C.H. Robinson Worldwide, Inc.(a) | | | 7,900 | | | | 703,811 | |
Deutsche Post AG (Germany) | | | 3,617 | | | | 171,929 | |
Expeditors International of Washington, Inc. | | | 10,100 | | | | 653,369 | |
FedEx Corp. | | | 13,780 | | | | 3,438,661 | |
United Parcel Service, Inc. (Class B Stock) | | | 38,200 | | | | 4,551,530 | |
| | | | | | | | |
| | | | | | | 9,519,300 | |
| | | | | | | | |
Airlines — 0.3% | |
Alaska Air Group, Inc. | | | 7,300 | | | | 536,623 | |
American Airlines Group, Inc. | | | 24,000 | | | | 1,248,720 | |
Delta Air Lines, Inc. | | | 36,900 | | | | 2,066,400 | |
Deutsche Lufthansa AG (Germany) | | | 12,701 | | | | 466,427 | |
International Consolidated Airlines Group SA (United Kingdom) | | | 3,186 | | | | 27,610 | |
Southwest Airlines Co. | | | 30,500 | | | | 1,996,225 | |
United Continental Holdings, Inc.* | | | 14,300 | | | | 963,820 | |
| | | | | | | | |
| | | | | | | 7,305,825 | |
| | | | | | | | |
Auto Components — 0.1% | |
Aisin Seiki Co. Ltd. (Japan) | | | 600 | | | | 33,614 | |
Aptiv PLC | | | 15,200 | | | | 1,289,416 | |
BorgWarner, Inc. | | | 10,800 | | | | 551,772 | |
Denso Corp. (Japan) | | | 600 | | | | 35,945 | |
Faurecia (France) | | | 4,482 | | | | 349,304 | |
Goodyear Tire & Rubber Co. (The) | | | 13,400 | | | | 432,954 | |
Koito Manufacturing Co. Ltd. (Japan) | | | 400 | | | | 28,005 | |
Stanley Electric Co. Ltd. (Japan) | | | 7,500 | | | | 303,469 | |
Toyota Industries Corp. (Japan) | | | 600 | | | | 38,459 | |
| | | | | | | | |
| | | | | | | 3,062,938 | |
| | | | | | | | |
Automobiles — 0.3% | |
Bayerische Motoren Werke AG (Germany) | | | 1,187 | | | | 123,070 | |
Daimler AG (Germany) | | | 3,463 | | | | 292,832 | |
Ferrari NV (Italy) | | | 442 | | | | 46,313 | |
Fiat Chrysler Automobiles NV (United Kingdom)* | | | 3,504 | | | | 62,558 | |
Ford Motor Co. | | | 216,685 | | | | 2,706,396 | |
General Motors Co. | | | 72,700 | | | | 2,979,973 | |
| | | | | | | | |
COMMON STOCKS
(continued) | | Shares | | | Value | |
Automobiles (continued) | |
Harley-Davidson, Inc.(a) | | | 9,100 | | | $ | 463,008 | |
Honda Motor Co. Ltd. (Japan) | | | 5,800 | | | | 197,939 | |
Peugeot SA (France) | | | 974 | | | | 19,783 | |
Suzuki Motor Corp. (Japan) | | | 8,100 | | | | 468,858 | |
Toyota Motor Corp. (Japan) | | | 9,300 | | | | 592,689 | |
Volkswagen AG (Germany) | | | 123 | | | | 24,822 | |
| | | | | | | | |
| | | | | | | 7,978,241 | |
| | | | | | | | |
Banks — 3.5% | |
ABN AMRO Group NV (Netherlands), CVA 144A | | | 11,682 | | | | 376,637 | |
Aozora Bank Ltd. (Japan) | | | 4,300 | | | | 166,850 | |
Banco Bilbao Vizcaya Argentaria SA (Spain) | | | 3,498 | | | | 29,727 | |
Banco Santander SA (Spain) | | | 3,911 | | | | 25,641 | |
Bank Leumi Le-Israel BM (Israel) | | | 5,300 | | | | 31,902 | |
Bank of America Corp. | | | 543,421 | | | | 16,041,788 | |
Bank of East Asia Ltd. (The) (Hong Kong) | | | 77,200 | | | | 333,868 | |
Bank of Queensland Ltd. (Australia) | | | 9,296 | | | | 91,949 | |
Bankinter SA (Spain) | | | 18,408 | | | | 174,134 | |
BB&T Corp. | | | 44,800 | | | | 2,227,456 | |
BNP Paribas SA (France) | | | 4,105 | | | | 305,364 | |
CaixaBank SA (Spain) | | | 12,804 | | | | 59,523 | |
Citigroup, Inc. | | | 148,885 | | | | 11,078,533 | |
Citizens Financial Group, Inc. | | | 27,300 | | | | 1,146,054 | |
Comerica, Inc. | | | 9,600 | | | | 833,376 | |
Commonwealth Bank of Australia (Australia) | | | 6,199 | | | | 386,870 | |
Danske Bank A/S (Denmark) | | | 4,882 | | | | 190,017 | |
DBS Group Holdings Ltd. (Singapore) | | | 6,500 | | | | 120,226 | |
Fifth Third Bancorp | | | 40,821 | | | | 1,238,509 | |
Hang Seng Bank Ltd. (Hong Kong) | | | 3,800 | | | | 94,274 | |
HSBC Holdings PLC (United Kingdom) | | | 69,370 | | | | 716,457 | |
Huntington Bancshares, Inc. | | | 58,036 | | | | 845,004 | |
ING Groep NV (Netherlands) | | | 13,999 | | | | 256,975 | |
Intesa Sanpaolo SpA (Italy) | | | 54,316 | | | | 180,212 | |
Intesa Sanpaolo SpA, RSP (Italy) | | | 11,867 | | | | 37,833 | |
JPMorgan Chase & Co. | | | 194,645 | | | | 20,815,336 | |
KBC Groep NV (Belgium) | | | 4,931 | | | | 420,186 | |
KeyCorp. | | | 59,400 | | | | 1,198,098 | |
Lloyds Banking Group PLC (United Kingdom) | | | 599,658 | | | | 549,875 | |
M&T Bank Corp. | | | 8,400 | | | | 1,436,316 | |
Mediobanca SpA (Italy) | | | 30,670 | | | | 347,513 | |
Mitsubishi UFJ Financial Group, Inc. (Japan) | | | 15,600 | | | | 113,536 | |
Mizrahi Tefahot Bank Ltd. (Israel) | | | 18,256 | | | | 336,278 | |
Mizuho Financial Group, Inc. (Japan) | | | 85,500 | | | | 154,592 | |
Oversea-Chinese Banking Corp. Ltd. (Singapore) | | | 37,000 | | | | 341,815 | |
People’s United Financial, Inc. | | | 16,500 | | | | 308,550 | |
PNC Financial Services Group, Inc. (The) | | | 26,633 | | | | 3,842,876 | |
Regions Financial Corp. | | | 64,803 | | | | 1,119,796 | |
SEE NOTES TO FINANCIAL STATEMENTS.
A1
| | | | | | |
| | CONSERVATIVE BALANCED PORTFOLIO (continued) | | |
| |
| SCHEDULE OF INVESTMENTS | | as of December 31, 2017 |
| | | | | | | | |
COMMON STOCKS
(continued) | | Shares | | | Value | |
Banks (continued) | |
Resona Holdings, Inc. (Japan) | | | 8,000 | | | $ | 47,670 | |
Skandinaviska Enskilda Banken AB (Sweden) (Class A Stock) | | | 5,540 | | | | 65,053 | |
Sumitomo Mitsui Financial Group, Inc. (Japan) | | | 4,900 | | | | 211,212 | |
SunTrust Banks, Inc. | | | 26,500 | | | | 1,711,635 | |
Swedbank AB (Sweden) (Class A Stock) | | | 3,315 | | | | 79,974 | |
U.S. Bancorp | | | 88,085 | | | | 4,719,594 | |
United Overseas Bank Ltd. (Singapore) | | | 4,700 | | | | 92,651 | |
Wells Fargo & Co. | | | 247,664 | | | | 15,025,775 | |
Zions Bancorporation | | | 11,550 | | | | 587,087 | |
| | | | | | | | |
| | | | | | | 90,514,597 | |
| | | | | | | | |
Beverages — 1.0% | |
Anheuser-Busch InBev SA/NV (Belgium) | | | 58 | | | | 6,475 | |
Asahi Group Holdings Ltd. (Japan) | | | 1,400 | | | | 69,468 | |
Brown-Forman Corp. (Class B Stock)(a) | | | 10,700 | | | | 734,769 | |
Coca-Cola Co. (The) | | | 212,801 | | | | 9,763,310 | |
Coca-Cola HBC AG (Switzerland)* | | | 2,160 | | | | 70,541 | |
Constellation Brands, Inc. (Class A Stock) | | | 9,700 | | | | 2,217,129 | |
Diageo PLC (United Kingdom) | | | 9,905 | | | | 363,061 | |
Dr. Pepper Snapple Group, Inc. | | | 10,500 | | | | 1,019,130 | |
Kirin Holdings Co. Ltd. (Japan) | | | 2,900 | | | | 73,084 | |
Molson Coors Brewing Co. (Class B Stock) | | | 10,500 | | | | 861,735 | |
Monster Beverage Corp.* | | | 22,900 | | | | 1,449,341 | |
PepsiCo, Inc. | | | 79,207 | | | | 9,498,504 | |
Pernod Ricard SA (France) | | | 753 | | | | 119,090 | |
Treasury Wine Estates Ltd. (Australia) | | | 639 | | | | 7,929 | |
| | | | | | | | |
| | | | | | | 26,253,566 | |
| | | | | | | | |
Biotechnology — 1.4% | |
AbbVie, Inc. | | | 88,400 | | | | 8,549,164 | |
Alexion Pharmaceuticals, Inc.* | | | 12,400 | | | | 1,482,916 | |
Amgen, Inc. | | | 40,437 | | | | 7,031,994 | |
Biogen, Inc.* | | | 11,760 | | | | 3,746,383 | |
Celgene Corp.* | | | 43,400 | | | | 4,529,224 | |
Gilead Sciences, Inc. | | | 72,400 | | | | 5,186,736 | |
Incyte Corp.* | | | 9,700 | | | | 918,687 | |
Regeneron Pharmaceuticals, Inc.* | | | 4,340 | | | | 1,631,667 | |
Vertex Pharmaceuticals, Inc.* | | | 14,200 | | | | 2,128,012 | |
| | | | | | | | |
| | | | | | | 35,204,783 | |
| | | | | | | | |
Building Products — 0.2% | |
A.O. Smith Corp. | | | 7,800 | | | | 477,984 | |
Allegion PLC | | | 5,133 | | | | 408,382 | |
Asahi Glass Co. Ltd. (Japan) | | | 700 | | | | 30,257 | |
Fortune Brands Home & Security, Inc. | | | 8,800 | | | | 602,272 | |
Johnson Controls International PLC | | | 51,622 | | | | 1,967,314 | |
Masco Corp. | | | 17,200 | | | | 755,768 | |
| | | | | | | | |
| | | | | | | 4,241,977 | |
| | | | | | | | |
| | | | | | | | |
COMMON STOCKS
(continued) | | Shares | | | Value | |
Capital Markets — 1.6% | |
3i Group PLC (United Kingdom) | | | 1,967 | | | $ | 24,216 | |
Affiliated Managers Group, Inc. | | | 3,100 | | | | 636,275 | |
Ameriprise Financial, Inc. | | | 8,320 | | | | 1,409,990 | |
Bank of New York Mellon Corp. (The) | | | 57,258 | | | | 3,083,916 | |
BlackRock, Inc. | | | 6,900 | | | | 3,544,599 | |
Cboe Global Markets, Inc. | | | 6,000 | | | | 747,540 | |
Charles Schwab Corp. (The) | | | 66,050 | | | | 3,392,988 | |
CME Group, Inc. | | | 18,900 | | | | 2,760,345 | |
E*TRADE Financial Corp.* | | | 15,820 | | | | 784,197 | |
Franklin Resources, Inc. | | | 18,200 | | | | 788,606 | |
Goldman Sachs Group, Inc. (The) | | | 20,000 | | | | 5,095,200 | |
Intercontinental Exchange, Inc. | | | 32,655 | | | | 2,304,137 | |
Invesco Ltd. | | | 22,500 | | | | 822,150 | |
Julius Baer Group Ltd. (Switzerland)* | | | 398 | | | | 24,338 | |
London Stock Exchange Group PLC (United Kingdom) | | | 1,157 | | | | 59,177 | |
Macquarie Group Ltd. (Australia) | | | 5,696 | | | | 440,556 | |
Moody’s Corp. | | | 9,500 | | | | 1,402,295 | |
Morgan Stanley | | | 78,380 | | | | 4,112,599 | |
Nasdaq, Inc. | | | 6,800 | | | | 522,444 | |
Natixis SA (France) | | | 42,078 | | | | 332,353 | |
Nomura Holdings, Inc. (Japan) | | | 900 | | | | 5,276 | |
Northern Trust Corp. | | | 12,300 | | | | 1,228,647 | |
Partners Group Holding AG (Switzerland)(a) | | | 557 | | | | 381,653 | |
Raymond James Financial, Inc. | | | 7,200 | | | | 642,960 | |
S&P Global, Inc. | | | 14,300 | | | | 2,422,420 | |
Schroders PLC (United Kingdom) | | | 595 | | | | 28,165 | |
State Street Corp. | | | 20,800 | | | | 2,030,288 | |
T. Rowe Price Group, Inc.(a) | | | 13,700 | | | | 1,437,541 | |
| | | | | | | | |
| | | | | | | 40,464,871 | |
| | | | | | | | |
Chemicals — 1.2% | |
Air Products & Chemicals, Inc. | | | 12,400 | | | | 2,034,592 | |
Albemarle Corp.(a) | | | 6,100 | | | | 780,129 | |
Arkema SA (France) | | | 245 | | | | 29,830 | |
Asahi Kasei Corp. (Japan) | | | 4,000 | | | | 51,478 | |
BASF SE (Germany) | | | 3,371 | | | | 369,567 | |
CF Industries Holdings, Inc. | | | 13,200 | | | | 561,528 | |
Covestro AG (Germany), 144A | | | 4,294 | | | | 442,137 | |
DowDuPont, Inc. | | | 129,341 | | | | 9,211,666 | |
Eastman Chemical Co.(a) | | | 8,400 | | | | 778,176 | |
Ecolab, Inc. | | | 14,400 | | | | 1,932,192 | |
FMC Corp. | | | 7,500 | | | | 709,950 | |
Hitachi Chemical Co. Ltd. (Japan) | | | 400 | | | | 10,242 | |
International Flavors & Fragrances, Inc. | | | 4,500 | | | | 686,745 | |
JSR Corp. (Japan) | | | 400 | | | | 7,858 | |
Koninklijke DSM NV (Netherlands) | | | 665 | | | | 63,523 | |
LyondellBasell Industries NV (Class A Stock) | | | 18,000 | | | | 1,985,760 | |
Mitsubishi Chemical Holdings Corp. (Japan) | | | 41,600 | | | | 455,184 | |
Mitsui Chemicals, Inc. (Japan) | | | 1,200 | | | | 38,481 | |
Monsanto Co. | | | 24,394 | | | | 2,848,731 | |
Mosaic Co. (The) | | | 17,500 | | | | 449,050 | |
SEE NOTES TO FINANCIAL STATEMENTS.
A2
| | | | | | |
| | CONSERVATIVE BALANCED PORTFOLIO (continued) | | |
| |
| SCHEDULE OF INVESTMENTS | | as of December 31, 2017 |
| | | | | | | | |
COMMON STOCKS
(continued) | | Shares | | | Value | |
Chemicals (continued) | |
PPG Industries, Inc. | | | 14,600 | | | $ | 1,705,572 | |
Praxair, Inc. | | | 16,100 | | | | 2,490,348 | |
Sherwin-Williams Co. (The) | | | 4,650 | | | | 1,906,686 | |
Shin-Etsu Chemical Co. Ltd. (Japan) | | | 1,400 | | | | 141,852 | |
Sumitomo Chemical Co. Ltd. (Japan) | | | 6,000 | | | | 42,934 | |
Teijin Ltd. (Japan) | | | 14,900 | | | | 331,077 | |
Tosoh Corp. (Japan) | | | 2,400 | | | | 54,144 | |
| | | | | | | | |
| | | | | | | 30,119,432 | |
| | | | | | | | |
Commercial Services & Supplies — 0.2% | |
Cintas Corp. | | | 4,800 | | | | 747,984 | |
Dai Nippon Printing Co. Ltd. (Japan) | | | 7,000 | | | | 155,843 | |
Republic Services, Inc. | | | 13,165 | | | | 890,086 | |
Secom Co. Ltd. (Japan) | | | 800 | | | | 60,354 | |
Stericycle, Inc.* | | | 4,900 | | | | 333,151 | |
Toppan Printing Co. Ltd. (Japan) | | | 2,000 | | | | 18,066 | |
Waste Management, Inc. | | | 22,342 | | | | 1,928,115 | |
| | | | | | | | |
| | | | | | | 4,133,599 | |
| | | | | | | | |
Communications Equipment — 0.5% | |
Cisco Systems, Inc. | | | 277,100 | | | | 10,612,930 | |
F5 Networks, Inc.* | | | 3,500 | | | | 459,270 | |
Harris Corp. | | | 6,700 | | | | 949,055 | |
Juniper Networks, Inc. | | | 20,500 | | | | 584,250 | |
Motorola Solutions, Inc. | | | 9,389 | | | | 848,202 | |
| | | | | | | | |
| | | | | | | 13,453,707 | |
| | | | | | | | |
Construction & Engineering — 0.1% | |
ACS Actividades de Construccion y Servicios SA (Spain) | | | 685 | | | | 26,759 | |
CIMIC Group Ltd. (Australia) | | | 8,546 | | | | 341,801 | |
Fluor Corp. | | | 7,800 | | | | 402,870 | |
Hochtief AG (Germany) | | | 71 | | | | 12,539 | |
Jacobs Engineering Group, Inc. | | | 6,700 | | | | 441,932 | |
Kajima Corp. (Japan) | | | 26,000 | | | | 249,805 | |
Obayashi Corp. (Japan) | | | 15,600 | | | | 188,450 | |
Quanta Services, Inc.* | | | 8,400 | | | | 328,524 | |
Taisei Corp. (Japan) | | | 800 | | | | 39,785 | |
Vinci SA (France) | | | 1,813 | | | | 185,092 | |
| | | | | | | | |
| | | | | | | 2,217,557 | |
| | | | | | | | |
Construction Materials — 0.1% | |
Martin Marietta Materials, Inc. | | | 3,700 | | | | 817,848 | |
Vulcan Materials Co. | | | 7,600 | | | | 975,612 | |
| | | | | | | | |
| | | | | | | 1,793,460 | |
| | | | | | | | |
Consumer Finance — 0.4% | |
American Express Co. | | | 40,700 | | | | 4,041,917 | |
Capital One Financial Corp. | | | 26,861 | | | | 2,674,818 | |
Discover Financial Services | | | 20,640 | | | | 1,587,629 | |
Navient Corp. | | | 13,200 | | | | 175,824 | |
Synchrony Financial | | | 41,372 | | | | 1,597,373 | |
| | | | | | | | |
| | | | | | | 10,077,561 | |
| | | | | | | | |
Containers & Packaging — 0.2% | |
Avery Dennison Corp. | | | 4,900 | | | | 562,814 | |
| | | | | | | | |
COMMON STOCKS
(continued) | | Shares | | | Value | |
Containers & Packaging (continued) | |
Ball Corp. | | | 19,900 | | | $ | 753,215 | |
International Paper Co. | | | 22,573 | | | | 1,307,880 | |
Packaging Corp. of America | | | 5,600 | | | | 675,080 | |
Sealed Air Corp. | | | 10,800 | | | | 532,440 | |
WestRock Co. | | | 14,344 | | | | 906,684 | |
| | | | | | | | |
| | | | | | | 4,738,113 | |
| | | | | | | | |
Distributors — 0.1% | |
Genuine Parts Co. | | | 8,400 | | | | 798,084 | |
LKQ Corp.* | | | 16,600 | | | | 675,122 | |
| | | | | | | | |
| | | | | | | 1,473,206 | |
| | | | | | | | |
Diversified Consumer Services — 0.0% | |
H&R Block, Inc.(a) | | | 11,600 | | | | 304,152 | |
| | | | | | | | |
Diversified Financial Services — 0.8% | |
Berkshire Hathaway, Inc. (Class B Stock)* | | | 106,700 | | | | 21,150,074 | |
Challenger Ltd. (Australia) | | | 2,081 | | | | 22,694 | |
Leucadia National Corp. | | | 16,700 | | | | 442,383 | |
ORIX Corp. (Japan) | | | 23,700 | | | | 399,603 | |
| | | | | | | | |
| | | | | | | 22,014,754 | |
| | | | | | | | |
Diversified Telecommunication Services — 1.1% | |
AT&T, Inc. | | | 340,338 | | | | 13,232,341 | |
CenturyLink, Inc. | | | 50,879 | | | | 848,662 | |
Deutsche Telekom AG (Germany) | | | 11,860 | | | | 209,642 | |
Koninklijke KPN NV (Netherlands) | | | 12,525 | | | | 43,728 | |
Nippon Telegraph & Telephone Corp. (Japan) | | | 9,000 | | | | 423,127 | |
Orange SA (France) | | | 9,710 | | | | 168,282 | |
Swisscom AG (Switzerland) | | | 95 | | | | 50,517 | |
TDC A/S (Denmark) | | | 29,410 | | | | 180,657 | |
Telecom Italia SpA (Italy)* | | | 370,517 | | | | 319,977 | |
Telecom Italia SpA, RSP (Italy) | | | 22,010 | | | | 15,612 | |
Telenor ASA (Norway) | | | 1,622 | | | | 34,722 | |
Verizon Communications, Inc. | | | 226,076 | | | | 11,966,203 | |
| | | | | | | | |
| | | | | | | 27,493,470 | |
| | | | | | | | |
Electric Utilities — 0.9% | |
Alliant Energy Corp. | | | 12,400 | | | | 528,364 | |
American Electric Power Co., Inc. | | | 27,160 | | | | 1,998,161 | |
CK Infrastructure Holdings Ltd. (Hong Kong) | | | 2,000 | | | | 17,162 | |
CLP Holdings Ltd. (Hong Kong) | | | 2,500 | | | | 25,576 | |
Duke Energy Corp. | | | 38,861 | | | | 3,268,599 | |
Edison International | | | 18,500 | | | | 1,169,940 | |
EDP-Energias de Portugal SA (Portugal) | | | 30,232 | | | | 104,577 | |
Endesa SA (Spain)(a) | | | 4,783 | | | | 102,298 | |
Enel SpA (Italy) | | | 78,259 | | | | 481,235 | |
Entergy Corp. | | | 10,300 | | | | 838,317 | |
Eversource Energy | | | 18,000 | | | | 1,137,240 | |
Exelon Corp. | | | 52,513 | | | | 2,069,537 | |
FirstEnergy Corp. | | | 24,206 | | | | 741,188 | |
Iberdrola SA (Spain) | | | 36,403 | | | | 281,806 | |
Kansai Electric Power Co., Inc. (The) (Japan) | | | 2,700 | | | | 33,021 | |
Kyushu Electric Power Co., Inc. (Japan) | | | 1,500 | | | | 15,712 | |
SEE NOTES TO FINANCIAL STATEMENTS.
A3
| | | | | | |
| | CONSERVATIVE BALANCED PORTFOLIO (continued) | | |
| |
| SCHEDULE OF INVESTMENTS | | as of December 31, 2017 |
| | | | | | | | |
COMMON STOCKS
(continued) | | Shares | | | Value | |
Electric Utilities (continued) | |
NextEra Energy, Inc. | | | 26,000 | | | $ | 4,060,940 | |
Orsted A/S (Denmark), 144A | | | 606 | | | | 33,032 | |
PG&E Corp. | | | 28,200 | | | | 1,264,206 | |
Pinnacle West Capital Corp. | | | 6,600 | | | | 562,188 | |
PPL Corp. | | | 37,300 | | | | 1,154,435 | |
Red Electrica Corp. SA (Spain) | | | 1,526 | | | | 34,254 | |
Southern Co. (The) | | | 55,400 | | | | 2,664,186 | |
SSE PLC (United Kingdom) | | | 15,720 | | | | 279,466 | |
Tohoku Electric Power Co., Inc. (Japan) | | | 1,700 | | | | 21,704 | |
Xcel Energy, Inc. | | | 27,710 | | | | 1,333,128 | |
| | | | | | | | |
| | | | | | | 24,220,272 | |
| | | | | | | | |
Electrical Equipment — 0.3% | |
Acuity Brands, Inc.(a) | | | 2,300 | | | | 404,800 | |
AMETEK, Inc. | | | 12,900 | | | | 934,863 | |
Eaton Corp. PLC | | | 24,637 | | | | 1,946,569 | |
Emerson Electric Co. | | | 35,500 | | | | 2,473,995 | |
Mitsubishi Electric Corp. (Japan) | | | 7,100 | | | | 117,665 | |
Rockwell Automation, Inc. | | | 7,300 | | | | 1,433,355 | |
Schneider Electric SE (France)* | | | 2,059 | | | | 174,563 | |
Siemens Gamesa Renewable Energy SA (Spain) | | | 831 | | | | 11,379 | |
| | | | | | | | |
| | | | | | | 7,497,189 | |
| | | | | | | | |
Electronic Equipment, Instruments & Components — 0.2% | |
Alps Electric Co. Ltd. (Japan) | | | 1,200 | | | | 34,135 | |
Amphenol Corp. (Class A Stock) | | | 16,800 | | | | 1,475,040 | |
Corning, Inc. | | | 50,000 | | | | 1,599,500 | |
FLIR Systems, Inc. | | | 8,100 | | | | 377,622 | |
Hitachi Ltd. (Japan) | | | 68,000 | | | | 527,558 | |
Kyocera Corp. (Japan) | | | 5,900 | | | | 385,193 | |
Nippon Electric Glass Co. Ltd. (Japan) | | | 800 | | | | 30,449 | |
Omron Corp. (Japan) | | | 700 | | | | 41,635 | |
TE Connectivity Ltd. | | | 19,600 | | | | 1,862,784 | |
| | | | | | | | |
| | | | | | | 6,333,916 | |
| | | | | | | | |
Energy Equipment & Services — 0.4% | |
Baker Hughes a GE Co. | | | 22,798 | | | | 721,329 | |
Halliburton Co. | | | 48,000 | | | | 2,345,760 | |
Helmerich & Payne, Inc.(a) | | | 6,200 | | | | 400,768 | |
National Oilwell Varco, Inc.(a) | | | 21,500 | | | | 774,430 | |
Schlumberger Ltd. | | | 77,024 | | | | 5,190,647 | |
TechnipFMC PLC (United Kingdom) | | | 24,300 | | | | 760,833 | |
| | | | | | | | |
| | | | | | | 10,193,767 | |
| | | | | | | | |
Equity Real Estate Investment Trusts (REITs) — 1.4% | |
Alexandria Real Estate Equities, Inc. | | | 5,200 | | | | 679,068 | |
American Tower Corp. | | | 24,100 | | | | 3,438,347 | |
Apartment Investment & Management Co. (Class A Stock) | | | 8,233 | | | | 359,864 | |
AvalonBay Communities, Inc. | | | 7,875 | | | | 1,404,979 | |
Boston Properties, Inc. | | | 8,800 | | | | 1,144,264 | |
British Land Co. PLC (The) (United Kingdom) | | | 37,277 | | | | 347,173 | |
Crown Castle International Corp. | | | 22,900 | | | | 2,542,129 | |
| | | | | | | | |
COMMON STOCKS
(continued) | | Shares | | | Value | |
Equity Real Estate Investment Trusts (REITs) (continued) | |
Digital Realty Trust, Inc. | | | 11,300 | | | $ | 1,287,070 | |
Duke Realty Corp. | | | 18,800 | | | | 511,548 | |
Equinix, Inc. | | | 4,454 | | | | 2,018,642 | |
Equity Residential | | | 20,800 | | | | 1,326,416 | |
Essex Property Trust, Inc. | | | 3,750 | | | | 905,137 | |
Extra Space Storage, Inc.(a) | | | 7,000 | | | | 612,150 | |
Federal Realty Investment Trust | | | 4,100 | | | | 544,521 | |
GGP, Inc. | | | 33,100 | | | | 774,209 | |
Goodman Group (Australia) | | | 6,830 | | | | 44,754 | |
GPT Group (The) (Australia) | | | 6,547 | | | | 26,043 | |
HCP, Inc. | | | 25,500 | | | | 665,040 | |
Host Hotels & Resorts, Inc.(a) | | | 39,182 | | | | 777,763 | |
Iron Mountain, Inc. | | | 14,702 | | | | 554,706 | |
Kimco Realty Corp.(a) | | | 21,800 | | | | 395,670 | |
Klepierre SA (France) | | | 9,121 | | | | 400,907 | |
Land Securities Group PLC (United Kingdom) | | | 2,729 | | | | 37,078 | |
Macerich Co. (The) | | | 6,400 | | | | 420,352 | |
Mid-America Apartment Communities, Inc. | | | 6,600 | | | | 663,696 | |
Mirvac Group (Australia) | | | 7,627 | | | | 13,948 | |
Nippon Building Fund, Inc. (Japan) | | | 5 | | | | 24,457 | |
Prologis, Inc. | | | 29,277 | | | | 1,888,659 | |
Public Storage | | | 8,500 | | | | 1,776,500 | |
Realty Income Corp.(a) | | | 15,500 | | | | 883,810 | |
Regency Centers Corp.(a) | | | 8,000 | | | | 553,440 | |
SBA Communications Corp.* | | | 6,600 | | | | 1,078,176 | |
Simon Property Group, Inc. | | | 17,293 | | | | 2,969,900 | |
SL Green Realty Corp.(a) | | | 5,500 | | | | 555,115 | |
Stockland (Australia) | | | 88,132 | | | | 307,434 | |
UDR, Inc. | | | 14,500 | | | | 558,540 | |
Ventas, Inc. | | | 20,118 | | | | 1,207,281 | |
Vornado Realty Trust | | | 9,925 | | | | 775,937 | |
Welltower, Inc. | | | 20,800 | | | | 1,326,416 | |
Weyerhaeuser Co. | | | 41,118 | | | | 1,449,821 | |
| | | | | | | | |
| | | | | | | 37,250,960 | |
| | | | | | | | |
Food & Staples Retailing — 0.9% | |
Costco Wholesale Corp. | | | 24,300 | | | | 4,522,716 | |
CVS Health Corp. | | | 56,348 | | | | 4,085,230 | |
ICA Gruppen AB (Sweden) | | | 2,386 | | | | 86,681 | |
J. Sainsbury PLC (United Kingdom) | | | 105,999 | | | | 345,167 | |
Kroger Co. (The) | | | 49,192 | | | | 1,350,321 | |
METRO AG (Germany)* | | | 4,278 | | | | 85,212 | |
Sysco Corp. | | | 26,900 | | | | 1,633,637 | |
Tesco PLC (United Kingdom) | | | 30,119 | | | | 85,210 | |
Wal-Mart Stores, Inc. | | | 81,100 | | | | 8,008,625 | |
Walgreens Boots Alliance, Inc. | | | 49,300 | | | | 3,580,166 | |
Wesfarmers Ltd. (Australia) | | | 10,054 | | | | 347,646 | |
WM Morrison Supermarkets PLC (United Kingdom) | | | 88,602 | | | | 263,189 | |
| | | | | | | | |
| | | | | | | 24,393,800 | |
| | | | | | | | |
Food Products — 0.7% | |
Archer-Daniels-Midland Co. | | | 31,126 | | | | 1,247,530 | |
Campbell Soup Co.(a) | | | 10,800 | | | | 519,588 | |
Chocoladefabriken Lindt & Spruengli AG (Switzerland) (Class C Stock) | | | 4 | | | | 24,418 | |
SEE NOTES TO FINANCIAL STATEMENTS.
A4
| | | | | | |
| | CONSERVATIVE BALANCED PORTFOLIO (continued) | | |
| |
| SCHEDULE OF INVESTMENTS | | as of December 31, 2017 |
| | | | | | | | |
COMMON STOCKS
(continued) | | Shares | | | Value | |
Food Products (continued) | |
Conagra Brands, Inc. | | | 23,100 | | | $ | 870,177 | |
General Mills, Inc. | | | 31,700 | | | | 1,879,493 | |
Golden Agri-Resources Ltd. (Singapore) | | | 299,500 | | | | 82,683 | |
Hershey Co. (The) | | | 8,000 | | | | 908,080 | |
Hormel Foods Corp.(a) | | | 15,300 | | | | 556,767 | |
J.M. Smucker Co. (The)(a) | | | 6,600 | | | | 819,984 | |
Kellogg Co.(a) | | | 14,300 | | | | 972,114 | |
Kraft Heinz Co. (The) | | | 33,117 | | | | 2,575,178 | |
Marine Harvest ASA (Norway)* | | | 21,265 | | | | 359,606 | |
McCormick & Co., Inc.(a) | | | 6,700 | | | | 682,797 | |
Mondelez International, Inc. (Class A Stock) | | | 83,553 | | | | 3,576,068 | |
Nestle SA (Switzerland) | | | 6,830 | | | | 587,218 | |
NH Foods Ltd. (Japan) | | | 11,000 | | | | 267,952 | |
Orkla ASA (Norway) | | | 5,128 | | | | 54,342 | |
Tate & Lyle PLC (United Kingdom) | | | 35,691 | | | | 338,295 | |
Tyson Foods, Inc. (Class A Stock) | | | 16,400 | | | | 1,329,548 | |
WH Group Ltd. (Hong Kong), 144A | | | 384,500 | | | | 433,344 | |
Wilmar International Ltd. (Singapore) | | | 5,800 | | | | 13,366 | |
| | | | | | | | |
| | | | | | | 18,098,548 | |
| | | | | | | | |
Gas Utilities — 0.0% | |
Gas Natural SDG SA (Spain) | | | 2,481 | | | | 57,258 | |
| | | | | | | | |
Health Care Equipment & Supplies — 1.3% | |
Abbott Laboratories | | | 96,300 | | | | 5,495,841 | |
Align Technology, Inc.* | | | 4,000 | | | | 888,760 | |
Baxter International, Inc. | | | 27,700 | | | | 1,790,528 | |
Becton, Dickinson & Co. | | | 14,810 | | | | 3,170,229 | |
Boston Scientific Corp.* | | | 75,867 | | | | 1,880,743 | |
Cochlear Ltd. (Australia) | | | 196 | | | | 26,127 | |
Cooper Cos., Inc. (The) | | | 2,840 | | | | 618,779 | |
Danaher Corp. | | | 33,900 | | | | 3,146,598 | |
DENTSPLY SIRONA, Inc. | | | 13,200 | | | | 868,956 | |
Edwards Lifesciences Corp.* | | | 11,900 | | | | 1,341,249 | |
Hologic, Inc.* | | | 14,900 | | | | 636,975 | |
IDEXX Laboratories, Inc.* | | | 4,800 | | | | 750,624 | |
Intuitive Surgical, Inc.* | | | 6,360 | | | | 2,321,018 | |
Medtronic PLC | | | 75,090 | | | | 6,063,518 | |
Olympus Corp. (Japan) | | | 1,100 | | | | 42,081 | |
ResMed, Inc.(a) | | | 8,100 | | | | 685,989 | |
Smith & Nephew PLC (United Kingdom) | | | 20,897 | | | | 361,582 | |
Sonova Holding AG (Switzerland) | | | 194 | | | | 30,282 | |
Straumann Holding AG (Switzerland) | | | 76 | | | | 53,614 | |
Stryker Corp. | | | 17,800 | | | | 2,756,152 | |
Varian Medical Systems, Inc.* | | | 5,000 | | | | 555,750 | |
Zimmer Biomet Holdings, Inc. | | | 11,400 | | | | 1,375,638 | |
| | | | | | | | |
| | | | | | | 34,861,033 | |
| | | | | | | | |
Health Care Providers & Services — 1.4% | |
Aetna, Inc. | | | 18,469 | | | | 3,331,623 | |
Alfresa Holdings Corp. (Japan) | | | 2,300 | | | | 53,872 | |
AmerisourceBergen Corp. | | | 8,900 | | | | 817,198 | |
Anthem, Inc. | | | 14,600 | | | | 3,285,146 | |
Cardinal Health, Inc. | | | 17,950 | | | | 1,099,797 | |
| | | | | | | | |
COMMON STOCKS
(continued) | | Shares | | | Value | |
Health Care Providers & Services (continued) | |
Centene Corp.* | | | 9,800 | | | $ | 988,624 | |
Cigna Corp. | | | 14,000 | | | | 2,843,260 | |
DaVita, Inc.* | | | 8,700 | | | | 628,575 | |
Envision Healthcare Corp.*(a) | | | 7,200 | | | | 248,832 | |
Express Scripts Holding Co.* | | | 32,049 | | | | 2,392,137 | |
Fresenius Medical Care AG & Co. KGaA (Germany) | | | 1,564 | | | | 164,235 | |
Fresenius SE & Co. KGaA (Germany) | | | 1,517 | | | | 117,979 | |
HCA Healthcare, Inc.* | | | 16,300 | | | | 1,431,792 | |
Henry Schein, Inc.* | | | 9,200 | | | | 642,896 | |
Humana, Inc. | | | 8,200 | | | | 2,034,174 | |
Laboratory Corp. of America Holdings* | | | 5,900 | | | | 941,109 | |
McKesson Corp. | | | 11,630 | | | | 1,813,698 | |
Medipal Holdings Corp. (Japan) | | | 7,000 | | | | 136,665 | |
Patterson Cos., Inc.(a) | | | 4,500 | | | | 162,585 | |
Quest Diagnostics, Inc. | | | 7,900 | | | | 778,071 | |
Ramsay Health Care Ltd. (Australia) | | | 540 | | | | 29,488 | |
Sonic Healthcare Ltd. (Australia) | | | 6,828 | | | | 121,425 | |
UnitedHealth Group, Inc. | | | 53,600 | | | | 11,816,656 | |
Universal Health Services, Inc. (Class B Stock) | | | 5,200 | | | | 589,420 | |
| | | | | | | | |
| | | | | | | 36,469,257 | |
| | | | | | | | |
Health Care Technology — 0.0% | |
Cerner Corp.* | | | 17,300 | | | | 1,165,847 | |
| | | | | | | | |
Hotels, Restaurants & Leisure — 1.0% | |
Aristocrat Leisure Ltd. (Australia) | | | 1,947 | | | | 35,852 | |
Carnival Corp. | | | 22,600 | | | | 1,499,962 | |
Chipotle Mexican Grill, Inc.*(a) | | | 1,400 | | | | 404,642 | |
Darden Restaurants, Inc. | | | 6,950 | | | | 667,339 | |
Galaxy Entertainment Group Ltd. (Hong Kong) | | | 31,000 | | | | 247,498 | |
Genting Singapore PLC (Singapore) | | | 338,500 | | | | 330,593 | |
Hilton Worldwide Holdings, Inc. | | | 11,800 | | | | 942,348 | |
Marriott International, Inc. (Class A Stock) | | | 17,668 | | | | 2,398,078 | |
McDonald’s Corp. | | | 44,900 | | | | 7,728,188 | |
MGM Resorts International | | | 28,900 | | | | 964,971 | |
Norwegian Cruise Line Holdings Ltd.* | | | 10,100 | | | | 537,825 | |
Oriental Land Co. Ltd. (Japan) | | | 1,500 | | | | 136,469 | |
Royal Caribbean Cruises Ltd. | | | 9,500 | | | | 1,133,160 | |
Starbucks Corp. | | | 80,000 | | | | 4,594,400 | |
TUI AG (Germany) | | | 1,957 | | | | 40,544 | |
Wyndham Worldwide Corp. | | | 5,620 | | | | 651,189 | |
Wynn Resorts Ltd. | | | 4,700 | | | | 792,373 | |
Yum! Brands, Inc. | | | 19,300 | | | | 1,575,073 | |
| | | | | | | | |
| | | | | | | 24,680,504 | |
| | | | | | | | |
Household Durables — 0.3% | |
Berkeley Group Holdings PLC (United Kingdom) | | | 1,121 | | | | 63,410 | |
D.R. Horton, Inc. | | | 18,700 | | | | 955,009 | |
Garmin Ltd.(a) | | | 6,000 | | | | 357,420 | |
SEE NOTES TO FINANCIAL STATEMENTS.
A5
| | | | | | |
| | CONSERVATIVE BALANCED PORTFOLIO (continued) | | |
| |
| SCHEDULE OF INVESTMENTS | | as of December 31, 2017 |
| | | | | | | | |
COMMON STOCKS
(continued) | | Shares | | | Value | |
Household Durables (continued) | |
Leggett & Platt, Inc.(a) | | | 7,400 | | | $ | 353,202 | |
Lennar Corp. (Class A Stock)(a) | | | 11,700 | | | | 739,908 | |
Mohawk Industries, Inc.* | | | 3,640 | | | | 1,004,276 | |
Newell Brands, Inc. | | | 27,414 | | | | 847,093 | |
Panasonic Corp. (Japan) | | | 7,800 | | | | 113,833 | |
Persimmon PLC (United Kingdom) | | | 11,972 | | | | 442,296 | |
PulteGroup, Inc.(a) | | | 14,622 | | | | 486,181 | |
Sony Corp. (Japan) | | | 12,500 | | | | 561,036 | |
Taylor Wimpey PLC (United Kingdom) | | | 11,771 | | | | 32,749 | |
Whirlpool Corp. | | | 4,026 | | | | 678,945 | |
| | | | | | | | |
| | | | | | | 6,635,358 | |
| | | | | | | | |
Household Products — 0.8% | |
Church & Dwight Co., Inc. | | | 13,400 | | | | 672,278 | |
Clorox Co. (The) | | | 7,300 | | | | 1,085,802 | |
Colgate-Palmolive Co. | | | 48,800 | | | | 3,681,960 | |
Henkel AG & Co. KGaA (Germany) | | | 372 | | | | 44,546 | |
Kimberly-Clark Corp. | | | 19,600 | | | | 2,364,936 | |
Procter & Gamble Co. (The) | | | 141,325 | | | | 12,984,941 | |
| | | | | | | | |
| | | | | | | 20,834,463 | |
| | | | | | | | |
Independent Power & Renewable Electricity Producers — 0.0% | |
AES Corp. | | | 34,000 | | | | 368,220 | |
NRG Energy, Inc. | | | 15,500 | | | | 441,440 | |
Uniper SE (Germany) | | | 723 | | | | 22,524 | |
| | | | | | | | |
| | | | | | | 832,184 | |
| | | | | | | | |
Industrial Conglomerates — 1.0% | |
3M Co. | | | 33,300 | | | | 7,837,821 | |
CK Hutchison Holdings Ltd. (Hong Kong) | | | 9,916 | | | | 124,250 | |
General Electric Co. | | | 479,830 | | | | 8,373,034 | |
Honeywell International, Inc. | | | 42,312 | | | | 6,488,968 | |
Jardine Matheson Holdings Ltd. (Hong Kong) | | | 5,500 | | | | 334,125 | |
Jardine Strategic Holdings Ltd. (Hong Kong) | | | 800 | | | | 31,664 | |
Roper Technologies, Inc. | | | 5,800 | | | | 1,502,200 | |
Siemens AG (Germany) | | | 490 | | | | 67,844 | |
| | | | | | | | |
| | | | | | | 24,759,906 | |
| | | | | | | | |
Insurance — 1.3% | |
Aflac, Inc. | | | 21,900 | | | | 1,922,382 | |
Ageas (Belgium) | | | 681 | | | | 33,266 | |
AIA Group Ltd. (Hong Kong) | | | 41,200 | | | | 350,433 | |
Allianz SE (Germany) | | | 1,629 | | | | 372,792 | |
Allstate Corp. (The) | | | 20,100 | | | | 2,104,671 | |
American International Group, Inc. | | | 49,839 | | | | 2,969,408 | |
Aon PLC | | | 14,100 | | | | 1,889,400 | |
Arthur J. Gallagher & Co. | | | 9,800 | | | | 620,144 | |
Assurant, Inc. | | | 3,000 | | | | 302,520 | |
AXA SA (France) | | | 6,965 | | | | 206,395 | |
Baloise Holding AG (Switzerland) | | | 176 | | | | 27,358 | |
Brighthouse Financial, Inc.* | | | 5,254 | | | | 308,095 | |
Chubb Ltd. | | | 25,786 | | | | 3,768,108 | |
Cincinnati Financial Corp. | | | 8,437 | | | | 632,522 | |
Direct Line Insurance Group PLC (United Kingdom) | | | 70,663 | | | | 363,616 | |
| | | | | | | | |
COMMON STOCKS
(continued) | | Shares | | | Value | |
Insurance (continued) | |
Everest Re Group Ltd. | | | 2,500 | | | $ | 553,150 | |
Hartford Financial Services Group, Inc. (The) | | | 19,900 | | | | 1,119,972 | |
Insurance Australia Group Ltd. (Australia) | | | 19,240 | | | | 108,365 | |
Legal & General Group PLC (United Kingdom) | | | 112,424 | | | | 413,897 | |
Lincoln National Corp. | | | 12,118 | | | | 931,511 | |
Loews Corp. | | | 15,875 | | | | 794,226 | |
Marsh & McLennan Cos., Inc. | | | 28,400 | | | | 2,311,476 | |
MetLife, Inc. | | | 58,900 | | | | 2,977,984 | |
Muenchener Rueckversicherungs-Gesellschaft AG in Muenchen (Germany) | | | 572 | | | | 123,523 | |
NN Group NV (Netherlands) | | | 1,140 | | | | 49,309 | |
Principal Financial Group, Inc. | | | 15,300 | | | | 1,079,568 | |
Progressive Corp. (The) | | | 32,300 | | | | 1,819,136 | |
Sampo OYJ (Finland) (Class A Stock) | | | 2,726 | | | | 149,608 | |
SCOR SE (France) | | | 8,497 | | | | 341,524 | |
Suncorp Group Ltd. (Australia) | | | 4,649 | | | | 50,108 | |
Swiss Life Holding AG (Switzerland)* | | | 982 | | | | 347,112 | |
Swiss Re AG (Switzerland) | | | 4,337 | | | | 405,599 | |
Torchmark Corp. | | | 6,225 | | | | 564,670 | |
Travelers Cos., Inc. (The) | | | 15,335 | | | | 2,080,039 | |
Unum Group | | | 12,610 | | | | 692,163 | |
Willis Towers Watson PLC | | | 7,540 | | | | 1,136,203 | |
XL Group Ltd. (Bermuda) | | | 14,000 | | | | 492,240 | |
Zurich Insurance Group AG (Switzerland) | | | 93 | | | | 28,276 | |
| | | | | | | | |
| | | | | | | 34,440,769 | |
| | | | | | | | |
Internet & Direct Marketing Retail — 1.4% | |
Amazon.com, Inc.* | | | 22,200 | | | | 25,962,234 | |
Expedia, Inc. | | | 6,950 | | | | 832,402 | |
Netflix, Inc.* | | | 23,950 | | | | 4,597,442 | |
Priceline Group, Inc. (The)* | | | 2,760 | | | | 4,796,162 | |
TripAdvisor, Inc.* | | | 6,150 | | | | 211,929 | |
| | | | | | | | |
| | | | | | | 36,400,169 | |
| | | | | | | | |
Internet Software & Services — 2.4% | |
Akamai Technologies, Inc.* | | | 9,400 | | | | 611,376 | |
Alphabet, Inc. (Class A Stock)* | | | 16,660 | | | | 17,549,644 | |
Alphabet, Inc. (Class C Stock)* | | | 16,823 | | | | 17,603,587 | |
eBay, Inc.* | | | 55,200 | | | | 2,083,248 | |
Facebook, Inc. (Class A Stock)* | | | 132,550 | | | | 23,389,773 | |
United Internet AG (Germany) | | | 451 | | | | 30,903 | |
VeriSign, Inc.*(a) | | | 5,100 | | | | 583,644 | |
| | | | | | | | |
| | | | | | | 61,852,175 | |
| | | | | | | | |
IT Services — 2.0% | |
Accenture PLC (Class A Stock) | | | 34,300 | | | | 5,250,987 | |
Alliance Data Systems Corp. | | | 2,740 | | | | 694,535 | |
Amadeus IT Group SA (Spain) | | | 6,083 | | | | 437,747 | |
Atos SE (France) | | | 354 | | | | 51,468 | |
Automatic Data Processing, Inc. | | | 24,700 | | | | 2,894,593 | |
Cognizant Technology Solutions Corp. (Class A Stock) | | | 32,700 | | | | 2,322,354 | |
SEE NOTES TO FINANCIAL STATEMENTS.
A6
| | | | | | |
| | CONSERVATIVE BALANCED PORTFOLIO (continued) | | |
| |
| SCHEDULE OF INVESTMENTS | | as of December 31, 2017 |
| | | | | | | | |
COMMON STOCKS
(continued) | | Shares | | | Value | |
IT Services (continued) | |
Computershare Ltd. (Australia) | | | 1,667 | | | $ | 21,120 | |
CSRA, Inc. | | | 8,200 | | | | 245,344 | |
DXC Technology Co. | | | 16,128 | | | | 1,530,547 | |
Fidelity National Information Services, Inc. | | | 18,800 | | | | 1,768,892 | |
Fiserv, Inc.* | | | 11,700 | | | | 1,534,221 | |
Gartner, Inc.* | | | 5,300 | | | | 652,695 | |
Global Payments, Inc. | | | 8,800 | | | | 882,112 | |
International Business Machines Corp. | | | 48,100 | | | | 7,379,502 | |
Mastercard, Inc. (Class A Stock) | | | 51,800 | | | | 7,840,448 | |
Paychex, Inc. | | | 18,100 | | | | 1,232,248 | |
PayPal Holdings, Inc.* | | | 63,000 | | | | 4,638,060 | |
Total System Services, Inc. | | | 9,696 | | | | 766,857 | |
Visa, Inc. (Class A Stock)(a) | | | 101,400 | | | | 11,561,628 | |
Western Union Co. (The)(a) | | | 25,210 | | | | 479,242 | |
| | | | | | | | |
| | | | | | | 52,184,600 | |
| | | | | | | | |
Leisure Products — 0.0% | |
Hasbro, Inc. | | | 6,300 | | | | 572,607 | |
Mattel, Inc.(a) | | | 16,051 | | | | 246,864 | |
| | | | | | | | |
| | | | | | | 819,471 | |
| | | | | | | | |
Life Sciences Tools & Services — 0.4% | |
Agilent Technologies, Inc. | | | 18,314 | | | | 1,226,489 | |
Illumina, Inc.* | | | 8,300 | | | | 1,813,467 | |
IQVIA Holdings, Inc.* | | | 8,600 | | | | 841,940 | |
Lonza Group AG (Switzerland)* | | | 56 | | | | 15,103 | |
Mettler-Toledo International, Inc.* | | | 1,450 | | | | 898,304 | |
PerkinElmer, Inc. | | | 6,600 | | | | 482,592 | |
QIAGEN NV* | | | 390 | | | | 12,164 | |
Thermo Fisher Scientific, Inc. | | | 22,200 | | | | 4,215,336 | |
Waters Corp.* | | | 4,600 | | | | 888,674 | |
| | | | | | | | |
| | | | | | | 10,394,069 | |
| | | | | | | | |
Machinery — 0.9% | |
Atlas Copco AB (Sweden) (Class A Stock) | | | 9,821 | | | | 423,836 | |
Atlas Copco AB (Sweden) (Class B Stock) | | | 1,000 | | | | 38,327 | |
Caterpillar, Inc. | | | 32,800 | | | | 5,168,624 | |
Cummins, Inc. | | | 8,800 | | | | 1,554,432 | |
Deere & Co. | | | 17,700 | | | | 2,770,227 | |
Dover Corp. | | | 9,000 | | | | 908,910 | |
Flowserve Corp.(a) | | | 7,200 | | | | 303,336 | |
Fortive Corp. | | | 17,150 | | | | 1,240,802 | |
Illinois Tool Works, Inc. | | | 17,200 | | | | 2,869,820 | |
IMI PLC (United Kingdom) | | | 998 | | | | 17,930 | |
Ingersoll-Rand PLC | | | 14,000 | | | | 1,248,660 | |
Komatsu Ltd. (Japan) | | | 7,200 | | | | 260,206 | |
Minebea Mitsumi, Inc. (Japan) | | | 1,400 | | | | 29,200 | |
PACCAR, Inc. | | | 19,243 | | | | 1,367,792 | |
Parker-Hannifin Corp. | | | 7,565 | | | | 1,509,823 | |
Pentair PLC (United Kingdom) | | | 9,577 | | | | 676,328 | |
Sandvik AB (Sweden) | | | 23,053 | | | | 403,536 | |
Schindler Holding AG (Switzerland) | | | 71 | | | | 16,055 | |
Schindler Holding AG (Switzerland) (Part. Cert.) | | | 148 | | | | 34,038 | |
SMC Corp. (Japan) | | | 200 | | | | 82,077 | |
| | | | | | | | |
COMMON STOCKS
(continued) | | Shares | | | Value | |
Machinery (continued) | |
Snap-on, Inc.(a) | | | 3,500 | | | $ | 610,050 | |
Stanley Black & Decker, Inc. | | | 8,697 | | | | 1,475,794 | |
Sumitomo Heavy Industries Ltd. (Japan) | | | 1,400 | | | | 58,990 | |
Volvo AB (Sweden) (Class B Stock) | | | 25,755 | | | | 479,607 | |
Xylem, Inc. | | | 10,400 | | | | 709,280 | |
Yangzijiang Shipbuilding Holdings Ltd. (China) | | | 36,500 | | | | 40,023 | |
| | | | | | | | |
| | | | | | | 24,297,703 | |
| | | | | | | | |
Marine — 0.0% | |
A.P. Moeller-Maersk A/S (Denmark) (Class A Stock) | | | 6 | | | | 9,996 | |
Kuehne + Nagel International AG (Switzerland) | | | 196 | | | | 34,676 | |
| | | | | | | | |
| | | | | | | 44,672 | |
| | | | | | | | |
Media — 1.4% | |
CBS Corp. (Class B Stock) | | | 20,034 | | | | 1,182,006 | |
Charter Communications, Inc. (Class A Stock)* | | | 11,080 | | | | 3,722,437 | |
Comcast Corp. (Class A Stock) | | | 260,680 | | | | 10,440,234 | |
Discovery Communications, Inc. (Class A Stock)*(a) | | | 8,500 | | | | 190,230 | |
Discovery Communications, Inc. (Class C Stock)* | | | 10,300 | | | | 218,051 | |
DISH Network Corp. (Class A Stock)* | | | 12,600 | | | | 601,650 | |
I-Cable Communications Ltd. (Hong Kong)* | | | 3,831 | | | | 112 | |
Interpublic Group of Cos., Inc. (The) | | | 21,031 | | | | 423,985 | |
News Corp. (Class A Stock) | | | 20,175 | | | | 327,037 | |
News Corp. (Class B Stock) | | | 4,800 | | | | 79,680 | |
Omnicom Group, Inc.(a) | | | 13,200 | | | | 961,356 | |
RTL Group SA (Luxembourg) | | | 287 | | | | 23,039 | |
Scripps Networks Interactive, Inc. (Class A Stock) | | | 5,400 | | | | 461,052 | |
Time Warner, Inc. | | | 43,166 | | | | 3,948,394 | |
Toho Co. Ltd. (Japan) | | | 4,000 | | | | 138,460 | |
Twenty-First Century Fox, Inc. (Class A Stock) | | | 57,700 | | | | 1,992,381 | |
Twenty-First Century Fox, Inc. (Class B Stock) | | | 24,300 | | | | 829,116 | |
Viacom, Inc. (Class B Stock) | | | 18,634 | | | | 574,113 | |
Walt Disney Co. (The) | | | 84,900 | | | | 9,127,599 | |
| | | | | | | | |
| | | | | | | 35,240,932 | |
| | | | | | | | |
Metals & Mining — 0.2% | |
Anglo American PLC (United Kingdom) | | | 22,190 | | | | 461,528 | |
ArcelorMittal (Luxembourg)* | | | 14,593 | | | | 473,443 | |
BHP Billiton Ltd. (Australia) | | | 11,736 | | | | 269,587 | |
BHP Billiton PLC (Australia) | | | 7,571 | | | | 153,088 | |
BlueScope Steel Ltd. (Australia) | | | 2,075 | | | | 24,714 | |
Boliden AB (Sweden) | | | 986 | | | | 33,719 | |
Fortescue Metals Group Ltd. (Australia) | | | 48,108 | | | | 182,058 | |
Freeport-McMoRan, Inc.* | | | 71,888 | | | | 1,362,997 | |
JFE Holdings, Inc. (Japan) | | | 3,000 | | | | 71,692 | |
SEE NOTES TO FINANCIAL STATEMENTS.
A7
| | | | | | |
| | CONSERVATIVE BALANCED PORTFOLIO (continued) | | |
| |
| SCHEDULE OF INVESTMENTS | | as of December 31, 2017 |
| | | | | | | | |
COMMON STOCKS
(continued) | | Shares | | | Value | |
Metals & Mining (continued) | |
Mitsubishi Materials Corp. (Japan) | | | 200 | | | $ | 7,097 | |
Newmont Mining Corp. | | | 28,800 | | | | 1,080,576 | |
Nippon Steel & Sumitomo Metal Corp. (Japan) | | | 2,900 | | | | 74,093 | |
Nucor Corp. | | | 18,100 | | | | 1,150,798 | |
Rio Tinto PLC (United Kingdom) | | | 2,769 | | | | 145,255 | |
South32 Ltd. (Australia) | | | 18,712 | | | | 50,720 | |
voestalpine AG (Austria) | | | 5,189 | | | | 309,798 | |
| | | | | | | | |
| | | | | | | 5,851,163 | |
| | | | | | | | |
Multi-Utilities — 0.5% | |
AGL Energy Ltd. (Australia) | | | 2,131 | | | | 40,382 | |
Ameren Corp. | | | 13,900 | | | | 819,961 | |
CenterPoint Energy, Inc. | | | 23,600 | | | | 669,296 | |
CMS Energy Corp. | | | 16,000 | | | | 756,800 | |
Consolidated Edison, Inc. | | | 17,300 | | | | 1,469,635 | |
Dominion Energy, Inc. | | | 35,732 | | | | 2,896,436 | |
DTE Energy Co. | | | 10,200 | | | | 1,116,492 | |
National Grid PLC (United Kingdom) | | | 8,177 | | | | 96,395 | |
NiSource, Inc. | | | 17,300 | | | | 444,091 | |
Public Service Enterprise Group, Inc. | | | 28,300 | | | | 1,457,450 | |
SCANA Corp. | | | 8,400 | | | | 334,152 | |
Sempra Energy | | | 14,219 | | | | 1,520,295 | |
WEC Energy Group, Inc. | | | 17,913 | | | | 1,189,961 | |
| | | | | | | | |
| | | | | | | 12,811,346 | |
| | | | | | | | |
Multiline Retail — 0.2% | |
Dollar General Corp. | | | 14,300 | | | | 1,330,043 | |
Dollar Tree, Inc.* | | | 13,465 | | | | 1,444,929 | |
Don Quijote Holdings Co. Ltd. (Japan) | | | 400 | | | | 20,852 | |
J. Front Retailing Co. Ltd. (Japan) | | | 10,000 | | | | 187,922 | |
Kohl’s Corp.(a) | | | 9,100 | | | | 493,493 | |
Macy’s, Inc.(a) | | | 16,174 | | | | 407,423 | |
Next PLC (United Kingdom) | | | 882 | | | | 53,757 | |
Nordstrom, Inc.(a) | | | 6,100 | | | | 289,018 | |
Target Corp. | | | 30,300 | | | | 1,977,075 | |
| | | | | | | | |
| | | | | | | 6,204,512 | |
| | | | | | | | |
Oil, Gas & Consumable Fuels — 2.7% | |
Anadarko Petroleum Corp. | | | 30,654 | | | | 1,644,281 | |
Andeavor | | | 8,000 | | | | 914,720 | |
Apache Corp.(a) | | | 20,514 | | | | 866,101 | |
BP PLC (United Kingdom) | | | 62,368 | | | | 437,528 | |
Cabot Oil & Gas Corp. | | | 25,600 | | | | 732,160 | |
Caltex Australia Ltd. (Australia) | | | 943 | | | | 24,981 | |
Chesapeake Energy Corp.*(a) | | | 40,100 | | | | 158,796 | |
Chevron Corp. | �� | | 105,622 | | | | 13,222,818 | |
Cimarex Energy Co. | | | 5,200 | | | | 634,452 | |
Concho Resources, Inc.* | | | 8,500 | | | | 1,276,870 | |
ConocoPhillips | | | 67,477 | | | | 3,703,813 | |
Devon Energy Corp. | | | 28,400 | | | | 1,175,760 | |
Enagas SA (Spain) | | | 833 | | | | 23,823 | |
EOG Resources, Inc. | | | 32,000 | | | | 3,453,120 | |
EQT Corp. | | | 12,800 | | | | 728,576 | |
Exxon Mobil Corp. | | | 235,499 | | | | 19,697,136 | |
Galp Energia SGPS SA (Portugal) | | | 4,071 | | | | 74,795 | |
| | | | | | | | |
COMMON STOCKS
(continued) | | Shares | | | Value | |
Oil, Gas & Consumable Fuels (continued) | |
Hess Corp.(a) | | | 15,100 | | | $ | 716,797 | |
JXTG Holdings, Inc. (Japan) | | | 16,000 | | | | 102,821 | |
Kinder Morgan, Inc. | | | 106,098 | | | | 1,917,191 | |
Marathon Oil Corp. | | | 45,882 | | | | 776,782 | |
Marathon Petroleum Corp. | | | 28,082 | | | | 1,852,850 | |
Neste Oyj (Finland) | | | 457 | | | | 29,253 | |
Newfield Exploration Co.* | | | 9,800 | | | | 308,994 | |
Noble Energy, Inc. | | | 25,800 | | | | 751,812 | |
Occidental Petroleum Corp. | | | 42,400 | | | | 3,123,184 | |
OMV AG (Austria) | | | 6,056 | | | | 383,186 | |
ONEOK, Inc. | | | 20,800 | | | | 1,111,760 | |
Phillips 66 | | | 23,838 | | | | 2,411,214 | |
Pioneer Natural Resources Co. | | | 9,650 | | | | 1,668,003 | |
Range Resources Corp. | | | 10,300 | | | | 175,718 | |
Repsol SA (Spain) | | | 23,631 | | | | 417,238 | |
Royal Dutch Shell PLC (Netherlands) (Class A Stock) | | | 15,815 | | | | 527,954 | |
Royal Dutch Shell PLC (Netherlands) (Class B Stock) | | | 13,687 | | | | 460,896 | |
TOTAL SA (France) | | | 8,548 | | | | 471,848 | |
Valero Energy Corp. | | | 24,500 | | | | 2,251,795 | |
Williams Cos., Inc. (The) | | | 45,100 | | | | 1,375,099 | |
Woodside Petroleum Ltd. (Australia) | | | 648 | | | | 16,672 | |
| | | | | | | | |
| | | | | | | 69,620,797 | |
| | | | | | | | |
Paper & Forest Products — 0.0% | |
UPM-Kymmene OYJ (Finland) | | | 1,905 | | | | 59,140 | |
| | | | | | | | |
Personal Products — 0.1% | |
Coty, Inc. (Class A Stock)(a) | | | 24,000 | | | | 477,360 | |
Estee Lauder Cos., Inc. (The) (Class A Stock) | | | 12,700 | | | | 1,615,948 | |
Kao Corp. (Japan) | | | 1,800 | | | | 121,626 | |
Unilever NV (United Kingdom), CVA | | | 10,600 | | | | 596,810 | |
Unilever PLC (United Kingdom) | | | 4,700 | | | | 260,690 | |
| | | | | | | | |
| | | | | | | 3,072,434 | |
| | | | | | | | |
Pharmaceuticals — 2.4% | |
Allergan PLC | | | 18,575 | | | | 3,038,498 | |
Astellas Pharma, Inc. (Japan) | | | 7,500 | | | | 95,275 | |
AstraZeneca PLC (United Kingdom) | | | 4,556 | | | | 314,389 | |
Bayer AG (Germany) | | | 3,649 | | | | 453,435 | |
Bristol-Myers Squibb Co. | | | 90,870 | | | | 5,568,514 | |
Daiichi Sankyo Co. Ltd. (Japan) | | | 2,100 | | | | 54,604 | |
Eli Lilly & Co. | | | 53,700 | | | | 4,535,502 | |
GlaxoSmithKline PLC (United Kingdom) | | | 6,410 | | | | 113,516 | |
Johnson & Johnson | | | 149,148 | | | | 20,838,958 | |
Merck & Co., Inc. | | | 151,633 | | | | 8,532,389 | |
Mitsubishi Tanabe Pharma Corp. (Japan) | | | 800 | | | | 16,488 | |
Mylan NV* | | | 29,300 | | | | 1,239,683 | |
Novartis AG (Switzerland) | | | 8,700 | | | | 732,127 | |
Novo Nordisk A/S (Denmark) (Class B Stock) | | | 6,660 | | | | 357,878 | |
Orion OYJ (Finland) (Class B Stock) | | | 375 | | | | 13,982 | |
SEE NOTES TO FINANCIAL STATEMENTS.
A8
| | | | | | |
| | CONSERVATIVE BALANCED PORTFOLIO (continued) | | |
| |
| SCHEDULE OF INVESTMENTS | | as of December 31, 2017 |
| | | | | | | | |
COMMON STOCKS
(continued) | | Shares | | | Value | |
Pharmaceuticals (continued) | |
Perrigo Co. PLC | | | 7,400 | | | $ | 644,984 | |
Pfizer, Inc. | | | 330,770 | | | | 11,980,489 | |
Recordati SpA (Italy) | | | 7,790 | | | | 346,183 | |
Roche Holding AG (Switzerland) | | | 3,854 | | | | 974,505 | |
Sanofi (France) | | | 7,238 | | | | 623,132 | |
Shionogi & Co. Ltd. (Japan) | | | 1,100 | | | | 59,438 | |
Zoetis, Inc. | | | 27,100 | | | | 1,952,284 | |
| | | | | | | | |
| | | | | | | 62,486,253 | |
| | | | | | | | |
Professional Services — 0.2% | |
Equifax, Inc. | | | 7,000 | | | | 825,440 | |
Experian PLC (United Kingdom) | | | 6,261 | | | | 138,009 | |
IHS Markit Ltd.* | | | 19,800 | | | | 893,970 | |
Intertek Group PLC (United Kingdom) | | | 591 | | | | 41,331 | |
Nielsen Holdings PLC(a) | | | 18,700 | | | | 680,680 | |
Recruit Holdings Co. Ltd. (Japan) | | | 3,500 | | | | 86,905 | |
Robert Half International, Inc. | | | 7,500 | | | | 416,550 | |
Verisk Analytics, Inc.* | | | 8,700 | | | | 835,200 | |
| | | | | | | | |
| | | | | | | 3,918,085 | |
| | | | | | | | |
Real Estate Management & Development — 0.1% | |
CBRE Group, Inc. (Class A Stock)* | | | 16,200 | | | | 701,622 | |
CK Asset Holdings Ltd. (Hong Kong) | | | 10,000 | | | | 87,172 | |
Daito Trust Construction Co. Ltd. (Japan) | | | 400 | | | | 81,493 | |
Daiwa House Industry Co. Ltd. (Japan) | | | 6,600 | | | | 253,093 | |
Henderson Land Development Co. Ltd. (Hong Kong) | | | 4,400 | | | | 28,930 | |
Kerry Properties Ltd. (Hong Kong) | | | 78,500 | | | | 352,645 | |
Sino Land Co. Ltd. (Hong Kong) | | | 12,000 | | | | 21,229 | |
Sumitomo Realty & Development Co. Ltd. (Japan) | | | 1,000 | | | | 32,819 | |
Wharf Holdings Ltd. (The) (Hong Kong) | | | 5,000 | | | | 17,242 | |
| | | | | | | | |
| | | | | | | 1,576,245 | |
| | | | | | | | |
Road & Rail — 0.5% | |
Central Japan Railway Co. (Japan) | | | 2,200 | | | | 393,713 | |
CSX Corp. | | | 50,600 | | | | 2,783,506 | |
DSV A/S (Denmark) | | | 687 | | | | 54,057 | |
East Japan Railway Co. (Japan) | | | 1,200 | | | | 117,022 | |
JB Hunt Transport Services, Inc. | | | 4,800 | | | | 551,904 | |
Kansas City Southern | | | 6,200 | | | | 652,364 | |
Norfolk Southern Corp. | | | 16,000 | | | | 2,318,400 | |
Union Pacific Corp. | | | 44,400 | | | | 5,954,040 | |
| | | | | | | | |
| | | | | | | 12,825,006 | |
| | | | | | | | |
Semiconductors & Semiconductor Equipment — 1.9% | |
Advanced Micro Devices, Inc.*(a) | | | 40,300 | | | | 414,284 | |
Analog Devices, Inc. | | | 20,258 | | | | 1,803,570 | |
Applied Materials, Inc. | | | 59,100 | | | | 3,021,192 | |
ASM Pacific Technology Ltd. (Hong Kong) | | | 1,000 | | | | 13,873 | |
ASML Holding NV (Netherlands) | | | 1,505 | | | | 261,656 | |
Broadcom Ltd. | | | 22,780 | | | | 5,852,182 | |
Intel Corp. | | | 260,400 | | | | 12,020,064 | |
| | | | | | | | |
COMMON STOCKS
(continued) | | Shares | | | Value | |
Semiconductors & Semiconductor Equipment (continued) | |
KLA-Tencor Corp. | | | 9,000 | | | $ | 945,630 | |
Lam Research Corp. | | | 9,150 | | | | 1,684,241 | |
Microchip Technology, Inc.(a) | | | 13,000 | | | | 1,142,440 | |
Micron Technology, Inc.* | | | 62,700 | | | | 2,578,224 | |
NVIDIA Corp. | | | 33,250 | | | | 6,433,875 | |
Qorvo, Inc.* | | | 7,507 | | | | 499,966 | |
QUALCOMM, Inc. | | | 81,900 | | | | 5,243,238 | |
Skyworks Solutions, Inc. | | | 10,500 | | | | 996,975 | |
STMicroelectronics NV (Switzerland) | | | 2,331 | | | | 50,848 | |
Texas Instruments, Inc. | | | 54,900 | | | | 5,733,756 | |
Tokyo Electron Ltd. (Japan) | | | 2,600 | | | | 469,013 | |
Xilinx, Inc. | | | 14,100 | | | | 950,622 | |
| | | | | | | | |
| | | | | | | 50,115,649 | |
| | | | | | | | |
Software — 2.6% | |
Activision Blizzard, Inc. | | | 41,600 | | | | 2,634,112 | |
Adobe Systems, Inc.* | | | 27,400 | | | | 4,801,576 | |
ANSYS, Inc.* | | | 4,800 | | | | 708,432 | |
Autodesk, Inc.* | | | 12,100 | | | | 1,268,443 | |
CA, Inc. | | | 17,264 | | | | 574,546 | |
Cadence Design Systems, Inc.* | | | 14,900 | | | | 623,118 | |
Check Point Software Technologies Ltd. (Israel)*(a) | | | 2,200 | | | | 227,964 | |
Citrix Systems, Inc.* | | | 8,000 | | | | 704,000 | |
Electronic Arts, Inc.* | | | 17,100 | | | | 1,796,526 | |
Intuit, Inc. | | | 13,800 | | | | 2,177,364 | |
Microsoft Corp. | | | 429,200 | | | | 36,713,768 | |
Nexon Co. Ltd. (Japan)* | | | 8,500 | | | | 246,502 | |
Oracle Corp. | | | 168,700 | | | | 7,976,136 | |
Red Hat, Inc.* | | | 10,100 | | | | 1,213,010 | |
Sage Group PLC (The) (United Kingdom) | | | 2,669 | | | | 28,693 | |
salesforce.com, inc.* | | | 37,900 | | | | 3,874,517 | |
SAP SE (Germany) | | | 276 | | | | 30,878 | |
Symantec Corp. | | | 32,878 | | | | 922,557 | |
Synopsys, Inc.* | | | 8,700 | | | | 741,588 | |
| | | | | | | | |
| | | | | | | 67,263,730 | |
| | | | | | | | |
Specialty Retail — 1.1% | |
Advance Auto Parts, Inc.(a) | | | 4,300 | | | | 428,667 | |
AutoZone, Inc.* | | | 1,600 | | | | 1,138,192 | |
Best Buy Co., Inc. | | | 14,925 | | | | 1,021,915 | |
CarMax, Inc.* | | | 10,500 | | | | 673,365 | |
Fast Retailing Co. Ltd. (Japan) | | | 200 | | | | 79,523 | |
Foot Locker, Inc. | | | 6,400 | | | | 300,032 | |
Gap, Inc. (The)(a) | | | 12,200 | | | | 415,532 | |
Home Depot, Inc. (The) | | | 65,350 | | | | 12,385,785 | |
L Brands, Inc. | | | 13,806 | | | | 831,397 | |
Lowe’s Cos., Inc. | | | 46,800 | | | | 4,349,592 | |
O’Reilly Automotive, Inc.* | | | 4,900 | | | | 1,178,646 | |
Ross Stores, Inc. | | | 21,400 | | | | 1,717,350 | |
Signet Jewelers Ltd.(a) | | | 3,400 | | | | 192,270 | |
Tiffany & Co. | | | 5,720 | | | | 594,594 | |
TJX Cos., Inc. (The) | | | 35,300 | | | | 2,699,038 | |
Tractor Supply Co. | | | 7,300 | | | | 545,675 | |
Ulta Beauty, Inc.* | | | 3,300 | | | | 738,078 | |
| | | | | | | | |
| | | | | | | 29,289,651 | |
| | | | | | | | |
SEE NOTES TO FINANCIAL STATEMENTS.
A9
| | | | | | |
| | CONSERVATIVE BALANCED PORTFOLIO (continued) | | |
| |
| SCHEDULE OF INVESTMENTS | | as of December 31, 2017 |
| | | | | | | | |
COMMON STOCKS
(continued) | | Shares | | | Value | |
Technology Hardware, Storage & Peripherals — 2.1% | |
Apple, Inc. | | | 286,590 | | | $ | 48,499,626 | |
Canon, Inc. (Japan)(a) | | | 10,200 | | | | 380,033 | |
FUJIFILM Holdings Corp. (Japan) | | | 1,500 | | | | 61,207 | |
Hewlett Packard Enterprise Co. | | | 90,948 | | | | 1,306,013 | |
HP, Inc. | | | 92,548 | | | | 1,944,433 | |
NetApp, Inc. | | | 15,200 | | | | 840,864 | |
Seagate Technology PLC(a) | | | 15,700 | | | | 656,888 | |
Western Digital Corp. | | | 16,503 | | | | 1,312,484 | |
Xerox Corp. | | | 12,090 | | | | 352,424 | |
| | | | | | | | |
| | | | | | | 55,353,972 | |
| | | | | | | | |
Textiles, Apparel & Luxury Goods — 0.4% | |
adidas AG (Germany) | | | 669 | | | | 133,793 | |
Hanesbrands, Inc.(a) | | | 18,500 | | | | 386,835 | |
Kering (France) | | | 421 | | | | 198,175 | |
LVMH Moet Hennessy Louis Vuitton SE (France) | | | 2,122 | | | | 622,817 | |
Michael Kors Holdings Ltd.* | | | 8,300 | | | | 522,485 | |
NIKE, Inc. (Class B Stock) | | | 72,800 | | | | 4,553,640 | |
PVH Corp. | | | 4,600 | | | | 631,166 | |
Ralph Lauren Corp.(a) | | | 3,400 | | | | 352,546 | |
Swatch Group AG (The) (Switzerland) | | | 363 | | | | 27,687 | |
Tapestry, Inc. | | | 16,100 | | | | 712,103 | |
Under Armour, Inc. (Class A Stock)*(a) | | | 9,600 | | | | 138,528 | |
Under Armour, Inc. (Class C Stock)*(a) | | | 9,474 | | | | 126,194 | |
VF Corp. | | | 18,200 | | | | 1,346,800 | |
| | | | | | | | |
| | | | | | | 9,752,769 | |
| | | | | | | | |
Tobacco — 0.7% | |
Altria Group, Inc. | | | 106,400 | | | | 7,598,024 | |
British American Tobacco PLC (United Kingdom) | | | 5,578 | | | | 377,065 | |
Imperial Brands PLC (United Kingdom) | | | 3,545 | | | | 151,210 | |
Japan Tobacco, Inc. (Japan)(a) | | | 4,000 | | | | 128,813 | |
Philip Morris International, Inc. | | | 86,100 | | | | 9,096,465 | |
Swedish Match AB (Sweden) | | | 9,492 | | | | 373,906 | |
| | | | | | | | |
| | | | | | | 17,725,483 | |
| | | | | | | | |
Trading Companies & Distributors — 0.1% | |
Fastenal Co.(a) | | | 16,500 | | | | 902,385 | |
ITOCHU Corp. (Japan) | | | 24,400 | | | | 454,853 | |
Marubeni Corp. (Japan) | | | 25,800 | | | | 186,526 | |
Mitsubishi Corp. (Japan) | | | 10,000 | | | | 275,738 | |
Mitsui & Co. Ltd. (Japan) | | | 6,700 | | | | 108,697 | |
Sumitomo Corp. (Japan) | | | 17,700 | | | | 300,223 | |
Toyota Tsusho Corp. (Japan) | | | 700 | | | | 28,121 | |
United Rentals, Inc.* | | | 4,900 | | | | 842,359 | |
W.W. Grainger, Inc.(a) | | | 2,900 | | | | 685,125 | |
| | | | | | | | |
| | | | | | | 3,784,027 | |
| | | | | | | | |
Transportation Infrastructure — 0.0% | |
Abertis Infraestructuras SA (Spain) | | | 2,121 | | | | 47,192 | |
Fraport AG Frankfurt Airport Services Worldwide (Germany) | | | 524 | | | | 57,555 | |
Sydney Airport (Australia) | | | 11,496 | | | | 63,080 | |
| | | | | | | | |
COMMON STOCKS
(continued) | | Shares | | | Value | |
Transportation Infrastructure (continued) | |
Transurban Group (Australia) | | | 7,516 | | | $ | 72,740 | |
| | | | | | | | |
| | | | | | | 240,567 | |
| | | | | | | | |
Water Utilities — 0.0% | |
American Water Works Co., Inc. | | | 10,300 | | | | 942,347 | |
| | | | | | | | |
Wireless Telecommunication Services — 0.0% | |
KDDI Corp. (Japan) | | | 18,600 | | | | 462,015 | |
Vodafone Group PLC (United Kingdom) | | | 94,634 | | | | 299,137 | |
| | | | | | | | |
| | | | | | | 761,152 | |
| | | | | | | | |
TOTAL COMMON STOCKS
(cost $466,040,976) | | | | | | | 1,322,814,216 | |
| | | | | | | | |
| PREFERRED STOCKS — 0.1% | |
Automobiles — 0.0% | |
Bayerische Motoren Werke AG (Germany) (PRFC) | | | 212 | | | | 18,917 | |
Volkswagen AG (PRFC) | | | 2,621 | | | | 520,616 | |
| | | | | | | | |
| | | | | | | 539,533 | |
| | | | | | | | |
Banks — 0.0% | |
Citigroup Capital XIII 7.748%, (Capital Security, fixed to floating preferred)(a) | | | 20,000 | | | | 549,600 | |
| | | | | | | | |
Capital Markets — 0.1% | |
State Street Corp. 5.350%, (Capital Security, fixed to floating preferred) | | | 30,000 | | | | 813,600 | |
| | | | | | | | |
Household Products — 0.0% | |
Henkel AG & Co. KGaA (PRFC) | | | 647 | | | | 85,440 | |
| | | | | | | | |
TOTAL PREFERRED STOCKS
(cost $1,692,159) | | | | | | | 1,988,173 | |
| | | | | | | | |
| UNAFFILIATED EXCHANGE TRADED FUNDS — 0.3% | |
iShares Core S&P 500 ETF | | | 24,500 | | | | 6,586,825 | |
iShares MSCI EAFE ETF | | | 8,562 | | | | 601,994 | |
| | | | | | | | |
TOTAL UNAFFILIATED EXCHANGE TRADED FUNDS
(cost $6,786,378) | | | | | | | 7,188,819 | |
| | | | | | | | |
SEE NOTES TO FINANCIAL STATEMENTS.
A10
| | | | | | |
| | CONSERVATIVE BALANCED PORTFOLIO (continued) | | |
| |
| SCHEDULE OF INVESTMENTS | | as of December 31, 2017 |
| | | | | | | | | | | | | | | | | | |
| ASSET-BACKED SECURITIES — 5.7% | | Interest
Rate | | | Maturity
Date | | | Principal
Amount
(000)# | | | Value | |
Automobiles — 1.7% | |
AmeriCredit Automobile Receivables Trust, Series 2016-2, Class A2B, 1 Month LIBOR + 0.700% | | | 2.107% | (c) | | | 10/08/19 | | | | | | 297 | | | $ | 296,922 | |
AmeriCredit Automobile Receivables Trust, Series 2016-3, Class A2B, 1 Month LIBOR + 0.560% | | | 1.967% | (c) | | | 11/08/19 | | | | | | 166 | | | | 166,247 | |
AmeriCredit Automobile Receivables Trust, Series 2016-4, Class C | | | 2.410% | | | | 07/08/22 | | | | | | 800 | | | | 794,950 | |
AmeriCredit Automobile Receivables Trust, Series 2017-3, Class C | | | 2.690% | | | | 06/19/23 | | | | | | 750 | | | | 748,322 | |
Americredit Automobile Receivables Trust, Series 2017-4, Class C | | | 2.600% | | | | 09/18/23 | | | | | | 1,500 | | | | 1,495,197 | |
Avis Budget Rental Car Funding AESOP LLC, Series 2013-1A, Class A, 144A | | | 1.920% | | | | 09/20/19 | | | | | | 1,475 | | | | 1,472,746 | |
Avis Budget Rental Car Funding AESOP LLC, Series 2015-1A, Class A, 144A | | | 2.500% | | | | 07/20/21 | | | | | | 2,800 | | | | 2,797,086 | |
Avis Budget Rental Car Funding AESOP LLC, Series 2015-2A, Class A, 144A | | | 2.630% | | | | 12/20/21 | | | | | | 3,200 | | | | 3,193,992 | |
Enterprise Fleet Financing LLC, Series 2017-1, Class A2, 144A | | | 2.130% | | | | 07/20/22 | | | | | | 2,544 | | | | 2,544,076 | |
Enterprise Fleet Financing LLC, Series 2017-2, Class A2, 144A | | | 1.970% | | | | 01/20/23 | | | | | | 1,700 | | | | 1,696,590 | |
Ford Credit Auto Owner Trust, Series 2016-2, Class A, 144A | | | 2.030% | | | | 12/15/27 | | | | | | 2,600 | | | | 2,562,444 | |
Ford Credit Auto Owner Trust, Series 2017-1, Class A, 144A | | | 2.620% | | | | 08/15/28 | | | | | | 4,400 | | | | 4,402,630 | |
Ford Credit Auto Owner Trust, Series 2017-2, Class A, 144A | | | 2.360% | | | | 03/15/29 | | | | | | 4,200 | | | | 4,161,899 | |
Ford Credit Floorplan Master Owner Trust, Series 2017-3, Class A | | | 2.480% | | | | 09/15/24 | | | | | | 3,300 | | | | 3,281,846 | |
GMF Floorplan Owner Revolving Trust, Series 2015-1, Class A2, 144A, 1 Month LIBOR + 0.500% | | | 1.977% | (c) | | | 05/15/20 | | | | | | 1,600 | | | | 1,602,059 | |
GMF Floorplan Owner Revolving Trust, Series 2016-1, Class A2, 144A, 1 Month LIBOR + 0.850% | | | 2.327% | (c) | | | 05/17/21 | | | | | | 1,700 | | | | 1,714,078 | |
Hertz Vehicle Financing II LP, Series 2016-1A, Class A, 144A | | | 2.320% | | | | 03/25/20 | | | | | | 2,400 | | | | 2,391,926 | |
OneMain Direct Auto Receivables Trust, Series 2016-1A, Class A, 144A | | | 2.040% | | | | 01/15/21 | | | | | | 197 | | | | 196,871 | |
OneMain Direct Auto Receivables Trust, Series 2017-1A, Class A, 144A | | | 2.160% | | | | 10/15/20 | | | | | | 5,700 | | | | 5,683,017 | |
OneMain Direct Auto Receivables Trust, Series 2017-2A, Class B, 144A | | | 2.550% | | | | 11/14/23 | | | | | | 2,300 | | | | 2,297,767 | |
OneMain Direct Auto Receivables Trust, Series 2017-2A, Class C, 144A | | | 2.820% | | | | 07/15/24 | | | | | | 600 | | | | 598,576 | |
| | | | | | | | | | | | | | | | | | |
| | | | | | | | | | | | | | | | | 44,099,241 | |
| | | | | | | | | | | | | | | | | | |
Collateralized Loan Obligations — 1.7% | |
ALM Ltd. (Cayman Islands), Series 2015-12A, Class A1R, 144A, 3 Month LIBOR + 1.050% | | | 2.409% | (c) | | | 04/16/27 | | | | | | 1,000 | | | | 1,002,249 | |
Anchorage Capital CLO Ltd. (Cayman Islands), Series 2014-3A, Class A1R, 144A, 3 Month LIBOR + 1.430% | | | 2.808% | (c) | | | 04/28/26 | | | | | | 400 | | | | 400,763 | |
Apidos CLO (Cayman Islands), Series 2014-17A, Class A1R, 144A, 3 Month LIBOR + 1.310% | | | 2.663% | (c) | | | 04/17/26 | | | | | | 420 | | | | 421,652 | |
ArrowMark Colorado Holdings (Cayman Islands), Series 2017-6A, Class A1, 144A, 3 Month LIBOR + 1.280% | | | 2.639% | (c) | | | 07/15/29 | | | | | | 500 | | | | 503,695 | |
Battalion CLO Ltd. (Cayman Islands), Series 2013-4A, Class A1R, 144A, 3 Month LIBOR + 1.140% | | | 2.503% | (c) | | | 10/22/25 | | | | | | 250 | | | | 250,196 | |
Battalion CLO Ltd. (Cayman Islands), Series 2015-8A, Class A1R, 144A, 3 Month LIBOR + 1.340% | | | 2.694% | (c) | | | 07/18/30 | | | | | | 1,000 | | | | 1,006,905 | |
Benefit Street Partners CLO Ltd. (Cayman Islands), Series 2013-IIA, Class A1R, 144A, 3 Month LIBOR + 1.250% | | | 2.609% | (c) | | | 07/15/29 | | | | | | 1,000 | | | | 1,006,436 | |
Brookside Mill CLO Ltd. (Cayman Islands), Series 2013-1A, Class A1, 144A, 3 Month LIBOR + 1.150% | | | 2.503% | (c) | | | 04/17/25 | | | | | | 2,034 | | | | 2,035,697 | |
Canyon Capital CLO Ltd. (Cayman Islands), Series 2015-1A, Class AS, 144A, 3 Month LIBOR + 1.250% | | | 2.609% | (c) | | | 04/15/29 | | | | | | 2,500 | | | | 2,514,162 | |
Carlyle Global Market Strategies CLO Ltd. (Cayman Islands), Series 2014-3A, Class A1AR, 144A, 3 Month LIBOR + 1.150% | | | 2.524% | (c) | | | 07/27/26 | | | | | | 750 | | | | 753,864 | |
SEE NOTES TO FINANCIAL STATEMENTS.
A11
| | | | | | |
| | CONSERVATIVE BALANCED PORTFOLIO (continued) | | |
| |
| SCHEDULE OF INVESTMENTS | | as of December 31, 2017 |
| | | | | | | | | | | | | | | | | | |
ASSET-BACKED SECURITIES
(continued) | | Interest
Rate | | | Maturity
Date | | | Principal
Amount
(000)# | | | Value | |
Collateralized Loan Obligations (continued) | |
Elevation CLO Ltd. (Cayman Islands), Series 2015-4A, Class A, 144A, 3 Month LIBOR + 1.550% | | | 2.904% | (c) | | | 04/18/27 | | | | | | 1,000 | | | $ | 1,009,534 | |
Highbridge Loan Management Ltd. (Cayman Islands), Series 2015-6A, Class A, 144A, 3 Month LIBOR + 1.450% | | | 2.841% | (c) | | | 05/05/27 | | | | | | 250 | | | | 250,373 | |
ICG US CLO Ltd. (Cayman Islands), Series 2017-2A, Class A1, 144A, 3 Month LIBOR + 1.280% | | | 2.597% | (c) | | | 10/23/29 | | | | | | 1,250 | | | | 1,258,509 | |
Jackson Mill CLO Ltd. (Cayman Islands), Series 2015-1A, Class A, 144A, 3 Month LIBOR + 1.540% | | | 2.899% | (c) | | | 04/15/27 | | | | | | 250 | | | | 250,288 | |
KVK CLO Ltd. (Cayman Islands), Series 2014-3A, Class AR, 144A, 3 Month LIBOR + 1.200% | | | 2.559% | (c) | | | 10/15/26 | | | | | | 2,500 | | | | 2,508,424 | |
Magnetite Ltd. (Cayman Islands), Series 2014-11A, Class A1R, 144A, 3 Month LIBOR + 1.120% | | | 2.474% | (c) | | | 01/18/27 | | | | | | 2,000 | | | | 2,005,804 | |
Mill Creek CLO Ltd. (Cayman Islands), Series 2016-1A, Class A, 144A, 3 Month LIBOR + 1.750% | | | 3.113% | (c) | | | 04/20/28 | | | | | | 1,250 | | | | 1,257,141 | |
OZLM Ltd. (Cayman Islands), Series 2015-11A, Class A1R, 144A, 3 Month LIBOR + 1.250% | | | 2.628% | (c) | | | 10/30/30 | | | | | | 750 | | | | 756,103 | |
Palmer Square CLO Ltd. (Cayman Islands), Series 2015-1A, Class A1R, 144A, 3 Month LIBOR + 1.300% | | | 2.741% | (c) | | | 05/21/29 | | | | | | 2,000 | | | | 2,010,179 | |
Park Avenue Institutional Advisers CLO Ltd. (Cayman Islands), Series 2017-1A, Class A1, 144A, 3 Month LIBOR + 1.220% | | | 2.633% | (c) | | | 11/14/29 | | | | | | 500 | | | | 501,723 | |
Shackleton CLO Ltd. (Cayman Islands), Series 2014-5A, Class AR, 144A, 3 Month LIBOR + 1.140% | | | 2.532% | (c) | | | 05/07/26 | | | | | | 2,500 | | | | 2,503,829 | |
Sound Point CLO Ltd. (Cayman Islands), Series 2015-2A, Class AR, 144A, 3 Month LIBOR + 0.880% | | | 2.243% | (c) | | | 07/20/27 | | | | | | 1,000 | | | | 1,002,777 | |
Telos CLO Ltd. (Cayman Islands), Series 2013-3A, Class AR, 144A, 3 Month LIBOR + 1.300% | | | 2.653% | (c) | | | 07/17/26 | | | | | | 2,500 | | | | 2,516,642 | |
TIAA CLO Ltd. (Cayman Islands), Series 2016-1A, Class A, 144A, 3 Month LIBOR + 1.700% | | | 3.063% | (c) | | | 07/20/28 | | | | | | 1,750 | | | | 1,762,506 | |
TICP CLO Ltd. (Cayman Islands), Series 2017-7A, Class AS, 144A, 3 Month LIBOR + 1.230% | | | 2.534% | (c) | | | 07/15/29 | | | | | | 1,000 | | | | 1,003,690 | |
Trinitas CLO Ltd. (Cayman Islands), Series 2016-5A, Class A, 144A, 3 Month LIBOR + 1.700% | | | 3.067% | (c) | | | 10/25/28 | | | | | | 2,500 | | | | 2,516,609 | |
Trinitas CLO Ltd. (Cayman Islands), Series 2017-6A, Class A, 144A, 3 Month LIBOR + 1.320% | | | 2.687% | (c) | | | 07/25/29 | | | | | | 1,000 | | | | 1,003,175 | |
Trinitas CLO Ltd. (Cayman Islands), Series 2017-7A, Class A, 144A, 3 Month LIBOR + 1.210% | | | 2.908% | (c) | | | 01/25/31 | | | | | | 1,750 | | | | 1,750,000 | |
Tyron Park CLO Ltd. (Cayman Islands), Series 2013-1A, Class A1, 144A, 3 Month LIBOR + 1.120% | | | 2.479% | (c) | | | 07/15/25 | | | | | | 1,874 | | | | 1,877,523 | |
Venture CLO Ltd. (Cayman Islands), Series 2015-21A, Class AR, 144A, 3 Month LIBOR + 0.880% | | | 2.239% | (c) | | | 07/15/27 | | | | | | 1,000 | | | | 1,002,381 | |
Wellfleet CLO Ltd. (Cayman Islands), Series 2017-1A, Class A1, 144A, 3 Month LIBOR + 1.320% | | | 2.683% | (c) | | | 04/20/29 | | | | | | 1,500 | | | | 1,509,959 | |
West CLO Ltd. (Cayman Islands), Series 2013-1A, Class A1AR, 144A, 3 Month LIBOR + 1.160% | | | 2.552% | (c) | | | 11/07/25 | | | | | | 1,500 | | | | 1,503,354 | |
Zais CLO Ltd. (Cayman Islands), Series 2017-1A, Class A1, 144A, 3 Month LIBOR + 1.370% | | | 2.729% | (c) | | | 07/15/29 | | | | | | 1,250 | | | | 1,262,753 | |
| | | | | | | | | | | | | | | | | | |
| | | | | | | | | | | | | | | | | 42,918,895 | |
| | | | | | | | | | | | | | | | | | |
Consumer Loans — 0.4% | |
OneMain Financial Issuance Trust, Series 2015-2A, Class A, 144A | | | 2.570% | | | | 07/18/25 | | | | | | 1,693 | | | | 1,691,642 | |
OneMain Financial Issuance Trust, Series 2017-1A, Class A2, 144A, 1 Month LIBOR + 0.800% | | | 2.272% | (c) | | | 09/14/32 | | | | | | 2,300 | | | | 2,312,120 | |
SpringCastle America Funding LLC, Series 2016-AA, Class A, 144A | | | 3.050% | | | | 04/25/29 | | | | | | 1,755 | | | | 1,765,681 | |
Springleaf Funding Trust, Series 2015-AA, Class A, 144A | | | 3.160% | | | | 11/15/24 | | | | | | 4,665 | | | | 4,683,524 | |
| | | | | | | | | | | | | | | | | | |
| | | | | | | | | | | | | | | | | 10,452,967 | |
| | | | | | | | | | | | | | | | | | |
SEE NOTES TO FINANCIAL STATEMENTS.
A12
| | | | | | |
| | CONSERVATIVE BALANCED PORTFOLIO (continued) | | |
| |
| SCHEDULE OF INVESTMENTS | | as of December 31, 2017 |
| | | | | | | | | | | | | | | | | | |
ASSET-BACKED SECURITIES
(continued) | | Interest
Rate | | | Maturity
Date | | | Principal
Amount
(000)# | | | Value | |
Credit Cards — 0.6% | |
American Express Credit Account Master Trust, Series 2017-2, Class A, 1 Month LIBOR + 0.450% | | | 2.038% | (c) | | | 09/16/24 | | | | | | 4,500 | | | $ | 4,534,877 | |
American Express Credit Account Master Trust, Series 2017-5, Class A, 1 Month LIBOR + 0.380% | | | 1.857% | (c) | | | 02/18/25 | | | | | | 500 | | | | 502,420 | |
Citibank Credit Card Issuance Trust, Series 2017-A5, Class A5, 1 Month LIBOR + 0.620% | | | 2.155% | (c) | | | 04/22/26 | | | | | | 2,700 | | | | 2,730,937 | |
Citibank Credit Card Issuance Trust, Series 2017-A7, Class A7, 1 Month LIBOR + 0.370% | | | 1.777% | (c) | | | 08/08/24 | | | | | | 2,800 | | | | 2,811,341 | |
Discover Card Execution Note Trust, Series 2017-A4, Class A4 | | | 2.530% | | | | 10/15/26 | | | | | | 2,800 | | | | 2,791,019 | |
Discover Card Execution Note Trust, Series 2017-A5, Class A5, 1 Month LIBOR + 0.600% | | | 2.077% | (c) | | | 12/15/26 | | | | | | 1,900 | | | | 1,921,011 | |
| | | | | | | | | | | | | | | | | | |
| | | | | | | | | | | | | | | | | 15,291,605 | |
| | | | | | | | | | | | | | | | | | |
Equipment — 0.2% | |
MMAF Equipment Finance LLC, Series 2017-AA, Class A4, 144A | | | 2.410% | | | | 08/16/24 | | | | | | 2,500 | | | | 2,479,317 | |
MMAF Equipment Finance LLC, Series 2017-B, Class A4, 144A | | | 2.410% | | | | 11/15/24 | | | | | | 1,300 | | | | 1,292,410 | |
MMAF Equipment Finance LLC, Series 2017-B, Class A5, 144A | | | 2.720% | | | | 06/15/40 | | | | | | 2,100 | | | | 2,088,580 | |
| | | | | | | | | | | | | | | | | | |
| | | | | | | | | | | | | | | | | 5,860,307 | |
| | | | | | | | | | | | | | | | | | |
Home Equity Loans — 0.1% | |
CDC Mortgage Capital Trust, Series 2002-HE3, Class M1, 1 Month LIBOR + 1.650% | | | 3.202% | (c) | | | 03/25/33 | | | | | | 155 | | | | 154,696 | |
Morgan Stanley ABS Capital I, Inc. Trust, Series 2003-HE1, Class M1, 1 Month LIBOR + 1.200% | | | 2.752% | (c) | | | 05/25/33 | | | | | | 90 | | | | 89,625 | |
Morgan Stanley Dean Witter Capital I, Inc. Trust, Series 2002-HE1, Class M1, 1 Month LIBOR + 0.900% | | | 2.452% | (c) | | | 07/25/32 | | | | | | 165 | | | | 166,447 | |
Morgan Stanley Dean Witter Capital I, Inc. Trust, Series 2002-NC4, Class M1, 1 Month LIBOR + 1.275% | | | 2.827% | (c) | | | 09/25/32 | | | | | | 2,160 | | | | 2,148,206 | |
| | | | | | | | | | | | | | | | | | |
| | | | | | | | | | | | | | | | | 2,558,974 | |
| | | | | | | | | | | | | | | | | | |
Other — 0.0% | |
Sierra Timeshare Receivables Funding LLC, Series 2013-3A, Class A, 144A | | | 2.200% | | | | 10/20/30 | | | | | | 712 | | | | 710,924 | |
SVO VOI Mortgage LLC, Series 2012-AA, Class A, 144A | | | 2.000% | | | | 09/20/29 | | | | | | 376 | | | | 373,168 | |
| | | | | | | | | | | | | | | | | | |
| | | | | | | | | | | | | | | | | 1,084,092 | |
| | | | | | | | | | | | | | | | | | |
Residential Mortgage-Backed Securities — 0.8% | |
Credit Suisse Mortgage Trust, Series 2016-RPL1, Class A1, 144A, 1 Month LIBOR + 3.150% | | | 4.511% | (c) | | | 12/26/46 | | | | | | 3,344 | | | | 3,368,892 | |
Credit Suisse Mortgage Trust, Series 2017-6R, Class A1, 144A, 1 Month LIBOR + 1.550%^ | | | 2.900% | (c) | | | 03/06/47 | | | | | | 1,542 | | | | 1,550,841 | |
Credit-Based Asset Servicing & Securitization LLC, Series 2005-CB6, Class A3 | | | 3.728% | (cc) | | | 07/25/35 | | | | | | 324 | | | | 322,339 | |
CWABS, Inc., Asset-Backed Certificates, Series 2004-1, Class M1, 1 Month LIBOR + 0.750% | | | 2.302% | (c) | | | 03/25/34 | | | | | | 1,268 | | | | 1,273,990 | |
Equity One Mortgage Pass-Through Trust, Series 2004-3, Class M1 | | | 4.657% | (cc) | | | 07/25/34 | | | | | | 303 | | | | 299,738 | |
Fremont Home Loan Trust, Series 2004-2, Class M1, 1 Month LIBOR + 0.855% | | | 2.407% | (c) | | | 07/25/34 | | | | | | 506 | | | | 505,302 | |
Long Beach Mortgage Loan Trust, Series 2004-2, Class M1, 1 Month LIBOR + 0.795% | | | 2.123% | (c) | | | 06/25/34 | | | | | | 322 | | | | 318,439 | |
Mill City Mortgage Loan Trust, Series 2017-3, Class A1, 144A | | | 2.750% | (cc) | | | 01/25/61 | | | | | | 2,677 | | | | 2,673,789 | |
Towd Point Mortgage Trust, Series 2017-4, Class A1, 144A | | | 2.750% | (cc) | | | 06/25/57 | | | | | | 1,703 | | | | 1,696,376 | |
Towd Point Mortgage Trust, Series 2017-5, Class A1, 144A, 1 Month LIBOR + 0.600% | | | 2.152% | (c) | | | 02/25/57 | | | | | | 4,299 | | | | 4,303,890 | |
Towd Point Mortgage Trust, Series 2017-6, Class A1, 144A | | | 2.750% | (cc) | | | 10/25/57 | | | | | | 3,693 | | | | 3,680,177 | |
VOLT LVII LLC, Series 2017-NPL4, Class A1, 144A | | | 3.375% | (cc) | | | 04/25/47 | | | | | | 309 | | | | 310,326 | |
VOLT LX LLC, Series 2017-NPL7, Class A1, 144A | | | 3.250% | (cc) | | | 04/25/59 | | | | | | 386 | | | | 386,204 | |
| | | | | | | | | | | | | | | | | | |
| | | | | | | | | | | | | | | | | 20,690,303 | |
| | | | | | | | | | | | | | | | | | |
SEE NOTES TO FINANCIAL STATEMENTS.
A13
| | | | | | |
| | CONSERVATIVE BALANCED PORTFOLIO (continued) | | |
| |
| SCHEDULE OF INVESTMENTS | | as of December 31, 2017 |
| | | | | | | | | | | | | | | | | | | | |
ASSET-BACKED SECURITIES
(continued) | | Interest
Rate | | | Maturity
Date | | | Principal
Amount
(000)# | | | Value | |
Student Loans — 0.2% | |
Commonbond Student Loan Trust, Series 2017-BGS, Class A1, 144A | | | 2.680% | | | | 09/25/42 | | | | | | | | 2,956 | | | $ | 2,944,077 | |
Laurel Road Prime Student Loan Trust, Series 2017-C, Class A2B, 144A | | | 2.810% | | | | 11/25/42 | | | | | | | | 1,500 | | | | 1,489,366 | |
| | | | | | | | | | | | | | | | | | | | |
| | | | | | | | | | | | | | | | | | | 4,433,443 | |
| | | | | | | | | | | | | | | | | | | | |
TOTAL ASSET-BACKED SECURITIES
(cost $146,795,066) | | | | 147,389,827 | |
| | | | | | | | | | | | | | | | | | | | |
| BANK LOAN(c) — 0.0% | |
Technology | |
Dell International LLC, Replacement Term A-3 Loan, 1 Month LIBOR + 1.500% (cost $393,888) | | | 3.193% | | | | 12/31/18 | | | | | | | | 399 | | | | 399,243 | |
| | | | | | | | | | | | | | | | | | | | |
| COMMERCIAL MORTGAGE-BACKED SECURITIES — 6.3% | |
Assurant Commercial Mortgage Trust, Series 2016-1A, Class AS, 144A | | | 3.172% | | | | 05/15/49 | | | | | | | | 3,100 | | | | 3,057,653 | |
CFCRE Commercial Mortgage Trust, Series 2016-C4, Class A3 | | | 3.014% | | | | 05/10/58 | | | | | | | | 2,500 | | | | 2,468,466 | |
Citigroup Commercial Mortgage Trust, Series 2013-GC11, Class A3 | | | 2.815% | | | | 04/10/46 | | | | | | | | 900 | | | | 902,163 | |
Citigroup Commercial Mortgage Trust, Series 2014-GC21, Class A4 | | | 3.575% | | | | 05/10/47 | | | | | | | | 2,090 | | | | 2,167,818 | |
Citigroup Commercial Mortgage Trust, Series 2016-C1, Class A3 | | | 2.944% | | | | 05/10/49 | | | | | | | | 2,700 | | | | 2,677,776 | |
Citigroup Commercial Mortgage Trust, Series 2017-P7, Class A3 | | | 3.442% | | | | 04/14/50 | | | | | | | | 4,000 | | | | 4,096,830 | |
Commercial Mortgage Trust, Series 2012-CR5, Class A3 | | | 2.540% | | | | 12/10/45 | | | | | | | | 1,000 | | | | 990,334 | |
Commercial Mortgage Trust, Series 2013-CR7, Class A3 | | | 2.929% | | | | 03/10/46 | | | | | | | | 1,066 | | | | 1,074,065 | |
Commercial Mortgage Trust, Series 2014-CR15, Class A2 | | | 2.928% | | | | 02/10/47 | | | | | | | | 1,883 | | | | 1,895,476 | |
Commercial Mortgage Trust, Series 2014-CR18, Class A4 | | | 3.550% | | | | 07/15/47 | | | | | | | | 2,100 | | | | 2,173,766 | |
Commercial Mortgage Trust, Series 2014-LC17, Class A4 | | | 3.648% | | | | 10/10/47 | | | | | | | | 5,000 | | | | 5,195,434 | |
Commercial Mortgage Trust, Series 2014-UBS3, Class A2 | | | 2.844% | | | | 06/10/47 | | | | | | | | 1,700 | | | | 1,713,067 | |
CSAIL Commercial Mortgage Trust, Series 2015-C4, Class A3 | | | 3.544% | | | | 11/15/48 | | | | | | | | 2,500 | | | | 2,581,668 | |
CSAIL Commercial Mortgage Trust, Series 2017-C8, Class A3 | | | 3.127% | | | | 06/15/50 | | | | | | | | 3,800 | | | | 3,790,549 | |
Fannie Mae-Aces, Series 2014-M2, Class A2 | | | 3.513% | (cc) | | | 12/25/23 | | | | | | | | 1,925 | | | | 2,015,093 | |
Fannie Mae-Aces, Series 2015-M8, Class AB2 | | | 2.829% | (cc) | | | 01/25/25 | | | | | | | | 4,100 | | | | 4,109,478 | |
Fannie Mae-Aces, Series 2015-M17, Class A2 | | | 2.939% | (cc) | | | 11/25/25 | | | | | | | | 3,000 | | | | 3,039,260 | |
Fannie Mae-Aces, Series 2016-M7, Class AB2 | | | 2.385% | | | | 09/25/26 | | | | | | | | 1,800 | | | | 1,731,638 | |
Fannie Mae-Aces, Series 2017-M1, Class A2 | | | 2.417% | (cc) | | | 10/25/26 | | | | | | | | 1,600 | | | | 1,546,914 | |
Fannie Mae-Aces, Series 2017-M4, Class A2 | | | 2.597% | (cc) | | | 12/25/26 | | | | | | | | 8,600 | | | | 8,427,752 | |
Fannie Mae-Aces, Series 2017-M8, Class A2 | | | 3.061% | (cc) | | | 05/25/27 | | | | | | | | 5,900 | | | | 5,969,814 | |
FHLMC Multifamily Structured Pass-Through Certificates, Series K020, Class X1, IO | | | 1.426% | (cc) | | | 05/25/22 | | | | | | | | 19,812 | | | | 1,015,693 | |
FHLMC Multifamily Structured Pass-Through Certificates, Series K021, Class X1, IO | | | 1.465% | (cc) | | | 06/25/22 | | | | | | | | 5,483 | | | | 295,396 | |
FHLMC Multifamily Structured Pass-Through Certificates, Series K045, Class A2 | | | 3.023% | | | | 01/25/25 | | | | | | | | 4,965 | | | | 5,075,254 | |
FHLMC Multifamily Structured Pass-Through Certificates, Series K048, Class A2 | | | 3.284% | (cc) | | | 06/25/25 | | | | | | | | 3,650 | | | | 3,784,887 | |
FHLMC Multifamily Structured Pass-Through Certificates, Series K055, Class X1, IO | | | 1.368% | (cc) | | | 03/25/26 | | | | | | | | 4,644 | | | | 428,412 | |
FHLMC Multifamily Structured Pass-Through Certificates, Series K064, Class AM | | | 3.327% | (cc) | | | 03/25/27 | | | | | | | | 4,200 | | | | 4,312,300 | |
FHLMC Multifamily Structured Pass-Through Certificates, Series K068, Class AM | | | 3.315% | | | | 08/25/27 | | | | | | | | 4,100 | | | | 4,206,455 | |
FHLMC Multifamily Structured Pass-Through Certificates, Series K069, Class A2 | | | 3.187% | (cc) | | | 09/25/27 | | | | | | | | 3,500 | | | | 3,588,993 | |
FHLMC Multifamily Structured Pass-Through Certificates, Series K069, Class AM | | | 3.248% | | | | 09/25/27 | | | | | | | | 750 | | | | 765,285 | |
FHLMC Multifamily Structured Pass-Through Certificates, Series K070, Class A2 | | | 3.303% | (cc) | | | 11/25/27 | | | | | | | | 2,400 | | | | 2,482,548 | |
FHLMC Multifamily Structured Pass-Through Certificates, Series K070, Class AM | | | 3.364% | (cc) | | | 12/25/27 | | | | | | | | 1,100 | | | | 1,134,181 | |
SEE NOTES TO FINANCIAL STATEMENTS.
A14
| | | | | | |
| | CONSERVATIVE BALANCED PORTFOLIO (continued) | | |
| |
| SCHEDULE OF INVESTMENTS | | as of December 31, 2017 |
| | | | | | | | | | | | | | | | | | |
COMMERCIAL MORTGAGE-BACKED SECURITIES
(continued) | | Interest
Rate | | | Maturity
Date | | | Principal
Amount
(000)# | | | Value | |
FHLMC Multifamily Structured Pass-Through Certificates, Series K710, Class X1, IO | | | 1.733% | (cc) | | | 05/25/19 | | | | | | 15,221 | | | $ | 269,294 | |
FHLMC Multifamily Structured Pass-Through Certificates, Series K711, Class X1, IO | | | 1.683% | (cc) | | | 07/25/19 | | | | | | 16,230 | | | | 296,486 | |
FHLMC Multifamily Structured Pass-Through Certificates, Series KS03, Class A4 | | | 3.161% | (cc) | | | 05/25/25 | | | | | | 1,900 | | | | 1,940,454 | |
GS Mortgage Securities Trust, Series 2015-GC28, Class A4 | | | 3.136% | | | | 02/10/48 | | | | | | 3,000 | | | | 3,024,554 | |
GS Mortgage Securities Trust, Series 2015-GC34, Class A3 | | | 3.244% | | | | 10/10/48 | | | | | | 4,800 | | | | 4,853,298 | |
GS Mortgage Securities Trust, Series 2016-GS3, Class A3 | | | 2.592% | | | | 10/10/49 | | | | | | 4,200 | | | | 4,056,305 | |
GS Mortgage Securities Trust, Series 2016-GS4, Class A3 | | | 3.178% | | | | 11/10/49 | | | | | | 4,000 | | | | 4,036,205 | |
JPMBB Commercial Mortgage Securities Trust, Series 2014-C25, Class A4A1 | | | 3.408% | | | | 11/15/47 | | | | | | 1,100 | | | | 1,129,436 | |
JPMBB Commercial Mortgage Securities Trust, Series 2015-C27, Class A3A1 | | | 2.920% | | | | 02/15/48 | | | | | | 5,000 | | | | 4,971,217 | |
JPMCC Commercial Mortgage Securities Trust, Series 2017-JP6, Class A3 | | | 3.109% | | | | 07/15/50 | | | | | | 5,581 | | | | 5,564,232 | |
JPMDB Commercial Mortgage Securities Trust, Series 2016-C2, Class A3A | | | 2.881% | | | | 06/15/49 | | | | | | 2,500 | | | | 2,468,739 | |
JPMorgan Chase Commercial Mortgage Securities Trust, Series 2012-CBX, Class A3 | | | 3.139% | | | | 06/15/45 | | | | | | 662 | | | | 665,221 | |
JPMorgan Chase Commercial Mortgage Securities Trust, Series 2012-LC9, Class A4 | | | 2.611% | | | | 12/15/47 | | | | | | 1,500 | | | | 1,495,578 | |
JPMorgan Chase Commercial Mortgage Securities Trust, Series 2013-C10, Class A4 | | | 2.875% | | | | 12/15/47 | | | | | | 1,987 | | | | 2,003,191 | |
JPMorgan Chase Commercial Mortgage Securities Trust, Series 2013-C16, Class A2 | | | 3.070% | | | | 12/15/46 | | | | | | 1,111 | | | | 1,116,664 | |
JPMorgan Chase Commercial Mortgage Securities Trust, Series 2013-LC11, Class A4 | | | 2.694% | | | | 04/15/46 | | | | | | 967 | | | | 968,790 | |
LB-UBS Commercial Mortgage Trust, Series 2007-C6, Class AM | | | 6.114% | (cc) | | | 07/15/40 | | | | | | 659 | | | | 659,017 | |
Morgan Stanley Bank of America Merrill Lynch Trust, Series 2013-C8, Class A3 | | | 2.863% | | | | 12/15/48 | | | | | | 1,194 | | | | 1,200,947 | |
Morgan Stanley Capital I Trust, Series 2015-UBS8, Class A3 | | | 3.540% | | | | 12/15/48 | | | | | | 5,000 | | | | 5,164,721 | |
Morgan Stanley Capital I Trust, Series 2016-UB11, Class A3 | | | 2.531% | | | | 08/15/49 | | | | | | 6,300 | | | | 6,037,095 | |
UBS Commercial Mortgage Trust, Series 2017-C2, Class ASB | | | 3.264% | | | | 08/15/50 | | | | | | 2,500 | | | | 2,541,117 | |
UBS Commercial Mortgage Trust, Series 2017-C5, Class A4 | | | 3.212% | | | | 11/15/50 | | | | | | 5,000 | | | | 5,041,980 | |
UBS-Barclays Commercial Mortgage Trust, Series 2012-C4, Class A4 | | | 2.792% | | | | 12/10/45 | | | | | | 1,400 | | | | 1,404,227 | |
UBS-Barclays Commercial Mortgage Trust, Series 2013-C5, Class A3 | | | 2.920% | | | | 03/10/46 | | | | | | 3,135 | | | | 3,156,490 | |
UBS-Barclays Commercial Mortgage Trust, Series 2013-C6, Class A3 | | | 2.971% | | | | 04/10/46 | | | | | | 1,500 | | | | 1,510,809 | |
Wells Fargo Commercial Mortgage Trust, Series 2016-BNK1, Class XB, IO | | | 1.341% | (cc) | | | 08/15/49 | | | | | | 9,000 | | | | 889,160 | |
Wells Fargo Commercial Mortgage Trust, Series 2016-NXS6, Class A3 | | | 2.642% | | | | 11/15/49 | | | | | | 4,500 | | | | 4,365,962 | |
Wells Fargo Commercial Mortgage Trust, Series 2017-C38, Class A4 | | | 3.190% | | | | 07/15/50 | | | | | | 3,300 | | | | 3,308,666 | |
| | | | | | | | | | | | | | | | | | |
TOTAL COMMERCIAL MORTGAGE-BACKED SECURITIES
(cost $163,807,674) | | | | 162,854,273 | |
| | | | | | | | | | | | | | | | | | |
| CORPORATE BONDS — 10.5% | |
Agriculture — 0.3% | |
Altria Group, Inc., Gtd. Notes | | | 4.000% | | | | 01/31/24 | | | | | | 1,585 | | | | 1,681,497 | |
BAT Capital Corp. (United Kingdom), Gtd. Notes, 144A | | | 3.222% | | | | 08/15/24 | | | | | | 2,685 | | | | 2,684,894 | |
Bunge Ltd. Finance Corp., Gtd. Notes | | | 8.500% | | | | 06/15/19 | | | | | | 690 | | | | 747,460 | |
Imperial Brands Finance PLC (United Kingdom), Gtd. Notes, 144A | | | 2.050% | | | | 02/11/18 | | | | | | 1,680 | | | | 1,679,781 | |
Reynolds American, Inc. (United Kingdom), Gtd. Notes | | | 8.125% | | | | 06/23/19 | | | | | | 290 | | | | 313,683 | |
| | | | | | | | | | | | | | | | | | |
| | | | | | | | | | | | | | | | | 7,107,315 | |
| | | | | | | | | | | | | | | | | | |
SEE NOTES TO FINANCIAL STATEMENTS.
A15
| | | | | | |
| | CONSERVATIVE BALANCED PORTFOLIO (continued) | | |
| |
| SCHEDULE OF INVESTMENTS | | as of December 31, 2017 |
| | | | | | | | | | | | | | | | | | |
CORPORATE BONDS
(continued) | | Interest
Rate | | | Maturity
Date | | | Principal
Amount
(000)# | | | Value | |
Airlines — 0.2% | |
American Airlines, Inc., Pass-Through Trust, Pass-Through Certificates, Series 2015-1, Class A | | | 3.375% | | | | 11/01/28 | | | | | | 2,315 | | | $ | 2,312,802 | |
Continental Airlines, Inc., Pass-Through Trust, Pass-Through Certificates, Series 2001-1, Class A-1 | | | 6.703% | | | | 12/15/22 | | | | | | 17 | | | | 18,128 | |
Continental Airlines, Inc., Pass-Through Trust, Pass-Through Certificates, Series 2009-2, Class A | | | 7.250% | | | | 05/10/21 | | | | | | 457 | | | | 492,509 | |
Continental Airlines, Inc., Pass-Through Trust, Pass-Through Certificates, Series 2010-1, Class A | | | 4.750% | | | | 07/12/22 | | | | | | 449 | | | | 470,074 | |
Continental Airlines, Inc., Pass-Through Trust, Pass-Through Certificates, Series 2012-2, Class A | | | 4.000% | | | | 04/29/26 | | | | | | 323 | | | | 336,638 | |
Delta Air Lines, Inc., Pass-Through Trust, Pass-Through Certificates, Series 2007-1, Class A | | | 6.821% | | | | 02/10/24 | | | | | | 242 | | | | 275,433 | |
Delta Air Lines, Inc., Pass-Through Trust, Pass-Through Certificates, Series 2010-2, Class A | | | 4.950% | | | | 11/23/20 | | | | | | 256 | | | | 262,918 | |
Delta Air Lines, Inc., Pass-Through Trust, Pass-Through Certificates, Series 2011-1, Class A | | | 5.300% | | | | 10/15/20 | | | | | | 507 | | | | 524,502 | |
Delta Air Lines, Inc., Sr. Unsec’d. Notes | | | 2.875% | | | | 03/13/20 | | | | | | 1,300 | | | | 1,307,544 | |
| | | | | | | | | | | | | | | | | | |
| | | | | | | | | | | | | | | | | 6,000,548 | |
| | | | | | | | | | | | | | | | | | |
Auto Manufacturers — 0.4% | |
Ford Motor Co., Sr. Unsec’d. Notes | | | 4.750% | | | | 01/15/43 | | | | | | 1,090 | | | | 1,105,403 | |
Ford Motor Co., Sr. Unsec’d. Notes(a) | | | 5.291% | | | | 12/08/46 | | | | | | 1,825 | | | | 1,985,981 | |
General Motors Co., Sr. Unsec’d. Notes | | | 6.250% | | | | 10/02/43 | | | | | | 1,065 | | | | 1,261,460 | |
General Motors Co., Sr. Unsec’d. Notes | | | 6.600% | | | | 04/01/36 | | | | | | 585 | | | | 712,757 | |
General Motors Financial Co., Inc., Gtd. Notes | | | 3.950% | | | | 04/13/24 | | | | | | 1,700 | | | | 1,750,133 | |
Harley-Davidson Financial Services, Inc., Gtd. Notes, 144A, MTN | | | 2.850% | | | | 01/15/21 | | | | | | 2,300 | | | | 2,314,027 | |
| | | | | | | | | | | | | | | | | | |
| | | | | | | | | | | | | | | | | 9,129,761 | |
| | | | | | | | | | | | | | | | | | |
Auto Parts & Equipment — 0.1% | |
Magna International, Inc. (Canada), Sr. Unsec’d. Notes | | | 3.625% | | | | 06/15/24 | | | | | | 1,690 | | | | 1,747,448 | |
| | | | | | | | | | | | | | | | | | |
Banks — 2.8% | |
Bank of America Corp., Jr. Sub. Notes(a) | | | 6.300% | | | | 12/31/49 | | | | | | 275 | | | | 310,750 | |
Bank of America Corp., Jr. Sub. Notes | | | 8.000% | | | | 12/31/49 | | | | | | 2,100 | | | | 2,107,140 | |
Bank of America Corp., Sr. Unsec’d. Notes, GMTN | | | 3.300% | | | | 01/11/23 | | | | | | 1,520 | | | | 1,554,960 | |
Bank of America Corp., Sr. Unsec’d. Notes, GMTN | | | 3.500% | | | | 04/19/26 | | | | | | 4,770 | | | | 4,876,862 | |
Bank of America Corp., Sr. Unsec’d. Notes, MTN | | | 4.000% | | | | 04/01/24 | | | | | | 745 | | | | 787,559 | |
Bank of America Corp., Sr. Unsec’d. Notes, MTN | | | 4.443% | | | | 01/20/48 | | | | | | 270 | | | | 304,278 | |
Bank of America Corp., Sr. Unsec’d. Notes, MTN | | | 5.650% | | | | 05/01/18 | | | | | | 105 | | | | 106,253 | |
Bank of America Corp., Sub. Notes, MTN | | | 4.000% | | | | 01/22/25 | | | | | | 1,700 | | | | 1,768,615 | |
Bank of America NA, Sub. Notes | | | 6.000% | | | | 10/15/36 | | | | | | 805 | | | | 1,049,780 | |
Barclays PLC (United Kingdom), Sr. Unsec’d. Notes | | | 3.684% | | | | 01/10/23 | | | | | | 320 | | | | 324,729 | |
Barclays PLC (United Kingdom), Sr. Unsec’d. Notes | | | 4.337% | | | | 01/10/28 | | | | | | 450 | | | | 465,734 | |
Barclays PLC (United Kingdom), Sr. Unsec’d. Notes | | | 4.375% | | | | 01/12/26 | | | | | | 1,205 | | | | 1,253,465 | |
Citigroup, Inc., Jr. Sub. Notes | | | 5.950% | | | | 12/31/49 | | | | | | 1,590 | | | | 1,661,550 | |
Citigroup, Inc., Jr. Sub. Notes | | | 6.125% | | | | 12/31/49 | | | | | | 945 | | | | 1,005,244 | |
Citigroup, Inc., Jr. Sub. Notes(a) | | | 6.250% | | | | 12/31/49 | | | | | | 640 | | | | 705,920 | |
Citigroup, Inc., Sr. Unsec’d. Notes | | | 3.700% | | | | 01/12/26 | | | | | | 1,610 | | | | 1,657,510 | |
Citigroup, Inc., Sr. Unsec’d. Notes | | | 4.281% | | | | 04/24/48 | | | | | | 630 | | | | 683,993 | |
Citigroup, Inc., Sr. Unsec’d. Notes | | | 8.125% | | | | 07/15/39 | | | | | | 850 | | | | 1,359,088 | |
Citigroup, Inc., Sub. Notes | | | 4.450% | | | | 09/29/27 | | | | | | 1,485 | | | | 1,572,173 | |
Citigroup, Inc., Sub. Notes | | | 4.750% | | | | 05/18/46 | | | | | | 440 | | | | 485,034 | |
Credit Suisse Group AG (Switzerland), Sr. Unsec’d. Notes, 144A | | | 4.282% | | | | 01/09/28 | | | | | | 980 | | | | 1,021,748 | |
Deutsche Bank AG (Germany), Sr. Unsec’d. Notes, GMTN | | | 3.375% | | | | 05/12/21 | | | | | | 1,240 | | | | 1,251,438 | |
Dexia Credit Local SA (France), Gov’t. Liquid Gtd. Notes, 144A | | | 1.875% | | | | 09/15/21 | | | | | | 1,000 | | | | 976,665 | |
Discover Bank, Sr. Unsec’d. Notes | | | 4.250% | | | | 03/13/26 | | | | | | 595 | | | | 620,553 | |
Discover Bank, Sub. Notes | | | 7.000% | | | | 04/15/20 | | | | | | 485 | | | | 528,641 | |
Goldman Sachs Group, Inc. (The), Jr. Sub. Notes | | | 5.300% | | | | 12/31/49 | | | | | | 560 | | | | 595,000 | |
Goldman Sachs Group, Inc. (The), Jr. Sub. Notes | | | 5.375% | | | | 12/31/49 | | | | | | 1,800 | | | | 1,854,000 | |
SEE NOTES TO FINANCIAL STATEMENTS.
A16
| | | | | | |
| | CONSERVATIVE BALANCED PORTFOLIO (continued) | | |
| |
| SCHEDULE OF INVESTMENTS | | as of December 31, 2017 |
| | | | | | | | | | | | | | | | | | |
CORPORATE BONDS
(continued) | | Interest
Rate | | | Maturity
Date | | | Principal
Amount
(000)# | | | Value | |
Banks (continued) | |
Goldman Sachs Group, Inc. (The), Sr. Unsec’d. Notes | | | 3.750% | | | | 02/25/26 | | | | | | 1,165 | | | $ | 1,195,395 | |
Goldman Sachs Group, Inc. (The), Sr. Unsec’d. Notes | | | 3.850% | | | | 01/26/27 | | | | | | 2,625 | | | | 2,694,975 | |
Goldman Sachs Group, Inc. (The), Sr. Unsec’d. Notes | | | 5.250% | | | | 07/27/21 | | | | | | 2,305 | | | | 2,498,137 | |
Goldman Sachs Group, Inc. (The), Sr. Unsec’d. Notes | | | 5.750% | | | | 01/24/22 | | | | | | 1,250 | | | | 1,386,038 | |
Goldman Sachs Group, Inc. (The), Sr. Unsec’d. Notes | | | 6.250% | | | | 02/01/41 | | | | | | 220 | | | | 296,472 | |
Goldman Sachs Group, Inc. (The), Sub. Notes | | | 6.750% | | | | 10/01/37 | | | | | | 1,100 | | | | 1,472,508 | |
HSBC Holdings PLC (United Kingdom), Sr. Unsec’d. Notes | | | 4.875% | | | | 01/14/22 | | | | | | 1,230 | | | | 1,323,398 | |
HSBC Holdings PLC (United Kingdom), Sr. Unsec’d. Notes | | | 5.100% | | | | 04/05/21 | | | | | | 920 | | | | 988,475 | |
JPMorgan Chase & Co., Jr. Sub. Notes | | | 6.100% | | | | 12/31/49 | | | | | | 1,175 | | | | 1,291,090 | |
JPMorgan Chase & Co., Jr. Sub. Notes | | | 7.900% | | | | 12/31/49 | | | | | | 2,000 | | | | 2,025,000 | |
JPMorgan Chase & Co., Sr. Unsec’d. Notes | | | 3.964% | | | | 11/15/48 | | | | | | 2,865 | | | | 2,958,189 | |
JPMorgan Chase & Co., Sr. Unsec’d. Notes | | | 4.032% | | | | 07/24/48 | | | | | | 200 | | | | 208,578 | |
JPMorgan Chase & Co., Sr. Unsec’d. Notes | | | 4.250% | | | | 10/15/20 | | | | | | 1,660 | | | | 1,740,542 | |
JPMorgan Chase & Co., Sub. Notes | | | 3.875% | | | | 09/10/24 | | | | | | 3,525 | | | | 3,677,008 | |
Lloyds Bank PLC (United Kingdom), Gtd. Notes, 144A, MTN | | | 5.800% | | | | 01/13/20 | | | | | | 1,770 | | | | 1,885,571 | |
Manufacturers & Traders Trust Co., Sr. Unsec’d. Notes | | | 2.900% | | | | 02/06/25 | | | | | | 2,385 | | | | 2,374,081 | |
Morgan Stanley, Jr. Sub. Notes | | | 5.450% | | | | 12/31/49 | | | | | | 640 | | | | 656,960 | |
Morgan Stanley, Sr. Unsec’d. Notes | | | 4.375% | | | | 01/22/47 | | | | | | 1,800 | | | | 1,973,128 | |
Morgan Stanley, Sr. Unsec’d. Notes, GMTN | | | 3.750% | | | | 02/25/23 | | | | | | 605 | | | | 626,999 | |
Morgan Stanley, Sr. Unsec’d. Notes, GMTN | | | 6.625% | | | | 04/01/18 | | | | | | 100 | | | | 101,096 | |
Morgan Stanley, Sr. Unsec’d. Notes, MTN | | | 3.971% | | | | 07/22/38 | | | | | | 440 | | | | 455,618 | |
Morgan Stanley, Sr. Unsec’d. Notes, MTN | | | 6.375% | | | | 07/24/42 | | | | | | 640 | | | | 889,822 | |
Morgan Stanley, Sub. Notes, GMTN | | | 4.350% | | | | 09/08/26 | | | | | | 3,050 | | | | 3,195,969 | |
National City Corp., Sub. Notes | | | 6.875% | | | | 05/15/19 | | | | | | 2,687 | | | | 2,848,850 | |
Nordea Bank AB (Sweden), Sr. Unsec’d. Notes, 144A, MTN (original cost $1,585,580; purchased 09/09/15)(f) | | | 1.875% | | | | 09/17/18 | | | | | | 1,590 | | | | 1,588,980 | |
PNC Bank NA, Sr. Unsec’d. Notes | | | 1.950% | | | | 03/04/19 | | | | | | 455 | | | | 454,202 | |
Sumitomo Mitsui Banking Corp. (Japan), Gtd. Notes | | | 2.450% | | | | 01/10/19 | | | | | | 925 | | | | 927,080 | |
| | | | | | | | | | | | | | | | | | |
| | | | | | | | | | | | | | | | | 72,622,843 | |
| | | | | | | | | | | | | | | | | | |
Beverages — 0.1% | |
Anheuser-Busch InBev Finance, Inc. (Belgium), Gtd. Notes | | | 4.700% | | | | 02/01/36 | | | | | | 2,005 | | | | 2,241,889 | |
| | | | | | | | | | | | | | | | | | |
Biotechnology — 0.1% | |
Amgen, Inc., Sr. Unsec’d. Notes | | | 4.663% | | | | 06/15/51 | | | | | | 1,527 | | | | 1,707,957 | |
Gilead Sciences, Inc., Sr. Unsec’d. Notes | | | 4.150% | | | | 03/01/47 | | | | | | 30 | | | | 31,910 | |
Gilead Sciences, Inc., Sr. Unsec’d. Notes | | | 5.650% | | | | 12/01/41 | | | | | | 110 | | | | 139,482 | |
| | | | | | | | | | | | | | | | | | |
| | | | | | | | | | | | | | | | | 1,879,349 | |
| | | | | | | | | | | | | | | | | | |
Building Materials — 0.0% | |
Standard Industries, Inc., Sr. Unsec’d. Notes, 144A | | | 5.375% | | | | 11/15/24 | | | | | | 1,135 | | | | 1,186,416 | |
| | | | | | | | | | | | | | | | | | |
Chemicals — 0.2% | |
Celanese US Holdings LLC, Gtd. Notes | | | 5.875% | | | | 06/15/21 | | | | | | 1,160 | | | | 1,269,849 | |
CF Industries, Inc., Gtd. Notes | | | 5.375% | | | | 03/15/44 | | | | | | 445 | | | | 439,437 | |
Dow Chemical Co. (The), Sr. Unsec’d. Notes | | | 4.625% | | | | 10/01/44 | | | | | | 5 | | | | 5,466 | |
Dow Chemical Co. (The), Sr. Unsec’d. Notes | | | 9.400% | | | | 05/15/39 | | | | | | 30 | | | | 51,281 | |
LyondellBasell Industries NV, Sr. Unsec’d. Notes | | | 4.625% | | | | 02/26/55 | | | | | | 955 | | | | 1,010,629 | |
LyondellBasell Industries NV, Sr. Unsec’d. Notes | | | 5.000% | | | | 04/15/19 | | | | | | 201 | | | | 206,372 | |
Mosaic Co. (The), Sr. Unsec’d. Notes(a) | | | 5.450% | | | | 11/15/33 | | | | | | 265 | | | | 288,599 | |
Mosaic Co. (The), Sr. Unsec’d. Notes | | | 5.625% | | | | 11/15/43 | | | | | | 295 | | | | 317,852 | |
Union Carbide Corp., Sr. Unsec’d. Notes | | | 7.500% | | | | 06/01/25 | | | | | | 500 | | | | 621,737 | |
Westlake Chemical Corp., Gtd. Notes | | | 4.625% | | | | 02/15/21 | | | | | | 750 | | | | 768,750 | |
| | | | | | | | | | | | | | | | | | |
| | | | | | | | | | | | | | | | | 4,979,972 | |
| | | | | | | | | | | | | | | | | | |
Commercial Services — 0.1% | |
ERAC USA Finance LLC, Gtd. Notes, 144A | | | 4.200% | | | | 11/01/46 | | | | | | 875 | | | | 856,973 | |
ERAC USA Finance LLC, Gtd. Notes, 144A | | | 7.000% | | | | 10/15/37 | | | | | | 390 | | | | 521,527 | |
United Rentals North America, Inc., Gtd. Notes | | | 4.875% | | | | 01/15/28 | | | | | | 410 | | | | 412,050 | |
United Rentals North America, Inc., Gtd. Notes | | | 5.875% | | | | 09/15/26 | | | | | | 400 | | | | 428,000 | |
| | | | | | | | | | | | | | | | | | |
| | | | | | | | | | | | | | | | | 2,218,550 | |
| | | | | | | | | | | | | | | | | | |
SEE NOTES TO FINANCIAL STATEMENTS.
A17
| | | | | | |
| | CONSERVATIVE BALANCED PORTFOLIO (continued) | | |
| |
| SCHEDULE OF INVESTMENTS | | as of December 31, 2017 |
| | | | | | | | | | | | | | | | | | |
CORPORATE BONDS
(continued) | | Interest
Rate | | | Maturity
Date | | | Principal
Amount
(000)# | | | Value | |
Computers — 0.3% | | | | | |
Apple, Inc., Sr. Unsec’d. Notes | | | 2.850% | | | | 05/11/24 | | | | | | 4,410 | | | $ | 4,429,756 | |
Apple, Inc., Sr. Unsec’d. Notes | | | 3.200% | | | | 05/13/25 | | | | | | 2,400 | | | | 2,448,443 | |
Dell International LLC/EMC Corp., Sr. Sec’d. Notes, 144A | | | 3.480% | | | | 06/01/19 | | | | | | 825 | | | | 835,335 | |
Hewlett Packard Enterprise Co., Sr. Unsec’d. Notes | | | 2.850% | | | | 10/05/18 | | | | | | 545 | | | | 547,626 | |
Seagate HDD Cayman, Gtd. Notes | | | 3.750% | | | | 11/15/18 | | | | | | 455 | | | | 461,598 | |
| | | | | | | | | | | | | | | | | | |
| | | | | | | | | | | | | | | | | 8,722,758 | |
| | | | | | | | | | | | | | | | | | |
Diversified Financial Services — 0.3% | |
AerCap Ireland Capital DAC/AerCap Global Aviation Trust (Netherlands), Gtd. Notes | | | 3.750% | | | | 05/15/19 | | | | | | 600 | | | | 609,496 | |
CDP Financial, Inc. (Canada), Sr. Unsec’d. Notes, 144A | | | 3.150% | | | | 07/24/24 | | | | | | 1,300 | | | | 1,329,893 | |
CPPIB Capital, Inc. (Canada), Gtd. Notes, 144A, MTN | | | 2.750% | | | | 11/02/27 | | | | | | 750 | | | | 747,971 | |
Discover Financial Services, Sr. Unsec’d. Notes | | | 3.850% | | | | 11/21/22 | | | | | | 900 | | | | 924,429 | |
Jefferies Group LLC, Sr. Unsec’d. Notes | | | 6.500% | | | | 01/20/43 | | | | | | 465 | | | | 548,505 | |
Lehman Brothers Holdings, Inc., Sr. Unsec’d. Notes(d) | | | 5.250% | | | | 02/06/12 | | | | | | 1,850 | | | | 85,100 | |
Lehman Brothers Holdings, Inc., Sr. Unsec’d. Notes(d) | | | 6.875% | | | | 05/02/18 | | | | | | 700 | | | | 32,760 | |
Navient Corp., Sr. Unsec’d. Notes, MTN | | | 8.450% | | | | 06/15/18 | | | | | | 295 | | | | 302,523 | |
Private Export Funding Corp., U.S. Gov’t. Gtd. Notes | | | 1.875% | | | | 07/15/18 | | | | | | 55 | | | | 55,051 | |
Private Export Funding Corp., U.S. Gov’t. Gtd. Notes | | | 2.450% | | | | 07/15/24 | | | | | | 285 | | | | 283,666 | |
Private Export Funding Corp., U.S. Gov’t. Gtd. Notes | | | 3.250% | | | | 06/15/25 | | | | | | 255 | | | | 267,741 | |
Synchrony Financial, Sr. Unsec’d. Notes | | | 2.700% | | | | 02/03/20 | | | | | | 2,175 | | | | 2,180,436 | |
| | | | | | | | | | | | | | | | | | |
| | | | | | | | | | | | | | | | | 7,367,571 | |
| | | | | | | | | | | | | | | | | | |
Electric — 0.9% | |
Baltimore Gas & Electric Co., Sr. Unsec’d. Notes | | | 6.350% | | | | 10/01/36 | | | | | | 530 | | | | 706,356 | |
Berkshire Hathaway Energy Co., Sr. Unsec’d. Notes | | | 6.125% | | | | 04/01/36 | | | | | | 332 | | | | 443,726 | |
Black Hills Corp., Sr. Unsec’d. Notes | | | 2.500% | | | | 01/11/19 | | | | | | 950 | | | | 952,589 | |
CenterPoint Energy Houston Electric LLC, Gen. Ref. Mtge. | | | 6.950% | | | | 03/15/33 | | | | | | 300 | | | | 417,424 | |
Consolidated Edison Co. of New York, Inc., Sr. Unsec’d. Notes | | | 5.500% | | | | 12/01/39 | | | | | | 145 | | | | 183,690 | |
Dominion Energy, Inc., Jr. Sub. Notes | | | 4.104% | | | | 04/01/21 | | | | | | 2,470 | | | | 2,570,402 | |
Duke Energy Carolinas LLC, First Mtge. | | | 6.050% | | | | 04/15/38 | | | | | | 530 | | | | 718,253 | |
El Paso Electric Co., Sr. Unsec’d. Notes | | | 6.000% | | | | 05/15/35 | | | | | | 845 | | | | 1,020,416 | |
Eversource Energy, Sr. Unsec’d. Notes | | | 4.500% | | | | 11/15/19 | | | | | | 605 | | | | 626,628 | |
Exelon Corp., Jr. Sub. Notes | | | 3.497% | | | | 06/01/22 | | | | | | 2,397 | | | | 2,442,783 | |
Exelon Generation Co. LLC, Sr. Unsec’d. Notes | | | 6.250% | | | | 10/01/39 | | | | | | 1,375 | | | | 1,608,491 | |
FirstEnergy Transmission LLC, Sr. Unsec’d. Notes, 144A | | | 5.450% | | | | 07/15/44 | | | | | | 265 | | | | 314,772 | |
Florida Power & Light Co., First Mtge. | | | 5.950% | | | | 10/01/33 | | | | | | 380 | | | | 489,589 | |
Iberdrola International BV (Spain), Gtd. Notes | | | 6.750% | | | | 09/15/33 | | | | | | 140 | | | | 177,348 | |
Monongahela Power Co., First Mtge., 144A | | | 4.100% | | | | 04/15/24 | | | | | | 1,560 | | | | 1,653,609 | |
Niagara Mohawk Power Corp., Sr. Unsec’d. Notes, 144A | | | 4.881% | | | | 08/15/19 | | | | | | 545 | | | | 565,756 | |
Northern States Power Co., First Mtge. | | | 3.600% | | | | 09/15/47 | | | | | | 1,035 | | | | 1,053,155 | |
NRG Energy, Inc., Gtd. Notes | | | 7.250% | | | | 05/15/26 | | | | | | 685 | | | | 745,787 | |
PPL Capital Funding, Inc., Gtd. Notes | | | 4.000% | | | | 09/15/47 | | | | | | 1,480 | | | | 1,520,761 | |
PSEG Power LLC, Gtd. Notes | | | 3.000% | | | | 06/15/21 | | | | | | 1,260 | | | | 1,271,079 | |
Public Service Co. of New Mexico, Sr. Unsec’d. Notes | | | 7.950% | | | | 05/15/18 | | | | | | 135 | | | | 137,811 | |
Public Service Electric & Gas Co., Sec’d. Notes, MTN | | | 3.000% | | | | 05/15/27 | | | | | | 675 | | | | 671,094 | |
Public Service Electric & Gas Co., Sr. Sec’d. Notes, MTN | | | 5.800% | | | | 05/01/37 | | | | | | 515 | | | | 671,458 | |
Southern California Edison Co., First Ref. Mtge. | | | 3.600% | | | | 02/01/45 | | | | | | 690 | | | | 695,658 | |
Southern California Edison Co., First Ref. Mtge. | | | 4.000% | | | | 04/01/47 | | | | | | 350 | | | | 375,924 | |
State Grid Overseas Investment 2014 Ltd. (China),
Gtd. Notes, 144A | | | 2.750% | | | | 05/07/19 | | | | | | 500 | | | | 501,847 | |
Xcel Energy, Inc., Sr. Unsec’d. Notes | | | 4.800% | | | | 09/15/41 | | | | | | 480 | | | | 545,235 | |
| | | | | | | | | | | | | | | | | | |
| | | | | | | | | | | | | | | | | 23,081,641 | |
| | | | | | | | | | | | | | | | | | |
Entertainment — 0.0% | |
GLP Capital LP/GLP Financing II, Inc., Gtd. Notes | | | 4.875% | | | | 11/01/20 | | | | | | 800 | | | | 830,000 | |
| | | | | | | | | | | | | | | | | | |
Foods 0.1% | |
Kraft Heinz Foods Co., Gtd. Notes | | | 3.000% | | | | 06/01/26 | | | | | | 1,510 | | | | 1,453,043 | |
Kraft Heinz Foods Co., Gtd. Notes | | | 4.375% | | | | 06/01/46 | | | | | | 360 | | | | 356,598 | |
SEE NOTES TO FINANCIAL STATEMENTS.
A18
| | | | | | |
| | CONSERVATIVE BALANCED PORTFOLIO (continued) | | |
| |
| SCHEDULE OF INVESTMENTS | | as of December 31, 2017 |
| | | | | | | | | | | | | | | | |
CORPORATE BONDS
(continued) | | Interest
Rate | | | Maturity
Date | | Principal
Amount
(000)# | | | Value | |
Foods (continued) | |
Kroger Co. (The), Sr. Unsec’d. Notes(a) | | | 4.450% | | | 02/01/47 | | | | | 240 | | | $ | 239,637 | |
| | | | | | | | | | | | | | | | |
| | | | | | | | | | | | | | | 2,049,278 | |
| | | | | | | | | | | | | | | | |
Forest Products & Paper — 0.1% | |
Georgia-Pacific LLC, Gtd. Notes, 144A | | | 5.400% | | | 11/01/20 | | | | | 275 | | | | 296,593 | |
International Paper Co., Sr. Unsec’d. Notes | | | 6.000% | | | 11/15/41 | | | | | 1,270 | | | | 1,589,626 | |
| | | | | | | | | | | | | | | | |
| | | | | | | | | | | | | | | 1,886,219 | |
| | | | | | | | | | | | | | | | |
Gas — 0.1% | |
Dominion Energy Gas Holdings LLC, Sr. Unsec’d. Notes | | | 4.800% | | | 11/01/43 | | | | | 45 | | | | 50,418 | |
NiSource Finance Corp., Gtd. Notes | | | 3.490% | | | 05/15/27 | | | | | 2,355 | | | | 2,397,016 | |
| | | | | | | | | | | | | | | | |
| | | | | | | | | | | | | | | 2,447,434 | |
| | | | | | | | | | | | | | | | |
Healthcare-Products — 0.2% | |
Becton Dickinson & Co., Sr. Unsec’d. Notes | | | 3.700% | | | 06/06/27 | | | | | 3,370 | | | | 3,395,983 | |
Becton Dickinson & Co., Sr. Unsec’d. Notes | | | 3.734% | | | 12/15/24 | | | | | 372 | | | | 381,001 | |
Medtronic, Inc., Gtd. Notes | | | 3.500% | | | 03/15/25 | | | | | 1,425 | | | | 1,478,220 | |
Medtronic, Inc., Gtd. Notes | | | 4.375% | | | 03/15/35 | | | | | 997 | | | | 1,123,932 | |
| | | | | | | | | | | | | | | | |
| | | | | | | | | | | | | | | 6,379,136 | |
| | | | | | | | | | | | | | | | |
Healthcare-Services — 0.3% | |
Aetna, Inc., Sr. Unsec’d. Notes | | | 6.625% | | | 06/15/36 | | | | | 480 | | | | 638,499 | |
Aetna, Inc., Sr. Unsec’d. Notes | | | 6.750% | | | 12/15/37 | | | | | 1,050 | | | | 1,440,053 | |
Anthem, Inc., Sr. Unsec’d. Notes | | | 4.625% | | | 05/15/42 | | | | | 330 | | | | 359,538 | |
Anthem, Inc., Sr. Unsec’d. Notes | | | 4.650% | | | 01/15/43 | | | | | 260 | | | | 285,096 | |
Fresenius Medical Care U.S. Finance II, Inc. (Germany), Gtd. Notes, 144A | | | 4.125% | | | 10/15/20 | | | | | 435 | | | | 448,050 | |
HCA, Inc., Sr. Sec’d. Notes | | | 5.250% | | | 04/15/25 | | | | | 350 | | | | 370,125 | |
HCA, Inc., Sr. Sec’d. Notes | | | 5.250% | | | 06/15/26 | | | | | 700 | | | | 742,000 | |
Kaiser Foundation Hospitals, Gtd. Notes | | | 4.150% | | | 05/01/47 | | | | | 670 | | | | 723,963 | |
Laboratory Corp. of America Holdings, Sr. Unsec’d. Notes | | | 3.200% | | | 02/01/22 | | | | | 160 | | | | 163,127 | |
New York & Presbyterian Hospital (The), Unsec’d. Notes | | | 4.024% | | | 08/01/45 | | | | | 340 | | | | 359,729 | |
UnitedHealth Group, Inc., Sr. Unsec’d. Notes | | | 3.950% | | | 10/15/42 | | | | | 440 | | | | 457,350 | |
UnitedHealth Group, Inc., Sr. Unsec’d. Notes | | | 6.625% | | | 11/15/37 | | | | | 410 | | | | 582,407 | |
| | | | | | | | | | | | | | | | |
| | | | | | | | | | | | | | | 6,569,937 | |
| | | | | | | | | | | | | | | | |
Housewares — 0.1% | |
Newell Brands, Inc., Sr. Unsec’d. Notes | | | 4.200% | | | 04/01/26 | | | | | 2,010 | | | | 2,099,261 | |
| | | | | | | | | | | | | | | | |
Insurance — 0.6% | |
Allied World Assurance Co. Holdings Ltd., Gtd. Notes | | | 5.500% | | | 11/15/20 | | | | | 480 | | | | 511,743 | |
American International Group, Inc., Sr. Unsec’d. Notes | | | 4.500% | | | 07/16/44 | | | | | 1,910 | | | | 2,057,264 | |
AXIS Specialty Finance LLC, Gtd. Notes | | | 5.875% | | | 06/01/20 | | | | | 990 | | | | 1,059,572 | |
Berkshire Hathaway, Inc., Sr. Unsec’d. Notes | | | 3.125% | | | 03/15/26 | | | | | 1,350 | | | | 1,365,271 | |
Chubb Corp. (The), Gtd. Notes, 3 Month LIBOR + 2.250% | | | 3.609% | (c) | | 03/29/67 | | | | | 1,260 | | | | 1,250,550 | |
Hartford Financial Services Group, Inc. (The), Sr. Unsec’d. Notes | | | 5.125% | | | 04/15/22 | | | | | 635 | | | | 692,960 | |
Liberty Mutual Group, Inc., Gtd. Notes, 144A | | | 6.500% | | | 05/01/42 | | | | | 215 | | | | 286,894 | |
Liberty Mutual Group, Inc., Gtd. Notes, 144A | | | 7.000% | | | 03/15/34 | | | | | 910 | | | | 1,194,330 | |
Lincoln National Corp., Sr. Unsec’d. Notes | | | 6.300% | | | 10/09/37 | | | | | 701 | | | | 903,563 | |
Markel Corp., Sr. Unsec’d. Notes | | | 5.000% | | | 03/30/43 | | | | | 165 | | | | 185,199 | |
New York Life Insurance Co., Sub. Notes, 144A | | | 6.750% | | | 11/15/39 | | | | | 650 | | | | 939,700 | |
Northwestern Mutual Life Insurance Co. (The), Sub. Notes, 144A | | | 6.063% | | | 03/30/40 | | | | | 350 | | | | 469,888 | |
Ohio National Financial Services, Inc., Sr. Unsec’d. Notes, 144A | | | 6.375% | | | 04/30/20 | | | | | 640 | | | | 688,916 | |
Principal Financial Group, Inc., Gtd. Notes | | | 4.625% | | | 09/15/42 | | | | | 105 | | | | 116,953 | |
Progressive Corp. (The), Sr. Unsec’d. Notes | | | 3.700% | | | 01/26/45 | | | | | 570 | | | | 574,680 | |
Teachers Insurance & Annuity Association of America, Sub. Notes, 144A | | | 4.270% | | | 05/15/47 | | | | | 1,430 | | | | 1,512,284 | |
Teachers Insurance & Annuity Association of America, Sub. Notes, 144A | | | 6.850% | | | 12/16/39 | | | | | 122 | | | | 172,367 | |
Travelers Cos., Inc. (The), Sr. Unsec’d. Notes | | | 4.000% | | | 05/30/47 | | | | | 660 | | | | 702,796 | |
SEE NOTES TO FINANCIAL STATEMENTS.
A19
| | | | | | |
| | CONSERVATIVE BALANCED PORTFOLIO (continued) | | |
| |
| SCHEDULE OF INVESTMENTS | | as of December 31, 2017 |
| | | | | | | | | | | | | | | | |
CORPORATE BONDS
(continued) | | Interest
Rate | | | Maturity
Date | | Principal
Amount
(000)# | | | Value | |
Insurance (continued) | |
Unum Group, Sr. Unsec’d. Notes | | | 5.625% | | | 09/15/20 | | | | | 315 | | | $ | 339,111 | |
W.R. Berkley Corp., Sr. Unsec’d. Notes | | | 6.150% | | | 08/15/19 | | | | | 575 | | | | 607,417 | |
| | | | | | | | | | | | | | | | |
| | | | | | | | | | | | | | | 15,631,458 | |
| | | | | | | | | | | | | | | | |
Lodging — 0.2% | |
Marriott International, Inc., Sr. Unsec’d. Notes | | | 3.000% | | | 03/01/19 | | | | | 490 | | | | 493,341 | |
Marriott International, Inc., Sr. Unsec’d. Notes | | | 3.250% | | | 09/15/22 | | | | | 805 | | | | 819,779 | |
Marriott International, Inc., Sr. Unsec’d. Notes | | | 6.750% | | | 05/15/18 | | | | | 2,700 | | | | 2,747,141 | |
Wyndham Worldwide Corp., Sr. Unsec’d. Notes | | | 2.500% | | | 03/01/18 | | | | | 405 | | | | 405,128 | |
| | | | | | | | | | | | | | | | |
| | | | | | | | | | | | | | | 4,465,389 | |
| | | | | | | | | | | | | | | | |
Machinery-Diversified — 0.0% | |
Xylem, Inc., Sr. Unsec’d. Notes | | | 4.875% | | | 10/01/21 | | | | | 1,060 | | | | 1,143,245 | |
| | | | | | | | | | | | | | | | |
Media — 0.4% | |
21st Century Fox America, Inc., Gtd. Notes | | | 6.150% | | | 03/01/37 | | | | | 250 | | | | 327,411 | |
21st Century Fox America, Inc., Gtd. Notes | | | 6.900% | | | 08/15/39 | | | | | 35 | | | | 49,398 | |
21st Century Fox America, Inc., Gtd. Notes | | | 7.625% | | | 11/30/28 | | | | | 1,265 | | | | 1,688,603 | |
AMC Networks, Inc., Gtd. Notes | | | 5.000% | | | 04/01/24 | | | | | 1,225 | | | | 1,240,312 | |
CCO Holdings LLC/CCO Holdings Capital Corp.,
Sr. Unsec’d. Notes, 144A | | | 5.375% | | | 05/01/25 | | | | | 720 | | | | 741,830 | |
Charter Communications Operating LLC/Charter Communications Operating Capital, Sr. Sec’d. Notes | | | 6.384% | | | 10/23/35 | | | | | 630 | | | | 735,604 | |
Charter Communications Operating LLC/Charter Communications Operating Capital, Sr. Sec’d. Notes | | | 6.484% | | | 10/23/45 | | | | | 1,000 | | | | 1,165,930 | |
Comcast Cable Holdings LLC, Gtd. Notes | | | 9.875% | | | 06/15/22 | | | | | 1,440 | | | | 1,823,244 | |
Discovery Communications LLC, Gtd. Notes | | | 5.000% | | | 09/20/37 | | | | | 125 | | | | 129,512 | |
Discovery Communications LLC, Gtd. Notes | | | 5.200% | | | 09/20/47 | | | | | 450 | | | | 469,674 | |
Time Warner Cable LLC, Sr. Sec’d. Notes | | | 5.500% | | | 09/01/41 | | | | | 270 | | | | 281,418 | |
Time Warner, Inc., Gtd. Notes | | | 3.800% | | | 02/15/27 | | | | | 585 | | | | 584,447 | |
Viacom, Inc., Sr. Unsec’d. Notes | | | 5.250% | | | 04/01/44 | | | | | 340 | | | | 332,164 | |
Videotron Ltd. (Canada), Gtd. Notes | | | 5.000% | | | 07/15/22 | | | | | 850 | | | | 894,625 | |
| | | | | | | | | | | | | | | | |
| | | | | | | | | | | | | | | 10,464,172 | |
| | | | | | | | | | | | | | | | |
Mining — 0.2% | |
BHP Billiton Finance USA Ltd. (Australia), Gtd. Notes | | | 5.000% | | | 09/30/43 | | | | | 180 | | | | 220,688 | |
BHP Billiton Finance USA Ltd. (Australia), Gtd. Notes, 144A | | | 6.250% | | | 10/19/75 | | | | | 315 | | | | 340,987 | |
Freeport-McMoRan, Inc., Gtd. Notes | | | 2.375% | | | 03/15/18 | | | | | 2,400 | | | | 2,397,000 | |
Southern Copper Corp. (Peru), Sr. Unsec’d. Notes | | | 5.875% | | | 04/23/45 | | | | | 400 | | | | 483,135 | |
Southern Copper Corp. (Peru), Sr. Unsec’d. Notes | | | 6.750% | | | 04/16/40 | | | | | 300 | | | | 391,120 | |
| | | | | | | | | | | | | | | | |
| | | | | | | | | | | | | | | 3,832,930 | |
| | | | | | | | | | | | | | | | |
Miscellaneous Manufacturing — 0.0% | |
Actuant Corp., Gtd. Notes | | | 5.625% | | | 06/15/22 | | | | | 1,040 | | | | 1,063,400 | |
| | | | | | | | | | | | | | | | |
Multi-National — 0.2% | |
Corp. Andina de Fomento (Supranational Bank),
Sr. Unsec’d. Notes | | | 2.000% | | | 05/10/19 | | | | | 1,065 | | | | 1,061,262 | |
Corp. Andina de Fomento (Supranational Bank),
Sr. Unsec’d. Notes | | | 2.125% | | | 09/27/21 | | | | | 1,195 | | | | 1,168,567 | |
Corp. Andina de Fomento (Supranational Bank),
Sr. Unsec’d. Notes | | | 2.750% | | | 01/06/23 | | | | | 385 | | | | 380,707 | |
North American Development Bank (Supranational Bank), Sr. Unsec’d. Notes | | | 2.400% | | | 10/26/22 | | | | | 855 | | | | 842,461 | |
North American Development Bank (Supranational Bank), Sr. Unsec’d. Notes | | | 4.375% | | | 02/11/20 | | | | | 800 | | | | 833,578 | |
| | | | | | | | | | | | | | | | |
| | | | | | | | | | | | | | | 4,286,575 | |
| | | | | | | | | | | | | | | | |
Oil & Gas — 0.8% | |
Anadarko Petroleum Corp., Sr. Unsec’d. Notes | | | 4.677% | (s) | | 10/10/36 | | | | | 1,000 | | | | 428,550 | |
Anadarko Petroleum Corp., Sr. Unsec’d. Notes | | | 6.450% | | | 09/15/36 | | | | | 1,040 | | | | 1,273,804 | |
SEE NOTES TO FINANCIAL STATEMENTS.
A20
| | | | | | |
| | CONSERVATIVE BALANCED PORTFOLIO (continued) | | |
| |
| SCHEDULE OF INVESTMENTS | | as of December 31, 2017 |
| | | | | | | | | | | | | | | | | | |
CORPORATE BONDS
(continued) | | Interest
Rate | | | Maturity
Date | | | Principal
Amount
(000)# | | | Value | |
Oil & Gas (continued) | |
Cenovus Energy, Inc. (Canada), Sr. Unsec’d. Notes | | | 5.400% | | | | 06/15/47 | | | | | | 850 | | | $ | 894,484 | |
Concho Resources, Inc., Gtd. Notes | | | 4.875% | | | | 10/01/47 | | | | | | 150 | | | | 163,114 | |
ConocoPhillips Co., Gtd. Notes | | | 4.950% | | | | 03/15/26 | | | | | | 1,280 | | | | 1,452,898 | |
Devon Energy Corp., Sr. Unsec’d. Notes | | | 5.000% | | | | 06/15/45 | | | | | | 85 | | | | 94,821 | |
Devon Energy Corp., Sr. Unsec’d. Notes | | | 5.600% | | | | 07/15/41 | | | | | | 225 | | | | 265,201 | |
Devon Financing Co. LLC, Gtd. Notes | | | 7.875% | | | | 09/30/31 | | | | | | 1,350 | | | | 1,853,286 | |
Encana Corp. (Canada), Sr. Unsec’d. Notes | | | 6.500% | | | | 02/01/38 | | | | | | 240 | | | | 302,867 | |
EOG Resources, Inc., Sr. Unsec’d. Notes | | | 3.900% | | | | 04/01/35 | | | | | | 830 | | | | 847,160 | |
Gazprom OAO Via Gaz Capital SA (Russia),
Sr. Unsec’d. Notes, 144A | | | 4.950% | | | | 07/19/22 | | | | | | 255 | | | | 266,845 | |
Gazprom OAO Via Gaz Capital SA (Russia),
Sr. Unsec’d. Notes, 144A | | | 6.510% | | | | 03/07/22 | | | | | | 440 | | | | 486,640 | |
Helmerich & Payne International Drilling Co., Gtd. Notes | | | 4.650% | | | | 03/15/25 | | | | | | 1,555 | | | | 1,636,870 | |
KazMunayGas National Co. JSC (Kazakhstan),
Sr. Unsec’d. Notes, 144A | | | 3.875% | | | | 04/19/22 | | | | | | 400 | | | | 406,000 | |
Nabors Industries, Inc., Gtd. Notes | | | 4.625% | | | | 09/15/21 | | | | | | 715 | | | | 681,038 | |
Noble Energy, Inc., Sr. Unsec’d. Notes | | | 5.050% | | | | 11/15/44 | | | | | | 925 | | | | 990,813 | |
Petrobras Global Finance BV (Brazil), Gtd. Notes, 144A | | | 5.299% | | | | 01/27/25 | | | | | | 535 | | | | 536,605 | |
Petroleos Mexicanos (Mexico), Gtd. Notes | | | 5.500% | | | | 01/21/21 | | | | | | 1,295 | | | | 1,373,995 | |
Petroleos Mexicanos (Mexico), Gtd. Notes | | | 6.500% | | | | 06/02/41 | | | | | | 955 | | | | 982,217 | |
Petroleos Mexicanos (Mexico), Gtd. Notes | | | 8.625% | | | | 12/01/23 | | | | | | 350 | | | | 413,130 | |
Petroleos Mexicanos (Mexico), Gtd. Notes, 144A | | | 5.375% | | | | 03/13/22 | | | | | | 330 | | | | 349,800 | |
Petroleos Mexicanos (Mexico), Gtd. Notes, 144A, MTN | | | 6.750% | | | | 09/21/47 | | | | | | 1,405 | | | | 1,466,609 | |
Petroleos Mexicanos (Mexico), Gtd. Notes, MTN | | | 6.875% | | | | 08/04/26 | | | | | | 1,000 | | | | 1,133,750 | |
Pioneer Natural Resources Co., Sr. Unsec’d. Notes | | | 6.875% | | | | 05/01/18 | | | | | | 1,450 | | | | 1,472,308 | |
Raizen Fuels Finance SA (Brazil), Gtd. Notes, 144A | | | 5.300% | | | | 01/20/27 | | | | | | 240 | | | | 251,112 | |
Sinopec Group Overseas Development 2015 Ltd. (China), Gtd. Notes, 144A | | | 2.500% | | | | 04/28/20 | | | | | | 1,000 | | | | 994,727 | |
| | | | | | | | | | | | | | | | | | |
| | | | | | | | | | | | | | | | | 21,018,644 | |
| | | | | | | | | | | | | | | | | | |
Oil & Gas Services — 0.1% | |
Schlumberger Holdings Corp., Sr. Unsec’d. Notes, 144A | | | 4.000% | | | | 12/21/25 | | | | | | 2,170 | | | | 2,280,325 | |
| | | | | | | | | | | | | | | | | | |
Packaging & Containers — 0.0% | |
Ball Corp., Gtd. Notes | | | 4.375% | | | | 12/15/20 | | | | | | 465 | | | | 481,275 | |
WestRock RKT Co., Gtd. Notes | | | 4.900% | | | | 03/01/22 | | | | | | 675 | | | | 727,908 | |
| | | | | | | | | | | | | | | | | | |
| | | | | | | | | | | | | | | | | 1,209,183 | |
| | | | | | | | | | | | | | | | | | |
Pharmaceuticals — 0.2% | |
AbbVie, Inc., Sr. Unsec’d. Notes | | | 3.600% | | | | 05/14/25 | | | | | | 950 | | | | 976,672 | |
AbbVie, Inc., Sr. Unsec’d. Notes | | | 4.500% | | | | 05/14/35 | | | | | | 1,595 | | | | 1,751,855 | |
Allergan Funding SCS, Gtd. Notes(a) | | | 3.800% | | | | 03/15/25 | | | | | | 380 | | | | 386,858 | |
Allergan Funding SCS, Gtd. Notes | | | 4.550% | | | | 03/15/35 | | | | | | 1,625 | | | | 1,719,520 | |
Allergan Funding SCS, Gtd. Notes | | | 4.750% | | | | 03/15/45 | | | | | | 144 | | | | 153,296 | |
Eli Lilly & Co., Sr. Unsec’d. Notes | | | 3.100% | | | | 05/15/27 | | | | | | 815 | | | | 827,258 | |
| | | | | | | | | | | | | | | | | | |
| | | | | | | | | | | | | | | | | 5,815,459 | |
| | | | | | | | | | | | | | | | | | |
Pipelines — 0.2% | |
DCP Midstream Operating LP, Gtd. Notes, 144A | | | 5.350% | | | | 03/15/20 | | | | | | 473 | | | | 493,103 | |
Energy Transfer LP, Sr. Unsec’d. Notes | | | 4.650% | | | | 06/01/21 | | | | | | 610 | | | | 640,290 | |
Enterprise Products Operating LLC, Gtd. Notes | | | 3.700% | | | | 02/15/26 | | | | | | 215 | | | | 220,147 | |
Enterprise Products Operating LLC, Gtd. Notes | | | 3.750% | | | | 02/15/25 | | | | | | 1,055 | | | | 1,087,806 | |
Kinder Morgan Energy Partners LP, Gtd. Notes | | | 5.950% | | | | 02/15/18 | | | | | | 530 | | | | 532,465 | |
MPLX LP, Sr. Unsec’d. Notes | | | 4.000% | | | | 02/15/25 | | | | | | 1,140 | | | | 1,163,281 | |
MPLX LP, Sr. Unsec’d. Notes | | | 5.200% | | | | 03/01/47 | | | | | | 25 | | | | 27,436 | |
ONEOK Partners LP, Gtd. Notes | | | 6.650% | | | | 10/01/36 | | | | | | 130 | | | | 159,559 | |
ONEOK, Inc., Gtd. Notes | | | 4.950% | | | | 07/13/47 | | | | | | 640 | | | | 665,846 | |
Williams Partners LP, Sr. Unsec’d. Notes | | | 4.900% | | | | 01/15/45 | | | | | | 1,100 | | | | 1,166,959 | |
| | | | | | | | | | | | | | | | | | |
| | | | | | | | | | | | | | | | | 6,156,892 | |
| | | | | | | | | | | | | | | | | | |
SEE NOTES TO FINANCIAL STATEMENTS.
A21
| | | | | | |
| | CONSERVATIVE BALANCED PORTFOLIO (continued) | | |
| |
| SCHEDULE OF INVESTMENTS | | as of December 31, 2017 |
| | | | | | | | | | | | | | | | |
CORPORATE BONDS
(continued) | | Interest
Rate | | | Maturity
Date | | Principal
Amount
(000)# | | | Value | |
Real Estate Investment Trusts (REITs) — 0.0% | |
Select Income REIT, Sr. Unsec’d. Notes | | | 2.850% | | | 02/01/18 | | | | | 550 | | | $ | 550,000 | |
Simon Property Group LP, Sr. Unsec’d. Notes | | | 3.375% | | | 03/15/22 | | | | | 190 | | | | 195,016 | |
| | | | | | | | | | | | | | | | |
| | | | | | | | | | | | | | | 745,016 | |
| | | | | | | | | | | | | | | | |
Retail — 0.2% | |
CVS Health Corp., Sr. Unsec’d. Notes | | | 5.125% | | | 07/20/45 | | | | | 590 | | | | 676,195 | |
CVS Health Corp., Sr. Unsec’d. Notes | | | 5.300% | | | 12/05/43 | | | | | 170 | | | | 197,817 | |
L Brands, Inc., Gtd. Notes | | | 5.625% | | | 02/15/22 | | | | | 1,000 | | | | 1,066,250 | |
Lowe’s Cos., Inc., Sr. Unsec’d. Notes | | | 6.500% | | | 03/15/29 | | | | | 116 | | | | 149,741 | |
Macy’s Retail Holdings, Inc., Gtd. Notes(a) | | | 3.875% | | | 01/15/22 | | | | | 300 | | | | 301,896 | |
McDonald’s Corp., Sr. Unsec’d. Notes, MTN | | | 3.700% | | | 01/30/26 | | | | | 1,925 | | | | 2,006,594 | |
Sally Holdings LLC/Sally Capital, Inc., Gtd. Notes | | | 5.625% | | | 12/01/25 | | | | | 1,020 | | | | 1,014,900 | |
Target Corp., Sr. Unsec’d. Notes | | | 3.500% | | | 07/01/24 | | | | | 265 | | | | 276,278 | |
| | | | | | | | | | | | | | | | |
| | | | | | | | | | | | | | | 5,689,671 | |
| | | | | | | | | | | | | | | | |
Savings & Loans — 0.1% | |
People’s United Financial, Inc., Sr. Unsec’d. Notes | | | 3.650% | | | 12/06/22 | | | | | 1,195 | | | | 1,223,603 | |
| | | | | | | | | | | | | | | | |
Semiconductors — 0.1% | |
Broadcom Corp./Broadcom Cayman Finance Ltd., Gtd. Notes, 144A | | | 3.875% | | | 01/15/27 | | | | | 1,555 | | | | 1,530,191 | |
NXP BV/NXP Funding LLC (Netherlands), Gtd. Notes, 144A | | | 5.750% | | | 03/15/23 | | | | | 1,200 | | | | 1,239,000 | |
| | | | | | | | | | | | | | | | |
| | | | | | | | | | | | | | | 2,769,191 | |
| | | | | | | | | | | | | | | | |
Software — 0.1% | |
Fidelity National Information Services, Inc., Sr. Unsec’d. Notes | | | 3.625% | | | 10/15/20 | | | | | 915 | | | | 940,138 | |
Microsoft Corp., Sr. Unsec’d. Notes | | | 4.000% | | | 02/12/55 | | | | | 360 | | | | 385,138 | |
Oracle Corp., Sr. Unsec’d. Notes | | | 4.300% | | | 07/08/34 | | | | | 700 | | | | 777,943 | |
| | | | | | | | | | | | | | | | |
| | | | | | | | | | | | | | | 2,103,219 | |
| | | | | | | | | | | | | | | | |
Telecommunications — 0.3% | |
AT&T Corp., Gtd. Notes | | | 8.250% | | | 11/15/31 | | | | | 10 | | | | 14,109 | |
AT&T, Inc., Sr. Unsec’d. Notes | | | 3.400% | | | 05/15/25 | | | | | 3,130 | | | | 3,077,261 | |
AT&T, Inc., Sr. Unsec’d. Notes | | | 4.500% | | | 05/15/35 | | | | | 225 | | | | 223,665 | |
AT&T, Inc., Sr. Unsec’d. Notes | | | 4.500% | | | 03/09/48 | | | | | 12 | | | | 11,244 | |
AT&T, Inc., Sr. Unsec’d. Notes | | | 4.550% | | | 03/09/49 | | | | | 479 | | | | 450,824 | |
AT&T, Inc., Sr. Unsec’d. Notes | | | 4.900% | | | 08/14/37 | | | | | 305 | | | | 308,841 | |
AT&T, Inc., Sr. Unsec’d. Notes | | | 5.150% | | | 03/15/42 | | | | | 520 | | | | 539,536 | |
AT&T, Inc., Sr. Unsec’d. Notes | | | 5.300% | | | 08/14/58 | | | | | 345 | | | | 346,132 | |
AT&T, Inc., Sr. Unsec’d. Notes | | | 5.350% | | | 09/01/40 | | | | | 113 | | | | 119,248 | |
British Telecommunications PLC (United Kingdom),
Sr. Unsec’d. Notes | | | 9.125% | | | 12/15/30 | | | | | 350 | | | | 522,924 | |
Sprint Spectrum Co. LLC/Sprint Spectrum Co. II LLC/Sprint Spectrum Co. III LLC, Sr. Sec’d. Notes, 144A | | | 3.360% | | | 03/20/23 | | | | | 1,313 | | | | 1,320,703 | |
Verizon Communications, Inc., Sr. Unsec’d. Notes | | | 4.500% | | | 08/10/33 | | | | | 865 | | | | 907,238 | |
| | | | | | | | | | | | | | | | |
| | | | | | | | | | | | | | | 7,841,725 | |
| | | | | | | | | | | | | | | | |
Transportation — 0.1% | |
Burlington Northern Santa Fe LLC, Sr. Unsec’d. Notes | | | 3.450% | | | 09/15/21 | | | | | 1,180 | | | | 1,219,200 | |
Burlington Northern Santa Fe LLC, Sr. Unsec’d. Notes | | | 6.700% | | | 08/01/28 | | | | | 735 | | | | 961,022 | |
CSX Corp., Sr. Unsec’d. Notes | | | 6.150% | | | 05/01/37 | | | | | 690 | | | | 905,356 | |
Norfolk Southern Corp., Sr. Unsec’d. Notes | | | 5.590% | | | 05/17/25 | | | | | 120 | | | | 137,627 | |
| | | | | | | | | | | | | | | | |
| | | | | | | | | | | | | | | 3,223,205 | |
| | | | | | | | | | | | | | | | |
TOTAL CORPORATE BONDS
(cost $259,675,779) | | | | 271,510,628 | |
| | | | | | | | | | | | | | | | |
| MUNICIPAL BONDS — 0.7% | | | | | | | | | | | | | | | | |
Alabama — 0.0% | |
Alabama Economic Settlement Authority, Revenue Bonds, BABs | | | 4.263% | | | 09/15/32 | | | | | 180 | | | | 193,766 | |
| | | | | | | | | | | | | | | | |
SEE NOTES TO FINANCIAL STATEMENTS.
A22
| | | | | | |
| | CONSERVATIVE BALANCED PORTFOLIO (continued) | | |
| |
| SCHEDULE OF INVESTMENTS | | as of December 31, 2017 |
| | | | | | | | | | | | | | | | |
MUNICIPAL BONDS
(continued) | | Interest
Rate | | | Maturity
Date | | Principal
Amount
(000)# | | | Value | |
California — 0.2% | |
Bay Area Toll Authority, Revenue Bonds, BABs | | | 6.263% | | | 04/01/49 | | | | | 1,305 | | | $ | 1,927,903 | |
California Educational Facilities Authority, Revenue Bonds, BABs | | | 5.000% | | | 06/01/46 | | | | | 550 | | | | 772,497 | |
State of California, GO, BABs | | | 7.300% | | | 10/01/39 | | | | | 1,250 | | | | 1,864,825 | |
State of California, GO, BABs | | | 7.500% | | | 04/01/34 | | | | | 350 | | | | 518,287 | |
State of California, GO, BABs | | | 7.550% | | | 04/01/39 | | | | | 245 | | | | 385,534 | |
State of California, GO, BABs | | | 7.625% | | | 03/01/40 | | | | | 205 | | | | 320,712 | |
| | | | | | | | | | | | | | | | |
| | | | | | | | | | | | | | | 5,789,758 | |
| | | | | | | | | | | | | | | | |
Colorado — 0.0% | |
Regional Transportation District, Revenue Bonds, Series 2010-B, BABs | | | 5.844% | | | 11/01/50 | | | | | 565 | | | | 769,745 | |
| | | | | | | | | | | | | | | | |
Illinois — 0.1% | |
Chicago O’Hare International Airport, Revenue Bonds, BABs | | | 6.395% | | | 01/01/40 | | | | | 970 | | | | 1,353,907 | |
State of Illinois, GO, BABs | | | 5.000% | | | 11/01/22 | | | | | 2,305 | | | | 2,466,765 | |
| | | | | | | | | | | | | | | | |
| | | | | | | | | | | | | | | 3,820,672 | |
| | | | | | | | | | | | | | | | |
New Jersey — 0.1% | |
New Jersey State Turnpike Authority, Revenue Bonds, Series F, BABs | | | 7.414% | | | 01/01/40 | | | | | 1,000 | | | | 1,543,520 | |
| | | | | | | | | | | | | | | | |
New York — 0.1% | |
New York City Transitional Finance Authority, Revenue Bonds, BABs | | | 5.767% | | | 08/01/36 | | | | | 1,100 | | | | 1,381,006 | |
| | | | | | | | | | | | | | | | |
Ohio — 0.0% | |
Ohio State University (The), Revenue Bonds, BABs | | | 4.910% | | | 06/01/40 | | | | | 415 | | | | 502,744 | |
Ohio State Water Development Authority, Revenue Bonds, BABs | | | 4.879% | | | 12/01/34 | | | | | 275 | | | | 316,899 | |
| | | | | | | | | | | | | | | | |
| | | | | | | | | | | | | | | 819,643 | |
| | | | | | | | | | | | | | | | |
Oregon — 0.0% | |
Oregon State Department of Transportation Highway, Revenue Bonds, Series A, BABs | | | 5.834% | | | 11/15/34 | | | | | 425 | | | | 547,358 | |
| | | | | | | | | | | | | | | | |
Pennsylvania — 0.0% | |
Pennsylvania Turnpike Commission, Revenue Bonds, Series B, BABs | | | 5.511% | | | 12/01/45 | | | | | 505 | | | | 660,560 | |
| | | | | | | | | | | | | | | | |
Tennessee — 0.1% | |
Metropolitan Government of Nashville & Davidson County Convention Center Authority, Revenue Bonds, BABs | | | 6.731% | | | 07/01/43 | | | | | 945 | | | | 1,304,525 | |
| | | | | | | | | | | | | | | | |
Texas — 0.1% | |
University of Texas System (The), Revenue Bonds, Ser. F, Rfdg. | | | 5.000% | | | 08/15/47 | | | | | 1,100 | | | | 1,510,993 | |
| | | | | | | | | | | | | | | | |
Virginia — 0.0% | |
University of Virginia, Revenue Bonds, Ser. C | | | 4.179% | | | 09/01/2117 | | | | | 355 | | | | 370,201 | |
| | | | | | | | | | | | | | | | |
TOTAL MUNICIPAL BONDS
(cost $14,832,501) | | | | 18,711,747 | |
| | | | | | | | | | | | | | | | |
| RESIDENTIAL MORTGAGE-BACKED SECURITIES — 1.6% | | | | | | | | | | | | | |
Alternative Loan Trust, Series 2004-18CB, Class 3A1 | | | 5.250% | | | 09/25/19 | | | | | 102 | | | | 102,032 | |
Banc of America Alternative Loan Trust, Series 2005-12, Class 3CB1 | | | 6.000% | | | 01/25/36 | | | | | 836 | | | | 782,092 | |
Banc of America Funding Trust, Series 2015-R4, Class 4A1, 144A | | | 3.500% | (cc) | | 01/27/30 | | | | | 1,017 | | | | 1,017,380 | |
Banc of America Mortgage Trust, Series 2005-A, Class 2A1 | | | 3.456% | (cc) | | 02/25/35 | | | | | 181 | | | | 179,698 | |
Banc of America Mortgage Trust, Series 2005-B, Class 2A1 | | | 3.632% | (cc) | | 03/25/35 | | | | | 197 | | | | 192,307 | |
Bayview Opportunity Master Fund IVb Trust, Series 2016-CRT1, Class M1, 144A, 1 Month LIBOR + 1.750% | | | 3.314% | (c) | | 10/27/27 | | | | | 399 | | | | 398,724 | |
Bayview Opportunity Master Fund IVb Trust, Series 2017-CRT1, Class M, 144A, 1 Month LIBOR + 2.150% | | | 3.714% | (c) | | 10/25/28 | | | | | 949 | | | | 950,666 | |
Bellemeade Re Ltd. (Bermuda), Series 2017-1, Class M1, 144A, 1 Month LIBOR + 1.700% | | | 3.252% | (c) | | 10/25/27 | | | | | 612 | | | | 613,082 | |
SEE NOTES TO FINANCIAL STATEMENTS.
A23
| | | | | | |
| | CONSERVATIVE BALANCED PORTFOLIO (continued) | | |
| |
| SCHEDULE OF INVESTMENTS | | as of December 31, 2017 |
| | | | | | | | | | | | | | | | |
RESIDENTIAL MORTGAGE-BACKED SECURITIES
(continued) | | Interest
Rate | | | Maturity
Date | | Principal
Amount
(000)# | | | Value | |
Chase Mortgage Finance Trust, Series 2007-A1, Class 1A5 | | | 3.664% | (cc) | | 02/25/37 | | | | | 369 | | | $ | 371,549 | |
CIM Trust, Series 2017-2, Class A1, 144A, 1 Month LIBOR + 2.000% | | | 3.361% | (c) | | 12/25/57 | | | | | 1,541 | | | | 1,557,252 | |
CIM Trust, Series 2017-3, Class A1, 144A, 1 Month LIBOR + 2.000% | | | 3.361% | (c) | | 01/25/57 | | | | | 3,219 | | | | 3,286,562 | |
CIM Trust, Series 2017-6, Class A1, 144A | | | 3.015% | (cc) | | 06/25/57 | | | | | 1,436 | | | | 1,421,455 | |
CIM Trust, Series 2017-8, Class A1, 144A^ | | | 3.000% | (cc) | | 12/25/65 | | | | | 2,909 | | | | 2,912,647 | |
Fannie Mae Connecticut Avenue Securities, Series 2016-C02, Class 1M1, 1 Month LIBOR + 2.150% | | | 3.702% | (c) | | 09/25/28 | | | | | 500 | | | | 504,900 | |
Fannie Mae Connecticut Avenue Securities, Series 2016-C03, Class 2M1, 1 Month LIBOR + 2.200% | | | 3.752% | (c) | | 10/25/28 | | | | | 625 | | | | 631,281 | |
Fannie Mae Connecticut Avenue Securities, Series 2016-C04, Class 1M1, 1 Month LIBOR + 1.450% | | | 3.002% | (c) | | 01/25/29 | | | | | 911 | | | | 920,043 | |
Freddie Mac Structured Agency Credit Risk Debt Notes, Series 2015-DNA1, Class M1, 1 Month LIBOR + 0.900% | | | 2.452% | (c) | | 10/25/27 | | | | | 988 | | | | 989,451 | |
Freddie Mac Structured Agency Credit Risk Debt Notes, Series 2016-DNA1, Class M1, 1 Month LIBOR + 1.450% | | | 3.002% | (c) | | 07/25/28 | | | | | 376 | | | | 377,030 | |
Freddie Mac Structured Agency Credit Risk Debt Notes, Series 2016-DNA4, Class M2, 1 Month LIBOR + 1.300% | | | 2.852% | (c) | | 03/25/29 | | | | | 950 | | | | 964,163 | |
Freddie Mac Structured Agency Credit Risk Debt Notes, Series 2016-HQA2, Class M2, 1 Month LIBOR + 2.250% | | | 3.802% | (c) | | 11/25/28 | | | | | 830 | | | | 851,421 | |
Freddie Mac Structured Agency Credit Risk Debt Notes, Series 2017-DNA1, Class M1, 1 Month LIBOR + 1.200% | | | 2.752% | (c) | | 07/25/29 | | | | | 2,182 | | | | 2,207,084 | |
Freddie Mac Structured Agency Credit Risk Debt Notes, Series 2017-DNA3, Class M1, 1 Month LIBOR + 0.750% | | | 2.302% | (c) | | 03/25/30 | | | | | 3,692 | | | | 3,706,675 | |
JPMorgan Mortgage Trust, Series 2007-A1, Class 4A1 | | | 3.728% | (cc) | | 07/25/35 | | | | | 186 | | | | 189,097 | |
LSTAR Securities Investment Ltd., Series 2017-3, Class A1, 144A, 1 Month LIBOR + 2.000% | | | 3.568% | (c) | | 04/01/22 | | | | | 1,441 | | | | 1,440,050 | |
LSTAR Securities Investment Ltd. (Cayman Islands), Series 2017-4, Class A, 144A, 1 Month LIBOR + 2.000% | | | 3.568% | (c) | | 05/01/22 | | | | | 4,918 | | | | 4,913,588 | |
LSTAR Securities Investment Ltd., Series 2017-5, Class A, 144A, 1 Month LIBOR + 2.000% | | | 3.568% | (c) | | 05/01/22 | | | | | 4,373 | | | | 4,371,687 | |
LSTAR Securities Investment Ltd., Series 2017-6, Class A, 144A, 1 Month LIBOR + 1.750%^ | | | 3.318% | (c) | | 09/01/22 | | | | | 1,450 | | | | 1,451,135 | |
LSTAR Securities Investment Ltd. (Cayman Islands), Series 2017-8, Class A, 144A, 1 Month LIBOR + 1.650% | | | 3.218% | (c) | | 11/01/22 | | | | | 1,482 | | | | 1,480,914 | |
MASTR Alternative Loan Trust, Series 2004-4, Class 4A1 | | | 5.000% | | | 04/25/19 | | | | | 13 | | | | 12,626 | |
Mortgage Repurchase Agreement Financing Trust, Series 2017-1, Class A2, 144A, 1 Month LIBOR + 0.850% | | | 2.282% | (c) | | 07/10/19 | | | | | 1,950 | | | | 1,950,141 | |
Structured Adjustable Rate Mortgage Loan Trust, Series 2004-1, Class 4A3 | | | 3.473% | (cc) | | 02/25/34 | | | | | 253 | | | | 255,278 | |
Washington Mutual Mortgage Pass-Through Certificates, Series 2005-1, Class 3A | | | 5.000% | | | 03/25/20 | | | | | 59 | | | | 58,734 | |
| | | | | | | | | | | | | | | | |
TOTAL RESIDENTIAL MORTGAGE-BACKED SECURITIES
(cost $40,854,506) | | | | 41,060,744 | |
| | | | | | | | | | | | | | | | |
| SOVEREIGN BONDS — 1.3% | |
Abu Dhabi Government International Bond (United Arab Emirates), Sr. Unsec’d. Notes, 144A | | | 3.125% | | | 10/11/27 | | | | | 3,145 | | | | 3,075,055 | |
Belgium Government International Bond (Belgium),
Sr. Unsec’d. Notes, 144A, EMTN | | | 1.125% | | | 08/03/19 | | | | | 1,200 | | | | 1,182,229 | |
Colombia Government International Bond (Colombia),
Sr. Unsec’d. Notes | | | 4.000% | | | 02/26/24 | | | | | 220 | | | | 228,140 | |
Colombia Government International Bond (Colombia),
Sr. Unsec’d. Notes | | | 4.375% | | | 07/12/21 | | | | | 400 | | | | 421,800 | |
Export-Import Bank of Korea (South Korea), Sr. Unsec’d. Notes | | | 5.125% | | | 06/29/20 | | | | | 265 | | | | 279,270 | |
Finnvera OYJ (Finland), Gov’t. Gtd. Notes, 144A, MTN | | | 2.375% | | | 06/04/25 | | | | | 400 | | | | 386,744 | |
Hungary Government International Bond (Hungary),
Sr. Unsec’d. Notes | | | 4.000% | | | 03/25/19 | | | | | 392 | | | | 400,408 | |
SEE NOTES TO FINANCIAL STATEMENTS.
A24
| | | | | | |
| | CONSERVATIVE BALANCED PORTFOLIO (continued) | | |
| |
| SCHEDULE OF INVESTMENTS | | as of December 31, 2017 |
| | | | | | | | | | | | | | | | |
SOVEREIGN BONDS
(continued) | | Interest
Rate | | | Maturity
Date | | Principal
Amount
(000)# | | | Value | |
Hungary Government International Bond (Hungary),
Sr. Unsec’d. Notes | | | 6.375% | | | 03/29/21 | | | | | 1,760 | | | $ | 1,953,741 | |
Hungary Government International Bond (Hungary),
Sr. Unsec’d. Notes | | | 7.625% | | | 03/29/41 | | | | | 688 | | | | 1,077,786 | |
Indonesia Government International Bond (Indonesia),
Sr. Unsec’d. Notes | | | 4.350% | | | 01/11/48 | | | | | 1,235 | | | | 1,252,947 | |
Indonesia Government International Bond (Indonesia),
Sr. Unsec’d. Notes, 144A | | | 3.375% | | | 07/30/25 | | EUR | | | 1,200 | | | | 1,625,192 | |
Indonesia Government International Bond (Indonesia),
Sr. Unsec’d. Notes, 144A, MTN | | | 2.150% | | | 07/18/24 | | EUR | | | 1,510 | | | | 1,898,914 | |
Indonesia Government International Bond (Indonesia),
Sr. Unsec’d. Notes, 144A, MTN | | | 5.875% | | | 01/15/24 | | | | | 750 | | | | 852,831 | |
Indonesia Government International Bond (Indonesia),
Sr. Unsec’d. Notes, EMTN | | | 4.750% | | | 01/08/26 | | | | | 350 | | | | 380,220 | |
Japan Bank for International Cooperation (Japan), Gov’t. Gtd. Notes | | | 1.500% | | | 07/21/21 | | | | | 600 | | | | 578,650 | |
Japan Bank for International Cooperation (Japan), Gov’t. Gtd. Notes | | | 2.125% | | | 06/01/20 | | | | | 400 | | | | 397,592 | |
Japan Bank for International Cooperation (Japan), Gov’t. Gtd. Notes | | | 2.125% | | | 07/21/20 | | | | | 1,000 | | | | 992,361 | |
Japan Bank for International Cooperation (Japan), Gov’t. Gtd. Notes | | | 2.125% | | | 11/16/20 | | | | | 1,200 | | | | 1,189,800 | |
Japan Bank for International Cooperation (Japan), Gov’t. Gtd. Notes | | | 2.250% | | | 02/24/20 | | | | | 600 | | | | 597,396 | |
Japan Finance Organization for Municipalities (Japan),
Sr. Unsec’d. Notes, 144A, MTN | | | 2.125% | | | 04/13/21 | | | | | 600 | | | | 589,604 | |
Japan Finance Organization for Municipalities (Japan),
Sr. Unsec’d. Notes, 144A, MTN | | | 2.125% | | | 10/25/23 | | | | | 1,000 | | | | 960,554 | |
Japan Finance Organization for Municipalities (Japan),
Sr. Unsec’d. Notes, 144A, MTN | | | 2.625% | | | 04/20/22 | | | | | 1,400 | | | | 1,391,895 | |
Mexico Government International Bond (Mexico),
Sr. Unsec’d. Notes | | | 4.000% | | | 10/02/23 | | | | | 438 | | | | 458,367 | |
Mexico Government International Bond (Mexico),
Sr. Unsec’d. Notes, MTN | | | 4.750% | | | 03/08/44 | | | | | 366 | | | | 370,026 | |
Panama Government International Bond (Panama),
Sr. Unsec’d. Notes | | | 3.750% | | | 03/16/25 | | | | | 490 | | | | 511,070 | |
Panama Government International Bond (Panama),
Sr. Unsec’d. Notes | | | 4.000% | | | 09/22/24 | | | | | 395 | | | | 420,083 | |
Province of Alberta (Canada), Sr. Unsec’d. Notes | | | 2.200% | | | 07/26/22 | | | | | 480 | | | | 473,007 | |
Province of Ontario (Canada), Sr. Unsec’d. Notes | | | 2.250% | | | 05/18/22 | | | | | 575 | | | | 568,881 | |
Province of Ontario (Canada), Sr. Unsec’d. Notes | | | 4.400% | | | 04/14/20 | | | | | 280 | | | | 293,264 | |
Province of Quebec (Canada), Sr. Unsec’d. Notes | | | 2.750% | | | 04/12/27 | | | | | 1,410 | | | | 1,398,330 | |
Saudi Government International Bond (Saudi Arabia),
Sr. Unsec’d. Notes, 144A, MTN | | | 2.375% | | | 10/26/21 | | | | | 980 | | | | 955,951 | |
Saudi Government International Bond (Saudi Arabia),
Sr. Unsec’d. Notes, 144A, MTN | | | 2.875% | | | 03/04/23 | | | | | 1,285 | | | | 1,263,183 | |
Svensk Exportkredit AB (Sweden), Sr. Unsec’d. Notes, GMTN | | | 1.750% | | | 03/10/21 | | | | | 2,385 | | | | 2,346,971 | |
Tokyo Metropolitan Government (Japan),
Sr. Unsec’d. Notes, 144A | | | 2.500% | | | 06/08/22 | | | | | 1,200 | | | | 1,187,479 | |
Turkey Government International Bond (Turkey),
Sr. Unsec’d. Notes | | | 7.000% | | | 06/05/20 | | | | | 1,260 | | | | 1,359,313 | |
Uruguay Government International Bond (Uruguay),
Sr. Unsec’d. Notes | | | 5.100% | | | 06/18/50 | | | | | 490 | | | | 543,900 | |
| | | | | | | | | | | | | | | | |
TOTAL SOVEREIGN BONDS
(cost $33,490,873) | | | | 33,862,954 | |
| | | | | | | | | | | | | | | | |
| U.S. GOVERNMENT AGENCY OBLIGATIONS — 9.2% | |
Federal Home Loan Bank(k) | | | 5.500% | | | 07/15/36 | | | | | 850 | | | | 1,165,765 | |
Federal Home Loan Mortgage Corp. | | | 2.000% | | | 01/01/32 | | | | | 496 | | | | 483,423 | |
SEE NOTES TO FINANCIAL STATEMENTS.
A25
| | | | | | |
| | CONSERVATIVE BALANCED PORTFOLIO (continued) | | |
| |
| SCHEDULE OF INVESTMENTS | | as of December 31, 2017 |
| | | | | | | | | | | | | | | | |
U.S. GOVERNMENT AGENCY OBLIGATIONS
(continued) | | Interest
Rate | | | Maturity
Date | | Principal
Amount
(000)# | | | Value | |
Federal Home Loan Mortgage Corp. | | | 2.500% | | | 03/01/30 | | | | | 681 | | | $ | 680,288 | |
Federal Home Loan Mortgage Corp. | | | 3.000% | | | 10/01/28 | | | | | 577 | | | | 589,382 | |
Federal Home Loan Mortgage Corp. | | | 3.000% | | | 06/01/29 | | | | | 1,094 | | | | 1,115,954 | |
Federal Home Loan Mortgage Corp. | | | 3.000% | | | 01/01/37 | | | | | 291 | | | | 295,362 | |
Federal Home Loan Mortgage Corp. | | | 3.000% | | | 06/01/42 | | | | | 464 | | | | 466,531 | |
Federal Home Loan Mortgage Corp. | | | 3.000% | | | 10/01/42 | | | | | 1,077 | | | | 1,082,442 | |
Federal Home Loan Mortgage Corp. | | | 3.000% | | | 01/01/43 | | | | | 969 | | | | 974,282 | |
Federal Home Loan Mortgage Corp. | | | 3.000% | | | 07/01/43 | | | | | 2,550 | | | | 2,562,237 | |
Federal Home Loan Mortgage Corp. | | | 3.000% | | | 12/01/44 | | | | | 1,139 | | | | 1,142,926 | |
Federal Home Loan Mortgage Corp. | | | 3.000% | | | 03/01/45 | | | | | 931 | | | | 934,526 | |
Federal Home Loan Mortgage Corp. | | | 3.000% | | | 03/01/45 | | | | | 1,030 | | | | 1,033,638 | |
Federal Home Loan Mortgage Corp. | | | 3.000% | | | 04/01/45 | | | | | 916 | | | | 919,241 | |
Federal Home Loan Mortgage Corp. | | | 3.500% | | | TBA | | | | | 19,500 | | | | 20,025,084 | |
Federal Home Loan Mortgage Corp. | | | 3.500% | | | 08/01/26 | | | | | 746 | | | | 775,073 | |
Federal Home Loan Mortgage Corp. | | | 3.500% | | | 06/01/42 | | | | | 473 | | | | 488,265 | |
Federal Home Loan Mortgage Corp. | | | 4.000% | | | TBA | | | | | 10,250 | | | | 10,718,457 | |
Federal Home Loan Mortgage Corp. | | | 4.000% | | | 06/01/26 | | | | | 733 | | | | 768,774 | |
Federal Home Loan Mortgage Corp. | | | 4.000% | | | 09/01/26 | | | | | 261 | | | | 272,512 | |
Federal Home Loan Mortgage Corp. | | | 4.000% | | | 10/01/39 | | | | | 791 | | | | 830,212 | |
Federal Home Loan Mortgage Corp. | | | 4.000% | | | 12/01/40 | | | | | 526 | | | | 552,403 | |
Federal Home Loan Mortgage Corp. | | | 4.000% | | | 10/01/41 | | | | | 587 | | | | 618,059 | |
Federal Home Loan Mortgage Corp. | | | 4.000% | | | 01/01/42 | | | | | 189 | | | | 197,913 | |
Federal Home Loan Mortgage Corp. | | | 4.500% | | | 02/01/19 | | | | | 7 | | | | 7,437 | |
Federal Home Loan Mortgage Corp. | | | 4.500% | | | 07/01/19 | | | | | 76 | | | | 76,587 | |
Federal Home Loan Mortgage Corp. | | | 4.500% | | | 07/01/20 | | | | | 53 | | | | 53,863 | |
Federal Home Loan Mortgage Corp. | | | 4.500% | | | 02/01/39 | | | | | 120 | | | | 128,225 | |
Federal Home Loan Mortgage Corp. | | | 4.500% | | | 09/01/39 | | | | | 199 | | | | 212,073 | |
Federal Home Loan Mortgage Corp. | | | 4.500% | | | 10/01/39 | | | | | 1,792 | | | | 1,911,892 | |
Federal Home Loan Mortgage Corp. | | | 4.500% | | | 12/01/39 | | | | | 171 | | | | 181,978 | |
Federal Home Loan Mortgage Corp. | | | 4.500% | | | 07/01/41 | | | | | 284 | | | | 302,389 | |
Federal Home Loan Mortgage Corp. | | | 4.500% | | | 07/01/41 | | | | | 2,244 | | | | 2,393,819 | |
Federal Home Loan Mortgage Corp. | | | 4.500% | | | 08/01/41 | | | | | 627 | | | | 667,048 | |
Federal Home Loan Mortgage Corp. | | | 4.500% | | | 08/01/41 | | | | | 238 | | | | 253,065 | |
Federal Home Loan Mortgage Corp. | | | 4.500% | | | 08/01/41 | | | | | 137 | | | | 146,124 | |
Federal Home Loan Mortgage Corp. | | | 4.500% | | | 10/01/41 | | | | | 260 | | | | 277,794 | |
Federal Home Loan Mortgage Corp. | | | 5.000% | | | 07/01/18 | | | | | 19 | | | | 19,748 | |
Federal Home Loan Mortgage Corp. | | | 5.000% | | | 12/01/18 | | | | | 15 | | | | 15,195 | |
Federal Home Loan Mortgage Corp. | | | 5.000% | | | 07/01/19 | | | | | 55 | | | | 55,872 | |
Federal Home Loan Mortgage Corp. | | | 5.000% | | | 07/01/19 | | | | | 62 | | | | 63,367 | |
Federal Home Loan Mortgage Corp. | | | 5.000% | | | 12/01/19 | | | | | 10 | | | | 10,255 | |
Federal Home Loan Mortgage Corp. | | | 5.000% | | | 05/01/34 | | | | | 23 | | | | 24,939 | |
Federal Home Loan Mortgage Corp. | | | 5.000% | | | 05/01/34 | | | | | 395 | | | | 426,750 | |
Federal Home Loan Mortgage Corp. | | | 5.000% | | | 10/01/35 | | | | | 9 | | | | 10,256 | |
Federal Home Loan Mortgage Corp. | | | 5.000% | | | 07/01/37 | | | | | 641 | | | | 697,382 | |
Federal Home Loan Mortgage Corp. | | | 5.000% | | | 05/01/39 | | | | | 89 | | | | 96,571 | |
Federal Home Loan Mortgage Corp. | | | 5.500% | | | 12/01/33 | | | | | 50 | | | | 54,120 | |
Federal Home Loan Mortgage Corp. | | | 5.500% | | | 01/01/34 | | | | | 55 | | | | 61,463 | |
Federal Home Loan Mortgage Corp. | | | 5.500% | | | 06/01/34 | | | | | 99 | | | | 109,943 | |
Federal Home Loan Mortgage Corp. | | | 5.500% | | | 07/01/34 | | | | | 253 | | | | 280,150 | |
Federal Home Loan Mortgage Corp. | | | 5.500% | | | 05/01/37 | | | | | 72 | | | | 79,541 | |
Federal Home Loan Mortgage Corp. | | | 5.500% | | | 02/01/38 | | | | | 568 | | | | 627,507 | |
Federal Home Loan Mortgage Corp. | | | 5.500% | | | 05/01/38 | | | | | 63 | | | | 69,421 | |
Federal Home Loan Mortgage Corp. | | | 5.500% | | | 07/01/38 | | | | | 152 | | | | 167,896 | |
Federal Home Loan Mortgage Corp. | | | 6.000% | | | 03/01/32 | | | | | 297 | | | | 336,139 | |
Federal Home Loan Mortgage Corp. | | | 6.000% | | | 12/01/33 | | | | | 82 | | | | 91,407 | |
Federal Home Loan Mortgage Corp. | | | 6.000% | | | 11/01/36 | | | | | 73 | | | | 81,666 | |
Federal Home Loan Mortgage Corp. | | | 6.000% | | | 01/01/37 | | | | | 62 | | | | 69,297 | |
Federal Home Loan Mortgage Corp. | | | 6.000% | | | 05/01/37 | | | | | 34 | | | | 38,036 | |
Federal Home Loan Mortgage Corp. | | | 6.000% | | | 02/01/38 | | | | | 6 | | | | 6,709 | |
SEE NOTES TO FINANCIAL STATEMENTS.
A26
| | | | | | |
| | CONSERVATIVE BALANCED PORTFOLIO (continued) | | |
| |
| SCHEDULE OF INVESTMENTS | | as of December 31, 2017 |
| | | | | | | | | | | | | | | | |
U.S. GOVERNMENT AGENCY OBLIGATIONS
(continued) | | Interest
Rate | | | Maturity
Date | | Principal
Amount
(000)# | | | Value | |
Federal Home Loan Mortgage Corp. | | | 6.000% | | | 08/01/39 | | | | | 79 | | | $ | 89,448 | |
Federal Home Loan Mortgage Corp.(k) | | | 6.750% | | | 03/15/31 | | | | | 550 | | | | 786,524 | |
Federal Home Loan Mortgage Corp. | | | 7.000% | | | 05/01/31 | | | | | 16 | | | | 17,600 | |
Federal Home Loan Mortgage Corp. | | | 7.000% | | | 06/01/31 | | | | | 15 | | | | 15,354 | |
Federal Home Loan Mortgage Corp. | | | 7.000% | | | 08/01/31 | | | | | 156 | | | | 171,492 | |
Federal Home Loan Mortgage Corp. | | | 7.000% | | | 10/01/31 | | | | | 7 | | | | 7,453 | |
Federal National Mortgage Assoc. | | | 1.875% | | | 09/24/26 | | | | | 150 | | | | 141,396 | |
Federal National Mortgage Assoc. | | | 2.000% | | | 08/01/31 | | | | | 1,062 | | | | 1,034,303 | |
Federal National Mortgage Assoc. | | | 2.500% | | | 01/01/28 | | | | | 1,050 | | | | 1,054,633 | |
Federal National Mortgage Assoc. | | | 2.500% | | | 10/01/43 | | | | | 799 | | | | 774,343 | |
Federal National Mortgage Assoc. | | | 2.500% | | | 12/01/46 | | | | | 1,640 | | | | 1,583,997 | |
Federal National Mortgage Assoc. | | | 3.000% | | | TBA | | | | | 2,500 | | | | 2,500,000 | |
Federal National Mortgage Assoc. | | | 3.000% | | | TBA | | | | | 5,000 | | | | 4,993,457 | |
Federal National Mortgage Assoc. | | | 3.000% | | | TBA | | | | | 3,750 | | | | 3,815,698 | |
Federal National Mortgage Assoc. | | | 3.000% | | | 02/01/27 | | | | | 2,254 | | | | 2,302,362 | |
Federal National Mortgage Assoc. | | | 3.000% | | | 08/01/30 | | | | | 1,509 | | | | 1,540,668 | |
Federal National Mortgage Assoc. | | | 3.000% | | | 02/01/31 | | | | | 3,034 | | | | 3,091,916 | |
Federal National Mortgage Assoc. | | | 3.000% | | | 05/01/31 | | | | | 2,059 | | | | 2,097,828 | |
Federal National Mortgage Assoc. | | | 3.000% | | | 11/01/36 | | | | | 2,692 | | | | 2,734,454 | |
Federal National Mortgage Assoc. | | | 3.000% | | | 12/01/42 | | | | | 2,137 | | | | 2,148,559 | |
Federal National Mortgage Assoc. | | | 3.000% | | | 04/01/43 | | | | | 6,664 | | | | 6,699,012 | |
Federal National Mortgage Assoc. | | | 3.000% | | | 07/01/43 | | | | | 1,572 | | | | 1,580,248 | |
Federal National Mortgage Assoc. | | | 3.000% | | �� | 08/01/43 | | | | | 4,314 | | | | 4,336,031 | |
Federal National Mortgage Assoc.(tt) | | | 3.500% | | | TBA | | | | | 1,750 | | | | 1,796,758 | |
Federal National Mortgage Assoc. | | | 3.500% | | | TBA | | | | | 1,750 | | | | 1,793,955 | |
Federal National Mortgage Assoc. | | | 3.500% | | | 07/01/27 | | | | | 1,650 | | | | 1,706,163 | |
Federal National Mortgage Assoc. | | | 3.500% | | | 06/01/39 | | | | | 690 | | | | 712,298 | |
Federal National Mortgage Assoc. | | | 3.500% | | | 01/01/42 | | | | | 5,479 | | | | 5,657,348 | |
Federal National Mortgage Assoc. | | | 3.500% | | | 05/01/42 | | | | | 2,837 | | | | 2,929,673 | |
Federal National Mortgage Assoc. | | | 3.500% | | | 07/01/42 | | | | | 1,068 | | | | 1,102,948 | |
Federal National Mortgage Assoc. | | | 3.500% | | | 08/01/42 | | | | | 449 | | | | 463,428 | |
Federal National Mortgage Assoc. | | | 3.500% | | | 08/01/42 | | | | | 1,380 | | | | 1,425,366 | |
Federal National Mortgage Assoc. | | | 3.500% | | | 09/01/42 | | | | | 566 | | | | 584,429 | |
Federal National Mortgage Assoc. | | | 3.500% | | | 09/01/42 | | | | | 2,119 | | | | 2,187,828 | |
Federal National Mortgage Assoc. | | | 3.500% | | | 11/01/42 | | | | | 385 | | | | 397,450 | |
Federal National Mortgage Assoc. | | | 3.500% | | | 03/01/43 | | | | | 3,255 | | | | 3,362,855 | |
Federal National Mortgage Assoc. | | | 3.500% | | | 04/01/43 | | | | | 746 | | | | 769,951 | |
Federal National Mortgage Assoc. | | | 3.500% | | | 04/01/43 | | | | | 1,135 | | | | 1,171,071 | |
Federal National Mortgage Assoc. | | | 3.500% | | | 01/01/46 | | | | | 2,298 | | | | 2,360,451 | |
Federal National Mortgage Assoc. | | | 4.000% | | | TBA | | | | | 6,000 | | | | 6,274,433 | |
Federal National Mortgage Assoc. | | | 4.000% | | | 10/01/41 | | | | | 3,194 | | | | 3,353,969 | |
Federal National Mortgage Assoc. | | | 4.000% | | | 09/01/44 | | | | | 3,477 | | | | 3,639,591 | |
Federal National Mortgage Assoc. | | | 4.500% | | | 11/01/18 | | | | | 33 | | | | 33,250 | |
Federal National Mortgage Assoc. | | | 4.500% | | | 01/01/19 | | | | | 24 | | | | 24,245 | |
Federal National Mortgage Assoc. | | | 4.500% | | | 01/01/19 | | | | | 30 | | | | 30,606 | |
Federal National Mortgage Assoc. | | | 4.500% | | | 06/01/19 | | | | | 11 | | | | 11,636 | |
Federal National Mortgage Assoc. | | | 4.500% | | | 07/01/33 | | | | | 64 | | | | 68,589 | |
Federal National Mortgage Assoc. | | | 4.500% | | | 08/01/33 | | | | | 62 | | | | 66,615 | |
Federal National Mortgage Assoc. | | | 4.500% | | | 09/01/33 | | | | | 146 | | | | 155,639 | |
Federal National Mortgage Assoc. | | | 4.500% | | | 10/01/33 | | | | | 168 | | | | 179,626 | |
Federal National Mortgage Assoc. | | | 4.500% | | | 10/01/33 | | | | | 12 | | | | 13,183 | |
Federal National Mortgage Assoc. | | | 4.500% | | | 10/01/33 | | | | | 41 | | | | 44,602 | |
Federal National Mortgage Assoc. | | | 4.500% | | | 01/01/35 | | | | | 2 | | | | 2,039 | |
Federal National Mortgage Assoc. | | | 4.500% | | | 07/01/39 | | | | | 1,151 | | | | 1,242,221 | |
Federal National Mortgage Assoc. | | | 4.500% | | | 08/01/39 | | | | | 1,797 | | | | 1,938,612 | |
Federal National Mortgage Assoc. | | | 4.500% | | | 03/01/41 | | | | | 637 | | | | 687,635 | |
Federal National Mortgage Assoc. | | | 5.000% | | | TBA | | | | | 6,500 | | | | 6,986,104 | |
Federal National Mortgage Assoc. | | | 5.000% | | | 10/01/18 | | | | | 9 | | | | 9,494 | |
Federal National Mortgage Assoc. | | | 5.000% | | | 01/01/19 | | | | | 36 | | | | 37,095 | |
SEE NOTES TO FINANCIAL STATEMENTS.
A27
| | | | | | |
| | CONSERVATIVE BALANCED PORTFOLIO (continued) | | |
| |
| SCHEDULE OF INVESTMENTS | | as of December 31, 2017 |
| | | | | | | | | | | | | | | | |
U.S. GOVERNMENT AGENCY OBLIGATIONS
(continued) | | Interest
Rate | | | Maturity
Date | | Principal
Amount
(000)# | | | Value | |
Federal National Mortgage Assoc. | | | 5.000% | | | 03/01/34 | | | | | 326 | | | $ | 353,489 | |
Federal National Mortgage Assoc. | | | 5.000% | | | 06/01/35 | | | | | 121 | | | | 131,327 | |
Federal National Mortgage Assoc. | | | 5.000% | | | 07/01/35 | | | | | 159 | | | | 173,059 | |
Federal National Mortgage Assoc. | | | 5.000% | | | 09/01/35 | | | | | 111 | | | | 120,720 | |
Federal National Mortgage Assoc. | | | 5.000% | | | 11/01/35 | | | | | 117 | | | | 127,587 | |
Federal National Mortgage Assoc. | | | 5.000% | | | 02/01/36 | | | | | 153 | | | | 166,002 | |
Federal National Mortgage Assoc. | | | 5.000% | | | 05/01/36 | | | | | 77 | | | | 83,278 | |
Federal National Mortgage Assoc. | | | 5.500% | | | 02/01/18 | | | | | — | (r) | | | 109 | |
Federal National Mortgage Assoc. | | | 5.500% | | | 05/01/20 | | | | | 27 | | | | 27,716 | |
Federal National Mortgage Assoc. | | | 5.500% | | | 05/01/21 | | | | | 70 | | | | 72,561 | |
Federal National Mortgage Assoc. | | | 5.500% | | | 09/01/33 | | | | | 352 | | | | 389,791 | |
Federal National Mortgage Assoc. | | | 5.500% | | | 10/01/33 | | | | | 104 | | | | 115,820 | |
Federal National Mortgage Assoc. | | | 5.500% | | | 12/01/33 | | | | | 67 | | | | 74,699 | |
Federal National Mortgage Assoc. | | | 5.500% | | | 01/01/34 | | | | | 2 | | | | 1,895 | |
Federal National Mortgage Assoc. | | | 5.500% | | | 12/01/34 | | | | | 253 | | | | 280,150 | |
Federal National Mortgage Assoc. | | | 5.500% | | | 10/01/35 | | | | | 1,013 | | | | 1,122,179 | |
Federal National Mortgage Assoc. | | | 5.500% | | | 03/01/36 | | | | | 164 | | | | 180,906 | |
Federal National Mortgage Assoc. | | | 5.500% | | | 05/01/36 | | | | | 169 | | | | 186,439 | |
Federal National Mortgage Assoc. | | | 5.500% | | | 04/01/37 | | | | | 139 | | | | 154,124 | |
Federal National Mortgage Assoc. | | | 6.000% | | | 05/01/21 | | | | | 55 | | | | 57,694 | |
Federal National Mortgage Assoc. | | | 6.000% | | | 08/01/22 | | | | | 55 | | | | 57,682 | |
Federal National Mortgage Assoc. | | | 6.000% | | | 04/01/33 | | | | | 26 | | | | 29,786 | |
Federal National Mortgage Assoc. | | | 6.000% | | | 06/01/33 | | | | | 7 | | | | 7,504 | |
Federal National Mortgage Assoc. | | | 6.000% | | | 10/01/33 | | | | | 497 | | | | 571,224 | |
Federal National Mortgage Assoc. | | | 6.000% | | | 11/01/33 | | | | | 7 | | | | 8,021 | |
Federal National Mortgage Assoc. | | | 6.000% | | | 11/01/33 | | | | | 74 | | | | 82,349 | |
Federal National Mortgage Assoc. | | | 6.000% | | | 11/01/33 | | | | | 23 | | | | 25,778 | |
Federal National Mortgage Assoc. | | | 6.000% | | | 01/01/34 | | | | | 390 | | | | 439,367 | |
Federal National Mortgage Assoc. | | | 6.000% | | | 02/01/34 | | | | | 91 | | | | 103,714 | |
Federal National Mortgage Assoc. | | | 6.000% | | | 03/01/34 | | | | | 70 | | | | 78,436 | |
Federal National Mortgage Assoc. | | | 6.000% | | | 03/01/34 | | | | | 39 | | | | 43,164 | |
Federal National Mortgage Assoc. | | | 6.000% | | | 07/01/34 | | | | | 241 | | | | 273,324 | |
Federal National Mortgage Assoc. | | | 6.000% | | | 08/01/34 | | | | | 1 | | | | 859 | |
Federal National Mortgage Assoc. | | | 6.000% | | | 10/01/34 | | | | | 5 | | | | 5,425 | |
Federal National Mortgage Assoc. | | | 6.000% | | | 11/01/34 | | | | | 3 | | | | 3,105 | |
Federal National Mortgage Assoc. | | | 6.000% | | | 11/01/34 | | | | | 55 | | | | 62,954 | |
Federal National Mortgage Assoc. | | | 6.000% | | | 12/01/34 | | | | | 24 | | | | 27,334 | |
Federal National Mortgage Assoc. | | | 6.000% | | | 01/01/35 | | | | | 83 | | | | 93,919 | |
Federal National Mortgage Assoc. | | | 6.000% | | | 01/01/35 | | | | | 274 | | | | 308,640 | |
Federal National Mortgage Assoc. | | | 6.000% | | | 02/01/35 | | | | | 5 | | | | 6,124 | |
Federal National Mortgage Assoc. | | | 6.000% | | | 02/01/35 | | | | | 82 | | | | 91,169 | |
Federal National Mortgage Assoc. | | | 6.000% | | | 02/01/35 | | | | | 316 | | | | 362,724 | |
Federal National Mortgage Assoc. | | | 6.000% | | | 03/01/35 | | | | | 4 | | | | 4,053 | |
Federal National Mortgage Assoc. | | | 6.000% | | | 04/01/35 | | | | | 1 | | | | 1,361 | |
Federal National Mortgage Assoc. | | | 6.000% | | | 07/01/36 | | | | | 60 | | | | 68,413 | |
Federal National Mortgage Assoc. | | | 6.000% | | | 02/01/37 | | | | | 104 | | | | 118,221 | |
Federal National Mortgage Assoc. | | | 6.000% | | | 05/01/37 | | | | | 39 | | | | 43,868 | |
Federal National Mortgage Assoc. | | | 6.000% | | | 06/01/37 | | | | | 1 | | | | 1,172 | |
Federal National Mortgage Assoc. | | | 6.000% | | | 08/01/37 | | | | | 24 | | | | 26,504 | |
Federal National Mortgage Assoc. | | | 6.000% | | | 08/01/37 | | | | | — | (r) | | | 258 | |
Federal National Mortgage Assoc. | | | 6.000% | | | 09/01/37 | | | | | 1 | | | | 727 | |
Federal National Mortgage Assoc. | | | 6.000% | | | 10/01/37 | | | | | 47 | | | | 52,996 | |
Federal National Mortgage Assoc. | | | 6.000% | | | 05/01/38 | | | | | 95 | | | | 107,388 | |
Federal National Mortgage Assoc. | | | 6.000% | | | 06/01/38 | | | | | 3 | | | | 3,412 | |
Federal National Mortgage Assoc.(k) | | | 6.250% | | | 05/15/29 | | | | | 1,245 | | | | 1,664,449 | |
Federal National Mortgage Assoc. | | | 6.500% | | | 07/01/32 | | | | | 59 | | | | 65,821 | |
Federal National Mortgage Assoc. | | | 6.500% | | | 07/01/32 | | | | | 2 | | | | 2,619 | |
Federal National Mortgage Assoc. | | | 6.500% | | | 09/01/32 | | | | | 75 | | | | 82,644 | |
Federal National Mortgage Assoc. | | | 6.500% | | | 09/01/32 | | | | | 15 | | | | 16,347 | |
SEE NOTES TO FINANCIAL STATEMENTS.
A28
| | | | | | |
| | CONSERVATIVE BALANCED PORTFOLIO (continued) | | |
| |
| SCHEDULE OF INVESTMENTS | | as of December 31, 2017 |
| | | | | | | | | | | | | | | | |
U.S. GOVERNMENT AGENCY OBLIGATIONS
(continued) | | Interest
Rate | | | Maturity
Date | | Principal
Amount
(000)# | | | Value | |
Federal National Mortgage Assoc. | | | 6.500% | | | 09/01/32 | | | | | 99 | | | $ | 109,240 | |
Federal National Mortgage Assoc. | | | 6.500% | | | 09/01/32 | | | | | 70 | | | | 77,929 | |
Federal National Mortgage Assoc. | | | 6.500% | | | 09/01/32 | | | | | 11 | | | | 12,149 | |
Federal National Mortgage Assoc. | | | 6.500% | | | 04/01/33 | | | | | 133 | | | | 149,547 | |
Federal National Mortgage Assoc. | | | 6.500% | | | 11/01/33 | | | | | 23 | | | | 25,794 | |
Federal National Mortgage Assoc. | | | 6.500% | | | 01/01/34 | | | | | 60 | | | | 66,929 | |
Federal National Mortgage Assoc. | | | 6.500% | | | 09/01/34 | | | | | 86 | | | | 94,839 | |
Federal National Mortgage Assoc. | | | 6.500% | | | 10/01/34 | | | | | 211 | | | | 233,656 | |
Federal National Mortgage Assoc. | | | 6.500% | | | 09/01/36 | | | | | 93 | | | | 106,373 | |
Federal National Mortgage Assoc. | | | 6.500% | | | 10/01/36 | | | | | 34 | | | | 38,462 | |
Federal National Mortgage Assoc. | | | 6.500% | | | 11/01/36 | | | | | 23 | | | | 25,403 | |
Federal National Mortgage Assoc. | | | 6.500% | | | 01/01/37 | | | | | 42 | | | | 46,227 | |
Federal National Mortgage Assoc. | | | 6.500% | | | 01/01/37 | | | | | 117 | | | | 129,225 | |
Federal National Mortgage Assoc.(k) | | | 6.625% | | | 11/15/30 | | | | | 800 | | | | 1,125,045 | |
Federal National Mortgage Assoc. | | | 7.000% | | | 02/01/32 | | | | | 39 | | | | 43,346 | |
Federal National Mortgage Assoc. | | | 7.000% | | | 03/01/32 | | | | | 3 | | | | 2,728 | |
Federal National Mortgage Assoc. | | | 7.000% | | | 05/01/32 | | | | | 19 | | | | 21,634 | |
Federal National Mortgage Assoc. | | | 7.000% | | | 06/01/32 | | | | | 22 | | | | 24,899 | |
Federal National Mortgage Assoc. | | | 7.000% | | | 07/01/32 | | | | | 62 | | | | 69,051 | |
Federal National Mortgage Assoc.(k) | | | 7.125% | | | 01/15/30 | | | | | 3,195 | | | | 4,602,570 | |
Federal National Mortgage Assoc. | | | 7.500% | | | 05/01/32 | | | | | 17 | | | | 17,436 | |
Government National Mortgage Assoc. | | | 2.500% | | | 12/20/46 | | | | | 870 | | | | 850,041 | |
Government National Mortgage Assoc. | | | 3.000% | | | TBA | | | | | 3,000 | | | | 3,027,187 | |
Government National Mortgage Assoc. | | | 3.000% | | | 12/20/44 | | | | | 427 | | | | 432,520 | |
Government National Mortgage Assoc. | | | 3.000% | | | 03/15/45 | | | | | 1,298 | | | | 1,308,738 | |
Government National Mortgage Assoc. | | | 3.000% | | | 03/20/46 | | | | | 2,736 | | | | 2,762,982 | |
Government National Mortgage Assoc. | | | 3.000% | | | 07/20/46 | | | | | 928 | | | | 936,910 | |
Government National Mortgage Assoc. | | | 3.000% | | | 08/20/46 | | | | | 1,860 | | | | 1,878,569 | |
Government National Mortgage Assoc. | | | 3.000% | | | 11/20/46 | | | | | 935 | | | | 944,829 | |
Government National Mortgage Assoc. | | | 3.000% | | | 01/20/47 | | | | | 472 | | | | 477,014 | |
Government National Mortgage Assoc. | | | 3.000% | | | 04/20/47 | | | | | 4,698 | | | | 4,745,142 | |
Government National Mortgage Assoc. | | | 3.500% | | | TBA | | | | | 4,500 | | | | 4,651,875 | |
Government National Mortgage Assoc. | | | 3.500% | | | 12/20/42 | | | | | 1,728 | | | | 1,795,811 | |
Government National Mortgage Assoc. | | | 3.500% | | | 05/20/43 | | | | | 534 | | | | 555,300 | |
Government National Mortgage Assoc. | | | 3.500% | | | 04/20/45 | | | | | 2,467 | | | | 2,554,121 | |
Government National Mortgage Assoc. | | | 3.500% | | | 07/20/46 | | | | | 13,205 | | | | 13,664,849 | |
Government National Mortgage Assoc. | | | 4.000% | | | TBA | | | | | 8,000 | | | | 8,339,375 | |
Government National Mortgage Assoc. | | | 4.000% | | | 06/15/40 | | | | | 120 | | | | 125,941 | |
Government National Mortgage Assoc. | | | 4.000% | | | 05/20/41 | | | | | 95 | | | | 99,957 | |
Government National Mortgage Assoc. | | | 4.000% | | | 12/20/42 | | | | | 873 | | | | 917,927 | |
Government National Mortgage Assoc. | | | 4.000% | | | 08/20/44 | | | | | 435 | | | | 456,600 | |
Government National Mortgage Assoc. | | | 4.000% | | | 11/20/45 | | | | | 1,012 | | | | 1,060,491 | |
Government National Mortgage Assoc. | | | 4.000% | | | 12/20/45 | | | | | 2,661 | | | | 2,793,714 | |
Government National Mortgage Assoc. | | | 4.500% | | | 04/15/40 | | | | | 881 | | | | 932,754 | |
Government National Mortgage Assoc. | | | 4.500% | | | 01/20/41 | | | | | 684 | | | | 725,895 | |
Government National Mortgage Assoc. | | | 4.500% | | | 02/20/41 | | | | | 1,150 | | | | 1,219,814 | |
Government National Mortgage Assoc. | | | 4.500% | | | 03/20/41 | | | | | 579 | | | | 614,124 | |
Government National Mortgage Assoc. | | | 4.500% | | | 06/20/44 | | | | | 876 | | | | 925,510 | |
Government National Mortgage Assoc. | | | 4.500% | | | 09/20/46 | | | | | 847 | | | | 891,534 | |
Government National Mortgage Assoc. | | | 4.500% | | | 11/20/46 | | | | | 1,263 | | | | 1,326,914 | |
Government National Mortgage Assoc. | | | 4.500% | | | 03/20/47 | | | | | 927 | | | | 973,499 | |
Government National Mortgage Assoc. | | | 5.000% | | | 10/20/37 | | | | | 140 | | | | 151,400 | |
Government National Mortgage Assoc. | | | 5.000% | | | 04/20/45 | | | | | 903 | | | | 967,731 | |
Government National Mortgage Assoc. | | | 5.500% | | | 08/15/33 | | | | | 264 | | | | 289,585 | |
Government National Mortgage Assoc. | | | 5.500% | | | 08/15/33 | | | | | 296 | | | | 324,909 | |
Government National Mortgage Assoc. | | | 5.500% | | | 09/15/33 | | | | | 85 | | | | 93,221 | |
Government National Mortgage Assoc. | | | 5.500% | | | 12/15/33 | | | | | 46 | | | | 50,235 | |
Government National Mortgage Assoc. | | | 5.500% | | | 03/15/34 | | | | | 172 | | | | 188,742 | |
Government National Mortgage Assoc. | | | 5.500% | | | 12/15/34 | | | | | 413 | | | | 462,687 | |
SEE NOTES TO FINANCIAL STATEMENTS.
A29
| | | | | | |
| | CONSERVATIVE BALANCED PORTFOLIO (continued) | | |
| |
| SCHEDULE OF INVESTMENTS | | as of December 31, 2017 |
| | | | | | | | | | | | | | | | |
U.S. GOVERNMENT AGENCY OBLIGATIONS
(continued) | | Interest
Rate | | | Maturity
Date | | Principal
Amount
(000)# | | | Value | |
Government National Mortgage Assoc. | | | 5.500% | | | 07/15/35 | | | | | 89 | | | $ | 99,338 | |
Government National Mortgage Assoc. | | | 5.500% | | | 04/15/36 | | | | | 167 | | | | 185,795 | |
Government National Mortgage Assoc. | | | 6.000% | | | 11/15/23 | | | | | 1 | | | | 577 | |
Government National Mortgage Assoc. | | | 6.000% | | | 05/15/32 | | | | | — | (r) | | | 419 | |
Government National Mortgage Assoc. | | | 6.000% | | | 04/15/33 | | | | | 11 | | | | 12,604 | |
Government National Mortgage Assoc. | | | 6.000% | | | 12/15/33 | | | | | 133 | | | | 148,675 | |
Government National Mortgage Assoc. | | | 6.000% | | | 01/15/34 | | | | | 63 | | | | 69,915 | |
Government National Mortgage Assoc. | | | 6.000% | | | 01/15/34 | | | | | 78 | | | | 88,331 | |
Government National Mortgage Assoc. | | | 6.000% | | | 01/15/34 | | | | | 39 | | | | 44,565 | |
Government National Mortgage Assoc. | | | 6.000% | | | 06/20/34 | | | | | 147 | | | | 166,416 | |
Government National Mortgage Assoc. | | | 6.000% | | | 07/15/34 | | | | | 105 | | | | 118,374 | |
Government National Mortgage Assoc. | | | 6.500% | | | 10/15/23 | | | | | 1 | | | | 1,373 | |
Government National Mortgage Assoc. | | | 6.500% | | | 12/15/23 | | | | | 6 | | | | 6,266 | |
Government National Mortgage Assoc. | | | 6.500% | | | 01/15/24 | | | | | 21 | | | | 23,387 | |
Government National Mortgage Assoc. | | | 6.500% | | | 01/15/24 | | | | | 72 | | | | 80,269 | |
Government National Mortgage Assoc. | | | 6.500% | | | 01/15/24 | | | | | 20 | | | | 22,300 | |
Government National Mortgage Assoc. | | | 6.500% | | | 01/15/24 | | | | | 46 | | | | 51,184 | |
Government National Mortgage Assoc. | | | 6.500% | | | 01/15/24 | | | | | — | (r) | | | 149 | |
Government National Mortgage Assoc. | | | 6.500% | | | 01/15/24 | | | | | 2 | | | | 1,996 | |
Government National Mortgage Assoc. | | | 6.500% | | | 01/15/24 | | | | | 1 | | | | 1,004 | |
Government National Mortgage Assoc. | | | 6.500% | | | 01/15/24 | | | | | 4 | | | | 4,536 | |
Government National Mortgage Assoc. | | | 6.500% | | | 01/15/24 | | | | | 14 | | | | 15,111 | |
Government National Mortgage Assoc. | | | 6.500% | | | 01/15/24 | | | | | 2 | | | | 1,678 | |
Government National Mortgage Assoc. | | | 6.500% | | | 02/15/24 | | | | | 9 | | | | 10,064 | |
Government National Mortgage Assoc. | | | 6.500% | | | 02/15/24 | | | | | 21 | | | | 23,842 | |
Government National Mortgage Assoc. | | | 6.500% | | | 02/15/24 | | | | | 20 | | | | 22,351 | |
Government National Mortgage Assoc. | | | 6.500% | | | 02/15/24 | | | | | 7 | | | | 7,536 | |
Government National Mortgage Assoc. | | | 6.500% | | | 02/15/24 | | | | | 6 | | | | 7,079 | |
Government National Mortgage Assoc. | | | 6.500% | | | 02/15/24 | | | | | 4 | | | | 3,973 | |
Government National Mortgage Assoc. | | | 6.500% | | | 03/15/24 | | | | | 2 | | | | 2,695 | |
Government National Mortgage Assoc. | | | 6.500% | | | 03/15/24 | | | | | 5 | | | | 5,085 | |
Government National Mortgage Assoc. | | | 6.500% | | | 03/15/24 | | | | | 4 | | | | 4,630 | |
Government National Mortgage Assoc. | | | 6.500% | | | 04/15/24 | | | | | 2 | | | | 1,890 | |
Government National Mortgage Assoc. | | | 6.500% | | | 04/15/24 | | | | | 1 | | | | 1,015 | |
Government National Mortgage Assoc. | | | 6.500% | | | 04/15/24 | | | | | 5 | | | | 5,930 | |
Government National Mortgage Assoc. | | | 6.500% | | | 04/15/24 | | | | | 3 | | | | 3,470 | |
Government National Mortgage Assoc. | | | 6.500% | | | 04/15/24 | | | | | 8 | | | | 9,225 | |
Government National Mortgage Assoc. | | | 6.500% | | | 04/15/24 | | | | | 17 | | | | 19,281 | |
Government National Mortgage Assoc. | | | 6.500% | | | 04/15/24 | | | | | 4 | | | | 4,495 | |
Government National Mortgage Assoc. | | | 6.500% | | | 04/15/24 | | | | | 3 | | | | 3,247 | |
Government National Mortgage Assoc. | | | 6.500% | | | 05/15/24 | | | | | 5 | | | | 5,333 | |
Government National Mortgage Assoc. | | | 6.500% | | | 05/15/24 | | | | | 7 | | | | 7,804 | |
Government National Mortgage Assoc. | | | 6.500% | | | 05/15/24 | | | | | 31 | | | | 34,087 | |
Government National Mortgage Assoc. | | | 6.500% | | | 10/15/24 | | | | | 27 | | | | 30,051 | |
Government National Mortgage Assoc. | | | 6.500% | | | 11/15/28 | | | | | 7 | | | | 7,716 | |
Government National Mortgage Assoc. | | | 6.500% | | | 08/15/31 | | | | | 8 | | | | 8,655 | |
Government National Mortgage Assoc. | | | 6.500% | | | 12/15/31 | | | | | 14 | | | | 15,498 | |
Government National Mortgage Assoc. | | | 6.500% | | | 01/15/32 | | | | | 28 | | | | 31,108 | |
Government National Mortgage Assoc. | | | 6.500% | | | 02/15/32 | | | | | 54 | | | | 59,783 | |
Government National Mortgage Assoc. | | | 6.500% | | | 06/15/32 | | | | | 25 | | | | 27,706 | |
Government National Mortgage Assoc. | | | 6.500% | | | 07/15/32 | | | | | 49 | | | | 54,639 | |
Government National Mortgage Assoc. | | | 6.500% | | | 08/15/32 | | | | | 8 | | | | 9,085 | |
Government National Mortgage Assoc. | | | 6.500% | | | 08/15/32 | | | | | 9 | | | | 10,150 | |
Government National Mortgage Assoc. | | | 6.500% | | | 08/15/32 | | | | | 7 | | | | 8,588 | |
Government National Mortgage Assoc. | | | 6.500% | | | 08/15/32 | | | | | 28 | | | | 31,357 | |
Government National Mortgage Assoc. | | | 6.500% | | | 08/15/32 | | | | | 239 | | | | 278,655 | |
Government National Mortgage Assoc. | | | 6.500% | | | 08/15/34 | | | | | 27 | | | | 30,536 | |
Government National Mortgage Assoc. | | | 6.500% | | | 06/15/35 | | | | | 49 | | | | 56,343 | |
Government National Mortgage Assoc. | | | 6.500% | | | 09/15/36 | | | | | 62 | | | | 72,639 | |
SEE NOTES TO FINANCIAL STATEMENTS.
A30
| | | | | | |
| | CONSERVATIVE BALANCED PORTFOLIO (continued) | | |
| |
| SCHEDULE OF INVESTMENTS | | as of December 31, 2017 |
| | | | | | | | | | | | | | | | | | |
U.S. GOVERNMENT AGENCY OBLIGATIONS
(continued) | | Interest
Rate | | | Maturity
Date | | | Principal
Amount
(000)# | | | Value | |
Government National Mortgage Assoc. | | | 8.000% | | | | 01/15/24 | | | | | | 10 | | | $ | 9,985 | |
Government National Mortgage Assoc. | | | 8.000% | | | | 07/15/24 | | | | | | 1 | | | | 761 | |
Hashemite Kingdom of Jordan, USAID Bond, U.S. Gov’t. Gtd. Notes | | | 3.000% | | | | 06/30/25 | | | | | | 915 | | | | 941,656 | |
Tennessee Valley Authority, Sr. Unsec’d. Notes | | | 2.875% | | | | 02/01/27 | | | | | | 300 | | | | 305,711 | |
Tennessee Valley Authority, Sr. Unsec’d. Notes | | | 7.125% | | | | 05/01/30 | | | | | | 510 | | | | 735,309 | |
| | | | | | | | | | | | | | | | | | |
TOTAL U.S. GOVERNMENT AGENCY OBLIGATIONS
(cost $239,145,280) | | | | 239,893,159 | |
| | | | | | | | | | | | | | | | | | |
| U.S. TREASURY OBLIGATIONS — 2.3% | |
U.S. Treasury Bonds | | | 2.750% | | | | 08/15/47 | | | | | | 225 | | | | 225,281 | |
U.S. Treasury Bonds | | | 3.000% | | | | 11/15/44 | | | | | | 190 | | | | 199,567 | |
U.S. Treasury Inflation Indexed Bonds, TIPS | | | 0.125% | | | | 04/15/22 | | | | | | 2,267 | | | | 2,250,952 | |
U.S. Treasury Inflation Indexed Bonds, TIPS | | | 2.000% | | | | 01/15/26 | | | | | | 31,138 | | | | 35,024,851 | |
U.S. Treasury Notes | | | 1.875% | | | | 12/31/19 | | | | | | 1,275 | | | | 1,274,602 | |
U.S. Treasury Notes(a) | | | 2.000% | | | | 11/30/22 | | | | | | 535 | | | | 530,131 | |
U.S. Treasury Notes | | | 2.125% | | | | 12/31/22 | | | | | | 705 | | | | 702,081 | |
U.S. Treasury Notes(k) | | | 2.125% | | | | 11/30/24 | | | | | | 6,805 | | | | 6,715,685 | |
U.S. Treasury Notes | | | 2.125% | | | | 05/15/25 | | | | | | 3,195 | | | | 3,146,201 | |
U.S. Treasury Strips Coupon | | | 2.184% | (s) | | | 02/15/28 | | | | | | 2,115 | | | | 1,638,428 | |
U.S. Treasury Strips Coupon | | | 2.241% | (s) | | | 05/15/28 | | | | | | 1,055 | | | | 812,565 | |
U.S. Treasury Strips Coupon | | | 2.280% | (s) | | | 02/15/29 | | | | | | 1,055 | | | | 793,717 | |
U.S. Treasury Strips Coupon | | | 2.384% | (s) | | | 05/15/29 | | | | | | 2,175 | | | | 1,626,489 | |
U.S. Treasury Strips Coupon | | | 2.519% | (s) | | | 08/15/25 | | | | | | 1,930 | | | | 1,601,462 | |
U.S. Treasury Strips Coupon | | | 2.783% | (s) | | | 08/15/29 | | | | | | 1,000 | | | | 742,594 | |
U.S. Treasury Strips Coupon | | | 2.878% | (s) | | | 05/15/31 | | | | | | 1,000 | | | | 705,979 | |
U.S. Treasury Strips Coupon | | | 3.042% | (s) | | | 11/15/35 | | | | | | 2,000 | | | | 1,237,741 | |
U.S. Treasury Strips Coupon | | | 3.202% | (s) | | | 08/15/40 | | | | | | 2,000 | | | | 1,069,571 | |
| | | | | | | | | | | | | | | | | | |
TOTAL U.S. TREASURY OBLIGATIONS
(cost $59,941,989) | | | | 60,297,897 | |
| | | | | | | | | | | | | | | | | | |
TOTAL LONG-TERM INVESTMENTS
(cost $1,433,457,069) | | | | 2,307,971,680 | |
| | | | | | | | | | | | | | | | | | |
| | | | | |
| | | | | | | | | | | Shares | | | | |
| SHORT-TERM INVESTMENTS — 15.6% | | | | | | | | | | | | | | | | | | |
AFFILIATED MUTUAL FUNDS — 15.5% | | | | | | | | | | | | | | | | | | |
Prudential Investment Portfolios 2 — Prudential Core Short-Term Bond Fund(w) | | | | | | | | | | | | | 11,033,031 | | | | 102,386,530 | |
Prudential Investment Portfolios 2 — Prudential Core Ultra Short Bond Fund(w) | | | | | | | | | | | | | 255,703,495 | | | | 255,703,495 | |
Prudential Investment Portfolios 2 — Prudential Institutional Money Market Fund (cost $45,333,840; includes $45,272,865 of cash collateral for securities on loan)(b)(w) | | | | | | | | | | | | | 45,333,840 | | | | 45,333,840 | |
| | | | | | | | | | | | | | | | | | |
TOTAL AFFILIATED MUTUAL FUNDS
(cost $406,548,541) | | | | 403,423,865 | |
| | | | | | | | | | | | | | | | | | |
SEE NOTES TO FINANCIAL STATEMENTS.
A31
| | | | | | |
| | CONSERVATIVE BALANCED PORTFOLIO (continued) | | |
| |
| SCHEDULE OF INVESTMENTS | | as of December 31, 2017 |
| | | | | | | | | | | | | | | | | | | | |
| | | Interest
Rate | | | Maturity
Date | | | Principal
Amount
(000)# | | | Value | |
| U.S. TREASURY OBLIGATION — 0.1% | | | | | | | | | | | | | | | | | | | | |
U.S. Treasury Bills(k)
(cost $1,391,223) | | | 1.365% | (n) | | | 03/15/18 | | | | | | | | 1,395 | | | $ | 1,391,387 | |
| | | | | | | | | | | | | | | | | | | | |
TOTAL SHORT-TERM INVESTMENTS
(cost $407,939,764) | | | | 404,815,252 | |
| | | | | | | | | | | | | | | | | | | | |
TOTAL INVESTMENTS — 104.6%
(cost $1,841,396,833) | | | | 2,712,786,932 | |
LIABILITIES IN EXCESS OF OTHER ASSETS(z) — (4.6)% | | | | (118,121,140 | ) |
| | | | | | | | | | | | | | | | | | | | |
NET ASSETS — 100.0% | | | $ | 2,594,665,792 | |
| | | | | | | | | | | | | | | | | | | | |
See the Glossary for abbreviations used in the annual report.
| * | Non-income producing security. |
| # | Principal or notional amount is shown in U.S. dollars unless otherwise stated. |
| ^ | Indicates a Level 3 security. The aggregate value of Level 3 securities is $5,914,623 and 0.2% of net assets. |
| (a) | All or a portion of security is on loan. The aggregate market value of such securities, including those sold and pending settlement, is $44,046,558; cash collateral of $45,272,865 (included in liabilities) was received with which the Portfolio purchased highly liquid short-term investments. |
| (b) | Represents security purchased with cash collateral received for securities on loan and includes dividend reinvestment. |
| (c) | Variable rate instrument. The interest rate shown reflects the rate in effect at December 31, 2017. |
| (cc) | Variable rate instrument. The rate shown is based on the latest available information as of December 31, 2017. Certain variable rate securities are not based on a published reference rate and spread but are determined by the issuer or agent and are based on current market conditions. These securities do not indicate a reference rate and spread in their description. |
| (d) | Represents issuer in default on interest payments and/or principal repayment; non-income producing security. Such securities may be post maturity. |
| (f) | Indicates a restricted security; the original cost of such security is $1,585,580. The value of $1,588,980 is 0.1% of net assets. |
| (k) | Represents security, or a portion thereof, segregated as collateral for centrally cleared/exchange-traded derivatives. |
| (n) | Rate quoted represents yield to maturity as of purchase date. |
| (s) | Represents zero coupon bond or principal only security. Rate represents yield to maturity at purchase date. |
| (tt) | All or partial principal amount represents “TBA” mortgage dollar rolls. The aggregate mortgage dollar roll principal amount of $1,750,000 is approximately 0.1% of net assets. |
| (w) | PGIM Investments LLC, the manager of the Portfolio, also serves as manager of the Prudential Investment Portfolios 2 — Prudential Core Short-Term Bond Fund, Prudential Core Ultra Short Bond Fund and Prudential Institutional Money Market Fund. |
| (z) | Includes net unrealized appreciation (depreciation) on the following derivative contracts held at reporting period end. |
Futures contracts outstanding at December 31, 2017:
| | | | | | | | | | | | | | | | | | | | |
Number of
Contracts | | Type | | | Expiration
Date | | | Value at
Trade Date | | | Current
Notional
Amount | | | Value /
Unrealized
Appreciation
(Depreciation) | |
| Long Positions: | | | | | | | | | | | | | | | | | | | | |
| 954 | | | 2 Year U.S. Treasury Notes | | | | Mar. 2018 | | | $ | 204,634,506 | | | $ | 204,260,344 | | | $ | (374,162 | ) |
| 1,306 | | | 5 Year U.S. Treasury Notes | | | | Mar. 2018 | | | | 152,356,701 | | | | 151,710,266 | | | | (646,435 | ) |
| 270 | | | 10 Year U.S. Treasury Notes | | | | Mar. 2018 | | | | 33,518,416 | | | | 33,492,656 | | | | (25,760 | ) |
| 83 | | | 10 Year U.S. Ultra Treasury Notes | | | | Mar. 2018 | | | | 11,122,130 | | | | 11,085,687 | | | | (36,443 | ) |
| 629 | | | 30 Year U.S. Ultra Treasury Bonds | | | | Mar. 2018 | | | | 104,910,367 | | | | 105,455,781 | | | | 545,414 | |
| 15 | | | Mini MSCI EAFE Index | | | | Mar. 2018 | | | | 1,515,160 | | | | 1,534,125 | | | | 18,965 | |
| 143 | | | S&P 500 E-Mini Index | | | | Mar. 2018 | | | | 19,008,495 | | | | 19,133,400 | | | | 124,905 | |
| 18 | | | S&P 500 Index | | | | Mar. 2018 | | | | 11,989,642 | | | | 12,042,000 | | | | 52,358 | |
| | | | | | | | | | | | | | | | | | | | |
| | | | | | | | (341,158 | ) |
| | | | | | | | | | | | | | | | | | | | |
SEE NOTES TO FINANCIAL STATEMENTS.
A32
| | | | | | |
| | CONSERVATIVE BALANCED PORTFOLIO (continued) | | |
| |
| SCHEDULE OF INVESTMENTS | | as of December 31, 2017 |
Futures contracts outstanding at December 31, 2017 (continued):
| | | | | | | | | | | | | | | | | | | | |
Number of
Contracts | | Type | | | Expiration
Date | | | Value at
Trade Date | | | Current
Notional
Amount | | | Value /
Unrealized
Appreciation
(Depreciation) | |
| Short Positions: | | | | | | | | | | | | | | | | | | | | |
| 666 | | | 20 Year U.S. Treasury Bonds | | | | Mar. 2018 | | | $ | 101,731,210 | | | $ | 101,898,000 | | | $ | (166,790 | ) |
| 237 | | | 90 Day Euro Dollar | | | | Dec. 2018 | | | | 58,097,097 | | | | 57,979,088 | | | | 118,009 | |
| | | | | | | | | | | | | | | | | | | | |
| | | | | | | | (48,781 | ) |
| | | | | | | | | | | | | | | | | | | | |
| | | | | | | $ | (389,939) | |
| | | | | | | | | | | | | | | | | | | | |
Securities with a combined market value of $2,756,397 and $1,391,387 have been segregated with Citigroup Global Markets and Goldman Sachs & Co., respectively, to cover requirements for open futures contracts at December 31, 2017.
Forward foreign currency exchange contracts outstanding at December 31, 2017:
| | | | | | | | | | | | | | | | | | | | | | | | |
Sale Contracts | | Counterparty | | | Notional
Amount
(000) | | | Value at
Settlement
Date | | | Current
Value | | | Unrealized
Appreciation
(Depreciation) | |
OTC forward foreign currency exchange contracts: | | | | | | | | | | | | | | | | | | | | | | | | |
Euro, | | | | | | | | | | | | | | | | | | | | | | | | |
Expiring 01/26/18 | | | Citigroup Global Markets | | | | EUR | | | | 2,827 | | | $ | 3,355,271 | | | $ | 3,397,539 | | | $ | (42,268 | ) |
| | | | | | | | | | | | | | | | | | | | | | | | |
Balances Reported in the Statement of Assets and Liabilities for OTC Forward Foreign Currency contracts:
| | | | | | | | | | | | |
| | | Unrealized
Appreciation | | | Unrealized
Depreciation | | | Net
Unrealized
Appreciation
(Depreciation) | |
Forward Foreign Currency | | $ | — | | | $ | (42,268 | ) | | $ | (42,268 | ) |
| | | | | | | | | | | | |
Inflation Swap Agreement outstanding at December 31, 2017:
| | | | | | | | | | | | | | | | | | | | | | |
Notional
Amount
(000)# | | | Termination
Date | | Fixed
Rate | | | Floating Rate | | Value at
Trade Date | | | Value at
December 31, 2017 | | | Unrealized
Appreciation
(Depreciation) | |
| | Centrally cleared swap agreement: | | | | | | | | | | | | |
| | 1,240 | | | 10/25/27 | | | 2.160%(T) | | | U.S. CPI Urban Consumers NSA Index(2)(T) | | $ | 29 | | | $ | (11,675 | ) | | $ | (11,704 | ) |
| | | | | | | | | | | | | | | | | | | | | | |
Interest rate swap agreements outstanding at December 31, 2017:
| | | | | | | | | | | | | | | | | | | | | | | | |
Notional
Amount
(000)# | | | Termination
Date | | | Fixed
Rate | | | Floating Rate | | Value at
Trade Date | | | Value at
December 31, 2017 | | | Unrealized
Appreciation
(Depreciation) | |
| | Centrally cleared swap agreements: | | | | | | | | | | | | |
| EUR | 2,835 | | | | 05/11/24 | | | | 0.396%(A) | | | 6 Month EURIBOR(1)(S) | | $ | 21,623 | | | $ | 9,009 | | | $ | (12,614 | ) |
| | 47,045 | | | | 06/30/19 | | | | 1.487%(A) | | | 1 Day USOIS(1)(A) | | | (17,942 | ) | | | 144,610 | | | | 162,552 | |
| | 9,895 | | | | 06/30/19 | | | | 1.502%(A) | | | 1 Day USOIS(1)(A) | | | (5,201 | ) | | | 27,695 | | | | 32,896 | |
| | 17,865 | | | | 09/30/19 | | | | 1.707%(A) | | | 1 Day USOIS(1)(A) | | | 5,028 | | | | 30,840 | | | | 25,812 | |
| | 21,785 | | | | 12/31/19 | | | | 1.840%(A) | | | 1 Day USOIS(1)(A) | | | (2,727 | ) | | | 21,338 | | | | 24,065 | |
| | 5,720 | | | | 11/30/21 | | | | 1.762%(S) | | | 3 Month LIBOR(2)(Q) | | | — | | | | (92,818 | ) | | | (92,818 | ) |
| | 2,080 | | | | 05/31/23 | | | | 1.203%(S) | | | 3 Month LIBOR(1)(Q) | | | 161 | | | | 112,071 | | | | 111,910 | |
| | 1,785 | | | | 05/31/23 | | | | 1.399%(S) | | | 3 Month LIBOR(1)(Q) | | | (32,437 | ) | | | 77,976 | | | | 110,413 | |
| | 5,865 | | | | 08/15/23 | | | | 1.459%(S) | | | 3 Month LIBOR(1)(Q) | | | 278,383 | | | | 227,114 | | | | (51,269 | ) |
| | 5,592 | | | | 11/15/23 | | | | 2.209%(S) | | | 3 Month LIBOR(1)(Q) | | | 134 | | | | 12,196 | | | | 12,062 | |
| | 3,280 | | | | 02/15/24 | | | | 2.115%(S) | | | 3 Month LIBOR(1)(Q) | | | 8,180 | | | | 10,411 | | | | 2,231 | |
| | 6,597 | | | | 02/15/24 | | | | 2.151%(S) | | | 3 Month LIBOR(1)(Q) | | | (6,804 | ) | | | 6,437 | | | | 13,241 | |
| | 3,525 | | | | 02/15/24 | | | | 2.183%(S) | | | 3 Month LIBOR(1)(Q) | | | (7,019 | ) | | | (3,591 | ) | | | 3,428 | |
| | 2,240 | | | | 08/15/24 | | | | 2.168%(S) | | | 3 Month LIBOR(1)(Q) | | | — | | | | 17,728 | | | | 17,728 | |
| | 20,310 | | | | 08/15/24 | | | | 2.170%(S) | | | 3 Month LIBOR(1)(Q) | | | 66,744 | | | | 154,282 | | | | 87,538 | |
| | 9,240 | | | | 08/15/24 | | | | 2.176%(S) | | | 3 Month LIBOR(1)(Q) | | | 32,628 | | | | 68,979 | | | | 36,351 | |
| | 7,370 | | | | 11/15/24 | | | | 2.334%(S) | | | 3 Month LIBOR(1)(Q) | | | 8,164 | | | | (767 | ) | | | (8,931 | ) |
| | 5,570 | | | | 09/04/25 | | | | 2.214%(S) | | | 3 Month LIBOR(1)(Q) | | | 190 | | | | 10,694 | | | | 10,504 | |
| | 22,150 | | | | 01/08/26 | | | | 2.210%(S) | | | 3 Month LIBOR(1)(Q) | | | 238 | | | | 49,393 | | | | 49,155 | |
| | 140 | | | | 05/15/26 | | | | 1.652%(S) | | | 3 Month LIBOR(1)(Q) | | | 7 | | | | 7,428 | | | | 7,421 | |
| | 5,668 | | | | 02/15/27 | | | | 1.824%(A) | | | 1 Day USOIS (1)(A) | | | 62,809 | | | | 94,980 | | | | 32,171 | |
| | 1,185 | | | | 02/15/27 | | | | 1.899%(A) | | | 1 Day USOIS(1)(A) | | | 1,502 | | | | 12,153 | | | | 10,651 | |
SEE NOTES TO FINANCIAL STATEMENTS.
A33
| | | | | | |
| | CONSERVATIVE BALANCED PORTFOLIO (continued) | | |
| |
| SCHEDULE OF INVESTMENTS | | as of December 31, 2017 |
Interest rate swap agreements outstanding at December 31, 2017 (continued):
| | | | | | | | | | | | | | | | | | | | | | | | |
Notional
Amount
(000)# | | | Termination
Date | | | Fixed
Rate | | | Floating Rate | | Value at
Trade Date | | | Value at
December 31, 2017 | | | Unrealized
Appreciation
(Depreciation) | |
| | Centrally cleared swap agreements (continued): | | | | | | | | | | | | |
| | 925 | | | | 02/15/27 | | | | 1.965%(A) | | | 1 Day USOIS(1)(A) | | $ | — | | | $ | 4,218 | | | $ | 4,218 | |
| | 3,150 | | | | 02/15/27 | | | | 2.068%(A) | | | 1 Day USOIS(1)(A) | | | (1,996 | ) | | | (13,674 | ) | | | (11,678 | ) |
| | 525 | | | | 05/15/27 | | | | 2.295%(S) | | | 3 Month LIBOR(1)(Q) | | | — | | | | 3,676 | | | | 3,676 | |
| | 5,435 | | | | 02/15/36 | | | | 2.338%(S) | | | 3 Month LIBOR(2)(Q) | | | (36,570 | ) | | | (124,924 | ) | | | (88,354 | ) |
| | 145 | | | | 11/15/43 | | | | 2.659%(S) | | | 3 Month LIBOR(1)(Q) | | | — | | | | (2,988 | ) | | | (2,988 | ) |
| | | | | | | | | | | | | | | | | | | | | | | | |
| | | $ | 375,095 | | | $ | 864,466 | | | $ | 489,371 | |
| | | | | | | | | | | | | | | | | | | | | | | | |
Securities with a combined market value of $3,599,421 have been segregated with Citigroup Global Markets to cover requirements for open centrally cleared swap contracts at December 31, 2017.
| (1) | The Portfolio pays the fixed rate and receives the floating rate. |
| (2) | The Portfolio pays the floating rate and receives the fixed rate. |
Fair Value Measurements:
Various inputs are used in determining the value of the Portfolio’s investments. These inputs are summarized in the three broad levels listed below.
| Level 1— | unadjusted quoted prices generally in active markets for identical securities. |
| Level 2— | quoted prices for similar securities, interest rates and yield curves, prepayment speeds, foreign currency exchange rates and other observable inputs. |
| Level 3— | unobservable inputs for securities valued in accordance with Board approved fair valuation procedures. |
The following is a summary of the inputs used as of December 31, 2017 in valuing such portfolio securities:
| | | | | | | | | | | | |
| | | Level 1 | | | Level 2 | | | Level 3 | |
Investments in Securities | |
Common Stocks | | $ | 1,270,127,570 | | | $ | 52,686,646 | | | $ | — | |
Preferred Stocks | | | 1,363,200 | | | | 624,973 | | | | — | |
Unaffiliated Exchange Traded Funds | | | 7,188,819 | | | | — | | | | — | |
Asset-Backed Securities | | | | | | | | | | | | |
Automobiles | | | — | | | | 44,099,241 | | | | — | |
Collateralized Loan Obligations | | | — | | | | 42,918,895 | | | | — | |
Consumer Loans | | | — | | | | 10,452,967 | | | | — | |
Credit Cards | | | — | | | | 15,291,605 | | | | — | |
Equipment | | | — | | | | 5,860,307 | | | | — | |
Home Equity Loans | | | — | | | | 2,558,974 | | | | — | |
Other | | | — | | | | 1,084,092 | | | | — | |
Residential Mortgage-Backed Securities | | | — | | | | 19,139,462 | | | | 1,550,841 | |
Student Loans | | | — | | | | 4,433,443 | | | | — | |
Bank Loan | | | — | | | | 399,243 | | | | — | |
Commercial Mortgage-Backed Securities | | | — | | | | 162,854,273 | | | | — | |
Corporate Bonds | | | — | | | | 271,510,628 | | | | — | |
Municipal Bonds | | | — | | | | 18,711,747 | | | | — | |
Residential Mortgage-Backed Securities | | | — | | | | 36,696,962 | | | | 4,363,782 | |
Sovereign Bonds | | | — | | | | 33,862,954 | | | | — | |
U.S. Government Agency Obligations | | | — | | | | 239,893,159 | | | | — | |
U.S. Treasury Obligations | | | — | | | | 61,689,284 | | | | — | |
Affiliated Mutual Funds | | | 403,423,865 | | | | — | | | | — | |
Other Financial Instruments* | |
Futures Contracts | | | (389,939 | ) | | | — | | | | — | |
OTC Forward Foreign Currency Exchange Contract | | | — | | | | (42,268 | ) | | | — | |
Centrally Cleared Inflation Swap Agreements | | | — | | | | (11,704 | ) | | | — | |
Centrally Cleared Interest Rate Swap Agreements | | | — | | | | 489,371 | | | | — | |
| | | | | | | | | | | | |
Total | | $ | 1,681,713,515 | | | $ | 1,025,204,254 | | | $ | 5,914,623 | |
| | | | | | | | | | | | |
| * | Other financial instruments are derivative instruments not reflected in the Schedule of Investments, such as futures, forwards and centrally cleared swap contracts, which are recorded at the unrealized appreciation (depreciation) on the instrument, and OTC swap contracts which are recorded at fair value. |
During the period, there were no transfers between Level 1, Level 2 and Level 3 to report.
SEE NOTES TO FINANCIAL STATEMENTS.
A34
| | | | | | |
| | CONSERVATIVE BALANCED PORTFOLIO (continued) | | |
| |
| SCHEDULE OF INVESTMENTS | | as of December 31, 2017 |
Industry Classification:
The industry classification of investments and liabilities in excess of other assets shown as a percentage of net assets as of December 31, 2017 were as follows (unaudited):
| | | | |
Affiliated Mutual Funds (including 1.7% of collateral for securities on loan) | | | 15.5 | % |
U.S. Government Agency Obligations | | | 9.2 | |
Banks | | | 6.3 | |
Commercial Mortgage-Backed Securities | | | 6.3 | |
Oil, Gas & Consumable Fuels | | | 2.7 | |
Software | | | 2.7 | |
Pharmaceuticals | | | 2.6 | |
Internet Software & Services | | | 2.4 | |
Residential Mortgage-Backed Securities | | | 2.4 | |
U.S. Treasury Obligations | | | 2.4 | |
Technology Hardware, Storage & Peripherals | | | 2.1 | |
Automobiles | | | 2.0 | |
IT Services | | | 2.0 | |
Semiconductors & Semiconductor Equipment | | | 1.9 | |
Insurance | | | 1.9 | |
Media | | | 1.8 | |
Collateralized Loan Obligations | | | 1.7 | |
Capital Markets | | | 1.7 | |
Biotechnology | | | 1.5 | |
Equity Real Estate Investment Trusts (REITs) | | | 1.4 | |
Health Care Providers & Services | | | 1.4 | |
Internet & Direct Marketing Retail | | | 1.4 | |
Chemicals | | | 1.4 | |
Health Care Equipment & Supplies | | | 1.3 | |
Sovereign Bonds | | | 1.3 | |
Aerospace & Defense | | | 1.3 | |
Diversified Financial Services | | | 1.1 | |
Specialty Retail | | | 1.1 | |
Beverages | | | 1.1 | |
Diversified Telecommunication Services | | | 1.1 | |
Industrial Conglomerates | | | 1.0 | |
Hotels, Restaurants & Leisure | | | 1.0 | |
Food & Staples Retailing | | | 0.9 | |
Machinery | | | 0.9 | |
Electric Utilities | | | 0.9 | |
Electric | | | 0.9 | |
Oil & Gas | | | 0.8 | |
Household Products | | | 0.8 | |
Municipal Bonds | | | 0.7 | |
Food Products | | | 0.7 | |
Tobacco | | | 0.7 | |
Credit Cards | | | 0.6 | |
Communications Equipment | | | 0.5 | |
Airlines | | | 0.5 | |
Road & Rail | | | 0.5 | |
Multi-Utilities | | | 0.5 | |
Consumer Loans | | | 0.4 | |
Life Sciences Tools & Services | | | 0.4 | |
Energy Equipment & Services | | | 0.4 | |
Consumer Finance | | | 0.4 | |
Textiles, Apparel & Luxury Goods | | | 0.4 | |
Air Freight & Logistics | | | 0.4 | |
Auto Manufacturers | | | 0.4 | |
Computers | | | 0.3 | |
Telecommunications | | | 0.3 | |
Electrical Equipment | | | 0.3 | |
Unaffiliated Exchange Traded Funds | | | 0.3 | |
Agriculture | | | 0.3 | |
| | | | |
Household Durables | | | 0.3 | % |
Healthcare-Services | | | 0.3 | |
Healthcare-Products | | | 0.2 | |
Electronic Equipment, Instruments & Components | | | 0.2 | |
Multiline Retail | | | 0.2 | |
Pipelines | | | 0.2 | |
Equipment | | | 0.2 | |
Metals & Mining | | | 0.2 | |
Retail | | | 0.2 | |
Containers & Packaging | | | 0.2 | |
Lodging | | | 0.2 | |
Student Loans | | | 0.2 | |
Multi-National | | | 0.2 | |
Building Products | | | 0.2 | |
Commercial Services & Supplies | | | 0.2 | |
Professional Services | | | 0.2 | |
Mining | | | 0.2 | |
Trading Companies & Distributors | | | 0.1 | |
Transportation | | | 0.1 | |
Personal Products | | | 0.1 | |
Auto Components | | | 0.1 | |
Semiconductors | | | 0.1 | |
Home Equity Loans | | | 0.1 | |
Gas | | | 0.1 | |
Oil & Gas Services | | | 0.1 | |
Commercial Services | | | 0.1 | |
Construction & Engineering | | | 0.1 | |
Housewares | | | 0.1 | |
Foods | | | 0.1 | |
Forest Products & Paper | | | 0.1 | |
Construction Materials | | | 0.1 | |
Auto Parts & Equipment | | | 0.1 | |
Real Estate Management & Development | | | 0.1 | |
Distributors | | | 0.1 | |
Savings & Loans | | | 0.1 | |
Packaging & Containers | | | 0.0 | * |
Building Materials | | | 0.0 | * |
Health Care Technology | | | 0.0 | * |
Machinery-Diversified | | | 0.0 | * |
Other | | | 0.0 | * |
Miscellaneous Manufacturing | | | 0.0 | * |
Water Utilities | | | 0.0 | * |
Independent Power & Renewable Electricity Producers | | | 0.0 | * |
Entertainment | | | 0.0 | * |
Leisure Products | | | 0.0 | * |
Wireless Telecommunication Services | | | 0.0 | * |
Real Estate Investment Trusts (REITs) | | | 0.0 | * |
Technology | | | 0.0 | * |
Diversified Consumer Services | | | 0.0 | * |
Transportation Infrastructure | | | 0.0 | * |
Paper & Forest Products | | | 0.0 | * |
Gas Utilities | | | 0.0 | * |
Marine | | | 0.0 | * |
| | | | |
| | | 104.6 | |
Liabilities in excess of other assets | | | (4.6 | ) |
| | | | |
| | | 100.0 | % |
| | | | |
SEE NOTES TO FINANCIAL STATEMENTS.
A35
| | | | | | |
| | CONSERVATIVE BALANCED PORTFOLIO (continued) | | |
| |
| SCHEDULE OF INVESTMENTS | | as of December 31, 2017 |
Effects of Derivative Instruments on the Financial Statements and Primary Underlying Risk Exposure:
The Portfolio invested in derivative instruments during the reporting period. The primary types of risk associated with these derivative instruments are credit contracts risk, equity contracts risk, foreign exchange contracts risk and interest rate contracts risk. The effect of such derivative instruments on the Portfolio’s financial position and financial performance as reflected in the Statement of Assets and Liabilities and Statement of Operations is presented in the summary below.
Fair values of derivative instruments as of December 31, 2017 as presented in the Statement of Assets and Liabilities:
| | | | | | | | | | | | |
Derivatives not accounted for as hedging
instruments, carried at fair value | | Asset Derivatives | | | Liability Derivatives | |
| | Balance Sheet Location | | Fair Value | | | Balance Sheet Location | | Fair Value | |
Equity contracts | | Due from/to broker — variation margin futures | | $ | 196,228 | * | | — | | $ | — | |
Foreign exchange contracts | | — | | | — | | | Unrealized depreciation on OTC forward foreign currency exchange contracts | | | 42,268 | |
Interest rate contracts | | Due from/to broker — variation margin futures | | | 663,423 | * | | Due from/to broker — variation margin futures | | | 1,249,590 | * |
Interest rate contracts | | Due from/to broker — variation margin swaps | | | 758,023 | * | | Due from/to broker — variation margin swaps | | | 280,356 | * |
| | | | | | | | | | | | |
Total | | | | $ | 1,617,674 | | | | | $ | 1,572,214 | |
| | | | | | | | | | | | |
| * | Includes cumulative appreciation (depreciation) as reported in the schedule of open futures and centrally cleared swap contracts. Only unsettled variation margin receivable (payable) is reported within the Statement of Assets and Liabilities. |
The effects of derivative instruments on the Statement of Operations for the year ended December 31, 2017 are as follows:
| | | | | | | | | | | | | | | | | | | | | | | | | | | | |
Amount of Realized Gain (Loss) on Derivatives Recognized in Income | |
Derivatives not accounted
for as hedging instruments,
carried at fair value | | Rights(1) | | | Options
Purchased(1) | | | Options
Written | | | Futures | | | Forward
Currency
Contracts | | | Forward
Rate
Agreements | | | Swaps | |
Credit contracts | | $ | — | | | $ | 42,252 | | | $ | 6,000 | | | $ | — | | | $ | — | | | $ | — | | | $ | (275,876 | ) |
Equity contracts | | | 3,255 | | | | — | | | | — | | | | 5,694,008 | | | | — | | | | — | | | | — | |
Foreign exchange contracts | | | — | | | | — | | | | — | | | | — | | | | 45,874 | | | | — | | | | — | |
Interest rate contracts | | | — | | | | (1,110,648 | ) | | | 585,218 | | | | 3,988,948 | | | | — | | | | 23,492 | | | | 1,720,017 | |
| | | | | | | | | | | | | | | | | | | | | | | | | | | | |
Total | | $ | 3,255 | | | $ | (1,068,396 | ) | | $ | 591,218 | | | $ | 9,682,956 | | | $ | 45,874 | | | $ | 23,492 | | | $ | 1,444,141 | |
| | | | | | | | | | | | | | | | | | | | | | | | | | | | |
| (1) | Included in net realized gain (loss) on investment transactions in the Statement of Operations. |
| | | | | | | | | | | | |
|
Change in Unrealized Appreciation (Depreciation) on Derivatives Recognized in Income | |
Derivatives not accounted for as hedging
instruments, carried at fair value | | Futures | | | Forward
Currency
Contracts | | | Swaps | |
Credit contracts | | $ | — | | | $ | — | | | $ | (111,279 | ) |
Equity contracts | | | 618,366 | | | | — | | | | — | |
Foreign exchange contracts | | | — | | | | (42,268 | ) | | | — | |
Interest rate contracts | | | (31,805 | ) | | | — | | | | (1,847,356 | ) |
| | | | | | | | | | | | |
Total | | $ | 586,561 | | | $ | (42,268 | ) | | $ | (1,958,635 | ) |
| | | | | | | | | | | | |
SEE NOTES TO FINANCIAL STATEMENTS.
A36
| | | | | | |
| | CONSERVATIVE BALANCED PORTFOLIO (continued) | | |
| |
| SCHEDULE OF INVESTMENTS | | as of December 31, 2017 |
For the year ended December 31, 2017, the Portfolio’s average volume of derivative activities is as follows:
| | | | | | |
Options Purchased(1) | | Options Written(4) | | Futures
Contracts—
Long Positions(2) | | Futures
Contracts—
Short Positions(2) |
| $169,801 | | $2,801,800 | | $386,497,701 | | $71,226,858 |
| | | |
Forward Foreign
Currency Exchange
Contracts—Sold(3) | | Credit Default
Swap Agreements—
Buy Protection(4) | | Inflation Swap
Agreements(4) | | Interest Rate Swap
Agreements(4) |
| $1,336,037 | | $21,200,000 | | $248,000 | | $312,992,646 |
| (3) | Value at Settlement Date. |
| (4) | Notional Amount in USD. |
Financial Instruments/Transactions — Summary of Offsetting and Netting Arrangements:
The Portfolio invested in OTC derivatives and entered into financial instruments/transactions during the reporting period that are either offset in accordance with current requirements or are subject to enforceable master netting arrangements or similar agreements that permit offsetting. The information about offsetting and related netting arrangements for OTC derivatives and financial instruments/transactions, where the legal right to set-off exists, is presented in the summary below.
Offsetting of financial instrument/transaction assets and liabilities:
| | | | | | | | | | | | |
Description | | Gross Market Value of
Recognized
Assets/(Liabilities) | | | Collateral
Pledged/
(Received)(2) | | | Net
Amount | |
Securities on Loan | | $ | 44,046,558 | | | $ | (44,046,558 | ) | | $ | — | |
| | | | | | | | | | | | |
Offsetting of OTC derivative assets and liabilities:
| | | | | | | | | | | | | | | | | | | | |
Counterparty | | Gross Amounts of
Recognized
Assets(1) | | | Gross Amounts of
Recognized
Liabilities(1) | | | Net Amounts of
Recognized
Assets/(Liabilities) | | | Collateral
Pledged/
(Received)(2) | | | Net
Amount | |
Citigroup Global Markets | | $ | — | | | $ | (42,268 | ) | | $ | (42,268 | ) | | $ | — | | | $ | (42,268 | ) |
| | | | | | | | | | | | | | | | | | | | |
| (1) | Includes unrealized appreciation/(depreciation) on swaps and forwards, premiums paid/(received) on swap agreements and market value of purchased and written options, as represented on the Statement of Assets and Liabilities. |
| (2) | Collateral amount disclosed by the Portfolio is limited to the market value of financial instruments/transactions and the Portfolio’s OTC derivative exposure by counterparty. |
SEE NOTES TO FINANCIAL STATEMENTS.
A37
| | | | | | |
| | CONSERVATIVE BALANCED PORTFOLIO (continued) | | |
STATEMENT OF ASSETS & LIABILITIES
as of December 31, 2017
| | | | |
| ASSETS | |
Investments at value, including securities on loan of $44,046,558: | | | | |
Unaffiliated investments (cost $1,434,848,292) | | $ | 2,309,363,067 | |
Affiliated investments (cost $406,548,541) | | | 403,423,865 | |
Cash | | | 18,038 | |
Foreign currency, at value (cost $85,922) | | | 86,665 | |
Receivable for investments sold | | | 16,149,542 | |
Dividends and interest receivable | | | 6,937,353 | |
Tax reclaim receivable | | | 503,671 | |
Due from broker—variation margin futures | | | 335,211 | |
Receivable for Series shares sold | | | 7,577 | |
Receivable from affiliate | | | 4,748 | |
Prepaid expenses | | | 17,833 | |
| | | | |
Total Assets | | | 2,736,847,570 | |
| | | | |
| LIABILITIES | |
Payable for investments purchased | | | 93,257,279 | |
Payable to broker for collateral for securities on loan | | | 45,272,865 | |
Payable for Series shares repurchased | | | 1,835,896 | |
Management fee payable | | | 1,212,108 | |
Accrued expenses and other liabilities | | | 308,790 | |
Due to broker—variation margin swaps | | | 138,307 | |
Due to broker—variation margin futures | | | 113,285 | |
Unrealized depreciation on OTC forward foreign currency exchange contracts | | | 42,268 | |
Affiliated transfer agent fee payable | | | 980 | |
| | | | |
Total Liabilities | | | 142,181,778 | |
| | | | |
| NET ASSETS | | $ | 2,594,665,792 | |
| | | | |
Net assets were comprised of: | |
Paid-in capital | | $ | 979,947,815 | |
Retained earnings | | | 1,614,717,977 | |
| | | | |
Net assets, December 31, 2017 | | $ | 2,594,665,792 | |
| | | | |
Net asset value and redemption price per share
$2,594,665,792 / 95,484,978 outstanding shares of beneficial interest | | $ | 27.17 | |
| | | | |
STATEMENT OF OPERATIONS
Year Ended December 31, 2017
| | | | |
| NET INVESTMENT INCOME (LOSS) | |
| INCOME | |
Interest income (net of foreign withholding taxes of $331) | | $ | 27,644,002 | |
Unaffiliated dividend income (net) (foreign withholding tax of $166,638, of which $29,305 is reimbursable by an affiliate) | | | 25,900,425 | |
Affiliated dividend income | | | 5,594,318 | |
Income from securities lending, net (including affiliated income of $104,838) | | | 125,166 | |
| | | | |
Total income | | | 59,263,911 | |
| | | | |
| EXPENSES | |
Management fee | | | 13,941,017 | |
Custodian and accounting fees | | | 349,298 | |
Shareholders’ reports | | | 309,177 | |
Audit fee | | | 52,264 | |
Trustees’ fees | | | 34,236 | |
Legal fees and expenses | | | 20,491 | |
Transfer agent’s fees and expenses (including affiliated expense of $5,882) | | | 10,846 | |
Miscellaneous | | | 87,614 | |
| | | | |
Total expenses | | | 14,804,943 | |
| | | | |
| NET INVESTMENT INCOME (LOSS) | | | 44,458,968 | |
| | | | |
| REALIZED AND UNREALIZED GAIN (LOSS) ON INVESTMENTS AND FOREIGN CURRENCY TRANSACTIONS | | | | |
Net realized gain (loss) on: | |
Investment transactions (including affiliated of $8,141) | | | 119,456,989 | |
Futures transactions | | | 9,682,956 | |
Options written transactions | | | 591,218 | |
Swap agreement transactions | | | 1,444,141 | |
Forward rate agreement transactions | | | 23,492 | |
Forward currency contract transactions | | | 45,874 | |
Foreign currency transactions | | | 231,931 | |
| | | | |
| | | 131,476,601 | |
| | | | |
Net change in unrealized appreciation (depreciation) on: | | | | |
Investments (including affiliated of $89,161) | | | 120,672,382 | |
Futures | | | 586,561 | |
Swap agreements | | | (1,958,635 | ) |
Forward currency contracts | | | (42,268 | ) |
Foreign currencies | | | 83,070 | |
| | | | |
| | | 119,341,110 | |
| | | | |
| NET GAIN (LOSS) ON INVESTMENT AND FOREIGN CURRENCY TRANSACTIONS | | | 250,817,711 | |
| | | | |
| NET INCREASE (DECREASE) IN NET ASSETS RESULTING FROM OPERATIONS | | $ | 295,276,679 | |
| | | | |
STATEMENTS OF CHANGES IN NET ASSETS
| | | | | | | | |
| | | Year Ended December 31, | |
| | | 2017 | | | 2016 | |
| INCREASE (DECREASE) IN NET ASSETS | |
| OPERATIONS | |
Net investment income (loss) | | $ | 44,458,968 | | | $ | 44,543,863 | |
Net realized gain (loss) on investment and foreign currency transactions | | | 131,476,601 | | | | 28,658,304 | |
Net change in unrealized appreciation (depreciation) on investments and foreign currencies | | | 119,341,110 | | | | 98,563,987 | |
| | | | | | | | |
NET INCREASE (DECREASE) IN NET ASSETS RESULTING FROM OPERATIONS | | | 295,276,679 | | | | 171,766,154 | |
| | | | | | | | |
| SERIES SHARE TRANSACTIONS | |
Series shares sold [357,202 and 338,782 shares, respectively] | | | 9,258,591 | | | | 7,843,814 | |
Series shares repurchased [7,143,196 and 11,378,786 shares, respectively] | | | (183,096,479 | ) | | | (262,953,434 | ) |
| | | | | | | | |
NET INCREASE (DECREASE) IN NET ASSETS FROM SERIES SHARE TRANSACTIONS | | | (173,837,888 | ) | | | (255,109,620 | ) |
| | | | | | | | |
| CAPITAL CONTRIBUTIONS | | | — | | | | 2,299,220 | |
| | | | | | | | |
| TOTAL INCREASE (DECREASE) | | | 121,438,791 | | | | (81,044,246 | ) |
| NET ASSETS: | |
Beginning of year | | | 2,473,227,001 | | | | 2,554,271,247 | |
| | | | | | | | |
End of year | | $ | 2,594,665,792 | | | $ | 2,473,227,001 | |
| | | | | | | | |
SEE NOTES TO FINANCIAL STATEMENTS.
A38
| | | | | | |
| | DIVERSIFIED BOND PORTFOLIO | | |
| |
| SCHEDULE OF INVESTMENTS | | as of December 31, 2017 |
| | | | | | | | | | | | | | | | | | |
LONG-TERM INVESTMENTS — 91.9% ASSET-BACKED SECURITIES — 20.0% | | Interest
Rate | | | Maturity
Date | | Principal
Amount
(000)# | | | Value | |
Automobiles — 0.3% | | | | | | | | | | | | | | | | | | |
Hertz Vehicle Financing II LP, Series 2015-1A, Class A, 144A | | | 2.730% | | | 03/25/21 | | | | | | | 900 | | | $ | 902,632 | |
Hertz Vehicle Financing LLC, Series 2016-2A, Class A, 144A | | | 2.950% | | | 03/25/22 | | | | | | | 400 | | | | 398,788 | |
OneMain Direct Auto Receivables Trust, Series 2016-1A, Class C, 144A | | | 4.580% | | | 09/15/21 | | | | | | | 1,600 | | | | 1,610,701 | |
| | | | | | | | | | | | | | | | | | |
| | | | | | | | | | | | | | | | | 2,912,121 | |
| | | | | | | | | | | | | | | | | | |
Collateralized Loan Obligations — 13.3% | | | | | | | | | | | | | | | | | | |
ArrowMark Colorado Holdings (Cayman Islands), Series 2017-6A, Class A1, 144A, 3 Month LIBOR + 1.280% | | | 2.639% | (c) | | 07/15/29 | | | | | | | 250 | | | | 251,848 | |
Atlas Sr. Loan Fund Ltd. (Cayman Islands), Series 2013-1A, Class AR, 144A, 3 Month LIBOR + 0.830% | | | 2.252% | (c) | | 11/17/27 | | | | | | | 4,500 | | | | 4,502,457 | |
Atlas Sr. Loan Fund Ltd. (Cayman Islands), Series 2014-1A, Class AR2, 144A, 3 Month LIBOR + 1.260% | | | 2.619% | (c) | | 07/16/29 | | | | | | | 500 | | | | 503,462 | |
Atrium (Cayman Islands), Series 12A, Class AR, 144A, 3 Month LIBOR + 0.830% | | | 2.203% | (c) | | 04/22/27 | | | | | | | 8,250 | | | | 8,252,913 | |
Battalion CLO Ltd. (Cayman Islands), Series 2013-4A, Class A1R, 144A, 3 Month LIBOR + 1.140% | | | 2.503% | (c) | | 10/22/25 | | | | | | | 1,000 | | | | 1,000,785 | |
Battalion CLO Ltd. (Cayman Islands), Series 2014-5A, Class A1R, 144A, 3 Month LIBOR + 1.170% | | | 2.523% | (c) | | 04/17/26 | | | | | | | 1,100 | | | | 1,102,993 | |
Benefit Street Partners CLO Ltd. (Cayman Islands), Series 2017-12A, Class A1, 144A, 3 Month LIBOR + 1.250% | | | 2.597% | (c) | | 10/15/30 | | | | | | | 4,500 | | | | 4,519,962 | |
Brookside Mill CLO Ltd. (Cayman Islands), Series 2013-1A, Class A1, 144A, 3 Month LIBOR + 1.150% | | | 2.503% | (c) | | 04/17/25 | | | | | | | 2,404 | | | | 2,405,824 | |
Carlyle US CLO Ltd. (Cayman Islands), Series 2017-4A, Class A1, 144A, 3 Month LIBOR + 1.180% | | | 2.667% | (c) | | 01/15/30 | | | | | | | 4,000 | | | | 4,002,582 | |
Catamaran CLO Ltd. (Cayman Islands), Series 2014-1A, Class A1AR, 144A, 3 Month LIBOR + 1.260% | | | 2.623% | (c) | | 04/22/30 | | | | | | | 7,750 | | | | 7,761,749 | |
CIFC Funding Ltd. (Cayman Islands), Series 2015-1A, Class ARR, 144A, 3 Month LIBOR + 1.110% | | | 2.473% | (c) | | 01/22/31 | | | | | | | 3,750 | | | | 3,750,000 | |
ECP CLO Ltd. (Cayman Islands), Series 2014-6A, Class A1A, 144A, 3 Month LIBOR + 1.450% | | | 2.809% | (c) | | 07/15/26 | | | | | | | 1,500 | | | | 1,501,185 | |
Elevation CLO Ltd. (Cayman Islands), Series 2014-2A, Class A1R, 144A, 3 Month LIBOR + 1.230% | | | 2.580% | (c) | | 10/15/29 | | | | | | | 7,500 | | | | 7,506,460 | |
Elevation CLO Ltd. (Cayman Islands), Series 2017-7A, Class A, 144A, 3 Month LIBOR + 1.220% | | | 2.824% | (c) | | 07/15/30 | | | | | | | 5,250 | | | | 5,250,874 | |
ICG US CLO Ltd. (Cayman Islands), Series 2017-2A, Class A1, 144A, 3 Month LIBOR + 1.280% | | | 2.597% | (c) | | 10/23/29 | | | | | | | 1,250 | | | | 1,258,509 | |
ICG US CLO Ltd. (Cayman Islands), Series 2014-3A, Class A1AR, 144A, 3 Month LIBOR + 1.230% | | | 2.597% | (c) | | 01/25/27 | | | | | | | 8,250 | | | | 8,266,634 | |
Jackson Mill CLO Ltd. (Cayman Islands), Series 2015-1A, Class A, 144A, 3 Month LIBOR + 1.540% | | | 2.899% | (c) | | 04/15/27 | | | | | | | 2,250 | | | | 2,252,590 | |
KVK CLO Ltd. (Cayman Islands), Series 2014-2A, Class AR, 144A, 3 Month LIBOR + 1.180% | | | 2.539% | (c) | | 07/15/26 | | | | | | | 250 | | | | 250,584 | |
KVK CLO Ltd. (Cayman Islands), Series 2014-3A, Class AR, 144A, 3 Month LIBOR + 1.200% | | | 2.559% | (c) | | 10/15/26 | | | | | | | 1,000 | | | | 1,003,369 | |
Magnetite Ltd. (Cayman Islands), Series 2014-11A, Class A1R, 144A, 3 Month LIBOR + 1.120% | | | 2.474% | (c) | | 01/18/27 | | | | | | | 7,300 | | | | 7,321,183 | |
Mountain View CLO LLC (Cayman Islands), Series 2017-2A, Class A, 144A, 3 Month LIBOR + 1.210% | | | 3.075% | (c) | | 01/16/31 | | | | | | | 4,000 | | | | 4,000,000 | |
Mountain View CLO Ltd. (Cayman Islands), Series 2013-1A, Class AR, 144A, 3 Month LIBOR + 1.250% | | | 2.607% | (c) | | 10/12/30 | | | | | | | 8,000 | | | | 8,014,444 | |
MP CLO Ltd. (Cayman Islands), Series 2015-1A, Class BR, 144A, 3 Month LIBOR + 1.500% | | | 3.030% | (c) | | 04/18/27 | | | | | | | 7,000 | | | | 7,000,000 | |
Neuberger Berman CLO Ltd. (Cayman Islands), Series 2017-16SA, Class A, 144A, 3 Month LIBOR + 0.850% | | | 2.572% | (c) | | 01/15/28 | | | | | | | 3,000 | | | | 3,000,000 | |
OCP CLO Ltd. (Cayman Islands), Series 2017-13A, Class A1A, 144A, 3 Month LIBOR + 1.260% | | | 2.561% | (c) | | 07/15/30 | | | | | | | 750 | | | | 756,080 | |
SEE NOTES TO FINANCIAL STATEMENTS.
A39
| | | | | | |
| | DIVERSIFIED BOND PORTFOLIO (continued) | | |
| |
| SCHEDULE OF INVESTMENTS | | as of December 31, 2017 |
| | | | | | | | | | | | | | | | | | | | |
ASSET-BACKED SECURITIES (continued) | | Interest
Rate | | | Maturity
Date | | | Principal
Amount
(000)# | | | Value | |
Collateralized Loan Obligations (continued) | | | | | | | | | | | | | | | | | | | | |
OZLM Ltd. (Cayman Islands), Series 2015-11A, Class A1R, 144A, 3 Month LIBOR + 1.250% | | | 2.628% | (c) | | | 10/30/30 | | | | | | | | 1,250 | | | $ | 1,260,171 | |
Palmer Square CLO Ltd. (Cayman Islands), Series 2014-1A, Class A1R2, 144A, 3 Month LIBOR + 1.130% | | | 2.861% | (c) | | | 01/17/31 | | | | | | | | 4,000 | | | | 4,000,000 | |
Palmer Square CLO Ltd. (Cayman Islands), Series 2015-2A, Class A1AR, 144A, 3 Month LIBOR + 1.270% | | | 2.633% | (c) | | | 07/20/30 | | | | | | | | 1,000 | | | | 1,006,971 | |
Park Avenue Institutional Advisers CLO Ltd. (Cayman Islands), Series 2017-1A, Class A1, 144A, 3 Month LIBOR + 1.220% | | | 2.633% | (c) | | | 11/14/29 | | | | | | | | 3,500 | | | | 3,512,061 | |
Shackleton CLO Ltd. (Cayman Islands), Series 2013-3A, Class B2, 144A | | | 3.440% | | | | 04/15/25 | | | | | | | | 700 | | | | 701,633 | |
Sound Point CLO (Cayman Islands), Series 2017-3A, Class A1A, 144A, 3 Month LIBOR + 1.220% | | | 2.580% | (c) | | | 10/20/30 | | | | | | | | 5,750 | | | | 5,756,039 | |
Sound Point CLO Ltd. (Cayman Islands), Series 2015-2A, Class AR, 144A, 3 Month LIBOR + 0.880% | | | 2.243% | (c) | | | 07/20/27 | | | | | | | | 4,000 | | | | 4,011,108 | |
TICP CLO Ltd. (Cayman Islands), Series 2017-9A, Class A, 144A | | | —% | (p) | | | 01/20/31 | | | | | | | | 3,000 | | | | 3,000,000 | |
Trinitas CLO Ltd. (Cayman Islands), Series 2016-5A, Class A, 144A, 3 Month LIBOR + 1.700% | | | 3.067% | (c) | | | 10/25/28 | | | | | | | | 3,250 | | | | 3,271,592 | |
Trinitas CLO Ltd. (Cayman Islands), Series 2017-7A, Class A, 144A, 3 Month LIBOR + 1.210% | | | 2.908% | (c) | | | 01/25/31 | | | | | | | | 4,000 | | | | 4,000,000 | |
Trinitas CLO Ltd. (Cayman Islands), Series 2017-7A, Class B, 144A, 3 Month LIBOR + 1.600% | | | 3.298% | (c) | | | 01/25/31 | | | | | | | | 1,500 | | | | 1,500,000 | |
Tyron Park CLO Ltd. (Cayman Islands), Series 2013-1A, Class A1, 144A, 3 Month LIBOR + 1.120% | | | 2.479% | (c) | | | 07/15/25 | | | | | | | | 255 | | | | 256,026 | |
Venture CLO Ltd. (Cayman Islands), Series 2015-21A, Class AR, 144A, 3 Month LIBOR + 0.880% | | | 2.239% | (c) | | | 07/15/27 | | | | | | | | 5,000 | | | | 5,011,907 | |
Voya CLO Ltd. (Cayman Islands), Series 2013-1A, Class A1AR, 144A, 3 Month LIBOR + 1.210% | | | 2.569% | (c) | | | 10/15/30 | | | | | | | | 7,500 | | | | 7,540,782 | |
Wellfleet CLO Ltd. (Cayman Islands), Series 2017-1A, Class A1, 144A, 3 Month LIBOR + 1.320% | | | 2.683% | (c) | | | 04/20/29 | | | | | | | | 1,750 | | | | 1,761,619 | |
Wellfleet CLO Ltd. (Cayman Islands), Series 2017-2A, Class A1, 144A, 3 Month LIBOR + 1.250% | | | 2.626% | (c) | | | 10/20/29 | | | | | | | | 1,000 | | | | 1,003,831 | |
Wellfleet CLO Ltd., Series 2017-3A, Class A1, 144A, 3 Month LIBOR + 1.150% | | | 2.881% | (c) | | | 01/17/31 | | | | | | | | 4,000 | | | | 4,000,000 | |
West CLO Ltd. (Cayman Islands), Series 2013-1A, Class A1AR, 144A, 3 Month LIBOR + 1.160% | | | 2.552% | (c) | | | 11/07/25 | | | | | | | | 2,500 | | | | 2,505,590 | |
York CLO Ltd. (Cayman Islands), Series 2015-1A, Class AR, 144A, 3 Month LIBOR + 1.150% | | | 2.609% | (c) | | | 01/22/31 | | | | | | | | 2,000 | | | | 2,000,784 | |
Zais CLO Ltd. (Cayman Islands), Series 2017-1A, Class A1, 144A, 3 Month LIBOR + 1.370% | | | 2.729% | (c) | | | 07/15/29 | | | | | | | | 1,000 | | | | 1,010,202 | |
| | | | | | | | | | | | | | | | | | | | |
| | | | | | | | | | | | | | | | | | | 152,546,803 | |
| | | | | | | | | | | | | | | | | | | | |
Consumer Loans — 2.3% | | | | | | | | | | | | | | | | | | | | |
Lendmark Funding Trust, Series 2016-2A, Class A, 144A | | | 3.260% | | | | 04/21/25 | | | | | | | | 700 | | | | 703,117 | |
Lendmark Funding Trust, Series 2017-1A, Class A, 144A | | | 2.830% | | | | 12/22/25 | | | | | | | | 1,000 | | | | 997,386 | |
OneMain Financial Issuance Trust, Series 2015-2A, Class A, 144A | | | 2.570% | | | | 07/18/25 | | | | | | | | 1,826 | | | | 1,825,192 | |
OneMain Financial Issuance Trust, Series 2015-2A, Class C, 144A | | | 4.320% | | | | 07/18/25 | | | | | | | | 1,100 | | | | 1,103,850 | |
OneMain Financial Issuance Trust, Series 2016-1A, Class A, 144A | | | 3.660% | | | | 02/20/29 | | | | | | | | 2,500 | | | | 2,540,200 | |
OneMain Financial Issuance Trust, Series 2016-2A, Class A, 144A | | | 4.100% | | | | 03/20/28 | | | | | | | | 2,600 | | | | 2,633,588 | |
OneMain Financial Issuance Trust, Series 2017-1A, Class B, 144A | | | 2.790% | | | | 09/14/32 | | | | | | | | 500 | | | | 492,380 | |
OneMain Financial Issuance Trust, Series 2017-1A, Class C, 144A | | | 3.350% | | | | 09/14/32 | | | | | | | | 500 | | | | 493,722 | |
Oportun Funding LLC, Series 2016-C, Class A, 144A | | | 3.280% | | | | 11/08/21 | | | | | | | | 2,300 | | | | 2,301,380 | |
Oportun Funding LLC, Series 2017-A, Class A, 144A | | | 3.230% | | | | 06/08/23 | | | | | | | | 1,000 | | | | 996,181 | |
Oportun Funding LLC, Series 2017-B, Class A, 144A | | | 3.220% | | | | 10/10/23 | | | | | | | | 2,750 | | | | 2,737,359 | |
PNMAC GMSR Issuer Trust, Series 2017-GT2, Class A, 144A, 1 Month LIBOR + 4.000% | | | 5.552% | (c) | | | 08/25/23 | | | | | | | | 1,275 | | | | 1,274,739 | |
SEE NOTES TO FINANCIAL STATEMENTS.
A40
| | | | | | |
| | DIVERSIFIED BOND PORTFOLIO (continued) | | |
| |
| SCHEDULE OF INVESTMENTS | | as of December 31, 2017 |
| | | | | | | | | | | | | | | | | | |
ASSET-BACKED SECURITIES (continued) | | Interest
Rate | | | Maturity
Date | | Principal
Amount
(000)# | | | Value | |
Consumer Loans (continued) | | | | | | | | | | | | | | | | | | |
SpringCastle America Funding LLC, Series 2016-AA, Class A, 144A | | | 3.050% | | | 04/25/29 | | | | | | | 3,105 | | | $ | 3,123,897 | |
Springleaf Funding Trust, Series 2015-AA, Class A, 144A | | | 3.160% | | | 11/15/24 | | | | | | | 5,200 | | | | 5,220,649 | |
| | | | | | | | | | | | | | | | | | |
| | | | | | | | | | | | | | | | | 26,443,640 | |
| | | | | | | | | | | | | | | | | | |
Home Equity Loans — 1.9% | | | | | | | | | | | | | | | | | | |
Ameriquest Mortgage Securities, Inc. Asset-Backed Pass-Through Certificates, Series 2003-AR1, Class M3, 1 Month LIBOR + 4.500% | | | 5.503% | (c) | | 01/25/33 | | | | | | | 1,809 | | | | 1,812,318 | |
Ameriquest Mortgage Securities, Inc. Floating Rate Mortgage Pass-Through Certificates, Series 2001-2, Class M3, 1 Month LIBOR + 2.925% | | | 4.477% | (c) | | 10/25/31 | | | | | | | 271 | | | | 285,032 | |
Argent Securities, Inc. Asset-Backed Pass-Through Certificates, Series 2003-W2, Class M4, 1 Month LIBOR + 5.625% | | | 4.292% | (c) | | 09/25/33 | | | | | | | 2,400 | | | | 2,255,322 | |
Argent Securities, Inc. Asset-Backed Pass-Through Certificates, Series 2004-W6, Class M1, 1 Month LIBOR + 0.825% | | | 2.377% | (c) | | 05/25/34 | | | | | | | 690 | | | | 687,746 | |
Asset-Backed Securities Corp. Home Equity Loan Trust, Series 2003-HE3, Class M1, 1 Month LIBOR + 1.245% | | | 2.722% | (c) | | 06/15/33 | | | | | | | 834 | | | | 823,837 | |
Bear Stearns Asset-Backed Securities Trust, Series 2004-HE2, Class M1, 1 Month LIBOR + 0.900% | | | 2.228% | (c) | | 03/25/34 | | | | | | | 2,645 | | | | 2,647,826 | |
Centex Home Equity Loan Trust, Series 2004-B, Class AF6 | | | 4.686% | | | 03/25/34 | | | | | | | 546 | | | | 559,462 | |
Credit Suisse First Boston Mortgage Securities Corp., Series 2002-HE4, Class M2, 1 Month LIBOR + 2.250% | | | 3.802% | (c) | | 08/25/32 | | | | | | | 35 | | | | 33,064 | |
Merrill Lynch Mortgage Investors Trust, Series 2004-HE2, Class M1, 1 Month LIBOR + 1.200% | | | 2.752% | (c) | | 08/25/35 | | | | | | | 326 | | | | 327,888 | |
Morgan Stanley ABS Capital I, Inc. Trust, Series 2003-HE1, Class M1, 1 Month LIBOR + 1.200% | | | 2.752% | (c) | | 05/25/33 | | | | | | | 673 | | | | 667,704 | |
Morgan Stanley ABS Capital I, Inc. Trust, Series 2003-HE3, Class M1, 1 Month LIBOR + 1.020% | | | 2.572% | (c) | | 10/25/33 | | | | | | | 486 | | | | 485,982 | |
Morgan Stanley ABS Capital I, Inc. Trust, Series 2004-OP1, Class M1, 1 Month LIBOR + 0.870% | | | 2.422% | (c) | | 11/25/34 | | | | | | | 3,688 | | | | 3,675,231 | |
New Century Home Equity Loan Trust, Series 2003-4, Class M1, 1 Month LIBOR + 1.125% | | | 2.677% | (c) | | 10/25/33 | | | | | | | 1,943 | | | | 1,901,501 | |
New Century Home Equity Loan Trust, Series 2004-4, Class M1, 1 Month LIBOR + 0.765% | | | 2.317% | (c) | | 02/25/35 | | | | | | | 2,214 | | | | 2,195,100 | |
Residential Asset Securities Corp., Series 2004-KS1, Class AI5 | | | 5.721% | | | 02/25/34 | | | | | | | 702 | | | | 717,038 | |
Securitized Asset-Backed Receivables LLC Trust, Series 2004-NC1, Class M1, 1 Month LIBOR + 0.780% | | | 2.332% | (c) | | 02/25/34 | | | | | | | 2,035 | | | | 2,049,555 | |
Specialty Underwriting & Residential Finance Trust, Series 2004-BC1, Class M1, 1 Month LIBOR + 0.765% | | | 2.317% | (c) | | 02/25/35 | | | | | | | 1,038 | | | | 1,022,467 | |
| | | | | | | | | | | | | | | | | | |
| | | | | | | | | | | | | | | | | 22,147,073 | |
| | | | | | | | | | | | | | | | | | |
Other — 0.1% | | | | | | | | | | | | | | | | | | |
Marriott Vacation Club Owner Trust, Series 2010-1A, Class A, 144A | | | 3.540% | | | 10/20/32 | | | | | | | 720 | | | | 720,800 | |
| | | | | | | | | | | | | | | | | | |
Residential Mortgage-Backed Securities — 2.1% | | | | | | | | | | | | | | | | | | |
Ameriquest Mortgage Securities, Inc. Asset-Backed Pass-Through Certificates, Series 2004-R8, Class M1, 1 Month LIBOR + 0.960% | | | 2.512% | (c) | | 09/25/34 | | | | | | | 395 | | | | 397,618 | |
Argent Securities, Inc. Asset-Backed Pass-Through Certificates, Series 2004-W10, Class A2, 1 Month LIBOR + 0.780% | | | 2.108% | (c) | | 10/25/34 | | | | | | | 1,377 | | | | 1,370,146 | |
Credit Suisse Mortgage Trust, Series 2016-RPL1, Class A1, 144A, 1 Month LIBOR + 3.150% | | | 4.511% | (c) | | 12/26/46 | | | | | | | 4,088 | | | | 4,118,430 | |
CSMC Trust, Series 2017-6R, 144A^ | | | 2.900% | (cc) | | 03/06/47 | | | | | | | 1,741 | | | | 1,751,539 | |
Equity One Mortgage Pass-Through Trust, Series 2004-3, Class M1 | | | 4.657% | | | 07/25/34 | | | | | | | 383 | | | | 379,186 | |
FBR Securitization Trust, Series 2005-2, Class M1, 1 Month LIBOR + 0.720% | | | 2.048% | (c) | | 09/25/35 | | | | | | | 868 | | | | 869,492 | |
SEE NOTES TO FINANCIAL STATEMENTS.
A41
| | | | | | |
| | DIVERSIFIED BOND PORTFOLIO (continued) | | |
| |
| SCHEDULE OF INVESTMENTS | | as of December 31, 2017 |
| | | | | | | | | | | | | | | | | | |
ASSET-BACKED SECURITIES (continued) | | Interest
Rate | | | Maturity
Date | | Principal
Amount
(000)# | | | Value | |
Residential Mortgage-Backed Securities (continued) | | | | | | | | | | | | | | | | | | |
Fremont Home Loan Trust, Series 2003-B, Class M1, 1 Month LIBOR + 1.050% | | | 2.602% | (c) | | 12/25/33 | | | | | | | 135 | | | $ | 132,376 | |
Long Beach Mortgage Loan Trust, Series 2004-1, Class M1, 1 Month LIBOR + 0.750% | | | 2.302% | (c) | | 02/25/34 | | | | | | | 2,097 | | | | 2,099,505 | |
Merrill Lynch Mortgage Investors Trust, Series 2004-OPT1, Class A1A, 1 Month LIBOR + 0.520% | | | 2.072% | (c) | | 06/25/35 | | | | | | | 1,000 | | | | 970,677 | |
Structured Asset Investment Loan Trust, Series 2004-7, Class A8, 1 Month LIBOR + 1.200% | | | 2.752% | (c) | | 08/25/34 | | | | | | | 1,400 | | | | 1,345,662 | |
Towd Point Mortgage Trust, Series 2017-4, Class A1, 144A | | | 2.750% | (cc) | | 06/25/57 | | | | | | | 4,240 | | | | 4,222,300 | |
Towd Point Mortgage Trust, Series 2017-6, Class A1, 144A | | | 2.750% | (cc) | | 10/25/57 | | | | | | | 4,177 | | | | 4,162,339 | |
VOLT LX LLC, Series 2017-NPL7, Class A1, 144A | | | 3.250% | | | 04/25/59 | | | | | | | 250 | | | | 250,694 | |
VOLT LXIII LLC, Series 2017-NP10, Class A1, 144A | | | 3.000% | | | 10/25/47 | | | | | | | 1,800 | | | | 1,797,287 | |
VOLT VII LLC, Series 2017-NPL4, Class A1, 144A | | | 3.375% | | | 04/25/47 | | | | | | | 353 | | | | 354,658 | |
| | | | | | | | | | | | | | | | | | |
| | | | | | | | | | | | | | | | | 24,221,909 | |
| | | | | | | | | | | | | | | | | | |
Student Loans — 0.0% | | | | | | | | | | | | | | | | | | |
Earnest Student Loan Program LLC, Series 2016-D, Class A1, 144A, 1 Month LIBOR + 1.400% | | | 2.952% | (c) | | 01/25/41 | | | | | | | 417 | | | | 427,372 | |
| | | | | | | | | | | | | | | | | | |
TOTAL ASSET-BACKED SECURITIES
(cost $224,744,721) | | | | 229,419,718 | |
| | | | | | | | | | | | | | | | | | |
| BANK LOANS — 1.1% | | | | | | | | | | | | | | | | | | |
Diversified Manufacturing — 0.1% | | | | | | | | | | | | | | | | | | |
Ceramtec Service GmbH (Germany), Initial Euro Term B-1 Loan | | | —% | (p) | | 08/30/20 | | | EUR | | | | 690 | | | | 826,458 | |
Ceramtec Service GmbH (Germany), Initial Euro Term B-2 Loan | | | —% | (p) | | 08/28/20 | | | EUR | | | | 210 | | | | 251,379 | |
| | | | | | | | | | | | | | | | | | |
| | | | | | | | | | | | | | | | | 1,077,837 | |
| | | | | | | | | | | | | | | | | | |
Electric — 0.0% | | | | | | | | | | | | | | | | | | |
Lightstone Holding Co. LLC, Refinancing Term C Loan, 1 Month LIBOR + 4.500% | | | 5.878% | (c) | | 01/30/24 | | | | | | | 28 | | | | 28,043 | |
Lightstone Holding Co. LLC, Tranche B-2 Loan | | | —% | (p) | | 01/30/24 | | | | | | | 436 | | | | 437,227 | |
| | | | | | | | | | | | | | | | | | |
| | | | | | | | | | | | | | | | | 465,270 | |
| | | | | | | | | | | | | | | | | | |
Financial Institutions — 0.2% | | | | | | | | | | | | | | | | | | |
McAfee LLC, First Lien Closing Date USD Term Loan, 1 Month LIBOR + 4.500% | | | 6.069% | (c) | | 09/30/24 | | | | | | | 2,195 | | | | 2,186,271 | |
McAfee LLC, Second Lien Initial Loan, 1 Month LIBOR + 8.500% | | | 10.069% | (c) | | 09/29/25 | | | | | | | 500 | | | | 500,000 | |
| | | | | | | | | | | | | | | | | | |
| | | | | | | | | | | | | | | | | 2,686,271 | |
| | | | | | | | | | | | | | | | | | |
Health Care & Pharmaceutical — 0.2% | | | | | | | | | | | | | | | | | | |
Avantor, Initial Euro Term Loan, 1 Month EURIBOR + 4.250% | | | 4.250% | (c) | | 11/21/24 | | | EUR | | | | 450 | | | | 542,884 | |
Nidda Heathcare Holding AG (Germany), Term Loan | | | —% | (p) | | 09/30/24 | | | GBP | | | | 1,000 | | | | 1,350,147 | |
| | | | | | | | | | | | | | | | | | |
| | | | | | | | | | | | | | | | | 1,893,031 | |
| | | | | | | | | | | | | | | | | | |
Retailers — 0.2% | | | | | | | | | | | | | | | | | | |
Intervias Finco Ltd. (United Kingdom), Facility D1, 3 Month GBP LIBOR + 5.000% | | | 5.440% | (c) | | 01/30/23 | | | GBP | | | | 1,000 | | | | 1,354,929 | |
Rite Aid Corp., Tranche 2 Term Loan (Second Lien), 1 Month LIBOR + 3.880% | | | 5.365% | (c) | | 06/21/21 | | | | | | | 1,375 | | | | 1,375,000 | |
| | | | | | | | | | | | | | | | | | |
| | | | | | | | | | | | | | | | | 2,729,929 | |
| | | | | | | | | | | | | | | | | | |
Technology — 0.4% | | | | | | | | | | | | | | | | | | |
BMC Software Finance, Inc., Term Loan, 3 Month LIBOR + 3.250% | | | 4.824% | (c) | | 09/12/22 | | | | | | | 421 | | | | 420,452 | |
Dell International LLC, Replacement Term A-3 Loan, 1 Month LIBOR + 1.500% | | | 3.193% | (c) | | 12/31/18 | | | | | | | 2,237 | | | | 2,235,762 | |
Peer Holdings BV, Facility B, 1 Month EURIBOR + 3.250% | | | 3.250% | (c) | | 02/25/22 | | | EUR | | | | 1,100 | | | | 1,323,130 | |
| | | | | | | | | | | | | | | | | | |
| | | | | | | | | | | | | | | | | 3,979,344 | |
| | | | | | | | | | | | | | | | | | |
TOTAL BANK LOANS
(cost $12,839,806) | | | | 12,831,682 | |
| | | | | | | | | | | | | | | | | | |
SEE NOTES TO FINANCIAL STATEMENTS.
A42
| | | | | | |
| | DIVERSIFIED BOND PORTFOLIO (continued) | | |
| |
| SCHEDULE OF INVESTMENTS | | as of December 31, 2017 |
| | | | | | | | | | | | | | | | | | |
COMMERCIAL MORTGAGE-BACKED
SECURITIES — 15.5% | | Interest
Rate | | | Maturity
Date | | Principal
Amount
(000)# | | | Value | |
245 Park Avenue Trust, Series 2017-245P, Class A, 144A | | | 3.508% | | | 06/05/37 | | | | | | | 1,045 | | | $ | 1,073,301 | |
Banc of America Commercial Mortgage Trust, Series 2016-UB10, Class A3 | | | 2.903% | | | 07/15/49 | | | | | | | 2,300 | | | | 2,276,308 | |
BANK, Series 2017-BNK5, Class A4 | | | 3.131% | | | 06/15/60 | | | | | | | 4,400 | | | | 4,401,980 | |
BANK, Series 2017-BNK6, Class A4 | | | 3.254% | | | 07/15/60 | | | | | | | 3,300 | | | | 3,340,181 | |
BANK, Series 2017-BNK8, Class A3 | | | 3.229% | | | 11/15/50 | | | | | | | 1,950 | | | | 1,964,107 | |
BBCMS Mortgage Trust, Series 2016-ETC, Class A, 144A | | | 2.937% | | | 08/14/36 | | | | | | | 1,170 | | | | 1,145,244 | |
BBCMS Mortgage Trust, Series 2016-ETC, Class B, 144A | | | 3.189% | | | 08/14/36 | | | | | | | 510 | | | | 492,873 | |
BBCMS Mortgage Trust, Series 2016-ETC, Class C, 144A | | | 3.391% | | | 08/14/36 | | | | | | | 430 | | | | 412,776 | |
BBCMS Mortgage Trust, Series 2016-ETC, Class D, 144A | | | 3.609% | (cc) | | 08/14/36 | | | | | | | 1,560 | | | | 1,484,601 | |
CD Mortgage Trust, Series 2017-CD5, Class A3 | | | 3.171% | | | 08/15/50 | | | | | | | 3,500 | | | | 3,519,089 | |
Citigroup Commercial Mortgage Trust, Series 2014-GC21, Class A4 | | | 3.575% | | | 05/10/47 | | | | | | | 3,200 | | | | 3,319,147 | |
Citigroup Commercial Mortgage Trust, Series 2016-C1, Class A4 | | | 3.209% | | | 05/10/49 | | | | | | | 1,700 | | | | 1,714,576 | |
Citigroup Commercial Mortgage Trust, Series 2016-GC37, Class A4 | | | 3.314% | | | 04/10/49 | | | | | | | 5,100 | | | | 5,172,182 | |
CityLine Commercial Mortgage Trust, Series 2016-CLNE, Class B, 144A | | | 2.778% | (cc) | | 11/10/31 | | | | | | | 2,400 | | | | 2,335,130 | |
CityLine Commercial Mortgage Trust, Series 2016-CLNE, Class C, 144A | | | 2.778% | (cc) | | 11/10/31 | | | | | | | 900 | | | | 861,370 | |
COMM Mortgage Trust, Series 2012-CR5, Class A3 | | | 2.540% | | | 12/10/45 | | | | | | | 2,000 | | | | 1,980,667 | |
COMM Mortgage Trust, Series 2013-CR7, Class A3 | | | 2.929% | | | 03/10/46 | | | | | | | 2,969 | | | | 2,992,038 | |
COMM Mortgage Trust, Series 2014-UBS4, Class A4 | | | 3.420% | | | 08/10/47 | | | | | | | 3,200 | | | | 3,290,027 | |
COMM Mortgage Trust, Series 2014-UBS5, Class A4 | | | 3.838% | | | 09/10/47 | | | | | | | 3,600 | | | | 3,784,765 | |
COMM Mortgage Trust, Series 2015-DC1, Class A4 | | | 3.078% | | | 02/10/48 | | | | | | | 5,000 | | | | 5,011,439 | |
COMM Mortgage Trust, Series 2015-LC21, Class A4 | | | 3.708% | | | 07/10/48 | | | | | | | 2,600 | | | | 2,715,212 | |
COMM Mortgage Trust, Series 2015-PC1, Class A5 | | | 3.902% | | | 07/10/50 | | | | | | | 2,100 | | | | 2,212,320 | |
COMM Mortgage Trust, Series 2016-COR1, Class A3 | | | 2.826% | | | 10/10/49 | | | | | | | 2,500 | | | | 2,448,734 | |
COMM Mortgage Trust, Series 2016-DC2, Class A5 | | | 3.765% | | | 02/10/49 | | | | | | | 300 | | | | 314,192 | |
COMM Mortgage Trust, Series 2017-COR2, Class A2 | | | 3.239% | | | 09/10/50 | | | | | | | 4,500 | | | | 4,552,083 | |
DBJPM Mortgage Trust, Series 2017-C6, Class A4 | | | 3.071% | | | 06/10/50 | | | | | | | 2,800 | | | | 2,794,098 | |
DBWF Mortgage Trust, Series 2016-85T, Class D, 144A | | | 3.808% | (cc) | | 12/10/36 | | | | | | | 1,400 | | | | 1,387,868 | |
Eleven Madison Trust Mortgage Trust, Series 2015-11MD, Class C, 144A | | | 3.555% | (cc) | | 09/10/35 | | | | | | | 3,000 | | | | 3,001,752 | |
FHLMC Multifamily Structured Pass-Through Certificates, Series K008, Class X1, IO | | | 1.534% | (cc) | | 06/25/20 | | | | | | | 7,733 | | | | 238,464 | |
FHLMC Multifamily Structured Pass-Through Certificates, Series K020, Class X1, IO | | | 1.426% | (cc) | | 05/25/22 | | | | | | | 27,184 | | | | 1,393,625 | |
FHLMC Multifamily Structured Pass-Through Certificates, Series K021, Class X1, IO | | | 1.465% | (cc) | | 06/25/22 | | | | | | | 15,519 | | | | 836,122 | |
FHLMC Multifamily Structured Pass-Through Certificates, Series K025, Class X1, IO | | | 0.870% | (cc) | | 10/25/22 | | | | | | | 10,701 | | | | 367,158 | |
FHLMC Multifamily Structured Pass-Through Certificates, Series K027, Class X1, IO | | | 0.798% | (cc) | | 01/25/23 | | | | | | | 133,035 | | | | 4,349,060 | |
FHLMC Multifamily Structured Pass-Through Certificates, Series K044, Class X1, IO | | | 0.752% | (cc) | | 01/25/25 | | | | | | | 83,165 | | | | 3,632,676 | |
FHLMC Multifamily Structured Pass-Through Certificates, Series K053, Class X1, IO | | | 0.892% | (cc) | | 12/25/25 | | | | | | | 89,375 | | | | 5,357,087 | |
FHLMC Multifamily Structured Pass-Through Certificates, Series K055, Class X1, IO | | | 1.368% | (cc) | | 03/25/26 | | | | | | | 13,931 | | | | 1,285,235 | |
FHLMC Multifamily Structured Pass-Through Certificates, Series K710, Class X1, IO | | | 1.733% | (cc) | | 05/25/19 | | | | | | | 21,041 | | | | 372,259 | |
FHLMC Multifamily Structured Pass-Through Certificates, Series K711, Class X1, IO | | | 1.683% | (cc) | | 07/25/19 | | | | | | | 25,968 | | | | 474,378 | |
GS Mortgage Securities Corp. II, Series 2015-GC30, Class A3 | | | 3.119% | | | 05/10/50 | | | | | | | 3,025 | | | | 3,053,144 | |
GS Mortgage Securities Trust, Series 2013-GC12, Class A3 | | | 2.860% | | | 06/10/46 | | | | | | | 1,430 | | | | 1,435,429 | |
GS Mortgage Securities Trust, Series 2017-GS6, Class A2 | | | 3.164% | | | 05/10/50 | | | | | | | 3,400 | | | | 3,417,837 | |
GS Mortgage Securities Trust, Series 2017-GS7, Class A3 | | | 3.167% | | | 08/10/50 | | | | | | | 4,560 | | | | 4,553,295 | |
SEE NOTES TO FINANCIAL STATEMENTS.
A43
| | | | | | |
| | DIVERSIFIED BOND PORTFOLIO (continued) | | |
| |
| SCHEDULE OF INVESTMENTS | | as of December 31, 2017 |
| | | | | | | | | | | | | | | | | | |
COMMERCIAL MORTGAGE-BACKED SECURITIES (continued) | | Interest
Rate | | | Maturity
Date | | Principal
Amount
(000)# | | | Value | |
IMT Trust, Series 2017-APTS, Class AFX, 144A | | | 3.478% | (cc) | | 06/15/34 | | | | | | | 1,050 | | | $ | 1,071,558 | |
JPMBB Commercial Mortgage Securities Trust, Series 2017-C7, Class A4 | | | 3.147% | | | 10/15/50 | | | | | | | 3,600 | | | | 3,617,303 | |
JPMBB Commercial Mortgage Securities Trust, Series 2014-C21, Class A4 | | | 3.493% | | | 08/15/47 | | | | | | | 3,200 | | | | 3,300,117 | |
JPMDB Commercial Mortgage Securities Trust, Series 2016-C2, Class A3A | | | 2.881% | | | 06/15/49 | | | | | | | 1,070 | | | | 1,056,620 | |
JPMDB Commercial Mortgage Securities Trust, Series 2017-C5, Class A4 | | | 3.414% | | | 03/15/50 | | | | | | | 2,300 | | | | 2,356,205 | |
JPMorgan Chase Commercial Mortgage Securities Corp., Series 2012-LC9, Class A4 | | | 2.611% | | | 12/15/47 | | | | | | | 2,000 | | | | 1,994,104 | |
JPMorgan Chase Commercial Mortgage Securities Trust, Series 2013-C10, Class A4 | | | 2.875% | | | 12/15/47 | | | | | | | 2,856 | | | | 2,879,587 | |
JPMorgan Chase Commercial Mortgage Securities Trust, Series 2016-JP2, Class A3 | | | 2.559% | | | 08/15/49 | | | | | | | 2,900 | | | | 2,794,381 | |
LCCM, Series 2017-LC26, Class A4, 144A | | | 3.551% | | | 07/12/50 | | | | | | | 4,300 | | | | 4,380,604 | |
Morgan Stanley Bank of America Merrill Lynch Trust, Series 2012-C5, Class XA, IO, 144A | | | 1.480% | (cc) | | 08/15/45 | | | | | | | 39,212 | | | | 2,091,246 | |
Morgan Stanley Bank of America Merrill Lynch Trust, Series 2013-C10, Class A3 | | | 3.967% | (cc) | | 07/15/46 | | | | | | | 4,800 | | | | 5,071,364 | |
Morgan Stanley Bank of America Merrill Lynch Trust, Series 2013-C8, Class A3 | | | 2.863% | | | 12/15/48 | | | | | | | 1,691 | | | | 1,701,342 | |
Morgan Stanley Bank of America Merrill Lynch Trust, Series 2013-C9, Class A3 | | | 2.834% | | | 05/15/46 | | | | | | | 2,300 | | | | 2,307,346 | |
Morgan Stanley Bank of America Merrill Lynch Trust, Series 2016-C30, Class A5 | | | 2.860% | | | 09/15/49 | | | | | | | 2,000 | | | | 1,961,492 | |
Morgan Stanley Capital I Trust, Series 2017-H1, Class A4 | | | 3.259% | | | 06/15/50 | | | | | | | 2,750 | | | | 2,785,366 | |
Morgan Stanley Capital I, Inc., Series 2017-HR2, Class A3 | | | 3.330% | | | 12/15/50 | | | | | | | 5,500 | | | | 5,560,894 | |
Shops at Crystals Trust, Series 2016-CSTL, Class A, 144A | | | 3.126% | | | 07/05/36 | | | | | | | 180 | | | | 176,903 | |
UBS Commercial Mortgage Trust, Series 2017-C2, Class A3 | | | 3.225% | | | 08/15/50 | | | | | | | 4,400 | | | | 4,430,908 | |
UBS Commercial Mortgage Trust, Series 2017-C7, Class A3 | | | 3.418% | | | 12/15/50 | | | | | | | 5,600 | | | | 5,686,662 | |
UBS-Barclays Commercial Mortgage Trust, Series 2013-C5, Class A3 | | | 2.920% | | | 03/10/46 | | | | | | | 4,506 | | | | 4,537,455 | |
Wells Fargo Commercial Mortgage Trust, Series 2014-LC16, Class A4 | | | 3.548% | | | 08/15/50 | | | | | | | 4,300 | | | | 4,443,947 | |
Wells Fargo Commercial Mortgage Trust, Series 2016-C32, Class A3 | | | 3.294% | | | 01/15/59 | | | | | | | 2,250 | | | | 2,285,335 | |
Wells Fargo Commercial Mortgage Trust, Series 2016-C34, Class A3 | | | 2.834% | | | 06/15/49 | | | | | | | 2,500 | | | | 2,458,346 | |
Wells Fargo Commercial Mortgage Trust, Series 2016-C35, Class A3 | | | 2.674% | | | 07/15/48 | | | | | | | 4,600 | | | | 4,468,105 | |
Wells Fargo Commercial Mortgage Trust, Series 2017-C39, Class A5 | | | 3.418% | | | 09/15/50 | | | | | | | 1,540 | | | | 1,577,782 | |
Wells Fargo Commercial Mortgage Trust, Series 2017-C40, Class A3 | | | 3.317% | | | 10/15/50 | | | | | | | 1,370 | | | | 1,391,743 | |
| | | | | | | | | | | | | | | | | | |
TOTAL COMMERCIAL MORTGAGE-BACKED SECURITIES
(cost $178,057,555) | | | | 177,150,544 | |
| | | | | | | | | | | | | | | | | | |
| CORPORATE BONDS — 40.2% | | | | | | | | | | | | | | | | | | |
Agriculture — 0.5% | | | | | | | | | | | | | | | | | | |
BAT Capital Corp. (United Kingdom), Gtd. Notes, 144A | | | 3.222% | | | 08/15/24 | | | | | | | 2,810 | | | | 2,809,889 | |
Imperial Brands Finance PLC (United Kingdom), Gtd. Notes, 144A | | | 2.050% | | | 02/11/18 | | | | | | | 2,375 | | | | 2,374,691 | |
Reynolds American, Inc. (United Kingdom), Gtd. Notes | | | 8.125% | | | 06/23/19 | | | | | | | 895 | | | | 968,090 | |
| | | | | | | | | | | | | | | | | | |
| | | | | | | | | | | | | | | | | 6,152,670 | |
| | | | | | | | | | | | | | | | | | |
Airlines — 0.6% | | | | | | | | | | | | | | | | | | |
American Airlines, Pass-Through Trust, Pass-Through Certificates, Series 2016-1, Class AA | | | 3.575% | | | 07/15/29 | | | | | | | 1,746 | | | | 1,777,779 | |
SEE NOTES TO FINANCIAL STATEMENTS.
A44
| | | | | | |
| | DIVERSIFIED BOND PORTFOLIO (continued) | | |
| |
| SCHEDULE OF INVESTMENTS | | as of December 31, 2017 |
| | | | | | | | | | | | | | | | | | |
CORPORATE BONDS (continued) | | Interest
Rate | | | Maturity
Date | | Principal
Amount
(000)# | | | Value | |
Airlines (continued) | | | | | | | | | | | | | | | | | | |
Continental Airlines, Inc., Pass-Through Trust, Pass-Through Certificates, Series 2001-1, Class A-1 | | | 6.703% | | | 12/15/22 | | | | | | | — | (r) | | $ | 342 | |
Continental Airlines, Inc., Pass-Through Trust, Pass-Through Certificates, Series 2007-1, Class A | | | 5.983% | | | 10/19/23 | | | | | | | 1,330 | | | | 1,450,152 | |
Continental Airlines, Inc., Pass-Through Trust, Pass-Through Certificates, Series 2010-1, Class A | | | 4.750% | | | 07/12/22 | | | | | | | 342 | | | | 358,152 | |
Delta Air Lines, Inc., Sr. Unsec’d. Notes | | | 2.875% | | | 03/13/20 | | | | | | | 1,180 | | | | 1,186,847 | |
Delta Air Lines, Inc., Pass-Through Trust, Pass-Through Certificates, Series 2007-1 Class A | | | 6.821% | | | 02/10/24 | | | | | | | 898 | | | | 1,021,858 | |
Delta Air Lines, Inc., Pass-Through Trust, Pass-Through Certificates, Series 2010-2, Class A | | | 4.950% | | | 11/23/20 | | | | | | | 297 | | | | 304,531 | |
Delta Air Lines, Inc., Pass-Through Trust, Pass-Through Certificates, Series 2011-1, Class A | | | 5.300% | | | 10/15/20 | | | | | | | 378 | | | | 391,076 | |
United Airlines, Pass-Through Trust, Pass-Through Certificates, Series 2007-071A, Class A | | | 6.636% | | | 01/02/24 | | | | | | | 666 | | | | 718,641 | |
| | | | | | | | | | | | | | | | | | |
| | | | | | | | | | | | | | | | | 7,209,378 | |
| | | | | | | | | | | | | | | | | | |
Apparel — 0.1% | | | | | | | | | | | | | | | | | | |
Hanesbrands Finance Luxembourg SCA, Gtd. Notes, 144A | | | 3.500% | | | 06/15/24 | | | EUR | | | | 575 | | | | 742,649 | |
| | | | | | | | | | | | | | | | | | |
Auto Manufacturers — 0.8% | | | | | | | | | | | | | | | | | | |
Ford Motor Co., Sr. Unsec’d. Notes | | | 4.750% | | | 01/15/43 | | | | | | | 1,755 | | | | 1,779,800 | |
Ford Motor Co., Sr. Unsec’d. Notes(a) | | | 5.291% | | | 12/08/46 | | | | | | | 525 | | | | 571,310 | |
Ford Motor Credit Co. LLC, Sr. Unsec’d. Notes | | | 2.375% | | | 01/16/18 | | | | | | | 2,225 | | | | 2,225,273 | |
General Motors Co., Sr. Unsec’d. Notes | | | 4.875% | | | 10/02/23 | | | | | | | 1,350 | | | | 1,460,934 | |
General Motors Co., Sr. Unsec’d. Notes | | | 6.250% | | | 10/02/43 | | | | | | | 1,885 | | | | 2,232,724 | |
General Motors Co., Sr. Unsec’d. Notes | | | 6.600% | | | 04/01/36 | | | | | | | 210 | | | | 255,861 | |
Jaguar Land Rover Automotive PLC (United Kingdom),
Gtd. Notes, 144A | | | 2.200% | | | 01/15/24 | | | EUR | | | | 350 | | | | 427,976 | |
| | | | | | | | | | | | | | | | | | |
| | | | | | | | | | | | | | | | | 8,953,878 | |
| | | | | | | | | | | | | | | | | | |
Auto Parts & Equipment — 0.5% | | | | | | | | | | | | | | | | | | |
Adient Global Holdings Ltd., Gtd. Notes, 144A | | | 3.500% | | | 08/15/24 | | | EUR | | | | 701 | | | | 897,496 | |
IHO Verwaltungs GmbH (Germany), 1st Lien, 144A | | | 3.750% | | | 09/15/26 | | | EUR | | | | 1,050 | | | | 1,347,876 | |
IHO Verwaltungs GmbH (Germany), Sr. Sec’d. Notes, Cash coupon 3.25% or PIK 4.000%, 144A | | | 3.250% | | | 09/15/23 | | | EUR | | | | 1,075 | | | | 1,344,653 | |
LKQ Italia Bondco SpA, Gtd. Notes, 144A | | | 3.875% | | | 04/01/24 | | | EUR | | | | 1,275 | | | | 1,669,102 | |
| | | | | | | | | | | | | | | | | | |
| | | | | | | | | | | | | | | | | 5,259,127 | |
| | | | | | | | | | | | | | | | | | |
Banks — 10.3% | | | | | | | | | | | | | | | | | | |
Bank of America Corp., Jr. Sub. Notes, Series K | | | 8.000% | | | 12/31/49 | | | | | | | 3,500 | | | | 3,511,900 | |
Bank of America Corp., Sr. Unsec’d. Notes, GMTN | | | 3.300% | | | 01/11/23 | | | | | | | 5,870 | | | | 6,005,010 | |
Bank of America Corp., Sr. Unsec’d. Notes, GMTN | | | 3.593% | | | 07/21/28 | | | | | | | 740 | | | | 752,176 | |
Bank of America Corp., Sr. Unsec’d. Notes, MTN | | | 4.000% | | | 04/01/24 | | | | | | | 1,150 | | | | 1,215,695 | |
Bank of America Corp., Sr. Unsec’d. Notes, MTN | | | 4.125% | | | 01/22/24 | | | | | | | 3,750 | | | | 3,988,332 | |
Bank of America Corp., Sr. Unsec’d. Notes, MTN | | | 4.443% | | | 01/20/48 | | | | | | | 1,200 | | | | 1,352,349 | |
Bank of America Corp., Sub. Notes, MTN | | | 4.450% | | | 03/03/26 | | | | | | | 1,735 | | | | 1,851,946 | |
Barclays PLC (United Kingdom), Sr. Unsec’d. Notes | | | 3.684% | | | 01/10/23 | | | | | | | 480 | | | | 487,093 | |
Barclays PLC (United Kingdom), Sr. Unsec’d. Notes | | | 4.337% | | | 01/10/28 | | | | | | | 520 | | | | 538,182 | |
Barclays PLC (United Kingdom), Sr. Unsec’d. Notes | | | 4.375% | | | 01/12/26 | | | | | | | 1,290 | | | | 1,341,884 | |
BNP Paribas SA (France), Sr. Unsec’d. Notes, 144A, MTN | | | 2.950% | | | 05/23/22 | | | | | | | 1,435 | | | | 1,438,122 | |
BNP Paribas SA (France), Sub. Notes, 144A | | | 4.625% | | | 03/13/27 | | | | | | | 230 | | | | 245,360 | |
BPCE SA (France), Sr. Unsec’d. Notes, 144A, MTN | | | 3.500% | | | 10/23/27 | | | | | | | 300 | | | | 295,197 | |
BPCE SA (France), Sub. Notes, 144A, MTN | | | 4.500% | | | 03/15/25 | | | | | | | 1,500 | | | | 1,567,800 | |
Branch Banking & Trust Co., Sr. Unsec’d. Notes | | | 2.850% | | | 04/01/21 | | | | | | | 2,450 | | | | 2,483,621 | |
CITIC Ltd. (China), Sr. Unsec’d. Notes, EMTN | | | 6.875% | | | 01/21/18 | | | | | | | 1,100 | | | | 1,101,991 | |
Citigroup, Inc., Jr. Sub. Notes, Series Q | | | 5.950% | | | 12/31/49 | | | | | | | 1,355 | | | | 1,415,975 | |
Citigroup, Inc., Jr. Sub. Notes, Series R | | | 6.125% | | | 12/31/49 | | | | | | | 1,085 | | | | 1,154,169 | |
Citigroup, Inc., Sr. Unsec’d. Notes | | | 8.125% | | | 07/15/39 | | | | | | | 2,995 | | | | 4,788,787 | |
SEE NOTES TO FINANCIAL STATEMENTS.
A45
| | | | | | |
| | DIVERSIFIED BOND PORTFOLIO (continued) | | |
| |
| SCHEDULE OF INVESTMENTS | | as of December 31, 2017 |
| | | | | | | | | | | | | | | | | | | | |
CORPORATE BONDS (continued) | | Interest
Rate | | | Maturity
Date | | | Principal
Amount
(000)# | | | Value | |
Banks (continued) | | | | | | | | | | | | | | | | | | | | |
Citigroup, Inc., Sub. Notes | | | 4.450% | | | | 09/29/27 | | | | | | | | 2,630 | | | $ | 2,784,388 | |
Credit Suisse/New York NY (Switzerland), Sr. Unsec’d. Notes, MTN | | | 3.625% | | | | 09/09/24 | | | | | | | | 1,050 | | | | 1,086,479 | |
Deutsche Bank AG (Germany), Sr. Unsec’d. Notes, GMTN | | | 3.375% | | | | 05/12/21 | | | | | | | | 900 | | | | 908,301 | |
Deutsche Bank AG (Germany), Sr. Unsec’d. Notes, MTN | | | 3.700% | | | | 05/30/24 | | | | | | | | 159 | | | | 160,068 | |
Development Bank of Japan, Inc. (Japan), Gov’t. Gtd. Notes, 144A, MTN | | | 2.125% | | | | 09/01/22 | | | | | | | | 600 | | | | 586,358 | |
Dexia Credit Local SA (France), Gov’t. Liquid Gtd. Notes | | | 1.875% | | | | 01/29/20 | | | | | | | | 2,500 | | | | 2,478,584 | |
Discover Bank, Sr. Unsec’d. Notes | | | 3.450% | | | | 07/27/26 | | | | | | | | 280 | | | | 276,402 | |
Discover Bank, Sr. Unsec’d. Notes | | | 4.250% | | | | 03/13/26 | | | | | | | | 1,150 | | | | 1,199,389 | |
Discover Bank, Sub. Notes | | | 7.000% | | | | 04/15/20 | | | | | | | | 2,005 | | | | 2,185,413 | |
Fifth Third Bank, Sr. Unsec’d. Notes | | | 2.375% | | | | 04/25/19 | | | | | | | | 425 | | | | 426,230 | |
Goldman Sachs Group, Inc. (The), Jr. Sub. Notes, Series M | | | 5.375% | | | | 12/31/49 | | | | | | | | 1,950 | | | | 2,008,500 | |
Goldman Sachs Group, Inc. (The), Sr. Unsec’d. Notes | | | 3.272% | | | | 09/29/25 | | | | | | | | 1,140 | | | | 1,135,407 | |
Goldman Sachs Group, Inc. (The), Sr. Unsec’d. Notes | | | 3.750% | | | | 02/25/26 | | | | | | | | 125 | | | | 128,261 | |
Goldman Sachs Group, Inc. (The), Sr. Unsec’d. Notes | | | 3.850% | | | | 01/26/27 | | | | | | | | 1,775 | | | | 1,822,316 | |
Goldman Sachs Group, Inc. (The), Sr. Unsec’d. Notes | | | 5.750% | | | | 01/24/22 | | | | | | | | 4,200 | | | | 4,657,089 | |
Goldman Sachs Group, Inc. (The), Sr. Unsec’d. Notes | | | 6.150% | | | | 04/01/18 | | | | | | | | 1,355 | | | | 1,369,261 | |
Goldman Sachs Group, Inc. (The), Sr. Unsec’d. Notes | | | 6.250% | | | | 02/01/41 | | | | | | | | 2,195 | | | | 2,957,978 | |
Goldman Sachs Group, Inc. (The), Sr. Unsec’d. Notes, Series D, MTN | | | 6.000% | | | | 06/15/20 | | | | | | | | 2,420 | | | | 2,616,542 | |
Goldman Sachs Group, Inc. (The), Sub. Notes | | | 6.750% | | | | 10/01/37 | | | | | | | | 440 | | | | 589,003 | |
Intesa Sanpaolo SpA (Italy), Sr. Unsec’d. Notes, 144A | | | 3.875% | | | | 07/14/27 | | | | | | | | 630 | | | | 629,705 | |
JPMorgan Chase & Co., Jr. Sub. Notes, Series 1 | | | 7.900% | | | | 12/31/49 | | | | | | | | 6,130 | | | | 6,206,625 | |
JPMorgan Chase & Co., Jr. Sub. Notes, Series X | | | 6.100% | | | | 12/31/49 | | | | | | | | 1,450 | | | | 1,593,260 | |
JPMorgan Chase & Co., Sr. Unsec’d. Notes | | | 2.750% | | | | 06/23/20 | | | | | | | | 5,400 | | | | 5,447,152 | |
JPMorgan Chase & Co., Sr. Unsec’d. Notes | | | 2.950% | | | | 10/01/26 | | | | | | | | 1,740 | | | | 1,709,098 | |
JPMorgan Chase & Co., Sr. Unsec’d. Notes | | | 3.200% | | | | 06/15/26 | | | | | | | | 3,020 | | | | 3,018,381 | |
JPMorgan Chase & Co., Sr. Unsec’d. Notes | | | 3.250% | | | | 09/23/22 | | | | | | | | 500 | | | | 511,926 | |
JPMorgan Chase & Co., Sr. Unsec’d. Notes(a) | | | 3.540% | | | | 05/01/28 | | | | | | | | 1,520 | | | | 1,546,367 | |
JPMorgan Chase & Co., Sr. Unsec’d. Notes | | | 3.882% | | | | 07/24/38 | | | | | | | | 410 | | | | 421,467 | |
JPMorgan Chase & Co., Sr. Unsec’d. Notes | | | 4.032% | | | | 07/24/48 | | | | | | | | 730 | | | | 761,308 | |
JPMorgan Chase & Co., Sr. Unsec’d. Notes | | | 4.250% | | | | 10/15/20 | | | | | | | | 600 | | | | 629,112 | |
JPMorgan Chase & Co., Sub. Notes | | | 4.250% | | | | 10/01/27 | | | | | | | | 420 | | | | 446,398 | |
KeyCorp, Sr. Unsec’d. Notes, MTN | | | 5.100% | | | | 03/24/21 | | | | | | | | 1,155 | | | | 1,244,714 | |
Lloyds Bank PLC (United Kingdom), Gtd. Notes, 144A, MTN | | | 5.800% | | | | 01/13/20 | | | | | | | | 2,650 | | | | 2,823,030 | |
Mizuho Bank Ltd. (Japan), Gtd. Notes, 144A | | | 1.850% | | | | 03/21/18 | | | | | | | | 1,125 | | | | 1,125,028 | |
Morgan Stanley, Jr. Sub. Notes, Series H | | | 5.450% | | | | 12/31/49 | | | | | | | | 975 | | | | 1,000,837 | |
Morgan Stanley, Sr. Unsec’d. Notes, MTN | | | 3.125% | | | | 07/27/26 | | | | | | | | 2,725 | | | | 2,687,749 | |
Morgan Stanley, Sr. Unsec’d. Notes, GMTN | | | 3.750% | | | | 02/25/23 | | | | | | | | 1,535 | | | | 1,590,815 | |
Morgan Stanley, Sr. Unsec’d. Notes, MTN | | | 3.971% | | | | 07/22/38 | | | | | | | | 385 | | | | 398,665 | |
Morgan Stanley, Sr. Unsec’d. Notes | | | 4.375% | | | | 01/22/47 | | | | | | | | 1,730 | | | | 1,896,395 | |
Morgan Stanley, Sr. Unsec’d. Notes, GMTN | | | 5.500% | | | | 07/28/21 | | | | | | | | 2,080 | | | | 2,275,184 | |
Morgan Stanley, Sr. Unsec’d. Notes, MTN | | | 5.625% | | | | 09/23/19 | | | | | | | | 2,635 | | | | 2,776,801 | |
Morgan Stanley, Sr. Unsec’d. Notes | | | 5.750% | | | | 01/25/21 | | | | | | | | 1,920 | | | | 2,092,292 | |
Morgan Stanley, Sub. Notes, GMTN | | | 4.350% | | | | 09/08/26 | | | | | | | | 750 | | | | 785,894 | |
People’s United Bank, Sub. Notes | | | 4.000% | | | | 07/15/24 | | | | | | | | 550 | | | | 555,487 | |
PNC Financial Services Group, Inc. (The), Sub. Notes | | | 3.900% | | | | 04/29/24 | | | | | | | | 975 | | | | 1,020,922 | |
Santander UK Group Holdings PLC (United Kingdom),
Sr. Unsec’d. Notes | | | 2.875% | | | | 10/16/20 | | | | | | | | 1,550 | | | | 1,555,123 | |
State Street Corp., Jr. Sub. Notes | | | 4.956% | | | | 03/15/18 | | | | | | | | 3,025 | | | | 3,042,305 | |
Sumitomo Mitsui Banking Corp. (Japan), Gtd. Notes | | | 2.450% | | | | 01/10/19 | | | | | | | | 625 | | | | 626,406 | |
UBS Group Funding Switzerland AG (Switzerland),
Gtd. Notes, 144A | | | 2.859% | | | | 08/15/23 | | | | | | | | 1,100 | | | | 1,087,424 | |
UBS Group Funding Switzerland AG (Switzerland),
Gtd. Notes, 144A | | | 4.253% | | | | 03/23/28 | | | | | | | | 1,485 | | | | 1,564,727 | |
| | | | | | | | | | | | | | | | | | | | |
| | | | | | | | | | | | | | | | | | | 117,982,155 | |
| | | | | | | | | | | | | | | | | | | | |
SEE NOTES TO FINANCIAL STATEMENTS.
A46
| | | | | | |
| | DIVERSIFIED BOND PORTFOLIO (continued) | | |
| |
| SCHEDULE OF INVESTMENTS | | as of December 31, 2017 |
| | | | | | | | | | | | | | | | | | | | |
CORPORATE BONDS (continued) | | Interest
Rate | | | Maturity
Date | | | Principal
Amount
(000)# | | | Value | |
Beverages — 0.0% | | | | | | | | | | | | | | | | | | | | |
Coca-Cola Icecek A/S (Turkey), Sr. Unsec’d. Notes, 144A | | | 4.750% | | | | 10/01/18 | | | | | | | | 375 | | | $ | 379,909 | |
| | | | | | | | | | | | | | | | | | | | |
Biotechnology — 0.3% | | | | | | | | | | | | | | | | | | | | |
Amgen, Inc., Sr. Unsec’d. Notes | | | 4.663% | | | | 06/15/51 | | | | | | | | 2,948 | | | | 3,297,352 | |
| | | | | | | | | | | | | | | | | | | | |
Building Materials — 0.4% | | | | | | | | | | | | | | | | | | | | |
Cemex SAB de CV (Mexico), Sr. Sec’d. Notes, 144A | | | 4.750% | | | | 01/11/22 | | | | EUR | | | | 900 | | | | 1,105,994 | |
Standard Industries, Inc., Sr. Unsec’d. Notes, 144A | | | 5.375% | | | | 11/15/24 | | | | | | | | 3,000 | | | | 3,135,900 | |
US Concrete, Inc., Gtd. Notes | | | 6.375% | | | | 06/01/24 | | | | | | | | 600 | | | | 643,500 | |
| | | | | | | | | | | | | | | | | | | | |
| | | | | | | | | | | | | | | | | | | 4,885,394 | |
| | | | | | | | | | | | | | | | | | | | |
Chemicals — 1.5% | | | | | | | | | | | | | | | | | | | | |
Agrium, Inc. (Canada), Sr. Unsec’d. Notes | | | 4.900% | | | | 06/01/43 | | | | | | | | 870 | | | | 970,714 | |
Agrium, Inc. (Canada), Sr. Unsec’d. Notes | | | 5.250% | | | | 01/15/45 | | | | | | | | 420 | | | | 488,657 | |
Agrium, Inc. (Canada), Sr. Unsec’d. Notes | | | 6.125% | | | | 01/15/41 | | | | | | | | 450 | | | | 572,443 | |
Ashland, Inc., Gtd. Notes | | | 6.875% | | | | 05/15/43 | | | | | | | | 3,000 | | | | 3,330,000 | |
CF Industries, Inc., Gtd. Notes | | | 4.950% | | | | 06/01/43 | | | | | | | | 675 | | | | 637,875 | |
CF Industries, Inc., Gtd. Notes | | | 5.375% | | | | 03/15/44 | | | | | | | | 700 | | | | 691,250 | |
CF Industries, Inc., Gtd. Notes | | | 7.125% | | | | 05/01/20 | | | | | | | | 141 | | | | 153,732 | |
Dow Chemical Co. (The), Sr. Unsec’d. Notes | | | 4.625% | | | | 10/01/44 | | | | | | | | 125 | | | | 136,650 | |
Dow Chemical Co. (The), Sr. Unsec’d. Notes | | | 9.400% | | | | 05/15/39 | | | | | | | | 1,002 | | | | 1,712,770 | |
LyondellBasell Industries NV, Sr. Unsec’d. Notes | | | 6.000% | | | | 11/15/21 | | | | | | | | 3,550 | | | | 3,943,350 | |
Mosaic Co. (The), Sr. Unsec’d. Notes(a) | | | 5.450% | | | | 11/15/33 | | | | | | | | 465 | | | | 506,410 | |
Mosaic Co. (The), Sr. Unsec’d. Notes | | | 5.625% | | | | 11/15/43 | | | | | | | | 155 | | | | 167,007 | |
Sherwin-Williams Co. (The), Sr. Unsec’d. Notes | | | 3.450% | | | | 06/01/27 | | | | | | | | 445 | | | | 452,118 | |
Union Carbide Corp., Sr. Unsec’d. Notes | | | 7.875% | | | | 04/01/23 | | | | | | | | 3,058 | | | | 3,702,438 | |
| | | | | | | | | | | | | | | | | | | | |
| | | | | | | | | | | | | | | | | | | 17,465,414 | |
| | | | | | | | | | | | | | | | | | | | |
Commercial Services — 0.5% | | | | | | | | | | | | | | | | | | | | |
ERAC USA Finance LLC, Gtd. Notes, 144A | | | 6.700% | | | | 06/01/34 | | | | | | | | 920 | | | | 1,161,233 | |
ERAC USA Finance LLC, Gtd. Notes, 144A | | | 7.000% | | | | 10/15/37 | | | | | | | | 770 | | | | 1,029,682 | |
Nielsen Finance LLC/Nielsen Finance Co., Gtd. Notes, 144A | | | 5.000% | | | | 04/15/22 | | | | | | | | 1,500 | | | | 1,543,125 | |
United Rentals North America, Inc., Gtd. Notes | | | 4.875% | | | | 01/15/28 | | | | | | | | 500 | | | | 502,500 | |
United Rentals North America, Inc., Gtd. Notes | | | 5.500% | | | | 07/15/25 | | | | | | | | 650 | | | | 689,000 | |
United Rentals North America, Inc., Gtd. Notes | | | 5.500% | | | | 05/15/27 | | | | | | | | 450 | | | | 473,625 | |
| | | | | | | | | | | | | | | | | | | | |
| | | | | | | | | | | | | | | | | | | 5,399,165 | |
| | | | | | | | | | | | | | | | | | | | |
Computers — 0.1% | | | | | | | | | | | | | | | | | | | | |
Dell International LLC/EMC Corp., Sr. Sec’d. Notes, 144A | | | 3.480% | | | | 06/01/19 | | | | | | | | 905 | | | | 916,337 | |
Hewlett Packard Enterprise Co., Sr. Unsec’d. Notes | | | 2.850% | | | | 10/05/18 | | | | | | | | 630 | | | | 633,036 | |
| | | | | | | | | | | | | | | | | | | | |
| | | | | | | | | | | | | | | | | | | 1,549,373 | |
| | | | | | | | | | | | | | | | | | | | |
Diversified Financial Services — 0.3% | | | | | | | | | | | | | | | | | | | | |
HSBC Finance Corp., Sub. Notes | | | 6.676% | | | | 01/15/21 | | | | | | | | 86 | | | | 95,615 | |
International Lease Finance Corp., Sr. Unsec’d. Notes | | | 6.250% | | | | 05/15/19 | | | | | | | | 1,400 | | | | 1,467,067 | |
Intrum Justitia AB (Sweden), Sr. Unsec’d. Notes, 144A | | | 3.125% | | | | 07/15/24 | | | | EUR | | | | 750 | | | | 902,028 | |
Jefferies Group LLC, Sr. Unsec’d. Notes | | | 6.500% | | | | 01/20/43 | | | | | | | | 650 | | | | 766,727 | |
Lehman Brothers Holdings, Inc., Sr. Unsec’d. Notes(d) | | | 6.875% | | | | 05/02/18 | | | | | | | | 2,740 | | | | 128,232 | |
Preferred Term Securities X Ltd./Preferred Term Securities X, Inc. (Cayman Islands), Sr. Sec’d. Notes, 144A, 3 Month LIBOR + 0.720% | | | 2.395% | (c) | | | 07/03/33 | | | | | | | | 314 | | | | 302,244 | |
| | | | | | | | | | | | | | | | | | | | |
| | | | | | | | | | | | | | | | | | | 3,661,913 | |
| | | | | | | | | | | | | | | | | | | | |
Electric — 2.6% | | | | | | | | | | | | | | | | | | | | |
AES Corp., Sr. Unsec’d. Notes | | | 5.500% | | | | 04/15/25 | | | | | | | | 5,000 | | | | 5,250,000 | |
Baltimore Gas & Electric Co., Sr. Unsec’d. Notes | | | 3.350% | | | | 07/01/23 | | | | | | | | 550 | | | | 563,829 | |
Calpine Corp., Sr. Unsec’d. Notes(a) | | | 5.375% | | | | 01/15/23 | | | | | | | | 396 | | | | 385,110 | |
Calpine Corp., Sr. Unsec’d. Notes(a) | | | 5.750% | | | | 01/15/25 | | | | | | | | 1,350 | | | | 1,275,750 | |
Consolidated Edison Co. of New York, Inc., Sr. Unsec’d. Notes | | | 4.300% | | | | 12/01/56 | | | | | | | | 235 | | | | 256,426 | |
ContourGlobal Power Holdings SA, Sr. Sec’d. Notes, 144A | | | 5.125% | | | | 06/15/21 | | | | EUR | | | | 1,350 | | | | 1,691,488 | |
SEE NOTES TO FINANCIAL STATEMENTS.
A47
| | | | | | |
| | DIVERSIFIED BOND PORTFOLIO (continued) | | |
| |
| SCHEDULE OF INVESTMENTS | | as of December 31, 2017 |
| | | | | | | | | | | | | | | | | | |
CORPORATE BONDS (continued) | | Interest
Rate | | | Maturity
Date | | Principal
Amount
(000)# | | | Value | |
Electric (continued) | | | | | | | | | | | | | | | | | | |
Dominion Energy, Inc., Jr. Sub. Notes | | | 4.104% | | | 04/01/21 | | | | | | | 2,710 | | | $ | 2,820,158 | |
Dynegy, Inc., Gtd. Notes | | | 5.875% | | | 06/01/23 | | | | | | | 2,400 | | | | 2,430,000 | |
Dynegy, Inc., Gtd. Notes(a) | | | 7.375% | | | 11/01/22 | | | | | | | 1,000 | | | | 1,055,000 | |
Dynegy, Inc., Gtd. Notes(a) | | | 7.625% | | | 11/01/24 | | | | | | | 225 | | | | 241,313 | |
El Paso Electric Co., Sr. Unsec’d. Notes | | | 6.000% | | | 05/15/35 | | | | | | | 2,325 | | | | 2,807,652 | |
Emera US Finance LP (Canada), Gtd. Notes | | | 3.550% | | | 06/15/26 | | | | | | | 820 | | | | 822,349 | |
Enel Americas SA (Chile), Sr. Unsec’d. Notes | | | 4.000% | | | 10/25/26 | | | | | | | 235 | | | �� | 238,708 | |
Exelon Generation Co. LLC, Sr. Unsec’d. Notes | | | 6.250% | | | 10/01/39 | | | | | | | 1,900 | | | | 2,222,643 | |
FirstEnergy Transmission LLC, Sr. Unsec’d. Notes, 144A | | | 5.450% | | | 07/15/44 | | | | | | | 400 | | | | 475,128 | |
Iberdrola International BV (Spain), Gtd. Notes | | | 6.750% | | | 09/15/33 | | | | | | | 1,150 | | | | 1,456,788 | |
Korea Hydro & Nuclear Power Co. Ltd. (South Korea),
Sr. Unsec’d. Notes, 144A | | | 4.750% | | | 07/13/21 | | | | | | | 250 | | | | 264,293 | |
Majapahit Holding BV (Indonesia), Gtd. Notes | | | 7.750% | | | 01/20/20 | | | | | | | 1,500 | | | | 1,640,700 | |
Pacific Gas & Electric Co., Sr. Unsec’d. Notes | | | 4.600% | | | 06/15/43 | | | | | | | 1,950 | | | | 2,131,374 | |
South Carolina Electric & Gas Co., First Mortgage | | | 4.600% | | | 06/15/43 | | | | | | | 2,025 | | | | 2,187,594 | |
| | | | | | | | | | | | | | | | | | |
| | | | | | | | | | | | | | | | | 30,216,303 | |
| | | | | | | | | | | | | | | | | | |
Electronics — 0.1% | | | | | | | | | | | | | | | | | | |
Honeywell International, Inc., Sr. Unsec’d. Notes | | | 0.650% | | | 02/21/20 | | | EUR | | | | 900 | | | | 1,093,638 | |
| | | | | | | | | | | | | | | | | | |
Engineering & Construction — 0.0% | | | | | | | | | | | | | | | | | | |
GMR Hyderabad International Airport Ltd. (India),
Sr. Sec’d. Notes, 144A | | | 4.250% | | | 10/27/27 | | | | | | | 345 | | | | 338,299 | |
| | | | | | | | | | | | | | | | | | |
Entertainment — 0.2% | | | | | | | | | | | | | | | | | | |
Cinemark USA, Inc., Gtd. Notes | | | 4.875% | | | 06/01/23 | | | | | | | 1,508 | | | | 1,526,850 | |
CPUK Finance Ltd. (United Kingdom), Sec’d. Notes, 144A | | | 4.250% | | | 02/28/47 | | | GBP | | | | 250 | | | | 343,642 | |
CPUK Finance Ltd. (United Kingdom), Sec’d. Notes, 144A | | | 4.875% | | | 02/28/47 | | | GBP | | | | 125 | | | | 171,512 | |
| | | | | | | | | | | | | | | | | | |
| | | | | | | | | | | | | | | | | 2,042,004 | |
| | | | | | | | | | | | | | | | | | |
Food — 0.6% | | | | | | | | | | | | | | | | | | |
Albertsons Cos LLC/Safeway, Inc./New Albertson’s, Inc./Albertson’s LLC, Gtd. Notes | | | 5.750% | | | 03/15/25 | | | | | | | 225 | | | | 202,950 | |
Ingles Markets, Inc., Sr. Unsec’d. Notes | | | 5.750% | | | 06/15/23 | | | | | | | 1,125 | | | | 1,136,250 | |
JBS USA LLC/JBS USA Finance, Inc. (Brazil), Gtd. Notes, 144A | | | 5.750% | | | 06/15/25 | | | | | | | 2,025 | | | | 1,949,062 | |
JBS USA LLC/JBS USA Finance, Inc. (Brazil), Gtd. Notes, Private Placement, 144A | | | 7.250% | | | 06/01/21 | | | | | | | 1,080 | | | | 1,097,550 | |
Kraft Heinz Foods Co., Gtd. Notes | | | 3.000% | | | 06/01/26 | | | | | | | 1,360 | | | | 1,308,701 | |
Kraft Heinz Foods Co., Gtd. Notes | | | 4.375% | | | 06/01/46 | | | | | | | 400 | | | | 396,220 | |
Kraft Heinz Foods Co., Gtd. Notes | | | 5.000% | | | 07/15/35 | | | | | | | 725 | | | | 791,535 | |
Kroger Co. (The), Sr. Unsec’d. Notes(a) | | | 4.450% | | | 02/01/47 | | | | | | | 275 | | | | 274,584 | |
| | | | | | | | | | | | | | | | | | |
| | | | | | | | | | | | | | | | | 7,156,852 | |
| | | | | | | | | | | | | | | | | | |
Forest Products & Paper — 0.2% | | | | | | | | | | | | | | | | | | |
International Paper Co., Sr. Unsec’d. Notes | | | 6.000% | | | 11/15/41 | | | | | | | 675 | | | | 844,880 | |
International Paper Co., Sr. Unsec’d. Notes | | | 7.300% | | | 11/15/39 | | | | | | | 1,000 | | | | 1,408,695 | |
| | | | | | | | | | | | | | | | | | |
| | | | | | | | | | | | | | | | | 2,253,575 | |
| | | | | | | | | | | | | | | | | | |
Gas — 0.3% | | | | | | | | | | | | | | | | | | |
Korea Gas Corp. (South Korea), Sr. Unsec’d. Notes | | | 4.250% | | | 11/02/20 | | | | | | | 1,750 | | | | 1,812,650 | |
NiSource Finance Corp., Gtd. Notes | | | 4.800% | | | 02/15/44 | | | | | | | 300 | | | | 339,601 | |
Southern Co. Gas Capital Corp., Gtd. Notes | | | 4.400% | | | 06/01/43 | | | | | | | 1,050 | | | | 1,116,896 | |
| | | | | | | | | | | | | | | | | | |
| | | | | | | | | | | | | | | | | 3,269,147 | |
| | | | | | | | | | | | | | | | | | |
Healthcare-Products — 1.0% | | | | | | | | | | | | | | | | | | |
Abbott Laboratories, Sr. Unsec’d. Notes | | | 2.900% | | | 11/30/21 | | | | | | | 2,780 | | | | 2,812,184 | |
Becton Dickinson and Co., Sr. Unsec’d. Notes | | | 3.363% | | | 06/06/24 | | | | | | | 3,415 | | | | 3,424,540 | |
Medtronic, Inc., Gtd. Notes | | | 3.500% | | | 03/15/25 | | | | | | | 3,435 | | | | 3,563,287 | |
Medtronic, Inc., Gtd. Notes | | | 4.375% | | | 03/15/35 | | | | | | | 1,358 | | | | 1,530,892 | |
| | | | | | | | | | | | | | | | | | |
| | | | | | | | | | | | | | | | | 11,330,903 | |
| | | | | | | | | | | | | | | | | | |
SEE NOTES TO FINANCIAL STATEMENTS.
A48
| | | | | | |
| | DIVERSIFIED BOND PORTFOLIO (continued) | | |
| |
| SCHEDULE OF INVESTMENTS | | as of December 31, 2017 |
| | | | | | | | | | | | | | | | | | | | |
CORPORATE BONDS (continued) | | Interest
Rate | | | Maturity
Date | | | Principal
Amount
(000)# | | | Value | |
Healthcare-Services — 1.8% | | | | | | | | | | | | | | | | | | | | |
Aetna, Inc., Sr. Unsec’d. Notes | | | 6.750% | | | | 12/15/37 | | | | | | | | 1,900 | | | $ | 2,605,811 | |
Anthem, Inc., Sr. Unsec’d. Notes | | | 4.650% | | | | 01/15/43 | | | | | | | | 385 | | | | 422,161 | |
CHS/Community Health Systems, Inc., Gtd. Notes(a) | | | 7.125% | | | | 07/15/20 | | | | | | | | 625 | | | | 467,188 | |
CHS/Community Health Systems, Inc., Gtd. Notes(a) | | | 8.000% | | | | 11/15/19 | | | | | | | | 2,600 | | | | 2,197,000 | |
Cigna Corp., Sr. Unsec’d. Notes | | | 4.375% | | | | 12/15/20 | | | | | | | | 745 | | | | 780,473 | |
DaVita, Inc., Gtd. Notes | | | 5.000% | | | | 05/01/25 | | | | | | | | 500 | | | | 499,850 | |
Fresenius Medical Care U.S. Finance II, Inc. (Germany),
Gtd. Notes, 144A | | | 4.125% | | | | 10/15/20 | | | | | | | | 330 | | | | 339,900 | |
HCA, Inc., Gtd. Notes | | | 5.375% | | | | 02/01/25 | | | | | | | | 2,325 | | | | 2,406,375 | |
HCA, Inc., Gtd. Notes | | | 5.875% | | | | 02/15/26 | | | | | | | | 725 | | | | 766,688 | |
HealthSouth Corp., Gtd. Notes | | | 5.125% | | | | 03/15/23 | | | | | | | | 300 | | | | 306,750 | |
Humana, Inc., Sr. Unsec’d. Notes | | | 3.950% | | | | 03/15/27 | | | | | | | | 1,000 | | | | 1,035,385 | |
Laboratory Corp. of America Holdings, Sr. Unsec’d. Notes | | | 3.200% | | | | 02/01/22 | | | | | | | | 240 | | | | 244,690 | |
Laboratory Corp. of America Holdings, Sr. Unsec’d. Notes | | | 3.250% | | | | 09/01/24 | | | | | | | | 1,495 | | | | 1,497,326 | |
Select Medical Corp., Gtd. Notes | | | 6.375% | | | | 06/01/21 | | | | | | | | 2,100 | | | | 2,155,125 | |
Synlab Bondco PLC (United Kingdom), Sr. Sec’d. Notes | | | 6.250% | | | | 07/01/22 | | | | EUR | | | | 1,100 | | | | 1,388,896 | |
Tenet Healthcare Corp., Sec’d. Notes, 144A(a) | | | 5.125% | | | | 05/01/25 | | | | | | | | 550 | | | | 536,250 | |
Tenet Healthcare Corp., Sr. Unsec’d. Notes | | | 6.750% | | | | 02/01/20 | | | | | | | | 500 | | | | 505,000 | |
UnitedHealth Group, Inc., Sr. Unsec’d. Notes | | | 3.950% | | | | 10/15/42 | | | | | | | | 1,260 | | | | 1,309,685 | |
UnitedHealth Group, Inc., Sr. Unsec’d. Notes | | | 6.500% | | | | 06/15/37 | | | | | | | | 760 | | | | 1,060,840 | |
UnitedHealth Group, Inc., Sr. Unsec’d. Notes | | | 6.625% | | | | 11/15/37 | | | | | | | | 195 | | | | 276,998 | |
| | | | | | | | | | | | | | | | | | | | |
| | | | | | | | | | | | | | | | | | | 20,802,391 | |
| | | | | | | | | | | | | | | | | | | | |
Home Builders — 0.4% | | | | | | | | | | | | | | | | | | | | |
Brookfield Residential Properties, Inc./Brookfield Residential US Corp. (Canada), Gtd. Notes, 144A | | | 6.125% | | | | 07/01/22 | | | | | | | | 1,000 | | | | 1,045,000 | |
PulteGroup, Inc., Gtd. Notes | | | 5.000% | | | | 01/15/27 | | | | | | | | 975 | | | | 1,018,875 | |
Taylor Morrison Communities, Inc./Taylor Morrison Holdings II, Inc., Gtd. Notes, 144A | | | 5.250% | | | | 04/15/21 | | | | | | | | 2,175 | | | | 2,218,500 | |
| | | | | | | | | | | | | | | | | | | | |
| | | | | | | | | | | | | | | | | | | 4,282,375 | |
| | | | | | | | | | | | | | | | | | | | |
Home Furnishings — 0.1% | | | | | | | | | | | | | | | | | | | | |
Tempur Sealy International, Inc., Gtd. Notes | | | 5.500% | | | | 06/15/26 | | | | | | | | 650 | | | | 666,380 | |
| | | | | | | | | | | | | | | | | | | | |
Housewares — 0.2% | | | | | | | | | | | | | | | | | | | | |
Newell Brands, Inc., Sr. Unsec’d. Notes | | | 4.200% | | | | 04/01/26 | | | | | | | | 670 | | | | 699,753 | |
Newell Brands, Inc., Sr. Unsec’d. Notes | | | 5.500% | | | | 04/01/46 | | | | | | | | 1,200 | | | | 1,430,732 | |
| | | | | | | | | | | | | | | | | | | | |
| | | | | | | | | | | | | | | | | | | 2,130,485 | |
| | | | | | | | | | | | | | | | | | | | |
Insurance — 1.9% | | | | | | | | | | | | | | | | | | | | |
Allied World Assurance Co. Holdings Ltd., Gtd. Notes | | | 5.500% | | | | 11/15/20 | | | | | | | | 430 | | | | 458,436 | |
American International Group, Inc., Sr. Unsec’d. Notes | | | 3.900% | | | | 04/01/26 | | | | | | | | 2,120 | | | | 2,198,457 | |
American International Group, Inc., Sr. Unsec’d. Notes | | | 4.500% | | | | 07/16/44 | | | | | | | | 1,075 | | | | 1,157,884 | |
Berkshire Hathaway, Inc., Sr. Unsec’d. Notes | | | 2.750% | | | | 03/15/23 | | | | | | | | 4,760 | | | | 4,791,105 | |
Chubb Corp. (The), Gtd. Notes, 3 Month LIBOR + 2.250% | | | 3.609% | (c) | | | 03/29/67 | | | | | | | | 1,775 | | | | 1,761,688 | |
Endurance Specialty Holdings Ltd. (Bermuda), Sr. Unsec’d. Notes | | | 7.000% | | | | 07/15/34 | | | | | | | | 1,350 | | | | 1,730,917 | |
Hartford Financial Services Group, Inc., Sr. Unsec’d. Notes | | | 5.125% | | | | 04/15/22 | | | | | | | | 500 | | | | 545,638 | |
Liberty Mutual Finance Europe DAC, Gtd. Notes, 144A | | | 1.750% | | | | 03/27/24 | | | | EUR | | | | 800 | | | | 992,357 | |
Liberty Mutual Group, Inc., Gtd. Notes, 144A | | | 6.500% | | | | 03/15/35 | | | | | | | | 1,030 | | | | 1,330,952 | |
Lincoln National Corp., Sr. Unsec’d. Notes | | | 7.000% | | | | 06/15/40 | | | | | | | | 405 | | | | 558,270 | |
Lincoln National Corp., Sr. Unsec’d. Notes | | | 8.750% | | | | 07/01/19 | | | | | | | | 388 | | | | 423,637 | |
Markel Corp., Sr. Unsec’d. Notes | | | 5.000% | | | | 03/30/43 | | | | | | | | 350 | | | | 392,847 | |
Northwestern Mutual Life Insurance Co. (The), Sub. Notes, 144A | | | 6.063% | | | | 03/30/40 | | | | | | | | 500 | | | | 671,269 | |
Ohio National Financial Services, Inc., Sr. Unsec’d. Notes, 144A | | | 6.375% | | | | 04/30/20 | | | | | | | | 850 | | | | 914,966 | |
Principal Financial Group, Inc., Gtd. Notes | | | 4.625% | | | | 09/15/42 | | | | | | | | 150 | | | | 167,076 | |
Teachers Insurance & Annuity Association of America, Sub. Notes, 144A | | | 4.270% | | | | 05/15/47 | | | | | | | | 2,310 | | | | 2,442,919 | |
Teachers Insurance & Annuity Association of America,
Sub. Notes, 144A | | | 6.850% | | | | 12/16/39 | | | | | | | | 196 | | | | 276,917 | |
SEE NOTES TO FINANCIAL STATEMENTS.
A49
| | | | | | |
| | DIVERSIFIED BOND PORTFOLIO (continued) | | |
| |
| SCHEDULE OF INVESTMENTS | | as of December 31, 2017 |
| | | | | | | | | | | | | | | | | | |
CORPORATE BONDS (continued) | | Interest
Rate | | | Maturity
Date | | Principal
Amount
(000)# | | | Value | |
Insurance (continued) | | | | | | | | | | | | | | | | | | |
Unum Group, Sr. Unsec’d. Notes | | | 5.625% | | | 09/15/20 | | | | | | | 500 | | | $ | 538,272 | |
| | | | | | | | | | | | | | | | | | |
| | | | | | | | | | | | | | | | | 21,353,607 | |
| | | | | | | | | | | | | | | | | | |
Internet — 0.2% | | | | | | | | | | | | | | | | | | |
Netflix, Inc., Sr. Unsec’d. Notes, 144A | | | 3.625% | | | 05/15/27 | | | EUR | | | | 1,750 | | | | 2,117,117 | |
| | | | | | | | | | | | | | | | | | |
Iron/Steel — 0.0% | | | | | | | | | | | | | | | | | | |
Vale Overseas Ltd. (Brazil), Gtd. Notes | | | 6.250% | | | 08/10/26 | | | | | | | 270 | | | | 312,795 | |
| | | | | | | | | | | | | | | | | | |
Lodging — 0.3% | | | | | | | | | | | | | | | | | | |
Marriott International, Inc., Sr. Unsec’d. Notes | | | 3.250% | | | 09/15/22 | | | | | | | 1,325 | | | | 1,349,325 | |
MGM Resorts International, Gtd. Notes | | | 6.625% | | | 12/15/21 | | | | | | | 1,325 | | | | 1,453,790 | |
Studio City Co. Ltd. (Hong Kong), Sr. Sec’d. Notes | | | 7.250% | | | 11/30/21 | | | | | | | 300 | | | | 316,500 | |
| | | | | | | | | | | | | | | | | | |
| | | | | | | | | | | | | | | | | 3,119,615 | |
| | | | | | | | | | | | | | | | | | |
Machinery-Diversified — 0.4% | | | | | | | | | | | | | | | | | | |
CNH Industrial Capital LLC, Gtd. Notes | | | 4.875% | | | 04/01/21 | | | | | | | 1,050 | | | | 1,102,500 | |
Rockwell Automation, Inc., Sr. Unsec’d. Notes | | | 5.200% | | | 01/15/98 | | | | | | | 1,100 | | | | 1,187,762 | |
Xylem, Inc., Sr. Unsec’d. Notes | | | 4.875% | | | 10/01/21 | | | | | | | 1,960 | | | | 2,113,924 | |
| | | | | | | | | | | | | | | | | | |
| | | | | | | | | | | | | | | | | 4,404,186 | |
| | | | | | | | | | | | | | | | | | |
Media — 3.0% | | | | | | | | | | | | | | | | | | |
21st Century Fox America, Inc., Gtd. Notes | | | 6.900% | | | 08/15/39 | | | | | | | 65 | | | | 91,739 | |
21st Century Fox America, Inc., Gtd. Notes | | | 7.625% | | | 11/30/28 | | | | | | | 1,415 | | | | 1,888,833 | |
CCO Holdings LLC/CCO Holdings Capital Corp., Sr. Unsec’d. Notes, 144A | | | 5.500% | | | 05/01/26 | | | | | | | 3,300 | | | | 3,382,500 | |
CCO Holdings LLC/CCO Holdings Capital Corp., Sr. Unsec’d. Notes, 144A | | | 5.875% | | | 04/01/24 | | | | | | | 800 | | | | 834,000 | |
CCO Holdings LLC/CCO Holdings Capital Corp., Sr. Unsec’d. Notes, 144A | | | 5.875% | | | 05/01/27 | | | | | | | 1,000 | | | | 1,030,000 | |
Cequel Communications Holdings I LLC/Cequel Capital Corp., Sr. Unsec’d. Notes, 144A | | | 5.125% | | | 12/15/21 | | | | | | | 1,425 | | | | 1,428,562 | |
Cequel Communications Holdings I LLC/Cequel Capital Corp., Sr. Unsec’d. Notes, 144A | | | 6.375% | | | 09/15/20 | | | | | | | 674 | | | | 684,110 | |
Cequel Communications Holdings I LLC/Cequel Capital Corp., Sr. Unsec’d. Notes, 144A | | | 7.750% | | | 07/15/25 | | | | | | | 2,675 | | | | 2,848,875 | |
Charter Communications Operating LLC/Charter Communications Operating Capital, Sr. Sec’d. Notes | | | 6.384% | | | 10/23/35 | | | | | | | 710 | | | | 829,014 | |
Charter Communications Operating LLC/Charter Communications Operating Capital, Sr. Sec’d. Notes | | | 6.484% | | | 10/23/45 | | | | | | | 855 | | | | 996,870 | |
Charter Communications Operating LLC/Charter Communications Operating Capital, Sr. Sec’d. Notes | | | 6.834% | | | 10/23/55 | | | | | | | 225 | | | | 270,640 | |
Comcast Corp., Gtd. Notes | | | 3.150% | | | 03/01/26 | | | | | | | 1,190 | | | | 1,198,836 | |
Cox Communications, Inc., Sr. Unsec’d. Notes, 144A | | | 3.150% | | | 08/15/24 | | | | | | | 2,800 | | | | 2,757,677 | |
Discovery Communications LLC, Gtd. Notes(a) | | | 3.950% | | | 03/20/28 | | | | | | | 375 | | | | 372,996 | |
Discovery Communications LLC, Gtd. Notes | | | 5.000% | | | 09/20/37 | | | | | | | 145 | | | | 150,233 | |
Discovery Communications LLC, Gtd. Notes | | | 5.200% | | | 09/20/47 | | | | | | | 510 | | | | 532,297 | |
DISH DBS Corp., Gtd. Notes | | | 4.250% | | | 04/01/18 | | | | | | | 1,850 | | | | 1,856,937 | |
Grupo Televisa SAB (Mexico), Sr. Unsec’d. Notes | | | 6.125% | | | 01/31/46 | | | | | | | 495 | | | | 586,043 | |
Liberty Interactive LLC, Sr. Unsec’d. Notes | | | 8.250% | | | 02/01/30 | | | | | | | 2,250 | | | | 2,441,250 | |
NBCUniversal Media LLC, Gtd. Notes | | | 4.450% | | | 01/15/43 | | | | | | | 290 | | | | 316,453 | |
Sky PLC (United Kingdom), Gtd. Notes, 144A | | | 6.100% | | | 02/15/18 | | | | | | | 210 | | | | 210,979 | |
TCI Communications, Inc., Sr. Unsec’d. Notes | | | 7.875% | | | 02/15/26 | | | | | | | 750 | | | | 997,583 | |
TEGNA, Inc., Gtd. Notes, 144A | | | 4.875% | | | 09/15/21 | | | | | | | 475 | | | | 484,500 | |
Time Warner Cable, Inc., Sr. Sec’d. Notes | | | 6.750% | | | 07/01/18 | | | | | | | 2,620 | | | | 2,678,073 | |
Time Warner, Inc., Gtd. Notes | | | 3.800% | | | 02/15/27 | | | | | | | 690 | | | | 689,348 | |
Unitymedia Hessen GmbH & Co. KG/Unitymedia NRW GmbH (Germany), Sr. Sec’d. Notes | | | 4.000% | | | 01/15/25 | | | EUR | | | | 1,100 | | | | 1,392,950 | |
Univision Communications, Inc., Sr. Sec’d. Notes, 144A | | | 5.125% | | | 02/15/25 | | | | | | | 1,175 | | | | 1,144,156 | |
UPCB Finance IV Ltd. (Netherlands), Sr. Sec’d. Notes, 144A | | | 5.375% | | | 01/15/25 | | | | | | | 1,140 | | | | 1,147,866 | |
SEE NOTES TO FINANCIAL STATEMENTS.
A50
| | | | | | |
| | DIVERSIFIED BOND PORTFOLIO (continued) | | |
| |
| SCHEDULE OF INVESTMENTS | | as of December 31, 2017 |
| | | | | | | | | | | | | | | | | | | | |
CORPORATE BONDS (continued) | | Interest
Rate | | | Maturity
Date | | | Principal
Amount
(000)# | | | Value | |
Media (continued) | | | | | | | | | | | | | | | | | | | | |
Ziggo Secured Finance BV (Netherlands), Sr. Sec’d. Notes | | | 3.750% | | | | 01/15/25 | | | | EUR | | | | 1,000 | | | $ | 1,236,826 | |
| | | | | | | | | | | | | | | | | | | | |
| | | | | | | | | | | | | | | | | | | 34,480,146 | |
| | | | | | | | | | | | | | | | | | | | |
Mining — 0.3% | | | | | | | | | | | | | | | | | | | | |
Barrick North America Finance LLC (Canada), Gtd. Notes | | | 5.750% | | | | 05/01/43 | | | | | | | | 410 | | | | 514,866 | |
Goldcorp, Inc. (Canada), Sr. Unsec’d. Notes | | | 3.625% | | | | 06/09/21 | | | | | | | | 825 | | | | 843,126 | |
Southern Copper Corp. (Peru), Sr. Unsec’d. Notes | | | 5.875% | | | | 04/23/45 | | | | | | | | 235 | | | | 283,842 | |
Southern Copper Corp. (Peru), Sr. Unsec’d. Notes | | | 6.750% | | | | 04/16/40 | | | | | | | | 990 | | | | 1,290,695 | |
| | | | | | | | | | | | | | | | | | | | |
| | | | | | | | | | | | | | | | | | | 2,932,529 | |
| | | | | | | | | | | | | | | | | | | | |
Miscellaneous Manufacturing — 0.6% | | | | | | | | | | | | | | | | | | | | |
Bombardier, Inc. (Canada), Sr. Unsec’d. Notes, 144A | | | 7.500% | | | | 12/01/24 | | | | | | | | 1,550 | | | | 1,573,250 | |
General Electric Co., Sr. Unsec’d. Notes | | | 0.875% | | | | 05/17/25 | | | | EUR | | | | 1,475 | | | | 1,763,273 | |
General Electric Co., Sub. Notes, MTN | | | 5.300% | | | | 02/11/21 | | | | | | | | 340 | | | | 367,129 | |
Ingersoll-Rand Global Holding Co. Ltd., Gtd. Notes | | | 5.750% | | | | 06/15/43 | | | | | | | | 425 | | | | 537,944 | |
Textron, Inc., Sr. Unsec’d. Notes | | | 7.250% | | | | 10/01/19 | | | | | | | | 2,350 | | | | 2,537,840 | |
| | | | | | | | | | | | | | | | | | | | |
| | | | | | | | | | | | | | | | | | | 6,779,436 | |
| | | | | | | | | | | | | | | | | | | | |
Multi-National — 0.6% | | | | | | | | | | | | | | | | | | | | |
Corp Andina de Fomento (Supranational Bank), Sr. Unsec’d. Notes | | | 2.200% | | | | 07/18/20 | | | | | | | | 205 | | | | 203,401 | |
Corp. Andina de Fomento (Supranational Bank), Sr. Unsec’d. Notes | | | 2.000% | | | | 05/10/19 | | | | | | | | 1,180 | | | | 1,175,858 | |
Corp. Andina de Fomento (Supranational Bank), Sr. Unsec’d. Notes | | | 2.125% | | | | 09/27/21 | | | | | | | | 3,095 | | | | 3,026,539 | |
Corp. Andina de Fomento (Supranational Bank), Sr. Unsec’d. Notes | | | 4.375% | | | | 06/15/22 | | | | | | | | 500 | | | | 532,695 | |
Inter-American Development Bank (Supranational Bank), Unsec’d. Notes | | | 6.950% | | | | 08/01/26 | | | | | | | | 1,500 | | | | 1,917,766 | |
| | | | | | | | | | | | | | | | | | | | |
| | | | | | | | | | | | | | | | | | | 6,856,259 | |
| | | | | | | | | | | | | | | | | | | | |
Office/Business Equipment — 0.1% | | | | | | | | | | | | | | | | | | | | |
CDW LLC/CDW Finance Corp., Gtd. Notes | | | 5.000% | | | | 09/01/23 | | | | | | | | 1,150 | | | | 1,188,812 | |
| | | | | | | | | | | | | | | | | | | | |
Oil & Gas — 3.1% | | | | | | | | | | | | | | | | | | | | |
Anadarko Petroleum Corp., Sr. Unsec’d. Notes | | | 4.677% | (s) | | | 10/10/36 | | | | | | | | 2,000 | | | | 857,099 | |
Anadarko Petroleum Corp., Sr. Unsec’d. Notes | | | 6.450% | | | | 09/15/36 | | | | | | | | 945 | | | | 1,157,447 | |
Apache Corp., Sr. Unsec’d. Notes | | | 5.100% | | | | 09/01/40 | | | | | | | | 650 | | | | 692,500 | |
Cenovus Energy, Inc. (Canada), Sr. Unsec’d. Notes | | | 5.400% | | | | 06/15/47 | | | | | | | | 1,000 | | | | 1,052,334 | |
CNOOC Finance 2013 Ltd. (China), Gtd. Notes | | | 3.000% | | | | 05/09/23 | | | | | | | | 750 | | | | 741,637 | |
Concho Resources, Inc., Gtd. Notes | | | 4.875% | | | | 10/01/47 | | | | | | | | 180 | | | | 195,737 | |
Devon Energy Corp., Sr. Unsec’d. Notes | | | 5.600% | | | | 07/15/41 | | | | | | | | 1,650 | | | | 1,944,809 | |
Encana Corp. (Canada), Sr. Unsec’d. Notes | | | 6.500% | | | | 02/01/38 | | | | | | | | 200 | | | | 252,389 | |
Gazprom OAO Via Gaz Capital SA (Russia), Sr. Unsec’d. Notes | | | 4.950% | | | | 07/19/22 | | | | | | | | 390 | | | | 408,116 | |
Gazprom OAO Via Gaz Capital SA (Russia), Sr. Unsec’d. Notes, 144A | | | 6.510% | | | | 03/07/22 | | | | | | | | 1,665 | | | | 1,841,490 | |
Helmerich & Payne International Drilling Co., Gtd. Notes | | | 4.650% | | | | 03/15/25 | | | | | | | | 1,500 | | | | 1,578,974 | |
KazMunayGas National Co. JSC (Kazakhstan), Sr. Unsec’d. Notes, 144A | | | 3.875% | | | | 04/19/22 | | | | | | | | 1,160 | | | | 1,177,400 | |
KazMunayGas National Co. JSC (Kazakhstan), Sr. Unsec’d. Notes, 144A | | | 4.750% | | | | 04/19/27 | | | | | | | | 200 | | | | 210,580 | |
KazMunayGas National Co. JSC (Kazakhstan), Sr. Unsec’d. Notes, 144A, MTN | | | 6.375% | | | | 04/09/21 | | | | | | | | 1,010 | | | | 1,101,910 | |
Lukoil International Finance BV (Russia), Gtd. Notes, 144A | | | 6.125% | | | | 11/09/20 | | | | | | | | 600 | | | | 647,070 | |
Nabors Industries, Inc., Gtd. Notes | | | 4.625% | | | | 09/15/21 | | | | | | | | 1,130 | | | | 1,076,325 | |
Noble Energy, Inc., Sr. Unsec’d. Notes | | | 6.000% | | | | 03/01/41 | | | | | | | | 1,530 | | | | 1,809,509 | |
Petrobras Global Finance BV (Brazil), Gtd. Notes | | | 6.125% | | | | 01/17/22 | | | | | | | | 165 | | | | 175,106 | |
Petrobras Global Finance BV (Brazil), Gtd. Notes | | | 7.375% | | | | 01/17/27 | | | | | | | | 405 | | | | 445,905 | |
Petrobras Global Finance BV (Brazil), Gtd. Notes | | | 8.375% | | | | 05/23/21 | | | | | | | | 2,475 | | | | 2,822,737 | |
Petrobras Global Finance BV (Brazil), Gtd. Notes, 144A | | | 5.299% | | | | 01/27/25 | | | | | | | | 625 | | | | 626,875 | |
Petroleos Mexicanos (Mexico), Gtd. Notes, EMTN | | | 2.750% | | | | 04/21/27 | | | | EUR | | | | 700 | | | | 805,255 | |
Petroleos Mexicanos (Mexico), Gtd. Notes, EMTN | | | 3.750% | | | | 02/21/24 | | | | EUR | | | | 400 | | | | 520,259 | |
Petroleos Mexicanos (Mexico), Gtd. Notes | | | 4.875% | | | | 01/24/22 | | | | | | | | 1,100 | | | | 1,146,475 | |
SEE NOTES TO FINANCIAL STATEMENTS.
A51
| | | | | | |
| | DIVERSIFIED BOND PORTFOLIO (continued) | | |
| |
| SCHEDULE OF INVESTMENTS | | as of December 31, 2017 |
| | | | | | | | | | | | | | | | | | | | |
CORPORATE BONDS (continued) | | Interest
Rate | | | Maturity
Date | | | Principal
Amount
(000)# | | | Value | |
Oil & Gas (continued) | | | | | | | | | | | | | | | | | | | | |
Petroleos Mexicanos (Mexico), Gtd. Notes, EMTN | | | 4.875% | | | | 02/21/28 | | | | EUR | | | | 400 | | | $ | 532,561 | |
Petroleos Mexicanos (Mexico), Gtd. Notes | | | 6.375% | | | | 01/23/45 | | | | | | | | 1,015 | | | | 1,020,430 | |
Petroleos Mexicanos (Mexico), Gtd. Notes, MTN | | | 6.750% | | | | 09/21/47 | | | | | | | | 225 | | | | 234,866 | |
Petroleos Mexicanos (Mexico), Gtd. Notes, 144A | | | 5.375% | | | | 03/13/22 | | | | | | | | 405 | | | | 429,300 | |
Petroleos Mexicanos (Mexico), Gtd. Notes, 144A | | | 6.500% | | | | 03/13/27 | | | | | | | | 370 | | | | 404,410 | |
Petroleos Mexicanos (Mexico), Gtd. Notes, 144A, MTN | | | 6.500% | | | | 03/13/27 | | | | | | | | 855 | | | | 934,515 | |
Petroleos Mexicanos (Mexico), Gtd. Notes, 144A, MTN | | | 6.750% | | | | 09/21/47 | | | | | | | | 1,610 | | | | 1,680,599 | |
Pioneer Natural Resources Co., Sr. Unsec’d. Notes | | | 6.875% | | | | 05/01/18 | | | | | | | | 1,750 | | | | 1,776,924 | |
Sasol Financing International PLC (South Africa), Gtd. Notes | | | 4.500% | | | | 11/14/22 | | | | | | | | 1,525 | | | | 1,544,978 | |
Sinopec Group Overseas Development 2015 Ltd. (China), Gtd. Notes, 144A | | | 2.500% | | | | 04/28/20 | | | | | | | | 1,250 | | | | 1,243,408 | |
Sunoco LP/Sunoco Finance Corp., Gtd. Notes | | | 6.250% | | | | 04/15/21 | | | | | | | | 1,533 | | | | 1,593,554 | |
YPF SA (Argentina), Sr. Unsec’d. Notes, 144A | | | 8.500% | | | | 03/23/21 | | | | | | | | 1,000 | | | | 1,131,000 | |
| | | | | | | | | | | | | | | | | | | | |
| | | | | | | | | | | | | | | | | | | 35,814,483 | |
| | | | | | | | | | | | | | | | | | | | |
Oil & Gas Services — 0.1% | | | | | | | | | | | | | | | | | | | | |
Baker Hughes a GE Co. LLC/Baker Hughes Co.-Obligor, Inc, Sr. Unsec’d. Notes, 144A | | | 4.080% | | | | 12/15/47 | | | | | | | | 240 | | | | 244,096 | |
Cameron International Corp., Gtd. Notes | | | 7.000% | | | | 07/15/38 | | | | | | | | 450 | | | | 592,224 | |
| | | | | | | | | | | | | | | | | | | | |
| | | | | | | | | | | | | | | | | | | 836,320 | |
| | | | | | | | | | | | | | | | | | | | |
Packaging & Containers — 0.4% | | | | | | | | | | | | | | | | | | | | |
Ball Corp., Gtd. Notes | | | 4.375% | | | | 12/15/23 | | | | EUR | | | | 1,125 | | | | 1,556,270 | |
Greif Nevada Holdings, Gtd. Notes, 144A | | | 7.375% | | | | 07/15/21 | | | | EUR | | | | 1,470 | | | | 2,090,072 | |
WestRock RKT Co., Gtd. Notes | | | 4.450% | | | | 03/01/19 | | | | | | | | 1,165 | | | | 1,190,945 | |
| | | | | | | | | | | | | | | | | | | | |
| | | | | | | | | | | | | | | | | | | 4,837,287 | |
| | | | | | | | | | | | | | | | | | | | |
Pharmaceuticals — 1.4% | | | | | | | | | | | | | | | | | | | | |
AbbVie, Inc., Sr. Unsec’d. Notes | | | 3.600% | | | | 05/14/25 | | | | | | | | 1,020 | | | | 1,048,637 | |
AbbVie, Inc., Sr. Unsec’d. Notes | | | 4.500% | | | | 05/14/35 | | | | | | | | 1,715 | | | | 1,883,656 | |
Allergan Funding SCS, Gtd. Notes(a) | | | 3.800% | | | | 03/15/25 | | | | | | | | 415 | | | | 422,489 | |
Allergan Funding SCS, Gtd. Notes | | | 4.550% | | | | 03/15/35 | | | | | | | | 1,850 | | | | 1,957,608 | |
Allergan Funding SCS, Gtd. Notes | | | 4.750% | | | | 03/15/45 | | | | | | | | 156 | | | | 166,071 | |
Endo Dac/Endo Finance LLC/Endo Finco, Inc., Gtd. Notes, 144A | | | 6.000% | | | | 07/15/23 | | | | | | | | 625 | | | | 490,625 | |
Express Scripts Holding Co., Gtd. Notes | | | 4.500% | | | | 02/25/26 | | | | | | | | 3,690 | | | | 3,915,855 | |
Forest Laboratories, Inc., Gtd. Notes, 144A | | | 4.875% | | | | 02/15/21 | | | | | | | | 1,350 | | | | 1,429,014 | |
Shire Acquisitions Investments Ireland DAC, Gtd. Notes | | | 3.200% | | | | 09/23/26 | | | | | | | | 3,745 | | | | 3,661,684 | |
Valeant Pharmaceuticals International, Inc., Gtd. Notes, 144A | | | 6.125% | | | | 04/15/25 | | | | | | | | 450 | | | | 411,750 | |
| | | | | | | | | | | | | | | | | | | | |
| | | | | | | | | | | | | | | | | | | 15,387,389 | |
| | | | | | | | | | | | | | | | | | | | |
Pipelines — 0.9% | | | | | | | | | | | | | | | | | | | | |
Enterprise Products Operating LLC, Gtd. Notes | | | 4.900% | | | | 05/15/46 | | | | | | | | 2,110 | | | | 2,324,787 | |
Fermaca Enterprises S de RL de CV (Mexico), Sr. Sec’d. Notes, 144A | | | 6.375% | | | | 03/30/38 | | | | | | | | 404 | | | | 434,158 | |
Magellan Midstream Partners LP, Sr. Unsec’d. Notes | | | 4.200% | | | | 03/15/45 | | | | | | | | 1,000 | | | | 977,139 | |
MPLX LP, Sr. Unsec’d. Notes | | | 5.200% | | | | 03/01/47 | | | | | | | | 115 | | | | 126,204 | |
NGPL PipeCo LLC, Sr. Unsec’d. Notes, 144A | | | 4.375% | | | | 08/15/22 | | | | | | | | 50 | | | | 50,844 | |
NGPL PipeCo LLC, Sr. Unsec’d. Notes, 144A(a) | | | 4.875% | | | | 08/15/27 | | | | | | | | 225 | | | | 233,438 | |
ONEOK Partners LP, Gtd. Notes | | | 6.850% | | | | 10/15/37 | | | | | | | | 1,250 | | | | 1,559,393 | |
ONEOK, Inc., Gtd. Notes | | | 4.950% | | | | 07/13/47 | | | | | | | | 450 | | | | 468,173 | |
Phillips 66 Partners LP, Sr. Unsec’d. Notes | | | 4.680% | | | | 02/15/45 | | | | | | | | 1,900 | | | | 1,951,550 | |
Western Gas Partners LP, Sr. Unsec’d. Notes | | | 5.450% | | | | 04/01/44 | | | | | | | | 575 | | | | 611,003 | |
Williams Partners LP, Sr. Unsec’d. Notes | | | 4.900% | | | | 01/15/45 | | | | | | | | 1,200 | | | | 1,273,046 | |
| | | | | | | | | | | | | | | | | | | | |
| | | | | | | | | | | | | | | | | | | 10,009,735 | |
| | | | | | | | | | | | | | | | | | | | |
Real Estate Investment Trusts (REITs) — 0.1% | | | | | | | | | | | | | | | | | | | | |
Simon Property Group LP, Sr. Unsec’d. Notes | | | 3.375% | | | | 03/15/22 | | | | | | | | 325 | | | | 333,579 | |
Trust F/1401 (Mexico), Sr. Unsec’d. Notes, 144A | | | 5.250% | | | | 12/15/24 | | | | | | | | 1,235 | | | | 1,310,644 | |
| | | | | | | | | | | | | | | | | | | | |
| | | | | | | | | | | | | | | | | | | 1,644,223 | |
| | | | | | | | | | | | | | | | | | | | |
SEE NOTES TO FINANCIAL STATEMENTS.
A52
| | | | | | |
| | DIVERSIFIED BOND PORTFOLIO (continued) | | |
| |
| SCHEDULE OF INVESTMENTS | | as of December 31, 2017 |
| | | | | | | | | | | | | | | | | | | | |
CORPORATE BONDS (continued) | | Interest
Rate | | | Maturity
Date | | | Principal
Amount
(000)# | | | Value | |
Retail — 0.5% | | | | | | | | | | | | | | | | | | | | |
CVS Health Corp., Sr. Unsec’d. Notes | | | 5.125% | | | | 07/20/45 | | | | | | | | 765 | | | $ | 876,762 | |
Limited Brands, Inc., Gtd. Notes | | | 6.625% | | | | 04/01/21 | | | | | | | | 551 | | | | 603,345 | |
Limited Brands, Inc., Gtd. Notes | | | 5.625% | | | | 02/15/22 | | | | | | | | 1,600 | | | | 1,706,000 | |
PetSmart, Inc., Sr. Sec’d. Notes, 144A | | | 5.875% | | | | 06/01/25 | | | | | | | | 375 | | | | 287,812 | |
PVH Corp., Sr. Unsec’d. Notes, 144A | | | 3.625% | | | | 07/15/24 | | | | EUR | | | | 1,250 | | | | 1,654,047 | |
Tops Holding LLC/Tops Markets II Corp., Sr. Sec’d. Notes, 144A | | | 8.000% | | | | 06/15/22 | | | | | | | | 775 | | | | 418,500 | |
| | | | | | | | | | | | | | | | | | | | |
| | | | | | | | | | | | | | | | | | | 5,546,466 | |
| | | | | | | | | | | | | | | | | | | | |
Savings & Loans — 0.2% | | | | | | | | | | | | | | | | | | | | |
People’s United Financial, Inc., Sr. Unsec’d. Notes | | | 3.650% | | | | 12/06/22 | | | | | | | | 1,675 | | | | 1,715,092 | |
| | | | | | | | | | | | | | | | | | | | |
Semiconductors — 0.7% | | | | | | | | | | | | | | | | | | | | |
Broadcom Corp./Broadcom Cayman Finance Ltd., Gtd. Notes, 144A | | | 3.500% | | | | 01/15/28 | | | | | | | | 1,460 | | | | 1,391,832 | |
Broadcom Corp./Broadcom Cayman Finance Ltd.,
Gtd. Notes, 144A | | | 3.875% | | | | 01/15/27 | | | | | | | | 1,850 | | | | 1,820,485 | |
NXP BV/NXP Funding LLC (Netherlands), Gtd. Notes, 144A | | | 4.625% | | | | 06/01/23 | | | | | | | | 2,975 | | | | 3,111,850 | |
Sensata Technologies BV, Gtd. Notes, 144A | | | 5.000% | | | | 10/01/25 | | | | | | | | 1,750 | | | | 1,850,625 | |
| | | | | | | | | | | | | | | | | | | | |
| | | | | | | | | | | | | | | | | | | 8,174,792 | |
| | | | | | | | | | | | | | | | | | | | |
Software — 0.7% | | | | | | | | | | | | | | | | | | | | |
Fidelity National Information Services, Inc., Sr. Unsec’d. Notes | | | 4.500% | | | | 10/15/22 | | | | | | | | 1,162 | | | | 1,243,838 | |
First Data Corp., Gtd. Notes, 144A | | | 7.000% | | | | 12/01/23 | | | | | | | | 2,225 | | | | 2,352,938 | |
Infor US, Inc., Sr. Sec’d. Notes, 144A | | | 5.750% | | | | 08/15/20 | | | | | | | | 1,350 | | | | 1,387,125 | |
Microsoft Corp., Sr. Unsec’d. Notes | | | 4.000% | | | | 02/12/55 | | | | | | | | 435 | | | | 465,376 | |
Microsoft Corp., Sr. Unsec’d. Notes | | | 4.500% | | | | 02/06/57 | | | | | | | | 1,430 | | | | 1,693,297 | |
Oracle Corp., Sr. Unsec’d. Notes | | | 4.300% | | | | 07/08/34 | | | | | | | | 1,070 | | | | 1,189,141 | |
| | | | | | | | | | | | | | | | | | | | |
| | | | | | | | | | | | | | | | | | | 8,331,715 | |
| | | | | | | | | | | | | | | | | | | | |
Telecommunications — 1.2% | | | | | | | | | | | | | | | | | | | | |
AT&T Corp., Gtd. Notes | | | 8.250% | | | | 11/15/31 | | | | | | | | 55 | | | | 77,601 | |
AT&T, Inc., Sr. Unsec’d. Notes | | | 4.900% | | | | 08/14/37 | | | | | | | | 520 | | | | 526,549 | |
AT&T, Inc., Sr. Unsec’d. Notes | | | 5.300% | | | | 08/14/58 | | | | | | | | 590 | | | | 591,936 | |
AT&T, Inc., Sr. Unsec’d. Notes | | | 3.400% | | | | 05/15/25 | | | | | | | | 2,320 | | | | 2,280,909 | |
AT&T, Inc., Sr. Unsec’d. Notes | | | 4.500% | | | | 03/09/48 | | | | | | | | 74 | | | | 69,337 | |
AT&T, Inc., Sr. Unsec’d. Notes | | | 4.550% | | | | 03/09/49 | | | | | | | | 499 | | | | 469,648 | |
AT&T, Inc., Sr. Unsec’d. Notes | | | 5.250% | | | | 03/01/37 | | | | | | | | 680 | | | | 719,184 | |
AT&T, Inc., Sr. Unsec’d. Notes | | | 5.350% | | | | 09/01/40 | | | | | | | | 49 | | | | 51,709 | |
Bharti Airtel International Netherlands BV (India), Gtd. Notes, 144A | | | 5.125% | | | | 03/11/23 | | | | | | | | 1,305 | | | | 1,383,025 | |
Sprint Capital Corp., Gtd. Notes | | | 6.900% | | | | 05/01/19 | | | | | | | | 1,300 | | | | 1,360,125 | |
Sprint Corp., Gtd. Notes(a) | | | 7.625% | | | | 02/15/25 | | | | | | | | 500 | | | | 523,750 | |
T-Mobile USA, Inc., Gtd. Notes | | | 6.500% | | | | 01/15/26 | | | | | | | | 1,675 | | | | 1,827,844 | |
Verizon Communications, Inc., Sr. Unsec’d. Notes | | | 4.500% | | | | 08/10/33 | | | | | | | | 990 | | | | 1,038,341 | |
Wind Tre SpA (Italy), Sr. Sec’d. Notes, 144A | | | 2.625% | | | | 01/20/23 | | | | EUR | | | | 675 | | | | 792,637 | |
Wind Tre SpA (Italy), Sr. Sec’d. Notes, 144A | | | 3.125% | | | | 01/20/25 | | | | EUR | | | | 1,550 | | | | 1,810,255 | |
| | | | | | | | | | | | | | | | | | | | |
| | | | | | | | | | | | | | | | | | | 13,522,850 | |
| | | | | | | | | | | | | | | | | | | | |
Textiles — 0.0% | | | | | | | | | | | | | | | | | | | | |
Mohawk Industries, Inc., Sr. Unsec’d. Notes | | | 3.850% | | | | 02/01/23 | | | | | | | | 294 | | | | 305,210 | |
| | | | | | | | | | | | | | | | | | | | |
Transportation — 0.1% | | | | | | | | | | | | | | | | | | | | |
Silk Bidco AS (Norway), Sr. Sec’d. Notes | | | 7.500% | | | | 02/01/22 | | | | EUR | | | | 1,300 | | | | 1,614,144 | |
| | | | | | | | | | | | | | | | | | | | |
TOTAL CORPORATE BONDS
(cost $436,419,907) | | | | 459,804,937 | |
| | | | | | | | | | | | | | | | | | | | |
| MUNICIPAL BONDS — 2.1% | | | | | | | | | | | | | | | | | | | | |
California — 0.7% | | | | | | | | | | | | | | | | | | | | |
Bay Area Toll Authority, Revenue Bonds, BABs | | | 6.907% | | | | 10/01/50 | | | | | | | | 1,125 | | | | 1,776,870 | |
State of California, GO, BABs | | | 7.300% | | | | 10/01/39 | | | | | | | | 2,280 | | | | 3,401,441 | |
State of California, GO, BABs | | | 7.625% | | | | 03/01/40 | | | | | | | | 725 | | | | 1,134,226 | |
SEE NOTES TO FINANCIAL STATEMENTS.
A53
| | | | | | |
| | DIVERSIFIED BOND PORTFOLIO (continued) | | |
| |
| SCHEDULE OF INVESTMENTS | | as of December 31, 2017 |
| | | | | | | | | | | | | | | | | | | | |
MUNICIPAL BONDS (continued) | | Interest
Rate | | | Maturity
Date | | | Principal
Amount
(000)# | | | Value | |
California (continued) | | | | | | | | | | | | | | | | | | | | |
University of California, Revenue Bonds, BABs | | | 5.770% | | | | 05/15/43 | | | | | | | | 1,400 | | | $ | 1,831,144 | |
| | | | | | | | | | | | | | | | | | | | |
| | | | | | | | | | | | | | | | | | | 8,143,681 | |
| | | | | | | | | | | | | | | | | | | | |
Colorado — 0.1% | | | | | | | | | | | | | | | | | | | | |
Regional Transportation District, Revenue Bonds,
Series 2010-B, BABs | | | 5.844% | | | | 11/01/50 | | | | | | | | 770 | | | | 1,049,033 | |
| | | | | | | | | | | | | | | | | | | | |
Illinois — 0.4% | | | | | | | | | | | | | | | | | | | | |
Chicago O’Hare International Airport, Revenue Bonds, BABs | | | 6.395% | | | | 01/01/40 | | | | | | | | 1,380 | | | | 1,926,176 | |
State of Illinois | | | 5.000% | | | | 11/01/22 | | | | | | | | 2,650 | | | | 2,835,977 | |
| | | | | | | | | | | | | | | | | | | | |
| | | | | | | | | | | | | | | | | | | 4,762,153 | |
| | | | | | | | | | | | | | | | | | | | |
New Jersey — 0.4% | | | | | | | | | | | | | | | | | | | | |
New Jersey State Turnpike Authority, Revenue Bonds,
Series A, BABs | | | 7.102% | | | | 01/01/41 | | | | | | | | 1,175 | | | | 1,755,368 | |
New Jersey State Turnpike Authority, Revenue Bonds,
Series F, BABs | | | 7.414% | | | | 01/01/40 | | | | | | | | 2,050 | | | | 3,164,216 | |
| | | | | | | | | | | | | | | | | | | | |
| | | | | | | | | | | | | | | | | | | 4,919,584 | |
| | | | | | | | | | | | | | | | | | | | |
Ohio — 0.1% | | | | | | | | | | | | | | | | | | | | |
Ohio State University (The), Revenue Bonds, BABs | | | 4.910% | | | | 06/01/40 | | | | | | | | 695 | | | | 841,944 | |
Ohio State Water Development Authority Water Pollution Control Loan Fund, Revenue Bonds, BABs | | | 4.879% | | | | 12/01/34 | | | | | | | | 450 | | | | 518,562 | |
| | | | | | | | | | | | | | | | | | | | |
| | | | | | | | | | | | | | | | | | | 1,360,506 | |
| | | | | | | | | | | | | | | | | | | | |
Oregon — 0.1% | | | | | | | | | | | | | | | | | | | | |
Oregon State Department of Transportation, Revenue Bonds, Series A, BABs | | | 5.834% | | | | 11/15/34 | | | | | | | | 615 | | | | 792,058 | |
| | | | | | | | | | | | | | | | | | | | |
Pennsylvania — 0.1% | | | | | | | | | | | | | | | | | | | | |
Pennsylvania Turnpike Commission, Revenue Bonds,
Series B, BABs | | | 5.511% | | | | 12/01/45 | | | | | | | | 800 | | | | 1,046,432 | |
| | | | | | | | | | | | | | | | | | | | |
Tennessee — 0.2% | | | | | | | | | | | | | | | | | | | | |
Metropolitan Government of Nashville & Davidson County Convention Center Authority, Revenue Bonds, BABs | | | 6.731% | | | | 07/01/43 | | | | | | | | 1,375 | | | | 1,898,119 | |
| | | | | | | | | | | | | | | | | | | | |
Virginia — 0.0% | | | | | | | | | | | | | | | | | | | | |
University of Virginia, Revenue Bonds, Taxable, Ser. C | | | 4.179% | | | | 09/01/2117 | | | | | | | | 425 | | | | 443,198 | |
| | | | | | | | | | | | | | | | | | | | |
TOTAL MUNICIPAL BONDS
(cost $18,162,999) | | | | 24,414,764 | |
| | | | | | | | | | | | | | | | | | | | |
| RESIDENTIAL MORTGAGE-BACKED SECURITIES — 4.5% | | | | | | | | | | | | | | | | | |
Alternative Loan Trust, Series 2004-18CB, Class 3A1 | | | 5.250% | | | | 09/25/19 | | | | | | | | 126 | | | | 126,197 | |
Bayview Opportunity Master Fund IVb Trust, Series 2016-CRT1, Class M1, 144A, 1 Month LIBOR + 1.750% | | | 3.314% | (c) | | | 10/27/27 | | | | | | | | 452 | | | | 452,399 | |
Bayview Opportunity Master Fund IVb Trust, Series 2017-CRT1, Class M, 144A, 1 Month LIBOR + 2.150% | | | 3.714% | (c) | | | 10/25/28 | | | | | | | | 1,158 | | | | 1,160,012 | |
Bellemeade Re Ltd. (Bermuda), Series 2017-1, Class M1, 144A, 1 Month LIBOR + 1.700% | | | 3.252% | (c) | | | 10/25/27 | | | | | | | | 722 | | | | 722,888 | |
CIM Trust, Series 2017-3, Class A1, 144A, 1 Month LIBOR + 2.000% | | | 3.361% | (c) | | | 01/25/57 | | | | | | | | 2,061 | | | | 2,104,095 | |
CIM Trust, Series 2017-6, Class A1, 144A | | | 3.015% | (cc) | | | 06/25/57 | | | | | | | | 1,635 | | | | 1,617,841 | |
CIM Trust, Series 2017-8, Class A1, 144A^ | | | 3.000% | (cc) | | | 12/25/65 | | | | | | | | 3,441 | | | | 3,444,858 | |
Citigroup Mortgage Loan Trust, Series 2011-12, Class 3A2, 144A | | | 3.477% | (cc) | | | 09/25/47 | | | | | | | | 881 | | | | 829,805 | |
Fannie Mae Connecticut Avenue Securities, Series 2016-C04, Class 1M1, 1 Month LIBOR + 1.450% | | | 3.002% | (c) | | | 01/25/29 | | | | | | | | 999 | | | | 1,009,080 | |
Freddie Mac Structured Agency Credit Risk Debt Notes, Series 2014-DN4, Class M3, 1 Month LIBOR + 4.550% | | | 6.102% | (c) | | | 10/25/24 | | | | | | | | 469 | | | | 517,593 | |
Freddie Mac Structured Agency Credit Risk Debt Notes, Series 2015-DNA1, Class M3, 1 Month LIBOR + 3.300% | | | 4.852% | (c) | | | 10/25/27 | | | | | | | | 3,460 | | | | 3,889,424 | |
SEE NOTES TO FINANCIAL STATEMENTS.
A54
| | | | | | |
| | DIVERSIFIED BOND PORTFOLIO (continued) | | |
| |
| SCHEDULE OF INVESTMENTS | | as of December 31, 2017 |
| | | | | | | | | | | | | | | | | | |
RESIDENTIAL MORTGAGE-BACKED
SECURITIES (continued) | | Interest
Rate | | | Maturity
Date | | Principal
Amount
(000)# | | | Value | |
Freddie Mac Structured Agency Credit Risk Debt Notes, Series 2016-HQA2, Class M2, 1 Month LIBOR + 2.250% | | | 3.802% | (c) | | 11/25/28 | | | | | | | 1,000 | | | $ | 1,025,809 | |
Freddie Mac Structured Agency Credit Risk Debt Notes, Series 2016-HQA3, Class M2, 1 Month LIBOR + 1.350% | | | 2.902% | (c) | | 03/25/29 | | | | | | | 760 | | | | 771,099 | |
Freddie Mac Structured Agency Credit Risk Debt Notes, Series 2016-HQA4, Class M2, 1 Month LIBOR + 1.300% | | | 2.852% | (c) | | 04/25/29 | | | | | | | 1,740 | | | | 1,762,812 | |
GSMSC Resecuritization Trust, Series 2015-3R, Class 1A1, 144A, 1 Month LIBOR + 0.140% | | | 1.378% | (c) | | 01/26/37 | | | | | | | 2,299 | | | | 2,276,198 | |
GSMSC Resecuritization Trust, Series 2015-3R, Class 1A2, 144A, 1 Month LIBOR + 0.140% | | | 1.378% | (c) | | 01/26/37 | | | | | | | 1,400 | | | | 1,359,027 | |
GSMSC Resecuritization Trust, Series 2015-4R, Class A1, 144A, 1 Month LIBOR + 0.140% | | | 1.469% | (c) | | 03/26/37 | | | | | | | 2,014 | | | | 1,994,532 | |
GSMSC Resecuritization Trust, Series 2015-4R, Class A2, 144A, 1 Month LIBOR + 0.140% | | | 1.378% | (c) | | 03/26/37 | | | | | | | 700 | | | | 672,504 | |
Harborview Mortgage Loan Trust, Series 2007-4, Class 2A1, 1 Month LIBOR + 0.220% | | | 1.715% | (c) | | 07/19/47 | | | | | | | 1,938 | | | | 1,887,420 | |
LSTAR Securities Investment Ltd. (Cayman Islands), Series 2017-4, Class A, 144A, 1 Month LIBOR + 2.000% | | | 3.568% | (c) | | 05/01/22 | | | | | | | 5,578 | | | | 5,572,728 | |
LSTAR Securities Investment Ltd., Series 2017-5, Class A, 144A, 1 Month LIBOR + 2.000% | | | 3.568% | (c) | | 05/01/22 | | | | | | | 4,964 | | | | 4,962,299 | |
LSTAR Securities Investment Ltd., Series 2017-6, Class A, 144A, 1 Month LIBOR + 1.750%^ | | | 3.318% | (c) | | 09/01/22 | | | | | | | 1,687 | | | | 1,687,733 | |
LSTAR Securities Investment Ltd. (Cayman Islands), Series 2017-8, Class A, 144A, 1 Month LIBOR + 1.650% | | | 3.218% | (c) | | 11/01/22 | | | | | | | 1,679 | | | | 1,678,369 | |
LSTAR Securities Investment Ltd., Series 2017-9, Class A, 144A, 1 Month LIBOR + 1.550%^ | | | 3.022% | (c) | | 12/01/22 | | | | | | | 800 | | | | 799,307 | |
MASTR Alternative Loan Trust, Series 2004-4, Class 4A1 | | | 5.000% | | | 04/25/19 | | | | | | | 13 | | | | 12,626 | |
Mortgage Repurchase Agreement Financing Trust, Series 2017-1, Class A2, 144A, 1 Month LIBOR + 0.850% | | | 2.282% | (c) | | 07/10/19 | | | | | | | 2,210 | | | | 2,210,160 | |
Structured Adjustable Rate Mortgage Loan Trust, Series 2004-1, Class 4A3 | | | 3.473% | (cc) | | 02/25/34 | | | | | | | 710 | | | | 714,779 | |
Structured Adjustable Rate Mortgage Loan Trust, Series 2004-18, Class 3A1 | | | 3.427% | (cc) | | 12/25/34 | | | | | | | 3,564 | | | | 3,475,619 | |
Towd Point Mortgage Funding PLC (United Kingdom), Series 2016-V1A, Class A1, 144A, 3 Month GBP LIBOR + 1.200% | | | 1.726% | (c) | | 02/20/54 | | | GBP | | | | 1,853 | | | | 2,519,598 | |
Washington Mutual Mortgage Pass-Through Certificates, Series 2005-1, Class 3A | | | 5.000% | | | 03/25/20 | | | | | | | 90 | | | | 90,103 | |
| | | | | | | | | | | | | | | | | | |
TOTAL RESIDENTIAL MORTGAGE-BACKED SECURITIES
(cost $49,769,067) | | | | 51,346,914 | |
| | | | | | | | | | | | | | | | | | |
| SOVEREIGN BONDS — 4.9% | | | | | | | | | | | | | | | | | | |
Argentine Republic Government International Bond (Argentina), Sr. Unsec’d. Notes | | | 6.875% | | | 04/22/21 | | | | | | | 1,175 | | | | 1,279,575 | |
Argentine Republic Government International Bond (Argentina), Sr. Unsec’d. Notes | | | 7.820% | | | 12/31/33 | | | EUR | | | | 634 | | | | 889,191 | |
Argentine Republic Government International Bond (Argentina), Sr. Unsec’d. Notes | | | 7.820% | | | 12/31/33 | | | EUR | | | | 84 | | | | 116,692 | |
Brazil Minas Spe Via State of Minas Gerais (Brazil), Gov’t. Gtd. Notes, 144A | | | 5.333% | | | 02/15/28 | | | | | | | 500 | | | | 506,250 | |
Colombia Government International Bond (Colombia),
Sr. Unsec’d. Notes | | | 4.000% | | | 02/26/24 | | | | | | | 250 | | | | 259,250 | |
Dominican Republic International Bond (Dominican Republic), Sr. Unsec’d. Notes | | | 7.500% | | | 05/06/21 | | | | | | | 2,250 | | | | 2,455,312 | |
Dominican Republic International Bond (Dominican Republic), Sr. Unsec’d. Notes, 144A | | | 7.500% | | | 05/06/21 | | | | | | | 600 | | | | 654,750 | |
Hellenic Republic Government Bond (Greece), Bonds | | | 3.000% | (cc) | | 02/24/31 | | | EUR | | | | 620 | | | | 652,558 | |
Hellenic Republic Government Bond (Greece), Bonds | | | 3.000% | (cc) | | 02/24/34 | | | EUR | | | | 640 | | | | 675,998 | |
SEE NOTES TO FINANCIAL STATEMENTS.
A55
| | | | | | |
| | DIVERSIFIED BOND PORTFOLIO (continued) | | |
| |
| SCHEDULE OF INVESTMENTS | | as of December 31, 2017 |
| | | | | | | | | | | | | | | | | | |
| SOVEREIGN BONDS (continued) | | Interest
Rate | | | Maturity
Date | | Principal
Amount
(000)# | | | Value | |
Hellenic Republic Government Bond (Greece), Sr. Unsec’d. Notes, 144A | | | 4.375% | | | 08/01/22 | | | EUR | | | | 1,350 | | | $ | 1,679,829 | |
Hellenic Republic Government International Bond (Greece), Bonds | | | 3.000% | (cc) | | 02/24/32 | | | EUR | | | | 1,280 | | | | 1,339,462 | |
Hellenic Republic Government International Bond (Greece), Sr. Unsec’d. Notes | | | 5.200% | | | 07/17/34 | | | EUR | | | | 1,500 | | | | 1,815,761 | |
Hungary Government International Bond (Hungary),
Sr. Unsec’d. Notes | | | 6.375% | | | 03/29/21 | | | | | | | 2,776 | | | | 3,081,582 | |
Hungary Government International Bond (Hungary),
Sr. Unsec’d. Notes | | | 4.125% | | | 02/19/18 | | | | | | | 2,020 | | | | 2,026,060 | |
Hungary Government International Bond (Hungary),
Sr. Unsec’d. Notes | | | 5.375% | | | 02/21/23 | | | | | | | 436 | | | | 485,050 | |
Hungary Government International Bond (Hungary),
Sr. Unsec’d. Notes | | | 5.375% | | | 03/25/24 | | | | | | | 290 | | | | 328,054 | |
Hungary Government International Bond (Hungary),
Sr. Unsec’d. Notes | | | 5.750% | | | 11/22/23 | | | | | | | 2,300 | | | | 2,630,386 | |
Hungary Government International Bond (Hungary),
Sr. Unsec’d. Notes | | | 6.000% | | | 01/11/19 | | | EUR | | | | 715 | | | | 911,900 | |
Indonesia Government International Bond (Indonesia), Sr. Unsec’d. Notes, MTN | | | 2.875% | | | 07/08/21 | | | EUR | | | | 1,225 | | | | 1,598,185 | |
Indonesia Government International Bond (Indonesia), Sr. Unsec’d. Notes | | | 3.375% | | | 07/30/25 | | | EUR | | | | 1,625 | | | | 2,200,781 | |
Indonesia Government International Bond (Indonesia), Sr. Unsec’d. Notes, MTN | | | 3.750% | | | 06/14/28 | | | EUR | | | | 500 | | | | 691,412 | |
Indonesia Government International Bond (Indonesia), Sr. Unsec’d. Notes, 144A | | | 3.375% | | | 07/30/25 | | | EUR | | | | 1,500 | | | | 2,031,490 | |
Japan Bank for International Cooperation (Japan),
Gov’t. Gtd. Notes | | | 1.750% | | | 05/29/19 | | | | | | | 600 | | | | 595,094 | |
Japan Bank for International Cooperation (Japan),
Gov’t. Gtd. Notes | | | 2.125% | | | 06/01/20 | | | | | | | 400 | | | | 397,592 | |
Japan Bank for International Cooperation (Japan),
Gov’t. Gtd. Notes | | | 2.125% | | | 07/21/20 | | | | | | | 400 | | | | 396,945 | |
Japan Bank for International Cooperation (Japan),
Gov’t. Gtd. Notes | | | 2.250% | | | 02/24/20 | | | | | | | 800 | | | | 796,528 | |
Japan Bank for International Cooperation (Japan),
Gov’t. Gtd. Notes | | | 2.500% | | | 06/01/22 | | | | | | | 400 | | | | 398,314 | |
Japan Finance Organization for Municipalities (Japan), Sr. Unsec’d. Notes, MTN | | | 2.500% | | | 09/12/18 | | | | | | | 2,000 | | | | 1,999,592 | |
Japan Finance Organization for Municipalities (Japan), Sr. Unsec’d. Notes, 144A, MTN | | | 2.000% | | | 09/08/20 | | | | | | | 1,200 | | | | 1,183,848 | |
Japan Finance Organization for Municipalities (Japan), Sr. Unsec’d. Notes, 144A, MTN | | | 2.625% | | | 04/20/22 | | | | | | | 1,000 | | | | 994,210 | |
Panama Government International Bond (Panama),
Sr. Unsec’d. Notes | | | 3.750% | | | 03/16/25 | | | | | | | 450 | | | | 469,350 | |
Peru Enhanced Pass-Through Finance Ltd. (Peru), Pass-Through Certificates, 144A | | | 3.974% | (s) | | 05/31/18 | | | | | | | 99 | | | | 97,828 | |
Portugal Government International Bond (Portugal), Sr. Unsec’d. Notes, MTN | | | 5.125% | | | 10/15/24 | | | | | | | 4,125 | | | | 4,425,795 | |
Portugal Obrigacoes do Tesouro OT (Portugal), Sr. Unsec’d. Notes, 144A | | | 3.875% | | | 02/15/30 | | | EUR | | | | 4,490 | | | | 6,247,685 | |
Provincia de Buenos Aires (Argentina), Sr. Unsec’d. Notes, 144A | | | 9.950% | | | 06/09/21 | | | | | | | 1,940 | | | | 2,247,218 | |
Romanian Government International Bond (Romania), Sr. Unsec’d. Notes, 144A, MTN | | | 3.875% | | | 10/29/35 | | | EUR | | | | 945 | | | | 1,243,748 | |
Romanian Government International Bond (Romania), Sr. Unsec’d. Notes, MTN | | | 3.875% | | | 10/29/35 | | | EUR | | | | 1,000 | | | | 1,316,136 | |
State of Minas Gerais (Brazil), Sec’d. Notes | | | 5.333% | | | 02/15/28 | | | | | | | 1,105 | | | | 1,118,812 | |
Tokyo Metropolitan Government (Japan), Sr. Unsec’d. Notes | | | 2.125% | | | 05/19/20 | | | | | | | 1,000 | | | | 990,084 | |
Tokyo Metropolitan Government (Japan), Sr. Unsec’d. Notes, 144A | | | 2.500% | | | 06/08/22 | | | | | | | 600 | | | | 593,740 | |
SEE NOTES TO FINANCIAL STATEMENTS.
A56
| | | | | | |
| | DIVERSIFIED BOND PORTFOLIO (continued) | | |
| |
| SCHEDULE OF INVESTMENTS | | as of December 31, 2017 |
| | | | | | | | | | | | | | | | | | |
| SOVEREIGN BONDS (continued) | | Interest
Rate | | | Maturity
Date | | Principal
Amount
(000)# | | | Value | |
Turkey Government International Bond (Turkey), Sr. Unsec’d. Notes | | | 5.625% | | | 03/30/21 | | | | | | | 500 | | | $ | 526,299 | |
Turkey Government International Bond (Turkey), Sr. Unsec’d. Notes | | | 7.000% | | | 06/05/20 | | | | | | | 1,510 | | | | 1,629,018 | |
| | | | | | | | | | | | | | | | | | |
TOTAL SOVEREIGN BONDS
(cost $53,368,656) | | | | 55,977,364 | |
| | | | | | | | | | | | | | | | | | |
| U.S. GOVERNMENT AGENCY OBLIGATIONS — 1.2% | | | | | | | | | | | | | | | | | | |
Federal Home Loan Mortgage Corp. | | | 5.500% | | | 10/01/33 | | | | | | | 714 | | | | 804,530 | |
Federal Home Loan Mortgage Corp. | | | 5.500% | | | 06/01/34 | | | | | | | 11 | | | | 11,823 | |
Federal Home Loan Mortgage Corp. | | | 6.000% | | | 11/01/33 | | | | | | | 231 | | | | 261,884 | |
Federal Home Loan Mortgage Corp. | | | 6.000% | | | 05/01/34 | | | | | | | 63 | | | | 70,223 | |
Federal Home Loan Mortgage Corp. | | | 6.000% | | | 06/01/34 | | | | | | | 157 | | | | 175,776 | |
Federal Home Loan Mortgage Corp.(k) | | | 6.250% | | | 07/15/32 | | | | | | | 830 | | | | 1,164,311 | |
Federal Home Loan Mortgage Corp. | | | 6.500% | | | 07/01/32 | | | | | | | 28 | | | | 31,105 | |
Federal Home Loan Mortgage Corp. | | | 6.500% | | | 07/01/32 | | | | | | | 32 | | | | 35,687 | |
Federal Home Loan Mortgage Corp. | | | 6.500% | | | 08/01/32 | | | | | | | 48 | | | | 53,270 | |
Federal Home Loan Mortgage Corp. | | | 6.500% | | | 08/01/32 | | | | | | | 49 | | | | 54,252 | |
Federal Home Loan Mortgage Corp. | | | 6.500% | | | 08/01/32 | | | | | | | 54 | | | | 59,662 | |
Federal Home Loan Mortgage Corp. | | | 6.500% | | | 09/01/32 | | | | | | | 152 | | | | 168,685 | |
Federal Home Loan Mortgage Corp. | | | 6.500% | | | 09/01/32 | | | | | | | 44 | | | | 48,197 | |
Federal Home Loan Mortgage Corp.(k) | | | 6.750% | | | 03/15/31 | | | | | | | 600 | | | | 858,026 | |
Federal National Mortgage Assoc. | | | 5.500% | | | 02/01/33 | | | | | | | 28 | | | | 31,595 | |
Federal National Mortgage Assoc. | | | 5.500% | | | 02/01/33 | | | | | | | 21 | | | | 23,362 | |
Federal National Mortgage Assoc. | | | 5.500% | | | 03/01/33 | | | | | | | 66 | | | | 73,151 | |
Federal National Mortgage Assoc. | | | 5.500% | | | 03/01/33 | | | | | | | 64 | | | | 70,700 | |
Federal National Mortgage Assoc. | | | 5.500% | | | 03/01/33 | | | | | | | 32 | | | | 35,122 | |
Federal National Mortgage Assoc. | | | 5.500% | | | 04/01/33 | | | | | | | 45 | | | | 49,631 | |
Federal National Mortgage Assoc. | | | 5.500% | | | 04/01/33 | | | | | | | 49 | | | | 54,851 | |
Federal National Mortgage Assoc. | | | 5.500% | | | 04/01/33 | | | | | | | 10 | | | | 10,937 | |
Federal National Mortgage Assoc. | | | 5.500% | | | 04/01/33 | | | | | | | 36 | | | | 39,937 | |
Federal National Mortgage Assoc. | | | 5.500% | | | 07/01/33 | | | | | | | 50 | | | | 55,105 | |
Federal National Mortgage Assoc. | | | 5.500% | | | 07/01/33 | | | | | | | 41 | | | | 45,353 | |
Federal National Mortgage Assoc. | | | 5.500% | | | 08/01/33 | | | | | | | 17 | | | | 19,059 | |
Federal National Mortgage Assoc. | | | 5.500% | | | 02/01/34 | | | | | | | 39 | | | | 42,534 | |
Federal National Mortgage Assoc. | | | 5.500% | | | 04/01/34 | | | | | | | 35 | | | | 37,936 | |
Federal National Mortgage Assoc. | | | 5.500% | | | 06/01/34 | | | | | | | 41 | | | | 45,252 | |
Federal National Mortgage Assoc. | | | 6.000% | | | 10/01/33 | | | | | | | 258 | | | | 289,442 | |
Federal National Mortgage Assoc. | | | 6.000% | | | 10/01/33 | | | | | | | 4 | | | | 4,229 | |
Federal National Mortgage Assoc. | | | 6.000% | | | 03/01/34 | | | | | | | 94 | | | | 104,582 | |
Federal National Mortgage Assoc. | | | 6.000% | | | 02/01/35 | | | | | | | 260 | | | | 298,136 | |
Federal National Mortgage Assoc. | | | 6.000% | | | 11/01/36 | | | | | | | 76 | | | | 85,817 | |
Federal National Mortgage Assoc.(k) | | | 6.250% | | | 05/15/29 | | | | | | | 1,090 | | | | 1,457,229 | |
Federal National Mortgage Assoc. | | | 6.500% | | | 08/01/32 | | | | | | | 158 | | | | 175,842 | |
Federal National Mortgage Assoc. | | | 6.500% | | | 09/01/32 | | | | | | | 124 | | | | 137,740 | |
Federal National Mortgage Assoc. | | | 6.500% | | | 09/01/32 | | | | | | | 226 | | | | 252,931 | |
Federal National Mortgage Assoc. | | | 6.500% | | | 10/01/32 | | | | | | | 109 | | | | 121,305 | |
Federal National Mortgage Assoc. | | | 6.500% | | | 04/01/33 | | | | | | | 225 | | | | 252,931 | |
Federal National Mortgage Assoc. | | | 6.500% | | | 11/01/33 | | | | | | | 8 | | | | 8,644 | |
Federal National Mortgage Assoc.(k) | | | 6.625% | | | 11/15/30 | | | | | | | 530 | | | | 745,342 | |
Federal National Mortgage Assoc. | | | 7.000% | | | 05/01/32 | | | | | | | 91 | | | | 99,246 | |
Federal National Mortgage Assoc. | | | 7.000% | | | 06/01/32 | | | | | | | 9 | | | | 10,019 | |
Federal National Mortgage Assoc.(k) | | | 7.125% | | | 01/15/30 | | | | | | | 785 | | | | 1,130,835 | |
Government National Mortgage Assoc. | | | 5.500% | | | 01/15/33 | | | | | | | 88 | | | | 97,729 | |
Government National Mortgage Assoc. | | | 5.500% | | | 02/15/33 | | | | | | | 67 | | | | 74,762 | |
Government National Mortgage Assoc. | | | 5.500% | | | 05/15/33 | | | | | | | 199 | | | | 217,840 | |
Government National Mortgage Assoc. | | | 5.500% | | | 05/15/33 | | | | | | | 143 | | | | 156,486 | |
Government National Mortgage Assoc. | | | 5.500% | | | 06/15/33 | | | | | | | 220 | | | | 243,250 | |
SEE NOTES TO FINANCIAL STATEMENTS.
A57
| | | | | | |
| | DIVERSIFIED BOND PORTFOLIO (continued) | | |
| |
| SCHEDULE OF INVESTMENTS | | as of December 31, 2017 |
| | | | | | | | | | | | | | | | | | | | |
U.S. GOVERNMENT AGENCY OBLIGATIONS
(continued) | | Interest
Rate | | | Maturity
Date | | | Principal
Amount
(000)# | | | Value | |
Government National Mortgage Assoc. | | | 5.500% | | | | 09/15/33 | | | | | | | | 121 | | | $ | 135,104 | |
Government National Mortgage Assoc. | | | 5.500% | | | | 07/15/35 | | | | | | | | 89 | | | | 99,338 | |
Government National Mortgage Assoc. | | | 6.000% | | | | 12/15/32 | | | | | | | | 165 | | | | 189,509 | |
Government National Mortgage Assoc. | | | 6.000% | | | | 11/15/33 | | | | | | | | 80 | | | | 90,142 | |
Government National Mortgage Assoc. | | | 6.000% | | | | 01/15/34 | | | | | | | | 14 | | | | 15,835 | |
Government National Mortgage Assoc. | | | 6.000% | | | | 06/20/34 | | | | | | | | 440 | | | | 499,247 | |
Government National Mortgage Assoc. | | | 6.000% | | | | 11/15/34 | | | | | | | | 672 | | | | 768,266 | |
Government National Mortgage Assoc. | | | 6.500% | | | | 09/15/32 | | | | | | | | 237 | | | | 262,747 | |
Government National Mortgage Assoc. | | | 6.500% | | | | 09/15/32 | | | | | | | | 254 | | | | 282,081 | |
Government National Mortgage Assoc. | | | 6.500% | | | | 09/15/32 | | | | | | | | 92 | | | | 101,546 | |
Government National Mortgage Assoc. | | | 6.500% | | | | 11/15/33 | | | | | | | | 212 | | | | 235,243 | |
Tennessee Valley Authority, Sr. Unsec’d. Notes | | | 7.125% | | | | 05/01/30 | | | | | | | | 510 | | | | 735,309 | |
| | | | | | | | | | | | | | | | | | | | |
TOTAL U.S. GOVERNMENT AGENCY OBLIGATIONS
(cost $13,419,398) | | | | 13,810,660 | |
| | | | | | | | | | | | | | | | | | | | |
| U.S. TREASURY OBLIGATIONS — 2.2% | | | | | | | | | | | | | | | | | | | | |
U.S. Treasury Bonds(k) | | | 2.500% | | | | 05/15/46 | | | | | | | | 965 | | | | 917,956 | |
U.S. Treasury Bonds | | | 2.875% | | | | 05/15/43 | | | | | | | | 830 | | | | 853,441 | |
U.S. Treasury Bonds | | | 3.000% | | | | 05/15/45 | | | | | | | | 570 | | | | 598,611 | |
U.S. Treasury Bonds(k) | | | 4.250% | | | | 11/15/40 | | | | | | | | 1,970 | | | | 2,501,900 | |
U.S. Treasury Inflation Indexed Bonds, TIPS | | | 0.125% | | | | 04/15/22 | | | | | | | | 1,156 | | | | 1,148,137 | |
U.S. Treasury Notes(h)(k) | | | 1.375% | | | | 05/31/21 | | | | | | | | 7,960 | | | | 7,780,900 | |
U.S. Treasury Notes(a) | | | 2.000% | | | | 11/30/22 | | | | | | | | 225 | | | | 222,952 | |
U.S. Treasury Notes | | | 2.125% | | | | 12/31/22 | | | | | | | | 300 | | | | 298,758 | |
U.S. Treasury Notes(h)(k) | | | 2.125% | | | | 11/30/24 | | | | | | | | 6,145 | | | | 6,064,347 | |
U.S. Treasury Strips Coupon, IO(k) | | | 2.783% | (s) | | | 08/15/29 | | | | | | | | 1,200 | | | | 891,113 | |
U.S. Treasury Strips Coupon, IO(k) | | | 2.878% | (s) | | | 05/15/31 | | | | | | | | 1,200 | | | | 847,175 | |
U.S. Treasury Strips Coupon, IO(k) | | | 3.042% | (s) | | | 11/15/35 | | | | | | | | 2,400 | | | | 1,485,290 | |
U.S. Treasury Strips Coupon, IO(k) | | | 3.202% | (s) | | | 08/15/40 | | | | | | | | 2,400 | | | | 1,283,485 | |
| | | | | | | | | | | | | | | | | | | | |
TOTAL U.S. TREASURY OBLIGATIONS
(cost $24,851,624) | | | | 24,894,065 | |
| | | | | | | | | | | | | | | | | | | | |
| | | | |
| | | | | | | | | Shares | | | | |
| PREFERRED STOCKS — 0.2% | | | | | | | | | | | | | | | | | | | | |
Banking | | | | | | | | | | | | | | | | | | | | |
Citigroup Capital XIII, 7.750%, (Capital Security, fixed to floating preferred)(a) | | | | | | | | | | | | | | | 45,000 | | | | 1,236,600 | |
State Street Corp., 5.350% | | | | | | | | | | | | | | | 35,000 | | | | 949,200 | |
| | | | | | | | | | | | | | | | | | | | |
TOTAL PREFERRED STOCKS
(cost $2,000,000) | | | | 2,185,800 | |
| | | | | | | | | | | | | | | | | | | | |
TOTAL LONG-TERM INVESTMENTS
(cost $1,013,633,733) | | | | 1,051,836,448 | |
| | | | | | | | | | | | | | | | | | | | |
| SHORT-TERM INVESTMENTS — 9.9% | | | | | | | | | | | | | | | | | | | | |
| AFFILIATED MUTUAL FUNDS — 9.8% | | | | | | | | | | | | | | | | | | | | |
Prudential Investment Portfolios 2 — Prudential Core Short-Term Bond Fund(w) | | | | 5,883,480 | | | | 54,598,691 | |
Prudential Investment Portfolios 2 — Prudential Core Ultra Short Bond Fund(w) | | | | 45,727,273 | | | | 45,727,273 | |
Prudential Investment Portfolios 2 — Prudential Institutional Money Market Fund
(cost $11,557,708; includes $11,544,137 of cash collateral for securities on loan)(b)(w) | | | | 11,557,301 | | | | 11,557,301 | |
| | | | | | | | | | | | | | | | | | | | |
TOTAL AFFILIATED MUTUAL FUNDS
(cost $113,336,565) | | | | 111,883,265 | |
| | | | | | | | | | | | | | | | | | | | |
OPTIONS PURCHASED~* — 0.1%
(cost $1,375,926) | | | | 1,079,315 | |
| | | | | | | | | | | | | | | | | | | | |
TOTAL SHORT-TERM INVESTMENTS
(cost $114,712,491) | | | | 112,962,580 | |
| | | | | | | | | | | | | | | | | | | | |
SEE NOTES TO FINANCIAL STATEMENTS.
A58
| | | | | | |
| | DIVERSIFIED BOND PORTFOLIO (continued) | | |
| |
| SCHEDULE OF INVESTMENTS | | as of December 31, 2017 |
| | | | | | | | | | | | |
| | | | | | | | | Value | |
TOTAL INVESTMENTS, BEFORE OPTIONS WRITTEN — 101.8%
(cost $1,128,346,224) | | $ | 1,164,799,028 | |
| | | | | | | | | | | | |
OPTIONS WRITTEN~* — (0.1)%
(premiums received $1,140,028) | | | (746,223 | ) |
| | | | | | | | | | | | |
TOTAL INVESTMENTS, NET OF OPTIONS WRITTEN — 101.7%
(cost $1,127,206,196) | | | 1,164,052,805 | |
LIABILITIES IN EXCESS OF OTHER ASSETS(z) — (1.7)% | | | (18,954,688 | ) |
| | | | | | | | | | | | |
NET ASSETS — 100.0% | | $ | 1,145,098,117 | |
| | | | | | | | | | | | |
See the Glossary for abbreviations used in the annual report.
| * | Non-income producing security. |
| ~ | See tables subsequent to the Schedule of Investments for options detail. |
| # | Principal or notional amount is shown in U.S. dollars unless otherwise stated. |
| ^ | Indicates a Level 3 security. The aggregate value of Level 3 securities is $7,713,794 and 0.7% of net assets. |
| (a) | All or a portion of security is on loan. The aggregate market value of such securities, including those sold and pending settlement, is $11,309,524; cash collateral of $11,544,137 (included in liabilities) was received with which the Portfolio purchased highly liquid short-term investments. |
| (b) | Represents security purchased with cash collateral received for securities on loan and includes dividend reinvestment. |
| (c) | Variable rate instrument. The interest rate shown reflects the rate in effect at December 31, 2017. |
| (cc) | Variable rate instrument. The rate shown is based on the latest available information as of December 31, 2017. Certain variable rate securities are not based on a published reference rate and spread but are determined by the issuer or agent and are based on current market conditions. These securities do not indicate a reference rate and spread in their description above. |
| (d) | Represents issuer in default on interest payments and/or principal repayment. Non-income producing security. Such securities may be post maturity. |
| (h) | Represents security, or a portion thereof, segregated as collateral for OTC derivatives. |
| (k) | Represents security, or a portion thereof, segregated as collateral for centrally cleared/exchange-traded derivatives. |
| (p) | Interest rate not available as of December 31, 2017. |
| (r) | Principal or notional amount is less than $500 par. |
| (s) | Represents zero coupon bond or principal only securities. Rate represents yield to maturity at purchase date. |
| (w) | PGIM Investments LLC, the manager of the Portfolio, also serves as manager of the Prudential Investment Portfolios 2 — Prudential Core Short-Term Bond Fund, Prudential Core Ultra Short Bond Fund and Prudential Institutional Money Market Fund. |
| (z) | Includes net unrealized appreciation (depreciation) on the following derivative contracts held at reporting period end, with the exception of options which are included in net assets at market value: |
Options Purchased:
Exchange Traded
| | | | | | | | | | | | | | | | | | | | | | | | |
Description | | Call/
Put | | | Expiration
Date | | | Strike | | | Contracts | | | Notional
Amount
(000)# | | | Value | |
1 Year Mid-Curve on 3 Month GBP LIBOR | | | Put | | | | 05/11/18 | | | | 98.50 | | | | 211 | | | GBP | 264 | | | $ | 1,780 | |
1 Year Mid-Curve on 3 Month GBP LIBOR | | | Put | | | | 05/11/18 | | | | 98.88 | | | | 211 | | | GBP | 264 | | | | 13,354 | |
| | | | | | | | | | | | | | | | | | | | | | | | |
| | | | | | | | | | | | | | | | | | | | | | | 15,134 | |
| | | | | | | | | | | | | | | | | | | | | | | | |
SEE NOTES TO FINANCIAL STATEMENTS.
A59
| | | | | | |
| | DIVERSIFIED BOND PORTFOLIO (continued) | | |
| |
| SCHEDULE OF INVESTMENTS | | as of December 31, 2017 |
OTC Swaptions
| | | | | | | | | | | | | | | | | | | | | | | | | | | | |
Description | | Call/
Put | | | Counterparty | | Expiration
Date | | | Strike | | | Receive | | | Pay | | Notional
Amount
(000)# | | | Value | |
1-Year Interest Rate Swap, 11/23/19 | | | Call | | | JPMorgan Chase | | | 11/20/18 | | | | 1.35% | | | | 1.35%(S) | | | 3 Month LIBOR(Q) | | | 204,840 | | | $ | 7,374 | |
1-Year Interest Rate Swap, 11/23/19 | | | Call | | | JPMorgan Chase | | | 11/20/18 | | | | 2.00% | | | | 2.00%(S) | | | 3 Month LIBOR(Q) | | | 204,840 | | | | 135,140 | |
5-Year x 10-Year Interest Rate Swap, 4/17/33 | | | Call | | | JPMorgan Chase | | | 04/12/18 | | | | 1.80% | | | | 1.80%(S) | | | 3 Month LIBOR(Q) | | | 42,750 | | | | 6,492 | |
5-Year x 10-Year Interest Rate Swap, 10/16/33 | | | Call | | | JPMorgan Chase | | | 10/12/18 | | | | 2.60% | | | | 2.60%(S) | | | 3 Month LIBOR(Q) | | | 42,750 | | | | 656,789 | |
CDX.NA.HY.29.V1, 12/20/22 | | | Call | | | Goldman Sachs & Co. | | | 02/21/18 | | | $ | 108.00 | | | | 5.00%(Q) | | | CDX.NA.HY.29.V1(Q) | | | 11,150 | | | | 37,834 | |
CDX.NA.HY.29.V1, 12/20/22 | | | Call | | | Goldman Sachs & Co. | | | 02/21/18 | | | $ | 108.50 | | | | 5.00%(Q) | | | CDX.NA.HY.29.V1(Q) | | | 11,150 | | | | 15,598 | |
CDX.NA.HY.29.V1, 12/20/22 | | | Call | | | Deutsche Bank AG | | | 02/21/18 | | | $ | 108.00 | | | | 5.00%(Q) | | | CDX.NA.HY.29.V1(Q) | | | 12,200 | | | | 41,396 | |
CDX.NA.HY.29.V1, 12/20/22 | | | Call | | | BNP Paribas | | | 02/21/18 | | | $ | 108.00 | | | | 5.00%(Q) | | | CDX.NA.HY.29.V1(Q) | | | 7,500 | | | | 25,449 | |
CDX.NA.HY.29.V1, 12/20/22 | | | Call | | | Goldman Sachs & Co. | | | 03/21/18 | | | $ | 108.00 | | | | 5.00%(Q) | | | CDX.NA.HY.29.V1(Q) | | | 12,500 | | | | 41,691 | |
iTraxx.XO.28.V1, 12/20/22 | | | Call | | | Goldman Sachs & Co. | | | 01/17/18 | | | EUR | 212.50 | | | | 5.00%(Q) | | | iTraxx.XO.28.V1(Q) | | EUR | 8,920 | | | | 2,138 | |
iTraxx.XO.28.V1, 12/20/22 | | | Call | | | Goldman Sachs & Co. | | | 02/21/18 | | | EUR | 212.50 | | | | 5.00%(Q) | | | iTraxx.XO.28.V1(Q) | | EUR | 6,690 | | | | 5,182 | |
30-Year Interest Rate Swap, 04/24/48 | | | Put | | | Barclays Capital Group | | | 04/20/18 | | | | 2.75% | | | | 3 Month LIBOR(Q) | | | 2.75%(S) | | | 7,540 | | | | 81,430 | |
30-Year Interest Rate Swap, 04/24/48 | | | Put | | | Citigroup Global Markets | | | 04/20/18 | | | | 2.75% | | | | 3 Month LIBOR(Q) | | | 2.75%(S) | | | 710 | | | | 7,668 | |
| | | | | | | | | | | | | | | | | | | | | | | | | | | | |
| | | | | | | | | | | | | | | | | | | | | | | | | | | 1,064,181 | |
| | | | | | | | | | | | | | | | | | | | | | | | | | | | |
Total Options Purchased | | | | | | | | | | | | | | | | | | | | | | | $ | 1,079,315 | |
| | | | | | | | | | | | | | | | | | | | | | | | | | | | |
Options Written:
Exchange Traded
| | | | | | | | | | | | | | | | | | | | | | | | |
Description | | Call/Put | | | Expiration
Date | | | Strike | | | Contracts | | | Notional
Amount
(000)# | | | Value | |
1 Year Mid-Curve on 3 Month GBP LIBOR | | | Put | | | | 05/11/18 | | | | 98.63 | | | | 211 | | | GBP | 264 | | | $ | (4,451 | ) |
1 Year Mid-Curve on 3 Month GBP LIBOR | | | Put | | | | 05/11/18 | | | | 98.75 | | | | 211 | | | GBP | 264 | | | | (7,122 | ) |
| | | | | | | | | | | | | | | | | | | | | | | | |
| | | | | | | | | | | | | | | | | | | | | | | (11,573 | ) |
| | | | | | | | | | | | | | | | | | | | | | | | |
SEE NOTES TO FINANCIAL STATEMENTS.
A60
| | | | | | |
| | DIVERSIFIED BOND PORTFOLIO (continued) | | |
| |
| SCHEDULE OF INVESTMENTS | | as of December 31, 2017 |
OTC Swaptions
| | | | | | | | | | | | | | | | | | | | | | | | | | |
Description | | Call/
Put | | | Counterparty | | Expiration
Date | | | Strike | | | Receive | | Pay | | Notional
Amount
(000)# | | | Value | |
1-Year Interest Rate Swap, 11/23/19 | | | Call | | | JPMorgan Chase | | | 11/20/2018 | | | | 1.70% | | | 3 Month LIBOR(Q) | | 1.70%(S) | | | 204,840 | | | $ | (37,660 | ) |
1-Year Interest Rate Swap, 11/23/19 | | | Call | | | JPMorgan Chase | | | 11/20/2018 | | | | 1.85% | | | 3 Month LIBOR(Q) | | 1.85%(S) | | | 204,840 | | | | (73,362 | ) |
5-Year x 10-Year Interest Rate Swap, 10/16/33 | | | Call | | | JPMorgan Chase | | | 10/12/2018 | | | | 2.10% | | | 3 Month LIBOR(Q) | | 2.10%(S) | | | 42,750 | | | | (167,509 | ) |
5-Year x 10-Year Interest Rate Swap, 10/16/33 | | | Call | | | JPMorgan Chase | | | 10/12/2018 | | | | 2.30% | | | 3 Month LIBOR(Q) | | 2.30%(S) | | | 42,750 | | | | (301,081 | ) |
30-Year Interest Rate Swap, 04/24/48 | | | Put | | | Barclays Capital Group | | | 4/20/2018 | | | | 3.05% | | | 3.05%(S) | | 3 Month LIBOR(Q) | | | 7,540 | | | | (18,386 | ) |
30-Year Interest Rate Swap, 04/24/48 | | | Put | | | Citigroup Global Markets | | | 4/20/2018 | | | | 3.05% | | | 3.05%(S) | | 3 Month LIBOR(Q) | | | 710 | | | | (1,731 | ) |
CDX.NA.HY.29.V1, 12/20/22 | | | Put | | | Citigroup Global Markets | | | 1/17/2018 | | | $ | 102.50 | | | 5.00%(Q) | | CDX.NA.HY.29.V1(Q) | | | 5,390 | | | | (1,594 | ) |
CDX.NA.HY.29.V1, 12/20/22 | | | Put | | | Deutsche Bank AG | | | 2/21/2018 | | | $ | 100.00 | | | 5.00%(Q) | | CDX.NA.HY.29.V1(Q) | | | 12,200 | | | | (8,502 | ) |
CDX.NA.HY.29.V1, 12/20/22 | | | Put | | | BNP Paribas | | | 2/21/2018 | | | $ | 101.50 | | | 5.00%(Q) | | CDX.NA.HY.29.V1(Q) | | | 7,500 | | | | (7,071 | ) |
CDX.NA.HY.29.V1, 12/20/22 | | | Put | | | Goldman Sachs & Co. | | | 2/21/2018 | | | $ | 102.00 | | | 5.00%(Q) | | CDX.NA.HY.29.V1(Q) | | | 11,150 | | | | (11,175 | ) |
CDX.NA.HY.29.V1, 12/20/22 | | | Put | | | Goldman Sachs & Co. | | | 2/21/2018 | | | $ | 103.00 | | | 5.00%(Q) | | CDX.NA.HY.29.V1(Q) | | | 11,150 | | | | (12,973 | ) |
CDX.NA.HY.29.V1, 12/20/22 | | | Put | | | Goldman Sachs & Co. | | | 3/21/2018 | | | $ | 101.00 | | | 5.00%(Q) | | CDX.NA.HY.29.V1(Q) | | | 12,500 | | | | (19,301 | ) |
CDX.NA.HY.29.V1, 12/20/22 | | | Put | | | Goldman Sachs & Co. | | | 6/20/2018 | | | $ | 97.00 | | | 5.00%(Q) | | CDX.NA.HY.29.V1(Q) | | | 20,000 | | | | (54,618 | ) |
iTraxx.XO.28.V1, 12/20/22 | | | Put | | | Goldman Sachs & Co. | | | 1/17/2018 | | | EUR | 275.00 | | | 5.00%(Q) | | iTraxx.XO.28.V1(Q) | | EUR | 8,920 | | | | (6,365 | ) |
iTraxx.XO.28.V1, 12/20/22 | | | Put | | | Goldman Sachs & Co. | | | 2/21/2018 | | | EUR | 300.00 | | | 5.00%(Q) | | iTraxx.XO.28.V1(Q) | | EUR | 6,690 | | | | (13,322 | ) |
| | | | | | | | | | | | | | | | | | | | | | | | | | |
| | | | | | | | | | | | | | | | | | | | | | | | | (734,650 | ) |
| | | | | | | | | | | | | | | | | | | | | | | | | | |
Total Options Written | | | | | | | | | | | | | | | | | | | | | $ | (746,223 | ) |
| | | | | | | | | | | | | | | | | | | | | | | | | | |
Futures contracts outstanding at December 31, 2017:
| | | | | | | | | | | | | | | | | | |
Number of
Contracts | | Type | | Expiration
Date | | | Value at
Trade Date | | | Current
Notional
Amount | | | Value /
Unrealized
Appreciation
(Depreciation) | |
| Long Positions: | | | | | | | | | | | | | | | | | | |
| 3,324 | | 5 Year U.S. Treasury Notes | | | Mar. 2018 | | | $ | 387,478,792 | | | $ | 386,129,344 | | | $ | (1,349,448 | ) |
| 180 | | 10 Year Euro-Bund | | | Mar. 2018 | | | | 35,186,241 | | | | 34,918,410 | | | | (267,831 | ) |
| 28 | | 10 Year U.K. Gilt | | | Mar. 2018 | | | | 4,693,311 | | | | 4,731,564 | | | | 38,253 | |
| 1,930 | | 10 Year U.S. Treasury Notes | | | Mar. 2018 | | | | 240,508,578 | | | | 239,410,469 | | | | (1,098,109 | ) |
| 275 | | 10 Year U.S. Ultra Treasury Notes | | | Mar. 2018 | | | | 36,850,432 | | | | 36,729,688 | | | | (120,744 | ) |
| 905 | | 30 Year U.S. Ultra Treasury Bonds | | | Mar. 2018 | | | | 150,607,573 | | | | 151,728,906 | | | | 1,121,333 | |
| | | | | | | | | | | | | | | | | | |
| | | | | | | | | | | | | | | | | (1,676,546 | ) |
| | | | | | | | | | | | | | | | | | |
| Short Positions: | | | | | | | | | | | | | | | | | | |
| 1,131 | | 2 Year U.S. Treasury Notes | | | Mar. 2018 | | | | 242,629,565 | | | | 242,157,703 | | | | 471,862 | |
| 17 | | 10 Year Japanese Bonds | | | Mar. 2018 | | | | 22,762,457 | | | | 22,749,146 | | | | 13,311 | |
| 359 | | 10 Year U.S. Treasury Bonds | | | Mar. 2018 | | | | 54,782,184 | | | | 54,927,000 | | | | (144,816 | ) |
| 63 | | 30 Year Euro Buxl | | | Mar. 2018 | | | | 12,616,123 | | | | 12,386,230 | | | | 229,893 | |
| | | | | | | | | | | | | | | | | | |
| | | | | | | | | | | | | | | | | 570,250 | |
| | | | | | | | | | | | | | | | | | |
| | | | | | | | | | | | | | | | $ | (1,106,296 | ) |
| | | | | | | | | | | | | | | | | | |
SEE NOTES TO FINANCIAL STATEMENTS.
A61
| | | | | | |
| | DIVERSIFIED BOND PORTFOLIO (continued) | | |
| |
| SCHEDULE OF INVESTMENTS | | as of December 31, 2017 |
Cash of $2,340,000 and securities with a combined market value of $5,235,583 have been segregated with Citigroup Global Markets to cover requirements for open futures contracts at December 31, 2017.
Forward foreign currency exchange contracts outstanding at December 31, 2017:
| | | | | | | | | | | | | | | | | | |
Purchase Contracts | | Counterparty | | Notional
Amount
(000) | | | Value at
Settlement
Date | | | Current
Value | | | Unrealized
Appreciation
(Depreciation) | |
OTC forward foreign currency exchange contracts: | | | | | | | | | | | | | |
British Pound, | | | | | | | | | | | | | | | | | | |
Expiring 01/26/18 | | Hong Kong & Shanghai Bank | | GBP | 1,064 | | | $ | 1,404,654 | | | $ | 1,437,514 | | | $ | 32,860 | |
Expiring 01/26/18 | | JPMorgan Chase | | GBP | 1,610 | | | | 2,129,605 | | | | 2,176,009 | | | | 46,404 | |
Euro, | | | | | | | | | | | | | | | | | | |
Expiring 01/26/18 | | Hong Kong & Shanghai Bank | | EUR | 663 | | | | 785,342 | | | | 796,211 | | | | 10,869 | |
Mexican Peso, | | | | | | | | | | | | | | | | | | |
Expiring 01/30/18 | | Citigroup Global Markets | | MXN | 8,053 | | | | 415,975 | | | | 407,060 | | | | (8,915 | ) |
| | | | | | | | | | | | | | | | | | |
| | | | | | | | $ | 4,735,576 | | | $ | 4,816,794 | | | | 81,218 | |
| | | | | | | | | | | | | | | | | | |
| | | | | | | | | | | | | | | | | | |
Sale Contracts | | Counterparty | | Notional
Amount
(000) | | | Value at
Settlement
Date | | | Current
Value | | | Unrealized
Appreciation
(Depreciation) | |
OTC forward foreign currency exchange contracts: | | | | | | | | | | | | | |
Australian Dollar, | | | | | | | | | | | | | | | | | | |
Expiring 01/12/18 | | Citigroup Global Markets | | AUD | 559 | | | $ | 435,244 | | | $ | 436,445 | | | $ | (1,201 | ) |
British Pound, | |
Expiring 01/26/18 | | Citigroup Global Markets | | GBP | 2,992 | | | | 3,976,174 | | | | 4,043,638 | | | | (67,464 | ) |
Expiring 01/26/18 | | JPMorgan Chase | | GBP | 47 | | | | 62,716 | | | | 63,026 | | | | (310 | ) |
Expiring 01/26/18 | | UBS AG | | GBP | 2,992 | | | | 3,976,937 | | | | 4,043,638 | | | | (66,701 | ) |
Euro, | | | | | | | | | | | | | | | | | | |
Expiring 01/26/18 | | Citigroup Global Markets | | EUR | 332 | | | | 387,118 | | | | 399,005 | | | | (11,887 | ) |
Expiring 01/26/18 | | Citigroup Global Markets | | EUR | 2,240 | | | | 2,616,707 | | | | 2,692,555 | | | | (75,848 | ) |
Expiring 01/26/18 | | Citigroup Global Markets | | EUR | 21,096 | | | | 25,038,696 | | | | 25,354,119 | | | | (315,423 | ) |
Expiring 01/26/18 | | JPMorgan Chase | | EUR | 425 | | | | 502,600 | | | | 510,774 | | | | (8,174 | ) |
Expiring 01/26/18 | | JPMorgan Chase | | EUR | 445 | | | | 520,882 | | | | 534,535 | | | | (13,653 | ) |
Expiring 01/26/18 | | JPMorgan Chase | | EUR | 788 | | | | 919,059 | | | | 947,241 | | | | (28,182 | ) |
Expiring 01/26/18 | | UBS AG | | EUR | 253 | | | | 301,511 | | | | 304,488 | | | | (2,977 | ) |
Expiring 01/26/18 | | UBS AG | | EUR | 21,096 | | | | 25,044,940 | | | | 25,354,119 | | | | (309,179 | ) |
South African Rand, | | | | | | | | | | | | | | | | | | |
Expiring 03/12/18 | | Toronto Dominion | | ZAR | 8,074 | | | | 588,543 | | | | 645,651 | | | | (57,108 | ) |
| | | | | | | | | | | | | | | | | | |
| | | | | | | | $ | 64,371,127 | | | $ | 65,329,234 | | | | (958,107 | ) |
| | | | | | | | | | | | | | | | | | |
| | | | | | | | | | | | | | | | $ | (876,889 | ) |
| | | | | | | | | | | | | | | | | | |
Balances Reported in the Statement of Assets and Liabilities for OTC Forward Foreign Currency contracts:
| | | | | | | | | | | | |
| | | Unrealized
Appreciation | | | Unrealized
Depreciation | | | Net
Unrealized
Appreciation
(Depreciation) | |
Forward Foreign Currency | | $ | 90,133 | | | $ | (967,022 | ) | | $ | (876,889 | ) |
| | | | | | | | | | | | |
Credit default swap agreements outstanding at December 31, 2017:
| | | | | | | | | | | | | | | | | | | | | | | | | | |
Reference Entity/ Obligation | | Termination
Date | | | Fixed
Rate | | | Notional
Amount
(000)#(3) | | | Fair
Value(4) | | | Upfront
Premiums
Paid
(Received) | | | Unrealized
Appreciation
(Depreciation) | | | Counterparty |
OTC credit default swaps on asset-backed securities—Sell Protection(2)^: |
3i Debt Management | | | 01/22/18 | | | | 1.000%(M) | | | | 539 | | | $ | 747 | | | $ | — | | | $ | 747 | | | Goldman Sachs & Co. |
3i Debt Management | | | 01/22/18 | | | | 1.000%(M) | | | | 75 | | | | 104 | | | | — | | | | 104 | | | Goldman Sachs & Co. |
Acis CLO Ltd. | | | 01/22/18 | | | | 1.000%(M) | | | | 50 | | | | 70 | | | | — | | | | 70 | | | Goldman Sachs & Co. |
Ameriquest Home Equity | | | 01/05/18 | | | | 1.500%(M) | | | | 306 | | | | 511 | | | | — | | | | 511 | | | Goldman Sachs & Co. |
SEE NOTES TO FINANCIAL STATEMENTS.
A62
| | | | | | |
| | DIVERSIFIED BOND PORTFOLIO (continued) | | |
| |
| SCHEDULE OF INVESTMENTS | | as of December 31, 2017 |
Credit default swap agreements outstanding at December 31, 2017 (continued):
| | | | | | | | | | | | | | | | | | | | | | | | | | |
Reference Entity/ Obligation | | Termination
Date | | | Fixed
Rate | | | Notional
Amount
(000)#(3) | | | Fair
Value(4) | | | Upfront
Premiums
Paid
(Received) | | | Unrealized
Appreciation
(Depreciation) | | | Counterparty |
OTC credit default swaps on asset-backed securities—Sell Protection(2)^ (continued): |
Angelogordon CLO | | | 01/22/18 | | | | 1.000%(M) | | | | 103 | | | $ | 143 | | | $ | — | | | $ | 143 | | | Goldman Sachs & Co. |
Banc of America Commercial Mortgage Trust | | | 01/30/18 | | | | 1.500%(M) | | | | 30 | | | | 46 | | | | — | | | | 46 | | | Goldman Sachs & Co. |
Banc of America Commercial Mortgage Trust | | | 01/30/18 | | | | 1.500%(M) | | | | 25 | | | | 38 | | | | — | | | | 38 | | | Goldman Sachs & Co. |
Bank of America Prime Mortgage | | | 01/05/18 | | | | 1.500%(M) | | | | 1,035 | | | | 1,723 | | | | — | | | | 1,723 | | | Goldman Sachs & Co. |
Bear Stearns Asset Backed Securities Trust | | | 01/05/18 | | | | 1.500%(M) | | | | 590 | | | | 983 | | | | — | | | | 983 | | | Goldman Sachs & Co. |
BNPP IP CLO Ltd. | | | 01/22/18 | | | | 1.000%(M) | | | | 118 | | | | 164 | | | | — | | | | 164 | | | Goldman Sachs & Co. |
Cathedral Lake Ltd. | | | 01/22/18 | | | | 1.000%(M) | | | | 49 | | | | 68 | | | | — | | | | 68 | | | Goldman Sachs & Co. |
CBASS Home Equity | | | 01/05/18 | | | | 1.500%(M) | | | | 509 | | | | 678 | | | | — | | | | 678 | | | Goldman Sachs & Co. |
Chase Mortgage | | | 01/05/18 | | | | 1.500%(M) | | | | 752 | | | | 1,252 | | | | — | | | | 1,252 | | | Goldman Sachs & Co. |
Chase Mortgage | | | 01/05/18 | | | | 1.500%(M) | | | | 630 | | | | 1,050 | | | | — | | | | 1,050 | | | Goldman Sachs & Co. |
Chase Mortgage | | | 01/05/18 | | | | 1.500%(M) | | | | 509 | | | | 678 | | | | — | | | | 678 | | | Goldman Sachs & Co. |
Chase Mortgage | | | 01/05/18 | | | | 1.500%(M) | | | | 226 | | | | 376 | | | | — | | | | 376 | | | Goldman Sachs & Co. |
Chase Mortgage | | | 01/05/18 | | | | 1.500%(M) | | | | 145 | | | | 193 | | | | — | | | | 193 | | | Goldman Sachs & Co. |
Citigroup Mortgage Loan Trust | | | 01/05/18 | | | | 1.500%(M) | | | | 266 | | | | 443 | | | | — | | | | 443 | | | Goldman Sachs & Co. |
COMM Mortgage Trust | | | 01/30/18 | | | | 1.500%(M) | | | | 212 | | | | 326 | | | | — | | | | 326 | | | Goldman Sachs & Co. |
COMM Mortgage Trust | | | 01/30/18 | | | | 1.500%(M) | | | | 187 | | | | 287 | | | | — | | | | 287 | | | Goldman Sachs & Co. |
COMM Mortgage Trust | | | 01/30/18 | | | | 1.500%(M) | | | | 83 | | | | 127 | | | | — | | | | 127 | | | Goldman Sachs & Co. |
COMM Mortgage Trust | | | 01/30/18 | | | | 1.500%(M) | | | | 56 | | | | 86 | | | | — | | | | 86 | | | Goldman Sachs & Co. |
COMM Mortgage Trust | | | 01/30/18 | | | | 1.500%(M) | | | | 54 | | | | 83 | | | | — | | | | 83 | | | Goldman Sachs & Co. |
COMM Mortgage Trust | | | 01/30/18 | | | | 1.500%(M) | | | | 37 | | | | 57 | | | | — | | | | 57 | | | Goldman Sachs & Co. |
COMM Mortgage Trust | | | 01/30/18 | | | | 1.500%(M) | | | | 33 | | | | 51 | | | | — | | | | 51 | | | Goldman Sachs & Co. |
Commercial Mortgage Pass Through Certificate | | | 01/30/18 | | | | 1.500%(M) | | | | 52 | | | | 80 | | | | — | | | | 80 | | | Goldman Sachs & Co. |
Conneticut Avenue Securities | | | 01/05/18 | | | | 1.500%(M) | | | | 428 | | | | 713 | | | | — | | | | 713 | | | Goldman Sachs & Co. |
Conneticut Avenue Securities | | | 01/05/18 | | | | 1.500%(M) | | | | 396 | | | | 660 | | | | — | | | | 660 | | | Goldman Sachs & Co. |
Conneticut Avenue Securities | | | 01/05/18 | | | | 1.500%(M) | | | | 266 | | | | 443 | | | | — | | | | 443 | | | Goldman Sachs & Co. |
Conneticut Avenue Securities | | | 01/05/18 | | | | 1.500%(M) | | | | 96 | | | | 160 | | | | — | | | | 160 | | | Goldman Sachs & Co. |
Countrywide Home Equity | | | 01/05/18 | | | | 1.500%(M) | | | | 1,116 | | | | 1,488 | | | | — | | | | 1,488 | | | Goldman Sachs & Co. |
Cutwater Ltd. | | | 01/22/18 | | | | 1.000%(M) | | | | 183 | | | | 253 | | | | — | | | | 253 | | | Goldman Sachs & Co. |
Ellington CLO Ltd. | | | 01/22/18 | | | | 1.000%(M) | | | | 220 | | | | 347 | | | | — | | | | 347 | | | Goldman Sachs & Co. |
Equity One Home Equity | | | 01/05/18 | | | | 1.500%(M) | | | | 145 | | | | 241 | | | | — | | | | 241 | | | Goldman Sachs & Co. |
Federal Home Loan Mortgage Corp. | | | 01/30/18 | | | | 1.500%(M) | | | | 340 | | | | 523 | | | | — | | | | 523 | | | Goldman Sachs & Co. |
Federal Home Loan Mortgage Corp. | | | 01/30/18 | | | | 1.500%(M) | | | | 136 | | | | 209 | | | | — | | | | 209 | | | Goldman Sachs & Co. |
Federal Home Loan Mortgage Corp. | | | 01/30/18 | | | | 1.500%(M) | | | | 67 | | | | 103 | | | | — | | | | 103 | | | Goldman Sachs & Co. |
Federal Home Loan Mortgage Corp. | | | 01/30/18 | | | | 1.500%(M) | | | | 7 | | | | 11 | | | | — | | | | 11 | | | Goldman Sachs & Co. |
Flagship | | | 01/22/18 | | | | 1.000%(M) | | | | 189 | | | | 262 | | | | — | | | | 262 | | | Goldman Sachs & Co. |
Flatiron CLO Ltd. | | | 01/22/18 | | | | 1.000%(M) | | | | 157 | | | | 218 | | | | — | | | | 218 | | | Goldman Sachs & Co. |
GS Mortgage Securities Trust | | | 01/30/18 | | | | 1.500%(M) | | | | 267 | | | | 411 | | | | — | | | | 411 | | | Goldman Sachs & Co. |
GS Mortgage Securities Trust | | | 01/30/18 | | | | 1.500%(M) | | | | 235 | | | | 361 | | | | — | | | | 361 | | | Goldman Sachs & Co. |
GS Mortgage Securities Trust | | | 01/30/18 | | | | 1.500%(M) | | | | 98 | | | | 151 | | | | — | | | | 151 | | | Goldman Sachs & Co. |
GS Mortgage Securities Trust | | | 01/30/18 | | | | 1.500%(M) | | | | 90 | | | | 138 | | | | — | | | | 138 | | | Goldman Sachs & Co. |
GS Mortgage Securities Trust | | | 01/30/18 | | | | 1.500%(M) | | | | 69 | | | | 106 | | | | — | | | | 106 | | | Goldman Sachs & Co. |
GS Mortgage Securities Trust | | | 01/30/18 | | | | 1.500%(M) | | | | 51 | | | | 78 | | | | — | | | | 78 | | | Goldman Sachs & Co. |
GS Mortgage Securities Trust | | | 01/30/18 | | | | 1.500%(M) | | | | 39 | | | | 60 | | | | — | | | | 60 | | | Goldman Sachs & Co. |
GSAMP Home Equity | | | 01/05/18 | | | | 1.500%(M) | | | | 226 | | | | 376 | | | | — | | | | 376 | | | Goldman Sachs & Co. |
GSAMP Home Equity | | | 01/05/18 | | | | 1.500%(M) | | | | 185 | | | | 308 | | | | — | | | | 308 | | | Goldman Sachs & Co. |
ICG U.S. CLO Ltd. | | | 01/22/18 | | | | 1.000%(M) | | | | 458 | | | | 635 | | | | — | | | | 635 | | | Goldman Sachs & Co. |
Invesco | | | 01/22/18 | | | | 1.000%(M) | | | | 64 | | | | 89 | | | | — | | | | 89 | | | Goldman Sachs & Co. |
JPMBB Commercial Mortgage Securities Trust | | | 01/30/18 | | | | 1.500%(M) | | | | 139 | | | | 214 | | | | — | | | | 214 | | | Goldman Sachs & Co. |
JPMBB Commercial Mortgage Securities Trust | | | 01/30/18 | | | | 1.500%(M) | | | | 108 | | | | 166 | | | | — | | | | 166 | | | Goldman Sachs & Co. |
JPMBB Commercial Mortgage Securities Trust | | | 01/30/18 | | | | 1.500%(M) | | | | 35 | | | | 54 | | | | — | | | | 54 | | | Goldman Sachs & Co. |
SEE NOTES TO FINANCIAL STATEMENTS.
A63
| | | | | | |
| | DIVERSIFIED BOND PORTFOLIO (continued) | | |
| |
| SCHEDULE OF INVESTMENTS | | as of December 31, 2017 |
Credit default swap agreements outstanding at December 31, 2017 (continued):
| | | | | | | | | | | | | | | | | | | | | | | | | | |
Reference Entity/ Obligation | | Termination
Date | | | Fixed
Rate | | | Notional
Amount
(000)#(3) | | | Fair
Value(4) | | | Upfront
Premiums
Paid
(Received) | | | Unrealized
Appreciation
(Depreciation) | | | Counterparty |
OTC credit default swaps on asset-backed securities—Sell Protection(2)^ (continued): |
JPMBB Commercial Mortgage Securities Trust | | | 01/30/18 | | | | 1.500%(M) | | | | 15 | | | $ | 23 | | | $ | — | | | $ | 23 | | | Goldman Sachs & Co. |
KVK CLO Ltd. | | | 01/22/18 | | | | 1.000%(M) | | | | 71 | | | | 99 | | | | — | | | | 99 | | | Goldman Sachs & Co. |
Lehman Home Equity | | | 01/05/18 | | | | 1.500%(M) | | | | 590 | | | | 983 | | | | — | | | | 983 | | | Goldman Sachs & Co. |
Lehman Home Equity | | | 01/05/18 | | | | 1.500%(M) | | | | 509 | | | | 848 | | | | — | | | | 848 | | | Goldman Sachs & Co. |
Morgan Stanley BAML Trust | | | 01/30/18 | | | | 1.500%(M) | | | | 80 | | | | 123 | | | | — | | | | 123 | | | Goldman Sachs & Co. |
Morgan Stanley BAML Trust | | | 01/30/18 | | | | 1.500%(M) | | | | 63 | | | | 97 | | | | — | | | | 97 | | | Goldman Sachs & Co. |
Morgan Stanley BAML Trust | | | 01/30/18 | | | | 1.500%(M) | | | | 57 | | | | 88 | | | | — | | | | 88 | | | Goldman Sachs & Co. |
Morgan Stanley BAML Trust | | | 01/30/18 | | | | 1.500%(M) | | | | 49 | | | | 75 | | | | — | | | | 75 | | | Goldman Sachs & Co. |
Morgan Stanley BAML Trust | | | 01/30/18 | | | | 1.500%(M) | | | | 40 | | | | 62 | | | | — | | | | 62 | | | Goldman Sachs & Co. |
Morgan Stanley BAML Trust | | | 01/30/18 | | | | 1.500%(M) | | | | 40 | | | | 62 | | | | — | | | | 62 | | | Goldman Sachs & Co. |
Morgan Stanley BAML Trust | | | 01/30/18 | | | | 1.500%(M) | | | | 24 | | | | 37 | | | | — | | | | 37 | | | Goldman Sachs & Co. |
Morgan Stanley Home Equity | | | 01/05/18 | | | | 1.500%(M) | | | | 185 | | | | 308 | | | | — | | | | 308 | | | Goldman Sachs & Co. |
Morgan Stanley Home Equity | | | 01/05/18 | | | | 1.500%(M) | | | | 145 | | | | 241 | | | | — | | | | 241 | | | Goldman Sachs & Co. |
Mountain Hawk CLO Ltd. | | | 01/22/18 | | | | 1.000%(M) | | | | 108 | | | | 150 | | | | — | | | | 150 | | | Goldman Sachs & Co. |
Mountain Hawk CLO Ltd. | | | 01/22/18 | | | | 1.000%(M) | | | | 88 | | | | 122 | | | | — | | | | 122 | | | Goldman Sachs & Co. |
New Century Home Equity | | | 01/05/18 | | | | 1.500%(M) | | | | 387 | | | | 646 | | | | — | | | | 646 | | | Goldman Sachs & Co. |
New Century Home Equity | | | 01/05/18 | | | | 1.500%(M) | | | | 306 | | | | 511 | | | | — | | | | 511 | | | Goldman Sachs & Co. |
New Century Home Equity | | | 01/05/18 | | | | 1.500%(M) | | | | 266 | | | | 443 | | | | — | | | | 443 | | | Goldman Sachs & Co. |
North End CLO Ltd. | | | 01/22/18 | | | | 1.000%(M) | | | | 159 | | | | 220 | | | | — | | | | 220 | | | Goldman Sachs & Co. |
OFSI Fund V Ltd. | | | 01/22/18 | | | | 1.000%(M) | | | | 44 | | | | 62 | | | | — | | | | 62 | | | Goldman Sachs & Co. |
Onex | | | 01/22/18 | | | | 1.000%(M) | | | | 52 | | | | 73 | | | | — | | | | 73 | | | Goldman Sachs & Co. |
Option One Home Equity | | | 01/05/18 | | | | 1.500%(M) | | | | 914 | | | | 1,522 | | | | — | | | | 1,522 | | | Goldman Sachs & Co. |
Option One Home Equity | | | 01/05/18 | | | | 1.500%(M) | | | | 306 | | | | 511 | | | | — | | | | 511 | | | Goldman Sachs & Co. |
Option One Home Equity | | | 01/05/18 | | | | 1.500%(M) | | | | 226 | | | | 301 | | | | — | | | | 301 | | | Goldman Sachs & Co. |
Sankaty | | | 01/22/18 | | | | 1.000%(M) | | | | 116 | | | | 161 | | | | — | | | | 161 | | | Goldman Sachs & Co. |
Sankaty | | | 01/22/18 | | | | 1.000%(M) | | | | 51 | | | | 70 | | | | — | | | | 70 | | | Goldman Sachs & Co. |
Soundview Home Equity Loan Trust | | | 01/05/18 | | | | 1.500%(M) | | | | 711 | | | | 1,185 | | | | — | | | | 1,185 | | | Goldman Sachs & Co. |
Staniford Street CLO Ltd. | | | 01/22/18 | | | | 1.000%(M) | | | | 91 | | | | 163 | | | | — | | | | 163 | | | Goldman Sachs & Co. |
Structured Agency Credit Risk | | | 01/05/18 | | | | 1.500%(M) | | | | 549 | | | | 915 | | | | — | | | | 915 | | | Goldman Sachs & Co. |
Structured Agency Credit Risk | | | 01/05/18 | | | | 1.500%(M) | | | | 40 | | | | 67 | | | | — | | | | 67 | | | Goldman Sachs & Co. |
Trimaran | | | 01/22/18 | | | | 1.000%(M) | | | | 115 | | | | 160 | | | | — | | | | 160 | | | Goldman Sachs & Co. |
Venture CDO Ltd. | | | 01/22/18 | | | | 1.000%(M) | | | | 153 | | | | 212 | | | | — | | | | 212 | | | Goldman Sachs & Co. |
Venture CDO Ltd. | | | 01/22/18 | | | | 1.000%(M) | | | | 119 | | | | 165 | | | | — | | | | 165 | | | Goldman Sachs & Co. |
Wells Fargo Commercial Mortgage Trust | | | 01/30/18 | | | | 1.500%(M) | | | | 87 | | | | 134 | | | | — | | | | 134 | | | Goldman Sachs & Co. |
WF-RBS Commercial Mortgage Trust | | | 01/30/18 | | | | 1.500%(M) | | | | 40 | | | | 62 | | | | — | | | | 62 | | | Goldman Sachs & Co. |
WF-RBS Commercial Mortgage Trust | | | 01/30/18 | | | | 1.500%(M) | | | | 25 | | | | 38 | | | | — | | | | 38 | | | Goldman Sachs & Co. |
Z Capital Credit Partners CLO | | | 01/22/18 | | | | 1.000%(M) | | | | 118 | | | | 164 | | | | — | | | | 164 | | | Goldman Sachs & Co. |
Z Capital Credit Partners CLO | | | 01/22/18 | | | | 1.000%(M) | | | | 81 | | | | 112 | | | | — | | | | 112 | | | Goldman Sachs & Co. |
| | | | | | | | | | | | | | | | | | | | | | | | | | |
| | | | | | | | | | | | | | $ | 30,357 | | | $ | — | | | $ | 30,357 | | | |
| | | | | | | | | | | | | | | | | | | | | | | | | | |
| | | | | | | | | | | | | | | | | | | | | | | | | | | | |
Reference Entity/ Obligation | | Termination
Date | | | Fixed
Rate | | | Notional
Amount
(000)#(3) | | | Implied Credit
Spread at
December 31,
2017(5) | | | Value at
Trade
Date | | | Value at
December 31,
2017 | | | Unrealized
Appreciation
(Depreciation) | |
Centrally cleared credit default swaps on corporate and/or sovereign issues—Sell Protection(2): | |
CIT Group, Inc. | | | 06/20/18 | | | | 5.000%(Q) | | | | 5,350 | | | | 0.071 | % | | $ | 341,965 | | | $ | 134,786 | | | $ | (207,179 | ) |
General Motors Co. | | | 06/20/19 | | | | 5.000%(Q) | | | | 1,925 | | | | 0.120 | % | | | 216,698 | | | | 140,981 | | | | (75,717 | ) |
| | | | | | | | | | | | | | | | | | | | | | | | | | | | |
| | | | | | | | | | | | | | | | | | $ | 558,663 | | | $ | 275,767 | | | $ | (282,896 | ) |
| | | | | | | | | | | | | | | | | | | | | | | | | | | | |
SEE NOTES TO FINANCIAL STATEMENTS.
A64
| | | | | | |
| | DIVERSIFIED BOND PORTFOLIO (continued) | | |
| |
| SCHEDULE OF INVESTMENTS | | as of December 31, 2017 |
| | | | | | | | | | | | | | | | | | | | | | | | | | | | | | |
Reference Entity/
Obligation | | Termination
Date | | | Fixed
Rate | | | Notional
Amount
(000)#(3) | | | Implied
Credit
Spread at
December 31,
2017(5) | | | Fair
Value | | | Upfront
Premiums
Paid
(Received) | | | Unrealized
Appreciation
(Depreciation) | | | Counterparty |
OTC credit default swaps on corporate and/or sovereign Issues —Sell Protection(2): |
Hellenic Republic | | | 06/20/22 | | | | 1.000%(Q) | | | | 1,020 | | | | 3.751 | % | | $ | (108,820 | ) | | $ | (176,063 | ) | | $ | 67,243 | | | Citigroup Global Markets |
Hellenic Republic | | | 06/20/22 | | | | 1.000%(Q) | | | | 260 | | | | 3.751 | % | | | (27,739 | ) | | | (46,151 | ) | | | 18,412 | | | Goldman Sachs & Co. |
Hellenic Republic | | | 06/20/24 | | | | 1.000%(Q) | | | | 500 | | | | 4.021 | % | | | (78,080 | ) | | | (108,125 | ) | | | 30,045 | | | Barclays Capital Group |
Petroleo Brasileriro SA | | | 06/20/18 | | | | 1.000%(Q) | | | | 2,250 | | | | 0.526 | % | | | 5,828 | | | | (172,518 | ) | | | 178,346 | | | Morgan Stanley |
Republic of Italy | | | 09/20/20 | | | | 1.000%(Q) | | | | 9,680 | | | | 0.816 | % | | | 50,471 | | | | 44,911 | | | | 5,560 | | | JPMorgan Chase |
Republic of Italy | | | 09/20/20 | | | | 1.000%(Q) | | | | 2,000 | | | | 0.816 | % | | | 10,428 | | | | 5,761 | | | | 4,667 | | | JPMorgan Chase |
| | | | | | | | | | | | | | | | | | | | | | | | | | | | | | |
| | | | | | | | | | | | | | | | | | $ | (147,912 | ) | | $ | (452,185 | ) | | $ | 304,273 | | | |
| | | | | | | | | | | | | | | | | | | | | | | | | | | | | | |
| | | | | | | | | | | | | | | | | | | | | | | | |
Reference Entity/ Obligation | | Termination
Date | | | Fixed
Rate | | | Notional
Amount
(000)#(3) | | | Value at
Trade Date | | | Value at
December 31,
2017(4) | | | Unrealized
Appreciation
(Depreciation) | |
Centrally cleared credit default swaps on credit indices—Buy Protection(1): | |
CDX.NA.HY.29.V1 | | | 12/20/22 | | | | 5.000%(Q) | | | | 13,900 | | | $ | (1,020,496 | ) | | $ | (1,174,712 | ) | | $ | (154,216 | ) |
| | | | | | | | | | | | | | | | | | | | | | | | |
| | | | | | | | | | | | | | | | | | | | | | | | | | |
Reference Entity/ Obligation | | Termination
Date | | | Fixed
Rate | | | Notional
Amount
(000)#(3) | | | Fair
Value(4) | | | Upfront
Premiums
Paid
(Received) | | | Unrealized
Appreciation
(Depreciation) | | | Counterparty |
OTC credit default swaps on credit indices—Buy Protection(1): |
CMBX.NA.10.AAA | | | 11/17/59 | | | | 0.500%(M) | | | | 6,000 | | | $ | 11,741 | | | $ | 68,925 | | | $ | (57,184 | ) | | Deutsche Bank AG |
| | | | | | | | | | | | | | | | | | | | | | | | | | |
| | | | | | | |
Reference Entity/ Obligation | | Termination
Date | | | Fixed
Rate | | | Notional
Amount
(000)#(3) | | | Fair
Value(4) | | | Upfront
Premiums
Paid
(Received) | | | Unrealized
Appreciation
(Depreciation) | | | Counterparty |
|
OTC credit default swaps on credit indices—Sell Protection(2): |
CMBX.NA.6.AA | | | 05/11/63 | | | | 1.500%(M) | | | | 650 | | | $ | (3,498 | ) | | $ | (2,368 | ) | | $ | (1,130 | ) | | Deutsche Bank AG |
CMBX.NA.6.AA | | | 05/11/63 | | | | 1.500%(M) | | | | 3,000 | | | | (16,147 | ) | | | (1,485 | ) | | | (14,662 | ) | | Goldman Sachs & Co. |
| | | | | | | | | | | | | | | | | | | | | | | | | | |
| | | | | | | | | | | | | | $ | (19,645 | ) | | $ | (3,853 | ) | | $ | (15,792 | ) | | |
| | | | | | | | | | | | | | | | | | | | | | | | | | |
The Portfolio entered into credit default swaps (“CDS”) to provide a measure of protection against defaults or to take an active long or short position with respect to the likelihood of a particular issuer’s default or the reference entity’s credit soundness. CDS contracts generally trade based on a spread which represents the cost a protection buyer has to pay the protection seller. The protection buyer is said to be short the credit as the value of the contract rises the more the credit deteriorates. The value of the CDS contract increases for the protection buyer if the spread increases.
| (1) | If the Portfolio is a buyer of protection, it pays the fixed rate. When a credit event occurs, as defined under the terms of that particular swap agreement, the Portfolio will either (i) receive from the seller of protection an amount equal to the notional amount of the swap and make delivery of the referenced obligation or underlying securities comprising the referenced index or (ii) receive a net settlement amount in the form of cash or securities equal to the notional amount of the swap less the recovery value of the referenced obligation or underlying securities comprising the referenced index. |
| (2) | If the Portfolio is a seller of protection, it receives the fixed rate. When a credit event occurs, as defined under the terms of that particular swap agreement, the Portfolio will either (i) pay to the buyer of protection an amount equal to the notional amount and take delivery of the referenced obligation or underlying securities comprising the referenced index or (ii) pay a net settlement amount in the form of cash or securities equal to the notional amount of the swap less the recovery value of the referenced obligation or underlying securities comprising the referenced index. |
| (3) | Notional amount represents the maximum potential amount the Portfolio could be required to pay as a seller of credit protection or receive as a buyer of credit protection if a credit event occurs as defined under the terms of that particular swap agreement. |
| (4) | The fair value of credit default swap agreements on credit indices and asset-backed securities serves as an indicator of the current status of the payment/performance risk and represents the likelihood of an expected liability (or profit) for the credit derivative should the notional amount of the swap agreement be closed/sold as of the reporting date. Increasing fair value in absolute terms, when compared to the notional amount of the swap, represents a deterioration of the referenced entity’s credit soundness and a greater likelihood of risk of default or other credit event occurring as defined under the terms of the agreement. |
SEE NOTES TO FINANCIAL STATEMENTS.
A65
| | | | | | |
| | DIVERSIFIED BOND PORTFOLIO (continued) | | |
| |
| SCHEDULE OF INVESTMENTS | | as of December 31, 2017 |
| (5) | Implied credit spreads, represented in absolute terms, utilized in determining the fair value of credit default swap agreements on corporate issues or sovereign issues of an emerging country as of the reporting date serve as an indicator of the current status of the payment/performance risk and represent the likelihood of risk of default for the credit derivative. The implied credit spread of a particular referenced entity reflects the cost of buying/selling protection and may include up-front payments required to be made to enter into the agreement. Wider credit spreads represent a deterioration of the referenced entity’s credit soundness and a greater likelihood of risk of default or other credit event occurring as defined under the terms of the agreement. |
Currency swap agreements outstanding at December 31, 2017:
| | | | | | | | | | | | | | | | | | | | | | | | | | | | | | |
Notional
Amount
(000)# | | | Fund
Receives | | Notional
Amount
(000)# | | | Fund Pays | | Counterparty | | Termination
Date | | Fair
Value | | | Upfront
Premiums
Paid
(Received) | | | Unrealized
Appreciation
(Depreciation) | |
| | OTC currency swap agreements: | |
| | 1,003 | | | 3 Month
LIBOR(Q) | | | EUR | | | | 900 | | | (0.613)%(A) | | JPMorgan Chase | | 02/22/20 | | $ | (67,751 | ) | | $ | �� | | | $ | (67,751 | ) |
| | JPY 2,297,800 | | | 3 Month JPY
LIBOR minus 52 bps(Q) | | | | | | | 20,189 | | | 3 Month
LIBOR(Q) | | UBS AG | | 11/10/18 | | | 118,108 | | | | — | | | | 118,108 | |
| | 20,189 | | | 3 Month
LIBOR(Q) | | | JPY | | | | 2,297,800 | | | 3 Month JPY
LIBOR minus 57.25 bps(Q) | | UBS AG | | 11/10/19 | | | (110,733 | ) | | | — | | | | (110,733 | ) |
| | | | | | | | | | | | | | | | | | | | | | | | | | | | | | |
| | | | | | | | | | | | | | | | | | | | $ | (60,376 | ) | | $ | — | | | $ | (60,376 | ) |
| | | | | | | | | | | | | | | | | | | | | | | | | | | | | | |
Inflation Swap Agreements outstanding at December 31, 2017:
| | | | | | | | | | | | | | | | | | | | | | | | |
Notional
Amount
(000)# | | | Termination
Date | | | Fixed
Rate | | | Floating Rate | | Value at
Trade Date | | | Value at
December 31, 2017 | | | Unrealized
Appreciation
(Depreciation) | |
| | Centrally cleared swap agreements: | | | | | | | | | | | | |
| EUR | 4,060 | | | | 08/15/22 | | | | 1.240%(T) | | | Eurostat Eurozone HICP ex Tobacco(2)(T) | | $ | — | | | $ | (45,931 | ) | | $ | (45,931 | ) |
| EUR | 3,750 | | | | 09/15/22 | | | | 1.260%(T) | | | Eurostat Eurozone HICP ex Tobacco(2)(T) | | | — | | | | (39,611 | ) | | | (39,611 | ) |
| EUR | 2,035 | | | | 08/15/27 | | | | 1.415%(T) | | | Eurostat Eurozone HICP ex Tobacco(1)(T) | | | — | | | | 37,526 | | | | 37,526 | |
| EUR | 1,825 | | | | 09/15/27 | | | | 1.438%(T) | | | Eurostat Eurozone HICP ex Tobacco(1)(T) | | | — | | | | 29,894 | | | | 29,894 | |
| GBP | 1,205 | | | | 08/15/24 | | | | 3.346%(T) | | | U.K. Retail Price Index(2)(T) | | | — | | | | (2,541 | ) | | | (2,541 | ) |
| GBP | 1,585 | | | | 08/15/27 | | | | 3.344%(T) | | | U.K. Retail Price Index(1)(T) | | | — | | | | 17,939 | | | | 17,939 | |
| GBP | 635 | | | | 08/15/29 | | | | 3.380%(T) | | | U.K. Retail Price Index(2)(T) | | | — | | | | (8,247 | ) | | | (8,247 | ) |
| GBP | 1,145 | | | | 07/15/32 | | | | 3.513%(T) | | | U.K. Retail Price Index(2)(T) | | | — | | | | 2,757 | | | | 2,757 | |
| GBP | 1,215 | | | | 07/15/37 | | | | 3.515%(T) | | | U.K. Retail Price Index(2)(T) | | | — | | | | (17,869 | ) | | | (17,869 | ) |
| GBP | 1,010 | | | | 08/15/42 | | | | 3.520%(T) | | | U.K. Retail Price Index(2)(T) | | | (3,721 | ) | | | (25,343 | ) | | | (21,622 | ) |
| GBP | 610 | | | | 07/15/47 | | | | 3.458%(T) | | | U.K. Retail Price Index(1)(T) | | | (40,028 | ) | | | 27,703 | | | | 67,731 | |
| GBP | 350 | | | | 08/15/47 | | | | 3.469%(T) | | | U.K. Retail Price Index(1)(T) | | | — | | | | 12,461 | | | | 12,461 | |
| GBP | 190 | | | | 10/15/47 | | | | 3.535%(T) | | | U.K. Retail Price Index(2)(T) | | | — | | | | 6,012 | | | | 6,012 | |
| GBP | 325 | | | | 07/15/57 | | | | 3.325%(T) | | | U.K. Retail Price Index(1)(T) | | | — | | | | 24,150 | | | | 24,150 | |
| GBP | 255 | | | | 08/15/57 | | | | 3.363%(T) | | | U.K. Retail Price Index(1)(T) | | | — | | | | 6,400 | | | | 6,400 | |
| GBP | 120 | | | | 10/15/57 | | | | 3.418%(T) | | | U.K. Retail Price Index(1)(T) | | | — | | | | (8,054 | ) | | | (8,054 | ) |
| | 3,650 | | | | 10/25/27 | | | | 2.160%(T) | | | U.S. CPI Urban Consumers NSA Index(2)(T) | | | 85 | | | | (34,366 | ) | | | (34,451 | ) |
| | | | | | | | | | | | | | | | | | | | | | | | |
| | | | | | | | | | | | | | $ | (43,664 | ) | | $ | (17,120 | ) | | $ | 26,544 | |
| | | | | | | | | | | | | | | | | | | | | | | | |
| (1) | The Portfolio pays the fixed rate and receives the floating rate. |
| (2) | The Portfolio pays the floating rate and receives the fixed rate. |
Interest rate swap agreements outstanding at December 31, 2017:
| | | | | | | | | | | | | | | | | | | | | | | | |
Notional
Amount
(000)# | | | Termination
Date | | | Fixed Rate | | | Floating Rate | | Value at
Trade Date | | | Value at
December 31, 2017 | | | Unrealized
Appreciation
(Depreciation) | |
| | Centrally cleared swap agreements: | | | | | | | | | | | | |
| AUD | 11,880 | | | | 09/25/22 | | | | 2.958%(S) | | | 6 Month BBSW(2)(S) | | $ | 1,076 | | | $ | 31,946 | | | $ | 30,870 | |
| AUD | 9,330 | | | | 09/28/22 | | | | 2.988%(S) | | | 6 Month BBSW(2)(S) | | | (156 | ) | | | 28,903 | | | | 29,059 | |
| AUD | 1,655 | | | | 07/19/32 | | | | 3.130%(S) | | | 6 Month BBSW(2)(S) | | | (854 | ) | | | 29,924 | | | | 30,778 | |
| BRL | 47,180 | | | | 01/02/19 | | | | 7.280%(T) | | | 1 Day BROIS(1)(T) | | | — | | | | (48,785 | ) | | | (48,785 | ) |
| BRL | 28,485 | | | | 01/02/19 | | | | 7.280%(T) | | | 1 Day BROIS(1)(T) | | | — | | | | (29,725 | ) | | | (29,725 | ) |
| BRL | 25,346 | | | | 01/04/21 | | | | 10.300%(T) | | | 1 Day BROIS(2)(T) | | | — | | | | 387,618 | | | | 387,618 | |
| BRL | 12,351 | | | | 01/04/21 | | | | 10.250%(T) | | | 1 Day BROIS(2)(T) | | | — | | | | 182,146 | | | | 182,146 | |
| BRL | 12,798 | | | | 01/04/21 | | | | 10.000%(T) | | | 1 Day BROIS(2)(T) | | | — | | | | 153,036 | | | | 153,036 | |
SEE NOTES TO FINANCIAL STATEMENTS.
A66
| | | | | | |
| | DIVERSIFIED BOND PORTFOLIO (continued) | | |
| |
| SCHEDULE OF INVESTMENTS | | as of December 31, 2017 |
Interest rate swap agreements outstanding at December 31, 2017 (continued):
| | | | | | | | | | | | | | | | | | | | | | | | |
Notional
Amount
(000)# | | | Termination
Date | | | Fixed Rate | | | Floating Rate | | Value at
Trade Date | | | Value at
December 31, 2017 | | | Unrealized
Appreciation
(Depreciation) | |
| | Centrally cleared swap agreements (continued): | | | | | | | | | | | | |
| BRL | 8,070 | | | | 01/04/21 | | | | 10.050%(T) | | | 1 Day BROIS(2)(T) | | $ | — | | | $ | 100,809 | | | $ | 100,809 | |
| BRL | 18,735 | | | | 01/04/21 | | | | 9.470%(T) | | | 1 Day BROIS(1)(T) | | | — | | | | (127,111 | ) | | | (127,111 | ) |
| BRL | 18,970 | | | | 01/04/21 | | | | 9.350%(T) | | | 1 Day BROIS(1)(T) | | | — | | | | (104,047 | ) | | | (104,047 | ) |
| BRL | 35,249 | | | | 01/04/21 | | | | 8.670%(T) | | | 1 Day BROIS(2)(T) | | | — | | | | (55,206 | ) | | | (55,206 | ) |
| BRL | 21,376 | | | | 01/04/21 | | | | 8.660%(T) | | | 1 Day BROIS(2)(T) | | | — | | | | (35,615 | ) | | | (35,615 | ) |
| BRL | 10,735 | | | | 01/02/23 | | | | 9.280%(T) | | | 1 Day BROIS(1)(T) | | | — | | | | 70,526 | | | | 70,526 | |
| BRL | 6,412 | | | | 01/02/23 | | | | 9.260%(T) | | | 1 Day BROIS(1)(T) | | | — | | | | 42,438 | | | | 42,438 | |
| BRL | 7,815 | | | | 01/02/25 | | | | 10.040%(T) | | | 1 Day BROIS(2)(T) | | | — | | | | (1,362 | ) | | | (1,362 | ) |
| BRL | 7,875 | | | | 01/02/25 | | | | 9.920%(T) | | | 1 Day BROIS(2)(T) | | | — | | | | (24,484 | ) | | | (24,484 | ) |
| CAD | 31,920 | | | | 07/26/19 | | | | 1.605%(S) | | | 3 Month Canadian Bankers Acceptance(2)(S) | | | 3,014 | | | | (112,233 | ) | | | (115,247 | ) |
| CHF | 2,520 | | | | 10/12/27 | | | | 0.746%(A) | | | 6 Month CHF LIBOR(1)(S) | | | — | | | | (11,391 | ) | | | (11,391 | ) |
| EUR | 9,735 | | | | 05/11/19 | | | | (0.144%)(A) | | | 6 Month EURIBOR(1)(S) | | | (17,481 | ) | | | (7,683 | ) | | | 9,798 | |
| EUR | 1,420 | | | | 05/11/21 | | | | 0.100%(A) | | | 6 Month EURIBOR(1)(S) | | | (3,472 | ) | | | (3,634 | ) | | | (162 | ) |
| EUR | 14,585 | | | | 05/11/22 | | | | 0.156%(A) | | | 6 Month EURIBOR(1)(S) | | | 1,015 | | | | 24,414 | | | | 23,399 | |
| EUR | 2,620 | | | | 05/11/24 | | | | 0.396%(A) | | | 6 Month EURIBOR(1)(S) | | | 15,866 | | | | 8,382 | | | | (7,484 | ) |
| EUR | 3,430 | | | | 05/11/25 | | | | 0.650%(A) | | | 6 Month EURIBOR(1)(S) | | | (13,414 | ) | | | (33,447 | ) | | | (20,033 | ) |
| EUR | 3,815 | | | | 05/11/26 | | | | 0.750%(A) | | | 6 Month EURIBOR(1)(S) | | | (5,568 | ) | | | (38,234 | ) | | | (32,666 | ) |
| EUR | 14,505 | | | | 08/15/26 | | | | 0.634%(A) | | | 1 Day EONIA(1)(A) | | | 4,239 | | | | (149,807 | ) | | | (154,046 | ) |
| EUR | 16,370 | | | | 08/15/26 | | | | 0.655%(A) | | | 1 Day EONIA(1)(A) | | | (5,957 | ) | | | (205,376 | ) | | | (199,419 | ) |
| EUR | 1,910 | | | | 05/11/27 | | | | 0.736%(A) | | | 6 Month EURIBOR(2)(S) | | | (23,253 | ) | | | (5,333 | ) | | | 17,920 | |
| EUR | 2,340 | | | | 10/12/27 | | | | 1.556%(A) | | | 6 Month EURIBOR(2)(S) | | | — | | | | 16,079 | | | | 16,079 | |
| EUR | 4,140 | | | | 02/15/30 | | | | 1.124%(A) | | | 6 Month EURIBOR(1)(S) | | | (990 | ) | | | (61,694 | ) | | | (60,704 | ) |
| EUR | 1,640 | | | | 05/11/30 | | | | 0.850%(A) | | | 6 Month EURIBOR(1)(S) | | | 60,674 | | | | 42,575 | | | | (18,099 | ) |
| EUR | 6,790 | | | | 10/04/32 | | | | 2.000%(A) | | | 1 Day EONIA(2)(A) | | | — | | | | 28,247 | | | | 28,247 | |
| EUR | 6,790 | | | | 10/04/32 | | | | 2.080%(A) | | | 3 Month EURIBOR(1)(Q) | | | — | | | | (38,546 | ) | | | (38,546 | ) |
| EUR | 5 | | | | 05/11/35 | | | | 1.050%(A) | | | 6 Month EURIBOR(1)(S) | | | 357 | | | | 239 | | | | (118 | ) |
| EUR | 550 | | | | 04/11/36 | | | | 0.962%(A) | | | 6 Month EURIBOR(1)(S) | | | 179 | | | | 40,330 | | | | 40,151 | |
| EUR | 695 | | | | 05/11/36 | | | | 1.050%(A) | | | 6 Month EURIBOR(1)(S) | | | 55,756 | | | | 39,435 | | | | (16,321 | ) |
| EUR | 230 | | | | 05/11/37 | | | | 1.253%(A) | | | 6 Month EURIBOR(1)(S) | | | 10,209 | | | | 4,683 | | | | (5,526 | ) |
| EUR | 9,795 | | | | 08/24/37 | | | | 1.960%(A) | | | 1 Day EONIA(2)(A) | | | — | | | | 35,228 | | | | 35,228 | |
| EUR | 9,795 | | | | 08/24/37 | | | | 2.033%(A) | | | 3 Month EURIBOR(1)(Q) | | | (1,069 | ) | | | (61,778 | ) | | | (60,709 | ) |
| EUR | 6,100 | | | | 10/25/37 | | | | 2.085%(A) | | | 3 Month EURIBOR(2)(Q) | | | — | | | | 50,982 | | | | 50,982 | |
| EUR | 6,100 | | | | 10/25/37 | | | | 2.114%(A) | | | 6 Month EURIBOR(1)(S) | | | — | | | | (51,544 | ) | | | (51,544 | ) |
| EUR | 1,780 | | | | 07/04/42 | | | | 1.416%(A) | | | 1 Day EONIA(2)(A) | | | (5,480 | ) | | | 45,507 | | | | 50,987 | |
| EUR | 5,945 | | | | 07/04/42 | | | | 1.438%(A) | | | 1 Day EONIA(2)(A) | | | — | | | | 187,389 | | | | 187,389 | |
| GBP | 213,735 | | | | 02/08/18 | | | | 0.442%(T) | | | 1 Day SONIA(1)(T) | | | — | | | | 13,103 | | | | 13,103 | |
| GBP | 44,480 | | | | 11/18/20 | | | | 1.127%(S) | | | 6 Month GBP LIBOR(2)(S) | | | — | | | | 31,787 | | | | 31,787 | |
| GBP | 1,995 | | | | 05/08/21 | | | | 0.716%(S) | | | 6 Month GBP LIBOR(1)(S) | | | 23,776 | | | | 17,468 | | | | (6,308 | ) |
| GBP | 44,830 | | | | 11/16/21 | | | | 1.257%(S) | | | 6 Month GBP LIBOR(1)(S) | | | — | | | | (42,056 | ) | | | (42,056 | ) |
| GBP | 2,960 | | | | 12/07/27 | | | | 1.350%(S) | | | 6 Month GBP LIBOR(1)(S) | | | 956 | | | | (22,520 | ) | | | (23,476 | ) |
| GBP | 1,410 | | | | 07/06/32 | | | | 1.933%(S) | | | 6 Month GBP LIBOR(2)(S) | | | — | | | | 58,091 | | | | 58,091 | |
| GBP | 5,010 | | | | 10/30/32 | | | | 1.633%(S) | | | 6 Month GBP LIBOR(2)(S) | | | 1,183 | | | | 225,012 | | | | 223,829 | |
| GBP | 1,695 | | | | 07/06/42 | | | | 1.850%(S) | | | 6 Month GBP LIBOR(1)(S) | | | — | | | | (56,484 | ) | | | (56,484 | ) |
| GBP | 2,810 | | | | 10/30/47 | | | | 1.680%(S) | | | 6 Month GBP LIBOR(1)(S) | | | — | | | | (246,009 | ) | | | (246,009 | ) |
| JPY | 2,650,595 | | | | 12/20/24 | | | | 0.126%(S) | | | 6 Month JPY LIBOR(2)(S) | | | (36,843 | ) | | | (102,843 | ) | | | (66,000 | ) |
| | 43,740 | | | | 01/07/18 | | | | 1.093%(T) | | | 1 Day USOIS(1)(T) | | | — | | | | 8,574 | | | | 8,574 | |
| | 52,160 | | | | 02/21/18 | | | | 0.941%(T) | | | 1 Day USOIS(1)(T) | | | 267 | | | | 78,300 | | | | 78,033 | |
| | 45,150 | | | | 09/30/18 | | | | 0.655%(A) | | | 1 Day USOIS(1)(A) | | | 252 | | | | 363,692 | | | | 363,440 | |
| | 22,510 | | | | 09/30/18 | | | | 0.747%(A) | | | 1 Day USOIS(1)(A) | | | 200 | | | | 160,449 | | | | 160,249 | |
| | 14,465 | | | | 10/07/18 | | | | 1.253%(A) | | | 1 Day USOIS(1)(A) | | | — | | | | 33,369 | | | | 33,369 | |
| | 55,120 | | | | 11/17/18 | | | | 1.080%(T) | | | 1 Day USOIS(1)(T) | | | 274 | | | | 275,101 | | | | 274,827 | |
| | 82,865 | | | | 11/18/18 | | | | 0.911%(A) | | | 1 Day USOIS(1)(A) | | | (4,269 | ) | | | 554,112 | | | | 558,381 | |
| | 14,825 | | | | 03/31/19 | | | | 1.431%(A) | | | 1 Day USOIS(1)(A) | | | — | | | | 28,703 | | | | 28,703 | |
| | 14,618 | | | | 03/31/19 | | | | 1.431%(A) | | | 1 Day USOIS(1)(A) | | | — | | | | 28,113 | | | | 28,113 | |
| | 6,015 | | | | 06/30/19 | | | | 1.486%(A) | | | 1 Day USOIS(1)(A) | | | — | | | | 18,489 | | | | 18,489 | |
| | 28,605 | | | | 06/30/19 | | | | 1.502%(A) | | | 1 Day USOIS(1)(A) | | | (13,977 | ) | | | 80,063 | | | | 94,040 | |
| | 11,650 | | | | 07/14/19 | | | | 1.428%(A) | | | 1 Day USOIS(1)(A) | | | — | | | | 41,149 | | | | 41,149 | |
SEE NOTES TO FINANCIAL STATEMENTS.
A67
| | | | | | |
| | DIVERSIFIED BOND PORTFOLIO (continued) | | |
| |
| SCHEDULE OF INVESTMENTS | | as of December 31, 2017 |
Interest rate swap agreements outstanding at December 31, 2017 (continued):
| | | | | | | | | | | | | | | | | | | | | | | | |
Notional
Amount
(000)# | | | Termination
Date | | | Fixed
Rate | | | Floating Rate | | Value at
Trade Date | | | Value at
December 31, 2017 | | | Unrealized
Appreciation
(Depreciation) | |
| | Centrally cleared swap agreements (continued): | | | | | | | | | | | | |
| | 28,185 | | | | 09/08/19 | | | | 1.290%(A) | | | 1 Day USOIS(1)(A) | | $ | — | | | $ | 217,884 | | | $ | 217,884 | |
| | 36,580 | | | | 09/30/19 | | | | 1.707%(A) | | | 1 Day USOIS(1)(A) | | | 10,331 | | | | 63,147 | | | | 52,816 | |
| | 54,465 | | | | 12/31/19 | | | | 1.840%(A) | | | 1 Day USOIS(1)(A) | | | (6,814 | ) | | | 53,347 | | | | 60,161 | |
| | 1,575 | | | | 03/11/20 | | | | 1.824%(S) | | | 3 Month LIBOR(1)(Q) | | | 28 | | | | 1,555 | | | | 1,527 | |
| | 13,970 | | | | 04/04/20 | | | | —(3)(S) | | | —(3)(S) | | | — | | | | 402 | | | | 402 | |
| | 13,600 | | | | 07/17/20 | | | | 1.521%(A) | | | 1 Day USOIS(1)(A) | | | — | | | | 92,985 | | | | 92,985 | |
| | 1,960 | | | | 08/31/21 | | | | 2.015%(S) | | | 3 Month LIBOR(1)(Q) | | | (5,595 | ) | | | 1,536 | | | | 7,131 | |
| | 7,255 | | | | 04/04/22 | | | | —(4)(S) | | | —(4)(S) | | | — | | | | (2,428 | ) | | | (2,428 | ) |
| | 13,290 | | | | 08/31/22 | | | | 1.788%(S) | | | 3 Month LIBOR(1)(Q) | | | 159 | | | | 193,221 | | | | 193,062 | |
| | 4,495 | | | | 09/28/22 | | | | 2.177%(S) | | | 3 Month LIBOR(1)(Q) | | | — | | | | 14,076 | | | | 14,076 | |
| | 40,350 | | | | 11/01/22 | | | | 1.815%(S) | | | 3 Month LIBOR(2)(Q) | | | — | | | | (745,314 | ) | | | (745,314 | ) |
| | 5,800 | | | | 12/31/22 | | | | 1.405%(S) | | | 3 Month LIBOR(1)(Q) | | | 181 | | | | 249,468 | | | | 249,287 | |
| | 4,400 | | | | 12/31/22 | | | | 1.406%(S) | | | 3 Month LIBOR(1)(Q) | | | 174 | | | | 188,944 | | | | 188,770 | |
| | 2,400 | | | | 12/31/22 | | | | 1.412%(S) | | | 3 Month LIBOR(1)(Q) | | | 163 | | | | 102,469 | | | | 102,306 | |
| | 12,100 | | | | 12/31/22 | | | | 1.416%(S) | | | 3 Month LIBOR(1)(Q) | | | 216 | | | | 514,086 | | | | 513,870 | |
| | 4,850 | | | | 12/31/22 | | | | 1.495%(S) | | | 3 Month LIBOR(1)(Q) | | | 177 | | | | 187,809 | | | | 187,632 | |
| | 10,495 | | | | 05/31/23 | | | | 1.394%(S) | | | 3 Month LIBOR(1)(Q) | | | 208 | | | | 461,402 | | | | 461,194 | |
| | 10,495 | | | | 05/31/23 | | | | 1.395%(S) | | | 3 Month LIBOR(1)(Q) | | | 207 | | | | 460,806 | | | | 460,599 | |
| | 10,290 | | | | 05/31/23 | | | | 1.513%(S) | | | 3 Month LIBOR(1)(Q) | | | 207 | | | | 388,610 | | | | 388,403 | |
| | 8,910 | | | | 05/31/23 | | | | 1.578%(S) | | | 3 Month LIBOR(1)(Q) | | | (16,959 | ) | | | 306,148 | | | | 323,107 | |
| | 3,950 | | | | 05/31/23 | | | | 1.584%(S) | | | 3 Month LIBOR(1)(Q) | | | 172 | | | | 134,585 | | | | 134,413 | |
| | 30,918 | | | | 11/15/23 | | | | 2.209%(S) | | | 3 Month LIBOR(1)(Q) | | | 298 | | | | 68,836 | | | | 68,538 | |
| | 6,920 | | | | 02/15/24 | | | | 2.115%(S) | | | 3 Month LIBOR(1)(Q) | | | 16,359 | | | | 21,956 | | | | 5,597 | |
| | 16,137 | | | | 02/15/24 | | | | 2.151%(S) | | | 3 Month LIBOR(1)(Q) | | | (17,629 | ) | | | 15,724 | | | | 33,353 | |
| | 19,590 | | | | 02/15/24 | | | | 2.183%(S) | | | 3 Month LIBOR(1)(Q) | | | (27,672 | ) | | | (19,982 | ) | | | 7,690 | |
| | 3,650 | | | | 05/15/24 | | | | 1.808%(A) | | | 1 Day USOIS(1)(A) | | | — | | | | 32,886 | | | | 32,886 | |
| | 11,070 | | | | 08/15/24 | | | | 2.168%(S) | | | 3 Month LIBOR(1)(Q) | | | — | | | | 88,195 | | | | 88,195 | |
| | 97,585 | | | | 08/15/24 | | | | 2.170%(S) | | | 3 Month LIBOR(1)(Q) | | | 368,219 | | | | 746,436 | | | | 378,217 | |
| | 29,940 | | | | 08/15/24 | | | | 2.176%(S) | | | 3 Month LIBOR(1)(Q) | | | 102,545 | | | | 225,092 | | | | 122,547 | |
| | 9,230 | | | | 09/01/24 | | | | 1.972%(S) | | | 3 Month LIBOR(2)(Q) | | | — | | | | (137,138 | ) | | | (137,138 | ) |
| | 20,655 | | | | 11/15/24 | | | | 2.334%(S) | | | 3 Month LIBOR(1)(Q) | | | 23,944 | | | | (2,149 | ) | | | (26,093 | ) |
| | 15,934 | | | | 02/15/27 | | | | 1.824%(A) | | | 1 Day USOIS(1)(A) | | | 211,227 | | | | 267,011 | | | | 55,784 | |
| | 6,555 | | | | 02/15/27 | | | | 1.899%(A) | | | 1 Day USOIS(1)(A) | | | 7,830 | | | | 67,229 | | | | 59,399 | |
| | 2,515 | | | | 02/15/27 | | | | 1.965%(A) | | | 1 Day USOIS(1)(A) | | | — | | | | 11,468 | | | | 11,468 | |
| | 7,480 | | | | 02/15/27 | | | | 2.067%(A) | | | 1 Day USOIS(1)(A) | | | (5,086 | ) | | | (32,471 | ) | | | (27,385 | ) |
| | 5,020 | | | | 05/08/27 | | | | 2.309%(S) | | | 3 Month LIBOR(1)(Q) | | | — | | | | 21,499 | | | | 21,499 | |
| | 3,295 | | | | 05/15/27 | | | | 1.823%(A) | | | 1 Day USOIS(1)(A) | | | — | | | | 63,852 | | | | 63,852 | |
| | 2,095 | | | | 05/15/27 | | | | 2.295%(S) | | | 3 Month LIBOR(1)(Q) | | | — | | | | 14,801 | | | | 14,801 | |
| | 9,930 | | | | 05/03/32 | | | | 2.434%(S) | | | 3 Month LIBOR(2)(Q) | | | — | | | | (37,082 | ) | �� | | (37,082 | ) |
| | 15,525 | | | | 02/15/36 | | | | 2.338%(S) | | | 3 Month LIBOR(2)(Q) | | | (102,774 | ) | | | (356,818 | ) | | | (254,044 | ) |
| | 7,865 | | | | 05/03/37 | | | | 2.508%(S) | | | 3 Month LIBOR(1)(Q) | | | — | | | | 9,875 | | | | 9,875 | |
| | 2,905 | | | | 02/15/42 | | | | 1.369%(A) | | | 1 Day USOIS(1)(A) | | | 203 | | | | 421,369 | | | | 421,166 | |
| | 3,090 | | | | 10/04/42 | | | | 2.527%(S) | | | 3 Month LIBOR(2)(Q) | | | — | | | | (311 | ) | | | (311 | ) |
| | 580 | | | | 11/15/43 | | | | 2.659%(S) | | | 3 Month LIBOR(1)(Q) | | | — | | | | (11,954 | ) | | | (11,954 | ) |
| | 1,835 | | | | 09/27/46 | | | | 1.380%(A) | | | 1 Day USOIS(1)(A) | | | 183 | | | | 302,194 | | | | 302,011 | |
| | 2,720 | | | | 10/04/47 | | | | 2.536%(S) | | | 3 Month LIBOR(1)(Q) | | | — | | | | (4,121 | ) | | | (4,121 | ) |
| | 1,100 | | | | 04/09/48 | | | | 2.545%(S) | | | 3 Month LIBOR(1)(Q) | | | — | | | | 1,558 | | | | 1,558 | |
| | 1,020 | | | | 05/08/48 | | | | 2.627%(S) | | | 3 Month LIBOR(1)(Q) | | | — | | | | (16,227 | ) | | | (16,227 | ) |
| ZAR | 57,330 | | | | 09/23/22 | | | | 7.430%(Q) | | | 3 Month JIBAR(2)(Q) | | | (5,190 | ) | | | (15,655 | ) | | | (10,465 | ) |
| ZAR | 26,700 | | | | 11/07/27 | | | | 8.360%(Q) | | | 3 Month JIBAR(2)(Q) | | | (28 | ) | | | 71,237 | | | | 71,265 | |
| | | | | | | | | | | | | | | | | | | | | | | | |
| | | | | | | | | | | | | | $ | 601,794 | | | $ | 6,591,512 | | | $ | 5,989,718 | |
| | | | | | | | | | | | | | | | | | | | | | | | |
Cash of $1,917,000 and securities with a combined market value of $15,094,092 have been segregated with Citigroup Global Markets to cover requirements for open centrally cleared swap contracts at December 31, 2017.
| (1) | The Portfolio pays the fixed rate and receives the floating rate. |
SEE NOTES TO FINANCIAL STATEMENTS.
A68
| | | | | | |
| | DIVERSIFIED BOND PORTFOLIO (continued) | | |
| |
| SCHEDULE OF INVESTMENTS | | as of December 31, 2017 |
| (2) | The Portfolio pays the floating rate and receives the fixed rate. |
| (3) | The Portfolio pays the floating rate of 3 Month LIBOR plus 12 bps and receives the floating rate of 6 Month LIBOR. |
| (4) | The Portfolio pays the floating rate of 6 Month LIBOR and receives the floating rate of 3 Month LIBOR plus 11.75 bps. |
Total return swap agreements outstanding at December 31, 2017:
| | | | | | | | | | | | | | | | | | | | |
Counterparty | | Termination
Date | | | Long (Short)
Notional
Amount
(000)# | | | Description | | Fair
Value | | Upfront
Premiums
Paid
(Received) | | | Unrealized
Appreciation
(Depreciation)(1) | |
OTC total return swap agreement: | |
Credit Suisse First Boston Corp. | | | 01/12/41 | | | | 3,258 | | | Pay monthly variable payments based on 1 Month LIBOR and receive fixed payments based on IOS.FN30.450.10 Index | | $(6,817) | | $ | (9,951 | ) | | $ | 3,134 | |
| | | | | | | | | | | | | | | | | | | | |
| (1) | Upfront/recurring fees or commissions, as applicable, are included in the net unrealized appreciation (depreciation). |
Balances Reported in the Statement of Assets and Liabilities for OTC Swap Agreements:
| | | | | | | | | | | | | | | | |
| | | Premiums
Paid | | | Premiums
Received | | | Unrealized
Appreciation | | | Unrealized
Depreciation | |
OTC Swap Agreements | | $ | 119,597 | | | $ | (516,661 | ) | | $ | 455,872 | | | $ | (251,460 | ) |
| | | | | | | | | | | | | | | | |
Fair Value Measurements:
Various inputs are used in determining the value of the Portfolio’s investments. These inputs are summarized in the three broad levels listed below.
| Level 1—unadjusted | quoted prices generally in active markets for identical securities. |
| Level 2—quoted | prices for similar securities, interest rates and yield curves, prepayment speeds, foreign currency exchange rates and other observable inputs. |
| Level 3—unobservable | inputs for securities valued in accordance with Board approved fair valuation procedures. |
The following is a summary of the inputs used as of December 31, 2017 in valuing such portfolio securities:
| | | | | | | | | | | | |
| | | Level 1 | | | Level 2 | | | Level 3 | |
Investments in Securities | | | | | | | | | | | | |
Asset-Backed Securities | | | | | | | | | | | | |
Automobiles | | $ | — | | | $ | 2,912,121 | | | $ | — | |
Collateralized Loan Obligations | | | — | | | | 152,546,803 | | | | — | |
Consumer Loans | | | — | | | | 26,443,640 | | | | — | |
Home Equity Loans | | | — | | | | 22,147,073 | | | | — | |
Other | | | — | | | | 720,800 | | | | — | |
Residential Mortgage-Backed Securities | | | — | | | | 22,470,370 | | | | 1,751,539 | |
Student Loans | | | — | | | | 427,372 | | | | — | |
Bank Loans | | | — | | | | 12,831,682 | | | | — | |
Commercial Mortgage-Backed Securities | | | — | | | | 177,150,544 | | | | — | |
Corporate Bonds | | | — | | | | 459,804,937 | | | | — | |
Municipal Bonds | | | — | | | | 24,414,764 | | | | — | |
Residential Mortgage-Backed Securities | | | — | | | | 45,415,016 | | | | 5,931,898 | |
Sovereign Bonds | | | — | | | | 55,977,364 | | | | — | |
U.S. Government Agency Obligations | | | — | | | | 13,810,660 | | | | — | |
U.S. Treasury Obligations | | | — | | | | 24,894,065 | | | | — | |
Preferred Stocks | | | 2,185,800 | | | | — | | | | — | |
Affiliated Mutual Funds | | | 111,883,265 | | | | — | | | | — | |
Options Purchased | | | 15,134 | | | | 1,064,181 | | | | — | |
Options Written | | | (11,573 | ) | | | (734,650 | ) | | | — | |
SEE NOTES TO FINANCIAL STATEMENTS.
A69
| | | | | | |
| | DIVERSIFIED BOND PORTFOLIO (continued) | | |
| |
| SCHEDULE OF INVESTMENTS | | as of December 31, 2017 |
| | | | | | | | | | | | |
| | | Level 1 | | | Level 2 | | | Level 3 | |
Other Financial Instruments* | | | | | | | | | | | | |
Futures Contracts | | $ | (1,106,296 | ) | | $ | — | | | $ | — | |
OTC Forward Foreign Currency Exchange Contracts | | | — | | | | (876,889 | ) | | | — | |
OTC Credit Default Swap Agreements | | | — | | | | (155,816 | ) | | | 30,357 | |
Centrally Cleared Credit Default Swap Agreements | | | — | | | | (437,112 | ) | | | — | |
OTC Currency Swap Agreements | | | — | | | | (60,376 | ) | | | — | |
Centrally Cleared Inflation Swap Agreements | | | — | | | | 26,544 | | | | — | |
Centrally Cleared Interest Rate Swap Agreements | | | — | | | | 5,989,718 | | | | — | |
OTC Total Return Swap Agreements | | | — | | | | (6,817 | ) | | | — | |
| | | | | | | | | | | | |
Total | | $ | 112,966,330 | | | $ | 1,046,775,994 | | | $ | 7,713,794 | |
| | | | | | | | | | | | |
During the period, there were no transfers between Level 1, Level 2 and Level 3 to report.
The following is a reconciliation of assets in which unobservable inputs (Level 3) were used in determining fair value:
| | | | | | | | | | | | | | | | |
| | | Asset-Backed
Securities-Residential
Mortgage-Backed
Securities | | | Bank Loans | | | Residential
Mortgage-
Backed
Securities | | | Credit Default
Swaps | |
Balance as of 12/31/16 | | $ | 3,440,000 | | | $ | 1,509,078 | | | $ | 26,091,730 | | | $ | 18,991 | |
Realized gain (loss) | | | — | | | | 26,147 | | | | 179,593 | | | | — | *** |
Change in unrealized appreciation (depreciation)** | | | 10,339 | | | | (26,147 | ) | | | (24,561 | ) | | | 11,366 | |
Purchases/Exchanges/Issuances | | | 2,400,000 | | | | — | | | | 6,391,450 | | | | — | |
Sales/Paydowns | | | (4,098,800 | ) | | | (1,509,078 | ) | | | (26,724,178 | ) | | | — | |
Accrued discount/premium | | | — | | | | — | | | | 17,864 | | | | — | |
Transfers into Level 3 | | | — | | | | — | | | | — | | | | — | |
Transfers out of Level 3 | | | — | | | | — | | | | — | | | | — | |
| | | | | | | | | | | | | | | | |
Balance as of 12/31/17 | | $ | 1,751,539 | | | $ | — | | | $ | 5,931,898 | | | $ | 30,357 | |
| | | | | | | | | | | | | | | | |
| * | Other financial instruments are derivative instruments not reflected in the Schedule of Investments, such as futures, forwards and centrally cleared swap contracts, which are recorded at the unrealized appreciation (depreciation) on the instrument, and OTC swap contracts which are recorded at fair value. |
| ** | Of which, $44,760 was relating to securities held at the reporting period end. |
| *** | The realized gain incurred during the period for other financial instruments was $20,100 |
Level 3 securities as presented in the table above are being fair valued using pricing methodologies approved by Board, which contain unobservable inputs as follows:
| | | | | | | | | | |
Level 3 Securities | | Fair Value as of
December 31, 2017 | | | Valuation
Methodology | | | Unobservable Inputs |
Asset-Backed Securities Residential Mortgage-Backed Securities | | $ | 1,751,539 | | | | Market Approach | | | Single Broker Indicative Quote |
Residential Mortgage-Backed Securities | | | 5,931,898 | | | | Market Approach | | | Single Broker Indicative Quote |
Credit Default Swap Agreements | | | 30,357 | | | | Market Approach | | | Single Broker Indicative Quote |
| | | | | | | | | | |
| | $ | 7,713,794 | | | | | | | |
| | | | | | | | | | |
Industry Classification:
The industry classification of investments and liabilities in excess of other assets shown as a percentage of net assets as of December 31, 2017 were as follows (unaudited):
| | | | |
Commercial Mortgage-Backed Securities | | | 15.5 | % |
Collateralized Loan Obligations | | | 13.3 | |
Banks | | | 10.3 | |
Affiliated Mutual Funds (including 1.0% of collateral for securities on loan) | | | 9.8 | |
Residential Mortgage-Backed Securities | | | 6.6 | |
Sovereign Bonds | | | 4.9 | |
Oil & Gas | | | 3.1 | |
| | | | |
Media | | | 3.0 | % |
Electric | | | 2.6 | |
Consumer Loans | | | 2.3 | |
U.S. Treasury Obligations | | | 2.2 | |
Municipal Bonds | | | 2.1 | |
Home Equity Loans | | | 1.9 | |
Insurance | | | 1.9 | |
Healthcare-Services | | | 1.8 | |
SEE NOTES TO FINANCIAL STATEMENTS.
A70
| | | | | | |
| | DIVERSIFIED BOND PORTFOLIO (continued) | | |
| |
| SCHEDULE OF INVESTMENTS | | as of December 31, 2017 |
| | | | |
Industry Classification (cont.) | | | |
Chemicals | | | 1.5 | % |
Pharmaceuticals | | | 1.4 | |
U.S. Government Agency Obligations | | | 1.2 | |
Telecommunications | | | 1.2 | |
Healthcare-Products | | | 1.0 | |
Pipelines | | | 0.9 | |
Auto Manufacturers | | | 0.8 | |
Software | | | 0.7 | |
Semiconductors | | | 0.7 | |
Airlines | | | 0.6 | |
Food | | | 0.6 | |
Multi-National | | | 0.6 | |
Miscellaneous Manufacturing | | | 0.6 | |
Agriculture | | | 0.5 | |
Retail | | | 0.5 | |
Commercial Services | | | 0.5 | |
Auto Parts & Equipment | | | 0.5 | |
Building Materials | | | 0.4 | |
Packaging & Containers | | | 0.4 | |
Machinery-Diversified | | | 0.4 | |
Home Builders | | | 0.4 | |
Technology | | | 0.4 | |
Diversified Financial Services | | | 0.3 | |
Biotechnology | | | 0.3 | |
Gas | | | 0.3 | |
Lodging | | | 0.3 | |
Mining | | | 0.3 | |
Automobiles | | | 0.3 | |
Retailers | | | 0.2 | |
| | | | |
Financial Institutions | | | 0.2 | % |
Forest Products & Paper | | | 0.2 | |
Banking | | | 0.2 | |
Housewares | | | 0.2 | |
Internet | | | 0.2 | |
Entertainment | | | 0.2 | |
Health Care & Pharmaceutical | | | 0.2 | |
Savings & Loans | | | 0.2 | |
Real Estate Investment Trusts (REITs) | | | 0.1 | |
Transportation | | | 0.1 | |
Computers | | | 0.1 | |
Office/Business Equipment | | | 0.1 | |
Electronics | | | 0.1 | |
Options Purchased | | | 0.1 | |
Diversified Manufacturing | | | 0.1 | |
Oil & Gas Services | | | 0.1 | |
Apparel | | | 0.1 | |
Other | | | 0.1 | |
Home Furnishings | | | 0.1 | |
Student Loans | | | 0.0 | * |
Beverages | | | 0.0 | * |
Engineering & Construction | | | 0.0 | * |
Iron/Steel | | | 0.0 | * |
Textiles | | | 0.0 | * |
| | | | |
| | | 101.8 | |
Options Written | | | (0.1 | ) |
Liabilities in excess of other assets | | | (1.7 | ) |
| | | | |
| | | 100.0 | % |
| | | | |
Effects of Derivative Instruments on the Financial Statements and Primary Underlying Risk Exposure:
The Portfolio invested in derivative instruments during the reporting period. The primary types of risk associated with these derivative instruments are credit contracts risk, foreign exchange contracts risk and interest rate contracts risk. The effect of such derivative instruments on the Portfolio’s financial position and financial performance as reflected in the Statement of Assets and Liabilities and Statement of Operations is presented in the summary below.
Fair values of derivative instruments as of December 31, 2017 as presented in the Statement of Assets and Liabilities:
| | | | | | | | | | | | |
Derivatives not accounted for as hedging
instruments, carried at fair value | | Asset Derivatives | | | Liability Derivatives | |
| | Balance Sheet Location | | Fair Value | | | Balance Sheet Location | | Fair Value | |
Credit contracts | | — | | $ | — | | | Due from/to broker-variation margin swaps | | $ | 437,112 | * |
Credit contracts | | Premiums paid for OTC swap agreements | | | 119,597 | | | Premiums received for OTC swap agreements | | | 506,710 | |
Credit contracts | | Unaffiliated investments | | | 169,288 | | | Options written outstanding, at value | | | 134,921 | |
Credit contracts | | Unrealized appreciation on OTC swap agreements | | | 334,630 | | | Unrealized depreciation on OTC swap agreements | | | 72,976 | |
Foreign exchange contracts | | Unrealized appreciation on OTC forward foreign currency exchange contracts | | | 90,133 | | | Unrealized depreciation on OTC forward foreign currency exchange contracts | | | 967,022 | |
Interest rate contracts | | Due from/to broker-variation margin futures | | | 1,874,652 | * | | Due from/to broker-variation margin futures | | | 2,980,948 | * |
Interest rate contracts | | Due from/to broker-variation margin swaps | | | 9,125,833 | * | | Due from/to broker-variation margin swaps | | | 3,109,571 | * |
Interest rate contracts | | — | | | — | | | Premiums received for OTC swap agreements | | | 9,951 | |
SEE NOTES TO FINANCIAL STATEMENTS.
A71
| | | | | | |
| | DIVERSIFIED BOND PORTFOLIO (continued) | | |
| |
| SCHEDULE OF INVESTMENTS | | as of December 31, 2017 |
| | | | | | | | | | | | |
Derivatives not accounted for as hedging
instruments, carried at fair value | | Asset Derivatives | | | Liability Derivatives | |
| | Balance Sheet Location | | Fair Value | | | Balance Sheet Location | | Fair Value | |
Interest rate contracts | | Unaffiliated investments | | $ | 910,027 | | | Options written outstanding, at value | | $ | 611,302 | |
Interest rate contracts | | Unrealized appreciation on OTC swap agreements | | | 121,242 | | | Unrealized depreciation on OTC swap agreements | | | 178,484 | |
| | | | | | | | | | | | |
Total | | | | $ | 12,745,402 | | | | | $ | 9,008,997 | |
| | | | | | | | | | | | |
| * | Includes cumulative appreciation (depreciation) as reported in the schedule of open futures and centrally cleared swap contracts. Only unsettled variation margin receivable (payable) is reported within the Statement of Assets and Liabilities. |
The effects of derivative instruments on the Statement of Operations for the year ended December 31, 2017 are as follows:
| | | | | | | | | | | | | | | | | | | | | | | | |
Amount of Realized Gain (Loss) on Derivatives Recognized in Income | |
Derivatives not accounted for as hedging
instruments, carried at fair value | | Options
Purchased(1) | | | Options
Written | | | Futures | | | Forward
Currency
Contracts | | | Forward
Rate
Agreements | | | Swaps | |
Credit contracts | | $ | 88,024 | | | $ | 12,500 | | | $ | — | | | $ | — | | | $ | — | | | $ | (526,028 | ) |
Foreign exchange contracts | | | — | | | | — | | | | — | | | | (1,835,829 | ) | | | — | | | | — | |
Interest rate contracts | | | (2,591,735 | ) | | | 2,302,676 | | | | 14,986,710 | | | | — | | | | (400,200 | ) | | | 1,518,676 | |
| | | | | | | | | | | | | | | | | | | | | | | | |
Total | | $ | (2,503,711 | ) | | $ | 2,315,176 | | | $ | 14,986,710 | | | $ | (1,835,829 | ) | | $ | (400,200 | ) | | $ | 992,648 | |
| | | | | | | | | | | | | | | | | | | | | | | | |
| (1) | Included in net realized gain (loss) on investment transactions in the Statement of Operations. |
| | | | | | | | | | | | | | | | | | | | |
Change in Unrealized Appreciation (Depreciation) on Derivatives Recognized in Income | |
Derivatives not accounted for as hedging
instruments, carried at fair value | | Options
Purchased(2) | | | Options
Written | | | Futures | | | Forward
Currency
Contracts | | | Swaps | |
Credit contracts | | $ | (2,152 | ) | | $ | 134,221 | | | $ | — | | | $ | — | | | $ | 281,003 | |
Foreign exchange contracts | | | — | | | | — | | | | — | | | | (1,732,946 | ) | | | — | |
Interest rate contracts | | | (294,459 | ) | | | 259,584 | | | | 3,024,097 | | | | — | | | | (4,310,260 | ) |
| | | | | | | | | | | | | | | | | | | | |
Total | | $ | (296,611 | ) | | $ | 393,805 | | | $ | 3,024,097 | | | $ | (1,732,946 | ) | | $ | (4,029,257 | ) |
| | | | | | | | | | | | | | | | | | | | |
| (2) | Included in net change in unrealized appreciation (depreciation) on investments in the Statement of Operations. |
For the year ended December 31, 2017, the Portfolio’s average volume of derivative activities are as follows:
| | | | | | | | | | | | |
Options
Purchased(1) | | Options
Written(4) | | Futures
Contracts—Long
Positions(2) | | Futures
Contracts—Short
Positions(2) | | Forward Foreign
Currency
Exchange
Contracts—Purchased(3) | | Forward Foreign
Currency
Exchange
Contracts—Sold(3) | | Cross
Currency
Exchange
Contracts(2) |
| $1,202,265 | | $250,190,463 | | $744,929,757 | | $171,250,588 | | $3,362,334 | | $51,944,929 | | $151,207 |
| | | | | | |
Credit Default
Swap
Agreements—Buy
Protection(4) | | Credit Default
Swap
Agreements—Sell
Protection(4) | | Currency Swap
Agreements(4) | | Forward Rate
Agreements(4) | | Inflation
Swap
Agreements(4) | | Interest Rate
Swap
Agreements(4) | | Total Return
Swap
Agreements(4) |
| $16,300,000 | | $36,070,800 | | $15,253,000 | | $470,400,000 | | $17,446,975 | | $1,516,271,333 | | $4,508,800 |
| (3) | Value at Settlement Date. |
| (4) | Notional Amount in USD. |
SEE NOTES TO FINANCIAL STATEMENTS.
A72
| | | | | | |
| | DIVERSIFIED BOND PORTFOLIO (continued) | | |
| |
| SCHEDULE OF INVESTMENTS | | as of December 31, 2017 |
Financial Instruments/Transactions—Summary of Offsetting and Netting Arrangements:
The Portfolio invested in OTC derivatives and entered into financial instruments/transactions during the reporting period that are either offset in accordance with current requirements or are subject to enforceable master netting arrangements or similar agreements that permit offsetting. The information about offsetting and related netting arrangements for OTC derivatives and financial instruments/transactions, where the legal right to set-off exists, is presented in the summary below.
Offsetting of financial instrument/transaction assets and liabilities:
| | | | | | | | | | | | |
Description | | Gross Market Value of
Recognized
Assets/(Liabilities) | | | Collateral
Pledged/(Received)(2) | | | Net Amount | |
Securities on Loan | | $ | 11,309,524 | | | $ | (11,309,524 | ) | | $ | — | |
| | | | | | | | | | | | |
Offsetting of OTC derivative assets and liabilities:
| | | | | | | | | | | | | | | | | | | | |
Counterparty | | Gross Amounts of
Recognized Assets(1) | | | Gross Amounts of
Recognized Liabilities(1) | | | Net Amounts of
Recognized
Assets/(Liabilities) | | | Collateral Pledged/
(Received)(2) | | | Net Amount | |
Barclays Capital Group | | $ | 111,475 | | | $ | (126,511 | ) | | $ | (15,036 | ) | | $ | — | | | $ | (15,036 | ) |
BNP Paribas | | | 25,449 | | | | (7,071 | ) | | | 18,378 | | | | — | | | | 18,378 | |
Citigroup Global Markets | | | 74,911 | | | | (660,126 | ) | | | (585,215 | ) | | | 316,366 | | | | (268,849 | ) |
Credit Suisse First Boston Corp. | | | 3,134 | | | | (9,951 | ) | | | (6,817 | ) | | | — | | | | (6,817 | ) |
Deutsche Bank AG | | | 110,321 | | | | (69,184 | ) | | | 41,137 | | | | — | | | | 41,137 | |
Goldman Sachs & Co. | | | 151,212 | | | | (180,052 | ) | | | (28,840 | ) | | | 28,840 | | | | — | |
Hong Kong & Shanghai Bank | | | 43,729 | | | | — | | | | 43,729 | | | | — | | | | 43,729 | |
JPMorgan Chase | | | 913,098 | | | | (697,682 | ) | | | 215,416 | | | | (215,416 | ) | | | — | |
Morgan Stanley | | | 178,346 | | | | (172,518 | ) | | | 5,828 | | | | — | | | | 5,828 | |
Toronto Dominion | | | — | | | | (57,108 | ) | | | (57,108 | ) | | | — | | | | (57,108 | ) |
UBS AG | | | 118,108 | | | | (489,590 | ) | | | (371,482 | ) | | | — | | | | (371,482 | ) |
| | | | | | | | | | | | | | | | | | | | |
| | $ | 1,729,783 | | | $ | (2,469,793 | ) | | $ | (740,010 | ) | | $ | 129,790 | | | $ | (610,220 | ) |
| | | | | | | | | | | | | | | | | | | | |
| (1) | Includes unrealized appreciation/(depreciation) on swaps and forwards, premiums paid/(received) on swap agreements and market value of purchased and written options, as represented on the Statement of Assets and Liabilities. |
| (2) | Collateral amount disclosed by the Portfolio is limited to the market value of financial instruments/transactions and the Portfolio’s OTC derivative exposure by counterparty. |
SEE NOTES TO FINANCIAL STATEMENTS.
A73
| | | | | | |
| | DIVERSIFIED BOND PORTFOLIO (continued) | | |
STATEMENT OF ASSETS & LIABILITIES
as of December 31, 2017
| | | | |
| ASSETS | | | | |
Investments at value, including securities on loan of $11,309,524: | | | | |
Unaffiliated investments (cost $1,015,009,659) | | $ | 1,052,915,763 | |
Affiliated investments (cost $113,336,565) | | | 111,883,265 | |
Cash | | | 48,338 | |
Foreign currency, at value (cost $335,661) | | | 335,964 | |
Dividends and interest receivable | | | 8,711,694 | |
Due from broker - variation margin futures | | | 1,024,252 | |
Deposit with broker for futures | | | 2,340,000 | |
Deposit with broker for centrally cleared swaps | | | 1,917,000 | |
Unrealized appreciation on OTC swap agreements | | | 455,872 | |
Receivable for investments sold | | | 291,078 | |
Premiums paid for OTC swap agreements | | | 119,597 | |
Unrealized appreciation on OTC forward foreign currency exchange contracts | | | 90,133 | |
Receivable for Series shares sold | | | 84,822 | |
Tax reclaim receivable | | | 51,930 | |
Prepaid expenses | | | 8,019 | |
| | | | |
Total Assets | | | 1,180,277,727 | |
| | | | |
| LIABILITIES | | | | |
Payable for investments purchased | | | 19,634,304 | |
Payable to broker for collateral for securities on loan | | | 11,544,137 | |
Unrealized depreciation on OTC forward foreign currency exchange contracts | | | 967,022 | |
Options written outstanding, at value (premiums received $1,140,028) | | | 746,223 | |
Payable for Series shares repurchased | | | 540,184 | |
Premium received for OTC swap agreements | | | 516,661 | |
Due to broker - variation margin swaps | | | 459,300 | |
Management fee payable | | | 385,078 | |
Unrealized depreciation on OTC swap agreements | | | 251,460 | |
Accrued expenses and other liabilities | | | 134,086 | |
Affiliated transfer agent fee payable | | | 980 | |
Deferred trustees’ fees | | | 175 | |
| | | | |
Total Liabilities | | | 35,179,610 | |
| | | | |
| NET ASSETS | | $ | 1,145,098,117 | |
| | | | |
Net assets were comprised of: | | | | |
Paid-in capital | | $ | 911,559,400 | |
Retained earnings | | | 233,538,717 | |
| | | | |
Net assets, December 31, 2017 | | $ | 1,145,098,117 | |
| | | | |
Net asset value and redemption price per share $1,145,098,117 / 87,156,926 outstanding shares of beneficial interest | | $ | 13.14 | |
| | | | |
STATEMENT OF OPERATIONS
Year Ended December 31, 2017
| | | | |
| NET INVESTMENT INCOME (LOSS) | | | | |
| INCOME | | | | |
Interest income (net of foreign withholding taxes of $1,006) | | $ | 39,418,470 | |
Affiliated dividend income | | | 2,217,910 | |
Unaffiliated dividend income | | | 131,812 | |
Income from securities lending, net (including affiliated income of $41,534) | | | 50,546 | |
| | | | |
Total income | | | 41,818,738 | |
| | | | |
| EXPENSES | | | | |
Management fee | | | 4,493,940 | |
Shareholders’ reports | | | 174,193 | |
Custodian and accounting fees | | | 170,851 | |
Audit fee | | | 59,538 | |
Trustees’ fees | | | 20,889 | |
Legal fees and expenses | | | 16,595 | |
Transfer agent’s fees and expenses (including affiliated expense of $5,882) | | | 11,066 | |
Miscellaneous | | | 32,282 | |
| | | | |
Total expenses | | | 4,979,354 | |
| | | | |
| NET INVESTMENT INCOME (LOSS) | | | 36,839,384 | |
| | | | |
| REALIZED AND UNREALIZED GAIN (LOSS) ON INVESTMENTS AND FOREIGN CURRENCY TRANSACTIONS | | | | |
Net realized gain (loss) on: | | | | |
Investment transactions (including affiliated of $(2,214,059)) | | | 3,124,480 | |
Futures transactions | | | 14,986,710 | |
Options written transactions | | | 2,315,176 | |
Forward rate agreement transactions | | | (400,200 | ) |
Swap agreement transactions | | | 992,648 | |
Forward currency contract transactions | | | (1,835,829 | ) |
Foreign currency transactions | | | (1,438,012 | ) |
| | | | |
| | | 17,744,973 | |
| | | | |
Net change in unrealized appreciation (depreciation) on: | | | | |
Investments (including affiliated of $2,397,114) | | | 23,122,750 | |
Futures | | | 3,024,097 | |
Options written | | | 393,805 | |
Swap agreements | | | (4,029,257 | ) |
Forward currency contracts | | | (1,732,946 | ) |
Foreign currencies | | | 207,753 | |
| | | | |
| | | 20,986,202 | |
| | | | |
| NET GAIN (LOSS) ON INVESTMENT AND FOREIGN CURRENCY TRANSACTIONS | | | 38,731,175 | |
| | | | |
| NET INCREASE (DECREASE) IN NET ASSETS RESULTING FROM OPERATIONS | | $ | 75,570,559 | |
| | | | |
STATEMENTS OF CHANGES IN NET ASSETS
| | | | | | | | |
| | | Year Ended December 31, | |
| | | 2017 | | | 2016 | |
| INCREASE (DECREASE) IN NET ASSETS | | | | | | | | |
| OPERATIONS | | | | | | | | |
Net investment income (loss) | | $ | 36,839,384 | | | $ | 39,465,698 | |
Net realized gain (loss) on investment and foreign currency transactions | | | 17,744,973 | | | | (3,347,958 | ) |
Net change in unrealized appreciation (depreciation) on investments and foreign currencies | | | 20,986,202 | | | | 23,594,004 | |
| | | | | | | | |
NET INCREASE (DECREASE) IN NET ASSETS RESULTING FROM OPERATIONS | | | 75,570,559 | | | | 59,711,744 | |
| | | | | | | | |
| SERIES SHARE TRANSACTIONS | | | | | | | | |
Series shares sold [8,208,158 and 2,764,375 shares, respectively] | | | 106,613,787 | | | | 34,011,481 | |
Series shares repurchased [10,992,821 and 6,055,908 shares, respectively] | | | (141,664,847 | ) | | | (74,059,176 | ) |
| | | | | | | | |
NET INCREASE (DECREASE) IN NET ASSETS FROM SERIES SHARE TRANSACTIONS | | | (35,051,060 | ) | | | (40,047,695 | ) |
| | | | | | | | |
| CAPITAL CONTRIBUTIONS | | | — | | | | 20,597 | |
| | | | | | | | |
| TOTAL INCREASE (DECREASE) | | | 40,519,499 | | | | 19,684,646 | |
| NET ASSETS: | | | | | | | | |
Beginning of year | | | 1,104,578,618 | | | | 1,084,893,972 | |
| | | | | | | | |
End of year | | $ | 1,145,098,117 | | | $ | 1,104,578,618 | |
| | | | | | | | |
SEE NOTES TO FINANCIAL STATEMENTS.
A74
| | | | | | |
| |
| SCHEDULE OF INVESTMENTS | | as of December 31, 2017 |
| | | | | | | | |
| LONG-TERM INVESTMENTS — 97.9% | |
| | |
| COMMON STOCKS | | Shares | | | Value | |
Aerospace & Defense — 3.5% | | | | | | | | |
Boeing Co. (The) | | | 394,176 | | | $ | 116,246,444 | |
United Technologies Corp. | | | 287,912 | | | | 36,728,934 | |
| | | | | | | | |
| | | | | | | 152,975,378 | |
| | | | | | | | |
Air Freight & Logistics — 1.5% | |
FedEx Corp. | | | 260,682 | | | | 65,050,586 | |
| | | | | | | | |
Automobiles — 0.8% | |
Tesla, Inc.*(a) | | | 110,780 | | | | 34,491,353 | |
| | | | | | | | |
Banks — 10.4% | |
Bank of America Corp. | | | 2,757,634 | | | | 81,405,356 | |
BB&T Corp. | | | 946,339 | | | | 47,051,975 | |
Citigroup, Inc. | | | 761,238 | | | | 56,643,720 | |
JPMorgan Chase & Co. | | | 1,991,247 | | | | 212,943,954 | |
PNC Financial Services Group, Inc. (The) | | | 421,090 | | | | 60,759,076 | |
| | | | | | | | |
| | | | | | | 458,804,081 | |
| | | | | | | | |
Biotechnology — 1.9% | |
AbbVie, Inc. | | | 330,169 | | | | 31,930,644 | |
BioMarin Pharmaceutical, Inc.* | | | 261,944 | | | | 23,357,546 | |
Vertex Pharmaceuticals, Inc.* | | | 200,017 | | | | 29,974,548 | |
| | | | | | | | |
| | | | | | | 85,262,738 | |
| | | | | | | | |
Building Products — 0.5% | |
Johnson Controls International PLC | | | 564,846 | | | | 21,526,281 | |
| | | | | | | | |
Capital Markets — 1.0% | |
Goldman Sachs Group, Inc. (The) | | | 179,762 | | | | 45,796,167 | |
| | | | | | | | |
Chemicals — 1.5% | |
DowDuPont, Inc. | | | 501,884 | | | | 35,744,179 | |
FMC Corp. | | | 343,464 | | | | 32,512,302 | |
| | | | | | | | |
| | | | | | | 68,256,481 | |
| | | | | | | | |
Communications Equipment — 0.8% | |
Cisco Systems, Inc. | | | 930,775 | | | | 35,648,682 | |
| | | | | | | | |
Consumer Finance — 1.7% | |
Capital One Financial Corp. | | | 441,465 | | | | 43,961,084 | |
SLM Corp.* | | | 2,815,769 | | | | 31,818,190 | |
| | | | | | | | |
| | | | | | | 75,779,274 | |
| | | | | | | | |
Containers & Packaging — 0.6% | |
Sealed Air Corp. | | | 557,252 | | | | 27,472,524 | |
| | | | | | | | |
Electric Utilities — 1.6% | |
American Electric Power Co., Inc. | | | 403,477 | | | | 29,683,803 | |
Exelon Corp. | | | 1,012,147 | | | | 39,888,713 | |
| | | | | | | | |
| | | | | | | 69,572,516 | |
| | | | | | | | |
Electrical Equipment — 0.8% | |
Eaton Corp. PLC | | | 450,412 | | | | 35,587,052 | |
| | | | | | | | |
Electronic Equipment, Instruments & Components — 0.9% | |
Flex Ltd.* | | | 2,107,991 | | | | 37,922,758 | |
| | | | | | | | |
Energy Equipment & Services — 1.4% | |
Halliburton Co. | | | 1,269,809 | | | | 62,055,566 | |
| | | | | | | | |
| | | | | | | | |
COMMON STOCKS
(continued) | | Shares | | | Value | |
Equity Real Estate Investment Trusts (REITs) — 0.7% | |
American Tower Corp. | | | 229,073 | | | $ | 32,681,845 | |
| | | | | | | | |
Food & Staples Retailing — 1.9% | |
Costco Wholesale Corp. | | | 212,320 | | | | 39,516,998 | |
Wal-Mart Stores, Inc. | | | 426,628 | | | | 42,129,515 | |
| | | | | | | | |
| | | | | | | 81,646,513 | |
| | | | | | | | |
Food Products — 1.2% | |
Conagra Brands, Inc. | | | 868,531 | | | | 32,717,563 | |
Mondelez International, Inc. (Class A Stock) | | | 489,548 | | | | 20,952,654 | |
| | | | | | | | |
| | | | | | | 53,670,217 | |
| | | | | | | | |
Health Care Equipment & Supplies — 0.8% | |
Zimmer Biomet Holdings, Inc. | | | 280,677 | | | | 33,869,293 | |
| | | | | | | | |
Health Care Providers & Services — 2.6% | |
Cigna Corp. | | | 152,440 | | | | 30,959,040 | |
Laboratory Corp. of America Holdings* | | | 219,616 | | | | 35,030,948 | |
UnitedHealth Group, Inc. | | | 212,446 | | | | 46,835,845 | |
| | | | | | | | |
| | | | | | | 112,825,833 | |
| | | | | | | | |
Hotels, Restaurants & Leisure — 4.0% | |
Carnival Corp. | | | 335,055 | | | | 22,237,600 | |
Marriott International, Inc. (Class A Stock) | | | 445,656 | | | | 60,488,889 | |
McDonald’s Corp. | | | 538,154 | | | | 92,627,067 | |
| | | | | | | | |
| | | | | | | 175,353,556 | |
| | | | | | | | |
Household Durables — 0.4% | |
Newell Brands, Inc. | | | 510,732 | | | | 15,781,619 | |
| | | | | | | | |
Household Products — 1.1% | |
Procter & Gamble Co. (The) | | | 543,185 | | | | 49,907,838 | |
| | | | | | | | |
Insurance — 2.3% | |
Brighthouse Financial, Inc.* | | | 254,045 | | | | 14,897,199 | |
Chubb Ltd. | | | 358,573 | | | | 52,398,272 | |
MetLife, Inc. | | | 679,144 | | | | 34,337,521 | |
| | | | | | | | |
| | | | | | | 101,632,992 | |
| | | | | | | | |
Internet & Direct Marketing Retail — 4.5% | |
Amazon.com, Inc.* | | | 85,776 | | | | 100,312,459 | |
Netflix, Inc.* | | | 359,904 | | | | 69,087,172 | |
Priceline Group, Inc. (The)* | | | 17,641 | | | | 30,655,471 | |
| | | | | | | | |
| | | | | | | 200,055,102 | |
| | | | | | | | |
Internet Software & Services — 10.4% | |
Alibaba Group Holding Ltd. (China), ADR*(a) | | | 582,328 | | | | 100,410,817 | |
Alphabet, Inc. (Class A Stock)* | | | 73,890 | | | | 77,835,726 | |
Alphabet, Inc. (Class C Stock)* | | | 46,227 | | | | 48,371,933 | |
eBay, Inc.* | | | 645,485 | | | | 24,360,604 | |
Facebook, Inc. (Class A Stock)* | | | 499,852 | | | | 88,203,884 | |
MercadoLibre, Inc. (Argentina)(a) | | | 126,632 | | | | 39,846,025 | |
Tencent Holdings Ltd. (China) | | | 1,540,745 | | | | 79,745,810 | |
| | | | | | | | |
| | | | | | | 458,774,799 | |
| | | | | | | | |
SEE NOTES TO FINANCIAL STATEMENTS.
A75
| | | | | | |
| | EQUITY PORTFOLIO (continued) | | |
| | | | | | |
| |
| SCHEDULE OF INVESTMENTS | | as of December 31, 2017 |
| | | | | | | | |
COMMON STOCKS
(continued) | | Shares | | | Value | |
IT Services — 5.1% | |
DXC Technology Co. | | | 258,504 | | | $ | 24,532,030 | |
Mastercard, Inc. (Class A Stock) | | | 512,416 | | | | 77,559,286 | |
PayPal Holdings, Inc.* | | | 615,238 | | | | 45,293,821 | |
Visa, Inc. (Class A Stock)(a) | | | 694,454 | | | | 79,181,645 | |
| | | | | | | | |
| | | | | | | 226,566,782 | |
| | | | | | | | |
Life Sciences Tools & Services — 0.6% | |
Illumina, Inc.* | | | 121,340 | | | | 26,511,577 | |
| | | | | | | | |
Media — 2.9% | |
Charter Communications, Inc. (Class A Stock)* | | | 112,523 | | | | 37,803,227 | |
Comcast Corp. (Class A Stock) | | | 993,767 | | | | 39,800,368 | |
Liberty Global PLC (United Kingdom) (Class C Stock)* | | | 712,032 | | | | 24,095,163 | |
Twenty-First Century Fox, Inc. (Class A Stock) | | | 737,486 | | | | 25,465,392 | |
| | | | | | | | |
| | | | | | | 127,164,150 | |
| | | | | | | | |
Oil, Gas & Consumable Fuels — 4.1% | |
Anadarko Petroleum Corp. | | | 277,508 | | | | 14,885,529 | |
Chevron Corp. | | | 430,962 | | | | 53,952,133 | |
Noble Energy, Inc. | | | 679,410 | | | | 19,798,007 | |
Royal Dutch Shell PLC (Netherlands) (Class A Stock), ADR | | | 878,845 | | | | 58,627,750 | |
Suncor Energy, Inc. (Canada) | | | 892,426 | | | | 32,764,885 | |
| | | | | | | | |
| | | | | | | 180,028,304 | |
| | | | | | | | |
Personal Products — 1.3% | |
Estee Lauder Cos., Inc. (The) (Class A Stock) | | | 449,050 | | | | 57,137,122 | |
| | | | | | | | |
Pharmaceuticals — 4.0% | |
Allergan PLC | | | 181,961 | | | | 29,765,180 | |
Bristol-Myers Squibb Co. | | | 1,032,106 | | | | 63,247,456 | |
Eli Lilly & Co. | | | 451,465 | | | | 38,130,734 | |
Pfizer, Inc. | | | 1,316,280 | | | | 47,675,661 | |
| | | | | | | | |
| | | | | | | 178,819,031 | |
| | | | | | | | |
Road & Rail — 0.8% | |
Union Pacific Corp. | | | 274,130 | | | | 36,760,833 | |
| | | | | | | | |
Semiconductors & Semiconductor Equipment — 4.3% | |
Broadcom Ltd. | | | 211,290 | | | | 54,280,401 | |
NVIDIA Corp. | | | 196,218 | | | | 37,968,183 | |
Texas Instruments, Inc. | | | 917,936 | | | | 95,869,236 | |
| | | | | | | | |
| | | | | | | 188,117,820 | |
| | | | | | | | |
Software — 8.6% | |
Activision Blizzard, Inc. | | | 431,504 | | | | 27,322,833 | |
Adobe Systems, Inc.* | | | 382,447 | | | | 67,020,012 | |
Microsoft Corp. | | | 1,713,321 | | | | 146,557,479 | |
PTC, Inc.* | | | 545,197 | | | | 33,131,622 | |
salesforce.com, Inc.* | | | 695,187 | | | | 71,068,967 | |
Workday, Inc. (Class A Stock)*(a) | | | 355,641 | | | | 36,182,915 | |
| | | | | | | | |
| | | | | | | 381,283,828 | |
| | | | | | | | |
| | | | | | | | |
COMMON STOCKS
(continued) | | Shares | | | Value | |
Specialty Retail — 1.3% | |
Home Depot, Inc. (The) | | | 302,058 | | | $ | 57,249,053 | |
| | | | | | | | |
Technology Hardware, Storage & Peripherals — 3.9% | |
Apple, Inc. | | | 1,019,080 | | | | 172,458,908 | |
| | | | | | | | |
Textiles, Apparel & Luxury Goods — 1.4% | |
Kering (France) | | | 74,058 | | | | 34,861,012 | |
Tapestry, Inc. | | | 648,030 | | | | 28,662,367 | |
| | | | | | | | |
| | | | | | | 63,523,379 | |
| | | | | | | | |
Wireless Telecommunication Services — 0.8% | | | | | |
Vodafone Group PLC (United Kingdom), ADR | | | 1,148,544 | | | | 36,638,554 | |
| | | | | | | | |
TOTAL LONG-TERM INVESTMENTS
(cost $2,803,379,531) | | | | 4,324,660,385 | |
| | | | | | | | |
| SHORT-TERM INVESTMENTS — 8.5% | |
AFFILIATED MUTUAL FUNDS | | | | | |
Prudential Investment Portfolios 2 — Prudential Core Ultra Short Bond Fund(w) | | | 93,453,847 | | | | 93,453,847 | |
Prudential Investment Portfolios 2 — Prudential Institutional Money Market Fund
(cost $281,454,993; includes $281,146,572 of cash collateral for securities on loan)(b)(w) | | | 281,455,354 | | | | 281,455,354 | |
| | | | | | | | |
TOTAL SHORT-TERM INVESTMENTS
(cost $374,908,840) | | | | 374,909,201 | |
| | | | | | | | |
TOTAL INVESTMENTS — 106.4%
(cost $3,178,288,371) | | | | 4,699,569,586 | |
LIABILITIES IN EXCESS OF
OTHER ASSETS — (6.4)% | | | | (282,329,592 | ) |
| | | | | | | | |
NET ASSETS — 100.0% | | | $ | 4,417,239,994 | |
| | | | | | | | |
See the Glossary for abbreviations used in the annual report.
| * | Non-income producing security. |
| (a) | All or a portion of security is on loan. The aggregate market value of such securities, including those sold and pending settlement, is $274,679,313; cash collateral of $281,146,572 (included in liabilities) was received with which the Portfolio purchased highly liquid short-term investments. |
| (b) | Represents security purchased with cash collateral received for securities on loan and includes dividend reinvestment. |
| (w) | PGIM Investments LLC, the manager of the Portfolio, also serves as manager of the Prudential Investment Portfolios 2 — Prudential Core Ultra Short Bond Fund and Prudential Institutional Money Market Fund. |
SEE NOTES TO FINANCIAL STATEMENTS.
A76
| | | | | | |
| | EQUITY PORTFOLIO (continued) | | |
| | | | | | |
| |
| SCHEDULE OF INVESTMENTS | | as of December 31, 2017 |
Fair Value Measurements:
Various inputs are used in determining the value of the Portfolio’s investments. These inputs are summarized in the three broad levels listed below.
| Level 1— | unadjusted quoted prices generally in active markets for identical securities. |
| Level 2— | quoted prices for similar securities, interest rates and yield curves, prepayment speeds, foreign currency exchange rates and other observable inputs. |
| Level 3— | unobservable inputs for securities valued in accordance with Board approved fair valuation procedures. |
The following is a summary of the inputs used as of December 31, 2017 in valuing such portfolio securities:
| | | | | | | | | | | | |
| | | Level 1 | | | Level 2 | | | Level 3 | |
Investments in Securities | |
Common Stocks | | | | | | | | | | | | |
Aerospace & Defense | | $ | 152,975,378 | | | $ | — | | | $ | — | |
Air Freight & Logistics | | | 65,050,586 | | | | — | | | | — | |
Automobiles | | | 34,491,353 | | | | — | | | | — | |
Banks | | | 458,804,081 | | | | — | | | | — | |
Biotechnology | | | 85,262,738 | | | | — | | | | — | |
Building Products | | | 21,526,281 | | | | — | | | | — | |
Capital Markets | | | 45,796,167 | | | | — | | | | — | |
Chemicals | | | 68,256,481 | | | | — | | | | — | |
Communications Equipment | | | 35,648,682 | | | | — | | | | — | |
Consumer Finance | | | 75,779,274 | | | | — | | | | — | |
Containers & Packaging | | | 27,472,524 | | | | — | | | | — | |
Electric Utilities | | | 69,572,516 | | | | — | | | | — | |
Electrical Equipment | | | 35,587,052 | | | | — | | | | — | |
Electronic Equipment, Instruments & Components | | | 37,922,758 | | | | — | | | | — | |
Energy Equipment & Services | | | 62,055,566 | | | | — | | | | — | |
Equity Real Estate Investment Trusts (REITs) | | | 32,681,845 | | | | — | | | | — | |
Food & Staples Retailing | | | 81,646,513 | | | | — | | | | — | |
Food Products | | | 53,670,217 | | | | — | | | | — | |
Health Care Equipment & Supplies | | | 33,869,293 | | | | — | | | | — | |
Health Care Providers & Services | | | 112,825,833 | | | | — | | | | — | |
Hotels, Restaurants & Leisure | | | 175,353,556 | | | | — | | | | — | |
Household Durables | | | 15,781,619 | | | | — | | | | — | |
Household Products | | | 49,907,838 | | | | — | | | | — | |
Insurance | | | 101,632,992 | | | | — | | | | — | |
Internet & Direct Marketing Retail | | | 200,055,102 | | | | — | | | | — | |
Internet Software & Services | | | 379,028,989 | | | | 79,745,810 | | | | — | |
IT Services | | | 226,566,782 | | | | — | | | | — | |
Life Sciences Tools & Services | | | 26,511,577 | | | | — | | | | — | |
Media | | | 127,164,150 | | | | — | | | | — | |
Oil, Gas & Consumable Fuels | | | 180,028,304 | | | | — | | | | — | |
Personal Products | | | 57,137,122 | | | | — | | | | — | |
Pharmaceuticals | | | 178,819,031 | | | | — | | | | — | |
Road & Rail | | | 36,760,833 | | | | — | | | | — | |
Semiconductors & Semiconductor Equipment | | | 188,117,820 | | | | — | | | | — | |
Software | | | 381,283,828 | | | | — | | | | — | |
Specialty Retail | | | 57,249,053 | | | | — | | | | — | |
Technology Hardware, Storage & Peripherals | | | 172,458,908 | | | | — | | | | — | |
Textiles, Apparel & Luxury Goods | | | 28,662,367 | | | | 34,861,012 | | | | — | |
Wireless Telecommunication Services | | | 36,638,554 | | | | — | | | | — | |
Affiliated Mutual Funds | | | 374,909,201 | | | | — | | | | — | |
| | | | | | | | | | | | |
Total | | $ | 4,584,962,764 | | | $ | 114,606,822 | | | $ | — | |
| | | | | | | | | | | | |
During the period, there were no transfers between Level 1, Level 2 and Level 3 to report.
SEE NOTES TO FINANCIAL STATEMENTS.
A77
| | | | | | |
| | EQUITY PORTFOLIO (continued) | | |
| | | | | | |
| |
| SCHEDULE OF INVESTMENTS | | as of December 31, 2017 |
Industry Classification:
The industry classification of investments and liabilities in excess of other assets shown as a percentage of net assets as of December 31, 2017 were as follows (unaudited):
| | | | |
Banks | | | 10.4 | % |
Internet Software & Services | | | 10.4 | |
Software | | | 8.6 | |
Affiliated Mutual Funds (including 6.4% of collateral for securities on loan) | | | 8.5 | |
IT Services | | | 5.1 | |
Internet & Direct Marketing Retail | | | 4.5 | |
Semiconductors & Semiconductor Equipment | | | 4.3 | |
Oil, Gas & Consumable Fuels | | | 4.1 | |
Pharmaceuticals | | | 4.0 | |
Hotels, Restaurants & Leisure | | | 4.0 | |
Technology Hardware, Storage & Peripherals | | | 3.9 | |
Aerospace & Defense | | | 3.5 | |
Media | | | 2.9 | |
Health Care Providers & Services | | | 2.6 | |
Insurance | | | 2.3 | |
Biotechnology | | | 1.9 | |
Food & Staples Retailing | | | 1.9 | |
Consumer Finance | | | 1.7 | |
Electric Utilities | | | 1.6 | |
Chemicals | | | 1.5 | |
Air Freight & Logistics | | | 1.5 | |
Textiles, Apparel & Luxury Goods | | | 1.4 | |
| | | | |
Energy Equipment & Services | | | 1.4 | % |
Specialty Retail | | | 1.3 | |
Personal Products | | | 1.3 | |
Food Products | | | 1.2 | |
Household Products | | | 1.1 | |
Capital Markets | | | 1.0 | |
Electronic Equipment, Instruments & Components | | | 0.9 | |
Road & Rail | | | 0.8 | |
Wireless Telecommunication Services | | | 0.8 | |
Communications Equipment | | | 0.8 | |
Electrical Equipment | | | 0.8 | |
Automobiles | | | 0.8 | |
Health Care Equipment & Supplies | | | 0.8 | |
Equity Real Estate Investment Trusts (REITs) | | | 0.7 | |
Containers & Packaging | | | 0.6 | |
Life Sciences Tools & Services | | | 0.6 | |
Building Products | | | 0.5 | |
Household Durables | | | 0.4 | |
| | | | |
| | | 106.4 | |
Liabilities in excess of other assets | | | (6.4 | ) |
| | | | |
| | | 100.0 | % |
| | | | |
Financial Instruments/Transactions — Summary of Offsetting and Netting Arrangements:
The Portfolio entered into financial instruments/transactions during the reporting period that are either offset in accordance with current requirements or are subject to enforceable master netting arrangements or similar agreements that permit offsetting. The information about offsetting and related netting arrangements for financial instruments/transactions, where the legal right to set-off exists, is presented in the summary below.
Offsetting of financial instrument/transaction assets and liabilities:
| | | | | | | | | | | | |
Description | | Gross Market Value of
Recognized Assets/
(Liabilities) | | | Collateral
Pledged/(Received)(1) | | | Net Amount | |
Securities on Loan | | $ | 274,679,313 | | | $ | (274,679,313 | ) | | $ | — | |
| | | | | | | | | | | | |
| (1) | Collateral amount disclosed by the Portfolio is limited to the market value of financial instruments/transactions. |
SEE NOTES TO FINANCIAL STATEMENTS.
A78
| | | | | | |
| | EQUITY PORTFOLIO (continued) | | |
STATEMENT OF ASSETS & LIABILITIES
as of December 31, 2017
| | | | |
| ASSETS | |
Investments at value, including securities on loan of $274,679,313: | | | | |
Unaffiliated investments (cost $2,803,379,531) | | $ | 4,324,660,385 | |
Affiliated investments (cost $374,908,840) | | | 374,909,201 | |
Dividends and interest receivable | | | 2,040,791 | |
Tax reclaim receivable | | | 1,230,385 | |
Receivable for investments sold | | | 17,094 | |
Receivable for Series shares sold | | | 12,948 | |
Prepaid expenses | | | 28,533 | |
| | | | |
Total assets | | | 4,702,899,337 | |
| | | | |
| LIABILITIES | |
Payable to broker for collateral for securities on loan | | | 281,146,572 | |
Payable for Series shares repurchased | | | 2,333,448 | |
Management fee payable | | | 1,682,226 | |
Accrued expenses and other liabilities | | | 495,369 | |
Affiliated transfer agent fee payable | | | 980 | |
Distribution fee payable | | | 391 | |
Administration fee payable | | | 311 | |
Deferred trustees’ fees | | | 46 | |
| | | | |
Total liabilities | | | 285,659,343 | |
| | | | |
| NET ASSETS | | $ | 4,417,239,994 | |
| | | | |
Net assets were comprised of: | |
Paid-in capital | | $ | 1,394,899,570 | |
Retained earnings | | | 3,022,340,424 | |
| | | | |
Net assets, December 31, 2017 | | $ | 4,417,239,994 | |
| | | | |
| Class I: | |
Net asset value and redemption price per share $4,415,555,344 / 85,702,549 outstanding shares of beneficial interest | | $ | 51.52 | |
| | | | |
| Class II: | |
Net asset value and redemption price per share $1,684,650 / 33,004 outstanding shares of beneficial interest | | $ | 51.04 | |
| | | | |
STATEMENT OF OPERATIONS
Year Ended December 31, 2017
| | | | |
| NET INVESTMENT INCOME (LOSS) | | | | |
Income | | | | |
Unaffiliated dividend income (net) (foreign withholding tax $743,946, of which $343,486 is reimbursable by an affiliate) | | $ | 54,402,903 | |
Income from securities lending, net (including affiliated income of $529,366) | | | 656,605 | |
Affiliated dividend income | | | 828,902 | |
| | | | |
Total income | | | 55,888,410 | |
| | | | |
| EXPENSES | | | | |
Management fee | | | 18,452,619 | |
Distribution fee—Class II | | | 4,547 | |
Administration fee—Class II | | | 2,728 | |
Shareholders’ reports | | | 308,734 | |
Custodian and accounting fees | | | 294,718 | |
Trustees’ fees | | | 50,079 | |
Audit fee | | | 31,948 | |
Legal fees and expenses | | | 26,339 | |
Transfer agent’s fees and expenses (including affiliated expense of $5,882) | | | 11,126 | |
Miscellaneous | | | 74,403 | |
| | | | |
Total expenses | | | 19,257,241 | |
| | | | |
| NET INVESTMENT INCOME (LOSS) | | | 36,631,169 | |
| | | | |
| REALIZED AND UNREALIZED GAIN (LOSS) ON INVESTMENTS AND FOREIGN CURRENCY TRANSACTIONS | | | | |
Net realized gain (loss) on: | | | | |
Investment transactions (including affiliated of $2,254) | | | 337,975,335 | |
Foreign currency transactions | | | (77,898 | ) |
| | | | |
| | | 337,897,437 | |
| | | | |
Net change in unrealized appreciation (depreciation) on: | | | | |
Investments (including affiliated of $(56,041)) | | | 560,882,633 | |
Foreign currencies | | | 106,603 | |
| | | | |
| | | 560,989,236 | |
| | | | |
| NET GAIN (LOSS) ON INVESTMENT AND FOREIGN CURRENCY TRANSACTIONS | | | 898,886,673 | |
| | | | |
| NET INCREASE (DECREASE) IN NET ASSETS RESULTING FROM OPERATIONS | | $ | 935,517,842 | |
| | | | |
STATEMENTS OF CHANGES IN NET ASSETS
| | | | | | | | |
| | | Year Ended December 31, | |
| | | 2017 | | | 2016 | |
| INCREASE (DECREASE) IN NET ASSETS | | | | | | | | |
| OPERATIONS | | | | | | | | |
Net investment income (loss) | | $ | 36,631,169 | | | $ | 36,343,383 | |
Net realized gain (loss) on investment and foreign currency transactions | | | 337,897,437 | | | | 217,876,396 | |
Net change in unrealized appreciation (depreciation) on investments and foreign currencies | | | 560,989,236 | | | | (128,098,315 | ) |
| | | | | | | | |
NET INCREASE (DECREASE) IN NET ASSETS RESULTING FROM OPERATIONS | | | 935,517,842 | | | | 126,121,464 | |
| | | | | | | | |
| SERIES SHARE TRANSACTIONS | | | | | | | | |
Series shares sold | | | 7,725,478 | | | | 9,112,648 | |
Series shares repurchased | | | (269,394,297 | ) | | | (243,276,531 | ) |
| | | | | | | | |
NET INCREASE (DECREASE) IN NET ASSETS FROM SERIES SHARE TRANSACTIONS | | | (261,668,819 | ) | | | (234,163,883 | ) |
| | | | | | | | |
| CAPITAL CONTRIBUTIONS | | | — | | | | 3,315,979 | |
| | | | | | | | |
| TOTAL INCREASE (DECREASE) | | | 673,849,023 | | | | (104,726,440 | ) |
| NET ASSETS: | | | | | | | | |
Beginning of year | | | 3,743,390,971 | | | | 3,848,117,411 | |
| | | | | | | | |
End of year | | $ | 4,417,239,994 | | | $ | 3,743,390,971 | |
| | | | | | | | |
SEE NOTES TO FINANCIAL STATEMENTS.
A79
| | | | | | |
| | FLEXIBLE MANAGED PORTFOLIO | | |
| |
| SCHEDULE OF INVESTMENTS | | as of December 31, 2017 |
| | | | | | | | |
| LONG-TERM INVESTMENTS — 95.2% | | | | |
| COMMON STOCKS — 63.5% | | Shares | | | Value | |
Aerospace & Defense — 1.6% | | | | | | | | |
Boeing Co. (The) | | | 48,000 | | | $ | 14,155,680 | |
Huntington Ingalls Industries, Inc. | | | 25,900 | | | | 6,104,630 | |
Lockheed Martin Corp. | | | 79,300 | | | | 25,459,265 | |
MTU Aero Engines AG (Germany) | | | 1,725 | | | | 308,248 | |
Northrop Grumman Corp. | | | 42,900 | | | | 13,166,439 | |
Safran SA (France) | | | 980 | | | | 101,082 | |
Spirit AeroSystems Holdings, Inc. (Class A Stock) | | | 105,300 | | | | 9,187,425 | |
| | | | | | | | |
| | | | | | | 68,482,769 | |
| | | | | | | | |
Air Freight & Logistics — 0.0% | | | | | | | | |
Deutsche Post AG (Germany) | | | 3,123 | | | | 148,447 | |
Royal Mail PLC (United Kingdom) | | | 19,665 | | | | 120,145 | |
United Parcel Service, Inc. (Class B Stock) | | | 7,300 | | | | 869,795 | |
| | | | | | | | |
| | | | | | | 1,138,387 | |
| | | | | | | | |
Airlines — 0.0% | | | | | | | | |
ANA Holdings, Inc. (Japan) | | | 400 | | | | 16,687 | |
Deutsche Lufthansa AG (Germany) | | | 10,593 | | | | 389,013 | |
International Consolidated Airlines Group SA (United Kingdom) | | | 2,273 | | | | 19,698 | |
Japan Airlines Co. Ltd. (Japan) | | | 400 | | | | 15,628 | |
| | | | | | | | |
| | | | | | | 441,026 | |
| | | | | | | | |
Auto Components — 0.2% | | | | | | | | |
Aisin Seiki Co. Ltd. (Japan) | | | 2,400 | | | | 134,454 | |
BorgWarner, Inc. | | | 192,000 | | | | 9,809,280 | |
Cooper-Standard Holdings, Inc.* | | | 400 | | | | 49,000 | |
Faurecia (France) | | | 3,893 | | | | 303,401 | |
Koito Manufacturing Co. Ltd. (Japan) | | | 300 | | | | 21,004 | |
Stanley Electric Co. Ltd. (Japan) | | | 6,000 | | | | 242,775 | |
Toyota Industries Corp. (Japan) | | | 500 | | | | 32,049 | |
| | | | | | | | |
| | | | | | | 10,591,963 | |
| | | | | | | | |
Automobiles — 0.8% | | | | | | | | |
Bayerische Motoren Werke AG (Germany) | | | 1,031 | | | | 106,896 | |
Daimler AG (Germany) | | | 2,990 | | | | 252,835 | |
Ferrari NV (Italy) | | | 347 | | | | 36,359 | |
Fiat Chrysler Automobiles NV (United Kingdom)* | | | 3,401 | | | | 60,719 | |
Ford Motor Co. | | | 753,000 | | | | 9,404,970 | |
General Motors Co. | | | 376,300 | | | | 15,424,537 | |
Honda Motor Co. Ltd. (Japan) | | | 5,400 | | | | 184,288 | |
Peugeot SA (France) | | | 1,508 | | | | 30,629 | |
Suzuki Motor Corp. (Japan) | | | 6,000 | | | | 347,302 | |
Thor Industries, Inc. | | | 50,300 | | | | 7,581,216 | |
Toyota Motor Corp. (Japan) | | | 8,300 | | | | 528,959 | |
Volkswagen AG (Germany) | | | 91 | | | | 18,365 | |
| | | | | | | | |
| | | | | | | 33,977,075 | |
| | | | | | | | |
Banks — 4.4% | | | | | | | | |
ABN AMRO Group NV (Netherlands) CVA, 144A | | | 10,148 | | | | 327,180 | |
Aozora Bank Ltd. (Japan) | | | 1,100 | | | | 42,683 | |
Banco Santander SA (Spain) | | | 4,418 | | | | 28,965 | |
Bank Leumi Le-Israel BM (Israel) | | | 4,340 | | | | 26,123 | |
| | | | | | | | |
COMMON STOCKS
(continued) | | Shares | | | Value | |
Banks (continued) | | | | | | | | |
Bank of America Corp. | | | 1,678,600 | | | $ | 49,552,272 | |
Bank of East Asia Ltd. (The) (Hong Kong) | | | 67,600 | | | | 292,351 | |
Bank of Queensland Ltd. (Australia) | | | 1,232 | | | | 12,186 | |
Bankinter SA (Spain) | | | 27,135 | | | | 256,688 | |
BNP Paribas SA (France) | | | 3,566 | | | | 265,269 | |
CaixaBank SA (Spain) | | | 11,274 | | | | 52,411 | |
Chiba Bank Ltd. (The) (Japan) | | | 2,000 | | | | 16,586 | |
Citigroup, Inc. | | | 478,900 | | | | 35,634,949 | |
Commonwealth Bank of Australia (Australia) | | | 6,581 | | | | 410,710 | |
Danske Bank A/S (Denmark) | | | 7,208 | | | | 280,550 | |
DBS Group Holdings Ltd. (Singapore) | | | 5,700 | | | | 105,429 | |
Hang Seng Bank Ltd. (Hong Kong) | | | 4,400 | | | | 109,159 | |
HSBC Holdings PLC (United Kingdom) | | | 44,239 | | | | 456,903 | |
ING Groep NV (Netherlands) | | | 12,266 | | | | 225,163 | |
Intesa Sanpaolo SpA (Italy) | | | 46,950 | | | | 155,773 | |
Intesa Sanpaolo SpA (Italy) RSP | | | 10,001 | | | | 31,884 | |
Japan Post Bank Co. Ltd. (Japan) | | | 11,200 | | | | 145,463 | |
JPMorgan Chase & Co. | | | 559,094 | | | | 59,789,512 | |
KBC Group NV (Belgium) | | | 4,257 | | | | 362,753 | |
Lloyds Banking Group PLC (United Kingdom) | | | 518,235 | | | | 475,212 | |
Mebuki Financial Group, Inc. (Japan) | | | 3,200 | | | | 13,519 | |
Mediobanca SpA (Italy) | | | 26,643 | | | | 301,884 | |
Mizrahi Tefahot Bank Ltd. (Israel) | | | 15,983 | | | | 294,409 | |
Mizuho Financial Group, Inc. (Japan) | | | 71,600 | | | | 129,459 | |
Oversea-Chinese Banking Corp. Ltd. (Singapore) | | | 30,900 | | | | 285,461 | |
PNC Financial Services Group, Inc. (The) | | | 20,300 | | | | 2,929,087 | |
Resona Holdings, Inc. (Japan) | | | 7,100 | | | | 42,307 | |
Skandinaviska Enskilda Banken AB (Sweden) (Class A Stock) | | | 4,812 | | | | 56,504 | |
Sumitomo Mitsui Financial Group, Inc. (Japan) | | | 4,300 | | | | 185,349 | |
Swedbank AB (Sweden) (Class A Stock) | | | 2,919 | | | | 70,420 | |
United Overseas Bank Ltd. (Singapore) | | | 4,100 | | | | 80,823 | |
Wells Fargo & Co. | | | 519,712 | | | | 31,530,927 | |
| | | | | | | | |
| | | | | | | 184,976,323 | |
| | | | | | | | |
Beverages — 1.6% | | | | | | | | |
Anheuser-Busch InBev SA/NV (Belgium) | | | 50 | | | | 5,582 | |
Asahi Group Holdings Ltd. (Japan) | | | 1,100 | | | | 54,582 | |
Coca-Cola Co. (The) | | | 673,300 | | | | 30,891,004 | |
Coca-Cola HBC AG (Switzerland) | | | 1,615 | | | | 52,743 | |
Constellation Brands, Inc. (Class A Stock) | | | 5,900 | | | | 1,348,563 | |
Diageo PLC (United Kingdom) | | | 8,674 | | | | 317,939 | |
SEE NOTES TO FINANCIAL STATEMENTS.
A80
| | | | | | |
| | FLEXIBLE MANAGED PORTFOLIO (continued) | | |
| |
| SCHEDULE OF INVESTMENTS | | as of December 31, 2017 |
| | | | | | | | |
COMMON STOCKS
(continued) | | Shares | | | Value | |
Beverages (continued) | | | | | | | | |
Kirin Holdings Co. Ltd. (Japan) | | | 2,700 | | | $ | 68,044 | |
PepsiCo, Inc. | | | 282,720 | | | | 33,903,782 | |
Pernod Ricard SA (France) | | | 658 | | | | 104,066 | |
Treasury Wine Estates Ltd. (Australia) | | | 1,006 | | | | 12,483 | |
| | | | | | | | |
| | | | | | | 66,758,788 | |
| | | | | | | | |
Biotechnology — 2.2% | | | | | | | | |
AbbVie, Inc. | | | 359,200 | | | | 34,738,232 | |
Amgen, Inc. | | | 89,108 | | | | 15,495,881 | |
Biogen, Inc.* | | | 30,100 | | | | 9,588,957 | |
Celgene Corp.* | | | 84,000 | | | | 8,766,240 | |
CSL Ltd. (Australia) | | | 558 | | | | 61,321 | |
Gilead Sciences, Inc. | | | 327,100 | | | | 23,433,444 | |
| | | | | | | | |
| | | | | | | 92,084,075 | |
| | | | | | | | |
Building Products — 0.2% | | | | | | | | |
Asahi Glass Co. Ltd. (Japan) | | | 600 | | | | 25,935 | |
Builders FirstSource, Inc.* | | | 48,500 | | | | 1,056,815 | |
Johnson Controls International PLC | | | 86,600 | | | | 3,300,326 | |
Universal Forest Products, Inc. | | | 75,700 | | | | 2,847,834 | |
| | | | | | | | |
| | | | | | | 7,230,910 | |
| | | | | | | | |
Capital Markets — 2.0% | | | | | | | | |
3i Group PLC (United Kingdom) | | | 6,206 | | | | 76,403 | |
Ameriprise Financial, Inc. | | | 25,200 | | | | 4,270,644 | |
BlackRock, Inc. | | | 4,000 | | | | 2,054,840 | |
Evercore, Inc. (Class A Stock) | | | 41,400 | | | | 3,726,000 | |
Goldman Sachs Group, Inc. (The) | | | 74,700 | | | | 19,030,572 | |
Hargreaves Lansdown PLC (United Kingdom) | | | 848 | | | | 20,594 | |
Invesco Ltd. | | | 294,300 | | | | 10,753,722 | |
Julius Baer Group Ltd. (Switzerland) | | | 692 | | | | 42,317 | |
London Stock Exchange Group PLC (United Kingdom) | | | 1,014 | | | | 51,863 | |
Macquarie Group Ltd. (Australia) | | | 4,917 | | | | 380,305 | |
Morgan Stanley | | | 90,400 | | | | 4,743,288 | |
Natixis SA (France) | | | 9,917 | | | | 78,329 | |
Nomura Holdings, Inc. (Japan) | | | 12,000 | | | | 70,341 | |
Northern Trust Corp. | | | 75,000 | | | | 7,491,750 | |
Partners Group Holding AG (Switzerland)(a) | | | 480 | | | | 328,893 | |
Raymond James Financial, Inc. | | | 62,300 | | | | 5,563,390 | |
S&P Global, Inc. | | | 120,600 | | | | 20,429,640 | |
Schroders PLC (United Kingdom) | | | 2,261 | | | | 107,027 | |
T. Rowe Price Group, Inc. | | | 37,700 | | | | 3,955,861 | |
| | | | | | | | |
| | | | | | | 83,175,779 | |
| | | | | | | | |
Chemicals — 1.6% | | | | | | | | |
AdvanSix, Inc.* | | | 7,116 | | | | 299,370 | |
Air Products & Chemicals, Inc. | | | 109,300 | | | | 17,933,944 | |
Arkema SA (France) | | | 201 | | | | 24,473 | |
Asahi Kasei Corp. (Japan) | | | 3,800 | | | | 48,904 | |
BASF SE (Germany) | | | 3,575 | | | | 391,931 | |
Chemours Co. (The) | | | 332,900 | | | | 16,664,974 | |
Covestro AG (Germany), 144A | | | 3,707 | | | | 381,696 | |
Hitachi Chemical Co. Ltd. (Japan) | | | 300 | | | | 7,682 | |
Huntsman Corp. | | | 151,900 | | | | 5,056,751 | |
| | | | | | | | |
COMMON STOCKS
(continued) | | Shares | | | Value | |
Chemicals (continued) | | | | | | | | |
Ingevity Corp.* | | | 52,800 | | | $ | 3,720,816 | |
JSR Corp. (Japan) | | | 600 | | | | 11,787 | |
Koninklijke DSM NV (Netherlands) | | | 575 | | | | 54,926 | |
LyondellBasell Industries NV (Class A Stock) | | | 164,600 | | | | 18,158,672 | |
Mitsubishi Chemical Holdings Corp. (Japan) | | | 36,700 | | | | 401,569 | |
Mitsubishi Gas Chemical Co., Inc. (Japan) | | | 3,100 | | | | 88,768 | |
Mitsui Chemicals, Inc. (Japan) | | | 600 | | | | 19,240 | |
Shin-Etsu Chemical Co. Ltd. (Japan) | | | 1,200 | | | | 121,588 | |
Sumitomo Chemical Co. Ltd. (Japan) | | | 5,000 | | | | 35,778 | |
Teijin Ltd. (Japan) | | | 12,000 | | | | 266,639 | |
Tosoh Corp. (Japan) | | | 2,000 | | | | 45,120 | |
Westlake Chemical Corp. | | | 49,300 | | | | 5,251,929 | |
| | | | | | | | |
| | | | | | | 68,986,557 | |
| | | | | | | | |
Commercial Services & Supplies — 0.0% | |
Dai Nippon Printing Co. Ltd. (Japan) | | | 4,000 | | | | 89,053 | |
Secom Co. Ltd. (Japan) | | | 700 | | | | 52,810 | |
Steelcase, Inc. (Class A Stock) | | | 5,000 | | | | 76,000 | |
Toppan Printing Co. Ltd. (Japan) | | | 2,000 | | | | 18,066 | |
| | | | | | | | |
| | | | | | | 235,929 | |
| | | | | | | | |
Communications Equipment — 0.2% | | | | | | | | |
Harris Corp. | | | 71,500 | | | | 10,127,975 | |
| | | | | | | | |
Construction & Engineering — 0.2% | | | | | | | | |
ACS Actividades de Construccion y Servicios SA (Spain) | | | 772 | | | | 30,157 | |
Argan, Inc. | | | 24,300 | | | | 1,093,500 | |
CIMIC Group Ltd. (Australia) | | | 7,424 | | | | 296,926 | |
EMCOR Group, Inc. | | | 53,100 | | | | 4,340,925 | |
HOCHTIEF AG (Germany) | | | 60 | | | | 10,597 | |
Kajima Corp. (Japan) | | | 27,000 | | | | 259,413 | |
MasTec, Inc.* | | | 27,100 | | | | 1,326,545 | |
Obayashi Corp. (Japan) | | | 9,400 | | | | 113,553 | |
Taisei Corp. (Japan) | | | 700 | | | | 34,812 | |
Vinci SA (France) | | | 1,576 | | | | 160,896 | |
| | | | | | | | |
| | | | | | | 7,667,324 | |
| | | | | | | | |
Consumer Finance — 0.7% | | | | | | | | |
Capital One Financial Corp. | | | 210,700 | | | | 20,981,506 | |
Navient Corp. | | | 505,300 | | | | 6,730,596 | |
| | | | | | | | |
| | | | | | | 27,712,102 | |
| | | | | | | | |
Containers & Packaging — 0.1% | | | | | | | | |
Greif, Inc. (Class A Stock) | | | 300 | | | | 18,174 | |
Owens-Illinois, Inc.* | | | 96,200 | | | | 2,132,754 | |
| | | | | | | | |
| | | | | | | 2,150,928 | |
| | | | | | | | |
Distributors — 0.3% | | | | | | | | |
LKQ Corp.* | | | 300,700 | | | | 12,229,469 | |
| | | | | | | | |
Diversified Financial Services — 0.6% | |
Berkshire Hathaway, Inc. (Class B Stock)* | | | 126,900 | | | | 25,154,118 | |
Eurazeo SA (France) | | | 149 | | | | 13,765 | |
ORIX Corp. (Japan) | | | 20,600 | | | | 347,334 | |
| | | | | | | | |
| | | | | | | 25,515,217 | |
| | | | | | | | |
SEE NOTES TO FINANCIAL STATEMENTS.
A81
| | | | | | |
| | FLEXIBLE MANAGED PORTFOLIO (continued) | | |
| |
| SCHEDULE OF INVESTMENTS | | as of December 31, 2017 |
| | | | | | | | |
COMMON STOCKS
(continued) | | Shares | | | Value | |
Diversified Telecommunication Services — 0.9% | |
Deutsche Telekom AG (Germany) | | | 10,443 | | | $ | 184,595 | |
Koninklijke KPN NV (Netherlands) | | | 10,828 | | | | 37,803 | |
Nippon Telegraph & Telephone Corp. (Japan) | | | 8,300 | | | | 390,217 | |
Orange SA (France) | | | 11,963 | | | | 207,328 | |
Swisscom AG (Switzerland) | | | 82 | | | | 43,604 | |
TDC A/S (Denmark) | | | 10,690 | | | | 65,665 | |
Telecom Italia SpA (Italy)* | | | 358,628 | | | | 309,710 | |
Telecom Italia SpA (Italy) RSP | | | 18,981 | | | | 13,464 | |
Verizon Communications, Inc. | | | 732,688 | | | | 38,781,176 | |
| | | | | | | | |
| | | | | | | 40,033,562 | |
| | | | | | | | |
Electric Utilities — 1.0% | | | | | | | | |
CK Infrastructure Holdings Ltd. (Hong Kong) | | | 1,000 | | | | 8,581 | |
CLP Holdings Ltd. (Hong Kong) | | | 3,500 | | | | 35,806 | |
EDP-Energias de Portugal SA (Portugal) | | | 46,235 | | | | 159,934 | |
Endesa SA (Spain)(a) | | | 6,428 | | | | 137,480 | |
Enel SpA (Italy) | | | 66,932 | | | | 411,582 | |
Entergy Corp. | | | 12,900 | | | | 1,049,931 | |
Exelon Corp. | | | 367,200 | | | | 14,471,352 | |
Iberdrola SA (Spain) | | | 18,949 | | | | 146,689 | |
Kansai Electric Power Co., Inc. (The) (Japan) | | | 2,000 | | | | 24,460 | |
Kyushu Electric Power Co., Inc. (Japan) | | | 1,300 | | | | 13,617 | |
NextEra Energy, Inc. | | | 76,900 | | | | 12,011,011 | |
Orsted A/S (Denmark), 144A | | | 530 | | | | 28,890 | |
PPL Corp. | | | 377,000 | | | | 11,668,150 | |
Red Electrica Corp. SA (Spain) | | | 1,404 | | | | 31,516 | |
Southern Co. (The) | | | 52,000 | | | | 2,500,680 | |
SSE PLC (United Kingdom) | | | 8,311 | | | | 147,751 | |
Tohoku Electric Power Co., Inc. (Japan) | | | 1,300 | | | | 16,597 | |
| | | | | | | | |
| | | | | | | 42,864,027 | |
| | | | | | | | |
Electrical Equipment — 0.5% | | | | | | | | |
AMETEK, Inc. | | | 145,900 | | | | 10,573,373 | |
Emerson Electric Co. | | | 145,800 | | | | 10,160,802 | |
Mitsubishi Electric Corp. (Japan) | | | 6,200 | | | | 102,750 | |
Nidec Corp. (Japan) | | | 700 | | | | 98,012 | |
Schneider Electric SE (France) | | | 1,803 | | | | 152,859 | |
Siemens Gamesa Renewable Energy SA (Spain) | | | 4,837 | | | | 66,235 | |
| | | | | | | | |
| | | | | | | 21,154,031 | |
| | | | | | | | |
Electronic Equipment, Instruments & Components — 0.0% | |
Alps Electric Co. Ltd. (Japan) | | | 600 | | | | 17,067 | |
Avnet, Inc. | | | 20,000 | | | | 792,400 | |
Hitachi Ltd. (Japan) | | | 59,000 | | | | 457,734 | |
Kyocera Corp. (Japan) | | | 2,900 | | | | 189,332 | |
Nippon Electric Glass Co. Ltd. (Japan) | | | 300 | | | | 11,419 | |
Omron Corp. (Japan) | | | 600 | | | | 35,687 | |
| | | | | | | | |
| | | | | | | 1,503,639 | |
| | | | | | | | |
Energy Equipment & Services — 0.2% | |
Halliburton Co. | | | 138,500 | | | | 6,768,495 | |
| | | | | | | | |
| | | | | | | | |
COMMON STOCKS
(continued) | | Shares | | | Value | |
Equity Real Estate Investment Trusts (REITs) — 1.3% | |
American Tower Corp. | | | 140,500 | | | $ | 20,045,135 | |
Apple Hospitality REIT, Inc. | | | 47,300 | | | | 927,553 | |
British Land Co. PLC (The) (United Kingdom) | | | 13,624 | | | | 126,885 | |
Brixmor Property Group, Inc.(a) | | | 97,600 | | | | 1,821,216 | |
CoreCivic, Inc. | | | 45,900 | | | | 1,032,750 | |
DDR Corp. | | | 497,300 | | | | 4,455,808 | |
Franklin Street Properties Corp. | | | 72,300 | | | | 776,502 | |
GEO Group, Inc. (The) | | | 253,350 | | | | 5,979,060 | |
Goodman Group (Australia) | | | 5,711 | | | | 37,421 | |
GPT Group (The) (Australia) | | | 5,687 | | | | 22,622 | |
Hospitality Properties Trust | | | 63,000 | | | | 1,880,550 | |
Klepierre SA (France) | | | 7,076 | | | | 311,020 | |
Land Securities Group PLC (United Kingdom) | | | 2,391 | | | | 32,486 | |
Mirvac Group (Australia) | | | 11,728 | | | | 21,448 | |
Nippon Building Fund, Inc. (Japan) | | | 4 | | | | 19,565 | |
Nomura Real Estate Master Fund, Inc. (Japan) | | | 12 | | | | 14,897 | |
Prologis, Inc. | | | 37,800 | | | | 2,438,478 | |
Spirit Realty Capital, Inc. | | | 1,326,200 | | | | 11,378,796 | |
Stockland (Australia) | | | 80,765 | | | | 281,736 | |
VEREIT, Inc. | | | 173,300 | | | | 1,350,007 | |
Weyerhaeuser Co. | | | 91,800 | | | | 3,236,868 | |
| | | | | | | | |
| | | | | | | 56,190,803 | |
| | | | | | | | |
Food & Staples Retailing — 1.7% | | | | | | | | |
CVS Health Corp. | | | 298,300 | | | | 21,626,750 | |
ICA Gruppen AB (Sweden) | | | 256 | | | | 9,300 | |
J Sainsbury PLC (United Kingdom) | | | 92,828 | | | | 302,278 | |
Jeronimo Martins SGPS SA (Portugal) | | | 814 | | | | 15,808 | |
Koninklijke Ahold Delhaize NV (Netherlands) | | | 424 | | | | 9,321 | |
Kroger Co. (The) | | | 609,800 | | | | 16,739,010 | |
METRO AG (Germany)* | | | 3,772 | | | | 75,133 | |
Performance Food Group Co.* | | | 113,900 | | | | 3,770,090 | |
Tesco PLC (United Kingdom) | | | 39,837 | | | | 112,704 | |
Wal-Mart Stores, Inc. | | | 272,600 | | | | 26,919,250 | |
Wesfarmers Ltd. (Australia) | | | 4,716 | | | | 163,070 | |
WM Morrison Supermarkets PLC (United Kingdom) | | | 108,457 | | | | 322,167 | |
Woolworths Group Ltd. (Australia) | | | 2,140 | | | | 45,467 | |
| | | | | | | | |
| | | | | | | 70,110,348 | |
| | | | | | | | |
Food Products — 0.7% | | | | | | | | |
Chocoladefabriken Lindt & Spruengli AG (Switzerland) | | | 3 | | | | 18,313 | |
Conagra Brands, Inc. | | | 77,100 | | | | 2,904,357 | |
Danone SA (France) | | | 1,083 | | | | 90,745 | |
Golden Agri-Resources Ltd. (Singapore) | | | 595,800 | | | | 164,483 | |
Marine Harvest ASA (Norway) | | | 16,965 | | | | 286,890 | |
Nestle SA (Switzerland) | | | 6,464 | | | | 555,751 | |
NH Foods Ltd. (Japan) | | | 4,000 | | | | 97,437 | |
Orkla ASA (Norway) | | | 2,520 | | | | 26,705 | |
Pilgrim’s Pride Corp.*(a) | | | 141,700 | | | | 4,401,202 | |
SEE NOTES TO FINANCIAL STATEMENTS.
A82
| | | | | | |
| | FLEXIBLE MANAGED PORTFOLIO (continued) | | |
| |
| SCHEDULE OF INVESTMENTS | | as of December 31, 2017 |
| | | | | | | | |
COMMON STOCKS
(continued) | | Shares | | | Value | |
Food Products (continued) | | | | | | | | |
Tate & Lyle PLC (United Kingdom) | | | 30,479 | | | $ | 288,894 | |
Tyson Foods, Inc. (Class A Stock) | | | 246,300 | | | | 19,967,541 | |
WH Group Ltd. (Hong Kong), 144A | | | 334,000 | | | | 376,429 | |
Wilmar International Ltd. (Singapore) | | | 5,000 | | | | 11,522 | |
| | | | | | | | |
| | | | | | | 29,190,269 | |
| | | | | | | | |
Gas Utilities — 0.1% | | | | | | | | |
Gas Natural SDG SA (Spain) | | | 1,102 | | | | 25,432 | |
UGI Corp. | | | 117,000 | | | | 5,493,150 | |
| | | | | | | | |
| | | | | | | 5,518,582 | |
| | | | | | | | |
Health Care Equipment & Supplies — 2.1% | |
Abbott Laboratories | | | 403,300 | | | | 23,016,331 | |
Baxter International, Inc. | | | 319,800 | | | | 20,671,872 | |
Boston Scientific Corp.* | | | 460,900 | | | | 11,425,711 | |
Cochlear Ltd. (Australia) | | | 175 | | | | 23,328 | |
Cooper Cos., Inc. (The) | | | 3,900 | | | | 849,732 | |
Danaher Corp. | | | 216,600 | | | | 20,104,812 | |
Inogen, Inc.* | | | 7,700 | | | | 916,916 | |
Medtronic PLC | | | 163,100 | | | | 13,170,325 | |
Olympus Corp. (Japan) | | | 900 | | | | 34,430 | |
Smith & Nephew PLC (United Kingdom) | | | 18,059 | | | | 312,476 | |
Straumann Holding AG (Switzerland) | | | 122 | | | | 86,065 | |
| | | | | | | | |
| | | | | | | 90,611,998 | |
| | | | | | | | |
Health Care Providers & Services — 1.9% | |
Alfresa Holdings Corp. (Japan) | | | 600 | | | | 14,054 | |
Anthem, Inc. | | | 22,000 | | | | 4,950,220 | |
Cigna Corp. | | | 36,400 | | | | 7,392,476 | |
Express Scripts Holding Co.* | | | 284,100 | | | | 21,205,224 | |
Fresenius Medical Care AG & Co. KGaA (Germany) | | | 1,976 | | | | 207,499 | |
Fresenius SE & Co. KGaA (Germany) | | | 1,261 | | | | 98,070 | |
McKesson Corp. | | | 27,400 | | | | 4,273,030 | |
Medipal Holdings Corp. (Japan) | | | 5,600 | | | | 109,332 | |
Ramsay Health Care Ltd. (Australia) | | | 417 | | | | 22,771 | |
Sonic Healthcare Ltd. (Australia) | | | 1,277 | | | | 22,709 | |
UnitedHealth Group, Inc. | | | 177,000 | | | | 39,021,420 | |
WellCare Health Plans, Inc.* | | | 7,700 | | | | 1,548,547 | |
| | | | | | | | |
| | | | | | | 78,865,352 | |
| | | | | | | | |
Health Care Technology — 0.0% | | | | | | | | |
Cerner Corp.* | | | 18,300 | | | | 1,233,237 | |
| | | | | | | | |
Hotels, Restaurants & Leisure — 1.6% | |
Aristocrat Leisure Ltd. (Australia) | | | 3,893 | | | | 71,686 | |
Galaxy Entertainment Group Ltd. (Hong Kong) | | | 24,500 | | | | 195,603 | |
Genting Singapore PLC (Singapore) | | | 338,300 | | | | 330,397 | |
Hilton Grand Vacations, Inc.* | | | 93,300 | | | | 3,913,935 | |
Hilton Worldwide Holdings, Inc. | | | 194,100 | | | | 15,500,826 | |
Las Vegas Sands Corp. | | | 34,700 | | | | 2,411,303 | |
McDonald’s Corp. | | | 194,400 | | | | 33,460,128 | |
Oriental Land Co. Ltd. (Japan) | | | 1,100 | | | | 100,078 | |
| | | | | | | | |
COMMON STOCKS
(continued) | | Shares | | | Value | |
Hotels, Restaurants & Leisure (continued) | |
TUI AG (Germany) | | | 1,434 | | | $ | 29,709 | |
Yum! Brands, Inc. | | | 162,000 | | | | 13,220,820 | |
| | | | | | | | |
| | | | | | | 69,234,485 | |
| | | | | | | | |
Household Durables — 0.1% | | | | | | | | |
Berkeley Group Holdings PLC (United Kingdom) | | | 2,212 | | | | 125,124 | |
NVR, Inc.* | | | 900 | | | | 3,157,398 | |
Panasonic Corp. (Japan) | | | 6,700 | | | | 97,779 | |
Persimmon PLC (United Kingdom) | | | 9,322 | | | | 344,394 | |
Sony Corp. (Japan) | | | 10,400 | | | | 466,782 | |
Taylor Wimpey PLC (United Kingdom) | | | 10,225 | | | | 28,448 | |
| | | | | | | | |
| | | | | | | 4,219,925 | |
| | | | | | | | |
Household Products — 0.6% | | | | | | | | |
Henkel AG & Co. KGaA (Germany) | | | 321 | | | | 38,439 | |
Kimberly-Clark Corp. | | | 137,000 | | | | 16,530,420 | |
Procter & Gamble Co. (The) | | | 75,305 | | | | 6,919,023 | |
| | | | | | | | |
| | | | | | | 23,487,882 | |
| | | | | | | | |
Independent Power & Renewable Electricity Producers — 0.5% | |
AES Corp. | | | 1,039,500 | | | | 11,257,785 | |
NRG Energy, Inc. | | | 333,800 | | | | 9,506,624 | |
Uniper SE (Germany) | | | 628 | | | | 19,565 | |
| | | | | | | | |
| | | | | | | 20,783,974 | |
| | | | | | | | |
Industrial Conglomerates — 1.3% | | | | | | | | |
3M Co. | | | 125,000 | | | | 29,421,250 | |
CK Hutchison Holdings Ltd. (Hong Kong) | | | 8,500 | | | | 106,507 | |
Honeywell International, Inc. | | | 178,800 | | | | 27,420,768 | |
Jardine Matheson Holdings Ltd. (Hong Kong) | | | 4,600 | | | | 279,450 | |
Siemens AG (Germany) | | | 356 | | | | 49,291 | |
| | | | | | | | |
| | | | | | | 57,277,266 | |
| | | | | | | | |
Insurance — 1.3% | | | | | | | | |
Aflac, Inc. | | | 155,000 | | | | 13,605,900 | |
AIA Group Ltd. (Hong Kong) | | | 36,200 | | | | 307,904 | |
Allianz SE (Germany) | | | 1,427 | | | | 326,565 | |
Allstate Corp. (The) | | | 168,500 | | | | 17,643,635 | |
Aon PLC | | | 9,300 | | | | 1,246,200 | |
AXA SA (France) | | | 6,134 | | | | 181,770 | |
Baloise Holding AG (Switzerland) | | | 153 | | | | 23,783 | |
CNP Assurances (France) | | | 547 | | | | 12,618 | |
Direct Line Insurance Group PLC (United Kingdom) | | | 61,865 | | | | 318,344 | |
Insurance Australia Group Ltd. (Australia) | | | 37,336 | | | | 210,286 | |
Legal & General Group PLC (United Kingdom) | | | 98,507 | | | | 362,661 | |
Muenchener Rueckversicherungs-Gesellschaft AG in Muenchen (Germany) | | | 207 | | | | 44,702 | |
NN Group NV (Netherlands) | | | 991 | | | | 42,864 | |
Old Republic International Corp. | | | 84,900 | | | | 1,815,162 | |
Sampo OYJ (Finland) (Class A Stock) | | | 2,246 | | | | 123,265 | |
SEE NOTES TO FINANCIAL STATEMENTS.
A83
| | | | | | |
| | FLEXIBLE MANAGED PORTFOLIO (continued) | | |
| |
| SCHEDULE OF INVESTMENTS | | as of December 31, 2017 |
| | | | | | | | |
COMMON STOCKS
(continued) | | Shares | | | Value | |
Insurance (continued) | | | | | | | | |
SCOR SE (France) | | | 7,381 | | | $ | 296,668 | |
Suncorp Group Ltd. (Australia) | | | 4,039 | | | | 43,533 | |
Swiss Life Holding AG (Switzerland) | | | 971 | | | | 343,223 | |
Swiss Re AG (Switzerland) | | | 2,863 | | | | 267,750 | |
Travelers Cos., Inc. (The) | | | 6,500 | | | | 881,660 | |
Unum Group | | | 278,200 | | | | 15,270,398 | |
Zurich Insurance Group AG (Switzerland) | | | 75 | | | | 22,803 | |
| | | | | | | | |
| | | | | | | 53,391,694 | |
| | | | | | | | |
Internet & Direct Marketing Retail — 1.3% | |
Amazon.com, Inc.* | | | 19,500 | | | | 22,804,665 | |
Groupon, Inc.*(a) | | | 826,600 | | | | 4,215,660 | |
Liberty Interactive Corp. QVC Group (Class A Stock)* | | | 562,600 | | | | 13,738,692 | |
Nutrisystem, Inc.(a) | | | 104,300 | | | | 5,486,180 | |
Priceline Group, Inc. (The)* | | | 5,300 | | | | 9,210,022 | |
| | | | | | | | |
| | | | | | | 55,455,219 | |
| | | | | | | | |
Internet Software & Services — 3.5% | | | | | | | | |
Alphabet, Inc. (Class A Stock)* | | | 32,700 | | | | 34,446,180 | |
Alphabet, Inc. (Class C Stock)* | | | 49,982 | | | | 52,301,165 | |
Etsy, Inc.* | | | 63,400 | | | | 1,296,530 | |
Facebook, Inc. (Class A Stock)* | | | 333,300 | | | | 58,814,118 | |
United Internet AG (Germany) | | | 395 | | | | 27,066 | |
| | | | | | | | |
| | | | | | | 146,885,059 | |
| | | | | | | | |
IT Services — 2.1% | | | | | | | | |
Accenture PLC (Class A Stock) | | | 151,500 | | | | 23,193,135 | |
Amadeus IT Group SA (Spain) | | | 5,303 | | | | 381,616 | |
Atos SE (France) | | | 298 | | | | 43,326 | |
CACI International, Inc. (Class A Stock)* | | | 5,200 | | | | 688,220 | |
Capgemini SE (France) | | | 498 | | | | 58,984 | |
Cognizant Technology Solutions Corp. (Class A Stock) | | | 300,800 | | | | 21,362,816 | |
Computershare Ltd. (Australia) | | | 1,481 | | | | 18,764 | |
Total System Services, Inc. | | | 56,800 | | | | 4,492,312 | |
Travelport Worldwide Ltd. | | | 27,300 | | | | 356,811 | |
Visa, Inc. (Class A Stock)(a) | | | 324,800 | | | | 37,033,696 | |
| | | | | | | | |
| | | | | | | 87,629,680 | |
| | | | | | | | |
Life Sciences Tools & Services — 0.2% | |
Bruker Corp. | | | 66,200 | | | | 2,271,984 | |
Illumina, Inc.* | | | 34,900 | | | | 7,625,301 | |
QIAGEN NV | | | 620 | | | | 19,338 | |
| | | | | | | | |
| | | | | | | 9,916,623 | |
| | | | | | | | |
Machinery — 1.5% | | | | | | | | |
Atlas Copco AB (Sweden) (Class A Stock) | | | 8,647 | | | | 373,171 | |
Atlas Copco AB (Sweden) (Class B Stock) | | | 1,137 | | | | 43,578 | |
Crane Co. | | | 15,700 | | | | 1,400,754 | |
Cummins, Inc. | | | 95,600 | | | | 16,886,784 | |
Daifuku Co. Ltd. (Japan) | | | 300 | | | | 16,299 | |
Fortive Corp. | | | 34,800 | | | | 2,517,780 | |
Hitachi Construction Machinery Co. Ltd. (Japan) | | | 300 | | | | 10,873 | |
| | | | | | | | |
COMMON STOCKS
(continued) | | Shares | | | Value | |
Machinery (continued) | | | | | | | | |
Illinois Tool Works, Inc. | | | 129,600 | | | $ | 21,623,760 | |
Ingersoll-Rand PLC | | | 80,000 | | | | 7,135,200 | |
Kawasaki Heavy Industries Ltd. (Japan) | | | 500 | | | | 17,492 | |
Komatsu Ltd. (Japan) | | | 2,900 | | | | 104,805 | |
MAN SE (Germany) | | | 110 | | | | 12,587 | |
MINEBEA MITSUMI, Inc. (Japan) | | | 5,400 | | | | 112,629 | |
Oshkosh Corp. | | | 96,900 | | | | 8,807,241 | |
Sandvik AB (Sweden) | | | 20,027 | | | | 350,567 | |
Schindler Holding AG (Switzerland) | | | 64 | | | | 14,472 | |
Schindler Holding AG (Switzerland) (Part. Cert.) | | | 131 | | | | 30,129 | |
SMC Corp. (Japan) | | | 200 | | | | 82,077 | |
Sumitomo Heavy Industries Ltd. (Japan) | | | 400 | | | | 16,854 | |
Terex Corp. | | | 65,700 | | | | 3,168,054 | |
THK Co. Ltd. (Japan) | | | 400 | | | | 14,952 | |
Volvo AB (Sweden) (Class B Stock) | | | 19,353 | | | | 360,389 | |
| | | | | | | | |
| | | | | | | 63,100,447 | |
| | | | | | | | |
Marine — 0.0% | | | | | | | | |
AP Moller—Maersk A/S (Denmark) (Class A Stock) | | | 10 | | | | 16,660 | |
Kuehne + Nagel International AG (Switzerland) | | | 169 | | | | 29,900 | |
| | | | | | | | |
| | | | | | | 46,560 | |
| | | | | | | | |
Media — 1.3% | | | | | | | | |
Axel Springer SE (Germany) | | | 152 | | | | 11,853 | |
Comcast Corp. (Class A Stock) | | | 846,046 | | | | 33,884,142 | |
Discovery Communications, Inc. (Class C Stock)*(a) | | | 338,800 | | | | 7,172,396 | |
I-CABLE Communications Ltd. (Hong Kong)* | | | 3,065 | | | | 90 | |
John Wiley & Sons, Inc. (Class A Stock) | | | 20,400 | | | | 1,341,300 | |
RTL Group SA (Luxembourg) | | | 111 | | | | 8,911 | |
TEGNA, Inc. | | | 171,500 | | | | 2,414,720 | |
Toho Co. Ltd. (Japan) | | | 3,500 | | | | 121,152 | |
Twenty-First Century Fox, Inc. (Class A Stock) | | | 76,300 | | | | 2,634,639 | |
Twenty-First Century Fox, Inc. (Class B Stock) | | | 180,800 | | | | 6,168,896 | |
| | | | | | | | |
| | | | | | | 53,758,099 | |
| | | | | | | | |
Metals & Mining — 0.8% | | | | | | | | |
Alcoa Corp.* | | | 194,400 | | | | 10,472,328 | |
Anglo American PLC (United Kingdom) | | | 19,427 | | | | 404,061 | |
ArcelorMittal (Luxembourg)* | | | 12,231 | | | | 396,812 | |
BHP Billiton Ltd. (Australia) | | | 10,283 | | | | 236,210 | |
BHP Billiton PLC (Australia) | | | 6,577 | | | | 132,989 | |
BlueScope Steel Ltd. (Australia) | | | 1,791 | | | | 21,332 | |
Boliden AB (Sweden) | | | 864 | | | | 29,547 | |
Fortescue Metals Group Ltd. (Australia) | | | 32,523 | | | | 123,079 | |
Freeport-McMoRan, Inc.* | | | 1,072,700 | | | | 20,338,392 | |
SEE NOTES TO FINANCIAL STATEMENTS.
A84
| | | | | | |
| | FLEXIBLE MANAGED PORTFOLIO (continued) | | |
| |
| SCHEDULE OF INVESTMENTS | | as of December 31, 2017 |
| | | | | | | | |
COMMON STOCKS
(continued) | | Shares | | | Value | |
Metals & Mining (continued) | | | | | | | | |
JFE Holdings, Inc. (Japan) | | | 1,700 | | | $ | 40,626 | |
Nippon Steel & Sumitomo Metal Corp. (Japan) | | | 2,400 | | | | 61,318 | |
Rio Tinto PLC (United Kingdom) | | | 3,885 | | | | 203,797 | |
South32 Ltd. (Australia) | | | 16,028 | | | | 43,445 | |
Southern Copper Corp. (Peru)(a) | | | 6,500 | | | | 308,425 | |
voestalpine AG (Austria) | | | 4,537 | | | | 270,872 | |
| | | | | | | | |
| | | | | | | 33,083,233 | |
| | | | | | | | |
Mortgage Real Estate Investment Trusts (REITs) — 0.0% | |
Ladder Capital Corp. | | | 64,500 | | | | 879,135 | |
| | | | | | | | |
Multi-Utilities — 0.2% | | | | | | | | |
AGL Energy Ltd. (Australia) | | | 2,172 | | | | 41,160 | |
CenterPoint Energy, Inc. | | | 233,700 | | | | 6,627,732 | |
DTE Energy Co. | | | 14,600 | | | | 1,598,116 | |
Innogy SE (Germany), 144A | | | 431 | | | | 16,868 | |
MDU Resources Group, Inc. | | | 79,400 | | | | 2,134,272 | |
National Grid PLC (United Kingdom) | | | 10,263 | | | | 120,985 | |
| | | | | | | | |
| | | | | | | 10,539,133 | |
| | | | | | | | |
Multiline Retail — 0.0% | | | | | | | | |
Don Quijote Holdings Co. Ltd. (Japan) | | | 400 | | | | 20,852 | |
J Front Retailing Co. Ltd. (Japan) | | | 9,300 | | | | 174,767 | |
Macy’s, Inc. | | | 34,500 | | | | 869,055 | |
Next PLC (United Kingdom) | | | 470 | | | | 28,646 | |
Takashimaya Co. Ltd. (Japan) | | | 14,000 | | | | 147,157 | |
| | | | | | | | |
| | | | | | | 1,240,477 | |
| | | | | | | | |
Oil, Gas & Consumable Fuels — 3.8% | | | | | | | | |
Anadarko Petroleum Corp. | | | 324,100 | | | | 17,384,724 | |
Andeavor | | | 102,100 | | | | 11,674,114 | |
BP PLC (United Kingdom) | | | 49,966 | | | | 350,525 | |
Caltex Australia Ltd. (Australia) | | | 826 | | | | 21,882 | |
ConocoPhillips | | | 251,800 | | | | 13,821,302 | |
CVR Energy, Inc.(a) | | | 4,700 | | | | 175,028 | |
Devon Energy Corp. | | | 408,000 | | | | 16,891,200 | |
Enagas SA (Spain) | | | 730 | | | | 20,877 | |
Exxon Mobil Corp. | | | 515,416 | | | | 43,109,394 | |
Galp Energia SGPS SA (Portugal) | | | 6,267 | | | | 115,142 | |
JXTG Holdings, Inc. (Japan) | | | 9,700 | | | | 62,335 | |
Marathon Petroleum Corp. | | | 291,200 | | | | 19,213,376 | |
Neste OYJ (Finland) | | | 397 | | | | 25,412 | |
Newfield Exploration Co.* | | | 479,600 | | | | 15,121,788 | |
OMV AG (Austria) | | | 4,900 | | | | 310,042 | |
Repsol SA (Spain) | | | 20,422 | | | | 360,579 | |
Royal Dutch Shell PLC (Netherlands) (Class A Stock) | | | 14,043 | | | | 468,799 | |
Royal Dutch Shell PLC (Netherlands) (Class B Stock) | | | 11,852 | | | | 399,104 | |
Total SA (France) | | | 7,226 | | | | 398,874 | |
Valero Energy Corp. | | | 246,100 | | | | 22,619,051 | |
Woodside Petroleum Ltd. (Australia) | | | 1,982 | | | | 50,993 | |
World Fuel Services Corp. | | | 15,600 | | | | 438,984 | |
| | | | | | | | |
| | | | | | | 163,033,525 | |
| | | | | | | | |
Paper & Forest Products — 0.0% | | | | | | | | |
UPM-Kymmene OYJ (Finland) | | | 1,669 | | | | 51,814 | |
| | | | | | | | |
| | | | | | | | |
COMMON STOCKS
(continued) | | Shares | | | Value | |
Personal Products — 0.0% | | | | | | | | |
Avon Products, Inc. (United Kingdom)* | | | 75,400 | | | $ | 162,110 | |
Kao Corp. (Japan) | | | 1,100 | | | | 74,327 | |
Kose Corp. (Japan) | | | 100 | | | | 15,583 | |
Pola Orbis Holdings, Inc. (Japan) | | | 300 | | | | 10,512 | |
Unilever NV (United Kingdom) CVA | | | 9,376 | | | | 527,895 | |
Unilever PLC (United Kingdom) | | | 4,071 | | | | 225,802 | |
| | | | | | | | |
| | | | | | | 1,016,229 | |
| | | | | | | | |
Pharmaceuticals — 2.5% | | | | | | | | |
Allergan PLC | | | 104,000 | | | | 17,012,320 | |
Astellas Pharma, Inc. (Japan) | | | 6,700 | | | | 85,112 | |
AstraZeneca PLC (United Kingdom) | | | 4,114 | | | | 283,888 | |
Bayer AG (Germany) | | | 3,149 | | | | 391,304 | |
Bristol-Myers Squibb Co. | | | 119,500 | | | | 7,322,960 | |
Corcept Therapeutics, Inc.*(a) | | | 134,100 | | | | 2,421,846 | |
Daiichi Sankyo Co. Ltd. (Japan) | | | 1,800 | | | | 46,804 | |
GlaxoSmithKline PLC (United Kingdom) | | | 8,349 | | | | 147,854 | |
H. Lundbeck A/S (Denmark) | | | 219 | | | | 11,106 | |
Johnson & Johnson | | | 207,498 | | | | 28,991,620 | |
Merck & Co., Inc. | | | 225,900 | | | | 12,711,393 | |
Mitsubishi Tanabe Pharma Corp. (Japan) | | | 600 | | | | 12,366 | |
Novartis AG (Switzerland) | | | 8,265 | | | | 695,520 | |
Novo Nordisk A/S (Denmark) (Class B Stock) | | | 6,368 | | | | 342,187 | |
Orion OYJ (Finland) (Class B Stock) | | | 324 | | | | 12,080 | |
Pfizer, Inc. | | | 489,100 | | | | 17,715,202 | |
Recordati SpA (Italy) | | | 5,425 | | | | 241,084 | |
Roche Holding AG (Switzerland) | | | 2,948 | | | | 745,418 | |
Sanofi (France) | | | 6,452 | | | | 555,464 | |
Shionogi & Co. Ltd. (Japan) | | | 800 | | | | 43,228 | |
Zoetis, Inc. | | | 223,300 | | | | 16,086,532 | |
| | | | | | | | |
| | | | | | | 105,875,288 | |
| | | | | | | | |
Professional Services — 0.1% | | | | | | | | |
Experian PLC (United Kingdom) | | | 6,425 | | | | 141,624 | |
Insperity, Inc. | | | 43,600 | | | | 2,500,460 | |
Intertek Group PLC (United Kingdom) | | | 513 | | | | 35,876 | |
Recruit Holdings Co. Ltd. (Japan) | | | 3,500 | | | | 86,905 | |
SGS SA (Switzerland) | | | 15 | | | | 39,105 | |
| | | | | | | | |
| | | | | | | 2,803,970 | |
| | | | | | | | |
Real Estate Management & Development — 0.4% | |
CBRE Group, Inc. (Class A Stock)* | | | 372,200 | | | | 16,119,982 | |
CK Asset Holdings Ltd. (Hong Kong) | | | 8,500 | | | | 74,096 | |
Daito Trust Construction Co. Ltd. (Japan) | | | 400 | | | | 81,492 | |
Daiwa House Industry Co. Ltd. (Japan) | | | 7,400 | | | | 283,771 | |
Henderson Land Development Co. Ltd. (Hong Kong) | | | 4,000 | | | | 26,300 | |
Kerry Properties Ltd. (Hong Kong) | | | 68,500 | | | | 307,722 | |
Mitsubishi Estate Co. Ltd. (Japan) | | | 1,300 | | | | 22,572 | |
Sino Land Co. Ltd. (Hong Kong) | | | 10,000 | | | | 17,691 | |
SEE NOTES TO FINANCIAL STATEMENTS.
A85
| | | | | | |
| | FLEXIBLE MANAGED PORTFOLIO (continued) | | |
| |
| SCHEDULE OF INVESTMENTS | | as of December 31, 2017 |
| | | | | | | | |
COMMON STOCKS
(continued) | | Shares | | | Value | |
Real Estate Management & Development (continued) | |
Sumitomo Realty & Development Co. Ltd. (Japan) | | | 1,000 | | | $ | 32,819 | |
Wharf Holdings Ltd. (The) (Hong Kong) | | | 4,000 | | | | 13,794 | |
| | | | | | | | |
| | | | | | | 16,980,239 | |
| | | | | | | | |
Road & Rail — 1.1% | | | | | | | | |
Central Japan Railway Co. (Japan) | | | 1,900 | | | | 340,025 | |
CSX Corp. | | | 237,800 | | | | 13,081,378 | |
DSV A/S (Denmark) | | | 275 | | | | 21,639 | |
East Japan Railway Co. (Japan) | | | 1,000 | | | | 97,518 | |
Kansas City Southern | | | 32,300 | | | | 3,398,606 | |
Norfolk Southern Corp. | | | 130,000 | | | | 18,837,000 | |
Union Pacific Corp. | | | 75,100 | | | | 10,070,910 | |
| | | | | | | | |
| | | | | | | 45,847,076 | |
| | | | | | | | |
Semiconductors & Semiconductor Equipment — 2.9% | |
Applied Materials, Inc. | | | 458,700 | | | | 23,448,744 | |
ASM Pacific Technology Ltd. (Hong Kong) | | | 800 | | | | 11,098 | |
ASML Holding NV (Netherlands) | | | 1,178 | | | | 204,805 | |
Broadcom Ltd. | | | 100,300 | | | | 25,767,070 | |
Entegris, Inc. | | | 65,800 | | | | 2,003,610 | |
Intel Corp. | | | 712,700 | | | | 32,898,232 | |
KLA-Tencor Corp. | | | 18,300 | | | | 1,922,781 | |
Micron Technology, Inc.* | | | 31,100 | | | | 1,278,832 | |
MKS Instruments, Inc. | | | 48,300 | | | | 4,564,350 | |
STMicroelectronics NV (Switzerland) | | | 2,025 | | | | 44,173 | |
Texas Instruments, Inc. | | | 285,100 | | | | 29,775,844 | |
Tokyo Electron Ltd. (Japan) | | | 2,300 | | | | 414,896 | |
| | | | | | | | |
| | | | | | | 122,334,435 | |
| | | | | | | | |
Software — 3.8% | | | | | | | | |
Activision Blizzard, Inc. | | | 115,000 | | | | 7,281,800 | |
Adobe Systems, Inc.* | | | 83,900 | | | | 14,702,636 | |
CA, Inc. | | | 154,000 | | | | 5,125,120 | |
Check Point Software Technologies Ltd. (Israel)*(a) | | | 1,200 | | | | 124,344 | |
Dell Technologies, Inc. (Class V Stock)* | | | 101,300 | | | | 8,233,664 | |
Intuit, Inc. | | | 100,400 | | | | 15,841,112 | |
Microsoft Corp. | | | 834,200 | | | | 71,357,468 | |
Nexon Co. Ltd. (Japan)* | | | 8,000 | | | | 232,002 | |
Nice Ltd. (Israel) | | | 321 | | | | 29,332 | |
Oracle Corp. | | | 661,300 | | | | 31,266,264 | |
Sage Group PLC (The) (United Kingdom) | | | 2,257 | | | | 24,264 | |
salesforce.com, Inc.* | | | 45,000 | | | | 4,600,350 | |
SAP SE (Germany) | | | 423 | | | | 47,323 | |
| | | | | | | | |
| | | | | | | 158,865,679 | |
| | | | | | | | |
Specialty Retail — 1.0% | | | | | | | | |
Burlington Stores, Inc.* | | | 53,000 | | | | 6,520,590 | |
Gap, Inc. (The)(a) | | | 462,800 | | | | 15,762,968 | |
Group 1 Automotive, Inc. | | | 15,900 | | | | 1,128,423 | |
Ross Stores, Inc. | | | 222,300 | | | | 17,839,575 | |
USS Co. Ltd. (Japan) | | | 700 | | | | 14,803 | |
| | | | | | | | |
| | | | | | | 41,266,359 | |
| | | | | | | | |
| | | | | | | | |
COMMON STOCKS
(continued) | | Shares | | | Value | |
Technology Hardware, Storage & Peripherals — 2.9% | |
Apple, Inc. | | | 558,200 | | | $ | 94,464,186 | |
Canon, Inc. (Japan)(a) | | | 10,000 | | | | 372,581 | |
FUJIFILM Holdings Corp. (Japan) | | | 4,100 | | �� | | 167,300 | |
HP, Inc. | | | 858,000 | | | | 18,026,580 | |
Western Digital Corp. | | | 112,200 | | | | 8,923,266 | |
| | | | | | | | |
| | | | | | | 121,953,913 | |
| | | | | | | | |
Textiles, Apparel & Luxury Goods — 0.6% | |
adidas AG (Germany) | | | 183 | | | | 36,598 | |
Kering (France) | | | 438 | | | | 206,178 | |
Lululemon Athletica, Inc.* | | | 175,000 | | | | 13,753,250 | |
LVMH Moet Hennessy Louis Vuitton SE (France) | | | 1,869 | | | | 548,560 | |
PVH Corp. | | | 60,500 | | | | 8,301,205 | |
Skechers U.S.A., Inc. (Class A Stock)* | | | 5,600 | | | | 211,904 | |
Swatch Group AG (The) (Switzerland) | | | 140 | | | | 10,678 | |
Wolverine World Wide, Inc. | | | 83,700 | | | | 2,668,356 | |
| | | | | | | | |
| | | | | | | 25,736,729 | |
| | | | | | | | |
Thrifts & Mortgage Finance — 0.1% | | | | | | | | |
Radian Group, Inc. | | | 238,100 | | | | 4,907,241 | |
| | | | | | | | |
Tobacco — 0.7% | | | | | | | | |
Altria Group, Inc. | | | 417,000 | | | | 29,777,970 | |
British American Tobacco PLC (United Kingdom) | | | 3,562 | | | | 240,786 | |
Imperial Brands PLC (United Kingdom) | | | 3,103 | | | | 132,357 | |
Japan Tobacco, Inc. (Japan)(a) | | | 4,800 | | | | 154,575 | |
Swedish Match AB (Sweden) | | | 8,221 | | | | 323,839 | |
| | | | | | | | |
| | | | | | | 30,629,527 | |
| | | | | | | | |
Trading Companies & Distributors — 0.2% | |
Applied Industrial Technologies, Inc. | | | 41,200 | | | | 2,805,720 | |
ITOCHU Corp. (Japan) | | | 22,600 | | | | 421,299 | |
Marubeni Corp. (Japan) | | | 15,000 | | | | 108,445 | |
Mitsubishi Corp. (Japan) | | | 7,500 | | | | 206,803 | |
Mitsui & Co. Ltd. (Japan) | | | 14,200 | | | | 230,373 | |
Sumitomo Corp. (Japan) | | | 10,800 | | | | 183,187 | |
Toyota Tsusho Corp. (Japan) | | | 700 | | | | 28,121 | |
United Rentals, Inc.* | | | 11,100 | | | | 1,908,201 | |
WESCO International, Inc.* | | | 22,000 | | | | 1,499,300 | |
| | | | | | | | |
| | | | | | | 7,391,449 | |
| | | | | | | | |
Transportation Infrastructure — 0.0% | | | | | | | | |
Abertis Infraestructuras SA (Spain) | | | 1,866 | | | | 41,518 | |
Atlantia SpA (Italy) | | | 1,098 | | | | 34,616 | |
Fraport AG Frankfurt Airport Services Worldwide (Germany) | | | 130 | | | | 14,279 | |
Sydney Airport (Australia) | | | 8,451 | | | | 46,371 | |
| | | | | | | | |
| | | | | | | 136,784 | |
| | | | | | | | |
Wireless Telecommunication Services — 0.0% | |
KDDI Corp. (Japan) | | | 16,200 | | | | 402,400 | |
Vodafone Group PLC (United Kingdom) | | | 82,153 | | | | 259,685 | |
| | | | | | | | |
| | | | | | | 662,085 | |
| | | | | | | | |
TOTAL COMMON STOCKS (cost $1,989,555,772) | | | | | | | 2,687,948,172 | |
| | | | | | | | |
SEE NOTES TO FINANCIAL STATEMENTS.
A86
| | | | | | |
| | FLEXIBLE MANAGED PORTFOLIO (continued) | | |
| |
| SCHEDULE OF INVESTMENTS | | as of December 31, 2017 |
| | | | | | | | |
UNAFFILIATED EXCHANGE
TRADED FUND — 0.0% | | Shares | | | Value | |
iShares MSCI EAFE Index Fund (cost $436,958) | | | 6,592 | | | $ | 463,484 | |
| | | | | | | | |
| PREFERRED STOCKS — 0.0% | | | | | | |
Automobiles — 0.0% | | | | | | | | |
Bayerische Motoren Werke AG (Germany) (PRFC) | | | 155 | | | | 13,831 | |
Volkswagen AG (Germany) (PRFC) | | | 2,200 | | | | 436,992 | |
| | | | | | | | |
| | | | | | | 450,823 | |
| | | | | | | | |
| | | | | | | | |
PREFERRED STOCKS
(continued) | | Shares | | | Value | |
Banks — 0.0% | | | | | | | | |
Citigroup Capital XIII, 7.748%, (Capital Security, fixed to floating preferred)(a) | | | 22,000 | | | $ | 604,560 | |
| | | | | | | | |
Household Products — 0.0% | | | | | | | | |
Henkel AG & Co. KGaA (Germany) (PRFC) | | | 562 | | | | 74,215 | |
| | | | | | | | |
TOTAL PREFERRED STOCKS (cost $885,431) | | | | | | | 1,129,598 | |
| | | | | | | | |
| | | | | | | | | | | | | | | | |
| ASSET-BACKED SECURITIES — 4.9% | | Interest
Rate | | | Maturity
Date | | | Principal
Amount
(000)# | | | | |
Automobiles — 1.5% | | | | | | | | | | | | | | | | |
AmeriCredit Automobile Receivables Trust, Series 2016-2, Class A2B, 1 Month LIBOR + 0.700% | | | 2.107% | (c) | | | 10/08/19 | | | | 386 | | | | 385,999 | |
AmeriCredit Automobile Receivables Trust, Series 2016-3, Class A2B, 1 Month LIBOR + 0.560% | | | 1.967% | (c) | | | 11/08/19 | | | | 208 | | | | 207,808 | |
AmeriCredit Automobile Receivables Trust, Series 2016-4, Class C | | | 2.410% | | | | 07/08/22 | | | | 1,000 | | | | 993,688 | |
Americredit Automobile Receivables Trust, Series 2017-3, Class C | | | 2.690% | | | | 06/19/23 | | | | 1,020 | | | | 1,017,718 | |
Americredit Automobile Receivables Trust, Series 2017-4, Class C | | | 2.600% | | | | 09/18/23 | | | | 2,100 | | | | 2,093,275 | |
Avis Budget Rental Car Funding AESOP LLC, Series 2013-1A, Class A, 144A | | | 1.920% | | | | 09/20/19 | | | | 1,700 | | | | 1,697,402 | |
Avis Budget Rental Car Funding AESOP LLC, Series 2015-1A, Class A, 144A | | | 2.500% | | | | 07/20/21 | | | | 5,000 | | | | 4,994,795 | |
Avis Budget Rental Car Funding AESOP LLC, Series 2015-2A, Class A, 144A | | | 2.630% | | | | 12/20/21 | | | | 4,000 | | | | 3,992,490 | |
Enterprise Fleet Financing LLC, Series 2017-1, Class A2, 144A | | | 2.130% | | | | 07/20/22 | | | | 3,425 | | | | 3,424,718 | |
Enterprise Fleet Financing LLC, Series 2017-2, Class A2, 144A | | | 1.970% | | | | 01/20/23 | | | | 2,400 | | | | 2,395,187 | |
Ford Credit Auto Owner Trust, Series 2016-2, Class A, 144A | | | 2.030% | | | | 12/15/27 | | | | 3,435 | | | | 3,385,383 | |
Ford Credit Auto Owner Trust, Series 2017-1, Class A, 144A | | | 2.620% | | | | 08/15/28 | | | | 6,200 | | | | 6,203,706 | |
Ford Credit Auto Owner Trust, Series 2017-2, Class A, 144A | | | 2.360% | | | | 03/15/29 | | | | 5,600 | | | | 5,549,198 | |
Ford Credit Floorplan Master Owner Trust, Series 2017-3, Class A | | | 2.480% | | | | 09/15/24 | | | | 4,500 | | | | 4,475,245 | |
GMF Floorplan Owner Revolving Trust, Series 2015-1, Class A2, 144A, 1 Month LIBOR + 0.500% | | | 1.977% | (c) | | | 05/15/20 | | | | 1,800 | | | | 1,802,317 | |
GMF Floorplan Owner Revolving Trust, Series 2016-1, Class A2, 144A, 1 Month LIBOR + 0.850% | | | 2.327% | (c) | | | 05/17/21 | | | | 2,300 | | | | 2,319,047 | |
Hertz Vehicle Financing LLC, Series 2016-1A, Class A, 144A | | | 2.320% | | | | 03/25/20 | | | | 3,000 | | | | 2,989,908 | |
OneMain Direct Auto Receivables Trust, Series 2016-1A, Class A, 144A | | | 2.040% | | | | 01/15/21 | | | | 272 | | | | 272,590 | |
OneMain Direct Auto Receivables Trust, Series 2017-1A, Class A, 144A | | | 2.160% | | | | 10/15/20 | | | | 7,700 | | | | 7,677,058 | |
Onemain Direct Auto Receivables Trust, Series 2017-2A, Class B, 144A | | | 2.550% | | | | 11/14/23 | | | | 5,800 | | | | 5,794,369 | |
Onemain Direct Auto Receivables Trust, Series 2017-2A, Class C, 144A | | | 2.820% | | | | 07/15/24 | | | | 1,400 | | | | 1,396,677 | |
| | | | | | | | | | | | | | | | |
| | | | | | | | | | | | | | | 63,068,578 | |
| | | | | | | | | | | | | | | | |
Collateralized Loan Obligations — 1.4% | | | | | | | | | | | | | | | | |
AIMCO CLO (Cayman Islands), Series 2015-AA, Class A1, 144A, 3 Month LIBOR + 1.700% | | | 3.059% | (c) | | | 01/15/28 | | | | 2,500 | | | | 2,500,016 | |
ALM Ltd. (Cayman Islands), Series 2015-12A, Class A1R, 144A, 3 Month LIBOR + 1.050% | | | 2.409% | (c) | | | 04/16/27 | | | | 1,500 | | | | 1,503,374 | |
Anchorage Capital CLO Ltd. (Cayman Islands), Series 2014-3A, Class A1R, 144A, 3 Month LIBOR + 1.430% | | | 2.808% | (c) | | | 04/28/26 | | | | 1,500 | | | | 1,502,862 | |
ArrowMark Colorado Holdings (Cayman Islands), Series 2017-6A, Class A1, 144A, 3 Month LIBOR + 1.280% | | | 2.639% | (c) | | | 07/15/29 | | | | 500 | | | | 503,695 | |
Battalion CLO Ltd. (Cayman Islands), Series 2013-4A, Class A1R, 144A, 3 Month LIBOR + 1.140% | | | 2.503% | (c) | | | 10/22/25 | | | | 250 | | | | 250,196 | |
Battalion CLO Ltd. (Cayman Islands), Series 2015-8A, Class A1R, 144A, 3 Month LIBOR + 1.340% | | | 2.694% | (c) | | | 07/18/30 | | | | 1,500 | | | | 1,510,357 | |
Benefit Street Partners CLO (Cayman Islands), Series 2017-11A, Class X, 144A, 3 Month LIBOR + 1.000% | | | 2.359% | (c) | | | 04/15/29 | | | | 1,875 | | | | 1,875,675 | |
SEE NOTES TO FINANCIAL STATEMENTS.
A87
| | | | | | |
| | FLEXIBLE MANAGED PORTFOLIO (continued) | | |
| |
| SCHEDULE OF INVESTMENTS | | as of December 31, 2017 |
| | | | | | | | | | | | | | |
| ASSET-BACKED SECURITIES (continued) | | Interest
Rate | | | Maturity
Date | | Principal
Amount
(000)# | | | Value | |
Collateralized Loan Obligations (continued) | | | | | | | | | | | | | | |
Benefit Street Partners CLO Ltd. (Cayman Islands), Series 2013-IIA, Class A1R, 144A, 3 Month LIBOR + 1.250% | | | 2.609% | (c) | | 07/15/29 | | | 1,500 | | | $ | 1,509,653 | |
Brookside Mill CLO Ltd. (Cayman Islands), Series 2013-1A, Class A1, 144A, 3 Month LIBOR + 1.150% | | | 2.503% | (c) | | 04/17/25 | | | 1,941 | | | | 1,943,165 | |
Canyon Capital CLO Ltd. (Cayman Islands), Series 2015-1A, Class AS, 144A, 3 Month LIBOR + 1.250% | | | 2.609% | (c) | | 04/15/29 | | | 3,000 | | | | 3,016,994 | |
Carlyle Global Market Strategies CLO Ltd. (Cayman Islands), Series 2014-3A, Class A1AR, 144A, 3 Month LIBOR + 1.150% | | | 2.525% | (c) | | 07/27/26 | | | 1,250 | | | | 1,256,440 | |
Catamaran CLO Ltd. (Cayman Islands), Series 2014-2A, Class A1R, 144A, 3 Month LIBOR + 1.400% | | | 2.754% | (c) | | 10/18/26 | | | 500 | | | | 502,225 | |
Eaton Vance CLO Ltd. (Cayman Islands), Series 2014-1A, Class AR, 144A, 3 Month LIBOR + 1.200% | | | 2.559% | (c) | | 07/15/26 | | | 1,000 | | | | 1,004,421 | |
Elevation CLO Ltd. (Cayman Islands), Series 2015-4A, Class A, 144A, 3 Month LIBOR + 1.550% | | | 2.904% | (c) | | 04/18/27 | | | 1,000 | | | | 1,009,534 | |
Flagship CLO Ltd. (Cayman Islands), Series 2014-8A, Class AR, 144A, 3 Month LIBOR + 1.250% | | | 2.609% | (c) | | 01/16/26 | | | 750 | | | | 750,718 | |
Highbridge Loan Management Ltd. (Cayman Islands), Series 2015-6A, Class A, 144A, 3 Month LIBOR + 1.450% | | | 2.841% | (c) | | 05/05/27 | | | 250 | | | | 250,373 | |
ICG US CLO Ltd. (Cayman Islands), Series 2014-3A, Class A1AR, 144A, 3 Month LIBOR + 1.230% | | | 2.597% | (c) | | 01/25/27 | | | 3,250 | | | | 3,256,553 | |
Jackson Mill CLO Ltd. (Cayman Islands), Series 2015-1A, Class A, 144A, 3 Month LIBOR + 1.540% | | | 2.899% | (c) | | 04/15/27 | | | 500 | | | | 500,576 | |
KVK CLO Ltd. (Cayman Islands), Series 2014-1A, Class A1R, 144A, 3 Month LIBOR + 1.300% | | | 2.716% | (c) | | 05/15/26 | | | 2,750 | | | | 2,758,851 | |
KVK CLO Ltd. (Cayman Islands), Series 2014-3A, Class AR, 144A, 3 Month LIBOR + 1.200% | | | 2.559% | (c) | | 10/15/26 | | | 3,250 | | | | 3,260,951 | |
Magnetite XI Ltd. (Cayman Islands), Series 2014-11A, Class A1R, 144A, 3 Month LIBOR + 1.120% | | | 2.474% | (c) | | 01/18/27 | | | 2,750 | | | | 2,757,980 | |
OCP CLO Ltd. (Cayman Islands), Series 2017-13A, Class A1A, 144A, 3 Month LIBOR + 1.260% | | | 2.561% | (c) | | 07/15/30 | | | 1,250 | | | | 1,260,134 | |
OZLM Ltd. (Cayman Islands), Series 2015-11A, Class A1R, 144A, 3 Month LIBOR + 1.250% | | | 2.628% | (c) | | 10/30/30 | | | 1,500 | | | | 1,512,206 | |
Palmer Square CLO Ltd. (Cayman Islands), Series 2014-1A, Class A1R2, 144A | | | —% | (p) | | 01/17/31 | | | 1,500 | | | | 1,500,000 | |
Palmer Square CLO Ltd. (Cayman Islands), Series 2015-1A, Class A1R, 144A, 3 Month LIBOR + 1.300% | | | 2.741% | (c) | | 05/21/29 | | | 1,750 | | | | 1,758,907 | |
Sound Point CLO Ltd. (Cayman Islands), Series 2015-2A, Class AR, 144A, 3 Month LIBOR + 0.880% | | | 2.243% | (c) | | 07/20/27 | | | 1,000 | | | | 1,002,777 | |
Telos CLO (Cayman Islands), Series 2013-3A, Class AR, 144A, 3 Month LIBOR + 1.300% | | | 2.653% | (c) | | 07/17/26 | | | 1,500 | | | | 1,509,985 | |
TICP CLO Ltd. (Cayman Islands), Series 2017-7A, Class AS, 144A, 3 Month LIBOR + 1.230% | | | 2.534% | (c) | | 07/15/29 | | | 1,250 | | | | 1,254,612 | |
Trinitas CLO Ltd. (Cayman Islands), Series 2016-5A, Class A, 144A, 3 Month LIBOR + 1.700% | | | 3.067% | (c) | | 10/25/28 | | | 3,250 | | | | 3,271,592 | |
Trintas CLO Ltd. (Cayman Islands), Series 2017-7A, Class A, 144A, 3 Month LIBOR + 1.210% | | | 2.908% | (c) | | 01/25/31 | | | 2,500 | | | | 2,500,000 | |
Tyron Park CLO Ltd. (Cayman Islands), Series 2013-1A, Class A1, 144A, 3 Month LIBOR + 1.120% | | | 2.479% | (c) | | 07/15/25 | | | 2,299 | | | | 2,304,233 | |
UCG U.S. CLO Ltd. (Cayman Islands), Series 2017-2A, Class A1, 144A, 3 Month LIBOR + 1.280% | | | 2.597% | (c) | | 10/23/29 | | | 1,250 | | | | 1,258,508 | |
Venture XXI CLO Ltd. (Cayman Islands), Series 2015-21A, Class AR, 144A, 3 Month LIBOR + 0.880% | | | 2.239% | (c) | | 07/15/27 | | | 1,000 | | | | 1,002,381 | |
Wellfleet CLO Ltd. (Cayman Islands), Series 2017-1A, Class A1, 144A, 3 Month LIBOR + 1.320% | | | 2.683% | (c) | | 04/20/29 | | | 2,000 | | | | 2,013,279 | |
West CLO Ltd. (Cayman Islands), Series 2013-1A, Class A1AR, 144A, 3 Month LIBOR + 1.160% | | | 2.552% | (c) | | 11/07/25 | | | 2,000 | | | | 2,004,472 | |
Zais CLO Ltd. (Cayman Islands), Series 2017-1A, Class A1, 144A, 3 Month LIBOR + 1.370% | | | 2.729% | (c) | | 07/15/29 | | | 1,750 | | | | 1,767,854 | |
| | | | | | | | | | | | | | |
| | | | | | | | | | | | | 59,345,549 | |
| | | | | | | | | | | | | | |
SEE NOTES TO FINANCIAL STATEMENTS.
A88
| | | | | | |
| | FLEXIBLE MANAGED PORTFOLIO (continued) | | |
| |
| SCHEDULE OF INVESTMENTS | | as of December 31, 2017 |
| | | | | | | | | | | | | | | | |
| ASSET-BACKED SECURITIES (continued) | | Interest
Rate | | | Maturity
Date | | | Principal
Amount
(000)# | | | Value | |
Consumer Loans — 0.3% | | | | | | | | | | | | | | | | |
OneMain Financial Issuance Trust, Series 2015-2A, Class A, 144A | | | 2.570% | | | | 07/18/25 | | | | 2,094 | | | $ | 2,092,293 | |
OneMain Financial Issuance Trust, Series 2017-1a, Class A2, 144A, 1 Month LIBOR + 0.800% | | | 2.272% | (c) | | | 09/14/32 | | | | 3,300 | | | | 3,317,390 | |
SpringCastle America Funding LLC, Series 2016-AA. Class A, 144A | | | 3.050% | | | | 04/25/29 | | | | 2,227 | | | | 2,241,057 | |
Springleaf Funding Trust, Series 2015-AA, Class A, 144A | | | 3.160% | | | | 11/15/24 | | | | 5,795 | | | | 5,818,012 | |
| | | | | | | | | | | | | | | | |
| | | | | | | | | | | | | | | 13,468,752 | |
| | | | | | | | | | | | | | | | |
Credit Cards — 0.5% | | | | | | | | | | | | | | | | |
American Express Credit Account Master Trust, Series 2017-2, Class A, 1 Month LIBOR + 0.450% | | | 1.927% | (c) | | | 09/16/24 | | | | 6,100 | | | | 6,147,278 | |
American Express Credit Account Master Trust, Series 2017-5, Class A, 1 Month LIBOR + 0.380% | | | 1.857% | (c) | | | 02/18/25 | | | | 800 | | | | 803,872 | |
Citibank Credit Card Issuance Trust, Series 2017-A5, Class A5, 1 Month LIBOR + 0.620% | | | 2.155% | (c) | | | 04/22/26 | | | | 3,800 | | | | 3,843,541 | |
Citibank Credit Card Issuance Trust, Series 2017-A7, Class A7, 1 Month LIBOR + 0.370% | | | 1.777% | (c) | | | 08/08/24 | | | | 3,900 | | | | 3,915,796 | |
Discover Card Execution Note Trust, Series 2017-A4, Class A4 | | | 2.530% | | | | 10/15/26 | | | | 4,000 | | | | 3,987,169 | |
Discover Card Execution Note Trust, Series 2017-A5, Class A5, 1 Month LIBOR + 0.600% | | | 2.077% | (c) | | | 12/15/26 | | | | 2,600 | | | | 2,628,752 | |
| | | | | | | | | | | | | | | | |
| | | | | | | | | | | | | | | 21,326,408 | |
| | | | | | | | | | | | | | | | |
Equipment — 0.2% | | | | | | | | | | | | | | | | |
MMAF Equipment Finance LLC, Series 2017-AA, Class A4, 144A | | | 2.410% | | | | 08/16/24 | | | | 3,500 | | | | 3,471,044 | |
MMAF Equipment Finance LLC, Series 2017-B, Class A4, 144A | | | 2.410% | | | | 11/15/24 | | | | 1,700 | | | | 1,690,075 | |
MMAF Equipment Finance LLC, Series 2017-B, Class A5, 144A | | | 2.720% | | | | 06/15/40 | | | | 2,800 | | | | 2,784,773 | |
| | | | | | | | | | | | | | | | |
| | | | | | | | | | | | | | | 7,945,892 | |
| | | | | | | | | | | | | | | | |
Home Equity Loans — 0.1% | | | | | | | | | | | | | | | | |
CDC Mortgage Capital Trust, Series 2002-HE3, Class M1, 1 Month LIBOR + 1.650% | | | 3.202% | (c) | | | 03/25/33 | | | | 123 | | | | 122,791 | |
Morgan Stanley ABS Capital I, Inc. Trust, Series 2003-HE1, Class M1, 1 Month LIBOR + 1.200% | | | 2.752% | (c) | | | 05/25/33 | | | | 226 | | | | 224,062 | |
Morgan Stanley ABS Capital I, Inc. Trust, Series 2004-HE5, Class M1, 1 Month LIBOR + 0.945% | | | 2.497% | (c) | | | 06/25/34 | | | | 557 | | | | 557,860 | |
Morgan Stanley Dean Witter Capital I, Inc. Trust, Series 2002-HE1, Class M1, 1 Month LIBOR + 0.900% | | | 2.452% | (c) | | | 07/25/32 | | | | 152 | | | | 153,306 | |
Morgan Stanley Dean Witter Capital I, Inc. Trust, Series 2002-NC4, Class M1, 1 Month LIBOR + 1.275% | | | 2.827% | (c) | | | 09/25/32 | | | | 2,784 | | | | 2,768,778 | |
| | | | | | | | | | | | | | | | |
| | | | | | | | | | | | | | | 3,826,797 | |
| | | | | | | | | | | | | | | | |
Other — 0.0% | | | | | | | | | | | | | | | | |
Sierra Timeshare Receivables Funding LLC, Series 2013-3A, Class A, 144A | | | 2.200% | | | | 10/20/30 | | | | 906 | | | | 904,812 | |
SVO VOI Mortgage LLC, Series 2012-AA, Class A, 144A | | | 2.000% | | | | 09/20/29 | | | | 456 | | | | 451,730 | |
| | | | | | | | | | | | | | | | |
| | | | | | | | | | | | | | | 1,356,542 | |
| | | | | | | | | | | | | | | | |
Residential Mortgage-Backed Securities — 0.7% | | | | | | | | | | | | | | | | |
Credit Suisse Mortgage Trust, Series 2016-RPL1, Class A1, 144A, 1 Month LIBOR + 3.150% | | | 4.511% | (c) | | | 12/26/46 | | | | 4,528 | | | | 4,561,706 | |
Credit-Based Asset Servicing & Securitization LLC, Series 2005-CB6, Class A3 | | | 3.728% | (cc) | | | 07/25/35 | | | | 261 | | | | 259,353 | |
CSMC Trust, Series 2017-6R, 144A^ | | | 2.900% | (cc) | | | 03/06/47 | | | | 2,140 | | | | 2,152,932 | |
Equity One Mortgage Pass-Through Trust, Series 2004-3, Class M1 | | | 4.657% | (cc) | | | 07/25/34 | | | | 233 | | | | 231,123 | |
Long Beach Mortgage Loan Trust, Series 2004-2, Class M1, 1 Month LIBOR + 0.795% | | | 2.123% | (c) | | | 06/25/34 | | | | 322 | | | | 318,439 | |
Mill City Mortgage Loan Trust, Series 2017-3, Class A1, 144A | | | 2.750% | (cc) | | | 01/25/61 | | | | 3,729 | | | | 3,724,206 | |
Towd Point Mortgage Trust, Series 2017-4, Class A1, 144A | | | 2.750% | (cc) | | | 06/25/57 | | | | 8,573 | | | | 8,537,806 | |
Towd Point Mortgage Trust, Series 2017-5, Class A1, 144A, 1 Month LIBOR + 0.600% | | | 2.152% | (c) | | | 02/25/57 | | | | 6,114 | | | | 6,121,089 | |
Towd Point Mortgage Trust, Series 2017-6, Class A1, 144A | | | 2.750% | (cc) | | | 10/25/57 | | | | 5,115 | | | | 5,097,143 | |
VOLT LVII LLC, Series 2017-NPL4, Class A1, 144A | | | 3.375% | | | | 04/25/47 | | | | 431 | | | | 432,240 | |
VOLT LX LLC, Series 2017-NPL7, Class A1, 144A | | | 3.250% | | | | 04/25/59 | | | | 541 | | | | 542,040 | |
| | | | | | | | | | | | | | | | |
| | | | | | | | | | | | | | | 31,978,077 | |
| | | | | | | | | | | | | | | | |
SEE NOTES TO FINANCIAL STATEMENTS.
A89
| | | | | | |
| | FLEXIBLE MANAGED PORTFOLIO (continued) | | |
| |
| SCHEDULE OF INVESTMENTS | | as of December 31, 2017 |
| | | | | | | | | | | | | | | | |
| ASSET-BACKED SECURITIES (continued) | | Interest
Rate | | | Maturity
Date | | | Principal
Amount
(000)# | | | Value | |
Student Loans — 0.2% | | | | | | | | | | | | | | | | |
Commonbond Student Loan Trust, Series 2017-BGS, Class A1, 144A | | | 2.680% | | | | 09/25/42 | | | | 4,040 | | | $ | 4,023,572 | |
Laurel Road Prime Student Loan Trust, Series 2017-C, Class A2B, 144A | | | 2.810% | | | | 11/25/42 | | | | 2,000 | | | | 1,985,821 | |
| | | | | | | | | | | | | | | | |
| | | | | | | | | | | | | | | 6,009,393 | |
| | | | | | | | | | | | | | | | |
TOTAL ASSET-BACKED SECURITIES
(cost $207,908,909) | | | | 208,325,988 | |
| | | | | | | | | | | | | | | | |
| BANK LOAN — 0.0% | | | | | | | | | | | | | | | | |
Technology | | | | | | | | | | | | | | | | |
Dell International LLC, Replacement Term A-3 Loan, 1 Month LIBOR + 1.500% (cost $472,666) | | | 3.070% | (c) | | | 12/31/18 | | | | 479 | | | | 479,092 | |
| | | | | | | | | | | | | | | | |
| COMMERCIAL MORTGAGE-BACKED SECURITIES — 5.0% | | | | | | | | | | | | | | | | |
Assurant Commercial Mortgage Trust, Series 2016-1A, Class AS, 144A | | | 3.172% | | | | 05/15/49 | | | | 4,000 | | | | 3,945,359 | |
BANK, Series 2017-BNK4, Class A3 | | | 3.362% | | | | 05/15/50 | | | | 6,500 | | | | 6,633,453 | |
Citigroup Commercial Mortgage Trust, Series 2013-GC11, Class A3 | | | 2.815% | | | | 04/10/46 | | | | 1,100 | | | | 1,102,644 | |
Citigroup Commercial Mortgage Trust, Series 2014-GC21, Class A4 | | | 3.575% | | | | 05/10/47 | | | | 2,750 | | | | 2,852,392 | |
Citigroup Commercial Mortgage Trust, Series 2014-GC23, Class A3 | | | 3.356% | | | | 07/10/47 | | | | 2,800 | | | | 2,874,990 | |
Citigroup Commercial Mortgage Trust, Series 2016-C1, Class A3 | | | 2.944% | | | | 05/10/49 | | | | 5,000 | | | | 4,958,843 | |
Citigroup Commercial Mortgage Trust, Series 2016-GC37, Class A3 | | | 3.050% | | | | 04/10/49 | | | | 6,500 | | | | 6,481,926 | |
Citigroup Commercial Mortgage Trust, Series 2017-P7, Class A3 | | | 3.442% | | | | 04/14/50 | | | | 5,500 | | | | 5,633,142 | |
Commercial Mortgage Trust, Series 2012-CR5, Class A3 | | | 2.540% | | | | 12/10/45 | | | | 1,000 | | | | 990,334 | |
Commercial Mortgage Trust, Series 2013-CR7, Class A3 | | | 2.929% | | | | 03/10/46 | | | | 1,294 | | | | 1,304,222 | |
Commercial Mortgage Trust, Series 2014-CR15, Class A2 | | | 2.928% | | | | 02/10/47 | | | | 2,542 | | | | 2,558,893 | |
Commercial Mortgage Trust, Series 2014-CR18, Class A4 | | | 3.550% | | | | 07/15/47 | | | | 2,800 | | | | 2,898,354 | |
Commercial Mortgage Trust, Series 2014-CR20, Class A3 | | | 3.326% | | | | 11/10/47 | | | | 5,000 | | | | 5,103,221 | |
Commercial Mortgage Trust, Series 2014-UBS3, Class A2 | | | 2.844% | | | | 06/10/47 | | | | 2,300 | | | | 2,317,679 | |
Commercial Mortgage Trust, Series 2015-CR27, Class A3 | | | 3.349% | | | | 10/10/48 | | | | 6,100 | | | | 6,227,586 | |
CSAIL Commercial Mortgage Trust, Series 2015-C4, Class A3 | | | 3.544% | | | | 11/15/48 | | | | 3,000 | | | | 3,098,002 | |
CSAIL Commercial Mortgage Trust, Series 2017-C8, Class A3 | | | 3.127% | | | | 06/15/50 | | | | 5,300 | | | | 5,286,819 | |
Fannie Mae-Aces, Series 2014-M2, Class A2 | | | 3.513% | (cc) | | | 12/25/23 | | | | 2,515 | | | | 2,632,707 | |
Fannie Mae-Aces, Series 2015-M17, Class A2 | | | 2.939% | (cc) | | | 11/25/25 | | | | 3,900 | | | | 3,951,039 | |
Fannie Mae-Aces, Series 2016-M7, Class AB2 | | | 2.385% | | | | 09/25/26 | | | | 2,400 | | | | 2,308,850 | |
Fannie Mae-Aces, Series 2017-M1, Class A2 | | | 2.417% | (cc) | | | 10/25/26 | | | | 2,200 | | | | 2,127,007 | |
Fannie Mae-Aces, Series 2017-M4, Class A2 | | | 2.597% | (cc) | | | 12/25/26 | | | | 11,800 | | | | 11,563,660 | |
Fannie Mae-Aces, Series 2017-M8, Class A2 | | | 3.061% | (cc) | | | 05/25/27 | | | | 8,250 | | | | 8,347,621 | |
FHLMC Multifamily Structured Pass-Through Certificates, Series K020, Class X1, IO | | | 1.426% | (cc) | | | 05/25/22 | | | | 23,959 | | | | 1,228,280 | |
FHLMC Multifamily Structured Pass-Through Certificates, Series K021, Class X1, IO | | | 1.465% | (cc) | | | 06/25/22 | | | | 6,784 | | | | 365,491 | |
FHLMC Multifamily Structured Pass-Through Certificates, Series K055, Class X1, IO | | | 1.368% | (cc) | | | 03/25/26 | | | | 13,929 | | | | 1,285,006 | |
FHLMC Multifamily Structured Pass-Through Certificates, Series K057, Class AM | | | 2.624% | | | | 08/25/26 | | | | 7,230 | | | | 7,044,111 | |
FHLMC Multifamily Structured Pass-Through Certificates, Series K064, Class AM | | | 3.327% | (cc) | | | 03/25/27 | | | | 5,900 | | | | 6,057,755 | |
FHLMC Multifamily Structured Pass-Through Certificates, Series K068, Class AM | | | 3.315% | | | | 08/25/27 | | | | 5,600 | | | | 5,745,402 | |
FHLMC Multifamily Structured Pass-through Certificates, Series K069, Class A2 | | | 3.187% | (cc) | | | 09/25/27 | | | | 4,900 | | | | 5,024,590 | |
FHLMC Multifamily Structured Pass-through Certificates, Series K069, Class AM | | | 3.248% | | | | 09/25/27 | | | | 1,050 | | | | 1,071,399 | |
FHLMC Multifamily Structured Pass-through Certificates, Series K070, Class A2 | | | 3.303% | (cc) | | | 11/25/27 | | | | 3,350 | | | | 3,465,223 | |
FHLMC Multifamily Structured Pass-through Certificates, Series K070, Class AM | | | 3.364% | (cc) | | | 12/25/27 | | | | 1,525 | | | | 1,572,387 | |
FHLMC Multifamily Structured Pass-Through Certificates, Series K710, Class X1, IO | | | 1.733% | (cc) | | | 05/25/19 | | | | 17,907 | | | | 316,816 | |
FHLMC Multifamily Structured Pass-Through Certificates, Series K711, Class X1, IO | | | 1.683% | (cc) | | | 07/25/19 | | | | 19,476 | | | | 355,784 | |
SEE NOTES TO FINANCIAL STATEMENTS.
A90
| | | | | | |
| | FLEXIBLE MANAGED PORTFOLIO (continued) | | |
| |
| SCHEDULE OF INVESTMENTS | | as of December 31, 2017 |
| | | | | | | | | | | | | | | | |
COMMERCIAL MORTGAGE-BACKED SECURITIES
(continued) | | Interest
Rate | | | Maturity
Date | | | Principal
Amount
(000)# | | | Value | |
FHLMC Multifamily Structured Pass-Through Certificates, Series KS03, Class A4 | | | 3.161% | (cc) | | | 05/25/25 | | | | 2,500 | | | $ | 2,553,229 | |
GS Mortgage Securities Trust, Series 2015-GC28, Class A4 | | | 3.136% | | | | 02/10/48 | | | | 4,000 | | | | 4,032,738 | |
GS Mortgage Securities Trust, Series 2015-GC32, Class A3 | | | 3.498% | | | | 07/10/48 | | | | 5,800 | | | | 6,001,540 | |
GS Mortgage Securities Trust, Series 2016-GS3, Class A3 | | | 2.592% | | | | 10/10/49 | | | | 5,800 | | | | 5,601,563 | |
GS Mortgage Securities Trust, Series 2016-GS4, Class A3 | | | 3.178% | | | | 11/10/49 | | | | 5,500 | | | | 5,549,782 | |
JPMBB Commercial Mortgage Securities Trust, Series 2014-C25, Class A4A1 | | | 3.408% | | | | 11/15/47 | | | | 1,400 | | | | 1,437,464 | |
JPMBB Commercial Mortgage Securities Trust, Series 2015-C27, Class A3A1 | | | 2.920% | | | | 02/15/48 | | | | 6,000 | | | | 5,965,460 | |
JPMorgan Chase Commercial Mortgage Securities Trust, Series 2012-CBX, Class A3 | | | 3.139% | | | | 06/15/45 | | | | 772 | | | | 776,091 | |
JPMorgan Chase Commercial Mortgage Securities Trust, Series 2012-LC9, Class A4 | | | 2.611% | | | | 12/15/47 | | | | 1,700 | | | | 1,694,988 | |
JPMorgan Chase Commercial Mortgage Securities Trust, Series 2013-C10, Class A4 | | | 2.875% | | | | 12/15/47 | | | | 2,421 | | | | 2,441,389 | |
JPMorgan Chase Commercial Mortgage Securities Trust, Series 2013-C16, Class A2 | | | 3.070% | | | | 12/15/46 | | | | 1,764 | | | | 1,773,525 | |
JPMorgan Chase Commercial Mortgage Securities Trust, Series 2013-LC11, Class A4 | | | 2.694% | | | | 04/15/46 | | | | 1,230 | | | | 1,233,006 | |
Morgan Stanley Bank of America Merrill Lynch Trust, Series 2013-C8, Class A3 | | | 2.863% | | | | 12/15/48 | | | | 1,492 | | | | 1,501,184 | |
Morgan Stanley Capital I Trust, Series 2016-UB11, Class A3 | | | 2.531% | | | | 08/15/49 | | | | 10,400 | | | | 9,965,999 | |
UBS Commercial Mortgage Trust, Series 2017-C2, Class ASB | | | 3.264% | | | | 08/15/50 | | | | 3,500 | | | | 3,557,563 | |
UBS Commercial Mortgage Trust, Series 2017-C5, Class A4 | | | 3.212% | | | | 11/15/50 | | | | 6,750 | | | | 6,806,672 | |
UBS-Barclays Commercial Mortgage Trust, Series 2012-C4, Class A4 | | | 2.792% | | | | 12/10/45 | | | | 1,700 | | | | 1,705,133 | |
UBS-Barclays Commercial Mortgage Trust, Series 2013-C5, Class A3 | | | 2.920% | | | | 03/10/46 | | | | 3,821 | | | | 3,846,972 | |
UBS-Barclays Commercial Mortgage Trust, Series 2013-C6, Class A3 | | | 2.971% | | | | 04/10/46 | | | | 1,800 | | | | 1,812,970 | |
Wells Fargo Commercial Mortgage Trust, Series 2016-NXS6, Class A3 | | | 2.642% | | | | 11/15/49 | | | | 8,000 | | | | 7,761,710 | |
Wells Fargo Commercial Mortgage Trust, Series 2017-C38, Class A4 | | | 3.190% | | | | 07/15/50 | | | | 4,600 | | | | 4,612,080 | |
| | | | | | | | | | | | | | | | |
TOTAL COMMERCIAL MORTGAGE-BACKED SECURITIES
(cost $210,480,847) | | | | 209,362,045 | |
| | | | | | | | | | | | | | | | |
| CORPORATE BONDS — 9.1% | | | | | | | | | | | | | | | | |
Aerospace & Defense — 0.0% | | | | | | | | | | | | | | | | |
Embraer Netherlands Finance BV (Brazil), Gtd. Notes | | | 5.050% | | | | 06/15/25 | | | | 1,000 | | | | 1,060,000 | |
| | | | | | | | | | | | | | | | |
Agriculture — 0.2% | | | | | | | | | | | | | | | | |
Altria Group, Inc., Gtd. Notes | | | 4.000% | | | | 01/31/24 | | | | 1,500 | | | | 1,591,322 | |
BAT Capital Corp. (United Kingdom), Gtd. Notes, 144A | | | 3.222% | | | | 08/15/24 | | | | 3,740 | | | | 3,739,852 | |
Bunge Ltd. Finance Corp., Gtd. Notes | | | 8.500% | | | | 06/15/19 | | | | 930 | | | | 1,007,447 | |
Imperial Brands Finance PLC (United Kingdom), Gtd. Notes, 144A | | | 2.050% | | | | 02/11/18 | | | | 2,050 | | | | 2,049,733 | |
Reynolds American, Inc. (United Kingdom), Gtd. Notes | | | 8.125% | | | | 06/23/19 | | | | 325 | | | | 351,541 | |
| | | | | | | | | | | | | | | | |
| | | | | | | | | | | | | | | 8,739,895 | |
| | | | | | | | | | | | | | | | |
Airlines — 0.2% | | | | | | | | | | | | | | | | |
American Airlines, Inc., Pass-Through Trust, Pass-Through Certificates, Series 2015-1, Class A | | | 3.375% | | | | 11/01/28 | | | | 2,864 | | | | 2,861,379 | |
Continental Airlines, Inc., Pass-Through Trust, Pass-Through Certificates, Series 2009-2, Class A | | | 7.250% | | | | 05/10/21 | | | | 498 | | | | 536,665 | |
Continental Airlines, Inc., Pass-Through Trust, Pass-Through Certificates, Series 2010-1, Class A | | | 4.750% | | | | 07/12/22 | | | | 522 | | | | 546,821 | |
Continental Airlines, Inc., Pass-Through Trust, Pass-Through Certificates, Series 2012-2, Class A(a) | | | 4.000% | | | | 04/29/26 | | | | 562 | | | | 586,000 | |
Delta Air Lines, Inc., Sr. Unsec’d. Notes | | | 2.875% | | | | 03/13/20 | | | | 2,000 | | | | 2,011,606 | |
Delta Air Lines, Inc., Pass-Through Trust, Pass-Through Certificates, Series 2007-1 Class A | | | 6.821% | | | | 02/10/24 | | | | 252 | | | | 286,451 | |
Delta Air Lines, Inc., Pass-Through Trust, Pass-Through Certificates, Series 2010-2, Class A | | | 4.950% | | | | 11/23/20 | | | | 282 | | | | 289,399 | |
Delta Air Lines, Inc., Pass-Through Trust, Pass-Through Certificates, Series 2011-1, Class A | | | 5.300% | | | | 10/15/20 | | | | 661 | | | | 683,232 | |
| | | | | | | | | | | | | | | | |
| | | | | | | | | | | | | | | 7,801,553 | |
| | | | | | | | | | | | | | | | |
SEE NOTES TO FINANCIAL STATEMENTS.
A91
| | | | | | |
| | FLEXIBLE MANAGED PORTFOLIO (continued) | | |
| |
| SCHEDULE OF INVESTMENTS | | as of December 31, 2017 |
| | | | | | | | | | | | | | | | |
| CORPORATE BONDS (continued) | | Interest
Rate | | | Maturity
Date | | | Principal
Amount
(000)# | | | Value | |
Auto Manufacturers — 0.4% | | | | | | | | | | | | | | | | |
Ford Motor Co., Sr. Unsec’d. Notes | | | 4.750% | | | | 01/15/43 | | | | 1,430 | | | $ | 1,450,207 | |
Ford Motor Co., Sr. Unsec’d. Notes(a) | | | 5.291% | | | | 12/08/46 | | | | 2,400 | | | | 2,611,702 | |
Ford Motor Credit Co. LLC, Sr. Unsec’d. Notes | | | 4.134% | | | | 08/04/25 | | | | 390 | | | | 403,345 | |
General Motors Co., Sr. Unsec’d. Notes | | | 6.600% | | | | 04/01/36 | | | | 760 | | | | 925,975 | |
General Motors Co., Sr. Unsec’d. Notes | | | 6.250% | | | | 10/02/43 | | | | 1,395 | | | | 1,652,334 | |
General Motors Financial Co, Inc., Gtd. Notes | | | 3.950% | | | | 04/13/24 | | | | 2,800 | | | | 2,882,572 | |
Harley-Davidson Financial Services, Inc., Gtd. Notes, 144A, MTN | | | 2.850% | | | | 01/15/21 | | | | 4,705 | | | | 4,733,695 | |
Jaguar Land Rover Automotive PLC (United Kingdom), Gtd. Notes, 144A | | | 4.250% | | | | 11/15/19 | | | | 715 | | | | 727,512 | |
| | | | | | | | | | | | | | | | |
| | | | | | | | | | | | | | | 15,387,342 | |
| | | | | | | | | | | | | | | | |
Auto Parts & Equipment — 0.1% | | | | | | | | | | | | | | | | |
Magna International, Inc. (Canada), Sr. Unsec’d. Notes | | | 3.625% | | | | 06/15/24 | | | | 2,350 | | | | 2,429,883 | |
| | | | | | | | | | | | | | | | |
Banks — 2.4% | | | | | | | | | | | | | | | | |
Bank of America Corp., Jr. Sub. Notes(a) | | | 6.300% | | | | 12/31/49 | | | | 445 | | | | 502,850 | |
Bank of America Corp., Jr. Sub. Notes | | | 8.000% | | | | 12/31/49 | | | | 2,200 | | | | 2,207,480 | |
Bank of America Corp., Sr. Unsec’d. Notes, GMTN | | | 3.300% | | | | 01/11/23 | | | | 2,875 | | | | 2,941,125 | |
Bank of America Corp., Sr. Unsec’d. Notes, MTN | | | 4.000% | | | | 04/01/24 | | | | 975 | | | | 1,030,698 | |
Bank of America Corp., Sr. Unsec’d. Notes, MTN | | | 4.125% | | | | 01/22/24 | | | | 3,820 | | | | 4,062,781 | |
Bank of America Corp., Sr. Unsec’d. Notes, MTN | | | 4.443% | | | | 01/20/48 | | | | 670 | | | | 755,061 | |
Bank of America Corp., Sub. Notes, MTN | | | 4.450% | | | | 03/03/26 | | | | 3,880 | | | | 4,141,528 | |
Bank of America Corp., Sub. Notes, MTN | | | 4.000% | | | | 01/22/25 | | | | 2,000 | | | | 2,080,724 | |
Bank of America NA, Sub. Notes | | | 6.000% | | | | 10/15/36 | | | | 410 | | | | 534,671 | |
Barclays PLC (United Kingdom), Sr. Unsec’d. Notes | | | 3.684% | | | | 01/10/23 | | | | 585 | | | | 593,645 | |
Barclays PLC (United Kingdom), Sr. Unsec’d. Notes | | | 4.337% | | | | 01/10/28 | | | | 630 | | | | 652,028 | |
Barclays PLC (United Kingdom), Sr. Unsec’d. Notes | | | 4.375% | | | | 01/12/26 | | | | 1,590 | | | | 1,653,950 | |
Citigroup, Inc., Jr. Sub. Notes(a) | | | 6.125% | | | | 12/31/49 | | | | 1,375 | | | | 1,462,656 | |
Citigroup, Inc., Jr. Sub. Notes(a) | | | 6.250% | | | | 12/31/49 | | | | 625 | | | | 689,375 | |
Citigroup, Inc., Jr. Sub. Notes | | | 5.950% | | | | 12/31/49 | | | | 2,205 | | | | 2,304,225 | |
Citigroup, Inc., Sr. Unsec’d. Notes | | | 3.700% | | | | 01/12/26 | | | | 2,440 | | | | 2,512,003 | |
Citigroup, Inc., Sr. Unsec’d. Notes | | | 4.281% | | | | 04/24/48 | | | | 1,150 | | | | 1,248,558 | |
Citigroup, Inc., Sr. Unsec’d. Notes | | | 8.125% | | | | 07/15/39 | | | | 710 | | | | 1,135,238 | |
Citigroup, Inc., Sub. Notes | | | 4.450% | | | | 09/29/27 | | | | 1,965 | | | | 2,080,351 | |
Citigroup, Inc., Sub. Notes | | | 4.750% | | | | 05/18/46 | | | | 820 | | | | 903,927 | |
Credit Suisse Group AG (Switzerland), Sr. Unsec’d. Notes, 144A | | | 4.282% | | | | 01/09/28 | | | | 1,370 | | | | 1,428,362 | |
Deutsche Bank AG (Germany), Sr. Unsec’d. Notes, GMTN | | | 3.375% | | | | 05/12/21 | | | | 1,640 | | | | 1,655,127 | |
Dexia Credit Local SA (France), Govt. Liquid Gtd. Notes, 144A | | | 1.875% | | | | 09/15/21 | | | | 1,250 | | | | 1,220,831 | |
Discover Bank, Sr. Unsec’d. Notes | | | 4.250% | | | | 03/13/26 | | | | 970 | | | | 1,011,658 | |
Discover Bank, Sub. Notes | | | 7.000% | | | | 04/15/20 | | | | 570 | | | | 621,289 | |
Goldman Sachs Group, Inc. (The), Jr. Sub. Notes | | | 5.300% | | | | 12/31/49 | | | | 740 | | | | 786,250 | |
Goldman Sachs Group, Inc. (The), Jr. Sub. Notes | | | 5.375% | | | | 12/31/49 | | | | 2,215 | | | | 2,281,450 | |
Goldman Sachs Group, Inc. (The), Sr. Unsec’d. Notes | | | 3.750% | | | | 02/25/26 | | | | 1,010 | | | | 1,036,351 | |
Goldman Sachs Group, Inc. (The), Sr. Unsec’d. Notes | | | 3.500% | | | | 01/23/25 | | | | 4,100 | | | | 4,164,911 | |
Goldman Sachs Group, Inc. (The), Sr. Unsec’d. Notes | | | 3.850% | | | | 01/26/27 | | | | 2,910 | | | | 2,987,572 | |
Goldman Sachs Group, Inc. (The), Sr. Unsec’d. Notes | | | 5.250% | | | | 07/27/21 | | | | 2,055 | | | | 2,227,190 | |
Goldman Sachs Group, Inc. (The), Sr. Unsec’d. Notes | | | 5.750% | | | | 01/24/22 | | | | 3,620 | | | | 4,013,967 | |
Goldman Sachs Group, Inc. (The), Sr. Unsec’d. Notes | | | 6.250% | | | | 02/01/41 | | | | 270 | | | | 363,852 | |
Goldman Sachs Group, Inc. (The), Sub. Notes | | | 6.750% | | | | 10/01/37 | | | | 104 | | | | 139,219 | |
HSBC Holdings PLC (United Kingdom), Sr. Unsec’d. Notes | | | 4.875% | | | | 01/14/22 | | | | 1,910 | | | | 2,055,033 | |
HSBC Holdings PLC (United Kingdom), Sr. Unsec’d. Notes | | | 5.100% | | | | 04/05/21 | | | | 1,025 | | | | 1,101,290 | |
JPMorgan Chase & Co., Jr. Sub. Notes | | | 6.100% | | | | 12/31/49 | | | | 1,275 | | | | 1,400,970 | |
JPMorgan Chase & Co., Jr. Sub. Notes | | | 7.900% | | | | 12/31/49 | | | | 2,000 | | | | 2,025,000 | |
JPMorgan Chase & Co., Sr. Unsec’d. Notes | | | 3.964% | | | | 11/15/48 | | | | 4,160 | | | | 4,295,312 | |
JPMorgan Chase & Co., Sr. Unsec’d. Notes | | | 4.032% | | | | 07/24/48 | | | | 525 | | | | 547,516 | |
JPMorgan Chase & Co., Sr. Unsec’d. Notes | | | 4.250% | | | | 10/15/20 | | | | 2,930 | | | | 3,072,162 | |
JPMorgan Chase & Co., Sub. Notes | | | 3.875% | | | | 09/10/24 | | | | 3,775 | | | | 3,937,788 | |
Lloyds Bank PLC (United Kingdom), Gtd. Notes, 144A, MTN | | | 5.800% | | | | 01/13/20 | | | | 1,870 | | | | 1,992,100 | |
Manufacturers & Traders Trust Co., Sr. Unsec’d. Notes | | | 2.900% | | | | 02/06/25 | | | | 3,080 | | | | 3,065,899 | |
Morgan Stanley, Jr. Sub. Notes | | | 5.450% | | | | 12/31/49 | | | | 840 | | | | 862,260 | |
SEE NOTES TO FINANCIAL STATEMENTS.
A92
| | | | | | |
| | FLEXIBLE MANAGED PORTFOLIO (continued) | | |
| |
| SCHEDULE OF INVESTMENTS | | as of December 31, 2017 |
| | | | | | | | | | | | | | | | |
| CORPORATE BONDS (continued) | | Interest
Rate | | | Maturity
Date | | | Principal
Amount
(000)# | | | Value | |
Banks (continued) | | | | | | | | | | | | | | | | |
Morgan Stanley, Sr. Unsec’d. Notes | | | 4.375% | | | | 01/22/47 | | | | 2,020 | | | $ | 2,214,288 | |
Morgan Stanley, Sr. Unsec’d. Notes | | | 5.750% | | | | 01/25/21 | | | | 1,400 | | | | 1,525,630 | |
Morgan Stanley, Sr. Unsec’d. Notes, GMTN | | | 3.750% | | | | 02/25/23 | | | | 940 | | | | 974,180 | |
Morgan Stanley, Sr. Unsec’d. Notes, GMTN | | | 6.625% | | | | 04/01/18 | | | | 105 | | | | 106,150 | |
Morgan Stanley, Sr. Unsec’d. Notes, MTN | | | 3.971% | | | | 07/22/38 | | | | 925 | | | | 957,832 | |
Morgan Stanley, Sr. Unsec’d. Notes, MTN | | | 5.625% | | | | 09/23/19 | | | | 1,415 | | | | 1,491,148 | |
Morgan Stanley, Sr. Unsec’d. Notes, MTN | | | 6.375% | | | | 07/24/42 | | | | 780 | | | | 1,084,471 | |
Morgan Stanley, Sub. Notes, GMTN | | | 4.350% | | | | 09/08/26 | | | | 3,825 | | | | 4,008,059 | |
National City Corp., Sub. Notes | | | 6.875% | | | | 05/15/19 | | | | 3,370 | | | | 3,572,990 | |
Nordea Bank AB (Sweden), Sr. Unsec’d. Notes, 144A, MTN (original cost $2,104,134; purchased 09/17/15)(f) | | | 1.875% | | | | 09/17/18 | | | | 2,110 | | | | 2,108,647 | |
People’s United Bank NA, Sub. Notes | | | 4.000% | | | | 07/15/24 | | | | 465 | | | | 469,639 | |
PNC Bank NA, Sr. Unsec’d. Notes | | | 1.950% | | | | 03/04/19 | | | | 515 | | | | 514,097 | |
Sumitomo Mitsui Banking Corp. (Japan), Gtd. Notes | | | 2.450% | | | | 01/10/19 | | | | 1,210 | | | | 1,212,721 | |
| | | | | | | | | | | | | | | | |
| | | | | | | | | | | | | | | 102,026,085 | |
| | | | | | | | | | | | | | | | |
Beverages — 0.1% | | | | | | | | | | | | | | | | |
Anheuser-Busch InBev Finance, Inc. (Belgium), Gtd. Notes | | | 4.700% | | | | 02/01/36 | | | | 855 | | | | 956,018 | |
Anheuser-Busch InBev Finance, Inc. (Belgium), Gtd. Notes | | | 4.900% | | | | 02/01/46 | | | | 225 | | | | 260,773 | |
Anheuser-Busch InBev Worldwide, Inc. (Belgium), Gtd. Notes | | | 8.000% | | | | 11/15/39 | | | | 1,285 | | | | 2,025,030 | |
Anheuser-Busch InBev Worldwide, Inc. (Belgium), Gtd. Notes | | | 8.200% | | | | 01/15/39 | | | | 250 | | | | 397,594 | |
Constellation Brands, Inc., Gtd. Notes | | | 4.250% | | | | 05/01/23 | | | | 1,400 | | | | 1,481,004 | |
| | | | | | | | | | | | | | | | |
| | | | | | | | | | | | | | | 5,120,419 | |
| | | | | | | | | | | | | | | | |
Biotechnology — 0.1% | | | | | | | | | | | | | | | | |
Amgen, Inc., Sr. Unsec’d. Notes | | | 4.663% | | | | 06/15/51 | | | | 1,834 | | | | 2,051,338 | |
Gilead Sciences, Inc., Sr. Unsec’d. Notes | | | 3.500% | | | | 02/01/25 | | | | 1,460 | | | | 1,509,946 | |
Gilead Sciences, Inc., Sr. Unsec’d. Notes | | | 4.150% | | | | 03/01/47 | | | | 40 | | | | 42,547 | |
Gilead Sciences, Inc., Sr. Unsec’d. Notes | | | 5.650% | | | | 12/01/41 | | | | 145 | | | | 183,863 | |
| | | | | | | | | | | | | | | | |
| | | | | | | | | | | | | | | 3,787,694 | |
| | | | | | | | | | | | | | | | |
Building Materials — 0.1% | | | | | | | | | | | | | | | | |
Owens Corning, Inc., Gtd. Notes | | | 4.200% | | | | 12/15/22 | | | | 775 | | | | 812,628 | |
Standard Industries, Inc., Sr. Unsec’d. Notes, 144A | | | 5.375% | | | | 11/15/24 | | | | 1,400 | | | | 1,463,420 | |
| | | | | | | | | | | | | | | | |
| | | | | | | | | | | | | | | 2,276,048 | |
| | | | | | | | | | | | | | | | |
Chemicals — 0.2% | | | | | | | | | | | | | | | | |
Agrium, Inc. (Canada), Sr. Unsec’d. Notes | | | 3.150% | | | | 10/01/22 | | | | 780 | | | | 788,806 | |
Celanese US Holdings LLC, Gtd. Notes | | | 5.875% | | | | 06/15/21 | | | | 1,500 | | | | 1,642,046 | |
CF Industries, Inc., Gtd. Notes | | | 5.375% | | | | 03/15/44 | | | | 585 | | | | 577,688 | |
Dow Chemical Co. (The), Sr. Unsec’d. Notes | | | 4.625% | | | | 10/01/44 | | | | 45 | | | | 49,194 | |
Dow Chemical Co. (The), Sr. Unsec’d. Notes | | | 9.400% | | | | 05/15/39 | | | | 347 | | | | 593,145 | |
LyondellBasell Industries NV, Sr. Unsec’d. Notes | | | 4.625% | | | | 02/26/55 | | | | 1,185 | | | | 1,254,027 | |
LyondellBasell Industries NV, Sr. Unsec’d. Notes | | | 5.000% | | | | 04/15/19 | | | | 600 | | | | 616,036 | |
Mexichem SAB de CV (Mexico), Gtd. Notes, 144A | | | 4.875% | | | | 09/19/22 | | | | 2,000 | | | | 2,125,000 | |
Mosaic Co. (The), Sr. Unsec’d. Notes(a) | | | 5.450% | | | | 11/15/33 | | | | 345 | | | | 375,724 | |
Mosaic Co. (The), Sr. Unsec’d. Notes | | | 5.625% | | | | 11/15/43 | | | | 430 | | | | 463,309 | |
Union Carbide Corp., Sr. Unsec’d. Notes | | | 7.500% | | | | 06/01/25 | | | | 460 | | | | 571,998 | |
Westlake Chemical Corp., Gtd. Notes | | | 4.625% | | | | 02/15/21 | | | | 950 | | | | 973,750 | |
| | | | | | | | | | | | | | | | |
| | | | | | | | | | | | | | | 10,030,723 | |
| | | | | | | | | | | | | | | | |
Commercial Services — 0.1% | | | | | | | | | | | | | | | | |
ERAC USA Finance LLC, Gtd. Notes, 144A | | | 4.200% | | | | 11/01/46 | | | | 975 | | | | 954,913 | |
ERAC USA Finance LLC, Gtd. Notes, 144A | | | 6.700% | | | | 06/01/34 | | | | 420 | | | | 530,128 | |
ERAC USA Finance LLC, Gtd. Notes, 144A | | | 7.000% | | | | 10/15/37 | | | | 380 | | | | 508,155 | |
United Rentals North America, Inc., Gtd. Notes | | | 4.875% | | | | 01/15/28 | | | | 590 | | | | 592,950 | |
United Rentals North America, Inc., Gtd. Notes | | | 5.875% | | | | 09/15/26 | | | | 485 | | | | 518,950 | |
| | | | | | | | | | | | | | | | |
| | | | | | | | | | | | | | | 3,105,096 | |
| | | | | | | | | | | | | | | | |
SEE NOTES TO FINANCIAL STATEMENTS.
A93
| | | | | | |
| | FLEXIBLE MANAGED PORTFOLIO (continued) | | |
| |
| SCHEDULE OF INVESTMENTS | | as of December 31, 2017 |
| | | | | | | | | | | | | | | | |
| CORPORATE BONDS (continued) | | Interest
Rate | | | Maturity
Date | | | Principal
Amount
(000)# | | | Value | |
Computers — 0.3% | | | | | | | | | | | | | | | | |
Apple, Inc., Sr. Unsec’d. Notes | | | 2.850% | | | | 05/11/24 | | | | 6,145 | | | $ | 6,172,528 | |
Apple, Inc., Sr. Unsec’d. Notes | | | 3.200% | | | | 05/13/25 | | | | 1,350 | | | | 1,377,249 | |
Apple, Inc., Sr. Unsec’d. Notes | | | 3.450% | | | | 02/09/45 | | | | 890 | | | | 868,576 | |
Dell International LLC/EMC Corp., Sr. Sec’d. Notes, 144A | | | 3.480% | | | | 06/01/19 | | | | 1,085 | | | | 1,098,592 | |
Hewlett Packard Enterprise Co., Sr. Unsec’d. Notes | | | 2.850% | | | | 10/05/18 | | | | 735 | | | | 738,542 | |
Seagate HDD Cayman, Gtd. Notes | | | 3.750% | | | | 11/15/18 | | | | 605 | | | | 613,773 | |
| | | | | | | | | | | | | | | | |
| | | | | | | | | | | | | | | 10,869,260 | |
| | | | | | | | | | | | | | | | |
Diversified Financial Services — 0.2% | | | | | | | | | | | | | | | | |
AerCap Ireland Capital Ltd./AerCap Global Aviation Trust (Netherlands), Gtd. Notes | | | 3.750% | | | | 05/15/19 | | | | 775 | | | | 787,265 | |
Bear Stearns Cos. LLC, Gtd. Notes | | | 7.250% | | | | 02/01/18 | | | | 1,175 | | | | 1,179,698 | |
CDP Financial, Inc. (Canada), Sr. Unsec’d. Notes, 144A | | | 3.150% | | | | 07/24/24 | | | | 800 | | | | 818,396 | |
CPPIB Capital, Inc. (Canada), Gtd. Notes, 144A, MTN | | | 2.750% | | | | 11/02/27 | | | | 1,000 | | | | 997,294 | |
Discover Financial Services, Sr. Unsec’d. Notes | | | 3.850% | | | | 11/21/22 | | | | 900 | | | | 924,429 | |
GE Capital International Funding Co., Gtd. Notes | | | 2.342% | | | | 11/15/20 | | | | 766 | | | | 762,468 | |
Jefferies Group LLC, Sr. Unsec’d. Notes | | | 6.500% | | | | 01/20/43 | | | | 560 | | | | 660,565 | |
Lehman Brothers Holdings, Inc., Sr. Unsec’d. Notes(d) | | | 5.250% | | | | 02/06/12 | | | | 1,715 | | | | 78,890 | |
Lehman Brothers Holdings, Inc., Sr. Unsec’d. Notes(d) | | | 6.875% | | | | 05/02/18 | | | | 700 | | | | 32,760 | |
Navient Corp., Sr. Unsec’d. Notes, MTN | | | 8.450% | | | | 06/15/18 | | | | 240 | | | | 246,120 | |
Private Export Funding Corp., U.S. Gov’t. Gtd. Notes | | | 2.450% | | | | 07/15/24 | | | | 475 | | | | 472,777 | |
Private Export Funding Corp., U.S. Gov’t. Gtd. Notes | | | 3.250% | | | | 06/15/25 | | | | 330 | | | | 346,489 | |
Synchrony Financial, Sr. Unsec’d. Notes | | | 2.700% | | | | 02/03/20 | | | | 2,700 | | | | 2,706,749 | |
| | | | | | | | | | | | | | | | |
| | | | | | | | | | | | | | | 10,013,900 | |
| | | | | | | | | | | | | | | | |
Electric — 0.8% | | | | | | | | | | | | | | | | |
Baltimore Gas & Electric Co., Sr. Unsec’d. Notes | | | 6.350% | | | | 10/01/36 | | | | 550 | | | | 733,011 | |
Berkshire Hathaway Energy Co., Sr. Unsec’d. Notes | | | 6.125% | | | | 04/01/36 | | | | 302 | | | | 403,630 | |
Black Hills Corp., Sr. Unsec’d. Notes | | | 2.500% | | | | 01/11/19 | | | | 1,245 | | | | 1,248,393 | |
CenterPoint Energy Houston Electric LLC, Gen. Ref. Mtge. | | | 6.950% | | | | 03/15/33 | | | | 590 | | | | 820,935 | |
Comision Federal de Electricidad (Mexico), Sr. Unsec’d. Notes, 144A | | | 4.875% | | | | 01/15/24 | | | | 245 | | | | 261,231 | |
Commonwealth Edison Co., First Mortgage | | | 3.750% | | | | 08/15/47 | | | | 1,610 | | | | 1,673,021 | |
Consolidated Edison Co. of New York, Inc., Sr. Unsec’d. Notes | | | 5.500% | | | | 12/01/39 | | | | 220 | | | | 278,702 | |
Dominion Resources, Inc., Jr. Sub. Notes | | | 4.104% | | | | 04/01/21 | | | | 3,210 | | | | 3,340,482 | |
Duke Energy Carolinas LLC, First Mortgage | | | 6.050% | | | | 04/15/38 | | | | 550 | | | | 745,357 | |
Duke Energy Carolinas LLC, First Ref. Mortgage | | | 4.000% | | | | 09/30/42 | | | | 570 | | | | 608,138 | |
El Paso Electric Co., Sr. Unsec’d. Notes | | | 6.000% | | | | 05/15/35 | | | | 670 | | | | 809,087 | |
Eversource Energy, Sr. Unsec’d. Notes | | | 4.500% | | | | 11/15/19 | | | | 615 | | | | 636,986 | |
Exelon Corp., Jr. Sub. Notes | | | 3.497% | | | | 06/01/22 | | | | 3,470 | | | | 3,536,277 | |
Exelon Generation Co. LLC, Sr. Unsec’d. Notes | | | 6.250% | | | | 10/01/39 | | | | 1,425 | | | | 1,666,982 | |
FirstEnergy Transmission LLC, Sr. Unsec’d. Notes, 144A | | | 5.450% | | | | 07/15/44 | | | | 355 | | | | 421,676 | |
Florida Power & Light Co., First Mortgage | | | 5.950% | | | | 10/01/33 | | | | 295 | | | | 380,075 | |
Iberdrola International BV (Spain), Gtd. Notes | | | 6.750% | | | | 09/15/33 | | | | 145 | | | | 183,682 | |
Monongahela Power Co., First Mortgage, 144A | | | 4.100% | | | | 04/15/24 | | | | 2,170 | | | | 2,300,212 | |
Nevada Power Co., Gen. Ref. Mtge. | | | 6.500% | | | | 05/15/18 | | | | 1,260 | | | | 1,281,634 | |
Niagara Mohawk Power Corp., Sr. Unsec’d. Notes, 144A | | | 4.881% | | | | 08/15/19 | | | | 610 | | | | 633,232 | |
Northern States Power Co., First Mortgage | | | 3.600% | | | | 09/15/47 | | | | 1,580 | | | | 1,607,714 | |
NRG Energy, Inc., Gtd. Notes | | | 7.250% | | | | 05/15/26 | | | | 895 | | | | 974,422 | |
PPL Capital Funding, Inc., Gtd. Notes | | | 4.000% | | | | 09/15/47 | | | | 2,060 | | | | 2,116,735 | |
PSEG Power LLC, Gtd. Notes | | | 3.000% | | | | 06/15/21 | | | | 1,760 | | | | 1,775,476 | |
Public Service Co. of New Mexico, Sr. Unsec’d. Notes | | | 7.950% | | | | 05/15/18 | | | | 140 | | | | 142,915 | |
Public Service Electric & Gas Co., Sec’d. Notes, MTN | | | 3.000% | | | | 05/15/27 | | | | 1,130 | | | | 1,123,461 | |
Public Service Electric & Gas Co., Sr. Sec’d. Notes, MTN | | | 5.800% | | | | 05/01/37 | | | | 535 | | | | 697,534 | |
Southern California Edison Co., First Ref. Mortgage | | | 3.600% | | | | 02/01/45 | | | | 860 | | | | 867,052 | |
Southern California Edison Co., First Ref. Mortgage | | | 4.000% | | | | 04/01/47 | | | | 580 | | | | 622,960 | |
State Grid Overseas Investment 2014 Ltd. (China), Gtd. Notes, 144A | | | 2.750% | | | | 05/07/19 | | | | 665 | | | | 667,456 | |
Xcel Energy, Inc., Sr. Unsec’d. Notes | | | 4.800% | | | | 09/15/41 | | | | 480 | | | | 545,235 | |
| | | | | | | | | | | | | | | | |
| | | | | | | | | | | | | | | 33,103,703 | |
| | | | | | | | | | | | | | | | |
SEE NOTES TO FINANCIAL STATEMENTS.
A94
| | | | | | |
| | FLEXIBLE MANAGED PORTFOLIO (continued) | | |
| |
| SCHEDULE OF INVESTMENTS | | as of December 31, 2017 |
| | | | | | | | | | | | | | | | |
| CORPORATE BONDS (continued) | | Interest
Rate | | | Maturity
Date | | | Principal
Amount
(000)# | | | Value | |
Foods — 0.1% | | | | | | | | | | | | | | | | |
Kraft Heinz Foods Co., Gtd. Notes | | | 3.000% | | | | 06/01/26 | | | | 1,630 | | | $ | 1,568,517 | |
Kraft Heinz Foods Co., Gtd. Notes | | | 4.375% | | | | 06/01/46 | | | | 475 | | | | 470,511 | |
Kraft Heinz Foods Co., Gtd. Notes | | | 5.000% | | | | 07/15/35 | | | | 815 | | | | 889,794 | |
Kroger Co. (The), Sr. Unsec’d. Notes(a) | | | 4.450% | | | | 02/01/47 | | | | 335 | | | | 334,493 | |
| | | | | | | | | | | | | | | | |
| | | | | | | | | | | | | | | 3,263,315 | |
| | | | | | | | | | | | | | | | |
Forest Products & Paper — 0.1% | | | | | | | | | | | | | | | | |
Georgia-Pacific LLC, Gtd. Notes, 144A | | | 5.400% | | | | 11/01/20 | | | | 290 | | | | 312,770 | |
International Paper Co., Sr. Unsec’d. Notes | | | 6.000% | | | | 11/15/41 | | | | 1,595 | | | | 1,996,420 | |
| | | | | | | | | | | | | | | | |
| | | | | | | | | | | | | | | 2,309,190 | |
| | | | | | | | | | | | | | | | |
Gas — 0.1% | | | | | | | | | | | | | | | | |
Dominion Gas Holdings LLC, Sr. Unsec’d. Notes | | | 4.800% | | | | 11/01/43 | | | | 65 | | | | 72,827 | |
NiSource Finance Corp., Gtd. Notes | | | 3.490% | | | | 05/15/27 | | | | 3,285 | | | | 3,343,608 | |
| | | | | | | | | | | | | | | | |
| | | | | | | | | | | | | | | 3,416,435 | |
| | | | | | | | | | | | | | | | |
Healthcare-Products — 0.2% | | | | | | | | | | | | | | | | |
Becton Dickinson and Co., Sr. Unsec’d. Notes | | | 3.700% | | | | 06/06/27 | | | | 4,695 | | | | 4,731,199 | |
Becton Dickinson and Co., Sr. Unsec’d. Notes | | | 3.734% | | | | 12/15/24 | | | | 474 | | | | 485,469 | |
Medtronic, Inc., Gtd. Notes | | | 3.500% | | | | 03/15/25 | | | | 1,830 | | | | 1,898,345 | |
Medtronic, Inc., Gtd. Notes | | | 4.375% | | | | 03/15/35 | | | | 1,269 | | | | 1,430,561 | |
| | | | | | | | | | | | | | | | |
| | | | | | | | | | | | | | | 8,545,574 | |
| | | | | | | | | | | | | | | | |
Healthcare-Services — 0.3% | | | | | | | | | | | | | | | | |
Aetna, Inc., Sr. Unsec’d. Notes | | | 6.625% | | | | 06/15/36 | | | | 515 | | | | 685,057 | |
Aetna, Inc., Sr. Unsec’d. Notes | | | 6.750% | | | | 12/15/37 | | | | 1,380 | | | | 1,892,642 | |
Anthem, Inc., Sr. Unsec’d. Notes | | | 4.625% | | | | 05/15/42 | | | | 390 | | | | 424,908 | |
Anthem, Inc., Sr. Unsec’d. Notes | | | 4.650% | | | | 01/15/43 | | | | 360 | | | | 394,748 | |
Fresenius Medical Care U.S. Finance II, Inc. (Germany), Gtd. Notes, 144A | | | 4.125% | | | | 10/15/20 | | | | 640 | | | | 659,200 | |
HCA, Inc., Sr. Sec’d. Notes | | | 4.250% | | | | 10/15/19 | | | | 555 | | | | 566,794 | |
HCA, Inc., Sr. Sec’d. Notes | | | 5.250% | | | | 04/15/25 | | | | 400 | | | | 423,000 | |
Kaiser Foundation Hospitals, Gtd. Notes | | | 4.150% | | | | 05/01/47 | | | | 940 | | | | 1,015,709 | |
Laboratory Corp. of America Holdings, Sr. Unsec’d. Notes | | | 3.200% | | | | 02/01/22 | | | | 190 | | | | 193,713 | |
New York & Presbyterian Hospital (The), Unsec’d. Notes | | | 4.024% | | | | 08/01/45 | | | | 445 | | | | 470,822 | |
Roche Holdings, Inc. (Switzerland), Gtd. Notes, 144A | | | 2.875% | | | | 09/29/21 | | | | 5,305 | | | | 5,383,089 | |
UnitedHealth Group, Inc., Sr. Unsec’d. Notes | | | 3.950% | | | | 10/15/42 | | | | 720 | | | | 748,391 | |
UnitedHealth Group, Inc., Sr. Unsec’d. Notes | | | 6.625% | | | | 11/15/37 | | | | 420 | | | | 596,612 | |
| | | | | | | | | | | | | | | | |
| | | | | | | | | | | | | | | 13,454,685 | |
| | | | | | | | | | | | | | | | |
Housewares — 0.0% | | | | | | | | | | | | | | | | |
Newell Rubbermaid, Inc., Sr. Unsec’d. Notes | | | 4.200% | | | | 04/01/26 | | | | 1,695 | | | | 1,770,272 | |
| | | | | | | | | | | | | | | | |
Insurance — 0.5% | | | | | | | | | | | | | | | | |
Allied World Assurance Co. Holdings Ltd., Gtd. Notes | | | 5.500% | | | | 11/15/20 | | | | 525 | | | | 559,719 | |
American International Group, Inc., Sr. Unsec’d. Notes | | | 4.500% | | | | 07/16/44 | | | | 1,980 | | | | 2,132,661 | |
AXIS Specialty Finance LLC, Gtd. Notes | | | 5.875% | | | | 06/01/20 | | | | 1,030 | | | | 1,102,383 | |
Berkshire Hathaway, Inc., Sr. Unsec’d. Notes | | | 3.125% | | | | 03/15/26 | | | | 2,455 | | | | 2,482,771 | |
Chubb Corp. (The), Gtd. Notes, 3 Month LIBOR + 2.250% | | | 3.609% | (c) | | | 03/29/67 | | | | 1,300 | | | | 1,290,250 | |
Chubb INA Holdings, Inc., Gtd. Notes | | | 4.350% | | | | 11/03/45 | | | | 130 | | | | 146,782 | |
Hartford Financial Services Group, Inc., Sr. Unsec’d. Notes | | | 5.125% | | | | 04/15/22 | | | | 755 | | | | 823,913 | |
Liberty Mutual Group, Inc., Gtd. Notes, 144A | | | 6.500% | | | | 05/01/42 | | | | 365 | | | | 487,052 | |
Liberty Mutual Group, Inc., Gtd. Notes, 144A | | | 7.000% | | | | 03/15/34 | | | | 850 | | | | 1,115,583 | |
Lincoln National Corp., Sr. Unsec’d. Notes | | | 6.300% | | | | 10/09/37 | | | | 772 | | | | 995,080 | |
Lincoln National Corp., Sr. Unsec’d. Notes | | | 8.750% | | | | 07/01/19 | | | | 186 | | | | 203,084 | |
Markel Corp., Sr. Unsec’d. Notes | | | 5.000% | | | | 03/30/43 | | | | 200 | | | | 224,484 | |
New York Life Global Funding, Sec’d. Notes, 144A | | | 1.950% | | | | 02/11/20 | | | | 3,030 | | | | 3,010,331 | |
New York Life Insurance Co., Sub. Notes, 144A | | | 6.750% | | | | 11/15/39 | | | | 660 | | | | 954,157 | |
Northwestern Mutual Life Insurance Co. (The), Sub. Notes, 144A | | | 6.063% | | | | 03/30/40 | | | | 370 | | | | 496,739 | |
Ohio National Financial Services, Inc., Sr. Unsec’d. Notes, 144A | | | 6.375% | | | | 04/30/20 | | | | 680 | | | | 731,973 | |
Principal Financial Group, Inc., Gtd. Notes | | | 4.625% | | | | 09/15/42 | | | | 130 | | | | 144,799 | |
Progressive Corp. (The), Sr. Unsec’d. Notes | | | 3.700% | | | | 01/26/45 | | | | 710 | | | | 715,830 | |
SEE NOTES TO FINANCIAL STATEMENTS.
A95
| | | | | | |
| | FLEXIBLE MANAGED PORTFOLIO (continued) | | |
| |
| SCHEDULE OF INVESTMENTS | | as of December 31, 2017 |
| | | | | | | | | | | | | | | | |
| CORPORATE BONDS (continued) | | Interest
Rate | | | Maturity
Date | | | Principal
Amount
(000)# | | | Value | |
Insurance (continued) | | | | | | | | | | | | | | | | |
Teachers Insurance & Annuity Association of America, Sub. Notes, 144A | | | 4.270% | | | | 05/15/47 | | | | 1,450 | | | $ | 1,533,434 | |
Teachers Insurance & Annuity Association of America, Sub. Notes, 144A | | | 6.850% | | | | 12/16/39 | | | | 124 | | | | 175,192 | |
Travelers Cos., Inc.(The), Sr. Unsec’d. Notes | | | 4.000% | | | | 05/30/47 | | | | 890 | | | | 947,710 | |
Unum Group, Sr. Unsec’d. Notes | | | 5.625% | | | | 09/15/20 | | | | 350 | | | | 376,790 | |
W.R. Berkley Corp., Sr. Unsec’d. Notes | | | 6.150% | | | | 08/15/19 | | | | 460 | | | | 485,934 | |
| | | | | | | | | | | | | | | | |
| | | | | | | | | | | | | | | 21,136,651 | |
| | | | | | | | | | | | | | | | |
Lodging — 0.1% | | | | | | | | | | | | | | | | |
Marriott International, Inc., Sr. Unsec’d. Notes | | | 3.000% | | | | 03/01/19 | | | | 580 | | | | 583,955 | |
Marriott International, Inc., Sr. Unsec’d. Notes | | | 3.250% | | | | 09/15/22 | | | | 980 | | | | 997,992 | |
Marriott International, Inc., Sr. Unsec’d. Notes | | | 6.750% | | | | 05/15/18 | | | | 2,800 | | | | 2,848,886 | |
Wyndham Worldwide Corp., Sr. Unsec’d. Notes | | | 2.500% | | | | 03/01/18 | | | | 490 | | | | 490,155 | |
| | | | | | | | | | | | | | | | |
| | | | | | | | | | | | | | | 4,920,988 | |
| | | | | | | | | | | | | | | | |
Machinery-Diversified — 0.0% | | | | | | | | | | | | | | | | |
Xylem, Inc., Sr. Unsec’d. Notes | | | 4.875% | | | | 10/01/21 | | | | 1,260 | | | | 1,358,951 | |
| | | | | | | | | | | | | | | | |
Media — 0.2% | | | | | | | | | | | | | | | | |
21st Century Fox America, Inc., Gtd. Notes | | | 6.150% | | | | 03/01/37 | | | | 515 | | | | 674,466 | |
21st Century Fox America, Inc., Gtd. Notes | | | 6.900% | | | | 08/15/39 | | | | 90 | | | | 127,024 | |
AMC Networks, Inc., Gtd. Notes | | | 5.000% | | | | 04/01/24 | | | | 1,520 | | | | 1,539,000 | |
CCO Holdings LLC/CCO Holdings Capital Corp., Sr. Unsec’d. Notes, 144A | | | 5.375% | | | | 05/01/25 | | | | 880 | | | | 906,682 | |
Charter Communications Operating LLC/Charter Communications Operating Capital, Sr. Sec’d. Notes | | | 6.384% | | | | 10/23/35 | | | | 875 | | | | 1,021,672 | |
Charter Communications Operating LLC/Charter Communications Operating Capital, Sr. Sec’d. Notes | | | 6.484% | | | | 10/23/45 | | | | 1,386 | | | | 1,615,979 | |
Comcast Cable Communications Holdings, Inc., Gtd. Notes | | | 9.455% | | | | 11/15/22 | | | | 255 | | | | 333,177 | |
Comcast Corp., Gtd. Notes | | | 6.400% | | | | 05/15/38 | | | | 530 | | | | 715,703 | |
Discovery Communications LLC, Gtd. Notes | | | 5.000% | | | | 09/20/37 | | | | 180 | | | | 186,497 | |
Discovery Communications LLC, Gtd. Notes | | | 5.200% | | | | 09/20/47 | | | | 625 | | | | 652,325 | |
Grupo Televisa SAB (Mexico), Sr. Unsec’d. Notes | | | 5.000% | | | | 05/13/45 | | | | 200 | | | | 204,471 | |
Time Warner Cable, Inc., Sr. Sec’d. Notes | | | 5.500% | | | | 09/01/41 | | | | 360 | | | | 375,223 | |
Time Warner, Inc., Gtd. Notes | | | 3.800% | | | | 02/15/27 | | | | 385 | | | | 384,636 | |
Viacom, Inc., Sr. Unsec’d. Notes | | | 5.250% | | | | 04/01/44 | | | | 450 | | | | 439,629 | |
Videotron Ltd. (Canada), Gtd. Notes | | | 5.000% | | | | 07/15/22 | | | | 1,040 | | | | 1,094,600 | |
| | | | | | | | | | | | | | | | |
| | | | | | | | | | | | | | | 10,271,084 | |
| | | | | | | | | | | | | | | | |
Mining — 0.1% | | | | | | | | | | | | | | | | |
BHP Billiton Finance USA Ltd. (Australia), Gtd. Notes | | | 5.000% | | | | 09/30/43 | | | | 255 | | | | 312,642 | |
BHP Billiton Finance USA Ltd. (Australia), Gtd. Notes, 144A | | | 6.250% | | | | 10/19/75 | | | | 425 | | | | 460,063 | |
Freeport-McMoRan, Inc., Gtd. Notes | | | 2.375% | | | | 03/15/18 | | | | 3,200 | | | | 3,196,000 | |
Southern Copper Corp. (Peru), Sr. Unsec’d. Notes | | | 5.875% | | | | 04/23/45 | | | | 530 | | | | 640,153 | |
Southern Copper Corp. (Peru), Sr. Unsec’d. Notes | | | 6.750% | | | | 04/16/40 | | | | 425 | | | | 554,086 | |
| | | | | | | | | | | | | | | | |
| | | | | | | | | | | | | | | 5,162,944 | |
| | | | | | | | | | | | | | | | |
Miscellaneous Manufacturing — 0.0% | | | | | | | | | | | | | | | | |
Actuant Corp., Gtd. Notes | | | 5.625% | | | | 06/15/22 | | | | 1,205 | | | | 1,232,113 | |
General Electric Co., Sr. Unsec’d. Notes, GMTN | | | 6.000% | | | | 08/07/19 | | | | 264 | | | | 279,732 | |
| | | | | | | | | | | | | | | | |
| | | | | | | | | | | | | | | 1,511,845 | |
| | | | | | | | | | | | | | | | |
Multi-National — 0.2% | | | | | | | | | | | | | | | | |
Corp. Andina de Fomento (Supranational Bank), Sr. Unsec’d. Notes | | | 2.000% | | | | 05/10/19 | | | | 1,410 | | | | 1,405,051 | |
Corp. Andina de Fomento (Supranational Bank), Sr. Unsec’d. Notes | | | 2.125% | | | | 09/27/21 | | | | 2,270 | | | | 2,219,787 | |
Corp. Andina de Fomento (Supranational Bank), Sr. Unsec’d. Notes | | | 2.750% | | | | 01/06/23 | | | | 315 | | | | 311,488 | |
North American Development Bank (Supranational Bank), Sr. Unsec’d. Notes | | | 2.400% | | | | 10/26/22 | | | | 1,095 | | | | 1,078,942 | |
North American Development Bank (Supranational Bank), Sr. Unsec’d. Notes | | | 4.375% | | | | 02/11/20 | | | | 1,000 | | | | 1,041,973 | |
| | | | | | | | | | | | | | | | |
| | | | | | | | | | | | | | | 6,057,241 | |
| | | | | | | | | | | | | | | | |
SEE NOTES TO FINANCIAL STATEMENTS.
A96
| | | | | | |
| | FLEXIBLE MANAGED PORTFOLIO (continued) | | |
| |
| SCHEDULE OF INVESTMENTS | | as of December 31, 2017 |
| | | | | | | | | | | | | | | | |
| CORPORATE BONDS (continued) | | Interest
Rate | | | Maturity
Date | | | Principal
Amount
(000)# | | | Value | |
Oil & Gas — 0.6% | | | | | | | | | | | | | | | | |
Anadarko Petroleum Corp., Sr. Unsec’d. Notes | | | 4.677% | (s) | | | 10/10/36 | | | | 2,000 | | | $ | 857,099 | |
Anadarko Petroleum Corp., Sr. Unsec’d. Notes | | | 6.450% | | | | 09/15/36 | | | | 1,155 | | | | 1,414,657 | |
Cenovus Energy, Inc. (Canada), Sr. Unsec’d. Notes | | | 5.400% | | | | 06/15/47 | | | | 1,200 | | | | 1,262,800 | |
Concho Resources, Inc., Gtd. Notes | | | 4.875% | | | | 10/01/47 | | | | 210 | | | | 228,360 | |
ConocoPhillips Co., Gtd. Notes | | | 4.950% | | | | 03/15/26 | | | | 1,700 | | | | 1,929,630 | |
Devon Energy Corp., Sr. Unsec’d. Notes | | | 5.000% | | | | 06/15/45 | | | | 110 | | | | 122,710 | |
Devon Energy Corp., Sr. Unsec’d. Notes | | | 5.600% | | | | 07/15/41 | | | | 300 | | | | 353,602 | |
Devon Financing Corp. LLC, Gtd. Notes | | | 7.875% | | | | 09/30/31 | | | | 1,700 | | | | 2,333,768 | |
Encana Corp. (Canada), Sr. Unsec’d. Notes | | | 6.500% | | | | 08/15/34 | | | | 370 | | | | 457,218 | |
Encana Corp. (Canada), Sr. Unsec’d. Notes | | | 6.500% | | | | 02/01/38 | | | | 275 | | | | 347,035 | |
EOG Resources, Inc., Sr. Unsec’d. Notes | | | 3.900% | | | | 04/01/35 | | | | 1,020 | | | | 1,041,088 | |
Gazprom OAO Via Gaz Capital SA (Russia), Sr. Unsec’d. Notes, 144A | | | 4.950% | | | | 07/19/22 | | | | 350 | | | | 366,258 | |
Gazprom OAO Via Gaz Capital SA (Russia), Sr. Unsec’d. Notes, 144A | | | 6.510% | | | | 03/07/22 | | | | 580 | | | | 641,480 | |
Helmerich & Payne International Drilling Co., Gtd. Notes | | | 4.650% | | | | 03/15/25 | | | | 1,995 | | | | 2,100,035 | |
KazMunayGas National Co. JSC (Kazakhstan), Sr. Unsec’d. Notes, 144A | | | 3.875% | | | | 04/19/22 | | | | 550 | | | | 558,250 | |
Nabors Industries, Inc., Gtd. Notes | | | 4.625% | | | | 09/15/21 | | | | 860 | | | | 819,150 | |
Noble Energy, Inc., Sr. Unsec’d. Notes | | | 5.050% | | | | 11/15/44 | | | | 1,200 | | | | 1,285,379 | |
Petrobras Global Finance BV (Brazil), Gtd. Notes, 144A | | | 5.299% | | | | 01/27/25 | | | | 740 | | | | 742,220 | |
Petroleos Mexicanos (Mexico), Gtd. Notes | | | 5.500% | | | | 01/21/21 | | | | 2,110 | | | | 2,238,710 | |
Petroleos Mexicanos (Mexico), Gtd. Notes | | | 6.500% | | | | 06/02/41 | | | | 1,255 | | | | 1,290,768 | |
Petroleos Mexicanos (Mexico), Gtd. Notes | | | 8.625% | | | | 12/01/23 | | | | 350 | | | | 413,130 | |
Petroleos Mexicanos (Mexico), Gtd. Notes, 144A | | | 5.375% | | | | 03/13/22 | | | | 450 | | | | 477,000 | |
Petroleos Mexicanos (Mexico), Gtd. Notes, MTN | | | 6.875% | | | | 08/04/26 | | | | 1,000 | | | | 1,133,750 | |
Petroleos Mexicanos (Mexico), Gtd. Notes, 144A, MTN | | | 6.750% | | | | 09/21/47 | | | | 1,285 | | | | 1,341,347 | |
Pioneer Natural Resources Co., Sr. Unsec’d. Notes | | | 6.875% | | | | 05/01/18 | | | | 1,500 | | | | 1,523,078 | |
Raizen Fuels Finance SA (Brazil), Gtd. Notes, 144A | | | 5.300% | | | | 01/20/27 | | | | 320 | | | | 334,816 | |
Sinopec Group Overseas Development 2015 Ltd. (China), Gtd. Notes, 144A | | | 2.500% | | | | 04/28/20 | | | | 1,250 | | | | 1,243,408 | |
| | | | | | | | | | | | | | | | |
| | | | | | | | | | | | | | | 26,856,746 | |
| | | | | | | | | | | | | | | | |
Oil & Gas Services — 0.1% | | | | | | | | | | | | | | | | |
Cameron International Corp., Gtd. Notes | | | 4.500% | | | | 06/01/21 | | | | 2,200 | | | | 2,286,082 | |
Schlumberger Holdings Corp., Sr. Unsec’d. Notes, 144A | | | 4.000% | | | | 12/21/25 | | | | 2,845 | | | | 2,989,642 | |
| | | | | | | | | | | | | | | | |
| | | | | | | | | | | | | | | 5,275,724 | |
| | | | | | | | | | | | | | | | |
Packaging & Containers — 0.0% | | | | | | | | | | | | | | | | |
Ball Corp., Gtd. Notes | | | 4.375% | | | | 12/15/20 | | | | 630 | | | | 652,050 | |
WestRock RKT Co., Gtd. Notes | | | 4.900% | | | | 03/01/22 | | | | 800 | | | | 862,706 | |
| | | | | | | | | | | | | | | | |
| | | | | | | | | | | | | | | 1,514,756 | |
| | | | | | | | | | | | | | | | |
Pharmaceuticals — 0.2% | | | | | | | | | | | | | | | | |
AbbVie, Inc., Sr. Unsec’d. Notes | | | 3.600% | | | | 05/14/25 | | | | 1,175 | | | | 1,207,989 | |
AbbVie, Inc., Sr. Unsec’d. Notes | | | 4.500% | | | | 05/14/35 | | | | 1,910 | | | | 2,097,833 | |
Allergan Funding SCS, Gtd. Notes(a) | | | 3.800% | | | | 03/15/25 | | | | 475 | | | | 483,572 | |
Allergan Funding SCS, Gtd. Notes | | | 4.550% | | | | 03/15/35 | | | | 2,010 | | | | 2,126,914 | |
Allergan Funding SCS, Gtd. Notes | | | 4.750% | | | | 03/15/45 | | | | 178 | | | | 189,491 | |
Eli Lilly & Co., Sr. Unsec’d. Notes | | | 3.100% | | | | 05/15/27 | | | | 1,140 | | | | 1,157,145 | |
Wyeth LLC, Gtd. Notes | | | 6.450% | | | | 02/01/24 | | | | 60 | | | | 72,350 | |
| | | | | | | | | | | | | | | | |
| | | | | | | | | | | | | | | 7,335,294 | |
| | | | | | | | | | | | | | | | |
Pipelines — 0.2% | | | | | | | | | | | | | | | | |
DCP Midstream Operating LP, Gtd. Notes, 144A | | | 5.350% | | | | 03/15/20 | | | | 717 | | | | 747,472 | |
Energy Transfer Partners LP, Sr. Unsec’d. Notes | | | 4.650% | | | | 06/01/21 | | | | 675 | | | | 708,518 | |
Enterprise Products Operating LLC, Gtd. Notes | | | 3.700% | | | | 02/15/26 | | | | 270 | | | | 276,464 | |
Enterprise Products Operating LLC, Gtd. Notes | | | 3.750% | | | | 02/15/25 | | | | 1,345 | | | | 1,386,824 | |
Kinder Morgan Energy Partners LP, Gtd. Notes | | | 5.950% | | | | 02/15/18 | | | | 510 | | | | 512,372 | |
MPLX LP, Sr. Unsec’d. Notes | | | 4.000% | | | | 02/15/25 | | | | 1,430 | | | | 1,459,204 | |
MPLX LP, Sr. Unsec’d. Notes | | | 5.200% | | | | 03/01/47 | | | | 40 | | | | 43,897 | |
ONEOK Partners LP, Gtd. Notes | | | 6.650% | | | | 10/01/36 | | | | 145 | | | | 177,970 | |
ONEOK, Inc., Gtd. Notes | | | 4.950% | | | | 07/13/47 | | | | 935 | | | | 972,759 | |
Williams Partners LP, Sr. Unsec’d. Notes | | | 4.900% | | | | 01/15/45 | | | | 1,000 | | | | 1,060,872 | |
Williams Partners LP, Sr. Unsec’d. Notes | | | 5.100% | | | | 09/15/45 | | | | 500 | | | | 549,886 | |
| | | | | | | | | | | | | | | | |
| | | | | | | | | | | | | | | 7,896,238 | |
| | | | | | | | | | | | | | | | |
SEE NOTES TO FINANCIAL STATEMENTS.
A97
| | | | | | |
| | FLEXIBLE MANAGED PORTFOLIO (continued) | | |
| |
| SCHEDULE OF INVESTMENTS | | as of December 31, 2017 |
| | | | | | | | | | | | | | | | |
| CORPORATE BONDS (continued) | | Interest
Rate | | | Maturity
Date | | | Principal
Amount
(000)# | | | Value | |
Real Estate Investment Trusts (REITs) — 0.0% | | | | | | | | | | | | | | | | |
Select Income REIT, Sr. Unsec’d. Notes | | | 2.850% | | | | 02/01/18 | | | | 715 | | | $ | 715,000 | |
Simon Property Group LP, Sr. Unsec’d. Notes | | | 3.375% | | | | 03/15/22 | | | | 230 | | | | 236,071 | |
| | | | | | | | | | | | | | | | |
| | | | | | | | | | | | | | | 951,071 | |
| | | | | | | | | | | | | | | | |
Retail — 0.2% | | | | | | | | | | | | | | | | |
CVS Health Corp., Sr. Unsec’d. Notes | | | 5.125% | | | | 07/20/45 | | | | 820 | | | | 939,797 | |
CVS Health Corp., Sr. Unsec’d. Notes | | | 5.300% | | | | 12/05/43 | | | | 225 | | | | 261,817 | |
L Brands, Inc., Gtd. Notes | | | 5.625% | | | | 02/15/22 | | | | 1,450 | | | | 1,546,062 | |
Lowe’s Cos., Inc., Sr. Unsec’d. Notes | | | 6.500% | | | | 03/15/29 | | | | 129 | | | | 166,522 | |
Macy’s Retail Holdings, Inc., Gtd. Notes(a) | | | 3.875% | | | | 01/15/22 | | | | 360 | | | | 362,275 | |
McDonald’s Corp., Sr. Unsec’d. Notes, MTN | | | 3.700% | | | | 01/30/26 | | | | 2,620 | | | | 2,731,053 | |
Sally Holdings LLC/Sally Capital, Inc., Gtd. Notes | | | 5.625% | | | | 12/01/25 | | | | 1,375 | | | | 1,368,125 | |
Target Corp., Sr. Unsec’d. Notes | | | 3.500% | | | | 07/01/24 | | | | 345 | | | | 359,683 | |
| | | | | | | | | | | | | | | | |
| | | | | | | | | | | | | | | 7,735,334 | |
| | | | | | | | | | | | | | | | |
Savings & Loans — 0.0% | | | | | | | | | | | | | | | | |
People’s United Financial, Inc., Sr. Unsec’d. Notes | | | 3.650% | | | | 12/06/22 | | | | 1,455 | | | | 1,489,826 | |
| | | | | | | | | | | | | | | | |
Semiconductors — 0.1% | | | | | | | | | | | | | | | | |
Broadcom Corp./Broadcom Cayman Finance Ltd., Gtd. Notes, 144A | | | 3.875% | | | | 01/15/27 | | | | 2,125 | | | | 2,091,097 | |
NXP BV/NXP Funding LLC (Netherlands), Gtd. Notes, 144A | | | 5.750% | | | | 03/15/23 | | | | 1,500 | | | | 1,548,750 | |
| | | | | | | | | | | | | | | | |
| | | | | | | | | | | | | | | 3,639,847 | |
| | | | | | | | | | | | | | | | |
Software — 0.2% | | | | | | | | | | | | | | | | |
Fidelity National Information Services, Inc., Sr. Unsec’d. Notes | | | 3.625% | | | | 10/15/20 | | | | 1,233 | | | | 1,266,874 | |
Fidelity National Information Services, Inc., Sr. Unsec’d. Notes | | | 2.850% | | | | 10/15/18 | | | | 1,650 | | | | 1,660,014 | |
Microsoft Corp., Sr. Unsec’d. Notes | | | 3.125% | | | | 11/03/25 | | | | 1,380 | | | | 1,408,901 | |
Microsoft Corp., Sr. Unsec’d. Notes | | | 2.375% | | | | 02/12/22 | | | | 3,085 | | | | 3,079,995 | |
Microsoft Corp., Sr. Unsec’d. Notes | | | 4.500% | | | | 02/06/57 | | | | 1,125 | | | | 1,332,140 | |
Oracle Corp., Sr. Unsec’d. Notes | | | 4.300% | | | | 07/08/34 | | | | 920 | | | | 1,022,439 | |
| | | | | | | | | | | | | | | | |
| | | | | | | | | | | | | | | 9,770,363 | |
| | | | | | | | | | | | | | | | |
Telecommunications — 0.3% | | | | | | | | | | | | | | | | |
Anixter, Inc., Gtd. Notes | | | 5.625% | | | | 05/01/19 | | | | 782 | | | | 806,437 | |
AT&T Corp., Gtd. Notes | | | 8.250% | | | | 11/15/31 | | | | 4 | | | | 5,644 | |
AT&T, Inc., Sr. Unsec’d. Notes | | | 3.400% | | | | 05/15/25 | | | | 3,460 | | | | 3,401,700 | |
AT&T, Inc., Sr. Unsec’d. Notes | | | 4.500% | | | | 03/09/48 | | | | 4 | | | | 3,748 | |
AT&T, Inc., Sr. Unsec’d. Notes | | | 4.550% | | | | 03/09/49 | | | | 614 | | | | 577,884 | |
AT&T, Inc., Sr. Unsec’d. Notes | | | 4.900% | | | | 08/14/37 | | | | 570 | | | | 577,179 | |
AT&T, Inc., Sr. Unsec’d. Notes | | | 5.150% | | | | 03/15/42 | | | | 860 | | | | 892,309 | |
AT&T, Inc., Sr. Unsec’d. Notes | | | 5.250% | | | | 03/01/37 | | | | 65 | | | | 68,746 | |
AT&T, Inc., Sr. Unsec’d. Notes | | | 5.300% | | | | 08/14/58 | | | | 650 | | | | 652,132 | |
AT&T, Inc., Sr. Unsec’d. Notes | | | 5.350% | | | | 09/01/40 | | | | 82 | | | | 86,534 | |
British Telecommunications PLC (United Kingdom), Sr. Unsec’d. Notes | | | 9.125% | | | | 12/15/30 | | | | 400 | | | | 597,627 | |
Sprint Spectrum Co. LLC/Sprint Spectrum Co. II LLC/Sprint Spectrum Co. III LLC, Sr. Sec’d. Notes, 144A | | | 3.360% | | | | 03/20/23 | | | | 1,875 | | | | 1,886,719 | |
Verizon Communications, Inc., Sr. Unsec’d. Notes | | | 4.500% | | | | 08/10/33 | | | | 1,205 | | | | 1,263,840 | |
| | | | | | | | | | | | | | | | |
| | | | | | | | | | | | | | | 10,820,499 | |
| | | | | | | | | | | | | | | | |
Transportation — 0.1% | | | | | | | | | | | | | | | | |
Burlington Northern Santa Fe LLC, Sr. Unsec’d. Notes | | | 6.700% | | | | 08/01/28 | | | | 670 | | | | 876,034 | |
CSX Corp., Sr. Unsec’d. Notes | | | 6.150% | | | | 05/01/37 | | | | 715 | | | | 938,159 | |
Norfolk Southern Corp., Sr. Unsec’d. Notes | | | 5.590% | | | | 05/17/25 | | | | 100 | | | | 114,689 | |
| | | | | | | | | | | | | | | | |
| | | | | | | | | | | | | | | 1,928,882 | |
| | | | | | | | | | | | | | | | |
TOTAL CORPORATE BONDS
(cost $368,141,023) | | | | 384,145,356 | |
| | | | | | | | | | | | | | | | |
SEE NOTES TO FINANCIAL STATEMENTS.
A98
| | | | | | |
| | FLEXIBLE MANAGED PORTFOLIO (continued) | | |
| |
| SCHEDULE OF INVESTMENTS | | as of December 31, 2017 |
| | | | | | | | | | | | | | |
| MUNICIPAL BONDS — 0.5% | | Interest
Rate | | | Maturity
Date | | Principal
Amount
(000)# | | | Value | |
Alabama — 0.0% | | | | | | | | | | | | | | |
Alabama Economic Settlement Authority, Revenue Bonds | | | 4.263% | | | 09/15/32 | | | 240 | | | $ | 258,355 | |
| | | | | | | | | | | | | | |
California — 0.2% | | | | | | | | | | | | | | |
Bay Area Toll Authority, Revenue Bonds, BABs | | | 6.263% | | | 04/01/49 | | | 1,325 | | | | 1,957,449 | |
California Educational Facilities Authority, Revenue Bonds | | | 5.000% | | | 06/01/46 | | | 750 | | | | 1,053,405 | |
State of California, GO Unlimited, BABs | | | 7.300% | | | 10/01/39 | | | 1,270 | | | | 1,894,662 | |
State of California, GO Unlimited, BABs | | | 7.500% | | | 04/01/34 | | | 475 | | | | 703,390 | |
State of California, GO Unlimited, BABs | | | 7.550% | | | 04/01/39 | | | 245 | | | | 385,534 | |
State of California, GO Unlimited, BABs | | | 7.625% | | | 03/01/40 | | | 215 | | | | 336,357 | |
| | | | | | | | | | | | | | |
| | | | | | | | | | | | | 6,330,797 | |
| | | | | | | | | | | | | | |
Colorado — 0.0% | | | | | | | | | | | | | | |
Regional Transportation District, Revenue Bonds, Series 2010-B, BABs | | | 5.844% | | | 11/01/50 | | | 680 | | | | 926,418 | |
| | | | | | | | | | | | | | |
Illinois — 0.1% | | | | | | | | | | | | | | |
Chicago O’Hare International Airport, Revenue Bonds, BABs | | | 6.395% | | | 01/01/40 | | | 1,030 | | | | 1,437,654 | |
State of Illinois, GO Unlimited, Series D | | | 5.000% | | | 11/01/22 | | | 3,190 | | | | 3,413,874 | |
| | | | | | | | | | | | | | |
| | | | | | | | | | | | | 4,851,528 | |
| | | | | | | | | | | | | | |
New Jersey — 0.1% | | | | | | | | | | | | | | |
New Jersey State Turnpike Authority, Revenue Bonds, Series F, BABs | | | 7.414% | | | 01/01/40 | | | 1,070 | | | | 1,651,566 | |
| | | | | | | | | | | | | | |
New York — 0.0% | | | | | | | | | | | | | | |
New York City Transitional Finance Authority, Revenue Bonds, BABs | | | 5.767% | | | 08/01/36 | | | 1,130 | | | | 1,418,670 | |
| | | | | | | | | | | | | | |
Ohio — 0.0% | | | | | | | | | | | | | | |
Ohio State University (The), Revenue Bonds, BABs | | | 4.910% | | | 06/01/40 | | | 455 | | | | 551,201 | |
Ohio State Water Development Authority, Revenue Bonds, BABs | | | 4.879% | | | 12/01/34 | | | 300 | | | | 345,708 | |
| | | | | | | | | | | | | | |
| | | | | | | | | | | | | 896,909 | |
| | | | | | | | | | | | | | |
Oregon — 0.0% | | | | | | | | | | | | | | |
Oregon State Department of Transportation Highway, Revenue Bonds, Series A, BABs | | | 5.834% | | | 11/15/34 | | | 445 | | | | 573,115 | |
| | | | | | | | | | | | | | |
Pennsylvania — 0.0% | | | | | | | | | | | | | | |
Pennsylvania Turnpike Commission, Revenue Bonds, Series B, BABs | | | 5.511% | | | 12/01/45 | | | 550 | | | | 719,422 | |
| | | | | | | | | | | | | | |
Tennessee — 0.0% | | | | | | | | | | | | | | |
Metropolitan Government of Nashville & Davidson County Convention Center Authority, Revenue Bonds, BABs | | | 6.731% | | | 07/01/43 | | | 1,000 | | | | 1,380,450 | |
| | | | | | | | | | | | | | |
Texas — 0.1% | | | | | | | | | | | | | | |
University of Texas System (The), Revenue Bonds, BABs | | | 5.000% | | | 08/15/47 | | | 1,490 | | | | 2,046,709 | |
| | | | | | | | | | | | | | |
Virginia — 0.0% | | | | | | | | | | | | | | |
University of Virginia, Revenue Bonds, Series C | | | 4.179% | | | 09/01/2117 | | | 495 | | | | 516,196 | |
| | | | | | | | | | | | | | |
TOTAL MUNICIPAL BONDS
(cost $17,386,609) | | | | 21,570,135 | |
| | | | | | | | | | | | | | |
| RESIDENTIAL MORTGAGE-BACKED SECURITIES — 1.4% | | | | | | | | | | | | | | |
Alternative Loan Trust, Series 2004-18CB, Class 3A1 | | | 5.250% | | | 09/25/19 | | | 80 | | | | 80,551 | |
Banc of America Alternative Loan Trust, Series 2005-12, Class 3CB1 | | | 6.000% | | | 01/25/36 | | | 1,004 | | | | 938,511 | |
Banc of America Funding Trust, Series 2015-R4, Class 4A1, 144A | | | 3.500% | (cc) | | 01/27/30 | | | 1,248 | | | | 1,248,602 | |
Bank of America Mortgage Trust, Series 2005-A, Class 2A1 | | | 3.456% | (cc) | | 02/25/35 | | | 489 | | | | 486,382 | |
Bank of America Mortgage Trust, Series 2005-B, Class 2A1 | | | 3.632% | (cc) | | 03/25/35 | | | 163 | | | | 158,974 | |
Bayview Opportunity Master Fund Trust, Series 2016-CRT1, Class M1, 144A, 1 Month LIBOR + 1.750% | | | 3.314% | (c) | | 10/27/27 | | | 544 | | | | 544,412 | |
Bayview Opportunity Master Fund Trust, Series 2017-CRT1, Class M, 144A, 1 Month LIBOR + 2.150% | | | 3.714% | (c) | | 10/25/28 | | | 1,285 | | | | 1,286,889 | |
Bellemeade Re Ltd. (Bermuda), Series 2017-1, Class M1, 144A, 1 Month LIBOR + 1.700% | | | 3.252% | (c) | | 10/25/27 | | | 849 | | | | 850,995 | |
Chase Mortgage Finance Trust, Series 2007-A1, Class 1A5 | | | 3.664% | (cc) | | 02/25/37 | | | 382 | | | | 384,819 | |
CIM Trust, Series 2017-2, Class A1, 144A, 1 Month LIBOR + 2.000% | | | 3.361% | (c) | | 12/25/57 | | | 2,090 | | | | 2,111,527 | |
CIM Trust, Series 2017-3, Class A, 144A, 1 Month LIBOR + 2.000% | | | 3.361% | (c) | | 01/25/57 | | | 4,352 | | | | 4,442,944 | |
CIM Trust, Series 2017-6, Class A1, 144A | | | 3.015% | (cc) | | 06/25/57 | | | 2,003 | | | | 1,982,556 | |
SEE NOTES TO FINANCIAL STATEMENTS.
A99
| | | | | | |
| | FLEXIBLE MANAGED PORTFOLIO (continued) | | |
| |
| SCHEDULE OF INVESTMENTS | | as of December 31, 2017 |
| | | | | | | | | | | | | | |
RESIDENTIAL MORTGAGE-BACKED SECURITIES
(continued) | | Interest
Rate | | | Maturity
Date | | Principal
Amount
(000)# | | | Value | |
CIM Trust, Series 2017-8, Class A1, 144A^ | | | 3.000% | (cc) | | 12/25/65 | | | 4,030 | | | $ | 4,035,129 | |
Fannie Mae Connecticut Avenue Securities, Series 2016-C02, Class 1M1, 1 Month LIBOR + 2.150% | | | 3.702% | (c) | | 09/25/28 | | | 649 | | | | 655,484 | |
Fannie Mae Connecticut Avenue Securities, Series 2016-C03, Class 2M1, 1 Month LIBOR + 2.200% | | | 3.752% | (c) | | 10/25/28 | | | 841 | | | | 848,965 | |
Fannie Mae Connecticut Avenue Securities, Series 2016-C04, Class 1M1, 1 Month LIBOR + 1.450% | | | 3.002% | (c) | | 01/25/29 | | | 1,190 | | | | 1,201,992 | |
Freddie Mac Structured Agency Credit Risk Debt Notes, Series 2015-DNA1, Class M1, 1 Month LIBOR + 0.900% | | | 2.452% | (c) | | 10/25/27 | | | 1,368 | | | | 1,370,008 | |
Freddie Mac Structured Agency Credit Risk Debt Notes, Series 2016-DNA1, Class M1, 1 Month LIBOR + 1.450% | | | 3.002% | (c) | | 07/25/28 | | | 495 | | | | 496,161 | |
Freddie Mac Structured Agency Credit Risk Debt Notes, Series 2016-DNA4, Class M2, 1 Month LIBOR + 1.300% | | | 2.852% | (c) | | 03/25/29 | | | 1,300 | | | | 1,319,381 | |
Freddie Mac Structured Agency Credit Risk Debt Notes, Series 2016-HQA2, Class M2, 1 Month LIBOR + 2.250% | | | 3.802% | (c) | | 11/25/28 | | | 1,110 | | | | 1,138,648 | |
Freddie Mac Structured Agency Credit Risk Debt Notes, Series 2016-HQA4, Class M2, 1 Month LIBOR + 1.300% | | | 2.852% | (c) | | 04/25/29 | | | 2,050 | | | | 2,076,876 | |
Freddie Mac Structured Agency Credit Risk Debt Notes, Series 2017-DNA1, Class M1, 1 Month LIBOR + 1.200% | | | 2.752% | (c) | | 07/25/29 | | | 2,960 | | | | 2,993,957 | |
Freddie Mac Structured Agency Credit Risk Debt Notes, Series 2017-DNA3, Class M1, 1 Month LIBOR + 0.750% | | | 2.302% | (c) | | 03/25/30 | | | 4,554 | | | | 4,571,565 | |
JPMorgan Mortgage Trust, Series 2007-A1, Class 4A1 | | | 3.728% | (cc) | | 07/25/35 | | | 201 | | | | 204,095 | |
LSTAR Securities Investment Ltd., Series 2017-3, Class A1, 144A, 1 Month LIBOR + 2.000% | | | 3.568% | (c) | | 04/01/22 | | | 2,008 | | | | 2,007,528 | |
LSTAR Securities Investment Ltd. (Cayman Islands), Series 2017-4, Class A, 144A, 1 Month LIBOR + 2.000% | | | 3.568% | (c) | | 05/01/22 | | | 6,856 | | | | 6,849,524 | |
LSTAR Securities Investment Ltd., Series 2017-5, Class A, 144A, 1 Month LIBOR + 2.000% | | | 3.568% | (c) | | 05/01/22 | | | 6,099 | | | | 6,097,200 | |
LSTAR Securities Investment Ltd., Series 2017-6, Class A, 144A, 1 Month LIBOR + 1.750%^ | | | 3.318% | (c) | | 09/01/22 | | | 2,010 | | | | 2,011,083 | |
LSTAR Securities Investment Ltd. (Cayman Islands), Series 2017-8, Class A, 144A, 1 Month LIBOR + 1.650% | | | 3.218% | (c) | | 11/01/22 | | | 2,074 | | | | 2,073,280 | |
MASTR Alternative Loan Trust, Series 2004-4, Class 4A1 | | | 5.000% | | | 04/25/19 | | | 13 | | | | 12,626 | |
Mortgage Repurchase Agreement Financing Trust, Series 2017-1, Class A2, 144A, 1 Month LIBOR + 0.850% | | | 2.282% | (c) | | 07/10/19 | | | 2,710 | | | | 2,710,196 | |
Structured Adjustable Rate Mortgage Loan Trust, Series 2004-1, Class 4A3 | | | 3.473% | (cc) | | 02/25/34 | | | 203 | | | | 204,223 | |
Washington Mutual Mortgage Pass-Through Certificates, Series 2005-1, Class 3A | | | 5.000% | | | 03/25/20 | | | 30 | | | | 30,034 | |
| | | | | | | | | | | | | | |
TOTAL RESIDENTIAL MORTGAGE-BACKED SECURITIES
(cost $57,027,641) | | | | 57,425,117 | |
| | | | | | | | | | | | | | |
| SOVEREIGN BONDS — 1.1% | | | | | | | | | | | | | | |
Abu Dhabi Government International Bond (United Arab Emirates), Sr. Unsec’d. Notes, 144A | | | 3.125% | | | 10/11/27 | | | 4,360 | | | | 4,263,034 | |
Belgium Government International Bond (Belgium), Sr. Unsec’d. Notes, 144A, EMTN | | | 1.125% | | | 08/03/19 | | | 1,600 | | | | 1,576,306 | |
Colombia Government International Bond (Colombia), Sr. Unsec’d. Notes | | | 4.000% | | | 02/26/24 | | | 175 | | | | 181,475 | |
Colombia Government International Bond (Colombia), Sr. Unsec’d. Notes | | | 4.375% | | | 07/12/21 | | | 500 | | | | 527,250 | |
Export-Import Bank of Korea (South Korea), Sr. Unsec’d. Notes | | | 5.125% | | | 06/29/20 | | | 400 | | | | 421,540 | |
Finnvera OYJ (Finland), Gov’t. Gtd. Notes, 144A, MTN | | | 2.375% | | | 06/04/25 | | | 400 | | | | 386,744 | |
Hungary Government International Bond (Hungary), Sr. Unsec’d. Notes | | | 4.000% | | | 03/25/19 | | | 580 | | | | 592,441 | |
Hungary Government International Bond (Hungary), Sr. Unsec’d. Notes | | | 6.375% | | | 03/29/21 | | | 2,280 | | | | 2,530,982 | |
Hungary Government International Bond (Hungary), Sr. Unsec’d. Notes | | | 7.625% | | | 03/29/41 | | | 880 | | | | 1,378,564 | |
Indonesia Government International Bond (Indonesia), Sr. Unsec’d. Notes | | | 4.350% | | | 01/11/48 | | | 1,710 | | | | 1,734,850 | |
Indonesia Government International Bond (Indonesia), Sr. Unsec’d. Notes | | | 4.750% | | | 01/08/26 | | | 540 | | | | 586,625 | |
Indonesia Government International Bond (Indonesia), Sr. Unsec’d. Notes, 144A, MTN | | | 2.150% | | | 07/18/24 | | | 2,100 | | | | 2,640,874 | |
Indonesia Government International Bond (Indonesia), Sr. Unsec’d. Notes, 144A | | | 3.375% | | | 07/30/25 | | | 1,500 | | | | 2,031,490 | |
SEE NOTES TO FINANCIAL STATEMENTS.
A100
| | | | | | |
| | FLEXIBLE MANAGED PORTFOLIO (continued) | | |
| |
| SCHEDULE OF INVESTMENTS | | as of December 31, 2017 |
| | | | | | | | | | | | | | |
SOVEREIGN BONDS
(continued) | | Interest
Rate | | | Maturity
Date | | Principal
Amount
(000)# | | | Value | |
Indonesia Government International Bond (Indonesia), Sr. Unsec’d. Notes, 144A, MTN | | | 5.875% | | | 01/15/24 | | | 950 | | | $ | 1,080,253 | |
Japan Bank for International Cooperation (Japan), Gov’t. Gtd. Notes | | | 1.500% | | | 07/21/21 | | | 600 | | | | 578,650 | |
Japan Bank for International Cooperation (Japan), Gov’t. Gtd. Notes | | | 2.125% | | | 06/01/20 | | | 400 | | | | 397,592 | |
Japan Bank for International Cooperation (Japan), Gov’t. Gtd. Notes | | | 2.125% | | | 07/21/20 | | | 1,600 | | | | 1,587,778 | |
Japan Bank for International Cooperation (Japan), Gov’t. Gtd. Notes | | | 2.125% | | | 11/16/20 | | | 800 | | | | 793,200 | |
Japan Bank for International Cooperation (Japan), Gov’t. Gtd. Notes | | | 2.250% | | | 02/24/20 | | | 800 | | | | 796,528 | |
Japan Finance Organization for Municipalities (Japan), Sr. Unsec’d. Notes, 144A, MTN | | | 2.000% | | | 09/08/20 | | | 1,200 | | | | 1,183,848 | |
Japan Finance Organization for Municipalities (Japan), Sr. Unsec’d. Notes, 144A, MTN | | | 2.125% | | | 04/13/21 | | | 800 | | | | 786,139 | |
Japan Finance Organization for Municipalities (Japan), Sr. Unsec’d. Notes, 144A, MTN | | | 2.125% | | | 10/25/23 | | | 1,400 | | | | 1,344,776 | |
Japan Finance Organization for Municipalities (Japan), Sr. Unsec’d. Notes, 144A, MTN | | | 2.625% | | | 04/20/22 | | | 2,000 | | | | 1,988,421 | |
Mexico Government International Bond (Mexico), Sr. Unsec’d. Notes | | | 4.000% | | | 10/02/23 | | | 566 | | | | 592,319 | |
Mexico Government International Bond (Mexico), Sr. Unsec’d. Notes, MTN | | | 4.750% | | | 03/08/44 | | | 606 | | | | 612,666 | |
Panama Government International Bond (Panama), Sr. Unsec’d. Notes | | | 3.750% | | | 03/16/25 | | | 600 | | | | 625,800 | |
Panama Government International Bond (Panama), Sr. Unsec’d. Notes | | | 4.000% | | | 09/22/24 | | | 515 | | | | 547,702 | |
Province of Alberta (Canada), Sr. Unsec’d. Notes | | | 2.200% | | | 07/26/22 | | | 670 | | | | 660,239 | |
Province of Manitoba (Canada), Sr. Unsec’d. Notes | | | 2.125% | | | 06/22/26 | | | 200 | | | | 188,138 | |
Province of Ontario (Canada), Sr. Unsec’d. Notes | | | 2.250% | | | 05/18/22 | | | 795 | | | | 786,539 | |
Province of Ontario (Canada), Sr. Unsec’d. Notes | | | 4.400% | | | 04/14/20 | | | 385 | | | | 403,237 | |
Province of Quebec (Canada), Sr. Unsec’d. Notes | | | 2.750% | | | 04/12/27 | | | 1,975 | | | | 1,958,654 | |
Saudi Government International Bond (Saudi Arabia), Sr. Unsec’d. Notes, 144A, MTN | | | 2.375% | | | 10/26/21 | | | 1,325 | | | | 1,292,484 | |
Saudi Government International Bond (Saudi Arabia), Sr. Unsec’d. Notes, 144A, MTN | | | 2.875% | | | 03/04/23 | | | 1,785 | | | | 1,754,694 | |
Svensk Exportkredit AB (Sweden), Sr. Unsec’d. Notes, GMTN | | | 1.750% | | | 03/10/21 | | | 3,100 | | | | 3,050,570 | |
Tokyo Metropolitan Government (Japan), Sr. Unsec’d. Notes, 144A | | | 2.500% | | | 06/08/22 | | | 1,800 | | | | 1,781,219 | |
Turkey Government International Bond (Turkey), Sr. Unsec’d. Notes | | | 7.000% | | | 06/05/20 | | | 1,710 | | | | 1,844,782 | |
Uruguay Government International Bond (Uruguay), Sr. Unsec’d. Notes | | | 5.100% | | | 06/18/50 | | | 680 | | | | 754,800 | |
| | | | | | | | | | | | | | |
TOTAL SOVEREIGN BONDS
(cost $45,757,758) | | | | 46,243,203 | |
| | | | | | | | | | | | | | |
| U.S. GOVERNMENT AGENCY OBLIGATIONS — 7.9% | | | | | | | | | | | | | | |
Federal Home Loan Banks(k) | | | 5.500% | | | 07/15/36 | | | 1,080 | | | | 1,481,207 | |
Federal Home Loan Mortgage Corp. | | | 2.500% | | | 03/01/30 | | | 681 | | | | 680,288 | |
Federal Home Loan Mortgage Corp. | | | 3.000% | | | 10/01/28 | | | 577 | | | | 589,382 | |
Federal Home Loan Mortgage Corp. | | | 3.000% | | | 06/01/29 | | | 1,368 | | | | 1,394,942 | |
Federal Home Loan Mortgage Corp. | | | 3.000% | | | 01/01/37 | | | 679 | | | | 689,178 | |
Federal Home Loan Mortgage Corp. | | | 3.000% | | | 01/01/43 | | | 1,292 | | | | 1,299,042 | |
Federal Home Loan Mortgage Corp. | | | 3.000% | | | 07/01/43 | | | 2,550 | | | | 2,562,238 | |
Federal Home Loan Mortgage Corp. | | | 3.000% | | | 06/01/45 | | | 1,214 | | | | 1,218,309 | |
Federal Home Loan Mortgage Corp. | | | 3.000% | | | 06/01/45 | | | 5,225 | | | | 5,242,085 | |
Federal Home Loan Mortgage Corp. | | | 3.500% | | | TBA | | | 21,000 | | | | 21,565,475 | |
Federal Home Loan Mortgage Corp. | | | 3.500% | | | 12/01/25 | | | 530 | | | | 550,328 | |
Federal Home Loan Mortgage Corp. | | | 3.500% | | | 08/01/26 | | | 995 | | | | 1,033,431 | |
Federal Home Loan Mortgage Corp. | | | 3.500% | | | 03/01/42 | | | 781 | | | | 806,290 | |
Federal Home Loan Mortgage Corp. | | | 3.500% | | | 06/01/42 | | | 473 | | | | 488,265 | |
Federal Home Loan Mortgage Corp. | | | 4.000% | | | TBA | | | 14,000 | | | | 14,639,843 | |
Federal Home Loan Mortgage Corp. | | | 4.000% | | | 06/01/26 | | | 856 | | | | 896,903 | |
Federal Home Loan Mortgage Corp. | | | 4.000% | | | 09/01/26 | | | 440 | | | | 459,186 | |
Federal Home Loan Mortgage Corp. | | | 4.000% | | | 10/01/39 | | | 1,055 | | | | 1,106,950 | |
Federal Home Loan Mortgage Corp. | | | 4.000% | | | 12/01/40 | | | 526 | | | | 552,403 | |
Federal Home Loan Mortgage Corp. | | | 4.000% | | | 10/01/41 | | | 587 | | | | 618,059 | |
Federal Home Loan Mortgage Corp. | | | 4.000% | | | 01/01/42 | | | 203 | | | | 213,399 | |
Federal Home Loan Mortgage Corp. | | | 4.000% | | | 10/01/45 | | | 913 | | | | 955,234 | |
Federal Home Loan Mortgage Corp. | | | 4.500% | | | 02/01/19 | | | 1 | | | | 1,353 | |
SEE NOTES TO FINANCIAL STATEMENTS.
A101
| | | | | | |
| | FLEXIBLE MANAGED PORTFOLIO (continued) | | |
| |
| SCHEDULE OF INVESTMENTS | | as of December 31, 2017 |
| | | | | | | | | | | | | | |
U.S. GOVERNMENT AGENCY OBLIGATIONS
(continued) | | Interest
Rate | | | Maturity
Date | | Principal
Amount
(000)# | | | Value | |
Federal Home Loan Mortgage Corp. | | | 4.500% | | | 07/01/19 | | | 69 | | | $ | 69,514 | |
Federal Home Loan Mortgage Corp. | | | 4.500% | | | 07/01/20 | | | 53 | | | | 53,955 | |
Federal Home Loan Mortgage Corp. | | | 4.500% | | | 09/01/39 | | | 398 | | | | 424,146 | |
Federal Home Loan Mortgage Corp. | | | 4.500% | | | 10/01/39 | | | 2,281 | | | | 2,433,317 | |
Federal Home Loan Mortgage Corp. | | | 4.500% | | | 12/01/39 | | | 682 | | | | 727,912 | |
Federal Home Loan Mortgage Corp. | | | 4.500% | | | 07/01/41 | | | 298 | | | | 317,262 | |
Federal Home Loan Mortgage Corp. | | | 4.500% | | | 07/01/41 | | | 2,354 | | | | 2,511,548 | |
Federal Home Loan Mortgage Corp. | | | 4.500% | | | 08/01/41 | | | 657 | | | | 699,854 | |
Federal Home Loan Mortgage Corp. | | | 4.500% | | | 08/01/41 | | | 249 | | | | 265,511 | |
Federal Home Loan Mortgage Corp. | | | 4.500% | | | 08/01/41 | | | 144 | | | | 153,310 | |
Federal Home Loan Mortgage Corp. | | | 4.500% | | | 10/01/41 | | | 260 | | | | 277,794 | |
Federal Home Loan Mortgage Corp. | | | 4.500% | | | 10/01/46 | | | 471 | | | | 500,749 | |
Federal Home Loan Mortgage Corp. | | | 5.000% | | | 07/01/18 | | | 17 | | | | 16,985 | |
Federal Home Loan Mortgage Corp. | | | 5.000% | | | 12/01/18 | | | 12 | | | | 12,156 | |
Federal Home Loan Mortgage Corp. | | | 5.000% | | | 07/01/19 | | | 31 | | | | 32,082 | |
Federal Home Loan Mortgage Corp. | | | 5.000% | | | 07/01/19 | | | 62 | | | | 63,367 | |
Federal Home Loan Mortgage Corp. | | | 5.000% | | | 12/01/19 | | | 10 | | | | 10,417 | |
Federal Home Loan Mortgage Corp. | | | 5.000% | | | 05/01/34 | | | 32 | | | | 34,624 | |
Federal Home Loan Mortgage Corp. | | | 5.000% | | | 05/01/34 | | | 316 | | | | 341,400 | |
Federal Home Loan Mortgage Corp. | | | 5.000% | | | 08/01/35 | | | 33 | | | | 36,332 | |
Federal Home Loan Mortgage Corp. | | | 5.000% | | | 09/01/35 | | | 43 | | | | 46,745 | |
Federal Home Loan Mortgage Corp. | | | 5.000% | | | 10/01/36 | | | 51 | | | | 54,880 | |
Federal Home Loan Mortgage Corp. | | | 5.000% | | | 05/01/37 | | | 33 | | | | 36,182 | |
Federal Home Loan Mortgage Corp. | | | 5.000% | | | 07/01/37 | | | 666 | | | | 724,999 | |
Federal Home Loan Mortgage Corp. | | | 5.000% | | | 09/01/38 | | | 93 | | | | 101,477 | |
Federal Home Loan Mortgage Corp. | | | 5.000% | | | 09/01/38 | | | 78 | | | | 84,439 | |
Federal Home Loan Mortgage Corp. | | | 5.000% | | | 09/01/38 | | | 81 | | | | 88,155 | |
Federal Home Loan Mortgage Corp. | | | 5.000% | | | 02/01/39 | | | 31 | | | | 33,572 | |
Federal Home Loan Mortgage Corp. | | | 5.000% | | | 06/01/39 | | | 83 | | | | 90,391 | |
Federal Home Loan Mortgage Corp. | | | 5.500% | | | 02/01/34 | | | 37 | | | | 40,041 | |
Federal Home Loan Mortgage Corp. | | | 5.500% | | | 04/01/34 | | | 335 | | | | 366,758 | |
Federal Home Loan Mortgage Corp. | | | 5.500% | | | 06/01/34 | | | 205 | | | | 226,928 | |
Federal Home Loan Mortgage Corp. | | | 5.500% | | | 06/01/34 | | | 175 | | | | 194,476 | |
Federal Home Loan Mortgage Corp. | | | 5.500% | | | 05/01/37 | | | 72 | | | | 79,542 | |
Federal Home Loan Mortgage Corp. | | | 5.500% | | | 02/01/38 | | | 568 | | | | 627,507 | |
Federal Home Loan Mortgage Corp. | | | 5.500% | | | 05/01/38 | | | 105 | | | | 115,701 | |
Federal Home Loan Mortgage Corp. | | | 5.500% | | | 07/01/38 | | | 502 | | | | 554,055 | |
Federal Home Loan Mortgage Corp. | | | 6.000% | | | 03/01/32 | | | 297 | | | | 336,139 | |
Federal Home Loan Mortgage Corp. | | | 6.000% | | | 12/01/33 | | | 82 | | | | 91,408 | |
Federal Home Loan Mortgage Corp. | | | 6.000% | | | 07/01/36 | | | 5 | | | | 5,363 | |
Federal Home Loan Mortgage Corp. | | | 6.000% | | | 12/01/36 | | | 12 | | | | 13,811 | |
Federal Home Loan Mortgage Corp. | | | 6.000% | | | 05/01/37 | | | 19 | | | | 21,279 | |
Federal Home Loan Mortgage Corp. | | | 6.000% | | | 12/01/37 | | | 46 | | | | 51,254 | |
Federal Home Loan Mortgage Corp. | | | 6.000% | | | 01/01/38 | | | 9 | | | | 10,099 | |
Federal Home Loan Mortgage Corp. | | | 6.000% | | | 01/01/38 | | | 396 | | | | 443,755 | |
Federal Home Loan Mortgage Corp. | | | 6.000% | | | 01/01/38 | | | 21 | | | | 23,037 | |
Federal Home Loan Mortgage Corp. | | | 6.000% | | | 10/01/38 | | | 94 | | | | 106,002 | |
Federal Home Loan Mortgage Corp. | | | 6.000% | | | 08/01/39 | | | 55 | | | | 62,302 | |
Federal Home Loan Mortgage Corp. | | | 6.750% | | | 03/15/31 | | | 700 | | | | 1,001,030 | |
Federal Home Loan Mortgage Corp. | | | 7.000% | | | 01/01/31 | | | 30 | | | | 33,107 | |
Federal Home Loan Mortgage Corp. | | | 7.000% | | | 06/01/31 | | | 33 | | | | 35,694 | |
Federal Home Loan Mortgage Corp. | | | 7.000% | | | 09/01/31 | | | 5 | | | | 5,354 | |
Federal Home Loan Mortgage Corp. | | | 7.000% | | | 10/01/31 | | | 60 | | | | 68,600 | |
Federal Home Loan Mortgage Corp. | | | 7.000% | | | 10/01/32 | | | 32 | | | | 34,239 | |
Federal National Mortgage Assoc. | | | 1.875% | | | 09/24/26 | | | 225 | | | | 212,093 | |
Federal National Mortgage Assoc. | | | 2.000% | | | 08/01/31 | | | 1,769 | | | | 1,723,838 | |
Federal National Mortgage Assoc. | | | 2.500% | | | 01/01/28 | | | 1,575 | | | | 1,581,949 | |
Federal National Mortgage Assoc. | | | 2.500% | | | 10/01/43 | | | 1,198 | | | | 1,161,515 | |
Federal National Mortgage Assoc. | | | 2.500% | | | 12/01/46 | | | 2,123 | | | | 2,049,878 | |
SEE NOTES TO FINANCIAL STATEMENTS.
A102
| | | | | | |
| | FLEXIBLE MANAGED PORTFOLIO (continued) | | |
| |
| SCHEDULE OF INVESTMENTS | | as of December 31, 2017 |
| | | | | | | | | | | | | | |
U.S. GOVERNMENT AGENCY OBLIGATIONS
(continued) | | Interest
Rate | | | Maturity
Date | | Principal
Amount
(000)# | | | Value | |
Federal National Mortgage Assoc. | | | 3.000% | | | TBA | | | 6,000 | | | $ | 6,000,000 | |
Federal National Mortgage Assoc. | | | 3.000% | | | TBA | | | 5,000 | | | | 4,993,457 | |
Federal National Mortgage Assoc. | | | 3.000% | | | TBA | | | 5,750 | | | | 5,850,737 | |
Federal National Mortgage Assoc. | | | 3.000% | | | 02/01/27 | | | 2,494 | | | | 2,547,240 | |
Federal National Mortgage Assoc. | | | 3.000% | | | 08/01/30 | | | 1,509 | | | | 1,540,668 | |
Federal National Mortgage Assoc. | | | 3.000% | | | 02/01/31 | | | 4,172 | | | | 4,251,384 | |
Federal National Mortgage Assoc. | | | 3.000% | | | 05/01/31 | | | 3,193 | | | | 3,253,813 | |
Federal National Mortgage Assoc. | | | 3.000% | | | 11/01/36 | | | 3,589 | | | | 3,645,939 | |
Federal National Mortgage Assoc. | | | 3.000% | | | 12/01/42 | | | 1,553 | | | | 1,561,208 | |
Federal National Mortgage Assoc. | | | 3.000% | | | 12/01/42 | | | 2,564 | | | | 2,578,271 | |
Federal National Mortgage Assoc. | | | 3.000% | | | 04/01/43 | | | 8,624 | | | | 8,669,310 | |
Federal National Mortgage Assoc. | | | 3.000% | | | 07/01/43 | | | 3,930 | | | | 3,950,620 | |
Federal National Mortgage Assoc. | | | 3.000% | | | 08/01/43 | | | 5,176 | | | | 5,203,174 | |
Federal National Mortgage Assoc. | | | 3.500% | | | TBA | | | 6,000 | | | | 6,160,313 | |
Federal National Mortgage Assoc. | | | 3.500% | | | TBA | | | 5,750 | | | | 5,894,424 | |
Federal National Mortgage Assoc. | | | 3.500% | | | 07/01/27 | | | 1,925 | | | | 1,990,523 | |
Federal National Mortgage Assoc. | | | 3.500% | | | 06/01/39 | | | 863 | | | | 890,373 | |
Federal National Mortgage Assoc. | | | 3.500% | | | 01/01/42 | | | 8,057 | | | | 8,319,628 | |
Federal National Mortgage Assoc. | | | 3.500% | | | 05/01/42 | | | 3,972 | | | | 4,101,213 | |
Federal National Mortgage Assoc. | | | 3.500% | | | 07/01/42 | | | 1,068 | | | | 1,102,948 | |
Federal National Mortgage Assoc. | | | 3.500% | | | 08/01/42 | | | 1,380 | | | | 1,425,366 | |
Federal National Mortgage Assoc. | | | 3.500% | | | 08/01/42 | | | 449 | | | | 463,428 | |
Federal National Mortgage Assoc. | | | 3.500% | | | 09/01/42 | | | 1,132 | | | | 1,168,857 | |
Federal National Mortgage Assoc. | | | 3.500% | | | 09/01/42 | | | 2,030 | | | | 2,094,979 | |
Federal National Mortgage Assoc. | | | 3.500% | | | 11/01/42 | | | 770 | | | | 794,902 | |
Federal National Mortgage Assoc. | | | 3.500% | | | 03/01/43 | | | 4,143 | | | | 4,279,998 | |
Federal National Mortgage Assoc. | | | 3.500% | | | 04/01/43 | | | 746 | | | | 769,951 | |
Federal National Mortgage Assoc. | | | 3.500% | | | 04/01/43 | | | 1,891 | | | | 1,951,786 | |
Federal National Mortgage Assoc. | | | 3.500% | | | 07/01/43 | | | 352 | | | | 363,184 | |
Federal National Mortgage Assoc. | | | 3.500% | | | 06/01/45 | | | 9,146 | | | | 9,395,545 | |
Federal National Mortgage Assoc. | | | 4.000% | | | TBA | | | 9,000 | | | | 9,411,650 | |
Federal National Mortgage Assoc. | | | 4.000% | | | 10/01/41 | | | 3,992 | | | | 4,192,461 | |
Federal National Mortgage Assoc. | | | 4.000% | | | 09/01/44 | | | 3,973 | | | | 4,159,532 | |
Federal National Mortgage Assoc. | | | 4.500% | | | 11/01/18 | | | 29 | | | | 29,465 | |
Federal National Mortgage Assoc. | | | 4.500% | | | 01/01/19 | | | 41 | | | | 41,390 | |
Federal National Mortgage Assoc. | | | 4.500% | | | 01/01/19 | | | 15 | | | | 15,175 | |
Federal National Mortgage Assoc. | | | 4.500% | | | 02/01/19 | | | 31 | | | | 31,286 | |
Federal National Mortgage Assoc. | | | 4.500% | | | 05/01/19 | | | 31 | | | | 31,305 | |
Federal National Mortgage Assoc. | | | 4.500% | | | 07/01/33 | | | 64 | | | | 68,589 | |
Federal National Mortgage Assoc. | | | 4.500% | | | 08/01/33 | | | 19 | | | | 20,301 | |
Federal National Mortgage Assoc. | | | 4.500% | | | 09/01/33 | | | 63 | | | | 67,123 | |
Federal National Mortgage Assoc. | | | 4.500% | | | 10/01/33 | | | 168 | | | | 179,626 | |
Federal National Mortgage Assoc. | | | 4.500% | | | 03/01/34 | | | 49 | | | | 52,056 | |
Federal National Mortgage Assoc. | | | 4.500% | | | 01/01/35 | | | 3 | | | | 3,500 | |
Federal National Mortgage Assoc. | | | 4.500% | | | 07/01/39 | | | 1,151 | | | | 1,242,221 | |
Federal National Mortgage Assoc. | | | 4.500% | | | 08/01/39 | | | 898 | | | | 969,306 | |
Federal National Mortgage Assoc. | | | 4.500% | | | 09/01/39 | | | 652 | | | | 696,253 | |
Federal National Mortgage Assoc. | | | 4.500% | | | 12/01/39 | | | 7 | | | | 7,611 | |
Federal National Mortgage Assoc. | | | 4.500% | | | 03/01/41 | | | 2,230 | | | | 2,406,722 | |
Federal National Mortgage Assoc. | | | 4.500% | | | 07/01/42 | | | 180 | | | | 192,630 | |
Federal National Mortgage Assoc. | | | 5.000% | | | TBA | | | 7,000 | | | | 7,523,496 | |
Federal National Mortgage Assoc. | | | 5.000% | | | 10/01/18 | | | 9 | | | | 9,494 | |
Federal National Mortgage Assoc. | | | 5.000% | | | 01/01/19 | | | 24 | | | | 24,730 | |
Federal National Mortgage Assoc. | | | 5.000% | | | 03/01/34 | | | 326 | | | | 353,489 | |
Federal National Mortgage Assoc. | | | 5.000% | | | 04/01/35 | | | 783 | | | | 850,766 | |
Federal National Mortgage Assoc. | | | 5.000% | | | 06/01/35 | | | 192 | | | | 208,614 | |
Federal National Mortgage Assoc. | | | 5.000% | | | 07/01/35 | | | 191 | | | | 207,671 | |
Federal National Mortgage Assoc. | | | 5.000% | | | 07/01/35 | | | 153 | | | | 166,194 | |
Federal National Mortgage Assoc. | | | 5.000% | | | 09/01/35 | | | 122 | | | | 132,792 | |
SEE NOTES TO FINANCIAL STATEMENTS.
A103
| | | | | | |
| | FLEXIBLE MANAGED PORTFOLIO (continued) | | |
| |
| SCHEDULE OF INVESTMENTS | | as of December 31, 2017 |
| | | | | | | | | | | | | | |
U.S. GOVERNMENT AGENCY OBLIGATIONS
(continued) | | Interest
Rate | | | Maturity
Date | | Principal
Amount
(000)# | | | Value | |
Federal National Mortgage Assoc. | | | 5.000% | | | 11/01/35 | | | 129 | | | $ | 140,346 | |
Federal National Mortgage Assoc. | | | 5.000% | | | 02/01/36 | | | 110 | | | | 119,115 | |
Federal National Mortgage Assoc. | | | 5.500% | | | 02/01/18 | | | — | (r) | | | 109 | |
Federal National Mortgage Assoc. | | | 5.500% | | | 05/01/20 | | | 27 | | | | 27,716 | |
Federal National Mortgage Assoc. | | | 5.500% | | | 01/01/21 | | | 104 | | | | 107,483 | |
Federal National Mortgage Assoc. | | | 5.500% | | | 02/01/33 | | | 208 | | | | 230,703 | |
Federal National Mortgage Assoc. | | | 5.500% | | | 08/01/33 | | | 265 | | | | 295,734 | |
Federal National Mortgage Assoc. | | | 5.500% | | | 10/01/33 | | | 69 | | | | 77,213 | |
Federal National Mortgage Assoc. | | | 5.500% | | | 12/01/33 | | | 67 | | | | 74,699 | |
Federal National Mortgage Assoc. | | | 5.500% | | | 12/01/34 | | | 202 | | | | 224,120 | |
Federal National Mortgage Assoc. | | | 5.500% | | | 10/01/35 | | | 912 | | | | 1,009,961 | |
Federal National Mortgage Assoc. | | | 5.500% | | | 03/01/36 | | | 104 | | | | 114,160 | |
Federal National Mortgage Assoc. | | | 5.500% | | | 04/01/36 | | | 140 | | | | 154,192 | |
Federal National Mortgage Assoc. | | | 5.500% | | | 01/01/37 | | | 96 | | | | 106,837 | |
Federal National Mortgage Assoc. | | | 5.500% | | | 04/01/37 | | | 53 | | | | 58,643 | |
Federal National Mortgage Assoc. | | | 5.500% | | | 05/01/37 | | | 316 | | | | 350,746 | |
Federal National Mortgage Assoc. | | | 5.500% | | | 08/01/37 | | | 375 | | | | 416,376 | |
Federal National Mortgage Assoc. | | | 6.000% | | | 05/01/21 | | | 91 | | | | 94,382 | |
Federal National Mortgage Assoc. | | | 6.000% | | | 10/01/33 | | | 426 | | | | 489,621 | |
Federal National Mortgage Assoc. | | | 6.000% | | | 11/01/33 | | | 47 | | | | 52,105 | |
Federal National Mortgage Assoc. | | | 6.000% | | | 11/01/33 | | | 37 | | | | 41,459 | |
Federal National Mortgage Assoc. | | | 6.000% | | | 01/01/34 | | | 341 | | | | 384,447 | |
Federal National Mortgage Assoc. | | | 6.000% | | | 02/01/34 | | | 146 | | | | 166,229 | |
Federal National Mortgage Assoc. | | | 6.000% | | | 03/01/34 | | | 3 | | | | 3,185 | |
Federal National Mortgage Assoc. | | | 6.000% | | | 03/01/34 | | | 47 | | | | 52,291 | |
Federal National Mortgage Assoc. | | | 6.000% | | | 03/01/34 | | | 16 | | | | 18,327 | |
Federal National Mortgage Assoc. | | | 6.000% | | | 11/01/34 | | | 71 | | | | 79,459 | |
Federal National Mortgage Assoc. | | | 6.000% | | | 01/01/35 | | | 206 | | | | 231,480 | |
Federal National Mortgage Assoc. | | | 6.000% | | | 01/01/35 | | | 82 | | | | 93,261 | |
Federal National Mortgage Assoc. | | | 6.000% | | | 02/01/35 | | | 4 | | | | 4,979 | |
Federal National Mortgage Assoc. | | | 6.000% | | | 02/01/35 | | | 273 | | | | 313,627 | |
Federal National Mortgage Assoc. | | | 6.000% | | | 02/01/35 | | | 116 | | | | 129,038 | |
Federal National Mortgage Assoc. | | | 6.000% | | | 04/01/35 | | | 25 | | | | 28,095 | |
Federal National Mortgage Assoc. | | | 6.000% | | | 12/01/35 | | | 261 | | | | 291,751 | |
Federal National Mortgage Assoc. | | | 6.000% | | | 05/01/36 | | | 52 | | | | 58,088 | |
Federal National Mortgage Assoc. | | | 6.000% | | | 06/01/36 | | | 36 | | | | 40,479 | |
Federal National Mortgage Assoc. | | | 6.000% | | | 02/01/37 | | | 104 | | | | 118,221 | |
Federal National Mortgage Assoc. | | | 6.000% | | | 06/01/37 | | | 42 | | | | 47,128 | |
Federal National Mortgage Assoc. | | | 6.000% | | | 05/01/38 | | | 276 | | | | 311,663 | |
Federal National Mortgage Assoc.(k) | | | 6.250% | | | 05/15/29 | | | 1,935 | | | | 2,586,915 | |
Federal National Mortgage Assoc. | | | 6.500% | | | 09/01/32 | | | 50 | | | | 55,096 | |
Federal National Mortgage Assoc. | | | 6.500% | | | 09/01/32 | | | 15 | | | | 16,119 | |
Federal National Mortgage Assoc. | | | 6.500% | | | 09/01/32 | | | 10 | | | | 10,898 | |
Federal National Mortgage Assoc. | | | 6.500% | | | 09/01/32 | | | 50 | | | | 54,895 | |
Federal National Mortgage Assoc. | | | 6.500% | | | 09/01/32 | | | 7 | | | | 8,099 | |
Federal National Mortgage Assoc. | | | 6.500% | | | 10/01/32 | | | 51 | | | | 57,068 | |
Federal National Mortgage Assoc. | | | 6.500% | | | 04/01/33 | | | 87 | | | | 98,348 | |
Federal National Mortgage Assoc. | | | 6.500% | | | 11/01/33 | | | 23 | | | | 25,794 | |
Federal National Mortgage Assoc. | | | 6.500% | | | 01/01/34 | | | 60 | | | | 66,929 | |
Federal National Mortgage Assoc. | | | 6.500% | | | 09/01/34 | | | 71 | | | | 78,633 | |
Federal National Mortgage Assoc. | | | 6.500% | | | 10/01/34 | | | 141 | | | | 155,771 | |
Federal National Mortgage Assoc. | | | 6.500% | | | 09/01/36 | | | 206 | | | | 234,873 | |
Federal National Mortgage Assoc. | | | 6.500% | | | 10/01/36 | | | 49 | | | | 55,194 | |
Federal National Mortgage Assoc. | | | 6.500% | | | 11/01/36 | | | 41 | | | | 45,074 | |
Federal National Mortgage Assoc. | | | 6.500% | | | 01/01/37 | | | 42 | | | | 46,227 | |
Federal National Mortgage Assoc. | | | 6.500% | | | 01/01/37 | | | 117 | | | | 129,225 | |
Federal National Mortgage Assoc. | | | 6.500% | | | 09/01/37 | | | 24 | | | | 26,485 | |
Federal National Mortgage Assoc.(k) | | | 6.625% | | | 11/15/30 | | | 1,185 | | | | 1,666,473 | |
Federal National Mortgage Assoc. | | | 7.000% | | | 02/01/32 | | | 39 | | | | 43,346 | |
SEE NOTES TO FINANCIAL STATEMENTS.
A104
| | | | | | |
| | FLEXIBLE MANAGED PORTFOLIO (continued) | | |
| |
| SCHEDULE OF INVESTMENTS | | as of December 31, 2017 |
| | | | | | | | | | | | | | |
U.S. GOVERNMENT AGENCY OBLIGATIONS
(continued) | | Interest
Rate | | | Maturity
Date | | Principal
Amount
(000)# | | | Value | |
Federal National Mortgage Assoc. | | | 7.000% | | | 03/01/32 | | | 2 | | | $ | 1,948 | |
Federal National Mortgage Assoc. | | | 7.000% | | | 05/01/32 | | | 19 | | | | 21,634 | |
Federal National Mortgage Assoc. | | | 7.000% | | | 06/01/32 | | | 16 | | | | 17,785 | |
Federal National Mortgage Assoc. | | | 7.000% | | | 07/01/32 | | | 62 | | | | 69,051 | |
Federal National Mortgage Assoc.(k) | | | 7.125% | | | 01/15/30 | | | 4,210 | | | | 6,064,732 | |
Federal National Mortgage Assoc. | | | 7.500% | | | 05/01/32 | | | 17 | | | | 17,436 | |
Government National Mortgage Assoc. | | | 2.500% | | | 12/20/46 | | | 1,196 | | | | 1,168,806 | |
Government National Mortgage Assoc. | | | 3.000% | | | TBA | | | 4,000 | | | | 4,036,250 | |
Government National Mortgage Assoc. | | | 3.000% | | | 03/15/45 | | | 1,622 | | | | 1,635,922 | |
Government National Mortgage Assoc. | | | 3.000% | | | 03/20/46 | | | 11,854 | | | | 11,972,923 | |
Government National Mortgage Assoc. | | | 3.000% | | | 02/20/47 | | | 6,587 | | | | 6,652,797 | |
Government National Mortgage Assoc. | | | 3.500% | | | TBA | | | 5,750 | | | | 5,944,062 | |
Government National Mortgage Assoc. | | | 3.500% | | | 12/20/42 | | | 2,592 | | | | 2,693,717 | |
Government National Mortgage Assoc. | | | 3.500% | | | 05/20/43 | | | 534 | | | | 555,300 | |
Government National Mortgage Assoc. | | | 3.500% | | | 03/20/45 | | | 2,494 | | | | 2,582,291 | |
Government National Mortgage Assoc. | | | 3.500% | | | 04/20/45 | | | 3,525 | | | | 3,648,744 | |
Government National Mortgage Assoc. | | | 3.500% | | | 07/20/46 | | | 16,183 | | | | 16,746,221 | |
Government National Mortgage Assoc. | | | 4.000% | | | TBA | | | 12,000 | | | | 12,509,063 | |
Government National Mortgage Assoc. | | | 4.000% | | | 06/15/40 | | | 245 | | | | 256,722 | |
Government National Mortgage Assoc. | | | 4.000% | | | 05/20/41 | | | 426 | | | | 448,323 | |
Government National Mortgage Assoc. | | | 4.000% | | | 12/20/42 | | | 873 | | | | 917,927 | |
Government National Mortgage Assoc. | | | 4.000% | | | 08/20/44 | | | 435 | | | | 456,601 | |
Government National Mortgage Assoc. | | | 4.000% | | | 11/20/45 | | | 2,530 | | | | 2,651,227 | |
Government National Mortgage Assoc. | | | 4.000% | | | 12/20/45 | | | 2,661 | | | | 2,793,714 | |
Government National Mortgage Assoc. | | | 4.000% | | | 11/20/46 | | | 648 | | | | 676,225 | |
Government National Mortgage Assoc. | | | 4.500% | | | 04/15/40 | | | 1,101 | | | | 1,165,942 | |
Government National Mortgage Assoc. | | | 4.500% | | | 01/20/41 | | | 1,862 | | | | 1,975,510 | |
Government National Mortgage Assoc. | | | 4.500% | | | 02/20/41 | | | 1,194 | | | | 1,266,111 | |
Government National Mortgage Assoc. | | | 4.500% | | | 06/20/44 | | | 1,315 | | | | 1,389,992 | |
Government National Mortgage Assoc. | | | 4.500% | | | 09/20/46 | | | 847 | | | | 891,534 | |
Government National Mortgage Assoc. | | | 4.500% | | | 11/20/46 | | | 1,684 | | | | 1,769,219 | |
Government National Mortgage Assoc. | | | 4.500% | | | 03/20/47 | | | 1,853 | | | | 1,946,998 | |
Government National Mortgage Assoc. | | | 5.000% | | | 10/20/37 | | | 184 | | | | 199,486 | |
Government National Mortgage Assoc. | | | 5.000% | | | 04/20/45 | | | 1,193 | | | | 1,278,463 | |
Government National Mortgage Assoc. | | | 5.500% | | | 11/15/32 | | | 102 | | | | 112,971 | |
Government National Mortgage Assoc. | | | 5.500% | | | 02/15/33 | | | 81 | | | | 89,594 | |
Government National Mortgage Assoc. | | | 5.500% | | | 08/15/33 | | | 155 | | | | 171,790 | |
Government National Mortgage Assoc. | | | 5.500% | | | 08/15/33 | | | 174 | | | | 191,182 | |
Government National Mortgage Assoc. | | | 5.500% | | | 09/15/33 | | | 96 | | | | 107,147 | |
Government National Mortgage Assoc. | | | 5.500% | | | 09/15/33 | | | 81 | | | | 89,101 | |
Government National Mortgage Assoc. | | | 5.500% | | | 10/15/33 | | | 106 | | | | 118,675 | |
Government National Mortgage Assoc. | | | 5.500% | | | 12/15/33 | | | 23 | | | | 25,118 | |
Government National Mortgage Assoc. | | | 5.500% | | | 02/15/34 | | | 46 | | | | 50,442 | |
Government National Mortgage Assoc. | | | 5.500% | | | 04/15/34 | | | 434 | | | | 484,370 | |
Government National Mortgage Assoc. | | | 5.500% | | | 07/15/35 | | | 89 | | | | 99,338 | |
Government National Mortgage Assoc. | | | 5.500% | | | 02/15/36 | | | 141 | | | | 157,510 | |
Government National Mortgage Assoc. | | | 6.000% | | | 02/15/33 | | | 3 | | | | 3,764 | |
Government National Mortgage Assoc. | | | 6.000% | | | 04/15/33 | | | 20 | | | | 22,244 | |
Government National Mortgage Assoc. | | | 6.000% | | | 09/15/33 | | | 28 | | | | 31,148 | |
Government National Mortgage Assoc. | | | 6.000% | | | 12/15/33 | | | 48 | | | | 54,080 | |
Government National Mortgage Assoc. | | | 6.000% | | | 12/15/33 | | | 133 | | | | 148,676 | |
Government National Mortgage Assoc. | | | 6.000% | | | 01/15/34 | | | 39 | | | | 44,565 | |
Government National Mortgage Assoc. | | | 6.000% | | | 01/15/34 | | | 25 | | | | 28,071 | |
Government National Mortgage Assoc. | | | 6.000% | | | 06/20/34 | | | 98 | | | | 110,944 | |
Government National Mortgage Assoc. | | | 6.000% | | | 07/15/34 | | | 210 | | | | 236,748 | |
Government National Mortgage Assoc. | | | 6.000% | | | 10/15/34 | | | 210 | | | | 236,833 | |
Government National Mortgage Assoc. | | | 6.500% | | | 10/15/23 | | | 1 | | | | 1,373 | |
Government National Mortgage Assoc. | | | 6.500% | | | 12/15/23 | | | 6 | | | | 6,266 | |
Government National Mortgage Assoc. | | | 6.500% | | | 01/15/24 | | | 21 | | | | 23,387 | |
SEE NOTES TO FINANCIAL STATEMENTS.
A105
| | | | | | |
| | FLEXIBLE MANAGED PORTFOLIO (continued) | | |
| |
| SCHEDULE OF INVESTMENTS | | as of December 31, 2017 |
| | | | | | | | | | | | | | |
U.S. GOVERNMENT AGENCY OBLIGATIONS
(continued) | | Interest
Rate | | | Maturity
Date | | Principal
Amount
(000)# | | | Value | |
Government National Mortgage Assoc. | | | 6.500% | | | 01/15/24 | | | 72 | | | $ | 80,269 | |
Government National Mortgage Assoc. | | | 6.500% | | | 01/15/24 | | | 6 | | | | 6,112 | |
Government National Mortgage Assoc. | | | 6.500% | | | 01/15/24 | | | 26 | | | | 28,487 | |
Government National Mortgage Assoc. | | | 6.500% | | | 01/15/24 | | | 2 | | | | 2,178 | |
Government National Mortgage Assoc. | | | 6.500% | | | 01/15/24 | | | 3 | | | | 3,011 | |
Government National Mortgage Assoc. | | | 6.500% | | | 01/15/24 | | | 2 | | | | 2,424 | |
Government National Mortgage Assoc. | | | 6.500% | | | 02/15/24 | | | 10 | | | | 11,385 | |
Government National Mortgage Assoc. | | | 6.500% | | | 02/15/24 | | | 23 | | | | 25,357 | |
Government National Mortgage Assoc. | | | 6.500% | | | 02/15/24 | | | 6 | | | | 6,402 | |
Government National Mortgage Assoc. | | | 6.500% | | | 02/15/24 | | | 21 | | | | 23,842 | |
Government National Mortgage Assoc. | | | 6.500% | | | 02/15/24 | | | 36 | | | | 39,535 | |
Government National Mortgage Assoc. | | | 6.500% | | | 02/15/24 | | | 20 | | | | 22,351 | |
Government National Mortgage Assoc. | | | 6.500% | | | 02/15/24 | | | 5 | | | | 5,308 | |
Government National Mortgage Assoc. | | | 6.500% | | | 02/15/24 | | | 5 | | | | 5,111 | |
Government National Mortgage Assoc. | | | 6.500% | | | 02/15/24 | | | 1 | | | | 824 | |
Government National Mortgage Assoc. | | | 6.500% | | | 02/15/24 | | | — | (r) | | | 487 | |
Government National Mortgage Assoc. | | | 6.500% | | | 03/15/24 | | | 10 | | | | 11,148 | |
Government National Mortgage Assoc. | | | 6.500% | | | 04/15/24 | | | 6 | | | | 6,569 | |
Government National Mortgage Assoc. | | | 6.500% | | | 04/15/24 | | | 17 | | | | 19,281 | |
Government National Mortgage Assoc. | | | 6.500% | | | 04/15/24 | | | 3 | | | | 3,247 | |
Government National Mortgage Assoc. | | | 6.500% | | | 04/15/24 | | | 3 | | | | 2,891 | |
Government National Mortgage Assoc. | | | 6.500% | | | 04/15/24 | | | 3 | | | | 2,784 | |
Government National Mortgage Assoc. | | | 6.500% | | | 04/15/24 | | | 6 | | | | 6,145 | |
Government National Mortgage Assoc. | | | 6.500% | | | 04/15/24 | | | 6 | | | | 6,123 | |
Government National Mortgage Assoc. | | | 6.500% | | | 04/15/24 | | | 1 | | | | 1,247 | |
Government National Mortgage Assoc. | | | 6.500% | | | 05/15/24 | | | 18 | | | | 20,520 | |
Government National Mortgage Assoc. | | | 6.500% | | | 05/15/24 | | | 18 | | | | 19,596 | |
Government National Mortgage Assoc. | | | 6.500% | | | 05/15/24 | | | — | (r) | | | 217 | |
Government National Mortgage Assoc. | | | 6.500% | | | 10/15/24 | | | 27 | | | | 30,052 | |
Government National Mortgage Assoc. | | | 6.500% | | | 12/15/30 | | | 12 | | | | 12,832 | |
Government National Mortgage Assoc. | | | 6.500% | | | 01/15/32 | | | 24 | | | | 27,010 | |
Government National Mortgage Assoc. | | | 6.500% | | | 02/15/32 | | | 25 | | | | 27,351 | |
Government National Mortgage Assoc. | | | 6.500% | | | 07/15/32 | | | 53 | | | | 58,422 | |
Government National Mortgage Assoc. | | | 6.500% | | | 08/15/32 | | | 9 | | | | 9,600 | |
Government National Mortgage Assoc. | | | 6.500% | | | 08/15/32 | | | 10 | | | | 10,779 | |
Government National Mortgage Assoc. | | | 6.500% | | | 08/15/32 | | | 30 | | | | 33,299 | |
Government National Mortgage Assoc. | | | 6.500% | | | 08/15/32 | | | 254 | | | | 295,971 | |
Government National Mortgage Assoc. | | | 6.500% | | | 06/15/35 | | | 48 | | | | 55,188 | |
Government National Mortgage Assoc. | | | 6.500% | | | 06/15/35 | | | 6 | | | | 6,153 | |
Government National Mortgage Assoc. | | | 6.500% | | | 07/15/35 | | | 7 | | | | 8,195 | |
Government National Mortgage Assoc. | | | 8.000% | | | 01/15/24 | | | 10 | | | | 9,985 | |
Government National Mortgage Assoc. | | | 8.000% | | | 04/15/25 | | | 9 | | | | 9,493 | |
Tennessee Valley Authority, Sr. Unsec’d. Notes | | | 2.875% | | | 02/01/27 | | | 410 | | | | 417,805 | |
Tennessee Valley Authority, Sr. Unsec’d. Notes | | | 7.125% | | | 05/01/30 | | | 705 | | | | 1,016,456 | |
| | | | | | | | | | | | | | |
TOTAL U.S. GOVERNMENT AGENCY OBLIGATIONS
(cost $331,768,849) | | | | 332,550,691 | |
| | | | | | | | | | | | | | |
| U.S. TREASURY OBLIGATIONS — 1.8% | | | | | | | | | | | | | | |
U.S. Treasury Bonds | | | 2.500% | | | 02/15/45 | | | 110 | | | | 104,865 | |
U.S. Treasury Bonds | | | 2.750% | | | 08/15/47 | | | 12 | | | | 12,015 | |
U.S. Treasury Bonds | | | 3.000% | | | 02/15/47 | | | 935 | | | | 983,320 | |
U.S. Treasury Inflation Indexed Bonds, TIPS | | | 0.125% | | | 04/15/22 | | | 3,139 | | | | 3,117,090 | |
U.S. Treasury Inflation Indexed Bonds, TIPS | | | 2.000% | | | 01/15/26 | | | 23,483 | | | | 26,413,672 | |
U.S. Treasury Notes | | | 1.875% | | | 12/31/19 | | | 1,725 | | | | 1,724,461 | |
U.S. Treasury Notes | | | 1.875% | | | 04/30/22 | | | 9,229 | | | | 9,118,685 | |
U.S. Treasury Notes | | | 1.875% | | | 09/30/22 | | | 5 | | | | 4,928 | |
U.S. Treasury Notes(a) | | | 2.000% | | | 11/30/22 | | | 420 | | | | 416,177 | |
U.S. Treasury Notes | | | 2.125% | | | 12/31/22 | | | 550 | | | | 547,723 | |
U.S. Treasury Notes(k) | | | 2.125% | | | 11/30/24 | | | 8,525 | | | | 8,413,109 | |
SEE NOTES TO FINANCIAL STATEMENTS.
A106
| | | | | | |
| | FLEXIBLE MANAGED PORTFOLIO (continued) | | |
| |
| SCHEDULE OF INVESTMENTS | | as of December 31, 2017 |
| | | | | | | | | | | | | | | | |
U.S. TREASURY OBLIGATIONS
(continued) | | Interest
Rate | | | Maturity
Date | | | Principal
Amount
(000)# | | | Value | |
U.S. Treasury Notes | | | 2.125% | | | | 05/15/25 | | | | 8,675 | | | $ | 8,542,503 | |
U.S. Treasury Notes | | | 2.375% | | | | 08/15/24 | | | | 695 | | | | 697,226 | |
U.S. Treasury Strips Coupon | | | 2.184% | (s) | | | 02/15/28 | | | | 5,465 | | | | 4,233,573 | |
U.S. Treasury Strips Coupon(k) | | | 2.241% | (s) | | | 05/15/28 | | | | 2,735 | | | | 2,106,508 | |
U.S. Treasury Strips Coupon | | | 2.280% | (s) | | | 02/15/29 | | | | 2,735 | | | | 2,057,646 | |
U.S. Treasury Strips Coupon | | | 2.384% | (s) | | | 05/15/29 | | | | 5,640 | | | | 4,217,655 | |
U.S. Treasury Strips Coupon | | | 2.783% | (s) | | | 08/15/29 | | | | 1,400 | | | | 1,039,632 | |
U.S. Treasury Strips Coupon | | | 2.878% | (s) | | | 05/15/31 | | | | 1,400 | | | | 988,371 | |
U.S. Treasury Strips Coupon | | | 3.042% | (s) | | | 11/15/35 | | | | 2,800 | | | | 1,732,838 | |
U.S. Treasury Strips Coupon | | | 3.202% | (s) | | | 08/15/40 | | | | 2,800 | | | | 1,497,399 | |
| | | | | | | | | | | | | | | | |
TOTAL U.S. TREASURY OBLIGATIONS
(cost $78,004,112) | | | | 77,969,396 | |
| | | | | | | | | | | | | | | | |
TOTAL LONG-TERM INVESTMENTS
(cost $3,307,826,575) | | | | 4,027,612,277 | |
| | | | | | | | | | | | | | | | |
| | | | |
| | | | | | | | | Shares | | | | |
| SHORT-TERM INVESTMENTS — 9.1% | | | | | | | | | | | | | | | | |
AFFILIATED MUTUAL FUNDS — 9.1% | | | | | | | | | | | | | | | | |
Prudential Investment Portfolios 2 — Prudential Core Short-Term Bond Fund(w) | | | | 14,360,134 | | | | 133,262,040 | |
Prudential Investment Portfolios 2 — Prudential Core Ultra Short Bond Fund(w) | | | | 173,027,546 | | | | 173,027,546 | |
Prudential Investment Portfolios 2 — Prudential Institutional Money Market Fund
(cost $78,209,771; includes $78,096,596 of cash collateral for securities on loan)(b)(w) | | | | 78,205,811 | | | | 78,205,811 | |
| | | | | | | | | | | | | | | | |
TOTAL AFFILIATED MUTUAL FUNDS
(cost $392,026,363) | | | | 384,495,397 | |
| | | | | | | | | | | | | | | | |
| | | | |
| | | | | | | | | Principal
Amount
(000)# | | | | |
U.S. TREASURY OBLIGATION — 0.0% | | | | | | | | | | | | | | | | |
U.S. Treasury Bills
(cost $149,594)(k) | | | 1.365% | (n) | | | 03/15/18 | | | | 150 | | | | 149,611 | |
| | | | | | | | | | | | | | | | |
TOTAL SHORT-TERM INVESTMENTS
(cost $392,175,957) | | | | 384,645,008 | |
| | | | | | | | | | | | | | | | |
TOTAL INVESTMENTS — 104.3%
(cost $3,700,002,532) | | | | 4,412,257,285 | |
| | | | | | | | | | | | | | | | |
LIABILITIES IN EXCESS OF OTHER ASSETS(z) — (4.3)% | | | | (182,556,340 | ) |
| | | | | | | | | | | | | | | | |
NET ASSETS —100.0% | | | $ | 4,229,700,945 | |
| | | | | | | | | | | | | | | | |
See the Glossary for abbreviations used in the annual report.
| # | Principal amount is shown in U.S. dollars unless otherwise stated. |
| * | Non-income producing security. |
| ^ | Indicates a Level 3 security. The aggregate value of Level 3 securities is $8,199,144 and 0.2% of net assets. |
| (a) | All or a portion of security is on loan. The aggregate market value of such securities, including those sold and pending settlement, is $75,977,812; cash collateral of $78,096,596 (included in liabilities) was received with which the Portfolio purchased highly liquid short-term investments. |
| (b) | Represents security purchased with cash collateral received for securities on loan and includes dividend reinvestment. |
| (c) | Variable rate instrument. The interest rate shown reflects the rate in effect at December 31, 2017. |
| (cc) | Variable rate instrument. The rate shown is based on the latest available information as of December 31, 2017. Certain variable rate securities are not based on a published reference rate and spread but are determined by the issuer or agent and are based on current market conditions. These securities do not indicate a reference rate and spread in their description. |
| (d) | Represents issuer in default on interest payments and/or principal repayment. Non-income producing security. Such securities may be post maturity. |
SEE NOTES TO FINANCIAL STATEMENTS.
A107
| | | | | | |
| | FLEXIBLE MANAGED PORTFOLIO (continued) | | |
| |
| SCHEDULE OF INVESTMENTS | | as of December 31, 2017 |
| (f) | Indicates a restricted security; the aggregate original cost of such securities is $2,104,134. The value of $2,108,647 is 0.0% of net assets. |
| (k) | Represents security, or a portion thereof, segregated as collateral for centrally cleared/exchange-traded derivatives. |
| (n) | Rate quoted represents yield to maturity as of purchase date. |
| (p) | Interest rate not available as of December 31, 2017. |
| (s) | Represents zero coupon bond or principal only securities. Rate represents yield to maturity at purchase date. |
| (w) | PGIM Investments LLC, the manager of the Portfolio, also serves as manager of the Prudential Investment Portfolios 2 — Prudential Core Short-Term Bond Fund, Prudential Core Ultra Short Bond Fund and Prudential Institutional Money Market Fund. |
| (z) | Includes net unrealized appreciation (depreciation) on the following derivative contracts held at reporting period end: |
Futures contracts outstanding at December 31, 2017:
| | | | | | | | | | | | | | | | | | | | |
Number of
Contracts | | Type | | | Expiration
Date | | | Value at
Trade Date | | | Current
Notional
Amount | | | Value /
Unrealized
Appreciation
(Depreciation) | |
| Long Positions: | | | | | | | | | | | | | | | | | | | | |
| 1,330 | | | 2 Year U.S. Treasury Notes | | | | Mar. 2018 | | | $ | 285,288,310 | | | $ | 284,765,469 | | | $ | (522,841 | ) |
| 1,705 | | | 5 Year U.S. Treasury Notes | | | | Mar. 2018 | | | | 198,940,916 | | | | 198,059,727 | | | | (881,189 | ) |
| 129 | | | 10 Year U.S. Ultra Treasury Notes | | | | Mar. 2018 | | | | 17,286,203 | | | | 17,229,563 | | | | (56,640 | ) |
| 379 | | | 10 Year U.S. Treasury Notes | | | | Mar. 2018 | | | | 47,075,866 | | | | 47,013,766 | | | | (62,100 | ) |
| 859 | | | 30 Year U.S. Ultra Treasury Bonds | | | | Mar. 2018 | | | | 143,276,557 | | | | 144,016,719 | | | | 740,162 | |
| 10 | | | Mini MSCI EAFE Index | | | | Mar. 2018 | | | | 1,010,708 | | | | 1,022,750 | | | | 12,042 | |
| | | | | | | | | | | | | | | | | | | | |
| | | | | | | | | | | | | | | | | | | (770,566 | ) |
| | | | | | | | | | | | | | | | | | | | |
| Short Positions: | | | | | | | | | | | | | | | | | | | | |
| 330 | | | 90 day Euro Dollar | | | | Mar. 2018 | | | | 80,894,692 | | | | 80,730,375 | | | | 164,317 | |
| 879 | | | 20 Year U.S. Treasury Bonds | | | | Mar. 2018 | | | | 134,276,371 | | | | 134,487,000 | | | | (210,629 | ) |
| | | | | | | | | | | | | | | | | | | | |
| | | | | | | | | | | | | | | | | | | (46,312 | ) |
| | | | | | | | | | | | | | | | | | | | |
| | | | | | | | | | | | | | | | | | $ | (816,878 | ) |
| | | | | | | | | | | | | | | | | | | | |
Securities with a combined market value of $3,875,569 and $149,611 have been segregated with Citigroup Global Markets and Goldman Sachs & Co., respectively, to cover requirements for open futures contracts at December 31, 2017.
Forward foreign currency exchange contracts outstanding at December 31, 2017:
| | | | | | | | | | | | | | | | | | | | | | | | |
Sale Contracts | | Counterparty | | | Notional
Amount (000) | | | Value at
Settlement Date | | | Current
Value | | | Unrealized
Appreciation
(Depreciation) | |
Euro, Expiring 01/26/18 | | | Citigroup Global Markets | | | | EUR | | | | 3,746 | | | $ | 4,445,844 | | | $ | 4,501,850 | | | $ | (56,006 | ) |
| | | | | | | | | | | | | | | | | | | | | | | | |
Balances Reported in the Statement of Assets and Liabilities for OTC Forward Foreign Currency contracts:
| | | | | | | | | | | | |
| | | Unrealized
Appreciation | | | Unrealized
Depreciation | | | Net
Unrealized
Appreciation
(Depreciation) | |
Forward Foreign Currency | | $ | — | | | $ | (56,006 | ) | | $ | (56,006 | ) |
| | | | | | | | | | | | |
Inflation swap agreement outstanding at December 31, 2017:
| | | | | | | | | | | | | | | | | | | | | | | | |
Notional
Amount
(000)# | | | Termination
Date | | | Fixed
Rate | | | Floating Rate | | Value at
Trade Date | | | Value at
December 31, 2017 | | | Unrealized
Appreciation
(Depreciation) | |
| | Centrally cleared swap agreement: | |
| | 1,720 | | | | 10/25/27 | | | | 2.160%(T) | | | U.S. CPI Urban Consumers NSA Index(1)(T) | | $ | 40 | | | $ | (16,194 | ) | | $ | (16,234 | ) |
| | | | | | | | | | | | | | | | | | | | | | | | |
SEE NOTES TO FINANCIAL STATEMENTS.
A108
| | | | | | |
| | FLEXIBLE MANAGED PORTFOLIO (continued) | | |
| |
| SCHEDULE OF INVESTMENTS | | as of December 31, 2017 |
Interest rate swap agreements outstanding at December 31, 2017:
| | | | | | | | | | | | | | | | | | | | | | | | |
Notional
Amount
(000)# | | | Termination
Date | | | Fixed
Rate | | | Floating Rate | | Value at
Trade Date | | | Value at
December 31, 2017 | | | Unrealized
Appreciation
(Depreciation) | |
| | Centrally cleared swap agreements: | |
| | EUR 3,905 | | | | 05/11/24 | | | | 0.396%(A) | | | 6 Month EURIBOR(1)(S) | | $ | 19,571 | | | $ | 12,419 | | | $ | (7,152 | ) |
| | 65,090 | | | | 06/30/19 | | | | 1.487%(A) | | | 1 Day USOIS(1)(A) | | | (23,719 | ) | | | 200,077 | | | | 223,796 | |
| | 14,410 | | | | 06/30/19 | | | | 1.502%(A) | | | 1 Day USOIS(1)(A) | | | (7,439 | ) | | | 40,333 | | | | 47,772 | |
| | 23,180 | | | | 09/30/19 | | | | 1.707%(A) | | | 1 Day USOIS(1)(A) | | | 6,555 | | | | 40,015 | | | | 33,460 | |
| | 28,615 | | | | 12/31/19 | | | | 1.840%(A) | | | 1 Day USOIS(1)(A) | | | (3,544 | ) | | | 28,027 | | | | 31,571 | |
| | 5,860 | | | | 11/30/21 | | | | 1.762%(S) | | | 3 Month LIBOR(2)(Q) | | | — | | | | (95,090 | ) | | | (95,090 | ) |
| | 2,730 | | | | 05/31/23 | | | | 1.203%(S) | | | 3 Month LIBOR(1)(Q) | | | 165 | | | | 147,094 | | | | 146,929 | |
| | 2,470 | | | | 05/31/23 | | | | 1.399%(S) | | | 3 Month LIBOR(1)(Q) | | | (44,913 | ) | | | 107,900 | | | | 152,813 | |
| | 10,615 | | | | 08/15/23 | | | | 1.459%(S) | | | 3 Month LIBOR(1)(Q) | | | 503,843 | | | | 411,052 | | | | (92,791 | ) |
| | 6,926 | | | | 11/15/23 | | | | 2.209%(S) | | | 3 Month LIBOR(1)(Q) | | | 132 | | | | 15,105 | | | | 14,973 | |
| | 4,500 | | | | 02/15/24 | | | | 2.115%(S) | | | 3 Month LIBOR(1)(Q) | | | 11,293 | | | | 14,284 | | | | 2,991 | |
| | 9,164 | | | | 02/15/24 | | | | 2.151%(S) | | | 3 Month LIBOR(1)(Q) | | | (9,365 | ) | | | 8,942 | | | | 18,307 | |
| | 545 | | | | 02/15/24 | | | | 2.167%(S) | | | 3 Month LIBOR(1)(Q) | | | (4,994 | ) | | | (3 | ) | | | 4,991 | |
| | 4,980 | | | | 02/15/24 | | | | 2.183%(S) | | | 3 Month LIBOR(1)(Q) | | | (9,862 | ) | | | (5,073 | ) | | | 4,789 | |
| | 610 | | | | 05/15/24 | | | | 1.808%(A) | | | 1 Day USOIS(1)(A) | | | — | | | | 5,496 | | | | 5,496 | |
| | 3,110 | | | | 08/15/24 | | | | 2.168%(S) | | | 3 Month LIBOR(1)(Q) | | | — | | | | 24,613 | | | | 24,613 | |
| | 27,940 | | | | 08/15/24 | | | | 2.170%(S) | | | 3 Month LIBOR(1)(Q) | | | 98,961 | | | | 212,242 | | | | 113,281 | |
| | 12,445 | | | | 08/15/24 | | | | 2.176%(S) | | | 3 Month LIBOR(1)(Q) | | | 44,329 | | | | 92,904 | | | | 48,575 | |
| | 9,705 | | | | 11/15/24 | | | | 2.334%(S) | | | 3 Month LIBOR(1)(Q) | | | 10,878 | | | | (1,010 | ) | | | (11,888 | ) |
| | 7,420 | | | | 09/04/25 | | | | 2.214%(S) | | | 3 Month LIBOR(1)(Q) | | | 203 | | | | 14,246 | | | | 14,043 | |
| | 28,775 | | | | 01/08/26 | | | | 2.210%(S) | | | 3 Month LIBOR(1)(Q) | | | 292 | | | | 64,167 | | | | 63,875 | |
| | 330 | | | | 05/15/26 | | | | 1.652%(S) | | | 3 Month LIBOR(1)(Q) | | | 12 | | | | 17,508 | | | | 17,496 | |
| | 8,033 | | | | 02/15/27 | | | | 1.824%(A) | | | 1 Day USOIS(1)(A) | | | 90,939 | | | | 134,611 | | | | 43,672 | |
| | 1,575 | | | | 02/15/27 | | | | 1.899%(A) | | | 1 Day USOIS(1)(A) | | | 1,997 | | | | 16,153 | | | | 14,156 | |
| | 1,325 | | | | 02/15/27 | | | | 1.965%(A) | | | 1 Day USOIS(1)(A) | | | — | | | | 6,042 | | | | 6,042 | |
| | 4,595 | | | | 02/15/27 | | | | 2.068%(A) | | | 1 Day USOIS(1)(A) | | | (2,908 | ) | | | (19,947 | ) | | | (17,039 | ) |
| | 1,580 | | | | 05/15/27 | | | | 1.823%(A) | | | 1 Day USOIS(1)(A) | | | — | | | | 30,618 | | | | 30,618 | |
| | 655 | | | | 05/15/27 | | | | 2.295%(S) | | | 3 Month LIBOR(1)(Q) | | | — | | | | 4,586 | | | | 4,586 | |
| | 7,700 | | | | 02/15/36 | | | | 2.338%(S) | | | 3 Month LIBOR(2)(Q) | | | (51,426 | ) | | | (176,985 | ) | | | (125,559 | ) |
| | 290 | | | | 11/15/43 | | | | 2.659%(S) | | | 3 Month LIBOR(1)(Q) | | | — | | | | (5,977 | ) | | | (5,977 | ) |
| | | | | | | | | | | | | | | | | | | | | | | | |
| | | | | | | | | | | | | | $ | 631,000 | | | $ | 1,344,349 | | | $ | 713,349 | |
| | | | | | | | | | | | | | | | | | | | | | | | |
Securities with a combined market value of $5,145,166 have been segregated with Citigroup Global Markets to cover requirements for open centrally cleared swap contracts at December 31, 2017.
| (1) | The Portfolio pays the fixed rate and receives the floating rate. |
| (2) | The Portfolio pays the floating rate and receives the fixed rate. |
Fair Value Measurements:
Various inputs are used in determining the value of the Portfolio’s investments. These inputs are summarized in the three broad levels listed below.
| Level 1— | unadjusted quoted prices generally in active markets for identical securities. |
| Level 2— | quoted prices for similar securities, interest rates and yield curves, prepayment speeds, foreign currency exchange rates and other observable inputs. |
| Level 3— | unobservable inputs for securities valued in accordance with Board approved fair valuation procedures. |
The following is a summary of the inputs used as of December 31, 2017 in valuing such portfolio securities:
| | | | | | | | | | | | |
| | | Level 1 | | | Level 2 | | | Level 3 | |
Investments in Securities | | | | | | | | | | | | |
Common Stocks | | $ | 2,641,794,612 | | | $ | 46,153,560 | | | $ | — | |
Unaffiliated Exchange Traded Fund | | | 463,484 | | | | — | | | | — | |
Preferred Stocks | | | 604,560 | | | | 525,038 | | | | — | |
SEE NOTES TO FINANCIAL STATEMENTS.
A109
| | | | | | |
| | FLEXIBLE MANAGED PORTFOLIO (continued) | | |
| |
| SCHEDULE OF INVESTMENTS | | as of December 31, 2017 |
| | | | | | | | | | | | |
| | | Level 1 | | | Level 2 | | | Level 3 | |
Investments in Securities (continued) | | | | | | | | | | | | |
Asset-Backed Securities | | | | | | | | | | | | |
Automobiles | | $ | — | | | $ | 63,068,578 | | | $ | — | |
Collateralized Loan Obligations | | | — | | | | 59,345,549 | | | | — | |
Consumer Loans | | | — | | | | 13,468,752 | | | | — | |
Credit Cards | | | — | | | | 21,326,408 | | | | — | |
Equipment | | | — | | | | 7,945,892 | | | | — | |
Home Equity Loans | | | — | | | | 3,826,797 | | | | — | |
Other | | | — | | | | 1,356,542 | | | | — | |
Residential Mortgage-Backed Securities | | | — | | | | 29,825,145 | | | | 2,152,932 | |
Student Loans | | | — | | | | 6,009,393 | | | | — | |
Bank Loan | | | — | | | | 479,092 | | | | — | |
Commercial Mortgage-Backed Securities | | | — | | | | 209,362,045 | | | | — | |
Corporate Bonds | | | — | | | | 384,145,356 | | | | — | |
Municipal Bonds | | | — | | | | 21,570,135 | | | | — | |
Residential Mortgage-Backed Securities | | | — | | | | 51,378,905 | | | | 6,046,212 | |
Sovereign Bonds | | | — | | | | 46,243,203 | | | | — | |
U.S. Government Agency Obligations | | | — | | | | 332,550,691 | | | | — | |
U.S. Treasury Obligations | | | — | | | | 78,119,007 | | | | — | |
Affiliated Mutual Funds | | | 384,495,397 | | | | — | | | | — | |
Other Financial Instruments* | | | | | | | | | | | | |
Futures Contracts | | | (816,878 | ) | | | — | | | | — | |
OTC Forward Foreign Currency Exchange Contract | | | — | | | | (56,006 | ) | | | — | |
Centrally Cleared Inflation Swap Agreement | | | — | | | | (16,234 | ) | | | — | |
Centrally Cleared Interest Rate Swap Agreements | | | — | | | | 713,349 | | | | — | |
| | | | | | | | | | | | |
Total | | $ | 3,026,541,175 | | | $ | 1,377,341,197 | | | $ | 8,199,144 | |
| | | | | | | | | | | | |
| * | Other financial instruments are derivative instruments not reflected in the Schedule of Investments, such as futures, forwards and centrally cleared swap contracts, which are recorded at the unrealized appreciation (depreciation) on the instrument, and OTC swap contracts which are recorded at fair value. |
During the period, there were no transfers between Level 1, Level 2 and Level 3 to report.
Industry Classification:
The industry classification of investments and liabilities in excess of other assets shown as a percentage of net assets as of December 31, 2017 were as follows (unaudited):
| | | | |
Affiliated Mutual Funds (including 1.8% of collateral for securities on loan) | | | 9.1 | % |
U.S. Government Agency Obligations | | | 7.9 | |
Banks | | | 6.8 | |
Commercial Mortgage-Backed Securities | | | 5.0 | |
Software | | | 4.0 | |
Oil, Gas & Consumable Fuels | | | 3.8 | |
Internet Software & Services | | | 3.5 | |
Semiconductors & Semiconductor Equipment | | | 2.9 | |
Technology Hardware, Storage & Peripherals | | | 2.9 | |
Pharmaceuticals | | | 2.7 | |
Automobiles | | | 2.3 | |
Biotechnology | | | 2.3 | |
Health Care Equipment & Supplies | | | 2.1 | |
IT Services | | | 2.1 | |
Residential Mortgage-Backed Securities | | | 2.1 | |
Capital Markets | | | 2.0 | |
Health Care Providers & Services | | | 1.9 | |
Chemicals | | | 1.8 | |
U.S. Treasury Obligations | | | 1.8 | |
Insurance | | | 1.8 | |
Beverages | | | 1.7 | |
Food & Staples Retailing | | | 1.7 | |
Aerospace & Defense | | | 1.6 | |
| | | | |
Hotels, Restaurants & Leisure | | | 1.6 | % |
Media | | | 1.5 | |
Machinery | | | 1.5 | |
Collateralized Loan Obligations | | | 1.4 | |
Industrial Conglomerates | | | 1.3 | |
Equity Real Estate Investment Trusts (REITs) | | | 1.3 | |
Internet & Direct Marketing Retail | | | 1.3 | |
Sovereign Bonds | | | 1.1 | |
Road & Rail | | | 1.1 | |
Electric Utilities | | | 1.0 | |
Specialty Retail | | | 1.0 | |
Diversified Telecommunication Services | | | 0.9 | |
Diversified Financial Services | | | 0.8 | |
Electric | | | 0.8 | |
Metals & Mining | | | 0.8 | |
Tobacco | | | 0.7 | |
Food Products | | | 0.7 | |
Consumer Finance | | | 0.7 | |
Oil & Gas | | | 0.6 | |
Textiles, Apparel & Luxury Goods | | | 0.6 | |
Household Products | | | 0.6 | |
Municipal Bonds | | | 0.5 | |
Credit Cards | | | 0.5 | |
Electrical Equipment | | | 0.5 | |
SEE NOTES TO FINANCIAL STATEMENTS.
A110
| | | | | | |
| | FLEXIBLE MANAGED PORTFOLIO (continued) | | |
| |
| SCHEDULE OF INVESTMENTS | | as of December 31, 2017 |
| | | | |
Industry Classification (cont.) | | | |
Independent Power & Renewable Electricity Producers | | | 0.5 | % |
Real Estate Management & Development | | | 0.4 | |
Auto Manufacturers | | | 0.4 | |
Consumer Loans | | | 0.3 | |
Healthcare-Services | | | 0.3 | |
Distributors | | | 0.3 | |
Computers | | | 0.3 | |
Telecommunications | | | 0.3 | |
Auto Components | | | 0.2 | |
Multi-Utilities | | | 0.2 | |
Communications Equipment | | | 0.2 | |
Life Sciences Tools & Services | | | 0.2 | |
Agriculture | | | 0.2 | |
Healthcare-Products | | | 0.2 | |
Airlines | | | 0.2 | |
Equipment | | | 0.2 | |
Pipelines | | | 0.2 | |
Retail | | | 0.2 | |
Construction & Engineering | | | 0.2 | |
Trading Companies & Distributors | | | 0.2 | |
Building Products | | | 0.2 | |
Energy Equipment & Services | | | 0.2 | |
Multi-National | | | 0.2 | |
Student Loans | | | 0.2 | |
Home Equity Loans | | | 0.1 | |
Gas Utilities | | | 0.1 | |
Oil & Gas Services | | | 0.1 | |
Mining | | | 0.1 | |
Lodging | | | 0.1 | |
Thrifts & Mortgage Finance | | | 0.1 | |
Household Durables | | | 0.1 | |
Semiconductors | | | 0.1 | |
| | | | |
Gas | | | 0.1 | % |
Foods | | | 0.1 | |
Commercial Services | | | 0.1 | |
Professional Services | | | 0.1 | |
Auto Parts & Equipment | | | 0.1 | |
Forest Products & Paper | | | 0.1 | |
Building Materials | | | 0.1 | |
Containers & Packaging | | | 0.1 | |
Transportation | | | 0.1 | |
Housewares | | | 0.0 | * |
Packaging & Containers | | | 0.0 | * |
Miscellaneous Manufacturing | | | 0.0 | * |
Electronic Equipment, Instruments & Components | | | 0.0 | * |
Savings & Loans | | | 0.0 | * |
Machinery-Diversified | | | 0.0 | * |
Other | | | 0.0 | * |
Multiline Retail | | | 0.0 | * |
Health Care Technology | | | 0.0 | * |
Air Freight & Logistics | | | 0.0 | * |
Personal Products | | | 0.0 | * |
Real Estate Investment Trusts (REITs) | | | 0.0 | * |
Mortgage Real Estate Investment Trusts (REITs) | | | 0.0 | * |
Wireless Telecommunication Services | | | 0.0 | * |
Technology | | | 0.0 | * |
Unaffiliated Exchange Traded Funds | | | 0.0 | * |
Commercial Services & Supplies | | | 0.0 | * |
Transportation Infrastructure | | | 0.0 | * |
Paper & Forest Products | | | 0.0 | * |
Marine | | | 0.0 | * |
| | | | |
| | | 104.3 | |
Liabilities in excess of other assets | | | (4.3 | ) |
| | | | |
| | | 100.0 | % |
| | | | |
Effects of Derivative Instruments on the Financial Statements and Primary Underlying Risk Exposure:
The Portfolio invested in derivative instruments during the reporting period. The primary types of risk associated with these derivative instruments are credit contracts risk, equity contracts risk, foreign exchange contracts risk and interest rate contracts risk. The effect of such derivative instruments on the Portfolio’s financial position and financial performance as reflected in the Statement of Assets and Liabilities and Statement of Operations is presented in the summary below.
Fair values of derivative instruments as of December 31, 2017 as presented in the Statement of Assets and Liabilities:
| | | | | | | | | | | | |
Derivatives not accounted for as hedging
instruments, carried at fair value | | Asset Derivatives | | | Liability Derivatives | |
| | Balance Sheet Location | | Fair Value | | | Balance Sheet Location | | Fair Value | |
Equity contracts | | Due from/to broker — variation margin futures | | $ | 12,042 | * | | — | | $ | — | |
Foreign exchange contracts | | — | | | — | | | Unrealized depreciation on OTC forward foreign currency exchange contracts | | | 56,006 | |
Interest rate contracts | | Due from/to broker — variation margin futures | | | 904,479 | * | | Due from/to broker — variation margin futures | | | 1,733,399 | * |
Interest rate contracts | | Due from/to broker — variation margin swaps | | | 1,068,845 | * | | Due from/to broker — variation margin swaps | | | 371,730 | * |
| | | | | | | | | | | | |
Total | | | | $ | 1,985,366 | | | | | $ | 2,161,135 | |
| | | | | | | | | | | | |
| * | Includes cumulative appreciation (depreciation) as reported in the schedule of open futures and centrally cleared swap contracts. Only unsettled variation margin receivable (payable) is reported within the Statement of Assets and Liabilities. |
SEE NOTES TO FINANCIAL STATEMENTS.
A111
| | | | | | |
| | FLEXIBLE MANAGED PORTFOLIO (continued) | | |
| |
| SCHEDULE OF INVESTMENTS | | as of December 31, 2017 |
The effects of derivative instruments on the Statement of Operations for the year ended December 31, 2017 are as follows:
| | | | | | | | | | | | | | | | | | | | | | | | | | | | |
Amount of Realized Gain (Loss) on Derivatives Recognized in Income | |
Derivatives not accounted for as hedging instruments, carried at fair value | | Rights(1) | | | Options
Purchased(1) | | | Options
Written | | | Futures | | | Forward
Currency
Contracts | | | Forward
Rate
Agreements | | | Swaps | |
Credit contracts | | $ | — | | | $ | 56,335 | | | $ | 8,000 | | | $ | — | | | $ | — | | | $ | — | | | $ | (268,099 | ) |
Equity contracts | | | 2,193 | | | | — | | | | — | | | | 213,073 | | | | — | | | | — | | | | — | |
Foreign exchange contracts | | | — | | | | — | | | | — | | | | — | | | | 6,330 | | | | — | | | | — | |
Interest rate contracts | | | — | | | | (1,524,797 | ) | | | 805,948 | | | | 5,055,880 | | | | — | | | | 32,034 | | | | 2,218,850 | |
| | | | | | | | | | | | | | | | | | | | | | | | | | | | |
Total | | $ | 2,193 | | | $ | (1,468,462 | ) | | $ | 813,948 | | | $ | 5,268,953 | | | $ | 6,330 | | | $ | 32,034 | | | $ | 1,950,751 | |
| | | | | | | | | | | | | | | | | | | | | | | | | | | | |
| (1) | Included in net realized gain (loss) on investment transactions in the Statement of Operations. |
| | | | | | | | | | | | |
Change in Unrealized Appreciation (Depreciation) on Derivatives Recognized in Income | |
Derivatives not accounted for as hedging instruments, carried at fair value | | Futures | | | Forward
Currency
Contracts | | | Swaps | |
Credit contracts | | $ | — | | | $ | — | | | $ | (108,099 | ) |
Equity contracts | | | 18,067 | | | | — | | | | — | |
Foreign exchange contracts | | | — | | | | (56,006 | ) | | | — | |
Interest rate contracts | | | (116,451 | ) | | | — | | | | (2,349,616 | ) |
| | | | | | | | | | | | |
Total | | $ | (98,384 | ) | | $ | (56,006 | ) | | $ | (2,457,715 | ) |
| | | | | | | | | | | | |
For the year ended December 31, 2017, the Portfolio’s average volume of derivative activities is as follows:
| | | | | | |
Options Purchased(1) | | Options Written(4) | | Futures Contracts— Long Positions(2) | | Futures Contracts— Short Positions(2) |
| $232,531 | | $3,753,000 | | $489,525,985 | | $100,520,664 |
| | | |
Forward Foreign Currency Exchange Contracts— Sold(3) | | Credit Default Swap Agreements— Buy Protection(4) | | Inflation Swap Agreements(4) | | Interest Rate Swap Agreements(4) |
| $1,770,082 | | $20,600,000 | | $344,000 | | $423,585,139 |
| (3) | Value at Settlement Date. |
| (4) | Notional Amount in USD. |
Financial Instruments/Transactions — Summary of Offsetting and Netting Arrangements:
The Portfolio invested in OTC derivatives and entered into financial instruments/transactions during the reporting period that are either offset in accordance with current requirements or are subject to enforceable master netting arrangements or similar agreements that permit offsetting. The information about offsetting and related netting arrangements for OTC derivatives and financial instruments/transactions, where the legal right to set-off exists, is presented in the summary below.
Offsetting of financial instrument/transaction assets and liabilities:
| | | | | | | | | | | | |
Description | | Gross Market Value
of Recognized
Assets/(Liabilities) | | | Collateral
Pledged/
(Received)(2) | | | Net Amount | |
Securities on Loan | | $ | 75,977,812 | | | $ | (75,977,812 | ) | | $ | — | |
| | | | | | | | | | | | |
SEE NOTES TO FINANCIAL STATEMENTS.
A112
| | | | | | |
| | FLEXIBLE MANAGED PORTFOLIO (continued) | | |
| |
| SCHEDULE OF INVESTMENTS | | as of December 31, 2017 |
Offsetting of OTC derivative assets and liabilities:
| | | | | | | | | | | | | | | | | | | | |
Counterparty | | Gross Amounts of
Recognized
Assets(1) | | | Gross Amounts of
Recognized
Liabilities(1) | | | Net Amounts of
Recognized
Assets/(Liabilities) | | | Collateral
Pledged/
(Received)(2) | | | Net Amount | |
Citigroup Global Markets | | $ | — | | | $ | (56,006 | ) | | $ | (56,006 | ) | | $ | — | | | $ | (56,006 | ) |
| | | | | | | | | | | | | | | | | | | | |
| (1) | Includes unrealized appreciation/(depreciation) on swaps and forwards, premiums paid/(received) on swap agreements and market value of purchased and written options, as represented on the Statement of Assets and Liabilities. |
| (2) | Collateral amount disclosed by the Portfolio is limited to the market value of financial instruments/transactions and the Portfolio’s OTC derivative exposure by counterparty. |
SEE NOTES TO FINANCIAL STATEMENTS.
A113
| | | | | | |
| | FLEXIBLE MANAGED PORTFOLIO (continued) | | |
STATEMENT OF ASSETS & LIABILITIES
as of December 31, 2017
| | | | |
| ASSETS | |
Investments at value, including securities on loan of $75,977,812: | | | | |
Unaffiliated investments (cost $3,307,976,169) | | $ | 4,027,761,888 | |
Affiliated investments (cost $392,026,363) | | | 384,495,397 | |
Cash | | | 48,017 | |
Foreign currency, at value (cost $89,847) | | | 90,947 | |
Receivable for investments sold | | | 26,612,601 | |
Dividends and interest receivable | | | 9,849,352 | |
Tax reclaim receivable | | | 606,639 | |
Due from broker—variation margin futures | | | 472,183 | |
Receivable for Series shares sold | | | 11,755 | |
Receivable from affiliate | | | 4,024 | |
Prepaid expenses | | | 28,298 | |
| | | | |
Total Assets | | | 4,449,981,101 | |
| | | | |
| LIABILITIES | |
Payable for investments purchased | | | 137,696,824 | |
Payable to broker for collateral for securities on loan | | | 78,096,596 | |
Management fee payable | | | 2,151,382 | |
Payable for Series shares repurchased | | | 1,706,183 | |
Accrued expenses and other liabilities | | | 377,296 | |
Due to broker—variation margin swaps | | | 194,889 | |
Unrealized depreciation on OTC forward foreign currency exchange contracts | | | 56,006 | |
Affiliated transfer agent fee payable | | | 980 | |
| | | | |
Total Liabilities | | | 220,280,156 | |
| | | | |
| NET ASSETS | | $ | 4,229,700,945 | |
| | | | |
Net assets were comprised of: | |
Paid-in capital | | $ | 1,823,657,282 | |
Retained earnings | | | 2,406,043,663 | |
| | | | |
Net assets, December 31, 2017 | | $ | 4,229,700,945 | |
| | | | |
Net asset value and redemption price per share
$4,229,700,945 / 141,576,806 outstanding shares of beneficial interest | | $ | 29.88 | |
| | | | |
STATEMENT OF OPERATIONS
Year Ended December 31, 2017
| | | | |
| NET INVESTMENT INCOME (LOSS) | |
| INCOME | |
Unaffiliated dividend income (net of foreign withholding taxes of $137,780, of which $25,175 is reimbursable by an affiliate) | | $ | 48,132,341 | |
Interest income (net of foreign withholding taxes of $2,004) | | | 36,971,362 | |
Affiliated dividend income | | | 5,549,192 | |
Income from securities lending, net (including affiliated income of $130,959) | | | 144,971 | |
| | | | |
Total income | | | 90,797,866 | |
| | | | |
| EXPENSES | |
Management fee | | | 24,259,373 | |
Custodian and accounting fees | | | 425,680 | |
Shareholders’ reports | | | 302,022 | |
Audit fee | | | 49,586 | |
Trustees’ fees | | | 49,497 | |
Legal fees and expenses | | | 25,725 | |
Transfer agent’s fees and expenses (including affiliated expense of $5,882) | | | 11,012 | |
Miscellaneous | | | 110,970 | |
| | | | |
Total expenses | | | 25,233,865 | |
| | | | |
| NET INVESTMENT INCOME (LOSS) | | | 65,564,001 | |
| | | | |
REALIZED AND UNREALIZED GAIN (LOSS) ON
INVESTMENTS AND FOREIGN CURRENCY
TRANSACTIONS | |
Net realized gain (loss) on: | |
Investment transactions (including affiliated of $5,251) | | | 290,004,833 | |
Futures transactions | | | 5,268,953 | |
Options written transactions | | | 813,948 | |
Forward rate agreement transactions | | | 32,034 | |
Swap agreement transactions | | | 1,950,751 | |
Forward currency contract transactions | | | 6,330 | |
Foreign currency transactions | | | (428,741 | ) |
| | | | |
| | | 297,648,108 | |
| | | | |
Net change in unrealized appreciation (depreciation) on: | |
Investments (including affiliated of $126,232) | | | 203,853,884 | |
Futures | | | (98,384 | ) |
Swap agreements | | | (2,457,715 | ) |
Forward currency contracts | | | (56,006 | ) |
Foreign currencies | | | 81,168 | |
| | | | |
| | | 201,322,947 | |
| | | | |
| NET GAIN (LOSS) ON INVESTMENT AND FOREIGN CURRENCY TRANSACTIONS | | | 498,971,055 | |
| | | | |
| NET INCREASE (DECREASE) IN NET ASSETS RESULTING FROM OPERATIONS | | $ | 564,535,056 | |
| | | | |
STATEMENTS OF CHANGES IN NET ASSETS
| | | | | | | | |
| | | Year Ended December 31, | |
| | | 2017 | | | 2016 | |
| INCREASE (DECREASE) IN NET ASSETS | |
| |
| OPERATIONS | |
Net investment income (loss) | | $ | 65,564,001 | | | $ | 67,711,730 | |
Net realized gain (loss) on investment and foreign currency transactions | | | 297,648,108 | | | | 129,427,295 | |
Net change in unrealized appreciation (depreciation) on investments and foreign currencies | | | 201,322,947 | | | | 111,497,510 | |
| | | | | | | | |
NET INCREASE (DECREASE) IN NET ASSETS RESULTING FROM OPERATIONS | | | 564,535,056 | | | | 308,636,535 | |
| | | | | | | | |
| SERIES SHARE TRANSACTIONS | |
Series shares sold [218,250 and 950,649 shares, respectively] | | | 6,080,347 | | | | 23,434,776 | |
Series shares repurchased [8,310,120 and 8,662,738 shares, respectively] | | | (230,747,682 | ) | | | (214,255,950 | ) |
| | | | | | | | |
NET INCREASE (DECREASE) IN NET ASSETS FROM SERIES SHARE TRANSACTIONS | | | (224,667,335 | ) | | | (190,821,174 | ) |
| | | | | | | | |
| CAPITAL CONTRIBUTIONS | | | — | | | | 3,201,924 | |
| | | | | | | | |
| TOTAL INCREASE (DECREASE) | | | 339,867,721 | | | | 121,017,285 | |
| NET ASSETS: | |
Beginning of year | | | 3,889,833,224 | | | | 3,768,815,939 | |
| | | | | | | | |
End of year | | $ | 4,229,700,945 | | | $ | 3,889,833,224 | |
| | | | | | | | |
SEE NOTES TO FINANCIAL STATEMENTS.
A114
| | | | | | |
| | GLOBAL PORTFOLIO | | |
| |
| SCHEDULE OF INVESTMENTS | | as of December 31, 2017 |
| | | | | | | | |
| LONG-TERM INVESTMENTS — 97.5% | |
| COMMON STOCKS — 97.2% | | Shares | | | Value | |
Australia — 2.5% | | | | | | | | |
AGL Energy Ltd. | | | 66,200 | | | $ | 1,254,493 | |
Asaleo Care Ltd. | | | 733,400 | | | | 855,165 | |
Ausdrill Ltd. | | | 123,200 | | | | 252,562 | |
Bendigo & Adelaide Bank Ltd. | | | 158,500 | | | | 1,438,308 | |
BHP Billiton PLC | | | 235,979 | | | | 4,771,567 | |
Caltex Australia Ltd. | | | 26,000 | | | | 688,772 | |
CSL Ltd. | | | 41,500 | | | | 4,560,590 | |
CSR Ltd. | | | 334,900 | | | | 1,238,163 | |
Downer EDI Ltd. | | | 131,300 | | | | 706,354 | |
Fortescue Metals Group Ltd. | | | 129,900 | | | | 491,589 | |
Harvey Norman Holdings Ltd.(a) | | | 168,800 | | | | 547,400 | |
LendLease Group | | | 124,300 | | | | 1,580,265 | |
Macquarie Group Ltd. | | | 47,761 | | | | 3,694,069 | |
Metcash Ltd. | | | 412,500 | | | | 1,000,109 | |
Mineral Resources Ltd. | | | 64,000 | | | | 1,050,235 | |
Myer Holdings Ltd. | | | 567,600 | | | | 291,758 | |
National Australia Bank Ltd. | | | 33,588 | | | | 771,354 | |
Qantas Airways Ltd. | | | 387,619 | | | | 1,519,874 | |
Wesfarmers Ltd. | | | 32,100 | | | | 1,109,951 | |
| | | | | | | | |
| | | | | | | 27,822,578 | |
| | | | | | | | |
Austria — 0.3% | | | | | | | | |
OMV AG | | | 28,000 | | | | 1,771,667 | |
voestalpine AG | | | 28,800 | | | | 1,719,442 | |
| | | | | | | | |
| | | | | | | 3,491,109 | |
| | | | | | | | |
Belgium — 0.4% | | | | | | | | |
AGFA-Gevaert NV* | | | 86,100 | | | | 401,169 | |
Bekaert SA | | | 13,500 | | | | 588,714 | |
KBC Group NV | | | 45,774 | | | | 3,900,548 | |
| | | | | | | | |
| | | | | | | 4,890,431 | |
| | | | | | | | |
Bermuda — 0.2% | | | | | | | | |
XL Group Ltd. | | | 69,602 | | | | 2,447,206 | |
| | | | | | | | |
Canada — 2.8% | | | | | | | | |
Brookfield Asset Management, Inc. (Class A Stock)(a) | | | 104,693 | | | | 4,558,333 | |
Canadian National Railway Co. | | | 63,812 | | | | 5,261,825 | |
Canadian Natural Resources Ltd. | | | 63,950 | | | | 2,284,294 | |
Canadian Pacific Railway Ltd. | | | 11,459 | | | | 2,094,247 | |
Constellation Software, Inc. | | | 6,367 | | | | 3,859,810 | |
Magna International, Inc. | | | 66,400 | | | | 3,762,888 | |
Suncor Energy, Inc. | | | 98,074 | | | | 3,600,728 | |
Toronto-Dominion Bank (The) | | | 68,907 | | | | 4,037,391 | |
TransCanada Corp. | | | 58,052 | | | | 2,823,649 | |
| | | | | | | | |
| | | | | | | 32,283,165 | |
| | | | | | | | |
China — 2.7% | | | | | | | | |
Alibaba Group Holding Ltd., ADR*(a) | | | 77,025 | | | | 13,281,421 | |
Brilliance China Automotive Holdings Ltd. | | | 958,000 | | | | 2,545,792 | |
China Merchants Bank Co. Ltd. (Class H Stock) | | | 1,027,500 | | | | 4,067,937 | |
China Resources Cement Holdings Ltd. | | | 886,000 | | | | 581,373 | |
NetEase, Inc., ADR | | | 9,706 | | | | 3,349,249 | |
Tencent Holdings Ltd. | | | 123,000 | | | | 6,366,229 | |
| | | | | | | | |
| | | | | | | 30,192,001 | |
| | | | | | | | |
| | | | | | | | |
COMMON STOCKS
(continued) | | Shares | | | Value | |
Denmark — 0.9% | | | | | | | | |
Danske Bank A/S | | | 61,200 | | | $ | 2,382,026 | |
Dfds A/S | | | 11,300 | | | | 603,510 | |
Novo Nordisk A/S (Class B Stock) | | | 100,352 | | | | 5,392,464 | |
Orsted A/S, 144A | | | 37,792 | | | | 2,059,997 | |
| | | | | | | | |
| | | | | | | 10,437,997 | |
| | | | | | | | |
Finland — 0.5% | | | | | | | | |
Sampo OYJ (Class A Stock) | | | 61,387 | | | | 3,369,042 | |
UPM-Kymmene OYJ | | | 57,300 | | | | 1,778,864 | |
| | | | | | | | |
| | | | | | | 5,147,906 | |
| | | | | | | | |
France — 5.2% | | | | | | | | |
Arkema SA | | | 31,475 | | | | 3,832,220 | |
Atos SE | | | 9,100 | | | | 1,323,048 | |
AXA SA | | | 46,300 | | | | 1,372,015 | |
BNP Paribas SA | | | 81,459 | | | | 6,059,605 | |
Carrefour SA | | | 34,100 | | | | 735,208 | |
Cie Generale des Etablissements Michelin | | | 31,370 | | | | 4,487,631 | |
CNP Assurances | | | 46,700 | | | | 1,077,243 | |
Credit Agricole SA | | | 78,500 | | | | 1,296,192 | |
Electricite de France SA | | | 61,800 | | | | 771,974 | |
Engie SA | | | 50,000 | | | | 859,573 | |
LVMH Moet Hennessy Louis Vuitton SE | | | 19,694 | | | | 5,780,278 | |
Orange SA | | | 79,700 | | | | 1,381,263 | |
Renault SA | | | 12,300 | | | | 1,234,647 | |
Safran SA | | | 33,831 | | | | 3,489,509 | |
Sanofi | | | 34,000 | | | | 2,927,119 | |
SCOR SE | | | 22,000 | | | | 884,255 | |
Societe Generale SA | | | 28,600 | | | | 1,474,484 | |
TOTAL SA | | | 111,213 | | | | 6,138,933 | |
TOTAL SA, ADR(a) | | | 134,750 | | | | 7,448,980 | |
Valeo SA | | | 79,409 | | | | 5,915,227 | |
| | | | | | | | |
| | | | | | | 58,489,404 | |
| | | | | | | | |
Germany — 2.7% | | | | | | | | |
Allianz SE | | | 9,800 | | | | 2,242,703 | |
Aurubis AG | | | 10,800 | | | | 1,002,493 | |
BASF SE | | | 16,400 | | | | 1,797,951 | |
Bayer AG | | | 14,100 | | | | 1,752,106 | |
Bayerische Motoren Werke AG | | | 12,200 | | | | 1,264,919 | |
CECONOMY AG | | | 46,000 | | | | 694,260 | |
Daimler AG | | | 27,600 | | | | 2,333,863 | |
Deutsche Lufthansa AG | | | 54,200 | | | | 1,990,420 | |
Deutsche Post AG | | | 34,500 | | | | 1,639,903 | |
Evonik Industries AG | | | 36,500 | | | | 1,370,905 | |
Hannover Rueck SE | | | 4,500 | | | | 564,586 | |
Infineon Technologies AG | | | 181,755 | | | | 4,949,940 | |
METRO AG* | | | 46,000 | | | | 916,258 | |
Muenchener Rueckversicherungs-Gesellschaft AG in Muenchen | | | 5,300 | | | | 1,144,531 | |
Rational AG | | | 3,432 | | | | 2,207,859 | |
Rheinmetall AG | | | 13,300 | | | | 1,681,960 | |
Uniper SE | | | 38,700 | | | | 1,205,660 | |
Volkswagen AG | | | 7,400 | | | | 1,493,383 | |
| | | | | | | | |
| | | | | | | 30,253,700 | |
| | | | | | | | |
SEE NOTES TO FINANCIAL STATEMENTS.
A115
| | | | | | |
| | GLOBAL PORTFOLIO (continued) | | |
| |
| SCHEDULE OF INVESTMENTS | | as of December 31, 2017 |
| | | | | | | | |
COMMON STOCKS
(continued) | | Shares | | | Value | |
Hong Kong — 1.5% | | | | | | | | |
AIA Group Ltd. | | | 764,200 | | | $ | 6,500,016 | |
Galaxy Entertainment Group Ltd. | | | 366,000 | | | | 2,922,068 | |
Kingboard Chemical Holdings Ltd. | | | 216,000 | | | | 1,165,133 | |
Lee & Man Paper Manufacturing Ltd. | | | 1,244,000 | | | | 1,464,754 | |
PAX Global Technology Ltd. | | | 933,000 | | | | 418,112 | |
Singamas Container Holdings Ltd. | | | 1,038,000 | | | | 212,037 | |
Skyworth Digital Holdings Ltd. | | | 1,072,000 | | | | 460,167 | |
WH Group Ltd., 144A | | | 1,914,500 | | | | 2,157,704 | |
Wheelock & Co. Ltd. | | | 97,000 | | | | 691,439 | |
Yue Yuen Industrial Holdings Ltd. | | | 220,500 | | | | 865,761 | |
| | | | | | | | |
| | | | | | | 16,857,191 | |
| | | | | | | | |
India — 0.3% | | | | | | | | |
HDFC Bank Ltd., ADR | | | 29,817 | | | | 3,031,494 | |
| | | | | | | | |
Ireland — 0.5% | | | | | | | | |
Kingspan Group PLC | | | 96,266 | | | | 4,218,172 | |
Smurfit Kappa Group PLC | | | 35,200 | | | | 1,193,919 | |
| | | | | | | | |
| | | | | | | 5,412,091 | |
| | | | | | | | |
Israel — 0.1% | | | | | | | | |
Bank Hapoalim BM | | | 125,500 | | | | 921,643 | |
Teva Pharmaceutical Industries Ltd. | | | 16,300 | | | | 308,272 | |
| | | | | | | | |
| | | | | | | 1,229,915 | |
| | | | | | | | |
Italy — 0.5% | | | | | | | | |
A2A SpA | | | 782,400 | | | | 1,447,657 | |
Astaldi SpA(a) | | | 62,200 | | | | 158,332 | |
Enel SpA | | | 470,000 | | | | 2,890,150 | |
Leonardo SpA | | | 45,200 | | | | 537,119 | |
Mediobanca SpA | | | 87,600 | | | | 992,570 | |
| | | | | | | | |
| | | | | | | 6,025,828 | |
| | | | | | | | |
Japan — 8.3% | | | | | | | | |
Aisan Industry Co. Ltd. | | | 68,400 | | | | 800,696 | |
Aoyama Trading Co. Ltd. | | | 9,900 | | | | 369,954 | |
Astellas Pharma, Inc. | | | 75,600 | | | | 960,368 | |
cocokara fine, Inc. | | | 15,800 | | | | 1,017,882 | |
Concordia Financial Group Ltd. | | | 121,000 | | | | 727,751 | |
Daikin Industries Ltd. | | | 42,700 | | | | 5,045,559 | |
Dowa Holdings Co. Ltd. | | | 21,700 | | | | 881,293 | |
Enplas Corp. | | | 11,200 | | | | 463,828 | |
FANUC Corp. | | | 18,700 | | | | 4,486,063 | |
Fujikura Ltd. | | | 200,200 | | | | 1,760,905 | |
Fujitec Co. Ltd. | | | 50,400 | | | | 726,925 | |
Hazama Ando Corp. | | | 85,900 | | | | 671,335 | |
Heiwa Corp. | | | 34,800 | | | | 652,879 | |
Isuzu Motors Ltd. | | | 78,200 | | | | 1,305,727 | |
ITOCHU Corp. | | | 37,100 | | | | 691,600 | |
Japan Airlines Co. Ltd. | | | 28,000 | | | | 1,093,956 | |
Japan Aviation Electronics Industry Ltd. | | | 46,000 | | | | 775,567 | |
Kaneka Corp. | | | 74,000 | | | | 674,477 | |
KDDI Corp. | | | 107,600 | | | | 2,672,734 | |
Keihin Corp. | | | 54,300 | | | | 1,102,811 | |
Keiyo Bank Ltd. (The) | | | 153,000 | | | | 699,021 | |
Keyence Corp. | | | 10,100 | | | | 5,642,177 | |
Komatsu Ltd. | | | 107,600 | | | | 3,888,634 | |
| | | | | | | | |
COMMON STOCKS
(continued) | | Shares | | | Value | |
Japan (continued) | | | | | | | | |
Komori Corp. | | | 13,100 | | | $ | 183,827 | |
Konica Minolta, Inc. | | | 129,600 | | | | 1,243,502 | |
Kureha Corp. | | | 25,500 | | | | 1,848,986 | |
KYORIN Holdings, Inc. | | | 25,800 | | | | 481,457 | |
Kyowa Exeo Corp. | | | 66,900 | | | | 1,729,543 | |
Lintec Corp. | | | 30,000 | | | | 835,455 | |
Marubeni Corp. | | | 109,700 | | | | 793,097 | |
Matsumotokiyoshi Holdings Co. Ltd. | | | 23,600 | | | | 969,513 | |
Mazda Motor Corp. | | | 56,700 | | | | 757,702 | |
Mitsubishi Gas Chemical Co., Inc. | | | 46,900 | | | | 1,342,981 | |
Mitsubishi UFJ Financial Group, Inc. | | | 746,500 | | | | 5,433,001 | |
Mitsui Chemicals, Inc. | | | 31,500 | | | | 1,010,125 | |
Mitsui Sugar Co. Ltd. | | | 25,400 | | | | 1,070,951 | |
Mixi, Inc. | | | 17,800 | | | | 797,226 | |
Mizuho Financial Group, Inc. | | | 597,700 | | | | 1,080,695 | |
NEC Corp. | | | 21,300 | | | | 573,764 | |
Nippon Prologis REIT, Inc.* | | | 1,053 | | | | 2,224,952 | |
Nippon Telegraph & Telephone Corp. | | | 69,300 | | | | 3,258,078 | |
Nishi-Nippon Financial Holdings, Inc. | | | 48,600 | | | | 579,914 | |
Nissan Motor Co. Ltd. | | | 161,600 | | | | 1,608,904 | |
Nisshinbo Holdings, Inc. | | | 81,000 | | | | 1,096,910 | |
Nitori Holdings Co. Ltd. | | | 22,100 | | | | 3,145,372 | |
NTT DOCOMO, Inc. | | | 39,300 | | | | 929,209 | |
ORIX Corp. | | | 247,800 | | | | 4,178,126 | |
Park24 Co. Ltd. | | | 29,700 | | | | 711,000 | |
Resona Holdings, Inc. | | | 355,300 | | | | 2,117,151 | |
Sankyu, Inc. | | | 22,400 | | | | 964,221 | |
Sawai Pharmaceutical Co. Ltd. | | | 9,200 | | | | 410,592 | |
Seino Holdings Co. Ltd. | | | 52,600 | | | | 834,473 | |
Shimachu Co. Ltd. | | | 30,700 | | | | 881,186 | |
SKY Perfect JSAT Holdings, Inc. | | | 151,000 | | | | 691,096 | |
Sumitomo Heavy Industries Ltd. | | | 16,800 | | | | 707,879 | |
Sumitomo Mitsui Financial Group, Inc. | | | 33,900 | | | | 1,461,243 | |
Sumitomo Osaka Cement Co. Ltd. | | | 184,500 | | | | 888,571 | |
Suzuki Motor Corp. | | | 40,300 | | | | 2,332,711 | |
Toagosei Co. Ltd. | | | 73,500 | | | | 933,009 | |
Toho Holdings Co. Ltd. | | | 36,900 | | | | 831,809 | |
Towa Pharmaceutical Co. Ltd. | | | 9,400 | | | | 512,004 | |
Toyo Tire & Rubber Co. Ltd. | | | 35,200 | | | | 723,370 | |
Toyoda Gosei Co. Ltd. | | | 33,200 | | | | 842,344 | |
Toyota Motor Corp. | | | 15,730 | | | | 1,002,473 | |
Tsubakimoto Chain Co. | | | 85,000 | | | | 685,819 | |
Ube Industries Ltd. | | | 30,100 | | | | 881,735 | |
Yokohama Rubber Co. Ltd. (The) | | | 45,000 | | | | 1,099,184 | |
| | | | | | | | |
| | | | | | | 93,797,302 | |
| | | | | | | | |
Liechtenstein — 0.0% | | | | | | | | |
VP Bank AG | | | 1,765 | | | | 240,964 | |
| | | | | | | | |
Luxembourg — 0.1% | | | | | | | | |
Tenaris SA | | | 106,227 | | | | 1,686,028 | |
| | | | | | | | |
SEE NOTES TO FINANCIAL STATEMENTS.
A116
| | | | | | |
| | GLOBAL PORTFOLIO (continued) | | |
| |
| SCHEDULE OF INVESTMENTS | | as of December 31, 2017 |
| | | | | | | | |
COMMON STOCKS
(continued) | | Shares | | | Value | |
Netherlands — 2.0% | | | | | | | | |
ABN AMRO Group NV, 144A, CVA | | | 45,300 | | | $ | 1,460,508 | |
Aegon NV | | | 95,000 | | | | 603,625 | |
ING Groep NV | | | 75,400 | | | | 1,384,094 | |
Koninklijke Ahold Delhaize NV | | | 41,800 | | | | 918,886 | |
Koninklijke Philips NV | | | 103,063 | | | | 3,891,512 | |
NN Group NV | | | 38,700 | | | | 1,673,908 | |
NXP Semiconductors NV* | | | 47,810 | | | | 5,598,073 | |
Philips Lighting NV, 144A | | | 22,300 | | | | 817,891 | |
Royal Dutch Shell PLC (Class A Stock) | | | 135,541 | | | | 4,516,898 | |
Royal Dutch Shell PLC (Class B Stock) | | | 36,900 | | | | 1,242,569 | |
| | | | | | | | |
| | | | | | | 22,107,964 | |
| | | | | | | | |
New Zealand — 0.2% | | | | | | | | |
Air New Zealand Ltd. | | | 606,600 | | | | 1,369,673 | |
Fletcher Building Ltd. | | | 88,500 | | | | 476,676 | |
| | | | | | | | |
| | | | | | | 1,846,349 | |
| | | | | | | | |
Norway — 0.3% | | | | | | | | |
DNB ASA | | | 68,200 | | | | 1,262,479 | |
Salmar ASA | | | 37,300 | | | | 1,120,625 | |
Statoil ASA | | | 37,300 | | | | 798,534 | |
Yara International ASA | | | 15,500 | | | | 711,672 | |
| | | | | | | | |
| | | | | | | 3,893,310 | |
| | | | | | | | |
Portugal — 0.1% | | | | | | | | |
EDP Energias de Portugal SA | | | 320,900 | | | | 1,110,040 | |
| | | | | | | | |
Singapore — 0.1% | | | | | | | | |
DBS Group Holdings Ltd. | | | 81,200 | | | | 1,501,898 | |
| | | | | | | | |
South Africa — 0.3% | | | | | | | | |
Bid Corp. Ltd. | | | 87,311 | | | | 2,122,091 | |
Investec PLC | | | 79,700 | | | | 573,859 | |
Mondi PLC | | | 17,100 | | | | 444,405 | |
| | | | | | | | |
| | | | | | | 3,140,355 | |
| | | | | | | | |
Spain — 0.8% | | | | | | | | |
Amadeus IT Group SA (Class A Stock) | | | 43,901 | | | | 3,159,217 | |
Banco Santander SA | | | 137,900 | | | | 904,102 | |
Distribuidora Internacional de Alimentacion SA | | | 175,100 | | | | 903,102 | |
Gas Natural SDG SA | | | 47,300 | | | | 1,091,609 | |
Iberdrola SA | | | 150,200 | | | | 1,162,739 | |
Mapfre SA | | | 219,300 | | | | 703,438 | |
Repsol SA | | | 73,100 | | | | 1,290,683 | |
| | | | | | | | |
| | | | | | | 9,214,890 | |
| | | | | | | | |
Sweden — 1.0% | | | | | | | | |
Atlas Copco AB (Class A Stock) | | | 106,089 | | | | 4,578,385 | |
Boliden AB | | | 21,500 | | | | 735,251 | |
Electrolux AB (Class B Stock) | | | 22,600 | | | | 727,616 | |
Hexagon AB (Class B Stock) | | | 60,495 | | | | 3,034,676 | |
JM AB | | | 25,700 | | | | 585,453 | |
Nordea Bank AB | | | 83,600 | | | | 1,012,226 | |
Swedbank AB (Class A Stock) | | | 29,700 | | | | 716,507 | |
| | | | | | | | |
| | | | | | | 11,390,114 | |
| | | | | | | | |
| | | | | | | | |
COMMON STOCKS
(continued) | | Shares | | | Value | |
Switzerland — 3.1% | | | | | | | | |
ALSO Holding AG* | | | 4,300 | | | $ | 591,263 | |
Baloise Holding AG | | | 10,300 | | | | 1,601,089 | |
Credit Suisse Group AG* | | | 113,100 | | | | 2,017,220 | |
Ferguson PLC | | | 38,916 | | | | 2,792,758 | |
Geberit AG | | | 6,796 | | | | 2,991,372 | |
Georg Fischer AG | | | 900 | | | | 1,188,150 | |
Helvetia Holding AG | | | 1,800 | | | | 1,012,426 | |
Lonza Group AG* | | | 16,928 | | | | 4,565,588 | |
Novartis AG | | | 23,100 | | | | 1,943,923 | |
Partners Group Holding AG(a) | | | 4,948 | | | | 3,390,336 | |
Roche Holding AG | | | 10,800 | | | | 2,730,838 | |
Swiss Life Holding AG* | | | 6,500 | | | | 2,297,582 | |
Swiss Re AG | | | 20,100 | | | | 1,879,767 | |
Temenos Group AG* | | | 26,994 | | | | 3,454,444 | |
UBS Group AG* | | | 66,800 | | | | 1,227,300 | |
Zurich Insurance Group AG | | | 5,700 | | | | 1,733,048 | |
| | | | | | | | |
| | | | | | | 35,417,104 | |
| | | | | | | | |
Taiwan — 0.4% | | | | | | | | |
Taiwan Semiconductor Manufacturing Co. Ltd. | | | 645,000 | | | | 4,938,813 | |
| | | | | | | | |
United Kingdom — 5.4% | | | | | | | | |
3i Group PLC | | | 120,600 | | | | 1,484,717 | |
Ashtead Group PLC | | | 35,000 | | | | 938,750 | |
Aviva PLC | | | 164,200 | | | | 1,119,894 | |
BAE Systems PLC | | | 288,900 | | | | 2,232,131 | |
Barratt Developments PLC | | | 109,300 | | | | 953,473 | |
Beazley PLC | | | 27,500 | | | | 198,336 | |
Bellway PLC | | | 25,400 | | | | 1,217,666 | |
Berkeley Group Holdings PLC | | | 25,300 | | | | 1,431,113 | |
Bovis Homes Group PLC | | | 66,300 | | | | 1,046,742 | |
BP PLC | | | 355,000 | | | | 2,490,421 | |
BT Group PLC | | | 365,300 | | | | 1,338,926 | |
Carillion PLC(a) | | | 145,900 | | | | 33,961 | |
Centrica PLC | | | 289,000 | | | | 536,105 | |
Compass Group PLC | | | 203,061 | | | | 4,378,435 | |
Crest Nicholson Holdings PLC | | | 143,814 | | | | 1,058,080 | |
Debenhams PLC(a) | | | 301,400 | | | | 141,573 | |
easyJet PLC | | | 25,500 | | | | 502,808 | |
Experian PLC | | | 175,714 | | | | 3,873,202 | |
GKN PLC | | | 188,200 | | | | 809,318 | |
GlaxoSmithKline PLC | | | 130,000 | | | | 2,302,190 | |
Go-Ahead Group PLC | | | 34,500 | | | | 694,203 | |
Inchcape PLC | | | 66,600 | | | | 701,593 | |
International Consolidated Airlines Group SA | | | 150,000 | | | | 1,313,625 | |
J Sainsbury PLC | | | 536,900 | | | | 1,748,319 | |
Keller Group PLC | | | 48,200 | | | | 631,089 | |
Kingfisher PLC | | | 160,800 | | | | 734,216 | |
Legal & General Group PLC | | | 577,500 | | | | 2,126,109 | |
Lloyds Banking Group PLC | | | 1,954,100 | | | | 1,791,872 | |
London Stock Exchange Group PLC | | | 41,989 | | | | 2,147,598 | |
Man Group PLC | | | 308,300 | | | | 857,888 | |
Marks & Spencer Group PLC | | | 142,500 | | | | 604,572 | |
Meggitt PLC | | | 108,000 | | | | 701,281 | |
Micro Focus International PLC* | | | 57,361 | | | | 1,949,512 | |
SEE NOTES TO FINANCIAL STATEMENTS.
A117
| | | | | | |
| | GLOBAL PORTFOLIO (continued) | | |
| |
| SCHEDULE OF INVESTMENTS | | as of December 31, 2017 |
| | | | | | | | |
COMMON STOCKS
(continued) | | Shares | | | Value | |
United Kingdom (continued) | | | | | | | | |
National Express Group PLC | | | 154,700 | | | $ | 796,667 | |
Old Mutual PLC | | | 274,800 | | | | 858,311 | |
Paragon Banking Group PLC | | | 105,900 | | | | 700,531 | |
Premier Foods PLC* | | | 357,756 | | | | 207,663 | |
QinetiQ Group PLC | | | 214,000 | | | | 666,405 | |
RELX PLC | | | 156,238 | | | | 3,663,493 | |
Rio Tinto Ltd. | | | 22,000 | | | | 1,293,491 | |
Royal Mail PLC | | | 120,900 | | | | 738,649 | |
SSE PLC | | | 51,500 | | | | 915,554 | |
St. James’s Place PLC | | | 150,107 | | | | 2,479,784 | |
Taylor Wimpey PLC | | | 104,700 | | | | 291,297 | |
Unilever NV, CVA | | | 58,624 | | | | 3,300,697 | |
Vesuvius PLC | | | 81,100 | | | | 636,716 | |
William Hill PLC | | | 25,000 | | | | 108,442 | |
| | | | | | | | |
| | | | | | | 60,747,418 | |
| | | | | | | | |
United States — 54.0% | | | | | | | | |
A.O. Smith Corp. | | | 117,641 | | | | 7,209,040 | |
Adobe Systems, Inc.* | | | 67,948 | | | | 11,907,208 | |
Aetna, Inc. | | | 35,300 | | | | 6,367,767 | |
Alphabet, Inc. (Class A Stock)* | | | 2,439 | | | | 2,569,243 | |
Alphabet, Inc. (Class C Stock)* | | | 11,096 | | | | 11,610,854 | |
Amazon.com, Inc.* | | | 11,169 | | | | 13,061,810 | |
American Express Co. | | | 18,400 | | | | 1,827,304 | |
American International Group, Inc. | | | 48,590 | | | | 2,894,992 | |
Ameriprise Financial, Inc. | | | 14,400 | | | | 2,440,368 | |
Amphenol Corp. (Class A Stock) | | | 138,536 | | | | 12,163,461 | |
ANSYS, Inc.* | | | 40,575 | | | | 5,988,464 | |
Apache Corp.(a) | | | 40,350 | | | | 1,703,577 | |
Apple, Inc. | | | 12,350 | | | | 2,089,991 | |
Applied Materials, Inc. | | | 43,950 | | | | 2,246,724 | |
Bank of New York Mellon Corp. (The) | | | 94,650 | | | | 5,097,849 | |
Becton, Dickinson & Co. | | | 10,844 | | | | 2,321,267 | |
Boeing Co. (The) | | | 16,200 | | | | 4,777,542 | |
Brighthouse Financial, Inc.* | | | 32,836 | | | | 1,925,503 | |
Bunge Ltd. | | | 50,700 | | | | 3,400,956 | |
BWX Technologies, Inc. | | | 82,788 | | | | 5,007,846 | |
Carnival Corp. | | | 30,900 | | | | 2,050,833 | |
CF Industries Holdings, Inc. | | | 74,200 | | | | 3,156,468 | |
Charter Communications, Inc. (Class A Stock)* | | | 20,353 | | | | 6,837,794 | |
Chubb Ltd. | | | 25,050 | | | | 3,660,556 | |
Cisco Systems, Inc. | | | 170,900 | | | | 6,545,470 | |
Citigroup, Inc. | | | 98,900 | | | | 7,359,149 | |
Comcast Corp. (Class A Stock) | | | 101,700 | | | | 4,073,085 | |
Costco Wholesale Corp. | | | 50,904 | | | | 9,474,252 | |
CVS Health Corp. | | | 29,350 | | | | 2,127,875 | |
Danaher Corp. | | | 122,088 | | | | 11,332,208 | |
DexCom, Inc.*(a) | | | 99,670 | | | | 5,720,061 | |
DowDuPont, Inc. | | | 66,764 | | | | 4,754,932 | |
Ecolab, Inc. | | | 83,005 | | | | 11,137,611 | |
Edwards Lifesciences Corp.* | | | 47,245 | | | | 5,324,984 | |
Electronic Arts, Inc.* | | | 55,829 | | | | 5,865,395 | |
EQT Corp. | | | 28,367 | | | | 1,614,650 | |
Estee Lauder Cos., Inc. (The) (Class A Stock) | | | 89,248 | | | | 11,355,916 | |
Exelon Corp. | | | 83,650 | | | | 3,296,647 | |
| | | | | | | | |
COMMON STOCKS
(continued) | | Shares | | | Value | |
United States (continued) | | | | | | | | |
Exxon Mobil Corp. | | | 75,550 | | | $ | 6,319,002 | |
Facebook, Inc. (Class A Stock)* | | | 69,008 | | | | 12,177,152 | |
Fifth Third Bancorp | | | 220,400 | | | | 6,686,936 | |
FleetCor Technologies, Inc.* | | | 51,150 | | | | 9,842,794 | |
Fortive Corp. | | | 149,120 | | | | 10,788,832 | |
General Electric Co. | | | 84,200 | | | | 1,469,290 | |
General Motors Co. | | | 16,112 | | | | 660,431 | |
Genpact Ltd. | | | 263,543 | | | | 8,364,855 | |
Gilead Sciences, Inc. | | | 40,200 | | | | 2,879,928 | |
Hess Corp. | | | 63,300 | | | | 3,004,851 | |
Hologic, Inc.* | | | 66,750 | | | | 2,853,563 | |
Illinois Tool Works, Inc. | | | 22,200 | | | | 3,704,070 | |
International Paper Co. | | | 66,450 | | | | 3,850,113 | |
Intuit, Inc. | | | 62,275 | | | | 9,825,749 | |
Intuitive Surgical, Inc.* | | | 32,957 | | | | 12,027,328 | |
Invesco Ltd. | | | 33,000 | | | | 1,205,820 | |
Johnson & Johnson | | | 45,850 | | | | 6,406,162 | |
Johnson Controls International PLC | | | 117,198 | | | | 4,466,416 | |
JPMorgan Chase & Co. | | | 138,250 | | | | 14,784,455 | |
Kimberly-Clark Corp. | | | 27,800 | | | | 3,354,348 | |
Kohl’s Corp.(a) | | | 34,800 | | | | 1,887,204 | |
Las Vegas Sands Corp. | | | 28,650 | | | | 1,990,889 | |
Loews Corp. | | | 76,550 | | | | 3,829,796 | |
Lowe’s Cos., Inc. | | | 15,550 | | | | 1,445,217 | |
Marsh & McLennan Cos., Inc. | | | 45,380 | | | | 3,693,478 | |
Mattel, Inc.(a) | | | 102,787 | | | | 1,580,864 | |
Medtronic PLC | | | 70,621 | | | | 5,702,646 | |
Merck & Co., Inc. | | | 107,050 | | | | 6,023,703 | |
MetLife, Inc. | | | 86,600 | | | | 4,378,496 | |
Microsoft Corp. | | | 128,381 | | | | 10,981,711 | |
Morgan Stanley | | | 139,150 | | | | 7,301,200 | |
News Corp. (Class A Stock) | | | 135,300 | | | | 2,193,213 | |
Occidental Petroleum Corp. | | | 58,600 | | | | 4,316,476 | |
PayPal Holdings, Inc.* | | | 172,557 | | | | 12,703,646 | |
PepsiCo, Inc. | | | 33,050 | | | | 3,963,356 | |
Perrigo Co. PLC | | | 34,700 | | | | 3,024,452 | |
Pfizer, Inc. | | | 176,850 | | | | 6,405,507 | |
PG&E Corp. | | | 85,800 | | | | 3,846,414 | |
Philip Morris International, Inc. | | | 52,100 | | | | 5,504,365 | |
Priceline Group, Inc. (The)* | | | 3,853 | | | | 6,695,512 | |
QUALCOMM, Inc. | | | 86,650 | | | | 5,547,333 | |
Raytheon Co. | | | 10,835 | | | | 2,035,355 | |
Roper Technologies, Inc. | | | 45,298 | | | | 11,732,182 | |
salesforce.com, Inc.* | | | 111,846 | | | | 11,434,017 | |
SBA Communications Corp.* | | | 70,011 | | | | 11,436,997 | |
Southern Co. (The) | | | 104,300 | | | | 5,015,787 | |
Southwest Airlines Co. | | | 67,750 | | | | 4,434,237 | |
Starbucks Corp. | | | 127,737 | | | | 7,335,936 | |
Stericycle, Inc.* | | | 28,420 | | | | 1,932,276 | |
TE Connectivity Ltd. | | | 36,750 | | | | 3,492,720 | |
Texas Instruments, Inc. | | | 29,400 | | | | 3,070,536 | |
Thermo Fisher Scientific, Inc. | | | 56,283 | | | | 10,687,016 | |
TJX Cos., Inc. (The) | | | 102,221 | | | | 7,815,818 | |
Twenty-First Century Fox, Inc. (Class B Stock) | | | 169,000 | | | | 5,766,280 | |
Tyson Foods, Inc. (Class A Stock) | | | 97,200 | | | | 7,880,004 | |
SEE NOTES TO FINANCIAL STATEMENTS.
A118
| | | | | | |
| | GLOBAL PORTFOLIO (continued) | | |
| |
| SCHEDULE OF INVESTMENTS | | as of December 31, 2017 |
| | | | | | | | |
COMMON STOCKS
(continued) | | Shares | | | Value | |
United States (continued) | | | | | | | | |
U.S. Bancorp | | | 92,400 | | | $ | 4,950,792 | |
United Parcel Service, Inc. (Class B Stock) | | | 23,500 | | | | 2,800,025 | |
United Technologies Corp. | | | 28,000 | | | | 3,571,960 | |
Verizon Communications, Inc. | | | 111,150 | | | | 5,883,169 | |
Visa, Inc. (Class A Stock)(a) | | | 123,627 | | | | 14,095,951 | |
Vulcan Materials Co. | | | 18,800 | | | | 2,413,356 | |
Wabtec Corp.(a) | | | 65,864 | | | | 5,363,306 | |
Wal-Mart Stores, Inc. | | | 53,750 | | | | 5,307,812 | |
Wells Fargo & Co. | | | 172,700 | | | | 10,477,709 | |
Westar Energy, Inc. | | | 53,300 | | | | 2,814,240 | |
Weyerhaeuser Co. | | | 81,300 | | | | 2,866,638 | |
Yum China Holdings, Inc. | | | 94,893 | | | | 3,797,618 | |
Zoetis, Inc. | | | 190,782 | | | | 13,743,935 | |
| | | | | | | | |
| | | | | | | 612,142,897 | |
| | | | | | | | |
TOTAL COMMON STOCKS
(cost $778,374,168) | | | | 1,101,187,462 | |
| | | | | | | | |
| PREFERRED STOCKS — 0.3% | | | | | |
United States — 0.3% | | | | | | | | |
Becton, Dickinson & Co., 6.125%* | | | 11,615 | | | | 672,508 | |
NextEra Energy, Inc., 6.123%*(a) | | | 44,898 | | | | 2,523,268 | |
| | | | | | | | |
TOTAL PREFERRED STOCKS
(cost $2,779,114) | | | | 3,195,776 | |
| | | | | | | | |
| | |
| | | Units | | | | |
| RIGHTS* — 0.0% | |
Spain | |
Repsol SA, expiring 01/10/2018
(Cost $33,417) | | | 73,100 | | | | 33,242 | |
| | | | | | | | |
TOTAL LONG-TERM INVESTMENTS
(cost $781,186,699) | | | | 1,104,416,480 | |
| | | | | | | | |
| SHORT-TERM INVESTMENTS — 6.4% | |
| | |
| | | Shares | | | | |
AFFILIATED MUTUAL FUNDS | |
Prudential Investment Portfolios 2 — Prudential Core Ultra Short Bond Fund(w) | | | 22,911,237 | | | | 22,911,237 | |
Prudential Investment Portfolios 2 — Prudential Institutional Money Market Fund
(cost $49,761,034; includes $49,698,057 of cash collateral for securities on loan)(b)(w) | | | 49,761,429 | | | | 49,761,429 | |
| | | | | | | | |
TOTAL SHORT-TERM INVESTMENTS
(cost $72,672,271) | | | | 72,672,666 | |
| | | | | | | | |
TOTAL INVESTMENTS — 103.9%
(cost $853,858,970) | | | | 1,177,089,146 | |
LIABILITIES IN EXCESS OF OTHER
ASSETS — (3.9)% | | | | (44,152,935 | ) |
| | | | | | | | |
NET ASSETS — 100.0% | | | $ | 1,132,936,211 | |
| | | | | | | | |
See the Glossary for abbreviations used in the annual report.
| * | Non-income producing security. |
| (a) | All or a portion of security is on loan. The aggregate market value of such securities, including those sold and pending settlement, is $48,490,151; cash collateral of $49,698,057 (included in liabilities) was received with which the Portfolio purchased highly liquid short-term investments. |
| (b) | Represents security purchased with cash collateral received for securities on loan and includes dividend reinvestment. |
| (w) | PGIM Investments LLC, the manager of the Portfolio, also serves as manager of the Prudential Investment Portfolios 2—Prudential Core Ultra Short Bond Fund and Prudential Institutional Money Market Fund. |
SEE NOTES TO FINANCIAL STATEMENTS.
A119
| | | | | | |
| | GLOBAL PORTFOLIO (continued) | | |
| |
| SCHEDULE OF INVESTMENTS | | as of December 31, 2017 |
Fair Value Measurements:
Various inputs are used in determining the value of the Portfolio’s investments. These inputs are summarized in the three broad levels listed below.
| Level 1— | unadjusted quoted prices generally in active markets for identical securities. |
| Level 2— | quoted prices for similar securities, interest rates and yield curves, prepayment speeds, foreign currency exchange rates and other observable inputs. |
| Level 3— | unobservable inputs for securities valued in accordance with Board approved fair valuation procedures. |
The following is a summary of the inputs used as of December 31, 2017 in valuing such portfolio securities:
| | | | | | | | | | | | |
| | | Level 1 | | | Level 2 | | | Level 3 | |
Investments in Securities | |
Common Stocks | | | | | | | | | | | | |
Australia | | $ | — | | | $ | 27,822,578 | | | $ | — | |
Austria | | | — | | | | 3,491,109 | | | | — | |
Belgium | | | — | | | | 4,890,431 | | | | — | |
Bermuda | | | 2,447,206 | | | | — | | | | — | |
Canada | | | 32,283,165 | | | | — | | | | — | |
China | | | 16,630,670 | | | | 13,561,331 | | | | — | |
Denmark | | | — | | | | 10,437,997 | | | | — | |
Finland | | | — | | | | 5,147,906 | | | | — | |
France | | | 7,448,980 | | | | 51,040,424 | | | | — | |
Germany | | | — | | | | 30,253,700 | | | | — | |
Hong Kong | | | — | | | | 16,857,191 | | | | — | |
India | | | 3,031,494 | | | | — | | | | — | |
Ireland | | | — | | | | 5,412,091 | | | | — | |
Israel | | | — | | | | 1,229,915 | | | | — | |
Italy | | | — | | | | 6,025,828 | | | | — | |
Japan | | | — | | | | 93,797,302 | | | | — | |
Liechtenstein | | | — | | | | 240,964 | | | | — | |
Luxembourg | | | — | | | | 1,686,028 | | | | — | |
Netherlands | | | 5,598,073 | | | | 16,509,891 | | | | — | |
New Zealand | | | — | | | | 1,846,349 | | | | — | |
Norway | | | — | | | | 3,893,310 | | | | — | |
Portugal | | | — | | | | 1,110,040 | | | | — | |
Singapore | | | — | | | | 1,501,898 | | | | — | |
South Africa | | | — | | | | 3,140,355 | | | | — | |
Spain | | | — | | | | 9,214,890 | | | | — | |
Sweden | | | — | | | | 11,390,114 | | | | — | |
Switzerland | | | — | | | | 35,417,104 | | | | — | |
Taiwan | | | — | | | | 4,938,813 | | | | — | |
United Kingdom | | | — | | | | 60,747,418 | | | | — | |
United States | | | 612,142,897 | | | | — | | | | — | |
Preferred Stocks | | | | | | | | | | | — | |
United States | | | 3,195,776 | | | | — | | | | — | |
Rights | | | | | | | | | | | — | |
Spain | | | 33,242 | | | | — | | | | — | |
Affiliated Mutual Funds | | | 72,672,666 | | | | — | | | | — | |
| | | | | | | | | | | | |
Total | | $ | 755,484,169 | | | $ | 421,604,977 | | | $ | — | |
| | | | | | | | | | | | |
During the period, there were no transfers between Level 1, Level 2 and Level 3 to report.
Industry Classification:
The industry classification of investments and liabilities in excess of other assets shown as a percentage of net assets as of December 31, 2017 were as follows (unaudited):
| | | | |
Banks | | | 8.5 | % |
Affiliated Mutual Funds (including 4.4% of collateral for securities on loan) | | | 6.4 | |
Software | | | 5.8 | |
| | | | |
Insurance | | | 4.9 | % |
Pharmaceuticals | | | 4.9 | |
Oil, Gas & Consumable Fuels | | | 4.6 | |
Internet Software & Services | | | 4.4 | |
SEE NOTES TO FINANCIAL STATEMENTS.
A120
| | | | | | |
| | GLOBAL PORTFOLIO (continued) | | |
| |
| SCHEDULE OF INVESTMENTS | | as of December 31, 2017 |
| | | | |
Industry Classification (con’t.) | | | |
Health Care Equipment & Supplies | | | 4.4 | % |
IT Services | | | 4.4 | |
Machinery | | | 3.5 | |
Capital Markets | | | 3.4 | |
Chemicals | | | 3.0 | |
Food & Staples Retailing | | | 2.5 | |
Electronic Equipment, Instruments & Components | | | 2.5 | |
Electric Utilities | | | 2.3 | |
Semiconductors & Semiconductor Equipment | | | 2.3 | |
Building Products | | | 2.1 | |
Aerospace & Defense | | | 2.0 | |
Hotels, Restaurants & Leisure | | | 2.0 | |
Internet & Direct Marketing Retail | | | 1.7 | |
Media | | | 1.7 | |
Auto Components | | | 1.7 | |
Equity Real Estate Investment Trusts (REITs) | | | 1.5 | |
Automobiles | | | 1.5 | |
Food Products | | | 1.4 | |
Personal Products | | | 1.4 | |
Industrial Conglomerates | | | 1.4 | |
Life Sciences Tools & Services | | | 1.3 | |
Specialty Retail | | | 1.3 | |
Metals & Mining | | | 1.1 | |
Airlines | | | 1.1 | |
Diversified Telecommunication Services | | | 1.1 | |
Road & Rail | | | 0.9 | |
Household Durables | | | 0.7 | |
Biotechnology | | | 0.7 | |
Professional Services | | | 0.7 | |
Health Care Providers & Services | | | 0.6 | |
Textiles, Apparel & Luxury Goods | | | 0.6 | |
Communications Equipment | | | 0.6 | |
| | | | |
Construction Materials | | | 0.5 | % |
Tobacco | | | 0.5 | |
Trading Companies & Distributors | | | 0.5 | |
Air Freight & Logistics | | | 0.5 | |
Containers & Packaging | | | 0.4 | |
Diversified Financial Services | | | 0.4 | |
Multi-Utilities | | | 0.4 | |
Technology Hardware, Storage & Peripherals | | | 0.3 | |
Multiline Retail | | | 0.3 | |
Commercial Services & Supplies | | | 0.3 | |
Beverages | | | 0.3 | |
Paper & Forest Products | | | 0.3 | |
Wireless Telecommunication Services | | | 0.3 | |
Household Products | | | 0.3 | |
Construction & Engineering | | | 0.3 | |
Electrical Equipment | | | 0.2 | |
Real Estate Management & Development | | | 0.2 | |
Leisure Products | | | 0.2 | |
Consumer Finance | | | 0.2 | |
Energy Equipment & Services | | | 0.1 | |
Independent Power & Renewable Electricity Producers | | | 0.1 | |
Gas Utilities | | | 0.1 | |
Distributors | | | 0.1 | |
Thrifts & Mortgage Finance | | | 0.1 | |
Marine | | | 0.1 | |
Health Care Technology | | | 0.0 | * |
| | | | |
| | | 103.9 | |
Liabilities in excess of other assets | | | (3.9 | ) |
| | | | |
| | | 100.0 | % |
| | | | |
Effects of Derivative Instruments on the Financial Statements and Primary Underlying Risk Exposure:
The Portfolio invested in derivative instruments during the reporting period. The primary type of risk associated with these derivative instruments is equity contracts risk. The effect of such derivative instruments on the Portfolio’s financial position and financial performance as reflected in the Statement of Assets and Liabilities and Statement of Operations is presented in the summary below.
Fair values of derivative instruments as of December 31, 2017 as presented in the Statement of Assets and Liabilities:
| | | | | | | | | | | | |
Derivatives not accounted for as hedging instruments,
carried at fair value | | Asset Derivatives | | | Liability Derivatives | |
| | Balance Sheet Location | | Fair Value | | | Balance Sheet Location | | Fair Value | |
Equity contracts | | Unaffiliated investments | | $ | 33,242 | | | — | | $ | — | |
| | | | | | | | | | | | |
The effects of derivative instruments on the Statement of Operations for the year ended December, 31, 2017 are as follows:
| | |
Amount of Realized Gain (Loss) on Derivatives Recognized in Income |
Derivatives not accounted for as hedging instruments, carried at fair value | | Rights(1) |
Equity contracts | | $92,458 |
| | |
| (1) | Included in net realized gain (loss) on investment transactions in the Statement of Operations. |
| | | | |
Change in Unrealized Appreciation (Depreciation) on Derivatives Recognized in Income | |
Derivatives not accounted for as hedging instruments, carried at fair value | | Rights(2) | |
Equity contracts | | $ | (1,791 | ) |
| | | | |
| (2) | Included in net change in unrealized appreciation (depreciation) on investments in the Statement of Operations. |
SEE NOTES TO FINANCIAL STATEMENTS.
A121
| | | | | | |
| | GLOBAL PORTFOLIO (continued) | | |
| |
| SCHEDULE OF INVESTMENTS | | as of December 31, 2017 |
Financial Instruments/Transactions — Summary of Offsetting and Netting Arrangements:
The Portfolio entered into financial instruments/transactions during the reporting period that are either offset in accordance with current requirements or are subject to enforceable master netting arrangements or similar agreements that permit offsetting. The information about offsetting and related netting arrangements for financial instruments/transactions, where the legal right to set-off exists, is presented in the summary below.
Offsetting of financial instrument/transaction assets and liabilities:
| | | | | | | | | | | | |
Description | | Gross Market Value of
Recognized
Assets/(Liabilities) | | | Collateral
Pledged/(Received)(1) | | | Net Amount | |
Securities on Loan | | $ | 48,490,151 | | | $ | (48,490,151 | ) | | $ | — | |
| | | | | | | | | | | | |
| (1) | Collateral amount disclosed by the Portfolio is limited to the market value of financial instruments/transactions. |
SEE NOTES TO FINANCIAL STATEMENTS.
A122
| | | | | | |
| | GLOBAL PORTFOLIO (continued) | | |
STATEMENT OF ASSETS & LIABILITIES
as of December 31, 2017
| | | | |
| ASSETS | |
Investments at value, including securities on loan of $48,490,151: | | | | |
Unaffiliated investments (cost $781,186,699) | | $ | 1,104,416,480 | |
Affiliated investments (cost $72,672,271) | | | 72,672,666 | |
Cash | | | 12,384 | |
Foreign currency, at value (cost $3,920,101) | | | 4,000,791 | |
Tax reclaim receivable | | | 1,411,212 | |
Dividends and interest receivable | | | 1,062,821 | |
Receivable for investments sold | | | 465,617 | |
Receivable from affiliate | | | 29,880 | |
Receivable for Series shares sold | | | 14,939 | |
Prepaid expenses | | | 7,414 | |
| | | | |
Total Assets | | | 1,184,094,204 | |
| | | | |
| LIABILITIES | | | | |
Payable to broker for collateral for securities on loan | | | 49,698,057 | |
Management fee payable | | | 696,327 | |
Payable for Series shares repurchased | | | 542,177 | |
Accrued expenses and other liabilities | | | 219,947 | |
Affiliated transfer agent fee payable | | | 980 | |
Payable for investments purchased | | | 505 | |
| | | | |
Total Liabilities | | | 51,157,993 | |
| | | | |
| NET ASSETS | | $ | 1,132,936,211 | |
| | | | |
Net assets were comprised of: | | | | |
Paid-in capital | | $ | 652,670,127 | |
Retained earnings | | | 480,266,084 | |
| | | | |
Net assets, December 31, 2017 | | $ | 1,132,936,211 | |
| | | | |
Net asset value and redemption price per share $1,132,936,211 / 32,996,729 outstanding shares of beneficial interest | | $ | 34.33 | |
| | | | |
STATEMENT OF OPERATIONS
Year Ended December 31, 2017
| | | | |
| NET INVESTMENT INCOME (LOSS) | | | | |
| INCOME | | | | |
Unaffiliated dividend income (net) (foreign withholding tax $1,342,191, of which $114,519 is reimbursable by an affiliate) | | $ | 21,675,491 | |
Income from securities lending, net (including affiliated income of $144,418) | | | 383,842 | |
Affiliated dividend income | | | 309,378 | |
| | | | |
Total income | | | 22,368,711 | |
| | | | |
| EXPENSES | | | | |
Management fee | | | 7,888,562 | |
Custodian and accounting fees | | | 308,424 | |
Shareholders’ reports | | | 181,199 | |
Audit fee | | | 28,627 | |
Trustees’ fees | | | 19,986 | |
Legal fees and expenses | | | 16,080 | |
Transfer agent’s fees and expenses (including affiliated expense of $5,882) | | | 11,112 | |
Miscellaneous | | | 67,106 | |
| | | | |
Total expenses | | | 8,521,096 | |
Less: Management fee waiver | | | (244,123 | ) |
| | | | |
Net expenses | | | 8,276,973 | |
| | | | |
| NET INVESTMENT INCOME (LOSS) | | | 14,091,738 | |
| | | | |
REALIZED AND UNREALIZED GAIN (LOSS) ON
INVESTMENTS AND FOREIGN CURRENCY TRANSACTIONS | | | | |
Net realized gain (loss) on: | | | | |
Investment transactions (including affiliated of $(5,412)) | | | 40,497,522 | |
Foreign currency transactions | | | 103,499 | |
| | | | |
| | | 40,601,021 | |
| | | | |
Net change in unrealized appreciation (depreciation) on: | | | | |
Investments (including affiliated of $(7,883)) | | | 176,714,320 | |
Foreign currencies | | | 315,680 | |
| | | | |
| | | 177,030,000 | |
| | | | |
| NET GAIN (LOSS) ON INVESTMENT AND FOREIGN CURRENCY TRANSACTIONS | | | 217,631,021 | |
| | | | |
| NET INCREASE (DECREASE) IN NET ASSETS RESULTING FROM OPERATIONS | | $ | 231,722,759 | |
| | | | |
STATEMENTS OF CHANGES IN NET ASSETS
| | | | | | | | |
| | | Year Ended December 31, | |
| | | 2017 | | | 2016 | |
| INCREASE (DECREASE) IN NET ASSETS | | | | | | | | |
| OPERATIONS | | | | | | | | |
Net investment income (loss) | | $ | 14,091,738 | | | $ | 12,128,554 | |
Net realized gain (loss) on investment and foreign currency transactions | | | 40,601,021 | | | | 6,968,304 | |
Net change in unrealized appreciation (depreciation) on investments and foreign currencies | | | 177,030,000 | | | | 20,952,242 | |
| | | | | | | | |
NET INCREASE (DECREASE) IN NET ASSETS RESULTING FROM OPERATIONS | | | 231,722,759 | | | | 40,049,100 | |
| | | | | | | | |
| SERIES SHARE TRANSACTIONS | | | | | | | | |
Series shares sold [246,184 and 177,123 shares, respectively] | | | 7,749,375 | | | | 4,692,671 | |
Series shares repurchased [1,990,951 and 2,096,896 shares, respectively] | | | (61,897,531 | ) | | | (55,475,254 | ) |
| | | | | | | | |
NET INCREASE (DECREASE) IN NET ASSETS FROM SERIES SHARE TRANSACTIONS | | | (54,148,156 | ) | | | (50,782,583 | ) |
| | | | | | | | |
| CAPITAL CONTRIBUTIONS | | | — | | | | 808,056 | |
| | | | | | | | |
| TOTAL INCREASE (DECREASE) | | | 177,574,603 | | | | (9,925,427 | ) |
| NET ASSETS: | | | | | | | | |
Beginning of year | | | 955,361,608 | | | | 965,287,035 | |
| | | | | | | | |
End of year | | $ | 1,132,936,211 | | | $ | 955,361,608 | |
| | | | | | | | |
SEE NOTES TO FINANCIAL STATEMENTS.
A123
| | | | | | |
| | GOVERNMENT INCOME PORTFOLIO | | |
| |
| SCHEDULE OF INVESTMENTS | | as of December 31, 2017 |
| | | | | | | | | | | | | | |
| LONG-TERM INVESTMENTS — 97.0% | | | | | | | | | | | |
| ASSET-BACKED SECURITIES — 10.3% | | Interest
Rate | | | Maturity
Date | | Principal
Amount
(000)# | | | Value | |
Collateralized Loan Obligations — 10.3% | |
Atlas Senior Loan Fund Ltd. (Cayman Islands), Series 2017-8A, Class A, 144A, 3 Month LIBOR + 1.300% | | | 2.615% | (c) | | 01/16/30 | | | 250 | | | $ | 251,363 | |
Avery Point CLO Ltd. (Cayman Islands), Series 2014-5A, Class AR, 144A, 3 Month LIBOR + 0.980% | | | 2.333% | (c) | | 07/17/26 | | | 2,500 | | | | 2,507,654 | |
Battalion CLO Ltd. (Cayman Islands), Series 2014-7A, Class A1R, 144A, 3 Month LIBOR + 1.190% | | | 2.543% | (c) | | 10/17/26 | | | 500 | | | | 501,461 | |
BlueMountain CLO Ltd. (Cayman Islands), Series 2015-1A, Class A1R, 144A, 3 Month LIBOR + 1.330% | | | 2.689% | (c) | | 04/13/27 | | | 1,750 | | | | 1,755,689 | |
Carlyle Global Market Strategies CLO Ltd. (Cayman Islands), Series 2014-2A, Class AR, 144A, 3 Month LIBOR + 1.250% | | | 2.666% | (c) | | 05/15/25 | | | 500 | | | | 503,234 | |
Catamaran CLO (Cayman Islands), Series 2014-1A, Class A1AR, 144A, 3 Month LIBOR + 1.260% | | | 2.623% | (c) | | 04/22/30 | | | 2,000 | | | | 2,003,032 | |
CIFC Funding Ltd. (Cayman Islands), Series 2017-4A, Class A1, 144A, 3 Month LIBOR + 1.250% | | | 2.633% | (c) | | 10/24/30 | | | 2,000 | | | | 2,019,680 | |
Eaton Vance CLO Ltd. (Cayman Islands), Series 2014-1A, Class AR, 144A, 3 Month LIBOR + 1.200% | | | 2.559% | (c) | | 07/15/26 | | | 2,500 | | | | 2,511,054 | |
Flagship CLO Ltd. (Cayman Islands), Series 2014-8A, Class AR, 144A, 3 Month LIBOR + 1.250% | | | 2.609% | (c) | | 01/16/26 | | | 2,500 | | | | 2,502,392 | |
ICG US CLO Ltd. (Cayman Islands), Series 2017-2A, Class A1, 144A, 3 Month LIBOR + 1.280% | | | 2.597% | (c) | | 10/23/29 | | | 500 | | | | 503,403 | |
KVK CLO Ltd. (Cayman Islands), Series 2014-1A, Class A1R, 144A, 3 Month LIBOR + 1.300% | | | 2.716% | (c) | | 05/15/26 | | | 2,500 | | | | 2,508,047 | |
Limerock CLO LLC (Cayman Islands), Series 2014-3A, Class A1R, 144A, 3 Month LIBOR + 1.200% | | | 2.563% | (c) | | 10/20/26 | | | 1,300 | | | | 1,305,604 | |
OCP CLO Ltd. (Cayman Islands), Series 2017-13A, Class A1A, 144A, 3 Month LIBOR + 1.260% | | | 2.561% | (c) | | 07/15/30 | | | 250 | | | | 252,027 | |
OZLM Ltd. (Cayman Islands), Series 2015-11A, Class A1R, 144A, 3 Month LIBOR + 1.250% | | | 2.628% | (c) | | 10/30/30 | | | 2,000 | | | | 2,016,274 | |
Palmer Square CLO Ltd. (Cayman Islands), Series 2015-1A, Class A1R, 144A, 3 Month LIBOR + 1.300% | | | 2.741% | (c) | | 05/21/29 | | | 500 | | | | 502,545 | |
Regatta Funding Ltd. (Cayman Islands), Series 2017-1A, Class A, 144A, 3 Month LIBOR + 1.250% | | | 2.619% | (c) | | 10/17/30 | | | 1,000 | | | | 1,003,686 | |
Trinitas CLO Ltd. (Cayman Islands), Series 2016-5A, Class A, 144A, 3 Month LIBOR + 1.700% | | | 3.067% | (c) | | 10/25/28 | | | 500 | | | | 503,322 | |
Wellfleet CLO Ltd. (Cayman Islands), Series 2017-2A, Class A1, 144A, 3 Month LIBOR + 1.250% | | | 2.626% | (c) | | 10/20/29 | | | 2,000 | | | | 2,007,661 | |
| | | | | | | | | | | | | | |
| | | | | | | | | | | | | 25,158,128 | |
| | | | | | | | | | | | | | |
Small Business Loan — 0.0% | |
Small Business Administration Participation Certificates, Series 1998-20I, Class 1 | | | 6.000% | | | 09/01/18 | | | 49 | | | | 49,652 | |
| | | | | | | | | | | | | | |
TOTAL ASSET-BACKED SECURITIES
(cost $25,098,811) | | | | 25,207,780 | |
| | | | | | | | | | | | | | |
| COMMERCIAL MORTGAGE-BACKED SECURITIES — 20.9% | |
Bank, Series 2017-BNK5, Class A3 | | | 3.020% | | | 06/15/60 | | | 2,800 | | | | 2,805,723 | |
Citigroup Commercial Mortgage Trust, Series 2015-GC33, Class A3 | | | 3.515% | | | 09/10/58 | | | 700 | | | | 722,896 | |
Commercial Mortgage Trust, Series 2012-CR5, Class A3 | | | 2.540% | | | 12/10/45 | | | 1,000 | | | | 990,334 | |
Commercial Mortgage Trust, Series 2015-CR24, Class A3 | | | 3.214% | | | 08/10/48 | | | 1,600 | | | | 1,616,375 | |
Commercial Mortgage Trust, Series 2015-CR25, Class A3 | | | 3.505% | | | 08/10/48 | | | 1,000 | | | | 1,031,198 | |
Deutsche Bank Commercial Mortgage Trust, Series 2017-C6, Class A3 | | | 3.269% | | | 06/10/50 | | | 2,800 | | | | 2,862,472 | |
Fannie Mae-Aces, Series 2012-M2, Class A2 | | | 2.717% | | | 02/25/22 | | | 200 | | | | 202,608 | |
Fannie Mae-Aces, Series 2014-M2, Class A2 | | | 3.513% | (cc) | | 12/25/23 | | | 2,650 | | | | 2,774,025 | |
Fannie Mae-Aces, Series 2015-M1, Class AB2 | | | 2.465% | | | 09/25/24 | | | 431 | | | | 416,189 | |
Fannie Mae-Aces, Series 2015-M10, Class A2 | | | 3.092% | (cc) | | 04/25/27 | | | 1,600 | | | | 1,620,627 | |
Fannie Mae-Aces, Series 2015-M17, Class A2 | | | 2.939% | (cc) | | 11/25/25 | | | 1,500 | | | | 1,519,630 | |
Fannie Mae-Aces, Series 2015-M3, Class AB2 | | | 2.625% | | | 10/25/24 | | | 1,682 | | | | 1,646,163 | |
SEE NOTES TO FINANCIAL STATEMENTS.
A124
| | | | | | |
| | GOVERNMENT INCOME PORTFOLIO (continued) | | |
| |
| SCHEDULE OF INVESTMENTS | | as of December 31, 2017 |
| | | | | | | | | | | | | | | | |
COMMERCIAL MORTGAGE-BACKED SECURITIES
(continued) | | Interest
Rate | | | Maturity
Date | | | Principal
Amount
(000)# | | | Value | |
Fannie Mae-Aces, Series 2015-M8, Class AB2 | | | 2.829% | (cc) | | | 01/25/25 | | | | 1,600 | | | $ | 1,603,699 | |
Fannie Mae-Aces, Series 2016-M11, Class A2 | | | 2.369% | (cc) | | | 07/25/26 | | | | 1,200 | | | | 1,155,405 | |
Fannie Mae-Aces, Series 2016-M13, Class A2 | | | 2.477% | (cc) | | | 09/25/26 | | | | 2,100 | | | | 2,043,239 | |
Fannie Mae-Aces, Series 2017-M8, Class A2 | | | 3.061% | (cc) | | | 05/25/27 | | | | 1,500 | | | | 1,517,749 | |
FHLMC Multifamily Structured Pass-Through Certificates, Series K008, Class X1, IO | | | 1.534% | (cc) | | | 06/25/20 | | | | 15,466 | | | | 476,928 | |
FHLMC Multifamily Structured Pass-Through Certificates, Series K019, Class X1, IO | | | 1.676% | (cc) | | | 03/25/22 | | | | 17,136 | | | | 995,130 | |
FHLMC Multifamily Structured Pass-Through Certificates, Series K020, Class X1, IO | | | 1.426% | (cc) | | | 05/25/22 | | | | 8,754 | | | | 448,795 | |
FHLMC Multifamily Structured Pass-Through Certificates, Series K021, Class X1, IO | | | 1.465% | (cc) | | | 06/25/22 | | | | 9,293 | | | | 500,672 | |
FHLMC Multifamily Structured Pass-Through Certificates, Series K025, Class X1, IO | | | 0.870% | (cc) | | | 10/25/22 | | | | 26,421 | | | | 906,522 | |
FHLMC Multifamily Structured Pass-Through Certificates, Series K038, Class A2 | | | 3.389% | | | | 03/25/24 | | | | 3,200 | | | | 3,344,230 | |
FHLMC Multifamily Structured Pass-Through Certificates, Series K041, Class A2 | | | 3.171% | | | | 10/25/24 | | | | 4,000 | | | | 4,130,838 | |
FHLMC Multifamily Structured Pass-Through Certificates, Series K044, Class A2 | | | 2.811% | | | | 01/25/25 | | | | 3,200 | | | | 3,228,043 | |
FHLMC Multifamily Structured Pass-Through Certificates, Series K060, Class AM | | | 3.300% | (cc) | | | 10/25/26 | | | | 1,930 | | | | 1,984,590 | |
FHLMC Multifamily Structured Pass-Through Certificates, Series K064, Class AM | | | 3.327% | (cc) | | | 03/25/27 | | | | 1,100 | | | | 1,129,412 | |
FHLMC Multifamily Structured Pass-Through Certificates, Series K068, Class AM | | | 3.315% | | | | 08/25/27 | | | | 1,700 | | | | 1,744,140 | |
FHLMC Multifamily Structured Pass-Through Certificates, Series K151, Class A3 | | | 3.511% | | | | 04/25/30 | | | | 400 | | | | 418,244 | |
FHLMC Multifamily Structured Pass-Through Certificates, Series K710, Class X1, IO | | | 1.733% | (cc) | | | 05/25/19 | | | | 7,610 | | | | 134,647 | |
FHLMC Multifamily Structured Pass-Through Certificates, Series K711, Class X1, IO | | | 1.683% | (cc) | | | 07/25/19 | | | | 7,419 | | | | 135,537 | |
FHLMC Multifamily Structured Pass-Through Certificates, Series KS03, Class A4 | | | 3.161% | (cc) | | | 05/25/25 | | | | 2,600 | | | | 2,655,358 | |
JPMBB Commercial Mortgage Securities Trust, Series 2013-C17, Class A2 | | | 3.003% | | | | 01/15/47 | | | | 988 | | | | 991,973 | |
JPMBB Commercial Mortgage Securities Trust, Series 2015-C30, Class A3 | | | 3.322% | | | | 07/15/48 | | | | 1,600 | | | | 1,639,074 | |
JPMorgan Chase Commercial Mortgage Securities Trust, Series 2013-LC11, Class A4 | | | 2.694% | | | | 04/15/46 | | | | 1,494 | | | | 1,497,221 | |
| | | | | | | | | | | | | | | | |
TOTAL COMMERCIAL MORTGAGE-BACKED SECURITIES
(cost $50,766,965) | | | | 50,889,686 | |
| | | | | | | | | | | | | | | | |
| CORPORATE BONDS — 1.3% | |
Diversified Financial Services | |
CDP Financial, Inc., Sr. Unsec’d. Notes, 144A | | | 3.150% | | | | 07/24/24 | | | | 820 | | | | 838,856 | |
Private Export Funding Corp., U.S. Gov’t. Gtd. Notes | | | 4.300% | | | | 12/15/21 | | | | 2,160 | | | | 2,325,441 | |
| | | | | | | | | | | | | | | | |
TOTAL CORPORATE BONDS
(cost $3,181,542) | | | | 3,164,297 | |
| | | | | | | | | | | | | | | | |
| MUNICIPAL BONDS — 0.2% | |
California 0.1% | |
California Educational Facilities Authority, Revenue Bonds, Stanford Univ., Ser. U-7, BABs | | | 5.000% | | | | 06/01/46 | | | | 125 | | | | 175,568 | |
| | | | | | | | | | | | | | | | |
Texas — 0.1% | | | | | | | | | | | | | | | | |
University of Texas System (The), Revenue Bonds, Ser. F, Rfdg. | | | 5.000% | | | | 08/15/47 | | | | 275 | | | | 377,748 | |
| | | | | | | | | | | | | | | | |
TOTAL MUNICIPAL BONDS
(cost $512,612) | | | | 553,316 | |
| | | | | | | | | | | | | | | | |
SEE NOTES TO FINANCIAL STATEMENTS.
A125
| | | | | | |
| | GOVERNMENT INCOME PORTFOLIO (continued) | | |
| |
| SCHEDULE OF INVESTMENTS | | as of December 31, 2017 |
| | | | | | | | | | | | | | | | |
| RESIDENTIAL MORTGAGE-BACKED SECURITIES — 0.1% | | Interest
Rate | | | Maturity
Date | | | Principal
Amount
(000)# | | | Value | |
Merrill Lynch Mortgage Investors Trust, Series 2003-E, Class A1, 1 Month LIBOR + 0.620% | | | 2.172% | (c) | | | 10/25/28 | | | | 24 | | | $ | 23,516 | |
Structured Adjustable Rate Mortgage Loan Trust, Series 2004-1, Class 4A3 | | | 3.473% | (cc) | | | 02/25/34 | | | | 117 | | | | 117,428 | |
| | | | | | | | | | | | | | | | |
TOTAL RESIDENTIAL MORTGAGE-BACKED SECURITIES
(cost $141,034) | | | | 140,944 | |
| | | | | | | | | | | | | | | | |
| U.S. GOVERNMENT AGENCY OBLIGATIONS — 41.5% | | | | | | | | | | | | | | | | |
Federal Home Loan Mortgage Corp. | | | 1.625% | | | | 09/29/20 | | | | 1,055 | | | | 1,042,948 | |
Federal Home Loan Mortgage Corp. | | | 1.875% | | | | 11/17/20 | | | | 610 | | | | 606,803 | |
Federal Home Loan Mortgage Corp. | | | 2.000% | | | | 01/01/32 | | | | 201 | | | | 196,105 | |
Federal Home Loan Mortgage Corp. | | | 2.500% | | | | 03/01/30 | | | | 681 | | | | 680,288 | |
Federal Home Loan Mortgage Corp. | | | 3.000% | | | | 06/01/29 | | | | 547 | | | | 557,977 | |
Federal Home Loan Mortgage Corp. | | | 3.000% | | | | 01/01/37 | | | | 941 | | | | 955,005 | |
Federal Home Loan Mortgage Corp. | | | 3.000% | | | | 06/01/45 | | | | 729 | | | | 730,377 | |
Federal Home Loan Mortgage Corp. | | | 3.500% | | | | TBA | | | | 3,500 | | | | 3,594,246 | |
Federal Home Loan Mortgage Corp. | | | 3.500% | | | | 08/01/26 | | | | 249 | | | | 258,358 | |
Federal Home Loan Mortgage Corp. | | | 3.500% | | | | 01/01/27 | | | | 261 | | | | 271,078 | |
Federal Home Loan Mortgage Corp. | | | 3.500% | | | | 07/01/42 | | | | 772 | | | | 796,286 | |
Federal Home Loan Mortgage Corp. | | | 3.500% | | | | 10/01/42 | | | | 1,257 | | | | 1,297,169 | |
Federal Home Loan Mortgage Corp. | | | 3.500% | | | | 08/01/43 | | | | 976 | | | | 1,006,738 | |
Federal Home Loan Mortgage Corp. | | | 4.000% | | | | TBA | | | | 2,750 | | | | 2,875,684 | |
Federal Home Loan Mortgage Corp. | | | 4.000% | | | | 06/01/26 | | | | 90 | | | | 93,852 | |
Federal Home Loan Mortgage Corp. | | | 4.000% | | | | 09/01/26 | | | | 293 | | | | 306,124 | |
Federal Home Loan Mortgage Corp. | | | 4.000% | | | | 09/01/40 | | | | 475 | | | | 498,928 | |
Federal Home Loan Mortgage Corp. | | | 4.000% | | | | 12/01/40 | | | | 491 | | | | 515,378 | |
Federal Home Loan Mortgage Corp. | | | 4.000% | | | | 12/01/40 | | | | 526 | | | | 552,403 | |
Federal Home Loan Mortgage Corp. | | | 4.500% | | | | 09/01/39 | | | | 1,789 | | | | 1,908,658 | |
Federal Home Loan Mortgage Corp. | | | 5.000% | | | | 06/01/33 | | | | 350 | | | | 381,852 | |
Federal Home Loan Mortgage Corp. | | | 5.000% | | | | 05/01/34 | | | | 344 | | | | 371,498 | |
Federal Home Loan Mortgage Corp. | | | 5.500% | | | | 05/01/37 | | | | 72 | | | | 79,542 | |
Federal Home Loan Mortgage Corp. | | | 5.500% | | | | 02/01/38 | | | | 244 | | | | 268,932 | |
Federal Home Loan Mortgage Corp. | | | 5.500% | | | | 05/01/38 | | | | 105 | | | | 115,701 | |
Federal Home Loan Mortgage Corp. | | | 6.000% | | | | 09/01/34 | | | | 76 | | | | 84,423 | |
Federal Home Loan Mortgage Corp. | | | 6.000% | | | | 01/01/37 | | | | 114 | | | | 127,932 | |
Federal Home Loan Mortgage Corp. | | | 6.000% | | | | 09/01/38 | | | | 71 | | | | 79,598 | |
Federal Home Loan Mortgage Corp. | | | 6.000% | | | | 08/01/39 | | | | 79 | | | | 89,448 | |
Federal Home Loan Mortgage Corp. | | | 6.500% | | | | 09/01/32 | | | | 45 | | | | 50,060 | |
Federal National Mortgage Assoc. | | | 1.000% | | | | 10/24/19 | | | | 2,300 | | | | 2,262,496 | |
Federal National Mortgage Assoc. | | | 2.000% | | | | 10/05/22 | | | | 535 | | | | 528,320 | |
Federal National Mortgage Assoc. | | | 2.000% | | | | 08/01/31 | | | | 354 | | | | 344,768 | |
Federal National Mortgage Assoc. | | | 2.500% | | | | 06/01/28 | | | | 2,342 | | | | 2,352,672 | |
Federal National Mortgage Assoc. | | | 2.500% | | | | 02/01/43 | | | | 231 | | | | 224,123 | |
Federal National Mortgage Assoc. | | | 2.500% | | | | 12/01/46 | | | | 772 | | | | 745,410 | |
Federal National Mortgage Assoc. | | | 3.000% | | | | TBA | | | | 500 | | | | 508,760 | |
Federal National Mortgage Assoc. | | | 3.000% | | | | TBA | | | | 3,750 | | | | 3,750,000 | |
Federal National Mortgage Assoc. | | | 3.000% | | | | 08/01/28 | | | | 1,196 | | | | 1,220,621 | |
Federal National Mortgage Assoc. | | | 3.000% | | | | 02/01/31 | | | | 1,517 | | | | 1,545,958 | |
Federal National Mortgage Assoc. | | | 3.000% | | | | 11/01/36 | | | | 897 | | | | 911,485 | |
Federal National Mortgage Assoc. | | | 3.000% | | | | 03/01/43 | | | | 865 | | | | 869,656 | |
Federal National Mortgage Assoc. | | | 3.000% | | | | 03/01/43 | | | | 1,126 | | | | 1,132,217 | |
Federal National Mortgage Assoc. | | | 3.000% | | | | 05/01/43 | | | | 1,479 | | | | 1,486,927 | |
Federal National Mortgage Assoc. | | | 3.000% | | | | 07/01/43 | | | | 1,309 | | | | 1,316,192 | |
Federal National Mortgage Assoc. | | | 3.000% | | | | 07/01/43 | | | | 1,048 | | | | 1,054,329 | |
Federal National Mortgage Assoc. | | | 3.500% | | | | TBA | | | | 3,750 | | | | 3,850,196 | |
Federal National Mortgage Assoc. | | | 3.500% | | | | TBA | | | | 3,500 | | | | 3,587,910 | |
Federal National Mortgage Assoc. | | | 3.500% | | | | 03/01/27 | | | | 507 | | | | 523,155 | |
Federal National Mortgage Assoc. | | | 3.500% | | | | 06/01/39 | | | | 345 | | | | 356,149 | |
Federal National Mortgage Assoc. | | | 3.500% | | | | 04/01/42 | | | | 578 | | | | 596,259 | |
SEE NOTES TO FINANCIAL STATEMENTS.
A126
| | | | | | |
| | GOVERNMENT INCOME PORTFOLIO (continued) | | |
| |
| SCHEDULE OF INVESTMENTS | | as of December 31, 2017 |
| | | | | | | | | | | | | | |
U.S. GOVERNMENT AGENCY OBLIGATIONS
(continued) | | Interest
Rate | | | Maturity
Date | | Principal
Amount
(000)# | | | Value | |
Federal National Mortgage Assoc. | | | 3.500% | | | 06/01/42 | | | 945 | | | $ | 975,990 | |
Federal National Mortgage Assoc. | | | 3.500% | | | 07/01/42 | | | 1,068 | | | | 1,102,948 | |
Federal National Mortgage Assoc. | | | 3.500% | | | 06/01/45 | | | 2,406 | | | | 2,472,054 | |
Federal National Mortgage Assoc. | | | 3.500% | | | 12/01/46 | | | 481 | | | | 493,743 | |
Federal National Mortgage Assoc. | | | 4.000% | | | TBA | | | 1,500 | | | | 1,568,608 | |
Federal National Mortgage Assoc. | | | 4.000% | | | 09/01/40 | | | 1,839 | | | | 1,931,877 | |
Federal National Mortgage Assoc. | | | 4.000% | | | 06/01/42 | | | 1,316 | | | | 1,381,926 | |
Federal National Mortgage Assoc. | | | 4.000% | | | 09/01/44 | | | 993 | | | | 1,039,883 | |
Federal National Mortgage Assoc. | | | 4.000% | | | 10/01/46 | | | 452 | | | | 472,841 | |
Federal National Mortgage Assoc. | | | 4.500% | | | 05/01/40 | | | 2,565 | | | | 2,767,657 | |
Federal National Mortgage Assoc. | | | 5.000% | | | TBA | | | 500 | | | | 537,393 | |
Federal National Mortgage Assoc. | | | 5.000% | | | 07/01/18 | | | 2 | | | | 2,327 | |
Federal National Mortgage Assoc. | | | 5.000% | | | 08/01/18 | | | 10 | | | | 10,253 | |
Federal National Mortgage Assoc. | | | 5.000% | | | 01/01/19 | | | 43 | | | | 43,277 | |
Federal National Mortgage Assoc. | | | 5.000% | | | 02/01/19 | | | 42 | | | | 43,132 | |
Federal National Mortgage Assoc. | | | 5.000% | | | 11/01/19 | | | 34 | | | | 35,140 | |
Federal National Mortgage Assoc. | | | 5.000% | | | 12/01/31 | | | 29 | | | | 30,953 | |
Federal National Mortgage Assoc. | | | 5.000% | | | 03/01/34 | | | 435 | | | | 471,319 | |
Federal National Mortgage Assoc. | | | 5.000% | | | 06/01/35 | | | 192 | | | | 208,614 | |
Federal National Mortgage Assoc. | | | 5.000% | | | 07/01/35 | | | 96 | | | | 103,836 | |
Federal National Mortgage Assoc. | | | 5.000% | | | 05/01/36 | | | 132 | | | | 143,144 | |
Federal National Mortgage Assoc. | | | 5.500% | | | 10/01/18 | | | 8 | | | | 7,561 | |
Federal National Mortgage Assoc. | | | 5.500% | | | 10/01/18 | | | 8 | | | | 7,970 | |
Federal National Mortgage Assoc. | | | 5.500% | | | 11/01/18 | | | 8 | | | | 8,078 | |
Federal National Mortgage Assoc. | | | 5.500% | | | 02/01/34 | | | 264 | | | | 292,836 | |
Federal National Mortgage Assoc. | | | 5.500% | | | 09/01/34 | | | 286 | | | | 318,502 | |
Federal National Mortgage Assoc. | | | 5.500% | | | 02/01/35 | | | 351 | | | | 390,827 | |
Federal National Mortgage Assoc. | | | 5.500% | | | 06/01/35 | | | 73 | | | | 79,583 | |
Federal National Mortgage Assoc. | | | 5.500% | | | 06/01/35 | | | 164 | | | | 180,205 | |
Federal National Mortgage Assoc. | | | 5.500% | | | 09/01/35 | | | 162 | | | | 178,199 | |
Federal National Mortgage Assoc. | | | 5.500% | | | 09/01/35 | | | 43 | | | | 47,569 | |
Federal National Mortgage Assoc. | | | 5.500% | | | 10/01/35 | | | 277 | | | | 304,074 | |
Federal National Mortgage Assoc. | | | 5.500% | | | 11/01/35 | | | 598 | | | | 666,689 | |
Federal National Mortgage Assoc. | | | 5.500% | | | 11/01/35 | | | 335 | | | | 371,029 | |
Federal National Mortgage Assoc. | | | 5.500% | | | 11/01/35 | | | 447 | | | | 493,617 | |
Federal National Mortgage Assoc. | | | 6.000% | | | 05/01/21 | | | 30 | | | | 31,461 | |
Federal National Mortgage Assoc. | | | 6.000% | | | 12/01/33 | | | 11 | | | | 12,683 | |
Federal National Mortgage Assoc. | | | 6.000% | | | 02/01/34 | | | 146 | | | | 166,231 | |
Federal National Mortgage Assoc. | | | 6.000% | | | 08/01/34 | | | 1 | | | | 573 | |
Federal National Mortgage Assoc. | | | 6.000% | | | 11/01/34 | | | 1 | | | | 1,182 | |
Federal National Mortgage Assoc. | | | 6.000% | | | 11/01/34 | | | 1 | | | | 689 | |
Federal National Mortgage Assoc. | | | 6.000% | | | 12/01/34 | | | 1 | | | | 1,115 | |
Federal National Mortgage Assoc. | | | 6.000% | | | 01/01/35 | | | 36 | | | | 40,764 | |
Federal National Mortgage Assoc. | | | 6.000% | | | 01/01/36 | | | 114 | | | | 128,173 | |
Federal National Mortgage Assoc. | | | 6.000% | | | 05/01/38 | | | 60 | | | | 68,092 | |
Federal National Mortgage Assoc. | | | 6.500% | | | 07/01/32 | | | 273 | | | | 305,719 | |
Federal National Mortgage Assoc. | | | 6.500% | | | 08/01/32 | | | 110 | | | | 121,768 | |
Federal National Mortgage Assoc. | | | 6.500% | | | 10/01/32 | | | 295 | | | | 333,745 | |
Federal National Mortgage Assoc. | | | 6.500% | | | 10/01/37 | | | 202 | | | | 228,444 | |
Federal National Mortgage Assoc. | | | 6.625% | | | 11/15/30 | | | 280 | | | | 393,766 | |
Federal National Mortgage Assoc. | | | 7.000% | | | 12/01/31 | | | 96 | | | | 108,068 | |
Federal National Mortgage Assoc. | | | 7.000% | | | 12/01/31 | | | 1 | | | | 582 | |
Federal National Mortgage Assoc. | | | 7.000% | | | 11/01/33 | | | 11 | | | | 11,391 | |
Federal National Mortgage Assoc. | | | 7.000% | | | 01/01/36 | | | 22 | | | | 23,850 | |
Federal National Mortgage Assoc. | | | 8.000% | | | 10/01/23 | | | — | (r) | | | 250 | |
Federal National Mortgage Assoc. | | | 8.000% | | | 09/01/24 | | | 1 | | | | 1,190 | |
Federal National Mortgage Assoc. | | | 8.000% | | | 11/01/24 | | | 1 | | | | 1,323 | |
Federal National Mortgage Assoc. | | | 8.000% | | | 01/01/26 | | | 1 | | | | 524 | |
SEE NOTES TO FINANCIAL STATEMENTS.
A127
| | | | | | |
| | GOVERNMENT INCOME PORTFOLIO (continued) | | |
| |
| SCHEDULE OF INVESTMENTS | | as of December 31, 2017 |
| | | | | | | | | | | | | | |
U.S. GOVERNMENT AGENCY OBLIGATIONS
(continued) | | Interest
Rate | | | Maturity
Date | | Principal
Amount
(000)# | | | Value | |
Federal National Mortgage Assoc. | | | 8.000% | | | 02/01/26 | | | — | (r) | | $ | 409 | |
Federal National Mortgage Assoc. | | | 9.000% | | | 02/01/25 | | | 11 | | | | 11,977 | |
Federal National Mortgage Assoc. | | | 9.000% | | | 04/01/25 | | | 6 | | | | 6,872 | |
Government National Mortgage Assoc. | | | 2.500% | | | 12/20/46 | | | 326 | | | | 318,765 | |
Government National Mortgage Assoc. | | | 3.000% | | | 03/15/45 | | | 1,946 | | | | 1,963,106 | |
Government National Mortgage Assoc. | | | 3.000% | | | 09/20/46 | | | 1,865 | | | | 1,883,823 | |
Government National Mortgage Assoc. | | | 3.000% | | | 10/20/46 | | | 467 | | | | 471,315 | |
Government National Mortgage Assoc. | | | 3.000% | | | 04/20/47 | | | 2,343 | | | | 2,366,100 | |
Government National Mortgage Assoc. | | | 3.500% | | | TBA | | | 1,500 | | | | 1,550,625 | |
Government National Mortgage Assoc. | | | 3.500% | | | 01/20/43 | | | 1,354 | | | | 1,407,513 | |
Government National Mortgage Assoc. | | | 3.500% | | | 04/20/43 | | | 675 | | | | 701,309 | |
Government National Mortgage Assoc. | | | 3.500% | | | 03/20/45 | | | 1,247 | | | | 1,291,145 | |
Government National Mortgage Assoc. | | | 3.500% | | | 04/20/45 | | | 1,056 | | | | 1,093,163 | |
Government National Mortgage Assoc. | | | 3.500% | | | 07/20/46 | | | 2,570 | | | | 2,659,703 | |
Government National Mortgage Assoc. | | | 4.000% | | | 06/15/40 | | | 249 | | | | 261,560 | |
Government National Mortgage Assoc. | | | 4.000% | | | 08/20/46 | | | 999 | | | | 1,043,565 | |
Government National Mortgage Assoc. | | | 4.000% | | | 11/20/46 | | | 648 | | | | 676,225 | |
Government National Mortgage Assoc. | | | 4.500% | | | 02/20/41 | | | 690 | | | | 731,888 | |
Government National Mortgage Assoc. | | | 4.500% | | | 03/20/41 | | | 588 | | | | 623,892 | |
Government National Mortgage Assoc. | | | 4.500% | | | 06/20/44 | | | 455 | | | | 481,058 | |
Government National Mortgage Assoc. | | | 4.500% | | | 09/20/46 | | | 630 | | | | 663,614 | |
Government National Mortgage Assoc. | | | 4.500% | | | 11/20/46 | | | 1,263 | | | | 1,326,914 | |
Government National Mortgage Assoc. | | | 4.500% | | | 01/20/47 | | | 158 | | | | 165,993 | |
Government National Mortgage Assoc. | | | 5.000% | | | 07/15/33 | | | 191 | | | | 209,397 | |
Government National Mortgage Assoc. | | | 5.000% | | | 09/15/33 | | | 262 | | | | 284,358 | |
Government National Mortgage Assoc. | | | 5.000% | | | 04/15/34 | | | 85 | | | | 91,946 | |
Government National Mortgage Assoc. | | | 5.500% | | | 03/15/34 | | | 375 | | | | 416,195 | |
Government National Mortgage Assoc. | | | 5.500% | | | 03/15/36 | | | 79 | | | | 88,398 | |
Government National Mortgage Assoc. | | | 6.500% | | | 07/15/32 | | | 22 | �� | | | 23,957 | |
Government National Mortgage Assoc. | | | 6.500% | | | 08/15/32 | | | 4 | | | | 3,943 | |
Government National Mortgage Assoc. | | | 6.500% | | | 08/15/32 | | | 4 | | | | 4,446 | |
Government National Mortgage Assoc. | | | 6.500% | | | 08/15/32 | | | 13 | | | | 13,875 | |
Government National Mortgage Assoc. | | | 6.500% | | | 08/15/32 | | | 105 | | | | 121,745 | |
Government National Mortgage Assoc. | | | 7.000% | | | 03/15/23 | | | — | (r) | | | 397 | |
Government National Mortgage Assoc. | | | 7.000% | | | 05/15/23 | | | 6 | | | | 6,637 | |
Government National Mortgage Assoc. | | | 7.000% | | | 06/15/23 | | | 1 | | | | 1,208 | |
Government National Mortgage Assoc. | | | 7.000% | | | 06/15/23 | | | 5 | | | | 5,008 | |
Government National Mortgage Assoc. | | | 7.000% | | | 06/15/23 | | | 1 | | | | 1,334 | |
Government National Mortgage Assoc. | | | 7.000% | | | 06/15/23 | | | 18 | | | | 19,079 | |
Government National Mortgage Assoc. | | | 7.000% | | | 07/15/23 | | | 14 | | | | 14,065 | |
Government National Mortgage Assoc. | | | 7.000% | | | 07/15/23 | | | 1 | | | | 896 | |
Government National Mortgage Assoc. | | | 7.000% | | | 08/15/23 | | | 10 | | | | 9,912 | |
Government National Mortgage Assoc. | | | 7.000% | | | 08/15/23 | | | 5 | | | | 5,671 | |
Government National Mortgage Assoc. | | | 7.000% | | | 08/15/23 | | | 1 | | | | 994 | |
Government National Mortgage Assoc. | | | 7.000% | | | 09/15/23 | | | 1 | | | | 1,467 | |
Government National Mortgage Assoc. | | | 7.000% | | | 10/15/23 | | | 5 | | | | 5,224 | |
Government National Mortgage Assoc. | | | 7.000% | | | 10/15/23 | | | — | (r) | | | 16 | |
Government National Mortgage Assoc. | | | 7.000% | | | 10/15/23 | | | 4 | | | | 4,719 | |
Government National Mortgage Assoc. | | | 7.000% | | | 11/15/23 | | | 5 | | | | 5,367 | |
Government National Mortgage Assoc. | | | 7.000% | | | 11/15/23 | | | 10 | | | | 10,964 | |
Government National Mortgage Assoc. | | | 7.000% | | | 11/15/23 | | | — | (r) | | | 339 | |
Government National Mortgage Assoc. | | | 7.000% | | | 01/15/24 | | | 64 | | | | 67,480 | |
Government National Mortgage Assoc. | | | 7.000% | | | 05/15/24 | | | 60 | | | | 63,492 | |
Government National Mortgage Assoc. | | | 7.000% | | | 08/15/28 | | | 53 | | | | 61,067 | |
Government National Mortgage Assoc. | | | 7.500% | | | 12/15/25 | | | 37 | | | | 40,104 | |
Government National Mortgage Assoc. | | | 7.500% | | | 12/15/25 | | | 5 | | | | 4,823 | |
Government National Mortgage Assoc. | | | 7.500% | | | 02/15/26 | | | 6 | | | | 6,141 | |
Government National Mortgage Assoc. | | | 8.500% | | | 09/15/24 | | | 73 | | | | 79,577 | |
SEE NOTES TO FINANCIAL STATEMENTS.
A128
| | | | | | |
| | GOVERNMENT INCOME PORTFOLIO (continued) | | |
| |
| SCHEDULE OF INVESTMENTS | | as of December 31, 2017 |
| | | | | | | | | | | | | | |
U.S. GOVERNMENT AGENCY OBLIGATIONS
(continued) | | Interest
Rate | | | Maturity
Date | | Principal
Amount
(000)# | | | Value | |
Government National Mortgage Assoc. | | | 8.500% | | | 04/15/25 | | | 8 | | | $ | 9,584 | |
Hashemite Kingdom of Jordan, USAID Bond, U.S. Gov’t. Gtd. Notes | | | 3.000% | | | 06/30/25 | | | 1,380 | | | | 1,420,202 | |
Israel Government, USAID Bond, U.S. Gov’t. Gtd. Notes | | | 5.500% | | | 09/18/23 | | | 1,300 | | | | 1,512,785 | |
Residual Funding Corp. Strips Principal, Unsec’d. Notes, PO | | | 2.194% | (s) | | 01/15/21 | | | 643 | | | | 602,285 | |
Residual Funding Corp. Strips Principal, Unsec’d. Notes, PO | | | 3.184% | (s) | | 04/15/30 | | | 3,035 | | | | 2,132,580 | |
Tennessee Valley Authority, Sr. Unsec’d. Notes | | | 2.875% | | | 02/01/27 | | | 175 | | | | 178,331 | |
Tennessee Valley Authority, Sr. Unsec’d. Notes | | | 6.750% | | | 11/01/25 | | | 510 | | | | 660,077 | |
Tennessee Valley Authority, Sr. Unsec’d. Notes | | | 7.125% | | | 05/01/30 | | | 530 | | | | 764,144 | |
| | | | | | | | | | | | | | |
TOTAL U.S. GOVERNMENT AGENCY OBLIGATIONS
(cost $100,790,041) | | | | 101,380,994 | |
| | | | | | | | | | | | | | |
| U.S. TREASURY OBLIGATIONS — 22.7% | |
U.S. Treasury Bonds | | | 2.750% | | | 08/15/47 | | | 520 | | | | 520,650 | |
U.S. Treasury Bonds | | | 3.000% | | | 05/15/45 | | | 375 | | | | 393,823 | |
U.S. Treasury Bonds | | | 3.000% | | | 05/15/47 | | | 365 | | | | 383,749 | |
U.S. Treasury Inflation Indexed Bonds, TIPS | | | 0.125% | | | 04/15/22 | | | 1,131 | | | | 1,122,958 | |
U.S. Treasury Notes | | | 0.750% | | | 02/28/18 | | | 570 | | | | 569,464 | |
U.S. Treasury Notes | | | 1.375% | | | 04/30/21 | | | 6,000 | | | | 5,870,156 | |
U.S. Treasury Notes | | | 1.750% | | | 05/15/23 | | | 115 | | | | 112,165 | |
U.S. Treasury Notes | | | 1.875% | | | 04/30/22 | | | 4,378 | | | | 4,325,669 | |
U.S. Treasury Notes(a) | | | 2.000% | | | 11/30/22 | | | 510 | | | | 505,358 | |
U.S. Treasury Notes | | | 2.000% | | | 06/30/24 | | | 260 | | | | 255,023 | |
U.S. Treasury Notes | | | 2.125% | | | 06/30/21 | | | 695 | | | | 696,357 | |
U.S. Treasury Notes | | | 2.125% | | | 09/30/21 | | | 9,700 | | | | 9,706,063 | |
U.S. Treasury Notes | | | 2.125% | | | 06/30/22 | | | 1,095 | | | | 1,092,990 | |
U.S. Treasury Notes | | | 2.125% | | | 12/31/22 | | | 670 | | | | 667,226 | |
U.S. Treasury Notes | | | 2.125% | | | 02/29/24 | | | 9,715 | | | | 9,618,989 | |
U.S. Treasury Notes | | | 2.125% | | | 11/30/24 | | | 2,705 | | | | 2,669,497 | |
U.S. Treasury Notes | | | 2.125% | | | 05/15/25 | | | 6,830 | | | | 6,725,682 | |
U.S. Treasury Notes | | | 2.250% | | | 02/15/27 | | | 305 | | | | 300,997 | |
U.S. Treasury Notes(a) | | | 2.250% | | | 11/15/27 | | | 560 | | | | 552,103 | |
U.S. Treasury Strips Coupon | | | 2.037% | (s) | | 02/15/24 | | | 1,230 | | | | 1,065,437 | |
U.S. Treasury Strips Coupon | | | 2.184% | (s) | | 02/15/28 | | | 550 | | | | 426,069 | |
U.S. Treasury Strips Coupon | | | 2.384% | (s) | | 05/15/29 | | | 565 | | | | 422,513 | |
U.S. Treasury Strips Coupon(k) | | | 2.404% | (s) | | 08/15/21 | | | 2,525 | | | | 2,340,648 | |
U.S. Treasury Strips Coupon | | | 2.783% | (s) | | 08/15/29 | | | 500 | | | | 371,297 | |
U.S. Treasury Strips Coupon | | | 2.878% | (s) | | 05/15/31 | | | 500 | | | | 352,990 | |
U.S. Treasury Strips Coupon | | | 3.042% | (s) | | 11/15/35 | | | 1,000 | | | | 618,871 | |
U.S. Treasury Strips Coupon | | | 3.202% | (s) | | 08/15/40 | | | 1,000 | | | | 534,785 | |
U.S. Treasury Strips Coupon | | | 4.138% | (s) | | 02/15/42 | | | 3,725 | | | | 1,897,836 | |
U.S. Treasury Strips Principal, PO | | | 2.351% | (s) | | 05/15/43 | | | 595 | | | | 295,439 | |
U.S. Treasury Strips Principal, PO | | | 2.543% | (s) | | 02/15/45 | | | 515 | | | | 242,106 | |
U.S. Treasury Strips Principal, PO(k) | | | 2.952% | (s) | | 05/15/45 | | | 800 | | | | 373,972 | |
U.S. Treasury Strips Principal, PO | | | 3.005% | (s) | | 11/15/44 | | | 715 | | | | 339,430 | |
| | | | | | | | | | | | | | |
TOTAL U.S. TREASURY OBLIGATIONS
(cost $55,275,087) | | | | 55,370,312 | |
| | | | | | | | | | | | | | |
TOTAL LONG-TERM INVESTMENTS
(cost $235,766,092) | | | | 236,707,329 | |
| | | | | | | | | | | | | | |
SEE NOTES TO FINANCIAL STATEMENTS.
A129
| | | | | | |
| | GOVERNMENT INCOME PORTFOLIO (continued) | | |
| |
| SCHEDULE OF INVESTMENTS | | as of December 31, 2017 |
| | | | | | | | |
| SHORT-TERM INVESTMENTS — 12.4% | | Shares | | | Value | |
AFFILIATED MUTUAL FUNDS | |
Prudential Investment Portfolios 2 – Prudential Core Short-Term Bond Fund(w) | | | 2,871,042 | | | $ | 26,643,269 | |
Prudential Investment Portfolios 2 – Prudential Core Ultra Short Bond Fund(w) | | | 2,764,602 | | | | 2,764,602 | |
Prudential Investment Portfolios 2 – Prudential Institutional Money Market Fund
(cost $958,151; includes $957,972 of cash collateral for securities on loan)(b)(w) | | | 958,151 | | | | 958,151 | |
| | | | | | | | |
TOTAL SHORT-TERM INVESTMENTS
| | | | | |
(cost $31,397,387) | | | | 30,366,022 | |
| | | | | | | | |
TOTAL INVESTMENTS — 109.4%
| | | | | |
(cost $267,163,479) | | | | 267,073,351 | |
Liabilities in excess of other assets(z) — (9.4)% | | | | (22,925,461 | ) |
| | | | | | | | |
NET ASSETS — 100.0% | | | $ | 244,147,890 | |
| | | | | | | | |
See the Glossary for abbreviations used in the annual report.
| # | Principal or notional amount shown in U.S. dollars unless otherwise stated. |
| (a) | All or a portion of security is on loan. The aggregate market value of such securities, including those sold and pending settlement, is $940,234; cash collateral of $957,972 (included in liabilities) was received with which the Portfolio purchased highly liquid short-term investments. |
| (b) | Represents security purchased with cash collateral received for securities on loan and includes dividend reinvestment. |
| (c) | Variable rate instrument. The interest rate shown reflects the rate in effect at December 31, 2017. |
| (cc) | Variable rate instrument. The rate shown is based on the latest available information as of December 31, 2017. Certain variable rate securities are not based on a published reference rate and spread but are determined by the issuer or agent and are based on current market conditions. These securities do not indicate a reference rate and spread in their description. |
| (k) | Represents security, or a portion thereof, segregated as collateral for centrally cleared/exchange-traded derivatives. |
| (s) | Represents zero coupon bond or principal only securities. Rate represents yield to maturity at purchase date. |
| (w) | PGIM Investments LLC, the manager of the Portfolio, also serves as manager of the Prudential Investment Portfolios 2 — Prudential Core Short-Term Bond Fund, Prudential Core Ultra Short Bond Fund and Prudential Institutional Money Market Fund. |
| (z) | Includes net unrealized appreciation (depreciation) on the following derivative contracts held at reporting period end: |
Futures contracts outstanding at December 31, 2017:
| | | | | | | | | | | | | | | | | | | | | | |
Number of
Contracts | | | Type | | | Expiration
Date | | | Value at
Trade Date | | | Current
Notional
Amount | | | Value /
Unrealized
Appreciation
(Depreciation) | |
| | Long Positions: | | | | | | | | | | | | | | | | | | | | | |
| | 469 | | | | 2 Year U.S. Treasury Notes | | | | Mar. 2018 | | | $ | 100,601,983 | | | | 100,417,297 | | | $ | (184,686 | ) |
| | 213 | | | | 5 Year U.S. Treasury Notes | | | | Mar. 2018 | | | | 24,839,935 | | | | 24,742,945 | | | | (96,990 | ) |
| | 37 | | | | 10 Year U.S. Ultra Treasury Notes | | | | Mar. 2018 | | | | 4,958,059 | | | | 4,941,813 | | | | (16,246 | ) |
| | 232 | | | | 10 Year U.S. Treasury Notes | | | | Mar. 2018 | | | | 28,856,485 | | | | 28,778,875 | | | | (77,610 | ) |
| | 238 | | | | 30 Year U.S. Ultra Treasury Bonds | | | | Mar. 2018 | | | | 39,697,486 | | | | 39,902,187 | | | | 204,701 | |
| | | | | | | | | | | | | | | | | | | | | | |
| | | | | | | | | | | | | | | | | | | | | (170,831 | ) |
| | | | | | | | | | | | | | | | | | | | | | |
| | Short Positions: | | | | | | | | | | | | | | | | | | | | | |
| | 120 | | | | 90 day Euro Dollar | | | | Mar. 2018 | | | $ | 29,416,252 | | | $ | 29,356,500 | | | $ | 59,752 | |
| | 295 | | | | 10 Year U.S. Treasury Bonds | | | | Mar. 2018 | | | | 45,069,026 | | | | 45,135,000 | | | | (65,974 | ) |
| | | | | | | | | | | | | | | | | | | | | | |
| | | | | | | | | | | | | | | | | | | | | (6,222 | ) |
| | | | | | | | | | | | | | | | | | | | | | |
| | | | | | | | | | | | | | | | | | | | $ | (177,053 | ) |
| | | | | | | | | | | | | | | | | | | | | | |
SEE NOTES TO FINANCIAL STATEMENTS.
A130
| | | | | | |
| | GOVERNMENT INCOME PORTFOLIO (continued) | | |
| |
| SCHEDULE OF INVESTMENTS | | as of December 31, 2017 |
A security with a market value of $1,051,206 has been segregated with Citigroup Global Markets to cover requirements for open futures contracts at December 31, 2017.
Inflation Swap Agreements outstanding at December 31, 2017:
| | | | | | | | | | | | | | | | | | | | | | | | |
Notional
Amount
(000)# | | | Termination
Date | | | Fixed
Rate | | | Floating Rate | | Value at
Trade
Date | | | Value at
December 31,
2017 | | | Unrealized
Appreciation
(Depreciation) | |
| | Centrally cleared swap agreements: | |
| | 540 | | | | 10/25/27 | | | | 2.160%(T) | | | U.S. CPI Urban Consumers NSA Index(2)(T) | | $ | 13 | | | $ | (5,084 | ) | | $ | (5,097 | ) |
| | | | | | | | | | | | | | | | | | | | | | | | |
Interest rate swap agreements outstanding at December 31, 2017:
| | | | | | | | | | | | | | | | | | | | | | | | |
Notional
Amount
(000)# | | | Termination
Date | | | Fixed
Rate | | | Floating Rate | | Value at
Trade
Date | | | Value at
December 31,
2017 | | | Unrealized
Appreciation
(Depreciation) | |
| | Centrally cleared swap agreements: | | | | | |
| | 21,265 | | | | 06/30/19 | | | | 1.486%(A) | | | 1 Day USOIS(1)(A) | | $ | (8,091 | ) | | $ | 65,365 | | | $ | 73,456 | |
| | 4,730 | | | | 06/30/19 | | | | 1.502%(A) | | | 1 Day USOIS(1)(A) | | | (2,550 | ) | | | 13,239 | | | | 15,789 | |
| | 7,870 | | | | 09/30/19 | | | | 1.707%(A) | | | 1 Day USOIS(1)(A) | | | 2,185 | | | | 13,586 | | | | 11,401 | |
| | 9,400 | | | | 12/31/19 | | | | 1.840%(A) | | | 1 Day USOIS(1)(A) | | | (1,128 | ) | | | 9,207 | | | | 10,335 | |
| | 3,860 | | | | 08/31/21 | | | | 2.015%(S) | | | 3 Month LIBOR(2)(Q) | | | 31,702 | | | | (2,740 | ) | | | (34,442 | ) |
| | 760 | | | | 11/30/21 | | | | 1.762%(S) | | | 3 Month LIBOR(2)(Q) | | | — | | | | (12,333 | ) | | | (12,333 | ) |
| | 6,910 | | | | 08/15/23 | | | | 1.459%(S) | | | 3 Month LIBOR(1)(Q) | | | 343,038 | | | | 267,581 | | | | (75,457 | ) |
| | 277 | | | | 11/15/23 | | | | 2.209%(S) | | | 3 Month LIBOR(1)(Q) | | | 12 | | | | 604 | | | | 592 | |
| | 1,460 | | | | 02/15/24 | | | | 2.115%(S) | | | 3 Month LIBOR(1)(Q) | | | 3,510 | | | | 4,634 | | | | 1,124 | |
| | 2,935 | | | | 02/15/24 | | | | 2.151%(S) | | | 3 Month LIBOR(1)(Q) | | | (2,985 | ) | | | 2,864 | | | | 5,849 | |
| | 1,580 | | | | 02/15/24 | | | | 2.183%(S) | | | 3 Month LIBOR(1)(Q) | | | (3,171 | ) | | | (1,610 | ) | | | 1,561 | |
| | 995 | | | | 08/15/24 | | | | 2.168%(S) | | | 3 Month LIBOR(1)(Q) | | | — | | | | 7,875 | | | | 7,875 | |
| | 21,820 | | | | 08/15/24 | | | | 2.170%(S) | | | 3 Month LIBOR(1)(Q) | | | 17,973 | | | | 165,752 | | | | 147,779 | |
| | 3,445 | | | | 08/15/24 | | | | 2.176%(S) | | | 3 Month LIBOR(1)(Q) | | | 11,612 | | | | 25,718 | | | | 14,106 | |
| | 3,075 | | | | 11/15/24 | | | | 2.334%(S) | | | 3 Month LIBOR(1)(Q) | | | 3,365 | | | | (320 | ) | | | (3,685 | ) |
| | 1,860 | | | | 09/04/25 | | | | 2.214%(S) | | | 3 Month LIBOR(1)(Q) | | | 163 | | | | 3,571 | | | | 3,408 | |
| | 130 | | | | 01/08/26 | | | | 2.210%(S) | | | 3 Month LIBOR(1)(Q) | | | 2 | | | | 290 | | | | 288 | |
| | 2,102 | | | | 02/15/27 | | | | 1.824%(A) | | | 1 Day USOIS(1)(A) | | | 29,738 | | | | 35,224 | | | | 5,486 | |
| | 790 | | | | 02/15/27 | | | | 1.899%(A) | | | 1 Day USOIS(1)(A) | | | 984 | | | | 8,102 | | | | 7,118 | |
| | 530 | | | | 02/15/27 | | | | 1.965%(A) | | | 1 Day USOIS(1)(A) | | | — | | | | 2,417 | | | | 2,417 | |
| | 1,445 | | | | 02/15/27 | | | | 2.067%(A) | | | 1 Day USOIS(1)(A) | | | (912 | ) | | | (6,273 | ) | | | (5,361 | ) |
| | 260 | | | | 05/15/27 | | | | 2.295%(S) | | | 3 Month LIBOR(1)(Q) | | | — | | | | 1,821 | | | | 1,821 | |
| | 2,525 | | | | 02/15/36 | | | | 2.338%(S) | | | 3 Month LIBOR(2)(Q) | | | (16,892 | ) | | | (58,037 | ) | | | (41,145 | ) |
| | 145 | | | | 11/15/43 | | | | 2.659%(S) | | | 3 Month LIBOR(1)(Q) | | | — | | | | (2,989 | ) | | | (2,989 | ) |
| | | | | | | | | | | | | | | | | | | | | | | | |
| | | | | | | | | | | | | | $ | 408,555 | | | $ | 543,548 | | | $ | 134,993 | |
| | | | | | | | | | | | | | | | | | | | | | | | |
Securities with a combined market value of $1,545,859 have been segregated with Citigroup Global Markets to cover requirement for open centrally cleared swap contracts at December 31, 2017.
| (1) | The Portfolio pays the fixed rate and receives the floating rate. |
| (2) | The Portfolio pays the floating rate and receives the fixed rate. |
Fair Value Measurements:
Various inputs are used in determining the value of the Portfolio’s investments. These inputs are summarized in the three broad levels listed below.
| Level 1—unadjusted | quoted prices generally in active markets for identical securities. |
| Level 2—quoted | prices for similar securities, interest rates and yield curves, prepayment speeds, foreign currency exchange rates and other observable inputs. |
| Level 3—unobservable | inputs for securities valued in accordance with Board approved fair valuation procedures. |
SEE NOTES TO FINANCIAL STATEMENTS.
A131
| | | | | | |
| | GOVERNMENT INCOME PORTFOLIO (continued) | | |
| |
| SCHEDULE OF INVESTMENTS | | as of December 31, 2017 |
The following is a summary of the inputs used as of December 31, 2017 in valuing such portfolio securities:
| | | | | | | | | | | | |
| | | Level 1 | | | Level 2 | | | Level 3 | |
Investments in Securities | | | | | | | | | | | | |
Asset-Backed Securities | | | | | | | | | | | | |
Collateralized Loan Obligations | | $ | — | | | $ | 25,158,128 | | | $ | — | |
Small Business Loan | | | — | | | | 49,652 | | | | — | |
Commercial Mortgage-Backed Securities | | | — | | | | 50,889,686 | | | | — | |
Corporate Bonds | | | — | | | | 3,164,297 | | | | — | |
Municipal Bonds | | | — | | | | 553,316 | | | | — | |
Residential Mortgage-Backed Securities | | | — | | | | 140,944 | | | | — | |
U.S. Government Agency Obligations | | | — | | | | 101,380,994 | | | | — | |
U.S. Treasury Obligations | | | — | | | | 55,370,312 | | | | — | |
Affiliated Mutual Funds | | | 30,366,022 | | | | — | | | | — | |
Other Financial Instruments* | |
Futures Contracts | | | (177,053 | ) | | | — | | | | — | |
Centrally Cleared Inflation Swap Agreements | | | — | | | | (5,097 | ) | | | — | |
Centrally Cleared Interest Rate Swap Agreements | | | — | | | | 134,993 | | | | — | |
| | | | | | | | | | | | |
Total | | $ | 30,188,969 | | | $ | 236,837,225 | | | $ | — | |
| | | | | | | | | | | | |
| * | Other financial instruments are derivative instruments not reflected in the Schedule of Investments, such as futures, forwards and centrally cleared swap contracts, which are recorded at the unrealized appreciation (depreciation) on the instrument, and OTC swap contracts which are recorded at fair value. |
During the period, there were no transfers between Level 1, Level 2 and Level 3 to report.
Industry Classification:
The industry classification of investments and liabilities in excess of other assets shown as a percentage of net assets as of December 31, 2017 were as follows (unaudited):
| | | | |
U.S. Government Agency Obligations | | | 41.5 | % |
U.S. Treasury Obligations | | | 22.7 | |
Commercial Mortgage-Backed Securities | | | 20.9 | |
Affiliated Mutual Funds (including 0.4% of collateral for securities on loan) | | | 12.4 | |
Collateralized Loan Obligations | | | 10.3 | |
Diversified Financial Services | | | 1.3 | |
Municipal Bonds | | | 0.2 | |
Residential Mortgage-Backed Securities | | | 0.1 | |
Small Business Loan | | | 0.0 | * |
| | | | |
| | | 109.4 | |
Liabilities in excess of other assets | | | (9.4 | ) |
| | | | |
| | | 100.0 | % |
| | | | |
SEE NOTES TO FINANCIAL STATEMENTS.
A132
| | | | | | |
| | GOVERNMENT INCOME PORTFOLIO (continued) | | |
| |
| SCHEDULE OF INVESTMENTS | | as of December 31, 2017 |
Effects of Derivative Instruments on the Financial Statements and Primary Underlying Risk Exposure:
The Portfolio invested in derivative instruments during the reporting period. The primary type of risk associated with these derivative instruments is interest rate contracts risk. The effect of such derivative instruments on the Portfolio’s financial position and financial performance as reflected in the Statement of Assets and Liabilities and Statement of Operations is presented in the summary below.
Fair values of derivative instruments as of December 31, 2017 as presented in the Statement of Assets and Liabilities:
| | | | | | | | | | | | |
Derivatives not accounted for as hedging instruments, carried at fair value | | Asset Derivatives | | | Liability Derivatives | |
| | Balance Sheet Location | | Fair Value | | | Balance Sheet Location | | Fair Value | |
Interest rate contracts | | Due from/to broker-variation margin futures | | $ | 264,453 | * | | Due from/to broker-variation margin futures | | $ | 441,506 | * |
Interest rate contracts | | Due from/to broker-variation margin swaps | | | 310,405 | * | | Due from/to broker-variation margin swaps | | | 180,509 | * |
| | | | | | | | | | | | |
Total | | | | $ | 574,858 | | | | | $ | 622,015 | |
| | | | | | | | | | | | |
| * | Includes cumulative appreciation (depreciation) as reported in the schedule of open futures and centrally cleared swap contracts. Only unsettled variation margin receivable (payable) is reported within the Statement of Assets and Liabilities. |
The effects of derivative instruments on the Statement of Operations for the year ended December 31, 2017 are as follows:
| | | | | | | | | | | | | | | | | | | | |
Amount of Realized Gain (Loss) on Derivatives Recognized in Income | |
Derivatives not accounted for as hedging instruments, carried at fair value | | Options
Purchased(1) | | | Options
Written | | | Futures | | | Forward Rate
Agreements | | | Swaps | |
Interest rate contracts | | $ | (500,274 | ) | | $ | 301,166 | | | $ | 1,264,133 | | | $ | 4,729 | | | $ | (102,676 | ) |
| | | | | | | | | | | | | | | | | | | | |
| (1) | Included in net realized gain (loss) on investment transactions in the Statement of Operations. |
| | | | | | | | |
Change in Unrealized Appreciation (Depreciation) on Derivatives Recognized in Income | |
Derivatives not accounted for as hedging instruments, carried at fair value | | Futures | | | Swaps | |
Interest rate contracts | | $ | (244,565 | ) | | $ | 70,603 | |
| | | | | | | | |
For the year ended December 31, 2017, the Portfolio’s average volume of derivative activities is as follows:
| | | | | | | | | | |
Options Purchased(1) | | Options Written(3) | | Futures Contracts – Long Positions(2) | | Futures Contracts – Short Positions(2) | | Inflation Swap Agreements(3) | | Interest Rate Swap Agreements(3) |
| $88,882 | | $210,400 | | $112,184,064 | | $27,817,163 | | $108,000 | | $147,001,400 |
| (3) | Notional Amount in USD. |
Financial Instruments/Transactions—Summary of Offsetting and Netting Arrangements:
The Portfolio entered into financial instruments/transactions during the reporting period that are either offset in accordance with current requirements or are subject to enforceable master netting arrangements or similar agreements that permit offsetting. The information about offsetting and related netting arrangements for financial instruments/transactions, where the legal right to set-off exists, is presented in the summary below.
Offsetting of financial instrument/transaction assets and liabilities:
| | | | | | | | | | | | |
Description | | Gross Market Value of
Recognized
Assets/(Liabilities) | | | Collateral
Pledged/(Received)(1) | | | Net Amount | |
Securities on Loan | | $ | 940,234 | | | $ | (940,234 | ) | | $ | — | |
| | | | | | | | | | | | |
| (1) | Collateral amount disclosed by the Portfolio is limited to the market value of financial instruments/transactions. |
SEE NOTES TO FINANCIAL STATEMENTS.
A133
| | | | | | |
| | GOVERNMENT INCOME PORTFOLIO (continued) | | |
STATEMENT OF ASSETS & LIABILITIES
as of December 31, 2017
| | | | |
| ASSETS | | | | |
Investments at value, including securities on loan of $940,234: | | | | |
Unaffiliated investments (cost $235,766,092) | | $ | 236,707,329 | |
Affiliated investments (cost $31,397,387) | | | 30,366,022 | |
Receivable for investments sold | | | 13,273,767 | |
Dividends receivable | | | 895,786 | |
Due from broker—variation margin futures | | | 122,663 | |
Receivable for Series shares sold | | | 373 | |
Prepaid expenses | | | 1,800 | |
| | | | |
Total Assets | | | 281,367,740 | |
| | | | |
| LIABILITIES | | | | |
Payable for investments purchased | | | 35,776,506 | |
Payable to broker for collateral for securities on loan | | | 957,972 | |
Payable for Series shares repurchased | | | 254,463 | |
Accrued expenses and other liabilities | | | 100,569 | |
Management fee payable | | | 83,237 | |
Due to broker—variation margin swaps | | | 46,048 | |
Affiliated transfer agent fee payable | | | 980 | |
Deferred trustees’ fees | | | 75 | |
| | | | |
Total Liabilities | | | 37,219,850 | |
| | | | |
| NET ASSETS | | $ | 244,147,890 | |
| | | | |
Net assets were comprised of: | | | | |
Paid-in capital | | $ | 216,227,287 | |
Retained earnings | | | 27,920,603 | |
| | | | |
Net assets, December 31, 2017 | | $ | 244,147,890 | |
| | | | |
Net asset value and redemption price per share $244,147,890 / 19,344,625 outstanding shares of beneficial interest | | $ | 12.62 | |
| | | | |
STATEMENT OF OPERATIONS
Year Ended December 31, 2017
| | | | |
| NET INVESTMENT INCOME (LOSS) | | | | |
Income | | | | |
Interest income | | $ | 5,243,085 | |
Affiliated dividend income | | | 739,785 | |
Income from securities lending, net (including affiliated income of $5,309) | | | 5,674 | |
| | | | |
Total income | | | 5,988,544 | |
| | | | |
| EXPENSES | | | | |
Management fee | | | 1,009,512 | |
Shareholders’ reports | | | 169,446 | |
Custodian and accounting fees | | | 78,708 | |
Audit fee | | | 36,240 | |
Legal fees and expenses | | | 14,555 | |
Trustees’ fees | | | 12,526 | |
Transfer agent’s fees and expenses (including affiliated expense of $5,882) | | | 10,861 | |
Miscellaneous | | | 14,867 | |
| | | | |
Total expenses | | | 1,346,715 | |
| | | | |
| NET INVESTMENT INCOME (LOSS) | | | 4,641,829 | |
| | | | |
| REALIZED AND UNREALIZED GAIN (LOSS) ON INVESTMENTS | | | | |
Net realized gain (loss) on: | | | | |
Investment transactions (including affiliated of $(913,961)) | | | (550,409 | ) |
Futures transactions | | | 1,264,133 | |
Options written transactions | | | 301,166 | |
Forward rate agreement transactions | | | 4,729 | |
Swap agreement transactions | | | (102,676 | ) |
| | | | |
| | | 916,943 | |
| | | | |
Net change in unrealized appreciation (depreciation) on: | | | | |
Investments (including affiliated of $954,483) | | | 2,049,863 | |
Futures | | | (244,565 | ) |
Swap agreements | | | 70,603 | |
| | | | |
| | | 1,875,901 | |
| | | | |
| NET GAIN (LOSS) ON INVESTMENT TRANSACTIONS | | | 2,792,844 | |
| | | | |
| NET INCREASE (DECREASE) IN NET ASSETS RESULTING FROM OPERATIONS | | $ | 7,434,673 | |
| | | | |
STATEMENTS OF CHANGES IN NET ASSETS
| | | | | | | | |
| | | Year Ended December 31, | |
| | | 2017 | | | 2016 | |
| INCREASE (DECREASE) IN NET ASSETS | | | | | | | | |
| OPERATIONS | | | | | | | | |
Net investment income (loss) | | $ | 4,641,829 | | | $ | 3,782,397 | |
Net realized gain (loss) on investment transactions | | | 916,943 | | | | 2,228,812 | |
Net change in unrealized appreciation (depreciation) on investments | | | 1,875,901 | | | | (1,008,606 | ) |
| | | | | | | | |
NET INCREASE (DECREASE) IN NET ASSETS RESULTING FROM OPERATIONS | | | 7,434,673 | | | | 5,002,603 | |
| | | | | | | | |
| SERIES SHARE TRANSACTIONS | | | | | | | | |
Series shares sold [3,422,868 and 942,340 shares, respectively] | | | 42,250,137 | | | | 11,729,036 | |
Series shares repurchased [2,543,772 and 1,792,349 shares, respectively] | | | (31,854,985 | ) | | | (22,240,242 | ) |
| | | | | | | | |
NET INCREASE (DECREASE) IN NET ASSETS FROM SERIES SHARE TRANSACTIONS | | | 10,395,152 | | | | (10,511,206 | ) |
| | | | | | | | |
| CAPITAL CONTRIBUTIONS | | | — | | | | 28,977 | |
| | | | | | | | |
| TOTAL INCREASE (DECREASE) | | | 17,829,825 | | | | (5,479,626 | ) |
| NET ASSETS: | | | | | | | | |
Beginning of year | | | 226,318,065 | | | | 231,797,691 | |
| | | | | | | | |
End of year | | $ | 244,147,890 | | | $ | 226,318,065 | |
| | | | | | | | |
SEE NOTES TO FINANCIAL STATEMENTS.
A134
| | | | | | |
| | GOVERNMENT MONEY MARKET PORTFOLIO | | |
| | | | | | |
| |
| SCHEDULE OF INVESTMENTS | | as of December 31, 2017 |
| | | | | | | | | | | | | | | | | | |
| U.S. GOVERNMENT AGENCY OBLIGATIONS — 80.3% | | Interest
Rate | | | Maturity
Date | | Principal
Amount
(000)# | | | Value | |
Federal Farm Credit Bank, 1 Month LIBOR + (0.100)% | | | 1.307% | (c) | | 08/08/18 | | | | | | | 9,000 | | | $ | 9,001,604 | |
Federal Farm Credit Bank, 1 Month LIBOR + 0.040% | | | 1.472% | (c) | | 08/10/18 | | | | | | | 12,000 | | | | 12,014,369 | |
Federal Farm Credit Bank, 1 Month LIBOR + (0.020)% | | | 1.481% | (c) | | 04/20/18 | | | | | | | 6,500 | | | | 6,499,897 | |
Federal Home Loan Bank | | | 1.088% | (n) | | 01/03/18 | | | | | | | 7,000 | | | | 6,999,586 | |
Federal Home Loan Bank | | | 1.123% | (n) | | 01/19/18 | | | | | | | 20,000 | | | | 19,989,000 | |
Federal Home Loan Bank | | | 1.164% | (n) | | 01/05/18 | | | | | | | 9,000 | | | | 8,998,860 | |
Federal Home Loan Bank, 3 Month LIBOR + (0.330)% | | | 1.185% | (c) | | 03/07/18 | | | | | | | 7,000 | | | | 6,998,383 | |
Federal Home Loan Bank, 1 Month LIBOR + (0.170)% | | | 1.191% | (c) | | 02/01/18 | | | | | | | 11,000 | | | | 11,000,000 | |
Federal Home Loan Bank | | | 1.195% | (n) | | 01/16/18 | | | | | | | 13,000 | | | | 12,993,662 | |
Federal Home Loan Bank, 1 Month LIBOR + (0.170)% | | | 1.202% | (c) | | 01/02/18 | | | | | | | 12,000 | | | | 12,000,000 | |
Federal Home Loan Bank | | | 1.238% | (n) | | 01/10/18 | | | | | | | 40,500 | | | | 40,487,724 | |
Federal Home Loan Bank | | | 1.246% | (n) | | 01/12/18 | | | | | | | 11,000 | | | | 10,995,900 | |
Federal Home Loan Bank, 1 Month LIBOR + (0.155)% | | | 1.252% | (c) | | 01/08/18 | | | | | | | 11,000 | | | | 11,000,000 | |
Federal Home Loan Bank, 3 Month LIBOR + (0.140)% | | | 1.257% | (c) | | 02/08/18 | | | | | | | 6,000 | | | | 6,000,000 | |
Federal Home Loan Bank, 3 Month LIBOR + (0.205)% | | | 1.263% | (c) | | 02/28/18 | | | | | | | 12,000 | | | | 12,000,454 | |
Federal Home Loan Bank | | | 1.265% | (n) | | 01/17/18 | | | | | | | 11,000 | | | | 10,993,943 | |
Federal Home Loan Bank, 3 Month LIBOR + (0.150)% | | | 1.266% | (c) | | 02/15/18 | | | | | | | 4,000 | | | | 4,000,000 | |
Federal Home Loan Bank | | | 1.277% | (n) | | 01/24/18 | | | | | | | 1,000 | | | | 999,201 | |
Federal Home Loan Bank | | | 1.287% | (n) | | 01/26/18 | | | | | | | 5,000 | | | | 4,995,625 | |
Federal Home Loan Bank, 1 Month LIBOR + (0.080)% | | | 1.292% | (c) | | 02/04/19 | | | | | | | 7,000 | | | | 7,000,000 | |
Federal Home Loan Bank, 3 Month LIBOR + (0.150)% | | | 1.296% | (c) | | 02/22/18 | | | | | | | 14,000 | | | | 13,999,496 | |
Federal Home Loan Bank | | | 1.298% | (n) | | 01/31/18 | | | | | | | 12,000 | | | | 11,987,290 | |
Federal Home Loan Bank, 1 Month LIBOR + (0.125)% | | | 1.307% | (c) | | 12/10/18 | | | | | | | 8,000 | | | | 8,000,000 | |
Federal Home Loan Bank | | | 1.318% | (n) | | 01/30/18 | | | | | | | 5,000 | | | | 4,994,804 | |
Federal Home Loan Bank | | | 1.318% | (n) | | 02/12/18 | | | | | | | 6,000 | | | | 5,990,970 | |
Federal Home Loan Bank | | | 1.324% | (n) | | 02/23/18 | | | | | | | 6,000 | | | | 5,988,561 | |
Federal Home Loan Bank | | | 1.327% | (n) | | 02/02/18 | | | | | | | 10,000 | | | | 9,988,449 | |
Federal Home Loan Bank | | | 1.328% | (n) | | 02/05/18 | | | | | | | 7,000 | | | | 6,991,153 | |
Federal Home Loan Bank | | | 1.328% | (n) | | 02/07/18 | | | | | | | 15,000 | | | | 14,979,958 | |
Federal Home Loan Bank | | | 1.328% | (n) | | 02/15/18 | | | | | | | 12,000 | | | | 11,980,500 | |
Federal Home Loan Bank | | | 1.329% | (n) | | 02/28/18 | | | | | | | 3,000 | | | | 2,993,717 | |
Federal Home Loan Bank, 1 Month LIBOR + (0.125)% | | | 1.366% | (c) | | 09/17/18 | | | | | | | 6,000 | | | | 6,000,000 | |
Federal Home Loan Bank, 1 Month LIBOR + (0.175)% | | | 1.377% | (c) | | 01/25/18 | | | | | | | 13,300 | | | | 13,299,997 | |
Federal Home Loan Bank, 1 Month LIBOR + (0.155)% | | | 1.397% | (c) | | 01/25/18 | | | | | | | 12,000 | | | | 12,000,000 | |
Federal Home Loan Bank, 1 Month LIBOR + (0.100)% | | | 1.411% | (c) | | 12/21/18 | | | | | | | 15,000 | | | | 15,000,000 | |
Federal Home Loan Bank, 3 Month LIBOR + (0.220)% | | | 1.473% | (c) | | 03/29/18 | | | | | | | 6,000 | | | | 6,000,000 | |
Federal Home Loan Mortgage Corp. | | | 1.173% | (n) | | 01/26/18 | | | | | | | 18,000 | | | | 17,985,646 | |
Federal Home Loan Mortgage Corp. | | | 1.177% | (n) | | 01/17/18 | | | | | | | 5,000 | | | | 4,997,438 | |
Federal Home Loan Mortgage Corp., 3 Month LIBOR + (0.030)% | | | 1.319% | (c) | | 01/08/18 | | | | | | | 5,000 | | | | 5,000,000 | |
Federal Home Loan Mortgage Corp., 1 Month LIBOR + (0.165)% | | | 1.326% | (c) | | 05/18/18 | | | | | | | 11,500 | | | | 11,500,000 | |
Federal Home Loan Mortgage Corp., 1 Month LIBOR + (0.160)% | | | 1.335% | (c) | | 07/19/18 | | | | | | | 14,000 | | | | 14,000,000 | |
Federal Home Loan Mortgage Corp., 1 Month LIBOR + (0.150)% | | | 1.361% | (c) | | 08/21/18 | | | | | | | 7,000 | | | | 7,000,000 | |
Federal Home Loan Mortgage Corp., 1 Month LIBOR + (0.125)% | | | 1.427% | (c) | | 11/27/18 | | | | | | | 6,000 | | | | 6,000,000 | |
Federal National Mortgage Assoc. | | | 0.875% | | | 02/08/18 | | | | | | | 1,000 | | | | 999,564 | |
Federal National Mortgage Assoc., 3 Month LIBOR + (0.030)% | | | 1.326% | (c) | | 01/11/18 | | | | | | | 8,000 | | | | 8,000,000 | |
Federal National Mortgage Assoc. | | | 1.329% | (n) | | 03/07/18 | | | | | | | 9,000 | | | | 8,978,875 | |
| | | | | | | | | | | | | | | | | | |
TOTAL U.S. GOVERNMENT AGENCY OBLIGATIONS | | | | 449,624,626 | |
| | | | | | | | | | | | | | | | | | |
| U.S. TREASURY OBLIGATIONS — 19.7% | | | | | | | | | | | | | | | | | | |
U.S. Treasury Bills | | | 1.090% | (n) | | 01/02/18 | | | | | | | 21,000 | | | | 20,999,378 | |
U.S. Treasury Bills | | | 1.132% | (n) | | 01/25/18 | | | | | | | 17,000 | | | | 16,987,433 | |
U.S. Treasury Bills | | | 1.204% | (n) | | 01/11/18 | | | | | | | 41,350 | | | | 41,336,451 | |
U.S. Treasury Bills | | | 1.346% | (n) | | 03/15/18 | | | | | | | 9,000 | | | | 8,975,971 | |
U.S. Treasury Bills | | | 1.387% | (n) | | 03/22/18 | | | | | | | 22,000 | | | | 21,933,676 | |
| | | | | | | | | | | | | | | | | | |
TOTAL U.S. TREASURY OBLIGATIONS | | | | 110,232,909 | |
| | | | | | | | | | | | | | | | | | |
SEE NOTES TO FINANCIAL STATEMENTS.
A135
| | | | | | |
| | GOVERNMENT MONEY MARKET PORTFOLIO (continued) | | |
| | | | | | |
| |
| SCHEDULE OF INVESTMENTS | | as of December 31, 2017 |
| | | | | | | | | | | | | | |
| REPURCHASE AGREEMENT(m) — 0.7% | | | | | | | | Principal
Amount
(000)# | | | Value | |
TD Securities (USA) LLC, 1.40%, dated 12/29/17, due 01/02/18 in the amount of $3,881,604 | | | 3,881 | | | $ | 3,881,000 | |
| | | | | | | | | | | | | | |
TOTAL INVESTMENTS — 100.7%
(amortized cost $563,738,535) | | | | 563,738,535 | |
LIABILITIES IN EXCESS OF OTHER ASSETS — (0.7)% | | | | (4,100,482 | ) |
| | | | | | | | | | | | | | |
NET ASSETS — 100.0% | | | $ | 559,638,053 | |
| | | | | | | | | | | | | | |
See the Glossary for abbreviations used in the annual report.
| # | Principal amount is shown in U.S. dollars unless otherwise stated. |
| (c) | Variable rate instrument. The interest rate shown reflects the rate in effect at December 31, 2017. |
| (m) | The Repurchase Agreement is collateralized by U.S. Treasury Obligations (coupon rates 2.125%-2.250%, maturity dates 12/31/23-02/29/24), with the value, including accrued interest, of $3,958,655. |
| (n) | Rate quoted represents yield to maturity as of purchase date. |
Fair Value Measurements:
Various inputs are used in determining the value of the Portfolio’s investments. These inputs are summarized in the three broad levels listed below.
| Level 1—unadjusted | quoted prices generally in active markets for identical securities. |
| Level 2—quoted | prices for similar securities, interest rates and yield curves, prepayment speeds, foreign currency exchange rates and other observable inputs. |
| Level 3—unobservable | inputs for securities valued in accordance with Board approved fair valuation procedures. |
The following is a summary of the inputs used as of December 31, 2017 in valuing such portfolio securities:
| | | | | | | | | | | | |
| | | Level 1 | | | Level 2 | | | Level 3 | |
Investments in Securities | | | | | | | | | | | | |
U.S. Government Agency Obligations | | $ | — | | | $ | 449,624,626 | | | $ | — | |
U.S. Treasury Obligations | | | — | | | | 110,232,909 | | | | — | |
Repurchase Agreement | | | — | | | | 3,881,000 | | | | — | |
| | | | | | | | | | | | |
Total | | $ | — | | | $ | 563,738,535 | | | $ | — | |
| | | | | | | | | | | | |
During the period, there were no transfers between Level 1, Level 2 and Level 3 to report.
Industry Classification:
The industry classification of investments and liabilities in excess of other assets shown as a percentage of net assets as of December 31, 2017 were as follows (unaudited):
| | | | |
U.S. Government Agency Obligations | | | 80.3 | % |
U.S. Treasury Obligations | | | 19.7 | |
Repurchase Agreement | | | 0.7 | |
| | | | |
| | | 100.7 | |
Liabilities in excess of other assets | | | (0.7 | ) |
| | | | |
| | | 100.0 | % |
| | | | |
SEE NOTES TO FINANCIAL STATEMENTS.
A136
| | | | | | |
| | GOVERNMENT MONEY MARKET PORTFOLIO (continued) | | |
| | | | | | |
| |
| SCHEDULE OF INVESTMENTS | | as of December 31, 2017 |
Financial instruments/transactions — summary of offsetting and netting arrangements:
The Portfolio entered into financial instruments/transactions during the reporting period that are either offset in accordance with current requirements or are subject to enforceable master netting arrangements or similar agreements that permit offsetting. The information about offsetting and related netting arrangements for financial instruments/transactions, where the legal right to set-off exists, is presented in the summary below.
Offsetting of financial instrument/transaction assets and liabilities:
| | | | | | | | | | | | | | |
Description | | Counterparty | | Gross Market Value of
Recognized
Assets/(Liabilities) | | | Collateral
Pledged/(Received)(1) | | | Net
Amount | |
Repurchase Agreements | | TD Securities USA LLC | | $ | 3,881,000 | | | $ | (3,881,000 | ) | | $ | — | |
| | | | | | | | | | | | | | |
| (1) | Collateral amount disclosed by the Portfolio is limited to the market value of financial instruments/transactions. |
SEE NOTES TO FINANCIAL STATEMENTS.
A137
| | | | | | |
| | GOVERNMENT MONEY MARKET PORTFOLIO (continued) | | |
STATEMENT OF ASSETS & LIABILITIES
as of December 31, 2017
| | | | |
| ASSETS | |
Investments, at amortized cost which approximates fair value: | | $ | 563,738,535 | |
Cash | | | 76,697 | |
Receivable for investments sold | | | 7,035,000 | |
Interest receivable | | | 205,612 | |
Receivable for Series shares sold | | | 137,472 | |
Prepaid expenses | | | 4,998 | |
| | | | |
Total Assets | | | 571,198,314 | |
| | | | |
| LIABILITIES | |
Payable for Series shares repurchased | | | 11,279,687 | |
Management fee payable | | | 144,992 | |
Accrued expenses and other liabilities | | | 95,156 | |
Dividends payable | | | 39,446 | |
Affiliated transfer agent fee payable | | | 980 | |
| | | | |
Total Liabilities | | | 11,560,261 | |
| | | | |
| NET ASSETS | | $ | 559,638,053 | |
| | | | |
Net assets were comprised of:
Paid-in capital | | $ | 559,636,936 | |
Retained earnings | | | 1,117 | |
| | | | |
Net assets, December 31, 2017 | | $ | 559,638,053 | |
| | | | |
Net asset value and redemption price per share
$559,638,053 / 55,960,713 outstanding shares of beneficial interest | | $ | 10.00 | |
| | | | |
STATEMENT OF OPERATIONS
Year Ended December 31, 2017
| | | | |
| NET INVESTMENT INCOME (LOSS) | |
Interest income | | $ | 5,958,840 | |
| | | | |
| EXPENSES | |
Management fee | | | 1,996,023 | |
Shareholders’ reports | | | 171,563 | |
Custodian and accounting fees | | | 72,140 | |
Audit fee | | | 24,086 | |
Trustees’ fees | | | 16,493 | |
Legal fees and expenses | | | 15,620 | |
Transfer agent’s fees and expenses (including affiliated expense of $5,882) | | | 11,072 | |
Miscellaneous | | | 23,575 | |
| | | | |
Total expenses | | | 2,330,572 | |
| | | | |
| NET INVESTMENT INCOME (LOSS) | | | 3,628,268 | |
| | | | |
| REALIZED AND UNREALIZED GAIN (LOSS) ON INVESTMENTS | | | | |
Net realized gain (loss) on investment transactions | | | 8,014 | |
| | | | |
| NET INCREASE (DECREASE) IN NET ASSETS RESULTING FROM OPERATIONS | | $ | 3,636,282 | |
| | | | |
STATEMENTS OF CHANGES IN NET ASSETS
| | | | | | | | |
| | | Year Ended December 31, | |
| | | 2017 | | | 2016 | |
| INCREASE (DECREASE) IN NET ASSETS | |
| OPERATIONS | |
Net investment income (loss) | | $ | 3,628,268 | | | $ | 657,253 | |
Net realized gain (loss) on investment transactions | | | 8,014 | | | | 29,234 | |
| | | | | | | | |
NET INCREASE (DECREASE) IN NET ASSETS RESULTING FROM OPERATIONS | | | 3,636,282 | | | | 686,487 | |
| | | | | | | | |
| DISTRIBUTIONS | | | (3,635,165 | ) | | | (686,487 | ) |
| | | | | | | | |
| SERIES SHARE TRANSACTIONS | |
Series shares sold [39,436,094 and 44,748,619 shares, respectively] | | | 394,360,938 | | | | 447,486,185 | |
Series shares issued in reinvestment of distributions [363,517 and 68,649 shares, respectively] | | | 3,635,165 | | | | 686,487 | |
Series shares repurchased [56,260,374 and 37,473,140 shares, respectively] | | | (562,603,761 | ) | | | (374,731,396 | ) |
| | | | | | | | |
NET INCREASE (DECREASE) IN NET ASSETS FROM SERIES SHARE TRANSACTIONS | | | (164,607,658 | ) | | | 73,441,276 | |
| | | | | | | | |
| TOTAL INCREASE (DECREASE) | | | (164,606,541 | ) | | | 73,441,276 | |
| NET ASSETS: | |
Beginning of year | | | 724,244,594 | | | | 650,803,318 | |
| | | | | | | | |
End of year | | $ | 559,638,053 | | | $ | 724,244,594 | |
| | | | | | | | |
SEE NOTES TO FINANCIAL STATEMENTS.
A138
| | | | | | |
| |
| SCHEDULE OF INVESTMENTS | | as of December 31, 2017 |
| | | | | | | | |
| LONG-TERM INVESTMENTS — 98.2% | | | | |
| | |
| COMMON STOCKS — 98.1% | | Shares | | | Value | |
Aerospace & Defense — 2.5% | | | | | | | | |
Arconic, Inc. | | | 68,592 | | | $ | 1,869,132 | |
Boeing Co. (The) | | | 94,326 | | | | 27,817,681 | |
General Dynamics Corp. | | | 47,100 | | | | 9,582,495 | |
L3 Technologies, Inc. | | | 13,300 | | | | 2,631,405 | |
Lockheed Martin Corp. | | | 42,398 | | | | 13,611,878 | |
Northrop Grumman Corp. | | | 29,656 | | | | 9,101,723 | |
Raytheon Co. | | | 49,318 | | | | 9,264,386 | |
Rockwell Collins, Inc. | | | 26,600 | | | | 3,607,492 | |
Textron, Inc. | | | 45,350 | | | | 2,566,356 | |
TransDigm Group, Inc.(a) | | | 8,400 | | | | 2,306,808 | |
United Technologies Corp. | | | 125,500 | | | | 16,010,035 | |
| | | | | | | | |
| | | | | | | 98,369,391 | |
| | | | | | | | |
Air Freight & Logistics — 0.7% | | | | | | | | |
C.H. Robinson Worldwide, Inc.(a) | | | 24,100 | | | | 2,147,069 | |
Expeditors International of Washington, Inc. | | | 31,200 | | | | 2,018,328 | |
FedEx Corp. | | | 41,740 | | | | 10,415,800 | |
United Parcel Service, Inc. (Class B Stock) | | | 116,600 | | | | 13,892,890 | |
| | | | | | | | |
| | | | | | | 28,474,087 | |
| | | | | | | | |
Airlines — 0.5% | | | | | | | | |
Alaska Air Group, Inc. | | | 21,200 | | | | 1,558,412 | |
American Airlines Group, Inc. | | | 73,200 | | | | 3,808,596 | |
Delta Air Lines, Inc. | | | 112,000 | | | | 6,272,000 | |
Southwest Airlines Co. | | | 93,537 | | | | 6,121,997 | |
United Continental Holdings, Inc.* | | | 43,700 | | | | 2,945,380 | |
| | | | | | | | |
| | | | | | | 20,706,385 | |
| | | | | | | | |
Auto Components — 0.2% | | | | | | | | |
Aptiv PLC | | | 45,700 | | | | 3,876,731 | |
BorgWarner, Inc. | | | 34,400 | | | | 1,757,496 | |
Goodyear Tire & Rubber Co. (The)(a) | | | 41,900 | | | | 1,353,789 | |
| | | | | | | | |
| | | | | | | 6,988,016 | |
| | | | | | | | |
Automobiles — 0.5% | | | | | | | | |
Ford Motor Co. | | | 662,559 | | | | 8,275,362 | |
General Motors Co. | | | 219,200 | | | | 8,985,008 | |
Harley-Davidson, Inc.(a) | | | 29,900 | | | | 1,521,312 | |
| | | | | | | | |
| | | | | | | 18,781,682 | |
| | | | | | | | |
Banks — 6.5% | | | | | | | | |
Bank of America Corp. | | | 1,645,882 | | | | 48,586,437 | |
BB&T Corp. | | | 134,700 | | | | 6,697,284 | |
Citigroup, Inc. | | | 448,322 | | | | 33,359,640 | |
Citizens Financial Group, Inc. | | | 86,000 | | | | 3,610,280 | |
Comerica, Inc. | | | 29,950 | | | | 2,599,960 | |
Fifth Third Bancorp | | | 122,749 | | | | 3,724,205 | |
Huntington Bancshares, Inc. | | | 183,075 | | | | 2,665,572 | |
JPMorgan Chase & Co. | | | 587,695 | | | | 62,848,103 | |
KeyCorp | | | 182,400 | | | | 3,679,008 | |
M&T Bank Corp. | | | 25,900 | | | | 4,428,641 | |
People’s United Financial, Inc. | | | 54,800 | | | | 1,024,760 | |
PNC Financial Services Group, Inc. (The) | | | 81,393 | | | | 11,744,196 | |
Regions Financial Corp. | | | 204,112 | | | | 3,527,055 | |
| | | | | | | | |
COMMON STOCKS
(continued) | | Shares | | | Value | |
Banks (continued) | | | | | | | | |
SunTrust Banks, Inc. | | | 82,000 | | | $ | 5,296,380 | |
U.S. Bancorp | | | 268,281 | | | | 14,374,496 | |
Wells Fargo & Co. | | | 751,436 | | | | 45,589,622 | |
Zions Bancorporation | | | 35,000 | | | | 1,779,050 | |
| | | | | | | | |
| | | | | | | 255,534,689 | |
| | | | | | | | |
Beverages — 2.0% | | | | | | | | |
Brown-Forman Corp. (Class B Stock)(a) | | | 31,500 | | | | 2,163,105 | |
Coca-Cola Co. (The) | | | 649,050 | | | | 29,778,414 | |
Constellation Brands, Inc. (Class A Stock) | | | 29,100 | | | | 6,651,387 | |
Dr. Pepper Snapple Group, Inc. | | | 31,400 | | | | 3,047,684 | |
Molson Coors Brewing Co. (Class B Stock) | | | 31,500 | | | | 2,585,205 | |
Monster Beverage Corp.* | | | 68,900 | | | | 4,360,681 | |
PepsiCo, Inc. | | | 240,494 | | | | 28,840,040 | |
| | | | | | | | |
| | | | | | | 77,426,516 | |
| | | | | | | | |
Biotechnology — 2.7% | | | | | | | | |
AbbVie, Inc. | | | 269,600 | | | | 26,073,016 | |
Alexion Pharmaceuticals, Inc.* | | | 38,300 | | | | 4,580,297 | |
Amgen, Inc. | | | 123,394 | | | | 21,458,216 | |
Biogen, Inc.* | | | 35,775 | | | | 11,396,842 | |
Celgene Corp.* | | | 132,600 | | | | 13,838,136 | |
Gilead Sciences, Inc. | | | 221,400 | | | | 15,861,096 | |
Incyte Corp.* | | | 28,800 | | | | 2,727,648 | |
Regeneron Pharmaceuticals, Inc.* | | | 12,930 | | | | 4,861,163 | |
Vertex Pharmaceuticals, Inc.* | | | 42,500 | | | | 6,369,050 | |
| | | | | | | | |
| | | | | | | 107,165,464 | |
| | | | | | | | |
Building Products — 0.3% | | | | | | | | |
A.O. Smith Corp. | | | 22,400 | | | | 1,372,672 | |
Allegion PLC | | | 16,533 | | | | 1,315,365 | |
Fortune Brands Home & Security, Inc. | | | 26,100 | | | | 1,786,284 | |
Johnson Controls International PLC | | | 159,015 | | | | 6,060,062 | |
Masco Corp. | | | 54,100 | | | | 2,377,154 | |
| | | | | | | | |
| | | | | | | 12,911,537 | |
| | | | | | | | |
Capital Markets — 3.0% | | | | | | | | |
Affiliated Managers Group, Inc. | | | 9,700 | | | | 1,990,925 | |
Ameriprise Financial, Inc. | | | 25,750 | | | | 4,363,853 | |
Bank of New York Mellon Corp. (The) | | | 174,549 | | | | 9,401,209 | |
BlackRock, Inc. | | | 20,650 | | | | 10,608,111 | |
Cboe Global Markets, Inc. | | | 18,100 | | | | 2,255,079 | |
Charles Schwab Corp. (The) | | | 201,900 | | | | 10,371,603 | |
CME Group, Inc. | | | 57,800 | | | | 8,441,690 | |
E*TRADE Financial Corp.* | | | 47,310 | | | | 2,345,157 | |
Franklin Resources, Inc. | | | 56,700 | | | | 2,456,811 | |
Goldman Sachs Group, Inc. (The) | | | 60,000 | | | | 15,285,600 | |
Intercontinental Exchange, Inc. | | | 100,090 | | | | 7,062,350 | |
Invesco Ltd. | | | 69,900 | | | | 2,554,146 | |
Moody’s Corp. | | | 28,520 | | | | 4,209,837 | |
Morgan Stanley | | | 238,810 | | | | 12,530,361 | |
Nasdaq, Inc. | | | 19,600 | | | | 1,505,868 | |
SEE NOTES TO FINANCIAL STATEMENTS.
A139
| | | | | | |
| | STOCK INDEX PORTFOLIO (continued) | | |
| |
| SCHEDULE OF INVESTMENTS | | as of December 31, 2017 |
| | | | | | | | |
COMMON STOCKS
(continued) | | Shares | | | Value | |
Capital Markets (continued) | | | | | | | | |
Northern Trust Corp. | | | 36,300 | | | $ | 3,626,007 | |
Raymond James Financial, Inc. | | | 21,900 | | | | 1,955,670 | |
S&P Global, Inc. | | | 43,780 | | | | 7,416,332 | |
State Street Corp. | | | 62,175 | | | | 6,068,902 | |
T. Rowe Price Group, Inc. | | | 41,200 | | | | 4,323,116 | |
| | | | | | | | |
| | | | | | | 118,772,627 | |
| | | | | | | | |
Chemicals — 2.2% | | | | | | | | |
Air Products & Chemicals, Inc. | | | 37,100 | | | | 6,087,368 | |
Albemarle Corp.(a) | | | 18,700 | | | | 2,391,543 | |
CF Industries Holdings, Inc. | | | 39,800 | | | | 1,693,092 | |
DowDuPont, Inc. | | | 392,668 | | | | 27,965,815 | |
Eastman Chemical Co. | | | 25,100 | | | | 2,325,264 | |
Ecolab, Inc. | | | 44,400 | | | | 5,957,592 | |
FMC Corp. | | | 23,150 | | | | 2,191,379 | |
International Flavors & Fragrances, Inc. | | | 13,700 | | | | 2,090,757 | |
LyondellBasell Industries NV (Class A Stock) | | | 55,400 | | | | 6,111,728 | |
Monsanto Co. | | | 74,296 | | | | 8,676,287 | |
Mosaic Co. (The) | | | 59,100 | | | | 1,516,506 | |
PPG Industries, Inc. | | | 43,300 | | | | 5,058,306 | |
Praxair, Inc. | | | 48,600 | | | | 7,517,448 | |
Sherwin-Williams Co. (The) | | | 13,700 | | | | 5,617,548 | |
| | | | | | | | |
| | | | | | | 85,200,633 | |
| | | | | | | | |
Commercial Services & Supplies — 0.3% | |
Cintas Corp. | | | 14,800 | | | | 2,306,284 | |
Republic Services, Inc. | | | 39,235 | | | | 2,652,678 | |
Stericycle, Inc.* | | | 14,500 | | | | 985,855 | |
Waste Management, Inc. | | | 68,330 | | | | 5,896,879 | |
| | | | | | | | |
| | | | | | | 11,841,696 | |
| | | | | | | | |
Communications Equipment — 1.0% | |
Cisco Systems, Inc. | | | 840,275 | | | | 32,182,533 | |
F5 Networks, Inc.* | | | 11,300 | | | | 1,482,786 | |
Harris Corp. | | | 20,600 | | | | 2,917,990 | |
Juniper Networks, Inc. | | | 66,000 | | | | 1,881,000 | |
Motorola Solutions, Inc. | | | 28,027 | | | | 2,531,959 | |
| | | | | | | | |
| | | | | | | 40,996,268 | |
| | | | | | | | |
Construction & Engineering — 0.1% | |
Fluor Corp. | | | 23,700 | | | | 1,224,105 | |
Jacobs Engineering Group, Inc. | | | 20,900 | | | | 1,378,564 | |
Quanta Services, Inc.* | | | 26,200 | | | | 1,024,682 | |
| | | | | | | | |
| | | | | | | 3,627,351 | |
| | | | | | | | |
Construction Materials — 0.1% | |
Martin Marietta Materials, Inc. | | | 10,800 | | | | 2,387,232 | |
Vulcan Materials Co. | | | 22,700 | | | | 2,913,999 | |
| | | | | | | | |
| | | | | | | 5,301,231 | |
| | | | | | | | |
Consumer Finance — 0.8% | | | | | | | | |
American Express Co. | | | 123,500 | | | | 12,264,785 | |
Capital One Financial Corp. | | | 81,869 | | | | 8,152,515 | |
Discover Financial Services | | | 62,405 | | | | 4,800,193 | |
Navient Corp. | | | 50,700 | | | | 675,324 | |
Synchrony Financial | | | 125,830 | | | | 4,858,296 | |
| | | | | | | | |
| | | | | | | 30,751,113 | |
| | | | | | | | |
| | | | | | | | |
COMMON STOCKS
(continued) | | Shares | | | Value | |
Containers & Packaging — 0.4% | |
Avery Dennison Corp. | | | 15,400 | | | $ | 1,768,844 | |
Ball Corp. | | | 59,100 | | | | 2,236,935 | |
International Paper Co. | | | 70,167 | | | | 4,065,476 | |
Packaging Corp. of America | | | 15,000 | | | | 1,808,250 | |
Sealed Air Corp. | | | 31,720 | | | | 1,563,796 | |
WestRock Co. | | | 42,761 | | | | 2,702,923 | |
| | | | | | | | |
| | | | | | | 14,146,224 | |
| | | | | | | | |
Distributors — 0.1% | | | | | | | | |
Genuine Parts Co. | | | 25,325 | | | | 2,406,128 | |
LKQ Corp.* | | | 51,900 | | | | 2,110,773 | |
| | | | | | | | |
| | | | | | | 4,516,901 | |
| | | | | | | | |
Diversified Consumer Services — 0.0% | |
H&R Block, Inc.(a) | | | 35,900 | | | | 941,298 | |
| | | | | | | | |
Diversified Financial Services — 1.7% | |
Berkshire Hathaway, Inc. (Class B Stock)* | | | 324,800 | | | | 64,381,856 | |
Leucadia National Corp. | | | 54,500 | | | | 1,443,705 | |
| | | | | | | | |
| | | | | | | 65,825,561 | |
| | | | | | | | |
Diversified Telecommunication Services — 2.0% | |
AT&T, Inc. | | | 1,037,935 | | | | 40,354,913 | |
CenturyLink, Inc. | | | 166,843 | | | | 2,782,941 | |
Verizon Communications, Inc. | | | 689,838 | | | | 36,513,125 | |
| | | | | | | | |
| | | | | | | 79,650,979 | |
| | | | | | | | |
Electric Utilities — 1.8% | | | | | | | | |
Alliant Energy Corp. | | | 38,400 | | | | 1,636,224 | |
American Electric Power Co., Inc. | | | 83,540 | | | | 6,146,038 | |
Duke Energy Corp. | | | 118,048 | | | | 9,929,017 | |
Edison International | | | 55,400 | | | | 3,503,496 | |
Entergy Corp. | | | 30,900 | | | | 2,514,951 | |
Eversource Energy | | | 54,100 | | | | 3,418,038 | |
Exelon Corp. | | | 158,673 | | | | 6,253,303 | |
FirstEnergy Corp. | | | 75,280 | | | | 2,305,074 | |
NextEra Energy, Inc. | | | 79,175 | | | | 12,366,343 | |
PG&E Corp. | | | 86,200 | | | | 3,864,346 | |
Pinnacle West Capital Corp. | | | 19,000 | | | | 1,618,420 | |
PPL Corp. | | | 116,100 | | | | 3,593,295 | |
Southern Co. (The) | | | 167,500 | | | | 8,055,075 | |
Xcel Energy, Inc. | | | 86,295 | | | | 4,151,652 | |
| | | | | | | | |
| | | | | | | 69,355,272 | |
| | | | | | | | |
Electrical Equipment — 0.6% | | | | | | | | |
Acuity Brands, Inc.(a) | | | 7,500 | | | | 1,320,000 | |
AMETEK, Inc. | | | 39,500 | | | | 2,862,565 | |
Eaton Corp. PLC | | | 75,861 | | | | 5,993,778 | |
Emerson Electric Co. | | | 108,600 | | | | 7,568,334 | |
Rockwell Automation, Inc. | | | 21,900 | | | | 4,300,065 | |
| | | | | | | | |
| | | | | | | 22,044,742 | |
| | | | | | | | |
Electronic Equipment, Instruments & Components — 0.4% | |
Amphenol Corp. (Class A Stock) | | | 52,300 | | | | 4,591,940 | |
Corning, Inc. | | | 149,000 | | | | 4,766,510 | |
FLIR Systems, Inc. | | | 23,000 | | | | 1,072,260 | |
TE Connectivity Ltd. | | | 60,200 | | | | 5,721,408 | |
| | | | | | | | |
| | | | | | | 16,152,118 | |
| | | | | | | | |
SEE NOTES TO FINANCIAL STATEMENTS.
A140
| | | | | | |
| | STOCK INDEX PORTFOLIO (continued) | | |
| |
| SCHEDULE OF INVESTMENTS | | as of December 31, 2017 |
| | | | | | | | |
COMMON STOCKS
(continued) | | Shares | | | Value | |
Energy Equipment & Services — 0.8% | |
Baker Hughes a GE Co. | | | 72,248 | | | $ | 2,285,927 | |
Halliburton Co. | | | 147,300 | | | | 7,198,551 | |
Helmerich & Payne, Inc.(a) | | | 18,900 | | | | 1,221,696 | |
National Oilwell Varco, Inc.(a) | | | 64,400 | | | | 2,319,688 | |
Schlumberger Ltd. | | | 235,298 | | | | 15,856,732 | |
TechnipFMC PLC (United Kingdom) | | | 74,200 | | | | 2,323,202 | |
| | | | | | | | |
| | | | | | | 31,205,796 | |
| | | | | | | | |
Equity Real Estate Investment Trusts (REITs) — 2.8% | |
Alexandria Real Estate Equities, Inc. | | | 14,800 | | | | 1,932,732 | |
American Tower Corp.(a) | | | 72,000 | | | | 10,272,240 | |
Apartment Investment & Management Co. (Class A Stock) | | | 27,374 | | | | 1,196,518 | |
AvalonBay Communities, Inc. | | | 23,318 | | | | 4,160,165 | |
Boston Properties, Inc.(a) | | | 26,200 | | | | 3,406,786 | |
Crown Castle International Corp.(a) | | | 67,200 | | | | 7,459,872 | |
Digital Realty Trust, Inc.(a) | | | 33,600 | | | | 3,827,040 | |
Duke Realty Corp. | | | 54,400 | | | | 1,480,224 | |
Equinix, Inc. | | | 13,055 | | | | 5,916,787 | |
Equity Residential | | | 62,500 | | | | 3,985,625 | |
Essex Property Trust, Inc.(a) | | | 11,200 | | | | 2,703,344 | |
Extra Space Storage, Inc.(a) | | | 21,400 | | | | 1,871,430 | |
Federal Realty Investment Trust | | | 12,400 | | | | 1,646,844 | |
GGP, Inc.(a) | | | 99,700 | | | | 2,331,983 | |
HCP, Inc. | | | 79,600 | | | | 2,075,968 | |
Host Hotels & Resorts, Inc.(a) | | | 124,626 | | | | 2,473,826 | |
Iron Mountain, Inc.(a) | | | 43,630 | | | | 1,646,160 | |
Kimco Realty Corp.(a) | | | 71,800 | | | | 1,303,170 | |
Macerich Co. (The)(a) | | | 18,400 | | | | 1,208,512 | |
Mid-America Apartment Communities, Inc.(a) | | | 19,500 | | | | 1,960,920 | |
Prologis, Inc. | | | 90,228 | | | | 5,820,608 | |
Public Storage | | | 25,350 | | | | 5,298,150 | |
Realty Income Corp.(a) | | | 44,900 | | | | 2,560,198 | |
Regency Centers Corp. | | | 24,400 | | | | 1,687,992 | |
SBA Communications Corp.* | | | 19,600 | | | | 3,201,856 | |
Simon Property Group, Inc.(a) | | | 52,761 | | | | 9,061,174 | |
SL Green Realty Corp.(a) | | | 17,100 | | | | 1,725,903 | |
UDR, Inc. | | | 45,100 | | | | 1,737,252 | |
Ventas, Inc. | | | 60,704 | | | | 3,642,847 | |
Vornado Realty Trust(a) | | | 29,457 | | | | 2,302,948 | |
Welltower, Inc. | | | 62,000 | | | | 3,953,740 | |
Weyerhaeuser Co. | | | 127,830 | | | | 4,507,286 | |
| | | | | | | | |
| | | | | | | 108,360,100 | |
| | | | | | | | |
Food & Staples Retailing — 1.8% | | | | | | | | |
Costco Wholesale Corp. | | | 74,022 | | | | 13,776,975 | |
CVS Health Corp. | | | 172,438 | | | | 12,501,755 | |
Kroger Co. (The) | | | 153,300 | | | | 4,208,085 | |
Sysco Corp. | | | 82,700 | | | | 5,022,371 | |
Wal-Mart Stores, Inc. | | | 247,400 | | | | 24,430,750 | |
Walgreens Boots Alliance, Inc. | | | 147,300 | | | | 10,696,926 | |
| | | | | | | | |
| | | | | | | 70,636,862 | |
| | | | | | | | |
| | | | | | | | |
COMMON STOCKS
(continued) | | Shares | | | Value | |
Food Products — 1.2% | | | | | | | | |
Archer-Daniels-Midland Co. | | | 96,438 | | | $ | 3,865,235 | |
Campbell Soup Co.(a) | | | 33,200 | | | | 1,597,252 | |
Conagra Brands, Inc. | | | 68,500 | | | | 2,580,395 | |
General Mills, Inc. | | | 97,600 | | | | 5,786,704 | |
Hershey Co. (The) | | | 23,900 | | | | 2,712,889 | |
Hormel Foods Corp.(a) | | | 46,300 | | | | 1,684,857 | |
J.M. Smucker Co. (The) | | | 19,600 | | | | 2,435,104 | |
Kellogg Co.(a) | | | 43,000 | | | | 2,923,140 | |
Kraft Heinz Co. (The) | | | 100,937 | | | | 7,848,861 | |
McCormick & Co., Inc. (Non-Voting Shares)(a) | | | 19,500 | | | | 1,987,245 | |
Mondelez International, Inc. (Class A Stock) | | | 255,511 | | | | 10,935,871 | |
Tyson Foods, Inc. (Class A Stock) | | | 49,600 | | | | 4,021,072 | |
| | | | | | | | |
| | | | | | | 48,378,625 | |
| | | | | | | | |
Health Care Equipment & Supplies — 2.6% | |
Abbott Laboratories | | | 293,825 | | | | 16,768,593 | |
Align Technology, Inc.* | | | 12,000 | | | | 2,666,280 | |
Baxter International, Inc. | | | 83,200 | | | | 5,378,048 | |
Becton, Dickinson & Co. | | | 44,449 | | | | 9,514,856 | |
Boston Scientific Corp.* | | | 231,899 | | | | 5,748,776 | |
Cooper Cos., Inc. (The) | | | 8,530 | | | | 1,858,516 | |
Danaher Corp. | | | 104,000 | | | | 9,653,280 | |
DENTSPLY SIRONA, Inc. | | | 39,300 | | | | 2,587,119 | |
Edwards Lifesciences Corp.* | | | 35,850 | | | | 4,040,653 | |
Hologic, Inc.* | | | 47,400 | | | | 2,026,350 | |
IDEXX Laboratories, Inc.* | | | 15,200 | | | | 2,376,976 | |
Intuitive Surgical, Inc.* | | | 18,870 | | | | 6,886,418 | |
Medtronic PLC | | | 229,428 | | | | 18,526,311 | |
ResMed, Inc. | | | 22,400 | | | | 1,897,056 | |
Stryker Corp. | | | 53,300 | | | | 8,252,972 | |
Varian Medical Systems, Inc.*(a) | | | 15,800 | | | | 1,756,170 | |
Zimmer Biomet Holdings, Inc. | | | 34,386 | | | | 4,149,359 | |
| | | | | | | | |
| | | | | | | 104,087,733 | |
| | | | | | | | |
Health Care Providers & Services — 2.7% | | | | | |
Aetna, Inc. | | | 55,657 | | | | 10,039,966 | |
AmerisourceBergen Corp. | | | 28,200 | | | | 2,589,324 | |
Anthem, Inc. | | | 43,500 | | | | 9,787,935 | |
Cardinal Health, Inc. | | | 53,775 | | | | 3,294,794 | |
Centene Corp.* | | | 29,400 | | | | 2,965,872 | |
Cigna Corp. | | | 42,480 | | | | 8,627,263 | |
DaVita, Inc.* | | | 26,400 | | | | 1,907,400 | |
Envision Healthcare Corp.*(a) | | | 20,200 | | | | 698,112 | |
Express Scripts Holding Co.* | | | 98,626 | | | | 7,361,445 | |
HCA Healthcare, Inc.* | | | 48,400 | | | | 4,251,456 | |
Henry Schein, Inc.* | | | 27,000 | | | | 1,886,760 | |
Humana, Inc. | | | 24,420 | | | | 6,057,869 | |
Laboratory Corp. of America Holdings* | | | 17,400 | | | | 2,775,474 | |
McKesson Corp. | | | 35,807 | | | | 5,584,102 | |
Patterson Cos., Inc.(a) | | | 14,200 | | | | 513,046 | |
Quest Diagnostics, Inc. | | | 23,300 | | | | 2,294,817 | |
UnitedHealth Group, Inc. | | | 163,300 | | | | 36,001,118 | |
Universal Health Services, Inc. (Class B Stock) | | | 15,100 | | | | 1,711,585 | |
| | | | | | | | |
| | | | | | | 108,348,338 | |
| | | | | | | | |
SEE NOTES TO FINANCIAL STATEMENTS.
A141
| | | | | | |
| | STOCK INDEX PORTFOLIO (continued) | | |
| |
| SCHEDULE OF INVESTMENTS | | as of December 31, 2017 |
| | | | | | | | |
COMMON STOCKS
(continued) | | Shares | | | Value | |
Health Care Technology — 0.1% | | | | | | | | |
Cerner Corp.* | | | 51,200 | | | $ | 3,450,368 | |
| | | | | | | | |
Hotels, Restaurants & Leisure — 1.8% | |
Carnival Corp. | | | 68,900 | | | | 4,572,893 | |
Chipotle Mexican Grill, Inc.*(a) | | | 4,520 | | | | 1,306,416 | |
Darden Restaurants, Inc. | | | 21,550 | | | | 2,069,231 | |
Hilton Worldwide Holdings, Inc. | | | 33,500 | | | | 2,675,310 | |
Marriott International, Inc. (Class A Stock) | | | 52,823 | | | | 7,169,666 | |
McDonald’s Corp. | | | 135,080 | | | | 23,249,969 | |
MGM Resorts International | | | 83,900 | | | | 2,801,421 | |
Norwegian Cruise Line Holdings Ltd.* | | | 27,700 | | | | 1,475,025 | |
Royal Caribbean Cruises Ltd. | | | 28,800 | | | | 3,435,264 | |
Starbucks Corp. | | | 240,800 | | | | 13,829,144 | |
Wyndham Worldwide Corp. | | | 17,763 | | | | 2,058,199 | |
Wynn Resorts Ltd. | | | 13,600 | | | | 2,292,824 | |
Yum! Brands, Inc. | | | 57,200 | | | | 4,668,092 | |
| | | | | | | | |
| | | | | | | 71,603,454 | |
| | | | | | | | |
Household Durables — 0.4% | | | | | | | | |
D.R. Horton, Inc. | | | 58,300 | | | | 2,977,381 | |
Garmin Ltd.(a) | | | 19,800 | | | | 1,179,486 | |
Leggett & Platt, Inc. | | | 22,700 | | | | 1,083,471 | |
Lennar Corp. (Class A Stock) | | | 34,600 | | | | 2,188,104 | |
Mohawk Industries, Inc.* | | | 10,900 | | | | 3,007,310 | |
Newell Brands, Inc. | | | 82,549 | | | | 2,550,764 | |
PulteGroup, Inc. | | | 48,085 | | | | 1,598,826 | |
Whirlpool Corp. | | | 12,367 | | | | 2,085,571 | |
| | | | | | | | |
| | | | | | | 16,670,913 | |
| | | | | | | | |
Household Products — 1.6% | | | | | | | | |
Church & Dwight Co., Inc. | | | 42,600 | | | | 2,137,242 | |
Clorox Co. (The) | | | 22,100 | | | | 3,287,154 | |
Colgate-Palmolive Co. | | | 149,600 | | | | 11,287,320 | |
Kimberly-Clark Corp. | | | 60,088 | | | | 7,250,218 | |
Procter & Gamble Co. (The) | | | 430,606 | | | | 39,564,079 | |
| | | | | | | | |
| | | | | | | 63,526,013 | |
| | | | | | | | |
Independent Power & Renewable Electricity Producers — 0.1% | |
AES Corp. | | | 110,400 | | | | 1,195,632 | |
NRG Energy, Inc. | | | 52,800 | | | | 1,503,744 | |
| | | | | | | | |
| | | | | | | 2,699,376 | |
| | | | | | | | |
Industrial Conglomerates — 1.9% | | | | | | | | |
3M Co. | | | 100,900 | | | | 23,748,833 | |
General Electric Co. | | | 1,462,047 | | | | 25,512,720 | |
Honeywell International, Inc. | | | 129,050 | | | | 19,791,108 | |
Roper Technologies, Inc. | | | 17,300 | | | | 4,480,700 | |
| | | | | | | | |
| | | | | | | 73,533,361 | |
| | | | | | | | |
Insurance — 2.4% | | | | | | | | |
Aflac, Inc. | | | 67,200 | | | | 5,898,816 | |
Allstate Corp. (The) | | | 61,588 | | | | 6,448,879 | |
American International Group, Inc. | | | 150,629 | | | | 8,974,476 | |
Aon PLC | | | 43,025 | | | | 5,765,350 | |
Arthur J. Gallagher & Co. | | | 30,700 | | | | 1,942,696 | |
Assurant, Inc. | | | 9,800 | | | | 988,232 | |
Brighthouse Financial, Inc.* | | | 16,772 | | | | 983,510 | |
| | | | | | | | |
COMMON STOCKS
(continued) | | Shares | | | Value | |
Insurance (continued) | | | | | | | | |
Chubb Ltd. | | | 78,930 | | | $ | 11,534,041 | |
Cincinnati Financial Corp. | | | 25,928 | | | | 1,943,822 | |
Everest Re Group Ltd. | | | 6,500 | | | | 1,438,190 | |
Hartford Financial Services Group, Inc. (The) | | | 61,200 | | | | 3,444,336 | |
Lincoln National Corp. | | | 38,363 | | | | 2,948,964 | |
Loews Corp. | | | 47,326 | | | | 2,367,720 | |
Marsh & McLennan Cos., Inc. | | | 86,600 | | | | 7,048,374 | |
MetLife, Inc. | | | 179,700 | | | | 9,085,632 | |
Principal Financial Group, Inc. | | | 45,700 | | | | 3,224,592 | |
Progressive Corp. (The) | | | 98,600 | | | | 5,553,152 | |
Torchmark Corp. | | | 18,875 | | | | 1,712,151 | |
Travelers Cos., Inc. (The) | | | 46,998 | | | | 6,374,809 | |
Unum Group | | | 39,056 | | | | 2,143,784 | |
Willis Towers Watson PLC | | | 22,100 | | | | 3,330,249 | |
XL Group Ltd. (Bermuda) | | | 45,000 | | | | 1,582,200 | |
| | | | | | | | |
| | | | | | | 94,733,975 | |
| | | | | | | | |
Internet & Direct Marketing Retail — 2.8% | | | | | |
Amazon.com, Inc.* | | | 67,490 | | | | 78,927,530 | |
Expedia, Inc. | | | 20,800 | | | | 2,491,216 | |
Netflix, Inc.* | | | 72,990 | | | | 14,011,161 | |
Priceline Group, Inc. (The)* | | | 8,320 | | | | 14,457,997 | |
TripAdvisor, Inc.*(a) | | | 19,400 | | | | 668,524 | |
| | | | | | | | |
| | | | | | | 110,556,428 | |
| | | | | | | | |
Internet Software & Services — 4.8% | |
Akamai Technologies, Inc.* | | | 29,400 | | | | 1,912,176 | |
Alphabet, Inc. (Class A Stock)* | | | 50,449 | | | | 53,142,977 | |
Alphabet, Inc. (Class C Stock)* | | | 51,040 | | | | 53,408,256 | |
eBay, Inc.* | | | 167,300 | | | | 6,313,902 | |
Facebook, Inc. (Class A Stock)* | | | 402,600 | | | | 71,042,796 | |
VeriSign, Inc.*(a) | | | 14,900 | | | | 1,705,156 | |
| | | | | | | | |
| | | | | | | 187,525,263 | |
| | | | | | | | |
IT Services — 4.0% | | | | | | | | |
Accenture PLC (Class A Stock) | | | 104,700 | | | | 16,028,523 | |
Alliance Data Systems Corp. | | | 8,380 | | | | 2,124,162 | |
Automatic Data Processing, Inc. | | | 75,300 | | | | 8,824,407 | |
Cognizant Technology Solutions Corp. (Class A Stock) | | | 100,800 | | | | 7,158,816 | |
CSRA, Inc. | | | 24,600 | | | | 736,032 | |
DXC Technology Co. | | | 47,150 | | | | 4,474,535 | |
Fidelity National Information Services, Inc. | | | 56,100 | | | | 5,278,449 | |
Fiserv, Inc.* | | | 35,800 | | | | 4,694,454 | |
Gartner, Inc.* | | | 14,400 | | | | 1,773,360 | |
Global Payments, Inc. | | | 26,000 | | | | 2,606,240 | |
International Business Machines Corp. | | | 145,725 | | | | 22,357,130 | |
Mastercard, Inc. (Class A Stock) | | | 157,800 | | | | 23,884,608 | |
Paychex, Inc. | | | 54,750 | | | | 3,727,380 | |
PayPal Holdings, Inc.* | | | 189,400 | | | | 13,943,628 | |
Total System Services, Inc. | | | 28,293 | | | | 2,237,693 | |
Visa, Inc. (Class A Stock)(a) | | | 308,100 | | | | 35,129,562 | |
Western Union Co. (The)(a) | | | 81,204 | | | | 1,543,688 | |
| | | | | | | | |
| | | | | | | 156,522,667 | |
| | | | | | | | |
SEE NOTES TO FINANCIAL STATEMENTS.
A142
| | | | | | |
| | STOCK INDEX PORTFOLIO (continued) | | |
| |
| SCHEDULE OF INVESTMENTS | | as of December 31, 2017 |
| | | | | | | | |
COMMON STOCKS
(continued) | | Shares | | | Value | |
Leisure Products — 0.1% | | | | | | | | |
Hasbro, Inc. | | | 19,150 | | | $ | 1,740,543 | |
Mattel, Inc.(a) | | | 57,281 | | | | 880,982 | |
| | | | | | | | |
| | | | | | | 2,621,525 | |
| | | | | | | | |
Life Sciences Tools & Services — 0.8% | |
Agilent Technologies, Inc. | | | 54,782 | | | | 3,668,751 | |
Illumina, Inc.* | | | 25,000 | | | | 5,462,250 | |
IQVIA Holdings, Inc.* | | | 24,600 | | | | 2,408,340 | |
Mettler-Toledo International, Inc.* | | | 4,450 | | | | 2,756,864 | |
PerkinElmer, Inc. | | | 18,600 | | | | 1,360,032 | |
Thermo Fisher Scientific, Inc. | | | 66,800 | | | | 12,683,984 | |
Waters Corp.* | | | 13,700 | | | | 2,646,703 | |
| | | | | | | | |
| | | | | | | 30,986,924 | |
| | | | | | | | |
Machinery — 1.7% | | | | | | | | |
Caterpillar, Inc. | | | 99,400 | | | | 15,663,452 | |
Cummins, Inc. | | | 26,500 | | | | 4,680,960 | |
Deere & Co. | | | 53,350 | | | | 8,349,809 | |
Dover Corp. | | | 26,400 | | | | 2,666,136 | |
Flowserve Corp.(a) | | | 22,500 | | | | 947,925 | |
Fortive Corp. | | | 51,400 | | | | 3,718,790 | |
Illinois Tool Works, Inc. | | | 52,575 | | | | 8,772,139 | |
Ingersoll-Rand PLC | | | 43,400 | | | | 3,870,846 | |
PACCAR, Inc. | | | 60,128 | | | | 4,273,898 | |
Parker-Hannifin Corp. | | | 22,787 | | | | 4,547,829 | |
Pentair PLC (United Kingdom) | | | 28,807 | | | | 2,034,350 | |
Snap-on, Inc.(a) | | | 10,000 | | | | 1,743,000 | |
Stanley Black & Decker, Inc. | | | 25,935 | | | | 4,400,910 | |
Xylem, Inc. | | | 30,400 | | | | 2,073,280 | |
| | | | | | | | |
| | | | | | | 67,743,324 | |
| | | | | | | | |
Media — 2.7% | | | | | | | | |
CBS Corp. (Class B Non-Voting Stock) | | | 61,868 | | | | 3,650,212 | |
Charter Communications, Inc. (Class A Stock)* | | | 32,900 | | | | 11,053,084 | |
Comcast Corp. (Class A Stock) | | | 792,092 | | | | 31,723,284 | |
Discovery Communications, Inc. (Class A Stock)*(a) | | | 26,300 | | | | 588,594 | |
Discovery Communications, Inc. (Class C Stock)*(a) | | | 34,400 | | | | 728,248 | |
DISH Network Corp. (Class A Stock)* | | | 38,600 | | | | 1,843,150 | |
Interpublic Group of Cos., Inc. (The) | | | 67,762 | | | | 1,366,082 | |
News Corp. (Class A Stock) | | | 63,625 | | | | 1,031,361 | |
News Corp. (Class B Stock) | | | 19,300 | | | | 320,380 | |
Omnicom Group, Inc.(a) | | | 39,500 | | | | 2,876,785 | |
Scripps Networks Interactive, Inc. (Class A Stock) | | | 16,200 | | | | 1,383,156 | |
Time Warner, Inc. | | | 131,315 | | | | 12,011,383 | |
Twenty-First Century Fox, Inc. (Class A Stock) | | | 178,700 | | | | 6,170,511 | |
Twenty-First Century Fox, Inc. (Class B Stock) | | | 75,200 | | | | 2,565,824 | |
Viacom, Inc. (Class B Stock) | | | 59,043 | | | | 1,819,115 | |
Walt Disney Co. (The) | | | 255,676 | | | | 27,487,727 | |
| | | | | | | | |
| | | | | | | 106,618,896 | |
| | | | | | | | |
| | | | | | | | |
COMMON STOCKS
(continued) | | Shares | | | Value | |
Metals & Mining — 0.3% | | | | | | | | |
Freeport-McMoRan, Inc.* | | | 223,512 | | | $ | 4,237,787 | |
Newmont Mining Corp. | | | 90,803 | | | | 3,406,929 | |
Nucor Corp. | | | 54,600 | | | | 3,471,468 | |
| | | | | | | | |
| | | | | | | 11,116,184 | |
| | | | | | | | |
Multi-Utilities — 1.0% | | | | | | | | |
Ameren Corp. | | | 41,500 | | | | 2,448,085 | |
CenterPoint Energy, Inc. | | | 72,810 | | | | 2,064,891 | |
CMS Energy Corp. | | | 47,800 | | | | 2,260,940 | |
Consolidated Edison, Inc. | | | 52,200 | | | | 4,434,390 | |
Dominion Energy, Inc. | | | 106,784 | | | | 8,655,911 | |
DTE Energy Co. | | | 30,600 | | | | 3,349,476 | |
NiSource, Inc. | | | 55,500 | | | | 1,424,685 | |
Public Service Enterprise Group, Inc. | | | 86,000 | | | | 4,429,000 | |
SCANA Corp. | | | 24,300 | | | | 966,654 | |
Sempra Energy | | | 42,754 | | | | 4,571,258 | |
WEC Energy Group, Inc. | | | 53,876 | | | | 3,578,983 | |
| | | | | | | | |
| | | | | | | 38,184,273 | |
| | | | | | | | |
Multiline Retail — 0.5% | | | | | | | | |
Dollar General Corp. | | | 43,000 | | | | 3,999,430 | |
Dollar Tree, Inc.* | | | 40,147 | | | | 4,308,174 | |
Kohl’s Corp.(a) | | | 29,500 | | | | 1,599,785 | |
Macy’s, Inc.(a) | | | 51,620 | | | | 1,300,308 | |
Nordstrom, Inc.(a) | | | 18,900 | | | | 895,482 | |
Target Corp. | | | 93,268 | | | | 6,085,737 | |
| | | | | | | | |
| | | | | | | 18,188,916 | |
| | | | | | | | |
Oil, Gas & Consumable Fuels — 5.2% | |
Anadarko Petroleum Corp. | | | 95,226 | | | | 5,107,923 | |
Andeavor | | | 24,700 | | | | 2,824,198 | |
Apache Corp.(a) | | | 64,350 | | | | 2,716,857 | |
Cabot Oil & Gas Corp. | | | 80,700 | | | | 2,308,020 | |
Chesapeake Energy Corp.*(a) | | | 125,800 | | | | 498,168 | |
Chevron Corp. | | | 320,262 | | | | 40,093,600 | |
Cimarex Energy Co. | | | 16,500 | | | | 2,013,165 | |
Concho Resources, Inc.* | | | 25,200 | | | | 3,785,544 | |
ConocoPhillips | | | 205,629 | | | | 11,286,976 | |
Devon Energy Corp. | | | 89,700 | | | | 3,713,580 | |
EOG Resources, Inc. | | | 97,900 | | | | 10,564,389 | |
EQT Corp. | | | 38,000 | | | | 2,162,960 | |
Exxon Mobil Corp. | | | 715,704 | | | | 59,861,482 | |
Hess Corp. | | | 46,175 | | | | 2,191,927 | |
Kinder Morgan, Inc. | | | 326,443 | | | | 5,898,825 | |
Marathon Oil Corp. | | | 142,994 | | | | 2,420,888 | |
Marathon Petroleum Corp. | | | 85,794 | | | | 5,660,688 | |
Newfield Exploration Co.* | | | 35,000 | | | | 1,103,550 | |
Noble Energy, Inc. | | | 77,200 | | | | 2,249,608 | |
Occidental Petroleum Corp. | | | 129,700 | | | | 9,553,702 | |
ONEOK, Inc. | | | 61,540 | | | | 3,289,313 | |
Phillips 66 | | | 72,964 | | | | 7,380,309 | |
Pioneer Natural Resources Co. | | | 29,000 | | | | 5,012,650 | |
Range Resources Corp. | | | 31,700 | | | | 540,802 | |
Valero Energy Corp. | | | 75,500 | | | | 6,939,205 | |
Williams Cos., Inc. (The) | | | 140,400 | | | | 4,280,796 | |
| | | | | | | | |
| | | | | | | 203,459,125 | |
| | | | | | | | |
SEE NOTES TO FINANCIAL STATEMENTS.
A143
| | | | | | |
| | STOCK INDEX PORTFOLIO (continued) | | |
| |
| SCHEDULE OF INVESTMENTS | | as of December 31, 2017 |
| | | | | | | | |
COMMON STOCKS
(continued) | | Shares | | | Value | |
Personal Products — 0.2% | | | | | | | | |
Coty, Inc. (Class A Stock)(a) | | | 78,200 | | | $ | 1,555,398 | |
Estee Lauder Cos., Inc. (The) (Class A Stock) | | | 38,100 | | | | 4,847,844 | |
| | | | | | | | |
| | | | | | | 6,403,242 | |
| | | | | | | | |
Pharmaceuticals — 4.5% | | | | | | | | |
Allergan PLC | | | 56,856 | | | | 9,300,505 | |
Bristol-Myers Squibb Co. | | | 277,740 | | | | 17,019,907 | |
Eli Lilly & Co. | | | 164,100 | | | | 13,859,886 | |
Johnson & Johnson | | | 453,296 | | | | 63,334,517 | |
Merck & Co., Inc. | | | 462,803 | | | | 26,041,925 | |
Mylan NV* | | | 87,200 | | | | 3,689,432 | |
Perrigo Co. PLC | | | 23,300 | | | | 2,030,828 | |
Pfizer, Inc. | | | 1,008,423 | | | | 36,525,081 | |
Zoetis, Inc. | | | 83,600 | | | | 6,022,544 | |
| | | | | | | | |
| | | | | | | 177,824,625 | |
| | | | | | | | |
Professional Services — 0.3% | | | | | | | | |
Equifax, Inc. | | | 20,500 | | | | 2,417,360 | |
IHS Markit Ltd.* | | | 58,400 | | | | 2,636,760 | |
Nielsen Holdings PLC(a) | | | 57,100 | | | | 2,078,440 | |
Robert Half International, Inc. | | | 22,000 | | | | 1,221,880 | |
Verisk Analytics, Inc.* | | | 26,300 | | | | 2,524,800 | |
| | | | | | | | |
| | | | | | | 10,879,240 | |
| | | | | | | | |
Real Estate Management & Development — 0.1% | |
CBRE Group, Inc. (Class A Stock)* | | | 52,200 | | | | 2,260,782 | |
| | | | | | | | |
Road & Rail — 0.9% | | | | | | | | |
CSX Corp. | | | 154,272 | | | | 8,486,503 | |
J.B. Hunt Transport Services, Inc. | | | 14,900 | | | | 1,713,202 | |
Kansas City Southern | | | 18,500 | | | | 1,946,570 | |
Norfolk Southern Corp. | | | 49,200 | | | | 7,129,080 | |
Union Pacific Corp. | | | 134,300 | | | | 18,009,630 | |
| | | | | | | | |
| | | | | | | 37,284,985 | |
| | | | | | | | |
Semiconductors & Semiconductor Equipment — 3.8% | |
Advanced Micro Devices, Inc.*(a) | | | 126,100 | | | | 1,296,308 | |
Analog Devices, Inc. | | | 62,223 | | | | 5,539,714 | |
Applied Materials, Inc. | | | 181,000 | | | | 9,252,720 | |
Broadcom Ltd. | | | 68,260 | | | | 17,535,994 | |
Intel Corp. | | | 792,300 | | | | 36,572,568 | |
KLA-Tencor Corp. | | | 26,900 | | | | 2,826,383 | |
Lam Research Corp. | | | 27,600 | | | | 5,080,332 | |
Microchip Technology, Inc.(a) | | | 37,800 | | | | 3,321,864 | |
Micron Technology, Inc.* | | | 192,200 | | | | 7,903,264 | |
NVIDIA Corp. | | | 101,750 | | | | 19,688,625 | |
Qorvo, Inc.* | | | 21,886 | | | | 1,457,607 | |
QUALCOMM, Inc. | | | 250,050 | | | | 16,008,201 | |
Skyworks Solutions, Inc. | | | 31,500 | | | | 2,990,925 | |
Texas Instruments, Inc. | | | 167,800 | | | | 17,525,032 | |
Xilinx, Inc. | | | 42,300 | | | | 2,851,866 | |
| | | | | | | | |
| | | | | | | 149,851,403 | |
| | | | | | | | |
Software — 5.1% | | | | | | | | |
Activision Blizzard, Inc. | | | 125,800 | | | | 7,965,656 | |
Adobe Systems, Inc.* | | | 83,675 | | | | 14,663,207 | |
| | | | | | | | |
COMMON STOCKS
(continued) | | Shares | | | Value | |
Software (continued) | | | | | | | | |
ANSYS, Inc.* | | | 13,900 | | | $ | 2,051,501 | |
Autodesk, Inc.* | | | 36,070 | | | | 3,781,218 | |
CA, Inc. | | | 52,873 | | | | 1,759,613 | |
Cadence Design Systems, Inc.* | | | 44,700 | | | | 1,869,354 | |
Citrix Systems, Inc.* | | | 24,500 | | | | 2,156,000 | |
Electronic Arts, Inc.* | | | 52,400 | | | | 5,505,144 | |
Intuit, Inc. | | | 41,300 | | | | 6,516,314 | |
Microsoft Corp. | | | 1,303,500 | | | | 111,501,390 | |
Oracle Corp. | | | 512,895 | | | | 24,249,676 | |
Red Hat, Inc.* | | | 30,400 | | | | 3,651,040 | |
salesforce.com, Inc.* | | | 115,300 | | | | 11,787,119 | |
Symantec Corp. | | | 105,211 | | | | 2,952,221 | |
Synopsys, Inc.* | | | 25,600 | | | | 2,182,144 | |
| | | | | | | | |
| | | | | | | 202,591,597 | |
| | | | | | | | |
Specialty Retail — 2.2% | | | | | | | | |
Advance Auto Parts, Inc.(a) | | | 12,560 | | | | 1,252,106 | |
AutoZone, Inc.* | | | 4,810 | | | | 3,421,690 | |
Best Buy Co., Inc. | | | 43,025 | | | | 2,945,922 | |
CarMax, Inc.* | | | 31,900 | | | | 2,045,747 | |
Foot Locker, Inc. | | | 22,300 | | | | 1,045,424 | |
Gap, Inc. (The)(a) | | | 37,187 | | | | 1,266,589 | |
Home Depot, Inc. (The) | | | 197,669 | | | | 37,464,206 | |
L Brands, Inc. | | | 41,196 | | | | 2,480,823 | |
Lowe’s Cos., Inc. | | | 141,825 | | | | 13,181,215 | |
O’Reilly Automotive, Inc.* | | | 14,400 | | | | 3,463,776 | |
Ross Stores, Inc. | | | 66,700 | | | | 5,352,675 | |
Signet Jewelers Ltd.(a) | | | 11,200 | | | | 633,360 | |
Tiffany & Co. | | | 17,300 | | | | 1,798,335 | |
TJX Cos., Inc. (The) | | | 107,600 | | | | 8,227,096 | |
Tractor Supply Co.(a) | | | 22,000 | | | | 1,644,500 | |
Ulta Beauty, Inc.* | | | 10,000 | | | | 2,236,600 | |
| | | | | | | | |
| | | | | | | 88,460,064 | |
| | | | | | | | |
Technology Hardware, Storage & Peripherals — 4.2% | |
Apple, Inc. | | | 869,155 | | | | 147,087,100 | |
Hewlett Packard Enterprise Co. | | | 273,666 | | | | 3,929,844 | |
HP, Inc. | | | 284,466 | | | | 5,976,631 | |
NetApp, Inc. | | | 46,700 | | | | 2,583,444 | |
Seagate Technology PLC(a) | | | 50,400 | | | | 2,108,736 | |
Western Digital Corp. | | | 49,568 | | | | 3,942,143 | |
Xerox Corp. | | | 36,002 | | | | 1,049,458 | |
| | | | | | | | |
| | | | | | | 166,677,356 | |
| | | | | | | | |
Textiles, Apparel & Luxury Goods — 0.7% | | | | | |
Hanesbrands, Inc.(a) | | | 62,100 | | | | 1,298,511 | |
Michael Kors Holdings Ltd.* | | | 26,700 | | | | 1,680,765 | |
NIKE, Inc. (Class B Stock) | | | 221,800 | | | | 13,873,590 | |
PVH Corp. | | | 13,300 | | | | 1,824,893 | |
Ralph Lauren Corp.(a) | | | 9,800 | | | | 1,016,162 | |
Tapestry, Inc. | | | 48,200 | | | | 2,131,886 | |
Under Armour, Inc. (Class A Stock)*(a) | | | 31,200 | | | | 450,216 | |
Under Armour, Inc. (Class C Stock)*(a) | | | 30,603 | | | | 407,632 | |
VF Corp. | | | 54,944 | | | | 4,065,856 | |
| | | | | | | | |
| | | | | | | 26,749,511 | |
| | | | | | | | |
SEE NOTES TO FINANCIAL STATEMENTS.
��
A144
| | | | | | |
| | STOCK INDEX PORTFOLIO (continued) | | |
| |
| SCHEDULE OF INVESTMENTS | | as of December 31, 2017 |
| | | | | | | | |
COMMON STOCKS
(continued) | | Shares | | | Value | |
Tobacco — 1.3% | | | | | | | | |
Altria Group, Inc. | | | 323,800 | | | $ | 23,122,558 | |
Philip Morris International, Inc. | | | 262,500 | | | | 27,733,125 | |
| | | | | | | | |
| | | | | | | 50,855,683 | |
| | | | | | | | |
Trading Companies & Distributors — 0.2% | | | | | |
Fastenal Co.(a) | | | 49,600 | | | | 2,712,624 | |
United Rentals, Inc.* | | | 14,500 | | | | 2,492,695 | |
W.W. Grainger, Inc.(a) | | | 9,120 | | | | 2,154,600 | |
| | | | | | | | |
| | | | | | | 7,359,919 | |
| | | | | | | | |
Water Utilities — 0.1% | | | | | | | | |
American Water Works Co., Inc. | | | 30,100 | | | | 2,753,849 | |
| | | | | | | | |
TOTAL COMMON STOCKS
(cost $1,169,577,523) | | | | 3,856,192,476 | |
| | | | | | | | |
| EXCHANGE TRADED FUND — 0.1% | | | | | |
iShares Core S&P 500 ETF
(cost $3,682,088) | | | 15,300 | | | | 4,113,405 | |
| | | | | | | | |
TOTAL LONG-TERM INVESTMENTS
(cost $1,173,259,611) | | | | 3,860,305,881 | |
| | | | | | | | |
| SHORT-TERM INVESTMENTS — 4.7% | | | | | |
AFFILIATED MUTUAL FUNDS — 4.6% | | | | | |
Prudential Investment Portfolios 2 — Prudential Core Ultra Short Bond Fund(w) | | | 59,834,393 | | | | 59,834,393 | |
Prudential Investment Portfolios 2 — Prudential Institutional Money Market Fund (cost $119,913,547; includes $119,754,122 of cash collateral for securities on loan)(b)(w) | | | 119,913,547 | | | | 119,913,547 | |
| | | | | | | | |
TOTAL AFFILIATED MUTUAL FUNDS
(cost $179,747,940) | | | | 179,747,940 | |
| | | | | | | | |
| | | | | | | | |
SHORT-TERM INVESTMENTS
(continued) | | Principal
Amount
(000)# | | | Value | |
U.S. TREASURY OBLIGATION — 0.1% | |
U.S. Treasury Bills, 1.290%, 03/15/18
(cost $2,792,617)(k)(n) | | | 2,800 | | | $ | 2,792,748 | |
| | | | | | | | |
TOTAL SHORT-TERM INVESTMENTS
(cost $182,540,557) | | | | 182,540,688 | |
| | | | | | | | |
TOTAL INVESTMENTS — 102.9%
(cost $1,355,800,168) | | | | 4,042,846,569 | |
LIABILITIES IN EXCESS OF
OTHER ASSETS(z) — (2.9)% | | | | (114,559,981 | ) |
| | | | | | | | |
NET ASSETS — 100.0% | | | $ | 3,928,286,588 | |
| | | | | | | | |
See the Glossary for abbreviations used in the annual report.
| # | Principal amount shown in U.S. dollars unless otherwise stated. |
| * | Non-income producing security. |
| (a) | All or a portion of security is on loan. The aggregate market value of such securities, including those sold and pending settlement, is $116,628,095; cash collateral of $119,754,122 (included in liabilities) was received with which the Portfolio purchased highly liquid short-term investments. |
| (b) | Represents security purchased with cash collateral received for securities on loan and includes dividend reinvestment. |
| (k) | Represents security, or a portion thereof, segregated as collateral for centrally cleared/exchange-traded derivatives. |
| (n) | Rate quoted represents yield to maturity as of purchase date. |
| (w) | PGIM Investments LLC, the manager of the Portfolio, also serves as manager of the Prudential Investment Portfolios 2 — Prudential Core Ultra Short Bond Fund and Prudential Institutional Money Market Fund. |
| (z) | Includes net unrealized appreciation (depreciation) on the following derivative contracts held at reporting period end: |
Futures contracts outstanding at December 31, 2017:
| | | | | | | | | | | | | | | | | | | | |
Number of
Contracts | | Type | | | Expiration
Date | | | Value at
Trade Date | | | Current
Notional
Amount | | | Value /
Unrealized
Appreciation
(Depreciation) | |
| Long Positions: | | | | | | | | | | | | | | | | | | | | |
| 50 | | | S&P 500 E-mini | | | | Mar. 2018 | | | $ | 6,669,512 | | | $ | 6,690,000 | | | $ | 20,488 | |
| 87 | | | S&P 500 Index | | | | Mar. 2018 | | | | 57,808,660 | | | | 58,203,000 | | | | 394,340 | |
| | | | | | | | | | | | | | | | | | | | |
| | | | | | | $ | 414,828 | |
| | | | | | | | | | | | | | | | | | | | |
A security with a market value of $2,792,748 has been segregated with UBS AG to cover requirements for open future contracts at December 31, 2017.
Fair Value Measurements:
Various inputs are used in determining the value of the Portfolio’s investments. These inputs are summarized in the three broad levels listed below.
| Level 1— | unadjusted quoted prices generally in active markets for identical securities. |
| Level 2— | quoted prices for similar securities, interest rates and yield curves, prepayment speeds, foreign currency exchange rates and other observable inputs. |
| Level 3— | unobservable inputs for securities valued in accordance with Board approved fair valuation procedures. |
SEE NOTES TO FINANCIAL STATEMENTS.
A145
| | | | | | |
| | STOCK INDEX PORTFOLIO (continued) | | |
| |
| SCHEDULE OF INVESTMENTS | | as of December 31, 2017 |
The following is a summary of the inputs used as of December 31, 2017 in valuing such portfolio securities:
| | | | | | | | | | | | |
| | | Level 1 | | | Level 2 | | | Level 3 | |
Investments in Securities | | | | | | | | | | | | |
Common Stocks | | | | | | | | | | | | |
Aerospace & Defense | | $ | 98,369,391 | | | $ | — | | | $ | — | |
Air Freight & Logistics | | | 28,474,087 | | | | — | | | | — | |
Airlines | | | 20,706,385 | | | | — | | | | — | |
Auto Components | | | 6,988,016 | | | | — | | | | — | |
Automobiles | | | 18,781,682 | | | | — | | | | — | |
Banks | | | 255,534,689 | | | | — | | | | — | |
Beverages | | | 77,426,516 | | | | — | | | | — | |
Biotechnology | | | 107,165,464 | | | | — | | | | — | |
Building Products | | | 12,911,537 | | | | — | | | | — | |
Capital Markets | | | 118,772,627 | | | | — | | | | — | |
Chemicals | | | 85,200,633 | | | | — | | | | — | |
Commercial Services & Supplies | | | 11,841,696 | | | | — | | | | — | |
Communications Equipment | | | 40,996,268 | | | | — | | | | — | |
Construction & Engineering | | | 3,627,351 | | | | — | | | | — | |
Construction Materials | | | 5,301,231 | | | | — | | | | — | |
Consumer Finance | | | 30,751,113 | | | | — | | | | — | |
Containers & Packaging | | | 14,146,224 | | | | — | | | | — | |
Distributors | | | 4,516,901 | | | | — | | | | — | |
Diversified Consumer Services | | | 941,298 | | | | — | | | | — | |
Diversified Financial Services | | | 65,825,561 | | | | — | | | | — | |
Diversified Telecommunication Services | | | 79,650,979 | | | | — | | | | — | |
Electric Utilities | | | 69,355,272 | | | | — | | | | — | |
Electrical Equipment | | | 22,044,742 | | | | — | | | | — | |
Electronic Equipment, Instruments & Components | | | 16,152,118 | | | | — | | | | — | |
Energy Equipment & Services | | | 31,205,796 | | | | — | | | | — | |
Equity Real Estate Investment Trusts (REITs) | | | 108,360,100 | | | | — | | | | — | |
Food & Staples Retailing | | | 70,636,862 | | | | — | | | | — | |
Food Products | | | 48,378,625 | | | | — | | | | — | |
Health Care Equipment & Supplies | | | 104,087,733 | | | | — | | | | — | |
Health Care Providers & Services | | | 108,348,338 | | | | — | | | | — | |
Health Care Technology | | | 3,450,368 | | | | — | | | | — | |
Hotels, Restaurants & Leisure | | | 71,603,454 | | | | — | | | | — | |
Household Durables | | | 16,670,913 | | | | — | | | | — | |
Household Products | | | 63,526,013 | | | | — | | | | — | |
Independent Power & Renewable Electricity Producers | | | 2,699,376 | | | | — | | | | — | |
Industrial Conglomerates | | | 73,533,361 | | | | — | | | | — | |
Insurance | | | 94,733,975 | | | | — | | | | — | |
Internet & Direct Marketing Retail | | | 110,556,428 | | | | — | | | | — | |
Internet Software & Services | | | 187,525,263 | | | | — | | | | — | |
IT Services | | | 156,522,667 | | | | — | | | | — | |
Leisure Products | | | 2,621,525 | | | | — | | | | — | |
Life Sciences Tools & Services | | | 30,986,924 | | | | — | | | | — | |
Machinery | | | 67,743,324 | | | | — | | | | — | |
Media | | | 106,618,896 | | | | — | | | | — | |
Metals & Mining | | | 11,116,184 | | | | — | | | | — | |
Multi-Utilities | | | 38,184,273 | | | | — | | | | — | |
Multiline Retail | | | 18,188,916 | | | | — | | | | — | |
Oil, Gas & Consumable Fuels | | | 203,459,125 | | | | — | | | | — | |
Personal Products | | | 6,403,242 | | | | — | | | | — | |
Pharmaceuticals | | | 177,824,625 | | | | — | | | | — | |
Professional Services | | | 10,879,240 | | | | — | | | | — | |
Real Estate Management & Development | | | 2,260,782 | | | | — | | | | — | |
Road & Rail | | | 37,284,985 | | | | — | | | | — | |
Semiconductors & Semiconductor Equipment | | | 149,851,403 | | | | — | | | | — | |
Software | | | 202,591,597 | | | | — | | | | — | |
Specialty Retail | | | 88,460,064 | | | | — | | | | — | |
SEE NOTES TO FINANCIAL STATEMENTS.
A146
| | | | | | |
| | STOCK INDEX PORTFOLIO (continued) | | |
| |
| SCHEDULE OF INVESTMENTS | | as of December 31, 2017 |
| | | | | | | | | | | | |
| | | Level 1 | | | Level 2 | | | Level 3 | |
Investments in Securities (continued) | | | | | | | | | | | | |
Common Stocks (continued) | | | | | | | | | | | | |
Technology Hardware, Storage & Peripherals | | $ | 166,677,356 | | | $ | — | | | $ | — | |
Textiles, Apparel & Luxury Goods | | | 26,749,511 | | | | — | | | | — | |
Tobacco | | | 50,855,683 | | | | — | | | | — | |
Trading Companies & Distributors | | | 7,359,919 | | | | — | | | | — | |
Water Utilities | | | 2,753,849 | | | | — | | | | — | |
Exchange Traded Fund | | | 4,113,405 | | | | — | | | | — | |
Affiliated Mutual Funds | | | 179,747,940 | | | | — | | | | — | |
U.S. Treasury Obligation | | | — | | | | 2,792,748 | | | | — | |
Other Financial Instruments* | |
Futures Contracts | | | 414,828 | | | | — | | | | — | |
| | | | | | | | | | | | |
Total | | $ | 4,040,468,649 | | | $ | 2,792,748 | | | $ | — | |
| | | | | | | | | | | | |
| * | Other financial instruments are derivative instruments not reflected in the Schedule of Investments, such as futures, forwards and centrally cleared swap contracts, which are recorded at the unrealized appreciation (depreciation) on the instrument, and OTC swap contracts which are recorded at fair value. |
During the period, there were no transfers between Level 1, Level 2 and Level 3 to report.
Industry Classification:
The industry classification of investments and liabilities in excess of other assets shown as a percentage of net assets as of December 31, 2017 were as follows (unaudited):
| | | | |
Banks | | | 6.5 | % |
Oil, Gas & Consumable Fuels | | | 5.2 | |
Software | | | 5.1 | |
Internet Software & Services | | | 4.8 | |
Affiliated Mutual Funds (including 3.0% of collateral for securities on loan) | | | 4.6 | |
Pharmaceuticals | | | 4.5 | |
Technology Hardware, Storage & Peripherals | | | 4.2 | |
IT Services | | | 4.0 | |
Semiconductors & Semiconductor Equipment | | | 3.8 | |
Capital Markets | | | 3.0 | |
Internet & Direct Marketing Retail | | | 2.8 | |
Equity Real Estate Investment Trusts (REITs) | | | 2.8 | |
Health Care Providers & Services | | | 2.7 | |
Biotechnology | | | 2.7 | |
Media | | | 2.7 | |
Health Care Equipment & Supplies | | | 2.6 | |
Aerospace & Defense | | | 2.5 | |
Insurance | | | 2.4 | |
Specialty Retail | | | 2.2 | |
Chemicals | | | 2.2 | |
Diversified Telecommunication Services | | | 2.0 | |
Beverages | | | 2.0 | |
Industrial Conglomerates | | | 1.9 | |
Hotels, Restaurants & Leisure | | | 1.8 | |
Food & Staples Retailing | | | 1.8 | |
Electric Utilities | | | 1.8 | |
Machinery | | | 1.7 | |
Diversified Financial Services | | | 1.7 | |
Household Products | | | 1.6 | |
Tobacco | | | 1.3 | |
Food Products | | | 1.2 | |
Communications Equipment | | | 1.0 | |
Multi-Utilities | | | 1.0 | |
Road & Rail | | | 0.9 | |
Energy Equipment & Services | | | 0.8 | |
| | | | |
Life Sciences Tools & Services | | | 0.8 | % |
Consumer Finance | | | 0.8 | |
Air Freight & Logistics | | | 0.7 | |
Textiles, Apparel & Luxury Goods | | | 0.7 | |
Electrical Equipment | | | 0.6 | |
Airlines | | | 0.5 | |
Automobiles | | | 0.5 | |
Multiline Retail | | | 0.5 | |
Household Durables | | | 0.4 | |
Electronic Equipment, Instruments & Components | | | 0.4 | |
Containers & Packaging | | | 0.4 | |
Building Products | | | 0.3 | |
Commercial Services & Supplies | | | 0.3 | |
Metals & Mining | | | 0.3 | |
Professional Services | | | 0.3 | |
Trading Companies & Distributors | | | 0.2 | |
Auto Components | | | 0.2 | |
Personal Products | | | 0.2 | |
Construction Materials | | | 0.1 | |
Distributors | | | 0.1 | |
Exchange Traded Fund | | | 0.1 | |
Construction & Engineering | | | 0.1 | |
Health Care Technology | | | 0.1 | |
U.S. Treasury Obligation | | | 0.1 | |
Water Utilities | | | 0.1 | |
Independent Power & Renewable Electricity Producers | | | 0.1 | |
Leisure Products | | | 0.1 | |
Real Estate Management & Development | | | 0.1 | |
Diversified Consumer Services | | | 0.0 | * |
| | | | |
| | | 102.9 | |
Liabilities in excess of other assets | | | (2.9 | ) |
| | | | |
| | | 100.0 | % |
| | | | |
SEE NOTES TO FINANCIAL STATEMENTS.
A147
| | | | | | |
| | STOCK INDEX PORTFOLIO (continued) | | |
| |
| SCHEDULE OF INVESTMENTS | | as of December 31, 2017 |
Effects of Derivative Instruments on the Financial Statements and Primary Underlying Risk Exposure:
The Portfolio invested in derivative instruments during the reporting period. The primary type of risk associated with these derivative instruments is equity contracts risk. The effect of such derivative instruments on the Portfolio’s financial position and financial performance as reflected in the Statement of Assets and Liabilities and Statement of Operations is presented in the summary below.
Fair values of derivative instruments as of December 31, 2017 as presented in the Statement of Assets and Liabilities:
| | | | | | | | | | | | |
Derivatives not accounted for as hedging
instruments, carried at fair value | | Asset Derivatives | | | Liability Derivatives | |
| | Balance Sheet Location | | Fair Value | | | Balance Sheet Location | | Fair Value | |
Equity contracts | | Due from/to broker — variation margin futures | | $ | 414,828 | * | | — | | $ | — | |
| | | | | | | | | | | | |
| * | Includes cumulative appreciation (depreciation) as reported in schedule of open futures and centrally cleared swap contracts. Only unsettled variation margin receivable (payable) is reported within the Statement of Assets and Liabilities. |
The effects of derivative instruments on the Statement of Operations for the year ended December 31, 2017 are as follows:
| | | | |
Amount of Realized Gain (Loss) on Derivatives Recognized in Income | |
Derivatives not accounted for as hedging
instruments, carried at fair value | | Futures | |
Equity contracts | | $ | 12,865,928 | |
| | | | |
| | | | |
Change in Unrealized Appreciation (Depreciation) on Derivatives Recognized in Income | |
Derivatives not accounted for as hedging
instruments, carried at fair value | | Futures | |
Equity contracts | | $ | 1,210,378 | |
| | | | |
For the year ended December 31, 2017, the Portfolio’s average volume of derivative activities is as follows:
|
Futures
Contracts —
Long Positions(1) |
| $77,975,358 |
Financial Instruments/Transactions — Summary of Offsetting and Netting Arrangements:
The Portfolio entered into financial instruments/transactions during the reporting period that are either offset in accordance with current requirements or are subject to enforceable master netting arrangements or similar agreements that permit offsetting. The information about offsetting and related netting arrangements for financial instruments/transactions, where the legal right to set-off exists, is presented in the summary below.
Offsetting of financial instrument/transaction assets and liabilities:
| | | | | | | | | | | | |
Description | | Gross Market Value of
Recognized
Assets/(Liabilities) | | | Collateral
Pledged/(Received)(1) | | | Net Amount | |
Securities on Loan | | $ | 116,628,095 | | | $ | (116,628,095 | ) | | $ | — | |
| | | | | | | | | | | | |
| (1) | Collateral amount disclosed by the Portfolio is limited to the market value of financial instruments/transactions. |
SEE NOTES TO FINANCIAL STATEMENTS.
A148
| | | | | | |
| | STOCK INDEX PORTFOLIO (continued) | | |
STATEMENT OF ASSETS & LIABILITIES
as of December 31, 2017
| | | | |
| ASSETS | | | | |
Investments at value, including securities on loan of $116,628,095: | | | | |
Unaffiliated investments (cost $1,176,052,228) | | $ | 3,863,098,629 | |
Affiliated investments (cost $179,747,940) | | | 179,747,940 | |
Cash | | | 22,175 | |
Receivable for investments sold | | | 5,834,600 | |
Dividends and interest receivable | | | 3,917,281 | |
Receivable for Series shares sold | | | 1,316,463 | |
Prepaid expenses | | | 25,484 | |
| | | | |
Total Assets | | | 4,053,962,572 | |
| | | | |
| LIABILITIES | | | | |
Payable to broker for collateral for securities on loan | | | 119,754,122 | |
Payable for Series shares repurchased | | | 3,043,816 | |
Payable for investments purchased | | | 1,362,153 | |
Management fee payable | | | 1,000,874 | |
Accrued expenses and other liabilities | | | 278,814 | |
Due to broker—variation margin futures | | | 235,225 | |
Affiliated transfer agent fee payable | | | 980 | |
| | | | |
Total Liabilities | | | 125,675,984 | |
| | | | |
| NET ASSETS | | $ | 3,928,286,588 | |
| | | | |
Net assets were comprised of: | | | | |
Paid-in capital | | $ | 1,175,930,520 | |
Retained earnings | | | 2,752,356,068 | |
| | | | |
Net assets, December 31, 2017 | | $ | 3,928,286,588 | |
| | | | |
Net asset value and redemption price per share $3,928,286,588 / 66,150,076 outstanding shares of beneficial interest | | $ | 59.38 | |
| | | | |
STATEMENT OF OPERATIONS
Year Ended December 31, 2017
| | | | |
| NET INVESTMENT INCOME (LOSS) | |
| INCOME | |
Unaffiliated dividend income (net of foreign withholding taxes of $220) | | $ | 71,636,425 | |
Affiliated dividend income | | | 806,066 | |
Income from securities lending, net (including affiliated income of $231,261) | | | 261,704 | |
Interest income | | | 30,634 | |
| | | | |
Total income | | | 72,734,829 | |
| | | | |
| EXPENSES | |
Management fee | | | 10,889,877 | |
Custodian and accounting fees | | | 233,643 | |
Shareholders’ reports | | | 174,207 | |
Trustees’ fees | | | 45,572 | |
Audit fee | | | 24,673 | |
Legal fees and expenses | | | 24,667 | |
Transfer agent’s fees and expenses (including affiliated expense of $5,882) | | | 11,057 | |
Miscellaneous | | | 100,985 | |
| | | | |
Total expenses | | | 11,504,681 | |
| | | | |
| NET INVESTMENT INCOME (LOSS) | | | 61,230,148 | |
| | | | |
| REALIZED AND UNREALIZED GAIN (LOSS) ON INVESTMENTS | | | | |
Net realized gain (loss) on: | | | | |
Investment transactions (including affiliated of $6,975) | | | 40,520,603 | |
Futures transactions | | | 12,865,928 | |
| | | | |
| | | 53,386,531 | |
| | | | |
Net change in unrealized appreciation (depreciation) on: | | | | |
Investments (including affiliated of ($29,540)) | | | 588,460,766 | |
Futures | | | 1,210,378 | |
| | | | |
| | | 589,671,144 | |
| | | | |
| NET GAIN (LOSS) ON INVESTMENT TRANSACTIONS | | | 643,057,675 | |
| | | | |
| NET INCREASE (DECREASE) IN NET ASSETS RESULTING FROM OPERATIONS | | $ | 704,287,823 | |
| | | | |
STATEMENTS OF CHANGES IN NET ASSETS
| | | | | | | | |
| | | Year Ended December 31, | |
| | | 2017 | | | 2016 | |
| INCREASE (DECREASE) IN NET ASSETS | | | | | | | | |
| OPERATIONS | | | | | | | | |
Net investment income (loss) | | $ | 61,230,148 | | | $ | 57,570,334 | |
Net realized gain (loss) on investment transactions | | | 53,386,531 | | | | 72,046,263 | |
Net change in unrealized appreciation (depreciation) on investments | | | 589,671,144 | | | | 228,987,837 | |
| | | | | | | | |
NET INCREASE (DECREASE) IN NET ASSETS RESULTING FROM OPERATIONS | | | 704,287,823 | | | | 358,604,434 | |
| | | | | | | | |
| DISTRIBUTIONS | | | (129,595,196 | ) | | | (210,338,581 | ) |
| | | | | | | | |
| SERIES SHARE TRANSACTIONS | | | | | | | | |
Series shares sold [2,742,922 and 2,976,732 shares, respectively] | | | 149,785,094 | | | | 136,335,898 | |
Series shares issued in reinvestment of distributions [2,421,435 and 4,481,009 shares, respectively] | | | 129,595,196 | | | | 210,338,581 | |
Series shares repurchased [4,202,101 and 4,217,650 shares, respectively] | | | (230,911,603 | ) | | | (204,352,773 | ) |
| | | | | | | | |
NET INCREASE (DECREASE) IN NET ASSETS FROM SERIES SHARE TRANSACTIONS | | | 48,468,687 | | | | 142,321,706 | |
| | | | | | | | |
| CAPITAL CONTRIBUTIONS | | | — | | | | 4,458,724 | |
| | | | | | | | |
| TOTAL INCREASE (DECREASE) | | | 623,161,314 | | | | 295,046,283 | |
| NET ASSETS: | | | | | | | | |
Beginning of year | | | 3,305,125,274 | | | | 3,010,078,991 | |
| | | | | | | | |
End of year | | $ | 3,928,286,588 | | | $ | 3,305,125,274 | |
| | | | | | | | |
SEE NOTES TO FINANCIAL STATEMENTS.
A149
| | | | | | |
| | GLOSSARY | | |
| |
| SCHEDULE OF INVESTMENTS | | as of December 31, 2017 |
The following abbreviations are used in the preceding Portfolios’ descriptions:
Currency
| | |
| AUD | | Australian Dollar |
| BRL | | Brazilian Real |
| CAD | | Canadian Dollar |
| CHF | | Swiss Franc |
| EUR | | Euro |
| GBP | | British Pound |
| JPY | | Japanese Yen |
| MXN | | Mexican Peso |
| ZAR | | South African Rand |
Index
| | |
| CDX | | Credit Derivative Index |
| CPI | | Consumer Price Index |
| CMBX | | Commercial Mortgage-Backed Index |
| iTraxx | | International Credit Derivative Index |
| NSA | | Non-Seasonally Adjusted |
Other
| | |
| 144A | | Security was purchased pursuant to Rule 144A under the Securities Act of 1933 and may not be resold subject to that rule except to qualified institutional buyers. Unless otherwise noted, 144A securities are deemed to be liquid. |
| A | | Annual payment frequency for swaps |
| M | | Monthly payment frequency for swaps |
| Q | | Quarterly payment frequency for swaps |
| S | | Semiannual payment frequency for swaps |
| T | | Swap payment upon termination |
| ABS | | Asset-Backed Security |
| Aces | | Alternative Credit Enhancements Securities |
| ADR | | American Depositary Receipt |
| BABs | | Build America Bonds |
| BBSW | | Australian Bank Bill Swap Reference Rate |
| bps | | Basis Points |
| BROIS | | Brazil Interbank Offered Rate |
| CDO | | Collateralized Debt Obligation |
| CLO | | Collateralized Loan Obligation |
| CVA | | Certificate Van Aandelen (Bearer) |
| EAFE | | Europe, Australasia and Far East |
| ETF | | Exchange Traded Fund |
| EMTN | | Euro Medium Term Note |
| EONIA | | Euro Overnight Index Average |
| EURIBOR | | Euro Interbank Offered Rate |
| FHLMC | | Federal Home Loan Mortgage Corp. |
| GMTN | | Global Medium Term Note |
| GO | | General Obligation |
| JIBAR | | Johannesburg Interbank Agreed Rate |
| IO | | Interest Only (Principal amount represents notional) |
| LIBOR | | London Interbank Offered Rate |
| MSCI | | Morgan Stanley Capital International |
| MTN | | Medium Term Note |
| NSA | | Non-Seasonally Adjusted |
| OIS | | Overnight Index Swap |
| OTC | | Over-the-counter |
| PIK | | Payment-in-Kind |
| PO | | Principal Only |
| PRFC | | Preference Shares |
| REITs | | Real Estate Investment Trusts |
SEE NOTES TO FINANCIAL STATEMENTS.
A150
| | | | | | |
| | GLOSSARY (continued) | | |
| |
| SCHEDULE OF INVESTMENTS | | as of December 31, 2017 |
| | |
| RSP | | Non-Voting Shares |
| SONIA | | Sterling Overnight Index Average |
| STRIPS | | Separate Trading of Registered Interest and Principal of Securities |
| TBA | | To Be Announced |
| TIPS | | Treasury Inflation-Protected Securities |
| USAID | | United States Agency for International Development |
| USOIS | | United States Overnight Index Swap |
SEE NOTES TO FINANCIAL STATEMENTS.
A151
NOTES TO FINANCIAL STATEMENTS OF
THE PRUDENTIAL SERIES FUND
The Prudential Series Fund (“Series Fund”), organized as a Delaware statutory trust, is registered under the Investment Company Act of 1940, as amended (“1940 Act”), as an open-end management investment company. The Series Fund is composed of seventeen Portfolios (“Portfolios”), each with separate series shares. The information presented in these financial statements pertains to the 8 Portfolios listed below together with their investment objectives. Each Portfolio listed below is a diversified investment company for purposes of the 1940 Act.
Conservative Balanced Portfolio: Total investment return consistent with a conservatively managed diversified portfolio.
Diversified Bond Portfolio: High level of income over a longer term while providing reasonable safety of capital.
Equity Portfolio: Long-term growth of capital.
Flexible Managed Portfolio: Total return consistent with an aggressively managed diversified portfolio.
Global Portfolio: Long-term growth of capital.
Government Income Portfolio: High level of income over the long-term consistent with the preservation of capital.
Government Money Market Portfolio: Maximum current income consistent with the stability of capital and
maintenance of liquidity.
Stock Index Portfolio: Achieve investment results that generally correspond to the performance of publicly traded common stocks.
The Series Fund follows investment company accounting and reporting guidance of the Financial Accounting Standards Board (“FASB”) Accounting Standard Codification Topic 946 Financial Services-Investment Companies. The following accounting policies conform to U.S. generally accepted accounting principles. The Series Fund and the Portfolios consistently follow such policies in the preparation of their financial statements.
Securities Valuation: Each Portfolio holds securities and other assets and liabilities that are fair valued at the close of each day (generally, 4:00 PM Eastern time) the New York Stock Exchange (“NYSE”) is open for trading. Fair value is the price that would be received to sell an asset or paid to transfer a liability in an orderly transaction between market participants on the measurement date. The Board of Trustees (the “Board”) has adopted valuation procedures for security valuation under which fair valuation responsibilities have been delegated to PGIM Investments LLC (“PGIM Investments” or “the Manager”) (formerly known as Prudential Investments LLC). Under the current valuation procedures, the Valuation Committee is responsible for supervising the valuation of portfolio securities and other assets and liabilities. The valuation procedures permit a Portfolio to utilize independent pricing vendor services, quotations from market makers, and alternative valuation methods when market quotations are either not readily available or not deemed representative of fair value. A record of the Valuation Committee’s actions is subject to the Board’s review, approval, and ratification at its next regularly scheduled quarterly meeting.
Various inputs determine how each Portfolio’s investments are valued, all of which are categorized according to the three broad levels (Level 1, 2, or 3) detailed in the Schedules of Investments.
Common and preferred stocks, exchange-traded funds, and derivative instruments, such as futures or options, that are traded on a national securities exchange are valued at the last sale price as of the close of trading on the applicable exchange where the security principally trades. Securities traded via NASDAQ are valued at the NASDAQ official closing price. To the extent these securities are valued at the last sale price or NASDAQ official closing price, they are classified as Level 1 in the fair value hierarchy. In the event that no sale or official closing price on valuation date exists, these securities are generally valued at the mean
B1
between the last reported bid and ask prices, or at the last bid price in the absence of an ask price. These securities are classified as Level 2 in the fair value hierarchy.
Foreign equities traded on foreign securities exchanges are generally valued using pricing vendor services that provide model prices derived using adjustment factors based on information such as local closing price, relevant general and sector indices, currency fluctuations, depositary receipts, and futures, as applicable. Securities valued using such model prices are classified as Level 2 in the fair value hierarchy. The models generate an evaluated adjustment factor for each security, which is applied to the local closing price to adjust it for post closing market movements. Utilizing that evaluated adjustment factor, the vendor provides an evaluated price for each security. If the vendor does not provide an evaluated price, securities are valued in accordance with exchange-traded common and preferred stock valuation policies discussed above.
Investments in open-end, non-exchange-traded mutual funds are valued at their net asset values as of the close of the NYSE on the date of valuation. These securities are classified as Level 1 in the fair value hierarchy since they may be purchased or sold at their net asset values on the date of valuation.
Fixed income securities traded in the OTC market are generally classified as Level 2 in the fair value hierarchy. Such fixed income securities are typically valued using the market approach which generally involves obtaining data from an approved independent third-party vendor source. The Portfolios utilize the market approach as the primary method to value securities when market prices of identical or comparable instruments are available. The third-party vendors’ valuation techniques used to derive the evaluated bid price are based on evaluating observable inputs, including but not limited to, yield curves, yield spreads, credit ratings, deal terms, tranche level attributes, default rates, cash flows, prepayment speeds, broker/dealer quotations and reported trades. Certain Level 3 securities are also valued using the market approach when obtaining a single broker quote or when utilizing transaction prices for identical securities that have been used in excess of five business days. During the reporting period, there were no changes to report with respect to the valuation approach and/or valuation techniques discussed above.
The Government Money Market Portfolio values all of its securities of sufficient credit quality at amortized cost, which approximates fair value. The amortized cost method involves valuing a security at its cost on the date of purchase and thereafter assuming a constant amortization to maturity of the difference between the principal amount due at maturity and cost. These securities are categorized as Level 2 of the fair value hierarchy.
Bank loans are generally valued at prices provided by approved independent pricing vendors. The pricing vendors utilize broker/dealer quotations and provide prices based on the average of such quotations. Bank loans valued using such vendor prices are generally classified as Level 2 in the fair value hierarchy. Bank loans valued based on a single broker quote or at the original transaction price are classified as Level 3 in the fair value hierarchy.
OTC derivative instruments are generally classified as Level 2 in the fair value hierarchy. Such derivative instruments are typically valued using the market approach and/or income approach which generally involves obtaining data from an approved independent third-party vendor source. The Portfolios utilize the market approach when quoted prices in broker-dealer markets are available but also include consideration of alternative valuation approaches, including the income approach. In the absence of reliable market quotations, the income approach is typically utilized for purposes of valuing OTC derivatives such as interest rate swaps based on a discounted cash flow analysis whereby the value of the instrument is equal to the present value of its future cash inflows or outflows. Such analysis includes projecting future cash flows and determining the discount rate (including the present value factors that affect the discount rate) used to discount the future cash flows. In addition, the third-party vendors’ valuation techniques used to derive the evaluated OTC derivative price is based on evaluating observable inputs, including but not limited to, underlying asset prices, indices, spreads, interest rates and exchange rates. Certain OTC derivatives may be classified as Level 3 when valued using the market approach by obtaining a single broker quote or when utilizing unobservable inputs in the income approach. During the reporting period, there were no changes to report with respect to the valuation approach and/or valuation techniques discussed above.
Centrally cleared swaps listed or traded on a multilateral or trade facility platform, such as a registered exchange, are generally valued at the daily settlement price determined by the respective exchange. These securities are classified as Level 2 in the fair value hierarchy, as the daily settlement price is not public.
B2
Securities and other assets that cannot be priced according to the methods described above are valued based on pricing methodologies approved by the Board. In the event that unobservable inputs are used when determining such valuations, the securities will be classified as Level 3 in the fair value hierarchy.
When determining the fair value of securities, some of the factors influencing the valuation include: the nature of any restrictions on disposition of the securities; assessment of the general liquidity of the securities; the issuer’s financial condition and the markets in which it does business; the cost of the investment; the size of the holding and the capitalization of the issuer; the prices of any recent transactions or bids/offers for such securities or any comparable securities; any available analyst media or other reports or information deemed reliable by the investment manager regarding the issuer or the markets or industry in which it operates. Using fair value to price securities may result in a value that is different from a security’s most recent closing price and from the price used by other unaffiliated mutual funds to calculate their net asset values.
Restricted and Illiquid Securities: Subject to guidelines adopted by the Board, each Portfolio may invest up to 15% of its net assets (the Government Money Market Portfolio may invest up to 5%) in illiquid securities, including those which are restricted as to disposition under securities law (“restricted securities”). Restricted securities are valued pursuant to the valuation procedures noted above. Illiquid securities are those that, because of the absence of a readily available market or due to legal or contractual restrictions on resale, cannot be sold within seven days in the ordinary course of business at approximately the amount at which the Portfolio has valued the investment. Therefore, a Portfolio may find it difficult to sell illiquid securities at the time considered most advantageous by its Subadviser and may incur expenses that would not be incurred in the sale of securities that were freely marketable. Certain securities that would otherwise be considered illiquid because of legal restrictions on resale to the general public may be traded among qualified institutional buyers under Rule 144A of the Securities Act of 1933. These Rule 144A securities, as well as commercial paper that is sold in private placements under Section 4(2) of the Securities Act, may be deemed liquid by the Portfolio’s Subadviser under the guidelines adopted by the Board of the Portfolio. However, the liquidity of a Portfolio’s investments in Rule 144A securities could be impaired if trading does not develop or declines.
Connecticut Avenue Securities (CAS) and Structured Agency Credit Risk (STACR): Certain Portfolios purchased government controlled Fannie Mae and Freddie Mac securities that transfer most of the cost of defaults to private investors including the Portfolios. These are insurance-like products that are called CAS by Fannie Mae and STACR securities by Freddie Mac. Payments on the securities are based primarily on the performance of a reference pool of underlying mortgages. With such securities, the Portfolios could lose some or all of their principal if the underlying mortgages experience credit defaults.
Foreign Currency Translation: The books and records of the Portfolios are maintained in U.S. dollars. Foreign currency amounts are translated into U.S. dollars on the following basis:
(i) market value of investment securities, other assets and liabilities — at the current rates of exchange;
(ii) purchases and sales of investment securities, income and expenses — at the rates of exchange prevailing on the respective dates of such transactions.
Although the net assets of the Portfolios are presented at the foreign exchange rates and market values at the close of the period, the Portfolios do not generally isolate that portion of the results of operations arising as a result of changes in the foreign exchange rates from the fluctuations arising from changes in the market prices of long-term portfolio securities held at the end of the period. Similarly, the Portfolios do not isolate the effect of changes in foreign exchange rates from the fluctuations arising from changes in the market prices of long-term portfolio securities sold during the period. Accordingly, holding period realized foreign currency gains (losses) are included in the reported net realized gains (losses) on investment transactions. Notwithstanding the above, the Portfolios do isolate the effect of fluctuations in foreign currency exchange rates when determining the gain (loss) upon the sale or maturity of foreign currency denominated debt obligations; such amounts are included in net realized gains (losses) on foreign currency transactions.
Additionally, net realized gains (losses) on foreign currency transactions represent net foreign exchange gains (losses) from the disposition of holdings of foreign currencies, currency gains (losses) realized between the trade and settlement dates on securities transactions, and the difference between the amounts of interest, dividends and foreign withholding taxes recorded on the Portfolios’ books and the U.S. dollar equivalent amounts actually received or paid. Net unrealized currency gains (losses) from valuing foreign currency denominated assets and liabilities (other than investments) at period end exchange rates are reflected as a component of net unrealized appreciation (depreciation) on foreign currencies.
B3
Forward and Cross Currency Contracts: A forward currency contract is a commitment to purchase or sell a foreign currency at a future date at a negotiated forward rate. Certain Portfolios, as defined in the prospectus, entered into forward currency contracts in order to hedge their exposure to changes in foreign currency exchange rates on their foreign portfolio holdings or on specific receivables and payables denominated in a foreign currency and to gain exposures to certain currencies. The contracts are valued daily at current forward exchange rates and any unrealized gain (loss) is included in net unrealized appreciation or depreciation on investments and foreign currencies. Gain (loss) is realized on the settlement date of the contract equal to the difference between the settlement value of the original and negotiated forward contracts. This gain (loss), if any, is included in net realized gain (loss) on forward and cross currency contract transactions. Risks may arise upon entering into these contracts from the potential inability of the counterparties to meet the terms of their contracts. Forward currency contracts involve risks from currency exchange rate and credit risk in excess of the amounts reflected on the Statement of Assets and Liabilities. A Portfolio’s maximum risk of loss from counterparty credit risk is the net value of the cash flows to be received from the counterparty at the end of the contract’s life. A cross currency contract is a forward contract where a specified amount of one foreign currency will be exchanged for a specified amount of another foreign currency.
Options: Certain Portfolios purchased or wrote options in order to hedge against adverse market movements or fluctuations in value caused by changes in prevailing interest rates, value of equities or foreign currency exchange rates with respect to securities or financial instruments which the Portfolio currently owns or intends to purchase. Portfolios may also use options to gain additional market exposure. The Portfolio’s principal reason for writing options is to realize, through receipt of premiums, a greater current return than would be realized on the underlying security alone. When the Portfolio purchases an option, it pays a premium and an amount equal to that premium is recorded as an asset. When the Portfolio writes an option, it receives a premium and an amount equal to that premium is recorded as a liability. The asset or liability is adjusted daily to reflect the current market value of the option. If an option expires unexercised, the Portfolio realizes a gain (loss) to the extent of the premium received or paid. If an option is exercised, the premium received or paid is recorded as an adjustment to the proceeds from the sale or the cost of the purchase in determining whether the Portfolio has realized a gain (loss). The difference between the premium and the amount received or paid at the closing of a purchase or sale transaction is also treated as a realized gain (loss). Gain (loss) on purchased options is included in net realized gain (loss) on investment transactions. Gain (loss) on written options is presented separately as net realized gain (loss) on options written transactions.
The Portfolio, as writer of an option, may have no control over whether the underlying securities or financial instruments may be sold (called) or purchased (put). As a result, the Portfolio bears the market risk of an unfavorable change in the price of the security or financial instrument underlying the written option. The Portfolio, as purchaser of an OTC option, bears the risk of the potential inability of the counterparties to meet the terms of their contracts. With exchange-traded options contracts, there is minimal counterparty credit risk to the Portfolio since the exchanges’ clearinghouse acts as counterparty to all exchange-traded options and guarantees the options contracts against default.
When a Portfolio writes an option on a swap, an amount equal to any premium received by the Portfolio is recorded as a liability and is subsequently adjusted to the current market value of the written option on the swap. If a call option on a swap is exercised, the Portfolio becomes obligated to pay a fixed interest rate (noted as the strike price) and receive a variable interest rate on a notional amount. If a put option on a swap is exercised, the Portfolio becomes obligated to pay a variable interest rate and receive a fixed interest rate (noted as the strike price) on a notional amount. Premiums received from writing options on swaps that expire or are exercised are treated as realized gains upon the expiration or exercise of such options on swaps. The risk associated with writing put and call options on swaps is that the Portfolio will be obligated to be party to a swap agreement if an option on a swap is exercised.
Financial Futures Contracts: A financial futures contract is an agreement to purchase (long) or sell (short) an agreed amount of securities at a set price for delivery on a future date. Upon entering into a financial futures contract, the Portfolio is required to pledge to the broker an amount of cash and/or other assets equal to a certain percentage of the contract amount. This amount is known as the “initial margin.” Subsequent payments, known as “variation margin,” are made or received by the Portfolio each day, depending on the daily fluctuations in the value of the underlying security. Such variation margin is recorded for financial statement purposes on a daily basis as unrealized gain (loss). When the contract expires or is closed, the gain (loss) is realized and is presented in the Statement of Operations as net realized gain (loss) on futures transactions.
B4
Certain Portfolios invested in financial futures contracts in order to hedge their existing portfolio securities, or securities the Portfolios intend to purchase, against fluctuations in value caused by changes in value of equities or prevailing interest rates. Should interest rates move unexpectedly, the Portfolios may not achieve the anticipated benefits of the financial futures contracts and may realize a loss. The use of futures transactions involves the risk of imperfect correlation in movements in the price of futures contracts, interest rates and the underlying hedged assets. Since futures contracts are exchange-traded, there is minimal counterparty credit risk to the Portfolios since the exchanges’ clearinghouse acts as counterparty to all exchange-traded futures and guarantees the futures contracts against default.
Short Sales: Certain Portfolios may sell a security they do not own in anticipation of a decline in the market value of that security (short sale). When the Portfolio makes a short sale, it must borrow the security sold short and deliver it to the broker-dealer through which it made the short sale as collateral for its obligation to deliver the security upon conclusion of the transaction. The Portfolio may have to pay a fee to borrow the particular security and may be obligated to return any interest or dividends received on such borrowed securities. Dividends declared on open short positions are recorded on the ex-date and the interest payable is accrued daily on fixed income securities sold short, both of which are recorded as an expense. A gain, limited to the price at which the Portfolio sold the security short, or a loss, unlimited in magnitude, will be recognized upon the termination of a short sale if the market price at termination is less than or greater than, respectively, the proceeds originally received.
Bank Loans: Each Portfolio may invest in bank loans. Bank loans include fixed and floating rate loans that are privately negotiated between a corporate borrower and one or more financial institutions, including, but not limited to, term loans, revolvers, and other instruments issued in the bank loan market. Each Portfolio may acquire interests in loans directly (by way of assignment from the selling institution) or indirectly (by way of the purchase of a participation interest from the selling institution). Under a bank loan assignment, a Portfolio generally will succeed to all the rights and obligations of an assigning lending institution and becomes a lender under the loan agreement with the relevant borrower in connection with that loan. Under a bank loan participation, the Portfolio generally will have a contractual relationship only with the lender, not with the relevant borrower. As a result, a Portfolio generally will have the right to receive payments of principal, interest, and any fees to which it is entitled only from the lender selling the participation and only upon receipt by the lender of the payments from the relevant borrower. The Portfolio may not directly benefit from the collateral supporting the debt obligation in which it has purchased the participation. As a result, a Portfolio will assume the credit risk of both the borrower and the institution selling the participation to the Portfolio.
Repurchase Agreements: In connection with transactions in repurchase agreements with United States financial institutions, it is each Portfolio’s policy that its custodian or designated subcustodians under triparty repurchase agreements, as the case may be, take possession of the underlying collateral securities, the value of which exceeds the principal amount of the repurchase transactions, including accrued interest. To the extent that any repurchase transaction exceeds one business day, the value of the collateral is marked-to-market on a daily basis to ensure the adequacy of the collateral. If the seller defaults and the value of the collateral declines or, if bankruptcy proceedings are commenced with respect to the seller of the security, realization of the collateral by the Portfolio may be delayed or limited.
Forward Rate Agreements: Forward rate agreements represent an agreement between counterparties to exchange cash flows based on the difference between two interest rates, applied to a notional principal amount on a fixed future date. Certain Portfolios entered into forward rate agreements to gain yield exposure based on anticipated market conditions at the specified termination date of the agreement.
Swap Agreements: Certain Portfolios may enter into credit default, interest rate, total return and other types of swap agreements. A swap agreement is an agreement to exchange the return generated by one instrument for the return generated by another instrument. Swap agreements are negotiated in the OTC market and may be executed either directly with a counterparty (“OTC-traded”) or through a central clearing facility, such as a registered exchange. Swap agreements are valued daily at current market value and any change in value is included in the net unrealized appreciation (depreciation) on swap agreements. Centrally cleared swaps pay or receive an amount, known as “variation margin”, based on daily changes in the valuation of the swap contract. Any upfront premiums paid and received are shown as swap premiums paid and swap premiums received in the Statement of Assets and Liabilities. Risk of loss may exceed amounts recognized on the Statement of Assets and Liabilities. Swap agreements outstanding at period end, if any, are listed on the Schedule of Investments.
B5
Interest Rate Swaps: Interest rate swaps represent agreements between counterparties to exchange cash flows based on the difference between two interest rates, applied to a notional principal amount for a specified period. Certain Portfolios are subject to interest rate risk exposure in the normal course of pursuing their investment objectives. Certain Portfolios used interest rate swaps to maintain their ability to generate steady cash flow by receiving a stream of fixed rate payments and to increase exposure to prevailing market rates by receiving floating rate payments. A Portfolio’s maximum risk of loss from counterparty credit risk is the discounted net present value of the cash flows to be received from the counterparty over the contract’s remaining life.
Inflation Swaps: Certain Portfolios entered into inflation swap agreements to protect against fluctuations in inflation rates. Inflation swaps are characterized by one party paying a fixed rate in exchange for a floating rate that is derived from an inflation index, such as the Consumer Price Index or UK Retail Price Index. Inflation swaps subject the Portfolios to interest rate risk.
Credit Default Swaps (“CDS”): CDS involve one party (the protection buyer) making a stream of payments to another party (the protection seller) in exchange for the right to receive a specified payment in the event of a default or as a result of a default (collectively a “credit event”) for the referenced entity (typically corporate issues or sovereign issues of an emerging country) on its obligation; or in the event of a write-down, principal shortfall, interest shortfall or default of all or part of the referenced entities comprising a credit index.
Certain Portfolios are subject to credit risk in the normal course of pursuing their investment objectives, and as such, have entered into CDS contracts to provide a measure of protection against defaults or to take an active long or short position with respect to the likelihood of a particular issuer’s default or the reference entity’s credit soundness. CDS contracts generally trade based on a spread which represents the cost a protection buyer has to pay the protection seller. The protection buyer is said to be short the credit as the value of the contract rises the more the credit deteriorates. The value of the CDS contract increases for the protection buyer if the spread increases. A Portfolio’s maximum risk of loss from counterparty credit risk for purchased CDS is the inability of the counterparty to honor the contract up to the notional value due to a credit event.
As a seller of protection on credit default swap agreements, the Portfolio generally receives an agreed upon payment from the buyer of protection throughout the term of the swap, provided no credit event occurs. As the seller, the Portfolio effectively increases its investment risk because, in addition to its total net assets, the Portfolio may be subject to investment exposure on the notional amount of the swap.
The maximum amount of the payment that the Portfolio, as a seller of protection, could be required to make under a credit default swap agreement would be equal to the notional amount of the underlying security or index contract as a result of a credit event. This potential amount will be partially offset by any recovery values of the respective referenced obligations, or net amounts received from the settlement of buy protection credit default swap agreements which the Portfolio entered into for the same referenced entity or index. As a buyer of protection, the Portfolio generally receives an amount up to the notional value of the swap if a credit event occurs.
Implied credit spreads, represented in absolute terms, utilized in determining the market value of credit default swap agreements on corporate or sovereign issues of an emerging country as of period end are disclosed in the footnotes to the Schedule of Investments, if applicable. These spreads serve as indicators of the current status of the payment/performance risk and represent the likelihood of default risk for the credit derivative. The implied credit spread of a particular referenced entity reflects the cost of buying/selling protection and may include upfront payments required to enter into the agreement. For credit default swap agreements on asset-backed securities and credit indices, the quoted market prices and resulting values serve as indicators of the current status of the payment/performance risk. Wider credit spreads and increased market value in absolute terms, when compared to the notional amount of the swap, represent a deterioration of the referenced entity’s credit soundness and a greater likelihood of risk of default or other credit event occurring as defined under the terms of the agreement.
Currency Swaps: Certain Portfolios entered into currency swap agreements primarily to gain yield exposure on foreign bonds. Currency swap agreements involve two parties exchanging two different currencies with an agreement to reverse the exchange at a later date at specified exchange rates.
Total Return Swaps: In a total return swap, one party would receive payments based on the market value of the security or the commodity involved, or total return of a specific referenced asset, such as an equity, index
B6
or bond, and in return pay a fixed amount. Certain Portfolios are subject to risk exposures associated with the referenced asset in the normal course of pursuing their investment objectives. Certain Portfolios entered into total return swaps to manage their exposure to a security or an index. A Portfolio’s maximum risk of loss from counterparty credit risk is the change in the value of the security, in favor of the Portfolio, from the point of entering into the contract.
Master Netting Arrangements: The Series Fund, on behalf of certain Portfolios, is subject to various Master Agreements, or netting arrangements, with select counterparties. These are agreements which a subadviser may have negotiated and entered into on behalf of the Portfolio. For multi-sleeve Portfolios, different subadvisers who manage their respective sleeve, may enter into such agreements with the same counterparty and are disclosed separately for each sleeve when presenting information about offsetting and related netting arrangements for OTC derivatives. A master netting arrangement between the Portfolio and the counterparty permits the Portfolio to offset amounts payable by the Portfolio to the same counterparty against amounts to be received; and by the receipt of collateral from the counterparty by the Portfolio to cover the Portfolio’s exposure to the counterparty. However, there is no assurance that such mitigating factors are easily enforceable. In addition to master netting arrangements, the right to set-off exists when all the conditions are met such that each of the parties owes the other determinable amounts, the reporting party has the right to set-off the amount owed with the amount owed by the other party, the reporting party intends to set-off, and the right of set-off is enforceable by law. During the reporting period, there was no intention to settle on a net basis and all amounts are presented on a gross basis on the Statement of Assets and Liabilities.
The Series Fund, on behalf of certain Portfolios, is a party to International Swaps and Derivatives Association, Inc. (“ISDA”) Master Agreements with certain counterparties that govern OTC derivative and foreign exchange contracts entered into from time to time. The Master Agreements may contain provisions regarding, among other things, the parties’ general obligations, representations, agreements, collateral requirements, events of default and early termination. With respect to certain counterparties, in accordance with the terms of the Master Agreements, collateral posted to the Portfolio is held in a segregated account by the Portfolio’s custodian and with respect to those amounts which can be sold or re-pledged, are presented in the Schedule of Investments. Collateral pledged by the Portfolio is segregated by the Portfolio’s custodian and identified in the Schedule of Investments. Collateral can be in the form of cash or debt securities issued by the U.S. Government or related agencies or other securities as agreed to by the Portfolio and the applicable counterparty. Collateral requirements are determined based on the Portfolio’s net position with each counterparty. Termination events applicable to the Portfolio may occur upon a decline in the Portfolio’s net assets below a specified threshold over a certain period of time. Termination events applicable to counterparties may occur upon a decline in the counterparty’s long-term and short-term credit ratings below a specified level. In each case, upon occurrence, the other party may elect to terminate early and cause settlement of all derivative and foreign exchange contracts outstanding, including the payment of any losses and costs resulting from such early termination, as reasonably determined by the terminating party. Any decision by one or more of the Portfolio’s counterparties to elect early termination could impact the Portfolio’s future derivative activity.
In addition to each instrument’s primary underlying risk exposure (e.g. interest rate, credit, equity or foreign exchange, etc.), swap agreements involve, to varying degrees, elements of credit, market and documentation risk. Such risks involve the possibility that no liquid market for these agreements will exist, the counterparty to the agreement may default on its obligation to perform or disagree on the contractual terms of the agreement, and changes in net interest rates will be unfavorable. In connection with these agreements, securities in a portfolio may be identified or received as collateral from the counterparty in accordance with the terms of the respective swap agreements to provide or receive assets of value and to serve as recourse in the event of default or bankruptcy/insolvency of either party. Such OTC derivative agreements include conditions which, when materialized, give the counterparty the right to cause an early termination of the transactions under those agreements. Any election by the counterparty for early termination of the contract(s) may impact the amounts reported on financial statements.
As of December 31, 2017, none of the Portfolios have met conditions under such agreements which give the counterparty the right to call for an early termination.
Forward currency contracts, forward rate agreements, written options, short sales, swaps and financial futures contracts involve elements of both market and credit risk in excess of the amounts reflected on the Statement of Assets and Liabilities. Such risks may be mitigated by engaging in master netting arrangements.
B7
Warrants and Rights: Certain Portfolios may hold warrants and rights acquired either through a direct purchase or pursuant to corporate actions. Warrants and rights entitle the holder to buy a proportionate amount of common stock, or such other security that the issuer may specify, at a specific price and time through the expiration dates. Such warrants and rights are held as long positions by the Portfolios until exercised, sold or expired. Warrants and rights are valued at fair value in accordance with the Board approved fair valuation procedures.
Payment-In-Kind: Certain fixed income Portfolios may invest in the open market or receive pursuant to debt restructuring, securities that pay-in-kind (PIK) the interest due on such debt instruments. The PIK interest, computed at the contractual rate specified, is added to the existing principal balance of the debt when issued bonds have same terms as the bond or recorded as a separate bond when terms are different from the existing debt, and is recorded as interest income.
Delayed-Delivery Transactions: Certain Portfolios may purchase or sell securities on a when-issued or delayed-delivery and forward commitment basis. These transactions involve a commitment by the Portfolio to purchase or sell securities for a predetermined price or yield, with payment and delivery taking place beyond the customary settlement period. When delayed-delivery purchases are outstanding, the Portfolio will set aside and maintain an amount of liquid assets sufficient to meet the purchase price in a segregated account until the settlement date. When purchasing a security on a delayed-delivery basis, the Portfolio assumes the rights and risks of ownership of the security, including the risk of price and yield fluctuations, and takes such fluctuations into account when determining its net asset value. The Portfolio may dispose of or renegotiate a delayed-delivery transaction subsequent to establishment, and may sell when-issued securities before they are delivered, which may result in a realized gain (loss). When selling a security on a delayed-delivery basis, the Portfolio forfeits its eligibility to realize future gains (losses) with respect to the security.
Securities Lending: The Portfolios may lend their portfolio securities to banks and broker-dealers. The loans are secured by collateral at least equal to the market value of the securities loaned. Collateral pledged by each borrower is invested in an affiliated money market fund and is marked to market daily, based on the previous day’s market value, such that the value of the collateral exceeds the value of the loaned securities. In the event of significant appreciation in value of securities on loan on the last business day of the reporting period, the financial statements may reflect a collateral value that is less than the market value of the loaned securities. Such shortfall is remedied as described above. Loans are subject to termination at the option of the borrower or the Portfolio. Upon termination of the loan, the borrower will return to the Portfolio securities identical to the loaned securities. Should the borrower of the securities fail financially, the Portfolio has the right to repurchase the securities in the open market using the collateral. The Portfolio recognizes income, net of any rebate and securities lending agent fees, for lending its securities in the form of fees or interest on the investment of any cash received as collateral. The borrower receives all interest and dividends from the securities loaned and such payments are passed back to the lender in amounts equivalent thereto. The Portfolio also continues to recognize any unrealized gain (loss) in the market price of the securities loaned and on the change in the value of the collateral invested that may occur during the term of the loan. In addition, realized gain (loss) is recognized on changes in the value of the collateral invested upon liquidation of the collateral. Net earnings from securities lending are disclosed on the Statement of Operations as “Income from securities lending, net”.
Mortgage Dollar Rolls: Certain Portfolios enter into mortgage dollar rolls in which the Portfolios sell mortgage securities for delivery in the current month, realizing a gain (loss), and simultaneously enter into contracts to repurchase somewhat similar (same type, coupon and maturity) securities on a specified future date. During the roll period, the Portfolios forgo principal and interest paid on the securities. The Portfolios are compensated by the interest earned on the cash proceeds of the initial sale and by the lower repurchase price at the future date. The difference between the sale proceeds and the lower repurchase price is recorded as a realized gain on investment transactions. The Portfolios maintain a segregated account, the dollar value of which is at least equal to its obligations, with respect to dollar rolls. The Portfolios are subject to the risk that the market value of the securities the Portfolios are obligated to repurchase under the agreement may decline below the repurchase price.
Concentration of Risk: The ability of debt securities issuers (other than those issued or guaranteed by the U.S. Government) held by the Portfolios to meet their obligations may be affected by the economic or political developments in a specific industry, region or country. Foreign security and currency transactions may involve certain considerations and risks not typically associated with those of domestic origin as a result of, among
B8
other factors, the possibility of political or economic instability or the level of the governmental supervision and regulation of foreign securities markets.
Equity and Mortgage Real Estate Investment Trusts (REITs): Certain Portfolios invest in equity REITs, which report information on the source of their distributions annually. Based on current and historical information, a portion of distributions received from equity REITs during the period is estimated to be dividend income, capital gain or return of capital and recorded accordingly. When material, these estimates are adjusted periodically when the actual source of distributions is disclosed by the equity REITs.
Concentration of Risk for REITs: Real estate securities are subject to the same risks as direct investments in real estate and mortgages, and their value will depend on the value of the underlying properties or the underlying loans or interests. The underlying loans may be subject to the risks of default or of prepayments that occur earlier or later than expected, and such loans may also include so-called “subprime” mortgages. The value of these securities will rise and fall in response to many factors, including economic conditions, the demand for rental property and interest rates. In particular, the value of these securities may decline when interest rates rise and will also be affected by the real estate market and by the management of the underlying properties.
In addition, investing in REITs involves certain unique risks in addition to those risks associated with investing in the real estate industry in general. Equity REITs may be affected by changes in the value of the underlying property owned by the REITs, while mortgage REITs may be affected by the quality of any credit extended. REITs are dependent upon management skills, may not be diversified geographically or by property/mortgage asset type, and are subject to heavy cash flow dependency, default by borrowers and self-liquidation. REITs may be more volatile and/or more illiquid than other types of equity securities. REITs (especially mortgage REITs) are subject to interest rate risks. REITs may incur significant amounts of leverage. The Portfolio will indirectly bear a portion of the expenses, including management fees, paid by each REIT in which it invests, in addition to the expenses of the Portfolio.
Securities Transactions and Net Investment Income: Securities transactions are recorded on the trade date. Realized gains (losses) from investment and currency transactions are calculated on the specific identification method. Dividend income is recorded on the ex-date. Interest income, including amortization of premium and accretion of discount on debt securities, as required, is recorded on the accrual basis. Expenses are recorded on an accrual basis, which may require the use of certain estimates by management that may differ from actual.
For Portfolios with multiple classes of shares, net investment income or loss (other than administration and distribution fees which are charged directly to the respective class), and unrealized and realized gains (losses) are allocated daily to each class of shares based upon the relative proportion of adjusted net assets of each class at the beginning of the day.
Taxes: For federal income tax purposes, each Portfolio is treated as a separate taxpaying entity. Each Portfolio is treated as a partnership for tax purposes. No provision has been made in the financial statements for U.S. federal, state, or local taxes, as any tax liability arising from operations of the Portfolios is the responsibility of the Portfolio’s shareholders (Participating Insurance Companies). Each Portfolio is not generally subject to entity-level taxation. Shareholders of each Portfolio are subject to taxes on their distributive share of partnership items. Withholding taxes on foreign dividends, interest and capital gains are accrued in accordance with each Portfolio’s understanding of the applicable country’s tax rules and regulations. Such taxes are accrued net of reclaimable amounts, at the time the related income/gain is recorded. Each Portfolio generally attempts to manage its diversification in a manner that supports the diversification requirements of the underlying separate accounts.
Distributions: Distributions, if any, from each Portfolio are made in cash and automatically reinvested in additional shares of the Portfolio. The Government Money Market Portfolio declares and reinvests distributions, if any, daily. Distributions are recorded on the ex-date.
Estimates: The preparation of financial statements requires management to make estimates and assumptions that affect the reported amounts and disclosures in the financial statements. Actual results could differ from those estimates.
B9
The Series Fund has a management agreement with PGIM Investments on behalf of the Portfolios. Pursuant to this agreement, PGIM Investments has responsibility for all investment management services and supervises the subadvisers’ performance of such services. PGIM Investments has entered into subadvisory agreements with PGIM, Inc., which provides subadvisory services to the Portfolios through its PGIM Fixed Income unit (“PFI”), Jennison Associates LLC (“Jennison”), Brown Advisory LLC (“Brown”), LSV Asset Management (“LSV”), Quantitative Management Associates LLC (“QMA”), T. Rowe Price Associates, Inc. (“T. Rowe”) and William Blair & Co. LLC (“William Blair”) (collectively, the “Subadvisers”), under which each provides investment advisory services for certain Portfolios of the Series Fund. PGIM Investments pays for the services of the Subadvisers, cost of compensation of officers, occupancy and certain clerical and administrative expenses of the Portfolios. The Portfolios bear all other costs and expenses.
The management fee paid to PGIM Investments is accrued daily and payable monthly, using the value of each of the Portfolio’s average daily net assets, at the respective annual rates specified below.
| | | | | | |
Portfolio | | Management Fee | | Effective
Management Fee | |
Conservative Balanced Portfolio | | 0.55% | | | 0.55 | % |
Diversified Bond Portfolio | | 0.40 | | | 0.40 | |
Equity Portfolio | | 0.45 | | | 0.45 | |
Flexible Managed Portfolio | | 0.60 | | | 0.60 | |
Global Portfolio | | 0.75 | | | 0.73 | * |
Government Income Portfolio | | 0.40 | | | 0.40 | |
Government Money Market Portfolio | | 0.30 | | | 0.30 | |
Stock Index Portfolio | | 0.30% up to $4 billion | | | | |
| | 0.25% over $4 billion | | | 0.30 | |
| | * | Effective June 1, 2017, PGIM Investments has contractually agreed, through June 30, 2018, to waive a portion of its management fee equal to an annual rate of 0.024% of the average daily net assets of the Portfolio. Prior to June 1, 2017, PGIM Investments had contractually agreed to waive a portion of its management fee equal to an annual rate of 0.022% of the average daily net assets of the Portfolio. |
At December 31, 2017, the Subadvisers that provide investment advisory services to the Portfolios are listed directly below. Where more than one Subadviser is listed, each Subadviser provides services to a segment of the Portfolio:
| | |
Portfolio | | Subadviser(s) |
Conservative Balanced Portfolio | | PFI, QMA |
Diversified Bond Portfolio | | PFI |
Equity Portfolio | | Jennison |
Flexible Income Portfolio | | PFI, QMA |
Global Portfolio | | Brown, LSV, QMA, T. Rowe & William Blair |
Government Income Portfolio | | PFI |
Government Money Market Portfolio | | PFI |
Stock Index Portfolio | | QMA |
The Series Fund, on behalf of the Portfolios, has a distribution agreement, pursuant to Rule 12b-1 under the 1940 Act, with Prudential Investment Management Services LLC (“PIMS”), which acts as the distributor of the Class I and Class II shares of the Portfolios. The Portfolios compensate PIMS for distributing and servicing the Portfolios’ Class II shares pursuant to a plan of distribution (the “Class II Plan”), regardless of expenses actually incurred by PIMS. The distribution fees are accrued daily and payable monthly. No distribution or service fees are paid to PIMS as distributor of the Class I shares of the Portfolios. Pursuant to the Class II Plan, the Class II shares of each Portfolio compensate PIMS for distribution-related activities at an annual rate of 0.25% of the average daily net assets of the Class II shares.
The Series Fund has an administration agreement with PGIM Investments, which acts as the administrator of the Class II shares of the Portfolios. The administration fee paid to PGIM Investments is accrued daily and payable monthly, at the annual rate of 0.15% of the average daily net assets of the Class II shares.
B10
PIMS, PGIM Investments, PGIM, Inc., QMA and Jennison are indirect, wholly-owned subsidiaries of Prudential Financial, Inc. (“Prudential”).
Certain Portfolios have entered into brokerage commission recapture agreements with certain registered broker-dealers. Under the brokerage commission recapture program, a portion of the commission is returned to the Portfolio on whose behalf the trades were made. Commission recapture is paid solely to those Portfolios generating the applicable trades. Such amounts are included within realized gain (loss) on investment transactions presented in the Statement of Operations. For the year ended December 31, 2017, brokerage commission recaptured under these agreements was as follows:
| | | | |
Portfolio | | Amount | |
Equity Portfolio | | $ | 260,224 | |
Global Portfolio | | | 42,531 | |
| 4. | | Other Transactions with Affiliates |
Prudential Mutual Fund Services LLC (“PMFS”), an affiliate of PGIM Investments and an indirect, wholly-owned subsidiary of Prudential, serves as the transfer agent of the Portfolios. The transfer agent’s fees and expenses in the Statement of Operations include certain out-of-pocket expenses paid to non-affiliates, where applicable.
The Portfolios may invest their overnight sweep cash in the Prudential Core Ultra Short Bond Fund (the “Core Fund”) and their securities lending cash collateral in the Prudential Institutional Money Market Fund (the “Money Market Fund”), each a series of Prudential Investment Portfolios 2, registered under the 1940 Act and managed by PGIM Investments. The Portfolios may also invest in the Prudential Core Short-Term Bond Fund, pursuant to an exemptive order received from Securities Exchange Commission (“SEC”), a series of the Prudential Investment Portfolios 2 (together with Prudential Core Ultra Short Bond Fund, the “Core Funds”), registered under the 1940 Act and managed by PGIM Investments. Earnings from the Core Fund and the Money Market Fund are disclosed on the Statement of Operations as “Affiliated dividend income” and “Income from securities lending, net”, respectively.
For the reporting period ended December 31, 2017, PGIM, Inc. was compensated by PGIM Investments for managing the Portfolios’ securities lending cash collateral as subadviser to the Money Market Fund:
| | | | |
Portfolio | | Amount | |
Conservative Balanced Portfolio | | $ | 50,791 | |
Diversified Bond Portfolio | | | 12,115 | |
Equity Portfolio | | | 185,352 | |
Flexible Managed Portfolio | | | 66,900 | |
Global Portfolio | | | 46,552 | |
Government Income Portfolio | | | 3,795 | |
Stock Index Portfolio | | | 114,143 | |
In February 2016, Prudential, the parent company of the Investment Manager (PGIM Investments) self reported to the Securities and Exchange Commission (“SEC”) and certain other regulators that, in some cases, it failed to maximize securities lending income for certain Portfolios of the Series Fund due to a long-standing restriction benefitting Prudential. The Board was not notified of the restriction until after it had been removed. Prudential paid the affected Portfolios an amount equal to the estimated loss associated with the unauthorized restriction. At the Board’s direction, this payment occurred on June 30, 2016. The estimated opportunity loss was calculated by an independent consultant hired by Prudential whose calculation methodology was subsequently reviewed by a consultant retained by the independent trustees of the Series Fund. The amount of opportunity loss payment to each of the Portfolios is disclosed in the Portfolio’s “Statements of Changes in Net Assets” and “Financial Highlights” as “Capital Contributions”.
In addition to the above, Prudential has paid and continues to directly pay certain legal, audit and other charges in connection with the matter on behalf of the Portfolios.
The SEC Staff and other regulators continue to review the matter.
Certain Portfolios may enter into certain securities purchase or sale transactions under Board approved Rule 17a-7 procedures. Rule 17a-7 is an exemptive rule under the 1940 Act, that permits purchase and sale
B11
transactions among affiliated investment companies, or between an investment company and a person that is affiliated solely by reason of having a common (or affiliated) investment adviser, common directors, and/or common officers. Such transactions are subject to ratification by the Board. For the reporting period ended December 31, 2017 no such transactions were entered into by the Portfolios.
The following Portfolios are reimbursed by Prudential for foreign withholding taxes for certain countries due to the Portfolios’ status as partnerships for tax purposes. The following amounts have been accrued or paid:
| | | | | | | | |
Portfolio | | 2016 Withholding Tax | | | 2017 Withholding Tax | |
Conservative Balanced Portfolio | | $ | 24,389 | | | $ | 29,305 | |
Equity Portfolio | | | — | | | | 343,486 | |
Flexible Managed Portfolio | | | 35,507 | | | | 25,175 | |
Global Portfolio | | | 99,518 | | | | 114,519 | |
The aggregate cost of purchases and proceeds from sales of portfolio securities (excluding short-term investments, in-kind transactions and U.S. Government securities) for the year ended December 31, 2017, were as follows:
| | | | | | | | |
| | | Cost of Purchases | | | Proceeds from Sales | |
Conservative Balanced Portfolio | | $ | 2,617,815,231 | | | $ | 2,715,111,130 | |
Diversified Bond Portfolio | | | 477,200,941 | | | | 468,509,022 | |
Equity Portfolio | | | 2,214,934,043 | | | | 2,455,921,491 | |
Flexible Managed Portfolio | | | 5,979,493,745 | | | | 6,080,311,584 | |
Global Portfolio | | | 333,709,501 | | | | 374,454,069 | |
Government Income Portfolio | | | 1,162,346,063 | | | | 1,168,080,920 | |
Stock Index Portfolio | | | 150,679,712 | | | | 135,951,829 | |
All Portfolios are treated as partnerships for tax purposes. The character of the cash distributions, if any, made by the partnerships is generally classified as nontaxable return of capital distributions. After each fiscal year each shareholder of record will receive information regarding their distributive allocable share of the partnership’s income, gains, losses and deductions.
With respect to the Portfolios, book cost of assets differs from tax cost of assets as a result of each Portfolio’s adoption of a mark to market method of accounting for tax purposes. Under this method, tax cost of assets will approximate fair market value.
Management has analyzed the Portfolios’ tax positions taken on federal, state and local income tax returns for all open tax years and has concluded that no provision for income tax is required in the Portfolios’ financial statements for the current reporting period. The Portfolios’ federal, state and local income tax returns for tax years for which the applicable statutes of limitations have not expired are subject to examination by the Internal Revenue Service and state departments of revenue.
The Series Fund, on behalf of the Portfolios, (excluding the Government Money Market Portfolio), along with other affiliated registered investment companies (the “Funds”), is a party to a Syndicated Credit Agreement (“SCA”) with a group of banks. The purpose of the SCA is to provide an alternative source of temporary funding for capital share redemptions. The SCA provides for a commitment of $900 million for the period October 5, 2017 through October 4, 2018. The Funds pay an annualized commitment fee of 0.15% of the unused portion of the SCA. Each Portfolios’ portion of the commitment fee for the unused amount, allocated based upon a method approved by the Board, is accrued daily and paid quarterly. Prior to October 5, 2017, the Portfolio had another SCA that provided a commitment of $900 million and the Portfolio paid an annualized commitment fee of 0.15% of the unused portion of the SCA. The interest on borrowings under the SCAs is paid monthly and at a per annum interest rate based upon a contractual spread plus the higher of (1) the effective federal funds rate, (2) the 1-month LIBOR rate or (3) zero percent.
B12
Other affiliated registered investment companies that are parties to the SCA include portfolios that are subject to a predetermined mathematical formula used to manage certain benefit guarantees offered under variable annuity contracts. The formula may result in large scale asset flows into and out of these portfolios. Consequently, these portfolios may be more likely to utilize the SCA for purposes of funding redemptions. It may be possible for those portfolios to fully exhaust the committed amount of the SCA, thereby requiring the Manager to allocate available funding per a Board-approved methodology designed to treat the Funds in the SCA equitably.
The following Portfolios utilized the SCA during the reporting period ended December 31, 2017. The average balance outstanding is for the number of days the Portfolios had utilized the credit facility.
| | | | | | | | | | | | | | | | | | | | |
Portfolio | | Average
Balance
Outstanding | | | Weighted
Average
Interest
Rates | | | Number of
Days
Outstanding | | | Maximum
Balance
Outstanding | | | Balance
Outstanding at
December 31,
2017 | |
Diversified Bond Portfolio | | $ | 6,047,000 | | | | 2.49 | % | | | 2 | | | $ | 10,151,000 | | | | — | |
Government Income Portfolio | | | 1,324,000 | | | | 2.49 | % | | | 1 | | | | 1,324,000 | | | | — | |
The Series Fund offers Class I and Class II shares. Neither Class I nor Class II shares of the Portfolio are subject to any sales charge or redemption charge and are sold at the net asset value of the Portfolio. Class I shares are sold only to certain separate accounts of Prudential to fund benefits under certain variable life insurance and variable annuity contracts (“contracts”). Class II shares are sold only to separate accounts of non-Prudential insurance companies as investment options under certain contracts. Class I shares are also offered to separate accounts of non-affiliated insurers for which Prudential or its affiliates administer and/or reinsure the variable life insurance or variable annuity contracts issued in connection with the separate accounts. The separate accounts invest in shares of the Series Fund through subaccounts that correspond to the Portfolios. The separate accounts will redeem shares of the Series Fund to the extent necessary to provide benefits under the contracts or for such other purposes as may be consistent with the contracts. As of December 31, 2017, the Equity Portfolio has Class II shares outstanding.
As of December 31, 2017, substantially all Class I shares of the Portfolios were owned of record by the following affiliates of the Series Fund: Prudential Annuities Life Assurance Corporation (“PALAC”), Pruco Life Insurance Company of New Jersey (“PLNJ”), Pruco Life Insurance Company (“PLAZ”) and Prudential Insurance Company of America (“PICA”) on behalf of the owners of the variable insurance products issued by each of these entities.
Transactions in shares of beneficial interest were as follows:
Equity Portfolio:
| | | | | | | | |
Class I | | Shares | | | Amount | |
Year ended December 31, 2017: | | | | | | | | |
Series shares sold | | | 167,133 | | | $ | 7,721,540 | |
Series shares repurchased | | | (5,811,087 | ) | | | (268,966,449 | ) |
| | | | | | | | |
Net increase (decrease) in shares outstanding | | | (5,643,954 | ) | | $ | (261,244,909 | ) |
| | | | | | | | |
Year ended December 31, 2016: | | | | | | | | |
Series shares sold | | | 239,387 | | | $ | 9,099,174 | |
Series shares repurchased | | | (6,334,813 | ) | | | (242,961,824 | ) |
Capital contributions | | | — | | | | 3,314,283 | |
| | | | | | | | |
Net increase (decrease) in shares outstanding | | | (6,095,426 | ) | | $ | (230,548,367 | ) |
| | | | | | | | |
B13
| | | | | | | | |
Class II | | Shares | | | Amount | |
Year ended December 31, 2017: | | | | | | | | |
Series shares sold | | | 85 | | | $ | 3,938 | |
Series shares repurchased | | | (8,919 | ) | | | (427,848 | ) |
| | | | | | | | |
Net increase (decrease) in shares outstanding | | | (8,834 | ) | | $ | (423,910 | ) |
| | | | | | | | |
Year ended December 31, 2016: | | | | | | | | |
Series shares sold | | | 398 | | | $ | 13,474 | |
Series shares repurchased | | | (8,058 | ) | | | (314,707 | ) |
Capital contributions | | | — | | | | 1,696 | |
| | | | | | | | |
Net increase (decrease) in shares outstanding | | | (7,660 | ) | | $ | (299,537 | ) |
| | | | | | | | |
| 9. | | Purchase & Redemption In-Kind |
As of the close of business on April 28, 2017, the Government Money Market Portfolio issued shares in exchange for portfolio securities, accrued interest and cash in a tax-free exchange with an affiliate. The value of the tax-free exchange was $23,004,509, which includes a cash portion of $9,096,772. Shares issued in this transaction were 2,300,451.
��
B14
Financial Highlights
| | | | | | | | | | | | | | | | | | | | |
| | | Conservative Balanced Portfolio | |
| | | Year Ended December 31, | |
| | | 2017 | | | 2016 | | | 2015 | | | 2014 | | | 2013 | |
Per Share Operating Performance(a): | | | | | | | | | | | | | | | | | | | | |
Net Asset Value, beginning of year | | $ | 24.18 | | | $ | 22.54 | | | $ | 22.45 | | | $ | 20.63 | | | $ | 17.77 | |
| | | | | | | | | | | | | | | | | | | | |
Income (Loss) From Investment Operations: | | | | | | | | | | | | | | | | | | | | |
Net investment income (loss) | | | 0.45 | | | | 0.42 | | | | 0.39 | | | | 0.36 | | | | 0.35 | |
Net realized and unrealized gain (loss) on investments | | | 2.54 | | | | 1.20 | | | | (0.30 | ) | | | 1.46 | | | | 2.51 | |
| | | | | | | | | | | | | | | | | | | | |
Total from investment operations | | | 2.99 | | | | 1.62 | | | | 0.09 | | | | 1.82 | | | | 2.86 | |
| | | | | | | | | | | | | | | | | | | | |
Capital Contributions(f) | | | — | | | | 0.02 | | | | — | | | | — | | | | — | |
| | | | | | | | | | | | | | | | | | | | |
Net Asset Value, end of year | | $ | 27.17 | | | $ | 24.18 | | | $ | 22.54 | | | $ | 22.45 | | | $ | 20.63 | |
| | | | | | | | | | | | | | | | | | | | |
Total Return(b) | | | 12.37 | % | | | 7.28 | %(g) | | | 0.40 | % | | | 8.82 | % | | | 16.09 | % |
Ratios/Supplemental Data: | | | | | | | | | | | | | | | | | | | | |
Net assets, end of year (in millions) | | $ | 2,594.7 | | | $ | 2,473.2 | | | $ | 2,554.3 | | | $ | 2,574.4 | | | $ | 2,504.4 | |
Ratios to average net assets(c): | | | | | | | | | | | | | | | | | | | | |
Expenses after waivers and/or expense reimbursement | | | 0.58 | % | | | 0.58 | % | | | 0.58 | % | | | 0.58 | % | | | 0.58 | % |
Expenses before waivers and/or expense reimbursement | | | 0.58 | % | | | 0.58 | % | | | 0.58 | % | | | 0.58 | % | | | 0.58 | % |
Net investment income (loss) | | | 1.75 | % | | | 1.79 | % | | | 1.70 | % | | | 1.66 | % | | | 1.84 | % |
Portfolio turnover rate(d) | | | 136 | % | | | 185 | % | | | 208 | % | | | 134 | % | | | 196 | % |
| |
| | | Diversified Bond Portfolio | |
| | | Year Ended December 31, | |
| | | 2017(a) | | | 2016(a) | | | 2015(a) | | | 2014(a) | | | 2013 | |
Per Share Operating Performance: | | | | |
Net Asset Value, beginning of year | | $ | 12.28 | | | $ | 11.64 | | | $ | 11.66 | | | $ | 11.01 | | | $ | 11.88 | |
| | | | | | | | | | | | | | | | | | | | |
Income (Loss) From Investment Operations: | | | | | | | | | | | | | | | | | | | | |
Net investment income (loss) | | | 0.42 | | | | 0.43 | | | | 0.41 | | | | 0.43 | | | | 0.48 | |
Net realized and unrealized gain (loss) on investments | | | 0.44 | | | | 0.21 | | | | (0.43 | ) | | | 0.34 | | | | (0.56 | ) |
| | | | | | | | | | | | | | | | | | | | |
Total from investment operations | | | 0.86 | | | | 0.64 | | | | (0.02 | ) | | | 0.77 | | | | (0.08 | ) |
| | | | | | | | | | | | | | | | | | | | |
Less Distributions: | | | — | | | | — | | | | — | | | | (0.12 | ) | | | (0.79 | ) |
| | | | | | | | | | | | | | | | | | | | |
Capital Contributions(f) | | | — | | | | — | (e) | | | — | | | | — | | | | — | |
| | | | | | | | | | | | | | | | | | | | |
Net Asset Value, end of year | | $ | 13.14 | | | $ | 12.28 | | | $ | 11.64 | | | $ | 11.66 | | | $ | 11.01 | |
| | | | | | | | | | | | | | | | | | | | |
Total Return(b) | | | 7.00 | % | | | 5.50 | %(h) | | | (0.17 | )% | | | 7.09 | % | | | (0.71 | )% |
Ratios/Supplemental Data: | | | | | | | | | | | | | | | | |
Net assets, end of year (in millions) | | $ | 1,145.1 | | | $ | 1,104.6 | | | $ | 1,084.9 | | | $ | 1,067.9 | | | $ | 1,197.5 | |
Ratios to average net assets(c): | | | | | | | | | | | | | | | | | | | | |
Expenses after waivers and/or expense reimbursement | | | 0.44 | % | | | 0.44 | % | | | 0.46 | % | | | 0.44 | % | | | 0.44 | % |
Expenses before waivers and/or expense reimbursement | | | 0.44 | % | | | 0.44 | % | | | 0.46 | % | | | 0.44 | % | | | 0.44 | % |
Net investment income (loss) | | | 3.28 | % | | | 3.52 | % | | | 3.48 | % | | | 3.73 | % | | | 4.10 | % |
Portfolio turnover rate | | | 71 | % | | | 49 | % | | | 81 | % | | | 50 | % | | | 111 | % |
| (a) | Calculated based on average shares outstanding during the year. |
| (b) | Total return is calculated assuming a purchase of a share on the first day and a sale on the last day of each year reported and includes reinvestment of distributions, if any, and does not reflect the effect of insurance contract charges. Total return does not reflect expenses associated with the separate account such as administrative fees, account charges and surrender charges which, if reflected, would reduce the total returns for all years shown. Performance figures may reflect fee waivers and/or expense reimbursements. In the absence of fee waivers and/or expense reimbursements, the total return would be lower. Past performance is no guarantee of future results. Total returns may reflect adjustments to conform to generally accepted accounting principles. |
| (c) | Does not include expenses of the underlying funds in which the Portfolio invests. |
| (d) | The Portfolio accounts for mortgage dollar roll transactions as purchases and sales which, as a result, can increase its portfolio turnover. |
| (e) | Less than $0.005 per share. |
| (f) | Represents payment received by the Portfolio, from Prudential, in connection with the failure to maximize securities lending income due to a restriction that benefited Prudential. |
| (g) | Total return for the year includes the impact of the capital contribution. Excluding the capital contribution, the total return would have been 7.19%. |
| (h) | Total return for the year includes the impact of the capital contribution, which was not material to the total return. |
SEE NOTES TO FINANCIAL STATEMENTS.
C1
Financial Highlights
| | | | | | | | | | | | | | | | | | | | |
| | | Equity Portfolio | |
| | | Class I | |
| | | Year Ended December 31, | |
| | | 2017(c) | | | 2016(c) | | | 2015(c) | | | 2014(c) | | | 2013 | |
Per Share Operating Performance: | | | | | | | | | | | | | | | | | | | | |
Net Asset Value, beginning of year | | $ | 40.96 | | | $ | 39.47 | | | $ | 38.56 | | | $ | 35.81 | | | $ | 26.81 | |
| | | | | | | | | | | | | | | | | | | | |
Income (Loss) From Investment Operations: | | | | | | | | | | | | | | | | | | | | |
Net investment income (loss) | | | 0.41 | | | | 0.38 | | | | 0.34 | | | | 0.19 | | | | 0.27 | |
Net realized and unrealized gain (loss) on investments | | | 10.15 | | | | 1.07 | | | | 0.57 | | | | 2.56 | | | | 8.73 | |
| | | | | | | | | | | | | | | | | | | | |
Total from investment operations | | | 10.56 | | | | 1.45 | | | | 0.91 | | | | 2.75 | | | | 9.00 | |
| | | | | | | | | | | | | | | | | | | | |
Capital Contributions(d) | | | — | | | | 0.04 | | | | — | | | | — | | | | — | |
| | | | | | | | | | | | | | | | | | | | |
Net Asset Value, end of year | | $ | 51.52 | | | $ | 40.96 | | | $ | 39.47 | | | $ | 38.56 | | | $ | 35.81 | |
| | | | | | | | | | | | | | | | | | | | |
Total Return(a) | | | 25.78 | % | | | 3.78 | %(e) | | | 2.36 | % | | | 7.68 | % | | | 33.57 | % |
Ratios/Supplemental Data: | | | | | | | | | | | | | | | | | | | | |
Net assets, end of year (in millions) | | $ | 4,415.6 | | | $ | 3,741.7 | | | $ | 3,846.2 | | | $ | 4,017.6 | | | $ | 3,970.9 | |
Ratios to average net assets(b): | | | | | | | | | | | | | | | | | | | | |
Expenses after waivers and/or expense reimbursement | | | 0.47 | % | | | 0.47 | % | | | 0.47 | % | | | 0.47 | % | | | 0.47 | % |
Expenses before waivers and/or expense reimbursement | | | 0.47 | % | | | 0.47 | % | | | 0.47 | % | | | 0.47 | % | | | 0.47 | % |
Net investment income (loss) | | | 0.89 | % | | | 1.01 | % | | | 0.86 | % | | | 0.52 | % | | | 0.86 | % |
Portfolio turnover rate | | | 55 | % | | | 39 | % | | | 37 | % | | | 51 | % | | | 45 | % |
| |
| | | Equity Portfolio | |
| | | Class II | |
| | | Year Ended December 31, | |
| | | 2017(c) | | | 2016(c) | | | 2015(c) | | | 2014(c) | | | 2013 | |
Per Share Operating Performance: | | | | | | | | | | | | | | | | | | | | |
Net Asset Value, beginning of year | | $ | 40.74 | | | $ | 39.42 | | | $ | 38.66 | | | $ | 36.05 | | | $ | 27.10 | |
| | | | | | | | | | | | | | | | | | | | |
Income (Loss) From Investment Operations: | | | | | | | | | | | | | | | | | | | | |
Net investment income (loss) | | | 0.23 | | | | 0.23 | | | | 0.18 | | | | 0.04 | | | | 0.13 | |
Net realized and unrealized gain (loss) on investments | | | 10.07 | | | | 1.05 | | | | 0.58 | | | | 2.57 | | | | 8.82 | |
| | | | | | | | | | | | | | | | | | | | |
Total from investment operations | | | 10.30 | | | | 1.28 | | | | 0.76 | | | | 2.61 | | | | 8.95 | |
| | | | | | | | | | | | | | | | | | | | |
Capital Contributions(d) | | | — | | | | 0.04 | | | | — | | | | — | | | | — | |
| | | | | | | | | | | | | | | | | | | | |
Net Asset Value, end of year | | $ | 51.04 | | | $ | 40.74 | | | $ | 39.42 | | | $ | 38.66 | | | $ | 36.05 | |
| | | | | | | | | | | | | | | | | | | | |
Total Return(a) | | | 25.28 | % | | | 3.35 | %(e) | | | 1.97 | % | | | 7.24 | % | | | 33.03 | % |
Ratios/Supplemental Data: | | | | | | | | | | | | | | | | | | | | |
Net assets, end of year (in millions) | | $ | 1.7 | | | $ | 1.7 | | | $ | 2.0 | | | $ | 2.2 | | | $ | 2.3 | |
Ratios to average net assets(b): | | | | | | | | | | | | | | | | | | | | |
Expenses after waivers and/or expense reimbursement | | | 0.87 | % | | | 0.87 | % | | | 0.87 | % | | | 0.87 | % | | | 0.87 | % |
Expenses before waivers and/or expense reimbursement | | | 0.87 | % | | | 0.87 | % | | | 0.87 | % | | | 0.87 | % | | | 0.87 | % |
Net investment income (loss) | | | 0.50 | % | | | 0.61 | % | | | 0.46 | % | | | 0.11 | % | | | 0.47 | % |
Portfolio turnover rate | | | 55 | % | | | 39 | % | | | 37 | % | | | 51 | % | | | 45 | % |
| (a) | Total return is calculated assuming a purchase of a share on the first day and a sale on the last day of each year reported and includes reinvestment of distributions, if any, and does not reflect the effect of insurance contract charges. Total return does not reflect expenses associated with the separate account such as administrative fees, account charges and surrender charges which, if reflected, would reduce the total return for all years shown. Performance figures may reflect fee waivers and/or expense reimbursements. In the absence of fee waivers and/or expense reimbursements, the total return would be lower. Past performance is no guarantee of future results. Total returns may reflect adjustments to conform to generally accepted accounting principles. |
| (b) | Does not include expenses of the underlying funds in which the Portfolio invests. |
| (c) | Calculated based on average shares outstanding during the year. |
| (d) | Represents payment received by the Portfolio, from Prudential, in connection with the failure to maximize securities lending income due to a restriction that benefited Prudential. |
| (e) | Total return for the year includes the impact of the capital contribution. Excluding the capital contribution, the total return for Class I and Class II would have been 3.68% and 3.25%, respectively. |
SEE NOTES TO FINANCIAL STATEMENTS.
C2
Financial Highlights
| | | | | | | | | | | | | | | | | | | | |
| | | Flexible Managed Portfolio | |
| | | Year Ended December 31, | |
| | | 2017 | | | 2016 | | | 2015 | | | 2014 | | | 2013 | |
Per Share Operating Performance(a): | | | | | | | | | | | | | | | | | | | | |
Net Asset Value, beginning of year | | $ | 25.99 | | | $ | 23.95 | | | $ | 23.71 | | | $ | 21.35 | | | $ | 17.77 | |
| | | | | | | | | | | | | | | | | | | | |
Income (Loss) From Investment Operations: | | | | | | | | | | | | | | | | | | | | |
Net investment income (loss) | | | 0.45 | | | | 0.44 | | | | 0.42 | | | | 0.37 | | | | 0.36 | |
Net realized and unrealized gain (loss) on investments | | | 3.44 | | | | 1.58 | | | | (0.18 | ) | | | 1.99 | | | | 3.22 | |
| | | | | | | | | | | | | | | | | | | | |
Total from investment operations | | | 3.89 | | | | 2.02 | | | | 0.24 | | | | 2.36 | | | | 3.58 | |
| | | | | | | | | | | | | | | | | | | | |
Capital Contributions(e) | | | — | | | | 0.02 | | | | — | | | | — | | | | — | |
| | | | | | | | | | | | | | | | | | | | |
Net Asset Value, end of year | | $ | 29.88 | | | $ | 25.99 | | | $ | 23.95 | | | $ | 23.71 | | | $ | 21.35 | |
| | | | | | | | | | | | | | | | | | | | |
Total Return(b) | | | 14.97 | % | | | 8.52 | %(f) | | | 1.01 | % | | | 11.05 | % | | | 20.15 | % |
Ratios/Supplemental Data: | | | | | | | | | | | | | | | | | | | | |
Net assets, end of year (in millions) | | $ | 4,229.7 | | | $ | 3,889.8 | | | $ | 3,768.8 | | | $ | 3,943.8 | | | $ | 3,730.6 | |
Ratios to average net assets(c): | | | | | | | | | | | | | | | | | | | | |
Expenses after waivers and/or expense reimbursement | | | 0.62 | % | | | 0.63 | % | | | 0.63 | % | | | 0.63 | % | | | 0.63 | % |
Expenses before waivers and/or expense reimbursement | | | 0.62 | % | | | 0.63 | % | | | 0.63 | % | | | 0.63 | % | | | 0.63 | % |
Net investment income (loss) | | | 1.62 | % | | | 1.78 | % | | | 1.74 | % | | | 1.66 | % | | | 1.86 | % |
Portfolio turnover rate(d) | | | 175 | % | | | 203 | % | | | 213 | % | | | 161 | % | | | 210 | % |
| |
| | | Global Portfolio | |
| | | Year Ended December 31, | |
| | | 2017(a) | | | 2016(a) | | | 2015(a) | | | 2014(a) | | | 2013 | |
Per Share Operating Performance: | | | | | | | | | | | | | | | | | | | | |
Net Asset Value, beginning of year | | $ | 27.50 | | | $ | 26.33 | | | $ | 25.72 | | | $ | 24.91 | | | $ | 19.57 | |
| | | | | | | | | | | | | | | | | | | | |
Income (Loss) From Investment Operations: | | | | | | | | | | | | | | | | | | | | |
Net investment income (loss) | | | 0.42 | | | | 0.34 | | | | 0.34 | | | | 0.37 | | | | 0.31 | |
Net realized and unrealized gain (loss) on investments | | | 6.41 | | | | 0.81 | | | | 0.27 | | | | 0.44 | | | | 5.03 | |
| | | | | | | | | | | | | | | | | | | | |
Total from investment operations | | | 6.83 | | | | 1.15 | | | | 0.61 | | | | 0.81 | | | | 5.34 | |
| | | | | | | | | | | | | | | | | | | | |
Capital Contributions(e) | | | — | | | | 0.02 | | | | — | | | | — | | | | — | |
| | | | | | | | | | | | | | | | | | | | |
Net Asset Value, end of year | | $ | 34.33 | | | $ | 27.50 | | | $ | 26.33 | | | $ | 25.72 | | | $ | 24.91 | |
| | | | | | | | | | | | | | | | | | | | |
Total Return(b) | | | 24.84 | % | | | 4.44 | %(g) | | | 2.37 | % | | | 3.25 | % | | | 27.29 | % |
Ratios/Supplemental Data: | | | | | | | | | | | | | | | | | | | | |
Net assets, end of year (in millions) | | $ | 1,132.9 | | | $ | 955.4 | | | $ | 965.3 | | | $ | 719.2 | | | $ | 744.5 | |
Ratios to average net assets(c): | | | | | | | | | | | | | | | | | | | | |
Expenses after waivers and/or expense reimbursement | | | 0.79 | % | | | 0.80 | % | | | 0.81 | % | | | 0.81 | % | | | 0.84 | % |
Expenses before waivers and/or expense reimbursement | | | 0.81 | % | | | 0.81 | % | | | 0.82 | % | | | 0.82 | % | | | 0.84 | % |
Net investment income (loss) | | | 1.34 | % | | | 1.29 | % | | | 1.28 | % | | | 1.45 | % | | | 1.29 | % |
Portfolio turnover rate | | | 33 | % | | | 40 | % | | | 33 | % | | | 37 | % | | | 70 | % |
| (a) | Calculated based on average shares outstanding during the year. |
| (b) | Total return is calculated assuming a purchase of a share on the first day and a sale on the last day of each year reported and includes reinvestment of distributions, if any, and does not reflect the effect of insurance contract charges. Total return does not reflect expenses associated with the separate account such as administrative fees, account charges and surrender charges which, if reflected, would reduce the total returns for all years shown. Performance figures may reflect fee waivers and/or expense reimbursements. In the absence of fee waivers and/or expense reimbursements, the total return would be lower. Past performance is no guarantee of future results. Total returns may reflect adjustments to conform to generally accepted accounting principles. |
| (c) | Does not include expenses of the underlying funds in which the Portfolio invests. |
| (d) | The Portfolio accounts for mortgage dollar roll transactions as purchases and sales which, as a result, can increase its portfolio turnover rate. |
| (e) | Represents payment received by the Portfolio, from Prudential, in connection with the failure to maximize securities lending income due to a restriction that benefited Prudential. |
| (f) | Total return for the year includes the impact of the capital contribution. Excluding the capital contribution, the total return would have been 8.44%. |
| (g) | Total return for the year includes the impact of the capital contribution. Excluding the capital contribution, the total return would have been 4.36%. |
SEE NOTES TO FINANCIAL STATEMENTS.
C3
Financial Highlights
| | | | | | | | | | | | | | | | | | | | |
| | | Government Income Portfolio | |
| | | Year Ended December 31, | |
| | | 2017(d) | | | 2016(d) | | | 2015(d) | | | 2014 | | | 2013 | |
Per Share Operating Performance: | | | | | | | | | | | | | | | | | | | | |
Net Asset Value, beginning of year | | $ | 12.26 | | | $ | 12.00 | | | $ | 11.92 | | | $ | 11.30 | | | $ | 12.15 | |
| | | | | | | | | | | | | | | | | | | | |
Income (Loss) From Investment Operations: | | | | | | | | | | | | | | | | | | | | |
Net investment income (loss) | | | 0.23 | | | | 0.20 | | | | 0.18 | | | | 0.21 | | | | 0.21 | |
Net realized and unrealized gain (loss) on investments | | | 0.13 | | | | 0.06 | | | | (0.10 | ) | | | 0.45 | | | | (0.49 | ) |
| | | | | | | | | | | | | | | | | | | | |
Total from investment operations | | | 0.36 | | | | 0.26 | | | | 0.08 | | | | 0.66 | | | | (0.28 | ) |
| | | | | | | | | | | | | | | | | | | | |
Less Distributions: | | | — | | | | — | | | | — | | | | (0.04 | ) | | | (0.57 | ) |
Capital Contributions(e) | | | — | | | | — | (f) | | | — | | | | — | | | | — | |
| | | | | | | | | | | | | | | | | | | | |
Net Asset Value, end of year | | $ | 12.62 | | | $ | 12.26 | | | $ | 12.00 | | | $ | 11.92 | | | $ | 11.30 | |
| | | | | | | | | | | | | | | | | | | | |
Total Return(a) | | | 2.94 | % | | | 2.17 | %(h) | | | 0.67 | % | | | 5.86 | % | | | (2.34 | )% |
Ratios/Supplemental Data: | | | | | | | | | | | | | | | | | | | | |
Net assets, end of year (in millions) | | $ | 244.1 | | | $ | 226.3 | | | $ | 231.8 | | | $ | 339.2 | | | $ | 341.1 | |
Ratios to average net assets(b): | | | | | | | | | | | | | | | | | | | | |
Expenses after waivers and/or expense reimbursement | | | 0.53 | % | | | 0.51 | % | | | 0.48 | % | | | 0.47 | % | | | 0.49 | % |
Expenses before waivers and/or expense reimbursement | | | 0.53 | % | | | 0.51 | % | | | 0.48 | % | | | 0.47 | % | | | 0.49 | % |
Net investment income (loss) | | | 1.84 | % | | | 1.60 | % | | | 1.48 | % | | | 1.73 | % | | | 1.78 | % |
Portfolio turnover rate(c) | | | 495 | % | | | 705 | % | | | 746 | % | | | 830 | % | | | 1135 | % |
| |
| | | Government Money Market Portfolio | |
| | | Year Ended December 31, | |
| | | 2017(d) | | | 2016(d) | | | 2015(d) | | | 2014 | | | 2013 | |
Per Share Operating Performance: | | | | | | | | | | | | | | | | | | | | |
Net Asset Value, beginning of year | | $ | 10.00 | | | $ | 10.00 | | | $ | 10.00 | | | $ | 10.00 | | | $ | 10.00 | |
| | | | | | | | | | | | | | | | | | | | |
Income From Investment Operations: | | | | | | | | | | | | | | | | | | | | |
Net investment income (loss) and realized gains (losses) | | | 0.06 | | | | 0.01 | | | | — | (f) | | | — | (f) | | | — | (f) |
Less Distributions: | | | (0.06 | ) | | | (0.01 | ) | | | — | (f) | | | — | (f) | | | — | (f) |
| | | | | | | | | | | | | | | | | | | | |
Net Asset Value, end of year | | $ | 10.00 | | | $ | 10.00 | | | $ | 10.00 | | | $ | 10.00 | | | $ | 10.00 | |
| | | | | | | | | | | | | | | | | | | | |
Total Return(a) | | | 0.56 | % | | | 0.10 | % | | | — | %(g) | | | — | %(g) | | | — | %(g) |
Ratios/Supplemental Data: | | | | | | | | | | | | | | | | | | | | |
Net assets, end of year (in millions) | | $ | 559.6 | | | $ | 724.2 | | | $ | 650.8 | | | $ | 823.6 | | | $ | 866.0 | |
Ratios to average net assets: | | | | | | | | | | | | | | | | | | | | |
Expenses after waivers and/or expense reimbursement | | | 0.35 | % | | | 0.35 | % | | | 0.19 | % | | | 0.16 | % | | | 0.17 | % |
Expenses before waivers and/or expense reimbursement | | | 0.35 | % | | | 0.35 | % | | | 0.44 | % | | | 0.44 | % | | | 0.44 | % |
Net investment income (loss) | | | 0.55 | % | | | 0.09 | % | | | 0.00 | % | | | 0.00 | %(g) | | | 0.00 | %(g) |
| (a) | Total return is calculated assuming a purchase of a share on the first day and a sale on the last day of each year reported and includes reinvestment of distributions, if any, and does not reflect the effect of insurance contract charges. Total return does not reflect expenses associated with the separate account such as administrative fees, account charges and surrender charges which, if reflected, would reduce the total returns for all years shown. Performance figures may reflect fee waivers and/or expense reimbursements. In the absence of fee waivers and/or expense reimbursements, the total return would be lower. Past performance is no guarantee of future results. Total returns may reflect adjustments to conform to generally accepted accounting principles. |
| (b) | Does not include expenses of the underlying funds in which the Portfolio invests. |
| (c) | The Portfolio accounts for mortgage dollar roll transactions as purchases and sales which, as a result, can increase its portfolio turnover rate. |
| (d) | Calculated based on average shares outstanding during the year. |
| (e) | Represents payment received by the Portfolio, from Prudential, in connection with the failure to maximize securities lending income due to a restriction that benefited Prudential. |
| (f) | Less than $0.005 per share. |
| (h) | Total return for the year includes the impact of the capital contribution, which was not material to the total return. |
SEE NOTES TO FINANCIAL STATEMENTS.
C4
Financial Highlights
| | | | | | | | | | | | | | | | | | | | |
| | | Stock Index Portfolio | |
| | | Year Ended December 31, | |
| | | 2017 | | | 2016 | | | 2015 | | | 2014 | | | 2013 | |
Per Share Operating Performance(c): | | | | | | | | | | | | | | | | | | | | |
Net Asset Value, beginning of year | | $ | 50.70 | | | $ | 48.59 | | | $ | 49.33 | | | $ | 47.02 | | | $ | 35.65 | |
| | | | | | | | | | | | | | | | | | | | |
Income (Loss) From Investment Operations: | | | | | | | | | | | | | | | | | | | | |
Net investment income (loss) | | | 0.92 | | | | 0.89 | | | | 0.86 | | | | 0.79 | | | | 0.73 | |
Net realized and unrealized gain (loss) on investments | | | 9.75 | | | | 4.52 | | | | (0.26 | ) | | | 5.20 | | | | 10.64 | |
| | | | | | | | | | | | | | | | | | | | |
Total from investment operations | | | 10.67 | | | | 5.41 | | | | 0.60 | | | | 5.99 | | | | 11.37 | |
| | | | | | | | | | | | | | | | | | | | |
Less Distributions: | | | (1.99 | ) | | | (3.37 | ) | | | (1.34 | ) | | | (3.68 | ) | | | — | |
Capital Contributions(d) | | | — | | | | 0.07 | | | | — | | | | — | | | | — | |
| | | | | | | | | | | | | | | | | | | | |
Net Asset Value, end of year | | $ | 59.38 | | | $ | 50.70 | | | $ | 48.59 | | | $ | 49.33 | | | $ | 47.02 | |
| | | | | | | | | | | | | | | | | | | | |
Total Return(a) | | | 21.46 | % | | | 11.83 | %(e) | | | 1.18 | % | | | 13.31 | % | | | 31.89 | % |
Ratios/Supplemental Data: | | | | | | | | | | | | | | | | | | | | |
Net assets, end of year (in millions) | | $ | 3,928.3 | | | $ | 3,305.1 | | | $ | 3,010.1 | | | $ | 3,312.7 | | | $ | 2,890.5 | |
Ratios to average net assets(b): | | | | | | | | | | | | | | | | | | | | |
Expenses after waivers and/or expense reimbursement | | | 0.32 | % | | | 0.32 | % | | | 0.32 | % | | | 0.32 | % | | | 0.32 | % |
Expenses before waivers and/or expense reimbursement | | | 0.32 | % | | | 0.34 | % | | | 0.37 | % | | | 0.37 | % | | | 0.37 | % |
Net investment income (loss) | | | 1.69 | % | | | 1.84 | % | | | 1.74 | % | | | 1.67 | % | | | 1.77 | % |
Portfolio turnover rate | | | 4 | % | | | 5 | % | | | 9 | % | | | 5 | % | | | 3 | % |
| (a) | Total return is calculated assuming a purchase of a share on the first day and a sale on the last day of each year reported and includes reinvestment of distributions, if any, and does not reflect the effect of insurance contract charges. Total return does not reflect expenses associated with the separate account such as administrative fees, account charges and surrender charges which, if reflected, would reduce the total returns for all years shown. Performance figures may reflect fee waivers and/or expense reimbursements. In the absence of fee waivers and/or expense reimbursements, the total return would be lower. Past performance is no guarantee of future results. Total returns may reflect adjustments to conform to generally accepted accounting principles. |
| (b) | Does not include expenses of the underlying funds in which the Portfolio invests. |
| (c) | Calculated based on average shares outstanding during the year. |
| (d) | Represents payment received by the Portfolio, from Prudential, in connection with the failure to maximize securities lending income due to a restriction that benefited Prudential. |
| (e) | Total return for the year includes the impact of the capital contribution. Excluding the capital contribution, the total return would have been 11.69%. |
SEE NOTES TO FINANCIAL STATEMENTS.
C5
REPORT OF INDEPENDENT REGISTERED PUBLIC ACCOUNTING FIRM
TO THE SHAREHOLDERS AND BOARD OF TRUSTEES
THE PRUDENTIAL SERIES FUND:
Opinion on the Financial Statements
We have audited the accompanying statements of assets and liabilities of Conservative Balanced Portfolio, Diversified Bond Portfolio, Equity Portfolio, Flexible Managed Portfolio, Global Portfolio, Government Income Portfolio, Government Money Market Portfolio and Stock Index Portfolio (the “Portfolios”), each a portfolio of The Prudential Series Fund, including the schedules of investments, as of December 31, 2017, the related statements of operations for the year then ended, the statements of changes in net assets for each of the years in the two-year period then ended, and the related notes (collectively, the “financial statements”) and the financial highlights for each of the years in the five-year period then ended. In our opinion, the financial statements and financial highlights referred to above present fairly, in all material respects, the financial position of the Portfolios as of December 31, 2017, the results of their operations for the year then ended, the changes in their net assets for each of the years in the two-year period then ended, and the financial highlights for each of the years in the five-year period then ended, in conformity with U.S. generally accepted accounting principles.
Basis for Opinion
These financial statements and financial highlights are the responsibility of the Portfolios’ management. Our responsibility is to express an opinion on these financial statements and financial highlights based on our audits. We are a public accounting firm registered with the Public Company Accounting Oversight Board (United States) (“PCAOB”) and are required to be independent with respect to the Portfolios in accordance with the U.S. federal securities laws and the applicable rules and regulations of the Securities and Exchange Commission and the PCAOB.
We conducted our audits in accordance with the standards of the PCAOB. Those standards require that we plan and perform the audit to obtain reasonable assurance about whether the financial statements and financial highlights are free of material misstatement, whether due to error or fraud. Our audits included performing procedures to assess the risks of material misstatement of the financial statements and financial highlights, whether due to error or fraud, and performing procedures that respond to those risks. Such procedures included examining, on a test basis, evidence supporting the amounts and disclosures in the financial statements and financial highlights. Such procedures also included confirmation of securities owned as of December 31, 2017, by correspondence with the custodian, transfer agent and brokers or by other appropriate auditing procedures when replies from brokers were not received. Our audits also included evaluating the accounting principles used and significant estimates made by management, as well as evaluating the overall presentation of the financial statements and financial highlights. We believe that our audits provide a reasonable basis for our opinion.
We have served as the auditor of one or more Prudential Insurance investment companies since 2003.
New York, New York
February 13, 2018
D1
INFORMATION ABOUT TRUSTEES AND OFFICERS (Unaudited)
Information about the Trustees and the Officers of the Prudential Series Fund (the Trust) is set forth below. Trustees who are not deemed to be “interested persons” of the Trust, as defined in the Investment Company Act of 1940, are referred to as “Independent Trustees.” Trustees who are deemed to be “interested persons” of the Trust are referred to as “Interested Trustees.” The Trustees are responsible for the overall supervision of the operations of the Trust and perform the various duties imposed on the directors of investment companies by the Investment Company Act of 1940.
| | | | |
| Independent Trustees | | | | |
Name, Age Position with the Fund Number of Portfolios in Fund Complex†
Overseen by Trustee | | Principal Occupation(s) During Past 5 Years | | Other Directorships Held by Trustee** |
Susan Davenport Austin* (Age: 50) Trustee Since February 2011 Overseen by Trustee: 107 | | Senior Managing Director of Brock Capital (Since 2014); formerly Vice Chairman (2013-2017), Senior Vice President and Chief Financial Officer (2007-2012) and Vice President of Strategic Planning and Treasurer (2002-2007) of Sheridan Broadcasting Corporation; formerly President of Sheridan Gospel Network (2004-2014); formerly Vice President, Goldman, Sachs & Co. (2000-2001); formerly Associate Director, Bear, Stearns & Co. Inc. (1997-2000); formerly Vice President, Salomon Brothers Inc. (1993-1997); Member of the Board of Directors, The MacDowell Colony (Since 2010); Director (Since 2017); formerly Presiding Director (2014-2017) and Chairman (2011-2014) of the Board of Directors, Broadcast Music, Inc.; Member of the Board of Directors, Hubbard Radio, LLC (Since 2011); President, Candide Business Advisors, Inc. (Since 2011); formerly Member of the Board of Directors, National Association of Broadcasters (2004-2010). | | Director of NextEra Energy Partners, LP (NYSE: NEP) (February 2015-Present). |
Sherry S. Barrat* (Age: 68) Trustee Since January 2013 Overseen by Trustee: 107 | | Formerly Vice Chairman of Northern Trust Corporation (financial services and banking institution) (2011-June 2012); formerly President, Personal Financial Services, Northern Trust Corporation (2006-2010); formerly Chairman & CEO, Western US Region, Northern Trust Corporation (1999-2005); formerly President & CEO, Palm Beach/Martin County Region, Northern Trust. | | Director of NextEra Energy, Inc. (NYSE: NEE) (1998-Present); Director of Arthur J. Gallagher & Company (Since July 2013). |
Jessica M. Bibliowicz* (Age: 58) Trustee Since September 2014 Overseen by Trustee: 107 | | Senior Adviser (Since 2013) of Bridge Growth Partners (private equity firm); formerly Director (2013-2016) of Realogy Holdings Corp. (residential real estate services); formerly Chief Executive Officer (1999-2013) of National Financial Partners (independent distributor of financial services products). | | Director (since 2006) of The Asia-Pacific Fund, Inc.; Sotheby’s (since 2014) (auction house and art-related finance). |
Kay Ryan Booth* (Age: 67) Trustee Since January 2013 Overseen by Trustee: 107 | | Partner, Trinity Private Equity Group (Since September 2014); formerly, Managing Director of Cappello Waterfield & Co. LLC (2011-2014); formerly Vice Chair, Global Research, J.P. Morgan (financial services and investment banking institution) (June 2008-January 2009); formerly Global Director of Equity Research, Bear Stearns & Co., Inc. (financial services and investment banking institution) (1995-2008); formerly Associate Director of Equity Research, Bear Stearns & Co., Inc. (1987-1995). | | None |
Stephen M. Chipman* (Age: 56) Trustee Since January 2018 Overseen by Trustee: 107 | | Chief Executive Officer of Radius GGE (USA), Inc. (Since June 2016); formerly, Senior Vice Chairman (December 2014-October 2015) and Chief Executive Officer (January 2010-December 2014) of Grant Thornton LLP. | | None |
Robert F. Gunia* (Age: 71) Trustee Since July 2003 Overseen by Trustee: 107 | | Director of ICI Mutual Insurance Company (June 2016-present); formerly Chief Administrative Officer (September 1999-September 2009) and Executive Vice President (December 1996-September 2009) of PGIM Investments LLC; formerly Executive Vice President (March 1999-September 2009) and Treasurer (May 2000-September 2009) of Prudential Mutual Fund Services LLC; formerly President (April 1999-December 2008) and Executive Vice President and Chief Operating Officer (December 2008-December 2009) of Prudential Investment Management Services LLC; formerly Chief Administrative Officer, Executive Vice President and Director (May 2003-September 2009) of AST Investment Services, Inc. | | Director (Since May 1989) of The Asia-Pacific Fund, Inc. |
Thomas T. Mooney* (Age: 76) Trustee Since July 2003 Independent Chair Since July 2003 Overseen by Trustee: 107 | | Formerly Chief Executive Officer, Excell Partners, Inc. (2005-2007); founding partner of High Technology of Rochester and the Lennox Technology Center; formerly President of the Greater Rochester Metro Chamber of Commerce (1976-2004); formerly Rochester City Manager (1973); formerly Deputy Monroe County Executive (1974-1976). | | None |
E1
| | | | |
| Independent Trustees | | | | |
Name, Age Position with the Fund Number of Portfolios in Fund Complex†
Overseen by Trustee | | Principal Occupation(s) During Past 5 Years | | Other Directorships Held by Trustee** |
Thomas M. O’Brien* (Age: 67) Trustee Since July 2003 Overseen by Trustee: 107 | | Director, President and CEO Sun Bancorp, Inc. N.A. (NASDAQ: SNBC) and Sun National Bank (Since July 2014); formerly Consultant, Valley National Bancorp, Inc. and Valley National Bank (January 2012-June 2012); formerly President and COO (November 2006-April 2017) and CEO (April 2007-December 2011) of State Bancorp, Inc. and State Bank; formerly Vice Chairman (January 1997-April 2000) of North Fork Bank; formerly President and Chief Executive Officer (December 1984-December 1996) of North Side Savings Bank; formerly President and Chief Executive Officer (May 2000-June 2006) Atlantic Bank of New York. | | Formerly Director, BankUnited, Inc. and BankUnited N.A. (NYSE: BKU) (May 2012-April 2014); formerly Director (April 2008-January 2012) of Federal Home Loan Bank of New York; formerly Director (December 1996-May 2000) of North Fork Bancorporation, Inc.; formerly Director (May 2000-April 2006) of Atlantic Bank of New York; Director (November 2006- January 2012) of State Bancorp, Inc. (NASDAQ: STBC) and State Bank of Long Island. |
| Interested Trustee | | | | |
Timothy S. Cronin* (Age: 52) Trustee Since October 2009 Overseen by Trustee: 107 | | President of Prudential Annuities (Since June 2015); Chief Investment Officer and Strategist of Prudential Annuities (Since January 2004); Director of Investment & Research Strategy (Since February 1998); President of AST Investment Services, Inc. (Since June 2005). | | None |
* The address of each Trustee is c/o PGIM Investments LLC, 655 Broad Street, Newark, New Jersey 07102.
** Includes only directorships of companies required to register or file reports with the Securities and Exchange Commission (SEC) under the Securities Exchange Act of 1934 (that is, “public companies”) or other investment companies registered under the Investment Company Act of 1940.
† The Fund Complex consists of all investment companies managed by PGIM Investments LLC. The Funds for which PGIM Investments LLC serves as manager include the Prudential Mutual Funds, The Prudential Variable Contract Accounts 2, 10 and 11, Prudential Short Duration High Yield Fund, Inc., Prudential Global Short Duration High Yield Fund, Inc., The Prudential Series Fund, Advanced Series Trust, and Prudential’s Gibraltar Fund, Inc.
| | |
| Trust Officers1 | | |
Name, Age Position with the Fund | | Principal Occupation(s) During Past 5 Years |
Edward C. Merrill, IV, CFA* (33) Vice President Since June 2017 | | Vice President of Prudential Annuities (since December 2014); formerly Director of Prudential Annuities (December 2010-December 2014); formerly Manager of Prudential Annuities (August 2009-December 2010); formerly Senior Analyst of Prudential Annuities (October 2008-August 2009). |
Raymond A. O’Hara* (62) Chief Legal Officer Since June 2012 | | Vice President and Corporate Counsel (since July 2010) of Prudential Insurance Company of America (Prudential); Vice President (March 2011-Present) of Pruco Life Insurance Company and Pruco Life Insurance Company of New Jersey; Vice President and Corporate Counsel (March 2011-Present) of Prudential Annuities Life Assurance Corporation; Chief Legal Officer of PGIM Investments LLC (since June 2012); Chief Legal Officer of Prudential Mutual Fund Services LLC (since June 2012) and Corporate Counsel of AST Investment Services, Inc. (since June 2012); formerly Assistant Vice President and Corporate Counsel (September 2008-July 2010) of The Hartford Financial Services Group, Inc.; formerly Associate (September 1980-December 1987) and Partner (January 1988-August 2008) of Blazzard & Hasenauer, P.C. (formerly, Blazzard, Grodd & Hasenauer, P.C.). |
Chad A. Earnst* (43) Chief Compliance Officer Since 2014 | | Chief Compliance Officer (September 2014-Present) of PGIM Investments LLC; Chief Compliance Officer (September 2014-Present) of the Prudential Mutual Funds, Target Funds, Advanced Series Trust, The Prudential Series Fund, Prudential’s Gibraltar Fund, Inc., Prudential Global Short Duration High Yield Income Fund, Inc., Prudential Short Duration High Yield Fund, Inc. and Prudential Jennison MLP Income Fund, Inc.; formerly Assistant Director (March 2010-August 2014) of the Asset Management Unit, Division of Enforcement, US Securities & Exchange Commission; Assistant Regional Director (January 2010-August 2014), Branch Chief (June 2006–December 2009) and Senior Counsel (April 2003-May 2006) of the Miami Regional Office, Division of Enforcement, US Securities & Exchange Commission. |
Deborah A. Docs* (60) Secretary Since May 2005 | | Vice President and Corporate Counsel (since January 2001) of Prudential; Vice President (since December 1996) and Assistant Secretary (since March 1999) of PGIM Investments LLC; formerly Vice President and Assistant Secretary (May 2003-June 2005) of AST Investment Services, Inc. |
Jonathan D. Shain* (59) Assistant Secretary Since May 2005 | | Vice President and Corporate Counsel (since August 1998) of Prudential; Vice President and Assistant Secretary (since May 2001) of PGIM Investments LLC; Vice President and Assistant Secretary (since February 2001) of Prudential Mutual Fund Services LLC; formerly Vice President and Assistant Secretary (May 2003-June 2005) of AST Investment Services, Inc. |
Claudia DiGiacomo* (43) Assistant Secretary Since 2005 | | Vice President and Corporate Counsel (since January 2005) of Prudential; Vice President and Assistant Secretary of PGIM Investments LLC (since December 2005); Associate at Sidley Austin Brown Wood LLP (1999-2004). |
Andrew R. French* (55) Assistant Secretary Since October 2006 | | Vice President and Corporate Counsel (since February 2010) of Prudential; formerly Director and Corporate Counsel (2006-2010) of Prudential; Vice President and Assistant Secretary (since January 2007) of PGIM Investments LLC; Vice President and Assistant Secretary (since January 2007) of Prudential Mutual Fund Services LLC. |
Kathleen DeNicholas* (43) Assistant Secretary Since May 2013 | | Vice President and Corporate Counsel (since May 2013) of Prudential; Managing Counsel at The Bank of New York Mellon Corporation (2011-2013); formerly Senior Counsel (2007-2011) and Assistant General Counsel (2001-2007) of The Dreyfus Corporation; Chief Legal Officer and Secretary of MBSC Securities Corporation (2011-2013); Vice President and Assistant Secretary of The Dreyfus Family of Funds (2010-2012). |
E2
| | |
| Trust Officers1 | | |
Name, Age Position with the Fund | | Principal Occupation(s) During Past 5 Years |
M. Sadiq Peshimam* (54) Treasurer and Principal Financial & Accounting Officer Since February 2006 | | Vice President (since 2005) of PGIM Investments LLC; formerly Assistant Treasurer of funds in the Prudential Mutual Fund Complex (2006-2014). |
Peter Parrella* (59) Assistant Treasurer Since June 2007 | | Vice President (since 2007) and Director (2004-2007) within Prudential Mutual Fund Administration; formerly Tax Manager at SSB Citi Fund Management LLC (1997-2004). |
Lana Lomuti* (50) Assistant Treasurer Since April 2014 | | Vice President (since 2007) and Director (2005-2007), within Prudential Mutual Fund Administration; formerly Assistant Treasurer (December 2007-February 2014) of The Greater China Fund, Inc. |
Linda McMullin* (56) Assistant Treasurer Since April 2014 | | Vice President (since 2011) and Director (2008-2011) within Prudential Mutual Fund Administration. |
Charles H. Smith* (44) Anti-Money Laundering Compliance Officer Since January 2017 | | Vice President, Corporate Compliance, Anti-Money Laundering Unit (since January 2015) of Prudential; committee member of the American Council of Life Insurers Anti-Money Laundering and Critical Infrastructure Committee (since January 2016); formerly Global Head of Economic Sanctions Compliance at AIG Property Casualty (February 2007-December 2014); Assistant Attorney General at the New York State Attorney General’s Office, Division of Public Advocacy. (August 1998-January 2007). |
Alina Srodecka, CPA* (51) Assistant Treasurer Since June 2017 | | Vice President of Tax at Prudential Financial, Inc. (Since August 2007); formerly Director of Tax at MetLife (January 2003-May 2006); formerly Tax Manager at Deloitte & Touché (October 1997-January 2003); formerly Staff Accountant at Marsh & McLennan (May 1994-May 1997). |
* The address for each officer is c/o PGIM Investments LLC, 655 Broad Street, Newark, New Jersey 07102.
1 Excludes Mr. Cronin, an Interested Trustee who serves as President. Biographical and other information with respect to Mr. Cronin appears under “Interested Trustee,” above.
E3
Supplemental Proxy Information (Unaudited)
A special meeting of Fund shareholders was held on January 16, 2018. At the meeting, the following proposals were approved by shareholders:
1. To elect Directors.
| | | | | | | | | | | | | | | | |
| DIRECTORS: | | Shares Voted
for: | | | % Voted
for: | | | Shares Voted
Withheld: | | | % Voted
Withheld: | |
Susan Davenport Austin | | | 1,407,770,019 | | | | 95.12 | % | | | 72,196,140.96 | | | | 4.88 | % |
Sherry S. Barrat | | | 1,408,457,601 | | | | 95.17 | % | | | 71,508,559.12 | | | | 4.83 | % |
Jessica M. Bibliowicz | | | 1,409,011,923 | | | | 95.21 | % | | | 70,954,237.08 | | | | 4.79 | % |
Kay Ryan Booth | | | 1,408,201,825 | | | | 95.15 | % | | | 71,764,334.59 | | | | 4.85 | % |
Robert F. Gunia | | | 1,407,204,010 | | | | 95.08 | % | | | 72,762,149.91 | | | | 4.92 | % |
Thomas T. Mooney | | | 1,405,767,109 | | | | 94.99 | % | | | 74,199,050.8 | | | | 5.01 | % |
Thomas M. O’Brien | | | 1,408,981,725 | | | | 95.20 | % | | | 70,984,435.19 | | | | 4.80 | % |
Timothy S. Cronin | | | 1,411,003,229 | | | | 95.34 | % | | | 68,962,931.22 | | | | 4.66 | % |
Stephen M. Chipman | | | 1,409,854,414 | | | | 95.26 | % | | | 70,111,745.39 | | | | 4.74 | % |
2. To approve a Policy to permit the Investment Manager of the Fund to enter into or make material changes to subadvisory agreements with subadvisers that are wholly-owned subsidiaries without shareholder approval.
| | | | | | | | | | | | |
| | | Shares Voted: | | | % Of Voted: | | | % Of Total: | |
| Conservative Balanced Portfolio: | | | | | | | | | | | | |
For | | | 76,323,189 | | | | 78.49 | % | | | 78.49 | % |
Against | | | 12,267,951 | | | | 12.62 | % | | | 12.62 | % |
Abstain | | | 8,644,548 | | | | 8.89 | % | | | 8.89 | % |
Total | | | 97,235,689 | | | | 100.00 | % | | | 100.00 | % |
| | | | | | | | | | | | |
| Diversified Bond Portfolio: | | | | | | | | | | | | |
For | | | 66,548,571 | | | | 75.77 | % | | | 75.75 | % |
Against | | | 14,996,619 | | | | 17.08 | % | | | 17.07 | % |
Abstain | | | 6,285,062 | | | | 7.16 | % | | | 7.15 | % |
Total | | | 87,830,252 | | | | 100.00 | % | | | 99.97 | % |
| | | | | | | | | | | | |
| Equity Portfolio: | | | | | | | | | | | | |
For | | | 68,157,489 | | | | 78.14 | % | | | 78.13 | % |
Against | | | 12,675,469 | | | | 14.53 | % | | | 14.53 | % |
Abstain | | | 6,393,819 | | | | 7.33 | % | | | 7.33 | % |
Total | | | 87,226,776 | | | | 100.00 | % | | | 99.99 | % |
| | | | | | | | | | | | |
| Flexible Managed Portfolio: | | | | | | | | | | | | |
For | | | 108,207,740 | | | | 75.16 | % | | | 75.16 | % |
Against | | | 19,663,718 | | | | 13.69 | % | | | 13.69 | % |
Abstain | | | 16,021,776 | | | | 11.15 | % | | | 11.15 | % |
Total | | | 143,646,259 | | | | 100.00 | % | | | 100.00 | % |
| | | | | | | | | | | | |
| | | | | | | | | | | | |
| | | Shares Voted: | | | % of Voted: | | | % of Total: | |
| Global Portfolio: | | | | | | | | | | | | |
For | | | 26,371,176 | | | | 79.03 | % | | | 79.00 | % |
Against | | | 4,996,261 | | | | 14.97 | % | | | 14.97 | % |
Abstain | | | 2,000,487 | | | | 6.00 | % | | | 5.99 | % |
Total | | | 33,367,923 | | | | 100.00 | % | | | 99.96 | % |
| | | | | | | | | | | | |
| Government Income Portfolio: | | | | | | | | | | | | |
For | | | 14,855,591 | | | | 74.76 | % | | | 74.71 | % |
Against | | | 3,203,488 | | | | 16.12 | % | | | 16.11 | % |
Abstain | | | 1,811,605 | | | | 9.12 | % | | | 9.11 | % |
Total | | | 19,870,685 | | | | 100.00 | % | | | 99.94 | % |
| | | | | | | | | | | | |
| Government Money Market Portfolio: | | | | | | | | | | | | |
For | | | 47,217,284 | | | | 75.99 | % | | | 75.99 | % |
Against | | | 9,751,635 | | | | 15.69 | % | | | 15.69 | % |
Abstain | | | 5,169,645 | | | | 8.32 | % | | | 8.32 | % |
Total | | | 62,138,563 | | | | 100.00 | % | | | 100.00 | % |
| | | | | | | | | | | | |
| Stock Index Portfolio: | | | | | | | | | | | | |
For | | | 48,258,463 | | | | 72.26 | % | | | 72.26 | % |
Against | | | 9,904,652 | | | | 14.83 | % | | | 14.83 | % |
Abstain | | | 8,625,885 | | | | 12.92 | % | | | 12.92 | % |
Total | | | 66,789,000 | | | | 100.00 | % | | | 100.00 | % |
3. To approve a proposal to designate the Portfolio’s investment objective as a non-fundamental policy of the Portfolio.
| | | | | | | | | | | | |
| | | Shares Voted: | | | % of Voted: | | | % of Total: | |
| Conservative Balanced Portfolio: | | | | | | | | | | | | |
For | | | 76,270,982 | | | | 78.44 | % | | | 78.44 | % |
Against | | | 11,000,658 | | | | 11.31 | % | | | 11.31 | % |
Abstain | | | 9,964,048 | | | | 10.25 | % | | | 10.25 | % |
Total | | | 97,235,689 | | | | 100.00 | % | | | 100.00 | % |
| | | | | | | | | | | | |
| Diversified Bond Portfolio: | | | | | | | | | | | | |
For | | | 68,302,282 | | | | 77.77 | % | | | 77.74 | % |
Against | | | 12,214,312 | | | | 13.91 | % | | | 13.90 | % |
Abstain | | | 7,313,658 | | | | 8.33 | % | | | 8.32 | % |
Total | | | 87,830,252 | | | | 100.00 | % | | | 99.97 | % |
| | | | | | | | | | | | |
| Equity Portfolio: | | | | | | | | | | | | |
For | | | 67,959,578 | | | | 77.91 | % | | | 77.90 | % |
Against | | | 11,519,388 | | | | 13.21 | % | | | 13.20 | % |
Abstain | | | 7,747,810 | | | | 8.88 | % | | | 8.88 | % |
Total | | | 87,226,776 | | | | 100.00 | % | | | 99.99 | % |
| | | | | | | | | | | | |
| Flexible Managed Portfolio: | | | | | | | | | | | | |
For | | | 108,207,740 | | | | 75.33 | % | | | 75.33 | % |
Against | | | 17,349,831 | | | | 12.08 | % | | | 12.08 | % |
Abstain | | | 18,088,689 | | | | 12.59 | % | | | 12.59 | % |
Total | | | 143,646,259 | | | | 100.00 | % | | | 100.00 | % |
| | | | | | | | | | | | |
| | | | | | | | | | | | |
| | | Shares Voted: | | | % of Voted: | | | % of Total: | |
| Global Portfolio: | | | | | | | | | | | | |
For | | | 26,380,785 | | | | 79.06 | % | | | 79.03 | % |
Against | | | 4,502,276 | | | | 13.49 | % | | | 13.49 | % |
Abstain | | | 2,484,862 | | | | 7.45 | % | | | 7.44 | % |
Total | | | 33,367,923 | | | | 100.00 | % | | | 99.96 | % |
| | | | | | | | | | | | |
| Government Income Portfolio: | | | | | | | | | | | | |
For | | | 14,860,152 | | | | 74.79 | % | | | 74.74 | % |
Against | | | 2,943,595 | | | | 14.81 | % | | | 14.80 | % |
Abstain | | | 2,066,938 | | | | 10.40 | % | | | 10.40 | % |
Total | | | 19,870,685 | | | | 100.00 | % | | | 99.94 | % |
| | | | | | | | | | | | |
| Government Money Market Portfolio: | | | | | | | | | | | | |
For | | | 46,234,056 | | | | 74.41 | % | | | 74.41 | % |
Against | | | 10,202,857 | | | | 16.42 | % | | | 16.42 | % |
Abstain | | | 5,701,651 | | | | 9.18 | % | | | 9.18 | % |
Total | | | 62,138,563 | | | | 100.00 | % | | | 100.00 | % |
| | | | | | | | | | | | |
| Stock Index Portfolio: | | | | | | | | | | | | |
For | | | 48,032,431 | | | | 71.92 | % | | | 71.92 | % |
Against | | | 9,230,216 | | | | 13.82 | % | | | 13.82 | % |
Abstain | | | 9,526,352 | | | | 14.26 | % | | | 14.26 | % |
Total | | | 66,789,000 | | | | 100.00 | % | | | 100.00 | % |
| | | | | | | | | | | | |
The toll-free number shown below can be used to make transfers and reallocations, review how your premiums are being allocated, and receive current investment option values in your contract. Unit values for each investment option are available to all participants from the toll-free number. Please be sure to have your contract number available when you call.
(800) 458-6333
Investors should consider the contract and the underlying portfolios’ investment objectives, risks, charges and expenses carefully before investing. This and other important information is contained in the prospectuses that can be obtained from your financial professional. You should read the prospectuses carefully before investing.
This report includes the financial statements of VCA-10, and the portfolios of The Prudential Series Fund (the “Funds”) available through VCA-11 and VCA-24.
This report does not include separate account financials for the VCA-11 and VCA-24 Subaccounts. If you would like separate account financial statements, please call the telephone number on the inside back cover of this report.
Annuity contracts contain exclusions, limitations, reductions of benefits, and terms for keeping them in force. Your plan sponsor or licensed financial professional can provide you with costs and complete details. Contract guarantees are based on the claims-paying ability of the issuing company.
A description of VCA-10’s proxy voting policies and procedures is available without charge, upon request. MEDLEY participants should call (800) 458-6333 to obtain a description of VCA-10’s proxy voting policies and procedures. Information regarding how the VCA-10 voted proxies relating to portfolio securities during the most recent 12-month period ended June 30 is available on the website of the Securities and Exchange Commission (the “Commission”) at www.sec.gov and on VCA-10’s website.
The MEDLEY Program Statement of Additional Information contains additional information about the Committee Members of VCA-10 and is available without charge upon request by calling (800) 458-6333.
VCA-10 files with the Commission a complete listing of portfolio holdings as of the end of the first and third quarters on Form N-Q. Form N-Q is available on the Commission’s website at www.sec.gov or by visiting the Commission’s Public Reference Room. For more information on the Commission’s Public Reference Room, please visit the Commission’s website or call (800) 732-0330. MEDLEY participants may obtain copies of Form N-Q filings by calling (800) 458-6333.
The Prudential Insurance Company of America
751 Broad Street
Newark, NJ 07102-3714
Presorted
Standard
U.S. Postage
PAID
Prudential
©2018 Prudential Financial, Inc. and its related entities. PGIM Investments, the Prudential logo, the Rock symbol, and Bring Your Challenges are service marks of Prudential Financial, Inc. and its related entities, registered in many jurisdictions worldwide.
MD.RS.011
Item 2 – Code of Ethics – – See Exhibit (a)
As of the end of the period covered by this report, the registrant has adopted a code of ethics (the “Section 406 Standards for Investment Companies – Ethical Standards for Principal Executive and Financial Officers”) that applies to the registrant’s Principal Executive Officer and Principal Financial Officer; the registrant’s Principal Financial Officer also serves as the Principal Accounting Officer. During the period covered by the report, there have been no amendments to any provisions of the code of ethics nor have any waivers been granted from any provision of the code of ethics.
The registrant hereby undertakes to provide any person, without charge, upon request, a copy of the code of ethics. To request a copy of the code of ethics, contact the registrant 973-367-7521, and ask for a copy of the Section 406 Standards for Investment Companies - Ethical Standards for Principal Executive and Financial Officers.
Item 3 – Audit Committee Financial Expert –
The registrant’s Board has determined that Mr. Kevin J. Bannon, member of the Board’s Audit Committee is an “audit committee financial expert,” and that he is “independent,” for purposes of this Item.
Item 4 – Principal Accountant Fees and Services –
(a) Audit Fees
For the fiscal years ended December 31, 2017 and December 31, 2016, KPMG LLP (“KPMG”), the Registrant’s principal accountant, billed the Registrant $24,165 and $19,961, respectively, for professional services rendered for the audit of the Registrant’s annual financial statements or services that are normally provided in connection with statutory and regulatory filings.
(b) Audit-Related Fees
For the fiscal years ended December 31, 2017 and December 31, 2016: none.
(c) Tax Fees
For the fiscal years ended December 31, 2017 and December 31, 2016: none.
(d) All Other Fees
For the fiscal years ended December 31, 2017 and December 31, 2016: none.
(e) (1) Audit Committee Pre-Approval Policies and Procedures
THE PRUDENTIAL MUTUAL FUNDS
AUDIT COMMITTEE POLICY
on
Pre-Approval of Services Provided by the Independent Accountants
The Audit Committee of each Prudential Mutual Fund is charged with the responsibility to monitor the independence of the Fund’s independent accountants. As part of this responsibility, the Audit Committee must pre-approve the independent accounting firm’s engagement to render audit and/or permissible non-audit services, as required by law. In evaluating a proposed engagement of the independent accountants, the Audit Committee will assess the effect that the engagement might reasonably be expected to have on the accountant’s independence. The Committee’s evaluation will be based on:
| | • | | a review of the nature of the professional services expected to be provided, |
| | • | | a review of the safeguards put into place by the accounting firm to safeguard independence, and |
| | • | | periodic meetings with the accounting firm. |
Policy for Audit and Non-Audit Services Provided to the Funds
On an annual basis, the scope of audits for each Fund, audit fees and expenses, and audit-related and non-audit services (and fees proposed in respect thereof) proposed to be performed by the Fund’s independent accountants will be presented by the Treasurer and the independent accountants to the Audit Committee for review and, as appropriate, approval prior to the initiation of such services. Such presentation shall be accompanied by confirmation by both the Treasurer and the independent accountants that the proposed non-audit services will not adversely affect the independence of the independent accountants. Such proposed non-audit services shall be described in sufficient detail to enable the Audit Committee to assess the appropriateness of such services and fees, and the compatibility of the provision of such services with the auditor’s independence. The Committee shall receive periodic reports on the progress of the audit and other services which are approved by the Committee or by the Committee Chair pursuant to authority delegated in this Policy.
The categories of services enumerated under “Audit Services”, “Audit-related Services”, and “Tax Services” are intended to provide guidance to the Treasurer and the independent accountants as to those categories of services which the Committee believes are generally consistent with the independence of the independent accountants and which the Committee (or the Committee Chair) would expect upon the presentation of specific proposals to pre-approve. The enumerated categories are not intended as an exclusive list of audit, audit-related or tax services, which the Committee (or the Committee Chair) would consider for pre-approval.
Audit Services
The following categories of audit services are considered to be consistent with the role of the Fund’s independent accountants:
| | ➣ | Annual Fund financial statement audits |
| | ➣ | Seed audits (related to new product filings, as required) |
| | ➣ | SEC and regulatory filings and consents |
Audit-related Services
The following categories of audit-related services are considered to be consistent with the role of the Fund’s independent accountants:
| | ➣ | Accounting consultations |
| | ➣ | Fund merger support services |
| | ➣ | Agreed Upon Procedure Reports |
| | ➣ | Other Internal Control Reports |
Individual audit-related services that fall within one of these categories (except for fund merger support services) and are not presented to the Audit Committee as part of the annual pre-approval process are subject to an authorized pre-approval by the Audit Committee so long as the estimated fee for those services does not exceed $30,000. Any services provided under such pre-approval will be reported to the Audit Committee at its next regular meeting. Should the amount of such services exceed $30,000 any additional fees will be subject to pre-approval by the Committee Chair (or any other Committee member on whom this responsibility has been delegated). Fees related to fund merger support services are subject to a separate authorized pre-approval by the Audit Committee with fees determined on a per occurrence and merger complexity basis.
Tax Services
The following categories of tax services are considered to be consistent with the role of the Fund’s independent accountants:
| | ➣ | Tax compliance services related to the filing or amendment of the following: |
| | ◾ | | Federal, state and local income tax compliance; and, |
| | ◾ | | Sales and use tax compliance |
| | ➣ | Timely RIC qualification reviews |
| | ➣ | Tax distribution analysis and planning |
| | ➣ | Tax authority examination services |
| | ➣ | Tax appeals support services |
| | ➣ | Accounting methods studies |
| | ➣ | Fund merger support services |
| | ➣ | Tax consulting services and related projects |
Individual tax services that fall within one of these categories and are not presented to the Audit
Committee as part of the annual pre-approval process are subject to an authorized pre-approval by the Audit Committee so long as the estimated fee for those services does not exceed $30,000. Any services provided under such pre-approval will be reported to the Audit Committee at its
next regular meeting. Should the amount of such services exceed $30,000 any additional fees will be subject to pre-approval by the Committee Chair (or any other Committee member on whom this responsibility has been delegated).
Other Non-Audit Services
Certain non-audit services that the independent accountants are legally permitted to render will be subject to pre-approval by the Committee or by one or more Committee members to whom the Committee has delegated this authority and who will report to the full Committee any pre-approval decisions made pursuant to this Policy. Non-audit services presented for pre-approval pursuant to this paragraph will be accompanied by a confirmation from both the Treasurer and the independent accountants that the proposed services will not adversely affect the independence of the independent accountants.
Proscribed Services
The Fund’s independent accountants will not render services in the following categories of non-audit services:
| | |
| Ø | | Bookkeeping or other services related to the accounting records or financial statements of the Fund |
| Ø | | Financial information systems design and implementation |
| Ø | | Appraisal or valuation services, fairness opinions, or contribution-in-kind reports |
| Ø | | Actuarial services |
| Ø | | Internal audit outsourcing services |
| Ø | | Management functions or human resources |
| Ø | | Broker or dealer, investment adviser, or investment banking services |
| Ø | | Legal services and expert services unrelated to the audit |
| Ø | | Any other service that the Public Company Accounting Oversight Board determines, by regulation, is impermissible. |
Pre-approval of Non-Audit Services Provided to Other Entities Within the Prudential Fund Complex
Certain non-audit services provided to PGIM Investments LLC or any of its affiliates that also provide ongoing services to the Prudential Mutual Funds will be subject to pre-approval by the Audit Committee. The only non-audit services provided to these entities that will require pre-approval are those related directly to the operations and financial reporting of the Funds. Individual projects that are not presented to the Audit Committee as part of the annual pre-approval process will be subject to pre-approval by the Committee Chair (or any other Committee member on whom this responsibility has been delegated) so long as the estimated fee for those services does not exceed $30,000. Services presented for pre-approval pursuant to this paragraph will be accompanied by a confirmation from both the Treasurer and the independent accountants that the proposed services will not adversely affect the independence of the independent accountants.
Although the Audit Committee will not pre-approve all services provided to PGIM Investments LLC and its affiliates, the Committee will receive an annual report from the Fund’s independent
accounting firm showing the aggregate fees for all services provided to Prudential Investments and its affiliates.
(e) (2) Percentage of services referred to in 4(b) – 4(d) that were approved by the audit committee –
For the fiscal years ended December 31, 2017 and December 31, 2016: none.
(f) Percentage of hours expended attributable to work performed by other than full time employees of principal accountant if greater than 50%.
The percentage of hours expended on the principal accountant’s engagement to audit the registrant’s financial statements for the most recent fiscal year that were attributed to work performed by persons other than the principal accountant’s full-time, permanent employees was 0%.
(g) Non-Audit Fees
The aggregate non-audit fees billed by KPMG for services rendered to the registrant’s investment adviser and any entity controlling, controlled by, or under common control with the investment adviser that provides ongoing services to the registrant for the fiscal years ended December 31, 2017 and December 31, 2016 was $0 and $0, respectively.
(h) Principal Accountant’s Independence
Not applicable as KPMG has not provided non-audit services to the registrant’s investment adviser and any entity controlling, controlled by, or under common control with the investment adviser that provides ongoing services to the registrant that were not pre-approved pursuant to Rule 2-01(c)(7)(ii) of Regulation S-X.
| | |
Item 5 – | | Audit Committee of Listed Registrants – Not applicable. |
| |
Item 6 – | | Schedule of Investments – The schedule is included as part of the report to shareholders filed under Item 1 of this Form. |
| |
Item 7 – | | Disclosure of Proxy Voting Policies and Procedures for Closed-End Management Investment Companies – Not applicable. |
| |
Item 8 – | | Portfolio Managers of Closed-End Management Investment Companies – Not applicable. |
| |
Item 9 – | | Purchases of Equity Securities by Closed-End Management Investment Company and Affiliated Purchasers – Not applicable. |
| | |
| |
Item 10 – | | Submission of Matters to a Vote of Security Holders – Not applicable. |
| |
Item 11 – | | Controls and Procedures |
| | (a) | It is the conclusion of the registrant’s principal executive officer and principal financial officer that the effectiveness of the registrant’s current disclosure controls and procedures (such disclosure controls and procedures having been evaluated within 90 days of the date of this filing) provide reasonable assurance that the information required to be disclosed by the registrant has been recorded, processed, summarized and reported within |
| | the time period specified in the Commission’s rules and forms and that the information required to be disclosed by the registrant has been accumulated and communicated to the registrant’s principal executive officer and principal financial officer in order to allow timely decisions regarding required disclosure. |
| | (b) | There has been no significant change in the registrant’s internal control over financial reporting that occurred during the registrant’s most recent fiscal quarter of the period covered by this report that has materially affected, or is likely to materially affect, the registrant’s internal control over financial reporting. |
Item 12 – Exhibits
| | | | | | |
| | (a) | | (1) | | Code of Ethics – Attached hereto as Exhibit EX-99.CODE-ETH |
| | | | (2) | | Certifications pursuant to Section 302 of the Sarbanes-Oxley Act – Attached hereto as
Exhibit EX-99.CERT. |
| | | | (3) | | Any written solicitation to purchase securities under Rule 23c-1. – Not applicable. |
| | (b) | | Certifications pursuant to Section 906 of the Sarbanes-Oxley Act – Attached hereto as
Exhibit EX-99.906CERT. |
SIGNATURES
Pursuant to the requirements of the Securities Exchange Act of 1934 and the Investment Company Act of 1940, the registrant has duly caused this report to be signed on its behalf by the undersigned, thereunto duly authorized.
| | |
| Registrant: | | The Prudential Variable Contract Account-10 |
| |
| By: | | /s/ Deborah A. Docs |
| | Deborah A. Docs |
| | Secretary |
| |
| Date: | | February 21, 2018 |
Pursuant to the requirements of the Securities Exchange Act of 1934 and the Investment Company Act of 1940, this report has been signed below by the following persons on behalf of the registrant and in the capacities and on the dates indicated.
| | |
| By: | | /s/ Stuart S. Parker |
| | Stuart S. Parker |
| | President and Principal Executive Officer |
| |
| Date: | | February 21, 2018 |
| |
| By: | | /s/ M. Sadiq Peshimam |
| | M. Sadiq Peshimam |
| | Treasurer and Principal Financial and Accounting Officer |
| |
| Date: | | February 21, 2018 |