UNITED STATES
SECURITIES AND EXCHANGE COMMISSION
WASHINGTON, D.C. 20549
FORM N-CSR
CERTIFIED SHAREHOLDER REPORT OF REGISTERED
MANAGEMENT INVESTMENT COMPANIES
Investment Company Act file number 811-3430
Oppenheimer Limited-Term Bond Fund
(Exact name of registrant as specified in charter)
6803 South Tucson Way, Centennial, Colorado 80112-3924
(Address of principal executive offices) (Zip code)
Arthur S. Gabinet
OFI Global Asset Management, Inc.
Two World Financial Center, New York, New York 10281-1008
(Name and address of agent for service)
Registrant’s telephone number, including area code: (303) 768-3200
Date of fiscal year end: August 31
Date of reporting period: 8/30/2013
Item 1. Reports to Stockholders.
Table of Contents
Class A Shares
AVERAGE ANNUAL TOTAL RETURNS AT 8/30/13*
| | | | | | | | |
| | | Class A Shares of the Fund | | | | |
| | | Without Sales Charge | | With Sales Charge | | Barclays U.S.
Aggregate Bond Index
1-3 Years | | Barclays U.S.
Government Bond
Index |
1-Year | | -1.21% | | -3.43% | | 0.33% | | -2.91% |
5-Year | | 4.45 | | 3.97 | | 2.49 | | 3.94 |
10-Year | | 4.21 | | 3.97 | | 3.10 | | 4.40 |
Performance data quoted represents past performance, which does not guarantee future results. The investment return and principal value of an investment in the Fund will fluctuate so that an investor’s shares, when redeemed, may be worth more or less than their original cost. Fund returns include changes in share price, reinvested distributions, and a 2.25% maximum applicable sales charge except where “without sales charge” is indicated. Prior to August 1, 2013, the maximum initial sales charge for Class A shares of the Fund was 4.75%. Current performance may be lower or higher than the performance quoted. Returns do not consider capital gains or income taxes on an individual’s investment. Returns for periods of less than one year are cumulative and not annualized. For performance data current to the most recent month-end, visit oppenheimerfunds.com or call 1.800.CALL OPP (225.5677).
*August 30, 2013, was the last business day of the Fund’s fiscal year. See Note 1 of the accompanying Notes to Financial Statements. Index returns are calculated through August 31, 2013.
Prior to August 1, 2013, Oppenheimer Limited-Term Bond Fund was named Oppenheimer U.S. Government Trust.
2 OPPENHEIMER LIMITED-TERM BOND FUND
Fund Performance Discussion
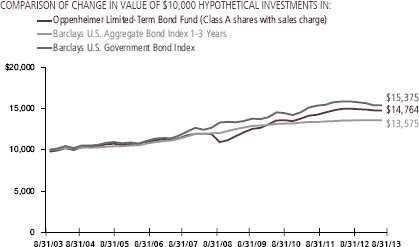
The Fund’s Class A shares (without sales charge) produced a return of -1.21% during the reporting period. On a relative basis, the Fund outperformed the Barclays U.S. Government Bond Index’s return of -2.91%. The Fund experienced declines in what was a difficult environment for fixed-income, particularly over the second half of the period after the Federal Reserve (the “Fed”) discussed the potential for tapering of its quantitative easing program.
On August 1, 2013, the Fund changed its name from Oppenheimer U.S. Government Trust to Oppenheimer Limited-Term Bond Fund, and its primary benchmark became the Barclays U.S. Aggregate Bond Index 1-3 Years. For the one-year period, the Barclays U.S. Aggregate Bond Index 1-3 Years returned 0.33%. The Fund will primarily invest in the debt securities of investment-grade issuers. This includes the debt of the U.S. Government (and its agencies), corporations, mortgage-related securities, and asset-backed securities. In an attempt to decrease volatility, the Fund will seek to maintain an average effective duration between 1 and 3.5 years. The change allows the Fund to invest in a more diversified opportunity set of securities and is intended to reduce its overall interest rate risk.
MARKET OVERVIEW
For the one-year reporting period, market movements were largely driven by central
bank policies. Over the first half of the period, central banks throughout the world
3 OPPENHEIMER LIMITED-TERM BOND FUND
established accommodative policies that resulted in a rally among risk markets. In the U.S., the Federal Reserve (the “Fed”) launched an open-ended quantitative easing program involving monthly purchases of $85 billion of U.S. government securities. The quantitative easing program was designed to help boost the U.S. economy by keeping mortgage rates and other long-term interest rates low. While Europe continued to struggle with its sovereign debt crisis, analysts were encouraged when the head of the European Central Bank publicly stated his intent to support the euro as the European Union’s common currency. Even in Japan, which had been mired in economic weakness for years, new government leadership adopted economic policies and its central bank announced a massive quantitative easing program.
At the end of May, market volatility picked up measurably as comments from Fed Chairman Ben Bernanke at a Congressional hearing surprised the market when he indicated a possible slowdown of the central bank’s asset purchase program if the economy continued to show improvement. Additionally, fears began to creep into the market about a possible slowdown in the world’s emerging economies. As a result, risk assets sold off across the board, with Japanese stocks and emerging market debt absorbing the brunt of the selling, although investment grade credit was certainly not immune. Simultaneously, the intermediate and long-end of the U.S. Treasury curve steepened quite dramatically as investors began to price in the likelihood
of higher interest rates in the future. The volatility continued through June as the Federal Open Market Committee (FOMC) issued a statement indicating again that if the U.S. economy continued to improve the Fed would begin to slow down its quantitative easing program.
Equity markets in the U.S. stabilized over the final months of the reporting period when investors came to the realization that an end to the quantitative easing program did not necessarily imply an imminent increase in short-term interest rates. However, fixed-income markets remained volatile.
FUND REVIEW
Throughout the reporting period, the Fund maintained minimal exposure to U.S. Treasuries. This contributed positively to the Fund’s performance as U.S. Treasuries suffered throughout this reporting period and particularly after the Fed’s announcement of potential tapering. Instead, the Fund remained most heavily invested in mortgage-backed securities (“MBS”) and agency securities for the majority of the period. These investments benefited the Fund over the first half of the reporting period when they rallied and outperformed U.S. Treasuries on the back of positive economic surprises, despite the Cyprus banking crisis, deteriorating conditions in the Eurozone and moderating growth in emerging markets. However, beginning in May, volatility impacted most fixed-income markets after the Fed began to discuss tapering. Before the Fed’s comments, we had already started reducing our position
4 OPPENHEIMER LIMITED-TERM BOND FUND
in MBS since we felt they were vulnerable to policy changes. At the same time, we increased our allocation to agency debt and initiated positions in investment grade and high yield debt. While the decreased exposure to MBS limited the negative impact on Fund performance, MBS still detracted from performance for the overall reporting period. Agency debt also detracted from performance this period, while investment grade and high yield produced modest positive results.
STRATEGY & OUTLOOK
Although it appears that all eyes remain firmly fixated on the Fed and its eventual asset purchase unwind and the perceived growth slowdown within the emerging markets, we believe there is reason for optimism. By historical standards central banks around the globe are executing exceedingly loose monetary policy, which provides plenty of liquidity to the markets. U.S. growth appears to be a surprising bright
spot and we are even beginning to see early signs that growth within Europe may be turning the corner. And while it may be clear that China’s growth trajectory is slowing, we believe policy makers have the situation in hand and the probability of a hard landing is still quite low.
In a “yield-starved” domestic fixed income market dominated by U.S. Treasuries hovering near historic lows, we continue to favor higher-yielding investments to seek a carry, or yield advantage. Given current conditions, we believe the additional carry of the Fund is positioned to help returns even in the context of spreads remaining at their current levels.
| | |
 | |  |
| | Peter A. Strzalkowski, CFA |
| | Portfolio Manager |
5 OPPENHEIMER LIMITED-TERM BOND FUND
Top Holdings and Allocations*
| | | | |
PORTFOLIO ALLOCATION | | | | |
Mortgage-Backed Obligations: | | | | |
Government Agency | | | 40 .1 | % |
Non-Agency | | | 7 .9 | |
U.S. Government Obligations | | | 29 .6 | |
Corporate Bonds and Notes | | | 18 .1 | |
Asset-Backed Securities | | | 4 .3 | |
Over-the-Counter Interest Rate | | | | |
Swaptions Purchased | | | – | ** |
Portfolio holdings and allocations are subject to change. Percentages are as of August 30, 2013, and are based on the total market value of investments.
*August 30, 2013, was the last business day of the Fund’s fiscal year. See Note 1 of the accompanying Notes to Financial Statements.
**Represents a value of less than 0.05%.
| | | | |
CREDIT RATING BREAKDOWN | | NRSRO
ONLY
TOTAL | |
AAA | | | 70 .0 | % |
AA | | | 1 .3 | |
A | | | 5 .2 | |
BBB | | | 15 .5 | |
BB | | | 5 .3 | |
B | | | 1 .1 | |
CCC | | | 0 .6 | |
CC | | | 0 .7 | |
D | | | 0 .3 | |
Total | | | 100 .0 | % |
The percentages above are based on the market value of the Fund’s securities as of August 30, 2013, and are subject to change. Except for certain securities issued or guaranteed by a foreign sovereign, all securities have been rated by at least one Nationally Recognized Statistical Rating Organization (“NRSRO”), such as Standard & Poor’s (“S&P”). For securities rated only by an NRSRO other than S&P, OppenheimerFunds, Inc. converts that rating to the equivalent S&P rating. If two or more NRSROs have assigned a rating to a security, the highest S&P equivalent rating is used. Unrated securities issued or guaranteed by a foreign sovereign are assigned a credit rating equal to the highest NRSRO rating assigned to that foreign sovereign. Fund assets invested in Oppenheimer Institutional Money Market Fund are assigned that fund’s S&P rating, which is currently AAA. For the purposes of this table, “investment-grade” securities are securities rated within the NRSROs’ four highest rating categories (AAA, AA, A and BBB). Unrated securities do not necessarily indicate low credit quality, and may or may not be the equivalent of investment-grade. Please consult the Fund’s prospectus and Statement of Additional Information for further information.
6 OPPENHEIMER LIMITED-TERM BOND FUND
Share Class Performance
AVERAGE ANNUAL TOTAL RETURNS WITHOUT SALES CHARGE AS OF 8/30/13
| | | | | | | | | | | | | | | | |
| | | Inception Date | | | 1-Year | | | 5-Year | | | 10-Year | |
Class A (OUSGX) | | | 8/16/85 | | | | -1.21% | | | | 4.45% | | | | 4.21% | |
Class B (UGTBX) | | | 7/21/95 | | | | -1.94% | | | | 3.67% | | | | 3.74% | |
Class C (OUSCX) | | | 12/1/93 | | | | -1.84% | | | | 3.69% | | | | 3.44% | |
Class I (OUSIX) | | | 8/1/13 | | | | -0.20% | * | | | N/A | | | | N/A | |
Class N (OUSNX) | | | 3/1/01 | | | | -1.45% | | | | 4.19% | | | | 3.94% | |
Class Y (OUSYX) | | | 5/18/98 | | | | -1.05% | | | | 4.72% | | | | 4.53% | |
|
AVERAGE ANNUAL TOTAL RETURNS WITH SALES CHARGE AS OF 8/30/13 | |
| | | Inception Date | | | 1-Year | | | 5-Year | | | 10-Year | |
Class A (OUSGX) | | | 8/16/85 | | | | -3.43% | | | | 3.97% | | | | 3.97% | |
Class B (UGTBX) | | | 7/21/95 | | | | -5.72% | | | | 3.50% | | | | 3.74% | |
Class C (OUSCX) | | | 12/1/93 | | | | -2.79% | | | | 3.69% | | | | 3.44% | |
Class I (OUSIX) | | | 8/1/13 | | | | -0.20% | * | | | N/A | | | | N/A | |
Class N (OUSNX) | | | 3/1/01 | | | | -2.40% | | | | 4.19% | | | | 3.94% | |
Class Y (OUSYX) | | | 5/18/98 | | | | -1.05% | | | | 4.72% | | | | 4.53% | |
*Shows performance since inception.
STANDARDIZED YIELDS
| | | | |
| For the 30 Days Ended 8/31/13 | | | | |
Class A | | | 2.49 | % |
Class B | | | 1.80 | |
Class C | | | 1.80 | |
Class I | | | 2.90 | |
Class N | | | 2.30 | |
Class Y | | | 2.77 | |
Performance data quoted represents past performance, which does not guarantee future results. The investment return and principal value of an investment in the Fund will fluctuate so that an investor’s shares, when redeemed, may be worth more or less than their original cost. Current performance may be lower or higher than the performance quoted. Returns do not consider capital gains or income taxes on an individual’s investment. For performance data current to the most recent month-end, visit oppenheimerfunds.com or call 1.800.CALL OPP (225.5677). Fund returns include changes in share price, reinvested distributions, and the applicable sales charge: for Class A shares, the current maximum initial sales charge of 2.25%; for Class B shares, the contingent deferred sales charge of 4% (1-year) and 1% (5-year); and for Class C and N shares, the contingent deferred sales charge of 1% for the 1-year period. There is no sales charge for Class I and Y shares. Prior to August 1, 2013, the maximum initial sales charge for Class A shares of the Fund was 4.75%; for Class B shares, the contingent deferred sales charge was 5% (1-year) and 2% (5-year). Because Class B shares convert to Class A shares 72 months after purchase, the 10-year return for Class B shares uses Class A performance for the period after conversion. Returns for periods of less than one year are cumulative and not annualized.
7 OPPENHEIMER LIMITED-TERM BOND FUND
Standardized yield is based on net investment income for the 30-day period ended 8/31/13 and the maximum offering price at the end of the period for Class A shares and the net asset value for Class B, Class C, Class I, Class N and Class Y shares. Each result is compounded semiannually and then annualized. Falling share prices will tend to artificially raise yields.
The Fund’s performance is compared to that of the Barclays U.S. Aggregate Bond Index 1-3 Years and the Barclays U.S. Government Bond Index. The Barclays U.S. Aggregate Bond Index 1-3 Years is an unmanaged index of publicly issued investment grade corporate, U.S. Treasury and government agency securities with remaining maturities of one to three years. The Barclays U.S. Government Bond Index is composed of publicly issued, nonconvertible, domestic debt of the U.S. Government or any agency thereof, quasi-federal corporations, or corporate debt guaranteed by the U.S. Government. Flower bonds and pass-through issues are excluded. The Fund has changed its benchmark from the Barclays U.S. Government Bond Index to the Barclays U.S. Aggregate Bond Index 1-3 Years, which it believes is a more appropriate measure of the Fund’s performance. The indices are unmanaged and cannot be purchased directly by investors. Index performance includes reinvestment of income, but does not reflect transaction costs, fees, expenses or taxes. Index performance is shown for illustrative purposes only as a benchmark for the Fund’s performance, and does not predict or depict performance of the Fund. The Fund’s performance reflects the effects of the Fund’s business and operating expenses.
The Fund’s investment strategy and focus can change over time. The mention of specific fund holdings does not constitute a recommendation by OppenheimerFunds, Inc. or its affiliates.
Before investing in any of the Oppenheimer funds, investors should carefully consider a fund’s investment objectives, risks, charges and expenses. Fund prospectuses and summary prospectuses contain this and other information about the funds, and may be obtained by asking your financial advisor, visiting oppenheimerfunds.com, or calling 1.800.CALL OPP (225.5677). Read prospectuses and summary prospectuses carefully before investing.
Shares of Oppenheimer funds are not deposits or obligations of any bank, are not guaranteed by any bank, are not insured by the FDIC or any other agency, and involve investment risks, including the possible loss of the principal amount invested.
6 OPPENHEIMER LIMITED-TERM BOND FUND
Fund Expenses
Fund Expenses. As a shareholder of the Fund, you incur two types of costs: (1) transaction costs, which may include sales charges (loads) on purchase payments, contingent deferred sales charges on redemptions; and (2) ongoing costs, including management fees; distribution and service fees; and other Fund expenses. These examples are intended to help you understand your ongoing costs (in dollars) of investing in the Fund and to compare these costs with the ongoing costs of investing in other mutual funds.
The examples are based on an investment of $1,000.00 invested at the beginning of the period and held for the entire 6-month period ended August 30, 2013.
Actual Expenses. The first section of the table provides information about actual account values and actual expenses. You may use the information in this section for the class of shares you hold, together with the amount you invested, to estimate the expense that you paid over the period. Simply divide your account value by $1,000.00 (for example, an $8,600.00 account value divided by $1,000.00 = 8.60), then multiply the result by the number in the first section under the heading entitled “Expenses Paid During Period” to estimate the expenses you paid on your account during this period.
Hypothetical Example for Comparison Purposes. The second section of the table provides information about hypothetical account values and hypothetical expenses based on the Fund’s actual expense ratio for each class of shares, and an assumed rate of return of 5% per year for each class before expenses, which is not the actual return. The hypothetical account values and expenses may not be used to estimate the actual ending account balance or expenses you paid for the period. You may use this information to compare the ongoing costs of investing in the Fund and other funds. To do so, compare this 5% hypothetical example for the class of shares you hold with the 5% hypothetical examples that appear in the shareholder reports of the other funds.
Please note that the expenses shown in the table are meant to highlight your ongoing costs only and do not reflect any transactional costs, such as front-end or contingent deferred sales charges (loads), or a $12.00 fee imposed annually on accounts valued at less than $500.00 (subject to exceptions described in the Statement of Additional Information). Therefore, the “hypothetical” section of the table is useful in comparing ongoing costs only, and will not help you determine the relative total costs of owning different funds. In addition, if these transactional costs were included, your costs would have been higher.
9 OPPENHEIMER LIMITED-TERM BOND FUND
| | | | | | | | | | | | |
| Actual | | Beginning
Account
Value
March 1, 2013 | | | Ending
Account
Value
August 30, 2013 | | | Expenses
Paid During
6 Months Ended
August 30, 2013 | |
Class A | | $ | 1,000 .00 | | | $ | 989 .90 | | | $ | 4 .55 | |
Class B | | | 1,000 .00 | | | | 987 .10 | | | | 8 .35 | |
Class C | | | 1,000 .00 | | | | 987 .10 | | | | 8 .35 | |
Class I | | | 1,000 .00 | | | | 998 .00 | | | | 2 .20 | |
Class N | | | 1,000 .00 | | | | 988 .60 | | | | 5 .80 | |
Class Y | | | 1,000 .00 | | | | 991 .20 | | | | 3 .35 | |
| | | |
Hypothetical
(5% return before expenses) | | | | | | | | | |
Class A | | | 1,000 .00 | | | | 1,020 .51 | | | | 4 .62 | |
Class B | | | 1,000 .00 | | | | 1,016 .70 | | | | 8 .48 | |
Class C | | | 1,000 .00 | | | | 1,016 .70 | | | | 8 .48 | |
Class I | | | 1,000 .00 | | | | 1,022 .86 | | | | 2 .23 | |
Class N | | | 1,000 .00 | | | | 1,019 .25 | | | | 5 .89 | |
Class Y | | | 1,000 .00 | | | | 1,021 .71 | | | | 3 .40 | |
Expenses are equal to the Fund’s annualized expense ratio for that class, multiplied by the average account value over the period, multiplied by 183/365 (to reflect the one-half year period). Those annualized expense ratios, excluding indirect expenses from affiliated funds, based on the 6-month period ended August 30, 2013 are as follows:
| | | | |
| Class | | Expense Ratios | |
Class A | | | 0 .91 | % |
Class B | | | 1 .67 | |
Class C | | | 1 .67 | |
Class I | | | 0 .44 | |
Class N | | | 1 .16 | |
Class Y | | | 0 .67 | |
The expense ratios reflect voluntary waivers and/or reimbursements of expenses by the Fund’s Manager. Some of these undertakings may be modified or terminated at any time, as indicated in the Fund’s prospectus. The “Financial Highlights” tables in the Fund’s financial statements, included in this report, also show the gross expense ratios, without such waivers or reimbursements and reduction to custodian expenses, if applicable.
10 OPPENHEIMER LIMITED-TERM BOND FUND
| | | | |
| | |
| | STATEMENT OF INVESTMENTS August 30, 2013* | | |
| | | | | | | | |
| |
| Principal
Amount |
| | | Value | |
Asset-Backed Securities—5.2% | | | | | | | | |
American Credit Acceptance Receivables Trust, Series 2012-3, Cl. C, 2.78%, 9/17/181 | | $ | 505,000 | | | $ | 502,192 | |
AmeriCredit Automobile Receivables Trust: | | | | | | | | |
Series 2012-3, Cl. E, 4.46%, 11/8/191 | | | 1,305,000 | | | | 1,342,877 | |
Series 2012-4, Cl. D, 2.68%, 10/9/18 | | | 950,000 | | | | 944,449 | |
Series 2013-1, Cl. D, 2.09%, 2/8/19 | | | 1,675,000 | | | | 1,618,069 | |
Series 2013-2, Cl. D, 2.42%, 5/8/19 | | | 2,505,000 | | | | 2,434,628 | |
Series 2013-3, Cl. D, 3.00%, 7/8/19 | | | 1,600,000 | | | | 1,577,624 | |
Avis Budget Rental Car Funding AESOP LLC, Series 2011-3A, Cl. B, 4.74%, 11/20/171 | | | 995,000 | | | | 1,054,645 | |
Capital Auto Receivables Asset Trust, Series 2013-1, Cl. D, 2.19%, 9/20/21 | | | 1,085,000 | | | | 1,049,431 | |
CarMax Auto Owner Trust, Series 2013-1, Cl. D, 1.99%, 8/15/19 | | | 730,000 | | | | 710,624 | |
CPS Auto Receivables Trust, Series 2012-C, Cl. A, 1.82%, 12/16/191 | | | 722,474 | | | | 725,948 | |
Credit Acceptance Auto Loan Trust, Series 2012-2A, Cl. B, 2.21%, 9/15/201 | | | 430,000 | | | | 431,264 | |
DT Auto Owner Trust: | | | | | | | | |
Series 2012-2A, Cl. D, 4.35%, 3/15/191 | | | 2,305,000 | | | | 2,364,394 | |
Series 2013-1A, Cl. D, 3.74%, 5/15/201 | | | 965,000 | | | | 962,623 | |
Exeter Automobile Receivables Trust, Series 2012-2A, Cl. C, 3.06%, 7/16/181 | | | 170,000 | | | | 170,179 | |
First Investors Auto Owner Trust, Series 2012-1A, Cl. D, 5.65%, 4/15/181 | | | 810,000 | | | | 852,834 | |
Ford Credit Floorplan Master Owner Trust A, Series 2013-3, Cl. D, 1.74%, 6/15/17 | | | 860,000 | | | | 860,599 | |
Santander Drive Auto Receivables Trust: | | | | | | | | |
Series 2011-S1A, Cl. D, 3.10%, 5/15/172 | | | 51,970 | | | | 52,018 | |
Series 2012-3, Cl. D, 3.64%, 5/15/18 | | | 3,305,000 | | | | 3,362,301 | |
Series 2012-5, Cl. D, 3.30%, 9/17/18 | | | 1,480,000 | | | | 1,485,144 | |
Series 2012-AA, Cl. D, 2.46%, 12/17/181 | | | 3,500,000 | | | | 3,414,215 | |
Series 2013-1, Cl. D, 2.27%, 1/15/19 | | | 3,450,000 | | | | 3,348,389 | |
Series 2013-2, Cl. D, 2.57%, 3/15/19 | | | 4,110,000 | | | | 3,984,086 | |
Series 2013-3, Cl. D, 2.42%, 4/15/19 | | | 3,465,000 | | | | 3,297,848 | |
SNAAC Auto Receivables Trust: | | | | | | | | |
Series 2012-1A, Cl. C, 4.38%, 6/15/171 | | | 60,000 | | | | 61,435 | |
Series 2013-1A, Cl. B, 2.09%, 7/16/181 | | | 745,000 | | | | 739,226 | |
Series 2013-1A, Cl. C, 3.07%, 8/15/181 | | | 830,000 | | | | 819,599 | |
Structured Asset Securities Corp., Interest-Only Stripped Pass-Through | | | | | | | | |
Certificates, Series 2002-AL1, Cl. AIO, 8.14%, 2/25/325 | | | 6,492,983 | | | | 584,668 | |
United Auto Credit Securitization Trust: | | | | | | | | |
Series 2012-1, Cl. B, 1.87%, 9/15/151 | | | 1,435,000 | | | | 1,434,481 | |
Series 2012-1, Cl. C, 2.52%, 3/15/161 | | | 1,040,000 | | | | 1,038,975 | |
Series 2013-1, Cl. B, 1.74%, 4/15/161 | | | 1,285,000 | | | | 1,281,910 | |
Series 2013-1, Cl. C, 2.22%, 12/15/171 | | | 820,000 | | | | 817,141 | |
Series 2013-1, Cl. D, 2.90%, 12/15/171 | | | 145,000 | | | | 144,263 | |
| | | | | | | | |
Total Asset-Backed Securities (Cost $44,138,895) | | | | | | | 43,468,079 | |
Mortgage-Backed Obligations—57.4% | | | | | | | | |
Government Agency—47.7% | | | | | | | | |
FHLMC/FNMA/FHLB/Sponsored—46.9% | | | | | | | | |
Federal Home Loan Mortgage Corp. Gold Pool: | | | | | | | | |
4.50%, 5/1/19 | | | 58,004 | | | | 61,150 | |
5.00%, 7/1/33-6/1/34 | | | 1,336,316 | | | | 1,445,794 | |
5.50%, 9/1/39 | | | 4,457,388 | | | | 4,859,639 | |
11 OPPENHEIMER LIMITED-TERM BOND FUND
| | | | |
| | |
| | STATEMENT OF INVESTMENTS Continued | | |
| | | | | | | | |
| | | Principal
Amount | | | Value | |
FHLMC/FNMA/FHLB/Sponsored Continued | | | | | | | | |
Federal Home Loan Mortgage Corp. Gold Pool: Continued | | | | | | | | |
6.00%, 1/1/22-7/1/24 | | $ | 1,547,216 | | | $ | 1,694,339 | |
6.50%, 4/1/18-4/1/34 | | | 1,023,215 | | | | 1,109,554 | |
7.00%, 8/1/16-3/1/35 | | | 3,187,236 | | | | 3,672,213 | |
7.50%, 1/1/32-2/1/32 | | | 1,938,788 | | | | 2,290,468 | |
8.00%, 4/1/16 | | | 163,035 | | | | 170,955 | |
9.00%, 8/1/22-5/1/25 | | | 69,972 | | | | 78,175 | |
11.50%, 6/1/20-11/17/20 | | | 14,607 | | | | 14,743 | |
12.50%, 7/1/19 | | | 1,691 | | | | 1,732 | |
13.00%, 8/1/15 | | | 1,764 | | | | 1,790 | |
Federal Home Loan Mortgage Corp., Interest-Only Stripped Mtg.-Backed Security: | | | | | | | | |
Series 192, Cl. IO, 11.93%, 2/1/285 | | | 116,482 | | | | 22,829 | |
Series 205, Cl. IO, 15.88%, 9/1/295 | | | 861,585 | | | | 175,105 | |
Series 206, Cl. IO, 0.00%, 12/1/295,8 | | | 252,620 | | | | 41,073 | |
Series 243, Cl. 6, 0.00%, 12/15/325,8 | | | 346,661 | | | | 73,042 | |
Federal Home Loan Mortgage Corp., Mtg.-Linked Amortizing Global Debt | | | | | | | | |
Securities, Series 2012-1, Cl. A10, 2.06%, 1/15/22 | | | 4,100,604 | | | | 4,138,104 | |
Federal Home Loan Mortgage Corp., Real Estate Mtg. Investment Conduit | | | | | | | | |
Multiclass Pass-Through Certificates: | | | | | | | | |
Series 151, Cl. F, 9.00%, 5/15/21 | | | 22,111 | | | | 24,633 | |
Series 1644, Cl. S, 2.404%, 12/15/233 | | | 3,802,418 | | | | 3,921,588 | |
Series 2043, Cl. ZP, 6.50%, 4/15/28 | | | 1,941,744 | | | | 2,204,014 | |
Series 2116, Cl. ZA, 6.00%, 1/15/29 | | | 1,131,085 | | | | 1,265,224 | |
Series 2148, Cl. ZA, 6.00%, 4/15/29 | | | 1,798,671 | | | | 2,011,407 | |
Series 2220, Cl. PD, 8.00%, 3/15/30 | | | 128,056 | | | | 149,554 | |
Series 2326, Cl. ZP, 6.50%, 6/15/31 | | | 214,977 | | | | 243,483 | |
Series 2344, Cl. FP, 1.134%, 8/15/313 | | | 310,915 | | | | 318,808 | |
Series 2368, Cl. PR, 6.50%, 10/15/31 | | | 884,094 | | | | 1,001,741 | |
Series 2427, Cl. ZM, 6.50%, 3/15/32 | | | 765,621 | | | | 858,447 | |
Series 2451, Cl. FD, 1.184%, 3/15/323 | | | 205,833 | | | | 211,393 | |
Series 2461, Cl. PZ, 6.50%, 6/15/32 | | | 502,429 | | | | 568,024 | |
Series 2464, Cl. FI, 1.184%, 2/15/323 | | | 193,888 | | | | 198,632 | |
Series 2465, Cl. PG, 6.50%, 6/15/32 | | | 671,968 | | | | 753,228 | |
Series 2470, Cl. LF, 1.184%, 2/15/323 | | | 194,459 | | | | 199,216 | �� |
Series 2471, Cl. FD, 1.184%, 3/15/323 | | | 294,041 | | | | 301,276 | |
Series 2500, Cl. FD, 0.684%, 3/15/323 | | | 383,906 | | | | 388,109 | |
Series 2517, Cl. GF, 1.184%, 2/15/323 | | | 154,109 | | | | 157,879 | |
Series 2526, Cl. FE, 0.584%, 6/15/293 | | | 446,950 | | | | 449,889 | |
Series 2530, Cl. FD, 0.684%, 2/15/323 | | | 400,124 | | | | 404,982 | |
Series 2538, Cl. F, 0.784%, 12/15/323 | | | 405,140 | | | | 409,168 | |
Series 2551, Cl. FD, 0.584%, 1/15/333 | | | 294,502 | | | | 296,612 | |
Series 2551, Cl. LF, 0.684%, 1/15/333 | | | 21,780 | | | | 22,013 | |
Series 2668, Cl. AZ, 4.00%, 9/15/18 | | | 361,086 | | | | 383,179 | |
Series 3015, Cl. GM, 5.00%, 8/15/35 | | | 8,440,000 | | | | 9,193,641 | |
Series 3134, Cl. FA, 0.484%, 3/15/363 | | | 5,076,731 | | | | 5,097,842 | |
Series 3465, Cl. HA, 4.00%, 7/15/17 | | | 179,700 | | | | 184,923 | |
Series 3617, Cl. DC, 4.00%, 7/15/27 | | | 1,324,730 | | | | 1,350,962 | |
Series 3822, Cl. JA, 5.00%, 6/15/40 | | | 1,446,782 | | | | 1,521,650 | |
Series 3848, Cl. WL, 4.00%, 4/15/40 | | | 1,738,773 | | | | 1,845,672 | |
Series 3917, Cl. BA, 4.00%, 6/15/38 | | | 1,726,494 | | | | 1,793,429 | |
12 OPPENHEIMER LIMITED-TERM BOND FUND
| | | | | | | | |
| | | Principal
Amount | | | Value | |
FHLMC/FNMA/FHLB/Sponsored Continued | | | | | | | | |
Federal Home Loan Mortgage Corp., Real Estate Mtg. Investment Conduit | | | | | | | | |
Multiclass Pass-Through Certificates, Interest-Only Stripped Mtg.-Backed | | | | | | | | |
Security: | | | | | | | | |
Series 2074, Cl. S, 55.51%, 7/17/285 | | $ | 181,900 | | | $ | 38,437 | |
Series 2079, Cl. S, 58.44%, 7/17/285 | | | 328,727 | | | | 70,489 | |
Series 2122, Cl. S, 38.90%, 2/15/295 | | | 1,010,065 | | | | 215,636 | |
Series 2304, Cl. SK, 47.80%, 6/15/295 | | | 1,019,170 | | | | 205,507 | |
Series 2493, Cl. S, 50.12%, 9/15/295 | | | 254,925 | | | | 55,033 | |
Series 2526, Cl. SE, 36.56%, 6/15/295 | | | 396,402 | | | | 84,311 | |
Series 2795, Cl. SH, 14.27%, 3/15/245 | | | 3,002,006 | | | | 471,678 | |
Series 2802, Cl. AS, 0.00%, 4/15/335,8 | | | 102,155 | | | | 3,551 | |
Series 2819, Cl. S, 46.32%, 6/15/345 | | | 3,914,041 | | | | 764,495 | |
Series 2920, Cl. S, 56.62%, 1/15/355 | | | 2,377,483 | | | | 474,342 | |
Series 2922, Cl. SE, 8.81%, 2/15/355 | | | 541,514 | | | | 99,875 | |
Series 3004, Cl. SB, 99.99%, 7/15/355 | | | 3,237,627 | | | | 577,485 | |
Series 3201, Cl. SG, 7.78%, 8/15/365 | | | 1,479,752 | | | | 283,317 | |
Series 3397, Cl. GS, 15.34%, 12/15/375 | | | 359,737 | | | | 64,733 | |
Series 3424, Cl. EI, 0.00%, 4/15/385,8 | | | 435,047 | | | | 61,877 | |
Series 3450, Cl. BI, 14.50%, 5/15/385 | | | 4,026,729 | | | | 728,908 | |
Series 3606, Cl. SN, 6.79%, 12/15/395 | | | 859,820 | | | | 102,512 | |
Series 3659, Cl. IE, 0.00%, 3/15/195,8 | | | 3,655,218 | | | | 297,543 | |
Series 3685, Cl. EI, 0.00%, 3/15/195,8 | | | 3,015,514 | | | | 211,395 | |
Series 3736, Cl. SN, 10.77%, 10/15/405 | | | 3,086,407 | | | | 463,756 | |
Federal Home Loan Mortgage Corp., Stripped Mtg.-Backed Security, | | | | | | | | |
Series 237, Cl. F16, 0.684%, 5/15/363 | | | 2,274,582 | | | | 2,306,209 | |
Federal National Mortgage Assn. Pool: | | | | | | | | |
2.50%, 9/1/276 | | | 21,350,000 | | | | 21,193,212 | |
2.667%, 10/1/363 | | | 9,044,895 | | | | 9,594,528 | |
3.00%, 4/25/266 | | | 34,900,000 | | | | 35,723,420 | |
3.50%, 9/1/276 | | | 68,310,000 | | | | 71,437,321 | |
4.00%, 9/1/266 | | | 8,845,000 | | | | 9,339,767 | |
4.50%, 2/1/19-12/1/20 | | | 5,604,949 | | | | 5,952,250 | |
4.50%, 9/1/22-9/1/396 | | | 51,445,000 | | | | 54,367,973 | |
5.00%, 12/1/17-6/1/22 | | | 10,560,386 | | | | 11,247,659 | |
5.00%, 9/1/396 | | | 9,202,000 | | | | 9,896,466 | |
5.50%, 2/1/35-5/1/36 | | | 1,472,840 | | | | 1,614,700 | |
6.00%, 6/1/30-3/1/37 | | | 11,075,061 | | | | 12,208,590 | |
6.50%, 6/1/17-1/1/34 | | | 8,618,852 | | | | 9,479,367 | |
7.00%, 11/1/17-11/1/35 | | | 6,466,504 | | | | 7,299,398 | |
7.50%, 2/1/27-8/1/33 | | | 5,173,568 | | | | 6,096,627 | |
8.00%, 12/1/22 | | | 16,860 | | | | 19,619 | |
8.50%, 7/1/32 | | | 33,603 | | | | 39,059 | |
11.00%, 7/1/16 | | | 7,285 | | | | 7,855 | |
11.50%, 11/1/15 | | | 9,351 | | | | 9,426 | |
Federal National Mortgage Assn., Interest-Only Stripped Mtg.-Backed Security: | | | | | | | | |
Series 221, Cl. 2, 44.31%, 5/1/235 | | | 745,524 | | | | 133,512 | |
Series 252, Cl. 2, 44.22%, 11/1/235 | | | 354,658 | | | | 64,435 | |
Series 303, Cl. IO, 40.74%, 11/1/295 | | | 2,991,628 | | | | 497,879 | |
Series 319, Cl. 2, 22.68%, 2/1/325 | | | 622,985 | | | | 127,229 | |
Series 321, Cl. 2, 9.09%, 4/1/325 | | | 918,239 | | | | 182,482 | |
Series 324, Cl. 2, 4.17%, 7/1/325 | | | 385,581 | | | | 76,559 | |
Series 328, Cl. 2, 0.00%, 12/1/325,8 | | | 2,448,025 | | | | 504,487 | |
13 OPPENHEIMER LIMITED-TERM BOND FUND
| | | | |
| | |
| | STATEMENT OF INVESTMENTS Continued | | |
| | | | | | | | |
| |
| Principal
Amount |
| | | Value | |
FHLMC/FNMA/FHLB/Sponsored Continued | | | | | | | | |
Federal National Mortgage Assn., Interest-Only Stripped Mtg.-Backed Security: Continued | | | | | | | | |
Series 334, Cl. 12, 0.00%, 3/1/335,8 | | $ | 1,378,052 | | | $ | 260,629 | |
Series 339, Cl. 7, 0.00%, 8/1/335,8 | | | 1,145,119 | | | | 192,121 | |
Series 351, Cl. 10, 0.00%, 4/1/345,8 | | | 983,173 | | | | 156,520 | |
Series 351, Cl. 8, 0.00%, 4/1/345,8 | | | 896,757 | | | | 142,909 | |
Series 356, Cl. 10, 0.00%, 6/1/355,8 | | | 673,421 | | | | 108,515 | |
Series 356, Cl. 12, 0.00%, 2/1/355,8 | | | 332,726 | | | | 53,646 | |
Series 362, Cl. 13, 0.00%, 8/1/355,8 | | | 598,888 | | | | 104,117 | |
Series 364, Cl. 15, 0.00%, 9/1/355,8 | | | 820,230 | | | | 132,639 | |
Federal National Mortgage Assn., Principal-Only Stripped Mtg.-Backed Security, Series 327, Cl. 1, 11.64%, 9/1/327 | | | 167,715 | | | | 160,399 | |
Federal National Mortgage Assn., Real Estate Mtg. Investment Conduit Multiclass Pass-Through Certificates: | | | | | | | | |
Series 1992-161, Cl. H, 7.50%, 9/25/22 | | | 2,174,322 | | | | 2,513,900 | |
Series 1993-87, Cl. Z, 6.50%, 6/25/23 | | | 609,463 | | | | 686,772 | |
Series 1999-54, Cl. LH, 6.50%, 11/25/29 | | | 448,577 | | | | 500,030 | |
Series 2001-51, Cl. OD, 6.50%, 10/25/31 | | | 1,943,984 | | | | 2,161,412 | |
Series 2001-69, Cl. PF, 1.184%, 12/25/313 | | | 445,823 | | | | 456,763 | |
Series 2002-29, Cl. F, 1.184%, 4/25/323 | | | 208,132 | | | | 213,290 | |
Series 2002-52, Cl. FD, 0.684%, 9/25/323 | | | 304,943 | | | | 308,674 | |
Series 2002-59, Cl. F, 0.584%, 9/25/323 | | | 883,156 | | | | 888,520 | |
Series 2002-60, Cl. FH, 1.184%, 8/25/323 | | | 373,822 | | | | 383,139 | |
Series 2002-64, Cl. FJ, 1.184%, 4/25/323 | | | 64,068 | | | | 65,656 | |
Series 2002-68, Cl. FH, 0.684%, 10/18/323 | | | 122,113 | | | | 123,445 | |
Series 2003-112, Cl. AN, 4.00%, 11/25/18 | | | 818,263 | | | | 868,740 | |
Series 2003-116, Cl. FA, 0.584%, 11/25/333 | | | 216,510 | | | | 217,847 | |
Series 2003-119, Cl. FK, 0.684%, 5/25/183 | | | 5,418,651 | | | | 5,448,500 | |
Series 2003-130, Cl. CS, 13.732%, 12/25/333 | | | 297,617 | | | | 362,135 | |
Series 2003-26, Cl. XF, 0.634%, 3/25/233 | | | 1,155,978 | | | | 1,163,484 | |
Series 2003-28, Cl. KG, 5.50%, 4/25/23 | | | 2,262,876 | | | | 2,477,993 | |
Series 2004-72, Cl. FB, 0.684%, 9/25/343 | | | 1,547,889 | | | | 1,567,126 | |
Series 2005-104, Cl. MC, 5.50%, 12/25/25 | | | 3,363,599 | | | | 3,686,725 | |
Series 2005-31, Cl. PB, 5.50%, 4/25/35 | | | 2,280,000 | | | | 2,607,644 | |
Series 2005-69, Cl. LE, 5.50%, 11/25/33 | | | 343,502 | | | | 345,820 | |
Series 2006-11, Cl. PS, 23.892%, 3/25/363 | | | 400,530 | | | | 615,078 | |
Series 2006-46, Cl. SW, 23.524%, 6/25/363 | | | 270,724 | | | | 414,214 | |
Series 2006-50, Cl. KS, 23.525%, 6/25/363 | | | 579,246 | | | | 880,270 | |
Series 2006-50, Cl. SK, 23.525%, 6/25/363 | | | 1,117,190 | | | | 1,675,564 | |
Series 2007-109, Cl. NF, 0.734%, 12/25/373 | | | 2,263,807 | | | | 2,292,204 | |
Series 2007-42, Cl. A, 6.00%, 2/25/33 | | | 46,889 | | | | 46,866 | |
Series 2007-9, Cl. LE, 5.50%, 3/25/37 | | | 2,000,000 | | | | 2,293,151 | |
Series 2008-14, Cl. BA, 4.25%, 3/25/23 | | | 365,596 | | | | 389,696 | |
Series 2009-114, Cl. AC, 2.50%, 12/25/23 | | | 1,772,936 | | | | 1,818,987 | |
Series 2009-36, Cl. FA, 1.124%, 6/25/373 | | | 1,634,416 | | | | 1,656,681 | |
Series 2011-122, Cl. EC, 1.50%, 1/25/20 | | | 4,965,772 | | | | 5,028,313 | |
Series 2011-15, Cl. DA, 4.00%, 3/25/41 | | | 1,308,646 | | | | 1,377,223 | |
Series 2011-3, Cl. KA, 5.00%, 4/25/40 | | | 2,019,323 | | | | 2,202,624 | |
Series 2011-6, Cl. BA, 2.75%, 6/25/20 | | | 2,414,833 | | | | 2,510,522 | |
Series 2011-69, Cl. EA, 3.00%, 11/25/29 | | | 1,608,964 | | | | 1,647,836 | |
Series 2011-88, Cl. AB, 2.50%, 9/25/26 | | | 1,467,269 | | | | 1,510,765 | |
Series 2012-20, Cl. FD, 0.584%, 3/25/423 | | | 996,541 | | | | 1,002,930 | |
14 OPPENHEIMER LIMITED-TERM BOND FUND
| | | | | | | | |
| | |
| Principal
Amount |
| | | Value | |
FHLMC/FNMA/FHLB/Sponsored Continued | | | | | | | | |
Federal National Mortgage Assn., Real Estate Mtg. Investment Conduit | | | | | | | | |
Multiclass Pass-Through Certificates, Interest-Only Stripped Mtg.-Backed Security: | | | | | | | | |
Series 2001-61, Cl. SH, 29.98%, 11/18/315 | | $ | 749,057 | | | $ | 160,318 | |
Series 2001-63, Cl. SD, 31.36%, 12/18/315 | | | 301,462 | | | | 60,204 | |
Series 2001-68, Cl. SC, 20.08%, 11/25/315 | | | 193,477 | | | | 40,682 | |
Series 2001-81, Cl. S, 27.10%, 1/25/325 | | | 190,591 | | | | 41,623 | |
Series 2002-28, Cl. SA, 36.93%, 4/25/325 | | | 199,510 | | | | 41,001 | |
Series 2002-38, Cl. SO, 46.04%, 4/25/325 | | | 322,133 | | | | 59,003 | |
Series 2002-39, Cl. SD, 38.75%, 3/18/325 | | | 340,464 | | | | 72,797 | |
Series 2002-41, Cl. S, 59.33%, 7/25/325 | | | 1,146,441 | | | | 240,362 | |
Series 2002-48, Cl. S, 32.88%, 7/25/325 | | | 306,794 | | | | 64,836 | |
Series 2002-52, Cl. SD, 35.60%, 9/25/325 | | | 304,943 | | | | 65,558 | |
Series 2002-52, Cl. SL, 35.17%, 9/25/325 | | | 204,203 | | | | 43,258 | |
Series 2002-53, Cl. SK, 35.96%, 4/25/325 | | | 212,371 | | | | 46,340 | |
Series 2002-56, Cl. SN, 34.64%, 7/25/325 | | | 419,211 | | | | 88,731 | |
Series 2002-77, Cl. IS, 43.37%, 12/18/325 | | | 548,820 | | | | 119,110 | |
Series 2002-77, Cl. SH, 41.04%, 12/18/325 | | | 281,895 | | | | 60,230 | |
Series 2002-9, Cl. MS, 28.75%, 3/25/325 | | | 322,296 | | | | 70,807 | |
Series 2003-23, Cl. ES, 0.00%, 10/25/225,8 | | | 717,182 | | | | 24,617 | |
Series 2003-25, Cl. IK, 23.66%, 4/25/335 | | | 4,871,578 | | | | 881,637 | |
Series 2003-33, Cl. SP, 30.38%, 5/25/335 | | | 725,259 | | | | 138,796 | |
Series 2003-4, Cl. S, 30.32%, 2/25/335 | | | 467,976 | | | | 97,538 | |
Series 2004-65, Cl. SA, 28.03%, 5/25/235 | | | 83,841 | | | | 545 | |
Series 2005-12, Cl. SC, 10.78%, 3/25/355 | | | 269,960 | | | | 57,352 | |
Series 2005-14, Cl. SE, 40.52%, 3/25/355 | | | 2,005,214 | | | | 322,481 | |
Series 2005-40, Cl. SB, 54.01%, 5/25/355 | | | 1,505,664 | | | | 262,243 | |
Series 2005-52, Cl. JH, 8.25%, 5/25/355 | | | 809,600 | | | | 162,393 | |
Series 2005-6, Cl. SE, 17.29%, 2/25/355 | | | 2,894,494 | | | | 539,210 | |
Series 2007-88, Cl. XI, 27.31%, 6/25/375 | | | 1,180,391 | | | | 149,634 | |
Series 2008-55, Cl. SA, 16.58%, 7/25/385 | | | 740,261 | | | | 107,058 | |
Series 2009-8, Cl. BS, 0.00%, 2/25/245,8 | | | 1,726,640 | | | | 150,971 | |
Series 2010-95, Cl. DI, 0.00%, 11/25/205,8 | | | 4,685,654 | | | | 388,471 | |
Series 2012-40, Cl. PI, 3.30%, 4/25/415 | | | 2,191,513 | | | | 397,450 | |
Vendee Mortgage Trust, Interest-Only Stripped Mtg.-Backed Security, | | | | | | | | |
Series 1995-2B, Cl. 2IO, 23.02%, 6/15/255 | | | 4,288,235 | | | | 101,199 | |
| | | | | | | | |
| | | | | | | | 393,054,721 | |
GNMA/Guaranteed—0.8% | | | | | | | | |
Government National Mortgage Assn. I Pool: | | | | | | | | |
6.50%, 11/15/23-12/15/23 | | | 44,066 | | | | 48,653 | |
7.00%, 1/15/28-8/15/28 | | | 261,061 | | | | 302,920 | |
7.50%, 2/15/22-11/15/26 | | | 175,764 | | | | 190,824 | |
8.00%, 9/15/16-8/15/28 | | | 36,999 | | | | 38,584 | |
8.50%, 8/15/17-12/15/17 | | | 109,534 | | | | 116,481 | |
9.50%, 7/15/18-12/15/19 | | | 4,949 | | | | 4,984 | |
10.00%, 8/15/17-8/15/19 | | | 31,768 | | | | 32,420 | |
10.50%, 12/15/15-12/15/20 | | | 84,157 | | | | 86,139 | |
Government National Mortgage Assn. II Pool: | | | | | | | | |
1.625%, 4/20/173 | | | 6,559 | | | | 6,828 | |
7.00%, 1/20/30 | | | 61,533 | | | | 71,545 | |
11.00%, 10/20/19-7/20/20 | | | 68,836 | | | | 71,536 | |
15 OPPENHEIMER LIMITED-TERM BOND FUND
| | | | |
| | |
| | STATEMENT OF INVESTMENTS Continued | | |
| | | | | | | | |
| |
| Principal
Amount |
| | | Value | |
GNMA/Guaranteed Continued | | | | | | | | |
Government National Mortgage Assn., Interest-Only Stripped Mtg.-Backed Security: | | | | | | | | |
Series 1998-19, Cl. SB, 54.32%, 7/16/285 | | $ | 735,301 | | | $ | 157,224 | |
Series 1998-6, Cl. SA, 62.05%, 3/16/285 | | | 438,114 | | | | 90,694 | |
Series 2007-17, Cl. AI, 16.85%, 4/16/375 | | | 3,349,823 | | | | 627,127 | |
Series 2010-111, Cl. GI, 28.75%, 9/16/135 | | | 22,212,504 | | | | 1,108 | |
Series 2011-52, Cl. HS, 8.66%, 4/16/415 | | | 5,402,292 | | | | 1,358,449 | |
Government National Mortgage Assn., Real Estate Mtg. Investment Conduit | | | | | | | | |
Multiclass Pass-Through Certificates: | | | | | | | | |
Series 1999-32, Cl. ZB, 8.00%, 9/16/29 | | | 3,111,729 | | | | 3,660,218 | |
Series 2000-12, Cl. ZA, 8.00%, 2/16/30 | | | 778,376 | | | | 911,217 | |
Series 2009-46, Cl. HC, 5.00%, 11/20/34 | | | 160,128 | | | | 163,193 | |
| | | | | | | | |
| | | | | | | 7,940,144 | |
Non-Agency—9.7% | | | | | | | | |
Commercial—7.3% | | | | | | | | |
BCAP LLC Trust, Mtg. Pass-Through Certificates: | | | | | | | | |
Series 2012-RR2, Cl. 6A3, 3.02%, 9/26/351,3 | | | 2,828,205 | | | | 2,882,197 | |
Series 2012-RR6, 2.404%, 11/26/362 | | | 3,354,886 | | | | 3,394,249 | |
Capital Lease Funding Securitization LP, Interest-Only Commercial Mtg. Pass-Through Certificates, Series 1997-CTL1, Cl. IO, 0.00%, 6/22/242,3,5,8 | | | 3,903,186 | | | | 186,856 | |
CHL Mortgage Pass-Through Trust, Mtg. Pass-Through Certificates, Series 2005-17, Cl. 1A8, 5.50%, 9/25/35 | | | 3,285,362 | | | | 3,278,453 | |
Citigroup Commercial Mortgage Trust, Commercial Mtg. Pass-Through | | | | | | | | |
Certificates, Series 20113-GCJ11, 4.459%, 4/10/231 | | | 880,000 | | | | 735,635 | |
Citigroup Mortgage Loan Trust, Inc., Mtg.-Backed Nts.: | | | | | | | | |
Series 2006-AR1, Cl. 1A1, 2.55%, 10/25/353 | | | 4,840,450 | | | | 4,557,138 | |
Series 2012-8, Cl. 1A1, 2.674%, 10/25/351,3 | | | 4,518,219 | | | | 4,545,130 | |
COMM Mortgage Trust, Commercial Mtg. Pass-Through Certificates: | | | | | | | | |
Series 2012-CR4, Cl. D, 4.73%, 10/15/451,3 | | | 270,000 | | | | 235,530 | |
Series 2012-CR5, Cl. E, 4.48%, 12/10/451,3 | | | 420,000 | | | | 351,260 | |
Series 2013-CR7, Cl. D, 4.501%, 3/10/461,3 | | | 955,000 | | | | 779,609 | |
COMM Mortgage Trust, Interest-Only Stripped Mtg.-Backed Security: | | | | | | | | |
Series 2010-C1, Cl. XPA, 0.00%, 7/10/461,3,5,8 | | | 21,552,051 | | | | 974,163 | |
Series 2012-CR5, Cl. XA, 2.33%, 12/10/453,5 | | | 17,534,068 | | | | 1,937,216 | |
Credit Suisse Commercial Mortgage Trust, Commercial Mtg. Pass-Through Certificates, Series 2006-C1, Cl. AJ, 5.567%, 2/15/393 | | | 2,650,000 | | | | 2,847,324 | |
Credit Suisse First Boston Commercial Trust, Commercial Mtg. Pass-Through Certificates, Series 2005-C6, Cl. AJ, 4.94%, 12/15/403 | | | 2,250,000 | | | | 2,352,239 | |
DBUBS Mortgage Trust, Commercial Mtg. Pass-Through Certificates, Series 2011-LC1A, Cl. E, 5.728%, 11/10/461,3 | | | 400,000 | | | | 385,937 | |
EverBank Mortgage Loan Trust, Commercial Mtg. Pass-Through Certificates, | | | | | | | | |
Series 2013-1, Cl. A1, 2.25%, 3/25/431,3 | | | 1,330,664 | | | | 1,205,733 | |
FREMF Mortgage Trust, Commercial Mtg. Pass-Through Certificates: | | | | | | | | |
Series 2013-K25, Cl. C, 3.742%, 11/25/451,3 | | | 515,000 | | | | 420,681 | |
Series 2013-K26, Cl. C, 3.723%, 12/25/451,3 | | | 345,000 | | | | 280,621 | |
Series 2013-K27, Cl. C, 3.616%, 1/25/461,3 | | | 530,000 | | | | 425,169 | |
Series 2013-K28, Cl. C, 3.614%, 6/25/461,3 | | | 530,000 | | | | 425,355 | |
Series 2013-K30, Cl. C, 3.666%, 6/25/451,3 | | | 855,000 | | | | 668,815 | |
Series 2013-K712, Cl. C, 3.483%, 5/25/451,3 | | | 890,000 | | | | 781,691 | |
Series 2013-K713, Cl. C, 3.274%, 4/25/461,3 | | | 2,670,000 | | | | 2,290,506 | |
16 OPPENHEIMER LIMITED-TERM BOND FUND
| | | | | | | | |
| | | Principal
Amount | | | Value | |
Commercial Continued | | | | | | | | |
GSR Mortgage Loan Trust, Mtg. Pass-Through Certificates, Series 2005-AR4, Cl. 6A1, 5.25%, 7/25/353 | | $ | 985,613 | | | $ | 971,538 | |
Heller Financial Commercial Mortgage Asset Corp., Interest-Only Commercial Mtg. Pass-Through Certificates, Series 2000-PH1, Cl. X, 0.00%, 1/17/341,3,5,8 | | | 5,425,248 | | | | 67,718 | |
JP Morgan Chase Commercial Mortgage Securities Trust, Commercial Mtg. Pass-Through Certificates: | | | | | | | | |
Series 2006-LDP7, Cl. AJ, 6.056%, 4/15/453 | | | 1,265,000 | | | | 1,265,397 | |
Series 2006-LDP8, Cl. AJ, 5.48%, 5/15/453 | | | 705,000 | | | | 727,248 | |
JP Morgan Mortgage Trust, Mtg. Pass-Through Certificates, Series 2006-A7, Cl. 2A2, 2.837%, 1/25/373 | | | 555,366 | | | | 449,654 | |
JPMBB Commercial Mortgage Securities Trust, Commercial Mtg. Pass- Through Certificates, Series 2013-C14, Cl. D, 4.712%, 8/15/461,3 | | | 855,000 | | | | 733,246 | |
LB-UBS Commercial Mortgage Trust, Commercial Mtg. Pass-Through Certificates, Series 2007-C6, Cl. AM, 6.114%, 7/15/403 | | | 1,010,000 | | | | 1,099,104 | |
Lehman Structured Securities Corp., Commercial Mtg. Pass-Through Certificates, Series 2002-GE1, Cl. A, 2.514%, 7/26/242,3 | | | 150,075 | | | | 131,585 | |
Morgan Stanley Bank of America Merrill Lynch Trust, Commercial Mtg. Pass-Through Certificates: | | | | | | | | |
Series 2012-C6, Cl. E, 4.82%, 11/15/451,3 | | | 810,000 | | | | 695,036 | |
Series 2013-C7, Cl. D, 4.444%, 2/15/461,3 | | | 980,000 | | | | 810,705 | |
Series 2013-C8, Cl. D, 4.312%, 12/15/481,3 | | | 710,000 | | | | 586,570 | |
Morgan Stanley Capital I Trust, Commercial Mtg. Pass-Through Certificates, | | | | | | | | |
Series 2007-IQ13, Cl. AM, 5.406%, 3/15/44 | | | 2,215,000 | | | | 2,357,349 | |
Morgan Stanley Reremic Trust, Re-Securitization Real Estate Mtg. Investment Conduit Multiclass Pass-Through Certificates, Series 2012-R3, Cl. 1A, 2.366%, 11/26/361,3 | | | 4,525,958 | | | | 4,489,675 | |
Sequoia Mortgage Trust, Mtg. Pass-Through Certificates, Series 2012-2, Cl. A2, 3.50%, 4/25/423 | | | 982,589 | | | | 968,829 | |
UBS-Barclays Commercial Mortgage Trust, Commercial Mtg. Pass-Through Certificates, Series 2012-C2, Cl. E, 5.05%, 5/10/631,3 | | | 380,000 | | | | 335,279 | |
Wells Fargo Mortgage-Backed Securities Trust, Mtg. Pass-Through Certificates, Series 2005-AR1, Cl. 1A1, 2.625%, 2/25/353 | | | 4,380,422 | | | | 4,332,073 | |
WF-RBS Commercial Mortgage Trust, Commercial Mtg. Pass-Through Certificates: | | | | | | | | |
Series 2012-C10, Cl. D, 4.609%, 12/15/451,3 | | | 410,000 | | | | 341,020 | |
Series 2012-C7, Cl. E, 5.004%, 6/15/451,3 | | | 710,000 | | | | 621,468 | |
Series 2012-C8, Cl. E, 5.042%, 8/15/451,3 | | | 800,000 | | | | 701,565 | |
Series 2013-C11, Cl. D, 4.324%, 3/15/451,3 | | | 416,000 | | | | 338,432 | |
Series 2013-C15, Cl. D, 4.636%, 8/15/461,3 | | | 725,000 | | | | 589,157 | |
WF-RBS Commercial Mortgage Trust, Interest-Only Commercial Mtg. Pass- Through Certificates, Series 2011-C3, Cl. XA, 1.85%, 3/15/441,3,5 | | | 14,370,078 | | | | 1,023,947 | |
| | | | | | | | |
| | | | | | | | 59,578,102 | |
Multi-Family—0.2% | | | | | | | | |
Wells Fargo Mortgage-Backed Securities Trust, Mtg. Pass Through Certificates, Series 2005-AR15, Cl. 1A2, 2.613%, 9/25/353 | | | 1,273,868 | | | | 1,226,152 | |
Residential—2.2% | | | | | | | | |
Argent Securities, Inc., Asset-Backed Pass-Through Certificates, | | | | | | | | |
Series 2004-W8, Cl. A2, 1.144%, 5/25/343 | | | 3,697,210 | | | | 3,561,275 | |
Banc of America Commercial Mortgage Trust, Commercial Mtg. Pass-Through Certificates, Series 2007-4, Cl. AM, 6.001%, 2/10/513 | | | 2,990,000 | | | | 3,244,709 | |
17 OPPENHEIMER LIMITED-TERM BOND FUND
| | | | |
| | |
| | STATEMENT OF INVESTMENTS Continued | | |
| | | | | | | | |
| | |
| Principal
Amount |
| | | Value | |
Residential Continued | | | | | | | | |
CHL Mortgage Pass-Through Trust, Mtg. Pass-Through Certificates: | | | | | | | | |
Series 2005-J4, Cl. A7, 5.50%, 11/25/35 | | $ | 2,371,463 | | | $ | 2,424,861 | |
Series 2007-HY3, Cl. 1A1, 2.758%, 6/25/473 | | | 2,676,444 | | | | 2,331,796 | |
CWABS Asset-Backed Certificates Trust, Asset-Backed Certificates, | | | | | | | | |
Series 2005-16, Cl. 2AF2, 5.098%, 5/25/363 | | | 512,785 | | | | 511,160 | |
Merrill Lynch Mortgage Investors Trust, Mtg. Pass-Through Certificates, | | | | | | | | |
Series 2005-A1, Cl. 2A1, 2.656%, 12/25/343 | | | 238,149 | | | | 239,870 | |
MLCC Mortgage Investors, Inc., Mtg. Pass-Through Certificates, Series 2006- 3, Cl. 2A1, 2.456%, 10/25/363 | | | 2,062,531 | | | | 1,950,277 | |
RALI Trust, Mtg. Asset-Backed Pass-Through Certificates, Series 2006-QS13, Cl. 1A8, 6%, 9/25/36 | | | 17,455 | | | | 13,575 | |
WaMu Mortgage Pass-Through Certificates Trust, Mtg. Pass-Through Certificates, Series 2007-HY1, Cl. 4A1, 2.544%, 2/25/373 | | | 3,712,945 | | | | 3,170,365 | |
Wells Fargo Mortgage-Backed Securities Trust, Mtg. Pass Through Certificates, Series 2005-9, Cl. 2A6, 5.25%, 10/25/35 | | | 771,739 | | | | 794,381 | |
| | | | | | | | |
| | | | | | | 18,242,269 | |
| | | | | | | | |
Total Mortgage-Backed Obligations (Cost $468,085,990) | | | | | | | 480,041,388 | |
| | | | | | | | |
U.S. Government Obligations—35.4% | | | | | | | | |
Federal Home Loan Mortgage Corp. Nts.: | | | | | | | | |
0.875%, 10/14/16-3/7/18 | | | 110,350,000 | | | | 108,392,687 | |
1.375%, 5/1/20 | | | 44,019,000 | | | | 41,102,521 | |
2.375%, 1/13/22 | | | 4,949,000 | | | | 4,745,319 | |
Federal National Mortgage Assn. Nts.: | | | | | | | | |
0.375%, 7/5/16 | | | 32,194,000 | | | | 31,787,744 | |
0.875%, 5/21/18 | | | 8,160,000 | | | | 7,836,799 | |
1.25%, 1/30/17 | | | 47,553,000 | | | | 47,790,908 | |
1.375%, 11/15/16 | | | 16,460,000 | | | | 16,646,854 | |
1.875%, 9/18/18 | | | 32,642,000 | | | | 32,624,830 | |
U.S. Treasury Nts., 0.25%, 2/28/149 | | | 5,000,000 | | | | 5,004,785 | |
| | | | | �� | | | |
Total U.S. Government Obligations (Cost $301,201,824) | | | | | | | 295,932,447 | |
| | | | | | | | |
Corporate Bonds and Notes—21.7% | | | | | | | | |
Consumer Discretionary—2.5% | | | | | | | | |
Automobiles—1.2% | | | | | | | | |
Ford Motor Credit Co. LLC, 3% Sr. Unsec. Nts., 6/12/17 | | | 8,800,000 | | | | 8,864,654 | |
Hyundai Capital America, 1.875% Unsec. Nts., 8/9/161 | | | 1,000,000 | | | | 999,276 | |
| | | | | | | | |
| | | | | | | 9,863,930 | |
| | | | | | | | |
Household Durables—0.4% | | | | | | | | |
Jarden Corp., 7.50% Sr. Sub. Nts., 5/1/17 | | | 1,800,000 | | | | 2,011,500 | |
Lennar Corp., 4.125% Sr. Unsec. Nts., 12/1/181 | | | 2,150,000 | | | | 2,053,250 | |
| | | | | | | | |
| | | | | | | 4,064,750 | |
| | | | | | | | |
Specialty Retail—0.3% | | | | | | | | |
Sally Holdings LLC/Sally Capital, Inc., 6.875% Sr. Unsec. Nts., 11/15/19 | | | 1,900,000 | | | | 2,080,500 | |
| | | | | | | | |
Textiles, Apparel & Luxury Goods—0.6% | | | | | | | | |
Hanesbrands, Inc., 6.375% Sr. Unsec. Unsub. Nts., 12/15/20 | | | 1,900,000 | | | | 2,061,500 | |
Levi Strauss & Co., 7.625% Sr. Unsec. Nts., 5/15/20 | | | 1,900,000 | | | | 2,047,250 | |
PVH Corp., 7.375% Sr. Unsec. Nts., 5/15/20 | | | 1,900,000 | | | | 2,061,500 | |
| | | | | | | | |
| | | | | | | 6,170,250 | |
18 OPPENHEIMER LIMITED-TERM BOND FUND
| | | | | | | | |
| | |
| Principal
Amount |
| | | Value | |
Consumer Staples—0.8% | | | | | | | | |
Food & Staples Retailing—0.3% | | | | | | | | |
Safeway, Inc., 3.40% Sr. Unsec. Nts., 12/1/16 | | $ | 2,000,000 | | | $ | 2,077,746 | |
Personal Products—0.2% | | | | | | | | |
Avon Products, Inc., 4.60% Sr. Unsec. Nts., 3/15/20 | | | 2,000,000 | | | | 2,051,060 | |
Tobacco—0.3% | | | | | | | | |
Lorillard Tobacco Co., 2.30% Sr. Unsec. Nts., 8/21/17 | | | 2,150,000 | | | | 2,115,295 | |
Energy—2.7% | | | | | | | | |
Energy Equipment & Services—0.4% | | | | | | | | |
Pacific Drilling SA, 5.375% Sr. Sec. Nts., 6/1/201 | | | 2,100,000 | | | | 2,031,750 | |
Seadrill Ltd., 5.625% Sr. Unsec. Nts., 9/15/171 | | | 2,000,000 | | | | 2,025,000 | |
| | | | | | | | |
| | | | | | | 4,056,750 | |
| | | | | | | | |
Oil, Gas & Consumable Fuels—2.3% | | | | | | | | |
Access Midstream Partners LP/ACMP Finance Corp., 5.875% Sr. Unsec. Nts., 4/15/21 | | | 2,000,000 | | | | 2,065,000 | |
Continental Resources, Inc., 5% Sr. Unsec. Nts., 9/15/22 | | | 2,100,000 | | | | 2,131,500 | |
DCP Midstream Operating LP, 2.50% Sr. Unsec. Unsub. Nts., 12/1/17 | | | 1,300,000 | | | | 1,278,217 | |
EQT Corp., 5.15% Sr. Unsec. Nts., 3/1/18 | | | 2,000,000 | | | | 2,126,358 | |
Kinder Morgan Energy Partners LP, 2.65% Sr. Unsec. Nts., 2/1/19 | | | 2,000,000 | | | | 1,977,836 | |
MEG Energy Corp., 6.50% Sr. Unsec. Nts., 3/15/211 | | | 1,600,000 | | | | 1,636,000 | |
Oasis Petroleum, Inc., 7.25% Sr. Unsec. Nts., 2/1/19 | | | 2,000,000 | | | | 2,130,000 | |
Pioneer Natural Resources Co., 6.65% Sr. Unsec. Nts., 3/15/17 | | | 2,490,000 | | | | 2,842,938 | |
Rockies Express Pipeline LLC, 3.90% Sr. Unsec. Unsub. Nts., 4/15/151 | | | 1,146,000 | | | | 1,151,730 | |
Spectra Energy Partners LP, 4.60% Sr. Unsec. Nts., 6/15/21 | | | 1,000,000 | | | | 1,023,354 | |
Western Gas Partners LP, 2.60% Sr. Unsec. Nts., 8/15/18 | | | 1,000,000 | | | | 989,220 | |
| | | | | | | | |
| | | | | | | | 19,352,153 | |
Financials—8.0% | | | | | | | | |
Capital Markets—0.8% | | | | | | | | |
Macquarie Bank Ltd., 2% Sr. Unsec. Nts., 8/15/161 | | | 3,400,000 | | | | 3,394,781 | |
UBS Preferred Funding Trust V, 6.243% Jr. Sub. Perpetual Bonds, Series 13,4 | | | 3,500,000 | | | | 3,696,875 | |
| | | | | | | | |
| | | | | | | 7,091,656 | |
| | | | | | | | |
Commercial Banks—3.3% | | | | | | | | |
Abbey National Treasury Services plc, 3.05% Sr. Unsec. Nts., 8/23/18 | | | 3,202,000 | | | | 3,213,345 | |
BNP Paribas SA, 2.70% Sr. Unsec. Nts., 8/20/18 | | | 3,000,000 | | | | 2,987,202 | |
HSBC Finance Capital Trust IX, 5.911% Unsec. Sub. Nts., 11/30/353 | | | 4,500,000 | | | | 4,584,375 | |
Huntington Bancshares, Inc., 2.60% Sr. Unsec. Nts., 8/2/18 | | | 3,400,000 | | | | 3,363,953 | |
LBG Capital No. 1 plc, 7.875% Unsec. Sub. Nts., 11/1/201 | | | 1,900,000 | | | | 2,028,250 | |
Lloyds TSB Bank plc, 6.50% Unsec. Sub. Nts., 9/14/201 | | | 900,000 | | | | 978,943 | |
Rabobank Capital Funding Trust III, 5.254% Jr. Sub. Perpetual Bonds1,3,4 | | | 2,700,000 | | | | 2,754,000 | |
Royal Bank of Scotland Group plc, 7.64% Jr. Sub. Perpetual Bonds, Series U3,4 | | | 2,300,000 | | | | 2,070,000 | |
Santander Holdings USA, Inc., 3.45% Sr. Unsec. Nts., 8/27/18 | | | 760,000 | | | | 769,634 | |
Zions Bancorporation, 4% Sr. Unsec. Nts., 6/20/16 | | | 3,806,000 | | | | 3,937,269 | |
| | | | | | | | |
| | | | | | | 26,686,971 | |
| | | | | | | | |
Consumer Finance—0.8% | | | | | | | | |
Ally Financial, Inc., 3.50% Sr. Unsec. Nts., 7/18/16 | | | 2,100,000 | | | | 2,118,375 | |
Discover Bank, 4.20% Sr. Unsec. Nts., 8/8/23 | | | 2,100,000 | | | | 2,067,549 | |
19 OPPENHEIMER LIMITED-TERM BOND FUND
| | | | |
| | |
| | STATEMENT OF INVESTMENTS Continued | | |
| | | | | | | | |
| | | Principal
Amount | | | Value | |
Consumer Finance Continued | | | | | | | | |
National Rural Utilities Cooperative Finance Corp., 4.75% Sr. Unsec. Sub. Nts., 4/30/433 | | $ | 1,800,000 | | | $ | 1,674,000 | |
| | | | | | | | |
| | | | | | | 5,859,924 | |
| | | | | | | | |
Diversified Financial Services—0.8% | | | | | | | | |
ING US, Inc., 5.65% Jr. Sub. Nts., 5/15/533 | | | 2,250,000 | | | | 2,082,551 | |
JPMorgan Chase & Co., 7.90% Jr. Sub. Perpetual Bonds, Series 13,4 | | | 3,750,000 | | | | 4,138,425 | |
| | | | | | | | |
| | | | | | | 6,220,976 | |
| | | | | | | | |
Insurance—1.7% | | | | | | | | |
Allstate Corp. (The), 5.75% Sub. Nts., 8/15/533 | | | 2,140,000 | | | | 2,111,912 | |
American International Group, Inc., 3.375% Sr. Unsec. Nts., 8/15/20 | | | 1,700,000 | | | | 1,678,772 | |
Lincoln National Corp., 6.05% Jr. Unsec. Sub. Nts., 4/20/673 | | | 2,700,000 | | | | 2,686,500 | |
Prudential Financial, Inc., 5.20% Jr. Sub. Nts., 3/15/443 | | | 2,285,000 | | | | 2,067,925 | |
Swiss Re Capital I LP, 6.854% Jr. Sub. Perpetual Bonds1,3,4 | | | 4,400,000 | | | | 4,620,000 | |
| | | | | | | | |
| | | | | | | 13,165,109 | |
| | | | | | | | |
Real Estate Investment Trusts (REITs)—0.6% | | | | | | | | |
American Tower Corp., 5.05% Sr. Unsec. Unsub. Nts., 9/1/20 | | | 2,000,000 | | | | 2,072,192 | |
Host Hotels & Resorts LP, 5.875%, 6/15/19 | | | 2,350,000 | | | | 2,553,000 | |
| | | | | | | | |
| | | | | | | | 4,625,192 | |
Health Care—0.4% | | | | | | | | |
Health Care Providers & Services—0.2% | | | | | | | | |
Omnicare, Inc., 7.75% Sr. Sub. Nts., 6/1/20 | | | 1,850,000 | | | | 2,044,250 | |
| | | | | | | | |
Pharmaceuticals—0.2% | | | | | | | | |
Hospira, Inc., 6.05% Sr. Unsec. Nts., 3/30/17 | | | 1,900,000 | | | | 2,045,814 | |
Industrials—2.4% | | | | | | | | |
Aerospace & Defense—0.2% | | | | | | | | |
Huntington Ingalls Industries, Inc., 6.875% Sr. Unsec. Nts., 3/15/18 | | | 1,900,000 | | | | 2,056,750 | |
Building Products—0.2% | | | | | | | | |
Masco Corp., 5.85% Sr. Unsec. Nts., 3/15/17 | | | 1,900,000 | | | | 2,042,500 | |
Commercial Services & Supplies—0.6% | | | | | | | | |
Clean Harbors, Inc., 5.25% Sr. Unsec. Unsub. Nts., 8/1/20 | | | 2,130,000 | | | | 2,114,025 | |
RR Donnelley & Sons Co., 8.25% Sr. Unsec. Nts., 3/15/19 | | | 1,900,000 | | | | 2,104,250 | |
| | | | | | | | |
| | | | | | | | 4,218,275 | |
Industrial Conglomerates—0.5% | | | | | | | | |
General Electric Capital Corp., 6.375% Unsec. Sub. Nts., 11/15/673 | | | 3,900,000 | | | | 4,129,125 | |
Machinery—0.3% | | | | | | | | |
Oshkosh Corp., 8.50% Sr. Unsec. Nts., 3/1/20 | | | 1,100,000 | | | | 1,218,250 | |
Xylem, Inc., 3.55% Sr. Unsec. Nts., 9/20/16 | | | 1,600,000 | | | | 1,672,803 | |
| | | | | | | | |
| | | | | | | | 2,891,053 | |
Professional Services—0.2% | | | | | | | | |
Nielsen Finance LLC/Nielsen Finance Co., 4.50% Sr. Unsec. Nts., 10/1/20 | | | 2,120,000 | | | | 2,024,600 | |
Road & Rail—0.2% | | | | | | | | |
Penske Truck Leasing Co. LP/PTL Finance Corp., 2.50% Sr. Unsec. Nts., 3/15/161 | | | 1,500,000 | | | | 1,518,379 | |
20 OPPENHEIMER LIMITED-TERM BOND FUND
| | | | | | | | |
| | | Principal
Amount | | | Value | |
Trading Companies & Distributors—0.2% | | | | | | | | |
International Lease Finance Corp., 5.875% Sr. Unsec. Unsub. Nts., 4/1/19 | | $ | 2,000,000 | | | $ | 2,036,240 | |
Information Technology—0.2% | | | | | | | | |
IT Services—0.2% | | | | | | | | |
Fidelity National Information Services, Inc., 7.875% Sr. Unsec. Nts., 7/15/20 | | | 1,500,000 | | | | 1,662,600 | |
Materials—1.6% | | | | | | | | |
Containers & Packaging—0.4% | | | | | | | | |
Cascades, Inc., 7.875% Sr. Unsec. Nts., 1/15/20 | | | 1,200,000 | | | | 1,269,000 | |
Sealed Air Corp., 8.125% Sr. Unsec. Nts., 9/15/191 | | | 1,850,000 | | | | 2,062,750 | |
| | | | | | | 3,331,750 | |
| | | | | | | | |
Metals & Mining—1.2% | | | | | | | | |
Barrick Gold Corp., 2.90% Sr. Unsec. Nts., 5/30/16 | | | 1,700,000 | | | | 1,710,589 | |
Freeport-McMoRan Copper & Gold, Inc., 2.375% Sr. Unsec. Nts., 3/15/181 | | | 2,250,000 | | | | 2,102,161 | |
Plains Exploration & Production Co., 8.625% Sr. Unsec. Nts., 10/15/19 | | | 1,500,000 | | | | 1,665,025 | |
Steel Dynamics, Inc., 7.625% Sr. Unsec. Nts., 3/15/20 | | | 1,850,000 | | | | 2,007,250 | |
Xstrata Finance Canada Ltd., 2.05% Sr. Unsec. Nts., 10/23/151 | | | 2,100,000 | | | | 2,091,762 | |
| | | | | | | | 9,576,787 | |
Telecommunication Services—2.0% | | | | | | | | |
Diversified Telecommunication Services—1.8% | | | | | | | | |
Frontier Communications Corp., 8.50% Sr. Unsec. Nts., 4/15/20 | | | 1,830,000 | | | | 2,008,425 | |
Koninklijke KPN NV, 7% Sr. Sub. Nts., 3/28/731,3 | | | 2,100,000 | | | | 2,106,180 | |
Telecom Italia Capital SA, 7.175% Sr. Unsec. Nts., 6/18/19 | | | 1,900,000 | | | | 2,074,230 | |
Telefonica Emisiones SAU, 5.877% Sr. Unsec. Nts., 7/15/19 | | | 4,100,000 | | | | 4,374,659 | |
T-Mobile USA, Inc., 5.25% Sr. Unsec. Nts., 9/1/181 | | | 2,100,000 | | | | 2,130,188 | |
Windstream Corp., 7.875% Sr. Unsec. Nts., 11/1/17 | | | 1,850,000 | | | | 2,062,750 | |
| | | | | | | 14,756,432 | |
| | | | | | | | |
Wireless Telecommunication Services—0.2% | | | | | | | | |
Crown Castle International Corp., 7.125% Sr. Unsec. Nts., 11/1/19 | | | 1,900,000 | | | | 2,052,000 | |
Utilities—1.1% | | | | | | | | |
Electric Utilities—0.8% | | | | | | | | |
EDP Finance BV, 6% Sr. Unsec. Nts., 2/2/181 | | | 1,850,000 | | | | 1,926,312 | |
Electricite de France SA, 5.25% Jr. Sub. Perpetual Bonds1,3,4 | | | 1,200,000 | | | | 1,127,040 | |
Great Plains Energy, Inc., 6.875% Sr. Unsec. Nts., 9/15/17 | | | 1,368,000 | | | | 1,571,468 | |
Iberdrola Finance Ireland Ltd., 5% Sr. Unsec. Nts., 9/11/191 | | | 2,000,000 | | | | 2,106,808 | |
| | | | | | | 6,731,628 | |
| | | | | | | | |
Multi-Utilities—0.3% | | | | | | | | |
CMS Energy Corp., 6.55% Sr. Unsec. Nts., 7/17/17 | | | 2,200,000 | | | | 2,528,768 | |
Total Corporate Bonds and Notes (Cost $181,434,076) | | | | | | | 181,129,213 | |
21 OPPENHEIMER LIMITED-TERM BOND FUND
| | | | |
| | |
| | STATEMENT OF INVESTMENTS Continued | | |
| | | | | | | | | | | | |
| | | Swaption
Expiration
Date | | | Notional
Amount | | | Value | |
Over-the-Counter Interest Rate Swaptions Purchased—0.0% | | | | | | | | | | | | |
JPMorgan Chase Bank NA; Interest Rate Swaption (European); Swap Terms: Paid: Three-Month USD BBA LIBOR; Received: 1.74%; Termination Date: 12/10/2310 (Cost $200,000) | | | 12/6/13 | | | $ | 100,000,000 | | | $ | 128 | |
Total Investments, at Value (Cost $995,060,785) | | | 119.7 | % | | | | | | | 1,000,571,255 | |
Liabilities in Excess of Other Assets | | | (19.7 | ) | | | | | | | (164,671,688 | ) |
| | | | |
Net Assets | | | 100.0 | % | | | | | | $ | 835,899,567 | |
| | | | |
Footnotes to Statement of Investments
*August 30, 2013 represents the last business day of the Fund’s 2013 fiscal year. See Note 1 of the accompanying Notes.
1. Represents securities sold under Rule 144A, which are exempt from registration under the Securities Act of 1933, as amended. These securities have been determined to be liquid under guidelines established by the Board of Trustees. These securities amount to $87,724,611 or 10.49% of the Fund’s net assets as of August 30, 2013.
2. Restricted security. The aggregate value of restricted securities as of August 30, 2013 was $3,764,708, which represents 0.45% of the Fund’s net assets. See Note 7 of the accompanying Notes. Information concerning restricted securities is as follows:
| | | | | | | | | | | | | | | | |
| Security | | Acquisition
Dates | | | Cost | | | Value | | | Unrealized
Appreciation/
(Depreciation) | |
BCAP LLC Trust, Mtg. Pass- Through Certificates, Series 2012-RR6, 2.404%, 11/26/36 | | | 6/14/12 | | | $ | 3,308,416 | | | $ | 3,394,249 | | | $ | 85,833 | |
Capital Lease Funding Securitization LP, Interest-Only Commercial Mtg. Pass-Through Certificates, Series 1997-CTL1, Cl. IO, 0.00%, 6/22/24 | | | 4/21/97-6/27/97 | | | | 789,752 | | | | 186,856 | | | | (602,896 | ) |
Lehman Structured Securities Corp., Commercial Mtg. Pass- Through Certificates, Series 2002-GE1, Cl. A, 2.514%, 7/26/24 | | | 1/28/02 | | | | 147,044 | | | | 131,585 | | | | (15,459 | ) |
Santander Drive Auto Receivables Trust, Series 2011- S1A, Cl. D, 3.10%, 5/15/17 | | | 2/4/11-4/14/11 | | | | 52,020 | | | | 52,018 | | | | (2 | ) |
| | | | | | | | |
| | | | | | $ | 4,297,232 | | | $ | 3,764,708 | | | $ | (532,524 | ) |
| | | | | | | | |
3. Represents the current interest rate for a variable or increasing rate security.
4. This bond has no contractual maturity date, is not redeemable and contractually pays an indefinite stream of interest. Rate reported represents the current interest rate for this variable rate security.
22 OPPENHEIMER LIMITED-TERM BOND FUND
5. Interest-Only Strips represent the right to receive the monthly interest payments on an underlying pool of mortgage loans. These securities typically decline in price as interest rates decline. Most other fixed income securities increase in price when interest rates decline. The principal amount of the underlying pool represents the notional amount on which current interest is calculated. The price of these securities is typically more sensitive to changes in prepayment rates than traditional mortgage-backed securities (for example, GNMA pass-throughs). Interest rates disclosed represent current yields based upon the current cost basis and estimated timing and amount of future cash flows. These securities amount to $20,390,233 or 2.44% of the Fund’s net assets as of August 30, 2013.
6. All or a portion of the security position is when-issued or delayed delivery to be delivered and settled after August 30, 2013. See Note 1 of the accompanying Notes.
7. Principal-Only Strips represent the right to receive the monthly principal payments on an underlying pool of mortgage loans. The value of these securities generally increases as interest rates decline and prepayment rates rise. The price of these securities is typically more volatile than that of coupon-bearing bonds of the same maturity. Interest rates disclosed represent current yields based upon the current cost basis and estimated timing of future cash flows. These securities amount to $160,399 or 0.02% of the Fund’s net assets as of August 30, 2013.
8. Interest rate is less than 0.0005%.
9. All or a portion of the security position is held in accounts at a futures clearing merchant and pledged to cover margin requirements on open futures contracts and written options on futures, if applicable. The aggregate market value of such securities is $5,004,785. See Note 6 of the accompanying Notes.
10. Non-income producing security.
| | | | | | | | | | | | | | | | | | | | |
| Futures Contracts as of August 30, 2013 are as follows: | | | | | | | | | | | | | | | |
| | | | | |
| Contract Description | | Buy/Sell | | | Number of
Contracts | | | Expiration
Date | | | Value | | | Unrealized
Appreciation (Depreciation) | |
U.S. Treasury Long Bonds | | | Sell | | | | 1,066 | | | | 12/19/13 | | | $ | 140,612,063 | | | $ | (1,716,956 | ) |
U.S. Treasury Nts., 2 yr. | | | Sell | | | | 32 | | | | 12/31/13 | | | | 7,032,000 | | | | (2,396 | ) |
U.S. Treasury Nts., 5 yr. | | | Sell | | | | 997 | | | | 12/31/13 | | | | 119,320,651 | | | | (274,364 | ) |
U.S. Treasury Nts., 10 yr. | | | Sell | | | | 1,063 | | | | 12/19/13 | | | | 132,110,969 | | | | (544,317 | ) |
U.S. Treasury Ultra Bonds | | | Buy | | | | 395 | | | | 12/19/13 | | | | 56,040,625 | | | | 1,618,013 | |
| | | | | | | | | | | | | | | | | | | | |
| | | | | | | | | | | | | | | | | | $ | (920,020 | ) |
| | | | | | | | | | | | | | | | | | | | |
See accompanying Notes to Financial Statements.
23 OPPENHEIMER LIMITED-TERM BOND FUND
| | | | |
| | |
| | STATEMENT OF ASSETS AND LIABILITIES August 30, 20131 | | |
| | | | |
Assets | | | | |
Investments, at value (cost $995,060,785)—see accompanying statement of investments | | $ | 1,000,571,255 | |
Cash | | | 40,863,520 | |
Receivables and other assets: | | | | |
Investments sold on a when-issued or delayed delivery basis | | | 132,831,415 | |
Interest and principal paydowns | | | 5,030,775 | |
Shares of beneficial interest sold | | | 3,687,060 | |
Variation margin receivable | | | 416,998 | |
Expense waivers/reimbursements due from manager | | | 18,266 | |
Other | | | 137,891 | |
| | | | |
Total assets | | | 1,183,557,180 | |
Liabilities | | | | |
Payables and other liabilities: | | | | |
Investments purchased (including $335,480,199 purchased on a when-issued or delayed delivery basis) | | | 345,499,051 | |
Shares of beneficial interest redeemed | | | 1,053,204 | |
Variation margin payable | | | 233,031 | |
Trustees’ compensation | | | 228,454 | |
Distribution and service plan fees | | | 185,779 | |
Transfer and shareholder servicing agent fees | | | 167,669 | |
Dividends | | | 119,599 | |
Shareholder communications | | | 39,736 | |
Other | | | 131,090 | |
| | | | |
Total liabilities | | | 347,657,613 | |
Net Assets | | $ | 835,899,567 | |
| | | | |
| | | | |
Composition of Net Assets | | | | |
Par value of shares of beneficial interest | | $ | 89,688 | |
Additional paid-in capital | | | 826,007,456 | |
Accumulated net investment income | | | 6,854,883 | |
Accumulated net realized loss on investments | | | (1,642,910 | ) |
Net unrealized appreciation on investments | | | 4,590,450 | |
| | | | |
Net Assets | | $ | 835,899,567 | |
| | | | |
1. August 30, 2013 represents the last business day of the Fund’s 2013 fiscal year. See Note 1 of the accompanying Notes.
24 OPPENHEIMER LIMITED-TERM BOND FUND
| | | | |
Net Asset Value Per Share | | | | |
Class A Shares: | | | | |
| Net asset value and redemption price per share (based on net assets of $632,387,117 and 67,837,522 shares of beneficial interest outstanding) | | $ | 9.32 | |
| Maximum offering price per share (net asset value plus sales charge of 2.25% of offering price) | | $ | 9.53 | |
| Class B Shares: | | | | |
| Net asset value, redemption price (excludes applicable contingent deferred sales charge) and offering price per share (based on net assets of $34,045,225 and 3,656,923 shares of beneficial interest outstanding) | | $ | 9.31 | |
| Class C Shares: | | | | |
| Net asset value, redemption price (excludes applicable contingent deferred sales charge) and offering price per share (based on net assets of $119,677,069 and 12,858,365 shares of beneficial interest outstanding) | | $ | 9.31 | |
| Class I Shares: | | | | |
| Net asset value, redemption price and offering price per share (based on net assets of $9,958 and 1,065 shares of beneficial interest outstanding) | | $ | 9.35 | |
| Class N Shares: | | | | |
| Net asset value, redemption price (excludes applicable contingent deferred sales charge) and offering price per share (based on net assets of $33,368,206 and 3,579,706 shares of beneficial interest outstanding) | | $ | 9.32 | |
| Class Y Shares: | | | | |
| Net asset value, redemption price and offering price per share (based on net assets of $16,411,992 and 1,754,543 shares of beneficial interest outstanding) | | $ | 9.35 | |
See accompanying Notes to Financial Statements
25 OPPENHEIMER LIMITED-TERM BOND FUND
| | | | |
| | |
| | STATEMENT OF OPERATIONS For the Year Ended August 30, 20131 | | |
| | | | |
Investment Income | | | | |
Interest | | $ | 20,449,526 | |
Fee income on when-issued securities | | | 6,336,109 | |
Other income | | | 16,976 | |
| | | | |
Total investment income | | | 26,802,611 | |
Expenses | | | | |
Management fees | | | 5,350,077 | |
Distribution and service plan fees: | | | | |
Class A | | | 1,750,669 | |
Class B | | | 452,807 | |
Class C | | | 1,461,289 | |
Class N | | | 193,767 | |
Transfer and shareholder servicing agent fees: | | | | |
Class A | | | 1,193,306 | |
Class B | | | 144,339 | |
Class C | | | 269,081 | |
Class N | | | 103,267 | |
Class Y | | | 25,306 | |
Shareholder communications: | | | | |
Class A | | | 193,722 | |
Class B | | | 22,194 | |
Class C | | | 39,875 | |
Class N | | | 8,251 | |
Class Y | | | 810 | |
Trustees’ compensation | | | 33,427 | |
Custodian fees and expenses | | | 12,361 | |
Other | | | 70,831 | |
| | | | |
Total expenses | | | 11,325,379 | |
Less waivers and reimbursements of expenses | | | (1,053,426 | ) |
| | | | |
Net expenses | | | 10,271,953 | |
Net Investment Income | | | 16,530,658 | |
1. August 30, 2013 represents the last business day of the Fund’s 2013 fiscal year. See Note 1 of the accompanying Notes.
26 OPPENHEIMER LIMITED-TERM BOND FUND
| | | | |
Realized and Unrealized Gain (Loss) | | | | |
Net realized gain (loss) on: | | | | |
Investments from unaffiliated companies | | $ | (7,830,795) | |
Closing and expiration of option contracts written | | | 266,954 | |
Closing and expiration of futures contracts | | | 8,766,788 | |
Swap contracts | | | 1,095,902 | |
Closing and expiration of swaption contracts written | | | (28,188 | ) |
| | | | |
Net realized gain | | | 2,270,661 | |
Net change in unrealized appreciation/depreciation on: | | | | |
Investments | | | (28,649,012 | ) |
Futures contracts | | | (2,813,629 | ) |
Option contracts written | | | (10,948 | ) |
Swaption contracts written | | | (23,454 | ) |
| | | | |
Net change in unrealized appreciation/depreciation | | | (31,497,043 | ) |
Net Decrease in Net Assets Resulting from Operations | | $ | (12,695,724) | |
| | | | |
See accompanying Notes to Financial Statements.
27 OPPENHEIMER LIMITED-TERM BOND FUND
| | | | |
| | |
| | STATEMENTS OF CHANGES IN NET ASSETS | | |
| | | | | | | | |
| | | Year Ended
August 30, 20131 | | | Year Ended
August 31, 2012 | |
Operations | | | | | | | | |
Net investment income | | $ | 16,530,658 | | | $ | 21,003,600 | |
Net realized gain | | | 2,270,661 | | | | 30,533,605 | |
Net change in unrealized appreciation/depreciation | | | (31,497,043 | ) | | | 2,015,161 | |
| | | | |
Net increase (decrease) in net assets resulting from operations | | | (12,695,724 | ) | | | 53,552,366 | |
Dividends and/or Distributions to Shareholders | | | | | | | | |
Dividends from net investment income: | | | | | | | | |
Class A | | | (13,419,150 | ) | | | (16,439,582 | ) |
Class B | | | (495,091 | ) | | | (852,759 | ) |
Class C | | | (1,604,046 | ) | | | (2,367,467 | ) |
Class I | | | (23 | ) | | | — | |
Class N | | | (639,805 | ) | | | (904,244 | ) |
Class Y | | | (392,846 | ) | | | (439,548 | ) |
| | | | |
| | | | (16,550,961 | ) | | | (21,003,600 | ) |
Distributions from net realized gain: | | | | | | | | |
Class A | | | (19,333,828 | ) | | | (7,801,334 | ) |
Class B | | | (1,285,124 | ) | | | (610,058 | ) |
Class C | | | (3,996,405 | ) | | | (1,683,231 | ) |
Class I | | | — | | | | — | |
Class N | | | (1,089,754 | ) | | | (470,053 | ) |
Class Y | | | (553,853 | ) | | | (193,052 | ) |
| | | | |
| | | (26,258,964 | ) | | | (10,757,728 | ) |
Beneficial Interest Transactions | | | | | | | | |
Net increase (decrease) in net assets resulting from beneficial interest transactions: | | | | | | | | |
Class A | | | (80,858,211 | ) | | | 72,277,182 | |
Class B | | | (17,415,152 | ) | | | (2,200,733 | ) |
Class C | | | (33,492,002 | ) | | | 16,611,652 | |
Class I | | | 10,000 | | | | — | |
Class N | | | (8,831,574 | ) | | | 617,176 | |
Class Y | | | 812,977 | | | | 4,592,329 | |
| | | | |
| | | (139,773,962 | ) | | | 91,897,606 | |
Net Assets | | | | | | | | |
Total increase (decrease) | | | (195,279,611 | ) | | | 113,688,644 | |
Beginning of period | | | 1,031,179,178 | | | | 917,490,534 | |
| | | | |
| End of period (including accumulated net investment income of $6,854,883 and $4,776,618, respectively) | | $ | 835,899,567 | | | $ | 1,031,179,178 | |
| | | | |
1. August 30, 2013 represents the last business day of the Fund’s 2013 fiscal year. See Note 1 of the accompanying Notes.
See accompanying Notes to Financial Statements.
28 OPPENHEIMER LIMITED-TERM BOND FUND
| | | | | | | | | | | | | | | | | | | | |
| Class A | | Year Ended
August 30,
20131 | | | Year Ended
August 31,
2012 | | | Year Ended
August 31,
2011 | | | Year Ended
August 31,
2010 | | | Year Ended
August 31,
2009 | |
| |
Per Share Operating Data | | | | | | | | | | | | | | | | | | | | |
Net asset value, beginning of period | | $ | 9.86 | | | $ | 9.64 | | | $ | 9.61 | | | $ | 9.01 | | | $ | 9.32 | |
| |
Income (loss) from investment operations: | | | | | | | | | | | | | | | | | | | | |
Net investment income2 | | | 0.18 | | | | 0.22 | | | | 0.34 | | | | 0.43 | | | | 0.48 | |
Net realized and unrealized gain (loss) | | | (0.29) | | | | 0.32 | | | | 0.06 | | | | 0.60 | | | | (0.31) | |
| | | | |
Total from investment operations | | | (0.11) | | | | 0.54 | | | | 0.40 | | | | 1.03 | | | | 0.17 | |
| |
Dividends and/or distributions to shareholders: | | | | | | | | | | | | | | | | | | | | |
Dividends from net investment income | | | (0.18) | | | | (0.22) | | | | (0.34) | | | | (0.43) | | | | 0.00 | |
Distributions from net realized gain | | | (0.25) | | | | (0.10) | | | | (0.03) | | | | 0.00 | | | | 0.00 | |
Tax return of capital distribution | | | 0.00 | | | | 0.00 | | | | 0.00 | | | | 0.00 | | | | (0.48) | |
| | | | |
Total dividends and/or distributions to shareholders | | | (0.43) | | | | (0.32) | | | | (0.37) | | | | (0.43) | | | | (0.48) | |
| |
Net asset value, end of period | | $ | 9.32 | | | $ | 9.86 | | | $ | 9.64 | | | $ | 9.61 | | | $ | 9.01 | |
| | | | |
|
| |
Total Return, at Net Asset Value3 | | | (1.21)% | | | | 5.77% | | | | 4.32% | | | | 11.75% | | | | 2.04% | |
|
| |
Ratios/Supplemental Data | | | | | | | | | | | | | | | | | | | | |
Net assets, end of period (in thousands) | | $ | 632,387 | | | $ | 754,344 | | | $ | 666,222 | | | $ | 746,068 | | | $ | 648,096 | |
| |
Average net assets (in thousands) | | $ | 722,428 | | | $ | 724,262 | | | $ | 672,108 | | | $ | 665,818 | | | $ | 697,010 | |
| |
Ratios to average net assets:4 | | | | | | | | | | | | | | | | | | | | |
Net investment income | | | 1.85% | | | | 2.27% | | | | 3.60% | | | | 4.66% | | | | 5.41% | |
Total expenses | | | 1.00% | | | | 0.99% | | | | 1.00% | 5 | | | 1.02% | 5 | | | 1.02% | 5 |
Expenses after payments, waivers and/or reimbursements and reduction to custodian expenses | | | 0.90% | | | | 0.90% | | | | 0.90% | | | | 0.90% | | | | 0.90% | |
| |
Portfolio turnover rate6 | | | 162% | | | | 143% | | | | 57% | | | | 56% | | | | 109% | |
1. August 30, 2013 represents the last business day of the Fund’s 2013 fiscal year. See Note 1 of the accompanying Notes.
2. Per share amounts calculated based on the average shares outstanding during the period.
3. Assumes an initial investment on the business day before the first day of the fiscal period, with all dividends and distributions reinvested in additional shares on the reinvestment date, and redemption at the net asset value calculated on the last business day of the fiscal period. Sales charges are not reflected in the total returns. Total returns are not annualized for periods less than one full year. Returns do not reflect the deduction of taxes that a shareholder would pay on fund distributions or the redemption of fund shares.
4. Annualized for periods less than one full year.
5. Total expenses including indirect expenses from affiliated fund were as follows:
| | | | | | | | |
| | Year Ended August 31, 2011 | | | 1.00 | % | | |
| | Year Ended August 31, 2010 | | | 1.02 | % | | |
| | Year Ended August 31, 2009 | | | 1.02 | % | | |
6. The portfolio turnover rate excludes purchase and sale transactions of To Be Announced (TBA) mortgage-related securities as follows:
| | | | | | | | |
| | | | | Purchase Transactions | | Sale Transactions | | |
| | Year Ended August 30, 2013 | | $5,364,504,647 | | $5,515,045,235 | | |
| | Year Ended August 31, 2012 | | $4,076,812,506 | | $3,925,961,964 | | |
| | Year Ended August 31, 2011 | | $3,566,485,464 | | $3,488,198,075 | | |
| | Year Ended August 31, 2010 | | $2,497,213,099 | | $2,598,100,426 | | |
| | Year Ended August 31, 2009 | | $4,625,764,360 | | $4,626,252,098 | | |
See accompanying Notes to Financial Statements.
29 OPPENHEIMER LIMITED-TERM BOND FUND
| | | | |
| | |
| | FINANCIAL HIGHLIGHTS Continued | | |
| | | | | | | | | | | | | | | | | | | | |
| Class B | | Year Ended
August 30,
20131 | | | Year Ended
August 31,
2012 | | | Year Ended
August 31,
2011 | | | Year Ended
August 31,
2010 | | | Year Ended
August 31,
2009 | |
| |
Per Share Operating Data | | | | | | | | | | | | | | | | | | | | |
Net asset value, beginning of period | | $ | 9.85 | | | $ | 9.63 | | | $ | 9.60 | | | $ | 8.99 | | | $ | 9.31 | |
| |
Income (loss) from investment operations: | | | | | | | | | | | | | | | | | | | | |
Net investment income2 | | | 0.11 | | | | 0.15 | | | | 0.27 | | | | 0.36 | | | | 0.41 | |
Net realized and unrealized gain (loss) | | | (0.29) | | | | 0.32 | | | | 0.06 | | | | 0.61 | | | | (0.32) | |
| | | | |
Total from investment operations | | | (0.18) | | | | 0.47 | | | | 0.33 | | | | 0.97 | | | | 0.09 | |
| |
Dividends and/or distributions to shareholders: | | | | | | | | | | | | | | | | | | | | |
Dividends from net investment income | | | (0.11) | | | | (0.15) | | | | (0.27) | | | | (0.36) | | | | 0.00 | |
| |
Distributions from net realized gain | | | (0.25) | | | | (0.10) | | | | (0.03) | | | | 0.00 | | | | 0.00 | |
Tax return of capital distribution | | | 0.00 | | | | 0.00 | | | | 0.00 | | | | 0.00 | | | | (0.41) | |
| | | | |
Total dividends and/or distributions to shareholders | | | (0.36) | | | | (0.25) | | | | (0.30) | | | | (0.36) | | | | (0.41) | |
| |
Net asset value, end of period | | $ | 9.31 | | | $ | 9.85 | | | $ | 9.63 | | | $ | 9.60 | | | $ | 8.99 | |
| | | | |
|
| |
Total Return, at Net Asset Value3 | | | (1.94)% | | | | 4.98% | | | | 3.55% | | | | 11.05% | | | | 1.17% | |
|
| |
Ratios/Supplemental Data | | | | | | | | | | | | | | | | | | | | |
Net assets, end of period (in thousands) | | $ | 34,046 | | | $ | 54,057 | | | $ | 55,064 | | | $ | 70,046 | | | $ | 74,066 | |
| |
Average net assets (in thousands) | | $ | 45,170 | | | $ | 55,554 | | | $ | 61,028 | | | $ | 68,025 | | | $ | 84,223 | |
| |
Ratios to average net assets:4 | | | | | | | | | | | | | | | | | | | | |
Net investment income | | | 1.10% | | | | 1.54% | | | | 2.86% | | | | 3.95% | | | | 4.65% | |
Total expenses | | | 1.93% | | | | 1.92% | | | | 1.95%5 | | | | 2.00%5 | | | | 1.97%5 | |
Expenses after payments, waivers and/or reimbursements and reduction to custodian expenses | | | 1.65% | | | | 1.65% | | | | 1.65% | | | | 1.65% | | | | 1.65% | |
| |
Portfolio turnover rate6 | | | 162% | | | | 143% | | | | 57% | | | | 56% | | | | 109% | |
1. August 30, 2013 represents the last business day of the Fund’s 2013 fiscal year. See Note 1 of the accompanying Notes.
2. Per share amounts calculated based on the average shares outstanding during the period.
3. Assumes an initial investment on the business day before the first day of the fiscal period, with all dividends and distributions reinvested in additional shares on the reinvestment date, and redemption at the net asset value calculated on the last business day of the fiscal period. Sales charges are not reflected in the total returns. Total returns are not annualized for periods less than one full year. Returns do not reflect the deduction of taxes that a shareholder would pay on fund distributions or the redemption of fund shares.
4. Annualized for periods less than one full year.
5. Total expenses including indirect expenses from affiliated fund were as follows:
| | | | | | | | |
| | Year Ended August 31, 2011 | | | 1.95 | % | | |
| | Year Ended August 31, 2010 | | | 2.00 | % | | |
| | Year Ended August 31, 2009 | | | 1.97 | % | | |
6. The portfolio turnover rate excludes purchase and sale transactions of To Be Announced (TBA) mortgage-related securities as follows:
| | | | | | | | |
| | | | | Purchase Transactions | | Sale Transactions | | |
| | Year Ended August 30, 2013 | | $5,364,504,647 | | $5,515,045,235 | | |
| | Year Ended August 31, 2012 | | $4,076,812,506 | | $3,925,961,964 | | |
| | Year Ended August 31, 2011 | | $3,566,485,464 | | $3,488,198,075 | | |
| | Year Ended August 31, 2010 | | $2,497,213,099 | | $2,598,100,426 | | |
| | Year Ended August 31, 2009 | | $4,625,764,360 | | $4,626,252,098 | | |
See accompanying Notes to Financial Statements.
30 OPPENHEIMER LIMITED-TERM BOND FUND
| | | | | | | | | | | | | | | | | | | | |
| Class C | | Year Ended
August 30,
20131 | | | Year Ended
August 31,
2012 | | | Year Ended
August 31,
2011 | | | Year Ended
August 31,
2010 | | | Year Ended
August 31,
2009 | |
| |
Per Share Operating Data | | | | | | | | | | | | | | | | | | | | |
Net asset value, beginning of period | | $ | 9.84 | | | $ | 9.63 | | | $ | 9.60 | | | $ | 8.99 | | | $ | 9.30 | |
| |
Income (loss) from investment operations: | | | | | | | | | | | | | | | | | | | | |
Net investment income2 | | | 0.11 | | | | 0.15 | | | | 0.27 | | | | 0.36 | | | | 0.41 | |
Net realized and unrealized gain (loss) | | | (0.28) | | | | 0.31 | | | | 0.06 | | | | 0.61 | | | | (0.31) | |
| | | | |
Total from investment operations | | | (0.17) | | | | 0.46 | | | | 0.33 | | | | 0.97 | | | | 0.10 | |
| |
Dividends and/or distributions to shareholders: | | | | | | | | | | | | | | | | | | | | |
Dividends from net investment income | | | (0.11) | | | | (0.15) | | | | (0.27) | | | | (0.36) | | | | 0.00 | |
Distributions from net realized gain | | | (0.25) | | | | (0.10) | | | | (0.03) | | | | 0.00 | | | | 0.00 | |
Tax return of capital distribution | | | 0.00 | | | | 0.00 | | | | 0.00 | | | | 0.00 | | | | (0.41) | |
| | | | |
| Total dividends and/or distributions to shareholders | | | (0.36) | | | | (0.25) | | | | (0.30) | | | | (0.36) | | | | (0.41) | |
| |
Net asset value, end of period | | $ | 9.31 | | | $ | 9.84 | | | $ | 9.63 | | | $ | 9.60 | | | $ | 8.99 | |
| | | | |
|
| |
Total Return, at Net Asset Value3 | | | (1.84)% | | | | 4.87% | | | | 3.55% | | | | 11.05% | | | | 1.28% | |
|
| |
Ratios/Supplemental Data | | | | | | | | | | | | | | | | | | | | |
Net assets, end of period (in thousands) | | $ | 119,677 | | | $ | 161,528 | | | $ | 141,529 | | | $ | 159,924 | | | $ | 129,835 | |
| |
Average net assets (in thousands) | | $ | 145,990 | | | $ | 155,641 | | | $ | 142,267 | | | $ | 136,902 | | | $ | 147,799 | |
| |
Ratios to average net assets:4 | | | | | | | | | | | | | | | | | | | | |
Net investment income | | | 1.10% | | | | 1.52% | | | | 2.85% | | | | 3.89% | | | | 4.67% | |
Total expenses | | | 1.78% | | | | 1.76% | | | | 1.79%5 | | | | 1.81%5 | | | | 1.80%5 | |
| Expenses after payments, waivers and/or reimbursements and reduction to custodian expenses | | | 1.65% | | | | 1.65% | | | | 1.65% | | | | 1.65% | | | | 1.65% | |
| |
Portfolio turnover rate6 | | | 162% | | | | 143% | | | | 57% | | | | 56% | | | | 109% | |
1. August 30, 2013 represents the last business day of the Fund’s 2013 fiscal year. See Note 1 of the accompanying Notes.
2. Per share amounts calculated based on the average shares outstanding during the period.
3. Assumes an initial investment on the business day before the first day of the fiscal period, with all dividends and distributions reinvested in additional shares on the reinvestment date, and redemption at the net asset value calculated on the last business day of the fiscal period. Sales charges are not reflected in the total returns. Total returns are not annualized for periods less than one full year. Returns do not reflect the deduction of taxes that a shareholder would pay on fund distributions or the redemption of fund shares.
4. Annualized for periods less than one full year.
5. Total expenses including indirect expenses from affiliated fund were as follows:
| | | | | | | | |
| | Year Ended August 31, 2011 | | | 1.79 | % | | |
| | Year Ended August 31, 2010 | | | 1.81 | % | | |
| | Year Ended August 31, 2009 | | | 1.80 | % | | |
6. The portfolio turnover rate excludes purchase and sale transactions of To Be Announced (TBA) mortgage-related securities as follows:
| | | | | | | | |
| | | | | Purchase Transactions | | Sale Transactions | | |
| | Year Ended August 30, 2013 | | $5,364,504,647 | | $5,515,045,235 | | |
| | Year Ended August 31, 2012 | | $4,076,812,506 | | $3,925,961,964 | | |
| | Year Ended August 31, 2011 | | $3,566,485,464 | | $3,488,198,075 | | |
| | Year Ended August 31, 2010 | | $2,497,213,099 | | $2,598,100,426 | | |
| | Year Ended August 31, 2009 | | $4,625,764,360 | | $4,626,252,098 | | |
See accompanying Notes to Financial Statements.
31 OPPENHEIMER LIMITED-TERM BOND FUND
| | | | |
| | |
| | FINANCIAL HIGHLIGHTS Continued | | |
| | | | |
| Class I | | Period Ended
August 30,
20131,2 | |
| |
Per Share Operating Data | | | | |
Net asset value, beginning of period | | $ | 9.40 | |
| |
Income (loss) from investment operations: | | | | |
Net investment income3 | | | 0.02 | |
Net realized and unrealized loss | | | (0.05) | |
| | | | |
Total from investment operations | | | (0.03) | |
| |
| Dividends and/or distributions to shareholders: | | | | |
Dividends from net investment income | | | (0.02) | |
Distributions from net realized gain | | | 0.00 | |
Tax return of capital distribution | | | 0.00 | |
| | | | |
| Total dividends and/or distributions to shareholders | | | (0.02) | |
| |
Net asset value, end of period | | $ | 9.35 | |
| | | | |
| |
Total Return, at Net Asset Value4 | | | (0.20)% | |
| |
Ratios/Supplemental Data | | | | |
Net assets, end of period (in thousands) | | $ | 10 | |
| |
Average net assets (in thousands) | | $ | 10 | |
| |
Ratios to average net assets:5 | | | | |
Net investment income | | | 2.58% | |
Total expenses | | | 0.44% | |
| Expenses after payments, waivers and/or reimbursements and reduction to custodian expenses | | | 0.44% | |
| |
Portfolio turnover rate6 | | | 162% | |
1. August 30, 2013 represents the last business day of the Fund’s 2013 fiscal year. See Note 1 of the accompanying Notes.
2. For the period from August 1, 2013 (inception of offering) to August 30, 2013.
3. Per share amounts calculated based on the average shares outstanding during the period.
4. Assumes an initial investment on the business day before the first day of the fiscal period, with all dividends and distributions reinvested in additional shares on the reinvestment date, and redemption at the net asset value calculated on the last business day of the fiscal period. Sales charges are not reflected in the total returns. Total returns are not annualized for periods less than one full year. Returns do not reflect the deduction of taxes that a shareholder would pay on fund distributions or the redemption of fund shares.
5. Annualized for periods less than one full year.
6. The portfolio turnover rate excludes purchase and sale transactions of To Be Announced (TBA) mortgage-related securities as follows:
| | | | | | | | |
| | | | | Purchase Transactions | | Sale Transactions | | |
| | Period Ended August 30, 2013 | | $5,364,504,647 | | $5,515,045,235 | | |
See accompanying Notes to Financial Statements.
32 OPPENHEIMER LIMITED-TERM BOND FUND
| | | | | | | | | | | | | | | | | | | | |
| Class N | | Year Ended
August 30,
20131 | | | Year Ended
August 31,
2012 | | | Year Ended
August 31,
2011 | | | Year Ended
August 31,
2010 | | | Year Ended
August 31,
2009 | |
| |
Per Share Operating Data | | | | | | | | | | | | | | | | | | | | |
Net asset value, beginning of period | | $ | 9.86 | | | $ | 9.64 | | | $ | 9.61 | | | $ | 9 .01 | | | $ | 9.32 | |
| |
Income (loss) from investment operations: | | | | | | | | | | | | | | | | | | | | |
Net investment income2 | | | 0.15 | | | | 0.20 | | | | 0.32 | | | | 0.41 | | | | 0.45 | |
Net realized and unrealized gain (loss) | | | (0.29) | | | | 0.32 | | | | 0.06 | | | | 0.60 | | | | (0.30) | |
| | | | |
Total from investment operations | | | (0.14) | | | | 0.52 | | | | 0.38 | | | | 1.01 | | | | 0.15 | |
| |
Dividends and/or distributions to shareholders: | | | | | | | | | | | | | | | | | | | | |
Dividends from net investment income | | | (0.15) | | | | (0.20) | | | | (0.32) | | | | (0.41) | | | | 0.00 | |
Distributions from net realized gain | | | (0.25) | | | | (0.10) | | | | (0.03) | | | | 0.00 | | | | 0.00 | |
Tax return of capital distribution | | | 0.00 | | | | 0.00 | | | | 0.00 | | | | 0.00 | | | | (0.46) | |
| | | | |
Total dividends and/or distributions to shareholders | | | (0.40) | | | | (0.30) | | | | (0.35) | | | | (0.41) | | | | (0.46) | |
| |
Net asset value, end of period | | $ | 9.32 | | | $ | 9.86 | | | $ | 9.64 | | | $ | 9.61 | | | $ | 9.01 | |
| | | | |
|
| |
Total Return, at Net Asset Value3 | | | (1.45)% | | | | 5.50% | | | | 4.06% | | | | 11.47% | | | | 1.79% | |
|
| |
Ratios/Supplemental Data | | | | | | | | | | | | | | | | | | | | |
Net assets, end of period (in thousands) | | $ | 33,368 | | | $ | 44,488 | | | $ | 42,871 | | | $ | 48,461 | | | $ | 41,287 | |
| |
Average net assets (in thousands) | | $ | 39,970 | | | $ | 44,693 | | | $ | 43,606 | | | $ | 43,197 | | | $ | 44,941 | |
| |
Ratios to average net assets:4 | | | | | | | | | | | | | | | | | | | | |
Net investment income | | | 1.60% | | | | 2.02% | | | | 3.35% | | | | 4.41% | | | | 5.15% | |
Total expenses | | | 1.33% | | | | 1.30% | | | | 1.36% | 5 | | | 1.45% | 5 | | | 1.48% | 5 |
Expenses after payments, waivers and/or reimbursements and reduction to custodian expenses | | | 1.15% | | | | 1.15% | | | | 1.15% | | | | 1.15% | | | | 1.15% | |
Portfolio turnover rate6 | | | 162% | | | | 143% | | | | 57% | | | | 56% | | | | 109% | |
1. August 30, 2013 represents the last business day of the Fund’s 2013 fiscal year. See Note 1 of the accompanying Notes.
2. Per share amounts calculated based on the average shares outstanding during the period.
3. Assumes an initial investment on the business day before the first day of the fiscal period, with all dividends and distributions reinvested in additional shares on the reinvestment date, and redemption at the net asset value calculated on the last business day of the fiscal period. Sales charges are not reflected in the total returns. Total returns are not annualized for periods less than one full year. Returns do not reflect the deduction of taxes that a shareholder would pay on fund distributions or the redemption of fund shares.
4. Annualized for periods less than one full year.
5. Total expenses including indirect expenses from affiliated fund were as follows:
| | | | | | | | |
| | Year Ended August 31, 2011 | | | 1.36 | % | | |
| | Year Ended August 31, 2010 | | | 1.45 | % | | |
| | Year Ended August 31, 2009 | | | 1.48 | % | | |
6. The portfolio turnover rate excludes purchase and sale transactions of To Be Announced (TBA) mortgage-related securities as follows:
| | | | | | | | |
| | | | | Purchase Transactions | | Sale Transactions | | |
| | Year Ended August 30, 2013 | | $5,364,504,647 | | $5,515,045,235 | | |
| | Year Ended August 31, 2012 | | $4,076,812,506 | | $3,925,961,964 | | |
| | Year Ended August 31, 2011 | | $3,566,485,464 | | $3,488,198,075 | | |
| | Year Ended August 31, 2010 | | $2,497,213,099 | | $2,598,100,426 | | |
| | Year Ended August 31, 2009 | | $4,625,764,360 | | $4,626,252,098 | | |
See accompanying Notes to Financial Statements.
33 OPPENHEIMER LIMITED-TERM BOND FUND
| | | | |
| | |
| | FINANCIAL HIGHLIGHTS Continued | | |
| | | | | | | | | | | | | | | | | | | | |
| Class Y | | Year Ended
August 30,
20131 | | | Year Ended
August 31,
2012 | | | Year Ended
August 31,
2011 | | | Year Ended
August 31,
2010 | | | Year Ended
August 31,
2009 | |
| |
Per Share Operating Data | | | | | | | | | | | | | | | | | | | | |
Net asset value, beginning of period | | $ | 9.90 | | | $ | 9.68 | | | $ | 9.65 | | | $ | 9.04 | | | $ | 9.35 | |
| |
Income (loss) from investment operations: | | | | | | | | | | | | | | | | | | | | |
Net investment income2 | | | 0.20 | | | | 0.24 | | | | 0.35 | | | | 0.48 | | | | 0.50 | |
Net realized and unrealized gain (loss) | | | (0.30) | | | | 0.33 | | | | 0.08 | | | | 0.59 | | | | (0.31) | |
| | | | |
Total from investment operations | | | (0.10) | | | | 0.57 | | | | 0.43 | | | | 1.07 | | | | 0.19 | |
| |
Dividends and/or distributions to shareholders: | | | | | | | | | | | | | | | | | | | | |
Dividends from net investment income | | | (0.20) | | | | (0.25) | | | | (0.37) | | | | (0.46) | | | | 0.00 | |
Distributions from net realized gain | | | (0.25) | | | | (0.10) | | | | (0.03) | | | | 0.00 | | | | 0.00 | |
Tax return of capital distribution | | | 0.00 | | | | 0.00 | | | | 0.00 | | | | 0.00 | | | | (0.50) | |
| | | | |
Total dividends and/or distributions to shareholders | | | (0.45) | | | | (0.35) | | | | (0.40) | | | | (0.46) | | | | (0.50) | |
| |
Net asset value, end of period | | $ | 9.35 | | | $ | 9.90 | | | $ | 9.68 | | | $ | 9.65 | | | $ | 9.04 | |
| | | | |
|
| |
Total Return, at Net Asset Value3 | | | (1.05)% | | | | 6.02% | | | | 4.60% | | | | 12.21% | | | | 2.30% | |
|
| |
Ratios/Supplemental Data | | | | | | | | | | | | | | | | | | | | |
Net assets, end of period (in thousands) | | $ | 16,412 | | | $ | 16,762 | | | $ | 11,805 | | | $ | 35,559 | | | $ | 143,552 | |
| |
Average net assets (in thousands) | | $ | 18,643 | | | $ | 17,648 | | | $ | 13,636 | | | $ | 122,075 | | | $ | 253,331 | |
| |
Ratios to average net assets:4 | | | | | | | | | | | | | | | | | | | | |
Net investment income | | | 2.11% | | | | 2.49% | | | | 3.69% | | | | 5.19% | | | | 5.61% | |
Total expenses | | | 0.70% | | | | 0.67% | | | | 0.89% | 5 | | | 0.59% | 5 | | | 0.67% | 5 |
Expenses after payments, waivers and/or reimbursements and reduction to custodian expenses | | | 0.65% | | | | 0.65% | | | | 0.65% | | | | 0.59% | | | | 0.65% | |
| |
Portfolio turnover rate6 | | | 162% | | | | 143% | | | | 57% | | | | 56% | | | | 109% | |
1. August 30, 2013 represents the last business day of the Fund’s 2013 fiscal year. See Note 1 of the accompanying Notes.
2. Per share amounts calculated based on the average shares outstanding during the period.
3. Assumes an initial investment on the business day before the first day of the fiscal period, with all dividends and distributions reinvested in additional shares on the reinvestment date, and redemption at the net asset value calculated on the last business day of the fiscal period. Sales charges are not reflected in the total returns. Total returns are not annualized for periods less than one full year. Returns do not reflect the deduction of taxes that a shareholder would pay on fund distributions or the redemption of fund shares.
4. Annualized for periods less than one full year.
5. Total expenses including indirect expenses from affiliated fund were as follows:
| | | | | | | | |
| | Year Ended August 31, 2011 | | | 0.89 | % | | |
| | Year Ended August 31, 2010 | | | 0.59 | % | | |
| | Year Ended August 31, 2009 | | | 0.67 | % | | |
6. The portfolio turnover rate excludes purchase and sale transactions of To Be Announced (TBA) mortgage-related securities as follows:
| | | | | | | | |
| | | | | Purchase Transactions | | Sale Transactions | | |
| | Year Ended August 30, 2013 | | $5,364,504,647 | | $5,515,045,235 | | |
| | Year Ended August 31, 2012 | | $4,076,812,506 | | $3,925,961,964 | | |
| | Year Ended August 31, 2011 | | $3,566,485,464 | | $3,488,198,075 | | |
| | Year Ended August 31, 2010 | | $2,497,213,099 | | $2,598,100,426 | | |
| | Year Ended August 31, 2009 | | $4,625,764,360 | | $4,626,252,098 | | |
See accompanying Notes to Financial Statements.
34 OPPENHEIMER LIMITED-TERM BOND FUND
| | | | |
| | |
| | NOTES TO FINANCIAL STATEMENTS | | |
| | | | |
1. Significant Accounting Policies
Oppenheimer Limited-Term Bond Fund (the “Fund”), formerly Oppenheimer U.S. Government Trust, is a diversified open-end management investment company registered under the Investment Company Act of 1940, as amended. The Fund’s investment objective is to seek high current income consistent with preservation of capital. The Fund’s investment adviser was OppenheimerFunds, Inc. (“OFI” or the “Sub-Adviser”) through December 31, 2012. Effective January 1, 2013, the Fund’s investment adviser is OFI Global Asset Management, Inc. (“OFI Global” or the “Manager”), a wholly-owned subsidiary of OFI. The Manager has entered into a sub-advisory agreement with OFI, as of the same effective date.
The Fund offers Class A, Class C, Class I, Class N and Class Y shares, and previously offered Class B shares for new purchase through June 29, 2012. Subsequent to that date, no new purchases of Class B shares are permitted, however reinvestment of dividend and/or capital gain distributions and exchanges of Class B shares into and from other Oppenheimer funds will be allowed. Class A shares are sold at their offering price, which is normally net asset value plus a front-end sales charge. Class C and Class N shares are sold, and Class B shares were sold, without a front-end sales charge but may be subject to a contingent deferred sales charge (“CDSC”). Class N shares are sold only through retirement plans. Retirement plans that offer Class N shares may impose charges on those accounts. Class I and Class Y shares are sold to certain institutional investors or intermediaries without either a front-end sales charge or a CDSC, however, the intermediaries may impose charges on their accountholders who beneficially own Class I and Class Y shares. All classes of shares have identical rights and voting privileges with respect to the Fund in general and exclusive voting rights on matters that affect that class alone. Earnings, net assets and net asset value per share may differ due to each class having its own expenses, such as transfer and shareholder servicing agent fees and shareholder communications, directly attributable to that class. Class A, B, C and N shares have separate distribution and/or service plans under which they pay fees. Class I and Class Y shares do not pay such fees. Class B shares will automatically convert to Class A shares 72 months after the date of purchase. Class I shares were first publicly offered on August 1, 2013.
The following is a summary of significant accounting policies consistently followed by the Fund.
Fiscal Year End. The last day of the Fund’s fiscal year was the last day the New York Stock Exchange was open for trading. The Fund’s financial statements have been presented through that date to maintain consistency with the Fund’s net asset value calculations used for shareholder transactions.
Securities on a When-Issued or Delayed Delivery Basis. The Fund may purchase securities on a “when-issued” basis, and may purchase or sell securities on a “delayed delivery” basis. “When-issued” or “delayed delivery” refers to securities whose terms and indenture are available and for which a market exists, but which are not available for immediate delivery. Delivery and payment for securities that have been purchased by the Fund on a when-issued basis normally takes place within six months and possibly as long as two years or more after the trade date. During this period, such securities do not earn interest, are
35 OPPENHEIMER LIMITED-TERM BOND FUND
| | | | |
| | |
| | NOTES TO FINANCIAL STATEMENTS Continued | | |
| | | | |
| | | | |
| | 1. Significant Accounting Policies (Continued) | | |
subject to market fluctuation and may increase or decrease in value prior to their delivery. The purchase of securities on a when-issued basis may increase the volatility of the Fund’s net asset value to the extent the Fund executes such transactions while remaining substantially fully invested. When the Fund engages in when-issued or delayed delivery transactions, it relies on the buyer or seller, as the case may be, to complete the transaction. Their failure to do so may cause the Fund to lose the opportunity to obtain or dispose of the security at a price and yield it considers advantageous. The Fund may also sell securities that it purchased on a when-issued basis or forward commitment prior to settlement of the original purchase.
As of August 30, 2013, the Fund had purchased securities issued on a when-issued or delayed delivery basis and sold securities issued on a delayed delivery basis as follows:
| | | | |
| | | When-Issued or
Delayed Delivery
Basis Transactions | |
Purchased securities | | | $335,480,199 | |
Sold securities | | | 132,831,415 | |
The Fund may enter into “forward roll” transactions with respect to mortgage-related securities. In this type of transaction, the Fund sells a mortgage-related security to a buyer and simultaneously agrees to repurchase a similar security (same type, coupon and maturity) at a later date at a set price. During the period between the sale and the repurchase, the Fund will not be entitled to receive interest and principal payments on the securities that have been sold. The Fund records the incremental difference between the forward purchase and sale of each forward roll as realized gain (loss) on investments or as fee income in the case of such transactions that have an associated fee in lieu of a difference in the forward purchase and sale price.
Forward roll transactions may be deemed to entail embedded leverage since the Fund purchases mortgage-related securities with extended settlement dates rather than paying for the securities under a normal settlement cycle. This embedded leverage increases the Fund’s market value of investments relative to its net assets which can incrementally increase the volatility of the Fund’s performance. Forward roll transactions can be replicated over multiple settlement periods.
Risks of entering into forward roll transactions include the potential inability of the counterparty to meet the terms of the agreement; the potential of the Fund to receive inferior securities at redelivery as compared to the securities sold to the counterparty; and counterparty credit risk.
Allocation of Income, Expenses, Gains and Losses. Income, expenses (other than those attributable to a specific class), gains and losses are allocated on a daily basis to each class of shares based upon the relative proportion of net assets represented by such class. Operating expenses directly attributable to a specific class are charged against the operations of that class.
36 OPPENHEIMER LIMITED-TERM BOND FUND
| | | | |
| | | | |
| | 1. Significant Accounting Policies (Continued) | | |
Federal Taxes. The Fund intends to comply with provisions of the Internal Revenue Code applicable to regulated investment companies and to distribute substantially all of its investment company taxable income, including any net realized gain on investments not offset by capital loss carryforwards, if any, to shareholders. Therefore, no federal income or excise tax provision is required. The Fund files income tax returns in U.S. federal and applicable state jurisdictions. The statute of limitations on the Fund’s tax return filings generally remain open for the three preceding fiscal reporting period ends.
The tax components of capital shown in the following table represent distribution requirements the Fund must satisfy under the income tax regulations, losses the Fund may be able to offset against income and gains realized in future years and unrealized appreciation or depreciation of securities and other investments for federal income tax purposes.
| | | | | | | | | | | | |
Undistributed
Net Investment
Income | | Undistributed
Long-Term
Gain | | | Accumulated
Loss
Carryforward1,2,3 | | | Net Unrealized
Appreciation
Based on cost of
Securities and
Other Investments
for Federal Income
Tax Purposes | |
| $7,292,638 | | | $— | | | | $2,016,787 | | | | $4,752,306 | |
1. As of August 30, 2013, the Fund had $2,016,787 of post-October losses available to offset future realized capital gains, if any.
2. During the fiscal year ended August 30, 2013, the Fund did not utilize any capital loss carryforward to offset capital gains realized in that fiscal year.
3. During the fiscal year ended August 31, 2012, the Fund did not utilize any capital loss carryforward.
Net investment income (loss) and net realized gain (loss) may differ for financial statement and tax purposes. The character of dividends and distributions made during the fiscal year from net investment income or net realized gains may differ from their ultimate characterization for federal income tax purposes. Also, due to timing of dividends and distributions, the fiscal year in which amounts are distributed may differ from the fiscal year in which the income or net realized gain was recorded by the Fund.
Accordingly, the following amounts have been reclassified for August 31, 2013. Net assets of the Fund were unaffected by the reclassifications.
| | | | |
Increase
to Accumulated
Net Investment
Income | | Reduction
to Accumulated Net
Realized Gain
on Investments | |
$2,098,568 | | | $2,098,568 | |
37 OPPENHEIMER LIMITED-TERM BOND FUND
| | | | |
| | |
| | NOTES TO FINANCIAL STATEMENTS Continued | | |
| | | | |
| | | | |
| | 1. Significant Accounting Policies (Continued) | | |
The tax character of distributions paid during the years ended August 31, 2013 and August 31, 2012 was as follows:
| | | | | | | | |
| | | Year Ended
August 31, 2013 | | | Year Ended
August 31, 2012 | |
Distributions paid from: | | | | | | | | |
Ordinary income | | $ | 34,064,433 | | | $ | 21,003,617 | |
Long-term capital gain | | | 8,745,492 | | | | 10,757,711 | |
| | | | |
Total | | $ | 42,809,925 | | | $ | 31,761,328 | |
| | | | |
The aggregate cost of securities and other investments and the composition of unrealized appreciation and depreciation of securities and other investments for federal income tax purposes as of August 30, 2013 are noted in the following table. The primary difference between book and tax appreciation or depreciation of securities and other investments, if applicable, is attributable to the tax deferral of losses or tax realization of financial statement unrealized gain or loss.
| | | | |
Federal tax cost of securities | | $ | 996,019,289 | |
Federal tax cost of other investments | | | (200,340 | ) |
| | | | |
Total federal tax cost | | $ | 995,818,949 | |
| | | | |
Gross unrealized appreciation | | $ | 21,055,597 | |
Gross unrealized depreciation | | | (16,303,291 | ) |
| | | | |
Net unrealized appreciation | | $ | 4,752,306 | |
| | | | |
Trustees’ Compensation. The Fund has adopted an unfunded retirement plan (the “Plan”) for the Fund’s independent trustees. Benefits are based on years of service and fees paid to each trustee during their period of service. The Plan was frozen with respect to adding new participants effective December 31, 2006 (the “Freeze Date”) and existing Plan Participants as of the Freeze Date will continue to receive accrued benefits under the Plan. Active independent trustees as of the Freeze Date have each elected a distribution method with respect to their benefits under the Plan. During the year ended August 30, 2013, the Fund’s projected benefit obligations, payments to retired trustees and accumulated liability were as follows:
| | | | |
Projected Benefit Obligations Increased | | $ | 16,203 | |
Payments Made to Retired Trustees | | | 14,616 | |
Accumulated Liability as of August 30, 2013 | | | 110,920 | |
The Board of Trustees has adopted a compensation deferral plan for independent trustees that enables trustees to elect to defer receipt of all or a portion of the annual compensation they are entitled to receive from the Fund. For purposes of determining the amount owed to the Trustee under the plan, deferred amounts are treated as though equal dollar amounts had been invested in shares of the Fund or in other Oppenheimer funds selected by the Trustee. The Fund purchases shares of the funds selected for deferral by the Trustee in amounts equal to his or her deemed investment, resulting in a Fund asset equal to the deferred compensation liability. Such assets are included as a component of “Other” within the asset section of the Statement of Assets and Liabilities. Deferral of trustees’ fees under the plan will not affect the net assets of the Fund, and will not materially affect the Fund’s assets, liabilities or net investment income per share. Amounts will be deferred until distributed in accordance with the compensation deferral plan.
38 OPPENHEIMER LIMITED-TERM BOND FUND
| | | | |
| | | | |
| | 1. Significant Accounting Policies (Continued) | | |
Dividends and Distributions to Shareholders. Dividends and distributions to shareholders, which are determined in accordance with income tax regulations and may differ from U.S. generally accepted accounting principles, are recorded on the ex-dividend date. Income distributions, if any, are declared daily and paid monthly. Capital gain distributions, if any, are declared and paid annually.
Investment Income. Dividend income is recorded on the ex-dividend date or upon ex-dividend notification in the case of certain foreign dividends where the ex-dividend date may have passed. Non-cash dividends included in dividend income, if any, are recorded at the fair market value of the securities received. Interest income is recognized on an accrual basis. Discount and premium, which are included in interest income on the Statement of Operations, are amortized or accreted daily.
Custodian Fees. “Custodian fees and expenses” in the Statement of Operations may include interest expense incurred by the Fund on any cash overdrafts of its custodian account during the period. Such cash overdrafts may result from the effects of failed trades in portfolio securities and from cash outflows resulting from unanticipated shareholder redemption activity. The Fund pays interest to its custodian on such cash overdraft at a rate equal to the 1 Month LIBOR Rate plus 2.00%. The “Reduction to custodian expenses” line item, if applicable, represents earnings on cash balances maintained by the Fund during the period. Such interest expense and other custodian fees may be paid with these earnings.
Security Transactions. Security transactions are recorded on the trade date. Realized gains and losses on securities sold are determined on the basis of identified cost.
Indemnifications. The Fund’s organizational documents provide current and former trustees and officers with a limited indemnification against liabilities arising in connection with the performance of their duties to the Fund. In the normal course of business, the Fund may also enter into contracts that provide general indemnifications. The Fund’s maximum exposure under these arrangements is unknown as this would be dependent on future claims that may be made against the Fund. The risk of material loss from such claims is considered remote.
Other. The preparation of financial statements in conformity with accounting principles generally accepted in the United States of America requires management to make estimates and assumptions that affect the reported amounts of assets and liabilities and disclosure of contingent assets and liabilities at the date of the financial statements and the reported amounts of increases and decreases in net assets from operations during the reporting period. Actual results could differ from those estimates.
39 OPPENHEIMER LIMITED-TERM BOND FUND
| | | | |
| | |
| | NOTES TO FINANCIAL STATEMENTS Continued | | |
| | | | |
2. Securities Valuation
The Fund calculates the net asset value of its shares as of the close of the New York Stock Exchange (the “Exchange”), normally 4:00 P.M. Eastern time, on each day the Exchange is open for trading.
The Fund’s Board has adopted procedures for the valuation of the Fund’s securities and has delegated the day-to-day responsibility for valuation determinations under those procedures to the Manager. The Manager has established a Valuation Committee which is responsible for determining a “fair valuation” for any security for which market quotations are not “readily available.” The Valuation Committee’s fair valuation determinations are subject to review, approval and ratification by the Fund’s Board at its next regularly scheduled meeting covering the calendar quarter in which the fair valuation was determined.
Valuation Methods and Inputs
Securities are valued using unadjusted quoted market prices, when available, as supplied primarily by third party pricing services or dealers.
The following methodologies are used to determine the market value or the fair value of the types of securities described below:
Securities traded on a registered U.S. securities exchange (including exchange-traded derivatives other than futures and futures options) are valued based on the last sale price of the security reported on the principal exchange on which it is traded, prior to the time when the Fund’s assets are valued. In the absence of a sale, the security is valued at the last sale price on the prior trading day, if it is within the spread of the current day’s closing “bid” and “asked” prices, and if not, at the current day’s closing bid price. A security of a foreign issuer traded on a foreign exchange but not listed on a registered U.S. securities exchange is valued based on the last sale price on the principal exchange on which the security is traded, as identified by the third party pricing service used by the Manager, prior to the time when the Fund’s assets are valued. If the last sale price is unavailable, the security is valued at the most recent official closing price on the principal exchange on which it is traded. If the last sales price or official closing price for a foreign security is not available, the security is valued at the mean between the bid and asked price per the exchange or, if not available from the exchange, obtained from two dealers. If bid and asked prices are not available from either the exchange or two dealers, the security is valued by using one of the following methodologies (listed in order of priority); (1) using a bid from the exchange, (2) the mean between the bid and asked price as provided by a single dealer, or (3) a bid from a single dealer.
Shares of a registered investment company that are not traded on an exchange are valued at that investment company’s net asset value per share.
Corporate and government debt securities (of U.S. or foreign issuers) and municipal debt securities, event-linked bonds, loans, mortgage-backed securities, collateralized mortgage obligations, and asset-backed securities are valued at the mean between the “bid” and “asked” prices utilizing evaluated prices obtained from third party pricing services or broker-dealers who may use matrix pricing methods to determine the evaluated prices.
Short-term money market type debt securities with a remaining maturity of sixty days or less are valued at cost adjusted by the amortization of discount or premium to maturity (amortized cost), which approximates market value. Short-term debt securities with a
40 OPPENHEIMER LIMITED-TERM BOND FUND
| | | | |
| | | | |
| | 2. Securities Valuation (Continued) | | |
remaining maturity in excess of sixty days are valued at the mean between the “bid” and “asked” prices utilizing evaluated prices obtained from third party pricing services or broker-dealers.
Structured securities, swaps, swaptions, and other over-the-counter derivatives are valued utilizing evaluated prices obtained from third party pricing services or broker-dealers.
Futures contracts and futures options traded on a commodities or futures exchange will be valued at the final settlement price or official closing price on the principal exchange as reported by such principal exchange at its trading session ending at, or most recently prior to, the time when the Fund’s assets are valued.
A description of the standard inputs that may generally be considered by the third party pricing vendors in determining their evaluated prices is provided below.
| | |
| Security Type | | Standard inputs generally considered by third-party pricing vendors |
Corporate debt, government debt, municipal, mortgage-backed and asset-backed securities | | Reported trade data, broker-dealer price quotations, benchmark yields, issuer spreads on comparable securities, the credit quality, yield, maturity, and other appropriate factors. |
Loans | | Information obtained from market participants regarding reported trade data and broker-dealer price quotations. |
Event-linked bonds | | Information obtained from market participants regarding reported trade data and broker-dealer price quotations. |
Structured securities | | Relevant market information such as the price of underlying financial instruments, stock market indices, foreign currencies, interest rate spreads, commodities, or the occurrence of other specific events. |
Swaps | | Relevant market information, including underlying reference assets such as credit spreads, credit event probabilities, index values, individual security values, forward interest rates, variable interest rates, volatility measures, and forward currency rates. |
If a market value or price cannot be determined for a security using the methodologies described above, or if, in the “good faith” opinion of the Manager, the market value or price obtained does not constitute a “readily available market quotation,” or a significant event has occurred that would materially affect the value of the security the security is fair valued either (i) by a standardized fair valuation methodology applicable to the security type or the significant event as previously approved by the Valuation Committee and the Fund’s Board or (ii) as determined in good faith by the Manager’s Valuation Committee. The Valuation Committee considers all relevant facts that are reasonably available, through either public information or information available to the Manager, when determining the fair value of a security. Fair value determinations by the Manager are subject to review, approval and ratification by the Fund’s Board at its next regularly scheduled meeting covering the calendar quarter in which the fair valuation was determined. Those fair valuation standardized
41 OPPENHEIMER LIMITED-TERM BOND FUND
| | | | |
| | |
| | NOTES TO FINANCIAL STATEMENTS Continued | | |
| | | | |
| | | | |
| | 2. Securities Valuation (Continued) | | |
methodologies include, but are not limited to, valuing securities at the last sale price or initially at cost and subsequently adjusting the value based on: changes in company specific fundamentals, changes in an appropriate securities index, or changes in the value of similar securities which may be further adjusted for any discounts related to security-specific resale restrictions. When possible, such methodologies use observable market inputs such as unadjusted quoted prices of similar securities, observable interest rates, currency rates and yield curves. The methodologies used for valuing securities are not necessarily an indication of the risks associated with investing in those securities nor can it be assured that the Fund can obtain the fair value assigned to a security if it were to sell the security.
To assess the continuing appropriateness of security valuations, the Manager, or its third party service provider who is subject to oversight by the Manager, regularly compares prior day prices, prices on comparable securities, and sale prices to the current day prices and challenges those prices exceeding certain tolerance levels with the third party pricing service or broker source. For those securities valued by fair valuations, whether through a standardized fair valuation methodology or a fair valuation determination, the Valuation Committee reviews and affirms the reasonableness of the valuations based on such methodologies and fair valuation determinations on a regular basis after considering all relevant information that is reasonably available.
Classifications
Each investment asset or liability of the Fund is assigned a level at measurement date based on the significance and source of the inputs to its valuation. Various data inputs are used in determining the value of each of the Fund’s investments as of the reporting period end. These data inputs are categorized in the following hierarchy under applicable financial accounting standards:
1) Level 1-unadjusted quoted prices in active markets for identical assets or liabilities (including securities actively traded on a securities exchange)
2) Level 2-inputs other than unadjusted quoted prices that are observable for the asset or liability (such as unadjusted quoted prices for similar assets and market corroborated inputs such as interest rates, prepayment speeds, credit risks, etc.)
3) Level 3-significant unobservable inputs (including the Manager’s own judgments about assumptions that market participants would use in pricing the asset or liability).
The inputs used for valuing securities are not necessarily an indication of the risks associated with investing in those securities.
42 OPPENHEIMER LIMITED-TERM BOND FUND
| | | | |
| | 2. Securities Valuation (Continued) | | |
The table below categorizes amounts that are included in the Fund’s Statement of Assets and Liabilities as of August 30, 2013 based on valuation input level:
| | | | | | | | | | | | | | | | |
| | | Level 1—
Unadjusted
Quoted Prices | | | Level 2— Other Significant
Observable Inputs | | | Level 3—
Significant
Unobservable
Inputs | | | Value | |
Assets Table | | | | | | | | | | | | | | | | |
Investments, at Value: | | | | | | | | | | | | | | | | |
Asset-Backed Securities | | $ | — | | | $ | 43,468,079 | | | $ | — | | | $ | 43,468,079 | |
Mortgage-Backed Obligations | | | — | | | | 479,909,803 | | | | 131,585 | | | | 480,041,388 | |
U.S. Government Obligations | | | — | | | | 295,932,447 | | | | — | | | | 295,932,447 | |
Corporate Bonds and Notes | | | — | | | | 181,129,213 | | | | — | | | | 181,129,213 | |
Over-the-Counter Interest Rate | | | | | | | | | | | | | | | | |
Swaptions Purchased | | | — | | | | 128 | | | | — | | | | 128 | |
| | | | |
Total Investments, at Value | | | — | | | | 1,000,439,670 | | | | 131,585 | | | | 1,000,571,255 | |
Other Financial Instruments: | | | | | | | | | | | | | | | | |
Variation margin receivable | | | 416,998 | | | | — | | | | — | | | | 416,998 | |
| | | | |
Total Assets | | $ | 416,998 | | | $ | 1,000,439,670 | | | $ | 131,585 | | | $ | 1,000,988,253 | |
| | | | |
| | | | | | | | | | | | | | | | |
Liabilities Table | | | | | | | | | | | | | | | | |
Other Financial Instruments: | | | | | | | | | | | | | | | | |
Variation margin payable | | $ | (233,031 | ) | | $ | — | | | $ | — | | | $ | (233,031 | ) |
| | | | |
Total Liabilities | | $ | (233,031 | ) | | $ | — | | | $ | — | | | $ | (233,031 | ) |
| | | | |
Currency contracts and forwards, if any, are reported at their unrealized appreciation/ depreciation at measurement date, which represents the change in the contract’s value from trade date. Futures, if any, are reported at their variation margin at measurement date, which represents the amount due to/from the Fund at that date. All additional assets and liabilities included in the above table are reported at their market value at measurement date.
The table below shows the transfers between Level 2 and Level 3. The Fund’s policy is to recognize transfers in and transfers out as of the beginning of the reporting period.
| | | | | | | | |
| | | Transfers out of
Level 2* | | | Transfers into
Level 3* | |
Assets Table | | | | | | | | |
Investments, at Value: | | | | | | | | |
Mortgage-Backed Obligations | | $ | (170,878 | ) | | $ | 170,878 | |
*Transferred from Level 2 to Level 3 because of the lack of observable market data.
3. Shares of Beneficial Interest
The Fund has authorized an unlimited number of $0.001 par value shares of beneficial interest of each class. Transactions in shares of beneficial interest were as follows:
| | | | | | | | | | | | | | | | |
| | | Year Ended August 30, 20131 | | | Year Ended August 31, 2012 | |
| | | Shares | | | Amount | | | Shares | | | Amount | |
Class A | | | | | | | | | | | | | | | | |
Sold | | | 15,965,723 | | | $ | 153,897,466 | | | | 29,617,558 | | | $ | 287,295,240 | |
Dividends and/or distributions reinvested | | | 3,178,464 | | | | 30,385,628 | | | | 2,303,189 | | | | 22,290,823 | |
Redeemed | | | (27,805,899 | ) | | | (265,141,305 | ) | | | (24,500,638 | ) | | | (237,308,881 | ) |
| | | | |
Net increase (decrease) | | | (8,661,712 | ) | | $ | (80,858,211 | ) | | | 7,420,109 | | | $ | 72,277,182 | |
| | | | |
43 OPPENHEIMER LIMITED-TERM BOND FUND
| | | | |
| | |
| | NOTES TO FINANCIAL STATEMENTS Continued | | |
| | | | |
| | 3. Shares of Beneficial Interest (Continued) | | |
| | | | | | | | | | | | | | | | |
| | | Year Ended August 30, 20131 | | | Year Ended August 31, 2012 | |
| | | Shares | | | Amount | | | Shares | | | Amount | |
Class B | | | | | | | | | | | | | | | | |
Sold | | | 315,044 | | | $ | 3,054,413 | | | | 1,835,412 | | | $ | 17,762,895 | |
Dividends and/or distributions reinvested | | | 172,258 | | | | 1,644,631 | | | | 139,505 | | | | 1,346,794 | |
Redeemed | | | (2,319,701 | ) | | | (22,114,196 | ) | | | (2,202,584 | ) | | | (21,310,422 | ) |
| | | | |
Net decrease | | | (1,832,399 | ) | | $ | (17,415,152 | ) | | | (227,667 | ) | | $ | (2,200,733 | ) |
| | | | |
| | | | | | | | | | | | | | | | |
Class C | | | | | | | | | | | | | | | | |
Sold | | | 2,949,582 | | | $ | 28,350,520 | | | | 6,207,259 | | | $ | 60,120,334 | |
Dividends and/or distributions reinvested | | | 536,385 | | | | 5,119,474 | | | | 376,981 | | | | 3,637,889 | |
Redeemed | | | (7,034,856 | ) | | | (66,961,996 | ) | | | (4,875,228 | ) | | | (47,146,571 | ) |
| | | | |
Net increase (decrease) | | | (3,548,889 | ) | | $ | (33,492,002 | ) | | | 1,709,012 | | | $ | 16,611,652 | |
| | | | |
| | | | | | | | | | | | | | | | |
Class I | | | | | | | | | | | | | | | | |
Sold | | | 1,065 | | | $ | 10,000 | | | | — | | | $ | — | |
Dividends and/or distributions reinvested | | | — | | | | — | | | | — | | | | — | |
Redeemed | | | — | | | | — | | | | — | | | | — | |
| | | | |
Net increase | | | 1,065 | | | $ | 10,000 | | | | — | | | $ | — | |
| | | | |
| | | | | | | | | | | | | | | | |
Class N | | | | | | | | | | | | | | | | |
Sold | | | 1,015,518 | | | $ | 9,746,391 | | | | 1,382,849 | | | $ | 13,407,031 | |
Dividends and/or distributions reinvested | | | 169,741 | | | | 1,623,132 | | | | 130,468 | | | | 1,262,329 | |
Redeemed | | | (2,117,533 | ) | | | (20,201,097 | ) | | | (1,446,912 | ) | | | (14,052,184 | ) |
| | | | |
Net increase (decrease) | | | (932,274 | ) | | $ | (8,831,574 | ) | | | 66,405 | | | $ | 617,176 | |
| | | | |
| | | | | | | | | | | | | | | | |
Class Y | | | | | | | | | | | | | | | | |
Sold | | | 2,068,686 | | | $ | 20,060,867 | | | | 3,075,343 | | | $ | 29,942,879 | |
Dividends and/or distributions reinvested | | | 94,940 | | | | 909,972 | | | | 52,982 | | | | 514,734 | |
Redeemed | | | (2,103,077 | ) | | | (20,157,862 | ) | | | (2,654,251 | ) | | | (25,865,284 | ) |
| | | | |
Net increase | | | 60,549 | | | $ | 812,977 | | | | 474,074 | | | $ | 4,592,329 | |
| | | | |
1. For the year ended August 30, 2013, for Class A, Class B, Class C, Class N and Class Y shares, and for the period from August 1, 2013 (inception of offering) to August 30 2013, for Class I shares.
4. Purchases and Sales of Securities
The aggregate cost of purchases and proceeds from sales of securities, other than short-term obligations, for the year ended August 30, 2013 were as follows:
| | | | | | | | |
| | | Purchases | | | Sales | |
Investment securities | | $ | 393,165,008 | | | $ | 212,663,929 | |
U.S. government and government agency obligations | | | 788,954,883 | | | | 813,730,242 | |
To Be Announced (TBA) mortgage-related securities | | | 5,364,504,647 | | | | 5,515,045,235 | |
44 OPPENHEIMER LIMITED-TERM BOND FUND
5. Fees and Other Transactions with Affiliates
Management Fees. Under the investment advisory agreement, the Fund pays the Manager a management fee based on the daily net assets of the Fund at an annual rate as shown in the following table:
| | | | | | | | | | |
Fee Schedule Effective August 1, 2013 | | | | | Fee Schedule Prior to August 1, 2013 | | | |
Up to $500 million | | | 0.45 | % | | Up to $300 million | | | 0.600 | % |
Next $500 million | | | 0.40 | | | Next $100 million | | | 0.570 | |
Next $4 billion | | | 0.35 | | | Next $400 million | | | 0.550 | |
Over $5 billion | | | 0.30 | | | Next $1.2 billion | | | 0.500 | |
| | | | | | Over $2 billion | | | 0.475 | |
Sub-Adviser Fees. The Manager has retained the Sub-Adviser to provide the day-to-day portfolio management of the Fund. Under the Sub-Advisory Agreement, the Manager pays the Sub-Adviser an annual fee in monthly installments, equal to a percentage of the investment management fee collected by the Manager from the Fund, which shall be calculated after any investment management fee waivers. The fee paid to the Sub-Adviser is paid by the Manager, not by the Fund.
Transfer Agent Fees. OppenheimerFunds Services (“OFS”), a division of OFI, acted as the transfer and shareholder servicing agent for the Fund through December 31, 2012. Effective January 1, 2013, OFI Global (the “Transfer Agent”) serves as the transfer and shareholder servicing agent for the Fund. Fees incurred by the Fund with respect to these services are detailed in the Statement of Operations.
Sub-Transfer Agent Fees. Effective January 1, 2013, the Transfer Agent has retained Shareholder Services, Inc., a wholly-owned subsidiary of OFI (the “Sub-Transfer Agent”), to provide the day-to-day transfer agent and shareholder servicing of the Fund. Under the Sub-Transfer Agency Agreement, the Transfer Agent pays the Sub-Transfer Agent an annual fee in monthly installments, equal to a percentage of the transfer agent fee collected by the Transfer Agent from the Fund, which shall be calculated after any applicable fee waivers. The fee paid to the Sub-Transfer Agent is paid by the Transfer Agent, not by the Fund.
Distribution and Service Plan (12b-1) Fees. Under its General Distributor’s Agreement with the Fund, OppenheimerFunds Distributor, Inc. (the “Distributor”) acts as the Fund’s principal underwriter in the continuous public offering of the Fund’s classes of shares.
Service Plan for Class A Shares. The Fund has adopted a Service Plan (the “Plan”) for Class A shares under Rule 12b-1 of the Investment Company Act of 1940. Under the Plan, the Fund reimburses the Distributor for a portion of its costs incurred for services provided to accounts that hold Class A shares. Reimbursement is made periodically at an annual rate of up to 0.25% of the daily net assets of Class A shares of the Fund. The Distributor currently uses all of those fees to pay dealers, brokers, banks and other financial institutions periodically for providing personal service and maintenance of accounts of their customers that hold Class A shares. Any unreimbursed expenses the Distributor incurs with respect to Class A shares in any fiscal year cannot be recovered in subsequent periods. Fees incurred by the Fund under the Plan are detailed in the Statement of Operations.
45 OPPENHEIMER LIMITED-TERM BOND FUND
| | | | |
| | |
| | NOTES TO FINANCIAL STATEMENTS Continued | | |
| | | | |
| | 5. Fees and Other Transactions with Affiliates (Continued) | | |
Distribution and Service Plans for Class B, Class C and Class N Shares. The Fund has adopted Distribution and Service Plans (the “Plans”) for Class B, Class C and Class N shares under Rule 12b-1 of the Investment Company Act of 1940 to compensate the Distributor for its services in connection with the distribution of those shares and servicing accounts. Under the Plans, the Fund pays the Distributor an annual asset-based sales charge of 0.75% on Class B and Class C shares daily net assets and 0.25% on Class N shares daily net assets. The Distributor also receives a service fee of 0.25% per year under each plan. If either the Class B, Class C or Class N plan is terminated by the Fund or by the shareholders of a class, the Board of Trustees and its independent trustees must determine whether the Distributor shall be entitled to payment from the Fund of all or a portion of the service fee and/or asset-based sales charge in respect to shares sold prior to the effective date of such termination. Fees incurred by the Fund under the Plans are detailed in the Statement of Operations. The Distributor determines its uncompensated expenses under the Plans at calendar quarter ends. The Distributor’s aggregate uncompensated expenses under the Plans at June 30, 2013 were as follows:
| | |
Class B | | $5,983,633 |
Class C | | 4,768,569 |
Class N | | 1,186,069 |
Sales Charges. Front-end sales charges and contingent deferred sales charges (“CDSC”) do not represent expenses of the Fund. They are deducted from the proceeds of sales of Fund shares prior to investment or from redemption proceeds prior to remittance, as applicable. The sales charges retained by the Distributor from the sale of shares and the CDSC retained by the Distributor on the redemption of shares is shown in the following table for the period indicated.
| | | | | | | | | | |
| Year Ended | | Class A Front-End Sales Charges Retained by Distributor | | Class A Contingent Deferred Sales
Charges Retained by Distributor | | Class B Contingent Deferred Sales Charges Retained by Distributor | | Class C Contingent Deferred Sales Charges Retained by Distributor | | Class N Contingent Deferred Sales Charges Retained by Distributor |
August 30, 2013 | | $225,070 | | $46,753 | | $93,324 | | $15,355 | | $852 |
Waivers and Reimbursements of Expenses. The Manager has voluntarily agreed to limit the “Total expenses” for all share classes so that “Expenses after payments, waivers and/or reimbursements and reduction to custodian expenses”, as a percentage of average annual net assets, will not exceed the following annual rates: 0.90% for Class A shares; 1.65% for Class B and Class C shares, respectively; 1.15% for Class N shares and 0.65% for Class Y shares. During the year ended August 30, 2013, the Manager waived fees and/or reimbursed the Fund $663,151, $128,151, $183,030, $70,519 and $8,575 for Class A, Class B, Class C, Class N and Class Y shares, respectively.
46 OPPENHEIMER LIMITED-TERM BOND FUND
| | | | |
| | 5. Fees and Other Transactions with Affiliates (Continued) | | |
The Transfer Agent has voluntarily agreed to limit transfer and shareholder servicing agent fees for Classes B, C, N and Y shares to 0.35% of average annual net assets per class and for Class A shares to 0.30% of average annual net assets of the class.
Some of these undertakings may be modified or terminated at any time; some may not be modified or terminated until after one year from the date of the current prospectus, as indicated therein.
| | | | |
| | 6. Risk Exposures and the Use of Derivative Instruments | | |
The Fund’s investment objectives not only permit the Fund to purchase investment securities, they also allow the Fund to enter into various types of derivatives contracts, including, but not limited to, futures contracts, forward currency exchange contracts, credit default swaps, interest rate swaps, total return swaps, variance swaps and purchased and written options. In doing so, the Fund will employ strategies in differing combinations to permit it to increase, decrease, or change the level or types of exposure to market risk factors. These instruments may allow the Fund to pursue its objectives more quickly and efficiently than if it were to make direct purchases or sales of securities capable of effecting a similar response to market factors. Such contracts may be entered into through a bilateral over-the-counter (“OTC”) transaction, or through a securities or futures exchange and cleared through a clearinghouse.
Market Risk Factors. In accordance with its investment objectives, the Fund may use derivatives to increase or decrease its exposure to one or more of the following market risk factors:
Commodity Risk. Commodity risk relates to the change in value of commodities or commodity indexes as they relate to increases or decreases in the commodities market.
Commodities are physical assets that have tangible properties. Examples of these types of assets are crude oil, heating oil, metals, livestock, and agricultural products.
Credit Risk. Credit risk relates to the ability of the issuer to meet interest and principal payments, or both, as they come due. In general, lower-grade, higher-yield bonds are subject to credit risk to a greater extent than lower-yield, higher-quality bonds.
Equity Risk. Equity risk relates to the change in value of equity securities as they relate to increases or decreases in the general market.
Foreign Exchange Rate Risk. Foreign exchange rate risk relates to the change in the U.S. dollar value of a security held that is denominated in a foreign currency. The U.S. dollar value of a foreign currency denominated security will decrease as the dollar appreciates against the currency, while the U.S. dollar value will increase as the dollar depreciates against the currency.
Interest Rate Risk. Interest rate risk refers to the fluctuations in value of fixed-income securities resulting from the inverse relationship between price and yield. For example, an increase in general interest rates will tend to reduce the market value of already issued fixed-income investments, and a decline in general interest rates will tend to increase their value. In addition, debt securities with longer maturities, which tend to have higher yields, are subject to potentially greater fluctuations in value from changes in interest rates than obligations with shorter maturities.
47 OPPENHEIMER LIMITED-TERM BOND FUND
| | | | |
| | |
| | NOTES TO FINANCIAL STATEMENTS Continued | | |
6. Risk Exposures and the Use of Derivative Instruments (Continued)
Volatility Risk. Volatility risk refers to the magnitude of the movement, but not the direction of the movement, in a financial instrument’s price over a defined time period. Large increases or decreases in a financial instrument’s price over a relative time period typically indicate greater volatility risk, while small increases or decreases in its price typically indicate lower volatility risk.
Derivatives may have little or no initial cash investment relative to their market value exposure and therefore can produce significant gains or losses in excess of their cost due to unanticipated changes in the market risk factors and the overall market. This use of embedded leverage allows the Fund to increase its market value exposure relative to its net assets and can substantially increase the volatility of the Fund’s performance. In instances where the Fund is using derivatives to decrease, or hedge, exposures to market risk factors for securities held by the Fund, there are also risks that those derivatives may not perform as expected resulting in losses for the combined or hedged positions. Some derivatives have the potential for unlimited loss, regardless of the size of the Fund’s initial investment.
Additional associated risks from investing in derivatives also exist and potentially could have significant effects on the valuation of the derivative and the Fund. Typically, the associated risks are not the risks that the Fund is attempting to increase or decrease exposure to, per its investment objectives, but are the additional risks from investing in derivatives. Examples of these associated risks are liquidity risk, which is the risk that the Fund will not be able to sell the derivative in the open market in a timely manner, and counterparty credit risk, which is the risk that the counterparty will not fulfill its obligation to the Fund.
The Fund’s actual exposures to these market risk factors and associated risks during the period are discussed in further detail, by derivative type, below.
Futures Contracts
A futures contract is a commitment to buy or sell a specific amount of a commodity, financial instrument or currency at a negotiated price on a stipulated future date. The Fund may buy and sell futures contracts and may also buy or write put or call options on these futures contracts. Futures contracts and options thereon are generally entered into on a regulated futures exchange and cleared through a clearinghouse associated with the exchange.
Upon entering into a futures contract, the Fund is required to deposit either cash or securities (initial margin) in an amount equal to a certain percentage of the contract value in an account registered in the futures commission merchant’s name. Subsequent payments (variation margin) are paid to or from the futures commission merchant each day equal to the daily changes in the contract value. Such payments are recorded as unrealized gains and losses. Should the Fund fail to make requested variation margin payments, the futures commission merchant can gain access to the initial margin to satisfy the Fund’s payment obligations.
Futures contracts are reported on a schedule following the Statement of Investments. Securities held by a futures commission merchant to cover initial margin requirements on open futures contracts are noted in the Statement of Investments. Cash held by a futures commission merchant to cover initial margin requirements on open futures contracts and the
48 OPPENHEIMER LIMITED-TERM BOND FUND
6. Risk Exposures and the Use of Derivative Instruments (Continued)
receivable and/or payable for the daily mark to market for the variation margin are noted in the Statement of Assets and Liabilities. The net change in unrealized appreciation and depreciation is reported in the Statement of Operations. Realized gains (losses) are reported in the Statement of Operations at the closing or expiration of futures contracts.
The Fund has purchased futures contracts on various bonds and notes to increase exposure to interest rate risk.
The Fund has sold futures contracts on various bonds and notes to decrease exposure to interest rate risk.
During the year ended August 30, 2013, the Fund had an ending monthly average market value of $111,094,731 and $319,906,575 on futures contracts purchased and sold, respectively.
Additional associated risks of entering into futures contracts (and related options) include the possibility that there may be an illiquid market where the Fund is unable to liquidate the contract or enter into an offsetting position and, if used for hedging purposes, the risk that the price of the contract will correlate imperfectly with the prices of the Fund’s securities.
Option Activity
The Fund may buy and sell put and call options, or write put and call options. When an option is written, the Fund receives a premium and becomes obligated to sell or purchase the underlying security, currency or other underlying financial instrument at a fixed price, upon exercise of the option.
Options can be traded through an exchange or through a privately negotiated arrangement with a dealer in an OTC transaction. Options traded through an exchange are generally cleared through a clearinghouse (such as The Options Clearing Corporation). The difference between the premium received or paid, and market value of the option, is recorded as unrealized appreciation or depreciation. The net change in unrealized appreciation or depreciation is reported in the Statement of Operations. When an option is exercised, the cost of the security purchased or the proceeds of the security sale are adjusted by the amount of premium received or paid. Upon the expiration or closing of the option transaction, a gain or loss is reported in the Statement of Operations.
The Fund has purchased call options on treasury and/or euro futures to increase exposure to interest rate risk. A purchased call option becomes more valuable as the price of the underlying financial instrument appreciates relative to the strike price.
The Fund has purchased put options on treasury and/or euro futures to decrease exposure to interest rate risk. A purchased put option becomes more valuable as the price of the underlying financial instrument depreciates relative to the strike price.
During the year ended August 30, 2013, the Fund had an ending monthly average market value of $4,269 and $24,015 on purchased call options and purchased put options, respectively.
Options written, if any, are reported in a schedule following the Statement of Investments and as a liability in the Statement of Assets and Liabilities. Securities held in collateral accounts to cover potential obligations with respect to outstanding written options are noted in the Statement of Investments.
49 OPPENHEIMER LIMITED-TERM BOND FUND
| | | | |
| | |
| | NOTES TO FINANCIAL STATEMENTS Continued | | |
| | | | |
| | | | |
| | 6. Risk Exposures and the Use of Derivative Instruments (Continued) | | |
The risk in writing a call option is that the market price of the security increases and if the option is exercised, the Fund must either purchase the security at a higher price for delivery or, if the Fund owns the underlying security, give up the opportunity for profit. The risk in writing a put option is that the Fund may incur a loss if the market price of the security decreases and the option is exercised. The risk in buying an option is that the Fund pays a premium whether or not the option is exercised. The Fund also has the additional risk that there may be an illiquid market where the Fund is unable to close the contract.
The Fund has written call options on treasury and/or euro futures to decrease exposure to interest rate risk. A written call option becomes more valuable as the price of the underlying financial instrument depreciates relative to the strike price.
The Fund has written put options on treasury and/or euro futures to increase exposure to interest rate risk. A written put option becomes more valuable as the price of the underlying financial instrument appreciates relative to the strike price.
During the year ended August 30, 2013, the Fund had an ending monthly average market value of $100 and $11,581 on written call options and written put options, respectively.
Additional associated risks to the Fund include counterparty credit risk and liquidity risk.
Written option activity for the year ended August 30, 2013 was as follows:
| | | | | | | | | | | | | | | | | | | | | | |
| | | | | Call Options | | | | | Put Options | | | |
| | | | | Number of
Contracts | | | Amount of
Premiums | | | | | Number of
Contracts | | | Amount of
Premiums | | | |
| | Options outstanding as of August 31, 2012 | | | — | | | $ | — | | | | | | 915 | | | $ | 34,746 | | | |
| | Options written | | | 572 | | | | 30,378 | | | | | | 8,515 | | | | 544,163 | | | |
| | Options closed or expired | | | (572 | ) | | | (30,378 | ) | | | | | (9,430 | ) | | | (578,909 | ) | | |
| | | | | | | | |
| | Options outstanding as of August 30, 2013 | | | — | | | $ | — | | | | | | — | | | $ | — | | | |
| | | | | | | | |
Swap Contracts
The Fund may enter into swap contract agreements with a counterparty to exchange a series of cash flows based on either specified reference rates, the price or volatility of asset or non-asset references, or the occurrence of a credit event, over a specified period. Swaps can be executed in a bi-lateral privately negotiated arrangement with a dealer in an OTC transaction (“OTC swaps”) or executed on a regulated market. Certain swaps, regardless of the venue of their execution, are required to be cleared through a clearinghouse (“cleared swaps”). Swap contracts may include interest rate, equity, debt, index, total return, credit default, currency, and volatility swaps.
Swap contracts are reported on a schedule following the Statement of Investments. Daily changes in the value of cleared swaps are reported as variation margin receivable or payable on the Statements of Assets and Liabilities. The values of OTC swap contracts are aggregated by positive and negative values and disclosed separately on the Statement of Assets and Liabilities. The unrealized appreciation (depreciation) related to the change in the valuation of the notional amount of the swap is combined with the accrued interest due to (owed by) the
50 OPPENHEIMER LIMITED-TERM BOND FUND
| | | | |
| | | | |
| | 6. Risk Exposures and the Use of Derivative Instruments (Continued) | | |
Fund, if any, at termination or settlement. The net change in this amount during the period is included on the Statement of Operations. The Fund also records any periodic payments received from (paid to) the counterparty, including at termination, under such contracts as realized gain (loss) on the Statement of Operations.
Swap contract agreements are exposed to the market risk factor of the specific underlying reference rate or asset. Swap contracts are typically more attractively priced compared to similar investments in related cash securities because they isolate the risk to one market risk factor and eliminate the other market risk factors. Investments in cash securities (for instance bonds) have exposure to multiple risk factors (credit and interest rate risk). Because swaps have embedded leverage, they can expose the Fund to substantial risk in the isolated market risk factor.
Interest Rate Swap Contracts. An interest rate swap is an agreement between counterparties to exchange periodic payments based on interest rates. One cash flow stream will typically be a floating rate payment based upon a specified floating interest rate while the other is typically a fixed interest rate.
The Fund has entered into interest rate swaps in which it pays a fixed interest rate and receives a floating interest rate in order to decrease exposure to interest rate risk. Typically, if relative interest rates rise, payments received by the Fund under the swap agreement will be greater than the payments made by the Fund.
For the year ended August 30, 2013, the Fund had ending monthly average notional amounts of $32,080,769 on interest rate swaps which pay a fixed rate.
Additional associated risks to the Fund include counterparty credit risk and liquidity risk.
Swaption Transactions
The Fund may enter into a swaption contract which grants the purchaser the right, but not the obligation, to enter into a swap transaction at preset terms detailed in the underlying agreement within a specified period of time. The purchaser pays a premium to the swaption writer who bears the risk of unfavorable changes in the preset terms on the underlying swap.
Purchased swaptions are reported as a component of investments in the Statement of Investments and the Statement of Assets and Liabilities. Written swaptions are reported on a schedule following the Statement of Investments and their value is reported as a separate asset or liability line item in the Statement of Assets and Liabilities. The net change in unrealized appreciation or depreciation on written swaptions is separately reported in the Statement of Operations. When a swaption is exercised, the cost of the swap is adjusted by the amount of premium paid or received. Upon the expiration or closing of an unexercised swaption contract, a gain or loss is reported in the Statement of Operations for the amount of the premium paid or received.
The Fund generally will incur a greater risk when it writes a swaption than when it purchases a swaption. When the Fund writes a swaption it will become obligated, upon exercise of the swaption, according to the terms of the underlying agreement. Swaption contracts written by the Fund do not give rise to counterparty credit risk prior to exercise as they obligate the Fund, not its counterparty, to perform. When the Fund purchases a swaption it only risks losing the amount of the premium it paid if the swaption expires unexercised. However, when the Fund exercises a purchased swaption there is a risk that the counterparty will fail to perform or otherwise default on its obligations under the swaption contract.
51 OPPENHEIMER LIMITED-TERM BOND FUND
| | | | |
| | |
| | NOTES TO FINANCIAL STATEMENTS Continued | | |
| | | | |
| | | | |
| | 6. Risk Exposures and the Use of Derivative Instruments (Continued) | | |
The Fund has purchased swaptions which gives it the option to enter into an interest rate swap in which it pays a fixed interest rate and receives a floating interest rate in order to decrease exposure to interest rate risk. A purchased swaption of this type becomes more valuable as the reference interest rate increases relative to the preset interest rate.
The Fund purchased swaptions which gives it the option to enter into an interest rate swap in which it pays a floating interest rate and receives a fixed interest rate in order to increase exposure to interest rate risk. A purchased swaption of this type becomes more valuable as the reference interest rate decreases relative to the preset interest rate.
The Fund has written swaptions which gives it the obligation, if exercised by the purchaser, to enter into an interest rate swap in which it pays a floating interest rate and receives a fixed interest rate in order to increase exposure to interest rate risk. A written swaption of this type becomes more valuable as the reference interest rate decreases relative to the preset interest rate.
During the year ended August 30, 2013, the Fund had an ending monthly average market value of $78,794 and $71,259 on purchased and written swaptions, respectively.
Written swaption activity for the year ended August 30, 2013 was as follows:
| | | | | | | | | | | | |
| | | | | Call Swaptions | | | |
| | | | | Notional
Amount | | | Amount of
Premiums | | | |
| | Swaptions outstanding as of August 31, 2012 | | | 6,470,000 | | | $ | 23,454 | | | |
| | Swaptions written | | | 5,735,012 | | | | 146,816 | | | |
| | Swaptions closed or expired | | | (12,205,012 | ) | | | (170,270 | ) | | |
| | | | | | | | | | | | |
| | Swaptions outstanding as of August 30, 2013 | | | — | | | $ | — | | | |
| | | | | | | | | | | | |
Counterparty Credit Risk. Derivative positions are subject to the risk that the counterparty will not fulfill its obligation to the Fund. The Fund intends to enter into derivative transactions with counterparties that the Manager believes to be creditworthy at the time of the transaction.
The Fund’s risk of loss from counterparty credit risk on OTC derivatives is generally limited to the aggregate unrealized gain netted against any collateral held by the Fund. For OTC options purchased, the Fund bears the risk of loss of the amount of the premiums paid plus the positive change in market values net of any collateral held by the Fund should the counterparty fail to perform under the contracts. Options written by the Fund do not typically give rise to counterparty credit risk, as options written generally obligate the Fund and not the counterparty to perform.
To reduce counterparty risk with respect to OTC transactions, the Fund has entered into master netting arrangements, established within the Fund’s International Swap and Derivatives Association, Inc. (“ISDA”) master agreements, which allow the Fund to make (or to have an entitlement to receive) a single net payment in the event of default (close-out
52 OPPENHEIMER LIMITED-TERM BOND FUND
| | | | |
| | | | |
| | 6. Risk Exposures and the Use of Derivative Instruments (Continued) | | |
netting) for outstanding payables and receivables with respect to certain OTC positions in swaps, options, swaptions, and forward currency exchange contracts for each individual counterparty. In addition, the Fund may require that certain counterparties post cash and/or securities in collateral accounts to cover their net payment obligations for those derivative contracts subject to ISDA master agreements. If the counterparty fails to perform under these contracts and agreements, the cash and/or securities will be made available to the Fund.
As of August 30, 2013, the Fund has not required certain counterparties to post collateral.
ISDA master agreements include credit related contingent features which allow counterparties to OTC derivatives to terminate derivative contracts prior to maturity in the event that, for example, the Fund’s net assets decline by a stated percentage or the Fund fails to meet the terms of its ISDA master agreements, which would cause the Fund to accelerate payment of any net liability owed to the counterparty.
For financial reporting purposes, the Fund does not offset derivative assets and derivative liabilities that are subject to netting arrangements in the Statements of Assets and Liabilities. Bankruptcy or insolvency laws of a particular jurisdiction may impose restrictions on or prohibitions against the right of offset in bankruptcy, insolvency or other events.
The Fund’s risk of loss from counterparty credit risk on exchange-traded derivatives cleared through a clearinghouse and for cleared swaps is generally considered lower than as compared to OTC derivatives. However, counterparty credit risk exists with respect to initial and variation margin deposited/paid by the Fund that is held in futures commission merchant, broker and/or clearinghouse accounts for such exchange-traded derivatives and for cleared swaps.
With respect to cleared swaps, such transactions will be submitted for clearing, and if cleared, will be held in accounts at futures commission merchants or brokers that are members of clearinghouses. While brokers, futures commission merchants and clearinghouses are required to segregate customer margin from their own assets, in the event that a broker, futures commission merchant or clearinghouse becomes insolvent or goes into bankruptcy and at that time there is a shortfall in the aggregate amount of margin held by the broker, futures commission merchant or clearinghouse for all its customers, U.S. bankruptcy laws will typically allocate that shortfall on a pro-rata basis across all the broker’s, futures commission merchant’s or clearinghouse’s customers, potentially resulting in losses to the Fund.
There is the risk that a broker, futures commission merchant or clearinghouse will decline to clear a transaction on the Fund’s behalf, and the Fund may be required to pay a termination fee to the executing broker with whom the Fund initially enters into the transaction. Clearinghouses may also be permitted to terminate cleared swaps at any time. The Fund is also subject to the risk that the broker or futures commission merchant will improperly use the Fund’s assets deposited/paid as initial or variation margin to satisfy payment obligations of another customer. In the event of a default by another customer of the broker or futures commission merchant, the Fund might not receive its variation margin payments from the clearinghouse, due to the manner in which variation margin payments are aggregated for all customers of the broker/futures commission merchant.
53 OPPENHEIMER LIMITED-TERM BOND FUND
| | | | |
| | |
| | NOTES TO FINANCIAL STATEMENTS Continued | | |
| | | | |
| | | | |
| | 6. Risk Exposures and the Use of Derivative Instruments (Continued) | | |
Collateral and margin requirements differ by type of derivative. Margin requirements are established by the broker, futures commission merchant or clearinghouse for exchange-traded and cleared derivatives, including cleared swaps. Brokers, futures commission merchants and clearinghouses can ask for margin in excess of the regulatory minimum, or increase the margin amount, in certain circumstances.
Collateral terms are contract specific for OTC derivatives. For derivatives traded under an ISDA master agreement, the collateral requirements are typically calculated by netting the mark to market amount for each transaction under such agreement and comparing that amount to the value of any collateral currently pledged by the Fund or the counterparty.
For financial reporting purposes, cash collateral that has been pledged to cover obligations of the Fund, if any, is reported separately on the Statements of Assets and Liabilities as cash pledged as collateral. Non-cash collateral pledged by the Fund, if any, is noted in the Statement of Investments. Generally, the amount of collateral due from or to a party must exceed a minimum transfer amount threshold (e.g. $250,000) before a transfer has to be made. To the extent amounts due to the Fund from its counterparties are not fully collateralized, contractually or otherwise, the Fund bears the risk of loss from counterparty nonperformance.
The following table presents by counterparty the Fund’s OTC derivative assets net of the related collateral posted for the benefit of the Fund at August 30, 2013:
| | | | | | | | | | | | | | | | | | | | |
| | | | | | Gross Amounts Not Offset in the
Statement of Assets and Liabilities | | | | |
| Counterparty | | Gross Amount
of Assets in the
Statement of
Assets and
Liabilities* | | | Financial
Instruments
Available for
Offset | | | Financial
Instruments
Collateral
Received** | | | Cash
Collateral
Received** | | | Net Amount | |
JPMorgan Chase Bank NA | | | $128 | | | | $— | | | | $— | | | | $— | | | | $128 | |
*OTC derivatives are reported gross on the Statement of Assets and Liabilities. Exchange traded options and margin related to cleared swaps and futures are excluded from these reported amounts.
**Reported collateral posted for the benefit of the Fund within this table is limited to the net outstanding amount due from an individual counterparty. The collateral posted for the benefit of the Fund may exceed these amounts.
The Fund had no OTC derivative liabilities at August 30, 2013.
54 OPPENHEIMER LIMITED-TERM BOND FUND
6. Risk Exposures and the Use of Derivative Instruments (Continued)
The following table presents the valuations of derivative instruments by risk exposure as reported within the Statement of Assets and Liabilities as of August 30, 2013:
| | | | | | | | | | | | |
| | | Asset Derivatives | | | Liability Derivatives | |
Derivatives Not Accounted for as
Hedging Instruments | | Statement of
Assets and
Liabilities Location | | Value | | | Statement of
Assets and
Liabilities Location | | Value | |
Interest rate contracts | | Variation margin
receivable | | | $416,998 | * | | Variation margin
payable | | | $233,031* | |
Interest rate contracts | | Investments, at
value | | | 128 | ** | | | | | | |
| | | | | | | | | | | | |
Total | | | | | $417,216 | | | | | | $233,031 | |
| | | | | | | | | | | | |
*Includes only the current day’s variation margin. Prior variation margin movements have been reflected in cash on the Statement of Assets and Liabilities upon receipt or payment.
**Amounts relate to purchased swaption contracts.
The effect of derivative instruments on the Statement of Operations is as follows:
| | | | | | | | | | | | |
| Amount of Realized Gain or (Loss) Recognized on Derivatives |
Derivatives Not
Accounted for
as Hedging
Instruments | | Investments
from
unaffiliated
companies* | | Closing and
expiration of
swaption
contracts
written | | Closing and
expiration of
option
contracts
written | | Closing and
expiration of
futures
contracts | | Swap
contracts | | Total |
Interest rate contracts | | $(271,168) | | $(28,188) | | $266,954 | | $8,766,788 | | $1,095,902 | | $9,830,288 |
*Includes purchased option contracts, purchased swaption contracts and written option contracts exercised, if any.
| | | | | | | | | | |
| Amount of Change in Unrealized Gain or (Loss) Recognized on Derivatives |
Derivatives Not Accounted
for as Hedging Instruments | | Investments* | | Swaption
contracts written | | Option contracts written | | Futures contracts | | Total |
Interest rate contracts | | $(126,036) | | $(23,454) | | $(10,948) | | $(2,813,629) | | $(2,974,067) |
*Includes purchased option contracts and purchased swaption contracts, if any.
7. Restricted Securities
As of August 30, 2013, investments in securities included issues that are restricted. A restricted security may have a contractual restriction on its resale and is valued under methods approved by the Board of Trustees as reflecting fair value. Securities that are restricted are marked with an applicable footnote on the Statement of Investments. Restricted securities are reported on a schedule following the Statement of Investments.
8. Pending Litigation
Since 2009, seven class action lawsuits have been pending in the U.S. District Court for the District of Colorado against OppenheimerFunds, Inc. (“OFI”), OppenheimerFunds Distributor, Inc., the Fund’s principal underwriter and distributor (the “Distributor”), and certain funds (but not including the Fund) advised by OFI Global Asset Management, Inc. and distributed by the Distributor (the “Defendant Funds”). The lawsuits also name as defendants certain officers and current and former trustees of the respective Defendant Funds. The lawsuits raise
55 OPPENHEIMER LIMITED-TERM BOND FUND
| | | | |
| | |
| | NOTES TO FINANCIAL STATEMENTS Continued | | |
| | | | |
| | | | |
| | 8. Pending Litigation (Continued) | | |
claims under federal securities law and allege, among other things, that the disclosure documents of the respective Defendant Funds contained misrepresentations and omissions and that the respective Defendant Funds’ investment policies were not followed. The plaintiffs in these actions seek unspecified damages, equitable relief and awards of attorneys’ fees and litigation expenses. The Defendant Funds’ Boards of Trustees have also engaged counsel to represent the Funds and the present and former Independent Trustees named in those suits. On August 26, 2013, the parties in six of these lawsuits executed a memorandum of understanding setting forth the terms of proposed settlements of those actions. The proposed settlements are subject to a variety of contingencies, including the execution of settlement agreements, which will require preliminary and final approval by the court. The proposed settlements do not resolve a seventh outstanding lawsuit relating to Oppenheimer California Municipal Fund.
Other class action and individual lawsuits have been filed since 2008 in various state and federal courts against OFI and certain of its affiliates by investors seeking to recover investments they allegedly lost as a result of the “Ponzi” scheme run by Bernard L. Madoff and his firm, Bernard L. Madoff Investment Securities, LLC (“BLMIS”). Plaintiffs in these suits allege that they suffered losses as a result of their investments in several funds managed by an affiliate of OFI and assert a variety of claims, including breach of fiduciary duty, fraud, negligent misrepresentation, unjust enrichment, and violation of federal and state securities laws and regulations, among others. They seek unspecified damages, equitable relief and awards of attorneys’ fees and litigation expenses. Neither the Distributor, nor any of the Oppenheimer mutual funds, their independent trustees or directors are named as defendants in these lawsuits. None of the Oppenheimer mutual funds invested in any funds or accounts managed by Madoff or BLMIS. On February 28, 2011, a stipulation of partial settlement of three groups of consolidated putative class action lawsuits relating to these matters was filed in the U.S. District Court for the Southern District of New York. On August 19, 2011, the court entered an order and final judgment approving the settlement as fair, reasonable and adequate. In September 2011, certain parties filed notices of appeal from the court’s order approving the settlement. The settlement does not resolve other outstanding lawsuits against OFI and its affiliates relating to BLMIS.
On April 16, 2010, a lawsuit was filed in New York state court against (i) OFI, (ii) an affiliate of OFI and (iii) AAArdvark IV Funding Limited (“AAArdvark IV”), an entity advised by OFI’s affiliate, in connection with investments made by the plaintiffs in AAArdvark IV. Plaintiffs allege breach of contract and common law fraud claims against the defendants and seek compensatory damages, costs and disbursements, including attorney fees. On April 11, 2013, the court granted defendants’ motion for summary judgment, dismissing plaintiffs’ fraud claim with prejudice and dismissing their contract claim without prejudice, and granted plaintiffs leave to replead their contract claim to assert a cause of action for specific performance within 30 days. On May 9, 2013, plaintiffs filed a notice of appeal from the court’s dismissal order. On July 15, 2011, a lawsuit was filed in New York state court against OFI, an affiliate of OFI and AAArdvark Funding Limited (“AAArdvark I”), an entity advised by OFI’s affiliate, in connection with investments made by the plaintiffs in AAArdvark I. The complaint alleges breach of contract and common law fraud claims against the defendants
56 OPPENHEIMER LIMITED-TERM BOND FUND
8. Pending Litigation (Continued)
and seeks compensatory damages, costs and disbursements, including attorney fees. On November 9, 2011, a lawsuit was filed in New York state court against OFI, an affiliate of OFI and AAArdvark XS Funding Limited (“AAArdvark XS”), an entity advised by OFI’s affiliate, in connection with investments made by the plaintiffs in AAArdvark XS. The complaint alleges breach of contract against the defendants and seeks compensatory damages, costs and disbursements, including attorney fees.
OFI believes the lawsuits and appeals described above are without legal merit and, with the exception of actions it has settled, is defending against them vigorously. While it is premature to render any opinion as to the outcome in these lawsuits, or whether any costs that the Defendant Funds may bear in defending the suits might not be reimbursed by insurance, OFI believes that these suits should not impair the ability of OFI or the Distributor to perform their respective duties to the Fund, and that the outcome of all of the suits together should not have any material effect on the operations of any of the Oppenheimer mutual funds.
57 OPPENHEIMER LIMITED-TERM BOND FUND
| | | | |
| | |
| | REPORT OF INDEPENDENT REGISTERED PUBLIC ACCOUNTING FIRM | | |
The Board of Trustees and Shareholders of Oppenheimer Limited-Term Bond Fund:
We have audited the accompanying statement of assets and liabilities of Oppenheimer Limited-Term Bond Fund, formerly Oppenheimer U.S. Government Trust, including the statement of investments, as of August 30, 2013, and the related statement of operations for the year then ended, the statements of changes in net assets for each of the years in the two-year period then ended, and the financial highlights for each of the years or periods in the five-year period then ended. These financial statements and financial highlights are the responsibility of the Fund’s management. Our responsibility is to express an opinion on these financial statements and financial highlights based on our audits.
We conducted our audits in accordance with the standards of the Public Company Accounting Oversight Board (United States). Those standards require that we plan and perform the audit to obtain reasonable assurance about whether the financial statements and financial highlights are free of material misstatement. An audit includes examining, on a test basis, evidence supporting the amounts and disclosures in the financial statements. Our procedures included confirmation of securities owned as of August 30, 2013, by correspondence with the custodian, transfer agent and brokers, or by other appropriate auditing procedures where replies from brokers were not received. An audit also includes assessing the accounting principles used and significant estimates made by management, as well as evaluating the overall financial statement presentation. We believe that our audits provide a reasonable basis for our opinion.
In our opinion, the financial statements and financial highlights referred to above present fairly, in all material respects, the financial position of Oppenheimer Limited-Term Bond Fund as of August 30, 2013, the results of its operations for the year then ended, the changes in its net assets for each of the years in the two-year period then ended, and the financial highlights for each of the years or periods in the five-year period then ended, in conformity with U.S. generally accepted accounting principles.
KPMG LLP
Denver, Colorado
October 17, 2013
58 OPPENHEIMER LIMITED-TERM BOND FUND
| | | | |
| | |
| | FEDERAL INCOME TAX INFORMATION Unaudited | | |
In early 2013, if applicable, shareholders of record received information regarding all dividends and distributions paid to them by the Fund during calendar year 2012.
Capital gain distributions of $0.08286 per share were paid to Class A, Class B, Class C, Class N and Class Y shareholders, respectively, on December 28, 2012. Whether received in stock or in cash, the capital gain distribution should be treated by shareholders as a gain from the sale of the capital assets held for more than one year (long-term capital gains).
None of the dividends paid by the Fund during the fiscal year ended August 30, 2013 are eligible for the corporate dividend-received deduction.
Dividends, if any, paid by the Fund during the fiscal year ended August 30, 2013 which are not designated as capital gain distributions, may be eligible for lower individual income tax rates to the extent that the Fund has received qualified dividend income as stipulated by recent tax legislation. In early 2013, shareholders of record received information regarding the percentage of distributions that are eligible for lower individual income tax rates. The amount will be the maximum amount allowed.
Recent tax legislation allows a regulated investment company to designate distributions not designated as capital gain distributions, as either interest related dividends or short-term capital gain dividends, both of which are exempt from the U.S. withholding tax applicable to non U.S. taxpayers. For the fiscal year ended August 30, 2013, the maximum amount allowable but not less than $18,738,274 of the ordinary distributions to be paid by the Fund qualifies as an interest related dividend.
The foregoing information is presented to assist shareholders in reporting distributions received from the Fund to the Internal Revenue Service. Because of the complexity of the federal regulations which may affect your individual tax return and the many variations in state and local tax regulations, we recommend that you consult your tax advisor for specific guidance.
59 OPPENHEIMER LIMITED-TERM BOND FUND
| | | | |
| | |
| | SPECIAL SHAREHOLDER MEETING Unaudited | | |
On June 21, 2013, a shareholder meeting of Oppenheimer Limited-Term Bond Fund (the “Fund”) was held at which the twelve Trustees identified below were elected to the Fund (Proposal No. 1). At the meeting the sub-proposals below (Proposal No. 2 (including all of its sub-proposals)) and an Agreement and Plan of Reorganization to reorganize the Fund into a Delaware statutory trust (Proposal No. 3) were approved as described in the Fund’s proxy statement dated April 12, 2013. The following is a report of the votes cast:
| | | | | | |
| | | Nominee/Proposal | | For | | Withheld |
| | Trustees | | | | |
| | | |
| | Brian F. Wruble | | 62,961,699 | | 1,367,506 |
| | | |
| | David K. Downes | | 62,929,604 | | 1,399,602 |
| | | |
| | Matthew P. Fink | | 62,977,903 | | 1,351,302 |
| | | |
| | Edmund Giambastiani, Jr. | | 62,965,413 | | 1,363,792 |
| | | |
| | Phillip A. Griffiths | | 62,970,350 | | 1,358,856 |
| | | |
| | Mary F. Miller | | 62,965,431 | | 1,363,774 |
| | | |
| | Joel W. Motley | | 62,984,396 | | 1,344,809 |
| | | |
| | Joanne Pace | | 62,937,456 | | 1,391,750 |
| | | |
| | Mary Ann Tynan | | 62,964,233 | | 1,364,972 |
| | | |
| | Joseph M. Wikler | | 62,980,218 | | 1,348,987 |
| | | |
| | Peter I. Wold | | 63,007,239 | | 1,321,966 |
| | | |
| | William F. Glavin, Jr. | | 62,943,908 | | 1,385,298 |
| | | | | | |
| | 2a: Proposal to revise the fundamental policy relating to borrowing |
| | | For | | Against | | Abstain |
| | 44,758,083 | | 1,447,970 | | 1,413,915 |
| |
| | 2b-1: Proposal to revise the fundamental policy relating to concentration of investments |
| | | For | | Against | | Abstain |
| | 44,919,550 | | 1,345,825 | | 1,354,594 |
| |
| | 2c-1: Proposal to remove the fundamental policy relating to diversification of investments |
| | | For | | Against | | Abstain |
| | 44,687,431 | | 1,495,955 | | 1,436,581 |
| |
| | 2d: Proposal to revise the fundamental policy relating to lending |
| | | For | | Against | | Abstain |
| | 44,670,735 | | 1,512,542 | | 1,436,689 |
| |
| | 2e: Proposal to remove the additional fundamental policy relating to estate and commodities |
| | | For | | Against | | Abstain |
| | 44,895,533 | | 1,262,266 | | 1,462,168 |
| |
| | 2f: Proposal to revise the fundamental policy relating to senior securities |
| | | For | | Against | | Abstain |
| | 44,807,954 | | 1,365,697 | | 1,446,316 |
60 OPPENHEIMER LIMITED-TERM BOND FUND
| | | | | | |
| | 2g: Proposal to remove the additional fundamental policy relating to underwriting |
| | | For | | Against | | Abstain |
| | 44,767,309 | | 1,412,081 | | 1,440,577 |
| |
| | 2r: Proposal to convert the Fund’s investment objective from fundamental to non-fundamental |
| | | For | | Against | | Abstain |
| | 43,822,708 | | 2,386,184 | | 1,411,074 |
| |
| | 2s: Proposal to approve a change in the Fund’s investment objective |
| | | For | | Against | | Abstain |
| | 44,478,938 | | 1,639,739 | | 1,501,293 |
| |
| | Proposal 3: To approve an Agreement and Plan of Reorganization that provides for the reorganization of a Fund from a Maryland corporation or Massachusetts business trust, as applicable, into a Delaware statutory trust. |
| | | For | | Against | | Abstain |
| | 44,971,746 | | 1,020,042 | | 1,628,178 |
61 OPPENHEIMER LIMITED-TERM BOND FUND
| | | | |
| | |
| | PORTFOLIO PROXY VOTING POLICIES AND PROCEDURES; UPDATES TO STATEMENTS OF INVESTMENTS Unaudited | | |
The Fund has adopted Portfolio Proxy Voting Policies and Procedures under which the Fund votes proxies relating to securities (“portfolio proxies”) held by the Fund. A description of the Fund’s Portfolio Proxy Voting Policies and Procedures is available (i) without charge, upon request, by calling the Fund toll-free at 1.800.CALL OPP (225.5677), (ii) on the Fund’s website at oppenheimerfunds.com, and (iii) on the SEC’s website at www.sec.gov. In addition, the Fund is required to file Form N-PX, with its complete proxy voting record for the 12 months ended June 30th, no later than August 31st of each year. The Fund’s voting record is available (i) without charge, upon request, by calling the Fund toll-free at 1.800.CALL OPP (225.5677), and (ii) in the Form N-PX filing on the SEC’s website at www.sec.gov.
The Fund files its complete schedule of portfolio holdings with the SEC for the first quarter and the third quarter of each fiscal year on Form N-Q. The Fund’s Form N-Q filings are available on the SEC’s website at www.sec.gov. Those forms may be reviewed and copied at the SEC’s Public Reference Room in Washington, D.C. Information on the operation of the Public Reference Room may be obtained by calling 1-800-SEC-0330.
Householding—Delivery of Shareholder Documents
This is to inform you about OppenheimerFunds’ “householding” policy. If more than one member of your household maintains an account in a particular fund, OppenheimerFunds will mail only one copy of the fund’s prospectus (or, if available, the fund’s summary prospectus), annual and semiannual report and privacy policy. The consolidation of these mailings, called householding, benefits your fund through reduced mailing expense, and benefits you by reducing the volume of mail you receive from OppenheimerFunds. Householding does not affect the delivery of your account statements.
Please note that we will continue to household these mailings for as long as you remain an OppenheimerFunds shareholder, unless you request otherwise. If you prefer to receive multiple copies of these materials, please call us at 1.800.CALL-OPP (225-5677). You may also notify us in writing or via email. We will begin sending you individual copies of the prospectus (or, if available, the summary prospectus), reports and privacy policy within 30 days of receiving your request to stop householding.
62 OPPENHEIMER LIMITED-TERM BOND FUND
| | | | |
| | |
| | TRUSTEES AND OFFICERS Unaudited | | |
| | |
Name, Position(s) Held with the
Fund, Length of Service, Age | | Principal Occupation(s) During the Past 5 Years; Other Trusteeships/Directorships Held; Number of
Portfolios in the Fund Complex Currently Overseen |
| |
INDEPENDENT TRUSTEES | | The address of each Trustee in the chart below is 6803 S. Tucson Way, Centennial, Colorado 80112-3924. Each Trustee serves for an indefinite term, or until his or her resignation, retirement, death or removal. |
| |
Brian F. Wruble, Chairman of the Board of Trustees (since 2007), Trustee (since 2005) Year of Birth: 1943 | | Director of Community Foundation of the Florida Keys (non-profit) (since July 2012); Chairman Emeritus and Non-Voting Trustee of The Jackson Laboratory (non-profit) (since August 2011); Director of Special Value Opportunities Fund, LLC (registered investment company) (affiliate of the Sub-Adviser’s parent company) (since September 2004); Member of Zurich Insurance Advisory Council (insurance) (since 2004); Treasurer (since 2007) and Trustee of the Institute for Advanced Study (non-profit educational institute) (since May 1992); Chairman (August 2007-August 2011) and Trustee (since August 1991) of the Board of Trustees of The Jackson Laboratory (non-profit); General Partner of Odyssey Partners, L.P. (hedge fund) (September 1995-December 2007); Special Limited Partner of Odyssey Investment Partners, LLC (private equity investment) (January 1999-September 2004). Oversees 51 portfolios in the OppenheimerFunds complex. Mr. Wruble has served on the Boards of certain Oppenheimer funds since April 2001, during which time he has become familiar with the Fund’s (and other Oppenheimer funds’) financial, accounting, regulatory and investment matters and has contributed to the Boards’ deliberations. |
| |
David K. Downes, Trustee (since 2007) Year of Birth: 1940 | | Director of THL Credit Inc. (since June 2009); Independent Chairman GSK Employee Benefit Trust (since April 2006); Trustee of Employee Trusts (since January 2006); Chief Executive Officer and Board Member of Community Capital Management (investment management company) (since January 2004); President of The Community Reinvestment Act Qualified Investment Fund (investment management company) (since 2004); Director of Internet Capital Group (information technology company) (since October 2003); Director of Correctnet (January 2006-2007); Independent Chairman of the Board of Trustees of Quaker Investment Trust (registered investment company) (2004-2007); Chief Operating Officer and Chief Financial Officer of Lincoln National Investment Companies, Inc. (subsidiary of Lincoln National Corporation, a publicly traded company) and Delaware Investments U.S., Inc. (investment management subsidiary of Lincoln National Corporation) (1993- 2003); President, Chief Executive Officer and Trustee of Delaware Investment Family of Funds (1993-2003); President and Board Member of Lincoln National Convertible Securities Funds, Inc. and the Lincoln National Income Funds, TDC (1993-2003); Chairman and Chief Executive Officer of Retirement Financial Services, Inc. (registered transfer agent and investment adviser and subsidiary of Delaware Investments U.S., Inc.) (1993-2003); President and Chief Executive Officer of Delaware Service Company, Inc. (1995-2003); Chief Administrative Officer, Chief Financial Officer, Vice Chairman and Director of Equitable Capital Management Corporation (investment subsidiary of Equitable Life Assurance Society) (1985-1992); Corporate Controller of Merrill Lynch Company (financial services holding company) (1977-1985); held the following positions at the Colonial Penn Group, Inc. (insurance company): Corporate Budget Director (1974-1977), Assistant Treasurer (1972-1974) and Director of Corporate Taxes (1969-1972); held the following positions at Price Waterhouse Company (financial services firm): Tax Manager (1967-1969), Tax Senior (1965-1967) and Staff Accountant (1963-1965); United States Marine |
63 OPPENHEIMER LIMITED-TERM BOND FUND
| | | | |
| | |
| | TRUSTEES AND OFFICERS Unaudited / Continued | | |
| | |
David K. Downes, Continued | | Corps (1957-1959). Oversees 51 portfolios in the OppenheimerFunds complex. Mr. Downes has served on the Boards of certain Oppenheimer funds since December 2005, during which time he has become familiar with the Fund’s (and other Oppenheimer funds’) financial, accounting, regulatory and investment matters and has contributed to the Boards’ deliberations. |
| |
Matthew P. Fink, Trustee (since 2005) Year of Birth: 1941 | | Trustee of the Committee for Economic Development (policy research foundation) (2005-2011); Director of ICI Education Foundation (education foundation) (October 1991-August 2006); President of the Investment Company Institute (trade association) (October 1991-June 2004); Director of ICI Mutual Insurance Company (insurance company) (October 1991-June 2004); Author of The Rise of Mutual Funds: An Insider’s View published by Oxford University Press (second edition 2010). Oversees 51 portfolios in the OppenheimerFunds complex. Mr. Fink has served on the Boards of certain Oppenheimer funds since January 2005, during which time he has become familiar with the Fund’s (and other Oppenheimer funds’) financial, accounting, regulatory and investment matters and has contributed to the Boards’ deliberations. |
| |
Edmund P. Giambastiani, Jr., Trustee (since 2013) Year of Birth: 1948 | | Advisory Board Member of the Maxwell School of Citizenship and Public Affairs of Syracuse University (since April 2012); Director of Mercury Defense Systems Inc. (information technology) (August 2011-February 2013); Trustee of the U.S. Naval Academy Foundation (since November 2010); Advisory Board Member of the Massachusetts Institute of Technology Lincoln Laboratory (federally-funded research development center) (since May 2010); Director of The Boeing Company (aerospace and defense) (since October 2009); Trustee of MITRE Corporation (federally-funded research development center) (since September 2008); Independent Director of QinetiQ Group Plc (defense technology and security) (February 2008-August 2011); Director of Monster Worldwide, Inc. (on-line career services) (since January 2008, Lead Director since June 2011); Chairman of Alenia North America, Inc. (military and defense products) (January 2008-October 2009); Director of SRA International, Inc. (information technology and services) (January 2008-July 2011); President of Giambastiani Group LLC (national security and energy consulting) (since October 2007); United States Navy, career nuclear submarine officer (June 1970-October 2007), Vice Chairman of the Joint Chiefs of Staff (2005-October 2007), NATO Supreme Allied Commander Transformation (2003-2005), Commander, U.S. Joint Forces Command (2002- 2005). Since his retirement from the U.S. Navy in October 2007, Admiral Giambastiani has also served on numerous U.S. Government advisory boards, investigations and task forces for the Secretaries of Defense, State and Interior and the Central Intelligence Agency. Oversees 51 portfolios in the OppenheimerFunds complex. Admiral Giambastiani has served on the Boards of certain Oppenheimer funds since February 2013, including as an Advisory Board Member for certain Oppenheimer funds, during which time he has become familiar with the Fund’s (and other Oppenheimer funds’) financial, accounting, regulatory and investment matters and has contributed to the Boards’ deliberations. For purposes of this report, Admiral Giambastiani is identified as a Trustee. |
| |
Phillip A. Griffiths, Trustee (since 1999) Year of Birth: 1938 | | Fellow of the Carnegie Corporation (since 2007); Member of the National Academy of Sciences (since 1979); Council on Foreign Relations (since 2002); Foreign Associate of Third World Academy of Sciences (since 2002); Chair of Science Initiative Group (since 1999); Member of the American Philosophical Society (since 1996); Trustee of Woodward Academy (since 1983); Director of |
64 OPPENHEIMER LIMITED-TERM BOND FUND
| | |
Phillip A. Griffiths, Continued | | GSI Lumonics Inc. (precision technology products company) (2001-2010); Senior Advisor of The
Andrew W. Mellon Foundation (2001-2010); Distinguished Presidential Fellow for International Affairs of the National Academy of Science (2002-2010); Director of the Institute for Advanced Study (1991-2004); Director of Bankers Trust New York Corporation (1994-1999); Provost at Duke University (1983-1991). Oversees 51 portfolios in the OppenheimerFunds complex. Mr. Griffiths has served on the Boards of certain Oppenheimer funds since June 1999, during which time he has become familiar with the Fund’s (and other Oppenheimer funds’) financial, accounting, regulatory and investment matters and has contributed to the Boards’ deliberations. |
| |
Mary F. Miller, Trustee (since 2004) Year of Birth: 1942 | | Trustee of International House (not-for-profit) (since June 2007); Trustee of the American Symphony Orchestra (not-for-profit) (October 1998-November 2011); and Senior Vice President and General Auditor of American Express Company (financial services company) (July 1998-February 2003). Oversees 51 portfolios in the OppenheimerFunds complex. Ms. Miller has served on the Boards of certain Oppenheimer funds since August 2004, during which time she has become familiar with the Fund’s (and other Oppenheimer funds’) financial, accounting, regulatory and investment matters and has contributed to the Boards’ deliberations. |
| |
Joel W. Motley, Trustee (since 2002) Year of Birth: 1952 | | Member of the Vestry of Trinity Wall Street (since April 2012); Director of Southern Africa Legal Services Foundation (since March 2012); Board Member of Pulitzer Center for Crisis Reporting (non-profit journalism) (since December 2010); Managing Director of Public Capital Advisors, LLC (privately- held financial advisor) (since January 2006); Managing Director of Carmona Motley, Inc. (privately-held financial advisor) (since January 2002); Director of Columbia Equity Financial Corp. (privately-held financial advisor) (2002-2007); Managing Director of Carmona Motley Hoffman Inc. (privately-held financial advisor) (January 1998-December 2001); Member of the Finance and Budget Committee of the Council on Foreign Relations, Member of the Investment Committee and Board of Human Rights Watch and Member of the Investment Committee and Board of Historic Hudson Valley. Oversees 51 portfolios in the OppenheimerFunds complex. Mr. Motley has served on the Boards of certain Oppenheimer funds since October 2002, during which time he has become familiar with the Fund’s (and other Oppenheimer funds’) financial, accounting, regulatory and investment matters and has contributed to the Boards’ deliberations. |
| |
Joanne Pace, Trustee (since 2012) Year of Birth: 1958 | | Board Director of Horizon Blue Cross Blue Shield of New Jersey (since November 2012); Advisory Board Director of The Alberleen Group LLC (since March, 2012); Advisory Board Director of The Agile Trading Group LLC (since March, 2012); Advisory Council Member of 100 Women in Hedge Funds (non- profit) (since December, 2012); Advisory Council Member of Morgan Stanley Children’s Hospital (non-profit) (since May, 2012); Board Director of The Komera Project (non-profit) (since April, 2012); New York Advisory Board Director of Peace First (non-profit) (since March, 2010); Senior Advisor of SECOR Asset Management, LP (2010-2011); Managing Director and Chief Operating Officer of Morgan Stanley Investment Management (2006-2010); Partner and Chief Operating Officer of FrontPoint Partners, LLC (hedge fund) (2005-2006); held the following positions at Credit Suisse: Managing Director (2003-2005); Global Head of Human Resources and member of Executive Board and Operating Committee (2004-2005), Global Head of Operations and Product Control (2003-2004); held the following positions at Morgan Stanley: Managing Director (1997-2003), Controller and Principal Accounting Officer |
65 OPPENHEIMER LIMITED-TERM BOND FUND
| | | | |
| | |
| | TRUSTEES AND OFFICERS Unaudited / Continued | | |
| | |
Joanne Pace, Continued | | (1999-2003); Chief Financial Officer (temporary assignment) for the Oversight Committee, Long Term Capital Management (1998-1999). Lead Independent Director and Chair of the Audit and Nominating Committee of The Global Chartist Fund, LLC of Oppenheimer Asset Management (2011-2012); Board Director of Managed Funds Association (2008-2010); Board Director of Morgan Stanley Foundation (2007-2010) and Investment Committee Chair (2008-2010). Oversees 51 portfolios in the OppenheimerFunds complex. Ms. Pace has served on the Boards of certain Oppenheimer funds since November 2012, including as an Advisory Board Member for certain Oppenheimer funds, during which time she has become familiar with the Fund’s (and other Oppenheimer funds’) financial, accounting, regulatory and investment matters and has contributed to the Board’s deliberations. For purposes of this report, Ms. Pace is identified as a Trustee. |
| |
Mary Ann Tynan, Trustee (since 2008) Year of Birth: 1945 | | Director and Secretary of the Appalachian Mountain Club (non-profit outdoor organization) (since January 2012); Director of Opera House Arts (non-profit arts organization) (since October 2011); Independent Director of the ICI Board of Governors (non-profit) (since October 2011); Vice Chair of Board of Trustees of Brigham and Women’s/Faulkner Hospitals (non-profit hospital) (since 2000); Chair of Board of Directors of Faulkner Hospital (non-profit hospital) (since 1990); Member of Audit and Compliance Committee of Partners Health Care System (non-profit) (since 2004); Board of Trustees of Middlesex School (educational institution) (since 1994); Chair of Board of Directors of Idealswork, Inc. (financial services provider) (since 2003); Partner, Senior Vice President and Director of Regulatory Affairs of Wellington Management Company, LLP (global investment manager) (1976-2002); Vice President and Corporate Secretary, John Hancock Advisers, Inc. (mutual fund investment adviser) (1970-1976). Oversees 51 portfolios in the OppenheimerFunds complex. Ms. Tynan has served on the Boards of certain Oppenheimer funds since October 2008, during which time she has become familiar with the Fund’s (and other Oppenheimer funds’) financial, accounting, regulatory and investment matters and has contributed to the Boards’ deliberations. |
| |
Joseph M. Wikler, Trustee (since 2005) Year of Birth: 1941 | | Director of C-TASC (bio-statistics services) (2007-2012); formerly, Director of the following medical device companies: Medintec (1992-2011) and Cathco (1996-2011); Member of the Investment Committee of the Associated Jewish Charities of Baltimore (since 1994); Director of Lakes Environmental Association (environmental protection organization) (1996-2008); Director of Fortis/Hartford mutual funds (1994-December 2001). Oversees 51 portfolios in the OppenheimerFunds complex. Mr. Wikler has served on the Boards of certain Oppenheimer funds since August 2005, during which time he has become familiar with the Fund’s (and other Oppenheimer funds’) financial, accounting, regulatory and investment matters and has contributed to the Boards’ deliberations. |
| |
Peter I. Wold, Trustee (since 2005) Year of Birth: 1948 | | Director of Arch Coal, Inc. (since 2010); President of Wold Oil Properties, Inc. (oil and gas exploration and production company) (since 1994); Vice President of American Talc Company, Inc. (talc mining and milling) (since 1999); Managing Member of Hole-in-the-Wall Ranch (cattle ranching) (since 1979); Director and Chairman of Wyoming Enhanced Oil Recovery Institute Commission (enhanced oil recovery study) (2004-2012); Director and Chairman of the Denver Branch of the Federal Reserve Bank of Kansas City |
66 OPPENHEIMER LIMITED-TERM BOND FUND
| | |
Peter I. Wold, Continued | | (1993-1999); and Director of PacifiCorp. (electric utility) (1995-1999). Oversees 51 portfolios in the OppenheimerFunds complex. Mr. Wold has served on the Boards of certain Oppenheimer funds since August 2005, during which time he has become familiar with the Fund’s (and other Oppenheimer funds’) financial, accounting, regulatory and investment matters and has contributed to the Boards’ deliberations. |
| INTERESTED TRUSTEE AND OFFICER | | Mr. Glavin is an “Interested Trustee” because he is affiliated with the Manager and the Sub-Adviser by virtue of his positions as an officer and director of the Manager and a director of the Sub-Adviser, and as a shareholder of the Sub- Adviser’s parent company. Both as a Trustee and as an officer, he serves for an indefinite term, or until his resignation, retirement, death or removal. Mr. Glavin’s address is Two World Financial Center, 225 Liberty Street, 11th Floor, New York, New York 10281-1008. |
| |
William F. Glavin, Jr., Trustee (since 2013), President and Principal Executive Officer (since 2009) Year of Birth: 1958 | | Director, Chairman and Chief Executive Officer of the Manager (since January 2013); President of the Manager (January 2013-May 2013); Chairman of the Sub-Adviser (December 2009-December 2012); Chief Executive Officer (January 2009-December 2012) and Director of the Sub-Adviser (since January 2009); President of the Sub-Adviser (May 2009-December 2012); Management Director (since June 2009), President (since December 2009) and Chief Executive Officer (since January 2011) of Oppenheimer Acquisition Corp. (“OAC”) (the Sub-Adviser’s parent holding company); Director of Oppenheimer Real Asset Management, Inc. (since March 2010); Executive Vice President (March 2006-February 2009) and Chief Operating Officer (July 2007-February 2009) of Massachusetts Mutual Life Insurance Company (OAC’s parent company); Director (May 2004-March 2006) and Chief Operating Officer and Chief Compliance Officer (May 2004-January 2005), President (January 2005-March 2006) and Chief Executive Officer (June 2005- March 2006) of Babson Capital Management LLC; Director (March 2005- March 2006), President (May 2003-March 2006) and Chief Compliance Officer (July 2005-March 2006) of Babson Capital Securities, Inc. (a broker-dealer); President (May 2003-March 2006) of Babson Investment Company, Inc.; Director (May 2004-August 2006) of Babson Capital Europe Limited; Director (May 2004-October 2006) of Babson Capital Guernsey Limited; Director (May 2004-March 2006) of Babson Capital Management LLC; Non-Executive Director (March 2005-March 2007) of Baring Asset Management Limited; Director (February 2005-June 2006) Baring Pension Trustees Limited; Director and Treasurer (December 2003-November 2006) of Charter Oak Capital Management, Inc.; Director (May 2006-September 2006) of C.M. Benefit Insurance Company; Director (May 2008-June 2009) and Executive Vice President (June 2007-July 2009) of C.M. Life Insurance Company; President (March 2006-May 2007) of MassMutual Assignment Company; Director (January 2005-December 2006), Deputy Chairman (March 2005-December 2006) and President (February 2005-March 2005) of MassMutual Holdings (Bermuda) Limited; Director (May 2008-June 2009) and Executive Vice President (June 2007-July 2009) of MML Bay State Life Insurance Company; Chief Executive Officer and President (April 2007-January 2009) of MML Distributors, LLC; and Chairman (March 2006-December 2008) and Chief Executive Officer (May 2007-December 2008) of MML Investors Services, Inc. An officer of 89 portfolios in the OppenheimerFunds complex. |
67 OPPENHEIMER LIMITED-TERM BOND FUND
| | | | |
| | |
| | TRUSTEES AND OFFICERS Unaudited | | |
| | |
OTHER OFFICERS OF THE FUND | | The addresses of the Officers in the chart below are as follows: for Messrs. Strzalkowski, Gabinet and Ms. Nasta, Two World Financial Center, 225 Liberty Street, New York, New York 10281-1008, for Messrs. Vandehey and Wixted, 6803 S. Tucson Way, Centennial, Colorado 80112-3924. Each Officer serves for an indefinite term or until his or her resignation, retirement, death or removal. |
| |
Peter A. Strzalkowski, Vice President (since 2009) Year of Birth: 1965 | | Vice President and Senior Portfolio Manager of the Sub-Adviser (since August 2007) and a member of the Sub-Adviser’s Investment Grade Fixed Income Team (since April 2009). Managing Partner and Chief Investment Officer of Vector Capital Management, LLC, a structured products money management firm he founded, (July 2006-August 2007). Senior Portfolio Manager at Highland Capital Management, L.P. (June 2005-July 2006) and a Senior Fixed Income Portfolio Manager at Microsoft Corp. (June 2003-June 2005). Vice President and Senior Fixed Income Portfolio Manager at First Citizens Bank Trust, Capital Management Group (April 2000-June 2003) and a Vice President and Fixed Income Portfolio Manager at Centura Banks (November 1998-April 2000). A portfolio manager and officer of other portfolios in the OppenheimerFunds complex. |
| |
Arthur S. Gabinet, Secretary and Chief Legal Officer (since 2011) Year of Birth: 1958 | | Executive Vice President, Secretary and General Counsel of the Manager (since January 2013); General Counsel OFI SteelPath, Inc. (since January 2013); Executive Vice President (May 2010-December 2012) and General Counsel (since January 2011) of the Sub-Adviser; General Counsel of the Distributor (since January 2011); General Counsel of Centennial Asset Management Corporation (January 2011-December 2012); Executive Vice President (January 2011-December 2012) and General Counsel of HarbourView Asset Management Corporation (since January 2011); Assistant Secretary (since January 2011) and Director (since January 2011) of OppenheimerFunds International Ltd. and OppenheimerFunds plc; Director of Oppenheimer Real Asset Management, Inc. (January 2011-December 2012) and General Counsel (since January 2011); Executive Vice President (January 2011-December 2011) and General Counsel of Shareholder Financial Services, Inc. and Shareholder Services, Inc. (since January 2011); Executive Vice President (January 2011-December 2012) and General Counsel of OFI Private Investments Inc. (since January 2011); Vice President of OppenheimerFunds Legacy Program (January 2011-December 2011); Executive Vice President (January 2011-December 2012) and General Counsel of OFI Global Institutional, Inc. (since January 2011); General Counsel, Asset Management of the Sub-Adviser (May 2010-December 2010); Principal, The Vanguard Group (November 2005-April 2010); District Administrator, U.S. Securities and Exchange Commission (January 2003- October 2005). An officer of 89 portfolios in the OppenheimerFunds complex. |
| |
Christina M. Nasta, Vice President and Chief Business Officer (since 2011) Year of Birth: 1973 | | Senior Vice President of OppenheimerFunds Distributor, Inc. (since January 2013); Senior Vice President of the Sub-Adviser (July 2010-December 2012); Vice President of the Sub-Adviser (January 2003-July 2010); Vice President of OppenheimerFunds Distributor, Inc. (January 2003-July 2010). An officer of 89 portfolios in the OppenheimerFunds complex. |
| |
Mark S. Vandehey, Vice President and Chief Compliance Officer (since 2004) Year of Birth: 1950 | | Senior Vice President and Chief Compliance Officer of the Manager (since January 2013); Chief Compliance Officer of OFI SteelPath, Inc. (since January 2013); Senior Vice President of the Sub-Adviser (March 2004-December 2012); Chief Compliance Officer of the Sub-Adviser, OppenheimerFunds Distributor, Inc., OFI Global Trust Company, OFI Global Institutional, Inc., |
68 OPPENHEIMER LIMITED-TERM BOND FUND
| | |
Mark S. Vandehey, Continued | | Oppenheimer Real Asset Management, Inc., OFI Private Investments, Inc., Harborview Asset Management Corporation, Trinity Investment Management Corporation, and Shareholder Services, Inc. (since March 2004); Vice President of OppenheimerFunds Distributor, Inc., Centennial Asset Management Corporation and Shareholder Services, Inc. (June 1983- December 2012). An officer of 89 portfolios in the OppenheimerFunds complex. |
| |
Brian W. Wixted, Treasurer and Principal Financial & Accounting Officer (since 1999) Year of Birth: 1959 | | Senior Vice President of the Manager (since January 2013); Treasurer of the Sub-Adviser, HarbourView Asset Management Corporation, Shareholder Financial Services, Inc., Shareholder Services, Inc., and Oppenheimer Real Asset Management, Inc. (March 1999-June 2008), OFI Private Investments, Inc. (March 2000-June 2008), OppenheimerFunds International Ltd. and OppenheimerFunds plc (since May 2000), OFI Global Institutional, Inc. (November 2000-June 2008), and OppenheimerFunds Legacy Program (charitable trust program established by the Sub-Adviser) (June 2003- December 2011); Treasurer and Chief Financial Officer of OFI Global Trust Company (since May 2000); Assistant Treasurer of Oppenheimer Acquisition Corporation (March 1999-June 2008). An officer of 89 portfolios in the OppenheimerFunds complex. |
The Fund’s Statement of Additional Information contains additional information about the Fund’s Trustees and Officers and is available without charge upon request, by calling 1.800.CALL OPP (225.5677).
69 OPPENHEIMER LIMITED-TERM BOND FUND
| | | | |
| | |
| | OPPENHEIMER LIMITED-TERM BOND FUND | | |
| | |
| |
Manager | | OFI Global Asset Management, Inc. |
| |
Sub-Adviser | | OppenheimerFunds, Inc. |
| |
Distributor | | OppenheimerFunds Distributor, Inc. |
| |
Transfer and Shareholder | | OFI Global Asset Management, Inc. |
Servicing Agent | | |
| |
Sub-Transfer Agent | | Shareholder Services, Inc. |
| | DBA OppenheimerFunds Services |
| |
Independent Registered | | KPMG LLP |
Public Accounting Firm | | |
| |
Legal Counsel | | Kramer Levin Naftalis & Frankel LLP |
© 2013 OppenheimerFunds, Inc. All rights reserved.
70 OPPENHEIMER LIMITED-TERM BOND FUND
As an Oppenheimer fund shareholder, you are entitled to know how we protect your personal information and how we limit its disclosure.
Information Sources
We obtain nonpublic personal information about our shareholders from the following sources:
| | • | | Applications or other forms |
| | • | | When you create a user ID and password for online account access |
| | • | | When you enroll in eDocs Direct, our electronic document delivery service |
| | • | | Your transactions with us, our affiliates or others |
| | • | | A software program on our website, often referred to as a “cookie,” which indicates which parts of our site you’ve visited |
| | • | | When you set up challenge questions to reset your password online |
If you visit oppenheimerfunds.com and do not log on to the secure account information areas, we do not obtain any personal information about you. When you do log on to a secure area, we do obtain your user ID and password to identify you. We also use this information to provide you with products and services you have requested, to inform you about products and services that you may be interested in and assist you in other ways.
We do not collect personal information through our website unless you willingly provide it to us, either directly by email or in those areas of the website that request information. In order to update your personal information (including your mailing address, email address and phone number) you must first log on and visit your user profile.
If you have set your browser to warn you before accepting cookies, you will receive the warning message with each cookie. You can refuse cookies by turning them off in your browser. However, doing so may limit your access to certain sections of our website.
We use cookies to help us improve and manage our website. For example, cookies help us recognize new versus repeat visitors to the site, track the pages visited, and enable some special features on the website. This data helps us provide a better service for our website visitors.
Protection of Information
We do not disclose any non-public personal information (such as names on a customer list) about current or former customers to anyone, except as permitted by law.
Disclosure of Information
We send your financial advisor (as designated by you) copies of confirmations, account statements and other documents reporting activity in your fund accounts. We may also use details about you and your investments to help us, our financial service affiliates, or firms that jointly market their financial products and services with ours, to better serve your investment needs or suggest financial services or educational material that may be of interest to you. If this requires us to provide you with an opportunity to “opt in” or “opt out” of such information sharing with a firm not affiliated with us, you will receive notification on how to do so, before any such sharing takes place.
Right of Refusal
We will not disclose your personal information to unaffiliated third parties (except as permitted by law), unless we first offer you a reasonable opportunity to refuse or “opt out” of such disclosure.
71 OPPENHEIMER LIMITED-TERM BOND FUND
| | | | |
| | |
| | PRIVACY POLICY NOTICE Continued | | |
Internet Security and Encryption
In general, the email services provided by our website are encrypted and provide a secure and private means of communication with us. To protect your own privacy, confidential and/or personal information should only be communicated via email when you are advised that you are using a secure website. As a security measure, we do not include personal or account information in non-secure emails, and we advise you not to send such information to us in non-secure emails. Instead, you may take advantage of the secure features of our website to encrypt your email correspondence. To do this, you will need to use a browser that supports Secure Sockets Layer (SSL) protocol.
We do not guarantee or warrant that any part of our website, including files available for download, are free of viruses or other harmful code. It is your responsibility to take appropriate precautions, such as use of an anti-virus software package, to protect your computer hardware and software.
| | • | | All transactions, including redemptions, exchanges and purchases, are secured by SSL and 128-bit encryption. SSL is used to establish a secure connection between your PC and OppenheimerFunds’ server. It transmits information in an encrypted and scrambled format. |
| | • | | Encryption is achieved through an electronic scrambling technology that uses a “key” to code and then decode the data. Encryption acts like the cable converter box you may have on your television set. It scrambles data with a secret code so that no one can make sense of it while it is being transmitted. When the data reaches its destination, the same software unscrambles the data. |
| | • | | You can exit the secure area by either closing your browser, or for added security, you can use the Log Out button before you close your browser. |
Other Security Measures
We maintain physical, electronic and procedural safeguards to protect your personal account information. Our employees and agents have access to that information only so that they may offer you products or provide services, for example, when responding to your account questions.
How You Can Help
You can also do your part to keep your account information private and to prevent unauthorized transactions. If you obtain a user ID and password for your account, do not allow it to be used by anyone else. Also, take special precautions when accessing your account on a computer used by others.
Who We Are
This joint notice describes the privacy policies of the Oppenheimer funds, OppenheimerFunds, Inc., and each of its financial institution subsidiaries, the trustee of OppenheimerFunds Individual Retirement Accounts (IRAs) and the custodian of the OppenheimerFunds 403(b)(7) tax sheltered custodial accounts. It applies to all Oppenheimer fund accounts you presently have, or may open in the future, using your Social Security number—whether or not you remain a shareholder of our funds. This notice was last updated November 2012. In the event it is updated or changed, we will post an updated notice on our website at oppenheimerfunds.com. If you have any questions about these privacy policies, write to us at P.O. Box 5270, Denver, CO 80217-5270, email us by clicking on the Contact Us section of our website at oppenheimerfunds.com or call us at 1.800.CALL OPP (225.5677).
72 OPPENHEIMER LIMITED-TERM BOND FUND
THIS PAGE INTENTIONALLY LEFT BLANK.
73 OPPENHEIMER LIMITED-TERM BOND FUND
THIS PAGE INTENTIONALLY LEFT BLANK.
74 OPPENHEIMER LIMITED-TERM BOND FUND
THIS PAGE INTENTIONALLY LEFT BLANK.
75 OPPENHEIMER LIMITED-TERM BOND FUND
THIS PAGE INTENTIONALLY LEFT BLANK.
76 OPPENHEIMER LIMITED-TERM BOND FUND
THIS PAGE INTENTIONALLY LEFT BLANK.
77 OPPENHEIMER LIMITED-TERM BOND FUND
THIS PAGE INTENTIONALLY LEFT BLANK.
78 OPPENHEIMER LIMITED-TERM BOND FUND
THIS PAGE INTENTIONALLY LEFT BLANK.
79 OPPENHEIMER LIMITED-TERM BOND FUND

Item 2. Code of Ethics.
The registrant has adopted a code of ethics that applies to the registrant’s principal executive officer, principal financial officer, principal accounting officer or controller or persons performing similar functions.
Item 3. Audit Committee Financial Expert.
The Board of Trustees of the registrant has determined that David Downes, the Board’s Audit Committee Chairman, is an audit committee financial expert and that Mr. Downes is “independent” for purposes of this Item 3.
Item 4. Principal Accountant Fees and Services.
The principal accountant for the audit of the registrant’s annual financial statements billed $35,500 in fiscal 2013 and $34,800 in fiscal 2012.
The principal accountant for the audit of the registrant’s annual financial statements billed $1,500 in fiscal 2013 and no such fees in fiscal 2012.
The principal accountant for the audit of the registrant’s annual financial statements billed $477,830 in fiscal 2013 and $583,556 in fiscal 2012 to the registrant’s investment adviser or any entity controlling, controlled by, or under common control with the adviser that provides ongoing services to the registrant.
Such services include: Internal control reviews, compliance procedures, GIPS attestation procedures, internal audit training, surprise exams, system conversion testing, corporate restructuring
The principal accountant for the audit of the registrant’s annual financial statements billed no such fees in fiscal 2013 and $3,800 in fiscal 2012.
The principal accountant for the audit of the registrant’s annual financial statements billed $492,036 in fiscal 2013 and $317,764 in fiscal 2012 to the registrant’s investment adviser or any entity controlling, controlled by, or under common control with the adviser that provides ongoing services to the registrant.
Such services include: tax compliance, tax planning and tax advice. Tax compliance generally involves preparation of original and amended tax returns, claims for a refund and tax payment-planning services. Tax planning and tax advice includes assistance with tax audits and appeals, tax advice related to mergers and acquisitions and requests for rulings or technical advice from taxing authorities.
The principal accountant for the audit of the registrant’s annual financial statements billed no such fees in fiscal 2013 and no such fees in fiscal 2012.
The principal accountant for the audit of the registrant’s annual financial statements billed no such fees in fiscal 2013 and no such fees in fiscal 2012 to the registrant’s investment adviser or any entity controlling, controlled by, or under common control with the adviser that provides ongoing services to the registrant.
Such fees would include the cost to the principal accountant of attending audit committee meetings and consultations regarding the registrant’s retirement plan with respect to its Trustees.
| (e) | (1) During its regularly scheduled periodic meetings, the registrant’s audit committee will pre-approve all audit, audit-related, tax and other services to be provided by the principal accountants of the registrant. |
The audit committee has delegated pre-approval authority to its Chairman for any subsequent new engagements that arise between regularly scheduled meeting dates provided that any fees such pre-approved are presented to the audit committee at its next regularly scheduled meeting.
Under applicable laws, pre-approval of non-audit services may be waived provided that: 1) the aggregate amount of all such services provided constitutes no more than five percent of the total amount of fees paid by the registrant to its principal accountant during the fiscal year in which services are provided 2) such services were not recognized by the registrant at the time of engagement as non-audit services and 3) such services are promptly brought to the attention of the audit committee of the registrant and approved prior to the completion of the audit.
(2) 0%
| (f) | Not applicable as less than 50%. |
| (g) | The principal accountant for the audit of the registrant’s annual financial statements billed $969,866 in fiscal 2013 and $905,120 in fiscal 2012 to the registrant and the registrant’s investment adviser or any entity controlling, controlled by, or under common control with the adviser that provides ongoing services to the registrant related to non-audit fees. Those billings did not include any prohibited non-audit services as defined by the Securities Exchange Act of 1934. |
| (h) | The registrant’s audit committee of the board of Trustees has considered whether the provision of non-audit services that were rendered to the registrant’s investment adviser, and any entity controlling, controlled by, or under common control with the investment adviser that provides ongoing services to the registrant that were not pre-approved pursuant to paragraph (c)(7)(ii) of Rule 2-01 of Regulation S-X is compatible with maintaining the principal accountant’s independence. No such services were rendered. |
Item 5. Audit Committee of Listed Registrants
Not applicable.
Item 6. Schedule of Investments.
a) Not applicable. The complete schedule of investments is included in Item 1 of this Form N-CSR.
b) Not applicable.
Item 7. Disclosure of Proxy Voting Policies and Procedures for Closed-End Management Investment Companies.
Not applicable.
Item 8. Portfolio Managers of Closed-End Management Investment Companies.
Not applicable.
Item 9. Purchases of Equity Securities by Closed-End Management Investment Company and Affiliated Purchasers.
Not applicable.
Item 10. Submission of Matters to a Vote of Security Holders.
The Fund’s Governance Committee Provisions with Respect to Nominations of Directors/Trustees to the Respective Boards
None
Item 11. Controls and Procedures.
Based on their evaluation of the registrant’s disclosure controls and procedures (as defined in rule 30a-3(c) under the Investment Company Act of 1940 (17 CFR 270.30a-3(c)) as of 8/30/2013, the registrant’s principal executive officer and principal financial officer found the registrant’s disclosure controls and procedures to provide reasonable assurances that information required to be disclosed by the registrant in the reports that it files under the Securities Exchange Act of 1934 (a) is accumulated and communicated to registrant’s management, including its principal executive officer and principal financial officer, to allow timely decisions regarding required disclosure, and (b) is recorded, processed, summarized and reported, within the time periods specified in the rules and forms adopted by the U.S. Securities and Exchange Commission.
There have been no changes in the registrant’s internal controls over financial reporting that occurred during the registrant’s second fiscal quarter of the period covered by this report that have materially affected, or are reasonably likely to materially affect, the registrant’s internal control over financial reporting.
Item 12. Exhibits.
| (a) | (1) Exhibit attached hereto. |
(2) Exhibits attached hereto.
(3) Not applicable.
| (b) | Exhibit attached hereto. |
SIGNATURES
Pursuant to the requirements of the Securities Exchange Act of 1934 and the Investment Company Act of 1940, the registrant has duly caused this report to be signed on its behalf by the undersigned, thereunto duly authorized.
| | |
| Oppenheimer Limited-Term Bond Fund |
| |
| By: | | /s/ William F. Glavin, Jr. |
| | William F. Glavin, Jr. |
| | Principal Executive Officer |
| |
| Date: | | 10/14/2013 |
Pursuant to the requirements of the Securities Exchange Act of 1934 and the Investment Company Act of 1940, this report has been signed below by the following persons on behalf of the registrant and in the capacities and on the dates indicated.
| | |
| By: | | /s/ William F. Glavin, Jr. |
| | William F. Glavin, Jr. |
| | Principal Executive Officer |
| |
| Date: | | 10/14/2013 |
| | |
| By: | | /s/ Brian W. Wixted |
| | Brian W. Wixted |
| | Principal Financial Officer |
| |
| Date: | | 10/14/2013 |