UNITED STATES
SECURITIES AND EXCHANGE COMMISSION
WASHINGTON, D.C. 20549
FORM N-CSR
CERTIFIED SHAREHOLDER REPORT OF REGISTERED MANAGEMENT
INVESTMENT COMPANIES
Investment Company Act file number 811-3430
Oppenheimer Limited-Term Bond Fund
(Exact name of registrant as specified in charter)
6803 South Tucson Way, Centennial, Colorado 80112-3924
(Address of principal executive offices) (Zip code)
Cynthia Lo Bessette
OFI Global Asset Management, Inc.
225 Liberty Street, New York, New York 10281-1008
(Name and address of agent for service)
Registrant’s telephone number, including area code: (303) 768-3200
Date of fiscal year end: August 31
Date of reporting period: 8/31/2016
Item 1. Reports to Stockholders.
| | | | | | |
| | Annual Report | | 8/31/2016 | | |
| | | | |
| | 
| | |
| | | | |
| | Oppenheimer Limited-Term Bond Fund | | |
Table of Contents
Class A Shares
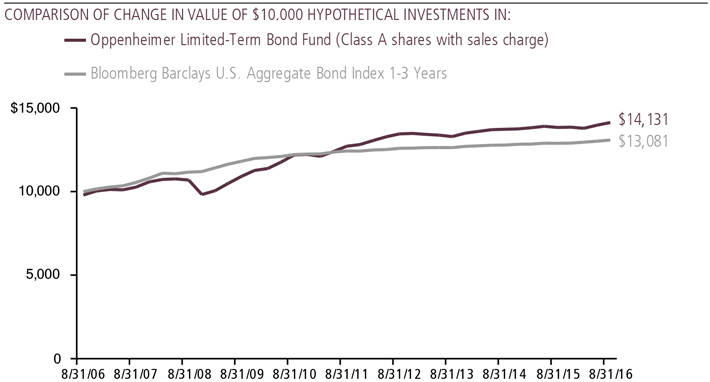
AVERAGE ANNUAL TOTAL RETURNS AT 8/31/16
| | | | | | | | | | | | |
| | | Class A Shares of the Fund | | | | |
| | | Without Sales Charge | | | With Sales Charge | | | Bloomberg Barclays
U.S. Aggregate Bond
Index 1-3 Years | |
1-Year | | | 2.01% | | | | -0.28% | | | | 1.51% | |
5-Year | | | 2.11 | | | | 1.64 | | | | 1.02 | |
10-Year | | | 3.74 | | | | 3.50 | | | | 2.72 | |
Performance data quoted represents past performance, which does not guarantee future results. The investment return and principal value of an investment in the Fund will fluctuate so that an investor’s shares, when redeemed, may be worth more or less than their original cost. Fund returns include changes in share price, reinvested distributions, and a 2.25% maximum applicable sales charge except where “without sales charge” is indicated. Current performance may be lower or higher than the performance quoted. Returns do not consider capital gains or income taxes on an individual’s investment. For performance data current to the most recent month-end, visit oppenheimerfunds.com or call 1.800.CALL OPP (225.5677). See Fund prospectuses and summary prospectuses for more information on share classes and sales charges.
2 OPPENHEIMER LIMITED-TERM BOND FUND
Fund Performance Discussion
The Fund’s Class A shares (without sales charge) produced a return of 2.01% during the reporting period. On a relative basis, the Fund outperformed the Bloomberg Barclays U.S. Aggregate Bond Index 1-3 Years (the “Index”), which returned 1.51% during the same period.
MARKET OVERVIEW
The first half of the reporting period was a turbulent time for various asset classes. The prospect of more sluggish demand for energy and construction materials from China and other emerging markets sent equity and commodity prices broadly lower. The Federal Reserve (the “Fed”) finally hiked interest rates 0.25% in December. 2016 started off with credit markets widening amid stock market weakness. The Fed’s statement in January suggested they would continue gradually raising rates this year, which further roiled markets as global growth continued to show
risk of slowing further. Risk asset weakness and the Bank of Japan cutting rates to negative levels at the end of January helped U.S. Treasury yields fall dramatically.
By mid-February markets began to turn. The European Central Bank (“ECB”) hinted it would likely ease further, the Bank of Japan’s tone remained dovish, China signaled it would provide further stimulus, and better than expected economic data helped turn sentiment. A dovish Fed statement in mid-March and further dovish statements from
3 OPPENHEIMER LIMITED-TERM BOND FUND
Chair Yellen (sometimes at odds with other Fed speakers) helped the better trend in risk sentiment persist.
The second quarter of 2016 began with improving data momentum, payrolls and wages remained steady, while survey indicators such as the Institute for Supply Management (ISM) and consumer sentiment also improved. Chinese and emerging market growth looked to have stabilized or modestly strengthened.
Data trends continued into May, which led to expectations that the Fed would hike at least twice during 2016 – including the potential for a June hike. A weak May payrolls report caused the market to back off the possibility of two hikes, as did a dovish Chair Yellen in her press conference after the mid-June Federal Open Market Committee meeting.
The big surprise news came late in June with voters in the United Kingdom opting to drop out of the European Union. U.S. markets became extremely volatile for two days. However, risk assets sharply rebounded, while bond yields remain depressed on expectations of further central bank easing. The market continues to delay its expectations for additional rate hikes.
FUND REVIEW
During the reporting period, the Fund’s outperformance versus the Index was driven by security selection in investment grade credit across a number of industries; some of which include consumer products, building materials, pharmaceuticals and retailers. An underweight position in U.S. Treasuries and security selection in asset-backed securities also contributed positively to the Fund’s performance versus the Index this period.
Relative to the Index, the primary detractor from the Fund’s performance was security selection in commercial mortgage-backed securities.
STRATEGY & OUTLOOK
We believe dovish central banks and a maturing credit cycle that has yet to turn may be good for spread sectors (those that offer yields above Treasury rates). In addition, we believe Treasury rates should remain low and largely range-bound due to strong foreign appetite. In the current environment, we continue to maintain a neutral duration posture, with an underweight to U.S. Treasuries versus the Index. We continue to favor diversified corporate and structured credit, including mortgage-backed securities, commercial mortgage-backed securities and asset-backed securities.
| | |
 | | 
Peter A Strzalkowski, CFA Portfolio Manager |
| |
| |
4 OPPENHEIMER LIMITED-TERM BOND FUND
Portfolio Allocation
| | |
| | | |
| Non-Convertible Corporate Bonds and Notes | | 61.7% |
| Mortgage-Backed Obligations | | |
Government Agency | | 9.0 |
Non-Agency | | 11.7 |
| Asset-Backed Securities | | 12.5 |
| Investment Companies | | |
Oppenheimer Institutional | | |
Money Market Fund* | | 2.0 |
| Short-Term Notes | | 1.8 |
| U.S. Government Obligations | | 1.2 |
| Over-the-Counter Credit Default Swaptions Purchased | | 0.1 |
*Effective September 28, 2016, the fund will change its name to Oppenheimer Institutional Government Money Market Fund.
Portfolio holdings and allocations are subject to change. Percentages are as of August 31, 2016, and are based on the total market value of investments.
5 OPPENHEIMER LIMITED-TERM BOND FUND
Share Class Performance
AVERAGE ANNUAL TOTAL RETURNS WITHOUT SALES CHARGE AS OF 8/31/16
| | | | | | | | | | | | | | |
| | | Inception | | | | | | | | | |
| | | Date | | | 1-Year | | | 5-Year | | | 10-Year |
Class A (OUSGX) | | | 8/16/85 | | | | 2.01 | % | | | 2.11 | % | | 3.74% |
Class B (UGTBX) | | | 7/21/95 | | | | 1.18 | | | | 1.28 | | | 3.29 |
Class C (OUSCX) | | | 12/1/93 | | | | 1.19 | | | | 1.29 | | | 2.94 |
Class I (OUSIX) | | | 8/1/13 | | | | 2.41 | | | | 2.24 | * | | N/A |
Class R (OUSNX) | | | 3/1/01 | | | | 1.82 | | | | 1.82 | | | 3.47 |
Class Y (OUSYX) | | | 5/18/98 | | | | 2.32 | | | | 2.32 | | | 3.99 |
AVERAGE ANNUAL TOTAL RETURNS WITH SALES CHARGE AS OF 8/31/16 |
| | | Inception | | | | | | | | | |
| | | Date | | | 1-Year | | | 5-Year | | | 10-Year |
Class A (OUSGX) | | | 8/16/85 | | | | -0.28 | % | | | 1.64 | % | | 3.50% |
Class B (UGTBX) | | | 7/21/95 | | | | -2.82 | | | | 1.10 | | | 3.29 |
Class C (OUSCX) | | | 12/1/93 | | | | 0.20 | | | | 1.29 | | | 2.94 |
Class I (OUSIX) | | | 8/1/13 | | | | 2.41 | | | | 2.24 | * | | N/A |
Class R (OUSNX) | | | 3/1/01 | | | | 1.82 | | | | 1.82 | | | 3.47 |
Class Y (OUSYX) | | | 5/18/98 | | | | 2.32 | | | | 2.32 | | | 3.99 |
*Shows performance since inception. STANDARDIZED YIELDS |
| | | | | | | | |
For the 30 Days Ended 8/31/16 | |
Class A | | | 1.53 | % | | | | |
Class B | | | 0.74 | | | | | |
Class C | | | 0.76 | | | | | |
Class I | | | 1.95 | | | | | |
Class R | | | 1.27 | | | | | |
Class Y | | | 1.75 | | | | | |
Performance data quoted represents past performance, which does not guarantee future results. The investment return and principal value of an investment in the Fund will fluctuate so that an investor’s shares, when redeemed, may be worth more or less than their original cost. Current performance may be lower or higher than the performance quoted. Returns do not consider capital gains or income taxes on an individual’s investment. For performance data current to the most recent month-end, visit oppenheimerfunds.com or call 1.800. CALL OPP (225.5677). Fund returns include changes in share price, reinvested distributions, and the applicable sales charge: for Class A shares, the current maximum initial sales charge of 2.25%; for Class B shares, the contingent deferred sales charge of 4% (1-year) and 1% (5-year); and for Class C shares, the contingent deferred sales charge (“CDSC”) of 1% for the 1-year period. There is no sales charge for Class I, Class R and Class Y shares. Because Class B shares convert to Class A shares 72 months after purchase, the 10-year return for Class B shares uses Class A performance for
6 OPPENHEIMER LIMITED-TERM BOND FUND
the period after conversion. See Fund prospectuses and summary prospectuses for more information on share classes and sales charges.
Standardized yield is based on net investment income for the 30-day period ended 8/31/16 and the maximum offering price at the end of the period for Class A shares and the net asset value for Class B, Class C, Class I, Class R and Class Y shares. Each result is compounded semiannually and then annualized. Falling share prices will tend to artificially raise yields.
The Fund’s performance is compared to that of the Bloomberg Barclays U.S. Aggregate Bond Index 1-3 Years, which is an unmanaged index of publicly issued investment grade corporate, U.S. Treasury and government agency securities with remaining maturities of one to three years. The Index is unmanaged and cannot be purchased directly by investors. While index comparisons may be useful to provide a benchmark for the Fund’s performance, it must be noted that the Fund’s investments are not limited to the investments comprising the indices. Index performance includes reinvestment of income, but does not reflect transaction costs, fees, expenses or taxes. Index performance is shown for illustrative purposes only as a benchmark for the Fund’s performance, and does not predict or depict performance of the Fund. The Fund’s performance reflects the effects of the Fund’s business and operating expenses.
The Fund’s investment strategy and focus can change over time. The mention of specific fund holdings does not constitute a recommendation by OppenheimerFunds, Inc. or its affiliates.
Before investing in any of the Oppenheimer funds, investors should carefully consider a fund’s investment objectives, risks, charges and expenses. Fund prospectuses and summary prospectuses contain this and other information about the funds, and may be obtained by asking your financial advisor, visiting oppenheimerfunds.com, or calling 1.800.CALL OPP (225.5677). Read prospectuses and summary prospectuses carefully before investing.
Shares of Oppenheimer funds are not deposits or obligations of any bank, are not guaranteed by any bank, are not insured by the FDIC or any other agency, and involve investment risks, including the possible loss of the principal amount invested.
7 OPPENHEIMER LIMITED-TERM BOND FUND
Fund Expenses
Fund Expenses. As a shareholder of the Fund, you incur two types of costs: (1) transaction costs, which may include sales charges (loads) on purchase payments and/or contingent deferred sales charges on redemptions; and (2) ongoing costs, including management fees; distribution and service fees; and other Fund expenses. These examples are intended to help you understand your ongoing costs (in dollars) of investing in the Fund and to compare these costs with the ongoing costs of investing in other mutual funds.
The examples are based on an investment of $1,000.00 invested at the beginning of the period and held for the entire 6-month period ended August 31, 2016.
Actual Expenses. The first section of the table provides information about actual account values and actual expenses. You may use the information in this section for the class of shares you hold, together with the amount you invested, to estimate the expense that you paid over the period. Simply divide your account value by $1,000.00 (for example, an $8,600.00 account value divided by $1,000.00 = 8.60), then multiply the result by the number in the first section under the heading entitled “Expenses Paid During 6 Months Ended August 31, 2016” to estimate the expenses you paid on your account during this period.
Hypothetical Example for Comparison Purposes. The second section of the table provides information about hypothetical account values and hypothetical expenses based on the Fund’s actual expense ratio for each class of shares, and an assumed rate of return of 5% per year for each class before expenses, which is not the Fund’s actual return. The hypothetical account values and expenses may not be used to estimate the actual ending account balance or expenses you paid for the period. You may use this information to compare the ongoing costs of investing in the Fund and other funds. To do so, compare this 5% hypothetical example for the class of shares you hold with the 5% hypothetical examples that appear in the shareholder reports of the other funds.
Please note that the expenses shown in the table are meant to highlight your ongoing costs only and do not reflect any transactional costs, such as front-end or contingent deferred sales charges (loads). Therefore, the “hypothetical” section of the table is useful in comparing ongoing costs only, and will not help you determine the relative total costs of owning different funds. In addition, if these transactional costs were included, your costs would have been higher.
8 OPPENHEIMER LIMITED-TERM BOND FUND
| | | | | | | | | | | | |
| Actual | | Beginning Account Value March 1, 2016 | | | | Ending Account Value August 31, 2016 | | | | Expenses
Paid During
6 Months Ended
August 31, 2016 | | |
Class A | | $ 1,000.00 | | | | $ 1,025.20 | | | | $ 4.18 | | |
Class B | | 1,000.00 | | | | 1,018.70 | | | | 8.41 | | |
Class C | | 1,000.00 | | | | 1,018.80 | | | | 8.31 | | |
Class I | | 1,000.00 | | | | 1,024.90 | | | | 2.24 | | |
Class R | | 1,000.00 | | | | 1,023.70 | | | | 5.71 | | |
Class Y | | 1,000.00 | | | | 1,026.10 | | | | 3.21 | | |
Hypothetical | | | | | | | | | | | | |
| (5% return before expenses) | | | | | | | | | | | | |
Class A | | 1,000.00 | | | | 1,021.01 | | | | 4.17 | | |
Class B | | 1,000.00 | | | | 1,016.84 | | | | 8.40 | | |
Class C | | 1,000.00 | | | | 1,016.94 | | | | 8.30 | | |
Class I | | 1,000.00 | | | | 1,022.92 | | | | 2.24 | | |
Class R | | 1,000.00 | | | | 1,019.51 | | | | 5.70 | | |
Class Y | | 1,000.00 | | | | 1,021.97 | | | | 3.21 | | |
Expenses are equal to the Fund’s annualized expense ratio for that class, multiplied by the average account value over the period, multiplied by 184/366 (to reflect the one-half year period). Those annualized expense ratios, excluding indirect expenses from affiliated funds, based on the 6-month period ended August 31, 2016 are as follows: |
| | |
| Class | | Expense Ratios |
Class A | | 0.82% |
Class B | | 1.65 |
Class C | | 1.63 |
Class I | | 0.44 |
Class R | | 1.12 |
Class Y | | 0.63 |
The expense ratios reflect voluntary and/or contractual waivers and/or reimbursements of expenses by the Fund’s Manager. Some of these undertakings may be modified or terminated at any time, as indicated in the Fund’s prospectus. The “Financial Highlights” tables in the Fund’s financial statements, included in this report, also show the gross expense ratios, without such waivers or reimbursements and reduction to custodian expenses, if applicable.
9 OPPENHEIMER LIMITED-TERM BOND FUND
STATEMENT OF INVESTMENTS August 31, 2016
| | | | | | | | |
| | | Principal Amount | | | Value | |
| |
| Asset-Backed Securities—13.1% | | | | | | | | |
| |
| Auto Loan—10.5% | | | | | | | | |
| |
| American Credit Acceptance Receivables Trust: | | | | | | | | |
| Series 2014-1, Cl. B, 2.39%, 11/12/191 | | $ | 417,019 | | | $ | 417,210 | |
| Series 2014-2, Cl. B, 2.26%, 3/10/201 | | | 184,592 | | | | 184,727 | |
| Series 2014-3, Cl. B, 2.43%, 6/10/201 | | | 1,709,114 | | | | 1,708,383 | |
| Series 2014-4, Cl. B, 2.60%, 10/10/171 | | | 905,943 | | | | 906,563 | |
| Series 2015-1, Cl. B, 2.85%, 2/12/211 | | | 2,690,000 | | | | 2,698,627 | |
| Series 2015-2, Cl. B, 2.97%, 5/12/211 | | | 2,825,000 | | | | 2,837,914 | |
| Series 2015-3, Cl. B, 3.56%, 10/12/211 | | | 2,950,000 | | | | 2,985,598 | |
| AmeriCredit Automobile Receivables Trust: | | | | | | | | |
| Series 2012-2, Cl. E, 4.85%, 8/8/191 | | | 1,295,000 | | | | 1,295,693 | |
| Series 2012-3, Cl. E, 4.46%, 11/8/191 | | | 1,305,000 | | | | 1,309,449 | |
| Series 2012-5, Cl. D, 2.35%, 12/10/18 | | | 795,000 | | | | 798,125 | |
| Series 2013-2, Cl. E, 3.41%, 10/8/201 | | | 1,845,000 | | | | 1,862,777 | |
| Series 2013-3, Cl. E, 3.74%, 12/8/201 | | | 1,065,000 | | | | 1,085,145 | |
| Series 2014-1, Cl. E, 3.58%, 8/9/21 | | | 675,000 | | | | 686,889 | |
| Series 2014-2, Cl. E, 3.37%, 11/8/21 | | | 2,980,000 | | | | 3,015,968 | |
| Series 2014-3, Cl. D, 3.13%, 10/8/20 | | | 5,345,000 | | | | 5,445,318 | |
| Series 2014-4, Cl. C, 2.47%, 11/9/20 | | | 2,000,000 | | | | 2,025,815 | |
| Series 2014-4, Cl. D, 3.07%, 11/9/20 | | | 4,645,000 | | | | 4,712,654 | |
| Series 2015-2, Cl. D, 3.00%, 6/8/21 | | | 480,000 | | | | 487,682 | |
| Series 2015-3, Cl. D, 3.34%, 8/8/21 | | | 1,440,000 | | | | 1,473,987 | |
| California Republic Auto Receivables Trust: | | | | | | | | |
| Series 2013-2, Cl. C, 3.32%, 8/17/20 | | | 1,230,000 | | | | 1,244,846 | |
| Series 2014-2, Cl. C, 3.29%, 3/15/21 | | | 450,000 | | | | 451,631 | |
| Series 2014-4, Cl. C, 3.56%, 9/15/21 | | | 700,000 | | | | 708,501 | |
| Capital Auto Receivables Asset Trust: | | | | | | | | |
| Series 2013-1, Cl. D, 2.19%, 9/20/21 | | | 1,085,000 | | | | 1,087,020 | |
| Series 2013-4, Cl. D, 3.22%, 5/20/19 | | | 560,000 | | | | 567,710 | |
| Series 2014-1, Cl. D, 3.39%, 7/22/19 | | | 615,000 | | | | 627,995 | |
| Series 2014-3, Cl. D, 3.14%, 2/20/20 | | | 1,005,000 | | | | 1,022,473 | |
| Series 2015-1, Cl. D, 3.16%, 8/20/20 | | | 1,160,000 | | | | 1,181,832 | |
| Series 2015-4, Cl. D, 3.62%, 5/20/21 | | | 2,380,000 | | | | 2,400,589 | |
| Series 2016-2, Cl. D, 3.16%, 11/20/23 | | | 610,000 | | | | 606,620 | |
| CarFinance Capital Auto Trust: | | | | | | | | |
| Series 2013-2A, Cl. B, 3.15%, 8/15/191 | | | 1,374,911 | | | | 1,384,366 | |
| Series 2014-1A, Cl. A, 1.46%, 12/17/181 | | | 44,230 | | | | 44,206 | |
| Series 2015-1A, Cl. A, 1.75%, 6/15/211 | | | 736,109 | | | | 732,162 | |
| CarMax Auto Owner Trust: | | | | | | | | |
| Series 2014-2, Cl. D, 2.58%, 11/16/20 | | | 1,570,000 | | | | 1,572,592 | |
| Series 2015-2, Cl. D, 3.04%, 11/15/21 | | | 750,000 | | | | 759,576 | |
| Series 2015-3, Cl. D, 3.27%, 3/15/22 | | | 1,440,000 | | | | 1,469,461 | |
| Series 2016-1, Cl. D, 3.11%, 8/15/22 | | | 1,915,000 | | | | 1,919,603 | |
| Series 2016-3, Cl. D, 2.94%, 1/17/23 | | | 1,155,000 | | | | 1,149,104 | |
| CPS Auto Receivables Trust: | | | | | | | | |
| Series 2014-A, Cl. A, 1.21%, 8/15/181 | | | 293,335 | | | | 293,095 | |
| Series 2014-C, Cl. A, 1.31%, 2/15/191 | | | 511,947 | | | | 511,182 | |
| CPS Auto Trust, Series 2012-C, Cl. A, 1.82%, 12/16/191 | | | 131,996 | | | | 131,788 | |
10 OPPENHEIMER LIMITED-TERM BOND FUND
| | | | | | | | |
| | | Principal Amount | | | Value | |
| |
| Auto Loan (Continued) | | | | | | | | |
| |
| Credit Acceptance Auto Loan Trust: | | | | | | | | |
| Series 2014-1A, Cl. B, 2.29%, 4/15/221 | | $ | 1,085,000 | | | $ | 1,084,131 | |
| Series 2014-2A, Cl. B, 2.67%, 9/15/221 | | | 1,015,000 | | | | 1,019,048 | |
| |
| Drive Auto Receivables Trust: | | | | | | | | |
| Series 2015-BA, Cl. C, 2.76%, 7/15/211 | | | 2,210,000 | | | | 2,220,881 | |
| Series 2015-DA, Cl. C, 3.38%, 11/15/211 | | | 2,260,000 | | | | 2,292,107 | |
| Series 2016-BA, Cl. C, 3.19%, 7/15/221 | | | 1,550,000 | | | | 1,555,461 | |
| |
| DT Auto Owner Trust: | | | | | | | | |
| Series 2013-1A, Cl. D, 3.74%, 5/15/201 | | | 600,176 | | | | 604,494 | |
| Series 2013-2A, Cl. D, 4.18%, 6/15/201 | | | 1,867,742 | | | | 1,884,510 | |
| Series 2014-1A, Cl. D, 3.98%, 1/15/211 | | | 4,190,000 | | | | 4,247,762 | |
| Series 2014-2A, Cl. D, 3.68%, 4/15/211 | | | 2,810,000 | | | | 2,845,289 | |
| Series 2014-3A, Cl. D, 4.47%, 11/15/211 | | | 1,405,000 | | | | 1,427,971 | |
| Series 2015-1A, Cl. C, 2.87%, 11/16/201 | | | 1,230,000 | | | | 1,229,834 | |
| Series 2016-1A, Cl. B, 2.79%, 5/15/201 | | | 2,540,000 | | | | 2,547,476 | |
| |
| Exeter Automobile Receivables Trust: | | | | | | | | |
| Series 2014-1A, Cl. B, 2.42%, 1/15/191 | | | 792,009 | | | | 793,341 | |
| Series 2014-1A, Cl. C, 3.57%, 7/15/191 | | | 1,225,000 | | | | 1,233,235 | |
| Series 2014-2A, Cl. A, 1.06%, 8/15/181 | | | 6,021 | | | | 6,019 | |
| Series 2014-2A, Cl. C, 3.26%, 12/16/191 | | | 625,000 | | | | 628,367 | |
| |
| First Investors Auto Owner Trust: | | | | | | | | |
| Series 2013-3A, Cl. C, 2.91%, 1/15/201 | | | 2,885,000 | | | | 2,899,438 | |
| Series 2013-3A, Cl. D, 3.67%, 5/15/201 | | | 900,000 | | | | 890,622 | |
| Series 2014-1A, Cl. C, 2.74%, 4/15/201 | | | 4,000,000 | | | | 4,008,381 | |
| Series 2014-1A, Cl. D, 3.28%, 4/15/211 | | | 2,555,000 | | | | 2,531,880 | |
| |
| Flagship Credit Auto Trust: | | | | | | | | |
| Series 2014-1, Cl. A, 1.21%, 4/15/191 | | | 167,332 | | | | 167,030 | |
| Series 2014-2, Cl. A, 1.43%, 12/16/191 | | | 608,861 | | | | 607,121 | |
| Series 2016-3, Cl. A1, 1.61%, 12/15/191 | | | 4,000,000 | | | | 3,996,726 | |
| |
| Ford Credit Floorplan Master Owner Trust A, Series 2016-3, Cl. A1, 1.55%, 7/15/21 | | | 3,685,000 | | | | 3,678,502 | |
| |
| GM Financial Automobile Leasing Trust, Series 2015-1, Cl. D, 3.01%, 3/20/20 | | | 1,680,000 | | | | 1,693,323 | |
| |
| GO Financial Auto Securitization Trust, Series 2015-1, Cl. A, 1.81%, 3/15/181 | | | 182,192 | | | | 182,071 | |
| |
| Navistar Financial Dealer Note Master Trust, Series 2014-1, Cl. D, 2.824%, 10/25/191,2 | | | 815,000 | | | | 813,559 | |
| |
| Santander Drive Auto Receivables Trust: | | | | | | | | |
| Series 2013-4, Cl. D, 3.92%, 1/15/20 | | | 3,595,000 | | | | 3,687,227 | |
| Series 2013-4, Cl. E, 4.67%, 1/15/201 | | | 2,370,000 | | | | 2,392,803 | |
| Series 2013-5, Cl. D, 2.73%, 10/15/19 | | | 2,223,000 | | | | 2,257,430 | |
| Series 2013-A, Cl. E, 4.71%, 1/15/211 | | | 2,145,000 | | | | 2,206,087 | |
| Series 2014-1, Cl. D, 2.91%, 4/15/20 | | | 985,000 | | | | 1,000,340 | |
| Series 2014-2, Cl. D, 2.76%, 2/18/20 | | | 2,680,000 | | | | 2,720,504 | |
| Series 2014-4, Cl. C, 2.60%, 11/16/20 | | | 4,000,000 | | | | 4,044,989 | |
| Series 2014-4, Cl. D, 3.10%, 11/16/20 | | | 4,240,000 | | | | 4,316,839 | |
| Series 2015-1, Cl. C, 2.57%, 4/15/21 | | | 3,000,000 | | | | 3,033,006 | |
| Series 2015-1, Cl. D, 3.24%, 4/15/21 | | | 710,000 | | | | 719,012 | |
| Series 2015-2, Cl. C, 2.44%, 4/15/21 | | | 2,720,000 | | | | 2,749,347 | |
11 OPPENHEIMER LIMITED-TERM BOND FUND
STATEMENT OF INVESTMENTS Continued
| | | | | | | | |
| | | Principal Amount | | | Value | |
| |
| Auto Loan (Continued) | | | | | | | | |
| |
| Santander Drive Auto Receivables Trust: (Continued) | | | | | | | | |
| Series 2015-2, Cl. D, 3.02%, 4/15/21 | | $ | 2,035,000 | | | $ | 2,071,825 | |
| Series 2015-3, Cl. B, 2.07%, 4/15/20 | | | 3,859,000 | | | | 3,872,431 | |
| Series 2015-3, Cl. D, 3.49%, 5/17/21 | | | 2,615,000 | | | | 2,676,465 | |
| Series 2015-5, Cl. C, 2.74%, 12/15/21 | | | 1,840,000 | | | | 1,866,045 | |
| Series 2016-2, Cl. D, 3.39%, 4/15/22 | | | 1,055,000 | | | | 1,079,186 | |
| |
| SNAAC Auto Receivables Trust: | | | | | | | | |
| Series 2013-1A, Cl. C, 3.07%, 8/15/181 | | | 141,774 | | | | 141,870 | |
| Series 2014-1A, Cl. D, 2.88%, 1/15/201 | | | 750,000 | | | | 741,335 | |
| |
| TCF Auto Receivables Owner Trust: | | | | | | | | |
| Series 2014-1A, Cl. C, 3.12%, 4/15/211 | | | 595,000 | | | | 591,548 | |
| Series 2015-1A, Cl. D, 3.53%, 3/15/221 | | | 1,230,000 | | | | 1,217,421 | |
| |
| United Auto Credit Securitization Trust, Series 2015-1, Cl. D, 2.92%, 6/17/191 | | | 1,565,000 | | | | 1,543,362 | |
| |
| Westlake Automobile Receivables Trust: | | | | | | | | |
| Series 2014-1A, Cl. D, 2.20%, 2/15/211 | | | 860,000 | | | | 858,894 | |
| Series 2014-2A, Cl. D, 2.86%, 7/15/211 | | | 1,070,000 | | | | 1,064,211 | |
| Series 2015-1A, Cl. C, 2.29%, 11/16/201 | | | 185,000 | | | | 185,301 | |
| Series 2015-2A, Cl. C, 2.45%, 1/15/211 | | | 1,650,000 | | | | 1,653,088 | |
| | | | | | | | |
| | | | | | | 151,584,021 | |
| |
| Credit Card—2.4% | | | | | | | | |
| |
| American Express Credit Account Master Trust: | | | | | | | | |
| Series 2014-2, Cl. A, 1.26%, 1/15/20 | | | 709,000 | | | | 710,247 | |
| Series 2014-3, Cl. A, 1.49%, 4/15/20 | | | 590,000 | | | | 592,694 | |
| |
| Cabela’s Credit Card Master Note Trust: | | | | | | | | |
| Series 2013-2A, Cl. A2, 1.158%, 8/16/211,2 | | | 5,235,000 | | | | 5,238,591 | |
| Series 2016-1, Cl. A1, 1.78%, 6/15/22 | | | 3,200,000 | | | | 3,194,177 | |
| |
| Capital One Multi-Asset Execution Trust: | | | | | | | | |
| Series 2014-A2, Cl. A2, 1.26%, 1/15/20 | | | 4,284,000 | | | | 4,290,101 | |
| Series 2014-A5, Cl. A5, 1.48%, 7/15/20 | | | 5,785,000 | | | | 5,809,228 | |
| |
| Chase Issuance Trust: | | | | | | | | |
| Series 2007-A3, Cl. A3, 5.23%, 4/15/19 | | | 895,000 | | | | 911,968 | |
| Series 2014-A1, Cl. A1, 1.15%, 1/15/19 | | | 5,440,000 | | | | 5,444,990 | |
| Series 2014-A6, Cl. A6, 1.26%, 7/15/19 | | | 3,395,000 | | | | 3,400,994 | |
| |
| Discover Card Execution Note Trust, Series 2014-A5, Cl. A, 1.39%, 4/15/20 | | | 5,225,000 | | | | 5,242,390 | |
| | | | | | | | |
| | | | | | | 34,835,380 | |
| |
| Equipment—0.1% | | | | | | | | |
| |
| Structured Asset Securities Corp., Interest-Only Stripped Pass-Through Certificates, Series 2002-AL1, Cl. AIO, 15.06%, 2/25/323 | | | 3,744,659 | | | | 350,059 | |
| |
| Trip Rail Master Funding LLC, Series 2014-1A, Cl. A1, 2.863%, 4/15/441 | | | 581,495 | | | | 575,322 | |
| | | | | | | | |
| | | | | | | 925,381 | |
| |
| Loans: Other—0.1% | | | | | | | | |
| |
| Element Rail Leasing I LLC, Series 2014-1A, Cl. A1, 2.299%, 4/19/441 | | | 2,239,736 | | | | 2,179,331 | |
| | | | | | | | |
| Total Asset-Backed Securities (Cost $188,416,684) | | | | | | | 189,524,113 | |
12 OPPENHEIMER LIMITED-TERM BOND FUND
| | | | | | | | |
| | | Principal Amount | | | Value | |
| |
| Mortgage-Backed Obligations—21.8% | | | | | | | | |
| |
| Government Agency—9.5% | | | | | | | | |
| |
| FHLMC/FNMA/FHLB/Sponsored—9.4% | | | | | | | | |
| |
| Federal Home Loan Mortgage Corp. Gold Pool: | | | | | | | | |
| 4.50%, 5/1/19 | | $ | 15,219 | | | $ | 15,608 | |
| 5.00%, 7/1/33-6/1/34 | | | 715,360 | | | | 797,105 | |
| 5.50%, 9/1/39 | | | 2,175,347 | | | | 2,436,451 | |
| 6.00%, 1/1/22-7/1/24 | | | 724,824 | | | | 824,821 | |
| 6.50%, 4/1/18-4/1/34 | | | 320,971 | | | | 363,762 | |
| 7.00%, 10/1/31-3/1/35 | | | 1,622,026 | | | | 1,917,713 | |
| 7.50%, 1/1/32-2/1/32 | | | 1,095,496 | | | | 1,352,526 | |
| 9.00%, 8/1/22-5/1/25 | | | 18,819 | | | | 20,568 | |
| |
| Federal Home Loan Mortgage Corp., Interest-Only Stripped Mtg.-Backed Security: | |
| Series 192, Cl. IO, 6.409%, 2/1/283 | | | 61,824 | | | | 13,475 | |
| Series 205, Cl. IO, 13.703%, 9/1/293 | | | 449,079 | | | | 96,274 | |
| Series 206, Cl. IO, 0.00%, 12/1/293,4 | | | 160,205 | | | | 42,465 | |
| Series 243, Cl. 6, 0.00%, 12/15/323,4 | | | 161,451 | | | | 27,309 | |
| |
| Federal Home Loan Mortgage Corp., Real Estate Mtg. Investment Conduit Multiclass Pass-Through Certificates: | |
| Series 151, Cl. F, 9.00%, 5/15/21 | | | 6,994 | | | | 7,604 | |
| Series 1644, Cl. S, 2.14%, 12/15/232 | | | 1,941,199 | | | | 1,999,320 | |
| Series 2043, Cl. ZP, 6.50%, 4/15/28 | | | 1,023,607 | | | | 1,137,446 | |
| Series 2116, Cl. ZA, 6.00%, 1/15/29 | | | 536,875 | | | | 604,989 | |
| Series 2148, Cl. ZA, 6.00%, 4/15/29 | | | 795,997 | | | | 920,446 | |
| Series 2220, Cl. PD, 8.00%, 3/15/30 | | | 71,882 | | | | 86,594 | |
| Series 2326, Cl. ZP, 6.50%, 6/15/31 | | | 116,887 | | | | 130,695 | |
| Series 2344, Cl. FP, 1.458%, 8/15/312 | | | 150,689 | | | | 154,571 | |
| Series 2368, Cl. PR, 6.50%, 10/15/31 | | | 396,608 | | | | 443,604 | |
| Series 2427, Cl. ZM, 6.50%, 3/1/32 | | | 400,840 | | | | 461,871 | |
| Series 2451, Cl. FD, 1.508%, 3/15/322 | | | 91,912 | | | | 94,475 | |
| Series 2461, Cl. PZ, 6.50%, 6/1/32 | | | 217,945 | | | | 258,597 | |
| Series 2464, Cl. FI, 1.508%, 2/15/322 | | | 92,113 | | | | 94,192 | |
| Series 2465, Cl. PG, 6.50%, 6/15/32 | | | 311,412 | | | | 363,379 | |
| Series 2470, Cl. LF, 1.508%, 2/15/322 | | | 92,384 | | | | 94,469 | |
| Series 2517, Cl. GF, 1.508%, 2/15/322 | | | 73,215 | | | | 74,867 | |
| Series 2551, Cl. LF, 1.008%, 1/15/332 | | | 9,724 | | | | 9,768 | |
| Series 2668, Cl. AZ, 4.00%, 9/15/18 | | | 74,018 | | | | 75,417 | |
| Series 3015, Cl. GM, 5.00%, 8/15/35 | | | 4,388,785 | | | | 4,870,999 | |
| Series 3848, Cl. WL, 4.00%, 4/1/40 | | | 676,752 | | | | 707,073 | |
| Series 3917, Cl. BA, 4.00%, 6/15/38 | | | 543,259 | | | | 570,450 | |
| |
| Federal Home Loan Mortgage Corp., Real Estate Mtg. Investment Conduit Multiclass Pass-Through Certificates, Interest-Only Stripped Mtg.-Backed Security: | |
| Series 2074, Cl. S, 82.608%, 7/17/283 | | | 98,805 | | | | 16,706 | |
| Series 2079, Cl. S, 0.00%, 7/17/283,5 | | | 169,981 | | | | 31,692 | |
| Series 2122, Cl. S, 30.941%, 2/15/293 | | | 511,667 | | | | 107,941 | |
| Series 2304, Cl. SK, 39.29%, 6/15/293 | | | 513,235 | | | | 108,114 | |
| Series 2493, Cl. S, 44.311%, 9/15/293 | | | 132,873 | | | | 32,493 | |
| Series 2526, Cl. SE, 28.907%, 6/15/293 | | | 199,621 | | | | 41,923 | |
| Series 2795, Cl. SH, 2.44%, 3/15/243 | | | 1,442,240 | | | | 163,688 | |
| Series 2920, Cl. S, 50.778%, 1/15/353 | | | 1,317,311 | | | | 239,242 | |
| Series 2922, Cl. SE, 5.726%, 2/15/353 | | | 298,457 | | | | 52,229 | |
13 OPPENHEIMER LIMITED-TERM BOND FUND
STATEMENT OF INVESTMENTS Continued
| | | | | | | | |
| | | Principal Amount | | | Value | |
| |
| FHLMC/FNMA/FHLB/Sponsored (Continued) | | | | | | | | |
| |
| Federal Home Loan Mortgage Corp., Real Estate Mtg. Investment Conduit Multiclass Pass-Through Certificates, Interest-Only Stripped Mtg.-Backed Security: (Continued) | |
| Series 2981, Cl. AS, 0.00%, 5/15/353,4 | | $ | 1,194,317 | | | $ | 229,691 | |
| Series 3004, Cl. SB, 99.999%, 7/15/353 | | | 1,623,506 | | | | 231,316 | |
| Series 3201, Cl. SG, 3.258%, 8/15/363 | | | 762,931 | | | | 156,028 | |
| Series 3397, Cl. GS, 14.40%, 12/15/373 | | | 183,897 | | | | 35,289 | |
| Series 3424, Cl. EI, 5.985%, 4/15/383 | | | 130,631 | | | | 15,047 | |
| Series 3450, Cl. BI, 9.665%, 5/15/383 | | | 2,087,257 | | | | 357,620 | |
| Series 3606, Cl. SN, 1.673%, 12/15/393 | | | 457,686 | | | | 88,522 | |
| Series 3659, Cl. IE, 0.00%, 3/15/193,4 | | | 882,581 | | | | 35,528 | |
| Series 3685, Cl. EI, 0.00%, 3/15/193,4 | | | 478,742 | | | | 14,135 | |
| |
| Federal National Mortgage Assn.: | | | | | | | | |
| 2.50%, 9/1/316 | | | 68,985,000 | | | | 71,253,960 | |
| 4.00%, 9/1/466 | | | 1,495,000 | | | | 1,601,168 | |
| 4.50%, 9/1/316 | | | 1,925,000 | | | | 1,970,625 | |
| |
| Federal National Mortgage Assn. Pool: | | | | | | | | |
| 4.50%, 2/1/19-12/1/20 | | | 1,532,604 | | | | 1,578,448 | |
| 5.00%, 12/1/17-6/1/22 | | | 1,997,369 | | | | 2,058,359 | |
| 5.50%, 2/1/35-5/1/36 | | | 656,957 | | | | 746,560 | |
| 6.00%, 6/1/30-3/1/37 | | | 5,062,494 | | | | 5,841,414 | |
| 6.50%, 6/1/17-1/1/34 | | | 3,900,680 | | | | 4,527,975 | |
| 7.00%, 11/1/17-11/1/35 | | | 3,246,167 | | | | 3,871,646 | |
| 7.50%, 2/1/27-8/1/33 | | | 2,717,551 | | | | 3,237,311 | |
| 8.00%, 12/1/22 | | | 9,881 | | | | 11,287 | |
| 8.50%, 7/1/32 | | | 21,991 | | | | 24,026 | |
| |
| Federal National Mortgage Assn., Interest-Only Stripped Mtg.-Backed Security: | | | | | | | | |
| Series 221, Cl. 2, 35.549%, 5/25/233 | | | 340,078 | | | | 60,444 | |
| Series 252, Cl. 2, 99.999%, 11/25/233 | | | 177,078 | | | | 31,535 | |
| Series 303, Cl. IO, 40.353%, 11/25/293 | | | 1,704,545 | | | | 435,902 | |
| Series 319, Cl. 2, 20.443%, 2/25/323 | | | 306,334 | | | | 66,050 | |
| Series 321, Cl. 2, 6.695%, 4/25/323 | | | 437,450 | | | | 94,426 | |
| Series 324, Cl. 2, 1.836%, 7/25/323 | | | 190,976 | | | | 41,180 | |
| Series 328, Cl. 2, 0.00%, 12/25/323,4 | | | 1,118,562 | | | | 218,277 | |
| Series 334, Cl. 12, 0.00%, 3/25/333,4 | | | 643,075 | | | | 140,332 | |
| Series 339, Cl. 7, 0.00%, 11/25/333,4 | | | 516,655 | | | | 101,274 | |
| Series 351, Cl. 10, 16.113%, 4/25/343 | | | 444,265 | | | | 87,962 | |
| Series 351, Cl. 8, 0.00%, 4/25/343,4 | | | 422,064 | | | | 83,385 | |
| Series 356, Cl. 10, 0.00%, 6/25/353,4 | | | 301,378 | | | | 55,071 | |
| Series 356, Cl. 12, 0.00%, 2/25/353,4 | | | 147,855 | | | | 27,038 | |
| Series 362, Cl. 13, 1.551%, 8/25/353 | | | 275,096 | | | | 55,092 | |
| Series 364, Cl. 15, 0.00%, 9/25/353,4 | | | 378,110 | | | | 67,862 | |
| |
| Federal National Mortgage Assn., Principal-Only Stripped Mtg.-Backed Security, Series 327, Cl. 1, 11.783%, 9/25/327 | | | 80,273 | | | | 71,745 | |
| |
Federal National Mortgage Assn., Real Estate Mtg. Investment Conduit Multiclass Pass-Through Certificates: | |
| Series 1992-161, Cl. H, 7.50%, 9/25/22 | | | 1,045,131 | | | | 1,167,721 | |
| Series 1993-87, Cl. Z, 6.50%, 6/25/23 | | | 298,800 | | | | 328,050 | |
| Series 1999-54, Cl. LH, 6.50%, 11/25/29 | | | 216,941 | | | | 254,140 | |
| Series 2002-29, Cl. F, 1.524%, 4/25/322 | | | 103,466 | | | | 105,872 | |
| Series 2002-64, Cl. FJ, 1.524%, 4/25/322 | | | 31,849 | | | | 32,590 | |
14 OPPENHEIMER LIMITED-TERM BOND FUND
| | | | | | | | |
| | | Principal Amount | | | Value | |
| |
| FHLMC/FNMA/FHLB/Sponsored (Continued) | | | | | | | | |
| |
| Federal National Mortgage Assn., Real Estate Mtg. Investment Conduit Multiclass Pass-Through Certificates: (Continued) | |
| Series 2002-68, Cl. FH, 1.007%, 10/18/322 | | $ | 61,687 | | | $ | 61,980 | |
| Series 2003-112, Cl. AN, 4.00%, 11/25/18 | | | 179,882 | | | | 183,289 | |
| Series 2003-116, Cl. FA, 0.924%, 11/25/332 | | | 112,335 | | | | 112,500 | |
| Series 2003-130, Cl. CS, 13.051%, 12/25/332 | | | 114,669 | | | | 129,416 | |
| Series 2005-31, Cl. PB, 5.50%, 4/25/35 | | | 2,280,000 | | | | 2,714,235 | |
| Series 2006-11, Cl. PS, 22.644%, 3/25/362 | | | 192,348 | | | | 299,177 | |
| Series 2006-46, Cl. SW, 22.277%, 6/25/362 | | | 121,112 | | | | 180,674 | |
| Series 2006-50, Cl. KS, 22.277%, 6/25/362 | | | 242,276 | | | | 360,249 | |
| Series 2006-50, Cl. SK, 22.277%, 6/25/362 | | | 602,945 | | | | 931,031 | |
| Series 2007-9, Cl. LE, 5.50%, 3/25/37 | | | 2,000,000 | | | | 2,349,723 | |
| Series 2010-43, Cl. KG, 3.00%, 1/25/21 | | | 239,833 | | | | 244,490 | |
| Series 2011-15, Cl. DA, 4.00%, 3/25/41 | | | 386,451 | | | | 406,091 | |
| Series 2011-3, Cl. KA, 5.00%, 4/25/40 | | | 1,036,189 | | | | 1,130,622 | |
| Series 2011-88, Cl. AB, 2.50%, 9/25/26 | | | 329,187 | | | | 332,933 | |
| Series 2012-20, Cl. FD, 0.924%, 3/25/422 | | | 288,253 | | | | 287,862 | |
| |
| Federal National Mortgage Assn., Real Estate Mtg. Investment Conduit Multiclass Pass-Through Certificates, Interest-Only Stripped Mtg.-Backed Security: | |
| Series 2001-61, Cl. SH, 35.225%, 11/18/313 | | | 378,395 | | | | 83,279 | |
| Series 2001-63, Cl. SD, 46.277%, 12/18/313 | | | 147,619 | | | | 29,767 | |
| Series 2001-68, Cl. SC, 33.276%, 11/25/313 | | | 99,659 | | | | 19,809 | |
| Series 2001-81, Cl. S, 35.375%, 1/25/323 | | | 99,265 | | | | 26,232 | |
| Series 2002-28, Cl. SA, 44.254%, 4/25/323 | | | 95,047 | | | | 19,366 | |
| Series 2002-38, Cl. SO, 57.278%, 4/25/323 | | | 171,878 | | | | 35,021 | |
| Series 2002-39, Cl. SD, 49.096%, 3/18/323 | | | 181,659 | | | | 39,814 | |
| Series 2002-41, Cl. S, 65.441%, 7/25/323 | | | 642,705 | | | | 140,618 | |
| Series 2002-48, Cl. S, 41.652%, 7/25/323 | | | 151,954 | | | | 32,388 | |
| Series 2002-52, Cl. SD, 48.525%, 9/25/323 | | | 162,706 | | | | 36,637 | |
| Series 2002-52, Cl. SL, 42.914%, 9/25/323 | | | 97,282 | | | | 20,073 | |
| Series 2002-53, Cl. SK, 49.408%, 4/25/323 | | | 113,313 | | | | 25,926 | |
| Series 2002-56, Cl. SN, 43.652%, 7/25/323 | | | 207,633 | | | | 43,577 | |
| Series 2002-77, Cl. IS, 52.091%, 12/18/323 | | | 292,830 | | | | 63,323 | |
| Series 2002-77, Cl. SH, 48.38%, 12/18/323 | | | 134,762 | | | | 31,795 | |
| Series 2002-9, Cl. MS, 36.707%, 3/25/323 | | | 158,480 | | | | 33,750 | |
| Series 2003-25, Cl. IK, 22.657%, 4/25/333 | | | 2,572,697 | | | | 483,703 | |
| Series 2003-33, Cl. SP, 38.269%, 5/25/333 | | | 354,924 | | | | 73,021 | |
| Series 2003-4, Cl. S, 37.258%, 2/25/333 | | | 213,830 | | | | 43,238 | |
| Series 2005-12, Cl. SC, 24.614%, 3/25/353 | | | 140,924 | | | | 24,054 | |
| Series 2005-14, Cl. SE, 45.08%, 3/25/353 | | | 1,095,897 | | | | 196,268 | |
| Series 2005-40, Cl. SB, 61.413%, 5/25/353 | | | 797,303 | | | | 131,718 | |
| Series 2005-52, Cl. JH, 19.274%, 5/25/353 | | | 507,026 | | | | 92,301 | |
| Series 2005-6, Cl. SE, 31.469%, 2/25/353 | | | 1,860,497 | | | | 348,334 | |
| Series 2007-88, Cl. XI, 24.926%, 6/25/373 | | | 492,260 | | | | 93,211 | |
| Series 2008-55, Cl. SA, 0.00%, 7/25/383,4 | | | 232,798 | | | | 27,892 | |
| Series 2009-8, Cl. BS, 99.999%, 2/25/243 | | | 162,354 | | | | 5,291 | |
| Series 2010-95, Cl. DI, 0.00%, 11/25/203,4 | | | 1,264,730 | | | | 55,902 | |
| Series 2011-96, Cl. SA, 12.287%, 10/25/413 | | | 1,044,459 | | | | 200,788 | |
| Series 2012-134, Cl. SA, 10.878%, 12/25/423 | | | 2,279,165 | | | | 493,772 | |
15 OPPENHEIMER LIMITED-TERM BOND FUND
STATEMENT OF INVESTMENTS Continued
| | | | | | | | |
| | | Principal Amount | | | Value | |
| |
| FHLMC/FNMA/FHLB/Sponsored (Continued) | | | | | | | | |
| |
| Federal National Mortgage Assn., Real Estate Mtg. Investment Conduit Multiclass Pass-Through Certificates, Interest-Only Stripped Mtg.-Backed Security: (Continued) | |
| Series 2012-40, Cl. PI, 0.00%, 4/25/413,4 | | $ | 1,415,414 | | | $ | 168,374 | |
| Series 2013-2, Cl. IA, 2.106%, 2/25/433 | | | 714,263 | | | | 138,583 | |
| |
| Vendee Mortgage Trust, Interest-Only Stripped Mtg.-Backed Security, Series 1995-2B, Cl. 2IO, 0.00%, 6/1/253,4 | | | 2,654,218 | | | | 58,858 | |
| | | | | | | | |
| | | | | | | 136,315,789 | |
| |
| GNMA/Guaranteed—0.1% | | | | | | | | |
| |
| Government National Mortgage Assn. I Pool: | | | | | | | | |
| 6.50%, 11/15/23-12/15/23 | | | 11,295 | | | | 13,003 | |
| 7.00%, 1/15/28-8/15/28 | | | 137,404 | | | | 150,340 | |
| 7.50%, 2/15/22-11/15/26 | | | 86,425 | | | | 90,972 | |
| 8.00%, 9/15/16-8/15/28 | | | 23,380 | | | | 23,853 | |
| 8.50%, 8/15/17-12/15/17 | | | 7,995 | | | | 8,048 | |
| 9.50%, 7/15/18-12/15/19 | | | 1,747 | | | | 1,755 | |
| 10.00%, 8/15/17-8/15/19 | | | 14,102 | | | | 14,173 | |
| 10.50%, 9/15/17-12/15/20 | | | 17,339 | | | | 17,431 | |
| |
| Government National Mortgage Assn. II Pool: | | | | | | | | |
| 2.125%, 4/20/172 | | | 549 | | | | 550 | |
| 7.00%, 1/20/30 | | | 34,578 | | | | 41,233 | |
| 11.00%, 10/20/19-7/20/20 | | | 14,258 | | | | 14,324 | |
| |
| Government National Mortgage Assn., Interest-Only Stripped Mtg.-Backed Security: | | | | | | | | |
| Series 2007-17, Cl. AI, 30.80%, 4/16/373 | | | 2,045,401 | | | | 431,760 | |
| Series 2011-52, Cl. HS, 20.87%, 4/16/413 | | | 3,277,436 | | | | 606,590 | |
| | | | | | | | |
| | | | | | | 1,414,032 | |
| |
| Non-Agency—12.3% | | | | | | | | |
| |
| Commercial—6.5% | | | | | | | | |
| |
| Banc of America Funding Trust: | | | | | | | | |
| Series 2006-G, Cl. 2A4, 0.802%, 7/20/362 | | | 3,326,807 | | | | 3,155,359 | |
| Series 2014-R7, Cl. 3A1, 2.87%, 3/26/361,2 | | | 1,833,722 | | | | 1,839,469 | |
| |
| BCAP LLC Trust: | | | | | | | | |
| Series 2011-R11, Cl. 18A5, 2.43%, 9/26/351,2 | | | 429,922 | | | | 431,174 | |
| Series 2012-RR2, Cl. 6A3, 3.05%, 9/26/351,2 | �� | | 818,512 | | | | 817,083 | |
| Series 2012-RR6, Cl. RR6, 2.054%, 11/26/361 | | | 1,596,791 | | | | 1,584,623 | |
| |
| Capital Lease Funding Securitization LP, Interest-Only Commercial Mtg. Pass-Through Certificates, Series 1997-CTL1, Cl. IO, 0.00%, 6/22/241,3,4 | | | 661,265 | | | | 19,922 | |
| |
| Chase Mortgage Finance Trust, Series 2005-A2, Cl. 1A3, 2.694%, 1/25/362 | | | 1,008,813 | | | | 948,555 | |
| |
| COMM Mortgage Trust: | | | | | | | | |
| Series 2013-CR7, Cl. D, 4.491%, 3/10/461,2 | | | 1,630,000 | | | | 1,538,741 | |
| Series 2014-UBS3, Cl. D, 4.974%, 6/10/471,2 | | | 650,000 | | | | 546,073 | |
| |
| COMM Mortgage Trust, Interest-Only Stripped Mtg.-Backed Security, Series 2012-CR5, Cl. XA, 0.00%, 12/10/453,4 | | | 15,774,042 | | | | 1,128,762 | |
| |
| Federal National Mortgage Assn., Alternative Credit Enhancement Securities, Series 2016-M5, Cl. A1, 2.073%, 4/25/26 | | | 817,362 | | | | 828,186 | |
| |
| FREMF Mortgage Trust: | | | | | | | | |
| Series 2011-K701, Cl. C, 4.436%, 7/25/481,2 | | | 3,606,000 | | | | 3,632,032 | |
| Series 2012-K501, Cl. C, 3.374%, 11/25/461,2 | | | 2,015,000 | | | | 2,015,009 | |
| Series 2012-K706, Cl. C, 4.167%, 11/25/441,2 | | | 3,762,000 | | | | 3,855,903 | |
16 OPPENHEIMER LIMITED-TERM BOND FUND
| | | | | | | | |
| | | Principal Amount | | | Value | |
| |
| Commercial (Continued) | | | | | | | | |
| |
| FREMF Mortgage Trust: (Continued) | | | | | | | | |
| Series 2012-K707, Cl. C, 4.019%, 1/25/471,2 | | $ | 4,000,000 | | | $ | 4,080,485 | |
| Series 2012-K708, Cl. C, 3.883%, 2/25/451,2 | | | 600,000 | | | | 599,440 | |
| Series 2012-K710, Cl. C, 3.952%, 6/25/471,2 | | | 4,250,000 | | | | 4,289,767 | |
| Series 2013-K26, Cl. C, 3.722%, 12/25/451,2 | | | 1,642,030 | | | | 1,611,200 | |
| Series 2013-K27, Cl. C, 3.616%, 1/25/461,2 | | | 530,000 | | | | 509,678 | |
| Series 2013-K28, Cl. C, 3.614%, 6/25/461,2 | | | 530,000 | | | | 508,526 | |
| Series 2013-K30, Cl. C, 3.668%, 6/25/451,2 | | | 855,000 | | | | 831,827 | |
| Series 2013-K502, Cl. C, 3.196%, 3/25/451,2 | | | 955,000 | | | | 958,525 | |
| Series 2013-K712, Cl. C, 3.484%, 5/25/451,2 | | | 4,200,000 | | | | 4,259,583 | |
| Series 2013-K713, Cl. B, 3.274%, 4/25/461,2 | | | 5,000,000 | | | | 5,120,510 | |
| Series 2014-K714, Cl. C, 3.981%, 1/25/471,2 | | | 4,000,000 | | | | 3,938,087 | |
| Series 2014-K715, Cl. C, 4.268%, 2/25/461,2 | | | 1,435,000 | | | | 1,444,404 | |
| |
| GSMSC Pass-Through Trust, Series 2009-3R, Cl. 1A2, 6%, 4/25/371,2 | | | 1,274,198 | | | | 1,205,036 | |
| |
| GSR Mortgage Loan Trust, Series 2005-AR4, Cl. 6A1, 3.20%, 7/25/352 | | | 432,983 | | | | 427,148 | |
| |
| Heller Financial Commercial Mortgage Asset Corp., Interest-Only Commercial Mtg. Pass-Through Certificates, Series 2000-PH1, Cl. X, 0.00%, 1/17/341,3,4 | | | 880,614 | | | | 9 | |
| |
| JP Morgan Chase Commercial Mortgage Securities Trust, Series 2013-C16, Cl. AS, 4.517%, 12/15/46 | | | 2,335,000 | | | | 2,649,031 | |
| |
| JP Morgan Mortgage Trust, Series 2007-A1, Cl. 5A1, 2.911%, 7/25/352 | | | 1,044,484 | | | | 1,046,136 | |
| |
| Lehman Structured Securities Corp., Series 2002-GE1, Cl. A, 2.514%, 7/26/241,2 | | | 78,896 | | | | 64,841 | |
| |
| Morgan Stanley Bank of America Merrill Lynch Trust, Series 2016-C29, Cl. A1, 1.597%, 5/15/49 | | | 1,061,967 | | | | 1,065,672 | |
| |
| Morgan Stanley Re-Remic Trust, Series 2012-R3, Cl. 1A, 2.212%, 11/26/361,2 | | | 2,278,874 | | | | 2,223,136 | |
| |
| Morgan Stanley Resecuritization Trust, Series 2013-R9, Cl. 3A, 2.693%, 6/26/461,2 | | | 772,464 | | | | 772,524 | |
| |
| RBSSP Resecuritization Trust, Series 2010-1, Cl. 2A1, 2.681%, 7/26/451,2 | | | 256,589 | | | | 256,543 | |
| |
| Structured Adjustable Rate Mortgage Loan Trust, Series 2004-10, Cl. 2A, 2.929%, 8/25/342 | | | 124,793 | | | | 124,991 | |
| |
| Structured Agency Credit Risk Debt Nts.: | | | | | | | | |
| Series 2013-DN1, Cl. M1, 3.924%, 7/25/232 | | | 2,857,502 | | | | 2,912,996 | |
| Series 2014-DN1, Cl. M2, 2.724%, 2/25/242 | | | 2,345,000 | | | | 2,404,788 | |
| Series 2014-HQ2, Cl. M1, 1.974%, 9/25/242 | | | 742,948 | | | | 746,844 | |
| Series 2015-DNA2, Cl. M2, 3.124%, 12/25/272 | | | 2,205,000 | | | | 2,254,569 | |
| Series 2015-DNA3, Cl. M1, 1.874%, 4/25/282 | | | 695,789 | | | | 697,061 | |
| Series 2015-DNA3, Cl. M2, 3.374%, 4/25/282 | | | 3,360,000 | | | | 3,488,066 | |
| Series 2015-HQA1, Cl. M1, 1.774%, 3/25/282 | | | 1,433,614 | | | | 1,435,409 | |
| Series 2015-HQA2, Cl. M2, 3.324%, 5/25/282 | | | 300,000 | | | | 309,325 | |
| Series 2016-DNA2, Cl. M1, 1.774%, 10/25/282 | | | 3,445,632 | | | | 3,455,597 | |
| Series 2016-DNA2, Cl. M2, 2.724%, 10/25/282 | | | 3,555,000 | | | | 3,621,463 | |
| Series 2016-DNA3, Cl. M1, 1.624%, 12/25/282 | | | 3,050,846 | | | | 3,056,847 | |
| Series 2016-DNA3, Cl. M2, 2.524%, 12/25/282 | | | 1,910,000 | | | | 1,942,448 | |
| Series 2016-HQA2, Cl. M1, 1.724%, 11/25/282 | | | 2,007,046 | | | | 2,012,581 | |
| Series 2016-HQA2, Cl. M2, 2.774%, 11/25/282 | | | 3,540,000 | | | | 3,616,746 | |
| |
| WF-RBS Commercial Mortgage Trust, Series 2012-C7, Cl. E, 4.991%, 6/15/451,2 | | | 710,000 | | | | 700,326 | |
17 OPPENHEIMER LIMITED-TERM BOND FUND
STATEMENT OF INVESTMENTS Continued
| | | | | | | | |
| | | Principal Amount | | | Value | |
| |
| Commercial (Continued) | | | | | | | | |
| |
| WF-RBS Commercial Mortgage Trust, Interest-Only Commercial Mtg. Pass-Through Certificates, Series 2011-C3, Cl. XA, 0.00%, 3/15/441,3,4 | | $ | 9,571,201 | | | $ | 451,305 | |
| | | | | | | | |
| | | | | | | 93,434,361 | |
| |
| Multi-Family—2.3% | | | | | | | | |
| |
| Federal Home Loan Mortgage Corp., Multifamily Structured Pass-Through Certificates: | | | | | | | | |
| Series K042, Cl. A2, 2.67%, 12/25/24 | | | 1,190,000 | | | | 1,253,752 | |
| Series K048, Cl. A2, 3.284%, 6/25/252 | | | 6,000,000 | | | | 6,596,875 | |
| Series K049, Cl. A2, 3.01%, 7/25/25 | | | 3,485,000 | | | | 3,759,171 | |
| Series K050, Cl. A2, 3.334%, 8/25/252 | | | 3,000,000 | | | | 3,314,722 | |
| Series K052, Cl. A1, 2.598%, 1/25/25 | | | 4,421,798 | | | | 4,598,066 | |
| Series K053, Cl. A1, 2.548%, 2/25/25 | | | 3,100,988 | | | | 3,203,596 | |
| Series K053, Cl. A2, 2.995%, 12/25/25 | | | 4,000,000 | | | | 4,313,962 | |
| Series K054, Cl. A1, 2.30%, 1/25/25 | | | 5,697,404 | | | | 5,842,997 | |
| | | | | | | | |
| | | | | | | 32,883,141 | |
| |
| Residential—3.5% | | | | | | | | |
| |
| Bear Stearns ARM Trust: | | | | | | | | |
| Series 2005-2, Cl. A1, 3.09%, 3/25/352 | | | 1,893,585 | | | | 1,905,274 | |
| Series 2005-9, Cl. A1, 2.83%, 10/25/352 | | | 772,663 | | | | 748,098 | |
| Series 2006-1, Cl. A1, 2.58%, 2/25/362 | | | 1,812,122 | | | | 1,776,314 | |
| |
| CHL Mortgage Pass-Through Trust: | | | | | | | | |
| Series 2005-17, Cl. 1A8, 5.50%, 9/25/35 | | | 1,383,586 | | | | 1,399,035 | |
| Series 2005-J4, Cl. A7, 5.50%, 11/1/35 | | | 1,235,187 | | | | 1,221,269 | |
| |
| Citigroup Mortgage Loan Trust, Inc.: | | | | | | | | |
| Series 2006-AR1, Cl. 1A1, 2.87%, 10/25/352 | | | 3,567,500 | | | | 3,541,930 | |
| Series 2012-8, Cl. 1A1, 3.008%, 10/25/351,2 | | | 1,668,094 | | | | 1,667,099 | |
| |
| Connecticut Avenue Securities: | | | | | | | | |
| Series 2014-C01, Cl. M1, 2.124%, 1/25/242 | | | 339,232 | | | | 341,779 | |
| Series 2014-C03, Cl. 1M1, 1.724%, 7/25/242 | | | 1,630,391 | | | | 1,634,756 | |
| Series 2014-C03, Cl. 2M1, 1.724%, 7/25/242 | | | 2,504,310 | | | | 2,509,277 | |
| Series 2014-C04, Cl. 2M1, 2.624%, 11/25/242 | | | 498,864 | | | | 501,023 | |
| Series 2015-C03, Cl. 1M1, 2.024%, 7/25/252 | | | 1,223,063 | | | | 1,227,837 | |
| Series 2016-C02, Cl. 1M1, 2.674%, 9/25/282 | | | 344,676 | | | | 349,209 | |
| Series 2016-C03, Cl. 1M1, 2.524%, 10/25/282 | | | 3,723,840 | | | | 3,780,770 | |
| Series 2016-C03, Cl. 2M1, 2.724%, 10/25/282 | | | 443,948 | | | | 450,441 | |
| Series 2016-C04, Cl. 1M1, 1.974%, 1/25/292 | | | 3,956,475 | | | | 3,978,165 | |
| Series 2016-C05, Cl. 2M1, 1.874%, 1/25/292 | | | 3,426,222 | | | | 3,438,824 | |
| |
| HomeBanc Mortgage Trust, Series 2005-3, Cl. A2, 0.834%, 7/25/352 | | | 393,657 | | | | 380,868 | |
| |
| Merrill Lynch Mortgage Investors Trust, Series 2005-A1, Cl. 2A1, 2.83%, 12/25/342 | | | 106,097 | | | | 106,097 | |
| |
| RALI Trust, Series 2006-QS13, Cl. 1A8, 6%, 9/1/36 | | | 11,097 | | | | 9,146 | |
| |
| WaMu Mortgage Pass-Through Certificates Trust: | | | | | | | | |
| Series 2003-AR10, Cl. A7, 6.00%, 10/25/332 | | | 497,318 | | | | 506,522 | |
| Series 2005-AR14, Cl. 1A4, 2.552%, 12/25/352 | | | 174,610 | | | | 169,137 | |
| Series 2005-AR16, Cl. 1A1, 2.585%, 12/25/352 | | | 744,873 | | | | 701,155 | |
| |
| Wells Fargo Mortgage-Backed Securities Trust: | | | | | | | | |
| Series 2005-AR1, Cl. 1A1, 2.766%, 2/25/352 | | | 2,311,763 | | | | 2,306,392 | |
| Series 2005-AR10, Cl. 1A1, 2.951%, 6/25/352 | | | 2,301,075 | | | | 2,394,942 | |
| Series 2005-AR13, Cl. 1A5, 3.058%, 5/25/352 | | | 2,110,865 | | | | 2,117,850 | |
18 OPPENHEIMER LIMITED-TERM BOND FUND
| | | | | | | | |
| | | Principal Amount | | | Value | |
| |
| Residential (Continued) | | | | | | | | |
| |
| Wells Fargo Mortgage-Backed Securities Trust: (Continued) | | | | | | | | |
| Series 2005-AR15, Cl. 1A2, 2.957%, 9/25/352 | | $ | 2,126,265 | | | $ | 2,070,530 | |
| Series 2005-AR4, Cl. 2A2, 2.988%, 4/25/352 | | | 3,753,826 | | | | 3,757,819 | |
| Series 2006-AR10, Cl. 5A5, 3.078%, 7/25/362 | | | 2,016,942 | | | | 1,952,480 | |
| Series 2006-AR7, Cl. 2A4, 3.087%, 5/1/362 | | | 20,361 | | | | 19,429 | |
| Series 2006-AR8, Cl. 2A1, 2.933%, 4/25/362 | | | 3,667,250 | | | | 3,592,400 | |
| Series 2006-AR8, Cl. 2A4, 2.933%, 4/25/362 | | | 369,092 | | | | 361,438 | |
| | | | | | | | |
| | | | | | | 50,917,305 | |
| | | | | | | | |
| Total Mortgage-Backed Obligations (Cost $306,818,128) | | | | | | | 314,964,628 | |
| | | | | | | | |
| |
| U.S. Government Obligations—1.2% | | | | | | | | |
| |
| Federal Home Loan Bank Nts., 0.875%, 8/5/19 | | | 3,125,000 | | | | 3,110,647 | |
| |
| Federal National Mortgage Assn. Nts.: | | | | | | | | |
| 0.875%, 8/2/19 | | | 3,746,000 | | | | 3,725,764 | |
| 1.00%, 8/28/19 | | | 2,622,000 | | | | 2,618,216 | |
| |
| United States Treasury Nts.: | | | | | | | | |
| 1.75%, 10/31/208 | | | 4,948,000 | | | | 5,068,316 | |
| 2.50%, 8/15/239 | | | 3,266,000 | | | | 3,495,577 | |
| | | | | | | | |
| Total U.S. Government Obligations (Cost $17,697,552) | | | | | | | 18,018,520 | |
| | | | | | | | |
| |
| Corporate Bonds and Notes—64.8% | | | | | | | | |
| |
| Consumer Discretionary—10.3% | | | | | | | | |
| |
| Auto Components—0.4% | | | | | | | | |
| |
| Johnson Controls, Inc., 1.40% Sr. Unsec. Nts., 11/2/17 | | | 2,111,000 | | | | 2,112,459 | |
| |
| ZF North America Capital, Inc., 4% Sr. Unsec. Nts., 4/29/201 | | | 3,400,000 | | | | 3,623,125 | |
| | | | | | | | |
| | | | | | | 5,735,584 | |
| |
| Automobiles—3.1% | | | | | | | | |
| |
| American Honda Finance Corp., 1.70% Sr. Unsec. Nts., 2/22/19 | | | 4,007,000 | | | | 4,050,688 | |
| |
| Daimler Finance North America LLC: | | | | | | | | |
| 2.00% Sr. Unsec. Nts., 8/3/181 | | | 2,225,000 | | | | 2,248,115 | |
| 2.25% Sr. Unsec. Nts., 3/2/201 | | | 2,100,000 | | | | 2,139,873 | |
| 2.45% Sr. Unsec. Nts., 5/18/201 | | | 1,600,000 | | | | 1,642,920 | |
| |
| Ford Motor Credit Co. LLC: | | | | | | | | |
| 1.684% Sr. Unsec. Nts., 9/8/17 | | | 1,500,000 | | | | 1,502,199 | |
| 2.24% Sr. Unsec. Nts., 6/15/18 | | | 4,000,000 | | | | 4,034,716 | |
| 2.459% Sr. Unsec. Nts., 3/27/20 | | | 3,000,000 | | | | 3,026,574 | |
| |
| General Motors Co., 3.50% Sr. Unsec. Nts., 10/2/18 | | | 3,000,000 | | | | 3,088,377 | |
| |
| General Motors Financial Co., Inc., 3.15% Sr. Unsec. Nts., 1/15/20 | | | 2,600,000 | | | | 2,656,703 | |
| |
| Harley-Davidson Financial Services, Inc., 2.15% Sr. Unsec. Nts., 2/26/201 | | | 1,600,000 | | | | 1,609,789 | |
| |
| Harley-Davidson Funding Corp., 6.80% Sr. Unsec. Nts., 6/15/181 | | | 3,000,000 | | | | 3,272,310 | |
| |
| Hyundai Capital America: | | | | | | | | |
| 2.40% Sr. Unsec. Nts., 10/30/181 | | | 3,200,000 | | | | 3,247,997 | |
| 2.45% Sr. Unsec. Nts., 6/15/211 | | | 3,000,000 | | | | 3,038,289 | |
19 OPPENHEIMER LIMITED-TERM BOND FUND
STATEMENT OF INVESTMENTS Continued
| | | | | | | | |
| | | Principal Amount | | | Value | |
| |
| Automobiles (Continued) | | | | | | | | |
| |
| Jaguar Land Rover Automotive plc, 3.50% Sr. Unsec. Nts., 3/15/201 | | $ | 2,600,000 | | | $ | 2,674,750 | |
| |
| Nissan Motor Acceptance Corp., 2% Sr. Unsec. Nts., 3/8/191 | | | 2,516,000 | | | | 2,535,444 | |
| |
| Volkswagen Group of America Finance LLC, 1.60% Sr. Unsec. Nts., 11/20/171 | | | 3,570,000 | | | | 3,566,130 | |
| | | | | | | | |
| | | | | | | 44,334,874 | |
| |
| Hotels, Restaurants & Leisure—1.0% | | | | | | | | |
| |
| Hilton Worldwide Finance LLC/Hilton Worldwide Finance Corp., 5.625% Sr. Unsec. Nts., 10/15/21 | | | 2,850,000 | | | | 2,948,935 | |
| |
| International Game Technology, 7.50% Sr. Sec. Nts., 6/15/19 | | | 2,000,000 | | | | 2,265,000 | |
| |
| Marriott International, Inc., 3% Sr. Unsec. Nts., 3/1/19 | | | 3,000,000 | | | | 3,089,346 | |
| |
| McDonald’s Corp., 2.10% Sr. Unsec. Nts., 12/7/18 | | | 3,300,000 | | | | 3,360,278 | |
| |
| Wyndham Worldwide Corp., 2.95% Sr. Unsec. Nts., 3/1/17 | | | 2,860,000 | | | | 2,876,299 | |
| | | | | | | | |
| | | | | | | 14,539,858 | |
| |
| Household Durables—1.0% | | | | | | | | |
| |
| DR Horton, Inc.: | | | | | | | | |
| 3.625% Sr. Unsec. Nts., 2/15/18 | | | 1,150,000 | | | | 1,171,562 | |
| 3.75% Sr. Unsec. Nts., 3/1/19 | | | 2,250,000 | | | | 2,328,750 | |
| |
| Lennar Corp., 4.125% Sr. Unsec. Nts., 12/1/18 | | | 2,300,000 | | | | 2,386,250 | |
| |
| Newell Brands, Inc., 2.60% Sr. Unsec. Nts., 3/29/19 | | | 1,000,000 | | | | 1,023,564 | |
| |
| Newell Rubbermaid, Inc., 2.875% Sr. Unsec. Nts., 12/1/19 | | | 3,115,000 | | | | 3,207,525 | |
| |
| Toll Brothers Finance Corp., 4% Sr. Unsec. Nts., 12/31/18 | | | 3,500,000 | | | | 3,653,125 | |
| |
| Whirlpool Corp.: | | | | | | | | |
| 1.35% Sr. Unsec. Nts., 3/1/17 | | | 545,000 | | | | 545,695 | |
| 1.65% Sr. Unsec. Nts., 11/1/17 | | | 585,000 | | | | 587,253 | |
| | | | | | | | |
| | | | | | | 14,903,724 | |
| |
| Internet & Catalog Retail—0.3% | | | | | | | | |
| |
QVC, Inc., 3.125% Sr. Sec. Nts., 4/1/19 | | | 4,150,000 | | | | 4,245,537 | |
| |
| Leisure Equipment & Products—0.4% | | | | | | | | |
| |
| Mattel, Inc.: | | | | | | | | |
| 1.70% Sr. Unsec. Nts., 3/15/18 | | | 4,160,000 | | | | 4,175,130 | |
| 2.35% Sr. Unsec. Nts., 8/15/21 | | | 1,000,000 | | | | 1,000,024 | |
| | | | | | | | |
| | | | | | | 5,175,154 | |
| |
| Media—2.8% | | | | | | | | |
| |
| 21st Century Fox America, Inc., 7.25% Sr. Unsec. Nts., 5/18/18 | | | 3,800,000 | | | | 4,164,690 | |
| |
| CBS Corp., 2.30% Sr. Unsec. Nts., 8/15/19 | | | 4,200,000 | | | | 4,255,075 | |
| |
| Charter Communications Operating LLC/Charter Communications Operating Capital, 3.579% Sr. Sec. Nts., 7/23/201 | | | 1,800,000 | | | | 1,884,105 | |
| |
| Interpublic Group of Cos, Inc. (The), 2.25% Sr. Unsec. Nts., 11/15/17 | | | 2,460,000 | | | | 2,471,223 | |
| |
| Omnicom Group, Inc., 4.45% Sr. Unsec. Nts., 8/15/20 | | | 2,370,000 | | | | 2,594,958 | |
| |
| Pearson plc, 4.625% Sr. Unsec. Nts., 6/15/181 | | | 2,100,000 | | | | 2,185,877 | |
| |
| Scripps Networks Interactive, Inc.: | | | | | | | | |
| 2.70% Sr. Unsec. Nts., 12/15/16 | | | 1,200,000 | | | | 1,205,141 | |
| 2.75% Sr. Unsec. Nts., 11/15/19 | | | 4,100,000 | | | | 4,181,016 | |
20 OPPENHEIMER LIMITED-TERM BOND FUND
| | | | | | | | |
| | | Principal Amount | | | Value | |
| |
| Media (Continued) | | | | | | | | |
| |
| Sky plc: | | | | | | | | |
| 2.625% Sr. Unsec. Nts., 9/16/191 | | $ | 1,900,000 | | | $ | 1,929,007 | |
| 6.10% Sr. Unsec. Nts., 2/15/181 | | | 2,000,000 | | | | 2,119,150 | |
| |
| Thomson Reuters Corp., 1.65% Sr. Unsec. Nts., 9/29/17 | | | 3,800,000 | | | | 3,815,705 | |
| |
| Time Warner Cable, Inc., 4% Sr. Unsec. Nts., 9/1/21 | | | 3,600,000 | | | | 3,841,333 | |
| |
| Time Warner, Inc., 2.10% Sr. Unsec. Nts., 6/1/19 | | | 2,036,000 | | | | 2,067,165 | |
| |
| Viacom, Inc., 2.75% Sr. Unsec. Nts., 12/15/19 | | | 4,090,000 | | | | 4,182,516 | |
| | | | | | | | |
| | | | | | | 40,896,961 | |
|
| |
| Multiline Retail—0.2% | | | | | | | | |
| |
| Dollar Tree, Inc., 5.25% Sr. Unsec. Nts., 3/1/20 | | | 3,350,000 | | | | 3,504,937 | |
|
| |
| Specialty Retail—1.1% | | | | | | | | |
| |
| AutoNation, Inc., 3.35% Sr. Unsec. Nts., 1/15/21 | | | 4,000,000 | | | | 4,104,688 | |
| |
| AutoZone, Inc., 1.30% Sr. Unsec. Nts., 1/13/17 | | | 4,000,000 | | | | 4,004,904 | |
| |
| Best Buy Co., Inc., 5% Sr. Unsec. Nts., 8/1/18 | | | 4,256,000 | | | | 4,501,103 | |
| |
| L Brands, Inc., 6.625% Sr. Unsec. Nts., 4/1/21 | | | 3,200,000 | | | | 3,712,000 | |
| | | | | | | | |
| | | | | | | 16,322,695 | |
|
| |
| Consumer Staples—5.7% | | | | | | | | |
| |
| Beverages—1.7% | | | | | | | | |
| |
| Anheuser-Busch InBev Finance, Inc., 1.90% Sr. Unsec. Nts., 2/1/19 | | | 7,899,000 | | | | 7,985,794 | |
| |
| Beam Suntory, Inc., 1.875% Sr. Unsec. Nts., 5/15/17 | | | 348,000 | | | | 349,126 | |
| |
| Constellation Brands, Inc., 3.75% Sr. Unsec. Nts., 5/1/21 | | | 3,455,000 | | | | 3,662,300 | |
| |
| Molson Coors Brewing Co.: | | | | | | | | |
| 2.00% Sr. Unsec. Nts., 5/1/17 | | | 2,000,000 | | | | 2,010,262 | |
| 2.10% Sr. Unsec. Nts., 7/15/21 | | | 4,000,000 | | | | 4,031,040 | |
| |
| Pernod Ricard SA, 5.75% Sr. Unsec. Nts., 4/7/211 | | | 4,300,000 | | | | 4,967,910 | |
| |
| SABMiller Holdings, Inc., 2.45% Sr. Unsec. Nts., 1/15/171 | | | 1,800,000 | | | | 1,808,203 | |
| | | | | | | | |
| | | | | | | 24,814,635 | |
|
| |
| Food & Staples Retailing—1.2% | | | | | | | | |
| |
| CVS Health Corp., 2.80% Sr. Unsec. Nts., 7/20/20 | | | 2,800,000 | | | | 2,918,664 | |
| |
| Koninklijke Ahold Delhaize NV: | | | | | | | | |
| 4.125% Sr. Unsec. Nts., 4/10/19 | | | 1,089,000 | | | | 1,147,042 | |
| 6.50% Sr. Unsec. Nts., 6/15/17 | | | 3,158,000 | | | | 3,277,246 | |
| |
| Kroger Co. (The): | | | | | | | | |
| 2.00% Sr. Unsec. Nts., 1/15/19 | | | 1,254,000 | | | | 1,271,799 | |
| 6.80% Sr. Unsec. Nts., 12/15/18 | | | 1,870,000 | | | | 2,090,363 | |
| |
| Tesco plc, 5.50% Sr. Unsec. Nts., 11/15/171 | | | 3,400,000 | | | | 3,529,768 | |
| |
| Walgreens Boots Alliance, Inc., 1.75% Sr. Unsec. Nts., 5/30/18 | | | 2,364,000 | | | | 2,378,834 | |
| | | | | | | | |
| | | | | | | 16,613,716 | |
|
| |
| Food Products—1.6% | | | | | | | | |
| |
| Bunge Ltd. Finance Corp., 8.50% Sr. Unsec. Nts., 6/15/19 | | | 3,940,000 | | | | 4,613,346 | |
| |
| ConAgra Foods, Inc., 1.90% Sr. Unsec. Nts., 1/25/18 | | | 4,945,000 | | | | 4,980,975 | |
| |
| JM Smucker Co. (The), 2.50% Sr. Unsec. Nts., 3/15/20 | | | 2,000,000 | | | | 2,051,184 | |
| |
| Kraft Heinz Foods Co.: | | | | | | | | |
| 2.25% Sr. Unsec. Nts., 6/5/17 | | | 2,500,000 | | | | 2,518,942 | |
| 2.80% Sr. Unsec. Nts., 7/2/20 | | | 3,000,000 | | | | 3,121,521 | |
| |
| Mead Johnson Nutrition Co., 3% Sr. Unsec. Nts., 11/15/20 | | | 1,000,000 | | | | 1,044,531 | |
21 OPPENHEIMER LIMITED-TERM BOND FUND
STATEMENT OF INVESTMENTS Continued
| | | | | | | | |
| | | Principal Amount | | | Value | |
| |
| Food Products (Continued) | | | | | | | | |
| |
| Tyson Foods, Inc., 2.65% Sr. Unsec. Nts., 8/15/19 | | $ | 4,000,000 | | | $ | 4,105,628 | |
| | | | | | | | |
| | | | | | | 22,436,127 | |
|
| |
| Tobacco—1.2% | | | | | | | | |
| |
| Altria Group, Inc., 2.625% Sr. Unsec. Nts., 1/14/20 | | | 2,500,000 | | | | 2,597,815 | |
| |
| BAT International Finance plc, 2.125% Sr. Unsec. Nts., 6/7/171 | | | 3,000,000 | | | | 3,022,416 | |
| |
| Imperial Tobacco Finance plc, 2.95% Sr. Unsec. Nts., 7/21/201 | | | 4,750,000 | | | | 4,908,265 | |
| |
| Philip Morris International, Inc., 1.375% Sr. Unsec. Nts., 2/25/19 | | | 3,384,000 | | | | 3,402,639 | |
| |
| Reynolds American, Inc.: | | | | | | | | |
| 3.25% Sr. Unsec. Nts., 6/12/20 | | | 2,032,000 | | | | 2,140,781 | |
| 8.125% Sr. Unsec. Nts., 6/23/19 | | | 1,650,000 | | | | 1,938,288 | |
| | | | | | | | |
| | | | | | | 18,010,204 | |
|
| |
| Energy—6.8% | | | | | | | | |
| |
| Energy Equipment & Services—0.9% | | | | | | | | |
| |
| Cameron International Corp., 1.15% Sr. Unsec. Nts., 12/15/16 | | | 3,250,000 | | | | 3,247,241 | |
| |
| Halliburton Co., 5.90% Sr. Unsec. Nts., 9/15/18 | | | 2,314,000 | | | | 2,499,974 | |
| |
| Nabors Industries, Inc., 2.35% Sr. Unsec. Nts., 9/15/16 | | | 3,400,000 | | | | 3,400,350 | |
| |
| Schlumberger Holdings Corp., 3% Sr. Unsec. Nts., 12/21/201 | | | 3,000,000 | | | | 3,123,894 | |
| | | | | | | | |
| | | | | | | 12,271,459 | |
|
| |
| Oil, Gas & Consumable Fuels—5.9% | | | | | | | | |
| |
| Anadarko Petroleum Corp.: | | | | | | | | |
| 6.375% Sr. Unsec. Nts., 9/15/17 | | | 417,000 | | | | 436,297 | |
| 6.95% Sr. Unsec. Nts., 6/15/19 | | | 2,600,000 | | | | 2,881,546 | |
| |
| Apache Corp., 6.90% Sr. Unsec. Nts., 9/15/18 | | | 1,900,000 | | | | 2,077,777 | |
| |
| BP Capital Markets plc, 1.676% Sr. Unsec. Nts., 5/3/19 | | | 3,552,000 | | | | 3,580,483 | |
| |
| Buckeye Partners LP, 2.65% Sr. Unsec. Nts., 11/15/18 | | | 3,450,000 | | | | 3,486,366 | |
| |
| Chevron Corp.: | | | | | | | | |
| 1.718% Sr. Unsec. Nts., 6/24/18 | | | 3,400,000 | | | | 3,436,173 | |
| 2.10% Sr. Unsec. Nts., 5/16/21 | | | 2,750,000 | | | | 2,800,754 | |
| |
| Columbia Pipeline Group, Inc., 2.45% Sr. Unsec. Nts., 6/1/18 | | | 2,000,000 | | | | 2,010,440 | |
| |
| ConocoPhillips Co., 1.50% Sr. Unsec. Nts., 5/15/18 | | | 3,500,000 | | | | 3,501,641 | |
| |
| DCP Midstream LLC, 9.75% Sr. Unsec. Nts., 3/15/191 | | | 1,300,000 | | | | 1,454,375 | |
| |
| DCP Midstream Operating LP, 2.50% Sr. Unsec. Unsub. Nts., 12/1/17 | | | 2,800,000 | | | | 2,796,500 | |
| |
| Enbridge Energy Partners LP, 5.875% Sr. Unsec. Nts., 12/15/16 | | | 1,000,000 | | | | 1,011,111 | |
| |
| Enbridge, Inc., 5.60% Sr. Unsec. Nts., 4/1/17 | | | 2,650,000 | | | | 2,718,823 | |
| |
| Energy Transfer Partners LP: | | | | | | | | |
| 4.15% Sr. Unsec. Nts., 10/1/20 | | | 3,000,000 | | | | 3,149,754 | |
| 6.125% Sr. Unsec. Nts., 2/15/17 | | | 1,700,000 | | | | 1,734,394 | |
| |
| EOG Resources, Inc.: | | | | | | | | |
| 5.875% Sr. Unsec. Nts., 9/15/17 | | | 2,150,000 | | | | 2,251,603 | |
| 6.875% Sr. Unsec. Nts., 10/1/18 | | | 1,000,000 | | | | 1,101,487 | |
| |
| EQT Corp., 5.15% Sr. Unsec. Nts., 3/1/18 | | | 1,955,000 | | | | 2,039,149 | |
| |
| Hiland Partners Holdings LLC/Hiland Partners Finance Corp., | | | | | | | | |
| 7.25% Sr. Unsec. Nts., 10/1/201 | | | 1,950,000 | | | | 2,023,125 | |
| |
| Husky Energy, Inc., 6.20% Sr. Unsec. Nts., 9/15/17 | | | 1,466,000 | | | | 1,532,410 | |
| |
| Kinder Morgan Finance Co. LLC, 6% Sr. Unsec. Nts., 1/15/181 | | | 3,400,000 | | | | 3,566,070 | |
22 OPPENHEIMER LIMITED-TERM BOND FUND
| | | | | | | | |
| | | Principal Amount | | | Value | |
| |
| Oil, Gas & Consumable Fuels (Continued) | | | | | | | | |
| |
| Magellan Midstream Partners LP, 6.55% Sr. Unsec. Nts., 7/15/19 | | $ | 2,248,000 | | | $ | 2,532,768 | |
| |
| Marathon Oil Corp., 6% Sr. Unsec. Nts., 10/1/17 | | | 3,300,000 | | | | 3,412,688 | |
| |
| NuStar Logistics LP, 8.15% Sr. Unsec. Nts., 4/15/18 | | | 2,950,000 | | | | 3,197,063 | |
| |
| Origin Energy Finance Ltd., 3.50% Sr. Unsec. Nts., 10/9/181 | | | 1,989,000 | | | | 2,017,805 | |
| |
| Pioneer Natural Resources Co., 6.65% Sr. Unsec. Nts., 3/15/17 | | | 1,018,000 | | | | 1,041,101 | |
| |
| Plains All American Pipeline LP/PAA Finance Corp.: | | | | | | | | |
| 2.60% Sr. Unsec. Nts., 12/15/19 | | | 1,900,000 | | | | 1,913,574 | |
| 6.125% Sr. Unsec. Nts., 1/15/17 | | | 2,800,000 | | | | 2,846,074 | |
| |
| QEP Resources, Inc., 6.05% Sr. Unsec. Nts., 9/1/16 | | | 1,550,000 | | | | 1,550,000 | |
| |
| Shell International Finance BV, 1.375% Sr. Unsec. Nts., 5/10/19 | | | 3,604,000 | | | | 3,602,717 | |
| |
| Spectra Energy Partners LP, 2.95% Sr. Unsec. Nts., 9/25/18 | | | 2,000,000 | | | | 2,037,484 | |
| |
| Total Capital Canada Ltd., 1.45% Sr. Unsec. Nts., 1/15/18 | | | 3,400,000 | | | | 3,415,093 | |
| |
| TransCanada PipeLines Ltd., 1.625% Sr. Unsec. Nts., 11/9/17 | | | 4,983,000 | | | | 4,997,127 | |
| |
| Woodside Finance Ltd., 8.75% Sr. Unsec. Nts., 3/1/191 | | | 3,000,000 | | | | 3,443,814 | |
| | | | | | | | |
| | | | | | | 85,597,586 | |
|
| |
| Financials—14.9% | | | | | | | | |
| |
| Capital Markets—1.9% | | | | | | | | |
| |
| Brookfield Asset Management, Inc., 5.80% Sr. Unsec. Nts., 4/25/17 | | | 2,471,000 | | | | 2,535,550 | |
| |
| Credit Suisse AG (New York), 2.30% Sr. Unsec. Nts., 5/28/19 | | | 4,000,000 | | | | 4,057,320 | |
| |
| E*TRADE Financial Corp., 5.375% Sr. Unsec. Nts., 11/15/22 | | | 3,350,000 | | | | 3,622,187 | |
| |
| Goldman Sachs Group, Inc. (The), 2.60% Sr. Unsec. Nts., 4/23/20 | | | 4,200,000 | | | | 4,287,885 | |
| |
| Lazard Group LLC, 6.85% Sr. Unsec. Nts., 6/15/17 | | | 1,164,000 | | | | 1,208,691 | |
| |
| Legg Mason, Inc., 2.70% Sr. Unsec. Nts., 7/15/19 | | | 2,000,000 | | | | 2,034,154 | |
| |
| Morgan Stanley, 2.65% Sr. Unsec. Nts., 1/27/20 | | | 5,000,000 | | | | 5,132,700 | |
| |
| UBS Group Funding Jersey Ltd., 2.65% Sr. Unsec. Nts., 2/1/221 | | | 4,300,000 | | | | 4,300,129 | |
| | | | | | | | |
| | | | | | | 27,178,616 | |
|
| |
| Commercial Banks—7.3% | | | | | | | | |
| |
| Bank of America Corp.: | | | | | | | | |
| 2.25% Sr. Unsec. Nts., 4/21/20 | | | 2,200,000 | | | | 2,218,936 | |
| 2.60% Sr. Unsec. Nts., 1/15/19 | | | 3,225,000 | | | | 3,298,124 | |
| 2.625% Sr. Unsec. Nts., 10/19/20 | | | 1,300,000 | | | | 1,331,643 | |
| |
| BPCE SA, 2.65% Sr. Unsec. Nts., 2/3/21 | | | 2,750,000 | | | | 2,843,599 | |
| |
| Branch Banking & Trust Co., 1.45% Sr. Unsec. Nts., 5/10/19 | | | 4,100,000 | | | | 4,102,136 | |
| |
| Citigroup, Inc.: | | | | | | | | |
| 1.80% Sr. Unsec. Nts., 2/5/18 | | | 2,100,000 | | | | 2,108,375 | |
| 2.35% Sr. Unsec. Nts., 8/2/21 | | | 1,600,000 | | | | 1,605,227 | |
| 2.50% Sr. Unsec. Nts., 9/26/18 | | | 3,300,000 | | | | 3,359,446 | |
| |
| Citizens Bank NA (Providence RI), 2.30% Sr. Unsec. Nts., 12/3/18 | | | 5,000,000 | | | | 5,061,675 | |
| |
| Danske Bank AS, 1.65% Sr. Unsec. Nts., 9/6/191,6 | | | 3,000,000 | | | | 2,996,160 | |
| |
| Fifth Third Bancorp, 2.30% Sr. Unsec. Nts., 3/1/19 | | | 3,000,000 | | | | 3,054,921 | |
23 OPPENHEIMER LIMITED-TERM BOND FUND
STATEMENT OF INVESTMENTS Continued
| | | | | | | | |
| | | Principal Amount | | | Value | |
| |
| Commercial Banks (Continued) | | | | | | | | |
| |
| Fifth Third Bank (Cincinnati, OH), 2.25% Sr. Unsec. Nts., 6/14/21 | | $ | 1,500,000 | | | $ | 1,525,305 | |
| |
| First Horizon National Corp., 3.50% Sr. Unsec. Nts., 12/15/20 | | | 3,000,000 | | | | 3,059,469 | |
| |
| HSBC USA, Inc., 1.625% Sr. Unsec. Nts., 1/16/18 | | | 4,000,000 | | | | 4,001,316 | |
| |
| Huntington National Bank (The), 2.20% Sr. Unsec. Nts., 11/6/18 | | | 4,215,000 | | | | 4,261,803 | |
| |
| JPMorgan Chase & Co.: | | | | | | | | |
| 2.25% Sr. Unsec. Nts., 1/23/20 | | | 4,200,000 | | | | 4,258,565 | |
| 2.295% Sr. Unsec. Nts., 8/15/21 | | | 2,265,000 | | | | 2,278,524 | |
| |
| KeyCorp, 2.90% Sr. Unsec. Nts., 9/15/20 | | | 5,000,000 | | | | 5,193,805 | |
| |
| Lloyds Bank plc, 1.75% Sr. Unsec. Nts., 5/14/18 | | | 2,700,000 | | | | 2,698,766 | |
| |
| Lloyds Banking Group plc, 6.267% Jr. Sub. Perpetual Bonds1,2,10 | | | 3,200,000 | | | | 3,080,032 | |
| |
| National Australia Bank Ltd. (New York), 1.375% Sr. Unsec. Nts., 7/12/19 | | | 3,600,000 | | | | 3,580,974 | |
| |
| National Rural Utilities Cooperative Finance Corp., 1.65% Sec. Nts., 2/8/19 | | | 2,000,000 | | | | 2,017,256 | |
| |
| PNC Bank NA, 1.95% Sr. Unsec. Nts., 3/4/19 | | | 5,000,000 | | | | 5,059,545 | |
| |
| Rabobank Capital Funding Trust III, 5.254% Jr. Sub. Perpetual Bonds1,2,10 | | | 4,900,000 | | | | 4,904,018 | |
| |
| Regions Bank (Birmingham AL), 2.25% Sr. Unsec. Nts., 9/14/18 | | | 1,134,000 | | | | 1,140,702 | |
| |
| Royal Bank of Scotland Group plc, 7.64% Jr. Sub. Perpetual Bonds2,10 | | | 1,990,000 | | | | 1,974,876 | |
| |
| Societe Generale SA, 5.922% Jr. Sub. Perpetual Bonds1,2,10 | | | 2,860,000 | | | | 2,919,545 | |
| |
| SunTrust Banks, Inc., 2.35% Sr. Unsec. Nts., 11/1/18 | | | 4,050,000 | | | | 4,118,567 | |
| |
| Svenska Handelsbanken AB, 2.40% Sr. Unsec. Nts., 10/1/20 | | | 4,000,000 | | | | 4,102,228 | |
| |
| US Bank NA (Cincinnati, OH), 1.45% Sr. Unsec. Nts., 1/29/18 | | | 5,336,000 | | | | 5,364,654 | |
| |
| Wells Fargo & Co.: | | | | | | | | |
| 2.10% Sr. Unsec. Nts., 7/26/21 | | | 2,200,000 | | | | 2,211,220 | |
| 2.60% Sr. Unsec. Nts., 7/22/20 | | | 5,700,000 | | | | 5,866,081 | |
| | | | | | | | |
| | | | | | | 105,597,493 | |
|
| |
| Consumer Finance—1.2% | | | | | | | | |
| |
| Ally Financial, Inc., 3.25% Sr. Unsec. Nts., 11/5/18 | | | 3,400,000 | | | | 3,440,375 | |
| |
| American Express Co., 6.80% Sub. Nts., 9/1/662 | | | 4,700,000 | | | | 4,700,000 | |
| |
| Capital One NA (Mclean VA), 2.40% Sr. Unsec. Nts., 9/5/19 | | | 4,000,000 | | | | 4,074,056 | |
| |
| Discover Bank (Greenwood DE), 3.10% Sr. Unsec. Nts., 6/4/20 | | | 1,500,000 | | | | 1,544,444 | |
| |
| Synchrony Financial, 2.70% Sr. Unsec. Nts., 2/3/20 | | | 3,423,000 | | | | 3,453,143 | |
| | | | | | | | |
| | | | | | | 17,212,018 | |
|
| |
| Diversified Financial Services—1.2% | | | | | | | | |
| |
| Berkshire Hathaway Finance Corp., 1.45% Sr. Unsec. Nts., 3/7/18 | | | 3,000,000 | | | | 3,018,027 | |
| |
| INVISTA Finance LLC, 4.25% Sr. Sec. Nts., 10/15/191 | | | 2,900,000 | | | | 2,866,694 | |
| |
| S&P Global, Inc.: | | | | | | | | |
| 2.50% Sr. Unsec. Nts., 8/15/18 | | | 2,067,000 | | | | 2,101,186 | |
| 5.90% Sr. Unsec. Nts., 11/15/17 | | | 2,000,000 | | | | 2,093,522 | |
| |
| Schaeffler Finance BV, 4.25% Sr. Sec. Nts., 5/15/211 | | | 1,500,000 | | | | 1,545,000 | |
| |
| Suntory Holdings Ltd., 1.65% Sr. Unsec. Nts., 9/29/171 | | | 2,236,000 | | | | 2,240,548 | |
24 OPPENHEIMER LIMITED-TERM BOND FUND
| | | | | | | | |
| | | Principal Amount | | | Value | |
| |
| Diversified Financial Services (Continued) | | | | | | | | |
| |
| Voya Financial, Inc., 2.90% Sr. Unsec. Nts., 2/15/18 | | $ | 4,149,000 | | | $ | 4,232,652 | |
| | | | | | | | |
| | | | | | | 18,097,629 | |
|
| |
| Insurance—1.5% | | | | | | | | |
| |
| AXIS Specialty Finance plc, 2.65% Sr. Unsec. Nts., 4/1/19 | | | 3,100,000 | | | | 3,140,541 | |
| |
| Boardwalk Pipelines LP, 5.50% Sr. Unsec. Nts., 2/1/17 | | | 5,300,000 | | | | 5,363,102 | |
| |
| Chubb INA Holdings, Inc., 2.30% Sr. Unsec. Nts., 11/3/20 | | | 2,000,000 | | | | 2,058,146 | |
| |
| MetLife, Inc., 2.463% Sr. Unsec. Nts., 12/15/17 | | | 3,000,000 | | | | 3,018,432 | |
| |
| Pricoa Global Funding I, 2.20% Sr. Sec. Nts., 5/16/191 | | | 3,400,000 | | | | 3,466,409 | |
| |
| TIAA Asset Management Finance Co. LLC, 2.95% Sr. Unsec. Nts., 11/1/191 | | | 4,500,000 | | | | 4,623,624 | |
| | | | | | | | |
| | | | | | | 21,670,254 | |
|
| |
| Real Estate Investment Trusts (REITs)—1.8% | | | | | | | | |
| |
| American Tower Corp.: | | | | | | | | |
| 2.80% Sr. Unsec. Nts., 6/1/20 | | | 500,000 | | | | 512,537 | |
| 5.05% Sr. Unsec. Unsub. Nts., 9/1/20 | | | 2,000,000 | | | | 2,221,798 | |
| |
| Boston Properties LP, 3.70% Sr. Unsec. Nts., 11/15/18 | | | 2,989,000 | | | | 3,121,715 | |
| |
| Crown Castle International Corp., 2.25% Sr. Unsec. Nts., 9/1/216 | | | 4,300,000 | | | | 4,296,685 | |
| |
| Highwoods Realty LP, 5.85% Sr. Unsec. Nts., 3/15/17 | | | 2,635,000 | | | | 2,690,037 | |
| |
| Liberty Property LP, 5.50% Sr. Unsec. Nts., 12/15/16 | | | 2,777,000 | | | | 2,809,702 | |
| |
| Prologis International Funding II SA, 4.875% Sr. Unsec. Nts., 2/15/201 | | | 525,000 | | | | 561,820 | |
| |
| Realty Income Corp., 2% Sr. Unsec. Nts., 1/31/18 | | | 2,250,000 | | | | 2,264,663 | |
| |
| Simon Property Group LP, 1.50% Sr. Unsec. Nts., 2/1/181 | | | 1,059,000 | | | | 1,063,037 | |
| |
| Ventas Realty LP, 1.25% Sr. Unsec. Nts., 4/17/17 | | | 4,533,000 | | | | 4,533,598 | |
| |
| Ventas Realty LP/Ventas Capital Corp., 2% Sr. Unsec. Nts., 2/15/18 | | | 1,750,000 | | | | 1,760,826 | |
| | | | | | | | |
| | | | | | | 25,836,418 | |
|
| |
| Health Care—6.7% | | | | | | | | |
| |
| Biotechnology—1.5% | | | | | | | | |
| |
| AbbVie, Inc.: | | | | | | | | |
| 1.75% Sr. Unsec. Nts., 11/6/17 | | | 2,620,000 | | | | 2,632,587 | |
| 1.80% Sr. Unsec. Nts., 5/14/18 | | | 2,700,000 | | | | 2,714,955 | |
| 2.30% Sr. Unsec. Nts., 5/14/21 | | | 3,000,000 | | | | 3,034,491 | |
| |
| Amgen, Inc., 2.50% Sr. Unsec. Nts., 11/15/16 | | | 2,600,000 | | | | 2,608,044 | |
| |
| Biogen, Inc., 2.90% Sr. Unsec. Nts., 9/15/20 | | | 5,400,000 | | | | 5,631,190 | |
| |
| Celgene Corp.: | | | | | | | | |
| 2.125% Sr. Unsec. Nts., 8/15/18 | | | 2,100,000 | | | | 2,125,866 | |
| 2.875% Sr. Unsec. Nts., 8/15/20 | | | 3,400,000 | | | | 3,531,930 | |
| | | | | | | | |
| | | | | | | 22,279,063 | |
|
| |
| Health Care Equipment & Supplies—1.4% | | | | | | | | |
| |
| Baxter International, Inc., 1.70% Sr. Unsec. Nts., 8/15/21 | | | 3,000,000 | | | | 2,987,682 | |
| |
| Becton Dickinson & Co.: | | | | | | | | |
| 1.45% Sr. Unsec. Nts., 5/15/17 | | | 2,125,000 | | | | 2,130,202 | |
| 2.675% Sr. Unsec. Nts., 12/15/19 | | | 2,000,000 | | | | 2,071,734 | |
| |
| Boston Scientific Corp.: | | | | | | | | |
| 2.85% Sr. Unsec. Nts., 5/15/20 | | | 3,000,000 | | | | 3,094,776 | |
25 OPPENHEIMER LIMITED-TERM BOND FUND
STATEMENT OF INVESTMENTS Continued
| | | | | | | | |
| | | Principal Amount | | | Value | |
| |
| Health Care Equipment & Supplies (Continued) | | | | | | | | |
| |
| Boston Scientific Corp.: (Continued) | | | | | | | | |
| 5.125% Sr. Unsec. Nts., 1/12/17 | | $ | 2,560,000 | | | $ | 2,596,106 | |
| |
| Stryker Corp., 2.625% Sr. Unsec. Nts., 3/15/21 | | | 3,400,000 | | | | 3,514,094 | |
| |
| Zimmer Biomet Holdings, Inc., 2.70% Sr. Unsec. Nts., 4/1/20 | | | 3,700,000 | | | | 3,788,782 | |
| | | | | | | | |
| | | | | | | 20,183,376 | |
|
| |
| Health Care Providers & Services—1.3% | | | | | | | | |
| |
| Cardinal Health, Inc., 1.95% Sr. Unsec. Nts., 6/15/18 | | | 3,000,000 | | | | 3,030,873 | |
| |
| Chevron Phillips Chemical Co. LLC/Chevron Phillips Chemical Co. LP, 1.70% Sr. Unsec. Nts., 5/1/181 | | | 1,345,000 | | | | 1,345,213 | |
| |
| Express Scripts Holding Co., 2.25% Sr. Unsec. Nts., 6/15/19 | | | 4,200,000 | | | | 4,271,568 | |
| |
| Fresenius Medical Care US Finance II, Inc., 4.125% Sr. Unsec. Nts., 10/15/201 | | | 3,400,000 | | | | 3,604,000 | |
| |
| HCA, Inc., 3.75% Sr. Sec. Nts., 3/15/19 | | | 2,700,000 | | | | 2,791,125 | |
| |
| Laboratory Corp. of America Holdings, 2.625% Sr. Unsec. Nts., 2/1/20 | | | 3,310,000 | | | | 3,376,233 | |
| | | | | | | | |
| | | | | | | 18,419,012 | |
|
| |
| Life Sciences Tools & Services—0.4% | | | | | | | | |
| |
| Life Technologies Corp., 6% Sr. Unsec. Nts., 3/1/20 | | | 3,300,000 | | | | 3,696,287 | |
| |
| Thermo Fisher Scientific, Inc.: | | | | | | | | |
| 1.30% Sr. Unsec. Nts., 2/1/17 | | | 898,000 | | | | 898,774 | |
| 2.15% Sr. Unsec. Nts., 12/14/18 | | | 1,283,000 | | | | 1,299,217 | |
| | | | | | | | |
| | | | | | | 5,894,278 | |
|
| |
| Pharmaceuticals—2.1% | | | | | | | | |
| |
| Actavis Funding SCS: | | | | | | | | |
| 1.30% Sr. Unsec. Nts., 6/15/17 | | | 1,350,000 | | | | 1,346,634 | |
| 2.35% Sr. Unsec. Nts., 3/12/18 | | | 5,000,000 | | | | 5,059,215 | |
| |
| AstraZeneca plc, 5.90% Sr. Unsec. Nts., 9/15/17 | | | 3,475,000 | | | | 3,643,590 | |
| |
| Mallinckrodt International Finance SA, 3.50% Sr. Unsec. Nts., 4/15/18 | | | 2,989,000 | | | | 3,007,681 | |
| |
| Mylan NV, 3.15% Sr. Unsec. Nts., 6/15/211 | | | 3,500,000 | | | | 3,581,357 | |
| |
| Perrigo Co. plc, 2.30% Sr. Unsec. Nts., 11/8/18 | | | 1,370,000 | | | | 1,377,620 | |
| |
| Perrigo Finance Unlimited Co., 3.50% Sr. Unsec. Nts., 3/15/21 | | | 3,000,000 | | | | 3,103,068 | |
| |
| Teva Pharmaceutical Finance Netherlands III BV: | | | | | | | | |
| 1.70% Sr. Unsec. Nts., 7/19/19 | | | 2,596,000 | | | | 2,602,036 | |
| 2.20% Sr. Unsec. Nts., 7/21/21 | | | 5,000,000 | | | | 5,007,445 | |
| |
| Wm Wrigley Jr Co., 1.40% Sr. Unsec. Nts., 10/21/161 | | | 1,750,000 | | | | 1,751,355 | |
| | | | | | | | |
| | | | | | | 30,480,001 | |
|
| |
| Industrials—5.3% | | | | | | | | |
| |
| Aerospace & Defense—0.5% | | | | | | | | |
| |
| BAE Systems Holdings, Inc., 2.85% Sr. Unsec. Nts., 12/15/201 | | | 5,000,000 | | | | 5,110,780 | |
| |
| Rolls-Royce plc, 2.375% Sr. Unsec. Nts., 10/14/201 | | | 2,600,000 | | | | 2,652,432 | |
| | | | | | | | |
| | | | | | | 7,763,212 | |
|
| |
| Building Products—0.5% | | | | | | | | |
| |
| Fortune Brands Home & Security, Inc., 3% Sr. Unsec. Nts., 6/15/20 | | | 2,700,000 | | | | 2,765,526 | |
| |
| Masco Corp., 3.50% Sr. Unsec. Nts., 4/1/21 | | | 3,450,000 | | | | 3,618,187 | |
26 OPPENHEIMER LIMITED-TERM BOND FUND
| | | | | | | | |
| | | Principal Amount | | | Value | |
| |
| Building Products (Continued) | | | | | | | | |
| |
| Owens Corning, 6.50% Sr. Unsec. Nts., 12/1/16 | | $ | 1,279,000 | | | $ | 1,288,717 | |
| | | | | | | | |
| | | | | | | 7,672,430 | |
| |
| Commercial Services & Supplies—0.4% | | | | | | | | |
| |
| Pitney Bowes, Inc., 4.75% Sr. Unsec. Nts., 5/15/18 | | | 1,988,000 | | | | 2,081,567 | |
| |
| Republic Services, Inc., 5% Sr. Unsec. Nts., 3/1/20 | | | 2,800,000 | | | | 3,088,215 | |
| | | | | | | | |
| | | | | | | 5,169,782 | |
| |
| Industrial Conglomerates—0.3% | | | | | | | | |
| |
| Roper Technologies, Inc., 3% Sr. Unsec. Nts., 12/15/20 | | | 4,857,000 | | | | 5,064,355 | |
| |
| Machinery—1.5% | | | | | | | | |
| |
| CNH Industrial Capital LLC, 3.25% Sr. Unsec. Nts., 2/1/17 | | | 2,600,000 | | | | 2,620,800 | |
| |
| Crane Co., 2.75% Sr. Unsec. Nts., 12/15/18 | | | 2,500,000 | | | | 2,564,843 | |
| |
| Fortive Corp., 2.35% Sr. Unsec. Nts., 6/15/211 | | | 3,000,000 | | | | 3,044,196 | |
| |
| Ingersoll-Rand Global Holding Co. Ltd., 2.875% Sr. Unsec. Nts., 1/15/19 | | | 3,490,000 | | | | 3,597,380 | |
| |
| Pentair Finance SA, 3.625% Sr. Unsec. Nts., 9/15/20 | | | 5,000,000 | | | | 5,116,780 | |
| |
| Stanley Black & Decker, Inc., 2.451% Sub. Nts., 11/17/18 | | | 4,853,000 | | | | 4,967,138 | |
| | | | | | | | |
| | | | | | | 21,911,137 | |
| |
| Professional Services—0.5% | | | | | | | | |
| |
| Equifax, Inc., 6.30% Sr. Unsec. Nts., 7/1/17 | | | 3,111,000 | | | | 3,239,285 | |
| |
| Nielsen Finance LLC/Nielsen Finance Co., 4.50% Sr. Unsec. Nts., 10/1/20 | | | 3,445,000 | | | | 3,533,881 | |
| | | | | | | | |
| | | | | | | 6,773,166 | |
| |
| Road & Rail—1.1% | | | | | | | | |
| |
| ERAC USA Finance LLC, 6.375% Sr. Unsec. Nts., 10/15/171 | | | 2,994,000 | | | | 3,149,667 | |
| |
| Penske Truck Leasing Co. LP/PTL Finance Corp.: | | | | | | | | |
| 3.05% Sr. Unsec. Nts., 1/9/201 | | | 750,000 | | | | 769,376 | |
| 3.20% Sr. Unsec. Nts., 7/15/201 | | | 5,150,000 | | | | 5,310,979 | |
| |
| Ryder System, Inc.: | | | | | | | | |
| 2.50% Sr. Unsec. Nts., 3/1/17 | | | 1,900,000 | | | | 1,906,891 | |
| 2.65% Sr. Unsec. Nts., 3/2/20 | | | 2,000,000 | | | | 2,043,162 | |
| 2.875% Unsec. Nts., 9/1/20 | | | 2,000,000 | | | | 2,039,540 | |
| | | | | | | | |
| | | | | | | 15,219,615 | |
| |
| Trading Companies & Distributors—0.5% | | | | | | | | |
| |
| AerCap Ireland Capital Ltd./AerCap Global Aviation Trust, 3.95% Sr. Unsec. Nts., 2/1/22 | | | 3,500,000 | | | | 3,640,000 | |
| |
| Air Lease Corp., 2.125% Sr. Unsec. Nts., 1/15/18 | | | 3,600,000 | | | | 3,612,528 | |
| | | | | | | | |
| | | | | | | 7,252,528 | |
| |
| Information Technology—3.3% | | | | | | | | |
| |
| Electronic Equipment, Instruments, & Components—0.7% | | | | | | | | |
| |
| Amphenol Corp., 1.55% Sr. Unsec. Nts., 9/15/17 | | | 2,300,000 | | | | 2,307,068 | |
| |
| Arrow Electronics, Inc., 6% Sr. Unsec. Nts., 4/1/20 | | | 495,000 | | | | 546,265 | |
| |
| FLIR Systems, Inc., 3.125% Sr. Unsec. Nts., 6/15/21 | | | 3,500,000 | | | | 3,616,525 | |
| |
| Keysight Technologies, Inc., 3.30% Sr. Unsec. Nts., 10/30/19 | | | 4,000,000 | | | | 4,075,944 | |
| | | | | | | | |
| | | | | | | 10,545,802 | |
27 OPPENHEIMER LIMITED-TERM BOND FUND
STATEMENT OF INVESTMENTS Continued
| | | | | | | | |
| | | Principal Amount | | | Value | |
| |
| Internet Software & Services—0.1% | | | | | | | | |
| |
| IAC/InterActiveCorp, 4.875% Sr. Unsec. Nts., 11/30/18 | | $ | 1,976,000 | | | $ | 2,027,870 | |
| |
| IT Services—0.8% | | | | | | | | |
| |
| Fidelity National Information Services, Inc.: | | | | | | | | |
| 1.45% Sr. Unsec. Nts., 6/5/17 | | | 2,066,000 | | | | 2,065,481 | |
| 2.85% Sr. Unsec. Nts., 10/15/18 | | | 3,141,000 | | | | 3,218,561 | |
| |
| Total System Services, Inc., 2.375% Sr. Unsec. Nts., 6/1/18 | | | 4,232,000 | | | | 4,263,503 | |
| |
| Xerox Corp.: | | | | | | | | |
| 2.95% Sr. Unsec. Nts., 3/15/17 | | | 900,000 | | | | 906,274 | |
| 6.75% Sr. Unsec. Nts., 2/1/17 | | | 452,000 | | | | 461,438 | |
| | | | | | | | |
| | | | | | | 10,915,257 | |
| |
| Semiconductors & Semiconductor Equipment—0.4% | | | | | | | | |
| |
| Altera Corp., 1.75% Sr. Unsec. Nts., 5/15/17 | | | 2,400,000 | | | | 2,416,745 | |
| |
| NXP BV/NXP Funding LLC, 4.125% Sr. Unsec. Nts., 6/1/211 | | | 3,500,000 | | | | 3,669,750 | |
| | | | | | | | |
| | | | | | | 6,086,495 | |
| |
| Software—0.4% | | | | | | | | |
| |
| Autodesk, Inc.: | | | | | | | | |
| 1.95% Sr. Unsec. Nts., 12/15/17 | | | 2,500,000 | | | | 2,509,705 | |
| 3.125% Sr. Unsec. Nts., 6/15/20 | | | 3,000,000 | | | | 3,075,111 | |
| | | | | | | | |
| | | | | | | 5,584,816 | |
| |
| Technology Hardware, Storage & Peripherals—0.9% | | | | | | | | |
| |
| Dell, Inc., 5.875% Sr. Unsec. Nts., 6/15/19 | | | 2,400,000 | | | | 2,577,000 | |
| |
| Diamond 1 Finance Corp./Diamond 2 Finance Corp.: | | | | | | | | |
| 4.42% Sr. Sec. Nts., 6/15/211 | | | 4,100,000 | | | | 4,293,983 | |
| 5.875% Sr. Unsec. Nts., 6/15/211 | | | 188,000 | | | | 199,088 | |
| |
| Hewlett Packard Enterprise Co.: | | | | | | | | |
| 2.45% Sr. Unsec. Nts., 10/5/171 | | | 2,607,000 | | | | 2,629,650 | |
| 3.60% Sr. Unsec. Nts., 10/15/201 | | | 3,200,000 | | | | 3,346,554 | |
| | | | | | | | |
| | | | | | | 13,046,275 | |
| |
| Materials—4.4% | | | | | | | | |
| |
| Chemicals—1.9% | | | | | | | | |
| |
| Airgas, Inc., 3.05% Sr. Unsec. Nts., 8/1/20 | | | 2,300,000 | | | | 2,385,565 | |
| |
| Albemarle Corp., 3% Sr. Unsec. Nts., 12/1/19 | | | 2,000,000 | | | | 2,045,326 | |
| |
| CF Industries, Inc., 6.875% Sr. Unsec. Nts., 5/1/18 | | | 4,200,000 | | | | 4,523,555 | |
| |
| Eastman Chemical Co.: | | | | | | | | |
| 2.40% Sr. Unsec. Nts., 6/1/17 | | | 409,000 | | | | 412,461 | |
| 2.70% Sr. Unsec. Nts., 1/15/20 | | | 4,950,000 | | | | 5,095,104 | |
| |
| LyondellBasell Industries NV, 5% Sr. Unsec. Nts., 4/15/19 | | | 3,920,000 | | | | 4,220,570 | |
| |
| Methanex Corp., 3.25% Sr. Unsec. Nts., 12/15/19 | | | 2,600,000 | | | | 2,573,202 | |
| |
| RPM International, Inc., 6.50% Sr. Unsec. Nts., 2/15/18 | | | 2,000,000 | | | | 2,134,174 | |
| |
| Yara International ASA, 7.875% Sr. Unsec. Nts., 6/11/191 | | | 2,750,000 | | | | 3,154,060 | |
| | | | | | | | |
| | | | | | | 26,544,017 | |
| |
| Construction Materials—0.1% | | | | | | | | |
| |
| CRH America, Inc., 6% Sr. Unsec. Nts., 9/30/16 | | | 1,504,000 | | | | 1,508,649 | |
| |
| Containers & Packaging—1.0% | | | | | | | | |
| |
| Ball Corp., 4.375% Sr. Unsec. Nts., 12/15/20 | | | 3,300,000 | | | | 3,568,125 | |
28 OPPENHEIMER LIMITED-TERM BOND FUND
| | | | | | | | |
| | | Principal Amount | | | Value | |
| |
| Containers & Packaging (Continued) | | | | | | | | |
| |
| Graphic Packaging International, Inc., 4.75% Sr. Unsec. Nts., 4/15/21 | | $ | 1,958,000 | | | $ | 2,107,297 | |
| |
| Packaging Corp. of America, 6.50% Sr. Unsec. Nts., 3/15/18 | | | 2,400,000 | | | | 2,584,099 | |
| |
| Silgan Holdings, Inc., 5% Sr. Unsec. Nts., 4/1/20 | | | 2,600,000 | | | | 2,665,000 | |
| |
| WestRock RKT Co., 3.50% Sr. Unsec. Unsub. Nts., 3/1/20 | | | 3,205,000 | | | | 3,336,136 | |
| | | | | | | | |
| | | | | | | 14,260,657 | |
| |
| Metals & Mining—1.4% | | | | | | | | |
| |
| Alcoa, Inc., 5.55% Sr. Unsec. Nts., 2/1/17 | | | 3,500,000 | | | | 3,562,125 | |
| |
| BHP Billiton Finance USA Ltd., 1.625% Sr. Unsec. Nts., 2/24/17 | | | 3,400,000 | | | | 3,408,143 | |
| |
| Freeport-McMoRan, Inc., 2.15% Sr. Unsec. Nts., 3/1/17 | | | 3,500,000 | | | | 3,504,375 | |
| |
| Glencore Finance Canada Ltd.: | | | | | | | | |
| 2.70% Sr. Unsec. Nts., 10/25/171 | | | 2,000,000 | | | | 2,010,920 | |
| 3.60% Sr. Unsec. Nts., 1/15/171 | | | 3,310,000 | | | | 3,326,848 | |
| |
| Glencore Funding LLC, 2.50% Sr. Unsec. Nts., 1/15/191 | | | 1,400,000 | | | | 1,394,750 | |
| |
| Goldcorp, Inc., 2.125% Sr. Unsec. Nts., 3/15/18 | | | 3,400,000 | | | | 3,409,999 | |
| | | | | | | | |
| | | | | | | 20,617,160 | |
| |
| Telecommunication Services—2.7% | | | | | | | | |
| |
| Diversified Telecommunication Services—2.4% | | | | | | | | |
| |
| AT&T, Inc., 2.80% Sr. Unsec. Nts., 2/17/21 | | | 9,050,000 | | | | 9,336,188 | |
| |
| British Telecommunications plc, 5.95% Sr. Unsec. Nts., 1/15/18 | | | 2,000,000 | | | | 2,125,612 | |
| |
| CenturyLink, Inc., 5.625% Sr. Unsec. Unsub. Nts., 4/1/20 | | | 3,400,000 | | | | 3,633,750 | |
| |
| Deutsche Telekom International Finance BV: | | | | | | | | |
| 2.25% Sr. Unsec. Nts., 3/6/171 | | | 2,275,000 | | | | 2,289,042 | |
| 6.75% Sr. Unsec. Nts., 8/20/18 | | | 2,800,000 | | | | 3,094,151 | |
| |
| Frontier Communications Corp.: | | | | | | | | |
| 8.50% Sr. Unsec. Nts., 4/15/20 | | | 1,830,000 | | | | 1,980,975 | |
| 8.875% Sr. Unsec. Nts., 9/15/20 | | | 1,000,000 | | | | 1,093,750 | |
| |
| Telecom Italia Capital SA, 7.175% Sr. Unsec. Nts., 6/18/19 | | | 2,100,000 | | | | 2,375,625 | |
| |
| Telefonica Emisiones SAU, 5.877% Sr. Unsec. Nts., 7/15/19 | | | 2,900,000 | | | | 3,226,256 | |
| |
| Verizon Communications, Inc.: | | | | | | | | |
| 1.75% Sr. Unsec. Nts., 8/15/21 | | | 1,973,000 | | | | 1,959,023 | |
| 4.50% Sr. Unsec. Nts., 9/15/20 | | | 3,800,000 | | | | 4,197,351 | |
| | | | | | | | |
| | | | | | | 35,311,723 | |
| |
| Wireless Telecommunication Services—0.3% | | | | | | | | |
| |
| Rogers Communications, Inc., 6.80% Sr. Unsec. Nts., 8/15/18 | | | 3,650,000 | | | | 4,010,824 | |
| |
| Utilities—4.7% | | | | | | | | |
| |
| Electric Utilities—3.2% | | | | | | | | |
| |
| Cleveland Electric Illuminating Co. (The), 8.875% Sec. Nts., 11/15/18 | | | 3,100,000 | | | | 3,566,342 | |
| |
| Edison International, 3.75% Sr. Unsec. Unsub. Nts., 9/15/17 | | | 4,314,000 | | | | 4,429,149 | |
| |
| EDP Finance BV, 6% Sr. Unsec. Nts., 2/2/181 | | | 3,350,000 | | | | 3,527,282 | |
| |
| Emera US Finance LP, 2.15% Sr. Unsec. Nts., 6/15/191 | | | 1,169,000 | | | | 1,183,796 | |
| |
| Enel Finance International NV, 6.25% Sr. Unsec. Nts., 9/15/171 | | | 2,750,000 | | | | 2,884,527 | |
| |
| Entergy Corp., 5.125% Sr. Unsec. Nts., 9/15/20 | | | 2,500,000 | | | | 2,778,813 | |
29 OPPENHEIMER LIMITED-TERM BOND FUND
STATEMENT OF INVESTMENTS Continued
| | | | | | | | |
| | | Principal Amount | | | Value | |
| |
| Electric Utilities (Continued) | | | | | | | | |
| |
| Entergy Texas, Inc., 7.125% Sec. Nts., 2/1/19 | | $ | 422,000 | | | $ | 474,703 | |
| |
| Exelon Generation Co. LLC, 6.20% Sr. Unsec. Nts., 10/1/17 | | | 2,472,000 | | | | 2,590,908 | |
| |
| Great Plains Energy, Inc., 6.875% Sr. Unsec. Nts., 9/15/17 | | | 2,368,000 | | | | 2,484,238 | |
| |
| Iberdrola Finance Ireland Ltd., 5% Sr. Unsec. Nts., 9/11/191 | | | 2,000,000 | | | | 2,188,490 | |
| |
| ITC Holdings Corp., 6.05% Sr. Unsec. Nts., 1/31/181 | | | 1,725,000 | | | | 1,812,701 | |
| |
| Kentucky Power Co., 6% Sr. Unsec. Nts., 9/15/171 | | | 1,106,000 | | | | 1,155,585 | |
| |
| NextEra Energy Capital Holdings, Inc., 2.40% Sr. Unsec. Nts., 9/15/19 | | | 3,400,000 | | | | 3,459,208 | |
| |
| PG&E Corp., 2.40% Sr. Unsec. Nts., 3/1/19 | | | 2,750,000 | | | | 2,805,212 | |
| |
| Progress Energy, Inc., 4.40% Sr. Unsec. Nts., 1/15/21 | | | 750,000 | | | | 823,285 | |
| |
| Public Service Co. of New Mexico, 7.95% Sr. Unsec. Nts., 5/15/18 | | | 2,230,000 | | | | 2,453,865 | |
| |
| Southern Co. (The), 1.55% Sr. Unsec. Nts., 7/1/18 | | | 3,350,000 | | | | 3,364,244 | |
| |
| Southwestern Electric Power Co., 5.875% Sr. Unsec. Nts., 3/1/18 | | | 1,515,000 | | | | 1,605,456 | |
| |
| TECO Finance, Inc., 6.572% Sr. Unsec. Nts., 11/1/17 | | | 3,004,000 | | | | 3,176,889 | |
| | | | | | | | |
| | | | | | | 46,764,693 | |
| |
| Independent Power and Renewable Electricity Producers—0.2% | | | | | | | | |
| |
| IPALCO Enterprises, Inc., 3.45% Sr. Sec. Nts., 7/15/20 | | | 2,750,000 | | | | 2,832,500 | |
| |
| Multi-Utilities—1.3% | | | | | | | | |
| |
| CenterPoint Energy, Inc., 5.95% Sr. Unsec. Nts., 2/1/17 | | | 2,175,000 | | | | 2,214,781 | |
| |
| CMS Energy Corp., 6.55% Sr. Unsec. Nts., 7/17/17 | | | 4,416,000 | | | | 4,615,374 | |
| |
| Dominion Resources, Inc., 2.962% Jr. Sub. Nts., 7/1/192 | | | 4,700,000 | | | | 4,828,681 | |
| |
| Florida Gas Transmission Co. LLC, 5.45% Sr. Unsec. Nts., 7/15/201 | | | 2,000,000 | | | | 2,196,962 | |
| |
| NiSource Finance Corp., 6.80% Sr. Unsec. Nts., 1/15/19 | | | 4,325,000 | | | | 4,830,865 | |
| | | | | | | | |
| | | | | | | 18,686,663 | |
| | | | | | | | |
| Total Corporate Bonds and Notes (Cost $924,843,197) | | | | | | | 937,820,835 | |
| |
| Short-Term Notes—2.0% | | | | | | | | |
| |
| Air Liquide US LLC, 0.902%, 11/4/161,11 | | | 6,400,000 | | | | 6,394,361 | |
| |
| Deutsche Telecom AG, 0.841%, 9/9/16 | | | 2,800,000 | | | | 2,799,477 | |
| |
| Hitachi Capital America, 0.86%, 9/15/16 | | | 6,400,000 | | | | 6,397,860 | |
| |
| Mizuho Bank Ltd., 0.912%, 11/23/1611 | | | 6,400,000 | | | | 6,387,321 | |
| |
| Sempra Energy, 0.871%, 10/4/1611 | | | 6,400,000 | | | | 6,394,896 | |
| | | | | | | | |
| Total Short-Term Notes (Cost $28,368,565) | | | | | | | 28,373,915 | |
| | | | | | | | | | | | | | | | | | | | | | | | | | |
| | | | | | Buy /Sell | | Reference | | | Fixed Expiration | | | | | | | |
| | | Counterparty | | | Protection | | Asset | | | Rate | | | Date | | | Notional (000’s) | | | | |
| |
| Over-the-Counter Credit Default Swaptions Purchased—0.1% | |
| |
| Credit Default Swap maturing 06/20/21 Call 12 | | | JPM | | | Buy | | | CDX.NA.HY.26 | | | | 5.000% | | | | 12/21/16 | | | USD | 19,811,000 | | | | 318,383 | |
30 OPPENHEIMER LIMITED-TERM BOND FUND
| | | | | | | | | | | | | | | | | | | | | | | | | | |
| | | | | | Buy /Sell | | Reference | | | Fixed Expiration | | | | | | | |
| Counterparty | | | | | Protection | | Asset | | | Rate | | | Date | | | Notional (000’s) | | | Value | |
| |
| Over-the-Counter Credit Default Swaptions Purchased (Continued) | |
| |
| Credit Default Swap maturing 06/20/21 Call 12 | | | JPM | | | Buy | | | CDX.NA.HY.26 | | | | 5.000% | | | | 12/21/16 | | | USD | 23,020,000 | | | $ | 369,954 | |
| |
Credit Default Swap maturing 06/20/21 Call 12 | | | JPM | | | Buy | | | CDX.NA.HY.26 | | | | 5.000 | | | | 12/21/16 | | | USD | 23,020,000 | | | | 369,955 | |
| | | | | | | | | | | | | | | | | | | | | | | | | | |
| Total Over-the-Counter Credit Default Swaptions Purchased (Cost $1,049,012) | | | | | | | | 1,058,292 | |
| | | | | | | |
| | | | | | | | | | | | | | | | | Shares | | | | |
| |
| Investment Company—2.1% | | | | | |
| |
| Oppenheimer Institutional Money Market Fund, Cl. E, 0.35%13,14,15 (Cost $29,850,112) | | | | 29,850,112 | | | | 29,850,112 | |
| |
| Total Investments, at Value (Cost $1,497,043,250) | | | | 105.1% | | | | 1,519,610,415 | |
| |
| Net Other Assets (Liabilities) | | | | (5.1) | | | | (73,329,860) | |
| | | | | | | | | | | | | | | | | | | | | | |
| Net Assets | | | | 100.0% | | | $ | 1,446,280,555 | |
| | | | | | | | | | | | | | | | | | | | | | |
Footnotes to Statement of Investments
1. Represents securities sold under Rule 144A, which are exempt from registration under the Securities Act of 1933, as amended. These securities have been determined to be liquid under guidelines established by the Board of Trustees. These securities amount to $318,594,929 or 22.03% of the Fund’s net assets at period end.
2. Represents the current interest rate for a variable or increasing rate security.
3. Interest-Only Strips represent the right to receive the monthly interest payments on an underlying pool of mortgage loans. These securities typically decline in price as interest rates decline. Most other fixed income securities increase in price when interest rates decline. The principal amount of the underlying pool represents the notional amount on which current interest is calculated. The price of these securities is typically more sensitive to changes in prepayment rates than traditional mortgage-backed securities (for example, GNMA pass-throughs). Interest rates disclosed represent current yields based upon the current cost basis and estimated timing and amount of future cash flows.
These securities amount to $10,007,647 or 0.69% of the Fund’s net assets at period end.
4. Interest rate is less than 0.0005%.
5. The current amortization rate of the security’s cost basis exceeds the future interest payments currently estimated to be received. Both the amortization rate and interest payments are contingent on future mortgage pre-payment speeds and are therefore subject to change.
6. All or a portion of the security position is when-issued or delayed delivery to be delivered and settled after period end. See Note 4 of the accompanying Notes.
7. Principal-Only Strips represent the right to receive the monthly principal payments on an underlying pool of mortgage loans. The value of these securities generally increases as interest rates decline and prepayment rates rise. The price of these securities is typically more volatile than that of coupon-bearing bonds of the same maturity. Interest rates disclosed represent current yields based upon the current cost basis and estimated timing of future cash flows. These securities amount to $71,745 or 0.00% of the Fund’s net assets at period end.
8. All or a portion of the security position has been pledged for collateral in association with forward roll transactions.
See Note 4 of the accompanying Notes.
9. All or a portion of the security position is held in accounts at a futures clearing merchant and pledged to cover margin requirements on open futures contracts and written options on futures, if applicable. The aggregate market value of such securities is $2,702,490. See Note 6 of the accompanying Notes.
31 OPPENHEIMER LIMITED-TERM BOND FUND
STATEMENT OF INVESTMENTS Continued
Footnotes to Statement of Investments (Continued)
10. This bond has no contractual maturity date, is not redeemable and contractually pays an indefinite stream of interest.
11. Security issued in an exempt transaction without registration under the Securities Act of 1933. Such securities amount to $19,176,578 or 1.33% of the Fund’s net assets, and have been determined to be liquid pursuant to guidelines adopted by the Board of Trustees.
12. Non-income producing security.
13. Rate shown is the 7-day yield at period end.
14. Is or was an affiliate, as defined in the Investment Company Act of 1940, as amended, at or during the reporting period, by virtue of the Fund owning at least 5% of the voting securities of the issuer or as a result of the Fund and the issuer having the same investment adviser. Transactions during the reporting period in which the issuer was an affiliate are as follows:
| | | | | | | | | | | | | | | | |
| | | Shares
August 31, 2015 | | | Gross Additions | | | Gross Reductions | | | Shares
August 31, 2016 | |
| |
| Oppenheimer Institutional Money | | | | | | | | | | | | | | | | |
| Market Fund, Cl. E15 | | | 61,867,197 | | | | 804,245,568 | | | | 836,262,653 | | | | 29,850,112 | |
| | | | | | | | |
| | | Value | | | Income | |
| |
| Oppenheimer Institutional Money Market Fund, Cl. E15 | | $ | 29,850,112 | | | $ | 402,968 | |
15. Effective September 28, 2016, the fund will change its name to Oppenheimer Institutional Government Money Market Fund.
| | | | | | | | | | | | | | | | | | |
| |
| Futures Contracts as of August 31, 2016 | | | | | | | | | | | | |
| Description | | Exchange | | Buy/Sell | | Expiration Date | | Number of Contracts | | | Value | | | Unrealized Appreciation (Depreciation) | |
| |
| United States Treasury Long Bonds | | CBT | | Buy | | 12/20/16 | | | 54 | | | $ | 9,200,250 | | | $ | (1,973) | |
| United States Treasury Nts., 10 yr. | | CBT | | Sell | | 12/20/16 | | | 1,103 | | | | 144,406,828 | | | | 253,699 | |
| United States Treasury Nts., 2 yr. | | CBT | | Buy | | 12/30/16 | | | 1,234 | | | | 269,397,625 | | | | 24,386 | |
| United States Treasury Nts., 5 yr. | | CBT | | Sell | | 12/30/16 | | | 153 | | | | 18,551,250 | | | | 39,207 | |
| | | | | | | | | | | | | | | | | | |
| | | | | | | | | | | | | | | | $ | 315,319 | |
| | | | | | | | | | | | | | | | | | |
| | | | | | | | | | | | | | | | | | | | | | | | | | | | | | |
| |
| Over-the-Counter Credit Default Swaptions Written at August 31, 2016 | |
| | | Counter- | | | Buy/Sell Reference | | | Fixed Expiration | | | Notional | | | Premiums | | | | |
| Description | | party | | | Protection | | Asset | | | Rate | | | Date | | | Amount (000’s) | | | Received | | | Value | |
| |
| Credit Default Swap maturing 06/20/21 Call | | | JPM | | | Sell | |
| CDX.
NA.HY.26 |
| | | 5.000% | | | | 12/21/16 | | | | 23,020 | | | $ | 124,308 | | | $ | (128,016) | |
| |
| Credit Default Swap maturing 06/20/21 Call | | | JPM | | | Sell | |
| CDX.
NA.HY.26 |
| | | 5.000 | | | | 12/21/16 | | | | 23,020 | | | | 124,308 | | | | (128,017) | |
| |
| Credit Default Swap maturing 06/20/21 Call | | | JPM | | | Sell | |
| CDX.
NA.HY.26 |
| | | 5.000 | | | | 12/21/16 | | | | 19,811 | | | | 103,017 | | | | (110,169) | |
| | | | | | | | | | | | | | | | | | | | | | | | | | |
| Total of Over-the-Counter Credit Default Swaptions Written | | | | | | | | | | | | | | | $ | 351,633 | | | $ | (366,202) | |
| | | | | | | | | | | | | | | | | | | | | | | | | | |
| | |
| Glossary: | | |
| Counterparty Abbreviations |
| JPM | | JPMorgan Chase Bank NA |
|
| Definitions |
| CDX.NA.HY.26 | | Markit CDX North American High Yield |
32 OPPENHEIMER LIMITED-TERM BOND FUND
| | |
| Exchange Abbreviations |
| CBT | | Chicago Board of Trade |
See accompanying Notes to Financial Statements.
33 OPPENHEIMER LIMITED-TERM BOND FUND
STATEMENT OF ASSETS AND LIABILITIES August 31, 2016
| | | | |
| |
| Assets | | | | |
| Investments, at value—see accompanying statement of investments: | | | | |
| Unaffiliated companies (cost $1,467,193,138) | | $ | 1,489,760,303 | |
| Affiliated companies (cost 29,850,112) | | | 29,850,112 | |
| | | | |
| | | 1,519,610,415 | |
| |
| Cash | | | 36,000 | |
| |
| Receivables and other assets: | | | | |
| Investments sold (including $99,943,292 sold on a when-issued or delayed delivery basis) | | | 102,907,065 | |
| Interest, dividends and principal paydowns | | | 10,133,399 | |
| Shares of beneficial interest sold | | | 1,994,744 | |
| Variation margin receivable | | | 41,262 | |
| Other | | | 106,048 | |
| | | | |
| Total assets | | | 1,634,828,933 | |
|
| |
| Liabilities | | | | |
| Swaptions written, at value (premiums received $351,633) | | | 366,202 | |
| |
| Payables and other liabilities: | | | | |
| Investments purchased (including $181,987,158 purchased on a when-issued or delayed delivery basis) | | | 185,654,079 | |
| Shares of beneficial interest redeemed | | | 1,736,333 | |
| Dividends | | | 351,703 | |
| Distribution and service plan fees | | | 204,578 | |
| Trustees’ compensation | | | 176,922 | |
| Shareholder communications | | | 13,421 | |
| Variation margin payable | | | 4,893 | |
| Other | | | 40,247 | |
| | | | |
| Total liabilities | | | 188,548,378 | |
|
| |
| Net Assets | | $ | 1,446,280,555 | |
| | | | |
|
| |
| Composition of Net Assets | | | | |
| Par value of shares of beneficial interest | | $ | 315,386 | |
| |
| Additional paid-in capital | | | 1,453,788,428 | |
| |
| Accumulated net investment income | | | 1,593,198 | |
| |
| Accumulated net realized loss on investments | | | (32,284,372) | |
| |
| Net unrealized appreciation on investments | | | 22,867,915 | |
| | | | |
| Net Assets | | $ | 1,446,280,555 | |
| | | | |
34 OPPENHEIMER LIMITED-TERM BOND FUND
| | | | |
| |
| Net Asset Value Per Share | | | | |
| Class A Shares: | | | | |
Net asset value and redemption price per share (based on net assets of $742,857,037 and 162,134,182 shares of beneficial interest outstanding) | | | $4.58 | |
Maximum offering price per share (net asset value plus sales charge of 2.25% of offering price) | | | $4.69 | |
| |
Class B Shares: | | | | |
Net asset value, redemption price (excludes applicable contingent deferred sales charge) and offering price per share (based on net assets of $10,324,095 and 2,256,707 shares of beneficial interest outstanding) | | | $4.57 | |
| |
Class C Shares: | | | | |
Net asset value, redemption price (excludes applicable contingent deferred sales charge) and offering price per share (based on net assets of $182,975,637 and 40,005,001 shares of beneficial interest outstanding) | | | $4.57 | |
| |
Class I Shares: | | | | |
Net asset value, redemption price and offering price per share (based on net assets of $189,946,397 and 41,341,239 shares of beneficial interest outstanding) | | | $4.59 | |
| |
Class R Shares: | | | | |
Net asset value, redemption price (excludes applicable contingent deferred sales charge) and offering price per share (based on net assets of $36,621,303 and 7,993,875 shares of beneficial interest outstanding) | | | $4.58 | |
| |
Class Y Shares: | | | | |
Net asset value, redemption price and offering price per share (based on net assets of $283,556,086 and 61,654,602 shares of beneficial interest outstanding) | | | $4.60 | |
See accompanying Notes to Financial Statements.
35 OPPENHEIMER LIMITED-TERM BOND FUND
STATEMENT OF OPERATIONS For the Year Ended August 31, 2016
| | | | |
| |
| Investment Income | | | | |
| Interest (net of foreign withholding taxes of $14,240) | | $ | 35,622,103 | |
| |
| Fee income on when-issued securities | | | 1,690,276 | |
| |
| Dividends—affiliated companies | | | 402,968 | |
| | | | |
| Total investment income | | | 37,715,347 | |
|
| |
| Expenses | | | | |
| Management fees | | | 5,447,402 | |
| |
| Distribution and service plan fees: | | | | |
| Class A | | | 1,742,013 | |
| Class B | | | 124,782 | |
| Class C | | | 1,743,979 | |
| Class R | | | 170,505 | |
| |
| Transfer and shareholder servicing agent fees: | | | | |
| Class A | | | 1,584,127 | |
| Class B | | | 27,542 | |
| Class C | | | 384,688 | |
| Class I | | | 45,314 | |
| Class R | | | 77,148 | |
| Class Y | | | 546,849 | |
| |
| Shareholder communications: | | | | |
| Class A | | | 40,088 | |
| Class B | | | 1,909 | |
| Class C | | | 8,976 | |
| Class I | | | 30 | |
| Class R | | | 1,689 | |
| Class Y | | | 4,234 | |
| |
| Trustees’ compensation | | | 23,060 | |
| |
| Borrowing fees | | | 21,416 | |
| |
| Custodian fees and expenses | | | 15,901 | |
| |
| Other | | | 86,480 | |
| | | | |
| Total expenses | | | 12,098,132 | |
| Less waivers and reimbursements of expenses | | | (503,809) | |
| | | | |
| Net expenses | | | 11,594,323 | |
|
| |
| Net Investment Income | | | 26,121,024 | |
36 OPPENHEIMER LIMITED-TERM BOND FUND
| | | | |
| |
| Realized and Unrealized Gain (Loss) | | | | |
| Net realized loss on: | | | | |
| Investments from unaffiliated companies | | $ | (4,863,836) | |
| Closing and expiration of futures contracts | | | (6,799,537) | |
| Swap contracts | | | (75,431) | |
| | | | |
| Net realized loss | | | (11,738,804) | |
| |
| Net change in unrealized appreciation/depreciation on: | | | | |
| Investments | | | 14,956,865 | |
| Futures contracts | | | (736,617) | |
| Swap contracts | | | (188,770) | |
| Swaption contracts written | | | (14,569) | |
| | | | |
| Net change in unrealized appreciation/depreciation | | | 14,016,909 | |
|
| |
| Net Increase in Net Assets Resulting from Operations | | $ | 28,399,129 | |
| | | | |
See accompanying Notes to Financial Statements.
37 OPPENHEIMER LIMITED-TERM BOND FUND
STATEMENTS OF CHANGES IN NET ASSETS
| | | | | | | | |
| | | Year Ended
August 31, 2016 | | | Year Ended
August 31, 2015 | |
| |
| Operations | | | | | | | | |
| Net investment income | | $ | 26,121,024 | | | $ | 23,689,982 | |
| |
| Net realized loss | | | (11,738,804) | | | | (7,812,300) | |
| |
| Net change in unrealized appreciation/depreciation | | | 14,016,909 | | | | (9,990,425) | |
| | | | |
| Net increase in net assets resulting from operations | | | 28,399,129 | | | | 5,887,257 | |
|
| |
| Dividends and/or Distributions to Shareholders | | | | | | | | |
| Dividends from net investment income: | | | | | | | | |
| Class A | | | (15,131,548) | | | | (18,308,834) | |
| Class B | | | (163,226) | | | | (349,728) | |
| Class C | | | (2,251,308) | | | | (2,751,913) | |
| Class I | | | (3,746,261) | | | | (286,961) | |
| Class R | | | (632,673) | | | | (737,632) | |
| Class Y | | | (5,637,344) | | | | (3,236,686) | |
| | | | |
| | | (27,562,360) | | | | (25,671,754) | |
|
| |
| Beneficial Interest Transactions | | | | | | | | |
| Net increase (decrease) in net assets resulting from beneficial interest transactions: | | | | | | | | |
| Class A | | | 23,523,492 | | | | 67,729,353 | |
| Class B | | | (5,422,962) | | | | (8,080,436) | |
| Class C | | | 23,186,043 | | | | 28,655,014 | |
| Class I | | | 73,084,580 | | | | 112,644,100 | |
| Class R | | | 2,305,242 | | | | 4,971,692 | |
| Class Y | | | 124,722,450 | | | | 98,462,005 | |
| | | | |
| | | 241,398,845 | | | | 304,381,728 | |
|
| |
| Net Assets | | | | | | | | |
| Total increase | | | 242,235,614 | | | | 284,597,231 | |
| |
| Beginning of period | | | 1,204,044,941 | | | | 919,447,710 | |
| | | | |
| End of period (including accumulated net investment income of $1,593,198 and $2,315,770, respectively) | | $ | 1,446,280,555 | | | $ | 1,204,044,941 | |
| | | | |
See accompanying Notes to Financial Statements.
38 OPPENHEIMER LIMITED-TERM BOND FUND
FINANCIAL HIGHLIGHTS
| | | | | | | | | | | | | | | | | | | | |
| Class A | | Year Ended
August 31,
20161 | | | Year Ended
August 31,
20151 | | | Year Ended
August 29,
20141,2 | | | Year Ended
August 30,
20131,2 | | | Year Ended
August 31,
20121 | |
| |
| Per Share Operating Data | | | | | | | | | | | | | | | | | | | | |
| Net asset value, beginning of period | | | $4.59 | | | | $4.67 | | | | $4.66 | | | | $4.93 | | | | $4.82 | |
| |
| Income (loss) from investment operations: | | | | | | | | | | | | | | | | | | | | |
| Net investment income3 | | | 0.09 | | | | 0.11 | | | | 0.13 | | | | 0.09 | | | | 0.11 | |
| Net realized and unrealized gain (loss) | | | 0.004 | | | | (0.07) | | | | 0.03 | | | | (0.15) | | | | 0.16 | |
| | | | |
| Total from investment operations | | | 0.09 | | | | 0.04 | | | | 0.16 | | | | (0.06) | | | | 0.27 | |
| |
| Dividends and/or distributions to shareholders: | | | | | | | | | | | | | | | | | | | | |
| Dividends from net investment income | | | (0.10) | | | | (0.12) | | | | (0.15) | | | | (0.09) | | | | (0.11) | |
| Distributions from net realized gain | | | 0.00 | | | | 0.00 | | | | 0.00 | | | | (0.12) | | | | (0.05) | |
| | | | |
| Total dividends and/or distributions to shareholders | | | (0.10) | | | | (0.12) | | | | (0.15) | | | | (0.21) | | | | (0.16) | |
| |
| Net asset value, end of period | | | $4.58 | | | | $4.59 | | | | $4.67 | | | | $4.66 | | | | $4.93 | |
| | | | |
| | | | | | | | | | | | | | | | | | | | |
| |
| Total Return, at Net Asset Value5 | | | 2.01% | | | | 0.77% | | | | 3.32% | | | | (1.21)% | | | | 5.77% | |
| | | | | | | | | | | | | | | | | | | | |
| |
| Ratios/Supplemental Data | | | | | | | | | | | | | | | | | | | | |
Net assets, end of period (in thousands) | | | $742,857 | | | | $719,405 | | | | $664,895 | | | | $632,387 | | | | $754,344 | |
| |
| Average net assets (in thousands) | | | $720,074 | | | | $703,391 | | | | $623,486 | | | | $722,428 | | | | $724,262 | |
| |
| Ratios to average net assets:6 | | | | | | | | | | | | | | | | | | | | |
| Net investment income | | | 1.99% | | | | 2.41% | | | | 2.62% | | | | 1.85% | | | | 2.27% | |
| Expenses excluding specific expenses listed below | | | 0.88% | | | | 0.90% | | | | 0.91% | | | | 1.00% | | | | 0.99% | |
| Interest and fees from borrowings | | | 0.00%7 | | | | 0.00%7 | | | | 0.00% | | | | 0.00% | | | | 0.00% | |
| | | | |
| Total expenses | | | 0.88%8 | | | | 0.90%8 | | | | 0.91%8 | | | | 1.00% | | | | 0.99% | |
| Expenses after payments, waivers and/or reimbursements and reduction to custodian expenses | | | 0.82% | | | | 0.82% | | | | 0.85% | | | | 0.90% | | | | 0.90% | |
| |
| Portfolio turnover rate9 | | | 55% | | | | 83% | | | | 147% | | | | 162% | | | | 143% | |
39 OPPENHEIMER LIMITED-TERM BOND FUND
FINANCIAL HIGHLIGHTS Continued
1. On September 11, 2015, the Fund effected a share split as described in Note 11 of the accompanying Notes. Per share data prior to this date has been restated to give effect to the share split.
2. August 29, 2014 and August 30, 2013 represent the last business days of the Fund’s respective reporting periods. See Note 2 of the accompanying Notes.
3. Per share amounts calculated based on the average shares outstanding during the period.
4. Less than $0.005 per share.
5. Assumes an initial investment on the business day before the first day of the fiscal period, with all dividends and distributions reinvested in additional shares on the reinvestment date, and redemption at the net asset value calculated on the last business day of the fiscal period. Sales charges are not reflected in the total returns. Total returns are not annualized for periods less than one full year. Returns do not reflect the deduction of taxes that a shareholder would pay on fund distributions or the redemption of fund shares.
6. Annualized for periods less than one full year.
7. Less than 0.005%.
8. Total expenses including indirect expenses from affiliated fund fees and expenses were as follows:
| | | | | | |
| | | | | | |
| | Year Ended August 31, 2016 | | | 0.89 | % |
| | Year Ended August 31, 2015 | | | 0.90 | % |
| | Year Ended August 29, 2014 | | | 0.91 | % |
9. The portfolio turnover rate excludes purchase and sale transactions of To Be Announced (TBA) mortgage-related securities as follows:
| | | | | | | | |
| | | Purchase Transactions | | | Sale Transactions | |
| |
Year Ended August 31, 2016 | | | $2,237,586,604 | | | | $2,271,024,565 | |
Year Ended August 31, 2015 | | | $2,927,863,777 | | | | $2,846,781,904 | |
Year Ended August 29, 2014 | | | $1,812,277,358 | | | | $2,019,761,146 | |
Year Ended August 30, 2013 | | | $5,364,504,647 | | | | $5,515,045,235 | |
Year Ended August 31, 2012 | | | $4,076,812,506 | | | | $3,925,961,964 | |
See accompanying Notes to Financial Statements.
40 OPPENHEIMER LIMITED-TERM BOND FUND
| | | | | | | | | | | | | | | | | | | | |
| Class B | | Year Ended August 31, 20161 | | | Year Ended August 31, 20151 | | | Year Ended August 29, 20141,2 | | | Year Ended August 30, 20131,2 | | | Year Ended August 31,
20121 | |
| | | | | |
| | | | | |
| |
| Per Share Operating Data | | | | | | | | | | | | | | | | | | | | |
| Net asset value, beginning of period | | | $4.58 | | | | $4.67 | | | | $4.65 | | | | $4.92 | | | | $4.81 | |
| |
| Income (loss) from investment operations: | | | | | | | | | | | | | | | | | | | | |
| Net investment income3 | | | 0.05 | | | | 0.08 | | | | 0.09 | | | | 0.05 | | | | 0.08 | |
| Net realized and unrealized gain (loss) | | | 0.004 | | | | (0.09) | | | | 0.03 | | | | (0.14) | | | | 0.16 | |
| | | | |
| Total from investment operations | | | 0.05 | | | | (0.01) | | | | 0.12 | | | | (0.09) | | | | 0.24 | |
| |
| Dividends and/or distributions to shareholders: | | | | | | | | | | | | | | | | | | | | |
| Dividends from net investment income | | | (0.06) | | | | (0.08) | | | | (0.10) | | | | (0.05) | | | | (0.08) | |
| Distributions from net realized gain | | | 0.00 | | | | 0.00 | | | | 0.00 | | | | (0.13) | | | | (0.05) | |
| | | | |
| Total dividends and/or distributions to shareholders | | | (0.06) | | | | (0.08) | | | | (0.10) | | | | (0.18) | | | | (0.13) | |
| |
| Net asset value, end of period | | | $4.57 | | | | $4.58 | | | | $4.67 | | | | $4.65 | | | | $4.92 | |
| | | | |
| | | | | | | | | | | | | | | | | | | | |
| |
| Total Return, at Net Asset Value5 | | | 1.18% | | | | (0.18)% | | | | 2.51% | | | | (1.94)% | | | | 4.98% | |
| | | | | | | | | | | | | | | | | | | | |
| |
| Ratios/Supplemental Data | | | | | | | | | | | | | | | | | | | | |
| Net assets, end of period (in thousands) | | | $10,324 | | | | $15,780 | | | | $24,216 | | | | $34,046 | | | | $54,057 | |
| |
| Average net assets (in thousands) | | | $12,502 | | | | $19,477 | | | | $28,962 | | | | $45,170 | | | | $55,554 | |
| |
| Ratios to average net assets:6 | | | | | | | | | | | | | | | | | | | | |
| Net investment income | | | 1.18% | | | | 1.58% | | | | 1.86% | | | | 1.10% | | | | 1.54% | |
| Expenses excluding specific expenses listed below | | | 1.65% | | | | 1.66% | | | | 1.66% | | | | 1.93% | | | | 1.92% | |
| Interest and fees from borrowings | | | 0.00%7 | | | | 0.00%7 | | | | 0.00% | | | | 0.00% | | | | 0.00% | |
| | | | |
| Total expenses | | | 1.65%8 | | | | 1.66%8 | | | | 1.66%8 | | | | 1.93% | | | | 1.92% | |
| Expenses after payments, waivers and/or reimbursements and reduction to custodian expenses | | | 1.64% | | | | 1.65% | | | | 1.63% | | | | 1.65% | | | | 1.65% | |
| |
| Portfolio turnover rate9 | | | 55% | | | | 83% | | | | 147% | | | | 162% | | | | 143% | |
41 OPPENHEIMER LIMITED-TERM BOND FUND
FINANCIAL HIGHLIGHTS Continued
1. On September 11, 2015, the Fund effected a share split as described in Note 11 of the accompanying Notes. Per share data prior to this date has been restated to give effect to the share split.
2. August 29, 2014 and August 30, 2013 represent the last business days of the Fund’s respective reporting periods. See Note 2 of the accompanying Notes.
3. Per share amounts calculated based on the average shares outstanding during the period.
4. Less than $0.005 per share.
5. Assumes an initial investment on the business day before the first day of the fiscal period, with all dividends and distributions reinvested in additional shares on the reinvestment date, and redemption at the net asset value calculated on the last business day of the fiscal period. Sales charges are not reflected in the total returns. Total returns are not annualized for periods less than one full year. Returns do not reflect the deduction of taxes that a shareholder would pay on fund distributions or the redemption of fund shares.
6. Annualized for periods less than one full year.
7. Less than 0.005%.
8. Total expenses including indirect expenses from affiliated fund fees and expenses were as follows:
| | | | | | |
| | | | | | |
| | Year Ended August 31, 2016 | | | 1.66 | % |
| | Year Ended August 31, 2015 | | | 1.66 | % |
| | Year Ended August 29, 2014 | | | 1.66 | % |
9. The portfolio turnover rate excludes purchase and sale transactions of To Be Announced (TBA) mortgage-related securities as follows:
| | | | | | | | |
| | | Purchase Transactions | | | Sale Transactions | |
| |
Year Ended August 31, 2016 | | | $2,237,586,604 | | | | $2,271,024,565 | |
Year Ended August 31, 2015 | | | $2,927,863,777 | | | | $2,846,781,904 | |
Year Ended August 29, 2014 | | | $1,812,277,358 | | | | $2,019,761,146 | |
Year Ended August 30, 2013 | | | $5,364,504,647 | | | | $5,515,045,235 | |
Year Ended August 31, 2012 | | | $4,076,812,506 | | | | $3,925,961,964 | |
See accompanying Notes to Financial Statements.
42 OPPENHEIMER LIMITED-TERM BOND FUND
| | | | | | | | | | | | | | | | | | | | |
| Class C | | Year Ended
August 31,
20161 | | | Year Ended
August 31,
20151 | | | Year Ended
August 29,
20141,2 | | | Year Ended
August 30,
20131,2 | | | Year Ended
August 31,
20121 | |
| |
| Per Share Operating Data | | | | | | | | | | | | | | | | | | | | |
| Net asset value, beginning of period | | | $4.57 | | | | $4.66 | | | | $4.66 | | | | $4.92 | | | | $4.81 | |
| |
| Income (loss) from investment operations: | | | | | | | | | | | | | | | | | | | | |
| Net investment income3 | | | 0.05 | | | | 0.07 | | | | 0.09 | | | | 0.06 | | | | 0.07 | |
| Net realized and unrealized gain (loss) | | | 0.01 | | | | (0.08) | | | | 0.02 | | | | (0.14) | | | | 0.16 | |
| | | | |
| Total from investment operations | | | 0.06 | | | | (0.01) | | | | 0.11 | | | | (0.08) | | | | 0.23 | |
| |
| Dividends and/or distributions to shareholders: | | | | | | | | | | | | | | | | | | | | |
| Dividends from net investment income | | | (0.06) | | | | (0.08) | | | | (0.11) | | | | (0.06) | | | | (0.07) | |
| Distributions from net realized gain | | | 0.00 | | | | 0.00 | | | | 0.00 | | | | (0.12) | | | | (0.05) | |
| | | | |
| Total dividends and/or distributions to shareholders | | | (0.06) | | | | (0.08) | | | | (0.11) | | | | (0.18) | | | | (0.12) | |
| |
| Net asset value, end of period | | | $4.57 | | | | $4.57 | | | | $4.66 | | | | $4.66 | | | | $4.92 | |
| | | | |
| | | | | | | | | | | | | | | | | | | | |
| |
| Total Return, at Net Asset Value4 | | | 1.19% | | | | (0.06)% | | | | 2.40% | | | | (1.84)% | | | | 4.87% | |
| | | | | | | | | | | | | | | | | | | | |
| |
| Ratios/Supplemental Data | | | | | | | | | | | | | | | | | | | | |
| Net assets, end of period (in thousands) | | | $182,976 | | | | $159,614 | | | | $134,000 | | | | $119,677 | | | | $161,528 | |
| |
| Average net assets (in thousands) | | | $174,995 | | | | $156,321 | | | | $122,206 | | | | $145,990 | | | | $155,641 | |
| |
| Ratios to average net assets:5 | | | | | | | | | | | | | | | | | | | | |
| Net investment income | | | 1.18% | | | | 1.58% | | | | 1.82% | | | | 1.10% | | | | 1.52% | |
| Expenses excluding specific expenses listed below | | | 1.64% | | | | 1.65% | | | | 1.65% | | | | 1.78% | | | | 1.76% | |
| Interest and fees from borrowings | | | 0.00%6 | | | | 0.00%6 | | | | 0.00% | | | | 0.00% | | | | 0.00% | |
| | | | |
| Total expenses | | | 1.64%7 | | | | 1.65%7 | | | | 1.65%7 | | | | 1.78% | | | | 1.76% | |
| Expenses after payments, waivers and/or reimbursements and reduction to custodian expenses | | | 1.63% | | | | 1.64% | | | | 1.64% | | | | 1.65% | | | | 1.65% | |
| |
| Portfolio turnover rate8 | | | 55% | | | | 83% | | | | 147% | | | | 162% | | | | 143% | |
43 OPPENHEIMER LIMITED-TERM BOND FUND
FINANCIAL HIGHLIGHTS Continued
1. On September 11, 2015, the Fund effected a share split as described in Note 11 of the accompanying Notes. Per share data prior to this date has been restated to give effect to the share split.
2. August 29, 2014 and August 30, 2013 represent the last business days of the Fund’s respective reporting periods. See Note 2 of the accompanying Notes.
3. Per share amounts calculated based on the average shares outstanding during the period.
4. Assumes an initial investment on the business day before the first day of the fiscal period, with all dividends and distributions reinvested in additional shares on the reinvestment date, and redemption at the net asset value calculated on the last business day of the fiscal period. Sales charges are not reflected in the total returns. Total returns are not annualized for periods less than one full year. Returns do not reflect the deduction of taxes that a shareholder would pay on fund distributions or the redemption of fund shares.
5. Annualized for periods less than one full year.
6. Less than 0.005%.
7. Total expenses including indirect expenses from affiliated fund fees and expenses were as follows:
| | | | | | |
| | | | | | |
| | Year Ended August 31, 2016 | | | 1.65 | % |
| | Year Ended August 31, 2015 | | | 1.65 | % |
| | Year Ended August 29, 2014 | | | 1.65 | % |
8. The portfolio turnover rate excludes purchase and sale transactions of To Be Announced (TBA) mortgage-related securities as follows:
| | | | | | | | |
| | | Purchase Transactions | | | Sale Transactions | |
| |
Year Ended August 31, 2016 | | | $2,237,586,604 | | | | $2,271,024,565 | |
Year Ended August 31, 2015 | | | $2,927,863,777 | | | | $2,846,781,904 | |
Year Ended August 29, 2014 | | | $1,812,277,358 | | | | $2,019,761,146 | |
Year Ended August 30, 2013 | | | $5,364,504,647 | | | | $5,515,045,235 | |
Year Ended August 31, 2012 | | | $4,076,812,506 | | | | $3,925,961,964 | |
See accompanying Notes to Financial Statements.
44 OPPENHEIMER LIMITED-TERM BOND FUND
| | | | | | | | | | | | | | | | |
| Class I | | Year Ended
August 31,
20161 | | | Year Ended
August 31,
20151 | | | Year Ended
August 29,
20141,2 | | | Period
Ended
August 30,
20131,2,3 | |
| |
Per Share Operating Data | | | | | | | | | | | | | | | | |
| Net asset value, beginning of period | | | $4.59 | | | | $4.68 | | | | $4.67 | | | | $4.70 | |
| |
| Income (loss) from investment operations: | | | | | | | | | | | | | | | | |
| Net investment income4 | | | 0.11 | | | | 0.13 | | | | 0.14 | | | | 0.01 | |
| Net realized and unrealized gain (loss) | | | 0.01 | | | | (0.08) | | | | 0.03 | | | | (0.03) | |
| | | | |
| Total from investment operations | | | 0.12 | | | | 0.05 | | | | 0.17 | | | | (0.02) | |
| |
| Dividends and/or distributions to shareholders: | | | | | | | | | | | | | | | | |
| Dividends from net investment income | | | (0.12) | | | | (0.14) | | | | (0.16) | | | | (0.01) | |
| Distributions from net realized gain | | | 0.00 | | | | 0.00 | | | | 0.00 | | | | 0.00 | |
| | | | |
| Total dividends and/or distributions to shareholders | | | (0.12) | | | | (0.14) | | | | (0.16) | | | | (0.01) | |
| |
| Net asset value, end of period | | | $4.59 | | | | $4.59 | | | | $4.68 | | | | $4.67 | |
| | | | |
| |
| |
| Total Return, at Net Asset Value5 | | | 2.41% | | | | 1.03% | | | | 3.70% | | | | (0.20)% | |
|
| |
Ratios/Supplemental Data | | | | | | | | | | | | | | | | |
| Net assets, end of period (in thousands) | | | $189,947 | | | | $116,806 | | | | $4,362 | | | | $10 | |
| |
| Average net assets (in thousands) | | | $151,529 | | | | $9,764 | | | | $4,274 | | | | $10 | |
| |
| Ratios to average net assets:6 | | | | | | | | | | | | | | | | |
| Net investment income | | | 2.36% | | | | 2.76% | | | | 3.01% | | | | 2.58% | |
| Expenses excluding specific expenses listed below | | | 0.45% | | | | 0.46% | | | | 0.47% | | | | 0.44% | |
| Interest and fees from borrowings | | | 0.00%7 | | | | 0.00%7 | | | | 0.00% | | | | 0.00% | |
| | | | |
| Total expenses | | | 0.45%8 | | | | 0.46%8 | | | | 0.47%8 | | | | 0.44% | |
| Expenses after payments, waivers and/or reimbursements and reduction to custodian expenses | | | 0.44% | | | | 0.46% | | | | 0.47% | | | | 0.44% | |
| |
| Portfolio turnover rate9 | | | 55% | | | | 83% | | | | 147% | | | | 162% | |
45 OPPENHEIMER LIMITED-TERM BOND FUND
FINANCIAL HIGHLIGHTS Continued
1. On September 11, 2015, the Fund effected a share split as described in Note 11 of the accompanying Notes. Per share data prior to this date has been restated to give effect to the share split.
2. August 29, 2014 and August 30, 2013 represent the last business days of the Fund’s respective reporting periods. See Note 2 of the accompanying Notes.
3. For the period from August 1, 2013 (inception of offering) to August 30, 2013.
4. Per share amounts calculated based on the average shares outstanding during the period.
5. Assumes an initial investment on the business day before the first day of the fiscal period, with all dividends and distributions reinvested in additional shares on the reinvestment date, and redemption at the net asset value calculated on the last business day of the fiscal period. Sales charges are not reflected in the total returns. Total returns are not annualized for periods less than one full year. Returns do not reflect the deduction of taxes that a shareholder would pay on fund distributions or the redemption of fund shares.
6. Annualized for periods less than one full year.
7. Less than 0.005%.
8. Total expenses including indirect expenses from affiliated fund fees and expenses were as follows:
| | | | | | |
| | | | | | |
| | Year Ended August 31, 2016 | | | 0.46 | % |
| | Year Ended August 31, 2015 | | | 0.46 | % |
| | Year Ended August 29, 2014 | | | 0.47 | % |
9. The portfolio turnover rate excludes purchase and sale transactions of To Be Announced (TBA) mortgage-related securities as follows:
| | | | | | | | |
| | | Purchase Transactions | | | Sale Transactions | |
| |
Year Ended August 31, 2016 | | | $2,237,586,604 | | | | $2,271,024,565 | |
Year Ended August 31, 2015 | | | $2,927,863,777 | | | | $2,846,781,904 | |
Year Ended August 29, 2014 | | | $1,812,277,358 | | | | $2,019,761,146 | |
Period Ended August 30, 2013 | | | $5,364,504,647 | | | | $5,515,045,235 | |
See accompanying Notes to Financial Statements.
46 OPPENHEIMER LIMITED-TERM BOND FUND
| | | | | | | | | | | | | | | | | | | | |
Class R | | Year Ended
August 31,
20161 | | | Year Ended
August 31,
20151 | | | Year Ended
August 29,
20141,2 | | | Year Ended
August 30,
20131,2 | | | Year Ended
August 31,
20121 | |
| |
Per Share Operating Data | | | | | | | | | | | | | | | | | | | | |
| Net asset value, beginning of period | | | $4.59 | | | | $4.67 | | | | $4.66 | | | | $4.93 | | | | $4.82 | |
| |
| Income (loss) from investment operations: | | | | | | | | | | | | | | | | | | | | |
| Net investment income3 | | | 0.08 | | | | 0.09 | | | | 0.11 | | | | 0.08 | | | | 0.10 | |
| Net realized and unrealized gain (loss) | | | (0.01) | | | | (0.07) | | | | 0.03 | | | | (0.15) | | | | 0.16 | |
| | | | |
| Total from investment operations | | | 0.07 | | | | 0.02 | | | | 0.14 | | | | (0.07) | | | | 0.26 | |
| |
| Dividends and/or distributions to shareholders: | | | | | | | | | | | | | | | | | | | | |
| Dividends from net investment income | | | (0.08) | | | | (0.10) | | | | (0.13) | | | | (0.08) | | | | (0.10) | |
| Distributions from net realized gain | | | 0.00 | | | | 0.00 | | | | 0.00 | | | | (0.12) | | | | (0.05) | |
| | | | |
| Total dividends and/or distributions to shareholders | | | (0.08) | | | | (0.10) | | | | (0.13) | | | | (0.20) | | | | (0.15) | |
| |
| Net asset value, end of period | | | $4.58 | | | | $4.59 | | | | $4.67 | | | | $4.66 | | | | $4.93 | |
| | | | |
| |
| |
| Total Return, at Net Asset Value4 | | | 1.82% | | | | 0.35% | | | | 3.03% | | | | (1.45)% | | | | 5.50% | |
|
| |
Ratios/Supplemental Data | | | | | | | | | | | | | | | | | | | | |
| Net assets, end of period (in thousands) | | | $36,621 | | | | $34,318 | | | | $29,966 | | | | $33,368 | | | | $44,488 | |
| |
| Average net assets (in thousands) | | | $35,078 | | | | $32,247 | | | | $31,470 | | | | $39,970 | | | | $44,693 | |
| |
| Ratios to average net assets:5 | | | | | | | | | | | | | | | | | | | | |
| Net investment income | | | 1.69% | | | | 2.10% | | | | 2.34% | | | | 1.60% | | | | 2.02% | |
| Expenses excluding specific expenses listed below | | | 1.13% | | | | 1.13% | | | | 1.13% | | | | 1.33% | | | | 1.30% | |
| Interest and fees from borrowings | | | 0.00%6 | | | | 0.00%6 | | | | 0.00% | | | | 0.00% | | | | 0.00% | |
| | | | |
| Total expenses | | | 1.13%7 | | | | 1.13%7 | | | | 1.13%7 | | | | 1.33% | | | | 1.30% | |
| Expenses after payments, waivers and/or reimbursements and reduction to custodian expenses | | | 1.12% | | | | 1.13% | | | | 1.13% | | | | 1.15% | | | | 1.15% | |
| |
| Portfolio turnover rate8 | | | 55% | | | | 83% | | | | 147% | | | | 162% | | | | 143% | |
47 OPPENHEIMER LIMITED-TERM BOND FUND
FINANCIAL HIGHLIGHTS Continued
1. On September 11, 2015, the Fund effected a share split as described in Note 11 of the accompanying Notes. Per share data prior to this date has been restated to give effect to the share split.
2. August 29, 2014 and August 30, 2013 represent the last business days of the Fund’s respective reporting periods. See Note 2 of the accompanying Notes.
3. Per share amounts calculated based on the average shares outstanding during the period.
4. Assumes an initial investment on the business day before the first day of the fiscal period, with all dividends and distributions reinvested in additional shares on the reinvestment date, and redemption at the net asset value calculated on the last business day of the fiscal period. Sales charges are not reflected in the total returns. Total returns are not annualized for periods less than one full year. Returns do not reflect the deduction of taxes that a shareholder would pay on fund distributions or the redemption of fund shares.
5. Annualized for periods less than one full year.
6. Less than 0.005%.
7. Total expenses including indirect expenses from affiliated fund fees and expenses were as follows:
| | | | | | |
| | | | | | | |
| | Year Ended August 31, 2016 | | | 1.14 | % |
| | Year Ended August 31, 2015 | | | 1.13 | % |
| | Year Ended August 29, 2014 | | | 1.13 | % |
8. The portfolio turnover rate excludes purchase and sale transactions of To Be Announced (TBA) mortgage-related securities as follows:
| | | | | | | | |
| | | Purchase Transactions | | | Sale Transactions | |
| |
Year Ended August 31, 2016 | | | $2,237,586,604 | | | | $2,271,024,565 | |
Year Ended August 31, 2015 | | | $2,927,863,777 | | | | $2,846,781,904 | |
Year Ended August 29, 2014 | | | $1,812,277,358 | | | | $2,019,761,146 | |
Year Ended August 30, 2013 | | | $5,364,504,647 | | | | $5,515,045,235 | |
Year Ended August 31, 2012 | | | $4,076,812,506 | | | | $3,925,961,964 | |
See accompanying Notes to Financial Statements.
48 OPPENHEIMER LIMITED-TERM BOND FUND
| | | | | | | | | | | | | | | | | | | | |
| | | Year Ended August 31, 20161 | | | Year Ended August 31, 20151 | | | Year Ended August 29, 20141,2 | | | Year Ended August 30, 20131,2 | | | Year Ended August 31, 20121 | |
| | | | | | |
| Class Y | | | | | |
| |
| Per Share Operating Data | | | | | | | | | | | | | | | | | | | | |
| Net asset value, beginning of period | | | $4.60 | | | | $4.68 | | | | $4.67 | | | | $4.95 | | | | $4.84 | |
| |
| Income (loss) from investment operations: | | | | | | | | | | | | | | | | | | | | |
| Net investment income3 | | | 0.10 | | | | 0.12 | | | | 0.13 | | | | 0.10 | | | | 0.12 | |
| Net realized and unrealized gain (loss) | | | 0.01 | | | | (0.07) | | | | 0.04 | | | | (0.15) | | | | 0.16 | |
| | | | |
| Total from investment operations | | | 0.11 | | | | 0.05 | | | | 0.17 | | | | (0.05) | | | | 0.28 | |
| |
| Dividends and/or distributions to shareholders: | | | | | | | | | | | | | | | | | | | | |
| Dividends from net investment income | | | (0.11) | | | | (0.13) | | | | (0.16) | | | | (0.10) | | | | (0.12) | |
| Distributions from net realized gain | | | 0.00 | | | | 0.00 | | | | 0.00 | | | | (0.13) | | | | (0.05) | |
| | | | |
| Total dividends and/or distributions to shareholders | | | (0.11) | | | | (0.13) | | | | (0.16) | | | | (0.23) | | | | (0.17) | |
| |
| Net asset value, end of period | | | $4.60 | | | | $4.60 | | | | $4.68 | | | | $4.67 | | | | $4.95 | |
| | | | |
|
| |
| Total Return, at Net Asset Value4 | | | 2.32% | | | | 0.95% | | | | 3.52% | | | | (1.05)% | | | | 6.02% | |
|
| |
| Ratios/Supplemental Data | | | | | | | | | | | | | | | | | | | | |
| Net assets, end of period (in thousands) | | | $283,556 | | | | $158,122 | | | | $62,009 | | | | $16,412 | | | | $16,762 | |
| |
| Average net assets (in thousands) | | | $249,010 | | | | $118,474 | | | | $27,625 | | | | $18,643 | | | | $17,648 | |
| |
| Ratios to average net assets:5 | | | | | | | | | | | | | | | | | | | | |
| Net investment income | | | 2.17% | | | | 2.56% | | | | 2.69% | | | | 2.11% | | | | 2.49% | |
| Expenses excluding specific expenses listed below | | | 0.64% | | | | 0.65% | | | | 0.66% | | | | 0.70% | | | | 0.67% | |
| Interest and fees from borrowings | | | 0.00%6 | | | | 0.00%6 | | | | 0.00% | | | | 0.00% | | | | 0.00% | |
| | | | |
| Total expenses | | | 0.64%7 | | | | 0.65%7 | | | | 0.66%7 | | | | 0.70% | | | | 0.67% | |
| Expenses after payments, waivers and/or reimbursements and reduction to custodian expenses | | | 0.63% | | | | 0.64% | | | | 0.65% | | | | 0.65% | | | | 0.65% | |
| |
| Portfolio turnover rate8 | | | 55% | | | | 83% | | | | 147% | | | | 162% | | | | 143% | |
49 OPPENHEIMER LIMITED-TERM BOND FUND
FINANCIAL HIGHLIGHTS Continued
1. On September 11, 2015, the Fund effected a share split as described in Note 11 of the accompanying Notes. Per share data prior to this date has been restated to give effect to the share split.
2. August 29, 2014 and August 30, 2013 represent the last business days of the Fund’s respective reporting periods. See Note 2 of the accompanying Notes.
3. Per share amounts calculated based on the average shares outstanding during the period.
4. Assumes an initial investment on the business day before the first day of the fiscal period, with all dividends and distributions reinvested in additional shares on the reinvestment date, and redemption at the net asset value calculated on the last business day of the fiscal period. Sales charges are not reflected in the total returns. Total returns are not annualized for periods less than one full year. Returns do not reflect the deduction of taxes that a shareholder would pay on fund distributions or the redemption of fund shares.
5. Annualized for periods less than one full year.
6. Less than 0.005%.
7. Total expenses including indirect expenses from affiliated fund fees and expenses were as follows:
| | | | | | |
| | | | | | |
| Year Ended August 31, 2016 | | | 0.65 | % | |
| Year Ended August 31, 2015 | | | 0.65 | % | |
| Year Ended August 29, 2014 | | | 0.66 | % | |
8. The portfolio turnover rate excludes purchase and sale transactions of To Be Announced (TBA) mortgage-related securities as follows:
| | | | | | | | |
| | | Purchase Transactions | | | Sale Transactions | |
| |
Year Ended August 31, 2016 | | | $2,237,586,604 | | | | $2,271,024,565 | |
Year Ended August 31, 2015 | | | $2,927,863,777 | | | | $2,846,781,904 | |
Year Ended August 29, 2014 | | | $1,812,277,358 | | | | $2,019,761,146 | |
Year Ended August 30, 2013 | | | $5,364,504,647 | | | | $5,515,045,235 | |
Year Ended August 31, 2012 | | | $4,076,812,506 | | | | $3,925,961,964 | |
See accompanying Notes to Financial Statements.
50 OPPENHEIMER LIMITED-TERM BOND FUND
NOTES TO FINANCIAL STATEMENTS August 31, 2016
1. Organization
Oppenheimer Limited-Term Bond Fund (the “Fund”) is a diversified open-end management investment company registered under the Investment Company Act of 1940 (“1940 Act”), as amended. The Fund’s investment objective is to seek income. The Fund’s investment adviser is OFI Global Asset Management, Inc. (“OFI Global” or the “Manager”), a wholly-owned subsidiary of OppenheimerFunds, Inc. (“OFI” or the “Sub-Adviser”). The Manager has entered into a sub-advisory agreement with OFI.
The Fund offers Class A, Class C, Class I, Class R and Class Y shares, and previously offered Class B shares for new purchase through June 29, 2012. Subsequent to that date, no new purchases of Class B shares are permitted, however reinvestment of dividend and/or capital gain distributions and exchanges of Class B shares into and from other Oppenheimer funds are allowed. As of July 1, 2014, Class N shares were renamed Class R shares. Class N shares subject to a contingent deferred sales charge (“CDSC”) on July 1, 2014, continue to be subject to a CDSC after the shares were renamed. Purchases of Class R shares occurring on or after July 1, 2014, are not subject to a CDSC upon redemption. Class A shares are sold at their offering price, which is normally net asset value plus a front-end sales charge. Class C and Class R shares are sold, and Class B shares were sold, without a front-end sales charge but may be subject to a CDSC. Class R shares are sold only through retirement plans. Retirement plans that offer Class R shares may impose charges on those accounts. Class I and Class Y shares are sold to certain institutional investors or intermediaries without either a front-end sales charge or a CDSC, however, the intermediaries may impose charges on their accountholders who beneficially own Class I and Class Y shares. All classes of shares have identical rights and voting privileges with respect to the Fund in general and exclusive voting rights on matters that affect that class alone. Earnings, net assets and net asset value per share may differ due to each class having its own expenses, such as transfer and shareholder servicing agent fees and shareholder communications, directly attributable to that class. Class A, B, C and R shares have separate distribution and/or service plans under which they pay fees. Class I and Class Y shares do not pay such fees. Class B shares will automatically convert to Class A shares 72 months after the date of purchase.
The following is a summary of significant accounting policies followed in the Fund’s preparation of financial statements in accordance with accounting principles generally accepted in the United States (“U.S. GAAP”).
2. Significant Accounting Policies
Security Valuation. All investments in securities are recorded at their estimated fair value, as described in Note 3.
Reporting Period End Date. The last day of the Fund’s previous reporting period was the last day the New York Stock Exchange was open for trading during that period. The Fund’s financial statements have been presented through that date to maintain consistency with the Fund’s net asset value calculations used for shareholder transactions.
51 OPPENHEIMER LIMITED-TERM BOND FUND
NOTES TO FINANCIAL STATEMENTS Continued
2. Significant Accounting Policies (Continued)
Allocation of Income, Expenses, Gains and Losses. Income, expenses (other than those attributable to a specific class), gains and losses are allocated on a daily basis to each class of shares based upon the relative proportion of net assets represented by such class. Operating expenses directly attributable to a specific class are charged against the operations of that class.
Dividends and Distributions to Shareholders. Dividends and distributions to shareholders, which are determined in accordance with income tax regulations and may differ from U.S. GAAP, are recorded on the ex-dividend date. Income distributions, if any, are declared daily and paid monthly. Capital gain distributions, if any, are declared and paid annually or at other times as deemed necessary by the Manager.
Investment Income. Dividend income is recorded on the ex-dividend date or upon ex-dividend notification in the case of certain foreign dividends where the ex-dividend date may have passed. Non-cash dividends included in dividend income, if any, are recorded at the fair market value of the securities received. Interest income is recognized on an accrual basis. Discount and premium, which are included in interest income on the Statement of Operations, are amortized or accreted daily.
Custodian Fees. “Custodian fees and expenses” in the Statement of Operations may include interest expense incurred by the Fund on any cash overdrafts of its custodian account during the period. Such cash overdrafts may result from the effects of failed trades in portfolio securities and from cash outflows resulting from unanticipated shareholder redemption activity. The Fund pays interest to its custodian on such cash overdraft at a rate equal to the Prime Rate plus 0.35%. The “Reduction to custodian expenses” line item, if applicable, represents earnings on cash balances maintained by the Fund during the period. Such interest expense and other custodian fees may be paid with these earnings.
Security Transactions. Security transactions are recorded on the trade date. Realized gains and losses on securities sold are determined on the basis of identified cost.
Indemnifications. The Fund’s organizational documents provide current and former Trustees and officers with a limited indemnification against liabilities arising in connection with the performance of their duties to the Fund. In the normal course of business, the Fund may also enter into contracts that provide general indemnifications. The Fund’s maximum exposure under these arrangements is unknown as this would be dependent on future claims that may be made against the Fund. The risk of material loss from such claims is considered remote.
Federal Taxes. The Fund intends to comply with provisions of the Internal Revenue Code applicable to regulated investment companies and to distribute substantially all of its investment company taxable income, including any net realized gain on investments not offset by capital loss carryforwards, if any, to shareholders. Therefore, no federal income or excise
52 OPPENHEIMER LIMITED-TERM BOND FUND
2. Significant Accounting Policies (Continued)
tax provision is required. The Fund files income tax returns in U.S. federal and applicable state jurisdictions. The statute of limitations on the Fund’s tax return filings generally remains open for the three preceding fiscal reporting period ends. The Fund has analyzed its tax positions for the fiscal year ended August 31, 2016, including open tax years, and does not believe there are any uncertain tax positions requiring recognition in the Fund’s financial statements.
The tax components of capital shown in the following table represent distribution requirements the Fund must satisfy under the income tax regulations, losses the Fund may be able to offset against income and gains realized in future years and unrealized appreciation or depreciation of securities and other investments for federal income tax purposes.
| | | | | | |
Undistributed Net Investment Income | | Undistributed
Long-Term
Gain | | Accumulated Loss
Carryforward1,2,3,4 | | Net Unrealized
Appreciation
Based on cost of
Securities and
Other Investments
for Federal Income
Tax Purposes |
| $1,874,439 | | $— | | $32,074,149 | | $22,549,331 |
1. At period end, the Fund had $31,733,937 of net capital loss carryforward available to offset future realized capital gains, if any, and thereby reduce future taxable gain distributions. Details of the capital loss carryforwards are included in the table below. Capital loss carryovers with no expiration, if any, must be utilized prior to those with expiration dates.
| | |
| Expiring | | |
| No expiration | | $ 31,733,937 |
2. The Fund had $340,212 of straddle losses which were deferred.
3. During the reporting period, the Fund did not utilize any capital loss carryforward.
4. During the previous reporting period, the Fund did not utilize any capital loss carryforward.
Net investment income (loss) and net realized gain (loss) may differ for financial statement and tax purposes. The character of dividends and distributions made during the fiscal year from net investment income or net realized gains are determined in accordance with federal income tax requirements, which may differ from the character of net investment income or net realized gains presented in those financial statements in accordance with U.S. GAAP. Also, due to timing of dividends and distributions, the fiscal year in which amounts are distributed may differ from the fiscal year in which the income or net realized gain was recorded by the Fund.
Accordingly, the following amounts have been reclassified for the reporting period. Net assets of the Fund were unaffected by the reclassifications.
| | | | |
Increase to Paid-in Capital | | Increase
to Accumulated
Net Investment
Income | | Increase
to Accumulated Net
Realized Loss
on Investments |
| $63,880 | | $718,764 | | $782,644 |
The tax character of distributions paid during the reporting periods:
53 OPPENHEIMER LIMITED-TERM BOND FUND
NOTES TO FINANCIAL STATEMENTS Continued
2. Significant Accounting Policies (Continued)
| | | | |
| | | Year Ended
August 31, 2016 | | Year Ended
August 31, 2015 |
Distributions paid from: | | | | |
Ordinary income | | $ 27,562,360 | | $ 25,671,754 |
The aggregate cost of securities and other investments and the composition of unrealized appreciation and depreciation of securities and other investments for federal income tax purposes at period end are noted in the following table. The primary difference between book and tax appreciation or depreciation of securities and other investments, if applicable, is attributable to the tax deferral of losses or tax realization of financial statement unrealized gain or loss.
| | | | |
| Federal tax cost of securities | | $ | 1,497,046,515 | |
| Federal tax cost of other investments | | | 115,288,164 | |
| | | | |
| Total federal tax cost | | $ | 1,612,334,679 | |
| | | | |
Gross unrealized appreciation | | $ | 27,233,592 | |
| Gross unrealized depreciation | | | (4,684,261) | |
| | | | |
| Net unrealized appreciation | | $ | 22,549,331 | |
| | | | |
Use of Estimates. The preparation of financial statements in conformity with U.S. GAAP requires management to make estimates and assumptions that affect the reported amounts of assets and liabilities and disclosure of contingent assets and liabilities at the date of the financial statements and the reported amounts of increases and decreases in net assets from operations during the reporting period. Actual results could differ from those estimates.
3. Securities Valuation
The Fund calculates the net asset value of its shares as of 4:00 P.M. Eastern time, on each day the New York Stock Exchange (the “Exchange”) is open for trading, except in the case of a scheduled early closing of the Exchange, in which case the Fund will calculate net asset value of the shares as of the scheduled early closing time of the Exchange.
The Fund’s Board has adopted procedures for the valuation of the Fund’s securities and has delegated the day-to-day responsibility for valuation determinations under those procedures to the Manager. The Manager has established a Valuation Committee which is responsible for determining a “fair valuation” for any security for which market quotations are not “readily available.” The Valuation Committee’s fair valuation determinations are subject to review, approval and ratification by the Fund’s Board at its next regularly scheduled meeting covering the calendar quarter in which the fair valuation was determined.
Valuation Methods and Inputs
Securities are valued using unadjusted quoted market prices, when available, as supplied primarily by third party pricing services or dealers.
The following methodologies are used to determine the market value or the fair value of the types of securities described below:
54 OPPENHEIMER LIMITED-TERM BOND FUND
3. Securities Valuation (Continued)
Securities traded on a registered U.S. securities exchange (including exchange-traded derivatives other than futures and futures options) are valued based on the last sale price of the security reported on the principal exchange on which it is traded, prior to the time when the Fund’s assets are valued. In the absence of a sale, the security is valued at the mean between the bid and asked price on the principal exchange or, if not available from the principal exchange, obtained from two dealers. If bid and asked prices are not available from either the exchange or two dealers, the security is valued by using one of the following methodologies (listed in order of priority): (1) a bid from the principal exchange, (2) the mean between the bid and asked price as provided by a single dealer, or (3) a bid from a single dealer. A security of a foreign issuer traded on a foreign exchange, but not listed on a registered U.S. securities exchange, is valued based on the last sale price on the principal exchange on which the security is traded, as identified by the third party pricing service used by the Manager, prior to the time when the Fund’s assets are valued. If the last sale price is unavailable, the security is valued at the most recent official closing price on the principal exchange on which it is traded. If the last sales price or official closing price for a foreign security is not available, the security is valued at the mean between the bid and asked price per the exchange or, if not available from the exchange, obtained from two dealers. If bid and asked prices are not available from either the exchange or two dealers, the security is valued by using one of the following methodologies (listed in order of priority): (1) a bid from the exchange, (2) the mean between the bid and asked price as provided by a single dealer, or (3) a bid from a single dealer.
Shares of a registered investment company that are not traded on an exchange are valued at that investment company’s net asset value per share.
Corporate and government debt securities (of U.S. or foreign issuers) and municipal debt securities, event-linked bonds, loans, mortgage-backed securities, collateralized mortgage obligations, and asset-backed securities are valued at the mean between the “bid” and “asked” prices utilizing evaluated prices obtained from third party pricing services or broker-dealers who may use matrix pricing methods to determine the evaluated prices.
Short-term money market type debt securities with a remaining maturity of sixty days or less are valued at cost adjusted by the amortization of discount or premium to maturity (amortized cost), which approximates market value. Short-term debt securities with a remaining maturity in excess of sixty days are valued at the mean between the “bid” and “asked” prices utilizing evaluated prices obtained from third party pricing services or broker-dealers.
Structured securities, swaps, swaptions, and other over-the-counter derivatives are valued utilizing evaluated prices obtained from third party pricing services or broker-dealers.
Futures contracts and futures options traded on a commodities or futures exchange will be valued at the final settlement price or official closing price on the principal exchange as reported by such principal exchange at its trading session ending at, or most recently prior to, the time when the Fund’s assets are valued.
A description of the standard inputs that may generally be considered by the third party pricing vendors in determining their evaluated prices is provided below.
55 OPPENHEIMER LIMITED-TERM BOND FUND
NOTES TO FINANCIAL STATEMENTS Continued
3. Securities Valuation (Continued)
| | |
| Security Type | | Standard inputs generally considered by third-party pricing vendors |
|
| Corporate debt, government debt, municipal, mortgage-backed and asset-backed securities | | Reported trade data, broker-dealer price quotations, benchmark yields, issuer spreads on comparable securities, the credit quality, yield, maturity, and other appropriate factors. |
|
| Loans | | Information obtained from market participants regarding reported trade data and broker-dealer price quotations. |
|
| Event-linked bonds | | Information obtained from market participants regarding reported trade data and broker-dealer price quotations. |
|
| Structured securities | | Relevant market information such as the price of underlying financial instruments, stock market indices, foreign currencies, interest rate spreads, commodities, or the occurrence of other specific events. |
|
| Swaps | | Relevant market information, including underlying reference assets such as credit spreads, credit event probabilities, index values, individual security values, forward interest rates, variable interest rates, volatility measures, and forward currency rates. |
If a market value or price cannot be determined for a security using the methodologies described above, or if, in the “good faith” opinion of the Manager, the market value or price obtained does not constitute a “readily available market quotation,” or a significant event has occurred that would materially affect the value of the security, the security is fair valued either (i) by a standardized fair valuation methodology applicable to the security type or the significant event as previously approved by the Valuation Committee and the Fund’s Board or (ii) as determined in good faith by the Manager’s Valuation Committee. The Valuation Committee considers all relevant facts that are reasonably available, through either public information or information available to the Manager, when determining the fair value of a security. Fair value determinations by the Manager are subject to review, approval and ratification by the Fund’s Board at its next regularly scheduled meeting covering the calendar quarter in which the fair valuation was determined. Those fair valuation standardized methodologies include, but are not limited to, valuing securities at the last sale price or initially at cost and subsequently adjusting the value based on: changes in company specific fundamentals, changes in an appropriate securities index, or changes in the value of similar securities which may be further adjusted for any discounts related to security-specific resale restrictions. When possible, such methodologies use observable market inputs such as unadjusted quoted prices of similar securities, observable interest rates, currency rates and yield curves. The methodologies used for valuing securities are not necessarily an indication of the risks associated with investing in those securities nor can it be assured that the Fund can obtain the fair value assigned to a security if it were to sell the security.
To assess the continuing appropriateness of security valuations, the Manager, or its third party service provider who is subject to oversight by the Manager, regularly compares prior day prices, prices on comparable securities, and sale prices to the current day prices and challenges those prices exceeding certain tolerance levels with the third party pricing service or broker source. For those securities valued by fair valuations, whether through a standardized fair valuation methodology or a fair valuation determination, the Valuation Committee reviews and affirms the reasonableness of the valuations based on such methodologies and fair
56 OPPENHEIMER LIMITED-TERM BOND FUND
3. Securities Valuation (Continued)
valuation determinations on a regular basis after considering all relevant information that is reasonably available.
Classifications
Each investment asset or liability of the Fund is assigned a level at measurement date based on the significance and source of the inputs to its valuation. Various data inputs are used in determining the value of each of the Fund’s investments as of the reporting period end. These data inputs are categorized in the following hierarchy under applicable financial accounting standards:
1) Level 1-unadjusted quoted prices in active markets for identical assets or liabilities (including securities actively traded on a securities exchange)
2) Level 2-inputs other than unadjusted quoted prices that are observable for the asset or liability (such as unadjusted quoted prices for similar assets and market corroborated inputs such as interest rates, prepayment speeds, credit risks, etc.)
3) Level 3-significant unobservable inputs (including the Manager’s own judgments about assumptions that market participants would use in pricing the asset or liability).
The inputs used for valuing securities are not necessarily an indication of the risks associated with investing in those securities.
The Fund classifies each of its investments in investment companies which are publicly offered as Level 1. Investment companies that are not publicly offered are measured using net asset value as a practical expedient, and are not classified in the fair value hierarchy.
The table below categorizes amounts that are included in the Fund’s Statement of Assets and Liabilities at period end based on valuation input level:
| | | | | | | | | | | | | | | | |
| | | Level 1—
Unadjusted
Quoted Prices | | | Level 2— Other Significant
Observable Inputs | | | Level 3—
Significant
Unobservable
Inputs | | | Value | |
| |
| Assets Table | | | | | | | | | | | | | | | | |
| Investments, at Value: | | | | | | | | | | | | | | | | |
| Asset-Backed Securities | | $ | — | | | $ | 189,524,113 | | | $ | — | | | $ | 189,524,113 | |
| Mortgage-Backed Obligations | | | — | | | | 314,879,865 | | | | 84,763 | | | | 314,964,628 | |
| U.S. Government Obligations | | | — | | | | 18,018,520 | | | | — | | | | 18,018,520 | |
| Corporate Bonds and Notes | | �� | — | | | | 937,820,835 | | | | — | | | | 937,820,835 | |
| Short-Term Notes | | | — | | | | 28,373,915 | | | | — | | | | 28,373,915 | |
| Over-the-Counter Credit Default | | | | | | | | | | | | | | | | |
| Swaptions Purchased | | | — | | | | 1,058,292 | | | | — | | | | 1,058,292 | |
| Investment Company | | | 29,850,112 | | | | — | | | | — | | | | 29,850,112 | |
| | | | |
| Total Investments, at Value | | | 29,850,112 | | | | 1,489,675,540 | | | | 84,763 | | | | 1,519,610,415 | |
| Other Financial Instruments: | | | | | | | | | | | | | | | | |
| Futures contracts | | | 317,292 | | | | — | | | | — | | | | 317,292 | |
| | | | |
| Total Assets | | $ | 30,167,404 | | | $ | 1,489,675,540 | | | $ | 84,763 | | | $ | 1,519,927,707 | |
| | | | |
57 OPPENHEIMER LIMITED-TERM BOND FUND
NOTES TO FINANCIAL STATEMENTS Continued
3. Securities Valuation (Continued)
| | | | | | | | | | | | | | | | |
| | | Level 1—
Unadjusted
Quoted Prices | | | Level 2—
Other Significant
Observable Inputs | | | Level 3—
Significant
Unobservable
Inputs | | | Value | |
| |
| | | | |
| Liabilities Table | | | | | | | | | | | | | | | | |
| Other Financial Instruments: | | | | | | | | | | | | | | | | |
| Futures contracts | | $ | (1,973 | ) | | $ | — | | | $ | — | | | $ | (1,973) | |
| Swaptions written, at value | | | — | | | | (366,202 | ) | | | — | | | | (366,202) | |
| | | | |
| Total Liabilities | | $ | (1,973 | ) | | $ | (366,202 | ) | | $ | — | | | $ | (368,175) | |
| | | | |
Forward currency exchange contracts and futures contracts, if any, are reported at their unrealized appreciation/depreciation at measurement date, which represents the change in the contract’s value from trade date. All additional assets and liabilities included in the above table are reported at their market value at measurement date.
The table below shows the transfers between Level 2 and Level 3. The Fund’s policy is to recognize transfers in and transfers out as of the beginning of the reporting period.
| | | | | | | | |
| | | Transfers into Level 2* | | | Transfers out of Level 3* | |
| |
| Assets Table | | | | | | | | |
| Investments, at Value: | | | | | | | | |
| Mortgage-Backed Obligations | | $ | 2,803,864 | | | $ | (2,803,864) | |
| | | | |
| Total Assets | | $ | 2,803,864 | | | $ | (2,803,864) | |
| | | | |
*Transferred from Level 3 to Level 2 due to the availability of market data for this security.
4. Investments and Risks
Investments in Affiliated Funds. The Fund is permitted to invest in other mutual funds advised by the Manager (“Affiliated Funds”). Affiliated Funds are open-end management investment companies registered under the 1940 Act, as amended. The Manager is the investment adviser of, and the Sub-Adviser provides investment and related advisory services to, the Affiliated Funds. When applicable, the Fund’s investments in Affiliated Funds are included in the Statement of Investments. Shares of Affiliated Funds are valued at their net asset value per share. As a shareholder, the Fund is subject to its proportional share of the Affiliated Funds’ expenses, including their management fee. The Manager will waive fees and/ or reimburse Fund expenses in an amount equal to the indirect management fees incurred through the Fund’s investment in the Affiliated Funds.
Each of the Affiliated Funds in which the Fund invests has its own investment risks, and those risks can affect the value of the Fund’s investments and therefore the value of the Fund’s shares. To the extent that the Fund invests more of its assets in one Affiliated Fund than in another, the Fund will have greater exposure to the risks of that Affiliated Fund.
Investment in Oppenheimer Institutional Money Market Fund. The Fund is permitted to invest daily available cash balances in a money market Affiliated Fund. The Fund may invest the available cash in Class E shares of Oppenheimer Institutional Money Market Fund
58 OPPENHEIMER LIMITED-TERM BOND FUND
4. Investments and Risks (Continued)
(“IMMF”) to seek current income while preserving liquidity or for defensive purposes. IMMF is regulated as a money market fund under the Investment Company Act of 1940, as amended. Effective September 28, 2016, IMMF will change its name to Oppenheimer Institutional Government Money Market Fund.
Securities on a When-Issued or Delayed Delivery Basis. The Fund may purchase securities on a “when-issued” basis, and may purchase or sell securities on a “delayed delivery” basis. “When-issued” or “delayed delivery” refers to securities whose terms and indenture are available and for which a market exists, but which are not available for immediate delivery. Delivery and payment for securities that have been purchased by the Fund on a when-issued basis normally takes place within six months and possibly as long as two years or more after the trade date. During this period, such securities do not earn interest, are subject to market fluctuation and may increase or decrease in value prior to their delivery. The purchase of securities on a when-issued basis may increase the volatility of the Fund’s net asset value to the extent the Fund executes such transactions while remaining substantially fully invested. When the Fund engages in when-issued or delayed delivery transactions, it relies on the buyer or seller, as the case may be, to complete the transaction. Their failure to do so may cause the Fund to lose the opportunity to obtain or dispose of the security at a price and yield it considers advantageous. The Fund may also sell securities that it purchased on a when-issued basis or forward commitment prior to settlement of the original purchase.
At period end, the Fund had purchased securities issued on a when-issued or delayed delivery basis and sold securities issued on a delayed delivery basis as follows:
| | | | |
| | | When-Issued or
Delayed Delivery
Basis Transactions | |
| |
Purchased securities | | | $181,987,158 | |
Sold securities | | | 99,943,292 | |
The Fund may enter into “forward roll” transactions with respect to mortgage-related securities. In this type of transaction, the Fund sells a mortgage-related security to a buyer and simultaneously agrees to repurchase a similar security (same type, coupon and maturity) at a later date at a set price. During the period between the sale and the repurchase, the Fund will not be entitled to receive interest and principal payments on the securities that have been sold. The Fund records the incremental difference between the forward purchase and sale of each forward roll as realized gain (loss) on investments or as fee income in the case of such transactions that have an associated fee in lieu of a difference in the forward purchase and sale price.
Forward roll transactions may be deemed to entail embedded leverage since the Fund purchases mortgage-related securities with extended settlement dates rather than paying for the securities under a normal settlement cycle. This embedded leverage increases the Fund’s market value of investments relative to its net assets which can incrementally increase the volatility of the Fund’s performance. Forward roll transactions can be replicated over multiple
59 OPPENHEIMER LIMITED-TERM BOND FUND
NOTES TO FINANCIAL STATEMENTS Continued
4. Investments and Risks (Continued)
settlement periods.
Risks of entering into forward roll transactions include the potential inability of the counterparty to meet the terms of the agreement; the potential of the Fund to receive inferior securities at redelivery as compared to the securities sold to the counterparty; and counterparty credit risk.
At period end, the Fund pledged $30,729 of collateral to the counterparty for forward roll transactions.
5. Market Risk Factors
The Fund’s investments in securities and/or financial derivatives may expose the Fund to various market risk factors:
Commodity Risk. Commodity risk relates to the change in value of commodities or commodity indexes as they relate to increases or decreases in the commodities market. Commodities are physical assets that have tangible properties. Examples of these types of assets are crude oil, heating oil, metals, livestock, and agricultural products.
Credit Risk. Credit risk relates to the ability of the issuer of debt to meet interest and principal payments, or both, as they come due. In general, lower-grade, higher-yield debt securities are subject to credit risk to a greater extent than lower-yield, higher-quality securities.
Equity Risk. Equity risk relates to the change in value of equity securities as they relate to increases or decreases in the general market.
Foreign Exchange Rate Risk. Foreign exchange rate risk relates to the change in the U.S. dollar value of a security held that is denominated in a foreign currency. The U.S. dollar value of a foreign currency denominated security will decrease as the dollar appreciates against the currency, while the U.S. dollar value will increase as the dollar depreciates against the currency.
Interest Rate Risk. Interest rate risk refers to the fluctuations in value of fixed-income securities resulting from the inverse relationship between price and yield. For example, an increase in general interest rates will tend to reduce the market value of already issued fixed-income investments, and a decline in general interest rates will tend to increase their value. In addition, debt securities with longer maturities, which tend to have higher yields, are subject to potentially greater fluctuations in value from changes in interest rates than obligations with shorter maturities.
Volatility Risk. Volatility risk refers to the magnitude of the movement, but not the direction of the movement, in a financial instrument’s price over a defined time period. Large increases or decreases in a financial instrument’s price over a relative time period typically indicate greater volatility risk, while small increases or decreases in its price typically indicate lower volatility risk.
6. Use of Derivatives
The Fund’s investment objective not only permits the Fund to purchase investment securities,
60 OPPENHEIMER LIMITED-TERM BOND FUND
6. Use of Derivatives (Continued)
it also allows the Fund to enter into various types of derivatives contracts, including, but not limited to, futures contracts, forward currency exchange contracts, credit default swaps, interest rate swaps, total return swaps, variance swaps and purchased and written options. In doing so, the Fund will employ strategies in differing combinations to permit it to increase, decrease, or change the level or types of exposure to market risk factors. These instruments may allow the Fund to pursue its objectives more quickly and efficiently than if it were to make direct purchases or sales of securities capable of effecting a similar response to market factors. Such contracts may be entered into through a bilateral over-the-counter (“OTC”) transaction, or through a securities or futures exchange and cleared through a clearinghouse.
Derivatives may have little or no initial cash investment relative to their market value exposure and therefore can produce significant gains or losses in excess of their cost due to unanticipated changes in the market risk factors and the overall market. This use of embedded leverage allows the Fund to increase its market value exposure relative to its net assets and can substantially increase the volatility of the Fund’s performance. In instances where the Fund is using derivatives to decrease, or hedge, exposures to market risk factors for securities held by the Fund, there are also risks that those derivatives may not perform as expected resulting in losses for the combined or hedged positions. Some derivatives have the potential for unlimited loss, regardless of the size of the Fund’s initial investment.
Additional associated risks from investing in derivatives also exist and potentially could have significant effects on the valuation of the derivative and the Fund. Typically, the associated risks are not the risks that the Fund is attempting to increase or decrease exposure to, per its investment objectives, but are the additional risks from investing in derivatives. Examples of these associated risks are liquidity risk, which is the risk that the Fund will not be able to sell the derivative in the open market in a timely manner, and counterparty credit risk, which is the risk that the counterparty will not fulfill its obligation to the Fund.
The Fund’s actual exposures to these market risk factors and associated risks during the period are discussed in further detail, by derivative type, below.
Futures Contracts
A futures contract is a commitment to buy or sell a specific amount of a commodity, financial instrument or currency at a negotiated price on a stipulated future date. The Fund may buy and sell futures contracts and may also buy or write put or call options on these futures contracts. Futures contracts and options thereon are generally entered into on a regulated futures exchange and cleared through a clearinghouse associated with the exchange.
Upon entering into a futures contract, the Fund is required to deposit either cash or securities (initial margin) in an amount equal to a certain percentage of the contract value in an account registered in the futures commission merchant’s name. Subsequent payments (variation margin) are paid to or from the futures commission merchant each day equal to the daily changes in the contract value. Such payments are recorded as unrealized gains and losses. Should the Fund fail to make requested variation margin payments, the futures commission merchant can gain access to the initial margin to satisfy the Fund’s payment obligations.
61 OPPENHEIMER LIMITED-TERM BOND FUND
NOTES TO FINANCIAL STATEMENTS Continued
6. Use of Derivatives (Continued)
Futures contracts are reported on a schedule following the Statement of Investments. Securities held by a futures commission merchant to cover initial margin requirements on open futures contracts are noted in the Statement of Investments. Cash held by a futures commission merchant to cover initial margin requirements on open futures contracts and the receivable and/or payable for the daily mark to market for the variation margin are noted in the Statement of Assets and Liabilities. The net change in unrealized appreciation and depreciation is reported in the Statement of Operations. Realized gains (losses) are reported in the Statement of Operations at the closing or expiration of futures contracts.
The Fund has purchased futures contracts on various bonds and notes to increase exposure to interest rate risk.
The Fund has sold futures contracts on various bonds and notes to decrease exposure to interest rate risk.
During the reporting period, the Fund had an ending monthly average market value of $250,690,970 and $243,137,922 on futures contracts purchased and sold, respectively.
Additional associated risks of entering into futures contracts (and related options) include the possibility that there may be an illiquid market where the Fund is unable to liquidate the contract or enter into an offsetting position and, if used for hedging purposes, the risk that the price of the contract will correlate imperfectly with the prices of the Fund’s securities.
Option Activity
The Fund may buy and sell put and call options, or write put and call options. When an option is written, the Fund receives a premium and becomes obligated to sell or purchase the underlying security, currency or other underlying financial instrument at a fixed price, upon exercise of the option.
Options can be traded through an exchange or through a privately negotiated arrangement with a dealer in an OTC transaction. Options traded through an exchange are generally cleared through a clearinghouse (such as The Options Clearing Corporation). The difference between the premium received or paid, and market value of the option, is recorded as unrealized appreciation or depreciation. The net change in unrealized appreciation or depreciation is reported in the Statement of Operations. When an option is exercised, the cost of the security purchased or the proceeds of the security sale are adjusted by the amount of premium received or paid. Upon the expiration or closing of the option transaction, a gain or loss is reported in the Statement of Operations.
The Fund has purchased call options on treasury and/or euro futures to increase exposure to interest rate risk. A purchased call option becomes more valuable as the price of the underlying financial instrument appreciates relative to the strike price.
The Fund has purchased put options on treasury and/or euro futures to decrease exposure to interest rate risk. A purchased put option becomes more valuable as the price of the underlying financial instrument depreciates relative to the strike price.
During the reporting period, the Fund had an ending monthly average market value of $284,729 and $2,681 on purchased call options and purchased put options, respectively.
At period end, the Fund had no purchased options outstanding.
62 OPPENHEIMER LIMITED-TERM BOND FUND
6. Use of Derivatives (Continued)
Options written, if any, are reported in a schedule following the Statement of Investments and as a liability in the Statement of Assets and Liabilities. Securities held in collateral accounts to cover potential obligations with respect to outstanding written options are noted in the Statement of Investments.
The risk in writing a call option is that the market price of the security increases and if the option is exercised, the Fund must either purchase the security at a higher price for delivery or, if the Fund owns the underlying security, give up the opportunity for profit. The risk in writing a put option is that the Fund may incur a loss if the market price of the security decreases and the option is exercised. The risk in buying an option is that the Fund pays a premium whether or not the option is exercised. The Fund also has the additional risk that there may be an illiquid market where the Fund is unable to close the contract.
At period end, the Fund had no written options outstanding.
Swap Contracts
The Fund may enter into swap contract agreements with a counterparty to exchange a series of cash flows based on either specified reference rates, the price or volatility of asset or non-asset references, or the occurrence of a credit event, over a specified period. Swaps can be executed in a bi-lateral privately negotiated arrangement with a dealer in an OTC transaction (“OTC swaps”) or executed on a regulated market. Certain swaps, regardless of the venue of their execution, are required to be cleared through a clearinghouse (“centrally cleared swaps”). Swap contracts may include interest rate, equity, debt, index, total return, credit default, currency, and volatility swaps.
Swap contracts are reported on a schedule following the Statement of Investments. The values of centrally cleared swap and OTC swap contracts are aggregated by positive and negative values and disclosed separately on the Statement of Assets and Liabilities. The unrealized appreciation (depreciation) related to the change in the valuation of the notional amount of the swap is combined with the accrued interest due to (owed by) the Fund, if any, at termination or settlement. The net change in this amount during the period is included on the Statement of Operations. The Fund also records any periodic payments received from (paid to) the counterparty, including at termination, under such contracts as realized gain (loss) on the Statement of Operations.
Swap contract agreements are exposed to the market risk factor of the specific underlying reference rate or asset. Swap contracts are typically more attractively priced compared to similar investments in related cash securities because they isolate the risk to one market risk factor and eliminate the other market risk factors. Investments in cash securities (for instance bonds) have exposure to multiple risk factors (credit and interest rate risk). Because swaps have embedded leverage, they can expose the Fund to substantial risk in the isolated market risk factor.
Interest Rate Swap Contracts. An interest rate swap is an agreement between counterparties to exchange periodic payments based on interest rates. One cash flow stream will typically be a floating rate payment based upon a specified floating interest rate while the other is typically a fixed interest rate.
63 OPPENHEIMER LIMITED-TERM BOND FUND
NOTES TO FINANCIAL STATEMENTS Continued
6. Use of Derivatives (Continued)
The Fund has entered into interest rate swaps in which it pays a fixed interest rate and receives a floating interest rate in order to decrease exposure to interest rate risk. Typically, if relative interest rates rise, payments received by the Fund under the swap agreement will be greater than the payments made by the Fund.
For the reporting period, the Fund had ending monthly average notional amounts of $6,761,154 on interest rate swaps which pay a fixed rate.
Additional associated risks to the Fund include counterparty credit risk and liquidity risk.
At period end, the Fund had no such interest rate swap agreements outstanding.
Swaption Transactions
The Fund may enter into a swaption contract which grants the purchaser the right, but not the obligation, to enter into a swap transaction at preset terms detailed in the underlying agreement within a specified period of time. The purchaser pays a premium to the swaption writer who bears the risk of unfavorable changes in the preset terms on the underlying swap.
Purchased swaptions are reported as a component of investments in the Statement of Investments and the Statement of Assets and Liabilities. Written swaptions are reported on a schedule following the Statement of Investments and their value is reported as a separate asset or liability line item in the Statement of Assets and Liabilities. The net change in unrealized appreciation or depreciation on written swaptions is separately reported in the Statement of Operations. When a swaption is exercised, the cost of the swap is adjusted by the amount of premium paid or received. Upon the expiration or closing of an unexercised swaption contract, a gain or loss is reported in the Statement of Operations for the amount of the premium paid or received.
The Fund generally will incur a greater risk when it writes a swaption than when it purchases a swaption. When the Fund writes a swaption it will become obligated, upon exercise of the swaption, according to the terms of the underlying agreement. Swaption contracts written by the Fund do not give rise to counterparty credit risk prior to exercise as they obligate the Fund, not its counterparty, to perform. When the Fund purchases a swaption it only risks losing the amount of the premium it paid if the swaption expires unexercised. However, when the Fund exercises a purchased swaption there is a risk that the counterparty will fail to perform or otherwise default on its obligations under the swaption contract.
The Fund has purchased swaptions which gives it the option to buy credit protection through credit default swaps in order to decrease exposure to the credit risk of individual issuers and/or indexes of issuers. A purchased swaption of this type becomes more valuable as the likelihood of a credit event on the reference asset increases.
The Fund has written swaptions which give it the obligation, if exercised by the purchaser, to sell credit protection through credit default swaps in order to increase exposure to the credit risk of individual issuers and/or indexes of issuers. A written swaption of this type becomes more valuable as the likelihood of a credit event on the reference asset decreases.
During the reporting period, the Fund had an ending monthly average market value of $81,407 and $28,169 on purchased and written swaptions, respectively.
Written swaption activity for the reporting period was as follows:
64 OPPENHEIMER LIMITED-TERM BOND FUND
6. Use of Derivatives (Continued)
| | | | | | | | |
| | | Number of
Contracts | | | Amount of
Premiums | |
| |
| Swaptions outstanding as of August 31, 2015 | | | — | | | $ | — | |
Swaptions written | | | 65,851,000 | | | | 351,633 | |
| | | | |
| Swaptions outstanding as of August 31, 2016 | | | 65,851,000 | | | $ | 351,633 | |
| | | | |
Counterparty Credit Risk. Derivative positions are subject to the risk that the counterparty will not fulfill its obligation to the Fund. The Fund intends to enter into derivative transactions with counterparties that the Manager believes to be creditworthy at the time of the transaction.
The Fund’s risk of loss from counterparty credit risk on OTC derivatives is generally limited to the aggregate unrealized gain netted against any collateral held by the Fund. For OTC options purchased, the Fund bears the risk of loss of the amount of the premiums paid plus the positive change in market values net of any collateral held by the Fund should the counterparty fail to perform under the contracts. Options written by the Fund do not typically give rise to counterparty credit risk, as options written generally obligate the Fund and not the counterparty to perform.
To reduce counterparty risk with respect to OTC transactions, the Fund has entered into master netting arrangements, established within the Fund’s International Swap and Derivatives Association, Inc. (“ISDA”) master agreements, which allow the Fund to make (or to have an entitlement to receive) a single net payment in the event of default (close-out netting) for outstanding payables and receivables with respect to certain OTC positions in swaps, options, swaptions, and forward currency exchange contracts for each individual counterparty. In addition, the Fund may require that certain counterparties post cash and/or securities in collateral accounts to cover their net payment obligations for those derivative contracts subject to ISDA master agreements. If the counterparty fails to perform under these contracts and agreements, the cash and/or securities will be made available to the Fund.
ISDA master agreements include credit related contingent features which allow counterparties to OTC derivatives to terminate derivative contracts prior to maturity in the event that, for example, the Fund’s net assets decline by a stated percentage or the Fund fails to meet the terms of its ISDA master agreements, which would cause the Fund to accelerate payment of any net liability owed to the counterparty.
For financial reporting purposes, the Fund does not offset derivative assets and derivative liabilities that are subject to netting arrangements in the Statement of Assets and Liabilities. Bankruptcy or insolvency laws of a particular jurisdiction may impose restrictions on or prohibitions against the right of offset in bankruptcy, insolvency or other events.
The Fund’s risk of loss from counterparty credit risk on exchange-traded derivatives cleared through a clearinghouse and for centrally cleared swaps is generally considered lower than as compared to OTC derivatives. However, counterparty credit risk exists with respect to initial and variation margin deposited/paid by the Fund that is held in futures commission merchant,
65 OPPENHEIMER LIMITED-TERM BOND FUND
NOTES TO FINANCIAL STATEMENTS Continued
6. Use of Derivatives (Continued)
broker and/or clearinghouse accounts for such exchange-traded derivatives and for centrally cleared swaps.
With respect to centrally cleared swaps, such transactions will be submitted for clearing, and if cleared, will be held in accounts at futures commission merchants or brokers that are members of clearinghouses. While brokers, futures commission merchants and clearinghouses are required to segregate customer margin from their own assets, in the event that a broker, futures commission merchant or clearinghouse becomes insolvent or goes into bankruptcy and at that time there is a shortfall in the aggregate amount of margin held by the broker, futures commission merchant or clearinghouse for all its customers, U.S. bankruptcy laws will typically allocate that shortfall on a pro-rata basis across all the broker’s, futures commission merchant’s or clearinghouse’s customers, potentially resulting in losses to the Fund.
There is the risk that a broker, futures commission merchant or clearinghouse will decline to clear a transaction on the Fund’s behalf, and the Fund may be required to pay a termination fee to the executing broker with whom the Fund initially enters into the transaction. Clearinghouses may also be permitted to terminate centrally cleared swaps at any time. The Fund is also subject to the risk that the broker or futures commission merchant will improperly use the Fund’s assets deposited/paid as initial or variation margin to satisfy payment obligations of another customer. In the event of a default by another customer of the broker or futures commission merchant, the Fund might not receive its variation margin payments from the clearinghouse, due to the manner in which variation margin payments are aggregated for all customers of the broker/futures commission merchant.
Collateral and margin requirements differ by type of derivative. Margin requirements are established by the broker, futures commission merchant or clearinghouse for exchange-traded and cleared derivatives, including centrally cleared swaps. Brokers, futures commission merchants and clearinghouses can ask for margin in excess of the regulatory minimum, or increase the margin amount, in certain circumstances.
Collateral terms are contract specific for OTC derivatives. For derivatives traded under an ISDA master agreement, the collateral requirements are typically calculated by netting the mark to market amount for each transaction under such agreement and comparing that amount to the value of any collateral currently pledged by the Fund or the counterparty.
For financial reporting purposes, cash collateral that has been pledged to cover obligations of the Fund, if any, is reported separately on the Statement of Assets and Liabilities as cash pledged as collateral. Non-cash collateral pledged by the Fund, if any, is noted in the Statement of Investments. Generally, the amount of collateral due from or to a party must exceed a minimum transfer amount threshold (e.g. $250,000) before a transfer has to be made. To the extent amounts due to the Fund from its counterparties are not fully collateralized, contractually or otherwise, the Fund bears the risk of loss from counterparty nonperformance.
The following table presents by counterparty the Fund’s OTC derivative assets net of the related collateral pledged by the Fund at period end:
66 OPPENHEIMER LIMITED-TERM BOND FUND
6. Use of Derivatives (Continued)
| | | | | | | | | | | | | | | | | | | | |
| | | | | | Gross Amounts Not Offset in the Statement of
Assets & Liabilities | | | | |
| Counterparty | | Gross Amounts
Not Offset in
the Statement
of Assets &
Liabilities* | | | Financial
Instruments
Available for
Offset | | | Financial
Instruments
Collateral
Received** | | | Cash Collateral
Received** | | | Net Amount | |
| |
JPMorgan Chase Bank NA | | $ | 1,058,292 | | | $ | (366,202) | | | $ | – | | | $ | – | | | $ | 692,090 | |
*OTC derivatives are reported gross on the Statement of Assets and Liabilities. Exchange traded options and margin related to centrally cleared swaps and futures are excluded from these reported amounts.
**Reported collateral posted for the benefit of the Fund within this table is limited to the net outstanding amount due from an individual counterparty. The collateral posted for the benefit of the Fund may exceed these amounts.
The following table presents by counterparty the Fund’s OTC derivative liabilities net of the related collateral pledged by the Fund at period end:
| | | | | | | | | | | | | | | | | | | | |
| | | | | | Gross Amounts Not Offset in the Statement of
Assets & Liabilities | | | | |
| Counterparty | | Gross Amounts
Not Offset in
the Statement
of Assets &
Liabilities* | | | Financial
Instruments
Available for
Offset | | | Financial
Instruments
Collateral
Pledged** | | | Cash Collateral
Pledged** | | | Net Amount | |
| |
JPMorgan Chase Bank NA | | $ | (366,202) | | | $ | 366,202 | | | $ | – | | | $ | – | | | $ | – | |
*OTC derivatives are reported gross on the Statement of Assets and Liabilities. Exchange traded options and margin related to centrally cleared swaps and futures are excluded from these reported amounts.
**Reported collateral pledged within this table is limited to the net outstanding amount due from the Fund. The securities pledged as collateral by the Fund as reported on the Statements of Investments may exceed these amounts.
The following table presents the valuations of derivative instruments by risk exposure as reported within the Statement of Assets and Liabilities at period end:
| | | | | | | | | | | | | | | | |
| | | Asset Derivatives | | | Liability Derivatives | |
Derivatives
Not Accounted
for as Hedging
Instruments | | Statement of Assets
and Liabilities Location | | | Value | | | Statement of Assets
and Liabilities Location | | | Value | |
| |
Interest rate contracts | | | Variation margin receivable | | | $ | 41,262* | | | | Variation margin payable | | | $ | 4,893* | |
Credit contracts | | | Investments, at value | | | | 1,058,292** | | | | Swaptions written, at value | | | | 366,202 | |
| | | | | | | | | | | | | | | | |
Total | | | | | | $ | 1,099,554 | | | | | | | $ | 371,095 | |
| | | | | | | | | | | | | | | | |
*Includes only the current day’s variation margin. Prior variation margin movements have been reflected in cash on the Statement of Assets and Liabilities upon receipt or payment.
**Amounts relate to purchased option contracts and purchased swaption contracts, if any.
The effect of derivative instruments on the Statement of Operations is as follows:
67 OPPENHEIMER LIMITED-TERM BOND FUND
NOTES TO FINANCIAL STATEMENTS Continued
6. Use of Derivatives (Continued)
| | | | | | | | | | | | | | | | |
| Amount of Realized Gain or (Loss) Recognized on Derivatives | |
| |
Derivatives Not Accounted
for as Hedging Instruments | | Investment from
unaffiliated
companies* | | | Closing and
expiration of
futures contracts | | | Swap contracts | | | Total | |
| |
Interest rate contracts | | $ | 871,781 | | | $ | (6,799,537) | | | $ | (75,431) | | | $ | (6,003,187) | |
*Includes purchased option contracts, purchased swaption contracts, written option contracts exercised and written swaption contracts written, if any.
| | | | | | | | | | | | | | | | | | | | |
| Amount of Change in Unrealized Gain or (Loss) Recognized on Derivatives | |
| |
Derivatives
Not Accounted
for as Hedging
Instruments | | Investments* | | | Swaption
contracts
written | | | Futures
contracts | | | Swap contracts | | | Total | |
| |
Credit contracts | | $ | 9,280 | | | $ | (14,569) | | | $ | — | | | $ | — | | | $ | (5,289) | |
Interest rate contracts | | | — | | | | – | | | | (736,617) | | | | (188,770) | | | | (925,387) | |
| | | | |
Total | | $ | 9,280 | | | $ | (14,569) | | | $ | (736,617) | | | $ | (188,770) | | | $ | (930,676) | |
| | | | |
*Includes purchased option contracts and purchased swaption contracts, if any.
7. Shares of Beneficial Interest
The Fund has authorized an unlimited number of $0.001 par value shares of beneficial interest of each class. Transactions in shares of beneficial interest were as follows:
| | | | | | | | | | | | | | | | |
| | | Year Ended August 31, 2016 | | | Year Ended August 31, 2015 | |
| | | Shares | | | Amount | | | Shares | | | Amount | |
| |
| Class A | | | | | | | | | | | | | | | | |
| Sold | | | 53,588,442 | | | $ | 246,518,436 | | | | 29,262,894 | | | $ | 271,240,344 | |
| Dividends and/or distributions reinvested | | | 3,030,484 | | | | 13,805,121 | | | | 1,828,430 | | | | 16,930,050 | |
| Redeemed | | | (51,452,705 | ) | | | (236,800,065 | ) | | | (23,788,593 | ) | | | (220,441,041) | |
| Shares tendered from share split | | | 78,484,4061 | | | | — | | | | — | | | | — | |
| | | | |
| Net increase | | | 83,650,627 | | | $ | 23,523,492 | | | | 7,302,731 | | | $ | 67,729,353 | |
| | | | |
|
| |
| Class B | | | | | | | | | | | | | | | | |
| Sold | | | 592,580 | | | $ | 2,724,291 | | | | 220,110 | | | $ | 2,037,900 | |
| Dividends and/or distributions reinvested | | | 34,806 | | | | 158,242 | | | | 35,898 | | | | 332,000 | |
| Redeemed | | | (1,769,354 | ) | | | (8,305,495 | ) | | | (1,128,206 | ) | | | (10,450,336) | |
| Shares tendered from share split | | | 1,674,4641 | | | | — | | | | — | | | | — | |
| | | | |
| Net increase (decrease) | | | 532,496 | | | $ | (5,422,962 | ) | | | (872,198 | ) | | $ | (8,080,436) | |
| | | | |
68 OPPENHEIMER LIMITED-TERM BOND FUND
7. Shares of Beneficial Interest (Continued)
| | | | | | | | | | | | | | | | |
| | | Year Ended August 31, 2016 | | | Year Ended August 31, 2015 | |
| | | Shares | | | Amount | | | Shares | | | Amount | |
| |
| Class C | | | | | | | | | | | | | | | | |
| Sold | | | 21,937,658 | | | $ | 100,447,379 | | | | 11,004,914 | | | $ | 101,817,949 | |
| Dividends and/or distributions reinvested | | | 438,365 | | | | 1,992,786 | | | | 268,699 | | | | 2,483,508 | |
| Redeemed | | | (17,206,594 | ) | | | (79,254,122 | ) | | | (8,200,028 | ) | | | (75,646,443) | |
| Shares tendered from share split | | | 17,392,3591 | | | | — | | | | — | | | | — | |
| | | | |
| Net increase | | | 22,561,788 | | | $ | 23,186,043 | | | | 3,073,585 | | | $ | 28,655,014 | |
| | | | |
|
| |
| Class I | | | | | | | | | | | | | | | | |
| Sold | | | 25,491,454 | | | $ | 116,983,485 | | | | 12,463,126 | | | $ | 114,675,331 | |
| Dividends and/or distributions reinvested | | | 807,928 | | | | 3,689,757 | | | | 25,685 | | | | 238,225 | |
| Redeemed | | | (10,391,649 | ) | | | (47,588,662 | ) | | | (244,520 | ) | | | (2,269,456) | |
| Shares tendered from share split | | | 12,723,5501 | | | | — | | | | — | | | | — | |
| | | | |
| Net increase | | | 28,631,283 | | | $ | 73,084,580 | | | | 12,244,291 | | | $ | 112,644,100 | |
| | | | |
|
| |
| Class R | | | | | | | | | | | | | | | | |
| Sold | | | 2,643,681 | | | $ | 12,177,962 | | | | 1,497,173 | | | $ | 13,873,528 | |
| Dividends and/or distributions reinvested | | | 130,121 | | | | 592,735 | | | | 75,245 | | | | 696,417 | |
| Redeemed | | | (2,273,345 | ) | | | (10,465,455 | ) | | | (1,036,387 | ) | | | (9,598,253) | |
| Shares tendered from share split | | | 3,749,0791 | | | | — | | | | — | | | | — | |
| | | | |
| Net increase | | | 4,249,536 | | | $ | 2,305,242 | | | | 536,031 | | | $ | 4,971,692 | |
| | | | |
|
| |
| Class Y | | | | | | | | | | | | | | | | |
| Sold | | | 58,594,120 | | | $ | 269,005,814 | | | | 21,410,904 | | | $ | 199,087,593 | |
| Dividends and/or distributions reinvested | | | 750,739 | | | | 3,434,328 | | | | 286,834 | | | | 2,662,414 | |
| Redeemed | | | (32,063,050 | ) | | | (147,717,692 | ) | | | (11,121,816 | ) | | | (103,288,002) | |
| Shares tendered from share split | | | 17,181,5781 | | | | — | | | | — | | | | — | |
| | | | |
| Net increase | | | 44,463,387 | | | $ | 124,722,450 | | | | 10,575,922 | | | $ | 98,462,005 | |
| | | | |
1. As of the close of September 11, 2015, the Fund implemented a share split which resulted in an addition of shares. See Note 11.
8. Purchases and Sales of Securities
The aggregate cost of purchases and proceeds from sales of securities, other than short-term obligations and investments in IMMF, for the reporting period were as follows:
| | | | | | | | |
| | | Purchases | | | Sales | |
| |
Investment securities | | | $876,784,035 | | | | $554,264,796 | |
| | |
U.S. government and government agency obligations | | | 72,374,349 | | | | 88,215,687 | |
| | |
To Be Announced (TBA) mortgage-related securities | | | 2,237,586,604 | | | | 2,271,024,565 | |
69 OPPENHEIMER LIMITED-TERM BOND FUND
NOTES TO FINANCIAL STATEMENTS Continued
9. Fees and Other Transactions with Affiliates
Management Fees. Under the investment advisory agreement, the Fund pays the Manager a management fee based on the daily net assets of the Fund at an annual rate as shown in the following table:
| | | | |
| Fee Schedule | | | |
Up to $500 million | | | 0.45% | |
Next $500 million | | | 0.40 | |
Next $4 billion | | | 0.35 | |
Over $5 billion | | | 0.30 | |
The Fund’s effective management fee for the reporting period was 0.41% of average annual net assets before any applicable waivers.
Sub-Adviser Fees. The Manager has retained the Sub-Adviser to provide the day-to-day portfolio management of the Fund. Under the Sub-Advisory Agreement, the Manager pays the Sub-Adviser an annual fee in monthly installments, equal to a percentage of the investment management fee collected by the Manager from the Fund, which shall be calculated after any investment management fee waivers. The fee paid to the Sub-Adviser is paid by the Manager, not by the Fund.
Transfer Agent Fees. OFI Global (the “Transfer Agent”) serves as the transfer and shareholder servicing agent for the Fund. The Fund pays the Transfer Agent a fee based on annual net assets. Fees incurred and average net assets for each class with respect to these services are detailed in the Statement of Operations and Financial Highlights, respectively.
Sub-Transfer Agent Fees. The Transfer Agent has retained Shareholder Services, Inc., a wholly-owned subsidiary of OFI (the “Sub-Transfer Agent”), to provide the day-to-day transfer agent and shareholder servicing of the Fund. Under the Sub-Transfer Agency Agreement, the Transfer Agent pays the Sub-Transfer Agent an annual fee in monthly installments, equal to a percentage of the transfer agent fee collected by the Transfer Agent from the Fund, which shall be calculated after any applicable fee waivers. The fee paid to the Sub-Transfer Agent is paid by the Transfer Agent, not by the Fund.
Trustees’ Compensation. The Fund has adopted an unfunded retirement plan (the “Plan”) for the Fund’s Independent Trustees. Benefits are based on years of service and fees paid to each Trustee during their period of service. The Plan was frozen with respect to adding new participants effective December 31, 2006 (the “Freeze Date”) and existing Plan Participants as of the Freeze Date will continue to receive accrued benefits under the Plan. Active
Independent Trustees as of the Freeze Date have each elected a distribution method with respect to their benefits under the Plan. During the reporting period, the Fund’s projected benefit obligations, payments to retired Trustees and accumulated liability were as follows:
| | | | |
Projected Benefit Obligations Increased | | $ | — | |
Payments Made to Retired Trustees | | | 11,692 | |
Accumulated Liability as of August 31, 2016 | | | 80,500 | |
70 OPPENHEIMER LIMITED-TERM BOND FUND
9. Fees and Other Transactions with Affiliates (Continued)
The Fund’s Board of Trustees (“Board”) has adopted a compensation deferral plan for Independent Trustees that enables Trustees to elect to defer receipt of all or a portion of the annual compensation they are entitled to receive from the Fund. For purposes of determining the amount owed to the Trustee under the plan, deferred amounts are treated as though equal dollar amounts had been invested in shares of the Fund or in other Oppenheimer funds selected by the Trustee. The Fund purchases shares of the funds selected for deferral by the Trustee in amounts equal to his or her deemed investment, resulting in a Fund asset equal to the deferred compensation liability. Such assets are included as a component of “Other” within the asset section of the Statement of Assets and Liabilities. Deferral of Trustees’ fees under the plan will not affect the net assets of the Fund and will not materially affect the Fund’s assets, liabilities or net investment income per share. Amounts will be deferred until distributed in accordance with the compensation deferral plan.
Distribution and Service Plan (12b-1) Fees. Under its General Distributor’s Agreement with the Fund, OppenheimerFunds Distributor, Inc. (the “Distributor”) acts as the Fund’s principal underwriter in the continuous public offering of the Fund’s classes of shares.
Service Plan for Class A Shares. The Fund has adopted a Service Plan (the “Plan”) for Class A shares pursuant to Rule 12b-1 under the 1940 Act. Under the Plan, the Fund reimburses the Distributor for a portion of its costs incurred for services provided to accounts that hold Class A shares. Reimbursement is made periodically at an annual rate of up to 0.25% of the daily net assets of Class A shares of the Fund. The Distributor currently uses all of those fees to pay dealers, brokers, banks and other financial institutions periodically for providing personal service and maintenance of accounts of their customers that hold Class A shares. Any unreimbursed expenses the Distributor incurs with respect to Class A shares in any fiscal year cannot be recovered in subsequent periods. Fees incurred by the Fund under the
Plan are detailed in the Statement of Operations.
Distribution and Service Plans for Class B, Class C and Class R Shares. The Fund has adopted Distribution and Service Plans (the “Plans”) for Class B, Class C and Class R shares pursuant to Rule 12b-1 under the 1940 Act to compensate the Distributor for distributing those share classes, maintaining accounts and providing shareholder services. Under the Plans, the Fund pays the Distributor an annual asset-based sales charge of 0.75% on Class B and Class C shares’ daily net assets and 0.25% on Class R shares’ daily net assets. The Fund also pays a service fee under the Plans at an annual rate of 0.25% of daily net assets. The Plans continue in effect from year to year only if the Fund’s Board of Trustees votes annually to approve their continuance at an in person meeting called for that purpose. Fees incurred by the Fund under the Plans are detailed in the Statement of Operations.
Sales Charges. Front-end sales charges and CDSC do not represent expenses of the Fund. They are deducted from the proceeds of sales of Fund shares prior to investment or from redemption proceeds prior to remittance, as applicable. The sales charges retained
71 OPPENHEIMER LIMITED-TERM BOND FUND
NOTES TO FINANCIAL STATEMENTS Continued
9. Fees and Other Transactions with Affiliates (Continued)
by the Distributor from the sale of shares and the CDSC retained by the Distributor on the redemption of shares is shown in the following table for the period indicated.
| | | | | | | | | | | | | | | | | | | | |
| Year Ended | | Class A
Front-End
Sales Charges
Retained by
Distributor | | | Class A
Contingent
Deferred
Sales Charges
Retained by
Distributor | | | Class B
Contingent
Deferred
Sales Charges
Retained by
Distributor | | | Class C
Contingent
Deferred
Sales Charges
Retained by
Distributor | | | Class R Contingent Deferred Sales Charges Retained by Distributor | |
| |
| August 31, 2016 | | | $123,241 | | | | $18,165 | | | | $16,993 | | | | $32,793 | | | | $— | |
Waivers and Reimbursements of Expenses. The Manager has contractually agreed to limit the “Total expenses” for Class A shares so that “Expenses after payments, waivers and/ or reimbursements and reduction to custodian expenses”, as a percentage of average annual net assets, will not exceed the annual rate of 0.82%. The expense limitations do not include interest and fees from borrowing and other expenses not incurred in the ordinary course of the Fund’s business. During the reporting period, the Manager waived fees and/or reimbursed the Fund $386,996 for Class A shares.
The Manager will waive fees and/or reimburse Fund expenses in an amount equal to the indirect management fees incurred through the Fund’s investment in IMMF. During the reporting period, the Manager waived fees and/or reimbursed the Fund $116,813 for IMMF management fees.
Waivers and/or reimbursements may be modified or terminated as set forth according to the terms in the prospectus.
10. Borrowings and Other Financing
Joint Credit Facility. A number of mutual funds managed by the Manager participate in a $1.3 billion revolving credit facility (the “Facility”) intended to provide short-term financing, if necessary, subject to certain restrictions in connection with atypical redemption activity. Expenses and fees related to the Facility are paid by the participating funds and are disclosed separately or as other expenses on the Statement of Operations. The Fund did not utilize the Facility during the reporting period.
11. Share Split
As of the close of business on September 11, 2015, the Fund implemented a 2 for 1 share split. This share split effectively increased the number of outstanding shares for the Fund. As a result, shareholders’ accounts reflect additional shares with a lower net asset value per share. While the number of shares increased, neither the Fund’s holdings nor the total value of shareholders’ investments was affected. Per share data in the financial highlights prior to September 11, 2015, has been adjusted to give effect to this share split.
72 OPPENHEIMER LIMITED-TERM BOND FUND
12. Pending Litigation
In 2009, several putative class action lawsuits were filed and later consolidated before the U.S. District Court for the District of Colorado against OppenheimerFunds, Inc. (“OFI”), OppenheimerFunds Distributor, Inc. (“OFDI”), and Oppenheimer Rochester California Municipal Fund, a fund advised by OFI Global Asset Management, Inc. and distributed by the Distributor (the “California Fund”), in connection with the California Fund’s investment performance. The plaintiffs asserted claims against OFI, OFDI and certain present and former trustees and officers of the California Fund under the federal securities laws, alleging, among other things, that the disclosure documents of the California Fund contained misrepresentations and omissions and the investment policies of the California Fund were not followed. Plaintiffs in the suit filed an amended complaint and defendants filed a motion to dismiss. In 2011, the court issued an order which granted in part and denied in part the defendants’ motion to dismiss. In 2012, plaintiffs filed a motion, which defendants opposed, to certify a class and appoint class representatives and class counsel. In March 2015, the court granted plaintiffs’ motion for class certification. In May 2015, the U.S. Court of Appeals for the Tenth Circuit vacated the class certification order and remanded the matter to the district court for further proceedings. In October 2015, the district court reaffirmed its order and determined that the suit will proceed as a class action. In December 2015, the Tenth Circuit denied defendants’ petition to appeal the district court’s reaffirmed class certification order.
OFI and OFDI believe the suit is without merit; that it is premature to render any opinion as to the likelihood of an outcome unfavorable to them in the suit; and that no estimate can yet be made as to the amount or range of any potential loss. Furthermore, OFI believes that the suit should not impair the ability of OFI or OFDI to perform their respective duties to the Fund and that the outcome of the suit should not have any material effect on the operations of any of the Oppenheimer funds.
73 OPPENHEIMER LIMITED-TERM BOND FUND
REPORT OF INDEPENDENT REGISTERED PUBLIC ACCOUNTING FIRM
The Board of Trustees and Shareholders of Oppenheimer Limited-Term Bond Fund:
We have audited the accompanying statement of assets and liabilities of Oppenheimer Limited-Term Bond Fund, including the statement of investments, as of August 31, 2016, and the related statement of operations for the year then ended, the statements of changes in net assets for each of the years in the two-year period then ended, and the financial highlights for each of the years or periods in the five-year period then ended. These financial statements and financial highlights are the responsibility of the Fund’s management. Our responsibility is to express an opinion on these financial statements and financial highlights based on our audits.
We conducted our audits in accordance with the standards of the Public Company Accounting Oversight Board (United States). Those standards require that we plan and perform the audit to obtain reasonable assurance about whether the financial statements and financial highlights are free of material misstatement. An audit includes examining, on a test basis, evidence supporting the amounts and disclosures in the financial statements. Our procedures included confirmation of securities owned as of August 31, 2016, by correspondence with the custodian, transfer agent and brokers, or by other appropriate auditing procedures where replies from brokers were not received. An audit also includes assessing the accounting principles used and significant estimates made by management, as well as evaluating the overall financial statement presentation. We believe that our audits provide a reasonable basis for our opinion.
In our opinion, the financial statements and financial highlights referred to above present fairly, in all material respects, the financial position of Oppenheimer Limited-Term Bond Fund as of August 31, 2016, the results of its operations for the year then ended, the changes in its net assets for each of the years in the two-year period then ended, and the financial highlights for each of the years or periods in the five-year period then ended, in conformity with U.S. generally accepted accounting principles.
KPMG LLP
Denver, Colorado
October 25, 2016
74 OPPENHEIMER LIMITED-TERM BOND FUND
FEDERAL INCOME TAX INFORMATION Unaudited
In early 2016, if applicable, shareholders of record received information regarding all dividends and distributions paid to them by the Fund during calendar year 2015.
None of the dividends paid by the Fund during the reporting period are eligible for the corporate dividend-received deduction.
Dividends, if any, paid by the Fund during the reporting period which are not designated as capital gain distributions, may be eligible for lower individual income tax rates to the extent that the Fund has received qualified dividend income as stipulated by recent tax legislation. In early 2016, shareholders of record received information regarding the percentage of distributions that are eligible for lower individual income tax rates. The amount will be the maximum amount allowed.
Recent tax legislation allows a regulated investment company to designate distributions not designated as capital gain distributions, as either interest related dividends or short-term capital gain dividends, both of which are exempt from the U.S. withholding tax applicable to non U.S. taxpayers. For the reporting period, the maximum amount allowable but not less than $23,883,334 of the ordinary distributions to be paid by the Fund qualifies as an interest related dividend.
The foregoing information is presented to assist shareholders in reporting distributions received from the Fund to the Internal Revenue Service. Because of the complexity of the federal regulations which may affect your individual tax return and the many variations in state and local tax regulations, we recommend that you consult your tax advisor for specific guidance.
75 OPPENHEIMER LIMITED-TERM BOND FUND
PORTFOLIO PROXY VOTING POLICIES AND GUIDELINES;
UPDATES TO STATEMENTS OF INVESTMENTS Unaudited
The Fund has adopted Portfolio Proxy Voting Policies and Guidelines under which the Fund votes proxies relating to securities (“portfolio proxies”) held by the Fund. A description of the Fund’s Portfolio Proxy Voting Policies and Guidelines is available (i) without charge, upon request, by calling the Fund toll-free at 1.800.CALL OPP (225.5677), (ii) on the Fund’s website at www.oppenheimerfunds.com, and (iii) on the SEC’s website at www.sec.gov. In addition, the Fund is required to file Form N-PX, with its complete proxy voting record for the 12 months ended June 30th, no later than August 31st of each year. The Fund’s voting record is available (i) without charge, upon request, by calling the Fund toll-free at 1.800.CALL OPP (225.5677), and (ii) in the Form N-PX filing on the SEC’s website at www.sec.gov.
The Fund files its complete schedule of portfolio holdings with the SEC for the first quarter and the third quarter of each fiscal year on Form N-Q. The Fund’s Form N-Q filings are available on the SEC’s website at www.sec.gov. Those forms may be reviewed and copied at the SEC’s Public Reference Room in Washington, D.C. Information on the operation of the Public Reference Room may be obtained by calling 1-800-SEC-0330.
Householding—Delivery of Shareholder Documents
This is to inform you about OppenheimerFunds’ “householding” policy. If more than one member of your household maintains an account in a particular fund, OppenheimerFunds will mail only one copy of the fund’s prospectus (or, if available, the fund’s summary prospectus), annual and semiannual report and privacy policy. The consolidation of these mailings, called householding, benefits your fund through reduced mailing expense, and benefits you by reducing the volume of mail you receive from OppenheimerFunds. Householding does not affect the delivery of your account statements.
Please note that we will continue to household these mailings for as long as you remain an OppenheimerFunds shareholder, unless you request otherwise. If you prefer to receive multiple copies of these materials, please call us at 1.800.CALL-OPP (225-5677). You may also notify us in writing or via email. We will begin sending you individual copies of the prospectus (or, if available, the summary prospectus), reports and privacy policy within 30 days of receiving your request to stop householding.
76 OPPENHEIMER LIMITED-TERM BOND FUND
TRUSTEES AND OFFICERS Unaudited
| | |
| Name, Position(s) Held with the Fund, Length of Service, Year of Birth | | Principal Occupation(s) During the Past 5 Years; Other Trusteeships/Directorships Held; Number of Portfolios in the Fund Complex Currently Overseen |
| |
| INDEPENDENT TRUSTEES | | The address of each Trustee in the chart below is 6803 S. Tucson Way, Centennial, Colorado 80112-3924. Each Trustee serves for an indefinite term, or until his or her resignation, retirement, death or removal. |
| |
Brian F. Wruble, Chairman of the Board of Trustees (since 2007), Trustee (since 2005) Year of Birth: 1943 | | Governor and Vice Chairman of Community Foundation of the Florida Keys (non-profit) (since July 2012); Trustee of the Board of Trustees, The Jackson Laboratory (non-profit) (1991-2011 and since May 2014); Chairman Emeritus (since August 2011) of The Jackson Laboratory (non-profit); Member of Zurich Insurance Group’s Investment Management Advisory Council (insurance) (since 2004); Treasurer (since 2007) and Trustee of the Institute for Advanced Study (non-profit educational institute) (since May 1992); Director of Special Value Opportunities Fund, LLC (registered investment company) (affiliate of the Sub-Adviser’s parent company) (September 2004-June 2015); General Partner of Odyssey Partners, L.P. (hedge fund) (September 1995-December 2007); Special Limited Partner of Odyssey Investment Partners, LLC (private equity investment) (January 1999-September 2004). Oversees 55 portfolios in the OppenheimerFunds complex. Mr. Wruble has served on the Boards of certain Oppenheimer funds since April 2001, during which time he has become familiar with the Fund’s (and other Oppenheimer funds’) financial, accounting, regulatory and investment matters and has contributed to the Boards’ deliberations. |
| |
Beth Ann Brown, Trustee (since 2016) Year of Birth: 1968 | | Advisor, Board of Advisors of Caron Engineering Inc. (since December 2014); Independent Consultant (since September 2012); held the following positions at Columbia Management Investment Advisers LLC: Head of Intermediary Distribution (2008-2012), Managing Director, Strategic Relations (2005-2008), Managing Director, Head of National Accounts (2004-2005); Senior Vice President, National Account Manager (2002-2004), Senior Vice President, Key Account Manager (1999-2002) and Vice President, Key Account Manager (1996-1999) of Liberty Funds Distributor, Inc.; President and Director, of Acton Shapleigh Youth Conservation Corps (non-profit) (since 2012); and Vice President and Director of Grahamtastic Connection (non-profit) (since May 2013). Oversees 55 portfolios in the OppenheimerFunds complex. Ms. Brown has served on the Boards of certain Oppenheimer funds since December 2005, during which time he has become familiar with the Fund’s (and other Oppenheimer funds’) financial, accounting, regulatory and investment matters and has contributed to the Boards’ deliberations. |
| |
Matthew P. Fink, Trustee (since 2005) Year of Birth: 1941 | | Trustee of the Committee for Economic Development (policy research foundation) (2005-2011); Director of ICI Education Foundation (education foundation) (October 1991-August 2006); President of the Investment Company Institute (trade association) (October 1991-June 2004); Director of ICI Mutual Insurance Company (insurance company) (October 1991-June 2004); Author of The Rise of Mutual Funds: An Insider’s View published by Oxford University Press (second edition 2011). Oversees 55 portfolios in the OppenheimerFunds complex. Mr. Fink has served on the Boards of certain Oppenheimer funds since January 2005, during which time he has become familiar with the Fund’s (and other Oppenheimer funds’) financial, accounting, regulatory and investment matters and has contributed to the Boards’ deliberations. |
77 OPPENHEIMER LIMITED-TERM BOND FUND
TRUSTEES AND OFFICERS Unaudited / Continued
| | |
Edmund P. Giambastiani, Jr., Trustee (since 2013) Year of Birth: 1948 | | Advisory Board Member of the Maxwell School of Citizenship and Public Affairs of Syracuse University (since April 2012); Director of Mercury Defense Systems Inc. (information technology) (August 2011-February 2013); Trustee of the U.S. Naval Academy Foundation (since November 2010); Advisory Board Member of the Massachusetts Institute of Technology Lincoln Laboratory (federally-funded research development center) (since May 2010); Director of The Boeing Company (aerospace and defense) (since October 2009); Trustee of MITRE Corporation (federally-funded research development center) (since September 2008); Independent Director of QinetiQ Group Plc (defense technology and security) (February 2008-August 2011); Chairman of Monster Worldwide, Inc. (on-line career services) (since March 2015), Lead Director (June 2011-March 2015); Chairman of Alenia North America, Inc. (military and defense products) (January 2008-October 2009); Director of SRA International, Inc. (information technology and services) (January 2008-July 2011); President of Giambastiani Group LLC (national security and energy consulting) (since October 2007); United States Navy, career nuclear submarine officer (June 1970-October 2007), Vice Chairman of the Joint Chiefs of Staff (2005-October 2007), Supreme Allied Commander of NATO Commander Transformation (2003-2005), Commander, U.S. Joint Forces Command (2002-2005). Since his retirement from the U.S. Navy in October 2007, Admiral Giambastiani has also served on numerous U.S. Government advisory boards, investigations and task forces for the Secretaries of Defense, State and Interior and the Central Intelligence Agency. He currently serves as a federal commissioner on the Military Compensation and Retirement Modernization Commission. Oversees 55 portfolios in the OppenheimerFunds complex. Admiral Giambastiani has served on the Boards of certain Oppenheimer funds since February 2013, including as an Advisory Board Member for certain Oppenheimer funds, during which time he has become familiar with the Fund’s (and other Oppenheimer funds’) financial, accounting, regulatory and investment matters and has contributed to the Boards’ deliberations. For purposes of this report, Admiral Giambastiani is identified as a Trustee. |
| |
Elizabeth Krentzman, Trustee (since 2014 Year of Birth: 1959 | | Advisory Board Member of the University of Florida Law Center Association (since 2016) and the Securities and Exchange Commission Historical Society (since 2007); held the following positions at Deloitte & Touche LLP: Principal and Chief Regulatory Advisor for Asset Management Services (2007-2014) and U.S. Mutual Fund Leader (2011-2014); General Counsel of the Investment Company Institute (trade association) (June 2004-April 2007); held the following positions at Deloitte & Touche LLP: National Director of the Investment Management Regulatory Consulting Practice (1997-2004), Principal (2003-2004), Director (1998-2003) and Senior Manager (1997-1998); Assistant Director of the Division of Investment Management – Office of Disclosure and Investment Adviser Regulation (1996-1997) and various positions with the Division of Investment Management – Office of Regulatory Policy (1991-1996) of the U.S. Securities and Exchange Commission; Associate at Ropes & Gray (1987-1991). Oversees 55 portfolios in the OppenheimerFunds complex. Ms. Krentzman has served on the Boards of certain Oppenheimer funds since August 2014, during which time she has become familiar with the Fund’s (and other Oppenheimer funds’) financial, accounting, regulatory and investment matters and has contributed to the Boards’ deliberations. |
78 OPPENHEIMER LIMITED-TERM BOND FUND
| | |
Mary F. Miller, Trustee (since 2004) Year of Birth: 1942 | | Trustee of International House (not-for-profit) (since June 2007); Trustee of the American Symphony Orchestra (not-for-profit) (October 1998-November 2011); and Senior Vice President and General Auditor of American Express Company (financial services company) (July 1998-February 2003). Oversees 55 portfolios in the OppenheimerFunds complex. Ms. Miller has served on the Boards of certain Oppenheimer funds since August 2004, during which time she has become familiar with the Fund’s (and other Oppenheimer funds’) financial, accounting, regulatory and investment matters and has contributed to the Boards’ deliberations. |
| |
Joel W. Motley, Trustee (since 2002) Year of Birth: 1952 | | Director of Greenwall Foundation (since October 2013); Member of Board and Investment Committee of The Greenwall Foundation (since April 2013); Member of the Vestry of Trinity Wall Street (since April 2012); Director of Southern Africa Legal Services Foundation (since March 2012); Board Member of Pulitzer Center for Crisis Reporting (non-profit journalism) (since March 2011); Managing Director of Public Capital Advisors, LLC (privately-held financial advisor) (since January 2006); Managing Director of Carmona Motley, Inc. (privately-held financial advisor) (since January 2002); Director of Columbia Equity Financial Corp. (privately-held financial advisor) (2002-2007); Managing Director of Carmona Motley Hoffman Inc. (privately-held financial advisor) (January 1998-December 2001); Member of the Finance and Budget Committee of the Council on Foreign Relations, Member of the Investment Committee and Board of Human Rights Watch (since July 2000) and Member of the Investment Committee and Board of Historic Hudson Valley (since February 2010). Oversees 55 portfolios in the OppenheimerFunds complex. Mr. Motley has served on the Boards of certain Oppenheimer funds since October 2002, during which time he has become familiar with the Fund’s (and other Oppenheimer funds’) financial, accounting, regulatory and investment matters and has contributed to the Boards’ deliberations. |
| |
Joanne Pace, Trustee (since 2012) Year of Birth: 1958 | | Advisory Board Director of Massey Quick and Company, LLC (since October 2014); Board Director of Horizon Blue Cross Blue Shield of New Jersey (since November 2012); Advisory Board Director of The Alberleen Group LLC (since March, 2012); Board Member (since January 2015), Advisory Council Member (December 2012-December 2014) of 100 Women in Hedge Funds (non-profit) (since December, 2012); Advisory Council Member of Morgan Stanley Children’s Hospital (non-profit) (since May, 2012); Board Director of The Komera Project (non-profit) (since April, 2012); New York Advisory Board Director of Peace First (non-profit) (2010-2015); Senior Advisor of SECOR Asset Management, LP (2010-2011); Managing Director and Chief Operating Officer of Morgan Stanley Investment Management (2006-2010); Partner and Chief Operating Officer of FrontPoint Partners, LLC (hedge fund) (2005-2006); held the following positions at Credit Suisse: Managing Director (2003-2005); Global Head of Human Resources and member of Executive Board and Operating Committee (2004-2005), Global Head of Operations and Product Control (2003-2004); held the following positions at Morgan Stanley: Managing Director (1997-2003), Controller and Principal Accounting Officer (1999-2003); Chief Financial Officer (temporary assignment) for the Oversight Committee, Long Term Capital Management (1998-1999). Lead Independent Director and Chair of the Audit and Nominating Committee of The Global Chartist Fund, LLC of Oppenheimer Asset Management (2011-2012); Board Director of Managed Funds Association (2008-2010); Board Director of Morgan |
79 OPPENHEIMER LIMITED-TERM BOND FUND
TRUSTEES AND OFFICERS Unaudited / Continued
| | |
Joanne Pace Continued | | Stanley Foundation (2007-2010) and Investment Committee Chair (2008-2010). Oversees 55 portfolios in the OppenheimerFunds complex. Ms. Pace has served on the Boards of certain Oppenheimer funds since November 2012, including as an Advisory Board Member for certain Oppenheimer funds, during which time she has become familiar with the Fund’s (and other Oppenheimer funds’) financial, accounting, regulatory and investment matters and has contributed to the Board’s deliberations. For purposes of this report, Ms. Pace is identified as a Trustee. |
| |
Daniel Vandivort, Trustee (since 2014) Year of Birth: 1954 | | Chairman and Lead Independent Director/Trustee (March 2010-September 2014), Chairman of the Audit Committee (March 2009-September 2014) and Director/Trustee (December 2008-September 2014) of the Board of Directors/Trustees of Value Line Funds; Trustee, Board of Trustees of Huntington Disease Foundation of America (since January 2015 and June 2007-December 2013): Trustee, Board of Trustees, RIM Retirement Savings Plan (2005-2007); President and Chief Investment Officer, Robeco Investment Management, formerly known as Weiss Peck and Greer (January 2005-June 2007); Member, Management Committee of Robeco Investment Management (2001-2007); Chairman and Trustee of the Board of Trustees of Weiss, Peck and Greer Funds (2004-2005); Managing Director and Head of Fixed Income, Weiss, Peck and Greer (November 1994-January 2005); Managing Director and Head of Fixed Income, CS First Boston Investment Management (January 1992-November 1994); Director, Global Product Development, First Boston Asset Management (November 1989 to January 1992); Vice President, Fixed Income Sales, First Boston Corp. (May 1984-November 1989). Oversees 55 portfolios in the OppenheimerFunds complex. Mr. Vandivort has served on the Boards of certain Oppenheimer funds since 2014, during which time he has become familiar with the Fund’s (and other Oppenheimer funds’) financial, accounting, regulatory and investment matters and has contributed to the Boards’ deliberations. |
INTERESTED TRUSTEES | | Mr. Steinmetz is an “Interested Trustee” because he is affiliated with the Manager and the Sub-Adviser by virtue of his positions as Chairman of the Sub-Adviser and officer and director of the Manager. Both as a Trustee and as an officer, Mr. Steinmetz serves for an indefinite term, or until his resignation, retirement, death or removal. Mr. Steinmetz’s address is 225 Liberty Street, New York, New York 10281-1008. |
| |
Arthur P. Steinmetz, Trustee (since 2015), President and Principal Executive Officer (since 2014) Year of Birth: 1958 | | Chairman of the Sub-Adviser (since January 2015); CEO and Chairman of the Manager (since July 2014), President of the Manager (since May 2013), a Director of the Manager (since January 2013), Director of the Sub-Adviser (since July 2014), President, Management Director and CEO of Oppenheimer Acquisition Corp. (the Sub-Adviser’s parent holding company) (since July 2014), and President and Director of OFI SteelPath, Inc. (since January 2013). Chief Investment Officer of the OppenheimerFunds advisory entities from (January 2013-December 2013); Executive Vice President of the Manager (January 2013-May 2013); Chief Investment Officer of the Sub-Adviser (October 2010-December 2012); Chief Investment Officer, Fixed-Income, of the Sub-Adviser (April 2009-October 2010); Executive Vice President of the Sub-Adviser (October 2009-December 2012); Director of Fixed Income of the Sub-Adviser (January 2009-April 2009); and a Senior Vice President of the Sub-Adviser (March 1993-September 2009). An officer of 101 portfolios in the OppenheimerFunds complex. |
OTHER OFFICERS OF THE FUND | | The addresses of the Officers in the chart below are as follows: for Mr. Strzalkowski, Mss. Lo Bessette, Foxson and Picciotto, 225 Liberty Street, New York, New York 10281-1008, for Mr. Petersen, 6803 S. Tucson Way, Centennial, Colorado 80112-3924. Each Officer serves for an indefinite term or until his or her resignation, retirement, death or removal. |
80 OPPENHEIMER LIMITED-TERM BOND FUND
| | |
Peter A. Strzalkowski, Vice President (since 2009) Year of Birth: 1965 | | Vice President and Senior Portfolio Manager of the Sub-Adviser (since August 2007) and co-Team Leader for the Sub-Adviser’s Investment Grade Fixed Income Team (since January 2014). A member of the Sub-Adviser’s Investment Grade Fixed Income Team (April 2009-January 2014). Managing Partner and Chief Investment Officer of Vector Capital Management, LLC, a structured products money management firm he founded, (July 2006-August 2007). Senior Portfolio Manager at Highland Capital Management, L.P. (June 2005-July 2006) and a Senior Fixed Income Portfolio Manager at Microsoft Corp. (June 2003-June 2005). Vice President and Senior Fixed Income Portfolio Manager at First Citizens Bank Trust, Capital Management Group (April 2000-June 2003) and a Vice President and Fixed Income Portfolio Manager at Centura Banks (November 1998-April 2000). A portfolio manager and officer of other portfolios in the OppenheimerFunds complex. |
| |
Cynthia Lo Bessette, Secretary and Chief Legal Officer (since 2016) Year of Birth: 1969 | | Senior Vice President and Deputy General Counsel (March 2015-February 2016) and Executive Vice President, General Counsel and Secretary of the Manager (since February 2016); Chief Legal Officer of the Sub-Adviser and the Distributor (since February 2016); Vice President, General Counsel and Secretary of Oppenheimer Acquisition Corp. (since February 2016); General Counsel of OFI SteelPath, Inc., VTL Associates, LLC and Index Management Solutions, LLC (since February 2016); Chief Legal Officer of OFI Global Institutional, Inc., HarbourView Asset Management Corporation, OFI Global Trust Company, Oppenheimer Real Asset Management, Inc., OFI Private Investments Inc., Shareholder Services, Inc. and Trinity Investment Management Corporation (since February 2016); Vice President, Corporate Counsel (February 2012-March 2015) and Deputy Chief Legal Officer (April 2013-March 2015) of Jennison Associates LLC; Assistant General Counsel (April 2008-September 2009) and Deputy General Counsel (October 2009-February 2012) of Lord Abbett & Co. LLC. An officer of 101 portfolios in the OppenheimerFunds complex. |
| |
Jennifer Foxson, Vice President and Chief Business Officer (since 2014) Year of Birth: 1969 | | Senior Vice President of OppenheimerFunds Distributor, Inc. (since June 2014); Vice President of OppenheimerFunds Distributor, Inc. (April 2006-June 2014); Vice President of the Sub-Adviser (January 1998-March 2006); Assistant Vice President of the Sub-Adviser (October 1991-December 1998). An officer of 101 portfolios in the OppenheimerFunds complex. |
| |
Mary Ann Picciotto, Chief Compliance Officer and Chief Anti-Money Laundering Officer (since 2014) Year of Birth: 1973 | | Senior Vice President and Chief Compliance Officer of the Manager (since March 2014); Chief Compliance Officer of the Sub-Adviser, OFI SteelPath, Inc., OFI Global Trust Company, OFI Global Institutional, Inc., Oppenheimer Real Asset Management, Inc., OFI Private Investments, Inc., Harborview Asset Management Corporation, Trinity Investment Management Corporation, and Shareholder Services, Inc. (since March 2014); Managing Director of Morgan Stanley Investment Management Inc. and certain of its various affiliated entities; Chief Compliance Officer of various Morgan Stanley Funds (May 2010-January 2014); Chief Compliance Officer of Morgan Stanley Investment Management Inc. (April 2007-January 2014). An officer of 101 portfolios in the OppenheimerFunds complex. |
| |
Brian S. Petersen, Treasurer and Principal Financial & Accounting Officer (since 2016) Year of Birth: 1970 | | Vice President of the Manager (since January 2013); Vice President of the Sub-Adviser (February 2007-December 2012); Assistant Vice President of the Sub-Adviser (August 2002-2007). An officer of 101 portfolios in the OppenheimerFunds complex. |
The Fund’s Statement of Additional Information contains additional information about the Fund’s Trustees and Officers and is available without charge upon request by calling 1.800.CALL OPP (225.5677).
81 OPPENHEIMER LIMITED-TERM BOND FUND
OPPENHEIMER LIMITED-TERM BOND FUND
| | |
| Manager | | OFI Global Asset Management, Inc. |
| |
| Sub-Adviser | | OppenheimerFunds, Inc. |
| |
| Distributor | | OppenheimerFunds Distributor, Inc. |
| |
| Transfer and Shareholder | | OFI Global Asset Management, Inc. |
| Servicing Agent | | |
| |
| Sub-Transfer Agent | | Shareholder Services, Inc. |
| | DBA OppenheimerFunds Services |
| |
| Independent Registered | | KPMG LLP |
| Public Accounting Firm | | |
| |
| Legal Counsel | | Kramer Levin Naftalis & Frankel LLP |
© 2016 OppenheimerFunds, Inc. All rights reserved.
82 OPPENHEIMER LIMITED-TERM BOND FUND
PRIVACY POLICY NOTICE
As an Oppenheimer fund shareholder, you are entitled to know how we protect your personal information and how we limit its disclosure.
Information Sources
We obtain nonpublic personal information about our shareholders from the following sources:
| | |
| ● | | Applications or other forms |
| ● | | When you create a user ID and password for online account access |
| ● | | When you enroll in eDocs Direct, our electronic document delivery service |
| ● | | Your transactions with us, our affiliates or others |
| ● | | A software program on our website, often referred to as a “cookie,” which indicates which parts of our site you’ve visited |
| ● | | When you set up challenge questions to reset your password online |
If you visit oppenheimerfunds.com and do not log on to the secure account information areas, we do not obtain any personal information about you. When you do log on to a secure area, we do obtain your user ID and password to identify you. We also use this information to provide you with products and services you have requested, to inform you about products and services that you may be interested in and assist you in other ways.
We do not collect personal information through our website unless you willingly provide it to us, either directly by email or in those areas of the website that request information. In order to update your personal information (including your mailing address, email address and phone number) you must first log on and visit your user profile.
If you have set your browser to warn you before accepting cookies, you will receive the warning message with each cookie. You can refuse cookies by turning them off in your browser. However, doing so may limit your access to certain sections of our website.
We use cookies to help us improve and manage our website. For example, cookies help us recognize new versus repeat visitors to the site, track the pages visited, and enable some special features on the website. This data helps us provide a better service for our website visitors.
Protection of Information
We do not disclose any non-public personal information (such as names on a customer list) about current or former customers to anyone, except as permitted by law.
Disclosure of Information
Copies of confirmations, account statements and other documents reporting activity in your fund accounts are made available to your financial advisor (as designated by you). We may also use details about you and your investments to help us, our financial service affiliates, or firms that jointly market their financial products and services with ours, to better serve your investment needs or suggest financial services or educational material that may be of interest to you. If this requires us to provide you with an opportunity to “opt in” or “opt out” of such information sharing with a firm not affiliated with us, you will receive notification on how to do so, before any such sharing takes place.
Right of Refusal
We will not disclose your personal information to unaffiliated third parties (except as permitted by law), unless we first offer you a reasonable opportunity to refuse or “opt out” of such disclosure.
83 OPPENHEIMER LIMITED-TERM BOND FUND
PRIVACY POLICY NOTICE Continued
Internet Security and Encryption
In general, the email services provided by our website are encrypted and provide a secure and private means of communication with us. To protect your own privacy, confidential and/or personal information should only be communicated via email when you are advised that you are using a secure website. As a security measure, we do not include personal or account information in non-secure emails, and we advise you not to send such information to us in non-secure emails. Instead, you may take advantage of the secure features of our website to encrypt your email correspondence. To do this, you will need to use a browser that supports Secure Sockets Layer (SSL) protocol.
We do not guarantee or warrant that any part of our website, including files available for download, are free of viruses or other harmful code. It is your responsibility to take appropriate precautions, such as use of an anti-virus software package, to protect your computer hardware and software.
| | |
| ● | | All transactions, including redemptions, exchanges and purchases, are secured by SSL and 256-bit encryption. SSL is used to establish a secure connection between your PC and OppenheimerFunds’ server. It transmits information in an encrypted and scrambled format. |
| ● | | Encryption is achieved through an electronic scrambling technology that uses a “key” to code and then decode the data. Encryption acts like the cable converter box you may have on your television set. It scrambles data with a secret code so that no one can make sense of it while it is being transmitted. When the data reaches its destination, the same software unscrambles the data. |
| ● | | You can exit the secure area by either closing your browser, or for added security, you can use the Log Out button before you close your browser. |
Other Security Measures
We maintain physical, electronic and procedural safeguards to protect your personal account information. Our employees and agents have access to that information only so that they may offer you products or provide services, for example, when responding to your account questions.
How You Can Help
You can also do your part to keep your account information private and to prevent unauthorized transactions. If you obtain a user ID and password for your account, do not allow it to be used by anyone else. Also, take special precautions when accessing your account on a computer used by others.
Who We Are
This joint notice describes the privacy policies of the Oppenheimer funds, OppenheimerFunds, Inc., each of its investment adviser subsidiaries, OppenheimerFunds Distributor, Inc. and OFI Global Trust Co. It applies to all Oppenheimer fund accounts you presently have, or may open in the future, using your Social Security number—whether or not you remain a shareholder of our funds. This notice was last updated March 2015. In the event it is updated or changed, we will post an updated notice on our website at oppenheimerfunds.com. If you have any questions about this privacy policy, write to us at P.O. Box 5270, Denver, CO 80217-5270, email us by clicking on the Contact Us section of our website at oppenheimerfunds.com or call us at 1.800.CALL OPP (225.5677).
84 OPPENHEIMER LIMITED-TERM BOND FUND
THIS PAGE INTENTIONALLY LEFT BLANK.
85 OPPENHEIMER LIMITED-TERM BOND FUND
THIS PAGE INTENTIONALLY LEFT BLANK.
86 OPPENHEIMER LIMITED-TERM BOND FUND
THIS PAGE INTENTIONALLY LEFT BLANK.
87 OPPENHEIMER LIMITED-TERM BOND FUND
| | | | |
| |  | | |
| | Visit us at oppenheimerfunds.com for 24-hr access to account information and transactions or call us at 800.CALL OPP (800.225.5677) for 24-hr automated information and automated transactions. Representatives also available Mon–Fri 8am-8pm ET. | | |
| | | | |
Visit Us oppenheimerfunds.com Call Us 800 225 5677 Follow Us 
| | | | |
| | | | |
| | | | |
| | | | |
| | | | |
| | Oppenheimer funds are distributed by OppenheimerFunds Distributor, Inc. | | |
| | 225 Liberty Street, New York, NY 10281-1008 | | |
| | © 2016 OppenheimerFunds Distributor, Inc. All rights reserved. | | |
| | RA0220.001.0816 October 25, 2016 | | |
Item 2. Code of Ethics.
The registrant has adopted a code of ethics that applies to the registrant’s principal executive officer, principal financial officer, principal accounting officer or controller or persons performing similar functions.
Item 3. Audit Committee Financial Expert.
The Board of Trustees of the registrant has determined that Joanne Pace, the Board’s Audit Committee Chairwoman, is an audit committee financial expert and that Ms. Pace is “independent” for purposes of this Item 3.
Item 4. Principal Accountant Fees and Services.
The principal accountant for the audit of the registrant’s annual financial statements billed $49,600 in fiscal 2016 and $37,900 in fiscal 2015.
The principal accountant for the audit of the registrant’s annual financial statements billed $254 in fiscal 2016 and no such fees in fiscal 2015.
The principal accountant for the audit of the registrant’s annual financial statements billed $672,785 in fiscal 2016 and $879,472 in fiscal 2015 to the registrant’s investment adviser or any entity controlling, controlled by, or under common control with the adviser that provides ongoing services to the registrant.
Such services include: Internal control reviews, GIPS attestation procedures, system conversion testing, custody exams, and additional audit services
The principal accountant for the audit of the registrant’s annual financial statements billed no such fees in fiscal 2016 and no such fees in fiscal 2015.
The principal accountant for the audit of the registrant’s annual financial statements billed $237,933 in fiscal 2016 and $595,129 in fiscal 2015 to the registrant’s investment adviser or any entity controlling, controlled by, or under common control with the adviser that provides ongoing services to the registrant.
0
The principal accountant for the audit of the registrant’s annual financial statements billed no such fees in fiscal 2016 and no such fees in fiscal 2015.
The principal accountant for the audit of the registrant’s annual financial statements billed no such fees in fiscal 2016 and no such fees in fiscal 2015 to the registrant’s investment adviser or any entity controlling, controlled by, or under common control with the adviser that provides ongoing services to the registrant.
Such fees would include the cost to the principal accountant of attending audit committee meetings and consultations regarding the registrant’s retirement plan with respect to its Trustees.
| (e) | (1) During its regularly scheduled periodic meetings, the registrant’s audit committee will pre-approve all audit, audit-related, tax and other services to be provided by the principal accountants of the registrant. |
The audit committee has delegated pre-approval authority to its Chairwoman for any subsequent new engagements that arise between regularly scheduled meeting dates provided that any fees such pre-approved are presented to the audit committee at its next regularly scheduled meeting.
Under applicable laws, pre-approval of non-audit services may be waived provided that: 1) the aggregate amount of all such services provided constitutes no more than five percent of the total amount of fees paid by the registrant to its principal accountant during the fiscal year in which services are provided 2) such services were not recognized by the registrant at the time of engagement as non-audit services and 3) such services are promptly brought to the attention of the audit committee of the registrant and approved prior to the completion of the audit.
(2) 0%
| (f) | Not applicable as less than 50%. |
| (g) | The principal accountant for the audit of the registrant’s annual financial statements billed $910,718 in fiscal 2016 and $1,474,601 in fiscal 2015 to the registrant and the registrant’s investment adviser or any entity controlling, controlled by, or under common control with the adviser that provides ongoing services to the registrant related to non-audit fees. Those billings did not include any prohibited non-audit services as defined by the Securities Exchange Act of 1934. |
| (h) | The registrant’s audit committee of the board of Trustees has considered whether the provision of non-audit services that were rendered to the registrant’s investment adviser, and any entity controlling, controlled by, or under common control with the investment adviser that provides ongoing services to the registrant that were not pre-approved pursuant to paragraph (c)(7)(ii) of Rule 2-01 of Regulation S-X is compatible with maintaining the principal accountant’s independence. No such services were rendered. |
Item 5. Audit Committee of Listed Registrants
Not applicable.
Item 6. Schedule of Investments.
a) Not applicable. The complete schedule of investments is included in Item 1 of this Form N-CSR.
b) Not applicable.
Item 7. Disclosure of Proxy Voting Policies and Procedures for Closed-End Management Investment Companies.
Not applicable.
Item 8. Portfolio Managers of Closed-End Management Investment Companies.
Not applicable.
Item 9. Purchases of Equity Securities by Closed-End Management Investment Company and Affiliated Purchasers.
Not applicable.
Item 10. Submission of Matters to a Vote of Security Holders.
The Fund’s Governance Committee Provisions with Respect to Nominations of Directors/Trustees to the Respective Boards
None
Item 11. Controls and Procedures.
Based on their evaluation of the registrant’s disclosure controls and procedures (as defined in rule 30a-3(c) under the Investment Company Act of 1940 (17 CFR 270.30a-3(c)) as of 8/31/2016, the registrant’s principal executive officer and principal financial officer found the registrant’s disclosure controls and procedures to provide reasonable assurances that information required to be disclosed by the registrant in the reports that it files under the Securities Exchange Act of 1934 (a) is accumulated and communicated to registrant’s management, including its principal executive officer and principal financial officer, to allow timely decisions regarding required disclosure, and (b) is recorded, processed, summarized and reported, within the time periods specified in the rules and forms adopted by the U.S. Securities and Exchange Commission.
There have been no changes in the registrant’s internal controls over financial reporting that occurred during the registrant’s second fiscal quarter of the period covered by this report that have materially affected, or are reasonably likely to materially affect, the registrant’s internal control over financial reporting.
Item 12. Exhibits.
| (a) | (1) Exhibit attached hereto. |
(2) Exhibits attached hereto.
(3) Not applicable.
| (b) | Exhibit attached hereto. |
SIGNATURES
Pursuant to the requirements of the Securities Exchange Act of 1934 and the Investment Company Act of 1940, the registrant has duly caused this report to be signed on its behalf by the undersigned, thereunto duly authorized.
Oppenheimer Limited-Term Bond Fund
| | |
| By: | | /s/ Arthur P. Steinmetz |
| | Arthur P. Steinmetz |
| | Principal Executive Officer |
| Date: | | 10/17/2016 |
Pursuant to the requirements of the Securities Exchange Act of 1934 and the Investment Company Act of 1940, this report has been signed below by the following persons on behalf of the registrant and in the capacities and on the dates indicated.
| | |
| By: | | /s/ Arthur P. Steinmetz |
| | Arthur P. Steinmetz |
| | Principal Executive Officer |
| Date: | | 10/17/2016 |
| | |
| By: | | /s/ Brian S. Petersen |
| | Brian S. Petersen |
| | Principal Financial Officer |
| Date: | | 10/17/2016 |