UNITED STATES
SECURITIES AND EXCHANGE COMMISSION
Washington, D.C. 20549
FORM N-CSR
CERTIFIED SHAREHOLDER REPORT OF REGISTERED
MANAGEMENT INVESTMENT COMPANIES
Investment Company Act file number 811-03445
The Merger Fund®
(Exact name of registrant as specified in charter)
101 Munson Street
Greenfield, MA 01301-9683
(Address of principal executive offices) (Zip code)
Jennifer Fromm, Esq.
Vice President, Chief Legal Officer, Counsel and Secretary for Registrant
One Financial Plaza
Hartford, CT 06103-2608
(Name and address of agent for service)
Registrant’s telephone number, including area code: (800) 243-1574
Date of fiscal year end: December 31
Date of reporting period: December 31, 2023
Form N-CSR is to be used by management investment companies to file reports with the Commission not later than 10 days after the transmission to stockholders of any report that is required to be transmitted to stockholders under Rule 30e-1 under the Investment Company Act of 1940 (17 CFR 270.30e-1). The Commission may use the information provided on Form N-CSR in its regulatory, disclosure review, inspection, and policymaking roles.
A registrant is required to disclose the information specified by Form N-CSR, and the Commission will make this information public. A registrant is not required to respond to the collection of information contained in Form N-CSR unless the Form displays a currently valid Office of Management and Budget (“OMB”) control number. Please direct comments concerning the accuracy of the information collection burden estimate and any suggestions for reducing the burden to Secretary, Securities and Exchange Commission, 450 Fifth Street, NW, Washington, DC 20549-0609. The OMB has reviewed this collection of information under the clearance requirements of 44 U.S.C. § 3507.
Item 1. Reports to Stockholders.
| | (a) | The Report to Shareholders is attached herewith. |
ANNUAL REPORT
THE MERGER FUND® AND VIRTUS EVENT
OPPORTUNITIES TRUST
| The Merger Fund® |
| Virtus Westchester Credit Event Fund |
| Virtus Westchester Event-Driven Fund |
Not FDIC Insured • No Bank Guarantee • May Lose Value
Table of Contents
| 1 |
| 2 |
| 4 |
| Fund | Fund
Summary | Schedule
of
Investments |
| 6 | 20 |
| 11 | 29 |
| 16 | 35 |
| 45 |
| 47 |
| 49 |
| 51 |
| 53 |
| 71 |
| 72 |
| 73 |
| 78 |
Proxy Voting Procedures and Voting Record (Form N-PX)
The subadviser votes proxies, if any, relating to portfolio securities in accordance with procedures that have been approved by the Board of Trustees of the Trust (“Trustees”, or the “Board”). You may obtain a description of these procedures, along with information regarding how the Funds voted proxies during the most recent 12-month period ended June 30, free of charge, by calling toll-free 1-800-243-1574. This information is also available through the Securities and Exchange Commission’s (the “SEC”) website at https://www.sec.gov.
PORTFOLIO HOLDINGS INFORMATION
The Trust files a complete schedule of portfolio holdings for each Fund with the SEC for the first and third quarters of each fiscal year as an exhibit to its reports on Form N-PORT-P. Form N-PORT-P is available on the SEC’s website at https://www.sec.gov.
This report is not authorized for distribution to prospective investors in the Funds presented in this book unless preceded or accompanied by an effective prospectus which includes information concerning the sales charge, each Fund’s record and other pertinent information.
To my fellow shareholders of Virtus Funds:
I am pleased to present this annual report, which reviews the performance of your Fund for the 12 months ended December 31, 2023.
After a challenging 2022, most markets posted positive returns in 2023. Inflation slowed measurably while the U.S. economy showed strength. The efforts of the Federal Reserve (“Fed”) and other central banks to manage inflation appeared more likely to generate an economic “soft landing.” A brief banking crisis in March of 2023 was quickly resolved without impacting economic growth, and investor optimism about the possibilities for artificial intelligence (AI) drove stocks higher. By year-end, interest rates were moderating and the Fed announced that rate cuts might be on the horizon, driving equity markets higher.
Domestic equity indexes demonstrated strong performance for the 12 months ended December 31, 2023. U.S. large-capitalization stocks were up 26.29%, as measured by the S&P 500® Index, while small-cap stocks returned 16.93%, as measured by the Russell 2000® Index. International equities also performed well, with developed markets, as measured by the MSCI EAFE® Index (net), returning 18.24%, while emerging markets, as measured by the MSCI Emerging Markets Index (net), returned 9.83%.
In fixed income markets, the yield on the 10-year Treasury made a round trip in 2023, closing at 3.88% on December 31, 2023, from 3.88% on December 31, 2022. The broader U.S. fixed income market, as represented by the Bloomberg U.S. Aggregate Bond Index, returned 5.53% for the 12-month period, while non-investment grade bonds, as measured by the Bloomberg U.S. Corporate High Yield Bond Index, were up 13.45%.
Thank you for entrusting the Virtus Funds with your assets. Please call our customer service team at 800-243-1574 if you have questions about your account or require assistance. We appreciate your business and remain committed to your long-term financial success.
George R. Aylward
President, Virtus Funds
February 2024
Refer to the Fund Summary section for your Fund’s performance. Performance data quoted represents past results. Past performance is no guarantee of future results, and current performance may be higher or lower than the performance shown above.
THE MERGER FUND® and VIRTUS EVENT OPPORTUNITIES TRUST
DISCLOSURE OF FUND EXPENSES (Unaudited)
FOR THE SIX-MONTH PERIOD OF July 1, 2023 TO December 31, 2023
We believe it is important for you to understand the impact of costs on your investment. All mutual funds have operating expenses. As a shareholder of The Merger Fund, Westchester Credit Event Fund and/or Westchester Event-Driven Fund (each, a “Fund”), you may incur two types of costs: (1) transaction costs, including sales charges on purchases of Class A shares and (2) ongoing costs, including investment advisory fees, distribution and service fees, and other expenses. Class I shares are sold without sales charges and do not incur distribution and service fees. For further information regarding applicable sales charges, see Note 1 in the Notes to Financial Statements. These examples are intended to help you understand your ongoing costs (in dollars) of investing in a Fund and to compare these costs with the ongoing costs of investing in other mutual funds. These examples are based on an investment of $1,000 invested at the beginning of the period and held for the entire six-month period. The Annualized Expense Ratios may be different from the expense ratios in the Financial Highlights which are for the fiscal year ended December 31, 2023.
Please note that the expenses shown in the accompanying tables are meant to highlight your ongoing costs only and do not reflect any transactional costs, such as sales charges or contingent deferred sales charges. Therefore, the accompanying tables are useful in comparing ongoing costs only, and will not help you determine the relative total costs of owning different funds. In addition, if these transactional costs were included, your costs would have been higher. The calculations assume no shares were bought or sold during the period. Your actual costs may have been higher or lower, depending on the amount of your investment and the timing of any purchases or redemptions.
Actual Expenses
The table below provides information about actual account values and actual expenses. You may use the information below, together with the amount you invested, to estimate the expenses that you paid over the period. Simply divide your account value by $1,000 (for example, an $8,600 account value divided by $1,000 = 8.6), then multiply the result by the number in the table under the heading entitled “Expenses Paid During Period” to estimate the expenses you paid on your account during this period.
| | | Beginning
Account Value
July 1, 2023 | | Ending
Account Value
December 31, 2023 | | Annualized
Expense
Ratio* | | Expenses
Paid
During
Period** |
The Merger Fund
| | | | | | | | |
| | Class A | $ 1,000.00 | | $ 1,053.00 | | 1.48 % | | $ 7.66 |
| | Class I | 1,000.00 | | 1,055.20 | | 1.19 | | 6.16 |
Westchester Credit Event Fund
| | | | | | | | |
| | Class A | 1,000.00 | | 1,041.60 | | 1.72 | | 8.85 |
| | Class I | 1,000.00 | | 1,043.70 | | 1.47 | | 7.57 |
Westchester Event-Driven Fund
| | | | | | | | |
| | Class A | 1,000.00 | | 1,055.40 | | 1.71 | | 8.86 |
| | Class I | 1,000.00 | | 1,056.60 | | 1.47 | | 7.62 |
| * | Annualized expense ratios include dividend and interest expense on securities sold short. |
| ** | Expenses are equal to the relevant Fund’s annualized expense ratio, which is net of waived fees and reimbursed expenses, if applicable, multiplied by the average account value over the period, multiplied by the number of days (184) expenses were accrued in the most recent fiscal half-year, then divided by 365 to reflect the one-half year period. |
For Funds which may invest in other funds, the annualized expense ratios noted above do not reflect fees and expenses associated with any underlying funds. If such fees and expenses had been included, the expenses would have been higher.
You can find more information about a Fund’s expenses in the Financial Statements section that follows. For additional information on operating expenses and other shareholder costs, refer to that Fund’s prospectus.
THE MERGER FUND® and VIRTUS EVENT OPPORTUNITIES TRUST
DISCLOSURE OF FUND EXPENSES (Unaudited) (Continued)
FOR THE SIX-MONTH PERIOD OF July 1, 2023 TO December 31, 2023
Hypothetical Example for Comparison Purposes
The table below provides information about hypothetical account values and hypothetical expenses based on a Fund’s actual expense ratio and an assumed rate of return of 5% per year before expenses, which is not your Fund’s actual return. The hypothetical account values and expenses may not be used to estimate the actual ending account balance or expenses you paid for the period. You may use this information to compare the ongoing costs of investing in your Fund and other funds. To do so, compare these 5% hypothetical examples with the 5% hypothetical examples that appear in the shareholder reports of other mutual funds.
| | | Beginning
Account Value
July 1, 2023 | | Ending
Account Value
December 31, 2023 | | Annualized
Expense
Ratio* | | Expenses
Paid
During
Period** |
The Merger Fund
| | | | | | | | |
| | Class A | $ 1,000.00 | | $ 1,017.74 | | 1.48 % | | $ 7.53 |
| | Class I | 1,000.00 | | 1,019.21 | | 1.19 | | 6.06 |
Westchester Credit Event Fund
| | | | | | | | |
| | Class A | 1,000.00 | | 1,016.53 | | 1.72 | | 8.74 |
| | Class I | 1,000.00 | | 1,017.80 | | 1.47 | | 7.48 |
Westchester Event-Driven Fund
| | | | | | | | |
| | Class A | 1,000.00 | | 1,016.59 | | 1.71 | | 8.69 |
| | Class I | 1,000.00 | | 1,017.80 | | 1.47 | | 7.48 |
| * | Annualized expense ratios include dividend and interest expense on securities sold short. |
| ** | Expenses are equal to the relevant Fund’s annualized expense ratio, which is net of waived fees and reimbursed expenses, if applicable, multiplied by the average account value over the period, multiplied by the number of days (184) expenses were accrued in the most recent fiscal half-year, then divided by 365 to reflect the one-half year period. |
For Funds which may invest in other funds, the annualized expense ratios noted above do not reflect fees and expenses associated with any underlying funds. If such fees and expenses had been included, the expenses would have been higher.
You can find more information about a Fund’s expenses in the Financial Statements section that follows. For additional information on operating expenses and other shareholder costs, refer to that Fund’s prospectus.
THE MERGER FUND® AND VIRTUS EVENT OPPORTUNITIES TRUST
KEY INVESTMENT TERMS (Unaudited)
December 31, 2023
American Depositary Receipt (“ADR”)
Represents shares of foreign companies traded in U.S. dollars on U.S. exchanges that are held by a U.S. bank or a trust. Foreign companies use ADRs in order to make it easier for Americans to buy their shares.
Bloomberg U.S. Aggregate Bond Index
The Bloomberg U.S. Aggregate Bond Index measures the U.S. investment-grade fixed-rate bond market. The index is calculated on a total return basis. The index is unmanaged, its returns do not reflect any fees, expenses, or sales charges, and it is not available for direct investment.
Bloomberg U.S. Corporate High Yield Bond Index
The Bloomberg U.S. Corporate High Yield Bond Index measures the U.S. dollar-denominated, high yield, fixed-rate corporate bond market. The index is calculated on a total return basis. The index is unmanaged, its returns do not reflect any fees, expenses, or sales charges, and it is not available for direct investment.
Exchange-Traded Fund (“ETF”)
An open-end fund that is traded on a stock exchange. Most ETFs have a portfolio of stocks or bonds that track a specific market index.
Federal Reserve (“Fed”)
The central bank of the U.S., responsible for controlling the money supply, interest rates, and credit with the goal of keeping the U.S. economy and currency stable. Governed by a seven-member board, the system includes 12 regional Federal Reserve Banks, 25 branches, and all national and state banks that are part of the system.
Leveraged Loans
Leveraged loans (also known as bank, senior or floating-rate loans) consists of below investment-grade credit quality loans that are arranged by banks and other financial institutions to help companies finance acquisitions, recapitalizations, or other highly leveraged transactions. Such loans may be especially vulnerable to adverse changes in economic or market conditions, although they are senior in the capital structure which typically provides investors/lenders a degree of potential credit risk protection.
London Interbank Offered Rate (“LIBOR”)
A benchmark rate that some of the world’s leading banks charge each other for short-term loans and that serves as the first step to calculating interest rates on various loans throughout the world.
MSCI EAFE® Index (net)
The MSCI EAFE® (Europe, Australasia, Far East) Index (net) is a free float-adjusted market capitalization-weighted index that measures developed foreign market equity performance, excluding the U.S. and Canada. The index is calculated on a total return basis with net dividends reinvested. The index is unmanaged, its returns do not reflect any fees, expenses, or sales charges, and it is not available for direct investment.
MSCI Emerging Markets Index (net)
The MSCI Emerging Markets Index (net) is a free float-adjusted market capitalization-weighted index designed to measure equity market performance in the global emerging markets. The index is calculated on a total return basis with net dividends reinvested. The index is unmanaged, its returns do not reflect any fees, expenses, or sales charges, and it is not available for direct investment.
Overnight Bank Funding Rate (“OBFR”)
The overnight bank funding rate is a measure of wholesale, unsecured, overnight bank funding costs. It is calculated using federal funds transactions, certain Eurodollar transactions, and certain domestic deposit transactions.
Prime Rate
The federal funds rate commercial banks charge their most creditworthy corporate customers.
Real Estate Investment Trust (“REIT”)
A publicly traded company that owns, develops and operates income-producing real estate such as apartments, office buildings, hotels, shopping centers and other commercial properties.
Russell 2000® Index
The Russell 2000® Index is a market capitalization-weighted index of the 2,000 smallest companies in the Russell Universe, which comprises the 3,000 largest U.S. companies. The index is calculated on a total return basis with dividends reinvested. The index is unmanaged, its returns do not reflect any fees, expenses, or sales charges, and it is not available for direct investment.
Secured Overnight Financing Rate (“SOFR”)
A broad measure of the cost of borrowing cash overnight collateralized by U.S. Treasury securities.
THE MERGER FUND® AND VIRTUS EVENT OPPORTUNITIES TRUST
KEY INVESTMENT TERMS (Unaudited) (Continued)
December 31, 2023
Special Purpose Acquisition Company (“SPAC”)
A special purpose acquisition company (SPAC) is a company that has no commercial operations and is formed strictly to raise capital through an initial public offering for the purpose of acquiring or merging with an existing company.
Standard & Poor’s Depositary Receipt (SPDR®)
A portfolio of stocks tracking an index, commonly held by ETFs that offer investors a manner in which to experience the investment performance of the index without owning each individual security.
S&P 500® Index
The S&P 500® Index is a free-float market capitalization-weighted index of 500 of the largest U.S. companies. The index is calculated on a total return basis with dividends reinvested. The index is unmanaged, its returns do not reflect any fees, expenses, or sales charges, and it is not available for direct investment.
| | Ticker Symbols: |
| | Class A: MERFX |
| | Class I: MERIX |
The Merger Fund
Fund Summary (Unaudited)
Portfolio Manager Commentary by
Westchester Capital Management LLC
| ■ | The Fund is diversified and has an investment objective of seeking to achieve capital growth by engaging in merger arbitrage. Merger arbitrage is a highly specialized investment approach generally designed to profit from the successful completion of publicly announced mergers, takeovers, tender offers, leveraged buyouts, spin-offs, liquidations and other corporate reorganizations. There is no guarantee that the Fund will meet its objective. |
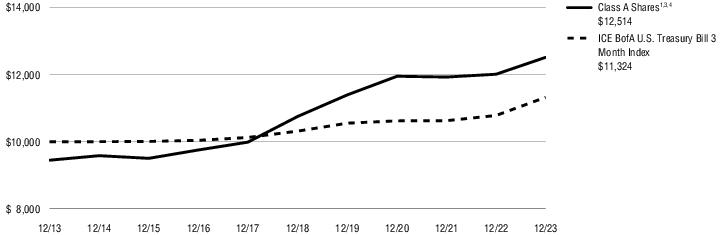
| ■ | For the fiscal year ended December 31, 2023, the Fund’s Class A shares at NAV returned 4.18% and Class I shares at NAV returned 4.51%. For the same period, the ICE BofA U.S. Treasury Bill 3 Month Index returned 5.01%. |
All performance figures assume reinvestment of distributions and exclude the effect of sales charges. Performance data quoted represents past results. Past performance is no guarantee of future results, and current performance may be higher or lower than the performance shown above. Investment return and principal value will fluctuate so your shares, when redeemed, may be worth more or less than their original cost. Please visit Virtus.com for performance data current to the most recent month-end.
How did the markets perform during the Fund’s fiscal year ended December 31, 2023?
Overall, 2023 presented a mixed picture for the mergers & acquisitions (M&A) market, especially considering the challenges faced in the previous year. Given the difficult conditions in 2022, it was no surprise that merger activity remained subdued. Factors such as rising interest rates, increased financing costs (particularly concerning private equity), ongoing geopolitical tensions, and a narrowly escaped banking crisis in the first quarter contributed to company boards adopting a more cautious approach toward corporate reorganizations, particularly in the first half of 2023.
However, as the year progressed, there was a noticeable improvement in CEO confidence. This positive shift could be attributed to a better understanding of the regulatory environment. Notably, several high-profile transactions, including Horizon/Amgen, Activision/Microsoft, and VMware/Broadcom, received clearance, boosting
confidence in the market. These positive developments paved the way for a solid second half of the year, with M&A volume reaching over $1.7 trillion, out of the total global value of $3.1 trillion for the entirety of 2023.
Despite the challenges faced earlier in the year, the market demonstrated resilience and adaptability. The improved regulatory environment played a crucial role in instilling confidence among corporate boards, leading to the increase in mega-cap deals.
Delving deeper into overall M&A activity, there were several noteworthy attributes both domestically and internationally. North America continued to be a driving force in merger activity, reaching a new record of 58% of the total global volume in 2023. This rebound was primarily propelled by strategic transactions, with deals worth over $20 billion accounting for a record 28% of the total volume alone in the region, as reported by Dealogic.
In examining the international landscape, cross-border transactions accounted for 28% of the overall volume, surpassing the average of 25% observed over the past four years. This increase in cross-border activity could be attributed to the improved regulatory clarity. A notable indication of this was the fact that deals valued at $10 billion or more contributed to 21% of the cross-border volume, a significant jump from 12% in the previous year.
The fact that companies were actively engaging in cross-border activities indicated that the previous uncertainties and obstacles that hindered such combinations were gradually being overcome. The increase in transactions signified a growing belief among companies that they could navigate the regulatory complexities and secure the necessary approvals to move forward with these transactions. This positive trend demonstrated a willingness to invest in expansion and strategic partnerships on a global scale, highlighting that companies in 2023 were more inclined to seize opportunities for growth and market access in foreign markets.
What factors affected the Fund’s performance during its fiscal year?
The Fund delivered positive performance for the fiscal year ended December 31, 2023. While macroeconomic factors influenced the Fund, investment returns are primarily driven by the
outcomes of corporate events. The biggest contributors to performance during the period were Special Purpose Acquisition Companies (SPACs), Activision Blizzard /Microsoft, and VMware/Broadcom.
The biggest detractors from performance during the period were positions in First Horizon/Toronto-Dominion Bank, Silicon Motion Technology/MaxLinear, and Euronav/Frontline.
The first half of 2023 was challenging for event-driven managers. Although equity markets were volatile, other factors also contributed to the unpredictability, including a sharp increase in interest rates, regulatory obstacles, and several deal failures. Performance recovered materially in the second half of the year. The rapid increase in risk-free rates – in this case, the yield on the U.S. 3-month Treasury bill – from 0% to over 5% since 2022 impacted the absolute-return investments in which the Fund invests. The Federal Reserve (the Fed) implemented 11 interest rate hikes since March 2022, marking the quickest pace in four decades and causing rates to reach a 22-year high. When rates rise slowly and steadily, deal spreads – or the amount below the offer price at which the target company’s stock is trading – typically react slowly as older deals, structured in a prior lower-rate environment, complete successfully and are replaced by new deals offering higher, market-dictated returns. However, swift increases like those we experienced in 2022 and 2023 can temporarily disrupt the positive correlation between interest rates and expected return from merger arbitrage investments, as existing deal spreads widen to market rates of return. This disruption has historically been a temporary delay until older deals are completed and new deals, priced at the now higher rates, take their place, a dynamic that unfolded since the middle of 2023.
The preceding information is the opinion of portfolio management only through the end of the period stated on the cover. Any such opinions are subject to change at any time based upon market or other conditions and should not be relied upon as investment advice. Past performance is no guarantee of future results, and there is no guarantee that market forecasts will be realized.
Fundamental Risk of Investing: There can be no assurance that the Fund will achieve its investment
For information regarding the indexes and certain investment terms, see the Key Investment Terms starting on page 4.
The Merger Fund (Continued)
objectives. An investment in the Fund is subject to the risk of loss of principal; shares may decrease in value.
Merger-arbitrage & Event-driven Investing: Merger-arbitrage and event-driven investing involve the risk that the adviser’s evaluation of the outcome of a proposed event, whether it be a merger, reorganization, regulatory issue, or other event, will prove incorrect and that the Fund’s return on the investment may be negative.
Short Sales: The Fund may engage in short sales, and may incur a loss if the price of a borrowed security increases before the date on which the Fund replaces the security.
Foreign Investing: Investing in foreign securities subjects the Fund to additional risks such as increased volatility; currency fluctuations; less liquidity; less publicly available information about the foreign investment; and political, regulatory, economic, and market risk.
Portfolio Turnover Risk: The Fund’s principal investment strategies may result in a consistently high portfolio turnover rate. A higher portfolio turnover rate may indicate higher transaction costs and may result in higher taxes when the Fund is held in a taxable account.
Credit & Interest: Debt instruments are subject to various risks, including credit and interest rate risk. The issuer of a debt security may fail to make interest and/or principal payments. Values of debt instruments may rise or fall in response to changes in interest rates, and this risk may be enhanced with longer-term maturities.
Derivatives: Derivatives may include, among other things, futures, options, forwards and swap agreements and may be used in order to hedge portfolio risks, create leverage, or attempt to increase returns. Investments in derivatives may result in increased volatility and the Fund may incur a loss greater than its principal investment.
Hedging: The Fund’s hedging strategy will be subject to the Fund’s investment adviser’s ability to correctly assess the degree of correlation between the performance of the instruments used in the hedging strategy and the performance of the investments in the Fund being hedged.
Technology Concentration: Because the Fund is presently heavily weighted in the technology sector, it will be impacted by that sector’s performance more than a portfolio with broader sector diversification.
Sector Focused Investing: Events negatively affecting a particular industry or market sector in which the Fund focuses its investments may cause the value of the portfolio to decrease.
Special Purpose Acquisition Companies Risk: The value of a SPAC’s securities is particularly dependent on the ability of its management to identify and complete a profitable acquisition. There is no guarantee that the SPACs in which the Fund invests will complete an acquisition or that any acquisitions completed by the SPACs in which the fund invests will be profitable. The values of investments in SPACs may be highly volatile and these investments may also have little or no liquidity.
Market Volatility: The value of the securities in the portfolio may go up or down in response to the prospects of individual companies and/or general economic conditions. Local, regional, or global events such as war or military conflict , terrorism, pandemic, or recession could impact the portfolio, including hampering the ability of the portfolio’s manager(s) to invest it’s assets as intended.
Prospectus: For additional information on risks, please see the Fund’s prospectus.
For information regarding the indexes and certain investment terms, see the Key Investment Terms starting on page 4.
The Merger Fund (Continued)
By Sector
| Energy | 24.8% |
| Materials | 14.1 |
| Health Care | 13.2 |
| Consumer Discretionary | 11.7 |
| Information Technology | 10.4 |
| Financials | 7.4 |
| Consumer Staples | 6.0 |
| Real Estate | 5.5 |
| Utilities | 2.4 |
| Communication Services | 2.3 |
| Industrials | 2.2 |
| Total | 100% |
* Data expressed as a percentage of long common stocks, private investments in public equity, preferred stocks, contingent value rights, rights, warrants, leveraged loans, convertible bonds, corporate bonds and long total return swap contract positions as of December 31, 2023. Data expressed excludes special purpose acquisition companies, escrow notes, short-term investments, securities sold short, written and purchased options, forward currency exchange contracts and short total return swap contracts. Please refer to the Schedule of Investments for more details on the Fund’s individual holdings.
| Type of Buyer | | Deal Terms* | |
| Strategic | 93.4% | Cash | 70.1% |
| Financial | 6.6% | Stock with Fixed Exchange Ratio | 19.8% |
| | | Cash and Stock | 5.5% |
| By Deal Type | | Undetermined (1) | 3.3% |
| Friendly | 100.0% | Stock and Stub | 1.3% |
| Hostile | 0.0% | Stock with Flexible Exchange
Ratio (Collar) | 0.0%** |
*Data expressed as a percentage of long common stock, corporate bonds and swap contract positions as of December 31, 2023.
** Amount less than 0.005%.
(1) The compensation is undetermined because the compensation to be received (e.g., stock, cash, escrow notes, other) will be determined at a later date, potentially at the option of the Fund’s investment adviser.
For information regarding the indexes and certain investment terms, see the Key Investment Terms starting on page 4.
The Merger Fund (Continued)
Average Annual Total Returns1 for periods ended 12/31/23
| | | 1 Year | 5 Years | 10 Years |
| Class A shares at NAV2 | 4.18 % | 3.08% | 2.85% |
| Class A shares at POP3,4 | -1.55 | 1.92 | 2.27 |
| Class I shares at NAV2 | 4.51 | 3.39 | 3.15 |
| ICE BofA U.S. Treasury Bill 3 Month Index | 5.01 | 1.88 | 1.25 |
| Fund Expense Ratios5: Class A shares: Gross 1.63%, Net 1.54%; Class I shares: Gross 1.36%, Net 1.25%. |
All returns represent past performance which is no guarantee of future results. Current performance may be higher or lower than the performance shown. The investment return and principal value of an investment will fluctuate so that an investor’s shares, when redeemed, may be worth more or less than their original cost.
The above table and graph below do not reflect the deduction of taxes that a shareholder would pay on fund distributions or the redemption of shares. Please visit Virtus.com for performance data current to the most recent month-end. |
Growth of $10,000 for periods ended 12/31
This chart assumes an initial investment of $10,000 made on December 31, 2013 for Class A shares including any applicable sales charges or fees. The performance of the other share class may be greater or less than that shown based on differences in inception dates, fees, and sales charges. Performance assumes reinvestment of dividends and capital gain distributions.
For information regarding the indexes and certain investment terms, see the Key Investment Terms starting on page 4.
The Merger Fund (Continued)
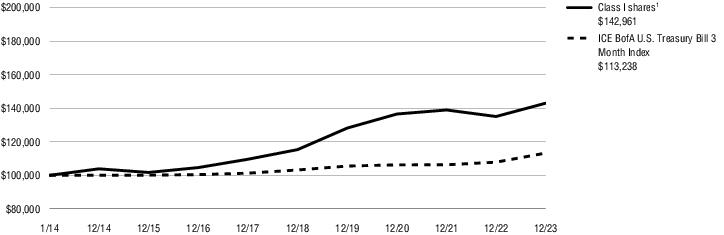
Growth of $100,000 for periods ended 12/31
This chart assumes an initial investment of $100,000 made on December 31, 2013 for Class I shares. The performance of the other share class may be greater or less than that shown based on differences in inception dates, fees, and sales charges. Performance assumes reinvestment of dividends and capital gain distributions.

| 1 | Total returns are historical and include changes in share price and the reinvestment of both dividends and capital gain distributions. |
| 2 | “NAV” (Net Asset Value) total returns do not include the effect of any sales charge. |
| 3 | “POP” (Public Offering Price) total returns include the effect of the maximum front-end 5.50% sales charge. |
| 4 | “CDSC” (contingent deferred sales charge) is applied to redemptions of certain classes of shares that do not have a sales charge applied at the time of purchase. CDSC for certain redemptions of Class A shares made within 18 months of a finder’s fee being paid. |
| 5 | The expense ratios of the Fund are set forth according to the prospectus for the Fund effective April 28, 2023, as supplemented and revised, and may differ from the expense ratios disclosed in the Financial Highlights tables in this report. See the Financial Highlights for more current expense ratios. Net Expense: Expenses reduced by a contractual expense limitation in effect through April 30, 2024. Gross Expense: Does not reflect the effect of the expense limitation. Expense ratios include fees and expenses associated with any underlying funds. |
The index is unmanaged and not available for direct investment; therefore, its performance does not reflect the expenses associated with active management of an actual portfolio.
For information regarding the indexes and certain investment terms, see the Key Investment Terms starting on page 4.
| | Ticker Symbols: |
| | Class A: WCFRX |
| | Class I: WCFIX |
Westchester Credit Event Fund
Fund Summary (Unaudited)
Portfolio Manager Commentary by
Westchester Capital Management LLC
| ■ | The Fund is diversified and has an investment objective of seeking to provide attractive risk-adjusted returns independent of market cycles. The intent is to provide such returns through both current income and capital appreciation. Risk-adjusted return is a concept that considers not only an investment’s return, but also the amount of potential risk involved in producing that return. There is no guarantee that the Fund will meet its objective. |
| ■ | For the fiscal year ended December 31, 2023, the Fund’s Class A shares at NAV returned 9.22% and Class I shares at NAV returned 9.56%. For the same period, the ICE BofA U.S. Treasury Bill 3 Month Index returned 5.01%. |
All performance figures assume reinvestment of distributions and exclude the effect of sales charges. Performance data quoted represents past results. Past performance is no guarantee of future results, and current performance may be higher or lower than the performance shown above. Investment return and principal value will fluctuate so your shares, when redeemed, may be worth more or less than their original cost. Please visit Virtus.com for performance data current to the most recent month-end.
How did the markets perform during the Fund’s fiscal year ended December 31, 2023?
The year 2023 was a challenging one for bond investors. Even as stocks and bonds posted gains for the year, volatility was elevated – especially in the bond market, which whipsawed during the year yet ended with a fourth-quarter surge.
Driving that volatility was the shifting outlook for Federal Reserve (Fed) actions. During the fourth quarter of 2023, as the Treasury bond market swung from a large mid-year selloff to a sharp rally, volatility jumped to its highest level in at least five years. The catalyst behind this reversal of fortune was the shift in Fed policy from interest rate increases to prospective cuts. This resulted in a sharp market rally that reversed bond market performance from negative for the first three quarters of the year to positive by year-end.
What factors affected the Fund’s performance during its fiscal year?
The Fund delivered positive performance for the 12 months ended December 31, 2023, and in every quarter of the fiscal year, despite the ongoing battle between bond bears and bulls.
Despite all the turmoil in the market, returns for 2023 were positive in nearly every sector of the fixed income market. Short-term investments with low durations, or sensitivity to changes in interest rates, posted modest gains, while intermediate to long-term bonds benefited from higher starting coupons and a downward drift in yields.
As of December 31, 2023, the Fund’s effective duration was 1.51 years. Effective duration measures a bond’s price sensitivity to changes in interest rates. Bonds with higher durations
may have greater price volatility than bonds with lower durations. However, when considering our internal assumptions about the expected holding duration to event completion, our unofficial assumption of 1.17 years is used. This shorter term lowers the sensitivity to interest rate movements compared to longer durations, which helped the Fund navigate the bond market’s rate fluctuations effectively in 2023.
While macroeconomic factors influenced the Fund, investment returns are primarily driven by the outcomes of corporate events. The biggest contributors to performance for the 12-month period were the Fund’s positions in special purpose acquisition companies (SPACs), closed-end funds, and initial public offerings (IPOs).
The biggest detractors from performance during the period were positions in Tegna/Standard General, Origin Energy/Mid-Ocean Partners, and government-sponsored entities (GSEs).
The preceding information is the opinion of portfolio management only through the end of the period stated on the cover. Any such opinions are subject to change at any time based upon market or other conditions and should not be relied upon as investment advice. Past performance is no guarantee of future results, and there is no guarantee that market forecasts will be realized.
Fundamental Risk of Investing: There can be no assurance that the Fund will achieve its investment
objectives. An investment in the Fund is subject to the risk of loss of principal; shares may decrease in value.
Merger-arbitrage & Event-driven Investing: Merger-arbitrage and event-driven investing involve the risk that the adviser’s evaluation of the outcome of a proposed event, whether it be a merger, reorganization, regulatory issue, or other event, will prove incorrect and that the Fund’s return on the investment may be negative.
Credit & Interest: Debt instruments are subject to various risks, including credit and interest rate risk. The issuer of a debt security may fail to make interest and/or principal payments. Values of debt instruments may rise or fall in response to changes in interest rates, and this risk may be enhanced with longer-term maturities.
Short Sales: The Fund may engage in short sales, and may incur a loss if the price of a borrowed security increases before the date on which the Fund replaces the security.
Portfolio Turnover Risk: The Fund’s principal investment strategies may result in a consistently high portfolio turnover rate. A higher portfolio turnover rate may indicate higher transaction costs and may result in higher taxes when the Fund is held in a taxable account.
Derivatives: Derivatives may include, among other things, futures, options, forwards and swap agreements and may be used in order to hedge portfolio risks, create leverage, or attempt to increase returns. Investments in derivatives may result in increased volatility and the Fund may incur a loss greater than its principal investment.
Hedging: The Fund’s hedging strategy will be subject to the Fund’s investment adviser’s ability to correctly assess the degree of correlation between the performance of the instruments used in the hedging strategy and the performance of the investments in the Fund being hedged.
Lower-rated securities: Instruments in lower-rated and non-rated securities present a greater risk of loss to principal and interest than higher-rated securities.
Foreign Investing: Investing in foreign securities subjects the Fund to additional risks such as increased volatility; currency fluctuations; less
For information regarding the indexes and certain investment terms, see the Key Investment Terms starting on page 4.
Westchester Credit Event Fund (Continued)
liquidity; less publicly available information about the foreign investment; and political, regulatory, economic, and market risk.
Special Purpose Acquisition Companies Risk: The value of a SPAC’s securities is particularly dependent on the ability of its management to identify and complete a profitable acquisition. There is no guarantee that the SPACs in which the Fund invests will complete an acquisition or that any acquisitions completed by the SPACs in which the fund invests will be profitable. The values of investments in SPACs may be highly volatile and these investments may also have little or no liquidity.
Market Volatility: The value of the securities in the portfolio may go up or down in response to the prospects of individual companies and/or general economic conditions. Local, regional, or global events such as war or military conflict, terrorism, pandemic, or recession could impact the portfolio, including hampering the ability of the portfolio’s manager(s) to invest its assets as intended.
Prospectus: For additional information on risks, please see the Fund’s prospectus.
For information regarding the indexes and certain investment terms, see the Key Investment Terms starting on page 4.
Westchester Credit Event Fund (Continued)
By Sector
| Consumer Discretionary | 21.3% |
| Energy | 21.0 |
| Financials | 16.5 |
| Information Technology | 13.5 |
| Industrials | 10.1 |
| Consumer Staples | 7.3 |
| Communication Services | 4.7 |
| Materials | 2.6 |
| Health Care | 1.7 |
| Utilities | 1.3 |
| Total | 100% |
*Data expressed as a percentage of long common stocks, private investments in public equity, preferred stocks, contingent value rights, rights, warrants, leveraged loans, convertible bonds, corporate bonds and long total return swap contract positions as of December 31, 2023. Data expressed excludes special purpose acquisition companies, escrow notes, short- term investments, securities sold short, written and purchased options, forward currency exchange contracts and short total return swap contracts. Please refer to the Schedule of Investments for more details on the Fund’s individual holdings.
For information regarding the indexes and certain investment terms, see the Key Investment Terms starting on page 4.
Westchester Credit Event Fund (Continued)
Average Annual Total Returns1 for periods ended 12/31/23
| | | 1 Year | 5 Years | Since
inception | Inception
date |
| Class A shares at NAV2 | | 9.22 % | 7.72 % | 5.81 % | 12/29/17 |
| Class A shares at POP3,4 | | 3.21 | 6.51 | 4.82 | 12/29/17 |
| Class I shares at NAV2 | | 9.56 | 7.96 | 6.06 | 12/29/17 |
| ICE BofA U.S. Treasury Bill 3 Month Index | | 5.01 | 1.88 | 1.88 5 | — |
| Fund Expense Ratios6: Class A shares: Gross 1.81%, Net 1.73%; Class I shares: Gross 1.53%, Net 1.48%. |
| All returns represent past performance which is no guarantee of future results. Current performance may be higher or lower than the performance shown. The investment return and principal value of an investment will fluctuate so that an investor’s shares, when redeemed, may be worth more or less than their original cost. The above table and graph below do not reflect the deduction of taxes that a shareholder would pay on fund distributions or the redemption of shares. Please visit Virtus.com for performance data current to the most recent month-end. |
Growth of $10,000 for periods ended 12/31
This chart assumes an initial investment of $10,000 made on December 29, 2017 (inception date of the Fund), for Class A shares including any applicable sales charges or fees. The performance of the other share class may be greater or less than that shown based on differences in inception dates, fees, and sales charges. Performance assumes reinvestment of dividends and capital gain distributions.
For information regarding the indexes and certain investment terms, see the Key Investment Terms starting on page 4.
Westchester Credit Event Fund (Continued)
Growth of $100,000 for periods ended 12/31
This chart assumes an initial investment of $100,000 made on December 29, 2017 (inception date of the Fund), for Class I shares. The performance of the other share class may be greater or less than that shown based on differences in inception dates, fees, and sales charges. Performance assumes reinvestment of dividends and capital gain distributions.

| 1 | Total returns are historical and include changes in share price and the reinvestment of both dividends and capital gain distributions. |
| 2 | “NAV” (Net Asset Value) total returns do not include the effect of any sales charge. |
| 3 | “POP” (Public Offering Price) total returns include the effect of the maximum front-end 5.50% sales charge. |
| 4 | “CDSC” (contingent deferred sales charge) is applied to redemptions of certain classes of shares that do not have a sales charge applied at the time of purchase. CDSC for certain redemptions of Class A shares made within 18 months of a finder’s fee being paid. |
| 5 | The since inception index return is from the Fund’s inception date. |
| 6 | The expense ratios of the Fund are set forth according to the prospectus for the Fund effective April 28, 2023, as supplemented and revised, and may differ from the expense ratios disclosed in the Financial Highlights tables in this report. See the Financial Highlights for more current expense ratios. Net Expense: Expenses reduced by a contractual expense limitation in effect through April 30, 2025. Gross Expense: Does not reflect the effect of the expense limitation. Expense ratios include fees and expenses associated with any underlying funds. |
The indexes are unmanaged and not available for direct investment; therefore, their performance does not reflect the expenses associated with active management of an actual portfolio.
For information regarding the indexes and certain investment terms, see the Key Investment Terms starting on page 4.
| | Ticker Symbols: |
| | Class A: WCERX |
| | Class I: WCEIX |
Westchester Event-Driven Fund
Fund Summary (Unaudited)
Portfolio Manager Commentary by
Westchester Capital Management LLC
| ■ | The Fund is diversified and has an investment objective of seeking to provide attractive risk adjusted returns with low relative volatility in virtually all market environments. Risk-adjusted return is a concept that considers not only an investment’s return, but also the amount of potential risk involved in producing that return. There is no guarantee that the Fund will meet its objective. |
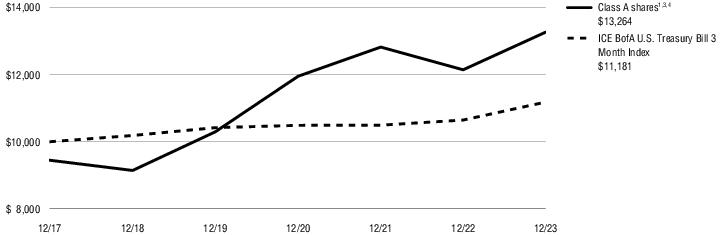
| ■ | For the fiscal year ended December 31, 2023, the Fund’s Class A shares at NAV returned 5.65% † and Class I shares at NAV returned 5.86%. For the same period, the ICE BofA U.S. Treasury Bill 3 Month Index returned 5.01%. |
† See footnote 3 on page 19.
All performance figures assume reinvestment of distributions and exclude the effect of sales charges. Performance data quoted represents past results. Past performance is no guarantee of future results, and current performance may be higher or lower than the performance shown above. Investment return and principal value will fluctuate so your shares, when redeemed, may be worth more or less than their original cost. Please visit Virtus.com for performance data current to the most recent month-end.
How did the markets perform during the Fund’s fiscal year ended December 31, 2023?
Overall, 2023 presented a mixed picture for the corporate reorganization market, especially considering the challenges faced in the previous year. Factors such as rising interest rates, increased financing costs (particularly concerning private equity), ongoing geopolitical tensions, and a narrowly escaped banking crisis in the first quarter contributed to company boards adopting a more cautious approach toward corporate reorganizations, particularly in the first half of 2023.
However, as the year progressed, there was a noticeable improvement in CEO confidence. This positive shift could be attributed to a better understanding of the regulatory environment. Notably, several high-profile transactions, including Horizon/Amgen, Activision/Microsoft, and VMware/Broadcom, received clearance, boosting confidence in the market. These positive
developments paved the way for a solid second half of the year, with mergers and acquisitions (M&A) volume reaching over $1.7 trillion, out of the total global value of $3.1 trillion for the entirety of 2023.
Despite the challenges faced earlier in the year, the market demonstrated resilience and adaptability. The improved regulatory environment played a crucial role in instilling confidence among corporate boards, leading to an increase in mega-cap deals. This momentum in the year’s second half indicated a positive trajectory for the market.
In addition to strategic transactions, corporate separations such as spin-offs and divestitures continued to rise. These restructuring activities were fueled by a focus on operational excellence, efficiency, and optimizing the balance sheet. Corporate separations may offer several advantages, the most notable being the increased M&A opportunities that often follow. When a business unit is separated from the larger corporate entity, it has the potential to become more focused, flexible, and capable of structuring its own deals. This newfound independence and specialization often make a separate entity attractive to strategic partners or buyers who have a specific interest in those business units.
Companies have recognized the value and potential of separating specific business units to maximize their performance and attract strategic partnerships or buyouts. In 2023, corporate separations played a significant role in volume, accounting for approximately 33% in the U.S. alone. This represented the highest share in almost a decade, and further indicated a shift in corporate confidence.
Moreover, activists have emerged as significant players in the space. In addition to their agitating for corporate separations to unlock value, activism has played a substantial role in take-private transactions, also known as management buyouts. These transactions occur when a company’s management team, along with external investors or a consortium, often in combination with a private equity firm or firms, acquire all the outstanding shares of the company’s stock, effectively transitioning the company from being publicly traded to privately owned. The goal of take-private transactions is to allow companies to operate with greater flexibility and focus on long-term strategic goals. Activists’ involvement in take-private transactions has
highlighted their influence in shaping the M&A landscape. In examining the international landscape, cross-border transactions accounted for 28% of the overall volume, surpassing the average of 25% observed over the past four years. This increase in cross-border activity could be attributed to the improved regulatory clarity. A notable indication of this was the fact that deals valued at $10 billion or more contributed to 21% of the cross-border volume, a significant jump from 12% in the previous year.
The fact that companies were actively engaging in cross-border activities indicated that the previous uncertainties and obstacles that hindered such combinations were gradually being overcome. The increased cross-border activity signified a growing belief among companies that they could navigate the regulatory complexities and secure the necessary approvals to move forward with these transactions. This positive trend demonstrated a willingness to invest in expansion and strategic partnerships on a global scale, highlighting that companies in 2023 were more inclined to seize opportunities for growth and market access in foreign markets.
What factors affected the Fund’s performance during its fiscal year?
The Fund delivered positive performance for the fiscal year ended December 31, 2023. While macroeconomic factors influenced the Fund, investment returns are primarily driven by the outcomes of corporate events. The biggest contributors to performance during the period were Special Purpose Acquisition Companies (SPACs), VMware/Broadcom, and Seagen/Pfizer.
The biggest detractors from performance during the period were positions in First Horizon/Toronto-Dominion Bank, Silicon Motion Technology/MaxLinear, and Kellogg.
The first half of 2023 was challenging for event-driven managers. Although equity markets were volatile, other factors also contributed to the unpredictability, including a sharp increase in interest rates, regulatory obstacles, and several deal failures. Performance recovered materially in the second half of the year. The rapid increase in risk-free rates – in this case, the yield on the U.S. 3-month Treasury bill – from 0% to over 5% since 2022 impacted the absolute-return investments in which the Fund invests. The Federal Reserve (the Fed) implemented
For information regarding the indexes and certain investment terms, see the Key Investment Terms starting on page 4.
Westchester Event-Driven Fund (Continued)
11 interest rate hikes since March 2022, marking the quickest pace in four decades and causing rates to reach a 22-year high. When rates rise slowly and steadily, event-driven returns typically react slowly as older deals, structured in a prior lower-rate environment, are completed successfully and are replaced by new situations offering higher, market-dictated returns. However, swift increases like those we experienced in 2023 can temporarily disrupt the positive correlation between interest rates and expected return from event-driven investments, as existing arbitrage spreads widen to market rates of return. This disruption has historically been a temporary delay until older transactions are completed and new transactions, priced at the now higher rates, take their place, a dynamic that unfolded since the middle of 2023.
The preceding information is the opinion of portfolio management only through the end of the period stated on the cover. Any such opinions are subject to change at any time based upon market or other conditions and should not be relied upon as investment advice. Past performance is no guarantee of future results, and there is no guarantee that market forecasts will be realized.
Fundamental Risk of Investing: There can be no assurance that the Fund will achieve its investment objectives. An investment in the Fund is subject to the risk of loss of principal; shares may decrease in value.
Merger-arbitrage & Event-driven Investing: Merger-arbitrage and event-driven
investing involve the risk that the adviser’s evaluation of the outcome of a proposed event, whether it be a merger, reorganization, regulatory issue, or other event, will prove incorrect and that the Fund’s return on the investment may be negative.
Foreign Investing: Investing in foreign securities subjects the Fund to additional risks such as increased volatility; currency fluctuations; less liquidity; less publicly available information about the foreign investment; and political, regulatory, economic, and market risk.
Short Sales: The Fund may engage in short sales, and may incur a loss if the price of a borrowed security increases before the date on which the Fund replaces the security.
Portfolio Turnover Risk: The Fund’s principal investment strategies may result in a consistently high portfolio turnover rate. A higher portfolio turnover rate may indicate higher transaction costs and may result in higher taxes when the Fund is held in a taxable account.
Credit & Interest: Debt instruments are subject to various risks, including credit and interest rate risk. The issuer of a debt security may fail to make interest and/or principal payments. Values of debt instruments may rise or fall in response to changes in interest rates, and this risk may be enhanced with longer-term maturities.
Derivatives: Derivatives may include, among other things, futures, options, forwards and swap agreements and may be used in order to hedge
portfolio risks, create leverage, or attempt to increase returns. Investments in derivatives may result in increased volatility and the Fund may incur a loss greater than its principal investment.
Hedging: The Fund’s hedging strategy will be subject to the Fund’s investment adviser’s ability to correctly assess the degree of correlation between the performance of the instruments used in the hedging strategy and the performance of the investments in the Fund being hedged.
Special Purpose Acquisition Companies Risk: The value of a SPAC’s securities is particularly dependent on the ability of its management to identify and complete a profitable acquisition. There is no guarantee that the SPACs in which the Fund invests will complete an acquisition or that any acquisitions completed by the SPACs in which the fund invests will be profitable. The values of investments in SPACs may be highly volatile and these investments may also have little or no liquidity.
Market Volatility: The value of the securities in the portfolio may go up or down in response to the prospects of individual companies and/or general economic conditions. Local, regional, or global events such as war or military conflict, terrorism, pandemic, or recession could impact the portfolio, including hampering the ability of the portfolio’s manager(s) to invest its assets as intended.
Prospectus: For additional information on risks, please see the Fund’s prospectus.
For information regarding the indexes and certain investment terms, see the Key Investment Terms starting on page 4.
Westchester Event-Driven Fund (Continued)
By Sector
| Energy | 24.3% |
| Materials | 14.5 |
| Information Technology | 11.1 |
| Consumer Discretionary | 10.6 |
| Health Care | 10.4 |
| Financials | 7.3 |
| Consumer Staples | 6.3 |
| Real Estate | 4.8 |
| Industrials | 4.7 |
| Communication Services | 4.5 |
| Utilities | 1.5 |
| Total | 100% |
* Data expressed as a percentage of long common stocks, private investments in public equity, preferred stocks, contingent value rights, rights, warrants, leveraged loans, convertible bonds, corporate bonds and long total return swap contract positions as of December 31, 2023. Data expressed excludes special purpose acquisition companies, escrow notes, short- term investments, securities sold short, written and purchased options, forward currency exchange contracts and short total return swap contracts. Please refer to the Schedule of Investments for more details on the Fund’s individual holdings.
For information regarding the indexes and certain investment terms, see the Key Investment Terms starting on page 4.
Westchester Event-Driven Fund (Continued)
Average Annual Total Returns1 for periods ended 12/31/23
| | | 1 Year | 5 Years | Since
inception | Inception
date |
| Class A shares at NAV2 | | 5.65 % 3 | 4.12 % | 4.33 % | 3/22/17 |
| Class A shares at POP4,5 | | -0.16 | 2.95 | 3.46 | 3/22/17 |
| Class I shares at NAV2 | | 5.86 3 | 4.39 | 3.64 | 1/2/14 |
| ICE BofA U.S. Treasury Bill 3 Month Index | | 5.01 | 1.88 | 1.25 6 | — |
| Fund Expense Ratios7: Class A shares: Gross 1.95%, Net 1.82%; Class I shares: Gross 1.70, Net 1.57%. |
| All returns represent past performance which is no guarantee of future results. Current performance may be higher or lower than the performance shown. The investment return and principal value of an investment will fluctuate so that an investor’s shares, when redeemed, may be worth more or less than their original cost. The above table and graph below do not reflect the deduction of taxes that a shareholder would pay on fund distributions or the redemption of shares. Please visit Virtus.com for performance data current to the most recent month-end. |
Growth of $100,000 for periods ended 12/31
This chart assumes an initial investment of $100,000 made on January 2, 2014 (inception date of Class A shares), for Class I shares. The performance of the other share class may be greater or less than that shown based on differences in inception dates, fees, and sales charges. Performance assumes reinvestment of dividends and capital gain distributions.
| 1 | Total returns are historical and include changes in share price and the reinvestment of both dividends and capital gain distributions. |
| 2 | “NAV” (Net Asset Value) total returns do not include the effect of any sales charge. |
| 3 | Total Return for the report period presented in the table differs from the return in the Financial Highlights. The total return presented in the above table is calculated based on the NAV at which shareholder transactions were processed. The total return presented in the Financial Highlights section of the report is calculated in the same manner, but also takes into account certain adjustments that are necessary under generally accepted accounting principles required in the annual report and semiannual report. |
| 4 | “POP” (Public Offering Price) total returns include the effect of the maximum front-end 5.50% sales charge. |
| 5 | “CDSC” (contingent deferred sales charge) is applied to redemptions of certain classes of shares that do not have a sales charge applied at the time of purchase. CDSC for certain redemptions of Class A shares made within 18 months of a finder’s fee being paid. |
| 6 | The since inception index returned 1.78% from the inception date of Class A shares and 1.25% from the inception date of Class I shares. |
| 7 | The expense ratios of the Fund are set forth according to the prospectus for the Fund effective April 28, 2023, as supplemented and revised, and may differ from the expense ratios disclosed in the Financial Highlights tables in this report. See the Financial Highlights for more current expense ratios. Net Expense: Expenses reduced by a contractual expense limitation in effect through April 30, 2025. Gross Expense: Does not reflect the effect of the expense limitation. Expense ratios include fees and expenses associated with any underlying funds. |
The indexes are unmanaged and not available for direct investment; therefore, their performance does not reflect the expenses associated with active management of an actual portfolio.
For information regarding the indexes and certain investment terms, see the Key Investment Terms starting on page 4.
The Merger Fund
SCHEDULE OF INVESTMENTS
December 31, 2023
($ reported in thousands)
| | Par Value | | Value |
| Convertible Bonds and Notes—1.7% |
| Health Care—0.2% | | |
Cerevel Therapeutics Holdings, Inc. 144A
2.500%, 8/15/27(1) | $ 3,698 | | $ 4,120 |
| Information Technology—1.5% | | |
Splunk, Inc.
1.125%, 6/15/27 | 43,713 | | 42,336 |
Total Convertible Bonds and Notes
(Identified Cost $45,876) | | 46,456 |
| | | | |
| |
| | | | |
| |
| Corporate Bonds and Notes—6.8% |
| Communication Services—1.8% | | |
Connect Finco S.a.r.l. 144A
6.750%, 10/1/26(1) | 1,998 | | 1,986 |
GrubHub Holdings, Inc. 144A
5.500%, 7/1/27(1) | 8,853 | | 7,442 |
| Lagardere S.A. | | | |
| RegS 1.625%, 6/21/24(2) | 2,600 EUR | | 2,856 |
| RegS 2.125%, 10/16/26(2) | 18,800 EUR | | 20,691 |
| RegS 1.750%, 10/7/27(2) | 16,600 EUR | | 18,257 |
| | | | 51,232 |
| | | | |
| |
| Consumer Discretionary—0.7% | | |
Michael Kors USA, Inc. 144A
4.250%, 11/1/24(1) | 19,096 | | 18,666 |
| Consumer Staples—0.3% | | |
TreeHouse Foods, Inc.
4.000%, 9/1/28 | 10,995 | | 9,733 |
| Energy—1.8% | | |
California Resources Corp. 144A
7.125%, 2/1/26(1) | 22,385 | | 22,703 |
Calumet Specialty Products Partners LP 144A
11.000%, 4/15/25(1) | 1,456 | | 1,472 |
PDC Energy, Inc.
5.750%, 5/15/26 | 26,314 | | 26,264 |
| | | | 50,439 |
| | | | |
| |
| Financials—1.5% | | |
Mobius Merger Sub, Inc. 144A
9.000%, 6/1/30(1) | 1,679 | | 1,629 |
NFP Corp. 144A
6.875%, 8/15/28(1) | 25,487 | | 25,910 |
Permian Resources Operating LLC 144A
8.000%, 4/15/27(1) | 5,995 | | 6,214 |
SEG Holding LLC 144A
5.625%, 10/15/28(1) | 6,587 | | 6,612 |
Verscend Escrow Corp. 144A
9.750%, 8/15/26(1) | 1,810 | | 1,823 |
| | | | 42,188 |
| | | | |
| |
| Industrials—0.5% | | |
PGT Innovations, Inc. 144A
4.375%, 10/1/29(1) | 14,506 | | 14,454 |
| | Par Value | | Value |
| | | | |
| Real Estate—0.1% | | |
Anywhere Real Estate Group LLC 144A
7.000%, 4/15/30(1) | $ 1,522 | | $ 1,404 |
Realogy Group LLC 144A
5.250%, 4/15/30(1) | 97 | | 72 |
| | | | 1,476 |
| | | | |
| |
| Utilities—0.1% | | |
Origin Energy Finance Ltd. RegS
1.000%, 9/17/29(2) | 3,126 EUR | | 3,003 |
Total Corporate Bonds and Notes
(Identified Cost $192,552) | | 191,191 |
| | | | |
| |
| | | | |
| |
| Leveraged Loans—0.7% |
| Health Care—0.2% | | |
Verscend Holding Corp. Tranche B (1 month Term SOFR + 4.114%)
9.470%, 8/27/25(3) | 4,949 | | 4,953 |
| Information Technology—0.5% | | |
NFP Corp. (1 month Term SOFR + 3.250%)
0.000%, 2/15/27(3)(4) | 8,750 | | 8,787 |
Syniverse Holdings, Inc. (3 month Term SOFR + 7.000%)
12.348%, 5/13/27(3) | 5,313 | | 4,629 |
| | | | 13,416 |
| | | | |
| |
Total Leveraged Loans
(Identified Cost $18,929) | | 18,369 |
| | Shares | |
| Preferred Stocks—0.5% |
| Industrials—0.5% | |
| Textainer Group Holdings Ltd., 7.000% | 427,470 | 10,623 |
| Textainer Group Holdings Ltd. Series B, 6.250% | 166,132 | 4,100 |
| | | 14,723 |
| | | |
| |
Total Preferred Stocks
(Identified Cost $14,608) | 14,723 |
| | | |
| |
| | | |
| |
| Common Stocks—45.6% |
| Communication Services—1.3% | |
| Endeavor Group Holdings, Inc. Class A | 1,551,564 | 36,819 |
| GCI Liberty, Inc. Escrow Share(5) | 70,800 | 9 |
| | | 36,828 |
| | | |
| |
| Consumer Discretionary—3.2% | |
| Capri Holdings Ltd.(5)(6) | 1,712,854 | 86,054 |
| NEOGAMES S.A.(5) | 118,608 | 3,396 |
| Next.e.GO N.V.(5) | 1 | — (7) |
| | | 89,450 |
| | | |
| |
| Consumer Staples—3.4% | |
| Albertsons Cos., Inc. Class A(6) | 1,872,855 | 43,076 |
See Notes to Financial Statements
The Merger Fund
SCHEDULE OF INVESTMENTS (Continued)
December 31, 2023
($ reported in thousands)
| | Shares | | Value |
| | | | |
| Consumer Staples—continued | | |
| Sovos Brands, Inc.(5)(6)(8) | 2,429,172 | | $ 53,514 |
| | | | 96,590 |
| | | | |
| |
| Energy—13.0% | | |
| Euronav N.V.(8) | 351,380 | | 6,181 |
| Hess Corp. | 1,030,288 | | 148,526 |
| Pioneer Natural Resources Co.(6) | 946,611 | | 212,874 |
| | | | 367,581 |
| | | | |
| |
| Financials—0.8% | | |
| Acropolis Infrastructure(5)(9) | 315,662 | | — |
| American Equity Investment Life Holding Co.(5) | 327,593 | | 18,280 |
| National Western Life Group, Inc. Class A | 10,853 | | 5,242 |
| | | | 23,522 |
| | | | |
| |
| Health Care—7.0% | | |
| ABIOMED, Inc.(5)(9) | 60,860 | | 129 |
| Amedisys, Inc.(5) | 785,750 | | 74,693 |
| Cerevel Therapeutics Holdings, Inc.(5) | 560,970 | | 23,785 |
| ImmunoGen, Inc.(5) | 1,048,618 | | 31,092 |
| Karuna Therapeutics, Inc.(5) | 74,135 | | 23,464 |
| Mirati Therapeutics, Inc.(5) | 71,146 | | 4,180 |
| Olink Holding AB ADR(5) | 1,570,996 | | 39,511 |
| | | | 196,854 |
| | | | |
| |
| Industrials—0.4% | | |
| SP Plus Corp.(5) | 227,967 | | 11,683 |
| Information Technology—5.1% | | |
| Splunk, Inc.(5)(6) | 946,148 | | 144,146 |
| Materials—6.3% | | |
| Newmont Corp. | 85,670 | | 3,546 |
| Teck Resources Ltd. Class B | 562,400 | | 23,772 |
| United States Steel Corp. | 1,092,287 | | 53,140 |
| Westrock Co.(6) | 2,310,449 | | 95,930 |
| | | | 176,388 |
| | | | |
| |
| Real Estate—3.7% | | |
| RPT Realty | 1,236,501 | | 15,864 |
| Spirit Realty Capital, Inc. | 1,996,131 | | 87,211 |
| | | | 103,075 |
| | | | |
| |
| Utilities—1.4% | | |
| Origin Energy Ltd. | 7,092,810 | | 40,939 |
Total Common Stocks
(Identified Cost $1,261,478) | | 1,287,056 |
| | | | |
| |
| | | | |
| |
| | Shares | | Value |
| | | | |
| | | | |
| Affiliated Mutual Fund—2.9% |
| Equity Fund—2.9% | | |
| Virtus Westchester Event-Driven Fund Class I(10)(11) | 7,603,483 | | $ 81,281 |
Total Affiliated Mutual Fund
(Identified Cost $79,470) | | 81,281 |
| | | | |
| |
| | | | |
| |
| Rights—0.0% |
| Financials—0.0% | | |
| Pershing Tontine Spar, 12/31/33(5)(9) | 136,884 | | 31 |
| Health Care—0.0% | | |
| Akouos, Inc., 12/31/49(5) | 336,679 | | 378 |
| Bristol Myers Squibb Co., 12/31/35(5)(9) | 453,175 | | 646 |
| | | | 1,024 |
| | | | |
| |
Total Rights
(Identified Cost $—) | | 1,055 |
| | | | |
| |
| | | | |
| |
| Warrants—0.1% |
| Communication Services—0.0% | | |
| Akazoo S.A., 12/31/35(5)(9) | 238,850 | | — |
| BuzzFeed, Inc., 12/01/26(5) | 116,254 | | 4 |
| | | | 4 |
| | | | |
| |
| Consumer Discretionary—0.1% | | |
| Allurion Technologies, Inc., 07/31/29(5) | 63,240 | | 29 |
| CEC Brands LLC, 12/31/25(5)(9) | 189,648 | | 569 |
| ECARX Holdings, Inc., 12/21/27(5) | 81,099 | | 3 |
| Grove Collaborative Holdings, 03/13/26(5) | 78,996 | | — (7) |
| Zapp Electric Vehicles Group Ltd., 03/03/28(5) | 168,623 | | 1 |
| | | | 602 |
| | | | |
| |
| Consumer Staples—0.0% | | |
| Whole Earth Brands, Inc., 06/25/25(5) | 55,224 | | 4 |
| Financials—0.0% | | |
| 26 Capital Acquisition Corp., 12/31/27(5) | 61,000 | | — |
| Alchemy Investments Acquisition Corp. 1, 06/26/28(5) | 183,897 | | 28 |
| Alpha Partners Technology Merger Corp., 03/31/28(5) | 83,333 | | 5 |
| AltEnergy Acquisition Corp., 11/10/28(5) | 62,809 | | 2 |
| Ares Acquisition Corp. II, 06/12/28(5) | 331,251 | | 50 |
| Arrowroot Acquisition Corp., 03/02/26(5) | 462,172 | | 37 |
| Cartesian Growth Corp II, 07/12/28(5) | 69,832 | | 9 |
| Cartica Acquisition Corp., 04/30/28(5) | 37,500 | | 1 |
| Corner Growth Acquisition Corp., 12/31/27(5) | 62,938 | | 4 |
| ESGEN Acquisition Corp., 10/20/26(5) | 73,376 | | 3 |
| EVe Mobility Acquisition Corp., 12/31/28(5) | 75,122 | | 2 |
| FTAC Emerald Acquisition Corp., 08/22/28(5) | 207,965 | | 10 |
| GCM Grosvenor, Inc. Class A, 11/17/25(5) | 102,070 | | 37 |
| Goal Acquisitions Corp., 02/11/26(5) | 564,935 | | 2 |
| Haymaker Acquisition Corp. 4, 09/12/28(5) | 119,080 | | 18 |
| Inflection Point Acquisition Corp. II, 07/17/28(5) | 147,761 | | 15 |
| Israel Acquisitions Corp., 02/28/28(5) | 447,969 | | 27 |
| Keen Vision Acquisition Corp., 09/15/28(5) | 537,265 | | 21 |
| Kensington Capital Acquisition Corp. V, 08/13/28(5) | 126,939 | | 13 |
See Notes to Financial Statements
The Merger Fund
SCHEDULE OF INVESTMENTS (Continued)
December 31, 2023
($ reported in thousands)
| | Shares | | Value |
| | | | |
| Financials—continued | | |
| LeddarTech Holdings, Inc., 09/21/28(5) | 155,088 | | $ 13 |
| Moneylion, Inc., 06/01/27(5) | 106,742 | | 11 |
| Nabors Energy Transition Corp. II, 09/05/28(5) | 187,613 | | 24 |
| Newbury Street Acquisition Corp., 12/31/27(5) | 31,054 | | 1 |
| Newcourt Acquisition Corp., 04/12/28(5) | 85,245 | | 1 |
| Phoenix Biotech Acquisition Corp., 09/01/26(5) | 62,781 | | 2 |
| Pyrophyte Acquisition Corp., 05/03/28(5) | 83,773 | | 7 |
| RMG Acquisition Corp. III, 12/31/27(5) | 85,180 | | 6 |
| Screaming Eagle Acquisition Corp. Class A, 12/15/27(5) | 250,784 | | 113 |
| Semper Paratus Acquisition Corp., 11/04/26(5) | 83,731 | | 3 |
| SilverBox Corp. III, 04/28/28(5) | 31,515 | | 3 |
| Slam Corp. Class A, 12/31/27(5) | 55,909 | | 11 |
| Spring Valley Acquisition Corp. II, 02/25/26(5) | ��� 158,098 | | 10 |
| Target Global Acquisition I Corp., 12/31/27(5) | 125,200 | | 9 |
| Volato Group, Inc., 12/03/28(5) | 167,228 | | 19 |
| XBP Europe Holdings, Inc., 12/31/27(5) | 40,000 | | 2 |
| | | | 519 |
| | | | |
| |
| Health Care—0.0% | | |
| Pear Therapeutics, Inc., 02/04/26(5) | 6,166 | | — (7) |
| Quantum-Si, Inc., 09/30/27(5) | 32,085 | | 9 |
| | | | 9 |
| | | | |
| |
| Industrials—0.0% | | |
| Amprius Technologies, Inc., 03/02/27(5) | 326,205 | | 127 |
| Bridger Aerospace Group Holdings, Inc., 12/31/27(5) | 58,300 | | 13 |
| Freightos Ltd., 01/23/28(5) | 54,429 | | 4 |
| Getaround, Inc., 03/09/26(5) | 12,698 | | — (7) |
| | | | 144 |
| | | | |
| |
| Information Technology—0.0% | | |
| KLDiscovery, Inc., 12/19/24(5) | 677,651 | | 2 |
| Movella Holdings, Inc., 12/31/27(5) | 74,121 | | 1 |
| Near Intelligence, Inc., 07/08/27(5) | 16,000 | | — (7) |
| | | | 3 |
| | | | |
| |
| Materials—0.0% | | |
| Ginkgo Bioworks Holdings, Inc., 12/31/27(5) | 2,620 | | — (7) |
Total Warrants
(Identified Cost $12,476) | | 1,285 |
| | Shares/Units | |
| Special Purpose Acquisition Companies—22.1% |
| Agriculture & Natural Solutions Acquisition Corp.(5) | 1,402,658 | 14,223 |
| Aimei Health Technology Co., Ltd.(5) | 269,392 | 2,748 |
| Aimfinity Investment Corp. I(5) | 107,731 | 1,180 |
| Alchemy Investments Acquisition Corp. 1(5) | 367,795 | 3,836 |
| Alpha Partners Technology Merger Corp. Class A(5)(10) | 1,146,417 | 12,267 |
| Alpha Star Acquisition Corp.(5)(10) | 710,257 | 7,948 |
| AltC Acquisition Corp. Class A(5) | 184,604 | 1,949 |
| Andretti Acquisition Corp. Class A(5) | 83,204 | 904 |
| AP Acquisition Corp. Class A(5) | 405,336 | 4,511 |
| APx Acquisition Corp. I(5) | 489,675 | 5,475 |
| Ares Acquisition Corp. II(5) | 1,538,410 | 16,061 |
| Arisz Acquisition Corp.(5)(10) | 339,292 | 3,701 |
| Arogo Capital Acquisition Corp. Class A(5) | 83,133 | 895 |
| | Shares/Units | | Value |
| Arrowroot Acquisition Corp. Class A(5)(10) | 345,322 | | $ 3,619 |
| ARYA Sciences Acquisition Corp. IV Class A(5) | 207,319 | | 2,256 |
| Aura FAT Projects Acquisition Corp. Class A(5) | 123,650 | | 1,344 |
| Aurora Technology Acquisition Corp. Class A(5) | 200,000 | | 2,182 |
| Bannix Acquisition Corp.(5) | 21,987 | | 237 |
| Battery Future Acquisition Corp. Class A(5) | 233,772 | | 2,536 |
| Bayview Acquisition Corp.(5) | 233,688 | | 2,365 |
| Bayview Acquisition Corp. Class A(5) | 28,267 | | 283 |
| Blue Ocean Acquisition Corp. Class A(5) | 271,847 | | 2,930 |
| Blue World Acquisition Corp.(5) | 139,717 | | 1,540 |
| Bowen Acquisition Corp.(5) | 189,738 | | 1,958 |
| Bukit Jalil Global Acquisition 1 Ltd.(5) | 291,371 | | 3,027 |
| Bukit Jalil Global Acquisition 1 Ltd.(5) | 121,363 | | 1,271 |
| byNordic Acquisition Corp.(5) | 142,352 | | 1,582 |
| Canna-Global Acquisition Corp. Class A(5) | 21,959 | | 239 |
| Capitalworks Emerging Markets Acquisition Corp. Class A(5) | 203,471 | | 2,228 |
| Cartesian Growth Corp. II Class A(5) | 1,019,800 | | 11,177 |
| Cartica Acquisition Corp. Class A(5) | 284,379 | | 3,103 |
| Cetus Capital Acquisition Corp.(5) | 322,132 | | 3,382 |
| CF Acquisition Corp. VII Class A(5) | 708,562 | | 7,688 |
| Chain Bridge I Class A(5) | 154,503 | | 1,676 |
| Chenghe Acquisition Co. Class A(5) | 301,319 | | 3,314 |
| Chenghe Acquisition I Co.(5) | 180,678 | | 1,991 |
| Churchill Capital Corp. VII Class A(5)(10) | 3,298,554 | | 34,635 |
| Colombier Acquisition Corp. II(5) | 151,325 | | 1,525 |
| Compass Digital Acquisition Corp.(5) | 170,419 | | 1,798 |
| Concord Acquisition Corp. II Class A(5)(10) | 1,067,227 | | 11,078 |
| Concord Acquisition Corp. III Class A(5) | 177,624 | | 1,876 |
| Constellation Acquisition Corp. I Class A(5)(10) | 381,194 | | 4,212 |
| Crown PropTech Acquisitions Class A(5) | 993 | | 11 |
| CSLM Acquisition Corp.(5) | 450,016 | | 4,896 |
| Denali Capital Acquisition Corp. Class A(5) | 224,555 | | 2,284 |
| Direct Selling Acquisition Corp. Class A(5) | 213,853 | | 2,329 |
| Distoken Acquisition Corp.(5) | 188,499 | | 1,998 |
| DUET Acquisition Corp. Class A(5) | 201,622 | | 2,210 |
| Enphys Acquisition Corp.(5) | 739,293 | | 7,888 |
| ESH Acquisition Corp.(5) | 321,082 | | 32 |
| ESH Acquisition Corp. Class A(5) | 321,082 | | 3,281 |
| EVe Mobility Acquisition Corp. Class A(5) | 606,371 | | 6,549 |
| Everest Consolidator Acquisition Corp.(5) | 533,272 | | 5,834 |
| Evergreen Corp. Class A(5) | 318,588 | | 3,549 |
| ExcelFin Acquisition Corp. Class A(5) | 161,036 | | 1,723 |
| Feutune Light Acquisition Corp. Class A(5) | 81,104 | | 877 |
| Finnovate Acquisition Corp. Class A(5) | 449,655 | | 4,964 |
| Fintech Ecosystem Development Corp. Class A(5) | 159,097 | | 1,704 |
| Focus Impact Acquisition Corp. Class A(5) | 375,863 | | 4,116 |
| FTAC Emerald Acquisition Corp. Class A(5) | 963,882 | | 10,188 |
| FutureTech II Acquisition Corp. Class A(5) | 258,648 | | 2,809 |
| Generation Asia I Acquisition Ltd. Class A(5) | 375,000 | | 4,069 |
| Global Lights Acquisition Corp.(5)(8) | 93,536 | | 942 |
| Global Lights Acquisition Corp.(5) | 140,267 | | 1,434 |
| Global Partner Acquisition Corp. II Class A(5) | 4,721 | | 52 |
| Global Star Acquisition, Inc. Class A(5) | 186,979 | | 1,976 |
| Globalink Investment, Inc.(5) | 268,023 | | 2,908 |
| Golden Star Acquisition Corp.(5) | 315,654 | | 3,289 |
| Golden Star Acquisition Corp.(5) | 205,869 | | 31 |
| Gores Holdings IX, Inc. Class A(5) | 2,327,807 | | 24,442 |
| Haymaker Acquisition Corp. 4(5) | 238,161 | | 2,444 |
| HCM Acquisition Corp. Class A(5) | 467,203 | | 5,219 |
| Hennessy Capital Investment Corp. VI Class A(5)(10) | 1,857,295 | | 19,372 |
| HH&L Acquisition Co. Class A(5) | 54,258 | | 578 |
| Hudson Acquisition I Corp.(5) | 118,200 | | 1,246 |
| InFinT Acquisition Corp. Class A(5) | 355,736 | | 3,991 |
See Notes to Financial Statements
The Merger Fund
SCHEDULE OF INVESTMENTS (Continued)
December 31, 2023
($ reported in thousands)
| | Shares/Units | | Value |
| Inflection Point Acquisition Corp. II Class A(5) | 374,166 | | $ 3,865 |
| Integral Acquisition Corp. 1 Class A(5) | 119,000 | | 1,289 |
| Integrated Rail & Resources Acquisition Corp. Class A(5) | 236,599 | | 2,555 |
| Integrated Wellness Acquisition Corp. Class A(5)(10) | 423,090 | | 4,747 |
| Investcorp Europe Acquisition Corp. I Class A(5) | 469,232 | | 5,171 |
| Investcorp India Acquisition Corp. Class A(5)(10) | 657,507 | | 7,226 |
| Iron Horse Acquisitions Corp.(5) | 187,379 | | 1,881 |
| Israel Acquisitions Corp. Class A(5) | 459,107 | | 4,908 |
| IX Acquisition Corp. Class A(5) | 195,300 | | 2,158 |
| Keen Vision Acquisition Corp.(5) | 622,800 | | 6,434 |
| Kernel Group Holdings, Inc. Class A(5) | 312,278 | | 3,354 |
| Keyarch Acquisition Corp.(5) | 125,176 | | 1,361 |
| L Catterton Asia Acquisition Corp. Class A(5) | 855,885 | | 9,227 |
| Lakeshore Acquisition II Corp.(5) | 94,593 | | 1,041 |
| Learn CW Investment Corp. Class A(5)(10) | 817,802 | | 8,816 |
| Liberty Resources Acquisition Corp. Class A(5) | 201,051 | | 2,197 |
| Magnum Opus Acquisition Ltd. Class A(5) | 299,757 | | 3,235 |
| Mars Acquisition Corp.(5) | 214,664 | | 2,282 |
| Mars Acquisition Corp.(5) | 5,944 | | 1 |
| Metal Sky Star Acquisition Corp.(5) | 66,472 | | 727 |
| Monterey Capital Acquisition Corp. Class A(5) | 358,230 | | 3,890 |
| Mountain & Co. I Acquisition Corp.(5)(10) | 923,431 | | 10,435 |
| Nabors Energy Transition Corp. II Class A(5) | 375,227 | | 3,895 |
| Newbury Street Acquisition Corp.(5) | 262,382 | | 2,781 |
| Newcourt Acquisition Corp. Class A(5) | 93,635 | | 1,066 |
| Nubia Brand International Corp. Class A(5) | 308,227 | | 3,369 |
| Oak Woods Acquisition Corp. Class A(5) | 241,946 | | 2,548 |
| OCA Acquisition Corp. Class A(5) | 139,497 | | 1,505 |
| Oxus Acquisition Corp. Class A(5) | 153,112 | | 1,732 |
| Patria Latin American Opportunity Acquisition Corp.(5)(10) | 1,301,323 | | 14,444 |
| Pegasus Digital Mobility Acquisition Corp. Class A(5) | 124,475 | | 1,375 |
| Perception Capital Corp. III Class A(5) | 66,337 | | 699 |
| Plum Acquisition Corp. I Class A(5) | 228,987 | | 2,484 |
| Plutonian Acquisition Corp.(5) | 193,386 | | 2,073 |
| Pono Capital Three, Inc. Class A(5) | 258,363 | | 2,744 |
| Power & Digital Infrastructure Acquisition II Corp. Class A(5)(10) | 658,824 | | 7,194 |
| PowerUp Acquisition Corp. Class A(5) | 27,909 | | 304 |
| Project Energy Reimagined Acquisition Corp.(5) | 546,831 | | 5,786 |
| Pyrophyte Acquisition Corp. Class A(5) | 665,963 | | 7,326 |
| Quadro Acquisition One Corp.(5) | 70,320 | | 759 |
| Quetta Acquisition Corp.(5) | 332,047 | | 3,390 |
| RCF Acquisition Corp. Class A(5) | 356,072 | | 3,910 |
| Redwoods Acquisition Corp.(5) | 198,928 | | 2,125 |
| Rigel Resource Acquisition Corp. Class A(5)(10) | 1,428,308 | | 15,654 |
| Ross Acquisition Corp. II Class A(5)(10) | 468,201 | | 5,099 |
| Roth CH Acquisition Co.(5) | 246,418 | | 2,682 |
| Screaming Eagle Acquisition Corp. Class A(5)(8) | 3,441,137 | | 36,476 |
| SDCL EDGE Acquisition Corp. Class A(5) | 606,577 | | 6,527 |
| Semper Paratus Acquisition Corp. Class A(5) | 83,094 | | 925 |
| SilverBox Corp. III Class A(5) | 94,545 | | 978 |
| Sizzle Acquisition Corp.(5) | 217,633 | | 2,396 |
| Slam Corp. Class A(5) | 330,441 | | 3,582 |
| Spark I Acquisition Corp.(5) | 381,965 | | 3,888 |
| Spring Valley Acquisition Corp. II(5) | 316,196 | | 4 |
| Spring Valley Acquisition Corp. II Class A(5) | 780,799 | | 8,464 |
| StoneBridge Acquisition Corp.(5) | 33,014 | | 367 |
| Target Global Acquisition I Corp. Class A(5) | 422,226 | | 4,657 |
| TenX Keane Acquisition Class A(5) | 251,058 | | 2,749 |
| TLGY Acquisition Corp. Class A(5)(8)(10) | 445,558 | | 4,937 |
| TMT Acquisition Corp.(5) | 244,827 | | 53 |
| TMT Acquisition Corp. Class A(5) | 327,009 | | 3,440 |
| | Shares/Units | | Value |
| TortoiseEcofin Acquisition Corp. III Class A(5)(10) | 1,363,243 | | $ 14,478 |
| Tristar Acquisition I Corp. Class A(5) | 447,946 | | 4,831 |
| two Class A(5) | 39,834 | | 420 |
| Valuence Merger Corp. I Class A(5)(10) | 581,603 | | 6,508 |
| Viveon Health Acquisition Corp.(5) | 76,597 | | 864 |
| Zalatoris Acquisition Corp.(5) | 252,668 | | 2,693 |
Total Special Purpose Acquisition Companies
(Identified Cost $598,667) | | 622,966 |
| | Shares | |
| Purchased Options—0.0% |
| (See open purchased options schedule) | |
Total Purchased Options
(Premiums Paid $7,320) | 910 |
| | | |
| |
| | | |
| |
| Escrow Notes—2.2% |
| Financials—2.2% | |
| Altaba, Inc. Escrow(5) | 25,792,925 | 63,064 |
| Pershing Square Escrow(5)(9) | 547,537 | — |
| | | 63,064 |
| | | |
| |
| Industrials—0.0% | |
| AMR Corp. Escrow(5) | 1,243,406 | 25 |
Total Escrow Notes
(Identified Cost $35,547) | 63,089 |
| | | |
| |
| | | |
| |
Total Long-Term Investments—82.6%
(Identified Cost $2,266,923) | 2,328,381 |
| | | |
| |
| | | |
| |
| Short-Term Investments—13.3% |
| Money Market Mutual Funds—13.3% |
| Goldman Sachs Financial Square Funds - Treasury Instruments Fund - Standard Shares (seven-day effective yield 5.214%)(11) | 192,800,000 | 192,800 |
| Goldman Sachs Financial Square Government Fund - Standard Shares (seven-day effective yield 5.244%)(11) | 181,159,801 | 181,160 |
Total Short-Term Investments
(Identified Cost $373,960) | 373,960 |
| | | |
| |
| | | |
| |
| Securities Lending Collateral—0.2% |
| Dreyfus Government Cash Management Fund - Institutional Shares (seven-day effective yield 5.250%)(11)(12) | 6,272,010 | 6,272 |
Total Securities Lending Collateral
(Identified Cost $6,272) | 6,272 |
| | | |
| |
| | | |
| |
TOTAL INVESTMENTS, BEFORE SECURITIES SOLD SHORT AND WRITTEN OPTIONS—96.1%
(Identified Cost $2,647,155) | 2,708,613 |
See Notes to Financial Statements
The Merger Fund
SCHEDULE OF INVESTMENTS (Continued)
December 31, 2023
($ reported in thousands)
| Securities Sold Short—(2.5)% |
| | Shares | | Value |
| Common Stocks—(2.5)% |
| Energy—(2.2)% | | |
| Chevron Corp. | (334,500) | | $ (49,894) |
| Exxon Mobil Corp. | (122,811) | | (12,279) |
| | | | (62,173) |
| | | | |
| |
| Materials—(0.1)% | | |
| Newmont Corp. | (83,185) | | (3,443) |
| Smurfit Kappa Group plc ADR | (3,891) | | (152) |
| | | | (3,595) |
| | | | |
| |
| Real Estate—(0.2)% | | |
| Kimco Realty Corp. | (118,164) | | (2,518) |
| Realty Income Corp. | (49,418) | | (2,838) |
| | | | (5,356) |
| | | | |
| |
Total Securities Sold Short
(Identified Proceeds $(69,322)) | | (71,124) |
| | | | |
| |
| | | | |
| |
| Written Options—(0.3)% |
| (See open written options schedule) | | | |
Total Written Options
(Premiums Received $8,415) | | (7,352) |
| | | | |
| |
| | | | |
| |
TOTAL INVESTMENTS, NET OF SECURITIES SOLD SHORT AND WRITTEN OPTIONS—93.3%
(Identified Cost $2,569,418) | | $ 2,630,137 |
| Other assets and liabilities, net—6.7% | | 189,871 |
| NET ASSETS—100.0% | | $ 2,820,008 |
| Abbreviations: |
| ADR | American Depositary Receipt |
| LLC | Limited Liability Company |
| LP | Limited Partnership |
| OBFR | Overnight Bank Funding Rate |
| S&P | Standard & Poor’s |
| SOFR | Secured Overnight Financing Rate |
| SPDR | S&P Depositary Receipt |
| Footnote Legend: |
| (1) | Security exempt from registration under Rule 144A of the Securities Act of 1933. These securities may be resold in transactions exempt from registration, normally to qualified institutional buyers. At December 31, 2023, these securities amounted to a value of $114,507 or 4.1% of net assets. |
| (2) | Regulation S security. Security is offered and sold outside of the United States; therefore, it is exempt from registration with the SEC under Rules 903 and 904 of the Securities Act of 1933. |
| (3) | Variable rate security. Rate disclosed is as of December 31, 2023. Information in parenthesis represents benchmark and reference rate for each security. Certain variable rate securities are not based on a published reference rate and spread but are determined by the issuer or agent and are based on current market conditions, or, for mortgage-backed securities, are impacted by the individual mortgages which are paying off over time. These securities do not indicate a reference rate and spread in their descriptions. |
| (4) | This loan will settle after December 31, 2023, at which time the interest rate, calculated on the base lending rate and the agreed upon spread on trade date, will be reflected. |
| (5) | Non-income producing. |
| (6) | All or a portion of the shares have been committed as collateral for open securities sold short and written option contracts. The value of securities segregated as collateral is $294,107. |
| (7) | Amount is less than $500 (not in thousands). |
| (8) | All or a portion of security is on loan. |
| (9) | The value of this security was determined using significant unobservable inputs and is reported as a Level 3 security in the Fair Value Hierarchy table located after the Schedule of Investments. |
| (10) | Affiliated investment. See Note 4G in Notes to Financial Statements. |
| (11) | Shares of this fund are publicly offered, and its prospectus and annual report are publicly available. |
| (12) | Represents security purchased with cash collateral received for securities on loan. |
| Counterparties: | |
| BAML | Bank of America-Merrill Lynch |
| GS | Goldman Sachs & Co. |
| JPM | JPMorgan Chase Bank N.A. |
| Foreign Currencies: | |
| AUD | Australian Dollar |
| EUR | Euro |
| GBP | United Kingdom Pound Sterling |
| JPY | Japanese Yen |
| USD | United States Dollar |
| Country Weightings (Unaudited)† |
| United States | 74% |
| Cayman Islands | 16 |
| Virgin Islands (British) | 3 |
| Australia | 2 |
| France | 2 |
| Sweden | 1 |
| Canada | 1 |
| Other | 1 |
| Total | 100% |
| †% of total investments, net of securities sold short and written options, as of December 31, 2023. |
| Open purchased options contracts as of December 31, 2023 were as follows: |
| Description of Options | Number of
Contracts | Contract
Notional
Amount | Strike
Price(1) | Expiration
Date | Value |
| Put Options(2) | | | | | |
| Cerevel Therapeutics Holdings, Inc. | 1,552 | $ 5,432 | $ 35.00 | 12/20/24 | $124 |
For information regarding the abbreviations, see the Key Investment Terms starting on page 4.
See Notes to Financial Statements
The Merger Fund
SCHEDULE OF INVESTMENTS (Continued)
December 31, 2023
($ reported in thousands)
| Open purchased options contracts as of December 31, 2023 were as follows (continued): |
| Description of Options | Number of
Contracts | Contract
Notional
Amount | Strike
Price(1) | Expiration
Date | Value |
| Put Options(2) (continued) | | | | | |
| Endeavor Group Holdings, Inc. | 15,514 | $31,028 | $ 20.00 | 02/16/24 | $388 |
| Seagen, Inc. | 3,422 | 65,018 | 190.00 | 06/21/24 | — |
| SPDR S&P 500® ETF Trust | 1,401 | 65,847 | 470.00 | 01/19/24 | 329 |
| SPDR S&P Retail® ETF | 941 | 6,022 | 64.00 | 01/19/24 | 11 |
| Teck Resources Ltd. | 3,674 | 11,757 | 32.00 | 01/19/24 | 28 |
| Teck Resources Ltd. | 1,898 | 7,213 | 38.00 | 01/19/24 | 23 |
| United States Steel Corp. | 7,463 | 23,135 | 31.00 | 01/19/24 | 7 |
| Total Purchased Options | | $910 |
| Footnote Legend: |
| (1) Strike price not reported in thousands. |
| (2) Exchange-traded options. |
| Open written options contracts as of December 31, 2023 were as follows: |
| Description of Options | Number of
Contracts | Contract
Notional
Amount | Strike
Price(1) | Expiration
Date | Value |
| Call Options(2) | | | | | |
| Albertsons Cos., Inc. | (766) | $ (1,915) | $ 25.00 | 04/19/24 | $ (58) |
| Capri Holdings Ltd. | (1,829) | (10,517) | 57.50 | 01/19/24 | (4) |
| Capri Holdings Ltd. | (5,136) | (25,680) | 50.00 | 01/19/24 | (449) |
| Cerevel Therapeutics Holdings, Inc. | (1,552) | (6,984) | 45.00 | 12/20/24 | (89) |
| Endeavor Group Holdings, Inc. | (15,515) | (34,909) | 22.50 | 02/16/24 | (3,026) |
| ImmunoGen, Inc. | (4,683) | (14,049) | 30.00 | 01/19/24 | (70) |
| ImmunoGen, Inc. | (18) | (56) | 31.00 | 07/19/24 | (1) |
| Karuna Therapeutics, Inc. | (152) | (4,864) | 320.00 | 01/19/24 | (5) |
| Karuna Therapeutics, Inc. | (13) | (429) | 330.00 | 02/16/24 | (1) |
| Sovos Brands, Inc. | (15,630) | (39,075) | 25.00 | 02/16/24 | (16) |
| SPDR S&P 500® ETF Trust | (1,001) | (48,048) | 480.00 | 01/19/24 | (295) |
| Splunk, Inc. | (508) | (7,874) | 155.00 | 02/16/24 | (8) |
| Splunk, Inc. | (1,072) | (16,616) | 155.00 | 04/19/24 | (161) |
| Teck Resources Ltd. | (1,021) | (4,084) | 40.00 | 01/19/24 | (306) |
| Teck Resources Ltd. | (1,898) | (7,971) | 42.00 | 01/19/24 | (258) |
| Teck Resources Ltd. | (907) | (3,447) | 38.00 | 02/16/24 | (449) |
| Teck Resources Ltd. | (1,798) | (7,192) | 40.00 | 02/16/24 | (638) |
| United States Steel Corp. | (2,800) | (13,720) | 49.00 | 01/19/24 | (140) |
| United States Steel Corp. | (1,881) | (8,652) | 46.00 | 02/16/24 | (630) |
| United States Steel Corp. | (4,663) | (22,382) | 48.00 | 02/16/24 | (746) |
| | | | | | (7,350) |
| Put Options(2) | | | | | |
| Seagen, Inc. | (3,423) | (49,634) | 145.00 | 06/21/24 | — |
| SPDR S&P Retail® ETF | (258) | (1,316) | 51.00 | 01/19/24 | (—) (3) |
| SPDR S&P Retail® ETF | (683) | (3,961) | 58.00 | 01/19/24 | (2) |
| | | | | | (2) |
| Total Written Options | | $ (7,352) |
| Footnote Legend: |
| (1) Strike price not reported in thousands. |
| (2) Exchange-traded options. |
| (3) Amount is less than $500 (not in thousands). |
See Notes to Financial Statements
The Merger Fund
SCHEDULE OF INVESTMENTS (Continued)
December 31, 2023
($ reported in thousands)
| Forward foreign currency exchange contracts as of December 31, 2023 were as follows: |
Currency
Purchased | Currency
Amount
Purchased | Currency
Sold | Currency
Amount
Sold | Counterparty | Settlement
Date | Unrealized
Appreciation | | Unrealized
Depreciation |
| AUD | 390 | USD | 267 | GS | 03/19/24 | $— | | $ — (1) |
| USD | 41,780 | EUR | 38,000 | JPM | 01/16/24 | — | | (202) |
| USD | 47,542 | GBP | 37,371 | GS | 01/30/24 | — | | (102) |
| USD | 3,441 | EUR | 3,126 | JPM | 02/20/24 | — | | (17) |
| USD | 26,893 | AUD | 39,434 | GS | 03/19/24 | — | | (44) |
| USD | 64,878 | JPY | 9,099,169 | GS | 03/27/24 | — | | (558) |
| Total | | | | | | $— | | $ (923) |
| Footnote Legend: |
| (1) | Amount is less than $500 (not in thousands). |
| Over-the-counter total return swaps outstanding as of December 31, 2023 were as follows: |
| Referenced Entity | Pay/Receive | Financing Rate(1) | Payment
Frequency | Counterparty | Expiration
Date | Notional
Amount | Value (2) | Unrealized
Appreciation | Unrealized
Depreciation |
| Long Total Return Swap Contracts | | | | | | | | | | |
| Bristol-Myers Squibb Co.(3),(4) | Pay | 6.070% (0.750% + OBFR) | 1 Month | BAML | 03/04/24 | $ —(5) | | $ 516 | $ 516 | $ — |
| Brookfield Property Preferred LP | Pay | 6.070% (0.750% + OBFR) | 1 Month | BAML | 01/08/24 | 846 | | (211) | — | (211) |
| Canna-Global Acquisition Corp. | Pay | 5.700% (0.380% + OBFR) | 3 Month | JPM | 01/13/25 | 611 | | — (5) | — | — (5) |
| Chr. Hansen Holding A/S | Pay | 5.930% (0.610% + OBFR) | 1 Month | GS | 02/19/24 | 14,633 | | 2,138 | 2,138 | — |
| Chr. Hansen Holding A/S | Pay | 5.870% (0.550% + OBFR) | 3 Month | JPM | 08/05/24 | 211 | | 42 | 42 | — |
| Chr. Hansen Holding A/S | Pay | 5.870% (0.550% + OBFR) | 3 Month | JPM | 08/12/24 | 4,782 | | 907 | 907 | — |
| Chr. Hansen Holding A/S | Pay | 5.870% (0.550% + OBFR) | 3 Month | JPM | 08/13/24 | 2,072 | | 369 | 369 | — |
| Chr. Hansen Holding A/S | Pay | 5.870% (0.550% + OBFR) | 3 Month | JPM | 08/14/24 | 2,546 | | 393 | 393 | — |
| Chr. Hansen Holding A/S | Pay | 5.870% (0.550% + OBFR) | 3 Month | JPM | 08/19/24 | 563 | | 73 | 73 | — |
| Dechra Pharmaceuticals plc | Pay | 5.930% (0.610% + OBFR) | 1 Month | GS | 05/27/24 | 43,135 | | 2,742 | 2,742 | — |
| Euronav N.V. | Pay | 5.930% (0.610% + OBFR) | 1 Month | GS | 11/11/24 | 1,881 | | (16) | — | (16) |
| Euronav N.V. | Pay | 5.870% (0.550% + OBFR) | 3 Month | JPM | 11/12/24 | 1,880 | | (16) | — | (16) |
| Euronav N.V. | Pay | 5.870% (0.550% + OBFR) | 3 Month | JPM | 11/13/24 | 2,507 | | (22) | — | (22) |
| Euronav N.V. | Pay | 5.870% (0.550% + OBFR) | 3 Month | JPM | 11/18/24 | 244 | | (2) | — | (2) |
| Euronav N.V. | Pay | 5.870% (0.550% + OBFR) | 3 Month | JPM | 11/20/24 | 1,736 | | (22) | — | (22) |
| Euronav N.V. | Pay | 5.870% (0.550% + OBFR) | 3 Month | JPM | 11/25/24 | 2,369 | | (30) | — | (30) |
| Euronav N.V. | Pay | 5.870% (0.550% + OBFR) | 3 Month | JPM | 12/02/24 | 177 | | (2) | — | (2) |
| Euronav N.V. | Pay | 5.870% (0.550% + OBFR) | 3 Month | JPM | 12/03/24 | 129 | | (2) | — | (2) |
| Euronav N.V. | Pay | 5.870% (0.550% + OBFR) | 3 Month | JPM | 12/09/24 | 574 | | (10) | — | (10) |
| Euronav N.V. | Pay | 5.870% (0.550% + OBFR) | 3 Month | JPM | 12/10/24 | 123 | | (2) | — | (2) |
| Euronav N.V. | Pay | 5.870% (0.550% + OBFR) | 3 Month | JPM | 12/13/24 | 189 | | (4) | — | (4) |
| Euronav N.V. | Pay | 5.870% (0.550% + OBFR) | 3 Month | JPM | 12/16/24 | 10 | | — (5) | — | — (5) |
| Hess Corp. | Pay | 5.930% (0.610% + OBFR) | 1 Month | GS | 01/09/25 | 28,297 | | 2,497 | 2,497 | — |
| JSR Corp. | Pay | 5.930% (0.610% + OBFR) | 1 Month | GS | 07/30/24 | 60,189 | | (672) | — | (672) |
| | | | | | | | | 8,666 | 9,677 | (1,011) |
| Short Total Return Swap Contracts | | | | | | | | | | |
| Brookfield Asset Management Ltd. | Receive | 4.970% ((0.350)% + OBFR) | 1 Month | GS | 09/30/24 | (1,246) | | (243) | — | (243) |
| Chevron Corp. | Receive | 4.970% ((0.350)% + OBFR) | 1 Month | GS | 12/06/24 | (137,924) | | (2,175) | — | (2,175) |
| Exxon Mobil Corp. | Receive | 4.970% ((0.350)% + OBFR) | 1 Month | GS | 09/16/24 | (216,510) | | 24,792 | 24,792 | — |
| Exxon Mobil Corp. | Receive | 4.970% ((0.350)% + OBFR) | 1 Month | GS | 09/18/24 | (15,443) | | (67) | — | (67) |
| Kimco Realty Corp. | Receive | 4.970% ((0.350)% + OBFR) | 1 Month | GS | 10/07/24 | (11,680) | | (1,733) | — | (1,733) |
| Newmont Corp. | Receive | 4.970% ((0.350)% + OBFR) | 1 Month | GS | 06/24/24 | (112) | | 1 | 1 | — |
| Novozymes A/S | Receive | 4.970% ((0.350)% + OBFR) | 1 Month | GS | 02/19/24 | (15,699) | | (1,150) | — | (1,150) |
| Novozymes A/S | Receive | 4.820% ((0.500)% + OBFR) | 3 Month | JPM | 08/05/24 | (217) | | (38) | — | (38) |
| Novozymes A/S | Receive | 4.820% ((0.500)% + OBFR) | 3 Month | JPM | 08/12/24 | (4,890) | | (819) | — | (819) |
| Novozymes A/S | Receive | 4.820% ((0.500)% + OBFR) | 3 Month | JPM | 08/13/24 | (2,122) | | (331) | — | (331) |
See Notes to Financial Statements
The Merger Fund
SCHEDULE OF INVESTMENTS (Continued)
December 31, 2023
($ reported in thousands)
| Over-the-counter total return swaps outstanding as of December 31, 2023 were as follows (continued): |
| Referenced Entity | Pay/Receive | Financing Rate(1) | Payment
Frequency | Counterparty | Expiration
Date | Notional
Amount | Value (2) | | Unrealized
Appreciation | | Unrealized
Depreciation |
| Novozymes A/S | Receive | 4.820% ((0.500)% + OBFR) | 3 Month | JPM | 08/14/24 | $ (2,608) | | $ (347) | | $ — | | $ (347) |
| Novozymes A/S | Receive | 4.820% ((0.500)% + OBFR) | 3 Month | JPM | 08/19/24 | (577) | | (63) | | — | | (63) |
| Origin Energy Ltd. | Receive | 4.920% ((0.400)% + OBFR) | 1 Month | GS | 01/20/25 | (938) | | (6) | | — | | (6) |
| Realty Income Corp. | Receive | 4.970% ((0.350)% + OBFR) | 1 Month | GS | 12/02/24 | (58,334) | | (9,930) | | — | | (9,930) |
| Realty Income Corp. | Receive | 4.720% ((0.600)% + OBFR) | 3 Month | JPM | 12/02/24 | (5,041) | | (1,242) | | — | | (1,242) |
| Realty Income Corp. | Receive | 4.720% ((0.600)% + OBFR) | 3 Month | JPM | 12/23/24 | (9,423) | | (779) | | — | | (779) |
| Smurfit Kappa Group plc | Receive | 5.050% ((0.270)% + OBFR) | 1 Month | GS | 10/14/24 | (82,661) | | (8,565) | | — | | (8,565) |
| | | | | | | | | (2,695) | | 24,793 | | (27,488) |
| Total | | | | | | | | $ 5,971 | | $34,470 | | $(28,499) |
| Footnote Legend: |
| (1) | The Fund pays the floating rate (+/- a spread) and receives the total return of the reference entity. |
| (2) | There were no upfront premiums paid or received for the open swap contracts held. |
| (3) | The value of this security was determined using significant unobservable inputs and is reported as a Level 3 security in the Fair Value Hierarchy table located after the Schedule of Investments. |
| (4) | Security held is the direct result of a corporate action. There is no associated financing rate and the security is held with a zero cost basis. |
| (5) | Amount is less than $500 (not in thousands). |
See Notes to Financial Statements
The Merger Fund
SCHEDULE OF INVESTMENTS (Continued)
December 31, 2023
($ reported in thousands)
The following table summarizes the value of the Fund’s investments as of December 31, 2023, based on the inputs used to value them (See Security Valuation Note 2A in the Notes to Financial Statements):
| | Total
Value at
December 31, 2023 | | Level 1
Quoted Prices | | Level 2
Significant
Observable
Inputs | | Level 3
Significant
Unobservable
Inputs |
| Assets: | | | | | | | |
| Debt Instruments: | | | | | | | |
| Convertible Bonds and Notes | $ 46,456 | | $ — | | $ 46,456 | | $ — |
| Corporate Bonds and Notes | 191,191 | | — | | 191,191 | | — |
| Leveraged Loans | 18,369 | | — | | 18,369 | | — |
| Equity Securities: | | | | | | | |
| Preferred Stocks | 14,723 | | 14,723 | | — | | — |
| Common Stocks | 1,287,056 | | 1,286,918 | | 9 | | 129 (1) |
| Rights | 1,055 | | — | | 378 | | 677 |
| Warrants | 1,285 | | 716 | | — | | 569 (1) |
| Special Purpose Acquisition Companies | 622,966 | | 603,810 | | 19,156 | | — |
| Escrow Notes | 63,089 | | — | | 63,089 | | — (1) |
| Affiliated Mutual Fund | 81,281 | | 81,281 | | — | | — |
| Money Market Mutual Funds | 373,960 | | 373,960 | | — | | — |
| Securities Lending Collateral | 6,272 | | 6,272 | | — | | — |
| Other Financial Instruments: | | | | | | | |
| Purchased Options | 910 | | 340 | | 570 | | — |
| Over-the-Counter Total Return Swaps* | 34,470 | | — | | 33,954 | | 516 |
| Total Assets | 2,743,083 | | 2,368,020 | | 373,172 | | 1,891 |
| Liabilities: | | | | | | | |
| Securities Sold Short: | | | | | | | |
| Common Stocks | (71,124) | | (71,124) | | — | | — |
| Other Financial Instruments: | | | | | | | |
| Written Options | (7,352) | | (1,932) | | (5,420) | | — |
| Forward Foreign Currency Exchange Contracts* | (923) | | — | | (923) | | — |
| Over-the-Counter Total Return Swaps* | (28,499) | | — | | (28,499) | | — |
| Total Liabilities | (107,898) | | (73,056) | | (34,842) | | — |
| Total Investments, Net of Securities Sold Short and Written Options | $2,635,185 | | $2,294,964 | | $ 338,330 | | $1,891 |
| (1) | Includes internally fair valued securities currently priced at zero ($0). |
| * | Swap contracts and forward currency exchange contracts are valued at the net unrealized appreciation (depreciation) on the instrument by level and counterparty. |
Securities held by the Fund with an end of period value of $25 were transferred from Level 3 to Level 2 due to an increase in trading activities at period end.
Some of the Fund’s investments that were categorized as Level 3 may have been valued utilizing third party pricing information without adjustment. If applicable, such valuations are based on unobservable inputs. A significant change in third party information could result in a significantly lower or higher value of Level 3 investments.
Management has determined that the amount of Level 3 securities compared to total net assets is not material; therefore, the roll-forward of Level 3 securities and assumptions are not shown for the period ended December 31, 2023.
See Notes to Financial Statements
Westchester Credit Event Fund
SCHEDULE OF INVESTMENTS
December 31, 2023
($ reported in thousands)
| | Par Value | | Value |
| Convertible Bonds and Notes—7.8% |
| Health Care—1.5% | | |
Cerevel Therapeutics Holdings, Inc. 144A
2.500%, 8/15/27(1) | $ 958 | | $ 1,067 |
| Information Technology—6.3% | | |
Splunk, Inc.
1.125%, 6/15/27 | 4,841 | | 4,689 |
Total Convertible Bonds and Notes
(Identified Cost $5,660) | | 5,756 |
| | | | |
| |
| | | | |
| |
| Corporate Bonds and Notes—60.6% |
| Communication Services—7.7% | | |
Allen Media LLC 144A
10.500%, 2/15/28(1) | 451 | | 241 |
Clear Channel Outdoor Holdings, Inc. 144A
7.500%, 6/1/29(1) | 1,456 | | 1,211 |
Connect Finco S.a.r.l. 144A
6.750%, 10/1/26(1) | 575 | | 571 |
Getty Images, Inc. 144A
9.750%, 3/1/27(1)(2) | 1,239 | | 1,246 |
GrubHub Holdings, Inc. 144A
5.500%, 7/1/27(1) | 181 | | 152 |
| Lagardere S.A. | | | |
| RegS 2.125%, 10/16/26(3) | 1,000 EUR | | 1,101 |
| RegS 1.750%, 10/7/27(3) | 1,100 EUR | | 1,210 |
| | | | 5,732 |
| | | | |
| |
| Consumer Discretionary—12.2% | | |
Aramark Services, Inc. 144A
5.000%, 4/1/25(1) | 1,097 | | 1,089 |
Carriage Services, Inc. 144A
4.250%, 5/15/29(1) | 1,967 | | 1,747 |
Light & Wonder International, Inc. 144A
7.000%, 5/15/28(1) | 426 | | 430 |
Michael Kors USA, Inc. 144A
4.250%, 11/1/24(1) | 3,888 | | 3,801 |
Valvoline, Inc. 144A
4.250%, 2/15/30(1) | 1,978 | | 1,962 |
| | | | 9,029 |
| | | | |
| |
| Consumer Staples—2.4% | | |
TreeHouse Foods, Inc.
4.000%, 9/1/28 | 1,482 | | 1,312 |
Vector Group Ltd. 144A
10.500%, 11/1/26(1) | 472 | | 473 |
| | | | 1,785 |
| | | | |
| |
| Energy—16.4% | | |
Alliance Resource Operating Partners LP 144A
7.500%, 5/1/25(1) | 2,249 | | 2,238 |
California Resources Corp. 144A
7.125%, 2/1/26(1) | 3,431 | | 3,480 |
Calumet Specialty Products Partners LP 144A
11.000%, 4/15/25(1) | 2,680 | | 2,709 |
PDC Energy, Inc.
5.750%, 5/15/26 | 1,957 | | 1,953 |
| | Par Value | | Value |
| | | | |
| Energy—continued | | |
Petroleum Geo-Services AS
13.500%, 3/31/27 | $ 1,600 | | $ 1,756 |
| | | | 12,136 |
| | | | |
| |
| Financials—13.1% | | |
Intercontinental Exchange, Inc.
3.650%, 5/23/25 | 1,268 | | 1,244 |
Mobius Merger Sub, Inc. 144A
9.000%, 6/1/30(1) | 1,359 | | 1,318 |
NFP Corp. 144A
6.875%, 8/15/28(1) | 2,138 | | 2,173 |
Permian Resources Operating LLC 144A
8.000%, 4/15/27(1) | 1,248 | | 1,294 |
SEG Holding LLC 144A
5.625%, 10/15/28(1) | 2,881 | | 2,892 |
United Airlines, Inc. Pass-Through Trust 2016-2, B
3.650%, 4/7/27 | 546 | | 513 |
Verscend Escrow Corp. 144A
9.750%, 8/15/26(1) | 218 | | 220 |
| | | | 9,654 |
| | | | |
| |
| Industrials—7.7% | | |
Bombardier, Inc. 144A
7.875%, 4/15/27(1) | 222 | | 222 |
IEA Energy Services LLC 144A
6.625%, 8/15/29(1) | 764 | | 712 |
| La Financiere Atalian SASU | | | |
| RegS 4.000%, 5/15/24(3) | 352 EUR | | 307 |
| RegS 5.125%, 5/15/25(3) | 419 EUR | | 339 |
Mauser Packaging Solutions Holding Co. 144A
9.250%, 4/15/27(1) | 1,694 | | 1,663 |
PGT Innovations, Inc. 144A
4.375%, 10/1/29(1) | 2,448 | | 2,439 |
| | | | 5,682 |
| | | | |
| |
| Utilities—1.1% | | |
Origin Energy Finance Ltd. RegS
1.000%, 9/17/29(3) | 845 EUR | | 812 |
Total Corporate Bonds and Notes
(Identified Cost $44,887) | | 44,830 |
| | | | |
| |
| | | | |
| |
| Leveraged Loans—4.3% |
| Health Care—1.2% | | |
Verscend Holding Corp. Tranche B (1 month Term SOFR + 4.114%)
9.470%, 8/27/25(4) | 893 | | 894 |
| Information Technology—2.6% | | |
NFP Corp. (1 month Term SOFR + 3.250%)
0.000%, 2/15/27(4)(5) | 700 | | 703 |
Syniverse Holdings, Inc. (3 month Term SOFR + 7.000%)
12.348%, 5/13/27(4) | 1,383 | | 1,204 |
| | | | 1,907 |
| | | | |
| |
See Notes to Financial Statements
Westchester Credit Event Fund
SCHEDULE OF INVESTMENTS (Continued)
December 31, 2023
($ reported in thousands)
| | Par Value | | Value |
| | | | |
| Retail—0.5% | | |
Claire’s Stores, Inc. Tranche B (1 month Term SOFR + 6.600%)
11.956%, 12/18/26(4) | $ 403 | | $ 367 |
Total Leveraged Loans
(Identified Cost $3,316) | | 3,168 |
| | Shares | |
| Closed-End Funds—8.2% |
| Equity Funds—8.2% | |
| Ares Dynamic Credit Allocation Fund, Inc. | 14,699 | 202 |
| BlackRock Debt Strategies Fund, Inc. | 59,125 | 638 |
| BlackRock MuniYield Quality Fund III, Inc. | 7,499 | 87 |
| Blackstone Senior Floating Rate 2027 Term Fund | 8,995 | 120 |
| Blackstone Strategic Credit 2027 Term Fund | 11,153 | 126 |
| First Trust Senior Floating Rate Income Fund II | 19,676 | 199 |
| Franklin Universal Trust | 15,487 | 103 |
| Invesco Municipal Opportunity Trust | 79,618 | 765 |
| Invesco Senior Income Trust | 139,220 | 571 |
| Invesco Value Municipal Income Trust | 7,269 | 85 |
| KKR Income Opportunities Fund | 34,775 | 437 |
| Nuveen AMT-Free Municipal Credit Income Fund | 112,236 | 1,327 |
| Nuveen AMT-Free Quality Municipal Income Fund | 30,071 | 331 |
| Nuveen Municipal Credit Income Fund | 68,635 | 811 |
| Nuveen Municipal Value Fund, Inc. | 24,298 | 209 |
| Nuveen Preferred & Income Term Fund | 3,841 | 70 |
| | | 6,081 |
| | | |
| |
Total Closed-End Funds
(Identified Cost $5,841) | 6,081 |
| | | |
| |
| | | |
| |
| Preferred Stocks—3.8% |
| Consumer Discretionary—0.4% | |
| Fossil Group, Inc., 7.000% | 20,031 | 309 |
| Industrials—3.4% | |
| Textainer Group Holdings Ltd., 7.000% | 93,841 | 2,332 |
| Textainer Group Holdings Ltd. Series B, 6.250% | 8,995 | 222 |
| | | 2,554 |
| | | |
| |
Total Preferred Stocks
(Identified Cost $3,039) | 2,863 |
| | | |
| |
| | | |
| |
| Common Stock—0.0% |
| Financials—0.0% | |
| Acropolis Infrastructure(6)(7) | 6,145 | — |
Total Common Stock
(Identified Cost $—) | — |
| | | |
| |
| | | |
| |
| Warrants—0.0% |
| Communication Services—0.0% | |
| BuzzFeed, Inc., 12/01/26(7) | 986 | — (8) |
| Consumer Discretionary—0.0% | |
| Allurion Technologies, Inc., 07/31/29(7) | 1,074 | — (8) |
| ECARX Holdings, Inc., 12/21/27(7) | 2,800 | — (8) |
| | Shares | | Value |
| | | | |
| Consumer Discretionary—continued | | |
| Grove Collaborative Holdings, 03/13/26(7) | 983 | | $ —(8) |
| Zapp Electric Vehicles Group Ltd., 03/03/28(7) | 601 | | — (8) |
| | | | — (8) |
| | | | |
| |
| Financials—0.0% | | |
| 26 Capital Acquisition Corp., 12/31/27(7) | 1,000 | | — |
| Alchemy Investments Acquisition Corp. 1, 06/26/28(7) | 3,082 | | 1 |
| AltEnergy Acquisition Corp., 11/10/28(7) | 243 | | — (8) |
| Arrowroot Acquisition Corp., 03/02/26(7) | 992 | | — (8) |
| ESGEN Acquisition Corp., 10/20/26(7) | 282 | | — (8) |
| EVe Mobility Acquisition Corp., 12/31/28(7) | 1,945 | | — (8) |
| FTAC Emerald Acquisition Corp., 08/22/28(7) | 807 | | — (8) |
| GCM Grosvenor, Inc. Class A, 11/17/25(7) | 4,103 | | 2 |
| Goal Acquisitions Corp., 02/11/26(7) | 10,907 | | — (8) |
| Haymaker Acquisition Corp. 4, 09/12/28(7) | 2,394 | | — (8) |
| Inflection Point Acquisition Corp. II, 07/17/28(7) | 2,574 | | — (8) |
| Kensington Capital Acquisition Corp. V, 08/13/28(7) | 5,397 | | 1 |
| LeddarTech Holdings, Inc., 09/21/28(7) | 3,202 | | — (8) |
| Newbury Street Acquisition Corp., 12/31/27(7) | 2,435 | | — (8) |
| Newcourt Acquisition Corp., 04/12/28(7) | 733 | | — (8) |
| Phoenix Biotech Acquisition Corp., 09/01/26(7) | 240 | | — (8) |
| Pyrophyte Acquisition Corp., 05/03/28(7) | 326 | | — (8) |
| RMG Acquisition Corp. III, 12/31/27(7) | 1,120 | | — (8) |
| Screaming Eagle Acquisition Corp. Class A, 12/15/27(7) | 1,138 | | 1 |
| Semper Paratus Acquisition Corp., 11/04/26(7) | 325 | | — (8) |
| Slam Corp. Class A, 12/31/27(7) | 217 | | — (8) |
| Spring Valley Acquisition Corp. II, 02/25/26(7) | 525 | | — (8) |
| Target Global Acquisition I Corp., 12/31/27(7) | 480 | | — (8) |
| Volato Group, Inc., 12/03/28(7) | 648 | | — (8) |
| XBP Europe Holdings, Inc., 12/31/27(7) | 1,227 | | — (8) |
| | | | 5 |
| | | | |
| |
| Health Care—0.0% | | |
| Newamsterdam Pharma Co. N.V., 11/22/27(7) | 3,067 | | 10 |
| Pear Therapeutics, Inc., 02/04/26(7) | 1,433 | | — (8) |
| | | | 10 |
| | | | |
| |
| Industrials—0.0% | | |
| Amprius Technologies, Inc., 03/02/27(7) | 3,369 | | 1 |
| Bridger Aerospace Group Holdings, Inc., 12/31/27(7) | 2,200 | | 1 |
| Freightos Ltd., 01/23/28(7) | 208 | | — (8) |
| Getaround, Inc., 03/09/26(7) | 458 | | — (8) |
| | | | 2 |
| | | | |
| |
| Information Technology—0.0% | | |
| FOXO Technologies, Inc., 08/01/27(7) | 1,072 | | — (8) |
| Near Intelligence, Inc., 07/08/27(7) | 2,500 | | — (8) |
| | | | — (8) |
| | | | |
| |
| Materials—0.0% | | |
| Ginkgo Bioworks Holdings, Inc., 12/31/27(7) | 940 | | — (8) |
Total Warrants
(Identified Cost $29) | | 17 |
| | Shares/Units | |
| Special Purpose Acquisition Companies—10.9% |
| Aimfinity Investment Corp. I(7) | 2,209 | 24 |
See Notes to Financial Statements
Westchester Credit Event Fund
SCHEDULE OF INVESTMENTS (Continued)
December 31, 2023
($ reported in thousands)
| | Shares/Units | | Value |
| Alchemy Investments Acquisition Corp. 1(7) | 6,164 | | $ 64 |
| Alpha Partners Technology Merger Corp. Class A(7) | 1,697 | | 18 |
| Alpha Star Acquisition Corp.(7) | 16,220 | | 182 |
| AltC Acquisition Corp. Class A(7) | 23,391 | | 247 |
| Andretti Acquisition Corp. Class A(7) | 2,148 | | 23 |
| AP Acquisition Corp. Class A(7) | 9,372 | | 104 |
| Arisz Acquisition Corp.(7) | 5,852 | | 64 |
| Arrowroot Acquisition Corp. Class A(7) | 1,190 | | 12 |
| Bannix Acquisition Corp.(7) | 288 | | 3 |
| Bayview Acquisition Corp. Class A(7) | 18,493 | | 185 |
| BlueRiver Acquisition Corp. Class A(7) | 43,440 | | 463 |
| Bowen Acquisition Corp.(7) | 3,946 | | 41 |
| Bukit Jalil Global Acquisition 1 Ltd.(7) | 2,411 | | 25 |
| byNordic Acquisition Corp.(7) | 2,964 | | 33 |
| Cartesian Growth Corp. II Class A(7) | 25,189 | | 276 |
| CF Acquisition Corp. VII Class A(7) | 3,767 | | 41 |
| Chain Bridge I Class A(7) | 3,587 | | 39 |
| Chenghe Acquisition Co. Class A(7) | 36,860 | | 405 |
| Clean Energy Special Situations Corp.(7) | 9,243 | | 97 |
| Colombier Acquisition Corp. II(7) | 4,147 | | 42 |
| Concord Acquisition Corp. II Class A(7) | 37,981 | | 394 |
| Crown PropTech Acquisitions Class A(7) | 18 | | — (8) |
| Direct Selling Acquisition Corp. Class A(7) | 2,939 | | 32 |
| Distoken Acquisition Corp.(7) | 2,872 | | 30 |
| DUET Acquisition Corp. Class A(7) | 3,522 | | 39 |
| ESH Acquisition Corp.(7) | 4,387 | | — (8) |
| ESH Acquisition Corp. Class A(7) | 4,387 | | 45 |
| EVe Mobility Acquisition Corp. Class A(7) | 60,000 | | 648 |
| Evergreen Corp. Class A(7) | 3,950 | | 44 |
| Fintech Ecosystem Development Corp. Class A(7) | 2,433 | | 26 |
| Focus Impact Acquisition Corp. Class A(7) | 3,302 | | 36 |
| Fortune Rise Acquisition Corp.(7) | 22,119 | | 242 |
| FTAC Emerald Acquisition Corp. Class A(7) | 22,771 | | 241 |
| Global Blockchain Acquisition Corp.(7) | 20,000 | | 211 |
| Global Partner Acquisition Corp. II Class A(7) | 82 | | 1 |
| Globalink Investment, Inc.(7) | 7,142 | | 77 |
| Golden Star Acquisition Corp.(7) | 2,386 | | 25 |
| Haymaker Acquisition Corp. 4(7) | 4,788 | | 49 |
| HCM Acquisition Corp. Class A(7) | 8,697 | | 97 |
| Hennessy Capital Investment Corp. VI Class A(7) | 32,505 | | 339 |
| Hudson Acquisition I Corp.(7) | 2,376 | | 25 |
| Inflection Point Acquisition Corp. II Class A(7) | 5,149 | | 53 |
| Integrated Rail & Resources Acquisition Corp. Class A(7) | 4,901 | | 53 |
| Investcorp Europe Acquisition Corp. I Class A(7) | 16,664 | | 184 |
| Investcorp India Acquisition Corp. Class A(7) | 2,150 | | 24 |
| Iron Horse Acquisitions Corp.(7) | 4,884 | | 49 |
| Keen Vision Acquisition Corp.(7) | 10,544 | | 109 |
| L Catterton Asia Acquisition Corp. Class A(7) | 27,662 | | 298 |
| Mountain & Co. I Acquisition Corp.(7) | 8,108 | | 92 |
| Newbury Street Acquisition Corp.(7) | 6,782 | | 72 |
| Newcourt Acquisition Corp. Class A(7) | 66 | | 1 |
| Nubia Brand International Corp. Class A(7) | 6,087 | | 67 |
| Oak Woods Acquisition Corp. Class A(7) | 4,226 | | 44 |
| Patria Latin American Opportunity Acquisition Corp.(7) | 14,119 | | 157 |
| Plum Acquisition Corp. I Class A(7) | 9,431 | | 102 |
| Plutonian Acquisition Corp.(7) | 4,024 | | 43 |
| Power & Digital Infrastructure Acquisition II Corp. Class A(7) | 255 | | 3 |
| PowerUp Acquisition Corp. Class A(7) | 577 | | 6 |
| Project Energy Reimagined Acquisition Corp.(7) | 25,614 | | 271 |
| Quadro Acquisition One Corp.(7) | 921 | | 10 |
| Quetta Acquisition Corp.(7) | 4,564 | | 47 |
| RCF Acquisition Corp. Class A(7) | 3,710 | | 41 |
| | Shares/Units | | Value |
| Rigel Resource Acquisition Corp. Class A(7) | 43,094 | | $ 472 |
| Ross Acquisition Corp. II Class A(7) | 3,655 | | 40 |
| Roth CH Acquisition Co.(7) | 4,341 | | 47 |
| Slam Corp. Class A(7) | 972 | | 11 |
| Spark I Acquisition Corp.(7) | 9,094 | | 93 |
| Spring Valley Acquisition Corp. II(7) | 1,051 | | — (8) |
| TenX Keane Acquisition Class A(7) | 3,283 | | 36 |
| TLGY Acquisition Corp. Class A(7) | 25,965 | | 288 |
| TMT Acquisition Corp.(7) | 3,695 | | 1 |
| TMT Acquisition Corp. Class A(7) | 3,695 | | 39 |
| TortoiseEcofin Acquisition Corp. III Class A(7) | 18,868 | | 200 |
| Twelve Seas Investment Co. II Class A(7) | 4,741 | | 50 |
| Valuence Merger Corp. I Class A(7) | 513 | | 6 |
| Zalatoris Acquisition Corp.(7) | 4,553 | | 49 |
Total Special Purpose Acquisition Companies
(Identified Cost $7,855) | | 8,047 |
| | Shares | |
| Escrow Notes—1.1% |
| Financials—1.1% | |
| Altaba, Inc. Escrow(7) | 327,452 | ��� 800 |
Total Escrow Notes
(Identified Cost $638) | 800 |
| | | |
| |
| | | |
| |
Total Long-Term Investments—96.7%
(Identified Cost $71,265) | 71,562 |
| | | |
| |
| | | |
| |
| Short-Term Investments—3.2% |
| Money Market Mutual Funds—3.2% |
| Goldman Sachs Financial Square Funds - Treasury Instruments Fund - Standard Shares (seven-day effective yield 5.214%)(9) | 1,900,000 | 1,900 |
| Goldman Sachs Financial Square Government Fund - Standard Shares (seven-day effective yield 5.244%)(9) | 461,208 | 461 |
Total Short-Term Investments
(Identified Cost $2,361) | 2,361 |
| | | |
| |
| | | |
| |
TOTAL INVESTMENTS, BEFORE SECURITIES SOLD SHORT—99.9%
(Identified Cost $73,626) | 73,923 |
| Securities Sold Short—(0.5)% |
| | Par Value | |
| U.S. Government Security—(0.5)% |
U.S. Treasury Notes
3.250%, 6/30/29 | $ (398) | (385) |
Total Securities Sold Short
(Identified Proceeds $(405)) | (385) |
| | | |
| |
| | | |
| |
TOTAL INVESTMENTS, NET OF SECURITIES SOLD SHORT—99.4%
(Identified Cost $73,221) | $ 73,538 |
| Other assets and liabilities, net—0.6% | 442 |
| NET ASSETS—100.0% | $ 73,980 |
See Notes to Financial Statements
Westchester Credit Event Fund
SCHEDULE OF INVESTMENTS (Continued)
December 31, 2023
($ reported in thousands)
| Abbreviations: |
| AMT | Alternative Minimum Tax |
| LLC | Limited Liability Company |
| LP | Limited Partnership |
| OBFR | Overnight Bank Funding Rate |
| SOFR | Secured Overnight Financing Rate |
| Footnote Legend: |
| (1) | Security exempt from registration under Rule 144A of the Securities Act of 1933. These securities may be resold in transactions exempt from registration, normally to qualified institutional buyers. At December 31, 2023, these securities amounted to a value of $35,350 or 47.8% of net assets. |
| (2) | All or a portion of the shares have been committed as collateral for securities sold short. The value of securities segregated as collateral is $655. |
| (3) | Regulation S security. Security is offered and sold outside of the United States; therefore, it is exempt from registration with the SEC under Rules 903 and 904 of the Securities Act of 1933. |
| (4) | Variable rate security. Rate disclosed is as of December 31, 2023. Information in parenthesis represents benchmark and reference rate for each security. Certain variable rate securities are not based on a published reference rate and spread but are determined by the issuer or agent and are based on current market conditions, or, for mortgage-backed securities, are impacted by the individual mortgages which are paying off over time. These securities do not indicate a reference rate and spread in their descriptions. |
| (5) | This loan will settle after December 31, 2023, at which time the interest rate, calculated on the base lending rate and the agreed upon spread on trade date, will be reflected. |
| (6) | The value of this security was determined using significant unobservable inputs and is reported as a Level 3 security in the Fair Value Hierarchy table located after the Schedule of Investments. |
| (7) | Non-income producing. |
| (8) | Amount is less than $500 (not in thousands). |
| (9) | Shares of this fund are publicly offered, and its prospectus and annual report are publicly available. |
| Counterparties: | |
| GS | Goldman Sachs & Co. |
| JPM | JPMorgan Chase Bank N.A. |
| Foreign Currencies: | |
| EUR | Euro |
| USD | United States Dollar |
| Country Weightings (Unaudited)† |
| United States | 81% |
| Cayman Islands | 7 |
| France | 4 |
| Bermuda | 4 |
| Norway | 2 |
| Australia | 1 |
| Luxembourg | 1 |
| Total | 100% |
| †% of total investments, net of securities sold short as of December 31, 2023. |
| Forward foreign currency exchange contracts as of December 31, 2023 were as follows: |
Currency
Purchased | Currency
Amount
Purchased | Currency
Sold | Currency
Amount
Sold | Counterparty | Settlement
Date | Unrealized
Appreciation | | Unrealized
Depreciation |
| USD | 2,309 | EUR | 2,100 | JPM | 01/16/24 | $— | | $ (11) |
| USD | 930 | EUR | 845 | JPM | 02/20/24 | — | | (4) |
| USD | 658 | EUR | 596 | JPM | 03/13/24 | — | | (2) |
| Total | | | | | | $— | | $ (17) |
For information regarding the abbreviations, see the Key Investment Terms starting on page 4.
See Notes to Financial Statements
Westchester Credit Event Fund
SCHEDULE OF INVESTMENTS (Continued)
December 31, 2023
($ reported in thousands)
| Over-the-counter total return swaps outstanding as of December 31, 2023 were as follows: |
| Referenced Entity | Pay/Receive | Financing Rate(1) | Payment
Frequency | Counterparty | Expiration
Date | Notional
Amount | Value (2) | | Unrealized
Appreciation | | Unrealized
Depreciation |
| Long Total Return Swap Contracts | | | | | | | | | | | | |
| BlackRock Floating Rate Income Strategies Fund, Inc. | Pay | 5.910% (0.590% + OBFR) | 3 Month | JPM | 03/25/24 | $ 17 | | $ 1 | | $ 1 | | $ — |
| BlackRock Floating Rate Income Strategies Fund, Inc. | Pay | 5.910% (0.590% + OBFR) | 3 Month | JPM | 03/28/24 | 9 | | 1 | | 1 | | — |
| BlackRock Floating Rate Income Strategies Fund, Inc. | Pay | 5.910% (0.590% + OBFR) | 3 Month | JPM | 04/08/24 | 8 | | — (3) | | — (3) | | — |
| BlackRock Floating Rate Income Strategies Fund, Inc. | Pay | 5.910% (0.590% + OBFR) | 3 Month | JPM | 11/25/24 | 34 | | 2 | | 2 | | — |
| Churchill Capital Corp. VII | Pay | 6.030% (0.710% + OBFR) | 1 Month | GS | 12/06/24 | 1,392 | | 1 | | 1 | | — |
| Invesco Dynamic Credit Opportunities | Pay | 5.930% (0.610% + OBFR) | 1 Month | GS | 03/27/24 | 3 | | — (3) | | — | | — (3) |
| Invesco Dynamic Credit Opportunities | Pay | 5.700% (0.380% + OBFR) | 3 Month | JPM | 01/04/24 | 22 | | — (3) | | — | | — (3) |
| Invesco Dynamic Credit Opportunities | Pay | 5.700% (0.380% + OBFR) | 3 Month | JPM | 01/30/24 | — (3) | | 1 | | 1 | | — |
| Invesco Dynamic Credit Opportunities | Pay | 5.700% (0.380% + OBFR) | 3 Month | JPM | 04/30/24 | — (3) | | 1 | | 1 | | — |
| Nuveen New York AMT-Free Quality Municipal Income Fund | Pay | 6.530% (1.210% + OBFR) | 1 Month | GS | 07/29/24 | 71 | | 1 | | 1 | | — |
| Nuveen New York AMT-Free Quality Municipal Income Fund | Pay | 5.700% (0.380% + OBFR) | 3 Month | JPM | 11/25/24 | 6 | | 1 | | 1 | | — |
| Pershing Square Escrow(4) | Pay | 6.530% (1.210% + OBFR) | 1 Month | GS | 10/02/24 | — (3) | | — (3) | | — | | — (3) |
| Pershing Tontine Spar(4) | Pay | 6.530% (1.210% + OBFR) | 1 Month | GS | 10/02/24 | — (3) | | — (3) | | — (3) | | — |
| Saba Capital Income & Opportunities Fund | Pay | 5.930% (0.610% + OBFR) | 1 Month | GS | 03/27/24 | 214 | | (6) | | — | | (6) |
| Saba Capital Income & Opportunities Fund | Pay | 5.700% (0.380% + OBFR) | 3 Month | JPM | 07/22/24 | 3 | | — (3) | | — (3) | | — |
| SK Growth Opportunities Corp. | Pay | 6.530% (1.210% + OBFR) | 1 Month | GS | 12/23/24 | 297 | | (2) | | — | | (2) |
| | | | | | | | | 1 | | 9 | | (8) |
| Total | | | | | | | | $ 1 | | $ 9 | | $(8) |
| Footnote Legend: |
| (1) | The Fund pays the floating rate (+/- a spread) and receives the total return of the reference entity. |
| (2) | There were no upfront premiums paid or received for the open swap contracts held. |
| (3) | Amount is less than $500 (not in thousands). |
| (4) | The value of this security was determined using significant unobservable inputs and is reported as a Level 3 security in the Fair Value Hierarchy table located after the Schedule of Investments. |
See Notes to Financial Statements
Westchester Credit Event Fund
SCHEDULE OF INVESTMENTS (Continued)
December 31, 2023
($ reported in thousands)
The following table summarizes the value of the Fund’s investments as of December 31, 2023, based on the inputs used to value them (See Security Valuation Note 2A in the Notes to Financial Statements):
| | Total
Value at
December 31, 2023 | | Level 1
Quoted Prices | | Level 2
Significant
Observable
Inputs | | Level 3
Significant
Unobservable
Inputs |
| Assets: | | | | | | | |
| Debt Instruments: | | | | | | | |
| Convertible Bonds and Notes | $ 5,756 | | $ — | | $ 5,756 | | $ — |
| Corporate Bonds and Notes | 44,830 | | — | | 44,830 | | — |
| Leveraged Loans | 3,168 | | — | | 3,168 | | — |
| Equity Securities: | | | | | | | |
| Closed-End Funds | 6,081 | | 6,081 | | — | | — |
| Preferred Stocks | 2,863 | | 2,863 | | — | | — |
| Common Stock | — (1) | | — | | — | | — (1) |
| Warrants | 17 | | 17 | | — | | — |
| Special Purpose Acquisition Companies | 8,047 | | 7,857 | | 190 | | — |
| Escrow Notes | 800 | | — | | 800 | | — |
| Money Market Mutual Funds | 2,361 | | 2,361 | | — | | — |
| Other Financial Instruments: | | | | | | | |
| Over-the-Counter Total Return Swaps* | 9 | | — | | 9 | | — (2) |
| Total Assets | 73,932 | | 19,179 | | 54,753 | | — |
| Liabilities: | | | | | | | |
| Securities Sold Short: | | | | | | | |
| U.S. Government Security | (385) | | — | | (385) | | — |
| Other Financial Instruments: | | | | | | | |
| Forward Foreign Currency Exchange Contracts* | (17) | | — | | (17) | | — |
| Over-the-Counter Total Return Swaps* | (8) | | — | | (8) | | — (2) |
| Total Liabilities | (410) | | — | | (410) | | — |
| Total Investments, Net of Securities Sold Short | $73,522 | | $19,179 | | $54,343 | | $ — |
| (1) | Includes internally fair valued securities currently priced at zero ($0). |
| (2) | Amount is less than $500 (not in thousands). |
| * | Swap contracts and forward currency exchange contracts are valued at the net unrealized appreciation (depreciation) on the instrument by level and counterparty. |
Over-the-counter total return swaps held by the Fund with an end of period value of $—(a) were transferred from Level 2 to Level 3 due to a decrease in trading activities at period end.
Some of the Fund’s investments that were categorized as Level 3 may have been valued utilizing third party pricing information without adjustment. If applicable, such valuations are based on unobservable inputs. A significant change in third party information could result in a significantly lower or higher value of Level 3 investments.
Management has determined that the amount of Level 3 securities compared to total net assets is not material; therefore, the roll-forward of Level 3 securities and assumptions are not shown for the period ended December 31, 2023.
(a) Amount is less than $500 (not in thousands).
See Notes to Financial Statements
Westchester Event-Driven Fund
SCHEDULE OF INVESTMENTS
December 31, 2023
($ reported in thousands)
| | Par Value | | Value |
| Convertible Bonds and Notes—1.8% |
| Health Care—0.3% | | |
Cerevel Therapeutics Holdings, Inc. 144A
2.500%, 8/15/27(1) | $ 1,323 | | $ 1,474 |
| Information Technology—1.5% | | |
Splunk, Inc.
1.125%, 6/15/27 | 7,434 | | 7,200 |
Total Convertible Bonds and Notes
(Identified Cost $8,572) | | 8,674 |
| | | | |
| |
| | | | |
| |
| Corporate Bonds and Notes—20.8% |
| Communication Services—4.0% | | |
Allen Media LLC 144A
10.500%, 2/15/28(1) | 3,724 | | 1,992 |
Clear Channel Outdoor Holdings, Inc. 144A
7.500%, 6/1/29(1) | 2,780 | | 2,311 |
Connect Finco S.a.r.l. 144A
6.750%, 10/1/26(1) | 2,071 | | 2,059 |
Getty Images, Inc. 144A
9.750%, 3/1/27(1)(2) | 6,830 | | 6,870 |
GrubHub Holdings, Inc. 144A
5.500%, 7/1/27(1) | 878 | | 738 |
| Lagardere S.A. | | | |
| RegS 1.625%, 6/21/24(3) | 300 EUR | | 329 |
| RegS 2.125%, 10/16/26(3) | 2,400 EUR | | 2,641 |
| RegS 1.750%, 10/7/27(3) | 1,900 EUR | | 2,090 |
| | | | 19,030 |
| | | | |
| |
| Consumer Discretionary—3.1% | | |
Aramark Services, Inc. 144A
5.000%, 4/1/25(1) | 1,105 | | 1,097 |
Carriage Services, Inc. 144A
4.250%, 5/15/29(1) | 6,676 | | 5,929 |
Light & Wonder International, Inc. 144A
7.000%, 5/15/28(1) | 3,366 | | 3,400 |
Valvoline, Inc. 144A
4.250%, 2/15/30(1) | 4,762 | | 4,724 |
| | | | 15,150 |
| | | | |
| |
| Consumer Staples—1.2% | | |
TreeHouse Foods, Inc.
4.000%, 9/1/28 | 3,268 | | 2,893 |
Vector Group Ltd. 144A
10.500%, 11/1/26(1) | 2,791 | | 2,797 |
| | | | 5,690 |
| | | | |
| |
| Energy—5.8% | | |
Alliance Resource Operating Partners LP 144A
7.500%, 5/1/25(1) | 4,530 | | 4,507 |
California Resources Corp. 144A
7.125%, 2/1/26(1) | 4,773 | | 4,841 |
Calumet Specialty Products Partners LP 144A
11.000%, 4/15/25(1) | 10,829 | | 10,949 |
PDC Energy, Inc.
5.750%, 5/15/26 | 2,657 | | 2,652 |
| | Par Value | | Value |
| | | | |
| Energy—continued | | |
Petroleum Geo-Services AS
13.500%, 3/31/27 | $ 4,400 | | $ 4,829 |
| | | | 27,778 |
| | | | |
| |
| Financials—3.5% | | |
Intercontinental Exchange, Inc.
3.650%, 5/23/25 | 1,283 | | 1,259 |
Mobius Merger Sub, Inc. 144A
9.000%, 6/1/30(1) | 1,060 | | 1,028 |
NFP Corp. 144A
6.875%, 8/15/28(1) | 6,883 | | 6,997 |
Permian Resources Operating LLC 144A
8.000%, 4/15/27(1) | 1,302 | | 1,350 |
SEG Holding LLC 144A
5.625%, 10/15/28(1) | 4,348 | | 4,364 |
United Airlines, Inc. Pass-Through Trust 2016-2, B
3.650%, 4/7/27 | 770 | | 723 |
Verscend Escrow Corp. 144A
9.750%, 8/15/26(1) | 930 | | 936 |
| | | | 16,657 |
| | | | |
| |
| Industrials—3.1% | | |
Bombardier, Inc. 144A
7.875%, 4/15/27(1) | 1,283 | | 1,283 |
IEA Energy Services LLC 144A
6.625%, 8/15/29(1) | 1,111 | | 1,036 |
| La Financiere Atalian SASU | | | |
| RegS 4.000%, 5/15/24(3) | 1,019 EUR | | 889 |
| RegS 5.125%, 5/15/25(3) | 977 EUR | | 790 |
Mauser Packaging Solutions Holding Co. 144A
9.250%, 4/15/27(1) | 5,703 | | 5,598 |
PGT Innovations, Inc. 144A
4.375%, 10/1/29(1) | 5,509 | | 5,489 |
| | | | 15,085 |
| | | | |
| |
| Utilities—0.1% | | |
Origin Energy Finance Ltd. RegS
1.000%, 9/17/29(3) | 329 EUR | | 316 |
Total Corporate Bonds and Notes
(Identified Cost $101,000) | | 99,706 |
| | | | |
| |
| | | | |
| |
| Leveraged Loans—1.1% |
| Health Care—0.5% | | |
Verscend Holding Corp. Tranche B (1 month Term SOFR + 4.114%)
9.470%, 8/27/25(4) | 2,537 | | 2,539 |
| Information Technology—0.5% | | |
Syniverse Holdings, Inc. (3 month Term SOFR + 7.000%)
12.348%, 5/13/27(4) | 2,765 | | 2,409 |
See Notes to Financial Statements
Westchester Event-Driven Fund
SCHEDULE OF INVESTMENTS (Continued)
December 31, 2023
($ reported in thousands)
| | Par Value | | Value |
| | | | |
| Retail—0.1% | | |
Claire’s Stores, Inc. Tranche B (1 month Term SOFR + 6.600%)
11.956%, 12/18/26(4) | $ 252 | | $ 229 |
Total Leveraged Loans
(Identified Cost $5,474) | | 5,177 |
| | Shares | |
| Closed-End Funds—3.3% |
| Equity Funds—3.3% | |
| Apollo Senior Floating Rate Fund, Inc. | 11,127 | 147 |
| Ares Dynamic Credit Allocation Fund, Inc. | 8,750 | 120 |
| BlackRock Debt Strategies Fund, Inc. | 88,408 | 954 |
| BlackRock Floating Rate Income Strategies Fund, Inc. | 9,611 | 122 |
| BlackRock MuniYield Quality Fund III, Inc. | 45,863 | 534 |
| Blackstone Senior Floating Rate 2027 Term Fund(5) | 54,814 | 732 |
| Blackstone Strategic Credit 2027 Term Fund | 68,041 | 770 |
| First Trust Senior Floating Rate Income Fund II | 11,712 | 118 |
| Franklin Universal Trust | 102,050 | 679 |
| Invesco Municipal Opportunity Trust | 100,962 | 970 |
| Invesco Senior Income Trust | 362,014 | 1,484 |
| Invesco Value Municipal Income Trust | 45,435 | 533 |
| KKR Income Opportunities Fund | 70,431 | 885 |
| Nuveen AMT-Free Municipal Credit Income Fund | 93,266 | 1,102 |
| Nuveen AMT-Free Quality Municipal Income Fund | 183,929 | 2,023 |
| Nuveen Municipal Credit Income Fund | 142,900 | 1,689 |
| Nuveen Municipal Value Fund, Inc. | 143,015 | 1,230 |
| Nuveen New York AMT-Free Quality Municipal Income Fund | 104,340 | 1,099 |
| Nuveen Preferred & Income Term Fund | 23,495 | 430 |
| Saba Capital Income & Opportunities Fund | 29,430 | 227 |
| | | 15,848 |
| | | |
| |
Total Closed-End Funds
(Identified Cost $15,703) | 15,848 |
| | | |
| |
| | | |
| |
| Preferred Stocks—0.9% |
| Consumer Discretionary—0.1% | |
| Fossil Group, Inc., 7.000% | 31,540 | 486 |
| Financials—0.3% | |
| Federal Home Loan Mortgage Corp. Series Z, 8.375%(4) | 369,204 | 1,071 |
| Federal National Mortgage Association Series S, 8.250%(4) | 168,144 | 541 |
| | | 1,612 |
| | | |
| |
| Industrials—0.5% | |
| Textainer Group Holdings Ltd., 7.000% | 65,360 | 1,624 |
| Textainer Group Holdings Ltd. Series B, 6.250% | 26,973 | 666 |
| | | 2,290 |
| | | |
| |
Total Preferred Stocks
(Identified Cost $4,298) | 4,388 |
| | | |
| |
| | | |
| |
| | Shares | | Value |
| | | | |
| | | | |
| Common Stocks—55.2% |
| Communication Services—2.6% | | |
| Endeavor Group Holdings, Inc. Class A (2) | 421,100 | | $ 9,993 |
| Liberty Media Corp.-Liberty SiriusXM Class A(6) | 88,000 | | 2,529 |
| | | | 12,522 |
| | | | |
| |
| Consumer Discretionary—2.8% | | |
| Capri Holdings Ltd.(2)(6) | 244,521 | | 12,285 |
| NEOGAMES S.A.(6) | 45,277 | | 1,296 |
| | | | 13,581 |
| | | | |
| |
| Consumer Staples—4.3% | | |
| Albertsons Cos., Inc. Class A(2) | 306,384 | | 7,047 |
| Kenvue, Inc. | 160,100 | | 3,447 |
| Sovos Brands, Inc.(6) | 450,015 | | 9,914 |
| | | | 20,408 |
| | | | |
| |
| Energy—17.1% | | |
| Euronav N.V.(5) | 72,445 | | 1,274 |
| Hess Corp.(2) | 273,352 | | 39,406 |
| Phillips 66 | 37,800 | | 5,033 |
| Pioneer Natural Resources Co.(2) | 161,791 | | 36,383 |
| | | | 82,096 |
| | | | |
| |
| Financials—1.7% | | |
| Acropolis Infrastructure(6)(7) | 39,798 | | — |
| American Equity Investment Life Holding Co.(6) | 60,624 | | 3,383 |
| Fidelity National Information Services, Inc. | 57,200 | | 3,436 |
| National Western Life Group, Inc. Class A | 2,677 | | 1,293 |
| | | | 8,112 |
| | | | |
| |
| Health Care—6.6% | | |
| Amedisys, Inc.(6) | 22,841 | | 2,171 |
| BioMarin Pharmaceutical, Inc.(6) | 82,600 | | 7,964 |
| Cerevel Therapeutics Holdings, Inc.(6) | 86,313 | | 3,660 |
| ImmunoGen, Inc.(6) | 177,670 | | 5,268 |
| Karuna Therapeutics, Inc.(6) | 15,541 | | 4,919 |
| Mirati Therapeutics, Inc.(6) | 15,421 | | 906 |
| Olink Holding AB ADR(6) | 266,179 | | 6,694 |
| | | | 31,582 |
| | | | |
| |
| Industrials—2.5% | | |
| Carrier Global Corp. | 174,500 | | 10,025 |
| SP Plus Corp.(6) | 37,774 | | 1,936 |
| | | | 11,961 |
| | | | |
| |
| Information Technology—5.1% | | |
| Splunk, Inc.(2)(6) | 161,931 | | 24,670 |
| Materials—6.9% | | |
| Ball Corp. | 69,500 | | 3,998 |
| Newmont Corp. | 8,263 | | 342 |
| Teck Resources Ltd. Class B | 123,100 | | 5,203 |
| United States Steel Corp. | 79,297 | | 3,858 |
| Vale S.A. Class B Sponsored ADR | 147,100 | | 2,333 |
See Notes to Financial Statements
Westchester Event-Driven Fund
SCHEDULE OF INVESTMENTS (Continued)
December 31, 2023
($ reported in thousands)
| | Shares | | Value |
| | | | |
| Materials—continued | | |
| Westrock Co.(2) | 415,017 | | $ 17,231 |
| | | | 32,965 |
| | | | |
| |
| Real Estate—4.2% | | |
| Crown Castle, Inc. | 41,500 | | 4,781 |
| RPT Realty | 27,514 | | 353 |
| Spirit Realty Capital, Inc. | 344,454 | | 15,049 |
| | | | 20,183 |
| | | | |
| |
| Utilities—1.4% | | |
| Origin Energy Ltd. | 1,190,131 | | 6,869 |
Total Common Stocks
(Identified Cost $258,736) | | 264,949 |
| | | | |
| |
| | | | |
| |
| Rights—0.1% |
| Financials—0.0% | | |
| Pershing Tontine Spar, 12/31/33(6)(7) | 11,093 | | 3 |
| Health Care—0.0% | | |
| Akouos, Inc., 12/31/49(6) | 26,079 | | 29 |
| Bristol Myers Squibb Co., 12/31/35(6)(7) | 169,085 | | 241 |
| | | | 270 |
| | | | |
| |
| Materials—0.1% | | |
| Pan American Silver Corp., 02/22/24(6) | 930,417 | | 479 |
Total Rights
(Identified Cost $568) | | 752 |
| | | | |
| |
| | | | |
| |
| Warrants—0.1% |
| Communication Services—0.0% | | |
| Akazoo S.A., 12/31/35(6)(7) | 35,748 | | — |
| BuzzFeed, Inc., 12/01/26(6) | 17,099 | | 1 |
| | | | 1 |
| | | | |
| |
| Consumer Discretionary—0.1% | | |
| Allurion Technologies, Inc., 07/31/29(6) | 13,340 | | 6 |
| CEC Brands LLC, 12/31/25(6)(7) | 45,120 | | 135 |
| ECARX Holdings, Inc., 12/21/27(6) | 27,750 | | 1 |
| Evergreen Corp., 02/15/27(6) | 28,500 | | 1 |
| Grove Collaborative Holdings, 03/13/26(6) | 20,136 | | — (8) |
| Kaixin Auto Holdings, 04/30/24(6) | 48,712 | | 2 |
| Zapp Electric Vehicles Group Ltd., 03/03/28(6) | 13,420 | | — (8) |
| | | | 145 |
| | | | |
| |
| Consumer Staples—0.0% | | |
| Whole Earth Brands, Inc., 06/25/25(6) | 7,431 | | 1 |
| Financials—0.0% | | |
| 26 Capital Acquisition Corp., 12/31/27(6) | 25,800 | | — |
| Achari Ventures Holdings Corp. I, 08/05/26(6) | 28,624 | | — (8) |
| Airship AI Holdings, Inc., 12/31/28(6) | 256,226 | | 15 |
| Alchemy Investments Acquisition Corp. 1, 06/26/28(6) | 17,935 | | 3 |
| AltEnergy Acquisition Corp., 11/10/28(6) | 5,160 | | — (8) |
| Ares Acquisition Corp. II, 06/12/28(6) | 32,327 | | 5 |
| | Shares | | Value |
| | | | |
| Financials—continued | | |
| Arogo Capital Acquisition Corp., 03/23/28(6) | 28,500 | | $ 1 |
| Arrowroot Acquisition Corp., 03/02/26(6) | 60,113 | | 5 |
| Cartesian Growth Corp II, 07/12/28(6) | 5,799 | | 1 |
| Cetus Capital Acquisition Corp., 03/24/28(6) | 51,637 | | 1 |
| Corner Growth Acquisition Corp., 12/31/27(6) | 20,673 | | 1 |
| ESGEN Acquisition Corp., 10/20/26(6) | 5,942 | | — (8) |
| EVe Mobility Acquisition Corp., 12/31/28(6) | 12,551 | | — (8) |
| FTAC Emerald Acquisition Corp., 08/22/28(6) | 17,092 | | 1 |
| GCM Grosvenor, Inc. Class A, 11/17/25(6) | 28,825 | | 10 |
| Global Blockchain Acquisition Corp., 05/10/27(6) | 60,562 | | 1 |
| Goal Acquisitions Corp., 02/11/26(6) | 272,843 | | 1 |
| Haymaker Acquisition Corp. 4, 09/12/28(6) | 14,997 | | 2 |
| Inflection Point Acquisition Corp. II, 07/17/28(6) | 14,919 | | 1 |
| International Media Acquisition Corp., 12/31/28(6) | 18,227 | | — (8) |
| Jaws Mustang Acquisition Corp., 01/30/26(6) | 23,996 | | 1 |
| Keen Vision Acquisition Corp., 09/15/28(6) | 67,562 | | 3 |
| Kensington Capital Acquisition Corp. V, 08/13/28(6) | 48,984 | | 5 |
| LeddarTech Holdings, Inc., 09/21/28(6) | 58,973 | | 5 |
| Nabors Energy Transition Corp. II, 09/05/28(6) | 20,650 | | 3 |
| Newbury Street Acquisition Corp., 12/31/27(6) | 28,549 | | 1 |
| Oak Woods Acquisition Corp., 05/17/28(6) | 62,481 | | 2 |
| Phoenix Biotech Acquisition Corp., 09/01/26(6) | 5,078 | | — (8) |
| Plum Acquisition Corp. I, 12/31/28(6) | 17,325 | | 2 |
| Pono Capital Three, Inc., 04/03/28(6) | 84,194 | | 8 |
| Pyrophyte Acquisition Corp., 05/03/28(6) | 6,863 | | 1 |
| RMG Acquisition Corp. III, 12/31/27(6) | 20,895 | | 1 |
| Screaming Eagle Acquisition Corp. Class A, 12/15/27(6) | 19,604 | | 9 |
| Semper Paratus Acquisition Corp., 11/04/26(6) | 6,900 | | — (8) |
| Slam Corp. Class A, 12/31/27(6) | 43,478 | | 8 |
| Spring Valley Acquisition Corp. II, 02/25/26(6) | 3,247 | | — (8) |
| Target Global Acquisition I Corp., 12/31/27(6) | 10,328 | | 1 |
| Volato Group, Inc., 12/03/28(6) | 13,646 | | 2 |
| XBP Europe Holdings, Inc., 12/31/27(6) | 14,261 | | 1 |
| | | | 101 |
| | | | |
| |
| Health Care—0.0% | | |
| Newamsterdam Pharma Co. N.V., 11/22/27(6) | 17,838 | | 56 |
| Pear Therapeutics, Inc., 02/04/26(6) | 36,173 | | — (8) |
| | | | 56 |
| | | | |
| |
| Industrials—0.0% | | |
| Amprius Technologies, Inc., 03/02/27(6) | 27,068 | | 11 |
| Bridger Aerospace Group Holdings, Inc., 12/31/27(6) | 27,000 | | 6 |
| Freightos Ltd., 01/23/28(6) | 4,398 | | — (8) |
| Getaround, Inc., 03/09/26(6) | 11,166 | | — (8) |
| | | | 17 |
| | | | |
| |
| Information Technology—0.0% | | |
| FOXO Technologies, Inc., 08/01/27(6) | 26,187 | | — (8) |
| Movella Holdings, Inc., 12/31/27(6) | 11,102 | | — (8) |
| Near Intelligence, Inc., 07/08/27(6) | 10,000 | | — (8) |
| | | | — (8) |
| | | | |
| |
| Materials—0.0% | | |
| Ginkgo Bioworks Holdings, Inc., 12/31/27(6) | 11,400 | | 1 |
Total Warrants
(Identified Cost $2,787) | | 322 |
See Notes to Financial Statements
Westchester Event-Driven Fund
SCHEDULE OF INVESTMENTS (Continued)
December 31, 2023
($ reported in thousands)
| | Shares/Units | | Value |
| Special Purpose Acquisition Companies—8.4% |
| Aimfinity Investment Corp. I(6) | 14,637 | | $ 160 |
| Alchemy Investments Acquisition Corp. 1(6) | 35,870 | | 374 |
| Alpha Partners Technology Merger Corp. Class A(6) | 36,400 | | 389 |
| Alpha Star Acquisition Corp.(6) | 77,897 | | 872 |
| AltC Acquisition Corp. Class A(6) | 28,134 | | 297 |
| Andretti Acquisition Corp. Class A(6) | 13,864 | | 151 |
| AP Acquisition Corp. Class A(6) | 24,240 | | 270 |
| Ares Acquisition Corp. II(6) | 223,483 | | 2,333 |
| Arisz Acquisition Corp.(6) | 33,967 | | 371 |
| Arrowroot Acquisition Corp. Class A(5)(6) | 44,532 | | 467 |
| Bannix Acquisition Corp.(6) | 1,688 | | 18 |
| Blue Ocean Acquisition Corp. Class A(6) | 17,159 | | 185 |
| Blue World Acquisition Corp.(6) | 13,659 | | 151 |
| Bowen Acquisition Corp.(6) | 27,563 | | 284 |
| Bukit Jalil Global Acquisition 1 Ltd.(6) | 16,823 | | 175 |
| Bukit Jalil Global Acquisition 1 Ltd.(6) | 13,190 | | 138 |
| byNordic Acquisition Corp.(6) | 20,617 | | 229 |
| Capitalworks Emerging Markets Acquisition Corp. Class A(6) | 21,250 | | 233 |
| Cartica Acquisition Corp. Class A(6) | 30,613 | | 334 |
| CF Acquisition Corp. VII Class A(6) | 102,691 | | 1,114 |
| Chain Bridge I Class A(6) | 21,592 | | 234 |
| Chenghe Acquisition Co. Class A(6) | 33,786 | | 372 |
| Churchill Capital Corp. VII Class A(6) | 482,715 | | 5,068 |
| Clean Energy Special Situations Corp.(6) | 54,751 | | 575 |
| Colombier Acquisition Corp. II(6) | 24,894 | | 251 |
| Concord Acquisition Corp. II Class A(6) | 136,589 | | 1,418 |
| Crown PropTech Acquisitions Class A(6) | 108 | | 1 |
| Direct Selling Acquisition Corp. Class A(6) | 17,638 | | 192 |
| Distoken Acquisition Corp.(6) | 17,107 | | 181 |
| DUET Acquisition Corp. Class A(6) | 20,404 | | 224 |
| ESH Acquisition Corp.(6) | 34,175 | | 3 |
| EVe Mobility Acquisition Corp. Class A(6) | 45,216 | | 488 |
| Evergreen Corp. Class A(6) | 22,483 | | 250 |
| ExcelFin Acquisition Corp. Class A(6) | 19,632 | | 210 |
| Feutune Light Acquisition Corp. Class A(6) | 8,687 | | 94 |
| Fintech Ecosystem Development Corp. Class A(6) | 16,876 | | 181 |
| Focus Impact Acquisition Corp. Class A(6) | 33,274 | | 364 |
| Fortune Rise Acquisition Corp.(6) | 130,088 | | 1,424 |
| Global Partner Acquisition Corp. II Class A(6) | 509 | | 6 |
| Golden Star Acquisition Corp.(6) | 24,428 | | 255 |
| Golden Star Acquisition Corp.(6) | 19,932 | | 3 |
| Gores Holdings IX, Inc. Class A(6) | 98,963 | | 1,039 |
| Haymaker Acquisition Corp. 4(6) | 29,995 | | 308 |
| HCM Acquisition Corp. Class A(6) | 33,834 | | 378 |
| Hudson Acquisition I Corp.(6) | 14,887 | | 157 |
| Inflection Point Acquisition Corp. II Class A(6) | 41,195 | | 426 |
| Investcorp India Acquisition Corp. Class A(6) | 35,215 | | 387 |
| Iron Horse Acquisitions Corp.(6) | 31,641 | | 318 |
| Keen Vision Acquisition Corp.(6) | 67,562 | | 698 |
| L Catterton Asia Acquisition Corp. Class A(6) | 105,509 | | 1,137 |
| Learn CW Investment Corp. Class A(6) | 70,838 | | 764 |
| Mars Acquisition Corp.(6) | 117,007 | | 1,244 |
| Mountain & Co. I Acquisition Corp.(6) | 77,015 | | 870 |
| Nabors Energy Transition Corp. II Class A(6) | 41,300 | | 429 |
| Nubia Brand International Corp. Class A(6) | 35,345 | | 386 |
| Oak Woods Acquisition Corp. Class A(6) | 24,485 | | 258 |
| Patria Latin American Opportunity Acquisition Corp.(6) | 189,383 | | 2,102 |
| Perception Capital Corp. III Class A(6) | 9,488 | | 100 |
| Plum Acquisition Corp. I Class A(6) | 36,815 | | 399 |
| Plutonian Acquisition Corp.(6) | 23,030 | | 247 |
| Power & Digital Infrastructure Acquisition II Corp. Class A(6) | 1,620 | | 18 |
| | Shares/Units | | Value |
| PowerUp Acquisition Corp. Class A(6) | 4,008 | | $ 44 |
| Project Energy Reimagined Acquisition Corp.(6) | 28,219 | | 299 |
| Quetta Acquisition Corp.(6) | 28,958 | | 296 |
| RCF Acquisition Corp. Class A(6) | 48,404 | | 531 |
| Redwoods Acquisition Corp.(6) | 21,658 | | 231 |
| Rigel Resource Acquisition Corp. Class A(6) | 191,186 | | 2,095 |
| Ross Acquisition Corp. II Class A(6) | 11,470 | | 125 |
| Roth CH Acquisition Co.(6) | 25,207 | | 274 |
| Semper Paratus Acquisition Corp. Class A(6) | 9,316 | | 104 |
| Slam Corp. Class A(6) | 36,931 | | 400 |
| Spark I Acquisition Corp.(6) | 57,694 | | 587 |
| Spring Valley Acquisition Corp. II(6) | 6,495 | | — (8) |
| TenX Keane Acquisition Class A(6) | 19,217 | | 210 |
| TMT Acquisition Corp.(6) | 21,997 | | 5 |
| TMT Acquisition Corp. Class A(6) | 30,067 | | 316 |
| TortoiseEcofin Acquisition Corp. III Class A(6) | 160,714 | | 1,707 |
| Tristar Acquisition I Corp. Class A(6) | 39,102 | | 422 |
| Twelve Seas Investment Co. II Class A(6) | 27,514 | | 291 |
| two Class A(6) | 4,351 | | 46 |
| Viveon Health Acquisition Corp.(6) | 8,292 | | 94 |
| Zalatoris Acquisition Corp.(6) | 26,388 | | 281 |
Total Special Purpose Acquisition Companies
(Identified Cost $39,120) | | 40,362 |
| | Shares | |
| Purchased Options—0.1% |
| (See open purchased options schedule) | |
Total Purchased Options
(Premiums Paid $2,586) | 291 |
| | | |
| |
| | | |
| |
| Escrow Notes—2.0% |
| Financials—2.0% | |
| Altaba, Inc. Escrow(6) | 3,887,713 | 9,505 |
| Pershing Square Escrow(6)(7) | 44,373 | — |
| | | 9,505 |
| | | |
| |
| Industrials—0.0% | |
| AMR Corp. Escrow(6) | 28,850 | 1 |
Total Escrow Notes
(Identified Cost $6,690) | 9,506 |
| | | |
| |
| | | |
| |
Total Long-Term Investments—93.8%
(Identified Cost $445,534) | 449,975 |
| | | |
| |
| | | |
| |
| Short-Term Investments—6.2% |
| Money Market Mutual Funds—6.2% |
| Goldman Sachs Financial Square Funds - Treasury Instruments Fund - Standard Shares (seven-day effective yield 5.214%)(9) | 15,600,000 | 15,600 |
| Goldman Sachs Financial Square Government Fund - Standard Shares (seven-day effective yield 5.244%)(9) | 14,025,695 | 14,026 |
Total Short-Term Investments
(Identified Cost $29,626) | 29,626 |
| | | |
| |
| | | |
| |
See Notes to Financial Statements
Westchester Event-Driven Fund
SCHEDULE OF INVESTMENTS (Continued)
December 31, 2023
($ reported in thousands)
| | Shares | | Value |
| | | | |
| | | | |
| Securities Lending Collateral—0.2% |
| Dreyfus Government Cash Management Fund - Institutional Shares (seven-day effective yield 5.250%)(9)(10) | 1,135,592 | | $ 1,136 |
Total Securities Lending Collateral
(Identified Cost $1,136) | | 1,136 |
| | | | |
| |
| | | | |
| |
TOTAL INVESTMENTS, BEFORE SECURITIES SOLD SHORT AND WRITTEN OPTIONS—100.2%
(Identified Cost $476,296) | | 480,737 |
| | | |
| Securities Sold Short—(5.8)% |
| | Par Value | |
| U.S. Government Security—(0.1)% |
U.S. Treasury Notes
3.250%, 6/30/29 | $ (578) | (559) |
Total U.S. Government Security
(Identified Proceeds $(588)) | (559) |
| | Shares | |
| Common Stocks—(5.7)% |
| Energy—(5.3)% | |
| Chevron Corp. | (147,980) | (22,073) |
| Exxon Mobil Corp. | (33,844) | (3,384) |
| | | (25,457) |
| | | |
| |
| Materials—(0.1)% | |
| Newmont Corp. | (8,100) | (335) |
| Real Estate—(0.3)% | |
| Kimco Realty Corp. | (17,384) | (370) |
| Realty Income Corp. | (20,753) | (1,192) |
| | | (1,562) |
| | | |
| |
Total Common Stocks
(Identified Proceeds $(26,487)) | (27,354) |
| | | |
| |
| | | |
| |
Total Securities Sold Short
(Identified Proceeds $(27,075)) | (27,913) |
| | | |
| |
| | | |
| |
| Written Options—(1.5)% |
| (See open written options schedule) | | |
Total Written Options
(Premiums Received $6,357) | (6,938) |
| | | |
| |
| | | |
| |
TOTAL INVESTMENTS, NET OF SECURITIES SOLD SHORT AND WRITTEN OPTIONS—92.9%
(Identified Cost $442,864) | $ 445,886 |
| Other assets and liabilities, net—7.1% | 33,842 |
| NET ASSETS—100.0% | $ 479,728 |
| Abbreviations: |
| ADR | American Depositary Receipt |
| AMT | Alternative Minimum Tax |
| ETF | Exchange-Traded Fund |
| LLC | Limited Liability Company |
| LP | Limited Partnership |
| OBFR | Overnight Bank Funding Rate |
| S&P | Standard & Poor’s |
| SOFR | Secured Overnight Financing Rate |
| Footnote Legend: |
| (1) | Security exempt from registration under Rule 144A of the Securities Act of 1933. These securities may be resold in transactions exempt from registration, normally to qualified institutional buyers. At December 31, 2023, these securities amounted to a value of $81,769 or 17.0% of net assets. |
| (2) | All or a portion of the shares have been committed as collateral for open securities sold short and written option contracts. The value of securities segregated as collateral is $91,013. |
| (3) | Regulation S security. Security is offered and sold outside of the United States; therefore, it is exempt from registration with the SEC under Rules 903 and 904 of the Securities Act of 1933. |
| (4) | Variable rate security. Rate disclosed is as of December 31, 2023. Information in parenthesis represents benchmark and reference rate for each security. Certain variable rate securities are not based on a published reference rate and spread but are determined by the issuer or agent and are based on current market conditions, or, for mortgage-backed securities, are impacted by the individual mortgages which are paying off over time. These securities do not indicate a reference rate and spread in their descriptions. |
| (5) | All or a portion of security is on loan. |
| (6) | Non-income producing. |
| (7) | The value of this security was determined using significant unobservable inputs and is reported as a Level 3 security in the Fair Value Hierarchy table located after the Schedule of Investments. |
| (8) | Amount is less than $500 (not in thousands). |
| (9) | Shares of this fund are publicly offered, and its prospectus and annual report are publicly available. |
| (10) | Represents security purchased with cash collateral received for securities on loan. |
| Counterparties: | |
| BAML | Bank of America-Merrill Lynch |
| GS | Goldman Sachs & Co. |
| JPM | JPMorgan Chase Bank N.A. |
| Foreign Currencies: | |
| AUD | Australian Dollar |
| EUR | Euro |
| GBP | United Kingdom Pound Sterling |
| JPY | Japanese Yen |
| USD | United States Dollar |
For information regarding the abbreviations, see the Key Investment Terms starting on page 4.
See Notes to Financial Statements
Westchester Event-Driven Fund
SCHEDULE OF INVESTMENTS (Continued)
December 31, 2023
($ reported in thousands)
| Country Weightings (Unaudited)† |
| United States | 83% |
| Cayman Islands | 5 |
| Virgin Islands (British) | 3 |
| Australia | 2 |
| Canada | 2 |
| France | 1 |
| Sweden | 1 |
| Other | 3 |
| Total | 100% |
| †% of total investments, net of securities sold short and written options, as of December 31, 2023. |
| Open purchased options contracts as of December 31, 2023 were as follows: |
| Description of Options | Number
of
Contracts | Contract
Notional
Amount | Strike
Price(1) | Expiration
Date | Value |
| Put Options(2) | | | | | |
| Ball Corp. | 1,606 | $ 6,825 | $ 42.50 | 01/19/24 | $ — |
| Ball Corp. | 291 | 1,164 | 40.00 | 01/19/24 | — |
| Baxter International, Inc. | 2,103 | 6,835 | 32.50 | 01/19/24 | 4 |
| BioMarin Pharmaceutical, Inc. | 826 | 6,608 | 80.00 | 01/19/24 | 4 |
| Carrier Global Corp. | 868 | 3,906 | 45.00 | 01/19/24 | 4 |
| Carrier Global Corp. | 877 | 4,166 | 47.50 | 01/19/24 | 7 |
| Cerevel Therapeutics Holdings, Inc. | 186 | 651 | 35.00 | 12/20/24 | 15 |
| Crown Castle, Inc. | 415 | 3,942 | 95.00 | 02/16/24 | 9 |
| Endeavor Group Holdings, Inc. | 100 | 150 | 15.00 | 02/16/24 | 1 |
| Endeavor Group Holdings, Inc. | 1,848 | 3,696 | 20.00 | 02/16/24 | 46 |
| Fidelity National Information Services, Inc. | 1,372 | 6,860 | 50.00 | 01/19/24 | 10 |
| Kenvue, Inc. | 1,601 | 2,802 | 17.50 | 02/16/24 | 14 |
| Liberty Media Corp.-Liberty SiriusXM | 880 | 1,760 | 20.00 | 01/19/24 | — |
| Phillips 66 | 378 | 4,158 | 110.00 | 01/19/24 | 2 |
| Seagen, Inc. | 717 | 13,623 | 190.00 | 06/21/24 | — |
| SPDR S&P 500® ETF Trust | 234 | 10,998 | 470.00 | 01/19/24 | 55 |
| SPDR S&P Retail® ETF | 142 | 909 | 64.00 | 01/19/24 | 2 |
| Teck Resources Ltd. | 852 | 2,726 | 32.00 | 01/19/24 | 6 |
| Teck Resources Ltd. | 352 | 1,338 | 38.00 | 01/19/24 | 4 |
| Thyssenkrupp AG | 3,225 | 2,096 | 6.50 | 01/19/24 | 103 |
| United States Steel Corp. | 1,250 | 3,875 | 31.00 | 01/19/24 | 1 |
| Vale S.A. | 1,409 | 1,832 | 13.00 | 01/19/24 | 4 |
| Total Purchased Options | | $291 |
| Footnote Legend: |
| (1) Strike price not reported in thousands. |
| (2) Unless otherwise noted, options are exchange-traded. |
| Open written options contracts as of December 31, 2023 were as follows: |
| Description of Options | Number
of
Contracts | Contract
Notional
Amount | Strike
Price(1) | Expiration
Date | Value |
| Call Options(2) | | | | | |
| Albertsons Cos., Inc. | (128) | $ (320) | $ 25.00 | 04/19/24 | $ (10) |
| Ball Corp. | (202) | (1,010) | 50.00 | 01/19/24 | (154) |
| Ball Corp. | (202) | (1,111) | 55.00 | 01/19/24 | (63) |
| Ball Corp. | (291) | (1,310) | 45.00 | 01/19/24 | (371) |
| BioMarin Pharmaceutical, Inc. | (826) | (7,021) | 85.00 | 01/19/24 | (991) |
| Capri Holdings Ltd. | (699) | (4,019) | 57.50 | 01/19/24 | (1) |
| Capri Holdings Ltd. | (1,179) | (5,895) | 50.00 | 01/19/24 | (103) |
| Carrier Global Corp. | (868) | (4,340) | 50.00 | 01/19/24 | (716) |
| Carrier Global Corp. | (877) | (4,604) | 52.50 | 01/19/24 | (473) |
See Notes to Financial Statements
Westchester Event-Driven Fund
SCHEDULE OF INVESTMENTS (Continued)
December 31, 2023
($ reported in thousands)
| Open written options contracts as of December 31, 2023 were as follows (continued): |
| Description of Options | Number
of
Contracts | Contract
Notional
Amount | Strike
Price(1) | Expiration
Date | Value |
| Call Options(2) (continued) | | | | | |
| Cerevel Therapeutics Holdings, Inc. | (186) | $ (837) | $ 45.00 | 12/20/24 | $ (11) |
| Crown Castle, Inc. | (415) | (4,358) | 105.00 | 02/16/24 | (498) |
| Endeavor Group Holdings, Inc. | (350) | (875) | 25.00 | 01/19/24 | (7) |
| Endeavor Group Holdings, Inc. | (1,848) | (4,158) | 22.50 | 02/16/24 | (360) |
| Endeavor Group Holdings, Inc. | (249) | (647) | 26.00 | 02/16/24 | (7) |
| Fidelity National Information Services, Inc. | (1,372) | (7,546) | 55.00 | 01/19/24 | (799) |
| ImmunoGen, Inc. | (683) | (2,049) | 30.00 | 01/19/24 | (10) |
| ImmunoGen, Inc. | (3) | (9) | 31.00 | 07/19/24 | (— ) (3) |
| Karuna Therapeutics, Inc. | (26) | (832) | 320.00 | 01/19/24 | (1) |
| Karuna Therapeutics, Inc. | (2) | (66) | 330.00 | 02/16/24 | (— ) (3) |
| Kenvue, Inc. | (519) | (1,038) | 20.00 | 02/16/24 | (95) |
| Kenvue, Inc. | (1,082) | (2,272) | 21.00 | 02/16/24 | (124) |
| Liberty Media Corp.-Liberty SiriusXM | (880) | (2,200) | 25.00 | 01/19/24 | (352) |
| Phillips 66 | (378) | (4,536) | 120.00 | 01/19/24 | (518) |
| Sovos Brands, Inc. | (2,554) | (6,385) | 25.00 | 02/16/24 | (3) |
| SPDR S&P 500® ETF Trust | (167) | (8,016) | 480.00 | 01/19/24 | (49) |
| Splunk, Inc. | (84) | (1,302) | 155.00 | 02/16/24 | (1) |
| Splunk, Inc. | (193) | (2,992) | 155.00 | 04/19/24 | (29) |
| Teck Resources Ltd. | (190) | (760) | 40.00 | 01/19/24 | (57) |
| Teck Resources Ltd. | (352) | (1,478) | 42.00 | 01/19/24 | (48) |
| Teck Resources Ltd. | (230) | (874) | 38.00 | 02/16/24 | (114) |
| Teck Resources Ltd. | (459) | (1,836) | 40.00 | 02/16/24 | (163) |
| Thyssenkrupp AG | (4,118) | (2,924) | 7.10 | 01/19/24 | (9) |
| Thyssenkrupp AG | (4,972) | (3,480) | 7.00 | 01/19/24 | (11) |
| United States Steel Corp. | (469) | (2,298) | 49.00 | 01/19/24 | (23) |
| United States Steel Corp. | (464) | (2,134) | 46.00 | 02/16/24 | (155) |
| United States Steel Corp. | (781) | (3,749) | 48.00 | 02/16/24 | (125) |
| Vale S.A. | (1,409) | (2,114) | 15.00 | 01/19/24 | (141) |
| | | | | | (6,592) |
| Put Options | | | | | |
| Ball Corp. | (1,606) | (7,629) | 47.50 | 01/19/24 | (2) |
| Baxter International, Inc. | (2,103) | (8,412) | 40.00 | 01/19/24 | (342) |
| Endeavor Group Holdings, Inc. | (100) | (200) | 20.00 | 02/16/24 | (2) |
| Seagen, Inc. | (717) | (10,397) | 145.00 | 06/21/24 | — |
| SPDR S&P Retail® ETF | (39) | (199) | 51.00 | 01/19/24 | (—) (3) |
| SPDR S&P Retail® ETF | (103) | (597) | 58.00 | 01/19/24 | (—) (3) |
| | | | | | (346) |
| Total Written Options | | $(6,938) |
| Footnote Legend: |
| (1) Strike price not reported in thousands. |
| (2) Unless otherwise noted, options are exchange-traded. |
| (3) Amount is less than $500 (not in thousands). |
| Forward foreign currency exchange contracts as of December 31, 2023 were as follows: |
Currency
Purchased | Currency
Amount
Purchased | Currency
Sold | Currency
Amount
Sold | Counterparty | Settlement
Date | Unrealized
Appreciation | Unrealized
Depreciation |
| USD | 5,057 | EUR | 4,600 | JPM | 01/16/24 | $— | $ (24) |
| USD | 10,078 | EUR | 9,341 | GS | 01/22/24 | — | (245) |
| USD | 5,779 | GBP | 4,543 | GS | 01/30/24 | — | (12) |
| USD | 362 | EUR | 329 | JPM | 02/20/24 | — | (2) |
| USD | 1,710 | EUR | 1,548 | JPM | 03/13/24 | — | (4) |
| USD | 4,278 | AUD | 6,273 | GS | 03/19/24 | — | (7) |
| USD | 1,210 | EUR | 1,095 | GS | 03/19/24 | — | (3) |
| USD | 917 | EUR | 830 | JPM | 03/19/24 | — | (2) |
See Notes to Financial Statements
Westchester Event-Driven Fund
SCHEDULE OF INVESTMENTS (Continued)
December 31, 2023
($ reported in thousands)
| Forward foreign currency exchange contracts as of December 31, 2023 were as follows: |
Currency
Purchased | Currency
Amount
Purchased | Currency
Sold | Currency
Amount
Sold | Counterparty | Settlement
Date | Unrealized
Appreciation | | Unrealized
Depreciation |
| USD | 1,719 | EUR | 1,569 | GS | 03/20/24 | $— | | $ (19) |
| USD | 9,980 | JPY | 1,399,682 | GS | 03/27/24 | — | | (86) |
| Total | | | | | | $— | | $ (404) |
| Over-the-counter total return swaps outstanding as of December 31, 2023 were as follows: |
| Referenced Entity | Pay/Receive | Financing Rate(1) | Payment
Frequency | Counterparty | Expiration
Date | Notional
Amount | Value (2) | Unrealized
Appreciation | Unrealized
Depreciation |
| Long Total Return Swap Contracts | | | | | | | | | | |
| Abiomed, Inc.(3) | Pay | 6.070% (0.750% + OBFR) | 1 Month | BAML | 01/30/24 | $ —(4) | | $ 8 | $ 8 | $ — |
| Amedisys, Inc. | Pay | 5.930% (0.610% + OBFR) | 1 Month | GS | 12/02/24 | 10,781 | | 399 | 399 | — |
| BlackRock Floating Rate Income Strategies Fund, Inc. | Pay | 6.120% (0.800% + OBFR) | 3 Month | JPM | 03/25/24 | 431 | | 31 | 31 | — |
| BlackRock Floating Rate Income Strategies Fund, Inc. | Pay | 6.120% (0.800% + OBFR) | 3 Month | JPM | 03/28/24 | 232 | | 14 | 14 | — |
| BlackRock Floating Rate Income Strategies Fund, Inc. | Pay | 6.120% (0.800% + OBFR) | 3 Month | JPM | 04/08/24 | 207 | | 10 | 10 | — |
| Bristol-Myers Squibb Co.(3),(5) | Pay | 6.070% (0.750% + OBFR) | 1 Month | BAML | 03/04/24 | — (4) | | 36 | 36 | — |
| Brookfield Property Preferred LP | Pay | 6.070% (0.750% + OBFR) | 1 Month | BAML | 01/08/24 | 64 | | (16) | — | (16) |
| Canna-Global Acquisition Corp. | Pay | 5.700% (0.380% + OBFR) | 3 Month | JPM | 01/13/25 | 95 | | — (4) | — | — (4) |
| Capri Holdings Ltd. | Pay | 5.930% (0.610% + OBFR) | 1 Month | GS | 11/12/24 | 4,624 | | (94) | — | (94) |
| Chr. Hansen Holding A/S | Pay | 5.930% (0.610% + OBFR) | 1 Month | GS | 02/19/24 | 1,148 | | 168 | 168 | — |
| Chr. Hansen Holding A/S | Pay | 5.870% (0.550% + OBFR) | 3 Month | JPM | 08/05/24 | 48 | | 9 | 9 | — |
| Chr. Hansen Holding A/S | Pay | 5.870% (0.550% + OBFR) | 3 Month | JPM | 08/12/24 | 1,079 | | 205 | 205 | — |
| Chr. Hansen Holding A/S | Pay | 5.870% (0.550% + OBFR) | 3 Month | JPM | 08/13/24 | 467 | | 84 | 84 | — |
| Chr. Hansen Holding A/S | Pay | 5.870% (0.550% + OBFR) | 3 Month | JPM | 08/14/24 | 575 | | 89 | 89 | — |
| Chr. Hansen Holding A/S | Pay | 5.870% (0.550% + OBFR) | 3 Month | JPM | 08/19/24 | 127 | | 16 | 16 | — |
| Covestro AG | Pay | 5.930% (0.610% + OBFR) | 1 Month | GS | 10/11/24 | 1,413 | | 45 | 45 | — |
| Dechra Pharmaceuticals plc | Pay | 5.930% (0.610% + OBFR) | 1 Month | GS | 05/27/24 | 5,236 | | 328 | 328 | — |
| Euronav N.V. | Pay | 5.930% (0.610% + OBFR) | 1 Month | GS | 11/11/24 | 427 | | (4) | — | (4) |
| Euronav N.V. | Pay | 5.870% (0.550% + OBFR) | 3 Month | JPM | 11/12/24 | 426 | | (4) | — | (4) |
| Euronav N.V. | Pay | 5.870% (0.550% + OBFR) | 3 Month | JPM | 11/13/24 | 569 | | (5) | — | (5) |
| Euronav N.V. | Pay | 5.870% (0.550% + OBFR) | 3 Month | JPM | 11/18/24 | 55 | | — (4) | — | — (4) |
| Euronav N.V. | Pay | 5.870% (0.550% + OBFR) | 3 Month | JPM | 11/20/24 | 394 | | (5) | — | (5) |
| Euronav N.V. | Pay | 5.870% (0.550% + OBFR) | 3 Month | JPM | 11/25/24 | 442 | | (5) | — | (5) |
| Euronav N.V. | Pay | 5.870% (0.550% + OBFR) | 3 Month | JPM | 12/02/24 | 27 | | — (4) | — | — (4) |
| Euronav N.V. | Pay | 5.870% (0.550% + OBFR) | 3 Month | JPM | 12/03/24 | 20 | | — (4) | — | — (4) |
| Euronav N.V. | Pay | 5.870% (0.550% + OBFR) | 3 Month | JPM | 12/09/24 | 87 | | (2) | — | (2) |
| Euronav N.V. | Pay | 5.870% (0.550% + OBFR) | 3 Month | JPM | 12/10/24 | 19 | | — (4) | — | — (4) |
| Euronav N.V. | Pay | 5.870% (0.550% + OBFR) | 3 Month | JPM | 12/13/24 | 29 | | (1) | — | (1) |
| Euronav N.V. | Pay | 5.870% (0.550% + OBFR) | 3 Month | JPM | 12/16/24 | 1 | | — (4) | — | — (4) |
| Fidelity National Information Services, Inc. | Pay | 5.930% (0.610% + OBFR) | 1 Month | GS | 09/16/24 | 4,465 | | 332 | 332 | — |
| Hess Corp. | Pay | 5.930% (0.610% + OBFR) | 1 Month | GS | 12/20/24 | 3,612 | | (16) | — | (16) |
| Invesco Dynamic | Pay | 5.930% (0.610% + OBFR) | 1 Month | GS | 03/27/24 | 67 | | (1) | — | (1) |
| Invesco Dynamic | Pay | 5.700% (0.380% + OBFR) | 3 Month | JPM | 01/30/24 | — (4) | | 9 | 9 | — |
| Invesco Dynamic | Pay | 5.700% (0.380% + OBFR) | 3 Month | JPM | 04/30/24 | — (4) | | 9 | 9 | — |
| Invesco Dynamic | Pay | 5.700% (0.380% + OBFR) | 3 Month | JPM | 02/03/25 | 231 | | (1) | — | (1) |
| JSR Corp. | Pay | 5.930% (0.610% + OBFR) | 1 Month | GS | 07/30/24 | 9,249 | | (95) | — | (95) |
See Notes to Financial Statements
Westchester Event-Driven Fund
SCHEDULE OF INVESTMENTS (Continued)
December 31, 2023
($ reported in thousands)
| Over-the-counter total return swaps outstanding as of December 31, 2023 were as follows (continued): |
| Referenced Entity | Pay/Receive | Financing Rate(1) | Payment
Frequency | Counterparty | Expiration
Date | Notional
Amount | Value (2) | | Unrealized
Appreciation | | Unrealized
Depreciation |
| Nuveen New York AMT-Free Quality Municipal Income Fund | Pay | 5.700% (0.380% + OBFR) | 3 Month | JPM | 11/25/24 | $ 789 | | $ 104 | | $ 104 | | $ — |
| RPT Realty | Pay | 5.930% (0.610% + OBFR) | 1 Month | GS | 10/08/24 | 2,634 | | 362 | | 362 | | — |
| Saba Capital Income & Opportunities Fund | Pay | 5.930% (0.610% + OBFR) | 1 Month | GS | 03/27/24 | 234 | | (7) | | — | | (7) |
| Saba Capital Income & Opportunities Fund | Pay | 5.700% (0.380% + OBFR) | 3 Month | JPM | 07/22/24 | 75 | | 1 | | 1 | | — |
| SLM Corp. | Pay | 5.700% (0.380% + OBFR) | 3 Month | JPM | 11/25/24 | 2,307 | | 53 | | 53 | | — |
| Thyssenkrupp AG | Pay | 5.930% (0.610% + OBFR) | 1 Month | GS | 07/12/24 | 10,193 | | (611) | | — | | (611) |
| United States Steel Corp. | Pay | 5.930% (0.610% + OBFR) | 1 Month | GS | 09/17/24 | 4,084 | | 2,146 | | 2,146 | | — |
| Vivendi SE | Pay | 5.930% (0.610% + OBFR) | 1 Month | GS | 05/20/24 | 1,189 | | (22) | | — | | (22) |
| Vivendi SE | Pay | 5.870% (0.550% + OBFR) | 3 Month | JPM | 12/30/24 | 1,001 | | 104 | | 104 | | — |
| | | | | | | | | 3,673 | | 4,562 | | (889) |
| Short Total Return Swap Contracts | | | | | | | | | | | | |
| Brookfield Asset Management Ltd. | Receive | 4.970% ((0.350)% + OBFR) | 1 Month | GS | 09/30/24 | (216) | | (42) | | — | | (42) |
| Chevron Corp. | Receive | 4.970% ((0.350)% + OBFR) | 1 Month | GS | 12/06/24 | (23,144) | | (356) | | — | | (356) |
| Exxon Mobil Corp. | Receive | 4.970% ((0.350)% + OBFR) | 1 Month | GS | 09/14/24 | (23,893) | | 2,487 | | 2,487 | | — |
| Exxon Mobil Corp. | Receive | 4.970% ((0.350)% + OBFR) | 1 Month | GS | 09/16/24 | (8,303) | | 672 | | 672 | | — |
| Exxon Mobil Corp. | Receive | 4.970% ((0.350)% + OBFR) | 1 Month | GS | 11/18/24 | (4,733) | | (43) | | — | | (43) |
| Kimco Realty Corp. | Receive | 4.970% ((0.350)% + OBFR) | 1 Month | GS | 10/07/24 | (2,610) | | (387) | | — | | (387) |
| Novozymes A/S | Receive | 4.970% ((0.350)% + OBFR) | 1 Month | GS | 02/19/24 | (1,232) | | (90) | | — | | (90) |
| Novozymes A/S | Receive | 4.820% ((0.500)% + OBFR) | 3 Month | JPM | 08/05/24 | (49) | | (9) | | — | | (9) |
| Novozymes A/S | Receive | 4.820% ((0.500)% + OBFR) | 3 Month | JPM | 08/12/24 | (1,103) | | (185) | | — | | (185) |
| Novozymes A/S | Receive | 4.820% ((0.500)% + OBFR) | 3 Month | JPM | 08/13/24 | (479) | | (74) | | — | | (74) |
| Novozymes A/S | Receive | 4.820% ((0.500)% + OBFR) | 3 Month | JPM | 08/14/24 | (589) | | (79) | | — | | (79) |
| Novozymes A/S | Receive | 4.820% ((0.500)% + OBFR) | 3 Month | JPM | 08/19/24 | (130) | | (14) | | — | | (14) |
| Pan American Silver Corp. | Receive | 4.920% ((0.400)% + OBFR) | 1 Month | BAML | 01/08/24 | (266) | | 5 | | 5 | | — |
| Pan American Silver Corp. | Receive | 4.720% ((0.600)% + OBFR) | 3 Month | JPM | 09/30/24 | (473) | | (19) | | — | | (19) |
| Realty Income Corp. | Receive | 4.970% ((0.350)% + OBFR) | 1 Month | GS | 12/02/24 | (9,324) | | (1,588) | | — | | (1,588) |
| Realty Income Corp. | Receive | 4.720% ((0.600)% + OBFR) | 3 Month | JPM | 12/02/24 | (802) | | (198) | | — | | (198) |
| Realty Income Corp. | Receive | 4.720% ((0.600)% + OBFR) | 3 Month | JPM | 12/23/24 | (1,856) | | (153) | | — | | (153) |
| Smurfit Kappa Group plc | Receive | 5.050% ((0.270)% + OBFR) | 1 Month | GS | 10/14/24 | (14,824) | | (1,590) | | — | | (1,590) |
| | | | | | | | | (1,663) | | 3,164 | | (4,827) |
| Total | | | | | | | | $ 2,010 | | $7,726 | | $ (5,716) |
| Footnote Legend: |
| (1) | The Fund pays the floating rate (+/- a spread) and receives the total return of the reference entity. |
| (2) | There were no upfront premiums paid or received for the open swap contracts held. |
| (3) | The value of this security was determined using significant unobservable inputs and is reported as a Level 3 security in the Fair Value Hierarchy table located after the Schedule of Investments. |
| (4) | Amount is less than $500 (not in thousands). |
| (5) | Security held is the direct result of a corporate action. There is no associated financing rate and the security is held with a zero cost basis. |
See Notes to Financial Statements
Westchester Event-Driven Fund
SCHEDULE OF INVESTMENTS (Continued)
December 31, 2023
($ reported in thousands)
The following table summarizes the value of the Fund’s investments as of December 31, 2023, based on the inputs used to value them (See Security Valuation Note 2A in the Notes to Financial Statements):
| | Total
Value at
December 31, 2023 | | Level 1
Quoted Prices | | Level 2
Significant
Observable
Inputs | | Level 3
Significant
Unobservable
Inputs |
| Assets: | | | | | | | |
| Debt Instruments: | | | | | | | |
| Convertible Bonds and Notes | $ 8,674 | | $ — | | $ 8,674 | | $ — |
| Corporate Bonds and Notes | 99,706 | | — | | 99,706 | | — |
| Leveraged Loans | 5,177 | | — | | 5,177 | | — |
| Equity Securities: | | | | | | | |
| Closed-End Funds | 15,848 | | 15,848 | | — | | — |
| Preferred Stocks | 4,388 | | 4,388 | | — | | — |
| Common Stocks | 264,949 | | 264,949 | | — | | — (1) |
| Rights | 752 | | 479 | | 29 | | 244 |
| Warrants | 322 | | 187 | | — | | 135 (1) |
| Special Purpose Acquisition Companies | 40,362 | | 39,068 | | 1,294 | | — |
| Escrow Notes | 9,506 | | — | | 9,506 | | — (1) |
| Money Market Mutual Funds | 29,626 | | 29,626 | | — | | — |
| Securities Lending Collateral | 1,136 | | 1,136 | | — | | — |
| Other Financial Instruments: | | | | | | | |
| Purchased Options | 291 | | 174 | | 117 | | — |
| Over-the-Counter Total Return Swaps* | 7,726 | | — | | 7,682 | | 44 |
| Total Assets | 488,463 | | 355,855 | | 132,185 | | 423 |
| Liabilities: | | | | | | | |
| Securities Sold Short: | | | | | | | |
| Common Stocks | (27,354) | | (27,354) | | — | | — |
| U.S. Government Security | (559) | | — | | (559) | | — |
| Other Financial Instruments: | | | | | | | |
| Written Options | (6,938) | | (2,566) | | (4,372) | | — |
| Forward Foreign Currency Exchange Contracts* | (404) | | — | | (404) | | — |
| Over-the-Counter Total Return Swaps* | (5,716) | | — | | (5,716) | | — |
| Total Liabilities | (40,971) | | (29,920) | | (11,051) | | — |
| Total Investments, Net of Securities Sold Short and Written Options | $447,492 | | $325,935 | | $121,134 | | $423 |
| (1) | Includes internally fair valued securities currently priced at zero ($0). |
| * | Swap contracts and forward currency exchange contracts are valued at the net unrealized appreciation (depreciation) on the instrument by level and counterparty. |
Securities held by the Fund with an end of period value of $1 were transferred from Level 3 to Level 2 due to an increase in trading activities at period end.
Over-the-counter total return swaps held by the Fund with an end of period value of $8 were transferred from Level 2 to Level 3 due to a decrease in trading activities at period end.
Some of the Fund’s investments that were categorized as Level 3 may have been valued utilizing third party pricing information without adjustment. If applicable, such valuations are based on unobservable inputs. A significant change in third party information could result in a significantly lower or higher value of Level 3 investments.
Management has determined that the amount of Level 3 securities compared to total net assets is not material; therefore, the roll-forward of Level 3 securities and assumptions are not shown for the period ended December 31, 2023.
See Notes to Financial Statements
THE MERGER FUND® and VIRTUS EVENT OPPORTUNITIES TRUST
STATEMENTS OF ASSETS AND LIABILITIES
December 31, 2023
(Reported in thousands except shares and per share amounts)
| | The Merger Fund | | Westchester Credit Event Fund | | Westchester Event-Driven Fund |
| Assets | | | | | |
Investment in securities at value(1)(2)
| $ 2,430,962 | | $ 73,923 | | $ 480,737 |
Investment in affiliates at value(3)
| 277,651 | | — | | — |
Foreign currency at value(4)
| 65 | | 11 | | 42 |
Cash
| 71,430 | | 667 | | 6,199 |
Due from broker for swap contracts
| 21 | | — (a) | | 30 |
Cash pledged as collateral for derivatives and securities sold short
| 147,035 | | 422 | | 33,668 |
Over-the-counter swaps at value
| 34,470 | | 9 | | 7,726 |
| Receivables | | | | | |
Investment securities sold
| 2,942 | | 4 | | 13 |
Fund shares sold
| 2,284 | | 15 | | 1,055 |
Dividends and interest
| 5,854 | | 723 | | 2,389 |
Tax reclaims
| 1,052 | | — | | 61 |
Securities lending income
| 8 | | — (a) | | 2 |
Prepaid expenses
| 29 | | 35 | | 118 |
Other assets
| 86 | | 2 | | 14 |
Total assets
| 2,973,889 | | 75,811 | | 532,054 |
| Liabilities | | | | | |
Written options at value(5)
| 7,352 | | — | | 6,938 |
Securities sold short at value(6)
| 71,124 | | 385 | | 27,913 |
Over-the-counter swaps at value
| 28,499 | | 8 | | 5,716 |
Unrealized depreciation on forward foreign currency exchange contracts
| 923 | | 17 | | 404 |
| Payables | | | | | |
Fund shares repurchased
| 3,482 | | 45 | | 86 |
Investment securities purchased
| 32,834 | | 1,248 | | 9,455 |
Collateral on securities loaned
| 6,272 | | — | | 1,136 |
Investment advisory fees
| 2,093 | | 56 | | 442 |
Distribution and service fees
| 117 | | 1 | | 1 |
Administration and accounting fees
| 242 | | 7 | | 42 |
Transfer agent and sub-transfer agent fees and expenses
| 630 | | 15 | | 115 |
Professional fees
| 150 | | 46 | | 61 |
Trustee deferred compensation plan
| 86 | | 2 | | 14 |
Interest expense and/or commitment fees
| 6 | | — (a) | | 3 |
Other accrued expenses
| 71 | | 1 | | — |
Total liabilities
| 153,881 | | 1,831 | | 52,326 |
Net Assets
| $ 2,820,008 | | $ 73,980 | | $ 479,728 |
| Net Assets Consist of: | | | | | |
Capital paid in on shares of beneficial interest
| $ 2,800,277 | | $ 74,658 | | $ 480,312 |
Accumulated earnings (loss)
| 19,731 | | (678) | | (584) |
Net Assets
| $ 2,820,008 | | $ 73,980 | | $ 479,728 |
| Net Assets: | | | | | |
Class A
| $ 550,230 | | $ 2,910 | | $ 4,077 |
Class I
| $ 2,269,778 | | $ 71,070 | | $ 475,651 |
| Shares Outstanding (unlimited number of shares authorized, no par value): | | | | | |
Class A
| 32,098,166 | | 259,487 | | 375,748 |
Class I
| 133,855,289 | | 6,483,736 | | 44,502,706 |
| Net Asset Value and Redemption Price Per Share:(b) | | | | | |
Class A
| $ 17.14 | | $ 11.21 | | $ 10.85 |
Class I
| $ 16.96 | | $ 10.96 | | $ 10.69 |
See Notes to Financial Statements
THE MERGER FUND® and VIRTUS EVENT OPPORTUNITIES TRUST
STATEMENTS OF ASSETS AND LIABILITIES (Continued)
December 31, 2023
(Reported in thousands except shares and per share amounts)
| | The Merger Fund | | Westchester Credit Event Fund | | Westchester Event-Driven Fund |
| Maximum Offering Price Per Share (NAV/(1-5.50%)): | | | | | |
Class A
| $ 18.14 | | $ 11.86 | | $ 11.48 |
Maximum Sales Charge - Class A
| 5.50% | | 5.50% | | 5.50% |
(1) Investment in securities at cost
| $ 2,379,755 | | $ 73,626 | | $ 476,296 |
(2) Market value of securities on loan
| $ 3,827 | | $ — | | $ 1,110 |
(3) Investment in affiliates at cost
| $ 267,400 | | $ — | | $ — |
(4) Foreign currency at cost
| $ 65 | | $ 11 | | $ 42 |
(5) Written options premiums received
| $ 8,415 | | $ — | | $ 6,357 |
(6) Securities sold short proceeds
| $ 69,322 | | $ 405 | | $ 27,075 |
| (a) | Amount is less than $500 (not in thousands). |
| (b) | Net Asset Value Per Share is calculated using unrounded net assets. |
See Notes to Financial Statements
THE MERGER FUND® and VIRTUS EVENT OPPORTUNITIES TRUST
STATEMENTS OF OPERATIONS YEAR ENDED
December 31, 2023
($ reported in thousands)
| | The Merger Fund | | Westchester Credit Event Fund | | Westchester Event-Driven Fund |
| Investment Income | | | | | |
Dividends
| $ 35,328 | | $ 490 | | $ 4,117 |
Dividends from affiliates
| 1,970 | | — | | — |
Interest
| 17,982 | | 3,058 | | 7,991 |
Securities lending, net of fees
| 107 | | 1 | | 11 |
Foreign taxes withheld
| (281) | | — | | (83) |
Total investment income
| 55,106 | | 3,549 | | 12,036 |
| Expenses | | | | | |
Investment advisory fees
| 34,325 | | 657 | | 4,886 |
Distribution and service fees, Class A
| 1,594 | | 6 | | 40 |
Administration and accounting fees
| 3,496 | | 75 | | 417 |
Transfer agent fees and expenses
| 1,520 | | 29 | | 170 |
Sub-transfer agent fees and expenses, Class A
| 892 | | 4 | | 23 |
Sub-transfer agent fees and expenses, Class I
| 2,511 | | 51 | | 495 |
Custodian fees
| 9 | | 1 | | 4 |
Printing fees and expenses
| 139 | | 3 | | 18 |
Professional fees
| 282 | | 51 | | 77 |
Interest expense and/or commitment fees
| 29 | | 1 | | 8 |
Registration fees
| 86 | | 34 | | 46 |
Trustees’ fees and expenses
| 308 | | 5 | | 30 |
Miscellaneous expenses
| 502 | | 23 | | 68 |
Total expenses
| 45,693 | | 940 | | 6,282 |
Dividend and interest expense on securities sold short
| 1,191 | | 12 | | 154 |
Total expenses, including dividend and interest expense on securities sold short
| 46,884 | | 952 | | 6,436 |
Less net expenses reimbursed and/or waived by investment adviser(1)
| (3,651) | | — | | (274) |
Less low balance account fees
| — (2) | | — | | — |
Plus net expenses recaptured(1)
| — | | 45 | | — |
Net expenses
| 43,233 | | 997 | | 6,162 |
Net investment income (loss)
| 11,873 | | 2,552 | | 5,874 |
| Net Realized and Unrealized Gain (Loss) on Investments | | | | | |
| Net realized gain (loss) from: | | | | | |
Investments
| 133,876 | | (413) | | 4,155 |
Investments in affiliates
| 2,726 | | — | | — |
Securities sold short
| (21,758) | | — (2) | | (827) |
Foreign currency transactions
| (370) | | (2) | | (26) |
Forward foreign currency exchange contracts
| 3,089 | | 29 | | 543 |
Written options
| (8,295) | | — | | 6,455 |
Swaps
| (41,197) | | (44) | | (7,689) |
| Net change in unrealized appreciation (depreciation) on: | | | | | |
Investments
| 36,653 | | 3,668 | | 13,474 |
Investments in affiliates
| 10,251 | | — | | — |
Securities sold short
| (2,611) | | (5) | | (982) |
Foreign currency transactions
| 36 | | — (2) | | 4 |
Forward foreign currency exchange contracts
| (597) | | (17) | | (274) |
Written options
| (2,027) | | — | | (66) |
Swaps
| 4,048 | | 235 | | 4,692 |
Net realized and unrealized gain (loss) on investments
| 113,824 | | 3,451 | | 19,459 |
See Notes to Financial Statements
THE MERGER FUND® and VIRTUS EVENT OPPORTUNITIES TRUST
STATEMENTS OF OPERATIONS (Continued)
YEAR ENDED December 31, 2023
($ reported in thousands)
| | The Merger Fund | | Westchester Credit Event Fund | | Westchester Event-Driven Fund |
Net increase (decrease) in net assets resulting from operations
| $125,697 | | $6,003 | | $25,333 |
| (1) | See Notes 4C and 4D in the Notes to Financial Statements. |
| (2) | Amount is less than $500 (not in thousands). |
See Notes to Financial Statements
THE MERGER FUND® AND VIRTUS EVENT OPPORTUNITIES TRUST
STATEMENTS OF CHANGES IN NET ASSETS
($ reported in thousands)
| | The Merger Fund | | Westchester Credit Event Fund |
| | Year Ended
December 31,
2023 | | Year Ended
December 31,
2022 | | Year Ended
December 31,
2023 | | Year Ended
December 31,
2022 |
| Increase (Decrease) in Net Assets Resulting from Operations | | | | | | | |
Net investment income (loss)
| $ 11,873 | | $ 6,815 | | $ 2,552 | | $ 1,478 |
Net realized gain (loss)
| 68,071 | | 251,178 | | (430) | | (133) |
Net change in unrealized appreciation (depreciation)
| 45,753 | | (217,598) | | 3,881 | | (3,541) |
Increase (decrease) in net assets resulting from operations
| 125,697 | | 40,395 | | 6,003 | | (2,196) |
| Dividends and Distributions to Shareholders | | | | | | | |
| Net Investment Income and Net Realized Gains: | | | | | | | |
Class A
| (14,025) | | (25,339) | | (116) | | (3) |
Class I
| (65,375) | | (164,411) | | (2,984) | | (1,380) |
Total dividends and distributions to shareholders
| (79,400) | | (189,750) | | (3,100) | | (1,383) |
| Change in Net Assets from Capital Transactions (See Note 6): | | | | | | | |
Class A
| (195,636) | | (93,584) | | 1,507 | | 754 |
Class I
| (1,298,061) | | 240,443 | | 12,971 | | 40,521 |
Increase (decrease) in net assets from capital transactions
| (1,493,697) | | 146,859 | | 14,478 | | 41,275 |
Net increase (decrease) in net assets
| (1,447,400) | | (2,496) | | 17,381 | | 37,696 |
| Net Assets | | | | | | | |
Beginning of period
| 4,267,408 | | 4,269,904 | | 56,599 | | 18,903 |
End of Period
| $ 2,820,008 | | $ 4,267,408 | | $ 73,980 | | $ 56,599 |
See Notes to Financial Statements
THE MERGER FUND® AND VIRTUS EVENT OPPORTUNITIES TRUST
STATEMENTS OF CHANGES IN NET ASSETS (Continued)
($ reported in thousands)
| | Westchester Event-Driven Fund |
| | Year Ended
December 31,
2023 | | Year Ended
December 31,
2022 |
| Increase (Decrease) in Net Assets Resulting from Operations | | | |
Net investment income (loss)
| $ 5,874 | | $ 4,271 |
Net realized gain (loss)
| 2,611 | | 2,675 |
Net change in unrealized appreciation (depreciation)
| 16,848 | | (17,358) |
Increase (decrease) in net assets resulting from operations
| 25,333 | | (10,412) |
| Dividends and Distributions to Shareholders | | | |
| Net Investment Income and Net Realized Gains: | | | |
Class I
| (11,500) | | (650) |
Total dividends and distributions to shareholders
| (11,500) | | (650) |
| Change in Net Assets from Capital Transactions (See Note 6): | | | |
Class A
| (15,732) | | (17,480) |
Class I
| 151,920 | | 26,542 |
Increase (decrease) in net assets from capital transactions
| 136,188 | | 9,062 |
Net increase (decrease) in net assets
| 150,021 | | (2,000) |
| Net Assets | | | |
Beginning of period
| 329,707 | | 331,707 |
End of Period
| $ 479,728 | | $ 329,707 |
See Notes to Financial Statements
THE MERGER FUND® AND VIRTUS EVENT OPPORTUNITIES TRUST
FINANCIAL HIGHLIGHTS
SELECTED PER SHARE DATA AND RATIOS FOR A SHARE OUTSTANDING
THROUGHOUT EACH PERIOD
| | | Net Asset Value,
Beginning of Period | Net Investment Income (Loss)(1) | Net Realized and
Unrealized Gain (Loss) | Total from Investment Operations | Dividends from
Net Investment Income | Distributions from
Net Realized Gains | Total Distributions | Change in Net Asset Value | Net Asset Value, End of Period | Total Return(2) | Net Assets, End of Period
(in thousands) | Ratio of Net Expenses to
Average Net Assets(3) | Ratio of Gross Expenses
to Average Net Assets(3) | Ratio of Net Investment Income (Loss)
to Average Net Assets | Portfolio Turnover Rate |
| | | | | | | | | | | | | | | | | |
| The Merger Fund | | | | | | | | | | | | | | | | |
| Class A | | | | | | | | | | | | | | | | |
| 1/1/23 to 12/31/23 | | $16.88 | 0.02 | 0.68 | 0.70 | (0.44) | — | (0.44) | 0.26 | $17.14 | 4.18 % | $ 550,230 | 1.50 % (4) | 1.61 % | 0.12 % | 218 % |
| 1/1/22 to 12/31/22 | | 17.35 | (0.02) | 0.14 | 0.12 | (0.14) | (0.45) | (0.59) | (0.47) | 16.88 | 0.71 | 737,427 | 1.50 (4) | 1.59 | (0.14) | 196 |
| 1/1/21 to 12/31/21 | | 17.43 | (0.10) (5) | 0.07 | (0.03) | — (6) | (0.05) | (0.05) | (0.08) | 17.35 | (0.19) | 851,000 | 1.54 (4) | 1.61 | (0.59) | 162 |
| 1/1/20 to 12/31/20 | | 17.17 | (0.04) (5) | 0.88 | 0.84 | (0.13) | (0.45) | (0.58) | 0.26 | 17.43 | 4.87 | 920,000 | 1.49 (4) | 1.51 | (0.22) | 188 |
| 1/1/19 to 12/31/19 | | 16.42 | 0.09 (5) | 0.89 | 0.98 | (0.05) | (0.18) | (0.23) | 0.75 | 17.17 | 5.96 | 1,031,000 | 2.01 (4)(7) | 2.03 (7) | 0.52 | 167 |
| Class I | | | | | | | | | | | | | | | | |
| 1/1/23 to 12/31/23 | | $16.70 | 0.07 | 0.68 | 0.75 | (0.49) | — | (0.49) | 0.26 | $16.96 | 4.51 % | $2,269,778 | 1.21 % (8) | 1.31 % | 0.40 % | 218 % |
| 1/1/22 to 12/31/22 | | 17.32 | 0.04 | 0.13 | 0.17 | (0.34) | (0.45) | (0.79) | (0.62) | 16.70 | 1.01 | 3,529,981 | 1.21 (8) | 1.32 | 0.22 | 196 |
| 1/1/21 to 12/31/21 | | 17.35 | (0.05) (9) | 0.07 | 0.02 | — (6) | (0.05) | (0.05) | (0.03) | 17.32 | 0.10 | 3,419,099 | 1.25 (8) | 1.31 | (0.30) | 162 |
| 1/1/20 to 12/31/20 | | 17.10 | 0.01 (9) | 0.87 | 0.88 | (0.18) | (0.45) | (0.63) | 0.25 | 17.35 | 5.15 | 2,709,370 | 1.20 (8) | 1.22 | 0.07 | 188 |
| 1/1/19 to 12/31/19 | | 16.30 | 0.14 (9) | 0.89 | 1.03 | (0.05) | (0.18) | (0.23) | 0.80 | 17.10 | 6.32 | 2,161,001 | 1.72 (7)(8) | 1.74 (7) | 0.81 | 167 |
| | | | | | | | | | | | | | | | | |
| Westchester Credit Event Fund | | | | | | | | | | | | | | | | |
| Class A | | | | | | | | | | | | | | | | |
| 1/1/23 to 12/31/23 | | $10.69 | 0.43 | 0.55 | 0.98 | (0.46) | — | (0.46) | 0.52 | $11.21 | 9.22 % | $ 2,910 | 1.74 % (10)(11) | 1.79 % | 3.82 % | 182 % |
| 1/1/22 to 12/31/22 | | 11.31 | 0.21 | (0.81) | (0.60) | — | (0.02) | (0.02) | (0.62) | 10.69 | (5.28) | 1,278 | 1.90 (11)(12)(13) | 1.78 | 1.89 | 151 |
| 1/1/21 to 12/31/21 | | 11.99 | (0.02) (14) | 0.90 | 0.88 | (0.29) | (1.27) | (1.56) | (0.68) | 11.31 | 7.36 | 870 | 2.21 (11) | 2.88 | (0.19) | 198 |
| 1/1/20 to 12/31/20 | | 10.43 | — (6)(14) | 1.67 | 1.67 | (0.03) | (0.08) | (0.11) | 1.56 | 11.99 | 15.99 (15) | 78 | 4.20 (11) | 5.69 | 0.01 | 208 |
| 1/1/19 to 12/31/19 | | 9.54 | 0.19 (14) | 1.01 | 1.20 | (0.27) | (0.04) | (0.31) | 0.89 | 10.43 | 12.60 | 463 | 2.13 (11) | 5.63 | 1.77 | 106 |
| Class I | | | | | | | | | | | | | | | | |
| 1/1/23 to 12/31/23 | | $10.44 | 0.43 | 0.57 | 1.00 | (0.48) | — | (0.48) | 0.52 | $10.96 | 9.56 % | $ 71,070 | 1.51 % (10)(16)(17) | 1.44 % | 3.89 % | 182 % |
| 1/1/22 to 12/31/22 | | 11.25 | 0.33 | (0.88) | (0.55) | (0.24) | (0.02) | (0.26) | (0.81) | 10.44 | (4.87) | 55,321 | 1.65 (13)(17) | 1.52 | 3.05 | 151 |
| 1/1/21 to 12/31/21 | | 11.91 | 0.01 (18) | 0.89 | 0.90 | (0.29) | (1.27) | (1.56) | (0.66) | 11.25 | 7.57 | 18,033 | 1.96 (17) | 2.63 | 0.06 | 198 |
| 1/1/20 to 12/31/20 | | 10.46 | 0.03 (18) | 1.63 | 1.66 | (0.13) | (0.08) | (0.21) | 1.45 | 11.91 | 15.99 (15) | 9,824 | 3.95 (17) | 5.44 | 0.26 | 208 |
| 1/1/19 to 12/31/19 | | 9.55 | 0.21 (18) | 1.02 | 1.23 | (0.28) | (0.04) | (0.32) | 0.91 | 10.46 | 12.87 | 4,698 | 1.88 (17) | 5.38 | 2.02 | 106 |
| | | | | | | | | | | | | | | | | |
| Westchester Event-Driven Fund | | | | | | | | | | | | | | | | |
| Class A | | | | | | | | | | | | | | | | |
| 1/1/23 to 12/31/23 | | $10.28 | 0.11 | 0.46 | 0.57 | — | — | — | 0.57 | $10.85 | 5.54 % | $ 4,077 | 1.80 % (10)(19) | 1.87 % | 1.07 % | 295 % |
| 1/1/22 to 12/31/22 | | 10.60 | 0.07 | (0.39) | (0.32) | — | — | — | (0.32) | 10.28 | (3.02) | 19,240 | 1.87 (19) | 1.96 | 0.66 | 194 |
| 1/1/21 to 12/31/21 | | 11.30 | (0.05) (20) | 0.23 | 0.18 | (0.55) | (0.33) | (0.88) | (0.70) | 10.60 | 1.57 | 37,426 | 1.94 (10)(19) | 1.96 | (0.42) | 237 |
| 1/1/20 to 12/31/20 | | 10.97 | (0.01) (20) | 0.70 | 0.69 | (0.10) | (0.26) | (0.36) | 0.33 | 11.30 | 6.30 | 23,298 | 1.99 (19) | 1.99 | (0.11) | 320 |
| 1/1/19 to 12/31/19 | | 10.12 | 0.03 (20) | 1.05 | 1.08 | (0.15) | (0.08) | (0.23) | 0.85 | 10.97 | 10.73 | 19,352 | 2.35 (19)(21) | 2.35 (21) | 0.27 | 238 |
| Class I | | | | | | | | | | | | | | | | |
| 1/1/23 to 12/31/23 | | $10.35 | 0.16 | 0.45 | 0.61 | (0.27) | — | (0.27) | 0.34 | $10.69 | 5.86 % | $ 475,651 | 1.53 % (10)(22) | 1.59 % | 1.48 % | 295 % |
| 1/1/22 to 12/31/22 | | 10.67 | 0.13 | (0.43) | (0.30) | (0.02) | — | (0.02) | (0.32) | 10.35 | (2.79) | 310,467 | 1.63 (22) | 1.71 | 1.27 | 194 |
| 1/1/21 to 12/31/21 | | 11.37 | (0.02) (23) | 0.22 | 0.20 | (0.57) | (0.33) | (0.90) | (0.70) | 10.67 | 1.75 | 294,281 | 1.69 (10)(22) | 1.71 | (0.17) | 237 |
| 1/1/20 to 12/31/20 | | 11.01 | 0.01 (23) | 0.71 | 0.72 | (0.10) | (0.26) | (0.36) | 0.36 | 11.37 | 6.55 | 236,865 | 1.74 (22) | 1.74 | 0.14 | 320 |
| 1/1/19 to 12/31/19 | | 10.14 | 0.06 (23) | 1.06 | 1.12 | (0.17) | (0.08) | (0.25) | 0.87 | 11.01 | 11.13 | 199,251 | 2.10��� (21)(22) | 2.10 (21) | 0.52 | 238 |
| Footnote Legend: |
| (1) | Calculated using average shares outstanding. |
The footnote legend is at the end of the financial highlights.
See Notes to Financial Statements
THE MERGER FUND® AND VIRTUS EVENT OPPORTUNITIES TRUST
FINANCIAL HIGHLIGHTS (Continued)
SELECTED PER SHARE DATA AND RATIOS FOR A SHARE OUTSTANDING
THROUGHOUT EACH PERIOD
| (2) | Total returns would have been lower had various fees and expenses not been waived and reimbursed during the period. The total returns in the table represent the rate that an investor would have earned (or lost) on an investment in a Fund (assuming reinvestment of all dividends and distributions). |
| (3) | The Funds will also indirectly bear their prorated share of expenses of any underlying funds in which they invest. Such expenses are not included in the calculation of this ratio. |
| (4) | Ratios of net expenses excluding dividend and interest expense on securities sold short to average net assets for the years ended December 31, 2023, 2022, 2021, 2020 and 2019 were 1.46%, 1.46%, 1.46%, 1.47%, and 1.48%*, respectively.
*The amount for the year ended December 31, 2019 excludes 0.10% of legal expenses related to the settlement of an appraisal right. |
| (5) | Net investment income (loss) before dividends and interest on short positions, borrowing expense on securities sold short, legal expenses related to the settlement of an appraisal right and professional fees related to tax reclaims processing for the years ended December 31, 2021, 2020 and 2019 was $(0.09), $(0.04) and $0.18, respectively. |
| (6) | Amount is less than $0.005 per share. |
| (7) | The amount for the year ended December 31, 2019 includes 0.10% of legal expenses related to the settlement of an appraisal right. |
| (8) | Ratios of net expenses excluding dividend and interest expense on securities sold short to average net assets for the years ended December 31, 2023, 2022, 2021, 2020 and 2019 were 1.17%, 1.17%, 1.17%, 1.18%, and 1.19%*, respectively.
*The amount for the year ended December 31, 2019 excludes 0.10% of legal expenses related to the settlement of an appraisal right. |
| (9) | Net investment income (loss) before dividends and interest on short positions, borrowing expense on securities sold short, legal expenses related to the settlement of an appraisal right and professional fees related to tax reclaims processing for the years ended December 31, 2021, 2020 and 2019 was $(0.04), $0.02 and $0.22, respectively. |
| (10) | Due to a change in expense cap, the ratio shown is a blended expense ratio. |
| (11) | Ratio of net expenses excluding dividend and interest expense on securities sold short to average net assets was for the year ended December 31, 2023 and 2022 was 1.72% and 1.89%, respectively. |
| (12) | See Notes 4C and 4D in the Notes to Financial Statements. |
| (13) | The share class is currently under its expense limitation. |
| (14) | Net investment income (loss) before borrowing expense on securities sold short and interest on securities sold short and reverse repurchase agreements for the years ended December 31, 2021, 2020 and 2019 was $0.02, $0.23 and $0.21, respectively. |
| (15) | Includes adjustments in accordance with accounting principles generally accepted in the United States of America and as such, the net asset values for financial reporting purposes and the returns based upon those net asset values may differ from the net asset values and returns for shareholder transactions. |
| (16) | See Note 4D in the Notes to Financial Statements for information on recapture of expenses previously reimbursed. |
| (17) | Ratio of net expenses excluding dividend and interest expense on securities sold short to average net assets was for the year ended December 31, 2023 and 2022 was 1.49% and 1.64%, respectively. |
| (18) | Net investment income before borrowing expense on securities sold short and interest on securities sold short and reverse repurchase agreements for the years ended December 31, 2021, 2020, and 2019 was $0.05, $0.26 and $0.23, respectively. |
| (19) | Ratios of net expenses excluding dividend and interest expense on securities sold short to average net assets for the years ended December 31, 2023, 2022, 2021, 2020 and 2019 were 1.75%, 1.80%, 1.79%, 1.82%, and 1.86%*, respectively.
*The amount for the year ended December 31, 2019 excludes 0.03% of legal expenses related to the settlement of an appraisal right. |
| (20) | Net investment income (loss) before dividends and interest on short positions, borrowing expense on securities sold short and legal expenses related to the settlement of an appraisal right for the periods ended December 31, 2021, 2020 and 2019 was $(0.03), $0.01 and $0.08, respectively. |
| (21) | The amount for the year ended December 31, 2019 includes 0.03% of legal expenses related to the settlement of an appraisal right. |
| (22) | Ratios of net expenses excluding dividend and interest expense on securities sold short to average net assets for the years ended December 31, 2023, 2022, 2021, 2020 and 2019 were 1.49%, 1.55%, 1.54%, 1.57%, and 1.61%*, respectively.
*The amount for the year ended December 31, 2019 excludes 0.03% of legal expenses related to the settlement of an appraisal right. |
| (23) | Net investment income (loss) before dividends and interest on short positions, borrowing expense on securities sold short and legal expenses related to the settlement of an appraisal right for the years ended December 31, 2021, 2020 and 2019 was $0.00, $0.03 and $0.11, respectively. |
See Notes to Financial Statements
THE MERGER FUND®AND VIRTUS EVENT OPPORTUNITIES TRUST
NOTES TO FINANCIAL STATEMENTS
December 31, 2023
Note 1. Organization
The Merger Fund is an open-end management investment company organized as a trust under the laws of the Commonwealth of Massachusetts on April 12, 1982, and registered under the Investment Company Act of 1940, as amended (the “1940 Act”). Each of Westchester Credit Event Fund and Westchester Event-Driven Fund is a series of Virtus Event Opportunities Trust, an open-end management investment company established under the laws of the Commonwealth of Massachusetts on March 20, 2013, and registered under the 1940 Act.
The Merger Fund, Westchester Credit Event Fund and Westchester Event-Driven Fund are each, a “Fund” and collectively, the “Funds”. Each Fund’s investment objective is outlined in its respective Fund Summary page. There is no guarantee that a Fund will achieve its objective(s).
Each Fund offers Class I and Class A Shares.
Class A shares are sold with a front-end sales charge of up to 5.50% with some exceptions. Generally, Class A shares are not subject to any charges by the Funds when redeemed; however, a 1.00% contingent deferred sales charge (“CDSC”) may be imposed on certain redemptions made within a certain period following purchases on which a finder’s fee has been paid. The period for which such CDSC applies for the Funds is 18 months. No front-end sales load is applied to purchases of $1,000,000 or more. The CDSC period begins on the last day of the month preceding the month in which the purchase was made.
Class I shares are offered primarily to clients of financial intermediaries that (i) charge such clients an ongoing fee for advisory, investment, consulting, or similar services; or (ii) have entered into an agreement with the Funds’ distributor to offer Class I Shares through a no-load network or platform. Such clients may include pension and profit sharing plans, other employee benefit trusts, endowments, foundations and corporations. Class I Shares are also offered to private and institutional clients of, or referred by, the adviser, a subadviser or their affiliates, and to Trustees of the funds and trustees/directors of affiliated open- and closed-end funds, and directors, officers and employees of Virtus and its affiliates. If you are eligible to purchase and do purchase Class I shares, you will pay no sales charge at any time. There are no distribution and service fees applicable to Class I shares.
The Funds may impose an annual fee on accounts having balances of less than $2,500. The small account fee may be waived in certain circumstances, as disclosed in the prospectuses and/or statement of additional information. The fees collected will be used to offset certain expenses of the Funds. These fees are reflected as “Less low balance account fees” in each Fund’s Statement of Operations for the period, as applicable.
Each class of shares has identical voting, dividend, liquidation and other rights and the same terms and conditions, except that each class bears any expenses attributable specifically to that class (“class-specific expenses”) and has exclusive voting rights with respect to any Rule 12b-1 and/or shareholder service plan (“12b-1 Plan”) approved by the Board. Class I shares are not subject to a 12b-1 Plan. Class-specific expenses may include shareholder servicing fees, sub-transfer agency fees, and fees under a 12b-1 Plan, as well as certain other expenses as designated by the Funds’ Treasurer and approved by the Board. Investment income, common operating expenses and realized and unrealized gains and losses of each Fund are borne pro-rata by the holders of each class of shares.
Note 2. Significant Accounting Policies
($ reported in thousands)
Each Fund is an investment company that follows the accounting and reporting guidance of the Financial Accounting Standards Board (“FASB”) Accounting Standards Codification Topic 946 Financial Services – Investment Companies. The following is a summary of significant accounting policies consistently followed by the Funds in the preparation of their financial statements and for derivatives, included in Note 3 below. The preparation of financial statements in conformity with U.S. generally accepted accounting principles (“U.S. GAAP”) requires management to make estimates and assumptions that affect the reported amounts of assets and liabilities, disclosure of contingent assets and liabilities at the date of the financial statements, and the reported amounts of increases and decreases in net assets from operations during the reporting period. Actual results could differ from those estimates and those differences could be significant.
| A. | Security Valuation |
| | The Funds’ Board of Trustees has designated the investment adviser as the valuation designee to perform fair valuations pursuant to Rule 2a-5 under the Investment Company Act of 1940. Each Fund utilizes a fair value hierarchy which prioritizes the inputs to valuation techniques used to measure fair value into three broad levels. The Funds’ policy is to recognize transfers into or out of Level 3 at the end of the reporting period. |
| | • | Level 1 – | quoted prices in active markets for identical securities (security types generally include listed equities). |
| | • | Level 2 – | prices determined using other significant observable inputs (including quoted prices for similar securities, interest rates, prepayment speeds, credit risk, etc.). |
| | • | Level 3 – | prices determined using significant unobservable inputs (including the investment adviser’s Valuation Committee’s own assumptions in determining the fair value of investments). |
A description of the valuation techniques applied to a Fund’s major categories of assets and liabilities measured at fair value on a recurring basis is as follows:
Equity securities are valued at the official closing price (typically last sale) on the exchange on which the securities are primarily traded or, if no closing price is available, at the last bid price and are categorized as Level 1 in the hierarchy. Illiquid, restricted equity securities and illiquid private placements are internally fair valued by the investment adviser’s Valuation Committee, and are generally categorized as Level 3 in the hierarchy.
Certain non-U.S. securities may be fair valued in cases where closing prices are not readily available or are deemed not reflective of readily available market prices. For example, significant events (such as movement in the U.S. securities market, or other regional and local developments) may occur between the time that non-U.S. markets close (where the security is principally traded) and the time that a Fund calculates its net asset
THE MERGER FUND®AND VIRTUS EVENT OPPORTUNITIES TRUST
NOTES TO FINANCIAL STATEMENTS (Continued)
December 31, 2023
value (“NAV”) at the close of regular trading on the New York Stock Exchange (“NYSE”) (generally 4 p.m. Eastern time) that may impact the value of securities traded in these non-U.S. markets. In such cases, the Funds fair value non-U.S. securities using an independent pricing service which considers the correlation of the trading patterns of the non-U.S. security to the intraday trading in the U.S. markets for investments such as ADRs, financial futures, ETFs, and certain indexes, as well as prices for similar securities. Such fair valuations are categorized as Level 2 in the hierarchy. Because the frequency of significant events is not predictable, fair valuation of certain non-U.S. common stocks may occur on a frequent basis.
Debt instruments, including convertible bonds, and restricted securities, are valued based on evaluated quotations received from independent pricing services or from dealers who make markets in such securities. For most bond types, the pricing service utilizes matrix pricing that considers one or more of the following factors: yield or price of bonds of comparable quality, coupon, maturity, current cash flows, type, activity of the underlying equities, and current day trade information, as well as dealer supplied prices. These valuations are generally categorized as Level 2 in the hierarchy. Structured debt instruments, such as mortgage-backed and asset-backed securities may also incorporate collateral analysis and utilize cash flow models for valuation and are generally categorized as Level 2 in the hierarchy. Pricing services do not provide pricing for all securities and therefore indicative bids from dealers are utilized which are based on pricing models used by market makers in the security and are generally categorized as Level 2 in the hierarchy. Debt instruments that are internally fair valued by the investment adviser’s Valuation Committee are generally categorized as Level 3 in the hierarchy.
Listed derivatives, such as options and futures, that are actively traded are valued at the last posted settlement price from the exchange where they are principally traded and are categorized as Level 1 in the hierarchy. Over-the-counter (“OTC”) derivative contracts, which include forward currency contracts, swaps, swaptions, options and equity linked instruments, are valued based on model prices provided by independent pricing services or from dealer quotes. Depending on the derivative type and the specific terms of the transaction, these models vary and include observable inputs in actively quoted markets including but not limited to: underlying reference entity details, indices, spreads, interest rates, yield curves, dividend and exchange rates. These instruments are generally categorized as Level 2 in the hierarchy. Centrally cleared swaps listed or traded on a bilateral or trade facility platform, such as a registered exchange, are valued at the last posted settlement price determined by the respective exchange. These securities are generally categorized as Level 2 within the hierarchy.
Investments in open-end mutual funds are valued at NAV. Investments in closed-end funds and ETFs are valued as of the close of regular trading on the NYSE each business day. Each is categorized as Level 1 in the hierarchy.
A summary of the inputs used to value a Fund’s net assets by each major security type is disclosed at the end of the Schedule of Investments for each Fund. The inputs or methodologies used for valuing securities are not necessarily an indication of the risk associated with investing in those securities.
| B. | Security Transactions and Investment Income |
| | Security transactions are recorded on the trade date. Realized gains and losses from the sale of securities are determined on the identified cost basis. Dividend income and capital gain distributions are recognized on the ex-dividend date or, in the case of certain foreign securities, as soon as a Fund is notified. Interest income is recorded on the accrual basis. Each Fund amortizes premiums and accretes discounts using the effective interest method. Premiums on callable debt instruments are amortized to interest income to the earliest call date using the effective interest method. Conversion premium is not amortized. Any distributions from underlying funds are recorded in accordance with the character of the distributions as designated by the underlying funds. |
| | Dividend income from REIT is recorded using management’s estimate of the percentage of income included in distributions received from such investments based on historical information and other industry sources. The return of capital portion of the estimate is a reduction to investment income and a reduction in the cost basis of each investment which increases net realized gain (loss) and net change in unrealized appreciation (depreciation). If the return of capital distributions exceed their cost basis, the distributions are treated as realized gains. The actual amounts of income, return of capital, and capital gains are only determined by each REIT and MLP after its fiscal year-end, and may differ from the estimated amounts. |
| C. | Income Taxes |
| | Each Fund is treated as a separate taxable entity. It is the intention of each Fund to comply with the requirements of Subchapter M of the Internal Revenue Code of 1986, as amended (the “Code”) and to distribute substantially all of its taxable income to its shareholders. Therefore, no provision for federal income taxes or excise taxes has been made. |
| | Certain Funds may be subject to foreign taxes on income, gains on investments or currency repatriation, a portion of which may be recoverable. Each Fund will accrue such taxes and recoveries as applicable based upon current interpretations of the tax rules and regulations that exist in the markets in which it invests. |
| | Management of the Funds has concluded that there are no significant uncertain tax positions that would require recognition in the financial statements. Each Fund’s U.S. federal income tax return is generally subject to examination by the Internal Revenue Service for a period of three years after it is filed. State, local and/or non-U.S. tax returns and/or other filings may be subject to examination for different periods, depending upon the tax rules of each applicable jurisdiction. |
| D. | Distributions to Shareholders |
| | Distributions are recorded by each Fund on the ex-dividend date. Income and capital gain distributions are determined in accordance with income tax regulations which may differ from U.S. GAAP. |
THE MERGER FUND®AND VIRTUS EVENT OPPORTUNITIES TRUST
NOTES TO FINANCIAL STATEMENTS (Continued)
December 31, 2023
| E. | Expenses |
| | Expenses incurred together by a Fund and other affiliated mutual funds are allocated in proportion to the net assets of each such fund, except where allocation of direct expenses to each Fund and each such other fund, or an alternative allocation method, can be more appropriately used. |
| | In addition to the net annual operating expenses that a Fund bears directly, the shareholders of a Fund indirectly bear the pro-rata expenses of any underlying mutual funds in which the Fund invests. |
| F. | Foreign Currency Transactions |
| | Non-U.S. investment securities and other assets and liabilities denominated in foreign currencies are translated into U.S. dollar amounts at the foreign currency exchange rate effective at the end of the reporting period. Cost of investments is translated at the currency exchange rate effective at the trade date. The gain or loss resulting from a change in currency exchange rates between the trade and settlement date of a portfolio transaction is treated as a gain or loss on foreign currency. Likewise, the gain or loss resulting from a change in currency exchange rates between the date income is accrued and the date it is paid is treated as a gain or loss on foreign currency. For fixed income instruments, the Funds bifurcate that portion of the results of operations arising from changes in foreign exchange rates on investments from the fluctuations arising from changes in the market prices of securities held and such fluctuations are included with the net realized and unrealized gain or loss on foreign currency transactions. For equity securities, the Funds do not isolate that portion of the results of operations arising from changes in foreign exchange rates on investments from the fluctuations arising from changes in the market prices of securities held and such fluctuations are included with the net realized and unrealized gain or loss on investments. |
| G. | Short Sales |
| | Each Fund may sell securities short. A short sale is a transaction in which a Fund sells a security it does not own in anticipation of a decline in market price. To sell a security short, a Fund must borrow the security. Each Fund’s obligation to replace the security borrowed and sold short will be fully collateralized at all times by the proceeds from the short sale retained by the broker and by cash and securities deposited in a segregated account with the Funds’ custodian. If the price of the security sold short increases between the time of the short sale and the time a Fund replaces the borrowed security, the Funds’ will realize a loss, and if the price declines during the period, the Funds will realize a gain. Any realized gain will be decreased, and any realized loss increased, by the amount of transaction costs. On ex-dividend date, dividends on short sales are recorded as an expense to the Funds. |
| | In addition, in accordance with the terms of its prime brokerage agreement, The Merger Fund may receive rebate income or be charged a fee on borrowed securities. Such income or fee is calculated on a daily basis based upon the market value of each borrowed security and a variable rate that is dependent upon the availability of such security. The dividends on short sales and rebate income/fees are recorded under “Dividend and interest expense on securities sold short” on the Statements of Operations. |
| H. | Convertible Securities |
| | Certain Funds may invest a portion of their assets in convertible securities. Although convertible securities derive part of their value from that of the securities into which they are convertible, they are not considered derivative financial instruments. However, certain of the Funds’ investments in convertible securities include features which render them sensitive to price changes in their underlying securities. The value of structured/synthetic convertible securities can be affected by interest rate changes and credit risks of the issuer. Such securities may be structured in ways that limit their potential for capital appreciation, and the entire value of the security may be at risk of loss depending on the performance of the underlying equity security. Consequently, the Funds are exposed to greater downside risk than traditional convertible securities, but typically still less than that of the underlying stock. |
| I. | Private Investment in a Public Equity (PIPE) with Special Purpose Acquisition Companies (SPAC) |
| | Special purpose acquisition companies (SPACs) are shell companies that have no operations but are formed to raise capital with the intention of merging with or acquiring a company with the proceeds of the SPAC’s initial public offering (IPO). Certain Funds may acquire equity securities of an issuer that are issued through a private investment in public equity (PIPE), including on a when-issued basis. PIPE transactions typically involve the purchase of securities directly from a publicly traded company or its affiliates in a private placement transaction, typically at a discount to the market price of the issuer’s common equity. Purchased PIPE shares will be restricted from trading until the registration statement for the shares is declared effective. Upon registration, the shares can be freely sold; however, in certain circumstances, the issuer may have the right to temporarily suspend trading of the shares in the first year after the merger or acquisition. The securities issued by a SPAC may be considered illiquid, more difficult to value, and/or be subject to restrictions on resale. PIPEs are valued based upon valuations of the underlying SPACs. |
| | At year ended December 31, 2023, the Funds had no commitments to purchase when-issued securities through PIPE transactions with SPACs. |
| J. | Leveraged Loans |
| | Certain Funds may invest in direct debt instruments which are interests in amounts owed by a corporate, governmental, or other borrower to lenders or lending syndicates. Leveraged loans are generally non-investment grade and often involve borrowers that are highly leveraged. The Funds may invest in obligations of borrowers who are in bankruptcy proceedings. Leveraged loans are typically senior in the corporate capital structure of the borrower. A loan is often administered by a bank or other financial institution (the “lender”) that acts as agent for all holders. The agent administers the terms of the loan, as specified in the leveraged loan. A Fund’s investments in loans may be in the form of participations in loans or assignments of all or a portion of loans from third parties. When investing in loan participations, a Fund has the right to receive payments of principal, interest and any fees to which it is entitled only from the lender selling the loan participation and only upon receipt by the lender of payments from the borrower. A Fund generally has no right to enforce compliance with the terms of the leveraged loan with the borrower. As a |
THE MERGER FUND®AND VIRTUS EVENT OPPORTUNITIES TRUST
NOTES TO FINANCIAL STATEMENTS (Continued)
December 31, 2023
| | result, a Fund may be subject to the credit risk of both the borrower and the lender that is selling the leveraged loan. When a Fund purchases assignments from lenders it acquires direct rights against the borrower on the loan. |
| | A Fund may invest in multiple series or tranches of a loan, which may have varying terms and carry different associated risks. Leveraged loans may involve foreign borrowers and investments may be denominated in foreign currencies. Direct indebtedness of emerging countries involves a risk that the government entities responsible for the repayment of the debt may be unable, or unwilling, to pay the principal and interest when due. |
| | The leveraged loans have floating rate loan interests which generally pay interest at rates that are periodically determined by reference to a base lending rate plus a premium. The base lending rates are generally LIBOR, SOFR, the prime rate offered by one or more U.S. banks or the certificate of deposit rate. When a leveraged loan is purchased a Fund may pay an assignment fee. On an ongoing basis, a Fund may receive a commitment fee based on the undrawn portion of the underlying line of credit portion of a leveraged loan. Prepayment penalty fees are received upon the prepayment of a leveraged loan by a borrower. Prepayment penalty, facility, commitment, consent and amendment fees are recorded to income as earned or paid. |
| | A Fund may invest in both secured loans and “covenant lite” loans which have few or no financial maintenance covenants that would require a borrower to maintain certain financial metrics. The lack of financial maintenance covenants in covenant lite loans increases the risk that the applicable Fund will experience difficulty or delays in enforcing its rights on its holdings of such loans, which may result in losses, especially during a downturn in the credit cycle. |
| K. | Warrants |
| | The Funds may receive warrants. Warrants are securities that are usually issued together with a debt instrument or preferred stock and that give the holder the right to buy a proportionate amount of common stock at a specified price. Warrants may be freely transferable and are often traded on major exchanges. Warrants normally have a life that is measured in years and entitle the holder to buy common stock of a company at a price that is usually higher than the market price at the time the warrant is issued. Warrants may entail greater risks than certain other types of investments. Generally, warrants do not carry the right to receive dividends or exercise voting rights with respect to the underlying securities, and they do not represent any rights in the assets of the issuer. In addition, their value does not necessarily change with the value of the underlying securities, and they cease to have value if they are not exercised on or before their expiration date. If the market price of the underlying stock does not exceed the exercise price during the life of the warrant, the warrant will expire worthless. Warrants may increase the potential profit or loss to be realized from the investment as compared with investing the same amount in the underlying securities. Similarly, the percentage increase or decrease in the value of an equity security warrant may be greater than the percentage increase or decrease in the value of the underlying common stock. Warrants may relate to the purchase of equity or debt instruments. Debt obligations with warrants attached to purchase equity securities have many characteristics of convertible securities and their prices may, to some degree, reflect the performance of the underlying stock. Debt obligations also may be issued with warrants attached to purchase additional debt instruments at the same coupon rate. A decline in interest rates would permit a Fund to sell such warrants at a profit. If interest rates rise, these warrants would generally expire with no value. |
| L. | Securities Lending |
| | The Funds may loan securities to qualified brokers through a securities lending agency agreement with The Bank of New York Mellon (“BNYM”). Under the securities lending policy, when lending securities a Fund is required to maintain collateral with a market value not less than 100% of the market value of loaned securities. Collateral is adjusted daily in connection with changes in the market value of securities on loan bringing the collateral market value in line with the required percent. Due to timing of collateral adjustments, the market value of collateral held with respect to a loaned security, may be more or less than the value of the security on loan. |
| | Collateral may consist of cash and securities issued by the U.S. government or its agencies. Cash collateral is invested in a short-term money market fund. Dividends earned on the collateral and premiums paid by the broker are recorded as income by the Fund net of fees and rebates charged/paid by BNYM for its services as securities lending agent and in connection with this securities lending program. Lending portfolio securities involves a risk of delay in the recovery of the loaned securities or in the declining value of the collateral. |
| | Securities lending transactions are entered into by each Fund under a Master Securities Lending Agreement (“MSLA”) which permits the Fund, under certain circumstances including an event of default (such as bankruptcy or insolvency), to offset amounts payable by the Fund to the same counterparty against amounts to be received and create one single net payment due to or from the Fund. |
| | At December 31, 2023, the securities loaned were subject to a MSLA on a net payment basis as follows: |
| | Fund | | Value of
Securities
on Loan | | Cash
Collateral
Received(1) | | Net
Amount(2) |
| | The Merger Fund
| | $ 3,827 | | $ 3,827 | | $ — |
| | Westchester Event-Driven
Fund
| | 1,110 | | 1,110 | | — |
| (1) | Collateral received in excess of the value of securities on loan is not presented in this table. The cash collateral received in connection with securities lending transactions has been used for the purchase of securities as disclosed in the Fund’s Schedule of Investments. |
| (2) | Net amount represents the net amount receivable due from the counterparty in the event of default. |
THE MERGER FUND®AND VIRTUS EVENT OPPORTUNITIES TRUST
NOTES TO FINANCIAL STATEMENTS (Continued)
December 31, 2023
The following table reflects a breakdown of investments made from cash collateral received from lending activities and the remaining contractual maturity of those transactions as of December 31, 2023 for the Funds:
| | Fund | | Investment of
Cash Collateral | | Overnight
and
Continuous |
| | The Merger Fund
| | Money Market Mutual Fund | | $6,272 |
| | Westchester Event-Driven Fund
| | Money Market Mutual Fund | | 1,136 |
Note 3. Derivative Financial Instruments and Transactions
($ reported in thousands)
Disclosures about derivative instruments and hedging activities are intended to enable investors to understand how and why a Fund uses derivatives, how derivatives are accounted for, and how derivative instruments affect a Fund’s results of operations and financial position. Summarized below are such disclosures and accounting policies for each specific type of derivative instrument used by the Funds.
| A. | Forward Foreign Currency Exchange Contracts |
| | A forward foreign currency exchange contract is an agreement between two parties to buy and sell a currency at a set exchange rate on a future date. Forward foreign currency exchange contracts, when used by a Fund, help to manage the overall exposure to the currencies in which some of the investments held by the Fund are denominated. The contract is marked-to-market daily and the change in market value is recorded by the Fund as an unrealized appreciation or depreciation. When the contract is closed, the Fund records a realized gain or loss equal to the difference between the value at the time it was opened and the value at the time it was closed. The use of forward foreign currency exchange contracts involves the risk that the value of the contract changes unfavorably due to movements in the value of the referenced foreign currencies. Non-deliverable forward foreign currency exchange contracts are settled with the counterparty in U.S. dollars without the delivery of foreign currency. Cash deposited is recorded on the Statements of Assets and Liabilities as “Cash pledged as collateral for derivatives and securities sold short”. |
| | During the year ended December 31, 2023, each Fund entered into forward foreign currency exchange contracts as an economic hedge against either specific transactions or portfolio instruments or to obtain exposure to, or hedge exposure away from, foreign currencies (foreign currency exchange rate risk). |
| | Forward foreign currency contracts outstanding at period end, if any, are listed after each Fund’s Schedule of Investments. |
| B. | Options Contracts |
| | An options contract provides the purchaser with the right, but not the obligation, to buy (call option) or sell (put option) a financial instrument at an agreed upon price. The Funds may purchase or write both put and call options on portfolio securities. When doing so, the Fund is subject to equity price risk and/or foreign currency risk in the normal course of pursuing its investment objectives. |
| | When a Fund purchases an option, it pays a premium and an amount equal to that premium is recorded as an asset. When a Fund writes an option, it receives a premium and an amount equal to that premium is recorded as a liability. The asset or liability is adjusted daily to reflect the current market value of the option. Holdings of the Fund designated to cover outstanding written options are noted in the Schedules of Investments. Purchased options are reported as an asset within “Investment in securities at value” in the Statements of Assets and Liabilities. Written options are reported as a liability within “Written options at value.” Changes in value of the purchased option are included in “Net change in unrealized appreciation (depreciation) from investments” in the Statements of Operations. Changes in value of written options are included in “Net change in unrealized appreciation (depreciation) from written options” in the Statements of Operations. |
| | If an option expires unexercised, the Fund realizes a gain or loss to the extent of the premium received or paid. If an option is exercised, the premium received or paid is recorded as an adjustment to the proceeds from the sale or the cost basis of the purchase. The difference between the premium and the amount received or paid on effecting a closing purchase or sale transaction is also treated as a realized gain or loss. Gain or loss on purchased options is included in “Net realized gain (loss) on investments” in the Statements of Operations. Gain or loss on written options is presented separately as “Net realized gain (loss) from written options” in the Statements of Operations. |
| | The risk in writing call options is that the Fund gives up the opportunity for profit if the market price/foreign currency rate of the referenced security/currency increases and the option is exercised. The risk in writing put options is that the Fund may incur a loss if the market price/foreign currency rate of the referenced security/currency decreases and the option is exercised. The risk in buying options is that the Fund pays a premium whether or not the option is exercised. The use of such instruments may involve certain additional risks as a result of unanticipated movements in the market. Writers (sellers) of options are subject to unlimited risk of loss, as the seller will be obligated to deliver or take delivery of the security at a predetermined price which may, upon exercise of the option, be significantly different from the then-market value. As the writer of a covered call option, the Fund forgoes, during the option’s life, the opportunity to profit from increases in the market value of the security covering the call option above the sum of the premium and the strike price of the call, but retains the risk of loss should the price of the underlying security decline. |
| | During the year ended December 31, 2023, each Fund invested in purchased call and put options contracts and written covered call and put options contracts in an attempt to manage equity price risk and with the purpose of generating realized gains. |
THE MERGER FUND®AND VIRTUS EVENT OPPORTUNITIES TRUST
NOTES TO FINANCIAL STATEMENTS (Continued)
December 31, 2023
| C. | Swaps |
| | Each Fund may enter into swap agreements, in which the Fund and a counterparty agree either to make periodic net payments on a specified notional amount or a net payment upon termination. Swap agreements are negotiated in the OTC market and may be entered into as a bilateral contract (“OTC swaps”) or centrally cleared (“centrally cleared swaps”). The value of the swap is reflected on the Statements of Assets and Liabilities as “Over-the-counter swaps at value” for OTC swaps and as “variation margin receivable/payable on cleared swaps” for centrally cleared swaps. Swaps are marked-to-market daily and changes in value are recorded as “Net change in unrealized appreciation (depreciation) on swaps” in the Statements of Operations. |
| | Any upfront premiums paid are recorded as assets and any upfront fees received are recorded as liabilities and are shown under “Over-the-counter swaps at value” in the Statements of Assets and Liabilities and are amortized over the term of the swap for OTC swaps. When a swap is terminated, the Fund records a realized gain or loss equal to the difference between the proceeds from (or cost of) the closing transaction and the Fund’s basis in the contract, if any. Generally, the basis of the contracts is the unamortized premium received or paid. Cash settlements between the Fund and the counterparty are recognized as “Net realized gain (loss) on swaps” in the Statements of Operations. Swap contracts outstanding at period end, if any, are listed after each Fund’s Schedule of Investments. |
| | In a centrally cleared swap, immediately following execution of the swap agreement, the swap agreement is submitted to a central counterparty (the “CCP”) and the Fund’s counterparty on the swap agreement becomes the CCP. Each Fund is required to interface with the CCP through a clearing broker. Upon entering into a centrally cleared swap, a Fund is required to deposit initial margin with the clearing broker in the form of cash or securities in an amount that varies depending on the size and risk profile of the particular swap. |
| | Securities deposited as margin are designated on the Schedule of Investments and cash deposited is recorded on the Statements of Assets and Liabilities as “Cash pledged as collateral for derivatives and securities sold short.” |
| | Swap transactions involve, to varying degrees, elements of interest rate, credit and market risk in excess of the amounts recognized in the Statements of Assets and Liabilities. Such risks involve the possibility that there will be no liquid market for these agreements, that the counterparty to the agreements may default on its obligation to perform or disagree as to the meaning of the contractual terms in the agreements, and that there may be unfavorable changes in interest rates and/or market values associated with these transactions. |
| | Total return swaps – Total return swaps are agreements in which there is an exchange of cash flows whereby one party commits to make payments based on the total return (coupons plus capital gains/losses) of an underlying instrument in exchange for fixed or floating rate interest payments. To the extent the total return of the instrument or index underlying the transaction exceeds or falls short of the offsetting interest rate obligation, the Fund will receive a payment from or make a payment to the counterparty. Each Fund may enter into total return swaps to obtain exposure to a security or market without owning such security or investing directly in that market or to transfer the risk/return of one market (e.g., fixed income) to another market (e.g., equity) (equity risk and/or interest rate risk). |
| | Each Fund may enter into equity basket swaps to obtain exposure to a portfolio of long and short securities. Under the terms of the agreement, the swap is designed to function as a portfolio of direct investments in long and short equity or fixed income positions. This means that the Fund has the ability to trade in and out of long and short positions within the swap and will receive all of the economic benefits and risks equivalent to direct investments in these positions such as: capital appreciation (depreciation), corporate actions, and dividends and interest received and paid, all of which are reflected in the swap value. The swap value also includes interest charges and credits related to the notional values of the long and short positions and cash balances within the swap. These interest charges and credits are based on defined market rates plus or minus a specified spread and are referred to herein as “financing costs”. Positions within the swap are reset periodically, and financing costs are reset monthly. |
| | During a reset, any unrealized gains (losses) on positions and accrued financing costs become available for cash settlement between the Fund and the swap counterparty. Cash settlement in and out of the swap may occur at a reset date or any other date, at the discretion of the Fund and the counterparty, over the life of the agreement, and is generally determined based on limits and thresholds established as part of the ISDA Master Agreement (defined below in “Derivative Risks”) between the Fund and the counterparty. |
| | The value of the swap is derived from a combination of (i) the net value of the underlying positions, which are valued daily using the last sale or closing prices on the principal exchange on which the securities are traded; (ii) financing costs; (iii) the value of dividends or accrued interest; (iv) cash balances within the swap; and (v) other factors, as applicable. The swap involves additional risks than if the Fund has invested in the underlying positions directly, including: the risk that changes in the swap may not correlate perfectly with the underlying long and short securities; credit risk related to the counterparty’s failure to perform under contract terms; and liquidity risk related to the lack of a liquid market for the swap contract, which may limit the ability of the Fund to close out its position(s). |
| | During the year ended December 31, 2023, each Fund utilized total return swaps to gain exposure to broad markets or to hedge the risk of individual securities within the portfolios and to obtain long or short exposure to the underlying reference instrument. At December 31, 2023, the Funds did not hold swap baskets. |
THE MERGER FUND®AND VIRTUS EVENT OPPORTUNITIES TRUST
NOTES TO FINANCIAL STATEMENTS (Continued)
December 31, 2023
The following is a summary of derivative instruments categorized by primary risk exposure, and location as presented in the Statements of Assets and Liabilities at December 31, 2023:
| Statement Line Description | | Primary Risk | The Merger Fund | Westchester Credit Event Fund | Westchester Event-Driven Fund |
| Asset Derivatives | | | |
| Purchased options at value(1) | | Equity contracts | $ 910 | $ — | $ 291 |
| Over-the-counter swaps at value(2) | | Equity contracts | 34,470 | 9 | 7,726 |
| Total Assets | | | $ 35,380 | $ 9 | $ 8,017 |
| Liability Derivatives | |
| Over-the-counter swaps at value(2) | | Equity contracts | $(28,499) | $ (8) | $ (5,716) |
| Written options at value | | Equity contracts | (7,352) | — | (6,938) |
Unrealized depreciation on forward
foreign currency exchange contracts | | Foreign currency contracts | (923) | (17) | (404) |
| Total Liabilities | | | $(36,774) | $ (25) | $ (13,058) |
| | |
| (1) | Amount included in Investment in securities at value. |
| (2) | Represents cumulative appreciation (depreciation) on swap contracts as reported in the Schedule of Investments. Only current day’s variation margin is shown in the Statements of Assets and Liabilities for centrally cleared swap contracts. For OTC swap contracts, the value (including premiums) at December 31, 2023 is shown in the Statements of Assets and Liabilities. |
The following is a summary of derivative instruments categorized by primary risk exposure, and location as presented in the Statements of Operations for the year ended December 31, 2023:
| Statement Line Description | | Primary Risk | The Merger Fund | Westchester Credit Event Fund | Westchester Event-Driven Fund |
| Net Realized Gain (Loss) from |
| Purchased options(1) | | Equity contracts | $(12,801) | $ — | $ (4,310) |
| Written options | | Equity contracts | (8,295) | — | 6,455 |
| Forward foreign currency exchange contracts | | Foreign currency contracts | 3,089 | 29 | 543 |
| Swaps | | Equity contracts | (41,197) | (44) | (7,689) |
| Total | | | $(59,204) | $ (15) | $ (5,001) |
| Net Change in Unrealized Appreciation (Depreciation) on |
| Purchased options(2) | | Equity contracts | $(4,150) | $ — | $ (1,784) |
| Written options | | Equity contracts | (2,027) | — | (66) |
| Forward foreign currency exchange contracts | | Foreign currency contracts | (597) | (17) | (274) |
| Swaps | | Equity contracts | 4,048 | 235 | 4,692 |
| Total | | | $(2,726) | $ 218 | $ 2,568 |
| |
| (1) Amount included in Net realized gain (loss) on investments. |
| (2) Amount included in Net change in unrealized appreciation (depreciation) on investments. |
The table below shows the quarterly average volume (unless otherwise specified) of the derivatives held by the Funds for the year ended December 31, 2023.
| | The Merger Fund | | Westchester Credit Event Fund | | Westchester Event-Driven Fund |
Purchased Options(1)
| $ 5,288 | | $ — | | $ 1,777 |
Written Options(1)
| 13,535 | | — | | 5,774 |
Forward Foreign Currency Exchange Purchase Contracts(2)
| 220,437 | | 2,761 | | 38,803 |
Forward Foreign Currency Exchange Sale Contracts(2)
| 22,343 | | — | | 2,773 |
THE MERGER FUND®AND VIRTUS EVENT OPPORTUNITIES TRUST
NOTES TO FINANCIAL STATEMENTS (Continued)
December 31, 2023
| | The Merger Fund | | Westchester Credit Event Fund | | Westchester Event-Driven Fund |
Long Total Return Swap Contracts(2)
| $181,620 | | $5,692 | | $70,682 |
Short Total Return Swap Contracts(2)
| 223,791 | | — | | 31,320 |
| (1) Average premium amount. |
| (2) Average notional amount. |
| D. | Derivative Risks |
| | A derivative contract may suffer a mark-to-market loss if the value of the contract decreases due to an unfavorable change in the market rates or values of the underlying instrument. Losses can also occur if the counterparty does not perform under the contract. |
| | A Fund’s risk of loss from counterparty credit risk on derivatives bought or sold OTC, rather than traded on a securities exchange, is generally limited to the aggregate unrealized gain netted against any collateral held by such Fund. For OTC purchased options, each Fund bears the risk of loss of the amount of the premiums paid plus the positive change in market values net of any collateral held by such Fund should the counterparty fail to perform under the contracts. Options written by a Fund do not typically give rise to counterparty credit risk, as options written generally obligate the Fund, and not the counterparty to perform. |
| | With exchange traded purchased options and futures and centrally cleared swaps generally speaking, there is less counterparty credit risk to the Fund since the exchange or clearinghouse, as counterparty to such instruments, guarantees against a possible default. The clearinghouse stands between the buyer and the seller of the contract; therefore, credit risk is limited to failure of the clearinghouse. While offset rights may exist under applicable law, a Fund does not have a contractual right of offset against a clearing broker or clearinghouse in the event of a default (including the bankruptcy or insolvency) of the clearing broker or clearinghouse. Additionally, credit risk exists in exchange traded futures and centrally cleared swaps with respect to initial and variation margin that is held in a clearing broker’s customer accounts. While clearing brokers are required to segregate customer margin from their own assets, in the event that a clearing broker becomes insolvent or goes into bankruptcy and at that time there is a shortfall in the aggregate amount of margin held by the clearing broker for all its clients, typically the shortfall would be allocated on a pro-rata basis across all the clearing broker’s customers, potentially resulting in losses to the Fund. |
| | In order to better define its contractual rights and to secure rights that will help a Fund mitigate its counterparty risk, each Fund may enter into an International Swaps and Derivatives Association, Inc. Master Agreement (“ISDA Master Agreement”) or similar agreement with its derivative contract counterparties. An ISDA Master Agreement is a bilateral agreement between a Fund and a counterparty that governs certain OTC derivatives and typically contains, among other things, collateral posting terms and netting provisions in the event of a default and/or termination event. Under an ISDA Master Agreement, a Fund may, under certain circumstances, offset with the counterparty certain derivative financial instruments’ payables and/or receivables with collateral held and/or posted and create one single net payment. The provisions of the ISDA Master Agreement typically permit a single net payment in the event of default including the bankruptcy or insolvency of the counterparty. However, bankruptcy or insolvency laws of a particular jurisdiction may impose restrictions on or prohibitions against the right of offset in bankruptcy, insolvency or other events. In addition, certain ISDA Master Agreements allow counterparties to OTC derivatives to terminate derivative contracts prior to maturity in the event a Fund’s net assets decline by a stated percentage or the Fund fails to meet the terms of its ISDA Master Agreements, which would cause the Fund to accelerate payment of any net liability owed to the counterparty. |
| E. | Collateral Requirements and Master Netting Agreements (“MNA”) |
| | For derivatives traded under an ISDA Master Agreement, the collateral requirements are typically calculated by netting the mark-to-market amount for each transaction under such agreement and comparing that amount to the value of any collateral currently pledged by the Funds and the counterparty. |
| | Cash collateral that has been pledged to cover obligations of a Fund and cash collateral received from the counterparty, if any, is reported separately on the Statements of Assets and Liabilities as cash pledged as collateral and cash received as collateral, respectively. Non-cash collateral pledged by a Fund, if any, is noted in the Schedules of Investments. Typically, the Funds and counterparties are not permitted to sell, re-pledge or use the collateral they receive. To the extent amounts due to a Fund from its counterparties are not fully collateralized, contractually or otherwise, the Fund bears the risk of loss from counterparty non-performance. The Funds attempt to mitigate counterparty risk by only entering into agreements with counterparties that they believe have the financial resources to honor their obligations and by monitoring the financial stability of those counterparties. |
| | For financial reporting purposes, the Funds do not offset derivative assets and derivative liabilities that are subject to netting arrangements in the Statements of Assets and Liabilities. |
THE MERGER FUND®AND VIRTUS EVENT OPPORTUNITIES TRUST
NOTES TO FINANCIAL STATEMENTS (Continued)
December 31, 2023
The following tables present the Funds’ derivative assets and liabilities by counterparty net of amounts available for offset under a MNA and net of the related collateral received/pledged by the Funds as of December 31, 2023:
| At December 31, 2023, the Funds’ derivative assets and liabilities (by type) are as follows: | | | | | | |
| | The Merger Fund | | Westchester Credit Event Fund | | Westchester Event-Driven Fund |
| | Assets | | Liabilities | | Assets | | Liabilities | | Assets | | Liabilities |
Derivative Financial
Instruments: | | | | | | | | | | | |
Forward foreign currency
exchange contracts | $ — | | $ 923 | | $— | | $17 | | $ — | | $ 404 |
| OTC swaps | 34,470 | | 28,499 | | 9 | | 8 | | 7,726 | | 5,716 |
| Purchased options | 910 | | — | | — | | — | | 291 | | — |
| Written options | — | | 7,352 | | — | | — | | — | | 6,938 |
Total derivative assets and
liabilities in the Statements of
Assets and Liabilities | $35,380 | | $ 36,774 | | $ 9 | | $25 | | $8,017 | | $ 13,058 |
Derivatives not subject to a MNA
or similar agreement | (910) | | (7,352) | | — | | — | | (291) | | (6,938) |
Total assets and liabilities
subject to a MNA | $34,470 | | $ 29,422 | | $ 9 | | $25 | | $7,726 | | $ 6,120 |
The following tables present the Funds’ derivative assets and liabilities by counterparty net of amounts available for offset under a MNA and net of the related collateral received/pledged by each Fund as of December 31, 2023:
| The Merger Fund |
| Counterparty | | Gross Derivative
Assets
Subject to
a MNA by
Counterparty | | Derivatives
Available
for Offset | | Non-cash
Collateral
Received(1) | | Cash
Collateral
Received(1) | | Net
Amount of
Derivative
Assets(1) |
Bank Of America Merrill Lynch
| | $ 516 | | $ (211) | | $ — | | $ — | | $ 305 |
Goldman Sachs & Co
| | 32,170 | | (25,261) | | — | | — | | 6,909 |
JPMorgan Chase Bank N.A.
| | 1,784 | | (1,784) | | — | | — | | — |
Total
| | $ 34,470 | | $ (27,256) | | $ — | | $ — | | $ 7,214 |
| Counterparty | | Gross Derivative
Liabilities
Subject to
a MNA by
Counterparty | | Derivatives
Available
for Offset | | Non-cash
Collateral
Pledged(1) | | Cash
Collateral
Pledged(1) | | Net
Amount of
Derivative
Liabilities(1) |
Bank of America Merrill Lynch
| | $ 211 | | $ (211) | | $ — | | $ — | | $ — |
Goldman Sachs & Co
| | 25,261 | | (25,261) | | — | | — | | — |
JPMorgan Chase Bank N.A.
| | 3,950 | | (1,784) | | — | | (2,166) | | — |
Total
| | $ 29,422 | | $ (27,256) | | $ — | | $ (2,166) | | $ — |
THE MERGER FUND®AND VIRTUS EVENT OPPORTUNITIES TRUST
NOTES TO FINANCIAL STATEMENTS (Continued)
December 31, 2023
| Westchester Credit Event Fund |
| Counterparty | | Gross Derivative
Assets
Subject to
a MNA by
Counterparty | | Derivatives
Available
for Offset | | Non-cash
Collateral
Received(1) | | Cash
Collateral
Received(1) | | Net
Amount of
Derivative
Assets(1) |
Goldman Sachs & Co.
| | $ 2 | | $ (2) | | $ — | | $ — | | $ — |
JPMorgan Chase Bank N.A.
| | 7 | | — | | — | | — | | 7 |
Total
| | $ 9 | | $ (2) | | $ — | | $ — | | $ 7 |
| Counterparty | | Gross Derivative
Liabilities
Subject to
a MNA by
Counterparty | | Derivatives
Available
for Offset | | Non-cash
Collateral
Pledged(1) | | Cash
Collateral
Pledged(1) | | Net
Amount of
Derivative
Liabilities(1) |
Goldman Sachs & Co.
| | $ 8 | | $ (2) | | $ — | | $ (6) | | $ — |
Total
| | $ 8 | | $ (2) | | $ — | | $ (6) | | $ — |
| Westchester Event-Driven Fund |
| Counterparty | | Gross Derivative
Assets
Subject to
a MNA by
Counterparty | | Derivatives
Available
for Offset | | Non-cash
Collateral
Received(1) | | Cash
Collateral
Received(1) | | Net
Amount of
Derivative
Assets(1) |
Bank Of America Merrill Lynch
| | $ 49 | | $ (16) | | $ — | | $ — | | $ 33 |
Goldman Sachs & Co
| | 6,939 | | (5,318) | | — | | — | | 1,621 |
JPMorgan Chase Bank N.A.
| | 738 | | (738) | | — | | — | | — |
Total
| | $ 7,726 | | $ (6,072) | | $ — | | $ — | | $ 1,654 |
| Counterparty | | Gross Derivative
Liabilities
Subject to
a MNA by
Counterparty | | Derivatives
Available
for Offset | | Non-cash
Collateral
Pledged(1) | | Cash
Collateral
Pledged(1) | | Net
Amount of
Derivative
Liabilities(1) |
Bank of America Merrill Lynch
| | $ 16 | | $ (16) | | $ — | | $ — | | $ — |
Goldman Sachs & Co
| | 5,318 | | (5,318) | | — | | — | | — |
JPMorgan Chase Bank N.A.
| | 786 | | (738) | | — | | (48) | | — |
Total
| | $ 6,120 | | $ (6,072) | | $ — | | $ (48) | | $ — |
| | |
| (1) | These amounts are limited to the derivatives asset/liability balance and, accordingly, do not include excess collateral received/pledged. |
THE MERGER FUND®AND VIRTUS EVENT OPPORTUNITIES TRUST
NOTES TO FINANCIAL STATEMENTS (Continued)
December 31, 2023
Note 4. Investment Advisory Fees and Related Party Transactions
($ reported in thousands)
| A. | Investment Adviser |
| | Virtus Investment Advisers, Inc. (the “Adviser”), an indirect, wholly-owned subsidiary of Virtus Investment Partners, Inc. (“Virtus”), is the investment adviser to the Funds. The Adviser manages the Funds’ investment programs and general operations of the Funds, including oversight of the Funds’ subadviser. |
| | As compensation for its services to the Funds, the Adviser is entitled to a fee, which is calculated daily and paid monthly based upon the following annual rates as a percentage of the average daily net assets of each Fund: |
| | Fund | | Advisory Fee |
| | The Merger Fund
| | 1.00%* |
| | Westchester Credit Event Fund
| | 1.00 |
| | Westchester Event-Driven Fund
| | 1.20** |
*Under the terms of The Merger Fund’s Advisory Agreement, the Adviser is entitled to receive a fee, calculated daily and payable monthly, at the annual rate of 1.00% of The Merger Fund’s average daily net assets. For the time period January 1, 2023 through September 30, 2023, the Adviser separately agreed to contractually reduce its advisory fee so that the advisory fee will be: (i) 1.00% of the first $2 billion in average daily net assets of The Merger Fund and (ii) 0.93% on average daily net assets above $2 billion. For the year ended December 31, 2023, the waiver amounted to $842. This waiver was in addition to the expense limitation and/or fee waiver covered elsewhere in these financial statements and is included in the Statements of Operations in “Less expenses reimbursed and/or waived by investment adviser.”
**Effective June 1, 2023. For the period January 1, 2023 through May 31, 2023, the investment advisory fee was as follows: 1.25%.
| B. | Subadviser |
| | Westchester Capital Management, LLC (the “Subadviser”), an indirect wholly-owned subsidiary of Virtus, is the subadviser to the Funds. The Subadviser manages the investments of each Fund, for which it is paid a fee by the Adviser. |
| C. | Expense Limitations |
| | The Adviser has contractually agreed to limit each Fund’s annual total operating expenses, subject to the exceptions listed below, so that such expenses do not exceed, on an annualized basis, the following respective percentages of average daily net assets through April 30, 2024, for The Merger Fund and through April 30, 2025, for the Westchester Credit Event Fund and Westchester Event-Driven Fund. Following the contractual period, the Adviser may discontinue these expense limitation arrangements at any time. The waivers and reimbursements are accrued daily and received monthly. |
| | Fund | | Class A | | Class I |
| | The Merger Fund
| | 1.46% | | 1.17% |
| | Westchester Credit Event Fund
| | 1.70 (1) | | 1.45 (1) |
| | Westchester Event-Driven Fund
| | 1.70 (1) | | 1.45 (1) |
| (1) | Effective June 1, 2023. For the period January 1, 2023 through May 31, 2023, the expense caps were as follows for Class A shares and Class I shares, respectively: 1.80% and 1.55%. |
The exclusions include front-end or contingent deferred sales charges, taxes, leverage and borrowing expenses (such as commitment, amendment and renewal expenses on credit or redemption facilities), interest, brokerage commissions, expenses incurred in connection with any merger or reorganization, unusual or infrequently occurring expenses (such as litigation), acquired fund fees and expenses, and dividend expenses, if any.
| D. | Expense Recapture |
| | Under certain conditions, the Adviser may recapture operating expenses reimbursed or fees waived under these arrangements within three years after the date on which such amounts were incurred or waived. A Fund must pay its ordinary operating expenses before the Adviser is entitled to any reimbursement and must remain in compliance with any applicable expense limitations or, if none, the expense limitation in effect at the time of the waiver or reimbursement. All or a portion of the following Adviser reimbursed expenses may be recaptured by the year ending December 31: |
| | | | Expiration | | |
| | Fund | | 2024 | | 2025 | | 2026 | | Total |
| | The Merger Fund | | | | | | | | |
| | Class A
| | $ 236 | | $ 380 | | $ 513 | | $ 1,129 |
| | Class I
| | 851 | | 2,576 | | 1,953 | | 5,380 |
THE MERGER FUND®AND VIRTUS EVENT OPPORTUNITIES TRUST
NOTES TO FINANCIAL STATEMENTS (Continued)
December 31, 2023
| | | | Expiration | | |
| | Fund | | 2024 | | 2025 | | 2026 | | Total |
| | Westchester Credit Event Fund | | | | | | | | |
| | Class A
| | $ 3 | | $ 1 | | $ 1 | | $ 5 |
| | Class I
| | 38 | | 8 | | 7 | | 53 |
| | Westchester Event-Driven Fund | | | | | | | | |
| | Class A
| | 2 | | 21 | | 11 | | 34 |
| | Class I
| | — | | 304 | | 263 | | 567 |
During the year ended December 31, 2023, the Adviser recaptured expenses previously waived for the following Fund:
| | Fund | | Class A | | Class I | | Total |
| | Westchester Credit Event Fund
| | $1 | | $52 | | $53 |
| E. | Distributor |
| | VP Distributors, LLC (“VP Distributors”), an indirect, wholly-owned subsidiary of Virtus, serves as the distributor of each Fund’s shares. VP Distributors has advised the Funds that for the year ended December 31, 2023, it retained net commissions of $5 for Class A shares. |
| | In addition, each Fund pays VP Distributors 12b-1 fees under a 12b-1 Plan, at the annual rate of 0.25% of the average daily net assets of such Fund’s Class A shares. Class I shares are not subject to a 12b-1 Plan. |
| | Under certain circumstances, shares of certain Virtus Funds may be exchanged for shares of the same class of certain other Virtus Funds on the basis of the relative NAV per share at the time of the exchange. On exchanges with share classes that carry a CDSC, the CDSC schedule of the original shares purchased continues to apply. |
| F. | Administrator and Transfer Agent |
| | Virtus Fund Services, LLC, an indirect, wholly-owned subsidiary of Virtus, serves as the administrator and transfer agent to the Funds. |
| | For the year ended December 31, 2023, The Merger Fund, Westchester Credit Event Fund, and Westchester Event-Driven Fund incurred administration fees totaling $3,246, $379, and $62, respectively, which are included in the Statements of Operations within the line item “Administration and accounting fees.” The fees are calculated daily and paid monthly. |
| | For the years ended December 31, 2023, The Merger Fund, Westchester Credit Event Fund, and Westchester Event-Driven Fund incurred transfer agent fees totaling $1,453, $170, and $28, respectively, which are included in the Statements of Operations within the line item “Transfer agent fees and expenses.” The fees are calculated daily and paid monthly. |
| G. | Investments with Affiliates |
| | The Funds are permitted to purchase assets from or sell assets to certain related affiliates under specified conditions outlined in procedures adopted by the Board. The procedures have been designed to ensure that any purchase or sale of assets by the Funds from or to another fund or portfolio that are, or could be, considered an affiliate by virtue of having a common investment adviser (or affiliated investment advisers), common Trustees and/or common officers comply with Rule 17a-7 under the 1940 Act. Further, as defined under the procedures, each transaction is effected at the current market price. |
| | During the year ended December 31, 2023, the Funds did not engage in any transactions pursuant to Rule 17a-7 under the 1940 Act. |
| | Outside of Rule 17a-7 transactions, other investments with affiliated issuers are separately reported in this Note. An affiliated issuer includes any company in which a Fund held 5% or more of a company’s outstanding voting shares at any point during the period, as well as other circumstances where an investment adviser or subadviser to a Fund is deemed to exercise, directly or indirectly, a certain level of control over the company. |
THE MERGER FUND®AND VIRTUS EVENT OPPORTUNITIES TRUST
NOTES TO FINANCIAL STATEMENTS (Continued)
December 31, 2023
A summary of The Merger Fund’s total long-term and short-term purchases and sales of the respective shares of the affiliated investments during the year ended December 31, 2023, is as follows:
| | Value,
beginning
of period | | Purchases | | Sales
proceeds | | Net
realized
gain
(loss)
on
affiliated
securities | | Net
change in
unrealized
appreciation
(depreciation)
on affiliated
securities(1) | | Value,
end of
period | | Shares | | Dividend
income | | Distributions
of realized
gains |
| The Merger Fund |
| Special Purpose Acquisition Companies—6.9% |
Alpha Partners Technology Merger Corp.(2),(3)
| $ 6,716 | | $ 4,836 | | $ — | | $ — | | $ 715 | | $ 12,267 | | 1,146,417 | | $ — | | $— |
Alpha Star Acquisition Corp.(2),(3)
| 2,220 | | 5,377 | | — | | — | | 351 | | 7,948 | | 710,257 | | — | | — |
Arisz Acquisition Corp.(2),(3)
| — | | 3,574 | | — | | — | | 127 | | 3,701 | | 339,292 | | — | | — |
Arrowroot Acquisition Corp.(2),(3)
| 5,784 | | — | | 2,342 | | 101 | | 76 | | 3,619 | | 345,322 | | — | | — |
Churchill Capital Corp. VII(2),(3)
| 19,449 | | 60,508 | | 46,298 | | 825 | | 151 | | 34,635 | | 3,298,554 | | — | | — |
Concord Acquisition Corp. II(2),(3)
| 6,593 | | 15,321 | | 11,314 | | 454 | | 24 | | 11,078 | | 1,067,227 | | — | | — |
Constellation Acquisition Corp. I(2),(3)
| 8,031 | | — | | 4,201 | | 37 | | 345 | | 4,212 | | 381,194 | | — | | — |
Hennessy Capital Investment Corp. VI(2),(3)
| 4,521 | | 29,678 | | 15,298 | | 416 | | 55 | | 19,372 | | 1,857,295 | | — | | — |
Integrated Wellness Acquisition Corp.(2),(3)
| — | | 4,389 | | — | | — | | 358 | | 4,747 | | 423,090 | | — | | — |
Investcorp India Acquisition Corp.(2),(3)
| 3,365 | | 8,068 | | 4,708 | | 179 | | 322 | | 7,226 | | 657,507 | | — | | — |
Learn CW Investment Corp.(2),(3)
| — | | 8,385 | | — | | — | | 431 | | 8,816 | | 817,802 | | — | | — |
Mountain & Co. I Acquisition Corp.(2),(3)
| 6,596 | | 3,114 | | — | | — | | 725 | | 10,435 | | 923,431 | | — | | — |
Patria Latin American Opportunity Acquisition Corp.(2),(3)
| — | | 13,830 | | — | | — | | 614 | | 14,444 | | 1,301,323 | | — | | — |
Power & Digital Infrastructure Acquisition II Corp.(2),(3)
| 421 | | 12,931 | | 6,832 | | 167 | | 507 | | 7,194 | | 658,824 | | — | | — |
Rigel Resource Acquisition Corp.(2),(3)
| 1,691 | | 13,256 | | — | | — | | 707 | | 15,654 | | 1,428,308 | | — | | — |
Ross Acquisition Corp. II(2),(3)
| 10,771 | | 2,769 | | 8,897 | | 277 | | 179 | | 5,099 | | 468,201 | | — | | — |
TLGY Acquisition Corp.(2),(3)
| 3,483 | | 2,405 | | 1,392 | | 115 | | 326 | | 4,937 | | 445,558 | | — | | — |
TortoiseEcofin Acquisition Corp. III(2),(3)
| 7,893 | | 5,892 | | — | | — | | 693 | | 14,478 | | 1,363,243 | | — | | — |
Valuence Merger Corp. I(2),(3)
| 436 | | 10,093 | | 4,597 | | 155 | | 421 | | 6,508 | | 581,603 | | — | | — |
| | $87,970 | | $204,426 | | $105,879 | | $2,726 | | $7,127 | | $196,370 | | | | $ — | | $— |
| Affiliated Mutual Fund—2.9% |
Virtus Westchester Event-Driven Fund Class I(4)
| — | | 79,470 | | — | | — | | 1,811 | | 81,281 | | 7,603,483 | | 1,970 | | — |
| Total | $87,970 | | $283,896 | | $105,879 | | $2,726 | | $8,938 | | $277,651 | | | | $1,970 | | $— |
THE MERGER FUND®AND VIRTUS EVENT OPPORTUNITIES TRUST
NOTES TO FINANCIAL STATEMENTS (Continued)
December 31, 2023
| (1) | Does not tie to Net change in unrealized appreciation (depreciation) on Investment in affiliates on the Statements of Operations as a result of previously affiliated securities moving to unaffiliated. |
| (2) | Issuer was not an affiliated investment at December 31, 2022. |
| (3) | Non-income producing. |
| (4) | Shares of this fund are publicly offered, and its prospectus and annual report are publicly available. |
| H. | Trustee Deferred Compensation Plan |
| | The Funds provide a deferred compensation plan for their Trustees who receive compensation from the Funds. Under the deferred compensation plan, Trustees may elect to defer all or a portion of their compensation. Amounts deferred are retained by the Funds, and then, to the extent permitted by the 1940 Act, in turn, may be invested in the shares of affiliated or unaffiliated mutual funds selected by the participating Trustees. Investments in such instruments are included in “Other assets” in the Statements of Assets and Liabilities at December 31, 2023. |
Note 5. Purchases and Sales of Securities
($ reported in thousands)
Purchases and sales of securities (excluding U.S. government and agency securities, forward currency contracts, written options, and short-term securities) during the year ended December 31, 2023, were as follows:
| | Purchases | | Sales |
The Merger Fund
| $6,232,956 | | $7,358,907 |
Westchester Credit Event Fund
| 127,775 | | 112,201 |
Westchester Event-Driven Fund
| 1,240,822 | | 1,115,715 |
Purchases and sales of long-term U.S. government and agency securities during the year ended December 31, 2023, were as follows:
| | Purchases | | Sales |
Westchester Credit Event Fund
| $ — | | $ 23 |
Westchester Event-Driven Fund
| 856 | | 822 |
Note 6. Capital Share Transactions
(reported in thousands)
Transactions in shares of capital stock, during the years ended as indicated below, were as follows:
| | The Merger Fund | | Westchester Credit Event Fund |
| | Year Ended
December 31, 2023 | | Year Ended
December 31, 2022 | | Year Ended
December 31, 2023 | | Year Ended
December 31, 2022 |
| | SHARES | | AMOUNT | | SHARES | | AMOUNT | | SHARES | | AMOUNT | | SHARES | | AMOUNT |
| Class A | | | | | | | | | | | | | | | |
| Shares sold | 2,987 | | $ 50,254 | | 17,797 | | $ 308,421 | | 589 | | $ 6,681 | | 646 | | $ 7,269 |
| Reinvestment of distributions | 807 | | 13,811 | | 1,484 | | 24,989 | | 10 | | 114 | | — (1) | | 3 |
| Shares repurchased | (15,383) | | (259,701) | | (24,643) | | (426,994) | | (459) | | (5,288) | | (604) | | (6,518) |
| Net Increase / (Decrease) | (11,589) | | $ (195,636) | | (5,362) | | $ (93,584) | | 140 | | $ 1,507 | | 42 | | $ 754 |
| Class I | | | | | | | | | | | | | | | |
| Shares sold | 27,883 | | $ 468,282 | | 81,779 | | $ 1,414,374 | | 2,191 | | $ 24,023 | | 4,871 | | $ 53,114 |
| Reinvestment of distributions | 3,023 | | 51,203 | | 8,019 | | 133,600 | | 266 | | 2,909 | | 120 | | 1,254 |
| Shares repurchased | (108,426) | | (1,817,546) | | (75,851) | | (1,307,531) | | (1,273) | | (13,961) | | (1,294) | | (13,847) |
| Net Increase / (Decrease) | (77,520) | | $ (1,298,061) | | 13,947 | | $ 240,443 | | 1,184 | | $ 12,971 | | 3,697 | | $ 40,521 |
| (1) | Amount is less than 500 shares (not in thousands). |
THE MERGER FUND®AND VIRTUS EVENT OPPORTUNITIES TRUST
NOTES TO FINANCIAL STATEMENTS (Continued)
December 31, 2023
| | Westchester Event-Driven Fund |
| | Year Ended
December 31, 2023 | | Year Ended
December 31, 2022 |
| | SHARES | | AMOUNT | | SHARES | | AMOUNT |
| Class A | | | | | | | |
| Shares sold | 345 | | $ 3,572 | | 521 | | $ 5,394 |
| Shares repurchased | (1,841) | | (19,304) | | (2,180) | | (22,874) |
| Net Increase / (Decrease) | (1,496) | | $ (15,732) | | (1,659) | | $ (17,480) |
| Class I | | | | | | | |
| Shares sold | 19,421 | | $ 203,628 | | 12,822 | | $ 133,991 |
| Reinvestment of distributions | 1,079 | | 11,491 | | 63 | | 647 |
| Shares repurchased | (5,997) | | (63,199) | | (10,463) | | (108,096) |
| Net Increase / (Decrease) | 14,503 | | $ 151,920 | | 2,422 | | $ 26,542 |
Note 7. 10% Shareholders
As of December 31, 2023, each Fund had individual shareholder account(s) and/or omnibus shareholder account(s) (comprised of a group of individual shareholders), which individually amounted to more than 10% of the total shares outstanding of such Fund as detailed below:
| | % of Shares
Outstanding | | Number of
Accounts |
The Merger Fund
| 39% | | 2 |
Westchester Credit Event Fund
| 46 | | 1 |
Westchester Event-Driven Fund
| 96 | | 3 * |
| * | Includes affiliated shareholder account(s). |
Note 8. Credit and Market Risk and Asset Concentration
In July 2017, the head of the United Kingdom Financial Conduct Authority (“FCA”) announced the intention to phase out the use of LIBOR by the end of 2021. However, after subsequent announcements by the FCA, the LIBOR administrator and other regulators, certain of the most widely used LIBORs continued until June 30, 2023. The ICE Benchmark Administration Limited, which is regulated and authorized by FCA, and the administrator of LIBOR, ceased publishing certain other LIBOR settings on December 31, 2021. On April 3, 2023, the FCA announced its decision to require LIBOR’s administrator to continue to publish the 1-month, 3-month, and 6-month U.S. dollar settings under an unrepresentative synthetic methodology until September 30, 2024. On March 15, 2022, the Adjustable Interest Act (LIBOR) Act (the “LIBOR Act”) was enacted into law which directs the Federal Reserve Board, as a fallback mechanism, to identify benchmark rates based on SOFR to replace LIBOR in certain financial contracts after June 30, 2023. On December 16, 2022, the Federal Reserve adopted regulations implementing the LIBOR Act. The Funds may be exposed to financial instruments tied to LIBOR to determine payment obligations, financing terms, hedging strategies or investment value. The discontinuation of LIBOR could have a significant impact on the financial markets and may present a material risk for certain market participants, including the Funds. Abandonment of or modifications to LIBOR could lead to significant short- and long-term uncertainty and market instability. The risks associated with this discontinuation and transition may be exacerbated if the work necessary to effect an orderly transition to an alternative reference rate is not completed in a timely manner. It remains uncertain the effects such changes will have on the Funds, issuers of instruments in which the Funds invest, and the financial markets generally.
Local, regional or global events such as war or military conflict, acts of terrorism, the spread of infectious illness or other public health issue, recessions, or other events could have a significant impact on a Fund and its investments, including hampering the ability of each Fund’s portfolio manager(s) to invest each Fund’s assets as intended.
In countries with limited or developing markets, investments may present greater risks than in more developed markets and the prices of such
investments may be volatile. The consequences of political, social, or economic changes in these markets may have disruptive effects on the market prices of these investments and the income they generate, as well as the Fund’s ability to repatriate such amounts.
Emerging market countries typically have economic and political systems that are less fully developed, and can be expected to be less stable than those of more developed countries. For example, the economies of such countries can be subject to rapid and unpredictable rates of inflation or deflation. Since these markets are often small, they may be more likely to suffer sharp and frequent price changes or long-term price depression because of adverse publicity, investor perceptions or the actions of a few large investors. They may also have policies that restrict investment by foreigners, or that prevent foreign investors from withdrawing their money at will.
Certain emerging markets may also face other significant internal or external risks, including the risk of war and civil unrest. Each of these factors can affect the value and liquidity of the assets of a Fund. Failure to generate adequate earnings from foreign trade would make it difficult for an emerging
THE MERGER FUND®AND VIRTUS EVENT OPPORTUNITIES TRUST
NOTES TO FINANCIAL STATEMENTS (Continued)
December 31, 2023
market country to service foreign debt. Disruptions resulting from social and political factors may cause the securities markets of emerging market countries to close. If this were to occur, the liquidity and value of a Fund’s assets invested in corporate debt obligations of emerging market companies would decline.
The imposition of sanctions, exchange controls (including repatriation restrictions), confiscation of assets and property, trade restrictions (including tariffs) and other government restrictions by the U.S. or other governments, or from problems in registration, settlement or custody, may also result in losses. The type and severity of sanctions and other similar measures, including counter sanctions and other retaliatory actions, that may be imposed could vary broadly in scope, and their impact is impossible to predict. For example, the imposition of sanctions and other similar measures could, among other things, cause a decline in the value and/or liquidity of securities issued by the sanctioned country or companies located in or economically tied to the sanctioned country and increase market volatility and disruption in the sanctioned country and throughout the world. Sanctions and other similar measures could limit or prevent a Fund from buying and selling securities (in the sanctioned country and other markets), significantly delay or prevent the settlement of securities transactions, and significantly impact a Fund’s liquidity and performance.
Sanctions threatened or imposed may result in a decline in the value and liquidity of a Fund’s assets. The securities of the Fund may be deemed to have a zero value. A Fund may make investments that are illiquid or that may become less liquid in response to market developments or adverse investor perceptions. Illiquid investments may be more difficult to value. Liquidity risk may also refer to the risk that a Fund will not be able to pay redemption proceeds within the allowable time period or without significant dilution to remaining investors’ interests because of unusual market conditions, an unusually high volume of redemption requests, or other reasons. To meet redemption requests, a Fund may be forced to sell investments at an unfavorable time and/or under unfavorable conditions. If a Fund is forced to sell securities at an unfavorable time and/or under unfavorable conditions, such sales may adversely affect a Fund’s NAV and dilute remaining investors’ interests. Liquidity risk may be the result of, among other things, the reduced number and capacity of traditional market participants to make a market in fixed income securities or the lack of an active market. The potential for liquidity risk may be magnified by a rising interest rate environment or other circumstances where investor redemptions from fixed income funds may be higher than normal, potentially causing increased supply in the market due to selling activity. These risks may be more pronounced in connection with the Funds’ investments in securities of issuers located in emerging market countries. Redemptions by large shareholders may have a negative impact on a Fund’s liquidity.
For all these reasons, investments in emerging markets may be considered speculative. To the extent that a Fund invests a significant portion of its assets in a particular emerging market, the Fund will be more vulnerable to financial, economic, political and other developments in that country, and conditions that negatively impact that country will have a greater impact on the Fund as compared with a fund that does not have its holdings concentrated in a particular country.
High-yield/high-risk securities typically entail greater price volatility and/or principal and interest rate risk. There is a greater chance that an issuer will not be able to make principal and interest payments on time. Analysis of the creditworthiness of issuers of high-yield/high-risk securities may be complex, and as a result, it may be more difficult for the Adviser and/or Subadviser to accurately predict risk.
Certain Funds may invest a high percentage of their assets in specific sectors of the market in the pursuit of their investment objectives. Fluctuations in these sectors of concentration may have a greater impact on a Fund, positive or negative, than if the Fund did not concentrate its investments in such sectors.
At December 31, 2023, the following Fund held securities issued by various companies in specific sectors as detailed below:
| | Sector | | Percentage of
Total Investments |
The Merger Fund®
| Energy | | 25% |
Note 9. Indemnifications
Under the Funds’ organizational documents and in separate agreements between each Trustee and the Funds, its Trustees and officers are indemnified against certain liabilities arising out of the performance of their duties to the Funds. In addition, in the normal course of business, the Funds enter into contracts that provide a variety of indemnifications to other parties. The Funds’ maximum exposure under these arrangements is unknown, as this would involve future claims that may be made against the Funds and that have not occurred. However, the Funds have not had prior claims or losses pursuant to these arrangements, and they expect the risk of loss to be remote.
Note 10. Restricted Securities
Restricted securities are not registered under the Securities Act of 1933, as amended (the “1933 Act”). Generally, 144A securities are excluded from this category. Each Fund will bear any costs, including those involved in registration under the 1933 Act, in connection with the disposition of such securities.
At December 31, 2023, the Funds did not hold any securities that were restricted.
Note 11. Redemption Facility
($ reported in thousands)
On March 10, 2022, the Funds and certain other affiliated funds entered into a $250,000 unsecured line of credit (“Credit Agreement”). This Credit Agreement, as amended, is with a commercial bank that allows the Funds to borrow cash from the bank to manage large unexpected redemptions and trade fails, up to a limit of one-third or one-fifth, as applicable, of each Fund’s total net assets in accordance with the terms of the agreement. This Credit
THE MERGER FUND®AND VIRTUS EVENT OPPORTUNITIES TRUST
NOTES TO FINANCIAL STATEMENTS (Continued)
December 31, 2023
Agreement has a term of 364 days and has been renewed for a period up to July 6, 2024. Interest is charged at the higher of the SOFR or the Federal Funds rate plus an additional percentage rate on the amount borrowed. Commitment fees are charged on the undrawn balance. Total commitment fees paid for the year ended December 31, 2023, are included in the “Interest expense and/or commitment fees” line on the Statements of Operations. The Funds and other affiliated funds that are parties are individually, and not jointly, liable for their particular advances, if any, under the Credit Agreement. The lending bank has the ability to require repayment of outstanding borrowings under this Credit Agreement upon certain circumstances such as an event of default.
The following Fund had outstanding loans during the year. The borrowings were valued at cost, which approximates fair value.
| | Fund | | Interest
Incurred on
Borrowing | | Average
Borrowing | | Weighted Average
Interest Rate | | Days
Outstanding |
| | Westchester Event-Driven Fund
| | $2 | | $3,500 | | 6.42% | | 4 |
Note 12. Federal Income Tax Information
($ reported in thousands)
At December 31, 2023, the approximate aggregate cost basis and the unrealized appreciation (depreciation) of investments and other financial instruments for federal income tax purposes were as follows:
| | Fund | | Federal
Tax Cost | | Unrealized
Appreciation | | Unrealized
(Depreciation) | | Net Unrealized
Appreciation
(Depreciation) |
| | The Merger Fund (Including Purchased Options)
| | $ 2,680,650 | | $ 104,865 | | $ (71,854) | | $ 33,011 |
| | The Merger Fund (Written options)
| | (8,415) | | 2,195 | | (1,132) | | 1,063 |
| | The Merger Fund (Short sales)
| | (69,322) | | 548 | | (2,350) | | (1,802) |
| | Westchester Credit Event Fund
| | 73,731 | | 1,293 | | (1,117) | | 176 |
| | Westchester Credit Event Fund (Short sales)
| | (405) | | 20 | | — | | 20 |
| | Westchester Event-Driven Fund (Including Purchased Options)
| | 481,341 | | 16,524 | | (15,522) | | 1,002 |
| | Westchester Event-Driven Fund (Written options)
| | (6,357) | | 1,947 | | (2,528) | | (581) |
| | Westchester Event-Driven Fund (Short sales)
| | (27,075) | | 134 | | (972) | | (838) |
Certain Funds have capital loss carryforwards available to offset future realized capital gains, if any, to the extent permitted by the Code. Net capital losses are carried forward without expiration and generally retain their short-term and/or long-term tax character, as applicable. For the year ended December 31, 2023, the Funds’ capital loss carryovers were as follows:
| | Fund | | Short-Term | | Long-Term |
| | Westchester Credit Event Fund
| | $— | | $822 |
| | Westchester Event-Driven Fund
| | — | | 746 |
The components of distributable earnings on a tax basis and certain tax attributes for the Funds consist of the following:
| | Fund | | Undistributed
Ordinary
Income | | Late Year
Ordinary Losses
Deferred | | Post-October
Capital Loss
Deferred | | Capital Loss
Deferred |
| | The Merger Fund
| | $6,325 | | $ 18,828 | | $ — | | $ — |
| | Westchester Credit Event Fund
| | — | | 13 | | 36 | | 822 |
| | Westchester Event-Driven Fund
| | 589 | | — | | — | | 746 |
The differences between the book and tax basis of distributable earnings relate principally to the timing of recognition of income and gains for federal income tax purposes. Short-term gain distributions, if any, are reported as ordinary income for federal tax purposes. Distributions are determined on a tax basis and may differ from net investment income and realized capital gains for financial reporting purposes.
THE MERGER FUND®AND VIRTUS EVENT OPPORTUNITIES TRUST
NOTES TO FINANCIAL STATEMENTS (Continued)
December 31, 2023
The tax character of dividends and distributions paid during the fiscal years ended December 31, 2023 and 2022 were as follows:
| | Ordinary
Income | | Long-Term
Capital Gains | | Total |
The Merger Fund
| | | | | |
12/31/23
| $ 79,400 | | $ — | | $ 79,400 |
12/31/22
| 156,094 | | 33,656 | | 189,750 |
Westchester Credit Event Fund
| | | | | |
12/31/23
| 3,100 | | — | | 3,100 |
12/31/22
| 1,372 | | 11 | | 1,383 |
Westchester Event-Driven Fund
| | | | | |
12/31/23
| 11,500 | | — | | 11,500 |
12/31/22
| 650 | | — | | 650 |
Certain capital accounts in the financial statements are periodically adjusted for permanent differences in order to reflect their tax character. Permanent reclassifications can arise from differing treatment of certain income and gain transactions and nondeductible current year net operating losses. These adjustments have no impact on net assets or net asset value per share of the Funds. Temporary differences that arise from recognizing certain items of income, expense, gain or loss in different periods for financial statement and tax purposes will likely reverse at some time in the future.
Note 13. Regulatory Matters and Litigation
From time to time, the Funds, the Adviser and/or Subadviser and/or their affiliates may be involved in litigation and arbitration as well as examinations and investigations by various regulatory bodies, including the SEC, involving compliance with, among other things, securities laws, client investment guidelines, laws governing the activities of broker-dealers and other laws and regulations affecting their activities. At this time, the Adviser believes that the outcomes of such matters are not likely, either individually or in aggregate, to be material to these financial statements.
Note 14. Recent Accounting Pronouncement
In March 2020, the FASB issued Accounting Standards Update (“ASU”) No. 2020-04 (“ASU 2020-04”), Reference Rate Reform (Topic 848) – Facilitation of the Effects of Reference Rate Reform on Financial Reporting. The amendments in ASU 2020-04 provide optional temporary financial reporting relief from the effect of certain types of contract modifications due to the planned discontinuation of the LIBOR and other interbank-offered reference rates as of the end of 2021. In March 2021, the administrator for LIBOR announced the extension of the publication of a majority of the USD LIBOR settings to June 30, 2023. On December 21, 2022, the FASB issued ASU 2022-06 to defer the sunset date of ASU 2020-04 until December 31, 2024. ASU 2020-04 is effective for certain reference rate-related contract modifications that occur during the period March 12, 2020 through December 31, 2024. Management is currently evaluating ASU 2020-04 and ASU 2020-06, but does not believe there will be a material impact.
Note 15. New Regulatory Pronouncement
In October 2022, the SEC adopted a rule and form amendments relating to tailored shareholder reports for mutual funds and ETFs; and fee information in investment company advertisements. The rule and form amendments will require mutual funds and ETFs to transmit streamlined shareholder reports that highlight key information to investors. The rule amendments will require that certain more in-depth information be made available online and available for delivery free of charge to investors on request. The amendments became effective in January 2023 and there is an 18-month transition period after the effective date of the amendment with a compliance date of July 2024.
Note 16. Subsequent Events
Management has evaluated the impact of all subsequent events on the Funds through the date the financial statements were available for issuance, and has determined that there are no subsequent events requiring recognition or disclosure in these financial statements.
Report of Independent Registered Public Accounting Firm
To the Board of Trustees of The Merger Fund® and Virtus Event Opportunities Trust and Shareholders of The Merger Fund®, Virtus Westchester Credit Event Fund and Virtus Westchester Event-Driven Fund
Opinions on the Financial Statements
We have audited the accompanying statements of assets and liabilities, including the schedules of investments, of The Merger Fund®, and Virtus Westchester Credit Event Fund and Virtus Westchester Event-Driven Fund (constituting Virtus Event Opportunities Trust) (hereafter collectively referred to as the “Funds”) as of December 31, 2023, the related statements of operations for the year ended December 31, 2023, the statements of changes in net assets for each of the two years in the period ended December 31, 2023, including the related notes, and the financial highlights for each of the five years in the period ended December 31, 2023 (collectively referred to as the “financial statements”). In our opinion, the financial statements present fairly, in all material respects, the financial position of each of the Funds as of December 31, 2023, the results of each of their operations for the year then ended, the changes in each of their net assets for each of the two years in the period ended December 31, 2023 and each of the financial highlights for each of the five years in the period ended December 31, 2023 in conformity with accounting principles generally accepted in the United States of America.
Basis for Opinions
These financial statements are the responsibility of the Funds’ management. Our responsibility is to express an opinion on the Funds’ financial statements based on our audits. We are a public accounting firm registered with the Public Company Accounting Oversight Board (United States) (PCAOB) and are required to be independent with respect to the Funds in accordance with the U.S. federal securities laws and the applicable rules and regulations of the Securities and Exchange Commission and the PCAOB.
We conducted our audits of these financial statements in accordance with the standards of the PCAOB. Those standards require that we plan and perform the audit to obtain reasonable assurance about whether the financial statements are free of material misstatement, whether due to error or fraud.
Our audits included performing procedures to assess the risks of material misstatement of the financial statements, whether due to error or fraud, and performing procedures that respond to those risks. Such procedures included examining, on a test basis, evidence regarding the amounts and disclosures in the financial statements. Our audits also included evaluating the accounting principles used and significant estimates made by management, as well as evaluating the overall presentation of the financial statements. Our procedures included confirmation of securities owned as of December 31, 2023 by correspondence with the custodian, transfer agents, agent banks, and brokers; when replies were not received from an agent bank, transfer agent, and brokers, we performed other auditing procedures. We believe that our audits provide a reasonable basis for our opinions.
/s/ PricewaterhouseCoopers LLP
Philadelphia, Pennsylvania
February 26, 2024
We have served as the auditor of one or more of the investment companies in the Virtus group of investment companies since at least 1977. We have not been able to determine the specific year we began serving as auditor.
THE MERGER FUND® AND VIRTUS EVENT OPPORTUNITIES TRUST
TAX INFORMATION NOTICE (Unaudited)
December 31, 2023
The following information ($ reported in thousands) is being provided in order to meet reporting requirements set forth by the Code and/or to meet state specific requirements. In early 2024, the Funds will notify applicable shareholders of amounts for use in preparing 2023 U.S. federal income tax forms. Shareholders should consult their tax advisors.
With respect to distributions paid during the fiscal year ended December 31, 2023, the Funds designate the following amounts (or, if subsequently determined to be different, the maximum amount allowable):
| Fund | | Qualified
Dividend
Income %
(non-corporate
shareholder) | | Dividend
Received
Deduction %
(corporate
shareholders) |
The Merger Fund
| | 13.63 % | | 11.75 % |
Westchester Credit Event Fund
| | 4.10 | | 2.93 |
Westchester Event-Driven Fund
| | 19.64 | | 16.83 |
CONSIDERATION OF ADVISORY AND SUBADVISORY AGREEMENTS
FOR THE MERGER FUND®, VIRTUS WESTCHESTER CREDIT EVENT FUND AND VIRTUS
WESTCHESTER EVENT-DRIVEN FUND (each a “FUND” and collectively, the “FUNDS”) BY THE
BOARD OF TRUSTEES (Unaudited)
The Board of Trustees (the “Board”) of The Merger Fund® (“TMF”) and Virtus Westchester Event Opportunities Trust (“VEOT”) (each of TMF and VEOT, a “Trust” and collectively, the “Trusts”) is responsible for determining whether to approve the continuation of each investment advisory agreement (each, an “Advisory Agreement” and collectively, the “Advisory Agreements”) between TMF and Virtus Investment Advisers, Inc. (“VIA”), with respect to The Merger Fund® and between VEOT and VIA, with respect to Virtus Westchester Credit Event Fund and Virtus Westchester Event-Driven Fund, each a series of VEOT, and the continuation of each subadvisory agreement (each, a “Subadvisory Agreement” and collectively, the “Subadvisory Agreements”) (together with the Advisory Agreements, the “Agreements”) among TMF, VIA and Westchester Capital Management, LLC (“Westchester” or the “Subadviser”) with respect to The Merger Fund® and among VEOT, VIA and Westchester with respect to Virtus Westchester Credit Event Fund and Virtus Westchester Event-Driven Fund. At meetings held on November 1, 2023, and November 13-15, 2023 (the “Meetings”), the Board, including a majority of the Trustees who are not interested persons of the Trusts as defined in Section 2(a)(19) of the Investment Company Act of 1940, as amended (such Act, the “1940 Act” and such Trustees, the “Independent Trustees”), considered and approved the continuation of each Agreement, as further discussed below. In addition, prior to the Meetings, the Independent Trustees met with their independent legal counsel to discuss and consider the information provided by management and submitted questions to management, and they considered the responses provided.
In connection with the approval of the Agreements, the Board requested and evaluated information provided by VIA and the Subadviser which, in the Board’s view, constituted information necessary for the Board to form a judgment as to whether the renewal of each of the Agreements would be in the best interests of each applicable Fund and its respective shareholders. The Board also considered information furnished throughout the year at regular Board meetings with respect to the services provided by VIA and the Subadviser, including quarterly performance reports prepared by management containing reviews of investment results and periodic presentations from the Subadviser with respect to the Funds. The Board noted the affiliation of the Subadviser with VIA and any potential conflicts of interest.
The Board was separately advised by independent legal counsel throughout the process. For each Agreement, the Board considered all the criteria with respect to the applicable Fund and its shareholders. In its deliberations, the Board considered various factors, including those discussed below, none of which were controlling, and each Trustee may have attributed different weights to the various factors. The Independent Trustees also discussed the proposed approval of the Agreements in private sessions with their independent legal counsel at which no representatives of management were present.
In considering whether to approve the renewal of the Agreements with respect to each Fund, the Board reviewed and analyzed the factors it deemed relevant, including: (a) the nature, extent and quality of the services provided to the Funds by VIA and the Subadviser; (b) the performance of the Funds as compared to an appropriate peer group and an appropriate index; (c) the level and method of computing each Fund’s advisory and subadvisory fees, and comparisons of the Funds’ advisory fee rates and total expenses with those of a group of funds with similar investment objective(s); (d) the profitability of VIA under the Advisory Agreement; (e) any “fall-out” benefits to VIA, the Subadviser and their affiliates (i.e., ancillary benefits realized by VIA, the Subadviser or their affiliates from VIA’s or the Subadviser’s relationship with the Trusts); (f) the anticipated effect of growth in size on each Fund’s performance and expenses; (g) fees paid to VIA and the Subadviser by comparable accounts, as applicable; (h) possible conflicts of interest; and (i) the terms of the Agreements.
Nature, Extent and Quality of Services
The Trustees received in advance of the Meetings information provided by VIA and the Subadviser, including completed questionnaires concerning a number of topics, including, among other items, such company’s investment philosophy, investment process and strategies, resources and personnel, operations, compliance structure and procedures, and overall performance. The Trustees noted that the Funds are managed using a “manager of managers” structure that generally involves the use of one or more subadvisers to manage some or all of a Fund’s portfolio. Under this structure, VIA is responsible for the management of the Funds’ investment programs and for evaluating and selecting subadvisers on an ongoing basis and making any recommendations to the Board regarding hiring, retaining or replacing subadvisers. In
CONSIDERATION OF ADVISORY AND SUBADVISORY AGREEMENTS
FOR THE MERGER FUND®, VIRTUS WESTCHESTER CREDIT EVENT FUND AND VIRTUS
WESTCHESTER EVENT-DRIVEN FUND (each a “FUND” and collectively, the “FUNDS”) BY THE
BOARD OF TRUSTEES (Unaudited) (Continued)
considering the Advisory Agreement with VIA, the Board considered VIA’s process for supervising and managing the Funds’ subadviser(s), including (a) VIA’s ability to select and monitor subadvisers; (b) VIA’s ability to provide the services necessary to monitor the subadviser’s compliance with the Funds’ respective investment objective(s), policies and restrictions as well as provide other oversight activities; and (c) VIA’s ability and willingness to identify instances in which a subadviser should be replaced and to carry out the required changes. The Trustees also considered: (a) the experience and capability of VIA’s management and other personnel; (b) the financial condition of VIA, and whether it had the financial wherewithal to provide a high level and quality of services to the Funds; (c) the quality of VIA’s own regulatory and legal compliance policies, procedures and systems; (d) the nature, extent and quality of administrative, transfer agency and other services provided by VIA and its affiliates to the Funds; (e) VIA’s supervision of the Funds’ other service providers; and (f) VIA’s risk management processes. It was noted that affiliates of VIA serve as administrator, transfer agent and distributor of the Funds. The Board also took into account its knowledge of VIA’s management and the quality of the performance of VIA’s duties through Board meetings, discussions and reports during the preceding year, as well as information from the Trusts’ Chief Compliance Officer regarding the Funds’ compliance policies and procedures established pursuant to Rule 38a-1 under the 1940 Act.
With respect to the services provided by the Subadviser, the Board considered information provided to the Board by the Subadviser, as well as information provided throughout the past year. With respect to the Subadvisory Agreements, the Board noted that the Subadviser provided portfolio management, compliance with the respective Fund’s investment policies and procedures, compliance with applicable securities laws and assurances thereof. The Board also noted that VIA’s and the Subadviser’s management of the Funds is subject to the oversight of the Board and must be carried out in accordance with the investment objective(s), policies and restrictions set forth in the Funds’ prospectuses and statement of additional information. In considering the renewal of the Subadvisory Agreements, the Board also considered the Subadviser’s investment management process, including (a) the experience and capability of the Subadviser’s management and other personnel committed by the Subadviser to the Funds; (b) the financial condition of the Subadviser; (c) the quality of the Subadviser’s regulatory and legal compliance policies, procedures and systems; and (d) the Subadviser’s brokerage and trading practices, including with respect to best execution and soft dollars. The Board also took into account the Subadviser’s risk assessment and monitoring process. The Board noted the Subadviser’s regulatory history, including whether it was currently involved in any regulatory actions or investigations as well as material litigation, and any settlements and amelioratory actions undertaken, as appropriate.
After considering all of the information provided to them, the Trustees concluded that the nature, extent and quality of the services provided by VIA and the Subadviser were satisfactory and that there was a reasonable basis on which to conclude that each would continue to provide a high quality of investment services to the Funds.
Investment Performance
The Board considered performance reports and discussions at Board meetings throughout the year, as well as a report for the Funds prepared by Broadridge (the “Broadridge Report”), an independent third party provider of investment company data, furnished in connection with the contract renewal process. The Broadridge Report presented each Fund’s performance relative to a peer group of other mutual funds (the “Performance Universe”) and relevant indexes, as selected by Broadridge. The Board also considered performance information presented by management and took into account management’s discussion of the same, including the effect of market conditions on each Fund’s performance. The Board noted that it also reviews on a quarterly basis detailed information about both the Funds’ performance results and their respective portfolio compositions, as well as the Subadviser’s investment strategy(ies). The Board noted VIA’s expertise and resources in monitoring the performance, investment style and risk-adjusted performance of the Subadviser. The Board also noted the Subadviser’s performance record with respect to each applicable Fund. The Board was mindful of VIA’s focus on the Subadviser’s performance and noted VIA’s performance in monitoring and responding to any performance issues with respect to the Funds. The Board also took into account its discussions with management regarding factors that contributed to the performance of each Fund.
CONSIDERATION OF ADVISORY AND SUBADVISORY AGREEMENTS
FOR THE MERGER FUND®, VIRTUS WESTCHESTER CREDIT EVENT FUND AND VIRTUS
WESTCHESTER EVENT-DRIVEN FUND (each a “FUND” and collectively, the “FUNDS”) BY THE
BOARD OF TRUSTEES (Unaudited) (Continued)
The Board considered, among other performance data, the information set forth below with respect to the performance of each Fund for the period ended March 31, 2023. The Board also reviewed comparisons of each Fund’s contractual and net management fee and net total expense levels to those of its peer universe when considering Fund performance.
The Merger Fund®. The Board noted that the Fund outperformed the median of its Performance Universe for the 1- and 5-year periods and underperformed the median of its Performance Universe for the 3-year period. The Board also noted that the Fund underperformed its benchmark for the 1-year period and outperformed its benchmark for the 3- and 5-year periods.
Virtus Westchester Credit Event Fund. The Board noted that the Fund underperformed both the median of its Performance Universe and its benchmark for the 1-year period. The Board also noted that the Fund outperformed both the median of its Performance Universe and its benchmark for the 3- and 5-year periods.
Virtus Westchester Event-Driven Fund. The Board noted that the Fund underperformed both the median of its Performance Universe and its benchmark for the 1-year period. The Board also noted that the Fund outperformed both the median of its Performance Universe and its benchmark for the 3- and 5-year periods.
The Board also considered management’s discussion about the reasons for each applicable Fund’s underperformance during certain periods relative to its peer group or benchmark. After reviewing these and related factors, the Board concluded that each Fund’s overall performance, taking into account reasons discussed for certain Fund’s underperformance and/or actions taken to address the underperformance, were satisfactory.
Management Fees and Total Expenses
The Board considered the fees charged to the Funds for advisory services as well as the total expense levels of the Funds. This information included comparisons of each Fund’s contractual and net management fee and net total expense level to those of its peer universe (the “Expense Universe”) and ranked according to quintile (the first quintile being lowest and, therefore, best in these expense component rankings, and fifth being highest and, therefore, worst in these expense component rankings). In comparing each Fund’s net management fee to that of comparable funds, the Board noted that in the materials presented by management such fee was comprised of advisory and administration fees. The Board also noted that each of the Funds had expense caps in place to limit the total expenses incurred by the Funds and their shareholders. The Board also noted that the subadvisory fees were paid by VIA out of its advisory fees rather than paid separately by the Funds. In this regard, the Board took into account management’s discussion with respect to the advisory/subadvisory fee structure, including the amount of the advisory fee retained by VIA after payment of the subadvisory fee. The Board also took into account the size of each of the Funds and the impact on expenses and economies of scale. The Subadviser provided, and the Board considered, fee information of comparable accounts managed by the Subadviser, as applicable.
In addition to the foregoing, the Board considered, among other data, the information set forth below with respect to each Fund’s fees and expenses. In each case, the Board took into account management’s discussion of each Fund’s expenses, including the type and size of the Fund relative to the other funds in its Expense Universe.
The Merger Fund®. The Board considered that the Fund’s net management fee was in the second quintile of the Expense Universe and net total expenses after waivers were in the first quintile of the Expense Universe.
Virtus Westchester Credit Event Fund. The Board considered that the Fund’s net management fee and net total expenses after waivers were each in the fourth quintile of the Expense Universe.
Virtus Westchester Event-Driven Fund. The Board considered that the Fund’s net management fee was in the fifth quintile of the Expense Universe and net total expenses after waivers were in the fourth quintile of the Expense Universe.
The Board concluded that the advisory and subadvisory fees for each Fund, including with any proposed amendments, were fair and reasonable in light of the usual and customary charges made for services of the same nature and quality and the other factors considered.
CONSIDERATION OF ADVISORY AND SUBADVISORY AGREEMENTS
FOR THE MERGER FUND®, VIRTUS WESTCHESTER CREDIT EVENT FUND AND VIRTUS
WESTCHESTER EVENT-DRIVEN FUND (each a “FUND” and collectively, the “FUNDS”) BY THE
BOARD OF TRUSTEES (Unaudited) (Continued)
Profitability
The Board also considered certain information relating to profitability that had been provided by VIA. In this regard, the Board considered information regarding the overall profitability, as well as on a fund-by-fund basis, of VIA for its management of the Funds, as well as its profits and those of its affiliates for managing and providing other services to the Trusts, such as distribution, transfer agency and administrative services provided to the Funds by VIA affiliates. In addition to the fees paid to VIA and its affiliates, including the Subadviser, the Board considered any other benefits derived by VIA or its affiliates from their relationships with the Funds. The Board reviewed the methodology used to allocate costs to each Fund, taking into account the fact that allocation methodologies are inherently subjective and various allocation methodologies may each be reasonable while producing different results. The Board concluded that the profitability to VIA and its affiliates from each Fund was reasonable in light of the quality of the services rendered to the Funds by VIA and its affiliates as well as other factors.
In considering the profitability to the Subadviser in connection with its relationship to the Funds, the Board noted that the fees under the Subadvisory Agreements are paid by VIA out of the fees that VIA receives under each Advisory Agreement, so that Fund shareholders are not directly impacted by those fees. In considering the reasonableness of the fees payable by VIA to the Subadviser, the Board noted that, because the Subadviser is an affiliate of VIA, such profitability might be directly or indirectly shared by VIA. For each of the above reasons, the Board concluded that the profitability to the Subadviser and its affiliates from their relationship with the Funds was not a material factor in approval of the Subadvisory Agreements.
Economies of Scale
The Board received and discussed information concerning whether VIA realizes economies of scale as the Funds’ assets grow. The Board noted that the management fees for the Funds included breakpoints based on assets under management, and that expense caps were also in place for all of the Funds. The Board also took into account management’s discussion of each Fund’s management fee and subadvisory fee structure. The Board also took into account the current sizes of the Funds. The Board also noted that VIA had agreed to implement an extension of each Fund’s expense cap through April 30, 2025. The Board then concluded that no changes to the advisory fee structure of the Funds with respect to economies of scale were necessary at this time. The Board noted that VIA and the Funds may realize certain economies of scale if the assets of the Funds were to increase, particularly in relationship to certain fixed costs, and that shareholders of the Funds would have an opportunity to benefit from these economies of scale.
For similar reasons as stated above with respect to the Subadviser’s profitability, and based upon the current sizes of the Funds managed by the Subadviser, the Board concluded that the potential for economies of scale in the Subadviser’s management of the Funds was not a material factor in the approval of the Subadvisory Agreements at this time.
Other Factors
The Board considered other benefits that may be realized by VIA and the Subadviser and their affiliates from their relationships with the Funds. Among them, the Board recognized that VP Distributors, LLC, an affiliate of VIA and the Subadviser, serves as the distributor for each Trust, and, as such, receives payments pursuant to Rule 12b-1 from the Funds to compensate it for providing selling activities, which could lead to growth in each Trust’s assets and corresponding benefits from such growth, including economies of scale. The Board noted that an affiliate of VIA and the Subadviser also provides administrative and transfer agency services to the Trusts. The Board noted management’s discussion of the fact that, while the Subadviser is an affiliate of VIA, there are no other direct benefits to the Subadviser or VIA in providing investment advisory services to the Funds, other than the fees to be earned under the applicable Agreements. There may be certain indirect benefits gained, including to the extent that serving the Funds could provide the opportunity to provide advisory services to additional portfolios of each Trust or certain reputational benefits.
CONSIDERATION OF ADVISORY AND SUBADVISORY AGREEMENTS
FOR THE MERGER FUND®, VIRTUS WESTCHESTER CREDIT EVENT FUND AND VIRTUS
WESTCHESTER EVENT-DRIVEN FUND (each a “FUND” and collectively, the “FUNDS”) BY THE
BOARD OF TRUSTEES (Unaudited) (Continued)
Conclusion
Based on all of the foregoing considerations, the Board, including a majority of the Independent Trustees, determined that approval of each Agreement, as amended, was in the best interests of each applicable Fund and its respective shareholders. Accordingly, the Board, and the Independent Trustees voting separately, approved the Agreements, as amended, with respect to each Fund.
FUND MANAGEMENT TABLES (Unaudited)
Information pertaining to the Trustees and officers of the Trust as of the date of issuance of this report, is set forth below. The statement of additional information (SAI) includes additional information about the Trustees and is available without charge, upon request, by calling (800) 243-4361.
The address of each individual, unless otherwise noted, is c/o The Merger Fund® or Virtus Event Opportunities Trust, One Financial Plaza, Hartford, CT 06103. There is no stated term of office for Trustees or officers of the Trust.
Independent Trustees
Name, Year of Birth,
Length of Time Served
and Number of
Portfolios in Fund
Complex Overseen by
Trustee | Principal Occupation(s) During Past 5 Years | Other Directorships Held by Trustee During Past 5 Years |
Burke, Donald C.
YOB: 1960
Served Since: 2021
100 Portfolios | Private investor (since 2009). Formerly, President and Chief Executive Officer, BlackRock U.S. Funds (2007 to 2009); Managing Director, BlackRock, Inc. (2006 to 2009); and Managing Director, Merrill Lynch Investment Managers (1990 to 2006). | Trustee (since May 2023) and Advisory Board Member (May 2023), Virtus Artificial Intelligence & Technology Opportunities Fund, Virtus Dividend, Interest & Premium Strategy Fund and Virtus Equity & Convertible Income Fund; Advisory Board Member (since May 2023), Virtus Convertible & Income 2024 Target Term Fund, Virtus Convertible & Income Fund, Virtus Convertible & Income Fund II and Virtus Diversified Income & Convertible Fund; Trustee (since 2022), Virtus Stone Harbor Emerging Markets Income Fund; Trustee (2022 to 2023), Virtus Stone Harbor Emerging Markets Total Income Fund; Trustee (since 2021), The Merger Fund®, The Merger Fund® VL, Virtus Event Opportunities Trust (2 portfolios), Virtus Investment Trust (13 portfolios) and Virtus Strategy Trust (8 portfolios); Director (2020 to 2021), Duff & Phelps Select MLP and Midstream Energy Fund Inc.; Director (since 2020), Virtus Total Return Fund Inc.; Trustee (since 2020), Virtus Global Multi-Sector Income Fund; Trustee (since 2016), Virtus Mutual Fund Family (50 portfolios), Virtus Variable Insurance Trust (8 portfolios) and Virtus Alternative Solutions Trust (4 portfolios); Director (since 2014), closed-end funds managed by Duff & Phelps Investment Management Co. (3 funds); Director, Avista Corp. (energy company) (since 2011); Trustee, Goldman Sachs Fund Complex (2010 to 2014); and Director, BlackRock Luxembourg and Cayman Funds (2006 to 2010). |
Cogan, Sarah E.
YOB: 1956
Served Since: 2021
97 Portfolios | Retired Partner, Simpson Thacher & Bartlett LLP (“STB”) (law firm) (since 2019); Director, Girl Scouts of Greater New York (since 2016); Trustee, Natural Resources Defense Council, Inc. (since 2013); and formerly, Partner, STB (1989 to 2018). | Trustee (since 2022) and Advisory Board Member (2021 to 2022), Virtus Alternative Solutions Trust (4 portfolios), Virtus Mutual Fund Family (50 portfolios) and Virtus Variable Insurance Trust (8 portfolios); Trustee (since 2022), Virtus Stone Harbor Emerging Markets Income Fund; Trustee (2022 to 2023), Virtus Stone Harbor Emerging Markets Total Income Fund; Trustee (since 2021), The Merger Fund®, The Merger Fund® VL, Virtus Event Opportunities Trust (2 portfolios), and Virtus Global Multi-Sector Income Fund; Director (since 2021), Virtus Total Return Fund Inc.; Advisory Board Member (February 2021 to June 2021), Duff & Phelps Select MLP and Midstream Energy Fund Inc.; Trustee (since 2019), Virtus Investment Trust (13 portfolios) and Virtus Strategy Trust (8 portfolios); Trustee (since 2019), Virtus Artificial Intelligence & Technology Opportunities Fund, Virtus Convertible & Income 2024 Target Term Fund, Virtus Convertible & Income Fund, Virtus Convertible & Income Fund II, Virtus Diversified Income & Convertible Fund, Virtus Equity & Convertible Income Fund, and Virtus Dividend, Interest & Premium Strategy Fund; and Trustee (since 2019), PIMCO Closed-End Funds* (30 portfolios). |
DeCotis, Deborah A.
YOB: 1952
Served Since: 2021
97 Portfolios | Director, Cadre Holdings Inc. (since 2022); Advisory Director, Morgan Stanley & Co., Inc. (since 1996); Member, Circle Financial Group (since 2009); Member, Council on Foreign Relations (since 2013); and Trustee, Smith College (since 2017). Formerly, Director, Watford Re (2017 to 2021); Co-Chair Special Projects Committee, Memorial Sloan Kettering (2005 to 2015); and Trustee, Stanford University (2010 to 2015). | Trustee (since 2022) and Advisory Board Member (2021 to 2022), Virtus Alternative Solutions Trust (4 portfolios), Virtus Mutual Fund Family (50 portfolios) and Virtus Variable Insurance Trust (8 portfolios); Trustee (since 2022), Virtus Stone Harbor Emerging Markets Income Fund; Trustee (2022 to 2023), Virtus Stone Harbor Emerging Markets Total Income Fund; Trustee (since 2021), The Merger Fund®, The Merger Fund® VL, Virtus Event Opportunities Trust (2 portfolios), and Virtus Global Multi-Sector Income Fund; Director (since 2021), Virtus Total Return Fund Inc.; Advisory Board Member (February 2021 to June 2021), Duff & Phelps Select MLP and Midstream Energy Fund Inc.; Trustee (since 2019), Virtus Artificial Intelligence & Technology Opportunities Fund; Trustee (since 2017), Virtus Convertible & Income 2024 Target Term Fund; Trustee (since 2015), Virtus Diversified Income & Convertible Fund; Trustee (since 2014), Virtus Investment Trust (13 portfolios); Trustee (since 2011), Virtus Strategy Trust (8 portfolios); Trustee (since 2011), Virtus Convertible & Income Fund, Virtus Convertible & Income Fund II, Virtus Equity & Convertible Income Fund, and Virtus Dividend, Interest & Premium Strategy Fund; and Trustee (since 2011), PIMCO Closed-End Funds* (30 portfolios). |
FUND MANAGEMENT TABLES (Unaudited) (Continued)
Name, Year of Birth,
Length of Time Served
and Number of
Portfolios in Fund
Complex Overseen by
Trustee | Principal Occupation(s) During Past 5 Years | Other Directorships Held by Trustee During Past 5 Years |
Drummond, F. Ford
YOB: 1962
Served Since: 2021
97 Portfolios | President (since 1998), F.G. Drummond Ranches, Inc.; and Director (since 2015), Texas and Southwestern Cattle Raisers Association. Formerly Chairman, Oklahoma Nature Conservancy (2019 to 2020); Trustee (since 2014), Frank Phillips Foundation; Trustee (since 2008), Oklahoma Nature Conservancy; Board Member (2006 to 2020) and Chairman (2016 to 2018), Oklahoma Water Resources Board; Director (1998 to 2008), The Cleveland Bank; and General Counsel (1998 to 2008), BMIHealth Plans (benefits administration). | Trustee (since 2022) and Advisory Board Member (2021 to 2022), Virtus Alternative Solutions Trust (4 portfolios), Virtus Mutual Fund Family (50 portfolios), and Virtus Variable Insurance Trust (8 portfolios); Trustee (since 2022), Virtus Stone Harbor Emerging Markets Income Fund; Trustee (2022 to 2023), Virtus Stone Harbor Emerging Markets Total Income Fund; Trustee (since 2021), The Merger Fund®, The Merger Fund® VL, and Virtus Event Opportunities Trust (2 portfolios); Advisory Board Member (February 2021 to June 2021), Duff & Phelps Select MLP and Midstream Energy Fund Inc.; Trustee (since 2021), Virtus Global Multi-Sector Income Fund; Director (since 2021), Virtus Total Return Fund Inc.; Trustee (since 2019), Virtus Artificial Intelligence & Technology Opportunities Fund; Trustee (since 2017), Virtus Convertible & Income 2024 Target Term Fund; Trustee (since 2015), Virtus Convertible & Income Fund, Virtus Convertible & Income Fund II, Virtus Diversified Income & Convertible Fund, Virtus Dividend, Interest & Premium Strategy Fund and Virtus Equity & Convertible Income Fund; Trustee (since 2014), Virtus Strategy Trust (8 portfolios); Director (since 2011), Bancfirst Corporation; and Trustee (since 2006), Virtus Investment Trust (13 portfolios). |
Harris, Sidney E.
YOB: 1949
Served Since: 2021
90 Portfolios | Private Investor (since 2021); Dean Emeritus (since 2015), Professor (2015 to 2021 and 1997 to 2014), and Dean (1997 to 2004), J. Mack Robinson College of Business, Georgia State University. | Trustee (since 2022), Virtus Stone Harbor Emerging Markets Income Fund; Trustee (2022 to 2023), Virtus Stone Harbor Emerging Markets Total Income Fund; Trustee (since 2021), The Merger Fund®, The Merger Fund® VL, Virtus Event Opportunities Trust (2 portfolios), Virtus Investment Trust (13 portfolios) and Virtus Strategy Trust (8 portfolios); Director (2020 to 2021), Duff & Phelps Select MLP and Midstream Energy Fund Inc.; Director (since 2020), Virtus Total Return Fund Inc.; Trustee (since 2020), Virtus Global Multi-Sector Income Fund; Trustee (since 2019), Mutual Fund Directors Forum; Trustee (since 2017), Virtus Mutual Fund Family (50 portfolios), Virtus Variable Insurance Trust (8 portfolios), and Virtus Alternative Solutions Trust (4 portfolios); Trustee (2013 to 2020) and Honorary Trustee (since 2020), KIPP Metro Atlanta; Director (1999 to 2019), Total System Services, Inc.; Trustee (2004 to 2017), RidgeWorth Funds; Chairman (2012 to 2017), International University of the Grand Bassam Foundation; Trustee (since 2012), International University of the Grand Bassam Foundation; and Trustee (2011 to 2015), Genspring Family Offices, LLC. |
Mallin, John R.
YOB: 1950
Served Since: 2021
90 Portfolios | Partner/Attorney (since 2003), McCarter & English LLP (law firm) Real Property Practice Group; and Member (2014 to 2022), Counselors of Real Estate. | Trustee (since 2022), Virtus Stone Harbor Emerging Markets Income Fund; Trustee (2022 to 2023), Virtus Stone Harbor Emerging Markets Total Income Fund; Trustee (since 2021), The Merger Fund®, The Merger Fund® VL, Virtus Event Opportunities Trust (2 portfolios), Virtus Investment Trust (13 portfolios) and Virtus Strategy Trust (8 portfolios); Director (2020 to 2021), Duff & Phelps Select MLP and Midstream Energy Fund Inc.; Director (since 2020), Virtus Total Return Fund Inc.; Trustee (since 2020), Virtus Global Multi-Sector Income Fund; Trustee (since 2016), Virtus Mutual Fund Family (50 portfolios) and Virtus Alternative Solutions Trust (4 portfolios); Director (since 2019), 1892 Club, Inc. (non-profit); Director (2013 to 2020), Horizons, Inc. (non-profit); and Trustee (since 1999), Virtus Variable Insurance Trust (8 portfolios). |
FUND MANAGEMENT TABLES (Unaudited) (Continued)
Name, Year of Birth,
Length of Time Served
and Number of
Portfolios in Fund
Complex Overseen by
Trustee | Principal Occupation(s) During Past 5 Years | Other Directorships Held by Trustee During Past 5 Years |
McDaniel, Connie D.
YOB: 1958
Served Since: 2021
97 Portfolios | Retired (since 2013). Vice President, Chief of Internal Audit, Corporate Audit Department (2009 to 2013); Vice President, Global Finance Transformation (2007 to 2009); and Vice President and Controller (1999 to 2007), The Coca-Cola Company. | Trustee (since May 2023) and Advisory Board Member (May 2023), Virtus Artificial Intelligence & Technology Opportunities Fund, Virtus Convertible & Income 2024 Target Term Fund, Virtus Convertible & Income Fund, Virtus Convertible & Income Fund II, Virtus Diversified Income & Convertible Fund, Virtus Dividend, Interest & Premium Strategy Fund and Virtus Equity & Convertible Income Fund; Trustee (since 2022), Virtus Stone Harbor Emerging Markets Income Fund; Trustee (2022 to 2023), Virtus Stone Harbor Emerging Markets Total Income Fund; Trustee (since 2021), The Merger Fund®, The Merger Fund® VL, Virtus Event Opportunities Trust (2 portfolios), Virtus Investment Trust (13 portfolios) and Virtus Strategy Trust (8 portfolios); Director (2020 to 2021), Duff & Phelps Select MLP and Midstream Energy Fund Inc.; Director (since 2020), Virtus Total Return Fund Inc.; Trustee (since 2020), Virtus Global Multi-Sector Income Fund; Director (since 2019), Global Payments Inc.; Chairperson (since 2021), Governance & Nominating Committee, Global Payments Inc; Trustee (since 2017), Virtus Mutual Fund Family (50 portfolios), Virtus Variable Insurance Trust (8 portfolios), and Virtus Alternative Solutions Trust (4 portfolios); Director (since 2021), North Florida Land Trust; Director (2014 to 2019), Total System Services, Inc.; Member (2011 to 2022) and Chair (2014 to 2016), Georgia State University, Robinson College of Business Board of Advisors; and Trustee (2005 to 2017), RidgeWorth Funds. |
McLoughlin, Philip
YOB: 1946
Served Since: 2021
100 Portfolios | Private investor since 2010. | Trustee and Chairman (since 2022), Virtus Stone Harbor Emerging Markets Income Fund; Trustee and Chairman (2022 to 2023), Virtus Stone Harbor Emerging Markets Total Income Fund; Trustee and Chairman (since 2021), The Merger Fund®, The Merger Fund® VL, Virtus Event Opportunities Trust (2 portfolios), Virtus Investment Trust (13 portfolios) and Virtus Strategy Trust (8 portfolios); Chairman (since 2023) and Trustee (since 2021), Virtus Artificial Intelligence & Technology Opportunities Fund, Virtus Convertible & Income Fund II, Virtus Diversified Income & Convertible Fund, Virtus Equity & Convertible Income Fund and Virtus Dividend, Interest & Premium Strategy Fund; Chairman (since 2023), Trustee (since 2022) and Advisory Board Member (2021), Virtus Convertible & Income 2024 Target Term Fund and Virtus Convertible & Income Fund; Director and Chairman (since 2016), Virtus Total Return Fund Inc.; Director and Chairman (2016 to 2019), the former Virtus Total Return Fund Inc.; Director and Chairman (2014 to 2021), Duff & Phelps Select MLP and Midstream Energy Fund Inc.; Trustee and Chairman (since 2013), Virtus Alternative Solutions Trust (4 portfolios); Trustee and Chairman (since 2011), Virtus Global Multi-Sector Income Fund; Chairman and Trustee (since 2003), Virtus Variable Insurance Trust (8 portfolios); Director (since 1995), closed-end funds managed by Duff & Phelps Investment Management Co. (3 funds); Director (1991 to 2019) and Chairman (2010 to 2019), Lazard World Trust Fund (closed-end investment firm in Luxembourg); and Trustee (since 1989) and Chairman (since 2002), Virtus Mutual Fund Family (50 portfolios). |
McNamara, Geraldine M.
YOB: 1951
Served Since: 2021
100 Portfolios | Private investor (since 2006); and Managing Director, U.S. Trust Company of New York (1982 to 2006). | Trustee (since May 2023) and Advisory Board Member (January 2023 to May 2023), Virtus Convertible & Income Fund, Virtus Convertible & Income Fund II, Virtus Diversified Income & Convertible Fund and Virtus Dividend, Interest & Premium Strategy Fund; Trustee (since 2023), Virtus Artificial Intelligence & Technology Opportunities Fund and Virtus Equity & Convertible Income Fund; Advisory Board Member (since 2023), Virtus Convertible & Income 2024 Target Term Fund; Trustee (since 2022), Virtus Stone Harbor Emerging Markets Income Fund; Trustee (2022 to 2023), Virtus Stone Harbor Emerging Markets Total Income Fund; Trustee (since 2021), The Merger Fund®, The Merger Fund® VL, Virtus Event Opportunities Trust (2 portfolios), Virtus Investment Trust (13 portfolios) and Virtus Strategy Trust (8 portfolios); Director (2020 to 2021), Duff & Phelps Select MLP and Midstream Energy Fund Inc.; Director (since 2020), Virtus Total Return Fund Inc.; Trustee (since 2020), Virtus Global Multi-Sector Income Fund; Trustee (since 2016) Virtus Alternative Solutions Trust (4 portfolios); Trustee (since 2015), Virtus Variable Insurance Trust (8 portfolios); Director (since 2003), closed-end funds managed by Duff & Phelps Investment Management Co. (3 funds); and Trustee (since 2001), Virtus Mutual Fund Family (50 portfolios). |
FUND MANAGEMENT TABLES (Unaudited) (Continued)
Name, Year of Birth,
Length of Time Served
and Number of
Portfolios in Fund
Complex Overseen by
Trustee | Principal Occupation(s) During Past 5 Years | Other Directorships Held by Trustee During Past 5 Years |
Walton, R. Keith
YOB: 1964
Served Since: 2021
97 Portfolios | Senior Adviser (since 2022), Brightwood Capital LLC; Venture and Operating Partner (2020 to 2021), Plexo Capital, LLC; Venture Partner (2019 to 2020) and Senior Adviser (2018 to 2019), Plexo, LLC; and Partner (since 2006), Global Infrastructure Partners. Formerly, Managing Director (2020 to 2021), Lafayette Square Holding Company LLC; Senior Adviser (2018 to 2019), Vatic Labs, LLC; Executive Vice President, Strategy (2017 to 2019), Zero Mass Water, LLC; and Vice President, Strategy (2013 to 2017), Arizona State University. | Trustee (since 2023) and Advisory Board Member (2022 to 2023), Virtus Convertible & Income 2024 Target Term Fund; Trustee (since 2023) and Advisory Board Member (2022 to 2023), Virtus Convertible & Income Fund II and Virtus Dividend, Interest & Premium Strategy Fund; Trustee (since 2022) and Advisory Board Member (January 2022 to July 2022), Virtus Artificial Intelligence & Technology Opportunities Fund, Virtus Convertible & Income Fund and Virtus Equity & Convertible Income Fund; Trustee (since 2022), Virtus Stone Harbor Emerging Markets Income Fund; Trustee (2022 to 2023), Virtus Stone Harbor Emerging Markets Total Income Fund; Trustee (since 2022), Virtus Diversified Income & Convertible Fund; Trustee (since 2021), The Merger Fund®, The Merger Fund® VL, Virtus Event Opportunities Trust (2 portfolios), Virtus Investment Trust (13 portfolios) and Virtus Strategy Trust (8 portfolios); Trustee (since 2020) Virtus Alternative Solutions Trust (4 portfolios), Virtus Variable Insurance Trust (8 portfolios) and Virtus Mutual Fund Family (50 portfolios); Director (since 2017), certain funds advised by Bessemer Investment Management LLC; Director (2016 to 2021), Duff & Phelps Select MLP and Midstream Energy Fund Inc.; Trustee (since 2016), Virtus Global Multi-Sector Income Fund; Director (2006 to 2019), Systematica Investments Limited Funds; Director (2006 to 2017), BlueCrest Capital Management Funds; Trustee (2014 to 2017), AZ Service; Director (since 2004), Virtus Total Return Fund Inc.; and Director (2004 to 2019), the former Virtus Total Return Fund Inc. |
Zino, Brian T.
YOB: 1952
Served Since: 2021
97 Portfolios | Retired. Various roles (1982 to 2009), J. & W. Seligman & Co. Incorporated, including President (1994 to 2009). | Trustee (since 2022), Virtus Stone Harbor Emerging Markets Income Fund; Trustee (2022 to 2023), Virtus Stone Harbor Emerging Markets Total Income Fund; Trustee (since 2021), The Merger Fund®, The Merger Fund® VL, Virtus Event Opportunities Trust (2 portfolios), Virtus Investment Trust (13 portfolios) and Virtus Strategy Trust (8 portfolios); Trustee (since 2022) and Advisory Board Member (2021), Virtus Artificial Intelligence & Technology Opportunities Fund, Virtus Convertible & Income 2024 Target Term Fund, Virtus Convertible & Income Fund, Virtus Convertible & Income Fund II, Virtus Diversified Income & Convertible Fund, Virtus Equity & Convertible Income Fund, and Virtus Dividend, Interest & Premium Strategy Fund; Trustee (since 2020) Virtus Alternative Solutions Trust (4 portfolios), Virtus Variable Insurance Trust (8 portfolios) and Virtus Mutual Fund Family (50 portfolios); Director (2016 to 2021), Duff & Phelps Select MLP and Midstream Energy Fund Inc.; Trustee (since 2016), Virtus Global Multi-Sector Income Fund; Director (since 2014), Virtus Total Return Fund Inc.; Director (2014 to 2019), the former Virtus Total Return Fund Inc.; Trustee (since 2011), Bentley University; Director (1986 to 2009) and President (1994 to 2009), J&W Seligman Co. Inc.; Director (1998 to 2009), Chairman (2002 to 2004) and Vice Chairman (2000 to 2002), ICI Mutual Insurance Company; Member, Board of Governors of ICI (1998 to 2008). |
* PIMCO Closed-End Funds are not part of the Virtus’ Fund Complex: PCM Fund, Inc.; PIMCO Access Income Fund; PIMCO California Flexible Municipal Income Fund; PIMCO California Municipal Income Fund; PIMCO California Municipal Income Fund II; PIMCO California Municipal Income Fund Ill; PIMCO Corporate & Income Strategy Fund; PIMCO Corporate & Income Opportunity Fund; PIMCO Dynamic Income Fund; PIMCO Dynamic Income Opportunities Fund; PIMCO Dynamic Income Strategy Fund; PIMCO Flexible Credit Income Fund; PIMCO Flexible Emerging Markets Income Fund; PIMCO Flexible Municipal Income Fund; PIMCO Global StocksPLUS® & Income Fund; PIMCO High Income Fund; PIMCO Income Strategy Fund; PIMCO Income Strategy Fund II; PIMCO Managed Accounts Trust (5 portfolios); PIMCO Municipal Income Fund; PIMCO Municipal Income Fund II; PIMCO Municipal Income Fund III; PIMCO New York Municipal Income Fund; PIMCO New York Municipal Income Fund II; PIMCO New York Municipal Income Fund Ill; and PIMCO Strategic Income Fund, Inc.
FUND MANAGEMENT TABLES (Unaudited) (Continued)
Interested Trustee
Name, Year of Birth,
Length of Time Served
and Number of
Funds Overseen | Principal Occupation(s) During Past
5 Years | Principal Occupation(s) During Past 5 Years and
Other Directorships Held by Trustee |
Aylward, George R.*
Trustee and President
YOB: 1964
Served Since: 2021
104 Portfolios | Director, President and Chief Executive Officer (since 2008), Virtus Investment Partners, Inc. and/or certain of its subsidiaries, and various senior officer positions with Virtus affiliates (since 2005). | Director (since 2023), Stone Harbor Investment Funds plc (21 sub-funds), Stone Harbor Global Funds plc (27 sub-funds), and Virtus Global Funds ICAV (5 portfolios); Trustee, President and Chief Executive Officer (since 2022), Virtus Stone Harbor Emerging Markets Income Fund; Trustee (2022 to 2023), Virtus Stone Harbor Emerging Markets Total Income Fund; Member, Board of Governors of the Investment Company Institute (since 2021); Trustee and President (since 2021), The Merger Fund®, The Merger Fund® VL, Virtus Event Opportunities Trust (2 portfolios), Virtus Investment Trust (13 portfolios) and Virtus Strategy Trust (8 portfolios); Trustee, President and Chief Executive Officer (since 2021), Virtus Artificial Intelligence & Technology Opportunities Fund, Virtus Convertible & Income 2024 Target Term Fund, Virtus Convertible & Income Fund, Virtus Convertible & Income Fund II, Virtus Diversified Income & Convertible Fund, Virtus Equity & Convertible Income Fund, and Virtus Dividend, Interest & Premium Strategy Fund; Chairman and Trustee (since 2015), Virtus ETF Trust II (6 portfolios); Director, President and Chief Executive Officer (2014 to 2021), Duff & Phelps Select MLP and Midstream Energy Fund Inc.; Trustee and President (since 2013), Virtus Alternative Solutions Trust (4 portfolios); Director (since 2013), Virtus Global Funds, plc (5 portfolios); Trustee (since 2012) and President (since 2010), Virtus Variable Insurance Trust (8 portfolios); Trustee, President and Chief Executive Officer (since 2011), Virtus Global Multi-Sector Income Fund; Trustee and President (since 2006) and Executive Vice President (2004 to 2006), Virtus Mutual Fund Family (50 portfolios); Director, President and Chief Executive Officer (since 2006), Virtus Total Return Fund Inc.; and Director, President and Chief Executive Officer (2006 to 2019), the former Virtus Total Return Fund Inc. |
*Mr. Aylward is an “interested person,” as defined in the 1940 Act, by reason of his position as President and Chief Executive Officer of Virtus Investment Partners, Inc. (“Virtus”), the ultimate parent company of the Adviser, and various positions with its affiliates, including the Adviser.
FUND MANAGEMENT TABLES (Unaudited) (Continued)
Officers of the Trust Who Are Not Trustees
Name, Address and
Year of Birth | Position(s) Held
with Trust and
Length of
Time Served | Principal Occupation(s) During Past 5 Years |
Batchelar, Peter J.
YOB: 1970 | Senior Vice President (since 2021). | Senior Vice President, Product Development (since 2017), Vice President, Product Development (2008 to 2017), and various officer positions (since 2008), Virtus Investment Partners, Inc. and/or certain of its subsidiaries; various officer positions (since 2008) of various registered funds advised by subsidiaries of Virtus Investment Partners, Inc. |
Bradley, W. Patrick
YOB: 1972 | Executive Vice President, Chief Financial Officer and Treasurer (since 2021). | Executive Vice President, Fund Services (since 2016), Senior Vice President, Fund Services (2010 to 2016) and various officer positions (since 2004), Virtus Investment Partners, Inc. and/or certain of its subsidiaries; Director (since 2023), Stone Harbor Investment Funds plc and Stone Harbor Global Funds plc; Director (since 2019), Virtus Global Funds ICAV; Director (since 2013), Virtus Global Funds, plc; various officer positions (since 2006) of various registered funds advised by subsidiaries of Virtus Investment Partners, Inc.; Member (since 2022), BNY Mellon Asset Servicing Client Advisory Board. |
Branigan, Timothy
YOB: 1976 | Vice President and Fund Chief Compliance Officer (since 2022); Assistant Vice President and Deputy Fund Chief Compliance Officer (March to May 2022); and Assistant Vice President and Assistant Chief Compliance Officer (2021 to 2022). | Various officer positions (since 2019) of various registered funds advised by subsidiaries of Virtus Investment Partners, Inc. |
Chisolm, Daphne
YOB: 1969 | Vice President, Counsel and Assistant Secretary (since 2023). | Vice President and Senior Counsel (since 2023), Virtus Investment Partners, Inc.; Attorney at Law engaged in private practice as a solo practitioner (2018 to 2023); and various officer positions (since 2023) of various registered funds advised by subsidiaries of Virtus Investment Partners, Inc. |
Fromm Jennifer
YOB: 1973 | Vice President, Chief Legal Officer, Counsel and Secretary (since 2021). | Vice President (since 2016) and Senior Counsel, Legal (since 2007) and various officer positions (since 2008), Virtus Investment Partners, Inc. and/or certain of its subsidiaries; various officer positions (since 2008) of various registered funds advised by subsidiaries of Virtus Investment Partners, Inc. |
Griswold, Heidi
YOB: 1973 | Vice President (since 2021). | Vice President, Head of Transfer Agent & Servicing, Mutual Fund Services (since 2018), Virtus Investment Partners, Inc. and/or certain of its subsidiaries; and Vice President (since 2016) of various registered funds advised by subsidiaries of Virtus Investment Partners, Inc. |
Hackett, Amy
YOB: 1968 | Vice President and Assistant Treasurer (since 2021). | Vice President (since 2010) and Assistant Vice President (2007 to 2010), Fund Services, Virtus Investment Partners, Inc. and/or certain of its subsidiaries; and various officer positions (since 2007) of various registered funds advised by subsidiaries of Virtus Investment Partners, Inc. |
Krishnan, Suneeta
YOB: 1965 | Vice President and Assistant Treasurer (since 2021). | Vice President (since 2017) and Assistant Treasurer (since 2007), Mutual Fund Administration, Virtus Investment Partners, Inc. and/or certain of its subsidiaries; and various officer positions (since 2009) of various registered funds advised by subsidiaries of Virtus Investment Partners, Inc. |
Lowe, Benjamin
YOB: 1978 | Vice President, Controller and Assistant Treasurer (since 2021). | Vice President, Fund Services (since 2017), Virtus Investment Partners, Inc. and/or certain of its subsidiaries; and various officer positions (since 2018) of various registered funds advised by subsidiaries of Virtus Investment Partners, Inc. |
Martin, David
YOB: 1959 | Anti-Money Laundering Compliance Officer (since 2021). | Vice President, Compliance – Broker/Dealer (since 2009), Virtus Investment Partners, Inc.; and Vice President and Chief Compliance Officer of certain Virtus subsidiaries (since 2004). |
Rahman, Mahmood
YOB: 1967 | Assistant Vice President (since 2021). | Vice President (since 2023), Tax Director (since 2020) and Assistant Vice President (2020 to 2023), Fund Administration, Virtus Investment Partners, Inc.; Assistant Vice President (since 2021) of various registered funds advised by subsidiaries of Virtus Investment Partners, Inc.; and Assistant Treasurer and Tax Director, Grantham, Mayo, Van Otterloo & Co. LLC (2007 to 2019). |
Short, Julia R.
YOB: 1972 | Senior Vice President (since 2021). | Senior Vice President, Product Development (since 2017), Virtus Investment Partners, Inc. and/or certain of its subsidiaries; Senior Vice President (since 2017) of various registered funds advised by subsidiaries of Virtus Investment Partners, Inc.; and Managing Director, Product Manager, RidgeWorth Investments (2004 to 2017). |
FUND MANAGEMENT TABLES (Unaudited) (Continued)
Name, Address and
Year of Birth | Position(s) Held
with Trust and
Length of
Time Served | Principal Occupation(s) During Past 5 Years |
Smirl, Richard W.
YOB: 1967 | Executive Vice President (since 2021). | Chief Operating Officer (since 2021), Virtus Investment Partners, Inc.; Executive Vice President (since 2021), Virtus Investment Partners, Inc. and/or certain of its subsidiaries; Executive Vice President (since 2021) of various registered funds advised by subsidiaries of Virtus Investment Partners, Inc.; Chief Operating Officer (2018 to 2021), Russell Investments; Executive Director (Jan. to July 2018), State of Wisconsin Investment Board; and Partner and Chief Operating Officer (2004 to 2018), William Blair Investment Management. |
Suss, Amanda
YOB: 1969 | Vice President, Controller and Assistant Treasurer (since 2022). | Vice President and Controller (since 2022), Mutual Fund Administration and Financial Reporting, Virtus Investment Partners, Inc.; Vice President, Controller and Assistant Treasurer (since 2022) of various registered funds advised by subsidiaries of Virtus Investment Partners, Inc.; and Senior Finance Associate (2011 to 2022), Stone Harbor Investment Partners LP. |
THE MERGER FUND® and VIRTUS EVENT OPPORTUNITIES TRUST
101 Munson Street
Greenfield, MA 01301-9668
Trustees
Philip R. McLoughlin, Chairman
George R. Aylward
Donald C. Burke
Deborah A. DeCotis
F. Ford Drummond
Sidney E. Harris
John R. Mallin
Connie D. McDaniel
Geraldine M. McNamara
R. Keith Walton
Brian T. Zino
Principal Officers
George R. Aylward, President
Peter Batchelar, Senior Vice President
W. Patrick Bradley, Executive Vice President, Chief Financial Officer and Treasurer
Timothy Branigan, Vice President and Fund Chief Compliance Officer
Jennifer Fromm, Vice President, Chief Legal Officer, Counsel and Secretary
Julia R. Short, Senior Vice President
Richard W. Smirl, Executive Vice President
Investment Adviser
Virtus Investment Advisers, Inc.
One Financial Plaza
Hartford, CT 06103-2608
Principal Underwriter
VP Distributors, LLC
One Financial Plaza
Hartford, CT 06103-2608
Administrator and Transfer Agent
Virtus Fund Services, LLC
One Financial Plaza
Hartford, CT 06103-2608
Custodian
The Bank of New York Mellon
240 Greenwich Street
New York, NY 10286-1048
Independent Registered Public
Accounting Firm
PricewaterhouseCoopers LLP
2001 Market Street
Philadelphia, PA 19103-7042
How to Contact Us
| Mutual Fund Services | 1-800-243-1574 |
| Adviser Consulting Group | 1-800-243-4361 |
Important Notice to Shareholders
The Securities and Exchange Commission has modified mailing regulations for semiannual and annual shareholder fund reports to allow mutual fund companies to send a single copy of these reports to shareholders who share the same mailing address. If you would like additional copies, please call Mutual Fund Services at 1-800-243-1574.
P.O. Box 534470
Pittsburgh, PA 15253-4470
For more information about Virtus Funds,
please contact us at 1-800-243-1574, or visit Virtus.com.
Item 2. Code of Ethics.
| | (a) | The registrant, as of the end of the period covered by this report, has adopted a code of ethics that applies to the registrant’s principal executive officer, principal financial officer, principal accounting officer or controller, or persons performing similar functions, regardless of whether these individuals are employed by the registrant or a third party. |
| | (c) | There have been no amendments during the period covered by this report, to a provision of the code of ethics that applies to the registrant’s principal executive officer, principal financial officer, principal accounting officer or controller, or persons performing similar functions, regardless of whether these individuals are employed by the registrant or a third party, and that relates to any element of the code of ethics described in Item 2(b) of the instructions for completion of Form N-CSR. A copy of the currently applicable code is included as an exhibit. |
| | (d) | The registrant has not granted any waivers, including an implicit waiver, from a provision of the code of ethics that applies to the registrant’s principal executive officer, principal financial officer, principal accounting officer or controller, or persons performing similar functions, regardless of whether these individuals are employed by the registrant or a third party, that relates to one or more of the items set forth in paragraph (b) of this item’s instructions. |
Item 3. Audit Committee Financial Expert.
| | (a)(1) | The Registrant’s Board of Trustees has determined that the Registrant has an “audit committee financial expert” serving on its Audit Committee. |
| | (a)(2) | The Registrant’s Board of Trustees has determined that each of Connie D. McDaniel, Donald C. Burke and Brian T. Zino possesses the technical attributes identified in Instruction 2(b) of Item 3 to Form N-CSR to qualify as an “audit committee financial expert.” Each such individual is an “independent” trustee pursuant to paragraph (a)(2) of Item 3 to Form N-CSR. |
Item 4. Principal Accountant Fees and Services.
Audit Fees
| | (a) | The aggregate fees billed for each of the last two fiscal years for professional services rendered by the principal accountant for the audit of the registrant’s annual financial statements or services that are normally provided by the accountant in connection with statutory and regulatory filings or engagements for those fiscal years are $111,982 for 2023 and $109,250 for 2022. |
Audit-Related Fees
| | (b) | The aggregate fees billed in each of the last two fiscal years for assurance and related services by the principal accountant that are reasonably related to the performance of the audit of the registrant’s financial statements and are not reported under paragraph (a) of this Item are $1,926 for 2023 and $1,022 for 2022. Such audit-related fees include out of pocket expenses. |
Tax Fees
| | (c) | The aggregate fees billed in each of the last two fiscal years for professional services rendered by the principal accountant for tax compliance, tax advice, and tax planning are $12,494 for 2023 and $15,451 for 2022. |
“Tax Fees” are those primarily associated with review of the Trust’s tax provision and qualification as a regulated investment company (RIC) in connection with audits of the Trust’s financial statement, review of year-end distributions by the Fund to avoid excise tax for the Trust, periodic discussion with management on tax issues affecting the Trust, and reviewing and signing the Fund’s federal income tax returns.
All Other Fees
| | (d) | The aggregate fees billed in each of the last two fiscal years for products and services provided by the principal accountant, other than the services reported in paragraphs (a) through (c) of this Item are $0 for 2023 and $0 for 2022. |
| | (e)(1) | Disclose the audit committee’s pre-approval policies and procedures described in paragraph (c)(7) of Rule 2-01 of Regulation S-X. |
The Virtus Event Opportunities Trust (the “Fund”) Board has adopted policies and procedures with regard to the pre-approval of services provided by its independent auditors. Audit, audit-related and tax compliance services provided to the Fund on an annual basis require specific pre-approval by the Audit Committee. The Audit Committee must also approve other non-audit services provided to the Fund and those non-audit services provided to the Fund’s Affiliate Service Providers that related directly to the operations and financial reporting of the Fund. Certain of these non-audit services that the Audit Committee believes are a) consistent with the SEC’s auditor independence rules and b) routine and recurring services that will not impair the independence of the independent auditors may be approved by the Audit Committee without consideration on a specific case-by-case basis (“general pre-approval”).
The Audit Committee has determined that the Chair of the Audit Committee may provide pre-approval for such services that meet the above requirements but are not included in the general pre-approval in the event such approval is sought between regularly scheduled meetings. In any event, the Audit Committee is informed of, and ratifies, each service approved at the next regularly scheduled in-person Audit Committee meeting.
| | (e)(2) | The percentage of services described in each of paragraphs (b) through (d) of this Item that were approved by the audit committee pursuant to paragraph (c)(7)(i)(C) of Rule 2-01 of Regulation S-X are as follows: |
(b) 0%
(c) 0%
(d) N/A
| | (f) | The percentage of hours expended on the principal accountant’s engagement to audit the registrant’s financial statements for the most recent fiscal year that were attributed to work performed by persons other than the principal accountant’s full-time, permanent employees was less than fifty percent. |
| | (g) | The aggregate non-audit fees billed by the registrant’s accountant for services rendered to the registrant, and rendered to the registrant’s investment adviser (not including any sub-adviser whose role is primarily portfolio management and is subcontracted with or overseen by another investment adviser), and any entity controlling, controlled by, or under common control with the adviser that provides ongoing services to the registrant for each of the last two fiscal years of the registrant was $14,420 for 2023 and $16,473 for 2022. |
| | (h) | The registrant’s audit committee of the board of directors has considered whether the provision of non-audit services that were rendered to the registrant’s investment adviser (not including any sub-adviser whose role is primarily portfolio management and is subcontracted with or overseen by another investment adviser), and any entity controlling, controlled by, or under common control with the investment adviser that provides ongoing services to the registrant that were not pre-approved pursuant to paragraph (c)(7)(ii) of Rule 2-01 of Regulation S-X is compatible with maintaining the principal accountant’s independence. |
Item 5. Audit Committee of Listed Registrants.
Disclosure not required for open-end management investment companies.
Item 6. Investments.
| | (a) | Schedule of Investments in securities of unaffiliated issuers as of the close of the reporting period is included as part of the report to shareholders filed under Item 1(a) of this form. |
Item 7. Disclosure of Proxy Voting Policies and Procedures for Closed-End Management Investment Companies.
Disclosure not required for open-end management investment companies.
Item 8. Portfolio Managers of Closed-End Management Investment Companies.
Disclosure not required for open-end management investment companies.
Item 9. Purchases of Equity Securities by Closed-End Management Investment Company and Affiliated Purchasers.
Disclosure not required for open-end management investment companies.
Item 10. Submission of Matters to a Vote of Security Holders.
There have been no material changes to the procedures by which the shareholders may recommend nominees to the Registrant’s Board of Trustees that were implemented after the Registrant last provided disclosure in response to the requirements of Item 407(c)(2)(iv) of Regulation S-K (17 CFR 229.407) (as required by Item 22(b)(15) of Schedule 14A (17 CFR 240.14a-101)), or this Item.
Item 11. Controls and Procedures.
| | (a) | The registrant’s principal executive and principal financial officers, or persons performing similar functions, have concluded that the registrant’s disclosure controls and procedures (as defined in Rule 30a-3(c) under the Investment Company Act of 1940, as amended (the “1940 Act”) (17 CFR 270.30a-3(c))) are effective, as of a date within 90 days of the filing date of the report that includes the disclosure required by this paragraph, based on their evaluation of these controls and procedures required by Rule 30a-3(b) under the 1940 Act (17 CFR 270.30a-3(b)) and Rules 13a-15(b) or 15d-15(b) under the Securities Exchange Act of 1934, as amended (17 CFR 240.13a-15(b) or 240.15d-15(b)). |
| | (b) | There were no changes in the registrant’s internal control over financial reporting (as defined in Rule 30a-3(d) under the 1940 Act (17 CFR 270.30a-3(d))) that occurred during the period covered by this report that has materially affected, or is reasonably likely to materially affect, the registrant’s internal control over financial reporting. |
Item 12. Disclosure of Securities Lending Activities for Closed-End Management Investment Companies.
Disclosure not required for open-end management investment companies.
Item 13. Exhibits.
SIGNATURES
Pursuant to the requirements of the Securities Exchange Act of 1934 and the Investment Company Act of 1940, the registrant has duly caused this report to be signed on its behalf by the undersigned, thereunto duly authorized.
| | | | |
| (Registrant) | | The Merger Fund® | | |
| | |
| By (Signature and Title)* | | /s/ George R. Aylward | | |
| | George R. Aylward, President | | |
| | (principal executive officer) | | |
Date 2/29/2024
Pursuant to the requirements of the Securities Exchange Act of 1934 and the Investment Company Act of 1940, this report has been signed below by the following persons on behalf of the registrant and in the capacities and on the dates indicated.
| | | | |
| By (Signature and Title)* | | /s/ George R. Aylward | | |
| | George R. Aylward, President | | |
| | (principal executive officer) | | |
Date 2/29/2024
| | | | |
| By (Signature and Title)* | | /s/ W. Patrick Bradley | | |
| | W. Patrick Bradley, Executive Vice President, | | |
| | Chief Financial Officer, and Treasurer | | |
| | (principal financial officer) | | |
Date 2/29/2024
| * | Print the name and title of each signing officer under his or her signature. |