UNITED STATES
SECURITIES AND EXCHANGE COMMISSION
Washington, D.C. 20549
SCHEDULE 14A
Proxy Statement Pursuant to Section 14(a) of the
Securities Exchange Act of 1934
(Amendment No. )
Filed by the Registrant x Filed by a Party other than the Registrant ¨
Check the appropriate box:
| ¨ | Preliminary Proxy Statement |
| ¨ | Confidential, for Use of the Commission Only (as permitted by Rule 14a-6(e)(2)) |
| ¨ | Definitive Proxy Statement |
| x | Definitive Additional Materials |
| ¨ | Soliciting Material Pursuant to § 240.14a-12 |
MENTOR GRAPHICS CORPORATION
(Name of Registrant as Specified In Its Charter)
N/A
(Name of Person(s) Filing Proxy Statement, if other than the Registrant)
Payment of Filing Fee (Check the appropriate box):
| x | No fee required. |
| ¨ | Fee computed on table below per Exchange Act Rules 14a-6(i)(1) and 0-11. |
| (1) | Title of each class of securities to which transaction applies: |
| (2) | Aggregate number of securities to which transaction applies: |
| (3) | Per unit price or other underlying value of transaction computed pursuant to Exchange Act Rule 0-11 (set forth the amount on which the filing fee is calculated and state how it was determined): |
| (4) | Proposed maximum aggregate value of transaction: |
| (5) | Total fee paid: |
| ¨ | Fee paid previously with preliminary materials: |
| ¨ | Check box if any part of the fee is offset as provided by Exchange Act Rule 0-11(a)(2) and identify the filing for which the offsetting fee was paid previously. Identify the previous filing by registration statement number, or the form or schedule and the date of its filing. |
| (1) | Amount previously paid: |
| (2) | Form, Schedule or Registration Statement No.: |
| (3) | Filing Party: |
| (4) | Date Filed: |
 Investor Presentation April 2011 |
 © 2011 Mentor Graphics Corp. www.mentor.com Forward-Looking Statements This presentation may contain “forward-looking” statements based on current expectations within the meaning of the Securities Exchange Act of 1934. Such forward-looking statements involve known and unknown risks, uncertainties and other factors that may cause the actual results, performance or achievements of the Company or industry results to be materially different from any results, performance or achievements expressed or implied by such forward-looking statements. Such factors include, among others, the following: (i) weakness or recession in the US, EU, Japan or other economies; (ii) the Company’s ability to successfully offer products and services that compete in the highly competitive EDA industry; (iii) product bundling or discounting of products and services by competitors, which could force the Company to lower its prices or offer other more favorable terms to customers; (iv) possible delayed or canceled customer orders, a loss of key personnel or other consequences resulting from the business disruption and uncertainty of prolonged proxy fights, offers to purchase the Company’s securities or other actions of activist shareholders; (v) effects of the increasing volatility of foreign currency fluctuations on the Company’s business and operating results; (vi) changes in accounting or reporting rules or interpretations; (vii) the impact of tax audits by the IRS or other taxing authorities, or changes in the tax laws, regulations or enforcement practices where the Company does business; (viii) effects of unanticipated shifts in product mix on gross margin; and (ix) effects of customer seasonal purchasing patterns and the timing of significant orders, which may negatively or positively impact the Company’s quarterly results of operations, all as may be discussed in more detail under the heading “Risk Factors” in the Company’s most recent Form 10-K or Form 10-Q. Given these uncertainties, prospective investors are cautioned not to place undue reliance on such forward-looking statements. In addition, statements regarding guidance do not reflect potential impacts of mergers or acquisitions that have not been announced or closed as of the time the statements are made. The Company disclaims any obligation to update any such factors or to publicly announce the results of any revisions to any of the forward-looking statements to reflect future events or developments. 2 Mentor Graphics Investor Presentation, April 2011 |
 © 2011 Mentor Graphics Corp. www.mentor.com Important Information On March 31, 2011, the Company filed a definitive proxy statement with the Securities and Exchange Commission (the “SEC”) in connection with the Company’s upcoming 2011 annual meeting of shareholders. Shareholders are advised to read the Company’s definitive proxy statement, and any other relevant documents filed by the Company with the SEC, before making any voting or investment decision because they contain important information. The definitive proxy statement is, and any other relevant documents and other material filed with the SEC concerning the Company will be, when filed, available free of charge at http://www.sec.gov and http://www.mentor.com/company/investor_relations. In addition, copies of the proxy materials may be requested from the company’s proxy solicitor, MacKenzie Partners, Inc., by telephone at 1-800-322- 2885 or by email at proxy@mackenziepartners.com. 3 Mentor Graphics Investor Presentation, April 2011 |
 © 2011 Mentor Graphics Corp. www.mentor.com Agenda Mentor Graphics Investor Presentation, April 2011 Business Strategy Overview Financial Highlights & Outlook 2011 Annual Meeting Appendix 4 Part 1 Part 2 Part 3 Part 4 |
 © 2011 Mentor Graphics Corp. www.mentor.com Summary Mentor achieved record results in fiscal 2011 driven by strong overall bookings growth of approximately 30% — All-time record revenues of $915 million — Non-GAAP earnings per share of $0.70 (49% increase from fiscal 2010) * For full-year fiscal 2012, company expects: — Revenue to be approximately $1 billion (up 9%) — Non-GAAP earnings per share of ~$1.00 (up 43%) * Mentor focuses on building #1 product positions — segment leader gains share while others may lose ground Expect Mentor’s growth to continue to exceed underlying growth of traditional EDA New applications including automotive and aerospace design are expected to continue to grow rapidly with minimal competition from EDA companies Growth anticipated to be between 8 and 10%, non-GAAP operating margin trending towards 20%+, generating significant cash flow*. Mentor presently anticipates using its strong cash flow to return approximately $150 million of capital to shareholders through stock repurchases or dividends Mentor Graphics Investor Presentation, April 2011 5 *For a reconciliation of non-GAAP to GAAP financial measures, see the appendix to this presentation |
 © 2011 Mentor Graphics Corp. www.mentor.com Summary (continued) The Mentor Board unanimously believes that continued execution of our strategic plan offers the greatest value to all Mentor shareholders Board remains open to any opportunity to enhance shareholder value, just as it was in 2008 when it evaluated the offer from Cadence $17 per share “stalking horse” proposal made by Icahn undervalues the company and its future prospects Analysis shows Icahn’s platform of a public sale is risky and potentially destructive — Substantial regulatory and commercial risk to in-market combination The Mentor Board urges shareholders to reject Icahn’s nominees, as the Board believes they: — Run on a singular risky platform of selling Mentor without any other stated vision or specific strategy — Do not have the collective knowledge, skill and experience of Mentor’s current Board 6 Mentor Graphics Investor Presentation, April 2011 |
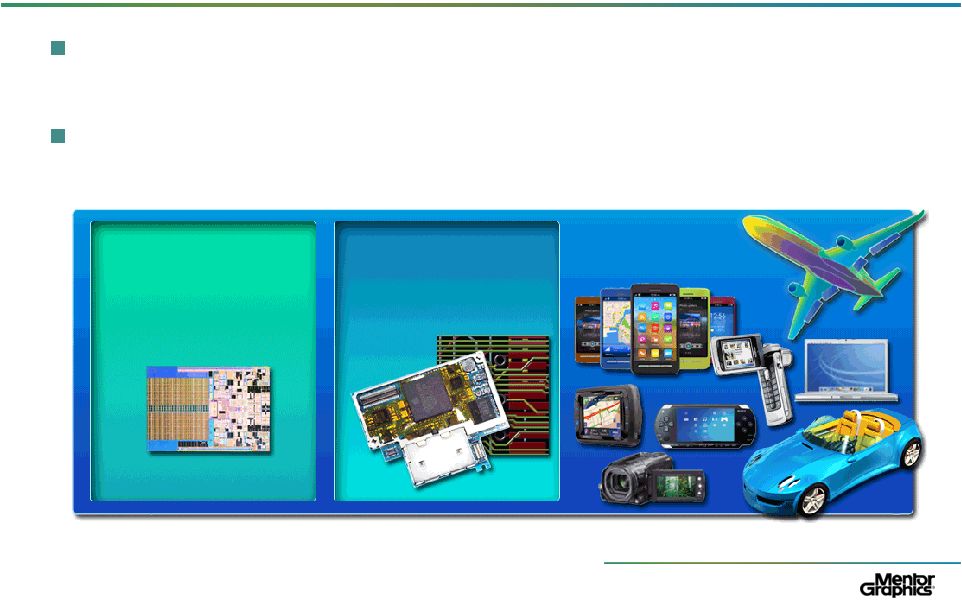 © 2011 Mentor Graphics Corp. www.mentor.com What Is Electronic Design Automation? Critical design software used to create the world’s electronic systems Comprehensive EDA product portfolios address all levels – from component to systems Integrated Circuit (IC) Printed Circuit Board (PCB) Systems 7 Mentor Graphics Investor Presentation, April 2011 |
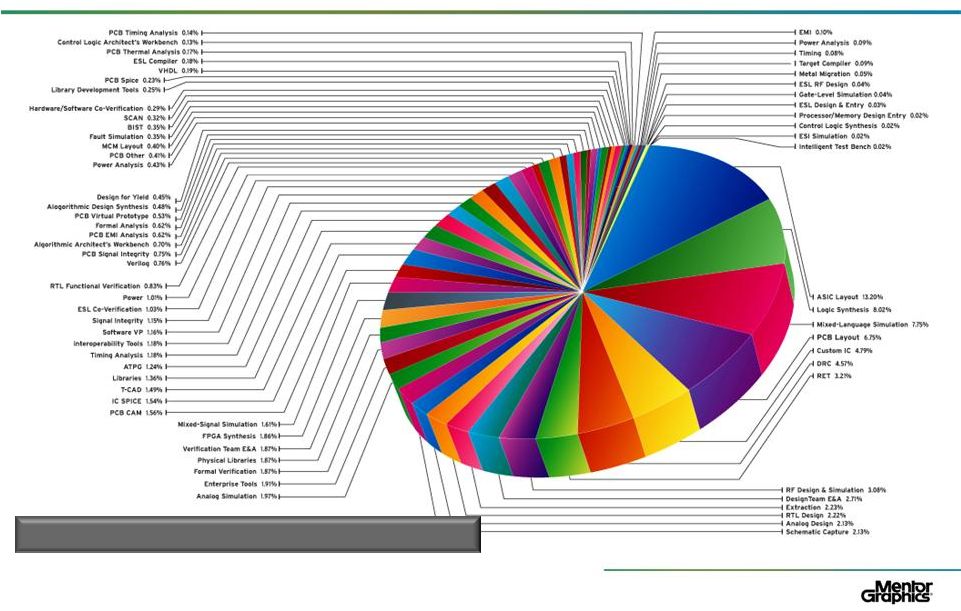 © 2011 Mentor Graphics Corp. www.mentor.com EDA Product Segments Mentor Graphics Investor Presentation, April 2011 8 EDA Product Segments >$1M of Sales Source: Gary Smith EDA Market Trends 2010 and Mentor analysis |
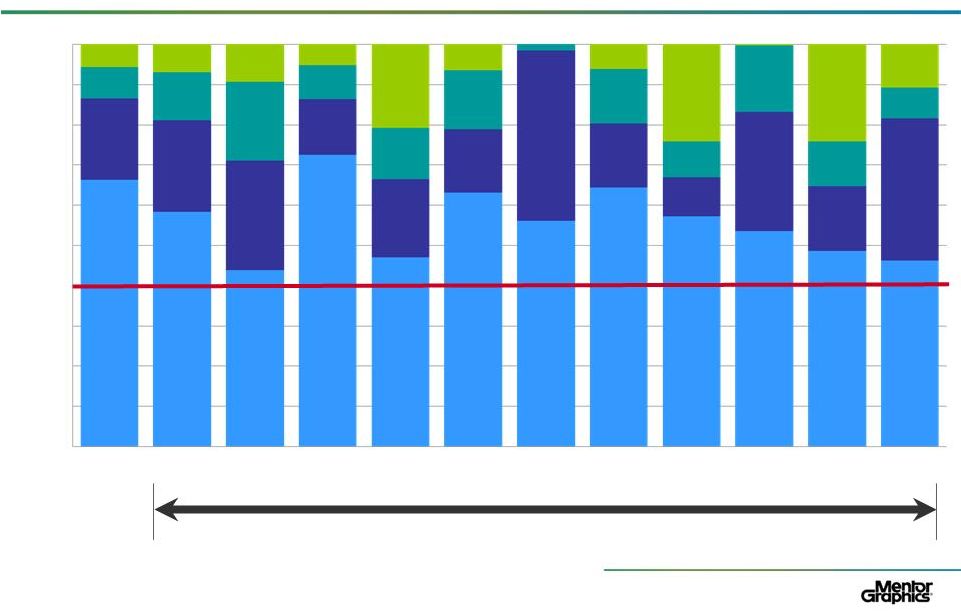 © 2011 Mentor Graphics Corp. www.mentor.com #1 Supplier in Each EDA Product Segment Averages 66% Revenue Share Mentor Graphics Investor Presentation, April 2011 SNPS CDNS MENT SNPS Other SNPS MENT CDNS MENT Other MENT 9 Source: Gary Smith EDA Market Trends, 2010 and Mentor analysis 0% 10% 20% 30% 40% 50% 60% 70% 80% 90% 100% EDA Average ASIC Layout RTL Simulation RTL Synthesis PCB Layout DRC RET RF Design & Verif. Custom Layout Emulation RTL Design DFT Largest EDA Product Segments |
 © 2011 Mentor Graphics Corp. www.mentor.com The EDA Industry and Mentor’s Strategy Mentor’s view of the EDA industry: Segment leader gains share while others may lose ground Profitability within product segment driven by category size (linear) and share (exponentially) Traditional EDA growth modest, new challenges drive new spend by customers Mentor’s strategy focuses on: Building #1 product positions — Mentor’s investments in recent years have yielded #1 product positions that Mentor expects to maintain for years Strengthening focus on internal development Making bolt-on acquisitions to build on #1 positions Actively seeking TAM-expanding green field opportunities Mentor Graphics Investor Presentation, April 2011 10 |
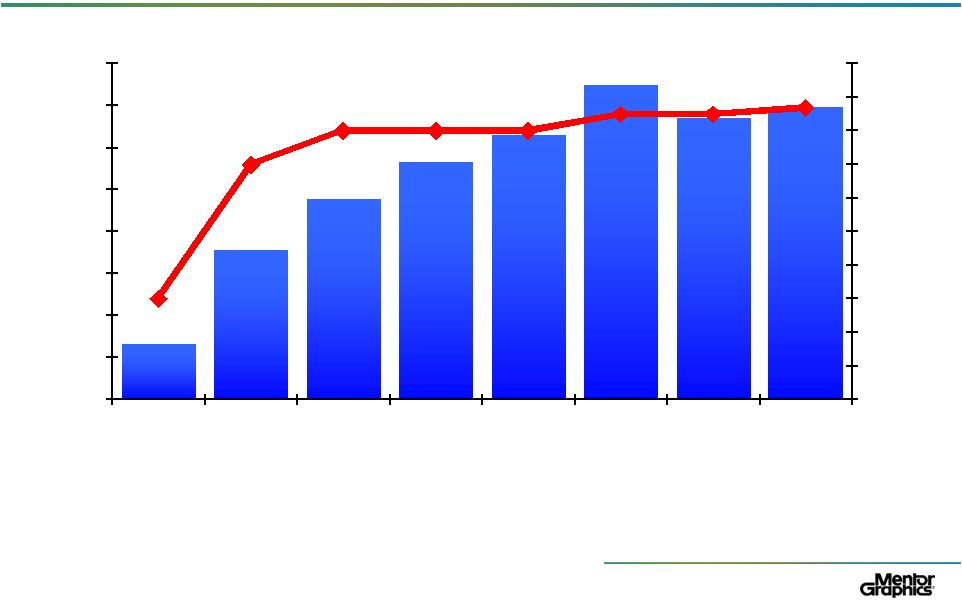 © 2011 Mentor Graphics Corp. www.mentor.com Mentor Graphics Investor Presentation, April 2011 11 Mentor Focuses on Product Categories Where Mentor Can Be #1 ($ millions) (% Revenue) $136 $360 $480 $570 $635 $753 $674 $700 Full market share data by company for EDA product segments is only available from the market analyst firm Gary Smith EDA. The most recently available data is from 2009. 2010 Product segment size (revenue) is available from the market statistics survey of the electronic design automation consortium, but companies can only compute their own market share using their own known revenue numbers; they cannot compute other companies’ market share. 30% 70% 80% 80% 80% 85% 85% 87% 0% 10% 20% 30% 40% 50% 60% 70% 80% 90% 100% 0 100 200 300 400 500 600 700 800 CY1996 CY1999 CY2002 CY2005 CY2006 FY2008 FY2009 FY2010 Product Revenue from Leadership Positions |
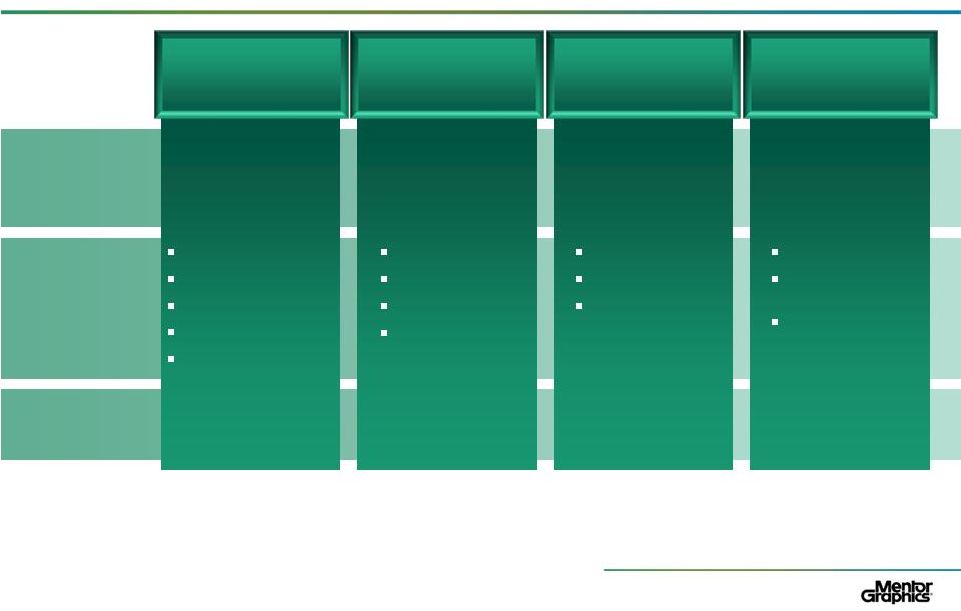 © 2011 Mentor Graphics Corp. www.mentor.com Mentor – Reporting Categories Mentor Graphics Investor Presentation, April 2011 12 Integrated System Design PCB Scalable Verification New & Emerging Markets IC Design- to-Silicon Tools for printed circuit board (PCB) and design and field programmable gate array (FPGA) design Used to examine and verify functionality before committing to silicon Tools to create integrated circuits (ICs) for 90nm and smaller Products targeting new and emerging markets Description Expedition Mechanical Analysis PADS Valor Precision Synthesis ModelSim Questa Veloce (Emulation) ADVance MS Calibre Platform IC Custom Design Olympus-SoC Place & Route Transportation Embedded Software Design-for-Test Key Product Areas 25% 25% 30% 15% *Percent of FY11 Revenue * Services & Other account for 5% of FY 11 revenue of $915 million. |
 © 2011 Mentor Graphics Corp. www.mentor.com Graphical Schematic and Layout Mentor Graphics 1 product: Board Station 1980s Multi-Disciplined, Concurrent Design and Virtual Prototyping Mentor Graphics delivers paradigm shift in PCB systems design 2008-2010 The Evolution of Mentor’s Leadership in PCB 13 Mentor Graphics Investor Presentation, April 2011 st |
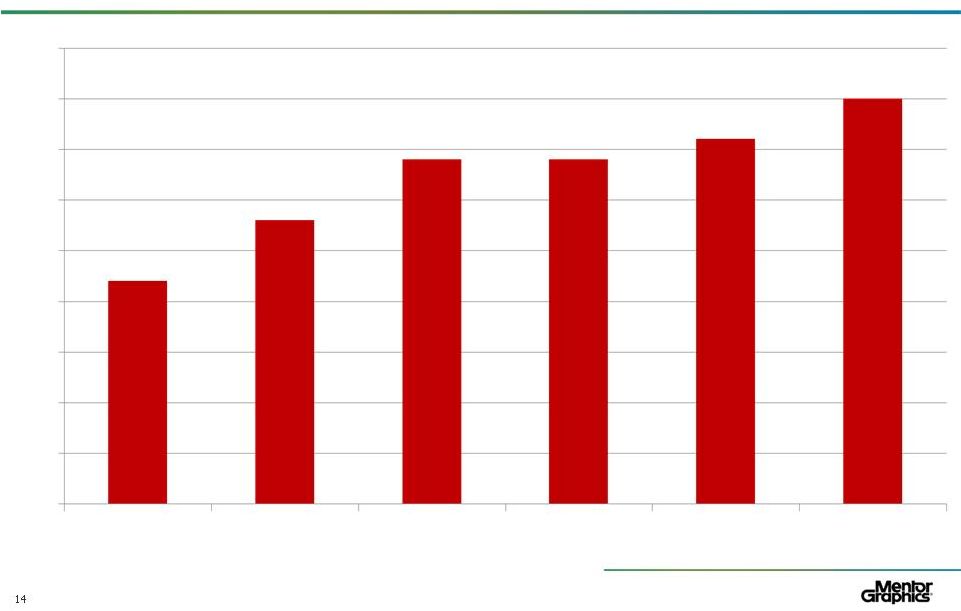 © 2011 Mentor Graphics Corp. www.mentor.com Mentor Worldwide PCB Revenue Share Mentor Graphics Investor Presentation, April 2011 Source: Gary Smith EDA 0% 5% 10% 15% 20% 25% 30% 35% 40% 45% 2000 2002 2004 2006 2008 2009 |
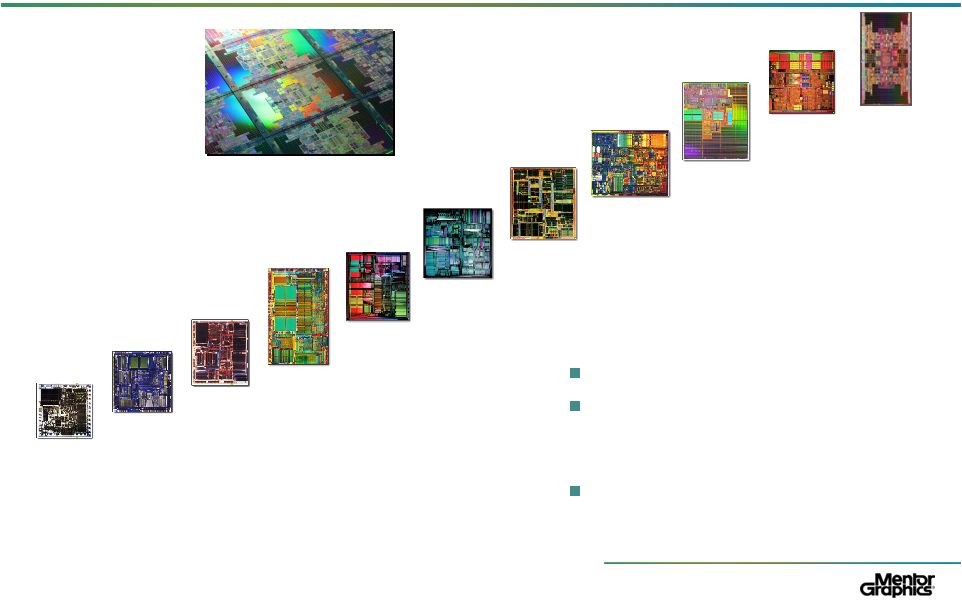   © 2011 Mentor Graphics Corp. www.mentor.com Mentor Graphics Investor Presentation, April 2011 15 Moore’s Law: IC Complexity Steadily Rises, Creating Opportunities for EDA Each new design generation creates demand for EDA tools More licenses of existing tools New tools and methodologies to address design problems that didn’t exist previously Replacement of older tools that break (discontinuity) 1979 29,000 Transistors 8088 1982 134,000 Transistors 286 1985 275,000 Transistors 386 1989 1,290,000 Transistors 486 1993 3.1M+ Transistors Pentium 1995 5.5M+ Transistors Pentium Pro 1997 7.5M+ Transistors Pentium II 2000 42M Transistors Pentium 4 2004 592M Transistors Itanium 2 (9MB cache) 2002 220M Transistors Itanium 2 2008 2.0B Transistors Tukwila 2010 3B Transistors |
 © 2011 Mentor Graphics Corp. www.mentor.com Discontinuity Leads to Success Mentor Graphics Investor Presentation, April 2011 16 Calibre nmDRC Calibre Pattern Matching Calibre Automatic Waivers Calibre nmLVS Calibre InRoute Calibre xRC Calibre xACT-3D Calibre xL Calibre PERC Calibre DESIGNrev Calibre Interactive Calibre RVE Calibre LFD Calibre CMP Analyzer Calibre YieldAnalyzer Calibre YieldEnhancer Calibre nmOPC (RET) Calibre OPCverify Calibre nmMPC Calibre MDP 1996 Calibre Point Tool ~ $1.1M Revenue 2011 Calibre nm Platform Approaching $300M Revenue 2011 Calibre Platform Building upon a #1 Position |
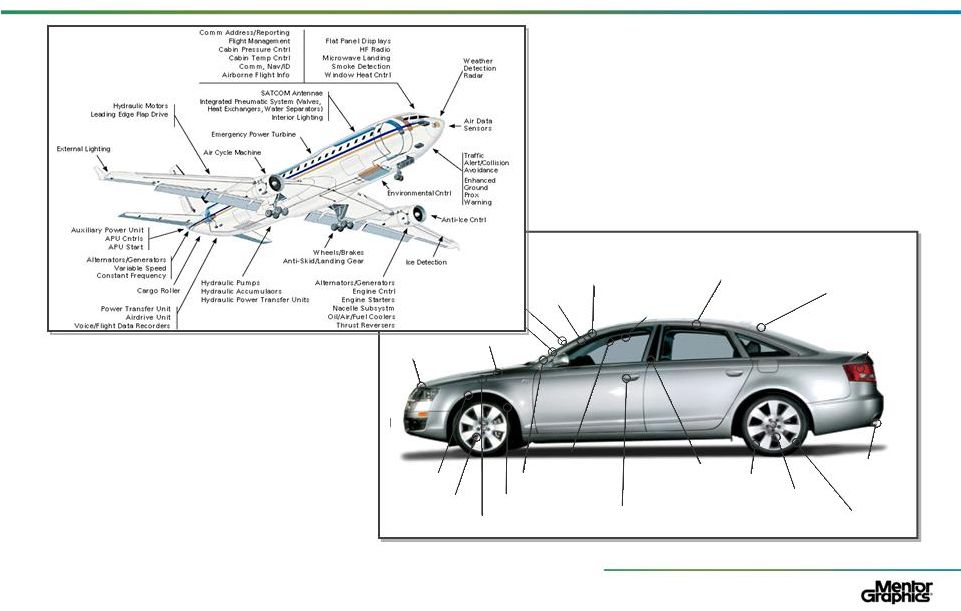 © 2011 Mentor Graphics Corp. www.mentor.com Transportation, an Exciting Opportunity Mentor Graphics Investor Presentation, April 2011 17 Collision Avoidance Automated Highway Navigation & Trip Computer Entertainment Electrochromic Glass Active Noise Cancellation Communication Lighting Engine & Emissions Management Traction Control Vehicle Stability Low Tire Pressure Monitors Airbag Deployment System Security Systems Multi-Zone Automatic Climate Control Lane Departure Warning Continuously Variable Transmission Engine Management Antilock Braking Active Suspension |
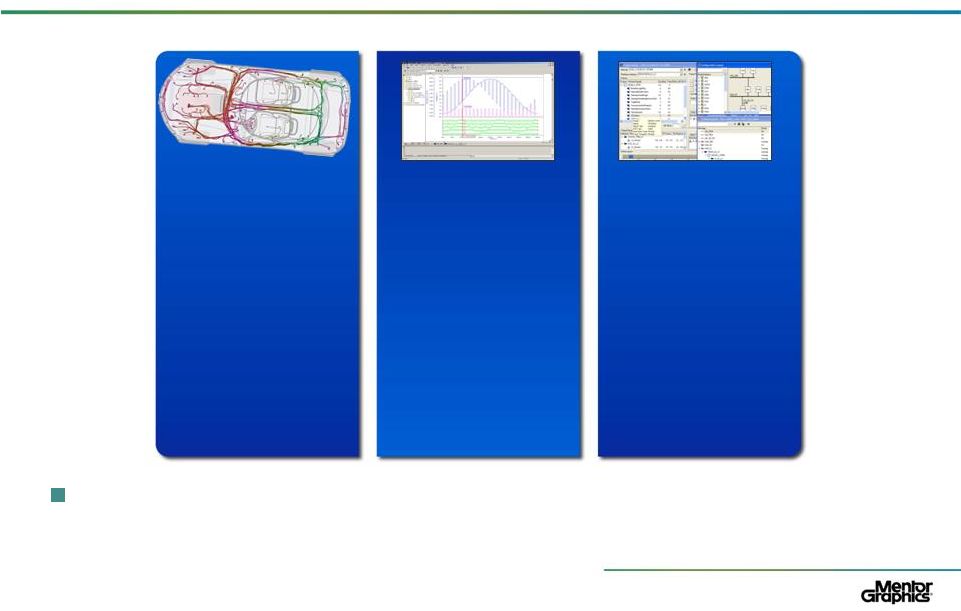 Mentor’s Transportation Solutions Transportation has accounted for approximately 15% of product bookings in recent quarters Mentor Graphics Investor Presentation, April 2011 18 CHS Electrical System Design and Wire Harness Engineering System Vision and Mechatronics Analysis Volcano Network Design and Analysis © 2011 Mentor Graphics Corp. www.mentor.com |
 Transportation – A Growing Opportunity for Mentor Mentor Graphics Investor Presentation, April 2011 19 Customers include … © 2011 Mentor Graphics Corp. www.mentor.com |
 © 2011 Mentor Graphics Corp. www.mentor.com Agenda Mentor Graphics Investor Presentation, April 2011 Business Strategy Overview Financial Highlights & Outlook 2011 Annual Meeting Appendix 20 Part 1 Part 2 Part 3 Part 4 |
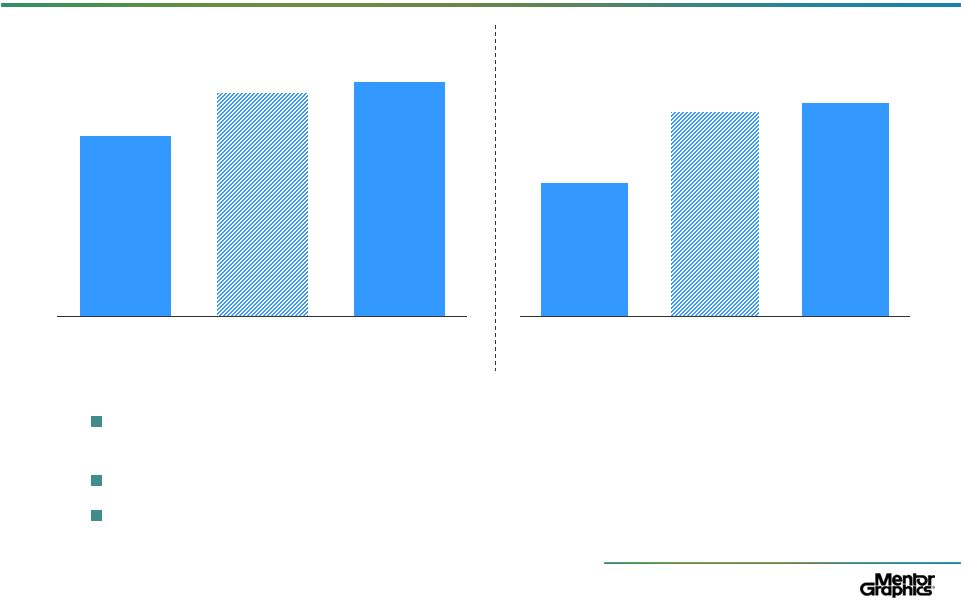 © 2011 Mentor Graphics Corp. www.mentor.com Q4 FY 2011 Results Q4 FY 2011 – marked the seventh out of the last eight quarters of exceeding non-GAAP EPS guidance Book-to-bill solidly above 1 with backlog at record levels Q4 FY 2011 cash from operations of $75 million 21 21 Mentor Graphics Investor Presentation, April 2011 *For a reconciliation of non-GAAP to GAAP financial measures, see the appendix to this presentation $237 $293 $307 Actual Q4 FY'10 Guidance Q4 FY'11 Actual Q4 FY'11 $0.30 $0.46 $0.48 Actual Q4 FY'10 Guidance Q4 FY'11 Actual Q4 FY'11 Revenue ($mm) +30% year-on-year Non-GAAP EPS * +60% year-on-year |
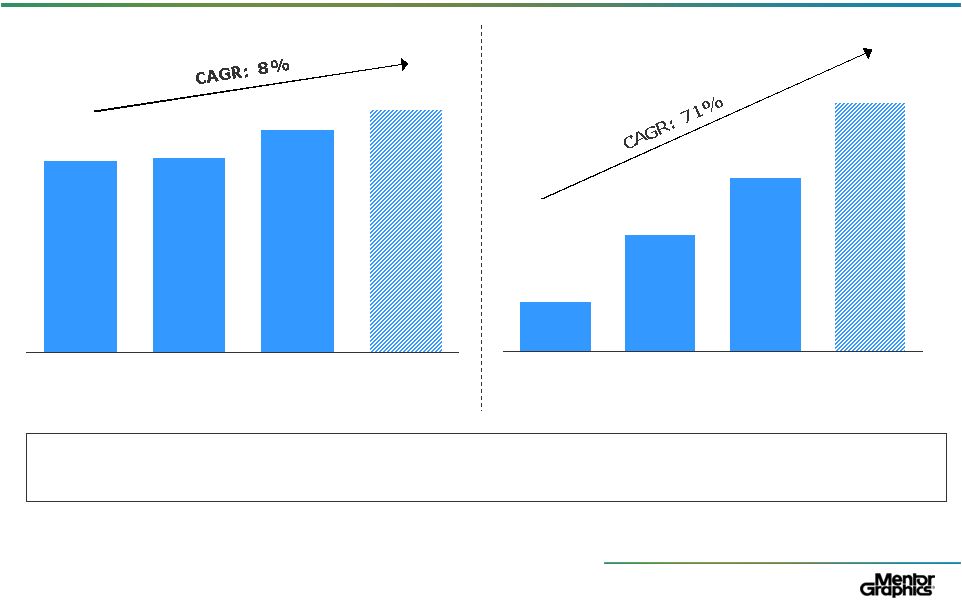 © 2011 Mentor Graphics Corp. www.mentor.com FY 2011 Results Mentor Graphics Investor Presentation, April 2011 22 *For a reconciliation of non-GAAP to GAAP financial measures, see the appendix to this presentation Mentor has demonstrated strong top-line and earnings growth over the past two years, and anticipates continued strength $1,000 $789 $803 $915 Actual FY 2009 Actual FY 2010 Actual FY 2011 Guidance FY 2012 Revenue ($mm) Non-GAAP EPS * $1.00 $0.20 $0.47 $0.70 Actual FY 2009 Actual FY 2010 Actual FY 2011 Guidance FY 2012 |
 © 2011 Mentor Graphics Corp. www.mentor.com FY 2011 Results Revenue of $915 million, up 14% from FY 2010 Non-GAAP EPS of $0.70, an increase of 49% * — GAAP EPS of $0.26 compared to a GAAP loss per share of $0.23 in FY 2010 Bookings up 30% for the year All regions showed bookings growth for the year Second largest provider of EDA software and support 23 Mentor Graphics Investor Presentation, April 2011 *For a reconciliation of non-GAAP to GAAP financial measures, see the appendix to this presentation |
 © 2011 Mentor Graphics Corp. www.mentor.com Successful FY 2011 Operating Expense Programs Aggressive program to reduce internal expenses — Implemented structural changes to commission and incentive plans — Reduced stock compensation expense — Modified ESPP plan provisions — Froze senior executive wages since 2007 Reduced outside expenditures — Lowered expenditures on outside services in FY11 by over 10% year- over-year — Decreased FY11 travel expenses by 20% from FY09 level Extracted facilities savings in excess of $4 million worldwide in FY11 24 Reduced non-GAAP SG&A expense by over 500 bps as % of revenue in last 2 years* On track to reduce non-GAAP SG&A expense by approximately 200 bps as % of revenue in FY12** Goal to achieve long-term operating model of 20% operating profit over next 2 years 24 Mentor Graphics Investor Presentation, April 2011 *For a reconciliation of non-GAAP to GAAP financial measures, see the appendix to this presentation **For a reconciliation of non-GAAP to GAAP financial measures, see the appendix to this presentation; estimate does not account for increased costs incurred in connection with Icahn’s proxy contest |
 © 2011 Mentor Graphics Corp. www.mentor.com Strengthened Balance Sheet and Disciplined Use of Leverage No near-term debt obligations Renewing $100 million bank facility and replaced convertible debt Overview of recent convertible offering $253 million Convertible Offering and concurrent $25 million share repurchase provide the following benefits relative to Mentor’s former 6.25% Convertible Subordinated Debentures: Lower interest rate of 4.00% vs. 6.25% Increases conversion price to $20.54 from $17.97 Increases flexibility by pushing out initial put date from 2013 to 2018 and maturity from 2026 to 2031 Reduces dilution by using $25 million of proceeds to repurchase approx. 1.7 million shares (net decrease of approximately 300,000 shares on a fully diluted basis) Enables Mentor to refinance revolving credit facility Proceeds used in part to repay the outstanding amounts owing under Mentor’s $18.5 million aggregate principal amount term loan due 2013 Make whole provision in-line with prior convertible debt and precedent transactions — will not have a material impact on the ability of a potential acquiror to consummate a transaction Mentor Graphics Investor Presentation, April 2011 25 |
 © 2011 Mentor Graphics Corp. www.mentor.com Fiscal 2012 Business Outlook Strong end-of-year momentum – bookings, revenue, new customers, consulting, training, support reinstatements and software and hardware benchmark activity Q1 FY 2012 expected revenue of approximately $225 million, up 25% year-over- year, and non-GAAP EPS of approximately $0.15, up from a loss of $0.02* — GAAP EPS of approximately $0.06, up from a loss of $0.22 in the prior year Fiscal 2012 revenue guidance of approximately $1 billion, up 9% year-over-year, and non-GAAP EPS of approximately $1.00, up 43% from the prior year* — GAAP EPS of approximately $0.77, up approximately 200% from $0.26 in the prior year Forecasting fiscal 2012 non-GAAP operating income margin of approximately 15%, a gain of another 200 bps, and 50% earnings leverage on incremental revenues* Revenue growth outlook, at 9%, is consistent with that of our two principal competitors 26 Mentor Graphics Investor Presentation, April 2011 26 *For a reconciliation of non-GAAP to GAAP financial measures, see the appendix to this presentation |
 © 2011 Mentor Graphics Corp. www.mentor.com Long-Term Outlook and Capital Policy Mentor’s leading industry products, presence in emerging markets and leverageable operating model, create a platform anticipated to generate significant returns for shareholders EPS growth driven by top line momentum and operating margin expansion; should be further enhanced by the use of our strong free cash flow to repurchase shares — Mentor has historically operated on a leveraged net debt basis to reduce our overall cost of capital and we presently anticipate using our strong cash flow to return approximately $150 million of capital to shareholders through stock repurchases or dividends 27 Mentor Graphics Investor Presentation, April 2011 27 Long-Term FY12 Model Revenue Growth 9% Y-o-Y 8-10% CAGR Growth in-line with industry analyst expectations 15% 20%+ Mild gross margin expansion due to both scale efficiencies and structural operating changes R&D constant at ~30% of revenues SG&A declining as % of revenue due to scale efficiencies Assumptions Operating Margin (non-GAAP)* * For a reconciliation of non-GAAP to GAAP financial measures, see the appendix to this presentation |
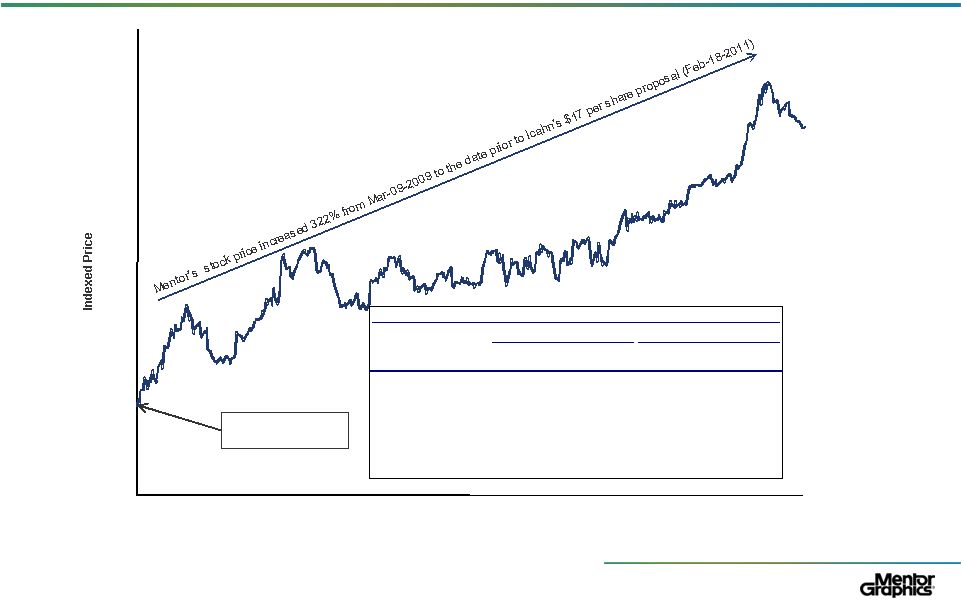 © 2011 Mentor Graphics Corp. www.mentor.com Mentor Delivers Shareholder Value Mentor Graphics Investor Presentation, April 2011 28 Source: Institutional Brokers’ Estimate System, Capital IQ * For a reconciliation of non-GAAP to GAAP financial measures, see the appendix to this presentation 09-Mar-09: NASDAQ recent low $0 $2 $4 $6 $8 $10 $12 $14 $16 $18 Mar-2009 Jul -2009 Oct-2009 Feb-2010 Jun-2010 Oct-2010 Feb-2011 Daily from 09-Mar-2009 to 15-Apr-2011 History of Outperforming Analyst Estimates Actual IBES Median (1-Month Prior) Quarter Date Revenue Non-GAAP EPS* Revenue Non-GAAP EPS Q4'FY11 Feb-2011 $ 307 $ 0.48 $ 293 $ 0.46 Q3'FY11 Nov-2010 239 0.22 220 0.16 Q2'FY11 Aug-2010 188 0.01 180 (0.04) Q1'FY11 May-2010 181 (0.02) 183 (0.02) Q4'FY10 Feb-2010 237 0.30 230 0.28 Q3'FY10 Nov-2009 189 0.05 183 0.01 Q2'FY10 Aug-2009 183 0.02 165 (0.10) Q1'FY10 May-2009 194 0.09 202 0.08 |
 © 2011 Mentor Graphics Corp. www.mentor.com Agenda Mentor Graphics Investor Presentation, April 2011 Business Strategy Overview Financial Highlights & Outlook 2011 Annual Meeting Appendix 29 Part 1 Part 2 Part 3 Part 4 |
 © 2011 Mentor Graphics Corp. www.mentor.com Key Dates Relating to the Proxy Contest 27-May-2010 – Icahn filed an initial 13D disclosing 6.86% ownership in Mentor June-2010 – Icahn filed 13D amendments disclosing up to 10.8% ownership in Mentor; filing on June 30, 2010 indicated that Icahn met with representatives of Mentor and looked forward to further conversations and working constructively together 24-June-2010 – Mentor adopted a limited duration shareholder rights plan with a 15% trigger, set to expire December 31, 2011 July-2010 – Icahn filed 13D amendments disclosing up to 14.1% ownership in Mentor 24-Aug-2010 – Icahn filed a 13D amendment disclosing 14.98% ownership in Mentor May-2010 to Jan-2011 – Mentor and Icahn’s associates had periodic business discussions; Icahn did not indicate any interest in nominating a slate of directors, engaging in a proxy solicitation or making a conditional proposal to purchase the Company 4-Feb-2011 – Mentor announced that its Annual Meeting would be held on May 12, 2011 8-Feb-2011 – Icahn announces the intent to nominate three directors for election and belief that Mentor should be put up for sale 11-Feb-2011 – Icahn announced its three nominees for election as director and its intent to make certain proposals with respect to the Company’s bylaws 22-Feb-2011 – Icahn announced a conditional proposal to acquire Mentor for $17/share, which Icahn subsequently characterized as a “stalking horse” offer 15-Mar-2011 – Mentor announced that its Board adopted certain amendments to the Company’s bylaws; Mentor filed a preliminary proxy statement that recommended a proposal for another amendment to the bylaws, identical to one of Icahn’s proposals 18-Mar-2011 – Icahn withdrew its proposals regarding amendments to the Company’s bylaws 28-Mar-2011 – Mentor announced that its Board rejected Icahn’s “stalking horse” proposal 29-Mar-2011 – Mentor announced the commencement of its convertible debt financing and concurrent share repurchase; Icahn offered to provide non-convertible, limited duration “stalking horse” financing in lieu of Mentor proceeding with the convertible financing 31-Mar-2011 – Mentor announced that its Board rejected Icahn’s “stalking horse” financing proposal and affirmed its decision to proceed with the convertible debt financing; Mentor filed its definitive proxy statement 12-May-2011 – Annual Meeting date 30 Mentor Graphics Investor Presentation, April 2011 |
 © 2011 Mentor Graphics Corp. www.mentor.com Icahn Has One Goal – A Risky Exit Strategy Icahn platform has one plank – that Mentor “should be put up for sale” In furtherance of his goal, Icahn seeks to replace three experienced, independent and highly-qualified directors with: — David Schechter – an employee of Icahn’s, who has no prior industry experience, and whose director history includes positions at WCI Communities and BKF Capital (companies that lost substantial shareholder value) — José Maria Alapont – the President and CEO of Federal Mogul, a company 76% owned by Icahn — Gary Meyers – the former President and CEO of Synplicity, a small EDA company that averaged SG&A expense as a percentage of revenue well above Mentor’s and generated a negative return for shareholders prior to its sale to Synopsys for approximately $220 million in 2008 Mentor’s Board is open to any opportunity to enhance shareholder value and periodically reviews its strategy and alternatives – however, it has determined that Icahn’s proposed course of action entails significant commercial and regulatory risk 31 Mentor Graphics Investor Presentation, April 2011 |
 © 2011 Mentor Graphics Corp. www.mentor.com Icahn’s Platform Carries Multiple Risks Icahn’s platform of simply putting the company up for sale demonstrates a fundamental lack of knowledge about the EDA industry Mentor undertook an analysis of the regulatory risks inherent to any combination with Cadence or Synopsys (the two companies that could be logical strategic buyers) following Cadence’s proposal in 2008. The FTC issued a Second Request; Cadence withdrew its proposal shortly thereafter Mentor updated its analysis in connection with the Icahn proposal. The analysis showed that serious regulatory risks persist If combined with Cadence, ~75% of Mentor’s total revenues would be derived from product areas in which Mentor and Cadence have a combined 50% to nearly 100% share of the product area overlapping If combined with Synopsys, ~65% of Mentor’s total revenues would be derived from product areas in which Mentor and Synopsys have a combined 50% to nearly 100% share of the product area overlapping For these reasons, Mentor believes a transaction between Mentor and either Cadence or Synopsys would face serious regulatory risks and a substantial risk that the deal would fail to close Any discussions concerning a combination with Cadence or Synopsys entail significant commercial risk including disruption to: — The growth and stability of the company’s customer base — The company’s relationship with its employees This disruption could result in serious adverse effects should discussions commence but not result in a completed transaction because of regulatory risks 32 We believe electing nominees committed to a sale process that is risky and unwise does not make sense Mentor Graphics Investor Presentation, April 2011 |
 © 2011 Mentor Graphics Corp. www.mentor.com 33 Icahn’s $17 per Share “Stalking Horse” Proposal Icahn proposed, as a part of his platform to put the company up for sale, a $17 per share “stalking horse” bid After carefully reviewing the proposal, together with its financial advisors, the Board unanimously determined that continued execution of Mentor’s strategic plan offers greatest long-term value to all Mentor shareholders Proposal undervalues the company and its future prospects — Excellent prospects for continued growth and shareholder value creation — Portfolio of highly profitable #1 product positions — Focused on building #1 product positions — Strength in PCB, design for physical verification, emulation and transportation We believe Icahn wants to catalyze a liquidity event for the significant stake he has taken in Mentor’s stock Icahn’s platform would create a significant conflict for his nominees if they were elected to Mentor’s Board Mentor’s Board remains open to any opportunity to enhance shareholder value, but Icahn’s proposal undervalues Mentor and represents a conflict of interest for Icahn’s nominees Mentor Graphics Investor Presentation, April 2011 |
 © 2011 Mentor Graphics Corp. www.mentor.com Mentor’s Strong Corporate Governance Profile Strong, experienced, independent Board — Wholly independent Nominating & Corporate Governance and Audit & Compensation committees — All independent directors have a deep understanding of Mentor’s business, significant technology sector knowledge and experience in serving as public company directors Structural profile ensures accountability — Annually elected board — Special meetings may be called by shareholders Responsive to Icahn’s governance proposals — Amended bylaws to permit shareholders to call special meetings — Amended bylaws to limit the directors’ ability to increase the size of the Board and to change the frequency of elections — Amended bylaws to opt out of Oregon Control Share Act Proposal to shareholders to opt out of the Oregon Business Combination Statute 34 Mentor’s Board is Experienced, Independent, Accountable and Responsive Mentor Graphics Investor Presentation, April 2011 |
 © 2011 Mentor Graphics Corp. www.mentor.com Summary Mentor achieved record results in fiscal 2011 driven by strong overall bookings growth of approximately 30% — All-time record revenues of $915 million — Non-GAAP earnings per share of $0.70 (49% increase from fiscal 2010) * For full-year fiscal 2012, company expects: — Revenue to be approximately $1 billion (up 9%) — Non-GAAP earnings per share of ~$1.00 (up 43%) * Mentor focuses on building #1 product positions — segment leader gains share while others may lose ground Expect Mentor’s growth to continue to exceed underlying growth of traditional EDA New applications including automotive and aerospace design are expected to continue to grow rapidly with minimal competition from EDA companies Growth anticipated to be between 8 and 10%, non-GAAP operating margin trending towards 20%+, generating significant cash flow*. Mentor presently anticipates using its strong cash flow to return approximately $150 million of capital to shareholders through stock repurchases or dividends Mentor Graphics Investor Presentation, April 2011 35 *For a reconciliation of non-GAAP to GAAP financial measures, see the appendix to this presentation |
 © 2011 Mentor Graphics Corp. www.mentor.com Summary (continued) The Mentor Board unanimously believes that continued execution of our strategic plan offers the greatest value to all Mentor shareholders Board remains open to any opportunity to enhance shareholder value, just as it was in 2008 when it evaluated the offer from Cadence $17 per share “stalking horse” proposal made by Icahn undervalues the company and its future prospects Analysis shows Icahn’s platform of a public sale is risky and potentially destructive — Substantial regulatory and commercial risk to in-market combination The Mentor Board urges shareholders to reject Icahn’s nominees, as the Board believes they: — Run on a singular risky platform of selling Mentor without any other stated vision or specific strategy — Do not have the collective knowledge, skill and experience of Mentor’s current Board 36 Mentor Graphics Investor Presentation, April 2011 |
 © 2011 Mentor Graphics Corp. www.mentor.com Agenda Mentor Graphics Investor Presentation, April 2011 Business Strategy Overview Financial Highlights & Outlook 2011 Annual Meeting Appendix 37 Part 1 Part 2 Part 3 Part 4 |
 © 2011 Mentor Graphics Corp. www.mentor.com 38 Mentor Directors Dr. Walden C. Rhines Dr. Rhines has been Chairman of the Board and Chief Executive Officer of the Company since 2000, and was President and Chief Executive Officer of the Company from 1993 to 2000. He is currently a director of TriQuint Semiconductor, Inc. (manufacturer of semiconductors), and served as a director of Cirrus Logic, Inc. (manufacturer of semiconductors) from 1995 to 2009. Dr. Rhines is currently in his fifth term as chair of the Electronic Design Automation Consortium. He is also a board member of the Semiconductor Research Corporation. He has previously served as chair of the Semiconductor Technical Advisory Committee of the Department of Commerce, and as a member of the boards of directors of the Computer and Business Equipment Manufacturers’ Association (CBEMA), SEMI–Sematech/SISA (a semiconductor equipment suppliers board), University of Michigan National Advisory Council, Lewis and Clark College and SEMATECH. Prior to joining Mentor, Dr. Rhines was Executive Vice President, Semiconductor Group of Texas Instruments Incorporated from 1987 to 1993. During a 21–year career at Texas Instruments, he held numerous executive and management positions. He was co–inventor of a patented invention that is fundamental to solid state lighting and DVDs. Dr. Rhines is nominated for election because he has been our CEO for the past 18 years, has extensive executive management experience, and has deep and broad knowledge of the semiconductor and electronics design industries. Gregory K. Hinckley Mr. Hinckley has been President of the Company since 2000, and was Executive Vice President, Chief Operating Officer and Chief Financial Officer of the Company from 1997 to 2000. He continued to function as the Company’s Chief Financial Officer from 2000 to July 2007, and again became the Chief Financial Officer in December 2008. He is a director of Intermec, Inc. (a provider of integrated system solutions), Super Micro Computer, Inc. (a server board, chassis and server systems supplier), and SI Bone, Inc. (a privately held medical device company). Until 2007, Mr. Hinckley was also a director of Amkor Technology, Inc. (a provider of semiconductor packaging and test services). Prior to joining Mentor, Mr. Hinckley was Vice President, and then Senior Vice President, of VLSI Technology, Inc. (a semiconductor company) from 1992 to 1997. Mr. Hinckley is nominated for election because he has been our Chief Operating Officer for the past 14 years and has broad business management experience with technology companies. Mentor Graphics Investor Presentation, April 2011 |
 © 2011 Mentor Graphics Corp. www.mentor.com 39 Mentor Directors Sir Peter Bonfield Sir Peter Bonfield has been a self–employed international business advisor since 2002 and has been Chairman of NXP Semiconductor N.V. (a semiconductor company) since 2006. He served as Chairman of the Executive Committee and Chief Executive Officer of British Telecommunications PLC (a provider of telecom services) from 1996 to 2002 and before that served as Chairman and Chief Executive Officer of ICL plc (a UK–based information technology company). Sir Peter is a director of Sony Corporation (a worldwide provider of electronics, games, music, movies and financial services), Taiwan Semiconductor Manufacturing Company Ltd. (a manufacturer of semiconductors), Telefonaktiebolaget LM Ericsson (a telecommunications equipment manufacturer), and Actis LLP (a private equity investor in emerging markets). He previously served as a director of AstraZeneca PLC (a pharmaceuticals company) from 1995 to 2007. He is a senior advisor to N.M. Rothschild London and a member of the advisory boards of the Longreach Group and New Venture Partners. He also serves as an advisor to Apax Partners LLP and a board mentor to CMi. He has received numerous honors for his contributions to business, including a knighthood, and is a fellow of the Royal Academy of Engineering. Sir Peter is nominated for election because he has extensive international business and CEO experience. Marsha B. Congdon Ms. Congdon has been self–employed as a private investor since 1997. She served as Vice President, Policy and Strategy, of US West Inc. (a provider of communications services) from 1995 to 1997; Chief Executive Officer Oregon and regional Vice President for US West Inc. from 1992 to 1994; and Vice President and Chief Executive Officer for US West Inc. Oregon from 1987 to 1992. Ms. Congdon also held executive positions with Directory Publishing Corp., DEX Publishing, AT&T, Northwestern Bell and Pacific Northwestern Bell. She previously served as a director of two publicly traded companies, Bohemia Corp. from 1989 until its merger with Weyerhaeuser Co. in 1991, and US Bank Corporation from 1988 until its merger with First Bank System, Inc. in 1997. She currently serves on the board of the not–for–profit entity, Jackson Hospital Injury Institute in Miami, Florida. She has served on the boards of the National Multiple Sclerosis Foundation, Marylhurst University, the Oregon Symphony, Reed College and the Oregon Investment Council. She was a founding director of the Oregon Children’s Foundation. She is a past chair of the Economic Development Commissions for each of Oregon and South Dakota. Ms. Congdon has been a guest lecturer at the Kennedy School, Harvard and served as a McKenzie Judge for the Harvard Business Review. In 2009, she was asked by the State Department to chair a strategic planning training session for the Royal University of Phnom Pehn. Ms. Congdon is nominated for election because she has extensive executive leadership and board experience with a wide range of profit and not–for–profit companies. Mentor Graphics Investor Presentation, April 2011 |
 © 2011 Mentor Graphics Corp. www.mentor.com 40 Mentor Directors Mentor Graphics Investor Presentation, April 2011 Dr. James R. Fiebiger Dr. Fiebiger has been a self–employed semiconductor industry consultant since 2005. He served as Chairman of the Board and Chief Executive Officer of Lovoltech Inc. (a semiconductor company) from 1999 to 2004; Vice Chairman and Managing Director of Technology Licensing of Gatefield Corporation (a semiconductor company) from 1998 to 2000; and President and Chief Executive Officer of Gatefield Corporation from 1996 to 1998. From 1987 to 1993, Dr. Fiebiger was President and Chief Operating Officer of VLSI Technology, Inc., an application–specific integrated circuit (“ASIC”) semiconductor company which developed electronic design automation (“EDA”) tools for ASIC design and manufactured the ASICs designed using their EDA tools. Dr. Fiebiger has also held executive positions such as Chief Executive Officer, Senior Corporate Vice President and Vice President with leading semiconductor manufacturers, including Thomson–Mostek, Motorola and Texas Instruments. Dr. Fiebiger is a director of Power Integrations, Inc. (a supplier of high–voltage integrated circuits), Pixelworks, Inc. (a fabless semiconductor company) and QLogic Corporation (a developer of semiconductor and board and box–level products), and served as a director of Actel Corporation (a developer of field programmable gate arrays) until it was acquired in November 2010. Dr. Fiebiger is nominated for election because he has extensive management experience in the semiconductor industry, and considerable experience as a board member of both hardware and software solutions providers. Kevin C. McDonough Mr. McDonough has been President of Kammstone LLC (a consulting firm providing services to the electronics industry) since 2002. He previously served as President and Chief Executive Officer of ChipData, Inc. (an internet service company) from 1999 to 2002; Vice President and General Manager of National Semiconductor Corporation (a manufacturer of electronic components) from 1997 to 1999; and Senior Vice President of Engineering of Cyrix Corporation (a manufacturer of microprocessors) from 1989 to 1997. Mr. McDonough spent 15 years in various semiconductor design and product development roles at Texas Instruments, where he was listed as inventor on 23 patents. Mr. McDonough is nominated for election because he has CEO experience running a software company serving the electronics design market. He has extensive engineering experience in semiconductor design. |
 © 2011 Mentor Graphics Corp. www.mentor.com 41 Mentor Directors Patrick B. McManus Mr. McManus has been self-employed as a private investor since 1987. He was Chief Financial Officer of Charles Schwab Corporation from 1984 to 1987, and Chief Financial Officer of various companies prior to 1984 including Univest, Pacific Express Airlines, Acurex Solar Corporation and Itel Corporation. Earlier in his career, he was controller of the African and Middle East division of Singer Corporation. Mr. McManus is nominated for election because he has strong financial credentials that he brings to his role as Chair of our Audit Committee, and broad business experience, including international experience. Dr. Fontaine K. Richardson Dr. Richardson has been self-employed as a private investor since 2000. He was General Partner of Eastech III and Vice President of Eastech Management Company (affiliated private venture capital firms) from 1983 to 2000. From 1984 to 2003, Dr. Richardson served as a director for the public company, Banyan Systems/ePresence (a computer software company that created and distributed a network operating system). In addition, he has been a director of Network Engines, Inc. (a provider of computer hardware and integration services) since 2002, including four years of service as lead director. Dr. Richardson was a director and co-founder of Applicon Incorporated (an early provider of CAD/CAM hardware and software products). He has been a director of numerous private hardware/software product companies, including Advanced Color Technology, Raster Technologies, Autographix, Meta Graphics, Aries Technology, and Channel Computing. Dr. Richardson is nominated for election because, as a private venture capitalist and longtime director of numerous technology companies, he has broad industry and business experience. Mentor Graphics Investor Presentation, April 2011 |
 © 2011 Mentor Graphics Corp. www.mentor.com GAAP vs Non-GAAP * The Non-GAAP Metric: Adopted by all public companies in the EDA industry Used by all equity analysts that track the EDA industry GAAP items excluded from non-GAAP results — Equity plan-related compensation — Special charges — Amortization of purchased technology — Amortization of other identified intangible assets — Amortization of debt discount and retirement costs — Other extraordinary items 42 Mentor Graphics Investor Presentation, April 2011 *For a reconciliation of non-GAAP to GAAP financial measures, see the slides immediately following this slide |
 © 2011 Mentor Graphics Corp. www.mentor.com Non-GAAP Financial Measures The Company’s management evaluates and makes operating decisions using various performance measures. In addition to our GAAP results, we also consider adjusted gross margin, operating margin, net income (loss), and earnings (loss) per share which we refer to as non-GAAP gross margin, operating margin, net income (loss), and earnings (loss) per share, respectively. These non-GAAP measures are derived from the revenues of our product, maintenance, and services business operations and the costs directly related to the generation of those revenues, such as cost of revenue, research and development, sales and marketing, and general and administrative expenses, that management considers in evaluating our ongoing core operating performance. These non-GAAP measures exclude amortization of intangible assets, special charges, equity plan-related compensation expenses and charges, interest expense attributable to net retirement premiums or discounts on the early retirement of debt and associated debt issuance costs, interest expense associated with the amortization of debt discount and premium on convertible debt, impairment of long-lived assets, impairment of cost method investments, and the equity in income or losses of unconsolidated entities (except Frontline P.C.B Solutions Limited Partnership (Frontline)), which management does not consider reflective of our core operating business. Identified intangible assets consist primarily of purchased technology, backlog, trade names, customer relationships, and employment agreements. Special charges primarily consist of costs incurred for employee terminations due to a reduction of personnel resources driven by modifications of business strategy or business emphasis. Special charges may also include expenses incurred related to potential acquisitions, abandonment of in-process research and development, excess facility costs, asset-related charges, post-acquisition rebalance costs and restructuring costs, including severance and benefits. Equity plan-related compensation expenses represent the fair value of all share-based payments to employees, including grants of employee stock options. For purposes of comparability across other periods and against other companies in our industry, non-GAAP net income (loss) is adjusted by the amount of additional tax expense or benefit that we would accrue using the normalized effective tax rate described below applied to the non-GAAP results. 43 Mentor Graphics Investor Presentation, April 2011 |
 © 2011 Mentor Graphics Corp. www.mentor.com Non-GAAP Financial Measures (cont.) 44 Management excludes from our non-GAAP measures certain recurring items to facilitate its review of the comparability of our core operating performance on a period-to-period basis because such items are not related to our ongoing core operating performance as viewed by management. Management considers our core operating performance to be that which can be affected by our managers in any particular period through their management of the resources that affect our underlying revenue and profit generating operations during that period. Management uses this view of our operating performance for purposes of comparison with our business plan and individual operating budgets and allocation of resources. Additionally, when evaluating potential acquisitions, management excludes the items described above from its consideration of target performance and valuation. More specifically, management adjusts for the excluded items for the following reasons: Amortization charges for our intangible assets are excluded as they are inconsistent in amount and frequency and are significantly impacted by the timing and magnitude of our acquisition transactions. We therefore consider our operating results without these charges when evaluating our core performance. Generally, the most significant impact to inter-period comparability of our net income (loss) is in the first twelve months following an acquisition. Special charges are incurred based on the particular facts and circumstances of acquisition and restructuring decisions and can vary in size and frequency. These charges are excluded as they are not ordinarily included in our annual operating plan and related budget due to the unpredictability of economic trends and the rapidly changing technology and competitive environment in our industry. We therefore exclude them when evaluating our managers’ performance internally. We view equity plan-related compensation as a key element of our employee retention and long-term incentives, not as an expense that we use in evaluating core operations in any given period. Interest expense attributable to net retirement premiums or discounts on the early retirement of debt, the write-off of associated debt issuance costs and the amortization of the debt discount and premium on convertible debt are excluded. Management does not consider these charges as a part of our core operating performance. The early retirement of debt and the associated debt issuance costs are not included in our annual operating plan and related budget due to unpredictability of market conditions which could facilitate an early retirement of debt. We do not consider the amortization of the debt discount and premium on convertible debt to be a direct cost of operations. 44 Mentor Graphics Investor Presentation, April 2011 |
 © 2011 Mentor Graphics Corp. www.mentor.com Non-GAAP Financial Measures (cont.) 45 Impairment of cost method investments can occur when the fair value of the investment is less than its cost. This can occur when there is a significant deterioration in the investee’s earnings performance, significant adverse changes in the general market conditions of the industry in which the investee operates, or indications that the investee may no longer be able to conduct business. These charges are inconsistent in amount and frequency. We therefore consider our operating results without these charges when evaluating our core performance. Equity in earnings or losses of unconsolidated subsidiaries, with the exception of our investment in Frontline, represents the net income (losses) in an investment accounted for under the equity method. The amounts represent our equity in the net income (losses) of a common stock investment. The carrying amount of our investment is adjusted for our share of earnings or losses of the investee. The amounts are excluded as we do not control the results of operations for these investments, we do not participate in regular and periodic operating activities and management does not consider these businesses a part of our core operating performance. In connection with the Company’s acquisition of Valor on March 18, 2010, we also acquired Valor’s 50% interest in Frontline, a joint venture. We report our equity in the earnings or losses of Frontline within operating income. We actively participate in regular and periodic activities such as budgeting, business planning, marketing and direction of research and development projects. Accordingly, we do not exclude our share of Frontline’s earnings or losses from our non-GAAP results as management considers the joint venture to be core to our operating performance. Income tax expense (benefit) is adjusted by the amount of additional tax expense or benefit that we would accrue if we used non-GAAP results instead of GAAP results in the calculation of our tax liability, taking into consideration our long-term tax structure. We use a normalized effective tax rate of 17%, which reflects the weighted average tax rate applicable under the various jurisdictions in which we operate. This non-GAAP tax rate eliminates the effects of non-recurring and period specific items which are often attributable to acquisition decisions and can vary in size and frequency and considers our US loss carryforwards that have not been previously benefited. This rate is subject to change over time for various reasons, including changes in the geographic business mix and changes in statutory tax rates. Our GAAP tax rate for the fiscal year ended January 31, 2011 was 11%. The GAAP tax rate considers certain mandatory and other non-scalable tax costs which may adversely or beneficially affect our tax rate depending upon our level of profitability in various jurisdictions. 45 Mentor Graphics Investor Presentation, April 2011 |
 © 2011 Mentor Graphics Corp. www.mentor.com Non-GAAP Financial Measures (cont.) In certain instances our GAAP results of operations may not be profitable when our corresponding non-GAAP results are profitable or vice versa. The number of shares on which our non-GAAP earnings per share is calculated may therefore differ from the GAAP presentation due to the anti-dilutive effect of stock options in a loss situation. Non-GAAP gross margin, operating margin, and net income (loss) are supplemental measures of our performance that are not required by, or presented in accordance with, GAAP. Moreover, they should not be considered as an alternative to any performance measure derived in accordance with GAAP, or as an alternative to cash flow from operating activities as a measure of our liquidity. We present non-GAAP gross margin, operating margin, and net income (loss) because we consider them to be important supplemental measures of our operating performance and profitability trends, and because we believe they give investors useful information on period-to-period performance as evaluated by management. Non-GAAP net income (loss) also facilitates comparison with other companies in our industry, which use similar financial measures to supplement their GAAP results. Non-GAAP net income (loss) has limitations as an analytical tool, and therefore should not be considered in isolation or as a substitute for analysis of our results as reported under GAAP. In the future we expect to continue to incur expenses similar to the non-GAAP adjustments described above and exclusion of these items in our non-GAAP presentation should not be construed as an inference that these costs are unusual, infrequent or non-recurring. Some of the limitations in relying on non-GAAP net income (loss) are: Amortization of intangibles represents the loss in value as the technology in our industry evolves, is advanced, or is replaced over time. The expense associated with this loss in value is not included in the non- GAAP net income (loss) presentation and therefore does not reflect the full economic effect of the ongoing cost of maintaining our current technological position in our competitive industry, which is addressed through our research and development program. We regularly engage in acquisition and assimilation activities as part of our ongoing business and regularly evaluate our businesses to determine whether any operations should be eliminated or curtailed. We therefore will continue to experience special charges on a regular basis. These costs also directly impact our available funds. We perform impairment analyses on cost method investments when triggering events occur and adjust the carrying value of assets when we determine it to be necessary. Impairment charges could therefore be incurred in any period. 46 46 Mentor Graphics Investor Presentation, April 2011 |
 © 2011 Mentor Graphics Corp. www.mentor.com Non-GAAP Financial Measures (cont.) Our stock option and stock purchase plans are important components of our incentive compensation arrangements and will be reflected as expenses in our GAAP results. Our income tax expense (benefit) will be ultimately based on our GAAP taxable income and actual tax rates in effect, which often differ significantly from the 17% rate assumed in our non-GAAP presentation. In addition, if we have a GAAP loss and non-GAAP net income, our non-GAAP results will not reflect any projected GAAP tax benefits. Similarly, in the event we were to have GAAP net income and a non-GAAP loss, our GAAP tax expense would be replaced by a credit in our non-GAAP presentation. Other companies, including other companies in our industry, calculate non-GAAP net income (loss) differently than we do, limiting its usefulness as a comparative measure. 47 47 Mentor Graphics Investor Presentation, April 2011 |
 © 2011 Mentor Graphics Corp. www.mentor.com Non-GAAP Financial Measures (cont.) Mentor Graphics Investor Presentation, April 2011 48 2011 2010 2009 GAAP net income (loss) 28,584 $ (21,889) $ (91,252) $ Non-GAAP adjustments: Equity plan-related compensation: (1) Cost of revenues 888 1,618 1,544 Research and development 7,785 10,931 12,005 Marketing and selling 6,112 8,406 8,627 General and administration 5,726 5,204 6,047 System and software cost of revenues (2) - - 103 Acquisition - related items: Amortization of purchased assets Cost of revenues (3) 13,771 12,012 12,403 Amortization of intangible assets (4) 7,347 11,184 11,113 Frontline purchased technology and intangible assets (5) 4,347 - - Impairment of long-lived assets (6) - - 4,553 In-process research and development (7) - - 22,075 Special charges (8) 10,257 21,334 16,888 Other income (expense), net (9) 938 1,108 4,920 Interest expense (10) 3,326 2,410 2,540 Non-GAAP income tax effects (11) (12,298) (7,028) 7,039 Total of non-GAAP adjustments 48,199 67,179 109,857 Non-GAAP net income 76,783 $ 45,290 $ 18,605 $ GAAP weighted average shares (diluted) 109,861 96,474 91,829 Non-GAAP adjustment - 1,901 714 Non-GAAP weighted average shares (diluted) a 109,861 98,375 92,543 GAAP net income (loss) per share (diluted) 0.26 $ (0.23) $ (0.99) $ Non-GAAP adjustments detailed above 0.44 0.70 1.19 Non-GAAP net income per share (diluted) a 0.70 $ 0.47 $ 0.20 $ Year Ended January 31, RECONCILIATION OF NON-GAAP ADJUSTMENTS (In thousands, except earnings per share data) MENTOR GRAPHICS CORPORATION |
 © 2011 Mentor Graphics Corp. www.mentor.com Mentor Graphics Investor Presentation, April 2011 49 Non-GAAP Financial Measures (cont.) (1) Equity plan-related compensation expense. (2) Amount represents the write-off of prepaid royalty amounts associated with the closure of our Intellectual Property division. (3) Amount represents amortization of purchased technology resulting from acquisitions. Purchased intangible assets are amortized over two to five years. (4) Other identified intangible assets are amortized to other operating expense over two to five years. Other identified intangible assets include trade names, employment agreements, customer relationships, and deferred compensation which are the result of acquisition transactions. (5) Amount represents amortization of purchased technology and other identified intangible assets identified as part of the fair value of the Frontline P.C.B. Solutions Limited Partnership (Frontline) investment. Mentor Graphics acquired a 50% joint venture in Frontline as a result of the Valor Computerized Systems, Ltd. acquisition in the first quarter of fiscal 2011. The purchased technology will be amortized over three years, other identified intangible assets will be amortized over three to four years, and are reflected in the income statement in the equity in earnings of Frontline results. This expense is the same type as being adjusted for in notes (3) and (4) above. (6) Amount represents write-off of fixed assets and purchased technology associated with our Emulation division. (7) Twelve months ended January 31, 2009 : Write-off of $8,090 for in-process research and development related to the Ponte and Flomerics acquisitions and $13,985 related to the acquisition of technology which has not yet reached technological feasibility and provided no alternative future uses. (8) Twelve months ended January 31, 2011: Special charges consist of (i) $6,114 of costs incurred for employee rebalances which includes severance benefits, notice pay, and outplacement services, (ii) $2,083 in advisory fees, (iii) $1,432 in lease restoration costs, (iv) $900 related to the abandonment of excess leased facility space, (v) $(566) related to a casualty loss, (vi) $360 related to an asset abandonment, (vii) $(231) in acquisition costs, and (viii) $165 in other costs. Twelve months ended January 31, 2010: Special charges consist of (i) $10,713 of costs incurred for employee rebalances which includes severance benefits, notice pay, and outplacement services, (ii) $4,700 in advisory fees, (iii) $2,530 related to the abandonment of excess leased facility space, (iv) $2,067 in acquisition costs, (v) $566 related to a casualty loss, (vi) $405 related to an asset abandonment, (vii) $302 in lease restoration costs, and (viii) $51 in other costs. Twelve months ended January 31, 2009: Special charges consist of (i) $9,793 of costs incurred for employee rebalances which includes severance benefits, notice pay, and outplacement services, (ii) $4,535 in advisory fees, (iii) $2,547 related to the abandonment of excess leased facility space, and (iv) $13 in fixed asset write-offs related to the closure of our Intellectual Property Division. (9) Twelve months ended January 31, 2011: Loss of $938 on investment accounted for under the equity method of accounting. Twelve months ended January 31, 2010: Other income (expense), net consists of: (i) loss of $995 on investment accounted for under the equity method of accounting and (ii) an impairment of $113 for an investment accounted for under the cost method. Twelve months ended January 31, 2009: Other income (expense), net consists of: (i) loss of $1,432 on investment accounted for under the equity method of accounting and (ii) an impairment of $3,488 for investments accounted for under the cost method. (10) Twelve months ended January 31, 2011: $2,981 in amortization of original issuance debt discount and premiums and $345 in premium on partial redemption of the $110.0M convertible debt. Twelve months ended January 31, 2010: $2,764 in amortization of original issuance debt discount and $(354) in discounts and unamortized debt costs relate to a partial redemption of the $110.0M convertible debt. Twelve months ended January 31, 2009: $2,540 in amortization of original issuance debt discount. (11) Non-GAAP income tax expense adjustment reflects the application of our assumed normalized effective 17% tax rate, instead of our GAAP tax rate, to our non-GAAP pre-tax income. a Diluted non-GAAP net income per share for the twelve months ended January 31, 2010 includes $633 of convertible debt interest, net of tax, added back to non-GAAP net income and 1,415 of corresponding dilutive shares added to the diluted weighted average number of shares outstanding. |
 © 2011 Mentor Graphics Corp. www.mentor.com Non-GAAP Financial Measures (cont.) 50 50 Mentor Graphics Investor Presentation, April 2011 2011 2010 2009 GAAP Selling, General, and Administrative (SG&A) expenses 421,205 $ 395,969 $ 412,487 $ Reconciling items to non-GAAP SG&A expenses Equity plan-related compensation (11,838) (13,610) (14,674) Non-GAAP SG&A expenses 409,367 $ 382,359 $ 397,813 $ 2011 2010 2009 GAAP SG&A expenses as a percent of total revenues 46% 49% 52% Non-GAAP adjustments detailed above -1% -1% -2% Non-GAAP SG&A expenses as a percent of total revenues 45% 48% 50% Twelve Months Ended January 31, MENTOR GRAPHICS CORPORATION UNAUDITED RECONCILIATION OF GAAP FINANCIAL MEASURES TO NON-GAAP FINANCIAL MEASURES (In thousands, except percentages) Twelve Months Ended January 31, |
 © 2011 Mentor Graphics Corp. www.mentor.com Q1 Q2 Q3 Q4 GAAP net income (loss) (23,025) $ (14,247) $ 15,257 $ 50,599 $ Non-GAAP adjustments: Equity plan-related compensation: (1) Cost of revenues 212 238 221 217 Research and development 2,438 1,771 1,798 1,778 Marketing and selling 2,190 1,313 1,299 1,310 General and administration 1,741 1,781 1,589 615 Acquisition-related items: Amortization of purchased assets Cost of revenues (2) 3,569 3,560 3,299 3,343 Amortization of intangible assets (3) 2,361 1,936 1,445 1,605 Frontline purchased technology and intangible assets (4) 621 1,242 1,242 1,242 Special charges (5) 3,268 3,206 1,578 2,205 Other income (expense), net (6) 270 1 - 667 Interest expense (7) 729 1,089 753 755 Non-GAAP income tax effects (8) 3,084 (1,139) (4,133) (10,110) Total of non-GAAP adjustments 20,483 14,998 9,091 3,627 Non-GAAP net income (loss) (2,542) $ 751 $ 24,348 $ 54,226 $ GAAP weighted average shares (diluted) 103,763 107,629 112,139 113,082 Non-GAAP adjustment - 2,040 - - Non-GAAP weighted average shares (diluted) 103,763 109,669 112,139 113,082 GAAP net income (loss) per share (diluted) (0.22) $ (0.13) $ 0.14 $ 0.45 $ Non-GAAP adjustments detailed above 0.20 0.14 0.08 0.03 Non-GAAP net income (loss) per share (diluted) (0.02) $ 0.01 $ 0.22 $ 0.48 $ MENTOR GRAPHICS CORPORATION RECONCILIATION OF NON-GAAP ADJUSTMENTS (In thousands, except earnings per share data) Fiscal Year Ended January 31, 2011 Non-GAAP Financial Measures (cont.) 51 51 Mentor Graphics Investor Presentation, April 2011 |
 © 2011 Mentor Graphics Corp. www.mentor.com Non-GAAP Financial Measures (cont.) 52 52 Mentor Graphics Investor Presentation, April 2011 (1) Equity plan-related compensation expense. (2) Amount represents amortization of purchased technology resulting from acquisitions. Purchased intangible assets are amortized over two to five years. (3) Other identified intangible assets are amortized to other operating expense over two to five years. Other identified intangible assets include trade names, employment agreements, customer relationships, and deferred compensation which are the result of acquisition transactions. Amount represents amortization of purchased technology and other identified intangible assets identified as part of the fair value of the Frontline P.C.B. Solutions Limited Partnership (Frontline) investment. Mentor Graphics acquired a 50% joint venture in Frontline as a result of the Valor Computerized Systems, Ltd. acquisition in the first quarter of fiscal 2011. The purchased technology will be amortized over three years, other identified intangible assets will be amortized over three to four years, and are reflected in the income statement in the equity in earnings of Frontline results. This expense is the same type as being adjusted for in notes (2) and (3) above. (5) Q1 Fiscal 2011: Special charges consist of (i) $1,589 of costs incurred for employee rebalances which includes severance benefits, notice pay, and outplacement services, (ii) $1,175 in advisory fees, (iii) $843 related to the abandonment of excess leased facility space, (iv) $200 in acquisition costs, (v) $(566) related to a casualty loss, and (vi) $27 in other adjustments. Q2 Fiscal 2011: Special charges consist of (i) $1,860 of costs incurred for employee rebalances which includes severance benefits, notice pay, and outplacement services, (ii) $825 in advisory fees, (iii) $247 related to the abandonment of excess leased facility space, (iv) $220 in acquisition costs, and (v) $54 in other adjustments. Q3 Fiscal 2011: Special charges consist of (i) $1,191 of costs incurred for employee rebalances which includes severance benefits, notice pay, and outplacement services, (ii) $734 related to the abandonment of excess leased facility space, (iii) $(513) in acquisition costs, (iv) $83 in advisory fees, and (v) $83 in other adjustments. Q4 Fiscal 2011 : Special charges consist of (i) $1,474 of costs incurred for employee rebalances which includes severance benefits, notice pay, and outplacement services, (ii) $412 in lease restoration costs, (iii) $360 related to an asset abandonment, (iv) $96 related to the abandonment of excess lease space, (v) $(138) in acquisition costs, and (vi) $1 in other adjustments. (6) Q1 Fiscal 2011: Loss of $270 on investment accounted for under the equity method of accounting. Q2 Fiscal 2011: Loss of $1 on investment accounted for under the equity method of accounting. Q4 Fiscal 2011: Loss of $667 on investment accounted for under the equity method of accounting. (7) Q1 Fiscal 2011: $729 in amortization of original issuance debt discount. Q2 Fiscal 2011: $744 in amortization of original issuance debt discount and $345 in premium on partial redemption of the $110.0M convertible debt Q3 Fiscal 2011: $753 in amortization of original issuance debt discount and bond premiums, net. Q4 Fiscal 2011: $755 in amortization of original issuance debt discount and bond premiums, net. Non-GAAP income tax expense adjustment reflects the application of our assumed normalized effective 17% tax rate, instead of our GAAP tax rate, to our non-GAAP pre- tax income. (4) (8) |
 © 2011 Mentor Graphics Corp. www.mentor.com Non-GAAP Financial Measures (cont.) 53 53 Mentor Graphics Investor Presentation, April 2011 Q1 Q2 Q3 Q4 GAAP net income (loss) (12,956) $ (21,266) $ (27,034) $ 39,367 $ Non-GAAP adjustments: Equity plan-related compensation: (1) Cost of revenues 499 470 349 300 Research and development 3,447 3,058 2,374 2,052 Marketing and selling 2,537 2,391 1,856 1,622 General and administration 1,287 1,578 1,130 1,209 Acquisition - related items: Amortization of purchased assets Cost of revenues (2) 2,948 2,928 3,089 3,047 Amortization of intangible assets (3) 2,870 2,888 2,796 2,630 Special charges (4) 5,695 4,202 5,993 5,444 Other income (expense), net (5) 437 244 170 257 Interest expense (6) 421 578 698 713 Non-GAAP income tax effects (7) 1,067 4,391 13,391 (25,877) Total of non-GAAP adjustments 21,208 22,728 31,846 (8,603) Non-GAAP net income 8,252 $ 1,462 $ 4,812 $ 30,764 $ GAAP weighted average shares (diluted) a 94,168 94,853 97,854 101,750 Non-GAAP adjustment 3 387 2,042 - Non-GAAP weighted average shares (diluted) 94,171 95,240 99,896 101,750 GAAP net income (loss) per share (diluted) a (0.14) $ (0.22) $ (0.28) $ 0.39 $ Non-GAAP adjustments detailed above 0.23 0.24 0.33 (0.09) Non-GAAP net income per share (diluted) 0.09 $ 0.02 $ 0.05 $ 0.30 $ MENTOR GRAPHICS CORPORATION RECONCILIATION OF NON-GAAP ADJUSTMENTS (In thousands, except earnings per share data) Fiscal Year Ended January 31, 2010 |
 © 2011 Mentor Graphics Corp. www.mentor.com Non-GAAP Financial Measures (cont.) 54 54 Mentor Graphics Investor Presentation, April 2011 a Diluted GAAP and non-GAAP net income per share for Q4 Fiscal 2010 includes $125 of convertible debt interest, net of tax, added back to GAAP and non-GAAP net income and 1,379 of corresponding dilutive shares added to the diluted weighted average number of shares outstanding. (1) Equity plan-related compensation expense. (2) Amount represents amortization of purchased technology resulting from acquisitions. Purchased intangible assets are amortized over two to five years. (3) Other identified intangible assets are amortized to other operating expense over two to five years. Other identified intangible assets include trade names, employment agreements, customer relationships, and deferred compensation which are the result of acquisition transactions. (4) Q1 Fiscal 2010: Special charges consist of (i) $4,028 of costs incurred for employee rebalances which includes severance benefits, notice pay, and outplacement services, (ii) $1,175 in advisory fees, (iii) $268 in acquisition costs, (iv) $265 related to a casualty loss, and (v) $(41) in other adjustments. Q2 Fiscal 2010: Special charges consist of (i) $1,599 of costs incurred for employee rebalances which includes severance benefits, notice pay, and outplacement services, (ii) $1,175 in advisory fees, (iii) $865 related to the abandonment of excess leased facility space, (iv) $270 in acquisition costs, (v) $242 related to a casualty loss, and (vi) $51 in other adjustments. Q3 Fiscal 2010: Special charges consist of (i) $3,369 of costs incurred for employee rebalances which includes severance benefits, notice pay, and outplacement services, (ii) $1,231 in acquisition costs, (iii) $1,175 in advisory fees, (iv) $159 related to the abandonment of excess leased facility space, and (v) $59 related to a casualty loss. Q4 Fiscal 2010: Special charges consist of (i) $1,717 of costs incurred for employee rebalances which includes severance benefits, notice pay, and outplacement services, (ii) $1,547 related to the abandonment of excess leased facility space, (iii) $1,175 in advisory fees, (iv) $405 related to an asset abandonment, (v) $302 in lease restoration costs, and (vi) $298 in acquisition costs. (5) Q1 Fiscal 2010: Other income, net consists of (i) loss of $324 on investment accounted for under the equity method of accounting and (ii) an impairment of $113 for an investment accounted for under the cost method. Q2 Fiscal 2010: Loss of $244 on investment accounted for under the equity method of accounting. Q3 Fiscal 2010: Loss of $170 on investment accounted for under the equity method of accounting. Q4 Fiscal 2010: Loss of $257 on investment accounted for under the equity method of accounting. (6) Q1 Fiscal 2010: $669 in amortization of original issuance debt discount and $(248) in discounts and unamortized debt costs related to a partial redemption of the $110.0M convertible debt. Q2 Fiscal 2010: $684 in amortization of original issuance debt discount and $(106) in discounts and unamortized debt costs related to a partial redemption of the $110.0M convertible debt. Q3 Fiscal 2010: $698 in amortization of original issuance debt discount. Q4 Fiscal 2010: $713 in amortization of original issuance debt discount. (7) Non-GAAP income tax expense adjustment reflects the application of our assumed normalized effective 17% tax rate, instead of our GAAP tax rate, to our non- GAAP pre-tax income. |
 © 2011 Mentor Graphics Corp. www.mentor.com Non-GAAP Financial Measures (cont.) 55 55 Mentor Graphics Investor Presentation, April 2011 Q1 FY12 FY12 Diluted GAAP net income per share $0.06 $0.77 Non-GAAP Adjustments: Amortization of purchased intangible assets (1) 0.03 0.08 Amortization of other identified intangible assets (2) 0.02 0.09 Equity plan-related compensation (3) 0.05 0.17 Special charges (4) - - Other expense, net and interest expense (5) 0.01 0.03 Non-GAAP income tax effects (6) (0.02) (0.14) Non-GAAP net income per share $0.15 $1.00 (1) (2) (3) (4) (5) (6) Excludes amortization of purchased intangible assets resulting from acquisition transactions. Purchased intangible assets are amortized over two to five years. The guidance for Q1 FY12 and Full Year FY12 assumes no additional acquisitions. Excludes amortization of other identified intangible assets including trade names, employment agreements, customer relationships, and deferred compensation resulting from acquisition transactions. Other identified intangible assets are amortized over two to five years. The guidance for Q1 FY12 and Full Year FY12 assumes no additional acquisitions. Excludes equity plan-related compensation expense. Excludes special charges consisting primarily of costs incurred for facility closures, employee rebalances (which includes severance benefits, notice pay and outplacement services), and acquisition costs. The guidance for Q1 FY12 and Full Year FY12 assumes no additional special charges. Reflects amortization of original issuance debt discount and premium, net. Non-GAAP income tax expense adjustment reflects the application of our assumed normalized effective 17% tax rate, instead of our GAAP tax rate, to our non-GAAP pre-tax income. MENTOR GRAPHICS CORPORATION UNAUDITED RECONCILIATION OF GAAP TO NON-GAAP EARNINGS PER SHARE GUIDANCE The following table reconciles management's estimates of the specific items excluded from GAAP in the calculation of expected non-GAAP loss per share for the periods shown below: |
 © 2011 Mentor Graphics Corp. www.mentor.com Mentor Graphics Investor Presentation, April 2011 56 Non-GAAP Financial Measures (cont.) AS OF NOVEMBER 19, 2010 Q4 FY11 FY11 Diluted GAAP net income per share $0.40 $0.19 Non-GAAP Adjustments: Amortization of purchased intangible assets (1) $0.03 0.17 Amortization of other identified intangible assets (2) $0.01 0.07 Equity plan-related compensation (3) $0.05 0.20 Special charges (4) $0.00 0.07 Other income and interest expense (5) $0.01 0.03 Non-GAAP income tax effects (6) ($0.04) (0.06) Non-GAAP net income per share $0.46 $0.67 (1) (2) (3) (4) (5) (6) Reflects amortization of original issuance debt discount and equity in losses on equity method investment. Non-GAAP income tax expense adjustment reflects the application of our assumed normalized effective 17% tax rate, instead of our GAAP tax rate, to our non-GAAP pre-tax income. Excludes amortization of purchased intangible assets resulting from acquisition transactions. Purchased intangible assets are amortized over two to five years. The guidance for Q4 FY11 and Full Year FY11 assumes no additional acquisitions. MENTOR GRAPHICS CORPORATION UNAUDITED RECONCILIATION OF GAAP TO NON-GAAP EARNINGS PER SHARE GUIDANCE The following table reconciles management's estimates of the specific items excluded from GAAP in the calculation of expected non-GAAP loss per share for the periods shown below: Excludes amortization of other identified intangible assets including trade names, employment agreements, customer relationships, and deferred compensation resulting from acquisition transactions. Other identified intangible assets are amortized over two to five years. The guidance for Q4 FY11 and Full Year FY11 assumes no additional acquisitions. Excludes equity plan-related compensation expense. Excludes special charges consisting primarily of costs incurred for facility closures, employee rebalances (which includes severance benefits, notice pay and outplacement services), advisory legal fees, and acquisition costs. The guidance for Q4 FY11 and Full Year FY11 assumes no additional special charges. |