UNITED STATES
SECURITIES AND EXCHANGE COMMISSION
Washington, D.C. 20549
SCHEDULE 14A
Proxy Statement Pursuant to Section 14(a) of the
Securities Exchange Act of 1934
(Amendment No. )
Filed by the Registrant x Filed by a Party other than the Registrant ¨
Check the appropriate box:
| ¨ | Preliminary Proxy Statement | |||
| ¨ | Confidential, for Use of the Commission Only (as permitted by Rule 14a-6(e)(2)) | |||
| ¨ | Definitive Proxy Statement | |||
| x | Definitive Additional Materials | |||
| ¨ | Soliciting Material Pursuant to § 240.14a-12 | |||
| MENTOR GRAPHICS CORPORATION | ||||
| (Name of Registrant as Specified In Its Charter) | ||||
| N/A | ||||
| (Name of Person(s) Filing Proxy Statement, if other than the Registrant) | ||||
| Payment of Filing Fee (Check the appropriate box): | ||||
| x | No fee required. | |||
| ¨ | Fee computed on table below per Exchange Act Rules 14a-6(i)(1) and 0-11. | |||
| (1) | Title of each class of securities to which transaction applies:
| |||
| (2) | Aggregate number of securities to which transaction applies:
| |||
| (3) | Per unit price or other underlying value of transaction computed pursuant to Exchange Act Rule 0-11 (set forth the amount on which the filing fee is calculated and state how it was determined):
| |||
| (4) | Proposed maximum aggregate value of transaction:
| |||
| (5) | Total fee paid: | |||
| ¨ | Fee paid previously with preliminary materials: | |||
| ¨ | Check box if any part of the fee is offset as provided by Exchange Act Rule 0-11(a)(2) and identify the filing for which the offsetting fee was paid previously. Identify the previous filing by registration statement number, or the form or schedule and the date of its filing. | |||
| (1) | Amount previously paid:
| |||
| (2) | Form, Schedule or Registration Statement No.:
| |||
| (3) | Filing Party:
| |||
| (4) | Date Filed:
| |||
 Walden C. Rhines Chairman & CEO May 2011 FY 2011 Annual Shareholder Meeting |
 © 2011 Mentor Graphics Corp. www.mentor.com Forward-Looking Statements 2 Annual Shareholder Meeting - May 2011 This presentation and commentary may contain “forward-looking” statements based on current expectations within the meaning of the Securities Exchange Act of 1934. Such forward-looking statements involve known and unknown risks, uncertainties and other factors that may cause the actual results, performance or achievements of the Company or industry results to be materially different from any results, performance or achievements expressed or implied by such forward-looking statements. Such factors include, among others, the following: (i) weakness or recession in the US, EU, Japan or other economies; (ii) the Company’s ability to successfully offer products and services that compete in the highly competitive EDA industry; (iii) product bundling or discounting of products and services by competitors, which could force the Company to lower its prices or offer other more favorable terms to customers; (iv) possible delayed or canceled customer orders, a loss of key personnel or other consequences resulting from the business disruption and uncertainty of prolonged proxy fights, offers to purchase the Company’s securities or other actions of activist shareholders; (v) effects of the increasing volatility of foreign currency fluctuations on the Company’s business and operating results; (vi) changes in accounting or reporting rules or interpretations; (vii) the impact of tax audits by the IRS or other taxing authorities, or changes in the tax laws, regulations or enforcement practices where the Company does business; (viii) effects of unanticipated shifts in product mix on gross margin; and (ix) effects of customer seasonal purchasing patterns and the timing of significant orders, which may negatively or positively impact the Company’s quarterly results of operations, all as may be discussed in more detail under the heading “Risk Factors” in the Company’s most recent Form 10-K or Form 10-Q. Given these uncertainties, prospective investors are cautioned not to place undue reliance on such forward-looking statements. In addition, statements regarding guidance do not reflect potential impacts of mergers or acquisitions that have not been announced or closed as of the time the statements are made. The Company disclaims any obligation to update any such factors or to publicly announce the results of any revisions to any of the forward-looking statements to reflect future events or developments. |
 © 2011 Mentor Graphics Corp. www.mentor.com FY 2011 Results Revenue of $915 million, up 14% from FY 2010 Non-GAAP EPS of $0.70, an increase of 49% * — GAAP EPS of $0.26 compared to a GAAP loss per share of $0.23 in FY 2010 Bookings up 30% for the year All regions showed bookings growth for the year Second largest provider of EDA software and support 3 Annual Shareholder Meeting - May 2011 *A reconciliation of non-GAAP to GAAP results is available in the Company’s press released dated March 3, 2011 |
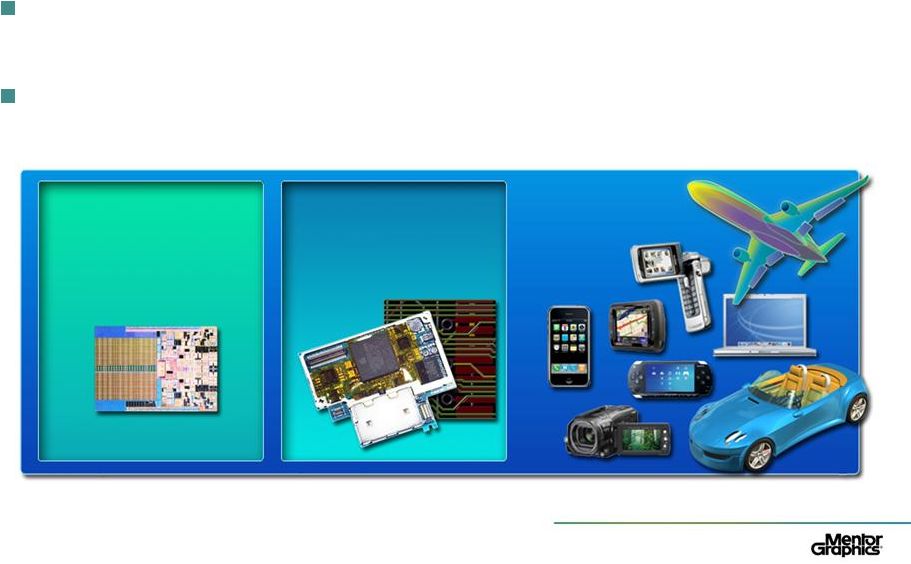 © 2011 Mentor Graphics Corp. www.mentor.com What Is Electronic Design Automation? Critical design software used to create the world’s electronic systems Comprehensive EDA product portfolios address all levels – from component to systems 4 Annual Shareholder Meeting - May 2011 Integrated Circuit (IC) Printed Circuit Board (PCB) Systems |
 © 2011 Mentor Graphics Corp. www.mentor.com EDA Product Segments Source: Gary Smith EDA Market Trends 2010 and Mentor Graphics analysis 5 Annual Shareholder Meeting - May 2011 EDA Product Segments >$1M of Sales |
 © 2011 Mentor Graphics Corp. www.mentor.com #1 Supplier in Each EDA Product Segment Averages 66% Revenue Share Largest EDA Product Segments SNPS CDNS MENT SNPS Other SNPS MENT CDNS MENT Other MENT 6 Source: Gary Smith EDA Market Trends, 2010 and Mentor analysis 6 Annual Shareholder Meeting - May 2011 |
 Mentor – Reporting Categories 7 Integrated System Design PCB Scalable Verification New & Emerging Markets IC Design- to-Silicon Tools for printed circuit board (PCB) and design and field programmable gate array (FPGA) design Used to examine and verify functionality before committing to silicon Tools to create integrated circuits (ICs) for 90nm and smaller Products targeting new and emerging markets Description Expedition Mechanical Analysis PADS Valor Precision Synthesis ModelSim Questa Veloce (Emulation) ADVance MS Calibre Platform IC Custom Design Olympus-SoC Place & Route Transportation Embedded Software Design-for-Test Key Product Areas 25% 25% 30% 15% *Percent of FY11 Revenue * Services & Other account for 5% of FY 11 revenue of $915 million. Annual Shareholder Meeting - May 2011 © 2011 Mentor Graphics Corp. www.mentor.com |
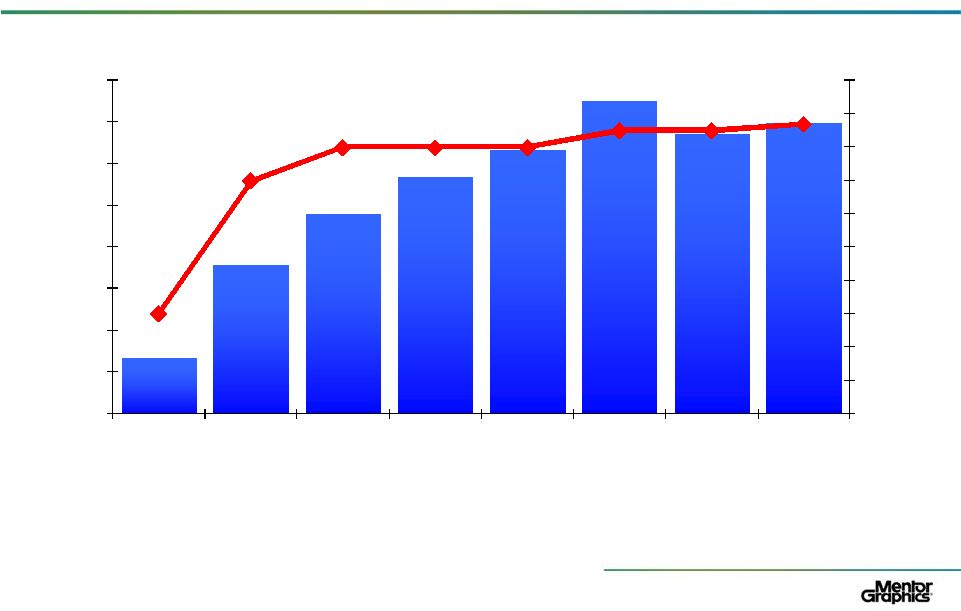 8 Mentor Focuses on Product Categories Where We Can Be #1 30% 70% 80% 80% 80% 85% 85% 87% 0% 10% 20% 30% 40% 50% 60% 70% 80% 90% 100% 0 100 200 300 400 500 600 700 800 CY1996 CY1999 CY2002 CY2005 CY2006 FY2008 FY2009 FY2010 Product Revenue from Leadership Positions ($ millions) (% Revenue) Source: Gary Smith EDA Market Trends, 2010 & MGC Analysis $136 $360 $480 $570 $635 $753 $674 $700 Annual Shareholder Meeting - May 2011 © 2011 Mentor Graphics Corp. www.mentor.com Product revenue where Mentor is #1 or primary contender for the #1 market position |
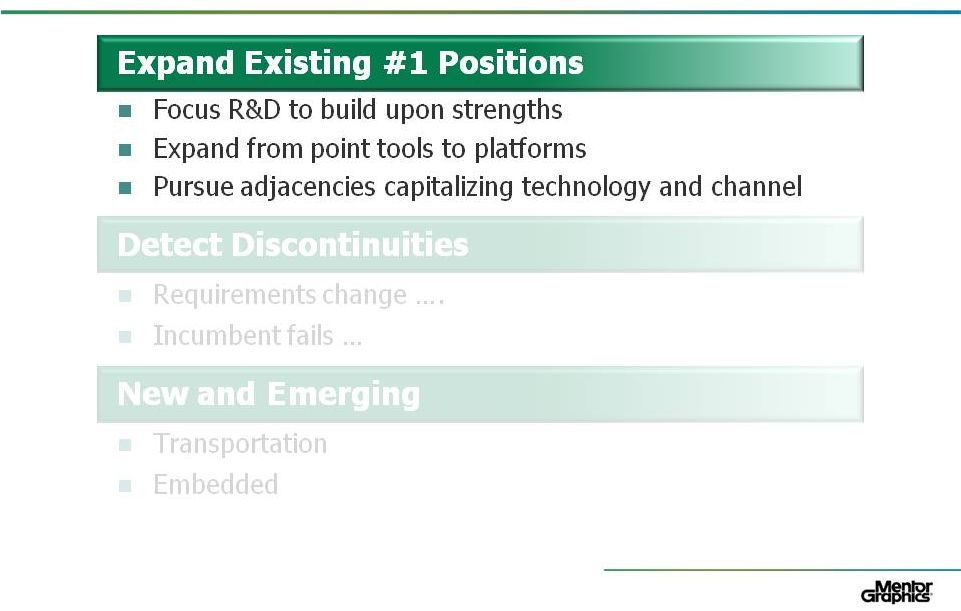 Strategy Based upon Being #1 9 Annual Shareholder Meeting - May 2011 © 2011 Mentor Graphics Corp. www.mentor.com |
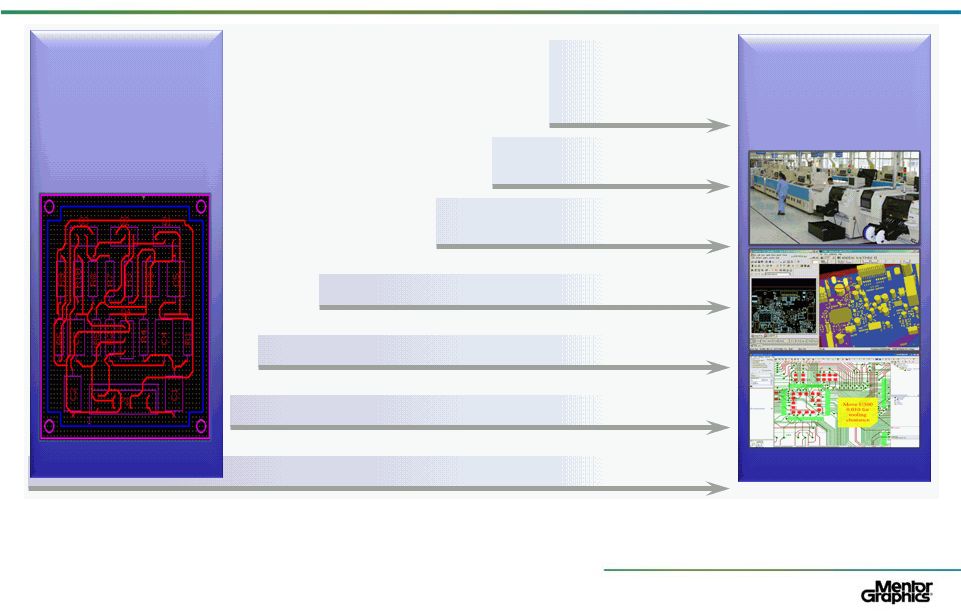 Multi-Disciplined Collaborative and Concurrent Design Mentor Graphics delivers paradigm shift in PCB systems design 2008-2010 The Evolution of Mentor’s Leadership in PCB 10 Board Station Product Group Enterprise Board Design 2000 – Data Management Systems 2002 – Personal Board Design 2006 – PCB/Supply Chain Collaboration 1999 – Expedition 2008 – System Thermal Analysis 2010 – Design for Manufacturing and Manufacturing Execution Systems Reliability High-frequency 3D analysis Annual Shareholder Meeting - May 2011 st Graphical Schematic And Layout 1980s Mentor Graphics 1 product Board Station © 2011 Mentor Graphics Corp. www.mentor.com |
 Mentor Worldwide PCB Revenue Share Source: Gary Smith EDA 11 Annual Shareholder Meeting - May 2011 © 2011 Mentor Graphics Corp. www.mentor.com |
 © 2011 Mentor Graphics Corp. www.mentor.com Strategy Based upon Being #1 12 Expand Existing #1 Positions Focus R&D to build upon strengths Expand from point tools to platforms Pursue adjacencies capitalizing technology and channel Detect Discontinuities Requirements change …. Incumbent fails … Transportation Embedded Annual Shareholder Meeting - May 2011 New and Emerging |
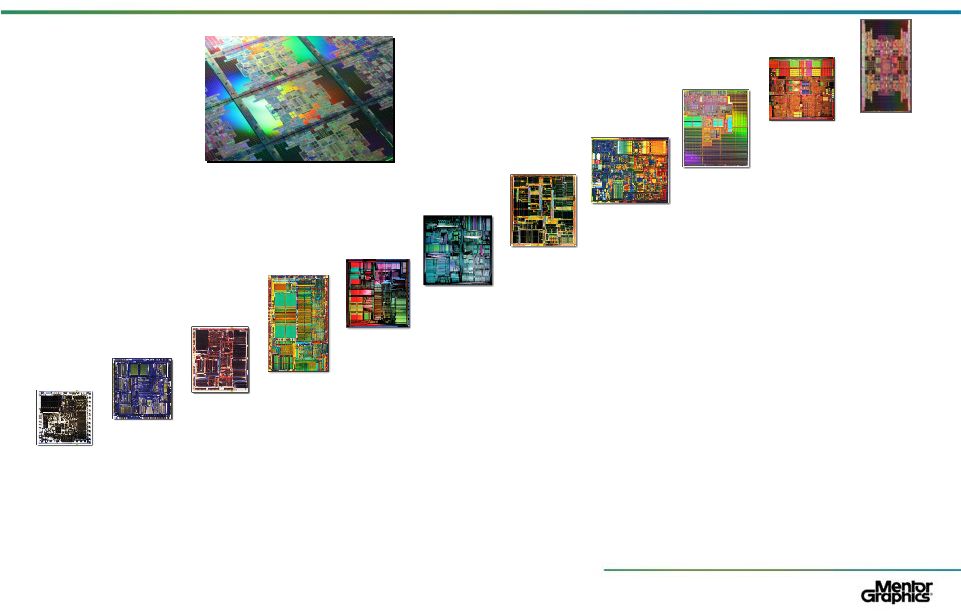   © 2011 Mentor Graphics Corp. www.mentor.com 13 Moore’s Law: IC Complexity Steadily Rises, Creating Opportunities for EDA 1979 29,000 Transistors 8088 1982 134,000 Transistors 286 1985 275,000 Transistors 386 1989 1,290,000 Transistors 486 1993 3.1M+ Transistors Pentium 1995 5.5M+ Transistors Pentium Pro 1997 7.5M+ Transistors Pentium II 2000 42M Transistors Pentium 4 2004 592M Transistors Itanium 2 (9MB cache) 2002 220M Transistors Itanium 2 2008 2.0B Transistors Tukwila 2010 3B Transistors Annual Shareholder Meeting - May 2011 |
 © 2011 Mentor Graphics Corp. www.mentor.com Discontinuity Leads to Success 14 Calibre nmDRC Calibre Pattern Matching Calibre Automatic Waivers Calibre nmLVS Calibre InRoute Calibre xRC Calibre xACT-3D Calibre xL Calibre PERC Calibre DESIGNrev Calibre Interactive Calibre RVE Calibre LFD Calibre CMP Analyzer Calibre YieldAnalyzer Calibre YieldEnhancer Calibre nmOPC (RET) Calibre OPCverify Calibre nmMPC Calibre MDP 1996 Calibre Point Tool ~ $1.1M Revenue 2011 Calibre nm Platform Approaching $300M Revenue 2011 Calibre Platform Building upon a #1 Position Annual Shareholder Meeting - May 2011 |
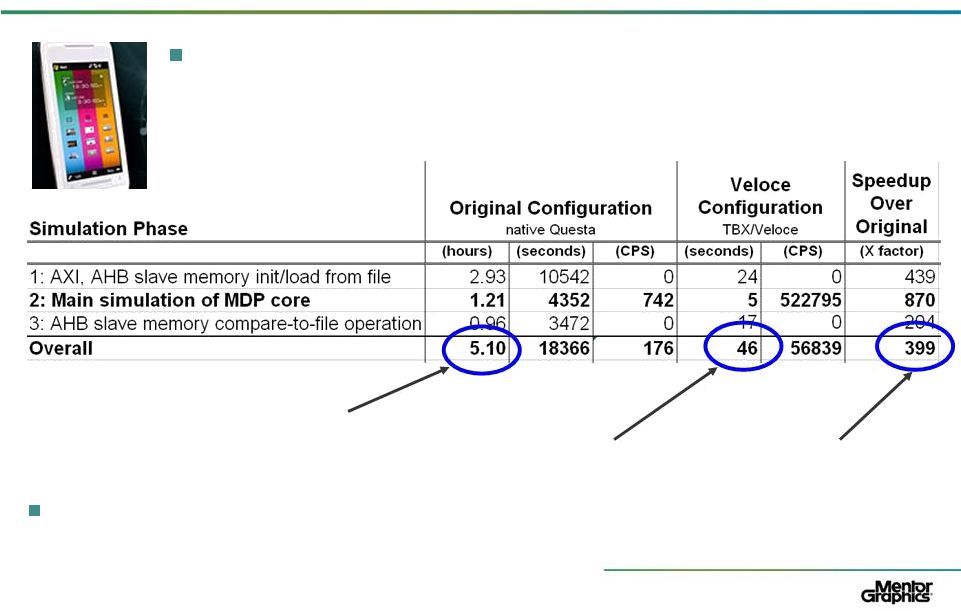 © 2011 Mentor Graphics Corp. www.mentor.com Functional Verification Discontinuity Drives Emulation 5 hour simulation 46 second emulation 400X speedup 15 Annual Shareholder Meeting - May 2011 Veloce system 5X faster in competitive runoff 2 million gate mobile display processor — A major telecommunications systems company |
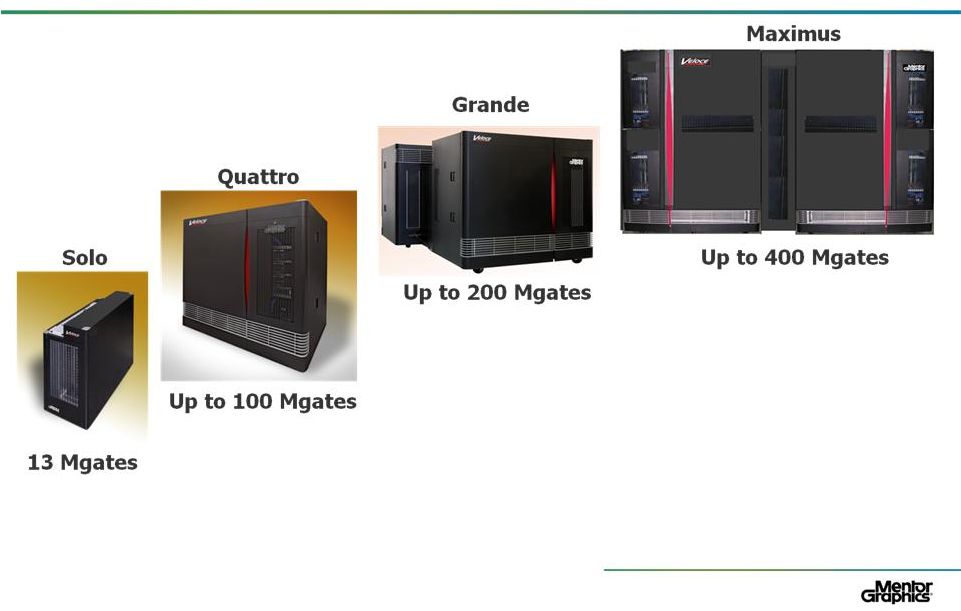 © 2011 Mentor Graphics Corp. www.mentor.com Functional Verification Discontinuity Mentor’s emulation market share more than doubled in FY 2010 16 Annual Shareholder Meeting - May 2011 |
 © 2011 Mentor Graphics Corp. www.mentor.com Strategy Based upon Being #1 17 Annual Shareholder Meeting - May 2011 Expand Existing #1 Positions Focus R&D to build upon strengths Expand from point tools to platforms Pursue adjacencies capitalizing technology and channel Detect Discontinuities Requirements change …. Incumbent fails … New and Emerging Transportation Embedded |
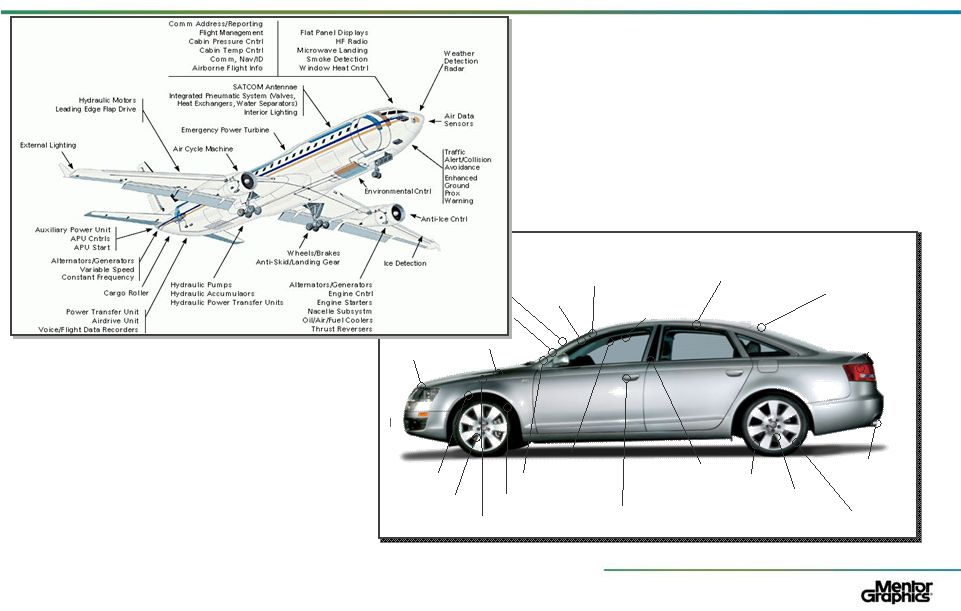 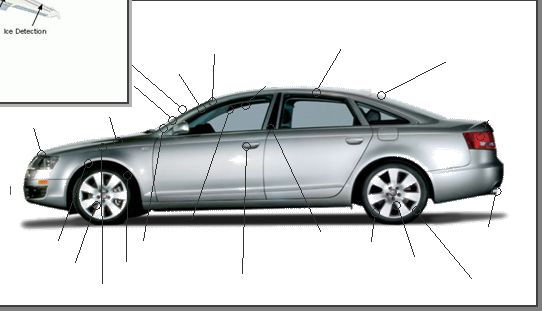 © 2011 Mentor Graphics Corp. www.mentor.com System Design Automation 18 Collision Avoidance Automated Highway Navigation & Trip Computer Entertainment Electrochromic Glass Active Noise Cancellation Communication Lighting Engine & Emissions Management Traction Control Vehicle Stability Low Tire Pressure Monitors Airbag Deployment System Security Systems Multi-Zone Automatic Climate Control Lane Departure Warning Continuously Variable Transmission Engine Management Antilock Braking Active Suspension Annual Shareholder Meeting - May 2011 |
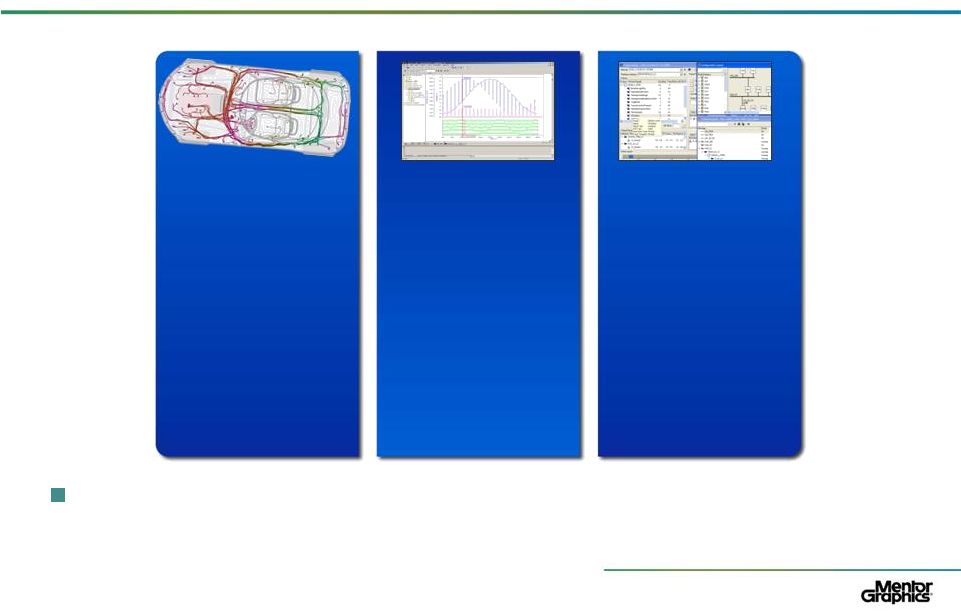 © 2011 Mentor Graphics Corp. www.mentor.com CHS Electrical System Design and Wire Harness Engineering System Vision and Mechatronics Analysis Volcano Network Design and Analysis Mentor‘s Transportation Solutions Transportation has accounted for approximately 15% of product bookings in recent quarters 19 Annual Shareholder Meeting - May 2011 |
 Transportation – A Growing Opportunity for Mentor 20 Annual Shareholder Meeting - May 2011 |
 © 2011 Mentor Graphics Corp. www.mentor.com Mentor Graphics’ Strategy is Working: Q1 FY12 Pre-Release Expect results to exceed prior revenue estimates with revenue of about $230 million, up over 25% from Q1 FY11 Non-GAAP earnings expected to be in range of $0.18 to $0.20 share vs. a loss per share of $0.02 in Q1 FY11 * — GAAP loss in the range of $0.02 to $0.06 per share vs. a loss per share of $0.22 in Q1 FY11 Expect non-GAAP operating margin of about 14% and GAAP operating margin of approximately 8% Full fiscal first quarter results on May 27, 2011 21 *A reconciliation of non-GAAP to GAAP results is available in the Company’s press released dated May 5, 2011 Annual Shareholders Meeting - May 2011 |
 © 2011 Mentor Graphics Corp. www.mentor.com Summary: Company Strategy is Working Total market share has grown over 30% in last 3 years Strong end-of-year momentum – bookings, revenue, new customers, consulting, training, support reinstatements and SW and HW benchmark activity Existing businesses and new businesses contributed to record fiscal 2011 revenues Fiscal 2012 revenue estimates of approximately $1 billion represents 9% revenue growth, with significantly stronger earnings growth 22 Mentor Graphics Investor Presentation, April 2011 22 |
 © 2011 Mentor Graphics Corp. www.mentor.com 23 |
 © 2011 Mentor Graphics Corp. www.mentor.com 24 Estimated Q1 FY12 Q1 FY11 Diluted GAAP net income (loss) per share $(0.06) - $(0.02) $ (0.22) Non-GAAP Adjustments: Amortization of purchased intangible assets (1) 0.03 0.04 Amortization of other identified intangible assets (2) 0.02 0.03 Equity plan-related compensation (3) 0.05 0.06 Special charges (4) 0.03 0.03 Other expense, net and interest expense (5) 0.11 0.01 Non-GAAP income tax effects (6) (0.00) - (0.02) 0.03 Non-GAAP net income (loss) per share $0.18 - $0.20 $ (0.02) |
 © 2011 Mentor Graphics Corp. www.mentor.com 25 MENTOR GRAPHICS CORPORATION UNAUDITED RECONCILIATION OF GAAP FINANCIAL MEASURES TO NON-GAAP FINANCIAL MEASURES (In thousands, except percentages) Estimated Three Months Ended April 30, 2011 Q1 FY12 GAAP operating income $ 17,394 Reconciling items to non-GAAP operating income: Amortization of Frontline purchased technology and other 1,242 identified intangible assets Equity plan-related compensation 5,097 Amortization of purchased intangible assets: Cost of revenues 3,357 Amortization of intangible assets 1,611 Special Charges 3,759 Non-GAAP operating income $ 32,460 Three Months Ended April 30, 2011 Q1 FY12 GAAP operating income as a percent of total revenues 8% Non-GAAP adjustments detailed above 6% Non-GAAP operating income as a percent of total revenues 14% |