EXHIBIT 99.2
|

EXHIBIT 99.2
BancorpSouth, Inc.
Financial Information As of September 30, 2011
|
Forward Looking Information
Certain statements contained in this presentation and the accompanying slides may not be based on historical facts and are “forward-looking statements” within the meaning of Section 27A of the Securities Act of 1933, as amended, and Section 21E of the Securities Exchange Act of 1934, as amended. These forward-looking statements may be identified by reference to a future period or by the use of forward-looking terminology, such as “anticipate,” “believe,” “estimate,” “expect,” “foresee,” “may,” “might,” “will,” “intend,” “could,” “would” or “plan,” or future or conditional verb tenses, and variations or negatives of such terms. These forward-looking statements include, without limitation, statements about long-term prospects for shareholder value, the impact of the prevailing economy, the use of non-GAAP financial measures, results of operations, and financial condition. We caution you not to place undue reliance on the forward-looking statements contained in this presentation, in that actual results could differ materially from those indicated in such forward-looking statements as a result of a variety of factors. These factors include, but are not limited to, conditions in the financial markets and economic conditions generally, the soundness of other financial institutions, the availability of capital on favorable terms if and when needed, liquidity risk, the credit risk associated with real estate construction, acquisition and development loans, estimates of costs and values associated with real estate construction, acquisition and development loans in the Company’s loan portfolio, the adequacy of the Company’s allowance for credit losses to cover actual credit losses, governmental regulation and supervision of the Company’s operations, the impact of recent legislation on service charges on core deposit accounts, the susceptibility of the Company’s business to local economic conditions, changes in interest rates, the impact of monetary policies and economic factors on the Company’s ability to attract deposits or make loans, volatility in capital and credit markets, the impact of hurricanes or other adverse weather events, risks in connection with completed or potential acquisitions, dilution caused by the Company’s issuance of any additional shares of its common stock to raise capital or acquire other banks, bank holding companies, financial holding companies and insurance agencies, restrictions on the Company’s ability to declare and pay dividends, the Company’s growth strategy, diversification in the types of financial services the Company offers, competition with other financial services companies, interruptions or breaches in security of the Company’s information systems, the failure of certain third party vendors to perform, the Company’s ability to improve its internal controls adequately, any requirement that the Company write down goodwill or other intangible assets, other factors generally understood to affect the financial results of financial services companies, and other factors detailed from time to time in the Company’s press releases and filings with the Securities and Exchange Commission. Forward-looking statements speak only as of the date they were made, and, except as required by law, we do not undertake any obligation to update or revise forward-looking statements to reflect events or circumstances after the date of this presentation. Certain tabular presentations may not reconcile because of rounding.
2 |
|
|
Non-GAAP Financial Disclaimer
This presentation contains financial information determined by methods other than those prescribed by accounting principles generally accepted in the United States (“GAAP’). Management uses these “non-GAAP” financial measures in its analysis of the Company’s capital and performance. Management believes that tangible book value per share is important to investors who are interested in changes from period to period in book value per share exclusive of changes in tangible assets. Management believes that pre-tax, pre-provision earnings is important to investors as it shows earnings trends without giving effect to the provision for credit losses. Management believes that earnings per share, excluding impact of MSR valuation adjustment, is important to investors because it shows earnings trends without giving effect to MSR valuation adjustments and related tax benefits.
You should not view these disclosures as a substitute for results determined in accordance with GAAP, and they are not necessarily comparable to non-GAAP measures used by other companies. The limitations associated with these measures are the risks that persons might disagree as to the appropriateness of items comprising these measures and that different companies might calculate these measures differently. Information provided in the Appendix of this presentation reconciles these non-GAAP measures with comparable measures calculated in accordance with GAAP.
3
|
Financial Overview
Net income of $11.9 million, or $0.14 per diluted share
Generated $51 million of pre-tax, pre-provision earnings (excluding
MSR Impairment)
Net interest margin remained stable at 3.66%
Provision for credit losses decreased $7.1 million, or 22%
Mortgage production increased to $375 million, although a negative
MSR market valuation adjustment reduced mortgage revenue by $11.7
million
At and for the three months ended September 30, 2011
4
|
Credit Quality
NPLs decreased $17 million, or 4.5%, from the previous quarter 48% of non-accrual loans were paying as agreed Net charge-offs declined $9.9 million, or 30%, from the previous quarter
Sales of OREO properties during the quarter totaled $13.1 million, resulting in no material net gain/loss
Write-downs of existing OREO properties totaled $4.4 million, compared to $2.3 million in the second quarter of 2011
At and for the three months ended September 30, 2011
5
|
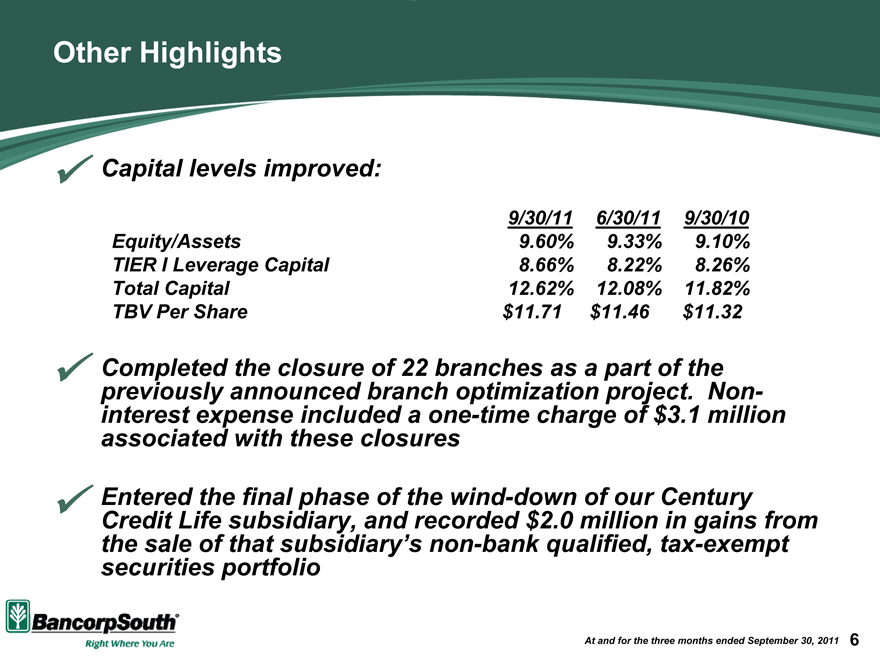
Other Highlights
Capital levels improved:
9/30/11 6/30/11 9/30/10
Equity/Assets 9.60% 9.33% 9.10%
TIER I Leverage Capital 8.66% 8.22% 8.26%
Total Capital 12.62% 12.08% 11.82%
TBV Per Share $11.71 $11.46 $11.32
Completed the closure of 22 branches as a part of the previously announced branch optimization project. Non-interest expense included a one-time charge of $3.1 million associated with these closures
Entered the final phase of the wind-down of our Century Credit Life subsidiary, and recorded $2.0 million in gains from the sale of that subsidiary’s non-bank qualified, tax-exempt securities portfolio
At and for the three months ended September 30, 2011
6
|
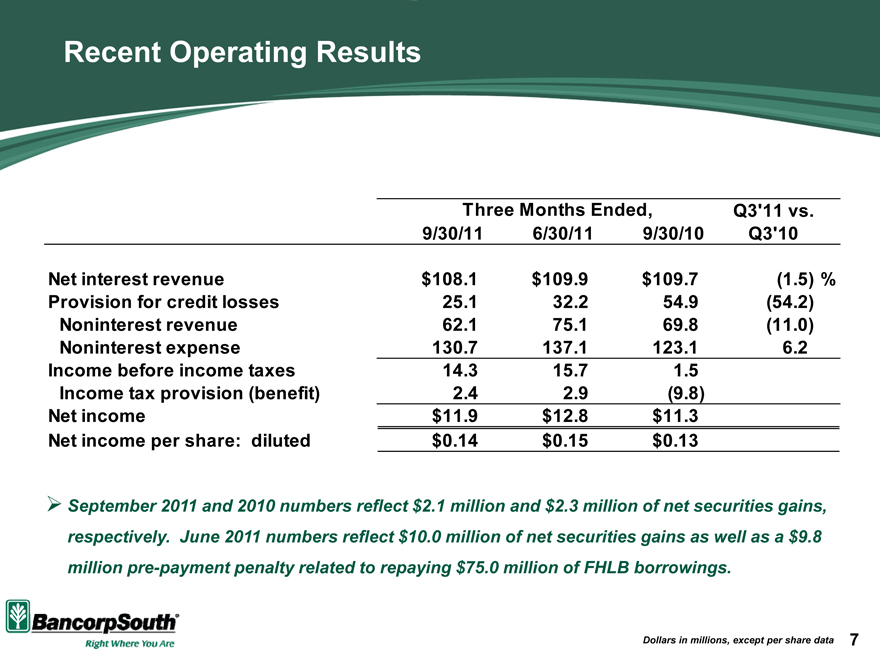
Recent Operating Results
Three Months Ended, Q3’11 vs.
9/30/11 6/30/11 9/30/10 Q3’10
Net interest revenue $108.1 $109.9 $109.7 (1.5) %
Provision for credit losses 25.1 32.2 54.9 (54.2)
Noninterest revenue 62.1 75.1 69.8 (11.0)
Noninterest expense 130.7 137.1 123.1 6.2
Income before income taxes 14.3 15.7 1.5
Income tax provision (benefit) 2.4 2.9 (9.8)
Net income $11.9 $12.8 $11.3
Net income per share: diluted $0.14 $0.15 $0.13
September 2011 and 2010 numbers reflect $2.1 million and $2.3 million of net securities gains, respectively. June 2011 numbers reflect $10.0 million of net securities gains as well as a $9.8 million pre-payment penalty related to repaying $75.0 million of FHLB borrowings.
Dollars in millions, except per share data
7
|
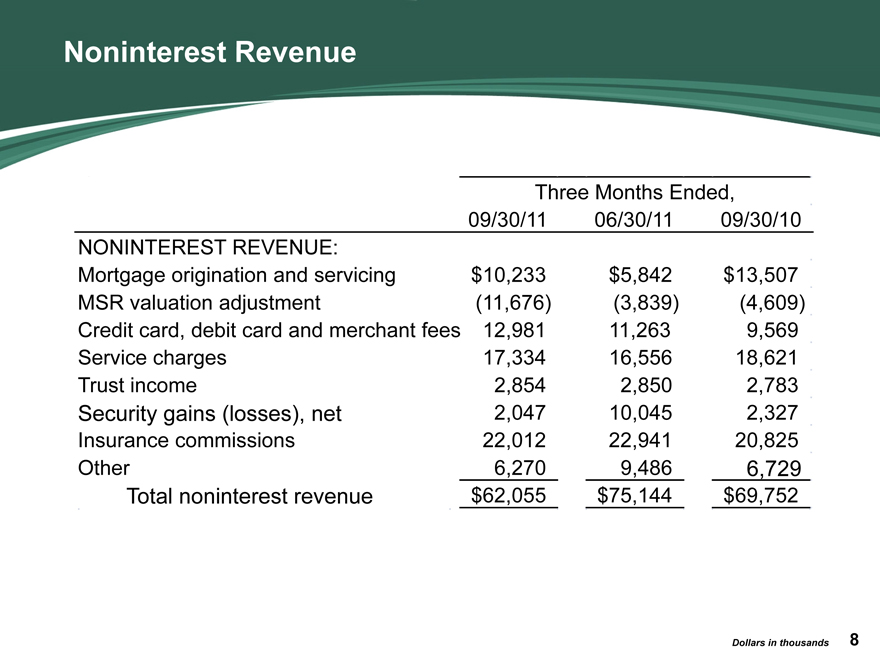
Noninterest Revenue
Three Months Ended,
09/30/11 06/30/11 09/30/10
NONINTEREST REVENUE:
Mortgage origination and servicing $10,233 $5,842 $13,507
MSR valuation adjustment (11,676) (3,839) (4,609)
Credit card, debit card and merchant fe 12,981 11,263 9,569
Service charges 17,334 16,556 18,621
Trust income 2,854 2,850 2,783
Security gains (losses), net 2,047 10,045 2,327
Insurance commissions 22,012 22,941 20,825
Other 6,270 9,486 6,729
Total noninterest revenue $62,055 $75,144 $69,752
Dollars in thousands
8
|
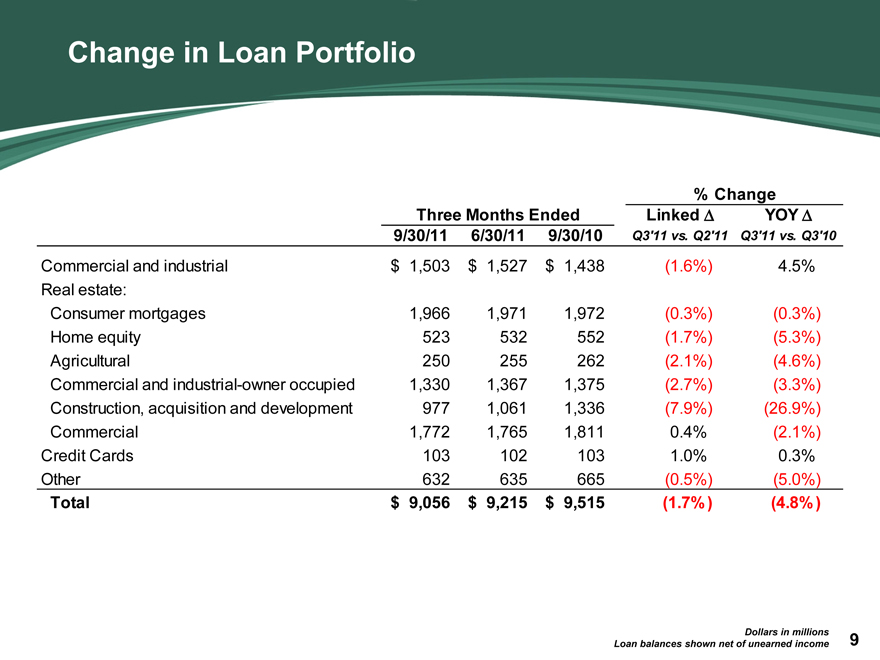
Change in Loan Portfolio
% Change
Three Months Ended Linked YOY
9/30/11 6/30/11 9/30/10 Q3’11 vs. Q2’11 Q3’11 vs. Q3’10
Commercial and industrial $ 1,503 $ 1,527 $ 1,438 (1.6%) 4.5%
Real estate:
Consumer mortgages 1,966 1,971 1,972 (0.3%) (0.3%)
Home equity 523 532 552 (1.7%) (5.3%)
Agricultural 250 255 262 (2.1%) (4.6%)
Commercial and industrial-owner occupied 1,330 1,367 1,375 (2.7%) (3.3%)
Construction, acquisition and development 977 1,061 1,336 (7.9%) (26.9%)
Commercial 1,772 1,765 1,811 0.4% (2.1%)
Credit Cards 103 102 103 1.0% 0.3%
Other 632 635 665 (0.5%) (5.0%)
Total $ 9,056 $ 9,215 $ 9,515 (1.7%) (4.8%)
Dollars in millions
Loan balances shown net of unearned income
9
|

NPLs
NPL as a Percent
Outstanding NPL of Outstanding
Commercial and industrial $1,503 $14.2 0.9%
Real estate:
Consumer mortgages 1,966 50.3 2.6%
Home equity 523 2.8 0.5%
Agricultural 250 7.1 2.9%
Commercial and industrial-owner occupied 1,330 34.2 2.6%
Construction, acquisition and development 977 174.0 17.8%
Commercial 1,772 66.3 3.7%
Credit cards 103 3.4 3.3%
All other 632 10.3 1.6%
Total loans $9,056 $362.8 4.0%
Dollars in millions
Net loans and leases as of September 30, 2011
10
|
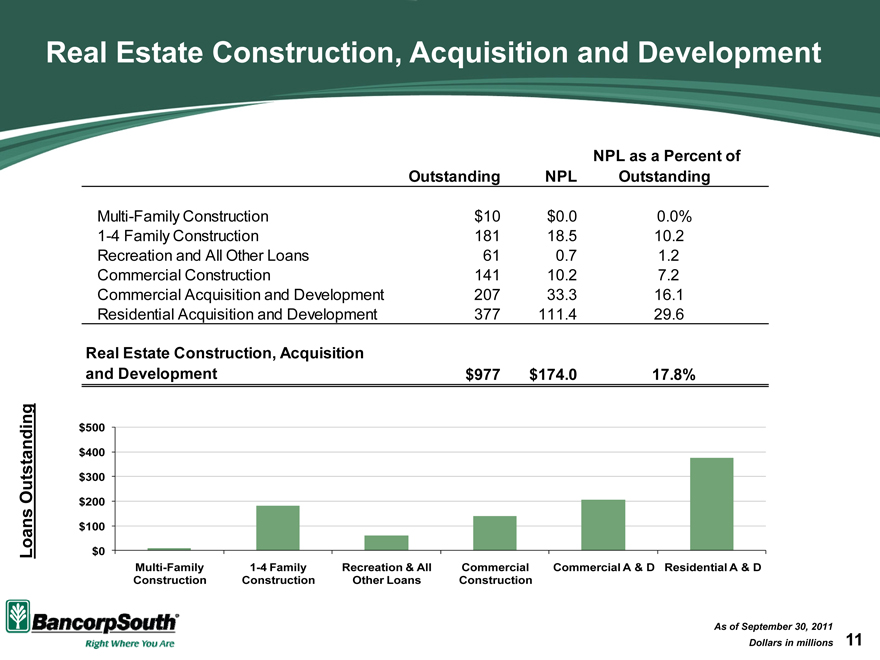
Real Estate Construction, Acquisition and Development
NPL as a Percent of
Outstanding NPL Outstanding
Multi-Family Construction $10 $0.0 0.0%
1-4 Family Construction 181 18.5 10.2
Recreation and All Other Loans 61 0.7 1.2
Commercial Construction 141 10.2 7.2
Commercial Acquisition and Development 207 33.3 16.1
Residential Acquisition and Development 377 111.4 29.6
Real Estate Construction, Acquisition
and Development $977 $174.0 17.8%
Loans Outstanding
$500 $400 $300 $200 $100 $0
Multi-Family Construction
1-4 Family
Construction
Recreation & All Other Loans
Commercial Construction
Commercial A & D
Residential A & D
As of September 30, 2011
Dollars in millions
11
|
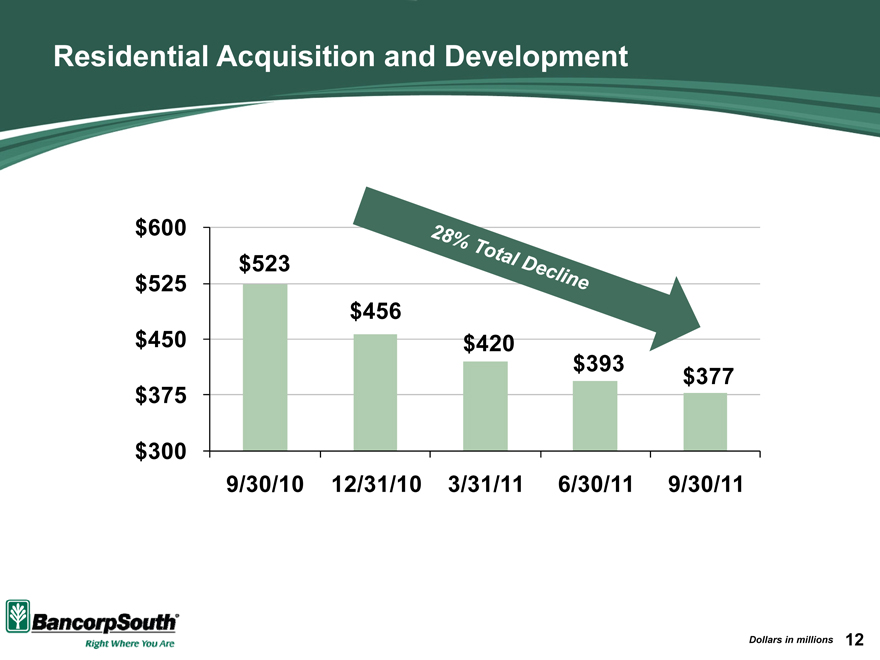
Residential Acquisition and Development
$600 $525 $450 $375 $300
9/30/10 12/31/10 3/31/11 6/30/11 9/30/11
$523
$456 $420 $393 $377
28% Total Decline
Dollars in millions
12
|
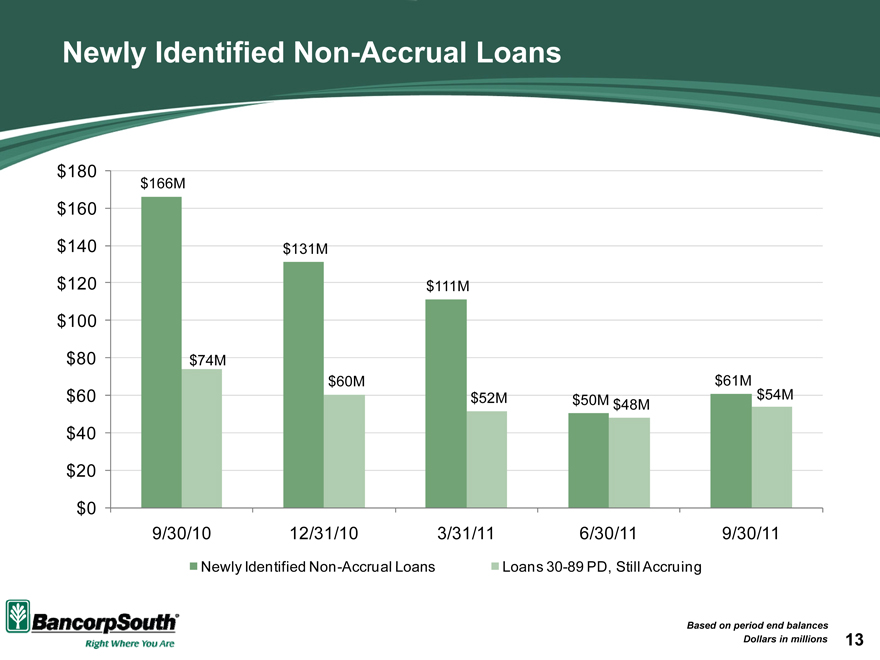
Newly Identified Non-Accrual Loans
$180 $160 $140 $120 $100 $80 $60 $40 $20 $0
9/30/10 12/31/10 3/31/11 6/30/11 9/30/11
$166M
$131M
$111M
$74M $60M $61M $52M $50M $54M $48M
Newly Identified Non-Accrual Loans Loans 30-89 PD, Still Accruing
Based on period end balances
Dollars in millions
13
|
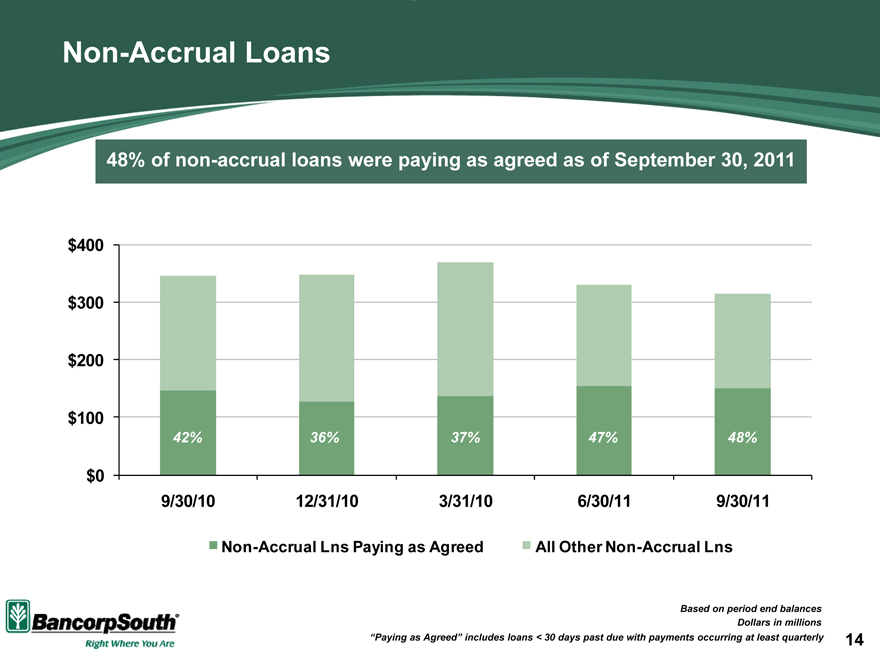
Non-Accrual Loans
48% of non-accrual loans were paying as agreed as of September 30, 2011
$400
$300
$200
$100
42% 36% 37% 47% 48%
$0
9/30/10 12/31/10 3/31/10 6/30/11 9/30/11
Non-Accrual Lns Paying as Agreed All Other Non-Accrual Lns
Based on period end balances
Dollars in millions
“Paying as Agreed” includes loans < 30 days past due with payments occurring at least quarterly
14
|
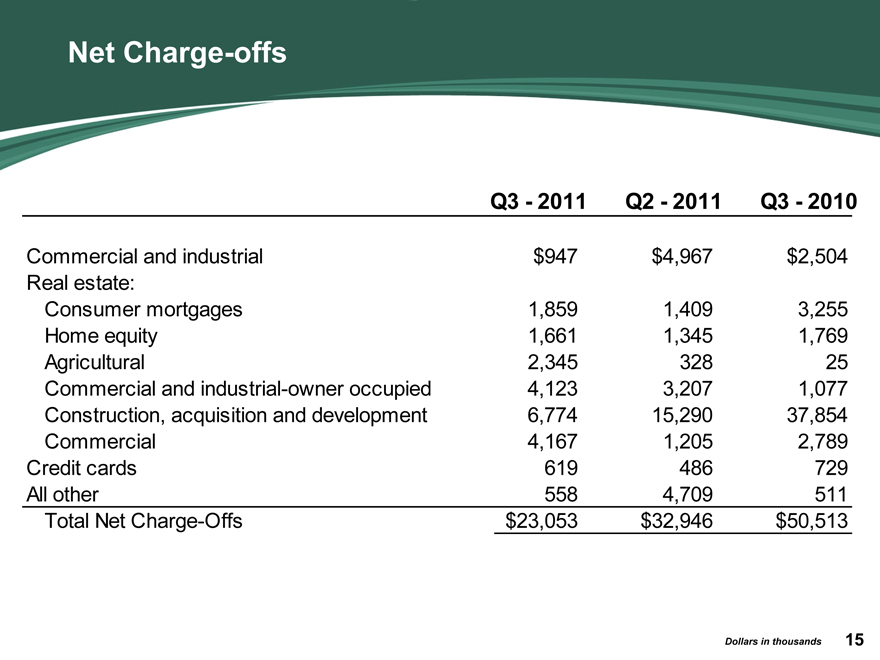
Net Charge-offs
Q3 - 2011 Q2 - 2011 Q3 - 2010
Commercial and industrial $947 $4,967 $2,504
Real estate:
Consumer mortgages 1,859 1,409 3,255
Home equity 1,661 1,345 1,769
Agricultural 2,345 328 25
Commercial and industrial-owner occupied 4,123 3,207 1,077
Construction, acquisition and development 6,774 15,290 37,854
Commercial 4,167 1,205 2,789
Credit cards 619 486 729
All other 558 4,709 511
Total Net Charge-Offs $23,053 $32,946 $50,513
Dollars in thousands
15
|
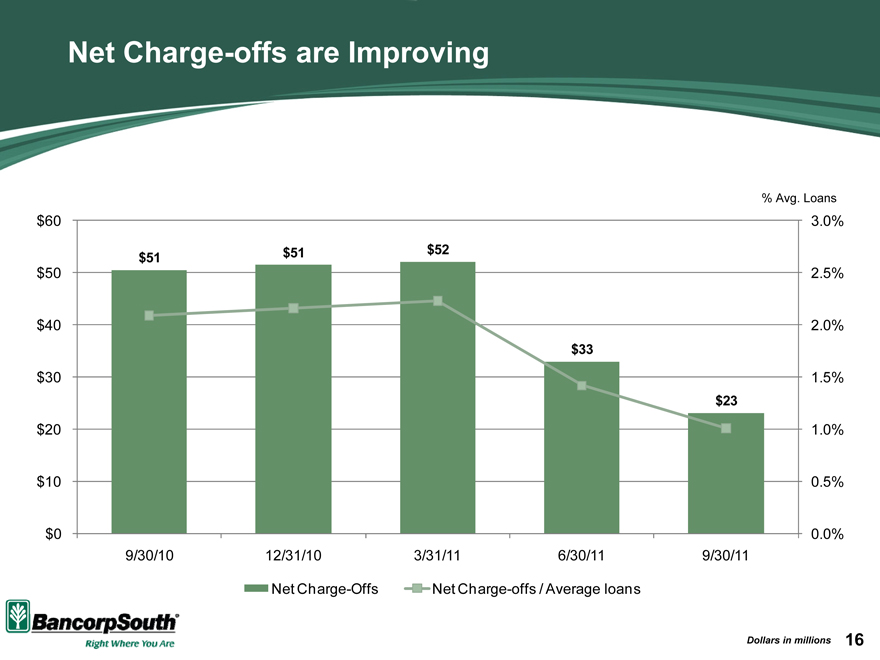
Net Charge-offs are Improving
% Avg. Loans
$60 3.0%
$51 $51 $52
$50 2.5%
$40 2.0%
$33
$30 1.5%
$23
$20 1.0%
$10 0.5%
$0 0.0%
9/30/10 12/31/10 3/31/11 6/30/11 9/30/11
Net Charge-Offs Net Charge-offs / Average loans
Dollars in millions
16
|
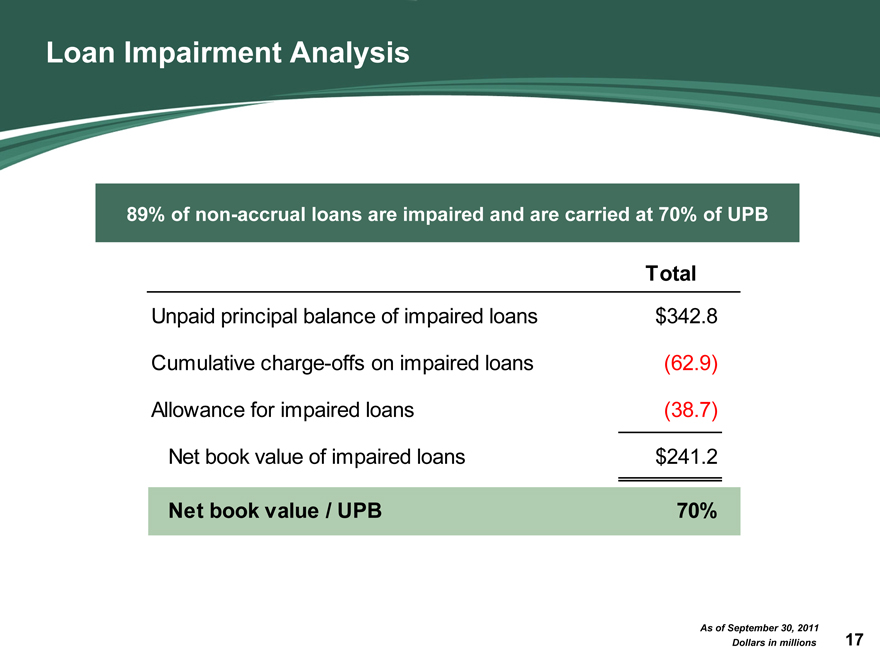
Loan Impairment Analysis
89% of non-accrual loans are impaired and are carried at 70% of UPB
Total
Unpaid principal balance of impaired loans $342.8
Cumulative charge-offs on impaired loans (62.9)
Allowance for impaired loans (38.7)
Net book value of impaired loans $241.2
Net book value / UPB 70%
As of September 30, 2011
Dollars in millions
17
|
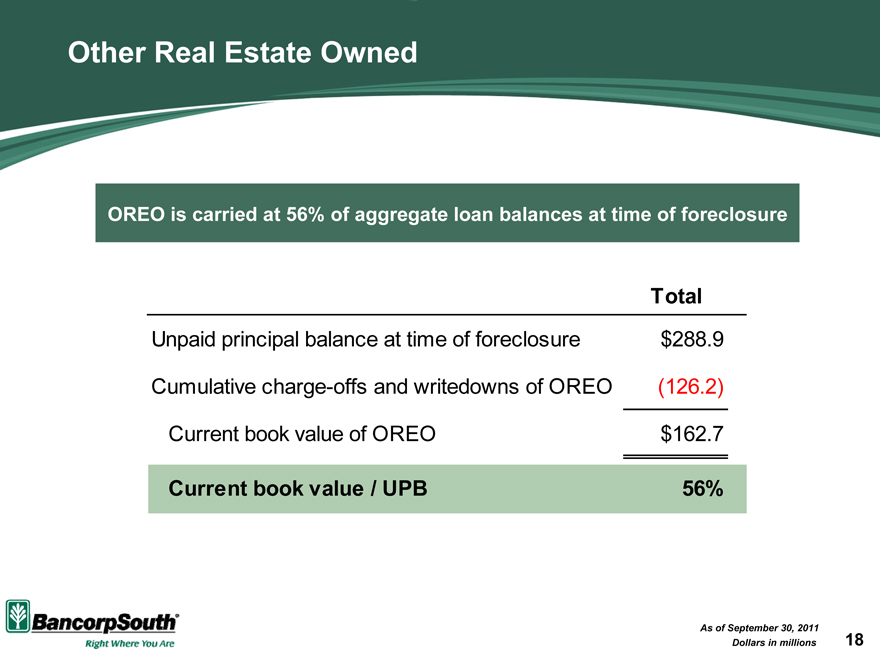
Other Real Estate Owned
OREO is carried at 56% of aggregate loan balances at time of foreclosure
Total
Unpaid principal balance at time of foreclosure $288.9
Cumulative charge-offs and writedowns of OREO (126.2)
Current book value of OREO $162.7
Current book value / UPB 56%
As of September 30, 2011
Dollars in millions
18
|

Appendix
|
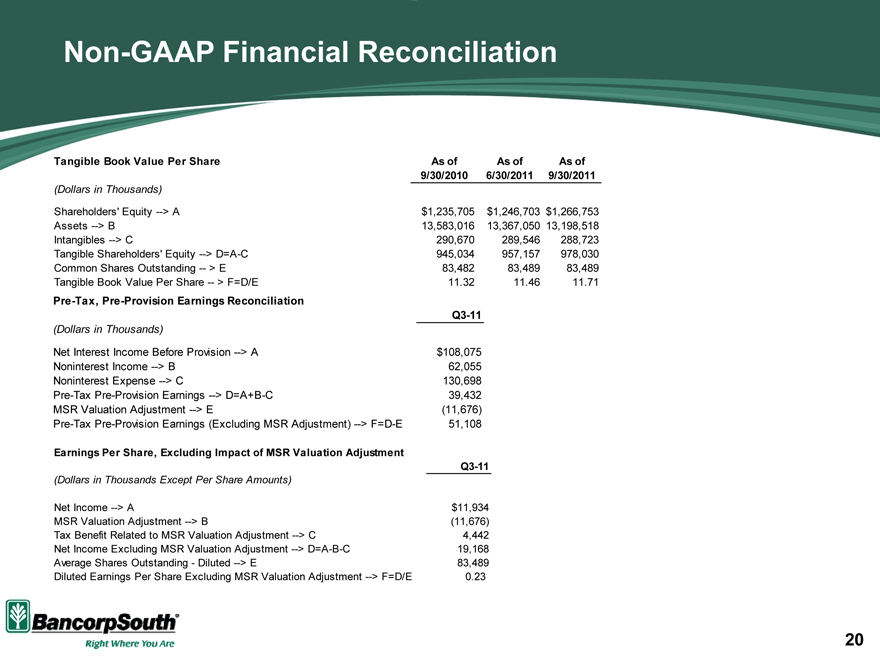
Non-GAAP Financial Reconciliation
Tangible Book Value Per Share As of As of As of
9/30/2010 6/30/2011 9/30/2011
(Dollars in Thousands)
Shareholders’ Equity —> A $1,235,705 $1,246,703 $1,266,753
Assets —> B 13,583,016 13,367,050 13,198,518
Intangibles —> C 290,670 289,546 288,723
Tangible Shareholders’ Equity —> D=A-C 945,034 957,157 978,030
Common Shares Outstanding — > E 83,482 83,489 83,489
Tangible Book Value Per Share — > F=D/E 11.32 11.46 11.71
Pre-Tax, Pre-Provision Earnings Reconciliation
Q3-11
(Dollars in Thousands)
Net Interest Income Before Provision —> A $108,075
Noninterest Income —> B 62,055
Noninterest Expense —> C 130,698
Pre-Tax Pre-Provision Earnings —> D=A+B-C 39,432
MSR Valuation Adjustment —> E (11,676)
Pre-Tax Pre-Provision Earnings (Excluding MSR Adjustment) —> F=D-E 51,108
Earnings Per Share, Excluding Impact of MSR Valuation Adjustment
Q3-11
(Dollars in Thousands Except Per Share Amounts)
Net Income —> A $11,934
MSR Valuation Adjustment —> B (11,676)
Tax Benefit Related to MSR Valuation Adjustment —> C 4,442
Net Income Excluding MSR Valuation Adjustment —> D=A-B-C 19,168
Average Shares Outstanding - Diluted —> E 83,489
Diluted Earnings Per Share Excluding MSR Valuation Adjustment —> F=D/E 0.23
20