Table of Contents
UNITED STATES
SECURITIES AND EXCHANGE COMMISSION
Washington, D.C. 20549
FORM N-CSR
CERTIFIED SHAREHOLDER REPORT OF REGISTERED
MANAGEMENT INVESTMENT COMPANIES
Investment Company Act file number 811-03451
SEI Daily Income Trust
(Exact name of registrant as specified in charter)
c/o CT Corporation
101 Federal Street
Boston, MA 02110
(Address of principal executive offices) (Zip code)
SEI Investments
One Freedom Valley Drive
Oaks, PA 19456
(Name and address of agent for service)
Registrant’s telephone number, including area code: 1-800-342-5734
Date of fiscal year end: January 31, 2010
Date of reporting period: January 31, 2010
Table of Contents
| Item 1. | Reports to Stockholders. |
Table of Contents

SEI Daily Income Trust
Annual Report as of January 31, 2010
Money Market Fund
Government Fund
Government II Fund
Prime Obligation Fund
Treasury Fund
Treasury II Fund
Short-Duration Government Fund
Intermediate-Duration Government Fund
GNMA Fund
Ultra Short Bond Fund
Table of Contents
| 1 | ||
| 6 | ||
| 34 | ||
| 36 | ||
| 38 | ||
| 42 | ||
| 46 | ||
| 55 | ||
| 56 | ||
| 59 | ||
| 61 | ||
| 62 | ||
The Trust files its complete schedule of portfolio holdings with the Securities and Exchange Commission for the first and third quarters of each fiscal year on Form N-Q within sixty days after the end of the period. The Trust’s Forms N-Q are available on the Commission’s website at http://www.sec.gov, and may be reviewed and copied at the Commission’s Public Reference Room in Washington, DC. Information on the operation of the Public Reference Room may be obtained by calling 1-800-SEC-0330.
Since the Funds in SEI Daily Income Trust typically hold only fixed income securities, they generally are not expected to hold securities for which they may be required to vote proxies. Regardless, in light of the possibility that a Fund could hold a security for which a proxy is voted, the Trust has adopted proxy voting policies. A description of the policies and procedures that the Trust uses to determine how to vote proxies relating to portfolio securities, as well as information relating to how a Fund voted proxies relating to portfolio securities during the most recent 12-month period ended June 30, is available without charge (i) upon request, by calling 1-800-DIAL-SEI; and (ii) on the Commission’s website at http://www.sec.gov.
Table of Contents
MANAGEMENT’S DISCUSSION AND ANALYSIS OF FUND PERFORMANCE
SEI DAILY INCOME TRUST — JANUARY 31, 2010
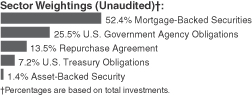
Short-Duration Government Fund
I. Objective
The Short-Duration Government Fund (the “Fund”) seeks to preserve principal value and maintain a high degree of liquidity while providing current income.
II. Multi-Manager Approach
The Fund uses a sub-adviser to manage the Fund under the supervision of SEI Investments Management Corporation. Currently, the sub-adviser is Wellington Management Company. There were no manager changes during the period.
III. Market Commentary
For the fiscal year ended January 31, 2010, the U.S. fixed-income market continued to experience high volatility. The flight to quality that began in the second half of 2007 intensified in the fourth quarter of 2008 following the bankruptcy of Lehman Brothers. In early 2009, the market began to show signs of stability as a series of government programs were implemented to restore market liquidity and inspire investor confidence. Specifically, the Federal Reserve’s acquisition of agency mortgage-backed securities (a $1.25 trillion program) and Treasury securities (a $300 billion program), the Term Asset-Backed Securities Loan Facility and the Public-Private Investment Program all served to provide liquidity to the financial system and capital to the most stressed sectors of the market. In 2009, because of the government’s accommodative policies, the pace of economic contraction slowed and credit markets started to recover. Liquidity conditions and investor sentiment dramatically improved, which was evidenced by strong corporate bond issuance, a retreat of inter-bank lending rates, a rising equity market and a significant tightening of yield spreads in residential mortgages, consumer asset-backed securities and commercial mortgage-backed securities. Encouraged by these events, investors increased their risk appetites and moved away from Treasury securities, driving a sharp credit rally across all fixed-income spread sectors. Improved sentiment in the capital markets was accompanied by a notable increase in longer-term Treasury yields during the fiscal year. Ten-year Treasury yields increased 74 basis points to 3.6%, and thirty-year yields increased 88 basis points to 4.5%. The rise in yields was also driven by unprecedented increases in Treasury issuance.
IV. Return vs. Benchmark
For the fiscal year ended January 31, 2010, the Short-Duration Government Fund, Class A, outperformed the Merrill Lynch 1-3 Year U.S. Treasury Bond Index (the “Index”), returning 4.94% versus the Index return of 1.90%.
V. Fund Attribution
The primary drivers of the Fund’s outperformance during the fiscal year were its allocations to agency pass-through securities, which are pools of residential mortgages where the originating banks, mortgage bankers and savings institutions pass all principal and interest payments directly to the investor, and agency debt, bonds issued by U.S. government-sponsored agencies. In particular, agency pass-through mortgages benefited from the Federal Reserve’s purchase program and outperformed duration-equivalent Treasuries.
At the end of the fiscal year, the Fund maintained reduced exposure to mortgage pass-through securities, as government support of the sector should gradually decrease over the coming months. The Fund continues to hold agency debentures, which are loans that are not secured by collateral, as valuations are compelling versus both Treasuries and agency mortgages.
Short-Duration Government Fund
AVERAGE ANNUAL TOTAL RETURN1
| One Year Return | Annualized 3-Year Return | Annualized 5-Year Return | Annualized 10-Year Return | Annualized Inception to Date | ||||||
| Short-Duration Government Fund, Class A | 4.94% | 5.54% | 4.47% | 4.53% | 5.56% |
Comparison of Change in the Value of a $10,000 Investment in the Short-Duration Government Fund, Class A, versus the Merrill Lynch 1-3 Year U.S. Treasury Bond Index
| 1 | For the period ended January 31, 2010. Past performance is not predictive of future performance. Class A shares were offered beginning 2/17/87. Returns shown do not reflect the deduction of taxes that a shareholder would pay on fund distributions or the redemption of fund shares. |
| SEI Daily Income Trust / Annual Report / January 31, 2010 | 1 |
Table of Contents
MANAGEMENT’S DISCUSSION AND ANALYSIS OF FUND PERFORMANCE
SEI DAILY INCOME TRUST — JANUARY 31, 2010
Intermediate-Duration Government Fund
I. Objective
The Intermediate-Duration Government Fund (the “Fund”) seeks to preserve principal value and maintain a high degree of liquidity while providing current income.
II. Multi-Manager Approach
The Fund uses a sub-adviser to manage the Fund under the supervision of SEI Investments Management Corporation. Currently, the sub-adviser is Wellington Management Company. There were no manager changes during the period.
III. Market Commentary
For the fiscal year ended January 31, 2010, the U.S. fixed-income market continued to experience high volatility. The flight to quality that began in the second half of 2007 intensified in the fourth quarter of 2008 following the bankruptcy of Lehman Brothers. In early 2009, the market began to show signs of stability as a series of government programs were implemented to restore market liquidity and inspire investor confidence. Specifically, the Federal Reserve’s acquisition of agency mortgage-backed securities (a $1.25 trillion program) and Treasury securities (a $300 billion program), the Term Asset-Backed Securities Loan Facility and the Public-Private Investment Program all served to provide liquidity to the financial system and capital to the most stressed sectors of the market. In 2009, because of the government’s accommodative policies, the pace of economic contraction slowed and credit markets started to recover. Liquidity conditions and investor sentiment dramatically improved, which was evidenced by strong corporate bond issuance, a retreat of inter-bank lending rates, a rising equity market and a significant tightening of yield spreads in residential mortgages, consumer asset-backed securities and commercial mortgage-backed securities. Encouraged by these events, investors increased their risk appetites and moved away from Treasury securities, driving a sharp credit rally across all fixed-income spread sectors. Improved sentiment in the capital markets was accompanied by a notable increase in longer-term Treasury yields during the fiscal year. Ten-year Treasury yields increased 74 basis points to 3.6%, and thirty-year yields increased 88 basis points to 4.5%. The rise in yields was also driven by unprecedented increases in Treasury issuance.
IV. Return vs. Benchmark
For the fiscal year ended January 31, 2010, the Intermediate-Duration Government Fund, Class A, outperformed the Merrill Lynch 3-5 Year U.S. Treasury Bond Index (the “Index”), returning 6.61% versus the Index return of 2.09%.
V. Fund Attribution
The primary drivers of the Fund’s outperformance were its allocations to agency pass-through mortgages, which are pools of residential mortgages where the originating banks, mortgage bankers and savings institutions pass all principal and interest payments directly to the investor, and agency debt, bonds issued by U.S. government-sponsored agencies. In particular, agency mortgage-backed pass-through securities continued to outperform Treasuries, with Federal Reserve purchases outpacing origination.
At the end of the fiscal year, the Fund maintained reduced exposure to mortgage pass-through securities as government support of the sector will gradually decrease over the coming months. The Fund continues to hold intermediate agency debentures, which are loans that are not secured by collateral, as valuations are compelling versus both Treasuries and agency mortgages.
Intermediate-Duration Government Fund
AVERAGE ANNUAL TOTAL RETURN1
| One Year Return | Annualized 3-Year Return | Annualized 5-Year Return | Annualized 10-Year Return | Annualized Inception to Date | ||||||
| Intermediate-Duration Government Fund, Class A | 6.61% | 8.46% | 5.94% | 6.29% | 6.55% |
Comparison of Change in the Value of a $10,000 Investment in the Intermediate-Duration Government Fund, Class A, versus the Merrill Lynch 3-5 Year U.S. Treasury Bond Index
| 1 | For the period ended January 31, 2010. Past performance is not predictive of future performance. Class A shares were offered beginning 2/17/87. Returns shown do not reflect the deduction of taxes that a shareholder would pay on fund distributions or the redemption of fund shares. |
| 2 | SEI Daily Income Trust / Annual Report / January 31, 2010 |
Table of Contents
MANAGEMENT’S DISCUSSION AND ANALYSIS OF FUND PERFORMANCE
SEI DAILY INCOME TRUST — JANUARY 31, 2010
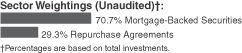
GNMA Fund
I. Objective
The GNMA Fund (the “Fund”) seeks to preserve principal value and maintain a high degree of liquidity while providing current income. The Fund invests primarily in mortgage-backed securities issued by the Government National Mortgage Association (“GNMA”) and backed by the full faith and credit of the U.S. Government.
II. Multi-Manager Approach
The Fund uses a sub-adviser to manage the Fund under the supervision of SEI Investments Management Corporation. Currently, the sub-adviser is Wellington Management Company. There were no manager changes during the period.
III. Market Commentary
For the fiscal year ended January 31, 2010, the U.S. fixed-income market continued to experience high volatility. The flight to quality that began in the second half of 2007 intensified in the fourth quarter of 2008 following the bankruptcy of Lehman Brothers. In early 2009, the market began to show signs of stability as a series of government programs were implemented to restore market liquidity and inspire investor confidence. Specifically, the Federal Reserve’s acquisition of agency mortgage-backed securities (a $1.25 trillion program) and Treasury securities (a $300 billion program), the Term Asset-Backed Securities Loan Facility and the Public-Private Investment Program all served to provide liquidity to the financial system and capital to the most stressed sectors of the market. In 2009, because of the government’s accommodative policies, the pace of economic contraction slowed and credit markets started to recover. Liquidity conditions and investor sentiment dramatically improved, which was evidenced by strong corporate bond issuance, a retreat of inter-bank lending rates, a rising equity market and a significant tightening of yield spreads in residential mortgages, consumer asset-backed securities and commercial mortgage-backed securities,. Encouraged by these events, investors increased their risk appetites and moved away from Treasury securities, driving a sharp credit rally across all fixed-income spread sectors. Improved sentiment in the capital markets was accompanied by a notable increase in longer-term Treasury yields during the fiscal year. Ten-year Treasury yields increased 74 basis points to 3.6%, and thirty-year yields increased 88 basis points to 4.5%. The rise in yields was also driven by unprecedented increases in Treasury issuance.
IV. Return vs. Benchmark
For the fiscal year ended January 31, 2010, the GNMA Fund, Class A, outperformed the Citigroup 30-Year GNMA Index (the “Index”), returning 8.18% versus the Index return of 6.72%.
V. Fund Attribution
Throughout the period, the Fund maintained its large allocation to GNMA pass-through securities, which are pools of residential mortgages where the originating banks, mortgage bankers and savings institutions pass all principal and interest payments directly to the investor. The Fund added value by investing in conventional Fannie Mae and Freddie Mac mortgage-backed securities. The Fund’s coupon and security selection was also beneficial to performance, as taking advantage of changing prepayment expectations and optimizing the convexity characteristics of the Fund.
GNMA Fund
AVERAGE ANNUAL TOTAL RETURN1
One Year Return | Annualized Return | Annualized Return | Annualized Return | Annualized to Date | ||||||
| GNMA Fund, Class A | 8.18% | 7.66% | 5.82% | 6.29% | 6.84% |
Comparison of Change in the Value of a $10,000 Investment in the GNMA Fund, Class A, versus the Citigroup 30-Year GNMA Index
| 1 | For the period ended January 31, 2010. Past performance is not predictive of future performance. Class A shares were offered beginning 3/20/87. Returns shown do not reflect the deduction of taxes that a shareholder would pay on fund distributions or the redemption of fund shares. |
| SEI Daily Income Trust / Annual Report / January 31, 2010 | 3 |
Table of Contents
MANAGEMENT’S DISCUSSION AND ANALYSIS OF FUND PERFORMANCE
SEI DAILY INCOME TRUST — JANUARY 31, 2010
Ultra Short Bond Fund
I. Objective
The Ultra Short Bond Fund (the “Fund”) seeks to provide higher current income than what is typically offered by a money market fund while maintaining a high degree of liquidity and minimal principal volatility. The Fund invests in U.S. Treasury and U.S. Agency securities, short average life mortgage-backed securities, and short-term investment-grade securities of U.S. issuers. The Fund’s duration will range between six and eighteen months.
II. Multi-Manager Approach
The Fund uses a sub-adviser to manage the Fund under the supervision of SEI Investments Management Corporation. Currently, the sub-adviser is Wellington Management Company. There were no manager changes during the period.
III. Market Commentary
For the fiscal year ended January 31, 2010, the U.S. fixed-income market continued to experience high volatility. The flight to quality that began in the second half of 2007 intensified in the fourth quarter of 2008 following the bankruptcy of Lehman Brothers. In early 2009, the market began to show signs of stability as a series of government programs were implemented to restore market liquidity and inspire investor confidence. Specifically, the Federal Reserve’s acquisition of agency mortgage-backed securities (a $1.25 trillion program) and Treasury securities (a $300 billion program), the Term Asset-Backed Securities Loan Facility (“TALF”) and the Public-Private Investment Program (“PPIP”) all served to provide liquidity to the financial system and capital to the most stressed sectors of the market. In 2009, because of the government’s accommodative policies, the pace of economic contraction slowed and credit markets started to recover. Liquidity conditions and investor sentiment dramatically improved, which was evidenced by strong corporate bond issuance, a retreat of inter-bank lending rates, a rising equity market and a significant tightening of yield spreads in residential mortgages, consumer asset-backed securities and commercial mortgage-backed securities. Encouraged by these events, investors increased their risk appetites and moved away from Treasury securities, driving a sharp credit rally across all fixed-income spread sectors. Improved sentiment in the capital markets was accompanied by a notable increase in longer-term Treasury yields during the fiscal year. Ten-year Treasury yields increased 74 basis points to 3.6%, and thirty-year yields increased 88 basis points to 4.5%. The rise in yields was also driven by unprecedented increases in Treasury issuance.
IV. Return vs. Benchmark
For the fiscal year ended January 31, 2010, the Ultra Short Bond Fund, Class A, outperformed the Barclays Capital Short U.S. Treasury 9-12 Month Index (the “Index”), returning 11.58% versus the Index return of 0.98%.
V. Fund Attribution
The primary driver of the Fund’s outperformance was an overweight in non-Treasury sectors, including non-agency mortgage-backed securities (“MBS”), asset-backed securities (“ABS”) and corporate bonds, especially bonds issued by financial companies. Non-agency MBS was the main contributor for the period thanks to strong demand from the PPIP and the relatively attractive loss-adjusted yield. Corporate bond spreads narrowed, driven by continued strong demand and improved earnings. ABS benefited from the success of the TALF program and steady demand across the buyer universe, resulting in tighter spreads for credit card and auto ABS.
Ultra Short Bond Fund
AVERAGE ANNUAL TOTAL RETURN1
One Year Return | Annualized Return | Annualized Return | Annualized Return | Annualized to Date | ||||||
| Ultra Short Bond Fund, Class A | 11.58% | 1.20% | 2.26% | 3.17% | 3.97% |
Comparison of Change in the Value of a $10,000 Investment in the Ultra Short Bond Fund, Class A, versus the Barclays Capital Short U.S. Treasury 9-12 Month Index
| 1 | For the period ended January 31, 2010. Past performance is no indication of future performance. Class A shares were offered beginning 9/28/93. Returns shown do not reflect the deduction of taxes that a shareholder would pay on fund distributions or the redemption of fund shares. |
| 4 | SEI Daily Income Trust / Annual Report / January 31, 2010 |
Table of Contents
Definition of the Comparative Indices*
Citigroup 30-year GNMA Index is a widely-recognized, market weighted index of GNMA mortgage-backed securities with remaining maturities of 30 years or less.
Barclays Capital Short U.S. Treasury 9-12 Month Index is a widely-recognized, market weighted index of U.S. Treasury Bonds with remaining maturities between nine and twelve months.
Merrill Lynch 1-3 Year U.S. Treasury Bond Index is a widely-recognized, market weighted index of the U.S. Treasury Bonds with maturities between one and three years.
Merrill Lynch 3-5 Year U.S. Treasury Bond Index is a widely-recognized, market weighted index of the U.S. Treasury Bonds with maturities between three and five years.
| * | An Index measures the market price of a specific group of securities in a particular market sector. You cannot invest directly in an index. An index does not have an investment adviser and does not pay any commissions or expenses. If an index had expenses, its performance would be lower. |
| SEI Daily Income Trust / Annual Report / January 31, 2010 | 5 |
Table of Contents
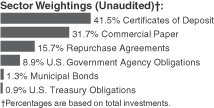
Money Market Fund
January 31, 2010
| Description | Face Amount ($ Thousands) | Value ($ Thousands) | ||||
CERTIFICATES OF DEPOSIT — 41.5% | ||||||
Allied Irish Banks PLC | ||||||
0.400%, 02/16/10 | $ | 2,000 | $ | 2,000 | ||
0.500%, 03/16/10 | 2,000 | 2,000 | ||||
0.500%, 03/16/10 | 500 | 500 | ||||
0.500%, 03/19/10 | 2,000 | 2,000 | ||||
0.600%, 04/15/10 | 2,000 | 2,000 | ||||
0.600%, 04/15/10 | 500 | 500 | ||||
0.600%, 04/20/10 | 2,000 | 2,000 | ||||
Banco Bilbao Vizcaya Argentaria | ||||||
0.290%, 02/26/10 | 2,000 | 2,000 | ||||
0.275%, 02/26/10 | 2,000 | 2,000 | ||||
0.275%, 03/02/10 | 1,000 | 1,000 | ||||
0.290%, 03/03/10 | 2,000 | 2,000 | ||||
0.280%, 03/10/10 | 1,000 | 1,000 | ||||
Bank of Ireland | ||||||
0.500%, 03/23/10 | 4,500 | 4,500 | ||||
0.600%, 04/21/10 | 2,250 | 2,250 | ||||
Bank of Montreal | ||||||
0.200%, 02/23/10 | 6,000 | 6,000 | ||||
Bank of Tokyo-Mitsubishi | ||||||
0.240%, 02/09/10 | 7,000 | 7,000 | ||||
0.205%, 03/05/10 | 1,000 | 1,000 | ||||
Barclays Bank PLC | ||||||
0.590%, 03/05/10 | 4,000 | 4,000 | ||||
0.575%, 03/15/10 | 1,000 | 1,000 | ||||
0.450%, 04/27/10 | 3,500 | 3,500 | ||||
0.440%, 05/07/10 | 9,000 | 9,000 | ||||
BNP Paribas | ||||||
0.230%, 02/16/10 | 4,000 | 4,000 | ||||
0.230%, 02/18/10 | 7,000 | 7,000 | ||||
0.230%, 03/10/10 | 1,000 | 1,000 | ||||
0.320%, 04/19/10 | 3,000 | 3,000 | ||||
Calyon New York | ||||||
0.220%, 04/23/10 | 2,000 | 2,000 | ||||
0.230%, 05/04/10 | 3,700 | 3,700 | ||||
Credit Agricole | ||||||
0.210%, 02/18/10 | 5,000 | 5,000 | ||||
0.300%, 07/26/10 | 4,000 | 4,000 | ||||
0.300%, 07/29/10 | 4,000 | 4,000 | ||||
Credit Industriel & Commercial | ||||||
0.395%, 03/18/10 | 6,000 | 6,000 | ||||
HSBC | ||||||
0.325%, 03/29/10 | 1,000 | 1,000 | ||||
| Description | Face Amount ($ Thousands) | Value ($ Thousands) | ||||
National Australia Bank | ||||||
0.400%, 02/05/10 | $ | 2,000 | $ | 2,000 | ||
Natixis | ||||||
0.220%, 02/11/10 | 5,000 | 5,000 | ||||
0.210%, 02/24/10 | 3,600 | 3,600 | ||||
0.220%, 03/01/10 | 3,000 | 3,000 | ||||
Rabobank Nederland | ||||||
0.350%, 03/24/10 | 1,000 | 1,000 | ||||
Societe Generale | ||||||
0.250%, 03/01/10 | 13,000 | 13,000 | ||||
Sumitomo Mitsui Banking | ||||||
0.250%, 02/11/10 | 10,000 | 10,000 | ||||
Svenska Handelsbanken | ||||||
0.230%, 02/10/10 | 3,000 | 3,000 | ||||
0.200%, 03/30/10 | 500 | 500 | ||||
Toronto Dominion Bank | ||||||
0.400%, 02/08/10 | 1,000 | 1,000 | ||||
0.330%, 03/18/10 | 1,000 | 1,000 | ||||
UBS | ||||||
0.520%, 05/19/10 | 9,000 | 9,000 | ||||
0.460%, 05/27/10 | 1,000 | 1,000 | ||||
0.480%, 05/28/10 | 4,500 | 4,500 | ||||
0.420%, 06/14/10 | 3,000 | 3,000 | ||||
Total Certificates of Deposit | 158,550 | |||||
COMMERCIAL PAPER (A) (B) — 31.7% | ||||||
American Honda Finance | ||||||
0.210%, 02/16/10 | 2,900 | 2,900 | ||||
0.190%, 03/02/10 | 1,000 | 1,000 | ||||
Atlantis One Funding | ||||||
0.270%, 02/19/10 | 3,000 | 2,999 | ||||
0.310%, 07/07/10 to 07/19/10 | 3,000 | 2,995 | ||||
0.305%, 07/13/10 | 1,000 | 999 | ||||
Australia & New Zealand Banking Group | ||||||
0.401%, 02/08/10 | 1,000 | 1,000 | ||||
Cancara Asset Securitisation LLC | ||||||
0.230%, 04/08/10 to 04/12/10 | 6,000 | 5,997 | ||||
Citibank Credit Card Issuance Trust | ||||||
0.200%, 02/24/10 | 1,000 | 1,000 | ||||
Citigroup Funding | ||||||
0.180%, 02/19/10 | 2,000 | 2,000 | ||||
Coca-Cola | ||||||
0.180%, 03/17/10 | 3,000 | 2,999 | ||||
0.200%, 04/13/10 | 1,000 | 1,000 | ||||
Dexia Delaware LLC | ||||||
0.280%, 02/23/10 | 7,250 | 7,249 | ||||
0.285%, 03/03/10 | 2,400 | 2,399 | ||||
E.ON | ||||||
0.260%, 02/12/10 | 1,000 | 1,000 | ||||
Edison Asset Securitization LLC | ||||||
0.210%, 03/09/10 to 03/16/10 | 5,500 | 5,499 | ||||
0.200%, 04/26/10 | 2,605 | 2,604 | ||||
| 6 | SEI Daily Income Trust / Annual Report / January 31, 2010 |
Table of Contents
| Description | Face Amount ($ Thousands) | Value ($ Thousands) | ||||
ENI Coordination Center | ||||||
0.175%, 02/22/10 | $ | 6,000 | $ | 5,999 | ||
0.200%, 04/20/10 | 500 | 500 | ||||
0.195%, 04/26/10 | 700 | 700 | ||||
Fairway Finance LLC | ||||||
0.220%, 02/08/10 | 1,000 | 1,000 | ||||
FCAR Owner Trust | ||||||
0.380%, 02/01/10 | 500 | 500 | ||||
0.350%, 02/12/10 | 1,000 | 1,000 | ||||
0.250%, 02/25/10 to 03/01/10 | 4,600 | 4,600 | ||||
General Electric Capital | ||||||
0.240%, 02/16/10 to 04/12/10 | 10,000 | 9,999 | ||||
0.300%, 04/16/10 | 2,000 | 1,999 | ||||
Governor & of the Bank of Ireland | ||||||
0.601%, 04/21/10 | 2,250 | 2,247 | ||||
Grampian Funding LLC | ||||||
0.310%, 03/03/10 | 500 | 500 | ||||
0.270%, 04/19/10 | 11,000 | 10,994 | ||||
Johnson & Johnson | ||||||
0.200%, 06/10/10 | 2,000 | 1,998 | ||||
Liberty Street Funding LLC | ||||||
0.220%, 02/22/10 | 1,000 | 1,000 | ||||
Matchpoint Master Trust | ||||||
0.316%, 05/10/10 | 5,000 | 4,996 | ||||
MetLife Short Term Funding LLC | ||||||
0.401%, 03/03/10 | 1,000 | 1,000 | ||||
0.421%, 03/08/10 | 1,000 | 999 | ||||
Old Line Funding LLC | ||||||
0.260%, 02/11/10 | 1,000 | 1,000 | ||||
0.200%, 03/02/10 to 03/08/10 | 1,500 | 1,500 | ||||
Prudential PLC | ||||||
0.200%, 04/15/10 to 04/20/10 | 3,000 | 2,998 | ||||
Royal Park Investments Funding | ||||||
0.230%, 03/23/10 to 03/24/10 (C) | 3,000 | 2,999 | ||||
Santander Central Hispano Finance | ||||||
0.310%, 04/30/10 | 1,000 | 999 | ||||
Santander Central Hispano Finance Delaware | ||||||
0.280%, 07/21/10 | 3,500 | 3,495 | ||||
Sheffield Receivables | ||||||
0.200%, 02/12/10 | 3,000 | 3,000 | ||||
Societe de Prise de Participation de l’Etat | ||||||
0.150%, 02/25/10 | 500 | 500 | ||||
0.200%, 02/26/10 | 1,000 | 1,000 | ||||
0.250%, 05/27/10 | 1,000 | 999 | ||||
Thunder Bay Funding LLC | ||||||
0.200%, 03/09/10 | 1,000 | 1,000 | ||||
Total Capital Canada | ||||||
0.190%, 03/04/10 | 1,000 | 1,000 | ||||
Toyota Credit Canada | ||||||
0.240%, 04/07/10 | 1,000 | 999 | ||||
Toyota Financial Services de Puerto Rico | ||||||
0.240%, 04/05/10 | 1,000 | 999 | ||||
| Description | Face Amount ($ Thousands) | Value ($ Thousands) | ||||
Toyota Motor Credit | ||||||
0.200%, 03/03/10 to 03/18/10 | $ | 5,000 | $ | 4,998 | ||
Total Commercial Paper | 121,157 | |||||
U.S. GOVERNMENT AGENCY OBLIGATIONS (D) — 8.9% | ||||||
FFCB | ||||||
0.159%, 04/20/10 | 2,000 | 2,000 | ||||
FHLB | ||||||
0.075%, 02/07/10 | 3,000 | 2,999 | ||||
0.059%, 04/30/10 | 2,000 | 2,000 | ||||
FHLMC | ||||||
0.303%, 04/07/10 | 8,000 | 8,002 | ||||
FHLMC MTN | ||||||
0.327%, 03/09/10 | 13,000 | 13,032 | ||||
0.299%, 04/30/10 | 1,000 | 1,002 | ||||
FHLMC, Ser 1 | ||||||
0.141%, 02/01/10 | 5,000 | 5,001 | ||||
Total U.S. Government Agency Obligations | 34,036 | |||||
MUNICIPAL BONDS (D) — 1.3% | ||||||
Connecticut — 0.1% | ||||||
Connecticut Housing Finance Authority, Sub-Ser A-5, RB 0.227%, 02/04/10 | 500 | 500 | ||||
Iowa — 0.5% | ||||||
Iowa Finance Authority, Ser C, RB 0.227%, 02/04/10 | 1,790 | 1,790 | ||||
Iowa Finance Authority, Ser G, RB 0.230%, 02/04/10 | 100 | 100 | ||||
| 1,890 | ||||||
Kentucky — 0.6% | ||||||
Kentucky Housing, Ser J, RB 0.450%, 02/04/10 | 2,000 | 2,000 | ||||
Wisconsin — 0.1% | ||||||
Wisconsin Housing & Economic Development Authority, Ser D, RB 0.250%, 02/03/10 | 500 | 500 | ||||
Total Municipal Bonds | 4,890 | |||||
U.S. TREASURY OBLIGATIONS — 0.9% | ||||||
U.S. Treasury Bill 0.200%, 07/01/10 (A) | 1,500 | 1,499 | ||||
U.S. Treasury Note 2.000%, 09/30/10 | 2,000 | 2,021 | ||||
Total U.S. Treasury Obligations | 3,520 | |||||
| SEI Daily Income Trust / Annual Report / January 31, 2010 | 7 |
Table of Contents
SCHEDULE OF INVESTMENTS
Money Market Fund (Concluded)
January 31, 2010
| Description | Face Amount ($ Thousands) | Value ($ Thousands) | ||||
REPURCHASE AGREEMENTS (E) — 15.7% | ||||||
BNP Paribas | $ | 45,338 | $ | 45,338 | ||
BNP Paribas | 450 | 450 | ||||
Citigroup | 4,000 | 4,000 | ||||
Deutsche Bank | 1,000 | 1,000 | ||||
Goldman Sachs | 1,000 | 1,000 | ||||
Goldman Sachs | 2,000 | 2,000 | ||||
Goldman Sachs | 2,000 | 2,000 | ||||
| Description | Face Amount ($ Thousands) | Value ($ Thousands) | ||||
Goldman Sachs | $ | 2,000 | $ | 2,000 | ||
JPMorgan Chase | 1,000 | 1,000 | ||||
JPMorgan Chase | 1,000 | 1,000 | ||||
Total Repurchase Agreements | 59,788 | |||||
Total Investments — 100.0% | $ | 381,941 | ||||
Percentages are based on Net Assets of $382,009 ($ Thousands).
(A) The rate reported is the effective yield at time of purchase.
| (B) | Securities are held in connection with a letter of credit issued by a major bank. |
| (C) | Securities sold within terms of a private placement memorandum, exempt from registration under Section 144A of the Securities Act of 1933, as amended, and may be sold only to dealers in that program or other “accredited investors.” These securities have been determined to be liquid under guidelines established by the Board of Trustees. |
| (D) | Floating Rate Instrument. The rate reflected on the Schedule of Investments is the rate in effect on January 31, 2010. The demand and interest rate reset features give this security a shorter effective maturity date. |
| (E) | Tri-Party Repurchase Agreement. |
| (F) | Security considered illiquid. The total market value of such securities as of January 31, 2010 was $10,450 ($ Thousands) and represented 2.74% of Net Assets. |
FFCB — Federal Farm Credit Bank
FHLB — Federal Home Loan Bank
FHLMC — Federal Home Loan Mortgage Corporation
FNMA — Federal National Mortgage Association
LLC — Limited Liability Company
MTN — Medium Term Note
PLC — Public Limited Company
RB — Revenue Bond
Ser — Series
As of January 31, 2010, all of the Fund’s investments are Level 2 in accordance with ASC 820 (formerly FAS 157). For more information on valuation inputs, see Note 2 — Significant Accounting Policies in Notes to Financial Statements.
The accompanying notes are an integral part of the financial statements.
| 8 | SEI Daily Income Trust / Annual Report / January 31, 2010 |
Table of Contents
SCHEDULE OF INVESTMENTS
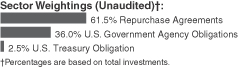
Government Fund
January 31, 2010
| Description | Face Amount ($ Thousands) | Value ($ Thousands) | ||||
U.S. GOVERNMENT AGENCY OBLIGATIONS — 37.2% | ||||||
FHLB | ||||||
0.075%, 02/07/10 (A) | $ | 35,000 | $ | 34,992 | ||
0.500%, 02/08/10 | 3,000 | 3,000 | ||||
4.375%, 03/17/10 | 3,000 | 3,015 | ||||
2.375%, 04/30/10 | 24,260 | 24,387 | ||||
4.875%, 05/14/10 | 25,000 | 25,336 | ||||
FHLB DN (B) | ||||||
0.060%, 02/19/10 | 4,980 | 4,980 | ||||
FHLB, Ser 2 | ||||||
0.950%, 03/30/10 | 25,000 | 25,029 | ||||
FNMA | ||||||
3.875%, 02/15/10 | 5,105 | 5,112 | ||||
4.750%, 03/12/10 | 30,000 | 30,148 | ||||
FNMA DN (B) | ||||||
0.180%, 05/24/10 | 20,000 | 19,989 | ||||
5.688%, 07/07/10 | 25,000 | 24,981 | ||||
FHLMC | ||||||
3.125%, 02/04/10 | 4,500 | 4,501 | ||||
4.875%, 02/09/10 | 24,445 | 24,470 | ||||
0.303%, 04/07/10 (A) | 63,000 | 63,018 | ||||
2.875%, 04/30/10 | 25,000 | 25,162 | ||||
FHLMC MTN | ||||||
3.125%, 02/12/10 | 25,000 | 25,022 | ||||
0.327%, 03/09/10 (A) | 50,000 | 50,117 | ||||
FHLMC DN, Ser RB (B) | ||||||
0.220%, 02/16/10 | 15,000 | 14,999 | ||||
0.190%, 06/01/10 | 16,571 | 16,561 | ||||
4.500%, 08/17/10 | 25,000 | 24,973 | ||||
FHLMC, Ser 1 | ||||||
0.141%, 02/01/10 (A) | 35,000 | 35,000 | ||||
FNMA | ||||||
2.375%, 05/20/10 | 15,000 | 15,097 | ||||
Total U.S. Government Agency Obligations | 499,889 | |||||
U.S. TREASURY OBLIGATION — 2.6% | ||||||
U.S. Treasury Note | ||||||
2.000%, 09/30/10 | 35,000 | 35,370 | ||||
Total U.S. Treasury Obligation | 35,370 | |||||
| Description | Face Amount ($ Thousands) | Value ($ Thousands) | ||||
REPURCHASE AGREEMENTS (C) — 63.7% | ||||||
Barclays Bank | $ | 40,000 | $ | 40,000 | ||
BNP Paribas | 40,000 | 40,000 | ||||
BNP Paribas | 200,000 | 200,000 | ||||
Citigroup | 72,000 | 72,000 | ||||
Deutsche Bank | 96,543 | 96,543 | ||||
Goldman Sachs | 212,000 | 212,000 | ||||
| SEI Daily Income Trust / Annual Report / January 31, 2010 | 9 |
Table of Contents
SCHEDULE OF INVESTMENTS
Government Fund (Concluded)
January 31, 2010
| Description | Face Amount ($ Thousands) | Value ($ Thousands) | ||||
Goldman Sachs | $ | 72,000 | $ | 72,000 | ||
Morgan Stanley | 72,000 | 72,000 | ||||
RBS | 50,000 | 50,000 | ||||
Total Repurchase Agreements | 854,543 | |||||
Total Investments — 103.5% | $ | 1,389,802 | ||||
Percentages are based on Net Assets of $1,342,635 ($ Thousands).
| (A) | Floating Rate Instrument. The rate reflected on the Schedule of Investments is the rate in effect on January 31, 2010. The demand and interest rate reset features give this security a shorter effective maturity date. |
| (B) | The rate reported is the effective yield at time of purchase. |
| (C) | Tri-Party Repurchase Agreement. |
| (D) | Security considered illiquid. The total market value of such securities as of January 31, 2010 was $80,000 ($ Thousands) and represented 5.96% of Net Assets. |
DN — Discount Note
FHLB — Federal Home Loan Bank
FHLMC — Federal Home Loan Mortgage Corporation
FNMA — Federal National Mortgage Association
GNMA — Government National Mortgage Association
MTN — Medium Term Note
Ser — Series
As of January 31, 2010, all of the Fund’s investments are Level 2 in accordance with ASC 820 (formerly FAS 157). For more information on valuation inputs, see Note 2 — Significant Accounting Policies in Notes to Financial Statements.
The accompanying notes are an integral part of the financial statements.
| 10 | SEI Daily Income Trust / Annual Report / January 31, 2010 |
Table of Contents
SCHEDULE OF INVESTMENTS
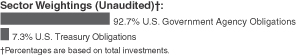
Government II Fund
January 31, 2010
| Description | Face Amount ($ Thousands) | Value ($ Thousands) | ||||
U.S. GOVERNMENT AGENCY OBLIGATIONS — 93.6% | ||||||
FFCB (A) (B) | ||||||
0.451%, 02/11/10 | $ | 500 | $ | 500 | ||
FHLB | ||||||
0.075%, 02/07/10 (A) | 45,000 | 44,990 | ||||
1.020%, 02/12/10 | 5,000 | 5,001 | ||||
5.015%, 02/16/10 | 20,000 | 20,039 | ||||
1.050%, 02/17/10 | 10,000 | 10,004 | ||||
4.375%, 03/17/10 | 4,140 | 4,162 | ||||
0.875%, 03/30/10 | 15,000 | 15,015 | ||||
3.350%, 04/15/10 | 15,000 | 15,099 | ||||
4.875%, 05/14/10 | 35,000 | 35,471 | ||||
3.000%, 06/11/10 | 13,510 | 13,648 | ||||
3.500%, 07/16/10 | 10,000 | 10,150 | ||||
FHLB DN | ||||||
0.090%, 02/02/10 to 05/11/10 (B) | 100,000 | 99,991 | ||||
0.089%, 02/05/10 (B) | 70,000 | 69,999 | ||||
0.080%, 02/12/10 to 03/05/10 (B) | 125,000 | 124,996 | ||||
0.073%, 02/19/10 (B) | 110,300 | 110,296 | ||||
0.074%, 02/26/10 (B) | 40,000 | 39,998 | ||||
0.060%, 03/03/10 (B) | 33,200 | 33,198 | ||||
0.082%, 03/10/10 (B) | 85,000 | 84,993 | ||||
0.100%, 03/12/10 to 04/21/10 (B) | 190,000 | 189,977 | ||||
0.093%, 03/24/10 (B) | 58,500 | 58,492 | ||||
0.210%, 03/26/10 (B) | 25,000 | 24,992 | ||||
0.075%, 04/14/10 (B) | 25,000 | 24,996 | ||||
0.088%, 04/16/10 (B) | 50,000 | 49,991 | ||||
0.095%, 04/23/10 (B) | 10,000 | 9,998 | ||||
0.000%, 04/28/10 | 15,000 | 14,995 | ||||
0.160%, 05/17/10 (B) | 25,000 | 24,988 | ||||
0.170%, 06/04/10 (B) | 25,000 | �� | 24,986 | |||
FHLB DN (B) | ||||||
0.100%, 02/08/10 | 18,100 | 18,100 | ||||
0.050%, 02/10/10 | 36,969 | 36,969 | ||||
FHLB DN, Ser 2005 (B) | ||||||
0.030%, 02/01/10 | 31,365 | 31,365 | ||||
0.100%, 02/03/10 | 21,958 | 21,958 | ||||
0.070%, 02/17/10 | 25,000 | 24,999 | ||||
FHLB, Ser 1 | ||||||
1.030%, 02/18/10 | 7,115 | 7,118 | ||||
1.050%, 02/23/10 | 29,820 | 29,836 | ||||
5.000%, 03/12/10 | 5,925 | 5,955 | ||||
FHLB | ||||||
1.020%, 02/26/10 | 3,000 | 3,002 | ||||
Total U.S. Government Agency Obligations | 1,340,267 | |||||
| Description | Face Amount ($ Thousands) | Value ($ Thousands) | ||||
U.S. TREASURY OBLIGATIONS — 7.3% | ||||||
U.S. Cash Management Bill | ||||||
0.085%, 04/01/10 (B) | $ | 85,000 | $ | 84,988 | ||
U.S. Treasury Note | ||||||
6.500%, 02/15/10 | 20,000 | 20,048 | ||||
Total U.S. Treasury Obligations | 105,036 | |||||
Total Investments — 100.9% | $ | 1,445,303 | ||||
Percentages are based on Net Assets of $1,432,564 ($ Thousands).
| (A) | Floating Rate Instrument. The rate reflected on the Schedule of Investments is the rate in effect on January 31, 2010. The demand and interest rate reset features give this security a shorter effective maturity date. |
| (B) | The rate reported is the effective yield at time of purchase. |
DN — Discount Note
FFCB — Federal Farm Credit Bank
FHLB — Federal Home Loan Bank
Ser — Series
As of January 31, 2010, all of the Fund’s investments are Level 2 in accordance with ASC 820 (formerly FAS 157). For more information on valuation inputs, see Note 2 — Significant Accounting Policies in Notes to Financial Statements.
The accompanying notes are an integral part of the financial statements.
| SEI Daily Income Trust / Annual Report / January 31, 2010 | 11 |
Table of Contents
SCHEDULE OF INVESTMENTS
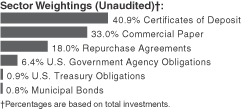
Prime Obligation Fund
January 31, 2010
| Description | Face Amount ($ Thousands) | Value ($ Thousands) | ||||
CERTIFICATES OF DEPOSIT — 41.1% | ||||||
Allied Irish Banks PLC | ||||||
0.400%, 02/16/10 | $ | 14,300 | $ | 14,300 | ||
0.500%, 03/16/10 | 7,500 | 7,500 | ||||
0.500%, 03/16/10 | 16,700 | 16,700 | ||||
0.500%, 03/19/10 | 14,300 | 14,300 | ||||
0.600%, 04/15/10 | 18,500 | 18,500 | ||||
0.600%, 04/15/10 | 7,500 | 7,500 | ||||
0.600%, 04/20/10 | 14,300 | 14,300 | ||||
Banco Bilbao Vizcaya Argentaria | ||||||
0.235%, 02/01/10 | 36,000 | 36,000 | ||||
0.290%, 02/26/10 | 12,000 | 12,000 | ||||
0.275%, 02/26/10 | 18,000 | 18,000 | ||||
0.235%, 03/01/10 | 7,000 | 7,000 | ||||
0.290%, 03/03/10 | 17,000 | 17,000 | ||||
Bank of Ireland | ||||||
0.500%, 03/23/10 | 39,500 | 39,500 | ||||
0.600%, 04/21/10 | 19,750 | 19,750 | ||||
Bank of Montreal | ||||||
0.200%, 02/23/10 | 150,650 | 150,650 | ||||
Bank of Tokyo-Mitsubishi | ||||||
0.205%, 03/05/10 | 17,000 | 17,000 | ||||
Barclays Bank PLC | ||||||
0.590%, 03/05/10 | 30,000 | 30,000 | ||||
0.575%, 03/15/10 | 23,175 | 23,175 | ||||
0.450%, 04/27/10 | 29,000 | 29,000 | ||||
0.440%, 05/07/10 | 51,500 | 51,500 | ||||
BNP Paribas | ||||||
0.230%, 02/16/10 | 35,000 | 35,000 | ||||
0.230%, 02/18/10 | 86,000 | 86,000 | ||||
0.230%, 03/09/10 | 5,000 | 5,000 | ||||
0.230%, 03/10/10 | 22,000 | 22,000 | ||||
0.230%, 05/26/10 | 4,000 | 4,000 | ||||
Calyon New York | ||||||
0.220%, 04/23/10 | 25,000 | 25,000 | ||||
0.230%, 05/04/10 | 27,000 | 27,000 | ||||
0.220%, 05/04/10 | 3,000 | 3,000 | ||||
Credit Agricole | ||||||
0.200%, 02/01/10 | 13,000 | 13,000 | ||||
0.210%, 02/18/10 | 43,000 | 43,000 | ||||
0.300%, 07/26/10 | 38,000 | 38,000 | ||||
0.300%, 07/29/10 | 27,000 | 27,000 | ||||
0.300%, 08/02/10 | 3,000 | 3,000 | ||||
| Description | Face Amount ($ Thousands) | Value ($ Thousands) | ||||
Credit Industriel & Commercial | ||||||
0.310%, 03/01/10 | $ | 50,000 | $ | 49,998 | ||
0.395%, 03/18/10 | 45,000 | 45,000 | ||||
HSBC | ||||||
0.325%, 03/29/10 | 11,000 | 11,000 | ||||
National Australia Bank | ||||||
0.285%, 02/01/10 | 42,000 | 42,000 | ||||
0.400%, 02/05/10 | 15,000 | 15,000 | ||||
Natixis | ||||||
0.240%, 02/03/10 | 20,000 | 20,000 | ||||
0.220%, 02/11/10 | 25,000 | 25,000 | ||||
0.210%, 02/24/10 | 27,000 | 27,000 | ||||
0.220%, 03/01/10 | 35,000 | 35,000 | ||||
Rabobank Nederland | ||||||
0.350%, 03/24/10 | 12,000 | 12,000 | ||||
Societe Generale | ||||||
0.250%, 03/01/10 | 70,000 | 70,000 | ||||
Sumitomo Mitsui Banking | ||||||
0.250%, 02/11/10 | 18,000 | 18,000 | ||||
Svenska Handelsbanken | ||||||
0.230%, 02/10/10 | 21,000 | 21,000 | ||||
0.200%, 03/30/10 | 3,700 | 3,700 | ||||
Toronto Dominion Bank | ||||||
0.400%, 02/08/10 | 2,000 | 2,000 | ||||
0.330%, 03/18/10 | 10,000 | 10,000 | ||||
UBS | ||||||
0.340%, 04/30/10 | 13,000 | 13,000 | ||||
0.520%, 05/19/10 | 61,000 | 61,000 | ||||
0.460%, 05/27/10 | 19,750 | 19,750 | ||||
0.480%, 05/28/10 | 37,000 | 37,000 | ||||
0.420%, 06/14/10 | 25,000 | 25,000 | ||||
Total Certificates of Deposit | 1,437,123 | |||||
COMMERCIAL PAPER (A) (B) — 33.2% | ||||||
American Honda Finance | ||||||
0.210%, 02/16/10 | 34,000 | 33,997 | ||||
0.190%, 03/02/10 | 5,000 | 4,999 | ||||
Atlantis One Funding | ||||||
0.331%, 04/06/10 | 22,000 | 21,987 | ||||
0.310%, 07/07/10 to 07/19/10 | 30,000 | 29,959 | ||||
0.305%, 07/13/10 | 11,000 | 10,985 | ||||
Australia & New Zealand Banking Group | ||||||
0.401%, 02/08/10 | 4,000 | 4,000 | ||||
Barton Capital | ||||||
0.253%, 02/02/10 | 4,000 | 4,000 | ||||
0.240%, 02/05/10 | 6,000 | 6,000 | ||||
BNZ International Funding | ||||||
0.270%, 02/02/10 | 7,000 | 7,000 | ||||
Cancara Asset Securitisation LLC | ||||||
0.230%, 04/08/10 to 04/12/10 | 45,000 | 44,980 | ||||
Citibank Credit Card Issuance Trust | ||||||
0.150%, 02/01/10 | 8,000 | 8,000 | ||||
0.200%, 02/24/10 | 9,000 | 8,999 | ||||
| 12 | SEI Daily Income Trust / Annual Report / January 31, 2010 |
Table of Contents
| Description | Face Amount ($ Thousands) | Value ($ Thousands) | ||||
Coca-Cola | ||||||
0.180%, 03/17/10 | $ | 20,000 | $ | 19,996 | ||
0.200%, 04/13/10 | 11,000 | 10,996 | ||||
Dexia Delaware LLC | ||||||
0.280%, 02/23/10 | 71,000 | 70,988 | ||||
0.285%, 03/03/10 | 35,000 | 34,992 | ||||
E.ON | ||||||
0.260%, 02/12/10 | 4,000 | 4,000 | ||||
Edison Asset Securitization LLC | ||||||
0.230%, 02/05/10 | 7,000 | 7,000 | ||||
0.210%, 03/09/10 to 03/16/10 | 45,000 | 44,989 | ||||
0.200%, 04/26/10 | 24,000 | 23,989 | ||||
ENI Coordination Center | ||||||
0.175%, 02/22/10 | 51,000 | 50,995 | ||||
0.200%, 04/20/10 | 4,000 | 3,998 | ||||
0.195%, 04/26/10 | 5,000 | 4,998 | ||||
Fairway Finance LLC | ||||||
0.220%, 02/01/10 to 02/08/10 | 6,000 | 6,000 | ||||
0.210%, 03/16/10 | 1,000 | 1,000 | ||||
FCAR Owner Trust | ||||||
0.380%, 02/01/10 | 2,500 | 2,500 | ||||
0.350%, 02/12/10 | 9,000 | 8,999 | ||||
0.250%, 02/25/10 to 03/01/10 | 57,500 | 57,489 | ||||
Gemini Securitization LLC | ||||||
0.200%, 03/04/10 | 13,000 | 12,998 | ||||
General Electric Capital | ||||||
0.240%, 02/16/10 to 04/12/10 | 95,000 | 94,979 | ||||
0.300%, 04/16/10 | 12,000 | 11,993 | ||||
Governor & of the Bank of Ireland | ||||||
0.601%, 04/21/10 | 19,750 | 19,724 | ||||
Grampian Funding LLC | ||||||
0.310%, 03/03/10 | 30,000 | 29,992 | ||||
0.270%, 04/19/10 to 04/22/10 | 79,000 | 78,954 | ||||
ING US Funding LLC | ||||||
0.300%, 02/05/10 | 11,000 | 11,000 | ||||
Johnson & Johnson | ||||||
0.200%, 06/10/10 | 13,000 | 12,991 | ||||
Liberty Street Funding LLC | ||||||
0.220%, 02/22/10 | 4,000 | 4,000 | ||||
Matchpoint Master Trust | ||||||
0.200%, 02/22/10 | 2,000 | 2,000 | ||||
0.316%, 05/10/10 | 41,000 | 40,965 | ||||
0.300%, 05/25/10 | 3,828 | 3,824 | ||||
MetLife Short Term Funding LLC | ||||||
0.390%, 02/16/10 | 2,000 | 2,000 | ||||
0.431%, 02/19/10 | 3,000 | 2,999 | ||||
0.401%, 03/03/10 to 03/09/10 | 7,000 | 6,997 | ||||
0.421%, 03/08/10 | 7,000 | 6,997 | ||||
0.391%, 03/23/10 | 2,000 | 1,999 | ||||
Old Line Funding LLC | ||||||
0.260%, 02/11/10 | 7,000 | 6,999 | ||||
0.200%, 03/02/10 | 7,000 | 6,999 | ||||
0.196%, 03/08/10 | 7,000 | 6,999 | ||||
| Description | Face Amount ($ Thousands) | Value ($ Thousands) | ||||
Prudential PLC | ||||||
0.200%, 04/20/10 | $ | 15,000 | $ | 14,993 | ||
Royal Park Investments Funding | ||||||
0.230%, 03/23/10 to 03/24/10 (C) | 37,000 | 36,988 | ||||
Santander Central Hispano Finance | ||||||
0.310%, 04/30/10 | 10,000 | 9,992 | ||||
Santander Central Hispano Finance Delaware | ||||||
0.280%, 07/21/10 | 38,000 | 37,950 | ||||
Sheffield Receivables | ||||||
0.200%, 02/12/10 to 05/13/10 | 19,720 | 19,716 | ||||
Societe de Prise de Participation de l’Etat | ||||||
0.160%, 02/25/10 | 14,000 | 13,998 | ||||
0.200%, 02/26/10 | 5,000 | 4,999 | ||||
0.250%, 05/27/10 | 5,000 | 4,996 | ||||
Starbird Funding | ||||||
0.200%, 03/04/10 | 17,000 | 16,997 | ||||
Straight-A Funding | ||||||
0.180%, 02/02/10 (C) | 6,000 | 6,000 | ||||
Thunder Bay Funding LLC | ||||||
0.200%, 03/09/10 | 7,000 | 6,999 | ||||
Total Capital Canada | ||||||
0.190%, 03/04/10 | 7,000 | 6,999 | ||||
Toyota Credit Canada | ||||||
0.240%, 02/03/10 to 04/07/10 | 10,000 | 9,999 | ||||
0.230%, 04/05/10 | 4,000 | 3,998 | ||||
Toyota Financial Services de Puerto Rico | ||||||
0.240%, 04/05/10 | 3,000 | 2,999 | ||||
Toyota Motor Credit | ||||||
0.200%, 03/03/10 to 03/18/10 | 53,000 | 52,987 | ||||
Victory Receivables | ||||||
0.220%, 02/03/10 | 8,000 | 8,000 | ||||
Total Commercial Paper | 1,161,854 | |||||
U.S. GOVERNMENT AGENCY OBLIGATIONS (D) — 6.4% | ||||||
FFCB | ||||||
0.159%, 04/20/10 | 12,000 | 12,000 | ||||
FHLB | ||||||
0.059%, 04/30/10 | 12,000 | 11,999 | ||||
0.075%, 02/07/10 | 24,000 | 23,995 | ||||
FHLMC | ||||||
0.303%, 04/07/10 | 50,600 | 50,615 | ||||
FHLMC MTN | ||||||
0.299%, 04/30/10 | 2,000 | 2,004 | ||||
0.327%, 03/09/10 | 90,000 | 90,219 | ||||
FHLMC, Ser 1 | ||||||
0.141%, 02/01/10 | 35,000 | 35,004 | ||||
Total U.S. Government Agency Obligations | 225,836 | |||||
| SEI Daily Income Trust / Annual Report / January 31, 2010 | 13 |
Table of Contents
SCHEDULE OF INVESTMENTS
Prime Obligation Fund (Continued)
January 31, 2010
| Description | Face Amount ($ Thousands) | Value ($ Thousands) | ||||
U.S. TREASURY OBLIGATIONS — 0.9% | ||||||
U.S. Treasury Bill | ||||||
0.200%, 07/01/10 (A) | $ | 13,000 | $ | 12,989 | ||
U.S. Treasury Note | ||||||
2.000%, 09/30/10 | 19,000 | 19,201 | ||||
Total U.S. Treasury Obligations | 32,190 | |||||
MUNICIPAL BONDS (D) — 0.8% | ||||||
Colorado — 0.3% | ||||||
Colorado Housing & Finance Authority, RB | ||||||
0.230%, 02/03/10 | 1,860 | 1,860 | ||||
0.230%, 02/03/10 | 1,000 | 1,000 | ||||
0.200%, 02/03/10 | 4,000 | 4,000 | ||||
0.210%, 02/03/10 | 2,000 | 2,000 | ||||
0.320%, 02/03/10 | 890 | 890 | ||||
0.230%, 02/03/10 | 700 | 700 | ||||
0.210%, 02/03/10 | 1,000 | 1,000 | ||||
| 11,450 | ||||||
Connecticut — 0.0% | ||||||
Connecticut Housing Finance Authority, Sub-Ser A-5, RB | ||||||
0.227%, 02/04/10 | 1,335 | 1,335 | ||||
Iowa — 0.4% | ||||||
Iowa Finance Authority, Ser B, RB | ||||||
0.220%, 02/04/10 | 1,000 | 1,000 | ||||
Iowa Finance Authority, Ser C, RB | ||||||
0.227%, 02/04/10 | 9,930 | 9,930 | ||||
Iowa Finance Authority, Ser M, RB | ||||||
0.230%, 02/04/10 | 950 | 950 | ||||
| 11,880 | ||||||
Texas — 0.1% | ||||||
Texas State, GO | ||||||
0.220%, 02/03/10 | 1,000 | 1,000 | ||||
0.250%, 02/03/10 | 1,000 | 1,000 | ||||
| 2,000 | ||||||
Total Municipal Bonds | 26,665 | |||||
REPURCHASE AGREEMENTS (E) — 18.1% | ||||||
Barclays Capital | 48,000 | 48,000 | ||||
| Description | Face Amount ($ Thousands) | Value ($ Thousands) | ||||
BNP Paribas | $ | 8,000 | $ | 8,000 | ||
BNP Paribas | 22,000 | 22,000 | ||||
Citigroup | 37,000 | 37,000 | ||||
Deutsche Bank | 18,500 | 18,500 | ||||
Deutsche Bank | 30,000 | 30,000 | ||||
Deutsche Bank | 8,500 | 8,500 | ||||
| 14 | SEI Daily Income Trust / Annual Report / January 31, 2010 |
Table of Contents
| Description | Face Amount ($ Thousands) | Value ($ Thousands) | ||||
Goldman Sachs | $ | 7,000 | $ | 7,000 | ||
Goldman Sachs | 16,000 | 16,000 | ||||
Goldman Sachs | 18,700 | 18,700 | ||||
Goldman Sachs | 17,000 | 17,000 | ||||
JPMorgan Chase | 5,000 | 5,000 | ||||
JPMorgan Chase | 14,000 | 14,000 | ||||
JPMorgan Chase | 19,000 | 19,000 | ||||
| Description | Face Amount ($ Thousands) | Value ($ Thousands) | ||||
JPMorgan Chase | $ | 15,000 | $ | 15,000 | ||
Morgan Stanley | 4,000 | 4,000 | ||||
RBS | 24,000 | 24,000 | ||||
RBS | 202,895 | 202,895 | ||||
UBS | 19,000 | 19,000 | ||||
UBS | 100,380 | $ | 100,380 | |||
Total Repurchase Agreements | 633,975 | |||||
Total Investments — 100.5% | $ | 3,517,643 | ||||
| SEI Daily Income Trust / Annual Report / January 31, 2010 | 15 |
Table of Contents
SCHEDULE OF INVESTMENTS
Prime Obligation Fund (Concluded)
January 31, 2010
Percentages are based on Net Assets of $3,500,099 ($ Thousands).
| (A) | The rate reported is the effective yield at time of purchase. |
| (B) | Securities are held in connection with a letter of credit issued by a major bank. |
| (C) | Securities sold within terms of a private placement memorandum, exempt from registration under Section 144A of the Securities Act of 1933, as amended, and may be sold only to dealers in that program or other “accredited investors.” These securities have been determined to be liquid under guidelines established by the Board of Trustees. |
| (D) | Floating Rate Instrument. The rate reflected on the Schedule of Investments is the rate in effect on January 31, 2010. The demand and interest rate reset features give this security a shorter effective maturity date. |
| (E) | Tri-Party Repurchase Agreement. |
| (F) | Security considered illiquid. The total market value of such securities as of January 31, 2010 was $99,200 ($ Thousands) and represented 2.83% of Net Assets. |
FFCB — Federal Farm Credit Bank
FHLB — Federal Home Loan Bank
FHLMC — Federal Home Loan Mortgage Corporation
FNMA — Federal National Mortgage Association
GNMA — Government National Mortgage Association
GO — General Obligation
LLC — Limited Liability Company
MTN — Medium Term Note
PLC — Public Limited Company
RB — Revenue Bond
Ser — Series
As of January 31, 2010, all of the Fund’s investments are Level 2 in accordance with ASC 820 (formerly FAS 157).
The following is a reconciliation of investments in which significant unobservable inputs (Level 3) were used in determining value ($ Thousands):
| Capital Support Agreement | Corporate Bonds | Total | ||||||||||
Beginning balance as of February 1, 2009 | $ | 150,858 | $ | 105,675 | $ | 256,533 | ||||||
Change in unrealized appreciation/(depreciation) | (150,858 | ) | 92,494 | (58,364 | ) | |||||||
Accrued discounts/premiums | — | 6,910 | 6,910 | |||||||||
Amortization sold | — | (5,444 | ) | (5,444 | ) | |||||||
Realized gain/(loss) | 152,452 | (95,553 | ) | 56,899 | ||||||||
Net purchases/sales | (152,452 | ) | (104,082 | ) | (256,534 | ) | ||||||
Ending balance as of January 31, 2010 | $ | — | $ | — | $ | — | ||||||
Changes in unrealized gains/(losses) included in earnings related to securities still held at reporting date | $ | — | $ | — | $ | — | ||||||
For more information on valuation inputs, see Note 2 — Significant Accounting Policies in Notes to Financial Statements.
The accompanying notes are an integral part of the financial statements.
| 16 | SEI Daily Income Trust / Annual Report / January 31, 2010 |
Table of Contents
SCHEDULE OF INVESTMENTS
Treasury Fund
January 31, 2010

| Description | Face Amount ($ Thousands) | Value ($ Thousands) | ||||
U.S. TREASURY OBLIGATIONS — 36.7% | ||||||
U.S. Cash Management Bill (A) | ||||||
0.110%, 04/01/10 | $ | 40,000 | $ | 39,993 | ||
U.S. Treasury Bills (A) | ||||||
0.260%, 02/25/10 | 10,000 | 9,998 | ||||
0.200%, 07/01/10 | 50,000 | 49,958 | ||||
U.S. Treasury Notes | ||||||
6.500%, 02/15/10 | 10,000 | 10,024 | ||||
3.500%, 02/15/10 | 30,000 | 30,036 | ||||
4.750%, 02/15/10 | 25,000 | 25,042 | ||||
2.000%, 02/28/10 to 09/30/10 | 41,000 | 41,256 | ||||
2.750%, 07/31/10 | 30,000 | 30,364 | ||||
Total U.S. Treasury Obligations | 236,671 | |||||
REPURCHASE AGREEMENTS (B) — 63.0% | ||||||
Barclays Bank | 10,000 | 10,000 | ||||
Barclays Bank | 20,000 | 20,000 | ||||
Barclays Bank | 20,000 | 20,000 | ||||
Deutsche Bank | 19,984 | 19,984 | ||||
| Description | Face Amount ($ Thousands) | Value ($ Thousands) | ||||
JPMorgan Chase | $ | 168,000 | $ | 168,000 | ||
Morgan Stanley | 168,000 | 168,000 | ||||
Total Repurchase Agreements | 405,984 | |||||
Total Investments — 99.7% | $ | 642,655 | ||||
Percentages are based on Net Assets of $644,683 ($ Thousands).
| (A) | The rate reported is the effective yield at time of purchase. |
| (B) | Tri-Party Repurchase Agreement. |
| (C) | Security considered illiquid. The total market value of such securities as of January 31, 2010 was $50,000 ($ Thousands) and represented 7.76% of Net Assets. |
As of January 31, 2010, all of the Fund’s investments are Level 2 in accordance with ASC 820 (formerly FAS 157). For more information on valuation inputs, see Note 2 — Significant Accounting Policies in Notes to Financial Statements.
The accompanying notes are an integral part of the financial statements.
| SEI Daily Income Trust / Annual Report / January 31, 2010 | 17 |
Table of Contents
SCHEDULE OF INVESTMENTS
Treasury II Fund
January 31, 2010

| Description | Face Amount ($ Thousands) | Value ($ Thousands) | ||||
U.S. TREASURY OBLIGATIONS — 99.9% | ||||||
U.S. Cash Management Bill (A) | ||||||
0.110%, 04/01/10 | $ | 60,000 | $ | 59,989 | ||
U.S. Treasury Bills (A) | ||||||
0.080%, 02/04/10 | 39,092 | 39,092 | ||||
0.060%, 02/11/10 | 55,000 | 54,999 | ||||
0.175%, 02/18/10 | 10,000 | 9,999 | ||||
0.048%, 02/25/10 | 64,265 | 64,263 | ||||
0.053%, 03/04/10 to 04/22/10 | 75,488 | 75,482 | ||||
0.074%, 03/11/10 | 54,561 | 54,557 | ||||
0.046%, 03/18/10 | 58,655 | 58,652 | ||||
0.050%, 03/25/10 to 04/15/10 | 50,000 | 49,996 | ||||
0.085%, 04/08/10 to 05/06/10 | 38,939 | 38,932 | ||||
0.063%, 04/29/10 | 23,000 | 22,996 | ||||
0.070%, 05/13/10 | 20,000 | 19,996 | ||||
0.200%, 07/01/10 | 5,000 | 4,996 | ||||
U.S. Treasury Notes | ||||||
6.500%, 02/15/10 | 10,000 | 10,024 | ||||
4.000%, 03/15/10 to 04/15/10 | 45,000 | 45,305 | ||||
Total U.S. Treasury Obligations | 609,278 | |||||
Total Investments — 99.9% | $ | 609,278 | ||||
Percentages are based on Net Assets of $610,161 ($ Thousands).
| (A) | The rate reported is the effective yield at time of purchase. |
As of January 31, 2010, all of the Fund’s investments are Level 2 in accordance with ASC 820 (formerly FAS 157). For more information on valuation inputs, see Note 2 — Significant Accounting Policies in Notes to Financial Statements.
The accompanying notes are an integral part of the financial statements.
| 18 | SEI Daily Income Trust / Annual Report / January 31, 2010 |
Table of Contents
SCHEDULE OF INVESTMENTS
Short-Duration Government Fund
January 31, 2010

| Description | Face Amount ($ Thousands) | Value ($ Thousands) | ||||
MORTGAGE-BACKED SECURITIES — 49.2% | ||||||
Agency Mortgage-Backed Obligations — 49.2% | ||||||
FHLMC | ||||||
7.375%, 09/01/18 (A) | $ | 7 | $ | 7 | ||
7.287%, 03/01/19 (A) | 23 | 24 | ||||
7.250%, 01/01/18 to 09/01/20 (A) | 51 | 51 | ||||
7.125%, 07/01/18 to 11/01/20 (A) | 18 | 18 | ||||
7.000%, 02/01/16 to 11/01/18 (A) | 33 | 34 | ||||
6.875%, 07/01/18 to 07/01/18 (A) | 22 | 23 | ||||
6.750%, 09/01/16 to 01/01/17 (A) | 13 | 13 | ||||
6.625%, 02/01/16 to 06/01/18 (A) | 9 | 9 | ||||
6.500%, 07/01/16 to 01/01/17 (A) | 16 | 17 | ||||
6.000%, 06/01/21 | 1,523 | 1,641 | ||||
4.500%, 07/01/23 to 01/01/39 | 1,372 | 1,390 | ||||
4.341%, 07/01/24 (A) | 23 | 24 | ||||
4.304%, 05/01/19 (A) | 36 | 37 | ||||
3.935%, 04/01/19 (A) | 22 | 22 | ||||
3.918%, 02/01/19 to 03/01/19 (A) | 74 | 75 | ||||
3.495%, 04/01/22 (A) | 79 | 79 | ||||
3.463%, 05/01/24 (A) | 64 | 65 | ||||
3.319%, 06/01/24 (A) | 59 | 61 | ||||
3.314%, 06/01/24 (A) | 131 | 135 | ||||
3.215%, 12/01/23 (A) | 2,555 | 2,616 | ||||
3.178%, 07/01/20 (A) | 5 | 5 | ||||
3.162%, 04/01/29 (A) | 119 | 121 | ||||
3.160%, 06/01/17 (A) | 37 | 37 | ||||
3.146%, 04/01/29 (A) | 55 | 56 | ||||
3.000%, 02/01/17 (A) | 4 | 4 | ||||
2.879%, 12/01/23 (A) | 164 | 168 | ||||
2.500%, 04/01/16 to 03/01/17 (A) | 9 | 9 | ||||
2.375%, 06/01/16 (A) | 5 | 5 | ||||
FHLMC REMIC, Ser 2004-2780, Cl LC | ||||||
5.000%, 07/15/27 | 1,159 | 1,198 | ||||
FHLMC REMIC, Ser 2004-2826, Cl BK | ||||||
5.000%, 01/15/18 | 621 | 645 | ||||
FHLMC REMIC, Ser 2587, Cl ET | ||||||
3.700%, 07/15/17 | 492 | 509 | ||||
FHLMC REMIC, Ser 2805, Cl DG | ||||||
4.500%, 04/15/17 | 545 | 564 | ||||
FHLMC REMIC, Ser 2975, Cl VT | ||||||
5.000%, 02/15/11 | 820 | 839 | ||||
FHLMC REMIC, Ser 3022, Cl MB | ||||||
5.000%, 12/15/28 | 1,500 | 1,578 | ||||
FHLMC REMIC, Ser 3029, Cl PE | ||||||
5.000%, 03/15/34 | 4,000 | 4,214 | ||||
FHLMC REMIC, Ser 3148, Cl CF | ||||||
0.633%, 02/15/34 (A) | 2,623 | 2,586 | ||||
| Description | Face Amount ($ Thousands) | Value ($ Thousands) | ||||
FHLMC REMIC, Ser 3153, Cl FX | ||||||
0.583%, 05/15/36 (A) | $ | 635 | $ | 626 | ||
FHLMC REMIC, Ser T-42, Cl A5 | ||||||
7.500%, 02/25/42 | 787 | 886 | ||||
FNMA TBA | ||||||
6.500%, 02/01/38 | 6,300 | 6,796 | ||||
6.000%, 02/01/36 | 9,400 | 10,054 | ||||
5.500%, 02/01/19 to 02/01/38 | 63,000 | 67,230 | ||||
FNMA | ||||||
7.000%, 06/01/37 | 182 | 201 | ||||
6.500%, 05/01/26 to 12/01/38 | 6,637 | 7,182 | ||||
6.442%, 04/01/14 | 3,969 | 4,351 | ||||
6.000%, 02/01/23 | 9,846 | 10,618 | ||||
5.942%, 11/01/11 | 341 | 361 | ||||
5.140%, 11/01/15 | 3,323 | 3,596 | ||||
5.090%, 11/01/15 | 4,237 | 4,574 | ||||
5.016%, 02/01/13 | 75 | 79 | ||||
4.974%, 12/01/13 | 1,450 | 1,561 | ||||
4.830%, 02/01/13 | 2,249 | 2,398 | ||||
4.771%, 09/01/15 | 7,342 | 7,819 | ||||
4.621%, 04/01/13 | 110 | 116 | ||||
4.527%, 12/01/29 (A) | 172 | 174 | ||||
4.100%, 07/01/13 | 982 | 1,030 | ||||
3.851%, 09/01/24 (A) | 962 | 982 | ||||
3.200%, 08/01/27 (A) | 560 | 567 | ||||
3.122%, 09/01/25 (A) | 160 | 163 | ||||
3.097%, 08/01/29 (A) | 686 | 704 | ||||
3.037%, 05/01/28 (A) | 995 | 1,002 | ||||
2.631%, 02/01/27 (A) | 159 | 160 | ||||
FNMA REMIC, Ser 1992-61, Cl FA | ||||||
0.900%, 10/25/22 (A) | 172 | 172 | ||||
FNMA REMIC, Ser 1993-32, Cl H | ||||||
6.000%, 03/25/23 | 74 | 80 | ||||
FNMA REMIC, Ser 1993-5, Cl Z | ||||||
6.500%, 02/25/23 | 34 | 38 | ||||
FNMA REMIC, Ser 1994-77, Cl FB | ||||||
1.750%, 04/25/24 (A) | 16 | 16 | ||||
FNMA REMIC, Ser 2001-51, Cl QN | ||||||
6.000%, 10/25/16 | 216 | 233 | ||||
FNMA REMIC, Ser 2002-3, Cl PG | ||||||
5.500%, 02/25/17 | 1,198 | 1,280 | ||||
FNMA REMIC, Ser 2002-53, Cl FK | ||||||
0.631%, 04/25/32 (A) | 317 | 316 | ||||
FNMA REMIC, Ser 2003-76, Cl CA | ||||||
3.750%, 07/25/33 | 1,052 | 1,073 | ||||
FNMA REMIC, Ser 2004-15, Cl AN | ||||||
4.000%, 09/25/17 | 4,000 | 4,159 | ||||
FNMA REMIC, Ser 2004-75, Cl KA | ||||||
4.500%, 03/25/18 | 397 | 413 | ||||
FNMA REMIC, Ser 2005-114, Cl EZ | ||||||
5.500%, 01/25/36 | 2,653 | 2,626 | ||||
FNMA REMIC, Ser 2005-43, Cl EN | ||||||
5.000%, 05/25/19 | 1,007 | 1,048 | ||||
| SEI Daily Income Trust / Annual Report / January 31, 2010 | 19 |
Table of Contents
SCHEDULE OF INVESTMENTS
Short-Duration Government Fund (Concluded)
January 31, 2010
| Description | Face Amount ($ Thousands) | Value ($ Thousands) | ||||
FNMA REMIC, Ser 2006-72, Cl FY | ||||||
0.651%, 08/25/36 (A) | $ | 2,883 | $ | 2,841 | ||
FNMA REMIC, Ser 2006-76, Cl QF | ||||||
0.631%, 08/25/36 (A) | 3,269 | 3,249 | ||||
FNMA REMIC, Ser 2006-79, Cl DF | ||||||
0.581%, 08/25/36 (A) | 3,599 | 3,558 | ||||
FNMA REMIC, Ser 2007-47, Cl DA | ||||||
5.600%, 05/25/37 | 6,984 | 7,484 | ||||
GNMA | ||||||
7.500%, 01/15/11 to 02/15/11 | 7 | 7 | ||||
6.500%, 04/15/17 to 02/20/39 | 3,947 | 4,240 | ||||
6.000%, 06/15/16 to 09/15/19 | 631 | 681 | ||||
GNMA REMIC, Ser 2006-38, Cl XS, IO | ||||||
7.017%, 09/16/35 (A) | 228 | 33 | ||||
Total Mortgage-Backed Securities | 185,656 | |||||
U.S. GOVERNMENT AGENCY OBLIGATIONS — 33.0% | ||||||
FHLB | ||||||
2.250%, 04/13/12 | 7,995 | 8,179 | ||||
3.250%, 09/12/14 | 13,400 | 13,730 | ||||
FNMA | ||||||
2.000%, 01/09/12 | 14,361 | 14,644 | ||||
5.000%, 03/15/16 | 14,800 | 16,350 | ||||
FHLMC | ||||||
1.125%, 12/15/11 | 28,000 | 28,064 | ||||
5.750%, 01/15/12 | 9,291 | 10,141 | ||||
2.125%, 09/21/12 | 21,100 | 21,524 | ||||
2.500%, 04/23/14 | 2,500 | 2,521 | ||||
3.750%, 03/27/19 | 9,141 | 9,068 | ||||
Total U.S. Government Agency Obligations | 124,221 | |||||
U.S. TREASURY OBLIGATIONS — 10.3% | ||||||
U.S. Treasury Inflation Protected Security | ||||||
2.000%, 04/15/12 | 20,600 | 23,087 | ||||
U.S. Treasury Note | ||||||
0.875%, 04/30/11 | 15,750 | 15,840 | ||||
Total U.S. Treasury Obligations | 38,927 | |||||
REPURCHASE AGREEMENTS (B) — 25.1% | ||||||
BNP Paribas | 51,700 | 51,700 | ||||
| Description | Face Amount ($ Thousands) | Value ($ Thousands) | ||||
JPMorgan Chase | $ | 42,800 | $ | 42,800 | ||
Total Repurchase Agreements | 94,500 | |||||
Total Investments — 117.6% | $ | 443,304 | ||||
Futures — A summary of the open futures contracts held by the Fund at January 31, 2010, is as follows (see Note 2 in Notes to Financial Statements):
| Type of Contract | Number of Contracts Long (Short) | Expiration Date | Unrealized Appreciation (Depreciation) ($ Thousands) | ||||||
U.S. 10-Year Treasury Note | (191 | ) | Mar-2010 | $ | 228 | ||||
U.S. 2-Year Treasury Note | 311 | Mar-2010 | 120 | ||||||
U.S. 5-Year Treasury Note | (230 | ) | Mar-2010 | (56 | ) | ||||
| $ | 292 | ||||||||
| �� | |||||||||
Percentages are based on Net Assets of $377,088 ($ Thousands).
| (A) | Floating Rate Instrument. The rate reflected on the Schedule of Investments is the rate in effect on January 31, 2010. The demand and interest rate reset features give this security a shorter effective maturity date. |
| (B) | Tri-Party Repurchase Agreement. |
Cl — Class
FHLB — Federal Home Loan Bank
FHLMC — Federal Home Loan Mortgage Corporation
FNMA — Federal National Mortgage Association
GNMA — Government National Mortgage Association
IO — Interest Only — face amount represents notional amount
REMIC — Real Estate Mortgage Investment Conduit
Ser — Series
TBA — To Be Announced
The following is a summary of the inputs used as of January 31, 2010 in valuing the Fund’s investments carried at value ($ Thousands):
| Investments in Securities | Level 1 | Level 2 | Level 3 | Total | ||||||||
Mortgage-Backed Securities | $ | — | $ | 185,656 | $ | — | $ | 185,656 | ||||
U.S. Government Agency Obligations | — | 124,221 | — | 124,221 | ||||||||
U.S. Treasury Obligations | — | 38,927 | — | 38,927 | ||||||||
Repurchase Agreements | — | 94,500 | — | 94,500 | ||||||||
Total | $ | — | $ | 443,304 | $ | — | $ | 443,304 | ||||
| Other Financial Instruments | Level 1 | Level 2 | Level 3 | Total | ||||||||
Futures | $ | 292 | $ | — | $ | — | $ | 292 | ||||
For more information on valuation inputs, see Note 2 – Significant Accounting Policies in Notes to Financial Statements.
The accompanying notes are an integral part of the financial statements.
| 20 | SEI Daily Income Trust / Annual Report / January 31, 2010 |
Table of Contents
SCHEDULE OF INVESTMENTS
Intermediate-Duration Government Fund
January 31, 2010
| Description | Face Amount ($ Thousands) | Value ($ Thousands) | ||||
MORTGAGE-BACKED SECURITIES — 58.6% | ||||||
Agency Mortgage-Backed Obligations — 58.6% | ||||||
FHLMC | ||||||
6.500%, 01/01/18 to 12/01/32 | $ | 363 | $ | 399 | ||
6.000%, 09/01/24 | 1,146 | 1,241 | ||||
5.500%, 06/01/19 to 12/01/20 | 703 | 757 | ||||
FHLMC REMIC, Ser 1599, Cl C | ||||||
6.100%, 10/15/23 | 289 | 307 | ||||
FHLMC REMIC, Ser 165, Cl K | ||||||
6.500%, 09/15/21 | 14 | 14 | ||||
FHLMC REMIC, Ser 2586, Cl NK | ||||||
3.500%, 08/15/16 | 64 | 66 | ||||
FHLMC REMIC, Ser 2587, Cl ET | ||||||
3.700%, 07/15/17 | 284 | 294 | ||||
FHLMC REMIC, Ser 2622, Cl PE | ||||||
4.500%, 05/15/18 | 2,780 | 2,930 | ||||
FHLMC REMIC, Ser 2630, Cl HA | ||||||
3.000%, 01/15/17 | 626 | 637 | ||||
FHLMC REMIC, Ser 2635, Cl NJ | ||||||
3.000%, 03/15/17 | 182 | 187 | ||||
FHLMC REMIC, Ser 2748, Cl LE | ||||||
4.500%, 12/15/17 | 865 | 910 | ||||
FHLMC REMIC, Ser 2802, Cl PF | ||||||
0.688%, 09/15/33 (A) | 966 | 961 | ||||
FHLMC REMIC, Ser 3029, Cl PE | ||||||
5.000%, 03/15/34 | 1,300 | 1,370 | ||||
FNMA | ||||||
9.500%, 05/01/18 | 32 | 35 | ||||
6.500%, 03/01/33 to 11/01/38 | 2,941 | 3,183 | ||||
6.450%, 10/01/18 | 603 | 677 | ||||
6.150%, 04/01/11 | 141 | 146 | ||||
6.000%, 02/01/23 | 895 | 965 | ||||
5.931%, 02/01/12 | 566 | 606 | ||||
5.920%, 06/01/14 | 486 | 542 | ||||
5.680%, 06/01/17 | 568 | 629 | ||||
5.626%, 12/01/11 | 1,573 | 1,672 | ||||
5.034%, 08/01/15 | 383 | 412 | ||||
5.016%, 02/01/13 | 195 | 206 | ||||
4.771%, 09/01/15 | 1,285 | 1,368 | ||||
3.790%, 07/01/13 | 1,078 | 1,122 | ||||
FNMA TBA | ||||||
6.000%, 02/01/36 | 1,700 | 1,818 | ||||
5.500%, 02/01/19 to 02/01/38 | 5,700 | 6,072 | ||||
FNMA REMIC, Ser 2001-51, Cl QN | ||||||
6.000%, 10/25/16 | 304 | 328 | ||||
| Description | Face Amount ($ Thousands) | Value ($ Thousands) | ||||
FNMA REMIC, Ser 2004-15, Cl AN | ||||||
4.000%, 09/25/17 | $ | 1,000 | $ | 1,040 | ||
FNMA REMIC, Ser 2004-27, Cl HN | ||||||
4.000%, 05/25/16 | 42 | 42 | ||||
FNMA REMIC, Ser 2005-114, Cl EZ | ||||||
5.500%, 01/25/36 | 835 | 826 | ||||
FNMA REMIC, Ser 2006-72, Cl FY | ||||||
0.651%, 08/25/36 (A) | 2,206 | 2,173 | ||||
FNMA REMIC, Ser 2006-79, Cl DF | ||||||
0.581%, 08/25/36 (A) | 635 | 628 | ||||
FNMA REMIC, Ser 2007-47, Cl DA | ||||||
5.600%, 05/25/37 | 1,215 | 1,301 | ||||
GNMA | ||||||
8.750%, 07/20/17 to 07/20/17 | 9 | 10 | ||||
8.500%, 11/20/16 to 08/20/17 | 56 | 61 | ||||
7.500%, 11/15/25 to 09/15/36 | 136 | 151 | ||||
6.000%, 09/15/24 | 759 | 818 | ||||
Total Mortgage-Backed Securities | 36,904 | |||||
U.S. GOVERNMENT AGENCY OBLIGATIONS — 28.5% | ||||||
FHLMC | ||||||
5.750%, 01/15/12 | 2,215 | 2,418 | ||||
2.125%, 09/21/12 | 2,000 | 2,040 | ||||
3.750%, 03/27/19 | 2,012 | 1,996 | ||||
FNMA | ||||||
2.750%, 03/13/14 | 7,050 | 7,196 | ||||
3.000%, 09/16/14 | 4,200 | 4,291 | ||||
Total U.S. Government Agency Obligations | 17,941 | |||||
U.S. TREASURY OBLIGATIONS — 8.1% | ||||||
U.S. Treasury Inflation Protected Security | ||||||
2.000%, 04/15/12 | 3,000 | 3,362 | ||||
U.S. Treasury Notes | ||||||
1.375%, 10/15/12 | 800 | 803 | ||||
2.250%, 05/31/14 (B) | 900 | 908 | ||||
Total U.S. Treasury Obligations | 5,073 | |||||
ASSET-BACKED SECURITY — 1.6% | ||||||
Small Business Administration, | ||||||
4.940%, 08/10/15 | 966 | 1,024 | ||||
Total Asset-Backed Security | 1,024 | |||||
| SEI Daily Income Trust / Annual Report / January 31, 2010 | 21 |
Table of Contents
SCHEDULE OF INVESTMENTS
Intermediate-Duration Government Fund (Concluded)
January 31, 2010
| Description | Face Amount ($ Thousands) | Value ($ Thousands) | ||||
REPURCHASE AGREEMENT (C) — 15.1% | ||||||
BNP Paribas | $ | 9,500 | $ | 9,500 | ||
Total Repurchase Agreement | 9,500 | |||||
Total Investments — 111.9% | $ | 70,442 | ||||
Futures — A summary of the open futures contracts held by the Fund at January 31, 2010, is as follows (see Note 2 in Notes to Financial Statements):
| Type of Contract | Number of Contracts Long (Short) | Expiration Date | Unrealized Appreciation (Depreciation) ($ Thousands) | ||||||
U.S. 10-Year Treasury Note | (16 | ) | Mar-2010 | $ | 26 | ||||
U.S. 2-Year Treasury Note | (44 | ) | Mar-2010 | (20 | ) | ||||
U.S. 5-Year Treasury Note | 223 | Mar-2010 | (109 | ) | |||||
| $ | (103 | ) | |||||||
Percentages are based on Net Assets of $62,977 ($ Thousands).
| (A) | Floating Rate Instrument. The rate reflected on the Schedule of Investments is the rate in effect on January 31, 2010. The demand and interest rate reset features give this security a shorter effective maturity date. |
| (B) | Security, or portion thereof, has been pledged as collateral on open futures contracts. |
| (C) | Tri-Party Repurchase Agreement. |
| Cl | — Class |
| FHLMC | — Federal Home Loan Mortgage Corporation |
| FNMA | — Federal National Mortgage Association |
| GNMA | — Government National Mortgage Association |
| REMIC | — Real Estate Mortgage Investment Conduit |
| Ser | — Series |
| TBA | — To Be Announced |
The following is a summary of the inputs used as of January 31, 2010 in valuing the Fund’s investments carried at value ($ Thousands):
| Investments in Securities | Level 1 | Level 2 | Level 3 | Total | ||||||||
Mortgage-Backed Securities | $ | — | $ | 36,904 | $ | — | $ | 36,904 | ||||
U.S. Government Agency Obligations | — | 17,941 | — | 17,941 | ||||||||
U.S. Treasury Obligations | — | 5,073 | — | 5,073 | ||||||||
Asset-Backed Security | — | 1,024 | — | 1,024 | ||||||||
Repurchase Agreement | — | 9,500 | — | 9,500 | ||||||||
Total | $ | — | $ | 70,442 | $ | — | $ | 70,442 | ||||
| Other Financial Instruments | Level 1 | Level 2 | Level 3 | Total | ||||||||||
Futures | $ | (103 | ) | $ | — | $ | — | $ | (103 | ) | ||||
For more information on valuation inputs, see Note 2 — Significant Accounting Policies in Notes to Financial Statements.
The accompanying notes are an integral part of the financial statements.
| 22 | SEI Daily Income Trust / Annual Report / January 31, 2010 |
Table of Contents
SCHEDULE OF INVESTMENTS
GNMA Fund
January 31, 2010
| Description | Face Amount ($ Thousands) | Value ($ Thousands) | ||||
MORTGAGE-BACKED SECURITIES — 98.0% | ||||||
Agency Mortgage-Backed Obligations — 98.0% | ||||||
FHLMC REMIC, Ser 3279, IO | ||||||
6.197%, 02/15/37 (A) | $ | 6,304 | $ | 774 | ||
FHLMC REMIC, Ser 3309, IO | ||||||
6.217%, 04/15/37 (A) | 5,333 | 633 | ||||
FNMA | ||||||
8.000%, 09/01/14 to 09/01/28 | 198 | 225 | ||||
7.000%, 08/01/29 to 09/01/32 | 396 | 438 | ||||
6.500%, 09/01/32 | 199 | 217 | ||||
FNMA TBA | ||||||
6.000%, 02/01/36 | 20,300 | 21,711 | ||||
FNMA REMIC, Ser 1990-91, Cl G | ||||||
7.000%, 08/25/20 | 38 | 42 | ||||
FNMA REMIC, Ser 1992-105, Cl B | ||||||
7.000%, 06/25/22 | 73 | 81 | ||||
FNMA REMIC, Ser 2002-42, Cl C | ||||||
6.000%, 07/25/17 | 1,500 | 1,640 | ||||
FNMA REMIC, Ser 2007-19, Cl SA, IO | ||||||
6.179%, 03/25/37 (A) | 13,507 | 1,715 | ||||
GNMA | ||||||
10.000%, 05/15/16 to 04/15/20 | 25 | 28 | ||||
9.500%, 11/15/16 to 11/15/20 | 69 | 79 | ||||
9.000%, 12/15/17 to 05/15/22 | 184 | 208 | ||||
8.500%, 10/15/16 to 06/15/17 | 52 | 59 | ||||
8.000%, 04/15/17 to 03/15/32 | 735 | 841 | ||||
7.750%, 10/15/26 | 45 | 51 | ||||
7.500%, 02/15/27 to 05/15/36 | 814 | 905 | ||||
7.250%, 01/15/28 | 155 | 174 | ||||
7.000%, 04/15/19 to 06/20/38 | 7,121 | 7,878 | ||||
6.750%, 11/15/27 | 49 | 55 | ||||
6.500%, 09/15/10 to 02/20/39 | 14,027 | 15,159 | ||||
6.000%, 07/15/24 to 10/15/39 | 24,312 | 25,994 | ||||
5.500%, 10/15/32 to 10/15/39 (B) | 22,117 | 23,516 | ||||
5.000%, 04/15/33 to 09/15/38 (B) | 24,499 | 25,689 | ||||
4.500%, 08/15/33 to 02/15/39 | 5,040 | 5,126 | ||||
GNMA REMIC, Ser 2002-45, Cl QE | ||||||
6.500%, 06/20/32 | 1,055 | 1,140 | ||||
GNMA REMIC, Ser 2005-70, Cl AI, IO | ||||||
5.000%, 10/20/33 | 6,194 | 592 | ||||
GNMA REMIC, Ser 2006-38, Cl XS, IO | ||||||
7.017%, 09/16/35 (A) | 3,041 | 439 | ||||
GNMA, Ser 2009-104, Cl XV | ||||||
5.000%, 05/20/26 | 2,700 | 2,840 | ||||
GNMA TBA | ||||||
6.000%, 02/15/35 | 3,500 | 3,737 | ||||
5.500%, 02/15/34 | 21,475 | 22,727 | ||||
4.500%, 02/15/39 to 02/15/40 | 29,850 | 30,242 | ||||
Total Mortgage-Backed Securities | 194,955 | |||||
| Description | Face Amount ($ Thousands) | Value ($ Thousands) | ||||
REPURCHASE AGREEMENTS (C) — 40.7% | ||||||
Credit Suisse | $ | 46,400 | $ | 46,400 | ||
UBS | 34,500 | 34,500 | ||||
Total Repurchase Agreements | 80,900 | |||||
Total Investments — 138.7% | $ | 275,855 | ||||
Futures — A summary of the open futures contracts held by the Fund at January 31, 2010, is as follows (see Note 2 in Notes to Financial Statements):
| Type of Contract | Number of Contracts Long (Short) | Expiration Date | Unrealized Appreciation (Depreciation) ($ Thousands) | ||||||
U.S. 10-Year Treasury Note | 160 | Mar-2010 | $ | (259 | ) | ||||
U.S. 2-Year Treasury Note | (33 | ) | Mar-2010 | (15 | ) | ||||
U.S. 5-Year Treasury Note | (31 | ) | Mar-2010 | 12 | |||||
U.S. Long Treasury Bond | 37 | Mar-2010 | (104 | ) | |||||
| $ | (366 | ) | |||||||
| SEI Daily Income Trust / Annual Report / January 31, 2010 | 23 |
Table of Contents
SCHEDULE OF INVESTMENTS
GNMA Fund (Concluded)
January 31, 2010
Percentages are based on Net Assets of $198,914 ($ Thousands).
| (A) | Floating Rate Instrument. The rate reflected on the Schedule of Investments is the rate in effect on January 31, 2010. The demand and interest rate reset features give this security a shorter effective maturity date. |
| (B) | Security, or portion thereof, has been pledged as collateral on open futures contracts. |
| (C) | Tri-Party Repurchase Agreement. |
Cl — Class
FHLMC — Federal Home Loan Mortgage Corporation
FNMA — Federal National Mortgage Association
GNMA — Government National Mortgage Association
IO — Interest Only — face amount represents notional amount
REMIC — Real Estate Mortgage Investment Conduit
Ser — Series
TBA — To Be Announced
The following is a summary of the inputs used as of January 31, 2010 in valuing the Fund’s investments carried at value ($ Thousands):
| Investments in Securities | Level 1 | Level 2 | Level 3 | Total | ||||||||
Mortgage-Backed Securities | $ | — | $ | 194,955 | $ | — | $ | 194,955 | ||||
Repurchase Agreement | — | 80,900 | — | 80,900 | ||||||||
Total | $ | — | $ | 275,855 | $ | — | $ | 275,855 | ||||
| Other Financial Instruments | Level 1 | Level 2 | Level 3 | Total | ||||||||||
Futures | $ | (366 | ) | $ | — | $ | — | $ | (366 | ) | ||||
For more information on valuation inputs, see Note 2 — Significant Accounting Policies in Notes to Financial Statements.
The accompanying notes are an integral part of the financial statements.
| 24 | SEI Daily Income Trust / Annual Report / January 31, 2010 |
Table of Contents
SCHEDULE OF INVESTMENTS
Ultra Short Bond Fund
January 31, 2010
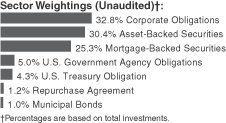
| Description | Face Amount ($ Thousands) | Value ($ Thousands) | ||||
CORPORATE OBLIGATIONS — 33.0% | ||||||
Banks — 8.2% | ||||||
ANZ National International | ||||||
2.375%, 12/21/12 (A) | $ | 815 | $ | 818 | ||
Bank of Nova Scotia | ||||||
2.250%, 01/22/13 | 1,065 | 1,075 | ||||
Bank of Tokyo-Mitsubishi | ||||||
2.600%, 01/22/13 (A) | 800 | 803 | ||||
BNP Paribas | ||||||
2.125%, 12/21/12 | 1,300 | 1,309 | ||||
Calyon | ||||||
0.281%, 02/26/10 (B) | 1,500 | 1,500 | ||||
Citibank | ||||||
0.251%, 07/12/11 (B) | 680 | 680 | ||||
1.250%, 09/22/11 | 1,250 | 1,259 | ||||
Comerica Bank | ||||||
0.331%, 05/10/10 (B) | 1,000 | 998 | ||||
Deutsche Bank | ||||||
2.375%, 01/11/13 | 750 | 751 | ||||
ING Bank | ||||||
2.650%, 01/14/13 (A) | 1,250 | 1,255 | ||||
Intesa Sanpaolo | ||||||
2.375%, 12/21/12 | 1,500 | 1,504 | ||||
National Australia Bank | ||||||
0.261%, 01/27/11 (A) (B) | 790 | 790 | ||||
2.500%, 01/08/13 (A) | 1,250 | 1,253 | ||||
PNC Funding | ||||||
0.531%, 06/22/11 (B) | 1,180 | 1,185 | ||||
Santander US Debt Unipersonal | ||||||
0.649%, 10/21/11 (A) (B) | 1,650 | 1,652 | ||||
Wachovia | ||||||
0.374%, 03/15/11 (B) | 1,750 | 1,750 | ||||
Wells Fargo | ||||||
0.474%, 06/15/12 (B) | 1,250 | 1,258 | ||||
Westpac Banking | ||||||
2.250%, 11/19/12 | 1,120 | 1,121 | ||||
| 20,961 | ||||||
Consumer Products — 2.4% | ||||||
CVS Caremark | ||||||
0.556%, 06/01/10 (B) | 865 | 865 | ||||
Dell | ||||||
3.375%, 06/15/12 | 350 | 364 | ||||
| Description | Face Amount ($ Thousands) | Value ($ Thousands) | ||||
Hewlett-Packard | ||||||
1.306%, 05/27/11 (B) | $ | 585 | $ | 593 | ||
President and Fellows of Harvard College | ||||||
3.700%, 04/01/13 | 1,325 | 1,405 | ||||
Procter & Gamble MTN | ||||||
0.437%, 03/09/10 (B) | 685 | 685 | ||||
Procter & Gamble | ||||||
0.285%, 05/07/10 (B) | 605 | 605 | ||||
1.350%, 08/26/11 | 1,250 | 1,263 | ||||
Staples | ||||||
7.750%, 04/01/11 | 350 | 376 | ||||
| 6,156 | ||||||
Financial Services — 5.6% | ||||||
American Express Credit MTN | ||||||
1.631%, 05/27/10 (B) | 1,750 | 1,757 | ||||
Bank of America | ||||||
7.800%, 02/15/10 | 594 | 595 | ||||
2.100%, 04/30/12 | 1,500 | 1,529 | ||||
Caterpillar Financial Services MTN | ||||||
1.900%, 12/17/12 | 835 | 838 | ||||
Citigroup | ||||||
2.125%, 04/30/12 | 150 | 153 | ||||
General Electric Capital | ||||||
0.339%, 04/28/11 (B) | 1,250 | 1,249 | ||||
0.253%, 12/21/12 (B) | 5,750 | 5,755 | ||||
GMAC | ||||||
2.200%, 12/19/12 | 600 | 610 | ||||
0.253%, 12/19/12 (B) | 1,750 | 1,753 | ||||
Nissan Motor Acceptance | ||||||
3.250%, 01/30/13 (A) | 290 | 291 | ||||
| 14,530 | ||||||
Food, Beverage & Tobacco — 1.4% | ||||||
Anheuser-Busch InBev Worldwide | ||||||
3.000%, 10/15/12 (A) | 1,250 | 1,290 | ||||
Dr Pepper Snapple Group | ||||||
1.700%, 12/21/11 | 1,000 | 1,005 | ||||
PepsiCo | ||||||
0.281%, 07/15/11 (B) | 1,250 | 1,250 | ||||
| 3,545 | ||||||
Health Care — 0.8% | ||||||
Merck | ||||||
1.875%, 06/30/11 | 1,010 | 1,022 | ||||
Pfizer | ||||||
4.450%, 03/15/12 | 1,000 | 1,065 | ||||
| 2,087 | ||||||
Industrials — 0.5% | ||||||
Boeing | ||||||
1.875%, 11/20/12 | 725 | 731 | ||||
Continental Airlines | ||||||
0.607%, 06/02/13 (B) | 750 | 596 | ||||
| 1,327 | ||||||
| SEI Daily Income Trust / Annual Report / January 31, 2010 | 25 |
Table of Contents
SCHEDULE OF INVESTMENTS
Ultra Short Bond Fund (Continued)
January 31, 2010
| Description | Face Amount ($ Thousands) | Value ($ Thousands) | ||||
Insurance — 3.4% | ||||||
MBIA Insurance | ||||||
14.000%, 01/15/33 (A) (B) | $ | 1,000 | $ | 480 | ||
Metropolitan Life Global Funding I | ||||||
2.157%, 06/10/11 (A) (B) | 965 | 983 | ||||
Metropolitan Life Global Funding I MTN | ||||||
1.001%, 06/25/10 (A) (B) | 2,225 | 2,230 | ||||
Monumental Global Funding III | ||||||
0.451%, 01/15/14 (A) (B) | 1,900 | 1,721 | ||||
New York Life Global Funding | ||||||
0.379%, 06/16/11 (A) (B) | 1,250 | 1,244 | ||||
Principal Life Income Funding Trusts | ||||||
0.433%, 11/15/10 (B) | 750 | 749 | ||||
Prudential Financial MTN | ||||||
2.750%, 01/14/13 | 1,250 | 1,252 | ||||
| 8,659 | ||||||
Investment Banker/Broker Dealer — 6.2% | ||||||
BlackRock | ||||||
2.250%, 12/10/12 | 1,000 | 1,004 | ||||
Citigroup Funding | ||||||
0.198%, 05/05/11 (B) | 1,960 | 1,960 | ||||
Goldman Sachs Group | ||||||
1.625%, 07/15/11 | 1,600 | 1,621 | ||||
3.250%, 06/15/12 | 2,500 | 2,618 | ||||
JPMorgan Chase | ||||||
3.125%, 12/01/11 | 1,250 | 1,300 | ||||
0.501%, 12/26/12 (B) | 375 | 378 | ||||
Merrill Lynch MTN | ||||||
4.250%, 02/08/10 | 1,600 | 1,601 | ||||
Morgan Stanley, Ser G | ||||||
0.549%, 01/09/14 (B) | 1,000 | 960 | ||||
Morgan Stanley | ||||||
2.000%, 09/22/11 | 2,200 | 2,246 | ||||
0.554%, 02/10/12 (B) | 1,200 | 1,208 | ||||
UBS MTN | ||||||
2.750%, 01/08/13 | 1,000 | 1,003 | ||||
| 15,899 | ||||||
Security And Commodity Brokers — 0.4% | ||||||
Genworth Global Funding Trusts, | ||||||
0.412%, 05/15/12 (B) | 1,200 | 1,137 | ||||
Sovereign — 0.9% | ||||||
Province of Ontario Canada | ||||||
0.717%, 05/22/12 (B) | 1,060 | 1,070 | ||||
Republic of Austria MTN | ||||||
2.000%, 11/15/12 (A) | 1,115 | 1,123 | ||||
| 2,193 | ||||||
Telephones & Telecommunication — 1.6% | ||||||
AT&T | ||||||
0.378%, 02/05/10 (B) | 1,000 | 1,000 | ||||
| Description | Face Amount ($ Thousands) | Value ($ Thousands) | ||||
Cellco Partnership | ||||||
2.869%, 05/20/11 (B) | $ | 795 | $ | 821 | ||
5.250%, 02/01/12 | 785 | 841 | ||||
Deutsche Telekom International Finance | ||||||
8.500%, 06/15/10 | 1,500 | 1,542 | ||||
| 4,204 | ||||||
Utilities — 1.6% | ||||||
Dominion Resources | ||||||
1.303%, 06/17/10 (B) | 1,640 | 1,646 | ||||
Pacific Gas & Electric | ||||||
1.206%, 06/10/10 (B) | 895 | 898 | ||||
Southern | ||||||
0.649%, 10/21/11 (B) | 1,500 | 1,508 | ||||
| 4,052 | ||||||
Total Corporate Obligations | 84,750 | |||||
ASSET-BACKED SECURITIES — 30.5% | ||||||
Automotive — 15.4% | ||||||
Ally Auto Receivables Trust, | ||||||
2.330%, 06/17/13 (A) | 435 | 443 | ||||
AmeriCredit Automobile Receivables Trust, Ser 2006-AF, Cl A4 | ||||||
5.640%, 09/06/13 | 804 | 828 | ||||
AmeriCredit Automobile Receivables Trust, Ser 2005-DA, Cl A4 | ||||||
5.020%, 11/06/12 | 460 | 471 | ||||
AmeriCredit Automobile Receivables Trust, Ser 2007-CM, Cl A3A | ||||||
5.420%, 05/07/12 | 677 | 687 | ||||
AmeriCredit Automobile Receivables Trust, Ser 2009-1, Cl A2 | ||||||
2.260%, 05/15/12 | 1,750 | 1,765 | ||||
Avis Budget Rental Car Funding , | ||||||
5.680%, 02/20/14 (A) | 615 | 643 | ||||
Bank of America Auto Trust, | ||||||
1.700%, 12/15/11 (A) | 1,250 | 1,256 | ||||
Bank of America Auto Trust, | ||||||
1.390%, 03/15/14 (A) | 1,015 | 1,015 | ||||
Capital Auto Receivables Asset Trust, | ||||||
5.020%, 09/15/11 | 726 | 735 | ||||
Capital One Auto Finance Trust, | ||||||
4.710%, 06/15/12 | 1,185 | 1,191 | ||||
Capital One Auto Finance Trust, | ||||||
0.243%, 12/15/12 (B) | 1,322 | 1,311 | ||||
| 26 | SEI Daily Income Trust / Annual Report / January 31, 2010 |
Table of Contents
| Description | Face Amount ($ Thousands) | Value ($ Thousands) | ||||
Capital One Auto Finance Trust, | ||||||
5.130%, 04/16/12 | $ | 773 | $ | 788 | ||
Capital One Prime Auto Receivables Trust, | ||||||
4.940%, 07/15/12 | 435 | 442 | ||||
Carmax Auto Owner Trust, | ||||||
4.060%, 09/15/11 | 660 | 668 | ||||
Carmax Auto Owner Trust, | ||||||
5.140%, 11/15/11 | 948 | 970 | ||||
Carmax Auto Owner Trust, | ||||||
4.790%, 02/15/13 | 1,750 | 1,842 | ||||
Chrysler Financial Auto Securitization Trust, Ser 2009-A, Cl A2 | ||||||
1.850%, 06/15/11 | 420 | 423 | ||||
CitiFinancial Auto Issuance Trust, | ||||||
1.830%, 11/15/12 (A) | 1,500 | 1,502 | ||||
Daimler Chrysler Auto Trust, | ||||||
4.980%, 11/08/11 | 1,265 | 1,276 | ||||
Daimler Chrysler Auto Trust, | ||||||
1.162%, 07/08/11 (B) | 480 | 481 | ||||
Daimler Chrysler Auto Trust, | ||||||
5.000%, 02/08/12 | 1,000 | 1,016 | ||||
Ford Credit Auto Lease Trust, | ||||||
1.040%, 03/15/13 (A) | 1,200 | 1,200 | ||||
Ford Credit Auto Owner Trust, | ||||||
5.070%, 12/15/10 | 173 | 173 | ||||
Ford Credit Auto Owner Trust, | ||||||
5.150%, 11/15/11 | 480 | 490 | ||||
Ford Credit Auto Owner Trust, | ||||||
1.210%, 01/15/12 | 560 | 562 | ||||
Ford Credit Auto Owner Trust, | ||||||
2.460%, 11/15/11 | 400 | 402 | ||||
Ford Credit Auto Owner Trust, | ||||||
2.733%, 05/15/13 (B) | 1,500 | 1,537 | ||||
Ford Credit Auto Owner Trust, | ||||||
5.250%, 09/15/11 | 983 | 1,002 | ||||
Ford Credit Auto Owner Trust, | ||||||
3.960%, 04/15/12 | 1,274 | 1,296 | ||||
| Description | Face Amount ($ Thousands) | Value ($ Thousands) | ||||
Ford Credit Auto Owner Trust, | ||||||
1.510%, 01/15/14 | $ | 1,185 | $ | 1,187 | ||
Ford Credit Auto Owner Trust, | ||||||
1.433%, 12/15/10 (B) | 63 | 63 | ||||
Harley-Davidson Motorcycle Trust, | ||||||
5.120%, 08/15/13 | 1,200 | 1,254 | ||||
Hertz Vehicle Financing LLC, | ||||||
4.260%, 03/25/14 (A) | 785 | 805 | ||||
Honda Auto Receivables Owner Trust, | ||||||
1.500%, 08/15/11 | 315 | 316 | ||||
Honda Auto Receivables Owner Trust, | ||||||
2.220%, 08/15/11 | 1,280 | 1,288 | ||||
Hyundai Auto Receivables Trust, | ||||||
2.030%, 08/15/13 | 425 | 431 | ||||
Hyundai Auto Receivables Trust, | ||||||
4.160%, 05/16/11 | 634 | 638 | ||||
Hyundai Auto Receivables Trust, | ||||||
5.040%, 01/17/12 | 597 | 607 | ||||
Hyundai Auto Receivables Trust, | ||||||
5.260%, 11/15/12 | 681 | 683 | ||||
Mercedes-Benz Auto Receivables Trust, | ||||||
0.830%, 03/15/12 | 680 | 681 | ||||
Nissan Auto Receivables Owner Trust, | ||||||
4.460%, 04/16/12 | 1,886 | 1,931 | ||||
Nissan Auto Receivables Owner Trust, | ||||||
3.890%, 08/15/11 | 375 | 379 | ||||
USAA Auto Owner Trust, | ||||||
4.160%, 04/16/12 | 571 | 580 | ||||
USAA Auto Owner Trust, | ||||||
2.640%, 08/15/11 | 299 | 301 | ||||
USAA Auto Owner Trust, | ||||||
4.900%, 02/15/12 | 452 | 457 | ||||
Volkswagen Auto Loan Enhanced Trust, Ser 2010-1, Cl A3 | ||||||
1.310%, 01/20/14 | 390 | 390 | ||||
Wachovia Auto Loan Owner Trust, | ||||||
5.080%, 04/20/12 (A) | 494 | 500 | ||||
| SEI Daily Income Trust / Annual Report / January 31, 2010 | 27 |
Table of Contents
SCHEDULE OF INVESTMENTS
Ultra Short Bond Fund (Continued)
January 31, 2010
| Description | Face Amount ($ Thousands) | Value ($ Thousands) | ||||
Wachovia Auto Owner Trust, | ||||||
4.090%, 05/20/11 | $ | 259 | $ | 260 | ||
World Omni Auto Receivables Trust, | ||||||
1.340%, 12/16/13 | 455 | 455 | ||||
| 39,621 | ||||||
Credit Card — 7.6% | ||||||
American Express Issuance Trust, | ||||||
0.263%, 08/15/11 (B) | 1,200 | 1,199 | ||||
American Express Issuance Trust, | ||||||
0.433%, 09/15/11 (B) | 715 | 715 | ||||
Bank of America Credit Card Trust, | ||||||
4.070%, 07/16/12 | 1,000 | 1,002 | ||||
Cabela’s Master Credit Card Trust, | ||||||
2.233%, 03/16/15 (A) (B) | 1,500 | 1,530 | ||||
Capital One Multi-Asset Execution Trust, Ser 2007-C2, Cl C2 | ||||||
0.533%, 11/15/14 (B) | 1,200 | 1,165 | ||||
Capital One Multi-Asset Execution Trust, Ser 2009-A1, Cl A1 | ||||||
1.333%, 04/15/13 (B) | 1,000 | 1,003 | ||||
Capital One Multi-Asset Execution Trust, Ser 2007-C3, Cl C3 | ||||||
0.523%, 04/15/13 (B) | 1,500 | 1,492 | ||||
Chase Issuance Trust, | ||||||
1.033%, 06/15/12 (B) | 1,500 | 1,504 | ||||
Chase Issuance Trust, | ||||||
4.260%, 05/15/13 | 1,200 | 1,252 | ||||
Discover Card Master Trust, | ||||||
1.533%, 02/17/15 (B) | 1,600 | 1,632 | ||||
Discover Card Master Trust, | ||||||
1.233%, 09/17/12 (B) | 2,750 | 2,752 | ||||
Discover Card Master Trust, | ||||||
5.100%, 10/15/13 | 810 | 850 | ||||
Discover Card Master Trust, | ||||||
1.533%, 12/15/14 (B) | 2,085 | 2,107 | ||||
Washington Mutual Master Note Trust, Ser 2006-C2A, Cl C2 | ||||||
0.733%, 08/15/15 (A) (B) | 1,300 | 1,280 | ||||
| 19,483 | ||||||
| Description | Face Amount ($ Thousands) | Value ($ Thousands) | ||||
Miscellaneous Business Services — 5.9% | ||||||
ACAS Business Loan Trust, | ||||||
1.123%, 08/16/19 (A) (B) | $ | 1,271 | $ | 343 | ||
ACAS Business Loan Trust, | ||||||
0.499%, 07/25/19 (A) (B) | 719 | 632 | ||||
Babson CLO Ltd., | ||||||
0.476%, 01/18/21 (A) (B) | 1,126 | 954 | ||||
Capital Source Commercial Loan Trust, Ser 2006-2A, Cl A1A | ||||||
0.441%, 09/20/22 (A) (B) | 631 | 586 | ||||
Capital Source Commercial Loan Trust, Ser 2006-1A, Cl C | ||||||
0.781%, 08/22/16 (A) (B) | 494 | 203 | ||||
Caterpillar Financial Asset Trust, | ||||||
4.090%, 12/27/10 | 3 | 3 | ||||
Citigroup Mortgage Loan Trust, | ||||||
0.521%, 10/25/36 (B) | 1,325 | 137 | ||||
Colts Trust, Ser 2006-2A, Cl A | ||||||
0.533%, 12/20/18 (A) (B) | 1,607 | 1,414 | ||||
Countrywide Asset-Backed Certificates, Ser 2006-2, Cl 2A2 | ||||||
0.421%, 06/25/36 (B) | 414 | 343 | ||||
Credit-Based Asset Servicing and Securitization , | ||||||
0.572%, 09/06/41 (A) (B) | 1,418 | 71 | ||||
First Franklin Mortgage Loan Asset Backed Certificates, | ||||||
0.491%, 01/25/38 (B) | 1,250 | 3 | ||||
Ford Credit Floorplan Master Owner Trust, Ser 2010-1, Cl A | ||||||
1.882%, 12/15/14 (A) (B) | 795 | 799 | ||||
Ford Credit Floorplan Master Owner Trust, Ser 2006-4, Cl A | ||||||
0.483%, 06/15/13 (B) | 1,440 | 1,412 | ||||
Franklin CLO, Ser 2003-4A, Cl A | ||||||
0.803%, 09/20/15 (A) (B) | 314 | 298 | ||||
GE Commercial Loan Trust, | ||||||
0.801%, 01/19/17 (A)(B) | 642 | 51 | ||||
GE Dealer Floorplan Master Note Trust, Ser 2007-2, Cl A | ||||||
0.241%, 07/20/12 (B) | 600 | 598 | ||||
GE Equipment Small Ticket LLC, | ||||||
5.010%, 06/22/15 (A) | 728 | 729 | ||||
GMAC Mortgage Loan Trust, | ||||||
0.411%, 12/25/36 (B) | 1,371 | 671 | ||||
| 28 | SEI Daily Income Trust / Annual Report / January 31, 2010 |
Table of Contents
| Description | Face Amount ($ Thousands) | Value ($ Thousands) | ||||
JP Morgan Mortgage Acquisition, | ||||||
0.501%, 05/25/37 (B) | $ | 2,000 | $ | 74 | ||
Katonah CLO, Ser 2005-7A, Cl B | ||||||
0.692%, 11/15/17 (A) (B) | 1,200 | 972 | ||||
Lambda Finance, Ser 2005-1A, Cl B3 | ||||||
0.642%, 11/15/29 (A)(B) | 840 | 735 | ||||
Long Beach Mortgage Loan Trust, | ||||||
0.381%, 07/25/36 (B) | 1,190 | 426 | ||||
Madison Park Funding CLO, | ||||||
0.551%, 03/22/21 (A)(B) | 1,000 | 770 | ||||
Marlin Leasing Receivables LLC, | ||||||
5.090%, 08/15/12 (A) | 3 | 3 | ||||
Merritt Funding Trust CLO, | ||||||
0.951%, 07/15/15 (A) (B) | 541 | 298 | ||||
Morgan Stanley ABS Capital I, | ||||||
0.431%, 12/25/35 (B) | 474 | 431 | ||||
Sierra Receivables Funding, | ||||||
4.520%, 08/20/26 (A) | 463 | 464 | ||||
Sierra Receivables Funding, | ||||||
1.231%, 09/20/19 (A) (B) | 375 | 316 | ||||
Sierra Receivables Funding, | ||||||
9.790%, 12/22/25 (A) | 375 | 389 | ||||
William Street Funding, Ser 2006-1, Cl A | ||||||
0.479%, 01/23/12 (A) (B) | 1,260 | 1,194 | ||||
| 15,319 | ||||||
Mortgage Related — 1.6% | ||||||
ACE Securities, Ser 2006-CW1, Cl A2C | ||||||
0.371%, 07/25/36 (B) | 895 | 455 | ||||
Asset-Backed Funding Certificates, | ||||||
0.341%, 10/25/36 (B) | 1,416 | 1,380 | ||||
Bear Stearns Asset-Backed Securities Trust, Ser 2005-HE11, Cl A2 | ||||||
0.481%, 11/25/35 (B) | 104 | 99 | ||||
Morgan Stanley Home Equity Loans, | ||||||
0.451%, 09/25/35 (B) | 55 | 54 | ||||
Option One Mortgage Loan Trust, | ||||||
0.831%, 06/25/33 (B) | 116 | 84 | ||||
Option One Mortgage Loan Trust, | ||||||
5.611%, 01/25/37 (B) | 305 | 110 | ||||
Option One Mortgage Loan Trust, | ||||||
0.441%, 12/25/35 (B) | 733 | 596 | ||||
| Description | Face Amount ($ Thousands) | Value ($ Thousands) | ||||
Option One Mortgage Loan Trust, | ||||||
5.900%, 03/25/37 (C) | $ | 467 | $ | 457 | ||
Option One Mortgage Loan Trust, | ||||||
0.361%, 01/25/36 (B) | 26 | 26 | ||||
Option One Mortgage Loan Trust, | ||||||
0.351%, 02/25/38 (B) | 281 | 274 | ||||
Residential Asset Securities, | ||||||
0.381%, 07/25/36 (B) | 1,005 | 514 | ||||
| 4,049 | ||||||
Total Asset-Backed Securities | 78,472 | |||||
MORTGAGE-BACKED SECURITIES — 25.7% | ||||||
Agency Mortgage-Backed Obligations — 6.9% | ||||||
FHLMC (B) | ||||||
3.195%, 02/01/22 | 982 | 1,001 | ||||
3.181%, 02/01/30 | 609 | 621 | ||||
FHLMC REMIC, Ser 1599, Cl C | ||||||
6.100%, 10/15/23 | 187 | 199 | ||||
FHLMC REMIC, Ser 2004-2780, Cl LC | ||||||
5.000%, 07/15/27 | 579 | 599 | ||||
FHLMC REMIC, Ser 2630, Cl HA | ||||||
3.000%, 01/15/17 | 666 | 678 | ||||
FNMA TBA | ||||||
4.000%, 03/01/20 | 3,000 | 3,082 | ||||
FNMA | ||||||
6.000%, 01/01/27 | 1,282 | 1,382 | ||||
5.000%, 01/01/19 | 2,254 | 2,402 | ||||
4.500%, 06/01/18 to 04/01/19 | 3,813 | 4,021 | ||||
3.966%, 09/01/24 (B) | 188 | 194 | ||||
3.851%, 09/01/24 (B) | 481 | 491 | ||||
3.609%, 11/01/25 (B) | 77 | 80 | ||||
3.186%, 11/01/23 (B) | 374 | 382 | ||||
3.083%, 01/01/29 (B) | 65 | 66 | ||||
3.037%, 05/01/28 (B) | 622 | 626 | ||||
2.764%, 11/01/21 (B) | 112 | 113 | ||||
FNMA REMIC, Ser 1993-220, Cl FA | ||||||
0.850%, 11/25/13 (B) | 82 | 81 | ||||
FNMA REMIC, Ser 1993-58, Cl H | ||||||
5.500%, 04/25/23 | 161 | 173 | ||||
FNMA REMIC, Ser 2001-33, Cl FA | ||||||
0.681%, 07/25/31 (B) | 207 | 206 | ||||
FNMA REMIC, Ser 2002-63, Cl QF | ||||||
0.531%, 04/25/29 (B) | 13 | 13 | ||||
FNMA REMIC, Ser 2002-64, Cl FG | ||||||
0.483%, 10/18/32 (B) | 127 | 126 | ||||
FNMA REMIC, Ser 2004-21, Cl QD | ||||||
4.500%, 02/25/29 | 1,225 | 1,295 | ||||
| 17,831 | ||||||
| SEI Daily Income Trust / Annual Report / January 31, 2010 | 29 |
Table of Contents
SCHEDULE OF INVESTMENTS
Ultra Short Bond Fund (Continued)
January 31, 2010
| Description | Face Amount ($ Thousands) | Value ($ Thousands) | ||||
Non-Agency Mortgage-Backed Obligations — 18.8% | ||||||
Banc of America Funding, | ||||||
5.286%, 09/20/35 (B) | $ | 710 | $ | 515 | ||
Banc of America Funding, | ||||||
5.493%, 05/20/36 (B) | 848 | 670 | ||||
Banc of America Large Loan, | ||||||
0.743%, 08/15/29 (A) (B) | 583 | 505 | ||||
Banc of America Mortgage Securities, | ||||||
4.439%, 02/25/35 (B) | 1,073 | 936 | ||||
Banc of America Mortgage Securities, | ||||||
4.982%, 07/25/35 (B) | 1,955 | 1,716 | ||||
Banc of America Mortgage Securities, | ||||||
4.787%, 09/25/35 (B) | 612 | 513 | ||||
Banc of America Mortgage Securities, | ||||||
5.076%, 11/25/35 (B) | 218 | 175 | ||||
Bear Stearns Adjustable Rate Mortgage Trust, Ser 2005-12, Cl 11A1 | ||||||
3.541%, 02/25/36 (B) | 460 | 288 | ||||
Bear Stearns Adjustable Rate Mortgage Trust, Ser 2005-3, Cl 2A1 | ||||||
5.080%, 06/25/35 (B) | 651 | 511 | ||||
Bear Stearns Adjustable Rate Mortgage Trust, Ser 2005-6, Cl 3A1 | ||||||
5.258%, 08/25/35 (B) | 1,020 | 752 | ||||
Bear Stearns Commercial Mortgage Securities, Ser 2000-WF2, Cl A2 | ||||||
7.320%, 10/15/32 (B) | 1,362 | 1,383 | ||||
Bear Stearns Commercial Mortgage Securities, Ser 2001-TOP2, Cl A2 | ||||||
6.480%, 02/15/35 | 1,596 | 1,653 | ||||
Citigroup Commercial Mortgage Trust, | ||||||
0.443%, 08/15/21 (A) (B) | 510 | 360 | ||||
Citigroup Commercial Mortgage Trust, | ||||||
1.183%, 04/15/22 (A) (B) | 550 | 34 | ||||
Citigroup Mortgage Loan Trust, | ||||||
3.466%, 09/25/34 (B) | 320 | 284 | ||||
Citigroup Mortgage Loan Trust, | ||||||
5.620%, 03/25/36 (B) | 860 | 658 | ||||
Countrywide Alternative Loan Trust, | ||||||
5.544%, 03/25/47 (B) | 953 | 828 | ||||
Countrywide Home Loans, | ||||||
0.771%, 02/25/35 (B) | 108 | 75 | ||||
| Description | Face Amount ($ Thousands) | Value ($ Thousands) | ||||
Countrywide Home Loans, | ||||||
0.501%, 03/25/35 (B) | $ | 178 | $ | 120 | ||
Countrywide Home Loans, | ||||||
5.351%, 02/20/36 (B) | 836 | 605 | ||||
Crusade Global Trust, Ser 2003-1, Cl A | ||||||
0.451%, 01/17/34 (B) | 303 | 302 | ||||
Crusade Global Trust, Ser 2004-1, Cl A1 | ||||||
0.401%, 01/16/35 (B) | 85 | 84 | ||||
CS First Boston Mortgage Securities, | ||||||
6.505%, 02/15/34 | 1,410 | 1,452 | ||||
DLJ Commercial Mortgage, | ||||||
7.180%, 11/10/33 | 884 | 899 | ||||
First Horizon Asset Securities, | ||||||
5.500%, 05/25/35 | 299 | 299 | ||||
Fosse Master Issuer PLC, | ||||||
0.801%, 10/18/54 (A) (B) | 1,305 | 1,254 | ||||
GE Commercial Loan Trust CLO, | ||||||
0.801%, 10/19/16 (A) (B) | 334 | 104 | ||||
GMAC Commercial Mortgage Securities, Ser 2000-C3, Cl A2 | ||||||
6.957%, 09/15/35 | 962 | 987 | ||||
GMAC Mortgage Loan Trust, | ||||||
5.196%, 11/19/35 (B) | 990 | 802 | ||||
GSR Mortgage Loan Trust, | ||||||
4.069%, 07/25/35 (B) | 1,246 | 839 | ||||
GSR Mortgage Loan Trust, | ||||||
5.156%, 01/25/36 (B) | 1,570 | 1,258 | ||||
GSR Mortgage Loan Trust, | ||||||
5.750%, 05/25/47 (B) | 1,233 | 899 | ||||
Impac CMB Trust, Ser 2004-9, Cl 1A1 | ||||||
0.991%, 01/25/35 (B) | 296 | 203 | ||||
Impac CMB Trust, Ser 2005-2, Cl 1A1 | ||||||
0.491%, 04/25/35 (B) | 329 | 202 | ||||
Impac CMB Trust, Ser 2005-3, Cl A1 | ||||||
0.471%, 08/25/35 (B) | 298 | 193 | ||||
Impac CMB Trust, Ser 2005-5, Cl A1 | ||||||
0.551%, 08/25/35 (B) | 241 | 149 | ||||
Impac CMB Trust, Ser 2005-8, Cl 1A | ||||||
0.491%, 02/25/36 (B) | 767 | 396 | ||||
Interstar Millennium Trust, | ||||||
0.654%, 03/14/36 (B) | 153 | 148 | ||||
| 30 | SEI Daily Income Trust / Annual Report / January 31, 2010 |
Table of Contents
| Description | Face Amount ($ Thousands) | Value ($ Thousands) | ||||
JP Morgan Mortgage Trust, | ||||||
4.959%, 08/25/35 (B) | $ | 762 | $ | 643 | ||
JP Morgan Mortgage Trust, | ||||||
5.366%, 05/25/37 (B) | 1,040 | 726 | ||||
Master Adjustable Rate Mortgages Trust, | ||||||
4.083%, 10/25/34 (B) | 168 | 134 | ||||
Medallion Trust, Ser 2004-1G, Cl A1 | ||||||
0.392%, 05/25/35 (B) | 130 | 128 | ||||
Merrill Lynch Mortgage Investors, | ||||||
4.258%, 02/25/35 (B) | 1,954 | 1,755 | ||||
Merrill Lynch Mortgage Investors, | ||||||
0.501%, 04/25/35 (B) | 340 | 201 | ||||
Merrill Lynch Mortgage-Backed Securities Trust, Ser 2007-2, Cl 1A1 | ||||||
5.800%, 08/25/36 (B) | 1,277 | 937 | ||||
Merrill Lynch Mortgage-Backed Securities Trust, Ser 2007-3, Cl 2A1 | ||||||
5.513%, 06/25/37 (B) | 1,243 | 881 | ||||
MLCC Mortgage Investors, | ||||||
0.511%, 01/25/30 (B) | 95 | 71 | ||||
MLCC Mortgage Investors, | ||||||
0.591%, 04/25/29 (B) | 141 | 108 | ||||
MLCC Mortgage Investors, | ||||||
0.461%, 03/25/30 (B) | 122 | 91 | ||||
MLCC Mortgage Investors, | ||||||
5.267%, 02/25/36 (B) | 577 | 497 | ||||
Morgan Stanley Dean Witter Capital I, | ||||||
6.660%, 02/15/33 | 390 | 401 | ||||
Morgan Stanley Dean Witter Capital I, | ||||||
6.390%, 07/15/33 | 1,120 | 1,171 | ||||
Morgan Stanley Dean Witter Capital I, | ||||||
7.200%, 10/15/33 | 747 | 760 | ||||
MortgageIT Trust, Ser 2005-2, Cl 1A1 | ||||||
0.491%, 05/25/35 (B) | 246 | 176 | ||||
MortgageIT Trust, Ser 2005-3, Cl A1 | ||||||
0.531%, 08/25/35 (B) | 834 | 592 | ||||
MortgageIT Trust, Ser 2005-4, Cl A1 | ||||||
0.511%, 10/25/35 (B) | 1,128 | 741 | ||||
MortgageIT Trust, Ser 2005-5, Cl A1 | ||||||
0.491%, 12/25/35 (B) | 1,068 | 746 | ||||
Paragon Mortgages PLC, Ser 12A, Cl A2C | ||||||
0.383%, 11/15/38 (A) (B) | 332 | 249 | ||||
| Description | Face Amount ($ Thousands) | Value ($ Thousands) | ||||
Paragon Mortgages PLC, Ser 15A, Cl A2C | ||||||
0.364%, 12/15/39 (A) (B) | $ | 784 | $ | 638 | ||
Permanent Master Issuer PLC, | ||||||
1.394%, 07/15/42 (A) (B) | 960 | 960 | ||||
Prima, Ser 2006-1, Cl A1 | ||||||
5.417%, 12/28/48 | 724 | 616 | ||||
Puma Finance, Ser S1, Cl A | ||||||
0.675%, 08/09/35 (A) (B) | 116 | 111 | ||||
Residential Funding Mortgage Securities I, | ||||||
5.301%, 11/25/35 (B) | 605 | 465 | ||||
Residential Funding Mortgage Securities I, | ||||||
5.651%, 04/25/37 (B) | 803 | 562 | ||||
Residential Funding Mortgage Securities I, | ||||||
5.738%, 07/27/37 (B) | 1,098 | 774 | ||||
Sequoia Mortgage Trust, | ||||||
0.501%, 01/20/35 (B) | 119 | 99 | ||||
Sequoia Mortgage Trust, | ||||||
0.461%, 02/20/35 (B) | 119 | 98 | ||||
WaMu Mortgage Pass-Through Certificates, Ser 2006-AR2, Cl 1A1 | ||||||
5.282%, 03/25/37 (B) | 1,423 | 1,157 | ||||
Wells Fargo Mortgage-Backed Securities Trust, Ser 2004-BB, Cl A2 | ||||||
2.935%, 01/25/35 (B) | 726 | 658 | ||||
Wells Fargo Mortgage-Backed Securities Trust, Ser 2005-AR1, Cl 2A1 | ||||||
4.489%, 02/25/35 (B) | 611 | 575 | ||||
Wells Fargo Mortgage-Backed Securities Trust, Ser 2005-AR16, Cl 3A2 | ||||||
4.081%, 10/25/35 (B) | 982 | 891 | ||||
Wells Fargo Mortgage-Backed Securities Trust, Ser 2005-AR16, Cl 6A3 | ||||||
5.000%, 10/25/35 (B) | 1,637 | 1,524 | ||||
Wells Fargo Mortgage-Backed Securities Trust, Ser 2005-AR4, Cl 2A2 | ||||||
4.338%, 04/25/35 (B) | 532 | 492 | ||||
Wells Fargo Mortgage-Backed Securities Trust, Ser 2006-AR10, Cl 2A1 | ||||||
5.605%, 07/25/36 (B) | 1,347 | 996 | ||||
Wells Fargo Mortgage-Backed Securities Trust, Ser 2006-AR12, Cl 1A1 | ||||||
6.025%, 09/25/36 (B) | 964 | 748 | ||||
Wells Fargo Mortgage-Backed Securities Trust, Ser 2006-AR5, Cl 2A1 | ||||||
5.541%, 04/25/36 (B) | 954 | 750 | ||||
Wells Fargo Mortgage-Backed Securities Trust, Ser 2006-AR6, Cl 2A1 | ||||||
5.095%, 03/25/36 (B) | 1,140 | 951 | ||||
| SEI Daily Income Trust / Annual Report / January 31, 2010 | 31 |
Table of Contents
SCHEDULE OF INVESTMENTS
Ultra Short Bond Fund (Concluded)
January 31, 2010
| Description | Face Amount ($ Thousands) | Value ($ Thousands) | ||||
Wells Fargo Mortgage-Backed Securities Trust, Ser 2006-AR8, Cl 2A1 | ||||||
5.240%, 04/25/36 (B) | $ | 1,212 | $ | 1,010 | ||
Westpac Securitisation Trust, | ||||||
0.319%, 03/23/36 (B) | 197 | 193 | ||||
| 48,327 | ||||||
Total Mortgage-Backed Securities | 66,158 | |||||
U.S. GOVERNMENT AGENCY OBLIGATIONS — 5.0% | ||||||
FHLB | ||||||
0.850%, 01/20/11 | 2,000 | 2,008 | ||||
1.375%, 05/16/11 | 2,500 | 2,524 | ||||
2.250%, 04/13/12 | 1,000 | 1,023 | ||||
FNMA | ||||||
1.750%, 03/23/11 | 5,000 | 5,070 | ||||
1.375%, 04/28/11 | 2,335 | 2,358 | ||||
Total U.S. Government Agency Obligations | 12,983 | |||||
U.S. TREASURY OBLIGATION — 4.3% | ||||||
U.S. Treasury Inflation Protected Security | ||||||
0.875%, 04/15/10 | 9,668 | 11,079 | ||||
Total U.S. Treasury Obligation | 11,079 | |||||
MUNICIPAL BONDS — 1.0% | ||||||
California — 0.5% | ||||||
Alameda County, Ser B, RB | ||||||
3.100%, 12/01/11 | 1,500 | 1,400 | ||||
New Jersey — 0.5% | ||||||
New Jersey Economic Development Authority, Ser B, RB | ||||||
5.226%, 02/15/10 | 1,305 | 1,304 | ||||
Total Municipal Bonds | 2,704 | |||||
REPURCHASE AGREEMENT (D) — 1.2% | ||||||
BNP Paribas | 3,000 | 3,000 | ||||
Total Repurchase Agreement | 3,000 | |||||
| Description | Face Amount ($ Thousands) | Value ($ Thousands) | |||
Total Investments — 100.7% | |||||
(Cost $280,644)($ Thousands) | $ | 259,146 | |||
Futures — A summary of the open futures contracts held by the Fund at January 31, 2010, is as follows (see Note 2 in Notes to Financial Statements):
| Type of Contract | Number of Contracts Long (Short) | Expiration Date | Unrealized Appreciation (Depreciation) ($ Thousands) | ||||||
U.S. 10-Year Treasury Note | (144 | ) | Mar-2010 | $ | (305 | ) | |||
U.S. 2-Year Treasury Note | 4 | Mar-2010 | 5 | ||||||
U.S. 5-Year Treasury Note | 149 | Mar-2010 | 248 | ||||||
U.S. Long Treasury Bond | (27 | ) | Mar-2010 | (49 | ) | ||||
| $ | (101 | ) | |||||||
Percentages are based on Net Assets of $257,238 ($ Thousands).
| (A) | Securities sold within terms of a private placement memorandum, exempt from registration under Section 144A of the Securities Act of 1933, as amended, and may be sold only to dealers in that program or other “accredited investors.” These securities have been determined to be liquid under guidelines established by the Board of Trustees. |
| (B) | Floating Rate Instrument. The rate reflected on the Schedule of Investments is the rate in effect on January 31, 2010. The demand and interest rate reset features give this security a shorter effective maturity date. |
| (C) | Step Bonds — The rate reflected on the Schedule of Investments is the effective yield on January 31, 2010. The coupon on a step bond changes on a specific date. |
| (D) | Tri-Party Repurchase Agreement. |
ABS — Asset-Backed Security
Cl — Class
CLO — Collateralized Loan Obligation
FHLB — Federal Home Loan Bank
FHLMC — Federal Home Loan Mortgage Corporation
FNMA — Federal National Mortgage Association
GNMA — Government National Mortgage Association
LLC — Limited Liability Company
Ltd. — Limited
MTN — Medium Term Note
PLC — Public Limited Company
RB — Revenue Bond
REMIC — Real Estate Mortgage Investment Conduit
Ser — Series
TBA — To Be Announced
The following is a summary of the inputs used as of January 31, 2010 in valuing the Fund’s investments carried at value ($ Thousands):
| Investments in Securities | Level 1 | Level 2 | Level 3 | Total | ||||||||
Corporate Obligations | $ | — | $ | 84,750 | $ | — | $ | 84,750 | ||||
Asset-Backed Securities | ||||||||||||
Automotive | — | 39,621 | — | 39,621 | ||||||||
Credit Card | — | 19,483 | — | 19,483 | ||||||||
Miscellaneous Business Services | — | 12,760 | 2,559 | 15,319 | ||||||||
Mortgage Related | — | 4,049 | — | 4,049 | ||||||||
Mortgage-Backed Securities | — | 66,158 | — | 66,158 | ||||||||
U.S. Government Agency Obligations | — | 12,983 | — | 12,983 | ||||||||
U.S. Treasury Obligation | — | 11,079 | — | 11,079 | ||||||||
Municipal Bonds | — | 2,704 | — | 2,704 | ||||||||
Repurchase Agreement | — | 3,000 | — | 3,000 | ||||||||
Total | $ | — | $ | 256,587 | $ | 2,559 | $ | 259,146 | ||||
| Other Financial Instruments | Level 1 | Level 2 | Level 3 | Total | |||||||||
Futures | $ | (101 | ) | $ | — | — | $ | (101 | ) | ||||
| 32 | SEI Daily Income Trust / Annual Report / January 31, 2010 |
Table of Contents
The following is a reconciliation of investments in which significant unobservable inputs (Level 3) were used in determining value ($ Thousands):
| Asset-Backed Securities | ||||
Beginning balance as of February 1, 2009 | $ | 1,139 | ||
Change in unrealized appreciation/(depreciation) | 349 | |||
Accrued discounts/premiums | — | |||
Amortization sold | — | |||
Realized gain/(loss) | (1 | ) | ||
Net purchases/sales | (147 | ) | ||
Net transfer in and/or out of Level 3 | 1,219 | |||
Ending balance as of January 31, 2010 | $ | 2,559 | ||
Changes in unrealized gains/(losses) included in earnings related to securities still held at reporting date | $ | 349 | ||
For more information on valuation inputs, see Note 2 – Significant Accounting Policies in Notes to Financial Statements.
The accompanying notes are an integral part of the financial statements.
| SEI Daily Income Trust / Annual Report / January 31, 2010 | 33 |
Table of Contents
Statements of Assets and Liabilities ($ Thousands)
For the year ended January 31, 2010
| Money Market Fund | Government Fund | Government II Fund | Prime Obligation Fund | |||||||||||||
ASSETS: | ||||||||||||||||
Investments, at value† | $ | 322,153 | $ | 535,259 | $ | 1,445,303 | $ | 2,883,668 | ||||||||
Repurchase agreements† | 59,788 | 854,543 | — | 633,975 | ||||||||||||
Cash | 2 | — | 1 | 5 | ||||||||||||
Receivable for administration | — | 4 | 14 | — | ||||||||||||
Receivable for investment securities sold | — | — | — | — | ||||||||||||
Interest receivable | 132 | 2,889 | 2,340 | 1,111 | ||||||||||||
Receivable for fund shares sold | — | — | — | — | ||||||||||||
Receivable for variation margin | — | — | — | — | ||||||||||||
Prepaid expenses | 27 | 92 | 90 | 185 | ||||||||||||
Total Assets | 382,102 | 1,392,787 | 1,447,748 | 3,518,944 | ||||||||||||
LIABILITIES: | ||||||||||||||||
Payable for investment securities purchased | — | 49,954 | 14,995 | 17,998 | ||||||||||||
Income distribution payable | 13 | 21 | 21 | 166 | ||||||||||||
Payable for fund shares redeemed | — | — | — | — | ||||||||||||
Payable for variation margin | — | — | — | — | ||||||||||||
Shareholder servicing fees payable | 13 | 7 | 1 | 8 | ||||||||||||
Administration fees payable | 19 | — | — | 266 | ||||||||||||
Investment advisory fees payable | 27 | 100 | 99 | 245 | ||||||||||||
Chief Compliance Officer fees payable | 1 | 2 | 2 | 6 | ||||||||||||
Trustees’ fees payable | 1 | 4 | 4 | 9 | ||||||||||||
Accrued expense payable | 19 | 64 | 62 | 147 | ||||||||||||
Total Liabilities | 93 | 50,152 | 15,184 | 18,845 | ||||||||||||
Net Assets | $ | 382,009 | $ | 1,342,635 | $ | 1,432,564 | $ | 3,500,099 | ||||||||
† Cost of investments and repurchase agreements | 381,941 | 1,389,802 | 1,445,303 | 3,517,643 | ||||||||||||
NET ASSETS: | ||||||||||||||||
Paid-in-Capital — (unlimited authorization — no par value) | $ | 382,004 | $ | 1,342,726 | $ | 1,432,576 | $ | 3,500,216 | ||||||||
Undistributed net investment income (Distributions in excess of net investment income) | (1 | ) | — | — | — | |||||||||||
Accumulated net realized gain/(loss) on investments and futures contracts | 6 | (91 | ) | (12 | ) | (117 | ) | |||||||||
Net unrealized appreciation/(depreciation) on investments | — | — | — | — | ||||||||||||
Net unrealized appreciation/(depreciation) on futures contracts | — | — | — | — | ||||||||||||
Net Assets | $ | 382,009 | $ | 1,342,635 | $ | 1,432,564 | $ | 3,500,099 | ||||||||
Net Asset Value, Offering and Redemption Price Per Share — Class A | $1.00 | $1.00 | $1.00 | $1.00 | ||||||||||||
| | ($228,375,141 ÷ 228,405,337 shares | ) | | ($825,341,444 ÷ 825,387,878 shares | ) | | ($1,280,351,900 ÷ 1,280,430,177 shares | ) | | ($3,158,830,483 ÷ 3,159,470,594 shares | )(1) | |||||
Net Asset Value, Offering and Redemption Price Per Share — Class B | $1.00 | $1.00 | $1.00 | $1.00 | ||||||||||||
| | ($51,141,861 ÷ 51,149,751 shares | ) | | ($427,711,244 ÷ 427,732,129 shares | ) | | ($146,959,965 ÷ 146,993,728 shares | ) | | ($182,593,018 ÷ 182,456,639 shares | )(1) | |||||
Net Asset Value, Offering and Redemption Price Per Share — Class C | $1.00 | $1.00 | $1.00 | $1.00 | ||||||||||||
| | ($74,046,595 ÷ 74,058,721 shares | ) | | ($59,564,628 ÷ 59,589,991 shares | ) | | ($5,251,868 ÷ 5,251,203 shares | ) | | ($95,092,283 ÷ 94,685,574 shares | )(1) | |||||
Net Asset Value, Offering and Redemption Price Per Share — Class H | N/A | N/A | N/A | $1.00 | ||||||||||||
| | ($31,796,696 ÷ 31,757,337 shares | )(1) | ||||||||||||||
Net Asset Value, Offering and Redemption Price Per Share — Sweep Class | $1.00 | $1.00 | N/A | $1.00 | ||||||||||||
| | ($28,445,321 ÷ 28,417,257 shares | ) | | ($30,018,134 ÷ 30,022,102 shares | ) | | ($31,786,804 ÷ 31,846,318 shares | )(1) | ||||||||
| (1) | See Note 9 in the Notes to Financial Statements. |
Amounts designated as “—” are either $0 or have been rounded to $0.
The accompanying notes are an integral part of the financial statements.
| 34 | SEI Daily Income Trust / Annual Report / January 31, 2010 |
Table of Contents
| Treasury Fund | Treasury II Fund | Short-Duration Government Fund | Intermediate-Duration Government Fund | GNMA Fund | Ultra Short Bond Fund | |||||||||||
| $236,671 | $609,278 | $348,804 | $60,942 | $194,955 | $256,146 | |||||||||||
| 405,984 | — | 94,500 | 9,500 | 80,900 | 3,000 | |||||||||||
| 414 | — | 500 | 54 | 42 | 436 | |||||||||||
| 10 | 36 | — | — | — | — | |||||||||||
| — | — | 7,491 | 1,489 | — | 13 | |||||||||||
| 1,653 | 890 | 1,560 | 317 | 587 | 727 | |||||||||||
| — | — | 15,912 | 12 | 568 | 4,761 | |||||||||||
| — | — | 50 | 66 | 97 | 44 | |||||||||||
| 47 | 39 | 25 | 4 | 11 | 7 | |||||||||||
| 644,779 | 610,243 | 468,842 | 72,384 | 277,160 | 265,134 | |||||||||||
| — | — | 91,012 | 9,318 | 77,802 | 6,537 | |||||||||||
| 13 | 3 | 54 | 16 | 124 | 65 | |||||||||||
| — | — | 372 | 25 | 184 | 1,114 | |||||||||||
| — | — | 153 | 16 | 15 | 84 | |||||||||||
| 2 | — | — | — | 42 | — | |||||||||||
| — | — | 103 | 18 | 40 | 58 | |||||||||||
| 44 | 47 | 26 | 5 | 16 | 14 | |||||||||||
| 1 | 1 | 1 | — | — | — | |||||||||||
| 2 | 2 | — | — | — | 1 | |||||||||||
| 34 | 29 | 33 | 9 | 23 | 23 | |||||||||||
| 96 | 82 | 91,754 | 9,407 | 78,246 | 7,896 | |||||||||||
| $644,683 | $610,161 | $377,088 | $62,977 | $198,914 | $257,238 | |||||||||||
| 642,655 | 609,278 | 439,352 | 68,837 | 268,619 | 280,644 | |||||||||||
| $644,776 | | $610,167 | $371,499 | $60,746 | $197,667 | $287,915 | ||||||||||
| — | — | 4 | | — | (6 | ) | (2 | ) | ||||||||
| (93 | ) | (6 | ) | 1,341 | | 729 | (5,617 | ) | (9,076 | ) | ||||||
| — | | — | 3,952 | 1,605 | 7,236 | (21,498 | ) | |||||||||
| — | | — | 292 | (103 | ) | (366 | ) | (101 | ) | |||||||
| $644,683 | $610,161 | $377,088 | $62,977 | $198,914 | $257,238 | |||||||||||
| $1.00 | | $1.00 | $10.52 | $11.24 | $10.28 | $9.24 | ||||||||||
| ($295,694,790 ÷ 295,731,618 shares | ) | ($436,276,181 ÷ 436,438,104 shares | ) | ($377,088,069 ÷ 35,833,253 shares | ) | ($62,976,547 ÷ 5,601,801 shares | ) | ($198,913,882 ÷ 19,346,952 shares | ) | ($257,238,206 ÷ 27,841,532 shares | ) | |||||
| $1.00 | | $1.00 | N/A | N/A | N/A | N/A | ||||||||||
| ($184,127,315 ÷ 184,163,333 shares | ) | ($165,266,429 ÷ 165,255,293 shares | ) | |||||||||||||
| $1.00 | | $1.00 | N/A | N/A | N/A | N/A | ||||||||||
| ($26,422,971 ÷ 26,437,134 shares | ) | ($8,618,830 ÷ 8,621,628 shares | ) | |||||||||||||
| N/A | | N/A | N/A | N/A | N/A | N/A | ||||||||||
| $1.00 | | N/A | N/A | N/A | N/A | N/A | ||||||||||
| ($138,437,522 ÷ 138,443,524 shares | ) |
| SEI Daily Income Trust / Annual Report / January 31, 2010 | 35 |
Table of Contents
Statements of Operations ($ Thousands)
For the year ended January 31, 2010
| Money Market Fund | Government Fund | Government II Fund | Prime Obligation Fund | |||||||||||||
Investment Income: | ||||||||||||||||
Interest Income | $ | 3,260 | $ | 6,701 | $ | 5,656 | $ | 19,967 | ||||||||
Expenses: | ||||||||||||||||
Administration Fees | 1,811 | 4,496 | 3,459 | 7,555 | ||||||||||||
Shareholder Servicing Fees — Class A Shares | 740 | 2,981 | 3,956 | 8,379 | ||||||||||||
Shareholder Servicing Fees — Sweep Class Shares | 113 | 147 | — | 18 | ||||||||||||
Distribution Fees — Sweep Class Shares | 226 | 73 | — | 177 | ||||||||||||
Administrative & Shareholder Servicing Fees — Class B Shares | 281 | 1,603 | 648 | 628 | ||||||||||||
Administrative & Shareholder Servicing Fees — Class C Shares | 569 | 596 | 122 | 1,683 | ||||||||||||
Administrative & Shareholder Servicing Fees — Class H Shares | — | — | — | 266 | ||||||||||||
Investment Advisory Fees | 144 | 498 | 484 | 1,080 | ||||||||||||
Trustees’ Fees | 15 | 50 | 49 | 98 | ||||||||||||
Chief Compliance Officer Fees | 3 | 10 | 9 | 21 | ||||||||||||
Registration Fees | 41 | 114 | 115 | 251 | ||||||||||||
Custodian/Wire Agent Fees | 39 | 128 | 124 | 254 | ||||||||||||
Treasury Expense | 351 | 468 | 382 | 1,345 | ||||||||||||
Pricing Fees | 1 | 4 | 4 | — | ||||||||||||
Other Expenses | 66 | 211 | 203 | 430 | ||||||||||||
Total Expenses | 4,400 | 11,379 | 9,555 | 22,185 | ||||||||||||
Less, Waiver of: | ||||||||||||||||
Investment Advisory Fees | — | — | — | — | ||||||||||||
Administration fees | (1,155 | ) | (2,189 | ) | (1,424 | ) | (1,710 | ) | ||||||||
Shareholder Servicing Fees — Class A Shares | (740 | ) | (2,981 | ) | (3,956 | ) | (8,379 | ) | ||||||||
Administrative & Shareholder Servicing Fees — Class B Shares | (101 | ) | (1,180 | ) | (518 | ) | (329 | ) | ||||||||
Administrative & Shareholder Servicing Fees — Class C Shares | (287 | ) | (480 | ) | (104 | ) | (1,159 | ) | ||||||||
Administrative & Shareholder Servicing Fees — Class H Shares | — | — | — | | (107 | ) | ||||||||||
Distribution Fees — Sweep Class Shares | (213 | ) | (192 | ) | — | (211 | ) | |||||||||
Net Expenses | 1,904 | 4,357 | 3,553 | 10,290 | ||||||||||||
Net Investment Income | 1,356 | 2,344 | 2,103 | 9,677 | ||||||||||||
Net Realized and Unrealized Gain (Loss) on/from: | ||||||||||||||||
Investments | 24 | — | 3 | (95,330 | ) | |||||||||||
Payment by Affiliate* | — | — | — | 152,452 | ||||||||||||
Futures Contracts | — | — | — | — | ||||||||||||
Net Change in Unrealized Appreciation (Depreciation) on/from: | ||||||||||||||||
Investments | — | — | — | 92,494 | ||||||||||||
Affiliated Investment | — | — | — | (150,858 | ) | |||||||||||
Futures Contracts | — | — | — | — | ||||||||||||
Net Increase in Net Assets from Operations | $ | 1,380 | $ | 2,344 | $ | 2,106 | $ | 8,435 | ||||||||
| * | See Note 3 in Notes to Financial Statements. |
Amounts designated as “—” are either $0 or have been rounded to $0.
The accompanying notes are an integral part of the financial statements.
| 36 | SEI Daily Income Trust / Annual Report / January 31, 2010 |
Table of Contents
| Treasury Fund | Treasury II Fund | Short-Duration Government Fund | Intermediate-Duration Government Fund | GNMA Fund | Ultra Short Bond Fund | |||||||||||||||||
| $ | 2,438 | $ | 1,271 | $ | 6,835 | $ | 2,513 | $ | 7,237 | $ | 7,575 | |||||||||||
| 2,315 | 1,892 | 955 | 263 | 611 | 856 | |||||||||||||||||
| 1,129 | 1,392 | 682 | 188 | 477 | 611 | |||||||||||||||||
| 367 | — | — | — | — | — | |||||||||||||||||
| 734 | — | — | — | — | — | |||||||||||||||||
| 967 | 662 | — | — | — | — | |||||||||||||||||
| 224 | 58 | — | — | — | — | |||||||||||||||||
| — | — | — | — | — | — | |||||||||||||||||
| 250 | 214 | 267 | 73 | 187 | 245 | |||||||||||||||||
| 26 | 21 | — | 2 | 4 | 5 | |||||||||||||||||
| 5 | 4 | 1 | — | 1 | 1 | |||||||||||||||||
| 69 | 53 | 13 | 5 | 8 | 17 | |||||||||||||||||
| 65 | 52 | 16 | 2 | 12 | 16 | |||||||||||||||||
| 159 | 71 | — | — | — | — | |||||||||||||||||
| 2 | 1 | 73 | 23 | 50 | 51 | |||||||||||||||||
| 109 | 87 | 32 | 11 | 19 | 26 | |||||||||||||||||
| 6,421 | 4,507 | 2,039 | 567 | 1,369 | 1,828 | |||||||||||||||||
| — | — | (32 | ) | (1 | ) | — | (84 | ) | ||||||||||||||
| (1,292 | ) | (1,451 | ) | (15 | ) | (2 | ) | (167 | ) | (203 | ) | |||||||||||
| (1,129 | ) | (1,392 | ) | (682 | ) | (166 | ) | — | (611 | ) | ||||||||||||
| (912 | ) | (662 | ) | — | — | — | — | |||||||||||||||
| (217 | ) | (58 | ) | — | — | — | — | |||||||||||||||
| (1,081 | ) | — | — | — | — | — | ||||||||||||||||
| 1,790 | 944 | 1,310 | 398 | 1,202 | 930 | |||||||||||||||||
| 648 | 327 | 5,525 | 2,115 | 6,035 | 6,645 | |||||||||||||||||
| — | 11 | 6,212 | 2,104 | 4,443 | (3,118 | ) | ||||||||||||||||
| — | — | — | — | — | — | |||||||||||||||||
| — | — | (713 | ) | 777 | 569 | 751 | ||||||||||||||||
| — | — | 1,449 | 389 | 4,230 | 24,490 | |||||||||||||||||
| — | — | — | — | — | — | |||||||||||||||||
| — | — | 467 | (506 | ) | (287 | ) | (603 | ) | ||||||||||||||
| $ | 648 | $ | 338 | $ | 12,940 | $ | 4,879 | $ | 14,990 | $ | 28,165 | |||||||||||
| SEI Daily Income Trust / Annual Report / January 31, 2010 | 37 |
Table of Contents
Statements of Changes in Net Assets ($ Thousands)
For the years ended January 31,
Money Market Fund | Government Fund | |||||||||||||||
| 2010 | 2009 | 2010 | 2009 | |||||||||||||
Operations: | ||||||||||||||||
Net Investment Income | $ | 1,356 | $ | 18,597 | $ | 2,344 | $ | 34,534 | ||||||||
Net Realized Gain (Loss) on Investments | 24 | (6,625 | ) | — | 9 | |||||||||||
Payment by Affiliate* | — | 6,574 | — | — | ||||||||||||
Net Change in Unrealized Appreciation (Depreciation) on Investments and Affiliated Investment | — | 2,861 | — | — | ||||||||||||
Net Increase in Net Assets Resulting from Operations | 1,380 | 21,407 | 2,344 | 34,543 | ||||||||||||
Dividends to Shareholders: | ||||||||||||||||
Net Investment Income | ||||||||||||||||
Class A | (998 | ) | (9,185 | ) | (1,868 | ) | (24,900 | ) | ||||||||
Class B | (171 | ) | (3,068 | ) | (378 | ) | (6,616 | ) | ||||||||
Class C | (108 | ) | (4,369 | ) | (78 | ) | (2,538 | ) | ||||||||
Class H | — | — | — | — | ||||||||||||
Sweep Class | (34 | ) | (1,984 | ) | (20 | ) | (480 | ) | ||||||||
Total Dividends | (1,311 | ) | (18,606 | ) | (2,344 | ) | (34,534 | ) | ||||||||
Capital Share Transactions (All at $1.00 per share): | ||||||||||||||||
Class A: | ||||||||||||||||
Proceeds from Shares Issued | 1,417,263 | 1,901,662 | 5,295,538 | 5,981,532 | ||||||||||||
Reinvestment of Dividends & Distributions | 554 | 5,470 | 1,136 | 16,138 | ||||||||||||
Cost of Shares Redeemed | (1,530,684 | ) | (1,968,247 | ) | (5,997,875 | ) | (5,502,747 | ) | ||||||||
Increase (Decrease) in Net Assets from Class A Transactions | (112,867 | ) | (61,115 | ) | (701,201 | ) | 494,923 | |||||||||
Class B: | ||||||||||||||||
Proceeds from Shares Issued | 465,220 | 674,343 | 1,707,234 | 1,940,587 | ||||||||||||
Reinvestment of Dividends & Distributions | 13 | 315 | 317 | 4,761 | ||||||||||||
Cost of Shares Redeemed | (535,025 | ) | (720,832 | ) | (1,903,745 | ) | (1,519,037 | ) | ||||||||
Increase (Decrease) in Net Assets from Class B Transactions | (69,792 | ) | (46,174 | ) | (196,194 | ) | 426,311 | |||||||||
Class C: | ||||||||||||||||
Proceeds from Shares Issued | 637,283 | 960,510 | 548,752 | 559,348 | ||||||||||||
Reinvestment of Dividends & Distributions | 6 | 166 | — | — | ||||||||||||
Cost of Shares Redeemed | (722,091 | ) | (1,062,248 | ) | (642,202 | ) | (560,578 | ) | ||||||||
Increase (Decrease) in Net Assets from Class C Transactions | (84,802 | ) | (101,572 | ) | (93,450 | ) | (1,230 | ) | ||||||||
Class H: | ||||||||||||||||
Proceeds from Shares Issued | N/A | N/A | N/A | N/A | ||||||||||||
Reinvestment of Dividends & Distributions | N/A | N/A | N/A | N/A | ||||||||||||
Cost of Shares Redeemed | N/A | N/A | N/A | N/A | ||||||||||||
Decrease in Net Assets from Class H Transactions | N/A | N/A | N/A | N/A | ||||||||||||
Sweep Class: | ||||||||||||||||
Proceeds from Shares Issued | 350,692 | 533,994 | 370,174 | 429,120 | ||||||||||||
Reinvestment of Dividends & Distributions | — | — | 7 | 43 | ||||||||||||
Cost of Shares Redeemed | (390,432 | ) | (599,457 | ) | (385,316 | ) | (412,243 | ) | ||||||||
Increase (Decrease) in Net Assets from Sweep Class Transactions | (39,740 | ) | (65,463 | ) | (15,135 | ) | 16,920 | |||||||||
Increase (Decrease) in Net Assets from Capital Share Transactions | (307,201 | ) | (274,324 | ) | (1,005,980 | ) | 936,924 | |||||||||
Total Increase (Decrease) in Net Assets | (307,132 | ) | (271,523 | ) | (1,005,980 | ) | 936,933 | |||||||||
Net Assets: | ||||||||||||||||
Beginning of Year | 689,141 | 960,664 | 2,348,615 | 1,411,682 | ||||||||||||
End of Year | $ | 382,009 | $ | 689,141 | $ | 1,342,635 | $ | 2,348,615 | ||||||||
Undistributed Distributions in Excess of Net Investment Income | $ | (1 | ) | $ | (46 | ) | $ | — | $ | — | ||||||
| * | See Note 3 in Notes to Financial Statements. |
Amounts designated as “—” are zero or have been rounded to zero.
The accompanying notes are an integral part of the financial statements.
| 38 | SEI Daily Income Trust / Annual Report / January 31, 2010 |
Table of Contents
Government II Fund | Prime Obligation Fund | Treasury Fund | Treasury II Fund | |||||||||||||||||||||||||||
| 2010 | 2009 | 2010 | 2009 | 2010 | 2009 | 2010 | 2009 | |||||||||||||||||||||||
| $ | 2,103 | $ | 32,492 | $ | 9,677 | $ | 121,620 | $ | 648 | $ | 15,408 | $ | 327 | $ | 6,683 | |||||||||||||||
| 3 | 16 | (95,330 | ) | (64,872 | ) | — | — | 11 | 14 | |||||||||||||||||||||
| — | — | 152,452 | — | — | — | — | — | |||||||||||||||||||||||
| | — | | — | (58,364 | ) | 72,844 | — | — | — | — | ||||||||||||||||||||
| 2,106 | 32,508 | 8,435 | 129,592 | 648 | 15,408 | 338 | 6,697 | |||||||||||||||||||||||
| (1,957 | ) | (28,023 | ) | (6,871 | ) | (96,337 | ) | (331 | ) | (7,469 | ) | (229 | ) | (5,274 | ) | |||||||||||||||
| (130 | ) | (3,807 | ) | (163 | ) | (7,370 | ) | (202 | ) | (5,961 | ) | (93 | ) | (1,349 | ) | |||||||||||||||
| (16 | ) | (662 | ) | (229 | ) | (10,268 | ) | (29 | ) | (960 | ) | (5 | ) | (60 | ) | |||||||||||||||
| — | — | (24 | ) | (1,431 | ) | — | — | — | — | |||||||||||||||||||||
| — | — | (10 | ) | (837 | ) | (86 | ) | (1,018 | ) | — | — | |||||||||||||||||||
| (2,103 | ) | (32,492 | ) | (7,297 | ) | (116,243 | ) | (648 | ) | (15,408 | ) | (327 | ) | (6,683 | ) | |||||||||||||||
| 4,465,711 | 4,216,167 | 15,271,504 | 20,904,381 | 18,103,049 | 19,984,359 | 1,489,228 | 2,788,233 | |||||||||||||||||||||||
| 171 | 2,310 | 2,690 | 23,064 | 162 | 2,558 | 128 | 1,600 | |||||||||||||||||||||||
| (5,235,768 | ) | (3,522,616 | ) | (15,912,304 | ) | (20,881,600 | ) | (18,380,423 | ) | (20,024,455 | ) | (1,741,901 | ) | (2,617,194 | ) | |||||||||||||||
| (769,886 | ) | 695,861 | (638,110 | ) | 45,845 | (277,212 | ) | (37,538 | ) | (252,545 | ) | 172,639 | ||||||||||||||||||
| 863,663 | 889,367 | 1,089,815 | 2,111,294 | 1,353,051 | 2,538,926 | 537,529 | 1,055,747 | |||||||||||||||||||||||
| 87 | 1,367 | 73 | 2,778 | 80 | 2,858 | 42 | 471 | |||||||||||||||||||||||
| (959,122 | ) | (799,304 | ) | (1,254,167 | ) | (2,244,412 | ) | (1,656,257 | ) | (2,816,033 | ) | (735,546 | ) | (802,368 | ) | |||||||||||||||
| (95,372 | ) | 91,430 | (164,279 | ) | (130,340 | ) | (303,126 | ) | (274,249 | ) | (197,975 | ) | 253,850 | |||||||||||||||||
| 74,849 | 121,329 | 2,405,551 | 3,319,590 | 509,512 | 977,573 | 73,252 | 161,148 | |||||||||||||||||||||||
| — | — | 122 | 3,901 | 1 | 24 | — | 4 | |||||||||||||||||||||||
| (101,059 | ) | (133,406 | ) | (2,778,522 | ) | (3,499,746 | ) | (555,893 | ) | (1,049,713 | ) | (77,997 | ) | (155,042 | ) | |||||||||||||||
| (26,210 | ) | (12,077 | ) | (372,849 | ) | (176,255 | ) | (46,380 | ) | (72,116 | ) | (4,745 | ) | 6,110 | ||||||||||||||||
| N/A | N/A | 50,778 | 143,780 | N/A | N/A | N/A | N/A | |||||||||||||||||||||||
| N/A | N/A | 10 | 1,431 | N/A | N/A | N/A | N/A | |||||||||||||||||||||||
| N/A | N/A | (77,298 | ) | (168,137 | ) | N/A | N/A | N/A | N/A | |||||||||||||||||||||
| N/A | N/A | (26,510 | ) | (22,926 | ) | N/A | N/A | N/A | N/A | |||||||||||||||||||||
| N/A | N/A | 275,288 | 412,431 | 376,096 | 811,013 | N/A | N/A | |||||||||||||||||||||||
| N/A | N/A | 10 | 214 | — | — | N/A | N/A | |||||||||||||||||||||||
| N/A | N/A | (300,625 | ) | (412,009 | ) | (444,377 | ) | (716,148 | ) | N/A | N/A | |||||||||||||||||||
| N/A | N/A | (25,327 | ) | 636 | (68,281 | ) | 94,865 | N/A | N/A | |||||||||||||||||||||
| (891,468 | ) | 775,214 | (1,227,075 | ) | (283,040 | ) | (694,999 | ) | (289,038 | ) | (455,265 | ) | 432,599 | |||||||||||||||||
| (891,465 | ) | 775,230 | (1,225,937 | ) | (269,691 | ) | (694,999 | ) | (289,038 | ) | (455,254 | ) | 432,613 | |||||||||||||||||
| 2,324,029 | 1,548,799 | 4,726,036 | 4,995,727 | 1,339,682 | 1,628,720 | 1,065,415 | 632,802 | |||||||||||||||||||||||
| $ | 1,432,564 | $ | 2,324,029 | $ | 3,500,099 | $ | 4,726,036 | $ | 644,683 | $ | 1,339,682 | $ | 610,161 | $ | 1,065,415 | |||||||||||||||
| $ | — | $ | — | $ | — | $ | (902 | ) | $ | — | $ | — | $ | — | $ | — | ||||||||||||||
| SEI Daily Income Trust / Annual Report / January 31, 2010 | 39 |
Table of Contents
Statements of Changes in Net Assets ($ Thousands)
For the years ended January 31,
| Short-Duration Government Fund | ||||||||
| 2010 | 2009 | |||||||
Operations: | ||||||||
Net Investment Income | $ | 5,525 | $ | 6,720 | ||||
Net Realized Gain (Loss) on Investments and Futures Contracts | 5,499 | 3,091 | ||||||
Net Change in Unrealized Appreciation (Depreciation) on Investments and Futures Contracts | 1,916 | (45 | ) | |||||
Net Increase (Decrease) in Net Assets Resulting from Operations | 12,940 | 9,766 | ||||||
Dividends and Distributions to Shareholders: | ||||||||
Net Investment Income | (5,907 | ) | (6,868 | ) | ||||
Net Capital Gains | — | — | ||||||
Total Dividends and Distributions | (5,907 | ) | (6,868 | ) | ||||
Capital Share Transactions: | ||||||||
Class A: | ||||||||
Proceeds from Shares Issued | 426,624 | 314,910 | ||||||
Reinvestment of Dividends & Distributions | 5,123 | 5,581 | ||||||
Cost of Shares Redeemed | (349,756 | ) | (208,217 | ) | ||||
Increase (Decrease) in Net Assets from Class A Transactions | 81,991 | 112,274 | ||||||
Net Increase (Decrease) in Net Assets | 89,024 | 115,172 | ||||||
Net Assets: | ||||||||
Beginning of Year | 288,064 | 172,892 | ||||||
End of Year | $ | 377,088 | $ | 288,064 | ||||
Undistributed (Distributions in Excess of) Net Investment Income | $ | 4 | $ | — | ||||
Share Transactions: | ||||||||
Class A: | ||||||||
Shares Issued | 40,958 | 31,072 | ||||||
Reinvestment of Distributions | 493 | 548 | ||||||
Shares Redeemed | (33,717 | ) | (20,447 | ) | ||||
Net Increase (Decrease) in Shares Outstanding from Share Transactions | 7,734 | 11,173 | ||||||
Amounts designated as “—” are zero or have been rounded to zero.
The accompanying notes are an integral part of the financial statements.
| 40 | SEI Daily Income Trust / Annual Report / January 31, 2010 |
Table of Contents
| Intermediate-Duration Government Fund | GNMA Fund | Ultra Short Bond Fund | ||||||||||||||||||||
| 2010 | 2009 | 2010 | 2009 | 2010 | 2009 | |||||||||||||||||
| $ | 2,115 | $ | 2,356 | $ | 6,035 | $ | 5,429 | $ | 6,645 | $ | 11,932 | |||||||||||
| 2,881 | 2,881 | 5,012 | 1,701 | (2,367 | ) | (987 | ) | |||||||||||||||
| (117 | ) | 191 | 3,943 | 810 | 23,887 | (39,795 | ) | |||||||||||||||
| 4,879 | 5,428 | 14,990 | 7,940 | 28,165 | (28,850 | ) | ||||||||||||||||
| (2,185 | ) | (2,389 | ) | (6,674 | ) | (5,478 | ) | (6,657 | ) | (11,795 | ) | |||||||||||
| (2,084 | ) | — | — | — | — | — | ||||||||||||||||
| (4,269 | ) | (2,389 | ) | (6,674 | ) | (5,478 | ) | (6,657 | ) | (11,795 | ) | |||||||||||
| 61,301 | 108,145 | 151,825 | 181,448 | 219,652 | 304,138 | |||||||||||||||||
| 3,587 | 2,060 | 4,651 | 3,048 | 5,869 | 11,302 | |||||||||||||||||
| (94,546 | ) | (71,591 | ) | (126,517 | ) | (141,143 | ) | (196,872 | ) | (477,077 | ) | |||||||||||
| (29,658 | ) | 38,614 | 29,959 | 43,353 | 28,649 | (161,637 | ) | |||||||||||||||
| (29,048 | ) | 41,653 | 38,275 | 45,815 | 50,157 | (202,282 | ) | |||||||||||||||
| 92,025 | 50,372 | 160,639 | 114,824 | 207,081 | 409,363 | |||||||||||||||||
| $ | 62,977 | $ | 92,025 | $ | 198,914 | $ | 160,639 | $ | 257,238 | $ | 207,081 | |||||||||||
| $ | — | $ | (2 | ) | $ | (6 | ) | $ | (9 | ) | $ | (2 | ) | $ | (4 | ) | ||||||
| 5,419 | 9,983 | 15,143 | 18,854 | 25,121 | 32,955 | |||||||||||||||||
| 317 | 190 | 461 | 317 | 666 | 1,227 | |||||||||||||||||
| (8,350 | ) | (6,640 | ) | (12,589 | ) | (14,766 | ) | (22,293 | ) | (52,091 | ) | |||||||||||
| (2,614 | ) | 3,533 | 3,015 | 4,405 | 3,494 | (17,909 | ) | |||||||||||||||
| SEI Daily Income Trust / Annual Report / January 31, 2010 | 41 |
Table of Contents
For the years ended January 31,
For a Share Outstanding Throughout the Years
| Net Asset Value, Beginning of Year | Net Investment Income(1) | Net Realized and Unrealized Gains (Losses) on Securities | Payment by Affiliate | Total from Operations | Dividends from Net Investment Income | Total Dividends | Net Asset Value, End of Year | Total Return† | Net Assets End of Year ($ Thousands) | Ratio of Expenses to Average Net Assets | Ratio of Expenses to Average Net Assets (Excluding Waivers) | Ratio of Net Investment Income to Average Net Assets | ||||||||||||||||||||||||||||||
Money Market Fund | ||||||||||||||||||||||||||||||||||||||||||
Class A | ||||||||||||||||||||||||||||||||||||||||||
2010 | $ | 1.00 | $ | — | $ | — | $ | — | $ | — | $ | — | (3) | $ | — | (3) | $ | 1.00 | 0.31 | % | $ | 228,375 | 0.24 | %* | 0.70 | % | 0.35 | % | ||||||||||||||
2009 | 1.00 | 0.02 | (0.01 | ) | 0.01 | 0.02 | (0.02 | ) | (0.02 | ) | 1.00 | 2.45 | †† | 341,204 | 0.20 | * | 0.64 | 2.46 | ||||||||||||||||||||||||
2008 | 1.00 | 0.05 | — | — | 0.05 | (0.05 | ) | (0.05 | ) | 1.00 | 5.23 | 401,174 | 0.18 | 0.63 | 5.13 | |||||||||||||||||||||||||||
2007 | 1.00 | 0.05 | — | — | 0.05 | (0.05 | ) | (0.05 | ) | 1.00 | 5.07 | 623,314 | 0.18 | 0.63 | 4.97 | |||||||||||||||||||||||||||
2006 | 1.00 | 0.03 | — | — | 0.03 | (0.03 | ) | (0.03 | ) | 1.00 | 3.30 | 392,207 | 0.18 | 0.62 | 3.25 | |||||||||||||||||||||||||||
Class B | ||||||||||||||||||||||||||||||||||||||||||
2010 | $ | 1.00 | $ | — | $ | — | $ | — | $ | — | $ | — | (3) | $ | — | (3) | $ | 1.00 | 0.15 | % | $ | 51,142 | 0.44 | %*(2) | 0.76 | % | 0.19 | % | ||||||||||||||
2009 | 1.00 | 0.02 | (0.01 | ) | 0.01 | 0.02 | (0.02 | ) | (0.02 | ) | 1.00 | 2.15 | †† | 120,925 | 0.50 | * | 0.70 | 2.19 | ||||||||||||||||||||||||
2008 | 1.00 | 0.05 | — | — | 0.05 | (0.05 | ) | (0.05 | ) | 1.00 | 4.92 | 166,627 | 0.48 | 0.68 | 4.82 | |||||||||||||||||||||||||||
2007 | 1.00 | 0.05 | — | — | 0.05 | (0.05 | ) | (0.05 | ) | 1.00 | 4.76 | 148,053 | 0.48 | 0.68 | 4.61 | |||||||||||||||||||||||||||
2006 | 1.00 | 0.03 | — | — | 0.03 | (0.03 | ) | (0.03 | ) | 1.00 | 2.99 | 123,851 | 0.48 | 0.67 | 2.98 | |||||||||||||||||||||||||||
Class C | ||||||||||||||||||||||||||||||||||||||||||
2010 | $ | 1.00 | $ | — | $ | — | $ | — | $ | — | $ | — | (3) | $ | — | (3) | $ | 1.00 | 0.08 | % | $ | 74,047 | 0.49 | %*(2) | 0.95 | % | 0.10 | % | ||||||||||||||
2009 | 1.00 | 0.02 | (0.01 | ) | 0.01 | 0.02 | (0.02 | ) | (0.02 | ) | 1.00 | 1.94 | †† | 158,833 | 0.70 | * | 0.89 | 2.00 | ||||||||||||||||||||||||
2008 | 1.00 | 0.05 | — | — | 0.05 | (0.05 | ) | (0.05 | ) | 1.00 | 4.71 | 259,640 | 0.68 | 0.88 | 4.61 | |||||||||||||||||||||||||||
2007 | 1.00 | 0.04 | — | — | 0.04 | (0.04 | ) | (0.04 | ) | 1.00 | 4.55 | 243,944 | 0.68 | 0.88 | 4.48 | |||||||||||||||||||||||||||
2006 | 1.00 | 0.03 | — | — | 0.03 | (0.03 | ) | (0.03 | ) | 1.00 | 2.78 | 232,072 | 0.68 | 0.87 | 2.83 | |||||||||||||||||||||||||||
Sweep Class | ||||||||||||||||||||||||||||||||||||||||||
2010 | $ | 1.00 | $ | — | $ | — | $ | — | $ | — | $ | — | (3) | $ | — | (3) | $ | 1.00 | 0.07 | % | $ | 28,445 | 0.52 | %*(2) | 1.20 | % | 0.08 | % | ||||||||||||||
2009 | 1.00 | 0.02 | (0.01 | ) | 0.01 | 0.02 | (0.02 | ) | (0.02 | ) | 1.00 | 1.69 | †† | 68,179 | 0.95 | * | 1.14 | 1.79 | ||||||||||||||||||||||||
2008 | 1.00 | 0.04 | — | — | 0.04 | (0.04 | ) | (0.04 | ) | 1.00 | 4.45 | 133,223 | 0.93 | 1.13 | 4.35 | |||||||||||||||||||||||||||
2007 | 1.00 | 0.04 | — | — | 0.04 | (0.04 | ) | (0.04 | ) | 1.00 | 4.29 | 91,087 | 0.93 | 1.13 | 4.19 | |||||||||||||||||||||||||||
2006 | 1.00 | 0.03 | — | — | 0.03 | (0.03 | ) | (0.03 | ) | 1.00 | 2.53 | 113,107 | 0.93 | 1.12 | 2.60 | |||||||||||||||||||||||||||
Government Fund | ||||||||||||||||||||||||||||||||||||||||||
Class A | ||||||||||||||||||||||||||||||||||||||||||
2010 | $ | 1.00 | $ | — | $ | — | $ | — | $ | — | $ | — | (3) | $ | — | (3) | $ | 1.00 | 0.14 | % | $ | 825,341 | 0.20 | %* | 0.57 | % | 0.16 | % | ||||||||||||||
2009 | 1.00 | 0.02 | — | — | 0.02 | (0.02 | ) | (0.02 | ) | 1.00 | 2.15 | 1,526,541 | 0.22 | * | 0.54 | 2.06 | ||||||||||||||||||||||||||
2008 | 1.00 | 0.05 | — | — | 0.05 | (0.05 | ) | (0.05 | ) | 1.00 | 4.98 | 1,031,612 | 0.20 | 0.53 | 4.79 | |||||||||||||||||||||||||||
2007 | 1.00 | 0.05 | — | — | 0.05 | (0.05 | ) | (0.05 | ) | 1.00 | 4.97 | 507,735 | 0.20 | 0.54 | 4.88 | |||||||||||||||||||||||||||
2006 | 1.00 | 0.03 | — | — | 0.03 | (0.03 | ) | (0.03 | ) | 1.00 | 3.21 | 467,445 | 0.20 | 0.53 | 3.23 | |||||||||||||||||||||||||||
Class B | ||||||||||||||||||||||||||||||||||||||||||
2010 | $ | 1.00 | $ | — | $ | — | $ | — | $ | — | $ | — | (3) | $ | — | (3) | $ | 1.00 | 0.07 | % | $ | 427,711 | 0.28 | %*(2) | 0.62 | % | 0.07 | % | ||||||||||||||
2009 | 1.00 | 0.02 | — | — | 0.02 | (0.02 | ) | (0.02 | ) | 1.00 | 1.84 | 623,905 | 0.52 | * | 0.60 | 1.62 | ||||||||||||||||||||||||||
2008 | 1.00 | 0.05 | — | — | 0.05 | (0.05 | ) | (0.05 | ) | 1.00 | 4.67 | 197,593 | 0.50 | 0.58 | 4.53 | |||||||||||||||||||||||||||
2007 | 1.00 | 0.05 | — | — | 0.05 | (0.05 | ) | (0.05 | ) | 1.00 | 4.66 | 122,674 | 0.50 | 0.59 | 4.57 | |||||||||||||||||||||||||||
2006 | 1.00 | 0.03 | — | — | 0.03 | (0.03 | ) | (0.03 | ) | 1.00 | 2.90 | 122,025 | 0.50 | 0.58 | 2.84 | |||||||||||||||||||||||||||
Class C | ||||||||||||||||||||||||||||||||||||||||||
2010 | $ | 1.00 | $ | — | $ | — | $ | — | $ | — | $ | — | (3) | $ | — | (3) | $ | 1.00 | 0.06 | % | $ | 59,565 | 0.31 | %*(2) | 0.82 | % | 0.07 | % | ||||||||||||||
2009 | 1.00 | 0.02 | — | — | 0.02 | (0.02 | ) | (0.02 | ) | 1.00 | 1.64 | 153,015 | 0.71 | *(2) | 0.79 | 1.65 | ||||||||||||||||||||||||||
2008 | 1.00 | 0.04 | — | — | 0.04 | (0.04 | ) | (0.04 | ) | 1.00 | 4.46 | 154,244 | 0.70 | 0.78 | 4.35 | |||||||||||||||||||||||||||
2007 | 1.00 | 0.04 | — | — | 0.04 | (0.04 | ) | (0.04 | ) | 1.00 | 4.45 | 137,375 | 0.70 | 0.79 | 4.37 | |||||||||||||||||||||||||||
2006 | 1.00 | 0.03 | — | — | 0.03 | (0.03 | ) | (0.03 | ) | 1.00 | 2.70 | 129,416 | 0.70 | 0.78 | 2.74 | |||||||||||||||||||||||||||
Sweep Class | ||||||||||||||||||||||||||||||||||||||||||
2010 | $ | 1.00 | $ | — | $ | — | $ | — | $ | — | $ | — | (3) | $ | — | (3) | $ | 1.00 | 0.06 | % | $ | 30,018 | 0.30 | %*(2) | 1.07 | % | 0.07 | % | ||||||||||||||
2009 | 1.00 | 0.01 | — | — | 0.01 | (0.01 | ) | (0.01 | ) | 1.00 | 1.39 | 45,154 | 0.96 | *(2) | 1.04 | 1.34 | ||||||||||||||||||||||||||
2008 | 1.00 | 0.04 | — | — | 0.04 | (0.04 | ) | (0.04 | ) | 1.00 | 4.20 | 28,233 | 0.95 | 1.03 | 4.06 | |||||||||||||||||||||||||||
2007 | 1.00 | 0.04 | — | — | 0.04 | (0.04 | ) | (0.04 | ) | 1.00 | 4.19 | 15,077 | 0.95 | 1.04 | 4.07 | |||||||||||||||||||||||||||
2006 | 1.00 | 0.02 | — | — | 0.02 | (0.02 | ) | (0.02 | ) | 1.00 | 2.44 | 26,361 | 0.95 | 1.03 | 2.43 | |||||||||||||||||||||||||||
Government II Fund | ||||||||||||||||||||||||||||||||||||||||||
Class A | ||||||||||||||||||||||||||||||||||||||||||
2010 | $ | 1.00 | $ | — | $ | — | $ | — | $ | — | $ | — | (3) | $ | — | (3) | $ | 1.00 | 0.11 | % | $ | 1,280,352 | 0.19 | %* | 0.52 | % | 0.12 | % | ||||||||||||||
2009 | 1.00 | 0.02 | — | — | 0.02 | (0.02 | ) | (0.02 | ) | 1.00 | 2.10 | 2,050,235 | 0.21 | * | 0.50 | 1.99 | ||||||||||||||||||||||||||
2008 | 1.00 | 0.05 | — | — | 0.05 | (0.05 | ) | (0.05 | ) | 1.00 | 4.97 | 1,354,361 | 0.20 | 0.48 | 4.81 | |||||||||||||||||||||||||||
2007 | 1.00 | 0.05 | — | — | 0.05 | (0.05 | ) | (0.05 | ) | 1.00 | 4.96 | 680,219 | 0.20 | 0.49 | 4.86 | |||||||||||||||||||||||||||
2006 | 1.00 | 0.03 | — | — | 0.03 | (0.03 | ) | (0.03 | ) | 1.00 | 3.18 | 576,242 | 0.20 | 0.48 | 3.18 | |||||||||||||||||||||||||||
| Amounts | designated as “—” are $0 or have been rounded to $0. |
| * | The expense ratio includes the Treasury Guarantee Program expense. Had the expense been excluded, the expense ratio would have been equal to, or less than, the expense ratio cap figure. See Note 3 for expense ratio cap figure. |
| † | Returns are for the period indicated and have not been annualized. Returns shown do not reflect the deduction of taxes that a shareholder would pay on Fund distributions or the redemption of Fund shares. |
| †† | The total return includes payment by affiliate. Had the payment been excluded the total return would have been 1.61%, 1.31%, 1.11% and 0.86% for Class A, Class B, Class C and Sweep Class, respectively. See Note 3 in Notes to Financial Statements. |
| (1) | Per share calculations were performed using average shares. |
| (2) | The Distributor and/or Administrator have voluntarily agreed to waive and reduce its fee and/or reimburse certain expenses of the Fund in order to limit the one-day net income yield of the Fund to not less than 0.01% of the Fund’s average daily net assets of the share class. Had these waivers and the Treasury Guarantee Program expense been excluded the ratio would have been at the expense ratio cap figure. See Note 3 for expense ratio cap figure. |
| (3) | Amount represents less than $0.01 per share. |
| The | accompanying notes are an integral part of the financial statements. |
| 42 | SEI Daily Income Trust / Annual Report / January 31, 2010 |
Table of Contents
| Net Asset Value, Beginning of Year | Net Investment Income(1) | Net Realized and Unrealized Gains (Losses) on Securities | Payment by Affiliate | Total from Operations | Dividends from Net Investment Income | Total Dividends | Net Asset Value, End of Year | Total Return† | Net Assets End of Year ($ Thousands) | Ratio of Expenses to Average Net Assets | Ratio of Expenses to Average Net Assets (Excluding Waivers) | Ratio of Net Investment Income to Average Net Assets | ||||||||||||||||||||||||||||||
Government II Fund (continued) | ||||||||||||||||||||||||||||||||||||||||||
Class B | ||||||||||||||||||||||||||||||||||||||||||
2010 | $ | 1.00 | $ | — | $ | — | $ | — | $ | — | $ | — | (3) | $ | — | (3) | $ | 1.00 | 0.06 | % | $ | 146,960 | 0.25 | %* | 0.56 | % | 0.06 | % | ||||||||||||||
2009 | 1.00 | 0.02 | — | — | 0.02 | (0.02 | ) | (0.02 | ) | 1.00 | 1.79 | 242,332 | 0.51 | * | 0.54 | 1.80 | ||||||||||||||||||||||||||
2008 | 1.00 | 0.05 | — | — | 0.05 | (0.05 | ) | (0.05 | ) | 1.00 | 4.66 | 150,900 | 0.50 | 0.53 | 4.53 | |||||||||||||||||||||||||||
2007 | 1.00 | 0.05 | — | — | 0.05 | (0.05 | ) | (0.05 | ) | 1.00 | 4.64 | 140,930 | 0.50 | 0.54 | 4.56 | |||||||||||||||||||||||||||
2006 | 1.00 | 0.03 | — | — | 0.03 | (0.03 | ) | (0.03 | ) | 1.00 | 2.87 | 168,616 | 0.50 | 0.53 | 2.80 | |||||||||||||||||||||||||||
Class C | ||||||||||||||||||||||||||||||||||||||||||
2010 | $ | 1.00 | $ | — | $ | — | $ | — | $ | — | $ | — | (3) | $ | — | (3) | $ | 1.00 | 0.06 | % | $ | 5,252 | 0.28 | %*(2) | 0.77 | % | 0.06 | % | ||||||||||||||
2009 | 1.00 | 0.02 | — | — | 0.02 | (0.02 | ) | (0.02 | ) | 1.00 | 1.60 | 31,462 | 0.70 | *(2) | 0.74 | 1.63 | ||||||||||||||||||||||||||
2008 | 1.00 | 0.04 | — | — | 0.04 | (0.04 | ) | (0.04 | ) | 1.00 | 4.45 | 43,538 | 0.70 | 0.73 | 4.05 | |||||||||||||||||||||||||||
2007 | 1.00 | 0.04 | — | — | 0.04 | (0.04 | ) | (0.04 | ) | 1.00 | 4.44 | 4,089 | 0.70 | 0.74 | 4.38 | |||||||||||||||||||||||||||
2006 | 1.00 | 0.03 | — | — | 0.03 | (0.03 | ) | (0.03 | ) | 1.00 | 2.67 | 4,457 | 0.70 | 0.73 | 2.39 | |||||||||||||||||||||||||||
Prime Obligation Fund | ||||||||||||||||||||||||||||||||||||||||||
Class A | ||||||||||||||||||||||||||||||||||||||||||
2010 | $ | 1.00 | $ | — | $ | (0.04 | ) | $ | 0.04 | $ | — | $ | — | (3) | $ | — | (3) | $ | 1.00 | 0.20 | %†† | $ | 3,158,830 | 0.23 | %* | 0.53 | % | 0.26 | % | |||||||||||||
2009 | 1.00 | 0.02 | — | — | 0.02 | (0.02 | ) | (0.02 | ) | 1.00 | 2.37 | 3,796,102 | 0.22 | * | 0.50 | 2.42 | ||||||||||||||||||||||||||
2008 | 1.00 | 0.05 | — | — | 0.05 | (0.05 | ) | (0.05 | ) | 1.00 | 5.21 | 3,740,714 | 0.20 | 0.48 | 5.10 | |||||||||||||||||||||||||||
2007 | 1.00 | 0.05 | — | — | 0.05 | (0.05 | ) | (0.05 | ) | 1.00 | 5.06 | 3,382,051 | 0.20 | 0.49 | 4.96 | |||||||||||||||||||||||||||
2006 | 1.00 | 0.03 | — | — | 0.03 | (0.03 | ) | (0.03 | ) | 1.00 | 3.28 | 2,957,074 | 0.20 | 0.48 | 3.26 | |||||||||||||||||||||||||||
Class B | ||||||||||||||||||||||||||||||||||||||||||
2010 | $ | 1.00 | $ | — | $ | (0.04 | ) | $ | 0.04 | $ | — | $ | — | (3) | $ | — | (3) | $ | 1.00 | 0.07 | %†† | $ | 182,593 | 0.38 | %*(2) | 0.58 | % | 0.15 | % | |||||||||||||
2009 | 1.00 | 0.02 | — | — | 0.02 | (0.02 | ) | (0.02 | ) | 1.00 | 2.06 | 346,741 | 0.51 | * | 0.55 | 2.17 | ||||||||||||||||||||||||||
2008 | 1.00 | 0.05 | — | — | 0.05 | (0.05 | ) | (0.05 | )�� | 1.00 | 4.90 | 475,700 | 0.50 | 0.53 | 4.82 | |||||||||||||||||||||||||||
2007 | 1.00 | 0.05 | — | — | 0.05 | (0.05 | ) | (0.05 | ) | 1.00 | 4.74 | 715,879 | 0.50 | 0.54 | 4.65 | |||||||||||||||||||||||||||
2006 | 1.00 | 0.03 | — | — | 0.03 | (0.03 | ) | (0.03 | ) | 1.00 | 2.98 | 625,831 | 0.50 | 0.53 | 2.88 | |||||||||||||||||||||||||||
Class C | ||||||||||||||||||||||||||||||||||||||||||
2010 | $ | 1.00 | $ | — | $ | (0.04 | ) | $ | 0.04 | $ | — | $ | — | (3) | $ | — | (3) | $ | 1.00 | 0.06 | %†† | $ | 95,092 | 0.39 | %*(2) | 0.78 | % | 0.14 | % | |||||||||||||
2009 | 1.00 | 0.02 | — | — | 0.02 | (0.02 | ) | (0.02 | ) | 1.00 | 1.86 | 467,782 | 0.71 | * | 0.75 | 2.04 | ||||||||||||||||||||||||||
2008 | 1.00 | 0.05 | — | — | 0.05 | (0.05 | ) | (0.05 | ) | 1.00 | 4.69 | 641,977 | 0.70 | 0.73 | 4.60 | |||||||||||||||||||||||||||
2007 | 1.00 | 0.04 | — | — | 0.04 | (0.04 | ) | (0.04 | ) | 1.00 | 4.53 | 780,951 | 0.70 | 0.74 | 4.45 | |||||||||||||||||||||||||||
2006 | 1.00 | 0.03 | — | — | 0.03 | (0.03 | ) | (0.03 | ) | 1.00 | 2.77 | 779,625 | 0.70 | 0.73 | 2.76 | |||||||||||||||||||||||||||
Class H | ||||||||||||||||||||||||||||||||||||||||||
2010 | $ | 1.00 | $ | — | $ | (0.04 | ) | $ | 0.04 | $ | — | $ | — | (3) | $ | — | (3) | $ | 1.00 | 0.02 | %†† | $ | 31,797 | 0.43 | %*(2) | 0.71 | % | 0.09 | % | |||||||||||||
2009 | 1.00 | 0.02 | — | — | 0.02 | (0.02 | ) | (0.02 | ) | 1.00 | 1.93 | 58,276 | 0.64 | * | 0.67 | 2.11 | ||||||||||||||||||||||||||
2008 | 1.00 | 0.05 | — | — | 0.05 | (0.05 | ) | (0.05 | ) | 1.00 | 4.76 | 80,958 | 0.63 | 0.66 | 4.65 | |||||||||||||||||||||||||||
2007 | 1.00 | 0.04 | — | — | 0.04 | (0.04 | ) | (0.04 | ) | 1.00 | 4.61 | 65,512 | 0.63 | 0.67 | 4.55 | |||||||||||||||||||||||||||
2006 | 1.00 | 0.03 | — | — | 0.03 | (0.03 | ) | (0.03 | ) | 1.00 | 2.84 | 36,006 | 0.63 | 0.66 | 2.81 | |||||||||||||||||||||||||||
Sweep Class | ||||||||||||||||||||||||||||||||||||||||||
2010 | $ | 1.00 | $ | — | $ | (0.04 | ) | $ | 0.04 | $ | — | $ | — | (3) | $ | — | (3) | $ | 1.00 | 0.06 | %†† | $ | 31,787 | 0.39 | %*(2) | 1.03 | % | 0.14 | % | |||||||||||||
2009 | 1.00 | 0.02 | — | — | 0.02 | (0.02 | ) | (0.02 | ) | 1.00 | 1.62 | 57,135 | 0.95 | *(2) | 1.00 | 1.54 | ||||||||||||||||||||||||||
2008 | 1.00 | 0.04 | — | — | 0.04 | (0.04 | ) | (0.04 | ) | 1.00 | 4.43 | 56,378 | 0.95 | 0.98 | 4.34 | |||||||||||||||||||||||||||
2007 | 1.00 | 0.04 | — | — | 0.04 | (0.04 | ) | (0.04 | ) | 1.00 | 4.27 | 47,991 | 0.95 | 0.99 | 4.20 | |||||||||||||||||||||||||||
2006 | 1.00 | 0.03 | — | — | 0.03 | (0.03 | ) | (0.03 | ) | 1.00 | 2.51 | 45,130 | 0.95 | 0.98 | 2.53 | |||||||||||||||||||||||||||
| Amounts | designated as “—” are $0 or have been rounded to $0. |
| * | The expense ratio includes the Treasury Guarantee Program expense. Had the expense been excluded, the expense ratio would have been equal to, or less than, the expense ratio cap figure. See Note 3 for expense ratio cap figure. |
| † | Returns are for the period indicated and have not been annualized. Returns shown do not reflect the deduction of taxes that a shareholder would pay on Fund distributions or the redemption of Fund shares. |
| †† | The total return includes payment by affiliate. Had the payment been excluded the total return would have been (3.28)%, (3.41)%, (3.42)%, (3.45)% and (3.42)% for Class A, Class B, Class C, Class H and Sweep Class, respectively. See Note 3 in Notes to Financial Statements. |
| (1) | Per share calculations were performed using average shares. |
| (2) | The Distributor and/or Administrator have voluntarily agreed to waive and reduce its fee and/or reimburse certain expenses of the Fund in order to limit the one-day net income yield of the Fund to not less than 0.01% of the Fund’s average daily net assets of the share class. Had these waivers and the Treasury Guarantee Program expense been excluded the ratio would have been at the expense ratio cap figure. See Note 3 for expense ratio cap figure. |
| (3) | Amount represents less than $0.01 per share. |
| The | accompanying notes are an integral part of the financial statements. |
| SEI Daily Income Trust / Annual Report / January 31, 2010 | 43 |
Table of Contents
Financial Highlights
For the years ended January 31,
For a Share Outstanding Throughout the Years
| Net Asset Value, Beginning of Year | Net Investment Income(1) | Net Realized and Unrealized Gains (Losses) on Securities | Payment by Affiliate | Total from Operations | Dividends from Net Investment Income | Total Dividends | Net Asset Value, End of Year | Total Return† | Net Assets End of Year ($ Thousands) | Ratio of Expenses to Average Net Assets | Ratio of Expenses to Average Net Assets (Excluding Waivers) | Ratio of Net Investment Income to Average Net Assets | |||||||||||||||||||||||||||||
Treasury Fund | |||||||||||||||||||||||||||||||||||||||||
Class A | |||||||||||||||||||||||||||||||||||||||||
2010 | $ | 1.00 | $ | — | $ | — | $ | — | $ | — | $ | — | (2) | $ | — | (2) | $ | 1.00 | 0.07 | % | $ | 295,695 | 0.17 | %* | 0.56 | % | 0.07 | % | |||||||||||||
2009 | 1.00 | 0.01 | — | — | 0.01 | (0.01 | ) | (0.01 | ) | 1.00 | 1.27 | 572,906 | 0.19 | * | 0.55 | 1.18 | |||||||||||||||||||||||||
2008 | 1.00 | 0.05 | — | — | 0.05 | (0.05 | ) | (0.05 | ) | 1.00 | 4.64 | 610,451 | 0.20 | 0.53 | 4.36 | ||||||||||||||||||||||||||
2007 | 1.00 | 0.05 | — | — | 0.05 | (0.05 | ) | (0.05 | ) | 1.00 | 4.95 | 287,595 | 0.20 | 0.54 | 4.87 | ||||||||||||||||||||||||||
2006 | 1.00 | 0.03 | — | — | 0.03 | (0.03 | ) | (0.03 | ) | 1.00 | 3.13 | 208,097 | 0.20 | 0.53 | 3.05 | ||||||||||||||||||||||||||
Class B | |||||||||||||||||||||||||||||||||||||||||
2010 | $ | 1.00 | $ | — | $ | — | $ | — | $ | — | $ | — | (2) | $ | — | (2) | $ | 1.00 | 0.06 | % | $ | 184,127 | 0.20 | %*(3) | 0.61 | % | 0.06 | % | |||||||||||||
2009 | 1.00 | 0.01 | — | — | 0.01 | (0.01 | ) | (0.01 | ) | 1.00 | 1.06 | 487,254 | 0.40 | *(3) | 0.59 | 1.12 | |||||||||||||||||||||||||
2008 | 1.00 | 0.04 | — | — | 0.04 | (0.04 | ) | (0.04 | ) | 1.00 | 4.33 | 761,497 | 0.50 | 0.58 | 4.07 | ||||||||||||||||||||||||||
2007 | 1.00 | 0.05 | — | — | 0.05 | (0.05 | ) | (0.05 | ) | 1.00 | 4.64 | 359,090 | 0.50 | 0.59 | 4.58 | ||||||||||||||||||||||||||
2006 | 1.00 | 0.03 | — | — | 0.03 | (0.03 | ) | (0.03 | ) | 1.00 | 2.82 | 239,461 | 0.50 | 0.58 | 2.81 | ||||||||||||||||||||||||||
Class C | |||||||||||||||||||||||||||||||||||||||||
2010 | $ | 1.00 | $ | — | $ | — | $ | — | $ | — | $ | — | (2) | $ | — | (2) | $ | 1.00 | 0.06 | % | $ | 26,423 | 0.20 | %*(3) | 0.81 | % | 0.06 | % | |||||||||||||
2009 | 1.00 | 0.01 | — | — | 0.01 | (0.01 | ) | (0.01 | ) | 1.00 | 0.93 | 72,803 | 0.53 | *(3) | 0.80 | 0.98 | |||||||||||||||||||||||||
2008 | 1.00 | 0.04 | — | — | 0.04 | (0.04 | ) | (0.04 | ) | 1.00 | 4.12 | 144,919 | 0.70 | 0.78 | 4.00 | ||||||||||||||||||||||||||
2007 | 1.00 | 0.04 | — | — | 0.04 | (0.04 | ) | (0.04 | ) | 1.00 | 4.43 | 100,928 | 0.70 | 0.79 | 4.34 | ||||||||||||||||||||||||||
2006 | 1.00 | 0.03 | — | — | 0.03 | (0.03 | ) | (0.03 | ) | 1.00 | 2.62 | 113,403 | 0.70 | 0.78 | 2.70 | ||||||||||||||||||||||||||
Sweep Class | |||||||||||||||||||||||||||||||||||||||||
2010 | $ | 1.00 | $ | — | $ | — | $ | — | $ | — | $ | — | (2) | $ | — | (2) | $ | 1.00 | 0.06 | % | $ | 138,438 | 0.18 | %*(3) | 1.06 | % | 0.06 | % | |||||||||||||
2009 | 1.00 | 0.01 | — | — | 0.01 | (0.01 | ) | (0.01 | ) | 1.00 | 0.77 | 206,719 | 0.61 | *(3) | 1.05 | 0.67 | |||||||||||||||||||||||||
2008 | 1.00 | 0.04 | — | — | 0.04 | (0.04 | ) | (0.04 | ) | 1.00 | 3.86 | 111,853 | 0.95 | 1.03 | 3.74 | ||||||||||||||||||||||||||
2007 | 1.00 | 0.04 | — | — | 0.04 | (0.04 | ) | (0.04 | ) | 1.00 | 4.17 | 97,004 | 0.95 | 1.04 | 4.11 | ||||||||||||||||||||||||||
2006 | 1.00 | 0.02 | — | — | 0.02 | (0.02 | ) | (0.02 | ) | 1.00 | 2.36 | 83,570 | 0.95 | 1.03 | 2.35 | ||||||||||||||||||||||||||
Treasury II Fund | |||||||||||||||||||||||||||||||||||||||||
Class A | |||||||||||||||||||||||||||||||||||||||||
2010 | $ | 1.00 | $ | — | $ | — | $ | — | $ | — | $ | — | (2) | $ | — | (2) | $ | 1.00 | 0.04 | % | $ | 436,276 | 0.12 | %* | 0.55 | % | 0.04 | % | |||||||||||||
2009 | 1.00 | 0.01 | — | — | 0.01 | (0.01 | ) | (0.01 | ) | 1.00 | 1.05 | 688,813 | 0.20 | * | 0.54 | 0.87 | |||||||||||||||||||||||||
2008 | 1.00 | 0.04 | — | — | 0.04 | (0.04 | ) | (0.04 | ) | 1.00 | 4.11 | 516,164 | 0.21 | 0.53 | 3.72 | ||||||||||||||||||||||||||
2007 | 1.00 | 0.05 | — | — | 0.05 | (0.05 | ) | (0.05 | ) | 1.00 | 4.62 | 181,976 | 0.25 | 0.53 | 4.50 | ||||||||||||||||||||||||||
2006 | 1.00 | 0.03 | — | — | 0.03 | (0.03 | ) | (0.03 | ) | 1.00 | 2.85 | 178,480 | 0.25 | 0.53 | 2.78 | ||||||||||||||||||||||||||
Class B | |||||||||||||||||||||||||||||||||||||||||
2010 | $ | 1.00 | $ | — | $ | — | $ | — | $ | — | $ | — | (2) | $ | — | (2) | $ | 1.00 | 0.04 | % | $ | 165,266 | 0.12 | %*(3) | 0.60 | % | 0.04 | % | |||||||||||||
2009 | 1.00 | 0.01 | — | — | 0.01 | (0.01 | ) | (0.01 | ) | 1.00 | 0.82 | 363,238 | 0.39 | *(3) | 0.59 | 0.58 | |||||||||||||||||||||||||
2008 | 1.00 | 0.04 | — | — | 0.04 | (0.04 | ) | (0.04 | ) | 1.00 | 3.81 | 109,384 | 0.51 | 0.58 | 3.54 | ||||||||||||||||||||||||||
2007 | 1.00 | 0.04 | — | — | 0.04 | (0.04 | ) | (0.04 | ) | 1.00 | 4.31 | 51,984 | 0.55 | 0.58 | 4.18 | ||||||||||||||||||||||||||
2006 | 1.00 | 0.03 | — | — | 0.03 | (0.03 | ) | (0.03 | ) | 1.00 | 2.54 | 70,593 | 0.55 | 0.58 | 2.50 | ||||||||||||||||||||||||||
Class C | |||||||||||||||||||||||||||||||||||||||||
2010 | $ | 1.00 | $ | — | $ | — | $ | — | $ | — | $ | — | (2) | $ | — | (2) | $ | 1.00 | 0.04 | % | $ | 8,619 | 0.12 | %*(3) | 0.80 | % | 0.04 | % | |||||||||||||
2009 | 1.00 | 0.01 | — | — | 0.01 | (0.01 | ) | (0.01 | ) | 1.00 | 0.69 | 13,364 | 0.47 | *(3) | 0.79 | 0.50 | |||||||||||||||||||||||||
2008 | 1.00 | 0.04 | — | — | 0.04 | (0.04 | ) | (0.04 | ) | 1.00 | 3.59 | 7,254 | 0.72 | 0.79 | 3.71 | ||||||||||||||||||||||||||
2007 | 1.00 | 0.04 | — | — | 0.04 | (0.04 | ) | (0.04 | ) | 1.00 | 4.10 | 20,267 | 0.75 | 0.78 | 4.04 | ||||||||||||||||||||||||||
2006 | 1.00 | 0.02 | — | — | 0.02 | (0.02 | ) | (0.02 | ) | 1.00 | 2.33 | 2,602 | 0.75 | 0.78 | 2.03 | ||||||||||||||||||||||||||
| Amounts | designated as “—” are $0 or have been rounded to $0. |
| * | The expense ratio includes the Treasury Guarantee Program expense. Had the expense been excluded, the expense ratio would have been equal to, or less than, the expense ratio cap figure. See Note 3 for expense ratio cap figure. |
| † | Returns are for the period indicated and have not been annualized. Returns shown do not reflect the deduction of taxes that a shareholder would pay on Fund distributions or the redemption of Fund shares. |
| (1) | Per share calculations were performed using average shares. |
| (2) | Amount represents less than $0.01 per share. |
| (3) | The Distributor and/or Administrator have voluntarily agreed to waive and reduce its fee and/or reimburse certain expenses of the Fund in order to limit the one-day net income yield of the Fund to not less than 0.01% of the Fund’s average daily net assets of the share class. Had these waivers and the Treasury Guarantee Program expense been excluded the ratio would have been at the expense ratio cap figure. See Note 3 for expense ratio cap figure. |
| The | accompanying notes are an integral part of the financial statements. |
| 44 | SEI Daily Income Trust / Annual Report / January 31, 2010 |
Table of Contents
| Net Asset Value, Beginning of Year | Net Investment Income(1) | Net Realized and Unrealized Gains (Losses) on Securities | Total from Operations | Dividends from Net Investment Income | Distributions from Realized Capital Gains | Total Dividends and Distributions | Net Asset Value, End of Year | Total Return† | Net Assets End of Year ($ Thousands) | Ratio of Expenses to Average Net Assets | Ratio of Expenses to Average Net Assets (Excluding Waivers) | Ratio of Net Investment Income to Average Net Assets | Portfolio Turnover Rate | ||||||||||||||||||||||||||||||||||
Short-Duration Government Fund |
| ||||||||||||||||||||||||||||||||||||||||||||||
Class A | |||||||||||||||||||||||||||||||||||||||||||||||
2010 | $ | 10.25 | $ | 0.21 | $ | 0.29 | $ | 0.50 | $ | (0.23 | ) | $ | — | $ | (0.23 | ) | $ | 10.52 | 4.94 | % | $ | 377,088 | 0.48 | % | 0.75 | % | 2.02 | % | 347 | % | |||||||||||||||||
2009 | 10.21 | 0.36 | 0.04 | 0.40 | (0.36 | ) | — | (0.36 | ) | 10.25 | 4.05 | 288,064 | 0.48 | 0.74 | 3.53 | 693 | |||||||||||||||||||||||||||||||
2008 | 9.95 | 0.46 | 0.28 | 0.74 | (0.48 | ) | — | (0.48 | ) | 10.21 | 7.65 | 172,892 | 0.45 | 0.76 | 4.63 | 266 | |||||||||||||||||||||||||||||||
2007 | 10.02 | 0.42 | (0.04 | ) | 0.38 | (0.45 | ) | — | (0.45 | ) | 9.95 | 3.84 | 115,462 | 0.45 | 0.78 | 4.19 | 210 | ||||||||||||||||||||||||||||||
2006 | 10.19 | 0.32 | (0.13 | ) | 0.19 | (0.36 | ) | — | (0.36 | ) | 10.02 | 1.93 | 155,512 | 0.45 | 0.75 | 3.15 | 162 | ||||||||||||||||||||||||||||||
Intermediate-Duration Government Fund |
| ||||||||||||||||||||||||||||||||||||||||||||||
Class A | |||||||||||||||||||||||||||||||||||||||||||||||
2010 | $ | 11.20 | $ | 0.32 | $ | 0.41 | $ | 0.73 | $ | (0.32 | ) | $ | (0.37 | ) | $ | (0.69 | ) | $ | 11.24 | 6.61 | % | $ | 62,977 | 0.53 | % | 0.76 | % | 2.82 | % | 213 | % | ||||||||||||||||
2009 | 10.76 | 0.38 | 0.44 | 0.82 | (0.38 | ) | — | (0.38 | ) | 11.20 | 7.85 | 92,025 | 0.53 | 0.74 | 3.48 | 641 | |||||||||||||||||||||||||||||||
2008 | 10.13 | 0.45 | 0.63 | 1.08 | (0.45 | ) | — | (0.45 | ) | 10.76 | 10.97 | 50,372 | 0.50 | 0.75 | 4.34 | 234 | |||||||||||||||||||||||||||||||
2007 | 10.21 | 0.42 | (0.06 | ) | 0.36 | (0.44 | ) | — | (0.44 | ) | 10.13 | 3.64 | 46,635 | 0.50 | 0.78 | 4.17 | 200 | ||||||||||||||||||||||||||||||
2006 | 10.50 | 0.36 | (0.26 | ) | 0.10 | (0.39 | ) | — | (0.39 | ) | 10.21 | 0.94 | 85,873 | 0.50 | 0.73 | 3.46 | 151 | ||||||||||||||||||||||||||||||
GNMA Fund |
| ||||||||||||||||||||||||||||||||||||||||||||||
Class A | |||||||||||||||||||||||||||||||||||||||||||||||
2010 | $ | 9.84 | $ | 0.32 | $ | 0.47 | $ | 0.79 | $ | (0.35 | ) | $ | — | $ | (0.35 | ) | $ | 10.28 | 8.18 | % | $ | 198,914 | 0.63 | % | 0.72 | % | 3.16 | % | 533 | % | |||||||||||||||||
2009 | 9.63 | 0.40 | 0.21 | 0.61 | (0.40 | ) | — | (0.40 | ) | 9.84 | 6.51 | 160,639 | 0.63 | 0.71 | 4.08 | 474 | |||||||||||||||||||||||||||||||
2008 | 9.34 | 0.45 | 0.30 | 0.75 | (0.46 | ) | — | (0.46 | ) | 9.63 | 8.31 | 114,824 | 0.60 | 0.72 | 4.82 | 271 | |||||||||||||||||||||||||||||||
2007 | 9.48 | 0.44 | (0.11 | ) | 0.33 | (0.47 | ) | — | (0.47 | ) | 9.34 | 3.65 | 143,711 | 0.60 | 0.74 | 4.72 | 105 | ||||||||||||||||||||||||||||||
2006 | 9.71 | 0.41 | (0.16 | ) | 0.25 | (0.48 | ) | — | (0.48 | ) | 9.48 | 2.60 | 166,324 | 0.60 | 0.71 | 4.26 | 97 | ||||||||||||||||||||||||||||||
Ultra Short Bond Fund |
| ||||||||||||||||||||||||||||||||||||||||||||||
Class A | |||||||||||||||||||||||||||||||||||||||||||||||
2010 | $ | 8.51 | $ | 0.24 | $ | 0.73 | $ | 0.97 | $ | (0.24 | ) | $ | — | $ | (0.24 | ) | $ | 9.24 | 11.58 | % | $ | 257,238 | 0.38 | % | 0.75 | % | 2.72 | % | 73 | % | |||||||||||||||||
2009 | 9.69 | 0.32 | (1.18 | ) | (0.86 | ) | (0.32 | ) | — | (0.32 | ) | 8.51 | (9.00 | ) | 207,081 | 0.38 | 0.75 | 3.50 | 99 | ||||||||||||||||||||||||||||
2008 | 9.97 | 0.48 | (0.28 | ) | 0.20 | (0.48 | ) | — | (0.48 | ) | 9.69 | 2.06 | 409,363 | 0.35 | 1.28 | 4.87 | 54 | ||||||||||||||||||||||||||||||
2007 | 9.95 | 0.45 | 0.03 | 0.48 | (0.46 | ) | — | (0.46 | ) | 9.97 | 4.88 | 238,820 | 0.35 | 0.76 | 4.51 | 40 | |||||||||||||||||||||||||||||||
2006†† | 10.00 | 0.32 | (0.04 | ) | 0.28 | (0.33 | ) | — | (0.33 | ) | 9.95 | 2.90 | 412,217 | 0.35 | 0.75 | 3.22 | 67 | ||||||||||||||||||||||||||||||
| Amounts | designated as “—” are $0 or have been rounded to $0. |
| † | Returns are for the period indicated and have not been annualized. Returns shown do not reflect the deduction of taxes that a shareholder would pay on Fund distributions or the redemption of Fund shares. |
| †† | Per share amounts have been adjusted for a 5 for 1 reverse stock split paid to shareholders of record on May 6, 2005. |
| (1) | Per share calculations were performed using average shares. |
| The | accompanying notes are an integral part of the financial statements. |
| SEI Daily Income Trust / Annual Report / January 31, 2010 | 45 |
Table of Contents
January 31, 2010
1. ORGANIZATION
SEI Daily Income Trust (the “Trust”) was organized as a Massachusetts business trust under a Declaration of Trust dated March 15, 1982.
The Trust is registered under the Investment Company Act of 1940, as amended, as a diversified, open-end investment company with ten operational Funds: the Money Market, Government, Government II, Prime Obligation, Treasury and Treasury II (each a “Fund,” collectively the “Money Market Funds”), the Short-Duration Government, Intermediate-Duration Government, GNMA and Ultra Short Bond (each a “Fund,” collectively the “Fixed Income Funds”). The Money Market Funds, Short-Duration Government, Intermediate-Duration Government, and GNMA Funds seek to preserve principal value and maintain a high degree of liquidity while providing current income. The Ultra Short Bond Fund seeks to provide higher current income than typically offered by a money market fund while maintaining a high degree of liquidity and a correspondingly higher risk of principal volatility. The assets of each Fund are segregated, and a shareholder’s interest is limited to the Fund in which shares are held.
2. SIGNIFICANT ACCOUNTING POLICIES
Financial Accounting Standards Board (“FASB”) has issued FASB ASC 105 (formerly FASB Statement No. 168), The “FASB Accounting Standards Codification™” and the Hierarchy of Generally Accepted Accounting Principles (“ASC 105”). ASC 105 established the FASB Accounting Standards Codification™ (“Codification” or “ASC”) as the single source of authoritative U.S. generally accepted accounting principles (“GAAP”) recognized by the FASB to be applied by non-governmental entities. Rules and interpretive releases of the Securities and Exchange Commission (“SEC”) under authority of federal securities laws are also sources of authoritative GAAP for SEC registrants. The Codification supersedes all existing non-SEC accounting and reporting standards. All other non-grandfathered, non-SEC accounting literature not included in the Codification will become non-authoritative.
Following the Codification, the FASB will not issue new standards in the form of Statements, FASB Staff Positions or Emerging Issues Task Force Abstracts. Instead, it will issue Accounting Standards Updates, which will serve to update the Codification, provide background information about the guidance and provide the basis for conclusions on the changes to the Codification.
GAAP is not intended to be changed as a result of the FASB’s Codification project, but it will change the way the guidance is organized and presented. As a result, these changes will have a significant impact on how companies reference GAAP in their financial statements and in their accounting policies for financial statements issued for interim and annual periods ending after September 15, 2009. The Trust has implemented the Codification as of January 31, 2010.
The following is a summary of significant accounting policies followed by the Funds.
Use of Estimates — The preparation of financial statements, in conformity with U.S. generally accepted accounting principles, requires management to make estimates and assumptions that affect the reported amount of assets and liabilities and disclosure of contingent assets at the date of the financial statements, and the reported results of operations during the reporting period. Actual results could differ from those estimates.
Security Valuation — Investment securities of the Money Market Funds, except those securities which were covered by the Capital Support Agreement, are stated at amortized cost which approximates market value. Under this valuation method, purchase discounts and premiums are accreted and amortized ratably to maturity and are included in interest income. The Funds’ use of amortized cost is subject to their compliance with certain conditions as specified by rule 2a-7 of the 1940 act. Refer to Note 9 for a discussion of the Capital Support Agreement entered into by the Money Market Funds.
Investment securities of the Fixed Income Funds listed on a securities exchange, market or automated quotation system for which quotations are readily available are valued at the last quoted sale price on the primary exchange or market on which they are traded, or, if there is no such reported sale, at the most recent quoted bid price. If available, debt securities are priced based upon valuations provided by independent, third-party pricing agents. Such values generally reflect the last reported sales price if the security is actively traded. The third-party pricing agents may also value debt securities at an evaluated bid price by employing methodologies that utilize actual market transactions, broker-supplied valuations, or other methodologies designed to identify the market value for such securities. Debt obligations with remaining maturities of sixty days or less may be valued at their amortized cost, which approximates market value. Prices for most securities held in the Fixed Income Funds are provided daily by recognized independent pricing agents. If a security price cannot be obtained from an independent, third-party pricing agent, the Fixed Income Funds seek to obtain a bid price from at least one independent broker.
Securities for which market prices are not “readily available” are valued in accordance with Fair Value Procedures established by the Trust’s Board of Trustees. The Trust’s Fair Value Procedures are implemented through a Fair Value Committee (the “Committee”) designated by the Trust’s Board of Trustees. Some of the more common reasons that may necessitate that a security be valued using Fair Value Procedures include: the security’s trading has been halted or suspended; the security has been de-listed from a national exchange; the security’s primary trading market is temporarily closed at a time when under normal conditions it would be open; or the security’s primary pricing source is not able or willing to provide a price. When a security is valued in accordance with the Fair Value Procedures, the Committee will determine the value after taking into consideration relevant information reasonably available to the Committee.
| 46 | SEI Daily Income Trust / Annual Report / January 31, 2010 |
Table of Contents
In accordance with the authoritative guidance on fair value measurements and disclosure under GAAP, ASC 820 (formerly FASB Statement No. 157), the Fund discloses fair value of its investments in a hierarchy that prioritizes the inputs to valuation techniques used to measure the fair value. The objective of a fair value measurement is to determine the price that would be received to sell an asset or paid to transfer a liability in an orderly transaction between market participants at the measurement date (an exit price). Accordingly, the fair value hierarchy gives the highest priority to quoted prices (unadjusted) in active markets for identical assets or liabilities (Level 1) and the lowest priority to unobservable inputs (Level 3). The three levels of the fair value hierarchy under ASC 820 are described below:
| • | Level 1 — Unadjusted quoted prices in active markets for identical, unrestricted assets or liabilities that the Fund has the ability to access at the measurement date; |
| • | Level 2 — Quoted prices which are not active, or inputs that are observable (either directly or indirectly) for substantially the full term of the asset or liability; and |
| • | Level 3 — Prices, inputs or exotic modeling techniques which are both significant to the fair value measurement and unobservable (supported by little or no market activity). |
Investments are classified within the level of the lowest significant input considered in determining fair value. Investments classified within Level 3 whose fair value measurement considers several inputs may include Level 1 or Level 2 inputs as components of the overall fair value measurement.
For the period ended January 31, 2010, there have been no significant changes to the Trust’s fair value methodologies.
Security Transactions and Investment Income — Security transactions are recorded on the trade date. Costs used in determining net realized capital gains and losses on the sale of securities are on the basis of specific identification. Dividend income is recognized on the ex-dividend date, and interest income is recognized using the accrual basis of accounting. Income from payment-in-kind securities is recorded daily based on the effective interest method of accrual.
Distributions received on securities that represent a return of capital or capital gain are recorded as a reduction of cost of investments and/or as a realized gain. The Trust estimates the components of distributions received that may be considered nontaxable distributions or capital gain distributions.
For the Fixed Income Funds, amortization and accretion is calculated using the scientific interest method, which approximates the effective interest method over the holding period of the security. Amortization of premiums and discounts is included in interest income.
For the Money Market Funds, all amortization is calculated using the straight line method over the holding period of the security. Amortization of premiums and accretion of discounts are included in interest income.
Repurchase Agreements — Securities pledged as collateral for repurchase agreements are held by each Fund’s custodian bank until the repurchase date of the repurchase agreement. The Funds also invest in tri-party repurchase agreements. Securities held as collateral for tri-party repurchase agreements are maintained by the broker’s custodian bank in a segregated account until the repurchase date of the repurchase agreement. Provisions of the repurchase agreements and the Trust’s policies require that the market value of the collateral, including accrued interest thereon, is sufficient in the event of default by the counterparty. If the counterparty defaults and the value of the collateral declines, or if the counterparty enters into an insolvency proceeding, realization of the collateral by the Funds may be delayed or limited.
Futures Contracts — The Fixed Income Funds’ utilized futures contracts during the year ended January 31, 2010. These Funds’ investments in futures contracts are designed to enable the Funds to more closely approximate the performance of their benchmark indices. The Funds may use futures contracts for tactical hedging purposes as well as to enhance the Fund’s returns. Initial margin deposits of cash or securities are made upon entering into futures contracts. The contracts are marked to market daily and the resulting changes in value are accounted for as unrealized gains and losses. Variation margin payments are paid or received, depending upon whether unrealized gains or losses are incurred. When the contract is closed, the Funds record a realized gain or loss equal to the difference between the proceeds from (or cost of) the closing transaction and the amount invested in the contract.
Risks of entering into futures contracts include the possibility that there will be an imperfect price correlation between the futures and the underlying securities. Second, it is possible that a lack of liquidity for futures contracts could exist in the secondary market, resulting in an inability to close a position prior to its maturity date. Third, the futures contract involves the risk that the Fund could lose more than the original margin deposit required to initiate a futures transaction.
Finally, the risk exists that losses could exceed amounts disclosed on the Statements of Assets and Liabilities.
Swap Agreements — A Fund’s investments in swap contracts is mainly used as an efficient means to take and manage risk in the portfolio, including interest rate risk, credit risk and overall yield sensitivity. A swap agreement is a two-party contract under which an agreement is made to exchange returns from predetermined investments or instruments, including a particular interest rate, foreign currency, or “basket” of securities representing a particular index. Interest rate swaps involve the exchange by a Fund with another party of their respective commitments to pay or receive interest (e.g., an exchange of floating rate payments for fixed rate payments) with respect to a notional amount of principal. Credit-default swaps involve periodic payments by a Fund or counterparty based on a specified rate multiplied by a notional amount assigned to an underlying debt
| SEI Daily Income Trust / Annual Report / January 31, 2010 | 47 |
Table of Contents
Notes to Financial Statements (Continued)
January 31, 2010
instrument or group of debt instruments in exchange for the assumption of credit risk on the same instruments. In the event of a credit event, usually in the form of a credit rating downgrade, the party receiving periodic payments (i.e. floating rate payer) must pay the other party (i.e. fixed rate payer) an amount equal to the recovery rate used to settle the contracts. The recovery rate is a function of how many credit default swap investors wish to deliver the security or receive the security. The recovery rate is determined through an auction process. Total return swaps allow an investor to benefit from the cash flow without ever actually owning the underlying security. The receiver must pay any decline in value to the payer at the end of the total return swap. However, the investor does not need to make a payment if there is no decline in price. Payments can be made on various indices, bonds (i.e. mortgage backed securities, bank debt and corporate), loans or commodities. The value of a total return swap is equal to the change in value of the underlying asset versus the accrued income payment based on LIBOR or some other form of indices on the notional amount. Interest rate swaps involve the exchange by a Fund with another party of their respective commitments to pay or receive interest (e.g., an exchange of floating rate payments for fixed rate payments) with respect to a notional amount of principal to manage a Fund’s exposure to interest rates. Payments received or made are recorded as realized gains or loss. A Fund could be exposed to credit or market risk due to unfavorable changes in the fluctuation of interest rates or if the counterparty defaults on its obligation to perform. Risk of loss may exceed amounts recognized on the statement of assets and liabilities. Interest rate swap contracts outstanding at period end, if any, are listed after a Fund’s portfolio. In connection with swap agreements securities may be set aside as collateral by a Fund’s custodian. A Fund may enter into swap agreements in order to, among other things, change the maturity or duration of the investment portfolio, to protect a Fund’s value from changes in interest rates, or to expose a Fund to a different security or market.
Swaps are marked-to-market daily based upon quotations from market makers and the resulting changes in market values, if any, are recorded as an unrealized gain or loss in the Statement of Operations. Net payments of interest are recorded as realized gains or losses.
Entering into swap agreements involves, to varying degrees, elements of credit and market risk in excess of the amounts recognized on the Statement of Assets and Liabilities. Such risks involve the possibility that there will be no liquid market for these agreements, that the counterparty to the agreement may default on its obligation to perform and that there may be unfavorable changes in the fluctuation of interest rates. Risks also arise from potential losses from adverse market movements.
This risk is mitigated by having a master netting arrangement between a Fund and the counterparty and by having the counterparty post collateral to cover a Fund’s exposure to the counterparty. See Note 3 for further details. There were no swap agreements as of January 31, 2010.
TBA Purchase Commitments — A Fixed Income Fund may engage in “to be announced” (“TBA”) purchase commitments to purchase securities for a fixed price at a future date. TBA purchase commitments may be considered securities and involve a risk of loss if the value of the security to be purchased declines prior to settlement date, which risk is in addition to the risk of decline in the value of a Fund’s other assets. Unsettled TBA purchase commitments are valued at the current market value of the underlying securities, according to the procedures described under “Security Valuation” above.
Collateralized Debt Obligations — A Fund may invest in collateralized debt obligations (“CDOs”), which include collateralized loan obligations (“CLOs”) and other similarly structured securities. CLOs are a type of asset-backed securities. A CLO is a trust typically collateralized by a pool of loans, which may include, among others, domestic and foreign senior secured loans, senior unsecured loans, and subordinate corporate loans, including loans that may be rated below investment grade or equivalent unrated loans. CDOs may charge management fees and administrative expenses.
For CDOs, the cashflows from the trust are split into two or more portions, called tranches, varying in risk and yield. The riskiest portion is the “equity” tranche which bears the bulk of defaults from the bonds or loans in the trust and serves to protect the other, more senior tranches from default in all but the most severe circumstances. Since it is partially protected from defaults, a senior tranche from a CDO trust typically has a higher rating and lower yield than its underlying securities, and can be rated investment grade. Despite the protection from the equity tranche, CDO tranches can experience substantial losses due to actual defaults, increased sensitivity to defaults due to collateral default and disappearance of protecting tranches, market anticipation of defaults, as well as aversion to CDO securities as a class.
The risks of an investment in a CDO depend largely on its Class and its collateral securities. Normally, CLOs and other CDOs are privately offered and sold, and thus, are not registered under the securities laws. As a result, investments in CDOs may be characterized by the Funds as illiquid securities; however, an active dealer market may exist for CDOs, allowing a CDO to qualify for Rule 144A transactions. In addition to the normal risks associated with fixed income securities (e.g., interest rate risk and default risk), CDOs carry additional risks including, but not limited to: (i) the possibility that distributions from collateral securities will not be adequate to make interest or other payments; (ii) the quality of the collateral may decline in value or default; (iii) the Funds may invest in CDOs that are subordinate to other classes; and (iv) the complex structure of the security may not be fully understood at the time of investment and may produce disputes with the issuer or unexpected investment results.
Illiquid Securities — A security is considered illiquid if it cannot be sold or disposed of in the ordinary course of business within seven days or less for its approximate carrying value on the books of a Fund. Valuations of illiquid securities may differ significantly from the values
| 48 | SEI Daily Income Trust / Annual Report / January 31, 2010 |
Table of Contents
that would have been used had an active market value for these securities existed.
Restricted Securities — Throughout the year, the Funds owned private placement investments that were purchased through private offerings or acquired through initial public offerings that could not be sold without prior registration under the Securities Act of 1933 or pursuant to an exemption there from. In addition, the Funds had generally agreed to further restrictions on the disposition of certain holdings as set forth in various agreements entered into in connection with the purchase of those investments. These investments were valued at amortized cost as determined in accordance with the procedures approved by the Board of Trustees. At January 31, 2010, the Funds did not own any restricted securities.
Classes — Class-specific expenses are borne by that class of shares. Income, realized and unrealized gains/losses and non-class-specific expenses are allocated to the respective class on the basis of relative daily net assets.
Expenses — Expenses that are directly related to one of the Funds are charged directly to that Fund. Other operating expenses of the Trust, which are not directly associated to a specific Fund, are prorated to each Fund on the basis of relative daily net assets.
Dividends and Distributions to Shareholders — Dividends and distributions to shareholders, which are determined in accordance with Federal tax regulations, are recorded on the ex-dividend date. Dividends from net investment income are declared on a daily basis and are payable on the first business day of the following month. Any net realized capital gains on sales of securities for a Fund are distributed to its shareholders at least annually.
3. AGREEMENTS AND OTHER TRANSACTIONS WITH AFFILIATES
Administration and Transfer Agent Agreement — SEI Investments Global Funds Services (the “Administrator”) provides administrative and transfer agency services to the Funds for annual fees, based on the average daily net assets of the respective funds, as presented below:
| Money Market Fund | .33 | % | |
| Government Fund | .24 | % | |
| Government II Fund | .19 | % | |
| Prime Obligation Fund | .19 | % | |
| Treasury Fund | .24 | % | |
| Treasury II Fund | .24 | % | |
| Short-Duration Government Fund | .35 | % | |
| Intermediate-Duration Government Fund | .35 | % | |
| GNMA Fund | .32 | % | |
| Ultra Short Bond Fund | .35 | % |
However, the Administrator and SEI Investments Management Corporation (the “Adviser”) have agreed to waive a portion or their entire fee, for various classes of shares in various funds, to limit total annual expenses up to the following amounts (expressed as a percentage of the Funds’ daily net assets). The expense waivers are allocated to each share class pro-rata based on the net assets of each share class.
| Money Market Fund | Government Fund | Government II Fund | Prime Obligation Fund | Treasury Fund | |||||||||||
Class A | .18 | %(1) | .20 | %(3) | .20 | %(2) | .20 | %(2) | .20 | %(2) | |||||
Class B | .48 | %(1) | .50 | %(3) | .50 | %(2) | .50 | %(2) | .50 | %(2) | |||||
Class C | .68 | %(1) | .70 | %(3) | .70 | %(2) | .70 | %(2) | .70 | %(2) | |||||
Class H | N/A | N/A | N/A | .63 | %(1) | N/A | |||||||||
Sweep Class | .93 | %(1) | .95 | %(1) | * | .95 | %(1) | .95 | %(1) |
| Treasury II Fund | Short- Duration Government Fund | Intermediate- Duration Government Fund | GNMA Fund | Ultra Short Bond Fund | |||||||||||
Class A | .20 | %(2) | .48 | %(4) | .53 | %(4) | .63 | %(4) | .38 | %(4) | |||||
Class B | .50 | %(2) | N/A | N/A | N/A | N/A | |||||||||
Class C | .70 | %(2) | N/A | N/A | N/A | N/A | |||||||||
Class H | N/A | N/A | N/A | N/A | N/A | ||||||||||
Sweep Class | * | N/A | N/A | N/A | N/A |
| * | Class not currently operational. |
| (1) | Represents a voluntary cap that may be discontinued at any time. |
| (2) | Represents a contractual cap effective through January 31, 2010, to be changed only by Board approval. |
| (3) | Represents a contractual cap of .25%, .55%, and .75% of Class A, B, and C, respectively, effective through January 31, 2010, to be changed only by Board approval. In addition, management has voluntarily waived fees to a cap of .20%, .50%, and .70% of Class A, B, and C, respectively, that may be discontinued at any time. |
| (4) | Represents a voluntary cap that may be discontinued at anytime. Prior to March 1, 2008, the cap for the Short-Duration Government, Intermediate-Duration Government, GNMA and Ultra Short Bond Funds were .45%, .50%, .60% and .35%, respectively. |
Temporary Guarantee Program — On September 18, 2008 the U.S. Treasury Department (the “Treasury”) commenced the Temporary Guarantee Program for Money Market Funds (the “Program”). The Trust’s Board of Trustees approved the participation of the below listed Funds in the Program from its commencement on September 18, 2008 through April 30, 2009. The Treasury offered funds participating in the Program an extension until September 18, 2009.
Under the Program, the Treasury guaranteed the share price of a participating fund’s shares outstanding as of September 19, 2008 at $1.00 per share if the fund’s net asset value per share (NAV) falls below $0.995. The Program did not protect investors who were not shareholders of a participating fund after September 18, 2008. The cost of participating in the Program and the Program extensions is borne by a participating fund, and will not be subject to any expense limitation or reimbursement agreement.
In connection with the Program’s extension period from May 1, 2009 through September 18, 2009, participation in the Program was as follows:
Continued to Participate in the Program Through September 18, 2009:
Money Market Fund
Prime Obligation Fund
Government Fund
Government II Fund
| SEI Daily Income Trust / Annual Report / January 31, 2010 | 49 |
Table of Contents
Notes to Financial Statements (Continued)
January 31, 2010
Did not Participate in the Program after April 30, 2009:
Treasury Fund
Treasury II Fund
Distribution Agreement — SEI Investments Distribution Co. (the “Distributor”), a wholly owned subsidiary of SEI and a registered broker-dealer, acts as the Distributor of the shares of the Trust under various Distribution Agreements. The Trust has adopted plans under which firms, including the Distributor, that provide shareholder and administrative services may receive compensation thereof. Specific classes of certain funds have also adopted distribution plans, pursuant to Rule 12b-1 under the Investment Company Act of 1940. Such plans provide fees payable to the Distributor up to the following amounts, calculated as a percentage of the average daily net assets attributable to each particular class of each respective fund.
| Shareholder Servicing Fees | Administrative Service Fees | Distribution Fees* | |||||||
Money Market Fund |
| ||||||||
Class A | .25 | % | — | — | |||||
Class B | .25 | % | .05 | % | — | ||||
Class C | .25 | % | .25 | % | — | ||||
Sweep Class | .25 | % | — | .50 | % | ||||
Government Fund |
| ||||||||
Class A | .25 | % | — | — | |||||
Class B | .25 | % | .05 | % | — | ||||
Class C | .25 | % | .25 | % | — | ||||
Sweep Class | .25 | % | — | .50 | % | ||||
Government II Fund |
| ||||||||
Class A | .25 | % | — | — | |||||
Class B | .25 | % | .05 | % | — | ||||
Class C | .25 | % | .25 | % | — | ||||
Prime Obligation Fund |
| ||||||||
Class A | .25 | % | — | — | |||||
Class B | .25 | % | .05 | % | — | ||||
Class C | .25 | % | .25 | % | — | ||||
Class H | .25 | % | .18 | % | — | ||||
Sweep Class | .25 | % | — | .50 | % | ||||
Treasury Fund |
| ||||||||
Class A | .25 | % | — | — | |||||
Class B | .25 | % | .05 | % | — | ||||
Class C | .25 | % | .25 | % | — | ||||
Sweep Class | .25 | % | — | .50 | % | ||||
Treasury II Fund |
| ||||||||
Class A | .25 | % | — | — | |||||
Class B | .25 | % | .05 | % | — | ||||
Class C | .25 | % | .25 | % | — | ||||
Short-Duration Government Fund | |||||||||
Class A | .25 | % | — | — | |||||
Intermediate-Duration Government Fund | |||||||||
Class A | .25 | % | — | — | |||||
GNMA Fund | |||||||||
Class A | .25 | % | — | — | |||||
Ultra Short Bond Fund | |||||||||
Class A | .25 | % | — | — | |||||
| * | These payments are characterized as “compensation” and are not directly tied to expenses incurred by the Distributor. The payments the Distributor receives during any year may therefore be higher or lower than its actual expenses. These payments may be used to compensate sweep class shareholders who provide distribution-related services to their customers. |
The Distributor has voluntarily waived all or a portion of the shareholder servicing fees for Class A of each fund, except for the GNMA Fund, since inception of the plan. Such waivers are voluntary and may be discontinued at any time. For Classes B, C, and H, the shareholder
servicing fees and the administrative service fees are shown combined as “Administrative & Shareholder Servicing Fees” in the Statement of Operations. The Administrator and Distributor have voluntarily agreed to waive and reduce their fee and/or reimburse certain expenses of the Money Market Funds in order to limit the one-day net income yield of the Funds to not less than 0.01% of the Funds’ average daily net assets. The following table shows the waivers by class for the year ended January 31, 2010 ($ Thousands):
| Administrative & Shareholder Servicing Fee Waiver | Administrative Fee Waiver | |||||
Money Market Fund | ||||||
Class A | $ | — | $ | 13 | ||
Class B | 101 | 3 | ||||
Class C | 287 | 6 | ||||
Sweep Class | 213 | 2 | ||||
Government Fund | ||||||
Class A | — | 276 | ||||
Class B | 1,180 | 130 | ||||
Class C | 480 | 23 | ||||
Sweep Class | 192 | 7 | ||||
Government II Fund | ||||||
Class A | — | 552 | ||||
Class B | 518 | 77 | ||||
Class C | 104 | 5 | ||||
Prime Obligation Fund | ||||||
Class A | — | 1 | ||||
Class B | 329 | — | ||||
Class C | 1,159 | — | ||||
Class H | 107 | — | ||||
Sweep Class | 211 | — | ||||
Treasury Fund | ||||||
Class A | — | 192 | ||||
Class B | 912 | 116 | ||||
Class C | 217 | 17 | ||||
Sweep Class | 1,081 | 68 | ||||
Treasury II Fund | ||||||
Class A | — | 503 | ||||
Class B | 662 | 197 | ||||
Class C | 58 | 10 | ||||
Other — Certain officers and Trustees of the Trust are also officers and/or Trustees of the Administrator or the Adviser. The Trust pays each unaffiliated Trustee an annual fee for attendance at quarterly, interim, and committee meetings. The Administrator or the Adviser pays compensation of officers and affiliated Trustees.
The services provided by the Chief Compliance Officer (“CCO”) and his staff, whom are employees of the Administrator, are paid for by the Trust as incurred. The services include regulatory oversight of the Trust’s Adviser, Sub-Advisers and service providers as required by SEC regulations. The CCO’s services have been approved by and are reviewed annually by the Board of Trustees.
Capital Support Agreement — The Prime Obligation Fund and the Money Market Fund entered into a Capital Support Agreement with SEI Investments Company (“SEI”). Please see Note 9 for more information.
Other Affiliated Transactions — During the fiscal year ended January 31, 2009, an affiliate of the Adviser purchased from the Money Market Fund all of the notes issued by Cheyne Finance, LLC
| 50 | SEI Daily Income Trust / Annual Report / January 31, 2010 |
Table of Contents
(“Cheyne”) and Gryphon Funding Limited (“Gryphon”) that were held by the Fund. This transaction was effected pursuant to Rule 17a-9 under the Investment Company Act of 1940 (the “Act”), which permits an affiliate to purchase a security from a money market fund if that security is no longer an Eligible Security pursuant to Rule 2a-7 under the Act. Cheyne and Gryphon were not Eligible Securities at the time of the transaction. The transaction is deemed as “Payment by Affiliate” in the amount of $6,574 ($ Thousands).
During the fiscal year ended January 31, 2010, an affiliate of the Adviser purchased from the Prime Obligation Fund all of the notes issued by Cheyne Finance, LLC, Gryphon Funding Limited and Stanfield Victoria Finance Limited that were held by the Prime Obligation Fund. This transaction was effected pursuant to Rule 17a-9 under the Investment Company Act of 1940 (the “Act”), which permits an affiliate to purchase a security from a money market fund if that security is no longer an Eligible Security pursuant to Rule 2a-7 under the Act. Cheyne and Gryphon were not Eligible Securities at the time of the transaction. The transaction is deemed as “Payment by Affiliate” on the Statement of Operations, in the amount of $152,452 ($ Thousands).
4. INVESTMENT ADVISORY AND CUSTODIAN AGREEMENTS
The Adviser serves as each Fund’s investment adviser and “manager of managers” under an investment advisory agreement approved by the shareholders of each Fund. Effective January 1, 2010, for its services, the Adviser receives an annual fee equal to 0.07% of each of the Money Market Funds’ net assets. Prior to January 1, 2010, for its services, the Adviser received an annual fee equal to .075% on the first $500 million of net assets and .02% on the net assets in excess of $500 million for the Money Market Funds. The fee was calculated based on the combined assets of the Money Market Funds. The Adviser also received an annual fee equal to .10% on the first $500 million of net assets, .075% of net assets between $500 million and $1 billion and .05% on the net assets in excess of $1 billion for the Short-Duration Government, Intermediate-Duration Government and GNMA Funds. The fee was calculated based on the combined assets of these Funds. The Adviser also received an annual fee equal to .10% on the first $500 million of net assets, .075% of net assets between $500 million and $1 billion and .05% on the net assets in excess of $1 billion for the Ultra Short Bond Fund. The fee was calculated based on the net assets of the Ultra Short Bond Fund.
Pursuant to the “manager of managers” structure, the Board of Trustees approved Columbia Management Advisors, LLC as each Money Market Fund’s investment sub-adviser under an investment sub-advisory agreement approved by the shareholders of each Money Market Fund. For its services to the Money Market Funds, the sub-adviser is entitled to receive a fee paid directly by the Adviser.
Wellington Management Company, LLP (“Wellington LLP”) serves as sub-adviser to the Fixed Income Funds under an investment
sub-advisory agreement approved by the shareholders of each Fixed Income Fund. For its services to the Fixed Income Funds, Wellington LLP is entitled to receive a fee paid directly by the Adviser.
U.S. Bank, N.A. serves as the custodian of the Funds. The custodian plays no role in determining the investment policies of the Funds or which securities are to be purchased or sold in the Funds.
5. INVESTMENT TRANSACTIONS
The cost of security purchases and the proceeds from the sale of securities, other than temporary investments in short-term securities, for the year ended January 31, 2010, were as follows for the Fixed Income Funds:
| Short- Duration Government Fund ($ Thousands) | Intermediate- Duration Government Fund ($ Thousands) | GNMA Fund ($ Thousands) | Ultra Short Bond Fund ($ Thousands) | |||||||||
Purchases | ||||||||||||
U.S. Government | $ | 951,319 | $ | 157,199 | $ | 987,106 | $ | 49,946 | ||||
Other | 27,438 | 1,311 | — | 66,504 | ||||||||
Sales | ||||||||||||
U.S. Government | $ | 872,554 | $ | 184,316 | $ | 957,853 | $ | 44,982 | ||||
Other | 41,743 | 7,055 | 315 | 61,427 | ||||||||
6. FEDERAL TAX INFORMATION
It is each Fund’s intention to continue to qualify as a regulated investment company for Federal income tax purposes and distribute all of its taxable income (including net capital gains). Accordingly, no provision for Federal income taxes is required.
Reclassification of Components of Net Assets — The timing and characterization of certain income and capital gain distributions are determined annually in accordance with Federal tax regulations which may differ from accounting principles generally accepted in the United States. As a result, net investment income (loss) and net realized gain (loss) on investment transactions for the reporting period may differ from distributions during such period. These book/tax differences may be temporary or permanent in nature. To the extent these differences are permanent, they are charged or credited to Paid-in Capital, undistributed net investment income, or accumulated net realized gain, as appropriate, in the periods that the differences arise. These reclassifications, which have no impact on net asset value of the Fund, are primarily attributable to market discount reclassification and tax treatment of paydown gain (loss) on mortgage and asset-backed securities. Accordingly, the following permanent differences have been reclassified to/from the following accounts during the year ended January 31, 2010:
| Paid-in Capital ($ Thousands) | Undistributed Net Investment Income ($ Thousands) | Accumulated Net Realized Gain (Loss) ($ Thousands) | |||||||||
Money Market Fund | $ | (5 | ) | — | $ | 5 | |||||
Prime Obligation Fund | — | (1,478 | ) | 1,478 | |||||||
Short-Duration Government Fund | — | 386 | (386 | ) | |||||||
Intermediate-Duration Government Fund | — | 72 | (72 | ) | |||||||
GNMA Fund | — | 642 | (642 | ) | |||||||
Ultra Short Bond Fund | — | 14 | (14 | ) | |||||||
| SEI Daily Income Trust / Annual Report / January 31, 2010 | 51 |
Table of Contents
Notes to Financial Statements (Continued)
January 31, 2010
The tax character of dividends and distributions during the last two fiscal years was as follows:
| Ordinary Income ($ Thousands) | Long-term Capital Gain ($ Thousands) | Total ($ Thousands) | |||||||||
Money Market Fund | 2010 | $ | 1,311 | $ | — | $ | 1,311 | ||||
| 2009 | 18,606 | — | 18,606 | ||||||||
Government Fund | 2010 | 2,344 | — | 2,344 | |||||||
| 2009 | 34,534 | — | 34,534 | ||||||||
Government II Fund | 2010 | 2,103 | — | 2,103 | |||||||
| 2009 | 32,492 | — | 32,492 | ||||||||
Prime Obligation Fund | 2010 | 7,297 | — | 7,297 | |||||||
| 2009 | 116,243 | — | 116,243 | ||||||||
Treasury Fund | 2010 | 648 | — | 648 | |||||||
| 2009 | 15,408 | — | 15,408 | ||||||||
Treasury II Fund | 2010 | 327 | — | 327 | |||||||
| 2009 | 6,683 | — | 6,683 | ||||||||
Short-Duration Government Fund | 2010 | 5,907 | — | 5,907 | |||||||
| 2009 | 6,868 | — | 6,868 | ||||||||
Intermediate-Duration Government Fund | 2010 | 3,570 | 699 | 4,269 | |||||||
| 2009 | 2,389 | — | 2,389 | ||||||||
GNMA Fund | 2010 | 6,674 | — | 6,674 | |||||||
| 2009 | 5,478 | — | 5,478 | ||||||||
Ultra Short Bond Fund | 2010 | 6,657 | — | 6,657 | |||||||
| 2009 | 11,795 | — | 11,795 | ||||||||
As of January 31, 2010, the components of Distributable Earnings/(Accumulated Losses) on a tax basis were as follows:
| Undistributed Ordinary Income ($ Thousands) | Undistributed Long-Term Capital Gain ($ Thousands) | Capital Loss Carryforwards ($ Thousands) | Post-October Losses ($ Thousands) | Other Temporary Differences ($ Thousands) | Unrealized Appreciation/ (Depreciation) ($ Thousands) | Total Accumulated Losses ($ Thousands) | ||||||||||||||||||||
Money Market Fund | $ | 26 | $ | — | $ | — | $ | — | $ | (21 | ) | $ | — | $ | 5 | |||||||||||
Government Fund | 51 | — | (91 | ) | — | (51 | ) | — | (91 | ) | ||||||||||||||||
Government II Fund | 26 | — | (12 | ) | — | (26 | ) | — | (12 | ) | ||||||||||||||||
Prime Obligation Fund | 228 | — | (117 | ) | — | (228 | ) | — | (117 | ) | ||||||||||||||||
Treasury Fund | 20 | — | (93 | ) | — | (20 | ) | — | (93 | ) | ||||||||||||||||
Treasury II Fund | 5 | — | (6 | ) | — | (5 | ) | — | (6 | ) | ||||||||||||||||
Short-Duration Government Fund | 2,001 | — | — | — | (364 | ) | 3,952 | 5,589 | ||||||||||||||||||
Intermediate-Duration Government Fund | 619 | 126 | — | — | (119 | ) | 1,605 | 2,231 | ||||||||||||||||||
GNMA Fund | 411 | — | (5,973 | ) | — | (416 | ) | 7,225 | 1,247 | |||||||||||||||||
Ultra Short Bond Fund | 506 | — | (8,899 | ) | (278 | ) | (508 | ) | (21,498 | ) | (30,677 | ) | ||||||||||||||
Amounts designated as “—” are $0 or have been rounded to $0.
At January 31, 2010, the following Funds had capital loss carry-forwards to offset future realized capital gains:
| Amount ($ Thousands) | Expiration Date | ||||
Government Fund | $ | 1 | 1/31/11 | ||
| 54 | 1/31/13 | ||||
| 4 | 1/31/14 | ||||
| 32 | 1/13/16 | ||||
Government II Fund | 12 | 1/31/16 | |||
Prime Obligation Fund | 117 | 1/31/17 | |||
Treasury Fund | 65 | 1/31/12 | |||
| 1 | 1/31/13 | ||||
| 22 | 1/31/14 | ||||
| 5 | 1/31/15 | ||||
Treasury II Fund | 2 | 1/31/14 | |||
| 4 | 1/31/16 | ||||
| Amount ($ Thousands) | Expiration Date | ||||
GNMA Fund | $ | 3,098 | 1/31/12 | ||
| 1,119 | 1/31/13 | ||||
| 6 | 1/31/14 | ||||
| 1,552 | 1/31/15 | ||||
| 198 | 1/31/16 | ||||
Ultra Short Bond Fund | 557 | 1/31/11 | |||
| 442 | 1/31/12 | ||||
| 1,020 | 1/31/13 | ||||
| 1,045 | 1/31/14 | ||||
| 1,716 | 1/31/15 | ||||
| 296 | 1/31/16 | ||||
| 181 | 1/31/17 | ||||
| 3,642 | 1/31/18 | ||||
| 52 | SEI Daily Income Trust / Annual Report / January 31, 2010 |
Table of Contents
For Federal income tax purposes, capital loss carryforwards may be carried forward and applied against future capital gains. It is the Funds’ intent that they will not distribute any realized gain distributions until the carryforwards have been offset or expired.
During the year ended January 31, 2010, the Money Market Fund, Government II Fund, Prime Obligation Fund, Treasury II Fund, Short-Duration Government Fund and GNMA Fund utilized, $17,667, $3,064, $60,925,000, $10,779, $2,812,144 and $4,085,867, respectively, of capital loss carryforwards to offset capital gains.
During the year ended January 31, 2010, the Money Market Funds’ cost of securities for Federal income tax purposes approximates the cost located in the Statements of Assets and Liabilities.
For Federal income tax purposes, the cost of securities owned at January 31, 2010, and net realized gains or losses on securities sold for the period, were different from amounts reported for financial reporting purposes, primarily due to wash sales which cannot be used for Federal income tax purposes in the current year and have been deferred for use in future years. The Federal tax cost and aggregate gross unrealized appreciation and depreciation on investments held by the Prime Obligation Fund and Fixed Income Funds at January 31, 2010, were as follows:
| Federal Tax Cost ($ Thousands) | Appreciated Securities ($ Thousands) | Depreciated Securities ($ Thousands) | Net Unrealized Appreciation/ (Depreciation) ($ Thousands) | |||||||||||
Short-Duration | $ | 439,352 | $ | 4,428 | $ | (476 | ) | $ | 3,952 | |||||
Intermediate-Duration Government Fund | 68,837 | 1,681 | (76 | ) | 1,605 | |||||||||
GNMA Fund | 268,630 | 7,675 | (450 | ) | 7,225 | |||||||||
Ultra Short Bond | 280,644 | 2,132 | (23,630 | ) | (21,498 | ) | ||||||||
Management has analyzed the Fund’s tax positions taken on the federal tax returns for all open tax years and has concluded that as of January 31, 2010, no provision for income tax is required in the Fund’s financial statements. All uncertain tax positions, except for the accretion of market discount associated with the structured investment vehicles subject to the capital support agreement, meet the more likely than not criteria established in FIN 48. SEI Investment Company (“SEI”), which is the parent company of the Adviser, has agreed to indemnify the fund if the Internal Revenue Service (“IRS”) were to disagree with a position taken on the tax return for the year ended January 31, 2010. Accordingly, no provision for taxes is required. The Fund’s federal income and excise tax returns are subject to examination by the IRS for all open tax years under the applicable Statute of Limitations.
7. INVESTMENT RISKS
In the normal course of business, a Fund may enter into contracts that provide general indemnifications by a Fund to the counterparty to the contract. A Fund’s maximum exposure under these arrangements is dependent on future claims that may be made against a Fund and,
therefore, cannot be established; however, based on experience, management believes the risk of loss from such claim is considered remote.
Investments in structured securities (such as those issued by Structured Investment Vehicles, or “SIVs”) which are collateralized by residential real estate mortgages are subject to certain credit and liquidity risks. When market conditions result in an increase in default rates of the underlying mortgages and the foreclosure values of underlying real estate properties are materially below the outstanding amount of these underlying mortgages, collection of accrued interest and principal on these investments may be doubtful. Such market conditions may significantly impair the value of these investments resulting in a lack of correlation between their credit ratings and values.
8. OTHER
The Board of Trustees approved a 5 for 1 reverse share split in the Ultra Short Bond Fund. The reverse share split occurred on May 6, 2005. This Fund is designed to be a low tracking error fund. This Fund experienced excess tracking error due to the impact of rounding on this Fund’s net asset value (“NAV”). The reverse share split resulted in a higher NAV for this Fund, thus decreasing the level of tracking error resulting from NAV rounding. The per share information included in the financial highlights for all periods prior to the reverse share split have been adjusted to properly reflect the effects of the reverse share spilt on a retroactive basis.
9. CAPITAL SUPPORT AGREEMENT
The Prime Obligation and Money Market Fund each entered into a Capital Support Agreement with SEI, an affiliate of the Adviser, on November 8, 2007. As of September 30, 2008, the Money Market Fund no longer held any structured investment vehicle (“SIV”) securities and the Capital Support Agreement with the Money Market Fund lapsed.
On November 5, 2008, the Prime Obligation Fund entered into an Amended and Restated Capital Support Agreement (the “Amended CSA”) with SEI which extended the termination date under the original Capital Support Agreement with the Prime Obligation Fund to November 6, 2009. The Amended CSA provides that if the Prime Obligation Fund realizes payments or sales proceeds from the ultimate disposition of any of the specified SIV securities which are less than its amortized cost, SEI will be required to provide capital to the Prime Obligation Fund equal to the amount by which the amortized cost of the specified SIV security exceeds the amount realized from the sale or other disposition of such security. In March 2009, SEI purchased at amortized cost from the Prime Obligation Fund certain of the SIV securities held by that Fund, thereby reducing the amount of specified SIV securities held in that Fund.
In September 2009, SEI purchased from the Prime Obligation Fund the notes issued by Stanfield Victoria Funding LLC (“Stanfield”) that were held by the Fund. As a result of SEI’s purchase, there was no loss incurred by the Prime Obligation Fund on this transaction. This
| SEI Daily Income Trust / Annual Report / January 31, 2010 | 53 |
Table of Contents
Notes to Financial Statements (Concluded)
January 31, 2010
transaction was effected pursuant to Rule 17a-9 under the Investment Company Act of 1940 (the “Act”), which permits an affiliate to purchase a security from a money market fund if that security is no longer an Eligible Security pursuant to Rule 2a-7 under the Act. Stanfield was not an Eligible Security at the time of the transaction. Since the Fund held no Eligible Notes as of September 28, 2009, the Capital Support Agreement with the Fund terminated as of that date.
10. RECENT ACCOUNTING PRONOUNCEMENT
In January 2010, the Financial Accounting Standards Board issued Accounting Standards Update (ASU) No. 2010-6, Fair Value Measurements and Disclosures (Topic 820): Improving Disclosures
about Fair Value Measurements. ASU No. 2010-6 enhances and clarifies existing fair value measurement disclosure requirements and is effective for interim and annual periods beginning after December 15, 2009. The Fund is currently evaluating the impact, if any, of applying the provisions of ASU No. 2010-6.
11. SUBSEQUENT EVENTS
The Trust, on behalf of the Funds, has evaluated the need for disclosures and/or adjustments resulting from subsequent events. Based on this evaluation, no adjustments were required to the financial statements as of January 31, 2010.
| 54 | SEI Daily Income Trust / Annual Report / January 31, 2010 |
Table of Contents
SEI DAILY INCOME TRUST — JANUARY 31, 2010
Report of Independent Registered Public Accounting Firm
To the Shareholders and Board of Trustees of SEI Daily Income Trust:
We have audited the accompanying statements of assets and liabilities, including the schedules of investments, of SEI Daily Income Trust, comprising the Money Market Fund, Government Fund, Government II Fund, Prime Obligation Fund, Treasury Fund, Treasury II Fund, Short Duration Government Fund, Intermediate Duration Government Fund, GNMA Fund, and Ultra Short Bond Fund, (collectively the “Funds”), as of January 31, 2010, and the related statements of operations for the year then ended, changes in net assets for each of the years in the two-year period then ended, and the financial highlights for each of the years in the five-year period then ended. These financial statements and financial highlights are the responsibility of the Fund’s management. Our responsibility is to express an opinion on these financial statements and financial highlights based on our audits.
We conducted our audits in accordance with the Standards of the Public Company Accounting Oversight Board (United States). Those standards require that we plan and perform the audit to obtain reasonable assurance about whether the financial statements and financial highlights are free of material misstatement. An audit includes examining, on a test basis, evidence supporting the amounts and disclosures in the financial statements. Our procedures included confirmation of securities owned as of January 31, 2010, by correspondence with the custodian and brokers or other appropriate auditing procedures. An audit also includes assessing the accounting principles used and significant estimates made by management, as well as evaluating the overall financial statement presentation. We believe that our audits provide a reasonable basis for our opinion.
In our opinion, the financial statements and financial highlights referred to above present fairly, in all material respects, the financial position of each of the funds comprising SEI Daily Income Trust as of January 31, 2010, and the results of their operations for the year then ended, the changes in their net assets for each of the years in the two-year period then ended, and the financial highlights for each of the years in the five-year period then ended, in conformity with U.S. generally accepted accounting principles.
Philadelphia, Pennsylvania April 1, 2010
| SEI Daily Income Trust / Annual Report / January 31, 2010 | 55 |
Table of Contents
TRUSTEES AND OFFICERS OF THE TRUST (Unaudited)
The following chart lists Trustees and Officers as of February 28, 2010.
Set forth below are the names, addresses, ages, position with the Trust, Term of Office and Length of Time Served, the principal occupations for the last five years, number of portfolios in fund complex overseen by trustee, and other directorships outside the fund complex of each of the persons currently serving as Trustees and Officers of the Trust. The Trust’s Statement of Additional Information (“SAI”) includes additional information about the Trustees and Officers. The SAI may be obtained without charge by calling 1-800-342-5734.
| Name Address, and Age | Position(s) Held with Trusts | Term of Office and Length of Time Served1 | Principal Occupation(s) During Past Five Years | Number of Portfolios in Fund Complex Overseen by Trustee2 | Other Directorships Held by Trustee | |||||
| INTERESTED TRUSTEES | ||||||||||
| Robert A. Nesher One Freedom Valley Drive, Oaks, PA 19456 63 yrs. old | Chairman of the Board of Trustees* | since 1982 | Currently performs various services on behalf of SEI for which Mr. Nesher is compensated. | 81 | Trustee of The Advisors’ Inner Circle Fund, The Advisors’ Inner Circle Fund II, Bishop Street Funds, Director of SEI Global Master Fund, plc, SEI Global Assets Fund, plc, SEI Global Investments Fund, plc, SEI Investments Global, Limited, SEI Investments — Global Fund Services, Limited, SEI Investments (Europe), Limited, SEI Investments — Unit Trust Management (UK), Limited, SEI Global Nominee Ltd., SEI Structured Credit Fund, L.P. | |||||
| William M. Doran One Freedom Valley Drive, Oaks, PA 19456 69 yrs. old | Trustee* | since 1982 | Self-employed consultant since 2003. Partner, Morgan, Lewis & Bockius LLP (law firm) from 1976 to 2003, counsel to the Trust, SEI, SIMC, the Administrator and the Distributor. Secretary of SEI since 1978. | 81 | Trustee of The Advisors’ Inner Circle Fund, The Advisors’ Inner Circle Fund II, Bishop Street Funds, Director of SEI since 1974. Director of the Distributor since 2003. Director of SEI Investments — Global Fund Services, Limited, SEI Investments Global, Limited, SEI Investments (Europe), Limited, SEI Investments (Asia), SEI Global Nominee Ltd., Limited and SEI Asset Korea Co., Ltd. | |||||
| TRUSTEES | ||||||||||
| James M. Storey One Freedom Valley Drive, Oaks, PA 19456 78 yrs. old | Trustee | since 1995 | Attorney, sole practitioner since 1994. Partner, Dechert Price & Rhoads, September 1987- December 1993. | 81 | Trustee of The Advisors’ Inner Circle Fund, The Advisors’ Inner Circle Fund II, Bishop Street Funds, and U.S. Charitable Gift Trust. | |||||
George J. Sullivan, Jr. One Freedom Valley Drive | Trustee | since 1996 | Self-Employed Consultant, Newfound Consultants Inc. since April 1997. | 81 | Trustee of The Advisors’ Inner Circle Fund, The Advisors’ Inner Circle Fund II, Bishop Street Funds, State Street Navigator Securities Lending Trust, and SEI Structured Credit Fund, L.P. member of the independent review committee for SEI’s Canadian registered mutual funds. | |||||
| *Messrs. | Nesher and Doran are Trustees who may be deemed as “interested” persons of the Trust as that term is defined in the 1940 Act by virtue of their affiliation with SIMC and the Trust’s Distributor. |
| 1Each | trustee shall hold office during the lifetime of this Trust until the election and qualification of his or her successor, or until he or she sooner dies, resigns or is removed in accordance with the Trust’s Declaration of Trust. |
| 2The | Fund Complex includes the following Trusts: SEI Asset Allocation Trust, SEI Daily Income Trust, SEI Institutional Investments Trust, SEI Institutional International Trust, SEI Institutional Managed Trust, SEI Liquid Asset Trust, SEI Tax Exempt Trust and SEI Alpha Strategy Portfolios, L.P. |
| 56 | SEI Daily Income Trust / Annual Report / January 31, 2010 |
Table of Contents
| Name Address, and Age | Position(s) Held with Trusts | Term of Office and Length of Time Served1 | Principal Occupation(s) During Past Five Years | Number of Portfolios in Fund Complex Overseen by Trustee2 | Other Directorships Held by Trustee | |||||
| TRUSTEES (continued) | ||||||||||
| Rosemarie B. Greco One Freedom Valley Drive Oaks, PA 19456 63 yrs. old | Trustee | since 1999 | Director, Governor’s Office of Health Care Reform, Commonwealth of Pennsylvania since 2003. | 81 | Director, Sonoco, Inc.; Director, Exelon Corporation; Trustee, Pennsylvania Real Estate Investment Trust. | |||||
| Nina Lesavoy One Freedom Valley Drive, Oaks, PA 19456 52 yrs. old | Trustee | since 2003 | Founder and Managing Director, Avec Capital since 2008. Managing Director, Cue Capital from March 2002-March 2008. | 81 | Director of SEI Structured Credit Fund, L.P. | |||||
James M. Williams One Freedom Oaks, PA 19456 | Trustee | since 2004 | Vice President and Chief Investment Officer, J. Paul Getty Trust, Non-Profit Foundation for Visual Arts, since December 2002. | 81 | Trustee/Director of Ariel Mutual Funds, and SEI Structured Credit Fund, L.P. | |||||
Mitchell A. Johnson One Freedom Valley Drive, | Trustee | since 2007 | Private Investor since 1994. | 81 | Trustee of the Advisors’ Inner Circle Fund, The Advisor’s Inner Circle Fund II, and Bishop Street Funds. | |||||
Hubert L. Harris, Jr. One Freedom 66 yrs. old | Trustee | since 2008 | Retired since December 2005. Chief Executive Officer and Chair of the Board of Directors, AMVESCAP Retirement, Inc., 1997-December 2005. Chief Executive Officer, INVESCO North America, September 2003-December 2005. | 81 | Director of Colonial BancGroup, Inc. and St. Joseph’s Translational Research Institute; Chair of the Board of Trustees, Georgia Tech Foundation, Inc. (nonprofit corporation); Board of Councilors of the Carter Center. | |||||
| OFFICERS | ||||||||||
| Robert A. Nesher One Freedom Valley Drive, Oaks, PA 19456 63 yrs. old | President & CEO | since 2005 | Currently performs various services on behalf of SEI for which Mr. Nesher is compensated. | N/A | N/A | |||||
Stephen F. Panner One Freedom 39 yrs. old | Controller and Chief Financial Officer | since 2005 | Fund Accounting Director of the Administrator since 2005. Fund Administration Manager, Old Mutual Fund Services, 2000-2005. Chief Financial Officer, Controller and Treasurer, PBHG Funds and PBHG Insurance Series Fund, 2004-2005. | N/A | N/A | |||||
| Russell Emery One Freedom Valley Drive Oaks, PA 19456 47 yrs. old | Chief Compliance Officer | since 2006 | Chief Compliance Officer of SEI Institutional Managed Trust, SEI Asset Allocation Trust, SEI Institutional International Trust, SEI Liquid Asset Trust, SEI Tax Exempt Trust, SEI Institutional Investments Trust, The Advisors’ Inner Circle Fund, The Advisors’ Inner Circle Fund II, and Bishop Street Funds, since March 2006. Chief Compliance Officer of SEI Structured Credit Fund, LP and SEI Alpha Strategy Portfolio, LP since June 2007. Director of Investment Product Management and Development of SIMC, February 2003-March 2006. | N/A | N/A | |||||
| SEI Daily Income Trust / Annual Report / January 31, 2010 | 57 |
Table of Contents
TRUSTEES AND OFFICERS OF THE TRUST (Unaudited)
Name and Age | Position(s) Held with Trusts | Term of Office and Length of Time Served1 | Principal Occupation(s) During Past Five Years | Number of Portfolios in Fund Complex Overseen by Trustee2 | Other Directorships Held by Trustee | |||||
| OFFICERS (continued) | ||||||||||
| Timothy D. Barto One Freedom Valley Drive Oaks, PA 19456 41 yrs. old | Vice President and Secretary | since 2002 | General Counsel, Vice President and Secretary of SIMC and the Administrator since 2004. Vice President and Assistant Secretary of SEI since 2001. Vice President of SIMC and the Administrator since 1999. | N/A | N/A | |||||
| James Ndiaye One Freedom Valley Drive Oaks, PA 19456 41 yrs. old | Vice President and Assistant Secretary | since 2005 | Vice President and Assistant Secretary of SIMC since 2005. | N/A | N/A | |||||
| Aaron Buser One Freedom Valley Drive Oaks, PA 19456 39 yrs. old | Vice President and Assistant Secretary | since 2008 | Vice President and Assistant Secretary of SIMC since 2007. Associate at Stark & Stark (2004-2007). | N/A | N/A | |||||
| David F. McCann One Freedom Valley Drive Oaks, PA 19456 33 yrs. old | Vice President and Assistant Secretary | since 2009 | Vice President and Assistant Secretary of SIMC since 2008. Attorney, Drinker Biddle & Reath, LLP (law firm), May 2005-October 2008. Attorney, Pepper Hamilton, LLP (law firm), September 2001-May 2005. | N/A | N/A | |||||
| John J. McCue One Freedom Valley Drive Oaks, PA 19456 46 yrs. old | Vice President | since 2004 | Director of Portfolio Implementations for SIMC since 1995. Managing Director of Money Market Investments for SIMC since 2003. | N/A | N/A | |||||
| Andrew S. Decker One Freedom Valley Drive Oaks, PA 19456 46 yrs. old | Anti-Money Laundering Compliance Officer | since 2008 | Compliance Officer and Product Manager, SEI 2005-2008. Vice President, Old Mutual Capital, 2000-2005. | N/A | N/A | |||||
| Keri E. Rohn One Freedom Valley Drive Oaks, PA 19456 29 yrs. old | Privacy Officer | since 2009 | Compliance Officer of SEI Investments Company, June 2003-present. | N/A | N/A | |||||
| 1Each | trustee shall hold office during the lifetime of this Trust until the election and qualification of his or her successor, or until he or she sooner dies, resigns or is removed in accordance with the Trust’s Declaration of Trust. |
| 2The | Fund Complex includes the following Trusts: SEI Asset Allocation Trust, SEI Daily Income Trust, SEI Institutional Investments Trust, SEI Institutional International Trust, SEI Institutional Managed Trust, SEI Liquid Asset Trust, SEI Tax Exempt Trust and SEI Alpha Strategy Portfolios, L.P. |
| 58 | SEI Daily Income Trust / Annual Report / January 31, 2010 |
Table of Contents
Disclosure of Fund Expenses (Unaudited)
All mutual funds have operating expenses. As a shareholder of a Fund, your investment is affected by these ongoing costs, which include (among others) costs for portfolio management, administrative services, and shareholder reports like this one. It is important for you to understand the impact of these costs on your investment returns.
Operating expenses such as these are deducted from the Fund’s gross income and directly reduce your final investment return. These expenses are expressed as a percentage of the Fund’s average net assets; this percentage is known as the Fund’s expense ratio.
The following examples use the expense ratio and are intended to help you understand the ongoing costs (in dollars) of investing in your Fund and to compare these costs with those of other mutual funds. The examples are based on an investment of $1,000 made at the beginning of the period shown and held for the entire period.
The table on the next page illustrates your Fund’s costs in two ways:
• Actual Fund return. This section helps you to estimate the actual expenses that your Fund incurred over the period. The “Expenses Paid During Period” column shows the actual dollar expense cost incurred by a $1,000 investment in the Fund, and the “Ending Account Value” number is derived from deducting that expense cost from the fund’s gross investment return.
You can use this information, together with the actual amount you invested in the fund, to estimate the expenses your Fund incurred over that period. Simply divide your actual starting account value by $1,000 to arrive at a ratio (for example, an $8,600 account value divided by $1,000 = 8.6), then multiply that ratio by the number shown for your Fund under “Expenses Paid During Period.”
• Hypothetical 5% return. This section helps you compare your Fund’s costs with those of other mutual funds. It assumes that the fund had an annual 5% return before expenses during the year, but that the expense ratio (Column 3) is unchanged. This example is useful in making comparisons because the Securities and Exchange Commission requires all mutual funds to make this 5% calculation. You can assess your Fund’s comparative cost by comparing the hypothetical result for your Fund in the “Expense Paid During Period” column with those that appear in the same charts in the shareholder reports for other funds.
NOTE: Because the return is set at 5% for comparison purposes — NOT your Fund’s actual return — the account values shown do not apply to your specific investment.
| SEI Daily Income Trust / Annual Report / January 31, 2010 | 59 |
Table of Contents
Disclosure of Fund Expenses (Unaudited) (Concluded)
| Beginning Account Value 8/1/09 | Ending Account Value 1/31/10 | Annualized Expense Ratios | Expense Paid During Period* | |||||||||
Money Market Fund | ||||||||||||
Actual Fund Return | ||||||||||||
Class A Shares | $ | 1,000.00 | $ | 1,000.50 | 0.22 | % | $ | 1.11 | ||||
Class B Shares | 1,000.00 | 1,000.30 | 0.28 | 1.41 | ||||||||
Class C Shares | 1,000.00 | 1,000.30 | 0.28 | 1.41 | ||||||||
Sweep Class Shares | 1,000.00 | 1,000.30 | 0.28 | 1.41 | ||||||||
Hypothetical 5% Return | ||||||||||||
Class A Shares | $ | 1,000.00 | $ | 1,024.10 | 0.22 | % | $ | 1.12 | ||||
Class B Shares | 1,000.00 | 1,023.79 | 0.28 | 1.43 | ||||||||
Class C Shares | 1,000.00 | 1,023.79 | 0.28 | 1.43 | ||||||||
Sweep Class Shares | 1,000.00 | 1,023.79 | 0.28 | 1.43 | ||||||||
Government Fund | ||||||||||||
Actual Fund Return | ||||||||||||
Class A Shares | $ | 1,000.00 | $ | 1,000.20 | 0.16 | % | $ | 0.81 | ||||
Class B Shares | 1,000.00 | 1,000.20 | 0.16 | 0.81 | ||||||||
Class C Shares | 1,000.00 | 1,000.20 | 0.17 | 0.86 | ||||||||
Sweep Class Shares | 1,000.00 | 1,000.20 | 0.16 | 0.81 | ||||||||
Hypothetical 5% Return | ||||||||||||
Class A Shares | $ | 1,000.00 | $ | 1,024.40 | 0.16 | % | $ | 0.82 | ||||
Class B Shares | 1,000.00 | 1,024.40 | 0.16 | 0.82 | ||||||||
Class C Shares | 1,000.00 | 1,024.35 | 0.17 | 0.87 | ||||||||
Sweep Class Shares | 1,000.00 | 1,024.40 | 0.16 | 0.82 | ||||||||
Government II Fund | ||||||||||||
Actual Fund Return | ||||||||||||
Class A Shares | $ | 1,000.00 | $ | 1,000.20 | 0.13 | % | $ | 0.66 | ||||
Class B Shares | 1,000.00 | 1,000.20 | 0.13 | 0.66 | ||||||||
Class C Shares | 1,000.00 | 1,000.20 | 0.15 | 0.76 | ||||||||
Hypothetical 5% Return | ||||||||||||
Class A Shares | $ | 1,000.00 | $ | 1,024.55 | 0.13 | % | $ | 0.66 | ||||
Class B Shares | 1,000.00 | 1,024.55 | 0.13 | 0.66 | ||||||||
Class C Shares | 1,000.00 | 1,024.45 | 0.15 | 0.77 | ||||||||
Prime Obligation Fund | ||||||||||||
Actual Fund Return | ||||||||||||
Class A Shares | $ | 1,000.00 | $ | 1,000.60 | 0.22 | % | $ | 1.11 | ||||
Class B Shares | 1,000.00 | 1,000.30 | 0.27 | 1.36 | ||||||||
Class C Shares | 1,000.00 | 1,000.30 | 0.28 | 1.41 | ||||||||
Class H Shares | 1,000.00 | 1,000.10 | 0.32 | 1.61 | ||||||||
Sweep Class Shares | 1,000.00 | 1,000.30 | 0.27 | 1.36 | ||||||||
Hypothetical 5% Return | ||||||||||||
Class A Shares | $ | 1,000.00 | $ | 1,024.10 | 0.22 | % | $ | 1.12 | ||||
Class B Shares | 1,000.00 | 1,023.84 | 0.27 | 1.38 | ||||||||
Class C Shares | 1,000.00 | 1,023.79 | 0.28 | 1.43 | ||||||||
Class H Shares | 1,000.00 | 1,023.59 | 0.32 | 1.63 | ||||||||
Sweep Class Shares | 1,000.00 | 1,023.84 | 0.27 | 1.38 | ||||||||
| Beginning Account Value 8/1/09 | Ending Account Value 1/31/10 | Annualized Expense Ratios | Expense Paid During Period* | |||||||||
Treasury Fund | ||||||||||||
Actual Fund Return | ||||||||||||
Class A Shares | $ | 1,000.00 | $ | 1,000.20 | 0.12 | % | $ | 0.60 | ||||
Class B Shares | 1,000.00 | 1,000.20 | 0.12 | 0.60 | ||||||||
Class C Shares | 1,000.00 | 1,000.20 | 0.12 | 0.60 | ||||||||
Sweep Class Shares | 1,000.00 | 1,000.20 | 0.12 | 0.60 | ||||||||
Hypothetical 5% Return | ||||||||||||
Class A Shares | $ | 1,000.00 | $ | 1,024.60 | 0.12 | % | $ | 0.61 | ||||
Class B Shares | 1,000.00 | 1,024.60 | 0.12 | 0.61 | ||||||||
Class C Shares | 1,000.00 | 1,024.60 | 0.12 | 0.61 | ||||||||
Sweep Class Shares | 1,000.00 | 1,024.60 | 0.12 | 0.61 | ||||||||
Treasury II Fund | ||||||||||||
Actual Fund Return | ||||||||||||
Class A Shares | $ | 1,000.00 | $ | 1,000.10 | 0.09 | % | $ | 0.45 | ||||
Class B Shares | 1,000.00 | 1,000.10 | 0.09 | 0.45 | ||||||||
Class C Shares | 1,000.00 | 1,000.10 | 0.09 | 0.45 | ||||||||
Hypothetical 5% Return | ||||||||||||
Class A Shares | $ | 1,000.00 | $ | 1,024.75 | 0.09 | % | $ | 0.46 | ||||
Class B Shares | 1,000.00 | 1,024.75 | 0.09 | 0.46 | ||||||||
Class C Shares | 1,000.00 | 1,024.75 | 0.09 | 0.46 | ||||||||
Short-Duration Government Fund | ||||||||||||
Actual Fund Return | ||||||||||||
Class A Shares | $ | 1,000.00 | $ | 1,023.30 | 0.48 | % | $ | 2.45 | ||||
Hypothetical 5% Return | ||||||||||||
Class A Shares | $ | 1,000.00 | $ | 1,022.79 | 0.48 | % | $ | 2.45 | ||||
Intermediate-Duration Government Fund | ||||||||||||
Actual Fund Return | ||||||||||||
Class A Shares | $ | 1,000.00 | $ | 1,038.80 | 0.53 | % | $ | 2.72 | ||||
Hypothetical 5% Return | ||||||||||||
Class A Shares | $ | 1,000.00 | $ | 1,022.53 | 0.53 | % | $ | 2.70 | ||||
GNMA Fund | ||||||||||||
Actual Fund Return | ||||||||||||
Class A Shares | $ | 1,000.00 | $ | 1,039.50 | 0.63 | % | $ | 3.24 | ||||
Hypothetical 5% Return | ||||||||||||
Class A Shares | $ | 1,000.00 | $ | 1,022.03 | 0.63 | % | $ | 3.21 | ||||
Ultra Short Bond Fund | ||||||||||||
Actual Fund Return | ||||||||||||
Class A Shares | $ | 1,000.00 | $ | 1,057.30 | 0.38 | % | $ | 1.97 | ||||
Hypothetical 5% Return | ||||||||||||
Class A Shares | $ | 1,000.00 | $ | 1,023.29 | 0.38 | % | $ | 1.94 | ||||
| * | Expenses are equal to the Fund’s annualized expense ratio multiplied by the average account value over the period, multiplied by 184/365. |
| 60 | SEI Daily Income Trust / Annual Report / January 31, 2010 |
Table of Contents
Notice to Shareholders (Unaudited)
For Taxpayers filing on a calendar year basis, this notice is for informational purposes only.
For the fiscal year ended January 31, 2010, each Fund is designating long-term capital gains and ordinary income with regard to distributions paid during the year as follows:
| Portfolio | (A) Long Term Capital Gains Distributions (Tax Basis) | (B) Ordinary Income Distributions (Tax Basis) | (C) Total Distributions (Tax Basis) | U.S. Government Interest (1) | Interest Related Dividends (2) | Short-Term Capital Gains Dividends (3) | ||||||||||||
| Money Market Fund | 0 | % | 100 | % | 100 | % | 2.16 | %* | 100 | % | 0 | % | ||||||
| Government Fund | 0 | % | 100 | % | 100 | % | 38.01 | %* | 100 | % | 0 | % | ||||||
| Government II Fund | 0 | % | 100 | % | 100 | % | 100.00 | % | 100 | % | 0 | % | ||||||
| Prime Obligation Fund | 0 | % | 100 | % | 100 | % | 5.02 | %* | 100 | % | 0 | % | ||||||
| Treasury Fund | 0 | % | 100 | % | 100 | % | 57.42 | %* | 100 | % | 0 | % | ||||||
| Treasury II Fund | 0 | % | 100 | % | 100 | % | 100.00 | % | 100 | % | 0 | % | ||||||
| Short-Duration Government Fund | 0 | % | 100 | % | 100 | % | 7.23 | %* | 84 | % | 0 | % | ||||||
| Intermediate-Duration Government Fund | 16 | % | 84 | % | 100 | % | 3.18 | %* | 62 | % | `100 | % | ||||||
| GNMA Fund | 0 | % | 100 | % | 100 | % | 0.01 | %* | 100 | % | 0 | % | ||||||
| Ultra Short Bond Fund | 0 | % | 100 | % | 100 | % | 4.21 | %* | 99 | % | 0 | % |
Items (A), (B) and (C) are based on the percentage of the Fund’s total distribution.
| (1) | “U.S. Government Interest” represents the amount of interest that was derived from direct U.S. Government obligations and distributed during the fiscal year. This amount is reflected as a percentage of total ordinary income distributions (the total of short-term capital gain and net investment income distributions). Generally, interest from direct U.S. Government obligations is exempt from state income tax. However, for shareholders of the “*” funds who are residents of California, Connecticut and New York, the statutory threshold requirements were not satisfied to permit exemption of these amounts from state income. |
| (2) | The percentage in this column represents the amount of “Interest Related Dividends” and is reflected as a percentage of net investment income distributions that is exempt from U.S. withholding tax when paid to foreign investors. This provision of the IRC will be expiring for years beginning after December 31, 2009. |
| (3) | The percentage in this column represents the amount of “Short-Term Capital Gains Dividends” and is reflected as a percentage of short-term capital gain distributions that is exempt from U.S. withholding tax when paid to foreign investors. This provision of the IRC will be expiring for years beginning after December 31, 2009. |
Please consult your tax adviser for proper treatment of this information.
| SEI Daily Income Trust / Annual Report / January 31, 2010 | 61 |
Table of Contents
Shareholder Voting Results (Unaudited)
At a special meeting held on September 11, 2009, the shareholders of the Money Market Funds (except the SDIT Government Fund which was adjourned until September 25, 2009), voted on the proposal listed below. The results of the voting were as follows:
Proposal 1: With respect to each fund, to approve an amendment to the Investment Advisory Agreement between the Advisor and the Trust, on behalf of the Fund, that would increase the management fee payable by the Fund to the Advisor for its investment advisory services.
| Money Market Fund | ||||||||
| Number of Shares | % of Outstanding Shares | % of Shares Present | ||||||
| Affirmative | 249,302,016.13 | 43.28 | % | 82.08 | % | |||
| Against | 52,521,157.48 | 9.11 | % | 17.29 | % | |||
| Abstain | 1,897,269.04 | 0.33 | % | 0.63 | % | |||
| Total | 303,720,442.65 | 52.72 | % | 100.00 | % | |||
| Government Fund (Results shown below for the Government Fund reflect votes and percentages as of the date of the adjourned meeting, September 25, 2009) | ||||||||
| Number of Shares | % of Outstanding Shares | % of Shares Present | ||||||
| Affirmative | 1,029,023,164.07 | 51.36 | % | 63.23 | % | |||
| Against | 569,508,287.75 | 28.43 | % | 35.00 | % | |||
| Abstain | 28,785,646.88 | 1.43 | % | 1.77 | % | |||
| Total | 1,627,317,098.70 | 81.22 | % | 100.00 | % | |||
| Government II Fund | ||||||||
| Number of Shares | % of Outstanding Shares | % of Shares Present | ||||||
| Affirmative | 1,227,988,443.27 | 66.66 | % | 85.04 | % | |||
| Against | 202,193,937.95 | 10.98 | % | 14.00 | % | |||
| Abstain | 13,896,194.03 | 0.75 | % | 0.96 | % | |||
| Total | 1,444,078,575.25 | 78.39 | % | 100.00 | % | |||
| Prime Obligation Fund | ||||||||
| Number of Shares | % of Outstanding Shares | % of Shares Present | ||||||
| Affirmative | 1,965,980,573.22 | 56.48 | % | 96.22 | % | |||
| Against | 68,926,687.31 | 1.98 | % | 3.37 | % | |||
| Abstain | 8,284,948.69 | 0.24 | % | 0.41 | % | |||
| Total | 2,043,192,209.22 | 58.70 | % | 100.00 | % | |||
| Treasury Fund | ||||||||
| Number of Shares | % of Outstanding Shares | % of Shares Present | ||||||
| Affirmative | 502,162,929.13 | 50.09 | % | 90.67 | % | |||
| Against | 40,317,647.65 | 4.02 | % | 7.28 | % | |||
| Abstain | 11,364,857.95 | 1.13 | % | 2.05 | % | |||
| Total | 553,845,434.73 | 55.24 | % | 100.00 | % | |||
| Treasury II Fund | ||||||||
| Number of Shares | % of Outstanding Shares | % of Shares Present | ||||||
| Affirmative | 438,275,484.05 | 54.42 | % | 93.90 | % | |||
| Against | 25,846,681.76 | 3.21 | % | 5.54 | % | |||
| Abstain | 2,635,605.44 | 0.33 | % | 0.56 | % | |||
| Total | 466,757,771.25 | 57.96 | % | 100.00 | % | |||
| 62 | SEI Daily Income Trust / Annual Report / January 31, 2010 |
Table of Contents
SEI DAILY INCOME TRUST ANNUAL REPORT JANUARY 31, 2010
Robert A. Nesher, Chairman
Trustees
William M. Doran
James M. Storey
George J. Sullivan, Jr.
Rosemarie B. Greco
Nina Lesavoy
James M. Williams
Mitchell A. Johnson
Hubert L. Harris, Jr.
Officers
Robert A. Nesher
President and Chief Executive Officer
Stephen F. Panner
Controller and Chief Financial Officer
Russell Emery
Chief Compliance Officer
Timothy D. Barto
Vice President, Secretary
David McCann
Vice President, Assistant Secretary
James Ndiaye
Vice President, Assistant Secretary
Aaron Buser
Vice President, Assistant Secretary
John J. McCue
Vice President
Andrew S. Decker
Anti-Money Laundering Compliance Officer
Keri E. Rohn
Privacy Officer
Investment Adviser
SEI Investments Management Corporation
Administrator
SEI Investments Global Funds Services
Distributor
SEI Investments Distribution Co.
Legal Counsel
Morgan, Lewis & Bockius LLP
Independent Registered Public Accounting Firm
KPMG LLP
This report and the financial statements contained herein are submitted for the general information of the shareholders of the Trust and must be preceded or accompanied by a current prospectus. Shares of the Funds are not deposits or obligations of, or guaranteed or endorsed by, any bank. The shares are not federally insured by the Federal Deposit Insurance Corporation (FDIC), the Federal Reserve Board, or any other government agency. Investment in the shares involves risk, including the possible loss of principal.
For more information call
1 800 DIAL SEI
(1 800 342 5734)
Table of Contents
SEI Investments Distribution Co.
Oaks, PA 19456 1.800.DIAL.SEI (1.800.342.5734)
SEI-F-022 (3/10)
Table of Contents
| Item 2. | Code of Ethics. |
The Registrant has adopted a code of ethics that applies to the Registrant’s principal executive officer, principal financial officer, comptroller or principal accounting officer, and any person who performs a similar function.
| Item 3. | Audit Committee Financial Expert. |
(a)(1) The Registrant’s Board of Trustees has determined that the Registrant has at least one audit committee financial expert serving on the audit committee.
(a) (2) The audit committee financial expert are George J. Sullivan, Jr. and Hubert L. Harris, Jr. Mr. Sullivan and Mr. Harris are independent as defined in Form N-CSR Item 3 (a) (2).
| Item 4. | Principal Accountant Fees and Services. |
Fees billed by KPMG LLP (“KPMG”) related to the Trust.
KPMG billed the Registrant aggregate fees for services rendered to the Registrant for the fiscal years 2010 and 2009 as follows:
| Fiscal 2010 | Fiscal 2009 | |||||||||||||||||||
| All fees and services to the Registrant that were pre-approved | All fees and services to service affiliates that were pre-approved | All other fees and services to service affiliates that did not require pre-approval | All fees and services to the Registrant that were pre-approved | All fees and services to service affiliates that were pre-approved | All other fees and services to service affiliates that did not require pre-approval | |||||||||||||||
| (a) | Audit Fees(1) | $ | 173,000 | N/A | $ | 0 | $ | 174,500 | N/A | $ | 0 | |||||||||
| (b) | Audit-Related Fees | $ | 0 | $ | 0 | $ | 0 | $ | 0 | $ | 0 | $ | 0 | |||||||
| (c) | Tax Fees | $ | 0 | $ | 0 | $ | 0 | $ | 0 | $ | 0 | $ | 0 | |||||||
| (d) | All Other Fees | $ | 0 | $ | 269,500 | $ | 0 | $ | 0 | $ | 234,500 | $ | 0 | |||||||
Notes:
| (1) | Audit fees include amounts related to the audit of the Registrant’s annual financial statements and services normally provided by the accountant in connection with statutory and regulatory filings. |
Table of Contents
(e)(1) The Registrant’s Audit Committee has adopted and the Board of Trustees has ratified an Audit and Non-Audit Services Pre-Approval Policy (the “Policy”), which sets forth the procedures and the conditions pursuant to which services proposed to be performed by the independent auditor of the Registrant may be pre-approved.
The Policy provides that all requests or applications for proposed services to be provided by the independent auditor must be submitted to the Registrant’s Chief Financial Officer (“CFO”) and must include a detailed description of the services proposed to be rendered. The CFO will determine whether such services: (1) require specific pre-approval; (2) are included within the list of services that have received the general pre-approval of the Audit Committee pursuant to the Policy; or (3) have been previously pre-approved in connection with the independent auditor’s annual engagement letter for the applicable year or otherwise. In any instance where services require pre-approval, the Audit Committee will consider whether such services are consistent with SEC’s rules and whether the provision of such services would impair the auditor’s independence.
Requests or applications to provide services that require specific pre-approval by the Audit Committee will be submitted to the Audit Committee by the CFO. The Audit Committee will be informed by the CFO on a quarterly basis of all services rendered by the independent auditor. The Audit Committee has delegated specific pre-approval authority to either the Audit Committee Chair or financial expert, provided that the estimated fee for any such proposed pre-approved service does not exceed $100,000 and any pre-approval decisions are reported to the Audit Committee at its next regularly scheduled meeting.
Services that have received the general pre-approval of the Audit Committee are identified and described in the Policy. In addition, the Policy sets forth a maximum fee per engagement with respect to each identified service that has received general pre-approval.
All services to be provided by the independent auditor shall be provided pursuant to a signed written engagement letter with the Registrant, the investment advisor or applicable control affiliate (except that matters as to which an engagement letter would be impractical because of timing issues or because the matter is small may not be the subject of an engagement letter) that sets forth both the services to be provided by the independent auditor and the total fees to be paid to the independent auditor for those services.
In addition, the Audit Committee has determined to take additional measures on an annual basis to meet its responsibility to oversee the work of the independent auditor and to assure the auditor’s independence from the Registrant, such as reviewing a formal written statement from the independent auditor delineating all relationships between the independent auditor and the Registrant, and discussing with the independent auditor its methods and procedures for ensuring independence.
(e)(2) Percentage of fees billed applicable to non-audit services pursuant to waiver of pre-approval requirement were as follows:
| Fiscal 2010 | Fiscal 2009 | |||||
Audit-Related Fees | 0 | % | 0 | % | ||
Tax Fees | 0 | % | 0 | % | ||
All Other Fees | 0 | % | 0 | % |
(f) Not Applicable.
Table of Contents
(g)(1) The aggregate non-audit fees and services billed by KPMG for the fiscal years 2010 and 2009 were $xxxx and $234,500, respectively. Non-audit fees consist of SAS No. 70 review of fund accounting and administration operations, attestation report in accordance with Rule 17Ad-13, agreed upon procedures report over certain internal controls related to compliance with federal securities laws and regulations and tax consulting services for various service affiliates of the Registrant.
(h) During the past fiscal year, Registrant’s principal accountant provided certain non-audit services to Registrant’s investment adviser or to entities controlling, controlled by, or under common control with Registrant’s investment adviser that provide ongoing services to Registrant that were not subject to pre-approval pursuant to paragraph (c)(7)(ii) of Rule 2-01 of Regulation S-X. The Audit Committee of Registrant’s Board of Trustees reviewed and considered these non-audit services provided by Registrant’s principal accountant to Registrant’s affiliates, including whether the provision of these non-audit services is compatible with maintaining the principal accountant’s independence.
| Item 5. | Audit Committee of Listed Registrants. |
Not Applicable.
| Item 6. | Schedule of Investments |
Included in Item 1.
| Item 7. | Disclosure of Proxy Voting Policies and Procedures for Closed-End Management Investment Companies. |
Not Applicable.
| Item 8. | Portfolio Managers of Closed-End Management Investment Companies |
Not Applicable.
| Item 9. | Purchases of Equity Securities by Closed-End Management Company and Affiliated Purchasers. |
Not Applicable.
| Item 10. | Submission of Matters to a Vote of Security Holders. |
The Registrant has a standing Nominating Committee (the “Committee”) currently consisting of the Independent Trustees. The Committee is responsible for evaluating and recommending nominees for election to the Registrant’s Board of Trustees (the “Board”). Pursuant to the Committee’s Charter, adopted on June 18th 2004, as amended, the Committee will review all shareholder recommendations for nominations to fill vacancies on the Board if such recommendations are submitted in writing and addressed to the Committee at the Trust’s office.
| Item 11. | Controls and Procedures. |
(a) The certifying officers, whose certifications are included herewith, have evaluated the Registrant’s disclosure controls and procedures within 90 days of the filing date of this report. Based on their evaluation, the certifying officers have concluded that the Registrant’s disclosure controls and procedures are adequately designed, and are operating effectively to ensure, that information required to be disclosed by the Registrant in the reports it files or submits under the Securities Exchange Act of 1934 is recorded, processed, summarized and reported within the time periods specified in the Securities and Exchange Commission’s rules and forms.
Table of Contents
(b) There were no significant changes in the Registrant’s internal control over financial reporting that occurred during the Registrant’s last fiscal half-year that have materially affected, or are reasonably likely to materially affect, the Registrant’s internal control over financial reporting.
| Items 12. | Exhibits. |
(a)(1) Code of Ethics attached hereto.
(a)(2) A separate certification for the principal executive officer and the principal financial officer of the Registrant as required by Rule 30a-2(a) under the Investment Company Act of 1940, as amended (17 CFR 270.30a-2(a)), are filed herewith.
(b) Officer certifications as required by Rule 30a-2(b) under the Investment Company Act of 1940, as amended (17 CFR 270.30a-2(b)) also accompany this filing as an exhibit.
Table of Contents
SIGNATURES
Pursuant to the requirements of the Securities Exchange Act of 1934 and the Investment Company Act of 1940, the registrant has duly caused this report to be signed on its behalf by the undersigned, thereunto duly authorized.
| SEI Daily Income Trust | ||
| By: | /S/ ROBERT A. NESHER | |
| Robert A. Nesher, CEO and President | ||
Date: March 31, 2010
Pursuant to the requirements of the Securities Exchange Act of 1934 and the Investment Company Act of 1940, this report has been signed below by the following persons on behalf of the registrant and in the capacities and on the dates indicated.
| By: | /S/ ROBERT A. NESHER | |
| Robert A. Nesher, CEO and President |
Date: March 31, 2010
| By: | /S/ STEPHEN F. PANNER | |
| Stephen F. Panner, Controller & CFO |
Date: March 31, 2010