Table of Contents
UNITED STATES
SECURITIES AND EXCHANGE COMMISSION
Washington, D.C. 20549
FORM N-CSR
CERTIFIED SHAREHOLDER REPORT OF REGISTERED
MANAGEMENT INVESTMENT COMPANIES
Investment Company Act file number 811-03451
SEI Daily Income Trust
(Exact name of registrant as specified in charter)
c/o CT Corporation
101 Federal Street
Boston, MA 02110
(Address of principal executive offices) (Zip code)
SEI Investments
One Freedom Valley Drive
Oaks, PA 19456
(Name and address of agent for service)
Registrant’s telephone number, including area code: 1-800-342-5734
Date of fiscal year end: January 31, 2012
Date of reporting period: January 31, 2012
Table of Contents
| Item 1. | Reports to Stockholders. |
Table of Contents

SEI Daily Income Trust
Annual Report as of January 31, 2012
Money Market Fund
Government Fund
Government II Fund
Prime Obligation Fund
Treasury Fund
Treasury II Fund
Short-Duration Government Fund
Intermediate-Duration Government Fund
GNMA Fund
Ultra Short Duration Bond Fund
Table of Contents
| 1 | ||||
| 10 | ||||
| 46 | ||||
| 48 | ||||
| 50 | ||||
| 54 | ||||
| 58 | ||||
| 67 | ||||
| 68 | ||||
| 71 | ||||
| 73 | ||||
The Trust files its complete schedule of portfolio holdings with the Securities and Exchange Commission for the first and third quarters of each fiscal year on Form N-Q within sixty days after the end of the period. The Trust’s Forms N-Q are available on the Commission’s website at http://www.sec.gov, and may be reviewed and copied at the Commission’s Public Reference Room in Washington, DC. Information on the operation of the Public Reference Room may be obtained by calling 1-800-SEC-0330.
Since the Funds in SEI Daily Income Trust typically hold only fixed income securities, they generally are not expected to hold securities for which they may be required to vote proxies. Regardless, in light of the possibility of the possibility that a Fund could hold a security for which a proxy is voted, the Trust has adopted proxy voting policies. A description of the policies and procedures that the Trust uses to determine how to vote proxies relating to portfolios ecurities, as well as information relating to how a Fund voted proxies relating to portfolio securities during the most recent 12-month period ended June 30, is available (i) without charge, upon request, by calling 1-800-DIAL-SEI; and (ii) on the Commission’s website at http://www.sec.gov.
Table of Contents
MANAGEMENT’S DISCUSSION AND ANALYSIS OF FUND PERFORMANCE
SEI DAILY INCOME TRUST — JANUARY 31, 2012
Short-Duration Government Fund
I. Objective
The Short-Duration Government Fund (the “Fund”) seeks to preserve principal value and maintain a high degree of liquidity while providing current income.
II. Multi-Manager Approach
The Fund is managed by a sub-advisor under the supervision of SEI Investments Management Corporation (“SIMC”). Currently, the sub-advisor is Wellington Management Company. There were no manager changes during the period.
III. Market Commentary
For the fiscal year ended January 31, 2012, the non-Treasury sectors of the U.S. fixed-income market were mixed in terms of spread compression and risk appetite. Geopolitical concerns dominated headlines, including the political tensions in the Middle East, the earthquake and tsunami in Japan and the ongoing fiscal challenges in peripheral Europe. In the U.S., the economic recovery continued at a slower pace due to weak employment and soft consumer demand. First and second quarter U.S. gross domestic product (“GDP”) reports showed that the economy grew at 1.9% and 1.3%, respectively. These numbers were lower than consensus expectations, and the market sharply lowered GDP expectations for the rest of the year. In response, the U.S. Federal Reserve kept the federal funds rate near zero to support the economy, but allowed its $600 billion quantitative easing program to expire at the end of June.
Despite the exit, Treasuries rallied significantly in the second and third quarters of 2011 due to weaker U.S. economic data and fears regarding Europe. In mid-September, the Federal Open Market Committee announced further accommodative measures, with “Operation Twist” effectively extending the maturity of its Treasury portfolio and reinvesting the proceeds of maturing agency debt and mortgage-backed securities (“MBS”) back into MBS rather than Treasuries. These events caused increased market volatility, with Treasuries rallying during the period and non-Treasury sectors broadly underperforming (with the exception of commercial mortgage-backed securities and asset-backed securities).
The corporate market continued to be supported by improving corporate fundamentals. However, spreads widened — particularly in Financials — as mortgage-related liabilities and European concerns remained. During the period, agency MBS underperformed duration-neutral Treasuries as spreads widened with the rally in Treasury rates and uncertainty surrounding policy initiatives impacted the market. The year finished with U.S. economic data showing better-than-expected strength. This development supported the performance of non-government sectors, allowing corporate and mortgage securities to recover some of the lost performance that occurred in the earlier flight to quality.
IV. Return vs. Benchmark
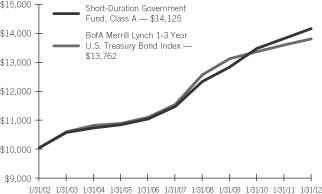
For the fiscal year ended January 31, 2012, the Short-Duration Government Fund, Class A outperformed the BofA Merrill Lynch 1-3 Year U.S. Treasury Bond Index (the “Index”), returning 2.53% versus the Index return of 1.50%.
V. Fund Attribution
The primary driver of performance during the fiscal year was the Fund’s yield-curve position, which emphasized a flattening bias by overweighting the intermediate part of the curve. This was a function of security selection. In addition, the Fund benefited from security selection within agency MBS, particularly 20-year and multi-family agency mortgages. The Fund continues to favor agency MBS, as changes in the mortgage capital market have reduced cash-flow variability and supply/demand technicals remain supportive of the asset class. In addition, the Federal Reserve’s announcement to reinvest the proceeds of maturing agency debt and MBS back into MBS rather than Treasuries serves as a modest positive technical to the mortgage market. The Fund used Treasury futures to effectively manage duration and yield-curve exposure.
| SEI Daily Income Trust / Annual Report / January 31, 2012 | 1 |
Table of Contents
MANAGEMENT’S DISCUSSION AND ANALYSIS OF FUND PERFORMANCE
SEI DAILY INCOME TRUST — JANUARY 31, 2012
Short-Duration Government Fund (Concluded)
Short-Duration Government Fund:
AVERAGE ANNUAL TOTAL RETURN1
| One Year Return | Annualized 3-Year Return | Annualized 5-Year Return | Annualized 10-Year Return | Annualized Inception to Date | ||||||||||||||||
| Short-Duration Government Fund, Class A | 2.53% | 3.35% | 4.34% | 3.51% | 5.32% | |||||||||||||||
| BofA Merrill Lynch 1-3 Year U.S. Treasury Bond Index | 1.50% | 1.71% | 3.67% | 3.25% | 5.47% | |||||||||||||||
Comparison of Change in the Value of a $10,000 Investment in the Short-Duration Government Fund, Class A, versus the BofA Merrill Lynch 1-3 Year U.S. Treasury Bond Index
| 1 | For the periods ended January 31, 2012. Past performance is no indication of future performance. Class A shares were offered beginning 2/17/87. Returns shown do not reflect the deduction of taxes that a shareholder would pay on fund distributions or the redemption of fund shares. |
| 2 | SEI Daily Income Trust / Annual Report / January 31, 2012 |
Table of Contents
MANAGEMENT’S DISCUSSION AND ANALYSIS OF FUND PERFORMANCE
SEI DAILY INCOME TRUST — JANUARY 31, 2012
Intermediate-Duration Government Fund
I. Objective
The Intermediate-Duration Government Fund (the “Fund”) seeks to preserve principal value and maintain a high degree of liquidity while providing current income.
II. Multi-Manager Approach
The Fund is managed by a sub-advisor under the supervision of SEI Investments Management Corporation (“SIMC”). Currently, the sub-advisor is Wellington Management Company. There were no manager changes during the period.
III. Market Commentary
For the fiscal year ended January 31, 2012, the non-Treasury sectors of the U.S. fixed-income market were mixed in terms of spread compression and risk appetite. Geopolitical concerns dominated headlines, including the political tensions in the Middle East, the earthquake and tsunami in Japan and the ongoing fiscal challenges in peripheral Europe. In the U.S., the economic recovery continued at a slower pace due to weak employment and soft consumer demand. First and second quarter U.S. gross domestic product (“GDP”) reports showed that the economy grew at 1.9% and 1.3%, respectively. These numbers were lower than consensus expectations, and the market sharply lowered GDP expectations for the rest of the year. In response, the U.S. Federal Reserve kept the federal funds rate near zero to support the economy, but allowed its $600 billion quantitative easing program to expire at the end of June.
Despite the exit, Treasuries rallied significantly in the second and third quarters of 2011 due to weaker U.S. economic data and fears regarding Europe. In mid-September, the Federal Open Market Committee announced further accommodative measures, with “Operation Twist” effectively extending the maturity of its Treasury portfolio and reinvesting the proceeds of maturing agency debt and mortgage-backed securities (“MBS”) back into MBS rather than Treasuries. These events caused increased market volatility, with Treasuries rallying during the period and non-Treasury sectors broadly underperforming (with the exception of commercial mortgage-backed securities and asset-backed securities).
The corporate market continued to be supported by improving corporate fundamentals. However, spreads widened — particularly in Financials — as mortgage-related liabilities and European concerns remained. During the period, agency MBS underperformed duration-neutral Treasuries as spreads widened with the rally in Treasury rates and uncertainty surrounding policy initiatives impacted the market. The year finished with U.S. economic data showing better-than-expected strength. This development supported the performance of non-government sectors, allowing corporate and mortgage securities to recover some of the lost performance that occurred in the earlier flight to quality.
IV. Return vs. Benchmark
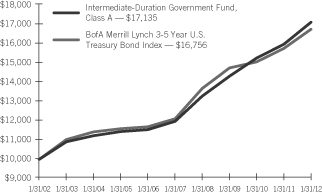
For the fiscal year ended January 31, 2012, the Intermediate-Duration Government Fund, Class A outperformed the BofA Merrill Lynch 3-5 Year U.S. Treasury Bond Index (the “Index”), returning 7.22% versus the Index return of 6.25%.
V. Fund Attribution
The primary driver of the Fund’s performance during the fiscal year was security selection within agency MBS, particularly 20-year and multi-family agency mortgages. The Fund continues to favor agency MBS, as changes in the mortgage capital market have reduced cash-flow variability and supply/demand technicals remain supportive of the asset class. In addition, the Federal Reserve’s announcement to reinvest the proceeds of maturing agency debt and MBS back into MBS rather than Treasuries serves as a modest positive technical to the mortgage market. The Fund used Treasury futures to effectively manage duration and yield-curve exposure.
Intermediate-Duration Government Fund:
AVERAGE ANNUAL TOTAL RETURN1
| One Year Return | Annualized 3-Year Return | Annualized 5-Year Return | Annualized 10-Year Return | Annualized Inception to Date | ||||||||||||||||
| Intermediate-Duration Government Fund, Class A | 7.22% | 6.14% | 7.43% | 5.53% | 6.50% | |||||||||||||||
| BofA Merrill Lynch 3-5 Year U.S. Treasury Bond Index | 6.25% | 4.32% | 6.69% | 5.30% | 6.73% | |||||||||||||||
| SEI Daily Income Trust / Annual Report / January 31, 2012 | 3 |
Table of Contents
MANAGEMENT’S DISCUSSION AND ANALYSIS OF FUND PERFORMANCE
SEI DAILY INCOME TRUST — JANUARY 31, 2012
Intermediate-Duration Government Fund (Concluded)
Comparison of Change in the Value of a $10,000 Investment in the Intermediate-Duration Government Fund, Class A, versus the BofA Merrill Lynch 3-5 Year U.S. Treasury Bond Index
| 1 | For the periods ended January 31, 2012. Past performance is no indication of future performance. Class A shares were offered beginning 2/17/87. Returns shown do not reflect the deduction of taxes that a shareholder would pay on fund distributions or the redemption of fund shares. |
| 4 | SEI Daily Income Trust / Annual Report / January 31, 2012 |
Table of Contents
MANAGEMENT’S DISCUSSION AND ANALYSIS OF FUND PERFORMANCE
SEI DAILY INCOME TRUST — JANUARY 31, 2012
GNMA Fund
I. Objective
The GNMA Fund (the “Fund”) seeks to preserve principal value and maintain a high degree of liquidity while providing current income.
II. Multi-Manager Approach
The Fund is managed by a sub-advisor under the supervision of SEI Investments Management Corporation (“SIMC”). Currently, the sub-advisor is Wellington Management Company. There were no manager changes during the period.
III. Market Commentary
For the fiscal year ended January 31, 2012, the non-Treasury sectors of the U.S. fixed-income market were mixed in terms of spread compression and risk appetite. Geopolitical concerns dominated headlines, including the political tensions in the Middle East, the earthquake and tsunami in Japan and the ongoing fiscal challenges in peripheral Europe. In the U.S., the economic recovery continued at a slower pace due to weak employment and soft consumer demand. First and second quarter U.S. gross domestic product (“GDP”) reports showed that the economy grew at 1.9% and 1.3%, respectively. These numbers were lower than consensus expectations, and the market sharply lowered GDP expectations for the rest of the year. In response, the U.S. Federal Reserve kept the federal funds rate near zero to support the economy, but allowed its $600 billion quantitative easing program to expire at the end of June.
Despite the exit, Treasuries rallied significantly in the second and third quarters of 2011 due to weaker U.S. economic data and fears regarding Europe. In mid-September, the Federal Open Market Committee announced further accommodative measures, with “Operation Twist” effectively extending the maturity of its Treasury portfolio and reinvesting the proceeds of maturing agency debt and mortgage-backed securities (“MBS”) back into MBS rather than Treasuries. These events caused increased market volatility, with Treasuries rallying during the period and non-Treasury sectors broadly underperforming (with the exception of commercial mortgage-backed securities and asset-backed securities).
The corporate market continued to be supported by improving fundamentals. However, spreads widened — particularly in
Financials — as mortgage-related liabilities and European concerns remained. During the period, agency MBS underperformed duration-neutral Treasuries, as spreads widened with the rally in Treasury rates and uncertainty surrounding policy initiatives impacted the market. The year finished with U.S. economic data showing better-than-expected strength. This development supported the performance of non-government sectors, allowing corporate and mortgage securities to recover some of the lost performance that occurred in the earlier flight to quality.
IV. Return vs. Benchmark
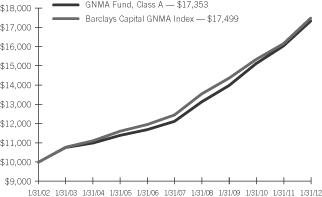
For the fiscal year ended January 31, 2012, the GNMA Fund, Class A underperformed the Barclays Capital GNMA Index (the “Index”), returning 8.09% versus the Index return of 8.21%.
V. Fund Attribution
The Fund invests primarily in MBS issued by the Government National Mortgage Association (“GNMA”) and is backed by the full faith and credit of the U.S. government. Throughout the period, the portfolio maintained its large allocation to GNMA pass-through securities, which are pools of residential mortgages in which the originating banks, mortgage bankers and savings institutions pass all principal and interest payments directly to the investor. The Fund’s allocation to conventional Fannie Mae and Freddie Mac MBS detracted from performance, as these securities underperformed GNMA pass-throughs. Coupon and security selection that emphasized 30-year higher-coupon bonds contributed to performance, with the Fund taking advantage of changing prepayment expectations and optimizing its convexity characteristic. The Fund used options to more effectively hedge duration and improve portfolio convexity. In addition, Treasury futures were employed in order to effectively manage duration and yield-curve exposure.
GNMA Fund:
AVERAGE ANNUAL TOTAL RETURN1
| One Year Return | Annualized 3-Year Return | Annualized 5-Year Return | Annualized 10-Year Return | Annualized Inception to Date | ||||||||||||||||
| GNMA Fund, Class A | 8.09% | 7.44% | 7.43% | 5.67% | 6.86% | |||||||||||||||
| Barclays Capital GNMA Index | 8.21% | 6.77% | 7.01% | 5.76% | 7.29% | |||||||||||||||
| SEI Daily Income Trust / Annual Report / January 31, 2012 | 5 |
Table of Contents
MANAGEMENT’S DISCUSSION AND ANALYSIS OF FUND PERFORMANCE
SEI DAILY INCOME TRUST — JANUARY 31, 2012
GNMA Fund (Concluded)
Comparison of Change in the Value of a $10,000 Investment in the GNMA Fund, Class A, versus the Barclays Capital GNMA Index
| 1 | For the periods ended January 31, 2012. Past performance is no indication of future performance. Class A shares were offered beginning 3/20/87. Returns shown do not reflect the deduction of taxes that a shareholder would pay on fund distributions or the redemption of fund shares. |
| 6 | SEI Daily Income Trust / Annual Report / January 31, 2012 |
Table of Contents
MANAGEMENT’S DISCUSSION AND ANALYSIS OF FUND PERFORMANCE
SEI DAILY INCOME TRUST — JANUARY 31, 2012
Ultra Short Duration Bond Fund
I. Objective
The Ultra Short Duration Bond Fund (the “Fund”) seeks to provide higher current income than what is typically offered by a money market fund while maintaining a high degree of liquidity and a correspondingly higher risk of principal volatility.
II. Multi-Manager Approach
The Fund is managed by a sub-advisor under the supervision of SEI Investments Management Corporation (“SIMC”). Currently, the sub-advisor is Wellington Management Company. There were no manager changes during the period.
III. Market Commentary
For the fiscal year ended January 31, 2012, the non-Treasury sectors of the U.S. fixed-income market were mixed in terms of spread compression and risk appetite. Geopolitical concerns dominated headlines, including the political tensions in the Middle East, the earthquake and tsunami in Japan and the ongoing fiscal challenges in peripheral Europe. In the U.S., the economic recovery continued at a slower pace due to weak employment and soft consumer demand. First and second quarter U.S. gross domestic product (“GDP”) reports showed that the economy grew at 1.9% and 1.3%, respectively. These numbers were lower than consensus expectations, and the market sharply lowered GDP expectations for the rest of the year. In response, the U.S. Federal Reserve kept the federal funds rate near zero to support the economy, but allowed its $600 billion quantitative easing program to expire at the end of June.
Despite the exit, Treasuries rallied significantly in the second and third quarters of 2011 due to weaker U.S. economic data and fears regarding Europe. In mid-September, the Federal Open Market Committee announced further accommodative measures, with “Operation Twist” effectively extending the maturity of its Treasury portfolio and reinvesting the proceeds of maturing agency debt and mortgage-backed securities (“MBS”) back into MBS rather than Treasuries. These events caused increased market volatility, with Treasuries rallying during the period and non-Treasury sectors broadly underperforming (with the exception of commercial mortgage-backed securities and asset-backed securities).
The corporate market continued to be supported by improving fundamentals. However, spreads widened — particularly in Financials — as mortgage-related liabilities and European concerns remained. During the period, agency MBS underperformed duration-neutral Treasuries as spreads widened with the rally in Treasury rates and uncertainty surrounding policy initiatives impacted the market. The year finished with U.S. economic data showing better-than-expected strength. This development supported the performance of non-government sectors, allowing corporate and mortgage securities to recover some of the lost performance that occurred in the earlier flight to quality.
IV. Return vs. Benchmark
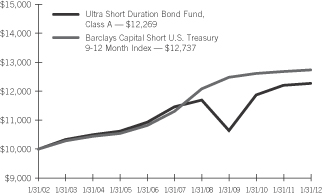
For the fiscal year ended January 31, 2012, the Ultra Short Duration Bond Fund, Class A outperformed the Barclays Capital Short U.S. Treasury 9-12 Month Index (the “Index”), returning 0.55% versus the Index return of 0.46%.
V. Fund Attribution
The Fund invests in U.S. Treasury and U.S. agency securities, short average life MBS and short-term investment-grade securities of U.S. issuers. Its duration ranges between six and eighteen months. The primary driver of performance was the Fund’s overweight to asset-backed securities (“ABS”), Corporate bonds and agency pass-through MBS, which are pools of residential mortgages in which the originating banks, mortgage bankers and savings institutions pass all principal and interest payments directly to the investor. ABS benefited from steady demand across the buyer universe that resulted in tighter spreads for credit card and auto ABS. The Fund continues to favor agency MBS, as changes in the mortgage capital market have reduced cash-flow variability and supply/demand technicals remain supportive of the asset class. In addition, the Federal Reserve’s announcement to reinvest the proceeds of maturing agency debt and MBS back into MBS rather than Treasuries serves as a modest positive technical to the mortgage market. Non-agency MBS was the main detractor for the period due to the concern over potential supply from Europe. The Fund utilized Treasury futures to efficiently manage duration and yield-curve exposure.
| SEI Daily Income Trust / Annual Report / January 31, 2012 | 7 |
Table of Contents
MANAGEMENT’S DISCUSSION AND ANALYSIS OF FUND PERFORMANCE
SEI DAILY INCOME TRUST — JANUARY 31, 2012
Ultra Short Duration Bond Fund (Concluded)
Ultra Short Duration Bond Fund:
AVERAGE ANNUAL TOTAL RETURN1
| One Year Return | Annualized 3-Year Return | Annualized 5-Year Return | Annualized 10-Year Return | Annualized Inception to Date | ||||||||||||||||
| Ultra Short Duration Bond Fund, Class A | 0.55% | 4.85% | 1.37% | 2.07% | 3.71% | |||||||||||||||
| Barclays Capital Short U.S. Treasury 9-12 Month Index | 0.46% | 0.66% | 2.40% | 2.45% | 3.91% | |||||||||||||||
Comparison of Change in the Value of a $10,000 Investment in the Ultra Short Duration Bond Fund, Class A, versus the Barclays Capital Short U.S. Treasury 9-12 Month Index
| 1 | For the period ended January 31, 2012. Past performance is no indication of future performance. Class A Shares were offered beginning 9/28/93. Returns shown do not reflect the deduction of taxes that a shareholder would pay on fund distributions or the redemption of fund shares. |
| 8 | SEI Daily Income Trust / Annual Report / January 31, 2012 |
Table of Contents
Definition of Comparative Indices*
Barclays Capital GNMA Index is a widely-recognized, capitalization-weighted index of 15-30 year fixed-rate securities backed by mortgage pools of GNMA.
Barclays Capital Short U.S. Treasury 9-12 Month Index is a widely-recognized, market weighted index of U.S. Treasury Bonds with remaining maturities between nine and twelve months.
BofA Merrill Lynch 1-3 Year U.S. Treasury Bond Index is a widely-recognized, unmanaged index that tracks the performance of the direct sovereign debt of the U.S. Government having a maturity of at least one year and less than 3 years.
BofA Merrill Lynch 3-5 Year U.S. Treasury Bond Index is a widely-recognized, unmanaged index that tracks the performance of the direct sovereign debt of the U.S. Government having a maturity of at least three years and less than five years.
| * | An Index measures the market price of a specific group of securities in a particular market sector. You cannot invest directly in an index. An index does not have an investment adviser and does not pay any commissions or expenses. If an index had expenses, its performance would be lower. |
| SEI Daily Income Trust / Annual Report / January 31, 2012 | 9 |
Table of Contents
Money Market Fund
January 31, 2012
| Description | Face Amount ($ Thousands) | Value ($ Thousands) | ||||||
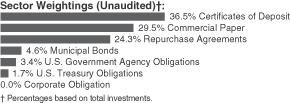
CERTIFICATES OF DEPOSIT — 36.6% |
| |||||||
Bank of Nova Scotia | ||||||||
0.300%, 02/03/12 | $ | 4,000 | $ | 4,000 | ||||
0.270%, 03/14/12 | 3,000 | 3,000 | ||||||
0.300%, 04/03/12 | 1,700 | 1,700 | ||||||
0.420%, 07/09/12 | 2,800 | 2,800 | ||||||
Bank of Tokyo-Mitsubishi UFJ NY | ||||||||
0.400%, 02/06/12 | 1,500 | 1,500 | ||||||
Barclays Bank PLC | ||||||||
0.390%, 03/23/12 | 1,700 | 1,700 | ||||||
0.380%, 03/26/12 | 3,000 | 3,000 | ||||||
0.360%, 03/26/12 | 2,000 | 2,000 | ||||||
Chase Bank USA | ||||||||
0.180%, 04/23/12 | 3,600 | 3,600 | ||||||
Credit Suisse NY | ||||||||
0.380%, 02/10/12 | 5,000 | 5,000 | ||||||
0.450%, 02/13/12 | 3,100 | 3,100 | ||||||
0.450%, 04/10/12 | 3,000 | 3,000 | ||||||
DnB Bank | ||||||||
0.420%, 02/17/12 | 3,100 | 3,100 | ||||||
0.470%, 04/23/12 | 3,000 | 3,000 | ||||||
National Australia Bank | ||||||||
0.400%, 07/16/12 | 1,000 | 1,000 | ||||||
0.400%, 07/18/12 | 4,000 | 4,000 | ||||||
0.380%, 07/18/12 | 1,700 | 1,700 | ||||||
Nordea Bank Finland PLC | ||||||||
0.385%, 02/06/12 | 3,000 | 3,000 | ||||||
0.380%, 02/10/12 | 1,000 | 1,000 | ||||||
0.430%, 02/16/12 | 2,765 | 2,765 | ||||||
0.500%, 03/12/12 | 1,000 | 1,000 | ||||||
0.480%, 03/22/12 | 2,795 | 2,795 | ||||||
Skandinav Enskilda Bank NY | ||||||||
0.350%, 02/01/12 | 1,315 | 1,315 | ||||||
0.460%, 03/05/12 | 2,500 | 2,500 | ||||||
0.580%, 03/07/12 | 1,450 | 1,450 | ||||||
0.840%, 03/09/12 | 135 | 135 | ||||||
0.470%, 03/20/12 | 4,000 | 4,000 | ||||||
Sumitomo Mitsui Banking | ||||||||
0.400%, 02/01/12 | 2,000 | 2,000 | ||||||
0.450%, 03/12/12 | 4,000 | 4,000 | ||||||
0.460%, 03/23/12 | 2,000 | 2,000 | ||||||
0.450%, 04/11/12 | 1,750 | 1,750 | ||||||
Svenska HandelsBanken | ||||||||
0.435%, 02/24/12 | 4,000 | 4,000 | ||||||
0.480%, 03/05/12 | 4,000 | 4,000 | ||||||
| Description | Face Amount ($ Thousands) | Value ($ Thousands) | ||||||
0.500%, 03/20/12 | $ | 3,000 | $ | 3,000 | ||||
0.515%, 04/05/12 | 2,500 | 2,500 | ||||||
Toronto-Dominion Bank | ||||||||
0.320%, 02/07/12 | 2,532 | 2,532 | ||||||
0.380%, 04/30/12 | 1,500 | 1,500 | ||||||
Westpac Banking | ||||||||
0.360%, 02/03/12 | 1,729 | 1,729 | ||||||
0.250%, 03/12/12 | 1,000 | 1,000 | ||||||
0.500%, 06/27/12 | 3,600 | 3,600 | ||||||
|
| |||||||
Total Certificates of Deposit |
| 100,771 | ||||||
|
| |||||||
COMMERCIAL PAPER (B) (C) — 29.6% |
| |||||||
American Honda Finance | ||||||||
0.150%, 04/18/12 | 500 | 500 | ||||||
Australia & New Zealand Banking Group | ||||||||
0.250%, 02/22/12 | 1,000 | 1,000 | ||||||
0.240%, 03/23/12 | 1,780 | 1,779 | ||||||
0.557%, 06/22/12 | 2,135 | 2,130 | ||||||
BHP Billiton Finance USA | ||||||||
0.170%, 02/21/12 | 5,425 | 5,424 | ||||||
0.130%, 04/23/12 | 1,000 | 1,000 | ||||||
BNZ International Funding | ||||||||
0.431%, 02/13/12 to 03/30/12 | 4,000 | 3,999 | ||||||
0.652%, 05/16/12 | 1,250 | 1,248 | ||||||
BP Capital Markets PLC | ||||||||
0.240%, 02/08/12 | 3,000 | 3,000 | ||||||
Chariot Funding LLC | ||||||||
0.250%, 02/13/12 | 1,000 | 1,000 | ||||||
Coca-Cola | ||||||||
0.180%, 03/07/12 | 2,000 | 2,000 | ||||||
0.140%, 05/04/12 to 05/15/12 | 1,600 | 1,600 | ||||||
0.130%, 05/17/12 | 2,000 | 1,999 | ||||||
Commonwealth Bank of Australia | ||||||||
0.250%, 03/15/12 | 2,080 | 2,079 | ||||||
0.602%, 06/06/12 | 3,000 | 2,994 | ||||||
0.491%, 07/12/12 | 1,000 | 998 | ||||||
DNB Bank | ||||||||
0.521%, 04/02/12 | 1,000 | 999 | ||||||
0.400%, 04/30/12 | 600 | 599 | ||||||
FCAR Owner Trust | ||||||||
0.340%, 03/01/12 | 1,750 | 1,749 | ||||||
0.290%, 03/01/12 | 1,000 | 1,000 | ||||||
0.300%, 04/02/12 | 3,500 | 3,498 | ||||||
0.310%, 04/02/12 to 04/03/12 | 1,350 | 1,349 | ||||||
0.552%, 07/02/12 | 5,000 | 4,988 | ||||||
General Electric Capital | ||||||||
0.280%, 04/06/12 to 04/11/12 | 6,000 | 5,997 | ||||||
HSBC Bank PLC | ||||||||
0.300%, 02/14/12 | 1,695 | 1,695 | ||||||
Jupiter Securitization LLC | ||||||||
0.220%, 03/09/12 | 1,000 | 1,000 | ||||||
Market Street Funding LLC | ||||||||
0.220%, 03/07/12 | 700 | 700 | ||||||
| 10 | SEI Daily Income Trust / Annual Report / January 31, 2012 |
Table of Contents
| Description | Face Amount ($ Thousands) | Value ($ Thousands) | ||||||
MetLife Short Term Funding LLC | ||||||||
0.340%, 03/19/12 to 05/14/12 | $ | 2,300 | $ | 2,298 | ||||
0.310%, 03/20/12 | 1,000 | 999 | ||||||
0.324%, 03/26/12 | 750 | 750 | ||||||
0.380%, 04/02/12 | 3,000 | 2,998 | ||||||
0.364%, 04/03/12 | 3,000 | 2,998 | ||||||
New York Life CAP | ||||||||
0.160%, 02/14/12 | 830 | 830 | ||||||
0.120%, 03/27/12 | 250 | 250 | ||||||
Old Line Funding LLC | ||||||||
0.210%, 04/23/12 | 1,670 | 1,669 | ||||||
Procter & Gamble | ||||||||
0.150%, 04/04/12 | 1,000 | 1,000 | ||||||
State Street | ||||||||
0.200%, 03/07/12 | 3,000 | 2,999 | ||||||
Straight-A Funding LLC | ||||||||
0.190%, 04/12/12 | 1,000 | 1,000 | ||||||
Toyota Credit Canada | ||||||||
0.200%, 03/12/12 | 1,500 | 1,500 | ||||||
Toyota Financial Services de Puerto Rico | ||||||||
0.250%, 04/13/12 to 04/20/12 | 2,000 | 1,999 | ||||||
Variable Funding Capital LLC | ||||||||
0.190%, 04/16/12 | 1,000 | 1,000 | ||||||
Westpac Banking | ||||||||
0.461%, 07/12/12 | 3,000 | 2,994 | ||||||
|
| |||||||
Total Commercial Paper |
| 81,608 | ||||||
|
| |||||||
MUNICIPAL BONDS (A) — 4.7% |
| |||||||
California — 0.5% | ||||||||
Southern California, Metropolitan Water District, Ser B-4, RB | ||||||||
0.060%, 02/06/12 | 1,300 | 1,300 | ||||||
|
| |||||||
Colorado — 0.1% | ||||||||
Colorado State, Housing & Finance Authority, Ser AA1, RB | ||||||||
0.150%, 02/01/12 | 395 | 395 | ||||||
|
| |||||||
Connecticut — 0.5% | ||||||||
Connecticut State, Housing & Finance Authority, Ser D-3, RB | ||||||||
0.100%, 02/02/12 | 570 | 570 | ||||||
Connecticut State, Housing & Finance Authority, Sub-Ser A-5, RB | ||||||||
0.128%, 02/02/12 | 670 | 670 | ||||||
|
| |||||||
| 1,240 | ||||||||
|
| |||||||
Indiana — 0.0% | ||||||||
City of Rockport, Ser A, RB | ||||||||
0.080%, 02/01/12 | 150 | 150 | ||||||
|
| |||||||
| Description | Face Amount ($ Thousands) | Value ($ Thousands) | ||||||
Iowa — 0.5% | ||||||||
Iowa State, Finance Authority, | ||||||||
0.167%, 02/02/12 | $ | 1,355 | $ | 1,355 | ||||
Iowa State, Finance Authority, | ||||||||
0.170%, 02/02/12 | 70 | 70 | ||||||
|
| |||||||
| 1,425 | ||||||||
|
| |||||||
Kentucky — 0.8% | ||||||||
Kentucky State, Housing Development Authority, Ser J, RB | ||||||||
0.440%, 02/01/12 | 1,915 | 1,915 | ||||||
Kentucky State, Housing Development Authority, Ser W, RB | ||||||||
0.430%, 02/02/12 | 165 | 165 | ||||||
|
| |||||||
| 2,080 | ||||||||
|
| |||||||
Massachusetts — 0.1% | ||||||||
Simmons College, RB | ||||||||
0.170%, 02/02/12 | 235 | 235 | ||||||
|
| |||||||
New Hampshire — 0.1% | ||||||||
New Hampshire State, Health & Education Facilities Authority, Ser C, RB | ||||||||
0.110%, 02/01/12 | 190 | 190 | ||||||
|
| |||||||
New Mexico — 0.1% | ||||||||
New Mexico State, Finance Authority, Sub-Ser D, GO | ||||||||
0.167%, 02/02/12 | 300 | 300 | ||||||
|
| |||||||
Texas — 1.5% | ||||||||
JP Morgan Chase Putters, | ||||||||
0.080%, 02/01/12 | 1,300 | 1,300 | ||||||
Texas State, GO | ||||||||
0.110%, 02/01/12 | 100 | 100 | ||||||
0.140%, 02/07/12 | 375 | 375 | ||||||
0.140%, 02/07/12 | 100 | 100 | ||||||
Texas State, Ser A, GO | ||||||||
0.140%, 02/07/12 | 485 | 485 | ||||||
Texas State, Ser A-2, GO | ||||||||
0.138%, 02/01/12 | 1,000 | 1,000 | ||||||
Texas State, Ser B, GO | ||||||||
0.140%, 02/07/45 | 375 | 375 | ||||||
Texas State, Ser B2, GO | ||||||||
0.108%, 02/01/12 | 100 | 100 | ||||||
Texas State, Ser I, GO | ||||||||
0.108%, 02/01/12 | 195 | 195 | ||||||
|
| |||||||
| 4,030 | ||||||||
|
| |||||||
| SEI Daily Income Trust / Annual Report / January 31, 2012 | 11 |
Table of Contents
SCHEDULE OF INVESTMENTS
Money Market Fund (Concluded)
January 31, 2012
| Description | Face Amount ($ Thousands) | Value ($ Thousands) | ||||||
Wisconsin — 0.5% | ||||||||
Wisconsin State, Health & Educational Facilities Authority, RB | ||||||||
0.060%, 02/01/12 | $ | 800 | $ | 800 | ||||
Wisconsin State, Housing & Economic Development Authority, Ser D, RB | ||||||||
1.300%, 02/01/12 | 600 | 600 | ||||||
|
| |||||||
| 1,400 | ||||||||
|
| |||||||
Total Municipal Bonds |
| 12,745 | ||||||
|
| |||||||
U.S. GOVERNMENT AGENCY OBLIGATIONS — 3.4% |
| |||||||
FFCB | ||||||||
0.316%, 02/10/12 (A) | 1,000 | 1,000 | ||||||
FFCB DN | ||||||||
0.150%, 07/05/12 (B) | 1,000 | 999 | ||||||
FHLB | ||||||||
0.130%, 02/24/12 | 1,100 | 1,100 | ||||||
FHLMC | ||||||||
0.410%, 02/01/12 (A) | 2,780 | 2,779 | ||||||
FNMA | ||||||||
0.311%, 02/20/12 (A) | 1,000 | 1,000 | ||||||
0.320%, 02/01/12 (A) | 500 | 500 | ||||||
0.330%, 02/01/12 (A) | 895 | 894 | ||||||
FNMA, Ser 1 | ||||||||
0.400%, 02/01/12 (A) | 1,000 | 1,000 | ||||||
|
| |||||||
Total U.S. Government Agency Obligations |
| 9,272 | ||||||
|
| |||||||
U.S. TREASURY OBLIGATIONS — 1.7% |
| |||||||
U.S. Treasury Notes | ||||||||
1.375%, 01/15/13 | 1,500 | 1,518 | ||||||
4.625%, 07/31/12 | 1,685 | 1,722 | ||||||
1.000%, 04/30/12 | 1,500 | 1,503 | ||||||
|
| |||||||
Total U.S. Treasury Obligations |
| 4,743 | ||||||
|
| |||||||
CORPORATE OBLIGATION — 0.0% |
| |||||||
Shell International Finance | ||||||||
0.920%, 06/22/12 (A) | 90 | 90 | ||||||
|
| |||||||
Total Corporate Obligation |
| 90 | ||||||
|
| |||||||
REPURCHASE AGREEMENTS (D) — 24.4% |
| |||||||
JPMorgan Chase | 5,000 | 5,000 | ||||||
| Description | Face Amount ($ Thousands) | Value ($ Thousands) | ||||||
JPMorgan Chase | $ | 17,000 | $ | 17,000 | ||||
RBC Capital | 3,000 | 3,000 | ||||||
RBC Capital | 17,000 | 17,000 | ||||||
UBS | 4,082 | 4,082 | ||||||
Wells Fargo | 4,000 | 4,000 | ||||||
Wells Fargo | 17,000 | 17,000 | ||||||
|
| |||||||
Total Repurchase Agreements | 67,082 | |||||||
|
| |||||||
Total Investments — 100.4% |
| $ | 276,311 | |||||
|
| |||||||
| 12 | SEI Daily Income Trust / Annual Report / January 31, 2012 |
Table of Contents
| * | A summary of the corporate obligations used to collateralize repurchase agreements entered into by the Fund at January 31, 2012, is as follows: |
| Counterparty | Corporate Obligation | Rate | Maturity Date | Par Amount ($ Thousands) | ||||||
| Wells Fargo | Phillip Morris International | 2.500% | 05/16/16 | $ | 2,770 | |||||
| Williams Partners LP | 4.000 | 11/15/21 | 1,276 | |||||||
Percentages are based on Net Assets of $275,306 ($ Thousands).
| (A) | Floating Rate Instrument. The rate reflected on the Schedule of Investments is the rate in effect on January 31, 2012. The demand and interest rate reset features give this security a shorter effective maturity date. |
| (B) | The rate reported is the effective yield at time of purchase. |
| (C) | Securities are held in connection with a letter of credit issued by a major bank. |
| (D) | Tri-Party Repurchase Agreement. |
DN — Discount Note
FFCB — Federal Farm Credit Bank
FHLB — Federal Home Loan Bank
FHLMC — Federal Home Loan Mortgage Corporation
FNMA — Federal National Mortgage Association
GO — General Obligation
LLC — Limited Liability Company
LP — Limited Partnership
NY — New York
PLC — Public Limited Company
RB — Revenue Bond
Ser — Series
As of January 31, 2012, all of the Fund’s investments were considered Level 2, in accordance with ASC-820. For more information on valuation inputs, see Note 2 —Significant Accounting Policies in Note to Financial Statements.
The accompanying notes are an integral part of the financial statements.
| SEI Daily Income Trust / Annual Report / January 31, 2012 | 13 |
Table of Contents
SCHEDULE OF INVESTMENTS
Government Fund
January 31, 2012
| Description | Face Amount ($ Thousands) | Value ($ Thousands) | ||||||
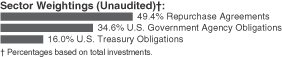
U.S. GOVERNMENT AGENCY OBLIGATIONS — 34.7% |
| |||||||
FFCB |
| |||||||
2.250%, 04/24/12 | $ | 735 | $ | 739 | ||||
0.230%, 03/23/12 | 20,000 | 20,002 | ||||||
0.280%, 03/16/12 | 7,000 | 7,001 | ||||||
0.950%, 03/05/12 | 3,065 | 3,067 | ||||||
0.221%, 02/29/12 (A) | 2,115 | 2,115 | ||||||
0.463%, 02/27/12 (A) | 125 | 125 | ||||||
0.243%, 02/27/12 (A) | 12,000 | 11,997 | ||||||
0.205%, 02/26/12 (A) | 3,000 | 2,999 | ||||||
0.247%, 02/24/12 (A) | 125 | 125 | ||||||
0.259%, 02/21/12 (A) | 10,000 | 10,000 | ||||||
0.311%, 02/20/12 (A) | 1,000 | 1,000 | ||||||
0.305%, 02/13/12 (A) | 8,848 | 8,850 | ||||||
0.315%, 02/13/12 (A) | 348 | 348 | ||||||
0.316%, 02/12/12 (A) | 847 | 847 | ||||||
0.316%, 02/10/12 (A) | 6,400 | 6,399 | ||||||
0.385%, 02/07/12 (A) | 3,000 | 3,000 | ||||||
0.315%, 02/05/12 (A) | 430 | 430 | ||||||
0.230%, 02/01/12 (A) | 8,000 | 8,000 | ||||||
0.290%, 02/01/12 (A) | 6,000 | 6,000 | ||||||
0.240%, 02/01/12 (A) | 8,500 | 8,498 | ||||||
0.395%, 02/01/12 (A) | 1,496 | 1,497 | ||||||
0.285%, 02/01/12 (A) | 10,000 | 10,000 | ||||||
0.300%, 02/01/12 (A) | 1,160 | 1,161 | ||||||
FFCB, Ser 1 (A) | ||||||||
0.505%, 04/25/12 | 1,470 | 1,470 | ||||||
0.480%, 03/22/12 | 2,000 | 2,000 | ||||||
FFCB, Ser 2 | ||||||||
0.260%, 02/28/12 (A) | 200 | 200 | ||||||
FHLB | ||||||||
0.200%, 11/19/12 to 11/29/12 | 7,600 | 7,604 | ||||||
1.625%, 11/21/12 | 325 | 329 | ||||||
0.150%, 04/16/12 | 2,065 | 2,065 | ||||||
0.120%, 03/02/12 | 8,000 | 8,000 | ||||||
0.225%, 02/26/12 (A) | 12,500 | 12,498 | ||||||
0.130%, 02/13/12 to 02/15/12 | 39,000 | 39,000 | ||||||
0.300%, 02/08/12 | 17,000 | 17,001 | ||||||
0.260%, 02/01/12 (A) | 100 | 100 | ||||||
0.350%, 02/01/12 (A) | 1,000 | 1,000 | ||||||
FHLB DN (B) | ||||||||
0.095%, 04/09/12 to 06/22/12 | 11,585 | 11,583 | ||||||
0.085%, 03/23/12 to 05/09/12 | 2,100 | 2,100 | ||||||
0.080%, 04/02/12 to 04/27/12 | 6,031 | 6,030 | ||||||
0.092%, 02/10/12 | 24,480 | 24,479 | ||||||
FHLB, Ser 1 | ||||||||
0.150%, 04/16/12 | 1,150 | 1,150 | ||||||
0.226%, 02/25/12 (A) | 2,000 | 2,000 | ||||||
| Description | Face Amount ($ Thousands) | Value ($ Thousands) | ||||||
FNMA | ||||||||
6.125%, 03/15/12 | $ | 12,000 | $ | 12,084 | ||||
5.000%, 02/16/12 | 1,735 | 1,738 | ||||||
FNMA DN (B) | ||||||||
0.085%, 05/02/12 | 1,500 | 1,500 | ||||||
0.140%, 02/15/12 | 7,960 | 7,960 | ||||||
FHLMC | ||||||||
2.125%, 03/23/12 | 8,370 | 8,393 | ||||||
0.239%, 02/21/12 (A) | 4,255 | 4,252 | ||||||
0.256%, 02/10/12 (A) | 4,790 | 4,789 | ||||||
0.245%, 02/03/12 to 02/04/12 (A) | 14,500 | 14,493 | ||||||
0.265%, 02/03/12 (A) | 5,149 | 5,149 | ||||||
0.230%, 02/01/12 (A) | 723 | 723 | ||||||
FHLMC DN (B) | ||||||||
0.080%, 05/07/12 | 7,000 | 6,998 | ||||||
0.085%, 04/16/12 | 1,900 | 1,900 | ||||||
0.115%, 04/03/12 | 18,000 | 17,996 | ||||||
0.100%, 02/23/12 | 13,000 | 12,999 | ||||||
0.130%, 02/13/12 | 10,000 | 10,000 | ||||||
FHLMC MTN (A) | ||||||||
0.250%, 02/16/12 | 10,291 | 10,291 | ||||||
0.235%, 02/02/12 | 8,000 | 7,999 | ||||||
FNMA (A) | ||||||||
0.311%, 02/20/12 | 4,000 | 3,999 | ||||||
0.265%, 02/08/12 | 18,500 | 18,490 | ||||||
0.320%, 02/01/12 | 1,700 | 1,700 | ||||||
0.330%, 02/01/12 | 5,000 | 4,998 | ||||||
FNMA, Ser 1 | ||||||||
4.750%, 11/19/12 | 2,708 | 2,807 | ||||||
0.290%, 02/01/12 (A) | 435 | 435 | ||||||
0.400%, 02/01/12 (A) | 5,850 | �� | 5,848 | |||||
|
| |||||||
Total U.S. Government Agency Obligations |
| 420,350 | ||||||
|
| |||||||
U.S. TREASURY OBLIGATIONS — 16.1% |
| |||||||
U.S. Treasury Notes | ||||||||
1.375%, 09/15/12 to 01/15/13 | 25,300 | 25,554 | ||||||
1.125%, 12/15/12 | 6,000 | 6,050 | ||||||
4.000%, 11/15/12 | 13,000 | 13,395 | ||||||
0.375%, 09/30/12 | 10,000 | 10,018 | ||||||
4.625%, 07/31/12 | 6,500 | 6,646 | ||||||
0.625%, 07/31/12 | 19,500 | 19,551 | ||||||
1.500%, 07/15/12 | 31,000 | 31,197 | ||||||
4.750%, 05/31/12 | 14,500 | 14,722 | ||||||
1.000%, 03/31/12 to 04/30/12 | 60,160 | 60,285 | ||||||
4.500%, 03/31/12 | 7,500 | 7,554 | ||||||
|
| |||||||
Total U.S. Treasury Obligations | 194,972 | |||||||
|
| |||||||
| 14 | SEI Daily Income Trust / Annual Report / January 31, 2012 |
Table of Contents
| Description | Face Amount ($ Thousands) | Value ($ Thousands) | ||||||
REPURCHASE AGREEMENTS — 49.6% |
| |||||||
Barclays Capital | $ | 6,000 | $ | 6,000 | ||||
Barclays Capital | 140,000 | 140,000 | ||||||
BNP Paribas | 12,000 | 12,000 | ||||||
BNP Paribas | 140,000 | 140,000 | ||||||
Credit Suisse | 17,000 | 17,000 | ||||||
Credit Suisse | 17,000 | 17,000 | ||||||
| Description | Face Amount ($ Thousands) | Value ($ Thousands) | ||||||
Deutsche Bank | $ | 150,000 | $ | 150,000 | ||||
UBS | 15,000 | 15,000 | ||||||
UBS | 103,205 | 103,205 | ||||||
|
| |||||||
Total Repurchase Agreements |
| 600,205 | ||||||
|
| |||||||
Total Investments — 100.4% |
| $ | 1,215,527 | |||||
|
| |||||||
| * | A summary of the corporate obligations used to collateralize repurchase agreements entered into by the Fund at January 31, 2012, is as follows: |
| Counterparty | Corporate Obligation | Rate | Maturity Date | Par Amount ($ Thousands) | ||||||
| UBS | Bank of The West | 2.150% | 03/27/12 | $ | 363 | |||||
| Citibank | 0.457 | 11/15/12 | 2,425 | |||||||
| Citibank | 0.292 | 09/21/12 | 2,100 | |||||||
| Citigroup Funding | 1.875 | 11/15/12 | 1,335 | |||||||
| GE Capital | 2.000 | 09/28/12 | 2,385 | |||||||
| GE Capital | 0.247 | 09/21/12 | 2,635 | |||||||
| GE Capital | 0.450 | 03/12/12 | 1,585 | |||||||
| US Bancorp | 1.800 | 05/15/12 | 2,500 | |||||||
Percentages are based on Net Assets of $1,210,485($ Thousands).
| † | Securities are FDIC guaranteed. |
| (A) | Floating Rate Instrument. The rate reflected on the Schedule of Investments is the rate in effect on January 31, 2012. The demand and interest rate reset features give this security a shorter effective maturity date. |
| (B) | The rate reported is the effective yield at time of purchase. |
| (C) | Securities considered illiquid. The total value of such securities as of January 31, 2012 was $40,000 ($ Thousands) and represented 3.3% of Net Assets. |
| (D) | Tri-Party Repurchase Agreement. |
| SEI Daily Income Trust / Annual Report / January 31, 2012 | 15 |
Table of Contents
SCHEDULE OF INVESTMENTS
Government Fund (Concluded)
January 31, 2012
DN — Discount Note
FAMC — Franklin American Mortgage Company
FCSB — Federal Farm Credit Banks Consolidated Systemwide Bonds
FFCB — Federal Farm Credit Bank
FHLB — Federal Home Loan Bank
FHLMC — Federal Home Loan Mortgage Corporation
FNMA — Federal National Mortgage Association
MTN — Medium Term Note
REFC — Rural Electrification Financing Corporation
Ser — Series
As of January 31, 2012, all of the Fund’s investments were considered Level 2, in accordance with ASC-820. For more information on valuation inputs, see Note 2 — Significant Accounting Policies in Notes to Financial Statements.
The accompanying notes are an integral part of the financial statements.
| 16 | SEI Daily Income Trust / Annual Report / January 31, 2012 |
Table of Contents
SCHEDULE OF INVESTMENTS
Government II Fund
January 31, 2012
| Description | Face Amount ($ Thousands) | Value ($ Thousands) | ||||||
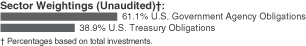
U.S. GOVERNMENT AGENCY OBLIGATIONS — 65.1% |
| |||||||
FFCB | ||||||||
2.250%, 04/24/12 | $ | 5,958 | $ | 5,987 | ||||
0.243%, 02/27/12 to 03/27/12 (A) | 23,000 | 22,996 | ||||||
0.230%, 03/23/12 | 2,000 | 2,000 | ||||||
0.280%, 03/01/12 to 03/16/12 | 9,200 | 9,201 | ||||||
0.950%, 02/10/12 to 03/05/12 | 3,728 | 3,731 | ||||||
0.221%, 02/29/12 (A) | 7,170 | 7,169 | ||||||
0.260%, 02/28/12 (A) | 13,000 | 13,000 | ||||||
0.463%, 02/27/12 (A) | 150 | 150 | ||||||
0.273%, 02/27/12 (A) | 2,000 | 2,000 | ||||||
0.230%, 02/26/12 (A) | 11,000 | 11,000 | ||||||
0.205%, 02/26/12 (A) | 5,000 | 4,999 | ||||||
0.247%, 02/24/12 (A) | 180 | 180 | ||||||
0.259%, 02/21/12 (A) | 13,000 | 13,000 | ||||||
0.311%, 02/20/12 (A) | 2,505 | 2,506 | ||||||
0.271%, 02/19/12 (A) | 1,000 | 1,000 | ||||||
0.315%, 02/13/12 (A) | 8,274 | 8,276 | ||||||
0.305%, 02/13/12 (A) | 775 | 775 | ||||||
0.316%, 02/12/12 (A) | 1,162 | 1,162 | ||||||
0.316%, 02/10/12 (A) | 14,500 | 14,498 | ||||||
0.385%, 02/07/12 (A) | 13,000 | 12,999 | ||||||
0.315%, 02/05/12 (A) | 540 | 540 | ||||||
0.285%, 02/01/12 (A) | 15,000 | 15,000 | ||||||
0.265%, 02/01/12 (A) | 7,000 | 6,998 | ||||||
0.395%, 02/01/12 (A) | 3,754 | 3,757 | ||||||
0.290%, 02/01/12 (A) | 20,500 | 20,500 | ||||||
0.240%, 02/01/12 (A) | 8,000 | 7,998 | ||||||
0.500%, 02/01/12 (A) | 2,000 | 2,001 | ||||||
0.300%, 02/01/12 (A) | 3,240 | 3,242 | ||||||
FFCB DN (B) | ||||||||
0.150%, 07/05/12 | 8,000 | 7,995 | ||||||
0.115%, 03/27/12 | 5,427 | 5,426 | ||||||
0.170%, 02/06/12 | 10,000 | 10,000 | ||||||
0.010%, 02/01/12 | 1,603 | 1,603 | ||||||
FFCB, Ser 1 (A) | ||||||||
0.505%, 04/25/12 | 1,848 | 1,848 | ||||||
0.480%, 03/22/12 | 5,000 | 5,000 | ||||||
0.203%, 02/27/12 | 14,000 | 13,998 | ||||||
FFCB, Ser 2 | �� | |||||||
0.260%, 02/28/12 (A) | 300 | 300 | ||||||
FHLB | ||||||||
0.200%, 11/19/12 to 11/29/12 | 9,000 | 9,004 | ||||||
1.625%, 11/21/12 | 375 | 379 | ||||||
0.150%, 04/16/12 | 7,760 | 7,760 | ||||||
1.050%, 03/15/12 | 200 | 200 | ||||||
3.250%, 03/09/12 | 1,200 | 1,204 | ||||||
0.120%, 03/02/12 | 9,000 | 9,000 | ||||||
0.225%, 02/26/12 (A) | 9,000 | 8,998 | ||||||
| Description | Face Amount ($ Thousands) | Value ($ Thousands) | ||||||
0.229%, 02/23/12 (A) | $ | 2,750 | $ | 2,750 | ||||
0.130%, 02/13/12 to 02/15/12 | 47,000 | 47,000 | ||||||
0.245%, 02/13/12 (A) | 7,000 | 6,999 | ||||||
0.324%, 02/10/12 (A) | 2,500 | 2,500 | ||||||
0.320%, 02/01/12 | 2,000 | 2,000 | ||||||
0.260%, 02/01/12 (A) | 4,700 | 4,700 | ||||||
FHLB DN (B) | ||||||||
0.076%, 04/27/12 | 1,520 | 1,520 | ||||||
0.120%, 04/23/12 | 750 | 750 | ||||||
0.095%, 04/09/12 | 14,500 | 14,497 | ||||||
0.085%, 03/23/12 | 1,500 | 1,500 | ||||||
0.060%, 02/10/12 to 03/12/12 | 91,000 | 90,998 | ||||||
0.100%, 03/02/12 | 4,000 | 4,000 | ||||||
0.118%, 03/01/12 | 21,000 | 20,998 | ||||||
0.050%, 02/24/12 | 18,000 | 17,999 | ||||||
0.030%, 02/17/12 | 9,000 | 9,000 | ||||||
0.040%, 02/08/12 | 160,564 | 160,563 | ||||||
0.027%, 02/03/12 | 126,000 | 126,000 | ||||||
FHLB, Ser 1 | ||||||||
0.150%, 04/16/12 | 4,310 | 4,310 | ||||||
0.226%, 02/25/12 (A) | 3,700 | 3,699 | ||||||
FHLB DN (B) | ||||||||
0.090%, 05/16/12 | 13,000 | 12,997 | ||||||
0.060%, 04/25/12 | 19,000 | 18,997 | ||||||
0.070%, 03/19/12 | 350 | 350 | ||||||
0.000%, 02/29/12 (A) | 41,000 | 40,998 | ||||||
2.650%, 02/22/12 | 3,000 | 3,000 | ||||||
0.018%, 02/01/12 | 84,628 | 84,628 | ||||||
Tennessee Valley Authority | ||||||||
6.790%, 05/23/12 | 1,775 | 1,812 | ||||||
|
| |||||||
Total U.S. Government Agency Obligations |
| 963,945 | ||||||
|
| |||||||
U.S. TREASURY OBLIGATIONS — 41.5% |
| |||||||
U.S. Treasury Bills (B) | ||||||||
0.000%, 03/01/12 | 46,535 | 46,533 | ||||||
0.019%, 02/23/12 | 1,900 | 1,900 | ||||||
0.028%, 02/16/12 | 63,000 | 62,999 | ||||||
0.029%, 02/09/12 | 27,000 | 27,000 | ||||||
0.024%, 02/02/12 | 233,660 | 233,660 | ||||||
U.S. Treasury Notes | ||||||||
1.375%, 04/15/12 to 01/15/13 | 31,200 | 31,470 | ||||||
1.125%, 12/15/12 | 7,000 | 7,059 | ||||||
4.000%, 11/15/12 | 15,500 | 15,970 | ||||||
3.875%, 10/31/12 | 14,750 | 15,163 | ||||||
0.375%, 09/30/12 to 10/31/12 | 12,200 | 12,223 | ||||||
4.125%, 08/31/12 | 15,000 | 15,349 | ||||||
1.750%, 08/15/12 | 7,000 | 7,061 | ||||||
4.625%, 07/31/12 | 6,000 | 6,135 | ||||||
0.625%, 07/31/12 | 9,000 | 9,024 | ||||||
1.500%, 07/15/12 | 29,000 | 29,185 | ||||||
4.750%, 05/31/12 | 4,000 | 4,061 | ||||||
1.000%, 03/31/12 to 04/30/12 | 68,575 | 68,717 | ||||||
| SEI Daily Income Trust / Annual Report / January 31, 2012 | 17 |
Table of Contents
SCHEDULE OF INVESTMENTS
Government II Fund (Concluded)
January 31, 2012
| Description | Face Amount ($ Thousands) | Value ($ Thousands) | ||||||
4.500%, 03/31/12 | $ | 11,300 | $ | 11,381 | ||||
0.875%, 02/29/12 | 9,450 | 9,455 | ||||||
|
| |||||||
Total U.S. Treasury Obligations |
| 614,345 | ||||||
|
| |||||||
Total Investments — 106.6% |
| $ | 1,578,290 | |||||
|
| |||||||
Percentages are based on Net Assets of $1,479,907 ($ Thousands).
| (A) | Floating Rate Instrument. The rate reflected on the Schedule of Investments is the rate in effect on January 31, 2012. The demand and interest rate reset features give this security a shorter effective maturity date. |
| (B) | The rate reported is the effective yield at time of purchase. |
DN — Discount Note
FFCB — Federal Farm Credit Bank
FHLB — Federal Home Loan Bank
Ser — Series
As of January 31, 2012, all of the Fund’s investments were considered Level 2, in accordance with ASC-820. For more information on valuation inputs, see Note 2 — Significant Accounting Policies in Notes to Financial Statements.
The accompanying notes are an integral part of the financial statements.
| 18 | SEI Daily Income Trust / Annual Report / January 31, 2012 |
Table of Contents
SCHEDULE OF INVESTMENTS
Prime Obligation Fund
January 31, 2012
| Description | Face Amount ($ Thousands) | Value ($ Thousands) | ||||||
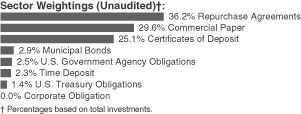
COMMERCIAL PAPER (B) (C) — 29.7% |
| |||||||
American Honda Finance | ||||||||
0.230%, 02/03/12 | $ | 2,650 | $ | 2,650 | ||||
0.153%, 04/18/12 | 14,650 | 14,645 | ||||||
Australia & New Zealand Banking Group | ||||||||
0.250%, 02/22/12 | 9,000 | 8,999 | ||||||
0.240%, 03/23/12 | 22,910 | 22,902 | ||||||
0.557%, 06/22/12 | 27,750 | 27,689 | ||||||
BHP Billiton Finance USA | ||||||||
0.130%, 04/23/12 to 05/01/12 | 20,000 | 19,994 | ||||||
BNZ International Funding | ||||||||
0.431%, 03/30/12 | 17,000 | 16,988 | ||||||
0.652%, 05/16/12 | 14,500 | 14,473 | ||||||
0.612%, 07/05/12 | 26,000 | 25,932 | ||||||
0.592%, 07/12/12 | 24,000 | 23,936 | ||||||
0.541%, 07/27/12 | 16,820 | 16,775 | ||||||
BP Capital Markets PLC | ||||||||
0.240%, 02/08/12 | 34,000 | 33,998 | ||||||
Chariot Funding LLC | ||||||||
0.250%, 02/13/12 | 8,000 | 7,999 | ||||||
0.220%, 03/08/12 | 5,000 | 4,999 | ||||||
0.321%, 07/05/12 | 8,000 | 7,989 | ||||||
Coca-Cola | ||||||||
0.140%, 05/04/12 to 05/15/12 | 23,000 | 22,991 | ||||||
0.130%, 05/16/12 to 05/17/12 | 70,088 | 70,061 | ||||||
0.160%, 06/04/12 | 10,000 | 9,995 | ||||||
Commonwealth Bank of Australia | ||||||||
0.250%, 03/15/12 | 22,395 | 22,388 | ||||||
0.602%, 06/06/12 | 31,000 | 30,935 | ||||||
0.491%, 07/12/12 | 15,000 | 14,967 | ||||||
DNB Bank | ||||||||
0.350%, 02/13/12 | 2,100 | 2,100 | ||||||
0.521%, 04/02/12 | 7,000 | 6,994 | ||||||
0.491%, 04/10/12 | 8,000 | 7,993 | ||||||
0.400%, 04/30/12 | 8,000 | 7,992 | ||||||
FCAR Owner Trust | ||||||||
0.340%, 03/01/12 | 28,000 | 27,992 | ||||||
0.280%, 03/05/12 | 9,975 | 9,972 | ||||||
0.310%, 04/02/12 to 04/03/12 | 11,000 | 10,994 | ||||||
0.300%, 04/02/12 | 38,000 | 37,981 | ||||||
0.306%, 04/04/12 | 49,300 | 49,274 | ||||||
0.552%, 07/02/12 | 39,000 | 38,909 | ||||||
General Electric Capital | ||||||||
0.280%, 04/06/12 to 04/11/12 | 32,000 | 31,984 | ||||||
| Description | Face Amount ($ Thousands) | Value ($ Thousands) | ||||||
Jupiter Securitization LLC | ||||||||
0.220%, 03/09/12 | $ | 11,000 | $ | 10,998 | ||||
0.321%, 07/05/12 | 8,000 | 7,989 | ||||||
Liberty Street Funding LLC | ||||||||
0.240%, 03/15/12 | 15,575 | 15,571 | ||||||
Market Street Funding LLC | ||||||||
0.220%, 03/07/12 | 7,100 | 7,098 | ||||||
MetLife Short Term Funding LLC | ||||||||
0.340%, 03/19/12 to 05/14/12 | 38,100 | 38,073 | ||||||
0.310%, 03/20/12 | 8,000 | 7,997 | ||||||
0.330%, 03/26/12 to 05/07/12 | 14,000 | 13,989 | ||||||
0.380%, 04/02/12 | 32,000 | 31,979 | ||||||
0.365%, 04/03/12 | 26,000 | 25,984 | ||||||
0.270%, 04/04/12 | 32,000 | 31,985 | ||||||
New York Life CAP | ||||||||
0.120%, 03/27/12 | 3,165 | 3,164 | ||||||
Old Line Funding LLC | ||||||||
0.210%, 04/23/12 | 24,295 | 24,283 | ||||||
0.260%, 05/14/12 | 45,500 | 45,466 | ||||||
0.320%, 07/17/12 | 5,980 | 5,971 | ||||||
Procter & Gamble | ||||||||
0.150%, 04/04/12 | 8,000 | 7,998 | ||||||
Sheffield Receivables | ||||||||
0.330%, 02/02/12 | 15,345 | 15,345 | ||||||
State Street | ||||||||
0.200%, 03/07/12 | 29,000 | 28,994 | ||||||
Straight-A Funding LLC | ||||||||
0.190%, 04/12/12 | 13,400 | 13,395 | ||||||
Toyota Credit Canada | ||||||||
0.200%, 03/12/12 | 18,000 | 17,996 | ||||||
Toyota Motor Credit | ||||||||
0.280%, 02/01/12 | 32,000 | 32,000 | ||||||
0.180%, 03/23/12 | 86,400 | 86,378 | ||||||
Variable Funding Capital LLC | ||||||||
0.180%, 03/12/12 | 18,500 | 18,496 | ||||||
0.190%, 04/16/12 | 13,400 | 13,395 | ||||||
Westpac Banking | ||||||||
0.240%, 03/19/12 | 41,145 | 41,132 | ||||||
0.491%, 07/10/12 | 42,000 | 41,909 | ||||||
0.481%, 07/12/12 | 39,000 | 38,916 | ||||||
|
| |||||||
Total Commercial Paper |
| 1,279,991 | ||||||
�� |
| |||||||
CERTIFICATES OF DEPOSIT — 25.2% |
| |||||||
Bank of Nova Scotia | ||||||||
0.270%, 03/14/12 | 42,000 | 42,000 | ||||||
0.300%, 04/03/12 | 28,000 | 28,000 | ||||||
0.420%, 07/09/12 | 37,000 | 37,000 | ||||||
Bank of Tokyo-Mitsubishi UFJ NY | ||||||||
0.470%, 03/09/12 | 39,000 | 39,000 | ||||||
0.410%, 04/30/12 | 45,000 | 45,000 | ||||||
Barclays Bank PLC | ||||||||
0.390%, 03/23/12 | 48,300 | 48,300 | ||||||
| SEI Daily Income Trust / Annual Report / January 31, 2012 | 19 |
Table of Contents
SCHEDULE OF INVESTMENTS
Prime Obligation Fund (Continued)
January 31, 2012
| Description | Face Amount ($ Thousands) | Value ($ Thousands) | ||||||
0.380%, 03/26/12 | $ | 49,000 | $ | 49,000 | ||||
0.360%, 03/26/12 | 25,000 | 25,000 | ||||||
Chase Bank USA | ||||||||
0.180%, 04/23/12 | 52,400 | 52,400 | ||||||
Credit Suisse NY | ||||||||
0.470%, 02/21/12 | 15,000 | 15,000 | ||||||
0.450%, 04/10/12 | 45,000 | 45,000 | ||||||
DnB Bank | ||||||||
0.456%, 02/25/12 (A) | 3,770 | 3,771 | ||||||
0.470%, 04/23/12 | 36,000 | 36,003 | ||||||
National Australia Bank | ||||||||
0.400%, 07/16/12 | 17,000 | 17,000 | ||||||
0.400%, 07/18/12 | 47,000 | 47,000 | ||||||
0.380%, 07/18/12 | 12,300 | 12,300 | ||||||
Nordea Bank Finland PLC | ||||||||
0.500%, 03/12/12 | 11,000 | 11,000 | ||||||
0.480%, 03/22/12 | 36,020 | 36,020 | ||||||
0.460%, 04/09/12 | 2,500 | 2,500 | ||||||
0.440%, 04/10/12 | 21,000 | 21,000 | ||||||
Skandinav Enskilda Bank NY | ||||||||
0.350%, 02/01/12 | 17,100 | 17,100 | ||||||
0.470%, 02/28/12 | 6,000 | 6,000 | ||||||
0.460%, 03/05/12 | 40,000 | 40,000 | ||||||
0.580%, 03/07/12 | 16,500 | 16,500 | ||||||
0.840%, 03/09/12 | 1,500 | 1,501 | ||||||
0.470%, 03/20/12 | 55,000 | 55,001 | ||||||
Sumitomo Mitsui Banking | ||||||||
0.450%, 03/12/12 | 41,000 | 41,000 | ||||||
0.460%, 03/23/12 | 30,000 | 30,000 | ||||||
0.450%, 04/11/12 | 22,800 | 22,800 | ||||||
Svenska HandelsBanken | ||||||||
0.435%, 02/24/12 | 46,000 | 46,000 | ||||||
0.480%, 03/05/12 | 45,000 | 45,000 | ||||||
0.500%, 03/20/12 | 46,000 | 46,000 | ||||||
0.515%, 04/05/12 | 20,000 | 20,000 | ||||||
0.450%, 04/23/12 | 10,000 | 10,000 | ||||||
Toronto-Dominion Bank | ||||||||
0.380%, 04/30/12 | 20,000 | 20,000 | ||||||
Westpac Banking | ||||||||
0.250%, 03/12/12 | 8,000 | 8,000 | ||||||
0.500%, 06/27/12 | 49,000 | 49,000 | ||||||
|
| |||||||
Total Certificates of Deposit | 1,086,196 | |||||||
|
| |||||||
MUNICIPAL BONDS (A) — 2.9% | ||||||||
California — 0.3% | ||||||||
Southern California, Metropolitan Water District, Ser B-4, RB | ||||||||
0.060%, 02/06/12 | 13,900 | 13,900 | ||||||
|
| |||||||
| Description | Face Amount ($ Thousands) | Value ($ Thousands) | ||||||
Colorado — 0.3% | ||||||||
Colorado State, Housing & Finance Authority, Ser A1, RB | ||||||||
0.250%, 02/06/12 | $ | 100 | $ | 100 | ||||
0.210%, 02/06/12 | 900 | 900 | ||||||
0.150%, 02/06/12 | 1,825 | 1,825 | ||||||
0.120%, 02/06/12 | 3,050 | 3,050 | ||||||
Colorado State, Housing & Finance Authority, Ser AA1, RB | ||||||||
0.150%, 02/01/12 | 3,665 | 3,665 | ||||||
Colorado State, Housing & Finance Authority, Ser B1, RB | ||||||||
0.140%, 02/01/12 | 3,425 | 3,425 | ||||||
Colorado State, Housing & Finance Authority, Ser C1, RB | ||||||||
0.200%, 02/01/12 | 1,000 | 1,000 | ||||||
Colorado State, Housing & Finance Authority, CL1, RB | ||||||||
0.210%, 02/01/12 | 400 | 400 | ||||||
|
| |||||||
| 14,365 | ||||||||
|
| |||||||
Connecticut — 0.2% | ||||||||
Connecticut State, Housing & Finance Authority, Ser D-3, RB | ||||||||
0.100%, 02/02/12 | 5,550 | 5,550 | ||||||
Connecticut State, Housing & Finance Authority, Sub-Ser A-5, RB | ||||||||
0.128%, 02/02/12 | 4,330 | 4,330 | ||||||
|
| |||||||
| 9,880 | ||||||||
|
| |||||||
Indiana — 0.0% | ||||||||
City of Rockport, Ser A, RB | ||||||||
0.080%, 02/01/12 | 1,500 | 1,500 | ||||||
|
| |||||||
Iowa — 0.3% | ||||||||
Iowa State, Finance Authority, Ser B, RB | ||||||||
0.130%, 02/02/12 | 900 | 900 | ||||||
Iowa State, Finance Authority, Ser C, RB | ||||||||
0.167%, 02/02/12 | 8,710 | 8,710 | ||||||
Iowa State, Finance Authority, Ser G, RB | ||||||||
0.170%, 02/02/12 | 345 | 345 | ||||||
Iowa State, Finance Authority, Ser M, RB | ||||||||
0.160%, 02/02/12 | 750 | 750 | ||||||
|
| |||||||
| 10,705 | ||||||||
|
| |||||||
Kentucky — 0.0% | ||||||||
Kentucky State, Housing Development Authority, Ser J, RB | ||||||||
0.440%, 02/02/12 | 250 | 250 | ||||||
Kentucky State, Housing Development Authority, Ser W, RB | ||||||||
0.430%, 02/01/12 | 1,440 | 1,440 | ||||||
|
| |||||||
| 1,690 | ||||||||
|
| |||||||
| 20 | SEI Daily Income Trust / Annual Report / January 31, 2012 |
Table of Contents
| Description | Face Amount ($ Thousands) | Value ($ Thousands) | ||||||
Massachusetts — 0.1% | ||||||||
Simmons College, RB | ||||||||
0.170%, 02/02/12 | $ | 2,905 | $ | 2,905 | ||||
|
| |||||||
Minnesota — 0.0% | ||||||||
Minnesota State, Housing Finance Agency, Ser T, RB | ||||||||
0.200%, 02/02/12 | 195 | 195 | ||||||
|
| |||||||
New Hampshire — 0.1% | ||||||||
New Hampshire State, Health & Education Facilities Authority, Ser C, RB | ||||||||
0.110%, 02/01/12 | 2,945 | 2,945 | ||||||
|
| |||||||
New Mexico — 0.1% | ||||||||
New Mexico State, Finance Authority, Sub-Ser D, GO | ||||||||
0.167%, 02/02/12 | 3,600 | 3,600 | ||||||
|
| |||||||
Texas — 1.3% | ||||||||
JPMorgan Chase Putters, Ser 3953, RB | ||||||||
0.080%, 02/01/12 | 19,000 | 19,000 | ||||||
Texas State, GO | ||||||||
0.110%, 02/01/12 | 1,150 | 1,150 | ||||||
0.170%, 02/07/12 | 4,210 | 4,210 | ||||||
0.140%, 02/07/12 | 3,975 | 3,975 | ||||||
0.140%, 02/07/12 | 3,300 | 3,300 | ||||||
Texas State, Ser A, GO | ||||||||
0.140%, 02/07/12 | 3,830 | 3,830 | ||||||
Texas State, Ser A-2, GO | ||||||||
0.138%, 02/01/12 | 400 | 400 | ||||||
Texas State, Ser B, GO | ||||||||
0.140%, 02/02/12 | 5,710 | 5,710 | ||||||
Texas State, Ser B2, GO | ||||||||
0.108%, 02/01/12 | 1,000 | 1,000 | ||||||
Texas State, Ser C, GO | ||||||||
0.110%, 02/01/12 | 9,290 | 9,290 | ||||||
Texas State, Ser I, GO | ||||||||
0.108%, 02/01/12 | 2,395 | 2,395 | ||||||
|
| |||||||
| 54,260 | ||||||||
|
| |||||||
Wisconsin — 0.2% | ||||||||
Wisconsin State, Health & Educational Facilities Authority, RB | ||||||||
0.060%, 02/01/12 | 8,300 | 8,300 | ||||||
Wisconsin State, Housing & Economic Development Authority, Ser B, RB | ||||||||
0.138%, 02/02/12 | 990 | 990 | ||||||
Wisconsin State, Housing & Economic Development Authority, Ser D, RB | ||||||||
1.300%, 02/01/12 | 1,050 | 1,050 | ||||||
1.279%, 02/01/12 | 220 | 220 | ||||||
|
| |||||||
| 10,560 | ||||||||
|
| |||||||
Total Municipal Bonds | 126,505 | |||||||
|
| |||||||
| Description | Face Amount ($ Thousands) | Value ($ Thousands) | ||||||
U.S. GOVERNMENT AGENCY OBLIGATIONS — 2.5% |
| |||||||
FFCB | ||||||||
0.316%, 02/10/12 (A) | $ | 10,000 | $ | 9,999 | ||||
FFCB DN | ||||||||
0.150%, 07/05/12 (B) | 7,000 | 6,995 | ||||||
FHLB | ||||||||
0.130%, 02/24/12 | 13,500 | 13,500 | ||||||
FHLMC | ||||||||
0.410%, 02/01/12 (A) | 28,310 | 28,300 | ||||||
FNMA | ||||||||
0.311%, 02/20/12 (A) | 8,000 | 7,998 | ||||||
0.320%, 02/01/12 (A) | 7,000 | 6,999 | ||||||
0.330%, 02/01/12 (A) | 11,000 | 10,996 | ||||||
FNMA, Ser 1 | ||||||||
0.400%, 02/01/12 (A) | 22,900 | 22,896 | ||||||
|
| |||||||
Total U.S. Government Agency Obligations | 107,683 | |||||||
|
| |||||||
TIME DEPOSIT — 2.3% |
| |||||||
Toronto-Dominion Bank | ||||||||
0.100%, 02/01/12 | 100,000 | 100,000 | ||||||
|
| |||||||
Total Time Deposit | 100,000 | |||||||
|
| |||||||
U.S. TREASURY OBLIGATIONS — 1.4% |
| |||||||
U.S. Treasury Notes | ||||||||
1.375%, 01/15/13 | 15,500 | 15,682 | ||||||
4.625%, 07/31/12 | 23,335 | 23,853 | ||||||
1.000%, 04/30/12 | 22,000 | 22,047 | ||||||
|
| |||||||
Total U.S. Treasury Obligations | 61,582 | |||||||
|
| |||||||
CORPORATE OBLIGATION — 0.0% |
| |||||||
Shell International Finance | ||||||||
0.920%, 03/22/12 (A) | 1,000 | 1,002 | ||||||
|
| |||||||
Total Corporate Obligation | 1,002 | |||||||
|
| |||||||
REPURCHASE AGREEMENTS (D) — 36.3% |
| |||||||
Barclays Capital | 56,675 | 56,675 | ||||||
| SEI Daily Income Trust / Annual Report / January 31, 2012 | 21 |
Table of Contents
SCHEDULE OF INVESTMENTS
Prime Obligation Fund (Concluded)
January 31, 2012
| Description | Face Amount ($ Thousands) | Value ($ Thousands) | ||||||
Barclays Capital | $ | 100,000 | $ | 100,000 | ||||
Barclays Capital | 200,000 | 200,000 | ||||||
Goldman Sachs | 137,000 | 137,000 | ||||||
JPMorgan Chase | 37,000 | 37,000 | ||||||
JPMorgan Chase | 69,000 | 69,000 | ||||||
RBC Capital | 38,000 | 38,000 | ||||||
| Description | Face Amount ($ Thousands) | Value ($ Thousands) | ||||||
RBC Capital | $ | 279,000 | $ | 279,000 | ||||
UBS | 167,153 | 167,153 | ||||||
UBS | 168,734 | 168,734 | ||||||
Wells Fargo | 65,000 | 65,000 | ||||||
Wells Fargo | 247,000 | 247,000 | ||||||
|
| |||||||
Total Repurchase Agreements | 1,564,562 | |||||||
|
| |||||||
Total Investments — 100.3% | $ | 4,327,521 | ||||||
|
| |||||||
| 22 | SEI Daily Income Trust / Annual Report / January 31, 2012 |
Table of Contents
| * | A summary of the corporate obligations used to collateralize repurchase agreements entered into by the Fund at January 31, 2012, is as follows: |
| Counterparty | Corporate Obligation | Rate | Maturity Date | Par Amount ($ Thousands) | ||||||||
| JPMorgan Chase | Anadarko Petroleum | 5.750% | 06/15/14 | $ | 1,408 | |||||||
| Anadarko Petroleum | 8.700 | 03/15/19 | 9,700 | |||||||||
| Boston Scientific | 5.500 | 11/15/15 | 1,500 | |||||||||
| Boston Scientific | 4.500 | 01/15/15 | 6,410 | |||||||||
| Boston Scientific | 5.450 | 06/15/14 | 327 | |||||||||
| CC Holdings | 7.750 | 05/01/17 | 530 | |||||||||
| Discover Bank | 7.000 | 04/15/20 | 99 | |||||||||
| El Paso Natural Gas | 5.950 | 04/15/17 | 3,328 | |||||||||
| Entertainment Proper | 7.750 | 07/15/20 | 400 | |||||||||
| QVC Network | 7.125 | 04/15/17 | 258 | |||||||||
| QVC Network | 7.500 | 10/01/19 | 606 | |||||||||
| Qwest Communications | 7.500 | 02/15/14 | 25 | |||||||||
| SLM Corp. | 5.000 | 10/01/13 | 143 | |||||||||
| SLM Corp. | 3.631 | 01/27/14 | 500 | |||||||||
| SLM Corp. | 5.375 | 05/15/14 | 668 | |||||||||
| Southern Natural Gas | 4.400 | 06/15/21 | 9,690 | |||||||||
| Tennessee Gas Pipeline | 7.500 | 04/01/17 | 5,354 | |||||||||
| Tennessee Gas Pipeline | 8.000 | 02/01/16 | 4,295 | |||||||||
| The Williams Co. | 7.625 | 07/15/19 | 402 | |||||||||
| The Williams Co. | 7.875 | 09/01/21 | 15,086 | |||||||||
| Wells Fargo | Bottling Group | 5.125 | 01/15/19 | 6,558 | ||||||||
| GE Capital | 2.100 | 01/07/14 | 9,046 | |||||||||
| Health Care Property | 5.625 | 05/01/17 | 8,772 | |||||||||
| Pan pac Retail | 5.250 | 09/01/15 | 8,500 | |||||||||
| Petrohawk Energy | 7.875 | 06/01/15 | 9,000 | |||||||||
| Prologis LP | 7.375 | 10/30/19 | 7,878 | |||||||||
| Scana Corp. | 6.250 | 04/01/20 | 3,596 | |||||||||
| Talisman Energy | 5.125 | 05/15/15 | 8,500 | |||||||||
Percentages are based on Net Assets of $4,315,330 ($ Thousands).
| † | Securities are FDIC guaranteed. |
| (A) | Floating Rate Instrument. The rate reflected on the Schedule of Investments is the rate in effect on January 31, 2012. The demand and interest rate reset features give this security a shorter effective maturity date. |
| (B) | The rate reported is the effective yield at time of purchase. |
| (C) | Securities are held in connection with a letter of credit issued by major bank. |
| (D) | Tri-Party Repurchase Agreement. |
Cl — Class
DN — Discount Note
FCSB — Federal Farm Credit Banks Consolidated Systemwide Bonds
FFCB — Federal Farm Credit Bank
FHLB — Federal Home Loan Bank
FHLMC — Federal Home Loan Mortgage Corporation
FNMA — Federal National Mortgage Association
GO — General Obligation
LLC — Limited Liability Company
LP — Limited Partnership
NY — New York
PLC — Public Limited Company
RB — Revenue Bond
Ser — Series
As of January 31, 2012, all of the Fund’s investments were considered Level 2, in accordance with ASC-820. For more information on valuation inputs, see Note 2 — Significant Accounting Policies in Notes to Financial Statements.
The accompanying notes are an integral part of the financial statements.
| SEI Daily Income Trust / Annual Report / January 31, 2012 | 23 |
Table of Contents
SCHEDULE OF INVESTMENTS
Treasury Fund
January 31, 2012

| Description | Face Amount ($ Thousands) | Value ($ Thousands) | ||||||
U.S. TREASURY OBLIGATIONS — 37.2% |
| |||||||
U.S. Treasury Bills (A) | ||||||||
0.120%, 02/02/12 | $ | 15,000 | $ | 15,000 | ||||
0.070%, 03/08/12 | 5,000 | 4,999 | ||||||
0.100%, 05/03/12 | 4,330 | 4,329 | ||||||
U.S. Treasury Notes | ||||||||
1.375%, 02/15/12 to 01/15/13 | 14,165 | 14,249 | ||||||
4.500%, 03/31/12 to 04/30/12 | 11,585 | 11,684 | ||||||
1.000%, 03/31/12 to 04/30/12 | 52,315 | 52,426 | ||||||
4.750%, 05/31/12 | 1,500 | 1,523 | ||||||
0.750%, 05/31/12 | 27,180 | 27,238 | ||||||
1.500%, 07/15/12 | 3,300 | 3,321 | ||||||
4.625%, 07/31/12 | 8,500 | 8,690 | ||||||
0.625%, 07/31/12 | 5,000 | 5,013 | ||||||
1.750%, 08/15/12 | 2,500 | 2,522 | ||||||
4.125%, 08/31/12 | 5,000 | 5,116 | ||||||
0.375%, 09/30/12 to 10/31/12 | 4,400 | 4,408 | ||||||
3.875%, 10/31/12 | 2,300 | 2,364 | ||||||
4.000%, 11/15/12 | 5,000 | 5,152 | ||||||
1.125%, 12/15/12 | 2,500 | 2,521 | ||||||
|
| |||||||
Total U.S. Treasury Obligations |
| 170,555 | ||||||
|
| |||||||
REPURCHASE AGREEMENTS (B) — 63.3% |
| |||||||
Barclays Capital | 10,000 | 10,000 | ||||||
Barclays Capital | 39,000 | 39,000 | ||||||
BNP Paribas | 40,000 | 40,000 | ||||||
| Description | Face Amount ($ Thousands) | Value ($ Thousands) | ||||||
Credit Suisse | $ | 2,000 | $ | 2,000 | ||||
Credit Suisse | 2,000 | 2,000 | ||||||
Credit Suisse | 40,000 | 40,000 | ||||||
Deutsche Bank | 50,000 | 50,000 | ||||||
JPMorgan Chase | 40,000 | 40,000 | ||||||
RBC Capital | 40,000 | 40,000 | ||||||
UBS | 26,809 | 26,809 | ||||||
|
| |||||||
Total Repurchase Agreements | 289,809 | |||||||
|
| |||||||
Total Investments — 100.5% | $ | 460,364 | ||||||
|
| |||||||
| 24 | SEI Daily Income Trust / Annual Report / January 31, 2012 |
Table of Contents
Percentages are based on Net Assets of $457,865($ Thousands).
| (A) | The rate reported is the effective yield at time of purchase. |
| (B) | Tri-Party Repurchase Agreement. |
| (C) | Securities considered illiquid. The total value of such securities as of January 31, 2012 was $14,000 ($ Thousands) and represented 3.1% of Net Assets. |
As of January 31, 2012, all of the Fund’s investments were considered Level 2, in accordance with ASC-820. For more information on valuation inputs, see Note 2 — Significant Accounting Policies in Notes to Financial Statements.
The accompanying notes are an integral part of the financial statements.
| SEI Daily Income Trust / Annual Report / January 31, 2012 | 25 |
Table of Contents
SCHEDULE OF INVESTMENTS
Treasury II Fund
January 31, 2012
| Description | Face Amount ($ Thousands) | Value ($ Thousands) | ||||||
U.S. TREASURY OBLIGATIONS — 103.0% |
| |||||||
U.S. Treasury Bills (A) | ||||||||
0.025%, 02/02/12 | $ | 348,002 | $ | 348,002 | ||||
0.011%, 02/09/12 | 67,042 | 67,042 | ||||||
0.021%, 02/16/12 | 87,468 | 87,467 | ||||||
0.027%, 02/23/12 | 72,000 | 71,999 | ||||||
0.000%, 03/01/12 | 26,000 | 25,999 | ||||||
0.070%, 03/08/12 | 6,000 | 5,999 | ||||||
0.045%, 04/05/12 to 04/12/12 | 13,374 | 13,373 | ||||||
0.040%, 04/19/12 | 9,000 | 8,999 | ||||||
0.100%, 05/03/12 | 1,620 | 1,620 | ||||||
U.S. Treasury Notes | ||||||||
4.875%, 02/15/12 | 21,700 | 21,740 | ||||||
1.375%, 02/15/12 to 01/15/13 | 50,660 | 50,877 | ||||||
0.875%, 02/29/12 | 10,000 | 10,006 | ||||||
4.500%, 03/31/12 to 04/30/12 | 20,730 | 20,934 | ||||||
1.000%, 03/31/12 to 04/30/12 | 69,000 | 69,147 | ||||||
4.750%, 05/31/12 | 7,000 | 7,107 | ||||||
0.750%, 05/31/12 | 15,800 | 15,834 | ||||||
1.875%, 06/15/12 | 10,000 | 10,066 | ||||||
1.500%, 07/15/12 | 19,400 | 19,523 | ||||||
4.625%, 07/31/12 | 9,000 | 9,201 | ||||||
1.750%, 08/15/12 | 3,000 | 3,026 | ||||||
4.125%, 08/31/12 | 7,000 | 7,163 | ||||||
0.375%, 09/30/12 to 10/31/12 | 6,700 | 6,712 | ||||||
3.875%, 10/31/12 | 4,100 | 4,215 | ||||||
4.000%, 11/15/12 | 8,000 | 8,243 | ||||||
3.375%, 11/30/12 | 2,000 | 2,053 | ||||||
1.125%, 12/15/12 | 3,500 | 3,529 | ||||||
|
| |||||||
Total U.S. Treasury Obligations |
| 899,876 | ||||||
|
| |||||||
Total Investments — 103.0% |
| $ | 899,876 | |||||
|
| |||||||
Percentages are based on Net Assets of $873,375 ($ Thousands).
| (A) | The rate reported is the effective yield at time of purchase. |
As of January 31, 2012, all of the Fund’s investments were considered Level 2, in accordance with ASC-820. For more information on valuation inputs, see Note 2 — Significant Accounting Policies in Notes to Financial Statements.
The accompanying notes are an integral part of the financial statements.
| 26 | SEI Daily Income Trust / Annual Report / January 31, 2012 |
Table of Contents
SCHEDULE OF INVESTMENTS
Short-Duration Government Fund
January 31, 2012
| Description | Face Amount ($ Thousands) | Value ($ Thousands) | ||||||
MORTGAGE-BACKED SECURITIES — 60.8% |
| |||||||
Agency Mortgage-Backed Obligations — 60.8% |
| |||||||
FHLMC | ||||||||
6.000%, 06/01/21 | $ | 814 | $ | 880 | ||||
4.500%, 07/01/23 | 6 | 6 | ||||||
3.500%, 01/01/41 to 10/01/41 | 16,482 | 17,109 | ||||||
2.629%, 06/01/24 (A) | 49 | 49 | ||||||
2.565%, 06/01/24 (A) | 102 | 104 | ||||||
2.500%, 01/01/18 (A) | 23 | 24 | ||||||
2.460%, 06/01/17 (A) | 23 | 23 | ||||||
2.451%, 04/01/22 (A) | 20 | 20 | ||||||
2.435%, 04/01/19 (A) | 15 | 16 | ||||||
2.427%, 07/01/20 (A) | 4 | 4 | ||||||
2.406%, 07/01/24 (A) | 14 | 15 | ||||||
2.381%, 03/01/19 (A) | 18 | 18 | ||||||
2.376%, 12/01/23 (A) | 1,831 | 1,930 | ||||||
2.375%, 09/01/20 (A) | 8 | 9 | ||||||
2.371%, 05/01/24 (A) | 56 | 56 | ||||||
2.347%, 05/01/19 (A) | 24 | 24 | ||||||
2.332%, 02/01/19 (A) | 23 | 23 | ||||||
2.330%, 09/01/18 (A) | 4 | 4 | ||||||
2.321%, 04/01/29 (A) | 85 | 88 | ||||||
2.257%, 12/01/23 (A) | 96 | 97 | ||||||
2.250%, 07/01/18 to 11/01/20 (A) | 11 | 11 | ||||||
2.184%, 04/01/29 (A) | 36 | 38 | ||||||
2.174%, 03/01/19 (A) | 26 | 26 | ||||||
2.125%, 02/01/16 to 11/01/18 (A) | 28 | 30 | ||||||
2.071%, 01/01/17 (A) | 4 | 4 | ||||||
2.000%, 02/01/17 to 07/01/18 (A) | 23 | 23 | ||||||
1.750%, 04/01/16 to 03/01/17 (A) | 12 | 12 | ||||||
1.625%, 02/01/16 to 12/01/16 (A) | 13 | 13 | ||||||
FHLMC REMIC, Ser 2002-42, Cl A5 | ||||||||
7.500%, 02/25/42 | 666 | 811 | ||||||
FHLMC REMIC, Ser 2003-2587, Cl ET | ||||||||
3.700%, 07/15/17 | 94 | 94 | ||||||
FHLMC REMIC, Ser 2004-2826, Cl BK | ||||||||
5.000%, 01/15/18 | 50 | 50 | ||||||
FHLMC REMIC, Ser 2004-2864, Cl NV | ||||||||
4.500%, 08/15/15 | 2,772 | 2,861 | ||||||
FHLMC REMIC, Ser 2005-3022, Cl MB | ||||||||
5.000%, 12/15/28 | 359 | 360 | ||||||
FHLMC REMIC, Ser 2005-3029, Cl PE | ||||||||
5.000%, 03/15/34 | 4,000 | 4,261 | ||||||
FHLMC REMIC, Ser 2006-3148, Cl CF | ||||||||
0.690%, 02/15/34 (A) | 1,409 | 1,407 | ||||||
| Description | Face Amount ($ Thousands) | Value ($ Thousands) | ||||||
FHLMC REMIC, Ser 2010-3628, Cl PJ | ||||||||
4.500%, 01/15/40 | $ | 12,723 | $ | 13,925 | ||||
FHLMC REMIC, Ser 3153, Cl FX | ||||||||
0.640%, 05/15/36 (A) | 455 | 454 | ||||||
FNMA | ||||||||
7.000%, 06/01/37 | 54 | 62 | ||||||
6.657%, 04/01/14 | 3,672 | 3,843 | ||||||
6.500%, 05/01/26 to 09/01/36 | 1,183 | 1,334 | ||||||
6.000%, 02/01/23 to 09/01/24 | 14,026 | 15,103 | ||||||
5.500%, 06/01/16 to 12/01/25 | 4,104 | 4,480 | ||||||
5.300%, 07/01/19 | 1,292 | 1,455 | ||||||
5.140%, 11/01/15 | 3,208 | 3,538 | ||||||
5.090%, 11/01/15 | 4,087 | 4,504 | ||||||
5.000%, 03/01/19 to 04/01/41 | 7,239 | 7,831 | ||||||
4.974%, 12/01/13 | 1,393 | 1,470 | ||||||
4.959%, 02/01/13 | 57 | 58 | ||||||
4.835%, 11/01/12 | 981 | 990 | ||||||
4.830%, 02/01/13 | 2,155 | 2,195 | ||||||
4.771%, 09/01/15 | 6,970 | 7,695 | ||||||
4.767%, 04/01/13 | 104 | 106 | ||||||
4.500%, 04/01/26 to 10/01/31 | 10,372 | 11,112 | ||||||
4.100%, 07/01/13 | 917 | 944 | ||||||
4.000%, 05/01/26 to 08/01/26 | 8,272 | 8,791 | ||||||
3.580%, 10/01/16 | 2,401 | 2,589 | ||||||
2.990%, 10/01/17 | 3,432 | 3,641 | ||||||
2.630%, 09/01/17 | 22,730 | 23,755 | ||||||
2.405%, 12/01/29 (A) | 125 | 126 | ||||||
2.381%, 08/01/29 (A) | 476 | 504 | ||||||
2.245%, 09/01/25 (A) | 97 | 102 | ||||||
2.195%, 02/01/27 (A) | 94 | 97 | ||||||
2.138%, 09/01/24 (A) | 697 | 727 | ||||||
2.097%, 05/01/28 (A) | 611 | 636 | ||||||
2.011%, 08/01/27 (A) | 412 | 417 | ||||||
FNMA REMIC, Ser 1992-61, Cl FA | ||||||||
0.931%, 10/25/22 (A) | 121 | 121 | ||||||
FNMA REMIC, Ser 1993-32, Cl H | ||||||||
6.000%, 03/25/23 | 49 | 53 | ||||||
FNMA REMIC, Ser 1993-5, Cl Z | ||||||||
6.500%, 02/25/23 | 25 | 28 | ||||||
FNMA REMIC, Ser 1994-77, Cl FB | ||||||||
1.781%, 04/25/24 (A) | 10 | 11 | ||||||
FNMA REMIC, Ser 2001-51, Cl QN | ||||||||
6.000%, 10/25/16 | 105 | 112 | ||||||
FNMA REMIC, Ser 2002-3, Cl PG | ||||||||
5.500%, 02/25/17 | 573 | 604 | ||||||
FNMA REMIC, Ser 2002-53, Cl FK | ||||||||
0.676%, 04/25/32 (A) | 202 | 202 | ||||||
FNMA REMIC, Ser 2003-76, Cl CA | ||||||||
3.750%, 07/25/33 | 554 | 583 | ||||||
FNMA REMIC, Ser 2004-15, Cl AN | ||||||||
4.000%, 09/25/17 | 1,250 | 1,265 | ||||||
FNMA REMIC, Ser 2004-75, Cl KA | ||||||||
4.500%, 03/25/18 | 16 | 16 | ||||||
| SEI Daily Income Trust / Annual Report / January 31, 2012 | 27 |
Table of Contents
SCHEDULE OF INVESTMENTS
Short-Duration Government Fund (Concluded)
January 31, 2012
| Description | Face Amount ($ Thousands) | Value ($ Thousands) | ||||||
FNMA REMIC, Ser 2006-76, Cl QF | ||||||||
0.676%, 08/25/36 (A) | $ | 2,333 | $ | 2,329 | ||||
FNMA REMIC, Ser 2006-79, Cl DF | ||||||||
0.626%, 08/25/36 (A) | 2,036 | 2,032 | ||||||
FNMA REMIC, Ser 2007-47, Cl DA | ||||||||
5.600%, 05/25/37 | 3,562 | 3,992 | ||||||
FNMA REMIC, Ser 2010-149, Cl VA | ||||||||
4.500%, 02/25/22 | 9,463 | 10,388 | ||||||
FNMA REMIC, Ser 2010-4, Cl PL | ||||||||
4.500%, 02/25/40 | 9,543 | 10,313 | ||||||
FNMA, Ser 2010-M5, Cl A2 | ||||||||
2.806%, 07/25/20 | 13,700 | 14,441 | ||||||
FNMA TBA | ||||||||
6.000%, 02/01/36 | 120,800 | 132,771 | ||||||
4.500%, 02/01/34 | 3,400 | 3,633 | ||||||
3.500%, 02/01/41 | 13,000 | 13,678 | ||||||
GNMA | ||||||||
6.500%, 04/15/17 to 02/20/39 | 2,160 | 2,482 | ||||||
6.000%, 06/15/16 to 09/15/19 | 384 | 421 | ||||||
5.500%, 10/15/34 to 02/15/41 | 25,831 | 28,874 | ||||||
GNMA REMIC, Ser 2006-38, Cl XS, IO | ||||||||
6.960%, 09/16/35 (A) | 167 | 37 | ||||||
GNMA TBA | ||||||||
5.000%, 02/01/39 | 50,000 | 55,398 | ||||||
4.000%, 02/01/40 | 10,600 | 11,430 | ||||||
NCUA Guaranteed Notes, Ser 2010- R1, Cl 2A | ||||||||
1.840%, 10/07/20 | 794 | 802 | ||||||
|
| |||||||
Total Mortgage-Backed Securities | 449,000 | |||||||
|
| |||||||
U.S. GOVERNMENT AGENCY OBLIGATIONS — 19.5% |
| |||||||
FHLB | ||||||||
3.250%, 09/12/14 | 9,915 | 10,634 | ||||||
2.750%, 03/13/15 | 4,440 | 4,737 | ||||||
FHLMC | ||||||||
2.500%, 04/23/14 | 50,024 | 52,272 | ||||||
FNMA | ||||||||
5.000%, 03/15/16 | 20,752 | 24,268 | ||||||
3.000%, 09/16/14 | 2,220 | 2,365 | ||||||
2.750%, 03/13/14 | 35,520 | 37,201 | ||||||
0.750%, 02/26/13 | 12,580 | 12,652 | ||||||
|
| |||||||
Total U.S. Government Agency Obligations | 144,129 | |||||||
|
| |||||||
U.S. TREASURY OBLIGATIONS — 13.0% |
| |||||||
U.S. Treasury Notes | ||||||||
2.625%, 11/15/20 | 19,136 | 20,757 | ||||||
3.875%, 02/15/13 | 72,500 | 75,292 | ||||||
|
| |||||||
Total U.S. Treasury Obligations | 96,049 | |||||||
|
| |||||||
| Description | Face Amount ($ Thousands) | Value ($ Thousands) | ||||||
REPURCHASE AGREEMENTS (B) — 34.9% |
| |||||||
BNP Paribas | $ | 140,300 | $ | 140,300 | ||||
JPMorgan Chase | 117,900 | 117,900 | ||||||
|
| |||||||
Total Repurchase Agreements | 258,200 | |||||||
|
| |||||||
Total Investments — 128.2% | $ | 947,378 | ||||||
|
| |||||||
The open futures contracts held by the Fund at January 31, 2012, is as follows (see Note 2 in Notes to Financial Statements):
| Type of Contract | Number of Contracts Long (Short) | Expiration Date | Unrealized Appreciation (Depreciation) ($ Thousands) | |||||||||
U.S. 10-Year Treasury Note | 76 | Mar-2012 | $ | 142 | ||||||||
U.S. 2-Year Treasury Note | 512 | Mar-2012 | 143 | |||||||||
U.S. 5-Year Treasury Note | (408 | ) | Mar-2012 | (543 | ) | |||||||
|
| |||||||||||
| $ | (258 | ) | ||||||||||
|
| |||||||||||
For the year ended January 31, 2012, the total amount of all open future contracts, as presented in the table above, are representative of the volume of activity for this derivative type during the year.
Percentages are based on Net Assets of $739,126 ($ Thousands).
| (A) | Floating Rate Instrument. The rate reflected on the Schedule of Investments is the rate in effect on January 31, 2012. The date reported is the final maturity date. |
| (B) | Tri-Party Repurchase Agreement. |
Cl — Class
FHLB — Federal Home Loan Bank
FHLMC — Federal Home Loan Mortgage Corporation
FNMA — Federal National Mortgage Association
GNMA — Government National Mortgage Association
NCUA — National Credit Union Administration
REMIC — Real Estate Mortgage Investment Conduit
Ser — Series
TBA — To Be Announced
| 28 | SEI Daily Income Trust / Annual Report / January 31, 2012 |
Table of Contents
The following is a summary of the inputs used as of January 31, 2012 in valuing the Fund’s investments and other financial instruments carried at value ($ Thousands):
| Investments in Securities | Level 1 | Level 2 | Level 3 | Total | ||||||||||||
Mortgage-Backed Securities | $ | — | $ | 449,000 | $ | — | $ | 449,000 | ||||||||
U.S. Government Agency | ||||||||||||||||
Obligations | — | 144,129 | — | 144,129 | ||||||||||||
U.S. Treasury Obligations | — | 96,049 | — | 96,049 | ||||||||||||
Repurchase Agreements | — | 258,200 | — | 258,200 | ||||||||||||
|
|
|
|
|
|
|
| |||||||||
Total Investments in Securities | $ | — | $ | 947,378 | $ | — | $ | 947,378 | ||||||||
|
|
|
|
|
|
|
| |||||||||
| Other Financial Instruments | Level 1 | Level 2 | Level 3 | Total | ||||||||||||
Futures Contracts* | $ | (258 | ) | $ | — | $ | — | $ | (258 | ) | ||||||
|
|
|
|
|
|
|
| |||||||||
| * | Futures contracts are valued at the unrealized appreciation/(depreciation). |
Amounts designated as “—” are $0 or have been rounded to $0.
The accompanying notes are an integral part of the financial statements.
| SEI Daily Income Trust / Annual Report / January 31, 2012 | 29 |
Table of Contents
SCHEDULE OF INVESTMENTS
Intermediate-Duration Government Fund
January 31, 2012
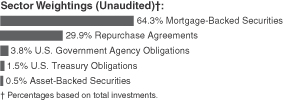
| Description | Face Amount ($ Thousands) | Value ($ Thousands) | ||||||
MORTGAGE-BACKED SECURITIES — 87.6% |
| |||||||
Agency Mortgage-Backed Obligations — 87.6% |
| |||||||
FHLMC | ||||||||
6.500%, 01/01/18 to 12/01/32 | $ | 212 | $ | 241 | ||||
6.000%, 09/01/24 | 673 | 742 | ||||||
5.500%, 06/01/19 to 12/01/20 | 412 | 449 | ||||||
FHLMC REMIC, Ser 1990-165, Cl K | ||||||||
6.500%, 09/15/21 | 8 | 9 | ||||||
FHLMC REMIC, Ser 1993-1599, Cl C | ||||||||
6.100%, 10/15/23 | 123 | 127 | ||||||
FHLMC REMIC, Ser 2003-2587, Cl ET | ||||||||
3.700%, 07/15/17 | 54 | 54 | ||||||
FHLMC REMIC, Ser 2003-2622, Cl PE | ||||||||
4.500%, 05/15/18 | 2,620 | 2,777 | ||||||
FHLMC REMIC, Ser 2003-2630, Cl HA | ||||||||
3.000%, 01/15/17 | 0 | 0 | ||||||
FHLMC REMIC, Ser 2004-2748, Cl LE | ||||||||
4.500%, 12/15/17 | 437 | 445 | ||||||
FHLMC REMIC, Ser 2004-2802, Cl PF | ||||||||
0.643%, 09/15/33 (A) | 560 | 560 | ||||||
FHLMC REMIC, Ser 2005-3029, Cl PE | ||||||||
5.000%, 03/15/34 | 1,300 | 1,385 | ||||||
FHLMC REMIC, Ser 2635, Cl NJ | ||||||||
3.000%, 03/15/17 | 23 | 23 | ||||||
FNMA | ||||||||
6.500%, 03/01/33 to 10/01/34 | 136 | 154 | ||||||
6.450%, 10/01/18 | 495 | 569 | ||||||
6.000%, 02/01/23 | 430 | 463 | ||||||
5.931%, 02/01/12 | 213 | 213 | ||||||
5.680%, 06/01/17 | 530 | 599 | ||||||
5.500%, 03/01/14 to 12/01/25 | 2,349 | 2,567 | ||||||
5.034%, 08/01/15 | 369 | 405 | ||||||
5.000%, 02/01/13 to 04/01/41 | 2,920 | 3,151 | ||||||
4.959%, 02/01/13 | 149 | 152 | ||||||
4.771%, 02/01/12 | 1,220 | 1,347 | ||||||
4.500%, 04/01/26 to 10/01/31 | 895 | 960 | ||||||
4.360%, 12/01/15 | 974 | 1,048 | ||||||
4.000%, 05/01/26 to 08/01/26 | 644 | 684 | ||||||
3.790%, 07/01/13 | 997 | 1,023 | ||||||
2.990%, 10/01/17 | 3,236 | 3,433 | ||||||
FNMA REMIC, Ser 2001-51, Cl QN | ||||||||
6.000%, 10/25/16 | 148 | 158 | ||||||
FNMA REMIC, Ser 2004-15, Cl AN | ||||||||
4.000%, 09/25/17 | 312 | 316 | ||||||
| Description | Face Amount ($ Thousands) | Value ($ Thousands) | ||||||
FNMA REMIC, Ser 2006-79, Cl DF | ||||||||
0.626%, 02/25/12 (A) | $ | 359 | $ | 359 | ||||
FNMA REMIC, Ser 2007-47, Cl DA | ||||||||
5.600%, 05/25/37 | 619 | 694 | ||||||
FNMA REMIC, Ser 2010-149, Cl VA | ||||||||
4.500%, 02/25/22 | 968 | 1,063 | ||||||
FNMA REMIC, Ser 2010-4, Cl PL | ||||||||
4.500%, 02/25/40 | 1,104 | 1,193 | ||||||
FNMA, Ser 2010-M5, Cl A2 | ||||||||
2.806%, 07/25/20 | 3,300 | 3,478 | ||||||
FNMA TBA | ||||||||
6.000%, 02/01/36 | 7,000 | 7,694 | ||||||
4.500%, 02/01/34 | 300 | 321 | ||||||
GNMA | ||||||||
8.750%, 07/20/17 to 07/20/17 | 7 | 7 | ||||||
8.500%, 11/20/16 to 08/20/17 | 31 | 34 | ||||||
7.500%, 11/15/25 to 03/15/27 | 27 | 32 | ||||||
6.000%, 09/15/24 | 589 | 669 | ||||||
5.500%, 06/15/38 to 01/15/39 | 3,754 | 4,196 | ||||||
GNMA TBA | ||||||||
5.500%, 02/15/34 | 400 | 447 | ||||||
5.000%, 02/01/39 | 8,700 | 9,639 | ||||||
4.000%, 02/01/40 | 7,900 | 8,518 | ||||||
NCUA Guaranteed Notes, Ser 2010-R1, | ||||||||
1.840%, 10/07/20 | 193 | 195 | ||||||
|
| |||||||
Total Mortgage-Backed Securities | 62,593 | |||||||
|
| |||||||
U.S. GOVERNMENT AGENCY OBLIGATIONS — 5.2% |
| |||||||
FHLB | ||||||||
2.750%, 03/13/15 | 1,500 | 1,600 | ||||||
FNMA | ||||||||
2.750%, 03/13/14 | 2,050 | 2,147 | ||||||
|
| |||||||
Total U.S. Government Agency Obligations | 3,747 | |||||||
|
| |||||||
U.S. TREASURY OBLIGATION — 2.1% |
| |||||||
U.S. Treasury Notes (B) |
| |||||||
2.250%, 05/31/14 | 1,400 | 1,465 | ||||||
|
| |||||||
Total U.S. Treasury Obligation | 1,465 | |||||||
|
| |||||||
ASSET-BACKED SECURITY — 0.7% |
| |||||||
Other — 0.7% |
| |||||||
Small Business Administration, | ||||||||
4.940%, 08/10/15 | 462 | 491 | ||||||
|
| |||||||
Total Asset-Backed Security | 491 | |||||||
|
| |||||||
| 30 | SEI Daily Income Trust / Annual Report / January 31, 2012 |
Table of Contents
| Description | Face Amount ($ Thousands) | Value ($ Thousands) | ||||||
REPURCHASE AGREEMENTS (C) — 40.7% |
| |||||||
BNP Paribas | $ | 15,300 | $ | 15,300 | ||||
Goldman Sachs | 13,800 | 13,800 | ||||||
|
| |||||||
Total Repurchase Agreements | 29,100 | |||||||
|
| |||||||
Total Investments — 136.3% | $ | 97,396 | ||||||
|
| |||||||
The open futures contracts held by the Fund at January 31, 2012, is as follows (see Note 2 in Notes to Financial Statements):
| Type of Contract | Number Of Contracts Long (Short) | Expiration Date | Unrealized Appreciation (Depreciation) ($ Thousands) | |||||||||
U.S. 10-Year Treasury Note | 63 | Mar-2012 | $ | 111 | ||||||||
U.S. 2-Year Treasury Note | (7 | ) | Mar-2012 | (2 | ) | |||||||
U.S. 5-Year Treasury Note | 215 | Mar-2012 | 285 | |||||||||
|
| |||||||||||
| $ | 394 | |||||||||||
|
| |||||||||||
For the year ended January 31, 2012, the total amount of all open future contracts, as presented in the table above, are representative of the volume of activity for this derivative type during the year.
Percentages are based on Net Assets of $71,458 ($ Thousands).
| (A) | Floating Rate Instrument. The rate reflected on the Schedule of Investments is the rate in effect on January 31, 2012. The date reported is the final maturity date. |
| (B) | Security, or portion thereof, has been pledged as collateral on open future contracts. |
| (C) | Tri-Party Repurchase Agreement. |
Cl — Class
FHLB — Federal Home Loan Bank
FHLMC — Federal Home Loan Mortgage Corporation
FNMA — Federal National Mortgage Association
GNMA — Government National Mortgage Association
NCUA — National Credit Union Administration
REMIC — Real Estate Mortgage Investment Conduit
Ser — Series
TBA — To Be Announced
The following is a summary of the inputs used as of January 31, 2012 in valuing the Fund’s investments and other financial instruments carried at value ($ Thousands):
| Investments in Securities | Level 1 | Level 2 | Level 3 | Total | ||||||||||||
Mortgage-Backed Securities | $ | — | $ | 62,593 | $ | — | $ | 62,593 | ||||||||
U.S. Government Agency | ||||||||||||||||
Obligations | — | 3,747 | — | 3,747 | ||||||||||||
U.S. Treasury Obligation | — | 1,465 | — | 1,465 | ||||||||||||
Asset-Backed Security | — | 491 | — | 491 | ||||||||||||
Repurchase Agreements | — | 29,100 | — | 29,100 | ||||||||||||
|
|
|
|
|
|
|
| |||||||||
Total Investments in Securities | $ | — | $ | 97,396 | $ | — | $ | 97,396 | ||||||||
|
|
|
|
|
|
|
| |||||||||
| Other Financial Instruments | Level 1 | Level 2 | Level 3 | Total | ||||||||||||
Futures Contracts* | $ | 394 | $ | — | $ | — | $ | 394 | ||||||||
|
|
|
|
|
|
|
| |||||||||
| * | Futures contracts are valued at the unrealized appreciation/(depreciation). |
Amounts designated as “—” are $0 or have been rounded to $0.
The accompanying notes are an integral part of the financial statements.
| SEI Daily Income Trust / Annual Report / January 31, 2012 | 31 |
Table of Contents
SCHEDULE OF INVESTMENTS
GNMA Fund
January 31, 2012
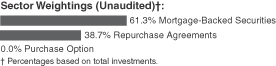
| Description | Face Amount ($ Thousands) | Value ($ Thousands) | ||||||
MORTGAGE-BACKED SECURITIES — 100.1% |
| |||||||
Agency Mortgage-Backed Obligations — 100.1% |
| |||||||
FHLMC REMIC, Ser 2006-3175, Cl SA, IO | ||||||||
6.860%, 06/15/36 (A) | $ | 511 | $ | 68 | ||||
FHLMC REMIC, Ser 2006-3179, Cl SP, IO | ||||||||
6.330%, 07/15/36 (A) | 1,032 | 149 | ||||||
FHLMC REMIC, Ser 2007-3279, Cl SD, IO | ||||||||
6.140%, 02/15/37 (A) | 3,567 | 528 | ||||||
FHLMC REMIC, Ser 2007-3309, Cl SC, IO | ||||||||
6.160%, 04/15/37 (A) | 3,321 | 500 | ||||||
FHLMC REMIC, Ser 2010-3631, Cl PS, IO | ||||||||
6.160%, 02/15/40 (A) | 14,754 | 2,482 | ||||||
FNMA | ||||||||
8.000%, 09/01/14 to 09/01/28 | 73 | 81 | ||||||
7.000%, 08/01/29 to 09/01/32 | 274 | 321 | ||||||
6.500%, 09/01/32 | 123 | 141 | ||||||
FNMA REMIC, Ser 1990-91, Cl G | ||||||||
7.000%, 08/25/20 | 26 | 28 | ||||||
FNMA REMIC, Ser 1992-105, Cl B | ||||||||
7.000%, 06/25/22 | 52 | 57 | ||||||
FNMA REMIC, Ser 2002-42, Cl C | ||||||||
6.000%, 07/25/17 | 1,059 | 1,137 | ||||||
FNMA REMIC, Ser 2007-19, Cl SA, IO | ||||||||
6.134%, 03/25/37 (A) | 7,898 | 1,168 | ||||||
GNMA | ||||||||
12.500%, 06/15/14 | 0 | 0 | ||||||
12.000%, 04/15/14 | 0 | 0 | ||||||
10.000%, 05/15/16 to 09/15/19 | 16 | 16 | ||||||
9.500%, 08/15/17 to 11/15/20 | 37 | 39 | ||||||
9.000%, 12/15/17 to 05/15/22 | 103 | 110 | ||||||
8.500%, 10/15/16 to 06/15/17 | 35 | 37 | ||||||
8.000%, 04/15/17 to 03/15/32 | 558 | 629 | ||||||
7.750%, 10/15/26 | 41 | 50 | ||||||
7.500%, 02/15/27 to 10/15/35 | 333 | 386 | ||||||
7.250%, 01/15/28 | 119 | 139 | ||||||
7.000%, 04/15/19 to 06/20/38 | 5,101 | 5,929 | ||||||
6.750%, 11/15/27 | 46 | 54 | ||||||
6.500%, 02/15/13 to 05/15/40 | 5,174 | 5,969 | ||||||
6.000%, 07/15/24 to 10/15/39 | 3,603 | 4,087 | ||||||
5.500%, 01/15/33 to 02/15/41 | 23,571 | 26,402 | ||||||
5.000%, 04/15/33 to 06/20/40 | 33,505 | 37,199 | ||||||
4.500%, 08/15/33 to 12/15/41 | 5,481 | 6,002 | ||||||
GNMA, Ser 2003-9, Cl Z | ||||||||
5.500%, 01/20/33 | 2,365 | 2,640 | ||||||
GNMA REMIC, Ser 2002-45, Cl QE | ||||||||
6.500%, 06/20/32 | 737 | 846 | ||||||
| Description | Face Amount ($ Thousands) | Value ($ Thousands) | ||||||
GNMA REMIC, Ser 2005-70, Cl AI, IO | ||||||||
5.000%, 10/20/33 | $ | 3,331 | $ | 264 | ||||
GNMA REMIC, Ser 2006-38, Cl XS, IO | ||||||||
6.960%, 09/16/35 (A) | 4,179 | 915 | ||||||
GNMA REMIC, Ser 2009-104, Cl XV | ||||||||
5.000%, 05/20/26 | 2,700 | 3,019 | ||||||
GNMA TBA | ||||||||
6.500%, 02/19/34 | 700 | 803 | ||||||
6.000%, 02/15/35 | 16,900 | 19,055 | ||||||
5.500%, 02/15/34 | 5,100 | 5,693 | ||||||
5.000%, 02/01/39 to 02/01/40 | 45,000 | 49,815 | ||||||
4.500%, 02/15/39 | 46,000 | 50,241 | ||||||
3.500%, 02/01/41 | 15,500 | 16,315 | ||||||
|
| |||||||
Total Mortgage-Backed Securities |
| 243,314 | ||||||
|
| |||||||
PURCHASED OPTION — 0.0% | ||||||||
Euro Dollar 1 Year Curve Put Option, Expires 09/17/12, Strike Price $ 98.75 | 487 | 33 | ||||||
|
| |||||||
Total Repurchased Option |
| 33 | ||||||
|
| |||||||
REPURCHASE AGREEMENTS (C) — 63.2% |
| |||||||
BNP Paribas | 55,700 | 55,700 | ||||||
JPMorgan Chase | 48,300 | 48,300 | ||||||
UBS | 49,600 | 49,600 | ||||||
|
| |||||||
Total Repurchase Agreements | 153,600 | |||||||
|
| |||||||
Total Investments — 163.3% | $ | 396,947 | ||||||
|
| |||||||
| 32 | SEI Daily Income Trust / Annual Report / January 31, 2012 |
Table of Contents
The open futures contracts held by the Fund at January 31, 2012, is as follows (see Note 2 in Notes to Financial Statements):
| Type of Contract | Number of Contracts Long (Short) | Expiration Date | Unrealized Appreciation (Depreciation) ($ Thousands) | |||||||||
U.S. 10-Year Treasury Note | 44 | Mar-2012 | $ | 92 | ||||||||
U.S. 2-Year Treasury Note | (51 | ) | Mar-2012 | (14 | ) | |||||||
|
| |||||||||||
| $ | 78 | |||||||||||
|
| |||||||||||
For the year ended January 31, 2012, the total amount of all open future contracts, as presented in the table above, are representative of the volume of activity for this derivative type during the year.
Percentages are based on Net Assets of $243,016 ($ Thousands).
| (A) | Floating Rate Instrument. The rate reflected on the Schedule of Investments is the rate in effect on January 31, 2012. The date reported is the final maturity date. |
| (B) | Security, or portion thereof, has been pledged as collateral on open future contracts. |
| (C) | Tri-Party Repurchase Agreement. |
Cl — Class
FHLMC — Federal Home Loan Mortgage Corporation
FNMA — Federal National Mortgage Association
GNMA — Government National Mortgage Association
IO — Interest Only — face amount represents notional amount
REMIC — Real Estate Mortgage Investment Conduit
Ser — Series
TBA — To Be Announced
The following is a summary of the inputs used as of January 31, 2012 in valuing the Fund’s investments and other financial instruments carried at value ($ Thousands):
| Investments in Securities | Level 1 | Level 2 | Level 3 | Total | ||||||||||||
Mortgage-Backed Securities | $ | — | $ | 243,314 | $ | — | $ | 243,314 | ||||||||
Purchased Option | 33 | — | — | 33 | ||||||||||||
Repurchase Agreements | — | 153,600 | — | 153,600 | ||||||||||||
|
|
|
|
|
|
|
| |||||||||
Total Investments in Securities | $ | 33 | $ | 396,914 | $ | — | $ | 396,947 | ||||||||
|
|
|
|
|
|
|
| |||||||||
| Other Financial Instruments | Level 1 | Level 2 | Level 3 | Total | ||||||||||||
Futures Contracts* | $ | 78 | $ | — | $ | — | $ | 78 | ||||||||
|
|
|
|
|
|
|
| |||||||||
| * | Futures contracts are valued at the unrealized appreciation/(depreciation). |
Amounts designated as “—” are $0 or have been rounded to $0.
The accompanying notes are an integral part of the financial statements.
| SEI Daily Income Trust / Annual Report / January 31, 2012 | 33 |
Table of Contents
SCHEDULE OF INVESTMENTS
Ultra Short Duration Bond Fund
January 31, 2012
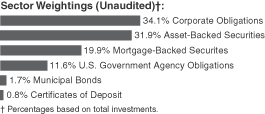
| Description | Face Amount ($ Thousands) | Value ($ Thousands) | ||||||
CORPORATE OBLIGATIONS — 36.8% |
| |||||||
Banks — 7.0% |
| |||||||
ANZ National International | ||||||||
2.375%, 12/21/12 (A) | $ | 342 | $ | 346 | ||||
Bank of America MTN | ||||||||
1.673%, 01/30/14 (B) | 1,000 | 968 | ||||||
Bank of Montreal | ||||||||
2.125%, 06/28/13 | 504 | 514 | ||||||
Bank of Montreal MTN | ||||||||
0.723%, 04/29/14 (B) | 500 | 499 | ||||||
Bank of Nova Scotia | ||||||||
1.850%, 01/12/15 | 1,000 | 1,019 | ||||||
Bank of Tokyo-Mitsubishi | ||||||||
2.600%, 01/22/13 (A) | 336 | 341 | ||||||
BB&T | ||||||||
1.125%, 04/28/14 (B) | 525 | 523 | ||||||
BB&T MTN | ||||||||
3.375%, 09/25/13 | 629 | 652 | ||||||
BNP Paribas MTN | ||||||||
2.125%, 12/21/12 | 546 | 546 | ||||||
BPCE | ||||||||
2.375%, 10/04/13 (A) | 504 | 493 | ||||||
Canadian Imperial Bank of Commerce | ||||||||
1.450%, 09/13/13 | 703 | 710 | ||||||
Danske Bank MTN | ||||||||
1.451%, 04/14/14 (A) (B) | 1,050 | 1,006 | ||||||
Deutsche Bank | ||||||||
2.375%, 01/11/13 | 315 | 317 | ||||||
HSBC Bank PLC | ||||||||
1.203%, 01/17/14 (A) (B) | 923 | 915 | ||||||
ING Bank | ||||||||
2.650%, 01/14/13 (A) | 525 | 524 | ||||||
2.000%, 10/18/13 (A) | 629 | 619 | ||||||
Nordea Bank | ||||||||
1.750%, 10/04/13 (A) | 629 | 624 | ||||||
Royal Bank of Canada MTN | ||||||||
0.703%, 04/17/14 (B) | 1,000 | 995 | ||||||
Royal Bank of Scotland PLC | ||||||||
3.400%, 08/23/13 | 839 | 853 | ||||||
Societe Generale | ||||||||
2.200%, 09/14/13 (A) | 525 | 511 | ||||||
Societe Generale MTN | ||||||||
1.441%, 04/11/14 (A) (B) | 350 | 330 | ||||||
| Description | Face Amount ($ Thousands) | Value ($ Thousands) | ||||||
Standard Chartered PLC | ||||||||
1.231%, 05/12/14 (A) (B) | $ | 1,000 | $ | 992 | ||||
State Street | ||||||||
0.683%, 03/07/14 (B) | 715 | 708 | ||||||
Swedbank Hypotek | ||||||||
0.813%, 03/28/14 (A) (B) | 1,400 | 1,377 | ||||||
Toronto-Dominion Bank | ||||||||
0.701%, 07/14/14 (B) | 620 | 614 | ||||||
Wachovia MTN | ||||||||
5.500%, 05/01/13 | 734 | 775 | ||||||
|
| |||||||
| 17,771 | ||||||||
|
| |||||||
Consumer Products — 1.1% |
| |||||||
Comcast Cable Holdings LLC | ||||||||
9.800%, 02/01/12 | 1,000 | 1,000 | ||||||
DIRECTV Holdings LLC | ||||||||
3.500%, 03/01/16 | 465 | 485 | ||||||
President and Fellows of Harvard College | ||||||||
3.700%, 04/01/13 | 556 | 575 | ||||||
Target | ||||||||
0.610%, 01/11/13 (B) | 750 | 751 | ||||||
|
| |||||||
| 2,811 | ||||||||
|
| |||||||
Energy — 0.6% |
| |||||||
BP Capital Markets PLC | ||||||||
5.250%, 11/07/13 | 525 | 566 | ||||||
0.937%, 03/11/14 (B) | 1,000 | 1,003 | ||||||
|
| |||||||
| 1,569 | ||||||||
|
| |||||||
Financial Services — 11.8% |
| |||||||
Ally Financial | ||||||||
0.350%, 12/19/12 (B) | 734 | 734 | ||||||
American Express Credit | ||||||||
1.208%, 06/24/14 (B) | 1,500 | 1,478 | ||||||
American Honda Finance | ||||||||
1.850%, 09/19/14 (A) | 1,500 | 1,516 | ||||||
Caterpillar Financial Services | ||||||||
0.662%, 04/01/14 (B) | 850 | 853 | ||||||
Caterpillar Financial Services MTN | ||||||||
1.900%, 12/17/12 | 350 | 354 | ||||||
Citigroup | ||||||||
5.125%, 05/05/14 | 839 | 881 | ||||||
1.302%, 04/01/14 (B) | 1,250 | 1,197 | ||||||
Daimler Finance North America LLC | ||||||||
2.300%, 01/09/15 (A) | 1,500 | 1,510 | ||||||
ERAC USA Finance LLC | ||||||||
2.750%, 07/01/13 (A) | 531 | 540 | ||||||
2.250%, 01/10/14 (A) | 135 | 135 | ||||||
General Electric Capital | ||||||||
1.234%, 01/07/14 (B) | 420 | 420 | ||||||
General Electric Capital MTN | ||||||||
2.625%, 12/28/12 | 2,000 | 2,045 | ||||||
2.125%, 12/21/12 | 9,881 | 10,055 | ||||||
1.142%, 05/09/16 (B) | 1,000 | 955 | ||||||
| 34 | SEI Daily Income Trust / Annual Report / January 31, 2012 |
Table of Contents
| Description | Face Amount ($ Thousands) | Value ($ Thousands) | ||||||
John Deere Capital MTN | ||||||||
1.875%, 06/17/13 | $ | 420 | $ | 427 | ||||
0.553%, 07/15/13 (B) | 655 | 657 | ||||||
Kimco Realty | ||||||||
6.000%, 11/30/12 | 734 | 755 | ||||||
National Rural Utilities Cooperative Finance | ||||||||
1.125%, 11/01/13 | 202 | 204 | ||||||
1.000%, 02/02/15 | 1,300 | 1,300 | ||||||
NCUA Guaranteed Notes | ||||||||
0.263%, 06/12/13 (B) | 530 | 530 | ||||||
Nissan Motor Acceptance | ||||||||
3.250%, 01/30/13 (A) | 1,272 | 1,286 | ||||||
Toyota Motor Credit MTN | ||||||||
1.375%, 08/12/13 | 839 | 845 | ||||||
Ventas Realty | ||||||||
3.125%, 11/30/15 | 519 | 523 | ||||||
Volkswagen International Finance | ||||||||
0.984%, 04/01/14 (A) (B) | 850 | 834 | ||||||
|
| |||||||
| 30,034 | ||||||||
|
| |||||||
Food, Beverage & Tobacco — 3.3% | ||||||||
Anheuser-Busch InBev Worldwide | ||||||||
0.972%, 01/27/14 (B) | 986 | 989 | ||||||
0.606%, 07/14/14 (B) | 1,200 | 1,198 | ||||||
Coca-Cola Enterprises | ||||||||
0.593%, 02/18/14 (B) | 1,049 | 1,046 | ||||||
General Mills | ||||||||
5.250%, 08/15/13 | 776 | 828 | ||||||
Kraft Foods | ||||||||
1.456%, 07/10/13 (B) | 1,500 | 1,505 | ||||||
PepsiCo | ||||||||
0.800%, 08/25/14 | 595 | 598 | ||||||
Philip Morris International | ||||||||
2.500%, 05/16/16 | 1,000 | 1,041 | ||||||
SABMiller Holdings | ||||||||
1.850%, 01/15/15 (A) | 1,300 | 1,304 | ||||||
|
| |||||||
| 8,509 | ||||||||
|
| |||||||
Health Care — 2.0% | ||||||||
AmerisourceBergen | ||||||||
5.625%, 09/15/12 | 1,049 | 1,079 | ||||||
Aristotle Holding | ||||||||
2.750%, 11/21/14 (A) | 1,000 | 1,021 | ||||||
Express Scripts | ||||||||
5.250%, 06/15/12 | 650 | 660 | ||||||
GlaxoSmithKline Capital | ||||||||
4.850%, 05/15/13 | 357 | 378 | ||||||
Mount Sinai Hospital | ||||||||
2.210%, 07/01/12 | 365 | 366 | ||||||
Quest Diagnostics | ||||||||
1.208%, 03/24/14 (B) | 335 | 337 | ||||||
| Description | Face Amount ($ Thousands) | Value ($ Thousands) | ||||||
Sanofi | ||||||||
0.673%, 03/28/14 (B) | $ | 1,000 | $ | 1,000 | ||||
Thermo Fisher Scientific | ||||||||
2.050%, 02/21/14 | 274 | 282 | ||||||
|
| |||||||
| 5,123 | ||||||||
|
| |||||||
Industrials — 0.5% | ||||||||
Boeing | ||||||||
1.875%, 11/20/12 | 304 | 307 | ||||||
Danaher | ||||||||
1.300%, 06/23/14 | 670 | 682 | ||||||
Textron | ||||||||
6.500%, 06/01/12 | 210 | 213 | ||||||
|
| |||||||
| 1,202 | ||||||||
|
| |||||||
Information Technology — 0.9% | ||||||||
eBay | ||||||||
0.875%, 10/15/13 | 290 | 292 | ||||||
Hewlett-Packard | ||||||||
0.719%, 05/30/14 (B) | 1,000 | 974 | ||||||
Xerox | ||||||||
1.110%, 05/16/14 (B) | 995 | 982 | ||||||
|
| |||||||
| 2,248 | ||||||||
|
| |||||||
Insurance — 3.0% | ||||||||
Allstate Life Global Funding Trust MTN | ||||||||
5.375%, 04/30/13 | 900 | 951 | ||||||
American International Group | ||||||||
4.250%, 09/15/14 | 650 | 653 | ||||||
Berkshire Hathaway Finance | ||||||||
0.721%, 01/10/14 (B) | 1,049 | 1,050 | ||||||
MBIA Insurance | ||||||||
14.000%, 01/15/33 (A) (B) | 210 | 127 | ||||||
Metropolitan Life Global Funding I | ||||||||
1.141%, 01/10/14 (A) (B) | 839 | 830 | ||||||
Metropolitan Life Global Funding I MTN | ||||||||
5.125%, 04/10/13 (A) | 839 | 879 | ||||||
Monumental Global Funding III | ||||||||
0.603%, 01/15/14 (A)(B) | 378 | 368 | ||||||
New York Life Global Funding | ||||||||
1.300%, 01/12/15 (A) | 750 | 753 | ||||||
0.634%, 04/04/14 (A) (B) | 1,000 | 991 | ||||||
Prudential Financial MTN | ||||||||
5.100%, 09/20/14 | 462 | 501 | ||||||
2.750%, 01/14/13 | 525 | 532 | ||||||
|
| |||||||
| 7,635 | ||||||||
|
| |||||||
Investment Banker/Broker Dealer — 3.8% |
| |||||||
BlackRock | ||||||||
2.250%, 12/10/12 | 420 | 426 | ||||||
Citigroup Funding | ||||||||
2.250%, 12/10/12 | 2,015 | 2,052 | ||||||
| SEI Daily Income Trust / Annual Report / January 31, 2012 | 35 |
Table of Contents
SCHEDULE OF INVESTMENTS
Ultra Short Duration Bond Fund (Continued)
January 31, 2012
| Description | Face Amount ($ Thousands) | Value ($ Thousands) | ||||||
Credit Agricole Home Loan | ||||||||
1.162%, 07/21/14 (A) (B) | $ | 1,000 | $ | 958 | ||||
Goldman Sachs Group | ||||||||
1.269%, 02/07/14 (B) | 1,431 | 1,383 | ||||||
Goldman Sachs Group MTN | ||||||||
6.000%, 05/01/14 | 239 | 257 | ||||||
JPMorgan Chase | ||||||||
4.650%, 06/01/14 | 944 | 1,013 | ||||||
JPMorgan Chase MTN | ||||||||
1.216%, 01/24/14 (B) | 839 | 837 | ||||||
Morgan Stanley | ||||||||
4.200%, 11/20/14 | 839 | 848 | ||||||
2.016%, 01/24/14 (B) | 525 | 505 | ||||||
Morgan Stanley, Ser G MTN | ||||||||
0.691%, 01/09/14 (B) | 252 | 237 | ||||||
UBS | ||||||||
1.875%, 01/23/15 (A) | 850 | 847 | ||||||
1.425%, 01/28/14 (B) | 407 | 399 | ||||||
|
| |||||||
| 9,762 | ||||||||
|
| |||||||
Materials — 0.2% | ||||||||
Anglo American Capital PLC | ||||||||
2.150%, 09/27/13 (A) | 376 | 377 | ||||||
|
| |||||||
Media — 0.3% | ||||||||
NBCUniversal Media LLC | ||||||||
2.100%, 04/01/14 | 734 | 747 | ||||||
|
| |||||||
Security & Commodity Brokers — 0.5% | ||||||||
Genworth Global Funding Trusts, | ||||||||
0.426%, 05/15/12 (B) | 504 | 502 | ||||||
MassMutual Global Funding II | ||||||||
0.781%, 01/14/14 (A) (B) | 874 | 874 | ||||||
|
| |||||||
| 1,376 | ||||||||
|
| |||||||
Sovereign — 0.2% | ||||||||
Republic of Austria MTN | ||||||||
2.000%, 11/15/12 (A) | 468 | 472 | ||||||
|
| |||||||
Telephones & Telecommunication — 0.5% |
| |||||||
Cellco Partnership | ||||||||
5.250%, 02/01/12 | 329 | 329 | ||||||
Verizon Communications | ||||||||
1.250%, 11/03/14 | 1,000 | 1,009 | ||||||
|
| |||||||
| 1,338 | ||||||||
|
| |||||||
Utilities — 1.1% | ||||||||
Allegheny Energy Supply LLC | ||||||||
8.250%, 04/15/12 (A) | 546 | 553 | ||||||
Commonwealth Edison | ||||||||
1.625%, 01/15/14 | 382 | 388 | ||||||
| Description | Face Amount ($ Thousands) | Value ($ Thousands) | ||||||
DTE Energy | ||||||||
1.031%, 06/03/13 (B) | $ | 430 | $ | 430 | ||||
Georgia Power | ||||||||
1.300%, 09/15/13 | 600 | 607 | ||||||
Sempra Energy | ||||||||
1.107%, 03/15/14 (B) | 800 | 798 | ||||||
|
| |||||||
| 2,776 | ||||||||
|
| |||||||
Total Corporate Obligations | 93,750 | |||||||
|
| |||||||
ASSET-BACKED SECURITIES — 34.5% |
| |||||||
Automotive — 23.9% | ||||||||
Ally Auto Receivables Trust, Ser 2009-A, Cl A3 | ||||||||
2.330%, 06/17/13 (A) | 719 | 722 | ||||||
Ally Auto Receivables Trust, Ser 2010-1, Cl A3 | ||||||||
1.450%, 05/15/14 | 665 | 668 | ||||||
Ally Auto Receivables Trust, Ser 2010-2, Cl A3 | ||||||||
1.380%, 07/15/14 | 292 | 294 | ||||||
Ally Auto Receivables Trust, Ser 2010-3, Cl A3 | ||||||||
1.110%, 10/15/14 | 965 | 970 | ||||||
Ally Auto Receivables Trust, Ser 2010-4, Cl A3 | ||||||||
0.910%, 11/17/14 | 428 | 429 | ||||||
Ally Auto Receivables Trust, Ser 2011-4, Cl A2 | ||||||||
0.650%, 03/17/14 | 350 | 350 | ||||||
Ally Auto Receivables Trust, Ser 2012-1, Cl A2 | ||||||||
0.710%, 09/15/14 | 1,100 | 1,101 | ||||||
Ally Master Owner Trust, Ser 2010-1, Cl A | ||||||||
1.993%, 01/15/15 (A) (B) | 944 | 955 | ||||||
Ally Master Owner Trust, Ser 2010-3, Cl A | ||||||||
2.880%, 04/15/15 (A) | 1,507 | 1,533 | ||||||
Ally Master Owner Trust, Ser 2011-1, Cl A1 |
| |||||||
1.113%, 01/15/16 (B) | 642 | 644 | ||||||
AmeriCredit Automobile Receivables Trust, Ser 2010-1, Cl B | ||||||||
3.720%, 11/17/14 | 327 | 333 | ||||||
AmeriCredit Automobile Receivables Trust, Ser 2010-2, Cl A2 | ||||||||
1.220%, 10/08/13 | 128 | 128 | ||||||
AmeriCredit Automobile Receivables Trust, Ser 2010-3, Cl A3 | ||||||||
1.140%, 04/08/15 | 473 | 473 | ||||||
AmeriCredit Automobile Receivables Trust, Ser 2010-4, Cl B | ||||||||
1.990%, 10/08/15 | 1,111 | 1,122 | ||||||
| 36 | SEI Daily Income Trust / Annual Report / January 31, 2012 |
Table of Contents
| Description | Face Amount ($ Thousands) | Value ($ Thousands) | ||||||
AmeriCredit Automobile Receivables Trust, Ser 2010-A, Cl A3 | ||||||||
3.510%, 07/06/17 | $ | 418 | $ | 431 | ||||
AmeriCredit Automobile Receivables Trust, Ser 2010-B, Cl A2 | ||||||||
1.180%, 02/06/14 | 91 | 91 | ||||||
AmeriCredit Automobile Receivables Trust, Ser 2011-2, Cl A2 | ||||||||
0.900%, 09/08/14 | 301 | 301 | ||||||
AmeriCredit Automobile Receivables Trust, Ser 2011-3, Cl A3 | ||||||||
1.170%, 01/08/16 | 440 | 442 | ||||||
AmeriCredit Automobile Receivables Trust, Ser 2011-4, Cl A2 | ||||||||
0.920%, 03/09/15 | 625 | 626 | ||||||
AmeriCredit Automobile Receivables Trust, Ser 2012-1, Cl A2 | ||||||||
0.910%, 10/08/15 | 215 | 215 | ||||||
Americredit Prime Automobile Receivable, Ser 2009-1, Cl A3 | ||||||||
2.210%, 01/15/14 | 252 | 253 | ||||||
Avis Budget Rental Car Funding, Ser 2009-1A, Cl A | ||||||||
9.310%, 10/20/13 (A) | 1,506 | 1,561 | ||||||
Avis Budget Rental Car Funding, Ser 2009-2A, Cl A | ||||||||
5.680%, 02/20/14 (A) | 813 | 841 | ||||||
Avis Budget Rental Car Funding, Ser 2010-2A, Cl A | ||||||||
3.630%, 08/20/14 (A) | 172 | 177 | ||||||
Avis Budget Rental Car Funding, Ser 2011-1A, Cl A | ||||||||
1.850%, 11/20/14 (A) | 560 | 562 | ||||||
Bank of America Auto Trust, Ser 2009-1A, Cl A4 | ||||||||
3.520%, 06/15/16 (A) | 1,282 | 1,303 | ||||||
Bank of America Auto Trust, Ser 2009-2A, Cl A3 | ||||||||
2.130%, 09/15/13 (A) | 158 | 158 | ||||||
Bank of America Auto Trust, Ser 2009-2A, Cl A4 | ||||||||
3.030%, 10/15/16 (A) | 462 | 470 | ||||||
Bank of America Auto Trust, Ser 2010-1A, Cl A3 | ||||||||
1.390%, 03/15/14 (A) | 453 | 454 | ||||||
Bank of America Auto Trust, Ser 2010-2, Cl A3 | ||||||||
1.310%, 07/15/14 | 174 | 175 | ||||||
BMW Vehicle Lease Trust, Ser 2010-1, Cl A3 | ||||||||
0.820%, 04/15/13 | 1,119 | 1,120 | ||||||
BMW Vehicle Lease Trust, Ser 2011-1, Cl A3 | ||||||||
1.060%, 02/20/14 | 460 | 461 | ||||||
| Description | Face Amount ($ Thousands) | Value ($ Thousands) | ||||||
BMW Vehicle Owner Trust, Ser 2011-A, Cl A3 | ||||||||
0.760%, 08/25/15 | $ | 1,020 | $ | 1,023 | ||||
Capital Auto Receivables Asset Trust, Ser 2007-3, Cl A4 | ||||||||
5.210%, 03/17/14 | 22 | 22 | ||||||
Capital Auto Receivables Asset Trust, Ser 2007-4A, Cl A4 | ||||||||
5.300%, 05/15/14 | 155 | 157 | ||||||
Carmax Auto Owner Trust, Ser 2008-1, Cl A4A | ||||||||
4.790%, 02/15/13 | 111 | 112 | ||||||
CarMax Auto Owner Trust, Ser 2009-1, Cl A3 | ||||||||
4.120%, 03/15/13 | 14 | 14 | ||||||
CarMax Auto Owner Trust, Ser 2009-2, Cl A4 | ||||||||
2.820%, 12/15/14 | 137 | 141 | ||||||
CarMax Auto Owner Trust, Ser 2010-1, Cl A3 | ||||||||
1.560%, 07/15/14 | 706 | 710 | ||||||
CarMax Auto Owner Trust, Ser 2010-1, Cl A4 | ||||||||
2.400%, 04/15/15 | 655 | 671 | ||||||
CarMax Auto Owner Trust, Ser 2010-2, Cl A3 | ||||||||
1.000%, 02/16/15 | 645 | 649 | ||||||
CarMax Auto Owner Trust, Ser 2010-3, Cl A3 | ||||||||
0.990%, 02/17/15 | 596 | 598 | ||||||
CarMax Auto Owner Trust, Ser 2011-3, Cl A2 | ||||||||
0.700%, 11/17/14 | 930 | 931 | ||||||
Chrysler Financial Auto Securitization Trust, Ser 2010-A, Cl A2 | ||||||||
0.690%, 01/08/13 | 124 | 124 | ||||||
Daimler Chrysler Auto Trust, Ser 2007-A, Cl A4 | ||||||||
5.280%, 03/08/13 | 40 | 40 | ||||||
Ford Credit Auto Lease Trust, Ser 2010-B, Cl A4 | ||||||||
1.040%, 12/15/13 (A) | 955 | 958 | ||||||
Ford Credit Auto Lease Trust, Ser 2010-B, Cl A3 | ||||||||
0.800%, 07/15/13 (A) | 810 | 811 | ||||||
Ford Credit Auto Lease Trust, Ser 2011-A, Cl A2 | ||||||||
0.740%, 09/15/13 | 605 | 605 | ||||||
Ford Credit Auto Lease Trust, Ser 2011-B, Cl A2 | ||||||||
0.820%, 01/15/14 | 1,500 | 1,502 | ||||||
Ford Credit Auto Owner Trust, Ser 2008-A, Cl A4 | ||||||||
4.370%, 10/15/12 | 6 | 6 | ||||||
| SEI Daily Income Trust / Annual Report / January 31, 2012 | 37 |
Table of Contents
SCHEDULE OF INVESTMENTS
Ultra Short Duration Bond Fund (Continued)
January 31, 2012
| Description | Face Amount ($ Thousands) | Value ($ Thousands) | ||||||
Ford Credit Auto Owner Trust, Ser 2009-A, Cl A3B | ||||||||
2.743%, 05/15/13 (B) | $ | 20 | $ | 20 | ||||
Ford Credit Auto Owner Trust, Ser 2009-B, Cl A3 | ||||||||
2.790%, 08/15/13 | 166 | 166 | ||||||
Ford Credit Auto Owner Trust, Ser 2010-A, Cl A3 | ||||||||
1.320%, 06/15/14 | 269 | 270 | ||||||
Ford Credit Auto Owner Trust, Ser 2010-B, Cl A3 | ||||||||
0.980%, 10/15/14 | 376 | 377 | ||||||
Ford Credit Floorplan Master Owner Trust, Ser 2009-2, Cl A3 | ||||||||
1.793%, 09/15/14 (B) | 1,424 | 1,434 | ||||||
Ford Credit Floorplan Master Owner Trust, Ser 2010-1, Cl B | ||||||||
2.493%, 12/15/14 (A) (B) | 1,001 | 1,014 | ||||||
Ford Credit Floorplan Master Owner Trust, Ser 2010-1, Cl A | ||||||||
1.893%, 12/15/14 (A)(B) | 1,593 | 1,609 | ||||||
Ford Credit Floorplan Master Owner Trust, Ser 2011-1, Cl A2 | ||||||||
0.843%, 02/15/16 (B) | 208 | 208 | ||||||
GE Dealer Floorplan Master Note Trust, Ser 2009-2A, Cl A | ||||||||
1.793%, 10/20/14 (A) (B) | 1,353 | 1,363 | ||||||
Harley-Davidson Motorcycle Trust, Ser 2007-2, Cl A4 | ||||||||
5.120%, 08/15/13 | 53 | 53 | ||||||
Harley-Davidson Motorcycle Trust, Ser 2009-2, Cl A3 | ||||||||
2.620%, 03/15/14 | 225 | 226 | ||||||
Harley-Davidson Motorcycle Trust, Ser 2009-4, Cl A3 | ||||||||
1.870%, 02/15/14 | 232 | 233 | ||||||
Harley-Davidson Motorcycle Trust, Ser 2010-1, Cl A3 | ||||||||
1.160%, 02/15/15 | 365 | 366 | ||||||
Harley-Davidson Motorcycle Trust, Ser 2011-2, Cl A2 | ||||||||
0.710%, 05/15/15 | 505 | 505 | ||||||
Hertz Vehicle Financing LLC, Ser 2009-2A, Cl A1 | ||||||||
4.260%, 03/25/14 (A) | 936 | 960 | ||||||
Hertz Vehicle Financing LLC, Ser 2010-1A, Cl A1 | ||||||||
2.600%, 02/25/15 (A) | 835 | 849 | ||||||
Hertz Vehicle Financing LLC, Ser 2011-1A, Cl A1 | ||||||||
2.200%, 03/25/16 (A) | 890 | 897 | ||||||
Honda Auto Receivables Owner Trust, Ser 2010-2, Cl A3 | ||||||||
1.340%, 03/18/14 | 402 | 404 | ||||||
| Description | Face Amount ($ Thousands) | Value ($ Thousands) | ||||||
Honda Auto Receivables Owner Trust, Ser 2010-3, Cl A3 | ||||||||
0.700%, 04/21/14 | $ | 665 | $ | 666 | ||||
Honda Auto Receivables Owner Trust, Ser 2011-1, Cl A2 | ||||||||
0.650%, 06/17/13 | 366 | 366 | ||||||
Honda Auto Receivables Owner Trust, Ser 2011-2, Cl A3 | ||||||||
0.940%, 03/18/15 | 445 | 447 | ||||||
Huntington Auto Trust, Ser 2009-1A, Cl A4 | ||||||||
5.730%, 01/15/14 (A) | 747 | 758 | ||||||
Huntington Auto Trust, Ser 2011-1A, Cl A3 | ||||||||
1.010%, 01/15/16 (A) | 670 | 669 | ||||||
Hyundai Auto Lease Securitization Trust, Ser 2011-A, Cl A2 | ||||||||
0.690%, 11/15/13 (A) | 555 | 555 | ||||||
Hyundai Auto Lease Securitization Trust, Ser 2011-A, Cl A3 | ||||||||
1.020%, 08/15/14 (A) | 1,000 | 1,001 | ||||||
Hyundai Auto Receivables Trust, | ||||||||
2.030%, 08/15/13 | 60 | 61 | ||||||
Hyundai Auto Receivables Trust, | ||||||||
1.500%, 10/15/14 | 315 | 317 | ||||||
Hyundai Auto Receivables Trust, | ||||||||
0.970%, 04/15/15 | 567 | 569 | ||||||
Hyundai Auto Receivables Trust, | ||||||||
0.690%, 11/15/13 | 383 | 383 | ||||||
Hyundai Auto Receivables Trust, | ||||||||
0.590%, 03/15/14 | 574 | 574 | ||||||
Hyundai Auto Receivables Trust, | ||||||||
0.830%, 12/15/15 | 1,250 | 1,252 | ||||||
Mercedes-Benz Auto Receivables Trust, | ||||||||
0.850%, 03/16/15 | 350 | 351 | ||||||
MMCA Automobile Trust, | ||||||||
0.810%, 08/15/14 (A) | 1,396 | 1,396 | ||||||
Navistar Financial Owner Trust, | ||||||||
4.170%, 10/20/14 (A) | 243 | 245 | ||||||
Navistar Financial Owner Trust, | ||||||||
1.990%, 01/21/14 (A) | 1,097 | 1,104 | ||||||
Navistar Financial Owner Trust, | ||||||||
0.810%, 01/18/13 (A) | 346 | 346 | ||||||
| 38 | SEI Daily Income Trust / Annual Report / January 31, 2012 |
Table of Contents
| Description | Face Amount ($ Thousands) | Value ($ Thousands) | ||||||
Nissan Auto Lease Trust, Ser 2010-B, Cl A2 | ||||||||
0.900%, 05/15/13 | $ | 420 | $ | 420 | ||||
Nissan Auto Lease Trust, | ||||||||
1.040%, 08/15/14 | 1,500 | 1,509 | ||||||
Nissan Auto Receivables Owner Trust, | ||||||||
0.650%, 12/16/13 | 593 | 594 | ||||||
Santander Consumer Acquired Receivables Trust, Ser 2011-WO, Cl A2 | ||||||||
0.910%, 11/15/13 (A) | 136 | 136 | ||||||
Santander Consumer Acquired Receivables Trust, Ser 2011-WO, Cl A3 | ||||||||
1.400%, 10/15/14 (A) | 1,350 | 1,354 | ||||||
Santander Drive Auto Receivables Trust, | ||||||||
1.240%, 02/17/14 | 659 | 660 | ||||||
Santander Drive Auto Receivables Trust, | ||||||||
0.930%, 06/17/13 | 170 | 170 | ||||||
Santander Drive Auto Receivables Trust, | ||||||||
0.940%, 02/18/14 | 732 | 732 | ||||||
Santander Drive Auto Receivables Trust, | ||||||||
1.250%, 04/15/15 | 975 | 976 | ||||||
Toyota Auto Receivables Owner Trust, | ||||||||
1.040%, 02/18/14 | 323 | 324 | ||||||
Toyota Auto Receivables Owner Trust, | ||||||||
0.770%, 04/15/14 | 627 | 628 | ||||||
USAA Auto Owner Trust, Ser 2009-2, Cl A4 | ||||||||
2.530%, 07/15/15 | 50 | 51 | ||||||
Volkswagen Auto Loan Enhanced Trust, | ||||||||
1.310%, 01/20/14 | 236 | 236 | ||||||
Volkswagen Auto Loan Enhanced Trust, | ||||||||
0.610%, 10/20/14 | 335 | 335 | ||||||
World Omni Auto Receivables Trust, | ||||||||
4.740%, 10/15/13 | 414 | 418 | ||||||
World Omni Auto Receivables Trust, | ||||||||
1.340%, 12/16/13 | 96 | 96 | ||||||
World Omni Auto Receivables Trust, | ||||||||
0.640%, 11/15/13 | 399 | 399 | ||||||
World Omni Automobile Lease Securitization Trust, Ser 2011-A, Cl A2 | ||||||||
0.810%, 10/15/13 | 730 | 731 | ||||||
| Description | Face Amount ($ Thousands) | Value ($ Thousands) | ||||||
World Omni Automobile Lease Securitization Trust, Ser 2011-A, Cl A4 | ||||||||
1.780%, 09/15/16 | $ | 570 | $ | 578 | ||||
|
| |||||||
| 60,798 | ||||||||
|
| |||||||
Credit Card — 4.1% |
| |||||||
Cabela’s Master Credit Card Trust, | ||||||||
2.243%, 03/16/15 (A) (B) | 632 | 633 | ||||||
Capital One Multi-Asset Execution Trust, | ||||||||
4.700%, 06/15/15 | 850 | 869 | ||||||
Capital One Multi-Asset Execution Trust, | ||||||||
0.647%, 10/15/15 (B) | 546 | 547 | ||||||
Citibank Omni Master Trust, | ||||||||
3.350%, 08/15/16 (A) | 1,670 | 1,693 | ||||||
Citibank Omni Master Trust, Ser 2009-A8, Cl A8 | ||||||||
2.343%, 05/16/16 (A) (B) | 1,600 | 1,608 | ||||||
Discover Card Master Trust, Ser 2009-A1, Cl A1 | ||||||||
1.543%, 12/15/14 (B) | 875 | 879 | ||||||
Discover Card Master Trust, Ser 2009-A2, Cl A | ||||||||
1.543%, 02/17/15 (B) | 1,175 | 1,183 | ||||||
Discover Card Master Trust, Ser 2011-A1, Cl A1 | ||||||||
0.593%, 08/15/16 (B) | 845 | 848 | ||||||
Discover Card Master Trust, Ser 2011-A2, Cl A2 | ||||||||
0.453%, 11/16/15 (B) | 535 | 536 | ||||||
GE Capital Credit Card Master Note Trust, | ||||||||
2.343%, 04/15/15 (B) | 1,120 | 1,125 | ||||||
GE Capital Credit Card Master Note Trust, | ||||||||
0.793%, 01/15/17 (B) | 619 | 624 | ||||||
|
| |||||||
| 10,545 | ||||||||
|
| |||||||
Miscellaneous Business Services — 6.4% |
| |||||||
ACAS Business Loan Trust, | ||||||||
1.140%, 08/16/19 (A) (B) | 298 | 193 | ||||||
Babson CLO Ltd., Ser 2007-1A, Cl A1 | ||||||||
0.630%, 01/18/21 (A) (B) | 473 | 436 | ||||||
Capital Source Commercial Loan Trust, Ser 2006-1A, Cl C | ||||||||
0.795%, 08/22/16 (A) (B) | 56 | 56 | ||||||
CNH Equipment Trust, Ser 2009-B, Cl A3 | ||||||||
5.170%, 10/15/14 | 413 | 422 | ||||||
CNH Equipment Trust, Ser 2010-C, Cl A3 | ||||||||
1.170%, 05/15/15 | 521 | 523 | ||||||
| SEI Daily Income Trust / Annual Report / January 31, 2012 | 39 |
Table of Contents
SCHEDULE OF INVESTMENTS
Ultra Short Duration Bond Fund (Continued)
January 31, 2012
| Description | Face Amount ($ Thousands) | Value ($ Thousands) | ||||||
CNH Equipment Trust, Ser 2011-A, Cl A2 | ||||||||
0.620%, 06/16/14 | $ | 307 | $ | 307 | ||||
CNH Equipment Trust, Ser 2011-C, Cl A2 | ||||||||
0.900%, 04/15/15 | 1,350 | 1,353 | ||||||
CNH Wholesale Master Note Trust, | ||||||||
1.043%, 12/15/15 (A) (B) | 647 | 648 | ||||||
Colts Trust, Ser 2006-2A, Cl A | ||||||||
0.631%, 12/20/18 (A) (B) | 30 | 30 | ||||||
Countrywide Asset-Backed Certificates, | ||||||||
0.435%, 06/25/36 (B) | 112 | 92 | ||||||
Dominos Pizza Master Issuer LLC, | ||||||||
5.261%, 04/25/37 (A) | 1,250 | 1,253 | ||||||
GE Equipment Midticket LLC, | ||||||||
0.940%, 07/14/14 (A) | 513 | 513 | ||||||
GE Equipment Midticket LLC, | ||||||||
1.470%, 07/14/15 (A) | 650 | 655 | ||||||
GE Equipment Small Ticket LLC, | ||||||||
0.880%, 08/21/13 (A) | 566 | 567 | ||||||
GE Equipment Transportation LLC, | ||||||||
1.330%, 05/20/19 | 480 | 483 | ||||||
John Deere Owner Trust, | ||||||||
1.570%, 10/15/13 | 197 | 197 | ||||||
John Deere Owner Trust, | ||||||||
2.330%, 05/16/16 | 610 | 614 | ||||||
John Deere Owner Trust, | ||||||||
0.640%, 06/16/14 | 354 | 354 | ||||||
Katonah CLO, Ser 2005-7A, Cl B | ||||||||
0.706%, 11/15/17 (A) (B) (C) | 504 | 391 | ||||||
Lambda Finance, Ser 2005-1A, Cl B3 | ||||||||
0.656%, 11/15/29 (A) (B) | 353 | 340 | ||||||
Madison Park Funding CLO, | ||||||||
0.655%, 03/22/21 (A) (B) | 420 | 350 | ||||||
Morgan Stanley ABS Capital I, | ||||||||
0.445%, 12/25/35 (B) | 72 | 69 | ||||||
Navistar Financial Dealer Note Master Trust, Ser 2009-1, Cl A | ||||||||
1.695%, 10/26/15 (A) (B) | 1,700 | 1,709 | ||||||
Prima Capital CDO, Ser 2006-CR1A, Cl A1 | ||||||||
5.417%, 12/28/48 (A) | 119 | 116 | ||||||
Sierra Receivables Funding LLC, | ||||||||
1.231%, 09/20/19 (A) (B) | 109 | 106 | ||||||
| Description | Face Amount ($ Thousands) | Value ($ Thousands) | ||||||
SLM Student Loan Trust, | ||||||||
0.508%, 07/25/22 (B) | $ | 547 | $ | 545 | ||||
SLM Student Loan Trust, | ||||||||
0.498%, 04/25/23 (B) | 354 | 353 | ||||||
SLM Student Loan Trust, | ||||||||
0.418%, 07/25/17 (B) | 349 | 346 | ||||||
SLM Student Loan Trust, | ||||||||
1.518%, 10/25/16 (B) | 578 | 582 | ||||||
SLM Student Loan Trust, | ||||||||
0.765%, 03/25/26 (B) | 1,840 | 1,836 | ||||||
SLM Student Loan Trust, | ||||||||
1.243%, 10/15/24 (A) (B) | 210 | 208 | ||||||
SLM Student Loan Trust, | ||||||||
1.093%, 12/16/24 (A) (B) | 649 | 642 | ||||||
|
| |||||||
| 16,289 | ||||||||
|
| |||||||
Mortgage Related — 0.1% |
| |||||||
Option One Mortgage Loan Trust, | ||||||||
0.845%, 06/25/33 (B) | 38 | 30 | ||||||
Option One Mortgage Loan Trust, | ||||||||
0.455%, 12/25/35 (B) | 223 | 178 | ||||||
Option One Mortgage Loan Trust, | ||||||||
5.611%, 01/25/37 (B) | 128 | 61 | ||||||
|
| |||||||
| 269 | ||||||||
|
| |||||||
Total Asset-Backed Securities | 87,901 | |||||||
|
| |||||||
MORTGAGE-BACKED SECURITIES — 21.4% |
| |||||||
Agency Mortgage-Backed Obligations — 12.5% |
| |||||||
FHLMC | ||||||||
2.293%, 02/01/22 (B) | 269 | 283 | ||||||
2.277%, 02/01/30 (B) | 195 | 205 | ||||||
FHLMC REMIC, Ser 1993-1599, Cl C | ||||||||
6.100%, 10/15/23 | 33 | 35 | ||||||
FHLMC REMIC, Ser 2003-2630, Cl HA | ||||||||
3.000%, 01/15/17 | — | — | ||||||
FHLMC REMIC, Ser 2004-2791, Cl UD | ||||||||
5.000%, 05/15/18 | 180 | 183 | ||||||
FHLMC TBA | ||||||||
4.000%, 02/15/41 | 7,300 | 7,697 | ||||||
FNMA | ||||||||
6.000%, 01/01/27 | 278 | 306 | ||||||
| 40 | SEI Daily Income Trust / Annual Report / January 31, 2012 |
Table of Contents
| Description | Face Amount ($ Thousands) | Value ($ Thousands) | ||||||
5.000%, 04/01/21 to 03/01/25 | $ | 4,726 | $ | 5,111 | ||||
2.466%, 11/01/23 (B) | 82 | 84 | ||||||
2.465%, 01/01/29 (B) | 25 | 26 | ||||||
2.360%, 11/01/25 (B) | 25 | 27 | ||||||
2.144%, 09/01/24 (B) | 146 | 153 | ||||||
2.109%, 05/01/28 (B) | 160 | 167 | ||||||
2.063%, 09/01/24 (B) | 58 | 60 | ||||||
1.347%, 11/01/21 (B) | 37 | 37 | ||||||
FNMA REMIC, Ser 1993-58, Cl H | ||||||||
5.500%, 04/25/23 | 44 | 48 | ||||||
FNMA REMIC, Ser 1993-220, Cl FA | ||||||||
0.850%, 11/25/13 (B) | 10 | 10 | ||||||
FNMA REMIC, Ser 2001-33, Cl FA | ||||||||
0.695%, 07/25/31 (B) | 52 | 53 | ||||||
FNMA REMIC, Ser 2002-64, Cl FG | ||||||||
0.493%, 10/18/32 (B) | 36 | 36 | ||||||
FNMA REMIC, Ser 2004-21, Cl QD | ||||||||
4.500%, 02/25/29 | 311 | 315 | ||||||
FNMA TBA | ||||||||
4.500%, 02/18/19 | 2,700 | 2,886 | ||||||
4.000%, 02/01/25 | 900 | 954 | ||||||
3.000%, 02/01/26 | 8,500 | 8,860 | ||||||
NCUA Guaranteed Notes, | ||||||||
0.691%, 10/07/20 (B) | 1,086 | 1,087 | ||||||
NCUA Guaranteed Notes, | ||||||||
1.840%, 10/07/20 | 76 | 77 | ||||||
NCUA Guaranteed Notes, | ||||||||
0.791%, 11/06/17 (B) | 270 | 270 | ||||||
NCUA Guaranteed Notes, | ||||||||
0.691%, 01/08/20 (B) | 225 | 225 | ||||||
NCUA Guaranteed Notes, | ||||||||
0.624%, 02/06/20 (B) | 358 | 358 | ||||||
NCUA Guaranteed Notes, | ||||||||
0.643%, 03/11/20 (B) | 1,091 | 1,091 | ||||||
NCUA Guaranteed Notes, | ||||||||
0.604%, 03/06/20 (B) | 438 | 438 | ||||||
NCUA Guaranteed Notes, | ||||||||
0.604%, 05/07/20(B) | 732 | 731 | ||||||
|
| |||||||
| 31,813 | ||||||||
|
| |||||||
Non-Agency Mortgage-Backed Obligations — 8.9% |
| |||||||
American Tower Trust, | ||||||||
5.420%, 04/15/37 (A) | 315 | 335 | ||||||
| Description | Face Amount ($ Thousands) | Value ($ Thousands) | ||||||
Arkle Master Issuer PLC, | ||||||||
2.500%, 05/17/60 (A) (B) | $ | 691 | $ | 691 | ||||
Banc of America Large Loan, | ||||||||
0.753%, 08/15/29 (A) (B) | 105 | 100 | ||||||
Banc of America Mortgage Securities, | ||||||||
2.873%, 02/25/35 (B) | 338 | 292 | ||||||
Banc of America Mortgage Securities, | ||||||||
2.861%, 07/25/35 (B) | 569 | 445 | ||||||
Banc of America Mortgage Securities, | ||||||||
2.764%, 09/25/35 (B) | 180 | 142 | ||||||
Banc of America Mortgage Securities, | ||||||||
3.097%, 11/25/35 (B) | 68 | 52 | ||||||
Bear Stearns Adjustable Rate Mortgage Trust, Ser 2005-3, Cl 2A1 | ||||||||
2.709%, 06/25/35 (B) | 217 | 156 | ||||||
Bear Stearns Adjustable Rate Mortgage Trust, Ser 2005-12, Cl 11A1 | ||||||||
2.917%, 02/25/36 (B) | 157 | 108 | ||||||
Bear Stearns Adjustable Rate Mortgage Trust, Ser 2005-6, Cl 3A1 | ||||||||
2.681%, 08/25/35 (B) | 351 | 217 | ||||||
Bear Stearns Commercial Mortgage Securities, Ser 2007-PW18, Cl A2 | ||||||||
5.613%, 06/11/50 | 334 | 346 | ||||||
Bear Stearns Commercial Mortgage Securities, Ser 2007-T26, Cl A2 | ||||||||
5.330%, 01/12/45 | 83 | 82 | ||||||
Citigroup Mortgage Loan Trust, | ||||||||
2.800%, 09/25/34 (B) | 106 | 100 | ||||||
Citigroup Mortgage Loan Trust, | ||||||||
2.840%, 03/25/36 (B) | 294 | 192 | ||||||
Commercial Mortgage Acceptance, | ||||||||
5.440%, 09/15/30 (A) (B) | 252 | 262 | ||||||
Commercial Mortgage Pass-Through Certificates, Ser 2006-FL12, Cl A2 | ||||||||
0.343%, 12/15/20 (A) (B) | 317 | 308 | ||||||
Commercial Mortgage Pass-Through Certificates, Ser 2011-STRT, Cl A | ||||||||
2.555%, 12/10/24 (A) | 675 | 677 | ||||||
Countrywide Alternative Loan Trust, | ||||||||
5.544%, 03/25/47 (B) | 220 | 207 | ||||||
Countrywide Home Loans, Ser 2004-29, Cl 1A1 | ||||||||
0.785%, 02/25/35 (B) | 39 | 30 | ||||||
| SEI Daily Income Trust / Annual Report / January 31, 2012 | 41 |
Table of Contents
SCHEDULE OF INVESTMENTS
Ultra Short Duration Bond Fund (Continued)
January 31, 2012
| Description | Face Amount ($ Thousands) | Value ($ Thousands) | ||||||
Countrywide Home Loans, Ser 2005-7, Cl 1A1 | ||||||||
0.515%, 03/25/35 (B) | $ | 63 | $ | 48 | ||||
Countrywide Home Loans, | ||||||||
2.786%, 02/20/36 (B) | 292 | 170 | ||||||
GMAC Commercial Mortgage Securities, Ser 2004-C3, Cl A4 | ||||||||
4.547%, 12/10/41 | 69 | 69 | ||||||
GMAC Mortgage Loan Trust, Ser 2005-AR6, Cl 2A1 | ||||||||
3.330%, 11/19/35 (B) | 307 | 202 | ||||||
GS Mortgage Securities II, Ser 2007-EOP, Cl A1 | ||||||||
1.142%, 03/06/20 (A) (B) | 591 | 590 | ||||||
GS Mortgage Securities II, Ser 2007-EOP, Cl A3 | ||||||||
1.535%, 03/06/20 (A) (B) | 734 | 734 | ||||||
GS Mortgage Securities II, | ||||||||
5.778%, 08/10/45 (B) | 662 | 672 | ||||||
GS Mortgage Securities II, Ser 2011-GC3, Cl A1 | ||||||||
2.331%, 03/10/44 (A) | 854 | 877 | ||||||
GSR Mortgage Loan Trust, Ser 2005-AR4, Cl 2A1 | ||||||||
2.783%, 07/25/35 (B) | 402 | 279 | ||||||
GSR Mortgage Loan Trust, Ser 2006-AR1, Cl 2A1 | ||||||||
2.795%, 01/25/36 (B) | 497 | 355 | ||||||
GSR Mortgage Loan Trust, Ser 2007-AR2, Cl 1A1 | ||||||||
5.429%, 05/25/47 (B) | 390 | 237 | ||||||
Impac CMB Trust, Ser 2004-9, Cl 1A1 | ||||||||
1.005%, 01/25/35 (B) | 98 | 71 | ||||||
Impac CMB Trust, Ser 2005-2, Cl 1A1 | ||||||||
0.765%, 04/25/35 (B) | 110 | 88 | ||||||
Impac CMB Trust, Ser 2005-3, Cl A1 | ||||||||
0.725%, 08/25/35 (B) | 101 | 63 | ||||||
Impac CMB Trust, Ser 2005-5, Cl A1 | ||||||||
0.565%, 08/25/35 (B) | 82 | 50 | ||||||
Impac CMB Trust, Ser 2005-8, Cl 1A | ||||||||
0.505%, 02/25/36 (B) | 265 | 177 | ||||||
JPMorgan Chase Commercial Mortgage Securities, Ser 2005-LDP4, Cl A3A2 | ||||||||
4.903%, 10/15/42 | 1,200 | 1,210 | ||||||
JPMorgan Chase Commercial Mortgage Securities, Ser 2011-C3, Cl A1 | ||||||||
1.875%, 02/15/46 (A) | 878 | 885 | ||||||
JPMorgan Chase Commercial Mortgage Securities, Ser 2011-C4, Cl A1 | ||||||||
1.525%, 07/15/46 (A) | 508 | 509 | ||||||
JPMorgan Mortgage Trust, Ser 2005-A6, Cl 7A1 | ||||||||
2.727%, 08/25/35 (B) | 228 | 161 | ||||||
| Description | Face Amount ($ Thousands) | Value ($ Thousands) | ||||||
JPMorgan Mortgage Trust, Ser 2007-A3, Cl 1A1 | ||||||||
4.671%, 05/25/37 (B) | $ | 316 | $ | 208 | ||||
LB-UBS Commercial Mortgage Trust, | ||||||||
6.462%, 03/15/31 | 19 | 19 | ||||||
LB-UBS Commercial Mortgage Trust, | ||||||||
4.853%, 09/15/31 | 603 | 611 | ||||||
Merill Lynch Mortgage Trust, | ||||||||
4.855%, 10/12/41 (B) | 629 | 678 | ||||||
Merrill Lynch Mortgage Investors, | ||||||||
2.621%, 02/25/35 (B) | 608 | 524 | ||||||
Merrill Lynch Mortgage Investors, | ||||||||
0.515%, 04/25/35 (B) | 118 | 86 | ||||||
Merrill Lynch Mortgage-Backed Securities Trust, Ser 2007-3, Cl 2A1 | ||||||||
5.072%, 06/25/37 (B) | 433 | 275 | ||||||
MLCC Mortgage Investors, Ser 2004-G, Cl A1 | ||||||||
0.805%, 01/25/30 (B) | 31 | 26 | ||||||
MLCC Mortgage Investors, Ser 2005-A, Cl A1 | ||||||||
0.475%, 03/25/30 (B) | 46 | 41 | ||||||
Morgan Stanley Capital I, Ser 2004-T13, Cl A4 | ||||||||
4.660%, 09/13/45 | 923 | 972 | ||||||
Morgan Stanley Capital I, Ser 2006-HQ9, Cl A2 | ||||||||
5.618%, 07/12/44 | 95 | 95 | ||||||
Morgan Stanley Dean Witter Capital I, | ||||||||
6.390%, 07/15/33 | 28 | 28 | ||||||
Morgan Stanley Dean Witter Capital I, | ||||||||
5.740%, 12/15/35 | 75 | 75 | ||||||
MortgageIT Trust, Ser 2005-2, Cl 1A1 | ||||||||
0.505%, 05/25/35 (B) | 84 | 66 | ||||||
MortgageIT Trust, Ser 2005-3, Cl A1 | ||||||||
0.545%, 08/25/35 (B) | 296 | 222 | ||||||
MortgageIT Trust, Ser 2005-4, Cl A1 | ||||||||
0.525%, 10/25/35 (B) | 386 | 260 | ||||||
MortgageIT Trust, Ser 2005-5, Cl A1 | ||||||||
0.505%, 12/25/35 (B) | 364 | 232 | ||||||
Nomura Asset Securities, Ser 1998-D6, Cl A1C | ||||||||
6.690%, 03/15/30 | 204 | 208 | ||||||
Paragon Mortgages PLC, Ser 2006-12A, Cl A2C | ||||||||
0.506%, 11/15/38 (A) (B) | 130 | 101 | ||||||
| 42 | SEI Daily Income Trust / Annual Report / January 31, 2012 |
Table of Contents
| Description | Face Amount ($ Thousands) | Value ($ Thousands) | ||||||
Paragon Mortgages PLC, Ser 2007-15A, Cl A2C | ||||||||
0.457%, 12/15/39 (A) (B) | $ | 311 | $ | 228 | ||||
Permanent Master Issuer PLC, | ||||||||
1.553%, 07/15/42 (A) (B) | 403 | 402 | ||||||
Residential Funding Mortgage Securities I, Ser 2005-SA5, Cl 2A | ||||||||
3.241%, 11/25/35 (B) | 202 | 130 | ||||||
Residential Funding Mortgage Securities I, Ser 2007-SA3, Cl 2A1 | ||||||||
5.685%, 07/27/37 (B) | 333 | 216 | ||||||
Sequoia Mortgage Trust, Ser 2004-12, Cl A1 | ||||||||
0.515%, 01/20/35 (B) | 43 | 34 | ||||||
Sequoia Mortgage Trust, Ser 2005-1, Cl A1 | ||||||||
0.475%, 02/20/35 (B) | 43 | 35 | ||||||
TIAA Seasoned Commercial Mortgage Trust, Ser 2007-C4, Cl A2 | ||||||||
5.666%, 08/15/39 (B) | 381 | 386 | ||||||
WaMu Mortgage Pass-Through Certificates, Ser 2006-AR2, Cl 1A1 | ||||||||
2.542%, 03/25/36 (B) | 414 | 294 | ||||||
Wells Fargo Mortgage-Backed Securities Trust, Ser 2004-BB, Cl A2 | ||||||||
2.729%, 01/25/35 (B) | 234 | 199 | ||||||
Wells Fargo Mortgage-Backed Securities Trust, Ser 2005-AR1, Cl 2A1 | ||||||||
2.735%, 02/25/35 (B) | 196 | 163 | ||||||
Wells Fargo Mortgage-Backed Securities Trust, Ser 2005-AR4, Cl 2A2 | ||||||||
2.741%, 04/25/35 (B) | 163 | 144 | ||||||
Wells Fargo Mortgage-Backed Securities Trust, Ser 2005-AR16, Cl 3A2 | ||||||||
2.709%, 03/25/35 (B) | 320 | 289 | ||||||
Wells Fargo Mortgage-Backed Securities Trust, Ser 2005-AR16, Cl 6A3 | ||||||||
2.722%, 10/25/35 (B) | 506 | 447 | ||||||
Wells Fargo Mortgage-Backed Securities Trust, Ser 2006-AR5, Cl 2A1 | ||||||||
2.738%, 04/25/36 (B) | 288 | 206 | ||||||
Wells Fargo Mortgage-Backed Securities Trust, Ser 2006-AR6, Cl 2A1 | ||||||||
2.795%, 03/25/36 (B) | 354 | 282 | ||||||
Wells Fargo Mortgage-Backed Securities Trust, Ser 2006-AR10, Cl 2A1 | ||||||||
2.734%, 07/25/36 (B) | 360 | 228 | ||||||
Wells Fargo Mortgage-Backed Securities Trust, Ser 2006-AR12, Cl 1A1 | ||||||||
2.806%, 09/25/36 (B) | 282 | 194 | ||||||
WF-RBS Commercial Mortgage Trust, | ||||||||
2.558%, 02/15/44 (A) | 1,482 | 1,516 | ||||||
| Description | Face Amount ($ Thousands) | Value ($ Thousands) | ||||||
WF-RBS Commercial Mortgage Trust, | ||||||||
1.988%, 03/15/44 (A) | $ | 569 | $ | 577 | ||||
|
| |||||||
| 22,886 | ||||||||
|
| |||||||
Total Mortgage-Backed Securities | 54,699 | |||||||
|
| |||||||
U.S. GOVERNMENT AGENCY OBLIGATIONS — 12.6% |
| |||||||
FFCB | ||||||||
1.875%, 12/07/12 | 1,849 | 1,875 | ||||||
FHLB | ||||||||
0.400%, 06/19/13 | 2,500 | 2,502 | ||||||
0.350%, 06/07/13 | 1,250 | 1,251 | ||||||
FHLMC | ||||||||
4.500%, 01/15/13 | 2,000 | 2,083 | ||||||
1.625%, 04/15/13 | 1,888 | 1,919 | ||||||
1.000%, 08/20/14 | 4,000 | 4,046 | ||||||
0.625%, 12/28/12 | 3,000 | 3,012 | ||||||
0.515%, 11/26/12 | 500 | 501 | ||||||
0.375%, 11/30/12 | 4,795 | 4,806 | ||||||
FHLMC MTN | ||||||||
1.375%, 01/09/13 | 4,000 | 4,045 | ||||||
FNMA | ||||||||
0.375%, 12/28/12 | 4,000 | 4,009 | ||||||
1.000%, 12/27/12 | 2,000 | 2,015 | ||||||
|
| |||||||
Total U.S. Government Agency Obligations |
| 32,064 | ||||||
|
| |||||||
MUNICIPAL BONDS — 1.8% |
| |||||||
California — 0.2% |
| |||||||
University of California, Build America Bonds, RB | ||||||||
1.988%, 05/15/50 (B) | 375 | 381 | ||||||
|
| |||||||
Louisiana — 0.2% |
| |||||||
Louisiana State, Local Government Environmental Facilites and Community Development Authority, Ser 2010-ELL, RB | ||||||||
1.110%, 02/01/16 | 584 | 585 | ||||||
|
| |||||||
Michigan — 0.3% |
| |||||||
Kalamazoo Hospital Finance Authority, | ||||||||
3.125%, 05/15/41 (B) | 750 | 753 | ||||||
|
| |||||||
New Jersey — 0.6% |
| |||||||
New Jersey State, Economic Development Authority, Build America Bonds, RB | ||||||||
1.347%, 06/15/13 (B) | 420 | 420 | ||||||
New Jersey State, Turnpike Authority, | ||||||||
4.252%, 01/01/16 | 1,085 | 1,132 | ||||||
|
| |||||||
| 1,552 | ||||||||
|
| |||||||
| SEI Daily Income Trust / Annual Report / January 31, 2012 | 43 |
Table of Contents
SCHEDULE OF INVESTMENTS
Ultra Short Duration Bond Fund (Concluded)
January 31, 2012
| Description | Face Amount ($ Thousands) | Value ($ Thousands) | ||||||
New York — 0.2% |
| |||||||
City of New York, Ser J, GO | ||||||||
4.300%, 06/01/13 | $ | 550 | $ | 575 | ||||
|
| |||||||
Virginia — 0.3% |
| |||||||
Louisiana State, Industrial Development Authority, Ser A, RB | ||||||||
2.500%, 03/01/31 (B) | 630 | 637 | ||||||
|
| |||||||
West Virginia — 0.1% |
| |||||||
West Virginia, Economic Development Authority, Ser A, RB | ||||||||
2.000%, 01/01/41 (B) | 175 | 176 | ||||||
|
| |||||||
Total Municipal Bonds | 4,659 | |||||||
|
| |||||||
CERTIFICATES OF DEPOSIT — 0.9% |
| |||||||
Bank of Nova Scotia | ||||||||
0.564%, 11/26/12 (B) | 776 | 777 | ||||||
Canadian Imperial Bank of Commerce | ||||||||
0.633%, 05/04/12 | 839 | 839 | ||||||
Intesa Sanpaolo | ||||||||
2.375%, 12/21/12 | 629 | 611 | ||||||
|
| |||||||
Total Certificates of Deposit | 2,227 | |||||||
|
| |||||||
Total Investments — 108.0% | $ | 275,300 | ||||||
|
| |||||||
The open futures contracts held by the Fund at January 31, 2012, is as follows (see Note 2 in Notes to Financial Statements):
| Type of Contract | Number of Contracts Long (Short) | Expiration Date | Unrealized Appreciation (Depreciation) ($ Thousands) | |||||||||
U.S. 10-Year Treasury Note | (55 | ) | Mar-2012 | $ | (144 | ) | ||||||
U.S. 2-Year Treasury Note | 9 | Mar-2012 | 3 | |||||||||
|
| |||||||||||
| $ | (141 | ) | ||||||||||
|
| |||||||||||
For the year ended January 31, 2012, the total amount of all open future contracts, as presented in the table above, are representative of the volume of activity for this derivative type during the year.
Percentages are based on Net Assets of $255,002 ($ Thousands).
| (A) | Securities sold within terms of a private placement memorandum, exempt from registration under Section 144A of the Securities Act of 1933, as amended, and may be sold only to dealers in that program or other “accredited investors.” These securities have been determined to be liquid under guidelines established by the Board of Trustees. |
| (B) | Floating Rate Instrument. The rate reflected on the Schedule of Investments is the rate in effect on January 31, 2012. The date reported is the final maturity date. |
| (C) | Security fair valued using methods determined in good faith by the Valuation Committee of the Board of Trustees. The total market value of such securities as of January 31, 2012 was $391 (Thousands) and represented 0.2% of Net Assets. |
ABS — Asset-Based Security
CDO — Collateralized Debt Obligation
Cl — Class
CLO — Collateralized Loan Obligation
FFCB — Federal Farm Credit Bank
FHLB — Federal Home Loan Bank
FHLMC — Federal Home Loan Mortgage Corporation
FNMA — Federal National Mortgage Association
GO — General Obligation
LLC — Limited Liability Company
Ltd. — Limited
MTN — Medium Term Note
NCUA — National Credit union Administration
PLC — Public Limited Company
RB — Revenue Bond
REMIC — Real Estate Mortgage Investment Conduit
Ser — Series
TBA — To Be Announced
The following is a summary of the inputs used as of January 31, 2012 in valuing the Fund’s investments and other financial instruments carried at value ($ Thousands):
| Investments in Securities | Level 1 | Level 2 | Level 3 | Total | ||||||||||||
Corporate Obligations | $ | — | $ | 93,750 | $ | — | $ | 93,750 | ||||||||
Asset-Backed Securities | — | 87,510 | 391 | 87,901 | ||||||||||||
Mortgage-Backed Securities | — | 54,699 | — | 54,699 | ||||||||||||
U.S. Government Agency | ||||||||||||||||
Obligations | — | 32,064 | — | 32,064 | ||||||||||||
Municipal Bonds | — | 4,659 | — | 4,659 | ||||||||||||
Certificates of Deposit | — | 2,227 | — | 2,227 | ||||||||||||
|
|
|
|
|
|
|
| |||||||||
Total Investments in Securities | $ | — | $ | 274,909 | $ | 391 | $ | 275,300 | ||||||||
|
|
|
|
|
|
|
| |||||||||
| Other Financial Instruments | Level 1 | Level 2 | Level 3 | Total | ||||||||||||
Futures Contracts* | $ | (141 | ) | $ | — | $ | — | $ | (141 | ) | ||||||
|
|
|
|
|
|
|
| |||||||||
| * | Futures Contracts are valued at the unrealized appreciation/(depreciation). |
The following is a reconciliation of investments in which significant unobservable inputs (Level 3) were used in determining value ($ Thousands):
| Asset-Backed Securities | ||||
Beginning balance as of February 1, 2011 | $ | 1,325 | ||
Change in unrealized appreciation/(depreciation) | 194 | |||
Accrued discounts/premiums | — | |||
Amortization sold | — | |||
Realized gain/(loss) | (153 | ) | ||
Net purchases/sales | (975 | ) | ||
|
| |||
Ending balance as of January 31, 2012 | $ | 391 | ||
|
| |||
Changes in unrealized gains/(losses) included in earnings related to securities still held at reporting date | $ | 194 | ||
|
| |||
Amounts designated as “—” are $0 or have been rounded to $0.
The accompanying notes are an integral part of the financial statements.
| 44 | SEI Daily Income Trust / Annual Report / January 31, 2012 |
Table of Contents
This page intentionally left blank.
Table of Contents
Statements of Assets and Liabilities ($ Thousands)
For the year ended January 31, 2012
Money Market | Government Fund | Government II Fund | Prime Obligation Fund | |||||||||||||
ASSETS: | ||||||||||||||||
Investments, at value† | $ | 209,229 | $ | 615,322 | $ | 1,578,290 | $ | 2,762,959 | ||||||||
Repurchase agreements† | 67,082 | 600,205 | — | 1,564,562 | ||||||||||||
Cash | 1 | 1 | — | — | ||||||||||||
Receivable for investment securities sold | — | — | — | — | ||||||||||||
Interest receivable | 84 | 1,176 | 1,366 | 608 | ||||||||||||
Receivable for fund shares sold | — | — | — | — | ||||||||||||
Receivable from Administrator | — | — | — | — | ||||||||||||
Foreign tax reclaim receivable | — | — | — | — | ||||||||||||
Receivable for variation margin | — | — | — | — | ||||||||||||
Prepaid expenses | 12 | 39 | 51 | 135 | ||||||||||||
Total Assets | 276,408 | 1,216,743 | 1,579,707 | 4,328,264 | ||||||||||||
LIABILITIES: | ||||||||||||||||
Payable for investment securities purchased | 1,012 | 6,070 | 99,636 | 11,864 | ||||||||||||
Administration fees payable | 35 | 65 | 25 | 522 | ||||||||||||
Shareholder servicing fees payable | 19 | 6 | — | 7 | ||||||||||||
Investment advisory fees payable | 10 | 37 | 43 | 134 | ||||||||||||
Income distribution payable | 6 | 10 | 10 | 118 | ||||||||||||
Trustees’ fees payable | — | 1 | 1 | 3 | ||||||||||||
Chief Compliance Officer fees payable | — | 2 | 2 | 6 | ||||||||||||
Payable for fund shares redeemed | — | — | — | — | ||||||||||||
Payable for variation margin | — | — | — | — | ||||||||||||
Accrued expense payable | 20 | 67 | 83 | 280 | ||||||||||||
Total Liabilities | 1,102 | 6,258 | 99,800 | 12,934 | ||||||||||||
Net Assets | $ | 275,306 | $ | 1,210,485 | $ | 1,479,907 | $ | 4,315,330 | ||||||||
† Cost of investments and repurchase agreements | $ | 276,311 | $ | 1,215,527 | $ | 1,578,290 | $ | 4,327,521 | ||||||||
NET ASSETS: | ||||||||||||||||
Paid-in Capital — (unlimited authorization — no par value) | $ | 275,301 | $ | 1,210,570 | $ | 1,479,889 | $ | 4,315,396 | ||||||||
Undistributed (Distributions in excess of) net investment income | — | — | — | — | ||||||||||||
Accumulated net realized gain (loss) on investments | 5 | (85 | ) | 18 | (66 | ) | ||||||||||
Net unrealized appreciation (depreciation) on investments | — | — | — | — | ||||||||||||
Net unrealized appreciation (depreciation) on futures contracts | — | — | — | — | ||||||||||||
Net Assets | $ | 275,306 | $ | 1,210,485 | $ | 1,479,907 | $ | 4,315,330 | ||||||||
Net Asset Value, Offering and Redemption Price Per Share — Class A | $1.00 | $1.00 | $1.00 | $1.00 | ||||||||||||
|
| (146,459,840 ÷ 146,490,388 shares | ) |
| (1,054,551,064 ÷ 1,054,607,994 shares | ) |
| (1,308,017,742 ÷ 1,308,069,442 shares | ) |
| (4,107,484,714 ÷ 4,107,545,841 shares | ) | |||||
Net Asset Value, Offering and Redemption Price Per Share — Class B | $1.00 | $1.00 | $1.00 | $1.00 | ||||||||||||
|
| (73,035,407 ÷ 73,042,943 shares | ) |
| (120,664,477 ÷ 120,694,466 shares | ) |
| (166,480,614 ÷ 166,511,055 shares | ) |
| (135,977,996 ÷ 135,982,123 shares | ) | |||||
Net Asset Value, Offering and Redemption Price Per Share — Class C | $1.00 | $1.00 | $1.00 | $1.00 | ||||||||||||
|
| (33,109,819 ÷ 33,122,409 shares | ) |
| (8,036,263 ÷ 8,037,844 shares | ) |
| (5,408,475 ÷ 5,407,631 shares | ) |
| (42,051,461 ÷ 42,051,985 shares | ) | |||||
Net Asset Value, Offering and Redemption Price Per Share — Class H | N/A | N/A | N/A | $1.00 | ||||||||||||
|
| (25,646,363 ÷ 25,647,785 shares | ) | ||||||||||||||
Net Asset Value, Offering and Redemption Price Per Share — Sweep Class | $1.00 | $1.00 | N/A | $1.00 | ||||||||||||
|
| (22,701,144 ÷ 22,673,097 shares | ) |
| (27,233,584 ÷ 27,235,761 shares | ) |
| (4,169,961 ÷ 4,169,517 shares | ) | ||||||||
Amounts designated as “—” are $0 or have been rounded to $0.
The accompanying notes are an integral part of the financial statements.
| 46 | SEI Daily Income Trust / Annual Report / January 31, 2012 |
Table of Contents
Treasury Fund | Treasury II Fund | Short-Duration Government Fund | Intermediate- Duration Government Fund | GNMA Fund | Ultra Short Duration Bond | |||||||||||||||||
| $170,555 | $899,876 | $689,178 | $ 68,296 | $243,347 | $275,300 | |||||||||||||||||
| 289,809 | — | 258,200 | 29,100 | 153,600 | — | |||||||||||||||||
| 1 | 1 | 1,567 | 92 | 398 | 2,446 | |||||||||||||||||
| — | — | 113,622 | 1,417 | 97,121 | 5 | |||||||||||||||||
| 579 | 1,550 | 3,547 | 174 | 445 | 682 | |||||||||||||||||
| — | — | 885 | 158 | 309 | 201 | |||||||||||||||||
| — | 45 | — | — | 14 | — | |||||||||||||||||
| — | — | — | — | — | 3 | |||||||||||||||||
| — | — | 30 | 34 | 24 | — | |||||||||||||||||
| 17 | 18 | 24 | 3 | 8 | 6 | |||||||||||||||||
| 460,961 | 901,490 | 1,067,053 | 99,274 | 495,266 | 278,643 | |||||||||||||||||
| 3,035 | 28,022 | 326,556 | 27,716 | 250,057 | 23,290 | |||||||||||||||||
| 5 | — | 225 | 24 | 55 | 58 | |||||||||||||||||
| 4 | — | 26 | — | 62 | — | |||||||||||||||||
| 19 | 43 | 51 | 6 | 19 | 15 | |||||||||||||||||
| 3 | 5 | 93 | 9 | 29 | 43 | |||||||||||||||||
| — | 1 | — | — | — | — | |||||||||||||||||
| 1 | 1 | 1 | — | — | — | |||||||||||||||||
| — | — | 851 | 54 | 1,986 | 200 | |||||||||||||||||
| — | — | 56 | — | — | 14 | |||||||||||||||||
| 29 | 43 | 68 | 7 | 42 | 21 | |||||||||||||||||
| 3,096 | 28,115 | 327,927 | 27,816 | 252,250 | 23,641 | |||||||||||||||||
| $457,865 | $873,375 | $739,126 | $ 71,458 | $243,016 | $255,002 | |||||||||||||||||
| $460,364 | $899,876 | $931,990 | $ 95,682 | $387,679 | $278,838 | |||||||||||||||||
| $457,893 |
| $873,365 | $724,261 | $ 71,353 | $230,962 | $282,656 | |||||||||||||||
| — |
| — | 10 | 1 | (9 | ) | 13 | ||||||||||||||
| (28 | ) | 10 | (275 | ) | (2,004 | ) | 2,717 | (23,988 | ) | |||||||||||||
| — |
| — | 15,388 | 1,714 | 9,268 | (3,538 | ) | ||||||||||||||
| — |
| — | (258 | ) | 394 | 78 | (141 | ) | |||||||||||||
| $457,865 | $873,375 | $739,126 | $ 71,458 | $243,016 | $255,002 | |||||||||||||||||
| $1.00 |
| $1.00 | $10.72 | $11.91 | $10.91 | $9.26 | |||||||||||||||
|
| (199,519,837 ÷ 199,558,952 shares | ) |
| (472,351,787 ÷ 472,504,032 shares | ) |
| (739,125,548 ÷ 68,934,370 shares | ) |
| (71,458,242 ÷ 5,997,812 shares | ) |
| (243,016,044 ÷ 22,272,695 shares | ) |
| (255,002,137 ÷ 27,531,459 shares | ) | |||||
| $1.00 |
| $1.00 | N/A | N/A | N/A | N/A | |||||||||||||||
| | (114,025,619 ÷ 114,050,674 shares | ) | | (395,099,309 ÷ 395,082,596 shares | ) | |||||||||||||||||
| $1.00 |
| $1.00 | N/A | N/A | N/A | N/A | |||||||||||||||
|
| (6,983,834 ÷ 6,983,896 shares | ) |
| (5,924,397 ÷ 5,926,966 shares | ) | |||||||||||||||||
| N/A |
| N/A | N/A | N/A | N/A | N/A | |||||||||||||||
| $1.00 |
| N/A | N/A | N/A | N/A | N/A | |||||||||||||||
|
| (137,336,198 ÷ 137,344,428 shares | ) | ||||||||||||||||||||
| SEI Daily Income Trust / Annual Report / January 31, 2012 | 47 |
Table of Contents
Statements of Operations ($ Thousands)
For the year ended January 31, 2012
Money Market | Government Fund | Government II Fund | Prime Obligation Fund | |||||||||||||
Investment Income: | ||||||||||||||||
Interest Income | $ | 837 | $ | 1,571 | $ | 1,485 | $ | 9,460 | ||||||||
Expenses: | ||||||||||||||||
Administration Fees | 1,158 | 2,701 | 2,738 | 7,707 | ||||||||||||
Shareholder Servicing Fees — Class A Shares | 566 | 1,697 | 3,197 | 9,579 | ||||||||||||
Shareholder Servicing Fees — Sweep Class Shares | 68 | 63 | — | 13 | ||||||||||||
Distribution Fees — Sweep Class Shares | 136 | 125 | — | 26 | ||||||||||||
Administrative and Shareholder Servicing Fees — Class B Shares | 153 | 1,159 | 462 | 419 | ||||||||||||
Administrative and Shareholder Servicing Fees — Class C Shares | 231 | 170 | 40 | 257 | ||||||||||||
Administrative and Shareholder Servicing Fees — Class H Shares | — | — | — | 109 | ||||||||||||
Investment Advisory Fees | 246 | 788 | 1,009 | 2,839 | ||||||||||||
Trustees’ Fees | 5 | 17 | 22 | 60 | ||||||||||||
Chief Compliance Officer Fees | 2 | 6 | 7 | 21 | ||||||||||||
Registration Fees | 20 | 66 | 77 | 206 | ||||||||||||
Custodian/Wire Agent Fees | 37 | 120 | 155 | 442 | ||||||||||||
Pricing Fees | 2 | 4 | 6 | 15 | ||||||||||||
Other Expenses | 30 | 108 | 131 | 405 | ||||||||||||
Total Expenses | 2,654 | 7,024 | 7,844 | 22,098 | ||||||||||||
Less, Waiver/Reimbursement of: | ||||||||||||||||
Investment Advisory Fees | (123 | ) | (394 | ) | (504 | ) | (1,419 | ) | ||||||||
Administration Fees | (750 | ) | (2,350 | ) | (2,303 | ) | (2,351 | ) | ||||||||
Reimbursement from Administrator | — | — | — | — | ||||||||||||
Shareholder Servicing Fees — Class A Shares | (566 | ) | (1,697 | ) | (3,197 | ) | (9,579 | ) | ||||||||
Administrative & Shareholder Servicing Fees — Class B Shares | (129 | ) | (1,159 | ) | (462 | ) | (374 | ) | ||||||||
Administrative & Shareholder Servicing Fees — Class C Shares | (207 | ) | (170 | ) | (40 | ) | (241 | ) | ||||||||
Administrative & Shareholder Servicing Fees — Class H Shares | — | — | — | (102 | ) | |||||||||||
Shareholder Servicing & Distribution Fees — Sweep Class Shares | (190 | ) | (188 | ) | — | (38 | ) | |||||||||
Net Expenses | 689 | 1,066 | 1,338 | 7,994 | ||||||||||||
Net Investment Income | 148 | 505 | 147 | 1,466 | ||||||||||||
Net Realized and Unrealized Gain (Loss) on/from: | ||||||||||||||||
Investments | 5 | 4 | 25 | 36 | ||||||||||||
Futures Contracts | — | — | — | — | ||||||||||||
Net Change in Unrealized Appreciation (Depreciation) on/from: | ||||||||||||||||
Investments | — | — | — | — | ||||||||||||
Futures Contracts | — | — | — | — | ||||||||||||
Net Increase in Net Assets Resulting from Operations | $ | 153 | $ | 509 | $ | 172 | $ | 1,502 | ||||||||
Amounts designated as “—” are $0 or have been rounded to $0.
The accompanying notes are an integral part of the financial statements.
| 48 | SEI Daily Income Trust / Annual Report / January 31, 2012 |
Table of Contents
Treasury Fund | Treasury II Fund | Short-Duration Government Fund | Intermediate- Duration Government Fund | GNMA Fund | Ultra Short Duration Bond Fund | |||||||||||||||||
| $ | 463 | $ | 330 | $ | 9,267 | $ | 1,388 | $ | 2,036 | $ | 3,789 | |||||||||||
| 1,219 | 1,407 | 2,469 | 243 | 767 | 910 | |||||||||||||||||
| 479 | 910 | 1,738 | 174 | 599 | 649 | |||||||||||||||||
| 351 | — | — | — | — | — | |||||||||||||||||
| 701 | — | — | — | — | — | |||||||||||||||||
| 489 | 645 | — | — | — | — | |||||||||||||||||
| 66 | 35 | — | — | — | — | |||||||||||||||||
| — | — | — | — | — | — | |||||||||||||||||
| 356 | 410 | 608 | 60 | 210 | 258 | |||||||||||||||||
| 7 | 8 | 11 | 2 | 4 | 5 | |||||||||||||||||
| 2 | 3 | 3 | — | 1 | 1 | |||||||||||||||||
| 28 | 27 | 39 | 7 | 15 | 20 | |||||||||||||||||
| 53 | 60 | 76 | 8 | 26 | 29 | |||||||||||||||||
| 2 | 2 | 122 | 16 | 43 | 48 | |||||||||||||||||
| 45 | 56 | 60 | 4 | 20 | 22 | |||||||||||||||||
| 3,798 | 3,563 | 5,126 | 514 | 1,685 | 1,942 | |||||||||||||||||
| (178 | ) | (208 | ) | (49 | ) | — | — | (88 | ) | |||||||||||||
| (1,123 | ) | (1,407 | ) | — | (2 | ) | (171 | ) | (214 | ) | ||||||||||||
| — | (84 | ) | — | — | — | — | ||||||||||||||||
| (479 | ) | (910 | ) | (1,738 | ) | (143 | ) | — | (649 | ) | ||||||||||||
| (489 | ) | (645 | ) | — | — | — | — | |||||||||||||||
| (66 | ) | (35 | ) | — | — | — | — | |||||||||||||||
| — | — | — | — | — | — | |||||||||||||||||
| (1,051 | ) | — | — | — | — | — | ||||||||||||||||
| 412 | 274 | 3,339 | 369 | 1,514 | 991 | |||||||||||||||||
| 51 | 56 | 5,928 | 1,019 | 522 | 2,798 | |||||||||||||||||
| 20 | 11 | 13,212 | 319 | 15,058 | (2,333 | ) | ||||||||||||||||
| — | — | (7,279 | ) | 647 | 623 | (787 | ) | |||||||||||||||
| — | — | 7,694 | 945 | 1,522 | 2,594 | |||||||||||||||||
| — | — | (3,136 | ) | 508 | 75 | (463 | ) | |||||||||||||||
| $ | 71 | $ | 67 | $ | 16,419 | $ | 3,438 | $ | 17,800 | $ | 1,809 | |||||||||||
| SEI Daily Income Trust / Annual Report / January 31, 2012 | 49 |
Table of Contents
Statements of Changes in Net Assets ($ Thousands)
For the years ended January 31,
Money Market Fund | Government Fund | |||||||||||||||
| 2012 | 2011 | 2012 | 2011 | |||||||||||||
Operations: | ||||||||||||||||
Net Investment Income | $ | 148 | $ | 359 | $ | 505 | $ | 645 | ||||||||
Net Realized Gain on Investments | 5 | 2 | 4 | 2 | ||||||||||||
Net Increase in Net Assets Resulting from Operations | 153 | 361 | 509 | 647 | ||||||||||||
Dividends and Distributions to Shareholders: | ||||||||||||||||
Net Investment Income | ||||||||||||||||
Class A | (134 | ) | (344 | ) | (302 | ) | (427 | ) | ||||||||
Class B | (5 | ) | (4 | ) | (175 | ) | (176 | ) | ||||||||
Class C | (5 | ) | (7 | ) | (17 | ) | (31 | ) | ||||||||
Class H | — | — | — | — | ||||||||||||
Sweep Class | (3 | ) | (3 | ) | (11 | ) | (11 | ) | ||||||||
Net Capital Gain | ||||||||||||||||
Class A | — | (6 | ) | — | — | |||||||||||
Class B | — | (1 | ) | — | — | |||||||||||
Class C | — | (1 | ) | — | — | |||||||||||
Sweep Class | — | (1 | ) | — | — | |||||||||||
Total Dividends and Distributions | (147 | ) | (367 | ) | (505 | ) | (645 | ) | ||||||||
Capital Share Transactions (All at $1.00 per share) | ||||||||||||||||
Class A: | ||||||||||||||||
Proceeds from Shares Issued | 1,640,331 | 1,734,955 | 5,212,895 | 5,567,117 | ||||||||||||
Reinvestment of Dividends & Distributions | 92 | 245 | 108 | 259 | ||||||||||||
Cost of Shares Redeemed | (1,708,746 | ) | (1,748,792 | ) | (4,791,600 | ) | (5,759,559 | ) | ||||||||
Net Increase (Decrease) from Class A Transactions | (68,323 | ) | (13,592 | ) | 421,403 | (192,183 | ) | |||||||||
Class B: | ||||||||||||||||
Proceeds from Shares Issued | 312,140 | 294,948 | 1,657,852 | 1,548,689 | ||||||||||||
Reinvestment of Dividends & Distributions | 2 | 1 | 148 | 151 | ||||||||||||
Cost of Shares Redeemed | (278,460 | ) | (306,739 | ) | (1,871,535 | ) | (1,642,343 | ) | ||||||||
Net Increase (Decrease) from Class B Transactions | 33,682 | (11,790 | ) | (213,535 | ) | (93,503 | ) | |||||||||
Class C: | ||||||||||||||||
Proceeds from Shares Issued | 252,507 | 396,468 | 331,272 | 590,208 | ||||||||||||
Reinvestment of Dividends & Distributions | — | 1 | — | — | ||||||||||||
Cost of Shares Redeemed | (272,274 | ) | (417,638 | ) | (378,665 | ) | (594,367 | ) | ||||||||
Net Increase (Decrease) from Class C Transactions | (19,767 | ) | (21,169 | ) | (47,393 | ) | (4,159 | ) | ||||||||
Class H: | ||||||||||||||||
Proceeds from Shares Issued | N/A | N/A | N/A | N/A | ||||||||||||
Reinvestment of Dividends & Distributions | N/A | N/A | N/A | N/A | ||||||||||||
Cost of Shares Redeemed | N/A | N/A | N/A | N/A | ||||||||||||
Net Increase (Decrease) from Class H Transactions | N/A | N/A | N/A | N/A | ||||||||||||
Sweep Class: | ||||||||||||||||
Proceeds from Shares Issued | 275,038 | 339,716 | 281,300 | 266,781 | ||||||||||||
Reinvestment of Dividends & Distributions | — | — | 8 | 6 | ||||||||||||
Cost of Shares Redeemed | (278,940 | ) | (341,558 | ) | (279,235 | ) | (271,646 | ) | ||||||||
Net Increase (Decrease) from Sweep Class Transactions | (3,902 | ) | (1,842 | ) | 2,073 | (4,859 | ) | |||||||||
Net Increase (Decrease) in Net Assets from Capital Shares Transactions | (58,310 | ) | (48,393 | ) | 162,548 | (294,704 | ) | |||||||||
Net Increase (Decrease) in Net Assets | (58,304 | ) | (48,399 | ) | 162,552 | (294,702 | ) | |||||||||
Net Assets: | ||||||||||||||||
Beginning of Year | 333,610 | 382,009 | 1,047,933 | 1,342,635 | ||||||||||||
End of Year | $ | 275,306 | $ | 333,610 | $ | 1,210,485 | $ | 1,047,933 | ||||||||
Undistributed (Distributions in Excess of) Net Investment Income | $ | — | $ | (1 | ) | $ | — | $ | — | |||||||
Amounts designated as “—” are zero or have been rounded to zero.
The accompanying notes are an integral part of the financial statements.
| 50 | SEI Daily Income Trust / Annual Report / January 31, 2012 |
Table of Contents
Government II Fund | Prime Obligation Fund | Treasury Fund | Treasury II Fund | |||||||||||||||||||||||||||
| 2012 | 2011 | 2012 | 2011 | 2012 | 2011 | 2012 | 2011 | |||||||||||||||||||||||
| $ | 147 | $ | 132 | $ | 1,466 | $ | 4,070 | $ | 51 | $ | 65 | $ | 56 | $ | 51 | |||||||||||||||
| 25 | 5 | 36 | 15 | 20 | 1 | 11 | 5 | |||||||||||||||||||||||
| 172 | 137 | 1,502 | 4,085 | 71 | 66 | 67 | 56 | |||||||||||||||||||||||
| (130 | ) | (117 | ) | (1,444 | ) | (4,037 | ) | (18 | ) | (30 | ) | (34 | ) | (34 | ) | |||||||||||||||
| (16 | ) | (15 | ) | (14 | ) | (20 | ) | (17 | ) | (19 | ) | (21 | ) | (16 | ) | |||||||||||||||
| (1 | ) | — | (5 | ) | (9 | ) | (2 | ) | (2 | ) | (1 | ) | (1 | ) | ||||||||||||||||
| — | — | (2 | ) | (3 | ) | — | — | — | — | |||||||||||||||||||||
| — | — | (1 | ) | (1 | ) | (14 | ) | (14 | ) | — | — | |||||||||||||||||||
| — | — | — | — | — | — | — | — | |||||||||||||||||||||||
| — | — | — | — | — | — | — | — | |||||||||||||||||||||||
| — | — | — | — | — | — | — | — | |||||||||||||||||||||||
| — | — | — | — | — | — | — | — | |||||||||||||||||||||||
| (147 | ) | (132 | ) | (1,466 | ) | (4,070 | ) | (51 | ) | (65 | ) | (56 | ) | (51 | ) | |||||||||||||||
| 3,976,972 | 4,095,746 | 23,221,923 | 20,017,875 | 17,103,687 | 16,949,017 | 1,431,958 | 1,332,020 | |||||||||||||||||||||||
| 14 | 15 | 328 | 1,261 | 8 | 16 | 14 | 16 | |||||||||||||||||||||||
| (3,902,559 | ) | (4,142,548 | ) | (22,258,952 | ) | (20,034,360 | ) | (17,079,921 | ) | (17,068,980 | ) | (1,247,451 | ) | (1,480,492 | ) | |||||||||||||||
| 74,427 | (46,787 | ) | 963,299 | (15,224 | ) | 23,774 | (119,947 | ) | 184,521 | (148,456 | ) | |||||||||||||||||||
| 1,058,494 | 939,511 | 1,022,254 | 1,022,342 | 1,051,080 | 1,262,822 | 841,043 | 514,619 | |||||||||||||||||||||||
| 9 | 9 | 6 | 8 | 9 | 8 | 5 | 4 | |||||||||||||||||||||||
| (1,011,890 | ) | (966,616 | ) | (1,021,603 | ) | (1,069,482 | ) | (1,115,844 | ) | (1,268,188 | ) | (623,989 | ) | (501,854 | ) | |||||||||||||||
| 46,613 | (27,096 | ) | 657 | (47,132 | ) | (64,755 | ) | (5,358 | ) | 217,059 | 12,769 | |||||||||||||||||||
| 88,863 | 27,205 | 359,071 | 655,743 | 112,983 | 183,546 | 54,715 | 75,202 | |||||||||||||||||||||||
| — | — | 1 | 1 | — | — | — | — | |||||||||||||||||||||||
| (92,914 | ) | (22,998 | ) | (373,058 | ) | (694,391 | ) | (116,962 | ) | (199,021 | ) | (54,974 | ) | (77,638 | ) | |||||||||||||||
| (4,051 | ) | 4,207 | (13,986 | ) | (38,647 | ) | (3,979 | ) | (15,475 | ) | (259 | ) | (2,436 | ) | ||||||||||||||||
| N/A | N/A | 43,261 | 47,551 | N/A | N/A | N/A | N/A | |||||||||||||||||||||||
| N/A | N/A | 3 | 3 | N/A | N/A | N/A | N/A | |||||||||||||||||||||||
| N/A | N/A | (42,023 | ) | (54,905 | ) | N/A | N/A | N/A | N/A | |||||||||||||||||||||
| N/A | N/A | 1,241 | (7,351 | ) | N/A | N/A | N/A | N/A | ||||||||||||||||||||||
| N/A | N/A | 41,089 | 116,698 | 433,766 | 396,053 | N/A | N/A | |||||||||||||||||||||||
| N/A | N/A | — | 1 | — | — | N/A | N/A | |||||||||||||||||||||||
| N/A | N/A | (41,630 | ) | (143,835 | ) | (425,941 | ) | (404,977 | ) | N/A | N/A | |||||||||||||||||||
| N/A | N/A | (541 | ) | (27,136 | ) | 7,825 | (8,924 | ) | N/A | N/A | ||||||||||||||||||||
| 116,989 | (69,676 | ) | 950,670 | (135,490 | ) | (37,135 | ) | (149,704 | ) | 401,321 | (138,123 | ) | ||||||||||||||||||
| 117,014 | (69,671 | ) | 950,706 | (135,475 | ) | (37,115 | ) | (149,703 | ) | 401,332 | (138,118 | ) | ||||||||||||||||||
| 1,362,893 | 1,432,564 | 3,364,624 | 3,500,099 | 494,980 | 644,683 | 472,043 | 610,161 | |||||||||||||||||||||||
| $ | 1,479,907 | $ | 1,362,893 | $ | 4,315,330 | $ | 3,364,624 | $ | 457,865 | $ | 494,980 | $ | 873,375 | $ | 472,043 | |||||||||||||||
| $ | — | $ | — | $ | — | $ | — | $ | — | $ | — | $ | — | $ | — | |||||||||||||||
| SEI Daily Income Trust / Annual Report / January 31, 2012 | 51 |
Table of Contents
Statements of Changes in Net Assets ($ Thousands)
For the years ended January 31,
Short-Duration Government Fund | ||||||||
| 2012 | 2011 | |||||||
Operations: | ||||||||
Net Investment Income | $ | 5,928 | $ | 5,939 | ||||
Net Realized Gain (Loss) on Investments and Futures Contracts | 5,933 | 3,701 | ||||||
Net Change in Unrealized Appreciation (Depreciation) on Investments and Futures Contracts | 4,558 | 6,328 | ||||||
Net Increase in Net Assets Resulting from Operations | 16,419 | 15,968 | ||||||
Dividends and Distributions to Shareholders: | ||||||||
Net Investment Income | (8,015 | ) | (9,316 | ) | ||||
Net Capital Gains | (993 | ) | (4,787 | ) | ||||
Total Dividends and Distributions | (9,008 | ) | (14,103 | ) | ||||
Capital Share Transactions: | ||||||||
Class A: | ||||||||
Proceeds from Shares Issued | 528,070 | 995,520 | ||||||
Reinvestment of Dividends & Distributions | 7,755 | 12,578 | ||||||
Cost of Shares Redeemed | (671,423 | ) | (519,738 | ) | ||||
Net Increase (Decrease) from Class A Transactions | (135,598 | ) | 488,360 | |||||
Net Increase (Decrease) in Net Assets | (128,187 | ) | 490,225 | |||||
Net Assets: | ||||||||
Beginning of Year | 867,313 | 377,088 | ||||||
End of Year | $ | 739,126 | $ | 867,313 | ||||
Undistributed (Distributions in Excess of) Net Investment Income | $ | 10 | $ | 16 | ||||
Capital Share Transactions: | ||||||||
Class A: | ||||||||
Shares Issued | 49,442 | 93,798 | ||||||
Reinvestment of Distributions | 726 | 1,184 | ||||||
Shares Redeemed | (63,098 | ) | (48,951 | ) | ||||
Net Increase (Decrease) in Shares Outstanding from Share Transactions | (12,930 | ) | 46,031 | |||||
Amounts designated as “—” are zero or have been rounded to zero.
The accompanying notes are an integral part of the financial statements.
| 52 | SEI Daily Income Trust / Annual Report / January 31, 2012 |
Table of Contents
| Intermediate-Duration Government Fund | GNMA Fund | Ultra Short Duration Bond Fund | ||||||||||||||||||||
| 2012 | 2011 | 2012 | 2011 | 2012 | 2011 | |||||||||||||||||
| $ | 1,019 | $ | 1,589 | $ | 522 | $ | 3,603 | $ | 2,798 | $ | 4,998 | |||||||||||
| 966 | 1,690 | 15,681 | 9,292 | (3,120 | ) | (11,033 | ) | |||||||||||||||
| 1,453 | (847 | ) | 1,597 | 879 | 2,131 | 15,789 | ||||||||||||||||
| 3,438 | 2,432 | 17,800 | 13,774 | 1,809 | 9,754 | |||||||||||||||||
| (1,242 | ) | (2,015 | ) | (2,741 | ) | (3,899 | ) | (3,373 | ) | (6,166 | ) | |||||||||||
| (1 | ) | (4,687 | ) | (8,838 | ) | (5,289 | ) | — | — | |||||||||||||
| (1,243 | ) | (6,702 | ) | (11,579 | ) | (9,188 | ) | (3,373 | ) | (6,166 | ) | |||||||||||
| 92,282 | 234,078 | 157,770 | 295,258 | 219,836 | 361,528 | |||||||||||||||||
| 1,098 | 6,262 | 9,102 | 7,361 | 2,936 | 5,248 | |||||||||||||||||
| (212,061 | ) | (111,103 | ) | (264,492 | ) | (171,704 | ) | (431,818 | ) | (161,990 | ) | |||||||||||
| (118,681 | ) | 129,237 | (97,620 | ) | 130,915 | (209,046 | ) | 204,786 | ||||||||||||||
| (116,486 | ) | 124,967 | (91,399 | ) | 135,501 | (210,610 | ) | 208,374 | ||||||||||||||
| 187,944 | 62,977 | 334,415 | 198,914 | 465,612 | 257,238 | |||||||||||||||||
| $ | 71,458 | $ | 187,944 | $ | 243,016 | $ | 334,415 | $ | 255,002 | $ | 465,612 | |||||||||||
| $ | 1 | $ | 2 | $ | (9 | ) | $ | 130 | $ | 13 | $ | 5 | ||||||||||
| 7,879 | 20,154 | 14,347 | 27,752 | 23,655 | 38,917 | |||||||||||||||||
| 95 | 547 | 837 | 695 | 316 | 564 | |||||||||||||||||
| (18,583 | ) | (9,696 | ) | (24,507 | ) | (16,198 | ) | (46,331 | ) | (17,431 | ) | |||||||||||
| (10,609 | ) | 11,005 | (9,323 | ) | 12,249 | (22,360 | ) | 22,050 | ||||||||||||||
| SEI Daily Income Trust / Annual Report / January 31, 2012 | 53 |
Table of Contents
For the years ended January 31,
For a Share Outstanding Throughout the Years
| Net Asset Value, Beginning of Year | Net Investment Income* | Net Realized and Unrealized Gains (Losses) on Securities | Payment by Affiliate* | Total from Operations* | Dividends from Net Investment Income | Distributions from Realized Capital Gains | Total Dividends | Net Asset Value, End of Year | Total Return† | Net Assets End of Year ($ Thousands) | Ratio of Expenses to Average Net Assets | Ratio of Expenses to Average Net Assets (Excluding Waivers) | Ratio of to Average | |||||||||||||||||||||||||||||||||||||||||||
Money Market Fund |
| |||||||||||||||||||||||||||||||||||||||||||||||||||||||
Class A |
| |||||||||||||||||||||||||||||||||||||||||||||||||||||||
2012 | $ | 1.00 | $ | — | $ | — | $ | — | $ | — | $ | — | (1) | $ | — | $ | — | (1) | $ | 1.00 | 0.06 | % | $ | 146,460 | 0.18 | % | 0.68 | % | 0.06 | % | ||||||||||||||||||||||||||
2011 | 1.00 | — | — | — | — | — | (1) | — | (1) | — | (1) | 1.00 | 0.14 | 214,779 | 0.18 | 0.68 | 0.14 | |||||||||||||||||||||||||||||||||||||||
2010 | 1.00 | — | — | — | — | — | (1) | — | — | (1) | 1.00 | 0.31 | 228,375 | 0.24 | (2) | 0.70 | 0.35 | |||||||||||||||||||||||||||||||||||||||
2009 | 1.00 | 0.02 | (0.01 | ) | 0.01 | 0.02 | (0.02 | ) | — | (0.02 | ) | 1.00 | 2.45 | †† | 341,204 | 0.20 | (2) | 0.64 | 2.46 | |||||||||||||||||||||||||||||||||||||
2008 | 1.00 | 0.05 | — | — | 0.05 | (0.05 | ) | — | (0.05 | ) | 1.00 | 5.23 | 401,174 | 0.18 | 0.63 | 5.13 | ||||||||||||||||||||||||||||||||||||||||
Class B |
| |||||||||||||||||||||||||||||||||||||||||||||||||||||||
2012 | $ | 1.00 | $ | — | $ | — | $ | — | $ | — | $ | — | (1) | $ | — | $ | — | (1) | $ | 1.00 | 0.01 | % | $ | 73,035 | 0.23 | %(3) | 0.73 | % | 0.01 | % | ||||||||||||||||||||||||||
2011 | 1.00 | — | — | — | — | — | (1) | — | (1) | — | (1) | 1.00 | 0.01 | 39,352 | 0.30 | 0.80 | 0.01 | |||||||||||||||||||||||||||||||||||||||
2010 | 1.00 | — | — | — | — | — | (1) | — | — | (1) | 1.00 | 0.15 | 51,142 | 0.44 | (2)(3) | 0.76 | 0.19 | |||||||||||||||||||||||||||||||||||||||
2009 | 1.00 | 0.02 | (0.01 | ) | 0.01 | 0.02 | (0.02 | ) | — | (0.02 | ) | 1.00 | 2.15 | †† | 120,925 | 0.50 | (2) | 0.70 | 2.19 | |||||||||||||||||||||||||||||||||||||
2008 | 1.00 | 0.05 | — | — | 0.05 | (0.05 | ) | — | (0.05 | ) | 1.00 | 4.92 | 166,627 | 0.48 | 0.68 | 4.82 | ||||||||||||||||||||||||||||||||||||||||
Class C |
| |||||||||||||||||||||||||||||||||||||||||||||||||||||||
2012 | $ | 1.00 | $ | — | $ | — | $ | — | $ | — | $ | — | (1) | $ | — | $ | — | (1) | $ | 1.00 | 0.01 | % | $ | 33,110 | 0.23 | %(3) | 0.93 | % | 0.01 | % | ||||||||||||||||||||||||||
2011 | 1.00 | — | — | — | — | — | (1) | — | (1) | — | (1) | 1.00 | 0.01 | 52,876 | 0.30 | 0.80 | 0.01 | |||||||||||||||||||||||||||||||||||||||
2010 | 1.00 | — | — | — | — | — | (1) | — | — | (1) | 1.00 | 0.08 | 74,047 | 0.49 | (2)(3) | 0.95 | 0.10 | |||||||||||||||||||||||||||||||||||||||
2009 | 1.00 | 0.02 | (0.01 | ) | 0.01 | 0.02 | (0.02 | ) | — | (0.02 | ) | 1.00 | 1.94 | †† | 158,833 | 0.70 | (2) | 0.89 | 2.00 | |||||||||||||||||||||||||||||||||||||
2008 | 1.00 | 0.05 | — | — | 0.05 | (0.05 | ) | — | (0.05 | ) | 1.00 | 4.71 | 259,640 | 0.68 | 0.88 | 4.61 | ||||||||||||||||||||||||||||||||||||||||
Sweep Class |
| |||||||||||||||||||||||||||||||||||||||||||||||||||||||
2012 | $ | 1.00 | $ | — | $ | — | $ | — | $ | — | $ | — | (1) | $ | — | $ | — | (1) | $ | 1.00 | 0.01 | % | $ | 22,701 | 0.23 | %(3) | 1.18 | % | 0.01 | % | ||||||||||||||||||||||||||
2011 | 1.00 | — | — | — | — | — | (1) | — | (1) | — | (1) | 1.00 | 0.01 | 26,603 | 0.31 | 0.81 | 0.01 | |||||||||||||||||||||||||||||||||||||||
2010 | 1.00 | — | — | — | — | — | (1) | — | — | (1) | 1.00 | 0.07 | 28,445 | 0.52 | (2)(3) | 1.20 | 0.08 | |||||||||||||||||||||||||||||||||||||||
2009 | 1.00 | 0.02 | (0.01 | ) | 0.01 | 0.02 | (0.02 | ) | — | (0.02 | ) | 1.00 | 1.69 | †† | 68,179 | 0.95 | (2) | 1.14 | 1.79 | |||||||||||||||||||||||||||||||||||||
2008 | 1.00 | 0.04 | — | — | 0.04 | (0.04 | ) | — | (0.04 | ) | 1.00 | 4.45 | 133,223 | 0.93 | 1.13 | 4.35 | ||||||||||||||||||||||||||||||||||||||||
Government Fund |
| |||||||||||||||||||||||||||||||||||||||||||||||||||||||
Class A |
| |||||||||||||||||||||||||||||||||||||||||||||||||||||||
2012 | $ | 1.00 | $ | — | $ | — | $ | — | $ | — | $ | — | (1) | $ | — | $ | — | (1) | $ | 1.00 | 0.05 | % | $ | 1,054,551 | 0.10 | %(3) | 0.59 | % | 0.05 | % | ||||||||||||||||||||||||||
2011 | 1.00 | — | — | — | — | — | (1) | — | — | (1) | 1.00 | 0.05 | 633,160 | 0.17 | (3) | 0.59 | 0.05 | |||||||||||||||||||||||||||||||||||||||
2010 | 1.00 | — | — | — | — | — | (1) | — | — | (1) | 1.00 | 0.14 | 825,341 | 0.20 | (2) | 0.57 | 0.16 | |||||||||||||||||||||||||||||||||||||||
2009 | 1.00 | 0.02 | — | — | 0.02 | (0.02 | ) | — | (0.02 | ) | 1.00 | 2.15 | 1,526,541 | 0.22 | (2) | 0.54 | 2.06 | |||||||||||||||||||||||||||||||||||||||
2008 | 1.00 | 0.05 | — | — | 0.05 | (0.05 | ) | — | (0.05 | ) | 1.00 | 4.98 | 1,031,612 | 0.20 | 0.53 | 4.79 | ||||||||||||||||||||||||||||||||||||||||
Class B |
| |||||||||||||||||||||||||||||||||||||||||||||||||||||||
2012 | $ | 1.00 | $ | — | $ | — | $ | — | $ | — | $ | — | (1) | $ | — | $ | — | (1) | $ | 1.00 | 0.05 | % | $ | 120,664 | 0.09 | %(3) | 0.64 | % | 0.05 | % | ||||||||||||||||||||||||||
2011 | 1.00 | — | — | — | — | — | (1) | — | — | (1) | 1.00 | 0.05 | 334,209 | 0.16 | (3) | 0.64 | 0.05 | |||||||||||||||||||||||||||||||||||||||
2010 | 1.00 | — | — | — | — | — | (1) | — | — | (1) | 1.00 | 0.07 | 427,711 | 0.28 | (2)(3) | 0.62 | 0.07 | |||||||||||||||||||||||||||||||||||||||
2009 | 1.00 | 0.02 | — | — | 0.02 | (0.02 | ) | — | (0.02 | ) | 1.00 | 1.84 | 623,905 | 0.52 | (2) | 0.60 | 1.62 | |||||||||||||||||||||||||||||||||||||||
2008 | 1.00 | 0.05 | — | — | 0.05 | (0.05 | ) | — | (0.05 | ) | 1.00 | 4.67 | 197,593 | 0.50 | 0.58 | 4.53 | ||||||||||||||||||||||||||||||||||||||||
Class C |
| |||||||||||||||||||||||||||||||||||||||||||||||||||||||
2012 | $ | 1.00 | $ | — | $ | — | $ | — | $ | — | $ | — | (1) | $ | — | $ | — | (1) | $ | 1.00 | 0.05 | % | $ | 8,036 | 0.10 | %(3) | 0.84 | % | 0.05 | % | ||||||||||||||||||||||||||
2011 | 1.00 | — | — | — | — | — | (1) | — | — | (1) | 1.00 | 0.05 | 55,406 | 0.17 | (3) | 0.84 | 0.05 | |||||||||||||||||||||||||||||||||||||||
2010 | 1.00 | — | — | — | — | — | (1) | — | — | (1) | 1.00 | 0.06 | 59,565 | 0.31 | (2)(3) | 0.82 | 0.07 | |||||||||||||||||||||||||||||||||||||||
2009 | 1.00 | 0.02 | — | — | 0.02 | (0.02 | ) | — | (0.02 | ) | 1.00 | 1.64 | 153,015 | 0.71 | (2)(3) | 0.79 | 1.65 | |||||||||||||||||||||||||||||||||||||||
2008 | 1.00 | 0.04 | — | — | 0.04 | (0.04 | ) | — | (0.04 | ) | 1.00 | 4.46 | 154,244 | 0.70 | 0.78 | 4.35 | ||||||||||||||||||||||||||||||||||||||||
Sweep Class |
| |||||||||||||||||||||||||||||||||||||||||||||||||||||||
2012 | $ | 1.00 | $ | — | $ | — | $ | — | $ | — | $ | — | (1) | $ | — | $ | — | (1) | $ | 1.00 | 0.05 | % | $ | 27,234 | 0.09 | %(3) | 1.09 | % | 0.05 | % | ||||||||||||||||||||||||||
2011 | 1.00 | — | — | — | — | — | (1) | — | — | (1) | 1.00 | 0.05 | 25,158 | 0.16 | (3) | 1.09 | 0.05 | |||||||||||||||||||||||||||||||||||||||
2010 | 1.00 | — | — | — | — | — | (1) | — | — | (1) | 1.00 | 0.06 | 30,018 | 0.30 | (2)(3) | 1.07 | 0.07 | |||||||||||||||||||||||||||||||||||||||
2009 | 1.00 | 0.01 | — | — | 0.01 | (0.01 | ) | — | (0.01 | ) | 1.00 | 1.39 | 45,154 | 0.96 | (2)(3) | 1.04 | 1.34 | |||||||||||||||||||||||||||||||||||||||
2008 | 1.00 | 0.04 | — | — | 0.04 | (0.04 | ) | — | (0.04 | ) | 1.00 | 4.20 | 28,233 | 0.95 | 1.03 | 4.06 | ||||||||||||||||||||||||||||||||||||||||
Amounts designated as “—” are zero or have been rounded to zero.
| (1) | Amount represents less than $0.01 per share. |
| (2) | The expense ratio includes the Treasury Guarantee Program expense. The Fund participated in the Temporary Guarantee Program for Money Market Funds from September 18, 2008 through September 18, 2009. Had the expense been excluded, the expense ratio would have been equal to, or less than, the expense ratio cap figure. See Note 3 for expense ratio cap figure. |
| (3) | The Distributor and/or Administrator have voluntarily agreed to waive and reduce its fee and/or reimburse certain expenses of the Fund in order to limit the one-day net income yield of the Fund to not less than 0.01% of the Fund’s average daily net assets of the share class. Had these waivers and the Treasury Guarantee Program expense been excluded the ratio would have been at the expense ratio cap figure. See Note 3 for expense ratio cap figure. |
| * | Per share calculations were performed using average shares. |
| † | Returns are for the period indicated and have not been annualized. Returns shown do not reflect the deduction of taxes that a shareholder would pay on Fund distributions or the redemption of Fund shares. |
| †† | The total return includes payment by affiliate. Had the payment been excluded the total return would have been 1.61%, 1.31%, 1.11% and 0.86% for Class A, Class B, Class C and Sweep Class, respectively. See Note 3 in Notes to Financial Statements. |
| 54 | SEI Daily Income Trust / Annual Report / January 31, 2012 |
Table of Contents
| Net Asset Value, Beginning of Year | Net Investment Income* | Net Realized and Unrealized Gains (Losses) on Securities | Payment by Affiliate* | Total from Operations* | Dividends from Net Investment Income | Total Dividends | Net Asset Value, End of Year | Total Return† | Net Assets End of Year ($ Thousands) | Ratio of Expenses to Average Net Assets | Ratio of Expenses to Average Net Assets (Excluding Waivers) | Ratio of to Average | ||||||||||||||||||||||||||||||||||||||||
Government II Fund |
| |||||||||||||||||||||||||||||||||||||||||||||||||||
Class A |
| |||||||||||||||||||||||||||||||||||||||||||||||||||
2012 | $ | 1.00 | $ | — | $ | — | $ | — | $ | — | $ | — | (1) | $ | — | (1) | $ | 1.00 | 0.01 | % | $ | 1,308,018 | 0.09 | %(3) | 0.54 | % | 0.01 | % | ||||||||||||||||||||||||
2011 | 1.00 | — | — | — | — | — | (1) | — | (1) | 1.00 | 0.01 | 1,233,569 | 0.16 | (3) | 0.54 | 0.01 | ||||||||||||||||||||||||||||||||||||
2010 | 1.00 | — | — | — | — | — | (1) | — | (1) | 1.00 | 0.11 | 1,280,352 | 0.19 | (2) | 0.52 | 0.12 | ||||||||||||||||||||||||||||||||||||
2009 | 1.00 | 0.02 | — | — | 0.02 | (0.02 | ) | (0.02 | ) | 1.00 | 2.10 | 2,050,235 | 0.21 | (2) | 0.50 | 1.99 | ||||||||||||||||||||||||||||||||||||
2008 | 1.00 | 0.05 | — | — | 0.05 | (0.05 | ) | (0.05 | ) | 1.00 | 4.97 | 1,354,361 | 0.20 | 0.48 | 4.81 | |||||||||||||||||||||||||||||||||||||
Class B |
| |||||||||||||||||||||||||||||||||||||||||||||||||||
2012 | $ | 1.00 | $ | — | $ | — | $ | — | $ | — | $ | — | (1) | $ | — | (1) | $ | 1.00 | 0.01 | % | $ | 166,481 | 0.09 | %(3) | 0.59 | % | 0.01 | % | ||||||||||||||||||||||||
2011 | 1.00 | — | — | — | — | — | (1) | — | (1) | 1.00 | 0.01 | 119,864 | 0.16 | (3) | 0.59 | 0.01 | ||||||||||||||||||||||||||||||||||||
2010 | 1.00 | — | — | — | — | — | (1) | — | (1) | 1.00 | 0.06 | 146,960 | 0.25 | (2) | 0.56 | 0.06 | ||||||||||||||||||||||||||||||||||||
2009 | 1.00 | 0.02 | — | — | 0.02 | (0.02 | ) | (0.02 | ) | 1.00 | 1.79 | 242,332 | 0.51 | (2) | 0.54 | 1.80 | ||||||||||||||||||||||||||||||||||||
2008 | 1.00 | 0.05 | — | — | 0.05 | (0.05 | ) | (0.05 | ) | 1.00 | 4.66 | 150,900 | 0.50 | 0.53 | 4.53 | |||||||||||||||||||||||||||||||||||||
Class C |
| |||||||||||||||||||||||||||||||||||||||||||||||||||
2012 | $ | 1.00 | $ | — | $ | — | $ | — | $ | — | $ | — | (1) | $ | — | (1) | $ | 1.00 | 0.01 | % | $ | 5,408 | 0.10 | %(3) | 0.79 | % | 0.01 | % | ||||||||||||||||||||||||
2011 | 1.00 | — | — | — | — | — | (1) | — | (1) | 1.00 | 0.01 | 9,460 | 0.16 | (3) | 0.79 | 0.01 | ||||||||||||||||||||||||||||||||||||
2010 | 1.00 | — | — | — | — | — | (1) | — | (1) | 1.00 | 0.06 | 5,252 | 0.28 | (2)(3) | 0.77 | 0.06 | ||||||||||||||||||||||||||||||||||||
2009 | 1.00 | 0.02 | — | — | 0.02 | (0.02 | ) | (0.02 | ) | 1.00 | 1.60 | 31,462 | 0.70 | (2)(3) | 0.74 | 1.63 | ||||||||||||||||||||||||||||||||||||
2008 | 1.00 | 0.04 | — | — | 0.04 | (0.04 | ) | (0.04 | ) | 1.00 | 4.45 | 43,538 | 0.70 | 0.73 | 4.05 | |||||||||||||||||||||||||||||||||||||
Prime Obligation Fund |
| |||||||||||||||||||||||||||||||||||||||||||||||||||
Class A |
| |||||||||||||||||||||||||||||||||||||||||||||||||||
2012 | $ | 1.00 | $ | — | $ | — | $ | — | $ | — | $ | — | (1) | $ | — | (1) | $ | 1.00 | 0.04 | % | $ | 4,107,485 | 0.20 | % | 0.54 | % | 0.04 | % | ||||||||||||||||||||||||
2011 | 1.00 | — | — | — | — | — | (1) | — | (1) | 1.00 | 0.11 | 3,144,153 | 0.20 | 0.54 | 0.12 | |||||||||||||||||||||||||||||||||||||
2010 | 1.00 | — | (0.04 | ) | 0.04 | — | — | (1) | — | (1) | 1.00 | 0.20 | †† | 3,158,830 | 0.23 | (2) | 0.53 | 0.26 | ||||||||||||||||||||||||||||||||||
2009 | 1.00 | 0.02 | — | — | 0.02 | (0.02 | ) | (0.02 | ) | 1.00 | 2.37 | 3,796,102 | 0.22 | (2) | 0.50 | 2.42 | ||||||||||||||||||||||||||||||||||||
2008 | 1.00 | 0.05 | — | — | 0.05 | (0.05 | ) | (0.05 | ) | 1.00 | 5.21 | 3,740,714 | 0.20 | 0.48 | 5.10 | |||||||||||||||||||||||||||||||||||||
Class B |
| |||||||||||||||||||||||||||||||||||||||||||||||||||
2012 | $ | 1.00 | $ | — | $ | — | $ | — | $ | — | $ | — | (1) | $ | — | (1) | $ | 1.00 | 0.01 | % | $ | 135,978 | 0.23 | %(3) | 0.59 | % | 0.01 | % | ||||||||||||||||||||||||
2011 | 1.00 | — | — | — | — | — | (1) | — | (1) | 1.00 | 0.01 | 135,319 | 0.31 | (3) | 0.59 | 0.01 | ||||||||||||||||||||||||||||||||||||
2010 | 1.00 | — | (0.04 | ) | 0.04 | — | — | (1) | — | (1) | 1.00 | 0.07 | †† | 182,593 | 0.38 | (2)(3) | 0.58 | 0.15 | ||||||||||||||||||||||||||||||||||
2009 | 1.00 | 0.02 | — | — | 0.02 | (0.02 | ) | (0.02 | ) | 1.00 | 2.06 | 346,741 | 0.51 | (2) | 0.55 | 2.17 | ||||||||||||||||||||||||||||||||||||
2008 | 1.00 | 0.05 | — | — | 0.05 | (0.05 | ) | (0.05 | ) | 1.00 | 4.90 | 475,700 | 0.50 | 0.53 | 4.82 | |||||||||||||||||||||||||||||||||||||
Class C |
| |||||||||||||||||||||||||||||||||||||||||||||||||||
2012 | $ | 1.00 | $ | — | $ | — | $ | — | $ | — | $ | — | (1) | $ | — | (1) | $ | 1.00 | 0.01 | % | $ | 42,051 | 0.23 | %(3) | 0.79 | % | 0.01 | % | ||||||||||||||||||||||||
2011 | 1.00 | — | — | — | — | — | (1) | — | (1) | 1.00 | 0.01 | 56,037 | 0.30 | (3) | 0.79 | 0.01 | ||||||||||||||||||||||||||||||||||||
2010 | 1.00 | — | (0.04 | ) | 0.04 | — | — | (1) | — | (1) | 1.00 | 0.06 | †† | 95,092 | 0.39 | (2)(3) | 0.78 | 0.14 | ||||||||||||||||||||||||||||||||||
2009 | 1.00 | 0.02 | — | — | 0.02 | (0.02 | ) | (0.02 | ) | 1.00 | 1.86 | 467,782 | 0.71 | (2) | 0.75 | 2.04 | ||||||||||||||||||||||||||||||||||||
2008 | 1.00 | 0.05 | — | — | 0.05 | (0.05 | ) | (0.05 | ) | 1.00 | 4.69 | 641,977 | 0.70 | 0.73 | 4.60 | |||||||||||||||||||||||||||||||||||||
Class H |
| |||||||||||||||||||||||||||||||||||||||||||||||||||
2012 | $ | 1.00 | $ | — | $ | — | $ | — | $ | — | $ | — | (1) | $ | — | (1) | $ | 1.00 | 0.01 | % | $ | 25,646 | 0.23 | %(3) | 0.72 | % | 0.01 | % | ||||||||||||||||||||||||
2011 | 1.00 | — | — | — | — | — | (1) | — | (1) | 1.00 | 0.01 | 24,405 | 0.30 | (3) | 0.72 | 0.01 | ||||||||||||||||||||||||||||||||||||
2010 | 1.00 | — | (0.04 | ) | 0.04 | — | — | (1) | — | (1) | 1.00 | 0.02 | †† | 31,797 | 0.43 | (2)(3) | 0.71 | 0.09 | ||||||||||||||||||||||||||||||||||
2009 | 1.00 | 0.02 | — | — | 0.02 | (0.02 | ) | (0.02 | ) | 1.00 | 1.93 | 58,276 | 0.64 | (2) | 0.67 | 2.11 | ||||||||||||||||||||||||||||||||||||
2008 | 1.00 | 0.05 | — | — | 0.05 | (0.05 | ) | (0.05 | ) | 1.00 | 4.76 | 80,958 | 0.63 | 0.66 | 4.65 | |||||||||||||||||||||||||||||||||||||
Sweep Class |
| |||||||||||||||||||||||||||||||||||||||||||||||||||
2012 | $ | 1.00 | $ | — | $ | — | $ | — | $ | — | $ | — | (1) | $ | — | (1) | $ | 1.00 | 0.01 | % | $ | 4,170 | 0.23 | %(3) | 1.04 | % | 0.01 | % | ||||||||||||||||||||||||
2011 | 1.00 | — | — | — | — | — | (1) | — | (1) | 1.00 | 0.01 | 4,710 | 0.30 | (3) | 1.04 | 0.01 | ||||||||||||||||||||||||||||||||||||
2010 | 1.00 | — | (0.04 | ) | 0.04 | — | — | (1) | — | (1) | 1.00 | 0.06 | †† | 31,787 | 0.39 | (2)(3) | 1.03 | 0.14 | ||||||||||||||||||||||||||||||||||
2009 | 1.00 | 0.02 | — | — | 0.02 | (0.02 | ) | (0.02 | ) | 1.00 | 1.62 | 57,135 | 0.95 | (2)(3) | 1.00 | 1.54 | ||||||||||||||||||||||||||||||||||||
2008 | 1.00 | 0.04 | — | — | 0.04 | (0.04 | ) | (0.04 | ) | 1.00 | 4.43 | 56,378 | 0.95 | 0.98 | 4.34 | |||||||||||||||||||||||||||||||||||||
Amounts designated as “—” are zero or have been rounded to zero.
| (1) | Amount represents less than $0.01 per share. |
| (2) | The expense ratio includes the Treasury Guarantee Program expense. The Fund participated in the Temporary Guarantee Program for Money Market Funds from September 18, 2008 through September 18, 2009. Had the expense been excluded, the expense ratio would have been equal to, or less than, the expense ratio cap figure. See Note 3 for expense ratio cap figure. |
| (3) | The Distributor and/or Administrator have voluntarily agreed to waive and reduce its fee and/or reimburse certain expenses of the Fund in order to limit the one-day net income yield of the Fund to not less than 0.01% of the Fund’s average daily net assets of the share class. Had these waivers and the Treasury Guarantee Program expense been excluded the ratio would have been at the expense ratio cap figure. See Note 3 for expense ratio cap figure. |
| * | Per share calculations were performed using average shares. |
| † | Returns are for the period indicated and have not been annualized. Returns shown do not reflect the deduction of taxes that a shareholder would pay on Fund distributions or the redemption of Fund shares. |
| †† | The total return includes payment by affiliate. Had the payment been excluded the total return would have been (3.28)%, (3.41)%, (3.42)%, (3.45)% and (3.42)% for Class A, Class B, Class C, Class H and Sweep Class, respectively. See Note 3 in Notes to Financial Statements. |
| SEI Daily Income Trust / Annual Report / January 31, 2012 | 55 |
Table of Contents
Financial Highlights
For the years ended January 31,
For a Share Outstanding Throughout the Years
| Net Asset Value, Beginning of Year | Net Investment | Net (Losses) on | Payment by Affiliate* | Total from Operations* | Dividends from Net Investment Income | Total Dividends | Net Asset Value, End of Year | Total Return† | Net Assets End of Year ($ Thousands) | Ratio of Expenses | Ratio of (Excluding | Ratio of to Average | ||||||||||||||||||||||||||||||||||||||||
Treasury Fund |
| |||||||||||||||||||||||||||||||||||||||||||||||||||
Class A |
| |||||||||||||||||||||||||||||||||||||||||||||||||||
2012 | $ | 1.00 | $ | — | $ | — | $ | — | $ | — | $ | — | (1) | $ | — | (1) | $ | 1.00 | 0.01 | % | $ | 199,520 | 0.08 | %(3) | 0.59 | % | 0.01 | % | ||||||||||||||||||||||||
2011 | 1.00 | — | — | — | — | — | (1) | — | (1) | 1.00 | 0.02 | 175,749 | 0.18 | (3) | 0.59 | 0.02 | ||||||||||||||||||||||||||||||||||||
2010 | 1.00 | — | — | — | — | — | (1) | — | (1) | 1.00 | 0.07 | 295,695 | 0.17 | (2) | 0.56 | 0.07 | ||||||||||||||||||||||||||||||||||||
2009 | 1.00 | 0.01 | — | — | 0.01 | (0.01 | ) | (0.01 | ) | 1.00 | 1.27 | 572,906 | 0.19 | (2) | 0.55 | 1.18 | ||||||||||||||||||||||||||||||||||||
2008 | 1.00 | 0.05 | — | — | 0.05 | (0.05 | ) | (0.05 | ) | 1.00 | 4.64 | 610,451 | 0.20 | 0.53 | 4.36 | |||||||||||||||||||||||||||||||||||||
Class B |
| |||||||||||||||||||||||||||||||||||||||||||||||||||
2012 | $ | 1.00 | $ | — | $ | — | $ | — | $ | — | $ | — | (1) | $ | — | (1) | $ | 1.00 | 0.01 | % | $ | 114,026 | 0.08 | %(3) | 0.64 | % | 0.01 | % | ||||||||||||||||||||||||
2011 | 1.00 | — | — | — | — | — | (1) | — | (1) | 1.00 | 0.01 | 178,769 | 0.19 | (3) | 0.64 | 0.01 | ||||||||||||||||||||||||||||||||||||
2010 | 1.00 | — | — | — | — | — | (1) | — | (1) | 1.00 | 0.06 | 184,127 | 0.20 | (2)(3) | 0.61 | 0.06 | ||||||||||||||||||||||||||||||||||||
2009 | 1.00 | 0.01 | — | — | 0.01 | (0.01 | ) | (0.01 | ) | 1.00 | 1.06 | 487,254 | 0.40 | (2)(3) | 0.59 | 1.12 | ||||||||||||||||||||||||||||||||||||
2008 | 1.00 | 0.04 | — | — | 0.04 | (0.04 | ) | (0.04 | ) | 1.00 | 4.33 | 761,497 | 0.50 | 0.58 | 4.07 | |||||||||||||||||||||||||||||||||||||
Class C |
| |||||||||||||||||||||||||||||||||||||||||||||||||||
2012 | $ | 1.00 | $ | — | $ | — | $ | — | $ | — | $ | — | (1) | $ | — | (1) | $ | 1.00 | 0.01 | % | $ | 6,984 | 0.08 | %(3) | 0.84 | % | 0.01 | % | ||||||||||||||||||||||||
2011 | 1.00 | — | — | — | — | — | (1) | — | (1) | 1.00 | 0.01 | 10,948 | 0.18 | (3) | 0.84 | 0.01 | ||||||||||||||||||||||||||||||||||||
2010 | 1.00 | — | — | — | — | — | (1) | — | (1) | 1.00 | 0.06 | 26,423 | 0.20 | (2)(3) | 0.81 | 0.06 | ||||||||||||||||||||||||||||||||||||
2009 | 1.00 | 0.01 | — | — | 0.01 | (0.01 | ) | (0.01 | ) | 1.00 | 0.93 | 72,803 | 0.53 | (2)(3) | 0.80 | 0.98 | ||||||||||||||||||||||||||||||||||||
2008 | 1.00 | 0.04 | — | — | 0.04 | (0.04 | ) | (0.04 | ) | 1.00 | 4.12 | 144,919 | 0.70 | 0.78 | 4.00 | |||||||||||||||||||||||||||||||||||||
Sweep Class |
| |||||||||||||||||||||||||||||||||||||||||||||||||||
2012 | $ | 1.00 | $ | — | $ | — | $ | — | $ | — | $ | — | (1) | $ | — | (1) | $ | 1.00 | 0.01 | % | $ | 137,336 | 0.08 | %(3) | 1.09 | % | 0.01 | % | ||||||||||||||||||||||||
2011 | 1.00 | — | — | — | — | — | (1) | — | (1) | 1.00 | 0.01 | 129,514 | 0.19 | (3) | 1.09 | 0.01 | ||||||||||||||||||||||||||||||||||||
2010 | 1.00 | — | — | — | — | — | (1) | — | (1) | 1.00 | 0.06 | 138,438 | 0.18 | (2)(3) | 1.06 | 0.06 | ||||||||||||||||||||||||||||||||||||
2009 | 1.00 | 0.01 | — | — | 0.01 | (0.01 | ) | (0.01 | ) | 1.00 | 0.77 | 206,719 | 0.61 | (2)(3) | 1.05 | 0.67 | ||||||||||||||||||||||||||||||||||||
2008 | 1.00 | 0.04 | — | — | 0.04 | (0.04 | ) | (0.04 | ) | 1.00 | 3.86 | 111,853 | 0.95 | 1.03 | 3.74 | |||||||||||||||||||||||||||||||||||||
Treasury II Fund |
| |||||||||||||||||||||||||||||||||||||||||||||||||||
Class A |
| |||||||||||||||||||||||||||||||||||||||||||||||||||
2012 | $ | 1.00 | $ | — | $ | — | $ | — | $ | — | $ | — | (1) | $ | — | (1) | $ | 1.00 | 0.01 | % | $ | 472,352 | 0.05 | %(3) | 0.59 | % | 0.01 | % | ||||||||||||||||||||||||
2011 | 1.00 | — | — | — | — | — | (1) | — | (1) | 1.00 | 0.01 | 287,823 | 0.12 | (3) | 0.59 | 0.01 | ||||||||||||||||||||||||||||||||||||
2010 | 1.00 | — | — | — | — | — | (1) | — | (1) | 1.00 | 0.04 | 436,276 | 0.12 | (2) | 0.55 | 0.04 | ||||||||||||||||||||||||||||||||||||
2009 | 1.00 | 0.01 | — | — | 0.01 | (0.01 | ) | (0.01 | ) | 1.00 | 1.05 | 688,813 | 0.20 | (2) | 0.54 | 0.87 | ||||||||||||||||||||||||||||||||||||
2008 | 1.00 | 0.04 | — | — | 0.04 | (0.04 | ) | (0.04 | ) | 1.00 | 4.11 | 516,164 | 0.21 | 0.53 | 3.72 | |||||||||||||||||||||||||||||||||||||
Class B |
| |||||||||||||||||||||||||||||||||||||||||||||||||||
2012 | $ | 1.00 | $ | — | $ | — | $ | — | $ | — | $ | — | (1) | $ | — | (1) | $ | 1.00 | 0.01 | % | $ | 395,099 | 0.05 | %(3) | 0.64 | % | 0.01 | % | ||||||||||||||||||||||||
2011 | 1.00 | — | — | — | — | — | (1) | — | (1) | 1.00 | 0.01 | 178,037 | 0.12 | (3) | 0.64 | 0.01 | ||||||||||||||||||||||||||||||||||||
2010 | 1.00 | — | — | — | — | — | (1) | — | (1) | 1.00 | 0.04 | 165,266 | 0.12 | (2)(3) | 0.60 | 0.04 | ||||||||||||||||||||||||||||||||||||
2009 | 1.00 | 0.01 | — | — | 0.01 | (0.01 | ) | (0.01 | ) | 1.00 | 0.82 | 363,238 | 0.39 | (2)(3) | 0.59 | 0.58 | ||||||||||||||||||||||||||||||||||||
2008 | 1.00 | 0.04 | — | — | 0.04 | (0.04 | ) | (0.04 | ) | 1.00 | 3.81 | 109,384 | 0.51 | 0.58 | 3.54 | |||||||||||||||||||||||||||||||||||||
Class C |
| |||||||||||||||||||||||||||||||||||||||||||||||||||
2012 | $ | 1.00 | $ | — | $ | — | $ | — | $ | — | $ | — | (1) | $ | — | (1) | $ | 1.00 | 0.01 | % | $ | 5,924 | 0.05 | %(3) | 0.84 | % | 0.01 | % | ||||||||||||||||||||||||
2011 | 1.00 | — | — | — | — | — | (1) | — | (1) | 1.00 | 0.01 | 6,183 | 0.12 | (3) | 0.84 | 0.01 | ||||||||||||||||||||||||||||||||||||
2010 | 1.00 | — | — | — | — | — | (1) | — | (1) | 1.00 | 0.04 | 8,619 | 0.12 | (2)(3) | 0.80 | 0.04 | ||||||||||||||||||||||||||||||||||||
2009 | 1.00 | 0.01 | — | — | 0.01 | (0.01 | ) | (0.01 | ) | 1.00 | 0.69 | 13,364 | 0.47 | (2)(3) | 0.79 | 0.50 | ||||||||||||||||||||||||||||||||||||
2008 | 1.00 | 0.04 | — | — | 0.04 | (0.04 | ) | (0.04 | ) | 1.00 | 3.59 | 7,254 | 0.72 | 0.79 | 3.71 | |||||||||||||||||||||||||||||||||||||
Amounts designated as “—” are zero or have been rounded to zero.
| (1) | Amount represents less than $0.01 per share. |
| (2) | The expense ratio includes the Treasury Guarantee Program expense. The Fund participated in the Temporary Guarantee Program for Money Market Funds from September 18, 2008 through September 18, 2009. Had the expense been excluded, the expense ratio would have been equal to, or less than, the expense ratio cap figure. See Note 3 for expense ratio cap figure. |
| (3) | The Distributor and/or Administrator have voluntarily agreed to waive and reduce its fee and/or reimburse certain expenses of the Fund in order to limit the one-day net income yield of the Fund to not less than 0.01% of the Fund’s average daily net assets of the share class. Had these waivers and the Treasury Guarantee Program expense been excluded the ratio would have been at the expense ratio cap figure. See Note 3 for expense ratio cap figure. |
| * | Per share calculations were performed using average shares. |
| † | Returns are for the period indicated and have not been annualized. Returns shown do not reflect the deduction of taxes that a shareholder would pay on Fund distributions or the redemption of Fund shares. |
| 56 | SEI Daily Income Trust / Annual Report / January 31, 2012 |
Table of Contents
| Net Asset Value, Beginning of Year | Net Investment Income* | Net Realized and Unrealized Gains (Losses) on Securities | Total from Operations* | Dividends from Net Investment Income | Distributions from Capital Gains | Total Distributions | Net Asset Value, End of Year | Total Return† | Net Assets End of Year ($ Thousands) | Ratio of Expenses | Ratio of (Excluding | Ratio of to Average | Portfolio Turnover Rate | |||||||||||||||||||||||||||||||||||||||||||
Short-Duration Government Fund |
| |||||||||||||||||||||||||||||||||||||||||||||||||||||||
Class A | ||||||||||||||||||||||||||||||||||||||||||||||||||||||||
2012 | $ | 10.59 | $ | 0.09 | $ | 0.17 | $ | 0.26 | $ | (0.12 | ) | $ | (0.01 | ) | $ | (0.13 | ) | $ | 10.72 | 2.53 | % | $ | 739,126 | 0.48 | % | 0.74 | % | 0.85 | % | 712 | % | |||||||||||||||||||||||||
2011 | 10.52 | 0.09 | 0.18 | 0.27 | (0.14 | ) | (0.06 | ) | (0.20 | ) | 10.59 | 2.59 | 867,313 | 0.48 | 0.72 | 0.84 | 521 | |||||||||||||||||||||||||||||||||||||||
2010 | 10.25 | 0.21 | 0.29 | 0.50 | (0.23 | ) | — | (0.23 | ) | 10.52 | 4.94 | 377,088 | 0.48 | 0.75 | 2.02 | 347 | ||||||||||||||||||||||||||||||||||||||||
2009 | 10.21 | 0.36 | 0.04 | 0.40 | (0.36 | ) | — | (0.36 | ) | 10.25 | 4.05 | 288,064 | 0.48 | 0.74 | 3.53 | 693 | ||||||||||||||||||||||||||||||||||||||||
2008 | 9.95 | 0.46 | 0.28 | 0.74 | (0.48 | ) | — | (0.48 | ) | 10.21 | 7.65 | 172,892 | 0.45 | 0.76 | 4.63 | 266 | ||||||||||||||||||||||||||||||||||||||||
Intermediate-Duration Government Fund |
| |||||||||||||||||||||||||||||||||||||||||||||||||||||||
Class A | ||||||||||||||||||||||||||||||||||||||||||||||||||||||||
2012 | $ | 11.32 | $ | 0.17 | $ | 0.64 | $ | 0.81 | $ | (0.22 | ) | $ | — | (1) | $ | (0.22 | ) | $ | 11.91 | 7.22 | % | $ | 71,458 | 0.53 | % | 0.74 | % | 1.47 | % | 726 | % | |||||||||||||||||||||||||
2011 | 11.24 | 0.13 | 0.39 | 0.52 | (0.19 | ) | (0.25 | ) | (0.44 | ) | 11.32 | 4.62 | 187,944 | 0.53 | 0.72 | 1.14 | 590 | |||||||||||||||||||||||||||||||||||||||
2010 | 11.20 | 0.32 | 0.41 | 0.73 | (0.32 | ) | (0.37 | ) | (0.69 | ) | 11.24 | 6.61 | 62,977 | 0.53 | 0.76 | 2.82 | 213 | |||||||||||||||||||||||||||||||||||||||
2009 | 10.76 | 0.38 | 0.44 | 0.82 | (0.38 | ) | — | (0.38 | ) | 11.20 | 7.85 | 92,025 | 0.53 | 0.74 | 3.48 | 641 | ||||||||||||||||||||||||||||||||||||||||
2008 | 10.13 | 0.45 | 0.63 | 1.08 | (0.45 | ) | — | (0.45 | ) | 10.76 | 10.97 | 50,372 | 0.50 | 0.75 | 4.34 | 234 | ||||||||||||||||||||||||||||||||||||||||
GNMA Fund |
| |||||||||||||||||||||||||||||||||||||||||||||||||||||||
Class A | ||||||||||||||||||||||||||||||||||||||||||||||||||||||||
2012 | $ | 10.58 | $ | 0.02 | $ | 0.83 | $ | 0.85 | $ | (0.13 | ) | $ | (0.39 | ) | $ | (0.52 | ) | $ | 10.91 | 8.09 | % | $ | 243,016 | 0.63 | % | 0.70 | % | 0.22 | %1,515% | |||||||||||||||||||||||||||
2011 | 10.28 | 0.13 | 0.49 | 0.62 | (0.16 | ) | (0.16 | ) | (0.32 | ) | 10.58 | 6.06 | 334,415 | 0.63 | 0.70 | 1.27 | 1,024 | |||||||||||||||||||||||||||||||||||||||
2010 | 9.84 | 0.32 | 0.47 | 0.79 | (0.35 | ) | — | (0.35 | ) | 10.28 | 8.18 | 198,914 | 0.63 | 0.72 | 3.16 | 533 | ||||||||||||||||||||||||||||||||||||||||
2009 | 9.63 | 0.40 | 0.21 | 0.61 | (0.40 | ) | — | (0.40 | ) | 9.84 | 6.51 | 160,639 | 0.63 | 0.71 | 4.08 | 474 | ||||||||||||||||||||||||||||||||||||||||
2008 | 9.34 | 0.45 | 0.30 | 0.75 | (0.46 | ) | — | (0.46 | ) | 9.63 | 8.31 | 114,824 | 0.60 | 0.72 | 4.82 | 271 | ||||||||||||||||||||||||||||||||||||||||
Ultra Short Duration Bond Fund |
| |||||||||||||||||||||||||||||||||||||||||||||||||||||||
Class A | ||||||||||||||||||||||||||||||||||||||||||||||||||||||||
2012 | $ | 9.33 | $ | 0.10 | $ | (0.05 | ) | $ | 0.05 | $ | (0.12 | ) | $ | — | $ | (0.12 | ) | $ | 9.26 | 0.55 | % | $ | 255,002 | 0.38 | % | 0.74 | % | 1.08 | % | 177 | % | |||||||||||||||||||||||||
2011 | 9.24 | 0.13 | 0.12 | 0.25 | (0.16 | ) | — | (0.16 | ) | 9.33 | 2.74 | 465,612 | 0.38 | 0.74 | 1.37 | 78 | ||||||||||||||||||||||||||||||||||||||||
2010 | 8.51 | 0.24 | 0.73 | 0.97 | (0.24 | ) | — | (0.24 | ) | 9.24 | 11.58 | 257,238 | 0.38 | 0.75 | 2.72 | 73 | ||||||||||||||||||||||||||||||||||||||||
2009 | 9.69 | 0.32 | (1.18 | ) | (0.86 | ) | (0.32 | ) | — | (0.32 | ) | 8.51 | (9.00 | ) | 207,081 | 0.38 | 0.75 | 3.50 | 99 | |||||||||||||||||||||||||||||||||||||
2008 | 9.97 | 0.48 | (0.28 | ) | 0.20 | (0.48 | ) | — | (0.48 | ) | 9.69 | 2.06 | 409,363 | 0.35 | 1.28 | 4.87 | 54 | |||||||||||||||||||||||||||||||||||||||
Amounts designated as “—” are zero or have been rounded to zero.
| * | Per share calculations were performed using average shares. |
| † | Returns are for the period indicated and have not been annualized. Returns shown do not reflect the deduction of taxes that a shareholder would pay on Fund distributions or the redemption of Fund shares. |
| (1) | Amounts represents less than $0.01 per share. |
| SEI Daily Income Trust / Annual Report / January 31, 2012 | 57 |
Table of Contents
January 31, 2012
1. ORGANIZATION
SEI Daily Income Trust (the “Trust”) was organized as a Massachusetts business trust under a Declaration of Trust dated March 15, 1982.
The Trust is registered under the Investment Company Act of 1940, as amended, as a diversified, open-end investment company with ten operational Funds: the Money Market, Government, Government II, Prime Obligation, Treasury and Treasury II (each a “Fund,” collectively the “Money Market Funds”), the Short-Duration Government, Intermediate-Duration Government, GNMA and Ultra Short Duration Bond (each a “Fund,” collectively the “Fixed Income Funds”). The Money Market Funds, Short-Duration Government, Intermediate-Duration Government, and GNMA Funds seek to preserve principal value and maintain a high degree of liquidity while providing current income. The Ultra Short Duration Bond Fund seeks to provide higher current income than typically offered by a money market fund while maintaining a high degree of liquidity and a correspondingly higher risk of principal volatility. The assets of each Fund are segregated, and a shareholder’s interest is limited to the Fund in which shares are held.
2. SIGNIFICANT ACCOUNTING POLICIES
The following is a summary of significant accounting policies followed by the Funds.
Use of Estimates — The preparation of financial statements, in conformity with U.S. generally accepted accounting principles, requires management to make estimates and assumptions that affect the reported amount of assets and liabilities and disclosure of contingent assets and liabilities at the date of the financial statements and the reported amounts of increases and decreases in net assets from operations during the reporting period. Actual results could differ from those estimates.
Security Valuation — Investment securities of the Money Market Funds are stated at amortized cost, which approximates market value. Under this valuation method, purchase discounts and premiums are accreted and amortized ratably to maturity and are included in interest income.
Investment securities of the Fixed Income Funds listed on a securities exchange, market or automated quotation system for which quotations are readily available are valued at the last quoted sale price on the primary exchange or market on which they are traded, or, if there is no such reported sale, at the most recent quoted bid price. If available, debt securities are priced based upon valuations provided by independent third-party pricing agents. Such values generally reflect the last reported sales price if the security is actively traded. The third party pricing agents may also value debt securities at an evaluated bid price by employing methodologies that utilize actual market transactions, broker-supplied valuations, or other methodologies designed to identify the market value for such securities. Debt obligations with remaining maturities of sixty days or less may be valued at their amortized cost, which approximates market value. Prices for most
securities held in the Funds are provided daily by recognized independent pricing agents. If a security price cannot be obtained from an independent third-party pricing agent, the Funds seek to obtain a bid price from at least one independent broker.
Securities for which market prices are not “readily available” are valued in accordance with Fair Value Procedures established by the Trust’s Board of Trustees. The Trust’s Fair Value Procedures are implemented through a Fair Value Committee (the “Committee”) designated by the Funds’ Board of Trustees. Some of the more common reasons that may necessitate that a security be valued using Fair Value Procedures include: the security’s trading has been halted or suspended; the security has been de-listed from a national exchange; the security’s primary trading market is temporarily closed at a time when under normal conditions it would be open; or the security’s primary pricing source is not able or willing to provide a price. When a security is valued in accordance with the Fair Value Procedures, the Committee will determine the value after taking into consideration relevant information reasonably available to the Committee. As of January 31, 2012, there were no fair valued securities in the Funds.
In accordance with U.S. generally accepted accounting principles, fair value is defined as the price that a Fund would receive upon selling an investment in a timely transaction to an independent buyer in the principal or most advantageous market of the investment. A three tier hierarchy has been established to maximize the use of observable and minimize the use of unobservable inputs and to establish classification of fair value measurements for disclosure purposes. Inputs refer broadly to the assumptions that market participants would use in pricing an asset. Inputs may be observable or unobservable. Observable inputs are inputs that reflect the assumptions market participants would use in pricing the asset or liability based on market data obtained from sources independent of the reporting entity. Unobservable inputs are inputs that reflect the reporting entity’s own assumptions about the assumptions market participants would use in pricing the asset or liability based on the best information available in the circumstances.
The three-tier hierarchy of inputs is summarized in the three broad Levels listed below:
Level 1 — Unadjusted quoted prices in active markets for identical, unrestricted assets or liabilities that the Fund has the ability to access at the measurement date;
Level 2 — Quoted prices which are not active, or inputs that are observable (either directly or indirectly) for substantially the full term of the asset or liability; and
Level 3 — Prices, inputs or exotic modeling techniques which are both significant to the fair value measurement and unobservable (supported by little or no market activity).
Investments are classified within the level of the lowest significant input considered in determining fair value. Investments classified
| 58 | SEI Daily Income Trust / Annual Report / January 31, 2012 |
Table of Contents
within Level 3 whose fair value measurement considers several inputs may include Level 1 or Level 2 inputs as components of the overall fair value measurement.
For the fiscal year ended January 31, 2012, there have been no significant changes to the Trust’s fair valuation methodologies.
Security Transactions and Investment Income — Security transactions are recorded on the trade date. Costs used in determining net realized capital gains and losses on the sale of securities are on the basis of specific identification. Dividend income is recognized on the ex-dividend date, and interest income is recognized using the accrual basis of accounting. Income from payment-in-kind securities is recorded daily based on the effective interest method of accrual.
Distributions received on securities that represent a return of capital or capital gain are recorded as a reduction of cost of investments and/or as a realized gain. The Trust estimates the components of distributions received that may be considered nontaxable distributions or capital gain distributions.
For the Fixed Income Funds, amortization and accretion is calculated using the scientific interest method, which approximates the effective interest method over the holding period of the security. Amortization of premiums and discounts is included in interest income.
For the Money Market Funds, all amortization is calculated using the straight line method over the holding period of the security. Amortization of premiums and accretion of discounts are included in interest income.
Repurchase Agreements — Securities pledged as collateral for repurchase agreements are held by each Fund’s custodian bank until the repurchase date of the repurchase agreement. The Funds also invest in tri-party repurchase agreements. Securities held as collateral for tri-party repurchase agreements are maintained by the broker’s custodian bank in a segregated account until the repurchase date of the repurchase agreement. Provisions of the repurchase agreements and the Trust’s policies require that the market value of the collateral, including accrued interest thereon, is sufficient in the event of default by the counterparty. If the counterparty defaults and the value of the collateral declines, or if the counterparty enters into an insolvency proceeding, realization of the collateral by the Funds may be delayed or limited.
Futures Contracts — The Fixed Income Funds utilized futures contracts during the fiscal year ended January 31, 2012. These Funds’ investments in futures contracts are designed to enable the Funds to more closely approximate the performance of their benchmark indices. The Funds may use futures contracts for tactical hedging purposes as well as to enhance the Funds’ returns. Initial margin deposits of cash or securities are made upon entering into futures contracts. The contracts are marked to market daily and the resulting changes in value are accounted for as unrealized gains and losses. Variation margin payments are paid or received, depending upon
whether unrealized gains or losses are incurred. When the contract is closed, the Funds record a realized gain or loss equal to the difference between the proceeds from (or cost of) the closing transaction and the amount invested in the contract.
Risks of entering into futures contracts include the possibility that there will be an imperfect price correlation between the futures and the underlying securities. Second, it is possible that a lack of liquidity for futures contracts could exist in the secondary market, resulting in an inability to close a position prior to its maturity date. Third, the futures contract involves the risk that the Fund could lose more than the original margin deposit required to initiate a futures transaction.
Finally, the risk exists that losses could exceed amounts disclosed on the Statements of Assets and Liabilities.
Swap Agreements — A Fund’s investments in swap contracts is mainly used as an efficient means to take and manage risk in the portfolio, including interest rate risk, credit risk and overall yield sensitivity. A swap agreement is a two-party contract under which an agreement is made to exchange returns from predetermined investments or instruments, including a particular interest rate, foreign currency, or “basket” of securities representing a particular index. Interest rate swaps involve the exchange by a Fund with another party of their respective commitments to pay or receive interest (e.g., an exchange of floating rate payments for fixed rate payments) with respect to a notional amount of principal. Credit-default swaps involve periodic payments by a Fund or counterparty based on a specified rate multiplied by a notional amount assigned to an underlying debt instrument or group of debt instruments in exchange for the assumption of credit risk on the same instruments. In the event of a credit event, usually in the form of a credit rating downgrade, the party receiving periodic payments (i.e. floating rate payer) must pay the other party (i.e. fixed rate payer) an amount equal to the recovery rate used to settle the contracts. The recovery rate is a function of how many credit default swap investors wish to deliver the security or receive the security. The recovery rate is determined through an auction process. Total return swaps allow an investor to benefit from the cash flow without ever actually owning the underlying security. The receiver must pay any decline in value to the payer at the end of the total return swap. However, the investor does not need to make a payment if there is no decline in price. Payments can be made on various indices, bonds (i.e. mortgage backed securities, bank debt and corporate), loans or commodities. The value of a total return swap is equal to the change in value of the underlying asset versus the accrued income payment based on LIBOR or some other form of indices on the notional amount. Interest rate swaps involve the exchange by a Fund with another party of their respective commitments to pay or receive interest (e.g., an exchange of floating rate payments for fixed rate payments) with respect to a notional amount of principal to manage a Fund’s exposure to interest rates. Payments received or made are recorded as realized gains or loss. A Fund could be exposed to credit or market risk due to unfavorable changes in the
| SEI Daily Income Trust / Annual Report / January 31, 2012 | 59 |
Table of Contents
Notes to Financial Statements (Continued)
January 31, 2012
fluctuation of interest rates or if the counterparty defaults on its obligation to perform. Risk of loss may exceed amounts recognized on the statement of assets and liabilities. Interest rate swap contracts outstanding at period end, if any, are listed after a Fund’s portfolio. In connection with swap agreements securities may be set aside as collateral by a Fund’s custodian. A Fund may enter into swap agreements in order to, among other things, change the maturity or duration of the investment portfolio, to protect a Fund’s value from changes in interest rates, or to expose a Fund to a different security or market.
Swaps are marked-to-market daily based upon quotations from market makers and the resulting changes in market values, if any, are recorded as an unrealized gain or loss in the Statement of Operations. Net payments of interest are recorded as realized gains or losses.
Entering into swap agreements involves, to varying degrees, elements of credit and market risk in excess of the amounts recognized on the Statement of Assets and Liabilities. Such risks involve the possibility that there will be no liquid market for these agreements, that the counterparty to the agreement may default on its obligation to perform and that there may be unfavorable changes in the fluctuation of interest rates. Risks also arise from potential losses from adverse market movements.
This risk is mitigated by having a master netting arrangement between a Fund and the counterparty and by having the counterparty post collateral to cover a Fund’s exposure to the counterparty. There were no outstanding swap agreements as of January 31, 2012.
Options Written/Purchased — To the extent consistent with its Investment Objective and Strategies, a Fund may invest in financial options contracts to add return or to hedge their existing portfolio securities. When the Fund writes or purchases an option, an amount equal to the premium received or paid by the Fund is recorded as a liability or an asset and is subsequently adjusted to the current market value of the option written or purchased. Premiums received or paid from purchasing or writing options which expire unexercised are treated by the Fund on the expiration date as realized gains or losses. The difference between the premium and the amount paid or received on effecting a closing purchase or sale transaction, including brokerage commissions, is also treated as a realized gain or loss. If an option is exercised, the premium paid or received is added to the cost of the purchase or proceeds from the sale in determining whether the Fund has realized a gain or a loss. The risk in writing a call option is that the Fund gives up the opportunity for profit if the market price of the security increases. The risk in writing a put option is that the Fund may incur a loss if the market price of the security decreases and the option is exercised. The risk in purchasing an option is that the Fund pays a premium whether or not the option is exercised. The Fund also has the additional risk of being unable to enter into a closing transaction at an acceptable price if a liquid secondary market does not exist. Option contracts also involve the risk that they may not work as
intended due to unanticipated developments in market conditions or other causes. Finally, the risk exists that losses could exceed amounts disclosed on the Statement of Assets and Liabilities.
TBA Purchase Commitments — A Fixed Income Fund may engage in “to be announced” (“TBA”) purchase commitments to purchase securities for a fixed price at a future date. TBA purchase commitments may be considered securities and involve a risk of loss if the value of the security to be purchased declines prior to settlement date, which risk is in addition to the risk of decline in the value of a Fund’s other assets. Unsettled TBA purchase commitments are valued at the current market value of the underlying securities, according to the procedures described under “Security Valuation” above.
Collateralized Debt Obligations — A Fund may invest in collateralized debt obligations (“CDOs”), which include collateralized loan obligations (“CLOs”) and other similarly structured securities. CLOs are a type of asset-backed securities. A CLO is a trust typically collateralized by a pool of loans, which may include, among others, domestic and foreign senior secured loans, senior unsecured loans, and subordinate corporate loans, including loans that may be rated below investment grade or equivalent unrated loans. CDOs may charge management fees and administrative expenses.
For CDOs, the cashflows from the trust are split into two or more portions, called tranches, varying in risk and yield. The riskiest portion is the “equity” tranche which bears the bulk of defaults from the bonds or loans in the trust and serves to protect the other, more senior tranches from default in all but the most severe circumstances. Since it is partially protected from defaults, a senior tranche from a CDO trust typically has a higher rating and lower yield than its underlying securities, and can be rated investment grade. Despite the protection from the equity tranche, CDO tranches can experience substantial losses due to actual defaults, increased sensitivity to defaults due to collateral default and disappearance of protecting tranches, market anticipation of defaults, as well as aversion to CDO securities as a class.
The risks of an investment in a CDO depend largely on its Class and its collateral securities. Normally, CLOs and other CDOs are privately offered and sold, and thus, are not registered under the securities laws. As a result, investments in CDOs may be characterized by the Funds as illiquid securities; however, an active dealer market may exist for CDOs, allowing a CDO to qualify for Rule 144A transactions. In addition to the normal risks associated with fixed income securities (e.g., interest rate risk and default risk), CDOs carry additional risks including, but not limited to: (i) the possibility that distributions from collateral securities will not be adequate to make interest or other payments; (ii) the quality of the collateral may decline in value or default; (iii) the Funds may invest in CDOs that are subordinate to other classes; and (iv) the complex structure of the security may not be fully understood at the time of investment and may produce disputes with the issuer or unexpected investment results.
| 60 | SEI Daily Income Trust / Annual Report / January 31, 2012 |
Table of Contents
Illiquid Securities — A security is considered illiquid if it cannot be sold or disposed of in the ordinary course of business within seven days or less for its approximate carrying value on the books of a Fund. Valuations of illiquid securities may differ significantly from the values that would have been used had an active market value for these securities existed.
Restricted Securities — Throughout the year, the Funds owned private placement investments that were purchased through private offerings or acquired through initial public offerings that could not be sold without prior registration under the Securities Act of 1933 or pursuant to an exemption there from. In addition, the Funds had generally agreed to further restrictions on the disposition of certain holdings as set forth in various agreements entered into in connection with the purchase of those investments. These investments were valued at amortized cost as determined in accordance with the procedures approved by the Board of Trustees. At January 31, 2012, the Funds did not own any restricted securities.
Classes — Class-specific expenses are borne by that class of shares. Income, expenses, and realized and unrealized gains/losses and nonclass specific expenses are allocated to the respective class on the basis of relative daily net assets.
Expenses — Expenses that are directly related to one of the Funds are charged directly to that Fund. Other operating expenses of the Funds are prorated to the Funds on the basis of relative net assets.
Dividends and Distributions to Shareholders — Dividends from net investment income are declared daily and paid monthly. Any net realized capital gains on sales of securities after capital loss carryover are distributed at least annually by the Funds.
Redemption Fees — The Fixed Income Funds retained a redemption fee based on a dollar threshold for redemptions, or a series of redemptions, of capital shares held for less than thirty days, as presented below:
| Dollar Threshold ($ Thousands) | Redemption Fee | |||||||
| Short-Duration Government Fund | $ | 25,000 | 0.25 | % | ||||
| Intermediate-Duration Government Fund | 10,000 | 0.25 | ||||||
| GNMA Fund | 10,000 | 0.25 | ||||||
| Ultra Short Duration Bond Fund | 10,000 | 0.50 | ||||||
For the year ended January 31, 2012, the Fixed Income Funds did not retain any redemption fees. Such fees, if any, are retained by the Fixed Income Funds for the benefit of the remaining shareholders.
3. AGREEMENTS AND OTHER TRANSACTIONS WITH AFFILIATES
Administration and Transfer Agency Agreement — SEI Investments Global Funds Services (the “Administrator”) provides administrative
and transfer agency services to the Funds for annual fees, based on the average daily net assets of the respective funds, as presented below:
| Money Market Fund | 0.33 | % | ||
| Government Fund | 0.24 | |||
| Government II Fund | 0.19 | |||
| Prime Obligation Fund | 0.19 | |||
| Treasury Fund | 0.24 | |||
| Treasury II Fund | 0.24 | |||
| Short-Duration Government Fund | 0.35 | |||
| Intermediate-Duration Government Fund | 0.35 | |||
| GNMA Fund | 0.32 | |||
| Ultra Short Duration Bond Fund | 0.35 |
However, the Administrator and SEI Investments Management Corporation (the “Adviser”) have agreed to waive a portion or their entire fee, for various classes of shares in various funds, to limit total annual expenses up to the following amounts (expressed as a percentage of the Funds’ daily net assets). The expense waivers are allocated to each share class pro-rata based on the net assets of each share class.
| Money Market Fund | Government Fund | Government II Fund | Prime Obligation Fund | Treasury Fund | ||||||||||||||||
| Class A | 0.18 | %(1) | 0.20 | %(3) | 0.20 | %(2) | 0.20 | %(2) | 0.20 | %(2) | ||||||||||
| Class B | 0.48 | (1) | 0.50 | (3) | 0.50 | (2) | 0.50 | (2) | 0.50 | (2) | ||||||||||
| Class C | 0.68 | (1) | 0.70 | (3) | 0.70 | (2) | 0.70 | (2) | 0.70 | (2) | ||||||||||
| Class H | N/A | N/A | N/A | 0.63 | (1) | N/A | ||||||||||||||
| Sweep Class | 0.93 | (1) | 0.95 | (1) | * | 0.95 | (1) | 0.95 | (1) | |||||||||||
| Treasury II Fund | Short- Duration Government Fund | Intermediate- Duration Government Fund | GNMA Fund | Ultra Short Duration Bond Fund | ||||||||||||||||
| Class A | 0.20 | %(2) | 0.48 | %(4) | 0.53 | %(4) | 0.63 | %(4) | 0.38 | %(4) | ||||||||||
| Class B | 0.50 | (2) | N/A | N/A | N/A | N/A | ||||||||||||||
| Class C | 0.70 | (2) | N/A | N/A | N/A | N/A | ||||||||||||||
| Class H | N/A | N/A | N/A | N/A | N/A | |||||||||||||||
| Sweep Class | * | N/A | N/A | N/A | N/A | |||||||||||||||
| * | Class not currently operational. |
| (1) | Represents a voluntary cap that my be discontinued at any time. |
| (2) | Represents a contractual cap effective through January 31, 2012, to be changed only by board approval. |
| (3) | Represents a contractual cap of .25%, .55%, and .75% of Class A, B, and C, respectively, effective through January 31, 2010, to be changed only by Board approval. In addition, management has voluntarily waived fees to a cap of .20%, .50%, and .70% of Class A, B, and C, respectively, that may be discontinued at any time |
| (4) | Represents a voluntary cap that may be discontinued at anytime. Prior to March 1, 2008, the cap for the Short-Duration Government, Intermediate-Duration Government, GNMA and Ultra Short Duration Bond Funds were .45%, .50%, .60% and .35%, respectively. |
Distribution Agreement — SEI Investments Distribution Co. (the “Distributor”), a wholly owned subsidiary of SEI and a registered broker-dealer, acts as the Distributor of the shares of the Trust under a Distribution Agreement. The Trust also has adopted plans under which firms, including the Distributor, that provide shareholder and
| SEI Daily Income Trust / Annual Report / January 31, 2012 | 61 |
Table of Contents
Notes to Financial Statements (Continued)
January 31, 2012
administrative services may receive compensation thereof. Specific classes of certain funds have also adopted distribution plans, pursuant to Rule 12b-1 under the Investment Company Act of 1940.
Such plans provide fees payable to the Distributor up to the following amounts, calculated as a percentage of the average daily net assets attributable to each particular class of each respective fund.
| Shareholder Servicing Fees | Administrative Service Fees | Distribution Fees* | ||||||||||
Money Market Fund | ||||||||||||
Class A | .25 | % | — | — | ||||||||
Class B | .25 | .05 | % | — | ||||||||
Class C | .25 | .25 | — | |||||||||
Sweep Class | .25 | — | .50 | % | ||||||||
Government Fund | ||||||||||||
Class A | .25 | — | — | |||||||||
Class B | .25 | .05 | — | |||||||||
Class C | .25 | .25 | — | |||||||||
Sweep Class | .25 | — | .50 | |||||||||
| Government II Fund | ||||||||||||
Class A | .25 | — | — | |||||||||
Class B | .25 | .05 | — | |||||||||
Class C | .25 | .25 | — | |||||||||
Prime Obligation Fund | ||||||||||||
Class A | .25 | — | — | |||||||||
Class B | .25 | .05 | — | |||||||||
Class C | .25 | .25 | — | |||||||||
Class H | .25 | .18 | — | |||||||||
Sweep Class | .25 | — | .50 | |||||||||
Treasury Fund | ||||||||||||
Class A | .25 | — | — | |||||||||
Class B | .25 | .05 | — | |||||||||
Class C | .25 | .25 | — | |||||||||
Sweep Class | .25 | — | .50 | |||||||||
Treasury II Fund | ||||||||||||
Class A | .25 | — | — | |||||||||
Class B | .25 | .05 | — | |||||||||
Class C | .25 | .25 | — | |||||||||
Short-Duration Government Fund | ||||||||||||
Class A | .25 | — | — | |||||||||
Intermediate-Duration Government Fund | ||||||||||||
Class A | .25 | — | — | |||||||||
GNMA Fund | ||||||||||||
Class A | .25 | — | — | |||||||||
Ultra Short Duration Bond Fund | ||||||||||||
Class A | .25 | — | — | |||||||||
| * | These payments are characterized as “compensation” and are not directly tied to expenses incurred by the Distributor. The payments the Distributor receives during any year may therefore be higher or lower than its actual expenses. These payments may be used to compensate sweep class shareholders who provide distribution-related services to their customers. |
The Distributor has voluntarily waived all or a portion of the shareholder servicing fees for Class A of each fund, except for the GNMA Fund, since inception of the plan. Such waivers are voluntary and may be discontinued at any time. For Classes B, C, and H, the shareholder servicing fees and the administrative service fees are shown combined as “Administrative & Shareholder Servicing Fees” in the Statements of
Operations. The Administrator and Distributor have voluntarily agreed to waive and reduce their fee and/or reimburse certain expenses of the Money Market Funds in order to limit the one-day net income yield of the Funds to not less than 0.01% of the Funds’ average daily net assets. The following table shows the waivers by class for the year ended January 31, 2012 ($ Thousands):
| Administrative & Shareholder Servicing Fee Waiver | Administrative Fee Waiver | |||||||
Money Market Fund | ||||||||
Class A | $ | — | $ | 2,408 | ||||
Class B | 129 | 503 | ||||||
Class C | 207 | 532 | ||||||
Sweep Class | 190 | 272 | ||||||
Government Fund | ||||||||
Class A | — | 714 | ||||||
Class B | 1,159 | 412 | ||||||
Class C | 171 | 35 | ||||||
Sweep Class | 188 | 27 | ||||||
Government II Fund | ||||||||
Class A | — | 1,367 | ||||||
Class B | 461 | 168 | ||||||
Class C | 40 | 8 | ||||||
Prime Obligation Fund | ||||||||
Class A | — | 178 | ||||||
Class B | 374 | 6 | ||||||
Class C | 241 | 2 | ||||||
Class H | 102 | 1 | ||||||
Sweep Class | 38 | — | ||||||
Treasury Fund | ||||||||
Class A | — | 230 | ||||||
Class B | 489 | 193 | ||||||
Class C | 66 | 15 | ||||||
Sweep Class | 1,051 | 166 | ||||||
Treasury II Fund | ||||||||
Class A | — | 560 | ||||||
Class B | 645 | 328 | ||||||
Class C | 35 | 10 | ||||||
Other — Certain officers and Trustees of the Trust are also officers and/or Trustees of the Administrator, Adviser, or the distributor. The Trust pays each unaffiliated Trustee an annual fee for attendance at quarterly, interim, and committee meetings. The Administrator, Adviser, or the Distributor pays compensation of Officers and affiliated Trustees.
A portion of the services provided by the Chief Compliance Officer (“CCO”) and his staff, whom are employees of the administrator, are paid for by the Trust as incurred. The services include regulatory oversidght of the Trust’s Adviser, Sub-Advisers and service providers as required by SEC regulations. The CCO’s services have been approved by and are reviewed annually by the Board of Trustees.
Interfund Lending — The SEC has granted an exemption that permits the Trust to participate in an interfund lending program (“The Program”) with existing or future investment companies registered under the 1940 Act that are advised by SIMC (the “SEI Funds”). The Program allows the SEI Funds to lend money to and borrow money from each other for temporary or emergency purposes. Participation in The Program is voluntary for both borrowing and lending funds.
| 62 | SEI Daily Income Trust / Annual Report / January 31, 2012 |
Table of Contents
Interfund loans may be made only when the rate of interest to be charged is more favorable to the lending fund than an investment in overnight repurchase agreements (“Repo Rate”), and more favorable to the borrowing fund than the rate of interest that would be charged by a bank for short-term borrowings (“Bank Loan Rate”). The Bank Loan Rate will be determined using a formula approved annually by the SEI Funds Board of Trustees. The interest rate imposed on interfund loans is the average of the Repo Rate and the Bank Loan Rate. For the year ended January 31, 2012, the Trust has not participated in The Program.
4. INVESTMENT ADVISORY AND CUSTODIAN AGREEMENTS
The Adviser serves as each Fund’s investment adviser and “manager of managers” under an investment advisory agreement approved by the shareholders of each Fund. Effective January 1, 2010, for its services, the Adviser receives an annual fee equal to 0.07% of each of the Money Market Funds’ net assets. Prior to January 1, 2010, for its services, the Adviser received an annual fee equal to .075% on the first $500 million of net assets and .02% on the net assets in excess of $500 million for the Money Market Funds. The fee was calculated based on the combined assets of the Money Market Funds. The Adviser also received an annual fee equal to .10% on the first $500 million of net assets, .075% of net assets between $500 million and $1 billion and .05% on the net assets in excess of $1 billion for the Short-Duration Government, Intermediate-Duration Government and GNMA Funds. The fee was calculated based on the combined assets of these Funds. The Adviser also received an annual fee equal to .10% on the first $500 million of net assets, .075% of net assets between $500 million and $1 billion and .05% on the net assets in excess of $1 billion for the Ultra Short Duration Bond Fund. The fee was calculated based on the net assets of the Ultra Short Duration Bond Fund.
Pursuant to the “manager of managers” structure, the Board of Trustees approved BofA Advisors, LLC (formerly Columbia Management Advisors, LLC) as sub-adviser to the Money Market Funds and Wellington Management Company, LLP (“Wellington LLP”) serves as sub-adviser to the Fixed Income Funds. For its services to the Funds, the sub-advisers are entitled to receive a fee paid directly by the Adviser.
U.S. Bank, N.A. serves as the custodian of the Funds. The custodian plays no role in determining the investment policies of the Funds or which securities are to be purchased or sold in the Funds.
5. INVESTMENT TRANSACTIONS
The cost of security purchases and the proceeds from the sale of securities, other than short-term investments, for the year ended January 31, 2012, were as follows for the Fixed Income Funds:
| Short- Duration Government Fund ($ Thousands) | Intermediate- Duration Government Fund ($ Thousands) | GMNA Fund ($ Thousands) | Ultra Short Duration Bond Fund ($ Thousands) | |||||||||||||
Purchases | ||||||||||||||||
U.S. Government | $ | 4,862,207 | $ | 511,547 | $ | 3,491,536 | $ | 276,325 | ||||||||
Other | 9,514 | 393 | — | 105,436 | ||||||||||||
Sales | ||||||||||||||||
U.S. Government | 5,034,677 | 631,267 | 3,593,504 | 298,591 | ||||||||||||
Other | 15,038 | 589 | 140 | 211,366 | ||||||||||||
6. FEDERAL TAX INFORMATION
It is each Fund’s intention to continue to qualify as a regulated investment company for Federal income tax purposes and distribute all of its taxable income (including net capital gains). Accordingly, no provision for Federal income taxes is required.
Reclassification of Components of Net Assets — The timing and characterization of certain income and capital gain distributions are determined annually in accordance with Federal tax regulations which may differ from accounting principles generally accepted in the United States. As a result, net investment income (loss) and net realized gain (loss) on investment transactions for the reporting period may differ from distributions during such period. These book/tax differences may be temporary or permanent in nature. To the extent these differences are permanent, they are charged or credited to Paid-in Capital, undistributed net investment income, or accumulated net realized gain, as appropriate, in the periods that the differences arise. Accordingly, the following permanent differences, primarily attributable to different treatment for gains and losses on paydowns of mortgage and asset-backed securities for tax purposes, distribution reclassification, and expiration of capital losses have been reclassified to/from the following accounts as of January 31, 2012:
| Paid-in- Capital ($ Thousands) | Undistributed Net Investment Income ($ Thousands) | Accumulated Net Realized Gain (Loss) ($ Thousands) | ||||||||||
Treasury Fund | (44 | ) | — | 44 | ||||||||
Short-Duration Government Fund | — | 2,081 | (2,081 | ) | ||||||||
Intermediate-Duration Government Fund | — | 222 | (222 | ) | ||||||||
GNMA Fund | — | 2,080 | (2,080 | ) | ||||||||
Ultra Short Duration Bond Fund | (442 | ) | 583 | (141 | ) | |||||||
These reclassifications have no impact on net assets or net asset value per share.
| SEI Daily Income Trust / Annual Report / January 31, 2012 | 63 |
Table of Contents
Notes to Financial Statements (Continued)
January 31, 2012
The tax character of dividends and distributions during the last two fiscal years was as follows:
| Ordinary Income ($ Thousands) | Long-term Capital Gain ($ Thousands) | Total ($ Thousands) | ||||||||||||||
Money Market Fund | 2012 | $ | 147 | $ | — | $ | 147 | |||||||||
| 2011 | 367 | — | 367 | |||||||||||||
Government Fund | 2012 | 505 | — | 505 | ||||||||||||
| 2011 | 645 | — | 645 | |||||||||||||
Government II Fund | 2012 | 147 | — | 147 | ||||||||||||
| 2011 | 132 | — | 132 | |||||||||||||
Prime Obligation Fund | 2012 | 1,466 | — | 1,466 | ||||||||||||
| 2011 | 4,070 | — | 4,070 | |||||||||||||
Treasury Fund | 2012 | 51 | — | 51 | ||||||||||||
| 2011 | 65 | — | 65 | |||||||||||||
Treasury II Fund | 2012 | 56 | — | 56 | ||||||||||||
| 2011 | 51 | — | 51 | |||||||||||||
Short-Duration Government Fund | 2012 | 8,871 | 137 | 9,008 | ||||||||||||
| 2011 | 14,103 | — | 14,103 | |||||||||||||
Intermediate-Duration Government Fund | 2012 | 1,242 | 1 | 1,243 | ||||||||||||
| 2011 | 4,812 | 1,890 | 6,702 | |||||||||||||
GNMA Fund | 2012 | 10,127 | 1,452 | 11,579 | ||||||||||||
| 2011 | 7,644 | 1,544 | 9,188 | |||||||||||||
Ultra Short Duration Bond Fund | 2012 | 3,373 | — | 3,373 | ||||||||||||
| 2011 | 6,166 | — | 6,166 | |||||||||||||
As of January 31, 2012, the components of Distributable Earnings/(Accumulated Losses) on a tax basis were as follows:
| Undistributed Ordinary Income ($ Thousands) | Undistributed Long-Term Capital Gain ($ Thousands) | Capital Loss Carryforwards ($ Thousands) | Post-October Losses ($ Thousands) | Other Temporary Differences ($ Thousands) | Unrealized Appreciation (Depreciation) ($ Thousands) | Total Earnings/ Losses) | ||||||||||||||||||||||
Money Market Fund | $ | 22 | $ | — | $ | — | $ | — | $ | (17 | ) | $ | — | $ | 5 | |||||||||||||
Government Fund | 21 | — | (85 | ) | — | (21 | ) | — | (85 | ) | ||||||||||||||||||
Government II Fund | 30 | — | — | — | (12 | ) | — | 18 | ||||||||||||||||||||
Prime Obligation Fund | 160 | — | (67 | ) | — | (159 | ) | — | (66 | ) | ||||||||||||||||||
Treasury Fund | 4 | — | (28 | ) | — | (4 | ) | — | (28 | ) | ||||||||||||||||||
Treasury II Fund | 16 | — | — | — | (6 | ) | — | 10 | ||||||||||||||||||||
Short-Duration Government Fund | 2,826 | — | — | — | (3,340 | ) | 15,379 | 14,865 | ||||||||||||||||||||
Intermediate-Duration Government Fund | 87 | — | (1,558 | ) | — | (123 | ) | 1,699 | 105 | |||||||||||||||||||
GNMA Fund | 3,057 | — | — | (61 | ) | (142 | ) | 9,200 | 12,054 | |||||||||||||||||||
Ultra Short Duration Bond Fund | 265 | — | (23,888 | ) | (240 | ) | (252 | ) | (3,539 | ) | (27,654 | ) | ||||||||||||||||
At January 31, 2012, the following Funds had capital loss carryforwards to offset future realized capital gains:
| Amount ($ Thousands) | Expiration | |||||||
Government Fund | $ | 49 | 1/31/13 | |||||
| 4 | 1/31/14 | |||||||
| 32 | 1/31/16 | |||||||
Prime Obligation Fund | 67 | 1/31/17 | ||||||
Treasury Fund | 1 | 1/31/13 | ||||||
| 22 | 1/31/14 | |||||||
| 5 | 1/31/15 | |||||||
Ultra Short Duration Bond Fund | 1,020 | 1/31/13 | ||||||
| 1,045 | 1/31/14 | |||||||
| 1,717 | 1/31/15 | |||||||
| 296 | 1/31/16 | |||||||
| 181 | 1/31/17 | |||||||
| 3,642 | 1/31/18 | |||||||
| 11,895 | 1/31/19 | |||||||
| 64 | SEI Daily Income Trust / Annual Report / January 31, 2012 |
Table of Contents
For Federal income tax purposes, capital loss carryforwards may be carried forward and applied against future capital gains. It is the Funds’ intent that they will not distribute any realized gain distributions until the carryforwards have been offset or expired.
During the fiscal year ended January 31, 2012, the Government Fund, Government Fund II, Prime Obligation Fund, Treasury Fund, and Treasury II Fund utilized, $3,738, $7,454, $35,648, $19,583, and $891, respectively, of capital loss carryforwards to offset capital gains.
Under the recently enacted Regulated Investment Company Modernization Act of 2010, Funds will be permitted to carry forward capital losses incurred in taxable years beginning after December 22, 2010 for an unlimited period. However, any losses incurred during those future taxable years will be required to be utilized prior to the losses incurred in pre-enactment taxable years. As a result of this ordering rule, pre-enactment capital loss carryforwards may be more likely to expire unused. Additionally, post-enactment capital losses that are carried forward will retain their character as either short-term or long-term capital losses rather than being considered all short-term as under previous law. Losses carried forward under these new provisions are as follows:
Short-Term Loss | Long-Term Loss | Total* | ||||||||||
Intermediate- | ||||||||||||
Duration Government | ||||||||||||
Fund | $ | 1,153 | $ | 405 | $ | 1,558 | ||||||
Ultra Short Duration | ||||||||||||
Bond Fund | — | 4,092 | 4,092 | |||||||||
| *This | table should be used in conjunction with the capital loss carryforwards table. |
During the fiscal year ended January 31, 2012, the Money Market Funds’ cost of securities for Federal income tax purposes approximates the cost located in the Statements of Assets and Liabilities.
For Federal income tax purposes, the cost of securities owned at January 31, 2012, and net realized gains or losses on securities sold for the period, were different from amounts reported for financial reporting purposes, primarily due to wash sales which cannot be used for Federal income tax purposes in the current year and have been deferred for use in future years. The Federal tax cost and aggregate gross unrealized appreciation and depreciation on investments held by the Fixed Income Funds at January 31, 2012, were as follows:
| Federal Tax Cost ($ Thousands) | Appreciated Securities ($ Thousands) | Depreciated Securities ($ Thousands) | Net Unrealized Appreciation/ (Depreciation) ($ Thousands) | |||||||||||||
Short-Duration Government Fund | $ | 931,999 | $ | 15,571 | $ | (192 | ) | $ | 15,379 | |||||||
Intermediate-Duration Government Fund | 95,697 | 1,750 | (51 | ) | 1,699 | |||||||||||
GNMA Fund | 387,747 | 10,121 | (921 | ) | 9,200 | |||||||||||
Ultra Short Duration Bond Fund | 278,839 | 1,105 | (4,644 | ) | (3,539 | ) | ||||||||||
Management has analyzed the Funds’ tax positions taken on the federal tax returns for all open tax years and has concluded that as of January 31, 2012, no provision for income tax is required in the Funds’ financial statements. All uncertain tax positions, except for the accretion of market discount associated with the structured investment vehicles subject to the capital support agreement, meet the more likely than not criteria established in ASC paragraph 740. SEI Investment Company (“SEI”), which is the parent company of the Adviser, has agreed to indemnify the fund if the Internal Revenue Service (“IRS”) were to disagree with a position taken on the tax return for the fiscal year ended January 31, 2010. Accordingly, no provision for taxes is required. The Funds’ federal income and excise tax returns are subject to examination by the IRS for all open tax years under the applicable Statute of Limitations have not expired are subject to examination by the Internal Revenue Service and state departments of revenue.
7. INVESTMENT RISKS
In the normal course of business, a Fund may enter into contracts that provide general indemnifications by a Fund to the counterparty to the contract. A Fund’s maximum exposure under these arrangements is dependent on future claims that may be made against a Fund and, therefore, cannot be established; however, based on experience, management believes the risk of loss from such claim is considered remote.
Investments in structured securities (such as those issued by Structured Investment Vehicles, or “SIVs”) which are collateralized by residential real estate mortgages are subject to certain credit and liquidity risks. When market conditions result in an increase in default rates of the underlying mortgages and the foreclosure values of underlying real estate properties are materially below the outstanding amount of these underlying mortgages, collection of accrued interest and principal on these investments may be doubtful. Such market conditions may significantly impair the value of these investments resulting in a lack of correlation between their credit ratings and values.
8. NEW ACCOUNTING PRONOUNCEMENTS
In April 2011, the Financial Accounting Standards Board (“FASB”) issued Accounting Standards Update (“ASU”) No. 2011-03 “Reconsideration of Effective Control of Repurchase Agreements”. ASU 2011-03 is an amendment to Topic 860 “Transfers and Servicing”. These amendments simplify the accounting for repurchase agreements by eliminating the requirement that the transferor demonstrate it has adequate collateral to fund substantially all the cost of purchasing replacement assets. As a result, more arrangements could be accounted for as secured borrowings rather than sales. The guidance applies to public and nonpublic companies and is effective for interim and annual reporting periods beginning on or after December 15, 2011. The guidance should be applied prospectively to transactions or modifications of existing transactions that occur on or
| SEI Daily Income Trust / Annual Report / January 31, 2012 | 65 |
Table of Contents
Notes to Financial Statements (Concluded)
January 31, 2012
after the effective date. Early adoption is not allowed. At this time, management is evaluating the implications of ASU 2011-03 and its impact on the financial statements.
In May 2011, the FASB issued ASU No. 2011-04 “Amendments to Achieve Common Fair Value Measurement and Disclosure Requirements in U.S. GAAP and International Financial Reporting Standards (“IFRS”)”. ASU 2011-04 includes common requirements for measurement of and disclosure about fair value between U.S. GAAP and IFRS. ASU 2011-04 will require reporting entities to disclose the following information for fair value measurements categorized within Level 3 of the fair value hierarchy: quantitative information about the unobservable inputs used in the fair value measurement, the valuation processes used by the reporting entity, and a narrative description of the sensitivity of the fair value measurement to changes in unobservable inputs and the interrelationships between those unobservable inputs. In addition, ASU 2011-04 will require reporting entities to make disclosures about amounts and reasons for all transfers in and out of Level 1 and Level 2 fair value measurements. The new and revised disclosures are effective for interim and annual reporting periods beginning after December 15, 2011. At this time, management is evaluating the implications of ASU 2011-04 and its impact on the financial statements.
9. SUBSEQUENT EVENTS
The Trust, on behalf of the Funds, has evaluated the need for disclosures and/or adjustments resulting from subsequent events. Based on this evaluation, no adjustments were required to the financial statements.
| 66 | SEI Daily Income Trust / Annual Report / January 31, 2012 |
Table of Contents
Report of Independent Registered Public Accounting Firm
To the Shareholders and Board of Trustees
SEI Daily Income Trust:
We have audited the accompanying statements of assets and liabilities, including the schedules of investments, of SEI Daily Income Trust, comprising the Money Market Fund, Government Fund, Government II Fund, Prime Obligation Fund, Treasury Fund, Treasury II Fund, Short-Duration Government Fund, Intermediate-Duration Government Fund, GNMA Fund, and Ultra Short Duration Bond Fund (collectively the “Funds”), as of January 31, 2012, and the related statements of operations for the year then ended, changes in net assets for each of the years in the two-year period then ended, and the financial highlights for each of the years in the five-year period then ended. These financial statements and financial highlights are the responsibility of the Funds’ management. Our responsibility is to express an opinion on these financial statements and financial highlights based on our audits.
We conducted our audits in accordance with the Standards of the Public Company Accounting Oversight Board (United States). Those standards require that we plan and perform the audit to obtain reasonable assurance about whether the financial statements and financial highlights are free of material misstatement. An audit includes examining, on a test basis, evidence supporting the amounts and disclosures in the financial statements. Our procedures included confirmation of securities owned as of January 31, 2012, by correspondence with the custodian and brokers or other appropriate auditing procedures. An audit also includes assessing the accounting principles used and significant estimates made by management, as well as evaluating the overall financial statement presentation. We believe that our audits provide a reasonable basis for our opinion.
In our opinion, the financial statements and financial highlights referred to above present fairly, in all material respects, the financial position of each of the funds comprising SEI Daily Income Trust as of January 31, 2012, and the results of their operations for the year then ended, the changes in their net assets for the years in the two-year period then ended, and the financial highlights for each of the years in the five-year period then ended, in conformity with U.S. generally accepted accounting principles.

Philadelphia, Pennsylvania
March 28, 2012
| SEI Daily Income Trust / Annual Report / January 31, 2012 | 67 |
Table of Contents
TRUSTEES AND OFFICERS OF THE TRUST (Unaudited)
The following chart lists Trustees and Officers as of January 31, 2012.
Set forth below are the names, addresses, ages, position with the Trust, Term of Office and Length of Time Served, the principal occupations for the last five years, number of portfolios in fund complex overseen by trustee, and other directorships outside the fund complex of each of the persons currently serving as Trustees and Officers of the Trust. The Trust’s Statement of Additional Information (“SAI”) includes additional information about the Trustees and Officers. The SAI may be obtained without charge by calling 1-800-342-5734.
| Name Address, and Age | Position(s) Held with Trusts | Term of Office And Length of Time Served1 | Principal Occupation(s) During Past Five Years | Number of Portfolios in Fund Complex Overseen by Trustee2 | Other Directorships Held by Trustee | |||||
| INTERESTED TRUSTEES | ||||||||||
Robert A. Nesher One Freedom Valley Drive Oaks, PA 19456 65 yrs. old | Chairman of the Board of Trustees* | since 1982 | Currently performs various services on behalf of SEI for which Mr. Nesher is compensated. | 90 | Trustee of The Advisors’ Inner Circle Fund, The Advisors’ Inner Circle Fund II, Bishop Street Funds, Director of SEI Global Master Fund, plc, SEI Global Assets Fund, plc, SEI Global Investments Fund, plc, SEI Investments Global, Limited, SEI Investments — Global Fund Services, Limited, SEI Investments (Europe), Limited, SEI Investments — Unit Trust Management (UK), Limited, SEI Global Nominee Ltd., SEI Structured Credit Fund, L.P. | |||||
William M. Doran One Freedom Valley Drive Oaks, PA 19456 71 yrs. old | Trustee* | since 1982 | Self-employed consultant since 2003. Partner, Morgan, Lewis & Bockius LLP (law firm) from 1976 to 2003, counsel to the Trust, SEI, SIMC, the Administrator and the Distributor. Secretary of SEI since 1978. | 90 | Trustee of The Advisors’ Inner Circle Fund, The Advisors’ Inner Circle Fund II, Bishop Street Funds, Director of SEI since 1974. Director of the Distributor since 2003. Director of SEI Investments — Global Fund Services, Limited, SEI Investments Global, Limited, SEI Investments (Europe), Limited, SEI Investments (Asia), SEI Global Nominee Ltd., Limited and SEI Asset Korea Co., Ltd. | |||||
| TRUSTEES | ||||||||||
George J. Sullivan, Jr. One Freedom Valley Drive Oaks, PA 19456 69 yrs. old | Trustee | since 1996 | Retired since January 2012. Self- Employed Consultant, Newfound Consultants Inc. since April 1997- December 2011. | 90 | Trustee of The Advisors’ Inner Circle Fund, The Advisors’ Inner Circle Fund II, Bishop Street Funds, State Street Navigator Securities Lending Trust, and SEI Structured Credit Fund, L.P., member of the independent review committee for SEI’s Canadian-registered mutual funds. | |||||
| * | Messrs. Nesher and Doran are Trustees who may be deemed as “interested” persons of the Trust as that term is defined in the 1940 Act by virtue of their affiliation with SIMC and the Trust’s Distributor. |
| 1 | Each trustee shall hold office during the lifetime of this Trust until the election and qualification of his or her successor, or until he or she sooner dies, resigns or is removed in accordance with the Trust’s Declaration of Trust. |
| 2 | The Fund Complex includes the following Trusts: SEI Asset Allocation Trust, SEI Daily Income Trust, SEI Institutional Investments Trust, Adviser Managed Trust, SEI Institutional International Trust, SEI Institutional Managed Trust, SEI Liquid Asset Trust, SEI Tax Exempt Trust and SEI Alpha Strategy Portfolios, L.P. |
| 68 | SEI Daily Income Trust / Annual Report / January 31, 2012 |
Table of Contents
| Name Address, and Age | Position(s) Held with Trusts | Term of Office And Length of Time Served1 | Principal Occupation(s) During Past Five Years | Number of by Trustee2 | Other Directorships Held by Trustee | |||||
| TRUSTEES (continued) | ||||||||||
Rosemarie B. Greco One Freedom Valley Drive Oaks, PA 19456 65 yrs. old | Trustee | since 1999 | Director, Governor’s Office of Health Care Reform, Commonwealth of Pennsylvania since 2003. | 90 | Director, Sunoco, Inc.; Director, Excelon Corporation; Trustee, Pennsylvania Real Estate Investment Trust. | |||||
Nina Lesavoy One Freedom Valley Drive Oaks, PA 19456 54 yrs. old | Trustee | since 2003 | Founder and Managing Director, Avec Capital since 2008. Managing Director, Cue Capital from March 2002-March 2008. | 90 | Director of SEI Structured Credit Fund, L.P. | |||||
James M. Williams Valley Drive Oaks, PA 19456 64 yrs. old | Trustee | since 2004 | Vice President and Chief Investment Officer, J. Paul Getty Trust, Non-Profit Foundation for Visual Arts, since December 2002. | 90 | Trustee/Director of Ariel Mutual Funds, and SEI Strucured Credit Fund, L.P. | |||||
Mitchell A. Johnson One Freedom Valley Drive Oaks, PA 19456 70 yrs. old | Trustee | Since 2007 | Private Investor since 1994. | 90 | Trustee of the Advisors’ Inner Circle Fund, The Advisors’ Inner Circle Fund II, and Bishop Street Funds | |||||
Hubert L. Harris, Jr. One Freedom Valley Drive Oaks, PA 19456 68 yrs. old | Trustee | since 2008 | Retired since December 2005. Chief Executive Officer and Chair of the Board of Directors, AMVESCAP Retirement, Inc., 1997-December 2005. Chief Executive Officer, INVESCO North America, September 2003-December 2005. | 90 | Director of Colonial BancGroup, Inc. and St. Joseph’s Translational Research Institute; Chair of the Board of Trustees, Georgia Tech Foundation, Inc. (nonprofit corporation); Board of Councilors of the Carter Center. | |||||
| OFFICERS | ||||||||||
Robert A. Nesher One Freedom Valley Drive Oaks, PA 19456 65 yrs. old | President & CEO | since 2005 | Currently performs various services on behalf of SEI for which Mr. Nesher is compensated. | N/A | N/A | |||||
Peter A. Rodriguez One Freedom Valley Drive Oaks, PA 19456 50 yrs. old | Controller and Chief Financial Officer | since 2011 | Director, Fund Accounting, SEI Investments Global Funds Services (March 2011, September 2002 to March 2005 and 1997- 2002); Director, Mutual Fund Trading, SEI Private Trust Company (May 2099 to February 2011); Director, Asset Data Services, Global Wealth Services (June 2006 to April 2009); Director, Portfolio Accounting, SEI Investments Global Fund Services (March 2005 to June 2006) | N/A | N/A | |||||
| SEI Daily Income Trust / Annual Report / January 31, 2012 | 69 |
Table of Contents
TRUSTEES AND OFFICERS OF THE TRUST (Unaudited)(Concluded)
| Name Address, and Age | Position(s) Held with Trusts | Term of Office And Length of Time Served1 | Principal Occupation(s) During Past Five Years | Number of by Trustee2 | Other Directorships Held by Trustee | |||||
| OFFICERS (continued) | ||||||||||
Russell Emery One Freedom Valley Drive Oaks, PA 19456 49 yrs. old | Chief Compliance Officer | since 2006 | Chief Compliance Officer of SEI Institutional Managed Trust, SEI Asset Allocation Trust, SEI Institutional International Trust, SEI Liquid Asset Trust, SEI Tax Exempt Trust, SEI Institutional Investments Trust, The Advisors’ Inner Circle Fund, The Advisors’ Inner Circle Fund II, and Bishop Street Funds, since March 2006. Chief Compliance Officer of SEI Structured Credit Fund, LP and SEI Alpha Strategy Portfolio, LP since June 2007. Chief Compliance Officer of Adviser Managed Trust since December 2010. | N/A | N/A | |||||
Timothy D. Barto One Freedom Valley Drive Oaks, PA 19456 43 yrs. old | Vice President and Secretary | since 2002 | General Counsel, Vice President and Secretary of SIMC and the Administrator since 2004. Vice President and Assistant Secretary of SEI since 2001. Vice President of SIMC and the Administrator since 1999. | N/A | N/A | |||||
Aaron Buser One Freedom Valley Drive Oaks, PA 19456 41 yrs. old | Vice President and Assistant Secretary | since 2008 | Vice President and Assistant Secretary of SIMC since 2007. Associate at Stark & Stark (2004-2007). | N/A | N/A | |||||
David F. McCann One Freedom Valley Drive Oaks, PA 19456 36 yrs. old | Vice President and Assistant Secretary | since 2009 | Vice President and Assistant Secretary of SIMC since 2008. Attorney, Drinker Biddle & Reath, LLP (law firm), May 2005-October 2008. Attorney, Pepper Hamilton, LLP (law firm), September 2001-May 2005. | N/A | N/A | |||||
John J. McCue One Freedom Valley Drive Oaks, PA 19456 48 yrs. old | Vice President | since 2004 | Director of Portfolio Implementation for SIMC since 1995. Managing Director of Money Market Investments for SIMC since 2003. | N/A | N/A | |||||
Keri E. Rohn One Freedom Valley Drive Oaks, PA 19456 31 yrs. old | Privacy Officer and Anti-Money Laundering Compliance Officer | since 2009 | Compliance Officer of SEI Investments Company since June 2003. | N/A | N/A | |||||
| 1 | Each trustee shall hold office during the lifetime of this Trust until the election and qualification of his or her successor, or until he or she sooner dies, resigns or is removed in accordance with the Trust’s Declaration of Trust. |
| 2 | The Fund Complex includes the following Trusts: SEI Asset Allocation Trust, SEI Daily Income Trust, SEI Institutional Investments Trust, Adviser Managed Trust, SEI Institutional International Trust, SEI Institutional Managed Trust, SEI Liquid Asset Trust, SEI Tax Exempt Trust and SEI Alpha Strategy Portfolios, L.P. |
| 70 | SEI Daily Income Trust / Annual Report / January 31, 2012 |
Table of Contents
Disclosure of Fund Expenses (Unaudited)
All mutual funds have operating expenses. As a shareholder of a mutual fund, your investment is affected by these ongoing costs, which include (among others) costs for portfolio management, administrative services, and shareholder reports like this one. It is important for you to understand the impact of these costs on your investment returns.
Operating expenses such as these are deducted from the mutual fund’s gross income and directly reduce your final investment return. These expenses are expressed as a percentage of the mutual fund’s average net assets; this percentage is known as the mutual fund’s expense ratio.
The following examples use the expense ratio and are intended to help you understand the ongoing costs (in dollars) of investing in your Fund and to compare these costs with those of other mutual funds. The examples are based on an investment of $1,000 made at the beginning of the period shown and held for the entire period.
The table on the next page illustrates your Fund’s costs in two ways:
• Actual Fund return. This section helps you to estimate the actual expenses after fee waivers that your Fund incurred over the period. The “Expenses Paid During Period” column shows the actual dollar expense cost incurred by a $1,000 investment in the Fund, and the “Ending Account Value” number is derived from deducting that expense cost from the Fund’s gross investment return.
You can use this information, together with the actual amount you invested in your Fund, to estimate the expenses you paid over that period. Simply divide your actual starting account value by $1,000 to arrive at a ratio (for example, an $8,600 account value divided by $1,000 = 8.6), then multiply that ratio by the number shown for your Fund under “Expenses Paid During Period.”
• Hypothetical 5% return. This section helps you compare your Fund’s costs with those of other mutual funds. It assumes that your Fund had an annual 5% return before expenses during the year, but that the expense ratio (Column 3) is unchanged. This example is useful in making comparisons because the Securities and Exchange Commission requires all mutual funds to make this 5% calculation. You can assess your Fund’s comparative cost by comparing the hypothetical result for your Fund in the “Expense Paid During Period” column with those that appear in the same charts in the shareholder reports for other mutual funds.
NOTE: Because the return is set at 5% for comparison purposes — NOT your Fund’s actual return — the account values shown do not apply to your specific investment.
| Beginning Account Value 8/1/11 | Ending Account Value 1/31/12 | Annualized Expense Ratios | Expenses Paid During Period* | |||||||||||||
Money Market Fund |
| |||||||||||||||
Actual Fund Return |
| |||||||||||||||
Class A | $ | 1,000.00 | $ | 1,000.20 | 0.18 | % | $ | 0.91 | ||||||||
Class B | 1,000.00 | 1,000.10 | 0.22 | 1.11 | ||||||||||||
Class C | 1,000.00 | 1,000.10 | 0.22 | 1.11 | ||||||||||||
Sweep Class | 1,000.00 | 1,000.10 | 0.22 | 1.11 | ||||||||||||
Hypothetical 5% Return |
| |||||||||||||||
Class A | $ | 1,000.00 | $ | 1,024.30 | 0.18 | % | $ | 0.92 | ||||||||
Class B | 1,000.00 | 1,024.10 | 0.22 | 1.12 | ||||||||||||
Class C | 1,000.00 | 1,024.10 | 0.22 | 1.12 | ||||||||||||
Sweep Class | 1,000.00 | 1,024.10 | 0.22 | 1.12 | ||||||||||||
Government Fund |
| |||||||||||||||
Actual Fund Return |
| |||||||||||||||
Class A | $ | 1,000.00 | $ | 1,000.20 | 0.09 | % | $ | 0.45 | ||||||||
Class B | 1,000.00 | 1,000.20 | 0.08 | 0.40 | ||||||||||||
Class C | 1,000.00 | 1,000.20 | 0.08 | 0.40 | ||||||||||||
Sweep Class | 1,000.00 | 1,000.20 | 0.08 | 0.40 | ||||||||||||
Hypothetical 5% Return |
| |||||||||||||||
Class A | $ | 1,000.00 | $ | 1,024.75 | 0.09 | % | $ | 0.46 | ||||||||
Class B | 1,000.00 | 1,024.80 | 0.08 | 0.41 | ||||||||||||
Class C | 1,000.00 | 1,024.80 | 0.08 | 0.41 | ||||||||||||
Sweep Class | 1,000.00 | 1,024.80 | 0.08 | 0.41 | ||||||||||||
| Beginning Account Value 8/1/11 | Ending Account Value 1/31/12 | Annualized Expense Ratios | Expenses Paid During Period* | |||||||||||||
Government II Fund |
| |||||||||||||||
Actual Fund Return |
| |||||||||||||||
Class A | $ | 1,000.00 | $ | 1,000.10 | 0.07 | % | $ | 0.35 | ||||||||
Class B | 1,000.00 | 1,000.10 | 0.07 | 0.35 | ||||||||||||
Class C | 1,000.00 | 1,000.10 | 0.07 | 0.35 | ||||||||||||
Hypothetical 5% Return |
| |||||||||||||||
Class A | $ | 1,000.00 | $ | 1,024.85 | 0.07 | % | $ | 0.36 | ||||||||
Class B | 1,000.00 | 1,024.85 | 0.07 | 0.36 | ||||||||||||
Class C | 1,000.00 | 1,024.85 | 0.07 | 0.36 | ||||||||||||
Prime Obligation Fund |
| |||||||||||||||
Actual Fund Return |
| |||||||||||||||
Class A | $ | 1,000.00 | $ | 1,000.10 | 0.19 | % | $ | 0.96 | ||||||||
Class B | 1,000.00 | 1,000.10 | 0.20 | 1.01 | ||||||||||||
Class C | 1,000.00 | 1,000.10 | 0.20 | 1.01 | ||||||||||||
Class H | 1,000.00 | 1,000.10 | 0.20 | 1.01 | ||||||||||||
Sweep Class | 1,000.00 | 1,000.10 | 0.20 | 1.01 | ||||||||||||
Hypothetical 5% Return |
| |||||||||||||||
Class A | $ | 1,000.00 | $ | 1,024.25 | 0.19 | % | $ | 0.97 | ||||||||
Class B | 1,000.00 | 1,024.20 | 0.20 | 1.02 | ||||||||||||
Class C | 1,000.00 | 1,024.20 | 0.20 | 1.02 | ||||||||||||
Class H | 1,000.00 | 1,024.20 | 0.20 | 1.02 | ||||||||||||
Sweep Class | 1,000.00 | 1,024.20 | 0.20 | 1.02 | ||||||||||||
| SEI Daily Income Trust / Annual Report / January 31, 2012 | 71 |
Table of Contents
Disclosure of Fund Expenses (Unaudited)(Concluded)
| Beginning Account Value 8/1/11 | Ending Account Value 1/31/12 | Annualized Expense Ratios | Expenses Paid During Period* | |||||||||||||
Treasury Fund |
| |||||||||||||||
Actual Fund Return | ||||||||||||||||
Class A | $ | 1,000.00 | $ | 1,000.00 | 0.06 | % | $ | 0.30 | ||||||||
Class B | 1,000.00 | 1,000.10 | 0.06 | 0.30 | ||||||||||||
Class C | 1,000.00 | 1,000.10 | 0.06 | 0.30 | ||||||||||||
Sweep Class | 1,000.00 | 1,000.10 | 0.06 | 0.30 | ||||||||||||
Hypothetical 5% Return |
| |||||||||||||||
Class A | $ | 1,000.00 | $ | 1,024.90 | 0.06 | % | $ | 0.31 | ||||||||
Class B | 1,000.00 | 1,024.90 | 0.06 | 0.31 | ||||||||||||
Class C | 1,000.00 | 1,024.90 | 0.06 | 0.31 | ||||||||||||
Sweep Class | 1,000.00 | 1,024.90 | 0.06 | 0.31 | ||||||||||||
Treasury II Fund |
| |||||||||||||||
Actual Fund Return |
| |||||||||||||||
Class A | $ | 1,000.00 | $ | 1,000.00 | 0.03 | % | $ | 0.15 | ||||||||
Class B | 1,000.00 | 1,000.10 | 0.03 | 0.15 | ||||||||||||
Class C | 1,000.00 | 1,000.10 | 0.03 | 0.15 | ||||||||||||
Hypothetical 5% Return |
| |||||||||||||||
Class A | $ | 1,000.00 | $ | 1,025.05 | 0.03 | % | $ | 0.15 | ||||||||
Class B | 1,000.00 | 1,025.05 | 0.03 | 0.15 | ||||||||||||
Class C | 1,000.00 | 1,025.05 | 0.03 | 0.15 | ||||||||||||
| Beginning Account Value 8/1/11 | Ending Account Value 1/31/12 | Annualized Expense Ratios | Expenses Paid During Period* | |||||||||||||
Short-Duration Government Fund |
| |||||||||||||||
Actual Fund Return |
| |||||||||||||||
Class A | $ | 1,000.00 | $ | 1,009.90 | 0.48 | % | $ | 2.43 | ||||||||
Hypothetical 5% Return |
| |||||||||||||||
Class A | $ | 1,000.00 | $ | 1,022.79 | 0.48 | % | $ | 2.45 | ||||||||
Intermediate-Duration Government Fund |
| |||||||||||||||
Actual Fund Return |
| |||||||||||||||
Class A | $ | 1,000.00 | $ | 1,029.80 | 0.53 | % | $ | 2.71 | ||||||||
Hypothetical 5% Return |
| |||||||||||||||
Class A | $ | 1,000.00 | $ | 1,022.53 | 0.53 | % | $ | 2.70 | ||||||||
GNMA Fund |
| |||||||||||||||
Actual Fund Return |
| |||||||||||||||
Class A | $ | 1,000.00 | $ | 1,029.70 | 0.63 | % | $ | 3.22 | ||||||||
Hypothetical 5% Return |
| |||||||||||||||
Class A | $ | 1,000.00 | $ | 1,022.03 | 0.63 | % | $ | 3.21 | ||||||||
Ultra Short Duration Bond Fund |
| |||||||||||||||
Actual Fund Return |
| |||||||||||||||
Class A | $ | 1,000.00 | $ | 1,000.00 | 0.38 | % | $ | 1.92 | ||||||||
Hypothetical 5% Return |
| |||||||||||||||
Class A | $ | 1,000.00 | $ | 1,023.29 | 0.38 | % | $ | 1.94 | ||||||||
| * | Expenses are equal to the Fund’s annualized expense ratio multiplied by the average account value over the period, multiplied by 184/365. |
| 72 | SEI Daily Income Trust / Annual Report / January 31, 2012 |
Table of Contents
Notice to Shareholders (Unaudited)
For shareholders that do not have a January 31, 2012, taxable year end, this notice is for information purposes only. For shareholders with a January 31, 2012, taxable year end, please consult your tax adviser as to the pertinence of this notice.
For the fiscal year ended January 31, 2012, the Funds are designating the following with regard to distributions paid during the year:
| Fund | (A) Long-Term | (B) Ordinary Income Distributions (Tax Basis) | (C) Total | U.S. Government Interest (1) | Interest Related Dividends (2) | Short-Term Capital Gains Dividends (3) | ||||||||||||||||||
| Money Market Fund | 0.00 | % | 100.00 | % | 100.00 | % | 1.89 | %* | 99.50 | % | 0.00 | % | ||||||||||||
| Government Fund | 0.00 | % | 100.00 | % | 100.00 | % | 28.21 | %* | 100.00 | % | 0.00 | % | ||||||||||||
| Government II Fund | 0.00 | % | 100.00 | % | 100.00 | % | 100.00 | %* | 98.92 | % | 0.00 | % | ||||||||||||
| Prime Obligation Fund | 0.00 | % | 100.00 | % | 100.00 | % | 1.59 | %* | 99.86 | % | 0.00 | % | ||||||||||||
| Treasury Fund | 0.00 | % | 100.00 | % | 100.00 | % | 49.67 | %* | 100.00 | % | 0.00 | % | ||||||||||||
| Treasury II Fund | 0.00 | % | 100.00 | % | 100.00 | % | 100.00 | %* | 97.37 | % | 0.00 | % | ||||||||||||
| Short-Duration Government Fund | 1.48 | % | 98.52 | % | 100.00 | % | 13.12 | %* | 79.26 | % | 100.00 | % | ||||||||||||
| Intermediate-Duration Government Fund | 0.05 | % | 99.95 | % | 100.00 | % | 6.96 | %* | 93.27 | % | 0.00 | % | ||||||||||||
| GNMA Fund | 12.43 | % | 87.57 | % | 100.00 | % | 0.00 | %* | 29.91 | % | 100.00 | % | ||||||||||||
| Ultra Short Duration Bond Fund | 0.00 | % | 100.00 | % | 100.00 | % | 4.54 | %* | 83.53 | % | 0.00 | % | ||||||||||||
Items (A), (B), (C) are based on the percentage of the Fund’s total distribution.
| (1) | “U.S. Government Interest” represents the amount of interest that was derived from direct U.S. Government obligations and distributed during the fiscal year. This amount is reflected as a percentage of total ordinary income distributions (the total of short-term capital gain and net investment income distributions). Generally, interest from direct U.S. Government obligations is exempt from state income tax. However, for shareholders of the “*” funds who are residents of California, Connecticut and New York, the statutory threshold requirements were not satisfied to permit exemption of these amounts from state income. |
| (2) | The percentage in this column represents the amount of “Interest Related Dividends” and is reflected as a percentage of net investment income distributions that is exempt from U.S. withholding tax when paid to foreign investors. |
| (3) | The percentage in this column represents the amount of “Short-Term Capital Gains Dividends” and is reflected as a percentage of short-term capital gain distributions that is exempt from U.S. withholding tax when paid to foreign investors. |
Please consult your tax adviser for proper treatment of this information.
| SEI Daily Income Trust / Annual Report / January 31, 2012 | 73 |
Table of Contents
SEI DAILY INCOME TRUST ANNUAL REPORT JANUARY 31, 2012
Robert A. Nesher, Chairman
Trustees
William M. Doran
George J. Sullivan, Jr.
Rosemarie B. Greco
Nina Lesavoy
James M. Williams
Mitchell A. Johnson
Hubert L. Harris, Jr.
Officers
Robert A. Nesher
President and Chief Executive Officer
Peter A. Rodriguez
Controller and Chief Financial Officer
Russell Emery
Chief Compliance Officer
Timothy D. Barto
Vice President, Secretary
David McCann
Vice President, Assistant Secretary
Aaron Buser
Vice President, Assistant Secretary
John J. McCue
Vice President
Keri E. Rohn
Anti-Money Laundering Compliance Officer
Privacy Officer
Investment Adviser
SEI Investments Management Corporation
Administrator
SEI Investments Global Funds Services
Distributor
SEI Investments Distribution Co.
Legal Counsel
Morgan, Lewis & Bockius LLP
Independent Registered Public Accounting Firm
KPMG LLP
This report and the financial statements contained herein are submitted for the general information of the shareholders of the Trust and must be preceded or accompanied by a current prospectus. Shares of the Funds are not deposits or obligations of, or guaranteed or endorsed by, any bank. The shares are not federally insured by the Federal Deposit Insurance Corporation (FDIC), the Federal Reserve Board, or any other government agency. Investment in the shares involves risk, including the possible loss of principal.
For more information call
1 800 DIAL SEI
(1 800 342 5734)
Table of Contents
SEI Investments Distribution Co.
Oaks, PA 19456 1.800.DIAL.SEI (1.800.342.5734)
SEI-F-022 (03/12)
Table of Contents
| Item 2. | Code of Ethics. |
The Registrant has adopted a code of ethics that applies to the Registrant’s principal executive officer, principal financial officer, comptroller or principal accounting officer, and any person who performs a similar function.
| Item 3. | Audit Committee Financial Expert. |
(a)(1) The Registrant’s Board of Trustees has determined that the Registrant has at least one audit committee financial expert serving on the audit committee.
(a) (2) The audit committee financial expert are George J. Sullivan, Jr. and Hubert L. Harris, Jr. Mrrs. Sullivan and Harris are independent as defined in Form N-CSR Item 3 (a) (2).
| Item 4. | Principal Accountant Fees and Services. |
Fees billed by KPMG LLP (“KPMG”) related to the Registrant.
KPMG billed the Registrant aggregate fees for services rendered to the Registrant for the fiscal years 2012 and 2011 as follows:
| Fiscal 2012 | Fiscal 2011 | |||||||||||||||||||||||||
All fees and services to the Registrant that were pre- approved | All fees and service affiliates that were pre- approved | All other fees and services to service affiliates that did not require pre-approval | All fees and services to the Registrant that were pre- approved | All fees and services to service affiliates that were pre- approved | All other fees and services to service affiliates that did not require pre-approval | |||||||||||||||||||||
(a) | Audit Fees(1) | $ | 183,000 | N/A | $ | 0 | $ | 183,000 | N/A | $ | 0 | |||||||||||||||
(b) | Audit-Related Fees | $ | 0 | $ | 0 | $ | 0 | $ | 0 | $ | 0 | $ | 0 | |||||||||||||
(c) | Tax Fees | $ | 0 | $ | 0 | $ | 0 | $ | 0 | $ | 0 | $ | 0 | |||||||||||||
(d) | All Other Fees | $ | 0 | $ | 261,000 | $ | 0 | $ | 0 | $ | 229,500 | $ | 0 | |||||||||||||
Notes:
| (1) | Audit fees include amounts related to the audit of the Registrant’s annual financial statements and services normally provided by the accountant in connection with statutory and regulatory filings. |
Table of Contents
(e)(1) The Registrant’s Audit Committee has adopted and the Board of Trustees has ratified an Audit and Non-Audit Services Pre-Approval Policy (the “Policy”), which sets forth the procedures and the conditions pursuant to which services proposed to be performed by the independent auditor of the Registrant may be pre-approved.
The Policy provides that all requests or applications for proposed services to be provided by the independent auditor must be submitted to the Registrant’s Chief Financial Officer (“CFO”) and must include a detailed description of the services proposed to be rendered. The CFO will determine whether such services: (1) require specific pre-approval; (2) are included within the list of services that have received the general pre-approval of the Audit Committee pursuant to the Policy; or (3) have been previously pre-approved in connection with the independent auditor’s annual engagement letter for the applicable year or otherwise. In any instance where services require pre-approval, the Audit Committee will consider whether such services are consistent with SEC’s rules and whether the provision of such services would impair the auditor’s independence.
Requests or applications to provide services that require specific pre-approval by the Audit Committee will be submitted to the Audit Committee by the CFO. The Audit Committee will be informed by the CFO on a quarterly basis of all services rendered by the independent auditor. The Audit Committee has delegated specific pre-approval authority to either the Audit Committee Chair or financial expert, provided that the estimated fee for any such proposed pre-approved service does not exceed $100,000 and any pre-approval decisions are reported to the Audit Committee at its next regularly scheduled meeting.
Services that have received the general pre-approval of the Audit Committee are identified and described in the Policy. In addition, the Policy sets forth a maximum fee per engagement with respect to each identified service that has received general pre-approval.
All services to be provided by the independent auditor shall be provided pursuant to a signed written engagement letter with the Registrant, the investment advisor or applicable control affiliate (except that matters as to which an engagement letter would be impractical because of timing issues or because the matter is small may not be the subject of an engagement letter) that sets forth both the services to be provided by the independent auditor and the total fees to be paid to the independent auditor for those services.
In addition, the Audit Committee has determined to take additional measures on an annual basis to meet its responsibility to oversee the work of the independent auditor and to assure the auditor’s independence from the Registrant, such as reviewing a formal written statement from the independent auditor delineating all relationships between the independent auditor and the Registrant, and discussing with the independent auditor its methods and procedures for ensuring independence.
(e)(2) Percentage of fees billed applicable to non-audit services pursuant to waiver of pre-approval requirement were as follows:
| Fiscal 2012 | Fiscal 2011 | |||||||
Audit-Related Fees | 0 | % | 0 | % | ||||
Tax Fees | 0 | % | 0 | % | ||||
All Other Fees | 0 | % | 0 | % | ||||
(f) Not Applicable.
Table of Contents
(g)(1) The aggregate non-audit fees and services billed by KPMG for the fiscal years 2012 and 2011 were $261,000 and $229,500, respectively. Non-audit fees consist of SSAE No. 16 review of fund accounting and administration operations, compliance attestation reports, and agreed upon procedures report over certain internal controls related to compliance with federal securities laws and regulations.
(h) During the past fiscal year, Registrant’s principal accountant provided certain non-audit services to Registrant’s investment adviser or to entities controlling, controlled by, or under common control with Registrant’s investment adviser that provide ongoing services to Registrant that were not subject to pre-approval pursuant to paragraph (c)(7)(ii) of Rule 2-01 of Regulation S-X. The Audit Committee of Registrant’s Board of Trustees reviewed and considered these non-audit services provided by Registrant’s principal accountant to Registrant’s affiliates, including whether the provision of these non-audit services is compatible with maintaining the principal accountant’s independence.
| Item 5. | Audit Committee of Listed Registrants. |
Not Applicable.
| Item 6. | Schedule of Investments |
Included in Item 1.
| Item 7. | Disclosure of Proxy Voting Policies and Procedures for Closed-End Management Investment Companies. |
Not Applicable.
| Item 8. | Portfolio Managers of Closed-End Management Investment Companies |
Not Applicable.
| Item 9. | Purchases of Equity Securities by Closed-End Management Company and Affiliated Purchasers. |
Not Applicable.
| Item 10. | Submission of Matters to a Vote of Security Holders. |
The Registrant has a standing Nominating Committee (the “Committee”) currently consisting of the Independent Trustees. The Committee is responsible for evaluating and recommending nominees for election to the Registrant’s Board of Trustees (the “Board”). Pursuant to the Committee’s Charter, adopted on June 18th 2004, as amended, the Committee will review all shareholder recommendations for nominations to fill vacancies on the Board if such recommendations are submitted in writing and addressed to the Committee at the Trust’s office.
| Item 11. | Controls and Procedures. |
(a) The registrant’s principal executive and principal financial officers, or persons performing similar functions, have concluded that the Registrant’s disclosure controls and procedures (as defined in Rule 30a-3(c) under the Investment Company Act of 1940 (the “1940 Act”)) are effective, based on the evaluation of these controls and procedures required by Rule 30a-3(b) under the 1940 Act and Rules 13a-15(b) or 15d-15(b) under the Securities Exchange Act of 1934 as of a date within 90 days of the filing date of this report.
Table of Contents
(b) There were no changes in the Registrant’s internal control over financial reporting (as defined in Rule 30a-3(d) under the 1940 Act) that occurred during the second fiscal quarter of the period covered by this report that have materially affected, or are reasonably likely to materially affect, the Registrant’s internal control over financial reporting.
| Items 12. | Exhibits. |
(a)(1) Code of Ethics attached hereto.
(a)(2) A separate certification for the principal executive officer and the principal financial officer of the Registrant as required by Rule 30a-2(a) under the 1940 Act, as amended (17 CFR 270.30a-2(a)), are filed herewith.
(b) Officer certifications as required by Rule 30a-2(b) under the 1940 Act, as amended (17 CFR 270.30a-2(b)) also accompany this filing as an exhibit.
Table of Contents
SIGNATURES
Pursuant to the requirements of the Securities Exchange Act of 1934 and the Investment Company Act of 1940, the registrant has duly caused this report to be signed on its behalf by the undersigned, thereunto duly authorized.
| SEI Daily Income Trust | ||
| /s/ Robert A. Nesher | ||
| Robert A. Nesher, CEO and President | ||
Date: April 9, 2012
Pursuant to the requirements of the Securities Exchange Act of 1934 and the Investment Company Act of 1940, this report has been signed below by the following persons on behalf of the registrant and in the capacities and on the dates indicated.
| /s/ Robert A. Nesher | ||
| Robert A. Nesher, CEO and President | ||
Date: April 9, 2012
| /s/ Peter A. Rodriguez | ||
| Peter A. Rodriguez, Controller & CFO | ||
Date: April 9, 2012