UNITED STATES
SECURITIES AND EXCHANGE COMMISSION
Washington, D.C. 20549
FORM N-CSR
CERTIFIED SHAREHOLDER REPORT OF REGISTERED
MANAGEMENT INVESTMENT COMPANIES
Investment Company Act file number 811-03451
SEI Daily Income Trust
(Exact name of registrant as specified in charter)
c/o CT Corporation
101 Federal Street
Boston, MA 02110
(Name and address of agent for service)
SEI Investments
One Freedom Valley Drive
Oaks, PA 19456
(Address of principal executive offices)
Registrant’s telephone number, including area code: 1-800-342-5734
Date of fiscal year end: January 31, 2015
Date of reporting period: January 31, 2015
| Item 1. | Reports to Stockholders. |

January 31, 2015
ANNUAL REPORT
SEI Daily Income Trust
† Money Market Fund
† Government Fund
† Government II Fund
† Prime Obligation Fund
† Treasury Fund
† Treasury II Fund
† Ultra Short Duration Bond Fund
† Short-Duration Government Fund
† Intermediate-Duration Government Fund
† GNMA Fund

| 1 | ||||
| 3 | ||||
| 10 | ||||
| 52 | ||||
| 54 | ||||
| 56 | ||||
| 60 | ||||
| 64 | ||||
| 73 | ||||
| 74 | ||||
| 77 | ||||
Board of Trustees’ Considerations in Approving | 79 | |||
| 82 | ||||
The Trust files its complete schedule of portfolio holdings with the Securities and Exchange Commission for the first and third quarter of each fiscal year on Form N-Q within sixty days after the end of the period. The Trust’s Forms N-Q are available on the Commission’s website at http://www.sec.gov, and may be reviewed and copied at the Commission’s Public Reference Room in Washington, DC. Information on the operation of the Public Reference Room may be obtained by calling 1-800-SEC-0330.
Since the Funds in SEI Daily Income Trust typically hold only fixed income securities, they generally are not expected to hold securities for which they may be required to vote proxies. Regardless, in light of the possibility that a Fund could hold a security for which a proxy is voted, the Trust has adopted proxy voting policies. A description of the policies and procedures that the Trust uses to determine how to vote proxies relating to portfolio securities, as well as information relating to how a Fund voted proxies relating to portfolio securities during the most recent 12-month period ended June 30, is available (i) without charge, upon request, by calling 1-800-DIAL-SEI; and (ii) on the Commission’s website at http://www.sec.gov.
SEI DAILY INCOME TRUST — JANUARY 31, 2015
To Our Shareholders:
During the Funds’ most recently completed fiscal year, from the start of February 2014 through the end of January 2015, fixed-income markets largely recovered from the challenging headwinds they faced during the prior year. Long-term interest rates, which were widely expected to rise during the period, defied consensus expectations by falling significantly. For example, the yield on the 10-year U.S. Treasury started the period at 2.7% and ended the period at 1.7%. The steady decline in rates provided a tailwind to most of the fixed-income market; although certain areas (such as emerging-market and high-yield debt) struggled, while shorter-term yields remained compressed due to central-bank policies.
Geopolitical Events
When Russian President Vladimir Putin successfully annexed Crimea from Ukraine in early 2014, he appeared to be running circles around western political rivals. The European Union and the U.S. imposed multiple rounds of economic sanctions in response, but these did not impact the Russian economy or financial markets too badly — until the price of oil began a sharp, deep descent after the middle of the year. (Russia is a major oil producer and its economy and public expenditures rely heavily on oil revenues.)
The falling oil price was the result of several factors, most notably expanding supply within North America, where significant investments have been made in energy production in recent years. The resulting pressure on oil prices was strong enough to overcome the supply interruptions caused by chaotic social and political conditions in other oil-producing areas, such as Iraq, Syria and Libya. The Organization of the Petroleum Exporting Countries, led by Saudi Arabia, chose not to cut production in order to support prices. As a result, the sharply lower price of oil in 2014 came to reflect an intense battle for market share, especially, many analysts believe, between Saudi Arabia and North America. While Saudi Arabia has thus far been able to weather the conflict, thanks to the massive foreign-currency reserves it has amassed over the years, there has been significant collateral damage to other countries that rely heavily on oil revenues. Examples include Iran (a major regional rival of Saudi Arabia), Russia (a key ally of Iran), Nigeria, Venezuela and others. Another factor driving oil prices lower was the sharp appreciation of the U.S. dollar against other currencies from the middle of 2014 through the end of January. (Most global oil transactions are denominated in dollars.)
Sharply lower oil prices have also had negative repercussions in the U.S. and Canada, given that many of North America’s recent energy investments require higher oil prices to remain profitable. On the other hand, the roughly 50% drop in oil prices during 2014 has acted as a boon to consumers and oil-importing countries. For U.S. fixed-income investors, falling oil prices had their most relevant impacts on inflation expectations and intermediate-to-long-term interest rates, which were both pulled lower.
Economic Performance
In the U.S., poor winter weather caused a surprise decline in economic activity in the first quarter of 2014. However, this was followed by a healthy rebound in the second quarter and an even stronger rebound in the third, as the economy got back on track. The state of the labor market continued to improve as a result. Nonfarm payrolls expanded steadily, layoffs declined, and the unemployment rate fell below 6% for the first time since 2008. Tepid wage growth remained a lingering concern; but with tightening labor markets, continued economic growth, and still-healthy corporate profits, this may begin to finally turn around. The combination of firming labor markets, falling oil prices and lower interest rates helped home prices regain traction in the second half of the period.
Given the continued improvement in the U.S. economy, the Federal Reserve (Fed) terminated its bond-buying programs during the year and is now widely expected to begin raising interest rates sometime in 2015. This kept slight-but-steady upward pressure on shorter-term yields, which continued to exhibit the higher volatility that began in mid-2013.
Market Developments
In many respects, the Funds’ recently completed fiscal year was a year of two halves. Over the full year, financial markets overcame continued sluggishness in the global economy, the end of the Fed’s quantitative-easing efforts and two sharp-but-brief periods of volatility — to deliver generally positive results. However, whereas the first half of the period was marked by calm markets and depressed volatility, the second half was
| SEI Daily Income Trust / Annual Report / January 31, 2015 | 1 |
SEI DAILY INCOME TRUST — JANUARY 31, 2015
Letter to Shareholders (Concluded)
marked by sharp trends in areas such as oil and other commodities, interest rates and the U.S. dollar. Market volatility spiked briefly in both October and December 2014. During those periods, riskier assets (such as stocks, commodities, high-yield debt and emerging-market securities) sold off, and investors bid up the prices of perceived safe havens (such as government and investment-grade corporate bonds). Inflation-sensitive assets (including commodities and Treasury inflation-protected securities) (“TIPS”) suffered, as the dollar strengthened dramatically during the second half of the year through the end of January.
Several areas of U.S. fixed-income markets regained their footing after a challenging prior year. This included U.S. Treasurys, investment-grade corporates, mortgages and municipals. The yield on the bellwether 10-year Treasury note fell by more than 80 basis points (0.80%), as worries about the end of the Fed’s quantitative easing receded, inflation expectations softened, and, at times (especially in the second half of the period), investors sought out safety. (Bond yields and prices typically move inversely.) This resulted in attractive returns for longer-dated Treasurys and, combined with the aforementioned upward pressure on short-term interest rates, caused the yield curve to flatten. Mortgage-backed securities (MBS) performed well overall despite the end of the Fed’s MBS purchase program in October. Commercial real estate also continued to perform well during the period, which was reflected in the solid performance of commercial mortgage-backed securities (CMBS).
While non-agency MBS performed well, agency MBS underperformed Treasurys and, within mortgages, Ginnie Maes (GNMA) underperformed conventional mortgage securities (such as those issued by Fannie Mae and Federal Home Loan Banks). These dynamics were driven in part by lower levels of foreign bank buying, but the more significant factor was increased refinancing activity. This occurred in response to lower interest rates and, at the end of the period in January 2015, the Federal Housing Agency’s (FHA) decision to substantially lower annual mortgage insurance premiums (MIP) for FHA purchases and mortgage refinancings. This was a big surprise, as most market participants expected MIP reductions to begin in the fall of 2015 and to unfold at a more gradual pace, and it had a negative impact on GNMA performance. The Fed’s exit from the MBS market in October also negatively impacted GNMAs, as it made it much easier for FHA homeowners to refinance existing mortgages. (This development may also increase the supply of GNMAs if their rates become more competitive with conventional mortgages for certain borrowers.)
The Barclays U.S. Aggregate Bond Index also performed well, thanks to its fairly long duration (higher price sensitivity to interest rates). Conversely, after finishing 2013 relatively unscathed and performing well through mid-2014, U.S. high-yield debt suffered in the second half of the year because of its exposure to the energy sector. And with falling inflation expectations globally and a strengthening U.S. dollar, inflation-sensitive securities like TIPS fared relatively poorly. Lower-duration securities underperformed longer-duration ones, as the likelihood of higher short-term interest rates weighed on shorter maturities.
Our View
We remain optimistic regarding global equity markets, given the tailwinds of lower energy prices, more accommodative monetary policies (including the European Central Bank’s commencement of a large scale asset-purchase program, which should help keep global interest rates low, including U.S. Treasurys) and some easing of fiscal constraints. In fixed-income markets, we believe valuations look a bit high, especially in perceived safe-haven government securities such as U.S. Treasurys. However, the concerted efforts of central banks to keep short-term interest rates low may limit the near-term danger of a big reversal in short-term yields and an associated drop in bond prices.
Of course, markets will almost surely react to the first interest-rate hike by the Fed. Should it happen in 2015, it will be an important event. Historically, the initial stages of a Fed tightening cycle do not usually mean the end of a bull-market run. Although credit markets are not as compelling as they were coming out of the financial crisis, skilled active managers should still be able to identify and exploit opportunities for outperformance.
Sincerely,

Bill Lawrence
Managing Director, Portfolio Management Group
| 2 | SEI Daily Income Trust / Annual Report / January 31, 2015 |
MANAGEMENT’S DISCUSSION AND ANALYSIS OF FUND PERFORMANCE
SEI DAILY INCOME TRUST — JANUARY 31, 2015
Ultra Short Duration Bond Fund
I. Objective
The Ultra Short Duration Bond Fund (the “Fund”) seeks to provide a higher current income than typically offered by a money-market fund while maintaining a high degree of liquidity and a correspondingly higher risk of principal volatility.
II. Investment Approach
The Fund uses a multi-manager approach, relying on a number of sub-advisors with differing investment approaches to manage portions of the Fund’s portfolio, under the general supervision of SEI Investments Management Corporation (“SIMC”). The Fund’s current sub-advisors are Wellington Management Company, LLP and Logan Circle Partners, L.P. There were no manager changes during the period.
III. Return vs. Benchmark
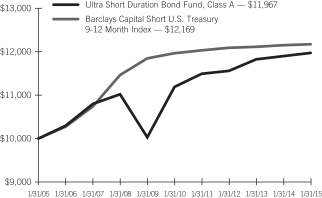
For the fiscal year ended January 31, 2015, the Fund’s Class A shares returned 0.60%. The Fund’s benchmark — the Barclays Capital Short U.S. Treasury 9-12 Month Index — returned 0.23%.
IV. Fund Attribution
Absolute Performance
Despite the low-rate environment, especially at the short end of the yield curve, short-term paper was able to generate a positive return.
Benchmark-Relative Performance
The Fund’s return was primarily driven by strong performance across a number of credit sectors; as noted in the accompanying shareholder letter, several areas of the fixed-income market outperformed, including financials, non-agency MBS, commercial mortgage-backed securities (CMBS) and several asset-backed securities (ABS) sectors. The Fund’s exposures to these sectors were largely driven by relative value considerations. Similar motivations led the Fund to underweight less-attractive sectors such as agency MBS, short-dated Treasurys and industrial issues; this also helped performance.
The Fund’s overweight to the financial sector (particularly banks) contributed to outperformance, as fundamentals continued to improve through a combination of improved operations and stricter regulatory capital requirements. Both Wellington and Logan Circle were overweight the sector.
The Fund’s overweight to non-agency MBS (Wellington) continued to benefit performance over the period, as security prices were modestly higher across the legacy non-agency sectors. The sector was supported by the continued housing recovery and attractive risk-adjusted yields compared to other sectors.
The Fund’s overweight to CMBS (both sub-advisors) was beneficial, as spreads tightened across the board in that sector.
A meaningful allocation to certain ABS sectors — auto loans (both sub-advisors), credit cards (Wellington) and equipment leases (Logan Circle) — contributed to outperformance, as the U.S. economy continued to experience steady growth.
Finally, a position in municipal bonds (Logan Circle) contributed to relative performance.
Use of Derivatives
The Fund used Treasury futures and to-be-announced (TBA) forward contracts to effectively manage duration, yield-curve and market exposures. (TBA contracts confer the obligation to buy or sell future debt obligations of the three U.S. government-sponsored agencies that issue or guarantee MBS — Fannie Mae, Freddie Mac and Ginnie Mae.) None of these had a meaningful impact on the Fund’s performance.
Ultra Short Duration Bond Fund:
AVERAGE ANNUAL TOTAL RETURN1
One Year Return | Annualized 3-Year Return | Annualized 5-Year Return | Annualized 10-Year Return | Annualized Inception to Date | ||||||||||||||||
| Ultra Short Duration Bond Fund, Class A | 0.60% | 1.18% | 1.36% | 1.81% | 3.35% | |||||||||||||||
| Barclays Capital Short U.S. Treasury 9-12 Month Index | 0.23% | 0.24% | 0.35% | 1.98% | 3.38% | |||||||||||||||
| SEI Daily Income Trust / Annual Report / January 31, 2015 | 3 |
MANAGEMENT’S DISCUSSION AND ANALYSIS OF FUND PERFORMANCE
SEI DAILY INCOME TRUST — JANUARY 31, 2015
Ultra Short Duration Bond Fund (Concluded)
Comparison of Change in the Value of a $10,000 Investment in the Ultra Short Duration Bond Fund, Class A, versus the Barclays Capital Short U.S. Treasury 9-12 Month Index
| 1 | For the periods ended January 31, 2015. Past performance is no indication of future performance. Class A Shares were offered beginning 9/28/93. Returns shown do not reflect the deduction of taxes that a shareholder would pay on fund distributions or the redemption of fund shares. |
| 4 | SEI Daily Income Trust / Annual Report / January 31, 2015 |
MANAGEMENT’S DISCUSSION AND ANALYSIS OF FUND PERFORMANCE
SEI DAILY INCOME TRUST — JANUARY 31, 2015
Short-Duration Government Fund
I. Objective
The Short-Duration Government Fund (the “Fund”) seeks to preserve principal value and maintain a high degree of liquidity while providing current income.
II. Investment Approach
The Fund uses a sub-advisor to manage the Fund under the supervision of SEI Investments Management Corporation (“SIMC”). The Fund’s current sub-advisor is Wellington Management Company, LLP. There were no manager changes during the period.
III. Return vs. Benchmark
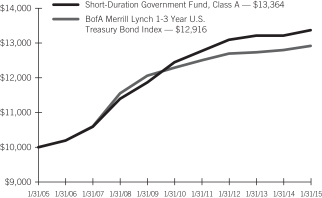
For the fiscal year ended January 31, 2015, the Fund’s Class A shares returned 1.20%. The Fund’s benchmark — the BofA Merrill Lynch 1-3 Year U.S. Treasury Bond Index — returned 0.97%.
IV. Fund Attribution
Absolute Performance
Despite the low-interest-rate environment — especially at the short end of the yield curve — the Fund was able to generate attractive returns following a disappointing 2013, thanks to an allocation to longer-duration assets. (As mentioned in the accompanying shareholder letter, intermediate-to-longer-term interest rates declined during the period.) One- and two-year Treasurys were negative
contributors to absolute returns, as their yields rose 5 and 12 basis points to end the period at 14 and 45 basis points, respectively.
Benchmark-Relative Performance
The Fund’s yield-curve-flattening bias, consisting of an overweight to the 7-year point of the curve and an underweight to the 1-to-3-year portion of the curve, had a positive impact on relative performance; as noted in the accompanying shareholder letter, the yield curve flattened substantially during the reporting period.
The Fund also benefited from an allocation to agency CMBS.
As noted in the shareholder letter, developments in agency mortgages caused them to underperform Treasurys over the reporting period. As a result, the Fund’s allocation to agency debentures detracted.
Use of Derivatives
Derivatives are used by the Fund on a limited basis.
The Fund used Treasury futures and to-be-announced (TBA) forward contracts to effectively manage duration, yield-curve and market exposures. (TBA contracts confer the obligation to buy or sell future debt obligations of the three U.S. government-sponsored agencies that issue or guarantee MBS — Fannie Mae, Freddie Mac and Ginnie Mae.) None of these had a meaningful impact on the Fund’s performance.
| SEI Daily Income Trust / Annual Report / January 31, 2015 | 5 |
MANAGEMENT’S DISCUSSION AND ANALYSIS OF FUND PERFORMANCE
SEI DAILY INCOME TRUST — JANUARY 31, 2015
Short-Duration Government Fund (Concluded)
Short-Duration Government Fund:
AVERAGE ANNUAL TOTAL RETURN1
| One Year Return | Annualized 3-Year Return | Annualized 5-Year Return | Annualized 10-Year Return | Annualized Inception to Date | ||||||||||||||||
| Short-Duration Government Fund, Class A | 1.20% | 0.70% | 1.44% | 2.94% | 4.81% | |||||||||||||||
| BofA Merrill Lynch 1-3 Year U.S. Treasury Bond Index | 0.97% | 0.60% | 1.01% | 2.59% | 4.92% | |||||||||||||||
Comparison of Change in the Value of a $10,000 Investment in the Short-Duration Government Fund, Class A, versus the Merrill Lynch 1-3 Year U.S. Treasury Bond Index
| 1 | For the periods ended January 31, 2015. Past performance is no indication of future performance. Class A shares were offered beginning 2/17/87. Returns shown do not reflect the deduction of taxes that a shareholder would pay on fund distributions or the redemption of fund shares. |
| 6 | SEI Daily Income Trust / Annual Report / January 31, 2015 |
MANAGEMENT’S DISCUSSION AND ANALYSIS OF FUND PERFORMANCE
SEI DAILY INCOME TRUST — JANUARY 31, 2015
Intermediate-Duration Government Fund
I. Objective
The Intermediate-Duration Government Fund (the “Fund”) seeks to preserve principal value and maintain a high degree of liquidity while providing current income.
II. Multi-Manager Approach
The Fund uses a sub-advisor to manage the Fund under the supervision of SEI Investments Management Corporation (“SIMC”). Currently the sub-advisor is Wellington Management Company, LLP. There were no manager changes during the period.
III. Return vs. Benchmark
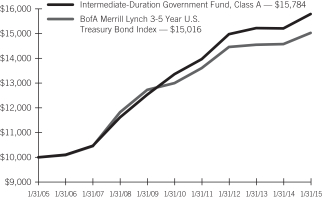
For the fiscal year ended January 31, 2015, the Fund’s Class A shares returned 3.88%. The Fund’s benchmark — the BofA Merrill Lynch 3-5 Year U.S. Treasury Bond Index — returned 3.06%.
IV. Fund Attribution
Absolute Performance
Despite the low-interest-rate environment — especially at the short end of the yield curve — the Fund was able to generate attractive returns following a disappointing 2013, thanks to an allocation to longer-duration assets. (As mentioned in the accompanying shareholder letter, intermediate-to-longer-term interest rates declined during the period.)
Benchmark-Relative Performance
As discussed in the shareholder letter, the yield curve flattened substantially during the reporting period. The Fund’s yield-curve-flattening bias helped performance as a result, driven by an overweight to the 7-to-10-year and an underweight to the 2-to-5 year parts of the curve. The Fund remains positioned for a further flattening of the yield curve.
The Fund benefited from an allocation to agency CMBS, which performed well, as noted in the shareholder letter.
As noted in the shareholder letter, developments in agency mortgages caused them to underperform Treasurys over the reporting period. As a result, the Fund’s allocation to agency debentures detracted.
Use of Derivatives
Derivatives are used by the Fund on a limited basis.
The Fund used Treasury futures and to-be-announced (TBA) forward contracts to effectively manage duration, yield-curve and market exposures. (TBA contracts confer the obligation to buy or sell future debt obligations of the three U.S. government-sponsored agencies that issue or guarantee MBS — Fannie Mae, Freddie Mac and Ginnie Mae.) None of these had a meaningful impact on the Fund’s performance.
Intermediate-Duration Government Fund:
AVERAGE ANNUAL TOTAL RETURN1
| One Year Return | Annualized 3-Year Return | Annualized 5-Year Return | Annualized 10-Year Return | Annualized Inception to Date | ||||||||||||||||
| Intermediate-Duration Government Fund, Class A | 3.88% | 1.78% | 3.41% | 4.67% | 5.98% | |||||||||||||||
| BofA Merrill Lynch 3-5 Year U.S. Treasury Bond Index | 3.06% | 1.30% | 2.94% | 4.15% | 6.14% | |||||||||||||||
Comparison of Change in the Value of a $10,000 Investment in the Intermediate-Duration Government Fund, Class A, versus the Merrill Lynch 3-5 Year U.S. Treasury Bond Index
| 1 | For the periods ended January 31, 2015. Past performance is no indication of future performance. Class A shares were offered beginning 2/17/87. Returns shown do not reflect the deduction of taxes that a shareholder would pay on fund distributions or the redemption of fund shares. |
| SEI Daily Income Trust / Annual Report / January 31, 2015 | 7 |
MANAGEMENT’S DISCUSSION AND ANALYSIS OF FUND PERFORMANCE
SEI DAILY INCOME TRUST — JANUARY 31, 2015
GNMA Fund
I. Objective
The GNMA Fund (the “Fund”) seeks to preserve principal value and maintain a high degree of liquidity while providing current income.
II. Investment Approach
The Fund uses a sub-advisor to manage the Fund under the supervision of SEI Investments Management Corporation (“SIMC”). Currently the sub-advisor is Wellington Management Company, LLP. There were no manager changes during the period.
III. Return vs. Benchmark
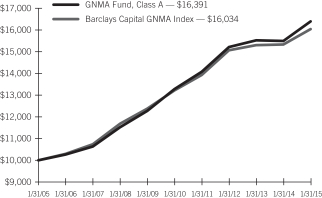
For the fiscal year ended January 31, 2015, the GNMA Fund, Class A, shares returned 5.79%. The Fund’s benchmark — the Barclays Capital GNMA Index — returned 4.56%.
IV. Fund Attribution
Absolute Performance
Despite the low-interest-rate environment — especially at the short end of the yield curve — mortgage-related securities helped the Fund generate attractive returns following a disappointing 2013. As mentioned in the preceding shareholder letter, intermediate-to-longer-term interest rates declined during the period. The Fund’s allocation to longer-duration assets helped performance as a result. MBS also continued to offer an attractive yield advantage over Treasurys.
Benchmark-Relative Performance
Allocations to conventional mortgages issued by Fannie Mae and Federal Home Loan Banks helped performance, as these securities outperformed Ginnie Maes, as discussed in the accompanying shareholder letter.
Security selection also helped results, as the Fund was underweight lower- and middle-coupon GNMAs, which were the most negatively impacted by the FHA’s surprise lowering of MIP (detailed in the shareholder letter).
The Fund’s slight overweight to older, seasoned, high-coupon MBS was also benefical.
Use of Derivatives
The Fund uses derivatives on a limited basis.
The Fund used Treasury futures and to-be-announced (TBA) forward contracts to effectively manage duration, yield-curve and market exposures. (TBA contracts confer the obligation to buy or sell future debt obligations of the three U.S. government-sponsored agencies that issue or guarantee MBS — Fannie Mae, Freddie Mac and Ginnie Mae.) None of these had a meaningful impact on the Fund’s performance.
The Fund made selective use of mortgage derivatives such as interest-only strip securities, principal-only strip securities and inverse floaters. The yields on these securities are sensitive to the expected or anticipated rate of principal payments on the underlying assets, and principal payments may have a material effect on their yields. These instruments are purchased only when rigorous stress testing and analysis suggest that a higher return can be earned at similar or lower risk compared to non-derivative securities.
GNMA Fund:
AVERAGE ANNUAL TOTAL RETURN1
| One Year Return | Annualized 3-Year Return | Annualized 5-Year Return | Annualized 10-Year Return | Annualized Inception to Date | ||||||||||||||||
| GNMA Fund, Class A | 5.79% | 2.51% | 4.31% | 5.07% | 6.39% | |||||||||||||||
| Barclays Capital GNMA Index | 4.56% | 2.10% | 3.94% | 4.83% | 6.71% | |||||||||||||||
Comparison of Change in the Value of a $10,000 Investment in the GNMA Fund, Class A, versus the Citigroup 30-Year GNMA Index
| 1 | For the periods ended January 31, 2015. Past performance is no indication of future performance. Class A shares were offered beginning 3/20/87. Returns shown do not reflect the deduction of taxes that a shareholder would pay on fund distributions or the redemption of fund shares. |
| 8 | SEI Daily Income Trust / Annual Report / January 31, 2015 |
Definition of Comparative Indices*
Barclays Capital GNMA Index is a widely-recognized, capitalization-weighted index of 15-30 year fixed-rate securities backed by mortgage pools of GNMA.
Barclays Capital Short U.S. Treasury 9-12 Month Index is a widely-recognized, market weighted index of U.S. Treasury Bonds with remaining maturities between nine and twelve months.
BofA Merrill Lynch 1-3 Year U.S. Treasury Bond Index is a widely-recognized, unmanaged index that tracks the performance of the direct sovereign debt of the U.S. Government having a maturity of at least one year and less than 3 years.
BofA Merrill Lynch 3-5 Year U.S. Treasury Bond Index is a widely-recognized, unmanaged index that tracks the performance of the direct sovereign debt of the U.S. Government having a maturity of at least three years and less than five years
| * | An Index measures the market price of a specific group of securities in a particular market sector. You cannot invest directly in an index. An index does not have an investment adviser and does not pay any commissions or expenses. If an index had expenses, its performance would be lower. |
| SEI Daily Income Trust / Annual Report / January 31, 2015 | 9 |
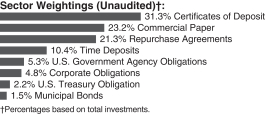
Money Market Fund
January 31, 2015
| Description | Face Amount ($ Thousands) | Value ($ Thousands) | ||||||
CERTIFICATES OF DEPOSIT — 30.7% |
| |||||||
ANZ New Zealand International | ||||||||
0.241%, 02/04/15 (A) | $ | 1,000 | $ | 1,000 | ||||
Bank of Montreal, Chicago | ||||||||
0.228%, 02/09/15 (A) | 2,000 | 2,000 | ||||||
0.230%, 06/01/15 | 2,000 | 2,000 | ||||||
Bank of Nova Scotia | ||||||||
0.247%, 02/09/15 (A) | 3,000 | 3,000 | ||||||
0.270%, 07/27/15 | 3,000 | 3,000 | ||||||
Bank of Tokyo-Mitsubishi UFJ NY | ||||||||
0.120%, 02/05/15 | 3,000 | 3,000 | ||||||
0.230%, 02/17/15 | 3,000 | 3,000 | ||||||
0.250%, 03/04/15 | 1,500 | 1,500 | ||||||
Canadian Imperial Bank of Commerce NY | ||||||||
0.227%, 02/10/15 (A) | 3,000 | 3,000 | ||||||
0.932%, 02/20/15 (A) | 3,200 | 3,201 | ||||||
0.256%, 02/23/15 (A) | 1,800 | 1,800 | ||||||
0.240%, 05/12/15 | 1,000 | 1,000 | ||||||
Commonwealth Bank of Australia | ||||||||
0.247%, 02/23/15 (A) | 1,882 | 1,882 | ||||||
DNB Bank | ||||||||
0.120%, 02/05/15 | 4,000 | 4,000 | ||||||
0.080%, 02/06/15 | 3,000 | 3,000 | ||||||
Mizuho Bank | ||||||||
0.250%, 04/02/15 | 1,579 | 1,579 | ||||||
National Australia Bank | ||||||||
0.248%, 02/07/15 (A) | 2,252 | 2,252 | ||||||
Nordea Bank | ||||||||
0.180%, 02/02/15 | 2,700 | 2,700 | ||||||
0.210%, 05/05/15 | 3,000 | 3,000 | ||||||
0.245%, 05/26/15 | 1,000 | 1,000 | ||||||
0.240%, 05/26/15 | 3,000 | 3,000 | ||||||
0.245%, 06/01/15 | 2,000 | 2,000 | ||||||
Old Line Funding (A) | ||||||||
0.268%, 02/07/15 | 332 | 332 | ||||||
0.268%, 02/17/15 | 2,000 | 2,000 | ||||||
Skandinaviska Enskida Banken | ||||||||
0.634%, 02/26/15 (A) | 1,000 | 1,000 | ||||||
0.230%, 03/02/15 | 2,000 | 2,000 | ||||||
0.250%, 03/30/15 | 1,000 | 1,000 | ||||||
State Street Bank | ||||||||
0.217%, 02/09/15 (A) | 2,000 | 2,000 | ||||||
| Description | Face Amount ($ Thousands) | Value ($ Thousands) | ||||||
Sumitomo Mitsui Banking | ||||||||
0.300%, 02/02/15 (A) | $ | 3,000 | $ | 3,000 | ||||
0.261%, 02/12/15 (A) | 1,400 | 1,400 | ||||||
0.250%, 04/02/15 | 3,000 | 3,000 | ||||||
Svenska Handelsbanken | ||||||||
0.175%, 02/09/15 | 383 | 383 | ||||||
0.185%, 03/19/15 | 1,000 | 1,000 | ||||||
Toronto-Dorminion Bank | ||||||||
0.195%, 04/01/15 | 540 | 540 | ||||||
0.230%, 05/11/15 | 548 | 548 | ||||||
0.230%, 05/29/15 | 734 | 734 | ||||||
0.260%, 07/17/15 | 1,265 | 1,265 | ||||||
Toyota Motor Credit | ||||||||
0.218%, 02/03/15 (A) | 3,400 | 3,400 | ||||||
Wells Fargo Bank | ||||||||
0.270%, 02/02/15 (A) | 202 | 202 | ||||||
0.220%, 02/13/15 | 976 | 976 | ||||||
0.256%, 04/02/15 (A) | 250 | 250 | ||||||
0.230%, 05/07/15 | 3,000 | 3,000 | ||||||
0.260%, 08/03/15 | 819 | 819 | ||||||
|
| |||||||
Total Certificates of Deposit (Cost $80,763) ($ Thousands) | 80,763 | |||||||
|
| |||||||
COMMERCIAL PAPER (B) (C) — 23.8% |
| |||||||
Albion Capital LLC | ||||||||
0.150%, 02/06/15 | 391 | 391 | ||||||
0.205%, 02/17/15 | 1,919 | 1,919 | ||||||
0.200%, 02/23/15 | 1,030 | 1,030 | ||||||
ANZ New Zealand International | ||||||||
0.220%, 04/01/15 | 7,000 | 6,997 | ||||||
0.280%, 07/17/15 | 860 | 859 | ||||||
Bank of Nova Scotia | ||||||||
0.230%, 02/06/15 | 4,900 | 4,900 | ||||||
Caisse Centrale Desjardins | ||||||||
0.230%, 04/06/15 | 889 | 889 | ||||||
Chariot Funding LLC | ||||||||
0.230%, 05/08/15 | 388 | 388 | ||||||
Coca-Cola | ||||||||
0.210%, 05/26/15 | 2,000 | 1,999 | ||||||
Exxon Mobil | ||||||||
0.180%, 06/22/15 | 1,000 | 999 | ||||||
Fairway Finance LLC | ||||||||
0.220%, 05/11/15 | 1,000 | 999 | ||||||
HSBC USA | ||||||||
0.250%, 02/23/15 | 450 | 450 | ||||||
JPMorgan Securities LLC | ||||||||
0.250%, 05/04/15 to 05/11/15 | 7,500 | 7,495 | ||||||
0.290%, 06/15/15 | 1,000 | 999 | ||||||
0.300%, 07/08/15 | 3,000 | 2,996 | ||||||
National Australia Bank | ||||||||
0.260%, 07/06/15 | 424 | 424 | ||||||
Old Line Funding | ||||||||
0.500%, 04/22/15 | 688 | 688 | ||||||
| 10 | SEI Daily Income Trust / Annual Report / January 31, 2015 |
| Description | Face Amount ($ Thousands) | Value ($ Thousands) | ||||||
Regency Markets LLC | ||||||||
0.130%, 02/05/15 to 02/06/15 | $ | 1,035 | $ | 1,035 | ||||
0.140%, 02/09/15 | 2,736 | 2,736 | ||||||
Skandinaviska Enskilda Banken | ||||||||
0.240%, 04/08/15 | 1,463 | 1,462 | ||||||
Thunder Bay Funding LLC | ||||||||
0.268%, 02/07/15 (A) | 957 | 957 | ||||||
0.230%, 05/18/15 | 1,127 | 1,126 | ||||||
Toyota Credit Canada | ||||||||
0.240%, 02/09/15 to 05/12/15 | 644 | 644 | ||||||
0.270%, 07/27/15 | 1,000 | 999 | ||||||
Toyota Motor Credit | ||||||||
0.230%, 05/19/15 to 05/20/15 | 2,000 | 1,998 | ||||||
0.250%, 05/29/15 | 1,000 | 999 | ||||||
0.270%, 07/30/15 | 3,000 | 2,996 | ||||||
Westpac Securities | ||||||||
0.258%, 02/21/15 (A) | 1,500 | 1,500 | ||||||
0.280%, 07/07/15 | 3,000 | 2,996 | ||||||
0.275%, 07/15/15 | 7,000 | 6,991 | ||||||
Working Capital Management | ||||||||
0.130%, 02/02/15 to 02/05/15 | 1,829 | 1,829 | ||||||
|
| |||||||
Total Commercial Paper (Cost $62,690) ($ Thousands) | 62,690 | |||||||
|
| |||||||
TIME DEPOSITS — 10.4% |
| |||||||
Citigroup | ||||||||
0.090%, 02/02/15 | 3,947 | 3,947 | ||||||
Lloyds Bank | ||||||||
0.050%, 02/02/15 | 12,500 | 12,500 | ||||||
Swedbank | ||||||||
0.060%, 02/02/15 | 11,000 | 11,000 | ||||||
|
| |||||||
Total Time Deposits (Cost $27,447) ($ Thousands) | 27,447 | |||||||
|
| |||||||
U.S. GOVERNMENT AGENCY OBLIGATIONS — 5.3% |
| |||||||
FFCB (A) | ||||||||
0.200%, 02/01/15 | 760 | 760 | ||||||
0.186%, 02/01/15 | 2,190 | 2,191 | ||||||
0.163%, 02/16/15 | 2,700 | 2,700 | ||||||
0.218%, 02/24/15 | 1,110 | 1,110 | ||||||
0.177%, 04/23/15 | 1,000 | 1,000 | ||||||
FFCB, Ser 1 (A) | ||||||||
0.230%, 02/01/15 | 350 | 350 | ||||||
FHLB DN | ||||||||
0.075%, 02/04/15 | 136 | 136 | ||||||
0.100%, 02/05/15 | 155 | 155 | ||||||
0.180%, 02/18/15 | 5,155 | 5,155 | ||||||
0.100%, 02/23/15 | 120 | 120 | ||||||
FNMA | ||||||||
0.187%, 02/15/15 (A) | 240 | 240 | ||||||
|
| |||||||
Total U.S. Government Agency Obligations (Cost $13,917) ($ Thousands) | 13,917 | |||||||
|
| |||||||
| Description | Face Amount ($ Thousands) | Value ($ Thousands) | ||||||
CORPORATE OBLIGATIONS — 4.8% |
| |||||||
American Honda Finance | ||||||||
3.500%, 03/16/15 (C) | $ | 200 | $ | 201 | ||||
Australia & New Zealand Banking Group MTN | ||||||||
0.432%, 02/07/15 (A) (C) | 2,170 | 2,171 | ||||||
General Electric Capital MTN | ||||||||
4.875%, 03/04/15 | 135 | 136 | ||||||
HSBC USA | ||||||||
2.375%, 02/13/15 | 657 | 658 | ||||||
International Business Machines | ||||||||
0.283%, 02/01/15 (A) | 2,474 | 2,474 | ||||||
National Australia Bank | ||||||||
3.750%, 03/02/15 (C) | 168 | 168 | ||||||
Nordea Bank | ||||||||
2.250%, 03/20/15 (C) | 400 | 401 | ||||||
Royal Bank of Canada MTN | ||||||||
1.150%, 03/13/15 | 3,583 | 3,587 | ||||||
Shell International | ||||||||
0.302%, 11/10/15 | 378 | 378 | ||||||
Sumitomo Mitsui Banking | ||||||||
1.350%, 07/18/15 | 1,176 | 1,181 | ||||||
Toronto-Dominion Bank MTN | ||||||||
0.412%, 02/07/15 (A) | 748 | 748 | ||||||
Toyota Motor Credit MTN | ||||||||
0.388%, 03/10/15 (A) | 263 | 263 | ||||||
Westpac Banking | ||||||||
3.000%, 08/04/15 | 279 | 283 | ||||||
|
| |||||||
Total Corporate Obligations (Cost $12,649) ($ Thousands) | 12,649 | |||||||
|
| |||||||
U.S. TREASURY OBLIGATION — 2.2% |
| |||||||
U.S. Treasury Notes | ||||||||
2.375%, 02/28/15 | 5,845 | 5,855 | ||||||
|
| |||||||
Total U.S. Treasury Obligation (Cost $5,855) ($ Thousands) | 5,855 | |||||||
|
| |||||||
MUNICIPAL BONDS (A) — 1.5% |
| |||||||
Arizona — 0.2% | ||||||||
Pima County, Industrial Development Authority, RB | ||||||||
0.050%, 02/04/15 | 600 | 600 | ||||||
|
| |||||||
Iowa — 0.3% | ||||||||
Iowa State, Finance Authority, Ser C, RB | ||||||||
0.100%, 02/05/15 | 810 | 810 | ||||||
Iowa State, Finance Authority, Ser G, RB | ||||||||
0.100%, 02/05/15 | 15 | 15 | ||||||
|
| |||||||
| 825 | ||||||||
|
| |||||||
| SEI Daily Income Trust / Annual Report / January 31, 2015 | 11 |
SCHEDULE OF INVESTMENTS
Money Market Fund (Continued)
January 31, 2015
| Description | Face Amount ($ Thousands) | Value ($ Thousands) | ||||||
Massachusetts — 0.1% | ||||||||
Simmons College, Higher Education Authority, RB | ||||||||
0.130%, 02/05/15 | $ | 185 | $ | 185 | ||||
|
| |||||||
Michigan — 0.4% | ||||||||
Kent, Hospital Finance Authority, Ser C, RB | ||||||||
0.020%, 02/04/15 | 1,005 | 1,005 | ||||||
|
| |||||||
Minnesota — 0.3% | ||||||||
Minnesota State, Office of Higher Education, Ser A, RB | ||||||||
0.110%, 02/05/15 | 700 | 700 | ||||||
|
| |||||||
New Hampshire — 0.1% | ||||||||
New Hampshire State, Health & Education Facilities Authority, Dartmouth College Project, Ser C, RB | ||||||||
0.070%, 02/04/15 | 190 | 190 | ||||||
|
| |||||||
Texas — 0.2% | ||||||||
Texas State, Ser B, GO | ||||||||
0.090%, 02/05/15 | 375 | 375 | ||||||
|
| |||||||
Total Municipal Bonds (Cost $3,880) ($ Thousands) | 3,880 | |||||||
|
| |||||||
REPURCHASE AGREEMENTS (D) — 21.3% |
| |||||||
Goldman Sachs | 15,206 | 15,206 | ||||||
RBC Capital | 1,635 | 1,635 | ||||||
RBC Capital | 3,917 | 3,917 | ||||||
| Description | Face Amount ($ Thousands) | Value ($ Thousands) | ||||||
RBC Capital | $ | 5,777 | $ | 5,777 | ||||
Wells Fargo | 1,635 | 1,635 | ||||||
Wells Fargo | 28,000 | 28,000 | ||||||
|
| |||||||
Total Repurchase Agreements (Cost $56,170) ($ Thousands) | 56,170 | |||||||
|
| |||||||
Total Investments — 100.0% (Cost $263,371) ($ Thousands) | $ | 263,371 | ||||||
|
| |||||||
| * | A summary of the corporate obligations used to collateralize repurchase agreements entered into by the Fund at January 31, 2015, is as follows: |
| Counterparty | Corporate Obligation | Rate | Maturity Date | Par Amount ($ Thousands) | ||||||||||
| RBC Capital | CDK Global | 4.500 | % | 10/15/24 | $ | 19 | ||||||||
| Intesa | 6.500 | 02/24/21 | — | |||||||||||
| Korea Bank Bank | 3.250 | 03/09/16 | 229 | |||||||||||
| Korea East West Power | 2.625 | 11/27/18 | 389 | |||||||||||
| Packaging Corporation | 4.500 | 11/01/23 | 11 | |||||||||||
| PNC | 4.375 | 08/11/20 | 54 | |||||||||||
| Reynolds American | 3.250 | 11/01/22 | 90 | |||||||||||
| Reynolds American | 3.250 | 11/01/22 | 81 | |||||||||||
| Thomson | 4.300 | 11/23/23 | 298 | |||||||||||
| Transcanada Pipeline | 9.875 | 01/01/21 | 308 | |||||||||||
| Transcanada Pipeline | 9.875 | 01/01/21 | 5 | |||||||||||
| Verizon Communications | 1.991 | 09/14/18 | 769 | |||||||||||
| Verizon Communications | 1.991 | 09/14/18 | 2,221 | |||||||||||
| Verizon Communications | 6.350 | 04/01/19 | 699 | |||||||||||
| Williams Partners | 3.900 | 01/15/25 | 4 | |||||||||||
| Williams Partners | 3.900 | 01/15/25 | 226 | |||||||||||
Percentages are based on Net Assets of $263,460 ($ Thousands).
| (A) | Floating Rate Instrument. The rate reflected on the Schedule of Investments is the rate in effect on January 31, 2015. The demand and interest rate reset features give this security a shorter effective maturity date. |
| (B) | The rate reported is the effective yield at time of purchase. |
| (C) | Securities are held in connection with a letter of credit issued by a major bank. |
| (D) | Tri-Party Repurchase Agreement. |
DN — Discount Note
FFCB — Federal Farm Credit Bank
FHLB — Federal Home Loan Bank
| 12 | SEI Daily Income Trust / Annual Report / January 31, 2015 |
FNMA — Federal National Mortgage Association
GNMA — Government National Mortgage Association
GO — General Obligation
LLC — Limited Liability Company
MTN — Medium Term Note
RB — Revenue Bond
Ser — Series
As of January 31, 2015, all of the Fund’s investments were considered Level 2, in accordance with the authoritative guidance on fair value measurements and disclosure under U.S. GAAP.
For the year ended January 31, 2015, there were no transfers between Level 1 and Level 2 assets and liabilities. For the year ended January 31, 2015, there were no Level 3 securities.
For more information on valuation inputs, see Note 2 — Significant Accounting Policies in Notes to Financial Statements.
The accompanying notes are an integral part of the financial statements.
| SEI Daily Income Trust / Annual Report / January 31, 2015 | 13 |
SCHEDULE OF INVESTMENTS
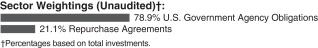
Government Fund
January 31, 2015
| Description | Face Amount ($ Thousands) | Value ($ Thousands) | ||||||
U.S. GOVERNMENT AGENCY OBLIGATIONS — 76.6% |
| |||||||
FFCB | ||||||||
0.350%, 02/01/15 (A) | $ | 4,280 | $ | 4,281 | ||||
0.169%, 02/01/15 (A) | 10,527 | 10,527 | ||||||
0.250%, 02/01/15 (A) | 2,265 | 2,265 | ||||||
0.220%, 02/01/15 (A) | 7,689 | 7,689 | ||||||
0.210%, 02/01/15 (A) | 1,710 | 1,710 | ||||||
0.195%, 02/01/15 (A) | 1,750 | 1,751 | ||||||
0.170%, 02/01/15 (A) | 5,540 | 5,540 | ||||||
0.100%, 02/01/15 (A) | 8,765 | 8,764 | ||||||
0.191%, 02/03/15 (A) | 15,228 | 15,232 | ||||||
0.151%, 02/03/15 (A) | 4,000 | 4,000 | ||||||
0.201%, 02/03/15 (A) | 1,705 | 1,706 | ||||||
0.198%, 02/06/15 (A) | 275 | 275 | ||||||
0.263%, 02/06/15 (A) | 490 | 491 | ||||||
0.188%, 02/08/15 (A) | 2,385 | 2,386 | ||||||
0.168%, 02/08/15 (A) | 706 | 706 | ||||||
3.850%, 02/11/15 | 435 | 435 | ||||||
0.196%, 02/11/15 (A) | 1,520 | 1,521 | ||||||
0.186%, 02/11/15 (A) | 3,605 | 3,606 | ||||||
0.196%, 02/12/15 (A) | 2,510 | 2,511 | ||||||
0.197%, 02/13/15 (A) | 385 | 385 | ||||||
0.187%, 02/14/15 (A) | 8,250 | 8,252 | ||||||
0.163%, 02/16/15 (A) | 8,170 | 8,170 | ||||||
4.375%, 02/17/15 | 2,445 | 2,450 | ||||||
0.208%, 02/17/15 (A) | 4,525 | 4,526 | ||||||
0.178%, 02/17/15 (A) | 1,940 | 1,940 | ||||||
2.050%, 02/18/15 | 204 | 204 | ||||||
0.200%, 02/18/15 (A) | 13,480 | 13,479 | ||||||
0.198%, 02/18/15 (A) | 3,000 | 3,001 | ||||||
0.178%, 02/18/15 (A) | 980 | 980 | ||||||
0.258%, 02/19/15 (A) | 8,960 | 8,971 | ||||||
0.168%, 02/19/15 | 4,330 | 4,330 | ||||||
0.178%, 02/19/15 (A) | 110 | 110 | ||||||
0.168%, 02/20/15 (A) | 7,000 | 7,001 | ||||||
0.238%, 02/20/15 (A) | 5,027 | 5,031 | ||||||
0.307%, 02/23/15 (A) | 10,665 | 10,668 | ||||||
0.187%, 02/23/15 (A) | 3,435 | 3,435 | ||||||
0.172%, 02/23/15 (A) | 5,900 | 5,898 | ||||||
0.270%, 02/24/15 | 6,780 | 6,781 | ||||||
0.218%, 02/24/15 (A) | 958 | 959 | ||||||
0.138%, 02/25/15 (A) | 2,270 | 2,270 | ||||||
0.188%, 02/26/15 (A) | 895 | 895 | ||||||
0.168%, 02/26/15 (A) | 4,355 | 4,355 | ||||||
0.178%, 02/27/15 (A) | 455 | 455 | ||||||
0.300%, 04/14/15 | 765 | 765 | ||||||
0.128%, 04/20/15 (A) | 10,260 | 10,260 | ||||||
0.177%, 04/23/15 (A) | 19,000 | 19,000 | ||||||
0.198%, 06/25/15 - 10/26/15 | 9,495 | 9,497 | ||||||
| Description | Face Amount ($ Thousands) | Value ($ Thousands) | ||||||
0.187%, 07/20/15 (A) | $ | 355 | $ | 355 | ||||
0.198%, 07/27/15 (A) | 1,500 | 1,500 | ||||||
0.300%, 08/17/15 | 1,000 | 1,001 | ||||||
0.194%, 09/22/15 (A) | 2,979 | 2,980 | ||||||
1.500%, 11/16/15 | 275 | 278 | ||||||
4.875%, 12/16/15 | 5,656 | 5,885 | ||||||
0.250%, 12/21/15 | 11,610 | 11,611 | ||||||
0.440%, 12/28/15 | 2,000 | 2,004 | ||||||
FFCB DN (B) | ||||||||
0.110%, 03/18/15 | 8,550 | 8,548 | ||||||
FFCB, Ser 1 | ||||||||
0.230%, 02/01/15 (A) | 1,185 | 1,185 | ||||||
FHLB | ||||||||
0.125%, 02/10/15 | 2,970 | 2,970 | ||||||
0.126%, 02/12/15 (A) | 8,510 | 8,510 | ||||||
4.750%, 02/13/15 | 930 | 931 | ||||||
4.375%, 02/13/15 | 420 | 421 | ||||||
0.128%, 02/17/15 (A) | 2,980 | 2,980 | ||||||
4.500%, 02/18/15 | 5,365 | 5,376 | ||||||
0.140%, 02/18/15 | 18,555 | 18,555 | ||||||
0.100%, 02/19/15 | 2,580 | 2,580 | ||||||
0.090%, 02/19/15 | 4,000 | 4,000 | ||||||
0.250%, 02/20/15 | 22,250 | 22,252 | ||||||
0.103%, 02/23/15 (A) | 23,590 | 23,590 | ||||||
0.090%, 02/27/15 | 11,945 | 11,945 | ||||||
0.140%, 03/02/15 | 13,080 | 13,081 | ||||||
0.110%, 03/06/15 | 2,295 | 2,295 | ||||||
0.100%, 03/06/15 | 29,205 | 29,205 | ||||||
0.100%, 03/09/15 | 2,900 | 2,900 | ||||||
0.100%, 03/10/15 | 10,420 | 10,420 | ||||||
0.160%, 03/12/15 | 6,500 | 6,500 | ||||||
0.140%, 03/12/15 | 4,305 | 4,305 | ||||||
4.125%, 03/13/15 | 130 | 131 | ||||||
3.500%, 03/13/15 | 205 | 206 | ||||||
2.750%, 03/13/15 | 14,050 | 14,091 | ||||||
0.375%, 03/13/15 | 11,035 | 11,038 | ||||||
0.150%, 03/17/15 | 735 | 735 | ||||||
0.113%, 03/20/15 (A) | 10,000 | 10,000 | ||||||
0.070%, 03/25/15 | 10,140 | 10,139 | ||||||
0.090%, 03/26/15 | 30,780 | 30,780 | ||||||
0.060%, 03/30/15 | 28,630 | 28,629 | ||||||
0.120%, 04/14/15 | 2,440 | 2,440 | ||||||
0.117%, 04/14/15 (A) | 30,000 | 30,001 | ||||||
0.128%, 04/16/15 (A) | 4,290 | 4,290 | ||||||
0.070%, 04/17/15 | 20,970 | 20,969 | ||||||
0.125%, 04/21/15 | 8,540 | 8,540 | ||||||
0.070%, 04/22/15 | 14,005 | 14,004 | ||||||
0.210%, 04/24/15 | 1,360 | 1,360 | ||||||
0.070%, 04/27/15 | 610 | 610 | ||||||
0.070%, 04/28/15 | 19,040 | 19,038 | ||||||
0.125%, 04/29/15 | 11,670 | 11,669 | ||||||
0.070%, 04/29/15 | 11,270 | 11,269 | ||||||
0.530%, 04/30/15 | 2,160 | 2,162 | ||||||
0.540%, 05/01/15 | 375 | 375 | ||||||
| 14 | SEI Daily Income Trust / Annual Report / January 31, 2015 |
| Description | Face Amount ($ Thousands) | Value ($ Thousands) | ||||||
0.125%, 05/01/15 | $ | 305 | $ | 305 | ||||
0.120%, 05/01/15 | 26,750 | 26,749 | ||||||
0.110%, 05/01/15 | 3,915 | 3,915 | ||||||
0.100%, 05/12/15 | 6,130 | 6,130 | ||||||
0.090%, 05/12/15 | 8,605 | 8,604 | ||||||
0.100%, 05/14/15 | 27,655 | 27,653 | ||||||
0.120%, 05/27/15 | 240 | 240 | ||||||
0.125%, 11/25/15 | 100 | 100 | ||||||
FHLB DN (B) | ||||||||
0.089%, 02/04/15 | 58,800 | 58,800 | ||||||
0.095%, 02/18/15 | 54,273 | 54,271 | ||||||
0.098%, 02/20/15 | 18,020 | 18,019 | ||||||
0.096%, 02/25/15 | 31,825 | 31,823 | ||||||
0.100%, 03/03/15 | 185 | 185 | ||||||
0.105%, 03/04/15 | 18,340 | 18,338 | ||||||
0.120%, 03/06/15 | 1,400 | 1,400 | ||||||
0.081%, 03/11/15 | 19,296 | 19,294 | ||||||
0.100%, 03/12/15 | 170 | 170 | ||||||
0.118%, 03/13/15 | 15,400 | 15,398 | ||||||
0.110%, 03/20/15 | 2,100 | 2,100 | ||||||
0.109%, 03/25/15 | 12,895 | 12,893 | ||||||
0.104%, 03/27/15 | 20,245 | 20,242 | ||||||
0.110%, 03/30/15 | 3,200 | 3,199 | ||||||
0.110%, 04/01/15 | 4,861 | 4,860 | ||||||
0.120%, 04/06/15 | 320 | 320 | ||||||
0.130%, 04/09/15 | 4,100 | 4,099 | ||||||
0.130%, 04/17/15 | 3,470 | 3,469 | ||||||
0.120%, 04/22/15 | 295 | 295 | ||||||
0.127%, 04/24/15 | 2,445 | 2,444 | ||||||
0.120%, 04/29/15 | 1,065 | 1,065 | ||||||
0.115%, 05/05/15 | 1,435 | 1,435 | ||||||
0.133%, 05/06/15 | 3,548 | 3,547 | ||||||
0.140%, 05/18/15 | 8,419 | 8,416 | ||||||
0.150%, 05/19/15 | 2,100 | 2,099 | ||||||
0.125%, 05/22/15 | 6,243 | 6,241 | ||||||
0.127%, 05/27/15 | 2,480 | 2,479 | ||||||
FHLMC | ||||||||
2.875%, 02/09/15 | 50,673 | 50,703 | ||||||
0.172%, 02/13/15 (A) | 12,000 | 11,998 | ||||||
0.148%, 02/16/15 (A) | 10,125 | 10,125 | ||||||
0.305%, 02/23/15 | 10,912 | 10,913 | ||||||
0.100%, 03/03/15 | 2,680 | 2,680 | ||||||
0.350%, 03/18/15 | 6,395 | 6,397 | ||||||
0.500%, 04/17/15 | 40,908 | 40,940 | ||||||
0.300%, 07/08/15 | 515 | 515 | ||||||
4.375%, 07/17/15 | 10,872 | 11,083 | ||||||
0.500%, 08/28/15 | 1,915 | 1,919 | ||||||
4.750%, 11/17/15 | 3,769 | 3,903 | ||||||
0.450%, 11/24/15 | 2,580 | 2,584 | ||||||
FHLMC DN (B) | ||||||||
0.120%, 02/23/15 | 11,120 | 11,119 | ||||||
0.100%, 03/05/15 | 540 | 540 | ||||||
0.120%, 03/25/15 | 1,700 | 1,700 | ||||||
0.090%, 03/26/15 | 17,920 | 17,918 | ||||||
| Description | Face Amount ($ Thousands) | Value ($ Thousands) | ||||||
0.100%, 04/09/15 | $ | 695 | $ | 695 | ||||
0.100%, 05/06/15 | 675 | 675 | ||||||
0.240%, 11/04/15 | 5,475 | 5,465 | ||||||
0.240%, 11/16/15 | 1,030 | 1,028 | ||||||
0.251%, 12/07/15 | 5,499 | 5,487 | ||||||
FHLMC MTN | ||||||||
5.150%, 03/01/15 | 665 | 668 | ||||||
FNMA | ||||||||
0.440%, 02/01/15 (A) | 1,720 | 1,722 | ||||||
0.070%, 02/09/15 | 568 | 568 | ||||||
0.187%, 02/15/15 (A) | 6,650 | 6,652 | ||||||
0.188%, 02/16/15 (A) | 6,750 | 6,752 | ||||||
2.000%, 02/18/15 | 1,060 | 1,061 | ||||||
4.000%, 02/19/15 (C) | 515 | 516 | ||||||
0.178%, 02/25/15 (A) | 1,360 | 1,360 | ||||||
0.183%, 02/26/15 (A) | 4,000 | 3,999 | ||||||
0.138%, 02/27/15 (A) | 25,000 | 24,999 | ||||||
5.000%, 03/02/15 | 5,623 | 5,645 | ||||||
0.375%, 03/16/15 | 73,267 | 73,291 | ||||||
1.750%, 03/23/15 | 1,140 | 1,143 | ||||||
5.000%, 04/15/15 | 21,422 | 21,633 | ||||||
0.500%, 05/27/15 | 26,419 | 26,448 | ||||||
0.500%, 07/02/15 | 56,966 | 57,049 | ||||||
2.375%, 07/28/15 | 24,530 | 24,796 | ||||||
2.000%, 08/18/15 | 1,000 | 1,010 | ||||||
0.670%, 08/26/15 | 510 | 511 | ||||||
0.375%, 12/21/15 | 6,557 | 6,565 | ||||||
FNMA DN (B) | ||||||||
0.100%, 02/18/15 | 1,207 | 1,207 | ||||||
0.116%, 03/03/15 | 3,335 | 3,335 | ||||||
0.100%, 03/25/15 | 550 | 550 | ||||||
0.100%, 04/01/15 | 730 | 730 | ||||||
0.126%, 04/27/15 | 6,305 | 6,303 | ||||||
Tennessee Valley Authority | ||||||||
4.375%, 06/15/15 | 640 | 650 | ||||||
|
| |||||||
Total U.S. Government Agency Obligations | 1,508,250 | |||||||
|
| |||||||
REPURCHASE AGREEMENTS (D) — 20.5% |
| |||||||
Bank of Montreal | 100,000 | 100,000 | ||||||
| SEI Daily Income Trust / Annual Report / January 31, 2015 | 15 |
SCHEDULE OF INVESTMENTS
Government Fund (Concluded)
January 31, 2015
| Description | Face Amount ($ Thousands) | Value ($ Thousands) | ||||||
Bank of Nova Scotia | $ | 77,572 | $ | 77,572 | ||||
Goldman Sachs | 60,000 | 60,000 | ||||||
Goldman Sachs | 5,000 | 75,000 | ||||||
Goldman Sachs | 91,000 | 91,000 | ||||||
|
| |||||||
Total Repurchase Agreements | 403,572 | |||||||
|
| |||||||
Total Investments — 97.1% | $ | 1,911,822 | ||||||
|
| |||||||
Percentages are based on Net Assets of $1,969,117 ($ Thousands).
| (A) | Floating Rate Instrument. The rate reflected on the Schedule of Investments is the rate in effect on January 31, 2015. The demand and interest rate reset features give this security a shorter effective maturity date. |
| (B) | The rate reported is the effective yield at time of purchase. |
| (C) | Step Bonds — The rate reflected on the Schedule of Investments is the effective yield on January 31, 2015. The coupon on a step bond changes on a specific date. |
| (D) | Tri-Party Repurchase Agreement. |
DN — Discount Note
FCSB — Federal Farm Credit Banks Consolidated Systemwide Bonds
FFCB — Federal Farm Credit Bank
FHLB — Federal Home Loan Bank
FHLMC — Federal Home Loan Mortgage Corporation
FNMA — Federal National Mortgage Association
GNMA — Government National Mortgage Association
MTN — Medium Term Note
TVDN — Tennessee Valley Discount Notes
Ser — Series
As of January 31, 2015, all of the Fund’s investments were considered Level 2, in accordance with the authoritative guidance on fair value measurements and disclosure under U.S. GAAP.
For the year ended January 31, 2015, there were no transfers between Level 1 and Level 2 assets and liabilities. For the year ended January 31, 2015, there were no Level 3 securities.
For more information on valuation inputs, see Note 2 — Significant Accounting Policies in Notes to Financial Statements.
The accompanying notes are an integral part of the financial statements.
| 16 | SEI Daily Income Trust / Annual Report / January 31, 2015 |
SCHEDULE OF INVESTMENTS
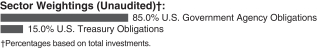
Government II Fund
January 31, 2015
| Description | Face Amount ($ Thousands) | Value ($ Thousands) | ||||||
U.S. GOVERNMENT AGENCY OBLIGATIONS — 80.7% |
| |||||||
FFCB | ||||||||
0.350%, 02/01/15 (A) | $ | 3,060 | $ | 3,061 | ||||
0.310%, 02/01/15 (A) | 595 | 595 | ||||||
0.250%, 02/01/15 (A) | 2,335 | 2,335 | ||||||
0.220%, 02/01/15 (A) | 6,926 | 6,926 | ||||||
0.210%, 02/01/15 (A) | 1,580 | 1,580 | ||||||
0.200%, 02/01/15 (A) | 11,070 | 11,069 | ||||||
0.170%, 02/01/15 (A) | 3,845 | 3,845 | ||||||
0.169%, 02/01/15 (A) | 5,855 | 5,855 | ||||||
0.155%, 02/01/15 (A) | 7,210 | 7,210 | ||||||
0.100%, 02/01/15 (A) | 5,625 | 5,624 | ||||||
0.200%, 02/02/15 (A) | 1,970 | 1,971 | ||||||
0.195%, 02/02/15 (A) | 1,250 | 1,251 | ||||||
0.201%, 02/03/15 (A) | 5,280 | 5,282 | ||||||
0.191%, 02/03/15 (A) | 8,977 | 8,980 | ||||||
0.171%, 02/03/15 (A) | 800 | 800 | ||||||
0.151%, 02/03/15 (A) | 5,000 | 5,000 | ||||||
0.263%, 02/06/15 (A) | 285 | 286 | ||||||
0.198%, 02/06/15 (A) | 1,005 | 1,005 | ||||||
0.188%, 02/08/15 (A) | 1,615 | 1,615 | ||||||
0.168%, 02/08/15 (A) | 523 | 523 | ||||||
0.166%, 02/10/15 (A) | 1,063 | 1,063 | ||||||
3.850%, 02/11/15 | 305 | 305 | ||||||
0.196%, 02/11/15 (A) | 480 | 480 | ||||||
0.186%, 02/11/15 (A) | 2,295 | 2,296 | ||||||
0.196%, 02/12/15 (A) | 1,540 | 1,541 | ||||||
0.197%, 02/13/15 (A) | 565 | 565 | ||||||
0.187%, 02/14/15 (A) | 5,250 | 5,251 | ||||||
0.167%, 02/14/15 (A) | 1,557 | 1,557 | ||||||
0.177%, 02/14/15 | 2,132 | 2,132 | ||||||
0.163%, 02/16/15 (A) | 5,830 | 5,830 | ||||||
4.375%, 02/17/15 | 1,640 | 1,643 | ||||||
0.218%, 02/17/15 (A) | 1,000 | 1,000 | ||||||
0.208%, 02/17/15 (A) | 3,658 | 3,659 | ||||||
0.178%, 02/17/15 (A) | 1,360 | 1,360 | ||||||
2.050%, 02/18/15 | 133 | 133 | ||||||
0.198%, 02/18/15 (A) | 6,500 | 6,503 | ||||||
0.178%, 02/18/15 (A) | 720 | 720 | ||||||
0.258%, 02/19/15 (A) | 6,840 | 6,848 | ||||||
0.178%, 02/19/15 (A) | 90 | 90 | ||||||
0.168%, 02/19/15 (A) | 2,500 | 2,500 | ||||||
0.238%, 02/20/15 (A) | 3,101 | 3,104 | ||||||
0.198%, 02/20/15 (A) | 270 | 270 | ||||||
0.193%, 02/20/15 (A) | 290 | 290 | ||||||
0.168%, 02/20/15 (A) | 5,575 | 5,576 | ||||||
0.128%, 02/20/15 (A) | 7,325 | 7,325 | ||||||
0.194%, 02/22/15 (A) | 2,189 | 2,190 | ||||||
0.189%, 02/22/15 (A) | 2,240 | 2,240 | ||||||
| Description | Face Amount ($ Thousands) | Value ($ Thousands) | ||||||
0.307%, 02/23/15 (A) | $ | 5,465 | $ | 5,467 | ||||
0.187%, 02/23/15 (A) | 3,054 | 3,054 | ||||||
0.172%, 02/23/15 (A) | 4,100 | 4,099 | ||||||
0.270%, 02/24/15 | 4,400 | 4,400 | ||||||
0.218%, 02/24/15 (A) | 625 | 625 | ||||||
0.138%, 02/25/15 (A) | 1,285 | 1,285 | ||||||
0.218%, 02/26/15 (A) | 1,460 | 1,461 | ||||||
0.198%, 02/26/15 (A) | 6,925 | 6,927 | ||||||
0.188%, 02/26/15 (A) | 605 | 605 | ||||||
0.168%, 02/26/15 (A) | 720 | 720 | ||||||
0.223%, 02/27/15 (A) | 3,030 | 3,032 | ||||||
0.183%, 02/27/15 (A) | 4,020 | 4,021 | ||||||
0.178%, 02/27/15 (A) | 775 | 775 | ||||||
0.300%, 04/14/15 | 438 | 438 | ||||||
0.177%, 04/23/15 (A) | 1,000 | 1,000 | ||||||
0.500%, 05/01/15 | 2,100 | 2,102 | ||||||
1.500%, 11/16/15 | 5,245 | 5,297 | ||||||
0.430%, 11/16/15 | 90 | 90 | ||||||
0.250%, 12/21/15 | 8,325 | 8,326 | ||||||
FFCB DN (B) | ||||||||
0.010%, 02/02/15 | 4,216 | 4,216 | ||||||
0.095%, 02/20/15 | 9,758 | 9,758 | ||||||
0.110%, 03/18/15 | 3,205 | 3,205 | ||||||
0.110%, 04/01/15 | 2,805 | 2,805 | ||||||
0.144%, 05/27/15 | 10,605 | 10,600 | ||||||
FFCB, Ser 1 | ||||||||
0.230%, 02/01/15 (A) | 1,095 | 1,095 | ||||||
FHLB | ||||||||
0.126%, 02/12/15 (A) | 985 | 985 | ||||||
4.750%, 02/13/15 | 905 | 906 | ||||||
4.375%, 02/13/15 | 300 | 300 | ||||||
0.128%, 02/16/15 (A) | 2,975 | 2,975 | ||||||
0.128%, 02/17/15 (A) | 3,780 | 3,780 | ||||||
4.500%, 02/18/15 | 24,825 | 24,875 | ||||||
0.210%, 02/18/15 | 940 | 940 | ||||||
0.140%, 02/18/15 | 9,600 | 9,600 | ||||||
0.100%, 02/19/15 | 8,810 | 8,810 | ||||||
0.090%, 02/19/15 | 7,630 | 7,630 | ||||||
0.250%, 02/20/15 | 12,255 | 12,256 | ||||||
0.100%, 02/20/15 | 7,940 | 7,940 | ||||||
0.090%, 02/23/15 | 11,455 | 11,455 | ||||||
0.090%, 02/27/15 | 14,875 | 14,875 | ||||||
0.140%, 03/02/15 | 7,340 | 7,340 | ||||||
0.100%, 03/05/15 | 515 | 515 | ||||||
0.110%, 03/06/15 (A) | 1,465 | 1,465 | ||||||
0.100%, 03/06/15 | 7,835 | 7,835 | ||||||
0.100%, 03/09/15 | 15,010 | 15,010 | ||||||
0.100%, 03/10/15 | 7,280 | 7,280 | ||||||
0.150%, 03/12/15 | 275 | 275 | ||||||
0.140%, 03/12/15 | 2,850 | 2,850 | ||||||
0.130%, 03/12/15 | 1,600 | 1,600 | ||||||
3.500%, 03/13/15 | 545 | 547 | ||||||
2.750%, 03/13/15 | 20,265 | 20,324 | ||||||
0.375%, 03/13/15 | 10,250 | 10,253 | ||||||
| SEI Daily Income Trust / Annual Report / January 31, 2015 | 17 |
SCHEDULE OF INVESTMENTS
Government II Fund (Continued)
January 31, 2015
| Description | Face Amount ($ Thousands) | Value ($ Thousands) | ||||||
0.150%, 03/17/15 | $ | 480 | $ | 480 | ||||
0.090%, 03/26/15 | 5,620 | 5,620 | ||||||
2.000%, 03/30/15 | 1,000 | 1,003 | ||||||
0.520%, 04/06/15 | 640 | 640 | ||||||
0.120%, 04/14/15 | 1,540 | 1,540 | ||||||
0.070%, 04/17/15 | 13,795 | 13,794 | ||||||
0.125%, 04/21/15 | 5,525 | 5,525 | ||||||
0.070%, 04/22/15 | 765 | 765 | ||||||
0.070%, 04/23/15 | 6,180 | 6,180 | ||||||
0.210%, 04/24/15 | 4,505 | 4,506 | ||||||
0.070%, 04/27/15 | 375 | 375 | ||||||
0.070%, 04/28/15 | 13,490 | 13,488 | ||||||
0.125%, 04/29/15 | 6,835 | 6,835 | ||||||
0.070%, 04/29/15 | 20,500 | 20,498 | ||||||
0.530%, 04/30/15 | 1,240 | 1,241 | ||||||
0.540%, 05/01/15 | 220 | 220 | ||||||
0.125%, 05/01/15 | 435 | 435 | ||||||
0.120%, 05/01/15 | 6,535 | 6,535 | ||||||
0.110%, 05/01/15 | 2,385 | 2,385 | ||||||
0.100%, 05/12/15 | 3,920 | 3,920 | ||||||
0.090%, 05/12/15 | 6,170 | 6,169 | ||||||
0.100%, 05/14/15 | 13,815 | 13,814 | ||||||
0.500%, 05/22/15 | 610 | 611 | ||||||
0.125%, 05/27/15 | 230 | 230 | ||||||
0.120%, 05/27/15 | 150 | 150 | ||||||
0.250%, 05/29/15 | 460 | 460 | ||||||
2.875%, 06/12/15 | 235 | 237 | ||||||
0.170%, 06/30/15 | 260 | 260 | ||||||
0.140%, 07/20/15 | 28,000 | 27,998 | ||||||
0.140%, 07/22/15 | 12,270 | 12,269 | ||||||
0.260%, 07/23/15 | 740 | 740 | ||||||
0.180%, 07/29/15 | 840 | 840 | ||||||
0.200%, 08/12/15 | 675 | 675 | ||||||
0.200%, 08/18/15 | 1,085 | 1,085 | ||||||
0.650%, 08/24/15 | 165 | 165 | ||||||
0.200%, 08/25/15 | 505 | 505 | ||||||
0.440%, 08/28/15 | 145 | 145 | ||||||
0.375%, 08/28/15 | 150 | 150 | ||||||
0.500%, 11/20/15 | 2,160 | 2,164 | ||||||
0.220%, 11/23/15 | 400 | 400 | ||||||
0.103%, 11/23/15 | 11,155 | 11,155 | ||||||
0.125%, 11/25/15 | 70 | 70 | ||||||
1.400%, 11/27/15 | 915 | 924 | ||||||
0.210%, 11/30/15 | 2,000 | 1,999 | ||||||
0.250%, 12/09/15 | 110 | 110 | ||||||
1.875%, 12/11/15 | 180 | 182 | ||||||
0.270%, 12/15/15 | 3,725 | 3,726 | ||||||
5.000%, 12/21/15 | 2,170 | 2,261 | ||||||
FHLB DN (B) | ||||||||
0.060%, 02/03/15 | 5,730 | 5,730 | ||||||
0.062%, 02/04/15 | 53,100 | 53,100 | ||||||
0.100%, 02/05/15 | 775 | 775 | ||||||
0.070%, 02/06/15 | 31,149 | 31,149 | ||||||
0.070%, 02/09/15 | 200 | 200 | ||||||
| Description | Face Amount ($ Thousands) | Value ($ Thousands) | ||||||
0.069%, 02/11/15 | $ | 18,099 | $ | 18,099 | ||||
0.065%, 02/13/15 | 105,794 | 105,792 | ||||||
0.099%, 02/18/15 | 45,288 | 45,286 | ||||||
0.096%, 02/20/15 | 7,555 | 7,555 | ||||||
0.092%, 02/23/15 | 3,530 | 3,530 | ||||||
0.100%, 02/24/15 | 3,985 | 3,985 | ||||||
0.094%, 02/25/15 | 10,082 | 10,081 | ||||||
0.080%, 03/02/15 | 1,481 | 1,481 | ||||||
0.100%, 03/03/15 | 120 | 120 | ||||||
0.106%, 03/04/15 | 26,005 | 26,003 | ||||||
0.141%, 03/06/15 | 2,704 | 2,704 | ||||||
0.087%, 03/11/15 | 38,195 | 38,191 | ||||||
0.100%, 03/12/15 | 110 | 110 | ||||||
0.090%, 03/13/15 | 1,855 | 1,855 | ||||||
0.145%, 03/18/15 | 3,785 | 3,784 | ||||||
0.100%, 03/20/15 | 250 | 250 | ||||||
0.107%, 03/25/15 | 3,780 | 3,779 | ||||||
0.107%, 03/27/15 | 6,475 | 6,474 | ||||||
0.127%, 04/06/15 | 11,285 | 11,282 | ||||||
0.160%, 04/21/15 | 4,070 | 4,069 | ||||||
0.120%, 04/22/15 | 190 | 190 | ||||||
0.100%, 04/28/15 | 562 | 562 | ||||||
0.096%, 04/24/15 | 21,220 | 21,215 | ||||||
0.146%, 04/29/15 | 2,550 | 2,549 | ||||||
0.160%, 05/01/15 | 390 | 390 | ||||||
0.115%, 05/05/15 | 880 | 880 | ||||||
0.126%, 05/06/15 | 3,535 | 3,534 | ||||||
0.155%, 05/08/15 | 1,145 | 1,145 | ||||||
0.149%, 05/18/15 | 6,326 | 6,323 | ||||||
0.160%, 05/19/15 | 1,515 | 1,514 | ||||||
0.141%, 05/22/15 | 1,919 | 1,918 | ||||||
0.127%, 05/26/15 | 1,310 | 1,309 | ||||||
0.160%, 05/29/15 | 390 | 390 | ||||||
0.145%, 07/17/15 | 3,550 | 3,548 | ||||||
0.140%, 07/24/15 | 21,372 | 21,358 | ||||||
0.135%, 07/29/15 | 3,040 | 3,038 | ||||||
0.230%, 11/02/15 | 2,965 | 2,960 | ||||||
0.240%, 11/06/15 | 900 | 898 | ||||||
0.240%, 11/17/15 | 180 | 180 | ||||||
0.225%, 12/01/15 | 4,304 | 4,296 | ||||||
0.271%, 12/08/15 | 180 | 180 | ||||||
Tennessee Valley Authority | ||||||||
4.375%, 06/15/15 | 455 | 462 | ||||||
Tennessee Valley Authority DN (B) | ||||||||
0.059%, 02/03/15 | 24,245 | 24,245 | ||||||
|
| |||||||
Total U.S. Government Agency Obligations | 1,083,255 | |||||||
|
| |||||||
| 18 | SEI Daily Income Trust / Annual Report / January 31, 2015 |
| Description | Face Amount ($ Thousands) | Value ($ Thousands) | ||||||
U.S. TREASURY OBLIGATIONS — 14.3% |
| |||||||
U.S. Treasury Notes | ||||||||
4.000%, 02/15/15 | $ | 65,265 | $ | 65,363 | ||||
0.250%, 02/15/15 | 9,410 | 9,411 | ||||||
2.375%, 02/28/15 | 27,735 | 27,783 | ||||||
0.250%, 02/28/15 | 70,185 | 70,196 | ||||||
2.500%, 04/30/15 | 18,875 | 18,985 | ||||||
|
| |||||||
Total U.S. Treasury Obligations | 191,738 | |||||||
|
| |||||||
Total Investments — 95.0% | $ | 1,274,993 | ||||||
|
| |||||||
Percentages are based on Net Assets of $1,342,118 ($ Thousands).
| (A) | Floating Rate Instrument. The rate reflected on the Schedule of Investments is the rate in effect on January 31, 2015. The demand and interest rate reset features give this security a shorter effective maturity date. |
| (B) | The rate reported is the effective yield at time of purchase. |
DN — Discount Note
FFCB — Federal Farm Credit Bank
FHLB — Federal Home Loan Bank
Ser — Series
As of January 31, 2015, all of the Fund’s investments were considered Level 2, in accordance with the authoritative guidance on fair value measurements and disclosure under U.S. GAAP.
For the year ended January 31, 2015, there were no transfers between Level 1 and Level 2 assets and liabilities. For the year ended January 31, 2015, there were no Level 3 securities.
For more information on valuation inputs, see Note 2 — Significant Accounting Policies in Notes to Financial Statements.
The accompanying notes are an integral part of the financial statements.
| SEI Daily Income Trust / Annual Report / January 31, 2015 | 19 |
SCHEDULE OF INVESTMENTS
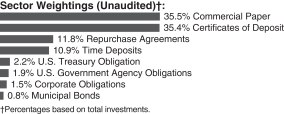
Prime Obligation Fund
January 31, 2015
| Description | Face Amount ($ Thousands) | Value ($ Thousands) | ||||||
COMMERCIAL PAPER (C) (D) — 35.5% |
| |||||||
Albion Capital LLC | ||||||||
0.150%, 02/06/15 | $ | 8,054 | $ | 8,054 | ||||
0.210%, 02/17/15 | 16,376 | 16,374 | ||||||
0.220%, 02/23/15 | 7,306 | 7,305 | ||||||
ANZ New Zealand International | ||||||||
0.280%, 07/17/15 | 16,355 | 16,334 | ||||||
ASB Finance | ||||||||
0.220%, 04/30/15 | 47,000 | 46,975 | ||||||
Bank of Nova Scotia | ||||||||
0.230%, 02/06/15 | 12,445 | 12,445 | ||||||
BNZ International Funding | ||||||||
0.230%, 04/14/15 | 24,199 | 24,188 | ||||||
0.270%, 07/15/15 | 30,717 | 30,679 | ||||||
Caisse Centrale Desjardins | ||||||||
0.238%, 03/30/15 | 116,082 | 116,038 | ||||||
0.230%, 04/06/15 | 12,825 | 12,820 | ||||||
0.290%, 04/20/15 | 30,000 | 29,981 | ||||||
Chariot Funding LLC | ||||||||
0.210%, 04/09/15 to 04/10/15 | 37,100 | 37,085 | ||||||
0.230%, 05/08/15 | 7,818 | 7,813 | ||||||
Chevron | ||||||||
0.160%, 03/17/15 | 20,000 | 19,996 | ||||||
0.150%, 04/06/15 | 14,000 | 13,996 | ||||||
Coca-Cola | ||||||||
0.170%, 02/09/15 | 17,750 | 17,749 | ||||||
0.200%, 02/27/15 | 3,665 | 3,664 | ||||||
0.190%, 04/17/15 to 04/20/15 | 70,000 | 69,972 | ||||||
0.210%, 05/26/15 | 2,015 | 2,014 | ||||||
0.240%, 06/23/15 | 31,329 | 31,299 | ||||||
DNB Bank | ||||||||
0.230%, 04/10/15 | 24,250 | 24,239 | ||||||
Exxon Mobil | ||||||||
0.130%, 02/23/15 | 50,000 | 49,996 | ||||||
0.180%, 06/22/15 | 19,000 | 18,987 | ||||||
Fairway Finance LLC | ||||||||
0.220%, 04/16/15 | 24,610 | 24,599 | ||||||
0.220%, 05/11/15 | 21,000 | 20,987 | ||||||
0.260%, 07/13/15 to 07/16/15 | 62,420 | 62,346 | ||||||
HSBC USA | ||||||||
0.250%, 02/23/15 | 8,975 | 8,974 | ||||||
JPMorgan Securities LLC | ||||||||
0.230%, 02/27/15 | 20,000 | 19,997 | ||||||
0.250%, 03/18/15 to 05/26/15 | 170,000 | 169,894 | ||||||
| Description | Face Amount ($ Thousands) | Value ($ Thousands) | ||||||
0.260%, 05/01/15 | $ | 4,100 | $ | 4,097 | ||||
0.280%, 05/05/15 | 20,000 | 19,986 | ||||||
0.300%, 07/08/15 to 07/22/15 | 24,000 | 23,967 | ||||||
Jupiter Securitization LLC | ||||||||
0.210%, 05/04/15 | 25,000 | 24,987 | ||||||
0.220%, 05/27/15 | 4,900 | 4,897 | ||||||
0.270%, 07/14/15 | 4,517 | 4,512 | ||||||
Liberty Street Funding LLC | ||||||||
0.220%, 05/11/15 | 50,000 | 49,970 | ||||||
Manhattan Asset Funding LLC | ||||||||
0.204%, 02/18/15 | 24,356 | 24,354 | ||||||
Massachusetts Mutual Life Insurance | ||||||||
0.130%, 02/11/15 | 25,000 | 24,999 | ||||||
0.120%, 02/18/15 | 25,000 | 24,999 | ||||||
National Australia Bank | ||||||||
0.235%, 05/18/15 | 55,100 | 55,062 | ||||||
0.260%, 07/06/15 to 07/07/15 | 13,074 | 13,059 | ||||||
Nestle Capital | ||||||||
0.225%, 07/14/15 | 20,000 | 19,980 | ||||||
Nordea Bank | ||||||||
0.225%, 03/17/15 | 22,000 | 21,994 | ||||||
Old Line Funding LLC | ||||||||
0.220%, 03/02/15 to 04/01/15 | 71,516 | 71,499 | ||||||
0.230%, 03/17/15 | 20,000 | 19,994 | ||||||
0.500%, 04/22/15 | 12,820 | 12,813 | ||||||
0.240%, 04/28/15 | 20,000 | 19,989 | ||||||
Regency Markets LLC | ||||||||
0.130%, 02/05/15 to 02/06/15 | 20,223 | 20,223 | ||||||
0.140%, 02/09/15 | 55,317 | 55,315 | ||||||
0.150%, 02/20/15 | 89,481 | 89,474 | ||||||
Thunder Bay Funding LLC | ||||||||
0.240%, 02/03/15 | 1,000 | 1,000 | ||||||
0.268%, 02/07/15 (A) | 17,304 | 17,304 | ||||||
0.230%, 02/25/15 | 4,345 | 4,344 | ||||||
Toronto-Dominion Bank | ||||||||
0.220%, 04/23/15 | 10,113 | 10,108 | ||||||
Toyota Credit Canada | ||||||||
0.240%, 05/12/15 | 3,786 | 3,784 | ||||||
Toyota Motor Credit | ||||||||
0.220%, 05/18/15 | 63,000 | 62,959 | ||||||
0.230%, 05/26/15 | 10,750 | 10,742 | ||||||
0.250%, 05/29/15 | 9,000 | 8,993 | ||||||
0.240%, 07/01/15 | 25,000 | 24,975 | ||||||
0.270%, 07/30/15 to 07/31/15 | 75,000 | 74,898 | ||||||
Westpac Banking | ||||||||
0.230%, 05/01/15 | 1,000 | 999 | ||||||
Westpac Securities NZ | ||||||||
0.230%, 06/01/15 | 26,000 | 25,980 | ||||||
0.280%, 07/07/15 | 50,000 | 49,939 | ||||||
0.275%, 07/15/15 | 40,000 | 39,950 | ||||||
Working Capital Management | ||||||||
0.128%, 02/02/15 | 16,173 | 16,173 | ||||||
| 20 | SEI Daily Income Trust / Annual Report / January 31, 2015 |
| Description | Face Amount ($ Thousands) | Value ($ Thousands) | ||||||
0.123%, 02/03/15 | $ | 12,799 | $ | 12,799 | ||||
0.130%, 02/04/15 to 02/06/15 | 27,389 | 27,389 | ||||||
|
| |||||||
Total Commercial Paper | 1,923,306 | |||||||
|
| |||||||
CERTIFICATES OF DEPOSIT — 35.4% |
| |||||||
ANZ New Zealand International | ||||||||
0.241%, 02/04/15 (A) | 20,000 | 20,000 | ||||||
ASB Finance | ||||||||
0.246%, 02/13/15 (A) | 8,184 | 8,184 | ||||||
Bank of Montreal, Chicago | ||||||||
0.228%, 02/09/15 (A) | 40,000 | 40,000 | ||||||
0.220%, 04/08/15 | 10,000 | 10,000 | ||||||
0.230%, 06/01/15 | 45,000 | 45,000 | ||||||
0.240%, 06/05/15 | 15,000 | 15,000 | ||||||
Bank of Nova Scotia | ||||||||
0.530%, 02/02/15 (A) | 494 | 494 | ||||||
0.240%, 02/02/15 (A) | 40,000 | 40,000 | ||||||
0.247%, 02/09/15 (A) | 47,000 | 47,000 | ||||||
0.230%, 02/17/15 | 4,117 | 4,117 | ||||||
0.270%, 07/27/15 | 80,000 | 80,000 | ||||||
Bank of Tokyo-Mitsubishi UFJ NY | ||||||||
0.120%, 02/05/15 | 85,000 | 85,000 | ||||||
0.170%, 02/12/15 | 8,431 | 8,431 | ||||||
0.230%, 02/17/15 | 25,000 | 25,000 | ||||||
0.250%, 02/19/15 | 20,500 | 20,500 | ||||||
0.250%, 03/04/15 | 8,000 | 8,000 | ||||||
Canadian Imperial Bank of Commerce NY (A) | ||||||||
0.200%, 02/01/15 | 26,000 | 26,000 | ||||||
0.227%, 02/10/15 | 20,100 | 20,100 | ||||||
0.932%, 02/20/15 | 44,250 | 44,267 | ||||||
Chase Bank | ||||||||
0.300%, 05/15/15 | 8,233 | 8,235 | ||||||
DNB Bank | ||||||||
0.120%, 02/05/15 | 74,000 | 74,000 | ||||||
0.080%, 02/06/15 | 62,000 | 62,000 | ||||||
Mizuho Bank | ||||||||
0.250%, 04/02/15 | 31,454 | 31,454 | ||||||
National Australia Bank (A) | ||||||||
0.248%, 02/07/15 | 43,767 | 43,767 | ||||||
0.227%, 02/09/15 | 40,000 | 40,000 | ||||||
0.237%, 02/14/15 | 11,329 | 11,329 | ||||||
Nordea Bank | ||||||||
0.180%, 02/02/15 | 82,300 | 82,300 | ||||||
0.210%, 04/28/15 | 50,000 | 50,000 | ||||||
0.210%, 05/05/15 | 55,200 | 55,199 | ||||||
0.240%, 05/26/15 | 20,000 | 20,000 | ||||||
Norinchukin Bank | ||||||||
0.200%, 02/05/15 | 18,832 | 18,832 | ||||||
Old Line Funding LLC (A) | ||||||||
0.248%, 02/08/15 | 27,000 | 27,000 | ||||||
0.267%, 02/15/15 | 22,000 | 22,000 | ||||||
0.268%, 02/17/15 | 12,000 | 12,000 | ||||||
| Description | Face Amount ($ Thousands) | Value ($ Thousands) | ||||||
Skandinaviska Enskilda Banken NY | ||||||||
0.230%, 02/10/15 | $ | 42,100 | $ | 42,100 | ||||
0.230%, 03/02/15 | 42,000 | 42,000 | ||||||
State Street Bank | ||||||||
0.208%, 02/09/15 (A) | 40,000 | 40,000 | ||||||
Sumitomo Mitsui Banking | ||||||||
0.270%, 02/01/15 (A) | 23,000 | 23,000 | ||||||
0.261%, 02/02/15 (A) | 65,500 | 65,500 | ||||||
0.220%, 02/05/15 | 12,000 | 12,000 | ||||||
0.250%, 02/13/15 | 7,000 | 7,000 | ||||||
0.300%, 02/21/15 (A) | 17,000 | 17,000 | ||||||
0.250%, 04/02/15 | 22,000 | 22,000 | ||||||
0.603%, 04/30/15 (A) | 4,000 | 4,003 | ||||||
0.250%, 05/12/15 | 11,000 | 11,000 | ||||||
Svenska Handelsbanken | ||||||||
0.195%, 02/18/15 | 3,995 | 3,995 | ||||||
0.185%, 03/19/15 | 25,000 | 24,999 | ||||||
0.230%, 03/24/15 | 32,000 | 32,000 | ||||||
0.220%, 04/08/15 | 41,700 | 41,700 | ||||||
Toronto-Dominion Bank | ||||||||
0.232%, 02/06/15 (A) | 7,699 | 7,699 | ||||||
0.240%, 02/10/15 | 1,476 | 1,476 | ||||||
0.700%, 02/25/15 | 1,000 | 1,000 | ||||||
0.600%, 03/03/15 | 3,525 | 3,526 | ||||||
0.190%, 03/03/15 | 46,450 | 46,451 | ||||||
0.170%, 03/09/15 | 26,000 | 26,000 | ||||||
0.195%, 04/01/15 | 11,016 | 11,016 | ||||||
0.280%, 05/08/15 | 10,000 | 10,002 | ||||||
0.230%, 05/11/15 | 11,024 | 11,024 | ||||||
0.230%, 05/11/15 | 64,000 | 64,000 | ||||||
0.230%, 05/29/15 | 15,247 | 15,247 | ||||||
0.260%, 07/17/15 | 24,068 | 24,068 | ||||||
Toyota Motor Credit (A) | ||||||||
0.221%, 02/03/15 | 39,264 | 39,264 | ||||||
0.227%, 02/09/15 | 2,338 | 2,338 | ||||||
Wells Fargo Bank | ||||||||
0.270%, 02/01/15 (A) | 4,231 | 4,231 | ||||||
0.238%, 02/07/15 (A) | 3,538 | 3,538 | ||||||
0.210%, 02/09/15 | 2,536 | 2,536 | ||||||
0.220%, 02/13/15 | 19,282 | 19,282 | ||||||
0.256%, 02/14/15 (A) | 759 | 759 | ||||||
0.235%, 03/06/15 (A) | 5,651 | 5,651 | ||||||
0.256%, 04/02/15 (A) | 1,670 | 1,670 | ||||||
0.272%, 04/11/15 (A) | 1,179 | 1,179 | ||||||
0.230%, 05/07/15 | 80,000 | 80,000 | ||||||
0.230%, 06/03/15 | 25,000 | 25,000 | ||||||
0.260%, 08/03/15 | 16,966 | 16,966 | ||||||
Westpac Banking | ||||||||
0.238%, 02/19/15 (A) | 3,100 | 3,100 | ||||||
|
| |||||||
Total Certificates of Deposit | 1,920,529 | |||||||
|
| |||||||
| SEI Daily Income Trust / Annual Report / January 31, 2015 | 21 |
SCHEDULE OF INVESTMENTS
Prime Obligation Fund (Continued)
January 31, 2015
| Description | Face Amount ($ Thousands) | Value ($ Thousands) | ||||||
TIME DEPOSITS — 10.9% |
| |||||||
Bank of New York | ||||||||
0.020%, 02/02/15 | $ | 137,415 | $ | 137,415 | ||||
Citigroup | ||||||||
0.090%, 02/02/15 | 81,254 | 81,254 | ||||||
Lloyds Bank | ||||||||
0.050%, 02/02/15 | 265,350 | 265,350 | ||||||
Swedbank | ||||||||
0.060%, 02/02/15 | 108,000 | 108,000 | ||||||
|
| |||||||
Total Time Deposits | 592,019 | |||||||
|
| |||||||
U.S. TREASURY OBLIGATION — 2.2% |
| |||||||
U.S. Treasury Notes | ||||||||
2.375%, 02/28/15 | 118,332 | 118,537 | ||||||
|
| |||||||
Total U.S. Treasury Obligation | 118,537 | |||||||
|
| |||||||
U.S. GOVERNMENT AGENCY OBLIGATIONS — 1.9% |
| |||||||
FFCB (A) | ||||||||
0.200%, 02/01/15 | 13,390 | 13,389 | ||||||
FFCB, Ser 1 (A) | ||||||||
0.230%, 02/01/15 | 2,850 | 2,850 | ||||||
FHLB DN (C) | ||||||||
0.075%, 02/04/15 | 2,664 | 2,664 | ||||||
0.100%, 02/05/15 | 3,150 | 3,150 | ||||||
0.103%, 02/17/15 | 3,891 | 3,891 | ||||||
0.101%, 02/18/15 | 68,806 | 68,803 | ||||||
0.110%, 02/20/15 | 4,355 | 4,355 | ||||||
0.100%, 02/23/15 | 2,475 | 2,475 | ||||||
FNMA | ||||||||
0.187%, 02/15/15 (A) | 3,460 | 3,461 | ||||||
|
| |||||||
Total U.S. Government Agency Obligations | 105,038 | |||||||
|
| |||||||
CORPORATE OBLIGATIONS — 1.5% |
| |||||||
Australia & New Zealand Banking Group MTN | ||||||||
0.432%, 02/07/15 (A) (B) | 8,533 | 8,536 | ||||||
Commonwealth Bank of Australia | ||||||||
0.731%, 02/21/15 (A) (B) | 2,000 | 2,003 | ||||||
3.500%, 03/19/15 (B) | 2,920 | 2,932 | ||||||
HSBC USA | ||||||||
2.375%, 02/13/15 | 6,071 | 6,075 | ||||||
National Australia Bank | ||||||||
3.750%, 03/02/15 (B) | 4,030 | 4,041 | ||||||
Nordea Bank | ||||||||
2.250%, 03/20/15 (B) | 6,058 | 6,074 | ||||||
Royal Bank of Canada MTN | ||||||||
1.150%, 03/13/15 | 11,774 | 11,786 | ||||||
| Description | Face Amount ($ Thousands) | Value ($ Thousands) | ||||||
Shell International | ||||||||
0.302%, 02/10/15 (A) | $ | 7,052 | $ | 7,056 | ||||
Toronto-Dominion Bank MTN | ||||||||
0.412%, 02/07/15 (A) | 4,046 | 4,048 | ||||||
Toyota Motor Credit | ||||||||
1.000%, 02/17/15 | 18,379 | 18,385 | ||||||
Westpac Banking | ||||||||
4.200%, 02/27/15 | 7,048 | 7,068 | ||||||
3.000%, 08/04/15 | 797 | 808 | ||||||
|
| |||||||
Total Corporate Obligations | 78,812 | |||||||
|
| |||||||
MUNICIPAL BONDS (A) — 0.8% |
| |||||||
Arizona — 0.1% | ||||||||
Pima County, Industrial Development Authority, RB | ||||||||
0.050%, 02/04/15 | 4,800 | 4,800 | ||||||
|
| |||||||
Colorado — 0.1% | ||||||||
Colorado State, Housing & Finance Authority, Ser A1, RB | ||||||||
0.120%, 02/04/15 | 800 | 800 | ||||||
0.080%, 02/04/15 | 2,365 | 2,365 | ||||||
Colorado State, Housing & Finance Authority, Ser C1, RB | ||||||||
0.100%, 02/04/15 | 900 | 900 | ||||||
|
| |||||||
| 4,065 | ||||||||
|
| |||||||
Illinois — 0.0% | ||||||||
University of Illinois, Higher Education Authority, Ser S, RB | ||||||||
0.100%, 02/05/15 | 1,300 | 1,300 | ||||||
|
| |||||||
Iowa — 0.1% | ||||||||
Iowa State, Finance Authority, | ||||||||
0.050%, 02/05/15 | 700 | 700 | ||||||
Iowa State, Finance Authority, | ||||||||
0.100%, 02/05/15 | 5,195 | 5,195 | ||||||
Iowa State, Finance Authority, | ||||||||
0.100%, 02/05/15 | 80 | 80 | ||||||
Iowa State, Finance Authority, | ||||||||
0.100%, 02/05/15 | 450 | 450 | ||||||
|
| |||||||
| 6,425 | ||||||||
|
| |||||||
Massachusetts — 0.0% | ||||||||
Simmons College, Higher Education Authority, RB | ||||||||
0.130%, 02/05/15 | 2,320 | 2,320 | ||||||
|
| |||||||
| 22 | SEI Daily Income Trust / Annual Report / January 31, 2015 |
| Description | Face Amount ($ Thousands) | Value ($ Thousands) | ||||||
Michigan — 0.3% | ||||||||
Kent, Hospital Finance Authority, | ||||||||
0.020%, 02/04/15 | $ | 14,940 | $ | 14,940 | ||||
|
| |||||||
New Hampshire — 0.1% | ||||||||
New Hampshire State, Health & Education Facilities Authority, Dartmouth College Project, | ||||||||
0.070%, 02/04/15 | 2,945 | 2,945 | ||||||
|
| |||||||
Texas — 0.1% | ||||||||
Texas State, Ser B, GO | ||||||||
0.090%, 02/05/15 | 5,710 | 5,710 | ||||||
|
| |||||||
Wisconsin — 0.0% | ||||||||
Wisconsin State, Housing & Economic Development Authority, Ser B, RB | ||||||||
0.100%, 02/05/15 | 915 | 915 | ||||||
Wisconsin Housing & Economic Development Authority, Ser B, RB | ||||||||
0.100%, 02/07/15 | 700 | 700 | ||||||
|
| |||||||
| 1,615 | ||||||||
|
| |||||||
Total Municipal Bonds | 44,120 | |||||||
|
| |||||||
REPURCHASE AGREEMENTS (E) — 11.8% |
| |||||||
Goldman Sachs | 62,986 | 62,986 | ||||||
Goldman Sachs | 250,000 | 250,000 | ||||||
| Description | Face Amount ($ Thousands) | Value ($ Thousands) | ||||||
RBC Capital | $ | 32,315 | $ | 32,315 | ||||
RBC Capital | 80,652 | 80,652 | ||||||
RBC Capital | 114,619 | 114,619 | ||||||
Wells Fargo | 8,713 | 8,713 | ||||||
Wells Fargo | 56,000 | 56,000 | ||||||
| SEI Daily Income Trust / Annual Report / January 31, 2015 | 23 |
SCHEDULE OF INVESTMENTS
Prime Obligation Fund (Concluded)
January 31, 2015
| Description | Face Amount ($ Thousands) | Value ($ Thousands) | ||||||
Wells Fargo | $ | 32,315 | $ | 32,315 | ||||
|
| |||||||
Total Repurchase Agreements | 637,600 | |||||||
|
| |||||||
Total Investments — 100.0% | $ | 5,419,961 | ||||||
|
| |||||||
| * | A summary of the corporate obligations used to collateralize repurchase agreements entered into by the Fund at January 31, 2015, is as follows: |
| Counterparty | Corporate Obligation | Rate | Maturity Date | Par Amount ($ Thousands) | ||||||||||
| RBC Capital | Golden Eagle Retail | 4.625 | % | 05/21/23 | $ | 250 | ||||||||
| Anglo | 4.125 | 09/27/22 | 500 | |||||||||||
| Xstrata | 4.950 | 11/15/21 | 673 | |||||||||||
| Xstrata | 4.250 | 10/25/22 | 637 | |||||||||||
| XL Capital | 5.750 | 10/01/21 | 1,025 | |||||||||||
| Westpac Banking Corp. | 1.375 | 07/17/15 | 1,000 | |||||||||||
| WPP | 3.750 | 09/19/24 | 4,559 | |||||||||||
| Verizon Communications | 1.991 | 09/14/18 | 3,608 | |||||||||||
| Verizon Communications | 6.350 | 04/01/19 | 111 | |||||||||||
| Verizon Communications | 4.150 | 03/15/24 | 500 | |||||||||||
| Stancorp Financial | 5.000 | 08/15/22 | 1 | |||||||||||
| Reinsurance Group of America | 4.700 | 09/15/23 | 500 | |||||||||||
| Raytheon | 3.150 | 12/15/24 | 670 | |||||||||||
| Province De Que Bec | 3.500 | 07/29/20 | 3,632 | |||||||||||
| Packaging Corporation of America | 4.500 | 11/01/23 | 2,791 | |||||||||||
| Nomura Holdings | 6.700 | 03/20/20 | 1 | |||||||||||
| Newcrest Financial | 4.450 | 11/15/21 | 112 | |||||||||||
| Korea Electric Power | 3.000 | 10/05/15 | 150 | |||||||||||
| Kinder Morgan | 3.500 | 03/01/21 | 656 | |||||||||||
| Intesa San Paolo | 6.500 | 02/24/21 | — | |||||||||||
| Ingram Micro | 4.950 | 12/15/24 | 177 | |||||||||||
| ING Bank | 5.800 | 09/25/23 | 2,128 | |||||||||||
| Hewlett Packard | 2.200 | 12/01/15 | 50 | |||||||||||
| Hewlett Packard | 3.000 | 09/15/16 | 200 | |||||||||||
| Heineken | 1.400 | 10/01/17 | 202 | |||||||||||
| General Electric | 0.880 | 07/12/16 | 532 | |||||||||||
| Express Scripts Holdings | 3.500 | 06/15/24 | 532 | |||||||||||
| Exelon Generation | 6.200 | 10/01/17 | 2,160 | |||||||||||
| Entertainment Properties Trust | 5.750 | 08/15/22 | 2,641 | |||||||||||
| Directv | 4.450 | 04/01/24 | 6 | |||||||||||
| Directv | 5.000 | 03/01/21 | 446 | |||||||||||
| Daimler Financial | 2.950 | 01/11/17 | 1,000 | |||||||||||
| The Bank of Tokyo-Mitubishi | 2.300 | 03/10/19 | 8,581 | |||||||||||
| St. Grid | 1.750 | 05/22/18 | 300 | |||||||||||
| Verizon Communications | 1.991 | 09/14/18 | 3,995 | |||||||||||
| Verizon Communications | 6.350 | 04/01/19 | 1,985 | |||||||||||
| U.S. Bank | 0.377 | 04/22/16 | 674 | |||||||||||
| Travelers Companies | 5.900 | 06/02/19 | 706 | |||||||||||
| Teva Pharmaceutical | 2.950 | 12/18/22 | 456 | |||||||||||
| Statpo:Sa | 0.432 | 11/09/17 | 3,524 | |||||||||||
| Province De Que Bec | 3.500 | 07/29/20 | 1,969 | |||||||||||
| Pepsico | 3.600 | 03/01/24 | 575 | |||||||||||
| Province of Ontario | 2.300 | 05/10/16 | 5,000 | |||||||||||
| Counterparty | Corporate Obligation | Rate | Maturity Date | Par Amount ($ Thousands) | ||||||||||
| CG Caps | 1.241 | % | 03/15/23 | $ | 101 | |||||||||
| CG Caps | 5.050 | 09/15/17 | 15 | |||||||||||
| FairFax | 4.875 | 08/13/24 | 1,900 | |||||||||||
| Entergy Texas | 7.125 | 02/01/19 | 7,500 | |||||||||||
| Directv | 5.000 | 03/01/21 | 4,505 | |||||||||||
| John Deere Capital | 2.300 | 09/16/19 | 1,906 | |||||||||||
| Costco | 3.000 | 12/15/19 | 3 | |||||||||||
| Commonwealth Bank | 0.750 | 01/15/16 | 1,000 | |||||||||||
| CDK | 4.500 | 10/15/24 | 7,963 | |||||||||||
| Buckeye Partners | 4.350 | 10/15/24 | 3,341 | |||||||||||
| The Bank of Nova Scotia | 1.450 | 04/25/18 | 6,202 | |||||||||||
| The Bank of Nova Scotia | 0.641 | 03/15/16 | 1,200 | |||||||||||
| BPCE | 1.700 | 04/25/16 | 86 | |||||||||||
| BNP Paribas | 2.450 | 03/18/19 | 861 | |||||||||||
| American Honda Finance | 1.000 | 08/11/15 | 35 | |||||||||||
| Alibaba Group | 3.600 | 11/28/24 | 388 | |||||||||||
| AT&T | 5.500 | 02/01/18 | 689 | |||||||||||
| AGL Capital | 6.375 | 07/15/16 | 4,472 | |||||||||||
| Mizuho | 1.700 | 09/25/17 | 10,000 | |||||||||||
Percentages are based on Net Assets of $5,421,661 ($ Thousands).
| (A) | Floating Rate Instrument. The rate reflected on the Schedule of Investments is the rate in effect on January 31, 2015. The demand and interest rate reset features give this security a shorter effective maturity date. |
| (B) | Securities sold within terms of a private placement memorandum, exempt from registration under Section 144A of the Securities Act of 1933, as amended, and may be sold only to dealers in that program or other “accredited investors.” These securities have been determined to be liquid under guidelines established by the Board of Trustees. |
| (C) | The rate reported is the effective yield at time of purchase. |
| (D) | Securities are held in connection with a letter of credit issued by a major bank. |
| (E) | Tri-Party Repurchase Agreement. |
DN — Discount Note
FFCB — Federal Farm Credit Bank
FHLB — Federal Home Loan Bank
FNMA — Federal National Mortgage Association
GNMA — Government National Mortgage Association
GO — General Obligation
LLC — Limited Liability Company
MTN — Medium Term Note
RB — Revenue Bond
Ser — Series
As of January 31, 2015, all of the Fund’s investments were considered level 2, in accordance with the authoritative guidance on fair value measurements and disclosure under U.S. GAAP.
For the year ended January 31, 2015, there were no transfers between Level 1 and Level 2 assets and liabilities. For the year ended January 31, 2015, there were no Level 3 securities.
For more information on valuation inputs, see Note 2 — Significant Accounting Policies in Notes to Financial Statements.
The accompanying notes are an integral part of the financial statements.
| 24 | SEI Daily Income Trust / Annual Report / January 31, 2015 |
SCHEDULE OF INVESTMENTS
Treasury Fund
January 31, 2015

| Description | Face Amount ($ Thousands) | Value ($ Thousands) | ||||||
U.S. TREASURY OBLIGATIONS — 41.6% |
| |||||||
U.S. Treasury Bills (A) | ||||||||
0.050%, 03/05/15 | $ | 2,315 | $ | 2,315 | ||||
0.010%, 06/11/15 | 1,595 | 1,594 | ||||||
U.S. Treasury Notes | ||||||||
0.089%, 02/03/15 (B) | 5,295 | 5,295 | ||||||
0.068%, 02/06/15 (B) | 6,065 | 6,063 | ||||||
0.065%, 02/06/15 (B) | 960 | 960 | ||||||
4.000%, 02/15/15 | 8,711 | 8,724 | ||||||
11.250%, 02/15/15 | 1,325 | 1,331 | ||||||
2.375%, 02/28/15 | 23,639 | 23,680 | ||||||
0.250%, 02/28/15 to 05/31/15 | 34,980 | 34,992 | ||||||
2.500%, 04/30/15 | 14,625 | 14,711 | ||||||
0.125%, 04/30/15 | 19,940 | 19,943 | ||||||
4.125%, 05/15/15 | 5,285 | 5,345 | ||||||
2.125%, 05/31/15 | 12,305 | 12,386 | ||||||
0.375%, 06/15/15 | 1,745 | 1,747 | ||||||
1.875%, 06/30/15 | 2,465 | 2,483 | ||||||
|
| |||||||
Total U.S. Treasury Obligations | 141,569 | |||||||
|
| |||||||
REPURCHASE AGREEMENTS (C) — 44.7% |
| |||||||
Bank of Montreal | 21,000 | 21,000 | ||||||
Bank of Nova Scotia | 21,000 | 21,000 | ||||||
| Description | Face Amount ($ Thousands) | Value ($ Thousands) | ||||||
Citibank | $ | 21,000 | $ | 21,000 | ||||
Goldman Sachs | 19,194 | 19,194 | ||||||
JPMorgan Chase | 22,000 | 22,000 | ||||||
TD Securities | 21,000 | 21,000 | ||||||
Wells Fargo | 1,525 | 1,525 | ||||||
Wells Fargo | 1,000 | 1,000 | ||||||
| SEI Daily Income Trust / Annual Report / January 31, 2015 | 25 |
SCHEDULE OF INVESTMENTS
Treasury Fund (Concluded)
January 31, 2015
| Description | Face Amount ($ Thousands) | Value ($ Thousands) | ||||||
Wells Fargo | $ | 22,000 | $ | 22,000 | ||||
Wells Fargo | 2,315 | 2,315 | ||||||
|
| |||||||
Total Repurchase Agreements | 152,034 | |||||||
|
| |||||||
Total Investments — 86.3% | $ | 293,603 | ||||||
|
| |||||||
Percentages are based on Net Assets of $340,425 ($ Thousands).
| (A) | The rate reported is the effective yield at time of purchase. |
| (B) | Floating Rate Instrument. The rate reflected on the Schedule of Investments is the rate in effect on January 31, 2015. The demand and interest rate reset features give this security a shorter effective maturity date. |
| (C) | Tri-Party Repurchase Agreement. |
| (D) | Securities considered illiquid. The total value of such securities as of January 31, 2015 was $4,840 ($ Thousands) and represented 1.4% of Net Assets |
As of January 31, 2015, all of the Fund’s investments were considered Level 2, in accordance with the authoritative guidance on fair value measurements and disclosure under U.S. GAAP.
For the year ended January 31, 2015, there were no transfers between Level 1 and Level 2 assets and liabilities. For the year ended January 31, 2015, there were no Level 3 securities.
For more information on valuation inputs, see Note 2 — Significant Accounting Policies in Notes to Financial Statements.
The accompanying notes are an integral part of the financial statements.
| 26 | SEI Daily Income Trust / Annual Report / January 31, 2015 |
SCHEDULE OF INVESTMENTS
Treasury II Fund
January 31, 2015

| Description | Face Amount ($ Thousands) | Value ($ Thousands) | ||||||
U.S. TREASURY OBLIGATIONS — 78.5% |
| |||||||
U.S. Treasury Bills (B) | ||||||||
0.013%, 02/05/15 | $ | 37,622 | $ | 37,622 | ||||
0.005%, 02/12/15 | 5,000 | 5,000 | ||||||
0.011%, 02/19/15 | 5,589 | 5,589 | ||||||
0.050%, 03/05/15 | 4,295 | 4,295 | ||||||
0.101%, 06/11/15 | 2,970 | 2,969 | ||||||
U.S. Treasury Notes | ||||||||
0.089%, 02/03/15 (A) | 10,205 | 10,205 | ||||||
0.090%, 02/05/15 (A) | 6,614 | 6,614 | ||||||
0.068%, 02/06/15 (A) | 7,480 | 7,477 | ||||||
0.065%, 02/06/15 (A) | 2,000 | 1,999 | ||||||
4.000%, 02/15/15 | 70,345 | 70,450 | ||||||
11.250%, 02/15/15 | 4,680 | 4,699 | ||||||
0.250%, 02/15/15 to 05/31/15 | 188,570 | 188,601 | ||||||
2.375%, 02/28/15 | 78,800 | 78,936 | ||||||
2.500%, 04/30/15 | 36,535 | 36,750 | ||||||
0.125%, 04/30/15 | 31,185 | 31,189 | ||||||
4.125%, 05/15/15 | 10,935 | 11,060 | ||||||
2.125%, 05/31/15 | 38,415 | 38,670 | ||||||
0.375%, 06/15/15 | 3,500 | 3,504 | ||||||
|
| |||||||
Total U.S. Treasury Obligations | 545,629 | |||||||
|
| |||||||
Total Investments — 78.5% | $ | 545,629 | ||||||
|
| |||||||
Percentages are based on Net Assets of $695,267 ($ Thousands).
| (A) | Floating Rate Instrument. The rate reflected on the Schedule of Investments is the rate in effect on January 31, 2015. The demand and interest rate reset features give this security a shorter effective maturity date. |
| (B) | The rate reported is the effective yield at time of purchase. |
As of January 31, 2015, all of the Fund’s investments were considered Level 2, in accordance with the authoritative guidance on fair value measurements and disclosure under U.S. GAAP.
For the year ended January 31, 2015, there were no transfers between Level 1 and Level 2 assets and liabilities. For the year ended January 31, 2015, there were no Level 3 securities.
For more information on valuation inputs, see Note 2 — Significant Accounting Policies in Notes to Financial Statements.
The accompanying notes are an integral part of the financial statements.
| SEI Daily Income Trust / Annual Report / January 31, 2015 | 27 |
SCHEDULE OF INVESTMENTS
Ultra Short Duration Bond Fund
January 31, 2015
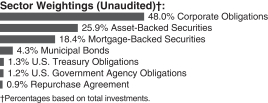
| Description | Face Amount ($ Thousands) | Value ($ Thousands) | ||||||
CORPORATE OBLIGATIONS — 48.9% |
| |||||||
Consumer Discretionary — 1.6% |
| |||||||
Autozone | ||||||||
1.300%, 01/13/17 | $ | 350 | $ | 352 | ||||
NBCUniversal Enterprise | ||||||||
0.938%, 04/15/15 (A) (B) | 575 | 576 | ||||||
0.790%, 04/15/15 (A) (B) | 945 | 947 | ||||||
Thomson Reuters | ||||||||
1.650%, 09/29/17 | 300 | 301 | ||||||
0.875%, 05/23/16 | 350 | 350 | ||||||
Time Warner Cable | ||||||||
5.850%, 05/01/17 | 400 | 438 | ||||||
TRW Automotive | ||||||||
7.250%, 03/15/17 (B) | 270 | 296 | ||||||
Walgreens | ||||||||
0.682%, 02/18/15 (A) | 580 | 580 | ||||||
Whirlpool | ||||||||
1.350%, 03/01/17 | 335 | 335 | ||||||
|
| |||||||
| 4,175 | ||||||||
|
| |||||||
Consumer Staples — 1.3% |
| |||||||
Anheuser-Busch InBev Finance | ||||||||
0.632%, 02/02/15 (A) | 350 | 349 | ||||||
BAT International Finance PLC | ||||||||
1.400%, 06/05/15 (B) | 295 | 296 | ||||||
CVS Caremark | ||||||||
1.200%, 12/05/16 | 340 | 343 | ||||||
Heineken | ||||||||
0.800%, 10/01/15 (B) | 375 | 376 | ||||||
Mondelez International | ||||||||
0.752%, 02/01/15 (A) | 450 | 444 | ||||||
Philip Morris International | ||||||||
2.500%, 05/16/16 | 500 | 513 | ||||||
Reynolds American | ||||||||
1.050%, 10/30/15 | 260 | 260 | ||||||
SABMiller Holdings | ||||||||
0.922%, 02/01/15 (A) (B) | 650 | 652 | ||||||
|
| |||||||
| 3,233 | ||||||||
|
| |||||||
Energy — 3.4% | ||||||||
BP Capital Markets PLC | ||||||||
0.742%, 02/10/15 (A) | 750 | 742 | ||||||
0.700%, 11/06/15 | 410 | 410 | ||||||
| Description | Face Amount ($ Thousands) | Value ($ Thousands) | ||||||
Chevron | ||||||||
0.402%, 02/17/15 (A) | $ | 1,210 | $ | 1,211 | ||||
CNOOC Nexen Finance, Ser 2014 | ||||||||
1.625%, 04/30/17 | 450 | 448 | ||||||
Devon Energy | ||||||||
0.781%, 03/15/15 (A) | 500 | 494 | ||||||
Enbridge | ||||||||
0.684%, 03/02/15 (A) | 540 | 532 | ||||||
Enterprise Products Operating LLC | ||||||||
1.250%, 08/13/15 | 45 | 45 | ||||||
Hess | ||||||||
1.300%, 06/15/17 | 300 | 296 | ||||||
Kinder Morgan | ||||||||
2.000%, 12/01/17 | 225 | 225 | ||||||
Petrobras Global Finance | ||||||||
1.852%, 02/20/15 (A) | 325 | 301 | ||||||
Petrobras Global Finance BV | ||||||||
2.603%, 03/17/15 (A) | 800 | 730 | ||||||
Schlumberger Norge | ||||||||
1.250%, 08/01/17 (B) | 145 | 145 | ||||||
Statoil | ||||||||
0.692%, 02/08/15 (A) | 550 | 548 | ||||||
0.432%, 02/09/15 (A) | 870 | 866 | ||||||
Total Capital Canada | ||||||||
0.633%, 04/17/15 (A) | 180 | 181 | ||||||
Total Capital International | ||||||||
0.802%, 02/12/15 (A) | 400 | 401 | ||||||
TransCanada PipeLines | ||||||||
1.042%, 04/12/15 (A) | 665 | 666 | ||||||
0.750%, 01/15/16 | 350 | 349 | ||||||
|
| |||||||
| 8,590 | ||||||||
|
| |||||||
Financials — 31.3% | ||||||||
Abbey National Treasury Services PLC | ||||||||
0.751%, 03/13/15 (A) | 1,610 | 1,611 | ||||||
ABN AMRO Bank | ||||||||
1.056%, 03/08/15 (A) (B) | 400 | 402 | ||||||
0.645%, 03/08/15 (A) (B) | 800 | 799 | ||||||
American Express Credit | ||||||||
0.793%, 03/18/15 (A) | 300 | 299 | ||||||
0.763%, 04/29/15 (A) | 760 | 763 | ||||||
American Express Credit MTN | ||||||||
1.125%, 06/05/17 | 600 | 601 | ||||||
American Honda Finance | ||||||||
0.609%, 02/26/15 (A) (B) | 815 | 818 | ||||||
Australia & New Zealand Banking Group | ||||||||
0.792%, 02/15/15 (A) | 375 | 376 | ||||||
0.632%, 04/10/15 (A) (B) | 300 | 300 | ||||||
Banco Santander Chile | ||||||||
1.152%, 04/15/15 (A) (B) | 500 | 498 | ||||||
Bank Nederlandse Gemeenten | ||||||||
0.625%, 07/18/16 (B) | 1,300 | 1,302 | ||||||
| 28 | SEI Daily Income Trust / Annual Report / January 31, 2015 |
| Description | Face Amount ($ Thousands) | Value ($ Thousands) | ||||||
Bank of America | ||||||||
1.500%, 10/09/15 | $ | 510 | $ | 512 | ||||
1.293%, 04/15/15 (A) | 750 | 756 | ||||||
Bank of America MTN | ||||||||
1.700%, 08/25/17 | 200 | 201 | ||||||
1.067%, 04/15/15 (A) | 200 | 201 | ||||||
0.843%, 02/25/15 (A) | 700 | 699 | ||||||
Bank of Montreal | ||||||||
0.503%, 04/14/15 (A) | 250 | 250 | ||||||
Bank of Montreal MTN | ||||||||
0.852%, 04/09/15 (A) | 500 | 502 | ||||||
Bank of New York Mellon MTN | ||||||||
0.675%, 04/15/15 (A) | 350 | 350 | ||||||
Bank of Nova Scotia | ||||||||
1.300%, 07/21/17 | 400 | 401 | ||||||
0.773%, 04/15/15 (A) | 670 | 673 | ||||||
0.679%, 03/11/15 (A) | 400 | 401 | ||||||
Bank of Tokyo-Mitsubishi | ||||||||
0.684%, 02/26/15 (A) (B) | 440 | 441 | ||||||
Bank of Tokyo-Mitsubishi UFJ | ||||||||
1.450%, 09/08/17 (B) | 325 | 324 | ||||||
0.846%, 03/08/15 (A) (B) | 200 | 201 | ||||||
0.545%, 03/08/15 (A) (B) | 325 | 324 | ||||||
Barclays Bank PLC | ||||||||
0.812%, 02/19/15 (A) | 600 | 601 | ||||||
Barclays Bank PLC MTN | ||||||||
6.050%, 12/04/17 (B) | 500 | 553 | ||||||
BB&T MTN | ||||||||
1.101%, 03/15/15 (A) | 380 | 384 | ||||||
0.892%, 02/01/15 (A) | 350 | 351 | ||||||
Berkshire Hathaway Finance | ||||||||
0.553%, 04/13/15 (A) | 600 | 600 | ||||||
BNP Paribas MTN | ||||||||
0.830%, 03/12/15 (A) | 550 | 551 | ||||||
BPCE MTN | ||||||||
1.082%, 02/10/15 (A) | 700 | 704 | ||||||
Branch Banking & Trust | ||||||||
0.664%, 03/01/15 (A) | 760 | 761 | ||||||
Capital One Bank USA | ||||||||
1.300%, 06/05/17 | 500 | 498 | ||||||
1.200%, 02/13/17 | 500 | 498 | ||||||
Capital One Financial | ||||||||
1.000%, 11/06/15 | 810 | 811 | ||||||
Chartered PLC | ||||||||
0.575%, 03/08/15 (A) (B) | 500 | 497 | ||||||
Citigroup | ||||||||
1.250%, 01/15/16 | 1,085 | 1,089 | ||||||
1.045%, 02/17/15 (A) | 470 | 471 | ||||||
1.021%, 04/08/15 (A) | 700 | 697 | ||||||
0.933%, 02/24/15 (A) | 730 | 728 | ||||||
Citizens Bank MTN | ||||||||
1.600%, 12/04/17 | 650 | 651 | ||||||
| Description | Face Amount ($ Thousands) | Value ($ Thousands) | ||||||
Cooperatieve Centrale Raiffeisen- Boerenleenbank BA | ||||||||
0.723%, 02/01/15 (A) | $ | 550 | $ | 552 | ||||
Credit Agricole | ||||||||
1.106%, 04/03/15 (A) (B) | 1,150 | 1,158 | ||||||
Credit Suisse MTN | ||||||||
1.375%, 05/26/17 | 380 | 381 | ||||||
0.943%, 04/29/15 (A) | 500 | 499 | ||||||
0.539%, 03/11/15 (A) | 960 | 960 | ||||||
Credit Suisse USA | ||||||||
5.375%, 03/02/16 | 450 | 472 | ||||||
Daimler Finance North America LLC | ||||||||
1.375%, 08/01/17 (B) | 535 | 536 | ||||||
1.250%, 01/11/16 (B) | 610 | 613 | ||||||
1.092%, 02/01/15 (A) (B) | 400 | 402 | ||||||
0.912%, 02/01/15 (A) (B) | 1,070 | 1,075 | ||||||
Deutsche Bank | ||||||||
1.350%, 05/30/17 | 650 | 651 | ||||||
ERAC USA Finance LLC | ||||||||
1.400%, 04/15/16 (B) | 240 | 241 | ||||||
Export-Import Bank of Korea | ||||||||
1.003%, 04/14/15 (A) | 945 | 950 | ||||||
Fifth Third Bank | ||||||||
1.350%, 06/01/17 | 750 | 753 | ||||||
0.644%, 02/26/15 (A) | 790 | 791 | ||||||
Ford Motor Credit LLC | ||||||||
1.724%, 12/06/17 | 350 | 349 | ||||||
1.500%, 01/17/17 | 520 | 520 | ||||||
1.482%, 02/09/15 (A) | 220 | 222 | ||||||
1.070%, 03/12/15 (A) | 300 | 297 | ||||||
General Electric Capital | ||||||||
0.965%, 02/11/15 (A) | 250 | 252 | ||||||
General Electric Capital MTN | ||||||||
0.433%, 02/11/15 (A) | 600 | 600 | ||||||
1.250%, 05/15/17 | 750 | 755 | ||||||
Goldman Sachs Group | ||||||||
3.625%, 02/07/16 | 505 | 518 | ||||||
1.455%, 04/30/15 (A) | 500 | 506 | ||||||
0.697%, 03/22/15 (A) | 1,455 | 1,453 | ||||||
Goldman Sachs Group MTN | ||||||||
1.332%, 02/15/15 (A) | 400 | 403 | ||||||
1.043%, 02/15/15 (A) | 700 | 701 | ||||||
HSBC Bank PLC | ||||||||
0.872%, 02/15/15 (A) (B) | 500 | 502 | ||||||
HSBC USA | ||||||||
1.300%, 06/23/17 | 1,590 | 1,597 | ||||||
Hyundai Capital America | ||||||||
1.875%, 08/09/16 (B) | 165 | 167 | ||||||
1.625%, 10/02/15 (B) | 685 | 688 | ||||||
ING Bank | ||||||||
1.895%, 02/15/15 (A) (B) | 550 | 555 | ||||||
0.945%, 04/02/15 (A) (B) | 300 | 300 | ||||||
| SEI Daily Income Trust / Annual Report / January 31, 2015 | 29 |
SCHEDULE OF INVESTMENTS
Ultra Short Duration Bond Fund (Continued)
January 31, 2015
| Description | Face Amount ($ Thousands) | Value ($ Thousands) | ||||||
ING US | ||||||||
2.900%, 02/15/18 | $ | 350 | $ | 361 | ||||
Intesa Sanpaolo | ||||||||
3.125%, 01/15/16 | 350 | 356 | ||||||
JPMorgan Chase | ||||||||
1.212%, 04/23/15 (A) | 500 | 503 | ||||||
0.886%, 04/28/15 (A) | 500 | 497 | ||||||
JPMorgan Chase MTN | ||||||||
0.854%, 02/25/15 (A) | 990 | 992 | ||||||
KeyBank | ||||||||
0.723%, 02/25/15 (A) | 700 | 702 | ||||||
KFW | ||||||||
2.000%, 06/01/16 | 950 | 970 | ||||||
Korea Development Bank | ||||||||
0.882%, 04/22/15 (A) | 1,005 | 1,005 | ||||||
Macquarie Group | ||||||||
1.255%, 04/30/15 (A) (B) | 350 | 353 | ||||||
Manufacturers & Traders Trust | ||||||||
1.400%, 07/25/17 | 450 | 453 | ||||||
0.535%, 03/07/15 (A) | 660 | 660 | ||||||
Metropolitan Life Global Funding I | ||||||||
1.500%, 01/10/18 (B) | 220 | 221 | ||||||
0.783%, 02/01/15 (A) (B) | 460 | 462 | ||||||
0.632%, 04/10/15 (A) (B) | 2,475 | 2,481 | ||||||
Mizuho Bank | ||||||||
0.705%, 03/25/15 (A) (B) | 580 | 580 | ||||||
Morgan Stanley | ||||||||
1.483%, 02/25/15 (A) | 1,320 | 1,331 | ||||||
1.106%, 04/24/15 (A) | 400 | 399 | ||||||
Morgan Stanley MTN | ||||||||
5.950%, 12/28/17 | 140 | 156 | ||||||
National Rural Utilities Cooperative Finance MTN | ||||||||
0.533%, 02/23/15 (A) | 600 | 601 | ||||||
New York Life Global Funding | ||||||||
0.607%, 04/23/15 (A) (B) | 550 | 552 | ||||||
Nissan Motor Acceptance | ||||||||
0.955%, 03/26/15 (A) (B) | 800 | 804 | ||||||
0.785%, 03/04/15 (A) (B) | 245 | 245 | ||||||
Nordea Bank | ||||||||
1.250%, 04/04/17 (B) | 600 | 600 | ||||||
PACCAR Financial MTN | ||||||||
1.100%, 06/06/17 | 325 | 326 | ||||||
PNC Bank | ||||||||
0.573%, 04/29/15 (A) | 700 | 700 | ||||||
Pricoa Global Funding I MTN | ||||||||
0.382%, 02/16/15 (A) (B) | 325 | 325 | ||||||
Principal Life Global Funding II | ||||||||
1.200%, 05/19/17 (B) | 370 | 369 | ||||||
1.000%, 12/11/15 (B) | 530 | 533 | ||||||
Principal Life Global Funding II MTN | ||||||||
1.125%, 02/24/17 (B) | 300 | 300 | ||||||
Province of Ontario Canada | ||||||||
1.600%, 09/21/16 | 1,400 | 1,422 | ||||||
| Description | Face Amount ($ Thousands) | Value ($ Thousands) | ||||||
Prudential Financial MTN | ||||||||
1.012%, 04/01/15 (A) | $ | 500 | $ | 502 | ||||
Rabobank MTN | ||||||||
2.125%, 10/13/15 | 880 | 890 | ||||||
Royal Bank of Canada MTN | ||||||||
1.200%, 01/23/17 | 400 | 402 | ||||||
0.850%, 03/08/16 | 990 | 993 | ||||||
0.587%, 04/23/15 (A) | 450 | 451 | ||||||
Royal Bank of Scotland Group PLC | ||||||||
1.875%, 03/31/17 | 300 | 302 | ||||||
Santander Bank | ||||||||
1.182%, 04/12/15 (A) | 600 | 600 | ||||||
Societe Generale | ||||||||
1.335%, 02/14/15 (A) | 450 | 458 | ||||||
Sumitomo Mitsui Banking | ||||||||
1.350%, 07/18/15 | 250 | 251 | ||||||
0.684%, 04/10/15 (A) | 500 | 500 | ||||||
SunTrust Bank | ||||||||
0.672%, 02/15/15 (A) | 300 | 299 | ||||||
Svenska Handelsbanken | ||||||||
0.722%, 03/25/15 (A) | 700 | 703 | ||||||
Synchrony Financial | ||||||||
1.875%, 08/15/17 | 255 | 256 | ||||||
0.001%, 02/02/15 (A) | 600 | 601 | ||||||
Toronto-Dominion Bank MTN | ||||||||
0.472%, 02/02/15 (A) | 400 | 400 | ||||||
Toyota Motor Credit MTN | ||||||||
1.125%, 05/16/17 | 500 | 503 | ||||||
Travelers | ||||||||
6.250%, 06/20/16 | 1,017 | 1,095 | ||||||
UBS MTN | ||||||||
5.875%, 12/20/17 | 550 | 616 | ||||||
Union Bank | ||||||||
1.005%, 03/26/15 (A) | 250 | 251 | ||||||
Ventas Realty† | ||||||||
1.550%, 09/26/16 | 550 | 554 | ||||||
1.250%, 04/17/17 | 140 | 140 | ||||||
Volkswagen Group of America Finance LLC | ||||||||
1.250%, 05/23/17 (B) | 500 | 500 | ||||||
0.672%, 02/20/15 (A) (B) | 1,120 | 1,120 | ||||||
Volkswagen International Finance | ||||||||
1.125%, 11/18/16 (B) | 260 | 260 | ||||||
0.672%, 02/20/15 (A) (B) | 775 | 777 | ||||||
WEA Finance LLC | ||||||||
1.750%, 09/15/17 (B) | 235 | 236 | ||||||
Wells Fargo MTN | ||||||||
1.150%, 06/02/17 | 650 | 650 | ||||||
0.787%, 04/20/15 (A) | 1,040 | 1,044 | ||||||
Westpac Banking | ||||||||
1.200%, 05/19/17 | 275 | 276 | ||||||
0.863%, 04/17/15 (A) | 325 | 326 | ||||||
|
| |||||||
| 80,084 | ||||||||
|
| |||||||
| 30 | SEI Daily Income Trust / Annual Report / January 31, 2015 |
| Description | Face Amount ($ Thousands) | Value ($ Thousands) | ||||||
Health Care — 3.6% | ||||||||
AbbVie | ||||||||
1.200%, 11/06/15 | $ | 675 | $ | 677 | ||||
0.992%, 02/06/15 (A) | 130 | 130 | ||||||
Actavis Funding SCS | ||||||||
1.300%, 06/15/17 | 450 | 446 | ||||||
Amgen | ||||||||
2.125%, 05/15/17 | 500 | 509 | ||||||
0.613%, 02/22/15 (A) | 1,150 | 1,148 | ||||||
Bayer US Finance LLC | ||||||||
0.536%, 04/06/15 (A) (B) | 600 | 599 | ||||||
0.504%, 04/07/15 (A) (B) | 400 | 400 | ||||||
Becton Dickinson | ||||||||
1.800%, 12/15/17 | 500 | 504 | ||||||
0.691%, 02/01/15 (A) | 260 | 260 | ||||||
Express Scripts Holding | ||||||||
2.650%, 02/15/17 | 550 | 565 | ||||||
1.250%, 06/02/17 | 600 | 599 | ||||||
GlaxoSmithKline Capital | ||||||||
0.700%, 03/18/16 | 844 | 846 | ||||||
McKesson | ||||||||
1.292%, 03/10/17 | 410 | 411 | ||||||
0.950%, 12/04/15 | 235 | 236 | ||||||
Medtronic | ||||||||
1.500%, 03/15/18 (B) | 255 | 257 | ||||||
Mylan | ||||||||
1.350%, 11/29/16 | 400 | 400 | ||||||
Providence Health & Services Obligated Group | ||||||||
1.055%, 04/01/15 (A) | 700 | 704 | ||||||
Thermo Fisher Scientific | ||||||||
1.300%, 02/01/17 | 165 | 165 | ||||||
WellPoint | ||||||||
1.250%, 09/10/15 | 210 | 211 | ||||||
|
| |||||||
| 9,067 | ||||||||
|
| |||||||
Industrials — 2.1% | ||||||||
Air Lease | ||||||||
4.500%, 01/15/16 | 300 | 307 | ||||||
2.125%, 01/15/18 | 230 | 229 | ||||||
Canadian National Railway | ||||||||
0.432%, 02/06/15 (A) | 1,000 | 1,000 | ||||||
GATX | ||||||||
1.250%, 03/04/17 | 215 | 214 | ||||||
Hutchison Whampoa International 14 | ||||||||
1.625%, 10/31/17 (B) | 400 | 397 | ||||||
John Deere Capital MTN | ||||||||
0.461%, 03/15/15 (A) | 1,055 | 1,054 | ||||||
Norfolk Southern | ||||||||
5.750%, 01/15/16 | 980 | 1,026 | ||||||
Pentair Finance | ||||||||
1.350%, 12/01/15 | 285 | 286 | ||||||
| Description | Face Amount ($ Thousands) | Value ($ Thousands) | ||||||
Precision Castparts | ||||||||
0.700%, 12/20/15 | $ | 145 | $ | 145 | ||||
Rockwell Collins | ||||||||
0.591%, 03/15/15 (A) | 690 | 690 | ||||||
|
| |||||||
| 5,348 | ||||||||
|
| |||||||
Information Technology — 0.7% |
| |||||||
Alibaba Group Holding | ||||||||
0.756%, 02/28/15 (A) (B) | 350 | 350 | ||||||
Fidelity National Information Services | ||||||||
1.450%, 06/05/17 | 170 | 170 | ||||||
Hewlett-Packard | ||||||||
3.000%, 09/15/16 | 450 | 463 | ||||||
1.193%, 04/14/15 (A) | 500 | 494 | ||||||
TSMC Global | ||||||||
0.950%, 04/03/16 (B) | 325 | 324 | ||||||
Western Union | ||||||||
2.375%, 12/10/15 | 85 | 86 | ||||||
|
| |||||||
| 1,887 | ||||||||
|
| |||||||
Materials — 1.5% |
| |||||||
Glencore Funding LLC | ||||||||
1.396%, 02/27/15 (A) (B) | 700 | 703 | ||||||
Monsanto | ||||||||
1.150%, 06/30/17 | 500 | 500 | ||||||
0.432%, 02/07/15 (A) | 710 | 709 | ||||||
Rio Tinto Finance USA PLC | ||||||||
1.083%, 03/17/15 (A) | 955 | 958 | ||||||
Xstrata Finance Canada | ||||||||
2.050%, 10/23/15 (B) | 900 | 903 | ||||||
|
| |||||||
| 3,773 | ||||||||
|
| |||||||
Telecommunications — 1.6% |
| |||||||
AT&T | ||||||||
0.618%, 02/12/15 (A) | 600 | 600 | ||||||
British Telecommunications PLC | ||||||||
1.250%, 02/14/17 | 270 | 270 | ||||||
Verizon Communications | ||||||||
1.991%, 03/14/15 (A) | 470 | 489 | ||||||
1.771%, 03/15/15 (A) | 410 | 418 | ||||||
1.350%, 06/09/17 | 600 | 599 | ||||||
0.636%, 03/09/15 (A) | 560 | 559 | ||||||
Vodafone Group PLC | ||||||||
0.617%, 02/19/15 (A) | 1,120 | 1,120 | ||||||
|
| |||||||
| 4,055 | ||||||||
|
| |||||||
Utilities — 1.8% | ||||||||
Dominion Gas Holdings LLC | ||||||||
1.050%, 11/01/16 | 550 | 551 | ||||||
Duke Energy | ||||||||
0.636%, 04/03/15 (A) | 1,450 | 1,452 | ||||||
Duke Energy Progress | ||||||||
0.435%, 03/06/15 (A) | 180 | 179 | ||||||
| SEI Daily Income Trust / Annual Report / January 31, 2015 | 31 |
SCHEDULE OF INVESTMENTS
Ultra Short Duration Bond Fund (Continued)
January 31, 2015
| Description | Face Amount ($ Thousands) | Value ($ Thousands) | ||||||
Exelon | ||||||||
4.900%, 06/15/15 | $ | 350 | $ | 355 | ||||
Georgia Power | ||||||||
0.625%, 11/15/15 | 1,500 | 1,501 | ||||||
NextEra Energy Capital Holdings | ||||||||
1.339%, 09/01/15 | 300 | 301 | ||||||
Southern | ||||||||
1.300%, 08/15/17 | 310 | 311 | ||||||
|
| |||||||
| 4,650 | ||||||||
|
| |||||||
Total Corporate Obligations | 124,862 | |||||||
|
| |||||||
ASSET-BACKED SECURITIES — 26.6% |
| |||||||
Automotive — 15.7% |
| |||||||
Ally Auto Receivables Trust, | ||||||||
0.720%, 05/20/16 | 237 | 237 | ||||||
Ally Auto Receivables Trust, | ||||||||
0.750%, 02/21/17 | 245 | 245 | ||||||
Ally Master Owner Trust, | ||||||||
1.210%, 06/15/17 | 480 | 481 | ||||||
Ally Master Owner Trust, | ||||||||
0.617%, 02/15/15 (A) | 310 | 310 | ||||||
Ally Master Owner Trust, | ||||||||
1.000%, 02/15/18 | 825 | 827 | ||||||
Ally Master Owner Trust, | ||||||||
0.617%, 02/15/15 (A) | 750 | 750 | ||||||
Ally Master Owner Trust, | ||||||||
0.637%, 02/15/15 (A) | 350 | 350 | ||||||
Ally Master Owner Trust, | ||||||||
0.567%, 02/15/15 (A) | 850 | 848 | ||||||
Ally Master Owner Trust, | ||||||||
1.430%, 06/17/19 | 635 | 636 | ||||||
Ally Master Owner Trust, | ||||||||
1.600%, 02/15/15 | 650 | 654 | ||||||
American Credit Acceptance Receivables Trust, Ser 2014-4, Cl A | ||||||||
1.330%, 07/10/18 (B) | 164 | 165 | ||||||
American Credit Acceptance Receivables Trust, Ser 2012-3, Cl A | ||||||||
1.640%, 11/15/16 (B) | 39 | 39 | ||||||
American Credit Acceptance Receivables Trust, Ser 2013-1, Cl A | ||||||||
1.450%, 04/16/18 (B) | 106 | 106 | ||||||
| Description | Face Amount ($ Thousands) | Value ($ Thousands) | ||||||
American Credit Acceptance Receivables Trust, | ||||||||
1.320%, 02/15/17 (B) | $ | 68 | $ | 68 | ||||
American Credit Acceptance Receivables Trust, | ||||||||
1.140%, 03/12/18 (B) | 83 | 83 | ||||||
AmeriCredit Automobile Receivables Trust, | ||||||||
1.310%, 11/08/17 | 330 | 331 | ||||||
AmeriCredit Automobile Receivables Trust, | ||||||||
0.620%, 06/08/17 | 265 | 265 | ||||||
AmeriCredit Automobile Receivables Trust, | ||||||||
0.650%, 12/08/17 | 490 | 490 | ||||||
AmeriCredit Automobile Receivables Trust, | ||||||||
0.920%, 04/09/18 | 300 | 300 | ||||||
AmeriCredit Automobile Receivables Trust, | ||||||||
0.740%, 11/08/16 | 69 | 69 | ||||||
AmeriCredit Automobile Receivables Trust, | ||||||||
0.548%, 02/26/15 (A) | 76 | 76 | ||||||
ARI Fleet Lease Trust, | ||||||||
0.717%, 02/15/15 (A) (B) | 27 | 27 | ||||||
ARI Fleet Lease Trust, | ||||||||
0.467%, 02/15/15 (A) (B) | 564 | 563 | ||||||
ARI Fleet Lease Trust, | ||||||||
0.920%, 07/15/21 (B) | 100 | 100 | ||||||
ARI Fleet Lease Trust, | ||||||||
0.700%, 12/15/15 (B) | 111 | 111 | ||||||
ARI Fleet Lease Trust, | ||||||||
0.810%, 11/15/22 (B) | 170 | 170 | ||||||
California Republic Auto Receivables Trust, | ||||||||
1.410%, 09/17/18 (B) | 646 | 649 | ||||||
Capital Auto Receivables Asset Trust, Ser 2013-4, Cl A1 | ||||||||
0.546%, 02/20/15 (A) | 199 | 199 | ||||||
Capital Auto Receivables Asset Trust, Ser 2014-1, Cl A3 | ||||||||
1.320%, 06/20/18 | 190 | 191 | ||||||
Capital Auto Receivables Asset Trust, Ser 2014-1, Cl A1A | ||||||||
0.680%, 05/20/16 | 325 | 325 | ||||||
CarMax Auto Owner Trust, | ||||||||
1.350%, 02/15/17 | 357 | 358 | ||||||
| 32 | SEI Daily Income Trust / Annual Report / January 31, 2015 |
| Description | Face Amount ($ Thousands) | Value ($ Thousands) | ||||||
CarMax Auto Owner Trust, | ||||||||
0.890%, 09/15/16 | $ | 44 | $ | 44 | ||||
CarMax Auto Owner Trust, | ||||||||
1.500%, 08/15/18 | 120 | 120 | ||||||
CFC LLC, Ser 2013-1A, Cl A | ||||||||
1.650%, 07/17/17 (B) | 16 | 16 | ||||||
Chesapeake Funding LLC, | ||||||||
1.418%, 02/07/15 (A) (B) | 287 | 289 | ||||||
Chesapeake Funding LLC, | ||||||||
0.918%, 02/07/15 (A) (B) | 449 | 450 | ||||||
Chesapeake Funding LLC, | ||||||||
0.618%, 02/07/15 (A) (B) | 154 | 154 | ||||||
Chesapeake Funding LLC, | ||||||||
0.588%, 02/07/15 (A) (B) | 685 | 685 | ||||||
Chrysler Capital Auto Receivables Trust, | ||||||||
0.610%, 11/15/16 (B) | 72 | 72 | ||||||
CNH Wholesale Master Note Trust, Ser 2013-2A, Cl A | ||||||||
0.767%, 02/15/15 (A) (B) | 425 | 426 | ||||||
CPS Auto Receivables Trust, | ||||||||
1.540%, 07/16/18 (B) | 758 | 760 | ||||||
CPS Auto Receivables Trust, | ||||||||
1.210%, 08/15/18 (B) | 253 | 253 | ||||||
Credit Acceptance Auto Loan Trust, Ser 2013-1A, Cl A | ||||||||
1.210%, 10/15/20 (B) | 290 | 290 | ||||||
Credit Acceptance Auto Loan Trust, Ser 2013-2A, Cl A | ||||||||
1.500%, 04/15/21 (B) | 365 | 366 | ||||||
Credit Acceptance Auto Loan Trust, Ser 2014-1A, Cl A | ||||||||
1.550%, 10/15/21 (B) | 415 | 416 | ||||||
DT Auto Owner Trust, | ||||||||
0.660%, 07/17/17 (B) | 75 | 75 | ||||||
DT Auto Owner Trust, | ||||||||
0.830%, 08/15/17 (B) | 358 | 358 | ||||||
Enterprise Fleet Financing LLC, | ||||||||
1.140%, 11/20/17 (B) | 40 | 40 | ||||||
Enterprise Fleet Financing LLC, | ||||||||
0.680%, 09/20/18 (B) | 332 | 332 | ||||||
| Description | Face Amount ($ Thousands) | Value ($ Thousands) | ||||||
Enterprise Fleet Financing LLC, | ||||||||
1.060%, 03/20/19 (B) | $ | 301 | $ | 302 | ||||
First Investors Auto Owner Trust, | ||||||||
1.470%, 05/15/18 (B) | 121 | 121 | ||||||
First Investors Auto Owner Trust, | ||||||||
0.900%, 10/15/18 (B) | 88 | 88 | ||||||
First Investors Auto Owner Trust, | ||||||||
1.230%, 03/15/19 (B) | 925 | 927 | ||||||
First Investors Auto Owner Trust, | ||||||||
0.890%, 09/15/17 (B) | 82 | 82 | ||||||
First Investors Auto Owner Trust, | ||||||||
1.440%, 10/15/19 (B) | 300 | 301 | ||||||
First Investors Auto Owner Trust, | ||||||||
0.800%, 02/15/18 (B) | 244 | 244 | ||||||
First Investors Auto Owner Trust, | ||||||||
0.860%, 08/15/18 (B) | 425 | 425 | ||||||
Ford Credit Auto Lease Trust, | ||||||||
1.100%, 11/15/17 | 615 | 618 | ||||||
Ford Credit Auto Owner Trust, | ||||||||
3.210%, 07/15/17 | 600 | 604 | ||||||
Ford Credit Auto Owner Trust, | ||||||||
1.880%, 08/15/17 | 475 | 480 | ||||||
Ford Credit Auto Owner Trust, | ||||||||
2.930%, 10/15/18 | 600 | 616 | ||||||
Ford Credit Floorplan Master Owner Trust, Ser 2014-4, Cl A2 | ||||||||
0.511%, 02/15/15 (A) | 375 | 374 | ||||||
Ford Credit Floorplan Master Owner Trust, Ser 2013-1, Cl A2 | ||||||||
0.547%, 02/15/15 (A) | 945 | 945 | ||||||
Ford Credit Floorplan Master Owner Trust, Ser 2013-5, Cl A2 | ||||||||
0.637%, 02/15/15 (A) | 310 | 311 | ||||||
Ford Credit Floorplan Master Owner Trust, Ser 2014-1, Cl B | ||||||||
1.400%, 02/15/19 | 80 | 80 | ||||||
GE Dealer Floorplan Master Note Trust, Ser 2012-1, Cl A | ||||||||
0.738%, 02/20/15 (A) | 598 | 598 | ||||||
GE Dealer Floorplan Master Note Trust, Ser 2012-3, Cl A | ||||||||
0.658%, 02/28/15 (A) | 480 | 480 | ||||||
| SEI Daily Income Trust / Annual Report / January 31, 2015 | 33 |
SCHEDULE OF INVESTMENTS
Ultra Short Duration Bond Fund (Continued)
January 31, 2015
| Description | Face Amount ($ Thousands) | Value ($ Thousands) | ||||||
GE Dealer Floorplan Master Note Trust, Ser 2012-4, Cl A | ||||||||
0.608%, 02/20/15 (A) | $ | 1,405 | $ | 1,406 | ||||
GE Dealer Floorplan Master Note Trust, Ser 2014-2, Cl A | ||||||||
0.618%, 02/20/15 (A) | 665 | 664 | ||||||
GM Financial Leasing Trust, | ||||||||
1.010%, 05/22/17 (B) | 1,140 | 1,142 | ||||||
Hertz Fleet Lease Funding, | ||||||||
1.212%, 02/10/15 (A) (B) | 765 | 767 | ||||||
Honda Auto Receivables Owner Trust, Ser 2012-3, Cl A3 | ||||||||
0.560%, 05/15/16 | 114 | 114 | ||||||
Hyundai Auto Lease Securitization Trust, Ser 2013-B, Cl A2 | ||||||||
0.750%, 03/15/16 (B) | 206 | 206 | ||||||
M&T Bank Auto Receivables Trust, | ||||||||
1.060%, 11/15/17 (B) | 725 | 727 | ||||||
Mercedes-Benz Auto Lease Trust, | ||||||||
0.620%, 07/15/16 | 150 | 150 | ||||||
Mercedes-Benz Auto Receivables Trust, Ser 2013-1, Cl A3 | ||||||||
0.780%, 08/15/17 | 200 | 200 | ||||||
Mercedes-Benz Master Owner Trust, | ||||||||
0.790%, 11/15/17 (B) | 360 | 360 | ||||||
Motor PLC, Ser 2013-1A, Cl A1 | ||||||||
0.668%, 02/15/15 (A) (B) | 79 | 79 | ||||||
Nissan Master Owner Trust Receivables, Ser 2012-A, Cl A | ||||||||
0.637%, 02/15/15 (A) | 1,240 | 1,241 | ||||||
Nissan Master Owner Trust Receivables, Ser 2013-A, Cl A | ||||||||
0.461%, 02/15/15 (A) | 250 | 250 | ||||||
Porsche Innovative Lease Owner Trust, Ser 2013-1, Cl A4 | ||||||||
0.880%, 10/22/19 (B) | 310 | 311 | ||||||
Prestige Auto Receivables Trust, | ||||||||
1.760%, 10/16/17 (B) | 181 | 182 | ||||||
Prestige Auto Receivables Trust, | ||||||||
1.090%, 02/15/18 (B) | 316 | 316 | ||||||
Prestige Auto Receivables Trust, | ||||||||
1.330%, 05/15/19 (B) | 250 | 251 | ||||||
Prestige Auto Receivables Trust, | ||||||||
0.970%, 03/15/18 (B) | 730 | 730 | ||||||
| Description | Face Amount ($ Thousands) | Value ($ Thousands) | ||||||
Santander Drive Auto Receivables Trust, | ||||||||
1.560%, 08/15/18 | $ | 136 | $ | 136 | ||||
Santander Drive Auto Receivables Trust, | ||||||||
3.780%, 11/15/17 | 526 | 532 | ||||||
Santander Drive Auto Receivables Trust, | ||||||||
3.640%, 05/15/18 | 430 | 444 | ||||||
Santander Drive Auto Receivables Trust, | ||||||||
1.830%, 03/15/17 | 514 | 515 | ||||||
Santander Drive Auto Receivables Trust, | ||||||||
1.330%, 05/15/17 | 325 | 333 | ||||||
1.330%, 05/15/17 | 79 | 79 | ||||||
Santander Drive Auto Receivables Trust, | ||||||||
0.660%, 06/15/17 | 58 | 58 | ||||||
Santander Drive Auto Receivables Trust, | ||||||||
1.330%, 03/15/18 | 485 | 486 | ||||||
Santander Drive Auto Receivables Trust, | ||||||||
0.541%, 02/16/15 (A) | 46 | 46 | ||||||
Santander Drive Auto Receivables Trust, | ||||||||
0.670%, 01/16/18 | 250 | 250 | ||||||
SMART Trust, Ser 2011-4USA | ||||||||
1.510%, 02/14/15 | 318 | 319 | ||||||
SMART Trust, | ||||||||
2.280%, 08/14/17 (B) | 280 | 282 | ||||||
SMART Trust, Ser 2014-1US, Cl A2B | ||||||||
0.467%, 02/14/15 (A) | 617 | 617 | ||||||
SNAAC Auto Receivables Trust, | ||||||||
1.140%, 07/16/18 (B) | 23 | 23 | ||||||
SNAAC Auto Receivables Trust, | ||||||||
1.030%, 09/17/18 (B) | 274 | 274 | ||||||
Susquehanna Auto Receivables Trust, Ser 2014-1 | ||||||||
1.000%, 02/15/18 | 425 | 425 | ||||||
Volkswagen Auto Lease Trust, | ||||||||
0.520%, 10/20/16 | 389 | 389 | ||||||
Volkswagen Credit Auto Master Trust, Ser 2014-1A, Cl A1 | ||||||||
0.518%, 02/20/15 (A) (B) | 400 | 400 | ||||||
Volvo Financial Equipment LLC, | ||||||||
0.740%, 02/20/15 (B) | 328 | 329 | ||||||
| 34 | SEI Daily Income Trust / Annual Report / January 31, 2015 |
| Description | Face Amount ($ Thousands) | Value ($ Thousands) | ||||||
Volvo Financial Equipment LLC, | ||||||||
0.820%, 04/16/18 (B) | $ | 240 | $ | 240 | ||||
Westlake Automobile Receivables Trust, Ser 2013-1A, Cl A2 | ||||||||
1.120%, 01/15/18 (B) | 300 | 300 | ||||||
Westlake Automobile Receivables Trust, Ser 2014-1A, Cl A2 | ||||||||
0.700%, 05/15/17 (B) | 331 | 330 | ||||||
Westlake Automobile Receivables Trust, Ser 2014-2A, Cl A2 | ||||||||
0.970%, 10/16/17 (B) | 635 | 635 | ||||||
Wheels SPV 2 LLC, | ||||||||
0.840%, 03/20/23 (B) | 250 | 250 | ||||||
World Omni Master Owner Trust, | ||||||||
0.517%, 02/15/15 (A) (B) | 555 | 555 | ||||||
|
| |||||||
| 40,108 | ||||||||
|
| |||||||
Credit Card — 3.0% | ||||||||
American Express Credit Account Master Trust, Ser 2013-3, Cl A | ||||||||
0.980%, 05/15/19 | 185 | 185 | ||||||
Barclays Dryrock Issuance Trust, | ||||||||
0.527%, 02/15/15 (A) | 320 | 320 | ||||||
Cabela’s Master Credit Card Trust, | ||||||||
0.817%, 02/15/15 (A) (B) | 210 | 211 | ||||||
Cabela’s Master Credit Card Trust, | ||||||||
0.517%, 02/15/15 (A) | 165 | 165 | ||||||
Capital One Multi-Asset Execution Trust, Ser 2013-A3, Cl A3 | ||||||||
0.960%, 09/16/19 | 360 | 360 | ||||||
Chase Issuance Trust, | ||||||||
0.417%, 02/15/15 (A) | 450 | 447 | ||||||
Chase Issuance Trust, | ||||||||
0.590%, 08/15/17 | 1,240 | 1,241 | ||||||
Chase Issuance Trust, | ||||||||
1.260%, 07/15/19 | 400 | 402 | ||||||
Citibank Credit Card Issuance Trust, | ||||||||
1.110%, 07/23/18 | 500 | 503 | ||||||
Citibank Credit Card Issuance Trust, | ||||||||
1.020%, 02/22/19 | 415 | 415 | ||||||
| Description | Face Amount ($ Thousands) | Value ($ Thousands) | ||||||
Citibank Credit Card Issuance Trust, | ||||||||
1.230%, 04/24/19 | $ | 650 | $ | 653 | ||||
Discover Card Execution Note Trust, | ||||||||
1.220%, 10/15/19 | 260 | 261 | ||||||
Dryrock Issuance Trust, | ||||||||
0.640%, 08/15/18 | 480 | 480 | ||||||
GE Capital Credit Card Master Note Trust, Ser 2012-5, Cl A | ||||||||
0.950%, 06/15/18 | 590 | 591 | ||||||
Golden Credit Card Trust, | ||||||||
0.790%, 09/15/17 (B) | 575 | 576 | ||||||
Master Credit Card Trust, | ||||||||
0.780%, 04/21/17 (B) | 360 | 360 | ||||||
Synchrony Credit Card Master Note | ||||||||
1.610%, 11/15/20 | 650 | 650 | ||||||
|
| |||||||
| 7,820 | ||||||||
|
| |||||||
Miscellaneous Business Services — 6.9% |
| |||||||
Apidos CDO, Ser 2013-12A, Cl A | ||||||||
1.353%, 02/02/15 (A) (B) | 600 | 588 | ||||||
Avalon IV Capital, | ||||||||
1.398%, 04/17/15 (A) (B) | 335 | 334 | ||||||
Bear Stearns Asset-Backed Securities | ||||||||
0.828%, 02/25/15 (A) | 155 | 155 | ||||||
Cent CLO 16, | ||||||||
1.482%, 02/03/15 (A) (B) | 500 | 496 | ||||||
Cent CLO 16, Ser 2014-20A, Cl A | ||||||||
1.724%, 01/25/26 (A) (B) | 600 | 595 | ||||||
CIFC Funding, Ser 2013-1A, Cl A1 | ||||||||
1.379%, 04/16/15 (A) (B) | 485 | 477 | ||||||
CIT Equipment Collateral, | ||||||||
0.860%, 05/22/17 (B) | 1,005 | 1,005 | ||||||
City of New York, Ser 2013-A, Cl A | ||||||||
1.190%, 11/10/26 (B) | 34 | 34 | ||||||
CNH Equipment Trust, | ||||||||
0.650%, 04/16/18 | 530 | 530 | ||||||
CNH Equipment Trust, | ||||||||
0.630%, 12/15/17 | 1,025 | 1,024 | ||||||
Dell Equipment Finance Trust, | ||||||||
0.940%, 06/22/20 (B) | 500 | 500 | ||||||
| SEI Daily Income Trust / Annual Report / January 31, 2015 | 35 |
SCHEDULE OF INVESTMENTS
Ultra Short Duration Bond Fund (Continued)
January 31, 2015
| Description | Face Amount ($ Thousands) | Value ($ Thousands) | ||||||
Dryden XXXI Senior Loan Fund, | ||||||||
1.607%, 04/18/15 (A) (B) | $ | 250 | $ | 247 | ||||
GE Equipment Midticket LLC, | ||||||||
0.600%, 05/23/16 | 89 | 89 | ||||||
GE Equipment Midticket LLC, | ||||||||
0.640%, 03/22/16 | 46 | 46 | ||||||
GE Equipment Small Ticket LLC, | ||||||||
0.950%, 09/25/17 (B) | 400 | 400 | ||||||
GE Equipment Transportation LLC, | ||||||||
0.620%, 07/25/16 | 127 | 127 | ||||||
HLSS Servicer Advance Receivables | ||||||||
1.990%, 10/15/45 (B) | 625 | 620 | ||||||
HLSS Servicer Advance Receivables | ||||||||
1.744%, 01/16/46 (B) | 405 | 405 | ||||||
ING IM CLO, Ser 2014-1A, Cl A1 | ||||||||
1.757%, 04/18/15 (A) (B) | 290 | 288 | ||||||
ING IM CLO, Ser 2014-1RA, Cl A2R | ||||||||
2.091%, 04/02/15 (A) (B) | 500 | 496 | ||||||
John Deere Owner Trust, | ||||||||
0.690%, 01/15/19 | 580 | 580 | ||||||
Kubota Credit Owner Trust, | ||||||||
0.940%, 02/15/15 (B) | 420 | 420 | ||||||
Kubota Credit Owner Trust, Ser 2014-1A, Cl A2 | ||||||||
0.580%, 02/15/17 (B) | 184 | 184 | ||||||
Limerock CLO II, Ser 2014-2A, Cl A | ||||||||
1.757%, 02/18/15 (A) (B) | 500 | 498 | ||||||
Madison Park Funding CLO, Ser 2007-4A, Cl A1B | ||||||||
0.547%, 03/24/15 (A) (B) | 420 | 409 | ||||||
MMAF Equipment Finance LLC, Ser 2011-AA, Cl A4 | ||||||||
2.100%, 07/15/17 (B) | 324 | 327 | ||||||
MMAF Equipment Finance LLC, Ser 2013-AA, Cl A2 | ||||||||
0.690%, 05/09/16 (B) | 204 | 204 | ||||||
MMAF Equipment Finance LLC, Ser 2014-AA, Cl A3 | ||||||||
0.870%, 01/08/19 (B) | 560 | 559 | ||||||
Navient Student Loan Trust, Ser 2014-1, Cl A1 | ||||||||
0.418%, 02/25/15 (A) | 1,394 | 1,392 | ||||||
Nelnet Education Loan Funding, Ser 2004-2A, Cl A4 | ||||||||
0.373%, 02/25/15 (A) | 8 | 8 | ||||||
| Description | Face Amount ($ Thousands) | Value ($ Thousands) | ||||||
Neuberger Berman CLO XVI, Ser 2014-16A, Cl A1 | ||||||||
1.723%, 03/11/15 (A) (B) | $ | 405 | $ | 402 | ||||
NYCTL Trust, Ser 2014-A, Cl A | ||||||||
1.030%, 11/10/27 (B) | 140 | 140 | ||||||
Oak Hill Credit Partners, Ser 2013-8A, Cl A | ||||||||
1.351%, 04/21/15 (A) (B) | 360 | 353 | ||||||
Octagon Investment Partners XVI, Ser 2013-1A, Cl A | ||||||||
1.377%, 04/17/15 (A) (B) | 550 | 538 | ||||||
OHA Intrepid Leveraged Loan Fund, Ser 2013-1AR, Cl AR | ||||||||
1.177%, 02/22/15 (A) (B) | 285 | 285 | ||||||
Race Point VI CLO, Ser 2014-6RA, Cl BR | ||||||||
2.383%, 02/24/15 (A) (B) | 425 | 425 | ||||||
SLM Student Loan Trust, Ser 2006-10, Cl A4 | ||||||||
0.326%, 04/25/15 (A) | 108 | 108 | ||||||
SLM Student Loan Trust, Ser 2006-4, Cl A5 | ||||||||
0.356%, 04/25/15 (A) | 189 | 188 | ||||||
SLM Student Loan Trust, Ser 2007-2, Cl A2 | ||||||||
0.256%, 04/25/15 (A) | 85 | 85 | ||||||
SLM Student Loan Trust, Ser 2011-A, Cl A1 | ||||||||
1.167%, 02/15/15 (A) (B) | 77 | 77 | ||||||
SLM Student Loan Trust, Ser 2011-B, Cl A1 | ||||||||
1.017%, 02/15/15 (A) (B) | 246 | 246 | ||||||
SLM Student Loan Trust, Ser 2012-7, Cl A1 | ||||||||
0.328%, 02/26/15 (A) | 20 | 20 | ||||||
Springleaf Funding Trust, Ser 2014-AA, Cl A | ||||||||
2.410%, 12/15/22 (B) | 445 | 445 | ||||||
Structured Asset Securities Mortgage Loan Trust, Ser 2006-GEL3, Cl A2 | ||||||||
0.398%, 02/25/15 (A) (B) | 595 | 592 | ||||||
Structured Asset Securities Mortgage Loan Trust, Ser 2006-WF1, Cl A1 | ||||||||
0.318%, 02/25/15 (A) | 158 | 156 | ||||||
Symphony CLO VIII, Ser 2014-8AR, Cl BR | ||||||||
2.002%, 03/25/15 (A) (B) | 475 | 473 | ||||||
|
| |||||||
| 17,570 | ||||||||
|
| |||||||
Mortgage Related — 1.0% | ||||||||
Accredited Mortgage Loan Trust, Ser 2004-4, Cl A1A | ||||||||
0.850%, 02/27/15 (A) | 250 | 245 | ||||||
| 36 | SEI Daily Income Trust / Annual Report / January 31, 2015 |
| Description | Face Amount ($ Thousands) | Value ($ Thousands) | ||||||
Aegis Asset-Backed Securities Trust Mortgage Pass-Through Certificates, Ser 2004-4, Cl A1 | ||||||||
0.888%, 02/27/15 (A) | $ | 327 | $ | 321 | ||||
Ameriquest Mortgage Securities Asset-Backed Pass-Through, Ser 2005-R3, Cl A1B | ||||||||
0.428%, 02/25/15 (A) | 88 | 87 | ||||||
Bear Stearns Asset-Backed-Securities I Trust, Ser 2005-HE3, Cl M2 | ||||||||
1.190%, 02/25/15 (A) | 383 | 379 | ||||||
HSBC Home Equity Loan Trust, Ser 2006-1, Cl A1 | ||||||||
0.328%, 02/20/15 (A) | 1,011 | 1,005 | ||||||
JPMorgan Mortgage Acquisition, Ser 2005-FLD1, Cl M2 | ||||||||
0.903%, 02/25/15 (A) | 214 | 213 | ||||||
Lake Country Mortgage Loan Trust, Ser 2006-HE1, Cl A4 | ||||||||
0.538%, 02/25/15 (A) (B) | 34 | 34 | ||||||
Option One Mortgage Loan Trust Asset-Backed Certificates, Ser 2005-4, Cl A3 | ||||||||
0.428%, 02/25/15 (A) | 64 | 63 | ||||||
Option One Mortgage Loan Trust, Ser 2005-1, Cl A1A | ||||||||
0.668%, 02/25/15 (A) | 220 | 217 | ||||||
|
| |||||||
| 2,564 | ||||||||
|
| |||||||
Total Asset-Backed Securities (Cost $68,140) ($ Thousands) | 68,062 | |||||||
|
| |||||||
MORTGAGE-BACKED SECURITIES — 18.5% |
| |||||||
Agency Mortgage-Backed Obligations — 5.5% |
| |||||||
FHLMC | ||||||||
5.000%, 12/01/18 to 06/01/26 | 321 | 342 | ||||||
4.500%, 09/01/26 | 78 | 83 | ||||||
4.000%, 05/01/19 to 04/01/20 | 558 | 590 | ||||||
2.218%, 02/01/15 (A) | 125 | 130 | ||||||
2.168%, 02/01/15 (A) | 110 | 116 | ||||||
FHLMC REMIC, Ser 2004-2764, Cl OE | ||||||||
4.500%, 03/15/19 | 81 | 85 | ||||||
FHLMC REMIC, Ser 2009-3570, Cl A | ||||||||
4.500%, 02/01/15 (A) | 100 | 106 | ||||||
FHLMC REMIC, Ser 2010-3634, Cl EA | ||||||||
4.000%, 11/15/23 | 64 | 64 | ||||||
FNMA | ||||||||
6.000%, 01/01/27 | 73 | 82 | ||||||
5.000%, 04/01/20 to 03/01/25 | 1,273 | 1,375 | ||||||
2.340%, 02/01/15 (A) | 21 | 22 | ||||||
2.253%, 02/01/15 (A) | 30 | 31 | ||||||
| Description | Face Amount ($ Thousands) | Value ($ Thousands) | ||||||
2.245%, 02/01/15 (A) | $ | 10 | $ | 10 | ||||
2.178%, 02/01/15 (A) | 101 | 105 | ||||||
2.114%, 02/01/15 (A) | 40 | 42 | ||||||
2.035%, 02/01/15 (A) | 51 | 54 | ||||||
1.940%, 01/01/17 | 546 | 548 | ||||||
1.357%, 02/01/15 (A) | 17 | 18 | ||||||
FNMA REMIC, Ser 1993-58, Cl H | ||||||||
5.500%, 04/25/23 | 33 | 36 | ||||||
FNMA REMIC, Ser 2001-33, Cl FA | ||||||||
0.618%, 02/25/15 (A) | 25 | 26 | ||||||
FNMA REMIC, Ser 2002-64, Cl FG | ||||||||
0.418%, 02/18/15 (A) | 26 | 26 | ||||||
FNMA REMIC, Ser 2002-77, Cl CB | ||||||||
5.000%, 12/25/17 | 147 | 154 | ||||||
FNMA REMIC, Ser 2008-18, Cl HD | ||||||||
4.000%, 12/25/18 | 109 | 113 | ||||||
FNMA REMIC, Ser 2010-64, Cl EH | ||||||||
5.000%, 10/25/35 | 24 | 25 | ||||||
FNMA REMIC, Ser 2011-109, Cl PK | ||||||||
4.000%, 08/25/41 | 133 | 142 | ||||||
FNMA REMIC, Ser 2011-6, Cl BA | ||||||||
2.750%, 06/25/20 | 202 | 207 | ||||||
FNMA TBA | ||||||||
3.500%, 02/15/30 | 850 | 902 | ||||||
3.000%, 02/15/30 | 4,200 | 4,416 | ||||||
GNMA | ||||||||
2.500%, 02/01/15 (A) | 144 | 153 | ||||||
GNMA, Ser 2009-10, Cl JA | ||||||||
4.500%, 03/16/34 | 100 | 104 | ||||||
GNMA, Ser 2009-104, Cl NJ | ||||||||
4.250%, 07/20/36 | 39 | 40 | ||||||
GNMA, Ser 2009-113, Cl MJ | ||||||||
4.000%, 03/16/23 | 323 | 334 | ||||||
GNMA, Ser 2010-86, Cl PG | ||||||||
3.000%, 01/20/36 | 141 | 143 | ||||||
GNMA, Ser 2011-106, Cl ME | ||||||||
3.000%, 06/20/38 | 369 | 376 | ||||||
GNMA, Ser 2011-110, Cl A | ||||||||
2.237%, 03/16/33 | 243 | 244 | ||||||
Mortgage-Linked Amortizing Notes, | ||||||||
Ser 2012-1, Cl A10 | ||||||||
2.060%, 01/15/22 | 72 | 74 | ||||||
NCUA Guaranteed Notes, | ||||||||
0.618%, 02/04/15 (A) | 634 | 638 | ||||||
NCUA Guaranteed Notes, | ||||||||
1.840%, 10/07/20 | 14 | 14 | ||||||
NCUA Guaranteed Notes, | ||||||||
0.527%, 02/06/15 (A) | 202 | 202 | ||||||
NCUA Guaranteed Notes, | ||||||||
0.618%, 02/04/15 (A) | 491 | 494 | ||||||
| SEI Daily Income Trust / Annual Report / January 31, 2015 | 37 |
SCHEDULE OF INVESTMENTS
Ultra Short Duration Bond Fund (Continued)
January 31, 2015
| Description | Face Amount ($ Thousands) | Value ($ Thousands) | ||||||
NCUA Guaranteed Notes, | ||||||||
0.557%, 02/09/15 (A) | $ | 271 | $ | 272 | ||||
NCUA Guaranteed Notes, | ||||||||
0.567%, 02/09/15 (A) | 627 | 630 | ||||||
NCUA Guaranteed Notes, | ||||||||
0.548%, 02/05/15 (A) | 356 | 357 | ||||||
NCUA Guaranteed Notes, | ||||||||
0.548%, 02/07/15 (A) | 188 | 188 | ||||||
|
| |||||||
| 14,113 | ||||||||
|
| |||||||
Non-Agency Mortgage-Backed Obligations — 12.7% |
| |||||||
BAMLL Commercial Mortgage Securities Trust, | ||||||||
0.961%, 02/15/15 (A) (B) | 150 | 150 | ||||||
Banc of America Merrill Lynch Commercial Mortgage, Ser 2, Cl A5 | ||||||||
4.857%, 07/10/43 (A) | 246 | 247 | ||||||
Banc of America Merrill Lynch Commercial Mortgage, Ser 4, Cl A5A | ||||||||
4.933%, 07/10/45 | 626 | 631 | ||||||
Banc of America Mortgage Securities, | ||||||||
2.637%, 02/01/15 (A) (B) | 320 | 296 | ||||||
Banc of America Mortgage Securities, | ||||||||
2.699%, 02/01/15 (A) (B) | 40 | 37 | ||||||
Bear Stearns Adjustable Rate Mortgage Trust, | ||||||||
2.551%, 02/01/15 (A) (B) | 102 | 80 | ||||||
Bear Stearns Adjustable Rate Mortgage Trust, | ||||||||
2.617%, 02/01/15 (A) (B) | 140 | 129 | ||||||
Bear Stearns Adjustable Rate Mortgage Trust, | ||||||||
2.652%, 02/01/15 (A) (B) | 245 | 220 | ||||||
Bear Stearns Commercial Mortgage Securities Trust, | ||||||||
5.468%, 06/11/41 (A) | 6 | 6 | ||||||
Bear Stearns Commercial Mortgage Securities Trust, | ||||||||
5.405%, 12/11/40 (A) | 407 | 417 | ||||||
| Description | Face Amount ($ Thousands) | Value ($ Thousands) | ||||||
Bear Stearns Commercial Mortgage Securities Trust, | ||||||||
4.674%, 06/11/41 | $ | 384 | $ | 385 | ||||
Bear Stearns Commercial Mortgage Securities Trust, | ||||||||
4.871%, 09/11/42 | 72 | 73 | ||||||
Bear Stearns Commercial Mortgage Securities Trust, | ||||||||
4.933%, 02/01/15 (A) | 6 | 6 | ||||||
Bear Stearns Commercial Mortgage Securities Trust, | ||||||||
5.140%, 02/01/15 (A) | 427 | 434 | ||||||
Bear Stearns Commercial Mortgage Securities Trust, | ||||||||
5.540%, 09/11/41 | 278 | 292 | ||||||
Bear Stearns Commercial Mortgage Securities Trust, | ||||||||
5.435%, 02/01/15 (A) | 441 | 455 | ||||||
Bear Stearns Commercial Mortgage Securities Trust, Ser PWR7, Cl A3 | ||||||||
5.116%, 02/11/41 (A) | 49 | 49 | ||||||
CD Mortgage Trust, | ||||||||
5.303%, 02/01/15 (A) | 377 | 387 | ||||||
CD Mortgage Trust, | ||||||||
5.322%, 12/11/49 | 575 | 609 | ||||||
CD Mortgage Trust, | ||||||||
5.886%, 02/01/15 (A) | 435 | 476 | ||||||
Citigroup Commercial Mortgage Trust, | ||||||||
6.150%, 02/01/15 (A) | 393 | 432 | ||||||
Citigroup Commercial Mortgage Trust, | ||||||||
0.685%, 09/10/45 | 246 | 246 | ||||||
Citigroup Commercial Mortgage Trust, | ||||||||
0.911%, 02/15/15 (A) (B) | 450 | 449 | ||||||
Citigroup Mortgage Loan Trust, | ||||||||
2.577%, 02/01/15 (A) (B) | 56 | 56 | ||||||
Citigroup Mortgage Loan Trust, | ||||||||
2.696%, 02/01/15 (A) (B) | 220 | 200 | ||||||
Commercial Mortgage Pass-Through Certificates, Ser 2010-C1, Cl A1 | ||||||||
3.156%, 07/10/46 (B) | 368 | 371 | ||||||
| 38 | SEI Daily Income Trust / Annual Report / January 31, 2015 |
| Description | Face Amount ($ Thousands) | Value ($ Thousands) | ||||||
Commercial Mortgage Pass-Through Certificates, Ser 2012-CR2, Cl A1 | ||||||||
0.824%, 08/15/45 | $ | 186 | $ | 186 | ||||
Commercial Mortgage Pass-Through Certificates, Ser 2012-CR3, Cl A1 | ||||||||
0.666%, 11/15/45 | 173 | 173 | ||||||
Commercial Mortgage Pass-Through Certificates, Ser 2012-CR4, Cl A1 | ||||||||
0.704%, 10/15/45 | 229 | 228 | ||||||
Commercial Mortgage Pass-Through Certificates, Ser 2013-CR10, Cl A1 | ||||||||
1.278%, 08/10/46 | 213 | 213 | ||||||
Commercial Mortgage Pass-Through Certificates, Ser CR9, Cl A1 | ||||||||
1.344%, 07/10/45 | 916 | 922 | ||||||
Commercial Mortgage Trust, | ||||||||
1.156%, 12/10/44 | 35 | 35 | ||||||
Commercial Mortgage Trust, | ||||||||
0.967%, 02/15/15 (A) (B) | 845 | 842 | ||||||
Countrywide Home Loans, | ||||||||
0.708%, 02/25/15 (A) (B) | 30 | 28 | ||||||
Countrywide Home Loans, | ||||||||
2.503%, 02/01/15 (A) (B) | 185 | 153 | ||||||
Credit Suisse Commercial Mortgage Trust, Ser C4, Cl A3 | ||||||||
5.467%, 09/15/39 | 372 | 391 | ||||||
DBUBS Mortgage Trust, | ||||||||
3.742%, 11/10/46 (B) | 758 | 775 | ||||||
FDIC Structured Sale Guaranteed Notes, Ser 2010-S1, Cl 1A | ||||||||
0.720%, 02/01/15 (A) (B) | 159 | 159 | ||||||
FDIC Trust, Ser 2012-C1, Cl A | ||||||||
0.841%, 02/01/15 (A) (B) | 84 | 84 | ||||||
FHLMC Structured Agency Credit Risk Debt Notes, | ||||||||
1.020%, 02/25/15 (A) (B) | 432 | 430 | ||||||
FNMA Connecticut Avenue Securities, Ser 2014-C02, Cl 2M1 | ||||||||
1.118%, 02/25/15 (A) (B) | 210 | 207 | ||||||
FNMA Connecticut Avenue Securities, Ser 2014-C02, Cl 1M1 | ||||||||
1.118%, 02/25/15 (A) (B) | 262 | 257 | ||||||
FNMA Connecticut Avenue Securities, | ||||||||
1.368%, 02/25/15 (A) (B) | 573 | 567 | ||||||
| Description | Face Amount ($ Thousands) | Value ($ Thousands) | ||||||
GE Capital Commercial Mortgage, | ||||||||
4.974%, 02/01/15 (A) | $ | 500 | $ | 504 | ||||
GE Capital Commercial Mortgage, | ||||||||
5.313%, 02/01/15 (A) | 1,070 | 1,086 | ||||||
GMAC Mortgage Loan Trust, | ||||||||
2.935%, 02/01/15 (A) (B) | 229 | 213 | ||||||
Granite Master Issuer PLC, | ||||||||
0.248%, 02/22/15 (A) (B) | 578 | 574 | ||||||
Granite Master Issuer PLC, | ||||||||
0.248%, 02/20/15 (A) (B) | 544 | 541 | ||||||
Granite Master Issuer PLC, | ||||||||
0.348%, 02/20/15 (A) (B) | 70 | 70 | ||||||
Granite Master Issuer PLC, | ||||||||
0.368%, 02/20/15 (A) (B) | 84 | 84 | ||||||
Granite Master Issuer PLC, | ||||||||
0.308%, 02/20/15 (A) (B) | 74 | 73 | ||||||
GS Mortgage Securities II, | ||||||||
3.849%, 12/10/43 (B) | 721 | 743 | ||||||
GS Mortgage Securities II, | ||||||||
0.662%, 11/10/45 | 194 | 193 | ||||||
GS Mortgage Securities II, | ||||||||
1.206%, 07/10/46 | 134 | 134 | ||||||
GS Mortgage Securities II, | ||||||||
1.217%, 08/10/46 | 201 | 202 | ||||||
GS Mortgage Securities Trust, | ||||||||
1.468%, 08/10/44 | 55 | 56 | ||||||
GSR Mortgage Loan Trust, | ||||||||
2.655%, 02/01/15 (A) (B) | 283 | 258 | ||||||
GSR Mortgage Loan Trust, | ||||||||
2.891%, 02/01/15 (A) (B) | 316 | 293 | ||||||
GSR Mortgage Loan Trust, | ||||||||
2.703%, 02/01/15 (A) (B) | 259 | 213 | ||||||
Hilton USA Trust, Ser HLF, Cl AFL | ||||||||
1.172%, 04/14/15 (A) (B) | 222 | 222 | ||||||
Hilton USA Trust, Ser ORL, Cl A | ||||||||
1.061%, 02/15/15 (A) (B) | 1,000 | 993 | ||||||
| SEI Daily Income Trust / Annual Report / January 31, 2015 | 39 |
SCHEDULE OF INVESTMENTS
Ultra Short Duration Bond Fund (Continued)
January 31, 2015
| Description | Face Amount ($ Thousands) | Value ($ Thousands) | ||||||
Impac CMB Trust, Ser 2004-9, | ||||||||
0.928%, 02/25/15 (A)(B) | $ | 72 | $ | 66 | ||||
Impac CMB Trust, Ser 2005-2, | ||||||||
0.688%, 02/03/15 (A) (B) | 81 | 74 | ||||||
Impac CMB Trust, Ser 2005-3, Cl A1 | ||||||||
0.648%, 02/25/15 (A) (B) | 75 | 67 | ||||||
Impac CMB Trust, Ser 2005-5, Cl A1 | ||||||||
0.808%, 02/25/15 (A) (B) | 60 | 54 | ||||||
Impac CMB Trust, Ser 2005-8, Cl 1A | ||||||||
0.428%, 02/25/15 (A) (B) | 198 | 171 | ||||||
JPMorgan Chase Commercial Mortgage Securities Trust, | ||||||||
4.936%, 02/01/15 (A) | 1,017 | 1,025 | ||||||
JPMorgan Chase Commercial Mortgage Securities Trust, | ||||||||
4.918%, 02/01/15 (A) | 529 | 535 | ||||||
JPMorgan Chase Commercial Mortgage Securities Trust, | ||||||||
5.875%, 02/01/15 (A) | 180 | 187 | ||||||
JPMorgan Chase Commercial Mortgage Securities Trust, | ||||||||
1.067%, 02/15/15 (A) (B) | 875 | 871 | ||||||
JPMorgan Chase Commercial Mortgage Securities Trust, | ||||||||
1.361%, 02/01/15 (A) (B) | 375 | 374 | ||||||
JPMorgan Chase Commercial Mortgage Securities Trust, | ||||||||
5.335%, 08/12/37 (A) | 42 | 42 | ||||||
JPMorgan Chase Commercial Mortgage Securities, | ||||||||
3.853%, 06/15/43 (B) | 213 | 214 | ||||||
JPMorgan Chase Commercial Mortgage Securities, | ||||||||
0.705%, 10/15/45 | 79 | 79 | ||||||
JPMorgan Chase Commercial Mortgage Securities, | ||||||||
1.303%, 01/15/46 | 181 | 182 | ||||||
JPMorgan Mortgage Trust, | ||||||||
2.527%, 02/01/15 (A) (B) | 143 | 140 | ||||||
JPMorgan Mortgage Trust, | ||||||||
2.627%, 02/01/15 (A) (B) | 168 | 144 | ||||||
| Description | Face Amount ($ Thousands) | Value ($ Thousands) | ||||||
LB-UBS Commercial Mortgage Trust, Ser 2005-C7, Cl A4 | ||||||||
5.197%, 11/15/30 (A) | $ | 224 | $ | 226 | ||||
Merrill Lynch Mortgage Investors, | ||||||||
0.438%, 02/25/15 (A) (B) | 77 | 73 | ||||||
Merrill Lynch Mortgage Trust, | ||||||||
5.291%, 11/01/15 (A) | 419 | 429 | ||||||
Merrill Lynch Mortgage-Backed Securities Trust, | ||||||||
2.805%, 06/25/37 (B) | 285 | 238 | ||||||
ML-CFC Commercial Mortgage Trust, Ser 2007-5, Cl A4 | ||||||||
5.378%, 08/12/48 | 115 | 122 | ||||||
Morgan Stanley Bank of America Merrill Lynch Trust, | ||||||||
0.664%, 11/15/45 | 109 | 108 | ||||||
Morgan Stanley Capital I Trust, | ||||||||
4.989%, 08/13/42 | 93 | 93 | ||||||
Morgan Stanley Capital I Trust, | ||||||||
2.602%, 09/15/47 (B) | 234 | 235 | ||||||
Morgan Stanley Capital I Trust, | ||||||||
1.085%, 03/15/45 | 242 | 243 | ||||||
Morgan Stanley Capital I Trust, | ||||||||
4.890%, 06/12/47 | 328 | 330 | ||||||
Morgan Stanley Re-Remic Trust, | ||||||||
1.000%, 03/27/51 (B) | 320 | 320 | ||||||
MortgageIT Trust, Ser 2005-5, Cl A1 | ||||||||
0.428%, 02/25/15 (A)(B) | 277 | 254 | ||||||
Opteum Mortgage Acceptance Asset- Backed Pass-Through Certificates, Ser 2005-2, Cl AII1 | ||||||||
0.428%, 02/25/15 (A) (B) | 401 | 401 | ||||||
Paragon Mortgages PLC, | ||||||||
0.452%, 02/15/15 (A) (B) | 116 | 109 | ||||||
Paragon Mortgages PLC, | ||||||||
0.351%, 04/19/15 (B) | 279 | 259 | ||||||
Residential Funding Mortgage Securities I, Ser 2007-SA3, Cl 2A1 | ||||||||
3.797%, 07/27/37 (B) | 217 | 182 | ||||||
| 40 | SEI Daily Income Trust / Annual Report / January 31, 2015 |
| Description | Face Amount ($ Thousands) | Value ($ Thousands) | ||||||
Sequoia Mortgage Trust, | ||||||||
0.436%, 02/20/15 (A) (B) | $ | 33 | $ | 32 | ||||
Silverstone Master Issuer PLC, | ||||||||
1.806%, 04/22/15 (A) (B) | 100 | 101 | ||||||
Springleaf Mortgage Loan Trust, | ||||||||
1.270%, 06/25/58 (A) (B) | 251 | 250 | ||||||
UBS-Barclays Commercial Mortgage Trust, Ser 2012-C3, Cl A1 | ||||||||
0.726%, 08/10/49 | 281 | 279 | ||||||
UBS-Citigroup Commercial Mortgage Trust, Ser 2011-C1, Cl A1 | ||||||||
1.524%, 01/10/45 | 407 | 409 | ||||||
Wachovia Bank Commercial Mortgage Trust, | ||||||||
5.242%, 02/01/15 (A) | 281 | 285 | ||||||
Wachovia Bank Commercial Mortgage Trust, | ||||||||
5.270%, 02/01/15 (A) | 270 | 275 | ||||||
WaMu Mortgage Pass-Through Certificates, Ser 2006-AR2, Cl 1A1 | ||||||||
2.317%, 02/01/15 (A) (B) | 307 | 284 | ||||||
Wells Fargo Commercial Mortgage Trust, Ser 2012-LC5, Cl A1 | ||||||||
0.687%, 10/15/45 | 281 | 281 | ||||||
Wells Fargo Mortgage-Backed Securities Trust, Ser 2004-BB, | ||||||||
2.616%, 02/01/15 (A) (B) | 133 | 131 | ||||||
Wells Fargo Mortgage-Backed Securities Trust, | ||||||||
2.609%, 07/25/36 (B) | 260 | 254 | ||||||
Wells Fargo Mortgage-Backed Securities Trust, | ||||||||
2.506%, 09/25/36 (B) | 153 | 142 | ||||||
WFRBS Commercial Mortgage Trust, Ser 2011-C2, Cl A1 | ||||||||
2.501%, 02/15/44 (B) | 274 | 276 | ||||||
WFRBS Commercial Mortgage Trust, Ser 2011-C2, Cl A2 | ||||||||
3.791%, 02/15/44 (B) | 920 | 937 | ||||||
WFRBS Commercial Mortgage Trust, Ser 2011-C3, Cl A1 | ||||||||
1.988%, 03/15/44 (B) | 215 | 216 | ||||||
WFRBS Commercial Mortgage Trust, Ser 2012-C10, Cl A1 | ||||||||
0.734%, 12/15/45 | 607 | 606 | ||||||
| Description | Face Amount ($ Thousands) | Value ($ Thousands) | ||||||
WFRBS Commercial Mortgage Trust, Ser 2012-C6, Cl A1 | ||||||||
1.081%, 04/15/45 | $ | 140 | $ | 140 | ||||
WFRBS Commercial Mortgage Trust, Ser 2012-C9, Cl A1 | ||||||||
0.673%, 11/15/45 | 351 | 350 | ||||||
WFRBS Commercial Mortgage Trust, Ser C15, Cl A1 | ||||||||
1.264%, 08/15/46 | 147 | 148 | ||||||
|
| |||||||
| 32,478 | ||||||||
|
| |||||||
Total Mortgage-Backed Securities | 46,591 | |||||||
|
| |||||||
MUNICIPAL BONDS — 4.4% |
| |||||||
California — 0.4% | ||||||||
Orange County, Ser A, RB | ||||||||
0.580%, 11/02/15 | 445 | 445 | ||||||
University of California, Ser Y-1, RB | ||||||||
0.671%, 02/01/15 (A) | 490 | 490 | ||||||
|
| |||||||
| 935 | ||||||||
|
| |||||||
Florida — 0.2% | ||||||||
Florida, Hurricane Catastrophe Fund Finance, Ser A, RB | ||||||||
1.298%, 07/01/16 | 620 | 625 | ||||||
|
| |||||||
Hawaii — 0.2% | ||||||||
Hawaii State, Ser ES, GO | ||||||||
0.731%, 08/01/16 | 655 | 656 | ||||||
|
| |||||||
Illinois — 0.2% | ||||||||
City of Chicago, Midway Airport Revenue, Ser C, RB | ||||||||
1.320%, 01/01/16 | 270 | 270 | ||||||
Illinois State, Ser B, GO | ||||||||
1.780%, 04/01/16 | 300 | 301 | ||||||
|
| |||||||
| 571 | ||||||||
|
| |||||||
Kentucky — 0.2% | ||||||||
Louisville, Regional Airport Authority, Ser C, RB | ||||||||
0.769%, 07/01/16 | 410 | 410 | ||||||
|
| |||||||
Maine — 0.2% | ||||||||
Maine, Municipal Bond Bank, RB | ||||||||
1.068%, 06/01/15 | 525 | 526 | ||||||
|
| |||||||
New Jersey — 1.8% | ||||||||
New Jersey State, Economic Development Authority, Ser 00, RB | ||||||||
1.059%, 03/01/16 | 500 | 499 | ||||||
| SEI Daily Income Trust / Annual Report / January 31, 2015 | 41 |
SCHEDULE OF INVESTMENTS
Ultra Short Duration Bond Fund (Continued)
January 31, 2015
| Description | Face Amount ($ Thousands) | Value ($ Thousands) | ||||||
New Jersey State, Economic Development Authority, Ser Q, RB | ||||||||
1.096%, 06/15/16 | $ | 2,675 | $ | 2,671 | ||||
New Jersey State, Transportation Trust Fund Authority, Ser B, RB | ||||||||
1.087%, 12/15/16 | 1,250 | 1,244 | ||||||
New Jersey State, Turnpike Authority, Ser B, RB | ||||||||
4.252%, 01/01/16 | 175 | 176 | ||||||
|
| |||||||
| 4,590 | ||||||||
|
| |||||||
Ohio — 0.5% | ||||||||
Hamilton County, Ohio Sewer System Revenue, RB | ||||||||
0.803%, 12/01/15 | 1,200 | 1,203 | ||||||
|
| |||||||
Texas — 0.5% | ||||||||
City of El Paso, Harris County Toll Road Authority, GO | ||||||||
1.049%, 08/15/16 | 455 | 455 | ||||||
Harris County, Toll Road Authority, RB | ||||||||
2.440%, 08/15/15 | 735 | 742 | ||||||
|
| |||||||
| 1,197 | ||||||||
|
| |||||||
Utah — 0.2% | ||||||||
Intermountain Power Agency, | ||||||||
0.785%, 07/01/16 | 610 | 608 | ||||||
|
| |||||||
Total Municipal Bonds | 11,321 | |||||||
|
| |||||||
U.S. TREASURY OBLIGATIONS (A) — 1.3% |
| |||||||
U.S. Treasury Notes | ||||||||
0.089%, 02/03/15 | 1,310 | 1,310 | ||||||
0.065%, 02/06/15 | 2,000 | 2,000 | ||||||
|
| |||||||
Total U.S. Treasury Obligations | 3,310 | |||||||
|
| |||||||
U.S. GOVERNMENT AGENCY OBLIGATIONS — 1.5% |
| |||||||
FHLB | ||||||||
1.625%, 04/13/17 | 950 | 959 | ||||||
FHLMC | ||||||||
1.250%, 12/05/17 | 700 | 701 | ||||||
1.200%, 08/21/17 | 800 | 800 | ||||||
0.800%, 11/18/16 | 1,400 | 1,401 | ||||||
|
| |||||||
Total U.S. Government Agency Obligations |
| 3,861 | ||||||
|
| |||||||
| Description | Face Amount ($ Thousands) | Value ($ Thousands) | ||||||
REPURCHASE AGREEMENT (C) — 0.9% |
| |||||||
BNP Paribas | $ | 2,300 | $ | 2,300 | ||||
|
| |||||||
Total Repurchase Agreement | 2,300 | |||||||
|
| |||||||
Total Investments — 101.8% | $ | 260,307 | ||||||
|
| |||||||
A list of the open futures contracts held by the Fund at January 31, 2015, is as follows:
| Type of Contract | Number of Contracts Long | Expiration Date | Unrealized Appreciation (Depreciation) ($Thousands) | |||||||||
U.S. 10-Year Treasury Note | (29 | ) | Mar-2015 | $ | (138 | ) | ||||||
U.S. 2-Year Treasury Note | (8 | ) | Mar-2015 | (7 | ) | |||||||
U.S. 5-Year Treasury Note | 12 | Mar-2015 | 28 | |||||||||
U.S. Long Treasury Bond | (3 | ) | Mar-2015 | (31 | ) | |||||||
|
| |||||||||||
| $ | (148 | ) | ||||||||||
|
| |||||||||||
For the year ended January 31, 2015, the total amount of all open futures contracts, as presented in the table above, are representative of the volume of activity for this derivative type during the year.
| † | Real Estate Investment Trust. |
Percentages are based on Net Assets of $255,614 ($ Thousands).
| (A) | Floating Rate Instrument. The rate reflected on the Schedule of Investments is the rate in effect on January 31, 2015. The demand and interest rate reset features give this security a shorter effective maturity date. |
| (B) | Securities sold within terms of a private placement memorandum, exempt from registration under Section 144A of the Securities Act of 1933, as amended, and may be sold only to dealers in that program or other “accredited investors.” These securities have been determined to be liquid under guidelines established by the Board of Trustees. |
| (C) | Tri-Party Repurchase Agreement. |
CDO — Collateralized Debt Obligation
Cl — Class
CLO — Collateralized Loan Obligation
FDIC — Federal Deposit Insurance Corporation
FHLB — Federal Home Loan Bank
FHLMC — Federal Home Loan Mortgage Corporation
FNMA — Federal National Mortgage Association
FMAC — Financial Management Advisory Committee
GNMA — Government National Mortgage Association
GO — General Obligation
LLC — Limited Liability Company
MTN — Medium Term Note
NCUA — National Credit Union Association
PLC — Public Limited Company
RB — Revenue Bond
REMIC — Real Estate Mortgage Investment Conduit
Ser — Series
TBA — To Be Announced
| 42 | SEI Daily Income Trust / Annual Report / January 31, 2015 |
The following is a summary of the inputs used as of January 31, 2015 in valuing the Fund’s investments and other financial instruments carried at value ($ Thousands):
| Investments in Securities | Level 1 | Level 2 | Level 3 | Total | ||||||||||||
Corporate Obligations | $ | — | $ | 124,862 | $ | — | $ | 124,862 | ||||||||
Asset-Backed Securities | — | 68,062 | — | 68,062 | ||||||||||||
Mortgage-Backed Securities | — | 46,591 | — | 46,591 | ||||||||||||
Municipal Bonds | — | 11,321 | — | 11,321 | ||||||||||||
U.S. Government Agency Obligations | — | 3,861 | — | 3,861 | ||||||||||||
Repurchase Agreement | — | 2,300 | — | 2,300 | ||||||||||||
U.S. Treasury Obligations | — | 3,310 | — | 3,310 | ||||||||||||
|
|
|
|
|
|
|
| |||||||||
Total Investments in Securities | $ | — | $ | 260,307 | $ | — | $ | 260,307 | ||||||||
|
|
|
|
|
|
|
| |||||||||
| Other Financial Instruments | Level 1 | Level 2 | Level 3 | Total | ||||||||||||
Futures Contracts * | ||||||||||||||||
Unrealized Appreciation | $ | 28 | $ | — | $ | — | $ | 28 | ||||||||
Unrealized Depreciation | (176 | ) | — | — | (176 | ) | ||||||||||
|
|
|
|
|
|
|
| |||||||||
Total Other Financial Instruments | $ | (148 | ) | $ | — | $ | — | $ | (148 | ) | ||||||
|
|
|
|
|
|
|
| |||||||||
| * | Futures Contracts are valued at the net unrealized appreciation/(depreciation) on the instruments. |
For the year ended January 31, 2015, there were no transfers between Level 1 and Level 2 assets and liabilities.
For more information on valuation inputs, see Note 2 — Significant Accounting Policies in Notes to Financial Statements.
Amounts designated as “—” are $0 or have been rounded to $0.
The accompanying notes are an integral part of the financial statements
| SEI Daily Income Trust / Annual Report / January 31, 2015 | 43 |
SCHEDULE OF INVESTMENTS
Short-Duration Government Fund
January 31, 2015
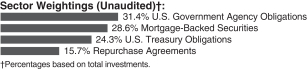
| Description | Face Amount ($ Thousands) | Value ($ Thousands) | ||||||
U.S. GOVERNMENT AGENCY OBLIGATIONS — 32.6% |
| |||||||
FHLMC | ||||||||
0.875%, 02/22/17 | $ | 70,815 | $ | 71,232 | ||||
FNMA | ||||||||
1.250%, 09/28/16 | 65,475 | 66,343 | ||||||
1.250%, 01/30/17 | 60,125 | 60,937 | ||||||
0.875%, 05/21/18 | 35,400 | 35,273 | ||||||
|
| |||||||
Total U.S. Government Agency Obligations | 233,785 | |||||||
|
| |||||||
MORTGAGE-BACKED SECURITIES — 29.8% |
| |||||||
Agency Mortgage-Backed Obligations — 29.8% |
| |||||||
FHLMC | ||||||||
4.879%, 05/19/17 | 5,000 | 5,402 | ||||||
4.500%, 02/01/22 to 06/01/26 | 10,146 | 10,946 | ||||||
2.564%, 02/01/15 (A) | 5,117 | 5,329 | ||||||
2.460%, 02/01/15 (A) | 28 | 29 | ||||||
2.458%, 02/01/15 (A) | 2 | 2 | ||||||
2.447%, 02/01/15 (A) | 40 | 42 | ||||||
2.389%, 02/01/15 (A) | 7 | 7 | ||||||
2.384%, 02/01/15 (A) | 11 | 11 | ||||||
2.375%, 02/01/15 (A) | 13 | 13 | ||||||
2.329%, 02/01/15 (A) | 38 | 40 | ||||||
2.328%, 02/01/15 (A) | 1,079 | 1,135 | ||||||
2.310%, 02/01/15 (A) | 20 | 20 | ||||||
2.302%, 02/01/15 (A) | 2 | 2 | ||||||
2.284%, 02/01/15 (A) | 44 | 46 | ||||||
2.260%, 02/01/15 (A) | 11 | 11 | ||||||
2.250%, 02/01/15 (A) | 9 | 9 | ||||||
2.235%, 02/01/15 (A) | 59 | 62 | ||||||
2.150%, 02/01/15 (A) | 11 | 12 | ||||||
2.125%, 02/01/15 (A) | 23 | 23 | ||||||
2.000%, 02/01/15 (A) | 3 | 3 | ||||||
1.875%, 02/01/15 (A) | 4 | 4 | ||||||
1.625%, 02/01/15 (A) | 6 | 6 | ||||||
FHLMC REMIC, Ser 2002-42, Cl A5 | ||||||||
7.500%, 02/25/42 | 497 | 586 | ||||||
FHLMC REMIC, Ser 2004-2864, Cl NV | ||||||||
4.500%, 08/15/15 | 289 | 291 | ||||||
FHLMC REMIC, Ser 2006-3148, Cl CF | ||||||||
0.561%, 02/15/15 (A) | 481 | 484 | ||||||
FHLMC REMIC, Ser 2010-3628, Cl PJ | ||||||||
4.500%, 01/15/40 | 5,380 | 5,835 | ||||||
| Description | Face Amount ($ Thousands) | Value ($ Thousands) | ||||||
FHLMC REMIC, Ser 3153, Cl FX | ||||||||
0.511%, 02/15/15 (A) | $ | 187 | $ | 188 | ||||
FHLMC, Ser K022, Cl A2 | ||||||||
2.355%, 07/25/22 | 1,600 | 1,638 | ||||||
FHLMC, Ser K710, Cl A2 | ||||||||
1.883%, 05/25/19 | 6,000 | 6,097 | ||||||
FHLMC, Ser KGRP, Cl A | ||||||||
0.534%, 02/25/15 (A) | 6,137 | 6,141 | ||||||
FNMA | ||||||||
7.000%, 06/01/37 | 15 | 17 | ||||||
6.500%, 05/01/26 to 09/01/36 | 461 | 533 | ||||||
6.000%, 02/01/23 to 09/01/24 | 4,861 | 5,429 | ||||||
5.500%, 06/01/16 to 12/01/25 | 1,272 | 1,401 | ||||||
5.300%, 07/01/19 | 849 | 919 | ||||||
5.250%, 08/01/24 | 1,309 | 1,597 | ||||||
5.090%, 11/01/15 | 3,830 | 3,944 | ||||||
5.000%, 03/01/19 to 04/01/41 | 4,156 | 4,637 | ||||||
4.771%, 11/01/15 | 6,324 | 6,388 | ||||||
4.500%, 04/01/26 to 10/01/31 | 5,854 | 6,364 | ||||||
4.070%, 04/01/19 | 1,193 | 1,299 | ||||||
4.000%, 05/01/26 to 08/01/26 | 4,135 | 4,409 | ||||||
3.890%, 01/01/24 | 1,146 | 1,287 | ||||||
3.840%, 08/01/21 | 1,334 | 1,482 | ||||||
3.800%, 01/01/23 | 1,975 | 2,208 | ||||||
3.750%, 06/01/22 | 1,260 | 1,399 | ||||||
3.500%, 11/01/21 | 1,596 | 1,740 | ||||||
3.470%, 11/01/20 | 168 | 183 | ||||||
3.400%, 03/01/22 | 3,749 | 4,094 | ||||||
3.270%, 05/01/21 | 500 | 538 | ||||||
3.260%, 12/01/20 | 591 | 641 | ||||||
3.250%, 04/01/21 to 11/01/21 | 2,695 | 2,907 | ||||||
3.050%, 10/01/20 | 59 | 63 | ||||||
2.990%, 10/01/17 | 3,252 | 3,404 | ||||||
2.830%, 05/01/21 | 456 | 480 | ||||||
2.720%, 05/01/21 | 2,165 | 2,264 | ||||||
2.515%, 10/01/22 | 700 | 723 | ||||||
2.400%, 10/01/22 | 483 | 496 | ||||||
2.360%, 06/01/19 | 1,540 | 1,595 | ||||||
2.350%, 10/01/22 | 1,484 | 1,519 | ||||||
2.341%, 11/01/15 (A) | 296 | 310 | ||||||
2.310%, 10/01/22 | 2,320 | 2,368 | ||||||
2.275%, 11/01/15 (A) | 19 | 20 | ||||||
2.250%, 10/01/22 to 10/01/22 | 5,366 | 5,457 | ||||||
2.220%, 10/01/22 | 2,305 | 2,350 | ||||||
2.178%, 02/01/15 (A) | 479 | 502 | ||||||
2.103%, 02/01/15 (A) | 37 | 38 | ||||||
2.067%, 02/01/15 (A) | 280 | 284 | ||||||
2.035%, 02/01/15 (A) | 194 | 205 | ||||||
1.959%, 02/01/15 (A) | 95 | 98 | ||||||
FNMA REMIC, Ser 1992-61, Cl FA | ||||||||
0.820%, 11/25/15 (A) | 66 | 67 | ||||||
FNMA REMIC, Ser 1993-32, Cl H | ||||||||
6.000%, 03/25/23 | 25 | 27 | ||||||
| 44 | SEI Daily Income Trust / Annual Report / January 31, 2015 |
| Description | Face Amount ($ Thousands) | Value ($ Thousands) | ||||||
FNMA REMIC, Ser 1993-5, Cl Z | ||||||||
6.500%, 02/25/23 | $ | 13 | $ | 15 | ||||
FNMA REMIC, Ser 1994-77, Cl FB | ||||||||
1.670%, 02/25/15 (A) | 5 | 5 | ||||||
FNMA REMIC, Ser 2001-51, Cl QN | ||||||||
6.000%, 10/25/16 | 19 | 20 | ||||||
FNMA REMIC, Ser 2002-3, Cl PG | ||||||||
5.500%, 02/25/17 | 100 | 103 | ||||||
FNMA REMIC, Ser 2002-53, Cl FK | ||||||||
0.570%, 02/25/15 (A) | 97 | 98 | ||||||
FNMA REMIC, Ser 2003-76, Cl CA | ||||||||
3.750%, 07/25/33 | 136 | 141 | ||||||
FNMA REMIC, Ser 2006-76, Cl QF | ||||||||
0.570%, 02/25/15 (A) | 915 | 918 | ||||||
FNMA REMIC, Ser 2006-79, Cl DF | ||||||||
0.520%, 02/25/15 (A) | 771 | 775 | ||||||
FNMA REMIC, Ser 2007-47, Cl DA | ||||||||
5.600%, 05/25/37 | 962 | 1,048 | ||||||
FNMA REMIC, Ser 2010-149, Cl VA | ||||||||
4.500%, 02/25/22 | 7,036 | 7,527 | ||||||
FNMA REMIC, Ser 2010-4, Cl PL | ||||||||
4.500%, 02/25/40 | 4,135 | 4,516 | ||||||
FNMA REMIC, Ser 2013-75, Cl FE | ||||||||
0.418%, 02/25/43 (A) | 5,427 | 5,426 | ||||||
FNMA, Ser 2010-M5, Cl A2 | ||||||||
2.806%, 07/25/20 | 11,072 | 11,405 | ||||||
FNMA TBA | ||||||||
5.000%, 02/01/38 | 900 | 995 | ||||||
4.500%, 02/01/34 | 18,100 | 19,643 | ||||||
3.000%, 02/15/45 | 7,400 | 7,652 | ||||||
GNMA | ||||||||
6.500%, 04/15/17 to 02/20/39 | 660 | 778 | ||||||
6.000%, 06/15/16 to 06/15/41 | 15,451 | 17,667 | ||||||
5.500%, 10/15/34 to 02/15/41 | 5,338 | 5,956 | ||||||
5.000%, 09/15/39 to 04/15/41 | 3,622 | 4,023 | ||||||
4.000%, 07/15/41 to 04/15/43 | 456 | 490 | ||||||
GNMA TBA | ||||||||
6.000%, 02/15/45 | 1,600 | 1,806 | ||||||
5.500%, 02/15/45 | 500 | 558 | ||||||
4.500%, 02/15/45 | 1,300 | 1,419 | ||||||
3.500%, 02/15/45 | 200 | 212 | ||||||
NCUA Guaranteed Notes, Ser 2010-R1, Cl 2A | ||||||||
1.840%, 10/07/20 | 150 | 151 | ||||||
|
| |||||||
Total Mortgage-Backed Securities |
| 213,447 | ||||||
|
| |||||||
| Description | Face Amount ($ Thousands) | Value ($ Thousands) | ||||||
U.S. TREASURY OBLIGATIONS — 25.3% |
| |||||||
U.S. Treasury Notes | ||||||||
4.500%, 02/15/16 | $ | 76,300 | $ | 79,662 | ||||
0.875%, 04/30/17 (C) | 92,865 | 93,547 | ||||||
1.500%, 01/31/19 | 7,475 | 7,609 | ||||||
|
| |||||||
Total U.S. Treasury Obligations |
| 180,818 | ||||||
|
| |||||||
REPURCHASE AGREEMENTS (B) — 16.3% |
| |||||||
BNP Paribas | 80,100 | 80,100 | ||||||
Deutsche Bank | 36,900 | 36,900 | ||||||
|
| |||||||
Total Repurchase Agreements | 117,000 | |||||||
|
| |||||||
Total Investments — 104.0% | $ | 745,050 | ||||||
|
| |||||||
A list of the open futures contracts held by the Fund at January 31, 2015, is as follows:
| Type of Contract | Number of Contracts Long | Expiration Date | Unrealized Appreciation (Depreciation) ($ Thousands) | |||||||||
U.S. 10-Year Treasury Note | 231 | Mar-2015 | $ | 647 | ||||||||
U.S. 2-Year Treasury Note | 240 | Mar-2015 | 202 | |||||||||
U.S. 5-Year Treasury Note | (499 | ) | Mar-2015 | (1,185 | ) | |||||||
U.S. Long Treasury Bond | (39 | ) | Mar-2015 | 19 | ||||||||
|
| |||||||||||
| $ | (317 | ) | ||||||||||
|
| |||||||||||
For the year ended January 31, 2015, the total amount of all open futures contracts, as presented in the table above, are representative of the volume of activity for this derivative type during the year.
Percentages are based on Net Assets of $716,118 ($ Thousands).
| (A) | Floating Rate Instrument. The rate reflected on the Schedule of Investments is the rate in effect on January 31, 2015. The demand and interest rate reset features give this security a shorter effective maturity date. |
| SEI Daily Income Trust / Annual Report / January 31, 2015 | 45 |
SCHEDULE OF INVESTMENTS
Short-Duration Government Fund (Concluded)
January 31, 2015
| (B) | Tri-Party Repurchase Agreement. |
| (C) | Security, or portion thereof, has been pledged as collateral on open futures contracts. |
Cl — Class
FHLMC — Federal Home Loan Mortgage Corporation
FMAC — Financial Management Advisory Committee
FNMA — Federal National Mortgage Association
GNMA — Government National Mortgage Association
NCUA — National Credit Union Association
REMIC — Real Estate Mortgage Investment Conduit
Ser — Series
TBA — To Be Announced
The following is a summary of the inputs used as of January 31, 2015 in valuing the Fund’s investments and other financial instruments carried at value ($ Thousands):
| Investments in Securities | Level 1 | Level 2 | Level 3 | Total | ||||||||||||
U.S. Government Agency Obligations | $ | — | $ | 233,785 | $ | — | $ | 233,785 | ||||||||
Mortgage-Backed Securities | — | 213,447 | — | 213,447 | ||||||||||||
Repurchase Agreements | — | 117,000 | — | 117,000 | ||||||||||||
U.S. Treasury Obligations | — | 180,818 | — | 180,818 | ||||||||||||
|
|
|
|
|
|
|
| |||||||||
Total Investments in Securities | $ | — | $ | 745,050 | $ | — | $ | 745,050 | ||||||||
|
|
|
|
|
|
|
| |||||||||
| Other Financial Instruments | Level 1 | Level 2 | Level 3 | Total | ||||||||||||
Futures Contracts* | ||||||||||||||||
Unrealized Appreciation | $ | 868 | $ | — | $ | — | $ | 868 | ||||||||
Unrealized Depreciation | (1,185 | ) | — | — | (1,185 | ) | ||||||||||
|
|
|
|
|
|
|
| |||||||||
Total Other Financial Instruments | $ | (317 | ) | $ | — | $ | — | $ | (317 | ) | ||||||
|
|
|
|
|
|
|
| |||||||||
| * | Futures Contracts are valued at the net unrealized appreciation/(depreciation) on the instruments. |
For the year ended January 31, 2015, there were no transfers between Level 1 and Level 2 assets and liabilities. For the year ended January 31, 2015, there were no Level 3 securities.
For more information on valuation inputs, see Note — 2 — Significant Accounting Policies in Notes to Financial Statements.
Amounts designated as “—” are $0 or have been rounded to $0.
The accompanying notes are an integral part of the financial statements.
| 46 | SEI Daily Income Trust / Annual Report / January 31, 2015 |
SCHEDULE OF INVESTMENTS
Intermediate-Duration Government Fund
January 31, 2015
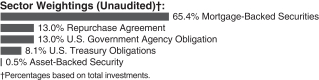
| Description | Face Amount ($ Thousands) | Value ($ Thousands) | ||||||
MORTGAGE-BACKED SECURITIES — 64.5% |
| |||||||
Agency Mortgage-Backed Obligations — 64.5% |
| |||||||
FHLMC | ||||||||
6.500%, 01/01/18 to 12/01/32 | $ | 89 | $ | 105 | ||||
6.000%, 09/01/24 | 306 | 345 | ||||||
5.500%, 06/01/19 to 12/01/20 | 144 | 153 | ||||||
2.564%, 02/01/15 (A) | 235 | 245 | ||||||
FHLMC REMIC, Ser 1990-165, Cl K | ||||||||
6.500%, 09/15/21 | 3 | 3 | ||||||
FHLMC REMIC, Ser 2004-2802, Cl PF | ||||||||
0.553%, 02/15/15 (A) | 136 | 137 | ||||||
FNMA | ||||||||
6.500%, 03/01/33 to 10/01/34 | 68 | 81 | ||||||
6.000%, 02/01/23 | 143 | 159 | ||||||
5.500%, 12/01/25 | 827 | 923 | ||||||
5.250%, 08/01/24 | 655 | 798 | ||||||
5.010%, 04/01/19 | 1,011 | 1,142 | ||||||
5.000%, 06/01/23 to 04/01/41 | 930 | 1,010 | ||||||
4.500%, 04/01/26 to 10/01/31 | 504 | 547 | ||||||
4.000%, 05/01/26 to 08/01/26 | 322 | 343 | ||||||
3.500%, 11/01/21 | 52 | 57 | ||||||
3.270%, 05/01/21 | 15 | 16 | ||||||
3.250%, 04/01/21 to 11/01/21 | 82 | 88 | ||||||
3.080%, 01/01/27 | 300 | 321 | ||||||
3.070%, 01/01/22 | 757 | 810 | ||||||
3.050%, 10/01/20 | 25 | 26 | ||||||
2.830%, 05/01/21 | 15 | 16 | ||||||
2.720%, 05/01/21 | 74 | 78 | ||||||
2.515%, 10/01/22 | 55 | 57 | ||||||
2.400%, 10/01/22 | 36 | 37 | ||||||
2.360%, 06/01/19 | 50 | 52 | ||||||
2.350%, 10/01/22 | 115 | 118 | ||||||
2.310%, 10/01/22 | 180 | 184 | ||||||
2.250%, 10/01/22 | 91 | 93 | ||||||
2.220%, 10/01/22 | 176 | 179 | ||||||
FNMA REMIC, Ser 2001-51, Cl QN | ||||||||
6.000%, 10/25/16 | 27 | 28 | ||||||
FNMA REMIC, Ser 2006-79, Cl DF | ||||||||
0.520%, 11/25/15 (A) | 136 | 137 | ||||||
FNMA REMIC, Ser 2007-47, Cl DA | ||||||||
5.600%, 05/25/37 | 167 | 182 | ||||||
FNMA REMIC, Ser 2010-149, Cl VA | ||||||||
4.500%, 02/25/22 | 720 | 770 | ||||||
FNMA REMIC, Ser 2013-75, Cl FE | ||||||||
0.418%, 02/25/43 | 153 | 153 | ||||||
| Description | Face Amount ($ Thousands) | Value ($ Thousands) | ||||||
FNMA, Ser 2010-M5, Cl A2 | ||||||||
2.806%, 07/25/20 | $ | 2,667 | $ | 2,747 | ||||
GNMA | ||||||||
8.750%, 07/20/17 to 07/20/17 | 3 | 3 | ||||||
8.500%, 11/20/16 to 08/20/17 | 7 | 7 | ||||||
7.500%, 11/15/25 to 03/15/27 | 11 | 13 | ||||||
6.000%, 09/15/24 | 320 | 361 | ||||||
5.000%, 05/15/40 to 06/15/40 | 45 | 51 | ||||||
4.500%, 06/15/41 | 190 | 211 | ||||||
4.000%, 07/15/41 | 229 | 246 | ||||||
NCUA Guaranteed Notes, | ||||||||
1.840%, 10/07/20 | 36 | 37 | ||||||
|
| |||||||
Total Mortgage-Backed Securities | 13,069 | |||||||
|
| |||||||
U.S GOVERNMENT AGENCY OBLIGATION — 12.8% |
| |||||||
FHLMC | ||||||||
0.875%, 03/07/18 | 2,600 | 2,597 | ||||||
|
| |||||||
Total U.S Government Agency Obligation | 2,597 | |||||||
|
| |||||||
U.S. TREASURY OBLIGATIONS — 8.0% |
| |||||||
U.S. Treasury Notes | ||||||||
1.500%, 01/31/19 | 1,275 | 1,298 | ||||||
2.375%, 08/15/24 | 300 | 319 | ||||||
|
| |||||||
Total U.S. Treasury Obligations | 1,617 | |||||||
|
| |||||||
ASSET-BACKED SECURITY — 0.5% |
| |||||||
Other — 0.5% | ||||||||
Small Business Administration, | ||||||||
4.940%, 08/10/15 | 94 | 96 | ||||||
|
| |||||||
Total Asset-Backed Security | 96 | |||||||
|
| |||||||
| SEI Daily Income Trust / Annual Report / January 31, 2015 | 47 |
SCHEDULE OF INVESTMENTS
Intermediate-Duration Government Fund (Concluded)
January 31, 2015
| Description | Face Amount ($ Thousands) | Value ($ Thousands) | ||||||
REPURCHASE AGREEMENT (B) — 12.8% |
| |||||||
BNP Paribas | $ | 2,600 | $ | 2,600 | ||||
|
| |||||||
Total Repurchase Agreement | 2,600 | |||||||
|
| |||||||
Total Investments — 98.6% | $ | 19,979 | ||||||
|
| |||||||
A list of the open futures contracts held by the Fund at January 31, 2015, is as follows:
| Type of Contract | Number of Contracts Long | Expiration Date | Unrealized Appreciation (Depreciation) ($ Thousands) | |||||||||
U.S. 10-Year Treasury Note | (7 | ) | Mar-2015 | $ | (27 | ) | ||||||
U.S. 2-Year Treasury Note | (18 | ) | Mar-2015 | (15 | ) | |||||||
U.S. 5-Year Treasury Note | 89 | Mar-2015 | 211 | |||||||||
U.S. Long Treasury Bond | (2 | ) | Mar-2015 | 1 | ||||||||
|
| |||||||||||
| $ | 170 | |||||||||||
|
| |||||||||||
For the year ended January 31, 2015, the total amount of all open futures contracts, as presented in the table above, are representative of the volume of activity for this derivative type during the year.
Percentages are based on Net Assets of $20,254 ($ Thousands).
| (A) | Floating Rate Instrument. The rate reflected on the Schedule of Investments is the rate in effect on January 31, 2015. The demand and interest rate reset features give this security a shorter effective maturity date. |
| (B) | Tri-Party Repurchase Agreement. |
Cl — Class
FHLMC — Federal Home Loan Mortgage Corporation
FMAC — Financial Management Advisory Committee
FNMA — Federal National Mortgage Association
GNMA — Government National Mortgage Association
NCUA — National Credit Union Association
REMIC — Real Estate Mortgage Investment Conduit
Ser — Series
The following is a summary of the inputs used as of January 31, 2015 in valuing the Fund’s investments and other financial instruments carried at value ($ Thousands):
| Investments in Securities | Level 1 | Level 2 | Level 3 | Total | ||||||||||||
Mortgage-Backed Securities | $ | — | $ | 13,069 | $ | — | $ | 13,069 | ||||||||
Asset-Backed Security | — | 96 | — | 96 | ||||||||||||
U.S Government Agency Obligation | — | 2,597 | — | 2,597 | ||||||||||||
U.S. Treasury Obligations | — | 1,617 | — | 1,617 | ||||||||||||
Repurchase Agreement | — | 2,600 | — | 2,600 | ||||||||||||
|
|
|
|
|
|
|
| |||||||||
Total Investments in Securities | $ | — | $ | 19,979 | $ | — | $ | 19,979 | ||||||||
|
|
|
|
|
|
|
| |||||||||
| Other Financial Instruments | Level 1 | Level 2 | Level 3 | Total | ||||||||||||
Futures Contracts* | ||||||||||||||||
Unrealized Appreciation | $ | 212 | $ | — | $ | — | $ | 212 | ||||||||
Unrealized Depreciation | (42 | ) | — | — | (42 | ) | ||||||||||
|
|
|
|
|
|
|
| |||||||||
Total Other Financial Instruments | $ | 170 | $ | — | $ | — | $ | 170 | ||||||||
|
|
|
|
|
|
|
| |||||||||
| * | Futures Contracts are valued at the net unrealized appreciation/(depreciation) on the instruments. |
For the year ended January 31, 2015, there were no transfers between Level 1 and Level 2 assets and liabilities. For the year ended January 31, 2015, there were no Level 3 securities.
For more information on valuation inputs, see Note 2 — Significant Accounting Policies in Notes to Financial Statements.
Amounts designated as “—” are $0 or have been rounded to $0.
The accompanying notes are an integral part of the financial statements.
| 48 | SEI Daily Income Trust / Annual Report / January 31, 2015 |
SCHEDULE OF INVESTMENTS
GNMA Fund
January 31, 2015
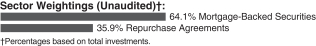
| Description | Face Amount ($ Thousands) | Value ($ Thousands) | ||||||
MORTGAGE-BACKED SECURITIES — 92.1% |
| |||||||
Agency Mortgage-Backed Obligations — 92.1% |
| |||||||
FHLMC REMIC, Ser 2010-3631, Cl PS, IO | ||||||||
6.284%, 02/15/15 (A) | $ | 6,407 | $ | 1,105 | ||||
FHLMC, Ser K022, Cl A2 | ||||||||
2.355%, 07/25/22 | 1,600 | 1,638 | ||||||
FHLMC TBA | ||||||||
3.000%, 02/15/42 | 300 | 310 | ||||||
FNMA | ||||||||
8.000%, 07/01/25 to 09/01/28 | 35 | 38 | ||||||
7.000%, 08/01/29 to 09/01/32 | 104 | 117 | ||||||
6.500%, 09/01/32 | 79 | 91 | ||||||
4.250%, 10/01/28 | 4,620 | 5,423 | ||||||
4.180%, 11/01/28 | 1,715 | 2,003 | ||||||
FNMA REMIC, Ser 1990-91, Cl G | ||||||||
7.000%, 08/25/20 | 14 | 16 | ||||||
FNMA REMIC, Ser 1992-105, Cl B | ||||||||
7.000%, 06/25/22 | 29 | 32 | ||||||
FNMA REMIC, Ser 2002-42, Cl C | ||||||||
6.000%, 07/25/17 | 250 | 261 | ||||||
FNMA TBA | ||||||||
4.500%, 02/01/34 | 1,000 | 1,085 | ||||||
GNMA | ||||||||
10.000%, 05/15/16 to 09/15/19 | 9 | 9 | ||||||
9.500%, 08/15/17 to 10/15/20 | 18 | 17 | ||||||
9.000%, 12/15/17 to 05/15/22 | 60 | 60 | ||||||
8.500%, 10/15/16 to 06/15/17 | 8 | 7 | ||||||
8.000%, 04/15/17 to 03/15/32 | 316 | 356 | ||||||
7.750%, 10/15/26 | 27 | 31 | ||||||
7.500%, 02/15/27 to 10/15/35 | 227 | 271 | ||||||
7.250%, 01/15/28 | 74 | 83 | ||||||
7.000%, 04/15/19 to 06/20/38 | 2,802 | 3,352 | ||||||
6.750%, 11/15/27 | 12 | 13 | ||||||
6.500%, 09/15/16 to 10/15/38 | 1,073 | 1,242 | ||||||
6.000%, 07/15/24 to 12/15/40 | 2,289 | 2,596 | ||||||
5.500%, 01/15/33 to 02/15/45 (C) | 2,957 | 3,342 | ||||||
5.000%, 06/15/33 to 02/15/45 | 8,721 | 9,747 | ||||||
4.500%, 08/15/33 to 09/20/41 | 6,605 | 7,288 | ||||||
4.000%, 08/20/39 to 04/15/43 (C) | 9,331 | 10,009 | ||||||
3.875%, 05/15/42 | 2,021 | 2,174 | ||||||
3.500%, 03/20/41 | 494 | 524 | ||||||
GNMA REMIC, Ser 2002-45, Cl QE | ||||||||
6.500%, 06/20/32 | 398 | 462 | ||||||
GNMA REMIC, Ser 2005-70, Cl AI, IO | ||||||||
5.000%, 10/20/33 | 49 | — | ||||||
| Description | Face Amount ($ Thousands) | Value ($ Thousands) | ||||||
GNMA TBA | ||||||||
4.500%, 02/15/45 to 03/15/45 | $ | 8,100 | $ | 8,833 | ||||
4.000%, 02/15/45 to 03/15/45 | 9,100 | 9,754 | ||||||
3.500%, 02/15/45 to 02/19/45 | 24,400 | 25,817 | ||||||
3.000%, 02/01/45 to 02/15/45 | 8,950 | 9,285 | ||||||
GNMA, Ser 2003-9, Cl Z | ||||||||
5.500%, 01/20/33 | 1,105 | 1,224 | ||||||
|
| |||||||
Total Mortgage-Backed Securities | 108,615 | |||||||
|
| |||||||
REPURCHASE AGREEMENTS (B) — 51.6% |
| |||||||
BNP Paribas | 39,100 | 39,100 | ||||||
Deutsche Bank | 21,700 | 21,700 | ||||||
|
| |||||||
Total Repurchase Agreements | 60,800 | |||||||
|
| |||||||
Total Investments — 143.7% | $ | 169,415 | ||||||
|
| |||||||
A list of the open futures contracts held by the Fund at January 31, 2015, is as follows:
| Type of Contract | Number of Contracts Long | Expiration Date | Unrealized Appreciation (Depreciation) ($ Thousands) | |||||||||
U.S. 10-Year Treasury Note | (51 | ) | Mar-2015 | $ | (85 | ) | ||||||
U.S. 5-Year Treasury Note | 25 | Mar-2015 | 59 | |||||||||
U.S. Long Treasury Bond | 8 | Mar-2015 | 77 | |||||||||
|
| |||||||||||
| $ | 51 | |||||||||||
|
| |||||||||||
For the year ended January 31, 2015, the total amount of all open futures contracts, as presented in the table above, are representative of the volume of activity for this derivative type during the year.
Percentages are based on Net Assets of $117,904 ($ Thousands).
| (A) | Floating Rate Instrument. The rate reflected on the Schedule of Investments is the rate in effect on January 31, 2015. The demand and interest rate reset features give this security a shorter effective maturity date. |
| SEI Daily Income Trust / Annual Report / January 31, 2015 | 49 |
SCHEDULE OF INVESTMENTS
GNMA Fund (Concluded)
January 31, 2015
| (B) | Tri-Party Repurchase Agreement. |
| (C) | Security, or portion thereof, has been pledged as collateral on open futures contracts. |
Cl — Class
FHLMC — Federal Home Loan Mortgage Corporation
FNMA — Federal National Mortgage Association
GNMA — Government National Mortgage Association
IO — Interest Only — face amount represents notional amount
REMIC — Real Estate Mortgage Investment Conduit
Ser — Series
TBA — To Be Announced
The following is a summary of the inputs used as of January 31, 2015 in valuing the Fund’s investments and other financial instruments carried at value ($ Thousands):
| Investments in Securities | Level 1 | Level 2 | Level 3 | Total | ||||||||||||
Mortgage-Backed Securities | $ | — | $ | 108,615 | $ | — | $ | 108,615 | ||||||||
Repurchase Agreements | — | 60,800 | — | 60,800 | ||||||||||||
|
|
|
|
|
|
|
| |||||||||
Total Investments in Securities | $ | — | $ | 169,415 | $ | — | $ | 169,415 | ||||||||
|
|
|
|
|
|
|
| |||||||||
| Other Financial Instruments | Level 1 | Level 2 | Level 3 | Total | ||||||||||||
Futures Contracts* | ||||||||||||||||
Unrealized Appreciation | $ | 136 | $ | — | $ | — | $ | 136 | ||||||||
Unrealized Depreciation | (85 | ) | — | — | (85 | ) | ||||||||||
|
|
|
|
|
|
|
| |||||||||
Total Other Financial Instruments | $ | 51 | $ | — | $ | — | $ | 51 | ||||||||
|
|
|
|
|
|
|
| |||||||||
| * | Futures Contracts are valued at the net unrealized appreciation/(depreciation) on the instruments. |
For the year ended January 31, 2015, there were no transfers between Level 1 and Level 2 assets and liabilities. For the year ended January 31, 2015, there were no Level 3 securities.
For more information on valuation inputs, see Note 2 — Significant Accounting Policies in
Notes to Financial Statements.
Amounts designated as “—” are $0 or have been rounded to $0.
The accompanying notes are an integral part of the financial statements.
| 50 | SEI Daily Income Trust / Annual Report / January 31, 2015 |
(This page intentionally left blank)
Statements of Assets and Liabilities ($ Thousands)
January 31, 2015
| Money Market Fund | Government Fund | Government II Fund | Prime Obligation Fund | |||||||||||||
ASSETS: | ||||||||||||||||
Investments, at value† | $207,201 | $1,508,250 | $1,274,993 | $4,782,361 | ||||||||||||
Repurchase agreements† | 56,170 | 403,572 | — | 637,600 | ||||||||||||
Cash | — | 55,375 | 1 | — | ||||||||||||
Cash pledged as collateral for future contracts | — | — | — | — | ||||||||||||
Receivable for investment securities sold | — | — | 64,548 | — | ||||||||||||
Interest receivable | 134 | 2,085 | 2,680 | 2,535 | ||||||||||||
Receivable for fund shares sold | — | — | — | — | ||||||||||||
Receivable from administration | — | — | — | — | ||||||||||||
Receivable for variation margin | — | — | — | — | ||||||||||||
Prepaid expenses | 9 | 60 | 42 | 153 | ||||||||||||
Total Assets | 263,514 | 1,969,342 | 1,342,264 | 5,422,649 | ||||||||||||
LIABILITIES: | ||||||||||||||||
Payable for investment securities purchased | — | — | — | — | ||||||||||||
Shareholder servicing fees payable | — | — | — | — | ||||||||||||
Investment advisory fees payable | 8 | 58 | 42 | 161 | ||||||||||||
Administration fees payable | 32 | 55 | 37 | 530 | ||||||||||||
Income distribution payable | 1 | 23 | 10 | 28 | ||||||||||||
Trustees’ fees payable | — | 1 | — | 2 | ||||||||||||
Chief Compliance Officer fees payable | 1 | 5 | 3 | 15 | ||||||||||||
Payable for fund shares redeemed | — | — | — | — | ||||||||||||
Payable for variation margin | — | — | — | — | ||||||||||||
Accrued expense payable | 12 | 83 | 54 | 252 | ||||||||||||
Total Liabilities | 54 | 225 | 146 | 988 | ||||||||||||
Net Assets | $263,460 | $1,969,117 | $1,342,118 | $5,421,661 | ||||||||||||
†Cost of investments and repurchase agreements | 263,371 | 1,911,822 | 1,274,993 | 5,419,961 | ||||||||||||
NET ASSETS: | ||||||||||||||||
Paid-in Capital — (unlimited authorization — no par value) | $263,458 | $1,969,148 | $1,342,121 | $5,421,711 | ||||||||||||
Undistributed (Distributions in excess of) net investment income | 2 | — | (3 | ) | — | |||||||||||
Accumulated net realized gain (loss) on investments | — | (31 | ) | — | (50 | ) | ||||||||||
Net unrealized appreciation (depreciation) on investments | — | — | — | — | ||||||||||||
Net unrealized (depreciation) on futures contracts | — | — | — | — | ||||||||||||
Net Assets | $263,460 | $1,969,117 | $1,342,118 | $5,421,661 | ||||||||||||
Net Asset Value, Offering and Redemption Price Per Share — Class A | $1.00 | $1.00 | $1.00 | $1.00 | ||||||||||||
| | (147,279,106 ÷ 147,308,891 shares | ) | | (1,788,289,878÷ 1,788,345,449 shares | ) | | (1,152,698,101 ÷ 1,152,767,050 shares | ) | | (5,291,310,576 ÷ 5,291,355,635 shares | ) | |||||
Net Asset Value, Offering and Redemption Price Per Share — Class B | $1.00 | $1.00 | $1.00 | $1.00 | ||||||||||||
| | (69,717,428 ÷ 69,717,128 shares | ) | | (119,425,415 ÷ 119,455,248 shares | ) | | (172,762,004 ÷ 172,797,166 shares | ) | | (83,496,778 ÷ 83,500,452 shares | ) | |||||
Net Asset Value, Offering and Redemption Price Per Share — Class C | $1.00 | $1.00 | $1.00 | $1.00 | ||||||||||||
| | (22,629,045 ÷ 22,628,945 shares | ) | | (5,795,211 ÷ 5,796,795 shares | ) | | (16,658,369 ÷ 16,657,876 shares | ) | | (22,711,495 ÷ 22,711,880 shares | ) | |||||
Net Asset Value, Offering and Redemption Price Per Share — Class H | N/A | N/A | N/A | $1.00 | ||||||||||||
| | (20,016,247 ÷ 20,017,579 shares | ) | ||||||||||||||
Net Asset Value, Offering and Redemption Price Per Share — Sweep Class | $1.00 | $1.00 | N/A | $1.00 | ||||||||||||
| | (23,834,551 ÷ 23,830,216 shares | ) | | (55,606,507 ÷ 55,608,656 shares | ) | | (4,125,998 ÷ 4,125,540 shares | ) | ||||||||
Net Asset Value, Offering and Redemption Price Per Share — Class Y | N/A | N/A | N/A | N/A | ||||||||||||
Amounts designated as “—” are $0 or have been rounded to $0.
N/A — Not applicable. Class B, C, H, Y and Sweep Class currently not offered.
The accompanying notes are an integral part of the financial statements.
| 52 | SEI Daily Income Trust / Annual Report / January 31, 2015 |
Treasury Fund | Treasury II Fund | Ultra Short Duration Bond | Short-Duration Government Fund | Intermediate- Duration Government Fund | GNMA Fund | |||||||||||||||||
| $141,569 | $545,629 | $258,007 | $628,050 | $17,379 | $108,615 | |||||||||||||||||
| 152,034 | — | 2,300 | 117,000 | 2,600 | 60,800 | |||||||||||||||||
| 3 | 7 | 830 | 90 | 46 | 7 | |||||||||||||||||
| — | — | 100 | 1,558 | 105 | — | |||||||||||||||||
| 46,148 | 170,861 | — | 268 | 11 | 21,532 | |||||||||||||||||
| 692 | 2,816 | 452 | 2,970 | 54 | 219 | |||||||||||||||||
| — | — | 67 | 28,394 | 61 | 26 | |||||||||||||||||
| — | — | — | — | — | — | |||||||||||||||||
| — | — | 6 | 202 | 44 | 34 | |||||||||||||||||
| 12 | 23 | 7 | 25 | 1 | 4 | |||||||||||||||||
| 340,458 | 719,336 | 261,769 | 778,557 | 20,301 | 191,237 | |||||||||||||||||
| — | 24,020 | 5,899 | 32,152 | — | 73,071 | |||||||||||||||||
| — | — | — | 48 | 4 | 25 | |||||||||||||||||
| 11 | 15 | 22 | 61 | 2 | 12 | |||||||||||||||||
| 2 | — | 16 | 160 | 9 | 25 | |||||||||||||||||
| 2 | 4 | 37 | 100 | 6 | 32 | |||||||||||||||||
| — | — | — | — | — | — | |||||||||||||||||
| 1 | 2 | 1 | 2 | — | — | |||||||||||||||||
| — | — | 132 | 29,601 | 13 | 103 | |||||||||||||||||
| — | — | 26 | 249 | 11 | 46 | |||||||||||||||||
| 17 | 28 | 22 | 66 | 2 | 19 | |||||||||||||||||
| 33 | 24,069 | 6,155 | 62,439 | 47 | 73,333 | |||||||||||||||||
| $340,425 | $695,267 | $255,614 | $716,118 | $20,254 | $117,904 | |||||||||||||||||
| 293,603 |
| 545,629 | 260,916 | 736,338 | 19,328 | 165,628 | |||||||||||||||
| $340,425 |
| $695,253 | $277,775 | $713,208 | $20,924 | $113,487 | |||||||||||||||
| — |
| 15 | (1 | ) | 595 | 12 | (3 | ) | |||||||||||||
| — |
| (1 | ) | (21,403 | ) | (6,080 | ) | (1,503 | ) | 582 | |||||||||||
| — |
| — | (609 | ) | 8,712 | 651 | 3,787 | ||||||||||||||
| — |
| — | (148 | ) | (317 | ) | 170 | 51 | |||||||||||||
| $340,425 | $695,267 | $255,614 | $716,118 | $20,254 | $117,904 | |||||||||||||||||
| $1.00 |
| $1.00 | $9.33 | $10.55 | $11.78 | $10.93 | |||||||||||||||
| | (124,645,600 ÷ 124,672,863 shares | ) | | (491,208,867 ÷ 491,321,707 shares | ) | | (255,613,940 ÷ 27,405,020 shares | ) | | (661,101,392 ÷ 62,678,699 shares | ) | | (20,253,629 ÷ 1,719,226 shares | ) | | (117,904,196 ÷ 10,791,598 shares | ) | |||||
| $1.00 |
| $1.00 | N/A | N/A | N/A | N/A | |||||||||||||||
| | (84,632,146 ÷ 84,651,568 shares | ) | | (199,889,023 ÷ 199,910,279 shares | ) | |||||||||||||||||
| $1.00 |
| $1.00 | N/A | N/A | N/A | N/A | |||||||||||||||
| | (10,570,975 ÷ 10,571,317 shares | ) | | (4,169,501 ÷ 4,169,399 shares | ) | |||||||||||||||||
| $1.00 |
| N/A | N/A | N/A | N/A | N/A | |||||||||||||||
| | (120,576,270 ÷ 120,594,876 shares | ) | ||||||||||||||||||||
| N/A |
| N/A | N/A | N/A | N/A | N/A | |||||||||||||||
| N/A |
| N/A | N/A | $10.55 | N/A | N/A | |||||||||||||||
| | (55,016,673 ÷ 5,215,921 shares | ) | ||||||||||||||||||||
| SEI Daily Income Trust / Annual Report / January 31, 2015 | 53 |
Statements of Operations ($ Thousands)
For the year ended January 31, 2015
| Money Market Fund | Government Fund | Government II Fund | Prime Obligation Fund | |||||||||||||
Investment Income: | ||||||||||||||||
Interest Income | $ | 457 | $ | 1,796 | $ | 1,094 | $ | 8,278 | ||||||||
Expenses: | ||||||||||||||||
Administration Fees | 910 | 4,534 | 2,429 | 9,420 | ||||||||||||
Shareholder Servicing Fees — Class A Shares | 384 | 4,187 | 2,700 | 12,043 | ||||||||||||
Shareholder Servicing Fees — Sweep Class Shares | 64 | 157 | — | 10 | ||||||||||||
Distribution Fees — Sweep Class Shares | 129 | 314 | — | 20 | ||||||||||||
Administrative and Shareholder Servicing Fees — Class B Shares | 234 | 433 | 548 | 255 | ||||||||||||
Administrative and Shareholder Servicing Fees — Class C Shares | 135 | 32 | 80 | 149 | ||||||||||||
Administrative and Shareholder Servicing Fees — Class H Shares | — | — | — | 81 | ||||||||||||
Investment Advisory Fees | 199 | 1,322 | 895 | 3,470 | ||||||||||||
Trustees’ Fees | 4 | 25 | 18 | 63 | ||||||||||||
Chief Compliance Officer Fees | 1 | 12 | 8 | 34 | ||||||||||||
Registration Fees | 17 | 82 | 67 | 204 | ||||||||||||
Custodian/Wire Agent Fees | 5 | 32 | 24 | 81 | ||||||||||||
Pricing Fees | 1 | 5 | 4 | 12 | ||||||||||||
Other Expenses | 23 | 225 | 156 | 621 | ||||||||||||
Total Expenses | 2,106 | 11,360 | 6,929 | 26,463 | ||||||||||||
Less, Waiver of: | ||||||||||||||||
Investment Advisory Fees | (99 | ) | (661 | ) | (447 | ) | (1,735 | ) | ||||||||
Administration Fees | (632 | ) | (4,158 | ) | (2,188 | ) | (4,388 | ) | ||||||||
Reimbursement from Administration Fees | — | — | — | — | ||||||||||||
Shareholder Servicing Fees — Class A Shares | (384 | ) | (4,187 | ) | (2,700 | ) | (12,043 | ) | ||||||||
Administrative & Shareholder Servicing Fees — Class B Shares | (234 | ) | (433 | ) | (548 | ) | (255 | ) | ||||||||
Administrative & Shareholder Servicing Fees — Class C Shares | (135 | ) | (32 | ) | (80 | ) | (149 | ) | ||||||||
Administrative & Shareholder Servicing Fees — Class H Shares | — | — | — | (81 | ) | |||||||||||
Shareholder Servicing & Distribution Fees — Sweep Class | (193 | ) | (471 | ) | — | (30 | ) | |||||||||
Net Expenses | 429 | 1,418 | 966 | 7,782 | ||||||||||||
Net Investment Income | 28 | 378 | 128 | 496 | ||||||||||||
Net Realized and Unrealized Gain (Loss) on/from: | ||||||||||||||||
Investments | — | 1 | 2 | 6 | ||||||||||||
Futures Contracts | — | — | — | — | ||||||||||||
Net Change in Unrealized Appreciation (Depreciation) on/from: | ||||||||||||||||
Investments | — | — | — | — | ||||||||||||
Futures Contracts | — | — | — | — | ||||||||||||
Net Increase in Net Assets Resulting from Operations | $ | 28 | $ | 379 | $ | 130 | $ | 502 | ||||||||
Amounts designated as “—” are $0 or have been rounded to $0.
The accompanying notes are an integral part of the financial statements.
| 54 | SEI Daily Income Trust / Annual Report / January 31, 2015 |
Treasury Fund | Treasury II Fund | Ultra Short Duration Bond Fund | Short-Duration Government Fund | Intermediate-Duration Government Fund | GNMA Fund | |||||||||||||||||
| $ | 225 | $ | 354 | $ | 2,623 | $ | 10,043 | $ | 573 | $ | 2,102 | |||||||||||
| 882 | 1,704 | 872 | 2,648 | 83 | 387 | |||||||||||||||||
| 310 | 1,191 | 653 | 1,880 | 61 | 308 | |||||||||||||||||
| 324 | — | — | — | — | — | |||||||||||||||||
| 647 | — | — | — | — | — | |||||||||||||||||
| 301 | 665 | — | — | — | — | |||||||||||||||||
| 67 | 60 | — | — | — | — | |||||||||||||||||
| — | — | — | — | — | — | |||||||||||||||||
| 257 | 497 | 265 | 691 | 20 | 113 | |||||||||||||||||
| 5 | 10 | 3 | 10 | — | 2 | |||||||||||||||||
| 2 | 4 | 2 | 5 | — | 1 | |||||||||||||||||
| 16 | 35 | 12 | 36 | 2 | 10 | |||||||||||||||||
| 6 | 13 | 5 | 13 | — | 2 | |||||||||||||||||
| 1 | 2 | 44 | — | — | — | |||||||||||||||||
| 44 | 86 | 33 | 209 | 6 | 35 | |||||||||||||||||
| 2,862 | 4,267 | 1,889 | 5,492 | 172 | 858 | |||||||||||||||||
| (128 | ) | (250 | ) | (17 | ) | (32 | ) | — | — | |||||||||||||
| (882 | ) | (1,704 | ) | (223 | ) | — | — | (79 | ) | |||||||||||||
| (15 | ) | (114 | ) | — | — | — | — | |||||||||||||||
| (310 | ) | (1,191 | ) | (653 | ) | (1,833 | ) | (54 | ) | — | ||||||||||||
| (301 | ) | (665 | ) | — | — | — | — | |||||||||||||||
| (67 | ) | (60 | ) | — | — | — | — | |||||||||||||||
| — | — | — | — | — | — | |||||||||||||||||
| (971 | ) | — | — | — | — | — | ||||||||||||||||
| 188 | 283 | 996 | 3,627 | 118 | 779 | |||||||||||||||||
| 37 | 71 | 1,627 | 6,416 | 455 | 1,323 | |||||||||||||||||
| 5 | 3 | 493 | 2,869 | (51 | ) | 5,874 | ||||||||||||||||
| — | — | (190 | ) | (3,307 | ) | (106 | ) | 538 | ||||||||||||||
| — | — | (398 | ) | 2,012 | 298 | (980 | ) | |||||||||||||||
| — | — | (142 | ) | 565 | 218 | 22 | ||||||||||||||||
| $ | 42 | $ | 74 | $ | 1,390 | $ | 8,555 | $ | 814 | $ | 6,777 | |||||||||||
| SEI Daily Income Trust / Annual Report / January 31, 2015 | 55 |
Statements of Changes in Net Assets ($ Thousands)
For the year ended January 31,
| Money Market Fund | Government Fund | |||||||||||||||
| 2015 | 2014 | 2015 | 2014 | |||||||||||||
Operations: | ||||||||||||||||
Net Investment Income | $ | 28 | $ | 66 | $ | 378 | $ | 320 | ||||||||
Net Realized Gain on Investments | — | — | 1 | — | ||||||||||||
Net Increase in Net Assets Resulting from Operations | 28 | 66 | 379 | 320 | ||||||||||||
Dividends to Shareholders: | ||||||||||||||||
Net Investment Income | ||||||||||||||||
Class A | (15 | ) | (54 | ) | (335 | ) | (283 | ) | ||||||||
Class B | (8 | ) | (6 | ) | (29 | ) | (27 | ) | ||||||||
Class C | (3 | ) | (3 | ) | (1 | ) | (1 | ) | ||||||||
Class H | — | — | — | — | ||||||||||||
Sweep Class | (2 | ) | (3 | ) | (13 | ) | (9 | ) | ||||||||
Total Dividends | (28 | ) | (66 | ) | (378 | ) | (320 | ) | ||||||||
Capital Share Transactions (All at $1.00 per share) | ||||||||||||||||
Class A: | ||||||||||||||||
Proceeds from Shares Issued | 501,241 | 891,471 | 11,108,570 | 9,551,203 | ||||||||||||
Reinvestment of Dividends & Distributions | 9 | 42 | 94 | 103 | ||||||||||||
Cost of Shares Redeemed | (523,529 | ) | (977,021 | ) | (10,843,937 | ) | (9,320,079 | ) | ||||||||
Net Increase (Decrease) from Class A Transactions | (22,279 | ) | (85,508 | ) | 264,727 | 231,227 | ||||||||||
Class B: | ||||||||||||||||
Proceeds from Shares Issued | 286,653 | 296,758 | 619,369 | 629,955 | ||||||||||||
Reinvestment of Dividends & Distributions | 5 | 3 | 20 | 17 | ||||||||||||
Cost of Shares Redeemed | (271,603 | ) | (302,176 | ) | (646,901 | ) | (616,727 | ) | ||||||||
Net Increase (Decrease) from Class B Transactions | 15,055 | (5,415 | ) | (27,512 | ) | 13,245 | ||||||||||
Class C: | ||||||||||||||||
Proceeds from Shares Issued | 197,324 | 222,996 | 389,657 | 206,169 | ||||||||||||
Reinvestment of Dividends & Distributions | 1 | 1 | — | — | ||||||||||||
Cost of Shares Redeemed | (200,137 | ) | (229,882 | ) | (394,117 | ) | (208,466 | ) | ||||||||
Net Increase (Decrease) from Class C Transactions | (2,812 | ) | (6,885 | ) | (4,460 | ) | (2,297 | ) | ||||||||
Class H: | ||||||||||||||||
Proceeds from Shares Issued | — | — | — | — | ||||||||||||
Reinvestment of Dividends & Distributions | — | — | — | — | ||||||||||||
Cost of Shares Redeemed | — | — | — | — | ||||||||||||
Net Decrease from Class H Transactions | — | — | — | — | ||||||||||||
Sweep Class: | ||||||||||||||||
Proceeds from Shares Issued | 277,785 | 267,166 | 224,637 | 322,485 | ||||||||||||
Reinvestment of Dividends & Distributions | — | — | 12 | 8 | ||||||||||||
Cost of Shares Redeemed | (275,420 | ) | (265,645 | ) | (279,594 | ) | (247,078 | ) | ||||||||
Net Increase (Decrease) from Sweep Class Transactions | 2,365 | 1,521 | (54,945 | ) | 75,415 | |||||||||||
Net Increase (Decrease) in Net Assets from Capital Shares Transactions | (7,671 | ) | (96,287 | ) | 177,810 | 317,590 | ||||||||||
Net Increase (Decrease) in Net Assets | (7,671 | ) | (96,287 | ) | 177,811 | 317,590 | ||||||||||
Net Assets: | ||||||||||||||||
Beginning of Year | 271,131 | 367,418 | 1,791,306 | 1,473,716 | ||||||||||||
End of Year | $ | 263,460 | $ | 271,131 | $ | 1,969,117 | $ | 1,791,306 | ||||||||
Undistibuted (Distributions in Excess of) Net Investment Income | $ | 2 | $ | 2 | $ | — | $ | — | ||||||||
Amounts designated as “—” are zero or have been rounded to zero
N/A — Not applicable. Class B, C, H, Y and Sweep Class currently not offered.
The accompanying notes are an integral part of the financial statements.
| 56 | SEI Daily Income Trust / Annual Report / January 31, 2015 |
| Government II Fund | Prime Obligation Fund | Treasury Fund | Treasury II Fund | |||||||||||||||||||||||||||
| 2015 | 2014 | 2015 | 2014 | 2015 | 2014 | 2015 | 2014 | |||||||||||||||||||||||
| $ | 128 | $ | 125 | $ | 496 | $ | 508 | $ | 37 | $ | 31 | $ | 71 | $ | 73 | |||||||||||||||
| 2 | 2 | 6 | 2 | 5 | 2 | 3 | 12 | |||||||||||||||||||||||
| 130 | 127 | 502 | 510 | 42 | 33 | 74 | 85 | |||||||||||||||||||||||
| (108 | ) | (109 | ) | (482 | ) | (490 | ) | (13 | ) | (6 | ) | (48 | ) | (44 | ) | |||||||||||||||
| (18 | ) | (19 | ) | (9 | ) | (11 | ) | (10 | ) | (11 | ) | (22 | ) | (28 | ) | |||||||||||||||
| (2 | ) | (1 | ) | (3 | ) | (4 | ) | (1 | ) | (1 | ) | (1 | ) | (1 | ) | |||||||||||||||
| — | — | (2 | ) | (2 | ) | — | — | — | — | |||||||||||||||||||||
| — | — | — | (1 | ) | (13 | ) | (13 | ) | — | — | ||||||||||||||||||||
| (128 | ) | (129 | ) | (496 | ) | (508 | ) | (37 | ) | (31 | ) | (71 | ) | (73 | ) | |||||||||||||||
| 3,046,015 | 2,983,443 | 32,895,448 | 35,446,083 | 982,066 | 504,410 | 1,890,227 | 1,638,660 | |||||||||||||||||||||||
| 11 | 12 | 184 | 137 | 9 | 4 | 22 | 16 | |||||||||||||||||||||||
| (3,139,591 | ) | (2,974,396 | ) | (31,812,544 | ) | (34,952,725 | ) | (903,757 | ) | (540,438 | ) | (1,839,502 | ) | (1,658,851 | ) | |||||||||||||||
| (93,565 | ) | 9,059 | 1,083,088 | 493,495 | 78,318 | (36,024 | ) | 50,747 | (20,175 | ) | ||||||||||||||||||||
| 974,037 | 1,043,529 | 409,317 | 531,022 | 515,970 | 616,354 | 991,366 | 1,071,233 | |||||||||||||||||||||||
| 12 | 13 | 1 | 4 | 9 | 8 | 2 | 3 | |||||||||||||||||||||||
| (975,015 | ) | (1,074,445 | ) | (417,649 | ) | (558,779 | ) | (540,994 | ) | (615,325 | ) | (1,039,276 | ) | (1,154,284 | ) | |||||||||||||||
| (966 | ) | (30,903 | ) | (8,331 | ) | (27,753 | ) | (25,015 | ) | 1,037 | (47,908 | ) | (83,048 | ) | ||||||||||||||||
| 106,851 | 155,543 | 238,965 | 254,032 | 53,042 | 103,433 | 41,616 | 42,099 | |||||||||||||||||||||||
| — | — | — | 1 | — | — | — | — | |||||||||||||||||||||||
| (111,024 | ) | (143,834 | ) | (234,001 | ) | (270,388 | ) | (54,725 | ) | (102,162 | ) | (52,895 | ) | (32,636 | ) | |||||||||||||||
| (4,173 | ) | 11,709 | 4,964 | (16,355 | ) | (1,683 | ) | 1,271 | (11,279 | ) | 9,463 | |||||||||||||||||||
| N/A | N/A | 32,334 | 55,377 | — | — | — | — | |||||||||||||||||||||||
| N/A | N/A | 2 | 2 | — | — | — | — | |||||||||||||||||||||||
| N/A | N/A | (33,121 | ) | (60,007 | ) | — | — | — | — | |||||||||||||||||||||
| N/A | N/A | (785 | ) | (4,628 | ) | — | — | — | — | |||||||||||||||||||||
| N/A | N/A | 26,554 | 31,245 | 178,641 | 224,093 | N/A | N/A | |||||||||||||||||||||||
| N/A | N/A | — | — | — | — | N/A | N/A | |||||||||||||||||||||||
| N/A | N/A | (26,417 | ) | (30,424 | ) | (184,407 | ) | (224,333 | ) | N/A | N/A | |||||||||||||||||||
| N/A | N/A | 137 | 821 | (5,766 | ) | (240 | ) | N/A | N/A | |||||||||||||||||||||
| (98,704 | ) | (10,135 | ) | 1,079,073 | 445,580 | 45,854 | (33,956 | ) | (8,440 | ) | (93,760 | ) | ||||||||||||||||||
| (98,702 | ) | (10,137 | ) | 1,079,079 | 445,582 | 45,859 | (33,954 | ) | (8,437 | ) | (93,748 | ) | ||||||||||||||||||
| 1,440,820 | 1,450,957 | 4,342,582 | 3,897,000 | 294,566 | 328,520 | 703,704 | 797,452 | |||||||||||||||||||||||
| $ | 1,342,118 | $ | 1,440,820 | $ | 5,421,661 | $ | 4,342,582 | $ | 340,425 | $ | 294,566 | $ | 695,267 | $ | 703,704 | |||||||||||||||
| $ | (3 | ) | $ | (5 | ) | $ | — | $ | — | $ | — | $ | — | $ | 15 | $ | 11 | |||||||||||||
| SEI Daily Income Trust / Annual Report / January 31, 2015 | 57 |
Statements of Changes in Net Assets ($ Thousands) (Continued)
For the year ended January 31,
| Ultra Short Duration Bond Fund | ||||||||
| 2015 | 2014 | |||||||
Operations: | ||||||||
Net Investment Income | $ | 1,627 | $ | 1,507 | ||||
Net Realized Gain on Investments and Futures Contracts | 303 | 413 | ||||||
Net Change in Unrealized Appreciation | (540 | ) | (163 | ) | ||||
Net Increase (Decrease) in Net Assets Resulting from Operations | 1,390 | 1,757 | ||||||
Dividends to Shareholders: | ||||||||
Net Investment Income | ||||||||
Class A | (2,129 | ) | (2,035 | ) | ||||
Class Y | N/A | N/A | ||||||
Total Dividends | (2,129 | ) | (2,035 | ) | ||||
Capital Share Transactions: | ||||||||
Class A: | ||||||||
Proceeds from Shares Issued | 76,923 | 202,670 | ||||||
Reinvestment of Dividends & Distributions | 1,669 | 1,524 | ||||||
Cost of Shares Redeemed | (93,460 | ) | (173,702 | ) | ||||
Net Increase (Decrease) from Class A Transactions | (14,868 | ) | 30,492 | |||||
Class Y: | ||||||||
Proceeds from Shares Issued | N/A | N/A | ||||||
Reinvestment of Dividends & Distributions | N/A | N/A | ||||||
Cost of Shares Redeemed | N/A | N/A | ||||||
Net Increase from Class Y Transactions | N/A | N/A | ||||||
Net Increase (Decrease) in Net Assets from Capital Share Transactions | (14,868 | ) | 30,492 | |||||
Net Increase (Decrease) in Net Assets | (15,607 | ) | 30,214 | |||||
Net Assets: | ||||||||
Beginning of Year | 271,221 | 241,007 | ||||||
End of Year | $ | 255,614 | $ | 271,221 | ||||
Undistributed (Distributions in Excess of) Net Investment Income | $ | (1 | ) | $ | — | |||
Capital Share Transactions: | ||||||||
Class A: | ||||||||
Shares Issued | 8,226 | 21,679 | ||||||
Reinvestment of Distributions | 178 | 163 | ||||||
Shares Redeemed | (9,995 | ) | (18,566 | ) | ||||
Total Class A Transactions | (1,591 | ) | 3,276 | |||||
Class Y: | ||||||||
Shares Issued | N/A | N/A | ||||||
Reinvestment of Distributions | N/A | N/A | ||||||
Shares Redeemed | N/A | N/A | ||||||
Total Class Y Transactions | N/A | N/A | ||||||
Net Increase (Decrease) in Shares Outstanding from Share Transactions | (1,591 | ) | 3,276 | |||||
Amounts designated as “—” are zero or have been rounded to zero.
N/A — Not applicable. Class B, C, H, Y and Sweep Class currently not offered.
The accompanying notes are an integral part of the financial statements.
| 58 | SEI Daily Income Trust / Annual Report / January 31, 2015 |
| Short-Duration Government Fund | Intermediate-Duration Government Fund | GNMA Fund | ||||||||||||||||||||
| 2015 | 2014 | 2015 | 2014 | 2015 | 2014 | |||||||||||||||||
| $ | 6,416 | $ | 4,121 | $ | 455 | $ | 516 | $ | 1,323 | $ | 1,487 | |||||||||||
| (438 | ) | 720 | (157 | ) | (147 | ) | 6,412 | (1,974 | ) | |||||||||||||
| 2,577 | (4,850 | ) | 516 | (584 | ) | (958 | ) | (1,914 | ) | |||||||||||||
| 8,555 | (9 | ) | 814 | (215 | ) | 6,777 | (2,401 | ) | ||||||||||||||
| (6,829 | ) | (6,916 | ) | (561 | ) | (643 | ) | (1,978 | ) | (3,835 | ) | |||||||||||
| (18 | ) | — | N/A | N/A | N/A | N/A | ||||||||||||||||
| (6,847 | ) | (6,916 | ) | (561 | ) | (643 | ) | (1,978 | ) | (3,835 | ) | |||||||||||
| 280,452 | 493,186 | 5,144 | 13,559 | 39,296 | 52,341 | |||||||||||||||||
| 5,783 | 6,044 | 447 | 539 | 1,607 | 3,275 | |||||||||||||||||
| (388,465 | ) | (441,666 | ) | (10,303 | ) | (26,050 | ) | (86,470 | ) | (195,133 | ) | |||||||||||
| (102,230 | ) | 57,564 | (4,712 | ) | (11,952 | ) | (45,567 | ) | (139,517 | ) | ||||||||||||
| 55,715 | — | N/A | N/A | N/A | N/A | |||||||||||||||||
| 21 | — | N/A | N/A | N/A | N/A | |||||||||||||||||
| (835 | ) | — | N/A | N/A | N/A | N/A | ||||||||||||||||
| 54,901 | — | N/A | N/A | N/A | N/A | |||||||||||||||||
| (47,329 | ) | 57,564 | (4,712 | ) | (11,952 | ) | (45,567 | ) | (139,517 | ) | ||||||||||||
| (45,621 | ) | 50,639 | (4,459 | ) | (12,810 | ) | (40,768 | ) | (145,753 | ) | ||||||||||||
| 761,739 | 711,100 | 24,713 | 37,523 | 158,672 | 304,425 | |||||||||||||||||
| $ | 716,118 | $ | 761,739 | $ | 20,254 | $ | 24,713 | $ | 117,904 | $ | 158,672 | |||||||||||
| $ | 595 | $ | 577 | $ | 12 | $ | 70 | $ | (3 | ) | $ | (4 | ) | |||||||||
| 26,686 | 46,785 | 444 | 1,154 | 3,675 | 4,962 | |||||||||||||||||
| 550 | 574 | 38 | 46 | 151 | 312 | |||||||||||||||||
| (36,956 | ) | (41,924 | ) | (887 | ) | (2,233 | ) | (8,150 | ) | (18,601 | ) | |||||||||||
| (9,720 | ) | 5,435 | (405 | ) | (1,033 | ) | (4,324 | ) | (13,327 | ) | ||||||||||||
| 5,293 | — | N/A | N/A | N/A | N/A | |||||||||||||||||
| 2 | — | N/A | N/A | N/A | N/A | |||||||||||||||||
| (79 | ) | — | N/A | N/A | N/A | N/A | ||||||||||||||||
| 5,216 | — | N/A | N/A | N/A | N/A | |||||||||||||||||
| (4,504 | ) | 5,435 | (405 | ) | (1,033 | ) | (4,324 | ) | (13,327 | ) | ||||||||||||
| SEI Daily Income Trust / Annual Report / January 31, 2015 | 59 |
For the years ended January 31,
For a Share Outstanding Throughout the Years
Net Asset Value, of Year | Net Investment Income* | Net Realized Unrealized | Payment Affiliate | Total from Operations | Dividends from Net Investment | Distributions from Realized Capital | Total Dividends | Net Asset Value, End of | Total Return† | Net Assets End of Year ($ Thousands) | Ratio of Expenses | Ratio of Expenses Net Waivers) | Ratio of Net | |||||||||||||||||||||||||||||||||||||||||||
Money Market Fund |
| |||||||||||||||||||||||||||||||||||||||||||||||||||||||
Class A |
| |||||||||||||||||||||||||||||||||||||||||||||||||||||||
2015 | $ | 1.00 | $ | — | $ | — | $ | — | $ | — | $ | — | (1) | $ | — | $ | — | (1) | $ | 1.00 | 0.01 | % | $ | 147,279 | 0.15 | %(2) | 0.66 | % | 0.01 | % | ||||||||||||||||||||||||||
2014 | 1.00 | — | — | — | — | — | (1) | — | — | (1) | 1.00 | 0.02 | 169,555 | 0.17 | (2) | 0.67 | 0.02 | |||||||||||||||||||||||||||||||||||||||
2013 | 1.00 | — | — | — | — | — | (1) | — | (1) | — | (1) | 1.00 | 0.09 | 255,063 | 0.18 | 0.68 | 0.09 | |||||||||||||||||||||||||||||||||||||||
2012 | 1.00 | — | — | — | — | — | (1) | — | — | (1) | 1.00 | 0.06 | 146,460 | 0.18 | 0.68 | 0.06 | ||||||||||||||||||||||||||||||||||||||||
2011 | 1.00 | — | — | — | — | — | (1) | — | (1) | — | (1) | 1.00 | 0.14 | 214,779 | 0.18 | 0.68 | 0.14 | |||||||||||||||||||||||||||||||||||||||
Class B |
| |||||||||||||||||||||||||||||||||||||||||||||||||||||||
2015 | $ | 1.00 | $ | — | $ | — | $ | — | $ | — | $ | — | (1) | $ | — | $ | — | $ | 1.00 | 0.01 | % | $ | 69,717 | 0.15 | %(2) | 0.71 | % | 0.01 | % | |||||||||||||||||||||||||||
2014 | 1.00 | — | — | — | — | — | (1) | — | — | 1.00 | 0.01 | 54,654 | 0.18 | (2) | 0.73 | 0.01 | ||||||||||||||||||||||||||||||||||||||||
2013 | 1.00 | — | — | — | — | — | (1) | — | (1) | — | (1) | 1.00 | 0.01 | 60,069 | 0.26 | (2) | 0.73 | 0.01 | ||||||||||||||||||||||||||||||||||||||
2012 | 1.00 | — | — | — | — | — | (1) | — | — | (1) | 1.00 | 0.01 | 73,035 | 0.23 | (2) | 0.73 | 0.01 | |||||||||||||||||||||||||||||||||||||||
2011 | 1.00 | — | — | — | — | — | (1) | — | (1) | — | (1) | 1.00 | 0.01 | 39,352 | 0.30 | (2) | 0.80 | 0.01 | ||||||||||||||||||||||||||||||||||||||
Class C |
| |||||||||||||||||||||||||||||||||||||||||||||||||||||||
2015 | $ | 1.00 | $ | — | $ | — | $ | — | $ | — | $ | — | (1) | $ | — | $ | — | (1) | $ | 1.00 | 0.01 | % | $ | 22,629 | 0.15 | %(2) | 0.91 | % | 0.01 | % | ||||||||||||||||||||||||||
2014 | 1.00 | — | — | — | — | — | (1) | — | — | (1) | 1.00 | 0.01 | 25,428 | 0.18 | (2) | 0.93 | 0.01 | |||||||||||||||||||||||||||||||||||||||
2013 | 1.00 | — | — | — | — | — | (1) | — | (1) | — | (1) | 1.00 | 0.01 | 32,314 | 0.26 | (2) | 0.93 | 0.01 | ||||||||||||||||||||||||||||||||||||||
2012 | 1.00 | — | — | — | — | — | (1) | — | — | (1) | 1.00 | 0.01 | 33,110 | 0.23 | (2) | 0.93 | 0.01 | |||||||||||||||||||||||||||||||||||||||
2011 | 1.00 | — | — | — | — | — | (1) | — | (1) | — | (1) | 1.00 | 0.01 | 52,876 | 0.30 | (2) | 0.80 | 0.01 | ||||||||||||||||||||||||||||||||||||||
Sweep Class |
| |||||||||||||||||||||||||||||||||||||||||||||||||||||||
2015 | $ | 1.00 | $ | — | $ | — | $ | — | $ | — | $ | — | (1) | $ | — | $ | — | (1) | $ | 1.00 | 0.01 | % | $ | 23,835 | 0.15 | %(2) | 1.16 | % | 0.01 | % | ||||||||||||||||||||||||||
2014 | 1.00 | — | — | — | — | — | (1) | — | — | (1) | 1.00 | 0.01 | 21,494 | 0.18 | (2) | 1.18 | 0.01 | |||||||||||||||||||||||||||||||||||||||
2013 | 1.00 | — | — | — | — | — | (1) | — | (1) | — | (1) | 1.00 | 0.01 | 19,972 | 0.26 | (2) | 1.18 | 0.01 | ||||||||||||||||||||||||||||||||||||||
2012 | 1.00 | — | — | — | — | — | (1) | — | — | (1) | 1.00 | 0.01 | 22,701 | 0.23 | (2) | 1.18 | 0.01 | |||||||||||||||||||||||||||||||||||||||
2011 | 1.00 | — | — | — | — | — | (1) | — | (1) | — | (1) | 1.00 | 0.01 | 26,603 | 0.31 | 0.81 | 0.01 | |||||||||||||||||||||||||||||||||||||||
Government Fund |
| |||||||||||||||||||||||||||||||||||||||||||||||||||||||
Class A |
| |||||||||||||||||||||||||||||||||||||||||||||||||||||||
2015 | $ | 1.00 | $ | — | $ | — | $ | — | $ | — | $ | — | (1) | $ | — | $ | — | (1) | $ | 1.00 | 0.02 | % | $ | 1,788,290 | 0.07 | %(2) | 0.58 | % | 0.02 | % | ||||||||||||||||||||||||||
2014 | 1.00 | — | — | — | — | — | (1) | — | — | (1) | 1.00 | 0.02 | 1,523,561 | 0.09 | (2) | 0.58 | 0.02 | |||||||||||||||||||||||||||||||||||||||
2013 | 1.00 | — | — | — | — | — | (1) | — | — | (1) | 1.00 | 0.02 | 1,292,334 | 0.16 | (2) | 0.59 | 0.02 | |||||||||||||||||||||||||||||||||||||||
2012 | 1.00 | — | — | — | — | — | (1) | — | — | (1) | 1.00 | 0.05 | 1,054,551 | 0.10 | (2) | 0.59 | 0.05 | |||||||||||||||||||||||||||||||||||||||
2011 | 1.00 | — | — | — | — | — | (1) | — | — | (1) | 1.00 | 0.05 | 633,160 | 0.17 | (2) | 0.59 | 0.05 | |||||||||||||||||||||||||||||||||||||||
Class B |
| |||||||||||||||||||||||||||||||||||||||||||||||||||||||
2015 | $ | 1.00 | $ | — | $ | — | $ | — | $ | — | $ | — | (1) | $ | — | $ | — | (1) | $ | 1.00 | 0.02 | % | $ | 119,425 | 0.07 | %(2) | 0.63 | % | 0.02 | % | ||||||||||||||||||||||||||
2014 | 1.00 | — | — | — | — | — | (1) | — | — | (1) | 1.00 | 0.02 | 146,938 | 0.09 | (2) | 0.63 | 0.02 | |||||||||||||||||||||||||||||||||||||||
2013 | 1.00 | — | — | — | — | — | (1) | — | — | (1) | 1.00 | 0.02 | 133,693 | 0.16 | (2) | 0.64 | 0.02 | |||||||||||||||||||||||||||||||||||||||
2012 | 1.00 | — | — | — | — | — | (1) | — | — | (1) | 1.00 | 0.05 | 120,664 | 0.09 | (2) | 0.64 | 0.05 | |||||||||||||||||||||||||||||||||||||||
2011 | 1.00 | — | — | — | — | — | (1) | — | — | (1) | 1.00 | 0.05 | 334,209 | 0.16 | (2) | 0.64 | 0.05 | |||||||||||||||||||||||||||||||||||||||
Class C |
| |||||||||||||||||||||||||||||||||||||||||||||||||||||||
2015 | $ | 1.00 | $ | — | $ | — | $ | — | $ | — | $ | — | (1) | $ | — | $ | — | (1) | $ | 1.00 | 0.02 | % | $ | 5,795 | 0.07 | %(2) | 0.83 | % | 0.02 | % | ||||||||||||||||||||||||||
2014 | 1.00 | — | — | — | — | — | (1) | — | — | (1) | 1.00 | 0.02 | 10,255 | 0.09 | (2) | 0.83 | 0.02 | |||||||||||||||||||||||||||||||||||||||
2013 | 1.00 | — | — | — | — | — | (1) | — | — | (1) | 1.00 | 0.02 | 12,552 | 0.16 | (2) | 0.84 | 0.02 | |||||||||||||||||||||||||||||||||||||||
2012 | 1.00 | — | — | — | — | — | (1) | — | — | (1) | 1.00 | 0.05 | 8,036 | 0.10 | (2) | 0.84 | 0.05 | |||||||||||||||||||||||||||||||||||||||
2011 | 1.00 | — | — | — | — | — | (1) | — | — | (1) | 1.00 | 0.05 | 55,406 | 0.17 | (2) | 0.84 | 0.05 | |||||||||||||||||||||||||||||||||||||||
Sweep Class |
| |||||||||||||||||||||||||||||||||||||||||||||||||||||||
2015 | $ | 1.00 | $ | — | $ | — | $ | — | $ | — | $ | — | (1) | $ | — | $ | — | (1) | $ | 1.00 | 0.02 | % | $ | 55,607 | 0.08 | %(2) | 1.08 | % | 0.02 | % | ||||||||||||||||||||||||||
2014 | 1.00 | — | — | — | — | — | (1) | — | — | (1) | 1.00 | 0.02 | 110,552 | 0.09 | (2) | 1.08 | 0.02 | |||||||||||||||||||||||||||||||||||||||
2013 | 1.00 | — | — | — | — | — | (1) | — | — | (1) | 1.00 | 0.02 | 35,137 | 0.16 | (2) | 1.09 | 0.02 | |||||||||||||||||||||||||||||||||||||||
2012 | 1.00 | — | — | — | — | — | (1) | — | — | (1) | 1.00 | 0.05 | 27,234 | 0.09 | (2) | 1.09 | 0.05 | |||||||||||||||||||||||||||||||||||||||
2011 | 1.00 | — | — | — | — | — | (1) | — | — | (1) | 1.00 | 0.05 | 25,158 | 0.16 | (2) | 1.09 | 0.05 | |||||||||||||||||||||||||||||||||||||||
Amounts designated as ‘‘—’’ are zero or have been rounded to zero.
| (1) | Amount represents less than $0.01 per share. |
| (2) | The Distributor and/or Administrator have voluntarily agreed to waive and reduce its fee and/or reimburse certain expenses of the Fund in order to limit the one-day net income yield of the Fund to not less than 0.01% of the Fund’s average daily net assets of the share class. Had these waivers expense been excluded the ratio would have been at the expense ratio cap figure. See Note 3 for expense ratio cap figure. |
| * | Per share calculations were performed using average shares. |
| † | Returns are for the period indicated and have not been annualized. Returns shown do not reflect the deduction of taxes that a shareholder would pay on Fund distributions or the redemption of Fund shares. |
The accompanying notes are an integral part of the financial statements.
| 60 | SEI Daily Income Trust / Annual Report / January 31, 2015 |
Net Asset Value, of Year | Net Investment Income* | Net Realized Unrealized | Payment by Affiliate | Total from Operations | Dividends from Net Investment | Distributions from Gains | Net Asset Value, End of Year | Total Return† | Net Assets End of Year ($ Thousands) | Ratio of Expenses to Average Net Assets | Ratio of Expenses to Average Net Assets (Excluding Waivers) | Ratio of Net Investment | ||||||||||||||||||||||||||||||||||||||||
Government II Fund |
| |||||||||||||||||||||||||||||||||||||||||||||||||||
Class A |
| |||||||||||||||||||||||||||||||||||||||||||||||||||
2015 | $ | 1.00 | $ | — | $ | — | $ | — | $ | — | $ | — | (1) | $ | — | $ | 1.00 | 0.01 | % | $ | 1,152,698 | 0.08 | %(2) | 0.53 | % | 0.01 | % | |||||||||||||||||||||||||
2014 | 1.00 | — | — | — | — | — | (1) | — | 1.00 | 0.01 | 1,246,262 | 0.09 | (2) | 0.53 | 0.01 | |||||||||||||||||||||||||||||||||||||
2013 | 1.00 | — | — | — | — | — | (1) | — | (1) | 1.00 | 0.01 | 1,237,205 | 0.12 | (2) | 0.54 | 0.01 | ||||||||||||||||||||||||||||||||||||
2012 | 1.00 | — | — | — | — | — | (1) | — | 1.00 | 0.01 | 1,308,018 | 0.09 | (2) | �� | 0.54 | 0.01 | ||||||||||||||||||||||||||||||||||||
2011 | 1.00 | — | — | — | — | — | (1) | — | 1.00 | 0.01 | 1,233,569 | 0.16 | (2) | 0.54 | 0.01 | |||||||||||||||||||||||||||||||||||||
Class B |
| |||||||||||||||||||||||||||||||||||||||||||||||||||
2015 | $ | 1.00 | $ | — | $ | — | $ | — | $ | — | $ | — | (1) | $ | — | $ | 1.00 | 0.01 | % | $ | 172,762 | 0.08 | %(2) | 0.58 | % | 0.01 | % | |||||||||||||||||||||||||
2014 | 1.00 | — | — | — | — | — | (1) | — | 1.00 | 0.01 | 173,727 | 0.09 | (2) | 0.58 | 0.01 | |||||||||||||||||||||||||||||||||||||
2013 | 1.00 | — | — | — | — | — | (1) | — | (1) | 1.00 | 0.01 | 204,630 | 0.12 | (2) | 0.59 | 0.01 | ||||||||||||||||||||||||||||||||||||
2012 | 1.00 | — | — | — | — | — | (1) | — | 1.00 | 0.01 | 166,481 | 0.09 | (2) | 0.59 | 0.01 | |||||||||||||||||||||||||||||||||||||
2011 | 1.00 | — | — | — | — | — | (1) | — | 1.00 | 0.01 | 119,864 | 0.16 | (2) | 0.59 | 0.01 | |||||||||||||||||||||||||||||||||||||
Class C |
| |||||||||||||||||||||||||||||||||||||||||||||||||||
2015 | $ | 1.00 | $ | — | $ | — | $ | — | $ | — | $ | — | (1) | $ | — | $ | 1.00 | 0.01 | % | $ | 16,658 | 0.08 | %(2) | 0.78 | % | 0.01 | % | |||||||||||||||||||||||||
2014 | 1.00 | — | — | — | — | — | (1) | — | 1.00 | 0.01 | 20,831 | 0.09 | (2) | 0.78 | 0.01 | |||||||||||||||||||||||||||||||||||||
2013 | 1.00 | — | — | — | — | — | (1) | — | (1) | 1.00 | 0.01 | 9,122 | 0.12 | (2) | 0.79 | 0.01 | ||||||||||||||||||||||||||||||||||||
2012 | 1.00 | — | — | — | — | — | (1) | — | 1.00 | 0.01 | 5,408 | 0.10 | (2) | 0.79 | 0.01 | |||||||||||||||||||||||||||||||||||||
2011 | 1.00 | — | — | — | — | — | (1) | — | 1.00 | 0.01 | 9,460 | 0.16 | (2) | 0.79 | 0.01 | |||||||||||||||||||||||||||||||||||||
Prime Obligation Fund |
| |||||||||||||||||||||||||||||||||||||||||||||||||||
Class A |
| |||||||||||||||||||||||||||||||||||||||||||||||||||
2015 | $ | 1.00 | $ | — | $ | — | $ | — | $ | — | $ | — | (1) | $ | — | $ | 1.00 | 0.01 | % | $ | 5,291,311 | 0.16 | %(2) | 0.53 | % | 0.01 | % | |||||||||||||||||||||||||
2014 | 1.00 | — | — | — | — | — | (1) | — | 1.00 | 0.01 | 4,208,216 | 0.17 | (2) | 0.53 | 0.01 | |||||||||||||||||||||||||||||||||||||
2013 | 1.00 | — | — | — | — | — | (1) | — | 1.00 | 0.07 | 3,714,719 | 0.20 | (2) | 0.54 | 0.07 | |||||||||||||||||||||||||||||||||||||
2012 | 1.00 | — | — | — | — | — | (1) | — | 1.00 | 0.04 | 4,107,485 | 0.20 | (2) | 0.54 | 0.04 | |||||||||||||||||||||||||||||||||||||
2011 | 1.00 | — | — | — | — | — | (1) | — | 1.00 | 0.11 | 3,144,153 | 0.20 | (2) | 0.54 | 0.12 | |||||||||||||||||||||||||||||||||||||
Class B |
| |||||||||||||||||||||||||||||||||||||||||||||||||||
2015 | $ | 1.00 | $ | — | $ | — | $ | — | $ | — | $ | — | (1) | $ | — | $ | 1.00 | 0.01 | % | $ | 83,497 | 0.16 | %(2) | 0.58 | % | 0.01 | % | |||||||||||||||||||||||||
2014 | 1.00 | — | — | — | — | — | (1) | — | 1.00 | 0.01 | 91,828 | 0.18 | (2) | 0.58 | 0.01 | |||||||||||||||||||||||||||||||||||||
2013 | 1.00 | — | — | — | — | — | (1) | — | 1.00 | 0.01 | 119,581 | 0.26 | (2) | 0.59 | 0.01 | |||||||||||||||||||||||||||||||||||||
2012 | 1.00 | �� | — | — | — | — | — | (1) | — | 1.00 | 0.01 | 135,978 | 0.23 | (2) | 0.59 | 0.01 | ||||||||||||||||||||||||||||||||||||
2011 | 1.00 | — | — | — | — | — | (1) | — | 1.00 | 0.01 | 135,319 | 0.31 | (2) | 0.59 | 0.01 | |||||||||||||||||||||||||||||||||||||
Class C |
| |||||||||||||||||||||||||||||||||||||||||||||||||||
2015 | $ | 1.00 | $ | — | $ | — | $ | — | $ | — | $ | — | (1) | $ | — | $ | 1.00 | 0.01 | % | $ | 22,711 | 0.16 | %(2) | 0.78 | % | 0.01 | % | |||||||||||||||||||||||||
2014 | 1.00 | — | — | — | — | — | (1) | — | 1.00 | 0.01 | 17,747 | 0.18 | (2) | 0.78 | 0.01 | |||||||||||||||||||||||||||||||||||||
2013 | 1.00 | — | — | — | — | — | (1) | — | 1.00 | 0.01 | 34,102 | 0.26 | (2) | 0.79 | 0.01 | |||||||||||||||||||||||||||||||||||||
2012 | 1.00 | — | — | — | — | — | (1) | — | 1.00 | 0.01 | 42,051 | 0.23 | (2) | 0.79 | 0.01 | |||||||||||||||||||||||||||||||||||||
2011 | 1.00 | — | — | — | — | — | (1) | — | 1.00 | 0.01 | 56,037 | 0.30 | (2) | 0.79 | 0.01 | |||||||||||||||||||||||||||||||||||||
Class H |
| |||||||||||||||||||||||||||||||||||||||||||||||||||
2015 | $ | 1.00 | $ | — | $ | — | $ | — | $ | — | $ | — | (1) | $ | — | $ | 1.00 | 0.01 | % | $ | 20,016 | 0.16 | %(2) | 0.71 | % | 0.01 | % | |||||||||||||||||||||||||
2014 | 1.00 | — | — | — | — | — | (1) | — | 1.00 | 0.01 | 20,801 | 0.18 | (2) | 0.71 | 0.01 | |||||||||||||||||||||||||||||||||||||
2013 | 1.00 | — | — | — | — | — | (1) | — | 1.00 | 0.01 | 25,429 | 0.26 | (2) | 0.72 | 0.01 | |||||||||||||||||||||||||||||||||||||
2012 | 1.00 | — | — | — | — | — | (1) | — | 1.00 | 0.01 | 25,646 | 0.23 | (2) | 0.72 | 0.01 | |||||||||||||||||||||||||||||||||||||
2011 | 1.00 | — | — | — | — | — | (1) | — | 1.00 | 0.01 | 24,405 | 0.30 | (2) | 0.72 | 0.01 | |||||||||||||||||||||||||||||||||||||
Sweep Class |
| |||||||||||||||||||||||||||||||||||||||||||||||||||
2015 | $ | 1.00 | $ | — | $ | — | $ | — | $ | — | $ | — | (1) | $ | — | $ | 1.00 | 0.01 | % | $ | 4,126 | 0.16 | %(2) | 1.03 | % | 0.01 | % | |||||||||||||||||||||||||
2014 | 1.00 | — | — | — | — | — | (1) | — | 1.00 | 0.01 | 3,990 | 0.18 | (2) | 1.03 | 0.01 | |||||||||||||||||||||||||||||||||||||
2013 | 1.00 | — | — | — | — | — | (1) | — | 1.00 | 0.01 | 3,169 | 0.26 | (2) | 1.04 | 0.01 | |||||||||||||||||||||||||||||||||||||
2012 | 1.00 | — | — | — | — | — | (1) | — | 1.00 | 0.01 | 4,170 | 0.23 | (2) | 1.04 | 0.01 | |||||||||||||||||||||||||||||||||||||
2011 | 1.00 | — | — | — | — | — | (1) | — | 1.00 | 0.01 | 4,710 | 0.30 | (2) | 1.04 | 0.01 | |||||||||||||||||||||||||||||||||||||
Amounts designated as ‘‘—’’ are zero or have been rounded to zero.
| (1) | Amount represents less than $0.01 per share. |
| (2) | The Distributor and/or Administrator have voluntarily agreed to waive and reduce its fee and/or reimburse certain expenses of the Fund in order to limit the one-day net income yield of the Fund to not less than 0.01% of the Fund’s average daily net assets of the share class. Had these waivers expense been excluded the ratio would have been at the expense ratio cap figure. See Note 3 for expense ratio cap figure. |
| * | Per share calculations were performed using average shares. |
| † | Returns are for the period indicated and have not been annualized. Returns shown do not reflect the deduction of taxes that a shareholder would pay on Fund distributions or the redemption of Fund shares. |
The accompanying notes are an integral part of the financial statements.
| SEI Daily Income Trust / Annual Report / January 31, 2015 | 61 |
Financial Highlights (Continued)
For the years ended January 31,
For a Share Outstanding Throughout the Years
Net Asset Value, of Year | Net Investment Income* | Net Realized Unrealized | Payment by Affiliate | Total from Operations | Dividends from Net Investment Income | Distributions from | Net Asset End of | Total Return† | Net Assets ($ Thousands) | Ratio of Expenses | Ratio of Expenses | Ratio of Net Investment | ||||||||||||||||||||||||||||||||||||||||
Treasury Fund |
| |||||||||||||||||||||||||||||||||||||||||||||||||||
Class A |
| |||||||||||||||||||||||||||||||||||||||||||||||||||
2015 | $ | 1.00 | $ | — | $ | — | $ | — | $ | — | $ | — | (1) | $ | — | $ | 1.00 | 0.01 | % | $ | 124,646 | 0.05 | %(2) | 0.58 | % | 0.01 | % | |||||||||||||||||||||||||
2014 | 1.00 | — | — | — | — | — | (1) | — | 1.00 | 0.01 | 46,315 | 0.08 | (2) | 0.58 | 0.01 | |||||||||||||||||||||||||||||||||||||
2013 | 1.00 | — | — | — | — | — | (1) | — | 1.00 | 0.01 | 82,339 | 0.14 | (2) | 0.59 | 0.01 | |||||||||||||||||||||||||||||||||||||
2012 | 1.00 | — | — | — | — | — | (1) | — | 1.00 | 0.01 | 199,520 | 0.08 | (2) | 0.59 | 0.01 | |||||||||||||||||||||||||||||||||||||
2011 | 1.00 | — | — | — | — | — | (1) | — | 1.00 | 0.02 | 175,749 | 0.18 | (2) | 0.59 | 0.02 | |||||||||||||||||||||||||||||||||||||
Class B |
| |||||||||||||||||||||||||||||||||||||||||||||||||||
2015 | $ | 1.00 | $ | — | $ | — | $ | — | $ | — | $ | — | (1) | $ | — | $ | 1.00 | 0.01 | % | $ | 84,632 | 0.05 | %(2) | 0.63 | % | 0.01 | % | |||||||||||||||||||||||||
2014 | 1.00 | — | — | — | — | — | (1) | — | 1.00 | 0.01 | 109,643 | 0.08 | (2) | 0.63 | 0.01 | |||||||||||||||||||||||||||||||||||||
2013 | 1.00 | — | — | — | — | — | (1) | — | 1.00 | 0.01 | 108,605 | 0.14 | (2) | 0.64 | 0.01 | |||||||||||||||||||||||||||||||||||||
2012 | 1.00 | — | — | — | — | — | (1) | — | 1.00 | 0.01 | 114,026 | 0.08 | (2) | 0.64 | 0.01 | |||||||||||||||||||||||||||||||||||||
2011 | 1.00 | — | — | — | — | — | (1) | — | 1.00 | 0.01 | 178,769 | 0.19 | (2) | 0.64 | 0.01 | |||||||||||||||||||||||||||||||||||||
Class C |
| |||||||||||||||||||||||||||||||||||||||||||||||||||
2015 | $ | 1.00 | $ | — | $ | — | $ | — | $ | — | $ | — | (1) | $ | — | $ | 1.00 | 0.01 | % | $ | 10,571 | 0.05 | %(2) | 0.83 | % | 0.01 | % | |||||||||||||||||||||||||
2014 | 1.00 | — | — | — | — | — | (1) | — | 1.00 | 0.01 | 12,254 | 0.08 | (2) | 0.83 | 0.01 | |||||||||||||||||||||||||||||||||||||
2013 | 1.00 | — | — | — | — | — | (1) | — | 1.00 | 0.01 | 10,983 | 0.14 | (2) | 0.84 | 0.01 | |||||||||||||||||||||||||||||||||||||
2012 | 1.00 | — | — | — | — | — | (1) | — | 1.00 | 0.01 | 6,984 | 0.08 | (2) | 0.84 | 0.01 | |||||||||||||||||||||||||||||||||||||
2011 | 1.00 | — | — | — | — | — | (1) | — | 1.00 | 0.01 | 10,948 | 0.18 | (2) | 0.84 | 0.01 | |||||||||||||||||||||||||||||||||||||
Sweep Class |
| |||||||||||||||||||||||||||||||||||||||||||||||||||
2015 | $ | 1.00 | $ | — | $ | — | $ | — | $ | — | $ | — | (1) | $ | — | $ | 1.00 | 0.01 | % | $ | 120,576 | 0.05 | %(2) | 1.08 | % | 0.01 | % | |||||||||||||||||||||||||
2014 | 1.00 | — | — | — | — | — | (1) | — | 1.00 | 0.01 | 126,354 | 0.08 | (2) | 1.08 | 0.01 | |||||||||||||||||||||||||||||||||||||
2013 | 1.00 | — | — | — | — | — | (1) | — | 1.00 | 0.01 | 126,593 | 0.14 | (2) | 1.09 | 0.01 | |||||||||||||||||||||||||||||||||||||
2012 | 1.00 | — | — | — | — | — | (1) | — | 1.00 | 0.01 | 137,336 | 0.08 | (2) | 1.09 | 0.01 | |||||||||||||||||||||||||||||||||||||
2011 | 1.00 | — | — | — | — | — | (1) | — | 1.00 | 0.01 | 129,514 | 0.19 | (2) | 1.09 | 0.01 | |||||||||||||||||||||||||||||||||||||
Treasury II Fund |
| |||||||||||||||||||||||||||||||||||||||||||||||||||
Class A |
| |||||||||||||||||||||||||||||||||||||||||||||||||||
2015 | $ | 1.00 | $ | — | $ | — | $ | — | $ | — | $ | — | (1) | $ | — | $ | 1.00 | 0.01 | % | $ | 491,209 | 0.04 | %(2) | 0.58 | % | 0.01 | % | |||||||||||||||||||||||||
2014 | 1.00 | — | — | — | — | — | (1) | — | 1.00 | 0.01 | 440,422 | 0.06 | (2) | 0.58 | 0.01 | |||||||||||||||||||||||||||||||||||||
2013 | 1.00 | — | — | — | — | — | (1) | — | (1) | 1.00 | 0.01 | 460,590 | 0.08 | (2) | 0.59 | 0.01 | ||||||||||||||||||||||||||||||||||||
2012 | 1.00 | — | — | — | — | — | (1) | — | 1.00 | 0.01 | 472,352 | 0.05 | (2) | 0.59 | 0.01 | |||||||||||||||||||||||||||||||||||||
2011 | 1.00 | — | — | — | — | — | (1) | — | 1.00 | 0.01 | 287,823 | 0.12 | (2) | 0.59 | 0.01 | |||||||||||||||||||||||||||||||||||||
Class B |
| |||||||||||||||||||||||||||||||||||||||||||||||||||
2015 | $ | 1.00 | $ | — | $ | — | $ | — | $ | — | $ | — | (1) | $ | — | $ | 1.00 | 0.01 | % | $ | 199,889 | 0.04 | %(2) | 0.63 | % | 0.01 | % | |||||||||||||||||||||||||
2014 | 1.00 | — | — | — | — | — | (1) | — | 1.00 | 0.01 | 247,836 | 0.06 | (2) | 0.63 | 0.01 | |||||||||||||||||||||||||||||||||||||
2013 | 1.00 | — | — | — | — | — | (1) | — | (1) | 1.00 | 0.01 | 330,880 | 0.08 | (2) | 0.64 | 0.01 | ||||||||||||||||||||||||||||||||||||
2012 | 1.00 | — | — | — | — | — | (1) | — | 1.00 | 0.01 | 395,099 | 0.05 | (2) | 0.64 | 0.01 | |||||||||||||||||||||||||||||||||||||
2011 | 1.00 | — | — | — | — | — | (1) | — | 1.00 | 0.01 | 178,037 | 0.12 | (2) | 0.64 | 0.01 | |||||||||||||||||||||||||||||||||||||
Class C |
| |||||||||||||||||||||||||||||||||||||||||||||||||||
2015 | $ | 1.00 | $ | — | $ | — | $ | — | $ | — | $ | — | (1) | $ | — | $ | 1.00 | 0.01 | % | $ | 4,169 | 0.04 | %(2) | 0.83 | % | 0.01 | % | |||||||||||||||||||||||||
2014 | 1.00 | — | — | — | — | — | (1) | — | 1.00 | 0.01 | 15,446 | 0.06 | (2) | 0.83 | 0.01 | |||||||||||||||||||||||||||||||||||||
2013 | 1.00 | — | — | — | — | — | (1) | — | (1) | 1.00 | 0.01 | 5,982 | 0.08 | (2) | 0.84 | 0.01 | ||||||||||||||||||||||||||||||||||||
2012 | 1.00 | — | — | — | — | — | (1) | — | 1.00 | 0.01 | 5,924 | 0.05 | (2) | 0.84 | 0.01 | |||||||||||||||||||||||||||||||||||||
2011 | 1.00 | — | — | — | — | — | (1) | — | 1.00 | 0.01 | 6,183 | 0.12 | (2) | 0.84 | 0.01 | |||||||||||||||||||||||||||||||||||||
| Amounts | designated as ‘‘—’’ are zero or have been rounded to zero. |
| (1) | Amount represents less than $0.01 per share. |
| (2) | The Distributor and/or Administrator have voluntarily agreed to waive and reduce its fee and/or reimburse certain expenses of the Fund in order to limit the one-day net income yield of the Fund to not less than 0.01% of the Fund’s average daily net assets of the share class. Had these waivers expense been excluded the ratio would have been at the expense ratio cap figure. See Note 3 for expense ratio cap figure. |
| * | Per share calculations were performed using average shares. |
| † | Returns are for the period indicated and have not been annualized. Returns shown do not reflect the deduction of taxes that a shareholder would pay on Fund distributions or the redemption of Fund shares. |
| The | accompanying notes are an integral part of the financial statements. |
| 62 | SEI Daily Income Trust / Annual Report / January 31, 2015 |
Net Asset Value, of Period | Net Investment Income* | Net Realized Unrealized | Payment by Affiliate | Total from Operations | Dividends from Net Investment Income | Distributions from Realized Capital Gains | Total Dividends and Distributions | Net Asset Value, End of Period | Total Return† | Net Assets ($ Thousands) | Ratio of Expenses to Average Net Assets | Ratio of Expenses to Average Net Assets (Excluding Waivers) | Ratio of Net Investment Income to Average Net Assets | Portfolio Turnover Rate | ||||||||||||||||||||||||||||||||||||||||||||||
Ultra Short Duration Bond Fund |
| |||||||||||||||||||||||||||||||||||||||||||||||||||||||||||
Class A |
| |||||||||||||||||||||||||||||||||||||||||||||||||||||||||||
2015 | $ | 9.35 | $ | 0.06 | $ | — | $ | — | $ | 0.06 | $ | (0.08 | ) | $ | — | $ | (0.08 | ) | $ | 9.33 | 0.60 | % | $ | 255,614 | 0.38 | % | 0.72 | % | 0.61 | % | 106 | % | ||||||||||||||||||||||||||||
2014 | 9.37 | 0.06 | — | — | 0.06 | (0.08 | ) | — | (0.08 | ) | 9.35 | 0.64 | 271,221 | 0.38 | 0.73 | 0.63 | 131 | |||||||||||||||||||||||||||||||||||||||||||
2013 | 9.26 | 0.08 | 0.13 | — | 0.21 | (0.10 | ) | — | (0.10 | ) | 9.37 | 2.31 | 241,007 | 0.38 | 0.74 | 0.85 | 197 | |||||||||||||||||||||||||||||||||||||||||||
2012 | 9.33 | 0.10 | (0.05 | ) | — | 0.05 | (0.12 | ) | — | (0.12 | ) | 9.26 | 0.55 | 255,002 | 0.38 | 0.74 | 1.08 | 177 | ||||||||||||||||||||||||||||||||||||||||||
2011 | 9.24 | 0.13 | 0.12 | — | 0.25 | (0.16 | ) | — | (0.16 | ) | 9.33 | 2.74 | 465,612 | 0.38 | 0.74 | 1.37 | 78 | |||||||||||||||||||||||||||||||||||||||||||
Short-Duration Government Fund |
| |||||||||||||||||||||||||||||||||||||||||||||||||||||||||||
Class A |
| |||||||||||||||||||||||||||||||||||||||||||||||||||||||||||
2015 | $ | 10.52 | $ | 0.09 | $ | 0.04 | $ | — | $ | 0.13 | $ | (0.10 | ) | $ | — | $ | (0.10 | ) | $ | 10.55 | 1.20 | % | $ | 661,101 | 0.48 | % | 0.73 | % | 0.85 | % | 151 | % | ||||||||||||||||||||||||||||
2014 | 10.62 | 0.06 | (0.06 | ) | — | 0.00 | (0.10 | ) | — | (0.10 | ) | 10.52 | (0.01 | ) | 761,739 | 0.48 | 0.73 | 0.56 | 565 | |||||||||||||||||||||||||||||||||||||||||
2013 | 10.72 | 0.06 | 0.04 | — | 0.10 | (0.10 | ) | (0.10 | ) | (0.20 | ) | 10.62 | 0.92 | 711,100 | 0.48 | 0.74 | 0.55 | 628 | ||||||||||||||||||||||||||||||||||||||||||
2012 | 10.59 | 0.09 | 0.17 | — | 0.26 | (0.12 | ) | (0.01 | ) | (0.13 | ) | 10.72 | 2.53 | 739,126 | 0.48 | 0.74 | 0.85 | 712 | ||||||||||||||||||||||||||||||||||||||||||
2011 | 10.52 | 0.09 | 0.18 | — | 0.27 | (0.14 | ) | (0.06 | ) | (0.20 | ) | 10.59 | 2.59 | 867,313 | 0.48 | 0.72 | 0.84 | 521 | ||||||||||||||||||||||||||||||||||||||||||
Class Y |
| |||||||||||||||||||||||||||||||||||||||||||||||||||||||||||
2015(2) | $ | 10.50 | $ | 0.01 | $ | 0.05 | $ | — | $ | 0.06 | $ | (0.01 | ) | $ | — | $ | (0.01 | ) | $ | 10.55 | 0.54 | % | $ | 55,017 | 0.38 | % | 0.46 | % | 0.97 | % | 151 | % | ||||||||||||||||||||||||||||
Intermediate-Duration Government Fund |
| |||||||||||||||||||||||||||||||||||||||||||||||||||||||||||
Class A |
| |||||||||||||||||||||||||||||||||||||||||||||||||||||||||||
2015 | $ | 11.63 | $ | 0.28 | $ | 0.16 | $ | — | $ | 0.44 | $ | (0.29 | ) | $ | — | $ | (0.29 | ) | $ | 11.78 | 3.88 | % | $ | 20,254 | 0.53 | % | 0.77 | % | 2.04 | % | 121 | % | ||||||||||||||||||||||||||||
2014 | 11.89 | 0.19 | (0.21 | ) | — | (0.02 | ) | (0.24 | ) | — | (0.24 | ) | 11.63 | (0.14 | ) | 24,713 | 0.53 | 0.72 | 1.64 | 373 | ||||||||||||||||||||||||||||||||||||||||
2013 | 11.91 | 0.16 | 0.03 | — | 0.19 | (0.21 | ) | — | (0.21 | ) | 11.89 | 1.63 | 37,523 | 0.53 | 0.73 | 1.33 | 740 | |||||||||||||||||||||||||||||||||||||||||||
2012 | 11.32 | 0.17 | 0.64 | — | 0.81 | (0.22 | ) | — | (1) | (0.22 | ) | 11.91 | 7.22 | 71,458 | 0.53 | 0.74 | 1.47 | 726 | ||||||||||||||||||||||||||||||||||||||||||
2011 | 11.24 | 0.13 | 0.39 | — | 0.52 | (0.19 | ) | (0.25 | ) | (0.44 | ) | 11.32 | 4.62 | 187,944 | 0.53 | 0.72 | 1.14 | 590 | ||||||||||||||||||||||||||||||||||||||||||
GNMA Fund |
| |||||||||||||||||||||||||||||||||||||||||||||||||||||||||||
Class A |
| |||||||||||||||||||||||||||||||||||||||||||||||||||||||||||
2015 | $ | 10.50 | $ | 0.11 | $ | 0.49 | $ | — | $ | 0.60 | $ | (0.17 | ) | $ | — | $ | (0.17 | ) | $ | 10.93 | 5.79 | % | $ | 117,904 | 0.63 | % | 0.69 | % | 1.07 | % | 758 | % | ||||||||||||||||||||||||||||
2014 | 10.70 | 0.07 | (0.09 | ) | — | (0.02 | ) | (0.18 | ) | — | (0.18 | ) | 10.50 | (0.14 | ) | 158,672 | 0.63 | 0.69 | 0.68 | 758 | ||||||||||||||||||||||||||||||||||||||||
2013 | 10.91 | 0.09 | 0.13 | — | 0.22 | (0.19 | ) | (0.24 | ) | (0.43 | ) | 10.70 | 1.98 | 304,425 | 0.63 | 0.70 | 0.83 | 867 | ||||||||||||||||||||||||||||||||||||||||||
2012 | 10.58 | 0.02 | 0.83 | — | 0.85 | (0.13 | ) | (0.39 | ) | (0.52 | ) | 10.91 | 8.09 | 243,016 | 0.63 | 0.70 | 0.22 | 1,515 | ||||||||||||||||||||||||||||||||||||||||||
2011 | 10.28 | 0.13 | 0.49 | — | 0.62 | (0.16 | ) | (0.16 | ) | (0.32 | ) | 10.58 | 6.06 | 334,415 | 0.63 | 0.70 | 1.27 | 1,024 | ||||||||||||||||||||||||||||||||||||||||||
| Amounts | designated as ‘‘—’’ are zero or have been rounded to zero. |
| (1) | Amount represents less than $.001 per share. |
| (2) | Commenced operations on December 31, 2014. |
| * | Per share calculations were performed using average shares. |
| † | Returns are for the period indicated and have not been annualized. Returns shown do not reflect the deduction of taxes that a shareholder would pay on Fund distributions or the redemption of Fund shares. |
| The | accompanying notes are an integral part of the financial statements. |
| SEI Daily Income Trust / Annual Report / January 31, 2015 | 63 |
January 31, 2015
1. ORGANIZATION
SEI Daily Income Trust (the “Trust”) was organized as a Massachusetts business trust under a Declaration of Trust dated March 15, 1982.
The Trust is registered under the Investment Company Act of 1940, as amended, as a diversified, open-end investment company with ten operational Funds: the Money Market, Government, Government II, Prime Obligation, Treasury and Treasury II (each a “Fund,” collectively, the “Money Market Funds”), the Ultra Short Duration Bond Class A, Short-Duration Government Class A and Y, Intermediate-Duration Government Class A and GNMA Class A (each a “Fund,” collectively, the “Fixed Income Funds”). The Trust is registered to offer: Class A shares of the Funds; Class B and Class C shares of the Money Market, Prime Obligation, Government, Government II, Treasury and Treasury II Funds; Class H shares of the Prime Obligation Fund; and Sweep Class shares of the Money Market, Government, Prime Obligation and Treasury Funds. The assets of each Fund are segregated, and a shareholder’s interest is limited to the Fund in which shares are held. The Funds’ prospectuses provide a description of each Fund’s investment objective and strategies.
2. SIGNIFICANT ACCOUNTING POLICIES
The following is a summary of significant accounting policies followed by the Funds.
Use of Estimates — The preparation of financial statements, in conformity with U.S. generally accepted accounting principles (“U.S. GAAP”), requires management to make estimates and assumptions that affect the reported amount of assets and liabilities and disclosure of contingent assets and liabilities at the date of the financial statements and the reported amounts of increases and decreases in net assets from operations during the reporting period. Actual results could differ from those estimates.
Security Valuation — Investment securities of the Money Market Funds are stated at amortized cost, which approximates market value. Under this valuation method, purchase discounts and premiums are accreted and amortized ratably to maturity and are included in interest income. The Fund’s use of amortized cost is subject to its compliance with certain conditions as specified by Rule 2a-7 of the 1940 Act.
Investment securities of the Fixed Income Funds listed on a securities exchange, market or automated quotation system for which quotations are readily available are valued at the last quoted sale price on the primary exchange or market on which they are traded, or, if there is no such reported sale, at the most recent quoted bid price. If available, debt securities are priced based upon valuations provided by independent third-party pricing agents. Such values generally reflect the last reported sales price if the security is actively traded. The third party pricing agents may also value debt securities at an evaluated bid price by employing methodologies that utilize actual market transactions, broker-supplied valuations, or other methodologies designed
to identify the market value for such securities. Debt obligations with remaining maturities of sixty days or less may be valued at their amortized cost, which approximates market value. Prices for most securities held in the Funds are provided daily by recognized independent pricing agents. If a security price cannot be obtained from an independent third-party pricing agent, the Fixed Income Funds seek to obtain a bid price from at least one independent broker.
Securities for which market prices are not “readily available” are valued in accordance with Fair Value Procedures established by the Trust’s Board of Trustees. The Trust’s Fair Value Procedures are implemented through a Fair Value Committee (the “Committee”) designated by the Funds’ Board of Trustees. Some of the more common reasons that may necessitate that a security be valued using Fair Value Procedures include: the security’s trading has been halted or suspended; the security has been de-listed from a national exchange; the security’s primary trading market is temporarily closed at a time when under normal conditions it would be open; or the security’s primary pricing source is not able or willing to provide a price. When a security is valued in accordance with the Fair Value Procedures, the Committee will determine the value after taking into consideration relevant information reasonably available to the Committee. As of January 31, 2015, there were no fair valued securities held by the Funds.
In accordance with U.S. GAAP, fair value is defined as the price that a Fund would receive upon selling an investment in an orderly transaction to an independent buyer in the principal or most advantageous market of the investment. A three tier hierarchy has been established to maximize the use of observable and minimize the use of unobservable inputs and to establish classification of fair value measurements for disclosure purposes. Inputs refer broadly to the assumptions that market participants would use in pricing an asset. Inputs may be observable or unobservable. Observable inputs are inputs that reflect the assumptions market participants would use in pricing the asset or liability based on market data obtained from sources independent of the reporting entity. Unobservable inputs are inputs that reflect the reporting entity’s own assumptions about the assumptions market participants would use in pricing the asset or liability based on the best information available in the circumstances.
The three-tier hierarchy of inputs is summarized in the three broad Levels listed below:
Level 1 — Unadjusted quoted prices in active markets for identical, unrestricted assets or liabilities that the Fund has the ability to access at the measurement date;
Level 2 — Quoted prices which are not active, or inputs that are observable (either directly or indirectly) for substantially the full term of the asset or liability; and
Level 3 — Prices, inputs or exotic modeling techniques which are both significant to the fair value measurement and unobservable (supported by little or no market activity).
| 64 | SEI Daily Income Trust / Annual Report / January 31, 2015 |
Investments are classified within the level of the lowest significant input considered in determining fair value. Investments classified within Level 3 whose fair value measurement considers several inputs may include Level 1 or Level 2 inputs as components of the overall fair value measurement.
For the fiscal year ended January 31, 2015, there have been no significant changes to the Trust’s fair valuation methodologies.
Security Transactions and Investment Income — Security transactions are recorded on the trade date. Costs used in determining net realized capital gains and losses on the sale of securities are on the basis of specific identification. Dividend income is recognized on the ex-dividend date, and interest income is recognized using the accrual basis of accounting. Income from payment-in-kind securities is recorded daily based on the effective interest method of accrual.
Distributions received on securities that represent a return of capital or capital gain are recorded as a reduction of cost of investments and/or as a realized gain. The Trust estimates the components of distributions received that may be considered nontaxable distributions or capital gain distributions.
For the Fixed Income Funds, amortization and accretion is calculated using the scientific interest method, which approximates the effective interest method over the holding period of the security. Amortization of premiums and discounts is included in interest income.
For the Money Market Funds, all amortization is calculated using the straight line method over the holding period of the security. Amortization of premiums and accretion of discounts are included in interest income.
Repurchase Agreements — To the extent consistent with its investment objective and strategies, securities pledged as collateral for repurchase agreements are held by each Fund’s custodian bank until the repurchase date of the repurchase agreement. The Funds also invest in tri-party repurchase agreements. Securities held as collateral for tri-party repurchase agreements are maintained by the broker’s custodian bank in a segregated account until the repurchase date of the repurchase agreement. Provisions of the repurchase agreements and the Trust’s policies require that the market value of the collateral, including accrued interest thereon, is sufficient in the event of default by the counterparty. If the counterparty defaults and the value of the collateral declines, or if the counterparty enters into an insolvency proceeding, realization of the collateral by the Funds may be delayed or limited.
It is the Funds’ policy to present the repurchase agreements contracts separately on the Statements of Assets and Liabilities, as the Funds do not have a master netting agreement with the counterparty to the repurchase agreements contracts. Refer to each Fund’s Schedule of Investments for details regarding repurchase agreements contracts as of January 31, 2015, if applicable.
Futures Contracts — To the extent consistent with its investment objective and strategies, the Fixed Income Funds utilized futures contracts during the fiscal year ended January 31, 2015. These Funds’ investments in futures contracts are designed to enable the Funds to more closely approximate the performance of their benchmark indices. The Funds chose to invest in futures contracts for tactical hedging purposes as well as to enhance the Funds’ returns. Initial margin deposits of cash or securities are made upon entering into futures contracts. The contracts are marked to market daily and the resulting changes in value are accounted for as unrealized gains and losses. Variation margin payments are paid or received, depending upon whether unrealized gains or losses are incurred. When the contract is closed, the Funds record a realized gain or loss equal to the difference between the proceeds from (or cost of) the closing transaction and the amount invested in the contract.
Risks of entering into futures contracts include the possibility that there will be an imperfect price correlation between the futures and the underlying securities. Second, it is possible that a lack of liquidity for futures contracts could exist in the secondary market, resulting in an inability to close a position prior to its maturity date. Third, the futures contract involves the risk that the Funds could lose more than the original margin deposit required to initiate a futures transaction.
Finally, the risk exists that losses could exceed amounts disclosed on the Statements of Assets and Liabilities.
It is the Funds’ policy to present the gross variation margin payable and the gross variation margin receivable of the future contracts separately on the Statements of Assets and Liabilities, as the Funds do not have a master netting agreement with the counterparty to the futures contracts. Refer to each Fund’s Schedule of Investments for details regarding open future contracts as of January 31, 2015, if applicable. The fair value of interest rate futures contracts held in the Fixed Income Funds can be found on the Statements of Assets and Liabilities under the captions Receivable for Variation Margin and Payable for Variation Margin. Only current day’s variation margin is reported within the Statements of Assets and Liabilities. Cumulative appreciation/ depreciation of futures contracts are reported in the respective Fixed Income Funds’ Schedule of Investments. Realized gains or losses on interest rate futures contracts related to the Fixed Income Funds are recognized on the Statements of Operations as part of Net Realized Gain (Loss) on Futures Contracts and any change in unrealized appreciation or depreciation is recognized on the Statements of Operations as Net Unrealized Gain (Loss) on Futures Contracts.
Swap Agreements — To the extent consistent with its investment objective and strategies, a Fund’s investment in swap contracts is mainly used as an efficient means to take and manage risk in the portfolio, including interest rate risk, credit risk and overall yield sensitivity. A swap agreement is a two-party contract under which an agreement is made to exchange returns from predetermined investments or
| SEI Daily Income Trust / Annual Report / January 31, 2015 | 65 |
Notes to Financial Statements (Continued)
January 31, 2015
instruments, including a particular interest rate, foreign currency, or “basket” of securities representing a particular index. Interest rate swaps involve the exchange by a Fund with another party of their respective commitments to pay or receive interest (e.g., an exchange of floating rate payments for fixed rate payments) with respect to a notional amount of principal. Credit-default swaps involve periodic payments by a Fund or counterparty based on a specified rate multiplied by a notional amount assigned to an underlying debt instrument or group of debt instruments in exchange for the assumption of credit risk on the same instruments. In the event of a credit event, usually in the form of a credit rating downgrade, the party receiving periodic payments (i.e. floating rate payer) must pay the other party (i.e. fixed rate payer) an amount equal to the recovery rate used to settle the contracts. The recovery rate is a function of how many credit default swap investors wish to deliver the security or receive the security. The recovery rate is determined through an auction process. Total return swaps allow an investor to benefit from the cash flow without ever actually owning the underlying security. The receiver must pay any decline in value to the payer at the end of the total return swap. However, the investor does not need to make a payment if there is no decline in price. Payments can be made on various indices, bonds (i.e. mortgage backed securities, bank debt and corporate), loans or commodities. The value of a total return swap is equal to the change in value of the underlying asset versus the accrued income payment based on LIBOR or some other form of indices on the notional amount. Interest rate swaps involve the exchange by a Fund with another party of their respective commitments to pay or receive interest (e.g., an exchange of floating rate payments for fixed rate payments) with respect to a notional amount of principal to manage a Fund’s exposure to interest rates. Payments received or made are recorded as realized gains or loss. A Fund could be exposed to credit or market risk due to unfavorable changes in the fluctuation of interest rates or if the counterparty defaults on its obligation to perform. Risk of loss may exceed amounts recognized on the statement of assets and liabilities. Interest rate swap contracts outstanding at period end, if any, are listed after a Fund’s portfolio. In connection with swap agreements securities may be set aside as collateral by a Fund’s custodian. A Fund may enter into swap agreements in order to, among other things, change the maturity or duration of the investment portfolio, to protect a Fund’s value from changes in interest rates, or to expose a Fund to a different security or market.
Swaps are marked-to-market daily based upon quotations from market makers and the resulting changes in market values, if any, are recorded as an unrealized gain or loss in the Statement of Operations. Net payments of interest are recorded as realized gains or losses.
Entering into swap agreements involves, to varying degrees, elements of credit and market risk in excess of the amounts recognized on the Statements of Assets and Liabilities. Such risks involve the possibility that there will be no liquid market for these agreements, that the counterparty to the agreement may default on its obligation to perform
and that there may be unfavorable changes in the fluctuation of interest rates. Risks also arise from potential losses from adverse market movements.
This risk is mitigated by having a master netting arrangement between a Fund and the counterparty and by having the counterparty post collateral to cover a Fund’s exposure to the counterparty. There were no outstanding swap agreements as of January 31, 2015.
Options Written/Purchased — To the extent consistent with its Investment Objective and Strategies, a Fund may invest in financial options contracts to add return or to hedge their existing portfolio securities. When the Fund writes or purchases an option, an amount equal to the premium received or paid by the Fund is recorded as a liability or an asset and is subsequently adjusted to the current market value of the option written or purchased. Premiums received or paid from purchasing or writing options which expire unexercised are treated by the Fund on the expiration date as realized gains or losses. The difference between the premium and the amount paid or received on effecting a closing purchase or sale transaction, including brokerage commissions, is also treated as a realized gain or loss. If an option is exercised, the premium paid or received is added to the cost of the purchase or proceeds from the sale in determining whether the Fund has realized a gain or a loss. The risk in writing a call option is that the Fund gives up the opportunity for profit if the market price of the security increases. The risk in writing a put option is that the Fund may incur a loss if the market price of the security decreases and the option is exercised. The risk in purchasing an option is that the Fund pays a premium whether or not the option is exercised. The Fund also has the additional risk of being unable to enter into a closing transaction at an acceptable price if a liquid secondary market does not exist. Option contracts also involve the risk that they may not work as intended due to unanticipated developments in market conditions or other causes. Finally, the risk exists that losses could exceed amounts disclosed on the Statement of Assets and Liabilities. There were no outstanding options contracts as of January 31, 2015.
TBA Purchase Commitments — To the extent consistent with its Investment Objective and Strategies, a Fixed Income Fund may engage in “to be announced” (“TBA”) purchase commitments to purchase securities for a fixed price at a future date. TBA purchase commitments may be considered securities and involve a risk of loss if the value of the security to be purchased declines prior to settlement date, which risk is in addition to the risk of decline in the value of a Fund’s other assets. Unsettled TBA purchase commitments are valued at the current market value of the underlying securities, according to the procedures described under “Security Valuation” above.
Collateralized Debt Obligations — To the extent consistent with its Investment Objective and Strategies, a Fund may invest in collateralized debt obligations (“CDOs”), which include collateralized loan obligations (“CLOs”) and other similarly structured securities. CLOs are a type of asset-backed securities. A CLO is a trust typically collateralized
| 66 | SEI Daily Income Trust / Annual Report / January 31, 2015 |
by a pool of loans, which may include, among others, domestic and foreign senior secured loans, senior unsecured loans, and subordinate corporate loans, including loans that may be rated below investment grade or equivalent unrated loans. CDOs may charge management fees and administrative expenses.
For CDOs and CLOs, the cash flows from the trust are split into two or more portions, called tranches, varying in risk and yield. The riskiest portion is the “equity” tranche which bears the bulk of defaults from the bonds or loans in the trust and serves to protect the other, more senior tranches from default in all but the most severe circumstances. Since it is partially protected from defaults, a senior tranche from a CDO and CLO trust typically has a higher rating and lower yield than its underlying securities, and can be rated investment grade. Despite the protection from the equity tranche, CDO and CLO tranches can experience substantial losses due to actual defaults, increased sensitivity to defaults due to collateral default and disappearance of protecting tranches, market anticipation of defaults, as well as aversion to CDO and CLO securities as a class.
The risks of an investment in a CDO and CLO depend largely on its class and its collateral securities. Normally, CLOs and other CDOs are privately offered and sold, and thus, are not registered under the securities laws. As a result, investments in CDOs and CLOs may be characterized by the Funds as illiquid securities; however, an active dealer market may exist for CDOs and CLOs, allowing a CDO and CLO to qualify for Rule 144A transactions. In addition to the normal risks associated with fixed income securities (e.g., interest rate risk and default risk), CDOs and CLOs carry additional risks including, but not limited to: (i) the possibility that distributions from collateral securities will not be adequate to make interest or other payments; (ii) the quality of the collateral may decline in value or default; (iii) the Funds may invest in CDOs and CLOs that are subordinate to other classes; and (iv) the complex structure of the security may not be fully understood at the time of investment and may produce disputes with the issuer or unexpected investment results.
Illiquid Securities — A security is considered illiquid if it cannot be sold or disposed of in the ordinary course of business within seven days or less for its approximate carrying value on the books of a Fund. Valuations of illiquid securities may differ significantly from the values that would have been used had an active market value for these securities existed.
Restricted Securities — Throughout the year, the Funds owned private placement investments that were purchased through private offerings or acquired through initial public offerings that could not be sold without prior registration under the Securities Act of 1933 or pursuant to an exemption there from. In addition, the Funds had generally agreed to further restrictions on the disposition of certain holdings as set forth in various agreements entered into in connection with the purchase of those investments. These investments were valued at amortized cost, which approximates fair value, as determined in
accordance with the procedures approved by the Board of Trustees. At January 31, 2015, the Funds did not own any restricted securities.
Classes — Class-specific expenses are borne by that class of shares. Income, expenses, and realized and unrealized gains/losses and non-class specific expenses are allocated to the respective class on the basis of relative daily net assets.
Expenses — Expenses that are directly related to one of the Funds are charged directly to that Fund. Other operating expenses of the Funds are prorated to the Funds on the basis of relative net assets.
Dividends and Distributions to Shareholders — Dividends from net investment income are declared daily and paid monthly. Any net realized capital gains on sales of securities after capital loss carryover are distributed at least annually by the Funds.
Redemption Fees — The Funds charge a redemption fee based on a redemption, or a series of redemptions from a single identifiable source that in the aggregate exceed a specified dollar threshold within any thirty day period, as presented below:
Dollar Threshold ($ Thousands) | Redemption Fee | |||||||
Ultra Short Duration Bond Fund | $ | 10,000 | 0.50 | % | ||||
Short-Duration Government Fund | 25,000 | 0.25 | % | |||||
Intermediate-Duration Government Fund | 10,000 | 0.25 | % | |||||
GNMA Fund | 10,000 | 0.25 | % | |||||
For the year ended January 31, 2015, the Fixed Income Funds did not retain any redemption fees. Such fees, if any, are retained by the Fixed Income Funds for the benefit of the remaining shareholders.
3. INVESTMENT ADVISORY, ADMINISTRATION, DISTRIBUTION AND CUSTODIAN AGREEMENTS AND OTHER TRANSACTIONS WITH AFFILIATES
Investment Advisory, Administration, Distribution and Custodian Agreements — SEI Investments Management Corporation (“SIMC”) serves as each Fund’s investment adviser (the “Adviser”) and “manager of managers” under an investment advisory agreement approved by the shareholders of each Fund. In connection with serving as Adviser, SIMC is entitled to a fee, which is calculated daily and paid monthly, based on the average daily net assets of each Fund. SEI Investments Global Funds Services (the “Administrator”) provides the Trust with administrative and transfer agency services. For its services, the Administrator is entitled to a fee, which is calculated daily and paid monthly, based on the average daily net assets of each Fund.
SEI Investments Distribution Co. (the “Distributor”), a wholly owned subsidiary of SEI Investments Company (“SEI”) and a registered broker-dealer, acts as the Distributor of the shares of the Trust under a Distribution Agreement. The Trust also has adopted plans under which firms, including the Distributor, that provide shareholder and administrative services may receive compensation thereof. Specific classes of certain funds have also adopted distribution plans, pursuant to Rule 12b-1 under the Investment Company Act of 1940.
| SEI Daily Income Trust / Annual Report / January 31, 2015 | 67 |
Notes to Financial Statements (Continued)
January 31, 2015
Such plans provide fees payable to the Distributor up to the amounts, calculated as a percentage of the average daily net assets attributable to each particular class of each respective fund.
The Adviser, Administrator and/or Distributor have voluntarily agreed to waive a portion of their fees in order to keep total direct operating expenses (exclusive of interest from borrowings, brokerage commissions, taxes, Trustee fees, prime broker fees, interest and dividend expenses related to short sales and extraordinary expenses not incurred in the ordinary course of the Funds’ business) at a specified level.
The waivers by the Funds’ Adviser, Administrator and/or Distributor are limited to the Funds’ direct operating expenses and, therefore, do not apply to indirect expenses incurred by the Funds, such as acquired fund fees and expenses. The waivers are voluntary and the Funds’ Adviser, Administrator and/or Distributor may discontinue all or part of any of these waivers at any time. In addition, some Funds may participate in a commission recapture program where the Funds’ trades may be executed through the Funds’ distributor, and a portion of the commissions paid on those trades are then used to pay the Funds’ expenses.
The following is a summary of annual fees payable to the Adviser, Administrator and Distributor and the voluntary expense limitations for each fund:
| Advisory Fees | Administration Fees | Shareholder Servicing Fees | Administrative Service Fees | Distribution Fees* | Voluntary Expense Limitations | |||||||||||||||||||
Money Market Fund | ||||||||||||||||||||||||
Class A | 0.07 | % | 0.30 | %(7) | 0.25 | % | — | 0.18 | %(1) | |||||||||||||||
Class B | 0.07 | % | 0.30 | %(7) | 0.25 | % | 0.05 | % | — | 0.48 | %(1) | |||||||||||||
Class C | 0.07 | % | 0.30 | %(7) | 0.25 | % | 0.25 | % | — | 0.68 | %(1) | |||||||||||||
Sweep Class | 0.07 | % | 0.30 | %(7) | 0.25 | % | — | 0.50 | % | 0.93 | %(1) | |||||||||||||
Government Fund | ||||||||||||||||||||||||
Class A | 0.07 | % | 0.24 | % | 0.25 | % | — | — | 0.20 | %(3) | ||||||||||||||
Class B | 0.07 | % | 0.24 | % | 0.25 | % | 0.05 | % | — | 0.50 | %(3) | |||||||||||||
Class C | 0.07 | % | 0.24 | % | 0.25 | % | 0.25 | % | — | 0.70 | %(3) | |||||||||||||
Sweep Class | 0.07 | % | 0.24 | % | 0.25 | % | — | 0.50 | % | 0.95 | %(1) | |||||||||||||
Government II Fund | ||||||||||||||||||||||||
Class A | 0.07 | % | 0.19 | % | 0.25 | % | — | — | 0.20 | %(2) | ||||||||||||||
Class B | 0.07 | % | 0.19 | % | 0.25 | % | 0.05 | % | — | 0.50 | %(2) | |||||||||||||
Class C | 0.07 | % | 0.19 | % | 0.25 | % | 0.25 | % | — | 0.70 | %(2) | |||||||||||||
Prime Obligation Fund | ||||||||||||||||||||||||
Class A | 0.07 | % | 0.19 | % | 0.25 | % | — | — | 0.20 | %(2) | ||||||||||||||
Class B | 0.07 | % | 0.19 | % | 0.25 | % | 0.05 | % | — | 0.50 | %(2) | |||||||||||||
Class C | 0.07 | % | 0.19 | % | 0.25 | % | 0.25 | % | — | 0.70 | %(2) | |||||||||||||
Class H | 0.07 | % | 0.19 | % | 0.25 | % | 0.18 | % | — | 0.63 | %(1) | |||||||||||||
Sweep Class | 0.07 | % | 0.19 | % | 0.25 | % | — | 0.50 | % | 0.95 | %(1) | |||||||||||||
Treasury Fund | ||||||||||||||||||||||||
Class A | 0.07 | % | 0.24 | % | 0.25 | % | — | — | 0.20 | %(2) | ||||||||||||||
Class B | 0.07 | % | 0.24 | % | 0.25 | % | 0.05 | % | — | 0.50 | %(2) | |||||||||||||
Class C | 0.07 | % | 0.24 | % | 0.25 | % | 0.25 | % | — | 0.70 | %(2) | |||||||||||||
Sweep Class | 0.07 | % | 0.24 | % | 0.25 | % | — | 0.50 | % | 0.95 | %(1) | |||||||||||||
Treasury II Fund | ||||||||||||||||||||||||
Class A | 0.07 | % | 0.24 | % | 0.25 | % | — | — | 0.20 | %(2) | ||||||||||||||
Class B | 0.07 | % | 0.24 | % | 0.25 | % | 0.05 | % | — | 0.50 | %(2) | |||||||||||||
Class C | 0.07 | % | 0.24 | % | 0.25 | % | 0.25 | % | — | 0.70 | %(2) | |||||||||||||
Ultra Short Duration Bond Fund | ||||||||||||||||||||||||
Class A | 0.10 | %(5) | 0.30 | %(7) | 0.25 | % | — | — | 0.38 | %(4) | ||||||||||||||
Short-Duration Government Fund | ||||||||||||||||||||||||
Class A | 0.09 | %(6) | 0.30 | %(7) | 0.25 | % | — | — | 0.48 | %(4) | ||||||||||||||
Class Y | 0.09 | %(6) | 0.30 | %(7) | — | — | — | 0.38 | %(4) | |||||||||||||||
Intermediate-Duration Government Fund | ||||||||||||||||||||||||
Class A | 0.09 | %(6) | 0.30 | %(7) | 0.25 | % | — | — | 0.53 | %(4) | ||||||||||||||
GNMA Fund | ||||||||||||||||||||||||
Class A | 0.09 | %(6) | 0.30 | %(7) | 0.25 | % | — | — | 0.63 | %(4) | ||||||||||||||
| (1) | Represents a voluntary cap that may be discontinued at any time. |
| (2) | Represents a contractual cap effective through January 31, 2016, to be changed only by board approval. |
| (3) | Represents a contractual cap of .25%, .55%, and .75% of Class A, B, and C, respectively, effective through January 31, 2016, to be changed only by Board approval. In addition, management has voluntarily waived fees to a cap of .20%, .50%, and .70% of Class A, B, and C, respectively, that may be discontinued at any time. |
| (4) | Represents a voluntary cap that may be discontinued at anytime. |
| 68 | SEI Daily Income Trust / Annual Report / January 31, 2015 |
| (5) | The Adviser receives an annual fee equal to .10% on the first $500 million of net assets, .075% of net assets between $500 million and $1 billion and .05% on the net assets in excess of $1 billion for the Ultra Short Duration Bond Fund. The fee is calculated based on the net assets of the Ultra Short Duration Bond Fund. |
| (6) | The Adviser receives an annual fee equal to .10% on the first $500 million of net assets, .075% of net assets between $500 million and $1 billion and .05% on the net assets in excess of $1 billion for the Short-Duration Government, Intermediate-Duration Government and GNMA Funds. The fee is a blended percentage and is calculated based on the combined assets of these Funds. |
| (7) | Prior October 1, 2014, the Administrator fee was 0.33% for the Money Market Fund and 0.35 for the Ultra Short Duration Bond Fund, Short-Duration Government Fund, Intermidate-Duration Government Fund and GNMA Fund. |
| * | These payments are characterized as “compensation” and are not directly tied to expenses incurred by the Distributor. The payments the Distributor receives during any year may therefore be higher or lower than its actual expenses. These payments may be used to compensate sweep class shareholders who provide distribution-related services to their customers. |
The Distributor has voluntarily waived all or a portion of the shareholder servicing fees for Class A of each fund, except for the GNMA Fund, since inception of the plan. Such waivers are voluntary and may be discontinued at any time. For Classes B, C, and H, the shareholder servicing fees and the administrative service fees are shown combined as “Administrative & Shareholder Servicing Fees” in the Statements of Operations. The Administrator and Distributor have voluntarily agreed to waive and reduce their fee and/or reimburse certain expenses of the Money Market Funds in order to limit the one-day net income yield of the Funds to not less than 0.01% of the Funds’ average daily net assets. The following table shows the waivers by class for the year ended January 31, 2015 ($ Thousands):
Administrative & Shareholder Servicing Fee Waiver | Administrative Fee Waiver | |||||||
Money Market Fund | ||||||||
Class A | $ | — | $ | 46 | ||||
Class B | 234 | 24 | ||||||
Class C | 135 | 8 | ||||||
Sweep Class | 193 | 8 | ||||||
Government Fund | ||||||||
Class A | — | 2,129 | ||||||
Class B | 433 | 184 | ||||||
Class C | 32 | 8 | ||||||
Sweep Class | 471 | 79 | ||||||
Government II Fund | ||||||||
Class A | — | 1,341 | ||||||
Class B | 548 | 228 | ||||||
Class C | 80 | 20 | ||||||
Prime Obligation Fund | ||||||||
Class A | — | 2,167 | ||||||
Class B | 255 | 38 | ||||||
Class C | 149 | 14 | ||||||
Class H | 81 | 9 | ||||||
Sweep Class | 30 | 2 | ||||||
Treasury Fund | ||||||||
Class A | — | 184 | ||||||
Class B | 301 | 150 | ||||||
Class C | 67 | 20 | ||||||
Sweep Class | 971 | 193 | ||||||
Treasury II Fund | ||||||||
Class A | — | 764 | ||||||
Class B | 665 | 356 | ||||||
Class C | 60 | 19 | ||||||
Pursuant to the “manager of managers” structure, the Board of Trustees approved BofA Advisors, LLC (formerly Columbia Management
Advisors, LLC) as sub-adviser to the Money Market Funds, Logan Circle Partners, L.P. serves as a sub-adviser to the Ultra Short Duration Bond Fund and Wellington Management Company, LLP (“Wellington LLP”) serves as sub-adviser to the Fixed Income Funds. Each sub-adviser is party to an investment sub-advisory agreement with the Advisor. For its services to the Funds, the sub-advisers are entitled to receive a fee paid directly by the Adviser.
U.S. Bank, N.A. serves as the custodian of the Funds. The custodian plays no role in determining the investment policies of the Funds or which securities are to be purchased or sold in the Funds.
Other — Certain officers and Trustees of the Trust are also officers and/or Trustees of the Administrator, Adviser, or the Distributor. The Trust pays each unaffiliated Trustee an annual fee for attendance at quarterly, interim, and committee meetings. The Administrator, Adviser and/or the Distributor pays compensation of Officers and affiliated Trustees.
A portion of the services provided by the Chief Compliance Officer (“CCO”) and his staff, whom are employees of the administrator, are paid for by the Trust as incurred. The services include regulatory oversight of the Trust’s Adviser, Sub-Advisers and service providers as required by SEC regulations. The CCO’s services have been approved by and are reviewed annually by the Board of Trustees.
Interfund Lending — The SEC has granted an exemption that permits the Trust to participate in an interfund lending program (the “Program”) with existing or future investment companies registered under the 1940 Act that are advised by SIMC (the “SEI Funds”). The Program allows the SEI Funds to lend money to and borrow money from each other for temporary or emergency purposes. Participation in the Program is voluntary for both borrowing and lending funds. Interfund loans may be made only when the rate of interest to be charged is more favorable to the lending fund than an investment in overnight repurchase agreements (“Repo Rate”), and more favorable to the borrowing fund than the rate of interest that would be charged by a bank for short-term borrowings (“Bank Loan Rate”). The Bank Loan Rate will be determined using a formula reviewed annually by the SEI Funds Board of Trustees. The interest rate imposed on interfund loans is the average of the Repo Rate and the Bank Loan Rate. For the year ended January 31, 2015, the Trust has not participated in the Program.
| SEI Daily Income Trust / Annual Report / January 31, 2015 | 69 |
Notes to Financial Statements (Continued)
January 31, 2015
4. INVESTMENT TRANSACTIONS
The cost of security purchases and the proceeds from the sale of securities, other than short-term investments, for the year ended January 31, 2015, were as follows for the Fixed Income Funds:
| Ultra Short Duration Bond Fund ($Thousands) | Short- Duration Government Fund | Intermediate- Duration Government Fund | GMNA Fund ($ Thousands) | |||||||||||||
Purchases | ||||||||||||||||
U.S. Government | $ | 84,832 | $ | 1,088,768 | $ | 25,925 | $ | 903,503 | ||||||||
Other | 97,147 | — | — | — | ||||||||||||
Sales | ||||||||||||||||
U.S. Government | 91,554 | 1,249,484 | 32,739 | 952,398 | ||||||||||||
Other | 88,872 | 367 | 63 | 79 | ||||||||||||
5. FEDERAL TAX INFORMATION
It is each Fund’s intention to continue to qualify as a regulated investment company for Federal income tax purposes and distribute all of its taxable income (including net capital gains). Accordingly, no provision for Federal income taxes is required.
Reclassification of Components of Net Assets — The timing and characterization of certain income and capital gain distributions are determined annually in accordance with Federal tax regulations which may differ from accounting principles generally accepted in the United States. As a result, net investment income (loss) and net realized gain (loss) on investment transactions for the reporting period
may differ from distributions during such period. These book/tax differences may be temporary or permanent in nature.
To the extent these differences are permanent, they are charged or credited to Paid-in Capital, undistributed net investment income, or accumulated net realized gain, as appropriate, in the periods that the differences arise.
Accordingly, the following permanent differences, primarily attributable to different treatment for gains and losses on paydowns of mortgage and asset-backed securities for tax purposes, distribution reclassification, expiration of capital losses and non-deductible excise tax have been reclassified to/from the following accounts as of January 31, 2015:
Paid-in- ($ Thousands) | Undistributed Net Investment Income ($ Thousands) | Accumulated Net Realized Gain (Loss) ($ Thousands) | ||||||||||
Government II Fund | $ | — | $ | 2 | $ | (2 | ) | |||||
Prime Obligation Fund | (1 | ) | 1 | — | ||||||||
Treasury II Fund | — | 4 | (4 | ) | ||||||||
Ultra Short Duration Bond Fund | (1,717 | ) | 501 | 1,216 | ||||||||
Short-Duration Government Fund | — | 449 | (449 | ) | ||||||||
Intermediate-Duration Government Fund | (2 | ) | 48 | (46 | ) | |||||||
GNMA Fund | — | 656 | (656 | ) | ||||||||
These reclassifications have no impact on net assets or net asset value per share.
The tax character of dividends and distributions during the last two fiscal years was as follows:
Ordinary Income ($ Thousands) | Long-term Capital Gain ($Thousands) | Total ($ Thousands) | ||||||||||||||
Money Market Fund | 2015 | $ | 28 | $ | — | $ | 28 | |||||||||
| 2014 | 66 | — | 66 | |||||||||||||
Government Fund | 2015 | 378 | — | 378 | ||||||||||||
| 2014 | 320 | — | 320 | |||||||||||||
Government II Fund | 2015 | 128 | — | 128 | ||||||||||||
| 2014 | 129 | — | 129 | |||||||||||||
Prime Obligation Fund | 2015 | 496 | — | 496 | ||||||||||||
| 2014 | 508 | — | 508 | |||||||||||||
Treasury Fund | 2015 | 37 | — | 37 | ||||||||||||
| 2014 | 31 | — | 31 | |||||||||||||
Treasury II Fund | 2015 | 71 | — | 71 | ||||||||||||
| 2014 | 73 | — | 73 | |||||||||||||
Ultra Short Duration Bond Fund | 2015 | 2,129 | — | 2,129 | ||||||||||||
| 2014 | 2,035 | — | 2,035 | |||||||||||||
Short-Duration Government Fund | 2015 | 6,847 | — | 6,847 | ||||||||||||
| 2014 | 6,916 | — | 6,916 | |||||||||||||
Intermediate-Duration Government Fund | 2015 | 561 | — | 561 | ||||||||||||
| 2014 | 643 | — | 643 | |||||||||||||
GNMA Fund | 2015 | 1,978 | — | 1,978 | ||||||||||||
| 2014 | 3,835 | — | 3,835 | |||||||||||||
| 70 | SEI Daily Income Trust / Annual Report / January 31, 2015 |
As of January 31, 2015, the components of Distributable Earnings/(Accumulated Losses) on a tax basis were as follows:
| Undistributed Ordinary Income ($ Thousands) | Undistributed Long-Term Capital Gain ($ Thousands) | Capital Loss Carryforwards ($ Thousands) | Post-October Losses ($ Thousands) | Other Temporary Differences ($ Thousands) | Unrealized Appreciation (Depreciation) ($ Thousands) | Total Earnings/ (Accumulated Losses) ($ Thousands) | ||||||||||||||||||||||
Money Market Fund | $ | 4 | $ | — | $ | — | $ | — | $ | (2 | ) | $ | — | $ | 2 | |||||||||||||
Government Fund | 33 | — | (31 | ) | — | (33 | ) | — | (31 | ) | ||||||||||||||||||
Government II Fund | 9 | — | — | — | (12 | ) | — | (3 | ) | |||||||||||||||||||
Prime Obligation Fund | 46 | — | (50 | ) | — | (46 | ) | — | (50 | ) | ||||||||||||||||||
Treasury Fund | 3 | — | — | — | (3 | ) | — | — | ||||||||||||||||||||
Treasury II Fund | 20 | — | — | — | (6 | ) | — | 14 | ||||||||||||||||||||
Ultra Short Duration Bond Fund | 172 | — | (21,294 | ) | (257 | ) | (25 | ) | (757 | ) | (22,161 | ) | ||||||||||||||||
Short-Duration Government Fund | 1,088 | — | (5,511 | ) | (103 | ) | (931 | ) | 8,367 | 2,910 | ||||||||||||||||||
Intermediate-Duration Government Fund | 47 | — | (1,273 | ) | — | (252 | ) | 808 | (670 | ) | ||||||||||||||||||
GNMA Fund | 137 | 720 | — | — | (188 | ) | 3,748 | 4,417 | ||||||||||||||||||||
At January 31, 2015, the following Funds had capital loss carryforwards to offset future realized capital gains:
Amount ($ Thousands) | Expiration | |||||||
Government Fund | $ | 31 | 1/31/16 | |||||
Prime Obligation Fund | 50 | 1/31/17 | ||||||
Ultra Short Duration Bond Fund | 296 | 1/31/16 | ||||||
| 181 | 1/31/17 | |||||||
| 3,642 | 1/31/18 | |||||||
| 11,895 | 1/31/19 | |||||||
For Federal income tax purposes, capital loss carryforwards may be carried forward and applied against future capital gains. It is the Funds’ intent that they will not distribute any realized gain distributions until the carryforwards have been offset or expired.
During the fiscal year ended January 31, 2015, the Prime Obligation Fund, Treasury Fund, Government Fund, Intermediate-Duration Government Fund and GNMA Fund utilized $6,484, $5,010, $1,497, $106,993 and $4,869,656, respectively, of capital loss carryforwards to offset capital gains.
Under the recently enacted Regulated Investment Company Modernization Act of 2010, Funds will be permitted to carry forward capital losses incurred in taxable years beginning after December 22, 2010 for an unlimited period. However, any losses incurred during those future taxable years will be required to be utilized prior to the losses incurred in pre-enactment taxable years. As a result of this ordering rule, pre-enactment capital loss carryforwards may be more likely to expire unused. Additionally, post-enactment capital losses that are carried forward will retain their character as either short-term or long-term capital losses rather than being considered all short-term as under previous law.
Losses carried forward under these new provisions are as follows ($ Thousands):
| Short-Term Loss | Long-Term Loss | Total* | ||||||||||
Ultra Short Duration Bond Fund | $ | — | $ | 5,280 | $ | 5,280 | ||||||
Short-Duration Government Fund | 2,026 | 3,485 | 5,511 | |||||||||
Intermediate-Duration Government Fund | 1,045 | 228 | 1,273 | |||||||||
| * | This table should be used in conjunction with the capital loss carryforwards table. |
During the fiscal year ended January 31, 2015, the Money Market Funds’ cost of securities for Federal income tax purposes approximates the cost located in the Statements of Assets and Liabilities.
For Federal income tax purposes, the cost of securities owned at January 31, 2015, and net realized gains or losses on securities sold for the period, were different from amounts reported for financial reporting purposes, primarily due to wash sales which cannot be used for Federal income tax purposes in the current year and have been deferred for use in future years. The Federal tax cost and aggregate gross unrealized appreciation and depreciation on investments held by the Fixed Income Funds at January 31, 2015, were as follows:
| Federal Tax Cost ($ Thousands) | Appreciated Securities ($ Thousands) | Depreciated Securities ($ Thousands) | Net Unrealized Appreciation/ (Depreciation) ($ Thousands) | |||||||||||||
Ultra Short Duration Bond Fund | 260,916 | 598 | (1,207 | ) | $ | (609 | ) | |||||||||
Short-Duration Government Fund | 736,365 | 8,751 | (67 | ) | 8,684 | |||||||||||
Intermediate-Duration Government Fund | 19,340 | 651 | (13 | ) | 638 | |||||||||||
GNMA Fund | 165,718 | 3,912 | (215 | ) | 3,697 | |||||||||||
Management has analyzed the Funds’ tax positions taken on the federal tax returns for all open tax years and has concluded that as of January 31, 2015, no provision for income tax is required in the Funds’ financial statements. The Funds’ federal income and excise tax returns are subject to examination by the IRS for all open tax years under the applicable Statute of Limitations have not expired are subject to examination by the Internal Revenue Service and state departments of revenue.
6. INVESTMENT RISKS
In the normal course of business, a Fund may enter into contracts that provide general indemnifications by a Fund to the counterparty to the contract. A Fund’s maximum exposure under these arrangements is dependent on future claims that may be made against a Fund and, therefore, cannot be established; however, based on experience, management believes the risk of loss from such claim is considered remote.
| SEI Daily Income Trust / Annual Report / January 31, 2015 | 71 |
Notes to Financial Statements (Concluded)
January 31, 2015
7. REGULATORY MATTERS
On July 23, 2014, the SEC adopted amendments to the rules that govern money market mutual funds. In part, the amendments will require structural changes to most types of money market funds to one extent or another; however, the SEC provided for an extended 2-year transition period to comply with such structural requirements. At this time, management is evaluating the reforms adopted and the manner for implementing these reforms over time and its impact on the financial statements.
8. SUBSEQUENT EVENTS
The Trust, on behalf of the Funds, has evaluated the need for disclosures and/or adjustments resulting from subsequent events. Based on this evaluation, no disclosures and/or adjustments were required to the financial statements.
| 72 | SEI Daily Income Trust / Annual Report / January 31, 2015 |
Report of Independent Registered Public Accounting Firm
To the Shareholders and Board of Trustees
SEI Daily Income Trust:
We have audited the accompanying statements of assets and liabilities, including the schedules of investments, of SEI Daily Income Trust, comprised of the Money Market Fund, Government Fund, Government II Fund, Prime Obligation Fund, Treasury Fund, Treasury II Fund, Ultra Short Duration Bond Fund, Short-Duration Government Fund, Intermediate-Duration Government Fund and GNMA Fund (collectively, the “Funds”), as of January 31, 2015, and the related statements of operations for the year then ended, changes in net assets for each of the years in the two-year period then ended, and the financial highlights for each of the years in the five-year period then ended. These financial statements and financial highlights are the responsibility of the Funds’ management. Our responsibility is to express an opinion on these financial statements and financial highlights based on our audits.
We conducted our audits in accordance with the standards of the Public Company Accounting Oversight Board (United States). Those standards require that we plan and perform the audit to obtain reasonable assurance about whether the financial statements and financial highlights are free of material misstatement. An audit includes examining, on a test basis, evidence supporting the amounts and disclosures in the financial statements. Our procedures included confirmation of securities owned as of January 31, 2015, by correspondence with the custodian and brokers or other appropriate auditing procedures. An audit also includes assessing the accounting principles used and significant estimates made by management, as well as evaluating the overall financial statement presentation. We believe that our audits provide a reasonable basis for our opinion.
In our opinion, the financial statements and financial highlights referred to above present fairly, in all material respects, the financial position of each of the Funds comprising SEI Daily Income Trust as of January 31, 2015, and the results of their operations for the year then ended, the changes in their net assets for each of the years in the two-year period then ended, and the financial highlights for each of the years in the five-year period then ended, in conformity with U.S. generally accepted accounting principles.
Philadelphia, Pennsylvania
March 30, 2015
| SEI Daily Income Trust / Annual Report / January 31, 2015 | 73 |
TRUSTEES AND OFFICERS OF THE TRUST (Unaudited)
The following chart lists Trustees and Officers as of January 31, 2015.
Set forth below are the names, addresses, ages, position with the Trust, Term of Office and Length of Time Served, the principal occupations for the last five years, number of portfolios in fund complex overseen by trustee, and other directorships outside the fund complex of each of the persons currently serving as Trustees and Officers of the Trust. The Trust’s Statement of Additional Information (“SAI”) includes additional information about the Trustees and Officers. The SAI may be obtained without charge by calling 1-800-342-5734.
Name Address, and Age | Position(s) Held with Trusts | Term of Office and Length of Time Served1 | Principal Occupation(s) During Past Five Years | Number of by Trustee2 | Other Directorships Held by Trustee | |||||
| INTERESTED TRUSTEES | ||||||||||
Robert A. Nesher One Freedom Valley Drive Oaks, PA 19456 67 yrs. old | Chairman of the Board of Trustees* | since 1982 | Currently performs various services on behalf of SEI for which Mr. Nesher is compensated. | 99 | Trustee of The Advisors’ Inner Circle Fund, The Advisors’ Inner Circle Fund II, Bishop Street Funds, Director of SEI Global Master Fund, plc, SEI Global Assets Fund, plc, SEI Global Investments Fund, plc, SEI Investments Global, Limited, SEI Investments — Global Fund Services, Limited, SEI Investments (Europe), Limited, SEI Global Nominee Ltd., SEI Structured Credit Fund, L.P. | |||||
William M. Doran One Freedom Valley Drive Oaks, PA 19456 73 yrs. old | Trustee* | since 1982 | Self-employed consultant since 2003. Partner, Morgan, Lewis & Bockius LLP (law firm) from 1976 to 2003, counsel to the Trust, SEI, SIMC, the Administrator and the Distributor. Secretary of SEI since 1978. | 99 | Trustee of The Advisors’ Inner Circle Fund, The Advisors’ Inner Circle Fund II, The Advisors’ Inner Circle Fund III, Bishop Street Funds, The KP Funds, O’Connor EQUUS, Director of SEI since 1974. Director of the Distributor since 2003. Director of SEI Investments — Global Fund Services, Limited, SEI Investments Global, Limited, SEI Investments (Europe), Limited, SEI Investments (Asia), SEI Global Nominee Ltd., Limited and SEI Asset Korea Co., Ltd. | |||||
| TRUSTEES | ||||||||||
George J. Sullivan, Jr. One Freedom Valley Drive Oaks, PA 19456 71 yrs. old | Trustee | since 1996 | Retired since January 2012. Self-Employed Consultant, Newfound Consultants Inc. since April 1997-December 2011. | 99 | Trustee of The Advisors’ Inner Circle Fund, The Advisors’ Inner Circle Fund II, Bishop Street Funds, The KP Funds, State Street Navigator Securities Lending Trust, and SEI Structured Credit Fund, L.P., member of the independent review committee for SEI’s Canadian-registered mutual funds. | |||||
| * | Messrs. Nesher and Doran are Trustees who may be deemed as “interested” persons of the Trust as that term is defined in the 1940 Act by virtue of their affiliation with SIMC and the Trust’s Distributor. |
| 1 | Each trustee shall hold office during the lifetime of this Trust until the election and qualification of his or her successor, or until he or she sooner dies, resigns or is removed in accordance with the Trust’s Declaration of Trust. |
| 2 | The Fund Complex includes the following Trusts: SEI Asset Allocation Trust, SEI Daily Income Trust, SEI Institutional Investments Trust, Adviser Managed Trust, SEI Institutional International Trust, SEI Institutional Managed Trust, SEI Liquid Asset Trust, SEI Tax Exempt Trust, SEI Insurance Products Trust and New Covenant Funds. |
| 74 | SEI Daily Income Trust / Annual Report / January 31, 2015 |
Name Address, and Age | Position(s) Held with Trusts | Term of Office and Length of Time Served1 | Principal Occupation(s) During Past Five Years | Number of by Trustee2 | Other Directorships Held by Trustee | |||||
| TRUSTEES (continued) | ||||||||||
Nina Lesavoy One Freedom Valley Drive Oaks, PA 19456 56 yrs. old | Trustee | since 2003 | Founder and Managing Director, Avec Capital since 2008. Managing Director, Cue Capital from March 2002-March 2008. | 99 | Director of SEI Structured Credit Fund, L.P. | |||||
James M. Williams One Freedom Valley Drive Oaks, PA 19456 66 yrs. old | Trustee | since 2004 | Vice President and Chief Investment Officer, J. Paul Getty Trust, Non-Profit Foundation for Visual Arts, since December 2002. | 99 | Trustee/Director of Ariel Mutual Funds, and SEI Structured Credit Fund, L.P. | |||||
Mitchell A. Johnson One Freedom Valley Drive Oaks, PA 19456 72 yrs. old | Trustee | Since 2007 | Private Investor since 1994. | 99 | Trustee of the Advisors’ Inner Circle Fund, The Advisors’ Inner Circle Fund II, Bishop Street Funds and The KP Funds | |||||
Hubert L. Harris, Jr. One Freedom Valley Drive Oaks, PA 19456 70 yrs. old | Trustee | since 2008 | Retired since December 2005. Chief Executive Officer and Chair of the Board of Directors, AMVESCAP Retirement, Inc., 1997-December 2005. Chief Executive Officer, INVESCO North America, September 2003-December 2005. | 99 | Director of Colonial BancGroup, Inc. and St. Joseph’s Translational Research Institute; Chair of the Board of Trustees, Georgia Tech Foundation, Inc. (nonprofit corporation); Board of Councilors of the Carter Center. | |||||
| OFFICERS | ||||||||||
Robert A. Nesher One Freedom Valley Drive Oaks, PA 19456 67 yrs. old | President and CEO | since 2005 | Currently performs various services on behalf of SEI for which Mr. Nesher is compensated. | N/A | N/A | |||||
Peter A. Rodriguez One Freedom Valley Drive Oaks, PA 19456 52 yrs. old | Controller and Chief Financial Officer | since 2011 | Director, Fund Accounting, SEI Investments Global Funds Services (March 2011, September 2002 to March 2005 and 1997-2002); Director, Mutual Fund Trading, SEI Private Trust Company (May 2009 to February 2011); Director, Asset Data Services, Global Wealth Services (June 2006 to April 2009); Director, Portfolio Accounting, SEI Investments Global Funds Services (March 2005 to June 2006) | N/A | N/A | |||||
Russell Emery One Freedom Valley Drive Oaks, PA 19456 50 yrs. old | Chief Compliance Officer | since 2006 | Chief Compliance Officer of SEI Institutional Managed Trust, SEI Asset Allocation Trust, SEI Daily Income Trust, SEI Institutional International Trust, SEI Liquid Asset Trust, SEI Tax Exempt Trust, SEI Institutional Investments Trust, The Advisors’ Inner Circle Fund, The Advisors’ Inner Circle Fund II, and Bishop Street Funds, since March 2006. Chief Compliance Officer of SEI Structured Credit Fund, LP since June 2007. Chief Compliance Officer of Adviser Managed Trust since December 2010. Chief Compliance Officer of New Covenant Funds since February 2012. Chief Compliance Officer of SEI Insurance Products Trust since 2013. | N/A | N/A | |||||
| SEI Daily Income Trust / Annual Report / January 31, 2015 | 75 |
TRUSTEES AND OFFICERS OF THE TRUST (Unaudited) (Concluded)
The following chart lists Trustees and Officers as of January 31, 2015.
Name Address, and Age | Position(s) Held with Trusts | Term of Office And Length of Time Served1 | Principal Occupation(s) During Past Five Years | Number of Portfolios in Fund Complex Overseen by Trustee2 | Other Directorships Held by Trustee | |||||
| OFFICERS (Continued) | ||||||||||
| Timothy D. Barto One Freedom Valley Drive Oaks, PA 19456 46 yrs. old | Vice President and Secretary | since 2002 | General Counsel, Vice President and Secretary of SIMC and the Administrator since 2004. Vice President and Assistant Secretary of SEI since 2001. Vice President of SIMC and the Administrator since 1999. | N/A | N/A | |||||
| Aaron Buser One Freedom Valley Drive Oaks, PA 19456 43 yrs. old | Vice President and Assistant Secretary | since 2008 | Vice President and Assistant Secretary of SIMC since 2007. Associate at Stark & Stark (2004-2007). | N/A | N/A | |||||
| David F. McCann One Freedom Valley Drive Oaks, PA 19456 38 yrs. old | Vice President and Assistant Secretary | since 2009 | Vice President and Assistant Secretary of SIMC since 2008. Attorney, Drinker Biddle & Reath, LLP (law firm), May 2005-October 2008. Attorney, Pepper Hamilton, LLP (law firm), September 2001-May 2005. | N/A | N/A | |||||
Stephen G. MacRae One Freedom Valley Drive Oaks, PA 19456 46 yrs. old | Vice President | since 2012 | Director of Global Investment Product Management, January 2004 to present. | N/A | N/A |
| 1 | Each trustee shall hold office during the lifetime of this Trust until the election and qualification of his or her successor, or until he or she sooner dies, resigns or is removed in accordance with the Trust’s Declaration of Trust. |
| 2 | The Fund Complex includes the following Trusts: SEI Asset Allocation Trust, SEI Daily Income Trust, SEI Institutional Investments Trust, Adviser Managed Trust, SEI Institutional International Trust, SEI Institutional Managed Trust, SEI Liquid Asset Trust, SEI Tax Exempt Trust, SEI Insurance Products Trust and New Covenant Funds. |
| 76 | SEI Daily Income Trust / Annual Report / January 31, 2015 |
Disclosure of Fund Expenses (Unaudited)
All mutual funds have operating expenses. As a shareholder of a mutual fund, your investment is affected by these ongoing costs, which include (among others) costs for portfolio management, administrative services, and shareholder reports like this one. It is important for you to understand the impact of these costs on your investment returns.
Operating expenses such as these are deducted from the mutual fund‘s gross income and directly reduce your final investment return. These expenses are expressed as a percentage of the mutual fund’s average net assets; this percentage is known as the mutual fund’s expense ratio.
The following examples use the expense ratio and are intended to help you understand the ongoing costs (in dollars) of investing in your Fund and to compare these costs with those of other mutual funds. The examples are based on an investment of $1,000 made at the beginning of the period shown and held for the entire period.
The table on the next page illustrates your Fund’s costs in two ways:
• Actual Fund Return. This section helps you to estimate the actual expenses after fee waivers that your Fund incurred over the period. The “Expenses Paid During Period” column shows the actual dollar expense cost incurred by a $1,000 investment in the Fund, and the “Ending Account Value” number is derived from deducting that expense cost from the Fund’s gross investment return.
You can use this information, together with the actual amount you invested in your Fund, to estimate the expenses you paid over that period. Simply divide your actual starting account value by $1,000 to arrive at a ratio (for example, an $8,600 account value divided by $1,000 = 8.6), then multiply that ratio by the number shown for your Fund under “Expenses Paid During Period.”
• Hypothetical 5% Return. This section helps you compare your Fund’s costs with those of other mutual funds. It assumes that your Fund had an annual 5% return before expenses during the year, but that the expense ratio (Column 3) is unchanged. This example is useful in making comparisons because the Securities and Exchange Commission requires all mutual funds to make this 5% calculation. You can assess your Fund’s comparative cost by comparing the hypothetical result for your Fund in the “Expense Paid During Period” column with those that appear in the same charts in the shareholder reports for other mutual funds.
NOTE: Because the return is set at 5% for comparison purposes — NOT your Fund’s actual return — the account values shown do not apply to your specific investment.
| Beginning Account Value 8/1/14 | Ending Account Value 1/31/15 | Annualized Expense Ratios | Expenses Paid During Period* | |||||||||||||
Money Market Fund |
| |||||||||||||||
Actual Fund Return |
| |||||||||||||||
Class A | $ | 1,000.00 | $ | 1,000.10 | 0.15 | % | $ | 0.76 | ||||||||
Class B | 1,000.00 | 1,000.10 | 0.15 | 0.76 | ||||||||||||
Class C | 1,000.00 | 1,000.10 | 0.15 | 0.76 | ||||||||||||
Sweep Class | 1,000.00 | 1,000.10 | 0.15 | 0.76 | ||||||||||||
Hypothetical 5% Return |
| |||||||||||||||
Class A | $ | 1,000.00 | $ | 1,024.45 | 0.15 | % | $ | 0.77 | ||||||||
Class B | 1,000.00 | 1,024.45 | 0.15 | 0.77 | ||||||||||||
Class C | 1,000.00 | 1,024.45 | 0.15 | 0.77 | ||||||||||||
Sweep Class | 1,000.00 | 1,024.45 | 0.15 | 0.77 | ||||||||||||
Government Fund |
| |||||||||||||||
Actual Fund Return |
| |||||||||||||||
Class A | $ | 1,000.00 | $ | 1,000.10 | 0.08 | % | $ | 0.40 | ||||||||
Class B | 1,000.00 | 1,000.10 | 0.08 | 0.40 | ||||||||||||
Class C | 1,000.00 | 1,000.10 | 0.08 | 0.40 | ||||||||||||
Sweep Class | 1,000.00 | 1,000.10 | 0.08 | 0.40 | ||||||||||||
Hypothetical 5% Return |
| |||||||||||||||
Class A | $ | 1,000.00 | $ | 1,024.80 | 0.08 | % | $ | 0.41 | ||||||||
Class B | 1,000.00 | 1,024.80 | 0.08 | 0.41 | ||||||||||||
Class C | 1,000.00 | 1,024.80 | 0.08 | 0.41 | ||||||||||||
Sweep Class | 1,000.00 | 1,024.80 | 0.08 | 0.41 | ||||||||||||
| Beginning Account Value 8/1/14 | Ending Account Value 1/31/15 | Annualized Expense Ratios | Expenses Paid During Period* | |||||||||||||
Government II Fund |
| |||||||||||||||
Actual Fund Return |
| |||||||||||||||
Class A | $ | 1,000.00 | $ | 1,000.10 | 0.08 | % | $ | 0.40 | ||||||||
Class B | 1,000.00 | 1,000.10 | 0.08 | 0.40 | ||||||||||||
Class C | 1,000.00 | 1,000.10 | 0.08 | 0.40 | ||||||||||||
Hypothetical 5% Return |
| |||||||||||||||
Class A | $ | 1,000.00 | $ | 1,024.80 | 0.08 | % | $ | 0.41 | ||||||||
Class B | 1,000.00 | 1,024.80 | 0.08 | 0.41 | ||||||||||||
Class C | 1,000.00 | 1,024.80 | 0.08 | 0.41 | ||||||||||||
Prime Obligation Fund |
| |||||||||||||||
Actual Fund Return |
| |||||||||||||||
Class A | $ | 1,000.00 | $ | 1,000.10 | 0.16 | % | $ | 0.81 | ||||||||
Class B | 1,000.00 | 1,000.10 | 0.16 | 0.81 | ||||||||||||
Class C | 1,000.00 | 1,000.10 | 0.16 | 0.81 | ||||||||||||
Class H | 1,000.00 | 1,000.10 | 0.16 | 0.81 | ||||||||||||
Sweep Class | 1,000.00 | 1,000.10 | 0.16 | 0.81 | ||||||||||||
Hypothetical 5% Return |
| |||||||||||||||
Class A | $ | 1,000.00 | $ | 1,024.40 | 0.16 | % | $ | 0.82 | ||||||||
Class B | 1,000.00 | 1,024.40 | 0.16 | 0.82 | ||||||||||||
Class C | 1,000.00 | 1,024.40 | 0.16 | 0.82 | ||||||||||||
Class H | 1,000.00 | 1,024.40 | 0.16 | 0.82 | ||||||||||||
Sweep Class | 1,000.00 | 1,024.40 | 0.16 | 0.82 | ||||||||||||
| SEI Daily Income Trust / Annual Report / January 31, 2015 | 77 |
Disclosure of Fund Expenses (Unaudited) (Concluded)
| Beginning Account Value 8/1/14 | Ending Account Value 1/31/15 | Annualized Expense Ratios | Expenses Paid During Period * | |||||||||||||
Treasury Fund |
| |||||||||||||||
Actual Fund Return |
| |||||||||||||||
Class A | $ | 1,000.00 | $ | 1,000.10 | 0.05 | % | $ | 0.25 | ||||||||
Class B | 1,000.00 | 1,000.10 | 0.05 | 0.25 | ||||||||||||
Class C | 1,000.00 | 1,000.10 | 0.05 | 0.25 | ||||||||||||
Sweep Class | 1,000.00 | 1,000.10 | 0.05 | 0.25 | ||||||||||||
Hypothetical 5% Return |
| |||||||||||||||
Class A | $ | 1,000.00 | $ | 1,024.95 | 0.05 | % | $ | 0.26 | ||||||||
Class B | 1,000.00 | 1,024.95 | 0.05 | 0.26 | ||||||||||||
Class C | 1,000.00 | 1,024.95 | 0.05 | 0.26 | ||||||||||||
Sweep Class | 1,000.00 | 1,024.95 | 0.05 | 0.26 | ||||||||||||
Treasury II Fund |
| |||||||||||||||
Actual Fund Return |
| |||||||||||||||
Class A | $ | 1,000.00 | $ | 1,000.10 | 0.04 | % | $ | 0.20 | ||||||||
Class B | 1,000.00 | 1,000.10 | 0.04 | 0.20 | ||||||||||||
Class C | 1,000.00 | 1,000.10 | 0.04 | 0.20 | ||||||||||||
Hypothetical 5% Return |
| |||||||||||||||
Class A | $ | 1,000.00 | $ | 1,025.00 | 0.04 | % | $ | 0.20 | ||||||||
Class B | 1,000.00 | 1,025.00 | 0.04 | 0.20 | ||||||||||||
Class C | 1,000.00 | 1,025.00 | 0.04 | 0.20 | ||||||||||||
Ultra Short Duration Bond Fund |
| |||||||||||||||
Actual Fund Return |
| |||||||||||||||
Class A | $ | 1,000.00 | $ | 1,002.00 | 0.38 | % | $ | 1.92 | ||||||||
Hypothetical 5% Return |
| |||||||||||||||
Class A | $ | 1,000.00 | $ | 1,023.29 | 0.38 | % | $ | 1.94 | ||||||||
| Beginning Account Value 8/1/14 | Ending Account Value 1/31/15 | Annualized Expense Ratios | Expenses Paid During Period * | |||||||||||||
Short-Duration Government Fund |
| |||||||||||||||
Actual Fund Return |
| |||||||||||||||
Class A | $ | 1,000.00 | $ | 1,009.80 | 0.48 | % | $ | 2.43 | ||||||||
Hypothetical 5% Return |
| |||||||||||||||
Class A | $ | 1,000.00 | $ | 1,022.79 | 0.48 | % | $ | 2.45 | ||||||||
Short-Duration Government Fund |
| |||||||||||||||
Actual Fund Return |
| |||||||||||||||
Class Y | $ | 1,000.00 | $ | 1,000.00 | 0.38 | % | $ | 0.34 | ** | |||||||
Hypothetical 5% Return |
| |||||||||||||||
Class Y | $ | 1,000.00 | $ | 1,023.29 | 0.38 | % | $ | 1.94 | ||||||||
Intermediate-Duration Government Fund |
| |||||||||||||||
Actual Fund Return |
| |||||||||||||||
Class A | $ | 1,000.00 | $ | 1,031.80 | 0.53 | % | $ | 2.71 | ||||||||
Hypothetical 5% Return |
| |||||||||||||||
Class A | $ | 1,000.00 | $ | 1,022.53 | 0.53 | % | $ | 2.70 | ||||||||
GNMA Fund |
| |||||||||||||||
Actual Fund Return |
| |||||||||||||||
Class A | $ | 1,000.00 | $ | 1,038.80 | 0.63 | % | $ | 3.24 | ||||||||
Hypothetical 5% Return |
| |||||||||||||||
Class A | $ | 1,000.00 | $ | 1,022.03 | 0.63 | % | $ | 3.21 | ||||||||
| * | Expenses are equal to the Fund’s annualized expense ratio multiplied by the average account value over the period, multiplied by 184/365. |
| ** | Expenses are equal to the Fund’s annualized expense ratio multiplied by the average account value over the period, multiplied by 33/365 (inception to date). |
| 78 | SEI Daily Income Trust / Annual Report / January 31, 2015 |
Board of Trustees’ Considerations in Approving the Advisory Agreement (Unaudited)
SEI Daily Income Trust (the “Trust”) and SEI Investments Management Corporation (“SIMC”) have entered into an investment advisory agreement (the “Advisory Agreement”). Pursuant to the Advisory Agreement, SIMC oversees the investment advisory services provided to the series of the Trust (the “Funds”) and may manage the cash portion of the Funds’ assets. Pursuant to separate sub-advisory agreements (the “Sub-Advisory Agreements” and, together with the Advisory Agreement, the “Investment Advisory Agreements”) with SIMC, and under the supervision of SIMC and the Trust’s Board of Trustees (the “Board”), the sub-advisers (each, a “Sub-Adviser” and collectively, the “Sub-Advisers”) are responsible for the day-to-day investment management of all or a discrete portion of the assets of the Funds. The Sub-Advisers are also responsible for managing their employees who provide services to these Funds. The Sub-Advisers are selected based primarily upon the research and recommendations of SIMC, which evaluates quantitatively and qualitatively the Sub-Advisers’ skills and investment results in managing assets for specific asset classes, investment styles and strategies.
The Investment Company Act of 1940, as amended (the “1940 Act”) requires that the initial approval of, as well as the continuation of, the Funds’ Investment Advisory Agreements must be specifically approved: (i) by the vote of the Board or by a vote of the shareholders of the Funds; and (ii) by the vote of a majority of the Trustees who are not parties to the Investment Advisory Agreements or “interested persons” of any party (the “Independent Trustees”), cast in person at a meeting called for the purpose of voting on such approval(s). In connection with their consideration of such approval(s), the Funds’ Trustees must request and evaluate, and SIMC and the Sub-Advisers are required to furnish, such information as may be reasonably necessary to evaluate the terms of the Investment Advisory Agreements. In addition, the Securities and Exchange Commission takes the position that, as part of their fiduciary duties with respect to a mutual fund’s fees, mutual fund boards are required to evaluate the material factors applicable to a decision to approve an Investment Advisory Agreement.
Consistent with these responsibilities, the Board calls and holds meetings each year that are dedicated to considering whether to approve new and terminate or renew existing Investment Advisory Agreements between the Trust and SIMC and SIMC and the Sub-Advisers with respect to the Funds of the Trust. In preparation for these meetings, the Board requests and reviews a wide variety of materials provided by SIMC and the Sub-Advisers, including information about SIMC’s and the Sub-Advisers’ affiliates, personnel and operations. The Board also receives data from third parties. This information is provided in addition to the detailed information about the Funds that the Board reviews during the course of each year, including information that relates to Fund operations and Fund performance. The Trustees also receive a memorandum from counsel regarding the responsibilities of Trustees in connection with their consideration of whether to approve the Trust’s Investment Advisory Agreements. Finally, the Independent Trustees receive advice from independent counsel to the Independent Trustees, meet in executive sessions outside the presence of Fund management and participate in question and answer sessions with representatives of SIMC and the Sub-Advisers.
Specifically, during the course of the Trust’s fiscal year, the Board requested and received written materials from SIMC and the Sub-Advisers regarding: (i) the quality of SIMC’s and the Sub-Advisers’ investment management and other services; (ii) SIMC’s and the Sub-Advisers’ investment management personnel; (iii) SIMC’s and the Sub-Advisers’ operations and financial condition; (iv) SIMC’s and the Sub-Advisers’ brokerage practices (including any soft dollar arrangements) and investment strategies; (v) the level of the advisory fees that SIMC charges the Funds and the level of the sub-advisory fees that SIMC pays the Sub-Advisers, compared with fees each charge to comparable accounts; (vi) the advisory fees charged by SIMC and the Funds’ overall fees and operating expenses compared with peer groups of mutual funds generally as classified by Lipper (unless otherwise adjusted), an independent provider of investment company data; (vii) the level of SIMC’s and the Sub-Advisers’ profitability from their Fund-related operations; (viii) SIMC’s and the Sub-Advisers’ compliance systems; (ix) the Adviser’s and Sub-Advisers’ potential economies of scale; (x) SIMC’s and the Sub-Advisers’ policies on and compliance procedures for personal securities transactions; (xi) SIMC’s and the Sub-Advisers’ expertise and resources in domestic and/or international financial markets; and (xii) the Funds’ performance compared with peer groups of mutual funds as classified by Lipper (unless otherwise adjusted) and the Funds’ benchmark indices.
| SEI Daily Income Trust / Annual Report / January 31, 2015 | 79 |
Board of Trustees’ Considerations in Approving the Advisory Agreement (Unaudited) (Continued)
At the March 25-26, 2014 meeting of the Board of Trustees, the Trustees, including a majority of the Independent Trustees, approved the Advisory Agreement and approved the selection of SIMC and at the March 25-26, 2014 and September 15-16, 2014 meetings of the Board of Trustees, the Trustees, including a majority of the Independent Trustees, approved Sub-Advisory Agreements with certain Sub-Advisers. The Board’s approvals were based on its consideration and evaluation of a variety of specific factors discussed at the meetings and at prior meetings, including but not necessarily limited to:
| • | the nature, extent and quality of the services provided to the Funds under the Investment Advisory Agreements, including the resources of SIMC and the Sub-Advisers dedicated to the Funds; |
| • | the Funds’ investment performance and how it compared to that of other comparable mutual funds and the applicable benchmarks; |
| • | the Funds’ expenses under each Investment Advisory Agreement and how those expenses compared to those of other comparable mutual funds |
| • | the profitability of SIMC and, in most cases, the Sub-Advisers and their affiliates with respect to the Funds, including both direct and indirect benefits accruing to SIMC and the Sub-Advisers and their affiliates; and |
| • | the extent to which economies of scale would be realized as the Funds grow and whether fee levels in the Investment Advisory Agreements reflect those economies of scale for the benefit of Fund investors. |
Nature, Extent and Quality of Services. The Board considered the nature, extent and quality of the services provided by SIMC and the Sub-Advisers to the Funds and the resources of SIMC and the Sub-Advisers and their affiliates dedicated to the Funds. In this regard, the Trustees evaluated, among other things, SIMC’s and each Sub-Adviser’s personnel, experience, track record and compliance program. Following evaluation, the Board concluded that, within the context of its full deliberations, the nature, extent and quality of services provided by SIMC and the Sub-Advisers to the Funds and the resources of SIMC and the Sub-Advisers and their affiliates dedicated to the Funds were sufficient to support renewal of the Investment Advisory Agreements.
Fund Performance. The Board considered Fund performance in determining whether to approve new and terminate or renew existing Investment Advisory Agreements. Specifically, the Trustees considered the Funds’ performance relative to their peer groups and appropriate indices/benchmarks in light of total return, yield and market trends. As part of this review, the Trustees considered the composition of each peer group and selection criteria. In evaluating performance, the Trustees considered both market risk and shareholder risk expectations for the Funds. The Trustees found Fund performance satisfactory, or, where performance was materially below the benchmark and/or peer group, the Trustees were satisfied that appropriate steps were being taken, but agreed that they would continue to closely monitor the Fund performance. Following evaluation, the Board concluded that, within the context of its full deliberations, the performance of the Funds was sufficient to support renewal of the Investment Advisory Agreements.
Fund Expenses. With respect to the Funds’ expenses under the Investment Advisory Agreements, the Trustees considered the rate of compensation called for by the Investment Advisory Agreements and the Funds’ net operating expense ratio in comparison to those of the Funds’ respective peer groups. The Trustees further considered the fact that the comparative fee analysis either showed that the various fees were below average or that there was a reasonable basis for the fee level. The Trustees also considered the effects of SIMC’s voluntary waiver of management and other fees to prevent total Fund expenses from exceeding a specified cap and concluded that SIMC, through waivers, has maintained the Funds’ net operating expenses at competitive levels for its distribution channels. Following evaluation, the Board concluded that, within the context of its full deliberations, the expenses of the Funds are reasonable and supported renewal of the Investment Advisory Agreements.
Profitability. With regard to profitability, the Trustees considered compensation flowing to SIMC and the Sub-Advisers and their affiliates, directly or indirectly. The Trustees considered whether the levels of compensation and profitability were reasonable. The Trustees found that profitability was reasonable. When considering the profitability of the Sub-Advisers, the Board took into
| 80 | SEI Daily Income Trust / Annual Report / January 31, 2015 |
account the fact that the Sub-Advisers are compensated by SIMC and not by the Funds directly, and such compensation with respect to any unaffiliated Sub-Adviser reflects an arms-length negotiation between the Sub-Adviser and SIMC. Based on this evaluation, the Board concluded that, within the context of its full deliberations, the profitability of each of SIMC and the Sub-Advisers is reasonable and supported renewal of the Investment Advisory Agreements.
Economies of Scale. The Trustees considered the existence of any economies of scale and whether those were passed along to the Funds’ shareholders through a graduated investment advisory fee schedule or other means, including any fee waivers by SIMC and its affiliates. The Trustees recognized that economies of scale are difficult to identify and quantify and are rarely identifiable on a fund-by-fund basis. Based on this evaluation, the Board was unable to conclude that economies of scale, if any, were not appropriately shared with the Funds.
Based on the Trustees’ deliberation and their evaluation of the information described above, the Board, including all of the Independent Trustees, unanimously approved the continuation of the Investment Advisory Agreements and concluded that the compensation under the Investment Advisory Agreements is fair and reasonable in light of such services and expenses and such other matters as the Trustees considered to be relevant in the exercise of their reasonable judgment. In the course of their deliberations, different factors may have been given varied weight by different Trustees, and the Trustees did not identify any particular information that was all-important or controlling
| SEI Daily Income Trust / Annual Report / January 31, 2015 | 81 |
Notice to Shareholders (Unaudited)
For shareholders that do not have a January 31, 2015, taxable year end, this notice is for information purposes only. For shareholders with a January 31, 2015, taxable year end, please consult your tax adviser as to the pertinence of this notice.
For the fiscal year ended January 31, 2015, the Funds are designating the following with regard to distributions paid during the year:
| Fund | (A) Long-Term Capital Gain Distribution | (B) Ordinary Income Distributions (Tax Basis) | (C) Total Distributions (Tax Basis) | U.S.Government Interest (1) | Interest Related Dividends (2) | Short-Term Capital Gains Dividends (3) | ||||||||||||||||||
| Money Market Fund | 0.00 | % | 100.00 | % | 100.00 | % | 4.00 | %* | 99.69 | % | 100.00 | % | ||||||||||||
| Government Fund | 0.00 | % | 100.00 | % | 100.00 | % | 51.37 | %* | 100.00 | % | 0.00 | % | ||||||||||||
| Government II Fund | 0.00 | % | 100.00 | % | 100.00 | % | 100.00 | %* | 99.77 | % | 100.00 | % | ||||||||||||
| Prime Obligation Fund | 0.00 | % | 100.00 | % | 100.00 | % | 1.25 | %* | 99.84 | % | 0.00 | % | ||||||||||||
| Treasury Fund | 0.00 | % | 100.00 | % | 100.00 | % | 49.85 | %* | 99.99 | % | 100.00 | % | ||||||||||||
| Treasury II Fund | 0.00 | % | 100.00 | % | 100.00 | % | 100.00 | %* | 98.72 | % | 100.00 | % | ||||||||||||
| Ultra Short Duration Bond Fund | 0.00 | % | 100.00 | % | 100.00 | % | 0.61 | %* | 99.61 | % | 0.00 | % | ||||||||||||
| Short-Duration Government Fund | 0.00 | % | 100.00 | % | 100.00 | % | 17.48 | %* | 100.00 | % | 0.00 | % | ||||||||||||
| Intermediate-Duration Government Fund | 0.00 | % | 100.00 | % | 100.00 | % | 7.48 | %* | 100.00 | % | 0.00 | % | ||||||||||||
| GNMA Fund | 0.00 | % | 100.00 | % | 100.00 | % | 0.00 | %* | 100.00 | % | 0.00 | % | ||||||||||||
Items (A), (B), (C) are based on the percentage of the Fund’s total distribution.
| (1) | “U.S. Government Interest” represents the amount of interest that was derived from direct U.S. Government obligations and distributed during the fiscal year. This amount is reflected as a percentage of total ordinary income distributions (the total of short-term capital gain and net investment income distributions). Generally, interest from direct U.S. Government obligations is exempt from state income tax. However, for shareholders of the “*” funds who are residents of California, Connecticut and New York, the statutory threshold requirements were not satisfied to permit exemption of these amounts from state income. |
| (2) | The percentage in this column represents the amount of “Interest Related Dividends” and is reflected as a percentage of net investment income distributions that is exempt from U.S. withholding tax when paid to foreign investors. |
| (3) | The percentage in this column represents the amount of “Short-Term Capital Gains Dividends” and is reflected as a percentage of short-term capital gain distributions that is exempt from U.S. withholding tax when paid to foreign investors. |
Please consult your tax adviser for proper treatment of this information.
| 82 | SEI Daily Income Trust / Annual Report / January 31, 2015 |
SEI DAILY INCOME TRUST ANNUAL REPORT JANNUARY 31, 2015
Robert A. Nesher, Chairman
Trustees
William M. Doran
George J. Sullivan, Jr.
Nina Lesavoy
James M. Williams
Mitchell A. Johnson
Hubert L. Harris, Jr.
Officers
Robert A. Nesher
President and Chief Executive Officer
Peter A. Rodriguez
Controller and Chief Financial Officer
Russell Emery
Chief Compliance Officer
Timothy D. Barto
Vice President, Secretary
David McCann
Vice President, Assistant Secretary
Aaron Buser
Vice President, Assistant Secretary
Stephen G. MacRae
Vice President
Investment Adviser
SEI Investments Management Corporation
Administrator
SEI Investments Global Funds Services
Distributor
SEI Investments Distribution Co.
Legal Counsel
Morgan, Lewis & Bockius LLP
Independent Registered Public Accounting Firm
KPMG LLP
This report and the financial statements contained herein are submitted for the general information of the shareholders of the Trust and must be preceded or accompanied by a current prospectus. Shares of the Funds are not deposits or obligations of, or guaranteed or endorsed by, any bank. The shares are not federally insured by the Federal Deposit Insurance Corporation (FDIC), the Federal Reserve Board, or any other government agency. Investment in the shares involves risk, including the possible loss of principal.
For more information call
1 800 DIAL SEI
(1 800 342 5734)

1 Freedom Valley Drive, P.O. Box 1100, Oaks, PA 19456
SEI-F-022 (1/15)
| Item 2. | Code of Ethics. |
The Registrant has adopted a code of ethics that applies to the Registrant’s principal executive officer, principal financial officer, comptroller or principal accounting officer, and any person who performs a similar function.
| Item 3. | Audit Committee Financial Expert. |
(a)(1) The Registrant’s Board of Trustees has determined that the Registrant has at least two audit committee financial experts serving on the audit committee.
(a) (2) The audit committee financial experts are George J. Sullivan, Jr. and Hubert L. Harris, Jr. Messrs. Sullivan and Harris are independent as defined in Form N-CSR Item 3 (a) (2).
| Item 4. | Principal Accountant Fees and Services. |
Fees billed by KPMG LLP (“KPMG”) related to the Registrant.
KPMG billed the Registrant aggregate fees for services rendered to the Registrant for the last two fiscal years as follows:
| Fiscal 2015 | Fiscal 2014 | |||||||||||||||||||||||||
| All fees and services to the Registrant that were pre- approved | All fees and services to service affiliates that were pre- approved | All other fees and services to service affiliates that did not require pre-approval | All fees and services to the Registrant that were pre- approved | All fees and services to service affiliates that were pre- approved | All other fees and services to service affiliates that did not require pre-approval | |||||||||||||||||||||
| (a) | Audit Fees(1) | $ | 197,000 | N/A | $ | 0 | $ | 190,000 | N/A | $ | 0 | |||||||||||||||
| (b) | Audit-Related Fees | $ | 0 | $ | 0 | $ | 0 | $ | 0 | $ | 0 | $ | 0 | |||||||||||||
| (c) | Tax Fees | $ | 0 | $ | 0 | $ | 0 | $ | 0 | $ | 0 | $ | 0 | |||||||||||||
| (d) | All Other Fees(2) | $ | 0 | $ | 240,350 | $ | 0 | $ | 0 | $ | 237,000 | $ | 0 | |||||||||||||
Notes:
| (1) | Audit fees include amounts related to the audit of the Registrant’s annual financial statements and services normally provided by the accountant in connection with statutory and regulatory filings. |
| (2) | See item 4(g)(1) for a description of the services comprising the fees disclosed in this category. |
(e)(1) The Registrant’s Audit Committee has adopted and the Board of Trustees has ratified an Audit and Non-Audit Services Pre-Approval Policy (the “Policy”), which sets forth the procedures and the conditions
pursuant to which services proposed to be performed by the independent auditor of the Registrant may be pre-approved.
The Policy provides that all requests or applications for proposed services to be provided by the independent auditor must be submitted to the Registrant’s Chief Financial Officer (“CFO”) and must include a detailed description of the services proposed to be rendered. The CFO will determine whether such services: (1) require specific pre-approval; (2) are included within the list of services that have received the general pre-approval of the Audit Committee pursuant to the Policy; or (3) have been previously pre-approved in connection with the independent auditor’s annual engagement letter for the applicable year or otherwise. In any instance where services require pre-approval, the Audit Committee will consider whether such services are consistent with SEC’s rules and whether the provision of such services would impair the auditor’s independence.
Requests or applications to provide services that require specific pre-approval by the Audit Committee will be submitted to the Audit Committee by the CFO. The Audit Committee will be informed by the CFO on a quarterly basis of all services rendered by the independent auditor. The Audit Committee has delegated specific pre-approval authority to either the Audit Committee Chair or financial expert, provided that the estimated fee for any such proposed pre-approved service does not exceed $50,000 and any pre-approval decisions are reported to the Audit Committee at its next regularly scheduled meeting.
Services that have received the general pre-approval of the Audit Committee are identified and described in the Policy. In addition, the Policy sets forth a maximum fee per engagement with respect to each identified service that has received general pre-approval.
All services to be provided by the independent auditor shall be provided pursuant to a signed written engagement letter with the Registrant, the investment advisor or applicable control affiliate (except that matters as to which an engagement letter would be impractical because of timing issues or because the matter is small may not be the subject of an engagement letter) that sets forth both the services to be provided by the independent auditor and the total fees to be paid to the independent auditor for those services.
In addition, the Audit Committee has determined to take additional measures on an annual basis to meet its responsibility to oversee the work of the independent auditor and to assure the auditor’s independence from the Registrant, such as reviewing a formal written statement from the independent auditor delineating all relationships between the independent auditor and the Registrant, and discussing with the independent auditor its methods and procedures for ensuring independence.
(e)(2) Percentage of fees billed applicable to non-audit services pursuant to waiver of pre-approval requirement were as follows:
| Fiscal 2015 | Fiscal 2014 | |||||||
Audit-Related Fees | 0 | % | 0 | % | ||||
Tax Fees | 0 | % | 0 | % | ||||
All Other Fees | 0 | % | 0 | % | ||||
(f) Not Applicable.
(g)(1) The aggregate non-audit fees and services billed by KPMG for the fiscal years 2015 and 2014 were $240,350 and $237,000, respectively. Non-audit fees consist of SSAE No. 16 review of fund accounting and administration operations, attestation report in accordance with Rule 17 Ad-13 and agreed
upon procedures report over certain internal controls related to compliance with federal securities laws and regulations.
(h) During the past fiscal year, Registrant’s principal accountant provided certain non-audit services to Registrant’s investment adviser or to entities controlling, controlled by, or under common control with Registrant’s investment adviser that provide ongoing services to Registrant that were not subject to pre-approval pursuant to paragraph (c)(7)(ii) of Rule 2-01 of Regulation S-X. The Audit Committee of Registrant’s Board of Trustees reviewed and considered these non-audit services provided by Registrant’s principal accountant to Registrant’s affiliates, including whether the provision of these non-audit services is compatible with maintaining the principal accountant’s independence.
| Item 5. | Audit Committee of Listed Registrants. |
Not Applicable.
| Item 6. | Schedule of Investments |
Included in Item 1.
| Item 7. | Disclosure of Proxy Voting Policies and Procedures for Closed-End Management Investment Companies. |
Not Applicable.
| Item 8. | Portfolio Managers of Closed-End Management Investment Companies |
Not Applicable.
| Item 9. | Purchases of Equity Securities by Closed-End Management Company and Affiliated Purchasers. |
Not Applicable.
| Item 10. | Submission of Matters to a Vote of Security Holders. |
The Registrant has a standing Governance Committee (the “Committee”) currently consisting of the Independent Trustees. The Committee is responsible for evaluating and recommending nominees for election to the Registrant’s Board of Trustees (the “Board”). Pursuant to the Committee’s Charter, adopted on June 18th, 2004, as amended, the Committee will review all shareholder recommendations for nominations to fill vacancies on the Board if such recommendations are submitted in writing and addressed to the Committee at the Trust’s office.
| Item 11. | Controls and Procedures. |
(a) The Registrant’s principal executive and principal financial officers, or persons performing similar functions, have concluded that the Registrant’s disclosure controls and procedures (as defined in Rule 30a-3(c) under the Act (17 CFR 270.30a-3(c)) are effective, based on the evaluation of these controls and procedures required by Rule 30a-3(b) under the Act (17 CFR 270.30a-3(b)) and Rules 13a-15(b) or 15d-15(b) under the Exchange Act (17 CFR 240.13a-15(b)) or 240.15d-15(b)) as of a date within 90 days of the filing date of this report.
(b) There were no changes in the Registrant’s internal control over financial reporting (as defined in Rule 30a-3(d) under the Act (17 CFR 270.30a-3(d)) that occurred during the second fiscal quarter of the period covered by this report that have materially affected, or are reasonably likely to materially affect, the Registrant’s internal control over financial reporting.
| Items 12. | Exhibits. |
(a)(1) Code of Ethics attached hereto.
(a)(2) A separate certification for the principal executive officer and the principal financial officer of the Registrant as required by Rule 30a-2(a) under the Act (17 CFR 270.30a-2(a)), are filed herewith.
(b) Officer certifications as required by Rule 30a-2(b) under the Investment Company Act of 1940, as amended (17 CFR 270.30a-2(b)) also accompany this filing as an exhibit.
SIGNATURES
Pursuant to the requirements of the Securities Exchange Act of 1934 and the Investment Company Act of 1940, the Registrant has duly caused this report to be signed on its behalf by the undersigned, thereunto duly authorized.
| SEI Daily Income Trust | ||||
| By: | /s/ Robert A. Nesher | |||
| Robert A. Nesher | ||||
| President & CEO | ||||
Date: April 7, 2015
Pursuant to the requirements of the Securities Exchange Act of 1934 and the Investment Company Act of 1940, this report has been signed below by the following persons on behalf of the Registrant and in the capacities and on the dates indicated.
| By: | /s/ Robert A. Nesher | |||
| Robert A. Nesher | ||||
| President & CEO |
Date: April 7, 2015
| By: | /s/ Peter A. Rodriguez | |||
| Peter A. Rodriguez | ||||
| Controller & CFO |
Date: April 7, 2015