UNITED STATES
SECURITIES AND EXCHANGE COMMISSION
Washington, D.C. 20549
FORM N-CSR
CERTIFIED SHAREHOLDER REPORT OF REGISTERED
MANAGEMENT INVESTMENT COMPANIES
Investment Company Act file number 811-03451
SEI Daily Income Trust
(Exact name of registrant as specified in charter)
SEI Investments
One Freedom Valley Drive
Oaks, PA 19456
(Address of principal executive offices)
CT Corporation
155 Federal Street
Boston, MA 02110
(Name and address of agent for service)
Registrant’s telephone number, including area code: 1-800-342-5734
Date of fiscal year end: January 31, 2018
Date of reporting period: January 31, 2018
| Item 1. | Reports to Stockholders. |

January 31, 2018
ANNUAL REPORT
SEI Daily Income Trust
> Government Fund
> Government II Fund
> Treasury Fund
> Treasury II Fund
> Ultra Short Duration Bond Fund
> Short-Duration Government Fund
> GNMA Fund

The Trust files its complete schedule of portfolio holdings with the Securities and Exchange Commission for the first and third quarters of each fiscal year on Form N-Q within sixty days after the end of the period. The Trust’s Forms N-Q are available on the Commission’s website at http://www.sec.gov, and may be reviewed and copied at the Commission’s Public Reference Room in Washington, DC. Information on the operation of the Public Reference Room may be obtained by calling 1-800-SEC-0330.
Since the Funds in SEI Daily Income Trust typically hold only fixed income securities, they generally are not expected to hold securities for which they may be required to vote proxies. Regardless, in light of the possibility of the possibility that a Fund could hold a security for which a proxy is voted, the Trust has adopted proxy voting policies. A description of the policies and procedures that the Trust uses to determine how to vote proxies relating to portfolio securities, as well as information relating to how a Fund voted proxies relating to portfolio securities during the most recent 12-month period ended June 30, is available (i) without charge, upon request, by calling 1-800-DIAL-SEI; and (ii) on the Commission’s website at http://www.sec.gov.
January 31, 2018
To Our Shareholders
Financial markets completed 2017 without any enduring missteps in an environment defined by strong investor appetite for higher-risk market segments. Fixed-income performance was positive across markets but ran the gamut in terms of strength—with emerging-market debt at the top end and U.S. Treasurys at the bottom, in keeping with the risk-on sentiment.
Looking back, the projections we shared for the Funds’ most recently completed fiscal year, from the start of February 2017 through the end of January 2018, mostly came to pass. The pace of interest-rate increases by the Federal Reserve (“Fed”) mostly followed the market’s expectations.
Strength in the euro relative to the U.S. dollar through the year prevented a quick end to the European Central Bank’s (“ECB”) commitment to stimulus; the Japanese yen remained mostly range-bound while the Bank of Japan (“BOJ”) held monetary policy stable through the fiscal year. China continued to guide its currency lower, hitting a low near the end of the fiscal period.
We suggested that market sentiment would remain attuned to geopolitical developments; these accounted for the only significant exceptions to the global tranquility trend. Also, a fixation on tax reform and continued flattening of the yield curve drove market movements throughout the latter part of the fiscal year.
The global oil supply-demand imbalance persisted throughout the first half of the period, before a strong rebound in oil during the second half of the fiscal year, supported by rising demand, geopolitical tensions and news that Saudi Arabia and Russia would extend an agreement to curb output.
Geopolitical Events
Geopolitical threats and an assortment of other noneconomic influences continued in various regions: civil war and domestic struggle in parts of the Middle East and Africa, the suffering of refugees and migrants in bordering countries and Europe, and acts of global terror. Severe unrest continued in some regions of the Middle East, driven by the conflicting and overlapping regional interests of extremist groups, nationalist fighters and state actors.
The lasting effect of the Syrian migrant crisis on the European Union (“EU”) remains unknown. Immigration served as one of the critical points of contention leading up to Great Britain’s Brexit vote to leave the European Union before the reporting year. Prime Minister May triggered Article 50 during the fiscal period and began the formal withdrawal process.
In the U.S., President Trump’s early actions following his inauguration just before the start of the fiscal year demonstrated a commitment to follow through on tighter U.S. immigration policy. President Trump stated that aggression from North Korea would be met with “fire and fury” while controversy over Trump’s response to violent clashes between protesters in Charlottesville, Virginia briefly drove market sentiment after the president dissolved two advisory councils. Setbacks in the Trump administration’s efforts to repeal and replace Obamacare initially sparked volatility, as investors assumed that tax and budget resolutions would have to wait until healthcare legislation was resolved. However, longer-term market reactions to geopolitical events were surprisingly muted.
A raft of political surprises unfolded during the fiscal period. Centrism prevailed in elections for Europe’s most economically significant states, although not across the continent. Brexit negotiations were less critical to investors globally than was Europe’s sustained economic expansion; while the euro’s appreciation versus sterling may offer a clue about the market’s perception of post-divorce relative advantages, both currencies gained against the U.S. dollar. The U.K. Conservative party relinquished its parliamentary majority and was forced to seek a partner to form a minority government. Emmanuel Macron’s early-May victory in the French presidential election amounted to a significant win for the establishment.
In the U.S., a high-profile special prosecutor was appointed to investigate the possibility of collusion between Donald Trump’s presidential campaign and Russia. In Brazil, an ongoing top-level corruption scandal was blown wide open in mid-May as potential evidence emerged from a taped conversation featuring President Michel Temer approving a sizeable hush-money bribe.
| SEI Daily Income Trust / Annual Report / January 31, 2018 | 1 |
LETTER TO SHAREHOLDERS (Continued)
January 31, 2018
Economic Performance
U.S. economic growth slumped early in 2017 and then rebounded solidly in the second quarter as consumer and spending boosted the economy. Fourth-quarter GDP grew at a 2.6% annual rate, following a 3.3% rise in the third quarter that was the fastest in three years, supported by a rebound in government investment and business spending on equipment. The labor market remained historically healthy throughout the year: the unemployment rate fell, finishing the period at 4.1%, while the labor-force participation rate ended at 62.9%, marginally down from a year ago. Average hourly earnings gained, bouncing around a mean of about 0.2% growth per month over the year; although a modest increase in price pressures weighed on real personal income growth as the period progressed. The Fed raised its target interest rate in March 2017, and again in both June and December, with three additional rate increases projected in 2018. The Fed also began to unwind its balance sheet starting in October, reversing some of the quantitative easing that has been so supportive of bond prices in recent years.
Market Developments
For the fiscal year ending January 31, 2018, the period started with enthusiasm for President Trump’s pro-business policies. The “reflation trade” saw markets move in reaction to coordinated global expansion and normalizing monetary policy. However, the first few months saw setbacks for the Trump administration after Washington failed to pass a replacement for the Affordable Care Act and controversies involving Russian election meddling plagued the new administration. There was a realization that the growth expected from promised regulatory changes would take a while to play out, and markets began to unwind the reflation trade. Over the last four months of the year, the “reflation” trade rebounded strongly amid steady global economic growth and the prospects of U.S. tax reform.
The U.S. equity market began the fiscal year with investors focused on the newly elected Trump administration. Growth stocks in general and the technology sector, in particular, outperformed during the full fiscal period, while high-dividend-yield segments of the market, such as utilities, lagged as they were seen as less attractive in a rising interest-rate environment. Stocks rallied toward the end of the fiscal period amid signs of global economic synchronization, stable earnings and continued central-bank stimulus. The current bull market is now the second-longest on record.
The risk-on sentiment that pushed equities higher was also visible in fixed-income markets, with credit outperforming government bonds. A continuing theme for U.S. fixed-income markets was the flattening yield curve. Yields for 10-year government bonds rose and ended the period at 2.72%, while 2-year yields climbed almost 100 basis points during the year to 2.14%. The U.S. Treasury yield curve flattened to a 10-year low, with short-term yields rising more than long-term yields. The Fed hiked rates three times in 2017 and pushed short-term yields higher. Longer-term bond yields remained flat as expectations for future inflation and economic growth remained subdued.
Front-end Treasury yields moved higher as the Fed increased the fed funds target rate to 1.25%-1.50%, marking the fifth rate hike in this tightening cycle. The Fed’s interest-rate projections, known as the dot plot, still suggest three more rate hikes in 2018, subject to inflation moving toward the Federal Open Market Committee’s 2% target. Jerome Powell was nominated to succeed Janet Yellen as Fed Chair, Randal Quarles was named vice chair for bank supervision and Marvin Goodfriend, former Fed economist, was nominated to fill one of three open governor seats. President Trump signed the Tax Cuts and Jobs Act into law, introducing several new policies, including a cap on state and local tax deductions, a one-time repatriation tax on overseas cash, a move to a territorial tax system, and a permanent drop in the corporate tax rate from 35% to 21%.
Inflation-sensitive assets, such as commodities and Treasury Inflation-Protected Securities, were positive. The Bloomberg Commodity Total Return Index (which represents the broad commodity market) rose 3.6% during the period, driven by the metals sector, while the Bloomberg Barclays 1-10 Year US TIPS Index (USD) edged 0.4% higher.
The price of oil ended the year up over 24%, after entering bear-market territory in June and then rallying 35% over the last six months of the fiscal period.
Global fixed income, as measured by the Bloomberg Barclays Global Aggregate Index, climbed 7.46% in U.S. dollar terms during the reporting period, while the high-yield market was also positive, with the ICE BofAML US High Yield Constrained Index up 6.74%.
| 2 | SEI Daily Income Trust / Annual Report / January 31, 2018 |
U.S. investment-grade corporate debt was higher, as the Bloomberg Barclays Investment Grade US Corporate Index returned 5.08%. U.S. asset- and mortgage-backed securities were both marginally positive during the fiscal year, despite headwinds from rising interest rates and expectations for further rate increases.
Our View
We can sum up the fiscal year gone by with the exclamation that, at long last, the global financial crisis appears to be in the rear-view mirror. In its place is synchronized expansion across most developed and emerging economies. Admittedly, developed economies continued to run at a somewhat sluggish pace of 2% to 2.5% gross domestic product (GDP) growth. This is, at best, a middling sort of performance in the context of the past five decades. Emerging-market economies, meanwhile, continued to expand at a clip well below that of the past 20 years.
Looking out over the next year or so, we think global growth can still be vibrant enough to allow risk assets to perform well.
U.S. tax legislation is hardly perfect: we believe it will not be as stimulative as advertised since tax cuts are skewed toward upper-income taxpayers who tend to have a higher saving rate than the median household. However, the permanent corporate tax changes, repatriation holiday, and the full expensing of capital equipment purchases over the next five years are positive developments for economic growth and investment.
We do not anticipate a more aggressive swing in Fed policy toward monetary tightness in the coming year. It is possible that the U.S. will see inflation pressures finally begin to build, but U.S. companies have proven able to maintain profit margins without resorting to price increases.
In our opinion, Europe has growth potential. According to the World Economic Forum’s annual report on global competitiveness, the high-income countries of Western Europe have made significant strides in improving labor-market efficiency over the last five years. We also would note that political concerns in the eurozone are far more muted compared with a year ago, although we have not yet seen the end of the massive anti-establishment undercurrent.
Given our view that the region is a long way from employment levels that will stir inflation pressures, we expect monetary policy to be supportive of growth throughout the coming year even as the ECB proceeds with its taper of quantitative easing. Since these asset purchases will continue at least until the end of September, it appears that policy rates will stay put until 2019.
These have not been easy days for U.K. Prime Minister Theresa May. The divorce stage of Brexit talks has finally concluded, with the U.K. mostly acceding to the EU’s demands. However, Parliament has begun to flex its muscles—and disapproval there would force the parties back to the negotiating table. Keep in mind that any changes to the withdrawal agreement demanded by Parliament would also entail unanimous approval of the 27 EU members on the other side of the negotiating table.
The pace of U.K. economic growth has been decelerating since 2014, although there is no indication that a recession is around the corner. The BOE’s Monetary Policy Committee forecasted only two rate increases between now and the end of 2019. While time will tell whether the central bank’s view regarding future policy moves is accurate, policymakers in the U.K. face tremendous challenges over the next few years. We think investors should tread lightly until there are more definite signs that inflation pressures have peaked and Brexit negotiations yield a favorable economic outcome for the country.
Japan is benefiting from the global economic recovery. Exports to China are growing particularly quickly and are now about equal to the share going to the U.S. Exports to the U.S. and Europe also have accelerated but not to the same extent.
Although there have been rumblings that the BOJ would like to take a step away from the extraordinary monetary policies that have been in place since the financial crisis, the central bank may find it difficult to do so. Domestic demand remains too weak, and the population has begun contracting, a trend that will likely accelerate.
Although China continued to reduce its dependence on heavy industry and increased the value added to GDP from service-producing sectors, there was some backsliding last year. While these macro statistics need to be taken
| SEI Daily Income Trust / Annual Report / January 31, 2018 | 3 |
LETTER TO SHAREHOLDERS (Concluded)
January 31, 2018
with a grain of salt, it appears that China’s growth has accelerated significantly from two years ago and advanced at its fastest clip since the 2012 to 2013 period. If China can maintain positive momentum, commodity prices should continue to rally as well.
Many possible events and developments could have a significant adverse impact, but we believe most have a low probability of actually happening. We will, therefore, maintain our risk-on bias until we see more evidence that such a stance merits revision.
On behalf of SEI Investments, I want to thank you for your continued confidence. We are working every day to maintain that trust, and we look forward to serving your investment needs in the future.
Sincerely,

William Lawrence, CFA
Head and Chief Investment Officer of Traditional Asset Management
| 4 | SEI Daily Income Trust / Annual Report / January 31, 2018 |
MANAGEMENT’S DISCUSSION AND ANALYSIS OF FUND PERFORMANCE
January 31, 2018
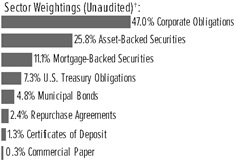
Ultra Short Duration Bond Fund
I. Objective
The Ultra Short Bond Duration Fund (the “Fund”) seeks to provide a higher current income than typically offered by a money-market fund while maintaining a high degree of liquidity and a correspondingly higher risk of principal volatility.
II. Investment Approach
The Fund uses a multi-manager approach, relying on a number of sub-advisors with differing investment approaches to manage portions of the Fund’s portfolio, under the general supervision of SEI Investments Management Corporation (“SIMC”). For the one-year period ending January 31, 2018, the sub-advisors were Wellington Management Company, LLP (“Wellington”) and Logan Circle Partners, L.P. (“Logan Circle”). There were no manager changes during the period.
III. Return
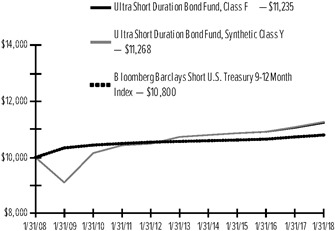
For the full year ended January 31, 2018, the Ultra Short Duration Bond Fund, Class F, returned 1.58%. The Fund’s benchmark—Bloomberg Barclays Short U.S. Treasury 9-12 Month Index—returned 0.64%.
IV. Performance Discussion
Shorter-term interest rates increased during the period, as noted in the shareholder letter, and benefited the Fund’s slightly short-duration posture. Additionally, the Fund’s barbell yield-curve position an overweight to longer-duration securities (1-5 years), which tends to act as a hedge to the Fund’s credit exposure was additive as rates rose, and the curve flattened, with 2-5 year U.S. Treasury yields rising less than the shorter end of the curve.
The Fund’s return was driven by strong performance across a number of investment-grade credit sectors particularly financials and industrials as well as allocations to several asset-backed securities (“ABS”) sectors and non-agency mortgage-backed securities (“MBS”).
The Fund’s overweight to financials contributed to out performance as banks continued to perform well on a relative basis and spreads tightened due to attractive fundamentals and potential tax reform benefits. The Fund’s overweight to industrials contributed to out performance as industrials are a spread sector utilized to outperform the short Treasury benchmark.
A significant allocation to specific ABS sectors contributed to out performance. Consumer-related ABS
sub-sectors, such as auto securitizations and credit cards, performed well as the U.S. consumer remained resilient and wage gains supported sector fundamentals.
Both sub-advisors, Logan Circle and Wellington, contributed to Fund outperformance. Both benefited from similar exposures that contributed to outperformance, including financials, industrials, consumer-related ABS and non-agency MBS. Short-duration positioning and yield-curve posture were also additive for both sub-advisors. An allocation to cash detracted from relative performance.
The Fund used Treasury futures to efficiently manage duration and yield-curve exposures. Additionally, the Fund used to-be-announced (“TBA”) forward contracts (TBA contracts confer the obligation to buy or sell future debt obligations of the three U.S. government-sponsored agencies that issue or guarantee MBS—Fannie Mae, Freddie Mac and GNMA) to manage market exposures. None of these had a meaningful impact on the Fund’s performance.
| SEI Daily Income Trust / Annual Report / January 31, 2018 | 5 |
MANAGEMENT’S DISCUSSION AND ANALYSIS OF FUND PERFORMANCE
January 31, 2018
Ultra Short Duration Bond Fund (Concluded)
Ultra Short Duration Bond Fund:
AVERAGE ANNUAL TOTAL RETURN1
| One Year Return | Annualized 3-Year Return | Annualized 5-Year Return | Annualized 10-Year Return | Annualized Inception to Date | ||||||||||||||||
Class F† | 1.58% | 1.12% | 0.92% | 1.17% | 3.07% | |||||||||||||||
Class Y† | 1.67% | N/A | N/A | N/A | 1.40%* | |||||||||||||||
| Bloomberg Barclays Short U.S. Treasury 9-12 Month Index | 0.64% | 0.56% | 0.43% | 0.77% | 3.03% | |||||||||||||||
Comparison of Change in the Value of a $10,000 Investment in the Ultra Short Duration Bond Fund, Class F and Class Y, versus the Bloomberg Barclays Short U.S. Treasury 9-12 Month Index.
| 1 | For the periods ended January 31, 2018. Past performance is no indication of future performance. Class F Shares (formerly Class A Shares) were offered beginning 9/28/93. Returns shown do not reflect the deduction of taxes that a shareholder would pay on fund distributions or the redemption of fund shares. |
| † | The graph is based on only Class F Shares (formerly Class A Shares); performance for Class Y Shares would be different due to differences in fee structures. |
| * | Cumulative inception to date as of August 31, 2015. |
N/A — Not Available.
| 6 | SEI Daily Income Trust / Annual Report / January 31, 2018 |
MANAGEMENT’S DISCUSSION AND ANALYSIS OF FUND PERFORMANCE
January 31, 2018
Short-Duration Government Fund
I. Objective
The Short-Duration Government Fund (the “Fund”) seeks to preserve principal value and maintain a high degree of liquidity while providing current income.
II. Investment Approach
The Fund uses a sub-advisor to manage the Fund under the supervision of SEI Investments Management Corporation (“SIMC”). For the one-year period ending January 31, 2018, the sub-advisor was Wellington Management Company, LLP (“Wellington”). No manager changes were made during the period.
III. Returns
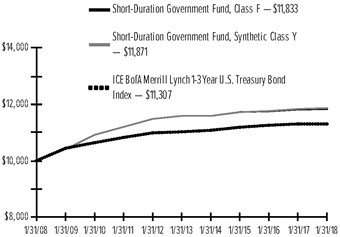
For the full year ended January 31, 2018, the Short-Duration Government Fund, Class F, returned 0.13%. The Fund’s benchmark—ICE BofAML 1-3 Year U.S. Treasury Index—returned 0.01%.
IV. Performance Discussion
Despite the low-interest-rate environment, the Fund was able to generate positive absolute returns due to its allocation to mortgage-backed securities (“MBS”) versus the Fund’s all-Treasury benchmark.
The Fund’s allocation to MBS added to relative performance. MBS generated strong excess returns and outperformed Treasurys over the fiscal year. The Fund’s yield-curve-flattening posture, via an overweight to the 7-10 year part of the curve and underweight to the 1-3 year part of the curve, was also additive given that short-term U.S. Treasury yields rose more than longer-term rates as the shareholder letter addressed.
Derivatives were used by the Fund on a limited basis. U.S. Treasury futures were used to manage yield-curve exposure and overall portfolio duration. The Fund used Treasury futures and to-be-announced (“TBA”) forward contracts to manage duration, yield-curve and market exposures (TBA contracts confer the obligation to buy or sell future debt obligations of the three U.S. government-sponsored agencies that issue or guarantee MBS—Fannie Mae, Freddie Mac and GNMA). Treasury futures detracted from the Fund’s performance.
Short-Duration Government Fund:
| AVERAGE ANNUAL TOTAL RETURN1 | ||||||||||
| Annualized | Annualized | Annualized | Annualized | |||||||
| One Year | 3-Year | 5-Year | 10-Year | Inception | ||||||
| Return | Return | Return | Return | to Date | ||||||
Class F† | 0.13% | 0.30% | 0.41% | 1.70% | 4.36% | |||||
Class Y† | 0.27% | 0.41% | N/A | N/A | 0.57% | |||||
| ICE BofA Merrill Lynch 1-3 Year U.S. Treasury Bond Index | 0.01% | 0.35% | 0.50% | 1.24% | 4.47% | |||||
Comparison of Change in the Value of a $10,000 Investment in the Short-Duration Government Fund, Class F and Class Y, versus the ICE BofA Merrill Lynch 1-3 Year U.S. Treasury Bond Index.
| 1 | For the periods ended January 31, 2018. Past performance is no indication of future performance. Class F Shares (formerly Class A Shares) were offered beginning 2/17/87. Returns shown do not reflect the deduction of taxes that a shareholder would pay on fund distributions or the redemption of fund shares. |
| † | The graph is based on only Class F Shares (formerly Class A Shares); performance for Class Y Shares would be different due to differences in fee structures. |
N/A — Not Available
| SEI Daily Income Trust / Annual Report / January 31, 2018 | 7 |
MANAGEMENT’S DISCUSSION AND ANALYSIS OF FUND PERFORMANCE
January 31, 2018
GNMA Fund
I. Objective
The GNMA Fund (the “Fund”) seeks to preserve principal value and maintain a high degree of liquidity while providing current income.
II. Investment Approach
The Fund uses a sub-advisor to manage the Fund under the supervision of SEI Investments Management Corporation (“SIMC”). For the one-year period ending January 31, 2018, the sub-advisor was Wellington Management Company, LLP (“Wellington”). No manager changes were made during the period.
III. Returns
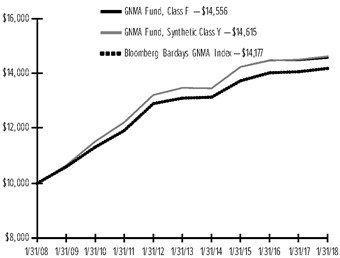
For the full year ended January 31, 2018, the GNMA Fund, Class F, returned 0.58%. The Fund’s benchmark—Bloomberg Barclays GNMA Index—returned 0.86%.
IV. Performance Discussion
Despite the low interest-rate environment over the period and the beginning of the Fed’s tightening cycle, the Fund was able to generate positive absolute returns.
The Fund’s overweight to higher coupons and underweight to 30-year mortgage-backed securities (“MBS”) detracted from relative performance. Higher-coupon MBS underperformed those with lower coupons, as the Fed’s unwinding of rates kept prepayment speeds lower on lower-coupon mortgages and made higher-coupon securities more subject to prepayment risk.
An underweight to GNMA securities, in favor of residential and multi-family conventional MBS, contributed to relative performance, as GNMA securities underperformed those sectors. GNMA underperformed conventionals due to unwinding in GNMA valuations after significant spread tightening in 2016.
The Fund’s long-duration posture, detracted as all rates except 30-year Treasurys rose across the curve in conjunction with the Federal Reserve’s rate hikes over the fiscal year, as noted in the shareholder letter.
The Fund used derivatives on a limited basis. U.S. Treasury futures were used to manage yield-curve exposure and overall portfolio duration. The Fund used Treasury futures and to-be-announced (“TBA”) forward contracts to manage duration, yield-curve and market exposures (TBA contracts confer the obligation to buy or sell future debt obligations of the three U.S. government-sponsored agencies that issue or guarantee MBS—Fannie Mae, Freddie Mac and GNMA). Treasury futures detracted from the Fund’s performance. The Fund made
selective use of mortgage derivatives, such as interest-only strip securities, principal-only strip securities and inverse floaters. The yields on these securities are sensitive to the expected or anticipated rate of principal payments on the underlying assets, and principal payments may have a material effect on their yields. These instruments are purchased only when rigorous stress testing and analysis suggest that a higher return can be earned at similar or lower risk compared to non-derivative securities.
GNMA Fund:
AVERAGE ANNUAL TOTAL RETURN1
| Annualized | Annualized | Annualized | Annualized | |||||||
| One Year | 3-Year | 5-Year | 10-Year | Inception | ||||||
| Return | Return | Return | Return | to Date | ||||||
Class F† | 0.58% | 0.75% | 1.56% | 3.83% | 5.83% | |||||
Class Y† | 0.82% | N/A | N/A | N/A | 1.04%* | |||||
| Bloomberg Barclays GNMA Index | 0.86% | 1.08% | 1.60% | 3.55% | 6.15% |
Comparison of Change in the Value of a $10,000 Investment in the GNMA Fund, Class F and Class Y, versus the Bloomberg Barclays GNMA Index.
| 1 | For the periods ended January 31, 2018. Past performance is no indication of future performance. Class F Shares (formerly Class A Shares) were offered beginning 3/20/87. Returns shown do not reflect the deduction of taxes that a shareholder would pay on fund distributions or the redemption of fund shares. |
| † | The graph is based on only Class F Shares (formerly Class A Shares); performance for Class Y Shares would be different due to differences in fee structures. |
| * | Cumulative inception to date as of October 30, 2015. |
N/A — Not Available
| 8 | SEI Daily Income Trust / Annual Report / January 31, 2018 |
Definition of Comparative Indices*
Bloomberg Barclays GNMA Index is a widely-recognized, capitalization-weighted index of 15-30 year fixed-rate securities backed by mortgage pools of GNMA.
Bloomberg Barclays Short U.S. Treasury 9-12 Month Index is a widely-recognized, market weighted index of U.S. Treasury Bonds with remaining maturities between nine and twelve months.
ICE BofA Merrill Lynch 1-3 Year U.S. Treasury Bond Index is a widely-recognized, unmanaged index that tracks the performance of the direct sovereign debt of the U.S. Government having a maturity of at least one year and less than 3 years.
| * | An Index measures the market price of a specific group of securities in a particular market sector. You cannot invest directly in an index. An index does not have an investment adviser and does not pay any commissions or expenses. If an index had expenses, its performance would be lower. |
| SEI Daily Income Trust / Annual Report / January 31, 2018 | 9 |
January 31, 2018
Government Fund
†Percentages are based on total investments.
| Description | Face Amount (Thousands) | Value ($ Thousands) | ||||||
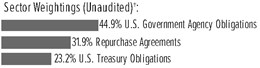
U.S. GOVERNMENT AGENCY OBLIGATIONS – 45.7% |
| |||||||
FFCB | ||||||||
1.530%, VAR ICE LIBOR USD 1 Month+-0.030%, 08/13/2018 | $ | 40,075 | $ | 40,075 | ||||
1.660%, VAR ICE LIBOR USD 1 Month+0.105%, 09/06/2018 | 69,315 | 69,314 | ||||||
FFCB DN | ||||||||
1.060%, 02/15/2018 (A) | 39,608 | 39,592 | ||||||
FHLB | ||||||||
1.281%, VAR ICE LIBOR USD 3 Month+-0.110%, 02/05/2018 | 47,500 | 47,500 | ||||||
1.287%, VAR ICE LIBOR USD 3 Month+-0.200%, 03/02/2018 | 20,000 | 20,000 | ||||||
0.875%, 03/19/2018 | 39,035 | 39,019 | ||||||
1.419%, VAR ICE LIBOR USD 1 Month+-0.140%, 04/13/2018 | 200,130 | 200,130 | ||||||
1.419%, VAR ICE LIBOR USD 1 Month+-0.140%, 04/17/2018 | 40,220 | 40,220 | ||||||
1.414%, VAR ICE LIBOR USD 1 Month+-0.145%, 04/17/2018 | 69,130 | 69,130 | ||||||
1.416%, VAR ICE LIBOR USD 1 Month+-0.140%, 05/18/2018 | 56,905 | 56,905 | ||||||
1.321%, VAR ICE LIBOR USD 3 Month+-0.160%, 05/30/2018 | 62,670 | 62,670 | ||||||
1.422%, VAR ICE LIBOR USD 1 Month+-0.135%, 06/05/2018 | 47,000 | 47,000 | ||||||
1.417%, VAR ICE LIBOR USD 1 Month+-0.140%, 07/05/2018 | 74,525 | 74,525 | ||||||
1.513%, VAR ICE LIBOR USD 1 Month+-0.040%, 07/09/2018 | 78,000 | 78,000 | ||||||
1.414%, VAR ICE LIBOR USD 1 Month+-0.145%, 08/15/2018 | 28,960 | 28,960 | ||||||
1.416%, VAR ICE LIBOR USD 1 Month+-0.145%, 08/22/2018 | 57,925 | 57,925 | ||||||
1.449%, VAR ICE LIBOR USD 1 Month+-0.115%, 10/03/2018 | 57,000 | 57,000 | ||||||
1.475%, VAR ICE LIBOR USD 1 Month+-0.100%, 11/01/2018 | 110,000 | 110,000 | ||||||
1.468%, VAR ICE LIBOR USD 1 Month+-0.100%, 11/02/2018 | 19,500 | 19,500 | ||||||
1.465%, VAR ICE LIBOR USD 1 Month+-0.090%, 11/08/2018 | 120,000 | 120,000 | ||||||
1.429%, VAR ICE LIBOR USD 1 Month+-0.130%, 11/15/2018 | 75,000 | 75,000 | ||||||
1.471%, VAR ICE LIBOR USD 1 Month+-0.090%, 01/25/2019 | 65,345 | 65,345 | ||||||
| Description | Face Amount (Thousands) | Value ($ Thousands) | ||||||
U.S. GOVERNMENT AGENCY OBLIGATIONS (continued) |
| |||||||
1.482%, VAR ICE LIBOR USD 1 Month+-0.080%, 02/04/2019 | $ | 135,000 | $ | 135,000 | ||||
1.389%, VAR ICE LIBOR USD 3 Month+-0.160%, 06/12/2019 | 23,955 | 23,947 | ||||||
1.465%, VAR ICE LIBOR USD 3 Month+-0.160%, 06/20/2019 | 55,365 | 55,365 | ||||||
1.473%, VAR ICE LIBOR USD 3 Month+-0.140%, 12/19/2019 | 29,005 | 29,005 | ||||||
FHLB DN (A) | ||||||||
1.189%, 02/02/2018 | 111,000 | 110,996 | ||||||
1.219%, 02/07/2018 | 63,500 | 63,487 | ||||||
1.179%, 02/14/2018 | 172,555 | 172,482 | ||||||
1.322%, 02/21/2018 | 68,030 | 67,980 | ||||||
1.128%, 02/23/2018 | 85,100 | 85,042 | ||||||
1.126%, 02/28/2018 | 137,600 | 137,484 | ||||||
1.131%, 03/02/2018 | 67,520 | 67,459 | ||||||
1.308%, 03/07/2018 | 68,870 | 68,785 | ||||||
1.332%, 03/09/2018 | 123,935 | 123,770 | ||||||
1.343%, 03/13/2018 | 81,140 | 81,019 | ||||||
1.182%, 03/21/2018 | 67,325 | 67,219 | ||||||
1.253%, 03/23/2018 | 125,220 | 125,003 | ||||||
1.343%, 03/27/2018 | 59,485 | 59,366 | ||||||
1.182%, 03/28/2018 | 26,395 | 26,348 | ||||||
1.363%, 04/03/2018 | 90,325 | 90,117 | ||||||
1.415%, 04/06/2018 | 50,755 | 50,628 | ||||||
1.500%, 04/11/2018 | 17,380 | 17,332 | ||||||
1.466%, 05/01/2018 | 59,315 | 59,101 | ||||||
1.644%, 08/01/2018 | 46,515 | 46,134 | ||||||
FHLB DN DN, Ser 2005- | ||||||||
1.303%, 02/15/2018 (A) | 57,495 | 57,466 | ||||||
FHLMC | ||||||||
0.875%, 03/07/2018 | 34,000 | 33,993 | ||||||
FHLMC DN | ||||||||
1.096%, 02/16/2018 (A) | 17,245 | 17,237 | ||||||
FNMA | ||||||||
0.875%, 05/21/2018 | 46,870 | 46,820 | ||||||
Total U.S. Government Agency Obligations | 3,336,395 | |||||||
U.S. TREASURY OBLIGATIONS – 23.5% |
| |||||||
U.S. Treasury Bills (A) | ||||||||
1.294%, 03/08/2018 | 125,000 | 124,843 | ||||||
1.187%, 03/22/2018 | 58,685 | 58,591 | ||||||
1.177%, 03/29/2018 | 328,290 | 327,692 | ||||||
1.197%, 04/05/2018 | 75,000 | 74,844 | ||||||
1.271%, 05/03/2018 | 57,130 | 56,948 | ||||||
1.446%, 05/31/2018 | 34,100 | 33,938 | ||||||
1.461%, 06/07/2018 | 114,320 | 113,740 | ||||||
1.461%, 06/14/2018 | 16,360 | 16,272 | ||||||
1.496%, 06/21/2018 | 5,340 | 5,309 | ||||||
1.542%, 06/28/2018 | 300,000 | 298,126 | ||||||
| 10 | SEI Daily Income Trust / Annual Report / January 31, 2018 |
| Description | Face Amount (Thousands) | Value ($Thousands) | ||||||
U.S. TREASURY OBLIGATIONS (continued) |
| |||||||
1.588%, 07/12/2018 | $ | 150,000 | $ | 148,943 | ||||
1.611%, 07/19/2018 | 223,175 | 221,511 | ||||||
1.638%, 08/02/2018 | 150,000 | 148,768 | ||||||
U.S. Treasury Notes | ||||||||
0.750%, 02/28/2018 | 33,930 | 33,921 | ||||||
1.375%, 07/31/2018 | 33,750 | 33,740 | ||||||
0.875%, 10/15/2018 | 12,615 | 12,543 | ||||||
1.375%, 11/30/2018
|
| 10,285
|
|
| 10,254
|
| ||
Total U.S. Treasury Obligations |
| 1,719,983 | ||||||
REPURCHASE AGREEMENTS(B) – 32.4% |
| |||||||
BNP Paribas | ||||||||
1.330%, dated 01/31/18, to be repurchased on 02/01/18, repurchase price $189,006,980 (collateralized by various U.S. Treasury obligations, ranging in par value $.01 - $79,146,100, 0.000% - 3.750%, 02/15/18 - 02/15/46; with total market value $192,780,000) | 189,000 | 189,000 | ||||||
Citigroup Global | ||||||||
1.350%, dated 01/31/2018, to be repurchased on 02/01/18, repurchase price $9,000,338 (collateralized by various FHLMC, FNMA, GNMA and U.S. Treasury obligations, ranging in par value$ 5,000 - $4,282,518, 0.000% - 5.000%, 08/15/24- 01/20/48; with total market value $9,221,374) | 9,000 | 9,000 | ||||||
Citigroup Global | ||||||||
1.330%, dated 01/31/2018, to be repurchased on 02/01/18, repurchase price $41,001,515 (collateralized by U.S. Treasury obligations, par value $41,467,100 2.500%, 08/15/23; with total market value $41,820,026) | 41,000 | 41,000 | ||||||
Goldman Sachs | ||||||||
1.250%, dated 01/31/2018, to be repurchased on 02/01/18, repurchase price $74,002,569 (collateralized by various U.S. Treasury obligations, ranging in par value $9,200 -$76,440,000, 0.000% - 0.5000%, 02/01/18- 01/15/28; with total market value $75,480,006) | 74,000 | 74,000 | ||||||
| Description | Face Amount (Thousands) | Value ($Thousands) | ||||||
REPURCHASE AGREEMENTS(B) (continued) |
| |||||||
Goldman Sachs | ||||||||
1.310%, dated 01/31/2018, to be repurchased on 02/01/18, repurchase price $325,011,826 (collateralized by FFCB, FNMA and U.S. Treasury obligation, ranging in par value $910,000 -$327,844,100, 2.000% - 7.125%, 08/31/21- 11/16/37; with total market value $331,500,031) | $ | 325,000 | $ | 325,000 | ||||
J P Morgan | ||||||||
1.370%, dated 01/31/2018, to be repurchased on 02/01/18, repurchase price $375,014,271 (collateralized by various U.S. Treasury obligations, ranging in par value $3,745,000 - $391,090,200, 1.435% - 2.125%, 01/31/20 - 05/16/25; with total market value $382,503,855) | 375,000 | 375,000 | ||||||
Merrill Lynch | ||||||||
1.360%, dated 01/31/2018, to be repurchased on 02/01/18, repurchase price $150,005,667 (collateralized by various U.S. Government Agency obligations, ranging in par value $13,095,266 - $146,277,996, 3.000% - 4.000%, 01/01/42- 01/01/48; with total market value $154,500,089) | 150,000 | 150,000 | ||||||
Mitsubishi UFJ | ||||||||
1.310%, dated 01/31/2018, to be repurchased on 02/01/18, repurchase price $280,010,189 (collateralized by various U.S. Treasury obligations, ranging in par value $200 - $139,790,800, 0.000% - 5.375%, 09/30/18 - 05/15/46; with total market value $285,600,010) | 280,000 | 280,000 | ||||||
Mizuho Securities | ||||||||
1.370%, dated 01/31/2018, to be repurchased on 02/01/18, repurchase price $150,005,708 (collateralized by FHLMC and GNMA obligations, ranging in par value $185,980 - $74,577,864, 4.500% - 5.000%, 01/20/47- 01/20/48; with total market value $153,322,978) | 150,000 | 150,000 | ||||||
Natixis S.A. | ||||||||
1.330%, dated 01/31/2018, to be repurchased on 02/01/18, repurchase price $65,002,401 (collateralized by various U.S. Government Agency and U.S. Treasury obligations, ranging in par value $100 - 31,253,364, 0.000% - 6.625%, 06/21/18 - 10/01/47; with total market value $66,659,232) | 65,000 | 65,000 | ||||||
| SEI Daily Income Trust / Annual Report / January 31, 2018 | 11 |
SCHEDULE OF INVESTMENTS
January 31, 2018
Government Fund (Concluded)
| Description | Face Amount (Thousands) | Value ($ Thousands) | ||||||
REPURCHASE AGREEMENTS(B) (continued) |
| |||||||
Natixis S.A. | ||||||||
1.320%, dated 01/31/2018, to be repurchased on 02/01/18, repurchase price $25,000,917 (collateralized by various U.S. Treasury obligations, ranging in par value $100 -$19,393,600, 0.000% - 2.500%, 04/15/18- 02/15/45; with total market value $25,500,080) | $ | 25,000 | $ | 25,000 | ||||
TD Securities | ||||||||
1.350%, dated 01/31/2018, to be repurchased on 02/01/18, repurchase price $250,009,375 (collateralized by FNMA and GNMA obligations, ranging in par value $50,147,533 -$183,686,399, 3.500% - 4.000%, 02/20/42- 08/01/46; with total market value $257,040,873) | 250,000 | 250,000 | ||||||
TD Securities | ||||||||
1.330%, dated 01/31/2018, to be repurchased on 02/01/18, repurchase price $250,009,236 (collateralized by various U.S. Treasury obligations, ranging in par value $79,738,400 -$156,095,900, 2.500% - 4.375%, 05/15/24- 05/15/40; with total market value $255,000,025) | 250,000 | 250,000 | ||||||
Bank of Nova Scotia | ||||||||
1.330%, dated 01/31/2018, to be repurchased on 02/01/18, repurchase price $13,000,480 (collateralized by various U.S. Treasury obligations, ranging in par value $35,000 - $6,517,600, 1.250% - 3.875%, 01/31/20 - 04/15/29; with total market value $13,260,501) | 13,000 | 13,000 | ||||||
Wells Fargo | ||||||||
1.350%, dated 01/31/2018, to be repurchased on 02/01/18, repurchase price $175,006,563 (collateralized by U.S. Treasury obligation, par value $181,013,400, 2.875%, 11/15/46; with total market value $178,500,089) | 175,000 | 175,000 | ||||||
Total Repurchase Agreements | 2,371,000 | |||||||
Total Investments — 101.6% | $ | 7,427,378 | ||||||
| Percentages are based on Net Assets of $7,309,291 ($ Thousands). |
| (A) | Zero coupon security. The rate shown on the Schedule of Investments is the effective yield at the time of purchase. |
| (B) | Tri-Party Repurchase Agreement. |
DN — Discount Note
FFCB — Federal Farm Credit Bank
FHLB — Federal Home Loan Bank
FHLMC — Federal Home Loan Mortgage Corporation
FNMA — Federal National Mortgage Association
GNMA — Government National Mortgage Association
Ser — Series
As of January 31, 2018, all of the Fund’s investments were considered Level 2, in accordance with the authoritative guidance on fair value measurements and disclosure under U.S. GAAP.
For the year ended January 31, 2018, there were no transfers between Level 1, Level 2 and/or Level 3 assets and liabilities.
For more information on valuation inputs, see Note 2—Significant Accounting Policies in Notes to Financial Statements.
The accompanying notes are an integral part of the financial statements.
| 12 | SEI Daily Income Trust / Annual Report / January 31, 2018 |
SCHEDULE OF INVESTMENTS
January 31, 2018
Government II Fund

†Percentages are based on total investments.
| Description | Face Amount (Thousands) | Market Value ($ Thousands) | ||||||
U.S. GOVERNMENT AGENCY OBLIGATIONS — 52.0% |
| |||||||
FFCB | ||||||||
1.470%, VAR ICE LIBOR USD 1 Month+-0.085%, 05/07/2019 | $ | 29,000 | $ | 28,998 | ||||
1.400%, VAR ICE LIBOR USD 1 Month+0.160%, 03/26/2018 | 6,740 | 6,742 | ||||||
1.598%, VAR ICE LIBOR USD 1 Month+0.045%, 04/09/2018 | 20,185 | 20,187 | ||||||
1.257%, VAR ICE LIBOR USD 1 Month+0.020%, 05/17/2018 | 5,260 | 5,261 | ||||||
1.529%, VAR ICE LIBOR USD 1 Month+-0.030%, 08/13/2018 | 9,925 | 9,925 | ||||||
FFCB DN DN | ||||||||
1.294%, 07/13/2018 (A) | 12,375 | 12,304 | ||||||
1.261%, 06/06/2018 (A) | 4,865 | 4,844 | ||||||
1.250%, 05/25/2018 (A) | 19,070 | 18,996 | ||||||
1.167%, 03/23/2018 (A) | 7,630 | 7,617 | ||||||
FHLB | ||||||||
1.482%, VAR ICE LIBOR USD 1 Month+-0.080%, 02/04/2019 | 15,000 | 15,000 | ||||||
1.473%, VAR ICE LIBOR USD 3 Month+-0.140%, 12/19/2019 | 8,040 | 8,040 | ||||||
1.471%, VAR ICE LIBOR USD 1 Month+-0.090%, 01/25/2019 | 15,470 | 15,470 | ||||||
1.466%, VAR ICE LIBOR USD 1 Month+-0.095%, 12/21/2018 | 17,000 | 17,000 | ||||||
1.465%, VAR ICE LIBOR USD 1 Month+-0.090%, 11/08/2018 to 06/20/2019 | 43,675 | 43,675 | ||||||
1.449%, VAR ICE LIBOR USD 1 Month+-0.115%, 10/03/2018 | 15,500 | 15,500 | ||||||
1.431%, VAR ICE LIBOR USD 1 Month+-0.130%, 01/28/2019 | 10,580 | 10,580 | ||||||
1.429%, VAR ICE LIBOR USD 1 Month+-0.130%, 11/15/2018 | 15,000 | 15,000 | ||||||
1.422%, VAR ICE LIBOR USD 1 Month+-0.135%, 06/05/2018 | 13,000 | 13,000 | ||||||
1.419%, VAR ICE LIBOR USD 1 Month+-0.140%, 04/17/2018 | 30,280 | 30,280 | ||||||
1.416%, VAR ICE LIBOR USD 1 Month+-0.140%, 05/18/2018 to 08/22/2018 | 44,445 | 44,445 | ||||||
1.414%, VAR ICE LIBOR USD 1 Month+-0.145%, 04/17/2018 to 08/15/2018 | 35,670 | 35,670 | ||||||
1.411%, VAR ICE LIBOR USD 1 Month+-0.150%, 07/27/2018 | 15,445 | 15,445 | ||||||
1.408%, VAR ICE LIBOR USD 1 Month+-0.160%, 07/27/2018 | 20,000 | 20,000 | ||||||
| Description | Face Amount (Thousands) | Market Value ($ Thousands) | ||||||
U.S. GOVERNMENT AGENCY OBLIGATIONS (continued) |
| |||||||
1.403%, VAR ICE LIBOR USD 1 Month+-0.155%, 05/25/2018 | $ | 15,000 | $ | 15,000 | ||||
1.389%, VAR ICE LIBOR USD 3 Month+-0.160%, 06/12/2019 | 6,510 | 6,507 | ||||||
1.202%, VAR ICE LIBOR USD 3 Month+-0.110%, 02/05/2018 | 5,000 | 5,000 | ||||||
1.513%, VAR ICE LIBOR USD 1 Month+-0.040%, 07/09/2018 | 19,000 | 19,000 | ||||||
1.321%, VAR ICE LIBOR USD 3 Month+-0.160%, 05/30/2018 | 14,080 | 14,080 | ||||||
1.118%, VAR ICE LIBOR USD 3 Month+-0.200%, 03/02/2018 | 4,000 | 4,000 | ||||||
FHLB DN | ||||||||
1.466%, 05/01/2018 (A) | 17,635 | 17,571 | ||||||
1.363%, 04/03/2018 (A) | 26,185 | 26,125 | ||||||
1.343%, 03/13/2018 to 03/27/2018 (A) | 43,185 | 43,112 | ||||||
1.332%, 03/09/2018 (A) | 37,805 | 37,755 | ||||||
1.322%, 02/21/2018 (A) | 19,520 | 19,506 | ||||||
1.308%, 03/07/2018 (A) | 18,185 | 18,163 | ||||||
1.253%, 03/23/2018 (A) | 16,535 | 16,504 | ||||||
1.219%, 02/07/2018 (A) | 15,500 | 15,497 | ||||||
1.182%, 03/21/2018 (A) | 25,000 | 24,961 | ||||||
1.179%, 02/14/2018 (A) | 44,570 | 44,551 | ||||||
1.131%, 03/02/2018 (A) | 17,035 | 17,019 | ||||||
1.128%, 02/23/2018 (A) | 123,620 | 123,523 | ||||||
1.126%, 02/28/2018 (A) | 96,245 | 96,153 | ||||||
1.430%, 04/11/2018 (A) | 5,165 | 5,151 | ||||||
1.265%, 02/02/2018 (A) | 95,500 | 95,497 | ||||||
0.060%, 08/01/2018 (A) | 38,200 | 37,887 | ||||||
FHLB DN DN, Ser 2005- | ||||||||
1.303%, 02/15/2018 (A) | 15,935 | 15,927 | ||||||
Total U.S. Government Agency Obligations | 1,132,468 | |||||||
U.S. TREASURY OBLIGATIONS — 50.1% |
| |||||||
U.S. Treasury Bills | ||||||||
1.252%, 02/01/2018 (A) | 1,000 | 1,000 | ||||||
1.271%, 02/08/2018 (A) | 184,000 | 183,955 | ||||||
1.266%, 02/15/2018 (A) | 415,000 | 414,796 | ||||||
1.294%, 03/08/2018 (A) | 75,000 | 74,906 | ||||||
1.177%, 03/29/2018 (A) | 62,775 | 62,660 | ||||||
1.197%, 04/05/2018 (A) | 24,000 | 23,950 | ||||||
1.270%, 05/03/2018 (A) | 13,330 | 13,287 | ||||||
1.446%, 05/31/2018 (A) | 13,595 | 13,531 | ||||||
1.461%, 06/07/2018 (A) | 32,860 | 32,693 | ||||||
1.496%, 06/21/2018 (A) | 1,460 | 1,452 | ||||||
1.542%, 06/28/2018 (A) | 111,810 | 111,112 | ||||||
1.588%, 07/12/2018 (A) | 45,000 | 44,683 | ||||||
1.611%, 07/19/2018 (A) | 67,800 | 67,294 | ||||||
| SEI Daily Income Trust / Annual Report / January 31, 2018 | 13 |
SCHEDULE OF INVESTMENTS
January 31, 2018
Government II Fund (Concluded)
| Description | Face Amount (Thousands) | Market Value ($ Thousands) | ||||
U.S. TREASURY OBLIGATIONS (continued) | ||||||
1.638%, 08/02/2018 (A) | $ | 45,000 | $ 44,630 | |||
Total U.S. Treasury Obligations | 1,089,949 | |||||
Total Investments in Securities— 102.1% | $ 2,222,417 | |||||
| Percentages are based on Net Assets of $2,177,761 ($ Thousands). |
| (A) | Zero Coupon Rate — The rate reported on the Schedule of Investments is the effective yield at the time of purchase. |
DN — Discount Note
FFCB — Federal Farm Credit Bank
FHLB — Federal Home Loan Bank
Ser — Series
As of January 31, 2018, all of the Fund’s investments were considered Level 2, in accordance with the authoritative guidance on fair value measurements and disclosure under U.S. GAAP.
For the year ended January 31, 2018, there were no transfers between Level 1, Level 2 and/or Level 3 assets and liabilities.
For more information on valuation inputs, see Note 2—Significant Accounting Policies in Notes to Financial Statements.
The accompanying notes are an integral part of the financial statements.
| 14 | SEI Daily Income Trust / Annual Report / January 31, 2018 |
SCHEDULE OF INVESTMENTS
January 31, 2018
Treasury Fund

†Percentages are based on total investments.
| Description | Face Amount (Thousands) | Value ($ Thousands) | ||||||
U.S. TREASURY OBLIGATIONS – 68.4% |
| |||||||
U.S. Treasury Bills (A) | ||||||||
1.252%, 02/01/2018 | $ | 10,000 | $ | 10,000 | ||||
1.294%, 03/08/2018 | 1,000 | 999 | ||||||
1.182%, 03/22/2018 | 4,945 | 4,937 | ||||||
1.249%, 03/29/2018 | 14,800 | 14,771 | ||||||
1.197%, 04/05/2018 | 2,000 | 1,996 | ||||||
1.227%, 04/12/2018 | 2,000 | 1,995 | ||||||
1.436%, 04/26/2018 | 1,000 | 997 | ||||||
1.270%, 05/03/2018 | 620 | 618 | ||||||
1.311%, 05/10/2018 | 2,195 | 2,187 | ||||||
1.359%, 05/17/2018 | 115 | 115 | ||||||
1.446%, 05/31/2018 | 1,180 | 1,174 | ||||||
1.461%, 06/07/2018 | 1,750 | 1,741 | ||||||
1.542%, 06/28/2018 | 2,635 | 2,618 | ||||||
1.588%, 07/12/2018 | 3,000 | 2,979 | ||||||
1.222%, 07/19/2018 | 6,760 | 6,715 | ||||||
1.639%, 08/02/2018 | 3,000 | 2,975 | ||||||
U.S. Treasury Notes | ||||||||
3.500%, 02/15/2018 | 750 | 751 | ||||||
1.000%, 02/15/2018 | 705 | 705 | ||||||
0.750%, 02/28/2018 | 470 | 470 | ||||||
2.875%, 03/31/2018 | 1,500 | 1,504 | ||||||
1.625%, VAR US Treasury 3 Month Bill Money Market Yield+0.190%, 04/30/2018 | 8,500 | 8,500 | ||||||
1.375%, 07/31/2018 | 465 | 465 | ||||||
0.875%, 10/15/2018 | 160 | 159 | ||||||
1.605%, VAR US Treasury 3 Month Bill Money Market Yield+0.170%, 10/31/2018 | 2,830 | 2,830 | ||||||
1.375%, 11/30/2018 | 120 | 120 | ||||||
1.505%, VAR US Treasury 3 Month Bill Money Market Yield+0.070%, 04/30/2019 | 1,735 | 1,735 | ||||||
1.483%, VAR US Treasury 3 Month Bill Money Market Yield+0.048%, 10/31/2019 | 2,000 | 2,000 | ||||||
1.435%, VAR US Treasury 3 Month Bill Money Market Yield+0.000%, 01/31/2020 |
| 2,000
|
|
| 2,000
|
| ||
Total U.S. Treasury Obligations (Cost $78,056) ($ Thousands) | 78,056 | |||||||
| Description | Face Amount (Thousands) | Value ($ Thousands) | ||||||
REPURCHASE AGREEMENTS(B) – 28.9% |
| |||||||
BNP Paribas | ||||||||
1.330%, dated 01/31/2018, to be repurchased on 02/01/18, repurchase price $5,000,185 (collateralized by various U.S. Treasury obligations, ranging in par value $200 - $3,043,000, 0.000% - 1.575%, 02/01/18- 01/31/19; with total market value $5,100,059) | $ | 5,000 | $ | 5,000 | ||||
Citigroup Global | ||||||||
1.330%, dated 01/31/2018, to be repurchased on 02/01/18, repurchase price $5,000,185 (collateralized by U.S. Treasury obligation, par value $5,157,800, 1.250%, 10/31/19; with total market value $5,100,042) | 5,000 | 5,000 | ||||||
Goldman Sachs | ||||||||
1.250%, dated 01/31/2018, to be repurchased on 02/01/18, repurchase price $1,000,035 (collateralized by U.S. Treasury obligation, par value $1,397,700, 0.000%, 08/15/29; with total market value $1,020,041) | 1,000 | 1,000 | ||||||
Mitsubishi UFJ | ||||||||
1.310%, dated 01/31/2018, to be repurchased on 02/01/18, repurchase price $4,000,146 (collateralized by various U.S. Treasury obligations, ranging in par value $800 - $6,188,000, 0.000% - 2.500%, 01/31/21 -10/15/44; with total market value$4,080,050) | 4,000 | 4,000 | ||||||
Natixis S.A. | ||||||||
1.320%, dated 01/31/2018, to be repurchased on 02/01/18, repurchase price $3,000,110 (collateralized by various U.S. Treasury obligations, ranging in par value $100 - $3,063,000, 0.000% - 2.500%, 03/22/18 - 05/15/24; with total market value $3,060,063) | 3,000 | 3,000 | ||||||
TD Securities | ||||||||
1.330%, dated 01/31/2018, to be repurchased on 02/01/18, repurchase price $4,000,148 (collateralized by U.S. Treasury obligation, par value $4,105,700, 2.375%, 01/31/23; with total market value $4,080,039) | 4,000 | 4,000 | ||||||
Bank of Nova Scotia | ||||||||
1.320%, dated 01/31/2018, to be repurchased on 02/01/18, repurchase price $2,000,073 (collateralized by various U.S. Treasury obligations, ranging in par value $200 - $2,055,200, 1.250% - 2.125%, 08/31/19- 07/31/24; with total market value $2,040,089) | 2,000 | 2,000 | ||||||
| SEI Daily Income Trust / Annual Report / January 31, 2018 | 15 |
SCHEDULE OF INVESTMENTS
January 31, 2018
Treasury Fund (Concluded)
| Description | Face Amount (Thousands) | Value ($ Thousands) | ||||
REPURCHASE AGREEMENTS(B) (continued) | ||||||
Wells Fargo | ||||||
1.350%, dated 01/31/2018, to be repurchased on 02/01/18, repurchase price $4,000,150 (collateralized by various U.S. Treasury obligations, ranging in par value $295,400 - $3,264,000, 1.000% - 2.875%, 09/30/19 - 11/15/46; with total market value $4,080,077) | $ | 4,000 | $ 4,000 | |||
Merrill Lynch | ||||||
1.350%, dated 01/31/2018, to be repurchased on 02/01/18, repurchase price $5,000,188 (collateralized by U.S. Treasury obligation, par value $5,150,800, 2.500%, 01/31/25; with total market value $5,100,097) | 5,000 | 5,000 | ||||
Total Repurchase Agreements | 33,000 | |||||
Total Investments – 97.3% | $ 111,056 | |||||
| Percentages are based on Net Assets of $114,120 ($ Thousands). |
| (A) | Zero coupon security. The rate shown on the Schedule of Investments is the effective yield at the time of purchase. |
| (B) | Tri-Party Repurchase Agreement. |
As of January 31, 2018, all of the Fund’s investments were considered Level 2, in accordance with the authoritative guidance on fair value measurements and disclosure under U.S. GAAP.
For the year ended January 31, 2018, there were no transfers between Level 1, Level 2 and/or Level 3 assets and liabilities.
For more information on valuation inputs, see Note 2–Significant Accounting Policies in Notes to Financial Statements.
The accompanying notes are an integral part of the financial statements.
| 16 | SEI Daily Income Trust / Annual Report / January 31, 2018 |
SCHEDULE OF INVESTMENTS
January 31, 2018
Treasury II Fund

†Percentages are based on total investments.
| Description | Face Amount (Thousands) | Value ($ Thousands) | ||||||
U.S. TREASURY OBLIGATIONS – 102.0% |
| |||||||
U.S. Treasury Bills (A) | ||||||||
1.252%, 02/01/2018 | $ | 13,000 | $ | 13,000 | ||||
1.271%, 02/08/2018 | 50,000 | 49,988 | ||||||
1.121%, 02/15/2018 | 157,000 | 156,922 | ||||||
1.240%, 02/22/2018 | 10,000 | 9,993 | ||||||
1.294%, 03/08/2018 | 20,000 | 19,975 | ||||||
1.147%, 03/15/2018 | 10,000 | 9,987 | ||||||
1.182%, 03/22/2018 | 18,845 | 18,812 | ||||||
1.177%, 03/29/2018 | 58,125 | 58,013 | ||||||
1.196%, 04/05/2018 | 11,000 | 10,977 | ||||||
1.227%, 04/12/2018 | 10,000 | 9,976 | ||||||
1.436%, 04/26/2018 | 7,000 | 6,977 | ||||||
1.266%, 05/03/2018 | 10,920 | 10,885 | ||||||
1.311%, 05/10/2018 | 11,180 | 11,140 | ||||||
1.359%, 05/17/2018 | 695 | 692 | ||||||
1.446%, 05/31/2018 | 2,770 | 2,757 | ||||||
1.461%, 06/07/2018 | 6,250 | 6,218 | ||||||
1.461%, 06/14/2018 | 4,360 | 4,337 | ||||||
1.496%, 06/21/2018 | 430 | 428 | ||||||
1.542%, 06/28/2018 | 30,835 | 30,642 | ||||||
1.588%, 07/12/2018 | 15,000 | 14,894 | ||||||
1.205%, 07/19/2018 | 20,820 | 20,669 | ||||||
1.638%, 08/02/2018 | 12,000 | 11,901 | ||||||
U.S. Treasury Notes | ||||||||
1.000%, 02/15/2018 | 3,325 | 3,325 | ||||||
0.750%, 02/28/2018 | 2,320 | 2,319 | ||||||
2.875%, 03/31/2018 | 4,000 | 4,011 | ||||||
1.298%, VAR US Treasury 3 Month Bill Money Market Yield+0.190%, 04/30/2018 | 30,000 | 30,000 | ||||||
1.375%, 07/31/2018 | 5,280 | 5,279 | ||||||
0.875%, 10/15/2018 | 990 | 984 | ||||||
1.605%, VAR US Treasury 3 Month Bill Money Market Yield+0.170%, 10/31/2018 | 11,940 | 11,940 | ||||||
1.375%, 11/30/2018 | 820 | 818 | ||||||
1.575%, VAR US Treasury 3 Month Bill Money Market Yield+0.140%, 01/31/2019 | 2,000 | 2,002 | ||||||
1.505%, VAR US Treasury 3 Month Bill Money Market Yield+0.070%, 04/30/2019 | 6,510 | 6,510 | ||||||
1.483%, VAR US Treasury 3 Month Bill Money Market Yield+0.048%, 10/31/2019 | 12,000 | 12,003 | ||||||
| Description | Face Amount (Thousands) | Value ($ Thousands) | ||||||
U.S. TREASURY OBLIGATIONS (continued) |
| |||||||
1.430%, VAR US Treasury 3 Month Bill Money Market Yield+0.000%, 01/31/2020 | $ | 6,250 | $ | 6,250 | ||||
|
| |||||||
Total U.S. Treasury Obligations | 564,624 | |||||||
|
| |||||||
Total Investments – 102.0% | $ | 564,624 | ||||||
|
| |||||||
| Percentages are based on Net Assets of $553,712 ($ Thousands). |
| (A) | Zero coupon security. The rate shown on the Schedule of Investments is the effective yield at the time of purchase. |
As of January 31, 2018, all of the Fund’s investments were considered Level 2, in accordance with the authoritative guidance on fair value measurements and disclosure under U.S. GAAP.
For the year ended January 31, 2018, there were no transfers between Level 1, Level 2 and/or Level 3 assets and liabilities.
For more information on valuation inputs, see Note 2 – Significant Accounting Policies in Notes to Financial Statements.
The accompanying notes are an integral part of the financial statements.
| SEI Daily Income Trust / Annual Report / January 31, 2018 | 17 |
SCHEDULE OF INVESTMENTS
January 31, 2018
Ultra Short Duration Bond Fund
†Percentages are based on total investments.
| Description | Face Amount (Thousands) | Market Value ($ Thousands) | ||||||
CORPORATE OBLIGATIONS – 47.8% |
| |||||||
Consumer Discretionary – 0.6% |
| |||||||
AutoZone | ||||||||
1.625%, 04/21/2019 | $ | 465 | $ | 460 | ||||
Discovery Communications LLC | ||||||||
2.200%, 09/20/2019 | 150 | 149 | ||||||
2.036%, VAR ICE LIBOR USD 3 Month+0.710%, 09/20/2019 | 490 | 492 | ||||||
NBCUniversal Enterprise | ||||||||
2.044%, VAR ICE LIBOR USD 3 Month+0.685%, 04/15/2018 | 825 | 826 | ||||||
| 1,927 | ||||||||
Consumer Staples – 3.1% | ||||||||
Anheuser-Busch InBev Worldwide | ||||||||
2.001%, VAR ICE LIBOR USD 3 Month+0.690%, 08/01/2018 | 900 | 903 | ||||||
BAT Capital | ||||||||
2.003%, VAR ICE LIBOR USD 3 Month+0.590%, 08/14/2020 (A) | 1,600 | 1,610 | ||||||
Constellation Brands | ||||||||
2.000%, 11/07/2019 | 525 | 520 | ||||||
CVS Health | ||||||||
1.900%, 07/20/2018 | 350 | 350 | ||||||
Kraft Heinz Foods | ||||||||
2.230%, VAR ICE LIBOR USD 3 Month+0.820%, 08/10/2022 | 400 | 404 | ||||||
Kroger MTN | ||||||||
1.500%, 09/30/2019 | 800 | 787 | ||||||
Molson Coors Brewing | ||||||||
1.450%, 07/15/2019 | 775 | 762 | ||||||
Mondelez International | ||||||||
1.831%, VAR ICE LIBOR USD 3 Month+0.520%, 02/01/2019 | 450 | 451 | ||||||
Mondelez International Holdings Netherlands | ||||||||
2.370%, VAR ICE LIBOR USD 3 Month+0.610%, 10/28/2019 (A) | 1,570 | 1,577 | ||||||
| Description | Face Amount (Thousands) | Market Value ($ Thousands) | ||||||
CORPORATE OBLIGATIONS (continued) |
| |||||||
Philip Morris International | ||||||||
1.861%, VAR ICE LIBOR USD 3 Month+0.420%, 02/21/2020 | $ | 1,655 | $ | 1,663 | ||||
Reynolds American | ||||||||
2.300%, 06/12/2018 | 645 | 645 | ||||||
| 9,672 | ||||||||
Energy – 2.5% | ||||||||
Anadarko Petroleum | ||||||||
8.700%, 03/15/2019 | 350 | 373 | ||||||
6.950%, 06/15/2019 | 235 | 247 | ||||||
Andeavor Logistics | ||||||||
5.500%, 10/15/2019 | 250 | 260 | ||||||
BP Capital Markets PLC | ||||||||
1.959%, VAR ICE LIBOR USD 3 Month+0.630%, 09/26/2018 | 450 | 451 | ||||||
1.819%, VAR ICE LIBOR USD 3 Month+0.510%, 05/10/2018 | 750 | 751 | ||||||
Energy Transfer Partners | ||||||||
2.500%, 06/15/2018 | 750 | 751 | ||||||
Enterprise Products Operating LLC | ||||||||
1.650%, 05/07/2018 | 1,020 | 1,019 | ||||||
Phillips 66 | ||||||||
2.472%, VAR ICE LIBOR USD 3 Month+0.750%, 04/15/2020 (A) | 620 | 621 | ||||||
Schlumberger Finance Canada | ||||||||
2.200%, 11/20/2020 (A) | 375 | 370 | ||||||
Shell International Finance BV | ||||||||
1.660%, VAR ICE LIBOR USD 3 Month+0.350%, 09/12/2019 | 1,170 | 1,176 | ||||||
1.375%, 05/10/2019 | 800 | 791 | ||||||
Statoil | ||||||||
1.772%, VAR ICE LIBOR USD 3 Month+0.460%, 11/08/2018 | 550 | 552 | ||||||
Total Capital International | ||||||||
1.839%, VAR ICE LIBOR USD 3 Month+0.570%, 08/10/2018 | 400 | 401 | ||||||
| 7,763 | ||||||||
Financials – 30.8% | ||||||||
ABN AMRO Bank | ||||||||
1.994%, VAR ICE LIBOR USD 3 Month+0.640%, 01/18/2019 (A) | 1,145 | 1,150 | ||||||
AIG Global Funding | ||||||||
1.815%, VAR ICE LIBOR USD 3 Month+0.480%, 07/02/2020 (A) | 775 | 776 | ||||||
AIG Global Funding MTN | ||||||||
1.950%, 10/18/2019 (A) | 885 | 875 | ||||||
Alimentation Couche-Tard | ||||||||
2.074%, VAR ICE LIBOR USD 3 Month+0.500%, 12/13/2019 (A) | 1,070 | 1,071 | ||||||
| 18 | SEI Daily Income Trust / Annual Report / January 31, 2018 |
| Description | Face Amount (Thousands) | Market Value ($ Thousands) | ||||||
CORPORATE OBLIGATIONS (continued) |
| |||||||
American Express Credit | ||||||||
1.871%, VAR ICE LIBOR USD 3 Month+0.550%, 03/18/2019 | $ | 300 | $ | 301 | ||||
American Express Credit MTN | ||||||||
1.875%, 11/05/2018 | 1,250 | 1,248 | ||||||
1.746%, VAR ICE LIBOR USD 3 Month+0.430%, 03/03/2020 | 900 | 904 | ||||||
1.641%, VAR ICE LIBOR USD 3 Month+0.330%, 05/03/2019 | 345 | 346 | ||||||
American Honda Finance MTN | ||||||||
2.140%, VAR ICE LIBOR USD 3 Month+0.825%, 02/22/2019 | 935 | 943 | ||||||
1.700%, 02/22/2019 | 650 | 647 | ||||||
Australia & New Zealand Banking Group | ||||||||
1.875%, VAR ICE LIBOR USD 3 Month+0.560%, 05/15/2018 | 375 | 376 | ||||||
Bank Nederlandse Gemeenten MTN | ||||||||
1.000%, 02/12/2018 (A) | 1,600 | 1,600 | ||||||
Bank of America | ||||||||
2.399%, VAR ICE LIBOR USD 3 Month+1.040%, 01/15/2019 | 750 | 756 | ||||||
Bank of America MTN | ||||||||
5.650%, 05/01/2018 | 90 | 91 | ||||||
2.543%, VAR ICE LIBOR USD 3 Month+1.180%, 10/21/2022 | 625 | 641 | ||||||
2.523%, VAR ICE LIBOR USD 3 Month+1.160%, 01/20/2023 | 400 | 411 | ||||||
2.205%, VAR ICE LIBOR USD 3 Month+0.870%, 04/01/2019 | 1,075 | 1,084 | ||||||
Bank of Montreal | ||||||||
1.400%, 04/10/2018 | 750 | 749 | ||||||
Bank of Montreal MTN | ||||||||
2.029%, VAR ICE LIBOR USD 3 Month+0.440%, 06/15/2020 | 1,335 | 1,341 | ||||||
1.950%, VAR ICE LIBOR USD 3 Month+0.600%, 04/09/2018 | 825 | 826 | ||||||
Bank of Nova Scotia | ||||||||
2.189%, VAR ICE LIBOR USD 3 Month+0.830%, 01/15/2019 | 1,085 | 1,092 | ||||||
2.155%, VAR ICE LIBOR USD 3 Month+0.640%, 03/07/2022 | 375 | 377 | ||||||
2.125%, 09/11/2019 | 765 | 761 | ||||||
Barclays Bank PLC | ||||||||
2.165%, VAR ICE LIBOR USD 3 Month+0.460%, 01/11/2021 | 905 | 907 | ||||||
BB&T MTN | ||||||||
1.971%, VAR ICE LIBOR USD 3 Month+0.660%, 02/01/2019 | 350 | 352 | ||||||
1.816%, VAR ICE LIBOR USD 3 Month+0.570%, 06/15/2020 | 400 | 402 | ||||||
Berkshire Hathaway | ||||||||
1.150%, 08/15/2018 | 400 | 398 | ||||||
| Description | Face Amount (Thousands) | Market Value ($ Thousands) | ||||||
CORPORATE OBLIGATIONS (continued) |
| |||||||
BMW US Capital LLC | ||||||||
1.998%, VAR ICE LIBOR USD 3 Month+0.410%, 09/13/2019 (A) | $ | 1,505 | $ | 1,514 | ||||
BPCE MTN | ||||||||
2.535%, VAR ICE LIBOR USD 3 Month+1.220%, 05/22/2022 (A) | 250 | 255 | ||||||
Branch Banking & Trust | ||||||||
1.809%, VAR ICE LIBOR USD 3 Month+0.450%, 01/15/2020 | 855 | 859 | ||||||
1.450%, 05/10/2019 | 590 | 583 | ||||||
Canadian Imperial Bank of Commerce | ||||||||
2.100%, 10/05/2020 | 1,075 | 1,061 | ||||||
2.093%, VAR ICE LIBOR USD 3 Month+0.315%, 02/02/2021 | 1,500 | 1,502 | ||||||
1.836%, VAR ICE LIBOR USD 3 Month+0.520%, 09/06/2019 | 980 | 984 | ||||||
Capital One | ||||||||
2.528%, VAR ICE LIBOR USD 3 Month+1.150%, 01/30/2023 | 500 | 504 | ||||||
2.082%, VAR ICE LIBOR USD 3 Month+0.765%, 09/13/2019 | 500 | 503 | ||||||
Capital One Financial | ||||||||
2.173%, VAR ICE LIBOR USD 3 Month+0.760%, 05/12/2020 | 670 | 673 | ||||||
Citibank | ||||||||
1.810%, VAR ICE LIBOR USD 3 Month+0.500%, 06/12/2020 | 775 | 779 | ||||||
Citigroup | ||||||||
2.150%, 07/30/2018 | 455 | 455 | ||||||
2.119%, VAR ICE LIBOR USD 3 Month+0.770%, 04/08/2019 | 700 | 704 | ||||||
2.450%, VAR ICE LIBOR USD 3 Month+0.690%, 04/27/2018 | 1,250 | 1,251 | ||||||
1.700%, 04/27/2018 | 300 | 300 | ||||||
Citizens Bank | ||||||||
2.127%, VAR ICE LIBOR USD 3 Month+0.810%, 05/26/2022 | 550 | 554 | ||||||
2.032%, VAR ICE LIBOR USD 3 Month+0.570%, 05/26/2020 | 700 | 703 | ||||||
1.856%, VAR ICE LIBOR USD 3 Month+0.540%, 03/02/2020 | 550 | 551 | ||||||
Commonwealth Bank of Australia | ||||||||
1.952%, VAR ICE LIBOR USD 3 Month+0.640%, 11/07/2019 (A) | 750 | 756 | ||||||
Cooperatieve Rabobank | ||||||||
2.180%, VAR ICE LIBOR USD 3 Month+0.830%, 01/10/2022 | 800 | 813 | ||||||
Credit Agricole MTN | ||||||||
2.287%, VAR ICE LIBOR USD 3 Month+0.970%, 06/10/2020 (A) | 950 | 965 | ||||||
Daimler Finance North America LLC | ||||||||
2.171%, VAR ICE LIBOR USD 3 Month+0.860%, 08/01/2018 (A) | 400 | 401 | ||||||
| SEI Daily Income Trust / Annual Report / January 31, 2018 | 19 |
SCHEDULE OF INVESTMENTS
January 31, 2018
Ultra Short Duration Bond Fund (Continued)
| Description | Face Amount (Thousands) | Market Value ($ Thousands) | ||||||
CORPORATE OBLIGATIONS (continued) |
| |||||||
2.436%, VAR ICE LIBOR USD 3 Month+0.740%, 07/05/2019 (A) | $ | 1,345 | $ | 1,354 | ||||
1.500%, 07/05/2019 (A) | 750 | 740 | ||||||
Danske Bank | ||||||||
1.896%, VAR ICE LIBOR USD 3 Month+0.580%, 09/06/2019 | 600 | 603 | ||||||
Danske Bank MTN | ||||||||
1.997%, VAR ICE LIBOR USD 3 Month+0.510%, 03/02/2020 (A) | 500 | 502 | ||||||
Deutsche Bank | ||||||||
1.989%, VAR ICE LIBOR USD 3 Month+0.680%, 02/13/2018 | 350 | 350 | ||||||
Deutsche Bank NY | ||||||||
2.329%, VAR ICE LIBOR USD 3 Month+0.970%, 07/13/2020 | 550 | 553 | ||||||
DNB Bank | ||||||||
1.705%, VAR ICE LIBOR USD 3 Month+0.370%, 10/02/2020 (A) | 550 | 552 | ||||||
DNB Boligkreditt | ||||||||
1.450%, 03/21/2018 (A) | 2,500 | 2,497 | ||||||
Fifth Third Bank | ||||||||
2.017%, VAR ICE LIBOR USD 3 Month+0.250%, 10/30/2020 | 400 | 400 | ||||||
2.265%, VAR ICE LIBOR USD 3 Month+0.590%, 09/27/2019 | 1,625 | 1,634 | ||||||
Ford Motor Credit LLC | ||||||||
2.956%, VAR ICE LIBOR USD 3 Month+1.270%, 03/28/2022 | 350 | 356 | ||||||
2.350%, VAR ICE LIBOR USD 3 Month+1.000%, 01/09/2020 | 750 | 758 | ||||||
2.488%, VAR ICE LIBOR USD 3 Month+0.900%, 06/15/2018 | 1,220 | 1,222 | ||||||
2.140%, VAR ICE LIBOR USD 3 Month+0.830%, 03/12/2019 | 500 | 502 | ||||||
1.897%, 08/12/2019 | 350 | 346 | ||||||
General Motors Financial | ||||||||
2.400%, 04/10/2018 | 1,025 | 1,026 | ||||||
2.289%, VAR ICE LIBOR USD 3 Month+0.930%, 04/13/2020 | 450 | 455 | ||||||
Goldman Sachs Group | ||||||||
2.485%, VAR ICE LIBOR USD 3 Month+1.170%, 11/15/2021 | 525 | 534 | ||||||
2.481%, VAR ICE LIBOR USD 3 Month+1.110%, 04/26/2022 | 750 | 763 | ||||||
2.363%, VAR ICE LIBOR USD 3 Month+0.800%, 12/13/2019 | 1,200 | 1,211 | ||||||
HSBC Bank PLC | ||||||||
1.955%, VAR ICE LIBOR USD 3 Month+0.640%, 05/15/2018 (A) | 800 | 801 | ||||||
Huntington National Bank | ||||||||
2.200%, 11/06/2018 | 1,510 | 1,510 | ||||||
1.827%, VAR ICE LIBOR USD 3 Month+0.510%, 03/10/2020 | 650 | 653 | ||||||
| Description | Face Amount (Thousands) | Market Value ($ Thousands) | ||||||
CORPORATE OBLIGATIONS (continued) |
| |||||||
Hyundai Capital America MTN | ||||||||
2.000%, 03/19/2018 (A) | $ | 165 | $ | 165 | ||||
2.000%, 07/01/2019 (A) | 300 | 296 | ||||||
ING Bank | ||||||||
2.025%, VAR ICE LIBOR USD 3 Month+0.690%, 10/01/2019 (A) | 300 | 302 | ||||||
ING Groep | ||||||||
2.843%, VAR ICE LIBOR USD 3 Month+1.150%, 03/29/2022 | 400 | 408 | ||||||
International Finance MTN | ||||||||
1.605%, VAR ICE LIBOR USD 1 Month+0.050%, 03/06/2018 | 775 | 775 | ||||||
Jackson National Life Global Funding | ||||||||
2.060%, VAR ICE LIBOR USD 3 Month+0.730%, 06/27/2022 (A) | 375 | 381 | ||||||
1.875%, 10/15/2018 (A) | 400 | 399 | ||||||
JPMorgan Chase | ||||||||
2.498%, VAR ICE LIBOR USD 3 Month+0.840%, 03/22/2019 | 1,500 | 1,511 | ||||||
2.318%, VAR ICE LIBOR USD 3 Month+0.955%, 01/23/2020 | 500 | 507 | ||||||
2.008%, VAR ICE LIBOR USD 3 Month+0.630%, 01/28/2019 | 500 | 502 | ||||||
1.867%, VAR ICE LIBOR USD 3 Month+0.550%, 03/09/2021 | 550 | 553 | ||||||
KeyBank | ||||||||
2.350%, 03/08/2019 | 250 | 250 | ||||||
2.125%, VAR ICE LIBOR USD 3 Month+0.810%, 11/22/2021 | 750 | 759 | ||||||
Manufacturers & Traders Trust | ||||||||
2.046%, VAR ICE LIBOR USD 3 Month+0.610%, 05/18/2022 | 450 | 454 | ||||||
2.015%, VAR ICE LIBOR USD 3 Month+0.270%, 01/25/2021 | 1,000 | 1,001 | ||||||
Metropolitan Life Global Funding I | ||||||||
2.400%, 01/08/2021 (A) | 795 | 789 | ||||||
Moody’s | ||||||||
1.666%, VAR ICE LIBOR USD 3 Month+0.350%, 09/04/2018 | 540 | 541 | ||||||
Morgan Stanley | ||||||||
2.543%, VAR ICE LIBOR USD 3 Month+1.180%, 01/20/2022 | 475 | 484 | ||||||
2.215%, VAR ICE LIBOR USD 3 Month+0.850%, 01/24/2019 | 625 | 629 | ||||||
2.213%, VAR ICE LIBOR USD 3 Month+0.800%, 02/14/2020 | 1,290 | 1,296 | ||||||
MUFG Americas Holdings | ||||||||
1.625%, 02/09/2018 | 905 | 905 | ||||||
National Bank of Canada MTN | ||||||||
1.870%, VAR ICE LIBOR USD 3 Month+0.560%, 06/12/2020 | 1,075 | 1,083 | ||||||
| 20 | SEI Daily Income Trust / Annual Report / January 31, 2018 |
| Description | Face Amount (Thousands) | Market Value ($ Thousands) | ||||||
CORPORATE OBLIGATIONS (continued) |
| |||||||
New York Life Global Funding | ||||||||
1.832%, VAR ICE LIBOR USD 3 Month+0.100%, 01/21/2020 (A) | $ | 665 | $ | 665 | ||||
1.755%, VAR ICE LIBOR USD 3 Month+0.390%, 10/24/2019 (A) | 600 | 603 | ||||||
Nissan Motor Acceptance MTN | ||||||||
2.076%, VAR ICE LIBOR USD 3 Month+0.390%, 09/28/2020 (A) | 500 | 501 | ||||||
1.939%, VAR ICE LIBOR USD 3 Month+0.580%, 01/13/2020 (A) | 1,000 | 1,006 | ||||||
1.500%, 03/02/2018 (A) | 300 | 300 | ||||||
Orlando Health Obligated Group | ||||||||
2.278%, 10/01/2018 | 785 | 785 | ||||||
PNC Bank | ||||||||
1.995%, VAR ICE LIBOR USD 3 Month+0.250%, 01/22/2021 | 1,050 | 1,051 | ||||||
1.796%, VAR ICE LIBOR USD 3 Month+0.360%, 05/19/2020 | 500 | 502 | ||||||
1.450%, 07/29/2019 | 350 | 345 | ||||||
Protective Life Global Funding | ||||||||
1.722%, 04/15/2019 (A) | 355 | 352 | ||||||
Prudential Financial MTN | ||||||||
2.095%, VAR ICE LIBOR USD 3 Month+0.780%, 08/15/2018 | 750 | 753 | ||||||
Reckitt Benckiser Treasury Services PLC | ||||||||
1.888%, VAR ICE LIBOR USD 3 Month+0.560%, 06/24/2022 (A) | 550 | 550 | ||||||
Regions Bank | ||||||||
7.500%, 05/15/2018 | 600 | 609 | ||||||
Societe Generale MTN | ||||||||
2.415%, VAR ICE LIBOR USD 3 Month+1.080%, 10/01/2018 | 700 | 705 | ||||||
Standard Chartered PLC MTN | ||||||||
1.993%, VAR ICE LIBOR USD 3 Month+0.640%, 04/17/2018 (A) | 900 | 901 | ||||||
Sumitomo Mitsui Banking | ||||||||
2.081%, VAR ICE LIBOR USD 3 Month+0.350%, 01/17/2020 | 250 | 250 | ||||||
1.896%, VAR ICE LIBOR USD 3 Month+0.540%, 01/11/2019 | 650 | 652 | ||||||
Sumitomo Mitsui Banking MTN | ||||||||
2.294%, VAR ICE LIBOR USD 3 Month+0.940%, 01/18/2019 | 850 | 856 | ||||||
SunTrust Bank | ||||||||
2.590%, VAR ICE LIBOR USD 3 Month+0.298%, 01/29/2021 | 450 | 450 | ||||||
2.302%, VAR ICE LIBOR USD 3 Month+0.530%, 01/31/2020 | 1,835 | 1,846 | ||||||
Svenska Handelsbanken MTN | ||||||||
1.806%, VAR ICE LIBOR USD 3 Month+0.490%, 09/06/2019 | 400 | 402 | ||||||
| Description | Face Amount (Thousands) | Market Value ($ Thousands) | ||||||
CORPORATE OBLIGATIONS (continued) |
| |||||||
Synchrony Financial | ||||||||
2.541%, VAR ICE LIBOR USD 3 Month+1.230%, 02/03/2020 | $ | 600 | $ | 609 | ||||
Toronto-Dominion Bank | ||||||||
2.250%, 09/25/2019 (A) | 1,420 | 1,415 | ||||||
Toronto-Dominion Bank MTN | ||||||||
2.203%, VAR ICE LIBOR USD 3 Month+0.840%, 01/22/2019 | 1,015 | 1,022 | ||||||
1.903%, VAR ICE LIBOR USD 3 Month+0.540%, 07/23/2018 | 400 | 401 | ||||||
1.450%, 08/13/2019 | 550 | 542 | ||||||
Toyota Motor Credit MTN | ||||||||
1.794%, VAR ICE LIBOR USD 3 Month+0.440%, 10/18/2019 | 400 | 403 | ||||||
1.200%, 04/06/2018 | 600 | 599 | ||||||
UBS | ||||||||
2.103%, VAR ICE LIBOR USD 3 Month+0.580%, 06/08/2020 (A) | 1,470 | 1,477 | ||||||
UBS MTN | ||||||||
1.949%, VAR ICE LIBOR USD 3 Month+0.640%, 08/14/2019 | 450 | 453 | ||||||
US Bancorp MTN | ||||||||
1.767%, VAR ICE LIBOR USD 3 Month+0.400%, 04/25/2019 | 400 | 401 | ||||||
US Bank | ||||||||
1.400%, 04/26/2019 | 350 | 346 | ||||||
Volkswagen Group of America Finance LLC | ||||||||
1.785%, VAR ICE LIBOR USD 3 Month+0.470%, 05/22/2018 (A) | 650 | 651 | ||||||
Voya Financial | ||||||||
2.900%, 02/15/2018 | 489 | 489 | ||||||
Wells Fargo | ||||||||
2.475%, VAR ICE LIBOR USD 3 Month+1.110%, 01/24/2023 | 400 | 409 | ||||||
Wells Fargo MTN | ||||||||
1.966%, VAR ICE LIBOR USD 3 Month+0.650%, 12/06/2019 | 650 | 656 | ||||||
Wells Fargo Bank | ||||||||
2.055%, VAR ICE LIBOR USD 3 Month+0.310%, 01/15/2021 | 880 | 882 | ||||||
Westpac Banking | ||||||||
1.963%, VAR ICE LIBOR USD 3 Month+0.610%, 01/17/2019 | 325 | 326 | ||||||
| 95,572 | ||||||||
Health Care – 5.2% | ||||||||
AbbVie | ||||||||
1.800%, 05/14/2018 | 400 | 400 | ||||||
Aetna | ||||||||
1.700%, 06/07/2018 | 2,010 | 2,008 | ||||||
Allergan Funding SCS | ||||||||
2.390%, VAR ICE LIBOR USD 3 Month+1.080%, 03/12/2018 | 975 | 976 | ||||||
| SEI Daily Income Trust / Annual Report / January 31, 2018 | 21 |
SCHEDULE OF INVESTMENTS
January 31, 2018
Ultra Short Duration Bond Fund (Continued)
| Description | Face Amount (Thousands) | Market Value ($ Thousands) | ||||||
CORPORATE OBLIGATIONS (continued) |
| |||||||
2.350%, 03/12/2018 | $ | 1,740 | $ | 1,741 | ||||
Amgen | ||||||||
1.863%, VAR ICE LIBOR USD 3 Month+0.450%, 05/11/2020 | 450 | 452 | ||||||
1.629%, VAR ICE LIBOR USD 3 Month+0.320%, 05/10/2019 | 1,035 | 1,038 | ||||||
Baxalta | ||||||||
2.438%, VAR ICE LIBOR USD 3 Month+0.780%, 06/22/2018 | 2,200 | 2,204 | ||||||
Cardinal Health | ||||||||
2.090%, VAR ICE LIBOR USD 3 Month+0.770%, 06/15/2022 | 775 | 778 | ||||||
Catholic Health Initiatives | ||||||||
2.600%, 08/01/2018 | 270 | 271 | ||||||
Gilead Sciences | ||||||||
1.875%, VAR ICE LIBOR USD 3 Month+0.250%, 09/20/2019 | 1,535 | 1,538 | ||||||
Medtronic | ||||||||
1.500%, 03/15/2018 | 255 | 255 | ||||||
Province of Quebec Canada MTN | ||||||||
1.717%, VAR ICE LIBOR USD 3 Month+0.230%, 09/04/2018 | 1,660 | 1,662 | ||||||
Teva Pharmaceutical Finance Netherlands III | ||||||||
1.700%, 07/19/2019 | 1,340 | 1,309 | ||||||
1.400%, 07/20/2018 | 900 | 895 | ||||||
UnitedHealth Group | ||||||||
1.419%, VAR ICE LIBOR USD 3 Month+0.070%, 10/15/2020
|
| 500
|
|
| 499
|
| ||
| 16,026 | ||||||||
Industrials – 1.6% | ||||||||
Air Lease | ||||||||
2.125%, 01/15/2020 | 300 | 297 | ||||||
Caterpillar Financial Services MTN | ||||||||
2.014%, VAR ICE LIBOR USD 3 Month+0.700%, 02/23/2018 | 1,175 | 1,175 | ||||||
1.603%, VAR ICE LIBOR USD 3 Month+0.280%, 03/22/2019 | 375 | 376 | ||||||
Fortive | ||||||||
1.800%, 06/15/2019 | 260 | 258 | ||||||
General Electric MTN | ||||||||
2.045%, VAR ICE LIBOR USD 3 Month+0.710%, 04/02/2018 | 250 | 250 | ||||||
1.970%, VAR ICE LIBOR USD 3 Month+0.620%, 01/09/2020 | 580 | 583 | ||||||
Honeywell International | ||||||||
1.658%, VAR ICE LIBOR USD 3 Month+0.280%, 10/30/2019 | 800 | 803 | ||||||
John Deere Capital MTN | ||||||||
2.350%, 01/08/2021 | 445 | 442 | ||||||
PACCAR Financial MTN | ||||||||
1.300%, 05/10/2019 | 160 | 158 | ||||||
| Description | Face Amount (Thousands) | Market Value ($ Thousands) | ||||||
CORPORATE OBLIGATIONS (continued) |
| |||||||
United Technologies | ||||||||
1.661%, VAR ICE LIBOR USD 3 Month+0.350%, 11/01/2019
| $
| 600
|
| $
| 602
|
| ||
| 4,944 | ||||||||
Information Technology – 1.3% | ||||||||
Broadcom | ||||||||
2.375%, 01/15/2020 (A) | 800 | 792 | ||||||
Cisco Systems | ||||||||
1.916%, VAR ICE LIBOR USD 3 Month+0.600%, 02/21/2018 | 350 | 350 | ||||||
DXC Technology | ||||||||
2.875%, 03/27/2020 | 400 | 400 | ||||||
eBay | ||||||||
2.637%, VAR ICE LIBOR USD 3 Month+0.870%, 01/30/2023 | 800 | 804 | ||||||
Fidelity National Information Services | ||||||||
2.850%, 10/15/2018 | 600 | 603 | ||||||
Hewlett Packard Enterprise | ||||||||
3.273%, VAR ICE LIBOR USD 3 Month+1.930%, 10/05/2018 | 160 | 162 | ||||||
2.100%, 10/04/2019 (A)
|
| 800
|
|
| 791
|
| ||
| 3,902 | ||||||||
Materials – 0.1% | ||||||||
Air Liquide Finance | ||||||||
1.375%, 09/27/2019 (A) | 400 | 393 | ||||||
Telecommunications – 1.1% | ||||||||
AT&T | ||||||||
5.500%, 02/01/2018 | 1,070 | 1,070 | ||||||
2.263%, VAR ICE LIBOR USD 3 Month+0.930%, 06/30/2020 | 700 | 709 | ||||||
Verizon Communications | ||||||||
1.786%, VAR ICE LIBOR USD 3 Month+0.370%, 08/15/2019
|
| 1,520
|
|
| 1,523
|
| ||
| 3,302 | ||||||||
Utilities – 1.5% | ||||||||
American Electric Power | ||||||||
2.150%, 11/13/2020 | 450 | 445 | ||||||
Connecticut Light & Power | ||||||||
5.650%, 05/01/2018 | 960 | 969 | ||||||
DTE Energy | ||||||||
1.500%, 10/01/2019 | 435 | 427 | ||||||
Emera US Finance | ||||||||
2.150%, 06/15/2019 | 165 | 164 | ||||||
NextEra Energy Capital Holdings | ||||||||
1.649%, 09/01/2018 | 95 | 95 | ||||||
Sempra Energy | ||||||||
1.959%, VAR ICE LIBOR USD 3 Month+0.250%, 07/15/2019 | 855 | 856 | ||||||
| 22 | SEI Daily Income Trust / Annual Report / January 31, 2018 |
| Description | Face Amount (Thousands) | Market Value ($ Thousands) | ||||||
CORPORATE OBLIGATIONS (continued) |
| |||||||
1.625%, 10/07/2019 | $ | 850 | $ | 838 | ||||
Southern | ||||||||
1.550%, 07/01/2018 | 300 | 299 | ||||||
Southern Power | ||||||||
1.500%, 06/01/2018
|
| 715
|
|
| 714
|
| ||
| 4,807 | ||||||||
Total Corporate Obligations | 148,308 | |||||||
ASSET-BACKED SECURITIES – 26.2% |
| |||||||
Automotive – 9.9% | ||||||||
American Credit Acceptance Receivables Trust, Ser 2016-3, Cl B | ||||||||
2.870%, 08/12/2022 (A) | 560 | 561 | ||||||
AmeriCredit Automobile Receivables Trust, Ser 2013-3, Cl D | ||||||||
3.000%, 07/08/2019 | 370 | 370 | ||||||
AmeriCredit Automobile Receivables Trust, Ser 2015-1, Cl B | ||||||||
1.880%, 03/09/2020 | 445 | 445 | ||||||
AmeriCredit Automobile Receivables Trust, Ser 2016-2, Cl A3 | ||||||||
1.600%, 11/09/2020 | 190 | 190 | ||||||
AmeriCredit Automobile Receivables Trust, Ser 2016-3, Cl A3 | ||||||||
1.460%, 05/10/2021 | 90 | 90 | ||||||
AmeriCredit Automobile Receivables Trust, Ser 2016-4, Cl A2A | ||||||||
1.340%, 04/08/2020 | 110 | 110 | ||||||
ARI Fleet Lease Trust, Ser 2017-A, Cl A2 | ||||||||
1.910%, 04/15/2026 (A) | 170 | 169 | ||||||
Canadian Pacer Auto Receivables Trust, Ser 2017-1A, Cl A2A | ||||||||
1.772%, 12/19/2019 (A) | 1,045 | 1,043 | ||||||
CarMax Auto Owner Trust, Ser 2014-1, Cl A4 | ||||||||
1.320%, 07/15/2019 | 269 | 269 | ||||||
CarMax Auto Owner Trust, Ser 2015-4, Cl A3 | ||||||||
1.560%, 11/16/2020 | 567 | 565 | ||||||
CarMax Auto Owner Trust, Ser 2016-4, Cl A2 | ||||||||
1.210%, 11/15/2019 | 316 | 315 | ||||||
Chesapeake Funding II LLC, Ser 2016-2A, Cl A2 | ||||||||
2.234%, VAR ICE LIBOR USD 1 | ||||||||
Month+1.000%, 06/15/2028 (A) | 566 | 568 | ||||||
Chesapeake Funding II LLC, Ser 2017-2A, Cl A1 | ||||||||
1.990%, 05/15/2029 (A) | 310 | 308 | ||||||
Chesapeake Funding II LLC, Ser 2017-3A, Cl A1 | ||||||||
1.910%, 08/15/2029 (A) | 360 | 357 | ||||||
| Description | Face Amount (Thousands) | Market Value ($ Thousands) | ||||||
ASSET-BACKED SECURITIES (continued) |
| |||||||
Chesapeake Funding II LLC, Ser 2017-3A, Cl A2 | ||||||||
1.579%, VAR ICE LIBOR USD 1 Month+0.340%, 08/15/2029 (A) | $ | 955 | $ | 955 | ||||
Chesapeake Funding II LLC, Ser 2017-4A, Cl A1 | ||||||||
2.120%, 11/15/2029 (A) | 380 | 377 | ||||||
Chesapeake Funding II LLC, Ser 2017-4A, Cl A2 | ||||||||
1.817%, VAR ICE LIBOR USD 1 Month+0.340%, 11/15/2029 (A) | 1,510 | 1,511 | ||||||
Chrysler Capital Auto Receivables Trust, Ser 2016-BA, Cl A3 | ||||||||
1.640%, 07/15/2021 (A) | 735 | 731 | ||||||
CIG Auto Receivables Trust, Ser 2017-1A, Cl A | ||||||||
2.710%, 05/15/2023 (A) | 158 | 158 | ||||||
CPS Auto Receivables Trust, Ser 2015-A, Cl A | ||||||||
1.530%, 07/15/2019 (A) | 41 | 41 | ||||||
CPS Auto Receivables Trust, Ser 2016-A, Cl B | ||||||||
3.340%, 05/15/2020 | 400 | 402 | ||||||
CPS Auto Receivables Trust, Ser 2017-C, Cl A | ||||||||
1.780%, 09/15/2020 (A) | 90 | 90 | ||||||
CPS Auto Receivables Trust, Ser 2018-A, Cl A | ||||||||
2.160%, 05/17/2021 (A) | 140 | 140 | ||||||
CPS Auto Trust, Ser 2017-D, Cl A | ||||||||
1.870%, 03/15/2021 (A) | 157 | 156 | ||||||
Credit Acceptance Auto Loan Trust, Ser 2015- 2A, Cl A | ||||||||
2.400%, 02/15/2023 (A) | 261 | 262 | ||||||
Credit Acceptance Auto Loan Trust, Ser 2017- 2A, Cl A | ||||||||
2.550%, 02/17/2026 (A) | 500 | 495 | ||||||
Credit Acceptance Auto Loan Trust, Ser 2017- 3A, Cl A | ||||||||
2.650%, 06/15/2026 (A) | 250 | 249 | ||||||
DT Auto Owner Trust, Ser 2016-2A, Cl B | ||||||||
2.920%, 05/15/2020 (A) | 107 | 108 | ||||||
DT Auto Owner Trust, Ser 2016-4A, Cl A | ||||||||
1.440%, 11/15/2019 (A) | 17 | 17 | ||||||
DT Auto Owner Trust, Ser 2017-1A, Cl A | ||||||||
1.560%, 06/15/2020 (A) | 230 | 230 | ||||||
Enterprise Fleet Financing LLC, Ser 2014-2, Cl A3 | ||||||||
1.640%, 03/20/2020 (A) | 454 | 454 | ||||||
Enterprise Fleet Financing LLC, Ser 2016-2, Cl A2 | ||||||||
1.740%, 02/22/2022 (A) | 174 | 173 | ||||||
Enterprise Fleet Financing LLC, Ser 2017-2, Cl A2 | ||||||||
1.970%, 01/20/2023 (A) | 225 | 224 | ||||||
Exeter Automobile Receivables Trust, Ser 2018-1A, Cl A | ||||||||
2.210%, 05/17/2021 (A) | 335 | 335 | ||||||
| SEI Daily Income Trust / Annual Report / January 31, 2018 | 23 |
SCHEDULE OF INVESTMENTS
January 31, 2018
Ultra Short Duration Bond Fund (Continued)
| Description | Face Amount (Thousands) | Market Value ($ Thousands) | ||||||
ASSET-BACKED SECURITIES (continued) |
| |||||||
First Investors Auto Owner Trust, Ser 2017- 1A, Cl A1 | ||||||||
1.690%, 04/15/2021 (A) | $ | 97 | $ | 97 | ||||
First Investors Auto Owner Trust, Ser 2017- 2A, Cl A1 | ||||||||
1.860%, 10/15/2021 (A) | 136 | 135 | ||||||
Flagship Credit Auto Trust, Ser 2017-2, Cl A | ||||||||
1.850%, 07/15/2021 (A) | 119 | 118 | ||||||
Flagship Credit Auto Trust, Ser 2017-3, Cl A | ||||||||
1.880%, 10/15/2021 (A) | 376 | 374 | ||||||
Ford Credit Auto Lease Trust, Ser 2015-B, Cl B | ||||||||
1.920%, 03/15/2019 | 300 | 300 | ||||||
Ford Credit Auto Owner Trust, Ser 2016-C, Cl A2A | ||||||||
1.040%, 09/15/2019 | 252 | 252 | ||||||
Ford Credit Floorplan Master Owner Trust, Ser 2015-4, Cl A2 | ||||||||
2.077%, VAR LIBOR USD 1 Month+0.600%, 08/15/2020 | 1,250 | 1,253 | ||||||
Ford Credit Floorplan Master Owner Trust, Ser 2016-4, Cl A | ||||||||
1.764%, VAR LIBOR USD 1 Month+0.530%, 07/15/2020 | 290 | 291 | ||||||
Ford Credit Floorplan Master Owner Trust, Ser 2016-5, Cl A1 | ||||||||
1.950%, 11/15/2021 | 450 | 446 | ||||||
GLS Auto Receivables Trust, Ser 2016-1A, Cl A | ||||||||
2.730%, 10/15/2020 (A) | 69 | 70 | ||||||
GLS Auto Receivables Trust, Ser 2017-1A, Cl A2 | ||||||||
2.670%, 04/15/2021 (A) | 525 | 525 | ||||||
GLS Auto Receivables Trust, Ser 2018-1A, Cl A | ||||||||
2.820%, 07/15/2022 (A) | 695 | 695 | ||||||
GM Financial Automobile Leasing Trust, Ser 2015-1, Cl B | ||||||||
2.140%, 06/20/2019 | 670 | 670 | ||||||
GM Financial Automobile Leasing Trust, Ser 2016-1, Cl A3 | ||||||||
1.640%, 07/20/2019 | 575 | 575 | ||||||
GM Financial Automobile Leasing Trust, Ser 2016-2, Cl A3 | ||||||||
1.620%, 09/20/2019 | 230 | 230 | ||||||
GM Financial Automobile Leasing Trust, Ser 2016-3, Cl A3 | ||||||||
1.610%, 12/20/2019 | 800 | 797 | ||||||
GMF Floorplan Owner Revolving Trust, Ser 2015-1, Cl A2 | ||||||||
1.977%, VAR LIBOR USD 1 Month+0.500%, 05/15/2020 (A) | 1,375 | 1,377 | ||||||
Huntington Auto Trust, Ser 2016-1, Cl A2 | ||||||||
1.290%, 05/15/2019 | 107 | 107 | ||||||
| Description | Face Amount (Thousands) | Market Value ($ Thousands) | ||||||
ASSET-BACKED SECURITIES (continued) |
| |||||||
Hyundai Auto Lease Securitization Trust, Ser 2016-B, Cl A3 | ||||||||
1.520%, 10/15/2019 (A) | $ | 180 | $ | 180 | ||||
Mercedes-Benz Auto Lease Trust, Ser 2016- B, Cl A2 | ||||||||
1.150%, 01/15/2019 | 81 | 81 | ||||||
Nissan Auto Receivables Owner Trust, Ser 2016-B, Cl A2A | ||||||||
1.050%, 04/15/2019 | 26 | 26 | ||||||
Nissan Master Owner Trust Receivables, Ser 2016-A, Cl A2 | ||||||||
1.540%, 06/15/2021 | 395 | 391 | ||||||
Prestige Auto Receivables Trust, Ser 2014-1A, Cl B | ||||||||
1.910%, 04/15/2020 (A) | 272 | 271 | ||||||
Prestige Auto Receivables Trust, Ser 2015-1, Cl A3 | ||||||||
1.530%, 02/15/2021 (A) | – | – | ||||||
Prestige Auto Receivables Trust, Ser 2016-1A, Cl A2 | ||||||||
1.780%, 08/15/2019 (A) | 4 | 4 | ||||||
Prestige Auto Receivables Trust, Ser 2016- 2A, Cl A2 | ||||||||
1.460%, 07/15/2020 (A) | 519 | 517 | ||||||
Prestige Auto Receivables Trust, Ser 2017-1A, Cl A3 | ||||||||
2.050%, 10/15/2021 (A) | 925 | 915 | ||||||
Santander Drive Auto Receivables Trust, Ser 2014-3, Cl D | ||||||||
2.650%, 08/17/2020 | 760 | 762 | ||||||
Santander Drive Auto Receivables Trust, Ser 2014-4, Cl D | ||||||||
3.100%, 11/16/2020 | 1,840 | 1,853 | ||||||
Santander Drive Auto Receivables Trust, Ser 2015-4, Cl C | ||||||||
2.970%, 03/15/2021 | 775 | 780 | ||||||
Santander Drive Auto Receivables Trust, Ser 2016-3, Cl C | ||||||||
2.460%, 03/15/2022 | 450 | 450 | ||||||
Santander Drive Auto Receivables Trust, Ser 2017-1, Cl A2 | ||||||||
1.490%, 02/18/2020 | 39 | 39 | ||||||
Santander Retail Auto Lease Trust, Ser 2017- A, Cl A3 | ||||||||
2.220%, 01/20/2021 (A) | 1,325 | 1,317 | ||||||
Securitized Term Auto Receivables Trust, Ser 2017-1A, Cl A2A | ||||||||
1.510%, 04/25/2019 (A) | 125 | 125 | ||||||
Securitized Term Auto Receivables Trust, Ser 2017-2A, Cl A2A | ||||||||
1.775%, 01/27/2020 (A) | 200 | 199 | ||||||
| 24 | SEI Daily Income Trust / Annual Report / January 31, 2018 |
| Description | Face Amount (Thousands) | Market Value ($ Thousands) | ||||||
ASSET-BACKED SECURITIES (continued) |
| |||||||
Toyota Auto Receivables Owner Trust, Ser 2016-B, Cl A3 | ||||||||
1.300%, 04/15/2020 | $ | 91 | $ | 90 | ||||
United Auto Credit Securitization Trust, Ser 2017-1, Cl A | ||||||||
1.890%, 05/10/2019 (A) | 294 | 294 | ||||||
United Auto Credit Securitization Trust, Ser 2018-1, Cl A | ||||||||
2.260%, 04/10/2020 (A) | 465 | 465 | ||||||
United Auto Credit Securitization Trust, Ser 2018-1, Cl B | ||||||||
2.760%, 10/13/2020 (A) | 300 | 300 | ||||||
Westlake Automobile Receivables Trust, Ser 2016-2A, Cl A2 | ||||||||
1.570%, 06/17/2019 (A) | 40 | 40 | ||||||
Westlake Automobile Receivables Trust, Ser 2016-2A, Cl B | ||||||||
2.300%, 11/15/2019 (A) | 350 | 350 | ||||||
Westlake Automobile Receivables Trust, Ser 2017-1A, Cl A2 | ||||||||
1.780%, 04/15/2020 (A) | 206 | 205 | ||||||
Westlake Automobile Receivables Trust, Ser 2017-2A, Cl A2A | ||||||||
1.800%, 07/15/2020 (A) | 245 | 244 | ||||||
World Omni Auto Receivables Trust, Ser 2016-B, Cl A2 | ||||||||
1.100%, 01/15/2020 | 57 | 57 | ||||||
| 30,735 | ||||||||
Credit Card – 5.8% | ||||||||
American Express Credit Account Master Trust, Ser 2013-2, Cl A | ||||||||
1.980%, VAR LIBOR USD 1 Month+0.420%, 05/17/2021 | 700 | 702 | ||||||
BA Credit Card Trust, Ser 2015-A2, Cl A | ||||||||
1.360%, 09/15/2020 | 370 | 370 | ||||||
Cabela’s Credit Card Master Note Trust, Ser 2013-2A, Cl A2 | ||||||||
1.889%, VAR LIBOR USD 1 Month+0.650%, 08/16/2021 (A) | 210 | 211 | ||||||
Cabela’s Credit Card Master Note Trust, Ser 2016-1, Cl A1 | ||||||||
1.780%, 06/15/2022 | 305 | 303 | ||||||
Capital One Multi-Asset Execution Trust, Ser 2014-A1, Cl A1 | ||||||||
1.689%, VAR LIBOR USD 1 Month+0.450%, 02/15/2022 | 800 | 803 | ||||||
Capital One Multi-Asset Execution Trust, Ser 2015-A3, Cl A3 | ||||||||
1.960%, VAR LIBOR USD 1 Month+0.400%, 03/15/2023 | 735 | 739 | ||||||
| Description | Face Amount (Thousands) | Market Value ($ Thousands) | ||||||
ASSET-BACKED SECURITIES (continued) |
| |||||||
Capital One Multi-Asset Execution Trust, Ser 2015-A7, Cl A7 | ||||||||
1.450%, 08/16/2021 | $ | 400 | $ | 398 | ||||
CARDS II Trust, Ser 2017-1A, Cl A | ||||||||
1.604%, VAR LIBOR USD 1 Month+0.370%, 04/18/2022 (A) | 865 | 867 | ||||||
Chase Issuance Trust, Ser 2015-A2, Cl A2 | ||||||||
1.590%, 02/18/2020 | 685 | 685 | ||||||
Chase Issuance Trust, Ser 2016-A5, Cl A5 | ||||||||
1.270%, 07/15/2021 | 500 | 493 | ||||||
Citibank Credit Card Issuance Trust, Ser 2008-A7, Cl A7 | ||||||||
2.936%, VAR LIBOR USD 1 Month+1.375%, 05/20/2020 | 3,000 | 3,015 | ||||||
Citibank Credit Card Issuance Trust, Ser 2013-A2, Cl A2 | ||||||||
1.518%, VAR LIBOR USD 1 Month+0.280%, 05/26/2020 | 650 | 651 | ||||||
Citibank Credit Card Issuance Trust, Ser 2013-A7, Cl A7 | ||||||||
1.984%, VAR LIBOR USD 1 Month+0.430%, 09/10/2020 | 2,275 | 2,281 | ||||||
Discover Card Execution Note Trust, Ser 2016-A2, Cl A2 | ||||||||
2.099%, VAR LIBOR USD 1 Month+0.540%, 09/15/2021 | 1,850 | 1,860 | ||||||
Evergreen Credit Card Trust, Ser 2016-1, Cl A | ||||||||
1.959%, VAR LIBOR USD 1 Month+0.720%, 04/15/2020 (A) | 1,100 | 1,101 | ||||||
Synchrony Credit Card Master Note Trust, Ser 2013-1, Cl A | ||||||||
1.350%, 03/15/2021 | 1,200 | 1,199 | ||||||
Synchrony Credit Card Master Note Trust, Ser 2015-2, Cl A | ||||||||
1.600%, 04/15/2021 | 1,650 | 1,649 | ||||||
Trillium Credit Card Trust II, Ser 2016-1A, Cl A | ||||||||
1.960%, VAR LIBOR USD 1 Month+0.720%, 05/26/2021 (A) | 620 | 621 | ||||||
| 17,948 | ||||||||
Miscellaneous Business Services – 10.1% |
| |||||||
Ajax Mortgage Loan Trust, Ser 2017-B, Cl A | ||||||||
3.163%, 09/25/2056 (A)(B) | 523 | 518 | ||||||
Apidos CLO XII, Ser 2013-12A, Cl A | ||||||||
2.404%, VAR ICE LIBOR USD 3 Month+1.100%, 04/15/2025 (A) | 319 | 319 | ||||||
Bayview Opportunity Master Fund IIIa Trust, Ser 2017-RN7, Cl A1 | ||||||||
3.105%, 09/28/2032 (A) | 88 | 87 | ||||||
Bayview Opportunity Master Fund IIIa Trust, Ser 2017-RN8, Cl A1 | ||||||||
3.352%, 12/28/2032 (A) | 692 | 691 | ||||||
| SEI Daily Income Trust / Annual Report / January 31, 2018 | 25 |
SCHEDULE OF INVESTMENTS
January 31, 2018
Ultra Short Duration Bond Fund (Continued)
| Description | Face Amount (Thousands) | Market Value ($ Thousands) | ||||||
ASSET-BACKED SECURITIES (continued) |
| |||||||
Bayview Opportunity Master Fund IVb Trust, Ser 2017-RT6, Cl A | ||||||||
3.500%, 10/28/2057 (A)(B) | $ | 505 | $ | 516 | ||||
Carlyle Global Market Strategies CLO, Ser 2014-1A, Cl AR | ||||||||
2.604%, VAR ICE LIBOR USD 3 Month+1.300%, 04/17/2025 (A) | 650 | 651 | ||||||
Cent CLO 20, Ser 2017-20A, Cl AR | ||||||||
2.467%, VAR ICE LIBOR USD 3 Month+1.100%, 01/25/2026 (A) | 995 | 995 | ||||||
Cent CLO, Ser 2014-16A, Cl A1AR | ||||||||
2.420%, VAR ICE LIBOR USD 3 Month+1.250%, 08/01/2024 (A) | 297 | 297 | ||||||
CIFC Funding, Ser 2017-1A, Cl A1R | ||||||||
2.972%, VAR ICE LIBOR USD 3 Month+1.250%, 07/16/2030 (A) | 485 | 489 | ||||||
CLUB Credit Trust, Ser 2017-P2, Cl A | ||||||||
2.610%, 01/15/2024 (A) | 475 | 475 | ||||||
CNH Equipment Trust, Ser 2014-C, Cl A3 | ||||||||
1.050%, 11/15/2019 | 11 | 11 | ||||||
CNH Equipment Trust, Ser 2016-B, Cl A2A | ||||||||
1.310%, 10/15/2019 | 55 | 55 | ||||||
CNH Equipment Trust, Ser 2017-C, Cl A2 | ||||||||
1.840%, 03/15/2021 | 1,285 | 1,280 | ||||||
Conn’s Receivables Funding LLC, Ser 2017-B, Cl A | ||||||||
2.730%, 03/15/2020 (A) | 158 | 158 | ||||||
Credit-Based Asset Servicing and Securitization LLC, Ser 2005-CB3, Cl M2 | ||||||||
2.167%, VAR ICE LIBOR USD 1 Month+0.930%, 05/25/2035 | 397 | 399 | ||||||
DLL Securitization Trust, Ser 2017-A, Cl A2 | ||||||||
1.890%, 07/15/2020 (A) | 185 | 184 | ||||||
Dryden XXXI Senior Loan Fund, Ser 2017-31A, Cl AR | ||||||||
2.434%, VAR ICE LIBOR USD 3 Month+1.080%, 04/18/2026 (A) | 1,210 | 1,211 | ||||||
Finance of America Structured Securities Trust, Ser 2017-HB1, Cl A | ||||||||
2.321%, 11/25/2027 (A)(B) | 334 | 334 | ||||||
GSAMP Trust, Ser 2006-HE1, Cl A2D | ||||||||
1.547%, VAR ICE LIBOR USD 1 Month+0.310%, 01/25/2036 | 444 | 444 | ||||||
Limerock CLO II, Ser 2017-2A, Cl AR | ||||||||
2.604%, VAR ICE LIBOR USD 3 Month+1.300%, 04/18/2026 (A) | 799 | 799 | ||||||
Madison Park Funding XII, Ser 2017-12A, Cl AR | ||||||||
2.623%, VAR ICE LIBOR USD 3 Month+1.260%, 07/20/2026 (A) | 305 | 305 | ||||||
Marlette Funding Trust, Ser 2016-1A, Cl A | ||||||||
3.060%, 10/15/2021 (A) | 311 | 312 | ||||||
| Description | Face Amount (Thousands) | Market Value ($ Thousands) | ||||||
ASSET-BACKED SECURITIES (continued) |
| |||||||
Marlette Funding Trust, Ser 2017-3A, Cl A | ||||||||
2.360%, 12/15/2024 (A) | $ | 230 | $ | 230 | ||||
Marlette Funding Trust, Ser 2018-1A, Cl A | ||||||||
2.610%, 03/15/2028 (A) | 346 | 346 | ||||||
MMAF Equipment Finance LLC, Ser 2014-AA, Cl A3 | ||||||||
0.870%, 01/08/2019 (A) | 6 | 6 | ||||||
MMAF Equipment Finance LLC, Ser 2017-AA, Cl A2 | ||||||||
1.730%, 05/18/2020 (A) | 172 | 171 | ||||||
Nationstar HECM Loan Trust, Ser 2017-1A, Cl A | ||||||||
1.968%, 05/25/2027 (A) | 148 | 148 | ||||||
Nationstar HECM Loan Trust, Ser 2017-2A, Cl A1 | ||||||||
2.038%, 09/25/2027 (A)(B) | 231 | 231 | ||||||
Navient Student Loan Trust, Ser 2015-1, Cl A1 | ||||||||
1.537%, VAR ICE LIBOR USD 1 Month+0.300%, 09/26/2022 | 119 | 119 | ||||||
Navient Student Loan Trust, Ser 2015-3, Cl A1 | ||||||||
1.881%, VAR ICE LIBOR USD 1 Month+0.320%, 07/25/2030 | 184 | 184 | ||||||
Navient Student Loan Trust, Ser 2016-6A, Cl A1 | ||||||||
1.718%, VAR ICE LIBOR USD 1 Month+0.480%, 03/25/2066 (A) | 113 | 113 | ||||||
New Residential Advance Receivables Trust, Ser 2016-T2, Cl AT2 | ||||||||
2.575%, 10/15/2049 (A) | 600 | 594 | ||||||
NextGear Floorplan Master Owner Trust, Ser 2017-2A, Cl A1 | ||||||||
2.240%, VAR LIBOR USD 1 Month+0.680%, 10/17/2022 (A) | 935 | 937 | ||||||
Nissan Master Owner Trust Receivables, Ser 2017-C, Cl A | ||||||||
1.797%, VAR LIBOR USD 1 Month+0.320%, 10/17/2022 | 1,225 | 1,228 | ||||||
NRZ Excess Spread-Collateralized Notes, Ser 2018-PLS1, Cl A | ||||||||
3.193%, 01/25/2023 (A) | 365 | 365 | ||||||
NYCTL Trust, Ser 2016-A, Cl A | ||||||||
1.470%, 11/10/2029 (A) | 34 | 33 | ||||||
NYCTL Trust, Ser 2017-A, Cl A | ||||||||
1.870%, 11/10/2030 (A) | 446 | 443 | ||||||
Oak Hill Credit Partners X, Ser 2017-10A, Cl AR | ||||||||
2.875%, VAR ICE LIBOR USD 3 Month+1.130%, 07/20/2026 (A) | 500 | 500 | ||||||
OCP CLO, Ser 2016-2A, Cl A1R | ||||||||
2.715%, VAR ICE LIBOR USD 3 Month+1.400%, 11/22/2025 (A) | 370 | 372 | ||||||
| 26 | SEI Daily Income Trust / Annual Report / January 31, 2018 |
| Description | Face Amount (Thousands) | Market Value ($ Thousands) | ||||||
ASSET-BACKED SECURITIES (continued) |
| |||||||
OCP CLO, Ser 2017-8A, Cl A1R | ||||||||
2.581%, VAR ICE LIBOR USD 3 Month+0.850%, 04/17/2027 (A) | $ | 500 | $ | 500 | ||||
Octagon Investment Partners XVI, Ser 2013- 1A, Cl A | ||||||||
2.424%, VAR ICE LIBOR USD 3 Month+1.120%, 07/17/2025 (A) | 374 | 374 | ||||||
Octagon Investment Partners XX, Ser 2017- 1A, Cl AR | ||||||||
2.439%, VAR ICE LIBOR USD 3 Month+1.130%, 08/12/2026 (A) | 740 | 740 | ||||||
OHA Credit Partners VIII, Ser 2013-8A, Cl A | ||||||||
2.427%, VAR ICE LIBOR USD 3 Month+1.120%, 04/20/2025 (A) | 270 | 270 | ||||||
OZLM XII, Ser 2015-12A, Cl A1 | ||||||||
2.761%, VAR ICE LIBOR USD 3 Month+1.450%, 04/30/2027 (A) | 395 | 396 | ||||||
Prosper Marketplace Issuance Trust, Ser 2017-3A, Cl A | ||||||||
2.360%, 11/15/2023 (A) | 253 | 252 | ||||||
SLM Student Loan Trust, Ser 2003-14, Cl A5 | ||||||||
1.544%, VAR ICE LIBOR USD 3 Month+0.230%, 01/25/2023 | 22 | 22 | ||||||
SLM Student Loan Trust, Ser 2004-3, Cl A5 | ||||||||
1.484%, VAR ICE LIBOR USD 3 Month+0.170%, 07/25/2023 | 223 | 223 | ||||||
SLM Student Loan Trust, Ser 2005-3, Cl A5 | ||||||||
1.404%, VAR ICE LIBOR USD 3 Month+0.090%, 10/25/2024 | 438 | 437 | ||||||
SLM Student Loan Trust, Ser 2005-4, Cl A3 | ||||||||
1.434%, VAR ICE LIBOR USD 3 Month+0.120%, 01/25/2027 | 324 | 323 | ||||||
SLM Student Loan Trust, Ser 2005-6, Cl A5A | ||||||||
1.424%, VAR ICE LIBOR USD 3 Month+0.110%, 07/27/2026 | 35 | 35 | ||||||
SLM Student Loan Trust, Ser 2008-5, Cl A4 | ||||||||
3.014%, VAR ICE LIBOR USD 3 Month+1.700%, 07/25/2023 | 776 | 800 | ||||||
SLM Student Loan Trust, Ser 2008-9, Cl A | ||||||||
2.814%, VAR ICE LIBOR USD 3 Month+1.500%, 04/25/2023 | 788 | 806 | ||||||
Sofi Consumer Loan Program LLC, Ser 2017- 1, Cl A | ||||||||
3.280%, 01/26/2026 (A) | 122 | 122 | ||||||
Sofi Consumer Loan Program Trust, Ser 2018-1, Cl A1 | ||||||||
2.550%, 02/25/2027 (A) | 445 | 445 | ||||||
Sofi Consumer Loan Program, Ser 2017-6, Cl A1 | ||||||||
2.200%, 11/25/2026 (A) | 318 | 318 | ||||||
| Description | Face Amount (Thousands) | Market Value ($ Thousands) | ||||||
ASSET-BACKED SECURITIES (continued) |
| |||||||
SoFi Professional Loan Program LLC, Ser 2017-A, Cl A1 | ||||||||
1.938%, VAR ICE LIBOR USD 1 Month+0.700%, 03/26/2040 (A) | $ | 279 | $ | 281 | ||||
Springleaf Funding Trust, Ser 2016-AA, Cl A | ||||||||
2.900%, 11/15/2029 (A) | 1,150 | 1,153 | ||||||
SPS Servicer Advance Receivables Trust, Ser 2016-T1, Cl AT1 | ||||||||
2.530%, 11/16/2048 (A) | 605 | 605 | ||||||
Symphony CLO VIII, Ser 2014-8A, Cl BR | ||||||||
2.985%, VAR ICE LIBOR USD 1 Month+1.750%, 01/09/2023 (A) | 475 | 475 | ||||||
Towd Point Mortgage Trust, Ser 2015-4, Cl A1B | ||||||||
2.750%, 04/25/2055 (A)(B) | 106 | 106 | ||||||
Towd Point Mortgage Trust, Ser 2015-5, Cl A1B | ||||||||
2.750%, 05/25/2055 (A)(B) | 104 | 103 | ||||||
Towd Point Mortgage Trust, Ser 2016-1, Cl A1B | ||||||||
2.750%, 02/25/2055 (A)(B) | 87 | 87 | ||||||
Towd Point Mortgage Trust, Ser 2016-3, Cl A1 | ||||||||
2.250%, 04/25/2056 (A)(B) | 217 | 214 | ||||||
Towd Point Mortgage Trust, Ser 2016-4, Cl A1 | ||||||||
2.250%, 07/25/2056 (A)(B) | 329 | 324 | ||||||
Towd Point Mortgage Trust, Ser 2017-1, Cl A1 | ||||||||
2.750%, 10/25/2056 (A)(B) | 688 | 690 | ||||||
Towd Point Mortgage Trust, Ser 2017-2, Cl A1 | ||||||||
2.750%, 04/25/2057 (A)(B) | 98 | 97 | ||||||
Towd Point Mortgage Trust, Ser 2017-4, Cl A1 | ||||||||
2.750%, 06/25/2057 | 292 | 291 | ||||||
Towd Point Mortgage Trust, Ser 2017-5, Cl A1 | ||||||||
1.842%, VAR ICE LIBOR USD 1 Month+0.600%, 02/25/2057 (A) | 652 | 650 | ||||||
Towd Point Mortgage Trust, Ser 2017-6, Cl A1 | ||||||||
2.750%, 10/25/2057 (A)(B) | 263 | 262 | ||||||
U.S. Residential Opportunity Fund IV Trust, Ser 2017-1III, Cl A | ||||||||
3.352%, 11/27/2037 (A) | 330 | 328 | ||||||
Utah State Board of Regents, Ser 2016-1, Cl A | ||||||||
1.987%, VAR ICE LIBOR USD 1 Month+0.750%, 09/25/2056 | 366 | 366 | ||||||
Verizon Owner Trust, Ser 2016-1A, Cl A | ||||||||
1.420%, 01/20/2021 (A) | 600 | 595 | ||||||
Verizon Owner Trust, Ser 2016-2A, Cl A | ||||||||
1.680%, 05/20/2021 (A) | 365 | 362 | ||||||
Verizon Owner Trust, Ser 2017-2A, Cl B | ||||||||
2.220%, 12/20/2021 (A) | 190 | 188 | ||||||
Vibrant CLO III, Ser 2016-3A, Cl A1R | ||||||||
2.787%, VAR ICE LIBOR USD 3 Month+1.480%, 04/20/2026 (A) | 540 | 540 | ||||||
VOLT LX LLC, Ser 2017-NPL7, Cl A1 | ||||||||
3.250%, 04/25/2059 (A) | 182 | 182 | ||||||
| SEI Daily Income Trust / Annual Report / January 31, 2018 | 27 |
SCHEDULE OF INVESTMENTS
January 31, 2018
Ultra Short Duration Bond Fund (Continued)
| Description | Face Amount (Thousands) | Market Value ($ Thousands) | ||||||
ASSET-BACKED SECURITIES (continued) |
| |||||||
VOLT LXIII LLC, Ser 2017-NP10, Cl A1 | ||||||||
3.000%, 10/25/2047 (A) | $ | 280 | $ | 280 | ||||
VOLT LXIV LLC, Ser 2017-NP11, Cl A1 | ||||||||
3.375%, 10/25/2047 (A) | 564 | 564 | ||||||
| 31,356 | ||||||||
Mortgage Related – 0.4% |
| |||||||
Accredited Mortgage Loan Trust, Ser 2004-4, Cl A1A | ||||||||
1.917%, VAR ICE LIBOR USD 1 Month+0.680%, 01/25/2035 | 132 | 133 | ||||||
Aegis Asset-Backed-Securities Trust Mortgage Pass-Through Certificates, Ser 2004-4, Cl A1 | ||||||||
1.957%, VAR ICE LIBOR USD 1 Month+0.720%, 10/25/2034 | 223 | 223 | ||||||
Bear Stearns Asset-Backed Securities Trust, Ser 2004-2, Cl A1 | ||||||||
2.237%, VAR ICE LIBOR USD 1 Month+1.000%, 08/25/2034 | 11 | 11 | ||||||
Bear Stearns Asset-Backed-Securities Trust, Ser 2005-HE3, Cl M2 | ||||||||
2.257%, VAR ICE LIBOR USD 1 Month+1.020%, 03/25/2035 | 135 | 135 | ||||||
New Residential Mortgage Loan Trust, Ser 2017-6A, Cl A1 | ||||||||
4.000%, 08/27/2057 (A)(B) | 723 | 737 | ||||||
Option One Mortgage Loan Trust, Ser 2005- 1, Cl A1A | ||||||||
1.737%, VAR ICE LIBOR USD 1 Month+0.500%, 02/25/2035 | 10 | 10 | ||||||
| 1,249 | ||||||||
Total Asset-Backed Securities | 81,288 | |||||||
MORTGAGE-BACKED SECURITIES — 11.3% |
| |||||||
Agency Mortgage-Backed Obligations — 2.9% |
| |||||||
FHLMC | ||||||||
5.000%, 06/01/2026 | 256 | 260 | ||||||
2.988%, VAR US Treas Yield Curve Rate T Note Const Mat 1 Yr+2.067%, 02/01/2030 | 55 | 58 | ||||||
2.949%, VAR US Treas Yield Curve Rate T Note Const Mat 1 Yr+2.100%, 02/01/2022 | 25 | 25 | ||||||
FHLMC Multifamily Structured Pass-Through Certificates, Ser K008, Cl A1 | ||||||||
2.746%, 12/25/2019 | 86 | 87 | ||||||
FHLMC Multifamily Structured Pass-Through Certificates, Ser K011, Cl A1 | ||||||||
2.917%, 08/25/2020 | 130 | 131 | ||||||
| Description | Face Amount (Thousands) | Market Value ($ Thousands) | ||||||
MORTGAGE-BACKED SECURITIES (continued) |
| |||||||
FHLMC Multifamily Structured Pass-Through Certificates, Ser K020, Cl A1 | ||||||||
1.573%, 01/25/2022 | $ | 277 | $ | 272 | ||||
FHLMC REMIC, Ser 2003-2641, Cl KW | ||||||||
4.500%, 07/15/2018 | 118 | 119 | ||||||
FHLMC REMIC, Ser 2003-2643, Cl MJ | ||||||||
4.500%, 07/15/2018 | 59 | 59 | ||||||
FHLMC REMIC, Ser 2003-2644, Cl EB | ||||||||
4.500%, 07/15/2018 | 67 | 67 | ||||||
FNMA | ||||||||
6.000%, 01/01/2027 | 20 | 22 | ||||||
5.000%, 05/01/2019 to 03/01/2025 (G) | 458 | 470 | ||||||
3.204%, VAR ICE LIBOR USD 6 Month+1.823%, 09/01/2024 | 51 | 52 | ||||||
3.199%, VAR ICE LIBOR USD 6 Month+1.774%, 09/01/2024 | 21 | 21 | ||||||
3.090%, VAR US Treas Yield Curve Rate T Note Const Mat 1 Yr+2.215%, 01/01/2029 | 10 | 10 | ||||||
3.000%, 12/01/2030 | 1,487 | 1,495 | ||||||
2.961%, VAR US Treas Yield Curve Rate T Note Const Mat 1 Yr+2.031%, 05/01/2028 | 4 | 5 | ||||||
2.831%, VAR US Treas Yield Curve Rate T Note Const Mat 1 Yr+2.120%, 11/01/2025 | 5 | 5 | ||||||
2.693%, VAR US Treas Yield Curve Rate T Note Const Mat 1 Yr+1.994%, 11/01/2023 | 8 | 9 | ||||||
2.375%, VAR ICE LIBOR USD 6 Month+1.000%, 11/01/2021 | 6 | 6 | ||||||
1.900%, 10/01/2019 | 350 | 349 | ||||||
FNMA REMIC, Ser 1993-58, Cl H | ||||||||
5.500%, 04/25/2023 | 14 | 14 | ||||||
FNMA REMIC, Ser 2001-33, Cl FA | ||||||||
1.687%, VAR LIBOR USD 1 Month+0.450%, 07/25/2031 | 13 | 13 | ||||||
FNMA REMIC, Ser 2002-64, Cl FG | ||||||||
1.484%, VAR LIBOR USD 1 Month+0.250%, 10/18/2032 | 13 | 13 | ||||||
FNMA REMIC, Ser 2008-18, Cl HD | ||||||||
4.000%, 12/25/2018 | 4 | 4 | ||||||
FNMA REMIC, Ser 2011-24, Cl PC | ||||||||
4.000%, 10/25/2039 | 711 | 724 | ||||||
FNMA TBA | ||||||||
3.500%, 02/15/2030 | 850 | 870 | ||||||
FNMA, Ser 2011-M7, Cl A2 | ||||||||
2.578%, 09/25/2018 | 161 | 161 | ||||||
FNMA, Ser 2017-KT01, Cl A | ||||||||
1.556%, VAR LIBOR USD 1 Month+0.320%, 02/25/2020 | 350 | 351 | ||||||
| 28 | SEI Daily Income Trust / Annual Report / January 31, 2018 |
| Description | Face Amount (Thousands) | Market Value ($ Thousands) | ||||||
MORTGAGE-BACKED SECURITIES (continued) |
| |||||||
FNMA, Ser M13, Cl FA | ||||||||
1.895%, VAR LIBOR USD 1 Month+0.400%, 10/25/2024 | $ | 420 | $ | 419 | ||||
FREMF Mortgage Trust, Ser 2011-K703, Cl B | ||||||||
5.045%, 07/25/2044 (A)(B) | 750 | 754 | ||||||
FREMF Mortgage Trust, Ser 2011-K704, Cl B | ||||||||
4.691%, 10/25/2030 (A)(B) | 355 | 358 | ||||||
FREMF Mortgage Trust, Ser 2012-K705, Cl C | ||||||||
4.301%, 09/25/2044 (A)(B) | 415 | 417 | ||||||
FREMF Mortgage Trust, Ser 2014-K503, Cl C | ||||||||
3.071%, 10/25/2047 (A)(B) | 210 | 208 | ||||||
FREMF Mortgage Trust, Ser K712, Cl B | ||||||||
3.362%, 05/25/2045 (A)(B) | 120 | 121 | ||||||
Mortgage-Linked Amortizing Notes, Ser 2012-1, Cl A10 | ||||||||
2.060%, 01/15/2022 | 80 | 79 | ||||||
NCUA Guaranteed Notes, Ser 2010-R1, Cl 1A | ||||||||
1.681%, VAR LIBOR USD 1 Month+0.450%, 10/07/2020 | 329 | 330 | ||||||
NCUA Guaranteed Notes, Ser 2011-R1, Cl 1A | ||||||||
1.681%, VAR LIBOR USD 1 Month+0.450%, 01/08/2020 | 251 | 252 | ||||||
NCUA Guaranteed Notes, Ser 2011-R2, Cl 1A | ||||||||
1.634%, VAR LIBOR USD 1 Month+0.400%, 02/06/2020 | 64 | 64 | ||||||
NCUA Guaranteed Notes, Ser 2011-R3, Cl 1A | ||||||||
1.637%, VAR LIBOR USD 1 Month+0.400%, 03/11/2020 | 143 | 143 | ||||||
|
8,817 |
| ||||||
Miscellaneous Business Services – 1.0% |
| |||||||
Apidos CLO XII, Ser 13-12A, Cl AR | ||||||||
1.954%, VAR ICE LIBOR USD 3 Month+1.080%, 04/15/2031 (A) | 600 | 600 | ||||||
Magnetite VII, Ser 2018-7A, Cl A1R2 | ||||||||
2.620%, VAR ICE LIBOR USD 3 Month+0.800%, 01/15/2028 (A) | 800 | 800 | ||||||
Mill City Mortgage Loan Trust, Ser 2017-3, Cl A1 | ||||||||
2.750%, 02/25/2058 (A)(B) | 541 | 536 | ||||||
Voya CLO, Ser 14-3A, Cl A1R | ||||||||
2.465%, VAR ICE LIBOR USD 3 Month+0.720%, 07/25/2026 (A) | 650 | 650 | ||||||
| Description | Face Amount (Thousands) | Market Value ($ Thousands) | ||||||
MORTGAGE-BACKED SECURITIES (continued) |
| |||||||
Z Capital Credit Partners CLO, Ser 15-1A, Cl A1R | ||||||||
2.672%, VAR ICE LIBOR USD 3 Month+0.950%, 07/16/2027 (A) | $ | 600 | $ | 600 | ||||
|
3,186 |
| ||||||
Non-Agency Mortgage-Backed Obligations – 7.4% |
| |||||||
Angel Oak Mortgage Trust I LLC, Ser 2017-2, Cl A1 | ||||||||
2.478%, 07/25/2047 (A)(B) | 276 | 272 | ||||||
Angel Oak Mortgage Trust LLC, Ser 2017-1, Cl A1 | ||||||||
2.810%, 01/25/2047 (A)(B) | 86 | 85 | ||||||
Angel Oak Mortgage Trust LLC, Ser 2017-3, Cl A1 | ||||||||
2.708%, 11/25/2047 (A)(B) | 236 | 237 | ||||||
BAMLL Commercial Mortgage Securities Trust, Ser 2014-ICTS, Cl A | ||||||||
2.034%, VAR LIBOR USD 1 Month+0.800%, 06/15/2028 (A) | 450 | 450 | ||||||
BAMLL Re-REMIC Trust, Ser 2015-FR11, Cl A705 | ||||||||
1.836%, 09/27/2044 (A)(B) | 625 | 616 | ||||||
Banc of America Mortgage Securities, Ser 2005-F, Cl 2A2 | ||||||||
3.723%, 07/25/2035 (B) | 126 | 118 | ||||||
Banc of America Mortgage Securities, Ser 2005-J, Cl 2A1 | ||||||||
3.435%, 11/25/2035 (B) | 15 | 14 | ||||||
BBCMS Mortgage Trust, Ser 2017-DELC, Cl A | ||||||||
2.089%, VAR LIBOR USD 1 Month+0.850%, 08/15/2036 (A) | 800 | 803 | ||||||
Bear Stearns Adjustable Rate Mortgage Trust, Ser 2005-3, Cl 2A1 | ||||||||
3.641%, 06/25/2035 (B) | 63 | 63 | ||||||
Bear Stearns Adjustable Rate Mortgage Trust, Ser 2005-6, Cl 3A1 | ||||||||
3.609%, 08/25/2035 (B) | 132 | 135 | ||||||
CGDBB Commercial Mortgage Trust, Ser BIOC, Cl A | ||||||||
2.029%, VAR LIBOR USD 1 Month+0.790%, 07/15/2019 (A) | 450 | 451 | ||||||
CIM Trust, Ser 2017-7, Cl A | ||||||||
3.000%, 04/25/2057 (A)(B) | 696 | 693 | ||||||
Citigroup Commercial Mortgage Trust, Ser GC11, Cl A2 | ||||||||
1.987%, 04/10/2046 | 274 | 274 | ||||||
Citigroup Mortgage Loan Trust, Ser 2004- HYB3, Cl 1A | ||||||||
3.579%, 09/25/2034 (B) | 25 | 25 | ||||||
| SEI Daily Income Trust / Annual Report / January 31, 2018 | 29 |
SCHEDULE OF INVESTMENTS
January 31, 2018
Ultra Short Duration Bond Fund (Continued)
| Description | Face Amount (Thousands) | Market Value ($ Thousands) | ||||||
MORTGAGE-BACKED SECURITIES (continued) |
| |||||||
Citigroup Mortgage Loan Trust, Ser 2006- AR2, Cl 1A1 | ||||||||
3.543%, 03/25/2036 (B) | $ | 113 | $ | 106 | ||||
COLT Mortgage Loan Trust, Ser 2016-3, Cl A3 | ||||||||
3.750%, 12/26/2046 (A)(B) | 287 | 288 | ||||||
COLT Mortgage Loan Trust, Ser 2016-3, Cl A1 | ||||||||
2.800%, 12/26/2046 (A)(B) | 103 | 102 | ||||||
COLT Mortgage Loan Trust, Ser 2017-1, Cl A1 | ||||||||
2.614%, 05/27/2047 (A)(B) | 246 | 243 | ||||||
COLT Mortgage Loan Trust, Ser 2018-1, Cl A1 | ||||||||
2.930%, 02/25/2048 (A)(B) | 310 | 310 | ||||||
Commercial Mortgage Pass-Through Certificates, Ser 2013-CR10, Cl A1 | ||||||||
1.278%, 08/10/2046 | 55 | 55 | ||||||
Countrywide Home Loans, Ser 2004-29, Cl 1A1 | ||||||||
1.777%, VAR ICE LIBOR USD 1 Month+0.540%, 02/25/2035 | 18 | 17 | ||||||
Countrywide Home Loans, Ser 2005-HY10, Cl 3A1A | ||||||||
3.285%, 02/20/2036 (B) | 96 | 87 | ||||||
Deephaven Residential Mortgage Trust, Ser 2017-1A, Cl A1 | ||||||||
2.725%, 12/26/2046 (A)(B) | 110 | 109 | ||||||
Deephaven Residential Mortgage Trust, Ser 2017-2A, Cl A1 | ||||||||
2.453%, 06/25/2047 (A)(B) | 215 | 211 | ||||||
Deephaven Residential Mortgage Trust, Ser 2017-3A, Cl A1 | ||||||||
2.577%, 10/25/2047 (A)(B) | 264 | 264 | ||||||
Deephaven Residential Mortgage Trust, Ser 2018-1A, Cl A1 | ||||||||
2.976%, 01/25/2058 (A)(B) | 285 | 285 | ||||||
FDIC Guaranteed Notes Trust, Ser 2010-S4, Cl A | ||||||||
1.953%, VAR LIBOR USD 1 Month+0.720%, 12/04/2020 (A) | 804 | 796 | ||||||
FHLMC Structured Agency Credit Risk Debt Notes, Ser 2013-DN1, Cl M1 | ||||||||
4.637%, VAR ICE LIBOR USD 1 Month+3.400%, 07/25/2023 | 79 | 80 | ||||||
FHLMC Structured Agency Credit Risk Debt Notes, Ser 2014-DN2, Cl M2 | ||||||||
2.888%, VAR ICE LIBOR USD 1 Month+1.650%, 04/25/2024 | 144 | 146 | ||||||
FHLMC Structured Agency Credit Risk Debt Notes, Ser 2015-HQ1, Cl M3 | ||||||||
5.361%, VAR ICE LIBOR USD 1 Month+3.800%, 03/25/2025 | 575 | 623 | ||||||
FHLMC Structured Agency Credit Risk Debt Notes, Ser 2016-DNA1, Cl M1 | ||||||||
2.687%, VAR ICE LIBOR USD 1 Month+1.450%, 07/25/2028 | 108 | 108 | ||||||
| Description | Face Amount (Thousands) | Market Value ($ Thousands) | ||||||
MORTGAGE-BACKED SECURITIES (continued) |
| |||||||
FHLMC Structured Agency Credit Risk Debt Notes, Ser 2016-DNA3, Cl M1 | ||||||||
2.337%, VAR ICE LIBOR USD 1 Month+1.100%, 12/25/2028 | $ | 222 | $ | 222 | ||||
FHLMC Structured Agency Credit Risk Debt Notes, Ser 2017-HQA1, Cl M1 | ||||||||
2.752%, VAR ICE LIBOR USD 1 Month+1.200%, 04/25/2029 | 1,721 | 1,737 | ||||||
FNMA Connecticut Avenue Securities, Ser 2014-C02, Cl 1M1 | ||||||||
2.187%, VAR ICE LIBOR USD 1 Month+0.950%, 05/25/2024 | 61 | 61 | ||||||
FNMA Connecticut Avenue Securities, Ser 2017-C02, Cl 2M1 | ||||||||
2.711%, VAR ICE LIBOR USD 1 Month+1.150%, 09/25/2029 | 394 | 397 | ||||||
GMAC Mortgage Loan Trust, Ser 2005-AR6, Cl 2A1 | ||||||||
3.601%, 11/19/2035 (B) | 130 | 126 | ||||||
GS Mortgage Securities II, Ser 2010-C2, Cl A1 | ||||||||
3.849%, 12/10/2043 (A) | 68 | 70 | ||||||
GS Mortgage Securities II, Ser GC30, Cl A2 | ||||||||
2.726%, 05/10/2020 | 275 | 276 | ||||||
GS Mortgage Securities Trust, Ser 500K, Cl A | ||||||||
2.260%, VAR LIBOR USD 1 Month+0.700%, 07/15/2032 (A) | 415 | 415 | ||||||
GSR Mortgage Loan Trust, Ser 2005-AR4, Cl 2A1 | ||||||||
3.836%, 07/25/2035 (B) | 174 | 156 | ||||||
GSR Mortgage Loan Trust, Ser 2007-AR2, Cl 1A1 | ||||||||
3.606%, 05/25/2037 (B) | 148 | 129 | ||||||
Impac CMB Trust, Ser 2004-9, Cl 1A1 | ||||||||
1.997%, VAR ICE LIBOR USD 1 Month+0.760%, 01/25/2035 | 48 | 48 | ||||||
Impac CMB Trust, Ser 2005-2, Cl 1A1 | ||||||||
1.757%, VAR ICE LIBOR USD 1 Month+0.520%, 04/25/2035 | 50 | 49 | ||||||
Impac CMB Trust, Ser 2005-3, Cl A1 | ||||||||
1.717%, VAR ICE LIBOR USD 1 Month+0.480%, 08/25/2035 | 46 | 44 | ||||||
Impac CMB Trust, Ser 2005-5, Cl A1 | ||||||||
1.877%, VAR ICE LIBOR USD 1 Month+0.640%, 08/25/2035 | 37 | 35 | ||||||
Impac CMB Trust, Ser 2005-8, Cl 1A | ||||||||
1.757%, VAR ICE LIBOR USD 1 Month+0.520%, 02/25/2036 | 121 | 116 | ||||||
JPMorgan Chase Commercial Mortgage Securities Trust, Ser 2013-C14, Cl A2 | ||||||||
3.019%, 08/15/2046 | 722 | 726 | ||||||
JPMorgan Chase Commercial Mortgage Securities Trust, Ser 2013-C15, Cl A2 | ||||||||
2.977%, 11/15/2045 | 248 | 249 | ||||||
| 30 | SEI Daily Income Trust / Annual Report / January 31, 2018 |
| Description | Face Amount (Thousands) | Market Value ($ Thousands) | ||||||
MORTGAGE-BACKED SECURITIES (continued) |
| |||||||
JPMorgan Chase Commercial Mortgage Securities Trust, Ser 2013-C16, Cl A2 | ||||||||
3.070%, 12/15/2046 | $ | 648 | $ | 651 | ||||
JPMorgan Chase Commercial Mortgage Securities Trust, Ser 2014-C18, Cl A1 | ||||||||
1.254%, 02/15/2047 | 206 | 205 | ||||||
JPMorgan Chase Commercial Mortgage Securities Trust, Ser 2014-CBM, Cl A | ||||||||
2.139%, VAR LIBOR USD 1 Month+0.900%, 10/15/2029 (A) | 875 | 875 | ||||||
JPMorgan Chase Commercial Mortgage Securities Trust, Ser 2014-PHH, Cl A | ||||||||
2.684%, VAR LIBOR USD 1 Month+1.450%, 08/15/2027 (A) | 575 | 575 | ||||||
JPMorgan Mortgage Trust, Ser 2005-A6, Cl 7A1 | ||||||||
3.601%, 08/25/2035 (B) | 68 | 66 | ||||||
JPMorgan Mortgage Trust, Ser 2007-A3, Cl 1A1 | ||||||||
3.933%, 05/25/2037 (B) | 92 | 88 | ||||||
LB-UBS Commercial Mortgage Trust, Ser 2008-C1, Cl A2 | ||||||||
6.319%, 04/15/2041 (B) | 501 | 507 | ||||||
LSTAR Securities Investment, Ser 2017-3, Cl A1 | ||||||||
3.568%, VAR ICE LIBOR USD 1 Month+2.000%, 04/01/2022 (A) | 127 | 127 | ||||||
LSTAR Securities Investment, Ser 2017-7, Cl A | ||||||||
3.317%, VAR ICE LIBOR USD 1 Month+1.750%, 10/01/2022 (A) | 177 | 176 | ||||||
LSTAR Securities Investment, Ser 2017-8, Cl A | ||||||||
3.217%, VAR ICE LIBOR USD 1 Month+1.650%, 11/01/2022 (A) | 312 | 311 | ||||||
Merrill Lynch Mortgage Investors, Ser 2005- A3, Cl A1 | ||||||||
1.507%, VAR ICE LIBOR USD 1 Month+0.270%, 04/25/2035 | 30 | 30 | ||||||
Merrill Lynch Mortgage-Backed Securities Trust, Ser 2007-3, Cl 2A1 | ||||||||
3.632%, 06/25/2037 (B) | 135 | 112 | ||||||
Metlife Securitization Trust, Ser 2017-1A, Cl A | ||||||||
3.000%, 04/25/2055 (A)(B) | 219 | 221 | ||||||
MFA Trust, Ser 2017-RPL1, Cl A1 | ||||||||
2.588%, 02/25/2057 (A)(B) | 176 | 172 | ||||||
Morgan Stanley Bank of America Merrill Lynch Trust, Ser 2013-C11, Cl A2 | ||||||||
3.085%, 08/15/2046 | 233 | 234 | ||||||
Morgan Stanley Bank of America Merrill Lynch Trust, Ser 2014-C16, Cl A2 | ||||||||
2.849%, 06/15/2019 | 661 | 664 | ||||||
Morgan Stanley Capital I Trust, Ser 2012-STAR | ||||||||
2.084%, 08/05/2034 | 127 | 124 | ||||||
| Description | Face Amount (Thousands) | Market Value ($ Thousands) | ||||||
MORTGAGE-BACKED SECURITIES (continued) |
| |||||||
Morgan Stanley Re-Remic Trust, Ser 2012-IO, Cl AXA | ||||||||
1.000%, 03/27/2051 (A) | $ | 63 | $ | 63 | ||||
MortgageIT Trust, Ser 2005-5, Cl A1 | ||||||||
1.497%, VAR ICE LIBOR USD 1 Month+0.260%, 12/25/2035 | 150 | 149 | ||||||
New Residential Mortgage Loan Trust, Ser 2017-3A, Cl A1 | ||||||||
4.000%, 04/25/2057 (A)(B) | 334 | 346 | ||||||
Paragon Mortgages No. 12 PLC, Ser 2006- 12A, Cl A2C | ||||||||
1.402%, VAR ICE LIBOR USD 3 Month+0.220%, 11/15/2038 (A) | 92 | 88 | ||||||
Paragon Mortgages No. 15 PLC, Ser 2007- 15A, Cl A2C | ||||||||
1.466%, VAR ICE LIBOR USD 3 Month+0.220%, 12/15/2039 (A) | 220 | 212 | ||||||
Pretium Mortgage Credit Partners, Ser 2017-NPLS, Cl A1 | ||||||||
3.327%, 12/30/2032 | 240 | 239 | ||||||
Residential Funding Mortgage Securities I, Ser 2007-SA3, Cl 2A1 | ||||||||
4.679%, 07/27/2037 (B) | 121 | 107 | ||||||
Sequoia Mortgage Trust, Ser 2004-12, Cl A1 | ||||||||
1.776%, VAR ICE LIBOR USD 1 Month+0.540%, 01/20/2035 | 15 | 14 | ||||||
Series RRX Trust, Ser 2014-1A, Cl A, PO | ||||||||
0.000%, 08/26/2044 (A)(C) | 540 | 533 | ||||||
Verus, Ser 2018-1, Cl A1 | ||||||||
2.929%, 02/25/2048 | 230 | 230 | ||||||
WaMu Mortgage Pass-Through Certificates, Ser 2006-AR2, Cl 1A1 | ||||||||
2.941%, 03/25/2036 (B) | 186 | 177 | ||||||
Wells Fargo Mortgage-Backed Securities Trust, Ser 2004-BB, Cl A2 | ||||||||
3.102%, 01/25/2035 (B) | 57 | 58 | ||||||
Wells Fargo Mortgage-Backed Securities Trust, Ser 2006-AR10, Cl 2A1 | ||||||||
3.328%, 07/25/2036 (B) | 123 | 123 | ||||||
WFRBS Commercial Mortgage Trust, Ser 2012-CP, Cl A2 | ||||||||
1.829%, 11/15/2045 | 79 | 79 | ||||||
WFRBS Commercial Mortgage Trust, Ser 2013-C13, Cl A2 | ||||||||
1.964%, 05/15/2045 | 978 | 977 | ||||||
WFRBS Commercial Mortgage Trust, Ser 2013-UBS1, Cl A2 | ||||||||
2.927%, 03/15/2046 | 655 | 658 | ||||||
| SEI Daily Income Trust / Annual Report / January 31, 2018 | 31 |
SCHEDULE OF INVESTMENTS
January 31, 2018
Ultra Short Duration Bond Fund (Continued)
| Description | Face Amount (Thousands) | Market Value ($ Thousands) | ||||||
MORTGAGE-BACKED SECURITIES (continued) |
| |||||||
WFRBS Commercial Mortgage Trust, Ser 2014-LC14, Cl A2 | ||||||||
2.862%, 03/15/2047 | $ | 875 | $ | 878 | ||||
| 22,991 | ||||||||
Total Mortgage-Backed Securities | 34,994 | |||||||
U.S. TREASURY OBLIGATIONS – 7.4% |
| |||||||
U.S. Treasury Notes | ||||||||
2.125%, 08/31/2020 | 4,630 | 4,615 | ||||||
1.500%, 10/31/2019 | 6,945 | 6,872 | ||||||
1.375%, 06/30/2018 | 4,260 | 4,257 | ||||||
1.125%, 12/31/2019
|
| 7,500
|
|
| 7,358
|
| ||
Total U.S. Treasury Obligations | 23,102 | |||||||
MUNICIPAL BONDS – 4.9% |
| |||||||
Arizona – 0.2% | ||||||||
Northern Arizona University, RB | ||||||||
5.020%, 08/01/2018 | 525 | 533 | ||||||
Arkansas – 0.3% |
| |||||||
Garland County, RB | ||||||||
1.540%, 11/01/2018 | 965 | 959 | ||||||
California – 0.5% |
| |||||||
California State, GO Callable 10/01/2021 @ 100 | ||||||||
2.344%, 04/01/2047 (D) | 775 | 782 | ||||||
Los Angeles, Municipal Improvement, Ser A, RB | ||||||||
2.344%, 11/01/2018 | 625 | 627 | ||||||
|
1,409 |
| ||||||
Florida – 0.1% |
| |||||||
Florida State, Board of Administration Finance, Ser A, RB | ||||||||
2.163%, 07/01/2019 | 400 | 399 | ||||||
Hawaii – 0.3% |
| |||||||
Hawaii State, Ser FV, GO | ||||||||
1.750%, 04/01/2018 | 850 | 850 | ||||||
| Description | Face Amount (Thousands) | Market Value ($ Thousands) | ||||||
MUNICIPAL BONDS (continued) |
| |||||||
Idaho – 0.3% |
| |||||||
Idaho State, Housing & Finance Association, Ser A, RB Callable 02/07/2018 @ 100 | ||||||||
1.470%, 07/01/2041 (D) | $ | 1,000 | $ | 1,000 | ||||
Illinois – 0.3% |
| |||||||
Illinois State, Finance Authority, RB | ||||||||
4.545%, 10/01/2018 | 310 | 313 | ||||||
Illinois State, GO | ||||||||
5.665%, 03/01/2018 | 410 | 411 | ||||||
5.163%, 02/01/2018 | 15 | 15 | ||||||
|
739 |
| ||||||
Maryland – 0.5% |
| |||||||
Maryland State, Community Development Administration, Ser J, AMT, RB | ||||||||
Callable 01/31/2018 @ 100 | ||||||||
1.190%, 09/01/2040 (D) | 1,700 | 1,700 | ||||||
Michigan – 0.2% |
| |||||||
Genesee, GO | ||||||||
Callable 02/12/2018 @ 100 | ||||||||
2.164%, 10/01/2019 (D) | 647 | 647 | ||||||
New Hampshire – 0.4% |
| |||||||
New Hampshire State, Business Finance Authority, Ser B, RB | ||||||||
1.580%, 11/01/2020 (D) | 1,350 | 1,350 | ||||||
New Jersey – 0.7% |
| |||||||
Gloucester County, Improvement Authority, Ser B, RB | ||||||||
1.850%, 11/01/2018 | 810 | 807 | ||||||
Monmouth County, Improvement Authority, RB | ||||||||
2.500%, 11/14/2019 | 715 | 714 | ||||||
New Jersey State, Economic Development Authority, Ser Q, RB | ||||||||
2.421%, 06/15/2018 | 645 | 645 | ||||||
|
2,166 |
| ||||||
New York – 0.5% |
| |||||||
New York State, Housing Finance Agency, Ser B, RB | ||||||||
Callable 01/31/2018 @ 100 | ||||||||
1.550%, 11/01/2048 (D)(E) | 1,100 | 1,100 | ||||||
Port Authority of New York & New Jersey, Ser 208 | ||||||||
2.114%, 09/15/2018 | 380 | 380 | ||||||
|
1,480 |
| ||||||
| 32 | SEI Daily Income Trust / Annual Report / January 31, 2018 |
| Description | Face Amount (Thousands) | Market Value ($ Thousands) | ||||||
MUNICIPAL BONDS (continued) |
| |||||||
Pennsylvania – 0.1% |
| |||||||
Pennsylvania State, Turnpike Commission, Sub-Ser B, RB | ||||||||
1.760%, 12/01/2019 | $ | 370 | $ | 364 | ||||
Wisconsin – 0.5% |
| |||||||
Wisconsin State, Housing & Economic Development Authority, Ser F, RB | ||||||||
1.600%, 05/01/2030 (D) | 1,600 | 1,600 | ||||||
Total Municipal Bonds | 15,196 | |||||||
COMMERCIAL PAPER(C) – 0.3% |
| |||||||
Credit Suisse | ||||||||
1.450%, 03/07/2018 | 1,000 | 1,000 | ||||||
Total Commercial Paper (Cost $1,000) ($ Thousands) | 1,000 | |||||||
CERTIFICATES OF DEPOSIT – 1.3% |
| |||||||
Bank of Montreal | ||||||||
1.460%, 03/06/2018 | 2,500 | 2,500 | ||||||
Bank of Tokyo | ||||||||
1.630%, 07/06/2018 | 1,600 | 1,598 | ||||||
Total Certificates of Deposit | 4,098 | |||||||
REPURCHASE AGREEMENT(F) – 2.5% |
| |||||||
BNP Paribas | ||||||||
1.330%, dated 01/31/18, to be repurchased on 02/01/18, repurchase price $7,600,281 (collateralized by various U.S. Government Agency obligations, ranging in par value $1,007 -$3,076,691, 1.375% – 4.500%, 06/12/19- 01/01/48; with total market value$7,752,000) | 7,600 | 7,600 | ||||||
Total Repurchase Agreement | 7,600 | |||||||
Total Investments in Securities– 101.7% | $ | 315,586 | ||||||
| SEI Daily Income Trust / Annual Report / January 31, 2018 | 33 |
SCHEDULE OF INVESTMENTS
January 31, 2018
Ultra Short Duration Bond Fund (Concluded)
A list of the open futures contracts held by the Fund at January 31, 2018, is as follows:
Type of Contract | Number of Contracts Long/(Short) | Expiration Date | Notional Amount (Thousands) | Value (Thousands) | Unrealized Appreciation (Depreciation) (Thousands) | |||||||||||||||
U.S. 10-Year Treasury Note | (15 | ) | Mar-2018 | $ | (1,874 | ) | $ | (1,824 | ) | $ | 50 | |||||||||
U.S. 2-Year Treasury Note | 24 | Mar-2018 | 5,145 | 5,118 | (27 | ) | ||||||||||||||
U.S. 5-Year Treasury Note | 11 | Mar-2018 | 1,285 | 1,262 | (23 | ) | ||||||||||||||
U.S. Long Treasury Bond | (1 | ) | Mar-2018 | (153 | ) | (148 | ) | 5 | ||||||||||||
$ |
4,403 |
|
$ |
4,408 |
|
$ |
5 |
| ||||||||||||
For the year ended January 31, 2018, the total amount of all open futures contracts, as presented in the table above, are representative of the volume of activity for this derivative type during the period.
Percentages are based on Net Assets of $310,159 ($ Thousands).
| (A) | Security exempt from registration under Rule 144A of the Securities Act of 1933. These securities may be resold in transactions exempt from registration normally to qualified institutions. On January 31, 2018, the value of these securities amounted to $95,986 ($ Thousands), representing 30.95% of the Net Assets of the Fund. |
| (B) | Variable or floating rate security, the interest rate of which adjusts periodically based on changes in current interest rates and prepayments on the underlying pool of assets. |
| (C) | Zero coupon security. The rate shown on the Schedule of Investments is the effective yield at the time of purchase. |
| (D) | Variable or floating rate security, the interest rate of which adjusts periodically based on prevailing interest rates. |
| (E) | Securities are held in connection with a letter of credit issued by a major bank. |
| (F) | Tri-Party Repurchase Agreement. |
| (G) | Security, or portion thereof, has been pledged as collateral on open futures contracts. |
Cl – Class
CLO – Collateralized Loan Obligation
FHLMC – Federal Home Loan Mortgage Corporation
FNMA – Federal National Mortgage Association
FREMF – Finnish Real Estate Management Federation
GO – General Obligation
ICE – Intercontinental Exchange
LIBOR – London Interbank Offered Rate
LLC – Limited Liability Company
MTN – Medium Term Note
NCUA – National Credit Union Association
PLC – Public Limited Company
RB – Revenue Bond
REMIC – Real Estate Mortgage Investment Conduit
Ser – Series
TBA – To Be Announced
VAR – Variable Rate
The following is a summary of the inputs used as of January 31, 2018 in valuing the Fund’s investments and other financial instruments carried at value ($ Thousands):
| Investments in Securities | Level 1 | Level 2 | Level 3 | Total | ||||||||||||
Corporate Obligations | $ | – | $ | 148,308 | $ | – | $ | 148,308 | ||||||||
Asset-Backed Securities | – | 81,288 | – | 81,288 | ||||||||||||
Mortgage-Backed Securities | – | 34,994 | – | 34,994 | ||||||||||||
U.S. Treasury Obligations | – | 23,102 | – | 23,102 | ||||||||||||
Municipal Bonds | – | 15,196 | – | 15,196 | ||||||||||||
Repurchase Agreement | – | 7,600 | – | 7,600 | ||||||||||||
Certificates of Deposit | – | 4,098 | – | 4,098 | ||||||||||||
Commercial Paper | – | 1,000 | – | 1,000 | ||||||||||||
|
|
|
|
|
|
|
|
|
|
|
| |||||
Total Investments in Securities | $ | – | $ | 315,586 | $ | – | $ | 315,586 | ||||||||
|
|
|
|
|
|
|
|
|
|
|
| |||||
| Other Financial Instruments | Level 1 | Level 2 | Level 3 | Total | ||||||||||||
Futures Contracts * | ||||||||||||||||
Unrealized Appreciation | $ | 55 | $ | – | $ | – | $ | 55 | ||||||||
Unrealized Depreciation | (50 | ) | – | – | (50 | ) | ||||||||||
|
|
|
|
|
|
|
|
|
|
|
| |||||
Total Other Financial Instruments | $ | 5 | $ | – | $ | – | $ | 5 | ||||||||
|
|
|
|
|
|
|
|
|
|
|
| |||||
* Futures Contracts are valued at the net unrealized appreciation (depreciation) on the instruments.
For the year ended January 31, 2018, there were no transfers between Level 1, Level 2 and/or Level 3 assets and liabilities.
For more information on valuation inputs, see Note 2 – Significant Accounting Policies in Notes to Financial Statements.
Amounts designated as “–” are $0 or have been rounded to $0.
The accompanying notes are an integral part of the financial statements
| 34 | SEI Daily Income Trust / Annual Report / January 31, 2018 |
SCHEDULE OF INVESTMENTS
January 31, 2018
Short-Duration Government Fund
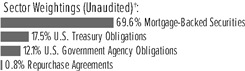
†Percentages are based on total investments.
| Description | Face Amount (Thousands) | Market Value ($ Thousands) | ||||||
MORTGAGE-BACKED SECURITIES – 64.1% |
| |||||||
Agency Mortgage-Backed Obligations – 64.1% |
| |||||||
FHLMC | ||||||||
4.500%, 02/01/2022 to 12/01/2039 | $ | 7,202 | $ | 7,550 | ||||
4.000%, 06/01/2044 | 464 | 480 | ||||||
3.000%, 11/01/2036 to 12/01/2046 | 22,375 | 22,114 | ||||||
2.916%, VAR US Treas Yield Curve Rate T Note Const Mat 1 Yr+2.308%, 06/01/2024 | 19 | 19 | ||||||
2.879%, VAR US Treas Yield Curve Rate T Note Const Mat 1 Yr+2.243%, 06/01/2024 | 13 | 13 | ||||||
2.875%, VAR US Treas Yield Curve Rate T Note Const Mat 1 Yr+2.250%, 09/01/2020 | 3 | 3 | ||||||
2.822%, VAR US Treas Yield Curve Rate T Note Const Mat 1 Yr+2.177%, 07/01/2020 | 1 | 1 | ||||||
2.758%, VAR US Treas Yield Curve Rate T Note Const Mat 1 Yr+2.257%, 07/01/2024 | 8 | 8 | ||||||
2.704%, VAR US Treas Yield Curve Rate T Note Const Mat 1 Yr+2.238%, 04/01/2029 | 19 | 19 | ||||||
2.696%, VAR US Treas Yield Curve Rate T Note Const Mat 1 Yr+2.208%, 05/01/2024 | 13 | 13 | ||||||
2.685%, VAR US Treas Yield Curve Rate T Note Const Mat 1 Yr+2.185%, 04/01/2019 | 2 | 2 | ||||||
2.625%, VAR US Treas Yield Curve Rate T Note Const Mat 1 Yr+2.000%, 07/01/2018 to 08/01/2018 | 1 | 1 | ||||||
2.614%, VAR US Treas Yield Curve Rate T Note Const Mat 1 Yr+2.188%, 12/01/2023 | 465 | 482 | ||||||
2.604%, VAR US Treas Yield Curve Rate T Note Const Mat 1 Yr+2.135%, 02/01/2019 | 1 | 2 | ||||||
2.500%, VAR US Treas Yield Curve Rate T Note Const Mat 1 Yr+2.000%, 07/01/2018 to 11/01/2020 | 2 | 2 | ||||||
2.499%, VAR US Treas Yield Curve Rate T Note Const Mat 1 Yr+2.185%, 05/01/2019 | 2 | 2 | ||||||
| Description | Face Amount (Thousands) | Market Value ($ Thousands) | ||||||
MORTGAGE-BACKED SECURITIES (continued) |
| |||||||
2.488%, VAR US Treas Yield Curve Rate T Note Const Mat 1 Yr+2.111%, 12/01/2023 | $ | 41 | $ | 42 | ||||
2.474%, VAR US Treas Yield Curve Rate T Note Const Mat 1 Yr+2.043%, 04/01/2029 | 1 | 1 | ||||||
2.435%, VAR US Treas Yield Curve Rate T Note Const Mat 1 Yr+2.185%, 03/01/2019 | 1 | 1 | ||||||
2.375%, VAR US Treas Yield Curve Rate T Note Const Mat 1 Yr+1.875%, 07/01/2018 to 09/01/2018 | 1 | 1 | ||||||
FHLMC REMIC, Ser 2002-42, Cl A5 | ||||||||
7.500%, 02/25/2042 | 337 | 384 | ||||||
FHLMC REMIC, Ser 2003-2571, Cl FY | ||||||||
2.309%, VAR LIBOR USD 1 Month+0.750%, 12/15/2032 | 5,459 | 5,565 | ||||||
FHLMC REMIC, Ser 2006-3148, Cl CF | ||||||||
0.924%, VAR LIBOR USD 1 Month+0.400%, 02/15/2034 | 237 | 238 | ||||||
FHLMC REMIC, Ser 2006-3174, Cl FA | ||||||||
0.835%, VAR LIBOR USD 1 Month+0.300%, 04/15/2036 | 1,531 | 1,530 | ||||||
FHLMC REMIC, Ser 2006-3219, Cl EF | ||||||||
1.167%, VAR LIBOR USD 1 Month+0.400%, 04/15/2032 | 3,095 | 3,092 | ||||||
FHLMC REMIC, Ser 2007-3339, Cl HF | ||||||||
2.079%, VAR LIBOR USD 1 Month+0.520%, 07/15/2037 | 4,226 | 4,254 | ||||||
FHLMC REMIC, Ser 2010-3628, Cl PJ | ||||||||
4.500%, 01/15/2040 | 2,274 | 2,380 | ||||||
FHLMC REMIC, Ser 2011-3930, Cl AI, IO | ||||||||
3.500%, 09/15/2026 | 768 | 73 | ||||||
FHLMC REMIC, Ser 2012-4018, Cl AI, IO | ||||||||
3.500%, 03/15/2027 | 1,324 | 122 | ||||||
FHLMC REMIC, Ser 2012-4030, Cl FD | ||||||||
1.909%, VAR LIBOR USD 1 Month+0.350%, 02/15/2041 | 13,927 | 13,927 | ||||||
FHLMC REMIC, Ser 2012-4032, Cl CI, IO | ||||||||
3.500%, 06/15/2026 | 2,226 | 161 | ||||||
FHLMC REMIC, Ser 2012-4060, Cl TI, IO | ||||||||
2.500%, 12/15/2026 | 1,933 | 102 | ||||||
FHLMC REMIC, Ser 2013-4170, Cl QI, IO | ||||||||
3.000%, 05/15/2032 | 1,812 | 151 | ||||||
FHLMC REMIC, Ser 2013-4176, Cl KI, IO | ||||||||
4.000%, 03/15/2028 | 2,189 | 228 | ||||||
FHLMC REMIC, Ser 2013-4178, Cl BI, IO | ||||||||
3.000%, 03/15/2033 | 1,110 | 145 | ||||||
FHLMC REMIC, Ser 2013-4178, Cl MI, IO | ||||||||
2.500%, 03/15/2028 | 967 | 75 | ||||||
FHLMC REMIC, Ser 2013-4182, Cl IE, IO | ||||||||
2.500%, 03/15/2028 | 757 | 64 | ||||||
| SEI Daily Income Trust / Annual Report / January 31, 2018 | 35 |
SCHEDULE OF INVESTMENTS
January 31, 2018
Short-Duration Government Fund (Continued)
| Description | Face Amount (Thousands) | Market Value ($Thousands) | ||||||
MORTGAGE-BACKED SECURITIES (continued) |
| |||||||
FHLMC REMIC, Ser 2013-4195, Cl AI, IO | ||||||||
3.000%, 04/15/2028 | $ | 2,294 | $ | 206 | ||||
FHLMC REMIC, Ser 2013-4199, Cl QI, IO | ||||||||
2.500%, 05/15/2028 | 1,261 | 99 | ||||||
FHLMC REMIC, Ser 2013-4220, Cl IE, IO | ||||||||
4.000%, 06/15/2028 | 1,165 | 126 | ||||||
FHLMC REMIC, Ser 2014-4340, Cl MI, IO | ||||||||
4.500%, 02/15/2027 | 4,287 | 479 | ||||||
FHLMC REMIC, Ser 2014-4419, Cl CW | ||||||||
2.500%, 10/15/2037 | 14,308 | 14,179 | ||||||
FHLMC REMIC, Ser 2016-4620, Cl IO, IO | ||||||||
5.000%, 09/15/2033 | 1,698 | 367 | ||||||
FHLMC REMIC, Ser 2017-4709, Cl AB | ||||||||
3.000%, 08/15/2047 | 2,045 | 2,039 | ||||||
FHLMC REMIC, Ser 3153, Cl FX | ||||||||
0.874%, VAR LIBOR USD 1 Month+0.350%, 05/15/2036 | 89 | 89 | ||||||
FHLMC, Ser 2013-303, Cl C2, IO | ||||||||
3.500%, 01/15/2028 | 4,086 | 405 | ||||||
FHLMC, Ser K710, Cl A2 | ||||||||
1.883%, 05/25/2019 | 6,000 | 5,977 | ||||||
FHLMC, Ser KGRP, Cl A | ||||||||
1.752%, VAR LIBOR USD 1 Month+0.380%, 04/25/2020 | 4,144 | 4,150 | ||||||
FNMA | ||||||||
7.000%, 06/01/2037 | 7 | 7 | ||||||
6.500%, 05/01/2026 to 01/01/2036 | 183 | 204 | ||||||
6.000%, 02/01/2023 to 09/01/2024 | 1,719 | 1,802 | ||||||
5.500%, 03/01/2018 to 06/01/2038 | 451 | 490 | ||||||
5.300%, 07/01/2019 | 311 | 316 | ||||||
5.240%, 07/01/2019 | 619 | 638 | ||||||
5.000%, 03/01/2019 to 08/01/2019 | 29 | 30 | ||||||
4.545%, 02/01/2020 | 783 | 813 | ||||||
4.500%, 08/01/2021 to 08/01/2044 | 3,054 | 3,304 | ||||||
4.448%, 01/01/2021 | 2,996 | 3,107 | ||||||
4.382%, 04/01/2021 | 4,731 | 4,935 | ||||||
4.330%, 04/01/2021 to 07/01/2021 | 3,772 | 3,960 | ||||||
4.302%, 07/01/2021 | 427 | 447 | ||||||
4.295%, 06/01/2021 | 3,550 | 3,718 | ||||||
4.230%, 01/01/2021 | 4,496 | 4,681 | ||||||
4.210%, 07/01/2020 | 666 | 689 | ||||||
4.070%, 04/01/2019 | 1,126 | 1,147 | ||||||
4.066%, 07/01/2020 | 2,513 | 2,593 | ||||||
4.050%, 01/01/2021 | 1,000 | 1,037 | ||||||
4.040%, 06/01/2021 | 11,128 | 11,567 | ||||||
4.010%, 08/01/2021 | 1,023 | 1,064 | ||||||
4.000%, 05/01/2026 to 04/01/2042 | 2,824 | 2,937 | ||||||
3.990%, 07/01/2021 | 266 | 277 | ||||||
3.980%, 07/01/2021 to 08/01/2021 | 8,934 | 9,275 | ||||||
3.970%, 06/01/2021 | 1,917 | 1,989 | ||||||
3.890%, 10/01/2023 | 855 | 891 | ||||||
3.880%, 12/01/2020 | 89 | 91 | ||||||
| Description | Face Amount (Thousands) | Market Value ($Thousands) | ||||||
MORTGAGE-BACKED SECURITIES (continued) |
| |||||||
3.870%, 01/01/2024 | $ | 849 | $ | 890 | ||||
3.850%, 01/01/2024 | 568 | 595 | ||||||
3.840%, 08/01/2021 | 6,636 | 6,878 | ||||||
3.830%, 07/01/2021 | 379 | 392 | ||||||
3.810%, 11/01/2023 | 94 | 98 | ||||||
3.800%, 01/01/2023 | 1,893 | 1,952 | ||||||
3.793%, 12/01/2020 | 7,628 | 7,853 | ||||||
3.770%, 08/01/2021 | 934 | 966 | ||||||
3.770%, 09/01/2021 | 100 | 104 | ||||||
3.765%, 12/01/2025 | 7,800 | 8,187 | ||||||
3.750%, 06/01/2022 to 09/01/2023 | 3,257 | 3,383 | ||||||
3.739%, 06/01/2018 | 772 | 772 | ||||||
3.730%, 07/01/2022 | 2,524 | 2,606 | ||||||
3.700%, 11/01/2020 | 820 | 844 | ||||||
3.650%, 11/01/2021 to 08/01/2023 | 3,518 | 3,630 | ||||||
3.620%, 09/01/2020 | 6,831 | 7,005 | ||||||
3.590%, 10/01/2020 | 181 | 186 | ||||||
3.580%, 12/01/2020 | 882 | 903 | ||||||
3.510%, 11/01/2021 | 1,071 | 1,100 | ||||||
3.500%, 02/01/2045 | 3,141 | 3,172 | ||||||
3.490%, 12/01/2020 | 6,306 | 6,440 | ||||||
3.470%, 11/01/2020 | 158 | 161 | ||||||
3.400%, 03/01/2022 | 3,573 | 3,649 | ||||||
3.265%, 01/01/2022 | 955 | 971 | ||||||
3.260%, 12/01/2020 | 565 | 573 | ||||||
3.250%, 12/01/2021 | 1,254 | 1,276 | ||||||
3.230%, 11/01/2020 | 1,520 | 1,545 | ||||||
3.210%, 09/01/2021 | 336 | 340 | ||||||
3.150%, 01/01/2027 | 1,495 | 1,503 | ||||||
3.100%, 10/01/2027 | 3,565 | 3,552 | ||||||
3.070%, 06/01/2027 | 970 | 967 | ||||||
3.030%, 11/01/2027 | 5,287 | 5,256 | ||||||
3.017%, 04/01/2022 | 272 | 272 | ||||||
3.000%, 09/01/2027 to 03/01/2031 | 647 | 653 | ||||||
2.970%, 06/01/2027 | 7,336 | 7,252 | ||||||
2.960%, 01/01/2027 | 1,279 | 1,271 | ||||||
2.940%, 06/01/2022 | 693 | 698 | ||||||
2.930%, 05/01/2022 to 01/01/2027 | 6,391 | 6,336 | ||||||
2.880%, 07/01/2020 to 12/01/2027 | 5,194 | 5,151 | ||||||
2.850%, 06/01/2027 | 3,803 | 3,744 | ||||||
2.830%, 06/01/2022 | 178 | 179 | ||||||
2.740%, 04/01/2022 | 177 | 177 | ||||||
2.733%, VAR US Treas Yield Curve Rate T Note Const Mat 1 Yr+2.243%, 08/01/2029 | 152 | 158 | ||||||
2.705%, VAR ICE LIBOR USD 6 Month+1.823%, 09/01/2024 | 244 | 250 | ||||||
2.693%, VAR US Treas Yield Curve Rate T Note Const Mat 1 Yr+2.031%, 05/01/2028 | 17 | 18 | ||||||
2.630%, 02/01/2019 | 4,462 | 4,467 | ||||||
| 36 | SEI Daily Income Trust / Annual Report / January 31, 2018 |
| Description | Face Amount (Thousands) | Market Value ($ Thousands) | ||||||
MORTGAGE-BACKED SECURITIES (continued) |
| |||||||
2.593%, VAR ICE LIBOR USD 6 Month+1.603%, 08/01/2027 | $ | 90 | $ | 91 | ||||
2.580%, 08/01/2022 | 2,200 | 2,183 | ||||||
2.540%, 03/01/2023 | 639 | 631 | ||||||
2.450%, 11/01/2022 | 400 | 394 | ||||||
2.410%, 07/01/2021 | 142 | 141 | ||||||
2.380%, 10/01/2019 | 8,278 | 8,267 | ||||||
2.360%, 04/01/2022 | 4,600 | 4,512 | ||||||
2.329%, VAR US Treas Yield Curve Rate T Note Const Mat 1 Yr+1.874%, 12/01/2029 | 64 | 65 | ||||||
2.250%, 10/01/2022 | 3,923 | 3,832 | ||||||
2.230%, 11/01/2023 | 4,486 | 4,320 | ||||||
2.220%, 10/01/2022 | 2,207 | 2,153 | ||||||
2.150%, 05/01/2022 | 4,692 | 4,568 | ||||||
2.110%, 01/01/2020 | 3,747 | 3,731 | ||||||
2.050%, 11/01/2023 | 1,296 | 1,238 | ||||||
1.970%, 11/01/2023 | 12,735 | 12,104 | ||||||
1.750%, 04/01/2019 to 06/01/2020 | 8,247 | 8,106 | ||||||
1.690%, 12/01/2019 | 2,000 | 1,969 | ||||||
FNMA Interest, Ser 2012-410, Cl C6, IO | ||||||||
4.000%, 05/25/2027 | 2,293 | 227 | ||||||
FNMA REMIC, Ser 1992-61, Cl FA | ||||||||
1.175%, VAR LIBOR USD 1 Month+0.650%, 10/25/2022 | 29 | 29 | ||||||
FNMA REMIC, Ser 1993-32, Cl H | ||||||||
6.000%, 03/25/2023 | 12 | 13 | ||||||
FNMA REMIC, Ser 1993-5, Cl Z | ||||||||
6.500%, 02/25/2023 | 6 | 7 | ||||||
FNMA REMIC, Ser 1994-77, Cl FB | ||||||||
2.025%, VAR LIBOR USD 1 Month+1.500%, 04/25/2024 | 3 | 3 | ||||||
FNMA REMIC, Ser 2002-53, Cl FK | ||||||||
0.925%, VAR LIBOR USD 1 Month+0.400%, 04/25/2032 | 57 | 58 | ||||||
FNMA REMIC, Ser 2003-76, Cl CA | ||||||||
3.750%, 07/25/2033 | 52 | 52 | ||||||
FNMA REMIC, Ser 2006-76, Cl QF | ||||||||
0.925%, VAR LIBOR USD 1 Month+0.400%, 08/25/2036 | 446 | 446 | ||||||
FNMA REMIC, Ser 2006-79, Cl DF | ||||||||
0.875%, VAR LIBOR USD 1 Month+0.350%, 08/25/2036 | 377 | 378 | ||||||
FNMA REMIC, Ser 2007-47, Cl DA | ||||||||
5.600%, 05/25/2037 | 509 | 552 | ||||||
FNMA REMIC, Ser 2007-64, Cl FB | ||||||||
0.895%, VAR LIBOR USD 1 Month+0.370%, 07/25/2037 | 2,877 | 2,881 | ||||||
FNMA REMIC, Ser 2008-16, Cl FA | ||||||||
1.225%, VAR LIBOR USD 1 Month+0.700%, 03/25/2038 | 2,698 | 2,737 | ||||||
| Description | Face Amount (Thousands) | Market Value ($ Thousands) | ||||||
MORTGAGE-BACKED SECURITIES (continued) |
| |||||||
FNMA REMIC, Ser 2009-110, Cl FD | ||||||||
2.311%, VAR LIBOR USD 1 Month+0.750%, 01/25/2040 | $ | 8,052 | $ | 8,183 | ||||
FNMA REMIC, Ser 2009-112, Cl FM | ||||||||
2.311%, VAR LIBOR USD 1 Month+0.750%, 01/25/2040 | 4,948 | 5,014 | ||||||
FNMA REMIC, Ser 2010-149, Cl VA | ||||||||
4.500%, 02/25/2022 | 4,260 | 4,383 | ||||||
FNMA REMIC, Ser 2010-4, Cl PL | ||||||||
4.500%, 02/25/2040 | 2,030 | 2,130 | ||||||
FNMA REMIC, Ser 2010-56, Cl AF | ||||||||
2.111%, VAR LIBOR USD 1 Month+0.550%, 06/25/2040 | 5,363 | 5,391 | ||||||
FNMA REMIC, Ser 2012-111, Cl NI, IO | ||||||||
3.500%, 10/25/2027 | 2,227 | 231 | ||||||
FNMA REMIC, Ser 2012-4083, Cl DI, IO | ||||||||
4.000%, 07/15/2027 | 704 | 74 | ||||||
FNMA REMIC, Ser 2012-43, Cl AI, IO | ||||||||
3.500%, 04/25/2027 | 7,727 | 759 | ||||||
FNMA REMIC, Ser 2012-47, Cl QI, IO | ||||||||
5.457%, 05/25/2042 (A) | 570 | 61 | ||||||
FNMA REMIC, Ser 2012-53, Cl BI, IO | ||||||||
3.500%, 05/25/2027 | 1,387 | 144 | ||||||
FNMA REMIC, Ser 2012-70, Cl IW, IO | ||||||||
3.000%, 02/25/2027 | 3,181 | 256 | ||||||
FNMA REMIC, Ser 2012-93, Cl IL, IO | ||||||||
3.000%, 09/25/2027 | 1,180 | 122 | ||||||
FNMA REMIC, Ser 2012-97, Cl JI, IO | ||||||||
3.000%, 07/25/2027 | 3,592 | 315 | ||||||
FNMA REMIC, Ser 2013-121, Cl FA | ||||||||
1.961%, VAR LIBOR USD 1 Month+0.400%, 12/25/2043 | 36,449 | 36,549 | ||||||
FNMA REMIC, Ser 2013-130, Cl FQ | ||||||||
1.761%, VAR LIBOR USD 1 Month+0.200%, 06/25/2041 | 6,783 | 6,731 | ||||||
FNMA REMIC, Ser 2013-5, Cl YI, IO | ||||||||
3.000%, 02/25/2028 | 2,859 | 264 | ||||||
FNMA REMIC, Ser 2014-50, Cl SC, IO | ||||||||
1.949%, 08/25/2044 (A) | 5,491 | 233 | ||||||
FNMA REMIC, Ser 2015-21, Cl WI, IO | ||||||||
1.617%, 04/25/2055 (A) | 3,407 | 160 | ||||||
FNMA REMIC, Ser 2015-42, Cl AI, IO | ||||||||
2.042%, 06/25/2055 (A) | 4,193 | 196 | ||||||
FNMA REMIC, Ser 2015-5, Cl CP | ||||||||
3.000%, 06/25/2043 | 2,988 | 2,995 | ||||||
FNMA REMIC, Ser 2015-57, Cl AB | ||||||||
3.000%, 08/25/2045 | 17,094 | 17,059 | ||||||
FNMA REMIC, Ser 2015-68, Cl JI, IO | ||||||||
3.500%, 08/25/2030 | 713 | 84 | ||||||
FNMA REMIC, Ser 2015-68, Cl HI, IO | ||||||||
3.500%, 09/25/2035 | 1,317 | 207 | ||||||
| SEI Daily Income Trust / Annual Report / January 31, 2018 | 37 |
SCHEDULE OF INVESTMENTS
January 31, 2018
Short-Duration Government Fund (Continued)
| Description | Face Amount (Thousands) | Market Value ($Thousands) | ||||||
MORTGAGE-BACKED SECURITIES (continued) |
| |||||||
FNMA REMIC, Ser 2016-3, Cl JI, IO | ||||||||
3.500%, 02/25/2031 | $ | 1,602 | $ | 155 | ||||
FNMA REMIC, Ser 2016-71, Cl IN, IO | ||||||||
3.500%, 10/25/2046 | 1,054 | 247 | ||||||
FNMA REMIC, Ser 2017-68, Cl BI, IO | ||||||||
6.000%, 09/25/2047 | 2,514 | 594 | ||||||
FNMA TBA | ||||||||
6.000%, 02/15/2045 | 2,200 | 2,449 | ||||||
3.500%, 02/25/2041 | 900 | 909 | ||||||
FNMA, Ser 2009-397, Cl 6 | ||||||||
2.000%, 09/25/2039 | 2,773 | 2,617 | ||||||
FNMA, Ser 2017-KT01, Cl A | ||||||||
1.349%, VAR LIBOR USD 1 Month+0.320%, 02/25/2020 | 11,090 | 11,124 | ||||||
FNMA, Ser M13, Cl FA | ||||||||
1.895%, VAR LIBOR USD 1 Month+0.400%, 10/25/2024 | 3,322 | 3,318 | ||||||
FNMA, Ser M5, Cl FA | ||||||||
1.728%, VAR LIBOR USD 1 Month+0.490%, 04/25/2024 | 4,628 | 4,640 | ||||||
GNMA | ||||||||
6.500%, 08/15/2037 to 02/20/2039 | 279 | 309 | ||||||
6.000%, 09/15/2019 to 06/15/2041 | 6,908 | 7,718 | ||||||
5.500%, 10/15/2034 to 02/15/2041 | 2,679 | 2,922 | ||||||
5.000%, 09/15/2039 to 04/15/2041 | 1,626 | 1,750 | ||||||
4.000%, 07/15/2041 to 03/20/2047 | 3,321 | 785 | ||||||
GNMA TBA | ||||||||
6.000%, 02/15/2045 | 1,600 | 1,777 | ||||||
GNMA, Ser 177, Cl A | ||||||||
2.400%, 09/16/2046 | 4,150 | 4,050 | ||||||
GNMA, Ser 2010-26, Cl JI, IO | ||||||||
5.000%, 02/16/2040 | 3,982 | 981 | ||||||
GNMA, Ser 2010-57, Cl TI, IO | ||||||||
5.000%, 05/20/2040 | 1,597 | 403 | ||||||
GNMA, Ser 2012-126, Cl IO, IO | ||||||||
3.500%, 10/20/2042 | 5,016 | 1,049 | ||||||
GNMA, Ser 2012-51, Cl GI, IO | ||||||||
3.500%, 07/20/2040 | 1,376 | 160 | ||||||
GNMA, Ser 2013-26, Cl IK, IO | ||||||||
3.000%, 02/16/2043 | 835 | 150 | ||||||
GNMA, Ser 2013-47, Cl IA, IO | ||||||||
4.000%, 03/20/2043 | 947 | 213 | ||||||
GNMA, Ser 2013-51, Cl IB, IO | ||||||||
3.500%, 03/20/2027 | 1,630 | 168 | ||||||
GNMA, Ser 2014-4, Cl BI, IO | ||||||||
4.000%, 01/20/2044 | 400 | 90 | ||||||
GNMA, Ser 2014-56, Cl BP | ||||||||
2.500%, 12/16/2039 | 4,542 | 4,459 | ||||||
GNMA, Ser 2015-126, Cl GI, IO | ||||||||
3.500%, 02/16/2027 | 715 | 68 | ||||||
GNMA, Ser 2015-126, Cl HI, IO | ||||||||
4.000%, 12/16/2026 | 501 | 47 | ||||||
| Description | Face Amount (Thousands) | Market Value ($Thousands) | ||||||
MORTGAGE-BACKED SECURITIES (continued) |
| |||||||
GNMA, Ser 2015-165, Cl I, IO | ||||||||
3.500%, 07/20/2043 | $ | 3,184 | $ | 507 | ||||
GNMA, Ser 2015-17, Cl BI, IO | ||||||||
3.500%, 05/20/2043 | 388 | 77 | ||||||
GNMA, Ser 2015-185, Cl GI, IO | ||||||||
3.500%, 02/20/2041 | 2,046 | 251 | ||||||
GNMA, Ser 2015-53, Cl IA, IO | ||||||||
4.500%, 04/20/2045 | 1,680 | 389 | ||||||
GNMA, Ser 2015-63, Cl PB | ||||||||
1.750%, 09/20/2043 | 659 | 629 | ||||||
GNMA, Ser 2016-126, Cl KI, IO | ||||||||
3.000%, 09/20/2028 | 1,572 | 141 | ||||||
GNMA, Ser 2016-167, Cl AI, IO | ||||||||
5.500%, 03/20/2039 | 3,484 | 801 | ||||||
GNMA, Ser 2016-23, Cl CI, IO | ||||||||
3.500%, 04/20/2042 | 3,447 | 468 | ||||||
GNMA, Ser 2016-42, Cl EI, IO | ||||||||
6.000%, 02/20/2046 | 2,638 | 616 | ||||||
GNMA, Ser 2016-99, Cl LI, IO | ||||||||
4.000%, 05/20/2029 | 7,011 | 716 | ||||||
GNMA, Ser 2017-2, Cl AI, IO | ||||||||
5.000%, 01/16/2047 | 986 | 235 | ||||||
GNMA, Ser 2017-26, Cl KI, IO | ||||||||
6.000%, 09/20/2040 | 3,183 | 764 | ||||||
GNMA, Ser 2017-26, Cl IB, IO | ||||||||
5.500%, 02/20/2047 | 1,820 | 391 | ||||||
GNMA, Ser 2017-26, Cl IA, IO | ||||||||
5.500%, 02/16/2047 | 3,007 | 691 | ||||||
GNMA, Ser 2017-99, Cl IO, IO | ||||||||
4.000%, 07/20/2047 |
| 4,794
|
|
| 967
|
| ||
Total Mortgage-Backed Securities | 479,771 | |||||||
U.S. TREASURY OBLIGATIONS – 16.1% |
| |||||||
U.S. Treasury Inflation Indexed Bonds | ||||||||
0.625%, 01/15/2026 | 28,729 | 28,813 | ||||||
U.S. Treasury Notes | ||||||||
1.625%, 07/31/2020 (C) | 34,501 | 33,987 | ||||||
1.500%, 07/15/2020 | 58,830 |
| 57,805
|
| ||||
Total U.S. Treasury Obligations | 120,605 | |||||||
U.S. GOVERNMENT AGENCY OBLIGATIONS – 11.2% |
| |||||||
FHLMC | ||||||||
1.375%, 05/01/2020 | 52,238 | 51,302 | ||||||
| 38 | SEI Daily Income Trust / Annual Report / January 31, 2018 |
| Description | Face Amount (Thousands) | Market Value ($ Thousands) | ||||||
U.S. GOVERNMENT AGENCY OBLIGATIONS (continued) |
| |||||||
FNMA | ||||||||
1.500%, 07/30/2020 | $ | 32,700 | $ | 32,094 | ||||
Total U.S. Government Agency Obligations | 83,396 | |||||||
REPURCHASE AGREEMENTS – 0.8% |
| |||||||
BNP Paribas | ||||||||
1.330%, dated 01/31/2018, to be repurchased on 02/01/18, repurchase price $3,800,140 (collateralized by various U.S. Government Agency and U.S. Treasury obligations, ranging in par value $3,045 - 2,895,000, 0.875% - 3.500%, 12/31/18 - 06/01/42; with total market value $3,876,000) (B) | 3,800 | 3,800 | ||||||
Deutsche Bank | ||||||||
1.320%, dated 01/31/2018, to be repurchased on 02/01/18, repurchase price $2,200,081 (collateralized by U.S. Treasury obligations, par value 2,244,200, 1.435%, 01/31/20; with total market value $2,244,043) (B) | 2,200 | 2,200 | ||||||
|
| |||||||
Total Repurchase Agreements | 6,000 | |||||||
|
| |||||||
Total Investments in Securities– 92.2% | $ | 689,772 | ||||||
|
| |||||||
A list of the open futures contracts held by the Fund at January 31, 2018, is as follows:
Type of Contract | Number of Contracts Long/(Short) | Expiration Date | Notional Amount (Thousands) | Value (Thousands) | Unrealized Appreciation (Depreciation) (Thousands) | |||||||||||||||
U.S. 2-Year Treasury Note | 1,426 | Mar-2018 | $ | 305,803 | $ | 304,072 | $ | (1,731 | ) | |||||||||||
U.S. 5-Year Treasury Note | (217 | ) | Mar-2018 | (25,348 | ) | (24,892 | ) | 456 | ||||||||||||
U.S. 10-Year Treasury Note | (567 | ) | Mar-2018 | (70,649 | ) | (68,935 | ) | 1,714 | ||||||||||||
Ultra 10-Year U.S. Treasury Note | (268 | ) | Mar-2018 | (35,736 | ) | (34,894 | ) | 842 | ||||||||||||
|
|
| ||||||||||||||||||
| $ | 174,070 | $ | 175,351 | $ | 1,281 | |||||||||||||||
|
|
| ||||||||||||||||||
Percentages are based on Net Assets of $748,246 ($ Thousands).
| (A) | Variable or floating rate security, the interest rate of which adjusts periodically based on changes in current interest rates and prepayments on the underlying pool of assets. |
| (B) | Tri-Party Repurchase Agreement. |
| (C) | Security, or portion thereof, has been pledged as collateral on open futures contracts. |
Cl – Class
FHLMC – Federal Home Loan Mortgage Corporation
FNMA – Federal National Mortgage Association
GNMA – Government National Mortgage Association
ICE– Intercontinental Exchange
IO – Interest Only - face amount represents notional amount
LIBOR – London Interbank Offered Rate
REMIC – Real Estate Mortgage Investment Conduit
Ser – Series
TBA – To Be Announced
VAR – Variable Rate
| SEI Daily Income Trust / Annual Report / January 31, 2018 | 39 |
SCHEDULE OF INVESTMENTS
January 31, 2018
Short-Duration Government Fund (Concluded)
The following is a summary of the inputs used as of January 31, 2018 in valuing the Fund’s investments and other financial instruments carried at value ($ Thousands):
| Investments in Securities |
Level 1 |
Level 2 |
Level 3 |
Total | ||||||||||||
Mortgage-Backed Securities | $ | – | $ | 479,771 | $ | – | $ | 479,771 | ||||||||
U.S. Treasury Obligations | – | 120,605 | – | 120,605 | ||||||||||||
U.S. Government Agency Obligations | – | 83,396 | – | 83,396 | ||||||||||||
Repurchase Agreements | – | 6,000 | – | 6,000 | ||||||||||||
|
|
|
|
|
|
|
| |||||||||
Total Investments in Securities | $ | – | $ | 689,772 | $ | – | $ | 689,772 | ||||||||
|
|
|
|
|
|
|
| |||||||||
| Other Financial Instruments | Level 1 | Level 2 | Level 3 | Total | ||||||||||||
Futures Contracts * | ||||||||||||||||
Unrealized Appreciation | $ | 3,012 | $ | – | $ | – | $ | 3,012 | ||||||||
Unrealized Depreciation | (1,731) | – | – | (1,731) | ||||||||||||
|
|
|
|
|
|
|
| |||||||||
Total Other Financial Instruments | $ | 1,281 | $ | – | $ | – | $ | 1,281 | ||||||||
|
|
|
|
|
|
|
| |||||||||
* Futures Contracts are valued at the net unrealized appreciation/(depreciation) on the instruments.
For the year ended January 31, 2018, there were no transfers between Level 1, Level 2 and/or Level 3 assets and liabilities.
For more information on valuation inputs, see Note 2 – Significant Accounting Policies in Notes to Financial Statements.
Amounts designated as “–” are $0 or have been rounded to $0.
The accompanying notes are an integral part of the financial statements.
| 40 | SEI Daily Income Trust / Annual Report / January 31, 2018 |
SCHEDULE OF INVESTMENTS
January 31, 2018
GNMA Fund

†Percentages are based on total investments.
| Description | Face Amount (Thousands) | Market Value ($ Thousands) | ||||||
MORTGAGE-BACKED SECURITIES – 99.3% |
| |||||||
Agency Mortgage-Backed Obligations – 99.3% |
| |||||||
FHLMC | ||||||||
3.650%, 04/01/2030 | $ | 595 | $ | 608 | ||||
FHLMC REMIC, Ser 2011-3930, Cl AI, IO | ||||||||
3.500%, 09/15/2026 | 105 | 10 | ||||||
FHLMC REMIC, Ser 2012-4018, Cl AI, IO | ||||||||
3.500%, 03/15/2027 | 185 | 17 | ||||||
FHLMC REMIC, Ser 2012-4032, Cl CI, IO | ||||||||
3.500%, 06/15/2026 | 304 | 22 | ||||||
FHLMC REMIC, Ser 2012-4060, Cl TI, IO | ||||||||
2.500%, 12/15/2026 | 258 | 14 | ||||||
FHLMC REMIC, Ser 2013-4166, Cl PI, IO | ||||||||
3.500%, 03/15/2041 | 730 | 91 | ||||||
FHLMC REMIC, Ser 2013-4176, Cl KI, IO | ||||||||
4.000%, 03/15/2028 | 269 | 28 | ||||||
FHLMC REMIC, Ser 2013-4178, Cl MI, IO | ||||||||
2.500%, 03/15/2028 | 134 | 10 | ||||||
FHLMC REMIC, Ser 2013-4182, Cl IE, IO | ||||||||
2.500%, 03/15/2028 | 111 | 9 | ||||||
FHLMC REMIC, Ser 2013-4199, Cl QI, IO | ||||||||
2.500%, 05/15/2028 | 156 | 12 | ||||||
FHLMC REMIC, Ser 2016-4624, Cl BI, IO | ||||||||
5.500%, 04/15/2036 | 325 | 70 | ||||||
FHLMC REMIC, Ser 2017-4654, Cl KY | ||||||||
3.000%, 02/15/2047 | 650 | 611 | ||||||
FHLMC REMIC, Ser 2017-4656, Cl KB | ||||||||
3.000%, 02/15/2047 | 275 | 254 | ||||||
FNMA | ||||||||
8.000%, 07/01/2025 to 09/01/2028 | 28 | 29 | ||||||
7.000%, 08/01/2029 to 09/01/2032 | 54 | 57 | ||||||
6.500%, 09/01/2032 | 54 | 60 | ||||||
4.180%, 11/01/2028 | 1,643 | 1,742 | ||||||
3.590%, 09/01/2030 | 210 | 215 | ||||||
3.390%, 09/01/2026 | 300 | 307 | ||||||
3.260%, 01/01/2027 to 06/01/2027 | 382 | 387 | ||||||
3.230%, 02/01/2027 | 148 | 150 | ||||||
3.130%, 02/01/2027 | 200 | 201 | ||||||
3.030%, 11/01/2027 | 658 | 654 | ||||||
2.990%, 11/01/2024 | 578 | 581 | ||||||
2.970%, 06/01/2027 | 198 | 196 | ||||||
2.850%, 12/01/2027 | 250 | 244 | ||||||
2.780%, 03/01/2027 | 300 | 294 | ||||||
FNMA Interest, Ser 2012-410, Cl C6, IO | ||||||||
4.000%, 05/25/2027 | 285 | 28 | ||||||
FNMA REMIC, Ser 1990-91, Cl G | ||||||||
7.000%, 08/25/2020 | 4 | 5 | ||||||
| Description | Face Amount (Thousands) | Market Value ($ Thousands) | ||||||
MORTGAGE-BACKED SECURITIES (continued) |
| |||||||
FNMA REMIC, Ser 1992-105, Cl B | ||||||||
7.000%, 06/25/2022 | $ | 10 | $ | 11 | ||||
FNMA REMIC, Ser 2012-53, Cl BI, IO | ||||||||
3.500%, 05/25/2027 | 170 | 18 | ||||||
FNMA REMIC, Ser 2012-93, Cl IL, IO | ||||||||
3.000%, 09/25/2027 | 166 | 17 | ||||||
FNMA REMIC, Ser 2013-5, Cl YI, IO | ||||||||
3.000%, 02/25/2028 | 352 | 32 | ||||||
FNMA REMIC, Ser 2015-21, Cl WI, IO | ||||||||
1.617%, 04/25/2055 (A) | 426 | 20 | ||||||
FNMA REMIC, Ser 2016-3, Cl JI, IO | ||||||||
3.500%, 02/25/2031 | 206 | 20 | ||||||
FNMA REMIC, Ser 2016-71, Cl IN, IO | ||||||||
3.500%, 10/25/2046 | 132 | 31 | ||||||
FNMA REMIC, Ser 2016-91, Cl PL | ||||||||
2.500%, 12/25/2046 | 325 | 285 | ||||||
FNMA REMIC, Ser 2017-42, Cl HL | ||||||||
3.000%, 06/25/2047 | 875 | 818 | ||||||
GNMA | ||||||||
10.000%, 10/15/2018 to 09/15/2019 | 1 | 1 | ||||||
9.500%, 09/15/2018 to 10/15/2020 | 5 | 5 | ||||||
9.000%, 04/15/2018 to 05/15/2022 | 25 | 25 | ||||||
8.000%, 10/15/2020 to 03/15/2032 | 171 | 185 | ||||||
7.750%, 10/15/2026 | 22 | 23 | ||||||
7.500%, 02/15/2027 to 10/15/2035 | 156 | 176 | ||||||
7.250%, 01/15/2028 | 35 | 37 | ||||||
7.000%, 04/15/2019 to 11/15/2033 | 1,535 | 1,739 | ||||||
6.750%, 11/15/2027 | 9 | 10 | ||||||
6.500%, 10/15/2023 to 10/15/2038 | 470 | 529 | ||||||
6.000%, 12/15/2027 to 12/15/2040 | 1,084 | 1,209 | ||||||
5.500%, 01/15/2033 to 02/15/2045 | 1,297 | 1,444 | ||||||
5.000%, 06/15/2033 to 02/15/2045 | 3,879 | 4,199 | ||||||
4.500%, 08/15/2033 to 01/20/2046 | 3,500 | 3,711 | ||||||
4.000%, 03/20/2040 to 12/20/2047 (C) | 12,273 | 12,457 | ||||||
3.875%, 05/15/2042 | 1,217 | 1,263 | ||||||
3.500%, 02/15/2041 to 01/20/2048 | 18,704 | 19,071 | ||||||
3.000%, 10/15/2042 to 05/20/2046 | 6,684 | 6,632 | ||||||
2.500%, 07/20/2045 to 12/20/2046 | 2,131 | 2,039 | ||||||
2.000%, 10/20/2044 | 801 | 759 | ||||||
GNMA REMIC, Ser 2002-45, Cl QE | ||||||||
6.500%, 06/20/2032 | 230 | 256 | ||||||
GNMA TBA | ||||||||
3.000%, 02/01/2045 | 6,045 | 5,985 | ||||||
GNMA, Ser 2010-26, Cl JI, IO | ||||||||
5.000%, 02/16/2040 | 484 | 119 | ||||||
GNMA, Ser 2010-57, Cl TI, IO | ||||||||
5.000%, 05/20/2040 | 397 | 100 | ||||||
GNMA, Ser 2012-113, Cl BZ | ||||||||
3.000%, 09/16/2042 | 189 | 172 | ||||||
GNMA, Ser 2012-126, Cl IO, IO | ||||||||
3.500%, 10/20/2042 | 613 | 128 | ||||||
| SEI Daily Income Trust / Annual Report / January 31, 2018 | 41 |
SCHEDULE OF INVESTMENTS
January 31, 2018
GNMA Fund (Concluded)
| Description | Face Amount (Thousands) | Market Value ($ Thousands) | ||||||
MORTGAGE-BACKED SECURITIES (continued) |
| |||||||
GNMA, Ser 2012-51, Cl GI, IO | ||||||||
3.500%, 07/20/2040 | $ | 171 | $ | 20 | ||||
GNMA, Ser 2012-69, Cl AI, IO | ||||||||
4.500%, 05/16/2027 | 383 | 38 | ||||||
GNMA, Ser 2013-187, Cl PE | ||||||||
2.000%, 09/20/2043 | 285 | 273 | ||||||
GNMA, Ser 2013-26, Cl IK, IO | ||||||||
3.000%, 02/16/2043 | 101 | 18 | ||||||
GNMA, Ser 2013-47, Cl IA, IO | ||||||||
4.000%, 03/20/2043 | 125 | 28 | ||||||
GNMA, Ser 2013-99, Cl AX | ||||||||
3.000%, 07/20/2043 | 206 | 202 | ||||||
GNMA, Ser 2014-115, Cl KZ | ||||||||
3.000%, 08/20/2044 | 194 | 181 | ||||||
GNMA, Ser 2014-122, Cl IP, IO | ||||||||
3.500%, 08/16/2029 | 1,026 | 104 | ||||||
GNMA, Ser 2014-144, Cl BI, IO | ||||||||
3.000%, 09/16/2029 | 367 | 35 | ||||||
GNMA, Ser 2014-21, Cl DI, IO | ||||||||
4.000%, 04/16/2026 | 1,582 | 156 | ||||||
GNMA, Ser 2015-125, Cl VA | ||||||||
2.700%, 05/16/2035 (A) | 54 | 51 | ||||||
GNMA, Ser 2015-165, Cl I, IO | ||||||||
3.500%, 07/20/2043 | 776 | 124 | ||||||
GNMA, Ser 2015-168, Cl MI, IO | ||||||||
5.500%, 10/20/2037 | 794 | 180 | ||||||
GNMA, Ser 2015-17, Cl BI, IO | ||||||||
3.500%, 05/20/2043 | 807 | 161 | ||||||
GNMA, Ser 2015-18, Cl IC, IO | ||||||||
3.500%, 02/16/2030 | 870 | 93 | ||||||
GNMA, Ser 2015-185, Cl GI, IO | ||||||||
3.500%, 02/20/2041 | 258 | 32 | ||||||
GNMA, Ser 2015-53, Cl IA, IO | ||||||||
4.500%, 04/20/2045 | 240 | 56 | ||||||
GNMA, Ser 2015-63, Cl PB | ||||||||
1.750%, 09/20/2043 | 69 | 66 | ||||||
GNMA, Ser 2015-84, Cl IO, IO | ||||||||
3.500%, 05/16/2042 | 591 | 116 | ||||||
GNMA, Ser 2016-123, Cl LM | ||||||||
3.000%, 09/20/2046 | 375 | 355 | ||||||
GNMA, Ser 2016-126, Cl KI, IO | ||||||||
3.000%, 09/20/2028 | 217 | 20 | ||||||
GNMA, Ser 2016-136, Cl A | ||||||||
3.000%, 07/20/2044 | 877 | 859 | ||||||
GNMA, Ser 2016-167, Cl AI, IO | ||||||||
5.500%, 03/20/2039 | 641 | 148 | ||||||
GNMA, Ser 2016-23, Cl CI, IO | ||||||||
3.500%, 04/20/2042 | 422 | 57 | ||||||
GNMA, Ser 2016-42, Cl EI, IO | ||||||||
6.000%, 02/20/2046 | 328 | 77 | ||||||
GNMA, Ser 2016-99, Cl LI, IO | ||||||||
4.000%, 05/20/2029 | 976 | 100 | ||||||
| Description | Face Amount (Thousands) | Market Value ($ Thousands) | ||||||
MORTGAGE-BACKED SECURITIES (continued) |
| |||||||
GNMA, Ser 2017-2, Cl AI, IO | ||||||||
5.000%, 01/16/2047 | $ | 123 | $ | 29 | ||||
GNMA, Ser 2017-26, Cl IA, IO | ||||||||
5.500%, 02/16/2047 | 415 | 95 | ||||||
GNMA, Ser 2017-78, Cl AZ | ||||||||
3.000%, 05/20/2047 | 204 | 180 | ||||||
GNMA, Ser 2017-80, Cl AZ | ||||||||
3.000%, 05/20/2047 | 153 | 137 | ||||||
GNMA, Ser 2017-99, Cl IO, IO | ||||||||
4.000%, 07/20/2047 | 584 | 118 | ||||||
GNMA, Ser 2018-13, Cl DB | ||||||||
3.000%, 01/20/2048 | 595 | 590 | ||||||
Total Mortgage-Backed Securities | 75,131 | |||||||
REPURCHASE AGREEMENT(B) — 0.8% |
| |||||||
Deutsche Bank | ||||||||
1.320%, dated 01/31/2018, to be repurchased on 02/01/18, repurchaseprice $600,022 (collateralized by GNMA obligations, ranging in par value $131,957 - $454,820, 4.000% 12/20/47; with total market value $612,000) | 600 | 600 | ||||||
Total Repurchase Agreement | 600 | |||||||
Total Investments in Securities—100.1% (Cost $75,947) ($ Thousands) | $ | 75,731 | ||||||
| 42 | SEI Daily Income Trust / Annual Report / January 31, 2018 |
A list of the open futures contracts held by the Fund at January 31, 2018, is as follows:
Type of Contract | Number of Contracts Long/(Short) | Expiration Date | Notional Amount (Thousands) | Value (Thousands) | Unrealized Appreciation (Depreciation) (Thousands) | |||||||||||||||
U.S. 10-Year Treasury Note | 20 | Mar-2018 | $ | 2,460 | $ | 2,432 | $ | (28 | ) | |||||||||||
U.S. 5-Year Treasury Note | 28 | Mar-2018 | 3,259 | 3,212 | (47 | ) | ||||||||||||||
Ultra 10-Year U.S. Treasury Note | (12 | ) | Mar-2018 | (1,604 | ) | (1,562 | ) | 42 | ||||||||||||
| $ | 4,115 | $ | 4,082 | $ | (33 | ) | ||||||||||||||
Percentages are based on Net Assets of $75,658 ($ Thousands).
| (A) | Variable or floating rate security, the interest rate of which adjusts periodically based on changes in current interest rates and prepayments on the underlying pool of assets. |
| (B) | Tri-Party Repurchase Agreement. |
| (C) | Security, or portion thereof, has been pledged as collateral on open futures contracts. |
Cl — Class
FHLMC — Federal Home Loan Mortgage Corporation
FNMA — Federal National Mortgage Association
GNMA — Government National Mortgage Association
IO — Interest Only - face amount represents notional amount
REMIC — Real Estate Mortgage Investment Conduit
Ser — Series
TBA — To Be Announced
The following is a summary of the inputs used as of January 31, 2018 in valuing the Fund’s investments and other financial instruments carried at value ($ Thousands):
| Investments in Securities | Level 1 | Level 2 | Level 3 | Total | ||||||||||||
Mortgage-Backed Securities | $ | – | $ | 75,131 | $ | – | $ | 75,131 | ||||||||
Repurchase Agreement | – | 600 | – | 600 | ||||||||||||
|
|
|
|
|
|
|
|
|
|
|
| |||||
Total Investments in Securities | $ | – | $ | 75,731 | $ | – | $ | 75,731 | ||||||||
|
|
|
|
|
|
|
|
|
|
|
| |||||
| Other Financial Instruments | Level 1 | Level 2 | Level 3 | Total | ||||||||||||
Futures Contracts * | ||||||||||||||||
Unrealized Appreciation | $ | 42 | $ | — | $ | — | $ | 42 | ||||||||
Unrealized Depreciation | (75) | — | — | (75) | ||||||||||||
|
|
|
|
|
|
|
|
|
|
|
| |||||
Total Other Financial | ||||||||||||||||
Instruments | $ | (33) | $ | — | $ | — | $ | (33) | ||||||||
|
|
|
|
|
|
|
|
|
|
|
| |||||
* Futures Contracts are valued at the net unrealized appreciation (depreciation) on the instruments.
For the year ended January 31, 2018, there were no transfers between Level 1, Level 2 and/or Level 3 assets and liabilities.
For more information on valuation inputs, see Note 2 — Significant Accounting Policies in Notes to Financial Statements.
Amounts designated as “—” are $0 or have been rounded to $0.
The accompanying notes are an integral part of the financial statements.
| SEI Daily Income Trust / Annual Report / January 31, 2018 | 43 |
STATEMENTS OF ASSETS AND LIABILITIES ($ Thousands)
January 31, 2018
| Government Fund | Government II Fund | |||||||
Assets: | ||||||||
Investments, at value† | $ | 5,056,378 | $ | 2,222,417 | ||||
Repurchase agreements† | 2,371,000 | – | ||||||
Cash | 33,697 | 1,582 | ||||||
Receivable from custodian | – | – | ||||||
Interest receivable | 2,296 | 368 | ||||||
Receivable for investment securities sold | – | – | ||||||
Receivable for fund shares sold | – | – | ||||||
Receivable for administration fees | – | – | ||||||
Receivable for variation margin | – | – | ||||||
Prepaid expenses | 154 | 42 | ||||||
Total Assets | 7,463,525 | 2,224,409 | ||||||
Liabilities: | ||||||||
Payable for investment securities purchased | 148,768 | 44,630 | ||||||
Income distribution payable | 3,987 | 1,590 | ||||||
Administration fees payable | 730 | 261 | ||||||
Investment advisory fees payable | 424 | 67 | ||||||
Chief Compliance Officer fees payable | 11 | 3 | ||||||
Shareholder servicing fees payable | – | – | ||||||
Trustees’ fees payable | 1 | – | ||||||
Payable for fund shares redeemed | – | – | ||||||
Payable for variation margin | – | – | ||||||
Accrued expense payable | 313 | 97 | ||||||
Total Liabilities | 154,234 | 46,648 | ||||||
Net Assets | $ | 7,309,291 | $ | 2,177,761 | ||||
† Cost of investments and repurchase agreements | $ | 7,427,378 | $ | 2,222,417 | ||||
Net Assets: | ||||||||
Paid-in Capital – (unlimited authorization – no par value) | $ | 7,309,341 | $ | 2,177,743 | ||||
Undistributed (Distributions in excess of) net investment income | (11 | ) | 18 | |||||
Accumulated net realized (loss) on investments | (39 | ) | – | |||||
Net unrealized (depreciation) on investments | – | – | ||||||
Net unrealized appreciation (depreciation) on futures contracts | – | – | ||||||
Net Assets | $ | 7,309,291 | $ | 2,177,761 | ||||
Net Asset Value, Offering and Redemption Price Per Share – Class F | | $1.00 ($7,277,765,892 ÷ | | | $1.00 ($2,177,761,190 ÷ 2,177,842,612 shares | ) | ||
Net Asset Value, Offering and Redemption Price Per Share – Class CAA | | $1.00 ($31,524,776 ÷ | | N/A | ||||
Net Asset Value, Offering and Redemption Price Per Share – Class Y | N/A | N/A | ||||||
Amounts designated as “—” are $0 or have been rounded to $0.
The accompanying notes are an integral part of the financial statements.
| 44 | SEI Daily Income Trust / Annual Report / January 31, 2018 |
| Treasury Fund | Treasury II Fund | Ultra Short Duration Bond Fund | Short-Duration Government Fund | GNMA Fund | ||||||||||||||
| $ 78,056 | $ 564,624 | $ 307,986 | $ 683,772 | $ 75,131 | ||||||||||||||
| 33,000 | – | 7,600 | 6,000 | 600 | ||||||||||||||
| 6,046 | 1,361 | 1,829 | 103 | 68 | ||||||||||||||
| – | – | – | – | – | ||||||||||||||
| 34 | 70 | 844 | 1,811 | 286 | ||||||||||||||
| – | – | 620 | 64,176 | 17,925 | ||||||||||||||
| – | – | 1,151 | 899 | 44 | ||||||||||||||
| 5 | – | – | – | – | ||||||||||||||
| – | – | 1 | 117 | – | ||||||||||||||
| 3 | 13 | 5 | 19 | 2 | ||||||||||||||
| 117,144 | 566,068 | 320,036 | 756,897 | 94,056 | ||||||||||||||
| 2,975 | 11,901 | 9,360 | 6,969 | 18,087 | ||||||||||||||
| 45 | 346 | 76 | 285 | 35 | ||||||||||||||
| – | 63 | 27 | 129 | 14 | ||||||||||||||
| – | 18 | 26 | 58 | 6 | ||||||||||||||
| – | – | – | 1 | – | ||||||||||||||
| – | – | 18 | 49 | 17 | ||||||||||||||
| – | – | – | – | – | ||||||||||||||
| – | – | 342 | 958 | 217 | ||||||||||||||
| – | – | 4 | 140 | 5 | ||||||||||||||
| 4 | 28 | 24 | 62 | 17 | ||||||||||||||
| 3,024 | 12,356 | 9,877 | 8,651 | 18,398 | ||||||||||||||
| $114,120 | $553,712 | $310,159 | $748,246 | $75,658 | ||||||||||||||
| $111,056 | $564,624 | $316,044 | $697,942 | $75,947 | ||||||||||||||
| $114,120 | $553,699 | $328,334 | $766,821 | $78,319 | ||||||||||||||
| 1 | 18 | 7 | 610 | (13 | ) | |||||||||||||
| (1 | ) | (5 | ) | (17,729 | ) | (12,296 | ) | (2,399 | ) | |||||||||
| – | – | (458 | ) | (8,170 | ) | (216 | ) | |||||||||||
| – | – | 5 | 1,281 | (33 | ) | |||||||||||||
| $114,120 | $553,712 | $310,159 | $748,246 | $75,658 | ||||||||||||||
| | $1.00 ($114,119,876 ÷ 114,185,173 shares | ) | | $1.00 ($553,712,243 ÷ 553,847,166 shares | ) | | $9.32 ($262,023,211 ÷ 28,100,473 shares | ) | | $10.27 ($696,751,510 ÷ 67,835,453 shares | ) | | $10.24 ($75,582,370 ÷ 7,381,143 shares | ) | ||||
|
| N/A
|
|
| N/A
|
|
| N/A
|
|
| N/A
|
|
| N/A
|
| ||||
| N/A | N/A | | $9.33 ($48,136,253 ÷ 5,159,758 shares | ) | | $10.27 ($51,494,897 ÷ 5,014,419 shares | ) | | $10.23 ($75,695 ÷ | | ||||||||
| SEI Daily Income Trust / Annual Report / January 31, 2018 | 45 |
STATEMENTS OF OPERATIONS ($ Thousands)
For the year ended January 31, 2018
| Government Fund | Government II Fund | |||||||
Investment Income: | ||||||||
Interest income | $ | 72,238 | $ | 19,410 | ||||
Total investment income | 72,238 | 19,410 | ||||||
Expenses: | ||||||||
Administration fees | 8,805 | 2,961 | ||||||
Shareholder servicing fees – Class F Shares | 19,085 | 5,056 | ||||||
Shareholder servicing fees – Class CAA Shares | 110 | – | ||||||
Investment advisory fees | 5,375 | 1,416 | ||||||
Trustees’ fees | – | 31 | ||||||
Chief Compliance Officer fees | 33 | 11 | ||||||
Proxy fees | 230 | – | ||||||
Custodian/Wire agent fees | 176 | 64 | ||||||
Registration fees | 87 | 36 | ||||||
Pricing fees | 18 | 6 | ||||||
Printing fees | – | – | ||||||
Other expenses | 1,024 | 314 | ||||||
Total expenses | 34,943 | 9,895 | ||||||
Less, waiver of: | ||||||||
Investment advisory fees | – | (708 | ) | |||||
Administration fees | (462 | ) | (91 | ) | ||||
Shareholder servicing fees – Class F Shares | (19,085 | ) | (5,056 | ) | ||||
Net expenses | 15,396 | 4,040 | ||||||
Net Investment Income | 56,842 | 15,370 | ||||||
Net Realized and Unrealized Gain (Loss) on/from: | ||||||||
Investments | (11 | ) | 18 | |||||
Futures contracts | – | – | ||||||
Net change in unrealized appreciation(depreciation) on/from: | ||||||||
Investments | – | – | ||||||
Futures contracts | – | – | ||||||
Net Increase in Net Assets Resulting from Operations | $ | 56,831 | $ | 15,388 | ||||
Amounts designated as “—” are $0 or have been rounded to $0.
The accompanying notes are an integral part of the financial statements.
| 46 | SEI Daily Income Trust / Annual Report / January 31, 2018 |
| Treasury Fund | Treasury II Fund | Ultra Short Duration Bond Fund | Short-Duration Government Fund | GNMA Fund | ||||||||||||||
| $ | 989 | $ | 5,253 | $ | 5,442 | $ | 15,185 | $ | 2,854 | |||||||||
| 989 | 5,253 | 5,442 | 15,185 | 2,854 | ||||||||||||||
| 158 | 833 | 619 | 1,600 | 192 | ||||||||||||||
| 263 | 1,388 | 659 | 1,876 | 244 | ||||||||||||||
| – | – | – | – | – | ||||||||||||||
| 74 | 389 | 310 | 712 | 87 | ||||||||||||||
| 3 | 11 | 5 | 17 | 2 | ||||||||||||||
| 1 | 4 | 2 | 6 | 1 | ||||||||||||||
| – | – | – | – | – | ||||||||||||||
| 6 | 24 | 10 | 33 | 4 | ||||||||||||||
| 2 | 13 | 6 | 23 | 3 | ||||||||||||||
| 1 | 2 | 54 | 137 | – | ||||||||||||||
| – | – | 23 | – | – | ||||||||||||||
| 34 | 115 | 27 | 158 | 50 | ||||||||||||||
| 542 | 2,779 | 1,715 | 4,562 | 583 | ||||||||||||||
| (37 | ) | (194 | ) | – | – | – | ||||||||||||
| (33 | ) | (85 | ) | (122 | ) | – | – | |||||||||||
| (263 | ) | (1,388 | ) | (448 | ) | (812 | ) | – | ||||||||||
| 209 | 1,112 | 1,145 | 3,750 | 583 | ||||||||||||||
| 780 | 4,141 | 4,297 | 11,435 | 2,271 | ||||||||||||||
| – | 2 | 730 | (1,152 | ) | (324 | ) | ||||||||||||
| – | – | (30 | ) | (1,863 | ) | (2 | ) | |||||||||||
| – | – | (45 | ) | (7,905 | ) | (1,069 | ) | |||||||||||
| – | – | (5 | ) | 996 | (29 | ) | ||||||||||||
| $ | 780 | $ | 4,143 | $ | 4,947 | $ | 1,511 | $ | 847 | |||||||||
| SEI Daily Income Trust / Annual Report / January 31, 2018 | 47 |
STATEMENTS OF CHANGES IN NET ASSETS ($ Thousands)
For the years ended January 31,
| Government Fund | ||||||||||||
| 2018 | 2017 | |||||||||||
Operations: | ||||||||||||
Net investment Income | $ | 56,842 | $ | 11,651 | ||||||||
Net realized gain (loss) on investments | (11 | ) | 41 | |||||||||
Net increase in net assets resulting from operations | 56,831 | 11,692 | ||||||||||
Dividends and Distributions to Shareholders: | ||||||||||||
Net investment income | ||||||||||||
Class F | (56,292 | ) | (11,802 | ) | ||||||||
Class CAA | (334 | ) | (64 | ) | ||||||||
Net realized gains | ||||||||||||
Class F | – | (81 | ) | |||||||||
Total dividends and distributions | (56,626 | ) | (11,947 | ) | ||||||||
Capital Share Transactions (All at $1.00 per share) | ||||||||||||
Class F: | ||||||||||||
Proceeds from shares issued | 47,958,619 | 37,455,225 | ||||||||||
Reinvestment of dividends & distributions | 23,892 | 4,482 | ||||||||||
Cost of shares redeemed | (48,580,625 | ) | (31,493,354 | ) | ||||||||
Net increase (decrease) from Class F Transactions | (598,114 | ) | 5,966,353 | |||||||||
Class CAA: | ||||||||||||
Proceeds from shares issued | 89,182 | 65,564 | ||||||||||
Reinvestment of dividends & distributions | 332 | 905 | ||||||||||
Cost of shares redeemed | (84,880 | ) | (75,586 | ) | ||||||||
Net increase (decrease) from Class CAA Transactions | 4,634 | (9,117 | ) | |||||||||
Net increase (decrease) in net assets from capital shares transactions | (593,480 | ) | 5,957,236 | |||||||||
Net increase (decrease) in net assets | (593,275 | ) | 5,956,981 | |||||||||
Net Assets: | ||||||||||||
Beginning of year | 7,902,566 | 1,945,585 | ||||||||||
End of year | $ | 7,309,291 | $ | 7,902,566 | ||||||||
Undistributed (distributions in excess of) Net Investment Income | $ | (11 | ) | $ | (227 | ) | ||||||
Amounts designated as “—” are $0 or have been rounded to $0.
N/A – Not applicable.
The accompanying notes are an integral part of the financial statements.
| 48 | SEI Daily Income Trust / Annual Report / January 31, 2018 |
| Government II Fund | Treasury Fund | Treasury II Fund | ||||||||||||||||||||
| 2018 | 2017 | 2018 | 2017 | 2018 | 2017 | |||||||||||||||||
| $ | 15,370 | $ | 3,067 | $ | 780 | $ | 261 | $ | 4,141 | $ | 846 | |||||||||||
| 18 | 35 | – | 20 | 2 | 13 | |||||||||||||||||
| 15,388 | 3,102 | 780 | 281 | 4,143 | 859 | |||||||||||||||||
| (15,370 | ) | (3,067 | ) | (780 | ) | (261 | ) | (4,142 | ) | (845 | ) | |||||||||||
| N/A | N/A | N/A | N/A | N/A | N/A | |||||||||||||||||
| – | (38 | ) | – | (20 | ) | – | (17 | ) | ||||||||||||||
| (15,370 | ) | (3,105 | ) | (780 | ) | (281 | ) | (4,142 | ) | (862 | ) | |||||||||||
| 6,118,667 | 5,684,066 | 592,584 | 912,870 | 1,953,133 | 2,084,759 | |||||||||||||||||
| 4,599 | 882 | 490 | 201 | 1,631 | 287 | |||||||||||||||||
| (5,996,921 | ) | (4,861,925 | ) | (584,003 | ) | (1,093,736 | ) | (1,924,359 | ) | (2,256,724 | ) | |||||||||||
| 126,345 | 823,023 | 9,071 | (180,665 | ) | 30,405 | (171,678 | ) | |||||||||||||||
| N/A | N/A | N/A | N/A | N/A | N/A | |||||||||||||||||
| N/A | N/A | N/A | N/A | N/A | N/A | |||||||||||||||||
| N/A | N/A | N/A | N/A | N/A | N/A | |||||||||||||||||
| N/A | N/A | N/A | N/A | N/A | N/A | |||||||||||||||||
| 126,345 | 823,023 | 9,071 | (180,665 | ) | 30,405 | (171,678 | ) | |||||||||||||||
| 126,363 | 823,020 | 9,071 | (180,665 | ) | 30,406 | (171,681 | ) | |||||||||||||||
| 2,051,398 | 1,228,378 | 105,049 | 285,714 | 523,306 | 694,987 | |||||||||||||||||
| $ | 2,177,761 | $ | 2,051,398 | $ | 114,120 | $ | 105,049 | $ | 553,712 | $ | 523,306 | |||||||||||
| $ | 18 | $ | – | $ | 1 | $ | – | $ | 18 | $ | 15 | |||||||||||
| SEI Daily Income Trust / Annual Report / January 31, 2018 | 49 |
STATEMENTS OF CHANGES IN NET ASSETS ($ Thousands)
For the year ended January 31,
| Ultra Short Duration Bond Fund | ||||||||
| 2018 | 2017 | |||||||
Operations: | ||||||||
Net investment income | $ | 4,297 | $ | 2,623 | ||||
Net realized gain (loss) on investments and futures contracts | 700 | 60 | ||||||
Net change in unrealized appreciation (depreciation) on investments and futures contracts | (50 | ) | 876 | |||||
Net increase (decrease) in net assets resulting from operations | 4,947 | 3,559 | ||||||
Dividends and Distributions to Shareholders: | ||||||||
Net investment income | ||||||||
Class F | (3,860 | ) | (2,485 | ) | ||||
Class Y | (710 | ) | (472 | ) | ||||
Net realized gains | ||||||||
Class F | – | – | ||||||
Class Y | – | – | ||||||
Total dividends and distributions | (4,570 | ) | (2,957 | ) | ||||
Capital share transactions: | ||||||||
Class F: | ||||||||
Proceeds from shares issued | 116,899 | 204,689 | ||||||
Reinvestment of dividends & distributions | 3,032 | 1,953 | ||||||
Cost of shares redeemed | (123,233 | ) | (139,885 | ) | ||||
Net increase (decrease) from Class F transactions | (3,302 | ) | 66,757 | |||||
Class Y: | ||||||||
Proceeds from shares issued | 6,871 | 14,248 | ||||||
Reinvestment of dividends & distributions | 700 | 464 | ||||||
Cost of shares redeemed | (4,532 | ) | (6,813 | ) | ||||
Net increase (decrease) from Class Y transactions | 3,039 | 7,899 | ||||||
Net Increase (Decrease) in net assets from capital share transactions | (263 | ) | 74,656 | |||||
Net increase (decrease) in net assets | 114 | 75,258 | ||||||
Net Assets: | ||||||||
Beginning of year | 310,045 | 234,787 | ||||||
End of year | $ | 310,159 | $ | 310,045 | ||||
Undistributed (Distributions in Excess of) net investment income | $ | 7 | $ | (332 | ) | |||
Capital Share Transactions: | ||||||||
Class F | ||||||||
Shares issued | 12,514 | 21,974 | ||||||
Reinvestment of distributions | 325 | 210 | ||||||
Shares redeemed | (13,193 | ) | (15,020 | ) | ||||
Net increase (decrease) in shares outstanding from Class F Share transactions | (354 | ) | 7,164 | |||||
Class Y | ||||||||
Shares issued | 736 | 1,528 | ||||||
Reinvestment of distributions | 75 | 50 | ||||||
Shares redeemed | (485 | ) | (732 | ) | ||||
Net increase (decrease) in shares outstanding from Class Y Share transactions | 326 | 846 | ||||||
Total increase (decrease) in shares outstanding from share transactions | (28 | ) | 8,010 | |||||
Amounts designated as “—” are zero or have been rounded to zero.
The accompanying notes are an integral part of the financial statements.
| 50 | SEI Daily Income Trust / Annual Report / January 31, 2018 |
| Short-Duration Government Fund | GNMA Fund | |||||||||||||||||
| 2018 | 2017 | 2018 | 2017 | |||||||||||||||
| $ | 11,435 | $ | 8,072 | $ | 2,271 | $ | 1,809 | |||||||||||
| (3,015 | ) | 1,429 | (326 | ) | 485 | |||||||||||||
| (6,909 | ) | (5,579 | ) | (1,098 | ) | (2,365 | ) | |||||||||||
| 1,511 | 3,922 | 847 | (71 | ) | ||||||||||||||
| (12,542 | ) | (9,240 | ) | (2,735 | ) | (2,406 | ) | |||||||||||
| (892 | ) | (605 | ) | (2 | ) | (1 | ) | |||||||||||
| – | – | – | (1,667 | ) | ||||||||||||||
| – | – | – | (1 | ) | ||||||||||||||
| (13,434 | ) | (9,845 | ) | (2,737 | ) | (4,075 | ) | |||||||||||
| 247,453 | 308,546 | 14,363 | 56,203 | |||||||||||||||
| 9,210 | 7,242 | 2,127 | 3,343 | |||||||||||||||
| (345,293 | ) | (312,890 | ) | (55,073 | ) | (61,383 | ) | |||||||||||
| (88,630 | ) | 2,898 | (38,583 | ) | (1,837 | ) | ||||||||||||
| 13,751 | 15,823 | 82 | – | |||||||||||||||
| 882 | 598 | 1 | 1 | |||||||||||||||
| (11,181 | ) | (18,143 | ) | (56 | ) | (23 | ) | |||||||||||
| 3,452 | (1,722 | ) | 27 | (22 | ) | |||||||||||||
| (85,178 | ) | 1,176 | (38,556 | ) | (1,859 | ) | ||||||||||||
| (97,101 | ) | (4,747 | ) | (40,446 | ) | (6,005 | ) | |||||||||||
| 845,347 | 850,094 | 116,104 | 122,109 | |||||||||||||||
| $ | 748,246 | $ | 845,347 | $ | 75,658 | $ | 116,104 | |||||||||||
| $ | 610 | $ | 533 | $ | (13 | ) | $ | 3 | ||||||||||
| 23,831 | 29,362 | 1,372 | 5,189 | |||||||||||||||
| 887 | 690 | 204 | 313 | |||||||||||||||
| (33,267 | ) | (29,835 | ) | (5,279 | ) | (5,700 | ) | |||||||||||
| (8,549 | ) | 217 | (3,703 | ) | (198 | ) | ||||||||||||
| 1,325 | 1,506 | 8 | – | |||||||||||||||
| 85 | 57 | – | – | |||||||||||||||
| (1,077 | ) | (1,726 | ) | (5 | ) | (2 | ) | |||||||||||
| 333 | (163 | ) | 3 | (2 | ) | |||||||||||||
| (8,216 | ) | 54 | (3,700 | ) | (200 | ) | ||||||||||||
| SEI Daily Income Trust / Annual Report / January 31, 2018 | 51 |
For the years ended January 31, For a Share Outstanding Throughout the Year or Period
Net Asset Value, Beginning of Period | Net Investment Income* | Net Realized and Unrealized Gains (Losses) on Securities | Total from Operations | Dividends from Net Investment Income | Total Dividends and Distributions | Net Asset Value, End of Period | Total Return† | Net Assets End of Period ($ Thousands) | Ratio of Expenses to Average Net Assets(1) | Ratio of Expenses to Average Net Assets (Excluding Waivers) | Ratio of Net Investment Income to Average Net Assets | |||||||||||||||||||||||||||||||||||||
Government Fund |
| |||||||||||||||||||||||||||||||||||||||||||||||
Class F | ||||||||||||||||||||||||||||||||||||||||||||||||
2018 | $ | 1.00 | $ | 0.01 | $ | – | $ | 0.01 | $ | (0.01) | $ | (0.01) | $ | 1.00 | 0.74% | $ | 7,277,766 | 0.20% | 0.45% | 0.74% | ||||||||||||||||||||||||||||
2017 | 1.00 | – | – | – | –(2) | –(2) | 1.00 | 0.19 | 7,875,681 | 0.20 | 0.56 | 0.21 | ||||||||||||||||||||||||||||||||||||
2016 | 1.00 | – | – | – | –(2) | –(2) | 1.00 | 0.03 | 1,909,582 | 0.12 | 0.58 | 0.03 | ||||||||||||||||||||||||||||||||||||
2015 | 1.00 | – | – | – | –(2) | –(2) | 1.00 | 0.02 | 1,788,290 | 0.07 | 0.58 | 0.02 | ||||||||||||||||||||||||||||||||||||
2014 | 1.00 | – | – | – | –(2) | –(2) | 1.00 | 0.02 | 1,523,561 | 0.09 | 0.58 | 0.02 | ||||||||||||||||||||||||||||||||||||
Class CAA |
| |||||||||||||||||||||||||||||||||||||||||||||||
2018 | $ | 1.00 | $ | 0.01 | $ | – | $ | 0.01 | $ | (0.01) | $ | (0.01) | $ | 1.00 | 0.74% | $ | 31,525 | 0.20% | 0.45% | 0.74% | ||||||||||||||||||||||||||||
2017 | 1.00 | – | – | – | –(2) | –(2) | 1.00 | 0.19 | 26,885 | 0.20 | 0.32 | 0.18 | ||||||||||||||||||||||||||||||||||||
2016(3) | 1.00 | – | – | – | –(2) | –(2) | 1.00 | 0.01 | 36,003 | 0.18 | 0.58 | 0.06 | ||||||||||||||||||||||||||||||||||||
Government II Fund |
| |||||||||||||||||||||||||||||||||||||||||||||||
Class F | ||||||||||||||||||||||||||||||||||||||||||||||||
2018 | $ | 1.00 | $ | 0.01 | $ | – | $ | 0.01 | $ | (0.01) | $ | (0.01) | $ | 1.00 | 0.76% | $ | 2,177,761 | 0.20% | 0.49% | 0.76% | ||||||||||||||||||||||||||||
2017 | 1.00 | – | – | �� | –(2) | –(2) | 1.00 | 0.19 | 2,051,398 | 0.20 | 0.53 | 0.19 | ||||||||||||||||||||||||||||||||||||
2016 | 1.00 | – | – | – | –(2) | –(2) | 1.00 | 0.02 | 1,228,378 | 0.11 | 0.53 | 0.02 | ||||||||||||||||||||||||||||||||||||
2015 | 1.00 | – | – | – | –(2) | –(2) | 1.00 | 0.01 | 1,152,698 | 0.08 | 0.53 | 0.01 | ||||||||||||||||||||||||||||||||||||
2014 | 1.00 | – | – | – | –(2) | –(2) | 1.00 | 0.01 | 1,246,262 | 0.09 | 0.53 | 0.01 | ||||||||||||||||||||||||||||||||||||
Treasury Fund |
| |||||||||||||||||||||||||||||||||||||||||||||||
Class F | ||||||||||||||||||||||||||||||||||||||||||||||||
2018 | $ | 1.00 | $ | 0.01 | $ | – | $ | 0.01 | $ | (0.01) | $ | (0.01) | $ | 1.00 | 0.75% | $ | 114,120 | 0.20% | 0.52% | 0.74% | ||||||||||||||||||||||||||||
2017 | 1.00 | – | – | – | –(2) | –(2) | 1.00 | 0.18 | 105,049 | 0.21 | 0.63 | 0.14 | ||||||||||||||||||||||||||||||||||||
2016 | 1.00 | – | – | – | –(2) | –(2) | 1.00 | 0.02 | 285,714 | 0.10 | 0.59 | 0.03 | ||||||||||||||||||||||||||||||||||||
2015 | 1.00 | – | – | – | –(2) | –(2) | 1.00 | 0.01 | 124,646 | 0.05 | 0.58 | 0.01 | ||||||||||||||||||||||||||||||||||||
2014 | 1.00 | – | – | – | –(2) | –(2) | 1.00 | 0.01 | 46,315 | 0.08 | 0.58 | 0.01 | ||||||||||||||||||||||||||||||||||||
Treasury II Fund |
| |||||||||||||||||||||||||||||||||||||||||||||||
Class F | ||||||||||||||||||||||||||||||||||||||||||||||||
2018 | $ | 1.00 | $ | 0.01 | $ | – | $ | 0.01 | $ | (0.01) | $ | (0.01) | $ | 1.00 | 0.74% | $ | 553,712 | 0.20% | 0.50% | 0.75% | ||||||||||||||||||||||||||||
2017 | 1.00 | – | – | – | –(2) | –(2) | 1.00 | 0.15 | 523,306 | 0.20 | 0.58 | 0.14 | ||||||||||||||||||||||||||||||||||||
2016 | 1.00 | – | – | – | –(2) | –(2) | 1.00 | 0.01 | 694,987 | 0.08 | 0.58 | 0.02 | ||||||||||||||||||||||||||||||||||||
2015 | 1.00 | – | – | – | –(2) | –(2) | 1.00 | 0.01 | 491,209 | 0.04 | 0.58 | 0.01 | ||||||||||||||||||||||||||||||||||||
2014 | 1.00 | – | – | – | –(2) | –(2) | 1.00 | 0.01 | 440,422 | 0.06 | 0.58 | 0.01 | ||||||||||||||||||||||||||||||||||||
| * | Per share calculations were performed using average shares. |
| † | Returns are for the period indicated and have not been annualized. Returns shown do not reflect the deduction of taxes that a shareholder would pay on Fund distributions or the redemption of Fund shares. |
| (1) | The Distributor and/or Administrator have voluntarily agreed to waive and reduce its fee and/or reimburse certain expenses of the Fund in order to limit the one-day net income yield of the Fund to not less than 0.01% of the Fund’s average daily net assets of the share class. Had these waivers and the Treasury Guarantee Program expense been excluded the ratio would have been at the expense ratio cap figure. See Note 3 for expense ratio cap figure. |
| (2) | Amount represents less than $0.01 per share. |
| (3) | Commenced operations on November 20, 2015. All ratios for the period have been annualized. |
Amounts designated as ‘‘—’’ are zero or have been rounded to zero
| 52 | SEI Daily Income Trust / Annual Report / January 31, 2018 |
Net Asset of Period | Net Investment Income* | Net Realized | Total from | Dividends from Net Investment Income | Distributions from Realized Capital Gains | Total Dividends and Distributions | Net Asset of Period | Total Return† | Net Assets End of Period ($ Thousands) | Ratio of Expenses to Average Net Assets | Ratio of Average | Ratio of Net to Average | Portfolio Turnover Rate | |||||||||||||||||||||||||||||||||||||||||||
Ultra Short Duration Bond Fund |
| |||||||||||||||||||||||||||||||||||||||||||||||||||||||
Class F |
| |||||||||||||||||||||||||||||||||||||||||||||||||||||||
2018 | $ | 9.31 | $ | 0.13 | $ | 0.02 | $ | 0.15 | $ | (0.14) | $ | – | $ | (0.14) | $ | 9.32 | 1.58% | $ | 262,023 | 0.38% | 0.59% | 1.38% | 59% | |||||||||||||||||||||||||||||||||
2017 | 9.29 | 0.09 | 0.03 | 0.12 | (0.10) | – | (0.10) | 9.31 | 1.33 | 264,997 | 0.38 | 0.68 | 0.99 | 89 | ||||||||||||||||||||||||||||||||||||||||||
2016 | 9.33 | 0.07 | (0.03) | 0.04 | (0.08) | – | (0.08) | 9.29 | 0.45 | 197,737 | 0.38 | 0.69 | 0.71 | 115 | ||||||||||||||||||||||||||||||||||||||||||
2015 | 9.35 | 0.06 | – | 0.06 | (0.08) | – | (0.08) | 9.33 | 0.60 | 255,614 | 0.38 | 0.72 | 0.61 | 106 | ||||||||||||||||||||||||||||||||||||||||||
2014 | 9.37 | 0.06 | – | 0.06 | (0.08) | – | (0.08) | 9.35 | 0.64 | 271,221 | 0.38 | 0.73 | 0.63 | 131 | ||||||||||||||||||||||||||||||||||||||||||
Class Y | ||||||||||||||||||||||||||||||||||||||||||||||||||||||||
2018 | $ | 9.32 | $ | 0.14 | $ | 0.01 | $ | 0.15 | $ | (0.14) | $ | – | $ | (0.14) | $ | 9.33 | 1.67% | $ | 48,136 | 0.30% | 0.34% | 1.46% | 59% | |||||||||||||||||||||||||||||||||
2017 | 9.29 | 0.10 | 0.04 | 0.14 | (0.11) | – | (0.11) | 9.32 | 1.52 | 45,048 | 0.30 | 0.43 | 1.06 | 89 | ||||||||||||||||||||||||||||||||||||||||||
2016(1) | 9.31 | 0.02 | – | 0.02 | (0.04) | – | (0.04) | 9.29 | 0.19 | 37,050 | 0.30 | 0.44 | 0.60 | 115 | ||||||||||||||||||||||||||||||||||||||||||
Short-Duration Government Fund |
| |||||||||||||||||||||||||||||||||||||||||||||||||||||||
Class F |
| |||||||||||||||||||||||||||||||||||||||||||||||||||||||
2018 | $ | 10.43 | $ | 0.15 | $ | (0.14) | $ | 0.01 | $ | (0.17) | $ | – | $ | (0.17) | $ | 10.27 | 0.13% | $ | 696,751 | 0.48% | 0.59% | 1.42% | 169% | |||||||||||||||||||||||||||||||||
2017 | 10.49 | 0.10 | (0.04) | 0.06 | (0.12) | – | (0.12) | 10.43 | 0.54 | 796,540 | 0.48 | 0.67 | 0.91 | 539 | ||||||||||||||||||||||||||||||||||||||||||
2016 | 10.55 | 0.07 | (0.05) | 0.02 | (0.08) | – | (0.08) | 10.49 | 0.22 | 799,269 | 0.48 | 0.69 | 0.64 | 245 | ||||||||||||||||||||||||||||||||||||||||||
2015 | 10.52 | 0.09 | 0.04 | 0.13 | (0.10) | – | (0.10) | 10.55 | 1.20 | 661,101 | 0.48 | 0.73 | 0.85 | 151 | ||||||||||||||||||||||||||||||||||||||||||
2014 | 10.62 | 0.06 | (0.06) | 0.00 | (0.10) | – | (0.10) | 10.52 | (0.01) | 761,739 | 0.48 | 0.73 | 0.56 | 565 | ||||||||||||||||||||||||||||||||||||||||||
Class Y | ||||||||||||||||||||||||||||||||||||||||||||||||||||||||
2018 | $ | 10.43 | $ | 0.16 | $ | (0.13) | $ | 0.03 | $ | (0.19) | $ | – | $ | (0.19) | $ | 10.27 | 0.27% | $ | 51,495 | 0.34% | 0.34% | 1.56% | 169% | |||||||||||||||||||||||||||||||||
2017 | 10.49 | 0.11 | (0.04) | 0.07 | (0.13) | – | (0.13) | 10.43 | 0.64 | 48,808 | 0.38 | 0.43 | 1.02 | 539 | ||||||||||||||||||||||||||||||||||||||||||
2016 | 10.55 | 0.08 | (0.05) | 0.03 | (0.09) | – | (0.09) | 10.49 | 0.32 | 50,825 | 0.38 | 0.44 | 0.74 | 245 | ||||||||||||||||||||||||||||||||||||||||||
2015(2) | 10.50 | 0.01 | 0.05 | 0.06 | (0.01) | – | (0.01) | 10.55 | 0.54 | 55,017 | 0.38 | 0.46 | 0.97 | 151 | ||||||||||||||||||||||||||||||||||||||||||
GNMA Fund |
| |||||||||||||||||||||||||||||||||||||||||||||||||||||||
Class F |
| |||||||||||||||||||||||||||||||||||||||||||||||||||||||
2018 | $ | 10.47 | $ | 0.24 | $ | (0.18) | $ | 0.06 | $ | (0.29) | $ | – | $ | (0.29) | $ | 10.24 | 0.58% | $ | 75,582 | 0.60% | 0.60% | 2.32% | 204% | |||||||||||||||||||||||||||||||||
2017 | 10.82 | 0.16 | (0.16) | 0.00 | (0.21) | (0.14) | (0.35) | 10.47 | 0.04 | 116,057 | 0.63 | 0.67 | 1.48 | 718 | ||||||||||||||||||||||||||||||||||||||||||
2016 | 10.93 | 0.15 | 0.02 | 0.17 | (0.19) | (0.09) | (0.28) | 10.82 | 1.65 | 122,040 | 0.63 | 0.69 | 1.36 | 718 | ||||||||||||||||||||||||||||||||||||||||||
2015 | 10.50 | 0.11 | 0.49 | 0.60 | (0.17) | – | (0.17) | 10.93 | 5.79 | 117,904 | 0.63 | 0.69 | 1.07 | 758 | ||||||||||||||||||||||||||||||||||||||||||
2014 | 10.70 | 0.07 | (0.09) | (0.02) | (0.18) | – | (0.18) | 10.50 | (0.14) | 158,672 | 0.63 | 0.69 | 0.68 | 758 | ||||||||||||||||||||||||||||||||||||||||||
Class Y |
| |||||||||||||||||||||||||||||||||||||||||||||||||||||||
2018 | $ | 10.46 | $ | 0.27 | $ | (0.18) | $ | 0.09 | $ | (0.32) | $ | – | $ | (0.32) | $ | 10.23 | 0.82% | $ | 76 | 0.36% | 0.36% | 2.56% | 204% | |||||||||||||||||||||||||||||||||
2017 | 10.81 | 0.18 | (0.15) | 0.03 | (0.24) | (0.14) | (0.38) | 10.46 | 0.25 | 47 | 0.42 | 0.43 | 1.69 | 718 | ||||||||||||||||||||||||||||||||||||||||||
2016(3) | 10.76 | 0.02 | 0.11 | 0.13 | (0.06) | (0.02) | (0.08) | 10.81 | 1.26 | 69 | 0.43 | 0.45 | 0.80 | 718 | ||||||||||||||||||||||||||||||||||||||||||
| * | Per share calculations were performed using average shares. |
| † | Returns are for the period indicated and have not been annualized. Returns shown do not reflect the deduction of taxes that a shareholder would pay on Fund distributions or the redemption of Fund shares. |
| (1) | Commenced operations on August 25, 2015. All ratios for the period have been annualized. |
| (2) | Commenced operations on December 31, 2014. All ratios for the period have been annualized. |
| (3) | Commenced operations on October 30, 2015. All ratios for the period have been annualized. |
Amounts designated as ‘‘—’’ are zero or have been rounded to zero.
The accompanying notes are an integral part of the financial statements.
| SEI Daily Income Trust / Annual Report / January 31, 2018 | 53 |
January 31, 2018
1. ORGANIZATION
SEI Daily Income Trust (the “Trust”) was organized as a Massachusetts business trust under a Declaration of Trust dated March 15, 1982.
The Trust is registered under the Investment Company Act of 1940, as amended, as a diversified, open-end investment company with seven operational Funds: the Government, Government II, Treasury and Treasury II (each a “Fund,” collectively, the “Money Market Funds”), the Ultra Short Duration Bond, Short-Duration Government and GNMA (each a “Fund,” collectively, the “Fixed Income Funds”). The Trust is registered to offer: Class F shares of the Funds (formerly Class A shares); and Class CAA shares of the Government Fund and Class Y shares of the Fixed Income Funds. The assets of each Fund are segregated, and a shareholder’s interest is limited to the Fund in which shares are held. The Funds’ prospectuses provide a description of each Fund’s investment objective and strategies. On June 24, 2016 the Money Market Fund closed. On July 22, 2016 the Prime Obligation Fund closed.
2. SIGNIFICANT ACCOUNTING POLICIES
The following is a summary of significant accounting policies followed by the Funds.
Use of Estimates — The preparation of financial statements, in conformity with U.S. generally accepted accounting principles (“U.S. GAAP”), requires management to make estimates and assumptions that affect the reported amount of assets and liabilities and disclosure of contingent assets and liabilities at the date of the financial statements and the reported amounts of increases and decreases in net assets from operations during the reporting period. Actual results could differ from those estimates.
Security Valuation — Investment securities of the Money Market Funds are stated at amortized cost, which approximates market value. Under this valuation method, purchase discounts and premiums are accreted and amortized ratably to maturity and are included in interest income. The Money Market Funds’ use of amortized cost is subject to its compliance with certain conditions as specified by Rule 2a-7 of the 1940 Act.
Investment securities of the Fixed Income Funds listed on a securities exchange, market or automated quotation system for which quotations are readily available are valued at the last quoted sale price on an exchange or market on which they are traded, or, if there is no such reported sale, at the most recent quoted bid price. If available, debt securities are priced based upon valuations provided by independent third-party pricing agents. Such values generally reflect the last reported
sales price if the security is actively traded. The third party pricing agents may also value debt securities at an evaluated bid price by employing methodologies that utilize actual market transactions, broker-supplied valuations, or other methodologies designed to identify the market value for such securities. Debt obligations with remaining maturities of sixty days or less may be valued at their amortized cost, which approximates market value. Prices for most securities held in the Funds are provided daily by recognized independent pricing agents. If a security price cannot be obtained from an independent third-party pricing agent, the Fixed Income Funds seek to obtain a bid price from at least one independent broker.
Securities for which market prices are not “readily available” are valued in accordance with Fair Value Procedures established by the Trust’s Board of Trustees. The Trust’s Fair Value Procedures are implemented through a Fair Value Committee (the “Committee”) designated by the Funds’ Board of Trustees. Some of the more common reasons that may necessitate that a security be valued using Fair Value Procedures include: the security’s trading has been halted or suspended; the security has been de-listed from a national exchange; the security’s primary trading market is temporarily closed at a time when under normal conditions it would be open; or the security’s primary pricing source is not able or willing to provide a price. When a security is valued in accordance with the Fair Value Procedures, the Committee will determine the value after taking into consideration relevant information reasonably available to the Committee. As of January 31, 2018, there were no fair valued securities held by the Funds.
In accordance with U.S. GAAP, fair value is defined as the price that a Fund would receive upon selling an investment in an orderly transaction to an independent buyer in the principal or most advantageous market of the investment. A three tier hierarchy has been established to maximize the use of observable and minimize the use of unobservable inputs and to establish classification of fair value measurements for disclosure purposes. Inputs refer broadly to the assumptions that market participants would use in pricing an asset. Inputs may be observable or unobservable. Observable inputs are inputs that reflect the assumptions market participants would use in pricing the asset or liability based on market data obtained from sources independent of the reporting entity. Unobservable inputs are inputs that reflect the reporting entity’s own assumptions about the assumptions market participants would use in pricing the asset or liability based on the best information available in the circumstances.
| 54 | SEI Daily Income Trust / Annual Report / January 31, 2018 |
The three-tier hierarchy of inputs is summarized in the three broad Levels listed below:
Level 1 — Unadjusted quoted prices in active markets for identical, unrestricted assets or liabilities that the Fund has the ability to access at the measurement date;
Level 2 — Quoted prices which are not active, or inputs that are observable (either directly or indirectly) for substantially the full term of the asset or liability; and
Level 3 — Prices, inputs or exotic modeling techniques which are both significant to the fair value measurement and unobservable (supported by little or no market activity).
Investments are classified within the level of the lowest significant input considered in determining fair value. Investments classified within Level 3 whose fair value measurement considers several inputs may include Level 1 or Level 2 inputs as components of the overall fair value measurement.
For the fiscal year ended January 31, 2018, there have been no significant changes to the Trust’s fair valuation methodologies.
Security Transactions and Investment Income — Security transactions are recorded on the trade date. Costs used in determining net realized capital gains and losses on the sale of securities are on the basis of specific identification. Dividend income is recognized on the ex-dividend date, and interest income is recognized using the accrual basis of accounting.
Distributions received on securities that represent a return of capital or capital gain are recorded as a reduction of cost of investments and/ or as a realized gain. The Trust estimates the components of distributions received that may be considered nontaxable distributions or capital gain distributions.
For the Fixed Income Funds, amortization and accretion is calculated using the scientific interest method, which approximates the effective interest method over the holding period of the security. Amortization of premiums and discounts is included in interest income.
For the Money Market Funds, all amortization is calculated using the straight line method over the holding period of the security. Amortization of premiums and accretion of discounts are included in interest income.
Repurchase Agreements — To the extent consistent with its investment objective and strategies, securities pledged as collateral for repurchase agreements are held by each Fund’s custodian bank until the repurchase date of the repurchase agreement. The Funds also invest in tri-party repurchase agreements. Securities
held as collateral for tri-party repurchase agreements are maintained by the broker’s custodian bank in a segregated account until the repurchase date of the repurchase agreement. Provisions of the repurchase agreements and the Trust’s policies require that the market value of the collateral, including accrued interest thereon, is sufficient in the event of default by the counterparty. If the counterparty defaults and the value of the collateral declines, or if the counterparty enters into an insolvency proceeding, realization of the collateral by the Funds may be delayed or limited.
It is the Funds’ policy to present the repurchase agreements contracts separately on the Statements of Assets and Liabilities, as the Funds do not have a master netting agreement with the counterparty to the repurchase agreements contracts. Refer to each Fund’s Schedule of Investments for details regarding repurchase agreements contracts as of January 31, 2018, if applicable.
Futures Contracts — To the extent consistent with its investment objective and strategies, the Fixed Income Funds utilized futures contracts during the fiscal year ended January 31, 2018. These Funds’ investments in futures contracts are designed to enable the Funds to more closely approximate the performance of their benchmark indices. The Funds chose to invest in futures contracts for tactical hedging purposes as well as to enhance the Funds’ returns. Initial margin deposits of cash or securities are made upon entering into futures contracts. The contracts are marked to market daily and the resulting changes in value are accounted for as unrealized gains and losses. Variation margin payments are paid or received, depending upon whether unrealized gains or losses are incurred. When the contract is closed, the Funds record a realized gain or loss equal to the difference between the proceeds from (or cost of) the closing transaction and the amount invested in the contract.
Risks of entering into futures contracts include the possibility that there will be an imperfect price correlation between the futures and the underlying securities. Second, it is possible that a lack of liquidity for futures contracts could exist in the secondary market, resulting in an inability to close a position prior to its maturity date. Third, the futures contract involves the risk that the Funds could lose more than the original margin deposit required to initiate a futures transaction.
Finally, the risk exists that losses could exceed amounts disclosed on the Statements of Assets and Liabilities.
It is the Funds’ policy to present the gross variation margin payable and the gross variation margin receivable of the future contracts separately on the
| SEI Daily Income Trust / Annual Report / January 31, 2018 | 55 |
NOTES TO FINANCIAL STATEMENTS (Continued)
January 31, 2018
Statements of Assets and Liabilities, as the Funds do not have a master netting agreement with the counterparty to the futures contracts. Refer to each Fund’s Schedule of Investments for details regarding open future contracts as of January 31, 2018, if applicable. The fair value of interest rate futures contracts held in the Fixed Income Funds can be found on the Statements of Assets and Liabilities under the captions Receivable for Variation Margin and Payable for Variation Margin. Only current day’s variation margin is reported within the Statements of Assets and Liabilities. Cumulative appreciation/ depreciation of futures contracts are reported in the respective Fixed Income Funds’ Schedule of Investments. Realized gains or losses on interest rate futures contracts related to the Fixed Income Funds are recognized on the Statements of Operations as part of Net Realized Gain (Loss) on Futures Contracts and any change in unrealized appreciation or depreciation is recognized on the Statements of Operations as Net Unrealized Gain (Loss) on Futures Contracts.
Swap Agreements — To the extent consistent with its investment objective and strategies, a Fund’s investment in swap contracts is mainly used as an efficient means to take and manage risk in the portfolio, including interest rate risk, credit risk and overall yield sensitivity. A swap agreement is a two-party contract under which an agreement is made to exchange returns from predetermined investments or instruments, including a particular interest rate, foreign currency, or “basket” of securities representing a particular index. Interest rate swaps involve the exchange by a Fund with another party of their respective commitments to pay or receive interest (e.g., an exchange of floating rate payments for fixed rate payments) with respect to a notional amount of principal. Credit-default swaps involve periodic payments by a Fund or counterparty based on a specified rate multiplied by a notional amount assigned to an underlying debt instrument or group of debt instruments in exchange for the assumption of credit risk on the same instruments. In the event of a credit event, usually in the form of a credit rating downgrade, the party receiving periodic payments (i.e. floating rate payer) must pay the other party (i.e. fixed rate payer) an amount equal to the recovery rate used to settle the contracts. The recovery rate is a function of how many credit default swap investors wish to deliver the security or receive the security. The recovery rate is determined through an auction process. Total return swaps allow an investor to benefit from the cash flow without ever actually owning the underlying security. The receiver must pay any decline in value to the payer at the end of the total return swap. However, the investor does not need to make a payment if there is
no decline in price. Payments can be made on various indices, bonds (i.e. mortgage backed securities, bank debt and corporate), loans or commodities. The value of a total return swap is equal to the change in value of the underlying asset versus the accrued income payment based on LIBOR or some other form of indices on the notional amount. Interest rate swaps involve the exchange by a Fund with another party of their respective commitments to pay or receive interest (e.g., an exchange of floating rate payments for fixed rate payments) with respect to a notional amount of principal to manage a Fund’s exposure to interest rates. Payments received or made are recorded as realized gains or loss. A Fund could be exposed to credit or market risk due to unfavorable changes in the fluctuation of interest rates or if the Counterparty defaults on its obligation to perform. Risk of loss may exceed amounts recognized on the statement of assets and liabilities. Interest rate swap contracts outstanding at period end, if any, are listed after a Fund’s portfolio. In connection with swap agreements securities may be set aside as collateral by a Fund’s custodian. A Fund may enter into swap agreements in order to, among other things, change the maturity or duration of the investment portfolio, to protect a Fund’s value from changes in interest rates, or to expose a Fund to a different security or market.
Swaps are marked-to-market daily based upon quotations from market makers and the resulting changes in market values, if any, are recorded as an unrealized gain or loss in the Statement of Operations. Net payments of interest are recorded as realized gains or losses.
Entering into swap agreements involves, to varying degrees, elements of credit and market risk in excess of the amounts recognized on the Statements of Assets and Liabilities. Such risks involve the possibility that there will be no liquid market for these agreements, that the counterparty to the agreement may default on its obligation to perform and that there may be unfavorable changes in the fluctuation of interest rates. Risks also arise from potential losses from adverse market movements.
This risk is mitigated by having a master netting arrangement between a Fund and the counterparty and by having the counterparty post collateral to cover a Fund’s exposure to the counterparty. There were no outstanding swap agreements as of January 31, 2018
Options Written/Purchased — To the extent consistent with its Investment Objective and Strategies, a Fund may invest in financial options contracts to add return or to hedge their existing portfolio securities. When the Fund writes or purchases an option, an amount equal to the premium received or paid by the Fund is recorded
| 56 | SEI Daily Income Trust / Annual Report / January 31, 2018 |
as a liability or an asset and is subsequently adjusted to the current market value of the option written or purchased. Premiums received or paid from purchasing or writing options which expire unexercised are treated by the Fund on the expiration date as realized gains or losses. The difference between the premium and the amount paid or received on effecting a closing purchase or sale transaction, including brokerage commissions, is also treated as a realized gain or loss. If an option is exercised, the premium paid or received is added to the cost of the purchase or proceeds from the sale in determining whether the Fund has realized a gain or a loss. The risk in writing a call option is that the Fund gives up the opportunity for profit if the market price of the security increases. The risk in writing a put option is that the Fund may incur a loss if the market price of the security decreases and the option is exercised. The risk in purchasing an option is that the Fund pays a premium whether or not the option is exercised. The Fund also has the additional risk of being unable to enter into a closing transaction at an acceptable price if a liquid secondary market does not exist. Option contracts also involve the risk that they may not work as intended due to unanticipated developments in market conditions or other causes. Finally, the risk exists that losses could exceed amounts disclosed on the Statement of Assets and Liabilities. There were no outstanding options contracts as of January 31, 2018.
TBA Purchase Commitments — To the extent consistent with its Investment Objective and Strategies, a Fixed Income Fund may engage in “to be announced” (“TBA”) purchase commitments to purchase securities for a fixed price at a future date. TBA purchase commitments may be considered securities and involve a risk of loss if the value of the security to be purchased declines prior to settlement date, which risk is in addition to the risk of decline in the value of a Fund’s other assets. Unsettled TBA purchase commitments are valued at the current market value of the underlying securities, according to the procedures described under “Security Valuation” above.
Collateralized Debt Obligations — To the extent consistent with its Investment Objective and Strategies, a Fund may invest in collateralized debt obligations (“CDOs”), which include collateralized loan obligations (“CLOs”) and other similarly structured securities. CLOs are a type of asset-backed securities. A CLO is a trust typically collateralized by a pool of loans, which may include, among others, domestic and foreign senior secured loans, senior unsecured loans, and subordinate corporate loans, including loans that may be rated below investment grade or equivalent unrated loans. CDOs may charge management fees and administrative expenses.
For CDOs and CLOs, the cash flows from the trust are split into two or more portions, called tranches, varying in risk and yield. The riskiest portion is the “equity” tranche which bears the bulk of defaults from the bonds or loans in the trust and serves to protect the other, more senior tranches from default in all but the most severe circumstances. Since it is partially protected from defaults, a senior tranche from a CDO and CLO trust typically has a higher rating and lower yield than its underlying securities, and can be rated investment grade. Despite the protection from the equity tranche, CDO and CLO tranches can experience substantial losses due to actual defaults, increased sensitivity to defaults due to collateral default and disappearance of protecting tranches, market anticipation of defaults, as well as aversion to CDO and CLO securities as a class.
The risks of an investment in a CDO and CLO depend largely on its class and its collateral securities. Normally, CLOs and other CDOs are privately offered and sold, and thus, are not registered under the securities laws. As a result, investments in CDOs and CLOs may be characterized by the Funds as illiquid securities; however, an active dealer market may exist for CDOs and CLOs, allowing a CDO and CLO to qualify for Rule 144A transactions. In addition to the normal risks associated with fixed income securities (e.g., interest rate risk and default risk), CDOs and CLOs carry additional risks including, but not limited to: (i) the possibility that distributions from collateral securities will not be adequate to make interest or other payments; (ii) the quality of the collateral may decline in value or default; (iii) the Funds may invest in CDOs and CLOs that are subordinate to other classes; and (iv) the complex structure of the security may not be fully understood at the time of investment and may produce disputes with the issuer or unexpected investment results.
Illiquid Securities — A security is considered illiquid if it cannot be sold or disposed of in the ordinary course of business within seven days or less for its approximate carrying value on the books of a Fund. Valuations of illiquid securities may differ significantly from the values that would have been used had an active market value for these securities existed.
Restricted Securities — Throughout the year, the Funds owned private placement investments that were purchased through private offerings or acquired through initial public offerings that could not be sold without prior registration under the Securities Act of 1933 or pursuant to an exemption there from. In addition, the Funds had generally agreed to further restrictions on the disposition of certain holdings as set forth in various agreements entered into in connection with the purchase of those investments. These investments
| SEI Daily Income Trust / Annual Report / January 31, 2018 | 57 |
NOTES TO FINANCIAL STATEMENTS (Continued)
January 31, 2018
were valued at amortized cost, which approximates fair value, as determined in accordance with the procedures approved by the Board of Trustees. At January 31, 2018, the Funds did not own any restricted securities.
Classes — Class-specific expenses are borne by that class of shares. Income, non-class specific expenses, and realized and unrealized gains/losses are allocated to the respective class on the basis of relative daily net assets.
Expenses — Expenses that are directly related to one of the Funds are charged directly to that Fund. Other operating expenses of the Funds are prorated to the Funds on the basis of relative net assets.
Dividends and Distributions to Shareholders — Dividends from net investment income are declared daily and paid monthly. Any net realized capital gains on sales of securities after capital loss carryover are distributed at least annually by the Funds.
Redemption Fees — As of July 17, 2015, the Fixed Income Funds no longer charge redemption fees. Prior to July 17, 2015, the Funds charged a redemption fee based on a redemption, or a series of redemptions from a single identifiable source that in the aggregate exceeded a specified dollar threshold within any thirty day period, as presented below:
Dollar Threshold ($ Thousands) | Redemption Fee | |||||
Ultra Short Duration Bond Fund | $ | 10,000 | 0.50% | |||
Short-Duration Government Fund | 25,000 | 0.25% | ||||
GNMA Fund | 10,000 | 0.25% | ||||
For the year ended January 31, 2018, the Fixed Income Funds did not retain any redemption fees. Such fees, if any, are retained by the Fixed Income Funds for the benefit of the remaining shareholders.
3. INVESTMENT ADVISORY, ADMINISTRATION, DISTRIBUTION AND CUSTODIAN AGREEMENTS AND OTHER TRANSACTIONS WITH AFFILIATES
Investment Advisory, Administration, Distribution and Custodian Agreements — SEI Investments Management Corporation (“SIMC”) serves as each Fund’s investment adviser (the “Adviser”) and ”manager of managers” under an investment advisory agreement approved by the shareholders of each Fund. In connection with serving as Adviser, SIMC is entitled to a fee, which is calculated daily and paid monthly, based on the average daily net assets of each Fund. SEI Investments Global Funds Services (the “Administrator”) provides the Trust with administrative and transfer agency services. For its services, the Administrator is entitled to a fee, which is calculated daily and paid monthly, based on the average daily net assets of each Fund.
SEI Investments Distribution Co. (the “Distributor”), a wholly owned subsidiary of SEI Investments Company (“SEI”) and a registered broker-dealer, acts as the Distributor of the shares of the Trust under a Distribution Agreement. The Trust also has adopted plans under which firms, including the Distributor, that provide shareholder and administrative services may receive compensation thereof. Specific classes of certain funds have also adopted distribution plans, pursuant to Rule 12b-1 under the Investment Company Act of 1940.
Such plans provide fees payable to the Distributor up to the amounts, calculated as a percentage of the average daily net assets attributable to each particular class of each respective fund.
The Adviser, Administrator and/or Distributor have voluntarily agreed to waive a portion of their fees in order to keep total direct operating expenses (exclusive of interest from borrowings, brokerage commissions, taxes, Trustee fees, prime broker fees, interest and dividend expenses related to short sales and extraordinary expenses not incurred in the ordinary course of the Funds’ business) at a specified level.
The waivers by the Funds’ Adviser, Administrator and/ or Distributor are limited to the Funds’ direct operating expenses and, therefore, do not apply to indirect expenses incurred by the Funds, such as acquired fund fees and expenses. The waivers are voluntary and the Funds’ Adviser, Administrator and/or Distributor may discontinue all or part of any of these waivers at any time. In addition, some Funds may participate in a commission recapture program where the Funds’ trades may be executed through the Funds’ distributor, and a portion of the commissions paid on those trades are then used to pay the Funds’ expenses.
| 58 | SEI Daily Income Trust / Annual Report / January 31, 2018 |
The following is a summary of annual fees payable to the Adviser, and Distributor and the voluntary expense limitations for each fund:
| Advisory Fees | Shareholder Servicing Fees | Expense Limitations | ||||||||
Government Fund | ||||||||||
Class F | 0.07% | 0.25% | 0.20% | (3) | ||||||
Class CAA | 0.07% | 0.25% | 0.25% | (2) | ||||||
Government II Fund | ||||||||||
Class F | 0.07% | 0.25% | 0.20% | (2) | ||||||
Treasury Fund | ||||||||||
Class F | 0.07% | 0.25% | 0.20% | (2) | ||||||
Treasury II Fund | ||||||||||
Class F | 0.07% | 0.25% | 0.20% | (2) | ||||||
Ultra Short Duration Bond Fund | ||||||||||
Class F | 0.10%(4) | 0.25% | 0.38% | (1) | ||||||
Class Y | 0.10%(4) | —% | 0.30% | (1) | ||||||
Short-Duration Government Fund | ||||||||||
Class F | 0.09%(5) | 0.25% | 0.48% | (1) | ||||||
Class Y | 0.09%(5) | —% | 0.38% | (1) | ||||||
GNMA Fund | ||||||||||
Class F | 0.09%(5) | 0.25% | 0.63% | (1) | ||||||
Class Y | 0.09%(5) | —% | 0.43% | (1) | ||||||
| (1) | Represents a voluntary cap that may be discontinued at any time. |
| (2) | Represents a contractual cap effective through May 31, 2018, to be changed only by board approval. |
| (3) | Represents a contractual cap of .25% of Class F (formerly Class A), effective through May 31, 2018 , to be changed only by Board approval. In addition, management has voluntarily waived fees to a cap of ..20 of Class F (formerly Class A) that may be discontinued at any time. |
| (4) | The Adviser receives an annual fee equal to .10% on the first $500 million of net assets, .075% of net assets between $500 million and $1 billion and .05% on the net assets in excess of $1 billion for the Ultra Short Duration Bond Fund. The fee is calculated based on the net assets of the Ultra Short Duration Bond Fund. |
| (5) | The Adviser receives an annual fee equal to .10% on the first $500 million of net assets, .075% of net assets between $500 million and $1 billion and .05% on the net assets in excess of $1 billion for the Short-Duration Government and GNMA Funds. The fee is a blended percentage and is calculated based on the combined assets of these Funds. |
The following is a summary of annual fees payable to the Administrator:
| Previous Administration Fees | Administration Fees as of January 1, 2017 | |||||||||||||||||||||||
| 1/31/16-12/31/16 | First $1.5 Billion of Assets | Next $500 Million of Assets | Next $500 Million of Assets | Next $500 Million of Assets | Over $3 Billion of Assets | |||||||||||||||||||
SDIT Government Fund | 0.240% | 0.150% | 0.1375% | 0.1250% | 0.1125% | 0.100% | ||||||||||||||||||
SDIT Government II Fund | 0.190% | 0.150% | 0.1375% | 0.1250% | 0.1125% | 0.100% | ||||||||||||||||||
SDIT Treasury Fund | 0.240% | 0.150% | 0.1375% | 0.1250% | 0.1125% | 0.100% | ||||||||||||||||||
SDIT Treasury II Fund | 0.240% | 0.150% | 0.1375% | 0.1250% | 0.1125% | 0.100% | ||||||||||||||||||
SDIT Ultra Short Duration Bond Fund | 0.300% | 0.200% | 0.1775% | 0.1550% | 0.1325% | 0.110% | ||||||||||||||||||
SDIT Short-Duration Government Fund | 0.300% | 0.200% | 0.1775% | 0.1550% | 0.1325% | 0.110% | ||||||||||||||||||
SDIT GNMA Fund | 0.300% | 0.200% | 0.1775% | 0.1550% | 0.1325% | 0.110% | ||||||||||||||||||
The Distributor has voluntarily waived all or a portion of the shareholder servicing fees for Class F (formerly Class A) of each fund, except for the GNMA Fund, since inception of the plan. Such waivers are voluntary and may be discontinued at any time. The Administrator and Distributor have voluntarily agreed to waive and reduce their fee and/or reimburse certain expenses of the Money Market Funds in order to limit the one-day net income yield of the Funds to not less than 0.01% of the Funds’ average daily net assets. The Funds did not have any such waivers by class for the year ended January 31, 2018.
Pursuant to the “manager of managers” structure, the Board of Trustees approved BofA Advisors, LLC (formerly Columbia Management Advisors, LLC) as sub-adviser to the Money Market Funds, Logan Circle Partners, L.P. serves as a sub-adviser to the Ultra Short Duration Bond Fund and Wellington Management Company, LLP (“Wellington LLP”) serves as sub-adviser to the Fixed Income Funds. Each sub-adviser is party to an investment sub-advisory agreement with the Advisor. For its services to the Funds, the sub-advisers are entitled to receive a fee paid directly by the Adviser.
| SEI Daily Income Trust / Annual Report / January 31, 2018 | 59 |
NOTES TO FINANCIAL STATEMENTS (Continued)
January 31, 2018
U.S. Bank, N.A. serves as the custodian of the Funds. The custodian plays no role in determining the investment policies of the Funds or which securities are to be purchased or sold in the Funds.
Other — Certain officers and Trustees of the Trust are also officers and/or Trustees of the Administrator, Adviser, or the Distributor. The Trust pays each unaffiliated Trustee an annual fee for attendance at quarterly, interim, and committee meetings. The Administrator, Adviser and/or the Distributor pays compensation of Officers and affiliated Trustees.
A portion of the services provided by the Chief Compliance Officer (“CCO”) and his staff, whom are employees of the administrator, are paid for by the Trust as incurred. The services include regulatory oversight of the Trust’s Adviser, Sub-Advisers and service providers as required by SEC regulations.
Interfund Lending — The SEC has granted an exemption that permits the Trust to participate in an inter-fund lending program (the “Program”) with existing or future investment companies registered under the 1940 Act that are advised by SIMC (the “SEI Funds”). The Program allows the SEI Funds to lend money to and borrow money from each other for temporary or emergency purposes. Participation in the Program is voluntary for both borrowing and lending funds. Inter-fund loans may be made only when the rate of interest to be charged is more favorable to the lending fund than an investment in overnight repurchase agreements (“Repo Rate”), and more favorable to the borrowing fund than the rate of interest that would be charged by a bank for short-term borrowings (“Bank Loan Rate”). The Bank Loan Rate will be determined using a formula reviewed annually by the SEI Funds Board of Trustees. The interest rate imposed on inter-fund loans is the average of the Repo Rate and the Bank Loan Rate. For the year ended January 31, 2018, the Trust has not participated in the Program.
4. INVESTMENT TRANSACTIONS
The cost of security purchases and the proceeds from the sale of securities, other than short-term investments, for the year ended January 31, 2018, were as follows for the Fixed Income Funds:
U.S. Gov’t ($ Thousands) | Other ($ Thousands) | Total ($ Thousands) | ||||||||||
Ultra Short Duration Bond Fund |
| |||||||||||
Purchases | $ | 30,670 | $ | 64,970 | $ | 95,640 | ||||||
Sales | 21,849 | 84,527 | 106,376 | |||||||||
Short-Duration Government Fund |
| |||||||||||
Purchases | 1,178,728 | 75,877 | 1,254,605 | |||||||||
U.S. Gov’t ($ Thousands) | Other ($ Thousands) | Total ($ Thousands) | ||||||||||
Sales | 1,354,389 | 99,324 | 1,453,713 | |||||||||
GNMA Fund | ||||||||||||
Purchases | 194,248 | 2,718 | 196,966 | |||||||||
Sales | 235,420 | 64 | 235,484 | |||||||||
5. FEDERAL TAX INFORMATION
It is each Fund’s intention to continue to qualify as a regulated investment company for Federal income tax purposes and distribute all of its taxable income (including net capital gains). Accordingly, no provision for Federal income taxes is required.
Reclassification of Components of Net Assets — The timing and characterization of certain income and capital gain distributions are determined annually in accordance with Federal tax regulations which may differ from accounting principles generally accepted in the United States. As a result, net investment income (loss) and net realized gain (loss) on investment transactions for the reporting period may differ from distributions during such period. These book/tax differences may be temporary or permanent in nature.
To the extent these differences are permanent, they are charged or credited to Paid-in Capital, undistributed net investment income, or accumulated net realized gain, as appropriate, in the periods that the differences arise.
Accordingly, the following permanent differences, primarily attributable to different treatment for gains and losses on paydowns of mortgage and asset-backed securities for tax purposes, distribution reclassification, and expiration of capital losses have been reclassified to/from the following accounts as of January 31, 2018:
Undistributed Net Investment Income (Loss) ($ Thousands) | Accumulated Realized Gain (Loss) ($Thousands) | Paid-in- Capital ($ Thousands) | ||||||||||
Government II Fund | 18 | (18 | ) | — | ||||||||
Treasury Fund | 1 | (1 | ) | — | ||||||||
Treasury II Fund | 4 | (4 | ) | — | ||||||||
Ultra Short Duration Bond Fund | 278 | 3,364 | (3,642 | ) | ||||||||
Short-Duration Government Fund | 2,076 | (2,076 | ) | — | ||||||||
GNMA Fund | 450 | (450 | ) | — | ||||||||
Amounts designated as “—“are $0 or have been rounded to $0.
These reclassifications have no impact on net assets or net asset value per share.
The tax character of dividends and distributions during the last two fiscal years was as follows:
| 60 | SEI Daily Income Trust / Annual Report / January 31, 2018 |
Ordinary Income ($ Thousands) | Long-term Capital Gain ($ Thousands) | Total ($ Thousands) | ||||||||||||||
Government Fund | ||||||||||||||||
| 2018 | $ | 56,626 | $ | — | $ | 56,626 | ||||||||||
| 2017 | 11,947 | — | 11,947 | |||||||||||||
Government II Fund | ||||||||||||||||
| 2018 | 15,370 | — | 15,370 | |||||||||||||
| 2017 | 3,105 | — | 3,105 | |||||||||||||
Treasury Fund | ||||||||||||||||
| 2018 | 780 | — | 780 | |||||||||||||
| 2017 | 281 | — | 281 | |||||||||||||
Treasury II Fund | ||||||||||||||||
| 2018 | 4,142 | — | 4,142 | |||||||||||||
| 2017 | 862 | — | 862 | |||||||||||||
Ultra Short Duration Bond Fund | ||||||||||||||||
| 2018 | 4,570 | — | 4,570 | |||||||||||||
| 2017 | 2,957 | — | 2,957 | |||||||||||||
Short-Duration Government Fund | ||||||||||||||||
| 2018 | 13,434 | — | 13,434 | |||||||||||||
| 2017 | 9,845 | — | 9,845 | |||||||||||||
GNMA Fund | ||||||||||||||||
| 2018 | 2,737 | — | 2,737 | |||||||||||||
| 2017 | 3,710 | 365 | 4,075 | |||||||||||||
As of January 31, 2018, the components of Distributable Earnings/(Accumulated Losses) on a tax basis were as follows:
Undistributed Ordinary Income ($ Thousands) | Undistributed Long-Term Capital Gain ($ Thousands) | Capital Loss Carryforwards ($ Thousands) | Post- October Losses ($ Thousands) | Late Year Ordinary Losses ($ Thousands) | Unrealized Appreciation (Depreciation) ($ Thousands) | Other Temporary Differences ($ Thousands) | Total Distributable Earnings (Accumulated Losses) ($ Thousands) | |||||||||||||||||||||||
Government Fund | $ | 6,867 | $ | — | $ | (39) | $ | — | $ | — | $ | — | $ | (6,879) | $ (51) | |||||||||||||||
Government II Fund | 2,147 | — | — | — | — | — | (2,129) | 18 | ||||||||||||||||||||||
Treasury Fund | 98 | — | — | — | — | — | (98) | — | ||||||||||||||||||||||
Treasury II Fund | 589 | — | — | — | — | (3) | (573) | 13 | ||||||||||||||||||||||
Ultra Short Duration Bond Fund | 440 | — | (17,724) | — | — | (458) | (437) | (18,179) | ||||||||||||||||||||||
Short-Duration Government Fund | 1,741 | — | (10,734) | — | — | (8,449) | (1,133) | (18,575) | ||||||||||||||||||||||
GNMA Fund | 181 | — | (2,430) | — | — | (225) | (191) | (2,665) | ||||||||||||||||||||||
At January 31, 2018, the following Funds had capital loss carryforwards to offset future realized capital gains:
Amount ($ Thousands) | Expiration | |||||||
Ultra Short Duration Bond Fund | 11,895 | 1/31/19 | ||||||
For Federal income tax purposes, capital loss carryforwards may be carried forward and applied against future capital gains. It is the Funds’ intent that they will not distribute any realized gain distributions until the carryforwards have been offset or expired.
During the fiscal year ended January 31, 2018, the Ultra Short Duration Government Fund utilized $343,056 of capital loss carryforwards to offset capital gains.
Under the recently enacted Regulated Investment Company Modernization Act of 2010, Funds will be permitted to carry forward capital losses incurred in taxable years beginning after December 22, 2010 for an unlimited period. However, any losses incurred during those future taxable years will be required to be utilized prior to the losses incurred in pre-enactment taxable years. As a result of this ordering rule, pre-enactment capital loss carryforwards may be more likely to expire unused. Additionally, post-enactment capital losses that are carried forward will retain their character as either
| SEI Daily Income Trust / Annual Report / January 31, 2018 | 61 |
NOTES TO FINANCIAL STATEMENTS (Concluded)
January 31, 2018
short-term or long-term capital losses rather than being considered all short-term as under previous law.
Losses carried forward under these new provisions are as follows:
Short-Term Loss ($ Thousands) | Long-Term Loss ($ Thousands) | Total ($ Thousands) | ||||||||||
Government Fund | $ | 39 | $ | – | $ | 39 | ||||||
Ultra Short Duration Bond Fund | 11,895 | 5,829 | 17,724 | |||||||||
Short-Duration Government Fund | 2,502 | 8,232 | 10,734 | |||||||||
GMNA Fund | 2,067 | 362 | 2,429 | |||||||||
During the fiscal year ended January 31, 2018, the Money Market Funds’ cost of securities for Federal income tax purposes approximates the cost located in the Statements of Assets and Liabilities.
For Federal income tax purposes, the cost of securities owned at January 31, 2018, and net realized gains or losses on securities sold for the year, were different from amounts reported for financial reporting purposes, primarily due to wash sales which cannot be used for Federal income tax purposes in the current year and have been deferred for use in future years. The Federal tax cost and aggregate gross unrealized appreciation and depreciation on investments held by the Fixed Income Funds at January 31, 2018, were as follows:
Federal Tax Cost ($ Thousands) | Appreciated Securities ($ Thousands) | Depreciated Securities ($ Thousands) | Net Unrealized Appreciation (Depreciation) ($ Thousands) | |||||||||||||
Government Fund | $ | 7,427,378 | $ | — | $ | — | $ | — | ||||||||
Government II Fund | 2,222,417 | — | — | — | ||||||||||||
Treasury | 111,056 | — | — | — | ||||||||||||
Treasury II | 564,624 | — | — | — | ||||||||||||
Ultra Short Duration | ||||||||||||||||
Bond Fund | 320,452 | 677 | (1,135) | (458) | ||||||||||||
Short-Duration | ||||||||||||||||
Government Fund | 873,572 | 4,930 | (13,379) | (8,449) | ||||||||||||
GNMA Fund | 80,036 | 1,069 | (1,293) | (224) | ||||||||||||
Management has analyzed the Funds’ tax positions taken on the federal tax returns for all open tax years and has concluded that as of January 31, 2018, no provision for income tax is required in the Funds’ financial statements. The Funds’ federal income and excise tax returns are subject to examination by the IRS for all open tax years under the applicable Statute of Limitations have not expired are subject to examination by the Internal Revenue Service and state departments of revenue.
6. INVESTMENT RISKS
In the normal course of business, a Fund may enter into contracts that provide general indemnifications by a Fund to the counterparty to the contract. A Fund’s
maximum exposure under these arrangements is dependent on future claims that may be made against a Fund and, therefore, cannot be established; however, based on experience, management believes the risk of loss from such claim is considered remote.
7. CONCENTRATION OF SHAREHOLDERS
SEI Private Trust Company (“SPTC”) and SIMC are subsidiaries of SEI Investments Company. As of January 31, 2018, SPTC held of record the following:
Government Fund, Cl CAA | 100.00% | |
Government Fund, Cl Y | 46.15% | |
Government II Fund | 68.73% | |
Treasury Fund | 92.26% | |
Treasury II Fund | 64.38% | |
Ultra Short Duration Bond Fund, Cl F | 91.89% | |
Ultra Short Duration Bond Fund, Cl Y | 76.87% | |
Short-Duration Government | 97.23% | |
Short-Duration Government | 11.11% | |
GNMA Fund, Cl F | 84.81% | |
GNMA Fund, Cl Y | 74.82% |
SPTC is not a direct service provider to the Funds. However, SPTC performs a key role in the comprehensive investment solution that SEI provides to investors. SPTC holds the vast majority of shares in the Funds as custodian for shareholders that are clients of the advisors and financial planners. SPTC maintains accounts at SEI Institutional Transfer Agency (“SITA”), and operates in an omnibus fund account environment.
8. REGULATORY MATTERS
In October 2016, the U.S. Securities and Exchange Commission adopted new rules and amended existing rules (together, final rules) intended to modernize the reporting and disclosure of information by registered investment companies. In part, the final rules amended Regulation S-X and require standardized, enhanced disclosures about derivatives in investment company financial statements, as well as other amendments. As of August 1, 2017, management has implemented the amendments to Regulation S-X, which did not have a material impact on the Fund’s financial statements and related disclosures or impact the Fund’s net assets or results of operations.
9. SUBSEQUENT EVENTS
Management has evaluated the need for disclosures and/or adjustments resulting from subsequent events through the date the financial statements were issued. Based on this evaluation, no disclosures and/ or adjustments were required to the financial statements as of January 31, 2018.
| 62 | SEI Daily Income Trust / Annual Report / January 31, 2018 |
REPORT OF INDEPENDENT REGISTERED ACCOUNTING FIRM
The Shareholders and Board of Trustees
SEI Daily Income Trust:
Opinion on the Financial Statements
We have audited the accompanying statements of assets and liabilities of SEI Daily Income Trust, comprised of the Government Fund, Government II Fund, Treasury Fund, Treasury II Fund, Ultra Short Duration Bond Fund, Short-Duration Government Fund, and GNMA Fund (collectively, the “Funds”), including the schedules of investments, as of January 31, 2018, the related statements of operations for the year then ended, the statements of changes in net assets for each of the years in the two year period then ended, and the related notes (collectively, the “financial statements”) and the financial highlights for each of the years in the five year period then ended. In our opinion, the financial statements and financial highlights present fairly, in all material respects, the financial position of the Funds as of January 31, 2018, the results of their operations for the year then ended, the changes in their net assets for each of the years in the two year period then ended, and the financial highlights for each of the years in the five year period then ended, in conformity with U.S. generally accepted accounting principles.
Basis for Opinion
These financial statements and financial highlights are the responsibility of the Funds’ management. Our responsibility is to express an opinion on these financial statements and financial highlights based on our audits. We are a public accounting firm registered with the Public Company Accounting Oversight Board (United States) (“PCAOB”) and are required to be independent with respect to the Funds in accordance with the U.S. federal securities laws and the applicable rules and regulations of the Securities and Exchange Commission and the PCAOB.
We conducted our audits in accordance with the standards of the PCAOB. Those standards require that we plan and perform the audits to obtain reasonable assurance about whether the financial statements and financial highlights are free of material misstatement, whether due to error or fraud. Our audits included performing procedures to assess the risks of material misstatement of the financial statements and financial highlights, whether due to error or fraud, and performing procedures that respond to those risks. Such procedures included examining, on a test basis, evidence regarding the amounts and disclosures in the financial statements and financial highlights. Such procedures also included confirmation of securities owned as of January 31, 2018, by correspondence with the custodian and brokers or by other appropriate auditing procedures when replies from brokers were not received. Our audits also included evaluating the accounting principles used and significant estimates made by management, as well as evaluating the overall presentation of the financial statements and financial highlights. We believe that our audits provide a reasonable basis for our opinion.

We have served as the auditor of one or more SEI Funds investment companies since 2005.
Philadelphia, Pennsylvania
March 28, 2018
| SEI Daily Income Trust / Annual Report / January 31, 2018 | 63 |
TRUSTEES AND OFFICERS OF THE TRUST (Unaudited)
The following chart lists Trustees and Officers as of January 31, 2018.
Set forth below are the names, addresses, ages, position with the Trust, Term of Office and Length of Time Served, the principal occupations for the last five years, number of positions in fund complex overseen by trustee, and other directorships outside the fund complex of each of the persons currently serving as Trustees and Officers of the Trust. The Trust’s Statement of Additional Information (“SAI”) includes additional information about the Trustees and Officers. The SAI may be obtained without charge by calling 1-800-342-5734.
Name, Address, and Age | Position(s) Held with Trusts | Term of Office and Length of Time Served1 | Principal Occupation(s) During Past Five Years | Number of Portfolios in Fund Complex Overseen by Trustee2 | Other Directorships Held by Trustee | |||||
| INTERESTED TRUSTEES | ||||||||||
Robert A. Nesher One Freedom Valley Drive Oaks, PA 19456 70 yrs. old | Chairman of the Board of Trustees* | since 1995 | Currently performs various services on behalf of SEI for which Mr. Nesher is compensated. | 104 | Vice Chairman of The Advisors’ Inner Circle Fund III, Winton Series Trust and Winton Diversified Opportunities Fund since 2014. Vice Chairman of Gallery Trust since 2015. President and Director of SEI Structured Credit Fund, LP. Director of SEI Global Master Fund plc, SEI Global Assets Fund plc, SEI Global Investments Fund plc, SEI Investments—Global Funds Services, Limited, SEI Investments Global, Limited, SEI Investments (Europe) Ltd., SEI Multi-Strategy Funds PLC, SEI Global Nominee Ltd and SEI Investments—Unit Trust Management (UK) Limited. Director and President of SEI Opportunity Fund, L.P. to 2010. President, Director and Chief Executive Officer of SEI Alpha Strategy Portfolios, LP from 2007 to 2013. Trustee of The Advisors’ Inner Circle Fund, The Advisors’ Inner Circle Fund II, Bishop Street Funds, SEI Asset Allocation Trust, SEI Daily Income Trust, SEI Institutional Managed Trust, SEI Institutional International Trust, SEI Institutional Investments Trust, SEI Tax Exempt Trust, SEI Insurance Products Trust, Adviser Managed Trust, The KP Funds and SEI Catholic Values Trust. | |||||
William M. Doran One Freedom Valley Drive Oaks, PA 19456 76 yrs. old | Trustee* | since 1995 | Self-employed consultant since 2003.Partner, Morgan, Lewis & Bockius LLP (law firm) from 1976 to 2003, counsel to the Trust, SEI, SIMC, the Administrator and the Distributor. | 104 | Director of SEI since 1974; Secretary of SEI since 1978. Director of SEI Investments Distribution Co. since 2003. Director of SEI Investments—Global Funds Services, Limited, SEI Investments Global, Limited, SEI Investments (Europe), Limited, SEI Investments (Asia) Limited, SEI Global Nominee Ltd. and SEI Investments—Unit Trust Management (UK) Limited. Trustee of SEI Liquid Asset Trust from 1982 to 2016. Trustee of O’Connor EQUUS from 2014 to 2016. Director of SEI Alpha Strategy Portfolios, LP from 2007 to 2013. Trustee of The Advisors’ Inner Circle Fund, The Advisors’ Inner Circle Fund II, The Advisors’ Inner Circle Fund III, Winton Series Trust, Winton Diversified Opportunities Fund, Gallery Trust, Bishop Street Funds, SEI Asset Allocation Trust, SEI Daily Income Trust, SEI Institutional Managed Trust, SEI Institutional International Trust, SEI Institutional Investments Trust, SEI Tax Exempt Trust, SEI Insurance Products Trust, Adviser Managed Trust, The KP Funds and SEI Catholic Values Trust. | |||||
| TRUSTEES | ||||||||||
George J. Sullivan Jr. One Freedom Valley Drive, Oaks, PA 19456 73 yrs. old | Trustee | since 1996 | Retired since January 2012. Self-Employed Consultant, Newfound Consultants Inc. April 1997-December 2011. | 104 | Member of the independent review committee for SEI’s Canadian-registered mutual funds. Director of SEI Opportunity Fund, L.P. to 2010. Director of SEI Alpha Strategy Portfolios, LP from 2007 to 2013. Trustee of SEI Liquid Asset Trust from 1996 to 2016. Trustee/Director of State Street Navigator Securities Lending Trust, The Advisors’ Inner Circle Fund, The Advisors’ Inner Circle Fund II, Bishop Street Funds, SEI Structured Credit Fund, LP, SEI Asset Allocation Trust, SEI Daily Income Trust, SEI Institutional Managed Trust, SEI Institutional International Trust, SEI Institutional Investments Trust, SEI Tax Exempt Trust, SEI Insurance Products Trust, Adviser Managed Trust, The KP Funds and SEI Catholic Values Trust. |
| * | Messrs. Nesher and Doran are Trustees who may be deemed as “interested” persons of the Trust as that term is defined in the 1940 Act by virtue of their affiliation with SIMC and the Trust’s Distributor. |
| 1 | Each trustee shall hold office during the lifetime of this Trust until the election and qualification of his or her successor, or until he or she sooner dies, resigns or is removed in accordance with the Trust’s Declaration of Trust |
| 2 | The Fund Complex includes the following Trusts: SEI Asset Allocation Trust, SEI Daily Income Trust, SEI Institutional Investments Trust, Adviser Managed Trust, SEI Institutional International Trust, SEI Institutional Managed Trust, SEI Liquid Asset Trust, SEI Tax Exempt Trust, SEI Insurance Products Trust and New Covenant Funds. |
| 64 | SEI Daily Income Trust / Annual Report / January 31, 2018 |
Name Address, and Age | Position(s) Held with Trusts | Term of Office and Length of Time Served1 | Principal Occupation(s) During Past Five Years | Number of Portfolios in Fund Complex Overseen by Trustee2 | Other Directorships Held by Trustee | |||||
| TRUSTEES (continued) | ||||||||||
Nina Lesavoy One Freedom Valley Drive, Oaks, PA 19456 57 yrs. old | Trustee | since 2003 | Founder and Managing Director, Avec Capital (strategic fundraising firm) since 2008. Managing Director, Cue Capital (strategic fundraising firm) from March 2002-March 2008. | 104 | Director of SEI Opportunity Fund, L.P. to 2010. Director of SEI Alpha Strategy Portfolios, LP from 2007 to 2013. Trustee of SEI Liquid Asset Trust from 2003 to 2016. Trustee/Director of SEI Structured Credit Fund, L.P., SEI Asset Allocation Trust, SEI Daily Income Trust, SEI Institutional Managed Trust, SEI Institutional International Trust, SEI Institutional Investments Trust, SEI Tax Exempt Trust, SEI Insurance Products Trust, Adviser Managed Trust and SEI Catholic Values Trust. | |||||
James M. Williams One Freedom Valley Drive, Oaks, PA 19456 69 yrs. old | Trustee | since 2004 | Vice President and Chief Investment Officer, J. Paul Getty Trust, Non-Profit Foundation for Visual Arts, since December 2002. President, Harbor Capital Advisors and Harbor Mutual Funds, 2000-2002. Director of SEI Alpha Strategy Portfolios, L.P. from 2007 to 2013. Manager, Pension Asset Management, Ford Motor Company, 1997-1999. | 104 | Director of SEI Opportunity Fund, L.P. to 2010. Director of SEI Alpha Strategy Portfolios, LP from 2007 to 2013, Trustee of SEI Liquid Asset Trust from 2004 to 2016. Trustee/Director of Ariel Mutual Funds, SEI Structured Credit Fund, LP, SEI Asset Allocation Trust, SEI Daily Income Trust, SEI Institutional Managed Trust, SEI Institutional International Trust, SEI Institutional Investments Trust, SEI Tax Exempt Trust, SEI Insurance Products Trust, Adviser Managed Trust and SEI Catholic Values Trust. | |||||
Mitchell A. Johnson One Freedom Valley Drive, Oaks, PA 19456 74 yrs. old | Trustee | since 2007 | Private Investor since 1994. | 104 | Director, Federal Agricultural Mortgage Corporation (Farmer Mac) since 1997. Director of SEI Alpha Strategy Portfolios, LP from 2007 to 2013. Trustee of SEI Liquid Asset Trust from 2007 to 2016. Trustee of the Advisors’ Inner Circle Fund, The Advisors’ Inner Circle Fund II, SEI Asset Allocation Trust, SEI Daily Income Trust, SEI Institutional Managed Trust, SEI Institutional International Trust, SEI Institutional Investments Trust, SEI Tax Exempt Trust, SEI Insurance Products Trust, Adviser Managed Trust, The KP Funds and SEI Catholic Values Trust. | |||||
Hubert L. Harris, Jr. One Freedom Valley Drive, Oaks, PA 19456 73 yrs. old | Trustee | since 2008 | Retired since December 2005. Owner of Harris Plantation, Inc. since 1995. Chief Executive Officer of Harris CAPM, a consulting asset and property management entity. Chief Executive Officer, INVESCO North America, August 2003-December 2005. Chief Executive Officer and Chair of the Board of Directors, AMVESCAP Retirement, Inc., January 1998- August 2003. | 104 | Director of AMVESCAP PLC from 1993-2004. Served as a director of a bank holding company, 2003-2009. Director, Aaron’s Inc., 2012-present. Chair of the Board of Trustees, Georgia Tech Foundation, Inc. (nonprofit corporation), 2007-2009, and member of the Executive Committee, 2003-2011; currently emeritus trustee. Member of the advisory board of the Georgia Tech Ivan Allen School of Liberal Arts and the Sam Nunn School of International Affairs, 2009-present. Member of the Board of Councilors of the Carter Center (nonprofit corporation). Director of SEI Alpha Strategy Portfolios, LP from 2008 to 2013. Trustee of SEI Asset Allocation Trust, SEI Daily Income Trust, SEI Institutional Managed Trust, SEI Institutional International Trust, SEI Institutional Investments Trust, SEI Tax Exempt Trust, SEI Insurance Products Trust, Adviser Managed Trust and SEI Catholic Values Trust. | |||||
Susan C. Cote One Freedom Valley Drive Oaks, PA 19456 61 years old | Trustee | since 2016 | Retired since July 2015. Americas Director of Asset Management, Ernst & Young LLP from 2006-2013. Global Asset Management Assurance Leader, Ernst & Young LLP from 2006-2015. Partner Ernst & Young LLP from 1997-2015. Prudential, 1983-1997. Retirement Investment Committee-Treasurer and Chair of Finance, Investment and Audit Committee of the New York Women’s Foundation. Independent Consultant to SEI Liquid Asset Allocation Trust. | 104 | Trustee of SEI Tax Exempt Trust, SEI Daily Income Trust, SEI Institutional International Trust, SEI Institutional Managed Trust, SEI Asset Allocation Trust, SEI Institutional Investments Trust, SEI Insurance Products Trust, Adviser Managed Trust and SEI Catholic Values Trust. | |||||
| OFFICERS | ||||||||||
Robert A. Nesher One Freedom Valley Drive, Oaks, PA 19456 70 yrs. Old | President and CEO | since 2005 | Currently performs various services on behalf of SEI for which Mr. Nesher is compensated. | N/A | N/A | |||||
James J. Hoffmayer One Freedom Valley Drive Oaks, PA 19456 43 yrs. old | Controller and Chief Financial Officer | since 2016 | Senior Director, Funds Accounting and Fund Administration, SEI Investments Global Funds Services (since September 2016); Senior Director of Fund Administration, SEI Investments Global Funds Services (since October 2014). Director of Financial Reporting, SEI Investments Global Funds Services (November 2004 – October 2014). | N/A | N/A |
| 1 | Each trustee shall hold office during the lifetime of this Trust until the election and qualification of his or her successor, or until he or she sooner dies, resigns or is removed in accordance with the Trust’s Declaration of Trust. |
| 2 | The Fund Complex includes the following Trusts: SEI Asset Allocation Trust, SEI Daily Income Trust, SEI Institutional Investments Trust, Adviser Managed Trust, SEI Institutional International Trust, SEI Institutional Managed Trust, SEI Liquid Asset Trust, SEI Tax Exempt Trust, SEI Insurance Products Trust and New Covenant Funds. |
| SEI Daily Income Trust / Annual Report / January 31, 2018 | 65 |
TRUSTEES AND OFFICERS OF THE TRUST (Unaudited) (Concluded)
Name Address, and Age | Position(s) Held with Trusts | Term of Office and Length of Time Served1 | Principal Occupation(s) During Past Five Years | Number of Portfolios in Fund Complex Overseen by Trustee2 | Other Directorships Held by Trustee | |||||
| OFFICERS (continued) | ||||||||||
Russell Emery One Freedom Valley Drive Oaks, PA 19456 53 yrs. old | Chief Compliance Officer | since 2006 | Chief Compliance Officer of SEI Institutional Investments Trust, SEI Institutional Managed Trust, SEI Asset Allocation Trust, SEI Institutional International Trust, SEI Tax Exempt Trust, The Advisors’ Inner Circle Fund, The Advisors’ Inner Circle Fund II and Bishop Street Funds since March 2006. Chief Compliance Officer of SEI Liquid Asset Trust from 2006 to 2016. Chief Compliance Officer of SEI Structured Credit Fund, LP June 2007. Chief Compliance Officer of Adviser Managed Trust since December 2010. Chief Compliance Officer of SEI Alpha Strategy Portfolios, LP from 2007 to 2013. Chief Compliance Officer of SEI Insurance Products Trust and The KP Funds since 2013. Chief Compliance Officer of O’Connor EQUUS from 2014 to 2016. Chief Compliance Officer of The Advisors’ Inner Circle Fund III, Winton Series Trust and Winton Diversified Opportunities Fund since 2014. Chief Compliance Officer of SEI Catholic Values Trust and Gallery Trust since 2015. | N/A | N/A | |||||
Timothy D Barto One Freedom Valley Drive Oaks, PA 19456 48 yrs. old | Vice President and Secretary | since 2002 | Vice President and Secretary of SEI Institutional Transfer Agent, Inc. since 2009. General Counsel and Secretary of SIMC and the Administrator since 2004. Vice President of SIMC and the Administrator since 1999. Vice President and Assistant Secretary of SEI since 2001. | N/A | N/A | |||||
Aaron Buser One Freedom Valley Drive, Oaks, PA 19456 45 yrs. old | Vice President and Assistant Secretary | since 2008 | Vice President and Assistant Secretary of SEI Institutional Transfer Agent, Inc. since 2009. Vice President and Assistant Secretary of SIMC since 2007. Attorney Stark & Stark (law firm), March 2004-July 2007. | N/A | N/A | |||||
David F. McCann One Freedom Valley Drive, Oaks, PA 19456 40 yrs. old | Vice President and Assistant Secretary | since 2009 | Vice President and Assistant Secretary of SEI Institutional Transfer Agent, Inc. since 2009. Vice President and Assistant Secretary of SIMC since 2008. Attorney, Drinker Biddle & Heath, LLP (law firm), May 2005 - October 2008. | N/A | N/A | |||||
Stephen G. MacRae One Freedom Valley Drive, Oaks, PA 19456 47 yrs. old | Vice President | since 2012 | Director of Global Investment Product Management January 2004 - to present. Global Funds Services, March 2005 to June 2006. | N/A | N/A | |||||
Bridget E. Sudall One Freedom Valley Drive Oaks, PA 19456 36 yrs. old | Anti-Money Laundering Compliance Officer and Privacy Officer | since 2015 | Anti-Money Laundering Compliance Officer and Privacy Officer (since 2015), Senior Associate and AML Officer, Morgan Stanley Alternative Investment Partners, April 2011-March 2015, Investor Services Team Lead, Morgan Stanley Alternative Investment Partners, July 2007-April 2011. | N/A | N/A |
| 1 | Each trustee shall hold office during the lifetime of this Trust until the election and qualification of his or her successor, or until he or she sooner dies, resigns or is removed in accordance with the Trust’s Declaration of Trust. |
| 2 | The Fund Complex includes the following Trusts: SEI Asset Allocation Trust, SEI Daily Income Trust, SEI Institutional Investments Trust, Adviser Managed Trust, SEI Institutional International Trust, SEI Institutional Managed Trust, SEI Liquid Asset Trust, SEI Tax Exempt Trust, SEI Insurance Products Trust and New Covenant Funds. |
| 66 | SEI Daily Income Trust / Annual Report / January 31, 2018 |
DISCLOSURE OF FUND EXPENSES (Unaudited)
January 31, 2018
All mutual funds have operating expenses. As a shareholder of a mutual fund, your investment is affected by these ongoing costs, which include (among others) costs for portfolio management, administrative services, and shareholder reports like this one. It is important for you to understand the impact of these costs on your investment returns.
Operating expenses such as these are deducted from the mutual fund‘s gross income and directly reduce your final investment return. These expenses are expressed as a percentage of the mutual fund’s average net assets; this percentage is known as the mutual fund’s expense ratio.
The following examples use the expense ratio and are intended to help you understand the ongoing costs (in dollars) of investing in your Fund and to compare these costs with those of other mutual funds. The examples are based on an investment of $1,000 made at the beginning of the period shown and held for the entire period (August 1, 2017 to January 31, 2018).
The table on the next page illustrates your Fund’s costs in two ways:
• Actual Fund Return. This section helps you to estimate the actual expenses after fee waivers that your Fund incurred over the period. The “Expenses Paid During Period” column shows the actual dollar expense cost incurred by a $1,000 investment in the Fund, and the “Ending Account Value” number is derived from deducting that expense cost from the Fund’s gross investment return.
You can use this information, together with the actual amount you invested in your Fund, to estimate the expenses you paid over that period. Simply divide your actual starting account value by $1,000 to arrive at a ratio (for example, an $8,600 account value divided by $1,000 = 8.6), then multiply that ratio by the number shown for your Fund under “Expenses Paid During Period.”
• Hypothetical 5% Return. This section helps you compare your Fund’s costs with those of other mutual funds. It assumes that your Fund had an annual 5% return before expenses during the year, but that the expense ratio (Column 3) is unchanged. This example is useful in making comparisons because the Securities and Exchange Commission requires all mutual funds to make this 5% calculation. You can assess your Fund’s comparative cost by comparing the hypothetical result for your Fund in the “Expense Paid During Period” column with those that appear in the same charts in the shareholder reports for other mutual funds.
NOTE: Because the return is set at 5% for comparison purposes — NOT your Fund’s actual return — the account values shown do not apply to your specific investment.
Beginning Account Value 8/1/17 | Ending Account Value 1/31/18 | Annualized Expense Ratios | Expenses Paid During Period * | |||||||||||||
Government Fund | ||||||||||||||||
Actual Fund Return | ||||||||||||||||
Class F** | $1,000.00 | $1,004.60 | 0.20 | % | $1.01 | |||||||||||
Class CAA | 1,000.00 | 1,004.60 | 0.20 | 1.01 | ||||||||||||
Hypothetical 5% Return | ||||||||||||||||
Class F** | $1,000.00 | $1,024.20 | 0.20 | % | $1.02 | |||||||||||
Class CAA | 1,000.00 | 1,024.20 | 0.20 | 1.02 | ||||||||||||
Government II Fund | ||||||||||||||||
Actual Fund Return | ||||||||||||||||
Class F** | $1,000.00 | $1,004.70 | 0.20 | % | $1.01 | |||||||||||
Hypothetical 5% Return | ||||||||||||||||
Class F** | $1,000.00 | $1,024.20 | 0.20 | % | $1.02 | |||||||||||
Beginning Account Value 8/1/17 | Ending Account Value 1/31/18 | Annualized Expense Ratios | Expenses Paid During Period * | |||||||||||||
Treasury Fund | ||||||||||||||||
Actual Fund Return | ||||||||||||||||
Class F** | $1,000.00 | $1,004.60 | 0.20 | % | $1.01 | |||||||||||
Hypothetical 5% Return | ||||||||||||||||
Class F** | $1,000.00 | $1,024.20 | 0.20 | % | $1.02 | |||||||||||
Treasury II Fund | ||||||||||||||||
Actual Fund Return | ||||||||||||||||
Class F** | $1,000.00 | $1,004.70 | 0.20 | % | $1.01 | |||||||||||
Hypothetical 5% Return | ||||||||||||||||
Class F** | $1,000.00 | $1,024.20 | 0.20 | % | $1.02 | |||||||||||
| SEI Daily Income Trust / Annual Report / January 31, 2018 | 67 |
DISCLOSURE OF FUND EXPENSES (Unaudited) (Concluded)
January 31, 2018
Beginning Account Value 8/1/17 | Ending Account Value 1/31/18 | Annualized Expense Ratios | Expenses Paid During Period * | |||||||||||||
Ultra Short Duration Bond Fund | ||||||||||||||||
Actual Fund Return | ||||||||||||||||
Class F** | $1,000.00 | $1,004.60 | 0.38 | % | $1.93 | |||||||||||
Class Y | 1,000.00 | 1,006.10 | 0.30 | 1.53 | ||||||||||||
Hypothetical 5% Return | ||||||||||||||||
Class F** | $1,000.00 | $1,023.28 | 0.38 | % | $1.95 | |||||||||||
Class Y | 1,000.00 | 1,023.68 | 0.30 | 1.54 | ||||||||||||
Short-Duration Government Fund | ||||||||||||||||
Actual Fund Return | ||||||||||||||||
Class F** | $1,000.00 | $996.00 | 0.48 | % | $2.41 | |||||||||||
Class Y | 1,000.00 | 996.70 | 0.35 | 1.75 | ||||||||||||
Hypothetical 5% Return | ||||||||||||||||
Class F** | $1,000.00 | $1,022.79 | 0.48 | % | $2.44 | |||||||||||
Class Y | 1,000.00 | 1,023.46 | 0.35 | 1.77 | ||||||||||||
Beginning Account Value 8/1/17 | Ending Account Value 1/31/18 | Annualized Expense Ratios | Expenses Paid During Period * | |||||||||||||
GNMA Fund | ||||||||||||||||
Actual Fund Return | ||||||||||||||||
Class F** | $1,000.00 | $991.80 | 0.62 | % | $3.10 | |||||||||||
Class Y | 1,000.00 | 992.00 | 0.37 | % | 1.85 | |||||||||||
Hypothetical 5% Return | ||||||||||||||||
Class F** | $1,000.00 | $1,022.09 | 0.62 | % | $3.15 | |||||||||||
Class Y | 1,000.00 | 1,023.35 | 0.37 | % | 1.88 | |||||||||||
| * | Expenses are equal to the Fund’s annualized expense ratio multiplied by the average account value over the period, multiplied by 184/365. |
| ** | Effective January 31, 2018, Class A Shares converted to Class F Shares of the same Fund. |
| 68 | SEI Daily Income Trust / Annual Report / January 31, 2018 |
BOARD OF TRUSTEES’ CONSIDERATIONS IN APPROVING THE ADVISORY AGREEMENT (Unaudited)
SEI Daily Income Trust (the “Trust”) and SEI Investments Management Corporation (“SIMC”) have entered into an investment advisory agreement (the “Advisory Agreement”). Pursuant to the Advisory Agreement, SIMC is responsible for the investment advisory services provided to the series of the Trust (the “Funds”). Pursuant to separate sub-advisory agreements with SIMC (the “Sub-Advisory Agreements” and, together with the Advisory Agreement, the “Investment Advisory Agreements”), and under the supervision of SIMC and the Trust’s Board of Trustees (the “Board”), the sub-advisers (each, a “Sub-Adviser” and collectively, the “Sub-Advisers”) provide security selection and certain other advisory services with respect to all or a discrete portion of the assets of the Funds. The Sub-Advisers are also responsible for managing their employees who provide services to the Funds. The Sub-Advisers are selected based primarily upon the research and recommendations of SIMC, which evaluates quantitatively and qualitatively the Sub-Advisers’ skills and investment results in managing assets for specific asset classes, investment styles and strategies.
The Investment Company Act of 1940, as amended (the “1940 Act”), requires that the initial approval of, as well as the continuation of, the Funds’ Investment Advisory Agreements be specifically approved: (i) by the vote of the Board or by a vote of the shareholders of the Funds; and (ii) by the vote of a majority of the Trustees who are not parties to the Investment Advisory Agreements or “interested persons” of any party (the “Independent Trustees”), cast in person at a meeting called for the purpose of voting on such approval(s). In connection with their consideration of such approval(s), the Funds’ Trustees must request and evaluate, and SIMC and the Sub-Advisers are required to furnish, such information as may be reasonably necessary to evaluate the terms of the Investment Advisory Agreements. In addition, the Securities and Exchange Commission takes the position that, as part of their fiduciary duties with respect to a mutual fund’s fees, mutual fund boards are required to evaluate the material factors applicable to a decision to approve an Investment Advisory Agreement.
Consistent with these responsibilities, the Board calls and holds meetings each year to consider whether to approve new and/or renew existing Investment Advisory Agreements between the Trust and SIMC and SIMC and the Sub-Advisers with respect to the Funds of the Trust. In preparation for these meetings, the Board requests and reviews a wide variety of materials provided by SIMC and the Sub-Advisers, including information about SIMC’s and the Sub-Advisers’ affiliates, personnel and operations and the services provided pursuant to the Investment Advisory Agreements. The Board also receives data from third parties. This information is provided in addition to the detailed information about the Funds that the Board reviews during the course of each year, including information that relates to Fund operations and Fund performance. The Trustees also receive a memorandum from counsel regarding the responsibilities of Trustees in connection with their consideration of whether to approve the Trust’s Investment Advisory Agreements. Finally, the Independent Trustees receive advice from independent counsel to the Independent Trustees, meet in executive sessions outside the presence of Fund management and participate in question and answer sessions with representatives of SIMC and the Sub-Advisers.
Specifically, during the course of the Trust’s fiscal year, the Board requested and received written materials from SIMC and the Sub-Advisers regarding: (i) the quality of SIMC’s and the Sub-Advisers’ investment management and other services; (ii) SIMC’s and the Sub-Advisers’ investment management personnel; (iii) SIMC’s and the Sub-Advisers’ operations and financial condition; (iv) SIMC’s and the Sub-Advisers’ brokerage practices (including any soft dollar arrangements) and investment strategies; (v) the level of the advisory fees that SIMC charges the Funds and the level of the sub-advisory fees that SIMC pays the Sub-Advisers, compared with fees each charge to comparable accounts (vi) the advisory fees charged by SIMC and the Funds’ overall fees and operating expenses compared with peer groups of mutual funds prepared by Broadridge, an independent provider of investment company data; (vii) the level of SIMC’s and the Sub-Advisers’ profitability from their Fund-related operations; (viii) SIMC’s and the Sub-Advisers’ compliance program, including a description of material compliance matters and material compliance violations; (ix) SIMC’s potential economies of scale; (x) SIMC’s and the Sub-Advisers’ policies on and compliance procedures for personal securities transactions; (xi) SIMC’s and the Sub-Advisers’ expertise and resources in domestic and/or international financial markets; and (xii) the Funds’ performance over various periods of time compared with peer groups of mutual funds prepared by Broadridge and the Funds’ benchmark indexes.
At the March 28–29, 2017 meeting of the Board, the Trustees, including a majority of the Independent Trustees, approved the renewal of the Advisory Agreement. Also, each Sub-Advisory Agreement was either initially approved or, if the Sub-Advisory Agreement was already in effect (unless operating under an initial two-year term), renewed at meetings of the Board held during the course of the Trust’s fiscal year on March 28–29, 2017 and September 11–13, 2017. In each case, the Board’s approval (or renewal) was based on its consideration and evaluation of the
| SEI Daily Income Trust / Annual Report / January 31, 2018 | 69 |
BOARD OF TRUSTEES’ CONSIDERATIONS IN APPROVING THE ADVISORY AGREEMENT (Unaudited) (Concluded)
factors described above, as discussed at the meetings and at prior meetings. The following discusses some, but not all, of the factors that were considered by the Board in connection with its assessment of the Investment Advisory Agreements.
Nature, Extent and Quality of Services. The Board considered the nature, extent and quality of the services provided by SIMC and the Sub-Advisers to the Funds and the resources of SIMC and the Sub-Advisers and their affiliates dedicated to the Funds. In this regard, the Trustees evaluated, among other things, SIMC’s and each Sub-Adviser’s personnel, experience, track record and compliance program. Following evaluation, the Board concluded that, within the context of its full deliberations, the nature, extent and quality of services provided by SIMC and the Sub-Advisers to the Funds and the resources of SIMC and the Sub-Advisers and their affiliates dedicated to the Funds were sufficient to support the renewal of the Investment Advisory Agreements. In addition to advisory services, the Board considered the nature and quality of certain administrative, transfer agency and other non-investment advisory services provided to the Funds by SIMC and/or its affiliates.
Performance. In determining whether to renew SIMC’s Advisory Agreement, the Trustees considered the Funds’ performance relative to their peer groups and appropriate indexes/benchmarks. The Trustees reviewed performance information for each Fund, noting that they receive performance reports that permit them to monitor each Fund’s performance at board meetings throughout the year. As part of this review, the Trustees considered the composition of each peer group and selection criteria. In assessing Fund performance, the Trustees considered a report compiled by Broadridge, an independent third-party that was engaged to prepare an assessment of the Funds in connection with the renewal of the Advisory Agreement (the “Broadridge Report”). The Broadridge Report included metrics on risk analysis, volatility versus total return, net total return and performance consistency for the Funds and a universe of comparable funds. Based on the materials considered and discussed at the meetings, the Trustees found Fund performance satisfactory, or, where performance was materially below the benchmark and/or peer group, the Trustees were satisfied with the reasons provided to explain such performance. In connection with the approval or renewal of Sub-Advisory Agreements, the Board considered the performance of the Sub-Adviser relative to appropriate indexes/benchmarks. Following evaluation, the Board concluded that, within the context of its full deliberations, the performance of the Funds was sufficient to support renewal of SIMC’s Advisory Agreement, and the performance of each Sub-Adviser was sufficient to support approval or renewal of the Sub-Advisory Agreement.
Fees. With respect to the Funds’ expenses under the Investment Advisory Agreements, the Trustees considered the rate of compensation called for by the Investment Advisory Agreements and the Funds’ net operating expense ratio in comparison to those of the Funds’ respective peer groups. In assessing Fund expenses, the Trustees considered the information in the Broadridge Report, which included various metrics related to fund expenses, including, but not limited to, contractual management fees at various asset levels, actual management fees (including transfer agent expenses), and actual total expenses for the Funds and a universe of comparable funds. Based on the materials considered and discussion at the meetings, the Trustees further determined that fees were either shown to be below the peer average in the comparative fee analysis, or that there was a reasonable basis for the fee level. The Trustees also considered the effects of SIMC’s waiver of management and other fees to prevent total Fund operating expenses from exceeding a specified cap and concluded that SIMC, through waivers, has maintained the Funds’ net operating expenses at competitive levels for its distribution channels. In determining the appropriateness of fees, the Board also took into consideration the impact of fees incurred indirectly by the Funds as a result of investments into underlying funds, including funds from which SIMC or its affiliates earn fees. The Board also took into consideration compensation earned from the Funds by SIMC or its affiliates for non-advisory services, such as administration, transfer agency, shareholder services or brokerage, and considered whether SIMC and its affiliates may have realized other benefits from their relationship with the Funds, such as any research and brokerage services received under soft dollar arrangements. When considering fees paid to Sub-Advisers, the Board took into account the fact that the Sub-Advisers are compensated by SIMC and not by the Funds directly, and that such compensation with respect to any unaffiliated Sub-Adviser reflects an arms-length negotiation between the Sub-Adviser and SIMC. Following evaluation, the Board concluded that, within the context of its full deliberations, the expenses of the Funds are reasonable and supported renewal of the Investment Advisory Agreements. The Board also considered whether the Sub-Advisers and their affiliates may have realized other benefits from their relationship with the Funds, such as any research and brokerage services received under soft dollar arrangements.
Profitability. With regard to profitability, the Trustees considered compensation flowing to SIMC and the Sub-Advisers and their affiliates, directly or indirectly. The Trustees considered whether the levels of compensation and
| 70 | SEI Daily Income Trust / Annual Report / January 31, 2018 |
profitability were reasonable. As with the fee levels, when considering the profitability of the Sub-Advisers, the Board took into account the fact that compensation with respect to any unaffiliated Sub-Adviser reflects an arms-length negotiation between the Sub-Adviser and SIMC. In connection with the approval or renewal of each Sub-Advisory Agreement, the Board also took into consideration the impact that the fees paid to the Sub-Adviser have on SIMC’s advisory fee margin and profitability. Based on this evaluation, the Board concluded that, within the context of its full deliberations, the profitability of each of SIMC and the Sub-Advisers is reasonable and supported renewal of the Investment Advisory Agreements.
Economies of Scale. With respect to the Advisory Agreement, the Trustees considered whether any economies of scale were being realized by SIMC and its affiliates and, if so, whether the benefits of such economies of scale were passed along to the Funds’ shareholders through a graduated investment advisory fee schedule or other means, including any fee waivers by SIMC and its affiliates. The Trustees recognized that economies of scale are difficult to identify and quantify and are rarely identifiable on a fund-by-fund basis. Based on this evaluation, the Board determined that the fees were reasonable in light of the information that was provided by SIMC with respect to economies of scale.
Based on the Trustees’ deliberation and their evaluation of the information described above, the Board, including all of the Independent Trustees, with the assistance of Fund counsel and Independent Trustees’ counsel, unanimously approved the approval or renewal, as applicable, of the Investment Advisory Agreements and concluded that the compensation under the Investment Advisory Agreements is fair and reasonable in light of such services and expenses and such other matters as the Trustees considered to be relevant in the exercise of their reasonable judgment. In the course of its deliberations, the Board did not identify any particular factor (or conclusion with respect thereto) or single piece of information that was all-important, controlling or determinative of its decision, but considered all of the factors together, and each Trustee may have attributed different weights to the various factors (and conclusions with respect thereto) and information.
| SEI Daily Income Trust / Annual Report / January 31, 2018 | 71 |
NOTICE TO SHAREHOLDERS (Unaudited)
For shareholders that do not have a January 31, 2018, taxable year end, this notice is for information purposes only. For shareholders with a January 31, 2018, taxable year end, please consult your tax adviser as to the pertinence of this notice.
For the fiscal year ended January 31, 2018, the Funds are designating the following with regard to distributions paid during the year:
| Fund | (A) Long-Term Capital Gain Distribution | (B) Ordinary Income Distributions (Tax Basis) | (C) Total Distributions (Tax Basis) | U.S. Government Interest (1) | Interest Related Dividends (2) | Short-Term Capital Gains | ||||||
Government Fund | 0.00% | 100.00% | 100.00% | 68.61%* | 99.99% | 0.00% | ||||||
Government II Fund | 0.00% | 100.00% | 100.00% | 100.00%* | 99.89% | 100.00% | ||||||
Treasury Fund | 0.00% | 100.00% | 100.00% | 64.47%* | 99.77% | 100.00% | ||||||
Treasury II Fund | 0.00% | 100.00% | 100.00% | 100.00%* | 99.90% | 100.00% | ||||||
Ultra Short Duration Bond Fund | 0.00% | 100.00% | 100.00% | 4.45%* | 99.91% | 0.00% | ||||||
Short-Duration Government Fund | 0.00% | 100.00% | 100.00% | 13.11%* | 99.97% | 0.00% | ||||||
GNMA Fund | 0.00% | 100.00% | 100.00% | 0.00%* | 97.46% | 0.00% |
Items (A), (B), (C) are based on the percentage of the Fund’s total distribution.
| (1) | “U.S. Government Interest” represents the amount of interest that was derived from direct U.S. Government obligations and distributed during the fiscal year. This amount is reflected as a percentage of total ordinary income distributions (the total of short-term capital gain and net investment income distributions). Generally, interest from direct U.S. Government obligations is exempt from state income tax. However, for shareholders of the “*” funds who are residents of California, Connecticut and New York, the statutory threshold requirements were not satisfied to permit exemption of these amounts from state income. |
| (2) | The percentage in this column represents the amount of “Interest Related Dividends” and is reflected as a percentage of net investment income distributions that is exempt from U.S. withholding tax when paid to foreign investors. |
| (3) | The percentage in this column represents the amount of “Short-Term Capital Gains Dividends” and is reflected as a percentage of short- term capital gain distributions that is exempt from U.S. withholding tax when paid to foreign investors. |
Please consult your tax adviser for proper treatment of this information.
| 72 | SEI Daily Income Trust / Annual Report / January 31, 2018 |
SEI DAILY INCOME TRUST ANNUAL REPORT JANUARY 31, 2018
Robert A. Nesher, Chairman
Trustees
William M. Doran
George J. Sullivan, Jr.
Nina Lesavoy
James M. Williams
Mitchell A. Johnson
Susan Cote
Hubert L. Harris, Jr.
Officers
Robert A. Nesher
President and Chief Executive Officer
James J. Hoffmayer
Controller and Chief Financial Officer
Glenn Kurdziel
Assistant Controller
Russell Emery
Chief Compliance Officer
Timothy D. Barto
Vice President, Secretary
David McCann
Vice President, Assistant Secretary
Aaron Buser
Vice President, Assistant Secretary
Stephen G. MacRae
Vice President
Bridget E. Sudall
Anti-Money Laundering Compliance Officer
Privacy Officer
Investment Adviser
SEI Investments Management Corporation
Administrator
SEI Investments Global Funds Services
Distributor
SEI Investments Distribution Co.
Legal Counsel
Morgan, Lewis & Bockius LLP
Independent Registered Public Accounting Firm
KPMG LLP
This report and the financial statements contained herein are submitted for the general information of the shareholders of the Trust and must be preceded or accompanied by a current prospectus. Shares of the Funds are not deposits or obligations of, or guaranteed or endorsed by, any bank. The shares are not federally insured by the Federal Deposit Insurance Corporation (FDIC), the Federal Reserve Board, or any other government agency. Investment in the shares involves risk, including the possible loss of principal.
For more information call
1 800 DIAL SEI
(1 800 342 5734)
| SEI | New ways. New answers.® | |
| 1 Freedom Valley Drive, P.O. Box 1100, Oaks, PA 19456 | ||
SEI-F-022 (1/18)
| Item 2. | Code of Ethics. |
The Registrant has adopted a code of ethics that applies to the Registrant’s principal executive officer, principal financial officer, comptroller or principal accounting officer, and any person who performs a similar function.
| Item 3. | Audit Committee Financial Expert. |
(a)(1) The Registrant’s Board of Trustees has determined that the Registrant has at least two audit committee financial experts serving on the audit committee.
(a) (2) The audit committee financial experts are Susan Cote, George J. Sullivan, Jr. and Hubert L. Harris, Jr. Messrs. Cote, Sullivan and Harris are independent as defined in Form N-CSR Item 3 (a) (2).
| Item 4. | Principal Accountant Fees and Services. |
Fees billed by KPMG LLP (“KPMG”) related to the Registrant.
KPMG billed the Registrant aggregate fees for services rendered to the Registrant for the last two fiscal years as follows:
| Fiscal 2018 | Fiscal 2017 | |||||||||||||
All fees and approved | All fees and approved | All other fees affiliates that | All fees and approved | All fees and approved | All other fees affiliates that | |||||||||
(a) | Audit Fees(1) | $139,930 | N/A | $0 | $136,500 | N/A | $0 | |||||||
(b) | Audit-Related Fees | $0 | $0 | $0 | $0 | $0 | $0 | |||||||
(c) | Tax Fees | $0 | $0 | $0 | $0 | $0 | $0 | |||||||
(d) | All Other Fees(2) | $0 | $341,057 | $0 | $0 | $326,979 | $0 | |||||||
Notes:
| (1) | Audit fees include amounts related to the audit of the Registrant’s annual financial statements and services normally provided by the accountant in connection with statutory and regulatory filings. |
| (2) | See item 4(g)(1) for a description of the services comprising the fees disclosed in this category. |
(e)(1) The Registrant’s Audit Committee has adopted and the Board of Trustees has ratified an Audit and Non-Audit Services Pre-Approval Policy (the “Policy”), which sets forth the procedures and the conditions pursuant to which services proposed to be performed by the independent auditor of the Registrant may be pre-approved.
The Policy provides that all requests or applications for proposed services to be provided by the independent auditor must be submitted to the Registrant’s Chief Financial Officer (“CFO”) and must include a detailed description of the services proposed to be rendered. The CFO will determine whether such services: (1) require specific pre-approval; (2) are included within the list of services that have received the general pre-approval of the Audit Committee pursuant to the Policy; or (3) have been previously pre-approved in connection with the independent auditor’s annual engagement letter for the applicable year or otherwise. In any instance where services require pre-approval, the Audit Committee will consider whether such services are consistent with SEC’s rules and whether the provision of such services would impair the auditor’s independence.
Requests or applications to provide services that require specific pre-approval by the Audit Committee will be submitted to the Audit Committee by the CFO. The Audit Committee will be informed by the CFO on a quarterly basis of all services rendered by the independent auditor. The Audit Committee has delegated specific pre-approval authority to either the Audit Committee Chair or financial expert, provided that the estimated fee for any such proposed pre-approved service does not exceed $100,000 and any pre-approval decisions are reported to the Audit Committee at its next regularly scheduled meeting.
Services that have received the general pre-approval of the Audit Committee are identified and described in the Policy. In addition, the Policy sets forth a maximum fee per engagement with respect to each identified service that has received general pre-approval.
All services to be provided by the independent auditor shall be provided pursuant to a signed written engagement letter with the Registrant, the investment advisor or applicable control affiliate (except that matters as to which an engagement letter would be impractical because of timing issues or because the matter is small may not be the subject of an engagement letter) that sets forth both the services to be provided by the independent auditor and the total fees to be paid to the independent auditor for those services.
In addition, the Audit Committee has determined to take additional measures on an annual basis to meet its responsibility to oversee the work of the independent auditor and to assure the auditor’s independence from the Registrant, such as reviewing a formal written statement from the independent auditor delineating all relationships between the independent auditor and the Registrant, and discussing with the independent auditor its methods and procedures for ensuring independence.
(e)(2) Percentage of fees billed applicable to non-audit services pursuant to waiver of pre-approval requirement were as follows:
| Fiscal 2018 | Fiscal 2017 | |||||||
Audit-Related Fees | 0% | 0% | ||||||
Tax Fees | 0% | 0% | ||||||
All Other Fees | 0% | 0% | ||||||
(f) Not Applicable.
(g)(1) The aggregate non-audit fees and services billed by KPMG for the fiscal years 2018 and 2017 were $341,057 and $326,979, respectively. Non-audit fees consist of SSAE No. 16 review of fund accounting and administration operations and an attestation report in accordance with Rule 17 Ad-13.
(h) During the past fiscal year, Registrant’s principal accountant provided certain non-audit services to Registrant’s investment adviser or to entities controlling, controlled by, or under common control with Registrant’s investment adviser that provide ongoing services to Registrant that were not subject to pre-approval pursuant to paragraph (c)(7)(ii) of Rule 2-01 of Regulation S-X. The Audit Committee of Registrant’s Board of Trustees reviewed and considered these non-audit services provided by Registrant’s principal accountant to Registrant’s affiliates, including whether the provision of these non-audit services is compatible with maintaining the principal accountant’s independence.
| Item 5. | Audit Committee of Listed Registrants. |
Not Applicable.
| Item 6. | Schedule of Investments |
Included in Item 1.
| Item 7. | Disclosure of Proxy Voting Policies and Procedures for Closed-End Management Investment Companies. |
Not Applicable.
| Item 8. | Portfolio Managers of Closed-End Management Investment Companies |
Not Applicable.
| Item 9. | Purchases of Equity Securities by Closed-End Management Company and Affiliated Purchasers. |
Not Applicable.
| Item 10. | Submission of Matters to a Vote of Security Holders. |
The Registrant has a standing Nominating Committee (the “Committee”) currently consisting of the Independent Trustees. The Committee is responsible for evaluating and recommending nominees for election to the Registrant’s Board of Trustees (the “Board”). Pursuant to the Committee’s Charter, adopted on June 18th, 2004, as amended, the Committee will review all shareholder recommendations for nominations to fill vacancies on the Board if such recommendations are submitted in writing and addressed to the Committee at the Trust’s office.
| Item 11. | Controls and Procedures. |
(a) The Registrant’s principal executive and principal financial officers, or persons performing similar functions, have concluded that the Registrant’s disclosure controls and procedures (as defined in Rule 30a-3(c) under the Investment Company Act of 1940 (the “1940 Act”) are effective, based on the evaluation of these controls and procedures required by Rule 30a-3(b) under the 1940 Act (17 CFR 270.30a-3(b)) and Rules 13a-15(b) or 15d-15(b) under the Securities Exchange Act of 1934 (17 CFR 240.13a-15(b)) or 240.15d-15(b)) as of a date within 90 days of the filing date of this report.
(b) There were no changes in the Registrant’s internal control over financial reporting (as defined in Rule 30a-3(d) under the 1940 Act (17 CFR 270.30a-3(d)) that occurred during the last fiscal quarter of the
period covered by this report that have materially affected, or are reasonably likely to materially affect, the Registrant’s internal control over financial reporting.
| Items 12. | Disclosure of Securities Lending Activities for Closed-End Management Investment Companies. |
Not applicable.
| Items 13. | Exhibits. |
(a)(1) Code of Ethics attached hereto.
(a)(2) A separate certification for the principal executive officer and the principal financial officer of the Registrant as required by Rule 30a-2(a) under the 1940 Act (17 CFR 270.30a-2(a)), are filed herewith.
(b) Officer certifications as required by Rule 30a-2(b) under the 1940 Act (17 CFR 270.30a-2(a)) also accompany this filing as an Exhibit.
SIGNATURES
Pursuant to the requirements of the Securities Exchange Act of 1934 and the Investment Company Act of 1940, the Registrant has duly caused this report to be signed on its behalf by the undersigned, thereunto duly authorized.
| SEI Daily Income Trust | ||||||
| By: | /s/ Robert A. Nesher | |||||
| Robert A. Nesher | ||||||
| President & CEO | ||||||
Date: April 10, 2018
Pursuant to the requirements of the Securities Exchange Act of 1934 and the Investment Company Act of 1940, this report has been signed below by the following persons on behalf of the Registrant and in the capacities and on the dates indicated.
| By: | /s/ Robert A. Nesher | |||||
| Robert A. Nesher | ||||||
| President & CEO |
Date: April 10, 2018
| By: | /s/ James J. Hoffmayer | |||||
| James J. Hoffmayer | ||||||
| Controller & CFO |
Date: April 10, 2018