Table of Contents
UNITED STATES
SECURITIES AND EXCHANGE COMMISSION
Washington, D.C. 20549
FORM N-CSRS
CERTIFIED SHAREHOLDER REPORT OF REGISTERED
MANAGEMENT INVESTMENT COMPANIES
Investment Company Act file number 811-03451
SEI Daily Income Trust
(Exact name of registrant as specified in charter)
c/o CT Corporation
101 Federal Street
Boston, MA 02110
(Address of principal executive offices) (Zip code)
SEI Investments
One Freedom Valley Drive
Oaks, PA 19456
(Name and address of agent for service)
Registrant’s telephone number, including area code: 1-800-342-5734
Date of fiscal year end: January 31, 2011
Date of reporting period: July 31, 2010
Table of Contents
| Item 1. | Reports to Stockholders. |
Table of Contents

SEI Daily Income Trust
Semi-Annual Report as of July 31, 2010
Money Market Fund
Government Fund
Government II Fund
Prime Obligation Fund
Treasury Fund
Treasury II Fund
Short-Duration Government Fund
Intermediate-Duration Government Fund
GNMA Fund
Ultra Short Duration Bond Fund
Table of Contents
| 1 | ||
| 28 | ||
| 30 | ||
| 32 | ||
| 36 | ||
| 40 | ||
| 48 | ||
The Trust files its complete schedule of portfolio holdings with the Securities and Exchange Commission for the first and third quarters of each fiscal year on Form N-Q within sixty days after the end of the period. The Trust’s Forms N-Q are available on the Commission’s website at http://www.sec.gov, and may be reviewed and copied at the Commission’s Public Reference Room in Washington, DC. Information on the operation of the Public Reference Room may be obtained by calling 1-800-SEC-0330.
Since the Funds in SEI Daily Income Trust typically hold only fixed income securities, they generally are not expected to hold securities for which they may be required to vote proxies. Regardless, in light of the possibility of the possibility that a Fund could hold a security for which a proxy is voted, the Trust has adopted proxy voting policies. A description of the policies and procedures that the Trust uses to determine how to vote proxies relating to portfolio securities, as well as information relating to how a Fund voted proxies relating to portfolio securities during the most recent 12-month period ended June 30, is available (i) without charge, upon request, by calling 1-800-DIAL-SEI; and (ii) on the Commission’s website at http://www.sec.gov.
Table of Contents
SCHEDULE OF INVESTMENTS (Unaudited)
Money Market Fund
July 31, 2010
| Description | Face Amount ($ Thousands) | Value ($ Thousands) | ||||
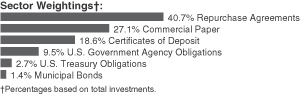
COMMERCIAL PAPER (A) (B) — 27.1% | ||||||
American Honda Finance | ||||||
0.370%, 09/02/10 | $ | 3,000 | $ | 2,999 | ||
Atlantis One Funding | ||||||
0.552%, 01/18/11 | 2,000 | 1,995 | ||||
BNZ International Funding | ||||||
0.601%, 08/27/10 | 1,000 | 999 | ||||
Cancara Asset Securitisation LLC | ||||||
0.501%, 10/18/10 | 2,000 | 1,998 | ||||
Chariot Funding LLC | ||||||
0.400%, 10/13/10 | 1,000 | 999 | ||||
Coca-Cola | ||||||
0.371%, 01/03/11 | 5,000 | 4,992 | ||||
Fairway Finance LLC | ||||||
0.450%, 08/09/10 | 750 | 750 | ||||
0.461%, 08/10/10 | 1,000 | 1,000 | ||||
0.491%, 09/02/10 | 1,000 | 999 | ||||
0.380%, 10/12/10 | 1,000 | 999 | ||||
Falcon Asset Securitization LLC | ||||||
0.481%, 01/21/11 | 1,000 | 998 | ||||
FCAR Owner Trust | ||||||
0.390%, 08/03/10 | 1,000 | 1,000 | ||||
0.521%, 09/01/10 | 1,000 | 999 | ||||
0.501%, 09/07/10 to 10/04/10 | 3,000 | 2,997 | ||||
Gemini Securitization LLC | ||||||
0.551%, 08/26/10 to 08/27/10 | 3,000 | 2,999 | ||||
0.501%, 09/28/10 | 2,000 | 1,998 | ||||
0.420%, 10/22/10 | 3,500 | 3,497 | ||||
General Electric Capital | ||||||
0.400%, 08/13/10 | 2,000 | 2,000 | ||||
0.420%, 08/17/10 to 10/01/10 | 2,000 | 1,999 | ||||
0.481%, 08/25/10 to 09/02/10 | 6,500 | 6,497 | ||||
0.370%, 10/07/10 | 2,000 | 1,999 | ||||
0.483%, 01/18/11 | 3,000 | 2,993 | ||||
Grampian Funding LLC | ||||||
0.531%, 10/18/10 | 800 | 799 | ||||
Jupiter Securitization LLC | ||||||
0.400%, 10/08/10 | 4,250 | 4,247 | ||||
0.481%, 01/21/11 | 8,000 | 7,981 | ||||
Liberty Street Funding LLC | ||||||
0.471%, 09/13/10 | 2,000 | 1,999 | ||||
0.400%, 10/12/10 | 500 | 500 | ||||
0.380%, 10/18/10 | 4,000 | 3,997 | ||||
| Description | Face Amount ($ Thousands) | Value ($ Thousands) | ||||
Market Street Funding LLC | ||||||
0.481%, 09/10/10 | $ | 1,000 | $ | 999 | ||
0.400%, 10/12/10 | 3,000 | 2,998 | ||||
0.390%, 10/13/10 | 1,000 | 999 | ||||
MetLife Short Term Funding LLC | ||||||
0.521%, 08/23/10 to 09/13/10 | 2,000 | 1,999 | ||||
0.471%, 08/30/10 | 1,000 | 1,000 | ||||
0.531%, 09/07/10 | 4,250 | 4,248 | ||||
0.501%, 10/04/10 to 10/19/10 | 2,000 | 1,998 | ||||
0.491%, 10/12/10 | 1,100 | 1,099 | ||||
Nestle Capital | ||||||
0.300%, 09/07/10 | 3,000 | 2,999 | ||||
Nestle Finance International | ||||||
0.270%, 08/24/10 | 1,000 | 1,000 | ||||
0.350%, 10/12/10 | 1,000 | 999 | ||||
Old Line Funding LLC | ||||||
0.481%, 09/02/10 | 1,000 | 999 | ||||
Royal Park Investments Funding | ||||||
0.440%, 10/25/10 (C) | 1,000 | 999 | ||||
Shell International Finance | ||||||
0.451%, 01/03/11 | 3,000 | 2,994 | ||||
Societe de Prise de Participation de l’Etat | ||||||
0.571%, 08/26/10 | 2,000 | 1,999 | ||||
Straight-A Funding LLC | ||||||
0.350%, 10/12/10 | 6,000 | 5,996 | ||||
Thunder Bay Funding LLC | ||||||
0.480%, 09/02/10 | 1,000 | 1,000 | ||||
0.481%, 09/13/10 | 1,000 | 999 | ||||
0.400%, 10/06/10 | 3,000 | 2,998 | ||||
Total Capital Canada | ||||||
0.451%, 09/01/10 | 1,000 | 1,000 | ||||
0.471%, 01/13/11 to 01/14/11 | 2,000 | 1,996 | ||||
Toyota Credit Canada | ||||||
0.601%, 08/23/10 | 1,000 | 1,000 | ||||
0.571%, 09/03/10 | 500 | 500 | ||||
Toyota Financial Services de Puerto Rico | ||||||
0.581%, 09/07/10 | 500 | 500 | ||||
0.491%, 10/18/10 | 1,000 | 999 | ||||
Toyota Motor Credit | ||||||
0.581%, 09/13/10 | 2,000 | 1,999 | ||||
0.470%, 10/12/10 | 3,000 | 2,997 | ||||
0.491%, 11/12/10 | 1,500 | 1,498 | ||||
Variable Funding Capital LLC | ||||||
0.400%, 08/09/10 | 1,750 | 1,750 | ||||
Total Commercial Paper | 119,790 | |||||
CERTIFICATES OF DEPOSIT — 18.6% | ||||||
Bank of Nova Scotia | ||||||
0.470%, 09/01/10 | 3,000 | 3,000 | ||||
0.450%, 01/18/11 | 2,000 | 2,000 | ||||
Bank of Tokyo-Mitsubishi | ||||||
0.550%, 09/07/10 | 2,000 | 2,000 | ||||
0.550%, 09/10/10 | 2,000 | 2,000 | ||||
| SEI Daily Income Trust / Semi-Annual Report / July 31, 2010 | 1 |
Table of Contents
SCHEDULE OF INVESTMENTS (Unaudited)
Money Market Fund (Continued)
July 31, 2010
| Description | Face Amount ($ Thousands) | Value ($ Thousands) | ||||
Barclays Bank PLC | ||||||
0.400%, 09/13/10 | $ | 500 | $ | 500 | ||
0.500%, 10/06/10 | 4,000 | 4,000 | ||||
0.500%, 10/12/10 | 5,000 | 5,000 | ||||
BNP Paribas | ||||||
0.570%, 09/02/10 | 3,000 | 3,000 | ||||
0.630%, 09/13/10 | 12,000 | 12,000 | ||||
0.630%, 09/14/10 | 3,000 | 3,000 | ||||
0.590%, 11/16/10 | 1,000 | 1,000 | ||||
Caisse Cent Desjardins | ||||||
0.450%, 10/13/10 | 2,000 | 2,000 | ||||
0.460%, 10/15/10 | 2,000 | 2,000 | ||||
0.470%, 10/20/10 | 3,000 | 3,000 | ||||
Credit Agricole | ||||||
0.320%, 08/23/10 | 3,000 | 3,000 | ||||
Credit Agricole Corporate and Investment Bank | ||||||
0.520%, 10/25/10 | 3,000 | 3,000 | ||||
0.520%, 11/01/10 | 4,000 | 4,000 | ||||
HSBC Bank PLC | ||||||
0.320%, 08/25/10 | 4,000 | 4,000 | ||||
Nordea Bank Finland PLC | ||||||
0.510%, 09/03/10 | 1,000 | 1,000 | ||||
0.540%, 01/10/11 | 2,000 | 2,000 | ||||
Rabobank Nederland | ||||||
0.570%, 01/10/11 | 2,000 | 2,000 | ||||
Societe Generale | ||||||
0.340%, 08/02/10 | 2,000 | 2,000 | ||||
0.340%, 08/04/10 | 2,000 | 2,000 | ||||
Svenska Handlesbanken | ||||||
0.480%, 12/09/10 | 1,000 | 1,000 | ||||
UBS | ||||||
0.570%, 08/30/10 | 1,000 | 1,000 | ||||
0.590%, 09/17/10 | 6,000 | 6,000 | ||||
0.470%, 10/18/10 | 3,000 | 3,000 | ||||
0.450%, 10/20/10 | 4,000 | 4,000 | ||||
Total Certificates of Deposit | 82,500 | |||||
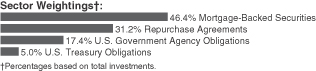
U.S. GOVERNMENT AGENCY OBLIGATIONS — 9.5% | ||||||
FFCB | ||||||
0.431%, 10/20/10 (D) | 2,000 | 2,000 | ||||
FHLB | ||||||
0.160%, 08/07/10 (D) | 3,000 | 3,000 | ||||
0.285%, 10/29/10 (D) | 2,000 | 2,000 | ||||
FHLMC | ||||||
0.581%, 10/07/10 (D) | 8,000 | 8,001 | ||||
FHLMC MTN | ||||||
0.607%, 09/09/10 (D) | 13,000 | 13,017 | ||||
0.525%, 10/30/10 (D) | 1,000 | 1,001 | ||||
FHLMC DN | ||||||
0.311%, 11/10/10 (A) | 1,000 | 999 | ||||
FHLMC, Ser 1 | ||||||
0.204%, 08/01/10 (D) | 5,000 | 5,000 | ||||
| Description | Face Amount ($ Thousands) | Value ($ Thousands) | ||||
FHLMC DN, Ser RB | ||||||
0.300%, 11/23/10 (A) | $ | 2,000 | $ | 1,998 | ||
0.250%, 01/18/11 (A) | 3,000 | 2,997 | ||||
FNMA DN | ||||||
0.250%, 01/19/11 (A) | 2,000 | 1,998 | ||||
Total U.S. Government Agency Obligations | 42,011 | |||||
U.S. TREASURY OBLIGATIONS — 2.7% | ||||||
U.S. Treasury Bills (A) | ||||||
0.180%, 08/26/10 | 2,000 | 2,000 | ||||
0.230%, 09/23/10 | 1,800 | 1,799 | ||||
0.265%, 10/07/10 | 2,000 | 1,999 | ||||
0.220%, 12/30/10 | 2,000 | 1,998 | ||||
0.205%, 01/06/11 | 1,000 | 999 | ||||
U.S. Treasury Notes | ||||||
2.000%, 09/30/10 | 2,000 | 2,005 | ||||
1.250%, 11/30/10 | 1,000 | 1,004 | ||||
Total U.S. Treasury Obligations | 11,804 | |||||
MUNICIPAL BONDS — 1.4% | ||||||
Connecticut — 0.1% | ||||||
Connecticut State, Housing & Finance Authority, Sub-Ser A-5, RB | 500 | 500 | ||||
Iowa — 0.4% | ||||||
Iowa State, Finance Authority, Ser C, RB | 1,685 | 1,685 | ||||
Iowa State, Finance Authority, Ser G, RB | 100 | 100 | ||||
| 1,785 | ||||||
Kentucky — 0.5% | ||||||
Kentucky State, Housing Development Authority, Ser J, RB | 2,000 | 2,000 | ||||
New Mexico — 0.1% | ||||||
New Mexico State, Finance Authortiy, Sub-Ser D, GO | 300 | 300 | ||||
Texas — 0.2% | ||||||
Texas State, Ser A2, GO | 1,000 | 1,000 | ||||
Wisconsin — 0.1% | ||||||
Wisconsin State, Housing & Economic Development Authority, Ser D, RB | 500 | 500 | ||||
Total Municipal Bonds | 6,085 | |||||
| 2 | SEI Daily Income Trust / Semi-Annual Report / July 31, 2010 |
Table of Contents
| Description | Face Amount ($ Thousands) | Value ($ Thousands) | ||||
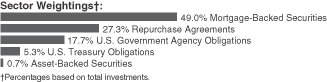
REPURCHASE AGREEMENTS (E) — 40.7% | ||||||
BNP Paribas 0.340%, dated 07/30/10, to be repurchased on 08/02/10, repurchase price $1,000,028 (collateralized by various corporate obligations*, ranging in par value $15,000-$360,000, 4.750%-7.200%, 08/01/11-01/13/20, with total market value $1,050,000) | $ | 1,000 | $ | 1,000 | ||
BNP Paribas 0.210%, dated 07/30/10, to be repurchased on 08/02/10, repurchase price $50,000,875 (collateralized by various FHLMC/FNMA/GNMA obligations, ranging in par value $486,988-$46,725,615, 1.687%-6.500%, 09/01/13-11/01/46, with total market value $51,000,001) | 50,000 | 50,000 | ||||
Citigroup 0.220%, dated 07/30/10, to be repurchased on 08/02/10, repurchase price $50,000,917 (collateralized by various FHLMC/FNMA/GNMA obligations, ranging in par value $139,455-$108,394,384, 1.613%-7.000%, 07/15/24-07/01/46, with total market value $51,000,000) | 50,000 | 50,000 | ||||
Deutsche Bank 0.310%, dated 07/30/10, to be repurchased on 08/02/10, repurchase price $1,000,026 (collateralized by Nordstrom, $1,001,555, 4.750%, 05/01/20, with total market value $1,050,001) | 1,000 | 1,000 | ||||
JPMorgan Chase 0.360%, dated 07/30/10, to be repurchased on 08/02/10, repurchase price $3,001,693 (collateralized by Yum! Brands, par value $2,690,000, 6.250%, 03/15/18, with total market value $3,151,778) | 3,000 | 3,000 | ||||
RBS 0.210%, dated 07/30/10, to be repurchased on 08/02/10, repurchase price $74,101,276 (collateralized by various GNMA obligations, ranging in par value $3,640,000-$29,184,391, 3.000%- 4.000%, 07/20/40-07/20/40, with total market value $75,583,303) | 74,100 | 74,100 | ||||
UBS 0.310%, dated 07/30/10, to be repurchased on 08/02/10, repurchase price $1,000,028 (collateralized by Anadarko Petroleum, par value $950,000, 8.700%, 03/15/19, with total market value $1,050,208) | 1,000 | 1,000 | ||||
Total Repurchase Agreements | 180,100 | |||||
Total Investments — 100.0% | $ | 442,290 | ||||
| * | A summary of the corporate obligations used to collateralize repurchase agreements entered into by the Fund at July 30, 2010, is as follows: |
| Counterparty | Corporate Obligation | Rate | Maturity Date | Par Amount ($ Thousands) | ||||||
BNP Paribas | Anheuser Busch Inbev Worldwide | 5.375 | % | 10/15/14 | $ | 15 | ||||
| Anheuser Busch Inbev Worldwide | 7.200 | 01/15/14 | 84 | |||||||
| JPMorgan Chase | 4.750 | 05/01/13 | 15 | |||||||
| Lloyds TSB Bank PLC | 5.800 | 01/13/20 | 200 | |||||||
| UBS AG Stanford Branch | 5.750 | 04/25/18 | 65 | |||||||
| Wells Fargo | 5.300 | 08/26/11 | 360 | |||||||
| Wells Fargo | 5.625 | 12/11/17 | 90 | |||||||
| Wells Fargo | 6.375 | 08/01/11 | 150 | |||||||
Percentages are based on Net Assets of $442,299 ($ Thousands).
| (A) | The rate reported is the effective yield at time of purchase. |
| (B) | Securities are held in connection with a letter of credit issued by a major bank. |
| (C) | Securities sold within terms of a private placement memorandum, exempt from registration under Section 144A of the Securities Act of 1933, as amended, and may be sold only to dealers in that program or other “accredited investors.” These securities have been determined to be liquid under guidelines established by the Board of Trustees. |
| (D) | Floating Rate Instrument. The rate reflected on the Schedule of Investments is the rate in effect on July 31, 2010. The demand and interest rate reset features give this security a shorter effective maturity date. |
| (E) | Tri-Party Repurchase Agreement. |
DN — Discount Note
FFCB — Federal Farm Credit Bank
FHLB — Federal Home Loan Bank
FHLMC — Federal Home Loan Mortgage Corporation
FNMA — Federal National Mortgage Association
GNMA — Government National Mortgage Association
GO — General Obligation
LLC — Limited Liability Company
MTN — Medium Term Note
PLC — Public Limited Company
RB — Revenue Bond
Ser — Series
As of July 31, 2010, all of the Fund’s investments are Level 2 in accordance with ASC 820. For more information on valuation inputs, see Note 2 — Significant Accounting Policies in Notes to Financial Statements.
The accompanying notes are an integral part of the financial statements.
| SEI Daily Income Trust / Semi-Annual Report / July 31, 2010 | 3 |
Table of Contents
SCHEDULE OF INVESTMENTS (Unaudited)
Government Fund
July 31, 2010
| Description | Face Amount ($ Thousands) | Value ($ Thousands) | ||||
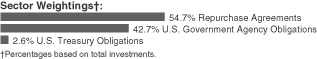
U.S. GOVERNMENT AGENCY OBLIGATIONS — 43.8% | ||||||
FFCB | ||||||
0.336%, 08/01/10 (A) | $ | 10,000 | $ | 9,997 | ||
FHLB | ||||||
0.160%, 08/07/10 (A) | 35,000 | 34,997 | ||||
1.400%, 09/23/10 | 4,000 | 4,007 | ||||
0.270%, 10/26/10 | 20,000 | 19,999 | ||||
0.260%, 01/14/11 to 02/04/11 | 47,000 | 46,993 | ||||
FHLB DN | ||||||
0.200%, 09/10/10 (B) | 26,000 | 25,994 | ||||
FHLB, Ser 2 | ||||||
3.050%, 09/10/10 | 1,000 | 1,003 | ||||
3.000%, 12/10/10 | 15,000 | 15,147 | ||||
FHLMC MTN | ||||||
0.607%, 09/09/10 (A) | 50,000 | 50,064 | ||||
1.450%, 09/10/10 | 9,017 | 9,029 | ||||
4.440%, 10/20/10 | 25,000 | 25,228 | ||||
FHLMC | ||||||
0.581%, 10/07/10 (A) | 63,000 | 63,011 | ||||
3.125%, 10/25/10 | 24,000 | 24,161 | ||||
FHLMC DN | ||||||
0.223%, 08/09/10 (B) | 38,652 | 38,650 | ||||
0.215%, 08/13/10 (B) | 25,000 | 24,998 | ||||
0.250%, 08/23/10 to 10/25/10 (B) | 31,000 | 30,992 | ||||
FHLMC, Ser 1 | ||||||
0.204%, 08/01/10 (A) | 35,000 | 35,000 | ||||
FHLMC DN, Ser RB | ||||||
0.220%, 08/05/10 (B) | 15,000 | 15,000 | ||||
0.200%, 08/17/10 (B) | 25,000 | 24,998 | ||||
FNMA | ||||||
3.250%, 08/12/10 | 23,903 | 23,925 | ||||
FNMA DN | ||||||
1.690%, 10/01/10 (B) | 15,000 | 14,994 | ||||
0.230%, 10/06/10 (B) | 23,000 | 22,990 | ||||
0.260%, 11/03/10 (B) | 25,000 | 24,983 | ||||
Total U.S. Government Agency Obligations | 586,160 | |||||
U.S. TREASURY OBLIGATION — 2.6% | ||||||
U.S. Treasury Notes | ||||||
2.000%, 09/30/10 | 35,000 | 35,092 | ||||
Total U.S. Treasury Obligation | 35,092 | |||||
| Description | Face Amount ($ Thousands) | Value ($ Thousands) | ||||
REPURCHASE AGREEMENTS (C) — 56.1% | ||||||
BNP Paribas 0.220%, dated 07/30/10, to be repurchased on 08/02/10, repurchase price $65,001,192 (collateralized by various corporate obligations*, ranging in par value $28,864,887-$37,421,281, 1.625%-1.625%, 01/07/11-07/15/11, with total market value $66,950,000) | $ | 65,000 | $ | 65,000 | ||
Deutsche Bank 0.200%, dated 07/30/10, to be repurchased on 08/02/10, repurchase price $231,143,852 (collateralized by various FHLMC/FNMA obligations, ranging in par value $18,658,000-$214,129,000, 0.000%-2.875%, 10/12/10-10/25/10, with total market value $235,763,424) | 231,140 | 231,140 | ||||
Deutsche Bank 0.190%, dated 07/30/10, to be repurchased on 08/02/10, repurchase price $59,667,945 (collateralized by a U.S. Treasury Bill, par value $60,875,500, 0.000%, 09/23/10, with total market value $60,860,342) | 59,667 | 59,667 | ||||
Goldman Sachs 0.220%, dated 07/30/10, to be repurchased on 08/02/10, repurchase price $65,001,192 (collateralized by various corporate obligations*, ranging in par value $24,078,416-$40,908,773, 1.875%-2.250%, 03/13/12-10/22/12, with total market value $66,951,228) | 65,000 | 65,000 | ||||
Morgan Stanley 0.220%, dated 07/30/10, to be repurchased on 08/02/10, repurchase price $65,001,192 (collateralized by GE Capital, par value $64,705,684, 2.250%, 03/12/12, with total market value $66,950,001) | 65,000 | 65,000 | ||||
UBS 0.220%, dated 07/30/10, to be repurchased on 08/02/10, repurchase price $65,004,238 (collateralized by various corporate obligations*, ranging in par value $650,000-$35,065,000, 1.269%-3.150%, 12/09/11-06/22/12, with total market value $66,954,363) | 65,000 | 65,000 | ||||
| 4 | SEI Daily Income Trust / Semi-Annual Report / July 31, 2010 |
Table of Contents
| Description | Face Amount ($ Thousands) | Value ($ Thousands) | ||||
UBS 0.210%, dated 07/30/10, to be repurchased on 08/02/10, repurchase price $200,000,223 (collateralized by various RFCO obligations, ranging in par value $10,000-$34,020,000, 0.000%-0.000%, 10/15/10-01/15/30, with total market value $204,000,227) | $ | 200,000 | $ | 200,000 | ||
Total Repurchase Agreements | 750,807 | |||||
Total Investments — 102.5% | $ | 1,372,059 | ||||
| * | A summary of the corporate obligations used to collateralize repurchase agreements entered into by the Fund at July 30, 2010, is as follows: |
| Counterparty | Corporate Obligation | Rate | Maturity Date | Par Amount ($ Thousands) | ||||||
BNP Paribas | GE Capital | 1.625 | % | 01/07/11 | $ | 28,865 | ||||
Goldman Sachs | 1.625 | 07/15/11 | 37,421 | |||||||
Goldman Sachs | Citigroup Funding | 1.875 | 10/22/12 | 40,909 | ||||||
Morgan Stanley | 2.250 | 03/13/12 | 24,078 | |||||||
UBS | American Express | 3.150 | 12/09/11 | 35,065 | ||||||
Citigroup Funding | 1.269 | 12/09/11 | 650 | |||||||
PNC Funding | 2.300 | 06/22/12 | 28,880 | |||||||
Percentages are based on Net Assets of $1,338,260 ($ Thousands).
| (A) | Floating Rate Instrument. The rate reflected on the Schedule of Investments is the rate in effect on July 31, 2010. The demand and interest rate reset features give this security a shorter effective maturity date. |
| (B) | The rate reported is the effective yield at time of purchase. |
| (C) | Tri-Party Repurchase Agreement. |
DN — Discount Note
FFCB — Federal Farm Credit Bank
FHLB — Federal Home Loan Bank
| FHLMC | — Federal Home Loan Mortgage Corporation |
| FNMA | — Federal National Mortgage Association |
| MTN | — Medium Term Note |
| RFCO | — Resolution Funding Corporation |
| Ser | — Series |
As of July 31, 2010, all of the Fund’s investments are Level 2 in accordance with ASC 820. For more information on valuation inputs, see Note 2 — Significant Accounting Policies in Notes to Financial Statements.
The accompanying notes are an integral part of the financial statements.
| SEI Daily Income Trust / Semi-Annual Report / July 31, 2010 | 5 |
Table of Contents
SCHEDULE OF INVESTMENTS (Unaudited)
Government II Fund
July 31, 2010
| Description | Face Amount ($ Thousands) | Value ($ Thousands) | ||||
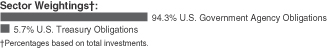
U.S. GOVERNMENT AGENCY OBLIGATIONS — 94.3% | ||||||
FFCB | ||||||
0.336%, 08/01/10 (A) | $ | 15,000 | $ | 14,995 | ||
FHLB | ||||||
0.160%, 08/07/10 (A) | 45,000 | 44,996 | ||||
4.375%, 10/22/10 | 21,215 | 21,409 | ||||
0.270%, 10/26/10 | 25,000 | 24,998 | ||||
0.375%, 11/05/10 | 15,000 | 15,006 | ||||
0.260%, 01/14/11 | 12,000 | 11,999 | ||||
0.250%, 01/27/11 | 11,500 | 11,499 | ||||
FHLB DN | ||||||
0.060%, 08/02/10 (B) | 81,466 | 81,466 | ||||
0.100%, 08/03/10 (B) | 17,000 | 17,000 | ||||
0.178%, 08/04/10 (B) | 107,950 | 107,948 | ||||
0.182%, 08/06/10 (B) | 26,000 | 25,999 | ||||
0.191%, 08/11/10 (B) | 55,000 | 54,997 | ||||
0.183%, 08/13/10 (B) | 82,000 | 81,995 | ||||
0.170%, 08/17/10 (B) | 17,000 | 16,999 | ||||
0.198%, 08/18/10 (B) | 44,085 | 44,081 | ||||
0.186%, 08/20/10 (B) | 35,000 | 34,997 | ||||
0.195%, 08/25/10 (B) | 46,660 | 46,654 | ||||
0.210%, 08/27/10 (B) | 10,000 | 9,998 | ||||
0.180%, 09/01/10 to 10/25/10 (B) | 35,300 | 35,291 | ||||
0.173%, 09/03/10 (B) | 22,300 | 22,296 | ||||
0.176%, 09/08/10 (B) | 42,000 | 41,992 | ||||
0.187%, 09/10/10 (B) | 79,235 | 79,219 | ||||
0.194%, 09/15/10 (B) | 106,500 | 106,474 | ||||
0.199%, 10/01/10 (B) | 35,000 | 34,988 | ||||
0.200%, 10/06/10 to 10/08/10 (B) | 42,000 | 41,984 | ||||
0.190%, 10/13/10 to 10/27/10 (B) | 98,000 | 97,959 | ||||
0.193%, 10/15/10 (B) | 28,000 | 27,989 | ||||
0.190%, 10/20/10 (B) | 45,000 | 44,981 | ||||
0.250%, 01/21/11 (B) | 35,000 | 34,958 | ||||
FHLB, Ser 2 | ||||||
3.000%, 12/10/10 | 10,000 | 10,098 | ||||
FHLB, Ser 3 | ||||||
0.280%, 11/10/10 | 15,000 | 14,998 | ||||
Total U.S. Government Agency Obligations | 1,260,263 | |||||
| Description | Face Amount ($ Thousands) | Value ($ Thousands) | ||||
U.S. TREASURY OBLIGATIONS — 5.7% | ||||||
U.S. Treasury Bills (A) | ||||||
0.125%, 08/12/10 | $ | 66,000 | $ | 65,997 | ||
U.S. Treasury Notes | ||||||
2.000%, 09/30/10 | 10,000 | 10,029 | ||||
Total U.S. Treasury Obligations | 76,026 | |||||
Total Investments — 100.0% | $ | 1,336,289 | ||||
Percentages are based on Net Assets of $1,336,575 ($ Thousands).
| (A) | Floating Rate Instrument. The rate reflected on the Schedule of Investments is the rate in effect on July 31, 2010. The demand and interest rate reset features give this security a shorter effective maturity date. |
| (B) | The rate reported is the effective yield at time of purchase. |
DN — Discount Note
FFCB — Federal Farm Credit Bank
FHLB — Federal Home Loan Bank
Ser — Series
As of July 31, 2010, all of the Fund’s investments are Level 2 in accordance with ASC 820. For more information on valuation inputs, see Note 2 — Significant Accounting Policies in Notes to Financial Statements.
The accompanying notes are an integral part of the financial statements.
| 6 | SEI Daily Income Trust / Semi-Annual Report / July 31, 2010 |
Table of Contents
SCHEDULE OF INVESTMENTS (Unaudited)
Prime Obligation Fund
July 31, 2010
| Description | Face Amount ($ Thousands) | Value ($ Thousands) | ||||
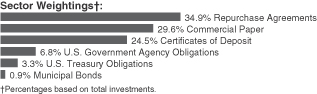
COMMERCIAL PAPER (A) (B) — 29.6% | ||||||
American Honda Finance | ||||||
0.370%, 09/02/10 | $ | 25,000 | $ | 24,992 | ||
0.390%, 09/21/10 | 8,000 | 7,996 | ||||
Argento Variable Funding LLC | ||||||
0.350%, 08/02/10 | 13,000 | 13,000 | ||||
0.360%, 08/03/10 | 7,000 | 7,000 | ||||
0.460%, 08/31/10 | 26,000 | 25,990 | ||||
Atlantis One Funding | ||||||
0.435%, 10/01/10 | 14,600 | 14,589 | ||||
0.552%, 01/18/11 | 21,000 | 20,945 | ||||
Cancara Asset Securitisation LLC | ||||||
0.501%, 10/18/10 | 24,000 | 23,974 | ||||
Chariot Funding LLC | ||||||
0.400%, 10/13/10 | 8,000 | 7,993 | ||||
Clipper Receivables LLC | ||||||
0.451%, 10/05/10 to 10/08/10 | 33,000 | 32,973 | ||||
Coca-Cola | ||||||
0.371%, 01/03/11 | 22,000 | 21,965 | ||||
Fairway Finance LLC | ||||||
0.491%, 09/02/10 | 7,000 | 6,997 | ||||
0.380%, 10/12/10 | 12,000 | 11,991 | ||||
Falcon Asset Securitization LLC | ||||||
0.430%, 09/24/10 | 8,000 | 7,995 | ||||
0.451%, 01/25/11 | 5,000 | 4,989 | ||||
FCAR Owner Trust | ||||||
0.500%, 09/02/10 | 4,000 | 3,998 | ||||
0.501%, 09/07/10 to 10/04/10 | 100,000 | 99,917 | ||||
Gemini Securitization LLC | ||||||
0.551%, 08/27/10 | 3,000 | 2,999 | ||||
0.501%, 09/28/10 | 5,000 | 4,996 | ||||
0.420%, 10/22/10 | 23,000 | 22,978 | ||||
General Electric Capital | ||||||
0.481%, 09/02/10 | 36,000 | 35,985 | ||||
0.461%, 09/15/10 | 40,000 | 39,977 | ||||
0.370%, 10/07/10 | 26,000 | 25,982 | ||||
0.483%, 01/18/11 | 30,000 | 29,932 | ||||
Grampian Funding LLC | ||||||
0.450%, 09/08/10 | 42,300 | 42,280 | ||||
0.531%, 10/18/10 | 4,000 | 3,995 | ||||
Jupiter Securitization LLC | ||||||
0.400%, 10/08/10 | 43,000 | 42,967 | ||||
0.481%, 01/21/11 | 44,700 | 44,597 | ||||
| Description | Face Amount ($ Thousands) | Value ($ Thousands) | ||||
Liberty Street Funding LLC | ||||||
0.501%, 09/03/10 | $ | 4,000 | $ | 3,998 | ||
0.471%, 09/13/10 | 20,000 | 19,989 | ||||
0.420%, 09/24/10 | 2,000 | 1,999 | ||||
0.400%, 10/12/10 | 4,000 | 3,997 | ||||
Market Street Funding LLC | ||||||
0.501%, 09/02/10 | 3,000 | 2,999 | ||||
0.481%, 09/10/10 | 12,000 | 11,994 | ||||
0.400%, 10/12/10 | 39,000 | 38,969 | ||||
0.390%, 10/13/10 | 6,000 | 5,995 | ||||
MetLife Short Term Funding LLC | ||||||
0.531%, 09/07/10 | 36,750 | 36,730 | ||||
0.521%, 09/13/10 | 5,000 | 4,997 | ||||
0.511%, 10/01/10 | 18,000 | 17,984 | ||||
0.501%, 10/04/10 to 10/19/10 | 55,300 | 55,250 | ||||
0.491%, 10/12/10 | 15,000 | 14,985 | ||||
National Australia Funding | ||||||
0.420%, 09/13/10 | 26,600 | 26,587 | ||||
Nestle Capital | ||||||
0.300%, 09/07/10 | 23,000 | 22,993 | ||||
0.310%, 10/04/10 | 5,000 | 4,997 | ||||
Nestle Finance International | ||||||
0.270%, 08/24/10 | 16,000 | 15,997 | ||||
0.350%, 10/12/10 | 8,000 | 7,994 | ||||
NRW.BANK | ||||||
0.500%, 10/06/10 | 21,000 | 20,981 | ||||
Old Line Funding LLC | ||||||
0.481%, 09/01/10 to 09/02/10 | 13,665 | 13,659 | ||||
0.430%, 10/01/10 | 10,000 | 9,993 | ||||
Royal Park Investments Funding | ||||||
0.440%, 10/25/10 (C) | 10,750 | 10,739 | ||||
Shell International Finance | ||||||
0.451%, 01/03/11 | 32,000 | 31,938 | ||||
Straight-A Funding LLC | ||||||
0.350%, 10/12/10 | 29,000 | 28,980 | ||||
Thunder Bay Funding LLC | ||||||
0.340%, 08/02/10 | 10,737 | 10,737 | ||||
0.481%, 09/01/10 to 09/13/10 | 13,000 | 12,993 | ||||
0.400%, 10/06/10 | 36,000 | 35,974 | ||||
Total Capital Canada | ||||||
0.471%, 01/13/11 to 01/14/11 | 22,000 | 21,952 | ||||
Toyota Credit Canada | ||||||
0.571%, 09/03/10 | 5,000 | 4,997 | ||||
0.561%, 09/13/10 | 35,000 | 34,977 | ||||
0.551%, 09/21/10 | 18,000 | 17,986 | ||||
0.541%, 09/22/10 | 15,000 | 14,988 | ||||
Toyota Financial Services de Puerto Rico | ||||||
0.581%, 09/07/10 | 4,000 | 3,998 | ||||
0.491%, 10/18/10 | 4,500 | 4,495 | ||||
Toyota Motor Credit | ||||||
0.581%, 09/13/10 | 26,000 | 25,982 | ||||
0.501%, 10/01/10 | 21,000 | 20,982 | ||||
0.470%, 10/12/10 | 34,000 | 33,968 | ||||
0.491%, 11/12/10 | 16,000 | 15,978 | ||||
| SEI Daily Income Trust / Semi-Annual Report / July 31, 2010 | 7 |
Table of Contents
SCHEDULE OF INVESTMENTS (Unaudited)
Prime Obligation Fund (Continued)
July 31, 2010
| Description | Face Amount ($ Thousands) | Value ($ Thousands) | ||||
Variable Funding Capital LLC | ||||||
0.400%, 08/09/10 | $ | 10,000 | $ | 9,999 | ||
0.481%, 09/01/10 | 6,000 | 5,997 | ||||
Total Commercial Paper | 1,324,739 | |||||
CERTIFICATES OF DEPOSIT — 24.5% | ||||||
Bank of Nova Scotia | ||||||
0.450%, 01/18/11 | 19,000 | 19,000 | ||||
Bank of Tokyo-Mitsubishi | ||||||
0.550%, 09/10/10 | 16,000 | 16,000 | ||||
Bank of Tokyo-Mitsubishi UFJ NY | ||||||
0.550%, 09/21/10 | 20,000 | 20,000 | ||||
0.550%, 09/21/10 | 40,000 | 40,000 | ||||
0.550%, 09/23/10 | 31,000 | 31,000 | ||||
Barclays Bank PLC | ||||||
0.400%, 09/13/10 | 16,000 | 16,000 | ||||
0.440%, 09/27/10 | 7,000 | 7,000 | ||||
0.500%, 10/06/10 | 60,000 | 60,000 | ||||
0.500%, 10/12/10 | 52,000 | 52,000 | ||||
BNP Paribas | ||||||
0.570%, 09/02/10 | 24,000 | 24,000 | ||||
0.630%, 09/13/10 | 82,000 | 82,000 | ||||
0.630%, 09/14/10 | 29,000 | 29,000 | ||||
0.590%, 11/16/10 | 20,000 | 20,000 | ||||
Caisse Cent Desjardins | ||||||
0.450%, 10/13/10 | 28,000 | 28,000 | ||||
0.460%, 10/15/10 | 21,000 | 21,000 | ||||
0.470%, 10/20/10 | 24,000 | 24,000 | ||||
Credit Agricole | ||||||
0.300%, 08/02/10 | 3,000 | 3,000 | ||||
0.320%, 08/23/10 | 28,000 | 28,000 | ||||
Credit Agricole Corporate and Investment Bank | ||||||
0.520%, 10/25/10 | 34,000 | 34,000 | ||||
0.520%, 11/01/10 | 30,000 | 30,000 | ||||
Credit Industriel et Commercial | ||||||
0.580%, 08/16/10 | 16,000 | 16,000 | ||||
0.580%, 08/16/10 | 24,000 | 24,000 | ||||
Deitsche Bank | ||||||
0.520%, 09/15/10 | 10,000 | 10,000 | ||||
HSBC Bank PLC | ||||||
0.320%, 08/25/10 | 37,000 | 37,000 | ||||
0.400%, 10/06/10 | 21,000 | 21,000 | ||||
National Australia Bank | ||||||
0.435%, 10/01/10 | 5,000 | 5,000 | ||||
0.435%, 10/01/10 | 9,000 | 9,000 | ||||
Nordea Bank Finland PLC | ||||||
0.510%, 09/03/10 | 12,000 | 12,000 | ||||
0.540%, 01/10/11 | 26,000 | 26,000 | ||||
Rabobank Nederland | ||||||
0.570%, 01/10/11 | 26,000 | 26,000 | ||||
| Description | Face Amount ($ Thousands) | Value ($ Thousands) | ||||
Societe Generale | ||||||
0.345%, 08/02/10 | $ | 48,000 | $ | 48,000 | ||
0.340%, 08/02/10 | 26,000 | 26,000 | ||||
0.340%, 08/04/10 | 43,000 | 43,000 | ||||
Sumitomo Mitsui Banking | ||||||
0.490%, 09/29/10 | 21,000 | 21,000 | ||||
Svenska Handelsbanken | ||||||
0.520%, 08/30/10 | 22,000 | 22,000 | ||||
0.470%, 09/22/10 | 17,000 | 17,001 | ||||
Svenska Handlesbanken | ||||||
0.480%, 12/09/10 | 5,050 | 5,051 | ||||
UBS | ||||||
0.590%, 09/17/10 | 63,000 | 63,000 | ||||
0.470%, 10/18/10 | 38,000 | 38,000 | ||||
0.450%, 10/20/10 | 43,000 | 43,000 | ||||
Total Certificates of Deposit | 1,096,052 | |||||
U.S. GOVERNMENT AGENCY OBLIGATIONS — 6.8% | ||||||
FFCB | ||||||
0.431%, 10/20/10 (A) | 12,000 | 12,000 | ||||
FHLB | ||||||
0.160%, 08/07/10 (D) | 24,000 | 23,998 | ||||
0.285%, 10/29/10 (D) | 12,000 | 12,000 | ||||
FHLMC | ||||||
0.581%, 10/07/10 (D) | 50,600 | 50,609 | ||||
FHLMC MTN | ||||||
0.607%, 09/09/10 (D) | 90,000 | 90,120 | ||||
0.525%, 10/30/10 (D) | 2,000 | 2,002 | ||||
FHLMC DN | ||||||
0.300%, 10/13/10 (A) | 14,000 | 13,994 | ||||
0.311%, 11/10/10 (A) | 13,071 | 13,060 | ||||
FHLMC, Ser 1 | ||||||
0.204%, 08/01/10 (D) | 35,000 | 35,002 | ||||
FHLMC DN, Ser RB | ||||||
0.000%, 11/23/10 (A) | 22,000 | 21,979 | ||||
0.250%, 01/18/11 (A) | 17,000 | 16,980 | ||||
FNMA DN | ||||||
0.250%, 01/19/11 (A) | 11,000 | 10,987 | ||||
FNMA DN | ||||||
0.250%, 10/01/10 (A) | 4,000 | 3,998 | ||||
Total U.S. Government Agency Obligations | 306,729 | |||||
U.S. TREASURY OBLIGATIONS — 3.3% | ||||||
U.S. Treasury Bills (A) | ||||||
0.180%, 08/26/10 | 23,000 | 22,997 | ||||
0.230%, 09/23/10 | 16,000 | 15,995 | ||||
0.265%, 10/07/10 | 20,000 | 19,990 | ||||
0.220%, 12/30/10 | 20,000 | 19,982 | ||||
0.205%, 01/06/11 | 40,000 | 39,964 | ||||
| 8 | SEI Daily Income Trust / Semi-Annual Report / July 31, 2010 |
Table of Contents
| Description | Face Amount ($ Thousands) | Value ($ Thousands) | ||||
U.S. Treasury Notes | ||||||
2.000%, 09/30/10 | $ | 19,000 | $ | 19,050 | ||
1.250%, 11/30/10 | 11,000 | 11,035 | ||||
Total U.S. Treasury Obligations | 149,013 | |||||
MUNICIPAL BONDS — 0.9% | ||||||
Colorado — 0.3% | ||||||
Colorado State, City of Colorado Springs, Ser C | ||||||
0.230%, 08/05/10 (D) | 3,500 | 3,500 | ||||
Colorado State, Housing & Finance Authority, Ser A1, RB | ||||||
0.310%, 08/04/10 (D) | 3,200 | 3,200 | ||||
0.230%, 08/04/10 (D) | 1,825 | 1,825 | ||||
0.230%, 08/04/10 (D) | 900 | 900 | ||||
Colorado State, Housing & Finance Authority, Ser B1, RB | ||||||
0.300%, 08/04/10 (D) | 3,950 | 3,950 | ||||
Colorado State, Housing & Finance Authority, Ser C1, RB | ||||||
0.210%, 08/04/10 (D) | 1,000 | 1,000 | ||||
Colorado State, Housing & Finance Authority, Ser CL1, RB | ||||||
0.230%, 08/04/10 (D) | 600 | 600 | ||||
| 14,975 | ||||||
Connecticut — 0.0% | ||||||
Connecticut State, Housing & Finance Authority, Sub-Ser A-5, RB | ||||||
0.296%, 08/05/10 (D) | 1,335 | 1,335 | ||||
Iowa — 0.3% | ||||||
Iowa State, Finance Authority, Ser B, RB | ||||||
0.220%, 08/05/10 (D) | 1,000 | 1,000 | ||||
Iowa State, Finance Authority, Ser C, RB | ||||||
0.296%, 08/05/10 (D) | 10,820 | 10,820 | ||||
Iowa State, Finance Authority, Ser M, RB | ||||||
0.230%, 08/05/10 (D) | 900 | 900 | ||||
| 12,720 | ||||||
New Hampshire — 0.1% | ||||||
New Hampshire State, Health & Education Facilities Authority, Ser C, RB | ||||||
0.340%, 08/04/10 (D) | 1,460 | 1,460 | ||||
New Mexico — 0.0% | ||||||
New Mexico State, Finance Authortiy, Sub-Ser D, GO | ||||||
0.310%, 08/05/10 (D) | 1,000 | 1,000 | ||||
| Description | Face Amount ($ Thousands) | Value ($ Thousands) | ||||
Texas — 0.2% | ||||||
Texas State, GO | ||||||
0.380%, 08/03/10 (D) | $ | 1,820 | $ | 1,820 | ||
0.320%, 08/03/10 (D) | 3,300 | 3,300 | ||||
Texas State, Small Business Project, Ser B, GO | ||||||
0.340%, 08/05/10 (D) | 585 | 585 | ||||
Texas State, Ser A2, GO | ||||||
0.296%, 08/04/10 (D) | 400 | 400 | ||||
Texas State, Ser C, GO | ||||||
0.250%, 08/04/10 (D) | 1,000 | 1,000 | ||||
| 7,105 | ||||||
Wisconsin — 0.0% | ||||||
Wisconsin State, Housing & Economic Development Authority, Ser D, RB | ||||||
0.395%, 08/04/10 (D) | 340 | 340 | ||||
Total Municipal Bonds | 38,935 | |||||
REPURCHASE AGREEMENTS (E) — 34.9% | ||||||
Barclays Capital 0.220%, dated 07/30/10, to be repurchased on 08/02/10, repurchase price $200,003,667 (collateralized by FNMA, par value $204,676,000, 0.000%, 07/11/11, with total market value $204,000,569) | 200,000 | 200,000 | ||||
Barclays Capital 0.220%, dated 07/30/10, to be repurchased on 08/02/10, repurchase price $200,003,667 (collateralized by various FHLMC/GNMA obligations, ranging in par value $7,585,234-$29,300,000, 3.299%-6.000%, 03/01/19-07/01/40, with total market value $204,000,000) | 200,000 | 200,000 | ||||
BNP Paribas 0.340%, dated 07/30/10, to be repurchased on 08/02/10, repurchase price $58,001,643 (collateralized by Federal Republic of Brazil, par value $44,206,292, 8.875%, 10/14/19, with total market value $60,900,000) | 58,000 | 58,000 | ||||
BNP Paribas 0.210%, dated 07/30/10, to be repurchased on 08/02/10, repurchase price $150,002,625 (collateralized by various FHLMC/FNMA/GNMA obligations, ranging in par value $1,005,223-$71,876,465, 1.911%-7.500%, 11/01/18-07/15/40, with total market value $153,000,000) | 150,000 | 150,000 | ||||
| SEI Daily Income Trust / Semi-Annual Report / July 31, 2010 | 9 |
Table of Contents
SCHEDULE OF INVESTMENTS (Unaudited)
Prime Obligation Fund (Concluded)
July 31, 2010
| Description | Face Amount ($ Thousands) | Value ($ Thousands) | ||||
Deutsche Bank 0.310%, dated 07/30/10, to be repurchased on 08/02/10, repurchase price $13,000,336 (collateralized by BP Capital Markets PLC, par value $14,104,017, 3.875%, 03/10/15, with total market value $13,650,001) | $ | 13,000 | $ | 13,000 | ||
Goldman Sachs 0.210%, dated 07/30/10, to be repurchased on 08/02/10, repurchase price $400,007,000 (collateralized by various GNMA obligations, ranging in par value $67,244,559-$180,000,000, 4.500%-6.500%, 01/15/39- 02/15/39, with total market value $408,007,140) | 400,000 | 400,000 | ||||
JPMorgan Chase 0.360%, dated 07/30/10, to be repurchased on 08/02/10, repurchase price $22,004,980 (collateralized by Yum! Brands, par value $19,720,000, 6.250%, 03/15/18, with total market value $23,105,228) | 22,000 | 22,000 | ||||
JPMorgan Chase 0.200%, dated 07/30/10, to be repurchased on 08/02/10, repurchase price $200,003,866 (collateralized by various FNMA obligations, ranging in par value $11,827,925-$75,679,128, 0.000%-0.000%, 11/01/29-08/01/40, with total market value $204,003,941) | 200,000 | 200,000 | ||||
Morgan Stanley 0.210%, dated 07/30/10, to be repurchased on 08/02/10, repurchase price $198,003,465 (collateralized by various FNMA obligations, ranging in par value $1,739-$337,189, 3.500%- 6.000%, 04/01/19-07/01/40, with total market value $202,851,399) | 198,000 | 198,000 | ||||
RBS 0.210%, dated 07/30/10, to be repurchased on 08/02/10, repurchase price $117,171,820 (collateralized by various GNMA obligations, ranging in par value $200,000-$21,257,672, 3.250%-6.000%, 08/20/32-07/20/40, with total market value $119,515,258) | 117,170 | 117,170 | ||||
| Description | Face Amount ($ Thousands) | Value ($ Thousands) | ||||
UBS 0.310%, dated 07/30/10, to be repurchased on 08/02/10, repurchase price $3,000,162 (collateralized by various corporate obligations*, ranging in par value $651,000-$1,755,000, 5.250%-7.625%, 03/15/14-06/15/15, with total market value $3,150,170) | $ | 3,000 | $ | 3,000 | ||
Total Repurchase Agreements | 1,561,170 | |||||
Total Investments — 100.0% | $ | 4,476,638 | ||||
| * | A summary of the coproate obligations used to collateralize repurchase agreements entered into by the Fund at July 30, 2010, is as follows: |
| Counterparty | Corporate Obligation | Rate | Maturity Date | Par Amount ($ Thousands) | ||||||
UBS | Alcoa | 5.250 | % | 03/15/14 | $ | 651 | ||||
Qwest | 7.625 | 06/15/15 | 1,755 | |||||||
Percentages are based on Net Assets of $4,476,719 ($ Thousands).
| (A) | The rate reported is the effective yield at time of purchase. |
| (B) | Securities are held in connection with a letter of credit issued by a major bank. |
| (C) | Securities sold within terms of a private placement memorandum, exempt from registration under Section 144A of the Securities Act of 1933, as amended, and may be sold only to dealers in that program or other “accredited investors.” These securities have been determined to be liquid under guidelines established by the Board of Trustees. |
| (D) | Floating Rate Instrument. The rate reflected on the Schedule of Investments is the rate in effect on July 31, 2010. The demand and interest rate reset features give this security a shorter effective maturity date. |
| (E) | Tri-Party Repurchase Agreement. |
DN — Discount Note
FFCB — Federal Farm Credit Bank
FHLB — Federal Home Loan Bank
FHLMC — Federal Home Loan Mortgage Corporation
FNMA — Federal National Mortgage Association
GNMA — Government National Mortgage Association
GO — General Obligation
LLC — Limited Liability Company
MTN — Medium Term Note
PLC — Public Limited Company
RB — Revenue Bond
Ser — Series
As of July 31, 2010, all of the Fund’s investments are Level 2 in accordance with ASC 820. For more information on valuation inputs, see Note 2 — Significant Accounting Policies in Notes to Financial Statements.
The accompanying notes are an integral part of the financial statements.
| 10 | SEI Daily Income Trust / Semi-Annual Report / July 31, 2010 |
Table of Contents
SCHEDULE OF INVESTMENTS (Unaudited)
Treasury Fund
July 31, 2010

| Description | Face Amount ($ Thousands) | Value ($ Thousands) | ||||
U.S. TREASURY OBLIGATIONS — 25.3% | ||||||
U.S. Treasury Bills (A) | ||||||
0.183%, 08/26/10 | $ | 15,000 | $ | 14,998 | ||
0.196%, 09/02/10 | 35,000 | 34,994 | ||||
0.220%, 12/30/10 | 4,000 | 3,996 | ||||
0.205%, 01/06/11 | 15,000 | 14,986 | ||||
U.S. Treasury Notes | ||||||
2.000%, 09/30/10 | 22,000 | 22,058 | ||||
1.250%, 11/30/10 | 10,000 | 10,033 | ||||
0.875%, 12/31/10 to 02/28/11 | 14,000 | 14,041 | ||||
Total U.S. Treasury Obligations | 115,106 | |||||
REPURCHASE AGREEMENTS (B) — 68.0% | ||||||
BNP Paribas 0.210%, dated 07/30/10, to be repurchased on 08/02/10, repurchase price $119,002,083 (collateralized by U.S. Treasury Note, par value $114,797,800, 3.000%, 09/30/16, with total market value $121,380,080) | 119,000 | 119,000 | ||||
Citigroup 0.210%, dated 07/30/10, to be repurchased on 08/02/10, repurchase price $119,002,083 (collateralized by U.S. Treasury Bond, par value $82,498,000, 8.125%, 05/15/21, with total market value $121,380,123) | 119,000 | 119,000 | ||||
Deutsche Bank 0.190%, dated 07/30/10, to be repurchased on 09/01/10, repurchase price $54,044,856 (collateralized by various U.S. Treasury obligations, ranging in par value $8,693,306-$105,571,000, 0.000%-0.000%, 11/15/31-05/15/34, with total market value $55,124,880) (C) | 54,044 | 54,044 | ||||
Deutsche Bank 0.220%, dated 07/30/10, to be repurchased on 09/01/10, repurchase price $17,000,416 (collateralized by various U.S. Treasury obligations, ranging in par value $317,500-$31,859,916, 0.000%-0.000%, 08/15/23-11/15/25, with total market value $17,340,000) (C) | 17,000 | 17,000 | ||||
Total Repurchase Agreements | 309,044 | |||||
Total Investments — 93.3% | $ | 424,150 | ||||
Percentages are based on Net Assets of $454,692 ($ Thousands).
| (A) | The rate reported is the effective yield at time of purchase. |
| (B) | Tri-Party Repurchase Agreement. |
| (C) | Security considered illiquid. The total value of such securities as of July 31, 2010 was $71,044 ($Thousands) and represented 15.62% of Net Assets. |
As of July 31, 2010, all of the Fund’s investments are Level 2 in accordance with ASC 820. For more information on valuation inputs, see Note 2 — Significant Accounting Policies in Notes to Financial Statements.
The accompanying notes are an integral part of the financial statements.
| SEI Daily Income Trust / Semi-Annual Report / July 31, 2010 | 11 |
Table of Contents
SCHEDULE OF INVESTMENTS (Unaudited)
Treasury II Fund
July 31, 2010

| Description | Face Amount ($ Thousands) | Value ($ Thousands) | ||||
U.S. TREASURY OBLIGATIONS — 99.9% | ||||||
U.S. Treasury Bills (A) | ||||||
0.091%, 08/05/10 | $ | 62,632 | $ | 62,631 | ||
0.117%, 08/12/10 | 55,000 | 54,998 | ||||
0.130%, 08/19/10 | 55,000 | 54,996 | ||||
0.166%, 08/26/10 to 10/07/10 | 61,291 | 61,283 | ||||
0.146%, 09/02/10 | 35,000 | 34,996 | ||||
0.156%, 09/09/10 | 23,000 | 22,996 | ||||
0.158%, 09/16/10 | 70,000 | 69,986 | ||||
0.142%, 09/30/10 | 5,000 | 4,999 | ||||
0.148%, 10/14/10 | 20,000 | 19,994 | ||||
0.147%, 10/28/10 | 15,000 | 14,995 | ||||
0.165%, 11/18/10 | 15,282 | 15,274 | ||||
0.160%, 11/26/10 | 10,000 | 9,995 | ||||
0.220%, 12/30/10 | 13,000 | 12,990 | ||||
U.S. Treasury Notes | ||||||
2.375%, 08/31/10 | 35,000 | 35,062 | ||||
3.875%, 09/15/10 | 7,000 | 7,031 | ||||
2.000%, 09/30/10 | 10,000 | 10,031 | ||||
Total U.S. Treasury Obligations | 492,257 | |||||
Total Investments — 99.9% | $ | 492,257 | ||||
Percentages are based on Net Assets of $492,747 ($ Thousands).
| (A) | The rate reported is the effective yield at time of purchase. |
As of July 31, 2010, all of the Fund’s investments are Level 2 in accordance with ASC 820. For more information on valuation inputs, see Note 2 — Significant Accounting Policies in Notes to Financial Statements.
The accompanying notes are an integral part of the financial statements.
| 12 | SEI Daily Income Trust / Semi-Annual Report / July 31, 2010 |
Table of Contents
SCHEDULE OF INVESTMENTS (Unaudited)
Short-Duration Government Fund
July 31, 2010
| Description | Face Amount ($ Thousands) | Value ($ Thousands) | ||||
MORTGAGE-BACKED SECURITIES — 64.2% | ||||||
Agency Mortgage-Backed Obligations — 64.2% | ||||||
FHLMC | ||||||
7.375%, 09/01/18 (A) | $ | 7 | $ | 7 | ||
7.287%, 03/01/19 (A) | 22 | 23 | ||||
7.250%, 01/01/18 to 09/01/20 (A) | 44 | 46 | ||||
7.125%, 07/01/18 to 11/01/20 (A) | 16 | 16 | ||||
7.000%, 02/01/16 to 11/01/18 (A) | 31 | 33 | ||||
6.875%, 07/01/18 (A) | 21 | 22 | ||||
6.750%, 09/01/16 to 01/01/17 (A) | 11 | 11 | ||||
6.625%, 02/01/16 to 06/01/18 (A) | 9 | 9 | ||||
6.500%, 07/01/16 to 01/01/17 (A) | 15 | 15 | ||||
6.000%, 06/01/21 | 1,358 | 1,482 | ||||
4.500%, 07/01/23 to 01/01/39 | 19 | 20 | ||||
2.946%, 06/01/24 (A) | 57 | 60 | ||||
2.941%, 07/01/24 (A) | 21 | 22 | ||||
2.843%, 12/01/23 (A) | 160 | 167 | ||||
2.839%, 12/01/23 (A) | 2,350 | 2,454 | ||||
2.768%, 05/01/24 (A) | 62 | 64 | ||||
2.711%, 06/01/24 (A) | 127 | 132 | ||||
2.669%, 04/01/29 (A) | 109 | 113 | ||||
2.651%, 06/01/17 (A) | 33 | 35 | ||||
2.631%, 04/01/22 (A) | 60 | 60 | ||||
2.562%, 04/01/29 (A) | 49 | 51 | ||||
2.560%, 04/01/19 to 05/01/19 (A) | 50 | 53 | ||||
2.552%, 07/01/20 (A) | 5 | 5 | ||||
2.510%, 02/01/19 (A) | 28 | 29 | ||||
2.375%, 03/01/19 (A) | 32 | 33 | ||||
2.125%, 02/01/17 (A) | 3 | 3 | ||||
1.875%, 04/01/16 to 03/01/17 (A) | 13 | 13 | ||||
FHLMC REMIC, Ser 2004-2780, Cl LC | ||||||
5.000%, 07/15/27 | 794 | 814 | ||||
FHLMC REMIC, Ser 2004-2826, Cl BK | ||||||
5.000%, 01/15/18 | 463 | 477 | ||||
FHLMC REMIC, Ser 2587, Cl ET | ||||||
3.700%, 07/15/17 | 389 | 400 | ||||
FHLMC REMIC, Ser 2805, Cl DG | ||||||
4.500%, 04/15/17 | 424 | 435 | ||||
FHLMC REMIC, Ser 2975, Cl VT | ||||||
5.000%, 02/15/11 | 426 | 431 | ||||
FHLMC REMIC, Ser 3022, Cl MB | ||||||
5.000%, 12/15/28 | 1,340 | 1,383 | ||||
FHLMC REMIC, Ser 3029, Cl PE | ||||||
5.000%, 03/15/34 | 4,000 | 4,332 | ||||
FHLMC REMIC, Ser 3148, Cl CF | ||||||
0.741%, 02/15/34 (A) | 2,276 | 2,276 | ||||
FHLMC REMIC, Ser 3153, Cl FX | ||||||
0.691%, 05/15/36 (A) | 588 | 587 | ||||
| Description | Face Amount ($ Thousands) | Value ($ Thousands) | ||||
FHLMC REMIC, Ser 3628, Cl PJ | ||||||
4.500%, 01/15/40 | $ | 17,356 | $ | 18,932 | ||
FHLMC REMIC, Ser T-42, Cl A5 | ||||||
7.500%, 02/25/42 | 758 | 868 | ||||
FHLMC TBA | ||||||
5.000%, 08/15/18 | 42,000 | 44,868 | ||||
FNMA | ||||||
7.000%, 06/01/37 | 87 | 97 | ||||
6.500%, 05/01/26 to 09/01/36 | 1,707 | 1,880 | ||||
6.442%, 04/01/14 | 3,899 | 4,267 | ||||
6.000%, 02/01/23 to 09/01/24 | 51,781 | 56,373 | ||||
5.926%, 11/01/11 | 312 | 324 | ||||
5.890%, 10/01/11 | 2,216 | 2,299 | ||||
5.500%, 01/01/12 to 12/01/25 | 8,358 | 9,020 | ||||
5.300%, 07/01/19 | 1,483 | 1,662 | ||||
5.140%, 11/01/15 | 3,295 | 3,667 | ||||
5.090%, 11/01/15 | 4,200 | 4,671 | ||||
5.016%, 02/01/13 | 74 | 78 | ||||
4.975%, 12/01/13 | 1,436 | 1,562 | ||||
4.835%, 11/01/12 | 1,013 | 1,079 | ||||
4.830%, 02/01/13 | 2,226 | 2,385 | ||||
4.771%, 09/01/15 | 7,251 | 7,966 | ||||
4.621%, 04/01/13 | 108 | 115 | ||||
4.107%, 12/01/29 (A) | 138 | 138 | ||||
4.100%, 07/01/13 | 966 | 1,024 | ||||
2.938%, 08/01/29 (A) | 605 | 633 | ||||
2.846%, 09/01/24 (A) | 911 | 933 | ||||
2.752%, 09/01/25 (A) | 148 | 155 | ||||
2.473%, 02/01/27 (A) | 144 | 149 | ||||
2.451%, 05/01/28 (A) | 896 | 930 | ||||
2.178%, 08/01/27 (A) | 502 | 504 | ||||
FNMA REMIC, Ser 1992-61, Cl FA | ||||||
0.994%, 10/25/22 (A) | 159 | 161 | ||||
FNMA REMIC, Ser 1993-32, Cl H | ||||||
6.000%, 03/25/23 | 68 | 75 | ||||
FNMA REMIC, Ser 1993-5, Cl Z | ||||||
6.500%, 02/25/23 | 32 | 36 | ||||
FNMA REMIC, Ser 1994-77, Cl FB | ||||||
1.844%, 04/25/24 (A) | 14 | 15 | ||||
FNMA REMIC, Ser 2001-51, Cl QN | ||||||
6.000%, 10/25/16 | 185 | 202 | ||||
FNMA REMIC, Ser 2002-3, Cl PG | ||||||
5.500%, 02/25/17 | 1,033 | 1,127 | ||||
FNMA REMIC, Ser 2002-53, Cl FK | ||||||
0.729%, 04/25/32 (A) | 277 | 277 | ||||
FNMA REMIC, Ser 2003-76, Cl CA | ||||||
3.750%, 07/25/33 | 936 | 986 | ||||
FNMA REMIC, Ser 2004-15, Cl AN | ||||||
4.000%, 09/25/17 | 3,897 | 4,034 | ||||
FNMA REMIC, Ser 2004-75, Cl KA | ||||||
4.500%, 03/25/18 | 311 | 322 | ||||
FNMA REMIC, Ser 2005-114, Cl EZ | ||||||
5.500%, 01/25/36 | 204 | 205 | ||||
FNMA REMIC, Ser 2005-43, Cl EN | ||||||
5.000%, 05/25/19 | 755 | 779 | ||||
| SEI Daily Income Trust / Semi-Annual Report / July 31, 2010 | 13 |
Table of Contents
SCHEDULE OF INVESTMENTS (Unaudited)
Short-Duration Government Fund (Concluded)
July 31, 2010
| Description | Face Amount ($ Thousands) | Value ($ Thousands) | ||||
FNMA REMIC, Ser 2006-76, Cl QF | ||||||
0.729%, 08/25/36 (A) | $ | 3,044 | $ | 3,043 | ||
FNMA REMIC, Ser 2006-79, Cl DF | ||||||
0.679%, 08/25/36 (A) | 3,124 | 3,122 | ||||
FNMA REMIC, Ser 2007-47, Cl DA | ||||||
5.600%, 05/25/37 | 5,502 | 6,001 | ||||
FNMA REMIC, Ser 2010-4, Cl PL | ||||||
4.500%, 02/25/40 | 12,974 | 14,108 | ||||
FNMA TBA | ||||||
6.000%, 08/01/33 | 60,500 | 65,718 | ||||
5.000%, 08/15/18 | 95,100 | 101,579 | ||||
4.500%, 08/17/18 | 55,400 | 58,698 | ||||
GNMA | ||||||
7.500%, 01/15/11 to 02/15/11 | 3 | 3 | ||||
6.500%, 04/15/17 to 02/20/39 | 3,204 | 3,536 | ||||
6.000%, 06/15/16 to 09/15/19 | 568 | 617 | ||||
GNMA REMIC, Ser 2006-38, Cl XS, IO | ||||||
6.909%, 09/16/35 (A) | 212 | 39 | ||||
Total Mortgage-Backed Securities | 447,375 | |||||
U.S. GOVERNMENT AGENCY OBLIGATIONS — 24.1% | ||||||
FHLB | ||||||
3.250%, 09/12/14 | 13,400 | 14,308 | ||||
2.750%, 03/13/15 | 6,000 | 6,277 | ||||
FHLMC | ||||||
3.750%, 03/27/19 | 12,141 | 12,848 | ||||
2.500%, 04/23/14 | 2,500 | 2,610 | ||||
2.125%, 09/21/12 | 21,100 | 21,720 | ||||
FNMA | ||||||
5.000%, 03/15/16 | 24,800 | 28,738 | ||||
2.750%, 03/13/14 | 48,000 | 50,549 | ||||
1.500%, 06/26/13 | 30,500 | 30,975 | ||||
Total U.S. Government Agency Obligations | 168,025 | |||||
U.S. TREASURY OBLIGATION — 6.9% | ||||||
U.S. Treasury Note | ||||||
1.000%, 03/31/12 | 47,900 | 48,321 | ||||
Total U.S. Treasury Obligation | 48,321 | |||||
REPURCHASE AGREEMENTS (B) — 43.1% | ||||||
BNP Paribas 0.200%, dated 07/30/10, to be repurchased on 08/02/10, repurchase price $142,902,501 (collateralized by various FHLMC/FNMA/GNMA obligations, ranging in par value $276,570-$109,160,924, 4.000%-8.000%, 07/01/11-06/15/45, with total market value $145,758,000) | 142,900 | 142,900 | ||||
| Description | Face Amount ($ Thousands) | Value ($ Thousands) | ||||
JPMorgan Chase 0.210%, dated 07/30/10, to be repurchased on 08/02/10, repurchase price $157,104,298 (collateralized by various FHLMC/FNMA obligations, ranging in par value $590,998-$133,768,123, 0.000%-4.6130%, 09/01/19-03/01/50, with total market value $160,246,384) | $ | 157,100 | $ | 157,100 | ||
Total Repurchase Agreements | 300,000 | |||||
Total Investments — 138.3% | $ | 963,721 | ||||
Futures — A summary of the open futures contracts held by the Fund at July 31, 2010, is as follows (see Note 2 in Notes to Financial Statements):
| Type of Contract* | Number of Contracts Long (Short) | Expiration Date | Unrealized Appreciation (Depreciation) ($ Thousands) | ||||||
U.S. 10-Year Treasury Note | (184 | ) | Sep-2010 | $ | (633 | ) | |||
U.S. 2-Year Treasury Note | 513 | Oct-2010 | 672 | ||||||
U.S. 5-Year Treasury Note | (643 | ) | Oct-2010 | (2,042 | ) | ||||
| $ | (2,003 | ) | |||||||
| * | Counterparty: Goldman Sachs |
Percentages are based on Net Assets of $696,899 ($ Thousands).
| (A) | Floating Rate Instrument. The rate reflected on the Schedule of Investments is the rate in effect on July 31, 2010. The demand and interest rate reset features give this security a shorter effective maturity date. |
| (B) | Tri-Party Repurchase Agreement. |
Cl — Class
FHLB — Federal Home Loan Bank
FHLMC — Federal Home Loan Mortgage Corporation
FNMA — Federal National Mortgage Association
GNMA — Government National Mortgage Association
IO — Interest Only — face amount represents notional amount
REMIC — Real Estate Mortgage Investment Conduit
Ser — Series
TBA — To Be Announced
The following is a summary of the inputs used as of July 31, 2010 in valuing the Fund’s investments carried at value ($ Thousands):
| Investments in Securities | Level 1 | Level 2 | Level 3 | Total | ||||||||
Mortgage-Backed Securities | $ | — | $ | 447,375 | $ | — | $ | 447,375 | ||||
U.S. Government Agency Obligations | — | 168,025 | — | 168,025 | ||||||||
U.S. Treasury Obligation | — | 48,321 | — | 48,321 | ||||||||
Repurchase Agreements | — | 300,000 | — | 300,000 | ||||||||
Total | $ | — | $ | 963,721 | $ | — | $ | 963,721 | ||||
| Other Financial Instruments* | Level 1 | Level 2 | Level 3 | Total | ||||||||||
Futures | $ | (2,003 | ) | $ | — | $ | — | $ | (2,003 | ) | ||||
| * | Other Financial Instruments are valued at unrealized appreciation/depreciation. |
As of July 31, 2010, all of the Fund’s investments are Level 2 in accordance with ASC 820. For more information on valuation inputs, see Note 2 — Significant Accounting Policies in Notes to Financial Statements.
Amounts designated as “—” are $0 or have been rounded to $0.
The accompanying notes are an integral part of the financial statements.
| 14 | SEI Daily Income Trust / Semi-Annual Report / July 31, 2010 |
Table of Contents
SCHEDULE OF INVESTMENTS (Unaudited)
Intermediate-Duration Government Fund
July 31, 2010
| Description | Face Amount ($ Thousands) | Value ($ Thousands) | ||||
MORTGAGE-BACKED SECURITIES — 65.9% | ||||||
Agency Mortgage-Backed Obligations — 65.9% | ||||||
FHLMC | ||||||
6.500%, 01/01/18 to 12/01/32 | $ | 313 | $ | 350 | ||
6.000%, 09/01/24 | 1,026 | 1,132 | ||||
5.500%, 06/01/19 to 12/01/20 | 640 | 693 | ||||
FHLMC REMIC, Ser 1599, Cl C | ||||||
6.100%, 10/15/23 | 236 | 249 | ||||
FHLMC REMIC, Ser 165, Cl K | ||||||
6.500%, 09/15/21 | 12 | 12 | ||||
FHLMC REMIC, Ser 2586, Cl NK | ||||||
3.500%, 08/15/16 | 45 | 46 | ||||
FHLMC REMIC, Ser 2587, Cl ET | ||||||
3.700%, 07/15/17 | 224 | 231 | ||||
FHLMC REMIC, Ser 2622, Cl PE | ||||||
4.500%, 05/15/18 | 2,780 | 3,032 | ||||
FHLMC REMIC, Ser 2630, Cl HA | ||||||
3.000%, 01/15/17 | 467 | 475 | ||||
FHLMC REMIC, Ser 2635, Cl NJ | ||||||
3.000%, 03/15/17 | 142 | 145 | ||||
FHLMC REMIC, Ser 2748, Cl LE | ||||||
4.500%, 12/15/17 | 865 | 915 | ||||
FHLMC REMIC, Ser 2802, Cl PF | ||||||
0.688%, 09/15/33 (A) | 877 | 876 | ||||
FHLMC REMIC, Ser 3029, Cl PE | ||||||
5.000%, 03/15/34 | 1,300 | 1,408 | ||||
FHLMC TBA | ||||||
5.000%, 08/15/18 | 3,000 | 3,205 | ||||
FNMA | ||||||
9.500%, 05/01/18 | 30 | 33 | ||||
6.500%, 03/01/33 to 10/01/34 | 178 | 198 | ||||
6.450%, 10/01/18 | 577 | 671 | ||||
6.150%, 04/01/11 | 139 | 141 | ||||
6.000%, 02/01/23 | 726 | 792 | ||||
5.931%, 02/01/12 | 561 | 591 | ||||
5.920%, 06/01/14 | 483 | 536 | ||||
5.680%, 06/01/17 | 558 | 631 | ||||
5.626%, 12/01/11 | 1,556 | 1,629 | ||||
5.500%, 03/01/14 to 12/01/25 | 3,665 | 3,963 | ||||
5.034%, 08/01/15 | 379 | 421 | ||||
5.016%, 02/01/13 | 193 | 203 | ||||
4.771%, 09/01/15 | 1,269 | 1,394 | ||||
3.790%, 07/01/13 | 1,058 | 1,114 | ||||
FNMA REMIC, Ser 2001-51, Cl QN | ||||||
6.000%, 10/25/16 | 262 | 285 | ||||
| Description | Face Amount ($ Thousands) | Value ($ Thousands) | ||||
FNMA REMIC, Ser 2004-15, Cl AN | ||||||
4.000%, 09/25/17 | $ | 974 | $ | 1,009 | ||
FNMA REMIC, Ser 2005-114, Cl EZ | ||||||
5.500%, 01/25/36 | 64 | 64 | ||||
FNMA REMIC, Ser 2006-79, Cl DF | ||||||
0.613%, 08/25/36 (A) | 551 | 551 | ||||
FNMA REMIC, Ser 2007-47, Cl DA | ||||||
5.600%, 05/25/37 | 957 | 1,044 | ||||
FNMA REMIC, Ser 2010-4, Cl PL | ||||||
4.500%, 02/25/40 | 1,501 | 1,632 | ||||
FNMA TBA | ||||||
6.000%, 08/01/33 | 8,400 | 9,124 | ||||
5.000%, 08/15/18 | 10,900 | 11,643 | ||||
4.500%, 08/17/18 | 8,000 | 8,476 | ||||
GNMA | ||||||
8.750%, 07/20/17 to 07/20/17 | 9 | 9 | ||||
8.500%, 11/20/16 to 08/20/17 | 45 | 50 | ||||
7.500%, 11/15/25 to 09/15/36 | 81 | 92 | ||||
6.000%, 09/15/24 | 685 | 754 | ||||
Total Mortgage-Backed Securities | 59,819 | |||||
U.S. GOVERNMENT AGENCY OBLIGATIONS — 23.9% | ||||||
FHLMC | ||||||
3.750%, 03/27/19 | 2,012 | 2,129 | ||||
FNMA | ||||||
5.000%, 03/15/16 | 2,700 | 3,129 | ||||
3.000%, 09/16/14 | 650 | 689 | ||||
2.750%, 03/13/14 | 7,050 | 7,424 | ||||
1.500%, 06/26/13 | 8,200 | 8,328 | ||||
Total U.S. Government Agency Obligations | 21,699 | |||||
U.S. TREASURY OBLIGATIONS — 7.1% | ||||||
U.S. Treasury Notes | ||||||
2.500%, 03/31/15 | 5,200 | 5,444 | ||||
2.250%, 05/31/14 (C) | 500 | 521 | ||||
1.375%, 10/15/12 | 500 | 508 | ||||
Total U.S. Treasury Obligations | 6,473 | |||||
ASSET-BACKED SECURITY — 1.0% | ||||||
Small Business Administration, Ser 2005-P10B, Cl 1 | 824 | 881 | ||||
Total Asset-Backed Security | 881 | |||||
| SEI Daily Income Trust / Semi-Annual Report / July 31, 2010 | 15 |
Table of Contents
SCHEDULE OF INVESTMENTS (Unaudited)
Intermediate-Duration Government Fund (Concluded)
July 31, 2010
| Description | Face Amount ($ Thousands) | Value ($ Thousands) | ||||
REPURCHASE AGREEMENTS (B) — 36.7% | ||||||
BNP Paribas 0.200%, dated 07/30/10, to be repurchased on 08/01/10, repurchase price $16,600,291 (collateralized by various FHLMC/FNMA obligations, ranging in par value $130,610-$13,068,337, 4.000%-7.000%, 12/01/13- 07/01/40, with total market value $16,932,001) | $ | 16,600 | $ | 16,600 | ||
Credit Suisse 0.210%, dated 07/30/10, to be repurchased on 08/01/10, repurchase price $16,701,858 (collateralized by various FNMA obligations, ranging in par value $575,000-$3,213,493, 4.500%- 7.000%, 07/01/20-07/01/40, with total market value $17,035,895) | 16,700 | 16,700 | ||||
Total Repurchase Agreements | 33,300 | |||||
Total Investments — 134.6% | $ | 122,172 | ||||
Futures — A summary of the open futures contracts held by the Fund at July 31, 2010, is as follows (see Note 2 in Notes to Financial Statements):
| Type of Contract* | Number of Contracts Long��(Short) | Expiration Date | Unrealized Appreciation (Depreciation) ($ Thousands) | ||||||
U.S. 10-Year Treasury Note | (4 | ) | Sep-2010 | $ | (14 | ) | |||
U.S. 2-Year Treasury Note | (55 | ) | Oct-2010 | (73 | ) | ||||
U.S. 5-Year Treasury Note | 295 | Oct-2010 | 853 | ||||||
| $ | 766 | ||||||||
| * | Counterparty: Goldman Sachs |
Percentages are based on Net Assets of $90,749 ($ Thousands).
| (A) | Floating Rate Instrument. The rate reflected on the Schedule of Investments is the rate in effect on July 31, 2010. The demand and interest rate reset features give this security a shorter effective maturity date. |
| (B) | Tri-Party Repurchase Agreement. |
| (C) | Security, or portion thereof, has been pledged as collateral on open futures contracts. |
Cl — Class
FHLMC — Federal Home Loan Mortgage Corporation
FNMA — Federal National Mortgage Association
GNMA — Government National Mortgage Association
REMIC — Real Estate Mortgage Investment Conduit
Ser — Series
TBA — To Be Announced
The following is a summary of the inputs used as of July 31, 2010 in valuing the Fund’s investments carried at value ($ Thousands):
| Investments in Securities | Level 1 | Level 2 | Level 3 | Total | ||||||||
Mortgage-Backed Securities | $ | — | $ | 59,819 | $ | — | $ | 59,819 | ||||
U.S. Government Agency Obligations | — | 21,699 | — | 21,699 | ||||||||
U.S. Treasury Obligations | — | 6,473 | — | 6,473 | ||||||||
Asset-Backed Security | — | 881 | — | 881 | ||||||||
Repurchase Agreements | — | 33,300 | — | 33,300 | ||||||||
Total | $ | — | $ | 122,172 | $ | — | $ | 122,172 | ||||
| Other Financial Instruments* | Level 1 | Level 2 | Level 3 | Total | ||||||||
Futures | $ | 766 | $ | — | $ | — | $ | 766 | ||||
| * | Other Financial Instruments are valued at unrealized appreciation/depreciation. |
Amounts designated as “—” are $O or have been rounded to $O.
The accompanying notes are an integral part of the financial statements.
| 16 | SEI Daily Income Trust / Semi-Annual Report / July 31, 2010 |
Table of Contents
SCHEDULE OF INVESTMENTS (Unaudited)
GNMA Fund
July 31, 2010

| Description | Face Amount ($ Thousands) | Value ($ Thousands) | ||||
MORTGAGE-BACKED SECURITIES — 97.2% | ||||||
Agency Mortgage-Backed Obligations — 97.2% | ||||||
FHLMC REMIC, Ser 3175, Cl SA, IO | ||||||
6.809%, 06/15/36 (A) | $ | 918 | $ | 123 | ||
FHLMC REMIC, Ser 3179, Cl SP, IO | ||||||
6.279%, 07/15/36 (A) | 1,446 | 188 | ||||
FHLMC REMIC, Ser 3279, Cl SD, IO | ||||||
6.089%, 02/15/37 (A) | 5,491 | 684 | ||||
FHLMC REMIC, Ser 3309, Cl SC, IO | ||||||
6.109%, 04/15/37 (A) | 4,593 | 562 | ||||
FNMA | ||||||
8.000%, 09/01/14 to 09/01/28 | 170 | 194 | ||||
7.000%, 08/01/29 to 09/01/32 | 340 | 386 | ||||
6.500%, 09/01/32 | 139 | 156 | ||||
FNMA REMIC, Ser 1990-91, Cl G | ||||||
7.000%, 08/25/20 | 34 | 38 | ||||
FNMA REMIC, Ser 1992-105, Cl B | ||||||
7.000%, 06/25/22 | 68 | 77 | ||||
FNMA REMIC, Ser 2002-42, Cl C | ||||||
6.000%, 07/25/17 | 1,500 | 1,660 | ||||
FNMA REMIC, Ser 2007-19, Cl SA, IO | ||||||
6.081%, 03/25/37 (A) | 11,424 | 1,480 | ||||
FNMA TBA | ||||||
6.000%, 08/01/33 | 20,100 | 21,834 | ||||
GNMA | ||||||
10.000%, 05/15/16 to 04/15/20 | 20 | 23 | ||||
9.500%, 11/15/16 to 11/15/20 | 64 | 72 | ||||
9.000%, 12/15/17 to 05/15/22 | 165 | 187 | ||||
8.500%, 10/15/16 to 06/15/17 | 48 | 50 | ||||
8.000%, 04/15/17 to 03/15/32 | 694 | 803 | ||||
7.750%, 10/15/26 | 44 | 51 | ||||
7.500%, 02/15/27 to 05/15/36 | 784 | 890 | ||||
7.250%, 01/15/28 | 153 | 175 | ||||
7.000%, 04/15/19 to 06/20/38 | 6,559 | 7,485 | ||||
6.750%, 11/15/27 | 49 | 56 | ||||
6.500%, 09/15/10 to 05/15/40 | 9,244 | 10,318 | ||||
6.000%, 07/15/24 to 10/15/39 | 13,737 | 15,066 | ||||
5.500%, 10/15/32 to 09/15/39 (C) | 17,484 | 19,100 | ||||
5.000%, 04/15/33 to 09/15/38 (C) | 22,477 | 24,357 | ||||
4.500%, 08/15/33 to 02/15/39 | 4,853 | 5,134 | ||||
GNMA REMIC, Ser 2002-45, Cl QE | ||||||
6.500%, 06/20/32 | 960 | 1,050 | ||||
GNMA REMIC, Ser 2005-70, Cl AI, IO | ||||||
5.000%, 10/20/33 | 5,445 | 396 | ||||
GNMA REMIC, Ser 2006-38, Cl XS, IO | ||||||
6.909%, 09/16/35 (A) | 2,820 | 496 | ||||
GNMA REMIC, Ser 2009-104, Cl XV | ||||||
5.000%, 05/20/26 | 2,700 | 2,993 | ||||
| Description | Face Amount ($ Thousands) | Value ($ Thousands) | ||||
GNMA TBA | ||||||
6.500%, 08/20/33 | $ | 3,055 | $ | 3,366 | ||
6.000%, 08/01/33 | 39,000 | 42,668 | ||||
5.500%, 08/01/23 | 16,500 | 17,931 | ||||
5.000%, 08/01/33 to 08/20/38 | 12,100 | 13,011 | ||||
4.500%, 08/15/39 | 58,200 | 61,355 | ||||
Total Mortgage-Backed Securities | 254,415 | |||||
REPURCHASE AGREEMENTS (B) — 63.1% | ||||||
Credit Suisse 0.210%, dated 07/30/10, to be repurchased on 08/02/10 , repurchase price $60,004,410 (collateralized by various FNMA obligations, ranging in par value $1,000,099-$21,615,038, 4.500%-8.000%, 01/01/19-06/01/33, with total market value $61,204,497) | 60,000 | 60,000 | ||||
JPMorgan Chase 0.210%, dated 07/30/10, to be repurchased on 08/02/10 , repurchase price $54,201,459 (collateralized by a FNMA obligation, par value $59,415,000, 4.000%, 04/01/24, with total market value $55,285,486) | 54,200 | 54,200 | ||||
UBS 0.210%, dated 07/30/10, to be repurchased on 08/02/10 , repurchase price $51,004,922 (collateralized by a FNMA obligation, par value $50,445,000, 3.500%, 08/01/25, with total market value $52,025,020) | 51,000 | 51,000 | ||||
Total Repurchase Agreements | 165,200 | |||||
Total Investments — 160.3% | $ | 419,615 | ||||
Futures — A summary of the open futures contracts held by the Fund at July 31, 2010, is as follows (see Note 2 in Notes to Financial Statements):
| Type of Contract* | Number of Contracts Long (Short) | Expiration Date | Unrealized Appreciation (Depreciation) ($ Thousands) | ||||||
U.S. 10-Year Treasury Note | 97 | Sep-2010 | $ | 186 | |||||
U.S. 2-Year Treasury Note | (76 | ) | Oct-2010 | (102 | ) | ||||
U.S. 5-Year Treasury Note | (27 | ) | Oct-2010 | (86 | ) | ||||
U.S. Long Treasury Bond | 31 | Oct-2010 | 153 | ||||||
| $ | 151 | ||||||||
| * | Counterparty: Goldman Sachs |
| SEI Daily Income Trust / Semi-Annual Report / July 31, 2010 | 17 |
Table of Contents
SCHEDULE OF INVESTMENTS (Unaudited)
GNMA Fund (Concluded)
July 31, 2010
Percentages are based on Net Assets of $261,842 ($ Thousands).
| (A) | Floating Rate Instrument. The rate reflected on the Schedule of Investments is the rate in effect on July 31, 2010. The demand and interest rate reset features give this security a shorter effective maturity date. |
| (B) | Tri-Party Repurchase Agreement. |
| (C) | Security, or portion thereof, has been pledged as collateral on open futures contracts. |
Cl — Class
FHLMC — Federal Home Loan Mortgage Corporation
FNMA — Federal National Mortgage Association
GNMA — Government National Mortgage Association
IO — Interest Only — face amount represents notional amount
REMIC — Real Estate Mortgage Investment Conduit
Ser — Series
TBA — To Be Announced
The following is a summary of the inputs used as of July 31, 2010 in valuing the Fund’s investments carried at fair value ($ Thousands):
| Investments in Securities | Level 1 | Level 2 | Level 3 | Total | ||||||||
Mortgage-Backed Securities | $ | — | $ | 254,415 | $ | — | $ | 254,415 | ||||
Repurchase Agreements | — | 165,200 | — | 165,200 | ||||||||
Total | $ | — | $ | 419,615 | $ | — | $ | 419,615 | ||||
| Other Financial Instruments* | Level 1 | Level 2 | Level 3 | Total | ||||||||
Futures | $ | 151 | $ | — | $ | — | $ | 151 | ||||
| * | Other Financial Instruments are valued at unrealized appreciation/depreciation. |
Amounts designated as “—” are $0 or have been rounded to $0.
The accompanying notes are an integral part of the financial statements.
| 18 | SEI Daily Income Trust / Semi-Annual Report / July 31, 2010 |
Table of Contents
SCHEDULE OF INVESTMENTS (Unaudited)
Ultra Short Duration Bond Fund‡
July 31, 2010
| Description | Face Amount ($ Thousands) | Value ($ Thousands) | ||||
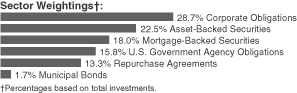
CORPORATE OBLIGATIONS — 28.9% | ||||||
Banks — 6.9% | ||||||
ANZ National International | ||||||
2.375%, 12/21/12 (A) | $ | 815 | $ | 826 | ||
Bank of Montreal | ||||||
2.125%, 06/28/13 | 1,200 | 1,227 | ||||
Bank of Nova Scotia | ||||||
2.250%, 01/22/13 | 1,065 | 1,094 | ||||
Bank of Tokyo-Mitsubishi | ||||||
2.600%, 01/22/13 (A) | 800 | 818 | ||||
BNP Paribas MTN | ||||||
2.125%, 12/21/12 | 1,300 | 1,311 | ||||
Citibank | ||||||
1.625%, 03/30/11 | 5,000 | 5,046 | ||||
1.500%, 07/12/11 | 2,165 | 2,188 | ||||
0.528%, 07/12/11 (B) | 680 | 681 | ||||
1.250%, 09/22/11 | 1,250 | 1,260 | ||||
Deutsche Bank | ||||||
2.375%, 01/11/13 | 750 | 759 | ||||
ING Bank | ||||||
2.650%, 01/14/13 (A) | 1,250 | 1,256 | ||||
Intesa Sanpaolo | ||||||
2.375%, 12/21/12 | 1,500 | 1,491 | ||||
National Australia Bank | ||||||
0.357%, 01/27/11 (A) (B) | 790 | 790 | ||||
PNC Funding | ||||||
0.818%, 06/22/11 (B) | 1,180 | 1,185 | ||||
Santander US Debt Unipersonal | ||||||
0.918%, 10/21/11 (A) (B) | 1,650 | 1,624 | ||||
Wachovia | ||||||
0.657%, 03/15/11 (B) | 1,750 | 1,752 | ||||
Wells Fargo | ||||||
4.875%, 01/12/11 | 1,750 | 1,782 | ||||
0.757%, 06/15/12 (B) | 1,250 | 1,258 | ||||
| 26,348 | ||||||
Consumer Products — 1.3% | ||||||
CVS Caremark | ||||||
5.750%, 08/15/11 | 1,750 | 1,831 | ||||
President and Fellows of Harvard College | ||||||
3.700%, 04/01/13 | 1,325 | 1,407 | ||||
Procter & Gamble | ||||||
1.350%, 08/26/11 | 1,250 | 1,259 | ||||
Staples | ||||||
7.750%, 04/01/11 | 350 | 364 | ||||
| 4,861 | ||||||
Energy — 0.3% | ||||||
BP Capital Markets PLC | ||||||
5.250%, 11/07/13 | 1,250 | 1,264 | ||||
| Description | Face Amount ($ Thousands) | Value ($ Thousands) | ||||
Financial Services — 6.4% | ||||||
American Honda Finance | ||||||
2.375%, 03/18/13 (A) | $ | 590 | $ | 601 | ||
Bank of America MTN | ||||||
2.100%, 04/30/12 | 1,500 | 1,537 | ||||
Caterpillar Financial Services MTN | ||||||
1.900%, 12/17/12 | 835 | 849 | ||||
Citigroup | ||||||
2.125%, 04/30/12 | 150 | 154 | ||||
Credit Suisse USA | ||||||
5.250%, 03/02/11 | 1,500 | 1,538 | ||||
ERAC USA Finance LLC | ||||||
2.750%, 07/01/13 (A) | 615 | 623 | ||||
General Electric Capital | ||||||
0.578%, 04/28/11 (B) | 750 | 750 | ||||
General Electric Capital MTN | ||||||
1.800%, 03/11/11 | 7,000 | 7,067 | ||||
0.539%, 12/21/12 (B) | 5,750 | 5,766 | ||||
GMAC | ||||||
2.200%, 12/19/12 | 600 | 619 | ||||
0.539%, 12/19/12 (B) | 1,750 | 1,755 | ||||
HSBC Finance | ||||||
5.250%, 01/14/11 | 2,000 | 2,031 | ||||
John Deere Capital MTN | ||||||
1.875%, 06/17/13 | 1,000 | 1,015 | ||||
Nissan Motor Acceptance | ||||||
3.250%, 01/30/13 (A) | 290 | 298 | ||||
| 24,603 | ||||||
Food, Beverage & Tobacco — 1.3% | ||||||
Anheuser-Busch InBev Worldwide | ||||||
3.000%, 10/15/12 | 1,250 | 1,292 | ||||
1.267%, 03/26/13 (A) (B) | 750 | 750 | ||||
Dr Pepper Snapple Group | ||||||
1.700%, 12/21/11 | 1,000 | 1,004 | ||||
Kraft Foods | ||||||
2.625%, 05/08/13 | 740 | 760 | ||||
PepsiCo | ||||||
0.556%, 07/15/11 (B) | 1,250 | 1,251 | ||||
| 5,057 | ||||||
Health Care — 1.0% | ||||||
GlaxoSmithKline Capital | ||||||
4.850%, 05/15/13 | 850 | 932 | ||||
Merck | ||||||
1.875%, 06/30/11 | 1,010 | 1,021 | ||||
Novartis Capital | ||||||
1.900%, 04/24/13 | 745 | 763 | ||||
Pfizer | ||||||
4.450%, 03/15/12 | 1,000 | 1,057 | ||||
| 3,773 | ||||||
Industrials — 0.2% | ||||||
Boeing | ||||||
1.875%, 11/20/12 | 725 | 738 | ||||
Information Technology — 0.8% | ||||||
Dell | ||||||
3.375%, 06/15/12 | 350 | 364 | ||||
Hewlett-Packard | ||||||
1.586%, 05/27/11 (B) | 585 | 590 | ||||
Oracle | ||||||
5.000%, 01/15/11 | 2,000 | 2,037 | ||||
| 2,991 | ||||||
| SEI Daily Income Trust / Semi-Annual Report / July 31, 2010 | 19 |
Table of Contents
SCHEDULE OF INVESTMENTS (Unaudited)
Ultra Short Duration Bond Fund (Continued)
July 31, 2010
| Description | Face Amount ($ Thousands) | Value ($ Thousands) | ||||
Insurance — 1.7% | ||||||
MBIA Insurance | ||||||
14.000%, 01/15/33 (A) (B) | $ | 500 | $ | 235 | ||
Metropolitan Life Global Funding I | ||||||
2.437%, 06/10/11 (A) (B) | 965 | 976 | ||||
Metropolitan Life Global Funding I MTN | ||||||
5.125%, 04/10/13 (A) | 1,000 | 1,089 | ||||
Monumental Global Funding III | ||||||
0.726%, 01/15/14 (A) (B) | 900 | 860 | ||||
New York Life Global Funding | ||||||
0.662%, 06/16/11 (A) (B) | 1,250 | 1,250 | ||||
Principal Life Income Funding Trusts | ||||||
0.596%, 11/15/10 (B) | 750 | 750 | ||||
Prudential Financial MTN | ||||||
2.750%, 01/14/13 | 1,250 | 1,268 | ||||
| 6,428 | ||||||
Investment Banker/Broker Dealer — 6.6% | ||||||
BlackRock | ||||||
2.250%, 12/10/12 | 1,000 | 1,025 | ||||
Citigroup Funding | ||||||
0.267%, 08/05/10 (B) | 1,960 | 1,961 | ||||
Goldman Sachs Group | ||||||
5.000%, 01/15/11 | 1,500 | 1,524 | ||||
1.700%, 03/15/11 | 5,184 | 5,232 | ||||
1.625%, 07/15/11 | 1,600 | 1,619 | ||||
3.250%, 06/15/12 | 2,500 | 2,621 | ||||
JPMorgan Chase | ||||||
4.600%, 01/17/11 | 1,250 | 1,273 | ||||
3.125%, 12/01/11 | 1,250 | 1,293 | ||||
0.787%, 12/26/12 (B) | 375 | 378 | ||||
Morgan Stanley | ||||||
5.050%, 01/21/11 | 2,000 | 2,037 | ||||
2.000%, 09/22/11 | 2,200 | 2,237 | ||||
0.654%, 02/10/12 (B) | 1,200 | 1,208 | ||||
Morgan Stanley, Ser G MTN | ||||||
0.830%, 01/09/14 (B) | 600 | 564 | ||||
UBS MTN | ||||||
1.584%, 02/23/12 (B) | 1,055 | 1,060 | ||||
2.750%, 01/08/13 | 1,000 | 1,010 | ||||
| 25,042 | ||||||
Security And Commodity Brokers — 0.3% | ||||||
Genworth Global Funding Trusts, | ||||||
0.576%, 05/15/12 (B) | 1,200 | 1,159 | ||||
Sovereign — 0.6% | ||||||
Province of Ontario Canada | ||||||
0.934%, 05/22/12 (B) | 1,060 | 1,063 | ||||
Republic of Austria MTN | ||||||
2.000%, 11/15/12 (A) | 1,115 | 1,134 | ||||
| 2,197 | ||||||
| Description | Face Amount ($ Thousands) | Value ($ Thousands) | ||||
Telephones & Telecommunication — 1.1% | ||||||
Cellco Partnership | ||||||
3.065%, 05/20/11 (B) | $ | 795 | $ | 811 | ||
3.750%, 05/20/11 | 1,250 | 1,281 | ||||
5.250%, 02/01/12 | 785 | 834 | ||||
Telefonica Emisiones SAU | ||||||
2.582%, 04/26/13 | 1,250 | 1,262 | ||||
| 4,188 | ||||||
Utilities — 0.4% | ||||||
Southern | ||||||
0.918%, 10/21/11 (B) | 1,500 | 1,505 | ||||
Total Corporate Obligations | 110,154 | |||||
ASSET-BACKED SECURITIES — 22.6% | ||||||
Automotive — 15.9% | ||||||
ACAS Business Loan Trust, Ser 2005-1A, Cl A1 | ||||||
0.748%, 07/25/19 (A) (B) | 545 | 502 | ||||
Ally Auto Receivables Trust, | ||||||
1.210%, 06/15/12 (A) | 1,775 | 1,780 | ||||
Ally Auto Receivables Trust, | ||||||
2.330%, 06/17/13 (A) | 435 | 444 | ||||
Ally Auto Receivables Trust, | ||||||
1.380%, 07/15/14 | 885 | 892 | ||||
Ally Auto Receivables Trust, | ||||||
1.450%, 05/15/14 | 1,115 | 1,125 | ||||
AmeriCredit Automobile Receivables Trust, Ser 2009-1, Cl A2 | ||||||
2.260%, 05/15/12 | 1,197 | 1,202 | ||||
AmeriCredit Automobile Receivables Trust, Ser 2005-DA, Cl A4 | ||||||
5.020%, 11/06/12 | 384 | 384 | ||||
AmeriCredit Automobile Receivables Trust, Ser 2006-AF, Cl A4 | ||||||
5.640%, 09/06/13 | 617 | 628 | ||||
AmeriCredit Automobile Receivables Trust, Ser 2010-A, Cl A3 | ||||||
3.510%, 07/06/17 | 995 | 1,035 | ||||
AmeriCredit Automobile Receivables Trust, Ser 2010-2, Cl A2 | ||||||
1.220%, 10/08/13 | 2,000 | 2,005 | ||||
AmeriCredit Automobile Receivables Trust, Ser 2007-CM, Cl A3A | ||||||
5.420%, 05/07/12 | 199 | 200 | ||||
AmeriCredit Automobile Receivables Trust, Ser 2010-1, Cl B | ||||||
3.720%, 11/17/14 | 770 | 786 | ||||
| 20 | SEI Daily Income Trust / Semi-Annual Report / July 31, 2010 |
Table of Contents
| Description | Face Amount ($ Thousands) | Value ($ Thousands) | ||||
Avis Budget Rental Car Funding, | ||||||
5.680%, 02/20/14 (A) | $ | 615 | $ | 658 | ||
Avis Budget Rental Car Funding AESOP LLC, Ser 2010-2A, Cl A | ||||||
3.630%, 08/20/14 (A) | 410 | 419 | ||||
Bank of America Auto Trust, | ||||||
1.700%, 12/15/11 (A) | 454 | 454 | ||||
Bank of America Auto Trust, | ||||||
1.310%, 07/15/14 | 615 | 620 | ||||
Bank of America Auto Trust, | ||||||
1.390%, 03/15/14 (A) | 1,015 | 1,023 | ||||
Capital Auto Receivables Asset Trust, Ser 2007-3, Cl A3A | ||||||
5.020%, 09/15/11 | 139 | 140 | ||||
Capital Auto Receivables Asset Trust, Ser 2007-3, Cl A4 | ||||||
5.210%, 03/17/14 | 1,495 | 1,546 | ||||
Capital Auto Receivables Asset Trust, Ser 2007-4A, Cl A4 | ||||||
5.300%, 05/15/14 | 1,250 | 1,306 | ||||
Capital One Auto Finance Trust, Ser 2006-A, Cl A4 | ||||||
0.351%, 12/15/12 (B) | 887 | 883 | ||||
Capital One Auto Finance Trust, Ser 2007-C, Cl A3A | ||||||
5.130%, 04/16/12 | 356 | 360 | ||||
Capital One Prime Auto Receivables Trust, Ser 2006-2, Cl A4 | ||||||
4.940%, 07/15/12 | 241 | 241 | ||||
Carmax Auto Owner Trust, | ||||||
5.140%, 11/15/11 | 457 | 460 | ||||
Carmax Auto Owner Trust, | ||||||
4.790%, 02/15/13 | 1,750 | 1,817 | ||||
Carmax Auto Owner Trust, | ||||||
4.060%, 09/15/11 | 120 | 120 | ||||
CarMax Auto Owner Trust, | ||||||
4.120%, 03/15/13 | 1,500 | 1,542 | ||||
CarMax Auto Owner Trust, | ||||||
1.560%, 07/15/14 | 620 | 626 | ||||
CarMax Auto Owner Trust, | ||||||
1.410%, 02/16/15 | 1,800 | 1,811 | ||||
Chrysler Financial Auto Securitization Trust, Ser 2009-A, Cl A2 | ||||||
1.850%, 06/15/11 | 369 | 370 | ||||
| Description | Face Amount ($ Thousands) | Value ($ Thousands) | ||||
CitiFinancial Auto Issuance Trust, | ||||||
1.830%, 11/15/12 (A) | $ | 1,322 | $ | 1,327 | ||
Daimler Chrysler Auto Trust, | ||||||
4.980%, 11/08/11 | 552 | 552 | ||||
Ford Credit Auto Lease Trust, | ||||||
1.040%, 03/15/13 (A) | 1,200 | 1,202 | ||||
Ford Credit Auto Owner Trust, | ||||||
2.840%, 05/15/13 (B) | 1,498 | 1,525 | ||||
Ford Credit Auto Owner Trust, | ||||||
0.720%, 09/15/12 | 495 | 496 | ||||
Ford Credit Auto Owner Trust, | ||||||
1.210%, 01/15/12 | 412 | 413 | ||||
Ford Credit Auto Owner Trust, | ||||||
2.460%, 11/15/11 | 140 | 140 | ||||
Ford Credit Auto Owner Trust, | ||||||
5.250%, 09/15/11 | 366 | 369 | ||||
Ford Credit Auto Owner Trust, | ||||||
5.430%, 02/15/12 | 1,425 | 1,459 | ||||
Ford Credit Auto Owner Trust, | ||||||
0.980%, 10/15/14 | 1,015 | 1,015 | ||||
Ford Credit Auto Owner Trust, | ||||||
3.960%, 04/15/12 | 723 | 732 | ||||
Ford Credit Auto Owner Trust, | ||||||
1.320%, 06/15/14 | 950 | 959 | ||||
Ford Credit Floorplan Master Owner Trust, Ser 2010-1, Cl A | ||||||
1.991%, 12/15/14 (A) (B) | 795 | 811 | ||||
Ford Credit Floorplan Master Owner Trust, Ser 2006-4, Cl A | ||||||
0.591%, 06/15/13 (B) | 1,440 | 1,421 | ||||
Harley-Davidson Motorcycle Trust, Ser 2007-2, Cl A4 | ||||||
5.120%, 08/15/13 | 1,101 | 1,137 | ||||
Harley-Davidson Motorcycle Trust, Ser 2009-4, Cl A3 | ||||||
1.870%, 02/15/14 | 475 | 481 | ||||
Hertz Vehicle Financing LLC, | ||||||
2.600%, 02/25/15 (A) | 1,990 | 1,997 | ||||
Hertz Vehicle Financing LLC, | ||||||
4.260%, 03/25/14 (A) | 785 | 822 | ||||
| SEI Daily Income Trust / Semi-Annual Report / July 31, 2010 | 21 |
Table of Contents
SCHEDULE OF INVESTMENTS (Unaudited)
Ultra Short Duration Bond Fund (Continued)
July 31, 2010
| Description | Face Amount ($ Thousands) | Value ($ Thousands) | ||||
Honda Auto Receivables Owner Trust, Ser 2010-2, Cl A3 | ||||||
1.340%, 03/18/14 | $ | 1,360 | $ | 1,372 | ||
Honda Auto Receivables Owner Trust, Ser 2009-3, Cl A2 | ||||||
1.500%, 08/15/11 | 177 | 178 | ||||
Honda Auto Receivables Owner Trust, Ser 2009-2, Cl A2 | ||||||
2.220%, 08/15/11 | 421 | 422 | ||||
Household Automotive Trust, | ||||||
5.340%, 09/17/13 | 1,652 | 1,686 | ||||
Hyundai Auto Receivables Trust, Ser 2007-A, Cl A3A | ||||||
5.040%, 01/17/12 | 193 | 194 | ||||
Hyundai Auto Receivables Trust, Ser 2010-A, Cl A3 | ||||||
1.500%, 10/15/14 | 865 | 874 | ||||
Hyundai Auto Receivables Trust, Ser 2009-A, Cl A3 | ||||||
2.030%, 08/15/13 | 425 | 432 | ||||
Mercedes-Benz Auto Receivables Trust, Ser 2009-1, Cl A2 | ||||||
0.830%, 03/15/12 | 596 | 596 | ||||
Nissan Auto Lease Trust, | ||||||
1.100%, 03/15/13 | 2,000 | 2,004 | ||||
Nissan Auto Receivables Owner Trust, Ser 2008-A, Cl A3 | ||||||
3.890%, 08/15/11 | 72 | 72 | ||||
Nissan Auto Receivables Owner Trust, Ser 2006-A, Cl A3 | ||||||
4.460%, 04/16/12 | 1,081 | 1,099 | ||||
Toyota Auto Receivables Owner Trust, Ser 2010-A, Cl A2 | ||||||
0.750%, 05/15/12 | 1,080 | 1,081 | ||||
Toyota Auto Receivables Owner Trust, | ||||||
1.040%, 02/18/14 | 945 | 948 | ||||
USAA Auto Owner Trust, | ||||||
4.900%, 02/15/12 | 48 | 48 | ||||
USAA Auto Owner Trust, | ||||||
4.160%, 04/16/12 | 195 | 196 | ||||
Volkswagen Auto Loan Enhanced Trust, Ser 2010-1, Cl A3 | ||||||
1.310%, 01/20/14 | 390 | 393 | ||||
Wachovia Auto Loan Owner Trust, Ser 2006-1, Cl A4 | ||||||
5.080%, 04/20/12 (A) | 136 | 137 | ||||
World Omni Auto Receivables Trust, Ser 2010-A, Cl A3 | ||||||
1.340%, 12/16/13 | 455 | 458 | ||||
| Description | Face Amount ($ Thousands) | Value ($ Thousands) | ||||
World Omni Auto Receivables Trust, Ser 2008-A, Cl A4 | ||||||
4.740%, 10/15/13 | $ | 2,185 | $ | 2,291 | ||
World Omni Automobile Lease Securitization Trust, Ser 2009-A, Cl A3 | ||||||
1.650%, 02/15/13 | 1,960 | 1,978 | ||||
World Omni Automobile Lease Securitization Trust, Ser 2009-A, Cl A2 | ||||||
1.020%, 01/16/12 | 2,011 | 2,015 | ||||
| 60,711 | ||||||
Credit Card — 2.9% | ||||||
American Express Issuance Trust, Ser 2007-1, Cl A | ||||||
0.541%, 09/15/11 (B) | 715 | 715 | ||||
American Express Issuance Trust, Ser 2005-1, Cl A | ||||||
0.371%, 08/15/11 (B) | 1,200 | 1,200 | ||||
Cabela’s Master Credit Card Trust, Ser 2009-1A, Cl A | ||||||
2.341%, 03/16/15 (A) (B) | 505 | 514 | ||||
Capital One Multi-Asset Execution Trust, Ser 2007-C2, Cl C2 | ||||||
0.641%, 11/15/14 (B) | 550 | 535 | ||||
Capital One Multi-Asset Execution Trust, Ser 2007-A8, Cl A8 | ||||||
0.837%, 10/15/15 (B) | 1,300 | 1,297 | ||||
Chase Issuance Trust, Ser 2008-A9, Cl A9 | ||||||
4.260%, 05/15/13 | 1,200 | 1,235 | ||||
Discover Card Master Trust, | ||||||
5.100%, 10/15/13 | 810 | 836 | ||||
Discover Card Master Trust, | ||||||
1.641%, 02/17/15 (B) | 1,600 | 1,631 | ||||
Discover Card Master Trust, | ||||||
1.641%, 12/15/14 (B) | 2,085 | 2,118 | ||||
GE Capital Credit Card Master Note Trust, Ser 2009-3, Cl A | ||||||
2.540%, 09/15/14 | 1,105 | 1,124 | ||||
| 11,205 | ||||||
Miscellaneous Business Services — 3.4% | ||||||
ACAS Business Loan Trust, | ||||||
1.286%, 08/16/19 (A) (B) | 710 | 284 | ||||
Ally Master Owner Trust, Ser 2010-3, Cl A | ||||||
2.880%, 04/15/15 (A) | 2,460 | 2,522 | ||||
Babson CLO Ltd., Ser 2007-1A, Cl A1 | ||||||
0.750%, 01/18/21 (A) (B) | 1,126 | 1,029 | ||||
Capital Source Commercial Loan Trust, Ser 2006-1A, Cl C | ||||||
0.888%, 08/22/16 (A) (B) | 494 | 321 | ||||
| 22 | SEI Daily Income Trust / Semi-Annual Report / July 31, 2010 |
Table of Contents
| Description | Face Amount ($ Thousands) | Value ($ Thousands) | ||||
Capital Source Commercial Loan Trust, Ser 2006-2A, Cl A1A | ||||||
0.548%, 09/20/22 (A) (B) | $ | 75 | $ | 70 | ||
Colts Trust, Ser 2006-2A, Cl A | ||||||
0.819%, 12/20/18 (A) (B) | 1,143 | 998 | ||||
Countrywide Asset-Backed Certificates, Ser 2006-2, Cl 2A2 | ||||||
0.519%, 06/25/36 (B) | 379 | 323 | ||||
Franklin CLO, Ser 2003-4A, Cl A | ||||||
1.089%, 09/20/15 (A) (B) | 211 | 204 | ||||
Katonah CLO, Ser 2005-7A, Cl B | ||||||
0.856%, 11/15/17 (A) (B) | 1,200 | 840 | ||||
Lambda Finance, Ser 2005-1A, Cl B3 | ||||||
0.806%, 11/15/29 (A) (B) | 840 | 725 | ||||
Madison Park Funding CLO, | ||||||
0.838%, 03/22/21 (A) (B) | 1,000 | 680 | ||||
Merritt Funding Trust CLO, | ||||||
1.226%, 07/15/15 (A) (B) | 284 | 199 | ||||
Morgan Stanley ABS Capital I, | ||||||
0.529%, 12/25/35 (B) | 398 | 371 | ||||
Sierra Receivables Funding, | ||||||
1.348%, 09/20/19 (A) (B) | 329 | 312 | ||||
Sierra Receivables Funding, | ||||||
4.520%, 08/20/26 (A) | 341 | 342 | ||||
Sierra Receivables Funding, | ||||||
9.790%, 12/22/25 (A) | 191 | 196 | ||||
SLM Student Loan Trust, | ||||||
0.588%, 07/25/22 (B) | 2,293 | 2,289 | ||||
William Street Funding, Ser 2006-1, Cl A | ||||||
0.736%, 01/23/12 (A) (B) | 1,260 | 1,200 | ||||
| 12,905 | ||||||
Mortgage Related — 0.4% | ||||||
Asset-Backed Funding Certificates, | ||||||
0.439%, 10/25/36 (B) | 755 | 740 | ||||
Option One Mortgage Loan Trust, | ||||||
5.611%, 01/25/37 (B) | 305 | 118 | ||||
Option One Mortgage Loan Trust, | ||||||
0.929%, 06/25/33 (B) | 109 | 87 | ||||
Option One Mortgage Loan Trust, | ||||||
0.539%, 12/25/35 (B) | 691 | 621 | ||||
| 1,566 | ||||||
Total Asset-Backed Securities | 86,387 | |||||
| Description | Face Amount ($ Thousands) | Value ($ Thousands) | ||||
MORTGAGE-BACKED SECURITIES — 18.1% | ||||||
Agency Mortgage-Backed Obligations — 6.5% | ||||||
FHLMC | ||||||
2.715%, 02/01/22 (B) | $ | 878 | $ | 919 | ||
2.699%, 02/01/30 (B) | 571 | 595 | ||||
FHLMC REMIC, Ser 1599, Cl C | ||||||
6.100%, 10/15/23 | 153 | 162 | ||||
FHLMC REMIC, Ser 2004-2780, Cl LC | ||||||
5.000%, 07/15/27 | 397 | 407 | ||||
FHLMC REMIC, Ser 2004-2791, Cl UD | ||||||
5.000%, 05/15/18 | 1,345 | 1,402 | ||||
FHLMC REMIC, Ser 2630, Cl HA | ||||||
3.000%, 01/15/17 | 497 | 506 | ||||
FHLMC REMIC, Ser 2921, Cl NV | ||||||
4.500%, 01/15/29 | 199 | 205 | ||||
FNMA | ||||||
6.000%, 02/01/23 to 01/01/27 | 3,010 | 3,280 | ||||
5.890%, 10/01/11 | 443 | 460 | ||||
5.000%, 01/01/19 to 07/01/24 | 6,301 | 6,773 | ||||
4.500%, 06/01/18 to 04/01/19 | 3,142 | 3,364 | ||||
4.000%, 08/15/20 | 3,000 | 3,180 | ||||
2.948%, 09/01/24 (B) | 169 | 172 | ||||
2.846%, 09/01/24 (B) | 455 | 467 | ||||
2.756%, 11/01/23 (B) | 337 | 353 | ||||
2.611%, 11/01/25 (B) | 74 | 77 | ||||
2.590%, 01/01/29 (B) | 64 | 66 | ||||
2.451%, 05/01/28 (B) | 560 | 582 | ||||
1.765%, 11/01/21 (B) | 107 | 108 | ||||
FNMA REMIC, Ser 1993-220, Cl FA | ||||||
0.944%, 11/25/13 (B) | 65 | 65 | ||||
FNMA REMIC, Ser 1993-58, Cl H | ||||||
5.500%, 04/25/23 | 145 | 158 | ||||
FNMA REMIC, Ser 2001-33, Cl FA | ||||||
0.779%, 07/25/31 (B) | 185 | 185 | ||||
FNMA REMIC, Ser 2002-64, Cl FG | ||||||
0.591%, 10/18/32 (B) | 109 | 109 | ||||
FNMA REMIC, Ser 2004-21, Cl QD | ||||||
4.500%, 02/25/29 | 1,225 | 1,304 | ||||
| 24,899 | ||||||
Non-Agency Mortgage-Backed Obligations — 11.6% | ||||||
Asset Securitization, Ser 1996-MD6, Cl A7 | ||||||
8.335%, 11/13/29 (B) | 756 | 808 | ||||
Banc of America Large Loan, | ||||||
0.851%, 08/15/29 (A) (B) | 501 | 458 | ||||
Banc of America Mortgage Securities, | ||||||
3.179%, 02/25/35 (B) | 984 | 849 | ||||
Banc of America Mortgage Securities, Ser 2005-F, Cl 2A2 | ||||||
4.176%, 07/25/35 (B) | 1,692 | 1,475 | ||||
| SEI Daily Income Trust / Semi-Annual Report / July 31, 2010 | 23 |
Table of Contents
SCHEDULE OF INVESTMENTS (Unaudited)
Ultra Short Duration Bond Fund (Continued)
July 31, 2010
| Description | Face Amount ($ Thousands) | Value ($ Thousands) | ||||
Banc of America Mortgage Securities, Ser 2005-H, Cl 2A1 | ||||||
4.784%, 09/25/35 (B) | $ | 542 | $ | 458 | ||
Banc of America Mortgage Securities, Ser 2005-J, Cl 2A1 | ||||||
5.068%, 11/25/35 (B) | 202 | 168 | ||||
Bear Stearns Adjustable Rate Mortgage Trust, Ser 2005-12, Cl 11A1 | ||||||
3.417%, 02/25/36 (B) | 441 | 285 | ||||
Bear Stearns Adjustable Rate Mortgage Trust, Ser 2005-3, Cl 2A1 | ||||||
2.811%, 06/25/35 (B) | 613 | 493 | ||||
Bear Stearns Adjustable Rate Mortgage Trust, Ser 2005-6, Cl 3A1 | ||||||
4.457%, 08/25/35 (B) | 962 | 689 | ||||
Bear Stearns Commercial Mortgage Securities, Ser 2000-WF2, Cl A2 | ||||||
7.320%, 10/15/32 (B) | 36 | 36 | ||||
Bear Stearns Commercial Mortgage Securities, Ser 2001-TOP2, Cl A2 | ||||||
6.480%, 02/15/35 | 1,615 | 1,645 | ||||
Bear Stearns Commercial Mortgage Securities, Ser 2001-TOP4, Cl A3 | ||||||
5.610%, 11/15/33 | 1,344 | 1,387 | ||||
Citigroup Mortgage Loan Trust, | ||||||
3.051%, 09/25/34 (B) | 311 | 249 | ||||
Citigroup Mortgage Loan Trust, | ||||||
5.553%, 03/25/36 (B) | 818 | 637 | ||||
Commercial Mortgage Acceptance, | ||||||
5.440%, 09/15/30 (A)(B) | 755 | 791 | ||||
Countrywide Alternative Loan Trust, | ||||||
5.544%, 03/25/47 (B) | 846 | 742 | ||||
Countrywide Home Loans, | ||||||
0.869%, 02/25/35 (B) | 103 | 85 | ||||
Countrywide Home Loans, | ||||||
0.599%, 03/25/35 (B) | 171 | 127 | ||||
Countrywide Home Loans, | ||||||
5.246%, 02/20/36 (B) | 789 | 522 | ||||
CS First Boston Mortgage Securities, Ser 2001-CF2, Cl A4 | ||||||
6.505%, 02/15/34 | 799 | 804 | ||||
DLJ Commercial Mortgage, | ||||||
7.180%, 11/10/33 | 60 | 60 | ||||
First Horizon Asset Securities, | ||||||
5.500%, 05/25/35 | 23 | 23 | ||||
| Description | Face Amount ($ Thousands) | Value ($ Thousands) | ||||
First Union National Bank Commercial Mortgage, Ser 2000-C2, Cl A2 | ||||||
7.202%, 10/15/32 | $ | 64 | $ | 64 | ||
GE Commercial Loan Trust CLO, | ||||||
1.075%, 10/19/16 (A)(B) | 334 | 150 | ||||
Global Tower Partners Acquisition Partners LLC, Ser 2007-1A, Cl AFL | ||||||
0.550%, 05/15/37 (A) (B) | 1,750 | 1,700 | ||||
GMAC Commercial Mortgage Securities, Ser 2000-C3, Cl A2 | ||||||
6.957%, 09/15/35 | 364 | 365 | ||||
GMAC Commercial Mortgage Securities, Ser 2001-C1, Cl A2 | ||||||
6.465%, 04/15/34 | 565 | 575 | ||||
GMAC Mortgage Loan Trust, | ||||||
5.031%, 11/19/35 (B) | 900 | 674 | ||||
GS Mortgage Securities II, | ||||||
0.438%, 03/06/20 (A) (B) | 1,531 | 1,480 | ||||
GSR Mortgage Loan Trust, | ||||||
2.894%, 07/25/35 (B) | 1,154 | 744 | ||||
GSR Mortgage Loan Trust, | ||||||
5.034%, 01/25/36 (B) | 1,440 | 1,187 | ||||
GSR Mortgage Loan Trust, | ||||||
5.675%, 05/25/47 (B) | 1,143 | 847 | ||||
Impac CMB Trust, Ser 2004-9, Cl 1A1 | ||||||
1.089%, 01/25/35 (B) | 281 | 208 | ||||
Impac CMB Trust, Ser 2005-2, Cl 1A1 | ||||||
0.589%, 04/25/35 (B) | 308 | 226 | ||||
Impac CMB Trust, Ser 2005-3, Cl A1 | ||||||
0.569%, 08/25/35 (B) | 282 | 192 | ||||
Impac CMB Trust, Ser 2005-5, Cl A1 | ||||||
0.649%, 08/25/35 (B) | 225 | 159 | ||||
Impac CMB Trust, Ser 2005-8, Cl 1A | ||||||
0.589%, 02/25/36 (B) | 725 | 477 | ||||
JP Morgan Mortgage Trust, | ||||||
4.943%, 08/25/35 (B) | 694 | 585 | ||||
JP Morgan Mortgage Trust, | ||||||
5.347%, 05/25/37 (B) | 969 | 751 | ||||
Merrill Lynch Mortgage Investors, | ||||||
2.800%, 02/25/35 (B) | 1,797 | 1,726 | ||||
Merrill Lynch Mortgage Investors, | ||||||
0.599%, 04/25/35 (B) | 318 | 220 | ||||
| 24 | SEI Daily Income Trust / Semi-Annual Report / July 31, 2010 |
Table of Contents
| Description | Face Amount ($ Thousands) | Value ($ Thousands) | ||||
Merrill Lynch Mortgage-Backed Securities Trust, Ser 2007-3, Cl 2A1 | ||||||
5.479%, 06/25/37 (B) | $ | 1,193 | $ | 838 | ||
MLCC Mortgage Investors, | ||||||
0.609%, 01/25/30 (B) | 92 | 81 | ||||
MLCC Mortgage Investors, | ||||||
0.559%, 03/25/30 (B) | 117 | 98 | ||||
Morgan Stanley Dean Witter Capital I, | ||||||
6.660%, 02/15/33 | 1,018 | 1,030 | ||||
Morgan Stanley Dean Witter Capital I, | ||||||
6.390%, 07/15/33 | 1,092 | 1,127 | ||||
Morgan Stanley Dean Witter Capital I, | ||||||
7.200%, 10/15/33 | 346 | 345 | ||||
MortgageIT Trust, Ser 2005-2, Cl 1A1 | ||||||
0.589%, 05/25/35 (B) | 231 | 177 | ||||
MortgageIT Trust, Ser 2005-3, Cl A1 | ||||||
0.629%, 08/25/35 (B) | 780 | 568 | ||||
MortgageIT Trust, Ser 2005-4, Cl A1 | ||||||
0.609%, 10/25/35 (B) | 1,051 | 709 | ||||
MortgageIT Trust, Ser 2005-5, Cl A1 | ||||||
0.589%, 12/25/35 (B) | 993 | 690 | ||||
Paragon Mortgages PLC, Ser 12A, Cl A2C | ||||||
0.546%, 11/15/38 (A) (B) | 326 | 261 | ||||
Paragon Mortgages PLC, Ser 15A, Cl A2C | ||||||
0.647%, 12/15/39 (A) (B) | 773 | 628 | ||||
Permanent Master Issuer PLC, | ||||||
1.676%, 07/15/42 (A) (B) | 960 | 954 | ||||
PNC Mortgage Acceptance, | ||||||
6.360%, 03/12/34 | 1,178 | 1,202 | ||||
Prima, Ser 2006-1, Cl A1 | ||||||
5.417%, 08/01/10 | 714 | 643 | ||||
Residential Funding Mortgage Securities I, Ser 2005-SA5, Cl 2A | ||||||
5.268%, 11/25/35 (B) | 567 | 476 | ||||
Residential Funding Mortgage Securities I, Ser 2007-SA3, Cl 2A1 | ||||||
5.707%, 07/27/37 (B) | 1,020 | 720 | ||||
Sequoia Mortgage Trust, | ||||||
0.608%, 01/20/35 (B) | 114 | 95 | ||||
Sequoia Mortgage Trust, | ||||||
0.568%, 02/20/35 (B) | 113 | 97 | ||||
WaMu Mortgage Pass-Through Certificates, Ser 2006-AR2, Cl 1A1 | ||||||
5.252%, 03/25/37 (B) | 1,274 | 1,048 | ||||
| Description | Face Amount ($ Thousands) | Value ($ Thousands) | ||||
Wells Fargo Mortgage-Backed Securities Trust, Ser 2004-BB, Cl A2 | ||||||
2.898%, 01/25/35 (B) | $ | 681 | $ | 652 | ||
Wells Fargo Mortgage-Backed Securities Trust, Ser 2005-AR1, Cl 2A1 | ||||||
2.866%, 02/25/35 (B) | 581 | 530 | ||||
Wells Fargo Mortgage-Backed Securities Trust, Ser 2005-AR16, Cl 6A3 | ||||||
3.601%, 10/25/35 (B) | 1,476 | 1,312 | ||||
Wells Fargo Mortgage-Backed Securities Trust, Ser 2005-AR16, Cl 3A2 | ||||||
2.939%, 10/25/35 (B) | 891 | 817 | ||||
Wells Fargo Mortgage-Backed Securities Trust, Ser 2005-AR4, Cl 2A2 | ||||||
2.966%, 04/25/35 (B) | 479 | 445 | ||||
Wells Fargo Mortgage-Backed Securities Trust, Ser 2006-AR10, Cl 2A1 | ||||||
5.493%, 07/25/36 (B) | 1,247 | 870 | ||||
Wells Fargo Mortgage-Backed Securities Trust, Ser 2006-AR12, Cl 1A1 | ||||||
6.025%, 09/25/36 (B) | 889 | 713 | ||||
Wells Fargo Mortgage-Backed Securities Trust, Ser 2006-AR5, Cl 2A1 | ||||||
5.475%, 04/25/36 (B) | 863 | 714 | ||||
Wells Fargo Mortgage-Backed Securities Trust, Ser 2006-AR6, Cl 2A1 | ||||||
5.043%, 03/25/36 (B) | 1,045 | 914 | ||||
Westpac Securitisation Trust, | ||||||
0.608%, 03/23/36 (B) | 175 | 171 | ||||
| 44,046 | ||||||
Total Mortgage-Backed Securities | 68,945 | |||||
U.S. GOVERNMENT AGENCY OBLIGATIONS — 15.9% | ||||||
FHLB | ||||||
0.750%, 03/18/11 | 2,000 | 2,006 | ||||
0.800%, 05/06/11 | 2,500 | 2,511 | ||||
1.375%, 05/16/11 | 2,500 | 2,521 | ||||
3.125%, 06/10/11 | 10,000 | 10,216 | ||||
0.760%, 07/19/11 | 21,645 | 21,735 | ||||
1.625%, 07/27/11 | 3,295 | 3,336 | ||||
1.125%, 05/18/12 | 1,000 | 1,009 | ||||
FHLB, Ser 1768 | ||||||
0.750%, 07/08/11 | 3,000 | 3,012 | ||||
FHLMC | ||||||
5.250%, 07/18/11 | 3,500 | 3,667 | ||||
1.625%, 04/15/13 | 3,000 | 3,058 | ||||
FNMA | ||||||
1.750%, 03/23/11 | 5,000 | 5,046 | ||||
1.375%, 04/28/11 | 2,335 | 2,353 | ||||
Total U.S. Government Agency Obligations | 60,470 | |||||
| SEI Daily Income Trust / Semi-Annual Report / July 31, 2010 | 25 |
Table of Contents
SCHEDULE OF INVESTMENTS (Unaudited)
Ultra Short Duration Bond Fund (Concluded)
July 31, 2010
| Description | Face Amount ($ Thousands) | Value ($ Thousands) | ||||
MUNICIPAL BONDS — 1.7% | ||||||
California — 0.5% | ||||||
Alameda County, Ser B, RB | ||||||
3.125%, 12/01/11 (D) | $ | 1,500 | $ | 1,444 | ||
San Francisco City & County, Airports Commission, Ser E, RB | ||||||
1.150%, 05/01/11 | 700 | 701 | ||||
| 2,145 | ||||||
Louisiana — 0.5% | ||||||
Louisiana State, Local Government Environmental Facilites and Community Development Authority, | ||||||
1.110%, 02/01/16 | 1,955 | 1,967 | ||||
New Jersey — 0.3% | ||||||
New Jersey State, Economic Development Authority, Build America Bonds, RB | ||||||
1.480%, 06/15/13 (B) | 1,000 | 1,000 | ||||
Virginia — 0.4% | ||||||
Louisa, Industrial Development Authority, Ser A, RB | ||||||
2.500%, 03/01/31 (B) | 1,500 | 1,500 | ||||
Total Municipal Bonds | 6,612 | |||||
REPURCHASE AGREEMENTS (C) — 13.3% | ||||||
BNP Paribas 0.210%, dated 07/30/10, to be repurchased on 08/02/10, repurchase price $28,100,492 (collateralized by various FHLMC/FNMA obligations, ranging in par value $134,253-$12,000,000, 4.000%-11.000%, 05/01/18-09/01/38, with total market value $28,662,001) | 28,100 | 28,100 | ||||
Credit Suisse 0.210%, dated 07/30/10, to be repurchased on 08/02/10, repurchase price $22,700,271 (collateralized by various FNMA obligations, ranging in par value $1,120,000-$3,090,933, 5.500%- 6.000%, 08/01/11-05/01/40, with total market value $23,154,276) | 22,700 | 22,700 | ||||
Total Repurchase Agreements | 50,800 | |||||
Total Investments — 100.5% | $ | 383,368 | ||||
Futures — A summary of the open futures contracts held by the Fund at July 31, 2010, is as follows (see Note 2 in Notes to Financial Statements):
| Type of Contract* | Number of Contracts Long (Short) | Expiration Date | Unrealized Appreciation (Depreciation) ($Thousands) | ||||||
U.S. 10-Year Treasury Note | (77 | ) | Sep-2010 | $ | (265 | ) | |||
U.S. 2-Year Treasury Note | (73 | ) | Oct-2010 | (98 | ) | ||||
U.S. 5-Year Treasury Note | 102 | Oct-2010 | 284 | ||||||
U.S. Long Treasury Bond | (7 | ) | Oct-2010 | (35 | ) | ||||
| $ | (114 | ) | |||||||
| * | Counterparty: Goldman Sachs |
Percentages are based on Net Assets of $381,624 ($ Thousands).
| ‡ | See Note 1 in Notes to Financial Statements. |
| (A) | Securities sold within terms of a private placement memorandum, exempt from registration under Section 144A of the Securities Act of 1933, as amended, and may be sold only to dealers in that program or other “accredited investors.” These securities have been determined to be liquid under guidelines established by the Board of Trustees. |
| (B) | Floating Rate Instrument. The rate reflected on the Schedule of Investments is the rate in effect on July 31, 2010. The demand and interest rate reset features give this security a shorter effective maturity date. |
| (C) | Tri-Party Repurchase Agreement. |
| (D) | The rate reported is the effective yield at time of purchase. |
ABS — Asset-Based Security
Cl — Class
CLO — Collateralized Loan Obligation
FHLB — Federal Home Loan Bank
FHLMC — Federal Home Loan Mortgage Corporation
FNMA — Federal National Mortgage Association
LLC — Limited Liability Company
Ltd. — Limited
MTN — Medium Term Note
PLC — Public Limited Company
REMIC — Real Estate Mortgage Investment Conduit
RB — Revenue Bond
Ser — Series
The following is a summary of the inputs used as of July 31, 2010 in valuing the Fund’s investments carried at value ($ Thousands):
| Investments in Securities | Level 1 | Level 2 | Level 3 | Total | ||||||||
Corporate Obligations | $ | — | $ | 110,154 | $ | — | $ | 110,154 | ||||
Asset-Backed Securities | — | 84,771 | 1,616 | 86,387 | ||||||||
Mortgage-Backed Securities | — | 68,945 | — | 68,945 | ||||||||
U.S. Government Agency Obligations | — | 60,470 | — | 60,470 | ||||||||
Municipal Bonds | — | 6,612 | — | 6,612 | ||||||||
Repurchase Agreements | — | 50,800 | — | 50,800 | ||||||||
Total | $ | — | $ | 381,752 | $ | 1,616 | $ | 383,368 | ||||
| Other Financial Instuments* | Level 1 | Level 2 | Level 3 | Total | ||||||||||
Futures | $ | (114 | ) | $ | — | $ | — | $ | (114 | ) | ||||
| * | Other Financial Instruments are valued at unrealized appreciation/depreciation. |
| 26 | SEI Daily Income Trust / Semi-Annual Report / July 31, 2010 |
Table of Contents
The following is a reconciliation of investments in which significant unobservable inputs (Level 3) were used in determining value ($ Thousands):
| Asset-Backed Securities | ||||
Beginning balance as of February 1, 2010 | $ | 2,559 | ||
Change in unrealized _appreciation/(depreciation) | 1,308 | |||
Accrued discounts/premiums | — | |||
Amortization sold | — | |||
Realized gain/(loss) | (1,367 | ) | ||
Net purchases/sales | (884 | ) | ||
Ending balance as of July 31, 2010 | $ | 1,616 | ||
Changes in unrealized gains/(losses) included in earnings related to securities still held at reporting date | $ | (39 | ) | |
For more information on valuation inputs, see Note 2 — Significant Accounting Policies in Notes to Financial Statements.
Amounts designated as “—” are $0 or have been rounded to $0.
The accompanying notes are an integral part of the financial statements.
| SEI Daily Income Trust / Semi-Annual Report / July 31, 2010 | 27 |
Table of Contents
Statements of Assets and Liabilities ($ Thousands)
For the six months ended July 31, 2010 (Unaudited)
| Money Market Fund | Government Fund | Government II Fund | Prime Obligation | |||||||||
ASSETS: | ||||||||||||
Investments, at value† | $262,190 | $621,252 | $1,336,289 | $2,915,468 | ||||||||
Repurchase agreements† | 180,100 | 750,807 | — | 1,561,170 | ||||||||
Cash | — | — | 1 | 1 | ||||||||
Receivable for investment securities sold | — | — | — | — | ||||||||
Interest receivable | 99 | 1,390 | 431 | 1,082 | ||||||||
Receivable for fund shares sold | — | — | — | — | ||||||||
Receivable for variation margin | — | — | — | — | ||||||||
Prepaid expenses | 19 | 66 | 67 | 155 | ||||||||
Total Assets | 442,408 | 1,373,515 | 1,336,788 | 4,477,876 | ||||||||
LIABILITIES: | ||||||||||||
Cash overdraft | — | — | — | — | ||||||||
Payable for investment securities purchased | — | 34,995 | — | — | ||||||||
Administration fees payable | 35 | 132 | 105 | 482 | ||||||||
Investment advisory fees payable | 16 | 55 | 53 | 163 | ||||||||
Income distribution payable | 13 | 18 | 9 | 330 | ||||||||
Trustees’ fees payable | 1 | 3 | 3 | 10 | ||||||||
Cheif Compliance Officer fees payable | 1 | 4 | 4 | 9 | ||||||||
Shareholder servicing fees payable | 29 | 7 | — | 45 | ||||||||
Payable for fund shares redeemed | — | — | — | — | ||||||||
Payable for variation margin | — | — | — | — | ||||||||
Accrued expense payable | 14 | 41 | 39 | 118 | ||||||||
Total Liabilities | 109 | 35,255 | 213 | 1,157 | ||||||||
Net Assets | $442,299 | $1,338,260 | $1,336,575 | $4,476,719 | ||||||||
† Cost of investments and repurchase agreements | $442,290 | $1,372,059 | $1,336,289 | $4,476,638 | ||||||||
NET ASSETS: | ||||||||||||
Paid-in Capital — (unlimited authorization — no par value) | $442,292 | $1,338,350 | $1,336,587 | $4,476,832 | ||||||||
Undistributed (Distributions in excess of) net investment income | — | — | — | — | ||||||||
Accumulated net realized gain (loss) on investments | 7 | (90 | ) | (12 | ) | (113 | ) | |||||
Net unrealized appreciation (depreciation) on investments | — | — | — | — | ||||||||
Net unrealized appreciation (depreciation) on futures contracts | — | — | — | — | ||||||||
Net Assets | $442,299 | $1,338,260 | $1,336,575 | $4,476,719 | ||||||||
Net Asset Value, Offering and Redemption Price Per Share — Class A | $1.00 | $1.00 | $1.00 | $1.00 | ||||||||
| (313,294,801 ÷ 313,323,878 shares | ) | (915,926,293 ÷ 915,972,373 shares | ) | (1,191,800,841 ÷ 1,191,879,014 shares | ) | (4,118,866,582 ÷ 4,118,970,965 shares | ) | |||||
Net Asset Value, Offering and Redemption Price Per Share — Class B | $1.00 | $1.00 | $1.00 | $1.00 | ||||||||
| (30,893,218 ÷ 30,900,853 shares | ) | (336,512,925 ÷ 336,533,677 shares | ) | (141,771,461 ÷ 141,805,210 shares | ) | (236,058,308 ÷ 236,064,243 shares | ) | |||||
Net Asset Value, Offering and Redemption Price Per Share — Class C | $1.00 | $1.00 | $1.00 | $1.00 | ||||||||
| (62,186,114 ÷ 62,197,929 shares | ) | (63,982,432 ÷ 64,007,790 shares | ) | (3,002,492 ÷ 3,001,827 shares | ) | (76,971,306 ÷ 76,973,141 shares | ) | |||||
Net Asset Value, Offering and Redemption Price Per Share — Class H | N/A | N/A | N/A | $1.00 | ||||||||
| (30,401,017 ÷ 30,402,769 shares | ) | |||||||||||
Net Asset Value, Offering and Redemption Price Per Share — Sweep Class | $1.00 | $1.00 | N/A | $1.00 | ||||||||
| (35,924,742 ÷ 35,896,505 shares | ) | (21,838,549 ÷ 21,842,508 shares | ) | (14,421,525 ÷ 14,421,157 shares | ) |
| ‡ | See Note 1 in Notes to Financial Statements. |
Amounts designated as “—” are $0 or have been rounded to $0.
The accompanying notes are an integral part of the financial statements.
| 28 | SEI Daily Income Trust / Semi-Annual Report / July 31, 2010 |
Table of Contents
| Treasury Fund | Treasury II Fund | Short-Duration Government Fund | Intermediate- Duration Government Fund | GNMA Fund | Ultra Short Duration Bond Fund‡ | |||||||||||
| $115,106 | $492,257 | $663,721 | $88,872 | $254,415 | $332,568 | |||||||||||
| 309,044 | — | 300,000 | 33,300 | 165,200 | 50,800 | |||||||||||
| 30,413 | 1 | 817 | 147 | — | 444 | |||||||||||
| — | — | 1,372 | 1 | 4,871 | 14 | |||||||||||
| 198 | 517 | 2,442 | 329 | 472 | 1,017 | |||||||||||
| — | — | 1,179 | 385 | 400 | 1,291 | |||||||||||
| — | — | 109 | 136 | 155 | 45 | |||||||||||
| 31 | 28 | 16 | 3 | 8 | 9 | |||||||||||
| 454,792 | 492,803 | 969,656 | 123,173 | 425,521 | 386,188 | |||||||||||
| — | — | — | — | 68 | — | |||||||||||
| — | — | 270,843 | 32,322 | 163,118 | 4,162 | |||||||||||
| 43 | — | 213 | 24 | 70 | 88 | |||||||||||
| 24 | 37 | 47 | 5 | 20 | 23 | |||||||||||
| 3 | 2 | 81 | 15 | 74 | 32 | |||||||||||
| 2 | 1 | 1 | — | — | — | |||||||||||
| 2 | 1 | 1 | — | 1 | 1 | |||||||||||
| 4 | — | — | 5 | 37 | — | |||||||||||
| — | — | 1,125 | 32 | 241 | 159 | |||||||||||
| — | — | 424 | 13 | 26 | 82 | |||||||||||
| 22 | 15 | 22 | 8 | 24 | 17 | |||||||||||
| 100 | 56 | 272,757 | 32,424 | 163,679 | 4,564 | |||||||||||
| $454,692 | $492,747 | $696,899 | $90,749 | $261,842 | $381,624 | |||||||||||
| $424,150 | $492,257 | $951,415 | $119,473 | $409,770 | $391,235 | |||||||||||
| $454,785 | $492,751 | $681,954 | $85,636 | $251,739 | $410,242 | |||||||||||
| — | — | (1,273 | ) | (78 | ) | (224 | ) | (581 | ) | |||||||
| (93 | ) | (4 | ) | 5,915 | 1,726 | 331 | (20,056 | ) | ||||||||
| — | — | 12,306 | 2,699 | 9,845 | (7,867 | ) | ||||||||||
| — | — | (2,003 | ) | 766 | 151 | (114 | ) | |||||||||
| $454,692 | $492,747 | $696,899 | $90,749 | $261,842 | $381,624 | |||||||||||
| $1.00 | $1.00 | $10.69 | $11.66 | $10.71 | $9.30 | |||||||||||
| (142,916,167 ÷ 142,952,910 shares | ) | (316,445,426 ÷ 316,605,990 shares | ) | (696,899,324 ÷ 65,212,357 shares | ) | (90,749,348 ÷ 7,783,838 shares | ) | (261,841,963 ÷ 24,455,171 shares | ) | (381,624,204 ÷ 41,044,665 shares | ) | |||||
| $1.00 | $1.00 | N/A | N/A | N/A | N/A | |||||||||||
| (172,019,065 ÷ 172,055,261 shares | ) | (168,402,768 ÷ 168,391,052 shares | ) | |||||||||||||
| $1.00 | $1.00 | N/A | N/A | N/A | N/A | |||||||||||
| (12,705,832 ÷ 12,720,116 shares | ) | (7,899,102 ÷ 7,901,873 shares | ) | |||||||||||||
| N/A | N/A | N/A | N/A | N/A | N/A | |||||||||||
| $1.00 | N/A | N/A | N/A | N/A | N/A | |||||||||||
| (127,051,000 ÷ 127,057,088 shares | ) | |||||||||||||||
| SEI Daily Income Trust / Semi-Annual Report / July 31, 2010 | 29 |
Table of Contents
Statements of Operations ($ Thousands)
For the six months ended July 31, 2010 (Unaudited)
Money Market | Government Fund | Government II Fund | Prime Obligation Fund | |||||||||||||
Investment Income: | ||||||||||||||||
Interest Income | $ | 573 | $ | 1,302 | $ | 1,046 | $ | 5,661 | ||||||||
Expenses: | ||||||||||||||||
Administration Fees | 623 | 1,557 | 1,292 | 3,590 | ||||||||||||
Shareholder Servicing Fees — Class A Shares | 297 | 1,035 | 1,505 | 4,269 | ||||||||||||
Shareholder Servicing Fees — Sweep Class Shares | 40 | 30 | — | 16 | ||||||||||||
Distribution Fees — Sweep Class Shares | 82 | 61 | — | 53 | ||||||||||||
Administrative and Shareholder Servicing Fees — Class B Shares | 59 | 572 | 228 | 318 | ||||||||||||
Administrative and Shareholder Servicing Fees — Class C Shares | 168 | 158 | 11 | 233 | ||||||||||||
Administrative and Shareholder Servicing Fees — Class H Shares | — | — | — | 78 | ||||||||||||
Investment Advisory Fees | 132 | 454 | 476 | 1,323 | ||||||||||||
Trustees’ Fees | 4 | 14 | 15 | 40 | ||||||||||||
Cheif Compliance Officer Fees | 1 | 3 | 3 | 8 | ||||||||||||
Registration Fees | 14 | 48 | 47 | 100 | ||||||||||||
Custodian/Wire Agent Fees | 12 | 39 | 40 | 110 | ||||||||||||
Pricing Fees | 1 | 2 | 2 | 4 | ||||||||||||
Other Expenses | 28 | 97 | 99 | 251 | ||||||||||||
Total Expenses | 1,461 | 4,070 | 3,718 | 10,393 | ||||||||||||
Less, Waiver of: | ||||||||||||||||
Investment Advisory Fees | (66 | ) | (227 | ) | (238 | ) | (661 | ) | ||||||||
Administration Fees | (408 | ) | (999 | ) | (754 | ) | (986 | ) | ||||||||
Shareholder Servicing Fees — Class A Shares | (297 | ) | (1,035 | ) | (1,505 | ) | (4,269 | ) | ||||||||
Administrative & Shareholder Servicing Fees — Class B Shares | (38 | ) | (572 | ) | (228 | ) | (223 | ) | ||||||||
Administrative & Shareholder Servicing Fees — Class C Shares | (131 | ) | (158 | ) | (11 | ) | (193 | ) | ||||||||
Administrative & Shareholder Servicing Fees — Class H Shares | — | — | — | (55 | ) | |||||||||||
Distribution Fees — Sweep Class Shares | (104 | ) | (91 | ) | — | (69 | ) | |||||||||
Net Expenses | 417 | 988 | 982 | 3,937 | ||||||||||||
Net Investment Income | 156 | 314 | 64 | 1,724 | ||||||||||||
Net Realized and Unrealized Gain (Loss) on/from: | ||||||||||||||||
Investments | 1 | 1 | — | 4 | ||||||||||||
Futures Contracts | — | — | — | — | ||||||||||||
Net Change in Unrealized Appreciation (Depreciation) on/from: | ||||||||||||||||
Investments | — | — | — | — | ||||||||||||
Futures Contracts | — | — | — | — | ||||||||||||
Net Increase in Net Assets Resulting from Operations | $ | 157 | $ | 315 | $ | 64 | $ | 1,728 | ||||||||
| ‡ | See Note 1 in Notes to Financial Statements. |
Amounts designated as “—” are $0 or have been rounded to $0.
The accompanying notes are an integral part of the financial statements.
| 30 | SEI Daily Income Trust / Semi-Annual Report / July 31, 2010 |
Table of Contents
| Treasury Fund | Treasury II Fund | Short-Duration Government Fund | Intermediate- Duration Government | GNMA Fund | Ultra Short Duration Bond Fund‡ | |||||||||||||||||
| $ | 511 | $ | 301 | $ | 4,086 | $ | 865 | $ | 2,661 | $ | 2,803 | |||||||||||
| 652 | 630 | 974 | 128 | 339 | 526 | |||||||||||||||||
| 282 | 451 | 676 | 92 | 265 | 376 | |||||||||||||||||
| 163 | — | — | — | — | — | |||||||||||||||||
| 334 | — | — | — | — | — | |||||||||||||||||
| 247 | 236 | — | — | — | — | |||||||||||||||||
| 53 | 19 | — | — | — | — | |||||||||||||||||
| — | — | — | — | — | — | |||||||||||||||||
| 190 | 184 | 244 | 31 | 97 | 151 | |||||||||||||||||
| 7 | 6 | 5 | 1 | 2 | 3 | |||||||||||||||||
| 1 | 1 | 1 | — | — | 1 | |||||||||||||||||
| 24 | 20 | 8 | 2 | 5 | 6 | |||||||||||||||||
| 17 | 15 | 14 | 1 | 6 | 8 | |||||||||||||||||
| 1 | 1 | 42 | 8 | 24 | 28 | |||||||||||||||||
| 43 | 39 | 30 | 5 | 14 | 18 | |||||||||||||||||
| 2,014 | 1,602 | 1,994 | 268 | 752 | 1,117 | |||||||||||||||||
| (95 | ) | (93 | ) | (19 | ) | — | — | (50 | ) | |||||||||||||
| (366 | ) | (528 | ) | — | — | (84 | ) | (119 | ) | |||||||||||||
| (282 | ) | (451 | ) | (676 | ) | (75 | ) | — | (376 | ) | ||||||||||||
| (245 | ) | (236 | ) | — | — | — | — | |||||||||||||||
| (52 | ) | (19 | ) | — | — | — | — | |||||||||||||||
| — | — | — | — | — | — | |||||||||||||||||
| (494 | ) | — | — | — | — | — | ||||||||||||||||
| 480 | 275 | 1,299 | 193 | 668 | 572 | |||||||||||||||||
| 31 | 26 | 2,787 | 672 | 1,993 | 2,231 | |||||||||||||||||
| — | 2 | 5,681 | 765 | 5,531 | (10,459 | ) | ||||||||||||||||
| — | — | (1,107 | ) | 232 | 417 | (521 | ) | |||||||||||||||
| — | — | 8,354 | 1,094 | 2,609 | 13,631 | |||||||||||||||||
| — | — | (2,295 | ) | 869 | 517 | (13 | ) | |||||||||||||||
| $ | 31 | $ | 28 | $ | 13,420 | $ | 3,632 | $ | 11,067 | $ | 4,869 | |||||||||||
| SEI Daily Income Trust / Semi-Annual Report / July 31, 2010 | 31 |
Table of Contents
Statements of Changes in Net Assets ($ Thousands)
For the six months ended July 31, 2010 (Unaudited) and the year ended January 31, 2010
Money Market Fund | Government Fund | |||||||||||||||
| 2/1/10-7/31/10 | 2/1/09-1/31/10 | 2/1/10-7/31/10 | 2/1/09-1/31/10 | |||||||||||||
Operations: | ||||||||||||||||
Net Investment Income | $ | 156 | $ | 1,356 | $ | 314 | $ | 2,344 | ||||||||
Net Realized Gain (Loss) on Investments | 1 | 24 | 1 | — | ||||||||||||
Payment by Affiliate* | — | — | — | — | ||||||||||||
Net Change in Unrealized Depreciation on Investments and Affiliated Investments | — | — | — | — | ||||||||||||
Net Increase in Net Assets Resulting from Operations | 157 | 1,380 | 315 | 2,344 | ||||||||||||
Dividends to Shareholders: | ||||||||||||||||
Net Investment Income | ||||||||||||||||
Class A | (148 | ) | (998 | ) | (201 | ) | (1,868 | ) | ||||||||
Class B | (2 | ) | (171 | ) | (92 | ) | (378 | ) | ||||||||
Class C | (3 | ) | (108 | ) | (15 | ) | (78 | ) | ||||||||
Class H | — | — | — | — | ||||||||||||
Sweep Class | (2 | ) | (34 | ) | (6 | ) | (20 | ) | ||||||||
Total Dividends | (155 | ) | (1,311 | ) | (314 | ) | (2,344 | ) | ||||||||
Capital Share Transactions (All at $1.00 per share) | ||||||||||||||||
Class A: | ||||||||||||||||
Proceeds from Shares Issued | 984,953 | 1,417,263 | 3,208,739 | 5,295,538 | ||||||||||||
Reinvestment of Dividends & Distributions | 96 | 554 | 123 | 1,136 | ||||||||||||
Cost of Shares Redeemed | (900,130 | ) | (1,530,684 | ) | (3,118,278 | ) | (5,997,875 | ) | ||||||||
Net Increase (Decrease) from Class A Transactions | 84,919 | (112,867 | ) | 90,584 | (701,201 | ) | ||||||||||
Class B: | ||||||||||||||||
Proceeds from Shares Issued | 142,742 | 465,220 | 913,076 | 1,707,234 | ||||||||||||
Reinvestment of Dividends & Distributions | — | 13 | 78 | 317 | ||||||||||||
Cost of Shares Redeemed | (162,991 | ) | (535,025 | ) | (1,004,352 | ) | (1,903,745 | ) | ||||||||
Net Increase (Decrease) from Class B Transactions | (20,249 | ) | (69,792 | ) | (91,198 | ) | (196,194 | ) | ||||||||
Class C: | ||||||||||||||||
Proceeds from Shares Issued | 228,426 | 637,283 | 298,164 | 548,752 | ||||||||||||
Reinvestment of Dividends & Distributions | — | 6 | — | — | ||||||||||||
Cost of Shares Redeemed | (240,287 | ) | (722,091 | ) | (293,746 | ) | (642,202 | ) | ||||||||
Net Increase (Decrease) from Class C Transactions | (11,861 | ) | (84,802 | ) | 4,418 | (93,450 | ) | |||||||||
Class H: | ||||||||||||||||
Proceeds from Shares Issued | N/A | N/A | N/A | N/A | ||||||||||||
Reinvestment of Dividends & Distributions | N/A | N/A | N/A | N/A | ||||||||||||
Cost of Shares Redeemed | N/A | N/A | N/A | N/A | ||||||||||||
Net Decrease from Class H Transactions | N/A | N/A | N/A | N/A | ||||||||||||
Sweep Class: | ||||||||||||||||
Proceeds from Shares Issued | 177,150 | 350,692 | 134,815 | 370,174 | ||||||||||||
Reinvestment of Dividends & Distributions | — | — | 3 | 7 | ||||||||||||
Cost of Shares Redeemed | (169,671 | ) | (390,432 | ) | (142,998 | ) | (385,316 | ) | ||||||||
Net Increase (Decrease) from Sweep Class Transactions | 7,479 | (39,740 | ) | (8,180 | ) | (15,135 | ) | |||||||||
Net Increase (Decrease) in Net Assets from Capital Shares Transactions | 60,288 | (307,201 | ) | (4,376 | ) | (1,005,980 | ) | |||||||||
Net Increase (Decrease) in Net Assets | 60,290 | (307,132 | ) | (4,375 | ) | (1,005,980 | ) | |||||||||
Net Assets: | ||||||||||||||||
Beginning of Period | 382,009 | 689,141 | 1,342,635 | 2,348,615 | ||||||||||||
End of Period | $ | 442,299 | $ | 382,009 | $ | 1,338,260 | $ | 1,342,635 | ||||||||
Undistributed (Distributions in Excess of) Net Investment Income | $ | — | $ | (1 | ) | $ | — | $ | — | |||||||
| * | See Note 3 in Notes to Financial Statements. |
Amounts designated as “—” are zero or have been rounded to zero
The accompanying notes are an integral part of the financial statements.
| 32 | SEI Daily Income Trust / Semi-Annual Report / July 31, 2010 |
Table of Contents
Government II Fund | Prime Obligation Fund | Treasury Fund | Treasury II Fund | |||||||||||||||||||||||||||
| 2/1/10-7/31/10 | 2/1/09-1/31/10 | 2/1/10-7/31/10 | 2/1/09-1/31/10 | 2/1/10-7/31/10 | 2/1/09-1/31/10 | 2/1/10-7/31/10 | 2/1/09-1/31/10 | |||||||||||||||||||||||
| $ | 64 | $ | 2,103 | $ | 1,724 | $ | 9,677 | $ | 31 | $ | 648 | $ | 26 | $ | 327 | |||||||||||||||
| — | 3 | 4 | (95,330 | ) | — | — | 2 | 11 | ||||||||||||||||||||||
| — | — | — | 152,452 | — | — | — | — | |||||||||||||||||||||||
| — | — | — | (58,364 | ) | — | — | — | — | ||||||||||||||||||||||
| 64 | 2,106 | 1,728 | 8,435 | 31 | 648 | 28 | 338 | |||||||||||||||||||||||
| (56 | ) | (1,957 | ) | (1,705 | ) | (6,871 | ) | (15 | ) | (331 | ) | (18 | ) | (229 | ) | |||||||||||||||
| (8 | ) | (130 | ) | (11 | ) | (163 | ) | (8 | ) | (202 | ) | (8 | ) | (93 | ) | |||||||||||||||
| — | (16 | ) | (5 | ) | (229 | ) | (1 | ) | (29 | ) | — | (5 | ) | |||||||||||||||||
| — | — | (2 | ) | (24 | ) | — | — | — | — | |||||||||||||||||||||
| — | — | (1 | ) | (10 | ) | (7 | ) | (86 | ) | — | — | |||||||||||||||||||
| (64 | ) | (2,103 | ) | (1,724 | ) | (7,297 | ) | (31 | ) | (648 | ) | (26 | ) | (327 | ) | |||||||||||||||
| 1,604,235 | 4,465,711 | 9,302,318 | 15,271,504 | 8,769,293 | 18,103,049 | 614,300 | 1,489,228 | |||||||||||||||||||||||
| 8 | 171 | 545 | 2,690 | 8 | 162 | 9 | 128 | |||||||||||||||||||||||
| (1,692,793 | ) | (5,235,768 | ) | (8,343,363 | ) | (15,912,304 | ) | (8,922,079 | ) | (18,380,423 | ) | (734,141 | ) | (1,741,901 | ) | |||||||||||||||
| (88,550 | ) | (769,886 | ) | 959,500 | (638,110 | ) | (152,778 | ) | (277,212 | ) | (119,832 | ) | (252,545 | ) | ||||||||||||||||
| 463,844 | 863,663 | 565,725 | 1,089,815 | 586,735 | 1,353,051 | 224,192 | 537,529 | |||||||||||||||||||||||
| 5 | 87 | 4 | 73 | 4 | 80 | 2 | 42 | |||||||||||||||||||||||
| (469,038 | ) | (959,122 | ) | (512,123 | ) | (1,254,167 | ) | (598,848 | ) | (1,656,257 | ) | (221,058 | ) | (735,546 | ) | |||||||||||||||
| (5,189 | ) | (95,372 | ) | 53,606 | (164,279 | ) | (12,109 | ) | (303,126 | ) | 3,136 | (197,975 | ) | |||||||||||||||||
| 3,913 | 74,849 | 341,258 | 2,405,551 | 121,816 | 509,512 | 34,844 | 73,252 | |||||||||||||||||||||||
| — | — | 2 | 122 | — | 1 | — | — | |||||||||||||||||||||||
| (6,163 | ) | (101,059 | ) | (358,971 | ) | (2,778,522 | ) | (135,533 | ) | (555,893 | ) | (35,564 | ) | (77,997 | ) | |||||||||||||||
| (2,250 | ) | (26,210 | ) | (17,711 | ) | (372,849 | ) | (13,717 | ) | (46,380 | ) | (720 | ) | (4,745 | ) | |||||||||||||||
| N/A | N/A | 24,956 | 50,778 | N/A | N/A | N/A | N/A | |||||||||||||||||||||||
| N/A | N/A | 2 | 10 | N/A | N/A | N/A | N/A | |||||||||||||||||||||||
| N/A | N/A | (26,312 | ) | (77,298 | ) | N/A | N/A | N/A | N/A | |||||||||||||||||||||
| N/A | N/A | (1,354 | ) | (26,510 | ) | N/A | N/A | N/A | N/A | |||||||||||||||||||||
| N/A | N/A | 78,065 | 275,288 | 159,311 | 376,096 | N/A | N/A | |||||||||||||||||||||||
| N/A | N/A | 1 | 10 | — | — | N/A | N/A | |||||||||||||||||||||||
| N/A | N/A | (95,491 | ) | (300,625 | ) | (170,698 | ) | (444,377 | ) | N/A | N/A | |||||||||||||||||||
| N/A | N/A | (17,425 | ) | (25,327 | ) | (11,387 | ) | (68,281 | ) | N/A | N/A | |||||||||||||||||||
| (95,989 | ) | (891,468 | ) | 976,616 | (1,227,075 | ) | (189,991 | ) | (694,999 | ) | (117,416 | ) | (455,265 | ) | ||||||||||||||||
| (95,989 | ) | (891,465 | ) | 976,620 | (1,225,937 | ) | (189,991 | ) | (694,999 | ) | (117,414 | ) | (455,254 | ) | ||||||||||||||||
| 1,432,564 | 2,324,029 | 3,500,099 | 4,726,036 | 644,683 | 1,339,682 | 610,161 | 1,065,415 | |||||||||||||||||||||||
| $ | 1,336,575 | $ | 1,432,564 | $ | 4,476,719 | $ | 3,500,099 | $ | 454,692 | $ | 644,683 | $ | 492,747 | $ | 610,161 | |||||||||||||||
| $ | — | $ | — | $ | — | $ | — | $ | — | $ | — | $ | — | $ | — | |||||||||||||||
| SEI Daily Income Trust / Semi-Annual Report / July 31, 2010 | 33 |
Table of Contents
Statements of Changes in Net Assets ($ Thousands)
For the six months ended July 31, 2010 (Unaudited) and the year ended January 31, 2010
Short-Duration Government Fund | ||||||||
| 2/1/10-7/31/10 | 2/1/09-1/31/10 | |||||||
Operations: | ||||||||
Net Investment Income | $ | 2,787 | $ | 5,525 | ||||
Net Realized Gain (Loss) on Investments and Futures Contracts | 4,574 | 5,499 | ||||||
Net Change in Unrealized Appreciation (Depreciation) on Investments and Futures Contracts | 6,059 | 1,916 | ||||||
Net Increase in Net Assets Resulting from Operations | 13,420 | 12,940 | ||||||
Dividends and Distributions to Shareholders: | ||||||||
Net Investment Income | (4,064 | ) | (5,907 | ) | ||||
Net Capital Gains | — | — | ||||||
Total Dividends and Distributions | (4,064 | ) | (5,907 | ) | ||||
Capital Share Transactions: | ||||||||
Class A: | ||||||||
Proceeds from Shares Issued | 512,426 | 426,624 | ||||||
Reinvestment of Dividends & Distributions | 3,499 | 5,123 | ||||||
Cost of Shares Redeemed | (205,470 | ) | (349,756 | ) | ||||
Net Increase (Decrease) from Class A Transactions | 310,455 | 81,991 | ||||||
Net Increase (Decrease) in Net Assets | 319,811 | 89,024 | ||||||
Net Assets: | ||||||||
Beginning of Period | 377,088 | 288,064 | ||||||
End of Period | $ | 696,899 | $ | 377,088 | ||||
Undistributed (Distributions in Excess of) Net Investment Income | $ | (1,273 | ) | $ | 4 | |||
Capital Share Transactions: | ||||||||
Class A: | ||||||||
Shares Issued | 48,481 | 40,958 | ||||||
Reinvestment of Distributions | 330 | 493 | ||||||
Shares Redeemed | (19,432 | ) | (33,717 | ) | ||||
Net Increase (Decrease) in Shares Outstanding from Share Transactions | 29,379 | 7,734 | ||||||
| ‡ | See Note 1 in Notes to Financial Statements. |
Amounts designated as “—” are zero or have been rounded to zero.
The accompanying notes are an integral part of the financial statements.
| 34 | SEI Daily Income Trust / Semi-Annual Report / July 31, 2010 |
Table of Contents
Intermediate-Duration Government Fund | GNMA Fund | Ultra Short Duration Bond Fund‡ | ||||||||||||||||||||
| 2/1/10-7/31/10 | 2/1/09-1/31/10 | 2/1/10-7/31/10 | 2/1/09-1/31/10 | 2/1/10-7/31/10 | 2/1/09-1/31/10 | |||||||||||||||||
| $ | 672 | $ | 2,115 | $ | 1,993 | $ | 6,035 | $ | 2,231 | $ | 6,645 | |||||||||||
| 997 | 2,881 | 5,948 | 5,012 | (10,980 | ) | (2,367 | ) | |||||||||||||||
| 1,963 | (117 | ) | 3,126 | 3,943 | 13,618 | 23,887 | ||||||||||||||||
| 3,632 | 4,879 | 11,067 | 14,990 | 4,869 | 28,165 | |||||||||||||||||
| (750 | ) | (2,185 | ) | (2,211 | ) | (6,674 | ) | (2,810 | ) | (6,657 | ) | |||||||||||
| — | (2,084 | ) | — | — | — | — | ||||||||||||||||
| (750 | ) | (4,269 | ) | (2,211 | ) | (6,674 | ) | (2,810 | ) | (6,657 | ) | |||||||||||
| 46,669 | 61,301 | 106,861 | 151,825 | 210,635 | 219,652 | |||||||||||||||||
| 648 | 3,587 | 1,564 | 4,651 | 2,499 | 5,869 | |||||||||||||||||
| (22,427 | ) | (94,546 | ) | (54,353 | ) | (126,517 | ) | (90,807 | ) | (196,872 | ) | |||||||||||
| 24,890 | (29,658 | ) | 54,072 | 29,959 | 122,327 | 28,649 | ||||||||||||||||
| 27,772 | (29,048 | ) | 62,928 | 38,275 | 124,386 | 50,157 | ||||||||||||||||
| 62,977 | 92,025 | 198,914 | 160,639 | 257,238 | 207,081 | |||||||||||||||||
| $ | 90,749 | $ | 62,977 | $ | 261,842 | $ | 198,914 | $ | 381,624 | $ | 257,238 | |||||||||||
| $ | (78 | ) | $ | — | $ | (224 | ) | $ | (6 | ) | $ | (581 | ) | $ | (2 | ) | ||||||
| 4,096 | 5,419 | 10,197 | 15,143 | 22,725 | 25,121 | |||||||||||||||||
| 57 | 317 | 150 | 461 | 269 | 666 | |||||||||||||||||
| (1,971 | ) | (8,350 | ) | (5,239 | ) | (12,589 | ) | (9,791 | ) | (22,293 | ) | |||||||||||
| 2,182 | (2,614 | ) | 5,108 | 3,015 | 13,203 | 3,494 | ||||||||||||||||
| SEI Daily Income Trust / Semi-Annual Report / July 31, 2010 | 35 |
Table of Contents
For the six months ended July 31, 2010 (Unaudited) and for the years ended January 31,
For a Share Outstanding Throughout the Years
| Net Asset Value, Beginning of Period | Net Investment Income* | Net Realized and Unrealized Gains (Losses) on Securities | Payment by Affiliate | Total from Operations | Dividends from Net Investment Income | Total Dividends | Net Asset Value, End of Period | Total Return† | Net Assets End of Period ($ Thousands) | Ratio of Expenses to Average Net Assets | Ratio of Expenses to Average Net Assets (Excluding Waivers) | Ratio of Net Investment Income to Average Net Assets | ||||||||||||||||||||||||||||||
Money Market Fund |
| |||||||||||||||||||||||||||||||||||||||||
Class A | ||||||||||||||||||||||||||||||||||||||||||
2010@ | $ | 1.00 | $ | — | $ | — | $ | — | $ | — | $ | — | (1) | $ | — | (1) | $ | 1.00 | 0.06 | % | $ | 313,295 | 0.18 | % | 0.68 | % | 0.12 | % | ||||||||||||||
2010 | 1.00 | — | — | — | — | — | (1) | — | (1) | 1.00 | 0.31 | 228,375 | 0.24 | (2) | 0.70 | 0.35 | ||||||||||||||||||||||||||
2009 | 1.00 | 0.02 | (0.01 | ) | 0.01 | 0.02 | (0.02 | ) | (0.02 | ) | 1.00 | 2.45 | †† | 341,204 | 0.20 | (2) | 0.64 | 2.46 | ||||||||||||||||||||||||
2008 | 1.00 | 0.05 | — | — | 0.05 | (0.05 | ) | (0.05 | ) | 1.00 | 5.23 | 401,174 | 0.18 | 0.63 | 5.13 | |||||||||||||||||||||||||||
2007 | 1.00 | 0.05 | — | — | 0.05 | (0.05 | ) | (0.05 | ) | 1.00 | 5.07 | 623,314 | 0.18 | 0.63 | 4.97 | |||||||||||||||||||||||||||
2006 | 1.00 | 0.03 | — | — | 0.03 | (0.03 | ) | (0.03 | ) | 1.00 | 3.30 | 392,207 | 0.18 | 0.62 | 3.25 | |||||||||||||||||||||||||||
Class B | ||||||||||||||||||||||||||||||||||||||||||
2010@ | $ | 1.00 | $ | — | $ | — | $ | — | $ | — | $ | — | (1) | $ | — | (1) | $ | 1.00 | 0.01 | % | $ | 30,893 | 0.29 | %(3) | 0.73 | % | 0.01 | % | ||||||||||||||
2010 | 1.00 | — | — | — | — | — | (1) | — | (1) | 1.00 | 0.15 | 51,142 | 0.44 | (2)(3) | 0.76 | 0.19 | ||||||||||||||||||||||||||
2009 | 1.00 | 0.02 | (0.01 | ) | 0.01 | 0.02 | (0.02 | ) | (0.02 | ) | 1.00 | 2.15 | †† | 120,925 | 0.50 | (2) | 0.70 | 2.19 | ||||||||||||||||||||||||
2008 | 1.00 | 0.05 | — | — | 0.05 | (0.05 | ) | (0.05 | ) | 1.00 | 4.92 | 166,627 | 0.48 | 0.68 | 4.82 | |||||||||||||||||||||||||||
2007 | 1.00 | 0.05 | — | — | 0.05 | (0.05 | ) | (0.05 | ) | 1.00 | 4.76 | 148,053 | 0.48 | 0.68 | 4.61 | |||||||||||||||||||||||||||
2006 | 1.00 | 0.03 | — | — | 0.03 | (0.03 | ) | (0.03 | ) | 1.00 | 2.99 | 123,851 | 0.48 | 0.67 | 2.98 | |||||||||||||||||||||||||||
Class C | ||||||||||||||||||||||||||||||||||||||||||
2010@ | $ | 1.00 | $ | — | $ | — | $ | — | $ | — | $ | — | (1) | $ | — | (1) | $ | 1.00 | 0.01 | % | $ | 62,186 | 0.29 | %(3) | 0.93 | % | 0.01 | % | ||||||||||||||
2010 | 1.00 | — | — | — | — | — | (1) | — | (1) | 1.00 | 0.08 | 74,047 | 0.49 | (2)(3) | 0.95 | 0.10 | ||||||||||||||||||||||||||
2009 | 1.00 | 0.02 | (0.01 | ) | 0.01 | 0.02 | (0.02 | ) | (0.02 | ) | 1.00 | 1.94 | †† | 158,833 | 0.70 | (2) | 0.89 | 2.00 | ||||||||||||||||||||||||
2008 | 1.00 | 0.05 | — | — | 0.05 | (0.05 | ) | (0.05 | ) | 1.00 | 4.71 | 259,640 | 0.68 | 0.88 | 4.61 | |||||||||||||||||||||||||||
2007 | 1.00 | 0.04 | — | — | 0.04 | (0.04 | ) | (0.04 | ) | 1.00 | 4.55 | 243,944 | 0.68 | 0.88 | 4.48 | |||||||||||||||||||||||||||
2006 | 1.00 | 0.03 | — | — | 0.03 | (0.03 | ) | (0.03 | ) | 1.00 | 2.78 | 232,072 | 0.68 | 0.87 | 2.83 | |||||||||||||||||||||||||||
Sweep Class | ||||||||||||||||||||||||||||||||||||||||||
2010@ | $ | 1.00 | $ | — | $ | — | $ | — | $ | — | $ | — | (1) | $ | — | (1) | $ | 1.00 | 0.01 | % | $ | 35,925 | 0.29 | %(3) | 1.18 | % | 0.01 | % | ||||||||||||||
2010 | 1.00 | — | — | — | — | — | (1) | — | (1) | 1.00 | 0.07 | 28,445 | 0.52 | (2)(3) | 1.20 | 0.08 | ||||||||||||||||||||||||||
2009 | 1.00 | 0.02 | (0.01 | ) | 0.01 | 0.02 | (0.02 | ) | (0.02 | ) | 1.00 | 1.69 | †† | 68,179 | 0.95 | (2) | 1.14 | 1.79 | ||||||||||||||||||||||||
2008 | 1.00 | 0.04 | — | — | 0.04 | (0.04 | ) | (0.04 | ) | 1.00 | 4.45 | 133,223 | 0.93 | 1.13 | 4.35 | |||||||||||||||||||||||||||
2007 | 1.00 | 0.04 | — | — | 0.04 | (0.04 | ) | (0.04 | ) | 1.00 | 4.29 | 91,087 | 0.93 | 1.13 | 4.19 | |||||||||||||||||||||||||||
2006 | 1.00 | 0.03 | — | — | 0.03 | (0.03 | ) | (0.03 | ) | 1.00 | 2.53 | 113,107 | 0.93 | 1.12 | 2.60 | |||||||||||||||||||||||||||
Government Fund |
| |||||||||||||||||||||||||||||||||||||||||
Class A | ||||||||||||||||||||||||||||||||||||||||||
2010@ | $ | 1.00 | $ | — | $ | — | $ | — | $ | — | $ | — | (1) | $ | — | (1) | $ | 1.00 | 0.02 | % | $ | 915,926 | 0.15 | %(3) | 0.59 | % | 0.05 | % | ||||||||||||||
2010 | 1.00 | — | — | — | — | — | (1) | — | (1) | 1.00 | 0.14 | 825,341 | 0.20 | (2) | 0.57 | 0.16 | ||||||||||||||||||||||||||
2009 | 1.00 | 0.02 | — | — | 0.02 | (0.02 | ) | (0.02 | ) | 1.00 | 2.15 | 1,526,541 | 0.22 | (2) | 0.54 | 2.06 | ||||||||||||||||||||||||||
2008 | 1.00 | 0.05 | — | — | 0.05 | (0.05 | ) | (0.05 | ) | 1.00 | 4.98 | 1,031,612 | 0.20 | 0.53 | 4.79 | |||||||||||||||||||||||||||
2007 | 1.00 | 0.05 | — | — | 0.05 | (0.05 | ) | (0.05 | ) | 1.00 | 4.97 | 507,735 | 0.20 | 0.54 | 4.88 | |||||||||||||||||||||||||||
2006 | 1.00 | 0.03 | — | — | 0.03 | (0.03 | ) | (0.03 | ) | 1.00 | 3.21 | 467,445 | 0.20 | 0.53 | 3.23 | |||||||||||||||||||||||||||
Class B | ||||||||||||||||||||||||||||||||||||||||||
2010@ | $ | 1.00 | $ | — | $ | — | $ | — | $ | — | $ | — | (1) | $ | — | (1) | $ | 1.00 | 0.02 | % | $ | 336,513 | 0.15 | %(3) | 0.64 | % | 0.05 | % | ||||||||||||||
2010 | 1.00 | — | — | — | — | — | (1) | — | (1) | 1.00 | 0.07 | 427,711 | 0.28 | (2)(3) | 0.62 | 0.07 | ||||||||||||||||||||||||||
2009 | 1.00 | 0.02 | — | — | 0.02 | (0.02 | ) | (0.02 | ) | 1.00 | 1.84 | 623,905 | 0.52 | (2) | 0.60 | 1.62 | ||||||||||||||||||||||||||
2008 | 1.00 | 0.05 | — | — | 0.05 | (0.05 | ) | (0.05 | ) | 1.00 | 4.67 | 197,593 | 0.50 | 0.58 | 4.53 | |||||||||||||||||||||||||||
2007 | 1.00 | 0.05 | — | — | 0.05 | (0.05 | ) | (0.05 | ) | 1.00 | 4.66 | 122,674 | 0.50 | 0.59 | 4.57 | |||||||||||||||||||||||||||
2006 | 1.00 | 0.03 | — | — | 0.03 | (0.03 | ) | (0.03 | ) | 1.00 | 2.90 | 122,025 | 0.50 | 0.58 | 2.84 | |||||||||||||||||||||||||||
Class C | ||||||||||||||||||||||||||||||||||||||||||
2010@ | $ | 1.00 | $ | — | $ | — | $ | — | $ | — | $ | — | (1) | $ | — | (1) | $ | 1.00 | 0.02 | % | $ | 63,982 | 0.15 | %(3) | 0.84 | % | 0.05 | % | ||||||||||||||
2010 | 1.00 | — | — | — | — | — | (1) | — | (1) | 1.00 | 0.06 | 59,565 | 0.31 | (2)(3) | 0.82 | 0.07 | ||||||||||||||||||||||||||
2009 | 1.00 | 0.02 | — | — | 0.02 | (0.02 | ) | (0.02 | ) | 1.00 | 1.64 | 153,015 | 0.71 | (2)(3) | 0.79 | 1.65 | ||||||||||||||||||||||||||
2008 | 1.00 | 0.04 | — | — | 0.04 | (0.04 | ) | (0.04 | ) | 1.00 | 4.46 | 154,244 | 0.70 | 0.78 | 4.35 | |||||||||||||||||||||||||||
2007 | 1.00 | 0.04 | — | — | 0.04 | (0.04 | ) | (0.04 | ) | 1.00 | 4.45 | 137,375 | 0.70 | 0.79 | 4.37 | |||||||||||||||||||||||||||
2006 | 1.00 | 0.03 | — | — | 0.03 | (0.03 | ) | (0.03 | ) | 1.00 | 2.70 | 129,416 | 0.70 | 0.78 | 2.74 | |||||||||||||||||||||||||||
Sweep Class | ||||||||||||||||||||||||||||||||||||||||||
2010@ | $ | 1.00 | $ | — | $ | — | $ | — | $ | — | $ | — | (1) | $ | — | (1) | $ | 1.00 | 0.02 | % | $ | 21,839 | 0.15 | %(3) | 1.09 | % | 0.05 | % | ||||||||||||||
2010 | 1.00 | — | — | — | — | — | (1) | — | (1) | 1.00 | 0.06 | 30,018 | 0.30 | (2)(3) | 1.07 | 0.07 | ||||||||||||||||||||||||||
2009 | 1.00 | 0.01 | — | — | 0.01 | (0.01 | ) | (0.01 | ) | 1.00 | 1.39 | 45,154 | 0.96 | (2)(3) | 1.04 | 1.34 | ||||||||||||||||||||||||||
2008 | 1.00 | 0.04 | — | — | 0.04 | (0.04 | ) | (0.04 | ) | 1.00 | 4.20 | 28,233 | 0.95 | 1.03 | 4.06 | |||||||||||||||||||||||||||
2007 | 1.00 | 0.04 | — | — | 0.04 | (0.04 | ) | (0.04 | ) | 1.00 | 4.19 | 15,077 | 0.95 | 1.04 | 4.07 | |||||||||||||||||||||||||||
2006 | 1.00 | 0.02 | — | — | 0.02 | (0.02 | ) | (0.02 | ) | 1.00 | 2.44 | 26,361 | 0.95 | 1.03 | 2.43 | |||||||||||||||||||||||||||
| (1) | Amount represents less than $0.01 per share. |
| (2) | The expense ratio includes the Treasury Guarantee Program expense. Had the expense been excluded, the expense ratio would have been equal to, or less than, the expense ratio cap figure. See Note 3 for expense ratio cap figure. |
| (3) | The Distributor and/or Administrator have voluntarily agreed to waive and reduce its fee and/or reimburse certain expenses of the Fund in order to limit the one-day net income yield of the Fund to not less than 0.01% of the Fund’s average daily net assets of the share class. Had these waivers and/or the Treasury Guarantee Program expense been excluded the ratio would have been at the expense ratio cap figure. See Note 3 for expense ratio cap figure. |
| * | Per share calculations were performed using average shares. |
| @ | For the six month period ended July 31, 2010. All ratios for the period have been annualized. |
| † | Returns are for the period indicated and have not been annualized. Returns shown do not reflect the deduction of taxes that a shareholder would pay on Fund distributions or the redemption of Fund shares. |
| †† | The total return includes payment by affiliate. Had the payment been excluded the total return would have been 1.61%, 1.31%, 1.11% and 0.86% for Class A, Class B, Class C and Sweep Class, respectively. See Note 3 in Notes to Financial Statements. |
Amounts designated as “—” are zero or have been rounded to zero.
| 36 | SEI Daily Income Trust / Semi-Annual Report / July 31, 2010 |
Table of Contents
| Net Asset Value, Beginning of Period | Net Investment Income* | Net Realized and Unrealized Gains (Losses) on Securities | Payment by Affiliate | Total from Operations | Dividends from Net Investment Income | Total Dividends | Net Asset Value, End of Period | Total Return† | Net Assets End of Period ($ Thousands) | Ratio of Expenses to Average Net Assets | Ratio of Expenses to Average Net Assets (Excluding Waivers) | Ratio of Net Investment Income to Average Net Assets | ||||||||||||||||||||||||||||||
Government II Fund |
| |||||||||||||||||||||||||||||||||||||||||
Class A | ||||||||||||||||||||||||||||||||||||||||||
2010@ | $ | 1.00 | $ | — | $ | — | $ | — | $ | — | $ | — | (1) | $ | — | (1) | $ | 1.00 | 0.00 | % | $ | 1,191,801 | 0.14 | %(3) | 0.54 | % | 0.01 | % | ||||||||||||||
2010 | 1.00 | — | — | — | — | — | (1) | — | (1) | 1.00 | 0.11 | 1,280,352 | 0.19 | (2) | 0.52 | 0.12 | ||||||||||||||||||||||||||
2009 | 1.00 | 0.02 | — | — | 0.02 | (0.02 | ) | (0.02 | ) | 1.00 | 2.10 | 2,050,235 | 0.21 | (2) | 0.50 | 1.99 | ||||||||||||||||||||||||||
2008 | 1.00 | 0.05 | — | — | 0.05 | (0.05 | ) | (0.05 | ) | 1.00 | 4.97 | 1,354,361 | 0.20 | 0.48 | 4.81 | |||||||||||||||||||||||||||
2007 | 1.00 | 0.05 | — | — | 0.05 | (0.05 | ) | (0.05 | ) | 1.00 | 4.96 | 680,219 | 0.20 | 0.49 | 4.86 | |||||||||||||||||||||||||||
2006 | 1.00 | 0.03 | — | — | 0.03 | (0.03 | ) | (0.03 | ) | 1.00 | 3.18 | 576,242 | 0.20 | 0.48 | 3.18 | |||||||||||||||||||||||||||
Class B | ||||||||||||||||||||||||||||||||||||||||||
2010@ | $ | 1.00 | $ | — | $ | — | $ | — | $ | — | $ | — | (1) | $ | — | (1) | $ | 1.00 | 0.00 | % | $ | 141,771 | 0.14 | %(3) | 0.59 | % | 0.01 | % | ||||||||||||||
2010 | 1.00 | — | — | — | — | — | (1) | — | (1) | 1.00 | 0.06 | 146,960 | 0.25 | (2) | 0.56 | 0.06 | ||||||||||||||||||||||||||
2009 | 1.00 | 0.02 | — | — | 0.02 | (0.02 | ) | (0.02 | ) | 1.00 | 1.79 | 242,332 | 0.51 | (2) | 0.54 | 1.80 | ||||||||||||||||||||||||||
2008 | 1.00 | 0.05 | — | — | 0.05 | (0.05 | ) | (0.05 | ) | 1.00 | 4.66 | 150,900 | 0.50 | 0.53 | 4.53 | |||||||||||||||||||||||||||
2007 | 1.00 | 0.05 | — | — | 0.05 | (0.05 | ) | (0.05 | ) | 1.00 | 4.64 | 140,930 | 0.50 | 0.54 | 4.56 | |||||||||||||||||||||||||||
2006 | 1.00 | 0.03 | — | — | 0.03 | (0.03 | ) | (0.03 | ) | 1.00 | 2.87 | 168,616 | 0.50 | 0.53 | 2.80 | |||||||||||||||||||||||||||
Class C | ||||||||||||||||||||||||||||||||||||||||||
2010@ | $ | 1.00 | $ | — | $ | — | $ | — | $ | — | $ | — | (1) | $ | — | (1) | $ | 1.00 | 0.00 | % | $ | 3,003 | 0.14 | %(3) | 0.79 | % | 0.01 | % | ||||||||||||||
2010 | 1.00 | — | — | — | — | — | (1) | — | (1) | 1.00 | 0.06 | 5,252 | 0.28 | (2)(3) | 0.77 | 0.06 | ||||||||||||||||||||||||||
2009 | 1.00 | 0.02 | — | — | 0.02 | (0.02 | ) | (0.02 | ) | 1.00 | 1.60 | 31,462 | 0.70 | (2)(3) | 0.74 | 1.63 | ||||||||||||||||||||||||||
2008 | 1.00 | 0.04 | — | — | 0.04 | (0.04 | ) | (0.04 | ) | 1.00 | 4.45 | 43,538 | 0.70 | 0.73 | 4.05 | |||||||||||||||||||||||||||
2007 | 1.00 | 0.04 | — | — | 0.04 | (0.04 | ) | (0.04 | ) | 1.00 | 4.44 | 4,089 | 0.70 | 0.74 | 4.38 | |||||||||||||||||||||||||||
2006 | 1.00 | 0.03 | — | — | 0.03 | (0.03 | ) | (0.03 | ) | 1.00 | 2.67 | 4,457 | 0.70 | 0.73 | 2.39 | |||||||||||||||||||||||||||
Prime Obligation Fund |
| |||||||||||||||||||||||||||||||||||||||||
Class A | ||||||||||||||||||||||||||||||||||||||||||
2010@ | $ | 1.00 | $ | — | $ | — | $ | — | $ | — | $ | — | (1) | $ | — | (1) | $ | 1.00 | 0.05 | % | $ | 4,118,867 | 0.20 | % | 0.54 | % | 0.10 | % | ||||||||||||||
2010 | 1.00 | — | (0.04 | ) | 0.04 | — | — | (1) | — | (1) | 1.00 | 0.20 | †† | 3,158,830 | 0.23 | (2) | 0.53 | 0.26 | ||||||||||||||||||||||||
2009 | 1.00 | 0.02 | — | — | 0.02 | (0.02 | ) | (0.02 | ) | 1.00 | 2.37 | 3,796,102 | 0.22 | (2) | 0.50 | 2.42 | ||||||||||||||||||||||||||
2008 | 1.00 | 0.05 | — | — | 0.05 | (0.05 | ) | (0.05 | ) | 1.00 | 5.21 | 3,740,714 | 0.20 | 0.48 | 5.10 | |||||||||||||||||||||||||||
2007 | 1.00 | 0.05 | — | — | 0.05 | (0.05 | ) | (0.05 | ) | 1.00 | 5.06 | 3,382,051 | 0.20 | 0.49 | 4.96 | |||||||||||||||||||||||||||
2006 | 1.00 | 0.03 | — | — | 0.03 | (0.03 | ) | (0.03 | ) | 1.00 | 3.28 | 2,957,074 | 0.20 | 0.48 | 3.26 | |||||||||||||||||||||||||||
Class B | ||||||||||||||||||||||||||||||||||||||||||
2010@ | $ | 1.00 | $ | — | $ | — | $ | — | $ | — | $ | — | (1) | $ | — | (1) | $ | 1.00 | 0.01 | % | $ | 236,058 | 0.29 | %(3) | 0.59 | % | 0.01 | % | ||||||||||||||
2010 | 1.00 | — | (0.04 | ) | 0.04 | — | — | (1) | — | (1) | 1.00 | 0.07 | †† | 182,593 | 0.38 | (2)(3) | 0.58 | 0.15 | ||||||||||||||||||||||||
2009 | 1.00 | 0.02 | — | — | 0.02 | (0.02 | ) | (0.02 | ) | 1.00 | 2.06 | 346,741 | 0.51 | (2) | 0.55 | 2.17 | ||||||||||||||||||||||||||
2008 | 1.00 | 0.05 | — | — | 0.05 | (0.05 | ) | (0.05 | ) | 1.00 | 4.90 | 475,700 | 0.50 | 0.53 | 4.82 | |||||||||||||||||||||||||||
2007 | 1.00 | 0.05 | — | — | 0.05 | (0.05 | ) | (0.05 | ) | 1.00 | 4.74 | 715,879 | 0.50 | 0.54 | 4.65 | |||||||||||||||||||||||||||
2006 | 1.00 | 0.03 | — | — | 0.03 | (0.03 | ) | (0.03 | ) | 1.00 | 2.98 | 625,831 | 0.50 | 0.53 | 2.88 | |||||||||||||||||||||||||||
Class C | ||||||||||||||||||||||||||||||||||||||||||
2010@ | $ | 1.00 | $ | — | $ | — | $ | — | $ | — | $ | — | (1) | $ | — | (1) | $ | 1.00 | 0.01 | % | $ | 76,971 | 0.29 | %(3) | 0.79 | % | 0.01 | % | ||||||||||||||
2010 | 1.00 | — | (0.04 | ) | 0.04 | — | — | (1) | — | (1) | 1.00 | 0.06 | †† | 95,092 | 0.39 | (2)(3) | 0.78 | 0.14 | ||||||||||||||||||||||||
2009 | 1.00 | 0.02 | — | — | 0.02 | (0.02 | ) | (0.02 | ) | 1.00 | 1.86 | 467,782 | 0.71 | (2) | 0.75 | 2.04 | ||||||||||||||||||||||||||
2008 | 1.00 | 0.05 | — | — | 0.05 | (0.05 | ) | (0.05 | ) | 1.00 | 4.69 | 641,977 | 0.70 | 0.73 | 4.60 | |||||||||||||||||||||||||||
2007 | 1.00 | 0.04 | — | — | 0.04 | (0.04 | ) | (0.04 | ) | 1.00 | 4.53 | 780,951 | 0.70 | 0.74 | 4.45 | |||||||||||||||||||||||||||
2006 | 1.00 | 0.03 | — | — | 0.03 | (0.03 | ) | (0.03 | ) | 1.00 | 2.77 | 779,625 | 0.70 | 0.73 | 2.76 | |||||||||||||||||||||||||||
Class H | ||||||||||||||||||||||||||||||||||||||||||
2010@ | $ | 1.00 | $ | — | $ | — | $ | — | $ | — | $ | — | (1) | $ | — | (1) | $ | 1.00 | 0.00 | % | $ | 30,401 | 0.29 | %(3) | 0.72 | % | 0.01 | % | ||||||||||||||
2010 | 1.00 | — | (0.04 | ) | 0.04 | — | — | (1) | — | (1) | 1.00 | 0.02 | †† | 31,797 | 0.43 | (2)(3) | 0.71 | 0.09 | ||||||||||||||||||||||||
2009 | 1.00 | 0.02 | — | — | 0.02 | (0.02 | ) | (0.02 | ) | �� | 1.00 | 1.93 | 58,276 | 0.64 | (2) | 0.67 | 2.11 | |||||||||||||||||||||||||
2008 | 1.00 | 0.05 | — | — | 0.05 | (0.05 | ) | (0.05 | ) | 1.00 | 4.76 | 80,958 | 0.63 | 0.66 | 4.65 | |||||||||||||||||||||||||||
2007 | 1.00 | 0.04 | — | — | 0.04 | (0.04 | ) | (0.04 | ) | 1.00 | 4.61 | 65,512 | 0.63 | 0.67 | 4.55 | |||||||||||||||||||||||||||
2006 | 1.00 | 0.03 | — | — | 0.03 | (0.03 | ) | (0.03 | ) | 1.00 | 2.84 | 36,006 | 0.63 | 0.66 | 2.81 | |||||||||||||||||||||||||||
Sweep Class | ||||||||||||||||||||||||||||||||||||||||||
2010@ | $ | 1.00 | $ | — | $ | — | $ | — | $ | — | $ | — | (1) | $ | — | (1) | $ | 1.00 | 0.01 | % | $ | 14,422 | 0.28 | %(3) | 1.04 | % | 0.01 | % | ||||||||||||||
2010 | 1.00 | — | (0.04 | ) | 0.04 | — | — | (1) | — | (1) | 1.00 | 0.06 | †† | 31,787 | 0.39 | (2)(3) | 1.03 | 0.14 | ||||||||||||||||||||||||
2009 | 1.00 | 0.02 | — | — | 0.02 | (0.02 | ) | (0.02 | ) | 1.00 | 1.62 | 57,135 | 0.95 | (2)(3) | 1.00 | 1.54 | ||||||||||||||||||||||||||
2008 | 1.00 | 0.04 | — | — | 0.04 | (0.04 | ) | (0.04 | ) | 1.00 | 4.43 | 56,378 | 0.95 | 0.98 | 4.34 | |||||||||||||||||||||||||||
2007 | 1.00 | 0.04 | — | — | 0.04 | (0.04 | ) | (0.04 | ) | 1.00 | 4.27 | 47,991 | 0.95 | 0.99 | 4.20 | |||||||||||||||||||||||||||
2006 | 1.00 | 0.03 | — | — | 0.03 | (0.03 | ) | (0.03 | ) | 1.00 | 2.51 | 45,130 | 0.95 | 0.98 | 2.53 | |||||||||||||||||||||||||||
| (1) | Amount represents less than $0.01 per share. |
| (2) | The expense ratio includes the Treasury Guarantee Program expense. Had the expense been excluded, the expense ratio would have been equal to, or less than, the expense ratio cap figure. See Note 3 for expense ratio cap figure. |
| (3) | The Distributor and/or Administrator have voluntarily agreed to waive and reduce its fee and/or reimburse certain expenses of the Fund in order to limit the one-day net income yield of the Fund to not less than 0.01% of the Fund’s average daily net assets of the share class. Had these waivers and/or the Treasury Guarantee Program expense been excluded the ratio would have been at the expense ratio cap figure. See Note 3 for expense ratio cap figure. |
| * | Per share calculations were performed using average shares. |
| @ | For the six month period ended July 31, 2010. All ratios for the period have been annualized. |
| † | Returns are for the period indicated and have not been annualized. Returns shown do not reflect the deduction of taxes that a shareholder would pay on Fund distributions or the redemption of Fund shares. |
| †† | The total return includes payment by affiliate. Had the payment been excluded the total return would have been (3.28)%, (3.41)%, (3.42)%, (3.45)% and (3.42)% for Class A, Class B, Class C, Class H and Sweep Class, respectively. See Note 3 in Notes to Financial Statements. |
Amounts designated as “—” are zero or have been rounded to zero.
| SEI Daily Income Trust / Semi-Annual Report / July 31, 2010 | 37 |
Table of Contents
Financial Highlights
For the six months ended July 31, 2010 (Unaudited) and for the years ended January 31,
For a Share Outstanding Throughout the Years
| Net Asset Value, Beginning of Period | Net Investment Income* | Net Realized and Unrealized Gains (Losses) on Securities | Payment by Affiliate | Total from Operations | Dividends from Net Investment Income | Total Dividends | Net Asset Value, End of Period | Total Return† | Net Assets End of Period | Ratio of Expenses to Average Net Assets | Ratio of Expenses to Average Net Assets (Excluding Waivers) | Ratio of Net Investment Income to Average Net Assets | |||||||||||||||||||||||||||||
Treasury Fund | |||||||||||||||||||||||||||||||||||||||||
Class A | |||||||||||||||||||||||||||||||||||||||||
2010@ | $ | 1.00 | $ | — | $ | — | $ | — | $ | — | $ | — | (1) | $ | — | (1) | $ | 1.00 | 0.01 | % | $ | 142,916 | 0.17 | %(3) | 0.60 | % | 0.01 | % | |||||||||||||
2010 | 1.00 | — | — | — | — | — | (1) | — | (1) | 1.00 | 0.07 | 295,695 | 0.17 | (2) | 0.56 | 0.07 | |||||||||||||||||||||||||
2009 | 1.00 | 0.01 | — | — | 0.01 | (0.01 | ) | (0.01 | ) | 1.00 | 1.27 | 572,906 | 0.19 | (2) | 0.55 | 1.18 | |||||||||||||||||||||||||
2008 | 1.00 | 0.05 | — | — | 0.05 | (0.05 | ) | (0.05 | ) | 1.00 | 4.64 | 610,451 | 0.20 | 0.53 | 4.36 | ||||||||||||||||||||||||||
2007 | 1.00 | 0.05 | — | — | 0.05 | (0.05 | ) | (0.05 | ) | 1.00 | 4.95 | 287,595 | 0.20 | 0.54 | 4.87 | ||||||||||||||||||||||||||
2006 | 1.00 | 0.03 | — | — | 0.03 | (0.03 | ) | (0.03 | ) | 1.00 | 3.13 | 208,097 | 0.20 | 0.53 | 3.05 | ||||||||||||||||||||||||||
Class B | |||||||||||||||||||||||||||||||||||||||||
2010@ | $ | 1.00 | $ | — | $ | — | $ | — | $ | — | $ | — | (1) | $ | — | (1) | $ | 1.00 | 0.01 | % | $ | 172,019 | 0.18 | %(3) | 0.64 | % | 0.01 | % | |||||||||||||
2010 | 1.00 | — | — | — | — | — | (1) | — | (1) | 1.00 | 0.06 | 184,127 | 0.20 | (2)(3) | 0.61 | 0.06 | |||||||||||||||||||||||||
2009 | 1.00 | 0.01 | — | — | 0.01 | (0.01 | ) | (0.01 | ) | 1.00 | 1.06 | 487,254 | 0.40 | (2)(3) | 0.59 | 1.12 | |||||||||||||||||||||||||
2008 | 1.00 | 0.04 | — | — | 0.04 | (0.04 | ) | (0.04 | ) | 1.00 | 4.33 | 761,497 | 0.50 | 0.58 | 4.07 | ||||||||||||||||||||||||||
2007 | 1.00 | 0.05 | — | — | 0.05 | (0.05 | ) | (0.05 | ) | 1.00 | 4.64 | 359,090 | 0.50 | 0.59 | 4.58 | ||||||||||||||||||||||||||
2006 | 1.00 | 0.03 | — | — | 0.03 | (0.03 | ) | (0.03 | ) | 1.00 | 2.82 | 239,461 | 0.50 | 0.58 | 2.81 | ||||||||||||||||||||||||||
Class C | |||||||||||||||||||||||||||||||||||||||||
2010@ | $ | 1.00 | $ | — | $ | — | $ | — | $ | — | $ | — | (1) | $ | — | (1) | $ | 1.00 | 0.01 | % | $ | 12,706 | 0.17 | %(3) | 0.84 | % | 0.01 | % | |||||||||||||
2010 | 1.00 | — | — | — | — | — | (1) | — | (1) | 1.00 | 0.06 | 26,423 | 0.20 | (2)(3) | 0.81 | 0.06 | |||||||||||||||||||||||||
2009 | 1.00 | 0.01 | — | — | 0.01 | (0.01 | ) | (0.01 | ) | 1.00 | 0.93 | 72,803 | 0.53 | (2)(3) | 0.80 | 0.98 | |||||||||||||||||||||||||
2008 | 1.00 | 0.04 | — | — | 0.04 | (0.04 | ) | (0.04 | ) | 1.00 | 4.12 | 144,919 | 0.70 | 0.78 | 4.00 | ||||||||||||||||||||||||||
2007 | 1.00 | 0.04 | — | — | 0.04 | (0.04 | ) | (0.04 | ) | 1.00 | 4.43 | 100,928 | 0.70 | 0.79 | 4.34 | ||||||||||||||||||||||||||
2006 | 1.00 | 0.03 | — | — | 0.03 | (0.03 | ) | (0.03 | ) | 1.00 | 2.62 | 113,403 | 0.70 | 0.78 | 2.70 | ||||||||||||||||||||||||||
Sweep Class | |||||||||||||||||||||||||||||||||||||||||
2010@ | $ | 1.00 | $ | — | $ | — | $ | — | $ | — | $ | — | (1) | $ | — | (1) | $ | 1.00 | 0.01 | % | $ | 127,051 | 0.18 | %(3) | 1.09 | % | 0.01 | % | |||||||||||||
2010 | 1.00 | — | — | — | — | — | (1) | — | (1) | 1.00 | 0.06 | 138,438 | 0.18 | (2)(3) | 1.06 | 0.06 | |||||||||||||||||||||||||
2009 | 1.00 | 0.01 | — | — | 0.01 | (0.01 | ) | (0.01 | ) | 1.00 | 0.77 | 206,719 | 0.61 | (2)(3) | 1.05 | 0.67 | |||||||||||||||||||||||||
2008 | 1.00 | 0.04 | — | — | 0.04 | (0.04 | ) | (0.04 | ) | 1.00 | 3.86 | 111,853 | 0.95 | 1.03 | 3.74 | ||||||||||||||||||||||||||
2007 | 1.00 | 0.04 | — | — | 0.04 | (0.04 | ) | (0.04 | ) | 1.00 | 4.17 | 97,004 | 0.95 | 1.04 | 4.11 | ||||||||||||||||||||||||||
2006 | 1.00 | 0.02 | — | — | 0.02 | (0.02 | ) | (0.02 | ) | 1.00 | 2.36 | 83,570 | 0.95 | 1.03 | 2.35 | ||||||||||||||||||||||||||
Treasury II Fund | |||||||||||||||||||||||||||||||||||||||||
Class A | |||||||||||||||||||||||||||||||||||||||||
2010@ | $ | 1.00 | $ | — | $ | — | $ | — | $ | — | $ | — | (1) | $ | — | (1) | $ | 1.00 | 0.00 | % | $ | 316,445 | 0.10 | %(3) | 0.59 | % | 0.01 | % | |||||||||||||
2010 | 1.00 | — | — | — | — | — | (1) | — | (1) | 1.00 | 0.04 | 436,276 | 0.12 | (2) | 0.55 | 0.04 | |||||||||||||||||||||||||
2009 | 1.00 | 0.01 | — | — | 0.01 | (0.01 | ) | (0.01 | ) | 1.00 | 1.05 | 688,813 | 0.20 | (2) | 0.54 | 0.87 | |||||||||||||||||||||||||
2008 | 1.00 | 0.04 | — | — | 0.04 | (0.04 | ) | (0.04 | ) | 1.00 | 4.11 | 516,164 | 0.21 | 0.53 | 3.72 | ||||||||||||||||||||||||||
2007 | 1.00 | 0.05 | — | — | 0.05 | (0.05 | ) | (0.05 | ) | 1.00 | 4.62 | 181,976 | 0.25 | 0.53 | 4.50 | ||||||||||||||||||||||||||
2006 | 1.00 | 0.03 | — | — | 0.03 | (0.03 | ) | (0.03 | ) | 1.00 | 2.85 | 178,480 | 0.25 | 0.53 | 2.78 | ||||||||||||||||||||||||||
Class B | |||||||||||||||||||||||||||||||||||||||||
2010@ | $ | 1.00 | $ | — | $ | — | $ | — | $ | — | $ | — | (1) | $ | — | (1) | $ | 1.00 | 0.00 | % | $ | 168,403 | 0.11 | %(3) | 0.64 | % | 0.01 | % | |||||||||||||
2010 | 1.00 | — | — | — | — | — | (1) | — | (1) | 1.00 | 0.04 | 165,266 | 0.12 | (2)(3) | 0.60 | 0.04 | |||||||||||||||||||||||||
2009 | 1.00 | 0.01 | — | — | 0.01 | (0.01 | ) | (0.01 | ) | 1.00 | 0.82 | 363,238 | 0.39 | (2)(3) | 0.59 | 0.58 | |||||||||||||||||||||||||
2008 | 1.00 | 0.04 | — | — | 0.04 | (0.04 | ) | (0.04 | ) | 1.00 | 3.81 | 109,384 | 0.51 | 0.58 | 3.54 | ||||||||||||||||||||||||||
2007 | 1.00 | 0.04 | — | — | 0.04 | (0.04 | ) | (0.04 | ) | 1.00 | 4.31 | 51,984 | 0.55 | 0.58 | 4.18 | ||||||||||||||||||||||||||
2006 | 1.00 | 0.03 | — | — | 0.03 | (0.03 | ) | (0.03 | ) | 1.00 | 2.54 | 70,593 | 0.55 | 0.58 | 2.50 | ||||||||||||||||||||||||||
Class C | |||||||||||||||||||||||||||||||||||||||||
2010@ | $ | 1.00 | $ | — | $ | — | $ | — | $ | — | $ | — | (1) | $ | — | (1) | $ | 1.00 | 0.00 | % | $ | 7,899 | 0.11 | %(3) | 0.84 | % | 0.01 | % | |||||||||||||
2010 | 1.00 | — | — | — | — | — | (1) | — | (1) | 1.00 | 0.04 | 8,619 | 0.12 | (2)(3) | 0.80 | 0.04 | |||||||||||||||||||||||||
2009 | 1.00 | 0.01 | — | — | 0.01 | (0.01 | ) | (0.01 | ) | 1.00 | 0.69 | 13,364 | 0.47 | (2)(3) | 0.79 | 0.50 | |||||||||||||||||||||||||
2008 | 1.00 | 0.04 | — | — | 0.04 | (0.04 | ) | (0.04 | ) | 1.00 | 3.59 | 7,254 | 0.72 | 0.79 | 3.71 | ||||||||||||||||||||||||||
2007 | 1.00 | 0.04 | — | — | 0.04 | (0.04 | ) | (0.04 | ) | 1.00 | 4.10 | 20,267 | 0.75 | 0.78 | 4.04 | ||||||||||||||||||||||||||
2006 | 1.00 | 0.02 | — | — | 0.02 | (0.02 | ) | (0.02 | ) | 1.00 | 2.33 | 2,602 | 0.75 | 0.78 | 2.03 | ||||||||||||||||||||||||||
| (1) | Amount represents less than $0.01 per share. |
| (2) | The expense ratio includes the Treasury Guarantee Program expense. Had the expense been excluded, the expense ratio would have been equal to, or less than, the expense ratio cap figure. See Note 3 for expense ratio cap figure. |
| (3) | The Distributor and/or Administrator have voluntarily agreed to waive and reduce its fee and/or reimburse certain expenses of the Fund in order to limit the one-day net income yield of the Fund to not less than 0.01% of the Fund’s average daily net assets of the share class. Had these waivers and/or the Treasury Guarantee Program expense been excluded the ratio would have been at the expense ratio cap figure. See Note 3 for expense ratio cap figure. |
| * | Per share calculations were performed using average shares. |
| @ | For the six month period ended July 31, 2010. All ratios for the period have been annualized. |
| † | Returns are for the period indicated and have not been annualized. Returns shown do not reflect the deduction of taxes that a shareholder would pay on Fund distributions or the redemption of Fund shares. |
Amounts designated as “—” are zero or have been rounded to zero.
| 38 | SEI Daily Income Trust / Semi-Annual Report / July 31, 2010 |
Table of Contents
| Net Asset Value, Beginning of Period | Net Investment Income* | Net Realized and Unrealized Gains (Losses) on Securities | Total from Operations | Dividends from Net Investment Income | Distributions from Realized Capital Gains | Total Dividends and Distributions | Net Asset End of | Total Return† | Net Assets End of Period ($ Thousands) | Ratio of Expenses to Average Net Assets | Ratio of Expenses to Average Net Assets (Excluding Waivers) | Ratio of Net Investment Income to Average Net Assets | Portfolio Turnover Rate | ||||||||||||||||||||||||||||||||||
Short-Duration Government Fund |
| ||||||||||||||||||||||||||||||||||||||||||||||
Class A | |||||||||||||||||||||||||||||||||||||||||||||||
2010@ | $ | 10.52 | $ | 0.05 | $ | 0.20 | $ | 0.25 | $ | (0.08 | ) | $ | — | $ | (0.08 | ) | $ | 10.69 | 2.38 | % | $ | 696,899 | 0.48 | % | 0.74 | % | 1.03 | % | 255 | % | |||||||||||||||||
2010 | 10.25 | 0.21 | 0.29 | 0.50 | (0.23 | ) | — | (0.23 | ) | 10.52 | 4.94 | 377,088 | 0.48 | 0.75 | 2.02 | 347 | |||||||||||||||||||||||||||||||
2009 | 10.21 | 0.36 | 0.04 | 0.40 | (0.36 | ) | — | (0.36 | ) | 10.25 | 4.05 | 288,064 | 0.48 | 0.74 | 3.53 | 693 | |||||||||||||||||||||||||||||||
2008 | 9.95 | 0.46 | 0.28 | 0.74 | (0.48 | ) | — | (0.48 | ) | 10.21 | 7.65 | 172,892 | 0.45 | 0.76 | 4.63 | 266 | |||||||||||||||||||||||||||||||
2007 | 10.02 | 0.42 | (0.04 | ) | 0.38 | (0.45 | ) | — | (0.45 | ) | 9.95 | 3.84 | 115,462 | 0.45 | 0.78 | 4.19 | 210 | ||||||||||||||||||||||||||||||
2006 | 10.19 | 0.32 | (0.13 | ) | 0.19 | (0.36 | ) | — | (0.36 | ) | 10.02 | 1.93 | 155,512 | 0.45 | 0.75 | 3.15 | 162 | ||||||||||||||||||||||||||||||
Intermediate-Duration Government Fund |
| ||||||||||||||||||||||||||||||||||||||||||||||
Class A | |||||||||||||||||||||||||||||||||||||||||||||||
2010@ | $ | 11.24 | $ | 0.10 | $ | 0.43 | $ | 0.54 | $ | (0.12 | ) | $ | — | $ | (0.12 | ) | $ | 11.66 | 4.82 | % | $ | 90,749 | 0.53 | % | 0.74 | % | 1.86 | % | 190 | % | |||||||||||||||||
2010 | 11.20 | 0.32 | 0.41 | 0.73 | (0.32 | ) | (0.37 | ) | (0.69 | ) | 11.24 | 6.61 | 62,977 | 0.53 | 0.76 | 2.82 | 213 | ||||||||||||||||||||||||||||||
2009 | 10.76 | 0.38 | 0.44 | 0.82 | (0.38 | ) | — | (0.38 | ) | 11.20 | 7.85 | 92,025 | 0.53 | 0.74 | 3.48 | 641 | |||||||||||||||||||||||||||||||
2008 | 10.13 | 0.45 | 0.63 | 1.08 | (0.45 | ) | — | (0.45 | ) | 10.76 | 10.97 | 50,372 | 0.50 | 0.75 | 4.34 | 234 | |||||||||||||||||||||||||||||||
2007 | 10.21 | 0.42 | (0.06 | ) | 0.36 | (0.44 | ) | — | (0.44 | ) | 10.13 | 3.64 | 46,635 | 0.50 | 0.78 | 4.17 | 200 | ||||||||||||||||||||||||||||||
2006 | 10.50 | 0.36 | (0.26 | ) | 0.10 | (0.39 | ) | — | (0.39 | ) | 10.21 | 0.94 | 85,873 | 0.50 | 0.73 | 3.46 | 151 | ||||||||||||||||||||||||||||||
GNMA Fund |
| ||||||||||||||||||||||||||||||||||||||||||||||
Class A | |||||||||||||||||||||||||||||||||||||||||||||||
2010@ | $ | 10.28 | $ | 0.10 | $ | 0.44 | $ | 0.54 | $ | (0.11 | ) | $ | — | $ | (0.11 | ) | $ | 10.71 | 5.29 | % | $ | 261,842 | 0.63 | % | 0.71 | % | 1.88 | % | 359 | % | |||||||||||||||||
2010 | 9.84 | 0.32 | 0.47 | 0.79 | (0.35 | ) | — | (0.35 | ) | 10.28 | 8.18 | 198,914 | 0.63 | 0.72 | 3.16 | 533 | |||||||||||||||||||||||||||||||
2009 | 9.63 | 0.40 | 0.21 | 0.61 | (0.40 | ) | — | (0.40 | ) | 9.84 | 6.51 | 160,639 | 0.63 | 0.71 | 4.08 | 474 | |||||||||||||||||||||||||||||||
2008 | 9.34 | 0.45 | 0.30 | 0.75 | (0.46 | ) | — | (0.46 | ) | 9.63 | 8.31 | 114,824 | 0.60 | 0.72 | 4.82 | 271 | |||||||||||||||||||||||||||||||
2007 | 9.48 | 0.44 | (0.11 | ) | 0.33 | (0.47 | ) | — | (0.47 | ) | 9.34 | 3.65 | 143,711 | 0.60 | 0.74 | 4.72 | 105 | ||||||||||||||||||||||||||||||
2006 | 9.71 | 0.41 | (0.16 | ) | 0.25 | (0.48 | ) | — | (0.48 | ) | 9.48 | 2.60 | 166,324 | 0.60 | 0.71 | 4.26 | 97 | ||||||||||||||||||||||||||||||
Ultra Short Duration Bond Fund‡ |
| ||||||||||||||||||||||||||||||||||||||||||||||
Class A | |||||||||||||||||||||||||||||||||||||||||||||||
2010@ | $ | 9.24 | $ | 0.07 | $ | 0.08 | $ | 0.15 | $ | (0.09 | ) | $ | — | $ | (0.09 | ) | $ | 9.30 | 1.60 | % | $ | 381,624 | 0.38 | % | 0.74 | % | 1.48 | % | 31 | % | |||||||||||||||||
2010 | 8.51 | 0.24 | 0.73 | 0.97 | (0.24 | ) | — | (0.24 | ) | 9.24 | 11.58 | 257,238 | 0.38 | 0.75 | 2.72 | 73 | |||||||||||||||||||||||||||||||
2009 | 9.69 | 0.32 | (1.18 | ) | (0.86 | ) | (0.32 | ) | — | (0.32 | ) | 8.51 | (9.00 | ) | 207,081 | 0.38 | 0.75 | 3.50 | 99 | ||||||||||||||||||||||||||||
2008 | 9.97 | 0.48 | (0.28 | ) | 0.20 | (0.48 | ) | — | (0.48 | ) | 9.69 | 2.06 | 409,363 | 0.35 | 1.28 | 4.87 | 54 | ||||||||||||||||||||||||||||||
2007 | 9.95 | 0.45 | 0.03 | 0.48 | (0.46 | ) | — | (0.46 | ) | 9.97 | 4.88 | 238,820 | 0.35 | 0.76 | 4.51 | 40 | |||||||||||||||||||||||||||||||
2006†† | 10.00 | 0.32 | (0.04 | ) | 0.28 | (0.33 | ) | — | (0.33 | ) | 9.95 | 2.90 | 412,217 | 0.35 | 0.75 | 3.22 | 67 | ||||||||||||||||||||||||||||||
| * | Per share calculations were performed using average shares. |
| @ | For the six month period ended July 31, 2010. All ratios for the period have been annualized. |
| ‡ | See Note 1 in Notes to Financial Statements. |
| † | Returns are for the period indicated and have not been annualized. Returns shown do not reflect the deduction of taxes that a shareholder would pay on Fund distributions or the redemption of Fund shares. |
| †† | Per share amounts have been adjusted for a 5 for 1 reverse stock split paid to the shareholders of record on May 6, 2005. |
Amounts designated as “—” are zero or have been rounded to zero.
| SEI Daily Income Trust / Semi-Annual Report / July 31, 2010 | 39 |
Table of Contents
July 31, 2010
1. ORGANIZATION
SEI Daily Income Trust (the “Trust”) was organized as a Massachusetts business trust under a Declaration of Trust dated March 15, 1982.
The Trust is registered under the Investment Company Act of 1940, as amended, as a diversified, open-end investment company with ten operational Funds: the Money Market, Government, Government II, Prime Obligation, Treasury and Treasury II (each a “Fund,” collectively the “Money Market Funds”), the Short-Duration Government, Intermediate-Duration Government, GNMA and Ultra Short Duration Bond (each a “Fund,” collectively the “Fixed Income Funds”). The Money Market Funds, Short-Duration Government, Intermediate-Duration Government, and GNMA Funds seek to preserve principal value and maintain a high degree of liquidity while providing current income. The Ultra Short Duration Bond Fund seeks to provide higher current income than typically offered by a money market fund while maintaining a high degree of liquidity and a correspondingly higher risk of principal volatility. The assets of each Fund are segregated, and a shareholder’s interest is limited to the Fund in which shares are held.
Effective July 1, 2010, the Ultra Short Bond Fund changed its name to the Ultra Short Duration Bond Fund.
2. SIGNIFICANT ACCOUNTING POLICIES
The following is a summary of significant accounting policies followed by the Funds.
Use of Estimates — The preparation of financial statements, in conformity with U.S. generally accepted accounting principles, requires management to make estimates and assumptions that affect the reported amount of assets and liabilities and disclosure of contingent assets and liabilities at the date of the financial statements and the reported amounts of increases and decreases in net assets from operations during the reporting period. Actual results could differ from those estimates.
Security Valuation — Investment securities of the Money Market Funds are stated at amortized cost, which approximates market value. Under this valuation method, purchase discounts and premiums are accreted and amortized ratably to maturity and are included in interest income.
Investment securities of the Fixed Income Funds listed on a securities exchange, market or automated quotation system for which quotations are readily available are valued at the last quoted sale price on the primary exchange or market on which they are traded, or, if there is no such reported sale, at the most recent quoted bid price. If available, debt securities are priced based upon valuations provided by independent third-party pricing agents. Such values generally reflect the last reported sales price if the security is actively traded. The thirdparty pricing agents may also value debt securities at an evaluated bid price by employing methodologies that utilize actual market transactions, broker-supplied valuations, or other methodologies
designed to identify the market value for such securities. Debt obligations with remaining maturities of sixty days or less may be valued at their amortized cost, which approximates market value. Prices for most securities held in the Funds are provided daily by recognized independent pricing agents. If a security price cannot be obtained from an independent third-party pricing agent, the Funds seek to obtain a bid price from at least one independent broker.
Securities for which market prices are not “readily available” are valued in accordance with Fair Value Procedures established by the Trust’s Board of Trustees. The Trust’s Fair Value Procedures are implemented through a Fair Value Committee (the “Committee”) designated by the Funds’ Board of Trustees. Some of the more common reasons that may necessitate that a security be valued using Fair Value Procedures include: the security’s trading has been halted or suspended; the security has been de-listed from a national exchange; the security’s primary trading market is temporarily closed at a time when under normal conditions it would be open; or the security’s primary pricing source is not able or willing to provide a price. When a security is valued in accordance with the Fair Value Procedures, the Committee will determine the value after taking into consideration relevant information reasonably available to the Committee. As of July 31, 2010, there were no fair valued securities in the Funds.
In accordance with U.S. generally accepted accounting principles, Fair Value is defined as the price that a Fund would receive upon selling an investment in a timely transaction to an independent buyer in the principal or most advantageous market of the investment. A three tier hierarchy has been established to maximize the use of observable and minimize the use of unobservable inputs and to establish classification of fair value measurements for disclosure purposes. Inputs refer broadly to the assumptions that market participants would use in pricing an asset. Inputs may be observable or unobservable. Observable inputs are inputs that reflect the assumptions market participants would use in pricing the asset or liability based on market data obtained from sources independent of the reporting entity. Unobservable inputs are inputs that reflect the reporting entity’s own assumptions about the assumptions market participants would use in pricing the asset or liability based on the best information available in the circumstances.
The three-tier hierarchy of inputs is summarized in the three broad Levels listed below:
Level 1 — Unadjusted quoted prices in active markets for identical, unrestricted assets or liabilities that the Fund has the ability to access at the measurement date;
Level 2 — Quoted prices which are not active, or inputs that are observable (either directly or indirectly) for substantially the full term of the asset or liability; and
Level 3 — Prices, inputs or exotic modeling techniques which are both significant to the fair value measurement and unobservable (supported by little or no market activity).
| 40 | SEI Daily Income Trust / Semi-Annual Report / July 31, 2010 |
Table of Contents
Investments are classified within the level of the lowest significant input considered in determining fair value. Investments classified within Level 3 whose fair value measurement considers several inputs may include Level 1 or Level 2 inputs as components of the overall fair value measurement.
In January 2010, the Financial Accounting Standards Board issued Accounting Standards Update (ASU) No. 2010-6, Fair Value Measurements and Disclosures (Topic 820): Improving Disclosures about Fair Value Measurements. ASU No. 2010-6 enhances and clarifies existing fair value measurement disclosure requirements and is effective for interim and annual periods beginning after December 15, 2009. The Trust adopted ASU No. 2010-6 on January 1, 2010. The adoption of ASU No. 2010-6 did not have any impact on the Trust’s financial statements.
For the six-month period ended July 31, 2010, there have been no significant changes to the Trust’s fair valuation methodologies.
Security Transactions and Investment Income — Security transactions are recorded on the trade date. Costs used in determining net realized capital gains and losses on the sale of securities are on the basis of specific identification. Dividend income is recognized on the ex-dividend date, and interest income is recognized using the accrual basis of accounting. Income from payment-in-kind securities is recorded daily based on the effective interest method of accrual.
Distributions received on securities that represent a return of capital or capital gain are recorded as a reduction of cost of investments and/ or as a realized gain. The Trust estimates the components of distributions received that may be considered nontaxable distributions or capital gain distributions.
For the Fixed Income Funds, amortization and accretion is calculated using the scientific interest method, which approximates the effective interest method over the holding period of the security. Amortization of premiums and discounts is included in interest income.
For the Money Market Funds, all amortization is calculated using the straight line method over the holding period of the security. Amortization of premiums and accretion of discounts are included in interest income.
Repurchase Agreements — Securities pledged as collateral for repurchase agreements are held by each Fund’s custodian bank until the repurchase date of the repurchase agreement. The Funds also invest in tri-party repurchase agreements. Securities held as collateral for tri-party repurchase agreements are maintained by the broker’s custodian bank in a segregated account until the repurchase date of the repurchase agreement. Provisions of the repurchase agreements and the Trust’s policies require that the market value of the collateral, including accrued interest thereon, is sufficient in the event of default by the counterparty. If the counterparty defaults and the value of the collateral declines, or if the counterparty enters into an insolvency proceeding, realization of the collateral by the Funds may be delayed or limited.
Futures Contracts — The Fixed Income Funds’ utilized futures contracts during the six month period ended July 31, 2010. These Funds’ investments in futures contracts are designed to enable the Funds to more closely approximate the performance of their benchmark indices. The Funds may use futures contracts for tactical hedging purposes as well as to enhance the Fund’s returns. Initial margin deposits of cash or securities are made upon entering into futures contracts. The contracts are marked to market daily and the resulting changes in value are accounted for as unrealized gains and losses. Variation margin payments are paid or received, depending upon whether unrealized gains or losses are incurred. When the contract is closed, the Funds record a realized gain or loss equal to the difference between the proceeds from (or cost of) the closing transaction and the amount invested in the contract.
Risks of entering into futures contracts include the possibility that there will be an imperfect price correlation between the futures and the underlying securities. Second, it is possible that a lack of liquidity for futures contracts could exist in the secondary market, resulting in an inability to close a position prior to its maturity date. Third, the futures contract involves the risk that the Fund could lose more than the original margin deposit required to initiate a futures transaction.
Finally, the risk exists that losses could exceed amounts disclosed on the Statements of Assets and Liabilities.
Swap Agreements — A Fund’s investments in swap contracts is mainly used as an efficient means to take and manage risk in the portfolio, including interest rate risk, credit risk and overall yield sensitivity. A swap agreement is a two-party contract under which an agreement is made to exchange returns from predetermined investments or instruments, including a particular interest rate, foreign currency, or “basket” of securities representing a particular index. Interest rate swaps involve the exchange by a Fund with another party of their respective commitments to pay or receive interest (e.g., an exchange of floating rate payments for fixed rate payments) with respect to a notional amount of principal. Credit-default swaps involve periodic payments by a Fund or counterparty based on a specified rate multiplied by a notional amount assigned to an underlying debt instrument or group of debt instruments in exchange for the assumption of credit risk on the same instruments. In the event of a credit event, usually in the form of a credit rating downgrade, the party receiving periodic payments (i.e. floating rate payer) must pay the other party (i.e. fixed rate payer) an amount equal to the recovery rate used to settle the contracts. The recovery rate is a function of how many credit default swap investors wish to deliver the security or receive the security. The recovery rate is determined through an auction process. Total return swaps allow an investor to benefit from the cash flow without ever actually owning the underlying security. The receiver must pay any decline in value to the payer at the end of the total return swap. However, the investor does not need to make a payment if there is no decline in price. Payments can be made on various indices, bonds (i.e. mortgage backed securities, bank debt and corporate), loans or
| SEI Daily Income Trust / Semi-Annual Report / July 31, 2010 | 41 |
Table of Contents
Notes to Financial Statements (Continued)
July 31, 2010
commodities. The value of a total return swap is equal to the change in value of the underlying asset versus the accrued income payment based on LIBOR or some other form of indices on the notional amount. Interest rate swaps involve the exchange by a Fund with another party of their respective commitments to pay or receive interest (e.g., an exchange of floating rate payments for fixed rate payments) with respect to a notional amount of principal to manage a Fund’s exposure to interest rates. Payments received or made are recorded as realized gains or loss. A Fund could be exposed to credit or market risk due to unfavorable changes in the fluctuation of interest rates or if the counterparty defaults on its obligation to perform. Risk of loss may exceed amounts recognized on the statement of assets and liabilities. Interest rate swap contracts outstanding at period end, if any, are listed after a Fund’s portfolio. In connection with swap agreements securities may be set aside as collateral by a Fund’s custodian. A Fund may enter into swap agreements in order to, among other things, change the maturity or duration of the investment portfolio, to protect a Fund’s value from changes in interest rates, or to expose a Fund to a different security or market.
Swaps are marked-to-market daily based upon quotations from market makers and the resulting changes in market values, if any, are recorded as an unrealized gain or loss in the Statement of Operations. Net payments of interest are recorded as realized gains or losses.
Entering into swap agreements involves, to varying degrees, elements of credit and market risk in excess of the amounts recognized on the Statement of Assets and Liabilities. Such risks involve the possibility that there will be no liquid market for these agreements, that the counterparty to the agreement may default on its obligation to perform and that there may be unfavorable changes in the fluctuation of interest rates. Risks also arise from potential losses from adverse market movements.
This risk is mitigated by having a master netting arrangement between a Fund and the counterparty and by having the counterparty post collateral to cover a Fund’s exposure to the counterparty. See Note 3 for further details. There were no swap agreements as of July 31, 2010.
TBA Purchase Commitments — A Fixed Income Fund may engage in “to be announced” (“TBA”) purchase commitments to purchase securities for a fixed price at a future date. TBA purchase commitments may be considered securities and involve a risk of loss if the value of the security to be purchased declines prior to settlement date, which risk is in addition to the risk of decline in the value of a Fund’s other assets. Unsettled TBA purchase commitments are valued at the current market value of the underlying securities, according to the procedures described under “Security Valuation” above.
Collateralized Debt Obligations — A Fund may invest in collateralized debt obligations (“CDOs”), which include collateralized loan obligations (“CLOs”) and other similarly structured securities. CLOs are a type of asset-backed securities. A CLO is a trust typically collateralized
by a pool of loans, which may include, among others, domestic and foreign senior secured loans, senior unsecured loans, and subordinate corporate loans, including loans that may be rated below investment grade or equivalent unrated loans. CDOs may charge management fees and administrative expenses.
For CDOs, the cashflows from the trust are split into two or more portions, called tranches, varying in risk and yield. The riskiest portion is the “equity” tranche which bears the bulk of defaults from the bonds or loans in the trust and serves to protect the other, more senior tranches from default in all but the most severe circumstances. Since it is partially protected from defaults, a senior tranche from a CDO trust typically has a higher rating and lower yield than its underlying securities, and can be rated investment grade. Despite the protection from the equity tranche, CDO tranches can experience substantial losses due to actual defaults, increased sensitivity to defaults due to collateral default and disappearance of protecting tranches, market anticipation of defaults, as well as aversion to CDO securities as a class.
The risks of an investment in a CDO depend largely on its Class and its collateral securities. Normally, CLOs and other CDOs are privately offered and sold, and thus, are not registered under the securities laws. As a result, investments in CDOs may be characterized by the Funds as illiquid securities; however, an active dealer market may exist for CDOs, allowing a CDO to qualify for Rule 144A transactions. In addition to the normal risks associated with fixed income securities (e.g., interest rate risk and default risk), CDOs carry additional risks including, but not limited to: (i) the possibility that distributions from collateral securities will not be adequate to make interest or other payments; (ii) the quality of the collateral may decline in value or default; (iii) the Funds may invest in CDOs that are subordinate to other classes; and (iv) the complex structure of the security may not be fully understood at the time of investment and may produce disputes with the issuer or unexpected investment results.
Illiquid Securities — A security is considered illiquid if it cannot be sold or disposed of in the ordinary course of business within seven days or less for its approximate carrying value on the books of a Fund. Valuations of illiquid securities may differ significantly from the values that would have been used had an active market value for these securities existed.
Restricted Securities — Throughout the year, the Funds owned private placement investments that were purchased through private offerings or acquired through initial public offerings that could not be sold without prior registration under the Securities Act of 1933 or pursuant to an exemption there from. In addition, the Funds had generally agreed to further restrictions on the disposition of certain holdings as set forth in various agreements entered into in connection with the purchase of those investments. These investments were valued at amortized cost as determined in accordance with the procedures approved by the Board of Trustees. At July 31, 2010, the Funds did not own any restricted securities.
| 42 | SEI Daily Income Trust / Semi-Annual Report / July 31, 2010 |
Table of Contents
Classes — Class-specific expenses are borne by that class of shares. Income, expenses, and realized and unrealized gains/losses and nonclass specific expenses are allocated to the respective class on the basis of relative daily net assets.
Expenses — Expenses that are directly related to one of the Funds are charged directly to that Fund. Other operating expenses of the Funds are prorated to the Funds on the basis of relative net assets.
Dividends and Distributions to Shareholders — Dividends from net investment income are declared daily and paid monthly. Any net realized capital gains on sales of securities after capital loss carryover are distributed at least annually by the Funds.
3. AGREEMENTS AND OTHER TRANSACTIONS WITH AFFILIATES
Administration and Transfer Agency Agreement — SEI Investments Global Funds Services (the “Administrator”) provides administrative and transfer agency services to the Funds for annual fees, based on the average daily net assets of the respective funds, as presented below:
| Money Market Fund | 0.33 | % | |
| Government Fund | 0.24 | % | |
| Government II Fund | 0.19 | % | |
| Prime Obligation Fund | 0.19 | % | |
| Treasury Fund | 0.24 | % | |
| Treasury II Fund | 0.24 | % | |
| Short-Duration Government Fund | 0.35 | % | |
| Intermediate-Duration Government Fund | 0.35 | % | |
| GNMA Fund | 0.32 | % | |
| Ultra Short Duration Bond Fund | 0.35 | % |
However, the Administrator and SEI Investments Management Corporation (the “Adviser”) have agreed to waive a portion or their entire fee, for various classes of shares in various funds, to limit total annual expenses up to the following amounts (expressed as a percentage of the Funds’ daily net assets). The expense waivers are allocated to each share class pro-rata based on the net assets of each share class.
Money Market | Government Fund | Government II Fund | Prime Obligation Fund | Treasury Fund | |||||||||||
Class A | 0.18 | %(1) | 0.20 | %(3) | 0.20 | %(2) | 0.20 | %(2) | 0.20 | %(2) | |||||
Class B | 0.48 | %(1) | 0.50 | %(3) | 0.50 | %(2) | 0.50 | %(2) | 0.50 | %(2) | |||||
Class C | 0.68 | %(1) | 0.70 | %(3) | 0.70 | %(2) | 0.70 | %(2) | 0.70 | %(2) | |||||
Class H | N/A | N/A | N/A | 0.63 | %(1) | N/A | |||||||||
Sweep Class | 0.93 | %(1) | 0.95 | %(1) | * | 0.95 | %(1) | 0.95 | %(1) |
| Treasury II Fund | Short- Duration Government Fund | Intermediate- Duration Government Fund | GNMA Fund | Ultra Short Duration Bond Fund | |||||||||||
Class A | 0.20 | %(2) | 0.48 | %(4) | 0.53 | %(4) | 0.63 | %(4) | 0.38 | %(4) | |||||
Class B | 0.50 | %(2) | N/A | N/A | N/A | N/A | |||||||||
Class C | 0.70 | %(2) | N/A | N/A | N/A | N/A | |||||||||
Class H | N/A | N/A | N/A | N/A | N/A | ||||||||||
Sweep Class | * | N/A | N/A | N/A | N/A |
| * | Class not currently operational |
| (1) | Represents a voluntary cap that my be discontinued at any time. |
| (2) | Represents a contractual cap effective through January 31, 2010, to be changed only by board approval. |
| (3) | Represents a contractual cap of .25%, .55%, and .75% of Class A, B, and C, respectively, effective through January 31, 2010, to be changed only by Board approval. In addition, management has voluntarily waived fees to a cap of .20%, .50%, and .70% of Class A, B, and C, respectively, that may be discontinued at any time. |
| (4) | Represents a voluntary cap that may be discontinued at anytime. Prior to March 1, 2008, the cap for the Short-Duration Government, Intermediate-Duration Government, GNMA and Ultra Short Duration Bond Funds were .45%, .50%, .60% and .35%, respectively. |
Temporary Guarantee Program — On September 18, 2008 the U.S. Treasury Department (the “Treasury”) commenced the Temporary Guarantee Program for Money Market Funds (the “Program”). The Trust’s Board of Trustees approved the participation of the below listed Funds in the Program from its commencement on September 18, 2008 through April 30, 2009. The Treasury offered funds participating in the Program an extension until September 18, 2009.
Under the Program, the Treasury guaranteed the share price of a participating fund’s shares outstanding as of September 19, 2008 at $1.00 per share if the fund’s net asset value per share (NAV) falls below $0.995. The Program did not protect investors who were not shareholders of a participating fund after September 18, 2008. The cost of participating in the Program and the Program extensions is borne by the participating fund, and will not be subject to any expense limitation or reimbursement agreement.
In connection with the Program’s extension period from May 1, 2009 through September 18, 2009, participation in the Program was as follows:
| Continued to Participate in the Program Through September 18, 2009: |
Money Market Fund |
Prime Obligation Fund |
Government Fund |
Government II Fund |
| Did Not Participate in the Program after April 30, 2009: |
Treasury Fund |
Treasury II Fund |
Distribution Agreement — SEI Investments Distribution Co. (the “Distributor”), a wholly owned subsidiary of SEI and a registered broker-dealer, acts as the Distributor of the shares of the Trust under a Distribution Agreement. The Trust also has adopted plans under which firms, including the Distributor, that provide shareholder and administrative services may receive compensation thereof. Specific classes of certain funds have also adopted distribution plans, pursuant to Rule 12b-1 under the Investment Company Act of 1940. Such plans provide fees payable to the Distributor up to the following amounts, calculated as a percentage of the average daily net assets attributable to each particular class of each respective fund.
| SEI Daily Income Trust / Semi-Annual Report / July 31, 2010 | 43 |
Table of Contents
Notes to Financial Statements (Continued)
July 31, 2010
| Shareholder Servicing Fees | Administrative Service Fees | Distribution Fees* | |||||||
Money Market Fund | |||||||||
Class A | .25 | % | — | — | |||||
Class B | .25 | % | .05 | % | — | ||||
Class C | .25 | % | .25 | % | — | ||||
Sweep Class | .25 | % | — | .50 | % | ||||
Government Fund | |||||||||
Class A | .25 | % | — | — | |||||
Class B | .25 | % | .05 | % | — | ||||
Class C | .25 | % | .25 | % | — | ||||
Sweep Class | .25 | % | — | .50 | % | ||||
Government II Fund | |||||||||
Class A | .25 | % | — | — | |||||
Class B | .25 | % | .05 | % | — | ||||
Class C | .25 | % | .25 | % | — | ||||
Prime Obligation Fund | |||||||||
Class A | .25 | % | — | — | |||||
Class B | .25 | % | .05 | % | — | ||||
Class C | .25 | % | .25 | % | — | ||||
Class H | .25 | % | .18 | % | — | ||||
Sweep Class | .25 | % | — | .50 | % | ||||
Treasury Fund | |||||||||
Class A | .25 | % | — | — | |||||
Class B | .25 | % | .05 | % | — | ||||
Class C | .25 | % | .25 | % | — | ||||
Sweep Class | .25 | % | — | .50 | % | ||||
Treasury II Fund | |||||||||
Class A | .25 | % | — | — | |||||
Class B | .25 | % | .05 | % | — | ||||
Class C | .25 | % | .25 | % | — | ||||
Short-Duration Government | |||||||||
Fund | |||||||||
Class A | .25 | % | — | — | |||||
Intermediate-Duration Government Fund | |||||||||
Class A | .25 | % | — | — | |||||
GNMA Fund | |||||||||
Class A | .25 | % | — | — | |||||
Ultra Short Duration Bond Fund | |||||||||
Class A | .25 | % | — | — |
| * | These payments are characterized as “compensation” and are not directly tied to expenses incurred by the Distributor. The payments the Distributor receives during any year may therefore be higher or lower than its actual expenses. These payments may be used to compensate sweep class shareholders who provide distribution-related services to their customers. |
The Distributor has voluntarily waived all or a portion of the shareholder servicing fees for Class A of each fund, except for the GNMA Fund, since inception of the plan. Such waivers are voluntary and may be discontinued at any time. For Classes B, C, and H, the shareholder servicing fees and the administrative service fees are shown combined as “Administrative & Shareholder Servicing Fees” in the Statement of Operations. The Administrator and Distributor have voluntarily agreed to waive and reduce their fee and/or reimburse certain expenses of the Money Market Funds in order to limit the one-day net income yield of the Funds to not less than 0.01% of the Funds’ average daily
net assets. The following table shows the waivers by class for the six-month period ended July 31, 2010 ($ Thousands):
Administrative & Shareholder Waiver | Administrative Waiver | |||
Money Market Fund | ||||
Class A | $ — | $ — | ||
Class B | 38 | — | ||
Class C | 131 | — | ||
Sweep Class | 104 | — | ||
Government Fund | ||||
Class A | — | 195 | ||
Class B | 572 | 95 | ||
Class C | 158 | 15 | ||
Sweep Class | 91 | 6 | ||
Government II Fund | ||||
Class A | — | 334 | ||
Class B | 228 | 42 | ||
Class C | 11 | 1 | ||
Prime Obligation Fund | ||||
Class A | — | — | ||
Class B | 223 | — | ||
Class C | 193 | — | ||
Class H | 69 | — | ||
Sweep Class | 55 | — | ||
Treasury Fund | ||||
Class A | — | 30 | ||
Class B | 245 | 20 | ||
Class C | 52 | 3 | ||
Sweep Class | 494 | 15 | ||
Treasury II Fund | ||||
Class A | — | 173 | ||
Class B | 236 | 74 | ||
Class C | 19 | 3 |
Other — Certain officers and Trustees of the Trust are also officers and/or Trustees of the Administrator or the Adviser. The Trust pays each unaffiliated Trustee an annual fee for attendance at quarterly, interim, and committee meetings. The Administrator or the Adviser pays compensation of Officers and affiliated Trustees.
A portion of the services provided by the Chief Compliance Officer (“CCO”) and his staff, whom are employees of the administrator, are paid for by the Trust as incurred. The services include regulatory oversidght of the Trust’s Adviser, Sub-Advisers and service providers as required by SEC regulations. The CCO’s services have been approved by and are reviewed annually by the Board of Trustees.
Capital Support Agreement — The Prime Obligation Fund and the Money Market Fund entered into a Capital Support Agreement with SEI Investments Company (“SEI”). Please see Note 8 for more information.
Other Affiliated Transactions — During the fiscal year ended January 31, 2009, an affiliate of the Adviser purchased from the Money Market Fund all of the notes issued by Cheyne Finance, LLC (“Cheyne”) and Gryphon Funding Limited (“Gryphon”) that were held by the Fund. This transaction was effected pursuant to Rule 17a-9
| 44 | SEI Daily Income Trust / Semi-Annual Report / July 31, 2010 |
Table of Contents
under the Investment Company Act of 1940 (the “Act”), which permits an affiliate to purchase a security from a money market fund if that security is no longer an Eligible Security pursuant to Rule 2a-7 under the Act. Cheyne and Gryphon were not Eligible Securities at the time of the transaction. The transaction is deemed as “Payment by Affiliate” in the amount of $6,574 ($ Thousands).
During the fiscal year ended January 31, 2010, an affiliate of the Adviser purchased from the Prime Obligation Fund all of the notes issued by Cheyne Finance, LLC, Gryphon Funding Limited and Stanfield Victoria Finance Limited that were held by the Prime Obligation Fund. This transaction was effected pursuant to Rule 17a-9 under the Investment Company Act of 1940 (the “Act”), which permits an affiliate to purchase a security from a money market fund if that security is no longer an Eligible Security pursuant to Rule 2a-7 under the Act. Cheyne and Gryphon were not Eligible Securities at the time of the transaction. The transaction is deemed as “Payment by Affiliate” on the Statement of Operations, in the amount of $152,452 ($ Thousands).
4. INVESTMENT ADVISORY AND CUSTODIAN AGREEMENTS
The Adviser serves as each Fund’s investment adviser and “manager of managers” under an investment advisory agreement approved by the shareholders of each Fund. Effective January 1, 2010, for its services, the Adviser receives an annual fee equal to 0.07% of each of the Money Market Funds’ net assets. Prior to January 1, 2010, for its services, the Adviser received an annual fee equal to .075% on the first $500 million of net assets and .02% on the net assets in excess of $500 million for the Money Market Funds. The fee was calculated based on the combined assets of the Money Market Funds. The Adviser also received an annual fee equal to .10% on the first $500 million of net assets, .075% of net assets between $500 million and $1 billion and .05% on the net assets in excess of $1 billion for the Short-Duration Government, Intermediate-Duration Government and GNMA Funds. The fee was calculated based on the combined assets of these Funds. The Adviser also received an annual fee equal to .10% on the first $500 million of net assets, .075% of net assets between $500 million and $1 billion and .05% on the net assets in excess of $1 billion for the Ultra Short Duration Bond Fund. The fee was calculated based on the net assets of the Ultra Short Duration Bond Fund.
Pursuant to the “manager of managers” structure, the Board of Trustees approved BofA Advisors, LLC as each Money Market Fund’s
investment sub-adviser under an investment sub-advisory agreement approved by the shareholders of each Money Market Fund. For its services to the Money Market Funds, the BofA Advisers, LLC is entitled to receive a fee paid directly by the Adviser.
Wellington Management Company, LLP (“Wellington LLP”) serves as sub-adviser to the Fixed Income Funds under an investment sub-advisory agreement approved by the shareholders of each Fixed Income Fund. For its services to the Fixed Income Funds, Wellington LLP is entitled to receive a fee paid directly by the Adviser.
U.S. Bank, N.A. serves as the custodian of the Funds. The custodian plays no role in determining the investment policies of the Funds or which securities are to be purchased or sold in the Funds.
5. INVESTMENT TRANSACTIONS
The cost of security purchases and the proceeds from the sale of securities, other than short-term investments, for the six months ended July 31, 2010, were as follows for the Fixed Income Funds:
Short- Duration Government | Intermediate- Duration Government Fund ($ Thousands) | GMNA Fund ($ Thousands) | Ultra Short Duration Bond Fund ($ Thousands) | |||||||||
Purchases | ||||||||||||
U.S. Government | $ | 1,582,024 | $ | 157,605 | $ | 774,741 | $ | 27,566 | ||||
Other | 89 | — | — | 95,300 | ||||||||
Sales | ||||||||||||
U.S. Government | 1,273,739 | 128,890 | 721,794 | 22,473 | ||||||||
Other | 4,549 | 2,456 | 95 | 37,082 | ||||||||
6. FEDERAL TAX INFORMATION
It is each Fund’s intention to continue to qualify as a regulated investment company for Federal income tax purposes and distribute all of its taxable income (including net capital gains). Accordingly, no provision for Federal income taxes is required.
Reclassification of Components of Net Assets — The timing and characterization of certain income and capital gain distributions are determined annually in accordance with Federal tax regulations which may differ from accounting principles generally accepted in the United States. As a result, net investment income (loss) and net realized gain (loss) on investment transactions for the reporting period may differ from distributions during such period. These book/tax differences may be temporary or permanent in nature. To the extent these differences are permanent, they are charged or credited to Paid-in Capital, undistributed net investment income, or accumulated net realized gain, as appropriate, in the periods that the differences arise.
The tax character of dividends and distributions during the last two fiscal years was as follows:
| Ordinary Income ($ Thousands) | Long-term Capital Gain ($ Thousands) | Total ($ Thousands) | |||||||||
Money Market Fund | 2010 | $ | 1,311 | $ | — | $ | 1,311 | ||||
| 2009 | 18,606 | — | 18,606 | ||||||||
Government Fund | 2010 | 2,344 | — | 2,344 | |||||||
| 2009 | 34,543 | — | 34,543 | ||||||||
| SEI Daily Income Trust / Semi-Annual Report / July 31, 2010 | 45 |
Table of Contents
Notes to Financial Statements (Continued)
July 31, 2010
| Ordinary Income ($ Thousands) | Long-term Capital Gain ($ Thousands) | Total ($ Thousands) | |||||||||
Government II Fund | 2010 | $ | 2,103 | $ | — | $ | 2,103 | ||||
| 2009 | 32,492 | — | 32,492 | ||||||||
Prime Obligation Fund | 2010 | 7,297 | — | 7,297 | |||||||
| 2009 | 116,243 | — | 116,243 | ||||||||
Treasury Fund | 2010 | 648 | — | 648 | |||||||
| 2009 | 15,408 | — | 15,408 | ||||||||
Treasury II Fund | 2010 | 327 | — | 327 | |||||||
| 2009 | 6,683 | — | 6,683 | ||||||||
Short-Duration Government Fund | 2010 | 5,907 | — | 5,907 | |||||||
| 2009 | 6,868 | — | 6,868 | ||||||||
Intermediate-Duration Government Fund | 2010 | 3,570 | — | 3,570 | |||||||
| 2009 | 2,389 | 669 | 3,058 | ||||||||
GNMA Fund | 2010 | 6,674 | — | 6,674 | |||||||
| 2009 | 5,478 | — | 5,478 | ||||||||
Ultra Short Duration Bond Fund | 2010 | 6,657 | — | 6,657 | |||||||
| 2009 | 11,795 | — | 11,795 | ||||||||
As of January 31, 2010, the components of Distributable Earnings/(Accumulated Losses) on a tax basis were as follows:
| Undistributed Ordinary Income ($ Thousands) | Undistributed Long-Term Capital Gain ($ Thousands) | Capital Loss Carryforwards ($ Thousands) | Post- October Losses ($ Thousands) | Other Temporary Differences ($ Thousands) | Unrealized Appreciation (Depreciation) ($ Thousands) | Total Distributable Earnings/ (Accumulated Losses) ($ Thousands) | ||||||||||||||||||||
Money Market Fund | $ | 26 | $ | — | $ | — | $ | — | $ | (21 | ) | $ | — | $ | 5 | |||||||||||
Government Fund | 51 | — | (91 | ) | — | (51 | ) | — | (91 | ) | ||||||||||||||||
Government II Fund | 26 | — | (12 | ) | — | (26 | ) | — | (12 | ) | ||||||||||||||||
Prime Obligation Fund | 228 | — | (117 | ) | — | (228 | ) | — | (117 | ) | ||||||||||||||||
Treasury Fund | 20 | — | (93 | ) | — | (20 | ) | — | (93 | ) | ||||||||||||||||
Treasury II Fund | 5 | — | (6 | ) | — | (5 | ) | — | (6 | ) | ||||||||||||||||
Short-Duration Government Fund | 2,001 | — | — | — | (364 | ) | 3,952 | 5,589 | ||||||||||||||||||
Intermediate-Duration Government Fund | 619 | 126 | — | — | (119 | ) | 1,605 | 2,231 | ||||||||||||||||||
GNMA Fund | 411 | — | (5,973 | ) | — | (416 | ) | 7,225 | 1,247 | |||||||||||||||||
Ultra Short Duration Bond Fund | 506 | — | (8,899 | ) | (278 | ) | (508 | ) | (21,498 | ) | (30,677 | ) | ||||||||||||||
At January 31, 2010, the following Funds had capital loss
| Amount ($ Thousands) | Expiration | ||||
Government Fund | $ | 1 | 1/31/11 | ||
| 54 | 1/31/13 | ||||
| 4 | 1/31/14 | ||||
| 32 | 1/31/16 | ||||
Government II Fund | 12 | 1/31/16 | |||
Prime Obligation Fund | 117 | 1/31/17 | |||
Treasury Fund | 65 | 1/31/12 | |||
| 1 | 1/31/13 | ||||
| 22 | 1/31/14 | ||||
| 5 | 1/31/15 | ||||
Treasury II Fund | 2 | 1/31/14 | |||
| 4 | 1/31/16 | ||||
GNMA Fund | 3,098 | 1/31/12 | |||
| 1,119 | 1/31/13 | ||||
| 6 | 1/31/14 | ||||
| 1,552 | 1/31/15 | ||||
| 198 | 1/31/16 | ||||
Ultra Short Duration Bond Fund | 557 | 1/31/11 | |||
| 442 | 1/31/12 | ||||
| 1,020 | 1/31/13 | ||||
| 1,045 | 1/31/14 | ||||
| 1,716 | 1/31/15 | ||||
| 296 | 1/31/16 | ||||
| 181 | 1/31/17 | ||||
| 3,642 | 1/31/18 | ||||
For Federal income tax purposes, capital loss carryforwards may be carried forward and applied against future capital gains. It is the Funds’ intent that they will not distribute any realized gain distributions until the carryforwards have been offset or expired.
During the year ended January 31, 2010, the Money Market Fund, Government II Fund, Prime Obligation Fund, Treasury II Fund, Short-Duration Government Fund and GNMA Fund utilized, $17,667, $3,064, $60,925,000, $10,779, $2,812,144 and $4,085,867, respectively, of capital loss carryforwards to offset capital gains.
During the year ended January 31, 2010, the Money Market Funds’ cost of securities for Federal income tax purposes approximates the cost located in the Statements of Assets and Liabilities.
For Federal income tax purposes, the cost of securities owned at January 31, 2010, and net realized gains or losses on securities sold for the period, were different from amounts reported for financial reporting purposes, primarily due to wash sales which cannot be used��for Federal income tax purposes in the current year and have been deferred for use in future years. The Federal tax cost and aggregate gross unrealized appreciation and depreciation on
| 46 | SEI Daily Income Trust / Semi-Annual Report / July 31, 2010 |
Table of Contents
investments held by the Prime Obligation Fund and Fixed Income Funds at July 31, 2010, were as follows:
| Federal Tax Cost ($ Thousands) | Appreciated Securities ($ Thousands) | Depreciated Securities ($ Thousands) | Net Unrealized Appreciation/ (Depreciation) ($ Thousands) | |||||||||||
Short-Duration Government Fund | $ | 951,415 | $ | 15,023 | $ | (2,717 | ) | $ | 12,306 | |||||
Intermediate-Duration Government Fund | 119,473 | 3,551 | (852 | ) | 2,699 | |||||||||
GNMA Fund | 409,770 | 10,723 | (878 | ) | 9,845 | |||||||||
Ultra Short Duration Bond Fund | 391,235 | 2,758 | (10,625 | ) | (7,867 | ) | ||||||||
Management has analyzed the Fund’s tax positions taken on the federal tax returns for all open tax years and has concluded that as of January 31, 2010, no provision for income tax is required in the Fund’s financial statements. All uncertain tax positions, except for the accretion of market discount associated with the structured investment vehicles subject to the capital support agreement, meet the more likely than not criteria. SEI Investment Company (“SEI”), which is the parent company of the Adviser, has agreed to indemnify the fund if the Internal Revenue Service (“IRS”) were to disagree with a position taken on the tax return for the year ended January 31, 2010. Accordingly, no provision for taxes is required. The Fund’s federal income and excise tax returns are subject to examination by the IRS for all open tax years under the applicable Statute of Limitations.
7. INVESTMENT RISKS
In the normal course of business, a Fund may enter into contracts that provide general indemnifications by a Fund to the counterparty to the contract. A Fund’s maximum exposure under these arrangements is dependent on future claims that may be made against a Fund and, therefore, cannot be established; however, based on experience, management believes the risk of loss from such claim is considered remote.
Investments in structured securities (such as those issued by Structured Investment Vehicles, or “SIVs”) which are collateralized by residential real estate mortgages are subject to certain credit and liquidity risks. When market conditions result in an increase in default rates of the underlying mortgages and the foreclosure values of underlying real estate properties are materially below the outstanding amount of these underlying mortgages, collection of accrued interest and principal on these investments may be doubtful. Such market conditions may significantly impair the value of these investments resulting in a lack of correlation between their credit ratings and values.
8. CAPITAL SUPPORT AGREEMENT
The Prime Obligation and Money Market Fund each entered into a Capital Support Agreement with SEI, an affiliate of the Adviser, on November 8, 2007. As of September 30, 2008, the Money Market Fund no longer held any structured investment vehicle (“SIV”) securities and the Capital Support Agreement with the Money Market Fund lapsed.
On November 5, 2008, the Prime Obligation Fund entered into an Amended and Restated Capital Support Agreement (the “Amended CSA”) with SEI which extended the termination date under the original Capital Support Agreement with the Prime Obligation Fund to November 6, 2009. The Amended CSA provides that if the Prime Obligation Fund realizes payments or sales proceeds from the ultimate disposition of any of the specified SIV securities which are less than its amortized cost, SEI will be required to provide capital to the Prime Obligation Fund equal to the amount by which the amortized cost of the specified SIV security exceeds the amount realized from the sale or other disposition of such security. In March 2009, SEI purchased at amortized cost from the Prime Obligation Fund certain of the SIV securities held by that Fund, thereby reducing the amount of specified SIV securities held in that Fund.
In September 2009, SEI purchased from the Prime Obligation Fund the notes issued by Stanfield Victoria Funding LLC (“Stanfield”) that were held by the Fund. As a result of SEI’s purchase, there was no loss incurred by the Prime Obligation Fund on this transaction. This transaction was effected pursuant to Rule 17a-9 under the Investment Company Act of 1940 (the “Act”), which permits an affiliate to purchase a security from a money market fund if that security is no longer an Eligible Security pursuant to Rule 2a-7 under the Act. Stanfield was not an Eligible Security at the time of the transaction. Since the Fund held no Eligible Notes as of September 28, 2009, the Capital Support Agreement with the Fund terminated as of that date.
9. SUBSEQUENT EVENTS
The Trust, on behalf of the Funds, has evaluated the need for disclosures and/or adjustments resulting from subsequent events. Based on this evaluation, no adjustments were required to the financial statements.
| SEI Daily Income Trust / Semi-Annual Report / July 31, 2010 | 47 |
Table of Contents
Disclosure of Fund Expenses (Unaudited)
All mutual funds have operating expenses. As a shareholder of a mutual fund, your investment is affected by these ongoing costs, which include (among others) costs for portfolio management, administrative services, and shareholder reports like this one. It is important for you to understand the impact of these costs on your investment returns.
Operating expenses such as these are deducted from the mutual fund’s gross income and directly reduce your final investment return. These expenses are expressed as a percentage of the mutual fund’s average net assets; this percentage is known as the mutual fund’s expense ratio.
The following examples use the expense ratio and are intended to help you understand the ongoing costs (in dollars) of investing in your Fund and to compare these costs with those of other mutual funds. The examples are based on an investment of $1,000 made at the beginning of the period shown and held for the entire period.
The table on the next page illustrates your Fund’s costs in two ways:
• Actual Fund Return. This section helps you to estimate the actual expenses after fee waivers that your Fund incurred over the period. The “Expenses Paid During Period” column shows the actual dollar expense cost incurred by a $1,000 investment in the Fund, and the “Ending Account Value” number is derived from deducting that expense cost from the Fund’s gross investment return.
You can use this information, together with the actual amount you invested in your Fund, to estimate the expenses you paid over that period. Simply divide your actual starting account value by $1,000 to arrive at a ratio (for example, an $8,600 account value divided by $1,000 = 8.6), then multiply that ratio by the number shown for your Fund under “Expenses Paid During Period.”
• Hypothetical 5% Return. This section helps you compare your Fund’s costs with those of other mutual funds. It assumes that your Fund had an annual 5% return before expenses during the year, but that the expense ratio (Column 3) is unchanged. This example is useful in making comparisons because the Securities and Exchange Commission requires all mutual funds to make this 5% calculation. You can assess your Fund’s comparative cost by comparing the hypothetical result for your Fund in the “Expense Paid During Period” column with those that appear in the same charts in the shareholder reports for other mutual funds.
NOTE: Because the return is set at 5% for comparison purposes — NOT your Fund’s actual return — the account values shown do not apply to your specific investment.
Beginning Value | Ending Value | Annualized Expense Ratios | Expenses Paid During Period* | |||||||||
Money Market Fund | ||||||||||||
Actual Fund Return | ||||||||||||
Class A | $ | 1,000.00 | $ | 1,000.60 | 0.18 | % | $ | 0.89 | ||||
Class B | 1,000.00 | 1,000.10 | 0.29 | 1.44 | ||||||||
Class C | 1,000.00 | 1,000.10 | 0.29 | 1.44 | ||||||||
Sweep Class | 1,000.00 | 1,000.10 | 0.29 | 1.44 | ||||||||
Hypothetical 5% Return | ||||||||||||
Class A | $ | 1,000.00 | $ | 1,023.90 | 0.18 | % | $ | 0.90 | ||||
Class B | 1,000.00 | 1,023.36 | 0.29 | 1.45 | ||||||||
Class C | 1,000.00 | 1,023.36 | 0.29 | 1.45 | ||||||||
Sweep Class | 1,000.00 | 1,023.36 | 0.29 | 1.45 | ||||||||
Government Fund | ||||||||||||
Actual Fund Return | ||||||||||||
Class A | $ | 1,000.00 | $ | 1,000.20 | 0.15 | % | $ | 0.74 | ||||
Class B | 1,000.00 | 1,000.20 | 0.15 | 0.74 | ||||||||
Class C | 1,000.00 | 1,000.20 | 0.15 | 0.74 | ||||||||
Sweep Class | 1,000.00 | 1,000.20 | 0.15 | 0.74 | ||||||||
Hypothetical 5% Return | ||||||||||||
Class A | $ | 1,000.00 | $ | 1,024.05 | 0.15 | % | $ | 0.75 | ||||
Class B | 1,000.00 | 1,024.05 | 0.15 | 0.75 | ||||||||
Class C | 1,000.00 | 1,024.05 | 0.15 | 0.75 | ||||||||
Sweep Class | 1,000.00 | 1,024.05 | 0.15 | 0.75 | ||||||||
Beginning Value | Ending Value | Annualized Expense Ratios | Expenses Paid During Period* | |||||||||
Government II Fund | ||||||||||||
Actual Fund Return | ||||||||||||
Class A | $ | 1,000.00 | $ | 1,000.00 | 0.14 | % | $ | 0.69 | ||||
Class B | 1,000.00 | 1,000.10 | 0.14 | 0.69 | ||||||||
Class C | 1,000.00 | 1,000.00 | 0.14 | 0.69 | ||||||||
Hypothetical 5% Return | ||||||||||||
Class A | $ | 1,000.00 | $ | 1,024.10 | 0.14 | % | $ | 0.70 | ||||
Class B | 1,000.00 | 1,024.10 | 0.14 | 0.70 | ||||||||
Class C | 1,000.00 | 1,024.10 | 0.14 | 0.70 | ||||||||
Prime Obligation Fund | ||||||||||||
Actual Fund Return | ||||||||||||
Class A | $ | 1,000.00 | $ | 1,000.50 | 0.20 | % | $ | 0.99 | ||||
Class B | 1,000.00 | 1,000.10 | 0.29 | 1.44 | ||||||||
Class C | 1,000.00 | 1,000.10 | 0.29 | 1.44 | ||||||||
Class H | 1,000.00 | 1,000.00 | 0.29 | 1.44 | ||||||||
Sweep Class | 1,000.00 | 1,000.10 | 0.28 | 1.39 | ||||||||
Hypothetical 5% Return | ||||||||||||
Class A | $ | 1,000.00 | $ | 1,023.80 | 0.20 | % | $ | 1.00 | ||||
Class B | 1,000.00 | 1,023.36 | 0.29 | 1.45 | ||||||||
Class C | 1,000.00 | 1,023.36 | 0.29 | 1.45 | ||||||||
Class H | 1,000.00 | 1,023.36 | 0.29 | 1.45 | ||||||||
Sweep Class | 1,000.00 | 1,023.41 | 0.28 | 1.40 | ||||||||
| 48 | SEI Daily Income Trust / Semi-Annual Report / July 31, 2010 |
Table of Contents
Beginning Value | Ending Value | Annualized Expense Ratios | Expenses Paid During Period* | |||||||||
Treasury Fund | ||||||||||||
Actual Fund Return | ||||||||||||
Class A | $ | 1,000.00 | $ | 1,000.10 | 0.17 | % | $ | 0.84 | ||||
Class B | 1,000.00 | 1,000.10 | 0.18 | 0.89 | ||||||||
Class C | 1,000.00 | 1,000.10 | 0.17 | 0.84 | ||||||||
Sweep Class | 1,000.00 | 1,000.10 | 0.18 | 0.89 | ||||||||
Hypothetical 5% Return | ||||||||||||
Class A | $ | 1,000.00 | $ | 1,023.95 | 0.17 | % | $ | 0.85 | ||||
Class B | 1,000.00 | 1,023.90 | 0.18 | 0.90 | ||||||||
Class C | 1,000.00 | 1,023.95 | 0.17 | 0.85 | ||||||||
Sweep Class | 1,000.00 | 1,023.90 | 0.18 | 0.90 | ||||||||
Treasury II Fund | ||||||||||||
Actual Fund Return | ||||||||||||
Class A | $ | 1,000.00 | $ | 1,000.00 | 0.10 | % | $ | 0.50 | ||||
Class B | 1,000.00 | 1,000.00 | 0.11 | 0.55 | ||||||||
Class C | 1,000.00 | 1,000.00 | 0.11 | 0.55 | ||||||||
Hypothetical 5% Return | ||||||||||||
Class A | $ | 1,000.00 | $ | 1,024.30 | 0.10 | % | $ | 0.50 | ||||
Class B | 1,000.00 | 1,024.25 | 0.11 | 0.55 | ||||||||
Class C | 1,000.00 | 1,024.25 | 0.11 | 0.55 | ||||||||
Beginning Value | Ending Value | Annualized Expense Ratios | Expenses Paid During Period* | |||||||||
Short-Duration Government Fund | ||||||||||||
Actual Fund Return | ||||||||||||
Class A | $ | 1,000.00 | $ | 1,023.80 | 0.48 | % | $ | 2.41 | ||||
Hypothetical 5% Return | ||||||||||||
Class A | $ | 1,000.00 | $ | 1,022.41 | 0.48 | % | $ | 2.41 | ||||
Intermediate-Duration Government Fund | ||||||||||||
Actual Fund Return | ||||||||||||
Class A | $ | 1,000.00 | $ | 1,048.20 | 0.53 | % | $ | 2.69 | ||||
Hypothetical 5% Return | ||||||||||||
Class A | $ | 1,000.00 | $ | 1,022.17 | 0.53 | % | $ | 2.66 | ||||
GNMA Fund | ||||||||||||
Actual Fund Return | ||||||||||||
Class A | $ | 1,000.00 | $ | 1,052.90 | 0.63 | % | $ | 3.21 | ||||
Hypothetical 5% Return | ||||||||||||
Class A | $ | 1,000.00 | $ | 1,021.67 | 0.63 | % | $ | 3.16 | ||||
Ultra Short Duration Bond Fund‡ | ||||||||||||
Actual Fund Return | ||||||||||||
Class A | $ | 1,000.00 | $ | 1,016.00 | 0.38 | % | $ | 1.90 | ||||
Hypothetical 5% Return | ||||||||||||
Class A | $ | 1,000.00 | $ | 1,022.91 | 0.38 | % | $ | 1.91 | ||||
| * | Expenses are equal to the Fund’s annualized expense ratio multiplied by the average account value over the period, multiplied by 181/365. |
| ‡ | See Note 1 in Notes to Financial Statements. |
| SEI Daily Income Trust / Semi-Annual Report / July 31, 2010 | 49 |
Table of Contents
SEI DAILY INCOME TRUST SEMI–ANNUAL REPORT JULY 31, 2010
Robert A. Nesher, Chairman
Trustees
William M. Doran
James M. Storey
George J. Sullivan, Jr.
Rosemarie B. Greco
Nina Lesavoy
James M. Williams
Mitchell A. Johnson
Hubert L. Harris, Jr.
Officers
Robert A. Nesher
President and Chief Executive Officer
Stephen F. Panner
Controller and Chief Financial Officer
Russell Emery
Chief Compliance Officer
Timothy D. Barto
Vice President, Secretary
David McCann
Vice President, Assistant Secretary
James Ndiaye
Vice President, Assistant Secretary
Aaron Buser
Vice President, Assistant Secretary
John J. McCue
Vice President
Andrew S. Decker
Anti-Money Laundering Compliance Officer
Kari E. Rohn
Privacy Officer
Investment Adviser
SEI Investments Management Corporation
Administrator
SEI Investments Global Funds Services
Distributor
SEI Investments Distribution Co.
Legal Counsel
Morgan, Lewis & Bockius LLP
Independent Registered Public Accounting Firm
KPMG LLP
This report and the financial statements contained herein are submitted for the general information of the shareholders of the Trust and must be preceded or accompanied by a current prospectus. Shares of the Funds are not deposits or obligations of, or guaranteed or endorsed by, any bank. The shares are not federally insured by the Federal Deposit Insurance Corporation (FDIC), the Federal Reserve Board, or any other government agency. Investment in the shares involves risk, including the possible loss of principal.
For more information call
1 800 DIAL SEI
(1 800 342 5734)
Table of Contents
SEI Investments Distribution Co.
Oaks, PA 19456 1.800.DIAL.SEI (1.800.342.5734)
SEI-F-037 (9/10)
Table of Contents
| Item 2. | Code of Ethics. |
Not applicable for semi-annual report.
| Item 3. | Audit Committee Financial Expert. |
Not applicable for semi-annual report.
| Item 4. | Principal Accountant Fees and Services. |
Not applicable for semi-annual report.
| Item 5. | Audit Committee of Listed Registrants. |
Not applicable.
| Item 6. | Schedule of Investments. |
Not applicable.
| Item 7. | Disclosure of Proxy Voting Policies and Procedures for Closed-End Management Investment Companies. |
Not applicable.
| Item 8. | Portfolio Managers of Closed-End Management Investment Companies. |
Not applicable.
| Item 9. | Purchases of Equity Securities by Closed-End Management Company and Affiliated Purchasers. |
Not applicable.
| Item 10. | Submission of Matters to a Vote of Security Holders. |
The Registrant has a standing Nominating Committee (the “Committee”) currently consisting of the Independent Trustees. The Committee is responsible for evaluating and recommending nominees for election to the Registrant’s Board of Trustees (the “Board”). Pursuant to the Committee’s Charter, adopted on June 18th 2004, as amended, the Committee will review all shareholder recommendations for nominations to fill vacancies on the Board if such recommendations are submitted in writing and addressed to the Committee at the Registrant’s office.
| Item 11. | Controls and Procedures. |
(a) The registrant’s principal executive and principal financial officers, or persons performing similar functions, have concluded that the Registrant’s disclosure controls and procedures (as defined in Rule 30a-3(c) under the Investment Company Act of 1940 (the “1940 Act”)) are effective, based on the evaluation of these controls and procedures required by Rule 30a-3(b) under the 1940 Act and Rules 13a-15(b) or 15d-15(b) under the Securities Exchange Act of 1934 as of a date within 90 days of the filing date of this report.
(b) There were no changes in the Registrant’s internal control over financial reporting (as defined in Rule 30a-3(d) under the 1940 Act) that occurred during the second fiscal quarter of the period covered by this report that have materially affected, or are reasonably likely to materially affect, the Registrants internal control over financial reporting.
| Items 12. | Exhibits. |
(a)(1) Not applicable for semi-annual report.
(a)(2) A separate certification for the principal executive officer and the principal financial officer of the Registrant as required by Rule 30a-2(a) under the Investment Company Act of 1940, as amended (17 CFR 270.30a-2(a)), are filed herewith.
(b) Officer certifications as required by Rule 30a-2(b) under the Investment Company Act of 1940, as amended (17 CFR 270.30a-2(b)) also accompany this filing as an Exhibit.
Table of Contents
SIGNATURES
Pursuant to the requirements of the Securities Exchange Act of 1934 and the Investment Company Act of 1940, the registrant has duly caused this report to be signed on its behalf by the undersigned, thereunto duly authorized.
| (Registrant) | SEI Daily Income Trust | |||||||
| By: | /s/ ROBERT A. NESHER | |||||||
| Robert A. Nesher, President & CEO | ||||||||
Date: September 29, 2010
Pursuant to the requirements of the Securities Exchange Act of 1934 and the Investment Company Act of 1940, this report has been signed below by the following persons on behalf of the Registrant and in the capacities and on the dates indicated.
| By: | /s/ ROBERT A. NESHER | |||||||
| Robert A. Nesher, President & CEO | ||||||||
Date: September 29, 2010 | ||||||||
| By: | /s/ STEPHEN F. PANNER | |||||||
| Stephen F. Panner, Controller & CFO | ||||||||
Date: September 29, 2010