UNITED STATES
SECURITIES AND EXCHANGE COMMISSION
Washington, D.C. 20549
FORM N-CSRS
CERTIFIED SHAREHOLDER REPORT OF REGISTERED MANAGEMENT
INVESTMENT COMPANIES
Investment Company Act file number 811-03451
SEI Daily Income Trust
(Exact name of registrant as specified in charter)
SEI Investments
One Freedom Valley Drive
Oaks, PA 19456
(Address of principal executive offices) (Zip code)
c/o CT Corporation
101 Federal Street
Boston, MA 02110
(Name and address of agent for service)
Registrant’s telephone number, including area code: 1-800-342-5734
Date of fiscal year end: January 31, 2016
Date of reporting period: July 31, 2015
| Item 1. | Reports to Stockholders. |

July 31, 2015
SEMI-ANNUAL REPORT
SEI Daily Income Trust
➤ Money Market Fund
➤ Government Fund
➤ Government II Fund
➤ Prime Obligation Fund
➤ Treasury Fund
➤ Treasury II Fund
➤ Ultra Short Duration Bond Fund
➤ Short-Duration Government Fund
➤ Intermediate-Duration Government Fund
➤ GNMA Fund

| 1 | ||||
| 40 | ||||
| 42 | ||||
| 44 | ||||
| 48 | ||||
| 52 | ||||
| 60 | ||||
The Trust files its complete schedule of portfolio holdings with the Securities and Exchange Commission for the first and third quarters of each fiscal year on Form N-Q within sixty days after the end of the period. The Trust’s Forms N-Q are available on the Commission’s website at http://www.sec.gov, and may be reviewed and copied at the Commission’s Public Reference Room in Washington, DC. Information on the operation of the Public Reference Room may be obtained by calling 1-800-SEC-0330.
Since the Funds in SEI Daily Income Trust typically hold only fixed income securities, they generally are not expected to hold securities for which they may be required to vote proxies. Regardless, in light of the possibility of the possibility that a Fund could hold a security for which a proxy is voted, the Trust has adopted proxy voting policies. A description of the policies and procedures that the Trust uses to determine how to vote proxies relating to portfolios securities, as well as information relating to how a Fund voted proxies relating to portfolio securities during the most recent 12-month period ended June 30, is available (i) without charge, upon request, by calling 1-800-DIAL-SEI; and (ii) on the Commission’s website at http://www.sec.gov.
SCHEDULE OF INVESTMENTS (Unaudited)
Money Market Fund
July 31, 2015
| Description | Face Amount ($ Thousands) | Value ($ Thousands) | ||||||
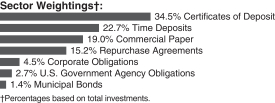
CERTIFICATES OF DEPOSIT — 33.1% |
| |||||||
ANZ New Zealand International | ||||||||
0.269%, 08/05/15 (A) | $ | 2,000 | $ | 2,000 | ||||
0.349%, 08/29/15 (A) (C) | 1,452 | 1,452 | ||||||
Bank of Montreal | ||||||||
0.278%, 08/04/15 (A) | 2,000 | 2,000 | ||||||
0.210%, 09/10/15 | 2,820 | 2,820 | ||||||
0.190%, 09/14/15 | 1,850 | 1,850 | ||||||
0.190%, 09/15/15 | 2,000 | 2,000 | ||||||
Bank of Nova Scotia | ||||||||
0.260%, 08/01/15 (A) | 1,000 | 1,000 | ||||||
0.250%, 08/01/15 (A) | 2,700 | 2,700 | ||||||
0.289%, 08/04/15 (A) | 101 | 101 | ||||||
0.298%, 08/09/15 (A) | 286 | 286 | ||||||
0.279%, 09/04/15 (A) | 2,000 | 2,000 | ||||||
Bank of Tokyo-Mitsubishi UFJ NY | ||||||||
0.327%, 08/01/15 (A) | 1,200 | 1,200 | ||||||
0.317%, 08/01/15 (A) | 2,300 | 2,300 | ||||||
0.250%, 09/08/15 | 3,000 | 3,000 | ||||||
BMO Harris Bank | ||||||||
0.300%, 08/03/15 | 135 | 135 | ||||||
BNZ International Funding | ||||||||
0.347%, 08/02/15 (A) | 1,102 | 1,102 | ||||||
DNB Bank | ||||||||
0.120%, 08/05/15 | 7,600 | 7,600 | ||||||
Fairway Finance LLC | ||||||||
0.268%, 08/20/15 (A) | 355 | 355 | ||||||
HSBC Bank | ||||||||
0.200%, 08/10/15 | 2,000 | 2,000 | ||||||
0.230%, 09/01/15 | 1,000 | 1,000 | ||||||
JPMorgan Securities LLC | ||||||||
0.287%, 08/01/15 (A) | 1,000 | 1,000 | ||||||
0.338%, 08/04/15 (A) | 1,500 | 1,500 | ||||||
0.308%, 08/04/15 (A) | 1,700 | 1,700 | ||||||
0.331%, 08/31/15 (A) | 1,000 | 1,000 | ||||||
Mizuho Bank | ||||||||
0.260%, 08/07/15 | 2,000 | 2,000 | ||||||
0.270%, 08/11/15 | 1,264 | 1,264 | ||||||
0.260%, 09/08/15 | 3,000 | 3,000 | ||||||
0.270%, 09/25/15 | 1,450 | 1,450 | ||||||
National Bank of Canada | ||||||||
0.320%, 08/20/15 | 340 | 340 | ||||||
Old Line Funding | ||||||||
0.281%, 08/03/15 (A) | 830 | 830 | ||||||
0.370%, 08/08/15 (A) | 2,000 | 2,000 | ||||||
| Description | Face Amount ($ Thousands) | Value ($ Thousands) | ||||||
0.367%, 08/08/15 (A) | $ | 527 | $ | 527 | ||||
0.277%, 08/20/15 (A) | 1,000 | 1,000 | ||||||
0.275%, 08/20/15 (A) | 1,000 | 1,000 | ||||||
State Street Bank | ||||||||
0.347%, 08/11/15 (A) | 1,000 | 1,000 | ||||||
0.327%, 08/15/15 (A) | 3,000 | 3,000 | ||||||
0.329%, 08/06/15 (A) | 2,000 | 2,000 | ||||||
Sumitomo Mitsui Banking | ||||||||
0.337%, 08/15/15 (A) | 1,082 | 1,082 | ||||||
0.335%, 08/23/15 (A) | 250 | 250 | ||||||
0.280%, 10/02/15 | 1,296 | 1,296 | ||||||
Svenska Handelsbanken | ||||||||
0.205%, 09/01/15 | 4,300 | 4,300 | ||||||
0.245%, 09/30/15 | 3,582 | 3,582 | ||||||
0.245%, 10/09/15 | 427 | 427 | ||||||
Toronto-Dominion Bank | ||||||||
0.220%, 09/17/15 | 2,000 | 2,000 | ||||||
0.280%, 09/18/15 | 1,500 | 1,500 | ||||||
Toyota Motor Credit | ||||||||
0.267%, 08/02/15 (A) | 1,300 | 1,300 | ||||||
0.268%, 08/19/15 (A) | 1,055 | 1,055 | ||||||
0.271%, 08/27/15 (A) | 710 | 710 | ||||||
Wells Fargo Bank | ||||||||
0.290%, 08/01/15 (A) | 202 | 202 | ||||||
0.260%, 08/01/15 (A) | 2,000 | 2,000 | ||||||
0.250%, 08/01/15 (A) | 2,000 | 2,000 | ||||||
0.250%, 08/01/15 (A) | 1,300 | 1,300 | ||||||
0.250%, 08/01/15 (A) | 1,300 | 1,300 | ||||||
0.260%, 08/03/15 | 819 | 819 | ||||||
0.268%, 08/07/15 (A) | 1,000 | 1,000 | ||||||
0.268%, 08/08/15 (A) | 1,000 | 1,000 | ||||||
|
| |||||||
Total Certificates of Deposit | 88,635 | |||||||
|
| |||||||
TIME DEPOSITS — 21.8% |
| |||||||
Australia & New Zealand Banking Group NY | ||||||||
0.080%, 08/03/15 | 8,000 | 8,000 | ||||||
Bank of Montreal | ||||||||
0.278%, 08/04/15 (A) | 1,583 | 1,583 | ||||||
Citibank | ||||||||
0.090%, 08/03/15 | 12,000 | 12,000 | ||||||
Lloyds Bank PLC | ||||||||
0.060%, 08/03/15 | 12,887 | 12,887 | ||||||
Skandinaviska Enskilda Banken | ||||||||
0.080%, 08/03/15 | 12,000 | 12,000 | ||||||
Swedbank | ||||||||
0.070%, 08/03/15 | 12,000 | 12,000 | ||||||
|
| |||||||
Total Time Deposits | 58,470 | |||||||
|
| |||||||
COMMERCIAL PAPER — 18.2% |
| |||||||
Albion Capital LLC | ||||||||
0.240%, 08/17/15 (C) (D) | 1,000 | 1,000 | ||||||
| SEI Daily Income Trust / Semi-Annual Report / July 31, 2015 | 1 |
SCHEDULE OF INVESTMENTS (Unaudited)
Money Market Fund (Continued)
July 31, 2015
| Description | Face Amount ($ Thousands) | Value ($ Thousands) | ||||||
0.210%, 08/26/15 (C) (D) | $ | 1,000 | $ | 1,000 | ||||
0.230%, 09/16/15 (C) (D) | 445 | 445 | ||||||
BNZ International Funding | ||||||||
0.230%, 09/14/15 (C) (D) | 3,000 | 2,999 | ||||||
Caisse Centrale Desjardins | ||||||||
0.220%, 09/14/15 (C) (D) | 674 | 674 | ||||||
Chariot Funding LLC | ||||||||
0.330%, 11/30/15 (C) (D) | 2,309 | 2,306 | ||||||
0.401%, 12/16/15 (C) (D) | 3,000 | 2,995 | ||||||
CRC Funding | ||||||||
0.200%, 09/14/15 (C) (D) | 698 | 698 | ||||||
Fairway Finance LLC | ||||||||
0.271%, 08/29/15 (A) (C) (D) | 710 | 710 | ||||||
0.280%, 09/03/15 (C) (D) | 399 | 399 | ||||||
JPMorgan Securities LLC | ||||||||
0.300%, 08/03/15 (C) (D) | 1,000 | 1,000 | ||||||
0.270%, 09/08/15 (C) (D) | 1,000 | 1,000 | ||||||
0.310%, 10/13/15 (C) (D) | 2,500 | 2,498 | ||||||
Jupiter Securitization | ||||||||
0.331%, 11/30/15 to 12/01/15 (C) (D) | 2,802 | 2,799 | ||||||
0.371%, 12/08/15 (C) (D) | 1,000 | 999 | ||||||
Liberty Street Funding | ||||||||
0.300%, 10/26/15 (C) (D) | 550 | 549 | ||||||
0.391%, 11/30/15 (C) (D) | 719 | 718 | ||||||
0.381%, 12/03/15 to | 3,438 | 3,432 | ||||||
Manhattan Asset Funding | ||||||||
0.250%, 08/31/15 to 09/18/15 (B) (C) (D) | 1,592 | 1,592 | ||||||
0.260%, 09/02/15 to | 2,200 | 2,199 | ||||||
0.220%, 09/15/15 (C) (D) | 676 | 676 | ||||||
National Bank of Canada | ||||||||
0.300%, 09/17/15 (C) (D) | 500 | 500 | ||||||
0.280%, 09/17/15 (C) (D) | 3,000 | 2,999 | ||||||
Old Line Funding | ||||||||
0.240%, 09/04/15 to 09/10/15 (C) (D) | 1,844 | 1,844 | ||||||
0.230%, 09/09/15 (C) (D) | 410 | 410 | ||||||
Svenska Handelsbanken | ||||||||
0.210%, 09/08/15 (C) (D) | 395 | 395 | ||||||
Thunder Bay Funding LLC | ||||||||
0.240%, 08/31/15 (C) (D) | 568 | 568 | ||||||
0.230%, 09/08/15 to 09/09/15 (C) (D) | 3,260 | 3,259 | ||||||
0.280%, 09/21/15 (C) (D) | 753 | 753 | ||||||
0.401%, 12/01/15 (C) (D) | 259 | 258 | ||||||
Toyota Motor Credit | ||||||||
0.200%, 09/14/15 (C) (D) | 1,236 | 1,236 | ||||||
Victory Receivables | ||||||||
0.230%, 09/15/15 (C) (D) | 1,000 | 1,000 | ||||||
Westpac Securities NZ | ||||||||
0.278%, 08/10/15 (A) (C) (D) | 1,500 | 1,500 | ||||||
| Description | Face Amount ($ Thousands) | Value ($ Thousands) | ||||||
Working Capital Management | ||||||||
0.230%, 09/02/15 (C) (D) | $ | 400 | $ | 400 | ||||
0.210%, 09/03/15 to 09/08/15 (C) (D) | 2,347 | 2,347 | ||||||
0.200%, 09/09/15 (C) (D) | 690 | 690 | ||||||
|
| |||||||
Total Commercial Paper |
| 48,847 | ||||||
|
| |||||||
CORPORATE OBLIGATIONS — 4.3% |
| |||||||
American Honda Finance MTN | ||||||||
1.000%, 08/11/15 (B) | 245 | 245 | ||||||
ANZ New Zealand International | ||||||||
1.850%, 10/15/15 (B) | 375 | 376 | ||||||
Bank of Montreal | ||||||||
0.350%, 08/23/15 (A) | 1,000 | 1,000 | ||||||
Bank of Nova Scotia | ||||||||
0.340%, 09/25/15 (A) | 2,000 | 2,000 | ||||||
Caisse Centrale Desjardins | ||||||||
2.650%, 09/16/15 (B) | 289 | 290 | ||||||
Canadian Imperial Bank Commerce | ||||||||
2.350%, 12/11/15 | 412 | 415 | ||||||
National Australia Bank | ||||||||
2.750%, 09/28/15 (B) | 145 | 146 | ||||||
Shell International | ||||||||
0.349%, 08/10/15 (A) | 378 | 378 | ||||||
Toronto-Dominion Bank | ||||||||
0.338%, 08/07/15 (A) | 2,377 | 2,377 | ||||||
Wells Fargo Bank | ||||||||
0.330%, 08/09/15 (A) | 3,000 | 3,000 | ||||||
Westpac Banking | ||||||||
3.000%, 08/04/15 | 913 | 913 | ||||||
1.125%, 09/25/15 | 316 | 316 | ||||||
|
| |||||||
Total Corporate Obligations | 11,456 | |||||||
|
| |||||||
U.S. GOVERNMENT AGENCY OBLIGATIONS — 2.6% |
| |||||||
FFCB | ||||||||
0.200%, 08/01/15 (A) | 760 | 760 | ||||||
0.207%, 08/11/15 (A) | 2,190 | 2,191 | ||||||
0.182%, 08/16/15 (A) | 2,700 | 2,700 | ||||||
0.237%, 08/24/15 (A) | 1,110 | 1,110 | ||||||
FNMA | ||||||||
0.207%, 08/15/15 (A) | 240 | 240 | ||||||
|
| |||||||
Total U.S. Government Agency Obligations |
| 7,001 | ||||||
|
| |||||||
MUNICIPAL BONDS — 1.4% | ||||||||
Arizona — 0.2% | ||||||||
Pima County, Industrial Development Authority, RB | ||||||||
0.240%, 08/05/15 (A) | 600 | 600 | ||||||
|
| |||||||
| 2 | SEI Daily Income Trust / Semi-Annual Report / July 31, 2015 |
| Description | Face Amount ($ Thousands) | Value ($ Thousands) | ||||||
Iowa — 0.2% | ||||||||
Iowa State, Finance Authority, Ser C, RB | ||||||||
0.110%, 08/06/15 (A) | $ | 765 | $ | 765 | ||||
Iowa State, Finance Authority, Ser G, RB | ||||||||
0.110%, 08/06/15 (A) | 15 | 15 | ||||||
|
| |||||||
| 780 | ||||||||
|
| |||||||
Massachusetts — 0.1% | ||||||||
Simmons College, Higher Education Authority, RB | ||||||||
0.140%, 08/06/15 (A) | 185 | 185 | ||||||
|
| |||||||
Michigan — 0.4% | ||||||||
Kent, Hospital Finance Authority, Ser C, RB | ||||||||
0.020%, 08/05/15 (A) | 1,005 | 1,005 | ||||||
|
| |||||||
Minnesota — 0.3% | ||||||||
Minnesota State, Office of Higher Education, Ser A, RB | ||||||||
0.120%, 08/06/15 (A) | 700 | 700 | ||||||
|
| |||||||
New Hampshire — 0.1% | ||||||||
New Hampshire State, Health & Education Facilities Authority, Dartmouth College Project, Ser C, RB | ||||||||
0.140%, 08/05/15 (A) | 190 | 190 | ||||||
|
| |||||||
New Jersey — 0.1% | ||||||||
North Hudson Sewage Authority, RB | ||||||||
0.120%, 08/06/15 (A) | 150 | 150 | ||||||
|
| |||||||
New York — 0.0% | ||||||||
New York State, Housing & Finance Authority, RB | ||||||||
0.220%, 08/04/15 (A) | 105 | 105 | ||||||
|
| |||||||
Total Municipal Bonds | 3,715 | |||||||
|
| |||||||
REPURCHASE AGREEMENTS — 14.6% |
| |||||||
Goldman Sachs | 8,118 | 8,118 | ||||||
| Description | Face Amount ($ Thousands) | Value ($ Thousands) | ||||||
Mistubishi | $ | 4,047 | $ | 4,047 | ||||
RBC Capital | 1,991 | 1,991 | ||||||
RBC Capital | 7,750 | 7,750 | ||||||
TD Securities | 7,750 | 7,750 | ||||||
Wells Fargo | 357 | 357 | ||||||
Wells Fargo | 1,413 | 1,413 | ||||||
| SEI Daily Income Trust / Semi-Annual Report / July 31, 2015 | 3 |
SCHEDULE OF INVESTMENTS (Unaudited)
Money Market Fund (Concluded)
July 31, 2015
| Description | Face Amount ($ Thousands) | Value ($ Thousands) | ||||||
Wells Fargo | $ | 7,750 | $ | 7,750 | ||||
|
| |||||||
Total Repurchase Agreements | 39,176 | |||||||
|
| |||||||
Total Investments — 96.0% | $ | 257,300 | ||||||
|
| |||||||
| * | A summary of the corporate obligations used to collateralize repurchase agreements entered into by the Fund at July 31, 2015, is as follows: |
| Counterparty | Corporate Obligation | Rate | Maturity Date | Par Amount ($ Thousands) | ||||||||||
| RBC Capital | AGL Capital | 6.375 | % | 07/15/16 | $ | 1 | ||||||||
| Amgen | 2.200 | 05/22/19 | 94 | |||||||||||
| BNP Paribas | 2.450 | 03/17/19 | 529 | |||||||||||
| Caterpillar Financial Services | 0.435 | 08/28/15 | 17 | |||||||||||
| CDK Global | 4.500 | 10/15/24 | 1 | |||||||||||
| Hospitality | 5.000 | 08/15/22 | 1,223 | |||||||||||
| Hydro-Queen | 9.400 | 02/01/21 | 2 | |||||||||||
| KKR Group | 6.375 | 09/29/20 | 1 | |||||||||||
| McKesson | 3.796 | 03/15/24 | 10 | |||||||||||
| Morgan Stanley | 2.800 | 06/16/20 | 31 | |||||||||||
| Province of Ontario Canada | 2.500 | 09/10/21 | 80 | |||||||||||
| Verizon Communications | 2.450 | 11/01/22 | 13 | |||||||||||
Percentages are based on Net Assets of $268,063 ($ Thousands).
| (A) | Floating Rate Instrument. The rate reflected on the Schedule of Investments is the rate in effect on July 31, 2015. The demand and interest rate reset features give this security a shorter effective maturity date. |
| (B) | Securities sold within terms of a private placement memorandum, exempt from registration under Section 144A of the Securities Act of 1933, as amended, and may be sold only to dealers in that program or other “accredited investors.” These securities have been determined to be liquid under guidelines established by the Board of Trustees. |
| (C) | The rate reported is the effective yield at time of purchase. |
| (D) | Securities are held in connection with a letter of credit issued by a major bank. |
| (E) | Tri-Party Repurchase Agreement. |
FFCB — Federal Farm Credit Bank
FMAC — Financial Management Advisory Committee
FNMA — Federal National Mortgage Association
GNMA — Government National Mortgage Association
LLC — Limited Liability Company
MTN — Medium Term Note
PLC — Public Limited Company
RB — Revenue Bond
As of July 31, 2015, all of the Fund’s investments were considered Level 2, in accordance with the authoritative guidance on fair value measurements and disclosure under U.S. Generally Accepted Accounting Principles.
As of July 31, 2015, there were no transfers between Level 1 and Level 2 assets and liabilities. As of July 31, 2015, there were no Level 3 securities.
For more information on valuation inputs, see Note 2 — Significant Accounting Policies in Notes to Financial Statements.
The accompanying notes are an integral part of the financial statements.
| 4 | SEI Daily Income Trust / Semi-Annual Report / July 31, 2015 |
SCHEDULE OF INVESTMENTS (Unaudited)
Government Fund
July 31, 2015
| Description | Face Amount ($ Thousands) | Value ($ Thousands) | ||||||
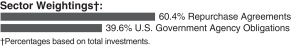
U.S. GOVERNMENT AGENCY OBLIGATIONS — 37.2% |
| |||||||
FFCB | ||||||||
0.210%, 08/01/15 (A) | $ | 1,710 | $ | 1,710 | ||||
0.187%, 08/01/15 (A) | 10,527 | 10,527 | ||||||
0.250%, 08/01/15 (A) | 310 | 310 | ||||||
0.187%, 08/01/15 (A) | 5,540 | 5,540 | ||||||
0.200%, 08/01/15 (A) | 13,480 | 13,480 | ||||||
0.212%, 08/02/15 (A) | 1,750 | 1,750 | ||||||
0.215%, 08/03/15 (A) | 1,705 | 1,706 | ||||||
0.165%, 08/03/15 (A) | 4,000 | 4,000 | ||||||
0.205%, 08/03/15 (A) | 15,738 | 15,741 | ||||||
0.160%, 08/03/15 (A) | 855 | 855 | ||||||
0.218%, 08/05/15 (A) | 3,770 | 3,772 | ||||||
0.198%, 08/06/15 (A) | 5,821 | 5,821 | ||||||
0.283%, 08/06/15 (A) | 490 | 491 | ||||||
0.206%, 08/08/15 (A) | 2,385 | 2,385 | ||||||
0.217%, 08/08/15 (A) | 3,420 | 3,421 | ||||||
0.187%, 08/08/15 (A) | 706 | 706 | ||||||
0.179%, 08/09/15 (A) | 12,335 | 12,335 | ||||||
0.207%, 08/11/15 (A) | 3,605 | 3,606 | ||||||
0.217%, 08/11/15 (A) | 4,030 | 4,032 | ||||||
0.212%, 08/13/15 (A) | 175 | 175 | ||||||
0.217%, 08/13/15 (A) | 37,345 | 37,375 | ||||||
0.206%, 08/14/15 (A) | 8,250 | 8,251 | ||||||
0.182%, 08/16/15 (A) | 8,170 | 8,170 | ||||||
0.196%, 08/17/15 (A) | 1,940 | 1,940 | ||||||
0.226%, 08/17/15 (A) | 4,525 | 4,525 | ||||||
0.300%, 08/17/15 | 1,000 | 1,000 | ||||||
0.236%, 08/17/15 (A) | 2,370 | 2,371 | ||||||
0.198%, 08/18/15 (A) | 1,090 | 1,090 | ||||||
0.218%, 08/18/15 (A) | 3,000 | 3,000 | ||||||
0.158%, 08/19/15 (A) | 6,895 | 6,894 | ||||||
0.188%, 08/19/15 (A) | 4,330 | 4,330 | ||||||
0.278%, 08/19/15 (A) | 8,960 | 8,966 | ||||||
0.188%, 08/20/15 (A) | 7,000 | 7,000 | ||||||
0.218%, 08/20/15 (A) | 11,337 | 11,344 | ||||||
0.258%, 08/20/15 (A) | 5,027 | 5,030 | ||||||
0.214%, 08/22/15 (A) | 2,979 | 2,979 | ||||||
0.190%, 08/23/15 (A) | 5,900 | 5,899 | ||||||
0.237%, 08/24/15 (A) | 958 | 958 | ||||||
0.227%, 08/24/15 (A) | 1,900 | 1,900 | ||||||
0.232%, 08/24/15 (A) | 8,240 | 8,245 | ||||||
0.221%, 08/25/15 (A) | 13,989 | 14,001 | ||||||
0.210%, 08/26/15 (A) | 895 | 895 | ||||||
0.221%, 08/26/15 (A) | 175 | 175 | ||||||
0.209%, 08/29/15 (A) | 6,000 | 6,001 | ||||||
0.250%, 09/10/15 | 13,365 | 13,365 | ||||||
1.500%, 11/16/15 | 275 | 276 | ||||||
4.875%, 12/16/15 | 5,656 | 5,755 | ||||||
0.440%, 12/28/15 | 2,000 | 2,002 | ||||||
| Description | Face Amount ($ Thousands) | Value ($ Thousands) | ||||||
FHLB | ||||||||
0.220%, 08/01/15 (A) | $ | 4,180 | $ | 4,180 | ||||
0.125%, 08/04/15 | 15,295 | 15,295 | ||||||
1.630%, 08/20/15 | 350 | 350 | ||||||
0.190%, 08/21/15 | 29,240 | 29,242 | ||||||
0.210%, 08/26/15 | 9,660 | 9,661 | ||||||
1.350%, 08/28/15 | 35 | 35 | ||||||
0.375%, 08/28/15 | 5,935 | 5,936 | ||||||
1.750%, 09/11/15 | 275 | 276 | ||||||
2.875%, 09/11/15 | 5,195 | 5,211 | ||||||
0.130%, 09/11/15 | 3,465 | 3,465 | ||||||
4.750%, 09/11/15 | 1,740 | 1,749 | ||||||
0.200%, 09/15/15 | 35,165 | 35,169 | ||||||
0.480%, 09/18/15 | 355 | 355 | ||||||
0.100%, 09/23/15 | 18,755 | 18,754 | ||||||
0.160%, 09/25/15 | 215 | 215 | ||||||
0.150%, 10/02/15 | 4,460 | 4,460 | ||||||
FHLB DN | ||||||||
0.065%, 08/07/15 (B) | 25,000 | 25,000 | ||||||
0.145%, 08/09/15 (A) (B) | 7,915 | 7,915 | ||||||
0.090%, 09/11/15 (B) | 675 | 675 | ||||||
0.075%, 09/17/15 (B) | 9,955 | 9,954 | ||||||
0.160%, 10/07/15 (B) | 8,465 | 8,463 | ||||||
0.155%, 10/14/15 (B) | 3,880 | 3,879 | ||||||
FHLMC | ||||||||
0.192%, 08/13/15 (A) | 12,000 | 11,998 | ||||||
0.167%, 08/16/15 (A) | 10,125 | 10,125 | ||||||
0.500%, 08/28/15 | 26,549 | 26,556 | ||||||
0.450%, 09/04/15 | 13,975 | 13,980 | ||||||
1.750%, 09/10/15 | 41,427 | 41,499 | ||||||
0.420%, 09/18/15 | 22,894 | 22,902 | ||||||
4.750%, 11/17/15 | 3,769 | 3,819 | ||||||
FHLMC DN | ||||||||
0.160%, 09/11/15 (B) | 29,875 | 29,870 | ||||||
0.071%, 10/05/15 (B) | 24,000 | 23,997 | ||||||
0.240%, 11/04/15 (B) | 6,505 | 6,501 | ||||||
0.251%, 12/07/15 (B) | 5,499 | 5,494 | ||||||
FHLMC MTN | ||||||||
0.500%, 09/25/15 | 10,145 | 10,151 | ||||||
FNMA | ||||||||
0.460%, 08/01/15 (A) | 2,465 | 2,467 | ||||||
2.150%, 08/04/15 | 4,296 | 4,297 | ||||||
0.207%, 08/15/15 (A) | 8,442 | 8,444 | ||||||
0.207%, 08/16/15 (A) | 7,695 | 7,696 | ||||||
2.000%, 08/18/15 | 2,499 | 2,501 | ||||||
0.200%, 08/25/15 (A) | 3,360 | 3,360 | ||||||
0.210%, 08/26/15 (A) | 565 | 565 | ||||||
0.670%, 08/26/15 | 510 | 510 | ||||||
0.205%, 08/26/15 (A) | 4,000 | 3,999 | ||||||
0.350%, 08/28/15 | 4,980 | 4,981 | ||||||
1.875%, 09/09/15 | 2,165 | 2,170 | ||||||
2.200%, 09/16/15 | 2,565 | 2,572 | ||||||
0.500%, 09/28/15 | 48,890 | 48,919 | ||||||
4.375%, 10/15/15 | 4,089 | 4,124 | ||||||
| SEI Daily Income Trust / Semi-Annual Report / July 31, 2015 | 5 |
SCHEDULE OF INVESTMENTS (Unaudited)
Government Fund (Concluded)
July 31, 2015
| Description | Face Amount ($ Thousands) | Value ($ Thousands) | ||||||
1.625%, 10/26/15 | $ | 1,590 | $ | 1,595 | ||||
0.375%, 12/21/15 | 6,557 | 6,561 | ||||||
FNMA DN | ||||||||
0.150%, 09/23/15 (B) | 535 | 535 | ||||||
|
| |||||||
Total U.S. Government Agency Obligations | 768,527 | |||||||
|
| |||||||
REPURCHASE AGREEMENTS — 56.5% |
| |||||||
Bank of Nova Scotia | 50,000 | 50,000 | ||||||
Goldman Sachs | 460,000 | 460,000 | ||||||
Mitsubishi | 450,000 | 450,000 | ||||||
TD Securities | 100,000 | 100,000 | ||||||
| Description | Face Amount ($ Thousands) | Value ($ Thousands) | ||||||
TD Securities | $ | 110,000 | $ | 110,000 | ||||
|
| |||||||
Total Repurchase Agreements | 1,170,000 | |||||||
|
| |||||||
Total Investments — 93.7% | $ | 1,938,527 | ||||||
|
| |||||||
Percentages are based on Net Assets of $2,069,769 ($ Thousands).
| (A) | Floating Rate Instrument. The rate reflected on the Schedule of Investments is the rate in effect on July 31, 2015. The demand and interest rate reset features give this security a shorter effective maturity date. |
| (B) | The rate reported is the effective yield at time of purchase. |
| (C) | Tri-Party Repurchase Agreement. |
DN — Discount Note
FCSB — Federal Farm Credit Banks Consolidated Systemwide Bonds
FFCB — Federal Farm Credit Bank
FHLB — Federal Home Loan Bank
FHLMC — Federal Home Loan Mortgage Corporation
FICO — Fair Isaac Credit Organization
FMAC — Financial Management Advisory Committee
FNMA — Federal National Mortgage Association
GNMA — Government National Mortgage Association
MTN — Medium Term Note
As of July 31, 2015, all of the Fund’s investments were considered Level 2, in accordance with the authoritative guidance on fair value measurements and disclosure under U.S. Generally Accepted Accounting Principles.
As of July 31, 2015, there were no transfers between Level 1 and Level 2 assets and liabilities. As of July 31, 2015, there were no Level 3 securities.
For more information on valuation inputs, see Note 2 — Significant Accounting Policies in Notes to Financial Statements.
The accompanying notes are an integral part of the financial statements.
| 6 | SEI Daily Income Trust / Semi-Annual Report / July 31, 2015 |
SCHEDULE OF INVESTMENTS (Unaudited)
Government II Fund
July 31, 2015
| Description | Face Amount ($ Thousands) | Value ($ Thousands) | ||||||
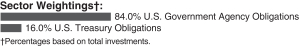
U.S. GOVERNMENT AGENCY OBLIGATIONS — 84.1% |
| |||||||
FFCB | ||||||||
0.340%, 08/01/15 (A) | $ | 595 | $ | 595 | ||||
0.250%, 08/01/15 (A) | 190 | 190 | ||||||
0.200%, 08/01/15 (A) | 13,785 | 13,785 | ||||||
0.187%, 08/01/15 (A) | 5,855 | 5,855 | ||||||
0.187%, 08/01/15 (A) | 3,845 | 3,845 | ||||||
0.210%, 08/01/15 (A) | 1,580 | 1,580 | ||||||
0.172%, 08/01/15 (A) | 7,210 | 7,210 | ||||||
0.212%, 08/02/15 (A) | 1,250 | 1,250 | ||||||
0.217%, 08/02/15 (A) | 1,970 | 1,971 | ||||||
0.185%, 08/03/15 (A) | 800 | 800 | ||||||
0.205%, 08/03/15 (A) | 9,317 | 9,319 | ||||||
0.165%, 08/03/15 (A) | 5,000 | 5,000 | ||||||
0.160%, 08/03/15 (A) | 570 | 570 | ||||||
0.215%, 08/03/15 (A) | 5,280 | 5,281 | ||||||
0.218%, 08/05/15 (A) | 2,330 | 2,331 | ||||||
0.283%, 08/06/15 (A) | 285 | 285 | ||||||
0.198%, 08/06/15 (A) | 3,904 | 3,904 | ||||||
0.217%, 08/08/15 (A) | 2,080 | 2,081 | ||||||
0.187%, 08/08/15 (A) | 523 | 523 | ||||||
0.206%, 08/08/15 (A) | 1,615 | 1,615 | ||||||
0.179%, 08/09/15 (A) | 7,665 | 7,665 | ||||||
0.188%, 08/10/15 (A) | 1,063 | 1,063 | ||||||
0.217%, 08/11/15 (A) | 2,020 | 2,021 | ||||||
0.207%, 08/11/15 (A) | 2,295 | 2,295 | ||||||
0.217%, 08/13/15 (A) | 22,655 | 22,673 | ||||||
0.206%, 08/14/15 (A) | 5,250 | 5,251 | ||||||
0.186%, 08/14/15 (A) | 1,557 | 1,557 | ||||||
0.182%, 08/16/15 (A) | 5,830 | 5,830 | ||||||
0.196%, 08/17/15 (A) | 1,360 | 1,360 | ||||||
0.226%, 08/17/15 (A) | 3,658 | 3,658 | ||||||
0.236%, 08/17/15 (A) | 360 | 360 | ||||||
0.236%, 08/17/15 (A) | 1,000 | 1,000 | ||||||
0.550%, 08/17/15 | 305 | 305 | ||||||
0.218%, 08/18/15 (A) | 6,500 | 6,501 | ||||||
0.198%, 08/18/15 (A) | 810 | 810 | ||||||
0.188%, 08/19/15 (A) | 7,500 | 7,500 | ||||||
0.158%, 08/19/15 (A) | 4,360 | 4,360 | ||||||
0.278%, 08/19/15 (A) | 6,840 | 6,845 | ||||||
0.258%, 08/20/15 (A) | 3,101 | 3,103 | ||||||
0.218%, 08/20/15 (A) | 6,968 | 6,972 | ||||||
0.214%, 08/22/15 (A) | 2,189 | 2,189 | ||||||
0.190%, 08/23/15 (A) | 4,100 | 4,099 | ||||||
0.232%, 08/24/15 (A) | 5,055 | 5,058 | ||||||
0.237%, 08/24/15 (A) | 625 | 625 | ||||||
0.221%, 08/25/15 (A) | 9,946 | 9,954 | ||||||
0.241%, 08/26/15 (A) | 1,460 | 1,460 | ||||||
0.210%, 08/26/15 (A) | 605 | 605 | ||||||
| Description | Face Amount ($ Thousands) | Value ($ Thousands) | ||||||
0.221%, 08/26/15 (A) | $ | 325 | $ | 325 | ||||
0.245%, 08/27/15 (A) | 3,030 | 3,032 | ||||||
0.250%, 09/10/15 | 9,415 | 9,415 | ||||||
0.420%, 10/15/15 | 300 | 300 | ||||||
0.430%, 11/16/15 | 90 | 90 | ||||||
1.500%, 11/16/15 | 5,245 | 5,264 | ||||||
FFCB DN | ||||||||
0.050%, 08/24/15 (B) | 1,455 | 1,455 | ||||||
FHLB | ||||||||
0.220%, 08/01/15 (A) | 2,355 | 2,355 | ||||||
0.120%, 08/03/15 | 13,525 | 13,525 | ||||||
0.125%, 08/04/15 | 25,715 | 25,715 | ||||||
0.200%, 08/12/15 | 34,445 | 34,448 | ||||||
0.196%, 08/14/15 (A) | 2,132 | 2,132 | ||||||
1.630%, 08/20/15 | 1,705 | 1,706 | ||||||
0.190%, 08/21/15 | 35,315 | 35,317 | ||||||
0.210%, 08/21/15 | 9,025 | 9,025 | ||||||
0.650%, 08/24/15 | 995 | 995 | ||||||
1.350%, 08/28/15 | 20 | 20 | ||||||
0.440%, 08/28/15 | 145 | 145 | ||||||
0.230%, 08/28/15 | 3,520 | 3,521 | ||||||
0.375%, 08/28/15 | 22,885 | 22,889 | ||||||
4.750%, 09/11/15 | 1,040 | 1,045 | ||||||
0.130%, 09/11/15 | 2,150 | 2,150 | ||||||
2.875%, 09/11/15 | 2,565 | 2,573 | ||||||
1.750%, 09/11/15 | 785 | 786 | ||||||
0.480%, 09/18/15 | 215 | 215 | ||||||
0.450%, 09/21/15 | 885 | 886 | ||||||
0.100%, 09/23/15 | 23,295 | 23,294 | ||||||
0.160%, 09/25/15 | 255 | 255 | ||||||
0.170%, 09/25/15 | 645 | 645 | ||||||
0.150%, 10/02/15 | 3,070 | 3,070 | ||||||
0.250%, 10/15/15 | 885 | 885 | ||||||
0.180%, 10/27/15 | 1,020 | 1,020 | ||||||
0.500%, 11/20/15 | 2,160 | 2,162 | ||||||
0.220%, 11/23/15 | 400 | 400 | ||||||
1.400%, 11/27/15 | 915 | 918 | ||||||
1.875%, 12/11/15 | 180 | 181 | ||||||
0.270%, 12/15/15 | 3,725 | 3,725 | ||||||
5.000%, 12/21/15 | 2,170 | 2,210 | ||||||
FHLB DN | ||||||||
0.050%, 08/03/15 (B) | 33,260 | 33,260 | ||||||
0.063%, 08/05/15 (B) | 10,153 | 10,153 | ||||||
0.060%, 08/07/15 (B) | 58,384 | 58,382 | ||||||
0.145%, 08/09/15 (A) (B) | 5,140 | 5,140 | ||||||
0.075%, 08/12/15 (B) | 48,753 | 48,752 | ||||||
0.061%, 08/14/15 (B) | 18,298 | 18,298 | ||||||
0.045%, 08/17/15 (B) | 22,606 | 22,606 | ||||||
0.066%, 08/19/15 (B) | 5,292 | 5,292 | ||||||
0.072%, 08/21/15 (B) | 61,900 | 61,898 | ||||||
0.076%, 08/26/15 (B) | 89,705 | 89,697 | ||||||
0.065%, 09/02/15 (B) | 31,020 | 31,018 | ||||||
0.059%, 09/04/15 (B) | 24,320 | 24,319 | ||||||
0.070%, 09/15/15 (B) | 11,309 | 11,308 | ||||||
| SEI Daily Income Trust / Semi-Annual Report / July 31, 2015 | 7 |
SCHEDULE OF INVESTMENTS (Unaudited)
Government II Fund (Concluded)
July 31, 2015
| Description | Face Amount ($ Thousands) | Value ($ Thousands) | ||||||
0.069%, 09/16/15 (B) | $ | 33,516 | $ | 33,513 | ||||
0.081%, 09/17/15 (B) | 13,883 | 13,882 | ||||||
0.090%, 10/02/15 (B) | 1,103 | 1,103 | ||||||
0.149%, 10/07/15 (B) | 6,933 | 6,931 | ||||||
0.099%, 10/09/15 (B) | 2,380 | 2,380 | ||||||
0.136%, 10/14/15 (B) | 6,015 | 6,013 | ||||||
0.100%, 10/20/15 (B) | 19,685 | 19,681 | ||||||
0.095%, 10/21/15 (B) | 6,313 | 6,312 | ||||||
0.112%, 10/28/15 (B) | 13,017 | 13,013 | ||||||
0.230%, 11/02/15 (B) | 2,965 | 2,963 | ||||||
0.240%, 11/06/15 (B) | 1,080 | 1,079 | ||||||
0.225%, 12/01/15 (B) | 4,304 | 4,301 | ||||||
0.271%, 12/08/15 (B) | 180 | 180 | ||||||
FHLMC DN | ||||||||
0.053%, 10/05/15 (B) | 18,817 | 18,815 | ||||||
Tennessee Valley Authority DN | ||||||||
0.051%, 08/04/15 (B) | 67,850 | 67,850 | ||||||
0.060%, 08/25/15 (B) | 3,780 | 3,780 | ||||||
|
| |||||||
Total U.S. Government Agency Obligations | 1,023,122 | |||||||
|
| |||||||
U.S. TREASURY OBLIGATIONS — 16.1% |
| |||||||
U.S. Treasury Bills | ||||||||
0.030%, 08/20/15 | 18,125 | 18,125 | ||||||
0.050%, 08/27/15 | 15,150 | 15,149 | ||||||
U.S. Treasury Notes | ||||||||
4.250%, 08/15/15 | 18,860 | 18,891 | ||||||
0.250%, 08/15/15 | 80,213 | 80,220 | ||||||
1.250%, 08/31/15 | 6,297 | 6,303 | ||||||
0.375%, 08/31/15 | 56,567 | 56,582 | ||||||
|
| |||||||
Total U.S. Treasury Obligations | 195,270 | |||||||
|
| |||||||
Total Investments — 100.2% | $ | 1,218,392 | ||||||
|
| |||||||
Percentages are based on Net Assets of $1,215,969 ($ Thousands).
| (A) | Floating Rate Instrument. The rate reflected on the Schedule of Investments is the rate in effect on July 31, 2015. The demand and interest rate reset features give this security a shorter effective maturity date. |
| (B) | The rate reported is the effective yield at time of purchase. |
DN — Discount Note
FFCB — Federal Farm Credit Bank
FHLB — Federal Home Loan Bank
FHLMC — Federal Home Loan Mortgage Corporation
As of July 31, 2015, all of the Fund’s investments were considered Level 2, in accordance with the authoritative guidance on fair value measurements and disclosure under U.S. Generally Accepted Accounting Principles.
As of July 31, 2015, there were no transfers between Level 1 and Level 2 assets and liabilities. As of July 31, 2015, there were no Level 3 securities.
For more information on valuation inputs, see Note 2 — Significant Accounting Policies in Notes to Financial Statements.
The accompanying notes are an integral part of the financial statements.
| 8 | SEI Daily Income Trust / Semi-Annual Report / July 31, 2015 |
SCHEDULE OF INVESTMENTS (Unaudited)
Prime Obligation Fund
July 31, 2015
| Description | Face Amount ($ Thousands) | Value ($ Thousands) | ||||||
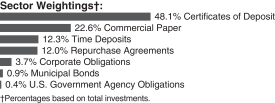
CERTIFICATES OF DEPOSIT — 46.0% |
| |||||||
ANZ New Zealand International | ||||||||
0.269%, 08/05/15 (A) | $ | 57,519 | $ | 57,519 | ||||
0.349%, 08/29/15 (A) | 30,078 | 30,078 | ||||||
Bank of Montreal | ||||||||
0.278%, 08/04/15 (A) | 42,000 | 42,000 | ||||||
0.210%, 09/10/15 | 54,180 | 54,182 | ||||||
0.190%, 09/14/15 | 53,000 | 53,000 | ||||||
0.190%, 09/15/15 | 26,000 | 26,000 | ||||||
0.250%, 09/16/15 | 34,000 | 34,000 | ||||||
Bank of Nova Scotia | ||||||||
0.260%, 08/01/15 (A) | 60,000 | 60,000 | ||||||
0.250%, 08/01/15 (A) | 26,000 | 26,000 | ||||||
0.279%, 09/04/15 (A) | 40,000 | 40,000 | ||||||
Bank of Tokyo-Mitsubishi UFJ NY | ||||||||
0.327%, 08/01/15 (A) | 26,800 | 26,800 | ||||||
0.317%, 08/01/15 (A) | 36,000 | 36,000 | ||||||
0.464%, 09/04/15 (A) | 1,612 | 1,612 | ||||||
0.250%, 09/08/15 | 22,000 | 22,000 | ||||||
BMO Harris Bank | ||||||||
0.300%, 08/03/15 | 2,547 | 2,547 | ||||||
BNZ International Funding | ||||||||
0.347%, 08/02/15 (A) | 22,552 | 22,552 | ||||||
DNB Bank | ||||||||
0.120%, 08/05/15 | 136,700 | 136,700 | ||||||
Fairway Finance LLC | ||||||||
0.268%, 08/20/15 (A) | 7,750 | 7,750 | ||||||
0.258%, 08/24/15 (A) | 29,000 | 29,000 | ||||||
HSBC Bank | ||||||||
0.200%, 08/10/15 | 44,000 | 44,000 | ||||||
0.230%, 09/01/15 | 80,500 | 80,500 | ||||||
JPMorgan Securities LLC | ||||||||
0.287%, 08/01/15 (A) | 40,000 | 40,000 | ||||||
0.308%, 08/04/15 (A) | 57,300 | 57,300 | ||||||
0.349%, 08/13/15 (A) | 6,425 | 6,426 | ||||||
0.331%, 08/31/15 (A) | 10,000 | 10,000 | ||||||
Mizuho Bank | ||||||||
0.260%, 08/07/15 | 45,000 | 45,000 | ||||||
0.270%, 08/11/15 | 26,362 | 26,362 | ||||||
0.270%, 09/10/15 | 9,166 | 9,166 | ||||||
0.270%, 09/25/15 | 37,950 | 37,951 | ||||||
0.280%, 10/01/15 | 4,000 | 4,000 | ||||||
0.270%, 10/07/15 | 34,000 | 34,001 | ||||||
National Bank of Canada | ||||||||
0.416%, 09/11/15 (A) | 2,324 | 2,324 | ||||||
| Description | Face Amount ($ Thousands) | Value ($ Thousands) | ||||||
Nordea Bank | ||||||||
0.250%, 09/08/15 | $ | 25,000 | $ | 25,001 | ||||
0.245%, 09/17/15 | 5,399 | 5,399 | ||||||
0.240%, 09/28/15 | 34,064 | 34,066 | ||||||
0.295%, 10/29/15 | 35,000 | 35,000 | ||||||
Old Line Funding | ||||||||
0.281%, 08/03/15 (A) | 17,000 | 17,000 | ||||||
0.370%, 08/08/15 (A) | 23,000 | 22,999 | ||||||
0.267%, 08/13/15 (A) | 8,000 | 8,000 | ||||||
0.277%, 08/20/15 (A) | 16,000 | 16,000 | ||||||
0.275%, 08/20/15 (A) | 16,000 | 16,000 | ||||||
0.267%, 08/26/15 (A) | 25,000 | 25,000 | ||||||
Royal Bank of Canada MTN | ||||||||
0.259%, 08/11/15 (A) | 49,750 | 49,750 | ||||||
State Street Bank | ||||||||
0.329%, 08/06/15 (A) | 32,000 | 32,000 | ||||||
0.347%, 08/11/15 (A) | 19,000 | 19,000 | ||||||
0.327%, 08/15/15 (A) | 40,000 | 40,000 | ||||||
Sumitomo Mitsui Banking | ||||||||
0.310%, 08/03/15 | 15,000 | 15,000 | ||||||
0.336%, 08/14/15 (A) | 25,000 | 25,000 | ||||||
0.337%, 08/15/15 (A) | 23,504 | 23,504 | ||||||
0.180%, 08/31/15 | 4,390 | 4,390 | ||||||
0.320%, 09/11/15 | 2,994 | 2,994 | ||||||
0.280%, 10/02/15 | 27,256 | 27,256 | ||||||
Svenska Handelsbanken | ||||||||
0.225%, 08/28/15 | 45,000 | 45,000 | ||||||
0.205%, 09/01/15 | 17,000 | 17,000 | ||||||
0.210%, 09/02/15 | 26,000 | 26,000 | ||||||
0.260%, 09/16/15 | 5,000 | 5,000 | ||||||
0.215%, 09/16/15 | 26,724 | 26,724 | ||||||
0.225%, 09/24/15 | 45,000 | 45,001 | ||||||
0.245%, 09/30/15 | 66,418 | 66,420 | ||||||
0.245%, 10/09/15 | 8,573 | 8,573 | ||||||
Toronto-Dominion Bank | ||||||||
0.278%, 08/06/15 (A) | 1,270 | 1,270 | ||||||
0.257%, 08/06/15 (A) | 25,000 | 25,000 | ||||||
0.190%, 09/08/15 | 45,000 | 45,000 | ||||||
0.220%, 09/17/15 | 50,000 | 50,000 | ||||||
0.280%, 09/18/15 | 29,500 | 29,500 | ||||||
Toyota Motor Credit | ||||||||
0.267%, 08/02/15 (A) | 20,700 | 20,700 | ||||||
0.278%, 08/05/15 (A) | 40,000 | 40,003 | ||||||
0.268%, 08/19/15 (A) | 22,934 | 22,934 | ||||||
0.271%, 08/27/15 (A) | 42,000 | 42,000 | ||||||
Wells Fargo Bank | ||||||||
0.290%, 08/01/15 (A) | 4,231 | 4,231 | ||||||
0.260%, 08/01/15 (A) | 30,000 | 30,000 | ||||||
0.250%, 08/01/15 (A) | 26,000 | 26,000 | ||||||
0.250%, 08/01/15 (A) | 26,200 | 26,200 | ||||||
0.260%, 08/03/15 | 16,966 | 16,966 | ||||||
0.268%, 08/07/15 (A) | 29,000 | 29,000 | ||||||
0.268%, 08/08/15 (A) | 53,000 | 53,000 | ||||||
0.266%, 08/17/15 (A) | 25,000 | 25,000 | ||||||
| SEI Daily Income Trust / Semi-Annual Report / July 31, 2015 | 9 |
SCHEDULE OF INVESTMENTS (Unaudited)
Prime Obligation Fund (Continued)
July 31, 2015
| Description | Face Amount ($ Thousands) | Value ($ Thousands) | ||||||
Westpac Securities NZ | ||||||||
0.277%, 08/11/15 (A) | $ | 32,010 | $ | 32,010 | ||||
|
| |||||||
Total Certificates of Deposit | 2,306,661 | |||||||
|
| |||||||
COMMERCIAL PAPER — 21.7% |
| |||||||
Albion Capital LLC | ||||||||
0.150%, 08/07/15 (C) (D) | 28,538 | 28,537 | ||||||
0.200%, 08/20/15 (C) (D) | 1,521 | 1,521 | ||||||
0.240%, 08/26/15 (C) (D) | 8,504 | 8,503 | ||||||
0.230%, 09/16/15 (C) (D) | 8,846 | 8,843 | ||||||
ANZ New Zealand International | ||||||||
0.267%, 08/02/15 (A) (C) (D) | 30,000 | 30,000 | ||||||
0.230%, 09/03/15 (C) (D) | 414 | 414 | ||||||
Australia & New Zealand Banking Group NY | ||||||||
0.213%, 09/11/15 (C) (D) | 6,000 | 5,999 | ||||||
BNZ International Funding | ||||||||
0.270%, 09/11/15 (C) (D) | 36,000 | 35,989 | ||||||
CAFCO | ||||||||
0.210%, 09/14/15 (C) (D) | 22,000 | 21,994 | ||||||
Chariot Funding LLC | ||||||||
0.331%, 11/30/15 (C) (D) | 47,691 | 47,638 | ||||||
0.401%, 12/16/15 (C) (D) | 55,000 | 54,916 | ||||||
Charta | ||||||||
0.220%, 09/01/15 (C) (D) | 1,694 | 1,694 | ||||||
Ciesco | ||||||||
0.250%, 09/01/15 (C) (D) | 8,506 | 8,504 | ||||||
DNB Bank | ||||||||
0.280%, 10/01/15 (C) (D) | 15,000 | 14,993 | ||||||
Fairway Finance LLC | ||||||||
0.280%, 09/03/15 (C) (D) | 8,251 | 8,249 | ||||||
0.250%, 09/14/15 (C) (D) | 10,667 | 10,664 | ||||||
0.271%, 08/29/15 (A) (C) (D) | 12,000 | 12,000 | ||||||
JPMorgan Securities LLC | ||||||||
0.376%, 09/19/15 (A) (C) (D) | 58,870 | 58,878 | ||||||
0.300%, 08/03/15 (C) (D) | 16,000 | 16,000 | ||||||
0.270%, 09/08/15 (C) (D) | 41,000 | 40,988 | ||||||
Jupiter Securitization | ||||||||
0.331%, 11/30/15 to 12/01/15 (C) (D) | 51,445 | 51,388 | ||||||
0.371%, 12/08/15 (C) (D) | 31,000 | 30,959 | ||||||
Liberty Street Funding | ||||||||
0.300%, 10/26/15 (C) (D) | 11,953 | 11,944 | ||||||
0.341%, 11/09/15 to 11/12/15 (C) (D) | 20,304 | 20,285 | ||||||
0.391%, 11/30/15 (C) (D) | 15,111 | 15,091 | ||||||
0.381%, 12/07/15 to 12/15/15 (C) (D) | 47,599 | 47,531 | ||||||
Manhattan Asset Funding | ||||||||
0.210%, 08/28/15 (C) (D) | 7,196 | 7,195 | ||||||
0.250%, 08/31/15 to 09/18/15 (C) (D) | 27,449 | 27,441 | ||||||
0.206%, 09/01/15 (C) (D) | 6,781 | 6,780 | ||||||
| Description | Face Amount ($ Thousands) | Value ($ Thousands) | ||||||
0.258%, 09/02/15 (C) (D) | $ | 38,731 | $ | 38,722 | ||||
0.260%, 09/03/15 to 09/08/15 (C) (D) | 14,625 | 14,621 | ||||||
0.220%, 09/15/15 (C) (D) | 4,300 | 4,299 | ||||||
Metlife | ||||||||
0.200%, 09/14/15 (C) (D) | 13,568 | 13,565 | ||||||
National Bank of Canada | ||||||||
0.300%, 09/17/15 (C) (D) | 8,000 | 8,000 | ||||||
0.280%, 09/17/15 (C) (D) | 36,000 | 35,987 | ||||||
Old Line Funding | ||||||||
0.240%, 08/27/15 to 09/10/15 (C) (D) | 81,034 | 81,016 | ||||||
0.230%, 09/09/15 (C) (D) | 8,284 | 8,282 | ||||||
Regency Markets LLC | ||||||||
0.120%, 08/06/15 (C) (D) | 15,487 | 15,487 | ||||||
0.170%, 08/18/15 (C) (D) | 25,000 | 24,998 | ||||||
0.047%, 08/18/15 (C) (D) | 19,976 | 19,976 | ||||||
Skandinaviska Enskilda Banken NY | ||||||||
0.250%, 10/08/15 (C) (D) | 5,621 | 5,618 | ||||||
Swedbank | ||||||||
0.235%, 08/11/15 (C) (D) | 1,255 | 1,255 | ||||||
Thunder Bay Funding LLC | ||||||||
0.230%, 09/08/15 to 09/09/15 (C) (D) | 57,455 | 57,441 | ||||||
0.280%, 09/21/15 (C) (D) | 16,907 | 16,900 | ||||||
0.401%, 12/01/15 (C) (D) | 5,440 | 5,433 | ||||||
Victory Receivables | ||||||||
0.200%, 09/08/15 (C) (D) | 15,000 | 14,997 | ||||||
0.230%, 09/15/15 (C) (D) | 30,000 | 29,991 | ||||||
0.260%, 10/02/15 (C) (D) | 598 | 598 | ||||||
Westpac Securities NZ | ||||||||
0.278%, 08/10/15 (A) (C) (D) | 4,095 | 4,095 | ||||||
0.351%, 12/11/15 (C) (D) | 8,385 | 8,374 | ||||||
Working Capital Management | ||||||||
0.230%, 09/02/15 (C) (D) | 8,184 | 8,182 | ||||||
0.200%, 09/08/15 to 09/11/15 (C) (D) | 32,382 | 32,375 | ||||||
|
| |||||||
Total Commercial Paper |
| 1,085,150 | ||||||
|
| |||||||
TIME DEPOSITS — 11.8% |
| |||||||
Australia & New Zealand Banking Group NY | ||||||||
0.080%, 08/03/15 | 57,000 | 57,000 | ||||||
Bank of Montreal | ||||||||
0.278%, 08/04/15 (A) | 35,865 | 35,865 | ||||||
Lloyds Bank PLC | ||||||||
0.060%, 08/03/15 | 250,000 | 250,000 | ||||||
Swedbank | ||||||||
0.070%, 08/03/15 | 248,000 | 248,000 | ||||||
|
| |||||||
Total Time Deposits | 590,865 | |||||||
|
| |||||||
| 10 | SEI Daily Income Trust / Semi-Annual Report / July 31, 2015 |
| Description | Face Amount ($ Thousands) | Value ($ Thousands) | ||||||
CORPORATE OBLIGATIONS — 3.5% |
| |||||||
American Honda Finance MTN | ||||||||
1.000%, 08/11/15 (B) | $ | 223 | $ | 223 | ||||
ANZ New Zealand International | ||||||||
1.850%, 10/15/15 (B) | 5,194 | 5,210 | ||||||
ANZ New Zealand International MTN | ||||||||
3.125%, 08/10/15 (B) | 1,475 | 1,476 | ||||||
Bank of Montreal MTN | ||||||||
0.800%, 11/06/15 | 532 | 533 | ||||||
Bank of Nova Scotia | ||||||||
0.260%, 08/01/15 (A) | 15,000 | 15,000 | ||||||
0.726%, 09/11/15 (A) | 1,547 | 1,548 | ||||||
0.340%, 09/25/15 (A) | 26,000 | 26,000 | ||||||
0.750%, 10/09/15 | 367 | 367 | ||||||
Bank of Tokyo-Mitsubishi UFJ NY | ||||||||
2.450%, 09/11/15 | 6,402 | 6,417 | ||||||
Caisse Centrale Desjardins | ||||||||
2.650%, 09/16/15 (B) | 4,772 | 4,785 | ||||||
Canadian Imperial Bank Commerce | ||||||||
0.900%, 10/01/15 | 4,164 | 4,167 | ||||||
2.350%, 12/11/15 | 8,226 | 8,284 | ||||||
HSBC Bank | ||||||||
0.449%, 08/15/15 (A) | 3,776 | 3,777 | ||||||
National Australia Bank | ||||||||
2.750%, 09/28/15 (B) | 7,375 | 7,403 | ||||||
Royal Bank of Canada MTM | ||||||||
0.800%, 10/30/15 | 4,907 | 4,913 | ||||||
Shell International | ||||||||
0.349%, 08/10/15 (A) | 7,052 | 7,056 | ||||||
Toronto-Dominion Bank | ||||||||
0.338%, 08/07/15 (A) | 15,000 | 15,000 | ||||||
Toyota Motor Credit MTN | ||||||||
0.436%, 09/18/15 (A) | 1,215 | 1,215 | ||||||
Wells Fargo Bank | ||||||||
0.280%, 08/01/15 (A) | 40,000 | 40,000 | ||||||
Westpac Banking | ||||||||
3.000%, 08/04/15 | 11,031 | 11,033 | ||||||
1.041%, 08/05/15 (A) | 4,269 | 4,274 | ||||||
1.125%, 09/25/15 | 7,824 | 7,834 | ||||||
|
| |||||||
Total Corporate Obligations | 176,515 | |||||||
|
| |||||||
MUNICIPAL BONDS — 0.9% |
| |||||||
Arizona — 0.1% | ||||||||
Pima County, Industrial Development Authority, RB | ||||||||
0.070%, 08/05/15 (A) | 4,800 | 4,800 | ||||||
|
| |||||||
Colorado — 0.1% | ||||||||
Colorado State, Housing & Finance Authority, Ser A1, RB | ||||||||
0.120%, 08/05/15 (A) | 800 | 800 | ||||||
0.120%, 08/05/15 (A) | 2,290 | 2,290 | ||||||
| Description | Face Amount ($ Thousands) | Value ($ Thousands) | ||||||
Colorado State, Housing & Finance Authority, Ser C1, RB | ||||||||
0.100%, 08/05/15 (A) | $ | 900 | $ | 900 | ||||
|
| |||||||
| 3,990 | ||||||||
|
| |||||||
Illinois — 0.0% | ||||||||
University of Illinois, Higher Education Authority, Ser S, RB | ||||||||
0.130%, 08/06/15 (A) | 1,300 | 1,300 | ||||||
|
| |||||||
Iowa — 0.1% | ||||||||
Iowa State, Finance Authority, Ser B, RB | ||||||||
0.040%, 08/06/15 (A) | 700 | 700 | ||||||
Iowa State, Finance Authority, Ser C, RB | ||||||||
0.110%, 08/06/15 (A) | 4,915 | 4,915 | ||||||
Iowa State, Finance Authority, Ser G, RB | ||||||||
0.110%, 08/06/15 (A) | 80 | 80 | ||||||
Iowa State, Finance Authority, Ser M, RB | ||||||||
0.130%, 08/06/15 (A) | 450 | 450 | ||||||
|
| |||||||
| 6,145 | ||||||||
|
| |||||||
Massachusetts — 0.1% | ||||||||
Simmons College, Higher Education Authority, RB | ||||||||
0.140%, 08/06/15 (A) | 2,320 | 2,320 | ||||||
|
| |||||||
Michigan — 0.2% | ||||||||
Kent, Hospital Finance Authority, Ser C, RB | ||||||||
0.020%, 08/05/15 (A) | 14,940 | 14,940 | ||||||
|
| |||||||
New Hampshire — 0.1% | ||||||||
New Hampshire State, Health & Education Facilities Authority, Dartmouth College Project, Ser C, GO | ||||||||
0.140%, 08/05/15 (A) | 2,945 | 2,945 | ||||||
|
| |||||||
New Jersey — 0.1% | ||||||||
North Hudson Sewage Authority, RB | ||||||||
0.120%, 08/06/15 (A) | 2,885 | 2,885 | ||||||
|
| |||||||
New York — 0.0% | ||||||||
New York State, Housing & Finance Authority, RB | ||||||||
0.220%, 08/04/15 (A) | 2,150 | 2,150 | ||||||
|
| |||||||
Wisconsin — 0.1% | ||||||||
Wisconsin State, Housing & Economic Development Authority, Ser B, RB | ||||||||
0.160%, 08/01/15 (A) | 700 | 700 | ||||||
| SEI Daily Income Trust / Semi-Annual Report / July 31, 2015 | 11 |
SCHEDULE OF INVESTMENTS (Unaudited)
Prime Obligation Fund (Continued)
July 31, 2015
| Description | Face Amount ($ Thousands) | Value ($ Thousands) | ||||||
Wisconsin State, Housing & Economic Development Authority, Ser B, RB | ||||||||
0.140%, 08/06/15 (A) | $ | 840 | $ | 840 | ||||
Wisconsin State, Housing & Economic Development Authority, RB | ||||||||
0.160%, 08/06/15 (A) | 980 | 980 | ||||||
|
| |||||||
| 2,520 | ||||||||
|
| |||||||
Total Municipal Bonds | 43,995 | |||||||
|
| |||||||
U.S. GOVERNMENT AGENCY OBLIGATIONS — 0.3% |
| |||||||
FFCB | ||||||||
0.200%, 08/01/15 (A) | 13,390 | 13,389 | ||||||
FNMA | ||||||||
0.207%, 08/15/15 (A) | 3,460 | 3,461 | ||||||
|
| |||||||
Total U.S. Government Agency Obligations | 16,850 | |||||||
|
| |||||||
REPURCHASE AGREEMENTS — 11.5% |
| |||||||
Goldman Sachs | 211,388 | 211,388 | ||||||
Mitsubishi | 78,523 | 78,523 | ||||||
RBC Capital | 39,178 | 39,178 | ||||||
| Description | Face Amount ($ Thousands) | Value ($ Thousands) | ||||||
RBC Capital | $ | 63,802 | $ | 63,802 | ||||
TD Securities | 44,250 | 44,250 | ||||||
Wells Fargo | 6,896 | 6,896 | ||||||
Wells Fargo | 27,704 | 27,704 | ||||||
Wells Fargo | 104,250 | 104,250 | ||||||
|
| |||||||
Total Repurchase Agreements | 575,991 | |||||||
|
| |||||||
Total Investments — 95.7% | $ | 4,796,027 | ||||||
|
| |||||||
| 12 | SEI Daily Income Trust / Semi-Annual Report / July 31, 2015 |
| * | A summary of the corporate obligations used to collateralize repurchase agreements entered into by the Fund at July 31, 2015, is as follows: |
| Counterparty | Corporate Obligation | Rate | Maturity Date | Par Amount ($ Thousands) | ||||||||||
| RBC Securities | Alterra Finance | 6.250 | % | 09/30/20 | $ | 171 | ||||||||
| Amgen | 3.450 | 10/01/20 | 115 | |||||||||||
| Bank of Montreal | 1.400 | 04/10/18 | 699 | |||||||||||
| Bank of New York | 2.100 | 01/15/19 | 597 | |||||||||||
| Barclays Bank | 3.000 | 11/24/20 | 35 | |||||||||||
| Barclays Bank | 10.179 | 06/12/21 | 11 | |||||||||||
| BAT International Finance | 3.500 | 06/15/22 | 1,520 | |||||||||||
| BNP Paribas | 2.450 | 03/17/19 | 494 | |||||||||||
| Cantor | 7.875 | 10/15/19 | 1,055 | |||||||||||
| CDK | 4.500 | 10/15/24 | 1,847 | |||||||||||
| Celgene | 4.000 | 08/15/23 | 536 | |||||||||||
| CG CAP | 1.286 | 03/15/23 | 256 | |||||||||||
| CISCO System | 3.625 | 03/04/24 | 645 | |||||||||||
| Entergy | 4.000 | 07/15/22 | 3,161 | |||||||||||
| Entertainment Properties | 5.750 | 08/15/22 | 17 | |||||||||||
| GE Capital | 0.923 | 02/15/25 | 235 | |||||||||||
| General Electric | 5.500 | 01/08/20 | 2,727 | |||||||||||
| H.J. Heinz | 2.800 | 07/02/20 | 440 | |||||||||||
| Hospitality | 5.000 | 08/15/22 | 1 | |||||||||||
| Hyundai Capital | 2.600 | 03/19/20 | 273 | |||||||||||
| Imperial Tobacco | 2.050 | 07/20/18 | 22 | |||||||||||
| JPMorgan Chase | 4.250 | 10/15/20 | 2,000 | |||||||||||
| KKR Group | 6.375 | 09/29/20 | 147 | |||||||||||
| McKesson | 3.796 | 03/15/24 | 25 | |||||||||||
| Monsato | 2.850 | 04/15/25 | 300 | |||||||||||
| Morgan Stanley | 2.800 | 06/16/20 | 134 | |||||||||||
| Morgan Stanley | 7.300 | 05/13/19 | 1.00 | |||||||||||
| Nomura | 6.700 | 05/04/20 | 73 | |||||||||||
| Oracle Corp | 2.500 | 05/15/22 | 164 | |||||||||||
| Pen VA Resources Partners | 8.375 | 06/01/20 | 2,582 | |||||||||||
| Plains All American Pipeline | 3.650 | 06/01/22 | — | |||||||||||
| Province of Ontario | 2.500 | 09/10/21 | 405 | |||||||||||
| Scottrade | 6.125 | 07/11/21 | 3,482 | |||||||||||
| SOC | 2.625 | 10/01/18 | 1,241 | |||||||||||
| Synchrony | 4.500 | 07/23/25 | 461 | |||||||||||
| Time Warner | 5.000 | 02/01/20 | 1,423 | |||||||||||
| Torchmark | 9.250 | 06/15/19 | 1,303 | |||||||||||
| Toyota Motor | 1.550 | 07/13/18 | 1 | |||||||||||
| UnitedHealth | 3.750 | 07/15/25 | 264 | |||||||||||
| Ventas Realty | 4.750 | 06/01/21 | 1,768 | |||||||||||
| Verizon Communications | 2.450 | 11/01/22 | 201 | |||||||||||
| Verizon Communications | 1.053 | 06/17/19 | 1,746 | |||||||||||
| Weatherford | 4.500 | 04/15/22 | 733 | |||||||||||
| Wells Partnership | 5.875 | 04/01/18 | 2,131 | |||||||||||
| Wellpoint | 1.875 | 01/15/18 | 156 | |||||||||||
| Yum Brands | 5.300 | 09/15/19 | 2,600 | |||||||||||
Percentages are based on Net Assets of $5,011,761 ($ Thousands).
| (A) | Floating Rate Instrument. The rate reflected on the Schedule of Investments is the rate in effect on July 31, 2015. The demand and interest rate reset features give this security a shorter effective maturity date. |
| (B) | Securities sold within terms of a private placement memorandum, exempt from registration under Section 144A of the Securities Act of 1933, as amended, and may be sold only to dealers in that program or other “accredited investors.” These securities have been determined to be liquid under guidelines established by the Board of Trustees. |
| (C) | Securities are held in connection with a letter of credit issued by a major bank. |
| (D) | The rate reported is the effective yield at time of purchase. |
| (E) | Tri-Party Repurchase Agreement. |
FCSB — Federal Farm Credit Banks Consolidated Systemwide Bonds
FFCB — Federal Farm Credit Bank
FHLB — Federal Home Loan Bank
FMAC — Financial Management Advisory Committee
FNMA — Federal National Mortgage Association
GNMA — Government National Mortgage Association
LLC — Limited Liability Company
MTN — Medium Term Note
RB — Revenue Bond
Ser — Series
As of July 31, 2015, all of the Fund’s investments were considered Level 2, in accordance with the authoritative guidance on fair value measurements and disclosure under U.S. Generally Accepted Accounting Principles.
As of July 31, 2015, there were no transfers between Level 1 and Level 2 assets and liabilities. As of July 31, 2015, there were no Level 3 securities.
For more information on valuation inputs, see Note 2 — Significant Accounting Policies in Notes to Financial Statements.
The accompanying notes are an integral part of the financial statements.
| SEI Daily Income Trust / Semi-Annual Report / July 31, 2015 | 13 |
SCHEDULE OF INVESTMENTS (Unaudited)
Treasury Fund
July 31, 2015
| Description | Face Amount ($ Thousands) | Value ($ Thousands) | ||||||
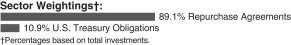
U.S. TREASURY OBLIGATIONS — 10.1% |
| |||||||
U.S. Treasury Notes | ||||||||
0.152%, 08/03/15 (A) | $ | 1,310 | $ | 1,310 | ||||
0.084%, 08/04/15 (A) | 5,295 | 5,295 | ||||||
0.060%, 08/04/15 (A) | 960 | 960 | ||||||
0.103%, 08/07/15 (A) | 6,065 | 6,063 | ||||||
4.250%, 08/15/15 | 830 | 832 | ||||||
0.375%, 08/31/15 | 5,920 | 5,921 | ||||||
|
| |||||||
Total U.S. Treasury Obligations | 20,381 | |||||||
|
| |||||||
REPURCHASE AGREEMENTS — 82.7% |
| |||||||
Bank of Montreal | 18,000 | 18,000 | ||||||
Bank of Nova Scotia | 18,000 | 18,000 | ||||||
Citibank | 18,000 | 18,000 | ||||||
Credit Suisse | 18,000 | 18,000 | ||||||
| Description | Face Amount ($ Thousands) | Value ($ Thousands) | ||||||
Goldman Sachs | $ | 18,000 | $ | 18,000 | ||||
JPMorgan Chase | 18,000 | 18,000 | ||||||
Mitsubishi | 18,000 | 18,000 | ||||||
TD Securities | 18,000 | 18,000 | ||||||
Wells Fargo | 1,000 | 1,000 | ||||||
Wells Fargo | 760 | 760 | ||||||
| 14 | SEI Daily Income Trust / Semi-Annual Report / July 31, 2015 |
| Description | Face Amount ($ Thousands) | Value ($ Thousands) | ||||||
Wells Fargo | $ | 19,000 | $ | 19,000 | ||||
Wells Fargo | 1,500 | 1,500 | ||||||
|
| |||||||
Total Repurchase Agreements | 166,260 | |||||||
|
| |||||||
Total Investments — 92.8% | $ | 186,641 | ||||||
|
| |||||||
Percentages are based on Net Assets of $201,126 ($ Thousands).
| (A) | Floating Rate Instrument. The rate reflected on the Schedule of Investments is the rate in effect on July 31, 2015. The demand and interest rate reset features give this security a shorter effective maturity date. |
| (B) | Tri-Party Repurchase Agreement. |
As of July 31, 2015, all of the Fund’s investments were considered Level 2, in accordance with the authoritative guidance on fair value measurements and disclosure under U.S. Generally Accepted Accounting Principles.
As of July 31, 2015, there were no transfers between Level 1 and Level 2 assets and liabilities. As of July 31, 2015, there were no Level 3 securities.
For more information on valuation inputs, see Note 2 — Significant Accounting Policies in Notes to Financial Statements.
The accompanying notes are an integral part of the financial statements.
| SEI Daily Income Trust / Semi-Annual Report / July 31, 2015 | 15 |
SCHEDULE OF INVESTMENTS (Unaudited)
Treasury II Fund
July 31, 2015

| Description | Face Amount ($ Thousands) | Value ($ Thousands) | ||||||
U.S. TREASURY OBLIGATIONS — 99.7% |
| |||||||
U.S. Treasury Bills | ||||||||
0.021%, 08/06/15 (B) | $ | 97,783 | $ | 97,783 | ||||
0.025%, 08/13/15 (B) | 60,000 | 59,999 | ||||||
0.032%, 08/20/15 (B) | 60,000 | 59,999 | ||||||
0.047%, 08/27/15 (B) | 55,000 | 54,998 | ||||||
0.036%, 09/03/15 (B) | 50,000 | 49,998 | ||||||
U.S. Treasury Notes | ||||||||
0.152%, 08/03/15 (A) | 3,425 | 3,425 | ||||||
0.060%, 08/04/15 (A) | 2,000 | 2,000 | ||||||
0.084%, 08/04/15 (A) | 10,205 | 10,205 | ||||||
0.120%, 08/06/15 (A) | 6,614 | 6,614 | ||||||
0.103%, 08/07/15 (A) | 7,480 | 7,478 | ||||||
0.250%, 08/15/15 | 71,532 | 71,537 | ||||||
4.250%, 08/15/15 | 63,140 | 63,243 | ||||||
0.375%, 08/31/15 | 101,000 | 101,027 | ||||||
|
| |||||||
Total U.S. Treasury Obligations |
| 588,306 | ||||||
|
| |||||||
Total Investments — 99.7% | $ | 588,306 | ||||||
|
| |||||||
Percentages are based on Net Assets of $589,785 ($ Thousands).
| (A) | Floating Rate Instrument. The rate reflected on the Schedule of Investments is the rate in effect on July 31, 2015. The demand and interest rate reset features give this security a shorter effective maturity date. |
| (B) | The rate reported is the effective yield at time of purchase. |
As of July 31, 2015, all of the Fund’s investments were considered Level 2, in accordance with the authoritative guidance on fair value measurements and disclosure under U.S. Generally Accepted Accounting Principles.
As of July 31, 2015, there were no transfers between Level 1 and Level 2 assets and liabilities. As of July 31, 2015, there were no Level 3 securities.
For more information on valuation inputs, see Note 2 — Significant Accounting Policies in Notes to Financial Statements.
The accompanying notes are an integral part of the financial statements.
| 16 | SEI Daily Income Trust / Semi-Annual Report / July 31, 2015 |
SCHEDULE OF INVESTMENTS (Unaudited)
Ultra Short Duration Bond Fund
July 31, 2015
| Description | Face Amount ($ Thousands) | Value ($ Thousands) | ||||||
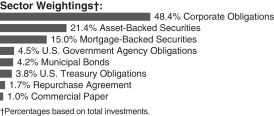
CORPORATE OBLIGATIONS — 49.1% |
| |||||||
Consumer Discretionary — 1.2% | ||||||||
Autozone | ||||||||
1.300%, 01/13/17 | $ | 350 | $ | 350 | ||||
NBCUniversal Enterprise | ||||||||
0.974%, 09/01/15 (A) (B) | 575 | 576 | ||||||
0.826%, 10/15/15 (A) (B) | 945 | 947 | ||||||
Thomson Reuters | ||||||||
0.875%, 05/23/16 | 350 | 350 | ||||||
1.650%, 09/29/17 | 300 | 300 | ||||||
Time Warner Cable | ||||||||
5.850%, 05/01/17 | 400 | 426 | ||||||
Whirlpool | ||||||||
1.350%, 03/01/17 | 335 | 335 | ||||||
|
| |||||||
| 3,284 | ||||||||
|
| |||||||
Consumer Staples — 1.9% |
| |||||||
Anheuser-Busch InBev Finance | ||||||||
0.678%, 08/02/15 (A) | 350 | 348 | ||||||
CVS Health | ||||||||
1.200%, 12/05/16 | 340 | 341 | ||||||
1.900%, 07/20/18 | 350 | 352 | ||||||
Heineken | ||||||||
0.800%, 10/01/15 (B) | 375 | 375 | ||||||
JM Smucker | ||||||||
1.750%, 03/15/18 (B) | 135 | 135 | ||||||
Mondelez International | ||||||||
0.798%, 08/01/15 (A) | 450 | 445 | ||||||
PepsiCo | ||||||||
1.250%, 08/13/17 | 1,000 | 1,001 | ||||||
Philip Morris International | ||||||||
2.500%, 05/16/16 | 500 | 508 | ||||||
Reynolds American | ||||||||
2.300%, 06/12/18 | 445 | 449 | ||||||
SABMiller Holdings | ||||||||
0.968%, 08/01/15 (A) (B) | 650 | 650 | ||||||
Walgreens Boots Alliance | ||||||||
1.750%, 11/17/17 | 685 | 687 | ||||||
|
| |||||||
| 5,291 | ||||||||
|
| |||||||
Energy — 3.1% |
| |||||||
BP Capital Markets PLC | ||||||||
0.789%, 08/10/15 (A) | 750 | 748 | ||||||
0.702%, 08/13/15 (A) | 400 | 398 | ||||||
| Description | Face Amount ($ Thousands) | Value ($ Thousands) | ||||||
1.674%, 02/13/18 | $ | 900 | $ | 903 | ||||
CNOOC Nexen Finance, Ser 2014 | ||||||||
1.625%, 04/30/17 | 450 | 449 | ||||||
ConocoPhillips | ||||||||
1.500%, 05/15/18 | 340 | 339 | ||||||
Devon Energy | ||||||||
0.826%, 09/15/15 (A) | 500 | 495 | ||||||
Enbridge | ||||||||
0.734%, 09/02/15 (A) | 540 | 534 | ||||||
Energy Transfer Partners | ||||||||
2.500%, 06/15/18 | 325 | 325 | ||||||
Enterprise Products Operating LLC | ||||||||
1.250%, 08/13/15 | 45 | 45 | ||||||
Hess | ||||||||
1.300%, 06/15/17 | 300 | 296 | ||||||
Kinder Morgan | ||||||||
2.000%, 12/01/17 | 225 | 224 | ||||||
Petrobras Global Finance BV | ||||||||
2.643%, 09/17/15 (A) | 800 | 771 | ||||||
Schlumberger Norge | ||||||||
1.250%, 08/01/17 (B) | 145 | 145 | ||||||
Statoil | ||||||||
0.736%, 08/08/15 (A) | 550 | 550 | ||||||
0.479%, 08/09/15 (A) | 870 | 866 | ||||||
Total Capital Canada | ||||||||
0.669%, 10/17/15 (A) | 180 | 180 | ||||||
Total Capital International | ||||||||
0.849%, 08/12/15 (A) | 400 | 401 | ||||||
TransCanada PipeLines | ||||||||
1.076%, 10/12/15 (A) | 495 | 496 | ||||||
0.750%, 01/15/16 | 350 | 350 | ||||||
|
| |||||||
| 8,515 | ||||||||
|
| |||||||
Financials — 29.9% |
| |||||||
Abbey National Treasury Services PLC | ||||||||
0.796%, 09/13/15 (A) | 1,610 | 1,608 | ||||||
ABN AMRO Bank | ||||||||
0.109%, 08/28/15 (A) (B) | 400 | 402 | ||||||
0.689%, 09/08/15 (A) (B) | 800 | 800 | ||||||
American Express Credit MTN | ||||||||
1.125%, 06/05/17 | 600 | 597 | ||||||
American Express Credit | ||||||||
0.836%, 09/18/15 (A) | 300 | 298 | ||||||
0.789%, 10/29/15 (A) | 1,060 | 1,061 | ||||||
American Honda Finance | ||||||||
0.657%, 08/26/15 (A) (B) | 815 | 817 | ||||||
Australia & New Zealand Banking Group | ||||||||
0.834%, 08/15/15 (A) | 375 | 376 | ||||||
0.663%, 10/10/15 (A) (B) | 300 | 300 | ||||||
Banco Santander Chile | ||||||||
1.186%, 10/15/15 (A) (B) | 500 | 498 | ||||||
Bank Nederlandse Gemeenten | ||||||||
0.625%, 07/18/16 (B) | 1,300 | 1,301 | ||||||
| SEI Daily Income Trust / Semi-Annual Report / July 31, 2015 | 17 |
SCHEDULE OF INVESTMENTS (Unaudited)
Ultra Short Duration Bond Fund (Continued)
July 31, 2015
| Description | Face Amount ($ Thousands) | Value ($ Thousands) | ||||||
Bank of America | ||||||||
1.500%, 10/09/15 | $ | 210 | $ | 210 | ||||
1.329%, 10/15/15 (A) | 750 | 756 | ||||||
5.300%, 03/15/17 | 350 | 370 | ||||||
2.000%, 01/11/18 | 160 | 161 | ||||||
Bank of America MTN | ||||||||
0.892%, 08/25/15 (A) | 700 | 699 | ||||||
1.700%, 08/25/17 | 200 | 201 | ||||||
5.650%, 05/01/18 | 90 | 98 | ||||||
Bank of Montreal MTN | ||||||||
0.883%, 10/09/15 (A) | 500 | 501 | ||||||
0.536%, 10/14/15 (A) | 250 | 249 | ||||||
Bank of Montreal | ||||||||
1.400%, 04/10/18 | 750 | 745 | ||||||
Bank of New York Mellon MTN | ||||||||
0.719%, 08/16/15 (A) | 350 | 350 | ||||||
Bank of Nova Scotia | ||||||||
0.726%, 09/11/15 (A) | 400 | 400 | ||||||
0.809%, 10/15/15 (A) | 670 | 672 | ||||||
1.300%, 07/21/17 | 400 | 401 | ||||||
Bank of Tokyo-Mitsubishi UFJ | ||||||||
0.891%, 08/01/15 (A) (B) | 200 | 200 | ||||||
0.732%, 08/26/15 (A) (B) | 440 | 440 | ||||||
0.589%, 09/08/15 (A) (B) | 325 | 324 | ||||||
1.450%, 09/08/17 (B) | 325 | 324 | ||||||
Barclays Bank PLC | ||||||||
0.856%, 08/19/15 (A) | 600 | 598 | ||||||
Barclays Bank PLC MTN | ||||||||
6.050%, 12/04/17 (B) | 500 | 543 | ||||||
BB&T MTN | ||||||||
0.938%, 08/01/15 (A) | 350 | 350 | ||||||
1.146%, 09/15/15 (A) | 380 | 382 | ||||||
Berkshire Hathaway Finance | ||||||||
0.586%, 10/13/15 (A) | 800 | 800 | ||||||
BNP Paribas MTN | ||||||||
0.878%, 09/12/15 (A) | 550 | 551 | ||||||
BPCE MTN | ||||||||
1.129%, 08/10/15 (A) | 700 | 703 | ||||||
Branch Banking & Trust | ||||||||
0.713%, 09/01/15 (A) | 760 | 759 | ||||||
Capital One Bank USA | ||||||||
1.200%, 02/13/17 | 500 | 497 | ||||||
1.300%, 06/05/17 | 500 | 497 | ||||||
Citigroup | ||||||||
0.982%, 08/24/15 (A) | 730 | 730 | ||||||
1.054%, 10/08/15 (A) | 700 | 698 | ||||||
1.250%, 01/15/16 | 1,085 | 1,087 | ||||||
1.800%, 02/05/18 | 470 | 469 | ||||||
1.700%, 04/27/18 | 300 | 298 | ||||||
Citizens Bank MTN | ||||||||
1.600%, 12/04/17 | 650 | 649 | ||||||
Cooperatieve Centrale Raiffeisen-Boerenleenbank BA | ||||||||
0.766%, 08/24/15 (A) | 345 | 346 | ||||||
3.375%, 01/19/17 | 985 | 1,016 | ||||||
| Description | Face Amount ($ Thousands) | Value ($ Thousands) | ||||||
Credit Agricole MTN | ||||||||
1.252%, 09/10/15 (A) (B) | $ | 700 | $ | 699 | ||||
1.133%, 10/03/15 (A) (B) | 450 | 452 | ||||||
Credit Suisse MTN | ||||||||
0.586%, 09/11/15 (A) | 960 | 959 | ||||||
0.969%, 10/29/15 (A) | 500 | 499 | ||||||
Credit Suisse NY | ||||||||
1.700%, 04/27/18 | 500 | 498 | ||||||
Daimler Finance North America LLC | ||||||||
1.138%, 08/01/15 (A) (B) | 400 | 403 | ||||||
1.250%, 01/11/16 (B) | 1,130 | 1,133 | ||||||
1.375%, 08/01/17 (B) | 535 | 533 | ||||||
Deutsche Bank | ||||||||
0.957%, 08/13/15 (A) | 350 | 349 | ||||||
1.350%, 05/30/17 | 650 | 647 | ||||||
ERAC USA Finance LLC | ||||||||
1.400%, 04/15/16 (B) | 240 | 240 | ||||||
Export-Import Bank of Korea | ||||||||
1.027%, 10/14/15 (A) | 945 | 949 | ||||||
Fifth Third Bank | ||||||||
1.350%, 06/01/17 | 750 | 749 | ||||||
1.450%, 02/28/18 | 800 | 793 | ||||||
Ford Motor Credit LLC | ||||||||
1.118%, 09/12/15 (A) | 300 | 298 | ||||||
1.500%, 01/17/17 | 520 | 519 | ||||||
1.724%, 12/06/17 | 350 | 348 | ||||||
1.186%, 06/15/18 (A) | 820 | 820 | ||||||
General Electric Capital MTN | ||||||||
0.993%, 08/27/15 (A) | 250 | 252 | ||||||
1.250%, 05/15/17 | 750 | 752 | ||||||
5.625%, 09/15/17 | 1,100 | 1,198 | ||||||
General Motors Financial | ||||||||
2.400%, 04/10/18 | 675 | 673 | ||||||
Goldman Sachs Group | ||||||||
1.454%, 10/23/15 (A) | 500 | 504 | ||||||
1.478%, 10/30/15 (A) | 125 | 126 | ||||||
2.375%, 01/22/18 | 1,050 | 1,065 | ||||||
Goldman Sachs Group MTN | ||||||||
1.086%, 08/15/15 (A) | 700 | 701 | ||||||
1.374%, 08/15/15 (A) | 400 | 402 | ||||||
HSBC Bank PLC | ||||||||
0.914%, 08/15/15 (A) (B) | 500 | 499 | ||||||
HSBC USA | ||||||||
1.300%, 06/23/17 | 1,590 | 1,594 | ||||||
Hyundai Capital America | ||||||||
1.625%, 10/02/15 (B) | 685 | 686 | ||||||
1.875%, 08/09/16 (B) | 165 | 166 | ||||||
2.000%, 03/19/18 (B) | 165 | 165 | ||||||
ING Bank | ||||||||
0.974%, 10/02/15 (A) (B) | 300 | 298 | ||||||
1.921%, 10/02/15 (A) (B) | 550 | 551 | ||||||
ING US | ||||||||
2.900%, 02/15/18 | 350 | 359 | ||||||
Intesa Sanpaolo MTN | ||||||||
3.125%, 01/15/16 | 350 | 353 | ||||||
| 18 | SEI Daily Income Trust / Semi-Annual Report / July 31, 2015 |
| Description | Face Amount ($ Thousands) | Value ($ Thousands) | ||||||
JPMorgan Chase | ||||||||
1.249%, 10/23/15 (A) | $ | 500 | $ | 503 | ||||
0.909%, 10/28/15 (A) | 500 | 499 | ||||||
JPMorgan Chase MTN | ||||||||
1.700%, 03/01/18 | 900 | 898 | ||||||
KeyBank | ||||||||
0.772%, 08/25/15 (A) | 700 | 700 | ||||||
0.803%, 09/01/15 (A) | 450 | 450 | ||||||
KFW | ||||||||
2.000%, 06/01/16 | 950 | 962 | ||||||
Korea Development Bank | ||||||||
0.920%, 10/22/15 (A) | 1,005 | 1,005 | ||||||
Lloyds Bank PLC | ||||||||
0.806%, 09/16/15 (A) | 500 | 500 | ||||||
Macquarie Group | ||||||||
1.278%, 10/30/15 (A) (B) | 350 | 352 | ||||||
Manufacturers & Traders Trust | ||||||||
1.400%, 07/25/17 | 450 | 449 | ||||||
Metropolitan Life Global Funding I | ||||||||
0.819%, 08/01/15 (A) (B) | 460 | 462 | ||||||
0.663%, 10/10/15 (A) (B) | 2,475 | 2,479 | ||||||
1.500%, 01/10/18 (B) | 220 | 220 | ||||||
Mizuho Bank | ||||||||
0.731%, 09/25/15 (A) (B) | 580 | 578 | ||||||
Morgan Stanley MTN | ||||||||
5.950%, 12/28/17 | 140 | 153 | ||||||
Morgan Stanley | ||||||||
1.532%, 08/25/15 (A) | 200 | 201 | ||||||
1.127%, 10/24/15 (A) | 400 | 400 | ||||||
New York Life Global Funding | ||||||||
0.644%, 10/23/15 (A) (B) | 550 | 551 | ||||||
Nissan Motor Acceptance MTN | ||||||||
0.812%, 09/04/15 (A) (B) | 245 | 245 | ||||||
0.981%, 09/26/15 (A) (B) | 500 | 502 | ||||||
1.500%, 03/02/18 | 300 | 299 | ||||||
Nordea Bank | ||||||||
1.250%, 04/04/17 (B) | 600 | 601 | ||||||
Pricoa Global Funding I | ||||||||
1.350%, 08/18/17 (B) | 550 | 548 | ||||||
Pricoa Global Funding I MTN | ||||||||
0.426%, 08/16/15 (A) (B) | 325 | 325 | ||||||
Principal Life Global Funding II MTN | ||||||||
1.125%, 02/24/17 (B) | 300 | 300 | ||||||
Principal Life Global Funding II | ||||||||
1.000%, 12/11/15 (B) | 530 | 531 | ||||||
1.200%, 05/19/17 (B) | 370 | 369 | ||||||
Province of Ontario Canada | ||||||||
1.600%, 09/21/16 | 1,600 | 1,617 | ||||||
Prudential Financial MTN | ||||||||
1.054%, 08/16/15 (A) | 500 | 502 | ||||||
Royal Bank of Canada MTN | ||||||||
0.624%, 10/23/15 (A) | 450 | 450 | ||||||
0.850%, 03/08/16 | 990 | 991 | ||||||
1.200%, 01/23/17 | 400 | 401 | ||||||
| Description | Face Amount ($ Thousands) | Value ($ Thousands) | ||||||
Santander Bank | ||||||||
1.216%, 10/12/15 | $ | 600 | $ | 599 | ||||
Societe Generale MTN | ||||||||
1.364%, 08/01/15 (A) | 450 | 457 | ||||||
Standard Chartered PLC MTN | ||||||||
0.929%, 10/17/15 (A) (B) | 500 | 500 | ||||||
Sumitomo Mitsui Banking | ||||||||
0.713%, 10/10/15 (A) | 500 | 499 | ||||||
SunTrust Bank | ||||||||
0.714%, 08/15/15 (A) | 300 | 300 | ||||||
Svenska Handelsbanken | ||||||||
0.751%, 09/25/15 (A) | 700 | 702 | ||||||
Synchrony Financial | ||||||||
1.509%, 08/02/15 (A) | 600 | 592 | ||||||
1.875%, 08/15/17 | 255 | 255 | ||||||
Toronto-Dominion Bank MTN | ||||||||
0.519%, 08/02/15 (A) | 750 | 749 | ||||||
0.827%, 10/23/15 (A) | 400 | 400 | ||||||
Toyota Motor Credit MTN | ||||||||
1.125%, 05/16/17 | 500 | 501 | ||||||
Travelers | ||||||||
6.250%, 06/20/16 | 1,017 | 1,067 | ||||||
UBS MTN | ||||||||
0.981%, 08/01/15 (A) | 1,000 | 1,002 | ||||||
5.875%, 12/20/17 | 550 | 603 | ||||||
Union Bank | ||||||||
1.031%, 09/26/15 (A) | 550 | 552 | ||||||
Ventas Realty | ||||||||
1.550%, 09/26/16‡ | 550 | 552 | ||||||
1.250%, 04/17/17‡ | 140 | 139 | ||||||
Volkswagen Group of America Finance LLC | ||||||||
0.716%, 08/20/15 (A) (B) | 1,075 | 1,076 | ||||||
0.754%, 08/22/15 (A) (B) | 650 | 650 | ||||||
1.250%, 05/23/17 (B) | 500 | 499 | ||||||
Volkswagen International Finance | ||||||||
0.716%, 08/20/15 (A) (B) | 775 | 776 | ||||||
1.125%, 11/18/16 (B) | 260 | 260 | ||||||
Wachovia MTN | ||||||||
5.750%, 02/01/18 | 1,300 | 1,430 | ||||||
WEA Finance LLC | ||||||||
1.750%, 09/15/17 (B) | 235 | 235 | ||||||
Wells Fargo MTN | ||||||||
1.150%, 06/02/17 | 650 | 649 | ||||||
Westpac Banking | ||||||||
0.898%, 10/17/15 (A) | 325 | 326 | ||||||
1.200%, 05/19/17 | 275 | 275 | ||||||
|
| |||||||
| 82,052 | ||||||||
|
| |||||||
Health Care — 5.7% | ||||||||
AbbVie | ||||||||
1.040%, 08/06/15 (A) | 130 | 130 | ||||||
1.200%, 11/06/15 | 675 | 676 | ||||||
1.800%, 05/14/18 | 400 | 399 | ||||||
| SEI Daily Income Trust / Semi-Annual Report / July 31, 2015 | 19 |
SCHEDULE OF INVESTMENTS (Unaudited)
Ultra Short Duration Bond Fund (Continued)
July 31, 2015
| Description | Face Amount ($ Thousands) | Value ($ Thousands) | ||||||
Actavis Funding SCS | ||||||||
1.368%, 09/12/15 (A) | $ | 675 | $ | 676 | ||||
1.300%, 06/15/17 | 450 | 446 | ||||||
2.350%, 03/12/18 | 640 | 642 | ||||||
Amgen | ||||||||
0.664%, 08/22/15 (A) | 1,150 | 1,149 | ||||||
2.125%, 05/15/17 | 500 | 506 | ||||||
Baxalta | ||||||||
1.063%, 09/22/15 (A) (B) | 1,500 | 1,503 | ||||||
Bayer US Finance LLC | ||||||||
0.564%, 10/06/15 (A) (B) | 600 | 598 | ||||||
0.534%, 10/07/15 (A) (B) | 800 | 801 | ||||||
Becton Dickinson | ||||||||
0.736%, 08/09/15 (A) | 780 | 780 | ||||||
1.800%, 12/15/17 | 500 | 498 | ||||||
Express Scripts Holding | ||||||||
2.650%, 02/15/17 | 1,250 | 1,271 | ||||||
1.250%, 06/02/17 | 600 | 597 | ||||||
GlaxoSmithKline Capital | ||||||||
0.700%, 03/18/16 | 844 | 845 | ||||||
McKesson | ||||||||
0.950%, 12/04/15 | 235 | 235 | ||||||
1.292%, 03/10/17 | 410 | 409 | ||||||
Medtronic | ||||||||
1.500%, 03/15/18 (B) | 255 | 255 | ||||||
Mylan | ||||||||
1.350%, 11/29/16 | 400 | 397 | ||||||
Providence Health & Services Obligated Group | ||||||||
1.084%, 10/01/15 (A) | 700 | 702 | ||||||
Thermo Fisher Scientific | ||||||||
1.300%, 02/01/17 | 165 | 165 | ||||||
UnitedHealth Group | ||||||||
1.450%, 07/17/17 | 1,235 | 1,238 | ||||||
WellPoint | ||||||||
1.250%, 09/10/15 | 210 | 210 | ||||||
Zimmer Holdings | ||||||||
1.450%, 04/01/17 | 450 | 450 | ||||||
|
| |||||||
| 15,578 | ||||||||
|
| |||||||
Industrials — 1.7% | ||||||||
Air Lease | ||||||||
4.500%, 01/15/16 | 300 | 304 | ||||||
2.125%, 01/15/18 | 230 | 228 | ||||||
Canadian National Railway | ||||||||
0.480%, 08/06/15 (A) | 1,000 | 1,000 | ||||||
GATX | ||||||||
1.250%, 03/04/17 | 215 | 214 | ||||||
Hutchison Whampoa International 14 | ||||||||
1.625%, 10/31/17 (B) | 400 | 399 | ||||||
Norfolk Southern | ||||||||
5.750%, 01/15/16 | 980 | 1,001 | ||||||
PACCAR Financial MTN | ||||||||
1.100%, 06/06/17 | 325 | 325 | ||||||
| Description | Face Amount ($ Thousands) | Value ($ Thousands) | ||||||
Pentair Finance | ||||||||
1.350%, 12/01/15 | $ | 285 | $ | 286 | ||||
Precision Castparts | ||||||||
0.700%, 12/20/15 | 145 | 145 | ||||||
Rockwell Collins | ||||||||
0.636%, 09/15/15 (A) | 690 | 690 | ||||||
|
| |||||||
| 4,592 | ||||||||
|
| |||||||
Information Technology — 0.8% | ||||||||
Fidelity National Information Services | ||||||||
1.450%, 06/05/17 | 170 | 169 | ||||||
Hewlett-Packard | ||||||||
1.226%, 08/10/15 (A) | 500 | 493 | ||||||
3.000%, 09/15/16 | 1,000 | 1,018 | ||||||
TSMC Global | ||||||||
0.950%, 04/03/16 (B) | 325 | 324 | ||||||
Western Union | ||||||||
2.375%, 12/10/15 | 85 | 85 | ||||||
|
| |||||||
| 2,089 | ||||||||
|
| |||||||
Materials — 1.4% | ||||||||
Glencore Funding LLC | ||||||||
1.445%, 08/27/15 (A) (B) | 700 | 700 | ||||||
Monsanto | ||||||||
0.476%, 08/07/15 (A) | 710 | 708 | ||||||
1.150%, 06/30/17 | 500 | 497 | ||||||
Rio Tinto Finance USA PLC | ||||||||
1.123%, 09/17/15 (A) | 955 | 956 | ||||||
Xstrata Finance Canada | ||||||||
2.050%, 10/23/15 (B) | 900 | 901 | ||||||
|
| |||||||
| 3,762 | ||||||||
|
| |||||||
Telecommunications — 1.6% | ||||||||
AT&T | ||||||||
0.665%, 08/12/15 (A) | 600 | 600 | ||||||
1.212%, 09/30/15 (A) | 450 | 452 | ||||||
5.500%, 02/01/18 | 870 | 947 | ||||||
British Telecommunications PLC | ||||||||
1.250%, 02/14/17 | 270 | 270 | ||||||
Verizon Communications | ||||||||
0.681%, 09/09/15 (A) | 560 | 558 | ||||||
2.036%, 09/14/15 (A) | 470 | 485 | ||||||
1.350%, 06/09/17 | 1,230 | 1,229 | ||||||
|
| |||||||
| 4,541 | ||||||||
|
| |||||||
Utilities — 1.8% | ||||||||
Dominion Gas Holdings LLC | ||||||||
1.050%, 11/01/16 | 550 | 550 | ||||||
Duke Energy | ||||||||
0.664%, 10/03/15 (A) | 1,450 | 1,447 | ||||||
Duke Energy Progress | ||||||||
0.479%, 09/06/15 (A) | 180 | 179 | ||||||
Exelon | ||||||||
1.550%, 06/09/17 | 585 | 585 | ||||||
| 20 | SEI Daily Income Trust / Semi-Annual Report / July 31, 2015 |
| Description | Face Amount ($ Thousands) | Value ($ Thousands) | ||||||
Georgia Power | ||||||||
0.625%, 11/15/15 | $ | 1,500 | $ | 1,499 | ||||
Hydro-Quebec | ||||||||
1.375%, 06/19/17 | 225 | 227 | ||||||
Southern | ||||||||
1.300%, 08/15/17 | 310 | 309 | ||||||
Xcel Energy | ||||||||
1.200%, 06/01/17 | 280 | 280 | ||||||
|
| |||||||
| 5,076 | ||||||||
|
| |||||||
Total Corporate Obligations | 134,780 | |||||||
|
| |||||||
ASSET-BACKED SECURITIES — 21.8% |
| |||||||
Automotive — 12.5% | ||||||||
Ally Auto Receivables Trust, | ||||||||
0.750%, 02/21/17 | 245 | 245 | ||||||
Ally Master Owner Trust, | ||||||||
0.587%, 08/15/15 (A) | 850 | 850 | ||||||
Ally Master Owner Trust, | ||||||||
1.600%, 08/15/15 | 650 | 652 | ||||||
Ally Master Owner Trust, | ||||||||
1.000%, 02/15/18 | 825 | 826 | ||||||
Ally Master Owner Trust, | ||||||||
0.637%, 08/15/15 (A) | 310 | 310 | ||||||
Ally Master Owner Trust, | ||||||||
1.430%, 06/17/19 | 635 | 636 | ||||||
American Credit Acceptance Receivables Trust, | ||||||||
1.450%, 04/16/18 (B) | 44 | 44 | ||||||
American Credit Acceptance Receivables Trust, | ||||||||
1.140%, 03/12/18 (B) | 24 | 24 | ||||||
American Credit Acceptance Receivables Trust, | ||||||||
1.330%, 07/10/18 (B) | 106 | 106 | ||||||
AmeriCredit Automobile Receivables Trust, Ser 2012-4, Cl B | ||||||||
1.310%, 11/08/17 | 330 | 330 | ||||||
AmeriCredit Automobile Receivables Trust, Ser 2013-2, Cl A3 | ||||||||
0.650%, 12/08/17 | 240 | 240 | ||||||
AmeriCredit Automobile Receivables Trust, Ser 2014-1, Cl A3 | ||||||||
0.900%, 02/08/19 | 700 | 700 | ||||||
| Description | Face Amount ($ Thousands) | Value ($ Thousands) | ||||||
AmeriCredit Automobile Receivables Trust, Ser 2013-3, Cl A3 | ||||||||
0.920%, 04/09/18 | $ | 197 | $ | 197 | ||||
AmeriCredit Automobile Receivables Trust, Ser 2012-5, Cl A3 | ||||||||
0.620%, 06/08/17 | 7 | 7 | ||||||
ARI Fleet Lease Trust, | ||||||||
0.737%, 08/15/15 (A) (B) | 167 | 167 | ||||||
ARI Fleet Lease Trust, | ||||||||
0.920%, 07/15/21 (B) | 100 | 100 | ||||||
ARI Fleet Lease Trust, | ||||||||
0.810%, 11/15/22 (B) | 116 | 116 | ||||||
ARI Fleet Lease Trust, | ||||||||
0.487%, 08/15/15 (A) (B) | 405 | 405 | ||||||
ARI Fleet Lease Trust, | ||||||||
0.700%, 12/15/15 (B) | 17 | 17 | ||||||
Bank of The West Auto Trust, | ||||||||
0.537%, 08/01/15 (A) (B) | 700 | 700 | ||||||
California Republic Auto Receivables Trust, Ser 2013-1, Cl A2 | ||||||||
1.410%, 09/17/18 (B) | 443 | 444 | ||||||
Capital Auto Receivables Asset Trust, | ||||||||
1.320%, 06/20/18 | 190 | 191 | ||||||
Capital Auto Receivables Asset Trust, | ||||||||
2.320%, 07/20/18 | 520 | 527 | ||||||
Capital Auto Receivables Asset Trust, | ||||||||
0.680%, 05/20/16 | 7 | 7 | ||||||
CarMax Auto Owner Trust, | ||||||||
1.350%, 02/15/17 | 166 | 166 | ||||||
CarMax Auto Owner Trust, | ||||||||
1.500%, 08/15/18 | 120 | 121 | ||||||
CarMax Auto Owner Trust, | ||||||||
0.790%, 04/16/18 | 1,230 | 1,229 | ||||||
CarMax Auto Owner Trust, | ||||||||
2.200%, 10/16/17 | 365 | 368 | ||||||
CarMax Auto Owner Trust, | ||||||||
3.090%, 08/15/18 | 875 | 885 | ||||||
Chesapeake Funding LLC, | ||||||||
0.608%, 08/07/15 (A) (B) | 609 | 609 | ||||||
| SEI Daily Income Trust / Semi-Annual Report / July 31, 2015 | 21 |
SCHEDULE OF INVESTMENTS (Unaudited)
Ultra Short Duration Bond Fund (Continued)
July 31, 2015
| Description | Face Amount ($ Thousands) | Value ($ Thousands) | ||||||
Chesapeake Funding LLC, | ||||||||
0.638%, 08/07/15 (A) (B) | $ | 97 | $ | 97 | ||||
Chesapeake Funding LLC, | ||||||||
0.938%, 08/07/15 (A) (B) | 177 | 177 | ||||||
Chesapeake Funding LLC, | ||||||||
1.138%, 08/09/15 (A) (B) | 460 | 459 | ||||||
Chesapeake Funding LLC, | ||||||||
1.438%, 08/07/15 (A) (B) | 193 | 194 | ||||||
CNH Wholesale Master Note Trust, | ||||||||
0.787%, 08/15/15 (A) (B) | 425 | 425 | ||||||
CPS Auto Receivables Trust, | ||||||||
1.210%, 08/15/18 (B) | 172 | 172 | ||||||
CPS Auto Receivables Trust, | ||||||||
1.540%, 07/16/18 (B) | 509 | 510 | ||||||
CPS Auto Receivables Trust, | ||||||||
1.530%, 07/15/19 (B) | 874 | 872 | ||||||
Credit Acceptance Auto Loan Trust, | ||||||||
1.550%, 10/15/21 (B) | 415 | 416 | ||||||
Credit Acceptance Auto Loan Trust, | ||||||||
1.210%, 10/15/20 (B) | 190 | 190 | ||||||
Credit Acceptance Auto Loan Trust, | ||||||||
1.500%, 04/15/21 (B) | 365 | 366 | ||||||
DT Auto Owner Trust, | ||||||||
0.680%, 08/15/17 (B) | 127 | 127 | ||||||
Enterprise Fleet Financing LLC, | ||||||||
1.050%, 03/20/20 (B) | 189 | 189 | ||||||
Enterprise Fleet Financing LLC, | ||||||||
1.060%, 03/20/19 (B) | 196 | 196 | ||||||
Enterprise Fleet Financing LLC, | ||||||||
0.680%, 09/20/18 (B) | 149 | 149 | ||||||
First Investors Auto Owner Trust, | ||||||||
0.800%, 02/15/18 (B) | 104 | 104 | ||||||
First Investors Auto Owner Trust, | ||||||||
0.860%, 08/15/18 (B) | 274 | 273 | ||||||
First Investors Auto Owner Trust, | ||||||||
1.440%, 10/15/19 (B) | 398 | 398 | ||||||
| Description | Face Amount ($ Thousands) | Value ($ Thousands) | ||||||
First Investors Auto Owner Trust, | ||||||||
0.900%, 10/15/18 (B) | $ | 46 | $ | 46 | ||||
First Investors Auto Owner Trust, | ||||||||
1.230%, 03/15/19 (B) | 205 | 205 | ||||||
First Investors Auto Owner Trust, | ||||||||
1.470%, 05/15/18 (B) | 52 | 52 | ||||||
Flagship Credit Auto Trust 2013-2, | ||||||||
1.940%, 01/15/19 (B) | 273 | 274 | ||||||
Ford Credit Auto Lease Trust, | ||||||||
1.100%, 11/15/17 | 615 | 616 | ||||||
Ford Credit Auto Owner Trust, | ||||||||
2.930%, 10/15/18 | 600 | 611 | ||||||
Ford Credit Auto Owner Trust, | ||||||||
1.880%, 08/15/17 | 475 | 478 | ||||||
Ford Credit Floorplan Master Owner | ||||||||
1.400%, 02/15/19 | 80 | 80 | ||||||
Ford Credit Floorplan Master Owner Trust, Ser 2013-1, Cl A2 | ||||||||
0.567%, 08/15/15 (A) | 945 | 945 | ||||||
Ford Credit Floorplan Master Owner Trust, Ser 2013-5, Cl A2 | ||||||||
0.655%, 08/15/15 (A) | 310 | 310 | ||||||
GE Dealer Floorplan Master Note Trust, Ser 2014-2, Cl A | ||||||||
0.637%, 08/20/15 (A) | 665 | 663 | ||||||
GM Financial Automobile Leasing Trust, Ser 2015-1, Cl B | ||||||||
2.140%, 06/20/19 | 390 | 393 | ||||||
GM Financial Leasing Trust, | ||||||||
1.010%, 05/22/17 (B) | 1,140 | 1,142 | ||||||
GMF Floorplan Owner Revolving Trust, Ser 2015-1, Cl A2 | ||||||||
0.686%, 05/15/20 (A) (B) | 1,475 | 1,475 | ||||||
Hertz Fleet Lease Funding, | ||||||||
1.235%, 08/10/15 (A) (B) | 765 | 765 | ||||||
Honda Auto Receivables Owner Trust, Ser 2012-3, Cl A3 | ||||||||
0.560%, 05/15/16 | 4 | 4 | ||||||
M&T Bank Auto Receivables Trust, Ser 2013-1A, Cl A3 | ||||||||
1.060%, 11/15/17 (B) | 430 | 431 | ||||||
M&T Bank Auto Receivables Trust, Ser 2013-1A, Cl A4 | ||||||||
1.570%, 08/15/18 (B) | 750 | 754 | ||||||
| 22 | SEI Daily Income Trust / Semi-Annual Report / July 31, 2015 |
| Description | Face Amount ($ Thousands) | Value ($ Thousands) | ||||||
Mercedes-Benz Auto Lease Trust, Ser 2013-B, Cl A3 | ||||||||
0.620%, 07/15/16 | $ | 62 | $ | 62 | ||||
Mercedes-Benz Auto Receivables Trust, Ser 2013-1, Cl A3 | ||||||||
0.780%, 08/15/17 | 125 | 125 | ||||||
Mercedes-Benz Master Owner Trust, Ser 2012-AA, Cl A | ||||||||
0.790%, 11/15/17 (B) | 360 | 360 | ||||||
Porsche Innovative Lease Owner Trust, Ser 2013-1, Cl A4 | ||||||||
0.880%, 10/22/19 (B) | 310 | 310 | ||||||
Prestige Auto Receivables Trust, Ser 2012-1A, Cl A3 | ||||||||
1.760%, 10/16/17 (B) | 60 | 60 | ||||||
Prestige Auto Receivables Trust, Ser 2013-1A, Cl A2 | ||||||||
1.090%, 02/15/18 (B) | 74 | 74 | ||||||
Prestige Auto Receivables Trust, Ser 2014-1A, Cl A2 | ||||||||
0.970%, 03/15/18 (B) | 445 | 445 | ||||||
Prestige Auto Receivables Trust, Ser 2015-1, Cl A2 | ||||||||
1.090%, 02/15/19 (B) | 210 | 210 | ||||||
Prestige Auto Receivables Trust, Ser 2013-1A, Cl A3 | ||||||||
1.330%, 05/15/19 (B) | 495 | 496 | ||||||
Santander Drive Auto Receivables Trust, Ser 2012-4, Cl C | ||||||||
2.940%, 12/15/17 | 308 | 310 | ||||||
Santander Drive Auto Receivables Trust, Ser 2013-2, Cl B | ||||||||
1.330%, 03/15/18 | 485 | 486 | ||||||
Santander Drive Auto Receivables Trust, Ser 2012-3, Cl D | ||||||||
3.640%, 05/15/18 | 430 | 438 | ||||||
Santander Drive Auto Receivables Trust, Ser 2013-2, Cl A2A | ||||||||
0.660%, 06/15/17 | 8 | 8 | ||||||
Santander Drive Auto Receivables Trust, Ser 2012-5, Cl B | ||||||||
1.560%, 08/15/18 | 175 | 175 | ||||||
Santander Drive Auto Receivables Trust, Ser 2012-1, Cl C | ||||||||
3.780%, 11/15/17 | 216 | 217 | ||||||
Santander Drive Auto Receivables Trust, Ser 2014-4, Cl A2A | ||||||||
0.670%, 01/16/18 | 142 | 142 | ||||||
SMART Trust, Ser 2014-1US, Cl A2B | ||||||||
0.486%, 08/14/15 (A) | 134 | 134 | ||||||
SNAAC Auto Receivables Trust, Ser 2014-1A, Cl A | ||||||||
1.030%, 09/17/18 (B) | 143 | 143 | ||||||
| Description | Face Amount ($ Thousands) | Value ($ Thousands) | ||||||
Susquehanna Auto Receivables Trust, Ser 2014-1, Cl A3 | ||||||||
1.000%, 02/15/18 (B) | $ | 425 | $ | 425 | ||||
Volkswagen Auto Lease Trust, | ||||||||
0.520%, 10/20/16 | 164 | 164 | ||||||
Volkswagen Credit Auto Master Trust, Ser 2014-1A, Cl A1 | ||||||||
0.538%, 08/20/15 (A) (B) | 400 | 400 | ||||||
Volvo Financial Equipment LLC, Ser 2014-1A, Cl A3 | ||||||||
0.820%, 04/16/18 (B) | 240 | 240 | ||||||
Volvo Financial Equipment LLC, Ser 2013-1A, Cl A3 | ||||||||
0.740%, 03/15/17 (B) | 181 | 181 | ||||||
Westlake Automobile Receivables Trust, Ser 2014-2A, Cl A2 | ||||||||
0.970%, 10/16/17 (B) | 498 | 498 | ||||||
Westlake Automobile Receivables Trust, Ser 2015-1A, Cl B | ||||||||
1.680%, 11/16/20 (B) | 505 | 503 | ||||||
Westlake Automobile Receivables Trust, Ser 2014-1A, Cl A2 | ||||||||
0.700%, 05/15/17 (B) | 131 | 131 | ||||||
Westlake Automobile Receivables Trust, Ser 2014-2A, Cl C | ||||||||
2.240%, 04/15/20 (B) | 250 | 250 | ||||||
Westlake Automobile Receivables Trust, Ser 2013-1A, Cl A2 | ||||||||
1.120%, 01/15/18 (B) | 58 | 58 | ||||||
Westlake Automobile Receivables Trust, Ser 2015-2A, Cl A2A | ||||||||
1.280%, 07/16/18 (B) | 645 | 645 | ||||||
Wheels SPV 2, Ser 2014-1A, Cl A2 | ||||||||
0.840%, 03/20/23 (B) | 197 | 196 | ||||||
World Omni Master Owner Trust, Ser 2013-1, Cl A | ||||||||
0.537%, 08/15/15 (A) (B) | 555 | 555 | ||||||
|
| |||||||
| 34,218 | ||||||||
|
| |||||||
Credit Card — 2.3% | ||||||||
American Express Credit Account Master Trust, Ser 2013-3, Cl A | ||||||||
0.980%, 05/15/19 | 185 | 185 | ||||||
Cabela’s Master Credit Card Trust, Ser 2014-1, Cl A | ||||||||
0.537%, 08/15/15 (A) | 165 | 165 | ||||||
Cabela’s Master Credit Card Trust, Ser 2013-2A A2, Cl A2 | ||||||||
0.837%, 08/15/15 (A) (B) | 210 | 211 | ||||||
Capital One Multi-Asset Execution Trust, Ser 2013-A3, Cl A3 | ||||||||
0.960%, 09/16/19 | 360 | 360 | ||||||
| SEI Daily Income Trust / Semi-Annual Report / July 31, 2015 | 23 |
SCHEDULE OF INVESTMENTS (Unaudited)
Ultra Short Duration Bond Fund (Continued)
July 31, 2015
| Description | Face Amount ($ Thousands) | Value ($ Thousands) | ||||||
Chase Issuance Trust, | ||||||||
0.590%, 08/15/17 | $ | 540 | $ | 540 | ||||
Chase Issuance Trust, | ||||||||
1.150%, 01/15/19 | 275 | 276 | ||||||
Chase Issuance Trust, | ||||||||
1.260%, 07/15/19 | 400 | 400 | ||||||
Chase Issuance Trust, | ||||||||
0.437%, 08/15/15 (A) | 450 | 448 | ||||||
Citibank Credit Card Issuance Trust, Ser 2014-A2, Cl A2 | ||||||||
1.020%, 02/22/19 | 415 | 415 | ||||||
Citibank Credit Card Issuance Trust, Ser 2014-A4, Cl A4 | ||||||||
1.230%, 04/24/19 | 650 | 652 | ||||||
Citibank Credit Card Issuance Trust, Ser 2013-A3, Cl A3 | ||||||||
1.110%, 07/23/18 | 500 | 501 | ||||||
Dryrock Issuance Trust, | ||||||||
0.640%, 08/15/18 | 480 | 480 | ||||||
Golden Credit Card Trust, | ||||||||
0.790%, 09/15/17 (B) | 575 | 575 | ||||||
Master Credit Card Trust, | ||||||||
0.780%, 04/21/17 (B) | 360 | 360 | ||||||
Synchrony Credit Card Master Note Trust, Ser 2014-1, Cl A | ||||||||
1.610%, 11/15/20 | 650 | 653 | ||||||
|
| |||||||
| 6,221 | ||||||||
|
| |||||||
Miscellaneous Business Services — 6.6% |
| |||||||
Apidos CDO, Ser 2013-12A, Cl A | ||||||||
1.274%, 08/15/15 (A) (B) | 600 | 591 | ||||||
Avalon IV Capital, | ||||||||
1.459%, 10/17/15 (A) (B) | 303 | 303 | ||||||
Bear Stearns Asset-Backed-Securities Trust, | ||||||||
0.847%, 08/25/15 (A) | 52 | 52 | ||||||
Cent CLO 16, | ||||||||
1.505%, 08/03/15 (A) (B) | 500 | 499 | ||||||
Cent CLO 16, Ser 2014-20A, Cl A | ||||||||
1.724%, 01/25/26 (A) (B) | 600 | 597 | ||||||
CIFC Funding, Ser 2013-1A, Cl A1 | ||||||||
1.426%, 10/16/15 (A) (B) | 485 | 480 | ||||||
CIT Equipment Collateral, | ||||||||
0.860%, 05/22/17 (B) | 1,005 | 1,005 | ||||||
| Description | Face Amount ($ Thousands) | Value ($ Thousands) | ||||||
CNH Equipment Trust, | ||||||||
0.650%, 04/16/18 | $ | 388 | $ | 388 | ||||
CNH Equipment Trust, | ||||||||
0.630%, 12/15/17 | 863 | 863 | ||||||
Credit-Based Asset Servicing and Securitization LLC, | ||||||||
0.805%, 08/27/15 (A) | 825 | 818 | ||||||
Dell Equipment Finance Trust, | ||||||||
0.940%, 06/22/20 (B) | 500 | 500 | ||||||
Dryden XXXI Senior Loan Fund, | ||||||||
1.523%, 10/18/15 (A) (B) | 250 | 249 | ||||||
GE Equipment Small Ticket LLC, | ||||||||
0.950%, 09/25/17 (B) | 400 | 400 | ||||||
GreatAmerica Leasing Receivables, | ||||||||
1.540%, 07/20/18 (B) | 905 | 907 | ||||||
HLSS Servicer Advance Receivables Backed Notes, | ||||||||
1.990%, 10/15/45 (B) | 625 | 624 | ||||||
HLSS Servicer Advance Receivables Backed Notes, | ||||||||
1.744%, 01/16/46 (B) | 405 | 405 | ||||||
ING IM CLO, Ser 2014-1A, Cl A1 | ||||||||
1.775%, 10/18/15 (A) (B) | 290 | 289 | ||||||
ING IM CLO, Ser 2014-1RA, Cl A2R | ||||||||
2.136%, 08/02/15 (A) (B) | 500 | 500 | ||||||
John Deere Owner Trust, | ||||||||
0.690%, 01/15/19 | 580 | 580 | ||||||
Kubota Credit Owner Trust, Ser 2015-1A, Cl A2 | ||||||||
0.940%, 08/15/15 (B) | 420 | 420 | ||||||
Kubota Credit Owner Trust, Ser 2014-1A, Cl A2 | ||||||||
0.580%, 02/15/17 (B) | 101 | 101 | ||||||
Limerock CLO II, Ser 2014-2A, Cl A | ||||||||
1.775%, 08/18/15 (A) (B) | 500 | 500 | ||||||
Madison Park Funding CLO, | ||||||||
0.581%, 09/24/15 (A) (B) | 420 | 409 | ||||||
MMAF Equipment Finance LLC, | ||||||||
2.100%, 07/15/17 (B) | 233 | 234 | ||||||
MMAF Equipment Finance LLC, | ||||||||
0.870%, 01/08/19 (B) | 560 | 558 | ||||||
| 24 | SEI Daily Income Trust / Semi-Annual Report / July 31, 2015 |
| Description | Face Amount ($ Thousands) | Value ($ Thousands) | ||||||
MMAF Equipment Finance LLC, | ||||||||
0.690%, 05/09/16 (B) | $ | 7 | $ | 7 | ||||
Navient Student Loan Trust, Ser 2014-1, Cl A1 | ||||||||
0.437%, 08/25/15 (A) | 985 | 983 | ||||||
Neuberger Berman CLO XVI, | ||||||||
1.759%, 09/11/15 (A) (B) | 405 | 403 | ||||||
NYCTL Trust, Ser 2015-A, Cl A | ||||||||
1.340%, 11/10/28 (B) | 580 | 580 | ||||||
NYCTL Trust, Ser 2014-A, Cl A | ||||||||
1.030%, 11/10/27 (B) | 82 | 82 | ||||||
Oak Hill Credit Partners, | ||||||||
1.294%, 10/21/15 (A) (B) | 360 | 356 | ||||||
Octagon Investment Partners XVI, | ||||||||
1.394%, 10/17/15 (A) (B) | 550 | 543 | ||||||
Ocwen Freddie Advance Funding, | ||||||||
2.062%, 11/15/45 (B) | 230 | 230 | ||||||
OHA Intrepid Leveraged Loan Fund, | ||||||||
1.208%, 08/22/15 (A) (B) | 239 | 239 | ||||||
Race Point VI CLO, | ||||||||
2.413%, 08/24/15 (A) (B) | 425 | 425 | ||||||
SLM Student Loan Trust, | ||||||||
0.365%, 10/25/15 (A) | 37 | 37 | ||||||
SLM Student Loan Trust, | ||||||||
1.187%, 08/15/15 (A) (B) | 24 | 25 | ||||||
SLM Student Loan Trust, | ||||||||
0.395%, 10/25/15 (A) | 148 | 147 | ||||||
SLM Student Loan Trust, | ||||||||
0.277%, 10/25/15 (A) | 13 | 13 | ||||||
SLM Student Loan Trust, | ||||||||
1.037%, 08/15/15 (A) (B) | 162 | 162 | ||||||
Springleaf Funding Trust, | ||||||||
2.410%, 12/15/22 (B) | 445 | 446 | ||||||
Structured Asset Securities Mortgage Loan Trust, Ser 2006-WF1, Cl A1 | ||||||||
0.331%, 08/25/15 (A) | 129 | 127 | ||||||
Structured Asset Securities Mortgage Loan Trust, Ser 2006-GEL3, Cl A2 | ||||||||
0.421%, 08/25/15 (A) (B) | 497 | 494 | ||||||
Symphony CLO VIII, | ||||||||
2.033%, 08/02/15 (A) (B) | 475 | 475 | ||||||
|
| |||||||
| 18,046 | ||||||||
|
| |||||||
| Description | Face Amount ($ Thousands) | Value ($ Thousands) | ||||||
Mortgage Related — 0.4% | ||||||||
Accredited Mortgage Loan Trust, Ser 2004-4, Cl A1A | ||||||||
0.867%, 08/27/15 (A) | $ | 239 | $ | 234 | ||||
Aegis Asset Backed Securities Trust Mortgage Pass-Through Certificates, Ser 2004-4, Cl A1 | ||||||||
0.907%, 08/27/15 (A) | 278 | 274 | ||||||
Bear Stearns Asset-Backed-Securities Trust, | ||||||||
1.105%, 08/25/15 (A) | 351 | 347 | ||||||
JPMorgan Mortgage Acquisition, Ser 2005-FLD1, Cl M2 | ||||||||
0.922%, 08/25/15 (A) | 108 | 108 | ||||||
Option One Mortgage Loan Trust, | ||||||||
0.441%, 08/25/15 (A) | 50 | 49 | ||||||
Option One Mortgage Loan Trust, | ||||||||
0.687%, 08/25/15 (A) | 194 | 191 | ||||||
|
| |||||||
| 1,203 | ||||||||
|
| |||||||
Total Asset-Backed Securities (Cost $59,754) ($ Thousands) | 59,688 | |||||||
|
| |||||||
MORTGAGE-BACKED SECURITIES — 15.2% |
| |||||||
Agency Mortgage-Backed Obligations — 4.3% |
| |||||||
FHLMC | ||||||||
5.000%, 06/01/26 | 126 | 132 | ||||||
4.500%, 09/01/26 | 64 | 68 | ||||||
2.251%, 08/01/15 (A) | 103 | 106 | ||||||
2.238%, 08/01/15 (A) | 102 | 108 | ||||||
FHLMC REMIC, | ||||||||
4.500%, 03/15/19 | 65 | 68 | ||||||
FHLMC REMIC, | ||||||||
4.500%, 08/01/15 | 157 | 165 | ||||||
FHLMC REMIC, | ||||||||
4.000%, 11/15/23 | 20 | 20 | ||||||
FNMA | ||||||||
6.000%, 01/01/27 | 34 | 39 | ||||||
5.000%, 04/01/20 to 03/01/25 | 791 | 849 | ||||||
2.465%, 08/01/15 (A) | 12 | 12 | ||||||
2.261%, 08/01/15 (A) | 25 | 26 | ||||||
2.245%, 08/01/15 (A) | 9 | 10 | ||||||
2.194%, 08/01/15 (A) | 94 | 98 | ||||||
2.140%, 08/01/15 (A) | 38 | 39 | ||||||
2.092%, 08/01/15 (A) | 39 | 41 | ||||||
1.375%, 08/01/15 (A) | 16 | 16 | ||||||
FNMA REMIC, Ser 1993-58, Cl H | ||||||||
5.500%, 04/25/23 | 29 | 32 | ||||||
| SEI Daily Income Trust / Semi-Annual Report / July 31, 2015 | 25 |
SCHEDULE OF INVESTMENTS (Unaudited)
Ultra Short Duration Bond Fund (Continued)
July 31, 2015
| Description | Face Amount ($ Thousands) | Value ($ Thousands) | ||||||
FNMA REMIC, Ser 2001-33, Cl FA | ||||||||
0.635%, 08/25/15 (A) | $ | 23 | $ | 23 | ||||
FNMA REMIC, Ser 2002-64, Cl FG | ||||||||
0.438%, 08/18/15 (A) | 24 | 24 | ||||||
FNMA REMIC, Ser 2002-77, Cl CB | ||||||||
5.000%, 12/25/17 | 109 | 113 | ||||||
FNMA REMIC, Ser 2008-18, Cl HD | ||||||||
4.000%, 12/25/18 | 83 | 85 | ||||||
FNMA REMIC, Ser 2010-64, Cl EH | ||||||||
5.000%, 10/25/35 | 14 | 14 | ||||||
FNMA REMIC, Ser 2011-109, Cl PK | ||||||||
4.000%, 08/25/41 | 105 | 111 | ||||||
FNMA TBA | ||||||||
3.500%, 08/01/40 | 850 | 897 | ||||||
3.000%, 08/25/26 | 4,200 | 4,358 | ||||||
GNMA | ||||||||
2.500%, 08/01/15 (A) | 116 | 123 | ||||||
GNMA, Ser 2009-10, Cl JA | ||||||||
4.500%, 03/16/34 | 83 | 87 | ||||||
GNMA, Ser 2009-113, Cl MJ | ||||||||
4.000%, 03/16/23 | 242 | 249 | ||||||
GNMA, Ser 2010-47, Cl AT | ||||||||
3.000%, 11/16/30 | 272 | 274 | ||||||
GNMA, Ser 2010-86, Cl PG | ||||||||
3.000%, 01/20/36 | 84 | 85 | ||||||
GNMA, Ser 2011-106, Cl ME | ||||||||
3.000%, 06/20/38 | 196 | 199 | ||||||
GNMA, Ser 2011-110, Cl A | ||||||||
2.237%, 03/16/33 | 134 | 134 | ||||||
GNMA, Ser 2011-62, Cl PA | ||||||||
3.000%, 01/20/40 | 753 | 765 | ||||||
Mortgage-Linked Amortizing Notes, | ||||||||
2.060%, 01/15/22 | 61 | 62 | ||||||
NCUA Guaranteed Notes, Ser 2010-R1, Cl 2A | ||||||||
1.840%, 10/07/20 | 7 | 7 | ||||||
NCUA Guaranteed Notes, Ser 2010-R1, Cl 1A | ||||||||
0.637%, 08/04/15 (A) | 586 | 589 | ||||||
NCUA Guaranteed Notes, Ser 2010-R2, Cl 1A | ||||||||
0.555%, 08/06/15 (A) | 180 | 181 | ||||||
NCUA Guaranteed Notes, Ser 2011-R1, Cl 1A | ||||||||
0.635%, 08/04/15 (A) | 455 | 457 | ||||||
NCUA Guaranteed Notes, Ser 2011-R2, Cl 1A | ||||||||
0.587%, 08/09/15 (A) | 252 | 252 | ||||||
NCUA Guaranteed Notes, Ser 2011-R3, Cl 1A | ||||||||
0.587%, 08/09/15 (A) | 579 | 580 | ||||||
NCUA Guaranteed Notes, | ||||||||
0.559%, 08/05/15 (A) | 289 | 289 | ||||||
| Description | Face Amount ($ Thousands) | Value ($ Thousands) | ||||||
NCUA Guaranteed Notes, | ||||||||
0.565%, 08/07/15 (A) | $ | 78 | $ | 78 | ||||
|
| |||||||
| 11,865 | ||||||||
|
| |||||||
Non-Agency Mortgage-Backed Obligations — 10.9% |
| |||||||
BAMLL Commercial Mortgage Securities Trust, | ||||||||
0.986%, 08/15/15 (A) (B) | 250 | 249 | ||||||
Banc of America Mortgage Securities, Ser 2005-F, Cl 2A2 | ||||||||
2.711%, 08/01/15 (A) (B) | 283 | 262 | ||||||
Banc of America Mortgage Securities, Ser 2005-J, Cl 2A1 | ||||||||
1.887%, 08/01/15 (A) (B) | 36 | 33 | ||||||
Bear Stearns Adjustable Rate Mortgage Trust, | ||||||||
2.639%, 08/01/15 (A) (B) | 89 | 70 | ||||||
Bear Stearns Adjustable Rate Mortgage Trust, | ||||||||
2.720%, 08/01/15 (A) (B) | 126 | 116 | ||||||
Bear Stearns Adjustable Rate Mortgage Trust, | ||||||||
2.723%, 08/01/15 (A) (B) | 215 | 194 | ||||||
Bear Stearns Commercial Mortgage Securities Trust, | ||||||||
5.405%, 12/11/40 (A) | 277 | 278 | ||||||
Bear Stearns Commercial Mortgage Securities Trust, | ||||||||
5.540%, 09/11/41 | 403 | 416 | ||||||
Bear Stearns Commercial Mortgage Securities Trust, | ||||||||
5.430%, 08/01/15 | 411 | 414 | ||||||
BLCP Hotel Trust, Ser CLRN, Cl A | ||||||||
1.137%, 08/15/15 (A) (B) | 500 | 499 | ||||||
CD Mortgage Trust, | ||||||||
5.378%, 08/12/15 (A) | 790 | 794 | ||||||
CD Mortgage Trust, | ||||||||
5.322%, 12/11/49 | 575 | 596 | ||||||
CD Mortgage Trust, | ||||||||
5.886%, 08/15/48 (A) | 431 | 463 | ||||||
Citigroup Commercial Mortgage Trust, Ser 2007-C6, Cl A4 | ||||||||
5.711%, 12/10/49 (A) | 650 | 692 | ||||||
| 26 | SEI Daily Income Trust / Semi-Annual Report / July 31, 2015 |
| Description | Face Amount ($ Thousands) | Value ($ Thousands) | ||||||
Citigroup Commercial Mortgage Trust, Ser 2008-C7, Cl A4 | ||||||||
6.144%, 08/01/15 (A) | $ | 389 | $ | 417 | ||||
Citigroup Commercial Mortgage Trust, Ser 2012-GC8, Cl A1 | ||||||||
0.685%, 09/10/45 | 194 | 194 | ||||||
Citigroup Commercial Mortgage Trust, Ser 2014-388G, Cl A | ||||||||
0.936%, 08/15/15 (A) (B) | 450 | 448 | ||||||
Citigroup Mortgage Loan Trust, | ||||||||
2.634%, 08/01/15 (A) (B) | 53 | 53 | ||||||
Citigroup Mortgage Loan Trust, | ||||||||
2.696%, 08/01/15 (A) (B) | 207 | 190 | ||||||
COBALT CMBS Commercial Mortgage Trust, | ||||||||
5.223%, 08/15/48 | 612 | 635 | ||||||
COMM 2012-9W57 Mortgage Trust, | ||||||||
2.365%, 08/06/15 (B) | 600 | 609 | ||||||
Commercial Mortgage Pass-Through Certificates, Ser 2010-C1, Cl A1 | ||||||||
3.156%, 07/10/46 (B) | 159 | 159 | ||||||
Commercial Mortgage Pass-Through Certificates, Ser 2012-CR2, Cl A1 | ||||||||
0.824%, 08/15/45 | 147 | 147 | ||||||
Commercial Mortgage Pass-Through Certificates, Ser 2012-CR3, Cl A1 | ||||||||
0.666%, 11/15/45 | 141 | 141 | ||||||
Commercial Mortgage Pass-Through Certificates, Ser 2012-CR4, Cl A1 | ||||||||
0.704%, 10/15/45 | 183 | 182 | ||||||
Commercial Mortgage Pass-Through Certificates, | ||||||||
1.278%, 08/10/46 | 188 | 188 | ||||||
Commercial Mortgage Pass-Through Certificates, Ser CR9, Cl A1 | ||||||||
1.344%, 07/10/45 | 805 | 805 | ||||||
Commercial Mortgage Trust, Ser 2014-BBG, Cl A | ||||||||
0.988%, 08/15/15 (A) (B) | 1,145 | 1,144 | ||||||
Countrywide Home Loans, Ser 2004-29, Cl 1A1 | ||||||||
0.725%, 08/25/15 (A) (B) | 29 | 27 | ||||||
Countrywide Home Loans, Ser 2005-HY10, Cl 3A1A | ||||||||
2.502%, 08/01/15 (A) (B) | 174 | 146 | ||||||
Credit Suisse Commercial Mortgage Trust, Ser C4, Cl A3 | ||||||||
5.467%, 09/15/39 | 811 | 834 | ||||||
CSMC Trust 2014, Ser TIKI, Cl A | ||||||||
1.137%, 08/15/15 (A) (B) | 430 | 428 | ||||||
| Description | Face Amount ($ Thousands) | Value ($ Thousands) | ||||||
DBUBS Mortgage Trust, | ||||||||
3.742%, 11/10/46 (B) | $ | 454 | $ | 457 | ||||
FDIC Structured Sale Guaranteed Notes, Ser 2010-S1, Cl 1A | ||||||||
0.737%, 08/01/15 (A) (B) | 126 | 126 | ||||||
FHLMC Structured Agency Credit Risk Debt Notes, | ||||||||
1.041%, 08/25/15 (A) (B) | 336 | 335 | ||||||
FNMA Connecticut Avenue Securities, Ser 2014-C02, Cl 1M1 | ||||||||
1.137%, 08/25/15 (A) (B) | 230 | 228 | ||||||
FNMA Connecticut Avenue Securities, Ser 2014-C02, Cl 2M1 | ||||||||
1.141%, 08/25/15 (A) (B) | 172 | 171 | ||||||
FNMA Connecticut Avenue Securities, Ser 2014-C03, Cl 1M1 | ||||||||
1.391%, 08/25/15 (A) (B) | 487 | 485 | ||||||
FNMA Connecticut Avenue Securities, Ser 2015-C02, Cl 1M1 | ||||||||
1.337%, 08/25/15 (A) (B) | 129 | 128 | ||||||
GE Capital Commercial Mortgage, | ||||||||
5.318%, 08/01/15 (A) | 777 | 777 | ||||||
GMAC Mortgage Loan Trust, | ||||||||
2.992%, 08/01/15 (A) (B) | 216 | 199 | ||||||
Granite Master Issuer PLC, | ||||||||
0.268%, 08/22/15 (A) (B) | 420 | 417 | ||||||
Granite Master Issuer PLC, | ||||||||
0.270%, 08/20/15 (A) (B) | 395 | 393 | ||||||
Granite Master Issuer PLC, | ||||||||
0.368%, 08/20/15 (A) (B) | 51 | 51 | ||||||
Granite Master Issuer PLC, | ||||||||
0.388%, 08/20/15 (A) (B) | 61 | 61 | ||||||
Granite Master Issuer PLC, | ||||||||
0.328%, 08/20/15 (A) (B) | 54 | 53 | ||||||
Granite Master Issuer PLC, | ||||||||
0.488%, 08/20/15 (A) (B) | 350 | 338 | ||||||
GS Mortgage Securities II, | ||||||||
3.849%, 12/10/43 (B) | 614 | 624 | ||||||
GS Mortgage Securities II, | ||||||||
0.662%, 11/10/45 | 154 | 153 | ||||||
GS Mortgage Securities II, | ||||||||
1.206%, 07/10/46 | 118 | 118 | ||||||
| SEI Daily Income Trust / Semi-Annual Report / July 31, 2015 | 27 |
SCHEDULE OF INVESTMENTS (Unaudited)
Ultra Short Duration Bond Fund (Continued)
July 31, 2015
| Description | Face Amount ($ Thousands) | Value ($ Thousands) | ||||||
GS Mortgage Securities II, | ||||||||
1.217%, 08/10/46 | $ | 169 | $ | 170 | ||||
GSR Mortgage Loan Trust, | ||||||||
2.778%, 08/01/15 (A) (B) | 260 | 236 | ||||||
GSR Mortgage Loan Trust, | ||||||||
2.701%, 08/01/15 (A) (B) | 288 | 267 | ||||||
GSR Mortgage Loan Trust, | ||||||||
2.739%, 08/01/15 (A) (B) | 248 | 203 | ||||||
Hilton USA Trust, Ser HLF, Cl AFL | ||||||||
1.188%, 08/10/15 (A) (B) | 222 | 222 | ||||||
Hilton USA Trust, Ser ORL, Cl A | ||||||||
1.086%, 08/15/15 (A) (B) | 1,000 | 984 | ||||||
Homestar Mortgage Acceptance, | ||||||||
0.765%, 08/25/15 (A) (B) | 392 | 391 | ||||||
Impac CMB Trust, | ||||||||
0.945%, 08/25/15 (A) (B) | 69 | 63 | ||||||
Impac CMB Trust, | ||||||||
0.710%, 08/03/15 (A) (B) | 76 | 70 | ||||||
Impac CMB Trust, Ser 2005-3, Cl A1 | ||||||||
0.665%, 08/25/15 (A) (B) | 70 | 63 | ||||||
Impac CMB Trust, Ser 2005-5, Cl A1 | ||||||||
0.825%, 08/25/15 (A) (B) | 57 | 51 | ||||||
Impac CMB Trust, Ser 2005-8, Cl 1A | ||||||||
0.445%, 08/25/15 (A) (B) | 186 | 160 | ||||||
JPMorgan Chase Commercial Mortgage Securities Trust, | ||||||||
4.918%, 08/01/15 (A) | 57 | 57 | ||||||
JPMorgan Chase Commercial Mortgage Securities Trust, | ||||||||
5.905%, 08/01/15 (A) | 164 | 167 | ||||||
JPMorgan Chase Commercial Mortgage Securities Trust, | ||||||||
2.977%, 11/15/45 | 585 | 604 | ||||||
JPMorgan Chase Commercial Mortgage Securities Trust, | ||||||||
1.087%, 08/15/15 (A) (B) | 875 | 870 | ||||||
JPMorgan Chase Commercial Mortgage Securities Trust, | ||||||||
1.384%, 08/15/15 (A) (B) | 375 | 376 | ||||||
| Description | Face Amount ($ Thousands) | Value ($ Thousands) | ||||||
JPMorgan Chase Commercial Mortgage Securities Trust, | ||||||||
1.436%, 08/15/15 (A) (B) | $ | 1,000 | $ | 998 | ||||
JPMorgan Chase Commercial Mortgage Securities, | ||||||||
3.853%, 06/15/43 (B) | 18 | 18 | ||||||
JPMorgan Chase Commercial Mortgage Securities, | ||||||||
0.705%, 10/15/45 | 55 | 55 | ||||||
JPMorgan Chase Commercial Mortgage Securities, | ||||||||
1.303%, 01/15/46 | 157 | 158 | ||||||
JPMorgan Mortgage Trust, Ser 2005-A6, Cl 7A1 | ||||||||
2.531%, 08/01/15 (A) (B) | 130 | 122 | ||||||
JPMorgan Mortgage Trust, | ||||||||
2.528%, 08/01/15 (A) (B) | 156 | 134 | ||||||
LB-UBS Commercial Mortgage Trust, Ser 2007-C6, Cl A4 | ||||||||
5.858%, 07/15/40 (A) | 394 | 413 | ||||||
Merrill Lynch Mortgage Investors, | ||||||||
0.457%, 08/25/15 (A) (B) | 67 | 64 | ||||||
Merrill Lynch Mortgage-Backed Securities Trust, | ||||||||
2.896%, 08/01/15 (A) (B) | 272 | 229 | ||||||
ML-CFC Commercial Mortgage Trust, | ||||||||
5.378%, 08/12/48 | 110 | 114 | ||||||
Morgan Stanley Bank of America Merrill Lynch Trust, | ||||||||
1.972%, 08/15/45 | 299 | 302 | ||||||
Morgan Stanley Bank of America Merrill Lynch Trust, | ||||||||
0.664%, 11/15/45 | 60 | 60 | ||||||
Morgan Stanley Bank of America Merrill Lynch Trust, | ||||||||
3.085%, 08/15/46 | 200 | 207 | ||||||
Morgan Stanley Re-Remic Trust, | ||||||||
1.000%, 03/27/51 (B) | 272 | 271 | ||||||
MortgageIT Trust, Ser 2005-5, Cl A1 | ||||||||
0.447%, 08/25/15 (A) (B) | 264 | 239 | ||||||
| 28 | SEI Daily Income Trust / Semi-Annual Report / July 31, 2015 |
| Description | Face Amount ($ Thousands) | Value ($ Thousands) | ||||||
Opteum Mortgage Acceptance Asset-Backed Pass-Through Certificates, | ||||||||
0.524%, 08/25/15 (A) (B) | $ | 165 | $ | 166 | ||||
Paragon Mortgages PLC, | ||||||||
0.494%, 08/15/15 (A) (B) | 114 | 103 | ||||||
Paragon Mortgages PLC, | ||||||||
0.506%, 10/19/15 (A) (B) | 271 | 244 | ||||||
Residential Funding Mortgage Securities I, | ||||||||
3.834%, 08/01/15 (A) (B) | 203 | 165 | ||||||
Sequoia Mortgage Trust, | ||||||||
0.728%, 08/20/15 (A) (B) | 32 | 30 | ||||||
Silverstone Master Issuer PLC, | ||||||||
1.842%, 10/22/15 (A) (B) | 100 | 100 | ||||||
Springleaf Mortgage Loan Trust, | ||||||||
1.270%, 06/25/58 (A) (B) | 198 | 198 | ||||||
UBS-Barclays Commercial Mortgage Trust, Ser 2012-C3, Cl A1 | ||||||||
0.726%, 08/10/49 | 228 | 227 | ||||||
Wachovia Bank Commercial Mortgage Trust, | ||||||||
5.262%, 08/01/15 (A) | 31 | 31 | ||||||
Wachovia Bank Commercial Mortgage Trust, | ||||||||
5.284%, 08/01/15 (A) | 165 | 165 | ||||||
WaMu Mortgage Pass-Through Certificates, | ||||||||
2.312%, 08/01/15 (A) (B) | 290 | 267 | ||||||
Wells Fargo Commercial Mortgage Trust, Ser 2012-LC5, Cl A1 | ||||||||
0.687%, 10/15/45 | 222 | 221 | ||||||
Wells Fargo Mortgage-Backed Securities Trust, | ||||||||
2.621%, 08/01/15 (A) (B) | 119 | 120 | ||||||
Wells Fargo Mortgage-Backed Securities Trust, | ||||||||
2.683%, 08/01/15 (A) (B) | 243 | 237 | ||||||
Wells Fargo Mortgage-Backed Securities Trust, | ||||||||
2.498%, 08/01/15 (A) (B) | 138 | 129 | ||||||
| Description | Face Amount ($ Thousands) | Value ($ Thousands) | ||||||
WFRBS Commercial Mortgage Trust, | ||||||||
3.791%, 02/15/44 (B) | $ | 859 | $ | 862 | ||||
WFRBS Commercial Mortgage Trust, | ||||||||
3.240%, 03/15/44 (B) | 282 | 285 | ||||||
WFRBS Commercial Mortgage Trust, | ||||||||
0.734%, 12/15/45 | 496 | 494 | ||||||
WFRBS Commercial Mortgage Trust, | ||||||||
1.081%, 04/15/45 | 91 | 91 | ||||||
WFRBS Commercial Mortgage Trust, | �� | |||||||
0.673%, 11/15/45 | 285 | 284 | ||||||
WFRBS Commercial Mortgage Trust, | ||||||||
1.264%, 08/15/46 | 119 | 120 | ||||||
|
| |||||||
| 29,814 | ||||||||
|
| |||||||
Total Mortgage-Backed Securities | 41,679 | |||||||
|
| |||||||
U.S. GOVERNMENT AGENCY OBLIGATIONS — 4.5% |
| |||||||
FFCB | ||||||||
0.450%, 09/08/16 | 3,000 | 3,000 | ||||||
FHLB | ||||||||
0.375%, 06/24/16 to 06/24/16 | 4,500 | 4,499 | ||||||
1.125%, 09/28/16 | 880 | 881 | ||||||
1.625%, 04/13/17 | 950 | 953 | ||||||
FHLMC | ||||||||
1.000%, 06/19/17 | 500 | 501 | ||||||
1.400%, 05/25/18 | 400 | 400 | ||||||
1.500%, 06/25/18 | 700 | 701 | ||||||
FHLMC MTN | ||||||||
1.400%, 05/25/18 | 1,500 | 1,501 | ||||||
|
| |||||||
Total U.S. Government Agency Obligations | 12,436 | |||||||
|
| |||||||
MUNICIPAL BONDS — 4.3% |
| |||||||
California — 0.7% | ||||||||
California State, RB | ||||||||
5.950%, 04/01/16 | 920 | 953 | ||||||
Orange County, Ser A, RB | ||||||||
0.580%, 11/02/15 | 445 | 445 | ||||||
University of California, Ser Y-1, RB | ||||||||
0.687%, 08/01/15 (A) | 490 | 490 | ||||||
|
| |||||||
| 1,888 | ||||||||
|
| |||||||
Florida — 0.2% | ||||||||
Florida State, Hurricane Catastrophe Fund Finance, Ser A, RB | ||||||||
1.298%, 07/01/16 | 620 | 623 | ||||||
|
| |||||||
| SEI Daily Income Trust / Semi-Annual Report / July 31, 2015 | 29 |
SCHEDULE OF INVESTMENTS (Unaudited)
Ultra Short Duration Bond Fund (Continued)
July 31, 2015
| Description | Face Amount ($ Thousands) | Value ($ Thousands) | ||||||
Hawaii — 0.2% | ||||||||
Hawaii State, Ser ES, GO | ||||||||
0.731%, 08/01/16 | $ | 655 | $ | 656 | ||||
|
| |||||||
Illinois — 0.2% | ||||||||
City of Chicago, Midway Airport Revenue, Ser C, RB | ||||||||
1.320%, 01/01/16 | 270 | 271 | ||||||
Illinois State, Ser B, GO | ||||||||
1.780%, 04/01/16 | 300 | 301 | ||||||
|
| |||||||
| 572 | ||||||||
|
| |||||||
Kentucky — 0.2% | ||||||||
Louisville, Regional Airport Authority, Ser C, RB | ||||||||
0.769%, 07/01/16 | 410 | 411 | ||||||
|
| |||||||
Minnesota — 0.2% | ||||||||
St. Paul, Housing and Redevelopment Authority, GO | ||||||||
1.041%, 07/01/16 | 415 | 415 | ||||||
|
| |||||||
New Jersey — 1.7% | ||||||||
New Jersey State, Economic Development Authority, Ser 00, RB | ||||||||
1.059%, 03/01/16 | 500 | 499 | ||||||
New Jersey State, Economic Development Authority, Ser Q, RB | ||||||||
1.096%, 06/15/16 | 2,675 | 2,664 | ||||||
New Jersey State, Transportation Trust Fund Authority, Ser B, RB | ||||||||
1.087%, 12/15/16 | 1,250 | 1,242 | ||||||
New Jersey State, Turnpike Authority, Ser B, RB | ||||||||
4.252%, 01/01/16 | 175 | 178 | ||||||
|
| |||||||
| 4,583 | ||||||||
|
| |||||||
North Carolina — 0.3% | ||||||||
North Carolina Eastern Municipal Power Agency, RB | ||||||||
1.561%, 07/01/17 | 790 | 793 | ||||||
|
| |||||||
Pennsylvania — 0.0% | ||||||||
Pennsylvania Industrial Development Authority, RB | ||||||||
1.635%, 07/01/16 (B) | 120 | 120 | ||||||
|
| |||||||
Texas — 0.4% | ||||||||
City of El Paso, Harris County Toll Road Authority, GO | ||||||||
1.049%, 08/15/16 | 455 | 457 | ||||||
| Description | Face Amount ($ Thousands) | Value ($ Thousands) | ||||||
Harris County, Toll Road Authority, RB | ||||||||
2.440%, 08/15/15 | $ | 735 | $ | 735 | ||||
|
| |||||||
| 1,192 | ||||||||
|
| |||||||
Utah — 0.2% | ||||||||
Intermountain Power Agency, | ||||||||
0.785%, 07/01/16 | 610 | 610 | ||||||
|
| |||||||
Total Municipal Bonds | 11,863 | |||||||
|
| |||||||
U.S. TREASURY OBLIGATIONS — 3.8% |
| |||||||
U.S. Treasury Notes | ||||||||
0.625%, 11/30/17 to 11/30/17 | 8,200 | 8,136 | ||||||
1.375%, 06/30/18 | 2,390 | 2,418 | ||||||
|
| |||||||
Total U.S. Treasury Obligations |
| 10,554 | ||||||
|
| |||||||
COMMERCIAL PAPER — 1.0% |
| |||||||
Motiva Enterprises | ||||||||
0.510%, 08/03/15 | 2,000 | 2,000 | ||||||
Prudential Financial | ||||||||
0.350%, 08/04/15 | 700 | 700 | ||||||
|
| |||||||
Total Commercial Paper |
| 2,700 | ||||||
|
| |||||||
REPURCHASE AGREEMENT — 1.8% |
| |||||||
BNP Paribas | 4,800 | 4,800 | ||||||
|
| |||||||
Total Repurchase Agreement (Cost $4,800) ($ Thousands) | 4,800 | |||||||
|
| |||||||
Total Investments — 101.5% | $ | 278,500 | ||||||
|
| |||||||
A list of the open futures contracts held by the Fund at July 31, 2015, is as follows:
| Type of Contract | Number of Contracts Long (Short) | Expiration Date | Unrealized Appreciation (Depreciation) ($ Thousands) | |||||||||
U.S. 2-Year Treasury Note | (6 | ) | Oct-2015 | $ | (3 | ) | ||||||
U.S. 5-Year Treasury Note | 10 | Oct-2015 | 6 | |||||||||
U.S. Long Treasury Bond | (1 | ) | Sep-2015 | (1 | ) | |||||||
U.S. 10-Year Tresuary Note | (23 | ) | Sep-2015 | (4 | ) | |||||||
|
| |||||||||||
| $ | (2 | ) | ||||||||||
|
| |||||||||||
| 30 | SEI Daily Income Trust / Semi-Annual Report / July 31, 2015 |
For the period ended July 31, 2015, the total amount of all open futures contracts, as presented in the table above, are representative of the volume of activity for this derivative type during the period.
Percentages are based on Net Assets of $274,424 ($ Thousands).
| † | Real Estate Investment Trust. |
| (A) | Floating Rate Instrument. The rate reflected on the Schedule of Investments is the rate in effect on July 31, 2015. The demand and interest rate reset features give this security a shorter effective maturity date. |
| (B) | Securities sold within terms of a private placement memorandum, exempt from registration under Section 144A of the Securities Act of 1933, as amended, and may be sold only to dealers in that program or other “accredited investors.” These securities have been determined to be liquid under guidelines established by the Board of Trustees. |
| (C) | Tri-Party Repurchase Agreement. |
CDO — Collateralized Debt Obligation
Cl — Class
CLO — Collateralized Loan Obligation
FDIC — Federal Deposit Insurance Corporation
FFCB — Federal Farm Credit Bank
FHLB — Federal Home Loan Bank
FHLMC — Federal Home Loan Mortgage Corporation
FMAC — Financial Management Advisory Committee
FNMA — Federal National Mortgage Association
GNMA — Government National Mortgage Association
GO — General Obligation
LLC — Limited Liability Company
MTN — Medium Term Note
NCUA — National Credit Union Association
PLC — Public Limited Company
RB — Revenue Bond
REMIC — Real Estate Mortgage Investment Conduit
Ser — Series
TBA — To Be Announced
The following is a summary of the inputs used as of July 31, 2015 in valuing the Fund’s investments and other financial instruments carried at value ($ Thousands):
| Investments in Securities | Level 1 | Level 2 | Level 3 | Total | ||||||||||||
Corporate Obligations | $ | — | $ | 134,780 | $ | — | $ | 134,780 | ||||||||
Asset-Backed Securities | — | 59,688 | — | 59,688 | ||||||||||||
Mortgage-Backed Securities | — | 41,679 | — | 41,679 | ||||||||||||
U.S. Government Agency Obligations | — | 12,436 | — | 12,436 | ||||||||||||
Municipal Bonds | — | 11,863 | — | 11,863 | ||||||||||||
Commercial Paper | — | 2,700 | — | 2,700 | ||||||||||||
U.S. Treasury Obligations | — | 10,554 | — | 10,554 | ||||||||||||
Repurchase Agreement | — | 4,800 | — | 4,800 | ||||||||||||
|
|
|
|
|
|
|
| |||||||||
Total Investments in Securities | $ | — | $ | 278,500 | $ | — | $ | 278,500 | ||||||||
|
|
|
|
|
|
|
| |||||||||
| Other Financial Instruments | Level 1 | Level 2 | �� | Level 3 | Total | |||||||||||
Futures Contracts* | ||||||||||||||||
Unrealized Appreciation | $ | 6 | $ | — | $ | — | $ | 6 | ||||||||
Unrealized Depreciation | (8 | ) | — | — | (8 | ) | ||||||||||
|
|
|
|
|
|
|
| |||||||||
Total Other Financial Instruments | $ | (2 | ) | $ | — | $ | — | $ | (2 | ) | ||||||
|
|
|
|
|
|
|
| |||||||||
| * | Futures Contracts are valued at the net unrealized appreciation/(depreciation) on the instruments. |
As of July 31, 2015, there were no transfers between Level 1 and Level 2 assets and liabilities. As of July 31, 2015, there were no Level 3 securities.
For more information on valuation inputs, see Note 2 — Significant Accounting Policies in Notes to Financial Statements.
Amounts designated as “—” are $0 or have been rounded to $0.
The accompanying notes are an integral part of the financial statements.
| SEI Daily Income Trust / Semi-Annual Report / July 31, 2015 | 31 |
SCHEDULE OF INVESTMENTS (Unaudited)
Short-Duration Government Fund
July 31, 2015
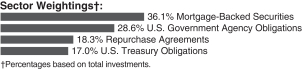
| Description | Face Amount ($ Thousands) | Value ($ Thousands) | ||||||
MORTGAGE-BACKED SECURITIES — 40.3% |
| |||||||
Agency Mortgage-Backed Obligations — 40.3% |
| |||||||
FHLMC | ||||||||
4.879%, 05/19/17 | $ | 5,000 | $ | 5,278 | ||||
4.500%, 02/01/22 to 06/01/26 | 8,730 | 9,317 | ||||||
2.705%, 08/01/15 (A) | 1 | 1 | ||||||
2.566%, 08/01/15 (A) | 38 | 39 | ||||||
2.551%, 08/01/15 (A) | 4,478 | 4,652 | ||||||
2.548%, 08/01/15 (A) | 25 | 26 | ||||||
2.427%, 08/01/15 (A) | 2 | 2 | ||||||
2.403%, 08/01/15 (A) | 11 | 11 | ||||||
2.381%, 08/01/15 (A) | 6 | 6 | ||||||
2.375%, 08/01/15 (A) | 11 | 11 | ||||||
2.357%, 08/01/15 (A) | 1,013 | 1,062 | ||||||
2.339%, 08/01/15 (A) | 25 | 26 | ||||||
2.310%, 08/01/15 (A) | 16 | 17 | ||||||
2.260%, 08/01/15 (A) | 9 | 10 | ||||||
2.250%, 08/01/15 (A) | 64 | 67 | ||||||
2.174%, 08/01/15 (A) | 8 | 9 | ||||||
2.169%, 08/01/15 (A) | 9 | 9 | ||||||
2.125%, 08/01/15 (A) | 9 | 9 | ||||||
2.000%, 08/01/15 (A) | 2 | 3 | ||||||
1.875%, 08/01/15 (A) | 2 | 2 | ||||||
1.750%, 08/01/15 (A) | 2 | 2 | ||||||
1.625%, 08/01/15 (A) | 3 | 3 | ||||||
FHLMC REMIC, Ser 2002-42, Cl A5 | ||||||||
7.500%, 02/25/42 | 474 | 564 | ||||||
FHLMC REMIC, Ser 2004-2864, Cl NV | ||||||||
4.500%, 08/15/15 | 32 | 32 | ||||||
FHLMC REMIC, Ser 2006-3148, Cl CF | ||||||||
0.587%, 11/15/15 | 426 | 430 | ||||||
FHLMC REMIC, Ser 2006-3174, Cl FA | ||||||||
0.487%, 04/15/36 | 3,081 | 3,085 | ||||||
FHLMC REMIC, Ser 2010-3628, Cl PJ | ||||||||
4.500%, 01/15/40 | 4,545 | 4,923 | ||||||
FHLMC REMIC, Ser 3153, Cl FX | ||||||||
0.537%, 11/15/15 | 162 | 163 | ||||||
FHLMC, Ser K710, Cl A2 | ||||||||
1.883%, 05/25/19 | 6,000 | 6,057 | ||||||
FHLMC, Ser KGRP, Cl A | ||||||||
0.564%, 08/25/15 | 6,083 | 6,105 | ||||||
FNMA | ||||||||
7.000%, 06/01/37 | 14 | 16 | ||||||
| Description | Face Amount ($ Thousands) | Value ($ Thousands) | ||||||
6.500%, 05/01/26 to 01/01/36 | $ | 376 | $ | 441 | ||||
6.000%, 02/01/23 to 09/01/24 | 4,159 | 4,602 | ||||||
5.500%, 06/01/16 to 12/01/25 | 1,083 | 1,195 | ||||||
5.300%, 07/01/19 | 767 | 823 | ||||||
5.250%, 08/01/24 | 1,299 | 1,529 | ||||||
5.090%, 08/01/15 (A) | 3,782 | 3,818 | ||||||
5.000%, 03/01/19 to 08/01/19 | 131 | 137 | ||||||
4.500%, 08/01/21 to 10/01/31 | 6,191 | 6,767 | ||||||
4.450%, 01/01/21 | 5,172 | 5,737 | ||||||
4.330%, 04/01/21 to 07/01/21 | 3,739 | 4,153 | ||||||
4.301%, 07/01/21 | 531 | 588 | ||||||
4.295%, 06/01/21 | 3,693 | 4,090 | ||||||
4.230%, 01/01/21 | 4,699 | 5,184 | ||||||
4.070%, 04/01/19 | 1,182 | 1,266 | ||||||
4.066%, 07/01/20 | 2,628 | 2,854 | ||||||
4.050%, 01/01/21 | 1,000 | 1,087 | ||||||
4.040%, 06/01/21 | 11,642 | 12,708 | ||||||
4.000%, 05/01/26 to 08/01/26 | 3,685 | 3,899 | ||||||
3.980%, 08/01/21 | 2,292 | 2,497 | ||||||
3.970%, 06/01/21 | 1,996 | 2,169 | ||||||
3.890%, 01/01/24 | 1,138 | 1,238 | ||||||
3.880%, 12/01/20 | 93 | 101 | ||||||
3.870%, 09/01/21 | 946 | 1,027 | ||||||
3.840%, 08/01/21 | 6,945 | 7,530 | ||||||
3.800%, 01/01/23 | 1,962 | 2,126 | ||||||
3.770%, 08/01/21 | 973 | 1,050 | ||||||
3.750%, 06/01/22 | 1,252 | 1,349 | ||||||
3.743%, 06/01/18 | 2,824 | 2,991 | ||||||
3.700%, 11/01/20 | 859 | 921 | ||||||
3.630%, 01/01/18 | 2,335 | 2,448 | ||||||
3.580%, 12/01/20 | 928 | 995 | ||||||
3.500%, 11/01/21 | 3,122 | 3,338 | ||||||
3.470%, 11/01/20 | 166 | 177 | ||||||
3.400%, 03/01/22 | 3,721 | 3,955 | ||||||
3.355%, 01/01/27 | 1,359 | 1,419 | ||||||
3.270%, 05/01/21 | 496 | 525 | ||||||
3.260%, 12/01/20 | 587 | 621 | ||||||
3.250%, 04/01/21 to 11/01/21 | 2,670 | 2,821 | ||||||
3.210%, 09/01/21 | 347 | 365 | ||||||
3.050%, 10/01/20 | 59 | 61 | ||||||
2.990%, 10/01/17 | 3,219 | 3,322 | ||||||
2.940%, 06/01/22 | 300 | 312 | ||||||
2.930%, 05/01/22 | 722 | 749 | ||||||
2.830%, 05/01/21 | 453 | 470 | ||||||
2.810%, 06/01/22 | 1,000 | 1,029 | ||||||
2.759%, 04/01/22 | 641 | 661 | ||||||
2.720%, 05/01/21 | 2,145 | 2,218 | ||||||
2.515%, 10/01/22 | 700 | 707 | ||||||
2.383%, 08/01/15 (A) | 283 | 296 | ||||||
2.360%, 06/01/19 | 1,540 | 1,578 | ||||||
2.310%, 10/01/22 | 2,320 | 2,322 | ||||||
2.295%, 08/01/15 (A) | 15 | 15 | ||||||
2.250%, 10/01/22 to 10/01/22 | 5,313 | 5,286 | ||||||
2.220%, 10/01/22 | 2,305 | 2,296 | ||||||
| 32 | SEI Daily Income Trust / Semi-Annual Report / July 31, 2015 |
| Description | Face Amount ($ Thousands) | Value ($ Thousands) | ||||||
2.194%, 08/01/15 (A) | $ | 449 | $ | 468 | ||||
2.150%, 05/01/22 | 4,752 | 4,715 | ||||||
2.103%, 08/01/15 (A) | 29 | 30 | ||||||
2.092%, 08/01/15 (A) | 150 | 157 | ||||||
2.067%, 08/01/15 (A) | 246 | 250 | ||||||
2.016%, 08/01/15 (A) | 90 | 92 | ||||||
FNMA REMIC, Ser 1992-61, Cl FA | ||||||||
0.841%, 11/25/15 (A) | 58 | 59 | ||||||
FNMA REMIC, Ser 1993-32, Cl H | ||||||||
6.000%, 03/25/23 | 23 | 25 | ||||||
FNMA REMIC, Ser 1993-5, Cl Z | ||||||||
6.500%, 02/25/23 | 12 | 13 | ||||||
FNMA REMIC, Ser 1994-77, Cl FB | ||||||||
1.691%, 08/25/15 (A) | 5 | 5 | ||||||
FNMA REMIC, Ser 2001-51, Cl QN | ||||||||
6.000%, 10/25/16 | 11 | 12 | ||||||
FNMA REMIC, Ser 2002-3, Cl PG | ||||||||
5.500%, 02/25/17 | 59 | 60 | ||||||
FNMA REMIC, Ser 2002-53, Cl FK | ||||||||
0.591%, 08/25/15 (A) | 87 | 88 | ||||||
FNMA REMIC, Ser 2003-76, Cl CA | ||||||||
3.750%, 07/25/33 | 122 | 127 | ||||||
FNMA REMIC, Ser 2006-76, Cl QF | ||||||||
0.591%, 11/25/15 (A) | 801 | 807 | ||||||
FNMA REMIC, Ser 2006-79, Cl DF | ||||||||
0.541%, 11/25/15 (A) | 663 | 666 | ||||||
FNMA REMIC, Ser 2007-47, Cl DA | ||||||||
5.600%, 05/25/37 | 843 | 936 | ||||||
FNMA REMIC, Ser 2007-64, Cl FB | ||||||||
0.561%, 07/25/37 (A) | 4,455 | 4,462 | ||||||
FNMA REMIC, Ser 2008-16, Cl FA | ||||||||
0.891%, 03/25/38 (A) | 6,472 | 6,551 | ||||||
FNMA REMIC, Ser 2010-149, Cl VA | ||||||||
4.500%, 02/25/22 | 6,599 | 7,121 | ||||||
FNMA REMIC, Ser 2010-4, Cl PL | ||||||||
4.500%, 02/25/40 | 3,494 | 3,852 | ||||||
FNMA TBA | ||||||||
6.000%, 08/01/33 | 2,200 | 2,497 | ||||||
5.500%, 08/01/37 | 700 | 786 | ||||||
5.000%, 08/15/40 | 500 | 553 | ||||||
4.500%, 09/01/33 | 28,300 | 30,702 | ||||||
4.000%, 08/13/39 | 21,100 | 22,447 | ||||||
3.500%, 08/01/40 to 09/01/40 | 27,800 | 29,002 | ||||||
FNMA, Ser 2010-M5, Cl A2 | ||||||||
2.806%, 07/25/20 | 7,705 | 7,914 | ||||||
GNMA | ||||||||
6.500%, 04/15/17 to 02/20/39 | 570 | 652 | ||||||
6.000%, 06/15/16 to 06/15/41 | 13,620 | 15,665 | ||||||
5.500%, 10/15/34 to 02/15/41 | 4,653 | 5,240 | ||||||
5.000%, 09/15/39 to 04/15/41 | 3,142 | 3,487 | ||||||
4.000%, 07/15/41 to 08/15/41 | 307 | 328 | �� | |||||
GNMA TBA | ||||||||
6.000%, 08/01/33 | 1,600 | 1,805 | ||||||
5.500%, 08/01/23 | 500 | 561 | ||||||
| Description | Face Amount ($ Thousands) | Value ($ Thousands) | ||||||
5.000%, 08/20/38 | $ | 500 | $ | 553 | ||||
4.000%, 08/01/39 | 100 | 106 | ||||||
3.500%, 08/15/41 | 8,500 | 8,876 | ||||||
NCUA Guaranteed Notes, Ser 2010-R1, Cl 2A | ||||||||
1.840%, 10/07/20 | 77 | 78 | ||||||
|
| |||||||
Total Mortgage-Backed Securities |
| 325,548 | ||||||
|
| |||||||
U.S. GOVERNMENT AGENCY OBLIGATIONS — 32.0% |
| |||||||
FHLMC | ||||||||
0.875%, 02/22/17 (C) | 88,715 | 89,013 | ||||||
FNMA | ||||||||
1.250%, 09/28/16 to 01/30/17 | 125,600 | 126,729 | ||||||
0.875%, 05/21/18 | 35,400 | 35,243 | ||||||
HUD | ||||||||
0.930%, 08/01/17 | 7,000 | 6,981 | ||||||
|
| |||||||
Total U.S. Government Agency Obligations |
| 257,966 | ||||||
|
| |||||||
U.S. TREASURY OBLIGATIONS — 19.0% |
| |||||||
U.S. Treasury Notes | ||||||||
4.500%, 02/15/16 | 46,550 | 47,612 | ||||||
0.875%, 04/30/17 | 97,365 | 97,806 | ||||||
1.500%, 01/31/19 | 7,575 | 7,657 | ||||||
|
| |||||||
Total U.S. Treasury Obligations |
| 153,075 | ||||||
|
| |||||||
REPURCHASE AGREEMENTS — 20.5% |
| |||||||
BNP Paribas | 133,500 | 133,500 | ||||||
Deutsche Bank | 32,100 | 32,100 | ||||||
|
| |||||||
Total Repurchase Agreements (Cost $165,600) ($ Thousands) | 165,600 | |||||||
|
| |||||||
Total Investments — 111.8% | $ | 902,189 | ||||||
|
| |||||||
| SEI Daily Income Trust / Semi-Annual Report / July 31, 2015 | 33 |
SCHEDULE OF INVESTMENTS (Unaudited)
Short-Duration Government Fund (Concluded)
July 31, 2015
A list of the open futures contracts held by the Fund at July 31, 2015, is as follows:
| Type of Contract | Number of Contracts | Expiration Date | Unrealized Appreciation (Depreciation) ($ Thousands) | |||||||||
U.S. 10-Year Treasury Note | 101 | Sep-2015 | $ | 59 | ||||||||
U.S. 2-Year Treasury Note | 209 | Oct-2015 | (37 | ) | ||||||||
U.S. 5-Year Treasury Note | (521 | ) | Oct-2015 | (299 | ) | |||||||
U.S. Long Treasury Bond | 15 | Sep-2015 | 64 | |||||||||
|
| |||||||||||
| $ | (213 | ) | ||||||||||
|
| |||||||||||
For the period ended July 31, 2015, the total amount of all open futures contracts, as presented in the table above, are representative of the volume of activity for this derivative type during the period.
Percentages are based on Net Assets of $806,974 ($ Thousands).
| (A) | Floating Rate Instrument. The rate reflected on the Schedule of Investments is the rate in effect on July 31, 2015. The demand and interest rate reset features give this security a shorter effective maturity date. |
| (B) | Tri-Party Repurchase Agreement. |
| (C) | Security, or portion thereof, has been pledged as collateral on open futures contracts. |
Cl — Class
FCSB — Federal Farm Credit Banks Consolidated Systemwide Bonds
FHLMC — Federal Home Loan Mortgage Corporation
FMAC — Financial Management Advisory Committee
FNMA — Federal National Mortgage Association
GNMA — Government National Mortgage Association
HUD — Housing and Urban Development
NCUA — National Credit Union Association
REMIC — Real Estate Mortgage Investment Conduit
Ser — Series
TBA — To Be Announced
The following is a summary of the inputs used as of July 31, 2015 in valuing the Fund’s investments and other financial instruments carried at value ($ Thousands):
| Investments in Securities | Level 1 | Level 2 | Level 3 | Total | ||||||||||||
Mortgage-Backed Securities | $ | — | $ | 325,548 | $ | — | $ | 325,548 | ||||||||
U.S. Government Agency Obligations | — | 257,966 | — | 257,966 | ||||||||||||
U.S. Treasury Obligations | — | 153,075 | — | 153,075 | ||||||||||||
Repurchase Agreements | — | 165,600 | — | 165,600 | ||||||||||||
|
|
|
|
|
|
|
| |||||||||
Total Investments in Securities | $ | — | $ | 902,189 | $ | — | $ | 902,189 | ||||||||
|
|
|
|
|
|
|
| |||||||||
| Other Financial Instruments | Level 1 | Level 2 | Level 3 | Total | ||||||||||||
Futures Contracts* | ||||||||||||||||
Unrealized Appreciation | $ | 123 | $ | — | $ | — | $ | 123 | ||||||||
Unrealized Depreciation | (336 | ) | — | — | (336 | ) | ||||||||||
|
|
|
|
|
|
|
| |||||||||
Total Other Financial Instruments | $ | (213 | ) | $ | — | $ | — | $ | (213 | ) | ||||||
|
|
|
|
|
|
|
| |||||||||
| * | Futures Contracts are valued at the net unrealized appreciation/(depreciation) on the instruments. |
As of July 31, 2015, there were no transfers between Level 1 and Level 2 assets and liabilities. As of July 31, 2015, there were no Level 3 securities.
For more information on valuation inputs, see Note — 2 — Significant Accounting Policies in Notes to Financial Statements.
Amounts designated as “—” are $0 or have been rounded to $0.
The accompanying notes are an integral part of the financial statements.
| 34 | SEI Daily Income Trust / Semi-Annual Report / July 31, 2015 |
SCHEDULE OF INVESTMENTS (Unaudited)
Intermediate-Duration Government Fund
July 31, 2015
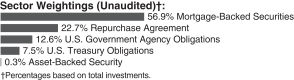
| Description | Face Amount ($ Thousands) | Value ($ Thousands) | ||||||
MORTGAGE-BACKED SECURITIES — 63.0% |
| |||||||
Agency Mortgage-Backed Obligations — 63.0% |
| |||||||
FHLMC | ||||||||
6.500%, 01/01/18 to 12/01/32 | $ | 80 | $ | 93 | ||||
6.000%, 09/01/24 | 271 | 307 | ||||||
5.500%, 06/01/19 to 12/01/20 | 120 | 127 | ||||||
2.551%, 08/01/15 (A) | 206 | 214 | ||||||
FHLMC REMIC, Ser 1990-165, Cl K | ||||||||
6.500%, 09/15/21 | 2 | 2 | ||||||
FHLMC REMIC, Ser 2004-2802, Cl PF | ||||||||
0.590%, 08/15/15 (A) | 106 | 106 | ||||||
FNMA | ||||||||
6.500%, 03/01/33 to 10/01/34 | 65 | 77 | ||||||
6.000%, 02/01/23 | 123 | 136 | ||||||
5.500%, 12/01/25 | 738 | 828 | ||||||
5.250%, 08/01/24 | 649 | 764 | ||||||
5.010%, 04/01/19 | 1,002 | 1,110 | ||||||
5.000%, 06/01/23 | 656 | 709 | ||||||
4.500%, 04/01/26 to 10/01/31 | 447 | 486 | ||||||
4.000%, 05/01/26 to 08/01/26 | 287 | 304 | ||||||
3.500%, 11/01/21 | 52 | 55 | ||||||
3.270%, 05/01/21 | 15 | 16 | ||||||
3.250%, 04/01/21 to 11/01/21 | 81 | 85 | ||||||
3.080%, 01/01/27 | 300 | 304 | ||||||
3.070%, 01/01/22 | 749 | 783 | ||||||
3.050%, 10/01/20 | 24 | 26 | ||||||
2.830%, 05/01/21 | 15 | 15 | ||||||
2.810%, 06/01/22 | 500 | 515 | ||||||
2.759%, 04/01/22 | 641 | 661 | ||||||
2.720%, 05/01/21 | 73 | 76 | ||||||
2.515%, 10/01/22 | 55 | 56 | ||||||
2.360%, 06/01/19 | 50 | 51 | ||||||
2.310%, 10/01/22 | 180 | 180 | ||||||
2.250%, 10/01/22 | 90 | 90 | ||||||
2.220%, 10/01/22 | 176 | 175 | ||||||
FNMA REMIC, Ser 2001-51, Cl QN | ||||||||
6.000%, 10/25/16 | 16 | 16 | ||||||
FNMA REMIC, Ser 2006-79, Cl DF | ||||||||
0.541%, 11/25/15 (A) | 117 | 118 | ||||||
FNMA REMIC, Ser 2007-47, Cl DA | ||||||||
5.600%, 05/25/37 | 147 | 163 | ||||||
FNMA REMIC, Ser 2010-149, Cl VA | ||||||||
4.500%, 02/25/22 | 675 | 729 | ||||||
| Description | Face Amount ($ Thousands) | Value ($ Thousands) | ||||||
FNMA TBA | ||||||||
4.500%, 09/01/33 | $ | 400 | $ | 434 | ||||
4.000%, 08/13/39 | 900 | 957 | ||||||
3.500%, 08/01/40 to 09/01/40 | 900 | 933 | ||||||
3.000%, 09/13/42 | 100 | 100 | ||||||
FNMA, Ser 2010-M5, Cl A2 | ||||||||
2.806%, 07/25/20 | 1,856 | 1,906 | ||||||
GNMA | ||||||||
8.750%, 07/20/17 to 07/20/17 | 2 | 2 | ||||||
8.500%, 11/20/16 to 08/20/17 | 3 | 3 | ||||||
7.500%, 11/15/25 to 03/15/27 | 10 | 12 | ||||||
6.000%, 09/15/24 | 306 | 346 | ||||||
5.000%, 05/15/40 to 06/15/40 | 36 | 40 | ||||||
4.500%, 06/15/41 | 158 | 172 | ||||||
4.000%, 07/15/41 | 209 | 223 | ||||||
GNMA TBA | ||||||||
3.500%, 08/15/41 | 200 | 209 | ||||||
3.000%, 08/15/42 | 100 | 103 | ||||||
NCUA Guaranteed Notes, Ser 2010-R1, Cl 2A | ||||||||
1.840%, 10/07/20 | 19 | 19 | ||||||
|
| |||||||
Total Mortgage-Backed Securities | 14,836 | |||||||
|
| |||||||
U.S. TREASURY OBLIGATIONS — 8.3% |
| |||||||
U.S. Treasury Notes | ||||||||
1.500%, 01/31/19 | 1,530 | 1,547 | ||||||
2.375%, 08/15/24 | 400 | 406 | ||||||
|
| |||||||
Total U.S. Treasury Obligations | 1,953 | |||||||
|
| |||||||
U.S. GOVERNMENT AGENCY OBLIGATIONS — 14.0% |
| |||||||
FHLMC | ||||||||
0.875%, 03/07/18 | 3,120 | 3,111 | ||||||
HUD | ||||||||
1.880%, 08/01/19 | 175 | 178 | ||||||
|
| |||||||
Total U.S. Government Agency Obligations |
| 3,289 | ||||||
|
| |||||||
ASSET-BACKED SECURITY — 0.4% |
| |||||||
Other — 0.4% | ||||||||
Small Business Administration, Ser 2005-P10B, Cl 1 | ||||||||
4.940%, 08/10/15 | 86 | 86 | ||||||
|
| |||||||
Total Asset-Backed Security | 86 | |||||||
|
| |||||||
| SEI Daily Income Trust / Semi-Annual Report / July 31, 2015 | 35 |
SCHEDULE OF INVESTMENTS (Unaudited)
Intermediate-Duration Government Fund (Concluded)
July 31, 2015
| Description | Face Amount ($ Thousands) | Value ($ Thousands) | ||||||
REPURCHASE AGREEMENT — 25.0% |
| |||||||
BNP Paribas | $ | 5,900 | $ | 5,900 | ||||
|
| |||||||
Total Repurchase Agreement | 5,900 | |||||||
|
| |||||||
Total Investments — 110.7% | $ | 26,064 | ||||||
|
| |||||||
A list of the open futures contracts held by the Fund at July 31, 2015, is as follows:
| Type of Contract | Number of Contracts Long | Expiration Date | Unrealized Appreciation ($ Thousands) | |||||||||
U.S. 10-Year Treasury Note | (6 | ) | Sep-2015 | $ | (3 | ) | ||||||
U.S. 2-Year Treasury Note | (21 | ) | Oct-2015 | (9 | ) | |||||||
U.S. 5-Year Treasury Note | 90 | Oct-2015 | 60 | |||||||||
U.S. Long Treasury Bond | (1 | ) | Sep-2015 | (5 | ) | |||||||
|
| |||||||||||
| $ | 43 | |||||||||||
|
| |||||||||||
For the period ended July 31, 2015, the total amount of all open futures contracts, as presented in the table above, are representative of the volume of activity for this derivative type during the period.
Percentages are based on Net Assets of $23,542 ($ Thousands).
| (A) | Floating Rate Instrument. The rate reflected on the Schedule of Investments is the rate in effect on July 31, 2015. The demand and interest rate reset features give this security a shorter effective maturity date. |
| (B) | Tri-Party Repurchase Agreement. |
Cl — Class
FHLMC — Federal Home Loan Mortgage Corporation
FMAC — Financial Management Advisory Committee
FNMA — Federal National Mortgage Association
GNMA — Government National Mortgage Association
HUD — Housing and Urban Development
NCUA — National Credit Union Association
REMIC — Real Estate Mortgage Investment Conduit
Ser — Series
The following is a summary of the inputs used as of July 31, 2015 in valuing the Fund’s investments and other financial instruments carried at value ($ Thousands):
| Investments in Securities | Level 1 | Level 2 | Level 3 | Total | ||||||||||||
Mortgage-Backed Securities | $ | — | $ | 14,836 | $ | — | $ | 14,836 | ||||||||
U.S. Government Agency Obligations | — | 3,289 | — | 3,289 | ||||||||||||
Asset-Backed Security | — | 86 | — | 86 | ||||||||||||
U.S. Treasury Obligations | — | 1,953 | — | 1,953 | ||||||||||||
Repurchase Agreement | — | 5,900 | — | 5,900 | ||||||||||||
|
|
|
|
|
|
|
| |||||||||
Total Investments in Securities | $ | — | $ | 26,064 | $ | — | $ | 26,064 | ||||||||
|
|
|
|
|
|
|
| |||||||||
| Other Financial Instruments | Level 1 | Level 2 | Level 3 | Total | ||||||||||||
Futures Contracts* | ||||||||||||||||
Unrealized Appreciation | $ | 60 | $ | — | $ | — | $ | 60 | ||||||||
Unrealized Depreciation | (17 | ) | — | — | (17 | ) | ||||||||||
|
|
|
|
|
|
|
| |||||||||
Total Other Financial Instruments | $ | 43 | $ | — | $ | — | $ | 43 | ||||||||
|
|
|
|
|
|
|
| |||||||||
| * | Futures Contracts are valued at the net unrealized appreciation/(depreciation) on the instruments. |
As of July 31, 2015, there were no transfers between Level 1 and Level 2 assets and liabilities. As of July 31, 2015, there were no Level 3 securities.
For more information on valuation inputs, see Note 2 — Significant Accounting Policies in Notes to Financial Statements.
Amounts designated as “—” are $0 or have been rounded to $0.
The accompanying notes are an integral part of the financial statements.
| 36 | SEI Daily Income Trust / Semi-Annual Report / July 31, 2015 |
SCHEDULE OF INVESTMENTS (Unaudited)
GNMA Fund
July 31, 2015
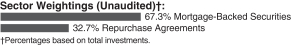
| Description | Face Amount ($ Thousands) | Value ($ Thousands) | ||||||
MORTGAGE-BACKED SECURITIES — 96.9% |
| |||||||
Agency Mortgage-Backed Obligations — 96.9% |
| |||||||
FNMA |
| |||||||
8.000%, 07/01/25 to 09/01/28 | $ | 34 | $ | 37 | ||||
7.000%, 08/01/29 to 09/01/32 | 69 | 73 | ||||||
6.500%, 09/01/32 | 78 | 89 | ||||||
4.250%, 10/01/28 | 4,587 | 5,061 | ||||||
4.180%, 11/01/28 | 1,703 | 1,869 | ||||||
3.355%, 01/01/27 | 1,359 | 1,419 | ||||||
FNMA REMIC, Ser 1990-91, Cl G | ||||||||
7.000%, 08/25/20 | 13 | 14 | ||||||
FNMA REMIC, Ser 1992-105, Cl B | ||||||||
7.000%, 06/25/22 | 25 | 27 | ||||||
FNMA REMIC, Ser 2002-42, Cl C | ||||||||
6.000%, 07/25/17 | 182 | 188 | ||||||
FNMA TBA | ||||||||
4.000%, 08/13/39 | 1,200 | 1,277 | ||||||
3.500%, 08/01/40 to 09/01/40 | 1,975 | 2,049 | ||||||
GNMA | ||||||||
10.000%, 05/15/16 to 09/15/19 | 8 | 7 | ||||||
9.500%, 08/15/17 to 10/15/20 | 16 | 17 | ||||||
9.000%, 12/15/17 to 05/15/22 | 54 | 56 | ||||||
8.500%, 10/15/16 to 06/15/17 | 6 | 6 | ||||||
8.000%, 04/15/17 to 03/15/32 | 274 | 305 | ||||||
7.750%, 10/15/26 | 26 | 30 | ||||||
7.500%, 02/15/27 to 10/15/35 | 209 | 247 | ||||||
7.250%, 01/15/28 | 72 | 80 | ||||||
7.000%, 04/15/19 to 06/20/38 | 2,553 | 3,016 | ||||||
6.750%, 11/15/27 | 11 | 13 | ||||||
6.500%, 09/15/16 to 10/15/38 | 945 | 1,095 | ||||||
6.000%, 07/15/24 to 12/15/40 | 2,034 | 2,317 | ||||||
5.500%, 01/15/33 to 02/15/41 | 3,336 | 3,799 | ||||||
5.000%, 06/15/33 to 01/20/45 | 10,431 | 11,632 | ||||||
4.500%, 08/15/33 to 09/20/41 | 5,741 | 6,279 | ||||||
4.000%, 12/15/40 to 11/15/42 | 5,478 | 5,853 | ||||||
3.875%, 05/15/42 | 1,892 | 2,013 | ||||||
3.500%, 03/20/41 to 06/20/45 | 6,950 | 7,265 | ||||||
2.500%, 07/20/45 | 1,000 | 975 | ||||||
GNMA REMIC, Ser 2002-45, Cl QE | ||||||||
6.500%, 06/20/32 | 366 | 429 | ||||||
GNMA TBA | ||||||||
4.500%, 08/15/39 | 1,200 | 1,293 | ||||||
4.000%, 08/01/39 to 08/01/42 (C) | 2,700 | 2,735 | ||||||
3.500%, 08/15/41 | 28,250 | 29,495 | ||||||
3.000%, 08/15/42 to 08/20/43 | 9,950 | 10,119 | ||||||
GNMA, Ser 2003-9, Cl Z | ||||||||
5.500%, 01/20/33 | 1,000 | 1,132 | ||||||
|
| |||||||
Total Mortgage-Backed Securities | 102,311 | |||||||
|
| |||||||
| Description | Face Amount ($ Thousands) | Value ($ Thousands) | ||||||
REPURCHASE AGREEMENTS — 47.1% |
| |||||||
BNP Paribas | $ | 24,800 | $ | 24,800 | ||||
Deutsche Bank | 25,000 | 25,000 | ||||||
|
| |||||||
Total Repurchase Agreements | 49,800 | |||||||
|
| |||||||
Total Investments — 144.0% | $ | 152,111 | ||||||
|
| |||||||
A list of the open futures contracts held by the Fund at July 31, 2015, is as follows:
| Type of Contract | Number of Contracts Long | Expiration Date | Unrealized Appreciation (Depreciation) ($ Thousands) | |||||||||
U.S. 10-Year Treasury Note | (7 | ) | Sep-2015 | $ | (1 | ) | ||||||
U.S. Long Treasury Bond | 6 | Sep-2015 | 35 | |||||||||
|
| |||||||||||
| $ | 34 | |||||||||||
|
| |||||||||||
For the period ended July 31, 2015, the total amount of all open futures contracts, as presented in the table above, are representative of the volume of activity for this derivative type during the period.
Percentages are based on Net Assets of $105,596 ($ Thousands).
| (A) | Floating Rate Instrument. The rate reflected on the Schedule of Investments is the rate in effect on July 31, 2015. The demand and interest rate reset features give this security a shorter effective maturity date. |
| (B) | Tri-Party Repurchase Agreement. |
| (C) | Security, or portion thereof, has been pledged as collateral on open futures contracts. |
Cl — Class
FMAC — Financial Management Advisory Committee
FNMA — Federal National Mortgage Association
GNMA — Government National Mortgage Association
REMIC — Real Estate Mortgage Investment Conduit
Ser — Series
TBA — To Be Announced
The following is a summary of the inputs used as of July 31, 2015 in valuing the Fund’s investments and other financial instruments carried at value ($ Thousands):
| Investments in Securities | Level 1 | Level 2 | Level 3 | Total | ||||||||||||
Mortgage-Backed Securities | $ | — | $ | 102,311 | $ | — | $ | 102,311 | ||||||||
Repurchase Agreements | — | 49,800 | — | 49,800 | ||||||||||||
|
|
|
|
|
|
|
| |||||||||
Total Investments in Securities | $ | — | $ | 152,111 | $ | — | $ | 152,111 | ||||||||
|
|
|
|
|
|
|
| |||||||||
| SEI Daily Income Trust / Semi-Annual Report / July 31, 2015 | 37 |
SCHEDULE OF INVESTMENTS (Unaudited)
GNMA Fund (Concluded)
July 31, 2015
| Other Financial Instruments | Level 1 | Level 2 | Level 3 | Total | ||||||||||||
Futures Contracts* | ||||||||||||||||
Unrealized Appreciation | $ | 35 | $ | — | $ | — | $ | 35 | ||||||||
Unrealized Depreciation | (1 | ) | — | — | (1 | ) | ||||||||||
|
|
|
|
|
|
|
| |||||||||
Total Other Financial Instruments | $ | 34 | $ | — | $ | — | $ | 34 | ||||||||
|
|
|
|
|
|
|
| |||||||||
| * | Futures Contracts are valued at the net unrealized appreciation/(depreciation) on the instruments. |
As of July 31, 2015, there were no transfers between Level 1 and Level 2 assets and liabilities. As of July 31, 2015, there were no Level 3 securities.
For more information on valuation inputs, see Note 2 — Significant Accounting Policies in Notes to Financial Statements.
Amounts designated as “—” are $0 or have been rounded to $0.
The accompanying notes are an integral part of the financial statements.
| 38 | SEI Daily Income Trust / Semi-Annual Report / July 31, 2015 |
This page intentionally left blank.
Statements of Assets and Liabilities ($ Thousands)
July 31, 2015 (Unaudited)
| Money Market Fund | Government Fund | Government II Fund | Prime Obligation Fund | |||||||||||||
ASSETS: | ||||||||||||||||
Investments, at value† | $ | 218,124 | $ | 768,527 | $ | 1,218,392 | $ | 4,220,036 | ||||||||
Repurchase agreements† | 39,176 | 1,170,000 | — | 575,991 | ||||||||||||
Cash | 10,755 | 135,881 | 1 | 215,617 | ||||||||||||
Receivable for investment securities sold | — | — | — | — | ||||||||||||
Interest receivable | 53 | 956 | 846 | 1,240 | ||||||||||||
Receivable for fund shares sold | — | — | — | 77 | ||||||||||||
Receivable for variation margin | — | — | — | — | ||||||||||||
Prepaid expenses | 11 | 77 | 51 | 201 | ||||||||||||
Total Assets | 268,119 | 2,075,441 | 1,219,290 | 5,013,162 | ||||||||||||
LIABILITIES: | ||||||||||||||||
Payable for investment securities purchased | — | 5,455 | 3,205 | 356 | ||||||||||||
Shareholder servicing fees payable | — | — | — | — | ||||||||||||
Investment advisory fees payable | 8 | 59 | 38 | 155 | ||||||||||||
Administration fees payable | 36 | 71 | 24 | 613 | ||||||||||||
Income distribution payable | 2 | 14 | 9 | 59 | ||||||||||||
Trustees’ fees payable | — | 1 | — | 3 | ||||||||||||
Chief Compliance Officer fees payable | 1 | 4 | 3 | 13 | ||||||||||||
Payable for fund shares redeemed | — | — | — | — | ||||||||||||
Payable for variation margin | — | — | — | — | ||||||||||||
Accrued expense payable | 9 | 68 | 42 | 202 | ||||||||||||
Total Liabilities | 56 | 5,672 | 3,321 | 1,401 | ||||||||||||
Net Assets | $ | 268,063 | $ | 2,069,769 | $ | 1,215,969 | $ | 5,011,761 | ||||||||
†Cost of investments and repurchase agreements | $ | 257,300 | $ | 1,938,527 | $ | 1,218,392 | $ | 4,796,027 | ||||||||
NET ASSETS: | ||||||||||||||||
Paid-in Capital — (unlimited authorization — no par value) | $ | 268,061 | $ | 2,069,800 | $ | 1,215,967 | $ | 5,011,808 | ||||||||
Undistributed (Distributions in excess of) net investment income | 2 | — | (3 | ) | — | |||||||||||
Accumulated net realized gain (loss) on investments | — | (31 | ) | 5 | (47 | ) | ||||||||||
Net unrealized appreciation (depreciation) on investments | — | — | — | — | ||||||||||||
Net unrealized depreciation on futures contracts | — | — | — | — | ||||||||||||
Net Assets | $ | 268,063 | $ | 2,069,769 | $ | 1,215,969 | $ | 5,011,761 | ||||||||
Net Asset Value, Offering and Redemption Price Per Share — Class A | $1.00 | $1.00 | $1.00 | $1.00 | ||||||||||||
| | ($153,131,819 ÷ 153,161,510 shares | ) | | ($1,904,020,286 ÷ 1,904,075,841 shares | ) | | ($1,054,018,021 ÷ 1,054,082,539 shares | ) | | ($4,906,693,209 ÷ 4,906,735,002 shares | ) | |||||
Net Asset Value, Offering and Redemption Price Per Share — Class B | $1.00 | $1.00 | $1.00 | $1.00 | ||||||||||||
| | ($70,900,642 ÷ 70,900,309 shares | ) | | ($120,911,435 ÷ 120,941,279 shares | ) | | ($143,361,031 ÷ 143,395,260 shares | ) | | ($75,512,160 ÷ 75,515,780 shares | ) | |||||
Net Asset Value, Offering and Redemption Price Per Share — Class C | $1.00 | $1.00 | $1.00 | $1.00 | ||||||||||||
| | ($22,332,355 ÷ 22,332,244 shares | ) | | ($2,225,656 ÷ 2,227,240 shares | ) | | ($18,589,660 ÷ 18,589,106 shares | ) | | ($7,930,669 ÷ 7,931,042 shares | ) | |||||
Net Asset Value, Offering and Redemption Price Per Share — Class H | N/A | N/A | N/A | $1.00 | ||||||||||||
| | ($18,331,608 ÷ 18,332,928 shares | ) | ||||||||||||||
Net Asset Value, Offering and Redemption Price Per Share — Class Y | N/A | N/A | N/A | N/A | ||||||||||||
Net Asset Value, Offering and Redemption Price Per Share — Sweep Class | $1.00 | $1.00 | N/A | $1.00 | ||||||||||||
| | ($21,698,166 ÷ 21,694,320 shares | ) | | ($42,611,937 ÷ 42,614,090 shares | ) | | ($3,293,449 ÷ 3,292,989 shares | ) | ||||||||
Amounts designated as “—” are $0 or have been rounded to $0.
N/A — Not applicable. Class B, C, H, Y and Sweep Class currently not offered.
The accompanying notes are an integral part of the financial statements.
| 40 | SEI Daily Income Trust / Semi-Annual Report / July 31, 2015 |
| Treasury Fund | Treasury II Fund | Ultra Short Duration Bond Fund | Short-Duration Government Fund | Intermediate-Duration Government Fund | GNMA Fund | |||||||||||||||||
| $ 20,381 | $588,306 | $273,700 | $736,589 | $20,164 | $102,311 | |||||||||||||||||
| 166,260 | — | 4,800 | 165,600 | 5,900 | 49,800 | |||||||||||||||||
| 14,475 | — | 90 | 4 | 132 | 76 | |||||||||||||||||
| — | — | 1,163 | 8,825 | 408 | 8,817 | |||||||||||||||||
| 27 | 1,479 | 608 | 2,543 | 55 | 197 | |||||||||||||||||
| — | — | 96 | 765 | 16 | 57 | |||||||||||||||||
| — | — | 4 | 95 | 36 | 7 | |||||||||||||||||
| 14 | 26 | 11 | 28 | 1 | 5 | |||||||||||||||||
| 201,157 | 589,811 | 280,472 | 914,449 | 26,712 | 161,270 | |||||||||||||||||
| — | — | 5,801 | 106,088 | 3,122 | 55,315 | |||||||||||||||||
| — | — | — | 64 | 2 | 50 | |||||||||||||||||
| 16 | 5 | 13 | 84 | 3 | 17 | |||||||||||||||||
| — | — | 23 | 455 | 9 | 121 | |||||||||||||||||
| 2 | 3 | 36 | 95 | 4 | 28 | |||||||||||||||||
| — | — | — | 1 | — | — | |||||||||||||||||
| 1 | 1 | 1 | 2 | — | — | |||||||||||||||||
| — | — | 136 | 432 | 6 | 119 | |||||||||||||||||
| — | — | 17 | 195 | 11 | 7 | |||||||||||||||||
| 12 | 17 | 21 | 59 | 13 | 17 | |||||||||||||||||
| 31 | 26 | 6,048 | 107,475 | 3,170 | 55,674 | |||||||||||||||||
| $201,126 | $589,785 | $274,424 | $806,974 | $23,542 | $105,596 | |||||||||||||||||
| $186,641 | $588,306 | $279,235 | $895,519 | $25,576 | $149,070 | |||||||||||||||||
| | $201,126 | | $589,771 | $296,886 | $808,880 | $24,432 | $102,226 | |||||||||||||||
| | — | | 15 | (247 | ) | 8 | (9 | ) | (243 | ) | ||||||||||||
| | — | | (1 | ) | (21,478 | ) | (8,371 | ) | (1,412 | ) | 538 | |||||||||||
| | — | | — | (735 | ) | 6,670 | 488 | 3,041 | ||||||||||||||
| — | — | (2 | ) | (213 | ) | 43 | 34 | |||||||||||||||
| $201,126 | $589,785 | $274,424 | $806,974 | $23,542 | $105,596 | |||||||||||||||||
| | $1.00 | | $1.00 | $9.32 | $10.48 | $11.64 | $10.83 | |||||||||||||||
| | ($98,059,344 ÷ 98,086,646 shares | ) | | ($417,769,864 ÷ 417,882,533 shares | ) | | ($274,424,414 ÷ 29,454,300 shares | ) | | ($752,579,801 ÷ 71,822,950 shares | ) | | ($23,542,308 ÷ 2,022,212 shares | ) | | ($105,596,080 ÷ 9,750,508 shares | ) | |||||
| | $1.00 | | $1.00 | N/A | N/A | N/A | N/A | |||||||||||||||
| | ($85,901,755 ÷ 85,921,175 shares | ) | | ($168,063,749 ÷ 168,084,915 shares | ) | |||||||||||||||||
| | $1.00 | | $1.00 | N/A | N/A | N/A | N/A | |||||||||||||||
| | ($10,895,171 ÷ 10,895,512 shares | ) | | ($3,951,192 ÷ 3,951,092 shares | ) | |||||||||||||||||
| | N/A | | N/A | N/A | N/A | N/A | N/A | |||||||||||||||
| | N/A | | N/A | N/A | $10.48 | N/A | N/A | |||||||||||||||
| | ($54,394,272 ÷ 5,190,936 shares | ) | ||||||||||||||||||||
| $1.00 | N/A | N/A | N/A | N/A | N/A | |||||||||||||||||
| | ($6,269,546 ÷ 6,287,960 shares | ) | ||||||||||||||||||||
| SEI Daily Income Trust / Semi-Annual Report / July 31, 2015 | 41 |
Statements of Operations ($ Thousands)
For the six months ended July 31, 2015 (Unaudited)
| Money Market Fund | Government Fund | Government II Fund | Prime Obligation Fund | |||||||||||||
Investment Income: | ||||||||||||||||
Interest Income | $ | 258 | $ | 1,084 | $ | 594 | $ | 5,446 | ||||||||
Expenses: | ||||||||||||||||
Administration Fees | 394 | 2,332 | 1,132 | 5,161 | ||||||||||||
Shareholder Servicing Fees — Class A Shares | 189 | 2,213 | 1,291 | 6,639 | ||||||||||||
Shareholder Servicing Fees — Sweep Class Shares | 27 | 54 | — | 4 | ||||||||||||
Distribution Fees — Sweep Class Shares | 56 | 110 | — | 9 | ||||||||||||
Administrative and Shareholder Servicing Fees — Class B Shares | 98 | 185 | 214 | 124 | ||||||||||||
Administrative and Shareholder Servicing Fees — Class C Shares | 59 | 13 | 41 | 45 | ||||||||||||
Administrative and Shareholder Servicing Fees — Class H Shares | — | — | — | 40 | ||||||||||||
Investment Advisory Fees | 92 | 680 | 417 | 1,901 | ||||||||||||
Trustees’ Fees | 2 | 12 | 8 | 35 | ||||||||||||
Chief Compliance Officer Fees | 1 | 4 | 3 | 11 | ||||||||||||
Registration Fees | 7 | 47 | 32 | 122 | ||||||||||||
Custodian/Wire Agent Fees | 8 | 57 | 35 | 157 | ||||||||||||
Pricing Fees | — | 4 | 2 | 10 | ||||||||||||
Other Expenses | 13 | 92 | 58 | 245 | ||||||||||||
Total Expenses | 946 | 5,803 | 3,233 | 14,503 | ||||||||||||
Less, Waiver of: | ||||||||||||||||
Investment Advisory Fees | (46 | ) | (340 | ) | (209 | ) | (951 | ) | ||||||||
Administration Fees | (236 | ) | (1,985 | ) | (944 | ) | (1,587 | ) | ||||||||
Reimbursement from Administration Fees | — | — | — | — | ||||||||||||
Shareholder Servicing Fees — Class A Shares | (189 | ) | (2,213 | ) | (1,291 | ) | (6,639 | ) | ||||||||
Administrative & Shareholder Servicing Fees — Class B Shares | (95 | ) | (185 | ) | (214 | ) | (123 | ) | ||||||||
Administrative & Shareholder Servicing Fees — Class C Shares | (58 | ) | (13 | ) | (41 | ) | (45 | ) | ||||||||
Administrative & Shareholder Servicing Fees — Class H Shares | — | — | — | (40 | ) | |||||||||||
Shareholder Servicing & Distribution Fees — Sweep Class | (83 | ) | (164 | ) | — | (13 | ) | |||||||||
Net Expenses | 239 | 903 | 534 | 5,105 | ||||||||||||
Net Investment Income | 19 | 181 | 60 | 341 | ||||||||||||
Net Realized and Unrealized Gain (Loss) on/from: | ||||||||||||||||
Investments | — | — | 5 | 3 | ||||||||||||
Futures Contracts | — | — | — | — | ||||||||||||
Net Change in Unrealized Appreciation (Depreciation) on/from: | ||||||||||||||||
Investments | — | — | — | — | ||||||||||||
Futures Contracts | — | — | — | — | ||||||||||||
Net Increase (Decrease) in Net Assets Resulting from Operations | $ | 19 | $ | 181 | $ | 65 | $ | 344 | ||||||||
Amounts designated as “—” are $0 or have been rounded to $0.
The accompanying notes are an integral part of the financial statements.
| 42 | SEI Daily Income Trust / Semi-Annual Report / July 31, 2015 |
| Treasury Fund | Treasury II Fund | Ultra Short Duration Bond Fund | Short-Duration Government Fund | Intermediate-Duration Government Fund | GNMA Fund | |||||||||||||||||
| $ | 118 | $ | 146 | $ | 1,391 | $ | 4,210 | $ | 225 | $ | 916 | |||||||||||
| 390 | 727 | 396 | 1,109 | 40 | 163 | |||||||||||||||||
| 142 | 536 | 330 | 857 | 25 | 136 | |||||||||||||||||
| 145 | — | — | — | — | — | |||||||||||||||||
| 296 | — | — | — | — | — | |||||||||||||||||
| 126 | 259 | — | — | — | — | |||||||||||||||||
| 26 | 10 | — | — | — | — | |||||||||||||||||
| — | — | — | — | — | — | |||||||||||||||||
| 114 | 212 | 132 | 370 | — | — | |||||||||||||||||
| 2 | 4 | 2 | 5 | 10 | 54 | |||||||||||||||||
| 1 | 1 | 1 | 2 | — | 1 | |||||||||||||||||
| 9 | 17 | 6 | 18 | — | — | |||||||||||||||||
| 10 | 18 | 8 | 22 | 1 | 3 | |||||||||||||||||
| 1 | 1 | 20 | 57 | 1 | 3 | |||||||||||||||||
| 15 | 30 | 12 | 35 | 2 | 15 | |||||||||||||||||
| 1,277 | 1,815 | 907 | 2,475 | 79 | 375 | |||||||||||||||||
| (57 | ) | (106 | ) | (106 | ) | — | (10 | ) | — | |||||||||||||
| (384 | ) | (727 | ) | (74 | ) | (208 | ) | — | — | |||||||||||||
| — | (62 | ) | — | — | — | (5 | ) | |||||||||||||||
| (142 | ) | (536 | ) | (224 | ) | (514 | ) | (15 | ) | (27 | ) | |||||||||||
| (126 | ) | (259 | ) | — | — | — | — | |||||||||||||||
| (26 | ) | (10 | ) | — | — | — | — | |||||||||||||||
| — | — | — | — | — | — | |||||||||||||||||
| (441 | ) | — | — | — | — | — | ||||||||||||||||
| 101 | 115 | 503 | 1,753 | 54 | 343 | |||||||||||||||||
| 17 | 31 | 888 | 2,457 | 171 | 573 | |||||||||||||||||
| — | — | 4 | 272 | 10 | 155 | |||||||||||||||||
| — | — | (79 | ) | (2,563 | ) | 81 | (199 | ) | ||||||||||||||
| — | — | (126 | ) | (2,042 | ) | (163 | ) | (746 | ) | |||||||||||||
| — | — | 146 | 104 | (127 | ) | (17 | ) | |||||||||||||||
| $ | 17 | $ | 31 | $ | 833 | $ | (1,772 | ) | $ | (28 | ) | $ | (234 | ) | ||||||||
| SEI Daily Income Trust / Semi-Annual Report / July 31, 2015 | 43 |
Statements of Changes in Net Assets ($ Thousands)
For the six months ended July 31, 2015 (Unaudited) and the year ended January 31
Money Market Fund | Government Fund | |||||||||||||||
| 2/1/15-7/31/15 | 2/1/14-1/31/15 | 2/1/15-7/31/15 | 2/1/14-1/31/15 | |||||||||||||
Operations: | ||||||||||||||||
Net Investment Income | $ | 19 | $ | 28 | $ | 181 | $ | 378 | ||||||||
Net Realized Gain on Investments | — | — | — | 1 | ||||||||||||
Net Increase in Net Assets Resulting from Operations | 19 | 28 | 181 | 379 | ||||||||||||
Dividends to Shareholders: | ||||||||||||||||
Net Investment Income | ||||||||||||||||
Class A | (14 | ) | (15 | ) | (165 | ) | (335 | ) | ||||||||
Class B | (3 | ) | (8 | ) | (12 | ) | (29 | ) | ||||||||
Class C | (1 | ) | (3 | ) | — | (1 | ) | |||||||||
Class H | — | — | — | — | ||||||||||||
Sweep Class | (1 | ) | (2 | ) | (4 | ) | (13 | ) | ||||||||
Total Dividends | (19 | ) | (28 | ) | (181 | ) | (378 | ) | ||||||||
Capital Share Transactions (All at $1.00 per share) | ||||||||||||||||
Class A: | ||||||||||||||||
Proceeds from Shares Issued | 180,864 | 501,241 | 5,547,232 | 11,108,570 | ||||||||||||
Reinvestment of Dividends & Distributions | 8 | 9 | 32 | 94 | ||||||||||||
Cost of Shares Redeemed | (175,019 | ) | (523,529 | ) | (5,431,535 | ) | (10,843,937 | ) | ||||||||
Net Increase (Decrease) from Class A Transactions | 5,853 | (22,279 | ) | 115,729 | 264,727 | |||||||||||
Class B: | ||||||||||||||||
Proceeds from Shares Issued | 101,398 | 286,653 | 262,924 | 619,369 | ||||||||||||
Reinvestment of Dividends & Distributions | 2 | 5 | 8 | 20 | ||||||||||||
Cost of Shares Redeemed | (100,217 | ) | (271,603 | ) | (261,446 | ) | (646,901 | ) | ||||||||
Net Increase (Decrease) from Class B Transactions | 1,183 | 15,055 | 1,486 | (27,512 | ) | |||||||||||
Class C: | ||||||||||||||||
Proceeds from Shares Issued | 92,512 | 197,324 | 154,908 | 389,657 | ||||||||||||
Reinvestment of Dividends & Distributions | — | 1 | — | — | ||||||||||||
Cost of Shares Redeemed | (92,809 | ) | (200,137 | ) | (158,477 | ) | (394,117 | ) | ||||||||
Net Increase (Decrease) from Class C Transactions | (297 | ) | (2,812 | ) | (3,569 | ) | (4,460 | ) | ||||||||
Class H: | ||||||||||||||||
Proceeds from Shares Issued | — | — | — | — | ||||||||||||
Reinvestment of Dividends & Distributions | — | — | — | — | ||||||||||||
Cost of Shares Redeemed | — | — | — | — | ||||||||||||
Net Increase (Decrease) from Class H Transactions | — | — | — | — | ||||||||||||
Sweep Class: | ||||||||||||||||
Proceeds from Shares Issued | 146,947 | 277,785 | 85,847 | 224,637 | ||||||||||||
Reinvestment of Dividends & Distributions | — | — | 4 | 12 | ||||||||||||
Cost of Shares Redeemed | (149,083 | ) | (275,420 | ) | (98,845 | ) | (279,594 | ) | ||||||||
Net Increase (Decrease) from Sweep Class Transactions | (2,136 | ) | 2,365 | (12,994 | ) | (54,945 | ) | |||||||||
Net Increase (Decrease) in Net Assets from Capital Shares Transactions | 4,603 | (7,671 | ) | 100,652 | 177,810 | |||||||||||
Net Increase (Decrease) in Net Assets | 4,603 | (7,671 | ) | 100,652 | 177,811 | |||||||||||
Net Assets: | ||||||||||||||||
Beginning of Period | 263,460 | 271,131 | 1,969,117 | 1,791,306 | ||||||||||||
End of Period | $ | 268,063 | $ | 263,460 | $ | 2,069,769 | $ | 1,969,117 | ||||||||
Undistributed (Distributions in Excess of) Net Investment Income | $ | 2 | $ | 2 | $ | — | $ | — | ||||||||
N/A — Not applicable. Class B, C, H, Y and Sweep Class currently not offered.
Amounts designated as “—” are zero or have been rounded to zero
The accompanying notes are an integral part of the financial statements.
| 44 | SEI Daily Income Trust / Semi-Annual Report / July 31, 2015 |
Government II Fund | Prime Obligation Fund | Treasury Fund | Treasury II Fund | |||||||||||||||||||||||||||
| 2/1/15-7/31/15 | 2/1/14-1/31/15 | 2/1/15-7/31/15 | 2/1/14-1/31/15 | 2/1/15-7/31/15 | 2/1/14-1/31/15 | 2/1/15-7/31/15 | 2/1/14-1/31/15 | |||||||||||||||||||||||
| $ | 60 | $ | 128 | $ | 341 | $ | 496 | $ | 17 | $ | 37 | $ | 31 | $ | 71 | |||||||||||||||
| 5 | 2 | 3 | 6 | — | 5 | — | 3 | |||||||||||||||||||||||
| 65 | 130 | 344 | 502 | 17 | 42 | 31 | 74 | |||||||||||||||||||||||
| (52 | ) | (108 | ) | (335 | ) | (482 | ) | (6 | ) | (13 | ) | (22 | ) | (48 | ) | |||||||||||||||
| (7 | ) | (18 | ) | (4 | ) | (9 | ) | (4 | ) | (10 | ) | (9 | ) | (22 | ) | |||||||||||||||
| (1 | ) | (2 | ) | (1 | ) | (3 | ) | (1 | ) | (1 | ) | — | (1 | ) | ||||||||||||||||
| — | — | (1 | ) | (2 | ) | — | — | — | — | |||||||||||||||||||||
| — | — | — | — | (6 | ) | (13 | ) | — | — | |||||||||||||||||||||
| (60 | ) | (128 | ) | (341 | ) | (496 | ) | (17 | ) | (37 | ) | (31 | ) | (71 | ) | |||||||||||||||
| 1,343,480 | 3,046,015 | 17,014,143 | 32,895,448 | 404,591 | 982,066 | 733,149 | 1,890,227 | |||||||||||||||||||||||
| 5 | 11 | 125 | 184 | 4 | 9 | 9 | 22 | |||||||||||||||||||||||
| (1,442,169 | ) | (3,139,591 | ) | (17,398,889 | ) | (31,812,544 | ) | (431,181 | ) | (903,757 | ) | (806,597 | ) | (1,839,502 | ) | |||||||||||||||
| (98,684 | ) | (93,565 | ) | (384,621 | ) | 1,083,088 | (26,586 | ) | 78,318 | (73,439 | ) | 50,747 | ||||||||||||||||||
| 268,552 | 974,037 | 218,206 | 409,317 | 221,282 | 515,970 | 304,062 | 991,366 | |||||||||||||||||||||||
| 6 | 12 | 1 | 1 | 3 | 9 | 1 | 2 | |||||||||||||||||||||||
| (297,959 | ) | (975,015 | ) | (226,191 | ) | (417,649 | ) | (220,015 | ) | (540,994 | ) | (335,888 | ) | (1,039,276 | ) | |||||||||||||||
| (29,401 | ) | (966 | ) | (7,984 | ) | (8,331 | ) | 1,270 | (25,015 | ) | (31,825 | ) | (47,908 | ) | ||||||||||||||||
| 57,481 | 106,851 | 66,801 | 238,965 | 14,578 | 53,042 | 13,005 | 41,616 | |||||||||||||||||||||||
| — | — | — | — | — | — | — | — | |||||||||||||||||||||||
| (55,550 | ) | (111,024 | ) | (81,582 | ) | (234,001 | ) | (14,254 | ) | (54,725 | ) | (13,223 | ) | (52,895 | ) | |||||||||||||||
| 1,931 | (4,173 | ) | (14,781 | ) | 4,964 | 324 | (1,683 | ) | (218 | ) | (11,279 | ) | ||||||||||||||||||
| N/A | N/A | 12,986 | 32,334 | — | — | — | — | |||||||||||||||||||||||
| N/A | N/A | 1 | 2 | — | — | — | — | |||||||||||||||||||||||
| N/A | N/A | (14,672 | ) | (33,121 | ) | — | — | — | — | |||||||||||||||||||||
| N/A | N/A | (1,685 | ) | (785 | ) | — | — | — | — | |||||||||||||||||||||
| N/A | N/A | 12,959 | 26,554 | 85,014 | 178,641 | N/A | N/A | |||||||||||||||||||||||
| N/A | N/A | — | — | — | — | N/A | N/A | |||||||||||||||||||||||
| N/A | N/A | (13,791 | ) | (26,417 | ) | (199,321 | ) | (184,407 | ) | N/A | N/A | |||||||||||||||||||
| N/A | N/A | (832 | ) | 137 | (114,307 | ) | (5,766 | ) | N/A | N/A | ||||||||||||||||||||
| (126,154 | ) | (98,704 | ) | (409,903 | ) | 1,079,073 | (139,299 | ) | 45,854 | (105,482 | ) | (8,440 | ) | |||||||||||||||||
| (126,149 | ) | (98,702 | ) | (409,900 | ) | 1,079,079 | (139,299 | ) | 45,859 | (105,482 | ) | (8,437 | ) | |||||||||||||||||
| 1,342,118 | 1,440,820 | 5,421,661 | 4,342,582 | 340,425 | 294,566 | 695,267 | 703,704 | |||||||||||||||||||||||
| $ | 1,215,969 | $ | 1,342,118 | $ | 5,011,761 | $ | 5,421,661 | $ | 201,126 | $ | 340,425 | $ | 589,785 | $ | 695,267 | |||||||||||||||
| $ | (3 | ) | $ | (3 | ) | $ | — | $ | — | $ | — | $ | — | $ | 15 | $ | 15 | |||||||||||||
| SEI Daily Income Trust / Semi-Annual Report / July 31, 2015 | 45 |
Statements of Changes in Net Assets ($ Thousands)
For the six months ended July 31, 2015 (Unaudited) and the year ended January 31
| Ultra Short Duration Bond Fund | ||||||||
| 2/1/15-7/31/15 | 2/1/14-1/31/15 | |||||||
Operations: | ||||||||
Net Investment Income | $ | 888 | $ | 1,627 | ||||
Net Realized Gain (Loss) on Investments and Futures Contracts | (75 | ) | 303 | |||||
Net Change in Unrealized Appreciation (Depreciation) on Investments and Futures Contracts | 20 | (540 | ) | |||||
Net Increase (Decrease) in Net Assets Resulting from Operations | 833 | 1,390 | ||||||
Dividends to Shareholders: | ||||||||
Net Investment Income | ||||||||
Class A | (1,134 | ) | (2,129 | ) | ||||
Class Y | N/A | N/A | ||||||
Total Dividends | (1,134 | ) | (2,129 | ) | ||||
Capital Share Transactions: | ||||||||
Class A: | ||||||||
Proceeds from Shares Issued | 58,288 | 76,923 | ||||||
Reinvestment of Dividends & Distributions | 906 | 1,669 | ||||||
Cost of Shares Redeemed | (40,083 | ) | (93,460 | ) | ||||
Net Increase (Decrease) from Class A Transactions | 19,111 | (14,868 | ) | |||||
Capital Share Transactions: | ||||||||
Class Y: | ||||||||
Proceeds from Shares Issued | N/A | N/A | ||||||
Reinvestment of Dividends & Distributions | N/A | N/A | ||||||
Cost of Shares Redeemed | N/A | N/A | ||||||
Net Increase (Decrease) from Class Y Transactions | N/A | N/A | ||||||
Net Increase (Decrease) in Net Assets from Capital Share Transactions | 19,111 | (14,868 | ) | |||||
Net Increase (Decrease) in Net Assets | 18,810 | (15,607 | ) | |||||
NET ASSETS: | ||||||||
Beginning of Period | 255,614 | 271,221 | ||||||
End of Period | $ | 274,424 | $ | 255,614 | ||||
Undistibuted (Distributions in Excess of) Net Investment Income | $ | (247 | ) | $ | (1 | ) | ||
Capital Share Transactions: | ||||||||
Class A | ||||||||
Shares Issued | 6,249 | 8,226 | ||||||
Reinvestment of Distributions | 97 | 178 | ||||||
Shares Redeemed | (4,297 | ) | (9,995 | ) | ||||
Net Increase (Decrease) in Shares Outstanding from Class A Share Transactions | 2,049 | (1,591 | ) | |||||
Capital Share Transactions: | ||||||||
Class Y | ||||||||
Shares Issued | N/A | N/A | ||||||
Reinvestment of Distributions | N/A | N/A | ||||||
Shares Redeemed | N/A | N/A | ||||||
Net Increase (Decrease) in Shares Outstanding from Class Y Share Transactions | N/A | N/A | ||||||
Total Increase (Decrease) in Shares Outstanding from Share Transactions | 2,049 | (1,591 | ) | |||||
N/A — Not applicable. Class B, C, H, Y and Sweep Class currently not offered.
Amounts designated as “—” are zero or have been rounded to zero
The accompanying notes are an integral part of the financial statements.
| 46 | SEI Daily Income Trust / Semi-Annual Report / July 31, 2015 |
Short-Duration Government Fund | Intermediate-Duration Government Fund | GNMA Fund | ||||||||||||||||||||
| 2/1/15-7/31/15 | 2/1/14-1/31/15 | 2/1/15-7/31/15 | 2/1/14-1/31/15 | 2/1/15-7/31/15 | 2/1/14-1/31/15 | |||||||||||||||||
| $ | 2,457 | $ | 6,416 | $ | 171 | $ | 455 | $ | 573 | $ | 1,323 | |||||||||||
| (2,291 | ) | (438 | ) | 91 | (157 | ) | (44 | ) | 6,412 | |||||||||||||
| (1,938 | ) | 2,577 | (290 | ) | 516 | (763 | ) | (958 | ) | |||||||||||||
| (1,772 | ) | 8,555 | (28 | ) | 814 | (234 | ) | 6,777 | ||||||||||||||
| (2,794 | ) | (6,829 | ) | (192 | ) | (561 | ) | (813 | ) | (1,978 | ) | |||||||||||
| (250 | ) | (18 | ) | N/A | N/A | N/A | N/A | |||||||||||||||
| (3,044 | ) | (6,847 | ) | (192 | ) | (561 | ) | (813 | ) | (1,978 | ) | |||||||||||
| 239,854 | 280,452 | 5,444 | 5,144 | 18,715 | 39,296 | |||||||||||||||||
| 2,268 | 5,783 | 163 | 447 | 633 | 1,607 | |||||||||||||||||
| (146,190 | ) | (388,465 | ) | (2,099 | ) | (10,303 | ) | (30,609 | ) | (86,470 | ) | |||||||||||
| 95,932 | (102,230 | ) | 3,508 | (4,712 | ) | (11,261 | ) | (45,567 | ) | |||||||||||||
| 3,311 | 55,715 | N/A | N/A | N/A | N/A | |||||||||||||||||
| 251 | 21 | N/A | N/A | N/A | N/A | |||||||||||||||||
| (3,822 | ) | (835 | ) | N/A | N/A | N/A | N/A | |||||||||||||||
| (260 | ) | 54,901 | N/A | N/A | N/A | N/A | ||||||||||||||||
| 95,672 | (47,329 | ) | 3,508 | (4,712 | ) | (11,261 | ) | (45,567 | ) | |||||||||||||
| 90,856 | (45,621 | ) | 3,288 | (4,459 | ) | (12,308 | ) | (40,768 | ) | |||||||||||||
| 716,118 | 761,739 | 20,254 | 24,713 | 117,904 | 158,672 | |||||||||||||||||
| $ | 806,974 | $ | 716,118 | $ | 23,542 | $ | 20,254 | $ | 105,596 | $ | 117,904 | |||||||||||
| $ | 8 | $ | 595 | $ | (9 | ) | $ | 12 | $ | (243 | ) | $ | (3 | ) | ||||||||
| 22,844 | 26,686 | 469 | 444 | 1,721 | 3,675 | |||||||||||||||||
| 216 | 550 | 14 | 38 | 58 | 151 | |||||||||||||||||
| (13,916 | ) | (36,956 | ) | (180 | ) | (887 | ) | (2,820 | ) | (8,150 | ) | |||||||||||
| 9,144 | (9,720 | ) | 303 | (405 | ) | (1,041 | ) | (4,324 | ) | |||||||||||||
| 315 | 5,293 | N/A | N/A | N/A | N/A | |||||||||||||||||
| 24 | 2 | N/A | N/A | N/A | N/A | |||||||||||||||||
| (364 | ) | (79 | ) | N/A | N/A | N/A | N/A | |||||||||||||||
| (25 | ) | 5,216 | N/A | N/A | N/A | N/A | ||||||||||||||||
| 9,119 | (4,504 | ) | 303 | (405 | ) | (1,041 | ) | (4,324 | ) | |||||||||||||
| SEI Daily Income Trust / Semi-Annual Report / July 31, 2015 | 47 |
For the six months ended July 31, 2015 (Unaudited) and for the years ending January 31,
For a Share Outstanding Throughout the Period
| Net Asset Value, Beginning of Period | Net Investment Income* | Net Realized and Unrealized Gains (Losses) on Securities | Total from Operations | Dividends from Net Investment Income | Distributions from Realized Capital Gains | Total Dividends | Net Asset Value, End of Period | Total Return† | Net Assets End of Period ($ Thousands) | Ratio of Expenses to Average Net Assets | Ratio of Expenses to Average Net Assets (Excluding Waivers) | Ratio of Net Investment Income to Average Net Assets | ||||||||||||||||||||||||||||||||||||||||
Money Market Fund |
| |||||||||||||||||||||||||||||||||||||||||||||||||||
Class A | ||||||||||||||||||||||||||||||||||||||||||||||||||||
2015@ | $ | 1.00 | $ | — | $ | — | $ | — | $ | — | (1) | $ | — | $ | — | (1) | $ | 1.00 | 0.01 | % | $ | 153,132 | 0.18 | %(2) | 0.64 | % | 0.02 | % | ||||||||||||||||||||||||
2015 | 1.00 | — | — | — | — | (1) | — | — | (1) | 1.00 | 0.01 | 147,279 | 0.15 | (2) | 0.66 | 0.01 | ||||||||||||||||||||||||||||||||||||
2014 | 1.00 | — | — | — | — | (1) | — | — | (1) | 1.00 | 0.02 | 169,555 | 0.17 | (2) | 0.67 | 0.02 | ||||||||||||||||||||||||||||||||||||
2013 | 1.00 | — | — | — | — | (1) | — | (1) | — | (1) | 1.00 | 0.09 | 255,063 | 0.18 | 0.68 | 0.09 | ||||||||||||||||||||||||||||||||||||
2012 | 1.00 | — | — | — | — | (1) | — | — | (1) | 1.00 | 0.06 | 146,460 | 0.18 | 0.68 | 0.06 | |||||||||||||||||||||||||||||||||||||
2011 | 1.00 | — | — | — | — | (1) | — | (1) | — | (1) | 1.00 | 0.14 | 214,779 | 0.18 | 0.68 | 0.14 | ||||||||||||||||||||||||||||||||||||
Class B | ||||||||||||||||||||||||||||||||||||||||||||||||||||
2015@ | $ | 1.00 | $ | — | $ | — | $ | — | $ | — | (1) | $ | — | $ | — | (1) | $ | 1.00 | 0.00 | % | $ | 70,901 | 0.19 | %(2) | 0.69 | % | 0.01 | % | ||||||||||||||||||||||||
2015 | 1.00 | — | — | — | — | (1) | — | — | (1) | 1.00 | 0.01 | 69,717 | 0.15 | (2) | 0.71 | 0.01 | ||||||||||||||||||||||||||||||||||||
2014 | 1.00 | — | — | — | — | (1) | — | — | (1) | 1.00 | 0.01 | 54,654 | 0.18 | (2) | 0.73 | 0.01 | ||||||||||||||||||||||||||||||||||||
2013 | 1.00 | — | — | — | — | (1) | — | (1) | — | (1) | 1.00 | 0.01 | 60,069 | 0.26 | (2) | 0.73 | 0.01 | |||||||||||||||||||||||||||||||||||
2012 | 1.00 | — | — | — | — | (1) | — | — | (1) | 1.00 | 0.01 | 73,035 | 0.23 | (2) | 0.73 | 0.01 | ||||||||||||||||||||||||||||||||||||
2011 | 1.00 | — | — | — | — | (1) | — | (1) | — | (1) | 1.00 | 0.01 | 39,352 | 0.30 | (2) | 0.80 | 0.01 | |||||||||||||||||||||||||||||||||||
Class C | ||||||||||||||||||||||||||||||||||||||||||||||||||||
2015@ | $ | 1.00 | $ | — | $ | — | $ | — | $ | — | (1) | $ | — | $ | — | (1) | $ | 1.00 | 0.00 | % | $ | 22,332 | 0.19 | %(2) | 0.89 | % | 0.01 | % | ||||||||||||||||||||||||
2015 | 1.00 | — | — | — | — | (1) | — | — | (1) | 1.00 | 0.01 | 22,629 | 0.15 | (2) | 0.91 | 0.01 | ||||||||||||||||||||||||||||||||||||
2014 | 1.00 | — | — | — | — | (1) | — | — | (1) | 1.00 | 0.01 | 25,428 | 0.18 | (2) | 0.93 | 0.01 | ||||||||||||||||||||||||||||||||||||
2013 | 1.00 | — | — | — | — | (1) | — | (1) | — | (1) | 1.00 | 0.01 | 32,314 | 0.26 | (2) | 0.93 | 0.01 | |||||||||||||||||||||||||||||||||||
2012 | 1.00 | — | — | — | — | (1) | — | — | (1) | 1.00 | 0.01 | 33,110 | 0.23 | (2) | 0.93 | 0.01 | ||||||||||||||||||||||||||||||||||||
2011 | 1.00 | — | — | — | — | (1) | — | (1) | — | (1) | 1.00 | 0.01 | 52,876 | 0.30 | (2) | 0.80 | 0.01 | |||||||||||||||||||||||||||||||||||
Sweep Class | ||||||||||||||||||||||||||||||||||||||||||||||||||||
2015@ | $ | 1.00 | $ | — | $ | — | $ | — | $ | — | (1) | $ | — | $ | — | (1) | $ | 1.00 | 0.00 | % | $ | 21,698 | 0.19 | %(2) | 1.14 | % | 0.01 | % | ||||||||||||||||||||||||
2015 | 1.00 | — | — | — | — | (1) | — | — | (1) | 1.00 | 0.01 | 23,835 | 0.15 | (2) | 1.16 | 0.01 | ||||||||||||||||||||||||||||||||||||
2014 | 1.00 | — | — | — | — | (1) | — | — | (1) | 1.00 | 0.01 | 21,494 | 0.18 | (2) | 1.18 | 0.01 | ||||||||||||||||||||||||||||||||||||
2013 | 1.00 | — | — | — | — | (1) | — | (1) | — | (1) | 1.00 | 0.01 | 19,972 | 0.26 | (2) | 1.18 | 0.01 | |||||||||||||||||||||||||||||||||||
2012 | 1.00 | — | — | — | — | (1) | — | — | (1) | 1.00 | 0.01 | 22,701 | 0.23 | (2) | 1.18 | 0.01 | ||||||||||||||||||||||||||||||||||||
2011 | 1.00 | — | — | — | — | (1) | — | (1) | — | (1) | 1.00 | 0.01 | 26,603 | 0.31 | 0.81 | 0.01 | ||||||||||||||||||||||||||||||||||||
Government Fund | ||||||||||||||||||||||||||||||||||||||||||||||||||||
Class A | ||||||||||||||||||||||||||||||||||||||||||||||||||||
2015@ | $ | 1.00 | $ | — | $ | — | $ | — | $ | — | (1) | $ | — | $ | — | (1) | $ | 1.00 | 0.01 | % | $ | 1,904,020 | 0.09 | %(2) | 0.58 | % | 0.02 | % | ||||||||||||||||||||||||
2015 | 1.00 | — | — | — | — | (1) | — | — | (1) | 1.00 | 0.02 | 1,788,290 | 0.07 | (2) | 0.58 | 0.02 | ||||||||||||||||||||||||||||||||||||
2014 | 1.00 | — | — | — | — | (1) | — | — | (1) | 1.00 | 0.02 | 1,523,561 | 0.09 | (2) | 0.58 | 0.02 | ||||||||||||||||||||||||||||||||||||
2013 | 1.00 | — | — | — | — | (1) | — | — | (1) | 1.00 | 0.02 | 1,292,334 | 0.16 | (2) | 0.59 | 0.02 | ||||||||||||||||||||||||||||||||||||
2012 | 1.00 | — | — | — | — | (1) | — | — | (1) | 1.00 | 0.05 | 1,054,551 | 0.10 | (2) | 0.59 | 0.05 | ||||||||||||||||||||||||||||||||||||
2011 | 1.00 | — | — | — | — | (1) | — | — | (1) | 1.00 | 0.05 | 633,160 | 0.17 | (2) | 0.59 | 0.05 | ||||||||||||||||||||||||||||||||||||
Class B | ||||||||||||||||||||||||||||||||||||||||||||||||||||
2015@ | $ | 1.00 | $ | — | $ | — | $ | — | $ | — | (1) | $ | — | $ | — | (1) | $ | 1.00 | 0.01 | % | $ | 120,911 | 0.09 | %(2) | 0.63 | % | 0.02 | % | ||||||||||||||||||||||||
2015 | 1.00 | — | — | — | — | (1) | — | — | (1) | 1.00 | 0.02 | 119,425 | 0.07 | (2) | 0.63 | 0.02 | ||||||||||||||||||||||||||||||||||||
2014 | 1.00 | — | — | — | — | (1) | — | — | (1) | 1.00 | 0.02 | 146,938 | 0.09 | (2) | 0.63 | 0.02 | ||||||||||||||||||||||||||||||||||||
2013 | 1.00 | — | — | — | — | (1) | — | — | (1) | 1.00 | 0.02 | 133,693 | 0.16 | (2) | 0.64 | 0.02 | ||||||||||||||||||||||||||||||||||||
2012 | 1.00 | — | — | — | — | (1) | — | — | (1) | 1.00 | 0.05 | 120,664 | 0.09 | (2) | 0.64 | 0.05 | ||||||||||||||||||||||||||||||||||||
2011 | 1.00 | — | — | — | — | (1) | — | — | (1) | 1.00 | 0.05 | 334,209 | 0.16 | (2) | 0.64 | 0.05 | ||||||||||||||||||||||||||||||||||||
Class C | ||||||||||||||||||||||||||||||||||||||||||||||||||||
2015@ | $ | 1.00 | $ | — | $ | — | $ | — | $ | — | (1) | $ | — | $ | — | (1) | $ | 1.00 | 0.01 | % | $ | 2,226 | 0.09 | %(2) | 0.83 | % | 0.02 | % | ||||||||||||||||||||||||
2015 | 1.00 | — | — | — | — | (1) | — | — | (1) | 1.00 | 0.02 | 5,795 | 0.07 | (2) | 0.83 | 0.02 | ||||||||||||||||||||||||||||||||||||
2014 | 1.00 | — | — | — | — | (1) | — | — | (1) | 1.00 | 0.02 | 10,255 | 0.09 | (2) | 0.83 | 0.02 | ||||||||||||||||||||||||||||||||||||
2013 | 1.00 | — | — | — | — | (1) | — | — | (1) | 1.00 | 0.02 | 12,552 | 0.16 | (2) | 0.84 | 0.02 | ||||||||||||||||||||||||||||||||||||
2012 | 1.00 | — | — | — | — | (1) | — | — | (1) | 1.00 | 0.05 | 8,036 | 0.10 | (2) | 0.84 | 0.05 | ||||||||||||||||||||||||||||||||||||
2011 | 1.00 | — | — | — | — | (1) | — | — | (1) | 1.00 | 0.05 | 55,406 | 0.17 | (2) | 0.84 | 0.05 | ||||||||||||||||||||||||||||||||||||
Sweep Class | ||||||||||||||||||||||||||||||||||||||||||||||||||||
2015@ | $ | 1.00 | $ | — | $ | — | $ | — | $ | — | (1) | $ | — | $ | — | (1) | $ | 1.00 | 0.01 | % | $ | 42,612 | 0.09 | %(2) | 1.08 | % | 0.02 | % | ||||||||||||||||||||||||
2015 | 1.00 | — | — | — | — | (1) | — | — | (1) | 1.00 | 0.02 | 55,607 | 0.08 | (2) | 1.08 | 0.02 | ||||||||||||||||||||||||||||||||||||
2014 | 1.00 | — | — | — | — | (1) | — | — | (1) | 1.00 | 0.02 | 110,552 | 0.09 | (2) | 1.08 | 0.02 | ||||||||||||||||||||||||||||||||||||
2013 | 1.00 | — | — | — | — | (1) | — | — | (1) | 1.00 | 0.02 | 35,137 | 0.16 | (2) | 1.09 | 0.02 | ||||||||||||||||||||||||||||||||||||
2012 | 1.00 | — | — | — | — | (1) | — | — | (1) | 1.00 | 0.05 | 27,234 | 0.09 | (2) | 1.09 | 0.05 | ||||||||||||||||||||||||||||||||||||
2011 | 1.00 | — | — | — | — | (1) | — | — | (1) | 1.00 | 0.05 | 25,158 | 0.16 | (2) | 1.09 | 0.05 | ||||||||||||||||||||||||||||||||||||
Amounts designated as ‘‘—’’ are zero or have been rounded to zero.
| @ | For the six month period ended July 31, 2015. All ratios for the period have been annualized. |
| (1) | Amount represents less than $0.01 per share. |
| (2) | The Distributor and/or Administrator have voluntarily agreed to waive and reduce its fee and/or reimburse certain expenses of the Fund in order to limit the one-day net income yield of the Fund to not less than 0.01% of the Fund’s average daily net assets of the share class. Had these waivers expense been excluded the ratio would have been at the expense ratio cap figure. See Note 3 for expense ratio cap figure. |
| * | Per share calculations were performed using average shares. |
| † | Returns are for the period indicated and have not been annualized. Returns shown do not reflect the deduction of taxes that a shareholder would pay on Fund distributions or the redemption of Fund shares. |
The accompanying notes are an integral part of the financial statements.
| 48 | SEI Daily Income Trust / Semi-Annual Report / July 31, 2015 |
| Net Asset Value, Beginning of Period | Net Investment Income* | Net Realized and Unrealized Gains (Losses) on Securities | Total from Operations | Dividends from Net Investment Income | Distributions from Realized Capital Gains | Net Asset Value, End of Period | Total Return† | Net Assets End of Period ($ Thousands) | Ratio of Expenses to Average Net Assets | Ratio of Expenses to Average Net Assets (Excluding Waivers) | Ratio of Net Investment Income to Average Net Assets | |||||||||||||||||||||||||||||||||||||
Government II Fund | ||||||||||||||||||||||||||||||||||||||||||||||||
Class A | ||||||||||||||||||||||||||||||||||||||||||||||||
2015@ | $ | 1.00 | $ | — | $ | — | $ | — | $ | — | (1) | $ | — | $ | 1.00 | 0.00 | % | $ | 1,054,018 | 0.09 | %(2) | 0.53 | % | 0.01 | % | |||||||||||||||||||||||
2015 | 1.00 | — | — | — | — | (1) | — | 1.00 | 0.01 | 1,152,698 | 0.08 | (2) | 0.53 | 0.01 | ||||||||||||||||||||||||||||||||||
2014 | 1.00 | — | — | — | — | (1) | — | 1.00 | 0.01 | 1,246,262 | 0.09 | (2) | 0.53 | 0.01 | ||||||||||||||||||||||||||||||||||
2013 | 1.00 | — | — | — | — | (1) | — | (1) | 1.00 | 0.01 | 1,237,205 | 0.12 | (2) | 0.54 | 0.01 | |||||||||||||||||||||||||||||||||
2012 | 1.00 | — | — | — | — | (1) | — | 1.00 | 0.01 | 1,308,018 | 0.09 | (2) | 0.54 | 0.01 | ||||||||||||||||||||||||||||||||||
2011 | 1.00 | — | — | — | — | (1) | — | 1.00 | 0.01 | 1,233,569 | 0.16 | (2) | 0.54 | 0.01 | ||||||||||||||||||||||||||||||||||
Class B | ||||||||||||||||||||||||||||||||||||||||||||||||
2015@ | $ | 1.00 | $ | — | $ | — | $ | — | $ | — | (1) | $ | — | $ | 1.00 | 0.00 | % | $ | 143,361 | 0.09 | %(2) | 0.58 | % | 0.01 | % | |||||||||||||||||||||||
2015 | 1.00 | — | — | — | — | (1) | — | 1.00 | 0.01 | 172,762 | 0.08 | (2) | 0.58 | 0.01 | ||||||||||||||||||||||||||||||||||
2014 | 1.00 | — | — | — | — | (1) | — | 1.00 | 0.01 | 173,727 | 0.09 | (2) | 0.58 | 0.01 | ||||||||||||||||||||||||||||||||||
2013 | 1.00 | — | — | — | — | (1) | — | (1) | 1.00 | 0.01 | 204,630 | 0.12 | (2) | 0.59 | 0.01 | |||||||||||||||||||||||||||||||||
2012 | 1.00 | — | — | — | — | (1) | — | 1.00 | 0.01 | 166,481 | 0.09 | (2) | 0.59 | 0.01 | ||||||||||||||||||||||||||||||||||
2011 | 1.00 | — | — | — | — | (1) | — | 1.00 | 0.01 | 119,864 | 0.16 | (2) | 0.59 | 0.01 | ||||||||||||||||||||||||||||||||||
Class C | ||||||||||||||||||||||||||||||||||||||||||||||||
2015@ | $ | 1.00 | $ | — | $ | — | $ | — | $ | — | (1) | $ | — | $ | 1.00 | 0.00 | % | $ | 18,590 | 0.09 | %(2) | 0.78 | % | 0.01 | % | |||||||||||||||||||||||
2015 | 1.00 | — | — | — | — | (1) | — | 1.00 | 0.01 | 16,658 | 0.08 | (2) | 0.78 | 0.01 | ||||||||||||||||||||||||||||||||||
2014 | 1.00 | — | — | — | — | (1) | — | 1.00 | 0.01 | 20,831 | 0.09 | (2) | 0.78 | 0.01 | ||||||||||||||||||||||||||||||||||
2013 | 1.00 | — | — | — | — | (1) | — | (1) | 1.00 | 0.01 | 9,122 | 0.12 | (2) | 0.79 | 0.01 | |||||||||||||||||||||||||||||||||
2012 | 1.00 | — | — | — | — | (1) | — | 1.00 | 0.01 | 5,408 | 0.10 | (2) | 0.79 | 0.01 | ||||||||||||||||||||||||||||||||||
2011 | 1.00 | — | — | — | — | (1) | — | 1.00 | 0.01 | 9,460 | 0.16 | (2) | 0.79 | 0.01 | ||||||||||||||||||||||||||||||||||
Prime Obligation Fund | ||||||||||||||||||||||||||||||||||||||||||||||||
Class A | ||||||||||||||||||||||||||||||||||||||||||||||||
2015@ | $ | 1.00 | $ | — | $ | — | $ | — | $ | — | (1) | $ | — | $ | 1.00 | 0.01 | % | $ | 4,906,693 | 0.19 | %(2) | 0.53 | % | 0.01 | % | |||||||||||||||||||||||
2015 | 1.00 | — | — | — | — | (1) | — | 1.00 | 0.01 | 5,291,311 | 0.16 | (2) | 0.53 | 0.01 | ||||||||||||||||||||||||||||||||||
2014 | 1.00 | — | — | — | — | (1) | — | 1.00 | 0.01 | 4,208,216 | 0.17 | (2) | 0.53 | 0.01 | ||||||||||||||||||||||||||||||||||
2013 | 1.00 | — | — | — | — | (1) | — | 1.00 | 0.07 | 3,714,719 | 0.20 | (2) | 0.54 | 0.07 | ||||||||||||||||||||||||||||||||||
2012 | 1.00 | — | — | — | — | (1) | — | 1.00 | 0.04 | 4,107,485 | 0.20 | (2) | 0.54 | 0.04 | ||||||||||||||||||||||||||||||||||
2011 | 1.00 | — | — | — | — | (1) | — | 1.00 | 0.11 | 3,144,153 | 0.20 | (2) | 0.54 | 0.12 | ||||||||||||||||||||||||||||||||||
Class B | ||||||||||||||||||||||||||||||||||||||||||||||||
2015@ | $ | 1.00 | $ | — | $ | — | $ | — | $ | — | (1) | $ | — | $ | 1.00 | 0.00 | % | $ | 75,512 | 0.19 | %(2) | 0.58 | % | 0.01 | % | |||||||||||||||||||||||
2015 | 1.00 | — | — | — | — | (1) | — | 1.00 | 0.01 | 83,497 | 0.16 | (2) | 0.58 | 0.01 | ||||||||||||||||||||||||||||||||||
2014 | 1.00 | — | — | — | — | (1) | — | 1.00 | 0.01 | 91,828 | 0.18 | (2) | 0.58 | 0.01 | ||||||||||||||||||||||||||||||||||
2013 | 1.00 | — | — | — | — | (1) | — | 1.00 | 0.01 | 119,581 | 0.26 | (2) | 0.59 | 0.01 | ||||||||||||||||||||||||||||||||||
2012 | 1.00 | — | — | — | — | (1) | — | 1.00 | 0.01 | 135,978 | 0.23 | (2) | 0.59 | 0.01 | ||||||||||||||||||||||||||||||||||
2011 | 1.00 | �� | — | — | — | (1) | — | 1.00 | 0.01 | 135,319 | 0.31 | (2) | 0.59 | 0.01 | ||||||||||||||||||||||||||||||||||
Class C | ||||||||||||||||||||||||||||||||||||||||||||||||
2015@ | $ | 1.00 | $ | — | $ | — | $ | — | $ | — | (1) | $ | — | $ | 1.00 | 0.00 | % | $ | 7,931 | 0.19 | %(2) | 0.78 | % | 0.01 | % | |||||||||||||||||||||||
2015 | 1.00 | — | — | — | — | (1) | — | 1.00 | 0.01 | 22,711 | 0.16 | (2) | 0.78 | 0.01 | ||||||||||||||||||||||||||||||||||
2014 | 1.00 | — | — | — | — | (1) | — | 1.00 | 0.01 | 17,747 | 0.18 | (2) | 0.78 | 0.01 | ||||||||||||||||||||||||||||||||||
2013 | 1.00 | — | — | — | — | (1) | — | 1.00 | 0.01 | 34,102 | 0.26 | (2) | 0.79 | 0.01 | ||||||||||||||||||||||||||||||||||
2012 | 1.00 | — | — | — | — | (1) | — | 1.00 | 0.01 | 42,051 | 0.23 | (2) | 0.79 | 0.01 | ||||||||||||||||||||||||||||||||||
2011 | 1.00 | — | — | — | — | (1) | — | 1.00 | 0.01 | 56,037 | 0.30 | (2) | 0.79 | 0.01 | ||||||||||||||||||||||||||||||||||
Class H | ||||||||||||||||||||||||||||||||||||||||||||||||
2015@ | $ | 1.00 | $ | — | $ | — | $ | — | $ | — | (1) | $ | — | $ | 1.00 | 0.00 | % | $ | 18,332 | 0.19 | %(2) | 0.71 | % | 0.01 | % | |||||||||||||||||||||||
2015 | 1.00 | — | — | — | — | (1) | — | 1.00 | 0.01 | 20,016 | 0.16 | (2) | 0.71 | 0.01 | ||||||||||||||||||||||||||||||||||
2014 | 1.00 | — | — | — | — | (1) | — | 1.00 | 0.01 | 20,801 | 0.18 | (2) | 0.71 | 0.01 | ||||||||||||||||||||||||||||||||||
2013 | 1.00 | — | — | — | — | (1) | — | 1.00 | 0.01 | 25,429 | 0.26 | (2) | 0.72 | 0.01 | ||||||||||||||||||||||||||||||||||
2012 | 1.00 | — | — | — | — | (1) | — | 1.00 | 0.01 | 25,646 | 0.23 | (2) | 0.72 | 0.01 | ||||||||||||||||||||||||||||||||||
2011 | 1.00 | — | — | — | — | (1) | — | 1.00 | 0.01 | 24,405 | 0.30 | (2) | 0.72 | 0.01 | ||||||||||||||||||||||||||||||||||
Sweep Class | ||||||||||||||||||||||||||||||||||||||||||||||||
2015@ | $ | 1.00 | $ | — | $ | — | $ | — | $ | — | (1) | $ | — | $ | 1.00 | 0.00 | % | $ | 3,293 | 0.19 | %(2) | 1.03 | % | 0.01 | % | |||||||||||||||||||||||
2015 | 1.00 | — | — | — | — | (1) | — | 1.00 | 0.01 | 4,126 | 0.16 | (2) | 1.03 | 0.01 | ||||||||||||||||||||||||||||||||||
2014 | 1.00 | — | — | — | — | (1) | — | 1.00 | 0.01 | 3,990 | 0.18 | (2) | 1.03 | 0.01 | ||||||||||||||||||||||||||||||||||
2013 | 1.00 | — | — | — | — | (1) | — | 1.00 | 0.01 | 3,169 | 0.26 | (2) | 1.04 | 0.01 | ||||||||||||||||||||||||||||||||||
2012 | 1.00 | — | — | — | — | (1) | — | 1.00 | 0.01 | 4,170 | 0.23 | (2) | 1.04 | 0.01 | ||||||||||||||||||||||||||||||||||
2011 | 1.00 | — | — | — | — | (1) | — | 1.00 | 0.01 | 4,710 | 0.30 | (2) | 1.04 | 0.01 | ||||||||||||||||||||||||||||||||||
Amounts designated as ‘‘—’’ are zero or have been rounded to zero.
| @ | For the six month period ended July 31, 2015. All ratios for the period have been annualized. |
| (1) | Amount represents less than $0.01 per share. |
| (2) | The Distributor and/or Administrator have voluntarily agreed to waive and reduce its fee and/or reimburse certain expenses of the Fund in order to limit the one-day net income yield of the Fund to not less than 0.01% of the Fund’s average daily net assets of the share class. Had these waivers expense been excluded the ratio would have been at the expense ratio cap figure. See Note 3 for expense ratio cap figure. |
| * | Per share calculations were performed using average shares. |
| † | Returns are for the period indicated and have not been annualized. Returns shown do not reflect the deduction of taxes that a shareholder would pay on Fund distributions or the redemption of Fund shares. |
The accompanying notes are an integral part of the financial statements.
| SEI Daily Income Trust / Semi-Annual Report / July 31, 2015 | 49 |
Financial Highlights
For the six months ended July 31, 2015 (Unaudited) and for the years ending January 31,
For a Share Outstanding Throughout the Period
| Net Asset Value, Beginning of Period | Net Investment Income* | Net Realized and Unrealized Gains (Losses) on Securities | Total from Operations | Dividends from Net Investment Income | Distributions from Realized Capital Gains | Net Asset Value, End of Period | Total Return† | Net Assets End of Period ($ Thousands) | Ratio of Expenses to Average Net Assets | Ratio of Expenses to Average Net Assets (Excluding Waivers) | Ratio of Average | |||||||||||||||||||||||||||||||||||||
Treasury Fund |
| |||||||||||||||||||||||||||||||||||||||||||||||
Class A |
| |||||||||||||||||||||||||||||||||||||||||||||||
2015@ | $ | 1.00 | $ | — | $ | — | $ | — | $ | — | (1) | $ | — | $ | 1.00 | 0.00 | % | $ | 98,059 | 0.06 | %(2) | 0.58 | % | 0.01 | % | |||||||||||||||||||||||
2015 | 1.00 | — | — | — | — | (1) | — | 1.00 | 0.01 | 124,646 | 0.05 | (2) | 0.58 | 0.01 | ||||||||||||||||||||||||||||||||||
2014 | 1.00 | — | — | — | — | (1) | — | 1.00 | 0.01 | 46,315 | 0.08 | (2) | 0.58 | 0.01 | ||||||||||||||||||||||||||||||||||
2013 | 1.00 | — | — | — | — | (1) | — | 1.00 | 0.01 | 82,339 | 0.14 | (2) | 0.59 | 0.01 | ||||||||||||||||||||||||||||||||||
2012 | 1.00 | — | — | — | — | (1) | — | 1.00 | 0.01 | 199,520 | 0.08 | (2) | 0.59 | 0.01 | ||||||||||||||||||||||||||||||||||
2011 | 1.00 | — | — | — | — | (1) | — | 1.00 | 0.02 | 175,749 | 0.18 | (2) | 0.59 | 0.02 | ||||||||||||||||||||||||||||||||||
Class B |
| |||||||||||||||||||||||||||||||||||||||||||||||
2015@ | $ | 1.00 | $ | — | $ | — | $ | — | $ | — | (1) | $ | — | $ | 1.00 | 0.00 | % | $ | 85,902 | �� | 0.06 | %(2) | 0.63 | % | 0.01 | % | ||||||||||||||||||||||
2015 | 1.00 | — | — | — | — | (1) | — | 1.00 | 0.01 | 84,632 | 0.05 | (2) | 0.63 | 0.01 | ||||||||||||||||||||||||||||||||||
2014 | 1.00 | — | — | — | — | (1) | — | 1.00 | 0.01 | 109,643 | 0.08 | (2) | 0.63 | 0.01 | ||||||||||||||||||||||||||||||||||
2013 | 1.00 | — | — | — | — | (1) | — | 1.00 | 0.01 | 108,605 | 0.14 | (2) | 0.64 | 0.01 | ||||||||||||||||||||||||||||||||||
2012 | 1.00 | — | — | — | — | (1) | — | 1.00 | 0.01 | 114,026 | 0.08 | (2) | 0.64 | 0.01 | ||||||||||||||||||||||||||||||||||
2011 | 1.00 | — | — | — | — | (1) | — | 1.00 | 0.01 | 178,769 | 0.19 | (2) | 0.64 | 0.01 | ||||||||||||||||||||||||||||||||||
Class C |
| |||||||||||||||||||||||||||||||||||||||||||||||
2015@ | $ | 1.00 | $ | — | $ | — | $ | — | $ | — | (1) | $ | — | $ | 1.00 | 0.00 | % | $ | 10,895 | 0.06 | %(2) | 0.83 | % | 0.01 | % | |||||||||||||||||||||||
2015 | 1.00 | — | — | — | — | (1) | — | 1.00 | 0.01 | 10,571 | 0.05 | (2) | 0.83 | 0.01 | ||||||||||||||||||||||||||||||||||
2014 | 1.00 | — | — | — | — | (1) | — | 1.00 | 0.01 | 12,254 | 0.08 | (2) | 0.83 | 0.01 | ||||||||||||||||||||||||||||||||||
2013 | 1.00 | — | — | — | — | (1) | — | 1.00 | 0.01 | 10,983 | 0.14 | (2) | 0.84 | 0.01 | ||||||||||||||||||||||||||||||||||
2012 | 1.00 | — | — | — | — | (1) | — | 1.00 | 0.01 | 6,984 | 0.08 | (2) | 0.84 | 0.01 | ||||||||||||||||||||||||||||||||||
2011 | 1.00 | — | — | — | — | (1) | — | 1.00 | 0.01 | 10,948 | 0.18 | (2) | 0.84 | 0.01 | ||||||||||||||||||||||||||||||||||
Sweep Class |
| |||||||||||||||||||||||||||||||||||||||||||||||
2015@ | $ | 1.00 | $ | — | $ | — | $ | — | $ | — | (1) | $ | — | $ | 1.00 | 0.00 | % | $ | 6,270 | 0.06 | %(2) | 1.08 | % | 0.01 | % | |||||||||||||||||||||||
2015 | 1.00 | — | — | — | — | (1) | — | 1.00 | 0.01 | 120,576 | 0.05 | (2) | 1.08 | 0.01 | ||||||||||||||||||||||||||||||||||
2014 | 1.00 | — | — | — | — | (1) | — | 1.00 | 0.01 | 126,354 | 0.08 | (2) | 1.08 | 0.01 | ||||||||||||||||||||||||||||||||||
2013 | 1.00 | — | — | — | — | (1) | — | 1.00 | 0.01 | 126,593 | 0.14 | (2) | 1.09 | 0.01 | ||||||||||||||||||||||||||||||||||
2012 | 1.00 | — | — | — | — | (1) | — | 1.00 | 0.01 | 137,336 | 0.08 | (2) | 1.09 | 0.01 | ||||||||||||||||||||||||||||||||||
2011 | 1.00 | — | — | — | — | (1) | — | 1.00 | 0.01 | 129,514 | 0.19 | (2) | 1.09 | 0.01 | ||||||||||||||||||||||||||||||||||
Treasury II Fund |
| |||||||||||||||||||||||||||||||||||||||||||||||
Class A |
| |||||||||||||||||||||||||||||||||||||||||||||||
2015@ | $ | 1.00 | $ | — | $ | — | $ | — | $ | — | (1) | $ | — | $ | 1.00 | 0.00 | % | $ | 417,770 | 0.04 | %(2) | 0.58 | % | 0.01 | % | |||||||||||||||||||||||
2015 | 1.00 | — | — | — | — | (1) | — | 1.00 | 0.01 | 491,209 | 0.04 | (2) | 0.58 | 0.01 | ||||||||||||||||||||||||||||||||||
2014 | 1.00 | — | — | — | — | (1) | — | 1.00 | 0.01 | 440,422 | 0.06 | (2) | 0.58 | 0.01 | ||||||||||||||||||||||||||||||||||
2013 | �� | 1.00 | — | — | — | — | (1) | — | (1) | 1.00 | 0.01 | 460,590 | 0.08 | (2) | 0.59 | 0.01 | ||||||||||||||||||||||||||||||||
2012 | 1.00 | — | — | — | — | (1) | — | 1.00 | 0.01 | 472,352 | 0.05 | (2) | 0.59 | 0.01 | ||||||||||||||||||||||||||||||||||
2011 | 1.00 | — | — | — | — | (1) | — | 1.00 | 0.01 | 287,823 | 0.12 | (2) | 0.59 | 0.01 | ||||||||||||||||||||||||||||||||||
Class B |
| |||||||||||||||||||||||||||||||||||||||||||||||
2015@ | $ | 1.00 | $ | — | $ | — | $ | — | $ | — | (1) | $ | — | $ | 1.00 | 0.00 | % | $ | 168,064 | 0.04 | %(2) | 0.63 | % | 0.01 | % | |||||||||||||||||||||||
2015 | 1.00 | — | — | — | — | (1) | — | 1.00 | 0.01 | 199,889 | 0.04 | (2) | 0.63 | 0.01 | ||||||||||||||||||||||||||||||||||
2014 | 1.00 | — | — | — | — | (1) | — | 1.00 | 0.01 | 247,836 | 0.06 | (2) | 0.63 | 0.01 | ||||||||||||||||||||||||||||||||||
2013 | 1.00 | — | — | — | — | (1) | — | (1) | 1.00 | 0.01 | 330,880 | 0.08 | (2) | 0.64 | 0.01 | |||||||||||||||||||||||||||||||||
2012 | 1.00 | — | — | — | — | (1) | — | 1.00 | 0.01 | 395,099 | 0.05 | (2) | 0.64 | 0.01 | ||||||||||||||||||||||||||||||||||
2011 | 1.00 | — | — | — | — | (1) | — | 1.00 | 0.01 | 178,037 | 0.12 | (2) | 0.64 | 0.01 | ||||||||||||||||||||||||||||||||||
Class C |
| |||||||||||||||||||||||||||||||||||||||||||||||
2015@ | $ | 1.00 | $ | — | $ | — | $ | — | $ | — | (1) | $ | — | $ | 1.00 | 0.00 | % | $ | 3,951 | 0.04 | %(2) | 0.83 | % | 0.01 | % | |||||||||||||||||||||||
2015 | 1.00 | — | — | — | — | (1) | — | 1.00 | 0.01 | 4,169 | 0.04 | (2) | 0.83 | 0.01 | ||||||||||||||||||||||||||||||||||
2014 | 1.00 | — | — | — | — | (1) | — | 1.00 | 0.01 | 15,446 | 0.06 | (2) | 0.83 | 0.01 | ||||||||||||||||||||||||||||||||||
2013 | 1.00 | — | — | — | — | (1) | — | (1) | 1.00 | 0.01 | 5,982 | 0.08 | (2) | 0.84 | 0.01 | |||||||||||||||||||||||||||||||||
2012 | 1.00 | — | — | — | — | (1) | — | 1.00 | 0.01 | 5,924 | 0.05 | (2) | 0.84 | 0.01 | ||||||||||||||||||||||||||||||||||
2011 | 1.00 | — | — | — | — | (1) | — | 1.00 | 0.01 | 6,183 | 0.12 | (2) | 0.84 | 0.01 | ||||||||||||||||||||||||||||||||||
Amounts designated as ‘‘—’’ are zero or have been rounded to zero.
| @ | For the six month period ended July 31, 2015. All ratios for the period have been annualized. |
| (1) | Amount represents less than $0.01 per share. |
| (2) | The Distributor and/or Administrator have voluntarily agreed to waive and reduce its fee and/or reimburse certain expenses of the Fund in order to limit the one-day net income yield of the Fund to not less than 0.01% of the Fund’s average daily net assets of the share class. Had these waivers expense been excluded the ratio would have been at the expense ratio cap figure. See Note 3 for expense ratio cap figure. |
| * | Per share calculations were performed using average shares. |
| † | Returns are for the period indicated and have not been annualized. Returns shown do not reflect the deduction of taxes that a shareholder would pay on Fund distributions or the redemption of Fund shares. |
The accompanying notes are an integral part of the financial statements.
| 50 | SEI Daily Income Trust / Semi-Annual Report / July 31, 2015 |
Net Asset of Period | Net Investment Income* | Net Realized and Unrealized Gains (Losses) on Securities | Total from Operations | Dividends from Net Investment Income | Distributions from Realized Capital Gains | Total Dividends and Distributions | Net Asset End of | Total Return† | Net Assets End of Period ($ Thousands) | Ratio of Expenses to Average Net Assets | Ratio of Expenses to Average Net Assets (Excluding Waivers) | Ratio of Net Investment Income to Average Net Assets | Portfolio Turnover Rate | |||||||||||||||||||||||||||||||||||||||||||
Ultra Short Duration Bond Fund |
| |||||||||||||||||||||||||||||||||||||||||||||||||||||||
Class A |
| |||||||||||||||||||||||||||||||||||||||||||||||||||||||
2015@ | $ | 9.33 | $ | 0.03 | $ | — | $ | 0.03 | $ | (0.04 | ) | $ | — | $ | (0.04 | ) | $ | 9.32 | 0.32 | % | $ | 274,424 | 0.38 | % | 0.69 | % | 0.67 | % | 53 | % | ||||||||||||||||||||||||||
2015 | 9.35 | 0.06 | — | 0.06 | (0.08 | ) | — | (0.08 | ) | 9.33 | 0.60 | 255,614 | 0.38 | 0.72 | 0.61 | 106 | ||||||||||||||||||||||||||||||||||||||||
2014 | 9.37 | 0.06 | — | 0.06 | (0.08 | ) | — | (0.08 | ) | 9.35 | 0.64 | 271,221 | 0.38 | 0.73 | 0.63 | 131 | ||||||||||||||||||||||||||||||||||||||||
2013 | 9.26 | 0.08 | 0.13 | 0.21 | (0.10 | ) | — | (0.10 | ) | 9.37 | 2.31 | 241,007 | 0.38 | 0.74 | 0.85 | 197 | ||||||||||||||||||||||||||||||||||||||||
2012 | 9.33 | 0.10 | (0.05 | ) | 0.05 | (0.12 | ) | — | (0.12 | ) | 9.26 | 0.55 | 255,002 | 0.38 | 0.74 | 1.08 | 177 | |||||||||||||||||||||||||||||||||||||||
2011 | 9.24 | 0.13 | 0.12 | 0.25 | (0.16 | ) | — | (0.16 | ) | 9.33 | 2.74 | 465,612 | 0.38 | 0.74 | 1.37 | 78 | ||||||||||||||||||||||||||||||||||||||||
Short-Duration Government Fund |
| |||||||||||||||||||||||||||||||||||||||||||||||||||||||
Class A |
| |||||||||||||||||||||||||||||||||||||||||||||||||||||||
2015@ | $ | 10.55 | $ | 0.03 | $ | (0.06 | ) | $ | (0.03 | ) | $ | (0.04 | ) | $ | — | $ | (0.04 | ) | $ | 10.48 | (0.26 | )% | $ | 752,580 | 0.48 | % | 0.69 | % | 0.66 | % | 102 | % | ||||||||||||||||||||||||
2015 | 10.52 | 0.09 | 0.04 | 0.13 | (0.10 | ) | — | (0.10 | ) | 10.55 | 1.20 | 661,101 | 0.48 | 0.73 | 0.85 | 151 | ||||||||||||||||||||||||||||||||||||||||
2014 | 10.62 | 0.06 | (0.06 | ) | 0.00 | (0.10 | ) | — | (0.10 | ) | 10.52 | (0.01 | ) | 761,739 | 0.48 | 0.73 | 0.56 | 565 | ||||||||||||||||||||||||||||||||||||||
2013 | 10.72 | 0.06 | 0.04 | 0.10 | (0.10 | ) | (0.10 | ) | (0.20 | ) | 10.62 | 0.92 | 711,100 | 0.48 | 0.74 | 0.55 | 628 | |||||||||||||||||||||||||||||||||||||||
2012 | 10.59 | 0.09 | 0.17 | 0.26 | (0.12 | ) | (0.01 | ) | (0.13 | ) | 10.72 | 2.53 | 739,126 | 0.48 | 0.74 | 0.85 | 712 | |||||||||||||||||||||||||||||||||||||||
2011 | 10.52 | 0.09 | 0.18 | 0.27 | (0.14 | ) | (0.06 | ) | (0.20 | ) | 10.59 | 2.59 | 867,313 | 0.48 | 0.72 | 0.84 | 521 | |||||||||||||||||||||||||||||||||||||||
Class Y |
| |||||||||||||||||||||||||||||||||||||||||||||||||||||||
2015@ | $ | 10.55 | $ | 0.04 | $ | (0.06 | ) | $ | (0.02 | ) | $ | (0.05 | ) | $ | — | $ | (0.05 | ) | $ | 10.48 | (0.21 | )% | $ | 54,394 | 0.38 | % | 0.44 | % | 0.76 | % | 102 | % | ||||||||||||||||||||||||
2015(2) | 10.50 | 0.01 | 0.05 | 0.06 | (0.01 | ) | — | (0.01 | ) | 10.55 | 0.54 | 55,017 | 0.38 | 0.46 | 0.97 | 151 | ||||||||||||||||||||||||||||||||||||||||
Intermediate-Duration Government Fund |
| |||||||||||||||||||||||||||||||||||||||||||||||||||||||
Class A |
| |||||||||||||||||||||||||||||||||||||||||||||||||||||||
2015@ | $ | 11.78 | $ | 0.10 | $ | (0.13 | ) | $ | (0.03 | ) | $ | (0.11 | ) | $ | — | $ | (0.11 | ) | $ | 11.64 | (0.25 | )% | $ | 23,542 | 0.53 | % | 0.78 | % | 1.70 | % | 40 | % | ||||||||||||||||||||||||
2015 | 11.63 | 0.28 | 0.16 | 0.44 | (0.29 | ) | — | (0.29 | ) | 11.78 | 3.88 | 20,254 | 0.53 | 0.77 | 2.04 | 121 | ||||||||||||||||||||||||||||||||||||||||
2014 | 11.89 | 0.19 | (0.21 | ) | (0.02 | ) | (0.24 | ) | — | (0.24 | ) | 11.63 | (0.14 | ) | 20,713 | 0.53 | 0.72 | 1.64 | 373 | |||||||||||||||||||||||||||||||||||||
2013 | 11.91 | 0.16 | 0.03 | 0.19 | (0.21 | ) | — | (0.21 | ) | 11.89 | 1.63 | 37,523 | 0.53 | 0.73 | 1.33 | 740 | ||||||||||||||||||||||||||||||||||||||||
2012 | 11.32 | 0.17 | 0.64 | 0.81 | (0.22 | ) | — | (1) | (0.22 | ) | 11.91 | 7.22 | 71,458 | 0.53 | 0.74 | 1.47 | 726 | |||||||||||||||||||||||||||||||||||||||
2011 | 11.24 | 0.13 | 0.39 | 0.52 | (0.19 | ) | (0.25 | ) | (0.44 | ) | 11.32 | 4.62 | 187,944 | 0.53 | 0.72 | 1.14 | 590 | |||||||||||||||||||||||||||||||||||||||
GNMA Fund |
| |||||||||||||||||||||||||||||||||||||||||||||||||||||||
Class A |
| |||||||||||||||||||||||||||||||||||||||||||||||||||||||
2015@ | $ | 10.93 | $ | 0.06 | $ | (0.08 | ) | $ | (0.02 | ) | $ | (0.08 | ) | $ | — | $ | (0.08 | ) | $ | 10.83 | (0.18 | )% | $ | 105,596 | 0.63 | % | 0.69 | % | 1.05 | % | 409 | % | ||||||||||||||||||||||||
2015 | 10.50 | 0.11 | 0.49 | 0.60 | (0.17 | ) | — | (0.17 | ) | 10.93 | 5.79 | 117,904 | 0.63 | 0.69 | 1.07 | 758 | ||||||||||||||||||||||||||||||||||||||||
2014 | 10.70 | 0.07 | (0.09 | ) | (0.02 | ) | (0.18 | ) | — | (0.18 | ) | 10.50 | (0.14 | ) | 158,672 | 0.63 | 0.69 | 0.68 | 758 | |||||||||||||||||||||||||||||||||||||
2013 | 10.91 | 0.09 | 0.13 | 0.22 | (0.19 | ) | (0.24 | ) | (0.43 | ) | 10.70 | 1.98 | 304,425 | 0.63 | 0.70 | 0.83 | 867 | |||||||||||||||||||||||||||||||||||||||
2012 | 10.58 | 0.02 | 0.83 | 0.85 | (0.13 | ) | (0.39 | ) | (0.52 | ) | 10.91 | 8.09 | 243,016 | 0.63 | 0.70 | 0.22 | 1,515 | |||||||||||||||||||||||||||||||||||||||
2011 | 10.28 | 0.13 | 0.49 | 0.62 | (0.16 | ) | (0.16 | ) | (0.32 | ) | 10.58 | 6.06 | 334,415 | 0.63 | 0.70 | 1.27 | 1,024 | |||||||||||||||||||||||||||||||||||||||
Amounts designated as ‘‘—’’ are zero or have been rounded to zero.
| @ | For the six month period ended July 31, 2015. All ratios for the period have been annualized. |
| (1) | Amount represents less than $.001 per share. |
| (2) | Commenced operations on December 31, 2014. |
| * | Per share calculations were performed using average shares. |
| † | Returns are for the period indicated and have not been annualized. Returns shown do not reflect the deduction of taxes that a shareholder would pay on Fund distributions or the redemption of Fund shares. |
The accompanying notes are an integral part of the financial statements.
| SEI Daily Income Trust / Semi-Annual Report / July 31, 2015 | 51 |
Notes to Financial Statements (Unaudited)
July 31, 2015
1. ORGANIZATION
SEI Daily Income Trust (the “Trust”) was organized as a Massachusetts business trust under a Declaration of Trust dated March 15, 1982.
The Trust is registered under the Investment Company Act of 1940, as amended, as a diversified, open-end investment company with ten operational Funds: the Money Market, Government, Government II, Prime Obligation, Treasury and Treasury II (each a “Fund,” collectively, the “Money Market Funds”), the Ultra Short Duration Bond Class A, Short-Duration Government Class A and Y, Intermediate-Duration Government Class A and GNMA Class A (each a “Fund,” collectively, the “Fixed Income Funds”). The Trust is registered to offer: Class A shares of the Funds; Class B and Class C shares of the Money Market, Prime Obligation, Government, Government II, Treasury and Treasury II Funds; Class H shares of the Prime Obligation Fund; and Sweep Class shares of the Money Market, Government, Prime Obligation and Treasury Funds. The assets of each Fund are segregated, and a shareholder’s interest is limited to the Fund in which shares are held. The Funds’ prospectuses provide a description of each Fund’s investment objective and strategies.
2. SIGNIFICANT ACCOUNTING POLICIES
The following is a summary of significant accounting policies followed by the Funds.
Use of Estimates — The preparation of financial statements, in conformity with U.S. generally accepted accounting principles (“U.S. GAAP”), requires management to make estimates and assumptions that affect the reported amount of assets and liabilities and disclosure of contingent assets and liabilities at the date of the financial statements and the reported amounts of increases and decreases in net assets from operations during the reporting period. Actual results could differ from those estimates.
Security Valuation — Investment securities of the Money Market Funds are stated at amortized cost, which approximates market value. Under this valuation method, purchase discounts and premiums are accreted and amortized ratably to maturity and are included in interest income. The Fund’s use of amortized cost is subject to its compliance with certain conditions as specified by Rule 2a-7 of the 1940 Act.
Investment securities of the Fixed Income Funds listed on a securities exchange, market or automated quotation system for which quotations are readily available are valued at the last quoted sale price on the primary exchange or market on which they are traded, or, if there is no such reported sale, at the most recent quoted bid price. If available, debt securities are priced based upon valuations provided by independent third-party pricing agents. Such values generally reflect the last reported sales price if the security is actively traded. The third party pricing agents may also value debt securities at an evaluated bid price by employing methodologies that utilize actual market transactions, broker-supplied valuations, or other methodologies designed to identify the market value for such securities. Debt obligations with
remaining maturities of sixty days or less may be valued at their amortized cost, which approximates market value. Prices for most securities held in the Funds are provided daily by recognized independent pricing agents. If a security price cannot be obtained from an independent third-party pricing agent, the Fixed Income Funds seek to obtain a bid price from at least one independent broker.
Securities for which market prices are not “readily available” are valued in accordance with Fair Value Procedures established by the Trust’s Board of Trustees. The Trust’s Fair Value Procedures are implemented through a Fair Value Committee (the “Committee”) designated by the Funds’ Board of Trustees. Some of the more common reasons that may necessitate that a security be valued using Fair Value Procedures include: the security’s trading has been halted or suspended; the security has been de-listed from a national exchange; the security’s primary trading market is temporarily closed at a time when under normal conditions it would be open; or the security’s primary pricing source is not able or willing to provide a price. When a security is valued in accordance with the Fair Value Procedures, the Committee will determine the value after taking into consideration relevant information reasonably available to the Committee. As of July 31, 2015, there were no fair valued securities held by the Funds.
In accordance with U.S. GAAP, fair value is defined as the price that a Fund would receive upon selling an investment in an orderly transaction to an independent buyer in the principal or most advantageous market of the investment. A three tier hierarchy has been established to maximize the use of observable and minimize the use of unobservable inputs and to establish classification of fair value measurements for disclosure purposes. Inputs refer broadly to the assumptions that market participants would use in pricing an asset. Inputs may be observable or unobservable. Observable inputs are inputs that reflect the assumptions market participants would use in pricing the asset or liability based on market data obtained from sources independent of the reporting entity. Unobservable inputs are inputs that reflect the reporting entity’s own assumptions about the assumptions market participants would use in pricing the asset or liability based on the best information available in the circumstances.
The three-tier hierarchy of inputs is summarized in the three broad Levels listed below:
Level 1 — Unadjusted quoted prices in active markets for identical, unrestricted assets or liabilities that the Fund has the ability to access at the measurement date;
Level 2 — Quoted prices which are not active, or inputs that are observable (either directly or indirectly) for substantially the full term of the asset or liability; and
Level 3 — Prices, inputs or exotic modeling techniques which are both significant to the fair value measurement and unobservable (supported by little or no market activity).
| 52 | SEI Daily Income Trust / Semi-Annual Report / July 31, 2015 |
Investments are classified within the level of the lowest significant input considered in determining fair value. Investments classified within Level 3 whose fair value measurement considers several inputs may include Level 1 or Level 2 inputs as components of the overall fair value measurement.
For the period ended July 31, 2015, there have been no significant changes to the Trust’s fair valuation methodologies.
Security Transactions and Investment Income — Security transactions are recorded on the trade date. Costs used in determining net realized capital gains and losses on the sale of securities are on the basis of specific identification. Dividend income is recognized on the ex-dividend date, and interest income is recognized using the accrual basis of accounting. Income from payment-in-kind securities is recorded daily based on the effective interest method of accrual.
Distributions received on securities that represent a return of capital or capital gain are recorded as a reduction of cost of investments and/or as a realized gain. The Trust estimates the components of distributions received that may be considered nontaxable distributions or capital gain distributions.
For the Fixed Income Funds, amortization and accretion is calculated using the scientific interest method, which approximates the effective interest method over the holding period of the security. Amortization of premiums and discounts is included in interest income.
For the Money Market Funds, all amortization is calculated using the straight line method over the holding period of the security. Amortization of premiums and accretion of discounts are included in interest income.
Repurchase Agreements — To the extent consistent with its investment objective and strategies, securities pledged as collateral for repurchase agreements are held by each Fund’s custodian bank until the repurchase date of the repurchase agreement. The Funds also invest in tri-party repurchase agreements. Securities held as collateral for tri-party repurchase agreements are maintained by the broker’s custodian bank in a segregated account until the repurchase date of the repurchase agreement. Provisions of the repurchase agreements and the Trust’s policies require that the market value of the collateral, including accrued interest thereon, is sufficient in the event of default by the counterparty. If the counterparty defaults and the value of the collateral declines, or if the counterparty enters into an insolvency proceeding, realization of the collateral by the Funds may be delayed or limited.
It is the Funds’ policy to present the repurchase agreements contracts separately on the Statements of Assets and Liabilities, as the Funds do not have a master netting agreement with the counterparty to the repurchase agreements contracts. Refer to each Fund’s Schedule of Investments for details regarding repurchase agreements contracts as of July 31, 2015, if applicable.
Futures Contracts — To the extent consistent with its investment objective and strategies, the Fixed Income Funds utilized futures contracts during the six months ended July 31, 2015. These Funds’ investments in futures contracts are designed to enable the Funds to more closely approximate the performance of their benchmark indices. The Funds chose to invest in futures contracts for tactical hedging purposes as well as to enhance the Funds’ returns. Initial margin deposits of cash or securities are made upon entering into futures contracts. The contracts are marked to market daily and the resulting changes in value are accounted for as unrealized gains and losses. Variation margin payments are paid or received, depending upon whether unrealized gains or losses are incurred. When the contract is closed, the Funds record a realized gain or loss equal to the difference between the proceeds from (or cost of) the closing transaction and the amount invested in the contract.
Risks of entering into futures contracts include the possibility that there will be an imperfect price correlation between the futures and the underlying securities. Second, it is possible that a lack of liquidity for futures contracts could exist in the secondary market, resulting in an inability to close a position prior to its maturity date. Third, the futures contract involves the risk that the Funds could lose more than the original margin deposit required to initiate a futures transaction.
Finally, the risk exists that losses could exceed amounts disclosed on the Statements of Assets and Liabilities.
It is the Funds’ policy to present the gross variation margin payable and the gross variation margin receivable of the future contracts separately on the Statements of Assets and Liabilities, as the Funds do not have a master netting agreement with the counterparty to the futures contracts. Refer to each Fund’s Schedule of Investments for details regarding open future contracts as of July 31, 2015, if applicable. The fair value of interest rate futures contracts held in the Fixed Income Funds can be found on the Statements of Assets and Liabilities under the captions Receivable for Variation Margin and Payable for Variation Margin. Only current day’s variation margin is reported within the Statements of Assets and Liabilities. Cumulative appreciation/ depreciation of futures contracts are reported in the respective Fixed Income Funds’ Schedule of Investments. Realized gains or losses on interest rate futures contracts related to the Fixed Income Funds are recognized on the Statements of Operations as part of Net Realized Gain (Loss) on Futures Contracts and any change in unrealized appreciation or depreciation is recognized on the Statements of Operations as Net Unrealized Gain (Loss) on Futures Contracts.
Swap Agreements — To the extent consistent with its investment objective and strategies, a Fund’s investment in swap contracts is mainly used as an efficient means to take and manage risk in the portfolio, including interest rate risk, credit risk and overall yield sensitivity. A swap agreement is a two-party contract under which an agreement is made to exchange returns from predetermined investments or instruments, including a particular interest rate, foreign
| SEI Daily Income Trust / Semi-Annual Report / July 31, 2015 | 53 |
Notes to Financial Statements (Unaudited) (Continued)
July 31, 2015
currency, or “basket” of securities representing a particular index. Interest rate swaps involve the exchange by a Fund with another party of their respective commitments to pay or receive interest (e.g., an exchange of floating rate payments for fixed rate payments) with respect to a notional amount of principal. Credit-default swaps involve periodic payments by a Fund or counterparty based on a specified rate multiplied by a notional amount assigned to an underlying debt instrument or group of debt instruments in exchange for the assumption of credit risk on the same instruments. In the event of a credit event, usually in the form of a credit rating downgrade, the party receiving periodic payments (i.e. floating rate payer) must pay the other party (i.e. fixed rate payer) an amount equal to the recovery rate used to settle the contracts. The recovery rate is a function of how many credit default swap investors wish to deliver the security or receive the security. The recovery rate is determined through an auction process. Total return swaps allow an investor to benefit from the cash flow without ever actually owning the underlying security. The receiver must pay any decline in value to the payer at the end of the total return swap. However, the investor does not need to make a payment if there is no decline in price. Payments can be made on various indices, bonds (i.e. mortgage backed securities, bank debt and corporate), loans or commodities. The value of a total return swap is equal to the change in value of the underlying asset versus the accrued income payment based on LIBOR or some other form of indices on the notional amount. Interest rate swaps involve the exchange by a Fund with another party of their respective commitments to pay or receive interest (e.g., an exchange of floating rate payments for fixed rate payments) with respect to a notional amount of principal to manage a Fund’s exposure to interest rates. Payments received or made are recorded as realized gains or loss. A Fund could be exposed to credit or market risk due to unfavorable changes in the fluctuation of interest rates or if the counterparty defaults on its obligation to perform. Risk of loss may exceed amounts recognized on the statement of assets and liabilities. Interest rate swap contracts outstanding at period end, if any, are listed after a Fund’s portfolio. In connection with swap agreements securities may be set aside as collateral by a Fund’s custodian. A Fund may enter into swap agreements in order to, among other things, change the maturity or duration of the investment portfolio, to protect a Fund’s value from changes in interest rates, or to expose a Fund to a different security or market.
Swaps are marked-to-market daily based upon quotations from market makers and the resulting changes in market values, if any, are recorded as an unrealized gain or loss in the Statement of Operations. Net payments of interest are recorded as realized gains or losses.
Entering into swap agreements involves, to varying degrees, elements of credit and market risk in excess of the amounts recognized on the Statements of Assets and Liabilities. Such risks involve the possibility that there will be no liquid market for these agreements, that the counterparty to the agreement may default on its obligation to perform
and that there may be unfavorable changes in the fluctuation of interest rates. Risks also arise from potential losses from adverse market movements.
This risk is mitigated by having a master netting arrangement between a Fund and the counterparty and by having the counterparty post collateral to cover a Fund’s exposure to the counterparty. There were no outstanding swap agreements as of July 31, 2015.
Options Written/Purchased — To the extent consistent with its Investment Objective and Strategies, a Fund may invest in financial options contracts to add return or to hedge their existing portfolio securities. When the Fund writes or purchases an option, an amount equal to the premium received or paid by the Fund is recorded as a liability or an asset and is subsequently adjusted to the current market value of the option written or purchased. Premiums received or paid from purchasing or writing options which expire unexercised are treated by the Fund on the expiration date as realized gains or losses. The difference between the premium and the amount paid or received on effecting a closing purchase or sale transaction, including brokerage commissions, is also treated as a realized gain or loss. If an option is exercised, the premium paid or received is added to the cost of the purchase or proceeds from the sale in determining whether the Fund has realized a gain or a loss. The risk in writing a call option is that the Fund gives up the opportunity for profit if the market price of the security increases. The risk in writing a put option is that the Fund may incur a loss if the market price of the security decreases and the option is exercised. The risk in purchasing an option is that the Fund pays a premium whether or not the option is exercised. The Fund also has the additional risk of being unable to enter into a closing transaction at an acceptable price if a liquid secondary market does not exist. Option contracts also involve the risk that they may not work as intended due to unanticipated developments in market conditions or other causes. Finally, the risk exists that losses could exceed amounts disclosed on the Statement of Assets and Liabilities. There were no outstanding options contracts as of July 31, 2015.
TBA Purchase Commitments — To the extent consistent with its Investment Objective and Strategies, a Fixed Income Fund may engage in “to be announced” (“TBA”) purchase commitments to purchase securities for a fixed price at a future date. TBA purchase commitments may be considered securities and involve a risk of loss if the value of the security to be purchased declines prior to settlement date, which risk is in addition to the risk of decline in the value of a Fund’s other assets. Unsettled TBA purchase commitments are valued at the current market value of the underlying securities, according to the procedures described under “Security Valuation” above.
Collateralized Debt Obligations — To the extent consistent with its Investment Objective and Strategies, a Fund may invest in collateralized debt obligations (“CDOs”), which include collateralized loan obligations (“CLOs”) and other similarly structured securities. CLOs are a type of asset-backed securities. A CLO is a trust typically collateralized
| 54 | SEI Daily Income Trust / Semi-Annual Report / July 31, 2015 |
by a pool of loans, which may include, among others, domestic and foreign senior secured loans, senior unsecured loans, and subordinate corporate loans, including loans that may be rated below investment grade or equivalent unrated loans. CDOs may charge management fees and administrative expenses.
For CDOs and CLOs, the cash flows from the trust are split into two or more portions, called tranches, varying in risk and yield. The riskiest portion is the “equity” tranche which bears the bulk of defaults from the bonds or loans in the trust and serves to protect the other, more senior tranches from default in all but the most severe circumstances. Since it is partially protected from defaults, a senior tranche from a CDO and CLO trust typically has a higher rating and lower yield than its underlying securities, and can be rated investment grade. Despite the protection from the equity tranche, CDO and CLO tranches can experience substantial losses due to actual defaults, increased sensitivity to defaults due to collateral default and disappearance of protecting tranches, market anticipation of defaults, as well as aversion to CDO and CLO securities as a class.
The risks of an investment in a CDO and CLO depend largely on its class and its collateral securities. Normally, CLOs and other CDOs are privately offered and sold, and thus, are not registered under the securities laws. As a result, investments in CDOs and CLOs may be characterized by the Funds as illiquid securities; however, an active dealer market may exist for CDOs and CLOs, allowing a CDO and CLO to qualify for Rule 144A transactions. In addition to the normal risks associated with fixed income securities (e.g., interest rate risk and default risk), CDOs and CLOs carry additional risks including, but not limited to: (i) the possibility that distributions from collateral securities will not be adequate to make interest or other payments; (ii) the quality of the collateral may decline in value or default; (iii) the Funds may invest in CDOs and CLOs that are subordinate to other classes; and (iv) the complex structure of the security may not be fully understood at the time of investment and may produce disputes with the issuer or unexpected investment results.
Illiquid Securities — A security is considered illiquid if it cannot be sold or disposed of in the ordinary course of business within seven days or less for its approximate carrying value on the books of a Fund. Valuations of illiquid securities may differ significantly from the values that would have been used had an active market value for these securities existed.
Restricted Securities — Throughout the year, the Funds owned private placement investments that were purchased through private offerings or acquired through initial public offerings that could not be sold without prior registration under the Securities Act of 1933 or pursuant to an exemption there from. In addition, the Funds had generally agreed to further restrictions on the disposition of certain holdings as set forth in various agreements entered into in connection with the purchase of those investments. These investments were valued at amortized cost, which approximates fair value, as determined in accordance with the procedures approved by the Board of Trustees. At July 31, 2015, the Funds did not own any restricted securities.
Classes — Class-specific expenses are borne by that class of shares. Income, expenses, and realized and unrealized gains/losses and non-class specific expenses are allocated to the respective class on the basis of relative daily net assets.
Expenses — Expenses that are directly related to one of the Funds are charged directly to that Fund. Other operating expenses of the Funds are prorated to the Funds on the basis of relative net assets.
Dividends and Distributions to Shareholders — Dividends from net investment income are declared daily and paid monthly. Any net realized capital gains on sales of securities after capital loss carryover are distributed at least annually by the Funds.
Redemption Fees — The Funds charge a redemption fee based on a redemption, or a series of redemptions from a single identifiable source that in the aggregate exceed a specified dollar threshold within any thirty day period, as presented below:
| Dollar Threshold ($ Thousands) | Redemption Fee | |||||||
Ultra Short Duration Bond Fund | $ | 10,000 | 0.50 | % | ||||
Short-Duration Government Fund | 25,000 | 0.25 | % | |||||
Intermediate-Duration Government Fund | 10,000 | 0.25 | % | |||||
GNMA Fund | 10,000 | 0.25 | % | |||||
For the period ended July 31, 2015, the Fixed Income Funds did not retain any redemption fees. Such fees, if any, are retained by the Fixed Income Funds for the benefit of the remaining shareholders.
3. INVESTMENT ADVISORY, ADMINISTRATION, DISTRIBUTION AND CUSTODIAN AGREEMENTS AND OTHER TRANSACTIONS WITH AFFILIATES
Investment Advisory, Administration, Distribution and Custodian Agreements — SEI Investments Management Corporation (“SIMC”) serves as each Fund’s investment adviser (the “Adviser”) and “manager of managers” under an investment advisory agreement approved by the shareholders of each Fund. In connection with serving as Adviser, SIMC is entitled to a fee, which is calculated daily and paid monthly, based on the average daily net assets of each Fund.
SEI Investments Global Funds Services (the “Administrator”) provides the Trust with administrative and transfer agency services. For its services, the Administrator is entitled to a fee, which is calculated daily and paid monthly, based on the average daily net assets of each Fund.
SEI Investments Distribution Co. (the “Distributor”), a wholly owned subsidiary of SEI Investments Company (“SEI”) and a registered broker-dealer, acts as the Distributor of the shares of the Trust under a Distribution Agreement. The Trust also has adopted plans under which firms, including the Distributor, that provide shareholder and administrative services may receive compensation thereof. Specific classes of certain funds have also adopted distribution plans, pursuant to Rule 12b-1 under the Investment Company Act of 1940.
| SEI Daily Income Trust / Semi-Annual Report / July 31, 2015 | 55 |
Notes to Financial Statements (Unaudited) (Continued)
July 31, 2015
Such plans provide fees payable to the Distributor up to the amounts, calculated as a percentage of the average daily net assets attributable to each particular class of each respective fund.
The Adviser, Administrator and/or Distributor have voluntarily agreed to waive a portion of their fees in order to keep total direct operating expenses (exclusive of interest from borrowings, brokerage commissions, taxes, Trustee fees, prime broker fees, interest and dividend expenses related to short sales and extraordinary expenses not incurred in the ordinary course of the Funds’ business) at a specified level.
The waivers by the Funds’ Adviser, Administrator and/or Distributor are limited to the Funds’ direct operating expenses and, therefore, do not apply to indirect expenses incurred by the Funds, such as acquired fund fees and expenses. The waivers are voluntary and the Funds’ Adviser, Administrator and/or Distributor may discontinue all or part of any of these waivers at any time. In addition, some Funds may participate in a commission recapture program where the Funds’ trades may be executed through the Funds’ distributor, and a portion of the commissions paid on those trades are then used to pay the Funds’ expenses.
The following is a summary of annual fees payable to the Adviser, Administrator and Distributor and the voluntary expense limitations for each fund:
| Advisory Fees | Administration Fees | Shareholder Servicing Fees | Administrative Fees | Distribution Fees* | Voluntary Expense Limitations | |||||||||||||||||||
Money Market Fund | ||||||||||||||||||||||||
Class A | 0.07 | % | 0.30 | %(6) | 0.25 | % | — | 0.18 | %(1) | |||||||||||||||
Class B | 0.07 | % | 0.30 | %(6) | 0.25 | % | 0.05 | % | — | 0.48 | %(1) | |||||||||||||
Class C | 0.07 | % | 0.30 | %(6) | 0.25 | % | 0.25 | % | — | 0.68 | %(1) | |||||||||||||
Sweep Class | 0.07 | % | 0.30 | %(6) | 0.25 | % | — | 0.50 | % | 0.93 | %(1) | |||||||||||||
Government Fund | ||||||||||||||||||||||||
Class A | 0.07 | % | 0.24 | % | 0.25 | % | — | — | 0.20 | %(3) | ||||||||||||||
Class B | 0.07 | % | 0.24 | % | 0.25 | % | 0.05 | % | — | 0.50 | %(3) | |||||||||||||
Class C | 0.07 | % | 0.24 | % | 0.25 | % | 0.25 | % | — | 0.70 | %(3) | |||||||||||||
Sweep Class | 0.07 | % | 0.24 | % | 0.25 | % | — | 0.50 | % | 0.95 | %(1) | |||||||||||||
Government II Fund | ||||||||||||||||||||||||
Class A | 0.07 | % | 0.19 | % | 0.25 | % | — | — | 0.20 | %(2) | ||||||||||||||
Class B | 0.07 | % | 0.19 | % | 0.25 | % | 0.05 | % | — | 0.50 | %(2) | |||||||||||||
Class C | 0.07 | % | 0.19 | % | 0.25 | % | 0.25 | % | — | 0.70 | %(2) | |||||||||||||
Prime Obligation Fund | ||||||||||||||||||||||||
Class A | 0.07 | % | 0.19 | % | 0.25 | % | — | — | 0.20 | %(2) | ||||||||||||||
Class B | 0.07 | % | 0.19 | % | 0.25 | % | 0.05 | % | — | 0.50 | %(2) | |||||||||||||
Class C | 0.07 | % | 0.19 | % | 0.25 | % | 0.25 | % | — | 0.70 | %(2) | |||||||||||||
Class H | 0.07 | % | 0.19 | % | 0.25 | % | 0.18 | % | — | 0.63 | %(1) | |||||||||||||
Sweep Class | 0.07 | % | 0.19 | % | 0.25 | % | — | 0.50 | % | 0.95 | %(1) | |||||||||||||
Treasury Fund | ||||||||||||||||||||||||
Class A | 0.07 | % | 0.24 | % | 0.25 | % | — | — | 0.20 | %(2) | ||||||||||||||
Class B | 0.07 | % | 0.24 | % | 0.25 | % | 0.05 | % | — | 0.50 | %(2) | |||||||||||||
Class C | 0.07 | % | 0.24 | % | 0.25 | % | 0.25 | % | — | 0.70 | %(2) | |||||||||||||
Sweep Class | 0.07 | % | 0.24 | % | 0.25 | % | — | 0.50 | % | 0.95 | %(1) | |||||||||||||
Treasury II Fund | ||||||||||||||||||||||||
Class A | 0.07 | % | 0.24 | % | 0.25 | % | — | — | 0.20 | %(2) | ||||||||||||||
Class B | 0.07 | % | 0.24 | % | 0.25 | % | 0.05 | % | — | 0.50 | %(2) | |||||||||||||
Class C | 0.07 | % | 0.24 | % | 0.25 | % | 0.25 | % | — | 0.70 | %(2) | |||||||||||||
Ultra Short Duration Bond Fund | ||||||||||||||||||||||||
Class A | 0.10 | %(4) | 0.30 | %(6) | 0.25 | % | — | — | 0.38 | %(1) | ||||||||||||||
Short-Duration Government Fund | ||||||||||||||||||||||||
Class A | 0.09 | %(5) | 0.30 | %(6) | 0.25 | % | — | — | 0.48 | %(1) | ||||||||||||||
Class Y | 0.09 | %(5) | 0.30 | %(6) | — | — | — | 0.38 | %(1) | |||||||||||||||
Intermediate-Duration Government Fund | ||||||||||||||||||||||||
Class A | 0.09 | %(5) | 0.30 | %(6) | 0.25 | % | — | — | 0.53 | %(1) | ||||||||||||||
GNMA Fund | ||||||||||||||||||||||||
Class A | 0.09 | %(5) | 0.30 | %(6) | 0.25 | % | — | — | 0.63 | %(1) | ||||||||||||||
| (1) | Represents a voluntary cap that may be discontinued at any time. |
| (2) | Represents a contractual cap effective through January 31, 2016, to be changed only by board approval. |
| (3) | Represents a contractual cap of .25%, .55%, and .75% of Class A, B, and C, respectively, effective through January 31, 2016, to be changed only by Board approval. In addition, management has voluntarily waived fees to a cap of .20%, .50%, and .70% of Class A, B, and C, respectively, that may be discontinued at any time. |
| (4) | The Adviser receives an annual fee equal to .10% on the first $500 million of net assets, .075% of net assets between $500 million and $1 billion and .05% on the net assets in excess of $1 billion for the Ultra Short Duration Bond Fund. The fee is calculated based on the net assets of the Ultra Short Duration Bond Fund. |
| (5) | The Adviser receives an annual fee equal to .10% on the first $500 million of net assets, .075% of net assets between $500 million and $1 billion and .05% on the net assets in excess of $1 billion for the Short-Duration Government, Intermediate-Duration Government and GNMA Funds. The fee is a blended percentage and is calculated based on the combined assets of these Funds. |
| (6) | Prior October 1, 2014, the Administrator fee was 0.33% for the Money Market Fund and 0.35 for the Ultra Short Duration Bond Fund, Short-Duration Government Fund, Intermidate-Duration Government Fund and GNMA Fund. |
| * | These payments are characterized as “compensation” and are not directly tied to expenses incurred by the Distributor. The payments the Distributor receives during any year may therefore be higher or lower than its actual expenses. These payments may be used to compensate sweep class shareholders who provide distribution-related services to their customers. |
| 56 | SEI Daily Income Trust / Semi-Annual Report / July 31, 2015 |
The Distributor has voluntarily waived all or a portion of the shareholder servicing fees for Class A of each fund, except for the GNMA Fund, since inception of the plan. Such waivers are voluntary and may be discontinued at any time. For Classes B, C, and H, the shareholder servicing fees and the administrative service fees are shown combined as “Administrative & Shareholder Servicing Fees” in the Statements of Operations. The Administrator and Distributor have voluntarily agreed to waive and reduce their fee and/or reimburse certain expenses of the Money Market Funds in order to limit the one-day net income yield of the Funds to not less than 0.01% of the Funds’ average daily net assets. The following table shows the waivers by class for the period ended July 31, 2015 ($ Thousands):
Administrative & Shareholder Servicing Fee Waiver | Administrative Fee Waiver | |||||||
Money Market Fund | ||||||||
Class A | $ | — | $ | 1 | ||||
Class B | 95 | 1 | ||||||
Class C | 58 | — | ||||||
Sweep Class | 83 | — | ||||||
Government Fund | ||||||||
Class A | — | 948 | ||||||
Class B | 185 | 66 | ||||||
Class C | 13 | 3 | ||||||
Sweep Class | 164 | 23 | ||||||
Government II Fund | ||||||||
Class A | — | 569 | ||||||
Class B | 214 | 79 | ||||||
Class C | 41 | 9 | ||||||
Prime Obligation Fund | ||||||||
Class A | — | 320 | ||||||
Class B | 123 | 5 | ||||||
Class C | 44 | 1 | ||||||
Class H | 40 | — | ||||||
Sweep Class | 13 | 1 | ||||||
Treasury Fund | ||||||||
Class A | — | 78 | ||||||
Class B | 126 | 58 | ||||||
Class C | 26 | 7 | ||||||
Sweep Class | 441 | 81 | ||||||
Treasury II Fund | ||||||||
Class A | — | 347 | ||||||
Class B | 259 | 140 | ||||||
Class C | 10 | 3 | ||||||
Pursuant to the “manager of managers” structure, the Board of Trustees approved BofA Advisors, LLC (formerly Columbia Management Advisors, LLC) as sub-adviser to the Money Market Funds, Logan Circle Partners, L.P., and Wellington Management Company, LLP serve as a sub-adviser to the Ultra Short Duration Bond Fund and Wellington Management Company, LLP (“Wellington LLP”) serves as sub-adviser to the Fixed Income Funds. Each sub-adviser is party to an investment sub-advisory agreement with the Advisor. For its services to the Funds, the sub-advisers are entitled to receive a fee paid directly by the Adviser.
U.S. Bank, N.A. serves as the custodian of the Funds. The custodian plays no role in determining the investment policies of the Funds or which securities are to be purchased or sold in the Funds.
Other — Certain officers and Trustees of the Trust are also officers and/or Trustees of the Administrator, Adviser, or the Distributor. The Trust pays each unaffiliated Trustee an annual fee for attendance at quarterly, interim, and committee meetings. The Administrator, Adviser and/or the Distributor pays compensation of Officers and affiliated Trustees.
A portion of the services provided by the Chief Compliance Officer (“CCO”) and his staff, whom are employees of the administrator, are paid for by the Trust as incurred. The services include regulatory oversight of the Trust’s Adviser, Sub-Advisers and service providers as required by SEC regulations. The CCO’s services have been approved by and are reviewed annually by the Board of Trustees.
Interfund Lending — The SEC has granted an exemption that permits the Trust to participate in an interfund lending program (the “Program”) with existing or future investment companies registered under the 1940 Act that are advised by SIMC (the “SEI Funds”). The Program allows the SEI Funds to lend money to and borrow money from each other for temporary or emergency purposes. Participation in the Program is voluntary for both borrowing and lending funds. Interfund loans may be made only when the rate of interest to be charged is more favorable to the lending fund than an investment in overnight repurchase agreements (“Repo Rate”), and more favorable to the borrowing fund than the rate of interest that would be charged by a bank for short-term borrowings (“Bank Loan Rate”). The Bank Loan Rate will be determined using a formula reviewed annually by the SEI Funds Board of Trustees. The interest rate imposed on interfund loans is the average of the Repo Rate and the Bank Loan Rate. For the period ended July 31, 2015, the Trust has not participated in the Program.
4. INVESTMENT TRANSACTIONS
The cost of security purchases and the proceeds from the sale of securities, other than short-term investments, for the six month period ended July 31, 2015, were as follows for the Fixed Income Funds:
Ultra Short Bond Fund | Short- Duration Government Fund | Intermediate- Duration Government Fund | GMNA Fund ($ Thousands) | |||||||||||||
Purchases | ||||||||||||||||
U.S. Government | $ | 65,330 | $ | 790,227 | $ | 10,261 | $ | 426,505 | ||||||||
Other | 48,703 | — | — | — | ||||||||||||
Sales | ||||||||||||||||
U.S. Government | 50,519 | 682,808 | 7,107 | 430,682 | ||||||||||||
Other | 42,722 | 120 | 21 | 33 | ||||||||||||
5. FEDERAL TAX INFORMATION
It is each Fund’s intention to continue to qualify as a regulated investment company for Federal income tax purposes and distribute all of its taxable income (including net capital gains). Accordingly, no provision for Federal income taxes is required.
| SEI Daily Income Trust / Semi-Annual Report / July 31, 2015 | 57 |
Notes to Financial Statements (Unaudited) (Continued)
July 31, 2015
Reclassification of Components of Net Assets — The timing and characterization of certain income and capital gain distributions are determined annually in accordance with Federal tax regulations which may differ from accounting principles generally accepted in the United States. As a result, net investment income (loss) and net realized gain (loss) on investment transactions for the reporting period may differ from distributions during such period. These book/tax differences may be temporary or permanent in nature.
To the extent these differences are permanent, they are charged or credited to Paid-in Capital, undistributed net investment income, or accumulated net realized gain, as appropriate, in the periods that the differences arise.
Accordingly, the following permanent differences, primarily attributable to different treatment for gains and losses on paydowns of
mortgage and asset-backed securities for tax purposes, distribution reclassification, expiration of capital losses and non-deductible excise tax have been reclassified to/from the following accounts as of January 31, 2015:
Paid-in- ($ Thousands) | Undistributed Net Investment Income ($ Thousands) | Accumulated Net Realized Gain (Loss) ($ Thousands) | ||||||||||
Government II Fund | $ | — | $ | 2 | $ | (2 | ) | |||||
Prime Obligation Fund | (1 | ) | 1 | — | ||||||||
Treasury II Fund | — | 4 | (4 | ) | ||||||||
Ultra Short Duration Bond Fund | (1,717 | ) | 501 | 1,216 | ||||||||
Short-Duration Government Fund | — | 449 | (449 | ) | ||||||||
Intermediate-Duration Government Fund | (2 | ) | 48 | (46 | ) | |||||||
GNMA Fund | — | 656 | (656 | ) | ||||||||
These reclassifications have no impact on net assets or net asset value per share.
The tax character of dividends and distributions during the last two fiscal years was as follows:
| Ordinary Income ($ Thousands) | Long-term Capital Gain ($ Thousands) | Total ($ Thousands) | ||||||||||||||
Money Market Fund | 2015 | $ | 28 | $ | — | $ | 28 | |||||||||
| 2014 | 66 | — | 66 | |||||||||||||
Government Fund | 2015 | 378 | — | 378 | ||||||||||||
| 2014 | 320 | — | 320 | |||||||||||||
Government II Fund | 2015 | 128 | — | 128 | ||||||||||||
| 2014 | 129 | — | 129 | |||||||||||||
Prime Obligation Fund | 2015 | 496 | — | 496 | ||||||||||||
| 2014 | 508 | — | 508 | |||||||||||||
Treasury Fund | 2015 | 37 | — | 37 | ||||||||||||
| 2014 | 31 | — | 31 | |||||||||||||
Treasury II Fund | 2015 | 71 | — | 71 | ||||||||||||
| 2014 | 73 | — | 73 | |||||||||||||
Ultra Short Duration Bond Fund | 2015 | 2,129 | — | 2,129 | ||||||||||||
| 2014 | 2,035 | — | 2,035 | |||||||||||||
Short-Duration Government Fund | 2015 | 6,847 | — | 6,847 | ||||||||||||
| 2014 | 6,916 | — | 6,916 | |||||||||||||
Intermediate-Duration Government Fund | 2015 | 561 | — | 561 | ||||||||||||
| 2014 | 643 | — | 643 | |||||||||||||
GNMA Fund | 2015 | 1,978 | — | 1,978 | ||||||||||||
| 2014 | 3,835 | — | 3,835 | |||||||||||||
As of January 31, 2015, the components of Distributable Earnings/(Accumulated Losses) on a tax basis were as follows:
| Undistributed Ordinary Income ($ Thousands) | Undistributed Long-Term Capital Gain ($ Thousands) | Capital Loss ($ Thousands) | Post-October ($ Thousands) | Other Temporary Differences ($ Thousands) | Unrealized Appreciation (Depreciation) ($ Thousands) | Total Earnings/ | ||||||||||||||||||||||
Money Market Fund | $ | 4 | $ | — | $ | — | $ | — | $ | (2 | ) | $ | — | $ | 2 | |||||||||||||
Government Fund | 33 | — | (31 | ) | — | (33 | ) | — | (31 | ) | ||||||||||||||||||
Government II Fund | 9 | — | — | — | (12 | ) | — | (3 | ) | |||||||||||||||||||
Prime Obligation Fund | 46 | — | (50 | ) | — | (46 | ) | — | (50 | ) | ||||||||||||||||||
Treasury Fund | 3 | — | — | — | (3 | ) | — | — | ||||||||||||||||||||
Treasury II Fund | 20 | — | — | — | (6 | ) | — | 14 | ||||||||||||||||||||
Ultra Short Duration Bond Fund | 172 | — | (21,294 | ) | (257 | ) | (25 | ) | (757 | ) | (22,161 | ) | ||||||||||||||||
Short-Duration Government Fund | 1,088 | — | (5,511 | ) | (103 | ) | (931 | ) | 8,367 | 2,910 | ||||||||||||||||||
Intermediate-Duration Government Fund | 47 | — | (1,273 | ) | — | (252 | ) | 808 | (670 | ) | ||||||||||||||||||
GNMA Fund | 137 | 720 | — | — | (188 | ) | 3,748 | 4,417 | ||||||||||||||||||||
| 58 | SEI Daily Income Trust / Semi-Annual Report / July 31, 2015 |
At January 31, 2015, the following Funds had capital loss carryforwards to offset future realized capital gains:
Amount ($ Thousands) | Expiration | |||||||
Government Fund | $ | 31 | 1/31/16 | |||||
Prime Obligation Fund | 50 | 1/31/17 | ||||||
Ultra Short Duration Bond Fund | 296 | 1/31/16 | ||||||
| 181 | 1/31/17 | |||||||
| 3,642 | 1/31/18 | |||||||
| 11,895 | 1/31/19 | |||||||
For Federal income tax purposes, capital loss carryforwards may be carried forward and applied against future capital gains. It is the Funds’ intent that they will not distribute any realized gain distributions until the carryforwards have been offset or expired.
During the fiscal year ended January 31, 2015, the Prime Obligation Fund, Treasury Fund, Government Fund, Intermediate-Duration and GNMA Fund utilized $6,484, $5010, $1,497,$106,993 and $4,869, respectively, of capital loss carryforwards to offset capital gains.
Under the recently enacted Regulated Investment Company Modernization Act of 2010, Funds will be permitted to carry forward capital losses incurred in taxable years beginning after December 22, 2010 for an unlimited period. However, any losses incurred during those future taxable years will be required to be utilized prior to the losses incurred in pre-enactment taxable years. As a result of this ordering rule, pre-enactment capital loss carryforwards may be more likely to expire unused. Additionally, post-enactment capital losses that are carried forward will retain their character as either short-term or long-term capital losses rather than being considered all short-term as under previous law.
Losses carried forward under these new provisions are as follows ($ Thousands):
| Short-Term Loss | Long-Term Loss | Total* | ||||||||||
Ultra Short Duration Bond Fund | $ | — | $ | 5,280 | $ | 5,280 | ||||||
Short-Duration Government Fund | 2,026 | 3,485 | 5,511 | |||||||||
Intermediate-Duration Government Fund | 1,045 | 228 | 1,273 | |||||||||
| * | This table should be used in conjunction with the capital loss carryforwards table. |
During the six month period ended July 31, 2015, the Money Market Funds’ cost of securities for Federal income tax purposes approximates the cost located in the Statements of Assets and Liabilities.
For Federal income tax purposes, the cost of securities owned at July 31, 2015, and net realized gains or losses on securities sold for the period, were different from amounts reported for financial reporting purposes, primarily due to wash sales which cannot be used for Federal income tax purposes in the current year and have been deferred for use in future years. The Federal tax cost and aggregate gross unrealized appreciation and depreciation on investments held by the Fixed Income Funds at July 31, 2015, were as follows:
Federal Tax ($ Thousands) | Appreciated Securities ($ Thousands) | Depreciated Securities ($ Thousands) | Net Unrealized Appreciation/ (Depreciation) ($ Thousands) | |||||||||||||
Ultra Short Duration Bond Fund | $ | 279,235 | $ | 384 | $ | (1,119 | ) | $ | (735 | ) | ||||||
Short-Duration Government Fund | 895,519 | 6,885 | (215 | ) | 6,670 | |||||||||||
Intermediate-Duration Government Fund | 25,576 | 500 | (12 | ) | 488 | |||||||||||
GNMA Fund | 149,070 | 3,201 | (160 | ) | 3,041 | |||||||||||
Management has analyzed the Funds’ tax positions taken on the federal tax returns for all open tax years and has concluded that as of July 31, 2015, no provision for income tax is required in the Funds’ financial statements. The Funds’ federal income and excise tax returns are subject to examination by the IRS for all open tax years under the applicable Statute of Limitations have not expired are subject to examination by the Internal Revenue Service and state departments of revenue.
6. INVESTMENT RISKS
In the normal course of business, a Fund may enter into contracts that provide general indemnifications by a Fund to the counterparty to the contract. A Fund’s maximum exposure under these arrangements is dependent on future claims that may be made against a Fund and, therefore, cannot be established; however, based on experience, management believes the risk of loss from such claim is considered remote.
7. NEW ACCOUNTING PRONOUNCEMENT
In May 2015, the Financial Accounting Standards Board (FASB) issued Accounting Standards Update (ASU) No. 2015-07 regarding “Disclosures for Investments in Certain Entities That Calculate Net Asset Value per Share”. The amendments in this update are effective for fiscal years beginning after December 15, 2015, and interim periods within those fiscal years. ASU No. 2015-07 will eliminate the requirement to categorize investments in the fair value hierarchy if their fair value is measured at net asset value (NAV) per share (or its equivalent) using the practical expedient in the FASB’s fair value measurement guidance. At this time, management is evaluating the implications of ASU No. 2015-07 and its impact on the financial statement disclosures has not yet been determined.
8. REGULATORY MATTERS
On July 23, 2014, the SEC adopted amendments to the rules that govern money market mutual funds. In part, the amendments will require structural changes to most types of money market funds to one extent or another; however, the SEC provided for an extended 2-year transition period to comply with such structural requirements. At this time, management is evaluating the reforms adopted and the manner for implementing these reforms over time and its impact on the financial statements.
9. SUBSEQUENT EVENTS
The Trust, on behalf of the Funds, has evaluated the need for disclosures and/or adjustments resulting from subsequent events. Based on this evaluation, no disclosures and/or adjustments were required to the financial statements.
| SEI Daily Income Trust / Semi-Annual Report / July 31, 2015 | 59 |
Disclosure of Fund Expenses (Unaudited)
All mutual funds have operating expenses. As a shareholder of a mutual fund, your investment is affected by these ongoing costs, which include (among others) costs for portfolio management, administrative services, and shareholder reports like this one. It is important for you to understand the impact of these costs on your investment returns.
Operating expenses such as these are deducted from the mutual fund‘s gross income and directly reduce your final investment return. These expenses are expressed as a percentage of the mutual fund’s average net assets; this percentage is known as the mutual fund’s expense ratio.
The following examples use the expense ratio and are intended to help you understand the ongoing costs (in dollars) of investing in your Fund and to compare these costs with those of other mutual funds. The examples are based on an investment of $1,000 made at the beginning of the period shown and held for the entire period.
The table on the next page illustrates your Fund’s costs in two ways:
• Actual Fund Return. This section helps you to estimate the actual expenses after fee waivers that your Fund incurred over the period. The “Expenses Paid During Period” column shows the actual dollar expense cost incurred by a $1,000 investment in the Fund, and the “Ending Account Value” number is derived from deducting that expense cost from the Fund’s gross investment return.
You can use this information, together with the actual amount you invested in your Fund, to estimate the expenses you paid over that period. Simply divide your actual starting account value by $1,000 to arrive at a ratio (for example, an $8,600 account value divided by $1,000 = 8.6), then multiply that ratio by the number shown for your Fund under “Expenses Paid During Period.”
• Hypothetical 5% Return. This section helps you compare your Fund’s costs with those of other mutual funds. It assumes that your Fund had an annual 5% return before expenses during the year, but that the expense ratio (Column 3) is unchanged. This example is useful in making comparisons because the Securities and Exchange Commission requires all mutual funds to make this 5% calculation. You can assess your Fund’s comparative cost by comparing the hypothetical result for your Fund in the “Expense Paid During Period” column with those that appear in the same charts in the shareholder reports for other mutual funds.
NOTE: Because the return is set at 5% for comparison purposes — NOT your Fund’s actual return — the account values shown do not apply to your specific investment.
| Beginning Account Value 2/1/15 | Ending Account Value 7/31/15 | Annualized Expense Ratios | Expenses Paid During Period* | |||||||||||||
Money Market Fund |
| |||||||||||||||
Actual Fund Return |
| |||||||||||||||
Class A | $ | 1,000.00 | $ | 1,000.10 | 0.18 | % | $ | 0.89 | ||||||||
Class B | 1,000.00 | 1,000.00 | 0.19 | 0.94 | ||||||||||||
Class C | 1,000.00 | 1,000.00 | 0.19 | 0.94 | ||||||||||||
Sweep Class | 1,000.00 | 1,000.00 | 0.19 | 0.94 | ||||||||||||
Hypothetical 5% Return |
| |||||||||||||||
Class A | $ | 1,000.00 | $ | 1,023.90 | 0.18 | % | $ | 0.90 | ||||||||
Class B | 1,000.00 | 1,023.85 | 0.19 | 0.95 | ||||||||||||
Class C | 1,000.00 | 1,023.85 | 0.19 | 0.95 | ||||||||||||
Sweep Class | 1,000.00 | 1,023.85 | 0.19 | 0.95 | ||||||||||||
Government Fund |
| |||||||||||||||
Actual Fund Return |
| |||||||||||||||
Class A | $ | 1,000.00 | $ | 1,000.10 | 0.09 | % | $ | 0.45 | ||||||||
Class B | 1,000.00 | 1,000.10 | 0.09 | 0.45 | ||||||||||||
Class C | 1,000.00 | 1,000.10 | 0.09 | 0.45 | ||||||||||||
Sweep Class | 1,000.00 | 1,000.10 | 0.09 | 0.45 | ||||||||||||
Hypothetical 5% Return |
| |||||||||||||||
Class A | $ | 1,000.00 | $ | 1,024.35 | 0.09 | % | $ | 0.45 | ||||||||
Class B | 1,000.00 | 1,024.35 | 0.09 | 0.45 | ||||||||||||
Class C | 1,000.00 | 1,024.35 | 0.09 | 0.45 | ||||||||||||
Sweep Class | 1,000.00 | 1,024.35 | 0.09 | 0.45 | ||||||||||||
| Beginning Account Value 2/1/15 | Ending Account Value 7/31/15 | Annualized Expense Ratios | Expenses Paid During Period* | |||||||||||||
Government II Fund |
| |||||||||||||||
Actual Fund Return |
| |||||||||||||||
Class A | $ | 1,000.00 | $ | 1,000.00 | 0.09 | % | $ | 0.45 | ||||||||
Class B | 1,000.00 | 1,000.00 | 0.09 | 0.45 | ||||||||||||
Class C | 1,000.00 | 1,000.00 | 0.09 | 0.45 | ||||||||||||
Hypothetical 5% Return |
| |||||||||||||||
Class A | $ | 1,000.00 | $ | 1,024.35 | 0.09 | % | $ | 0.45 | ||||||||
Class B | 1,000.00 | 1,024.35 | 0.09 | 0.45 | ||||||||||||
Class C | 1,000.00 | 1,024.35 | 0.09 | 0.45 | ||||||||||||
Prime Obligation Fund |
| |||||||||||||||
Actual Fund Return |
| |||||||||||||||
Class A | $ | 1,000.00 | $ | 1,000.10 | 0.19 | % | $ | 0.94 | ||||||||
Class B | 1,000.00 | 1,000.00 | 0.19 | 0.94 | ||||||||||||
Class C | 1,000.00 | 1,000.00 | 0.19 | 0.94 | ||||||||||||
Class H | 1,000.00 | 1,000.00 | 0.19 | 0.94 | ||||||||||||
Sweep Class | 1,000.00 | 1,000.00 | 0.19 | 0.94 | ||||||||||||
Hypothetical 5% Return |
| |||||||||||||||
Class A | $ | 1,000.00 | $ | 1,023.85 | 0.19 | % | $ | 0.95 | ||||||||
Class B | 1,000.00 | 1,023.85 | 0.19 | 0.95 | ||||||||||||
Class C | 1,000.00 | 1,023.85 | 0.19 | 0.95 | ||||||||||||
Class H | 1,000.00 | 1,023.85 | 0.19 | 0.95 | ||||||||||||
Sweep Class | 1,000.00 | 1,023.85 | 0.19 | 0.95 | ||||||||||||
| 60 | SEI Daily Income Trust / Semi-Annual Report / July 31, 2015 |
| Beginning Account Value 2/1/15 | Ending Account Value 7/31/15 | Annualized Expense Ratios | Expenses Paid During Period* | |||||||||||||
Treasury Fund |
| |||||||||||||||
Actual Fund Return |
| |||||||||||||||
Class A | $ | 1,000.00 | $ | 1,000.00 | 0.06 | % | $ | 0.30 | ||||||||
Class B | 1,000.00 | 1,000.00 | 0.06 | 0.30 | ||||||||||||
Class C | 1,000.00 | 1,000.00 | 0.06 | 0.30 | ||||||||||||
Sweep Class | 1,000.00 | 1,000.00 | 0.06 | 0.30 | ||||||||||||
Hypothetical 5% Return |
| |||||||||||||||
Class A | $ | 1,000.00 | $ | 1024.50 | 0.06 | % | $ | 0.30 | ||||||||
Class B | 1,000.00 | 1,024.50 | 0.06 | 0.30 | ||||||||||||
Class C | 1,000.00 | 1,024.50 | 0.06 | 0.30 | ||||||||||||
Sweep Class | 1,000.00 | 1,024.50 | 0.06 | 0.30 | ||||||||||||
Treasury II Fund |
| |||||||||||||||
Actual Fund Return |
| |||||||||||||||
Class A | $ | 1,000.00 | $ | 1,000.00 | 0.04 | % | $ | 0.20 | ||||||||
Class B | 1,000.00 | 1,000.00 | 0.04 | 0.20 | ||||||||||||
Class C | 1,000.00 | 1,000.00 | 0.04 | 0.20 | ||||||||||||
Hypothetical 5% Return |
| |||||||||||||||
Class A | $ | 1,000.00 | $ | 1,024.60 | 0.04 | % | $ | 0.20 | ||||||||
Class B | 1,000.00 | 1,024.60 | 0.04 | 0.20 | ||||||||||||
Class C | 1,000.00 | 1,024.60 | 0.04 | 0.20 | ||||||||||||
Ultra Short Duration Bond Fund |
| |||||||||||||||
Actual Fund Return |
| |||||||||||||||
Class A | $ | 1,000.00 | $ | 1,003.20 | 0.38 | % | $ | 1.89 | ||||||||
Hypothetical 5% Return |
| |||||||||||||||
Class A | $ | 1,000.00 | $ | 1,022.91 | 0.38 | % | $ | 1.91 | ||||||||
| Beginning Account Value 2/1/15 | Ending Account Value 7/31/15 | Annualized Expense Ratios | Expenses Paid During Period* | |||||||||||||
Short-Duration Government Fund |
| |||||||||||||||
Actual Fund Return |
| |||||||||||||||
Class A | $ | 1,000.00 | $ | 997.40 | 0.48 | % | $ | 2.38 | ||||||||
Class Y | $ | 1,000.00 | $ | 997.90 | 0.38 | % | $ | 1.88 | ||||||||
Hypothetical 5% Return |
| |||||||||||||||
Class A | $ | 1,000.00 | $ | 1,022.41 | 0.48 | % | $ | 2.41 | ||||||||
Class Y | $ | 1,000.00 | $ | 1,022.91 | 0.38 | % | $ | 1.91 | ||||||||
Intermediate-Duration Government Fund |
| |||||||||||||||
Actual Fund Return |
| |||||||||||||||
Class A | $ | 1,000.00 | $ | 997.50 | 0.53 | % | $ | 2.62 | ||||||||
Hypothetical 5% Return |
| |||||||||||||||
Class A | $ | 1,000.00 | $ | 1,022.17 | 0.53 | % | $ | 2.66 | ||||||||
GNMA Fund |
| |||||||||||||||
Actual Fund Return |
| |||||||||||||||
Class A | $ | 1,000.00 | $ | 998.20 | 0.63 | % | $ | 3.12 | ||||||||
Hypothetical 5% Return |
| |||||||||||||||
Class A | $ | 1,000.00 | $ | 1,021.67 | 0.63 | % | $ | 3.16 | ||||||||
| * | Expenses are equal to the Fund’s annualized expense ratio multiplied by the average account value over the period, multiplied by 181/365. |
| SEI Daily Income Trust / Semi-Annual Report / July 31, 2015 | 61 |
SEI DAILY INCOME TRUST SEMI-ANNUAL REPORT JULY 31, 2015
Robert A. Nesher, Chairman
Trustees
William M. Doran
George J. Sullivan, Jr.
Nina Lesavoy
James M. Williams
Mitchell A. Johnson
Hubert L. Harris, Jr.
Officers
Robert A. Nesher
President and Chief Executive Officer
Arthur Ramanjulu
Controller and Chief Financial Officer
Russell Emery
Chief Compliance Officer
Timothy D. Barto
Vice President, Secretary
David F. McCann
Vice President, Assistant Secretary
Aaron Buser
Vice President, Assistant Secretary
Stephen G. MacRae
Vice President
Bridget E. Sudall
Anti-Money Laundering Compliance Officer
Privacy Officer
Investment Adviser
SEI Investments Management Corporation
Administrator
SEI Investments Global Funds Services
Distributor
SEI Investments Distribution Co.
Legal Counsel
Morgan, Lewis & Bockius LLP
Independent Registered Public Accounting Firm
KPMG LLP
This report and the financial statements contained herein are submitted for the general information of the shareholders of the Trust and must be preceded or accompanied by a current prospectus. Shares of the Funds are not deposits or obligations of, or guaranteed or endorsed by, any bank. The shares are not federally insured by the Federal Deposit Insurance Corporation (FDIC), the Federal Reserve Board, or any other government agency. Investment in the shares involves risk, including the possible loss of principal.
For more information call
1 800 DIAL SEI
(1 800 342 5734)

1 Freedom Valley Drive, P.O. Box 1100, Oaks, PA 19456
SEI-F-037 (7/15)
| Item 2. | Code of Ethics. |
Not applicable for semi-annual report.
| Item 3. | Audit Committee Financial Expert. |
Not applicable for semi-annual report.
| Item 4. | Principal Accountant Fees and Services. |
Not applicable for semi-annual report.
| Item 5. | Audit Committee of Listed Registrants. |
Not applicable.
| Item 6. | Schedule of Investments. |
Included in Item 1.
| Item 7. | Disclosure of Proxy Voting Policies and Procedures for Closed-End Management Investment Companies. |
Not applicable.
| Item 8. | Portfolio Managers of Closed-End Management Investment Companies. |
Not applicable.
| Item 9. | Purchases of Equity Securities by Closed-End Management Company and Affiliated Purchasers. |
Not applicable.
| Item 10. | Submission of Matters to a Vote of Security Holders. |
The Registrant has a standing Governance Committee (the “Committee”) currently consisting of the Independent Trustees. The Committee is responsible for evaluating and recommending nominees for election to the Registrant’s Board of Trustees (the “Board”). Pursuant to the Committee’s Charter, adopted on June 18th 2004, as amended, the Committee will review all shareholder recommendations for nominations to fill vacancies on the Board if such recommendations are submitted in writing and addressed to the Committee at the Registrant’s office.
| Item 11. | Controls and Procedures. |
(a) The Registrant’s principal executive and principal financial officers, or persons performing similar functions, have concluded that the Registrant’s disclosure controls and procedures (as defined in Rule 30a-3(c) under the Investment Company Act of 1940 (the “1940 Act”)) are effective, based on the evaluation of these controls and procedures required by Rule 30a-3(b) under the 1940 Act and Rules 13a-15(b) or 15d-15(b) under the Securities Exchange Act of 1934 as of a date within 90 days of the filing date of this report.
(b) There were no changes in the Registrant’s internal control over financial reporting (as defined in Rule 30a-3(d) under the 1940 Act) that occurred during the second fiscal quarter of the period covered by this report that have materially affected, or are reasonably likely to materially affect, the Registrants internal control over financial reporting.
| Items 12. | Exhibits. |
(a)(1) Not applicable for semi-annual report.
(a)(2) A separate certification for the principal executive officer and the principal financial officer of the Registrant as required by Rule 30a-2(a) under the 1940 Act, as amended (17 CFR 270.30a-2(a)), are filed herewith.
(b) Officer certifications as required by Rule 30a-2(b) under the 1940 Act, as amended (17 CFR 270.30a-2(b)) also accompany this filing as an exhibit.
SIGNATURES
Pursuant to the requirements of the Securities Exchange Act of 1934 and the Investment Company Act of 1940, the Registrant has duly caused this report to be signed on its behalf by the undersigned, thereunto duly authorized.
| SEI Daily Income Trust | ||
| By: | /s/ Robert A. Nesher | |
| Robert A. Nesher, President & CEO | ||
Date: October 1, 2015
Pursuant to the requirements of the Securities Exchange Act of 1934 and the Investment Company Act of 1940, this report has been signed below by the following persons on behalf of the Registrant and in the capacities and on the dates indicated.
| By: | /s/ Robert A. Nesher | |
| Robert A. Nesher, President & CEO |
Date: October 1, 2015
| By: | /s/ Arthur Ramanjulu | |
| Arthur Ramanjulu, Controller & CFO |
Date: October 1, 2015