UNITED STATES
SECURITIES AND EXCHANGE COMMISSION
Washington, D.C. 20549
FORM N-CSRS
CERTIFIED SHAREHOLDER REPORT OF REGISTERED MANAGEMENT
INVESTMENT COMPANIES
Investment Company Act file number 811-03451
SEI Daily Income Trust
(Exact name of registrant as specified in charter)
SEI Investments
One Freedom Valley Drive
Oaks, PA 19456
(Address of principal executive offices) (Zip code)
Timothy D. Barto, Esq.
SEI Investments Co.
One Freedom Valley Drive
Oaks, PA 19456
(Name and address of agent for service)
Registrant’s telephone number, including area code: 1-610-676-1000
Date of fiscal year end: January 31, 2019
Date of reporting period: July 31, 2018
| Item 1. Reports | to Stockholders. |

JULY 31, 2018
SEMI-ANNUAL REPORT
SEI Daily Income Trust
| Government Fund
| |
| Government II Fund
| |
| Treasury Fund
| |
| Treasury II Fund
| |
| Ultra Short Duration Bond Fund
| |
| Short-Duration Government Fund
| |
 | GNMA Fund |

| 1 | ||||
| 36 | ||||
| 38 | ||||
| 40 | ||||
| 44 | ||||
| 46 | ||||
| 57 | ||||
Board of Trustees’ Considerations in Approving | 59 | |||
The Trust files its complete schedule of portfolio holdings with the Securities and Exchange Commission for the first and third quarters of each fiscal year on Form N-Q within sixty days after the end of the period. The Trust’s Forms N-Q are available on the Commission’s website at http://www.sec.gov, and may be reviewed and copied at the Commission’s Public Reference Room in Washington, DC. Information on the operation of the Public Reference Room may be obtained by calling 1-800-SEC-0330.
Since the Funds in SEI Daily Income Trust typically hold only fixed income securities, they generally are not expected to hold securities for which they may be required to vote proxies. Regardless, in light of the possibility of the possibility that a Fund could hold a security for which a proxy is voted, the Trust has adopted proxy voting policies. A description of the policies and procedures that the Trust uses to determine how to vote proxies relating to portfolio securities, as well as information relating to how a Fund voted proxies relating to portfolio securities during the most recent 12-month period ended June 30, is available (i) without charge, upon request, by calling 1-800-DIAL-SEI; and (ii) on the Commission’s website at http://www.sec.gov.
SCHEDULE OF INVESTMENTS (Unaudited)
July 31, 2018
Government Fund
| Description |
Face Amount |
Value | ||||||
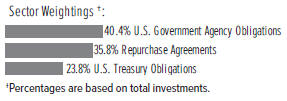
U.S. GOVERNMENT AGENCY OBLIGATIONS — 41.9% |
| |||||||
FFCB | ||||||||
2.044%, VAR ICE LIBOR USD 1 | $ | 40,075 | $ | 40,075 | ||||
2.192%, VAR ICE LIBOR USD 1 | 69,315 | 69,315 | ||||||
1.000%, 01/07/2019 | 15,785 | 15,701 | ||||||
2.047%, VAR ICE LIBOR USD 1 | 79,365 | 79,364 | ||||||
FHLB | ||||||||
1.927%, VAR ICE LIBOR USD 1 | 28,960 | 28,960 | ||||||
1.936%, VAR ICE LIBOR USD 1 | 57,925 | 57,925 | ||||||
1.975%, VAR ICE LIBOR USD 1 | 57,000 | 57,000 | ||||||
1.930%, VAR ICE LIBOR USD 1 | 28,500 | 28,500 | ||||||
1.982%, VAR ICE LIBOR USD 1 | 110,000 | 110,000 | ||||||
1.992%, VAR ICE LIBOR USD 1 | 19,500 | 19,500 | ||||||
2.007%, VAR ICE LIBOR USD 1 | 120,000 | 120,000 | ||||||
1.922%, VAR ICE LIBOR USD 1 | 66,085 | 66,085 | ||||||
1.942%, VAR ICE LIBOR USD 1 | 75,000 | 75,000 | ||||||
1.949%, VAR ICE LIBOR USD 1 | 110,885 | 110,884 | ||||||
1.961%, VAR ICE LIBOR USD 1 | 55,325 | 55,330 | ||||||
1.962%, VAR ICE LIBOR USD 1 | 30,445 | 30,448 | ||||||
2.004%, VAR ICE LIBOR USD 1 | 44,735 | 44,732 | ||||||
2.006%, VAR ICE LIBOR USD 3 | 35,735 | 35,735 | ||||||
1.952%, VAR ICE LIBOR USD 1 | 38,935 | 38,920 | ||||||
1.974%, VAR ICE LIBOR USD 1 | 65,345 | 65,345 | ||||||
1.952%, VAR ICE LIBOR USD 1 | 49,095 | 49,095 | ||||||
2.020%, VAR ICE LIBOR USD 1 | 135,000 | 135,000 | ||||||
| Description |
Face Amount |
Value | ||||||
U.S. GOVERNMENT AGENCY OBLIGATIONS (continued) |
| |||||||
1.949%, VAR ICE LIBOR USD 1 | $ | 42,730 | $ | 42,730 | ||||
1.944%, VAR ICE LIBOR USD 1 | 87,345 | 87,345 | ||||||
2.016%, VAR ICE LIBOR USD 3 | 59,970 | 59,970 | ||||||
1.985%, VAR ICE LIBOR USD 1 | 58,135 | 58,135 | ||||||
2.166%, VAR ICE LIBOR USD 3 | 23,955 | 23,950 | ||||||
2.165%, VAR ICE LIBOR USD 3 | 55,365 | 55,365 | ||||||
1.998%, VAR ICE LIBOR USD 1 | 93,315 | 93,315 | ||||||
1.981%, VAR ICE LIBOR USD 1 | 118,295 | 118,295 | ||||||
1.997%, VAR ICE LIBOR USD 1 | 51,990 | 51,990 | ||||||
2.186%, VAR ICE LIBOR USD 3 | 29,005 | 29,005 | ||||||
2.033%, VAR ICE LIBOR USD 1 | 41,910 | 41,910 | ||||||
FHLB DN (A) | ||||||||
1.698%, 08/01/2018 | 46,515 | 46,515 | ||||||
1.894%, 08/02/2018 | 33,605 | 33,603 | ||||||
1.901%, 08/03/2018 | 39,770 | 39,766 | ||||||
1.850%, 08/08/2018 | 65,795 | 65,771 | ||||||
1.915%, 08/21/2018 | 14,835 | 14,819 | ||||||
1.899%, 08/22/2018 | 96,455 | 96,348 | ||||||
1.936%, 08/29/2018 | 51,695 | 51,618 | ||||||
1.921%, 09/06/2018 | 60,000 | 59,885 | ||||||
1.939%, 09/07/2018 | 49,355 | 49,257 | ||||||
1.921%, 09/12/2018 | 11,590 | 11,564 | ||||||
1.935%, 09/19/2018 | 128,525 | 128,188 | ||||||
1.939%, 09/21/2018 | 68,145 | 67,956 | ||||||
1.980%, 10/09/2018 | 42,265 | 42,106 | ||||||
2.005%, 10/17/2018 | 74,050 | 73,734 | ||||||
2.020%, 10/22/2018 | 6,945 | 6,913 | ||||||
2.000%, 10/24/2018 | 101,810 | 101,338 | ||||||
2.000%, 10/26/2018 | 53,850 | 53,594 | ||||||
2.188%, 01/30/2019 | 40,270 | 39,830 | ||||||
FHLMC DN | ||||||||
1.898%, 08/20/2018 (A) | 51,685 | 51,633 | ||||||
|
|
| ||||||
Total U.S. Government Agency Obligations |
| 3,029,362 | ||||||
|
|
| ||||||
U.S. TREASURY OBLIGATIONS — 24.8% | ||||||||
U.S. Treasury Bills (A) | ||||||||
1.844%, 08/02/2018 | 134,280 | 134,274 | ||||||
1.746%, 08/09/2018 | 149,175 | 149,119 | ||||||
1.883%, 08/16/2018 | 236,325 | 236,150 | ||||||
| SEI Daily Income Trust / Semi-Annual Report / July 31, 2018 | 1 |
SCHEDULE OF INVESTMENTS (Unaudited)
July 31, 2018
Government Fund (Concluded)
| Description |
Face Amount |
Value | ||||||
U.S. TREASURY OBLIGATIONS (continued) |
| |||||||
1.871%, 08/23/2018 | $ | 33,850 | $ | 33,813 | ||||
1.887%, 09/13/2018 | 187,575 | 187,156 | ||||||
1.913%, 09/27/2018 | 11,930 | 11,894 | ||||||
1.924%, 10/04/2018 | 125,000 | 124,577 | ||||||
2.006%, 10/25/2018 | 86,875 | 86,468 | ||||||
2.010%, 11/01/2018 | 121,500 | 120,886 | ||||||
2.097%, 12/20/2018 | 7,755 | 7,692 | ||||||
2.107%, 12/27/2018 | 325,000 | 322,214 | ||||||
2.163%, 01/17/2019 | 150,000 | 148,493 | ||||||
2.184%, 01/31/2019 | 125,000 | 123,635 | ||||||
U.S. Treasury Notes | ||||||||
0.875%, 10/15/2018 | 12,615 | 12,594 | ||||||
1.375%, 11/30/2018 | 10,285 | 10,272 | ||||||
1.500%, 01/31/2019 | 14,380 | 14,331 | ||||||
1.500%, 03/31/2019 | 65,000 | 64,664 | ||||||
|
|
| ||||||
Total U.S. Treasury Obligations |
| 1,788,232 | ||||||
|
|
| ||||||
REPURCHASE AGREEMENTS(B) — 37.1% |
| |||||||
Barclays Bank | 101,000 | 101,000 | ||||||
BNP Paribas | 100,000 | 100,000 | ||||||
Citigroup Global | 9,000 | 9,000 | ||||||
| Description |
Face Amount |
Value | ||||||
REPURCHASE AGREEMENTS(B) (continued) |
| |||||||
Citigroup Global | $ | 375,000 | $ | 375,000 | ||||
Credit Suisse | 100,000 | 100,000 | ||||||
Goldman Sachs | 350,000 | 350,000 | ||||||
Goldman Sachs | 95,000 | 95,000 | ||||||
J.P. Morgan | 295,000 | 295,000 | ||||||
Merrill Lynch | 150,000 | 150,000 | ||||||
| 2 | SEI Daily Income Trust / Semi-Annual Report / July 31, 2018 |
| Description |
Face Amount |
Value | ||||||
REPURCHASE AGREEMENTS(B) (continued) |
| |||||||
Mizuho Securities | $ | 79,000 | $ | 79,000 | ||||
MUFG Securities | 280,000 | 280,000 | ||||||
Natixis | 65,000 | 65,000 | ||||||
Natixis | 25,000 | 25,000 | ||||||
TD Securities | 275,000 | 275,000 | ||||||
TD Security | 100,000 | 100,000 | ||||||
| Description |
Face Amount |
Value | ||||||
REPURCHASE AGREEMENTS(B) (continued) |
| |||||||
The Bank of Nova Scotia | $ | 10,000 | $ | 10,000 | ||||
Wells Fargo | 275,000 | 275,000 | ||||||
|
|
| ||||||
Total Repurchase Agreements |
| 2,684,000 | ||||||
|
|
| ||||||
Total Investments — 103.8% |
| $ | 7,501,594 | |||||
|
|
| ||||||
Percentages are based on Net Assets of $7,226,326 ($ Thousands).
| (A) | Variable Rate Security – The rate reported on the Schedule of Investments is the rate in effect as of July 31, 2018. |
| (B) | Tri-Party Repurchase Agreement. |
DN – Discount Note
FFCB – Federal Farm Credit Bank
ICE – Intercontinental Exchange
FHLB – Federal Home Loan Bank
FHLMC – Federal Home Loan Mortgage Corporation
FNMA – Federal National Mortgage Association
GNMA – Government National Mortgage Association
LIBOR – London Interbank Offered Rate
Ser – Series
USD – United States Dollar
VAR – Variable Rate
As of July 31, 2018, all of the Fund’s investments were considered Level 2, in accordance with the authoritative guidance on fair value measurements and disclosure under U.S. GAAP.
For the period ended July 31, 2018, there were no transfers between Level 1, Level 2 and/or Level 3 assets and liabilities.
For more information on valuation inputs, see Note 2 – Significant Accounting Policies in Notes to Financial Statements.
The accompanying notes are an integral part of the financial statements.
| SEI Daily Income Trust / Semi-Annual Report / July 31, 2018 | 3 |
SCHEDULE OF INVESTMENTS (Unaudited)
July 31, 2018
Government II Fund
| Description |
Face Amount |
Market Value | ||||||
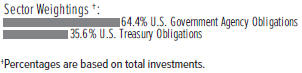
U.S. GOVERNMENT AGENCY OBLIGATIONS — 68.6% |
| |||||||
FFCB | ||||||||
2.044%, VAR ICE LIBOR USD 1 | $ | 9,925 | $ | 9,925 | ||||
1.000%, 01/07/2019 | 4,215 | 4,192 | ||||||
2.012%, VAR ICE LIBOR USD 1 | 29,000 | 28,999 | ||||||
2.047%, VAR ICE LIBOR USD 1 | 20,870 | 20,870 | ||||||
FFCB DN (A) | ||||||||
2.150%, 01/15/2019 (A) | 18,930 | 18,744 | ||||||
FHLB | ||||||||
1.932%, VAR ICE LIBOR USD 1 | 5,545 | 5,545 | ||||||
1.927%, VAR ICE LIBOR USD 1 | 7,220 | 7,220 | ||||||
1.936%, VAR ICE LIBOR USD 1 | 14,445 | 14,445 | ||||||
1.975%, VAR ICE LIBOR USD 1 | 15,500 | 15,500 | ||||||
1.930%, VAR ICE LIBOR USD 1 | 7,500 | 7,500 | ||||||
2.007%, VAR ICE LIBOR USD 1 | 29,060 | 29,060 | ||||||
1.922%, VAR ICE LIBOR USD 1 | 17,405 | 17,405 | ||||||
1.942%, VAR ICE LIBOR USD 1 | 15,000 | 15,000 | ||||||
1.949%, VAR ICE LIBOR USD 1 | 26,530 | 26,530 | ||||||
1.961%, VAR ICE LIBOR USD 1 | 13,620 | 13,621 | ||||||
1.962%, VAR ICE LIBOR USD 1 | 7,700 | 7,701 | ||||||
2.004%, VAR ICE LIBOR USD 1 | 29,485 | 29,484 | ||||||
1.952%, VAR ICE LIBOR USD 1 | 11,065 | 11,061 | ||||||
1.974%, VAR ICE LIBOR USD 1 | 15,470 | 15,470 | ||||||
1.942%, VAR ICE LIBOR USD 1 | 10,580 | 10,580 | ||||||
2.020%, VAR ICE LIBOR USD 1 | 15,000 | 15,000 | ||||||
1.949%, VAR ICE LIBOR USD 1 | 11,135 | 11,135 | ||||||
| Description |
Face Amount |
Market Value | ||||||
U.S. GOVERNMENT AGENCY OBLIGATIONS (continued) |
| |||||||
1.944%, VAR ICE LIBOR USD 1 | $ | 17,000 | $ | 17,000 | ||||
2.016%, VAR ICE LIBOR USD 3 | 14,910 | 14,910 | ||||||
2.166%, VAR ICE LIBOR USD 3 | 6,510 | 6,508 | ||||||
2.165%, VAR ICE LIBOR USD 3 | 14,615 | 14,615 | ||||||
1.981%, VAR ICE LIBOR USD 1 | 30,645 | 30,645 | ||||||
2.001%, VAR ICE LIBOR USD 1 | 8,130 | 8,129 | ||||||
1.997%, VAR ICE LIBOR USD 1 | 14,270 | 14,270 | ||||||
2.186%, VAR ICE LIBOR USD 3 | 8,040 | 8,040 | ||||||
2.033%, VAR ICE LIBOR USD 1 | 10,850 | 10,850 | ||||||
FHLB DN(A) | ||||||||
1.698%, 08/01/2018 (A) | 48,200 | 48,200 | ||||||
1.850%, 08/08/2018 (A) | 86,720 | 86,689 | ||||||
1.915%, 08/21/2018 (A) | 3,665 | 3,661 | ||||||
1.899%, 08/22/2018 (A) | 212,045 | 211,811 | ||||||
1.889%, 08/24/2018 (A) | 40,495 | 40,446 | ||||||
1.936%, 08/29/2018 (A) | 4,150 | 4,144 | ||||||
1.947%, 09/05/2018 (A) | 10,000 | 9,981 | ||||||
1.921%, 09/06/2018 (A) | 101,800 | 101,605 | ||||||
1.939%, 09/07/2018 (A) | 12,915 | 12,889 | ||||||
1.935%, 09/19/2018 (A) | 43,365 | 43,252 | ||||||
1.939%, 09/21/2018 (A) | 18,395 | 18,345 | ||||||
2.005%, 10/17/2018 (A) | 59,660 | 59,406 | ||||||
2.007%, 10/19/2018 (A) | 61,630 | 61,360 | ||||||
2.020%, 10/22/2018 (A) | 16,435 | 16,360 | ||||||
2.000%, 10/24/2018 (A) | 25,350 | 25,232 | ||||||
2.000%, 10/26/2018 (A) | 13,480 | 13,416 | ||||||
2.188%, 01/30/2019 (A) | 9,730 | 9,624 | ||||||
|
|
| ||||||
Total U.S. Government Agency Obligations |
| 1,226,375 | ||||||
|
|
| ||||||
U.S. TREASURY OBLIGATIONS — 37.8% |
| |||||||
U.S. Treasury Bills (A) | ||||||||
1.844%, 08/02/2018 | 25,000 | 24,999 | ||||||
1.746%, 08/09/2018 | 61,570 | 61,546 | ||||||
1.883%, 08/16/2018 | 50,000 | 49,961 | ||||||
1.871%, 08/23/2018 | 102,075 | 101,959 | ||||||
1.887%, 09/13/2018 | 57,025 | 56,898 | ||||||
1.913%, 09/27/2018 | 35,555 | 35,448 | ||||||
1.924%, 10/04/2018 | 40,000 | 39,865 | ||||||
1.990%, 10/18/2018 | 10,000 | 9,957 | ||||||
| 4 | SEI Daily Income Trust / Semi-Annual Report / July 31, 2018 |
| Description |
Face Amount |
Market Value | ||||||
U.S. TREASURY OBLIGATIONS (continued) |
| |||||||
2.006%, 10/25/2018 | $ | 11,105 | $ | 11,053 | ||||
2.010%, 11/01/2018 | 66,000 | 65,666 | ||||||
2.107%, 12/27/2018 | 20,875 | 20,696 | ||||||
2.123%, 01/10/2019 | 50,000 | 49,528 | ||||||
2.163%, 01/17/2019 | 55,000 | 54,447 | ||||||
2.184%, 01/31/2019 | 40,000 | 39,563 | ||||||
U.S. Treasury Notes | ||||||||
0.750%, 10/31/2018 | 23,365 | 23,289 | ||||||
1.250%, 10/31/2018 | 30,480 | 30,418 | ||||||
1.125%, 01/31/2019 | 855 | 851 | ||||||
1.250%, 01/31/2019 | 855 | 851 | ||||||
|
|
| ||||||
Total U.S. Treasury Obligations |
| 676,995 | ||||||
|
|
| ||||||
Total Investments in Securities — 106.4% |
| $ | 1,903,370 | |||||
|
|
| ||||||
Percentages are based on Net Assets of $1,789,007 ($ Thousands). |
| (A) | Variable Rate Security – The rate reported on the Schedule of Investments is the rate In effect as of July 31, 2018. |
| (B) | Zero coupon security. The rate shown on the Schedule of Investments is the security’s effective yield at the time of purchase. |
DN – Discount Note
FFCB – Federal Farm Credit Bank
FHLB – Federal Home Loan Bank
ICE – Intercontinental Exchange
LIBOR – London Interbank Offered Rate
VAR – Variable Rate
USD – United States Dollar
As of July 31, 2018, all of the Fund’s investments were considered Level 2, in accordance with the authoritative guidance on fair value measurements and disclosure under U.S. GAAP.
For the period ended July 31, 2018, there were no transfers between Level 1, Level 2 and/or Level 3 assets and liabilities.
For more information on valuation inputs, see Note 2–Significant Accounting Policies in Notes to Financial Statements.
The accompanying notes are an integral part of the financial statements.
| SEI Daily Income Trust / Semi-Annual Report / July 31, 2018 | 5 |
SCHEDULE OF INVESTMENTS (Unaudited)
July 31, 2018
Treasury Fund
| Description |
Face Amount |
Value | ||||||
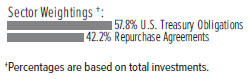
U.S. TREASURY OBLIGATIONS — 56.8% |
| |||||||
U.S. Treasury Bills (A) | ||||||||
1.844%, 08/02/2018 | $ | 3,000 | $ | 3,000 | ||||
1.746%, 08/09/2018 | 8,195 | 8,192 | ||||||
1.871%, 08/23/2018 | 1,190 | 1,189 | ||||||
1.887%, 09/13/2018 | 3,000 | 2,994 | ||||||
1.903%, 09/20/2018 | 3,000 | 2,992 | ||||||
1.913%, 09/27/2018 | 3,465 | 3,455 | ||||||
1.924%, 10/04/2018 | 3,000 | 2,990 | ||||||
1.898%, 10/11/2018 | 2,820 | 2,809 | ||||||
2.006%, 10/25/2018 | 1,650 | 1,642 | ||||||
2.010%, 11/01/2018 | 3,500 | 3,482 | ||||||
2.107%, 12/27/2018 | 1,410 | 1,398 | ||||||
2.184%, 01/31/2019 | 3,000 | 2,967 | ||||||
U.S. Treasury Notes | ||||||||
0.875%, 10/15/2018 | 160 | 160 | ||||||
1.278%, VAR US Treasury 3 Month Bill Money Market Yield+0.170%, 10/31/2018 | 2,830 | 2,830 | ||||||
1.375%, 11/30/2018 | 120 | 120 | ||||||
1.250%, 01/31/2019 | 55 | 55 | ||||||
1.125%, 01/31/2019 | 55 | 55 | ||||||
2.750%, 02/15/2019 | 3,000 | 3,008 | ||||||
1.125%, 02/28/2019 | 280 | 278 | ||||||
2.080%, VAR US Treasury 3 Month Bill Money Market Yield+0.070%, 04/30/2019 | 1,735 | 1,735 | ||||||
2.070%, VAR US Treasury 3 Month Bill Money Market Yield+0.060%, 07/31/2019 | 1,025 | 1,026 | ||||||
2.058%, VAR US Treasury 3 Month Bill Money Market Yield+0.048%, 10/31/2019 | 2,000 | 2,000 | ||||||
2.010%, VAR US Treasury 3 Month Bill Money Market Yield+0.000%, 01/31/2020 | 4,415 | 4,413 | ||||||
2.043%, VAR US Treasury 3 Month Bill Money Market Yield+0.033%, 04/30/2020 | 3,295 | 3,295 | ||||||
2.053%, VAR US Treasury 3 Month Bill Money Market Yield+0.043%, 07/31/2020 | 1,500 | 1,500 | ||||||
|
|
| ||||||
Total U.S. Treasury Obligations |
| 57,585 | ||||||
|
|
| ||||||
| Description |
Face Amount |
Value | ||||||
REPURCHASE AGREEMENTS(B) — 41.5% |
| |||||||
Bank of Montreal | $ | 3,000 | $ | 3,000 | ||||
Barclays Bank | 4,000 | 4,000 | ||||||
BNP Paribas | 5,000 | 5,000 | ||||||
Citigroup Global | 5,000 | 5,000 | ||||||
Credit Suisse | 1,000 | 1,000 | ||||||
Goldman Sachs | 5,000 | 5,000 | ||||||
| 6 | SEI Daily Income Trust / Semi-Annual Report / July 31, 2018 |
| Description |
Face Amount |
Value | ||||||
REPURCHASE AGREEMENTS(B) (continued) |
| |||||||
Merrill Lynch | $ | 5,000 | $ | 5,000 | ||||
MUFG Securities | 4,000 | 4,000 | ||||||
Natixis | 3,000 | 3,000 | ||||||
TD Securities | 1,000 | 1,000 | ||||||
The Bank of Nova Scotia | 5,000 | 5,000 | ||||||
| Description |
Face Amount |
Value | ||||||
REPURCHASE AGREEMENTS(B) (continued) |
| |||||||
Wells Fargo | $ | 1,000 | $ | 1,000 | ||||
|
|
| ||||||
Total Repurchase Agreements |
| 42,000 | ||||||
|
|
| ||||||
Total Investments — 98.3% |
| $ | 99,585 | |||||
|
|
| ||||||
Percentages are based on Net Assets of $101,312 ($ Thousands). |
| (A) | Zero coupon security. The rate shown on the Schedule of Investments is the security’s effective yield at the time of purchase. |
| (B) | Tri-Party Repurchase Agreement. |
As of July 31, 2018, all of the Fund’s investments were considered Level 2, in accordance with the authoritative guidance on fair value measurements and disclosure under U.S. GAAP.
For the period ended July 31, 2018, there were no transfers between Level 1, Level 2 and/or Level 3 assets and liabilities.
For more information on valuation inputs, see Note 2–Significant Accounting Policies in Notes to Financial Statements.
The accompanying notes are an integral part of the financial statements.
| SEI Daily Income Trust / Semi-Annual Report / July 31, 2018 | 7 |
SCHEDULE OF INVESTMENTS (Unaudited)
July 31, 2018
Treasury II Fund
| Description |
Face Amount |
Value | ||||||
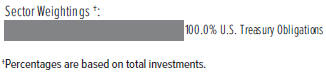
U.S. TREASURY OBLIGATIONS — 114.6% |
| |||||||
U.S. Treasury Bills (A) | ||||||||
1.844%, 08/02/2018 | $ | 84,900 | $ | 84,896 | ||||
1.746%, 08/09/2018 | 115,580 | 115,533 | ||||||
1.883%, 08/16/2018 | 13,130 | 13,120 | ||||||
1.871%, 08/23/2018 | 85,985 | 85,887 | ||||||
1.913%, 08/30/2018 | 29,000 | 28,957 | ||||||
1.887%, 09/13/2018 | 15,000 | 14,967 | ||||||
1.903%, 09/20/2018 | 33,400 | 33,312 | ||||||
1.913%, 09/27/2018 | 165 | 164 | ||||||
1.924%, 10/04/2018 | 21,645 | 21,571 | ||||||
1.898%, 10/11/2018 | 13,470 | 13,419 | ||||||
2.006%, 10/25/2018 | 9,353 | 9,309 | ||||||
2.010%, 11/01/2018 | 54,825 | 54,547 | ||||||
2.014%, 11/08/2018 | 235 | 234 | ||||||
2.107%, 12/27/2018 | 6,185 | 6,132 | ||||||
2.123%, 01/10/2019 | 17,000 | 16,839 | ||||||
2.163%, 01/17/2019 | 20,000 | 19,799 | ||||||
2.184%, 01/31/2019 | 10,000 | 9,891 | ||||||
U.S. Treasury Notes | ||||||||
0.875%, 10/15/2018 | 990 | 988 | ||||||
1.278%, VAR US Treasury 3 Month Bill Money Market Yield+0.170%, 10/31/2018 | 11,940 | 11,940 | ||||||
1.250%, 10/31/2018 | 9,605 | 9,586 | ||||||
0.750%, 10/31/2018 | 7,340 | 7,316 | ||||||
1.375%, 11/30/2018 | 820 | 819 | ||||||
2.150%, VAR US Treasury 3 Month Bill Money Market Yield+0.140%, 01/31/2019 | 2,000 | 2,001 | ||||||
1.250%, 01/31/2019 | 250 | 249 | ||||||
1.125%, 01/31/2019 | 250 | 249 | ||||||
2.080%, VAR US Treasury 3 Month Bill Money Market Yield+0.070%, 04/30/2019 | 6,510 | 6,510 | ||||||
2.070%, VAR US Treasury 3 Month Bill Money Market Yield+0.060%, 07/31/2019 | 5,645 | 5,651 | ||||||
2.058%, VAR US Treasury 3 Month Bill Money Market Yield+0.048%, 10/31/2019 | 12,000 | 12,002 | ||||||
2.010%, VAR US Treasury 3 Month Bill Money Market Yield+0.000%, 01/31/2020 | 20,895 | 20,884 | ||||||
2.043%, VAR US Treasury 3 Month Bill Money Market Yield+0.033%, 04/30/2020 | 15,850 | 15,851 | ||||||
| Description |
Face Amount |
Value | ||||||
U.S. TREASURY OBLIGATIONS (continued) |
| |||||||
2.053%, VAR US Treasury 3 Month Bill Money Market Yield+0.043%, 07/31/2020 | $ | 6,000 | $ | 6,000 | ||||
|
|
| ||||||
Total U.S. Treasury Obligations | 628,623 | |||||||
|
|
| ||||||
Total Investments — 114.6% |
| $ | 628,623 | |||||
|
|
| ||||||
Percentages are based on Net Assets of $548,549 ($ Thousands). |
| (A) | Zero coupon security. The rate shown on the Schedule of investments is the security’s effective yield at the time of purchase. |
As of July 31, 2018, all of the Fund’s investments were considered Level 2, in accordance with the authoritative guidance on fair value measurements and disclosure under U.S. GAAP.
For the period ended July 31, 2018, there were no transfers between Level 1, Level 2 and/or Level 3 assets and liabilities.
For more information on valuation inputs, see Note 2 – Significant Accounting Policies in Notes to Financial Statements.
The accompanying notes are an integral part of the financial statements.
| 8 | SEI Daily Income Trust / Semi-Annual Report / July 31, 2018 |
SCHEDULE OF INVESTMENTS (Unaudited)
July 31, 2018
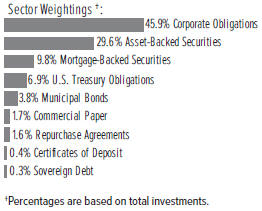
Ultra Short Duration Bond Fund
| Description |
Face Amount |
Market Value | ||||||
CORPORATE OBLIGATIONS — 46.1% |
| |||||||
Consumer Discretionary — 2.1% |
| |||||||
AutoZone | ||||||||
1.625%, 04/21/2019 | $ | 465 | $ | 461 | ||||
BMW US Capital LLC | ||||||||
2.747%, VAR ICE LIBOR USD 3 | 990 | 993 | ||||||
Discovery Communications LLC | ||||||||
3.035%, VAR ICE LIBOR USD 3 | 490 | 493 | ||||||
2.200%, 09/20/2019 | 150 | 148 | ||||||
Dollar Tree | ||||||||
3.036%, VAR ICE LIBOR USD 3 | 660 | 661 | ||||||
Ford Motor Credit LLC | ||||||||
3.147%, VAR ICE LIBOR USD 3 | 1,020 | 1,026 | ||||||
General Motors | ||||||||
3.163%, VAR ICE LIBOR USD 3 | 600 | 602 | ||||||
General Motors Financial | ||||||||
3.189%, VAR ICE LIBOR USD 3 | 525 | 528 | ||||||
Hyundai Capital America | ||||||||
3.261%, VAR ICE LIBOR USD 3 | 450 | 451 | ||||||
Hyundai Capital America MTN | ||||||||
2.000%, 07/01/2019 (A) | 300 | 297 | ||||||
Nissan Motor Acceptance MTN | ||||||||
2.726%, VAR ICE LIBOR USD 3 | 500 | 500 | ||||||
|
|
| ||||||
| 6,160 | ||||||||
|
|
| ||||||
Consumer Staples — 2.7% |
| |||||||
BAT Capital | ||||||||
2.945%, VAR ICE LIBOR USD 3 | 1,600 | 1,606 | ||||||
Constellation Brands | ||||||||
2.000%, 11/07/2019 | 525 | 518 | ||||||
| Description |
Face Amount |
Market Value | ||||||
CORPORATE OBLIGATIONS (continued) |
| |||||||
Kraft Heinz Foods | ||||||||
3.173%, VAR ICE LIBOR USD 3 | $ | 400 | $ | 401 | ||||
Kroger MTN | ||||||||
1.500%, 09/30/2019 | 800 | 786 | ||||||
Molson Coors Brewing | ||||||||
1.450%, 07/15/2019 | 775 | 765 | ||||||
Mondelez International | ||||||||
2.863%, VAR ICE LIBOR USD 3 | 450 | 451 | ||||||
Mondelez International Holdings Netherlands | ||||||||
2.949%, VAR ICE LIBOR USD 3 | 1,905 | 1,911 | ||||||
Philip Morris International | ||||||||
2.751%, VAR ICE LIBOR USD 3 | 1,655 | 1,662 | ||||||
|
|
| ||||||
| 8,100 | ||||||||
|
|
| ||||||
Energy — 1.9% |
| |||||||
Anadarko Petroleum | ||||||||
8.700%, 03/15/2019 | 350 | 362 | ||||||
6.950%, 06/15/2019 | 235 | 243 | ||||||
Andeavor Logistics | ||||||||
5.500%, 10/15/2019 | 250 | 256 | ||||||
BP Capital Markets PLC | ||||||||
2.969%, VAR ICE LIBOR USD 3 | 450 | 450 | ||||||
Equinor | ||||||||
2.823%, VAR ICE LIBOR USD 3 | 550 | 551 | ||||||
Petroleos Mexicanos | ||||||||
6.000%, 03/05/2020 | 550 | 567 | ||||||
Phillips 66 | ||||||||
3.089%, VAR ICE LIBOR USD 3 | 620 | 620 | ||||||
Schlumberger Finance Canada | ||||||||
2.200%, 11/20/2020 (A) | 375 | 365 | ||||||
Shell International Finance BV | ||||||||
2.676%, VAR ICE LIBOR USD 3 | 1,170 | 1,175 | ||||||
1.375%, 05/10/2019 | 800 | 793 | ||||||
Total Capital International | ||||||||
2.923%, VAR ICE LIBOR USD 3 | 400 | 400 | ||||||
|
|
| ||||||
| 5,782 | ||||||||
|
|
| ||||||
Financials — 29.2% |
| |||||||
ABN AMRO Bank | ||||||||
2.973%, VAR ICE LIBOR USD 3 | 1,145 | 1,148 | ||||||
| SEI Daily Income Trust / Semi-Annual Report / July 31, 2018 | 9 |
SCHEDULE OF INVESTMENTS (Unaudited)
July 31, 2018
Ultra Short Duration Bond Fund (Continued)
| Description |
Face Amount |
Market Value | ||||||
CORPORATE OBLIGATIONS (continued) |
| |||||||
AIG Global Funding | ||||||||
2.817%, VAR ICE LIBOR USD 3 | $ | 775 | $ | 777 | ||||
AIG Global Funding MTN | ||||||||
1.950%, 10/18/2019 (A) | 885 | 873 | ||||||
Alimentation Couche-Tard | ||||||||
2.833%, VAR ICE LIBOR USD 3 | 1,070 | 1,071 | ||||||
American Express | ||||||||
2.846%, VAR ICE LIBOR USD 3 | 450 | 453 | ||||||
American Express Credit | ||||||||
2.885%, VAR ICE LIBOR USD 3 | 300 | 301 | ||||||
American Express Credit MTN | ||||||||
2.200%, 03/03/2020 | 1,060 | 1,046 | ||||||
American Honda Finance MTN | ||||||||
3.154%, VAR ICE LIBOR USD 3 | 1,290 | 1,296 | ||||||
1.700%, 02/22/2019 | 650 | 647 | ||||||
Assurant | ||||||||
3.589%, VAR ICE LIBOR USD 3 | 465 | 466 | ||||||
Bank of America | ||||||||
3.379%, VAR ICE LIBOR USD 3 | 750 | 753 | ||||||
Bank of America MTN | ||||||||
5.625%, 07/01/2020 | 2,065 | 2,158 | ||||||
3.527%, VAR ICE LIBOR USD 3 | 625 | 635 | ||||||
3.508%, VAR ICE LIBOR USD 3 | 400 | 407 | ||||||
Bank of Montreal MTN | ||||||||
2.781%, VAR ICE LIBOR USD 3 | 1,335 | 1,340 | ||||||
Bank of Nova Scotia | ||||||||
3.169%, VAR ICE LIBOR USD 3 | 1,085 | 1,089 | ||||||
2.959%, VAR ICE LIBOR USD 3 | 375 | 377 | ||||||
2.125%, 09/11/2019 | 765 | 759 | ||||||
Barclays Bank PLC | ||||||||
2.793%, VAR ICE LIBOR USD 3 | 905 | 906 | ||||||
BB&T MTN | ||||||||
3.003%, VAR ICE LIBOR USD 3 | 350 | 351 | ||||||
2.911%, VAR ICE LIBOR USD 3 | 400 | 402 | ||||||
BPCE MTN | ||||||||
3.549%, VAR ICE LIBOR USD 3 | 250 | 253 | ||||||
| Description |
Face Amount |
Market Value | ||||||
CORPORATE OBLIGATIONS (continued) |
| |||||||
Branch Banking & Trust | ||||||||
2.789%, VAR ICE LIBOR USD 3 | $ | 855 | $ | 858 | ||||
1.450%, 05/10/2019 | 590 | 585 | ||||||
Canadian Imperial Bank of Commerce | ||||||||
2.834%, VAR ICE LIBOR USD 3 | 980 | 985 | ||||||
2.664%, VAR ICE LIBOR USD 3 | 1,500 | 1,500 | ||||||
2.100%, 10/05/2020 | 1,075 | 1,049 | ||||||
Capital One | ||||||||
3.489%, VAR ICE LIBOR USD 3 | 500 | 505 | ||||||
3.098%, VAR ICE LIBOR USD 3 | 500 | 503 | ||||||
Capital One Financial | ||||||||
3.115%, VAR ICE LIBOR USD 3 | 670 | 674 | ||||||
Citibank | ||||||||
2.826%, VAR ICE LIBOR USD 3 | 375 | 377 | ||||||
2.705%, VAR ICE LIBOR USD 3 | 1,950 | 1,949 | ||||||
Citigroup | ||||||||
3.109%, VAR ICE LIBOR USD 3 | 700 | 702 | ||||||
2.650%, 10/26/2020 | 385 | 380 | ||||||
Citizens Bank | ||||||||
3.129%, VAR ICE LIBOR USD 3 | 550 | 547 | ||||||
2.889%, VAR ICE LIBOR USD 3 | 700 | 702 | ||||||
2.861%, VAR ICE LIBOR USD 3 | 550 | 552 | ||||||
Commonwealth Bank of Australia | ||||||||
3.003%, VAR ICE LIBOR USD 3 | 750 | 754 | ||||||
Compass Bank | ||||||||
3.057%, VAR ICE LIBOR USD 3 | 500 | 500 | ||||||
Cooperatieve Rabobank | ||||||||
3.161%, VAR ICE LIBOR USD 3 | 800 | 811 | ||||||
Cooperatieve Rabobank UA | ||||||||
2.765%, VAR ICE LIBOR USD 3 | 750 | 751 | ||||||
Credit Agricole MTN | ||||||||
3.297%, VAR ICE LIBOR USD 3 | 950 | 962 | ||||||
CSABS | ||||||||
3.420%, 07/25/2024 | 300 | 300 | ||||||
| 10 | SEI Daily Income Trust / Semi-Annual Report / July 31, 2018 |
| Description |
Face Amount |
Market Value | ||||||
CORPORATE OBLIGATIONS (continued) |
| |||||||
Daimler Finance North America LLC | ||||||||
3.218%, VAR ICE LIBOR USD 3 | $ | 400 | $ | 400 | ||||
3.077%, VAR ICE LIBOR USD 3 | 1,345 | 1,353 | ||||||
1.500%, 07/05/2019 (A) | 750 | 740 | ||||||
Danske Bank | ||||||||
2.894%, VAR ICE LIBOR USD 3 | 600 | 602 | ||||||
Danske Bank MTN | ||||||||
2.831%, VAR ICE LIBOR USD 3 | 500 | 501 | ||||||
Deutsche Bank NY | ||||||||
3.307%, VAR ICE LIBOR USD 3 | 550 | 545 | ||||||
DNB Bank | ||||||||
2.707%, VAR ICE LIBOR USD 3 | 550 | 551 | ||||||
Fifth Third Bank | ||||||||
2.927%, VAR ICE LIBOR USD 3 | 1,625 | 1,629 | ||||||
2.589%, VAR ICE LIBOR USD 3 | 400 | 400 | ||||||
Ford Motor Credit LLC | ||||||||
3.606%, VAR ICE LIBOR USD 3 | 350 | 355 | ||||||
3.339%, VAR ICE LIBOR USD 3 | 750 | 756 | ||||||
3.156%, VAR ICE LIBOR USD 3 | 500 | 502 | ||||||
1.897%, 08/12/2019 | 350 | 346 | ||||||
General Motors Financial | ||||||||
3.267%, VAR ICE LIBOR USD 3 | 450 | 453 | ||||||
Glencore Funding LLC | ||||||||
2.500%, 01/15/2019 (A) | 300 | 299 | ||||||
Goldman Sachs Bank USA NY | ||||||||
3.200%, 06/05/2020 | 1,300 | 1,303 | ||||||
Goldman Sachs Group | ||||||||
3.513%, VAR ICE LIBOR USD 3 | 525 | 532 | ||||||
3.445%, VAR ICE LIBOR USD 3 | 750 | 759 | ||||||
HSBC Bank PLC | ||||||||
4.125%, 08/12/2020 (A) | 1,445 | 1,471 | ||||||
HSBC Holdings PLC | ||||||||
2.926%, VAR ICE LIBOR USD 3 | 640 | 642 | ||||||
Huntington National Bank | ||||||||
2.837%, VAR ICE LIBOR USD 3 | 650 | 651 | ||||||
2.200%, 11/06/2018 | 1,510 | 1,510 | ||||||
| Description |
Face Amount |
Market Value | ||||||
CORPORATE OBLIGATIONS (continued) |
| |||||||
ING Bank | ||||||||
3.027%, VAR ICE LIBOR USD 3 | $ | 300 | $ | 301 | ||||
ING Groep | ||||||||
3.484%, VAR ICE LIBOR USD 3 | 400 | 407 | ||||||
Jackson National Life Global Funding | ||||||||
3.067%, VAR ICE LIBOR USD 3 | 375 | 379 | ||||||
2.807%, VAR ICE LIBOR USD 3 | 1,345 | 1,348 | ||||||
1.875%, 10/15/2018 (A) | 400 | 400 | ||||||
JPMorgan Chase | ||||||||
4.400%, 07/22/2020 | 1,370 | 1,402 | ||||||
3.302%, VAR ICE LIBOR USD 3 | 500 | 505 | ||||||
2.969%, VAR ICE LIBOR USD 3 | 600 | 602 | ||||||
2.877%, VAR ICE LIBOR USD 3 | 550 | 552 | ||||||
KeyBank | ||||||||
3.139%, VAR ICE LIBOR USD 3 | 750 | 758 | ||||||
2.350%, 03/08/2019 | 250 | 249 | ||||||
Lloyds Bank PLC | ||||||||
2.853%, VAR ICE LIBOR USD 3 | 1,275 | 1,280 | ||||||
Manufacturers & Traders Trust | ||||||||
2.936%, VAR ICE LIBOR USD 3 | 450 | 452 | ||||||
2.605%, VAR ICE LIBOR USD 3 | 1,000 | 999 | ||||||
Metropolitan Life Global Funding I | ||||||||
2.400%, 01/08/2021 (A) | 795 | 779 | ||||||
Moody’s | ||||||||
2.671%, VAR ICE LIBOR USD 3 | 540 | 540 | ||||||
Morgan Stanley | ||||||||
3.528%, VAR ICE LIBOR USD 3 | 475 | 483 | ||||||
3.192%, VAR ICE LIBOR USD 3 | 625 | 627 | ||||||
3.155%, VAR ICE LIBOR USD 3 | 910 | 912 | ||||||
National Bank of Canada MTN | ||||||||
2.886%, VAR ICE LIBOR USD 3 | 1,075 | 1,081 | ||||||
New York Life Global Funding | ||||||||
2.732%, VAR ICE LIBOR USD 3 | 600 | 603 | ||||||
2.447%, VAR ICE LIBOR USD 3 | 665 | 665 | ||||||
| SEI Daily Income Trust / Semi-Annual Report / July 31, 2018 | 11 |
SCHEDULE OF INVESTMENTS (Unaudited)
July 31, 2018
Ultra Short Duration Bond Fund (Continued)
| Description |
Face Amount |
Market Value | ||||||
CORPORATE OBLIGATIONS (continued) |
| |||||||
Nissan Motor Acceptance MTN | ||||||||
2.917%, VAR ICE LIBOR USD 3 | $ | 1,000 | $ | 1,004 | ||||
Orlando Health Obligated Group | ||||||||
2.278%, 10/01/2018 | 785 | 784 | ||||||
PNC Bank | ||||||||
2.691%, VAR ICE LIBOR USD 3 | 500 | 502 | ||||||
2.597%, VAR ICE LIBOR USD 3 | 1,050 | 1,048 | ||||||
1.450%, 07/29/2019 | 350 | 346 | ||||||
Protective Life Global Funding | ||||||||
1.722%, 04/15/2019 (A) | 355 | 352 | ||||||
Prudential Financial MTN | ||||||||
3.123%, VAR ICE LIBOR USD 3 | 750 | 750 | ||||||
Reckitt Benckiser Treasury Services PLC | ||||||||
2.895%, VAR ICE LIBOR USD 3 | 550 | 548 | ||||||
Santander UK PLC | ||||||||
2.920%, VAR ICE LIBOR USD 3 | 525 | 528 | ||||||
Societe Generale MTN | ||||||||
3.417%, VAR ICE LIBOR USD 3 | 700 | 701 | ||||||
Sumitomo Mitsui Banking | ||||||||
2.873%, VAR ICE LIBOR USD 3 | 650 | 651 | ||||||
2.686%, VAR ICE LIBOR USD 3 | 250 | 251 | ||||||
SunTrust Bank | ||||||||
2.872%, VAR ICE LIBOR USD 3 | 1,835 | 1,842 | ||||||
2.590%, VAR ICE LIBOR USD 3 | 450 | 446 | ||||||
Svenska Handelsbanken MTN | ||||||||
2.804%, VAR ICE LIBOR USD 3 | 400 | 402 | ||||||
2.800%, VAR ICE LIBOR USD 3 | 525 | 526 | ||||||
Synchrony Financial | ||||||||
3.584%, VAR ICE LIBOR USD 3 | 600 | 604 | ||||||
Toronto-Dominion Bank | ||||||||
2.250%, 09/25/2019 (A) | 1,420 | 1,410 | ||||||
Toronto-Dominion Bank MTN | ||||||||
2.756%, VAR ICE LIBOR USD 3 | 1,400 | 1,402 | ||||||
1.450%, 08/13/2019 | 550 | 543 | ||||||
Toyota Motor Credit MTN | ||||||||
2.773%, VAR ICE LIBOR USD 3 | 400 | 402 | ||||||
| Description | Face Amount (Thousands) | Market Value ($ Thousands) | ||||||
CORPORATE OBLIGATIONS (continued) |
| |||||||
UBS MTN | ||||||||
2.995%, VAR ICE LIBOR USD 3 | $ | 450 | $ | 452 | ||||
2.200%, 06/08/2020 (A) | 1,265 | 1,240 | ||||||
US Bancorp MTN | ||||||||
2.735%, VAR ICE LIBOR USD 3 | 400 | 401 | ||||||
US Bank | ||||||||
3.150%, 04/26/2021 | 1,500 | 1,496 | ||||||
1.400%, 04/26/2019 | 350 | 347 | ||||||
Wells Fargo | ||||||||
3.452%, VAR ICE LIBOR USD 3 | 400 | 407 | ||||||
Wells Fargo MTN | ||||||||
2.964%, VAR ICE LIBOR USD 3 | 650 | 655 | ||||||
2.600%, 07/22/2020 | 1,515 | 1,499 | ||||||
Westpac Banking | ||||||||
2.946%, VAR ICE LIBOR USD 3 | 325 | 326 | ||||||
|
|
| ||||||
| 86,943 | ||||||||
|
|
| ||||||
Health Care — 3.9% |
| |||||||
Amgen | ||||||||
2.806%, VAR ICE LIBOR USD 3 | 450 | 452 | ||||||
2.673%, VAR ICE LIBOR USD 3 | 1,035 | 1,037 | ||||||
Bayer US Finance II LLC | ||||||||
3.500%, 06/25/2021 (A) | 425 | 426 | ||||||
2.965%, VAR ICE LIBOR USD 3 | 775 | 780 | ||||||
Becton Dickinson | ||||||||
3.209%, VAR ICE LIBOR USD 3 | 375 | 376 | ||||||
Cardinal Health | ||||||||
3.111%, VAR ICE LIBOR USD 3 | 775 | 773 | ||||||
Catholic Health Initiatives | ||||||||
2.600%, 08/01/2018 | 270 | 270 | ||||||
CVS Health | ||||||||
3.047%, VAR ICE LIBOR USD 3 | 435 | 438 | ||||||
2.957%, VAR ICE LIBOR USD 3 | 820 | 824 | ||||||
Dignity Health | ||||||||
2.637%, 11/01/2019 | 1,260 | 1,258 | ||||||
Gilead Sciences | ||||||||
2.575%, VAR ICE LIBOR USD 3 | 1,535 | 1,538 | ||||||
Province of Quebec Canada MTN | ||||||||
2.551%, VAR ICE LIBOR USD 3 | 1,660 | 1,660 | ||||||
| 12 | SEI Daily Income Trust / Semi-Annual Report / July 31, 2018 |
| Description | Face Amount (Thousands) | Market Value ($ Thousands) | ||||||
CORPORATE OBLIGATIONS (continued) |
| |||||||
Teva Pharmaceutical Finance Netherlands III | ||||||||
1.700%, 07/19/2019 | $ | 1,340 | $ | 1,315 | ||||
UnitedHealth Group | ||||||||
2.409%, VAR ICE LIBOR USD 3 | 500 | 499 | ||||||
|
|
| ||||||
| 11,646 | ||||||||
|
|
| ||||||
Industrials — 2.3% |
| |||||||
Air Lease | ||||||||
2.125%, 01/15/2020 | 300 | 295 | ||||||
Aviation Capital Group LLC | ||||||||
3.013%, VAR ICE LIBOR USD 3 | 570 | 571 | ||||||
Caterpillar Financial Services MTN | ||||||||
2.612%, VAR ICE LIBOR USD 3 | 375 | 376 | ||||||
Equifax | ||||||||
3.200%, VAR ICE LIBOR USD 3 | 765 | 770 | ||||||
Fortive | ||||||||
1.800%, 06/15/2019 | 260 | 257 | ||||||
GE Capital International Funding Unlimited Co | ||||||||
2.342%, 11/15/2020 | 1,215 | 1,190 | ||||||
General Dynamics | ||||||||
2.875%, 05/11/2020 | 1,255 | 1,253 | ||||||
Honeywell International | ||||||||
2.619%, VAR ICE LIBOR USD 3 | 800 | 803 | ||||||
John Deere Capital MTN | ||||||||
2.350%, 01/08/2021 | 445 | 438 | ||||||
PACCAR Financial MTN | ||||||||
1.300%, 05/10/2019 | 160 | 158 | ||||||
United Technologies | ||||||||
2.693%, VAR ICE LIBOR USD 3 | 600 | 602 | ||||||
|
|
| ||||||
| 6,713 | ||||||||
|
|
| ||||||
Information Technology — 1.0% |
| |||||||
Broadcom | ||||||||
2.375%, 01/15/2020 | 800 | 789 | ||||||
DXC Technology | ||||||||
2.875%, 03/27/2020 | 400 | 396 | ||||||
eBay | ||||||||
3.209%, VAR ICE LIBOR USD 3 | 800 | 810 | ||||||
Hewlett Packard Enterprise | ||||||||
4.267%, VAR ICE LIBOR USD 3 | 160 | 161 | ||||||
2.100%, 10/04/2019 (A) | 800 | 790 | ||||||
|
|
| ||||||
| 2,946 | ||||||||
|
|
| ||||||
| Description | Face Amount (Thousands) | Market Value ($ Thousands) | ||||||
CORPORATE OBLIGATIONS (continued) |
| |||||||
Materials — 0.6% |
| |||||||
Air Liquide Finance | ||||||||
1.375%, 09/27/2019 (A) | $ | 400 | $ | 393 | ||||
BP Capital Markets PLC | ||||||||
2.705%, VAR ICE LIBOR USD 3 | 870 | 870 | ||||||
Syngenta Finance | ||||||||
3.698%, 04/24/2020 (A) | 450 | 449 | ||||||
|
|
| ||||||
| 1,712 | ||||||||
|
|
| ||||||
Real Estate — 0.1% |
| |||||||
Boston Properties | ||||||||
5.875%, 10/15/2019 | 400 | 411 | ||||||
|
|
| ||||||
Telecommunications — 0.8% |
| |||||||
AT&T | ||||||||
3.264%, VAR ICE LIBOR USD 3 | 700 | 707 | ||||||
Verizon Communications | ||||||||
2.713%, VAR ICE LIBOR USD 3 | 1,520 | 1,523 | ||||||
|
|
| ||||||
| 2,230 | ||||||||
|
|
| ||||||
Utilities — 1.5% |
| |||||||
American Electric Power | ||||||||
2.150%, 11/13/2020 | 450 | 439 | ||||||
Consolidated Edison of New York | ||||||||
2.739%, VAR ICE LIBOR USD 3 | 1,260 | 1,263 | ||||||
DTE Energy | ||||||||
1.500%, 10/01/2019 | 435 | 427 | ||||||
Emera US Finance | ||||||||
2.150%, 06/15/2019 | 165 | 164 | ||||||
NextEra Energy Capital Holdings | ||||||||
1.649%, 09/01/2018 | 95 | 95 | ||||||
Sempra Energy | ||||||||
2.589%, VAR ICE LIBOR USD 3 | 1,255 | 1,255 | ||||||
1.625%, 10/07/2019 | 850 | 834 | ||||||
|
|
| ||||||
| 4,477 | ||||||||
|
|
| ||||||
Total Corporate Obligations |
| 137,120 |
| |||||
|
|
| ||||||
ASSET-BACKED SECURITIES — 29.8% |
| |||||||
Automotive — 9.5% |
| |||||||
American Credit Acceptance Receivables Trust, Ser 2016-3, Cl B | ||||||||
2.870%, 08/12/2022 (A) | 469 | 469 | ||||||
| SEI Daily Income Trust / Semi-Annual Report / July 31, 2018 | 13 |
SCHEDULE OF INVESTMENTS (Unaudited)
July 31, 2018
Ultra Short Duration Bond Fund (Continued)
| Description |
Face Amount |
Market Value | ||||||
ASSET-BACKED SECURITIES (continued) |
| |||||||
American Credit Acceptance Receivables Trust, Ser 2018-1, CI A | ||||||||
2.720%, 03/10/2021 (A) | $ | 330 | $ | 330 | ||||
AmeriCredit Automobile Receivables Trust, Ser 2014-2, Cl C | ||||||||
2.180%, 06/08/2020 | 85 | 85 | ||||||
AmeriCredit Automobile Receivables Trust, Ser 2014-3, Cl D | ||||||||
3.130%, 10/08/2020 | 775 | 776 | ||||||
AmeriCredit Automobile Receivables Trust, Ser 2015-1, Cl B | ||||||||
1.880%, 03/09/2020 | 36 | 36 | ||||||
AmeriCredit Automobile Receivables Trust, Ser 2016-2, Cl A3 | ||||||||
1.600%, 11/09/2020 | 101 | 101 | ||||||
AmeriCredit Automobile Receivables Trust, Ser 2016-3, Cl A3 | ||||||||
1.460%, 05/10/2021 | 66 | 66 | ||||||
AmeriCredit Automobile Receivables Trust, Ser 2016-4, Cl A2A | ||||||||
1.340%, 04/08/2020 | 13 | 13 | ||||||
Americredit Automobile Receivables Trust, Ser 2018-1, Cl A2A | ||||||||
2.710%, 07/19/2021 | 345 | 345 | ||||||
ARI Fleet Lease Trust, Ser 2017-A, Cl A2 | ||||||||
1.910%, 04/15/2026 (A) | 325 | 323 | ||||||
Canadian Pacer Auto Receivables Trust, Ser 2017-1A, Cl A2A | ||||||||
1.772%, 12/19/2019 (A) | 621 | 620 | ||||||
CarMax Auto Owner Trust, Ser 2015-4, Cl A3 | ||||||||
1.560%, 11/16/2020 | 341 | 339 | ||||||
CarMax Auto Owner Trust, Ser 2016-4, Cl A2 | ||||||||
1.210%, 11/15/2019 | 35 | 35 | ||||||
Chesapeake Funding II LLC, Ser 2016-2A, CI A2 | ||||||||
3.072%, VAR ICE LIBOR USD 1 | 399 | 400 | ||||||
Chesapeake Funding II LLC, Ser 2017-2A, CI A1 | ||||||||
1.990%, 05/15/2029 (A) | 256 | 253 | ||||||
Chesapeake Funding II LLC, Ser 2017-3A, CI A1 | ||||||||
1.910%, 08/15/2029 (A) | 310 | 306 | ||||||
Chesapeake Funding II LLC, Ser 2017-3A, CI A2 | ||||||||
2.412%, VAR ICE LIBOR USD 1 | 823 | 823 | ||||||
Chesapeake Funding II LLC, Ser 2017-4A, CI A1 | ||||||||
2.120%, 11/15/2029 (A) | 367 | 363 | ||||||
| Description |
Face Amount |
Market Value | ||||||
ASSET-BACKED SECURITIES (continued) |
| |||||||
Chesapeake Funding II LLC, Ser 2017-4A, CI A2 | ||||||||
2.412%, VAR ICE LIBOR USD 1 | $ | 1,460 | $ | 1,460 | ||||
Chesapeake Funding II LLC, Ser 2018-1A, CI A1 | ||||||||
3.040%, 04/15/2030 (A) | 325 | 323 | ||||||
Chrysler Capital Auto Receivables Trust, Ser 2016-BA, Cl A3 | ||||||||
1.640%, 07/15/2021 (A) | 649 | 645 | ||||||
CIG Auto Receivables Trust, Ser 2017-1A, Cl A | ||||||||
2.710%, 05/15/2023 (A) | 111 | 110 | ||||||
CPS Auto Receivables Trust, Ser 2016-A, Cl B | ||||||||
3.340%, 05/15/2020 | 223 | 223 | ||||||
CPS Auto Receivables Trust, Ser 2017-C, Cl A | ||||||||
1.780%, 09/15/2020 (A) | 48 | 47 | ||||||
CPS Auto Receivables Trust, Ser 2018-A, Cl A | ||||||||
2.160%, 05/17/2021 (A) | 98 | 98 | ||||||
CPS Auto Trust, Ser 2017-D, CI A | ||||||||
1.870%, 03/15/2021 (A) | 101 | 100 | ||||||
CPS Auto Trust, Ser 2018-C, CI A | ||||||||
2.870%, 09/15/ 2021 (A) | 302 | 302 | ||||||
Credit Acceptance Auto Loan Trust, Ser 2017-2A, CI A | ||||||||
2.550%, 02/17/2026 (A) | 499 | 494 | ||||||
Credit Acceptance Auto Loan Trust, Ser 2017-3A, CI A | ||||||||
2.650%, 06/15/2026 (A) | 250 | 247 | ||||||
Drive Auto Receivables Trust, Ser 2018-3, Cl A3 | ||||||||
3.010%, 11/15/2021 | 790 | 790 | ||||||
DT Auto Owner Trust, Ser 2018-1A, Cl A | ||||||||
2.590%, 05/17/2021 (A) | 368 | 368 | ||||||
Enterprise Fleet Financing LLC, | ||||||||
1.740%, 02/22/2022 (A) | 287 | 285 | ||||||
Enterprise Fleet Financing LLC, | ||||||||
1.970%, 01/20/2023 (A) | 200 | 199 | ||||||
Enterprise Fleet Financing LLC, | ||||||||
3.140%, 02/20/2024 (A) | 290 | 290 | ||||||
Exeter Automobile Receivables Trust, Ser 2018-1A, Cl A | ||||||||
2.210%, 05/17/2021 (A) | 191 | 191 | ||||||
Exeter Automobile Receivables Trust, Ser 2018-3A, CIA | ||||||||
2.900%, 01/18/2022 (A) | 575 | 574 | ||||||
First Investors Auto Owner Trust, | ||||||||
1.690%, 04/15/2021 (A) | 52 | 52 | ||||||
| 14 | SEI Daily Income Trust / Semi-Annual Report / July 31, 2018 |
| Description |
Face Amount |
Market Value | ||||||
ASSET-BACKED SECURITIES (continued) |
| |||||||
First Investors Auto Owner Trust, Ser 2017-2A, CI A1 | ||||||||
1.860%, 10/15/2021 (A) | $ | 84 | $ | 84 | ||||
First Investors Auto Owner Trust, Ser 2018-1A, CI A1 | ||||||||
2.840%, 05/16/2022 (A) | 225 | 225 | ||||||
Flagship Credit Auto Trust, Ser 2017-2, Cl A | ||||||||
1.850%, 07/15/2021 (A) | 81 | 81 | ||||||
Flagship Credit Auto Trust, Ser 2017-3, Cl A | ||||||||
1.880%, 10/15/2021 (A) | 271 | 269 | ||||||
Ford Credit Auto Owner Trust, Ser 2014-1, CI A | ||||||||
2.260%, 11/15/2025 (A) | 930 | 926 | ||||||
Ford Credit Auto Owner Trust, Ser 2016-C, Cl A2A | ||||||||
1.040%, 09/15/2019 | 32 | 32 | ||||||
Ford Credit Floorplan Master Owner Trust, Ser 2015-4, Cl A2 | ||||||||
2.672%, VAR LIBOR USD 1 | 1,250 | 1,250 | ||||||
Ford Credit Floorplan Master Owner Trust, Ser 2016-5, Cl A1 | ||||||||
1.950%, 11/15/2021 | 450 | 444 | ||||||
GLS Auto Receivables Trust, Ser 2016-1A, Cl A | ||||||||
2.730%, 10/15/2020 (A) | 16 | 16 | ||||||
GLS Auto Receivables Trust, Ser 2017-1A, CI A2 | ||||||||
2.670%, 04/15/2021 (A) | 325 | 324 | ||||||
GLS Auto Receivables Trust, Ser 2018-1A, Cl A | ||||||||
2.820%, 07/15/2022 (A) | 506 | 504 | ||||||
GM Financial Automobile Leasing Trust, Ser 2016-1, Cl A3 | ||||||||
1.640%, 07/20/2019 | 82 | 82 | ||||||
GM Financial Automobile Leasing Trust, Ser 2016-2, Cl A3 | ||||||||
1.620%, 09/20/2019 | 90 | 90 | ||||||
GM Financial Automobile Leasing Trust, Ser 2016-3, Cl A3 | ||||||||
1.610%, 12/20/2019 | 638 | 636 | ||||||
Hyundai Auto Lease Securitization Trust, Ser 2016-B, Cl A3 | ||||||||
1.520%, 10/15/2019 (A) | 75 | 75 | ||||||
Mercedes-Benz Auto Receivables Trust, Ser 2016-1, Cl A4 | ||||||||
1.460%, 12/15/2022 | 1,465 | 1,428 | ||||||
Nissan Master Owner Trust Receivables, Ser 2016-A,CI A2 | ||||||||
1.540%, 06/15/2021 | 395 | 391 | ||||||
Prestige Auto Receivables Trust, Ser 2016-2A, CI A2 | ||||||||
1.460%, 07/15/2020 (A) | 164 | 164 | ||||||
| Description |
Face Amount |
Market Value | ||||||
ASSET-BACKED SECURITIES (continued) |
| |||||||
Prestige Auto Receivables Trust, Ser 2017-1A, Cl A3 | ||||||||
2.050%, 10/15/2021 (A) | $ | 925 | $ | 918 | ||||
Santander Drive Auto Receivables Trust, Ser 2014-3, Cl D | ||||||||
2.650%, 08/17/2020 | 567 | 567 | ||||||
Santander Drive Auto Receivables Trust, Ser 2014-4, Cl D | ||||||||
3.100%, 11/16/2020 | 1,838 | 1,841 | ||||||
Santander Drive Auto Receivables Trust, Ser 2015-4, Cl C | ||||||||
2.970%, 03/15/2021 | 642 | 642 | ||||||
Santander Drive Auto Receivables Trust, Ser 2016-3, Cl C | ||||||||
2.460%, 03/15/2022 | 450 | 446 | ||||||
Santander Drive Auto Receivables Trust, Ser 2018-3, Cl A3 | ||||||||
3.030%, 02/15/2022 | 220 | 220 | ||||||
Santander Retail Auto Lease Trust, Ser 2017- A, Cl A3 | ||||||||
2.220%, 01/20/2021 (A) | 1,325 | 1,309 | ||||||
Securitized Term Auto Receivables Trust, Ser 2017-2A, Cl A2A | ||||||||
1.775%, 01/27/2020 (A) | 134 | 134 | ||||||
Skopos Auto Receivables Trust, Ser 2018-1A, CI A | ||||||||
3.190%, 09/15/2021 (A) | 339 | 339 | ||||||
Tesla Auto Lease Trust, Ser 2018-A, Cl A | ||||||||
2.320%, 12/20/2019 (A) | 484 | 482 | ||||||
Tidewater Auto Receivables, Ser 2018-AA, CI A1 | ||||||||
2.500%, 05/15/2019 (A) | 512 | 512 | ||||||
Toyota Auto Receivables Owner Trust, Ser 2016-B, Cl A3 | ||||||||
1.300%, 04/15/2020 | 52 | 52 | ||||||
United Auto Credit Securitization Trust, Ser 2018-1, CI A | ||||||||
2.260%, 04/10/2020 (A) | 266 | 265 | ||||||
United Auto Credit Securitization Trust, Ser 2018-1, Cl B | ||||||||
2.760%, 10/13/2020 (A) | 300 | 299 | ||||||
Westlake Automobile Receivables Trust, Ser 2016-2A, Cl B | ||||||||
2.300%, 11/15/2019 (A) | 117 | 117 | ||||||
Westlake Automobile Receivables Trust, Ser 2017-1A, CI A2 | ||||||||
1.780%, 04/15/2020 (A) | 68 | 68 | ||||||
Westlake Automobile Receivables Trust, Ser 2017-2A, Cl A2A | ||||||||
1.800%, 07/15/2020 (A) | 154 | 153 | ||||||
| SEI Daily Income Trust / Semi-Annual Report / July 31, 2018 | 15 |
SCHEDULE OF INVESTMENTS (Unaudited)
July 31, 2018
Ultra Short Duration Bond Fund (Continued)
| Description |
Face Amount |
Market Value | ||||||
ASSET-BACKED SECURITIES (continued) |
| |||||||
Westlake Automobile Receivables Trust, Ser 2018-2A, Cl A2A | ||||||||
2.840%, 09/15/2021 (A) | $ | 350 | $ | 350 | ||||
|
|
| ||||||
| 28,216 | ||||||||
|
|
| ||||||
Business Services — 0.3% | ||||||||
Navient Student Loan Trust, Ser 2015-3, Cl A1 | ||||||||
2.384%, VAR ICE LIBOR USD 1 | 3 | 3 | ||||||
SLM Student Loan Trust, Ser 2004-8A, Cl A5 | ||||||||
2.835%, VAR ICE LIBOR USD 3 Month+0.500%, 04/25/2024 (A) | 191 | 191 | ||||||
SLM Student Loan Trust, Ser 2006-5, Cl A5 | ||||||||
2.445%, VAR ICE LIBOR USD 3 Month+0.110%, 01/25/2027 | 547 | 546 | ||||||
|
|
| ||||||
| 740 | ||||||||
|
|
| ||||||
Credit Card — 5.6% | ||||||||
American Express Credit Account Master Trust, Ser 2013-2, Cl A | ||||||||
2.492%, VAR ICE LIBOR USD 1 | 700 | 700 | ||||||
American Express Credit Account Master Trust, Ser 2014-1, Cl A | ||||||||
2.442%, VAR ICE LIBOR USD 1 | 1,000 | 1,002 | ||||||
Cabela’s Credit Card Master Note Trust, Ser 2016-1, Cl A1 | ||||||||
1.780%, 06/15/2022 | 305 | 302 | ||||||
Cabela’s Master Credit Card Trust, Ser 2013-2A A2, CI A2 | ||||||||
2.722%, VAR LIBOR USD 1 | 210 | 210 | ||||||
Capital One Multi-Asset Execution Trust, Ser 2014-A1, CI A1 | ||||||||
2.522%, VAR LIBOR USD 1 | 800 | 802 | ||||||
Capital One Multi-Asset Execution Trust, Ser 2015-A3, Cl A3 | ||||||||
2.472%, VAR LIBOR USD 1 | 735 | 738 | ||||||
Capital One Multi-Asset Execution Trust, Ser 2015-A7, CI A7 | ||||||||
1.450%, 08/16/2021 | 868 | 866 | ||||||
Capital One Multi-Asset Execution Trust, Ser 2016-A3, Cl A3 | ||||||||
1.340%, 04/15/2022 | 1,700 | 1,680 | ||||||
Capital One Multi-Asset Execution Trust, Ser 2016-A6, CI A6 | ||||||||
1.820%, 09/15/2022 | 1,395 | 1,377 | ||||||
CARDS II Trust, Ser 2017-1A, CI A | ||||||||
2.442%, VAR LIBOR USD 1 | 865 | 866 | ||||||
| Description |
Face Amount |
Market Value | ||||||
ASSET-BACKED SECURITIES (continued) |
| |||||||
Chase Issuance Trust, Ser 2016-A5, Cl A5 | ||||||||
1.270%, 07/15/2021 | $ | 500 | $ | 493 | ||||
Discover Card Execution Note Trust, | ||||||||
1.900%, 10/17/2022 | 2,205 | 2,165 | ||||||
Discover Card Execution Note Trust, Ser 2016-A2, CI A2 | ||||||||
2.612%, VAR LIBOR USD 1 | 1,850 | 1,854 | ||||||
GE Capital Credit Card Master Note Trust, Ser 2012-7, Cl A | ||||||||
1.760%, 09/15/2022 | 650 | 642 | ||||||
Golden Credit Card Trust, | ||||||||
1.600%, 09/15/2021 (A) | 335 | 330 | ||||||
Synchrony Credit Card Master Note Trust, Ser 2016-1, CI A | ||||||||
2.040%, 03/15/2022 | 1,825 | 1,818 | ||||||
Synchrony Credit Card Master Note Trust, Ser 2016-3, Cl B | ||||||||
1.910%, 09/15/2022 | 772 | 763 | ||||||
|
|
| ||||||
| 16,608 | ||||||||
|
|
| ||||||
Miscellaneous Business Services — 14.1% |
| |||||||
Ajax Mortgage Loan Trust, Ser 2017-B, Cl A | ||||||||
3.163%, 09/25/2056 (A)(B) | 486 | 476 | ||||||
ALM VI, Ser 2018-6A, CI A1B3 | ||||||||
3.548%, VAR ICE LIBOR USD 3 | 600 | 600 | ||||||
ALM XVII, Ser 2018-17A, CI A1AR | ||||||||
3.269%, VAR ICE LIBOR USD 3 | 725 | 725 | ||||||
Apidos CLO XII, Ser 2018-12A, CI AR | ||||||||
3.419%, VAR ICE LIBOR USD 3 | 600 | 601 | ||||||
Bayview Opportunity Master Fund IIIa Trust, Ser 2017-RN7, CI A1 | ||||||||
3.105%, 09/28/2032 (A) | 11 | 11 | ||||||
Bayview Opportunity Master Fund IIIa Trust, Ser 2017-RN8, CI A1 | ||||||||
3.352%, 11/28/2032 (A) | 227 | 225 | ||||||
Bayview Opportunity Master Fund IVb Trust, Ser 2017-RT6, CI A | ||||||||
3.500%, 10/28/2057 (A)(B) | 425 | 422 | ||||||
Bayview Opportunity Master Fund | ||||||||
3.820%, 04/28/2033 (A) | 263 | 263 | ||||||
Carlyle Global Market Strategies, | ||||||||
3.306%, VAR ICE LIBOR USD 3 | 650 | 645 | ||||||
| 16 | SEI Daily Income Trust / Semi-Annual Report / July 31, 2018 |
| Description |
Face Amount |
Market Value | ||||||
ASSET-BACKED SECURITIES (continued) |
| |||||||
Carlyle Global Market Strategies, Ser 2018-2A, CI A1R | ||||||||
3.117%, VAR ICE LIBOR USD 3 | $ | 750 | $ | 745 | ||||
Cent CLO, Ser 2017-20A, Cl AR | ||||||||
3.435%, VAR ICE LIBOR USD 3 | 878 | 878 | ||||||
CIFC Funding, Ser 2017-1A, CI A1R | ||||||||
3.589%, VAR ICE LIBOR USD 3 | 485 | 488 | ||||||
CLUB Credit Trust, Ser 2017-P2, Cl A | ||||||||
2.610%, 01/15/2024 (A) | 313 | 312 | ||||||
CNH Equipment Trust, Ser 2017-C, | ||||||||
1.840%, 03/15/2021 | 1,285 | 1,278 | ||||||
Conn’s Receivables Funding LLC, Ser 2017-B, CI A | ||||||||
2.730%, 07/15/2020 (A) | 54 | 54 | ||||||
Credit-Based Asset Servicing and Securitization LLC, Ser 2005-CB3, | ||||||||
2.994%, VAR ICE LIBOR USD 1 | 306 | 307 | ||||||
Dell Equipment Finance Trust, Ser 2018-1, Cl A2A | ||||||||
2.970%, 10/22/2020 (A) | 375 | 375 | ||||||
DLL LLC, Ser 2018-1, Cl A2 | ||||||||
2.810%, 11/17/2020 (A) | 740 | 740 | ||||||
DLL Securitization Trust, Ser 2017-A, Cl A2 | ||||||||
1.890%, 07/15/2020 (A) | 170 | 169 | ||||||
Engs Commercial Finance Trust, Ser 2018-1A, CI A1 | ||||||||
2.970%, 02/22/2021 (A) | 227 | 227 | ||||||
Finance of America Structured Securities Trust, Ser 2017-HB1, CI A | ||||||||
2.321%, 11/25/2027 (A)(B) | 205 | 204 | ||||||
GSAMP Trust, Ser 2006-HE1, CI A2D | ||||||||
2.374%, VAR ICE LIBOR USD 1 | 339 | 339 | ||||||
John Deere Owner Trust, Ser 2018-A, Cl A1 | ||||||||
1.950%, 03/15/2019 | 170 | 170 | ||||||
KKR,Ser 2018-21, CI A | ||||||||
3.345%, VAR ICE LIBOR USD 3 | 465 | 460 | ||||||
Madison Park Funding XII, Ser 2017-12A, CI AR | ||||||||
3.608%, VAR ICE LIBOR USD 3 | 305 | 305 | ||||||
Magnetite VII, Ser 2018-7A, CI A1R2 | ||||||||
3.139%, VAR ICE LIBOR USD 3 | 800 | 791 | ||||||
Magnetite VIII, Ser 2018-8A, CI AR2 | ||||||||
3.319%, VAR ICE LIBOR USD 3 | 685 | 682 | ||||||
| Description |
Face Amount |
Market Value | ||||||
ASSET-BACKED SECURITIES (continued) | ||||||||
Marlette Funding Trust, Ser 2016-1A, | ||||||||
3.060%, 01/17/2023 (A) | $ | 32 | $ | 32 | ||||
Marlette Funding Trust, Ser 2017-3A, | ||||||||
2.360%, 12/15/2024 (A) | 146 | 146 | ||||||
Marlette Funding Trust, Ser 2018-1A, | ||||||||
2.610%, 03/15/2028 (A) | 251 | 250 | ||||||
Marlette Funding Trust, Ser 2018-2A, | ||||||||
3.060%, 07/17/2028 (A) | 261 | 261 | ||||||
Mill City Mortgage Loan Trust, Ser 2017-3, CI A1 | ||||||||
2.750%, 01/25/2061 (A)(B) | 486 | 476 | ||||||
Mill City Mortgage Loan Trust, Ser 2018-1, CI A1 | ||||||||
3.250%, 05/25/2062 (A)(B) | 231 | 231 | ||||||
MMAF Equipment Finance LLC, Ser 2017-AA, CI A2 | ||||||||
1.730%, 05/18/2020 (A) | 100 | 100 | ||||||
Nationstar HECM Loan Trust, Ser 2017-1A, CI A | ||||||||
1.968%, 05/25/2027 (A) | 97 | 97 | ||||||
Nationstar HECM Loan Trust, Ser 2017-2A, CI A1 | ||||||||
2.038%, 09/25/2027 (A)(B) | 157 | 157 | ||||||
Nationstar HECM Loan Trust, Ser 2018-1A, CI A | ||||||||
2.760%, 02/25/2028 (A)(B) | 205 | 205 | ||||||
Nationstar HECM Loan Trust, Ser 2018-2A, CI A | ||||||||
3.188%, 07/25/2028 (A)(B) | 280 | 280 | ||||||
Navient Student Loan Trust, Ser 2016-6A, CI A1 | ||||||||
2.544%, VAR ICE LIBOR USD 1 | 51 | 51 | ||||||
New Residential Advance Receivables Trust, Ser 2016-T2, CI AT2 | ||||||||
2.575%, 10/15/2049 (A) | 600 | 595 | ||||||
New Residential Mortgage LLC, Ser 2018-FNT1, CI A | ||||||||
3.610%, 05/25/2023 (A) | 642 | 640 | ||||||
New Residential Mortgage LLC, Ser 2018-FNT2, CI A | ||||||||
3.790%, 07/25/2054 (A) | 390 | 390 | ||||||
NextGear Floorplan Master Owner Trust, Ser 2017-2A, CI A1 | ||||||||
2.752%, VAR LIBOR USD 1 | 935 | 939 | ||||||
Nissan Master Owner Trust Receivables, Ser 2017-C, CI A | ||||||||
2.392%, VAR LIBOR USD 1 | 1,225 | 1,226 | ||||||
NRZ Excess Spread-Collateralized Notes, Ser 2018-PLS1, Cl A | ||||||||
3.193%, 01/25/2023 (A) | 317 | 315 | ||||||
| SEI Daily Income Trust / Semi-Annual Report / July 31, 2018 | 17 |
SCHEDULE OF INVESTMENTS (Unaudited)
July 31, 2018
Ultra Short Duration Bond Fund (Continued)
| Description |
Face Amount |
Market Value | ||||||
ASSET-BACKED SECURITIES (continued) |
| |||||||
NRZ Excess Spread-Collateralized Notes, Ser 2018-PLS2, CI A | ||||||||
3.265%, 02/25/2023 (A) | $ | 151 | $ | 150 | ||||
NYCTL Trust, Ser 2016-A, Cl A | ||||||||
1.470%, 11/10/2029 (A) | 10 | 10 | ||||||
NYCTL Trust, Ser 2017-A, CI A | ||||||||
1.870%, 11/10/2030 (A) | 281 | 278 | ||||||
NYCTL Trust, Ser 2018-A, CI A | ||||||||
3.280%, 11/10/2031 (A) | 1,415 | 1,415 | ||||||
Oak Hill Credit Partners X, Ser 2017-10A, CI AR | ||||||||
3.478%, VAR ICE LIBOR USD 3 | 500 | 500 | ||||||
OCP CLO, Ser 2016-2A, CI A1R | ||||||||
3.729%, VAR ICE LIBOR USD 3 | 370 | 370 | ||||||
OCP CLO, Ser 2017-8A, CI A1R | ||||||||
3.186%, VAR ICE LIBOR USD 3 | 500 | 499 | ||||||
Octagon Investment Partners 24, Ser 2017-1A, CI A1R | ||||||||
3.231%, VAR ICE LIBOR USD 3 | 725 | 724 | ||||||
Octagon Investment Partners XX, Ser 2017-1A, CI AR | ||||||||
3.485%, VAR ICE LIBOR USD 3 | 740 | 740 | ||||||
OneMain Financial Issuance Trust, Ser 2016-1A, Cl B | ||||||||
4.570%, 02/20/2029 (A) | 185 | 187 | ||||||
OZLM VII, Ser 2018-7RA, CI A1R | ||||||||
3.346%, VAR ICE LIBOR USD 3 Month+1.010%, 07/17/2029 (A) | 590 | 590 | ||||||
OZLM XII, Ser 2015-12A, CI A1 | ||||||||
3.789%, VAR ICE LIBOR USD 3 | 395 | 395 | ||||||
Pretium Mortgage Credit Partners, Ser 2017-NPL5, CI A1 | ||||||||
3.327%, 12/30/2032 (A)(B) | 191 | 190 | ||||||
Pretium Mortgage Credit Partners, Ser 2018-NPL2, Cl A1 | ||||||||
3.700%, 03/27/2033 (A) | 425 | 423 | ||||||
Prosper Marketplace Issuance Trust, Ser 2017-3A, CI A | ||||||||
2.540%, 11/15/2023 (A) | 141 | 141 | ||||||
Prosper Marketplace Issuance Trust, Ser 2018-1A, Cl A | ||||||||
3.110%, 06/17/2024 (A) | 419 | 419 | ||||||
PRPM, Ser 2018-1A, CI A1 | ||||||||
3.750%, 04/25/2023 (A)(B) | 299 | 297 | ||||||
Regional Management Issuance, Ser 2018-1, CI A | ||||||||
3.830%, 07/15/2027 (A) | 290 | 290 | ||||||
| Description |
Face Amount |
Market Value | ||||||
ASSET-BACKED SECURITIES (continued) |
| |||||||
Shackleton, Ser 2018-6RA, Cl A | ||||||||
3.356%, VAR ICE LIBOR USD 3 | $ | 500 | $ | 499 | ||||
SLM Student Loan Trust, Ser 2003-14, Cl A5 | ||||||||
2.565%, VAR ICE LIBOR USD 3 | 6 | 6 | ||||||
SLM Student Loan Trust, Ser 2004-3, Cl A5 | ||||||||
2.505%, VAR ICE LIBOR USD 3 | 157 | 157 | ||||||
SLM Student Loan Trust, Ser 2005-3, Cl A5 | ||||||||
2.425%, VAR ICE LIBOR USD 3 | 330 | 330 | ||||||
SLM Student Loan Trust, Ser 2005-4, Cl A3 | ||||||||
2.455%, VAR ICE LIBOR USD 3 | 287 | 286 | ||||||
SLM Student Loan Trust, Ser 2008-5, Cl A4 | ||||||||
4.035%, VAR ICE LIBOR USD 3 | 715 | 733 | ||||||
SLM Student Loan Trust, Ser 2008-9, Cl A | ||||||||
3.835%, VAR ICE LIBOR USD 3 | 726 | 740 | ||||||
Sofi Consumer Loan Program, Ser 2016-2, CI A | ||||||||
3.090%, 10/27/2025 (A) | 558 | 557 | ||||||
Sofi Consumer Loan Program, Ser 2016-3, CI A | ||||||||
3.050%, 12/26/2025 (A) | 574 | 572 | ||||||
Sofi Consumer Loan Program, Ser 2017-1, CI A | ||||||||
3.280%, 01/26/2026 (A) | 94 | 94 | ||||||
Sofi Consumer Loan Program, Ser 2017-6, CI A1 | ||||||||
2.200%, 11/25/2026 (A) | 190 | 189 | ||||||
Sofi Consumer Loan Program, Ser 2018-1, CI A1 | ||||||||
2.550%, 02/25/2027 (A) | 310 | 308 | ||||||
Sofi Consumer Loan Program, Ser 2018-2, CI A1 | ||||||||
2.930%, 04/26/2027 (A) | 333 | 333 | ||||||
Sofi Consumer Loan Program, Ser 2018-3, CI A1 | ||||||||
3.200%, 08/25/2027 (A) | 255 | 255 | ||||||
Sofi Professional Loan Program, Ser 2017-A, CI A1 | ||||||||
2.764%, VAR ICE LIBOR USD 1 | 188 | 188 | ||||||
Springleaf Funding Trust, Ser 2016-AA, Cl A | ||||||||
2.900%, 11/15/2029 (A) | 1,150 | 1,146 | ||||||
SPS Servicer Advance Receivables Trust, Ser 2016-T1, CI AT1 | ||||||||
2.530%, 11/16/2048 (A) | 605 | 607 | ||||||
| 18 | SEI Daily Income Trust / Semi-Annual Report / July 31, 2018 |
| Description |
Face Amount |
Market Value | ||||||
ASSET-BACKED SECURITIES (continued) |
| |||||||
Stanwich Mortgage Loan Trust, Ser 2018- NPB1, Cl A1 | ||||||||
4.016%, 05/16/2023 (A) | $ | 710 | $ | 709 | ||||
Symphony CLO VIII, Ser 2014-8A, Cl BR | ||||||||
3.847%, VAR ICE LIBOR USD 1 | 380 | 380 | ||||||
Towd Point Mortgage Trust, Ser 2015-4, CI A1B | ||||||||
2.750%, 04/25/2055 (A)(B) | 89 | 87 | ||||||
Towd Point Mortgage Trust, Ser 2015-5, CI A1B | ||||||||
2.750%, 05/25/2055 (A)(B) | 89 | 87 | ||||||
Towd Point Mortgage Trust, Ser 2016-1, CI A1B | ||||||||
2.750%, 02/25/2055 (A)(B) | 75 | 74 | ||||||
Towd Point Mortgage Trust, Ser 2016-3, Cl A1 | ||||||||
2.250%, 04/25/2056 (A)(B) | 185 | 180 | ||||||
Towd Point Mortgage Trust, Ser 2016-4, Cl A1 | ||||||||
2.250%, 07/25/2056 (A)(B) | 293 | 284 | ||||||
Towd Point Mortgage Trust, Ser 2017-1, Cl A1 | ||||||||
2.750%, 10/25/2056 (A)(B) | 610 | 598 | ||||||
Towd Point Mortgage Trust, Ser 2017-2, Cl A1 | ||||||||
2.750%, 04/25/2057 (A)(B) | 342 | 335 | ||||||
Towd Point Mortgage Trust, Ser 2017-4, Cl A1 | ||||||||
2.750%, 06/25/2057 (A)(B) | 265 | 258 | ||||||
Towd Point Mortgage Trust, Ser 2017-5, Cl A1 | ||||||||
2.664%, VAR ICE LIBOR USD 1 | 556 | 556 | ||||||
Towd Point Mortgage Trust, Ser 2017-6, Cl A1 | ||||||||
2.750%, 10/25/2057 (A)(B) | 242 | 236 | ||||||
Towd Point Mortgage Trust, Ser 2018-1, Cl A1 | ||||||||
3.000%, 01/25/2058 (A)(B) | 171 | 168 | ||||||
U.S. Residential Opportunity Fund IV Trust, Ser 2017-1111, CI A | ||||||||
3.352%, 11/27/2037 (A) | 194 | 192 | ||||||
Utah State Board of Regents, Ser 2016-1, Cl A | ||||||||
2.710%, VAR ICE LIBOR USD 1 | 330 | 331 | ||||||
Verizon Owner Trust, Ser 2016-1A, Cl A | ||||||||
1.420%, 01/20/2021 (A) | 835 | 831 | ||||||
Verizon Owner Trust, Ser 2016-2A, Cl A | ||||||||
1.680%, 05/20/2021 (A) | 365 | 361 | ||||||
Verizon Owner Trust, Ser 2017-2A, Cl B | ||||||||
2.220%, 12/20/2021 (A) | 190 | 186 | ||||||
Vibrant CLO III, Ser 2016-3A, CI A1R | ||||||||
3.828%, VAR ICE LIBOR USD 3 | 540 | 540 | ||||||
VOLT LX LLC, Ser 2017-NPL7, CI A1 | ||||||||
3.250%, 06/25/2047 (A) | 149 | 148 | ||||||
VOLT LXIII LLC, Ser 2017-NP10, CI A1 | ||||||||
3.000%, 10/25/2047 (A) | 224 | 221 | ||||||
VOLT LXIV LLC, Ser 2017-NP11,CI A1 | ||||||||
3.375%, 10/25/2047 (A) | 484 | 482 | ||||||
| Description |
Face Amount |
Market Value | ||||||
ASSET-BACKED SECURITIES (continued) |
| |||||||
Voya CLO, Ser 2017-3A, CI A1R | ||||||||
3.055%, VAR ICE LIBOR USD 3 | $ | 650 | $ | 650 | ||||
Z Capital Credit Partners CLO, Ser 2018-1A, CI A1R | ||||||||
3.289%, VAR ICE LIBOR USD 3 | 600 | 600 | ||||||
|
|
| ||||||
| 41,995 | ||||||||
|
|
| ||||||
Mortgage Related — 0.3% |
| |||||||
Accredited Mortgage Loan Trust, Ser 2004-4, CI A1A | ||||||||
2.744%, VAR ICE LIBOR USD 1 | 108 | 108 | ||||||
Aegis Asset-Backed-Securities Trust Mortgage Pass-Through Certificates, Ser 2004-4, CI A1 | ||||||||
2.784%, VAR ICE LIBOR USD 1 Month+0.720%, 10/25/2034 | 151 | 151 | ||||||
Bear Stearns Asset-Backed-Securities Trust, Ser 2005-HE3, CI M2 | ||||||||
3.084%, VAR ICE LIBOR USD 1 | 89 | 90 | ||||||
New Residential Mortgage Loan Trust, Ser 2017-6A, CI A1 | ||||||||
4.000%, 08/27/2057 (A)(B) | 649 | 652 | ||||||
|
|
| ||||||
| 1,001 | ||||||||
|
|
| ||||||
Total Asset-Backed Securities | 88,560 | |||||||
|
|
| ||||||
MORTGAGE-BACKED SECURITIES — 9.8% |
| |||||||
Agency Mortgage-Backed Obligations — 2.4% |
| |||||||
FHLMC | ||||||||
5.000%, 06/01/2026 | 162 | 165 | ||||||
3.790%, VAR US Treas Yield Curve Rate T Note Const Mat 1 Yr+2.075%, 02/01/2030 | 41 | 43 | ||||||
3.368%, VAR US Treas Yield Curve Rate T Note Const Mat 1 Yr+2.095%, 02/01/2022 | 16 | 17 | ||||||
FHLMC Multifamily Structured Pass-Through Certificates, Ser K008, Cl A1 | 68 | 68 | ||||||
2.746%, 12/25/2019 | ||||||||
FHLMC Multifamily Structured Pass-Through Certificates, Ser K020, Cl A1 | ||||||||
1.573%, 01/25/2022 | 246 | 240 | ||||||
FNMA | ||||||||
6.000%, 01/01/2027 | 17 | 19 | ||||||
5.000%, 05/01/2019 to 03/01/2025 | 430 | 441 | ||||||
| SEI Daily Income Trust / Semi-Annual Report / July 31, 2018 | 19 |
SCHEDULE OF INVESTMENTS (Unaudited)
July 31, 2018
Ultra Short Duration Bond Fund (Continued)
| Description |
Face Amount |
Market Value | ||||||
MORTGAGE-BACKED SECURITIES (continued) |
| |||||||
3.965%, VAR US Treas Yield Curve Rate T Note Const Mat 1 Yr+2.215%, 01/01/2029 | $ | 9 | $ | 9 | ||||
3.862%, VAR ICE LIBOR USD 6 Month+1.820%, 09/01/2024 | 46 | 47 | ||||||
3.695%, VAR US Treas Yield Curve Rate T Note Const Mat 1 Yr+2.079%, 05/01/2028 | 3 | 3 | ||||||
3.570%, VAR ICE LIBOR USD 6 Month+1.775%, 09/01/2024 | 19 | 19 | ||||||
3.433%, VAR US Treas Yield Curve Rate T Note Const Mat 1 Yr+2.120%, 11/01/2025 | 3 | 4 | ||||||
3.373%, VAR US Treas Yield Curve Rate T Note Const Mat 1 Yr+1.977%, 11/01/2023 | 7 | 7 | ||||||
3.110%, VAR ICE LIBOR USD 6 Month+1.000%, 11/01/2021 | 4 | 4 | ||||||
3.000%, 12/01/2030 | 1,349 | 1,337 | ||||||
1.900%, 10/01/2019 | 350 | 349 | ||||||
FNMA REMIC, Ser 1993-58, CI H | ||||||||
5.500%, 04/25/2023 | 12 | 12 | ||||||
FNMA REMIC, Ser 2001-33, Cl FA | ||||||||
2.514%, VAR LIBOR USD 1 | 11 | 11 | ||||||
FNMA REMIC, Ser 2002-64, Cl FG | ||||||||
2.329%, VAR LIBOR USD 1 | 11 | 11 | ||||||
FNMA REMIC, Ser 2008-18, Cl HD | ||||||||
4.000%, 12/25/2018 | – | – | ||||||
FNMA REMIC, Ser 2011-24, Cl PC | ||||||||
4.000%, 10/25/2039 | 590 | 597 | ||||||
FNMA, Ser 2011-M7, Cl A2 | ||||||||
2.578%, 09/25/2018 | 36 | 36 | ||||||
FNMA, Ser 2017-M13, Cl FA | ||||||||
2.485%, VAR LIBOR USD 1 | 409 | 409 | ||||||
FREMF Mortgage Trust, Ser 2012-K705, Cl C | ||||||||
4.150%, 09/25/2044 (A)(B) | 415 | 414 | ||||||
FREMF Mortgage Trust, Ser K503, | ||||||||
3.020%, 10/25/2047 (A)(B) | 210 | 207 | ||||||
FREMF Mortgage Trust, Ser K704, CI B | ||||||||
4.418%, 09/25/2018 (A)(B) | 355 | 354 | ||||||
FREMF Mortgage Trust, Ser K706, CI P | ||||||||
4.428%, 11/25/2044 (A)(B) | 750 | 746 | ||||||
FREMF Mortgage Trust, Ser K712, CI B | ||||||||
3.360%, 05/25/2045 (A)(B) | 120 | 120 | ||||||
FREMF Mortgage Trust, Ser K712, CI C | ||||||||
3.360%, 05/25/2045 (A)(B) | 315 | 314 | ||||||
FREMF Multifamily Aggregation Risk Transfer Trust, Ser 2017-KT01, CI A | ||||||||
2.389%, VAR LIBOR USD 1 | 350 | 351 | ||||||
| Description |
Face Amount |
Market Value | ||||||
MORTGAGE-BACKED SECURITIES (continued) |
| |||||||
Mortgage-Linked Amortizing Notes, Ser 2012-1, CI A10 | ||||||||
2.060%, 01/15/2022 | $ | 72 | $ | 71 | ||||
NCUA Guaranteed Notes, Ser 2010-R1, Cl 1A | ||||||||
2.537%, VAR LIBOR USD 1 | 279 | 280 | ||||||
NCUA Guaranteed Notes, Ser 2011-R1, Cl 1A | ||||||||
2.537%, VAR ICE LIBOR USD 1 | 201 | 201 | ||||||
NCUA Guaranteed Notes, Ser 2011-R2, Cl 1A | ||||||||
2.425%, VAR ICE LIBOR USD 1 Month+0.400%, 02/06/2020 | 54 | 54 | ||||||
NCUA Guaranteed Notes, Ser 2011-R3, Cl 1A | ||||||||
2.478%, VAR LIBOR USD 1 | 121 | 121 | ||||||
|
|
| ||||||
| 7,081 | ||||||||
|
|
| ||||||
Non-Agency Mortgage-Backed Obligations — 7.4% |
| |||||||
Angel Oak Mortgage Trust I LLC, Ser 2017-2, CI A1 | ||||||||
2.478%, 07/25/2047 (A)(B) | 224 | 221 | ||||||
Angel Oak Mortgage Trust LLC, Ser 2017-1, CI A1 | ||||||||
2.810%, 01/25/2047 (A)(B) | 59 | 58 | ||||||
Angel Oak Mortgage Trust LLC, Ser 2017-3, CI A1 | ||||||||
2.708%, 11/25/2047 (A)(B) | 179 | 177 | ||||||
BABSN.CI A1 | ||||||||
3.319%, 07/20/2029 | 372 | 370 | ||||||
BAMLL Re-REMIC Trust, Ser 2015-FR11, CI A705 | ||||||||
1.544%, 09/27/2044 (A)(B) | 625 | 622 | ||||||
Banc of America Mortgage Securities, Ser 2005-F, Cl 2A2 | ||||||||
4.316%, 07/25/2035 (B) | 104 | 97 | ||||||
Banc of America Mortgage Securities, Ser 2005-J, CI 2A1 | ||||||||
3.636%, 11/25/2035 (B) | 12 | 12 | ||||||
BBCMS Mortgage Trust, Ser DELC, Cl A | ||||||||
2.922%, VAR LIBOR USD 1 | 800 | 800 | ||||||
Bear Stearns Adjustable Rate Mortgage Trust, Ser 2005-3, Cl 2A1 | ||||||||
4.304%, 06/25/2035 (B) | 54 | 55 | ||||||
Bear Stearns Adjustable Rate Mortgage Trust, Ser 2005-6, Cl 3A1 | ||||||||
4.216%, 08/25/2035 (B) | 118 | 116 | ||||||
BX Trust, Ser MCSF, CI A | ||||||||
2.648%, VAR LIBOR USD 1 | 470 | 466 | ||||||
| 20 | SEI Daily Income Trust / Semi-Annual Report / July 31, 2018 |
| Description | Face Amount (Thousands) | Market Value ($ Thousands) | ||||||
MORTGAGE-BACKED SECURITIES (continued) |
| |||||||
CGDBB Commercial Mortgage Trust, Ser BIOC, CI A | ||||||||
2.862%, VAR LIBOR USD 1 | $ | 450 | $ | 450 | ||||
CIM Trust, Ser 2017-7, CI A | ||||||||
3.000%, 04/25/2057 (A)(B) | 626 | 618 | ||||||
Citigroup Mortgage Loan Trust, Ser 2004-HYB3, CI 1A | ||||||||
4.381%, 09/25/2034 (B) | 23 | 23 | ||||||
Citigroup Mortgage Loan Trust, Ser 2006-AR2, CI 1A1 | ||||||||
3.893%, 03/25/2036 (B) | 99 | 92 | ||||||
Citigroup Mortgage Loan Trust, Ser 2018-RP2, CI A1 | ||||||||
3.500%, 02/25/2058 (A)(B) | 358 | 357 | ||||||
COLT Mortgage Loan Trust, Ser 2016-3, Cl A1 | ||||||||
2.800%, 12/26/2046 (A)(B) | 69 | 68 | ||||||
COLT Mortgage Loan Trust, Ser 2016-3, Cl A3 | ||||||||
3.750%, 12/26/2046 (A)(B) | 191 | 191 | ||||||
COLT Mortgage Loan Trust, Ser 2017-1, Cl A1 | ||||||||
2.614%, 05/27/2047 (A)(B) | 177 | 176 | ||||||
COLT Mortgage Loan Trust, Ser 2018-1, Cl A1 | ||||||||
2.930%, 02/25/2048 (A)(B) | 233 | 232 | ||||||
COLT Mortgage Loan Trust, Ser 2018-2, Cl A1 | ||||||||
3.470%, 07/27/2048 (A)(B) | 594 | 594 | ||||||
Countrywide Home Loans, Ser 2004-29, CI 1A1 | ||||||||
2.604%, VAR ICE LIBOR USD 1 | 15 | 14 | ||||||
Countrywide Home Loans, Ser 2005-HY10, Cl 3A1A | ||||||||
3.581%, 02/20/2036 (B) | 87 | 79 | ||||||
Deephaven Residential Mortgage Trust, Ser 2017-1A, CI A1 | ||||||||
2.725%, 12/26/2046 (A)(B) | 73 | 73 | ||||||
Deephaven Residential Mortgage Trust, Ser 2017-2A, CI A1 | ||||||||
2.453%, 06/25/2047 (A)(B) | 155 | 153 | ||||||
Deephaven Residential Mortgage Trust, Ser 2017-3A, CI A1 | ||||||||
2.577%, 10/25/2047 (A)(B) | 194 | 192 | ||||||
Deephaven Residential Mortgage Trust, Ser 2018-1A, Cl A1 | ||||||||
2.976%, 12/25/2057 (A)(B) | 233 | 231 | ||||||
Deephaven Residential Mortgage Trust, Ser 2018-2A, CI A1 | ||||||||
3.479%, 04/25/2058 (A)(B) | 522 | 520 | ||||||
FDIC Guaranteed Notes Trust, Ser 2010-S4, CI A | ||||||||
2.806%, VAR LIBOR USD 1 | 709 | 698 | ||||||
| Description | Face Amount (Thousands) | Market Value ($ Thousands) | ||||||
MORTGAGE-BACKED SECURITIES (continued) |
| |||||||
FHLMC Structured Agency Credit Risk Debt Notes, Ser 2013-DN1, Cl M1 | ||||||||
5.464%, VAR ICE LIBOR USD 1 Month+3.400%, 07/25/2023 | $ | 22 | $ | 22 | ||||
FHLMC Structured Agency Credit Risk Debt Notes, Ser 2014-DN2, Cl M2 | ||||||||
3.714%, VAR ICE LIBOR USD 1 | 115 | 116 | ||||||
FHLMC Structured Agency Credit Risk Debt Notes, Ser 2015-HQ1, Cl M3 | ||||||||
5.864%, VAR ICE LIBOR USD 1 | 575 | 616 | ||||||
FHLMC Structured Agency Credit Risk Debt Notes, Ser 2017-HQA1, CI M1 | ||||||||
3.264%, VAR ICE LIBOR USD 1 | 1,629 | 1,639 | ||||||
FHLMC Structured Agency Credit Risk Debt Notes, Ser 2018-SPI2, Cl M1 | ||||||||
3.820%, 05/25/2048 (A)(B) | 424 | 424 | ||||||
FNMA Connecticut Avenue Securities, Ser 2014-C02, CI 1M1 | ||||||||
3.014%, VAR ICE LIBOR USD 1 | 36 | 37 | ||||||
FNMA Connecticut Avenue Securities, Ser 2017-C02, CI 2M1 | ||||||||
3.214%, VAR ICE LIBOR USD 1 | 336 | 338 | ||||||
GMAC Mortgage Loan Trust, Ser 2005-AR6, CI 2A1 | ||||||||
3.748%, 11/19/2035 (B) | 121 | 118 | ||||||
GS Mortgage Securities II, Ser 2010-C2, | ||||||||
3.849%, 12/10/2043 (A) | 56 | 57 | ||||||
GS Mortgage Securities II, Ser GC30, Cl A2 | ||||||||
2.726%, 05/10/2050 | 275 | 273 | ||||||
GS Mortgage Securities Trust, Ser 500K, CI A | ||||||||
2.772%, VAR LIBOR USD 1 | 415 | 415 | ||||||
GS Mortgage Securities Trust, Ser GC16, CI A2 | ||||||||
3.033%, 11/10/2046 | 857 | 857 | ||||||
GS Mortgage Securities Trust, Ser GC28, CI A2 | ||||||||
2.898%, 02/10/2048 | 210 | 210 | ||||||
GSR Mortgage Loan Trust, Ser 2005-AR4, CI 2A1 | ||||||||
4.179%, 07/25/2035 (B) | 153 | 136 | ||||||
GSR Mortgage Loan Trust, Ser 2007-AR2, CI 1A1 | ||||||||
3.753%, 05/25/2037 (B) | 135 | 115 | ||||||
Holmes Master Issuer PLC, Ser 2018-1A, Cl A1 | ||||||||
2.442%, VAR ICE LIBOR USD 1 | 469 | 469 | ||||||
| SEI Daily Income Trust / Semi-Annual Report / July 31, 2018 | 21 |
SCHEDULE OF INVESTMENTS (Unaudited)
July 31, 2018
Ultra Short Duration Bond Fund (Continued)
| Description | Face Amount (Thousands) | Market Value ($ Thousands) | ||||||
MORTGAGE-BACKED SECURITIES (continued) |
| |||||||
Impac CMB Trust, Ser 2004-9, Cl 1A1 | ||||||||
2.824%, VAR ICE LIBOR USD 1 | $ | 43 | $ | 43 | ||||
Impac CMB Trust, Ser 2005-2, Cl 1A1 | ||||||||
2.584%, VAR ICE LIBOR USD 1 | 47 | 47 | ||||||
Impac CMB Trust, Ser 2005-3, Cl A1 | ||||||||
2.544%, VAR ICE LIBOR USD 1 | 44 | 42 | ||||||
Impac CMB Trust, Ser 2005-5, Cl A1 | ||||||||
2.704%, VAR ICE LIBOR USD 1 | 35 | 32 | ||||||
Impac CMB Trust, Ser 2005-8, Cl 1A | ||||||||
2.584%, VAR ICE LIBOR USD 1 | 113 | 108 | ||||||
JPMBB Commercial Mortgage Securities Trust, Ser C25, CI A2 | ||||||||
2.949%, 11/15/2047 | 530 | 529 | ||||||
JPMorgan Chase Commercial Mortgage Securities Trust, Ser 2013-C14, Cl A2 | ||||||||
3.019%, 08/15/2046 | 298 | 299 | ||||||
JPMorgan Chase Commercial Mortgage Securities Trust, Ser 2013-C15, Cl A2 | ||||||||
2.977%, 11/15/2045 | 164 | 163 | ||||||
JPMorgan Chase Commercial Mortgage Securities Trust, Ser 2013-C16, Cl A2 | ||||||||
3.070%, 12/15/2046 | 310 | 310 | ||||||
JPMorgan Chase Commercial Mortgage Securities Trust, Ser C13, Cl A2 | ||||||||
2.665%, 01/15/2046 | 31 | 31 | ||||||
JPMorgan Mortgage Trust, Ser 2005-A6, CI 7A1 | ||||||||
3.732%, 08/25/2035 (B) | 60 | 58 | ||||||
JPMorgan Mortgage Trust, Ser 2007-A3, CI 1A1 | ||||||||
3.748%, 05/25/2037 (B) | 82 | 74 | ||||||
JPMorgan Mortgage Trust, Ser 2018-7FRB, CI A2 | ||||||||
2.841%, VAR ICE LIBOR USD 1 | 475 | 475 | ||||||
LSTAR Securities Investment, Ser 2017-7, Cl A | ||||||||
0.038%, VAR ICE LIBOR USD 1 | 89 | 88 | ||||||
LSTAR Securities Investment, Ser 2017-8, Cl A | ||||||||
3.742%, VAR ICE LIBOR USD 1 | 176 | 176 | ||||||
Merrill Lynch Mortgage Investors, Ser 2005- A3, CI A1 | ||||||||
2.334%, VAR ICE LIBOR USD 1 | 22 | 22 | ||||||
Merrill Lynch Mortgage-Backed Securities Trust, Ser 2007-3, Cl 2A1 | ||||||||
3.933%, 06/25/2037 (B) | 110 | 90 | ||||||
| Description | Face Amount (Thousands) | Market Value ($ Thousands) | ||||||
MORTGAGE-BACKED SECURITIES (continued) |
| |||||||
Metlife Securitization Trust, Ser 2017-1A, Cl A | ||||||||
3.000%, 04/25/2055 (A)(B) | $ | 203 | $ | 199 | ||||
MFA Trust, Ser 2017-RPL1, CI A1 | ||||||||
2.588%, 02/25/2057 (A)(B) | 156 | 153 | ||||||
Morgan Stanley Bank of America Merrill Lynch Trust, Ser 2013-C11, CI A2 | ||||||||
3.085%, 08/15/2046 | 159 | 158 | ||||||
Morgan Stanley Bank of America Merrill Lynch Trust, Ser C16, Cl A2 | ||||||||
2.849%, 06/15/2047 | 661 | 660 | ||||||
Morgan Stanley Capital I Trust, Ser STAR, CI A1 | ||||||||
2.084%, 08/05/2034 (A) | 114 | 111 | ||||||
Morgan Stanley Re-Remic Trust, Ser 2012-10, CI AXA | ||||||||
1.000%, 03/27/2051 (A) | 32 | 32 | ||||||
MortgageIT Trust, Ser 2005-5, Cl A1 | ||||||||
2.324%, VAR ICE LIBOR USD 1 Month+0.260%, 12/25/2035 | 135 | 134 | ||||||
New Residential Mortgage Loan Trust, Ser 2017-3A, CI A1 | ||||||||
4.000%, 04/25/2057 (A)(B) | 300 | 302 | ||||||
OBX Trust, Ser 2018-1, Cl A2 | ||||||||
2.714%, VAR ICE LIBOR USD 1 | 99 | 99 | ||||||
Paragon Mortgages No. 12 PLC, Ser 2006-12A, CI A2C | ||||||||
2.541%, VAR ICE LIBOR USD 3 | 88 | 84 | ||||||
Paragon Mortgages No. 15 PLC, Ser 2007-15A, CI A2C | ||||||||
2.561%, VAR ICE LIBOR USD 3 | 212 | 204 | ||||||
Residential Funding Mortgage Securities, Ser 2007-SA3, CI 2A1 | ||||||||
5.062%, 07/27/2037 (B) | 112 | 100 | ||||||
Sequoia Mortgage Trust, Ser 2004-12, Cl A1 | ||||||||
2.626%, VAR ICE LIBOR USD 1 | 13 | 13 | ||||||
Sequoia Mortgage Trust, Ser 2018-CH3, Cl A1 | ||||||||
4.500%, 08/25/2048 (A)(B) | 500 | 509 | ||||||
SG Residential Mortgage Trust, Ser 2018-1, CI A1 | ||||||||
3.425%, 04/27/2048 (A)(B) | 535 | 535 | ||||||
Verus Securitization Trust, Ser 2018-2, Cl A1 | ||||||||
3.677%, 06/01/2058 (A)(B) | 565 | 565 | ||||||
Verus, Ser 2018-1, Cl A1 | ||||||||
2.929%, 02/25/2048 (A)(B) | 200 | 197 | ||||||
WaMu Mortgage Pass-Through Certificates, Ser 2006-AR2, Cl 1A1 | ||||||||
3.394%, 03/25/2036 (B) | 168 | 159 | ||||||
| 22 | SEI Daily Income Trust / Semi-Annual Report / July 31, 2018 |
| Description | Face Amount (Thousands) | Market Value ($ Thousands) | ||||||
MORTGAGE-BACKED SECURITIES (continued) |
| |||||||
Wells Fargo Mortgage-Backed Securities Trust, Ser 2004-BB, CI A2 | ||||||||
3.740%, 01/25/2035 (B) | $ | 48 | $ | 49 | ||||
Wells Fargo Mortgage-Backed Securities Trust, Ser 2006-AR10, Cl 2A1 | ||||||||
4.239%, 07/25/2036 (B) | 98 | 98 | ||||||
WFRBS Commercial Mortgage Trust, Ser LC14, Cl A2 | ||||||||
2.862%, 03/15/2047 | 831 | 831 | ||||||
WFRBS Commercial Mortgage Trust, Ser UBS1, Cl A2 | ||||||||
2.927%, 03/15/2046 | 641 | 641 | ||||||
|
|
| ||||||
| 22,017 | ||||||||
|
|
| ||||||
Total Mortgage-Backed Securities | 29,098 | |||||||
|
|
| ||||||
U.S. TREASURY OBLIGATIONS — 6.9% | ||||||||
U.S. Treasury Notes | ||||||||
2.125%, 08/31/2020 | 7,460 | 7,375 | ||||||
1.500%, 10/31/2019 | 6,945 | 6,857 | ||||||
1.125%, 12/31/2019 | 2,720 | 2,665 | ||||||
0.750%, 02/15/2019 | 3,765 | 3,734 | ||||||
|
|
| ||||||
Total U.S. Treasury Obligations | 20,631 | |||||||
|
|
| ||||||
MUNICIPAL BONDS — 3.8% | ||||||||
Arizona — 0.2% | ||||||||
Northern Arizona University, RB | ||||||||
5.020%, 08/01/2018 | 525 | 525 | ||||||
|
|
| ||||||
Arkansas — 0.3% | ||||||||
Garland County, RB | ||||||||
1.540%, 11/01/2018 | 965 | 963 | ||||||
|
|
| ||||||
California — 0.5% | ||||||||
California State, GO Callable 10/01/2021 @ 100 | ||||||||
2.870%, 04/01/2047 (C) | 775 | 780 | ||||||
Los Angeles, Municipal Improvement, Ser A, RB | ||||||||
2.344%, 11/01/2018 | 625 | 625 | ||||||
|
|
| ||||||
| 1,405 | ||||||||
|
|
| ||||||
Florida — 0.1% | ||||||||
Florida State, Board of Administration Finance, Ser A, RB | ||||||||
2.163%, 07/01/2019 | 400 | 398 | ||||||
|
|
| ||||||
| Description | Face Amount (Thousands) | Market Value ($ Thousands) | ||||||
MUNICIPAL BONDS (continued) |
| |||||||
Idaho — 0.3% | ||||||||
Idaho State, Housing & Finance Association, Ser A, RB Callable 08/01/2018 @ 100 | ||||||||
1.950%, 07/01/2041 (C) | $ | 805 | $ | 805 | ||||
|
|
| ||||||
Illinois — 0.2% | ||||||||
Illinois State, Finance Authority, RB | ||||||||
4.545%, 10/01/2018 | 310 | 311 | ||||||
Illinois State, GO | ||||||||
5.363%, 02/01/2019 | 330 | 333 | ||||||
|
|
| ||||||
| 644 | ||||||||
|
|
| ||||||
Michigan — 0.1% | ||||||||
Genesee, GO Callable 08/13/2018 @ 100 | ||||||||
2.692%, 10/01/2019 (C) | 374 |
| 374 |
| ||||
|
|
| ||||||
New Hampshire — 0.5% | ||||||||
New Hampshire State, Business Finance Authority, Ser B, RB | ||||||||
2.100%, 11/01/2020 (C) | 1,350 | 1,350 | ||||||
|
|
| ||||||
New Jersey — 0.5% | ||||||||
Gloucester County, Improvement Authority, Ser B, RB | ||||||||
1.850%, 11/01/2018 | 810 | 809 | ||||||
Monmouth County, Improvement Authority, RB | ||||||||
2.500%, 11/14/2019 | 715 | 711 | ||||||
|
|
| ||||||
| 1,520 | ||||||||
|
|
| ||||||
New York — 0.5% | ||||||||
New York State, Housing Finance Agency, Ser B, RB, JP MORGAN CHASE BANK NA Callable 07/31/2018 @ 100 | ||||||||
2.000%, 11/01/2048 (C)(D) | 1,100 | 1,100 | ||||||
Port Authority of New York & New Jersey, Ser 208,RB | ||||||||
2.114%, 09/15/2018 | 380 | 380 | ||||||
|
|
| ||||||
| 1,480 | ||||||||
|
|
| ||||||
Pennsylvania — 0.1% | ||||||||
Pennsylvania State, Turnpike Commission, Sub-Ser B, RB | ||||||||
1.760%, 12/01/2019 | 370 | 364 | ||||||
|
|
| ||||||
Wisconsin — 0.5% | ||||||||
City of Franklin, GO Callable 12/01/2018 @ 100 | ||||||||
2.500%, 03/01/2019 | 675 | 674 | ||||||
| SEI Daily Income Trust / Semi-Annual Report / July 31, 2018 | 23 |
SCHEDULE OF INVESTMENTS (Unaudited)
July 31, 2018
Ultra Short Duration Bond Fund (Concluded)
| Description |
Face Amount |
Market Value | ||||||
MUNICIPAL BONDS (continued) | ||||||||
Wisconsin State, Housing & Economic Development Authority, Ser F, RB Callable 07/31/2018 @ 100 | ||||||||
2.000%, 05/01/2030 (C) | $ | 865 | $ | 865 | ||||
|
|
| ||||||
| 1,539 | ||||||||
|
|
| ||||||
Total Municipal Bonds | 11,367 | |||||||
|
|
| ||||||
COMMERCIAL PAPER — 1.7% | ||||||||
Edison Company | ||||||||
2.172%, 08/07/2018 (A) | 2,625 | 2,624 | ||||||
Northwest Natural Gas | ||||||||
2.050%, 08/01/2018 (A) | 1,500 | 1,500 | ||||||
Raytheon | ||||||||
2.082%, 08/08/2018 (A) | 1,000 | 999 | ||||||
|
|
| ||||||
Total Commercial Paper | 5,123 | |||||||
|
|
| ||||||
SOVEREIGN DEBT — 0.3% | ||||||||
Export Development Canada | ||||||||
0.875%, 08/27/2018 (A) | 1,000 | 999 | ||||||
|
|
| ||||||
Total Sovereign Debt | 999 | |||||||
|
|
| ||||||
CERTIFICATE OF DEPOSIT — 0.4% | ||||||||
Toronto-Dominion Bank | ||||||||
2.200%, 08/06/2018 | 1,100 | 1,100 | ||||||
|
|
| ||||||
Total Certificate of Deposit | 1,100 | |||||||
|
|
| ||||||
| Description |
Face Amount |
Market Value | ||||||
REPURCHASE AGREEMENT — 1.6% | ||||||||
BNP Paribas | ||||||||
1.920%, dated 07/31/18, to be repurchased on 08/01/18, repurchase price $4,800,256 (collateralized by FNMA and GNMA obligations, ranging in par value $1,000 - 3,453,633, 2.536% - 4.686%, 12/01/2033 - 04/01/2048; with total market value $4,893,635) (E) | $ | 4,800 | $ | 4,800 | ||||
|
|
| ||||||
Total Repurchase Agreement | 4,800 | |||||||
|
|
| ||||||
Total Investments in Securities — 100.4% | $ | 298,798 | ||||||
|
|
| ||||||
| 24 | SEI Daily Income Trust / Semi-Annual Report / July 31, 2018 |
A list of the open futures contracts held by the Fund at July 31, 2018, is as follows:
Type of Contract | Number of Contracts Long/(Short) | Expiration Date | Notional Amount (Thousands) | Value (Thousands) | Unrealized Appreciation (Depreciation) (Thousands) | |||||||||||||||
U.S. 10-Year Treasury Note | (15 | ) | Sep-2018 | $ | (1,788 | ) | $ | (1,791 | ) | $ | (3 | ) | ||||||||
U.S. 2-Year Treasury Note | 24 | Sep-2018 | 5,081 | 5,073 | (8 | ) | ||||||||||||||
U.S. 5-Year Treasury Note | (1 | ) | Sep-2018 | (114 | ) | (113 | ) | 1 | ||||||||||||
U.S. Long Treasury Bond | (1 | ) | Sep-2018 | (142 | ) | (143 | ) | (1 | ) | |||||||||||
|
|
| ||||||||||||||||||
| $ | 3,037 | $ | 3,026 | $ | (11 | ) | ||||||||||||||
|
|
| ||||||||||||||||||
For the period ended July 31, 2018, the total amount of all open futures contracts, as presented in the table above, are representative of the volume of activity for this derivative type during the period.
Percentages are based on Net Assets of $297,620 ($ Thousands).
| (A) | Security exempt from registration under Rule 144A of the Securities Act of 1933. These securities may be resold in transactions exempt from registration normally to qualified institutions. On July 31, 2018, the value of these securities amounted to $106,832 ($ Thousands), representing 35.9% of the Net Assets of the Fund. |
| (B) | Variable or floating rate security, the interest rate of which adjusts periodically based on changes in current interest rates and prepayments on the underlying pool of assets. |
| (C) | Variable or floating rate security, the interest rate of which adjusts periodically based on prevailing interest rates. |
| (D) | Securities are held in connection with a letter of credit issued by a major bank. |
| (E) | Tri-Party Repurchase Agreement. |
Cl – Class
CLO – Collateralized Loan Obligation
FHLMC – Federal Home Loan Mortgage Corporation
FNMA – Federal National Mortgage Association
FREMF – Finnish Real Estate Management Federation
GO – General Obligation
ICE – Intercontinental Exchange
LIBOR – London Interbank Offered Rate
LLC – Limited Liability Company
MTN – Medium Term Note
NCUA – National Credit Union Association
PLC – Public Limited Company
RB – Revenue Bond
REMIC – Real Estate Mortgage Investment Conduit
Ser – Series
VAR – Variable Rate
The following is a summary of the inputs used as of July 31, 2018 in valuing the Fund’s investments and other financial instruments carried at value ($ Thousands):
| Investments in Securities | Level 1 | Level 2 | Level 3 | Total | ||||||||||||
Corporate Obligations | $ | – | $ | 137,120 | $ | – | $ | 137,120 | ||||||||
Asset-Backed Securities | – | 88,560 | – | 88,560 | ||||||||||||
Mortgage-Backed Securities | – | 29,098 | – | 29,098 | ||||||||||||
U.S. Treasury Obligations | – | 20,631 | – | 20,631 | ||||||||||||
Municipal Bonds | – | 11,367 | – | 11,367 | ||||||||||||
Commercial Paper | – | 5,123 | – | 5,123 | ||||||||||||
Certificates of Deposit | – | 1,100 | – | 1,100 | ||||||||||||
Sovereign Debt | – | 999 | – | 999 | ||||||||||||
Repurchase Agreement | – | 4,800 | – | 4,800 | ||||||||||||
|
|
|
|
|
|
|
|
|
|
|
| |||||
Total Investments in Securities | $ | – | $ | 298,798 | $ | – | $ | 298,798 | ||||||||
|
|
|
|
|
|
|
|
|
|
|
| |||||
| Other Financial Instruments | Level 1 | Level 2 | Level 3 | Total | ||||||||||||
Futures Contracts * | ||||||||||||||||
Unrealized Appreciation | $ | 1 | $ | – | $ | – | $ | 1 | ||||||||
Unrealized Depreciation | (12 | ) | – | – | (12 | ) | ||||||||||
|
|
|
|
|
|
|
|
|
|
|
| |||||
Total Other Financial Instruments | $ | (11 | ) | $ | – | $ | – | $ | (11 | ) | ||||||
|
|
|
|
|
|
|
|
|
|
|
| |||||
* Futures Contracts are valued at the net unrealized appreciation (depreciation) on the instruments.
For the year ended July 31, 2018, there were no transfers between Level 1, Level 2 and/or Level 3 assets and liabilities.
For more information on valuation inputs, see Note 2 – Significant Accounting Policies in Notes to Financial Statements.
Amounts designated as “–” are $0 or have been rounded to $0.
The accompanying notes are an integral part of the financial statements
| SEI Daily Income Trust / Semi-Annual Report / July 31, 2018 | 25 |
SCHEDULE OF INVESTMENTS (Unaudited)
July 31, 2018
Short-Duration Government Fund
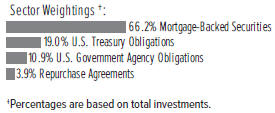
| Description | Face Amount (Thousands) | Market Value ($ Thousands) | ||||||
MORTGAGE-BACKED SECURITIES — 68.5% |
| |||||||
Agency Mortgage-Backed Obligations — 68.5% |
| |||||||
FHLMC | ||||||||
7.375%, VAR US Treas Yield Curve Rate T Note Const Mat 1 Yr+2.125%, 09/01/2018 | $ | – | $ | – | ||||
7.250%, VAR US Treas Yield Curve Rate T Note Const Mat 1 Yr+2.000%, 09/01/2018 to 09/01/2020 | 2 | 2 | ||||||
7.000%, VAR US Treas Yield Curve Rate T Note Const Mat 1 Yr+2.000%, 08/01/2018 | – | – | ||||||
6.946%, VAR US Treas Yield Curve Rate T Note Const Mat 1 Yr+2.185%, 03/01/2019 | 1 | 1 | ||||||
6.250%, VAR US Treas Yield Curve Rate T Note Const Mat 1 Yr+2.125%, 11/01/2018 to 11/01/2020 | 1 | 1 | ||||||
5.935%, VAR US Treas Yield Curve Rate T Note Const Mat 1 Yr+2.185%, 04/01/2019 | 1 | 1 | ||||||
4.500%, 02/01/2022 to 12/01/2039 | 6,304 | 6,553 | ||||||
4.248%, VAR US Treas Yield Curve Rate T Note Const Mat 1 Yr+2.243%, 06/01/2024 | 12 | 12 | ||||||
4.177%, VAR US Treas Yield Curve Rate T Note Const Mat 1 Yr+2.177%, 07/01/2020 | – | – | ||||||
4.146%, VAR US Treas Yield Curve Rate T Note Const Mat 1 Yr+2.308%, 06/01/2024 | 12 | 12 | ||||||
4.000%, 06/01/2044 | 459 | 468 | ||||||
3.900%, VAR US Treas Yield Curve Rate T Note Const Mat 1 Yr+2.249%, 04/01/2029 | 14 | 15 | ||||||
3.632%, VAR US Treas Yield Curve Rate T Note Const Mat 1 Yr+2.219%, 05/01/2024 | 10 | 11 | ||||||
3.597%, VAR US Treas Yield Curve Rate T Note Const Mat 1 Yr+2.185%, 05/01/2019 | 1 | 1 | ||||||
3.595%, VAR US Treas Yield Curve Rate T Note Const Mat 1 Yr+2.180%, 12/01/2023 | 400 | 414 | ||||||
| Description | Face Amount (Thousands) | Market Value ($ Thousands) | ||||||
MORTGAGE-BACKED SECURITIES (continued) |
| |||||||
3.538%, VAR US Treas Yield Curve Rate T Note Const Mat 1 Yr+2.135%, 02/01/2019 | $ | 1 | $ | 1 | ||||
3.480%, VAR US Treas Yield Curve Rate T Note Const Mat 1 Yr+2.257%, 07/01/2024 | 7 | 7 | ||||||
3.434%, VAR US Treas Yield Curve Rate T Note Const Mat 1 Yr+2.126%, 12/01/2023 | 33 | 34 | ||||||
3.376%, VAR US Treas Yield Curve Rate T Note Const Mat 1 Yr+2.052%, 04/01/2029 | – | – | ||||||
3.000%, 11/01/2036 to 12/01/2046 | 32,431 | 31,424 | ||||||
FHLMC REMIC, Ser 2002-42, Cl A5 | ||||||||
7.500%, 02/25/2042 | 319 | 363 | ||||||
FHLMC REMIC, Ser 2003-2571, Cl FY | ||||||||
2.822%, VAR LIBOR USD 1 Month+0.750%, 12/15/2032 | 4,982 | 5,078 | ||||||
FHLMC REMIC, Ser 2006-3148, Cl CF | ||||||||
2.472%, VAR LIBOR USD 1 Month+0.400%, 02/15/2034 | 214 | 215 | ||||||
FHLMC REMIC, Ser 2006-3174, Cl FA | ||||||||
2.372%, VAR LIBOR USD 1 Month+0.300%, 04/15/2036 | 1,394 | 1,393 | ||||||
FHLMC REMIC, Ser 2006-3219, Cl EF | ||||||||
2.472%, VAR LIBOR USD 1 Month+0.400%, 04/15/2032 | 3,082 | 3,078 | ||||||
FHLMC REMIC, Ser 2007-3339, Cl HF | ||||||||
2.592%, VAR LIBOR USD 1 Month+0.520%, 07/15/2037 | 3,832 | 3,857 | ||||||
FHLMC REMIC, Ser 2010-3628, Cl PJ | ||||||||
4.500%, 01/15/2040 | 1,876 | 1,939 | ||||||
FHLMC REMIC, Ser 2011-3795, Cl EB | ||||||||
2.500%, 10/15/2039 | 105 | 103 | ||||||
FHLMC REMIC, Ser 2011-3930, Cl AI, IO | ||||||||
3.500%, 09/15/2026 | 670 | 60 | ||||||
FHLMC REMIC, Ser 2012-4018, Cl AI, IO | ||||||||
3.500%, 03/15/2027 | 1,161 | 101 | ||||||
FHLMC REMIC, Ser 2012-4030, Cl FD | ||||||||
2.422%, VAR LIBOR USD 1 Month+0.350%, 02/15/2041 | 12,040 | 12,031 | ||||||
FHLMC REMIC, Ser 2012-4032, Cl CI, IO | ||||||||
3.500%, 06/15/2026 | 1,921 | 126 | ||||||
FHLMC REMIC, Ser 2012-4060, Cl TI, IO | ||||||||
2.500%, 12/15/2026 | 1,686 | 84 | ||||||
FHLMC REMIC, Ser 2013-4170, Cl QI, IO | ||||||||
3.000%, 05/15/2032 | 1,604 | 117 | ||||||
FHLMC REMIC, Ser 2013-4176, Cl KI, IO | ||||||||
4.000%, 03/15/2028 | 1,890 | 190 | ||||||
FHLMC REMIC, Ser 2013-4178, Cl BI, IO | ||||||||
3.000%, 03/15/2033 | 1,028 | 127 | ||||||
FHLMC REMIC, Ser 2013-4178, Cl MI, IO | ||||||||
2.500%, 03/15/2028 | 870 | 64 | ||||||
| 26 | SEI Daily Income Trust / Semi-Annual Report / July 31, 2018 |
| Description | Face Amount (Thousands) | Market Value ($ Thousands) | ||||||
MORTGAGE-BACKED SECURITIES (continued) |
| |||||||
FHLMC REMIC, Ser 2013-4182, Cl IE, IO | ||||||||
2.500%, 03/15/2028 | $ | 681 | $ | 55 | ||||
FHLMC REMIC, Ser 2013-4195, Cl AI, IO | ||||||||
3.000%, 04/15/2025 | 1,996 | 171 | ||||||
FHLMC REMIC, Ser 2013-4199, Cl QI, IO | ||||||||
2.500%, 05/15/2028 | 1,145 | 86 | ||||||
FHLMC REMIC, Ser 2013-4220, Cl IE, IO | ||||||||
4.000%, 06/15/2028 | 1,022 | 107 | ||||||
FHLMC REMIC, Ser 2013-4223, Cl AL | ||||||||
3.000%, 08/15/2042 | 3,935 | 3,892 | ||||||
FHLMC REMIC, Ser 2014-4340, Cl MI, IO | ||||||||
4.500%, 02/15/2027 | 3,752 | 402 | ||||||
FHLMC REMIC, Ser 2014-4419, Cl CW | ||||||||
2.500%, 10/15/2037 | 12,404 | 12,118 | ||||||
FHLMC REMIC, Ser 2015-4484, Cl CI | ||||||||
4.000%, 07/15/2030 | 2,454 | 264 | ||||||
FHLMC REMIC, Ser 2016-4620, IO | ||||||||
5.000%, 09/15/2033 | 1,533 | 299 | ||||||
FHLMC REMIC, Ser 2017-4709, Cl AB | ||||||||
3.000%, 08/15/2047 | 1,824 | 1,800 | ||||||
FHLMC REMIC, Ser 3153, Cl FX | ||||||||
2.422%, VAR LIBOR USD | 82 | 82 | ||||||
FHLMC, Ser 2013-303, Cl C2, IO | ||||||||
3.500%, 01/15/2028 | 3,513 | 318 | ||||||
FHLMC, Ser K710, Cl A2 | ||||||||
1.883%, 05/25/2019 | 5,898 | 5,865 | ||||||
FHLMC, Ser KGRP, Cl A | ||||||||
2.470%, VAR LIBOR USD | 2,661 | 2,664 | ||||||
FNMA | ||||||||
7.000%, 06/01/2037 | 6 | 6 | ||||||
6.500%, 05/01/2026 to 01/01/2036 | 164 | 181 | ||||||
6.000%, 02/01/2023 to 09/01/2024 | 1,410 | 1,465 | ||||||
5.500%, 10/01/2018 to 06/01/2038 | 392 | 419 | ||||||
5.300%, 07/01/2019 | 211 | 212 | ||||||
5.240%, 07/01/2019 | 613 | 622 | ||||||
5.000%, 03/01/2019 to 08/01/2019 | 10 | 11 | ||||||
4.545%, 02/01/2020 | 740 | 756 | ||||||
4.500%, 08/01/2021 to 08/01/2044 | 2,381 | 2,575 | ||||||
4.450%, 01/01/2021 | 2,775 | 2,833 | ||||||
4.383%, 04/01/2021 | 4,558 | 4,677 | ||||||
4.330%, 04/01/2021 to 07/01/2021 | 3,743 | 3,858 | ||||||
4.300%, 07/01/2021 | 372 | 383 | ||||||
4.295%, 06/01/2021 | 3,517 | 3,619 | ||||||
4.230%, 01/01/2021 | 4,450 | 4,557 | ||||||
4.210%, 07/01/2020 | 658 | 672 | ||||||
4.070%, 04/01/2019 | 1,114 | 1,122 | ||||||
4.066%, 07/01/2020 | 2,487 | 2,533 | ||||||
4.050%, 01/01/2021 | 1,000 | 1,020 | ||||||
4.040%, 06/01/2021 | 11,012 | 11,256 | ||||||
4.000%, 05/01/2026 to 04/01/2042 | 2,590 | 2,654 | ||||||
| Description | Face Amount (Thousands) | Market Value ($ Thousands) | ||||||
MORTGAGE-BACKED SECURITIES (continued) |
| |||||||
3.990%, 07/01/2021 | $ | 222 | $ | 227 | ||||
3.980%, 07/01/2021 to 08/01/2021 | 8,899 | 9,085 | ||||||
3.970%, 06/01/2021 | 1,899 | 1,937 | ||||||
3.890%, 10/01/2023 | 848 | 866 | ||||||
3.880%, 12/01/2020 | 88 | 89 | ||||||
3.870%, 01/01/2024 | 842 | 863 | ||||||
3.862%, VAR ICE LIBOR USD 6 | 217 | 223 | ||||||
3.850%, 01/01/2024 | 563 | 577 | ||||||
3.840%, 08/01/2021 | 6,566 | 6,701 | ||||||
3.827%, VAR US Treas Yield Curve Rate T Note Const Mat 1 Yr+2.245%, 08/01/2029 | 142 | 147 | ||||||
3.810%, 11/01/2023 | 93 | 95 | ||||||
3.794%, 12/01/2020 | 5,896 | 5,988 | ||||||
3.770%, 09/01/2021 | 100 | 102 | ||||||
3.765%, 12/01/2025 | 7,800 | 7,961 | ||||||
3.750%, 06/01/2022 to 09/01/2023 | 3,227 | 3,287 | ||||||
3.730%, 07/01/2022 | 2,204 | 2,239 | ||||||
3.700%, 11/01/2020 | 812 | 823 | ||||||
3.695%, VAR US Treas Yield | 11 | 11 | ||||||
3.650%, 11/01/2021 to 08/01/2023 | 3,478 | 3,530 | ||||||
3.620%, 09/01/2020 | 6,751 | 6,826 | ||||||
3.597%, VAR ICE LIBOR USD 6 | 78 | 80 | ||||||
3.590%, 10/01/2020 | 180 | 182 | ||||||
3.580%, 12/01/2020 | 872 | 881 | ||||||
3.510%, 11/01/2021 | 1,059 | 1,070 | ||||||
3.500%, 02/01/2045 | 2,923 | 2,905 | ||||||
3.490%, 12/01/2020 | 6,226 | 6,281 | ||||||
3.470%, 11/01/2020 | 156 | 157 | ||||||
3.403%, VAR US Treas Yield Curve | 60 | 61 | ||||||
3.400%, 03/01/2022 | 3,540 | 3,559 | ||||||
3.330%, 10/01/2020 | 1,734 | 1,744 | ||||||
3.265%, 01/01/2022 | 851 | 852 | ||||||
3.250%, 12/01/2021 | 1,239 | 1,243 | ||||||
3.230%, 11/01/2020 | 3,092 | 3,103 | ||||||
3.150%, 01/01/2027 | 1,495 | 1,464 | ||||||
3.070%, 06/01/2027 | 970 | 940 | ||||||
3.017%, 04/01/2022 | 269 | 268 | ||||||
3.000%, 08/25/2026 to 02/01/2031 | 634 | 630 | ||||||
2.960%, 01/01/2027 | 1,268 | 1,229 | ||||||
2.940%, 06/01/2022 | 687 | 682 | ||||||
2.930%, 05/01/2022 to 01/01/2027 | 6,339 | 6,142 | ||||||
2.880%, 07/01/2020 to 12/01/2027 | 5,175 | 5,017 | ||||||
2.830%, 06/01/2022 | 176 | 173 | ||||||
2.740%, 04/01/2022 | 169 | 167 | ||||||
2.630%, 02/01/2019 | 4,408 | 4,398 | ||||||
2.580%, 08/01/2022 | 2,200 | 2,155 | ||||||
| SEI Daily Income Trust / Semi-Annual Report / July 31, 2018 | 27 |
SCHEDULE OF INVESTMENTS (Unaudited)
July 31, 2018
Short-Duration Government Fund (Continued)
| Description | Face Amount (Thousands) | Market Value ($ Thousands) | ||||||
MORTGAGE-BACKED SECURITIES (continued) |
| |||||||
2.540%, 03/01/2023 | $ | 632 | $ | 617 | ||||
2.450%, 11/01/2022 | 400 | 389 | ||||||
2.410%, 07/01/2021 | 141 | 138 | ||||||
2.360%, 04/01/2022 | 4,600 | 4,475 | ||||||
2.230%, 11/01/2023 | 4,486 | 4,287 | ||||||
2.220%, 10/01/2022 | 2,184 | 2,106 | ||||||
2.150%, 05/01/2022 | 4,645 | 4,487 | ||||||
2.110%, 01/01/2020 | 3,712 | 3,682 | ||||||
2.050%, 11/01/2023 | 1,283 | 1,218 | ||||||
1.970%, 11/01/2023 | 12,735 | 12,022 | ||||||
1.750%, 04/01/2019 to 06/01/2020 | 8,152 | 7,979 | ||||||
1.690%, 12/01/2019 | 2,000 | 1,964 | ||||||
FNMA Interest, Ser 2009-397, Cl 6 | ||||||||
2.000%, 09/25/2039 | 2,503 | 2,333 | ||||||
FNMA Interest, Ser 2012-410, Cl C6, IO | ||||||||
4.000%, 05/25/2027 | 2,037 | 184 | ||||||
FNMA REMIC, Ser 1992-61, Cl FA | ||||||||
2.714%, VAR LIBOR USD 1 Month+0.650%, 10/25/2022 | 24 | 24 | ||||||
FNMA REMIC, Ser 1993-32, Cl H | ||||||||
6.000%, 03/25/2023 | 10 | 11 | ||||||
FNMA REMIC, Ser 1993-5, Cl Z | ||||||||
6.500%, 02/25/2023 | 5 | 6 | ||||||
FNMA REMIC, Ser 1994-77, Cl FB | ||||||||
3.564%, VAR LIBOR USD 1 Month+1.500%, 04/25/2024 | 2 | 2 | ||||||
FNMA REMIC, Ser 2002-53, Cl FK | ||||||||
2.464%, VAR LIBOR USD 1 Month+0.400%, 04/25/2032 | 52 | 52 | ||||||
FNMA REMIC, Ser 2003-76, Cl CA | ||||||||
3.750%, 07/25/2033 | 39 | 39 | ||||||
FNMA REMIC, Ser 2006-76, Cl QF | ||||||||
2.464%, VAR LIBOR USD 1 Month+0.400%, 08/25/2036 | 403 | 403 | ||||||
FNMA REMIC, Ser 2006-79, Cl DF | ||||||||
2.414%, VAR LIBOR USD 1 Month+0.350%, 08/25/2036 | 344 | 344 | ||||||
FNMA REMIC, Ser 2007-47, Cl DA | ||||||||
5.600%, 05/25/2037 | 455 | 489 | ||||||
FNMA REMIC, Ser 2007-64, Cl FB | ||||||||
2.434%, VAR LIBOR USD 1 Month+0.370%, 07/25/2037 | 2,628 | 2,632 | ||||||
FNMA REMIC, Ser 2008-16, Cl FA | ||||||||
2.764%, VAR LIBOR USD 1 Month+0.700%, 03/25/2038 | 2,276 | 2,309 | ||||||
FNMA REMIC, Ser 2009-110, Cl FD | ||||||||
2.814%, VAR LIBOR USD 1 Month+0.750%, 01/25/2040 | 7,174 | 7,291 | ||||||
FNMA REMIC, Ser 2009-112, Cl FM | ||||||||
2.814%, VAR LIBOR USD 1 Month+0.750%, 01/25/2040 | 4,451 | 4,512 | ||||||
FNMA REMIC, Ser 2010-4, Cl PL | ||||||||
4.500%, 02/25/2040 | 1,755 | 1,819 | ||||||
| Description | Face Amount (Thousands) | Market Value ($ Thousands) | ||||||
MORTGAGE-BACKED SECURITIES (continued) |
| |||||||
FNMA REMIC, Ser 2010-56, Cl AF | ||||||||
2.614%, VAR LIBOR USD 1 Month+0.550%, 06/25/2040 | $ | 4,934 | $ | 4,984 | ||||
FNMA REMIC, Ser 2012-111, Cl NI, IO | ||||||||
3.500%, 10/25/2027 | 1,982 | 191 | ||||||
FNMA REMIC, Ser 2012-4083, Cl DI, IO | ||||||||
4.000%, 07/15/2027 | 619 | 61 | ||||||
FNMA REMIC, Ser 2012-43, Cl AI, IO | ||||||||
3.500%, 04/25/2027 | 6,787 | 650 | ||||||
FNMA REMIC, Ser 2012-47, Cl QI, IO | ||||||||
5.462%, 05/25/2042 (A) | 474 | 49 | ||||||
FNMA REMIC, Ser 2012-53, Cl BI, IO | ||||||||
3.500%, 05/25/2027 | 1,237 | 126 | ||||||
FNMA REMIC, Ser 2012-70, Cl IW, IO | ||||||||
3.000%, 02/25/2027 | 2,849 | 213 | ||||||
FNMA REMIC, Ser 2012-93, Cl IL, IO | ||||||||
3.000%, 09/25/2027 | 1,094 | 97 | ||||||
FNMA REMIC, Ser 2012-97, Cl JI, IO | ||||||||
3.000%, 07/25/2027 | 3,174 | 266 | ||||||
FNMA REMIC, Ser 2012-98, Cl BI, IO | ||||||||
6.000%, 01/25/2042 | 3,285 | 633 | ||||||
FNMA REMIC, Ser 2013-121, Cl FA | ||||||||
2.464%, VAR LIBOR USD 1 Month+0.400%, 12/25/2043 | 32,859 | 32,946 | ||||||
FNMA REMIC, Ser 2013-130, Cl FQ | ||||||||
2.264%, VAR LIBOR USD 1 Month+0.200%, 06/25/2041 | 6,163 | 6,116 | ||||||
FNMA REMIC, Ser 2014-50, Cl SC, IO | ||||||||
1.512%, 08/25/2044 (A) | 4,811 | 191 | ||||||
FNMA REMIC, Ser 2015-21, Cl WI, IO | ||||||||
1.398%, 04/25/2055 (A) | 2,991 | 141 | ||||||
FNMA REMIC, Ser 2015-42, Cl AI, IO | ||||||||
1.442%, 06/25/2055 (A) | 3,683 | 181 | ||||||
FNMA REMIC, Ser 2015-5, Cl CP | ||||||||
3.000%, 06/25/2043 | 2,733 | 2,702 | ||||||
FNMA REMIC, Ser 2015-68, Cl HI, IO | ||||||||
3.500%, 09/25/2035 | 1,200 | 188 | ||||||
FNMA REMIC, Ser 2015-68, Cl JI, IO | ||||||||
3.500%, 08/25/2030 | 638 | 73 | ||||||
FNMA REMIC, Ser 2016-3, Cl JI, IO | ||||||||
3.500%, 02/25/2031 | 1,388 | 125 | ||||||
FNMA REMIC, Ser 2016-71, Cl IN, IO | ||||||||
3.500%, 10/25/2046 | 1,015 | 236 | ||||||
FNMA REMIC, Ser 2017-68, Cl BI, IO | ||||||||
6.000%, 09/25/2047 | 2,264 | 530 | ||||||
FNMA REMIC, Ser 2018-13, Cl MP | ||||||||
3.500%, 12/25/2057 | 6,724 | 6,720 | ||||||
FNMA REMIC, Ser 2018-38, Cl PC | ||||||||
3.500%, 03/25/2045 | 6,956 | 6,986 | ||||||
FNMA REMIC, Ser 2018-55, Cl PA | ||||||||
3.500%, 01/25/2047 | 7,050 | 7,074 | ||||||
| 28 | SEI Daily Income Trust / Semi-Annual Report / July 31, 2018 |
| Description | Face Amount (Thousands) | Market Value ($ Thousands) | ||||||
MORTGAGE-BACKED SECURITIES (continued) |
| |||||||
FNMA TBA | ||||||||
6.000%, 08/01/2033 | $ | 2,200 | $ | 2,388 | ||||
3.500%, 08/01/2040 to 09/01/2040 | 34,325 | 33,993 | ||||||
FNMA, Ser 2017-M13, Cl FA | ||||||||
2.485%, VAR LIBOR USD 1 | 3,234 | 3,239 | ||||||
FNMA, Ser 2017-M5, Cl FA | ||||||||
2.575%, VAR LIBOR USD 1 | 4,364 | 4,378 | ||||||
FNMA, Ser 2018-M5, Cl A2 | ||||||||
3.560%, 09/25/2021 (A) | 9,000 | 9,103 | ||||||
FREMF Multifamily Aggregation Risk Transfer Trust, Ser 2017-KT01, Cl A | ||||||||
2.389%, VAR LIBOR USD 1 | 11,090 | 11,114 | ||||||
GNMA | ||||||||
6.500%, 08/15/2037 to 02/20/2039 | 273 | 300 | ||||||
6.000%, 09/15/2019 to 06/15/2041 | 6,209 | 6,770 | ||||||
5.500%, 10/15/2034 to 02/15/2041 | 2,409 | 2,587 | ||||||
5.000%, 09/15/2039 to 04/15/2041 | 1,464 | 1,556 | ||||||
4.000%, 07/15/2041 to 03/20/2047 | 3,178 | 744 | ||||||
GNMA TBA | ||||||||
6.000%, 08/01/2033 | 1,600 | 1,733 | ||||||
GNMA, Ser 2010-26, Cl JI, IO | ||||||||
5.000%, 02/16/2040 | 3,655 | 880 | ||||||
GNMA, Ser 2010-57, Cl TI, IO | ||||||||
5.000%, 05/20/2040 | 1,474 | 366 | ||||||
GNMA, Ser 2010-68, Cl WA | ||||||||
3.000%, 12/16/2039 | 3,153 | 3,128 | ||||||
GNMA, Ser 2011-131, Cl PC | ||||||||
3.500%, 12/20/2040 | 1,305 | 1,312 | ||||||
GNMA, Ser 2012-126, IO | ||||||||
3.500%, 10/20/2042 | 4,647 | 829 | ||||||
GNMA, Ser 2012-51, Cl GI, IO | ||||||||
3.500%, 07/20/2040 | 1,237 | 144 | ||||||
GNMA, Ser 2012-84, Cl TE | ||||||||
1.500%, 03/20/2042 | 4,411 | 4,107 | ||||||
GNMA, Ser 2013-26, Cl IK, IO | ||||||||
3.000%, 02/16/2043 | 784 | 130 | ||||||
GNMA, Ser 2013-47, Cl IA, IO | ||||||||
4.000%, 03/20/2043 | 883 | 195 | ||||||
GNMA, Ser 2013-51, Cl IB, IO | ||||||||
3.500%, 03/20/2027 | 1,438 | 143 | ||||||
GNMA, Ser 2014-4, Cl BI, IO | ||||||||
4.000%, 01/20/2044 | 370 | 85 | ||||||
GNMA, Ser 2014-46, IO | ||||||||
5.000%, 03/16/2044 | 1,593 | 326 | ||||||
GNMA, Ser 2014-56, Cl BP | ||||||||
2.500%, 12/16/2039 | 4,083 | 3,961 | ||||||
GNMA, Ser 2015-126, Cl GI, IO | ||||||||
3.500%, 02/16/2027 | 626 | 56 | ||||||
| Description | Face Amount (Thousands) | Market Value ($ Thousands) | ||||||
MORTGAGE-BACKED SECURITIES (continued) |
| |||||||
GNMA, Ser 2015-126, Cl HI, IO | ||||||||
4.000%, 12/16/2026 | $ | 435 | $ | 45 | ||||
GNMA, Ser 2015-165, Cl I, IO | ||||||||
3.500%, 07/20/2043 | 2,875 | 438 | ||||||
GNMA, Ser 2015-17, Cl BI, IO | ||||||||
3.500%, 05/20/2043 | 353 | 62 | ||||||
GNMA, Ser 2015-185, Cl GI, IO | ||||||||
3.500%, 02/20/2041 | 1,887 | 232 | ||||||
GNMA, Ser 2015-40, Cl PA | ||||||||
2.000%, 04/20/2044 | 8,193 | 7,805 | ||||||
GNMA, Ser 2015-53, Cl IA, IO | ||||||||
4.500%, 04/20/2045 | 1,551 | 370 | ||||||
GNMA, Ser 2015-63, Cl PB | ||||||||
1.750%, 09/20/2043 | 589 | 555 | ||||||
GNMA, Ser 2016-126, Cl KI, IO | ||||||||
3.000%, 09/20/2028 | 1,401 | 122 | ||||||
GNMA, Ser 2016-167, Cl AI, IO | ||||||||
5.500%, 03/20/2039 | 3,179 | 723 | ||||||
GNMA, Ser 2016-23, Cl CI, IO | ||||||||
3.500%, 04/20/2042 | 3,151 | 423 | ||||||
GNMA, Ser 2016-42, Cl EI, IO | ||||||||
6.000%, 02/20/2046 | 2,406 | 556 | ||||||
GNMA, Ser 2016-99, Cl LI, IO | ||||||||
4.000%, 05/20/2029 | 6,164 | 628 | ||||||
GNMA, Ser 2017-2, Cl AI, IO | ||||||||
5.000%, 01/16/2047 | 888 | 220 | ||||||
GNMA, Ser 2017-26, Cl KI, IO | ||||||||
6.000%, 09/20/2040 | 2,943 | 701 | ||||||
GNMA, Ser 2017-26, Cl IB, IO | ||||||||
5.500%, 02/20/2047 | 1,669 | 366 | ||||||
GNMA, Ser 2017-26, Cl IA, IO | ||||||||
5.500%, 02/16/2047 | 2,753 | 619 | ||||||
GNMA, Ser 2017-99, IO | ||||||||
4.000%, 07/20/2047 | 4,608 | 862 | ||||||
|
|
| ||||||
Total Mortgage-Backed Securities | 483,984 | |||||||
|
|
| ||||||
U.S. TREASURY OBLIGATIONS — 19.7% |
| |||||||
U.S. Treasury Inflation Indexed Bonds | ||||||||
0.625%, 01/15/2026 | 48,320 | 47,566 | ||||||
U.S. Treasury Notes | ||||||||
2.000%, 10/31/2021 | 16,375 | 15,975 | ||||||
1.625%, 07/31/2020 (B) | 30,005 | 29,392 | ||||||
1.500%, 07/15/2020 | 47,246 | 46,194 | ||||||
|
|
| ||||||
Total U.S. Treasury Obligations | 139,127 | |||||||
|
|
| ||||||
| SEI Daily Income Trust / Semi-Annual Report / July 31, 2018 | 29 |
SCHEDULE OF INVESTMENTS (Unaudited)
July 31, 2018
Short-Duration Government Fund (Continued)
| Description | Face Amount (Thousands) | Market Value ($ Thousands) | ||||||
U.S. GOVERNMENT AGENCY OBLIGATIONS — 11.3% |
| |||||||
FHLMC | ||||||||
1.375%, 05/01/2020 | $ | 48,663 | $ | 47,583 | ||||
FNMA | ||||||||
1.500%, 07/30/2020 | 32,700 | 31,940 | ||||||
|
|
| ||||||
Total U.S. Government Agency Obligations | 79,523 | |||||||
|
|
| ||||||
REPURCHASE AGREEMENTS — 4.1% |
| |||||||
BNP Paribas | 17,800 | 17,800 | ||||||
Deutsche Bank | 10,900 | 10,900 | ||||||
|
|
| ||||||
Total Repurchase Agreements | 28,700 | |||||||
|
|
| ||||||
Total Investments in Securities — 103.6% | $ | 731,334 | ||||||
|
|
| ||||||
A list of the open futures contracts held by the Fund at July 31, 2018, is as follows:
Type of Contract | Number of Contracts Long/(Short) | Expiration Date | Notional Amount (Thousands) | Value (Thousands) | Unrealized Appreciation (Depreciation) (Thousands) | |||||||||||||||
U.S. 10-Year Treasury Notes | (1,119 | ) | Sep-2018 | $ | (133,510 | ) | $ | (133,633 | ) | $ | (123 | ) | ||||||||
U.S. 2-Year Treasury Notes | 1,291 | Sep-2018 | 273,310 | 272,885 | (425 | ) | ||||||||||||||
U.S. 5-Year Treasury Notes | (57 | ) | Sep-2018 | (6,472 | ) | (6,448 | ) | 24 | ||||||||||||
U.S. Long Treasury Bond | (1 | ) | Sep-2018 | (143 | ) | (143 | ) | – | ||||||||||||
Ultra 10-Year U.S. Treasury Notes | (175 | ) | Sep-2018 | (22,162 | ) | (22,244 | ) | (82 | ) | |||||||||||
|
|
| ||||||||||||||||||
| $ | 111,023 | $ | 110,417 | $ | (606 | ) | ||||||||||||||
|
|
| ||||||||||||||||||
For the period ended July 31, 2018, the total amount of all open futures contracts, as presented in the table above, are representative of the volume of activity for this derivative type during the period.
Percentages are based on Net Assets of $705,974 ($ Thousands).
| (A) | Variable or floating rate security, the interest rate of which adjusts periodically based on changes in current interest rates and prepayments on the underlying pool of assets. |
| (B) | Security, or portion thereof, has been pledged as collateral on open futures contracts. |
| (C) | Tri-Party Repurchase Agreement. |
| 30 | SEI Daily Income Trust / Semi-Annual Report / July 31, 2018 |
Cl – Class
FCSB – Federal Farm Credit Bank
FHLMC – Federal Home Loan Mortgage Corporation
FMAC – Freddie Mac
FNMA – Federal National Mortgage Association
FREMF – Freddie Mac Multi-Family
GNMA – Government National Mortgage Association
ICE – Intercontinental Exchange
IO – Interest Only - face amount represents notional amount
LIBOR – London Interbank Offered Rate
REMIC – Real Estate Mortgage Investment Conduit
Ser – Series
TBA – To Be Announced
USD – United States Dollar
VAR – Variable Rate
| SEI Daily Income Trust / Semi-Annual Report / July 31, 2018 | 31 |
SCHEDULE OF INVESTMENTS (Unaudited)
July 31, 2018
Short-Duration Government Fund (Concluded)
The following is a summary of the inputs used as of July 31, 2018 in valuing the Fund’s investments and other financial instruments carried at value ($ Thousands):
| Investments in Securities | Level 1 | Level 2 | Level 3 | Total | ||||||||||||
Mortgage-Backed Securities | $ | – | $ | 483,984 | $ | – | $ | 483,984 | ||||||||
U.S. Treasury Obligations | – | 139,127 | – | 139,127 | ||||||||||||
U.S. Government Agency Obligations | – | 79,523 | – | 79,523 | ||||||||||||
Repurchase Agreements | – | 28,700 | – | 28,700 | ||||||||||||
|
|
|
|
|
|
|
|
|
|
| ||||||
Total Investments in Securities | $ | – | $ | 731,334 | $ | – | $ | 731,334 | ||||||||
|
|
|
|
|
|
|
|
|
|
| ||||||
| Other Financial Instruments | Level 1 | Level 2 | Level 3 | Total | ||||||||||||
Futures Contracts * | ||||||||||||||||
Unrealized Appreciation | $ | 24 | $ | – | $ | – | $ | 24 | ||||||||
Unrealized Depreciation | (630 | ) | – | – | (630 | ) | ||||||||||
|
|
|
|
|
|
|
|
|
|
|
| |||||
Total Other Financial Instruments | $ | (606 | ) | $ | – | $ | – | $ | (606 | ) | ||||||
|
|
|
|
|
|
|
|
|
|
|
| |||||
* Futures Contracts are valued at the net unrealized appreciation/(depreciation) on the instruments.
For the period ended July 31, 2018, there were no transfers between Level 1, Level 2 and/or Level 3 assets and liabilities.
For more information on valuation inputs, see Note 2 – Significant Accounting Policies in Notes to Financial Statements.
Amounts designated as “–” are $0 or have been rounded to $0.
The accompanying notes are an integral part of the financial statements.
| 32 | SEI Daily Income Trust / Semi-Annual Report / July 31, 2018 |
SCHEDULE OF INVESTMENTS (Unaudited)
July 31, 2018
GNMA Fund
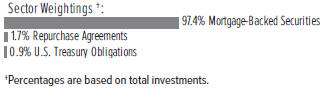
| Description |
Face Amount |
Market Value | ||||||
MORTGAGE-BACKED SECURITIES — 97.7% |
| |||||||
Agency Mortgage-Backed Obligations — 97.7% |
| |||||||
FHLMC | ||||||||
3.650%, 04/01/2030 | $ | 592 | $ | 593 | ||||
FHLMC REMIC, Ser 2011-3930, Cl AI, IO | ||||||||
3.500%, 09/15/2026 | 92 | 8 | ||||||
FHLMC REMIC, Ser 2012-4018, Cl AI, IO | ||||||||
3.500%, 03/15/2027 | 162 | 14 | ||||||
FHLMC REMIC, Ser 2012-4032, Cl CI, IO | ||||||||
3.500%, 06/15/2026 | 262 | 17 | ||||||
FHLMC REMIC, Ser 2012-4060, Cl TI, IO | ||||||||
2.500%, 12/15/2026 | 225 | 11 | ||||||
FHLMC REMIC, Ser 2013-4166, Cl PI, IO | ||||||||
3.500%, 03/15/2041 | 661 | 81 | ||||||
FHLMC REMIC, Ser 2013-4176, Cl KI, IO | ||||||||
4.000%, 03/15/2028 | 232 | 23 | ||||||
FHLMC REMIC, Ser 2013-4178, Cl MI, IO | ||||||||
2.500%, 03/15/2028 | 120 | 9 | ||||||
FHLMC REMIC, Ser 2013-4182, Cl IE, IO | ||||||||
2.500%, 03/15/2028 | 100 | 8 | ||||||
FHLMC REMIC, Ser 2013-4199, Cl QI, IO | ||||||||
2.500%, 05/15/2028 | 141 | 11 | ||||||
FHLMC REMIC, Ser 2015-4484, Cl CI, IO | ||||||||
4.000%, 07/15/2030 | 247 | 27 | ||||||
FHLMC REMIC, Ser 2016-4624, Cl BI, IO | ||||||||
5.500%, 04/15/2036 | 292 | 57 | ||||||
FHLMC REMIC, Ser 2017-4654, Cl KY | ||||||||
3.000%, 02/15/2047 | 650 | 596 | ||||||
FHLMC REMIC, Ser 2017-4656, Cl KB | ||||||||
3.000%, 02/15/2047 | 275 | 251 | ||||||
FNMA | ||||||||
8.000%, 07/01/2025 to 09/01/2028 | 25 | 26 | ||||||
7.000%, 08/01/2029 to 09/01/2032 | 52 | 54 | ||||||
6.500%, 09/01/2032 | 53 | 58 | ||||||
4.180%, 11/01/2028 | 1,629 | 1,714 | ||||||
3.660%, 07/01/2030 | 125 | 125 | ||||||
3.590%, 09/01/2030 | 210 | 209 | ||||||
3.460%, 09/01/2037 | 425 | 405 | ||||||
3.260%, 01/01/2027 to 06/01/2027 | 379 | 373 | ||||||
3.230%, 02/01/2027 | 147 | 144 | ||||||
2.970%, 06/01/2027 | 196 | 190 | ||||||
2.960%, 01/01/2028 | 190 | 181 | ||||||
FNMA Interest, Ser 2012-410, Cl C6, IO | ||||||||
4.000%, 05/25/2027 | 253 | 23 | ||||||
FNMA REMIC, Ser 1990-91, Cl G | ||||||||
7.000%, 08/25/2020 | 3 | 3 | ||||||
| Description | Face Amount (Thousands) | Market Value ($ Thousands) | ||||||
MORTGAGE-BACKED SECURITIES (continued) |
| |||||||
FNMA REMIC, Ser 1992-105, Cl B | ||||||||
7.000%, 06/25/2022 | $ | 8 | $ | 8 | ||||
FNMA REMIC, Ser 2012-53, Cl BI, IO | ||||||||
3.500%, 05/25/2027 | 151 | 15 | ||||||
FNMA REMIC, Ser 2012-93, Cl IL, IO | ||||||||
3.000%, 09/25/2027 | 150 | 13 | ||||||
FNMA REMIC, Ser 2012-98, Cl BI, IO | ||||||||
6.000%, 01/25/2042 | 321 | 62 | ||||||
FNMA REMIC, Ser 2015-21, Cl WI, IO | ||||||||
1.398%, 04/25/2055 (A) | 374 | 18 | ||||||
FNMA REMIC, Ser 2016-3, Cl JI, IO | ||||||||
3.500%, 02/25/2031 | 178 | 16 | ||||||
FNMA REMIC, Ser 2016-71, Cl IN, IO | ||||||||
3.500%, 10/25/2046 | 127 | 30 | ||||||
FNMA REMIC, Ser 2016-91, Cl PL | ||||||||
2.500%, 12/25/2046 | 325 | 278 | ||||||
FNMA REMIC, Ser 2017-42, Cl HL | ||||||||
3.000%, 06/25/2047 | 875 | 800 | ||||||
FNMA REMIC, Ser 2018-13, Cl MP | ||||||||
3.500%, 12/25/2057 | 684 | 684 | ||||||
FNMA REMIC, Ser 2018-45, Cl AB | ||||||||
3.000%, 06/25/2048 | 267 | 258 | ||||||
| GNMA | ||||||||
10.000%, 10/15/2018 to 09/15/2019 | – | – | ||||||
9.500%, 09/15/2020 to 10/15/2020 | 4 | 4 | ||||||
9.000%, 10/15/2019 to 05/15/2022 | 20 | 21 | ||||||
8.000%, 01/15/2022 to 03/15/2032 | 156 | 167 | ||||||
7.750%, 10/15/2026 | 21 | 22 | ||||||
7.500%, 02/15/2027 to 10/15/2035 | 148 | 165 | ||||||
7.250%, 01/15/2028 | 33 | 35 | ||||||
7.000%, 04/15/2019 to 11/15/2033 | 1,381 | 1,542 | ||||||
6.750%, 11/15/2027 | 8 | 9 | ||||||
6.500%, 10/15/2023 to 10/15/2038 | 427 | 483 | ||||||
6.000%, 12/15/2027 to 12/15/2040 | 996 | 1,082 | ||||||
5.500%, 08/01/2023 to 02/15/2041 | 1,082 | 1,189 | ||||||
5.000%, 06/15/2033 to 01/20/2045 | 2,714 | 2,902 | ||||||
4.500%, 08/15/2033 to 02/20/2048 | 4,333 | 4,550 | ||||||
4.000%, 01/15/2041 (B) | 846 | 870 | ||||||
4.000%, 03/20/2040 to 03/20/2048 | 10,172 | 10,123 | ||||||
3.875%, 05/15/2042 | 1,108 | 1,133 | ||||||
3.500%, 03/20/2041 to 09/20/2047 | 13,382 | 13,408 | ||||||
3.000%, 10/15/2042 to 05/20/2046 | 6,174 | 6,042 | ||||||
2.500%, 07/20/2045 to 12/20/2046 | 2,001 | 1,890 | ||||||
GNMA REMIC, Ser 2002-45, Cl QE | ||||||||
6.500%, 06/20/2032 | 214 | 236 | ||||||
GNMA TBA | ||||||||
4.500%, 08/15/2039 | 650 | 675 | ||||||
3.500%, 08/15/2041 | 886 | 896 | ||||||
3.000%, 08/15/2042 | 1,231 | 1,200 | ||||||
GNMA, Ser 2010-26, Cl JI, IO | ||||||||
5.000%, 02/16/2040 | 445 | 107 | ||||||
| SEI Daily Income Trust / Semi-Annual Report / July 31, 2018 | 33 |
SCHEDULE OF INVESTMENTS (Unaudited)
July 31, 2018
GNMA Fund (Concluded)
| Description | Face Amount (Thousands) | Market Value ($ Thousands) | ||||||
MORTGAGE-BACKED SECURITIES (continued) |
| |||||||
GNMA, Ser 2010-57, Cl TI, IO | ||||||||
5.000%, 05/20/2040 | $ | 373 | $ | 93 | ||||
GNMA, Ser 2011-131, Cl PZ | ||||||||
3.500%, 12/20/2040 | 201 | 199 | ||||||
GNMA, Ser 2012-113, Cl BZ | ||||||||
3.000%, 09/16/2042 | 192 | 166 | ||||||
GNMA, Ser 2012-126, IO | ||||||||
3.500%, 10/20/2042 | 574 | 102 | ||||||
GNMA, Ser 2012-140, Cl LD | ||||||||
1.750%, 10/20/2042 | 737 | 678 | ||||||
GNMA, Ser 2012-51, Cl GI, IO | ||||||||
3.500%, 07/20/2040 | 158 | 18 | ||||||
GNMA, Ser 2012-69, Cl AI, IO | ||||||||
4.500%, 05/16/2027 | 329 | 30 | ||||||
GNMA, Ser 2012-84, Cl QN | ||||||||
2.500%, 07/16/2042 | 575 | 490 | ||||||
GNMA, Ser 2012-91, Cl NC | ||||||||
3.000%, 05/20/2042 | 614 | 590 | ||||||
GNMA, Ser 2013-187, Cl PE | ||||||||
2.000%, 09/20/2043 | 264 | 248 | ||||||
GNMA, Ser 2013-26, Cl IK, IO | ||||||||
3.000%, 02/16/2043 | 95 | 16 | ||||||
GNMA, Ser 2013-47, Cl IA, IO | ||||||||
4.000%, 03/20/2043 | 118 | 26 | ||||||
GNMA, Ser 2013-99, Cl AX | ||||||||
3.000%, 07/20/2043 | 190 | 183 | ||||||
GNMA, Ser 2014-115, Cl KZ | ||||||||
3.000%, 08/20/2044 | 197 | 182 | ||||||
GNMA, Ser 2014-119, Cl ZK | ||||||||
3.500%, 08/16/2044 | 14 | 14 | ||||||
GNMA, Ser 2014-122, Cl IP, IO | ||||||||
3.500%, 08/16/2029 | 929 | 90 | ||||||
GNMA, Ser 2014-144, Cl BI, IO | ||||||||
3.000%, 09/16/2029 | 326 | 30 | ||||||
GNMA, Ser 2014-21, Cl DI, IO | ||||||||
4.000%, 04/16/2026 | 1,373 | 138 | ||||||
GNMA, Ser 2015-165, Cl I, IO | ||||||||
3.500%, 07/20/2043 | 713 | 109 | ||||||
GNMA, Ser 2015-168, Cl MI, IO | ||||||||
5.500%, 10/20/2037 | 737 | 162 | ||||||
GNMA, Ser 2015-17, Cl BI, IO | ||||||||
3.500%, 05/20/2043 | 745 | 131 | ||||||
GNMA, Ser 2015-18, Cl IC, IO | ||||||||
3.500%, 02/16/2030 | 784 | 81 | ||||||
GNMA, Ser 2015-185, Cl GI, IO | ||||||||
3.500%, 02/20/2041 | 241 | 30 | ||||||
GNMA, Ser 2015-53, Cl IA, IO | ||||||||
4.500%, 04/20/2045 | 224 | 53 | ||||||
GNMA, Ser 2015-63, Cl PB | ||||||||
1.750%, 09/20/2043 | 61 | 58 | ||||||
GNMA, Ser 2015-84, Cl IO, IO | ||||||||
3.500%, 05/16/2042 | 550 | 112 | ||||||
| Description | Face Amount (Thousands) | Market Value ($ Thousands) | ||||||
MORTGAGE-BACKED SECURITIES (continued) |
| |||||||
GNMA, Ser 2016-123, Cl LM | ||||||||
3.000%, 09/20/2046 | $ | 375 | $ | 348 | ||||
GNMA, Ser 2016-126, Cl KI, IO | ||||||||
3.000%, 09/20/2028 | 197 | 17 | ||||||
GNMA, Ser 2016-136, Cl A | ||||||||
3.000%, 07/20/2044 | 825 | 794 | ||||||
GNMA, Ser 2016-167, Cl AI, IO | ||||||||
5.500%, 03/20/2039 | 594 | 135 | ||||||
GNMA, Ser 2016-18, Cl TA | ||||||||
2.000%, 10/20/2044 | 723 | 677 | ||||||
GNMA, Ser 2016-19, Cl AC | ||||||||
3.000%, 02/20/2046 | 152 | 140 | ||||||
GNMA, Ser 2016-23, Cl CI, IO | ||||||||
3.500%, 04/20/2042 | 391 | 53 | ||||||
GNMA, Ser 2016-42, Cl EI, IO | ||||||||
6.000%, 02/20/2046 | 302 | 70 | ||||||
GNMA, Ser 2016-99, Cl LI, IO | ||||||||
4.000%, 05/20/2029 | 876 | 89 | ||||||
GNMA, Ser 2017-176, Cl CM | ||||||||
2.500%, 11/20/2047 | 141 | 112 | ||||||
GNMA, Ser 2017-182, Cl LZ | ||||||||
3.000%, 12/20/2047 | 101 | 84 | ||||||
GNMA, Ser 2017-2, Cl AI, IO | ||||||||
5.000%, 01/16/2047 | 111 | 28 | ||||||
GNMA, Ser 2017-26, Cl IA, IO | ||||||||
5.500%, 02/16/2047 | 380 | 85 | ||||||
GNMA, Ser 2017-78, Cl AZ | ||||||||
3.000%, 05/20/2047 | 207 | 178 | ||||||
GNMA, Ser 2017-99, IO | ||||||||
4.000%, 07/20/2047 | 566 | 106 | ||||||
GNMA, Ser 2018-13, Cl DB | ||||||||
3.000%, 01/20/2048 | 557 | 546 | ||||||
|
|
| ||||||
Total Mortgage-Backed Securities | 63,635 | |||||||
|
|
| ||||||
U.S. TREASURY OBLIGATION — 0.9% |
| |||||||
U.S. Treasury Inflation Indexed Bonds | ||||||||
0.625%, 01/15/2026 | 582 | 573 | ||||||
|
|
| ||||||
Total U.S. Treasury Obligation | 573 | |||||||
|
|
| ||||||
| 34 | SEI Daily Income Trust / Semi-Annual Report / July 31, 2018 |
| Description |
Face Amount |
Market Value | ||||||
REPURCHASE AGREEMENT — 1.7% |
| |||||||
Deutsche Bank | $ | 1,100 | $ | 1,100 | ||||
|
|
| ||||||
Total Repurchase Agreement | 1,100 | |||||||
|
|
| ||||||
Total Investments in Securities — 100.3% | $ | 65,308 | ||||||
|
|
| ||||||
A list of the open futures contracts held by the Fund at July 31, 2018, is as follows:
Type of Contract |
Number of Contracts Long/(Short) | Expiration Date |
Notional Amount (Thousands) |
Value (Thousands) |
Unrealized Depreciation (Thousands) | |||||||||||||||
U.S. 10-Year Treasury Notes | (1 | ) | Sep-2018 | $ | (119 | ) | $ | (119 | ) | $ | – | |||||||||
U.S. 2-Year Treasury Notes | (1 | ) | Sep-2018 | (212 | ) | (212 | ) | – | ||||||||||||
U.S. 5-Year Treasury Notes | 20 | Sep-2018 | 2,262 | 2,262 | – | |||||||||||||||
Ultra 10-Year U.S. Treasury Notes | (12 | ) | Sep-2018 | (1,519 | ) | (1,525 | ) | (6 | ) | |||||||||||
|
|
| ||||||||||||||||||
| $ | 412 | $ | 406 | $ | (6 | ) | ||||||||||||||
|
|
| ||||||||||||||||||
For the period ended July 31, 2018, the total amount of all open futures contracts, as presented in the table above, are representative of the volume of activity for this derivative type during the period.
Percentages are based on Net Assets of $65,131 ($ Thousands).
| (A) | Variable or floating rate security, the interest rate of which adjusts periodically based on changes in current interest rates and prepayments on the underlying pool of assets. |
| (B) | Security, or portion thereof, has been pledged as collateral on open futures contracts. |
| (C) | Tri-Party Repurchase Agreement. |
Cl – Class
FHLMC – Federal Home Loan Mortgage Corporation
FNMA – Federal National Mortgage Association
GNMA – Government National Mortgage Association
IO – Interest Only - face amount represents notional amount
REMIC – Real Estate Mortgage Investment Conduit
Ser – Series
TBA – To Be Announced
The following is a summary of the inputs used as of July 31, 2018 in valuing the Fund’s investments and other financial instruments carried at value ($ Thousands):
Investments in Securities |
Level 1 |
Level 2 |
Level 3 |
Total | ||||||||||||
Mortgage-Backed Securities | $ | – | $ | 63,635 | $ | – | $ | 63,635 | ||||||||
U.S. Treasury Obligation | – | 573 | – | 573 | ||||||||||||
Repurchase Agreement | – | 1,100 | – | 1,100 | ||||||||||||
|
|
|
|
|
|
|
|
|
|
|
| |||||
Total Investments in Securities | $ | – | $ | 65,308 | $ | – | $ | 65,308 | ||||||||
|
|
|
|
|
|
|
|
|
|
|
| |||||
Other Financial Instruments |
Level 1 |
Level 2 |
Level 3 |
Total | ||||||||||||
Futures Contracts * | ||||||||||||||||
Unrealized Depreciation | $ | (6) | $ | – | $ | – | $ | (6) | ||||||||
|
|
|
|
|
|
|
|
|
|
|
| |||||
Total Other Financial Instruments | $ | (6) | $ | – | $ | – | $ | (6) | ||||||||
|
|
|
|
|
|
|
|
|
|
|
| |||||
| * | Futures Contracts are valued at the net unrealized depreciation on the instruments. |
For the period ended July 31, 2018, there were no transfers between Level 1, Level 2 and/or Level 3 assets and liabilities.
For more information on valuation inputs, see Note 2 – Significant Accounting Policies in Notes to Financial Statements.
Amounts designated as “–” are $0 or have been rounded to $0.
The accompanying notes are an integral part of the financial statements.
| SEI Daily Income Trust / Semi-Annual Report / July 31, 2018 | 35 |
STATEMENTS OF ASSETS AND LIABILITIES (Unaudited) ($ Thousands)
July 31, 2018
Government Fund | Government II Fund | |||||||
Assets: | ||||||||
Investments, at value† | $ 4,817,594 | $ 1,903,370 | ||||||
Repurchase agreements† | 2,684,000 | – | ||||||
Cash | 67,036 | 1,950 | ||||||
Interest receivable | 2,790 | 601 | ||||||
Receivable for investment securities sold | – | – | ||||||
Receivable for fund shares sold | – | – | ||||||
Receivable for administration fees | – | – | ||||||
Receivable for variation margin | – | – | ||||||
Prepaid expenses | 184 | 43 | ||||||
Total Assets | 7,571,604 | 1,905,964 | ||||||
Liabilities: | ||||||||
Payable for investment securities purchased | 338,917 | 114,856 | ||||||
Income distribution payable | 4,862 | 1,719 | ||||||
Administration fees payable | 678 | 222 | ||||||
Investment advisory fees payable | 437 | 54 | ||||||
Chief Compliance Officer fees payable | 12 | 3 | ||||||
Distribution fees payable | 1 | – | ||||||
Shareholder servicing fees payable | – | – | ||||||
Cash overdraft | – | – | ||||||
Payable for fund shares redeemed | – | – | ||||||
Payable for variation margin | – | – | ||||||
Accrued expense payable | 371 | 103 | ||||||
Total Liabilities | 345,278 | 116,957 | ||||||
Net Assets | $7,226,326 | $1,789,007 | ||||||
† Cost of investments and repurchase agreements | $7,501,594 | $1,903,370 | ||||||
Net Assets: | ||||||||
Paid-in Capital – (unlimited authorization – no par value) | $7,226,365 | $1,789,014 | ||||||
Undistributed (Distributions in excess of) net investment income | (10 | ) | 18 | |||||
Accumulated net realized (loss) on investments | (29 | ) | (25 | ) | ||||
Net unrealized (depreciation) on investments | – | – | ||||||
Net unrealized (depreciation) on futures contracts | – | – | ||||||
Net Assets | $7,226,326 | $1,789,007 | ||||||
Net Asset Value, Offering and Redemption Price Per Share – Class F | $1.00 | $1.00 | ||||||
| | ($7,203,157,048 ÷ 7,203,291,729 shares) | | | ($1,789,007,376 ÷ 1,789,113,581 shares) | | |||
Net Asset Value, Offering and Redemption Price Per Share – Class CAA | $1.00 | N/A | ||||||
| | ($23,168,761 ÷ 23,162,817 shares) |
| ||||||
Net Asset Value, Offering and Redemption Price Per Share – Class Y | N/A | N/A | ||||||
Amounts designated as “–” are $0 or have been rounded to $0.
The accompanying notes are an integral part of the financial statements.
| 36 | SEI Daily Income Trust / Semi-Annual Report / July 31, 2018 |
| Treasury Fund | Treasury II Fund | Ultra Short Duration Bond Fund | Short-Duration Government Fund | GNMA Fund | ||||||||||||||
| $ 57,585 | $ 628,623 | $ 293,998 | $ 702,634 | $ 64,208 | ||||||||||||||
| 42,000 | – | 4,800 | 28,700 | 1,100 | ||||||||||||||
| 6,246 | 2,112 | 612 | 172 | – | ||||||||||||||
| 43 | 53 | 961 | 1,717 | 252 | ||||||||||||||
| 1,980 | – | 1,214 | 56,959 | 5,537 | ||||||||||||||
| – | – | 172 | 329 | – | ||||||||||||||
| 6 | – | – | – | – | ||||||||||||||
| – | – | – | 46 | 2 | ||||||||||||||
| 1 | 9 | 3 | 12 | 1 | ||||||||||||||
| 107,861 | 630,797 | 301,760 | 790,569 | 71,100 | ||||||||||||||
| 6,450 | 81,690 | 3,711 | 82,943 | 4,740 | ||||||||||||||
| 91 | 449 | 88 | 311 | 23 | ||||||||||||||
| – | 61 | 40 | 120 | 11 | ||||||||||||||
| 3 | 16 | 25 | 55 | 5 | ||||||||||||||
| – | 1 | 1 | 1 | – | ||||||||||||||
| – | – | – | – | – | ||||||||||||||
| – | – | 17 | 67 | 14 | ||||||||||||||
| – | – | – | – | 112 | ||||||||||||||
| – | – | 206 | 949 | 1,044 | ||||||||||||||
| – | – | 1 | 86 | 2 | ||||||||||||||
| 5 | 31 | 51 | 63 | 18 | ||||||||||||||
| 6,549 | 82,248 | 4,140 | 84,595 | 5,969 | ||||||||||||||
| $101,312 | $548,549 | $297,620 | $705,974 | $65,131 | ||||||||||||||
| $99,585 | $628,623 | $299,613 | $742,952 | $66,172 | ||||||||||||||
| $101,312 | $548,540 | $316,364 | $729,478 | $68,869 | ||||||||||||||
| 1 | 17 | (149 | ) | (265 | ) | (193 | ) | |||||||||||
| (1 | ) | (8 | ) | (17,769 | ) | (11,015 | ) | (2,675 | ) | |||||||||
| – | – | (815 | ) | (11,618 | ) | (864 | ) | |||||||||||
| – | – | (11 | ) | (606 | ) | (6 | ) | |||||||||||
| $101,312 | $548,549 | $297,620 | $705,974 | $65,131 | ||||||||||||||
| $1.00 | $1.00 | $9.31 | $10.20 | $10.09 | ||||||||||||||
| | ($101,312,498 ÷ 101,377,377 shares) |
| | ($548,549,196 ÷ 548,686,998 shares) |
| | ($249,208,640 26,775,446 shares | ÷ ) | | ($658,051,906 64,507,252 shares | ÷ ) | | ($65,053,404 ÷ 6,448,783 shares) | | ||||
| N/A | N/A | N/A | N/A | N/A | ||||||||||||||
| | | |||||||||||||||||
| N/A | N/A | $9.31 | $10.20 | $10.08 | ||||||||||||||
| | ($48,411,734 ÷ 5,198,811 shares) | | | ($47,922,191 ÷ 4,698,467 shares) | | | ($77,630 ÷ 7,700 shares) |
| ||||||||||
| SEI Daily Income Trust / Semi-Annual Report / July 31, 2018 | 37 |
STATEMENTS OF OPERATIONS (Unaudited) ($ Thousands)
For the six months ended July 31, 2018
| Government Fund | Government II Fund | |||||||
Investment Income: | ||||||||
Interest income | $ | 58,449 | $ | 15,854 | ||||
Total investment income | 58,449 | 15,854 | ||||||
Expenses: | ||||||||
Administration fees | 4,115 | 1,385 | ||||||
Shareholder servicing fees – Class F Shares | 8,859 | 2,350 | ||||||
Shareholder servicing fees – Class CAA Shares | 35 | – | ||||||
Investment advisory fees | 2,490 | 657 | ||||||
Trustees’ fees | 60 | 16 | ||||||
Chief Compliance Officer fees | 18 | 5 | ||||||
Custodian/Wire agent fees | 110 | 29 | ||||||
Registration fees | 75 | 23 | ||||||
Pricing fees | 8 | 2 | ||||||
Printing fees | – | – | ||||||
Proxy fees | – | – | ||||||
Other expenses | 499 | 132 | ||||||
Total expenses | 16,269 | 4,599 | ||||||
Less, waiver of: | ||||||||
Investment advisory fees | – | (329 | ) | |||||
Administration fees | (260 | ) | (40 | ) | ||||
Shareholder servicing fees – Class F Shares | (8,893 | ) | (2,350 | ) | ||||
Net expenses | 7,116 | 1,880 | ||||||
Net Investment Income | 51,333 | 13,974 | ||||||
Net Realized and Unrealized Gain (Loss) on/from: | ||||||||
Investments | 10 | (25 | ) | |||||
Futures contracts | – | – | ||||||
Options contracts | – | – | ||||||
Net change in unrealized appreciation(depreciation) on/from: | ||||||||
Investments | – | – | ||||||
Futures contracts | – | – | ||||||
Net Increase (Decrease) in Net Assets Resulting from Operations | $ | 51,343 | $ | 13,949 | ||||
Amounts designated as “–” are $0 or have been rounded to $0.
The accompanying notes are an integral part of the financial statements.
| 38 | SEI Daily Income Trust / Semi-Annual Report / July 31, 2018 |
| Treasury Fund | Treasury II Fund | Ultra Short Duration Bond Fund | Short-Duration Government Fund | GNMA Fund | ||||||||||||||
| $ 957 | $ | 4,785 | $ | 3,479 | $ | 7,958 | $ | 1,050 | ||||||||||
| 957 | 4,785 | 3,479 | 7,958 | 1,050 | ||||||||||||||
| 88 | 429 | 300 | 711 | 67 | ||||||||||||||
| 146 | 715 | 315 | 827 | 88 | ||||||||||||||
| – | – | – | – | – | ||||||||||||||
| 41 | 200 | 150 | 323 | 32 | ||||||||||||||
| 1 | 5 | 2 | 6 | 1 | ||||||||||||||
| – | 2 | 1 | 2 | – | ||||||||||||||
| – | 10 | 5 | 12 | 1 | ||||||||||||||
| 2 | 7 | 4 | 11 | 1 | ||||||||||||||
| – | 1 | 27 | 65 | – | ||||||||||||||
| – | – | 6 | – | 7 | ||||||||||||||
| – | – | – | – | – | ||||||||||||||
| 11 | 44 | 17 | 53 | 11 | ||||||||||||||
| 289 | 1,413 | 827 | 2,010 | 208 | ||||||||||||||
| (21) | (100 | ) | – | – | – | |||||||||||||
| (4) | (25 | ) | (58 | ) | – | – | ||||||||||||
| (146) | (715 | ) | (214 | ) | (325 | ) | – | |||||||||||
| 118 | 573 | 555 | 1,685 | 208 | ||||||||||||||
| 839 | 4,212 | 2,924 | 6,273 | 842 | ||||||||||||||
| – | (3 | ) | (53 | ) | (735 | ) | (267 | ) | ||||||||||
| – | – | 13 | 2,090 | – | ||||||||||||||
| – | – | – | (74 | ) | (9 | ) | ||||||||||||
| – | – | (357 | ) | (3,448 | ) | (648 | ) | |||||||||||
| – | – | (16 | ) | (1,887 | ) | 27 | ||||||||||||
| $ 839 | $ | 4,209 | $ | 2,511 | $ | 2,219 | $ | (55 | ) | |||||||||
| SEI Daily Income Trust / Semi-Annual Report / July 31, 2018 | 39 |
STATEMENTS OF CHANGES IN NET ASSETS ($ Thousands)
For the six months ended July 31, 2018 (Unaudited) and the year ended January 31,
| Government Fund | ||||||||||
| 2/1/18 - 7/31/18 | 2018 | |||||||||
Operations: | ||||||||||
Net investment Income | $ | 51,333 | $ | 56,842 | ||||||
Net realized gain (loss) on investments | 10 | (11 | ) | |||||||
Net increase in net assets resulting from operations | 51,343 | 56,831 | ||||||||
Dividends and Distributions to Shareholders: | ||||||||||
Net investment income | ||||||||||
Class F | (51,137 | ) | (56,292 | ) | ||||||
Class CAA | (195 | ) | (334 | ) | ||||||
Total dividends and distributions | (51,332 | ) | (56,626 | ) | ||||||
Capital Share Transactions (All at $1.00 per share) | ||||||||||
Class F: | ||||||||||
Proceeds from shares issued | 25,655,189 | 47,958,619 | ||||||||
Reinvestment of dividends & distributions | 24,157 | 23,892 | ||||||||
Cost of shares redeemed | (25,753,965 | ) | (48,580,625 | ) | ||||||
Net increase (decrease) from Class F Transactions | (74,619 | ) | (598,114 | ) | ||||||
Class CAA: | ||||||||||
Proceeds from shares issued | 30,704 | 89,182 | ||||||||
Reinvestment of dividends & distributions | 195 | 332 | ||||||||
Cost of shares redeemed | (39,256 | ) | (84,880 | ) | ||||||
Net increase (decrease) from Class CAA Transactions | (8,357 | ) | 4,634 | |||||||
Net increase (decrease) in net assets from capital shares transactions | (82,976 | ) | (593,480 | ) | ||||||
Net increase (decrease) in net assets | (82,965 | ) | (593,275 | ) | ||||||
Net Assets: | ||||||||||
Beginning of period | 7,309,291 | 7,902,566 | ||||||||
End of period | $ | 7,226,326 | $ | 7,309,291 | ||||||
Undistributed (distributions in excess of) Net Investment Income | $ | (10 | ) | $ | (11 | ) | ||||
Amounts designated as “–” are $0 or have been rounded to $0.
N/A – Not applicable.
The accompanying notes are an integral part of the financial statements.
| 40 | SEI Daily Income Trust / Semi-Annual Report / July 31, 2018 |
| Government II Fund | Treasury Fund | Treasury II Fund | ||||||||||||||||||||
| 2/1/18 - 7/31/18 | 2018 | 2/1/18 - 7/31/18 | 2018 | 2/1/18 - 7/31/18 | 2018 | |||||||||||||||||
| $ 13,974 | $ | 15,370 | $ | 839 | $ | 780 | $ | 4,212 | $ | 4,141 | ||||||||||||
| (25 | ) | 18 | – | – | (3 | ) | 2 | |||||||||||||||
| 13,949 | 15,388 | 839 | 780 | 4,209 | 4,143 | |||||||||||||||||
| (13,974 | ) | (15,370 | ) | (839 | ) | (780 | ) | (4,213 | ) | (4,142 | ) | |||||||||||
| N/A | N/A | N/A | N/A | N/A | N/A | |||||||||||||||||
| (13,974 | ) | (15,370 | ) | (839 | ) | (780 | ) | (4,213 | ) | (4,142 | ) | |||||||||||
| 2,881,808 | 6,118,667 | 300,717 | 592,584 | 823,399 | 1,953,133 | |||||||||||||||||
| 4,477 | 4,599 | 367 | 490 | 1,655 | 1,631 | |||||||||||||||||
| (3,275,014 | ) | (5,996,921 | ) | (313,892 | ) | (584,003 | ) | (830,213 | ) | (1,924,359 | ) | |||||||||||
| (388,729 | ) | 126,345 | (12,808 | ) | 9,071 | (5,159 | ) | 30,405 | ||||||||||||||
| N/A | N/A | N/A | N/A | N/A | N/A | |||||||||||||||||
| N/A | N/A | N/A | N/A | N/A | N/A | |||||||||||||||||
| N/A | N/A | N/A | N/A | N/A | N/A | |||||||||||||||||
| N/A | N/A | N/A | N/A | N/A | N/A | |||||||||||||||||
| (388,729 | ) | 126,345 | (12,808 | ) | 9,071 | (5,159 | ) | 30,405 | ||||||||||||||
| (388,754 | ) | 126,363 | (12,808 | ) | 9,071 | (5,163 | ) | 30,406 | ||||||||||||||
| 2,177,761 | 2,051,398 | 114,120 | 105,049 | 553,712 | 523,306 | |||||||||||||||||
| $ | 1,789,007 | $ | 2,177,761 | $ | 101,312 | $ | 114,120 | $ | 548,549 | $ | 553,712 | |||||||||||
| $ | 18 | $ | 18 | $ | 1 | $ | 1 | $ | 17 | $ | 18 | |||||||||||
| SEI Daily Income Trust / Semi-Annual Report / July 31, 2018 | 41 |
STATEMENTS OF CHANGES IN NET ASSETS ($ Thousands)
For the six months ended July 31, 2018 (Unaudited) and the year ended January 31,
| Ultra Short Duration Bond Fund | ||||||||
| 2/1/18 - 7/31/18 | 2018 | |||||||
Operations: | ||||||||
Net investment income | $ | 2,924 | $ | 4,297 | ||||
Net realized gain (loss) on investments, futures contracts, and options contracts | (40) | 700 | ||||||
Net change in unrealized (depreciation) on investments and futures contracts | (373) | (50) | ||||||
Net increase (decrease) in net assets resulting from operations | 2,511 | 4,947 | ||||||
Dividends and Distributions to Shareholders: | ||||||||
Net investment income | ||||||||
Class F | (2,574) | (3,860) | ||||||
Class Y | (506) | (710) | ||||||
Net realized gains | ||||||||
Total dividends and distributions | (3,080) | (4,570) | ||||||
Capital share transactions: | ||||||||
Class F: | ||||||||
Proceeds from shares issued | 37,978 | 116,899 | ||||||
Reinvestment of dividends & distributions | 2,077 | 3,032 | ||||||
Cost of shares redeemed | (52,388) | (123,233) | ||||||
Net increase (decrease) from Class F transactions | (12,333) | (3,302) | ||||||
Class Y: | ||||||||
Proceeds from shares issued | 2,925 | 6,871 | ||||||
Reinvestment of dividends & distributions | 499 | 700 | ||||||
Cost of shares redeemed | (3,061) | (4,532) | ||||||
Net increase (decrease) from Class Y transactions | 363 | 3,039 | ||||||
Net Decrease in net assets from capital share transactions | (11,970) | (263) | ||||||
Net increase (decrease) in net assets | (12,539) | 114 | ||||||
Net Assets: | ||||||||
Beginning of period | 310,159 | 310,045 | ||||||
End of period | $ | 297,620 | $ | 310,159 | ||||
Undistributed (Distributions in Excess of) net investment income | $ | (149) | $ | 7 | ||||
Capital Share Transactions: | ||||||||
Class F | ||||||||
Shares issued | 4,077 | 12,514 | ||||||
Reinvestment of distributions | 223 | 325 | ||||||
Shares redeemed | (5,625) | (13,193) | ||||||
Net decrease in shares outstanding from Class F Share transactions | (1,325) | (354) | ||||||
Class Y | ||||||||
Shares issued | 314 | 736 | ||||||
Reinvestment of distributions | 54 | 75 | ||||||
Shares redeemed | (329) | (485) | ||||||
Net increase (decrease) in shares outstanding from Class Y Share transactions | 39 | 326 | ||||||
Total decrease in shares outstanding from share transactions | (1,286) | (28) | ||||||
Amounts designated as “–” are zero or have been rounded to zero.
The accompanying notes are an integral part of the financial statements.
| 42 | SEI Daily Income Trust / Semi-Annual Report / July 31, 2018 |
| Short-Duration Government Fund | GNMA Fund | |||||||||||||
| 2/1/18 - 7/31/18 | 2018 | 2/1/18 - 7/31/18 | 2018 | |||||||||||
| $ | 6,273 | $ | 11,435 | $ | 842 | $ | 2,271 | |||||||
| 1,281 | (3,015 | ) | (276) | (326) | ||||||||||
| (5,335) | (6,909 | ) | (621) | (1,098) | ||||||||||
| 2,219 | 1,511 | (55) | 847 | |||||||||||
| (6,622) | (12,542 | ) | (1,021) | (2,735) | ||||||||||
| (526) | (892 | ) | (1) | (2) | ||||||||||
| (7,148) | (13,434 | ) | (1,022) | (2,737) | ||||||||||
| 87,733 | 247,453 | 6,597 | 14,363 | |||||||||||
| 4,931 | 9,210 | 878 | 2,127 | |||||||||||
| (126,773) | (345,293 | ) | (16,928) | (55,073) | ||||||||||
| (34,109) | (88,630 | ) | (9,453) | (38,583) | ||||||||||
| 3,932 | 13,751 | 2 | 82 | |||||||||||
| 520 | 882 | 1 | 1 | |||||||||||
| (7,686) | (11,181 | ) | – | (56) | ||||||||||
| (3,234) | 3,452 | 3 | 27 | |||||||||||
| (37,343) | (85,178 | ) | (9,450) | (38,556) | ||||||||||
| (42,272) | (97,101 | ) | (10,527) | (40,446) | ||||||||||
| 748,246 | 845,347 | 75,658 | 116,104 | |||||||||||
| $ | 705,974 | $ | 748,246 | $ | 65,131 | $ | 75,658 | |||||||
| $ | (265) | $ | 610 | $ | (193) | $ | (13) | |||||||
| 8,571 | 23,831 | 652 | 1,372 | |||||||||||
| 482 | 887 | 86 | 204 | |||||||||||
| (12,381) | (33,267 | ) | (1,670) | (5,279) | ||||||||||
| (3,328) | (8,549 | ) | (932) | (3,703) | ||||||||||
| 384 | 1,325 | 1 | 8 | |||||||||||
| 51 | 85 | – | – | |||||||||||
| (751) | (1,077 | ) | – | (5) | ||||||||||
| (316) | 333 | 1 | 3 | |||||||||||
| (3,644) | (8,216 | ) | (931) | (3,700) | ||||||||||
| SEI Daily Income Trust / Semi-Annual Report / July 31, 2018 | 43 |
For the six months ended July 31, 2018 (Unaudited) and the years ended January 31,
For a Share Outstanding Throughout the Year or Period
Net Asset of Period | Net Investment Income* | Net Realized and Unrealized Gains (Losses) on Securities | Total from Operations | Dividends from Net Investment Income | Total Dividends and Distributions | Net Asset Value, End of Period | Total Return† |
Net Assets End of Period ($ Thousands) | Ratio of Expenses to Average Net Assets(1) | Ratio of Expenses to Average Net Assets (Excluding Waivers) |
Ratio of Net Investment Income to Average Assets | |||||||||||||||||||||||||||||||||||||
Government Fund |
| |||||||||||||||||||||||||||||||||||||||||||||||
Class F | ||||||||||||||||||||||||||||||||||||||||||||||||
2018@ | $ | 1.00 | $ | 0.01 | $ | – | $ | 0.01 | $ | (0.01 | ) | $ | (0.01 | ) | $ | 1.00 | 0.72% | $ | 7,203,157 | 0.20% | 0.46% | 1.44% | ||||||||||||||||||||||||||
2018 | 1.00 | 0.01 | – | 0.01 | (0.01 | ) | (0.01 | ) | 1.00 | 0.74 | 7,277,766 | 0.20 | 0.45 | 0.74 | ||||||||||||||||||||||||||||||||||
2017 | 1.00 | – | – | – | –(2) | –(2) | 1.00 | 0.19 | 7,875,681 | 0.20 | 0.56 | 0.21 | ||||||||||||||||||||||||||||||||||||
2016 | 1.00 | – | – | – | –(2) | –(2) | 1.00 | 0.03 | 1,909,582 | 0.12 | 0.58 | 0.03 | ||||||||||||||||||||||||||||||||||||
2015 | 1.00 | – | – | – | –(2) | –(2) | 1.00 | 0.02 | 1,788,290 | 0.07 | 0.58 | 0.02 | ||||||||||||||||||||||||||||||||||||
2014 | 1.00 | – | – | – | –(2) | –(2) | 1.00 | 0.02 | 1,523,561 | 0.09 | 0.58 | 0.02 | ||||||||||||||||||||||||||||||||||||
Class CAA | ||||||||||||||||||||||||||||||||||||||||||||||||
2018@ | $ | 1.00 | $ | 0.01 | $ | – | $ | 0.01 | $ | (0.01 | ) | $ | (0.01 | ) | $ | 1.00 | 0.72% | $ | 23,169 | 0.20% | 0.46% | 1.44% | ||||||||||||||||||||||||||
2018 | 1.00 | 0.01 | – | 0.01 | (0.01 | ) | (0.01 | ) | 1.00 | 0.74 | 31,525 | 0.20 | 0.45 | 0.74 | ||||||||||||||||||||||||||||||||||
2017 | 1.00 | – | – | – | –(2) | –(2) | 1.00 | 0.19 | 26,885 | 0.20 | 0.56 | 0.18 | ||||||||||||||||||||||||||||||||||||
2016(3) | 1.00 | – | – | – | –(2) | –(2) | 1.00 | 0.01 | 36,003 | 0.18 | 0.58 | 0.06 | ||||||||||||||||||||||||||||||||||||
Government II Fund |
| |||||||||||||||||||||||||||||||||||||||||||||||
Class F | ||||||||||||||||||||||||||||||||||||||||||||||||
2018@ | $ | 1.00 | $ | 0.01 | $ | – | $ | 0.01 | $ | (0.01 | ) | $ | (0.01 | ) | $ | 1.00 | 0.74% | $ | 1,789,007 | 0.20% | 0.49% | 1.49% | ||||||||||||||||||||||||||
2018 | 1.00 | 0.01 | – | 0.01 | (0.01 | ) | (0.01 | ) | 1.00 | 0.76 | 2,177,761 | 0.20 | 0.49 | 0.76 | ||||||||||||||||||||||||||||||||||
2017 | 1.00 | – | – | – | –(2) | –(2) | 1.00 | 0.19 | 2,051,398 | 0.20 | 0.53 | 0.19 | ||||||||||||||||||||||||||||||||||||
2016 | 1.00 | – | – | – | –(2) | –(2) | 1.00 | 0.02 | 1,228,378 | 0.11 | 0.53 | 0.02 | ||||||||||||||||||||||||||||||||||||
2015 | 1.00 | – | – | – | –(2) | –(2) | 1.00 | 0.01 | 1,152,698 | 0.08 | 0.53 | 0.01 | ||||||||||||||||||||||||||||||||||||
2014 | 1.00 | – | – | – | –(2) | –(2) | 1.00 | 0.01 | 1,246,262 | 0.09 | 0.53 | 0.01 | ||||||||||||||||||||||||||||||||||||
Treasury Fund |
| |||||||||||||||||||||||||||||||||||||||||||||||
Class F | ||||||||||||||||||||||||||||||||||||||||||||||||
2018@ | $ | 1.00 | $ | 0.01 | $ | – | $ | 0.01 | $ | (0.01 | ) | $ | (0.01 | ) | $ | 1.00 | 0.72% | $ | 101,312 | 0.20% | 0.49% | 1.43% | ||||||||||||||||||||||||||
2018 | 1.00 | 0.01 | – | 0.01 | (0.01 | ) | (0.01 | ) | 1.00 | 0.75 | 114,120 | 0.20 | 0.52 | 0.74 | ||||||||||||||||||||||||||||||||||
2017 | 1.00 | – | – | – | –(2) | –(2) | 1.00 | 0.18 | 105,049 | 0.21 | 0.63 | 0.14 | ||||||||||||||||||||||||||||||||||||
2016 | 1.00 | – | – | – | –(2) | –(2) | 1.00 | 0.02 | 285,714 | 0.10 | 0.59 | 0.03 | ||||||||||||||||||||||||||||||||||||
2015 | 1.00 | – | – | – | –(2) | –(2) | 1.00 | 0.01 | 124,646 | 0.05 | 0.58 | 0.01 | ||||||||||||||||||||||||||||||||||||
2014 | 1.00 | – | – | – | –(2) | –(2) | 1.00 | 0.01 | 46,315 | 0.08 | 0.58 | 0.01 | ||||||||||||||||||||||||||||||||||||
Treasury II Fund |
| |||||||||||||||||||||||||||||||||||||||||||||||
Class F | ||||||||||||||||||||||||||||||||||||||||||||||||
2018@ | $ | 1.00 | $ | 0.01 | $ | – | $ | 0.01 | $ | (0.01 | ) | $ | (0.01 | ) | $ | 1.00 | 0.73% | $ | 548,549 | 0.20% | 0.49% | 1.47% | ||||||||||||||||||||||||||
2018 | 1.00 | 0.01 | – | 0.01 | (0.01 | ) | (0.01 | ) | 1.00 | 0.74 | 553,712 | 0.20 | 0.50 | 0.75 | ||||||||||||||||||||||||||||||||||
2017 | 1.00 | – | – | – | –(2) | –(2) | 1.00 | 0.15 | 523,306 | 0.20 | 0.58 | 0.14 | ||||||||||||||||||||||||||||||||||||
2016 | 1.00 | – | – | – | –(2) | –(2) | 1.00 | 0.01 | 694,987 | 0.08 | 0.58 | 0.02 | ||||||||||||||||||||||||||||||||||||
2015 | 1.00 | – | – | – | –(2) | –(2) | 1.00 | 0.01 | 491,209 | 0.04 | 0.58 | 0.01 | ||||||||||||||||||||||||||||||||||||
2014 | 1.00 | – | – | – | –(2) | –(2) | 1.00 | 0.01 | 440,422 | 0.06 | 0.58 | 0.01 | ||||||||||||||||||||||||||||||||||||
| * | Per share calculations were performed using average shares. |
| @ | For the six month period ended July 31, 2018. All ratios for the period have been annualized. |
| † | Returns are for the period indicated and have not been annualized. Returns shown do not reflect the deduction of taxes that a shareholder would pay on Fund distributions or the redemption of Fund shares. |
| (1) | The Distributor and/or Administrator have voluntarily agreed to waive and reduce its fee and/or reimburse certain expenses of the Fund in order to limit the one-day net income yield of the Fund to not less than 0.01% of the Fund’s average daily net assets of the share class. Had these waivers and the Treasury Guarantee Program expense been excluded the ratio would have been at the expense ratio cap figure. See Note 3 for expense ratio cap figure. |
| (2) | Amount represents less than $0.01 per share. |
| (3) | Commenced operations on November 20, 2015. All ratios for the period have been annualized. |
Amounts designated as “–’’ are zero or have been rounded to zero
| 44 | SEI Daily Income Trust / Semi-Annual Report / July 31, 2018 |
Net Asset Value, Beginning of Period | Net Investment Income* | Net Realized and Unrealized Gains (Losses) on Securities | Total from Operations | Dividends from Net Investment Income | Distributions from Realized Capital Gains | Total Dividends and Distributions | Net Asset Value, End of Period | Total Return† | Net Assets End of Period ($ Thousands) | Ratio of Expenses to Average Net Assets | Ratio of Expenses to Average Net Assets (Excluding Waivers) |
Ratio of Net Investment Income to Average | Portfolio Turnover Rate | |||||||||||||||||||||||||||||||||||||||||||
Ultra Short Duration Bond Fund |
| |||||||||||||||||||||||||||||||||||||||||||||||||||||||
Class F | ||||||||||||||||||||||||||||||||||||||||||||||||||||||||
2018@ | $ | 9.32 | $ | 0.09 | $ | (0.01 | ) | $ | 0.08 | $ | (0.09 | ) | $ | – | $ | (0.09 | ) | $ | 9.31 | 0.91 | % | $ | 249,208 | 0.38 | % | 0.59 | % | 1.94 | % | 39 | % | |||||||||||||||||||||||||
2018 | 9.31 | 0.13 | 0.02 | 0.15 | (0.14 | ) | – | (0.14 | ) | 9.32 | 1.58 | 262,023 | 0.38 | 0.59 | 1.38 | 59 | ||||||||||||||||||||||||||||||||||||||||
2017 | 9.29 | 0.09 | 0.03 | 0.12 | (0.10 | ) | – | (0.10 | ) | 9.31 | 1.33 | 264,997 | 0.38 | 0.68 | 0.99 | 89 | ||||||||||||||||||||||||||||||||||||||||
2016 | 9.33 | 0.07 | (0.03 | ) | 0.04 | (0.08 | ) | – | (0.08 | ) | 9.29 | 0.45 | 197,737 | 0.38 | 0.69 | 0.71 | 115 | |||||||||||||||||||||||||||||||||||||||
2015 | 9.35 | 0.06 | – | 0.06 | (0.08 | ) | – | (0.08 | ) | 9.33 | 0.60 | 255,614 | 0.38 | 0.72 | 0.61 | 106 | ||||||||||||||||||||||||||||||||||||||||
2014 | 9.37 | 0.06 | – | 0.06 | (0.08 | ) | – | (0.08 | ) | 9.35 | 0.64 | 271,221 | 0.38 | 0.73 | 0.63 | 131 | ||||||||||||||||||||||||||||||||||||||||
Class Y | ||||||||||||||||||||||||||||||||||||||||||||||||||||||||
2018@ | $ | 9.33 | $ | 0.09 | $ | (0.01 | ) | $ | 0.08 | $ | (0.10 | ) | $ | – | $ | (0.10 | ) | $ | 9.31 | 0.84 | % | $ | 48,412 | 0.30 | % | 0.34 | % | 2.02 | % | 39 | % | |||||||||||||||||||||||||
2018 | 9.32 | 0.14 | 0.01 | 0.15 | (0.14 | ) | – | (0.14 | ) | 9.33 | 1.67 | 48,136 | 0.30 | 0.34 | 1.46 | 59 | ||||||||||||||||||||||||||||||||||||||||
2017 | 9.29 | 0.10 | 0.04 | 0.14 | (0.11 | ) | – | (0.11 | ) | 9.32 | 1.52 | 45,048 | 0.30 | 0.43 | 1.06 | 89 | ||||||||||||||||||||||||||||||||||||||||
2016(1) | 9.31 | 0.02 | – | 0.02 | (0.04 | ) | – | (0.04 | ) | 9.29 | 0.19 | 37,050 | 0.30 | 0.44 | 0.60 | 115 | ||||||||||||||||||||||||||||||||||||||||
Short-Duration Government Fund |
| |||||||||||||||||||||||||||||||||||||||||||||||||||||||
Class F | ||||||||||||||||||||||||||||||||||||||||||||||||||||||||
2018@ | $ | 10.27 | $ | 0.09 | $ | (0.06 | ) | $ | 0.03 | $ | (0.10 | ) | $ | – | $ | (0.10 | ) | $ | 10.20 | 0.31 | % | $ | 658,052 | 0.48 | % | 0.58 | % | 1.76 | % | 13 | % | |||||||||||||||||||||||||
2018 | 10.43 | 0.15 | (0.14 | ) | 0.01 | (0.17 | ) | – | (0.17 | ) | 10.27 | 0.13 | 696,751 | 0.48 | 0.59 | 1.42 | 169 | |||||||||||||||||||||||||||||||||||||||
2017 | 10.49 | 0.10 | (0.04 | ) | 0.06 | (0.12 | ) | – | (0.12 | ) | 10.43 | 0.54 | 796,540 | 0.48 | 0.67 | 0.91 | 539 | |||||||||||||||||||||||||||||||||||||||
2016 | 10.55 | 0.07 | (0.05 | ) | 0.02 | (0.08 | ) | – | (0.08 | ) | 10.49 | 0.22 | 799,269 | 0.48 | 0.69 | 0.64 | 245 | |||||||||||||||||||||||||||||||||||||||
2015 | 10.52 | 0.09 | 0.04 | 0.13 | (0.10 | ) | – | (0.10 | ) | 10.55 | 1.20 | 661,101 | 0.48 | 0.73 | 0.85 | 151 | ||||||||||||||||||||||||||||||||||||||||
2014 | 10.62 | 0.06 | (0.06 | ) | 0.00 | (0.10 | ) | – | (0.10 | ) | 10.52 | (0.01 | ) | 761,739 | 0.48 | 0.73 | 0.56 | 565 | ||||||||||||||||||||||||||||||||||||||
Class Y | ||||||||||||||||||||||||||||||||||||||||||||||||||||||||
2018@ | $ | 10.27 | $ | 0.10 | $ | (0.06 | ) | $ | 0.04 | $ | (0.11 | ) | $ | – | $ | (0.11 | ) | $ | 10.20 | 0.38 | % | $ | 47,922 | 0.33 | % | 0.33 | % | 1.91 | % | 13 | % | |||||||||||||||||||||||||
2018 | 10.43 | 0.16 | (0.13 | ) | 0.03 | (0.19 | ) | – | (0.19 | ) | 10.27 | 0.27 | 51,495 | 0.34 | 0.34 | 1.56 | 169 | |||||||||||||||||||||||||||||||||||||||
2017 | 10.49 | 0.11 | (0.04 | ) | 0.07 | (0.13 | ) | – | (0.13 | ) | 10.43 | 0.64 | 48,808 | 0.38 | 0.43 | 1.02 | 539 | |||||||||||||||||||||||||||||||||||||||
2016 | 10.55 | 0.08 | (0.05 | ) | 0.03 | (0.09 | ) | – | (0.09 | ) | 10.49 | 0.32 | 50,825 | 0.38 | 0.44 | 0.74 | 245 | |||||||||||||||||||||||||||||||||||||||
2015(2) | 10.50 | 0.01 | 0.05 | 0.06 | (0.01 | ) | – | (0.01 | ) | 10.55 | 0.54 | 55,017 | 0.38 | 0.46 | 0.97 | 151 | ||||||||||||||||||||||||||||||||||||||||
GNMA Fund |
| |||||||||||||||||||||||||||||||||||||||||||||||||||||||
Class F | ||||||||||||||||||||||||||||||||||||||||||||||||||||||||
2018@ | $ | 10.24 | $ | 0.12 | $ | (0.12 | ) | $ | 0.00 | $ | (0.15 | ) | $ | – | $ | (0.15 | ) | $ | 10.09 | (0.03 | )% | $ | 65,053 | 0.59 | % | 0.59 | % | 2.40 | % | 70 | % | |||||||||||||||||||||||||
2018 | 10.47 | 0.24 | (0.18 | ) | 0.06 | (0.29 | ) | – | (0.29 | ) | 10.24 | 0.58 | 75,582 | 0.60 | 0.60 | 2.32 | 204 | |||||||||||||||||||||||||||||||||||||||
2017 | 10.82 | 0.16 | (0.16 | ) | 0.00 | (0.21 | ) | (0.14 | ) | (0.35 | ) | 10.47 | 0.04 | 116,057 | 0.63 | 0.67 | 1.48 | 718 | ||||||||||||||||||||||||||||||||||||||
2016 | 10.93 | 0.15 | 0.02 | 0.17 | (0.19 | ) | (0.09 | ) | (0.28 | ) | 10.82 | 1.65 | 122,040 | 0.63 | 0.69 | 1.36 | 718 | |||||||||||||||||||||||||||||||||||||||
2015 | 10.50 | 0.11 | 0.49 | 0.60 | (0.17 | ) | – | (0.17 | ) | 10.93 | 5.79 | 117,904 | 0.63 | 0.69 | 1.07 | 758 | ||||||||||||||||||||||||||||||||||||||||
2014 | 10.70 | 0.07 | (0.09 | ) | (0.02 | ) | (0.18 | ) | – | (0.18 | ) | 10.50 | (0.14 | ) | 158,672 | 0.63 | 0.69 | 0.68 | 758 | |||||||||||||||||||||||||||||||||||||
Class Y | ||||||||||||||||||||||||||||||||||||||||||||||||||||||||
2018@ | $ | 10.23 | $ | 0.13 | $ | (0.12 | ) | $ | 0.01 | $ | (0.16 | ) | $ | – | $ | (0.16 | ) | $ | 10.08 | 0.09 | % | $ | 78 | 0.34 | % | 0.34 | % | 2.65 | % | 70 | % | |||||||||||||||||||||||||
2018 | 10.46 | 0.27 | (0.18 | ) | 0.09 | (0.32 | ) | – | (0.32 | ) | 10.23 | 0.82 | 76 | 0.36 | 0.36 | 2.56 | 204 | |||||||||||||||||||||||||||||||||||||||
2017 | 10.81 | 0.18 | (0.15 | ) | 0.03 | (0.24 | ) | (0.14 | ) | (0.38 | ) | 10.46 | 0.25 | 47 | 0.42 | 0.43 | 1.69 | 718 | ||||||||||||||||||||||||||||||||||||||
2016(3) | 10.76 | 0.02 | 0.11 | 0.13 | (0.06 | ) | (0.02 | ) | (0.08 | ) | 10.81 | 1.26 | 69 | 0.43 | 0.45 | 0.80 | 718 | |||||||||||||||||||||||||||||||||||||||
| * | Per share calculations were performed using average shares. |
| @ | For the six month period ended July 31, 2018. All ratios for the period have been annualized. |
| † | Returns are for the period indicated and have not been annualized. Returns shown do not reflect the deduction of taxes that a shareholder would pay on Fund distributions or the redemption of Fund shares. |
| (1) | Commenced operations on August 25, 2015. All ratios for the period have been annualized. |
| (2) | Commenced operations on December 31, 2014. All ratios for the period have been annualized. |
| (3) | Commenced operations on October 30, 2015. All ratios for the period have been annualized. |
Amounts designated as ‘‘–’’ are zero or have been rounded to zero.
The accompanying notes are an integral part of the financial statements.
| SEI Daily Income Trust / Semi-Annual Report / July 31, 2018 | 45 |
NOTES TO FINANCIAL STATEMENTS (Unaudited)
July 31, 2018
1. ORGANIZATION
SEI Daily Income Trust (the “Trust”) was organized as a Massachusetts business trust under a Declaration of Trust dated March 15, 1982.
The Trust is registered under the Investment Company Act of 1940, as amended, as a diversified, open-end investment company with seven operational Funds: the Government, Government II, Treasury and Treasury II (each a “Fund,” collectively, the “Money Market Funds”), the Ultra Short Duration Bond, Short-Duration Government and GNMA (each a “Fund,” collectively, the “Fixed Income Funds”). The Trust is registered to offer: Class F shares of the Funds; and Class CAA shares of the Government Fund and Class Y shares of the Fixed Income Funds. The assets of each Fund are segregated, and a shareholder’s interest is limited to the Fund in which shares are held. The Funds’ prospectuses provide a description of each Fund’s investment objective and strategies.
2. SIGNIFICANT ACCOUNTING POLICIES
The following are significant accounting policies, which are consistently followed in the preparation of its financial statements by the Funds. The Funds are investment companies that apply the accounting and reporting guidance issued in Topic 946 by the U.S. Financial Accounting Standards Board (“FASB”).
Use of Estimates — The preparation of financial statements, in conformity with U.S. generally accepted accounting principles (“U.S. GAAP”), requires management to make estimates and assumptions that affect the reported amount of assets and liabilities and disclosure of contingent assets and liabilities at the date of the financial statements and the reported amounts of increases and decreases in net assets from operations during the reporting period. Actual results could differ from those estimates.
Security Valuation — Investment securities of the Money Market Funds are stated at amortized cost, which approximates market value. Under this valuation method, purchase discounts and premiums are accreted and amortized ratably to maturity and are included in interest income. The Money Market Funds’ use of amortized cost is subject to its compliance with certain conditions as specified by Rule 2a-7 of the 1940 Act.
Investment securities of the Fixed Income Funds listed on a securities exchange, market or automated quotation system for which quotations are readily available are valued at the last quoted sale price on an exchange or market on which they are traded, or, if there is no such reported sale, at the most recent quoted bid price. If available, debt securities are priced based upon
valuations provided by independent third-party pricing agents. Such values generally reflect the last reported sales price if the security is actively traded. The third party pricing agents may also value debt securities at an evaluated bid price by employing methodologies that utilize actual market transactions, broker-supplied valuations, or other methodologies designed to identify the market value for such securities. Debt obligations with remaining maturities of sixty days or less may be valued at their amortized cost, which approximates market value. Prices for most securities held in the Funds are provided daily by recognized independent pricing agents. If a security price cannot be obtained from an independent third-party pricing agent, the Fixed Income Funds seek to obtain a bid price from at least one independent broker.
Securities for which market prices are not “readily available” are valued in accordance with Fair Value Procedures established by the Trust’s Board of Trustees. The Trust’s Fair Value Procedures are implemented through a Fair Value Committee (the “Committee”) designated by the Funds’ Board of Trustees. Some of the more common reasons that may necessitate that a security be valued using Fair Value Procedures include: the security’s trading has been halted or suspended; the security has been de-listed from a national exchange; the security’s primary trading market is temporarily closed at a time when under normal conditions it would be open; or the security’s primary pricing source is not able or willing to provide a price. When a security is valued in accordance with the Fair Value Procedures, the Committee will determine the value after taking into consideration relevant information reasonably available to the Committee. As of July 31, 2018, there were no fair valued securities held by the Funds.
In accordance with U.S. GAAP, fair value is defined as the price that a Fund would receive upon selling an investment in an orderly transaction to an independent buyer in the principal or most advantageous market of the investment. A three tier hierarchy has been established to maximize the use of observable and minimize the use of unobservable inputs and to establish classification of fair value measurements for disclosure purposes. Inputs refer broadly to the assumptions that market participants would use in pricing an asset. Inputs may be observable or unobservable. Observable inputs are inputs that reflect the assumptions market participants would use in pricing the asset or liability based on market data obtained from sources independent of the reporting entity. Unobservable inputs are inputs that reflect the reporting entity’s own assumptions about the assumptions market participants would use in pricing the asset or liability based on the best information available in the circumstances.
| 46 | SEI Daily Income Trust / Semi-Annual Report / July 31, 2018 |
The three-tier hierarchy of inputs is summarized in the three broad Levels listed below:
Level 1 — Unadjusted quoted prices in active markets for identical, unrestricted assets or liabilities that the Fund has the ability to access at the measurement date;
Level 2 — Quoted prices which are not active, or inputs that are observable (either directly or indirectly) for substantially the full term of the asset or liability; and
Level 3 — Prices, inputs or exotic modeling techniques which are both significant to the fair value measurement and unobservable (supported by little or no market activity).
Investments are classified within the level of the lowest significant input considered in determining fair value. Investments classified within Level 3 whose fair value measurement considers several inputs may include Level 1 or Level 2 inputs as components of the overall fair value measurement.
For the period ended July 31, 2018, there have been no significant changes to the Trust’s fair valuation methodologies.
Security Transactions and Investment Income —
Security transactions are recorded on the trade date. Costs used in determining net realized capital gains and losses on the sale of securities are on the basis of specific identification. Dividend income is recognized on the ex-dividend date, and interest income is recognized using the accrual basis of accounting.
Distributions received on securities that represent a return of capital or capital gain are recorded as a reduction of cost of investments and/ or as a realized gain. The Trust estimates the components of distributions received that may be considered nontaxable distributions or capital gain distributions.
For the Fixed Income Funds, amortization and accretion is calculated using the scientific interest method, which approximates the effective interest method over the holding period of the security. Amortization of premiums and discounts is included in interest income.
For the Money Market Funds, all amortization is calculated using the straight line method over the holding period of the security. Amortization of premiums and accretion of discounts are included in interest income.
Repurchase Agreements — To the extent consistent with its investment objective and strategies, securities pledged as collateral for repurchase agreements are held by each Fund’s custodian bank until the repurchase date of the repurchase agreement. The Funds also invest in tri-party repurchase agreements. Securities
held as collateral for tri-party repurchase agreements are maintained by the broker’s custodian bank in a segregated account until the repurchase date of the repurchase agreement. Provisions of the repurchase agreements and the Trust’s policies require that the market value of the collateral, including accrued interest thereon, is sufficient in the event of default by the counterparty. If the counterparty defaults and the value of the collateral declines, or if the counterparty enters into an insolvency proceeding, realization of the collateral by the Funds may be delayed or limited.
It is the Funds’ policy to present the repurchase agreements contracts separately on the Statements of Assets and Liabilities, as the Funds do not have a master netting agreement with the counterparty to the repurchase agreements contracts. Refer to each Fund’s Schedule of Investments for details regarding repurchase agreements contracts as of July 31, 2018, if applicable.
Futures Contracts — To the extent consistent with its investment objective and strategies, the Fixed Income Funds utilized futures contracts during the fiscal year ended January 31, 2018. These Funds’ investments in futures contracts are designed to enable the Funds to more closely approximate the performance of their benchmark indices. The Funds chose to invest in futures contracts for tactical hedging purposes as well as to enhance the Funds’ returns. Initial margin deposits of cash or securities are made upon entering into futures contracts. The contracts are marked to market daily and the resulting changes in value are accounted for as unrealized gains and losses. Variation margin payments are paid or received, depending upon whether unrealized gains or losses are incurred. When the contract is closed, the Funds record a realized gain or loss equal to the difference between the proceeds from (or cost of) the closing transaction and the amount invested in the contract.
Risks of entering into futures contracts include the possibility that there will be an imperfect price correlation between the futures and the underlying securities. Second, it is possible that a lack of liquidity for futures contracts could exist in the secondary market, resulting in an inability to close a position prior to its maturity date. Third, the futures contract involves the risk that the Funds could lose more than the original margin deposit required to initiate a futures transaction.
Finally, the risk exists that losses could exceed amounts disclosed on the Statements of Assets and Liabilities.
It is the Funds’ policy to present the gross variation margin payable and the gross variation margin receivable of the future contracts separately on the
| SEI Daily Income Trust / Semi-Annual Report / July 31, 2018 | 47 |
NOTES TO FINANCIAL STATEMENTS (Unaudited) (Continued)
July 31, 2018
Statements of Assets and Liabilities, as the Funds do not have a master netting agreement with the counterparty to the futures contracts. Refer to each Fund’s Schedule of Investments for details regarding open future contracts as of July 31, 2018, if applicable. The fair value of interest rate futures contracts held in the Fixed Income Funds can be found on the Statements of Assets and Liabilities under the captions Receivable for Variation Margin and Payable for Variation Margin. Only current day’s variation margin is reported within the Statements of Assets and Liabilities. Cumulative appreciation/ depreciation of futures contracts are reported in the respective Fixed Income Funds’ Schedule of Investments. Realized gains or losses on interest rate futures contracts related to the Fixed Income Funds are recognized on the Statements of Operations as part of Net Realized Gain (Loss) on Futures Contracts and any change in unrealized appreciation or depreciation is recognized on the Statements of Operations as Net Unrealized Gain (Loss) on Futures Contracts.
Swap Agreements — To the extent consistent with its investment objective and strategies, a Fund’s investment in swap contracts is mainly used as an efficient means to take and manage risk in the portfolio, including interest rate risk, credit risk and overall yield sensitivity. A swap agreement is a two-party contract under which an agreement is made to exchange returns from predetermined investments or instruments, including a particular interest rate, foreign currency, or “basket” of securities representing a particular index. Interest rate swaps involve the exchange by a Fund with another party of their respective commitments to pay or receive interest (e.g., an exchange of floating rate payments for fixed rate payments) with respect to a notional amount of principal. Credit-default swaps involve periodic payments by a Fund or counterparty based on a specified rate multiplied by a notional amount assigned to an underlying debt instrument or group of debt instruments in exchange for the assumption of credit risk on the same instruments. In the event of a credit event, usually in the form of a credit rating downgrade, the party receiving periodic payments (i.e. floating rate payer) must pay the other party (i.e. fixed rate payer) an amount equal to the recovery rate used to settle the contracts. The recovery rate is a function of how many credit default swap investors wish to deliver the security or receive the security. The recovery rate is determined through an auction process. Total return swaps allow an investor to benefit from the cash flow without ever actually owning the underlying security. The receiver must pay any decline in value to the payer at the end of the total return swap. However, the investor does not need to make a payment if there is
no decline in price. Payments can be made on various indices, bonds (i.e. mortgage backed securities, bank debt and corporate), loans or commodities. The value of a total return swap is equal to the change in value of the underlying asset versus the accrued income payment based on LIBOR or some other form of indices on the notional amount. Interest rate swaps involve the exchange by a Fund with another party of their respective commitments to pay or receive interest (e.g., an exchange of floating rate payments for fixed rate payments) with respect to a notional amount of principal to manage a Fund’s exposure to interest rates. Payments received or made are recorded as realized gains or loss. A Fund could be exposed to credit or market risk due to unfavorable changes in the fluctuation of interest rates or if the Counterparty defaults on its obligation to perform. Risk of loss may exceed amounts recognized on the statement of assets and liabilities. Interest rate swap contracts outstanding at period end, if any, are listed after a Fund’s portfolio. In connection with swap agreements securities may be set aside as collateral by a Fund’s custodian. A Fund may enter into swap agreements in order to, among other things, change the maturity or duration of the investment portfolio, to protect a Fund’s value from changes in interest rates, or to expose a Fund to a different security or market.
Swaps are marked-to-market daily based upon quotations from market makers and the resulting changes in market values, if any, are recorded as an unrealized gain or loss in the Statement of Operations. Net payments of interest are recorded as realized gains or losses.
Entering into swap agreements involves, to varying degrees, elements of credit and market risk in excess of the amounts recognized on the Statements of Assets and Liabilities. Such risks involve the possibility that there will be no liquid market for these agreements, that the counterparty to the agreement may default on its obligation to perform and that there may be unfavorable changes in the fluctuation of interest rates. Risks also arise from potential losses from adverse market movements.
This risk is mitigated by having a master netting arrangement between a Fund and the counterparty and by having the counterparty post collateral to cover a Fund’s exposure to the counterparty. There were no outstanding swap agreements as of July 31, 2018
Options Written/Purchased — To the extent consistent with its Investment Objective and Strategies, a Fund may invest in financial options contracts to add return or to hedge their existing portfolio securities. When the Fund writes or purchases an option, an amount equal to the premium received or paid by the Fund is recorded
| 48 | SEI Daily Income Trust / Semi-Annual Report / July 31, 2018 |
as a liability or an asset and is subsequently adjusted to the current market value of the option written or purchased. Premiums received or paid from purchasing or writing options which expire unexercised are treated by the Fund on the expiration date as realized gains or losses. The difference between the premium and the amount paid or received on effecting a closing purchase or sale transaction, including brokerage commissions, is also treated as a realized gain or loss. If an option is exercised, the premium paid or received is added to the cost of the purchase or proceeds from the sale in determining whether the Fund has realized a gain or a loss. The risk in writing a call option is that the Fund gives up the opportunity for profit if the market price of the security increases. The risk in writing a put option is that the Fund may incur a loss if the market price of the security decreases and the option is exercised. The risk in purchasing an option is that the Fund pays a premium whether or not the option is exercised. The Fund also has the additional risk of being unable to enter into a closing transaction at an acceptable price if a liquid secondary market does not exist. Option contracts also involve the risk that they may not work as intended due to unanticipated developments in market conditions or other causes. Finally, the risk exists that losses could exceed amounts disclosed on the Statement of Assets and Liabilities. There were no outstanding options contracts as of July 31, 2018.
TBA Purchase Commitments — To the extent consistent with its Investment Objective and Strategies, a Fixed Income Fund may engage in “to be announced” (“TBA”) purchase commitments to purchase securities for a fixed price at a future date. TBA purchase commitments may be considered securities and involve a risk of loss if the value of the security to be purchased declines prior to settlement date, which risk is in addition to the risk of decline in the value of a Fund’s other assets. Unsettled TBA purchase commitments are valued at the current market value of the underlying securities, according to the procedures described under “Security Valuation” above.
Collateralized Debt Obligations — To the extent consistent with its Investment Objective and Strategies, a Fund may invest in collateralized debt obligations (“CDOs”), which include collateralized loan obligations (“CLOs”) and other similarly structured securities. CLOs are a type of asset-backed securities. A CLO is a trust typically collateralized by a pool of loans, which may include, among others, domestic and foreign senior secured loans, senior unsecured loans, and subordinate corporate loans, including loans that may be rated below investment grade or equivalent unrated loans. CDOs may charge management fees and administrative expenses.
For CDOs and CLOs, the cash flows from the trust are split into two or more portions, called tranches, varying in risk and yield. The riskiest portion is the “equity” tranche which bears the bulk of defaults from the bonds or loans in the trust and serves to protect the other, more senior tranches from default in all but the most severe circumstances. Since it is partially protected from defaults, a senior tranche from a CDO and CLO trust typically has a higher rating and lower yield than its underlying securities, and can be rated investment grade. Despite the protection from the equity tranche, CDO and CLO tranches can experience substantial losses due to actual defaults, increased sensitivity to defaults due to collateral default and disappearance of protecting tranches, market anticipation of defaults, as well as aversion to CDO and CLO securities as a class.
The risks of an investment in a CDO and CLO depend largely on its class and its collateral securities. Normally, CLOs and other CDOs are privately offered and sold, and thus, are not registered under the securities laws. As a result, investments in CDOs and CLOs may be characterized by the Funds as illiquid securities; however, an active dealer market may exist for CDOs and CLOs, allowing a CDO and CLO to qualify for Rule 144A transactions. In addition to the normal risks associated with fixed income securities (e.g., interest rate risk and default risk), CDOs and CLOs carry additional risks including, but not limited to: (i) the possibility that distributions from collateral securities will not be adequate to make interest or other payments; (ii) the quality of the collateral may decline in value or default; (iii) the Funds may invest in CDOs and CLOs that are subordinate to other classes; and (iv) the complex structure of the security may not be fully understood at the time of investment and may produce disputes with the issuer or unexpected investment results.
Illiquid Securities — A security is considered illiquid if it cannot be sold or disposed of in the ordinary course of business within seven days or less for its approximate carrying value on the books of a Fund. Valuations of illiquid securities may differ significantly from the values that would have been used had an active market value for these securities existed.
Restricted Securities — Throughout the year, the Funds owned private placement investments that were purchased through private offerings or acquired through initial public offerings that could not be sold without prior registration under the Securities Act of 1933 or pursuant to an exemption there from. In addition, the Funds had generally agreed to further restrictions on the disposition of certain holdings as set forth in various agreements entered into in connection with the purchase of those investments. These investments
| SEI Daily Income Trust / Semi-Annual Report / July 31, 2018 | 49 |
NOTES TO FINANCIAL STATEMENTS (Unaudited) (Continued)
July 31, 2018
were valued at amortized cost, which approximates fair value, as determined in accordance with the procedures approved by the Board of Trustees. At July 31, 2018, the Funds did not own any restricted securities.
Classes — Class-specific expenses are borne by that class of shares. Income, non-class specific expenses, and realized and unrealized gains/losses are allocated to the respective class on the basis of relative daily net assets.
Expenses — Expenses that are directly related to one of the Funds are charged directly to that Fund. Other operating expenses of the Funds are prorated to the Funds on the basis of relative net assets.
Dividends and Distributions to Shareholders — Dividends from net investment income are declared daily and paid monthly. Any net realized capital gains on sales of securities after capital loss carryover are distributed at least annually by the Funds.
3. INVESTMENT ADVISORY, ADMINISTRATION, DISTRIBUTION AND CUSTODIAN AGREEMENTS AND OTHER TRANSACTIONS WITH AFFILIATES
Investment Advisory, Administration, Distribution and Custodian Agreements — SEI Investments Management Corporation (“SIMC”) serves as each Fund’s investment adviser (the “Adviser”) and ’’manager of managers” under an investment advisory agreement approved by the shareholders of each Fund. In connection with serving as Adviser, SIMC is entitled to a fee, which is calculated daily and paid monthly, based on the average daily net assets of each Fund. SEI Investments Global Funds Services (the “Administrator”) provides the Trust with administrative and transfer agency services. For its services, the Administrator is entitled to a fee, which is calculated daily and paid monthly, based on the average daily net assets of each Fund.
SEI Investments Distribution Co. (the “Distributor”), a wholly owned subsidiary of SEI Investments Company (“SEI”) and a registered broker-dealer, acts as the Distributor of the shares of the Trust under a Distribution Agreement. The Trust also has adopted plans under which firms, including the Distributor, that provide shareholder and administrative services may receive compensation thereof. Specific classes of certain funds have also adopted distribution plans, pursuant to Rule 12b-1 under the Investment Company Act of 1940.
Such plans provide fees payable to the Distributor up to the amounts, calculated as a percentage of the average daily net assets attributable to each particular class of each respective fund.
The Money Market Funds’ Administrator and/or the Distributor have contractually agreed to waive fees
or reimburse expenses for each money market Fund until May 31, 2019, in order to keep total fund operating expenses (exclusive of interest from borrowings, brokerage commissions, trustees’ fees, taxes and other extraordinary expenses not incurred in the ordinary course of the Fund’s business) from exceeding the levels specified in the table below. These contractual waivers and reimbursements will only apply if a Money Market Fund’s total operating costs exceed the applicable thresholds and will not affect the Money Market Fund’s total operating costs if they are less than the applicable thresholds. In other words, shareholders will pay the lower of a Money Market Fund’s actual total fund operating expenses or total fund operating expenses after contractual waivers and expense reimbursements. The contractual waiver and expense reimbursement are limited to the Money Market Fund’s direct operating expenses and, therefore, do not apply to indirect expenses incurred by a fund, such as acquired fund fees and expenses (“AFFE”). The agreement may be amended or terminated only with the consent of the Board of Trustees.
The Adviser, Administrator and/or Distributor have voluntarily agreed to waive a portion of their fees in order to keep total direct operating expenses (exclusive of interest from borrowings, brokerage commissions, taxes, Trustee fees, prime broker fees, interest and dividend expenses related to short sales and extraordinary expenses not incurred in the ordinary course of the Fixed Income Funds’ business) at a specified level.
The waivers by the Fixed Income Funds’ Adviser, Administrator and/or Distributor are limited to the Fixed Income Funds’ direct operating expenses and, therefore, do not apply to indirect expenses incurred by the Funds, such as acquired fund fees and expenses. The waivers are voluntary and the Fixed Income Funds’ Adviser, Administrator and/or Distributor may discontinue all or part of any of these waivers at any time. In addition, some Funds may participate in a commission recapture program where the Funds’ trades may be executed through the Funds’ distributor, and a portion of the commissions paid on those trades are then used to pay the Funds’ expenses.
| 50 | SEI Daily Income Trust / Semi-Annual Report / July 31, 2018 |
The following is a summary of annual fees payable to the Adviser, and Distributor and the expense limitations for each fund:
| Advisory Fees | Shareholder Servicing Fees | Expense Limitations | ||||
Government Fund | ||||||
Class F | 0.07% | 0.25% | 0.20%(3) | |||
Class CAA | 0.07% | 0.25% | 0.25%(2) | |||
Government II Fund | ||||||
Class F | 0.07% | 0.25% | 0.20%(2) | |||
Treasury Fund | ||||||
Class F | 0.07% | 0.25% | 0.20%(2) | |||
Treasury II Fund | ||||||
Class F | 0.07% | 0.25% | 0.20%(2) | |||
Ultra Short Duration Bond Fund | ||||||
Class F | 0.10%(4) | 0.25% | 0.38%(1) | |||
Class Y | 0.10%(4) | –% | 0.30%(1) | |||
Short-Duration Government Fund | ||||||
Class F | 0.09%(5) | 0.25% | 0.48%(1) | |||
Class Y | 0.09%(5) | –% | 0.38%(1) | |||
GNMA Fund | ||||||
Class F | 0.09%(5) | 0.25% | 0.63%(1) | |||
Class Y | 0.09%(5) | –% | 0.43%(1) |
| (1) | Represents a voluntary cap that may be discontinued at any time. |
| (2) | Represents a contractual cap effective through May 31, 2019, to be changed only by board approval. |
| (3) | Represents a contractual cap of .25% of Class F (formerly Class A), effective through May 31, 2019 , to be changed only by Board approval. In addition, management has voluntarily waived fees to a cap of .20 of Class F (formerly Class A) that may be discontinued at any time. |
| (4) | The Adviser receives an annual fee equal to .10% on the first $500 million of net assets, .075% of net assets between $500 million and $1 billion and .05% on the net assets in excess of $1 billion for the Ultra Short Duration Bond Fund. The fee is calculated based on the net assets of the Ultra Short Duration Bond Fund. |
| (5) | The Adviser receives an annual fee equal to .10% on the first $500 million of net assets, .075% of net assets between $500 million and $1 billion and .05% on the net assets in excess of $1 billion for the Short-Duration Government and GNMA Funds. The fee is a blended percentage and is calculated based on the combined assets of these Funds. |
The following is a summary of annual fees payable to the Administrator:
| Administration Fees | ||||||||||||||||||||
First $1.5 Billion of Assets | Next $500 Million of Assets | Next $500 Million of Assets | Next $500 Million of Assets | Over $3 Billion of Assets | ||||||||||||||||
SDIT Government Fund | 0.150% | 0.1375% | 0.1250% | 0.1125% | 0.100% | |||||||||||||||
SDIT Government II Fund | 0.150% | 0.1375% | 0.1250% | 0.1125% | 0.100% | |||||||||||||||
SDIT Treasury Fund | 0.150% | 0.1375% | 0.1250% | 0.1125% | 0.100% | |||||||||||||||
SDIT Treasury II Fund | 0.150% | 0.1375% | 0.1250% | 0.1125% | 0.100% | |||||||||||||||
SDIT Ultra Short Duration Bond Fund | 0.200% | 0.1775% | 0.1550% | 0.1325% | 0.110% | |||||||||||||||
SDIT Short-Duration Government Fund | 0.200% | 0.1775% | 0.1550% | 0.1325% | 0.110% | |||||||||||||||
SDIT GNMA Fund | 0.200% | 0.1775% | 0.1550% | 0.1325% | 0.110% | |||||||||||||||
The Distributor has voluntarily waived all or a portion of the shareholder servicing fees for Class F of each fund, except for the GNMA Fund, since inception of the plan. Such waivers are voluntary and may be discontinued at any time. The Administrator and Distributor have voluntarily agreed to waive and reduce their fee and/or reimburse certain expenses of the Money Market Funds in order to limit the one-day net income yield of the Funds to not less than 0.01% of the Funds’ average daily net assets. The Funds did not have any such waivers by class for the period ended July 31, 2018.
Pursuant to the “manager of managers” structure, the Board of Trustees approved BlackRock Advisors, LLC as sub-adviser to the Money Market Funds, Logan
Circle Partners, L.P. serves as a sub-adviser to the Ultra Short Duration Bond Fund and Wellington Management Company, LLP (“Wellington LLP”) serves as sub-adviser to the Fixed Income Funds. Each sub-adviser is party to an investment sub-advisory agreement with the Advisor. For its services to the Funds, the sub-advisers are entitled to receive a fee paid directly by the Adviser.
U.S. Bank, N.A. serves as the custodian of the Funds. The custodian plays no role in determining the investment policies of the Funds or which securities are to be purchased or sold in the Funds.
Other — Certain officers and Trustees of the Trust are also officers and/or Trustees of the Administrator, Adviser, or the Distributor. The Trust pays each
| SEI Daily Income Trust / Semi-Annual Report / July 31, 2018 | 51 |
NOTES TO FINANCIAL STATEMENTS (Unaudited) (Continued)
July 31, 2018
unaffiliated Trustee an annual fee for attendance at quarterly, interim, and committee meetings. The Administrator, Adviser and/or the Distributor pays compensation of Officers and affiliated Trustees.
A portion of the services provided by the Chief Compliance Officer (“CCO”) and his staff, whom are employees of the administrator, are paid for by the Trust as incurred. The services include regulatory oversight of the Trust’s Adviser, Sub-Advisers and service providers as required by SEC regulations.
Interfund Lending — The SEC has granted an exemption that permits the Trust to participate in an inter-fund lending program (the “Program”) with existing or future investment companies registered under the 1940 Act that are advised by SIMC (the “SEI Funds”). The Program allows the SEI Funds to lend money to and borrow money from each other for temporary or emergency purposes. Participation in the Program is voluntary for both borrowing and lending funds. Inter-fund loans may be made only when the rate of interest to be charged is more favorable to the lending fund than an investment in overnight repurchase agreements (“Repo Rate”), and more favorable to the borrowing fund than the rate of interest that would be charged by a bank for short-term borrowings (“Bank Loan Rate”). The Bank Loan Rate will be determined using a formula reviewed annually by the SEI Funds Board of Trustees. The interest rate imposed on inter-fund loans is the average of the Repo Rate and the Bank Loan Rate. For the period ended July 31, 2018, the Trust has not participated in the Program.
4. INVESTMENT TRANSACTIONS
The cost of security purchases and the proceeds from the sale of securities, other than short-term investments,
for the period ended July 31, 2018, were as follows for the Fixed Income Funds:
U.S. Gov’t ($ Thousands) |
Other ($ Thousands) |
Total ($ Thousands) | ||||||||||
Ultra Short Duration Bond Fund |
| |||||||||||
Purchases | $ | 10,235 | $ | 51,792 | $ | 62,027 | ||||||
Sales | 20,623 | 44,735 | 65,358 | |||||||||
Short-Duration Government Fund |
| |||||||||||
Purchases | 112,517 | – | 112,517 | |||||||||
Sales | 60,492 | 25,628 | 86,120 | |||||||||
GNMA Fund |
| |||||||||||
Purchases | 49,037 | 310 | 49,347 | |||||||||
Sales | 57,602 | 641 | 58,243 | |||||||||
5. FEDERAL TAX INFORMATION
It is each Fund’s intention to continue to qualify as a regulated investment company for Federal income tax purposes and distribute all of its taxable income (including net capital gains). Accordingly, no provision for Federal income taxes is required.
Reclassification of Components of Net Assets — The timing and characterization of certain income and capital gain distributions are determined annually in accordance with Federal tax regulations which may differ from accounting principles generally accepted in the United States. As a result, net investment income (loss) and net realized gain (loss) on investment transactions for the reporting period may differ from distributions during such period. These book/tax differences may be temporary or permanent in nature.
To the extent these differences are permanent, they are charged or credited to Paid-in Capital, undistributed net investment income, or accumulated net realized gain, as appropriate, in the periods that the differences arise.
The tax character of dividends and distributions during the last two fiscal years was as follows:
Ordinary Income | Long-term Capital Gain ($ Thousands) | Total ($ Thousands) | ||||||||||||||
Government Fund | ||||||||||||||||
| 2018 | $ | 56,626 | $ | – | $ | 56,626 | ||||||||||
| 2017 | 11,947 | – | 11,947 | |||||||||||||
Government II Fund | ||||||||||||||||
| 2018 | 15,370 | – | 15,370 | |||||||||||||
| 2017 | 3,105 | – | 3,105 | |||||||||||||
Treasury Fund | ||||||||||||||||
| 2018 | 780 | – | 780 | |||||||||||||
| 2017 | 281 | – | 281 | |||||||||||||
Treasury II Fund | ||||||||||||||||
| 2018 | 4,142 | – | 4,142 | |||||||||||||
| 2017 | 862 | – | 862 | |||||||||||||
| 52 | SEI Daily Income Trust / Semi-Annual Report / July 31, 2018 |
| Ordinary Income ($ Thousands) | Long-term Capital Gain ($ Thousands) | Total ($ Thousands) | ||||||||||||||
Ultra Short Duration Bond Fund | ||||||||||||||||
| 2018 | 4,570 | – | 4,570 | |||||||||||||
| 2017 | 2,957 | – | 2,957 | |||||||||||||
Short-Duration Government Fund | ||||||||||||||||
| 2018 | 13,434 | – | 13,434 | |||||||||||||
| 2017 | 9,845 | – | 9,845 | |||||||||||||
GNMA Fund | ||||||||||||||||
| 2018 | 2,737 | – | 2,737 | |||||||||||||
| 2017 | 3,710 | 365 | 4,075 | |||||||||||||
As of January 31, 2018, the components of Distributable Earnings/(Accumulated Losses) on a tax basis were as follows:
| Undistributed Ordinary Income ($ Thousands) | Undistributed Long-Term Capital Gain ($ Thousands) | Capital Loss Carryforwards | Post- October | Late Year Ordinary Losses ($ Thousands) | Unrealized Appreciation (Depreciation) ($ Thousands) | Other Temporary Differences ($ Thousands) | Total Distributable Earnings (Accumulated Losses) ($ Thousands) | |||||||||||||||||||||||||
Government Fund | $ | 6,867 | $ | – | $ | (39 | ) | $ | – | $ | – | $ | – | $ | (6,879 | ) | $ | (51 | ) | |||||||||||||
Government II Fund | 2,147 | – | – | – | – | – | (2,129 | ) | 18 | |||||||||||||||||||||||
Treasury Fund | 98 | – | – | – | – | – | (98 | ) | – | |||||||||||||||||||||||
Treasury II Fund | 589 | – | – | – | – | (3 | ) | (573 | ) | 13 | ||||||||||||||||||||||
Ultra Short Duration Bond Fund | 440 | – | (17,724 | ) | – | – | (458 | ) | | (437 | ) | (18,179 | ) | |||||||||||||||||||
Short-Duration Government Fund | 1,741 | – | (10,734 | ) | – | – | (8,449 | ) | (1,133 | ) | (18,575 | ) | ||||||||||||||||||||
GNMA Fund | 181 | – | (2,430 | ) | – | – | (225 | ) | (191 | ) | (2,665 | ) | ||||||||||||||||||||
At January 31, 2018, the following Funds had capital loss carryforwards to offset future realized capital gains:
| Amount ($ Thousands) | Expiration | |||||||
Ultra Short Duration Bond Fund | 11,895 | 1/31/19 | ||||||
For Federal income tax purposes, capital loss carryforwards may be carried forward and applied against future capital gains. It is the Funds’ intent that they will not distribute any realized gain distributions until the carryforwards have been offset or expired.
During the fiscal year ended January 31, 2018, the Ultra Short Duration Government Fund utilized $343,056 of capital loss carryforwards to offset capital gains.
Under the recently enacted Regulated Investment Company Modernization Act of 2010, Funds will be permitted to carry forward capital losses incurred in taxable years beginning after December 22, 2010 for an unlimited period. However, any losses incurred during those future taxable years will be required to be utilized prior to the losses incurred in pre-enactment taxable years. As a result of this ordering rule, pre-enactment capital loss carryforwards may be more likely to expire unused. Additionally, post-enactment capital losses that
are carried forward will retain their character as either short-term or long-term capital losses rather than being considered all short-term as under previous law.
Losses carried forward under these new provisions are as follows:
Short-Term Loss ($ Thousands) | Long-Term Loss ($ Thousands) | Total ($ Thousands) | ||||||||||
Government Fund | $ | 39 | $ | – | $ | 39 | ||||||
Ultra Short Duration Bond Fund | 11,895 | 5,829 | 17,724 | |||||||||
Short-Duration Government Fund | 2,502 | 8,232 | 10,734 | |||||||||
GMNA Fund | 2,067 | 362 | 2,429 | |||||||||
During the period ended July 31, 2018, the Money Market Funds’ cost of securities for Federal income tax purposes approximates the cost located in the Statements of Assets and Liabilities.
For Federal income tax purposes, the cost of securities owned at July 31, 2018, and net realized gains or losses on securities sold for the year, were different from amounts reported for financial reporting purposes, primarily due to wash sales which cannot be used for Federal income tax purposes in the current year and have been deferred for use in future years. The Federal
| SEI Daily Income Trust / Semi-Annual Report / July 31, 2018 | 53 |
NOTES TO FINANCIAL STATEMENTS (Unaudited) (Continued)
July 31, 2018
tax cost and aggregate gross unrealized appreciation and depreciation on investments held by the Fixed Income Funds at July 31, 2018, were as follows:
| Federal Tax Cost ($ Thousands) | Appreciated Securities ($ Thousands) | Depreciated Securities ($ Thousands) | Net Unrealized Depreciation ($ Thousands) | |||||||||||||
Ultra Short Duration Bond Fund | $302,655 | $456 | $(1,287 | ) | $(831 | ) | ||||||||||
Short-Duration Government Fund | 855,535 | 1,403 | (15,187 | ) | (13,784 | ) | ||||||||||
GNMA Fund | 66,592 | 780 | (1,658 | ) | (878 | ) | ||||||||||
Management has analyzed the Funds’ tax positions taken on the federal tax returns for all open tax years and has concluded that as of July 31, 2018, no provision for income tax is required in the Funds’ financial statements. The Funds’ federal income and excise tax returns are subject to examination by the IRS for all open tax years under the applicable Statute of Limitations have not expired are subject to examination by the Internal Revenue Service and state departments of revenue.
6. CONCENTRATION/RISKS
In the normal course of business, a Fund may enter into contracts that provide general indemnifications by a Fund to the counterparty to the contract. A Fund’s maximum exposure under these arrangements is dependent on future claims that may be made against a Fund and, therefore, cannot be established; however, based on experience, management believes the risk of loss from such claim is considered remote.
The following is not intended to be a complete discussion of the risks associated with investing in a fund. Please review each Fund’s prospectus for additional disclosures regarding principal risks associated with investing in a fund.
Asset-Backed Securities Risk — The Ultra Short Duration Bond Fund is subject to asset-backed securities risk, whereas payment of principal and interest on asset- backed securities is dependent largely on the cash flows generated by the assets backing the securities. Securitization trusts generally do not have any assets or sources of funds other than the receivables and related property they own, and asset-backed securities are generally not insured or guaranteed by the related sponsor or any other entity. Asset-backed securities may be more illiquid than more conventional types of fixed income securities that the Fund may acquire.
Commercial Paper Risk — The Ultra Short Duration Bond Fund is subject to commercial paper risk. Commercial paper is a short-term obligation with a maturity generally ranging from one to 270 days and is issued by U.S. or foreign companies or other entities
in order to finance their current operations. Such investments are unsecured and usually discounted from their value at maturity. The value of commercial paper may be affected by changes in the credit rating or financial condition of the issuing entities and will tend to fall when interest rates rise and rise when interest rates fall. Asset-backed commercial paper may be issued by structured investment vehicles or other conduits that are organized to issue the commercial paper and to purchase trade receivables or other financial assets. The repayment of asset-backed commercial paper depends primarily on the cash collections received from such an issuer’s underlying asset portfolio and the issuer’s ability to issue new asset-backed commercial paper.
Corporate Fixed Income Risk — The Ultra Short Duration Bond Fund is subject to corporate fixed income risk. Corporate fixed income securities respond to economic developments, especially changes in interest rates, as well as to perceptions of the creditworthiness and business prospects of individual issuers.
Credit Risk — The Funds are all subject to the risk that the issuer of a security or the counterparty to a contract will default or otherwise become unable to honor a financial obligation.
Derivatives Risk — The Fixed Income Funds’ use of futures contracts and forward contracts is subject to market risk, leverage risk, correlation risk and liquidity risk. Leverage risk, liquidity risk and market risk are described below. Many over-the-counter (OTC) derivative instruments will not have liquidity beyond the counterparty to the instrument. Correlation risk is the risk that changes in the value of the derivative instrument may not correlate perfectly with the underlying asset, rate or index. The Fund’s use of forward contracts is also subject to credit risk and valuation risk. Valuation risk is the risk that the derivative may be difficult to value and/or valued incorrectly. Credit risk is described above. Each of these risks could cause the Fund to lose more than the principal amount invested in a derivative instrument. Some derivatives have the potential for unlimited loss, regardless of the size of the Fund’s initial investment. The other parties to certain derivative contracts present the same types of credit risk as issuers of fixed income securities. The Fixed Income Funds’ use of derivatives may also increase the amount of taxes payable by shareholders. Both U.S. and non-U.S. regulators are in the process of adopting and implementing regulations governing derivatives markets, the ultimate impact of which remains unclear.
Duration Risk — The longer-term securities in which the Fixed Income Funds may invest tend to be more volatile than shorter-term securities. A portfolio with a longer average portfolio duration is more sensitive to changes
| 54 | SEI Daily Income Trust / Semi-Annual Report / July 31, 2018 |
in interest rates than a portfolio with a shorter average portfolio duration.
Extension Risk — The Funds are subject to the risk that rising interest rates may extend the duration of a fixed income security, typically reducing the security’s value.
Fixed Income Market Risk — The prices of the Funds’ fixed income securities respond to economic developments, particularly interest rate changes, as well as to perceptions about the creditworthiness of individual issuers, including governments and their agencies. Generally, the Funds’ fixed income securities will decrease in value if interest rates rise and vice versa. In a low interest rate environment, risks associated with rising rates are heightened. Declines in dealer market-making capacity as a result of structural or regulatory changes could decrease liquidity and/or increase volatility in the fixed income markets. In the case of foreign securities, price fluctuations will reflect international economic and political events, as well as changes in currency valuations relative to the U.S. dollar. In response to these events, the Funds’ value may fluctuate and/or the Funds may experience increased redemptions from shareholders, which may impact the Funds’ liquidity or force the Funds to sell securities into a declining or illiquid market.
Foreign Issuer Risk — The Ultra Short Duration Bond Fund is subject to the risk that issuers in foreign countries face political and economic events unique to such countries. These events will not necessarily affect the U.S. economy or similar issuers located in the U.S.
Interest Rate Risk — The Funds are subject to the risk that a rise in interest rates will cause a fall in the value of fixed income securities, including U.S. Government securities, in which the Funds invest. Although U.S. Government securities are considered to be among the safest investments, they are not guaranteed against price movements due to changing interest rates. A low interest rate environment may present greater interest rate risk, because there may be a greater likelihood of rates increasing and rates may increase more rapidly.
Investment Style Risk — The Fixed Income Funds are subject to the risk that a Funds’ investments in certain securities in a particular market segment pursuant to its particular investment strategy may underperform other market segments or the market as a whole.
Leverage Risk — The Fixed Income Funds’ use of derivatives or investments in repurchase agreements may result in the Funds’ total investment exposure substantially exceeding the value of its portfolio securities and the Funds’ investment returns depending
substantially on the performance of securities that the Funds may not directly own. The use of leverage can amplify the effects of market volatility on the Funds’ share price and may also cause the Funds to liquidate portfolio positions when it would not be advantageous to do so in order to satisfy its obligations. The Funds’ use of leverage may result in a heightened risk of investment loss.
Liquidity Risk — The Funds are subject to the risk that certain securities may be difficult or impossible to sell at the time and the price that the seller would like. The seller may have to lower the price of the security, sell other securities instead or forego an investment opportunity, any of which could have a negative effect on Fund management or performance.
Market Risk — The Funds are subject to the risk that the market value of a security may move up and down, sometimes rapidly and unpredictably. Market risk may affect a single issuer, an industry, a sector or the bond market as a whole.
Mortgage-Backed Securities Risk — The Fixed Income Funds are subject to mortgage-backed securities risk. Mortgage-backed securities are affected significantly by the rate of prepayments and modifications of the mortgage loans backing those securities, as well as by other factors such as borrower defaults, delinquencies, realized or liquidation losses and other shortfalls. Mortgage-backed securities are particularly sensitive to prepayment risk, which is described below, given that the term to maturity for mortgage loans is generally substantially longer than the expected lives of those securities; however, the timing and amount of prepayments cannot be accurately predicted. The timing of changes in the rate of prepayments of the mortgage loans may significantly affect the Fund’s actual yield to maturity on any mortgage-backed securities, even if the average rate of principal payments is consistent with the Funds’ expectations. Along with prepayment risk, mortgage-backed securities are significantly affected by interest rate risk, which is described above. In a low interest rate environment, mortgage loan prepayments would generally be expected to increase due to factors such as refinancings and loan modifications at lower interest rates. In contrast, if prevailing interest rates rise, prepayments of mortgage loans would generally be expected to decline and therefore extend the weighted average lives of mortgage-backed securities held or acquired by a fund.
Opportunity Risk — The Funds are subject to the risk of missing out on an investment opportunity because the assets necessary to take advantage of it are tied up in other investments.
| SEI Daily Income Trust / Semi-Annual Report / July 31, 2018 | 55 |
NOTES TO FINANCIAL STATEMENTS (Unaudited) (Concluded)
July 31, 2018
Prepayment Risk — The Funds (excluding the Treasury Fund and Treasury II Fund) are subject to the risk that, in a declining interest rate environment, fixed income securities with stated interest rates may have the principal paid earlier than expected, requiring the Funds to invest the proceeds at generally lower interest rates.
Portfolio Turnover Risk — Due to their investment strategies, the Short-Duration Government Fund and GNMA Fund may buy and sell securities frequently. This may result in higher transaction costs and additional capital gains tax liabilities, which may affect the Funds’ performance.
Redemption Risk — The Money Market Funds may experience periods of heavy redemptions that could cause the Funds to liquidate its assets at inopportune times or at a loss or depressed value, particularly during periods of declining or illiquid markets. This could have a significant adverse effect on the Funds’ ability to maintain a stable $1.00 share price, and, in extreme circumstances, could cause the Funds to suspend redemptions and liquidate completely.
Repurchase Agreement Risk — The Funds (excluding the Government Fund and Treasury Fund) are subject to repurchase agreement risk. Although repurchase agreement transactions must be fully collateralized at all times, they generally create leverage and involve some counterparty risk to the Fund whereby a defaulting counterparty could delay or prevent the Funds’ recovery of collateral.
U.S. Government Securities Risk — The Funds are subject to U.S. Government securities risk. Although U.S. Government securities are considered to be among the safest investments, they are not guaranteed against price movements due to changing interest rates. Obligations issued by some U.S. Government agencies are backed by the U.S. Treasury, while others are backed solely by the ability of the agency to borrow from the U.S. Treasury or by the agency’s own resources.
7. CONCENTRATION OF SHAREHOLDERS
SEI Private Trust Company (“SPTC”) and SIMC are subsidiaries of SEI Investments Company. As of July 31, 2018, SPTC held of record the following:
Government Fund, Cl CAA | 100.00% | |
Government Fund, Cl Y | 57.41% | |
Government II Fund | 67.19% | |
Treasury Fund | 86.53% | |
Treasury II Fund | 67.77% | |
Ultra Short Duration Bond Fund, Cl F | 92.56% | |
Ultra Short Duration Bond Fund, Cl Y | 77.70% | |
Short-Duration Government Fund, Cl F | 97.37% | |
Short-Duration Government Fund, Cl Y | 10.46% | |
GNMA Fund, Cl F | 79.42% |
GNMA Fund, Cl Y | 75.81% |
SPTC is not a direct service provider to the Funds. However, SPTC performs a key role in the comprehensive investment solution that SEI provides to investors. SPTC holds the vast majority of shares in the Funds as custodian for shareholders that are clients of the advisors and financial planners. SPTC maintains accounts at SEI Institutional Transfer Agency (“SITA”), and operates in an omnibus fund account environment.
8. SUBSEQUENT EVENTS
Management has evaluated the need for disclosures and/or adjustments resulting from subsequent events through the date the financial statements were issued. Based on this evaluation, no disclosures and/ or adjustments were required to the financial statements as of July 31, 2018.
| 56 | SEI Daily Income Trust / Semi-Annual Report / July 31, 2018 |
DISCLOSURE OF FUND EXPENSES (Unaudited)
July 31, 2018
All mutual funds have operating expenses. As a shareholder of a mutual fund, your investment is affected by these ongoing costs, which include (among others) costs for portfolio management, administrative services, and shareholder reports like this one. It is important for you to understand the impact of these costs on your investment returns.
Operating expenses such as these are deducted from the mutual fund‘s gross income and directly reduce your final investment return. These expenses are expressed as a percentage of the mutual fund’s average net assets; this percentage is known as the mutual fund’s expense ratio.
The following examples use the expense ratio and are intended to help you understand the ongoing costs (in dollars) of investing in your Fund and to compare these costs with those of other mutual funds. The examples are based on an investment of $1,000 made at the beginning of the period shown and held for the entire period (February 1, 2018 to July 31, 2018).
The table on the next page illustrates your Fund’s costs in two ways:
• Actual Fund Return. This section helps you to estimate the actual expenses after fee waivers that your Fund incurred over the period. The “Expenses Paid During Period” column shows the actual dollar expense cost incurred by a $1,000 investment in the Fund, and the “Ending Account Value” number is derived from deducting that expense cost from the Fund’s gross investment return.
You can use this information, together with the actual amount you invested in your Fund, to estimate the expenses you paid over that period. Simply divide your actual starting account value by $1,000 to arrive at a ratio (for example, an $8,600 account value divided by $1,000 = 8.6), then multiply that ratio by the number shown for your Fund under “Expenses Paid During Period.”
• Hypothetical 5% Return. This section helps you compare your Fund’s costs with those of other mutual funds. It assumes that your Fund had an annual 5% return before expenses during the year, but that the expense ratio (Column 3) is unchanged. This example is useful in making comparisons because the Securities and Exchange Commission requires all mutual funds to make this 5% calculation. You can assess your Fund’s comparative cost by comparing the hypothetical result for your Fund in the “Expense Paid During Period” column with those that appear in the same charts in the shareholder reports for other mutual funds.
NOTE: Because the return is set at 5% for comparison purposes — NOT your Fund’s actual return — the account values shown do not apply to your specific investment.
| Beginning | Ending | Expenses | ||||||||||||||
| Account | Account | Annualized | Paid | |||||||||||||
| Value | Value | Expense | During | |||||||||||||
| 2/1/18 | 7/31/18 | Ratios | Period * | |||||||||||||
Government Fund | ||||||||||||||||
Actual Fund Return | ||||||||||||||||
Class F | $1,000.00 | $1,007.20 | 0.20 | % | $1.00 | |||||||||||
Class CAA | 1,000.00 | 1,007.20 | 0.20 | 1.00 | ||||||||||||
Hypothetical 5% Return | ||||||||||||||||
Class F | $1,000.00 | $1,023.80 | 0.20 | % | $1.00 | |||||||||||
Class CAA | 1,000.00 | 1,023.80 | 0.20 | 1.00 | ||||||||||||
Government II Fund | ||||||||||||||||
Actual Fund Return | ||||||||||||||||
Class F | $1,000.00 | $1,007.40 | 0.20 | % | $1.00 | |||||||||||
Hypothetical 5% Return | ||||||||||||||||
Class F | $1,000.00 | $1,023.80 | 0.20 | % | $1.00 | |||||||||||
| Beginning | Ending | Expenses | ||||||||||||||
| Account | Account | Annualized | Paid | |||||||||||||
| Value | Value | Expense | During | |||||||||||||
| 2/1/18 | 7/31/18 | Ratios | Period * | |||||||||||||
Treasury Fund | ||||||||||||||||
Actual Fund Return | ||||||||||||||||
Class F | $1,000.00 | $1,007.20 | 0.20 | % | $1.00 | |||||||||||
Hypothetical 5% Return | ||||||||||||||||
Class F | $1,000.00 | $1,023.80 | 0.20 | % | $1.00 | |||||||||||
Treasury II Fund | ||||||||||||||||
Actual Fund Return | ||||||||||||||||
Class F | $1,000.00 | $1,007.30 | 0.20 | % | $1.00 | |||||||||||
Hypothetical 5% Return | ||||||||||||||||
Class F | $1,000.00 | $1,023.80 | 0.20 | % | $1.00 | |||||||||||
| SEI Daily Income Trust / Semi-Annual Report / July 31, 2018 | 57 |
DISCLOSURE OF FUND EXPENSES (Unaudited) (Concluded)
July 31, 2018
Beginning Account Value 2/1/18 | Ending Account Value 7/31/18 | Annualized Expense Ratios | Expenses Paid During Period * | |||||||||||||
Ultra Short Duration Bond Fund |
| |||||||||||||||
Actual Fund Return | ||||||||||||||||
Class F | $1,000.00 | $1,009.10 | 0.38 | % | $1.89 | |||||||||||
Class Y | 1,000.00 | 1,008.40 | 0.30 | 1.49 | ||||||||||||
Hypothetical 5% Return | ||||||||||||||||
Class F | $1,000.00 | $1,022.91 | 0.38 | % | $1.91 | |||||||||||
Class Y | 1,000.00 | 1,023.31 | 0.30 | 1.51 | ||||||||||||
Short-Duration Government Fund |
| |||||||||||||||
Actual Fund Return | ||||||||||||||||
Class F | $1,000.00 | $1,003.10 | 0.48 | % | $2.38 | |||||||||||
Class Y | 1,000.00 | 1,003.80 | 0.33 | 1.64 | ||||||||||||
Hypothetical 5% Return | ||||||||||||||||
Class F | $1,000.00 | $1,022.41 | 0.48 | % | $2.41 | |||||||||||
Class Y | 1,000.00 | 1,023.16 | 0.33 | 1.66 | ||||||||||||
Beginning Account Value 2/1/18 | Ending Account Value 7/31/18 | Annualized Expense Ratios | Expenses Paid During Period * | |||||||||||||
GNMA Fund | ||||||||||||||||
Actual Fund Return | ||||||||||||||||
Class F | $1,000.00 | $999.70 | 0.59 | % | $2.93 | |||||||||||
Class Y | 1,000.00 | 1,000.90 | 0.34 | 1.69 | ||||||||||||
Hypothetical 5% Return | ||||||||||||||||
Class F | $1,000.00 | $1,021.87 | 0.59 | % | $2.96 | |||||||||||
Class Y | 1,000.00 | 1,023.11 | 0.34 | 1.71 | ||||||||||||
| * | Expenses are equal to the Fund’s annualized expense ratio multiplied by the average account value over the period, multiplied by 181/365. |
| 58 | SEI Daily Income Trust / Semi-Annual Report / July 31, 2018 |
BOARD OF TRUSTEES’ CONSIDERATIONS IN APPROVING THE ADVISORY AGREEMENT (Unaudited)
SEI Daily Income Trust (the “Trust”) and SEI Investments Management Corporation (“SIMC”) have entered into an investment advisory agreement (the “Advisory Agreement”). Pursuant to the Advisory Agreement, SIMC is responsible for the investment advisory services provided to the series of the Trust (the “Funds”). Pursuant to separate sub-advisory agreements with SIMC (the “Sub-Advisory Agreements” and, together with the Advisory Agreement, the “Investment Advisory Agreements”), and under the supervision of SIMC and the Trust’s Board of Trustees (the “Board”), the sub-advisers (each, a “Sub-Adviser” and collectively, the “Sub-Advisers”) provide security selection and certain other advisory services with respect to all or a discrete portion of the assets of the Funds. The Sub-Advisers are also responsible for managing their employees who provide services to the Funds. The Sub-Advisers are selected based primarily upon the research and recommendations of SIMC, which evaluates quantitatively and qualitatively the Sub-Advisers’ skills and investment results in managing assets for specific asset classes, investment styles and strategies.
The Investment Company Act of 1940, as amended (the “1940 Act”), requires that the initial approval of, as well as the continuation of, the Funds’ Investment Advisory Agreements be specifically approved: (i) by the vote of the Board or by a vote of the shareholders of the Funds; and (ii) by the vote of a majority of the Trustees who are not parties to the Investment Advisory Agreements or “interested persons” of any party (the “Independent Trustees”), cast in person at a meeting called for the purpose of voting on such approval(s). In connection with their consideration of such approval(s), the Funds’ Trustees must request and evaluate, and SIMC and the Sub-Advisers are required to furnish, such information as may be reasonably necessary to evaluate the terms of the Investment Advisory Agreements. In addition, the Securities and Exchange Commission takes the position that, as part of their fiduciary duties with respect to a mutual fund’s fees, mutual fund boards are required to evaluate the material factors applicable to a decision to approve an investment advisory agreement.
Consistent with these responsibilities, the Board calls and holds meetings each year to consider whether to approve new and/or renew existing Investment Advisory Agreements between the Trust and SIMC and SIMC and the Sub-Advisers with respect to the Funds of the Trust. In preparation for these meetings, the Board requests and reviews a wide variety of materials provided by SIMC and the Sub-Advisers, including information about SIMC’s and the Sub-Advisers’ affiliates, personnel and operations and the services provided pursuant to the Investment Advisory Agreements. The Board also receives data from third parties. This information is provided in addition to the detailed information about the Funds that the Board reviews during the course of each year, including information that relates to Fund operations and Fund performance. The Trustees also receive a memorandum from counsel regarding the responsibilities of Trustees in connection with their consideration of whether to approve the Trust’s Investment Advisory Agreements. Finally, the Independent Trustees receive advice from independent counsel to the Independent Trustees, meet in executive sessions outside the presence of Fund management and participate in question and answer sessions with representatives of SIMC and the Sub-Advisers.
Specifically, during the first half of the Trust’s fiscal year, the Board requested and received written materials from SIMC and the Sub-Advisers regarding: (i) the quality of SIMC’s and the Sub-Advisers’ investment management and other services; (ii) SIMC’s and the Sub-Advisers’ investment management personnel; (iii) SIMC’s and the Sub-Advisers’ operations and financial condition; (iv) SIMC’s and the Sub-Advisers’ brokerage practices (including any soft dollar arrangements) and investment strategies; (v) the level of the advisory fees that SIMC charges the Funds and the level of the sub-advisory fees that SIMC pays the Sub-Advisers, compared with fees each charge to comparable accounts; (vi) the advisory fees charged by SIMC and the Funds’ overall fees and operating expenses compared with peer groups of mutual funds prepared by Broadridge, an independent provider of investment company data; (vii) the level of SIMC’s and the Sub-Advisers’ profitability from their Fund-related operations; (viii) SIMC’s and the Sub-Advisers’ compliance program, including a description of material compliance matters and material compliance violations; (ix) SIMC’s potential economies of scale; (x) SIMC’s and the Sub-Advisers’ policies on and compliance procedures for personal securities transactions; (xi) SIMC’s and the Sub-Advisers’ expertise and resources in domestic and/or international financial markets; and (xii) the Funds’ performance over various periods of time compared with peer groups of mutual funds prepared by Broadridge and the Funds’ benchmark indexes.
At the March 27–28, 2018 meeting of the Board, the Trustees, including a majority of the Independent Trustees, approved the renewal of the Advisory Agreement. Also, certain Sub-Advisory Agreements were either initially approved or, if the Sub-Advisory Agreement was already in effect (unless operating under an initial two-year term), renewed at a meeting of the Board held during the course of the Trust’s fiscal year on March 27–28, 2018. In each case, the Board’s approval (or renewal) was based on its consideration and evaluation of the factors described
| SEI Daily Income Trust / Semi-Annual Report / July 31, 2018 | 59 |
BOARD OF TRUSTEES’ CONSIDERATIONS IN APPROVING THE ADVISORY AGREEMENT (Unaudited) (Concluded)
above, as discussed at the meeting and at prior meetings. The following discusses some, but not all, of the factors that were considered by the Board in connection with its assessment of the Investment Advisory Agreements.
Nature, Extent and Quality of Services. The Board considered the nature, extent and quality of the services provided by SIMC and the Sub-Advisers to the Funds and the resources of SIMC and the Sub-Advisers and their affiliates dedicated to the Funds. In this regard, the Trustees evaluated, among other things, SIMC’s and each Sub-Adviser’s personnel, experience, track record and compliance program. Following evaluation, the Board concluded that, within the context of its full deliberations, the nature, extent and quality of services provided by SIMC and the Sub-Advisers to the Funds and the resources of SIMC and the Sub-Advisers and their affiliates dedicated to the Funds were sufficient to support the renewal of the Investment Advisory Agreements. In addition to advisory services, the Board considered the nature and quality of certain administrative, transfer agency and other non-investment advisory services provided to the Funds by SIMC and/or its affiliates.
Performance. In determining whether to renew SIMC’s Advisory Agreement, the Trustees considered the Funds’ performance relative to their peer groups and appropriate indexes/benchmarks. The Trustees reviewed performance information for each Fund, noting that they receive performance reports that permit them to monitor each Fund’s performance at board meetings throughout the year. As part of this review, the Trustees considered the composition of each peer group and selection criteria. In assessing Fund performance, the Trustees considered a report compiled by Broadridge, an independent third-party that was engaged to prepare an assessment of the Funds in connection with the renewal of the Advisory Agreement (the “Broadridge Report”). The Broadridge Report included metrics on risk analysis, volatility versus total return, net total return and performance consistency for the Funds and a universe of comparable funds. Based on the materials considered and discussed at the meeting, the Trustees found Fund performance satisfactory, or, where performance was materially below the benchmark and/or peer group, the Trustees were satisfied with the reasons provided to explain such performance. In connection with the approval or renewal of Sub-Advisory Agreements, the Board considered the performance of the Sub-Adviser relative to appropriate indexes/benchmarks. Following evaluation, the Board concluded that, within the context of its full deliberations, the performance of the Funds was sufficient to support renewal of SIMC’s Advisory Agreement, and the performance of each Sub-Adviser was sufficient to support approval or renewal of the Sub-Advisory Agreement.
Fees. With respect to the Funds’ expenses under the Investment Advisory Agreements, the Trustees considered the rate of compensation called for by the Investment Advisory Agreements and the Funds’ net operating expense ratio in comparison to those of the Funds’ respective peer groups. In assessing Fund expenses, the Trustees considered the information in the Broadridge Report, which included various metrics related to fund expenses, including, but not limited to, contractual management fees at various asset levels, actual management fees (including transfer agent expenses), and actual total expenses for the Funds and a universe of comparable funds. Based on the materials considered and discussion at the meeting, the Trustees further determined that fees were either shown to be below the peer average in the comparative fee analysis, or that there was a reasonable basis for the fee level. The Trustees also considered the effects of SIMC’s waiver of management and other fees to prevent total Fund operating expenses from exceeding a specified cap and concluded that SIMC, through waivers, has maintained the Funds’ net operating expenses at competitive levels for its distribution channels. In determining the appropriateness of fees, the Board also took into consideration the impact of fees incurred indirectly by the Funds as a result of investments into underlying funds, including funds from which SIMC or its affiliates earn fees. The Board also took into consideration compensation earned from the Funds by SIMC or its affiliates for non-advisory services, such as administration, transfer agency, shareholder services or brokerage, and considered whether SIMC and its affiliates may have realized other benefits from their relationship with the Funds, such as any research and brokerage services received under soft dollar arrangements. When considering fees paid to Sub-Advisers, the Board took into account the fact that the Sub-Advisers are compensated by SIMC and not by the Funds directly, and that such compensation with respect to any unaffiliated Sub-Adviser reflects an arms-length negotiation between the Sub-Adviser and SIMC. Following evaluation, the Board concluded that, within the context of its full deliberations, the expenses of the Funds are reasonable and supported renewal of the Investment Advisory Agreements. The Board also considered whether the Sub-Advisers and their affiliates may have realized other benefits from their relationship with the Funds, such as any research and brokerage services received under soft dollar arrangements.
Profitability. With regard to profitability, the Trustees considered compensation flowing to SIMC and the Sub-Advisers and their affiliates, directly or indirectly. The Trustees considered whether the levels of compensation and profitability were reasonable. As with the fee levels, when considering the profitability of the Sub-Advisers, the Board
| 60 | SEI Daily Income Trust / Semi-Annual Report / July 31, 2018 |
took into account the fact that compensation with respect to any unaffiliated Sub-Adviser reflects an arms-length negotiation between the Sub-Adviser and SIMC. In connection with the approval or renewal of each Sub-Advisory Agreement, the Board also took into consideration the impact that the fees paid to the Sub-Adviser have on SIMC’s advisory fee margin and profitability. Based on this evaluation, the Board concluded that, within the context of its full deliberations, the profitability of each of SIMC and the Sub-Advisers is reasonable and supported renewal of the Investment Advisory Agreements.
Economies of Scale. With respect to the Advisory Agreement, the Trustees considered whether any economies of scale were being realized by SIMC and its affiliates and, if so, whether the benefits of such economies of scale were passed along to the Funds’ shareholders through a graduated investment advisory fee schedule or other means, including any fee waivers by SIMC and its affiliates. The Trustees recognized that economies of scale are difficult to identify and quantify and are rarely identifiable on a fund-by-fund basis. Based on this evaluation, the Board determined that the fees were reasonable in light of the information that was provided by SIMC with respect to economies of scale.
Based on the Trustees’ deliberation and their evaluation of the information described above, the Board, including all of the Independent Trustees, with the assistance of Fund counsel and Independent Trustees’ counsel, unanimously approved the approval or renewal, as applicable, of the Investment Advisory Agreements and concluded that the compensation under the Investment Advisory Agreements is fair and reasonable in light of such services and expenses and such other matters as the Trustees considered to be relevant in the exercise of their reasonable judgment. In the course of its deliberations, the Board did not identify any particular factor (or conclusion with respect thereto) or single piece of information that was all-important, controlling or determinative of its decision, but considered all of the factors together, and each Trustee may have attributed different weights to the various factors (and conclusions with respect thereto) and information.
| SEI Daily Income Trust / Semi-Annual Report / July 31, 2018 | 61 |
SEI DAILY INCOME TRUST SEMI-ANNUAL REPORT July 31, 2018
Robert A. Nesher, Chairman
Trustees
William M. Doran
George J. Sullivan, Jr.
Nina Lesavoy
James M. Williams
Mitchell A. Johnson
Susan Cote
Hubert L. Harris, Jr.
James B. Taylor
Officers
Robert A. Nesher
President and Chief Executive Officer
James J. Hoffmayer
Controller and Chief Financial Officer
Glenn Kurdziel
Assistant Controller
Russell Emery
Chief Compliance Officer
Timothy D. Barto
Vice President, Secretary
David McCann
Vice President, Assistant Secretary
Aaron Buser
Vice President, Assistant Secretary
Stephen G. MacRae
Vice President
Bridget E. Sudall
Anti-Money Laundering Compliance Officer
Privacy Officer
Investment Adviser
SEI Investments Management Corporation
Administrator
SEI Investments Global Funds Services
Distributor
SEI Investments Distribution Co.
Legal Counsel
Morgan, Lewis & Bockius LLP
Independent Registered Public Accounting Firm
KPMG LLP
This report and the financial statements contained herein are submitted for the general information of the shareholders of the Trust and must be preceded or accompanied by a current prospectus. Shares of the Funds are not deposits or obligations of, or guaranteed or endorsed by, any bank. The shares are not federally insured by the Federal Deposit Insurance Corporation (FDIC), the Federal Reserve Board, or any other government agency. Investment in the shares involves risk, including the possible loss of principal.
For more information call
1 800 DIAL SEI
(1 800 342 5734)

1 Freedom Valley Drive, P.O. Box 1100, Oaks, PA 19456
SEI-F-037 (7/18)
Item 2. Code of Ethics.
Not applicable for semi-annual report.
Item 3. Audit Committee Financial Expert.
Not applicable for semi-annual report.
Item 4. Principal Accountant Fees and Services.
Not applicable for semi-annual report.
Item 5. Audit Committee of Listed Registrants.
Not applicable.
Item 6. Investments.
Included in Item 1.
Item 7. Disclosure of Proxy Voting Policies and Procedures for Closed-End Management Investment Companies.
Not applicable.
Item 8. Portfolio Managers of Closed-End Management Investment Companies.
Not applicable.
Item 9. Purchases of Equity Securities by Closed-End Management Company and Affiliated Purchasers.
Not applicable.
Item 10. Submission of Matters to a Vote of Security Holders.
There have been no material changes to the procedures by which shareholders may recommend nominees to the Registrants Board of Trustees (the “Board”). The Registrant has a standing Governance Committee (the “Committee”) currently consisting of the independent trustees. The Committee is responsible for evaluating and recommending nominees for election. Pursuant to the Committee’s Charter, adopted on June 18th 2004, as amended, the Committee will review all shareholder recommendations for nominations to fill vacancies on the Board if such recommendations are submitted in writing and addressed to the Committee at the Registrant’s office.
Item 11. Controls and Procedures.
(a) The Registrant’s principal executive and principal financial officers, or persons performing similar functions, have concluded that the Registrant’s disclosure controls and procedures (as defined in Rule 30a-3(c) under the Investment Company Act of 1940 (the “1940 Act”)) are effective, based on the evaluation of these controls and procedures required by Rule 30a-3(b) under the 1940 Act and Rules 13a-15(b) or 15d-15(b) under the Securities Exchange Act of 1934 as of a date within 90 days of the filing date of this report.
(b) There were no changes in the Registrant’s internal control over financial reporting (as defined in Rule 30a-3(d) under the 1940 Act) that occurred during the last fiscal quarter of the period covered by this report that have materially affected, or are reasonably likely to materially affect, the Registrant’s internal control over financial reporting.
Items 12. Disclosure of Securities Lending Activities for Closed-End Management Investment Companies.
Not applicable.
Items 13. Exhibits.
(a)(1) Not applicable for semi-annual report.
(a)(2) A separate certification for the principal executive officer and the principal financial officer of the Registrant as required by Rule 30a-2(a) under the Investment Company Act of 1940, are filed herewith.
(b) Officer certifications as required by Rule 30a-2(b) under the Investment Company Act of 1940, also accompany this filing as an exhibit.
SIGNATURES
Pursuant to the requirements of the Securities Exchange Act of 1934 and the Investment Company Act of 1940, the Registrant has duly caused this report to be signed on its behalf by the undersigned, thereunto duly authorized.
| SEI Daily Income Trust | ||
| By: | /s/ Robert A. Nesher | |
| Robert A. Nesher, President & CEO | ||
Date: October 5, 2018
Pursuant to the requirements of the Securities Exchange Act of 1934 and the Investment Company Act of 1940, this report has been signed below by the following persons on behalf of the Registrant and in the capacities and on the dates indicated.
| By: | /s/ Robert A. Nesher | |
| Robert A. Nesher, President & CEO |
Date: October 5, 2018
| By: | /s/ James J. Hoffmayer | |
| James J. Hoffmayer, Controller & CFO |
Date: October 5, 2018