UNITED STATES
SECURITIES AND EXCHANGE COMMISSION
Washington, D.C. 20549
FORM N-CSR
CERTIFIED SHAREHOLDER REPORT OF REGISTERED
MANAGEMENT INVESTMENT COMPANIES
Investment Company Act file number 811-03455
North Carolina Capital Management Trust
(Exact name of registrant as specified in charter)
245 Summer St., Boston, Massachusetts 02210
(Address of principal executive offices) (Zip code)
Margaret Carey, Secretary
245 Summer St.
Boston, Massachusetts 02210
(Name and address of agent for service)
Registrant's telephone number, including area code:
617-563-7000
| |
Date of fiscal year end: | June 30 |
|
|
Date of reporting period: | June 30, 2023 |
Item 1.
Reports to Stockholders
Government Portfolio
Annual Report
June 30, 2023
Contents
To view a fund's proxy voting guidelines and proxy voting record for the 12-month period ended June 30, visit http://www.fidelity.com/proxyvotingresults or visit the Securities and Exchange Commission's (SEC) web site at http://www.sec.gov.
You may also call 1-800-222-3232 to request a free copy of the proxy voting guidelines.
You may also call to request a free copy of the proxy voting guidelines.
Standard & Poor's, S&P and S&P 500 are registered service marks of The McGraw-Hill Companies, Inc. and have been licensed for use by Fidelity Distributors Corporation.
Other third-party marks appearing herein are the property of their respective owners.
All other marks appearing herein are registered or unregistered trademarks or service marks of FMR LLC or an affiliated company. © 2023 FMR LLC. All rights reserved.
This report and the financial statements contained herein are submitted for the general information of the shareholders of the Fund. This report is not authorized for distribution to prospective investors in the Fund unless preceded or accompanied by an effective prospectus.
A fund files its complete schedule of portfolio holdings with the SEC for the first and third quarters of each fiscal year on Form N-PORT. Forms N-PORT are available on the SEC's web site at http://www.sec.gov. A fund's Forms N-PORT may be reviewed and copied at the SEC's Public Reference Room in Washington, DC. Information regarding the operation of the SEC's Public Reference Room may be obtained by calling 1-800-SEC-0330.
For a complete list of a fund's portfolio holdings, view the most recent holdings listing, semiannual report, or annual report on Fidelity's web site at http://www.fidelity.com, http://www.institutional.fidelity.com, or http://www.401k.com, as applicable.
NOT FDIC INSURED •MAY LOSE VALUE •NO BANK GUARANTEE
Neither the Fund nor Fidelity Distributors Corporation is a bank.
| Current 7-Day Yields |
| | | |
| Government Portfolio | 5.02% | |
| | | |
Yield refers to the income paid by the Fund over a given period. Yield for money market funds is usually for seven-day periods, as it is here, though it is expressed as an annual percentage rate. Past performance is no guarantee of future results. Yield will vary and it's possible to lose money investing in the Fund. A portion of the Fund's expenses was reimbursed and/or waived. Absent such reimbursements and/or waivers the yield for the period ending June 30, 2023, the most recent period shown in the table, would have been 4.95% for Government Portfolio. | |
| Effective Maturity Diversification (% of Fund's Investments) |
| Days |
| 1 - 7 | 83.6 | |
| 8 - 30 | 3.0 | |
| 31 - 60 | 2.3 | |
| 61 - 90 | 1.0 | |
| 91 - 180 | 6.2 | |
| > 180 | 3.9 | |
| Effective maturity is determined in accordance with the requirements of Rule 2a-7 under the Investment Company Act of 1940. |
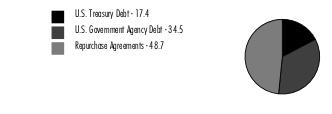
Asset Allocation (% of Fund's net assets) |
|
Net Other Assets (Liabilities) - (0.6)% |
|
| Average Annual Total Returns |
| | | | |
| Periods ended June 30, 2023 | Past 1 year | Past 3 years | Past 5 years | Past 10 years |
| | | | | |
| Government Portfolio | 3.75% | 1.30% | 1.47% | 0.92% |
| Lipper Institutional U.S. Government Money Market Funds Average | 3.48% | 1.19% | 1.31% | 0.78% |
Average annual total return reflects the change in the value of an investment, assuming reinvestment of distributions from dividend income and capital gains (the profits earned upon the sale of securities that have grown in value, if any) and assuming a constant rate of performance each year. The average annual total returns do not reflect the deduction of taxes that a shareholder would pay on fund distributions or the redemption of fund shares. During periods of reimbursement by Fidelity, a fund's total return will be greater than it would be had the reimbursement not occurred. How a fund did yesterday is no guarantee of how it will do tomorrow.
Showing Percentage of Net Assets
| U.S. Treasury Debt - 17.4% |
| | | Yield (%) (a) | Principal Amount (b) | Value ($) |
| U.S. Treasury Inflation Protected Obligations - 1.2% | | | | |
| U.S. Treasury Notes | | | | |
| 7/15/23 | | 5.48 to 5.53 | 215,087,400 | 215,046,505 |
| | | | | |
| U.S. Treasury Obligations - 16.2% | | | | |
| U.S. Treasury Bills | | | | |
| 7/6/23 to 11/24/23 | | 4.72 to 5.48 | 2,118,200,000 | 2,097,853,553 |
| U.S. Treasury Notes | | | | |
| 7/31/23 to 10/31/24 (c) | | 5.10 to 5.39 | 791,000,000 | 790,412,349 |
TOTAL U.S. TREASURY OBLIGATIONS | | | | 2,888,265,902 |
| TOTAL U.S. TREASURY DEBT (Cost $3,103,312,407) | | | | 3,103,312,407 |
| | | | | |
| U.S. Government Agency Debt - 34.5% |
| | | Yield (%) (a) | Principal Amount (b) | Value ($) |
| Federal Agencies - 34.5% | | | | |
| Federal Farm Credit Bank | | | | |
| 10/3/24 (c)(d)(e) | | 0.00 | 6,000,000 | 6,000,000 |
| 7/7/23 to 5/15/25 (c) | | 4.99 to 5.27 | 1,788,427,000 | 1,788,318,129 |
| Federal Home Loan Bank | | | | |
| 7/3/23 to 11/18/24 (c) | | 4.86 to 5.33 | 4,207,500,000 | 4,204,403,348 |
| Federal Home Loan Bank | | | | |
| 8/10/23 | | 5.19 | 8,000,000 | 7,981,589 |
| Freddie Mac | | | | |
| 6/11/24 | | 5.32 | 150,000,000 | 150,000,000 |
| | | | | |
| TOTAL U.S. GOVERNMENT AGENCY DEBT (Cost $6,156,703,066) | | | | 6,156,703,066 |
| | | | | |
| U.S. Treasury Repurchase Agreement - 48.7% |
| | | Maturity Amount ($) | Value ($) |
| In a joint trading account at 5.04% dated 6/30/23 due 7/3/23 (Collateralized by U.S. Treasury Obligations) # | | 4,191,667,753 | 4,189,909,000 |
| With: | | | |
| BMO Harris Bank NA at: | | | |
5.07%, dated 6/29/23 due 7/6/23 (Collateralized by U.S. Treasury Obligations valued at $30,780,810, 2.25% - 6.63%, 2/15/26 - 2/15/52) | | 30,029,575 | 30,000,000 |
5.11%, dated 5/25/23 due 7/7/23 (Collateralized by U.S. Treasury Obligations valued at $23,565,018, 1.13%, 8/15/40) (c)(e)(f) | | 23,300,354 | 23,000,000 |
| BofA Securities, Inc. at 5.05%, dated: | | | |
6/15/23 due 7/7/23 (Collateralized by U.S. Treasury Obligations valued at $663,962,310, 1.63% - 2.38%, 11/15/49 - 11/15/50) | | 646,788,342 | 643,000,000 |
6/21/23 due 7/7/23 (Collateralized by U.S. Treasury Obligations valued at $256,056,216, 1.38% - 4.50%, 2/15/36 - 5/15/44) | | 251,052,083 | 250,000,000 |
| Goldman Sachs & Co. at 5.05%, dated 6/30/23 due 7/3/23 (Collateralized by U.S. Treasury Obligations valued at $1,785,751,269, 0.00% - 3.88%, 8/8/23 - 8/15/41) | | 1,750,736,458 | 1,750,000,000 |
| NatWest Markets Securities, Inc. at: | | | |
5.06%, dated 6/30/23 due 7/3/23 (Collateralized by U.S. Treasury Obligations valued at $9,183,910, 4.13%, 6/15/26) | | 9,003,795 | 9,000,000 |
5.07%, dated 6/29/23 due 7/6/23 (Collateralized by U.S. Treasury Obligations valued at $46,946,518, 1.75%, 7/31/24) | | 46,045,348 | 46,000,000 |
| TD Securities (U.S.A.) at 5.05%, dated 6/30/23 due 7/3/23 (Collateralized by U.S. Treasury Obligations valued at $1,791,116,500, 0.00% - 7.63%, 8/15/23 - 5/15/53) | | 1,750,736,458 | 1,750,000,000 |
| TOTAL U.S. TREASURY REPURCHASE AGREEMENT (Cost $8,690,909,000) | | | 8,690,909,000 |
| | | | |
| TOTAL INVESTMENT IN SECURITIES - 100.6% (Cost $17,950,924,473) | 17,950,924,473 |
NET OTHER ASSETS (LIABILITIES) - (0.6)% | (99,920,919) |
| NET ASSETS - 100.0% | 17,851,003,554 |
| | |
The date shown for securities represents the date when principal payments must be paid, taking into account any call options exercised by the issuer and any permissible maturity shortening features other than interest rate resets.
Legend
| (a) | Yield represents either the annualized yield at the date of purchase, or the stated coupon rate, or, for floating and adjustable rate securities, the rate at period end. |
| (b) | Amount is stated in United States dollars unless otherwise noted. |
| (c) | Coupon rates for floating and adjustable rate securities reflect the rates in effect at period end. |
| (d) | Security or a portion of the security purchased on a delayed delivery or when-issued basis. |
| (e) | Coupon is indexed to a floating interest rate which may be multiplied by a specified factor and/or subject to caps or floors. |
| (f) | The maturity amount is based on the rate at period end. |
Investment Valuation
All investments are categorized as Level 2 under the Fair Value Hierarchy. The inputs or methodology used for valuing securities may not be an indication of the risk associated with investing in these securities. For more information on valuation inputs, refer to the Investment Valuation section in the accompanying Notes to Financial Statements.
| Other Information |
| # Additional information on each counterparty to the repurchase agreement is as follows: |
| Repurchase Agreement / Counterparty | Value ($) | |
| $4,189,909,000 due 7/03/23 at 5.04% | | |
| BofA Securities, Inc. | 1,000,000,000 | |
| Citigroup Global Markets, Inc. | 400,000,000 | |
| JP Morgan Securities LLC | 864,909,000 | |
| Nomura Securities International | 850,000,000 | |
| Societe Generale | 1,075,000,000 | |
| | 4,189,909,000 | |
| | | |
| Statement of Assets and Liabilities |
| | | | June 30, 2023 |
| | | | | |
| Assets | | | | |
Investment in securities, at value (including repurchase agreements of $8,690,909,000) - See accompanying schedule Unaffiliated issuers (cost $17,950,924,473): | | | $ | 17,950,924,473 |
| Cash | | | | 42,001,565 |
| Receivable for fund shares sold | | | | 140,940 |
| Interest receivable | | | | 52,775,732 |
| Receivable from investment adviser for expense reductions | | | | 996,923 |
Total assets | | | | 18,046,839,633 |
| Liabilities | | | | |
| Payable for investments purchased | | | | |
Regular delivery | $ | 176,914,300 | | |
Delayed delivery | | 6,000,000 | | |
| Payable for fund shares redeemed | | 8,131,095 | | |
| Distributions payable | | 1,729,351 | | |
| Accrued management fee | | 3,061,333 | | |
| Total Liabilities | | | | 195,836,079 |
| Net Assets | | | $ | 17,851,003,554 |
| Net Assets consist of: | | | | |
| Paid in capital | | | $ | 17,850,715,960 |
| Total accumulated earnings (loss) | | | | 287,594 |
| Net Assets | | | $ | 17,851,003,554 |
Net Asset Value , offering price and redemption price per share ($17,851,003,554 ÷ 17,848,006,124 shares) | | | $ | 1.00 |
| Statement of Operations |
| | | | Year ended June 30, 2023 |
| Investment Income | | | | |
| Interest | | | $ | 637,446,980 |
| Expenses | | | | |
| Management fee | $ | 33,183,922 | | |
| Independent trustees' fees and expenses | | 380,808 | | |
| Total expenses before reductions | | 33,564,730 | | |
| Expense reductions | | (10,934,967) | | |
| Total expenses after reductions | | | | 22,629,763 |
| Net Investment income (loss) | | | | 614,817,217 |
| Realized and Unrealized Gain (Loss) | | | | |
| Net realized gain (loss) on: | | | | |
| Investment Securities: | | | | |
| Unaffiliated issuers | | 143,996 | | |
| Total net realized gain (loss) | | | | 143,996 |
| Net increase in net assets resulting from operations | | | $ | 614,961,213 |
| Statement of Changes in Net Assets |
| |
| | Year ended June 30, 2023 | | Year ended June 30, 2022 |
| Increase (Decrease) in Net Assets | | | | |
| Operations | | | | |
| Net investment income (loss) | $ | 614,817,217 | $ | 19,811,993 |
| Net realized gain (loss) | | 143,996 | | (33,896) |
Net increase in net assets resulting from operations | | 614,961,213 | | 19,778,097 |
| Distributions to shareholders | | (613,634,475) | | (20,827,268) |
| | | | | |
| Share transactions | | | | |
| Proceeds from sales of shares | | 22,079,189,785 | | 16,760,968,950 |
| Reinvestment of distributions | | 595,650,244 | | 20,087,356 |
| Cost of shares redeemed | | (18,491,767,923) | | (15,213,685,741) |
| | | | | |
Net increase (decrease) in net assets and shares resulting from share transactions | | 4,183,072,106 | | 1,567,370,565 |
| Total increase (decrease) in net assets | | 4,184,398,844 | | 1,566,321,394 |
| | | | | |
| Net Assets | | | | |
| Beginning of period | | 13,666,604,710 | | 12,100,283,316 |
| End of period | $ | 17,851,003,554 | $ | 13,666,604,710 |
| | | | | |
| Other Information | | | | |
| Shares | | | | |
| Sold | | 22,079,189,785 | | 16,760,968,950 |
| Issued in reinvestment of distributions | | 595,650,244 | | 20,087,356 |
| Redeemed | | (18,491,767,923) | | (15,213,685,741) |
| Net increase (decrease) | | 4,183,072,106 | | 1,567,370,565 |
| | | | | |
| Years ended June 30, | | 2023 | | 2022 | | 2021 | | 2020 | | 2019 |
Selected Per-Share Data | | | | | | | | | | |
| Net asset value, beginning of period | $ | 1.00 | $ | 1.00 | $ | 1.00 | $ | 1.00 | $ | 1.00 |
| Income from Investment Operations | | | | | | | | | | |
Net investment income (loss) A | | .037 | | .002 | | - B | | .013 | | .021 |
| Net realized and unrealized gain (loss) | | - | | - | | - | | - | | - |
| Total from investment operations | | .037 | | .002 | | - | | .013 | | .021 |
| Distributions from net investment income | | (.037) | | (.002) | | - B | | (.013) | | (.021) |
| Total distributions | | (.037) | | (.002) | | - B | | (.013) | | (.021) |
| Net asset value, end of period | $ | 1.00 | $ | 1.00 | $ | 1.00 | $ | 1.00 | $ | 1.00 |
Total Return C | | 3.75% | | .16% | | .02% | | 1.31% | | 2.13% |
Ratios to Average Net Assets A,D,E | | | | | | | | | | |
| Expenses before reductions | | .21% | | .22% | | .22% | | .23% | | .23% |
| Expenses net of fee waivers, if any | | .14% | | .08% | | .09% | | .17% | | .18% |
| Expenses net of all reductions | | .14% | | .08% | | .09% | | .17% | | .18% |
| Net investment income (loss) | | 3.80% | | .16% | | .02% | | 1.23% | | 2.14% |
| Supplemental Data | | | | | | | | | | |
| Net assets, end of period (000 omitted) | $ | 17,851,004 | $ | 13,666,605 | $ | 12,100,283 | $ | 8,580,943 | $ | 6,132,802 |
A Net investment income (loss) is affected by the timing of the declaration of dividends by any underlying mutual funds or exchange-traded funds (ETFs). Net investment income (loss) of any mutual funds or ETFs is not included in the Fund's net investment income (loss) ratio.
B Amount represents less than $.0005 per share.
C Total returns would have been lower if certain expenses had not been reduced during the applicable periods shown.
D Fees and expenses of any underlying mutual funds or exchange-traded funds (ETFs) are not included in the Fund's expense ratio. The Fund indirectly bears its proportionate share of these expenses.
E Expense ratios reflect operating expenses of the class. Expenses before reductions do not reflect amounts reimbursed, waived, or reduced through arrangements with the investment adviser, brokerage services, or other offset arrangements, if applicable, and do not represent the amount paid by the class during periods when reimbursements, waivers or reductions occur.
For the period ended June 30, 2023
1. Organization.
Government Portfolio (the Fund) is a fund of The North Carolina Capital Management Trust (the Trust). The Trust is registered under the Investment Company Act of 1940, as amended (the 1940 Act), as an open-end management investment company organized as a Massachusetts business trust. Shares of the Trust are offered exclusively to local government and public authorities of the state of North Carolina. The Fund is authorized to issue an unlimited number of shares.
2. Significant Accounting Policies.
The Fund is an investment company and applies the accounting and reporting guidance of the Financial Accounting Standards Board (FASB) Accounting Standards Codification Topic 946 Financial Services - Investment Companies . The financial statements have been prepared in conformity with accounting principles generally accepted in the United States of America (GAAP), which require management to make certain estimates and assumptions at the date of the financial statements. Actual results could differ from those estimates. Subsequent events, if any, through the date that the financial statements were issued have been evaluated in the preparation of the financial statements. The Fund's Schedule of Investments lists any underlying mutual funds or exchange-traded funds (ETFs) but does not include the underlying holdings of these funds. The following summarizes the significant accounting policies of the Fund:
Investment Valuation. The Fund categorizes the inputs to valuation techniques used to value its investments into a disclosure hierarchy consisting of three levels as shown below:
Level 1 - unadjusted quoted prices in active markets for identical investments
Level 2 - other significant observable inputs (including quoted prices for similar investments, interest rates, prepayment speeds, etc.)
Level 3 - unobservable inputs (including the Fund's own assumptions based on the best information available)
As permitted by compliance with certain conditions under Rule 2a-7 of the 1940 Act, securities are valued at amortized cost, which approximates fair value. The amortized cost of an instrument is determined by valuing it at its original cost and thereafter amortizing any discount or premium from its face value at a constant rate until maturity. Securities held by a money market fund are generally high quality and liquid; however, they are reflected as Level 2 because the inputs used to determine fair value are not quoted prices in an active market.
Investment Transactions and Income. Gains and losses on securities sold are determined on the basis of identified cost. Interest income is accrued as earned and includes coupon interest and amortization of premium and accretion of discount on debt securities as applicable. The principal amount on inflation-indexed securities is periodically adjusted to the rate of inflation and interest is accrued based on the principal amount. The adjustments to principal due to inflation are reflected as increases or decreases to Interest in the accompanying Statement of Operations.
Expenses. Expenses directly attributable to a fund are charged to that fund. Expenses attributable to more than one fund are allocated among the respective funds on the basis of relative net assets or other appropriate methods. Expenses included in the accompanying financial statements reflect the expenses of that fund and do not include any expenses associated with any underlying mutual funds or exchange-traded funds. Although not included in a fund's expenses, a fund indirectly bears its proportionate share of these expenses through the net asset value of each underlying mutual fund or exchange-traded fund. Expense estimates are accrued in the period to which they relate and adjustments are made when actual amounts are known.
Income Tax Information and Distributions to Shareholders. Each year, the Fund intends to qualify as a regulated investment company under Subchapter M of the Internal Revenue Code, including distributing substantially all of its taxable income and realized gains. As a result, no provision for U.S. Federal income taxes is required. As of June 30, 2023, the Fund did not have any unrecognized tax benefits in the financial statements; nor is the Fund aware of any tax positions for which it is reasonably possible that the total amounts of unrecognized tax benefits will significantly change in the next twelve months. The Fund files a U.S. federal tax return, in addition to state and local tax returns as required. The Fund's federal income tax returns are subject to examination by the Internal Revenue Service (IRS) for a period of three fiscal years after they are filed. State and local tax returns may be subject to examination for an additional fiscal year depending on the jurisdiction.
Distributions are declared and recorded daily and paid monthly from net investment income. Distributions from realized gains, if any, are declared and recorded on the ex-dividend date. Income and capital gain distributions are determined in accordance with income tax regulations, which may differ from GAAP. In addition, the fund claimed a portion of the payment made to redeeming shareholders as a distribution for income tax purposes.
Capital accounts within the financial statements are adjusted for permanent book-tax differences. These adjustments have no impact on net assets or the results of operations. Capital accounts are not adjusted for temporary book-tax differences which will reverse in a subsequent period.
Book to tax differences are primarily due to capital loss carryforwards and losses deferred due to wash sales.
As of period end, the cost and unrealized appreciation (depreciation) in securities for federal income tax purposes were as follows:
| Gross unrealized appreciation | $- |
| Gross unrealized depreciation | - |
| Net unrealized appreciation (depreciation) | $- |
| Tax Cost | $17,950,924,473 |
The tax-based components of distributable earnings as of period end were as follows:
| Undistributed ordinary income | $146,619 |
The tax character of distributions paid was as follows:
| | June 30, 2023 | June 30, 2022 |
| Ordinary Income | $613,634,475 | $20,827,268 |
Repurchase Agreements. Pursuant to an Exemptive Order issued by the Securities and Exchange Commission, funds and other registered investment companies having management contracts with Fidelity Management and Research Company LLC, or its affiliates are permitted to transfer uninvested cash balances into joint trading accounts which are then invested in repurchase agreements. Funds may also invest directly with institutions in repurchase agreements. Repurchase agreements may be collateralized by cash or government securities. Upon settlement date, collateral is held in segregated accounts with custodian banks and may be obtained in the event of a default of the counterparty. The collateral balance is monitored on a daily basis to ensure it is at least equal to the principal amount of the repurchase agreement (including accrued interest). In the event of a default by the counterparty, realization of the collateral proceeds could be delayed, during which time the value of the collateral may decline.
Delayed Delivery Transactions and When-Issued Securities. During the period, certain Funds transacted in securities on a delayed delivery or when-issued basis. Payment and delivery may take place after the customary settlement period for that security. The price of the underlying securities and the date when the securities will be delivered and paid for are fixed at the time the transaction is negotiated. Securities purchased on a delayed delivery or when-issued basis are identified as such in the Schedule of Investments. Compensation for interest forgone in the purchase of a delayed delivery or when-issued debt security may be received. With respect to purchase commitments, each applicable Fund identifies securities as segregated in its records with a value at least equal to the amount of the commitment. Payables and receivables associated with the purchases and sales of delayed delivery securities having the same coupon, settlement date and broker are offset. Delayed delivery or when-issued securities that have been purchased from and sold to different brokers are reflected as both payables and receivables in the Statement of Assets and Liabilities under the caption "Delayed delivery", as applicable. Losses may arise due to changes in the value of the underlying securities or if the counterparty does not perform under the contract's terms, or if the issuer does not issue the securities due to political, economic, or other factors.
3. Fees and Other Transactions with Affiliates.
Management Fee. Fidelity Management & Research Company LLC (the investment adviser) and its affiliates provides the Fund with investment management related services for which the Fund pays a monthly management fee. During October 2022 the Board approved a change in the management fee rate to .205% of average net assets effective November 1, 2022. For the period July 1, 2022 through October 31, 2022, the management fee was based upon a graduated series of annual rates ranging between .195% and .275% of average net assets. The investment adviser pays all other expenses, except the compensation of the independent Trustees and certain exceptions such as interest expense. The management fee is reduced by an amount equal to the fees and expenses paid by the Fund to the independent Trustees. For the reporting period the Fund's annual management fee rate, expressed as a percentage of average net assets, was as follows:
Distribution and Service Plan Fees. In accordance with Rule 12b-1 of the 1940 Act, the Fund has adopted a separate Distribution and Service plan. The Fund does not pay any fees for these services. The investment adviser pays Fidelity Distributors Company LLC (FDC), an affiliate of the investment adviser, a Distribution and Service fee from the management fee paid by the Fund. During October 2022 the Board approved a change in the distribution and service plan fee rate to .065% of average net assets effective November 1, 2022. For the period July 1, 2022 through October 31, 2022, the distribution and service fee was based on a graduated series of rates ranging from .06% to .08% of average net assets. For the period, the investment adviser paid FDC $10,290,186 on behalf of the Fund, all of which was paid to the Capital Management of the Carolinas LLC.
Interfund Trades. Funds may purchase from or sell securities to other Fidelity Funds under procedures adopted by the Board. The procedures have been designed to ensure these interfund trades are executed in accordance with Rule 17a-7 of the 1940 Act. During the period, there were no interfund trades.
4. Expense Reductions.
For the period July 1, 2022 through October 31, 2022, the investment adviser or its affiliates voluntarily agreed to waive a portion of the Fund's management fee during the period. The amount of the waiver for the Fund was as follows:
| Government Portfolio | $2,150,497 |
Effective November 1, 2022, the investment adviser contractually agreed to reimburse the Fund to the extent annual operating expenses exceeded .14% of average net assets. Some expenses, for example the compensation of the independent Trustees, and certain miscellaneous expenses such as interest expense, are excluded from this reimbursement. For the period November 1, 2022 through June 30, 2023, this reimbursement reduced the Fund's expenses by $7,485,483.
For the period July 1, 2022 through October 31, 2022, the investment adviser voluntarily agreed to reimburse the Fund to the extent annual operating expenses exceeded .14% of average net assets. Some expenses, for example the compensation of the independent Trustees, and certain miscellaneous expenses such as interest expense, are excluded from this reimbursement. For the period July 1, 2022 through October 31, 2022, this reimbursement reduced the Fund's expenses by $1,264,309.
Through arrangements with the Fund's custodian, credits realized as a result of certain uninvested cash balances were used to reduce the Fund's expenses by $34,678.
5. Other.
A fund's organizational documents provide former and current trustees and officers with a limited indemnification against liabilities arising in connection with the performance of their duties to the fund. In the normal course of business, a fund may also enter into contracts that provide general indemnifications. A fund's maximum exposure under these arrangements is unknown as this would be dependent on future claims that may be made against a fund. The risk of material loss from such claims is considered remote.
6. Risk and Uncertainties.
Many factors affect a fund's performance. Developments that disrupt global economies and financial markets, such as pandemics, epidemics, outbreaks of infectious diseases, war, terrorism, and environmental disasters, may significantly affect a fund's investment performance. The effects of these developments to a fund will be impacted by the types of securities in which a fund invests, the financial condition, industry, economic sector, and geographic location of an issuer, and a fund's level of investment in the securities of that issuer. Significant concentrations in security types, issuers, industries, sectors, and geographic locations may magnify the factors that affect a fund's performance.
To the Board of Trustees of The North Carolina Capital Management Trust and Shareholders of Government Portfolio
Opinion on the Financial Statements
We have audited the accompanying statement of assets and liabilities, including the schedule of investments, of Government Portfolio (the "Fund") as of June 30, 2023, the related statement of operations for the year ended June 30, 2023, the statement of changes in net assets for each of the two years in the period ended June 30, 2023, including the related notes, and the financial highlights for each of the five years in the period ended June 30, 2023 (collectively referred to as the "financial statements"). In our opinion, the financial statements present fairly, in all material respects, the financial position of the Fund as of June 30, 2023, the results of its operations for the year then ended, the changes in its net assets for each of the two years in the period ended June 30, 2023 and the financial highlights for each of the five years in the period ended June 30, 2023 in conformity with accounting principles generally accepted in the United States of America.
Basis for Opinion
These financial statements are the responsibility of the Fund's management. Our responsibility is to express an opinion on the Fund's financial statements based on our audits. We are a public accounting firm registered with the Public Company Accounting Oversight Board (United States) (PCAOB) and are required to be independent with respect to the Fund in accordance with the U.S. federal securities laws and the applicable rules and regulations of the Securities and Exchange Commission and the PCAOB.
We conducted our audits of these financial statements in accordance with the standards of the PCAOB. Those standards require that we plan and perform the audit to obtain reasonable assurance about whether the financial statements are free of material misstatement, whether due to error or fraud.
Our audits included performing procedures to assess the risks of material misstatement of the financial statements, whether due to error or fraud, and performing procedures that respond to those risks. Such procedures included examining, on a test basis, evidence regarding the amounts and disclosures in the financial statements. Our audits also included evaluating the accounting principles used and significant estimates made by management, as well as evaluating the overall presentation of the financial statements. Our procedures included confirmation of securities owned as of June 30, 2023 by correspondence with the custodian and brokers; when replies were not received from brokers, we performed other auditing procedures. We believe that our audits provide a reasonable basis for our opinion.
/s/ PricewaterhouseCoopers LLP
Boston, Massachusetts
August 11, 2023
We have served as the auditor of one or more investment companies in the Fidelity group of funds since 1932.
The Trustees, Members of the Advisory Board (if any), and officers of the trust and fund, as applicable, are listed below. The Board of Trustees governs the fund and is responsible for protecting the interests of shareholders. The Trustees are experienced executives who meet periodically throughout the year to oversee the fund's activities, review contractual arrangements with companies that provide services to the fund, oversee management of the risks associated with such activities and contractual arrangements, and review the fund's performance. Each of the Trustees oversees one fund.
The Trustees hold office without limit in time except that (a) any Trustee may resign; (b) any Trustee may be removed by written instrument, signed by at least two-thirds of the number of Trustees prior to such removal; (c) any Trustee who requests to be retired or who has become incapacitated by illness or injury may be retired by written instrument signed by a majority of the other Trustees; and (d) any Trustee may be removed at any special meeting of shareholders by a two-thirds vote of the outstanding voting securities of the trust. Each Trustee who is not an interested person (as defined in the 1940 Act) of the trust and the fund is referred to herein as an Independent Trustee. Each Independent Trustee shall retire not later than the last day of the calendar year in which his or her 75th birthday occurs. Officers and Advisory Board Members hold office without limit in time, except that any officer or Advisory Board Member may resign or may be removed by a vote of a majority of the Trustees at any regular meeting or any special meeting of the Trustees. Except as indicated, each individual has held the office shown or other offices in the same company for the past five years.
The fund's Statement of Additional Information (SAI) includes more information about the Trustees. To request a free copy, call Fidelity at .
Experience, Skills, Attributes, and Qualifications of the Trustees. The Board of Trustees has adopted a statement of policy that describes the experience, qualifications, attributes and skills that are necessary and desirable for potential Independent Trustee candidates (Statement of Policy). With respect to the criteria for selecting Independent Trustees, it is expected that all candidates will possess the following minimum qualifications: (i) unquestioned personal integrity; (ii) not an interested person of FMR or its affiliates within the meaning of the Investment Company Act of 1940 (1940 Act); (iii) does not have a material relationship (e.g., commercial, banking, consulting, legal, or accounting) that could create an appearance of lack of independence in respect of FMR and its affiliates; (iv) has the disposition to act independently in respect of FMR and its affiliates and others in order to protect the interests of the funds and all shareholders; (v) ability to attend regularly scheduled meetings during the year; (vi) demonstrates sound business judgment gained through broad experience in significant positions where the candidate has dealt with management, technical, financial, or regulatory issues; (vii) sufficient financial or accounting knowledge to add value in the complex financial environment of the funds; (viii) experience on corporate or other institutional oversight bodies having similar responsibilities, but which board memberships or other relationships could not result in business or regulatory conflicts with the funds; (ix) capacity for the hard work and attention to detail that is required to be an effective Independent Trustee in light of the fund's complex regulatory, operational, and marketing setting; and (x) understanding of the economy of North Carolina and the financing needs of North Carolina counties and municipalities. The Board may determine that a candidate who does not have the type of previous experience or knowledge referred to above should nevertheless be considered as a nominee if the Board finds that the candidate has additional qualifications such that his or her qualifications, taken as a whole, demonstrate the same level of fitness to serve as an Independent Trustee. The Board believes that each Trustee satisfied at the time he was initially elected or appointed a Trustee, and continues to satisfy, the standards contemplated by the Statement of Policy. The Board of Trustees may also engage professional search firms to help identify potential Independent Trustee candidates with experience, qualifications, attributes and skills consistent with the Statement of Policy. Additional criteria based on the composition and skills of the current Independent Trustees as well as experience or skills that may be appropriate in light of future changes to board composition, business conditions, and regulatory or other developments may be considered by a professional search firm and the Board of Trustees. In addition, the Board takes into account the Trustees' commitment and participation in Board and committee meetings, as well as their leadership of standing and ad hoc committees throughout their tenure.
In determining that a particular Trustee was and continues to be qualified to serve as a Trustee, the Board has considered a variety of criteria, none of which, in isolation, was controlling. The Board believes that, collectively, the Trustees have balanced and diverse experience, qualifications, attributes, and skills, which allow the Board to operate effectively in governing the fund and protecting the interests of shareholders. Information about the specific experience, skills, attributes, and qualifications of each Trustee, which in each case led to the Board's conclusion that the Trustee should serve (or continue to serve) as a trustee of the fund, is provided below.
Board Structure and Oversight Function. Robert L. Powell is an Independent Trustee and currently serves as Chairman. The Trustees have determined that an independent Chairman is appropriate and benefits shareholders. In his capacity as Chairman, Mr. Powell (i) acts as a liaison between the Independent Trustees and management with respect to matters important to the Independent Trustees; and (ii) with management, prepares agendas for Board meetings. The Independent Trustees also meet regularly in executive session.
The Trustees oversee one fund that is offered exclusively to certain governmental entities of the State of North Carolina. The Trustees primarily operate as a full Board, but have also established one standing committee, the Audit Committee, to facilitate the timely and efficient consideration of all matters of importance to the Trustees, the fund, and fund shareholders and to facilitate compliance with legal and regulatory requirements and oversight of the fund's activities and associated risks. The Board has charged FMR and its affiliates with (i) identifying events or circumstances the occurrence of which could have demonstrably adverse effects on the fund's business and/or reputation; (ii) implementing processes and controls to lessen the possibility that such events or circumstances occur or to mitigate the effects of such events or circumstances if they do occur; and (iii) creating and maintaining a system designed to evaluate continuously business and market conditions in order to facilitate the identification and implementation processes described in (i) and (ii) above. Because the day-to-day operations and activities of the fund are carried out by or through FMR, its affiliates, and other service providers, the fund's exposure to risks is mitigated but not eliminated by the processes overseen by the Trustees. Board oversight of different aspects of the fund's activities is exercised primarily through the full Board, but also through the Audit Committee. The Operations Committee also worked and continues to work with FMR to enhance the stress tests required under SEC regulations for money market funds. Appropriate personnel, including but not limited to the fund's Chief Compliance Officer (CCO), FMR's internal auditor, the independent accountants, and the fund's Treasurer and portfolio management personnel, make periodic reports to the Board and Audit Committee, as appropriate. The responsibilities of the Audit Committee, including its oversight responsibilities, are described further under "Audit Committee."
Interested Trustees*:
Correspondence intended for a Trustee who is an interested person may be sent to Fidelity Investments, 245 Summer Street, Boston, Massachusetts 02210.
Name, Year of Birth; Principal Occupations and Other Relevant Experience+
Robert A. Litterst (1959)
Year of Election or Appointment: 2014
Trustee
Mr. Litterst currently serves as a director of Beacon Trust Company (2015-present). Mr. Litterst was the Chief Investment Officer of the Money Market Group at Fidelity Management & Research Company (investment adviser firm, 2011-2014) and a portfolio manager at FMR LLC (diversified financial services company, 1991-2014). Mr. Litterst also previously served as the portfolio manager for The North Carolina Capital Management Trust: Cash Portfolio and Term Portfolio (2003-2011).
Cynthia L. Strauss (1954)
Year of Election or Appointment: 2019
Trustee
Ms. Strauss currently serves as a member of the Board of Trustees of the Worcester Art Museum (2020-present), a member of the Board of Directors of Fidelity Digital Assets Services, LLC (2018-present), a member of the Board of Trustees of WGBH (public television and radio, 2017-present), and a member of the Board of Exceptional Lives (disability information non-profit, 2015-present). Prior to her retirement, Ms. Strauss was Director of Research at Fidelity Charitable (independent public charity, 2007-2015) and Director of Research, Equity Division (2005-2007), Director of Taxable Bond Fund Research, Fixed Income Division (2002-2005), and Director of Taxable Money Market Fund Research, Fixed Income Division (1992-2002), at Fidelity Management & Research Company (investment adviser firm).
* Determined to be an "Interested Trustee" by virtue of, among other things, his or her affiliation with the trust, CMC, or various entities under common control with FMR.
+ The information includes the Trustee's principal occupation during the last five years and other information relating to the experience, attributes, and skills relevant to the Trustee's qualifications to serve as a Trustee, which led to the conclusion that the Trustee should serve as a Trustee for the fund.
Independent Trustees:
Correspondence intended for an Independent Trustee may be sent to Fidelity Investments, P.O. Box 55235, Boston, Massachusetts 02205-5235.
Name, Year of Birth; Principal Occupations and Other Relevant Experience+
John H. Grigg (1961)
Year of Election or Appointment: 2018
Trustee
Mr. Grigg is a Managing Director of Fidus Partners, LLC (investment banking, 2005-present) and Fidus Securities, LLC (broker-dealer, 2005-present), a Partner and member of the Investment Committee of Fidus Investment Advisors, LLC (2011-present), and a member of the Board of Directors of Fidus Group Holdings, LLC (financial services, 2015-present). Previously, Mr. Grigg served as a Member of the Advisory Board of the funds (2018), a Managing Director of First Union Securities, Inc. (financial services, 1998-1999), served in various positions including Managing Director and Partner with Bowles Hollowell Conner & Co. (investment banking, 1989-1998), and worked in the investment banking group at Merrill Lynch & Co. (financial services, 1987-1989).
Arrington H. Mixon (1960)
Year of Election or Appointment: 2017
Trustee
Ms. Mixon is Chair of the Governing Board of Directors (2020-present) and Chair of the Investment Committee (2016-present) of Foundation for the Carolinas, a member of the Board of Directors of The Leon Levine Foundation, and a member of the Board of Trustees of the George Washington Foundation. Previously, Ms. Mixon served as a member of the Board of Directors and Chair of the Audit Committee of TIAA, FSB (banking and financial services, 2017-2023), a member of the Board of Directors and Audit Committee and Chair of the Risk Committee of EverBank Financial Corporation (2013-2017), and a member of the Board of Directors of Women's Impact Fund (2008-2013; 2017-2020). She was a Senior Program Officer of The Leon Levine Foundation (2011-2018) and Portfolio Manager of L&L Management (financial planning, 2011-2018). She held a variety of positions at Bank of America Corporation (banking and financial services, 1982-2009), including head of Enterprise Credit Risk (2007-2009), Global Portfolio Strategies (2005-2007), and European Global Markets (2002-2005).
Robert L. Powell (1949)
Year of Election or Appointment: 2014
Trustee
Chairman of the Board of Trustees
Mr. Powell is a retired Senior Advisor for Cansler Fuquay Solutions, Inc. (consulting firm). Previously, Mr. Powell served as Chairman (2017-2018) and a member (2010-2018) of the board of directors of the North Carolina State University Investment Fund, North Carolina State Controller (2001-2008) and a member of the Board of Directors of the State Employees' Supplemental Retirement Board (2003-2009). Prior to his retirement as North Carolina State Controller, Mr. Powell held various positions during his 37-year career in North Carolina State government, including a 4-year term as a corporate tax auditor for the NC Department of Revenue, and 25 years in the NC Office of State Budget and Management during which he served as Deputy State Budget Director and Acting State Budget Director prior to being approved for a 7-year term as State Controller.
+ The information includes the Trustee's principal occupation during the last five years and other information relating to the experience, attributes, and skills relevant to the Trustee's qualifications to serve as a Trustee, which led to the conclusion that the Trustee should serve as a Trustee for the fund.
Advisory Board Members and Officers:
Correspondence intended for a Member of the Advisory Board (if any) may be sent to Fidelity Investments, P.O. Box 55235, Boston, Massachusetts 02205-5235. Correspondence intended for an officer may be sent to Fidelity Investments, 245 Summer Street, Boston, Massachusetts 02210. Officers appear below in alphabetical order.
Name, Year of Birth; Principal Occupation
John J. Burke III (1964)
Year of Election or Appointment: 2018
Chief Financial Officer
Mr. Burke also serves as Chief Financial Officer of other funds. Mr. Burke serves as Head of Investment Operations for Fidelity Fund and Investment Operations (2018-present) and is an employee of Fidelity Investments (1998-present). Previously Mr. Burke served as head of Asset Management Investment Operations (2012-2018).
Margaret Carey (1973)
Year of Election or Appointment: 2023
Secretary and Chief Legal Officer (CLO)
Ms. Carey also serves as an officer of other funds and as CLO of certain other Fidelity entities. She is a Senior Vice President and Deputy General Counsel of FMR LLC (diversified financial services company, 2019-present), and is an employee of Fidelity Investments.
David J. Carter (1973)
Year of Election or Appointment: 2022
Assistant Secretary
Mr. Carter also serves as Assistant Secretary of other funds. Mr. Carter serves as Senior Vice President, Deputy General Counsel (2022-present) and is an employee of Fidelity Investments (2005-present).
Jonathan Davis (1968)
Year of Election or Appointment: 2014
Assistant Treasurer
Mr. Davis also serves as an officer of other funds. Mr. Davis serves as Vice President Assistant Treasurer and is an employee of Fidelity Investments. Mr. Davis serves as Assistant Treasurer of certain Fidelity entities.
Laura M. Del Prato (1964)
Year of Election or Appointment: 2021
President and Treasurer
Ms. Del Prato also serves as an officer of other funds. Ms. Del Prato serves as Assistant Treasurer of FIMM, LLC (2021-present) and is an employee of Fidelity Investments (2017-present). Previously, Ms. Del Prato served as President and Treasurer of The North Carolina Capital Management Trust: Cash Portfolio and Term Portfolio (2018-2020). Prior to joining Fidelity Investments, Ms. Del Prato served as a Managing Director and Treasurer of the JPMorgan Mutual Funds (2014-2017). Prior to JPMorgan, Ms. Del Prato served as a partner at Cohen Fund Audit Services (accounting firm, 2012-2013) and KPMG LLP (accounting firm, 2004-2012).
Joshua W. Gould (1982)
Year of Election or Appointment: 2019
Chief Compliance Officer
Mr. Gould serves as Vice President and is an employee of Fidelity Investments (2019-present).
J. Calvin Rivers, Jr. (1945)
Year of Election or Appointment: 2001
Vice President
Mr. Rivers also serves as President of Capital Management of the Carolinas, L.L.C. Previously, Mr. Rivers served as a Director of Bojangle's Inc. (fast-food restaurant chain, 2001-2007) and a Director of the Board of Trustees of the Teachers' and State Employees' Retirement System (2002-2005).
Brett Segaloff (1972)
Year of Election or Appointment: 2020
Anti-Money Laundering (AML) Officer
Mr. Segaloff also serves as an AML Officer of other funds and other related entities. He is Director, Anti-Money Laundering (2007-present) of FMR LLC (diversified financial services company) and is an employee of Fidelity Investments (1996-present).
As a shareholder, you incur two types of costs: (1) transaction costs, which may include sales charges (loads) on purchase payments or redemption proceeds, as applicable and (2) ongoing costs, which generally include management fees, distribution and/or service (12b-1) fees and other Fund expenses. This Example is intended to help you understand your ongoing costs (in dollars) of investing in a fund and to compare these costs with the ongoing costs of investing in other mutual funds.
| The Example is based on an investment of $1,000 invested at the beginning of the period and held for the entire period (January 1, 2023 to June 30, 2023). |
Actual Expenses
The first line of the accompanying table provides information about actual account values and actual expenses. You may use the information in this line, together with the amount you invested, to estimate the expenses that you paid over the period. Simply divide your account value by $1,000.00 (for example, an $8,600 account value divided by $1,000.00 = 8.6), then multiply the result by the number in the first line for a class/Fund under the heading entitled "Expenses Paid During Period" to estimate the expenses you paid on your account during this period. If any fund is a shareholder of any underlying mutual funds or exchange-traded funds (ETFs) (the Underlying Funds), such fund indirectly bears its proportional share of the expenses of the Underlying Funds in addition to the direct expenses incurred presented in the table. These fees and expenses are not included in the annualized expense ratio used to calculate the expense estimate in the table below.
Hypothetical Example for Comparison Purposes
The second line of the accompanying table provides information about hypothetical account values and hypothetical expenses based on the actual expense ratio and an assumed rate of return of 5% per year before expenses, which is not the actual return. The hypothetical account values and expenses may not be used to estimate the actual ending account balance or expenses you paid for the period. You may use this information to compare the ongoing costs of investing in the Fund and other funds. To do so, compare this 5% hypothetical example with the 5% hypothetical examples that appear in the shareholder reports of the other funds. If any fund is a shareholder of any Underlying Funds, such fund indirectly bears its proportional share of the expenses of the Underlying Funds in addition to the direct expenses as presented in the table. These fees and expenses are not included in the annualized expense ratio used to calculate the expense estimate in the table below.
Please note that the expenses shown in the table are meant to highlight your ongoing costs only and do not reflect any transaction costs. Therefore, the second line of the table is useful in comparing ongoing costs only, and will not help you determine the relative total costs of owning different funds. In addition, if these transactional costs were included, your costs would have been higher.
| | | | | Annualized Expense Ratio- A | | Beginning Account Value January 1, 2023 | | Ending Account Value June 30, 2023 | | Expenses Paid During Period- C January 1, 2023 to June 30, 2023 |
| | | | | | | | | | |
| Government Portfolio | | | | .14% | | | | | | |
| Actual | | | | | | $ 1,000 | | $ 1,023.30 | | $ .70 |
Hypothetical- B | | | | | | $ 1,000 | | $ 1,024.10 | | $ .70 |
| |
A Annualized expense ratio reflects expenses net of applicable fee waivers.
B 5% return per year before expenses
C Expenses are equal to the annualized expense ratio, multiplied by the average account value over the period, multiplied by 181/ 365 (to reflect the one-half year period). The fees and expenses of any Underlying Funds are not included in each annualized expense ratio.
The dividend and capital gains distributions for the fund(s) are available on Fidelity.com or Institutional.Fidelity.com .
The fund designates $613,634,475 of distributions paid during the fiscal year ended 2023 as qualifying to be taxed as section 163(j) interest dividends.
The fund will notify shareholders in January 2024 of amounts for use in preparing 2023 income tax returns.
1.923759.113
NCX-ANN-0823
Item 2.
Code of Ethics
As of the end of the period, June 30, 2023, North Carolina Capital Management Trust (the trust) has adopted a code of ethics, as defined in Item 2 of Form N-CSR, that applies to its President and Treasurer and its Chief Financial Officer. A copy of the code of ethics is filed as an exhibit to this Form N-CSR.
Item 3.
Audit Committee Financial Expert
The Board of Trustees of the trust has determined that Arrington H. Mixon is an audit committee financial expert, as defined in Item 3 of Form N-CSR. Mr. Mixon is independent for purposes of Item 3 of Form N-CSR.
Item 4.
Principal Accountant Fees and Services
Fees and Services
The following table presents fees billed by PricewaterhouseCoopers LLP (“PwC”) in each of the last two fiscal years for services rendered to the Government Portfolio (the “Fund”):
Services Billed by PwC
June 30, 2023 FeesA
| | | | |
| Audit Fees | Audit-Related Fees | Tax Fees | All Other Fees |
Government Portfolio | $34,900 | $2,600 | $1,700 | $11,900 |
| | | | |
| Audit Fees | Audit-Related Fees | Tax Fees | All Other Fees |
Government Portfolio | $33,100 | $2,700 | $1,600 | $11,700 |
A Amounts may reflect rounding.
The following table(s) present(s) fees billed by PwC that were required to be approved by the Audit Committee for services that relate directly to the operations and financial reporting of the Fund(s) and that are rendered on behalf of Fidelity Management & Research Company LLC ("FMR") and entities controlling, controlled by, or under common control with FMR (not including any sub-adviser whose role is primarily portfolio management and is subcontracted with or overseen by another investment adviser) that provide ongoing services to the Fund(s) (“Fund Service Providers”):
Services Billed by PwC
| | |
| June 30, 2023A | June 30, 2022A |
Audit-Related Fees | $8,284,200 | $7,914,600 |
Tax Fees | $1,000 | $353,200 |
All Other Fees | $- | $- |
A Amounts may reflect rounding.
“Audit-Related Fees” represent fees billed for assurance and related services that are reasonably related to the performance of the fund audit or the review of the fund's financial statements and that are not reported under Audit Fees.
“Tax Fees” represent fees billed for tax compliance, tax advice or tax planning that relate directly to the operations and financial reporting of the fund.
“All Other Fees” represent fees billed for services provided to the fund or Fund Service Provider, a significant portion of which are assurance related, that relate directly to the operations and financial reporting of the fund, excluding those services that are reported under Audit Fees, Audit-Related Fees or Tax Fees.
Assurance services must be performed by an independent public accountant.
* * *
The aggregate non-audit fees billed by PwC for services rendered to the Fund(s), FMR (not including any sub-adviser whose role is primarily portfolio management and is subcontracted with or overseen by another investment adviser), and any Fund Service Provider for each of the last two fiscal years of the Fund(s) are as follows:
| | |
Billed By | June 30, 2023A | June 30, 2022A |
PwC | $13,604,000 | $13,301,200 |
A Amounts may reflect rounding.
The trust's Audit Committee has considered non-audit services that were not pre-approved that were provided by PwC to Fund Service Providers to be compatible with maintaining the independence of PwC in its(their) audit of the Fund(s), taking into account representations from PwC, in accordance with Public Company Accounting Oversight Board rules, regarding its independence from the Fund(s) and its(their) related entities and FMR’s review of the appropriateness and permissibility under applicable law of such non-audit services prior to their provision to the Fund(s) Service Providers.
Audit Committee Pre-Approval Policies and Procedures
The trust’s Audit Committee must pre-approve all audit and non-audit services provided by a fund’s independent registered public accounting firm relating to the operations or financial reporting of the fund. Prior to the commencement of any audit or non-audit services to a fund, the Audit Committee reviews the services to determine whether they are appropriate and permissible under applicable law.
The Audit Committee has adopted policies and procedures to, among other purposes, provide a framework for the Committee’s consideration of non-audit services by the audit firms that audit the Fidelity funds. The policies and procedures require that any non-audit service provided by a fund audit firm to a Fidelity fund and any non-audit service provided by a fund auditor to a Fund Service Provider that relates directly to the operations and financial reporting of a Fidelity fund (“Covered Service”) are subject to approval by the Audit Committee before such service is provided.
All Covered Services must be approved in advance of provision of the service either: (i) by formal resolution of the Audit Committee, or (ii) by oral or written approval of the service by the Chair of the Audit Committee (or if the Chair is unavailable, such other member of the Audit Committee as may be designated by the Chair to act in the Chair’s absence). The approval contemplated by (ii) above is permitted where the Treasurer determines that action on such an engagement is necessary before the next meeting of the Audit Committee.
Non-audit services provided by a fund audit firm to a Fund Service Provider that do not relate directly to the operations and financial reporting of a Fidelity fund are reported to the Audit Committee periodically.
Non-Audit Services Approved Pursuant to Rule 2-01(c)(7)(i)(C) and (ii) of Regulation S-X (“De Minimis Exception”)
There were no non-audit services approved or required to be approved by the Audit Committee pursuant to the De Minimis Exception during the Fund’s(s’) last two fiscal years relating to services provided to (i) the Fund(s) or (ii) any Fund Service Provider that relate directly to the operations and financial reporting of the Fund(s).
Item 5.
Audit Committee of Listed Registrants
Not applicable.
Item 6.
Investments
(a)
Not applicable.
(b)
Not applicable.
Item 7.
Disclosure of Proxy Voting Policies and Procedures for Closed-End Management Investment Companies
Not applicable.
Item 8.
Portfolio Managers of Closed-End Management Investment Companies
Not applicable.
Item 9.
Purchase of Equity Securities by Closed-End Management Investment Company and Affiliated Purchasers
Not applicable.
Item 10.
Submission of Matters to a Vote of Security Holders
There were no material changes to the procedures by which shareholders may recommend nominees to the trust’s Board of Trustees.
Item 11.
Controls and Procedures
(a)(i) The President and Treasurer and the Chief Financial Officer have concluded that the trust’s disclosure controls and procedures (as defined in Rule 30a-3(c) under the Investment Company Act) provide reasonable assurances that material information relating to the trust is made known to them by the appropriate persons, based on their evaluation of these controls and procedures as of a date within 90 days of the filing date of this report.
(a)(ii) There was no change in the trust’s internal control over financial reporting (as defined in Rule 30a-3(d) under the Investment Company Act) that occurred during the period covered by this report that has materially affected, or is reasonably likely to materially affect, the trust’s internal control over financial reporting.
Item 12.
Disclosure of Securities Lending Activities for Closed-End Management
Investment Companies
Not applicable.
Item 13.
Exhibits
SIGNATURES
Pursuant to the requirements of the Securities Exchange Act of 1934 and the Investment Company Act of 1940, the registrant has duly caused this report to be signed on its behalf by the undersigned, thereunto duly authorized.
North Carolina Capital Management Trust
| |
By: | /s/Laura M. Del Prato |
| Laura M. Del Prato |
| President and Treasurer |
| |
Date: | August 22, 2023 |
Pursuant to the requirements of the Securities Exchange Act of 1934 and the Investment Company Act of 1940, this report has been signed below by the following persons on behalf of the registrant and in the capacities and on the dates indicated.
| |
By: | /s/Laura M. Del Prato |
| Laura M. Del Prato |
| President and Treasurer |
| |
Date: | August 22, 2023 |
By:
| |
| /s/John J. Burke III |
| John J. Burke III |
| Chief Financial Officer |
| |
Date: | August 22, 2023 |