UNITED STATES
SECURITIES AND EXCHANGE COMMISSION
Washington, D.C. 20549
FORM N-CSR
CERTIFIED SHAREHOLDER REPORT OF REGISTERED
MANAGEMENT INVESTMENT COMPANIES
Investment Company Act file number 811-03455
North Carolina Capital Management Trust
(Exact name of registrant as specified in charter)
245 Summer St., Boston, Massachusetts 02210
(Address of principal executive offices) (Zip code)
Margaret Carey, Secretary
245 Summer St.
Boston, Massachusetts 02210
(Name and address of agent for service)
Registrant's telephone number, including area code:
617-563-7000
| |
Date of fiscal year end: | June 30 |
|
|
Date of reporting period: | June 30, 2024 |
Item 1.
Reports to Stockholders
| |
| | ANNUAL SHAREHOLDER REPORT | AS OF JUNE 30, 2024 | This report describes changes to the Fund that occurred during the reporting period. |
| | Government Portfolio Government Portfolio : NCCTX |
| | | |
This annual shareholder report contains information about Government Portfolio for the period July 1, 2023 to June 30, 2024. You can find additional information about the Fund at fundresearch.fidelity.com/
prospectus/sec. You can also request this information by contacting us at 1-800-222-3232.
What were your Fund costs for the last year?(based on hypothetical $10,000 investment)
FUND COST (PREVIOUS YEAR)
| | Costs of a $10,000 investment | Costs paid as a percentage of a $10,000 investment | |
| Government Portfolio | $ 14 | 0.14% | |
Key Fund Statistics (as of June 30, 2024)
KEY FACTS | | |
| Fund Size | $20,603,345,239 | |
| Number of Holdings | 289 | |
| Total Advisory Fee | $40,152,360 | |
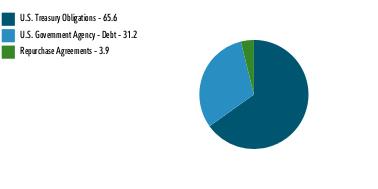
What did the Fund invest in?
(as of June 30, 2024)
EFFECTIVE MATURITY DIVERSIFICATION (% of Fund's net assets) |
| Days |
| 1-7 | 42.7 | |
| 8-30 | 29.9 | |
| 31-60 | 11.7 | |
| 61-90 | 5.9 | |
| 91-180 | 8.0 | |
| >180 | 2.5 | |
| |
| U.S. Treasury Obligations | 65.6 |
| U.S. Government Agency - Debt | 31.2 |
| Repurchase Agreements | 3.9 |
ASSET ALLOCATION (% of Fund's net assets) |
|
| Net Other Assets (Liabilities) - (0.7)% |
|
How has the Fund changed?
This is a summary of certain changes to the Fund since July 1, 2023. For more complete information, you may review the Fund's next prospectus, which we expect to be available by August 29, 2024 at fundresearch.fidelity.com/prospectus/sec or upon request at 1-800-222-3232 .
The fund's principal investment risks were updated in connection with the implementation of recent rule amendments related to money market funds adopted by the SEC. | |
| Fidelity, the Fidelity Investments Logo and all other Fidelity trademarks or service marks used herein are trademarks or service marks of FMR LLC. Any third-party marks that are used herein are trademarks or service marks of their respective owners. © 2024 FMR LLC. All rights reserved. |
| | For additional information about the Fund; including its prospectus, financial information, holdings and proxy information, scan the QR code or visit fundresearch.fidelity.com/prospectus/sec 1.9913351.100 47-TSRA-0824 |
Item 2.
Code of Ethics
As of the end of the period, June 30, 2024, North Carolina Capital Management Trust (the trust) has adopted a code of ethics, as defined in Item 2 of Form N-CSR, that applies to its President and Treasurer and its Chief Financial Officer. A copy of the code of ethics is filed as an exhibit to this Form N-CSR.
Item 3.
Audit Committee Financial Expert
The Board of Trustees of the trust has determined that Arrington H. Mixon is an audit committee financial expert, as defined in Item 3 of Form N-CSR. Mr. Mixon is independent for purposes of Item 3 of Form N-CSR.
Item 4.
Principal Accountant Fees and Services
Fees and Services
The following table presents fees billed by PricewaterhouseCoopers LLP (“PwC”) in each of the last two fiscal years for services rendered to the Government Portfolio (the “Fund”):
Services Billed by PwC
June 30, 2024 FeesA
| | | | |
| Audit Fees | Audit-Related Fees | Tax Fees | All Other Fees |
Government Portfolio | $35,100 | $2,700 | $1,700 | $12,300 |
| | | | |
| Audit Fees | Audit-Related Fees | Tax Fees | All Other Fees |
Government Portfolio | $34,900 | $2,600 | $1,700 | $11,900 |
A Amounts may reflect rounding.
The following table(s) present(s) fees billed by PwC that were required to be approved by the Audit Committee for services that relate directly to the operations and financial reporting of the Fund(s) and that are rendered on behalf of Fidelity Management & Research Company LLC ("FMR") and entities controlling, controlled by, or under common control with FMR (not including any sub-adviser whose role is primarily portfolio management and is subcontracted with or overseen by another investment adviser) that provide ongoing services to the Fund(s) (“Fund Service Providers”):
Services Billed by PwC
| | |
| June 30, 2024A | June 30, 2023A |
Audit-Related Fees | $9,437,800 | $8,699,200 |
Tax Fees | $61,000 | $1,000 |
All Other Fees | $35,000 | $- |
A Amounts may reflect rounding.
“Audit-Related Fees” represent fees billed for assurance and related services that are reasonably related to the performance of the fund audit or the review of the fund's financial statements and that are not reported under Audit Fees.
“Tax Fees” represent fees billed for tax compliance, tax advice or tax planning that relate directly to the operations and financial reporting of the fund.
“All Other Fees” represent fees billed for services provided to the fund or Fund Service Provider, a significant portion of which are assurance related, that relate directly to the operations and financial reporting of the fund, excluding those services that are reported under Audit Fees, Audit-Related Fees or Tax Fees.
Assurance services must be performed by an independent public accountant.
* * *
The aggregate non-audit fees billed by PwC for services rendered to the Fund(s), FMR (not including any sub-adviser whose role is primarily portfolio management and is subcontracted with or overseen by another investment adviser), and any Fund Service Provider for each of the last two fiscal years of the Fund(s) are as follows:
| | |
Billed By | June 30, 2024A | June 30, 2023A |
PwC | $15,025,100 | $14,169,200 |
A Amounts may reflect rounding.
The trust's Audit Committee has considered non-audit services that were not pre-approved that were provided by PwC to Fund Service Providers to be compatible with maintaining the independence of PwC in its(their) audit of the Fund(s), taking into account representations from PwC, in accordance with Public Company Accounting Oversight Board rules, regarding its independence from the Fund(s) and its(their) related entities and FMR’s review of the appropriateness and permissibility under applicable law of such non-audit services prior to their provision to the Fund(s) Service Providers.
Audit Committee Pre-Approval Policies and Procedures
The trust’s Audit Committee must pre-approve all audit and non-audit services provided by a fund’s independent registered public accounting firm relating to the operations or financial reporting of the fund. Prior to the commencement of any audit or non-audit services to a fund, the Audit Committee reviews the services to determine whether they are appropriate and permissible under applicable law.
The Audit Committee has adopted policies and procedures to, among other purposes, provide a framework for the Committee’s consideration of non-audit services by the audit firms that audit the Fidelity funds. The policies and procedures require that any non-audit service provided by a fund audit firm to a Fidelity fund and any non-audit service provided by a fund auditor to a Fund Service Provider that relates directly to the operations and financial reporting of a Fidelity fund (“Covered Service”) are subject to approval by the Audit Committee before such service is provided.
All Covered Services must be approved in advance of provision of the service either: (i) by formal resolution of the Audit Committee, or (ii) by oral or written approval of the service by the Chair of the Audit Committee (or if the Chair is unavailable, such other member of the Audit Committee as may be designated by the Chair to act in the Chair’s absence). The approval contemplated by (ii) above is permitted where the Treasurer determines that action on such an engagement is necessary before the next meeting of the Audit Committee.
Non-audit services provided by a fund audit firm to a Fund Service Provider that do not relate directly to the operations and financial reporting of a Fidelity fund are reported to the Audit Committee periodically.
Non-Audit Services Approved Pursuant to Rule 2-01(c)(7)(i)(C) and (ii) of Regulation S-X (“De Minimis Exception”)
There were no non-audit services approved or required to be approved by the Audit Committee pursuant to the De Minimis Exception during the Fund’s(s’) last two fiscal years relating to services provided to (i) the Fund(s) or (ii) any Fund Service Provider that relate directly to the operations and financial reporting of the Fund(s).
The Registrant has not retained, for the preparation of the audit report on the financial statements included in the Form N-CSR, a registered public accounting firm that has a branch or office that is located in a foreign jurisdiction and that the Public Company Accounting Oversight Board (the “PCAOB”) has determined that the PCAOB is unable to inspect or investigate completely because of a position taken by an authority in the foreign jurisdiction.
The Registrant is not a “foreign issuer,” as defined in 17 CFR 240.3b-4.
Item 5.
Audit Committee of Listed Registrants
Not applicable.
Item 6.
Investments
(a)
Not applicable.
(b)
Not applicable.
Item 7.
Financial Statements and Financial Highlights for Open-End Management Investment Companies

Government Portfolio
Annual Report
June 30, 2024
Contents
To view a fund's proxy voting guidelines and proxy voting record for the 12-month period ended June 30, visit http://www.fidelity.com/proxyvotingresults or visit the Securities and Exchange Commission's (SEC) web site at http://www.sec.gov.
You may also call 1-800-222-3232 to request a free copy of the proxy voting guidelines.
Standard & Poor's, S&P and S&P 500 are registered service marks of The McGraw-Hill Companies, Inc. and have been licensed for use by Fidelity Distributors Corporation.
Other third-party marks appearing herein are the property of their respective owners.
All other marks appearing herein are registered or unregistered trademarks or service marks of FMR LLC or an affiliated company. © 2024 FMR LLC. All rights reserved.
This report and the financial statements contained herein are submitted for the general information of the shareholders of the Fund. This report is not authorized for distribution to prospective investors in the Fund unless preceded or accompanied by an effective prospectus.
A fund files its complete schedule of portfolio holdings with the SEC for the first and third quarters of each fiscal year on Form N-PORT. Forms N-PORT are available on the SEC's web site at http://www.sec.gov. A fund's Forms N-PORT may be reviewed and copied at the SEC's Public Reference Room in Washington, DC. Information regarding the operation of the SEC's Public Reference Room may be obtained by calling 1-800-SEC-0330.
For a complete list of a fund's portfolio holdings, view the most recent holdings listing, semiannual report, or annual report on Fidelity's web site at http://www.nccmt.fidelity.com.
NOT FDIC INSURED •MAY LOSE VALUE •NO BANK GUARANTEE
Neither the Fund nor Fidelity Distributors Corporation is a bank.
Item 7: Financial Statements and Financial Highlights for Open-End Management Investment Companies (Annual Report)
Schedule of Investments June 30, 2024
Showing Percentage of Net Assets
| U.S. Treasury Debt - 65.6% |
| | | Yield (%)(a) | Principal Amount (b) | Value ($) |
| U.S. Treasury Inflation Protected Obligations - 1.0% | | | | |
| U.S. Treasury Notes | | | | |
| 7/15/24 | | 5.33 to 5.34 | 200,716,000 | 200,581,154 |
| | | | | |
| U.S. Treasury Obligations - 64.6% | | | | |
| U.S. Treasury Bills | | | | |
| 7/2/24 to 12/5/24 | | 5.11 to 5.34 | 12,716,791,000 | 12,651,643,914 |
| U.S. Treasury Notes | | | | |
| 7/31/24 to 5/15/25 (c) | | 4.88 to 5.45 | 664,000,000 | 659,644,138 |
TOTAL U.S. TREASURY OBLIGATIONS | | | | 13,311,288,052 |
| TOTAL U.S. TREASURY DEBT (Cost $13,511,869,206) | | | | 13,511,869,206 |
| | | | | |
| U.S. Government Agency Debt - 31.1% |
| | | Yield (%)(a) | Principal Amount (b) | Value ($) |
| Federal Agencies - 31.1% | | | | |
| Fannie Mae | | | | |
| 7/11/24 to 6/18/26 (c) | | 5.23 to 5.44 | 190,000,000 | 189,775,250 |
| Federal Farm Credit Bank | | | | |
| 5/5/26 (c)(d) | | 0.00 | 8,000,000 | 7,999,296 |
| 7/23/24 to 6/24/26 (c) | | 5.02 to 5.54 | 1,911,263,000 | 1,911,380,247 |
| Federal Home Loan Bank | | | | |
| 7/1/24 to 6/26/26 (c) | | 4.86 to 5.50 | 4,314,800,000 | 4,311,174,118 |
| | | | | |
| TOTAL U.S. GOVERNMENT AGENCY DEBT (Cost $6,420,328,911) | | | | 6,420,328,911 |
| | | | | |
| U.S. Treasury Repurchase Agreement - 4.0% |
| | | Maturity Amount ($) | Value ($) |
| In a joint trading account at 5.32% dated 6/28/24 due 7/1/24 (Collateralized by U.S. Treasury Obligations) # | | 142,637,266 | 142,574,000 |
| With: | | | |
| BMO Harris Bank NA at 5.33%, dated 6/13/24 due 7/5/24 (Collateralized by U.S. Treasury Obligations valued at $9,204,535, 2.88%, 5/15/32) | | 9,045,305 | 9,000,000 |
| BofA Securities, Inc. at: | | | |
5.33%, dated 4/2/24 due 7/2/24 (Collateralized by U.S. Treasury Obligations valued at $15,644,323, 2.25% - 5.47%, 4/30/25 - 2/15/52) | | 15,202,096 | 15,000,000 |
5.37%, dated: | | | |
| 4/25/24 due 7/25/24 (Collateralized by U.S. Treasury Obligations valued at $24,757,183, 0.00% - 6.88%, 8/6/24 - 2/15/52) (c)(d)(e) | | 24,325,780 | 24,000,000 |
| 5/6/24 due 8/5/24 (Collateralized by U.S. Treasury Obligations valued at $83,307,568, 0.00% - 0.75%, 3/20/25 - 8/31/26) (c)(d)(e) | | 82,099,508 | 81,000,000 |
| 5/29/24 due 8/27/24 (Collateralized by U.S. Treasury Obligations valued at $82,000,635, 0.25% - 4.63%, 11/30/24 - 8/15/29) (c)(d)(e) | | 81,074,000 | 80,000,000 |
| Goldman Sachs & Co. at 5.32%, dated 6/28/24 due 7/1/24 (Collateralized by U.S. Treasury Obligations valued at $32,654,567, 4.63%, 4/30/29) | | 32,014,187 | 32,000,000 |
| HSBC Securities, Inc. at 5.35%, dated 6/25/24 due 7/2/24 (Collateralized by U.S. Treasury Obligations valued at $37,773,681, 0.00% - 1.25%, 8/8/24 - 9/30/28) | | 37,038,490 | 37,000,000 |
| J.P. Morgan Securities, LLC at 5.36%, dated 6/28/24 due 7/5/24 (Collateralized by U.S. Treasury Obligations valued at $330,627,644, 0.75% - 4.63%, 3/31/26 - 4/30/29) (c)(d)(e) | | 325,495,440 | 324,000,000 |
| NatWest Markets Securities, Inc. at: | | | |
5.32%, dated 6/28/24 due 7/1/24 (Collateralized by U.S. Treasury Obligations valued at $9,199,611, 1.63% - 7.63%, 2/15/25 - 11/15/50) | | 9,003,990 | 9,000,000 |
5.35%, dated 6/25/24 due 7/2/24 (Collateralized by U.S. Treasury Obligations valued at $32,669,113, 2.25%, 11/15/27) | | 32,033,289 | 32,000,000 |
| Societe Generale at 5.33%, dated 6/24/24 due 7/1/24 (Collateralized by U.S. Treasury Obligations valued at $9,189,550, 2.25%, 5/15/41) | | 9,009,328 | 9,000,000 |
| TD Securities (U.S.A.) at 5.32%, dated 6/28/24 due 7/1/24 (Collateralized by U.S. Treasury Obligations valued at $28,572,740, 1.13% - 5.00%, 7/31/25 - 8/31/28) | | 28,012,413 | 28,000,000 |
| TOTAL U.S. TREASURY REPURCHASE AGREEMENT (Cost $822,574,000) | | | 822,574,000 |
| | | | |
| TOTAL INVESTMENT IN SECURITIES - 100.7% (Cost $20,754,772,117) | 20,754,772,117 |
NET OTHER ASSETS (LIABILITIES) - (0.7)% | (151,426,878) |
| NET ASSETS - 100.0% | 20,603,345,239 |
| | |
The date shown for securities represents the date when principal payments must be paid, taking into account any call options exercised by the issuer and any permissible maturity shortening features other than interest rate resets.
Legend
| (a) | Yield represents either the annualized yield at the date of purchase, or the stated coupon rate, or, for floating and adjustable rate securities, the rate at period end. |
| (b) | Amount is stated in United States dollars unless otherwise noted. |
| (c) | Coupon rates for floating and adjustable rate securities reflect the rates in effect at period end. |
| (d) | Coupon is indexed to a floating interest rate which may be multiplied by a specified factor and/or subject to caps or floors. |
| (e) | The maturity amount is based on the rate at period end. |
Investment Valuation
All investments are categorized as Level 2 under the Fair Value Hierarchy. The inputs or methodology used for valuing securities may not be an indication of the risk associated with investing in these securities. For more information on valuation inputs, refer to the Investment Valuation section in the accompanying Notes to Financial Statements.
| Other Information |
| # Additional information on each counterparty to the repurchase agreement is as follows: |
| Repurchase Agreement / Counterparty | Value ($) | |
| $142,574,000 due 7/01/24 at 5.32% | | |
| Bank of Nova Scotia | 22,119,000 | |
| Citigroup Global Markets, Inc. | 51,607,000 | |
| HSBC Securities (USA), Inc. | 27,649,000 | |
| JP Morgan Securities LLC | 22,769,000 | |
| Mizuho Securities USA, Inc. | 18,430,000 | |
| | 142,574,000 | |
Financial Statements
| Statement of Assets and Liabilities |
| | | | June 30, 2024 |
| | | | | |
| Assets | | | | |
Investment in securities, at value (including repurchase agreements of $822,574,000) - See accompanying schedule Unaffiliated issuers (cost $20,754,772,117): | | | $ | 20,754,772,117 |
| Cash | | | | 102,000,882 |
| Receivable for investments sold | | | | 274,641,914 |
| Receivable for fund shares sold | | | | 910,338 |
| Interest receivable | | | | 39,426,863 |
| Receivable from investment adviser for expense reductions | | | | 1,155,990 |
Total assets | | | | 21,172,908,104 |
| Liabilities | | | | |
| Payable for investments purchased | $ | 496,906,251 | | |
| Payable for fund shares redeemed | | 67,415,067 | | |
| Distributions payable | | 1,708,074 | | |
| Accrued management fee | | 3,533,473 | | |
| Total liabilities | | | | 569,562,865 |
| Net Assets | | | $ | 20,603,345,239 |
| Net Assets consist of: | | | | |
| Paid in capital | | | $ | 20,603,087,088 |
| Total accumulated earnings (loss) | | | | 258,151 |
| Net Assets | | | $ | 20,603,345,239 |
Net Asset Value, offering price and redemption price per share ($20,603,345,239 ÷ 20,600,298,288 shares) | | | $ | 1.00 |
| Statement of Operations |
| | | | Year ended June 30, 2024 |
| Investment Income | | | | |
| Interest | | | $ | 1,064,582,765 |
| Expenses | | | | |
| Management fee | $ | 40,152,360 | | |
| Independent trustees' fees and expenses | | 434,604 | | |
| Total expenses before reductions | | 40,586,964 | | |
| Expense reductions | | (12,883,995) | | |
| Total expenses after reductions | | | | 27,702,969 |
| Net Investment income (loss) | | | | 1,036,879,796 |
| Realized and Unrealized Gain (Loss) | | | | |
| Net realized gain (loss) on: | | | | |
| Investment Securities: | | | | |
| Unaffiliated issuers | | 2,979 | | |
| Total net realized gain (loss) | | | | 2,979 |
| Net increase in net assets resulting from operations | | | $ | 1,036,882,775 |
| Statement of Changes in Net Assets |
| |
| | Year ended June 30, 2024 | | Year ended June 30, 2023 |
| Increase (Decrease) in Net Assets | | | | |
| Operations | | | | |
| Net investment income (loss) | $ | 1,036,879,796 | $ | 614,817,217 |
| Net realized gain (loss) | | 2,979 | | 143,996 |
Net increase in net assets resulting from operations | | 1,036,882,775 | | 614,961,213 |
| Distributions to shareholders | | (1,036,833,254) | | (613,634,475) |
| | | | | |
| Share transactions | | | | |
| Proceeds from sales of shares | | 25,027,855,645 | | 22,079,189,785 |
| Reinvestment of distributions | | 1,016,987,828 | | 595,650,244 |
| Cost of shares redeemed | | (23,292,551,309) | | (18,491,767,923) |
| | | | | |
Net increase (decrease) in net assets and shares resulting from share transactions | | 2,752,292,164 | | 4,183,072,106 |
| Total increase (decrease) in net assets | | 2,752,341,685 | | 4,184,398,844 |
| | | | | |
| Net Assets | | | | |
| Beginning of period | | 17,851,003,554 | | 13,666,604,710 |
| End of period | $ | 20,603,345,239 | $ | 17,851,003,554 |
| | | | | |
| Other Information | | | | |
| Shares | | | | |
| Sold | | 25,027,855,645 | | 22,079,189,785 |
| Issued in reinvestment of distributions | | 1,016,987,828 | | 595,650,244 |
| Redeemed | | (23,292,551,309) | | (18,491,767,923) |
| Net increase (decrease) | | 2,752,292,164 | | 4,183,072,106 |
| | | | | |
Financial Highlights
| Years ended June 30, | | 2024 | | 2023 | | 2022 | | 2021 | | 2020 |
Selected Per-Share Data | | | | | | | | | | |
| Net asset value, beginning of period | $ | 1.00 | $ | 1.00 | $ | 1.00 | $ | 1.00 | $ | 1.00 |
| Income from Investment Operations | | | | | | | | | | |
Net investment income (loss) A | | .052 | | .037 | | .002 | | - B | | .013 |
Net realized and unrealized gain (loss) B | | - | | - | | - | | - | | - |
| Total from investment operations | | .052 | | .037 | | .002 | | - B | | .013 |
| Distributions from net investment income | | (.052) | | (.037) | | (.002) | | - B | | (.013) |
| Total distributions | | (.052) | | (.037) | | (.002) | | - B | | (.013) |
| Net asset value, end of period | $ | 1.00 | $ | 1.00 | $ | 1.00 | $ | 1.00 | $ | 1.00 |
Total Return C | | | | 3.75% | | .16% | | .02% | | 1.31% |
Ratios to Average Net Assets A,D,E | | | | | | | | | | |
| Expenses before reductions | | .21% | | .21% | | .22% | | .22% | | .23% |
| Expenses net of fee waivers, if any | | | | .14% | | .08% | | .09% | | .17% |
| Expenses net of all reductions | | .14% | | .14% | | .08% | | .09% | | .17% |
| Net investment income (loss) | | 5.24% | | 3.80% | | .16% | | .02% | | 1.23% |
| Supplemental Data | | | | | | | | | | |
| Net assets, end of period (000 omitted) | $ | 20,603,345 | $ | 17,851,004 | $ | 13,666,605 | $ | 12,100,283 | $ | 8,580,943 |
ANet investment income (loss) is affected by the timing of the declaration of dividends by any underlying mutual funds or exchange-traded funds (ETFs). Net investment income (loss) of any mutual funds or ETFs is not included in the Fund's net investment income (loss) ratio.
BAmount represents less than $.0005 per share.
CTotal returns would have been lower if certain expenses had not been reduced during the applicable periods shown.
DFees and expenses of any underlying mutual funds or exchange-traded funds (ETFs) are not included in the Fund's expense ratio. The Fund indirectly bears its proportionate share of these expenses.
EExpense ratios reflect operating expenses of the class. Expenses before reductions do not reflect amounts reimbursed, waived, or reduced through arrangements with the investment adviser, brokerage services, or other offset arrangements, if applicable, and do not represent the amount paid by the class during periods when reimbursements, waivers or reductions occur.
Notes to Financial Statements
For the period ended June 30, 2024
1. Organization.
Government Portfolio (the Fund) is a fund of The North Carolina Capital Management Trust (the Trust). The Trust is registered under the Investment Company Act of 1940, as amended (the 1940 Act), as an open-end management investment company organized as a Massachusetts business trust. Shares of the Trust are offered exclusively to local government and public authorities of the state of North Carolina. The Fund is authorized to issue an unlimited number of shares.
2. Significant Accounting Policies.
The Fund is an investment company and applies the accounting and reporting guidance of the Financial Accounting Standards Board (FASB) Accounting Standards Codification Topic 946 Financial Services - Investment Companies. The financial statements have been prepared in conformity with accounting principles generally accepted in the United States of America (GAAP), which require management to make certain estimates and assumptions at the date of the financial statements. Actual results could differ from those estimates. Subsequent events, if any, through the date that the financial statements were issued have been evaluated in the preparation of the financial statements. The Fund's Schedule of Investments lists any underlying mutual funds or exchange-traded funds (ETFs) but does not include the underlying holdings of these funds. The following summarizes the significant accounting policies of the Fund:
Investment Valuation. The Fund categorizes the inputs to valuation techniques used to value its investments into a disclosure hierarchy consisting of three levels as shown below:
Level 1 - unadjusted quoted prices in active markets for identical investments
Level 2 - other significant observable inputs (including quoted prices for similar investments, interest rates, prepayment speeds, etc.)
Level 3 - unobservable inputs (including the Fund's own assumptions based on the best information available)
As permitted by compliance with certain conditions under Rule 2a-7 of the 1940 Act, securities are valued at amortized cost, which approximates fair value. The amortized cost of an instrument is determined by valuing it at its original cost and thereafter amortizing any discount or premium from its face value at a constant rate until maturity. Securities held by a money market fund are generally high quality and liquid; however, they are reflected as Level 2 because the inputs used to determine fair value are not quoted prices in an active market.
Investment Transactions and Income. Gains and losses on securities sold are determined on the basis of identified cost. Interest income is accrued as earned and includes coupon interest and amortization of premium and accretion of discount on debt securities as applicable. The principal amount on inflation-indexed securities is periodically adjusted to the rate of inflation and interest is accrued based on the principal amount. The adjustments to principal due to inflation are reflected as increases or decreases to Interest in the accompanying Statement of Operations.
Expenses. Expenses directly attributable to a fund are charged to that fund. Expenses attributable to more than one fund are allocated among the respective funds on the basis of relative net assets or other appropriate methods. Expenses included in the accompanying financial statements reflect the expenses of that fund and do not include any expenses associated with any underlying mutual funds or exchange-traded funds. Although not included in a fund's expenses, a fund indirectly bears its proportionate share of these expenses through the net asset value of each underlying mutual fund or exchange-traded fund. Expense estimates are accrued in the period to which they relate and adjustments are made when actual amounts are known.
Income Tax Information and Distributions to Shareholders. Each year, the Fund intends to qualify as a regulated investment company under Subchapter M of the Internal Revenue Code, including distributing substantially all of its taxable income and realized gains. As a result, no provision for U.S. Federal income taxes is required. As of June 30, 2024, the Fund did not have any unrecognized tax benefits in the financial statements; nor is the Fund aware of any tax positions for which it is reasonably possible that the total amounts of unrecognized tax benefits will significantly change in the next twelve months. The Fund files a U.S. federal tax return, in addition to state and local tax returns as required. The Fund's federal income tax returns are subject to examination by the Internal Revenue Service (IRS) for a period of three fiscal years after they are filed. State and local tax returns may be subject to examination for an additional fiscal year depending on the jurisdiction.
Distributions are declared and recorded daily and paid monthly from net investment income. Distributions from realized gains, if any, are declared and recorded on the ex-dividend date. Income and capital gain distributions are determined in accordance with income tax regulations, which may differ from GAAP. In addition, the Fund claimed a portion of the payment made to redeeming shareholders as a distribution for income tax purposes.
Capital accounts within the financial statements are adjusted for permanent book-tax differences. These adjustments have no impact on net assets or the results of operations. Capital accounts are not adjusted for temporary book-tax differences which will reverse in a subsequent period.
Book-tax differences are primarily due to losses deferred due to wash sales.
As of period end, the cost and unrealized appreciation (depreciation) in securities for federal income tax purposes were as follows:
| Gross unrealized appreciation | $- |
| Gross unrealized depreciation | - |
| Net unrealized appreciation (depreciation) | $- |
| Tax Cost | $20,754,772,117 |
The tax-based components of distributable earnings as of period end were as follows:
| Undistributed ordinary income | $138,642 |
The tax character of distributions paid was as follows:
| | June 30, 2024 | June 30, 2023 |
| Ordinary Income | $1,036,833,254 | $613,634,475 |
Repurchase Agreements. Pursuant to an Exemptive Order issued by the Securities and Exchange Commission, funds and other registered investment companies having management contracts with Fidelity Management and Research Company LLC, or its affiliates are permitted to transfer uninvested cash balances into joint trading accounts which are then invested in repurchase agreements. Funds may also invest directly with institutions in repurchase agreements. Repurchase agreements may be collateralized by cash or government securities. Upon settlement date, collateral is held in segregated accounts with custodian banks and may be obtained in the event of a default of the counterparty. The collateral balance is monitored on a daily basis to ensure it is at least equal to the principal amount of the repurchase agreement (including accrued interest). In the event of a default by the counterparty, realization of the collateral proceeds could be delayed, during which time the value of the collateral may decline.
New Rule Issuance. In July 2023, the Securities and Exchange Commission issued a Final Rule relative to Money Market Reform. Among other things, the Final Rule includes amendments for: (1) Removal of redemption gates except for liquidations; (2) Required liquidity fees for institutional prime and institutional tax-exempt money market funds; (3) Discretionary liquidity fees for non-government money market funds; (4) Higher liquidity requirements; and (5) Changes to reporting requirements for Form N-MFP and Form N-CR. The Final Rule imposes different implementation dates for the amendments through October 2, 2024. Management has evaluated the amendments and does not expect them to have a material impact to the Fund's financial statements and related disclosures.
3. Fees and Other Transactions with Affiliates.
Management Fee. Fidelity Management & Research Company LLC (the investment adviser) and its affiliates provides the Fund with investment management related services for which the Fund pays a monthly management fee that is based on an annual rate of .205% of average net assets. The investment adviser pays all other expenses, except the compensation of the independent Trustees and certain exceptions such as interest expense. The management fee is reduced by an amount equal to the fees and expenses paid by the Fund to the independent Trustees.
Distribution and Service Plan Fees. In accordance with Rule 12b-1 of the 1940 Act, the Fund has adopted a separate Distribution and Service plan. The Fund does not pay any fees for these services. The investment adviser pays Fidelity Distributors Company LLC (FDC), an affiliate of the investment adviser, a Distribution and Service fee from the management fee paid by the Fund that is based on an annual rate of .065% of average net assets. For the period, the investment adviser paid FDC $12,845,319 on behalf of the Fund, all of which was paid to the Capital Management of the Carolinas LLC.
Interfund Trades. Funds may purchase from or sell securities to other Fidelity Funds under procedures adopted by the Board. The procedures have been designed to ensure these interfund trades are executed in accordance with Rule 17a-7 of the 1940 Act. During the period, there were no interfund trades.
4. Expense Reductions.
The investment adviser contractually agreed to reimburse the Fund to the extent annual operating expenses exceeded .14% of average net assets. This reimbursement will remain in place through October 31, 2027. Some expenses, for example the compensation of the independent Trustees, and certain miscellaneous expenses such as interest expense, are excluded from this reimbursement. This reimbursement reduced the Fund's expenses by $12,881,622.
Through arrangements with the Fund's custodian, credits realized as a result of certain uninvested cash balances were used to reduce the Fund's expenses by $2,373.
5. Other.
A fund's organizational documents provide former and current trustees and officers with a limited indemnification against liabilities arising in connection with the performance of their duties to the fund. In the normal course of business, a fund may also enter into contracts that provide general indemnifications. A fund's maximum exposure under these arrangements is unknown as this would be dependent on future claims that may be made against a fund. The risk of material loss from such claims is considered remote.
6. Risk and Uncertainties.
Many factors affect a fund's performance. Developments that disrupt global economies and financial markets, such as pandemics, epidemics, outbreaks of infectious diseases, war, terrorism, and environmental disasters, may significantly affect a fund's investment performance. The effects of these developments to a fund will be impacted by the types of securities in which a fund invests, the financial condition, industry, economic sector, and geographic location of an issuer, and a fund's level of investment in the securities of that issuer. Significant concentrations in security types, issuers, industries, sectors, and geographic locations may magnify the factors that affect a fund's performance.
Report of Independent Registered Public Accounting Firm
To the Board of Trustees of North Carolina Capital Management Trust and Shareholders of Government Portfolio
Opinion on the Financial Statements
We have audited the accompanying statement of assets and liabilities, including the schedule of investments, of Government Portfolio (the "Fund") as of June 30, 2024, the related statement of operations for the year ended June 30, 2024, the statement of changes in net assets for each of the two years in the period ended June 30, 2024, including the related notes, and the financial highlights for each of the five years in the period ended June 30, 2024 (collectively referred to as the "financial statements"). In our opinion, the financial statements present fairly, in all material respects, the financial position of the Fund as of June 30, 2024, the results of its operations for the year then ended, the changes in its net assets for each of the two years in the period ended June 30, 2024 and the financial highlights for each of the five years in the period ended June 30, 2024 in conformity with accounting principles generally accepted in the United States of America.
Basis for Opinion
These financial statements are the responsibility of the Fund's management. Our responsibility is to express an opinion on the Fund's financial statements based on our audits. We are a public accounting firm registered with the Public Company Accounting Oversight Board (United States) (PCAOB) and are required to be independent with respect to the Fund in accordance with the U.S. federal securities laws and the applicable rules and regulations of the Securities and Exchange Commission and the PCAOB.
We conducted our audits of these financial statements in accordance with the standards of the PCAOB. Those standards require that we plan and perform the audit to obtain reasonable assurance about whether the financial statements are free of material misstatement, whether due to error or fraud.
Our audits included performing procedures to assess the risks of material misstatement of the financial statements, whether due to error or fraud, and performing procedures that respond to those risks. Such procedures included examining, on a test basis, evidence regarding the amounts and disclosures in the financial statements. Our audits also included evaluating the accounting principles used and significant estimates made by management, as well as evaluating the overall presentation of the financial statements. Our procedures included confirmation of securities owned as of June 30, 2024 by correspondence with the custodian and brokers; when replies were not received from brokers, we performed other auditing procedures. We believe that our audits provide a reasonable basis for our opinion.
/s/ PricewaterhouseCoopers LLP
Boston, Massachusetts
August 14, 2024
We have served as the auditor of one or more investment companies in the Fidelity group of funds since 1932.
Distributions
(Unaudited)
The dividend and capital gains distributions for the fund(s) are available on Fidelity.com or Institutional.Fidelity.com.
The fund designates $1,036,718,074 of distributions paid during the fiscal year ended 2024 as qualifying to be taxed as section 163(j) interest dividends.
The fund will notify shareholders in January 2025 of amounts for use in preparing 2024 income tax returns.
Item 8: Changes in and Disagreements with Accountants for Open-End Management Investment Companies
Note: This is not applicable for any fund included in this document.
Item 9: Proxy Disclosures for Open-End Management Investment Companies
Note: This is not applicable for any fund included in this document.
Item 10: Remuneration Paid to Directors, Officers, and others of Open-End Management Investment Companies
Note: This information is disclosed as part of the financial statements for each Fund as part of Item 7: Financial Statements and Financial Highlights for Open-End Management Investment companies.
Item 11: Statement Regarding Basis for Approval of Investment Advisory Contract
Note: This is not applicable for any fund included in this document.
1.923759.114
NCX-ANN-0824
Item 8.
Changes in and Disagreements with Accountants for Open-End Management Investment Companies
See Item 7.
Item 9.
Proxy Disclosures for Open-End Management Investment Companies
See Item 7.
Item 10.
Remuneration Paid to Directors, Officers, and Others of Open-End Management Investment Companies
See Item 7.
Item 11.
Statement Regarding Basis for Approval of Investment Advisory Contract
See Item 7.
Item 12.
Disclosure of Proxy Voting Policies and Procedures for Closed-End Management Investment Companies
Not applicable.
Item 13.
Portfolio Managers of Closed-End Management Investment Companies
Not applicable.
Item 14.
Purchase of Equity Securities by Closed-End Management Investment Company and Affiliated Purchasers
Not applicable.
Item 15.
Submission of Matters to a Vote of Security Holders
There were no material changes to the procedures by which shareholders may recommend nominees to the trust’s Board of Trustees.
Item 16.
Controls and Procedures
(a)(i) The President and Treasurer and the Chief Financial Officer have concluded that the trust’s disclosure controls and procedures (as defined in Rule 30a-3(c) under the Investment Company Act) provide reasonable assurances that material information relating to the trust is made known to them by the appropriate persons, based on their evaluation of these controls and procedures as of a date within 90 days of the filing date of this report.
(a)(ii) There was no change in the trust’s internal control over financial reporting (as defined in Rule 30a-3(d) under the Investment Company Act) that occurred during the period covered by this report that has materially affected, or is reasonably likely to materially affect, the trust’s internal control over financial reporting.
Item 17.
Disclosure of Securities Lending Activities for Closed-End Management Investment Companies
Not applicable.
Item 18.
Recovery of Erroneously Awarded Compensation
(a)
Not applicable.
(b)
Not applicable.
Item 19.
Exhibits
SIGNATURES
Pursuant to the requirements of the Securities Exchange Act of 1934 and the Investment Company Act of 1940, the registrant has duly caused this report to be signed on its behalf by the undersigned, thereunto duly authorized.
North Carolina Capital Management Trust
|
By: | /s/Laura M. Del Prato |
| Laura M. Del Prato |
| President and Treasurer (Principal Executive Officer) |
|
|
Date: | August 22, 2024 |
Pursuant to the requirements of the Securities Exchange Act of 1934 and the Investment Company Act of 1940, this report has been signed below by the following persons on behalf of the registrant and in the capacities and on the dates indicated.
|
By: | /s/Laura M. Del Prato |
| Laura M. Del Prato |
| President and Treasurer (Principal Executive Officer) |
|
|
Date: | August 22, 2024 |
|
By: | /s/John J. Burke III |
| John J. Burke III |
| Chief Financial Officer (Principal Financial Officer) |
|
|
Date: | August 22, 2024 |