First Quarter Results 2007
James A. Squires
Executive Vice President Finance
1

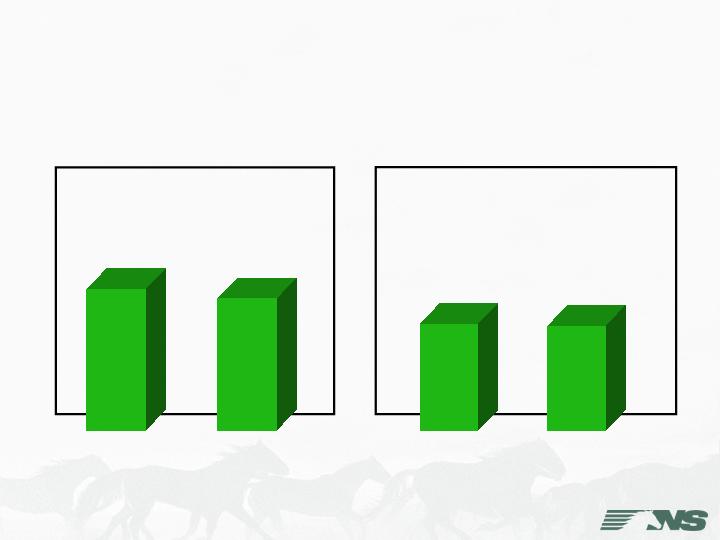
Net Income
$ 285
$ 305
Diluted Earnings per Share
$ 0.72
$ 0.71
2006 2007 2006 2007
% Change vs. Prior Period - 7% - 1%
Net Income and
Diluted Earnings per Share
First Quarter
($ Millions except per share)
2

First Qtr
2006
Favorable
(Unfavorable)
First Qtr
2007
Railway Operating Revenues $ 2,247$ 2,303 $(56) (2%)
Railway Operating Expenses 1,719 1,752 33 2
Income From Railway Operations $ 528$ 551 $(23) (4%)
Income From Railway Operations
First Quarter 2007 vs. 2006
($ Millions)
$ %
Railway Operating Ratio 76.5 76.1 (0.4) (1%)
3

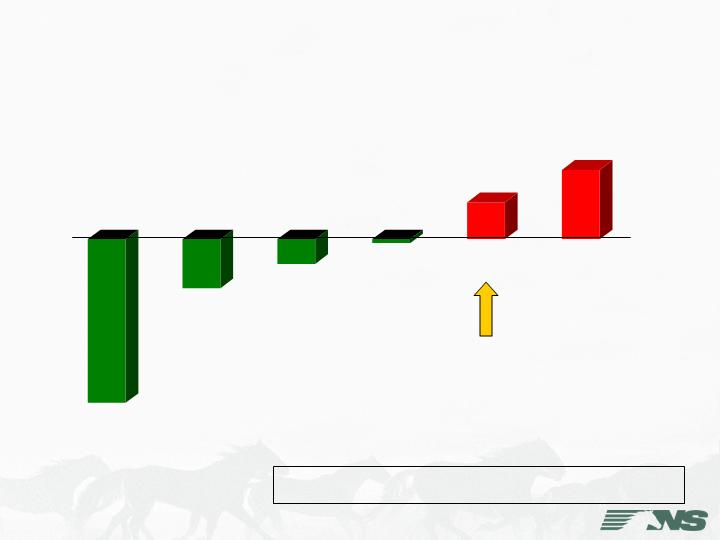
Casualties
and Other
Claims
+ $9
- $12
- $1
- $40
Materials,
Services
and Rents
Diesel Fuel
Compensation
and
Benefits
Depreciation
- $6
+ $17
Other
Net Decrease $ 33 Million / 2%
Railway Operating Expense Analysis
First Quarter 2007 vs. 2006
($ Millions)
4

Increase
(Decrease)
Retirement and Waiver Agreements and
Stock Grants to Former CEO and CMO $ (24)
Performance Based Compensation (17)
Stock Price (14)
Medical Benefits (Active and Retiree) 10
Wage Rates & nbsp; 4
Other Items 1
Total Net Variance $ (40)
Compensation and Benefits Analysis
First Quarter 2007 vs. 2006
($ Millions)
5

Casualties
and Other
Claims
+ $9
- $12
- $1
- $40
Materials,
Services
and Rents
Diesel Fuel
Compensation
and
Benefits
Depreciation
- $6
+ $17
Other
Net Decrease $ 33 Million / 2%
Railway Operating Expense Analysis
First Quarter 2007 vs. 2006
($ Millions)
6

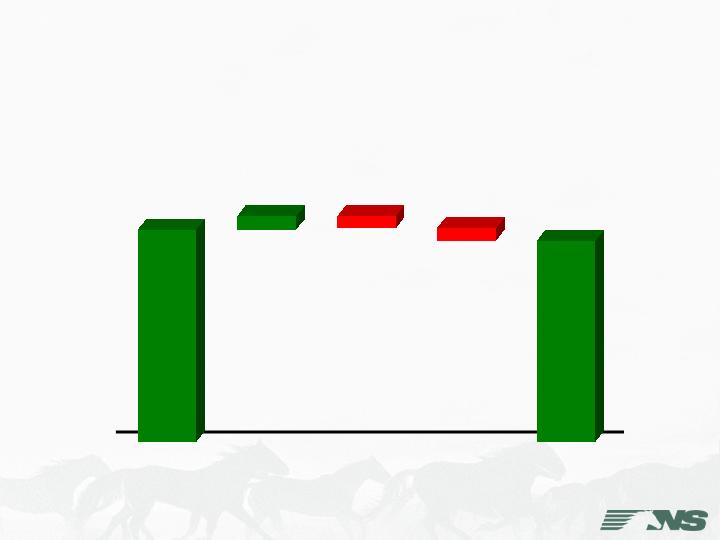
First Qtr
2006
Decreased
Consumption
Reduced
Hedge
Benefit
Lower
Prices
First Qtr
2007
$ 231
- $ 13
- $ 14
+ $ 15
$ 219
Diesel Fuel Cost Analysis
First Quarter 2007 vs. 2006
($ Millions)
7

Casualties
and Other
Claims
+ $9
- $12
- $1
- $40
Materials,
Services
and Rents
Diesel Fuel
Compensation
and
Benefits
Depreciation
- $6
+ $17
Other
Net Decrease $ 33 Million / 2%
Railway Operating Expense Analysis
First Quarter 2007 vs. 2006
($ Millions)
8

Casualties
and Other
Claims
+ $9
- $12
- $1
- $40
Materials,
Services
and Rents
Diesel Fuel
Compensation
and
Benefits
Depreciation
- $6
+ $17
Other
Net Decrease $ 33 Million / 2%
Railway Operating Expense Analysis
First Quarter 2007 vs. 2006
($ Millions)
9

Casualties
and Other
Claims
+ $9
- $12
- $1
- $40
Materials,
Services
and Rents
Diesel Fuel
Compensation
and
Benefits
Depreciation
- $6
+ $17
Other
Net Decrease $ 33 Million / 2%
Railway Operating Expense Analysis
First Quarter 2007 vs. 2006
($ Millions)
10

Nonoperating Items
First Quarter 2007 vs. 2006
($ Millions)
First Qtr
2006
Change
2007 vs. 2006
Favorable
(Unfavorable)
First Qtr
2007
Other Income – net:
Gain on Sale of Property
and Investments $ 2 $19 $ (17)
Expenses Related to
Synthetic Fuel Investments (20) (14) (6)
&nb sp;
All Other 25 30 (5)
Other Income - net $ 7$ 35 $(28)
Interest Expense on Debt $115 $120 $ 5
11

Synthetic Fuel Investments
First Quarter 2007 vs. 2006
($ Millions)
First Qtr
2006
Change
2007 vs. 2006
Favorable
(Unfavorable)
First Qtr
2007
Effect in “Other income – net” $ 20$ 14 $(6)
Effect in “Provision for income taxes” 27 19 8
Net benefit from synthetic fuel
related investments $ 7 $5 $ 2
12

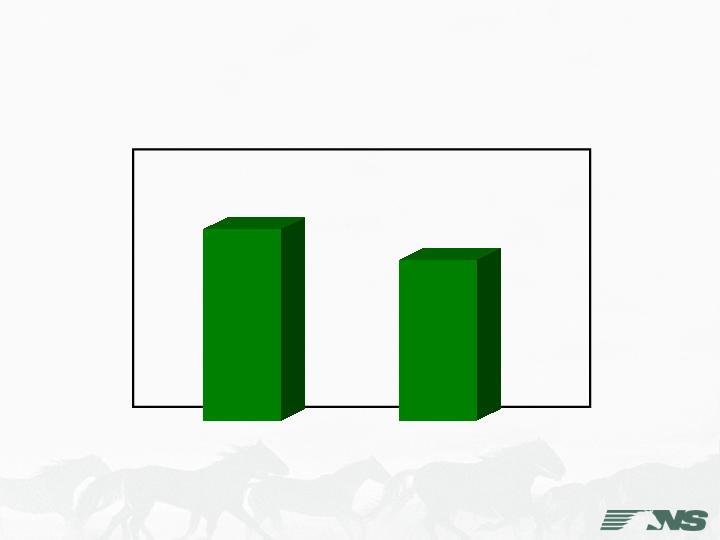
$ 420
$ 466
Income Before Income Taxes
First Quarter
($ Millions)
% Change vs. Prior Period - 10%
2006 2007
13

$ 135
$ 161
Provision for Income Taxes
First Quarter
($ Millions)
% Change vs. Prior Period - 16%
2006 2007
14


