
First Quarter Results 2007
Donald W. Seale
Executive Vice President and Chief Marketing Officer
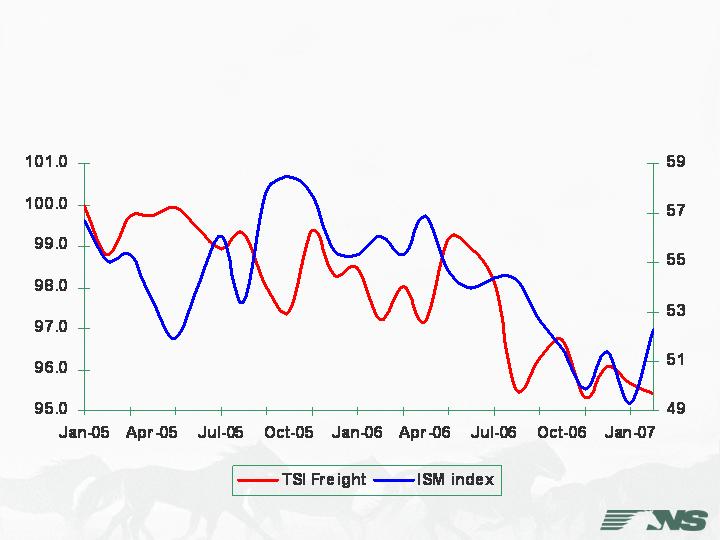
Transportation Services Demand and
ISM Purchasing Managers Index
Sources: ISM Purchasing Managers Index & BTS (Transportation Services Index) – April 2007
TSI Index (Base=Jan. 2005)
ISM Index

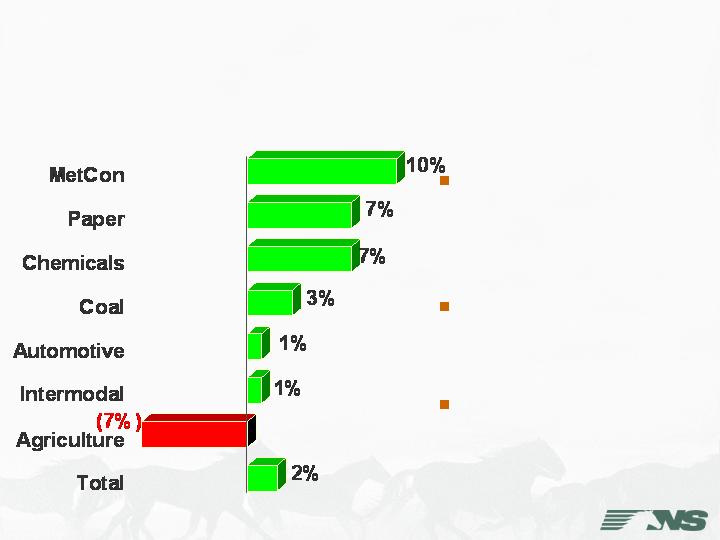
Railway Volume
1 st Quarter 2007 vs. 2006
1Q 2007
vs. 2006
Units
Abs.
% Chg
Agriculture
146,728
(3,116)
(2%)
MetCon
185,592
(23,043)
(11%)
Paper
109,275
(9,146)
(8%)
Chemicals
105,755
(1,534)
(1%)
Automotive
132,477
(21,742)
(14%)
Merchandise
679,827
(58,581)
(8%)
Intermodal
771,459
(11,680)
(1%)
Coal
420,241
(15,445)
(4%)
Total
1,871,527
(85,706)
(4%)

Automotive & Housing Losses
1 st Quarter 2007 vs. 2006
Automotive Sector
Housing Sector
(10,661)
(35,862)
Total
(50)
(4,508)
Coal
(2,308)
(2,761)
Intermodal
0
(21,742)
Automotive
(387)
(539)
Chemicals
(4,675)
0
Paper
(3,159)
(6,312)
MetCon
(82)
0
Agriculture
Carloads
Carloads
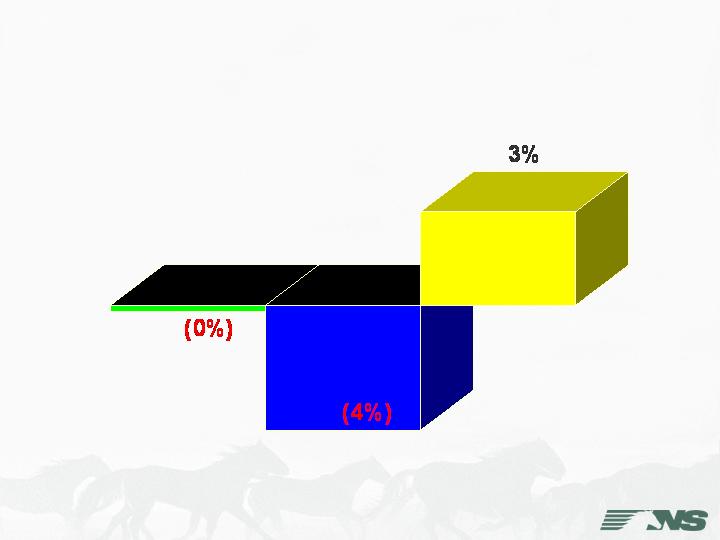
Railway Operating Revenue
1 st Quarter 2007 vs. 2006
19 consecutive
quarters of growth
2Q 2002 – 4Q 2006
Declines driven by
volume, mix, and FSC
4% net pricing gain
Total - $2.247 Billion
Down $56 Million, 2% vs. 1Q 2006
Rev. $Millions
Coal
$557
Intermodal
$462
Merchandise
$1,228
(4%)
(1%)
(0%)
Revenue Per Unit
1 st Quarter 2007 vs. 2006
18 consecutive
quarters of RPU
growth
Continued pricing
leverage
Mix effect and
negative fuel
surcharge revenue
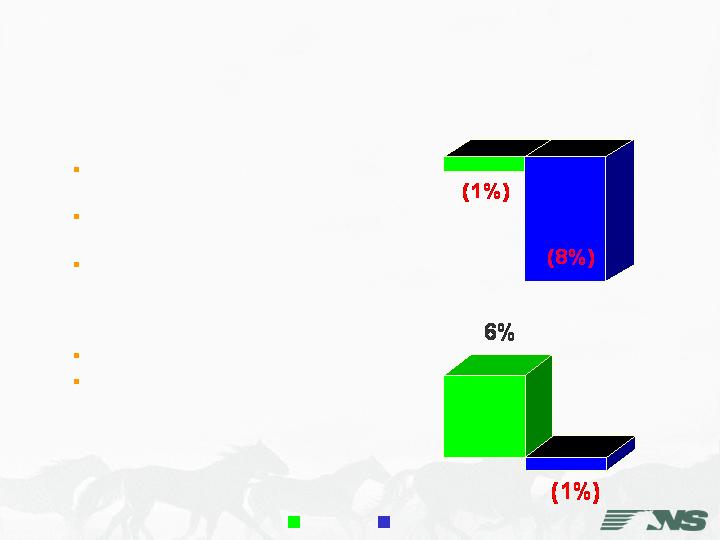
Coal Variance Analysis
1st Quarter 2007 vs. 2006
Revenue
Carloads
Rev Per Car

Coal Volume
1 st Quarter 2007 vs. 2006
Utility 3%
Service disrupted by winter weather
Increases at Southern power plants
Export 4%
Problems at foreign coal ports
Weakening dollar
Industrial 17%
Strong contract renegotiations
New business
Stronger demand
Met/Coke/Iron Ore 23%
Loss of spot traffic
Coking furnace outages
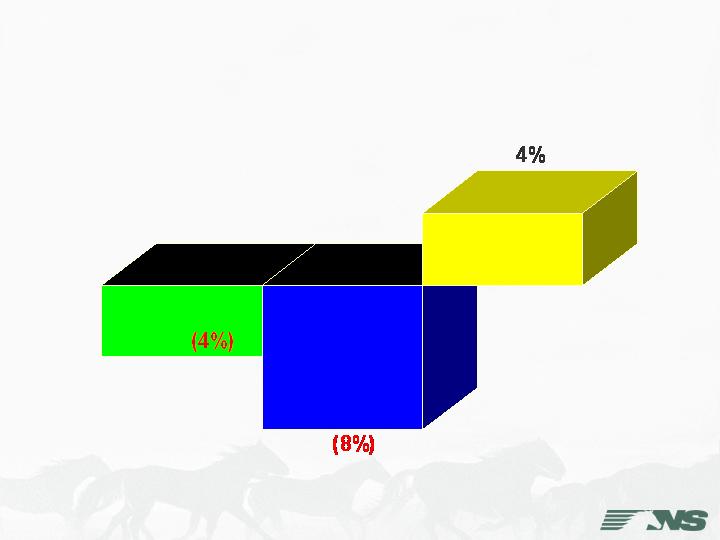
Merchandise Variance Analysis
1st Quarter 2007 vs. 2006
Revenue
Carloads
Rev Per Car

Merchandise Revenue & Units
1 st Quarter 2007 vs. 2006
Agriculture
Non-recurring hurricane
related traffic
Continued ethanol
opportunities
Higher corn and fertilizer
demand
Revenue
Units

Merchandise Revenue & Units
1 st Quarter 2007 vs. 2006
Agriculture
Non-recurring hurricane
related traffic
Continued ethanol
opportunities
Higher corn and fertilizer
demand
Metals/Construction
Steel orders & production
down
Construction markets impacted
by housing starts
Revenue
Units

Merchandise Revenue & Units
1 st Quarter 2007 vs. 2006
Paper
Lumber impacted by
housing starts
Continued declines in
conventional paper markets
Import paper growth
Revenue
Units
Merchandise Revenue & Units
1 st Quarter 2007 vs. 2006
Paper
Lumber impacted by
housing starts
Continued declines in
conventional paper markets
Import paper growth
Chemicals
Strong pricing gains
Volume impacted by housing &
automotive
Revenue
Units

Merchandise Revenue & Units
1st Quarter 2007 vs. 2006
Automotive
Big 3 restructuring
Continued growth in new
domestics
Loss of higher RPU auto
parts
Revenue
Units

Automotive Industry Restructuring
Production Cuts Impacting NS
Manufacturer
Plant
Comments
Effective Date
Ford
St Louis, MO
Plant idled
March 2006
Ford
Norfolk, VA
Plant reduced from two to one shift
August 2006
Ford
Plant will be idled
June 2007
Ford
Hapeville, GA
Plant idled
October 2006
Ford
St Paul, MN
Plant reduced from two to one shift
January 2007
Ford
Plant will be idled
Mid 2008
Ford
St Thomas, ON
Plant reduced from two to one shift
April 2007
Ford
Wixom, MI
Plant will be idled
May 2007
General Motors
Oklahoma City, OK
Plant idled
February 2006
General Motors
Moraine, OH
Plant reduced from three to two shifts
July 2006
General Motors
Doraville, GA
Plant reduced from two to one shift
September 2006
General Motors
Plant will be idled
Mid-2008
DaimlerChrysler
Newark, DE
Plant reduced from two to one shift
August 2006
DaimlerChrysler
Plant will be idled
Mid-2009
DaimlerChrysler
Warren Truck, MI
Plant reduced from three to two shifts
3rd Quarter 2007
DaimlerChrysler
St Louis South, MO
Plant reduced from two to one shift
1st Quarter 2008
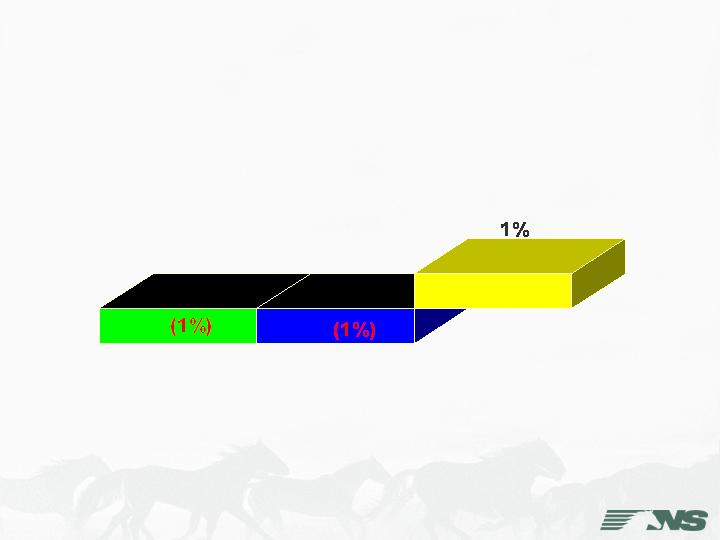
Intermodal Variance Analysis
1st Quarter 2007 vs. 2006
Revenue
Units
Rev Per Unit

Intermodal Volume
1st Quarter 2007 vs. 2006
Domestic 7%
Increased truck competition
Truckload 2%
Gains across the network

Intermodal Volume
1st Quarter 2007 vs. 2006
Domestic 7%
Increased truck competition
Truckload 2%
Gains across the network
International 0%
Increase in East Coast volume
Decrease in West Coast volume
West Coast volumes impacted by
ocean carrier market shifts

Intermodal Volume
1st Quarter 2007 vs. 2006
Domestic 7%
Increased truck competition
Truckload 2%
Gains across the network
International 0%
Increase in East Coast volume
Decrease in West Coast volume
West Coast volumes impacted by
ocean carrier market shifts
Premium 6%
Increase in parcel shipments
Triple Crown 6%
Lower automotive volume

Looking Ahead
Difficult 2nd quarter comparisons
Ongoing housing & automotive weakness
Intermodal
Stronger demand & less trucking capacity
New international contracts
New domestic service – Los Angeles to Atlanta
Coal
Improving met coal outlook
Moderated utility stockpiles, but close to target
Favorable export market

Looking Ahead
Merchandise
Growing ethanol market
Higher fertilizer demand
Stronger plastics shipments
Higher steel production projected
Automotive
Lower auto parts volume
Increased volume from “New Domestics”
Big Three restructuring continues
Pricing
Continued focus on strong market based pricing