UNITED STATES
SECURITIES AND EXCHANGE COMMISSION
Washington, D.C. 20549 |
CERTIFIED SHAREHOLDER REPORT OF REGISTERED MANAGEMENT
INVESTMENT COMPANIES |
Investment Company Act file number 811-3456
General Government Securities Money Market Funds, Inc.
(Exact name of Registrant as specified in charter) |
c/o The Dreyfus Corporation
200 Park Avenue
New York, New York 10166
(Address of principal executive offices) (Zip code) |
Michael A. Rosenberg, Esq.
200 Park Avenue
New York, New York 10166
(Name and address of agent for service) |
Registrant's telephone number, including area code: (212) 922-6000
Date of fiscal year end: 11/30
Date of reporting period: 11/30/08
FORM N-CSR
Item 1. Reports to Stockholders.

Save time. Save paper. View your next shareholder report online as soon as it’s available. Log into www.dreyfus.com and sign up for Dreyfus eCommunications. It’s simple and only takes a few minutes.
The views expressed in this report reflect those of the portfolio manager only through the end of the period covered and do not necessarily represent the views of Dreyfus or any other person in the Dreyfus organization. Any such views are subject to change at any time based upon market or other conditions and Dreyfus disclaims any responsibility to update such views.These views may not be relied on as investment advice and, because investment decisions for a Dreyfus fund are based on numerous factors, may not be relied on as an indication of trading intent on behalf of any Dreyfus fund.

| | Contents |
| |
| | THE FUND |
| |
| 2 | A Letter from the CEO |
| |
| 3 | Discussion of Fund Performance |
| |
| 6 | Understanding Your Fund’s Expenses |
| |
| 6 | Comparing Your Fund’s Expenses With Those of Other Funds |
| |
| 7 | Statement of Investments |
| |
| 9 | Statement of Assets and Liabilities |
| |
| 10 | Statement of Operations |
| |
| 11 | Statement of Changes in Net Assets |
| |
| 12 | Financial Highlights |
| |
| 14 | Notes to Financial Statements |
| |
| 24 | Report of Independent Registered Public Accounting Firm |
| |
| 25 | Important Tax Information |
| |
| 26 | Information About the Review and Approval of the Fund’s Management Agreement |
| |
| 31 | Board Members Information |
| |
| 34 | Officers of the Fund |
| |
| | FOR MORE INFORMATION |
| |
| | Back Cover |
| |
General Government Securities
Money Market Fund |

A LETTER FROM THE CEO
Dear Shareholder: |
We present to you this annual report for General Government Securities Money Market Fund, covering the 12-month period from December 1, 2007, through November 30, 2008.
The U.S.and global economies suffered during the reporting period amid a financial crisis that sparked declines in virtually all areas of the financial markets.According to our Chief Economist, four key elements fueled the crisis: a sharp decline in home prices; high leverage and an ambiguous private/public status at mortgage agencies Fannie Mae and Freddie Mac; high leverage among financial institutions,especially investment banks;and regulatory policies and behaviors that exacerbated financial stresses.
The federal government subsequently stepped in with a number of measures, including aTemporary Guarantee Program for Money Market Funds and a $700 billion rescue package intended to promote greater liquidity in the financial markets. However, the U.S. and global financial systems remain fragile, and economic weakness is likely to persist.
In our view, today’s investment environment is rife with near-term challenges and long-term opportunities. Now more than ever, it is important to ensure that your investments are aligned with your current needs, future goals and attitudes toward risk.We urge you to speak regularly with your financial advisor, who can recommend the course of action that is right for you.
For information about how the fund performed during the reporting period, as well as market perspectives, we have provided a Discussion of Fund Performance given by the fund’s Portfolio Manager.
Thank you for your continued confidence and support.
Jonathan R. Baum
Chief Executive Officer
The Dreyfus Corporation |

DISCUSSION OF FUND PERFORMANCE
For the period of December 1, 2007, through November 30, 2008, as provided by Bernard W. Kiernan, Jr., Senior Portfolio Manager
Fund and Market Performance Overview
For the 12-month period ended November 30, 2008, General Government Securities Money Market Fund’s Class A shares produced a yield of 1.99%, and its Class B shares produced a yield of 1.77% .Taking into account the effects of compounding, the fund’s Class A and Class B shares produced effective yields of 2.01% and 1.79%, respectively.1
Money market yields declined over the reporting period along with short-term interest rates in a weakening U.S. economy.The U.S. government securities in which the fund invests also were influenced by robust investor demand, which put additional downward pressure on yields.
The Fund’s Investment Approach
The fund seeks as high a level of current income as is consistent with the preservation of capital and the maintenance of liquidity.
To pursue this goal, the fund invests in securities issued or guaranteed as to principal and interest by the U.S. government or its agencies or instrumentalities, and repurchase agreements (including tri-party repurchase agreements). These instruments include those backed by the full faith and credit of the U.S. government and those that are neither insured nor guaranteed by the U.S. government.
Interest Rates Fell as U.S. Economy Struggled
Slumping U.S. housing markets, sluggish consumer spending and resurgent energy prices already had produced a weaker U.S. economy by the start of the reporting period. As a result, the Federal Reserve Board (the “Fed”) had reduced the overnight federal funds rate in several moves to 4.25% at the start of the reporting period.
Evidence of economic weakness continued to mount through the first quarter of 2008, and the credit crisis intensified as institutional
| DISCUSSION OF FUND PERFORMANCE (continued) |
investors de-levered their portfolios to raise cash to meet margin calls and redemption requests. Despite aggressive easing by the Fed and an economic stimulus package from Congress in January 2008, job losses and deleveraging pressures intensified. In March, the Fed participated in the rescue of investment bank Bear Stearns and made funds available toWall Street firms in an unprecedented program allowing the use of mortgage-backed securities as collateral.
Reports of additional write-downs by major banks in June and greater-than-expected losses by mortgage agencies Fannie Mae and Freddie Mac in July sparked renewed volatility in the stock and bond markets. The bad news continued to mount in August, including a jump in the unemployment rate to its highest level in five years.
September ranked as one of the most challenging months in memory, as financial institutions found themselves unable to obtain short-term funding for their operations. In the ensuing tumult, the U.S. government effectively nationalized Fannie Mae, Freddie Mac and insurer AIG, Lehman Brothers Holdings filed for bankruptcy, Washington Mutual was seized by regulators, and Merrill Lynch and Wachovia were sold to former rivals. The U.S. Treasury Department proposed and Congress passed a $700 billion rescue package for the nation’s banking system. It later was estimated that U.S. GDP contracted at a –0.5% annualized rate in the third quarter of the year.
Fund Suffered in the Financial Crisis
Money market funds that invest in corporate-backed instruments were not immune to the financial crisis.The Lehman Brothers bankruptcy led to challenging liquidity conditions in the commercial paper market, prompting investors to shift assets to funds that invest solely in U.S. government securities. In an effort to curtail diminishing confidence and help restore liquidity and stability to the financial system, the Department ofTreasury initiated several measures including theTemporary Guarantee Program specifically for money market funds. Consequently, the commercial paper market began to stabilize, as evidenced by rising trading activity and a resumption of inflows to prime money market funds.
4
In October, the Fed and other central banks around the world implemented a coordinated rate cut to combat spreading global economic weakness.The Fed followed up with another reduction later in the month, and the federal funds rate ended the reporting period at just 1.00% . In November,the National Bureau of Economic Research officially declared that the U.S. economy has been in a recession since December 2007, a pronouncement that appeared to be confirmed by another month of severe job losses and a rise in the unemployment rate to 6.70%, the highest since 1993.As the financial crisis persisted, the Fed reduced the federal funds rate further in December to a range of 0% – 0.25% in its latest effort to support the credit markets and economic activity.
Maintaining a Cautious Posture
For most of the reporting period, we maintained the fund’s weighted average maturity in a position we considered longer than industry averages.This strategy enabled us to maintain higher yields while yields of U.S. government securities declined. We intend to maintain this position for as long as we deem practical.
We currently expect reduced liquidity and tighter loan standards to dampen economic growth well into 2009. Therefore, we intend to maintain the fund’s conservative credit posture and a focus on liquidity.
December 16, 2008
| | | An investment in the fund is not insured or guaranteed by the FDIC or any other government |
| | | agency. Although the fund seeks to preserve the value of your investment at $1.00 per share, it is |
| | | possible to lose money by investing in the fund. |
| 1 | | Effective yield is based upon dividends declared daily and reinvested monthly. Past performance is |
| | | no guarantee of future results.Yields fluctuate.Yields provided for the fund’s Class B shares reflect |
| | | the absorption of certain fund expenses by The Dreyfus Corporation pursuant to an undertaking |
| | | in effect that may be extended, terminated or modified at any time. Had these expenses not been |
| | | absorbed, the fund’s Class B shares would have produced a yield of 1.75% and an effective yield |
| | | of 1.76%. |
The Fund 5
UNDERSTANDING YOUR FUND’S EXPENSES (Unaudited)
As a mutual fund investor, you pay ongoing expenses, such as management fees and other expenses. Using the information below, you can estimate how these expenses affect your investment and compare them with the expenses of other funds.You also may pay one-time transaction expenses, including sales charges (loads) and redemption fees, which are not shown in this section and would have resulted in higher total expenses. For more information, see your fund’s prospectus or talk to your financial adviser.
Review your fund’s expenses
The table below shows the expenses you would have paid on a $1,000 investment in General Government Securities Money Market Fund from June 1, 2008 to November 30, 2008. It also shows how much a $1,000 investment would be worth at the close of the period, assuming actual returns and expenses.
| | Expenses and Value of a $1,000 Investment
assuming actual returns for the six months ended November 30, 2008 |
| | | Class A | | Class B |
| |
| |
|
| Expenses paid per $1,000† | | $ 4.01 | | $ 5.21 |
| Ending value (after expenses) | | $1,006.20 | | $1,005.10 |
COMPARING YOUR FUND’S EXPENSES
WITH THOSE OF OTHER FUNDS (Unaudited) |
Using the SEC’s method to compare expenses
The Securities and Exchange Commission (SEC) has established guidelines to help investors assess fund expenses. Per these guidelines, the table below shows your fund’s expenses based on a $1,000 investment, assuming a hypothetical 5% annualized return. You can use this information to compare the ongoing expenses (but not transaction expenses or total cost) of investing in the fund with those of other funds.All mutual fund shareholder reports will provide this information to help you make this comparison. Please note that you cannot use this information to estimate your actual ending account balance and expenses paid during the period.
| | Expenses and Value of a $1,000 Investment
assuming a hypothetical 5% annualized return for the six months ended November 30, 2008 |
| | | Class A | | Class B |
| |
| |
|
| Expenses paid per $1,000† | | $ 4.04 | | $ 5.25 |
| Ending value (after expenses) | | $1,021.00 | | $1,019.80 |
| † Expenses are equal to the fund’s annualized expense ratio of .80% for Class A shares and 1.04% for Class B shares, |
| multiplied by the average account value over the period, multiplied by 183/366 (to reflect the one-half year period). |
6
STATEMENT OF INVESTMENTS
November 30, 2008 |
| | | Annualized | | | | | |
| | | Yield on | | | | | |
| | | Date of | | Principal | | | |
| U.S. Government Agencies—69.1% | | Purchase (%) | | Amount ($) | | | Value ($) |
| |
| |
|
| |
|
| Federal Farm Credit Bank: | | | | | | | |
| 9/15/09 | | 1.05 | | 100,000,000 | a | | 99,996,208 |
| 3/12/10 | | 1.20 | | 54,180,000 | a | | 54,117,981 |
| Federal Home Loan Bank: | | | | | | | |
| 1/14/09 | | 2.41 | | 50,000,000 | | | 49,853,333 |
| 1/20/09 | | 0.55 | | 70,925,000 | | | 70,870,821 |
| 2/2/09 | | 1.55 | | 200,000,000 | | | 199,458,813 |
| 2/9/09 | | 0.75 | | 100,000,000 | | | 99,854,167 |
| 2/13/09 | | 1.90 | | 100,000,000 | | | 100,122,066 |
| 2/27/09 | | 2.55 | | 35,000,000 | | | 35,003,207 |
| 3/4/09 | | 2.43 | | 75,000,000 | | | 74,535,000 |
| 3/5/09 | | 2.59 | | 40,000,000 | | | 40,001,648 |
| 3/17/09 | | 2.56 | | 115,000,000 | | | 114,975,081 |
| 4/14/09 | | 2.26 | | 65,100,000 | | | 65,096,645 |
| 5/7/09 | | 2.40 | | 20,000,000 | | | 20,011,958 |
| 5/19/09 | | 2.50 | | 50,000,000 | | | 50,003,449 |
| 9/4/09 | | 1.11 | | 150,000,000 | a | | 150,000,000 |
| 9/18/09 | | 1.14 | | 66,000,000 | a | | 66,005,178 |
| Federal Home Loan Mortgage Corp.: | | | | | | | |
| 12/19/08 | | 2.48 | | 43,000,000 | b | | 42,947,325 |
| 12/29/08 | | 2.50 | | 35,633,000 | b | | 35,564,545 |
| 1/12/09 | | 2.27 | | 40,000,000 | b | | 40,132,554 |
| 2/17/09 | | 2.21 | | 1,200,000 | b | | 1,206,549 |
| Federal National Mortgage Association | | | | | | | |
| 12/1/08 | | 0.77 | | 175,000,000 a,b | | 175,000,000 |
| Total U.S. Government Agencies | | | | | | | |
| (cost $1,584,756,528) | | | | | 1,584,756,528 |
| |
| |
|
|
| |
| |
| Repurchase Agreements—31.0% | | | | | | | |
| |
| |
|
| |
|
| Banc of America Securities LLC | | | | | | | |
| dated 11/28/08, due 12/1/08 in the | | | | | | | |
| amount of $82,001,025 (fully collateralized | | | | | | | |
| by $72,279,800 U.S. Treasury Bonds, | | | | | | | |
| 4.375%, due 2/15/38, value $83,640,090) | | 0.15 | | 82,000,000 | | | 82,000,000 |
| STATEMENT OF INVESTMENTS (continued) |
| | | Annualized | | | | |
| | | Yield on | | | | |
| | | Date of | | Principal | | |
| Repurchase Agreements (continued) | | Purchase (%) | | Amount ($) | | Value ($) |
| |
| |
| |
|
| Barclays Financial LLC | | | | | | |
| dated 11/28/08, due 12/1/08 in the amount | | | | | | |
| of $228,003,800 (fully collateralized by | | | | | | |
| $143,240,000 Federal Home Loan Mortgage | | | | | | |
| Corp., 4.125%, due 11/30/09, value | | | | | | |
| $149,249,753, $51,968,000 Federal | | | | | | |
| National Mortgage Association, 6.375%, | | | | | | |
| due 6/15/09, value $54,751,021 and | | | | | | |
| $27,960,600 U.S. Treasury Notes, 4.875%, | | | | | | |
| due 5/15/09, value $28,560,095) | | 0.20 | | 228,000,000 | | 228,000,000 |
| Deutsche Bank Securities | | | | | | |
| dated 11/28/08, due 12/1/08 in the amount of | | | | | | |
| $200,003,333 (fully collateralized by $140,676,000 | | | | |
| Treasury Inflation Protected Securities, 3.375%, | | | | | | |
| due 4/15/32, value $182,705,528 and | | | | | | |
| $38,480,905 U.S. Treasury Strips, | | | | | | |
| due 2/15/22-5/15/26 , value $21,294,600) | | 0.20 | | 200,000,000 | | 200,000,000 |
| HSBC USA Inc. | | | | | | |
| dated 11/28/08, due 12/1/08 in the amount of | | | | | | |
| $200,003,333 (fully collateralized by $198,365,000 | | | | |
| Federal Home Loan Bank, 3.26%-5%, due | | | | | | |
| 10/2/09-8/13/10, value $204,001,120) | | 0.20 | | 200,000,000 | | 200,000,000 |
| Total Repurchase Agreements | | | | | | |
| (cost $710,000,000) | | | | | | 710,000,000 |
| |
| |
| |
|
| |
| Total Investments (cost $2,294,756,528) | | | | 100.1% | | 2,294,756,528 |
| |
| Liabilities, Less Cash and Receivables | | | | (.1%) | | (1,311,774) |
| |
| Net Assets | | | | 100.0% | | 2,293,444,754 |
| a Variable rate security—interest rate subject to periodic change. |
| b On September 7, 2008, the Federal Housing Finance Agency (FHFA) placed Federal National Mortgage |
| Association and Federal Home Loan Mortgage Corporation into conservatorship with FHFA as the conservator. As |
| such, the FHFA will oversee the continuing affairs of these companies. |
| Portfolio Summary (Unaudited)† | | | | |
| | | Value (%) | | | | Value (%) |
| |
| |
| |
|
| U.S. Government Agencies | | 69.1 | | Repurchase Agreements | | 31.0 |
| | | | | | | 100.1 |
| † Based on net assets. | | | | | | |
| See notes to financial statements. | | | | | | |
8
| | STATEMENT OF ASSETS AND LIABILITIES
November 30, 2008 |
| | | Cost | | Value |
| |
| |
|
| Assets ($): | | | | |
| Investments in securities—See Statement of | | | | |
| Investments (including repurchase agreements | | | | |
| of $710,000,000)—Note 1(b) | | 2,294,756,528 | | 2,294,756,528 |
| Interest receivable | | | | 5,469,234 |
| Prepaid expenses | | | | 98,782 |
| | | | | 2,300,324,544 |
| |
| |
|
| Liabilities ($): | | | | |
| Due to The Dreyfus Corporation and affiliates—Note 2(c) | | | | 1,867,560 |
| Cash overdraft due to Custodian | | | | 4,412,761 |
| Payable for shares of Common Stock redeemed | | | | 541,073 |
| Accrued expenses | | | | 58,396 |
| | | | | 6,879,790 |
| |
| |
|
| Net Assets ($) | | | | 2,293,444,754 |
| |
| |
|
| Composition of Net Assets ($): | | | | |
| Paid-in capital | | | | 2,293,568,006 |
| Accumulated net realized gain (loss) on investments | | | | (123,252) |
| |
| |
|
| Net Assets ($) | | | | 2,293,444,754 |
| Net Asset Value Per Share | | | | |
| | | Class A | | Class B |
| |
| |
|
| Net Assets ($) | | 121,136,514 | | 2,172,308,240 |
| Shares Outstanding | | 121,144,164 | | 2,172,439,608 |
| |
| |
|
| Net Asset Value Per Share ($) | | 1.00 | | 1.00 |
| |
| See notes to financial statements. | | | | |
STATEMENT OF OPERATIONS
Year Ended November 30, 2008 |
| Investment Income ($): | | |
| Interest Income | | 48,821,805 |
| Expenses: | | |
| Management fee—Note 2(a) | | 9,055,629 |
| Shareholder servicing costs—Note 2(c) | | 5,284,947 |
| Distribution fees, service and prospectus fees—Note 2(b) | | 3,638,208 |
| Treasury insurance expense—Note 1(e) | | 166,492 |
| Registration fees | | 142,613 |
| Custodian fees—Note 2(c) | | 140,225 |
| Directors’ fees and expenses—Note 2(d) | | 81,003 |
| Professional fees | | 57,382 |
| Shareholders’ reports | | 12,309 |
| Miscellaneous | | 29,627 |
| Total Expenses | | 18,608,435 |
| Less—reduction in shareholder servicing costs | | |
| due to undertaking—Note 2(c) | | (236,805) |
| Less—reduction in fees due to earnings credits—Note 1(b) | | (7,249) |
| Net Expenses | | 18,364,381 |
| Investment Income—Net | | 30,457,424 |
| |
|
| Net Realized Gain (Loss) on Investments—Note 1(b) ($) | | 279,500 |
| Net Increase in Net Assets Resulting from Operations | | 30,736,924 |
| |
| See notes to financial statements. | | |
10
STATEMENT OF CHANGES IN NET ASSETS
| | | Year Ended November 30, |
| | |
|
| | | 2008 | | 2007 |
| |
| |
|
| Operations ($): | | | | |
| Investment income—net | | 30,457,424 | | 54,001,184 |
| Net realized gain (loss) on investments | | 279,500 | | 18,863 |
| Net Increase (Decrease) in Net Assets | | | | |
| Resulting from Operations | | 30,736,924 | | 54,020,047 |
| |
| |
|
| Dividends to Shareholders from ($): | | | | |
| Investment income—net: | | | | |
| Class A Shares | | (1,560,129) | | (6,827,626) |
| Class B Shares | | (28,897,295) | | (47,173,558) |
| Total Dividends | | (30,457,424) | | (54,001,184) |
| |
| |
|
| Capital Stock Transactions ($1.00 per share): | | | | |
| Net proceeds from shares sold: | | | | |
| Class A Shares | | 577,719,521 | | 1,301,604,325 |
| Class B Shares | | 5,105,202,161 | | 4,177,326,486 |
| Dividends reinvested: | | | | |
| Class A Shares | | 1,515,036 | | 6,008,008 |
| Class B Shares | | 28,718,967 | | 46,674,892 |
| Cost of shares redeemed: | | | | |
| Class A Shares | | (524,690,084) | | (1,601,638,284) |
| Class B Shares | | (4,387,846,750) | | (3,887,546,069) |
| Increase (Decrease) in Net Assets | | | | |
| from Capital Stock Transactions | | 800,618,851 | | 42,429,358 |
| Total Increase (Decrease) in Net Assets | | 800,898,351 | | 42,448,221 |
| |
| |
|
| Net Assets ($): | | | | |
| Beginning of Period | | 1,492,546,403 | | 1,450,098,182 |
| End of Period | | 2,293,444,754 | | 1,492,546,403 |
| |
| See notes to financial statements. | | | | |
The Fund 11
FINANCIAL HIGHLIGHTS
The following tables describe the performance for each share class for the fiscal periods indicated. All information reflects financial results for a single fund share. Total return shows how much your investment in the fund would have increased (or decreased) during each period, assuming you had reinvested all dividends and distributions.These figures have been derived from the fund’s financial statements.
| | | | | Year Ended November 30, | | |
| | |
| |
| |
|
| Class A Shares | | 2008 | | 2007 | | 2006 | | 2005 | | 2004 |
| |
| |
| |
| |
| |
|
| Per Share Data ($): | | | | | | | | | | |
| Net asset value, beginning of period | | 1.00 | | 1.00 | | 1.00 | | 1.00 | | 1.00 |
| Investment Operations: | | | | | | | | | | |
| Investment income—net | | .020 | | .043 | | .041 | | .022 | | .005 |
| Distributions: | | | | | | | | | | |
| Dividends from investment income—net | | (.020) | | (.043) | | (.041) | | (.022) | | (.005) |
| Net asset value, end of period | | 1.00 | | 1.00 | | 1.00 | | 1.00 | | 1.00 |
| |
| |
| |
| |
| |
|
| Total Return (%) | | 2.01 | | 4.44 | | 4.16 | | 2.24 | | .52 |
| |
| |
| |
| |
| |
|
| Ratios/Supplemental Data (%): | | | | | | | | | | |
| Ratio of total expenses | | | | | | | | | | |
| to average net assets | | .81 | | .78 | | .80 | | .79 | | .79 |
| Ratio of net expenses | | | | | | | | | | |
| to average net assets | | .81a | | .78 | | .80 | | .79 | | .79 |
| Ratio of net investment income | | | | | | | | | | |
| to average net assets | | 1.84 | | 4.45 | | 4.06 | | 2.18 | | .51 |
| |
| |
| |
| |
| |
|
| Net Assets, end of period ($ x 1,000) | | 121,137 | | 66,357 | | 360,382 | | 443,079 | | 517,063 |
| |
| a Expense waivers and/or reimbursements amounted to less than .01%. | | | | | | |
| See notes to financial statements. | | | | | | | | | | |
12
| | | | | Year Ended November 30, | | |
| | |
| |
| |
|
| Class B Shares | | 2008 | | 2007 | | 2006 | | 2005 | | 2004 |
| |
| |
| |
| |
| |
|
| Per Share Data ($): | | | | | | | | | | |
| Net asset value, beginning of period | | 1.00 | | 1.00 | | 1.00 | | 1.00 | | 1.00 |
| Investment Operations: | | | | | | | | | | |
| Investment income—net | | .018 | | .042 | | .039 | | .020 | | .003 |
| Distributions: | | | | | | | | | | |
| Dividends from | | | | | | | | | | |
| investment income—net | | (.018) | | (.042) | | (.039) | | (.020) | | (.003) |
| Net asset value, end of period | | 1.00 | | 1.00 | | 1.00 | | 1.00 | | 1.00 |
| |
| |
| |
| |
| |
|
| Total Return (%) | | 1.79 | | 4.25 | | 3.95 | | 2.02 | | .32 |
| |
| |
| |
| |
| |
|
| Ratios/Supplemental Data (%): | | | | | | | | | | |
| Ratio of total expenses | | | | | | | | | | |
| to average net assets | | 1.04 | | 1.04 | | 1.03 | | 1.04 | | 1.04 |
| Ratio of net expenses | | | | | | | | | | |
| to average net assets | | 1.02 | | 1.01 | | 1.01 | | 1.01 | | .98 |
| Ratio of net investment income | | | | | | | | | | |
| to average net assets | | 1.67 | | 4.16 | | 3.89 | | 1.96 | | .30 |
| |
| |
| |
| |
| |
|
| Net Assets, end of period | | | | | | | | | | |
| ($ x 1,000) | | 2,172,308 | | 1,426,190 | | 1,089,717 | | 1,061,190 | | 719,095 |
| |
| See notes to financial statements. | | | | | | | | | | |
NOTES TO FINANCIAL STATEMENTS
NOTE 1—Significant Accounting Policies:
General Government Securities Money Market Fund (the “fund”) is a separate diversified series of General Government Securities Money Market Funds, Inc. (the “Company”) which is registered under the Investment Company Act of 1940, as amended (the “Act”), as an open-end management investment company and operates as a series company, currently offering two series, including the fund.The fund’s investment objective is to provide investors with as high a level of current income as is consistent with the preservation of capital and the maintenance of liquidity. The Dreyfus Corporation (the “Manager” or “Dreyfus”), a wholly-owned subsidiary of The Bank of New York Mellon Corporation (“BNY Mellon”), serves as the fund’s investment adviser.
Effective July 1, 2008, BNY Mellon has reorganized and consolidated a number of its banking and trust company subsidiaries. As a result of the reorganization, any services previously provided to the fund by Mellon Bank, N.A. or Mellon Trust of New England, N.A. are now provided by The Bank of New York, which has changed its name to The Bank of New York Mellon.
MBSC Securities Corporation (the “Distributor”), a wholly-owned subsidiary of the Manager, is the distributor of the fund’s shares. The fund is authorized to issue 16 billion shares of $.001 par value Common Stock.The fund currently offers two classes of shares: Class A (10 billion shares authorized) and Class B (6 billion shares authorized). Class A shares and Class B shares are identical except for the services offered to and the expenses borne by each class, the allocation of certain transfer agency costs and certain voting rights. Class A shares are subject to a Service Plan adopted pursuant to Rule 12b-1 under the Act, Class B shares are subject to a Distribution Plan adopted pursuant to Rule 12b-1 under the Act and Class A and Class B shares are subject to a Shareholder Services Plan. In addition, Class B shares are charged directly for sub-accounting services provided by Service Agents (a securities dealer, financial institution or other industry professional) at an annual rate of .05% of the value of the average daily net
14
assets of Class B shares. During the period ended November 30, 2008, sub-accounting service fees amounted to $863,115 for Class B shares and are included in shareholder servicing costs. Income, expenses (other than expenses attributable to a specific class), and realized and unrealized gains or losses on investments are allocated to each class of shares based on its relative net assets.
The Company accounts separately for the assets, liabilities and operations of each series. Expenses directly attributable to each series are charged to that series’ operations; expenses which are applicable to all series are allocated among them on a pro rata basis.
It is the fund’s policy to maintain a continuous net asset value per share of $1.00; the fund has adopted certain investment, portfolio valuation and dividend and distribution policies to enable it to do so.There is no assurance, however, that the fund will be able to maintain a stable net asset value per share of $1.00.
The fund’s financial statements are prepared in accordance with U.S. generally accepted accounting principles, which may require the use of management estimates and assumptions. Actual results could differ from those estimates.
The fund enters into contracts that contain a variety of indemnifications. The fund’s maximum exposure under these arrangements is unknown.The fund does not anticipate recognizing any loss related to these arrangements.
(a) Portfolio valuation: Investments in securities are valued at amortized cost in accordance with Rule 2a-7 of the Act, which has been determined by the Board of Directors to represent the fair value of the fund’s investments.
The fund adopted Statement of Financial Accounting Standards No. 157 “FairValue Measurements” (“FAS 157”). FAS 157 establishes an authoritative definition of fair value, sets out a framework for measuring fair value, and requires additional disclosures about fair-value measurements.
| NOTES TO FINANCIAL STATEMENTS (continued) |
Various inputs are used in determining the value of the fund’s investments relating to FAS 157.These inputs are summarized in the three broad levels listed below.
| Level 1—quoted prices in active markets for identical securities. |
| Level 2—other significant observable inputs (including quoted |
| prices for similar securities, interest rates, prepayment speeds, credit |
| risk, etc.). |
| Level 3—significant unobservable inputs (including the fund’s own |
| assumptions in determining the fair value of investments). |
The inputs or methodology used for valuing securities are not necessarily an indication of the risk associated with investing in those securities. For example, money market securities are valued using amortized cost, in accordance with rules under the Act. Generally, amortized cost approximates the current fair value of a security, but since the value is not obtained from a quoted price in an active market, such securities are reflected as Level 2.
The following is a summary of the inputs used as of November 30, 2008 in valuing the fund’s investments carried at fair value:
| | | Investments in |
| Valuation Inputs | | Securities ($) |
| |
|
| Level 1—Quoted Prices | | 0 |
| Level 2—Other Significant Observable Inputs | | 2,294,756,528 |
| Level 3—Significant Unobservable Inputs | | 0 |
| Total | | 2,294,756,528 |
(b) Securities transactions and investment income: Securities transactions are recorded on a trade date basis. Interest income, adjusted for accretion of discount and amortization of premium on investments, is earned from settlement date and recognized on the accrual basis. Realized gains and losses from securities transactions are recorded on the identified cost basis. Cost of investments represents amortized cost.
In March 2008, the Financial Accounting Standards Board (“FASB”) released Statement of Financial Accounting Standards No. 161, “Disclosures about Derivative Instruments and Hedging Activities”
16
(“FAS 161”). FAS 161 requires qualitative disclosures about objectives and strategies for using derivatives, quantitative disclosures about fair value amounts of gains and losses on derivative instruments, and disclosures about credit-risk-related contingent features in derivative agreements.The application of FAS 161 is required for fiscal years and interim periods beginning after November 15, 2008. At this time, management is evaluating the implications of FAS 161 and its impact on the financial statements and the accompanying notes has not yet been determined.
The fund has arrangements with the custodian and cash management banks whereby the fund may receive earnings credits when positive cash balances are maintained, which are used to offset custody and cash management fees. For financial reporting purposes, the fund includes net earnings credits as an expense offset in the Statement of Operations.
The fund may enter into repurchase agreements with financial institutions, deemed to be creditworthy by the fund’s Manager, subject to the seller’s agreement to repurchase and the fund’s agreement to resell such securities at a mutually agreed upon price. Securities purchased subject to repurchase agreements are deposited with the fund’s custodian and, pursuant to the terms of the repurchase agreement, must have an aggregate market value greater than or equal to the repurchase price plus accrued interest at all times. If the value of the underlying securities falls below the value of the repurchase price plus accrued interest, the fund will require the seller to deposit additional collateral by the next business day. If the request for additional collateral is not met, or the seller defaults on its repurchase obligation, the fund maintains the right to sell the underlying securities at market value and may claim any resulting loss against the seller.
(c) Dividends to shareholders: It is the policy of the fund to declare dividends from investment income-net on each business day; such dividends are paid monthly. Dividends from net realized capital gains, if any, are normally declared and paid annually, but the fund may make distributions on a more frequent basis to comply with the
The Fund 17
| NOTES TO FINANCIAL STATEMENTS (continued) |
distribution requirements of the Internal Revenue Code of 1986, as amended (the “Code”). To the extent that net realized capital gains can be offset by capital loss carryovers, it is the policy of the fund not to distribute such gains.
(d) Federal income taxes: It is the policy of the fund to continue to qualify as a regulated investment company, if such qualification is in the best interests of its shareholders, by complying with the applicable provisions of the Code, and to make distributions of taxable income sufficient to relieve it from substantially all federal income and excise taxes.
The fund adopted FASB Interpretation No. 48 “Accounting for Uncertainty in Income Taxes” (“FIN 48”). FIN 48 provides guidance for how uncertain tax positions should be recognized, measured, presented and disclosed in the financial statements. FIN 48 requires the evaluation of tax positions taken or expected to be taken in the course of preparing the fund’s tax returns to determine whether the tax positions are “more-likely-than-not” of being sustained by the applicable tax authority. Liability for tax positions not deemed to meet the more-likely-than-not threshold would be recorded as a tax expense in the current year.The adoption of FIN 48 had no impact on the operations of the fund for the period ended November 30, 2008.
As of and during the period ended November 30, 2008, the fund did not have any liabilities for any unrecognized tax positions. The fund recognizes interest and penalties, if any, related to unrecognized tax positions as income tax expense in the Statement of Operations. During the period, the fund did not incur any interest or penalties.
Each of the tax years in the four-year period ended November 30, 2008 remains subject to examination by the Internal Revenue Service and state taxing authorities.
At November 30, 2008, the components of accumulated earnings on a tax basis were substantially the same as for financial reporting purposes.
18
The accumulated capital loss carryover of $123,252 is available for federal income tax purposes to be applied against future net securities profits, if any, realized subsequent to November 30, 2008. If not applied, the carryover expires in fiscal 2013.
The tax character of distributions paid to shareholders during the fiscal periods ended November 30, 2008 and November 30, 2007 were all ordinary income.
At November 30, 2008, the cost of investments for federal income tax purposes was substantially the same as the cost for financial reporting purposes (see the Statement of Investments).
(e) Treasury’s Temporary Guarantee Program: The fund has entered into a Guarantee Agreement with the United States Department of the Treasury (the “Treasury”) to participate in the Treasury’s Temporary Guarantee Program for Money Market Funds (the “Program”).
Under the Program, the Treasury guarantees the share price of shares of the fund held by shareholders as of September 19, 2008 at $1.00 per share if the fund’s net asset value per share falls below $0.995 (a “Guarantee Event”) and the fund liquidates. Recovery under the Program is subject to certain conditions and limitations.
Fund shares acquired by investors after September 19, 2008 that increase the number of fund shares the investor held at the close of business on September 19, 2008 are not eligible for protection under the Program. In addition, fund shares acquired by investors who did not hold fund shares at the close of business on September 19, 2008 are not eligible for protection under the Program.
The Program, which was originally set to expire on December 18, 2008, has been extended by the Treasury until April 30, 2009, after which the Secretary of the Treasury will review the need for, and terms of, the Program. Participation in the initial term and the
| NOTES TO FINANCIAL STATEMENTS (continued) |
extended period of the Program required a payment to the Treasury in the amount of .01% and .015%, respectively, of the fund’s shares outstanding as of September 19, 2008 (valued at $1.00 per share).This expense is being borne by the fund without regard to any expense limitation currently in effect.
NOTE 2—Management Fee and Other Transactions with Affiliates:
(a) Pursuant to a management agreement (“Agreement”) with the Manager, the management fee is computed at the annual rate of .50% of the value of the fund’s average daily net assets and is payable monthly. The Agreement provides that if in any full fiscal year the aggregate expenses of the fund, exclusive of taxes, brokerage fees, interest on borrowings and extraordinary expenses, exceed 1 1 / 2% of the value of the fund’s average daily net assets, the fund may deduct from payments to be made to the Manager, or the Manager will bear such excess expense. During the period ended November 30, 2008, there was no expense reimbursement pursuant to the Agreement.
The Manager has undertaken to reimburse expenses in the event that current yields drop below a certain level.This undertaking is voluntary and not contractual and may be terminated at any time. During the period ended November 30, 2008, there was no expense reimbursement pursuant to the undertaking.
(b) Under the Service Plan with respect to Class A shares (the “Plan”), adopted pursuant to Rule 12b-1 under the Act, Class A shares bear directly the costs of preparing, printing and distributing prospectuses and statements of additional information and of implementing and operating the Plan, such aggregate amount not to exceed in any fiscal year of the fund, the greater of $100,000 or .005% of the average daily net assets of Class A. In addition, Class A shares pay the Distributor for distributing Class A shares, servicing shareholder accounts (“Servicing”) and advertising and marketing relating to Class A shares at an aggregate annual rate of .20% of the value of the average daily net assets of Class A.The Distributor may pay one or more Service Agents a fee in respect of Class A shares owned by shareholders with whom the Service Agent
20
has a Servicing relationship or for whom the Service Agent is the dealer or holder of record.The schedule of such fees and the basis upon which such fees will be paid shall be determined from time to time by the Distributor. If a holder of Class A shares ceases to be a client of a Service Agent, but continues to hold Class A shares, the Distributor will be permitted to act as a Service Agent in respect of such fund shareholders and receive payments under the Plan for Servicing.The fees payable for Servicing are payable without regard to actual expenses incurred. During the period ended November 30, 2008, Class A shares were charged $170,569 pursuant to the Plan.
Under the Distribution Plan with respect to Class B shares (“Class B Distribution Plan”), adopted pursuant to Rule 12b-1 under the Act, Class B shares bear directly the costs of preparing, printing and distributing prospectuses and statements of additional information and of implementing and operating the Class B Distribution Plan, such aggregate amount not to exceed in any fiscal year of the fund, the greater of $100,000 or .005% of the average daily net assets of Class B. In addition, Class B shares reimburse the Distributor for payments made to third parties for distributing Class B shares at an aggregate annual rate not to exceed .20% of the value of the average daily net assets of Class B. During the period ended November 30, 2008, Class B shares were charged $3,467,639 pursuant to the Class B Distribution Plan.
(c) Under the Shareholder Services Plan with respect to Class A (“Class A Shareholder Services Plan”), Class A shares reimburse the Distributor an amount not to exceed an annual rate of .25% of the value of the average daily net assets of Class A for certain allocated expenses of providing personal services and/or maintaining shareholder accounts.The services provided may include personal services relating to shareholder accounts, such as answering shareholder inquiries regarding the fund and providing reports and other information, and services related to the maintenance of shareholder accounts. During the period ended November 30, 2008, Class A shares were charged $34,098 pursuant to the Class A Shareholder Services Plan.
| NOTES TO FINANCIAL STATEMENTS (continued) |
Under the Shareholder Services Plan with respect to Class B (“Class B Shareholder Services Plan”), Class B shares pay the Distributor at an annual rate of .25% of the value of the average daily net assets of Class B for servicing shareholder accounts. The services provided may include personal services relating to shareholder accounts, such as answering shareholder inquiries regarding Class B shares and providing reports and other information, and services related to the maintenance of shareholder accounts.The Distributor may make payments to Service Agents in respect of these services.The Distributor determines the amounts to be paid to Service Agents.
The Manager had undertaken from December 1, 2007 through November 30, 2008, to reduce the expenses of Class B shares, if the aggregate expenses of Class B shares of the fund, exclusive of taxes, brokerage fees, interest on borrowings and extraordinary expenses, exceed an annual rate of 1.02% of the value of the average daily net assets of Class B shares. Such expense limitations are voluntary, temporary and may be terminated at anytime. During the period ended November 30, 2008, Class B shares were charged $4,315,574 pursuant to the Class B Shareholder Services Plan, of which $236,805 was reimbursed by the Manager.
The fund compensates Dreyfus Transfer, Inc., a wholly-owned subsidiary of the Manager, under a transfer agency agreement, for providing personnel and facilities to perform transfer agency services for the fund. During the period ended November 30, 2008, the fund was charged $36,588, pursuant to the transfer agency agreement.
The fund compensates The Bank of NewYork Mellon, a subsidiary of BNY Mellon and an affiliate of Dreyfus, under a cash management agreement for performing cash management services related to fund subscriptions and redemptions. During the period ended November 30, 2008, the fund was charged $2,357 pursuant to the cash management agreement.
22
The fund compensates The Bank of New York Mellon under a custody agreement for providing custodial services for the fund. During the period ended November 30, 2008, the fund was charged $140,225 pursuant to the custody agreement.
During the period ended November 30, 2008, the fund was charged $6,086 for services performed by the Chief Compliance Officer.
The components of “Due to The Dreyfus Corporation and affiliates” in the Statement of Assets and Liabilities consist of: management fees $921,286, Rule 12b-1 distribution plan fees $367,881, shareholder services plan fees $523,840, custodian fees $51,866, chief compliance officer fees $2,466 and transfer agency per account fees $6,984, which are offset against an expense reimbursement currently in effect in the amount of $6,763.
(d) Each Board member also serves as a Board member of other funds within the Dreyfus complex. Annual retainer fees and attendance fees are allocated to each fund based on net assets.
REPORT OF INDEPENDENT REGISTERED
PUBLIC ACCOUNTING FIRM |
Shareholders and Board of Directors
General Government Securities Money Market Fund |
We have audited the accompanying statement of assets and liabilities, including the statement of investments, of General Government Securities Money Market Fund (one of the series comprising General Government Securities Money Market Funds, Inc.), as of November 30, 2008, and the related statement of operations for the year then ended, the statement of changes in net assets for each of the two years in the period then ended, and financial highlights for each of the years indicated therein. These financial statements and financial highlights are the responsibility of the Fund’s management. Our responsibility is to express an opinion on these financial statements and financial highlights based on our audits.
We conducted our audits in accordance with the standards of the Public Company Accounting Oversight Board (United States).Those standards require that we plan and perform the audit to obtain reasonable assurance about whether the financial statements and financial highlights are free of material misstatement.We were not engaged to perform an audit of the Fund’s internal control over financial reporting. Our audits included consideration of internal control over financial reporting as a basis for designing audit procedures that are appropriate in the circumstances, but not for the purpose of expressing an opinion on the effectiveness of the Fund’s internal control over financial reporting.Accordingly, we express no such opinion. An audit also includes examining, on a test basis, evidence supporting the amounts and disclosures in the financial statements and financial highlights, assessing the accounting principles used and significant estimates made by management, and evaluating the overall financial statement presentation. Our procedures included confirmation of securities owned as of November 30, 2008 by correspondence with the custodian and others.We believe that our audits provide a reasonable basis for our opinion.
In our opinion, the financial statements and financial highlights referred to above present fairly, in all material respects, the financial position of General Government Securities Money Market Fund at November 30, 2008, the results of its operations for the year then ended, the changes in net assets for each of the two years in the period then ended, and the financial highlights for each of the indicated years, in conformity with U.S. generally accepted accounting principles.

24
IMPORTANT TAX INFORMATION (Unaudited)
For federal tax purposes, the fund hereby designates 100% of ordinary income dividends paid during the fiscal year ended November 30, 2008 as qualifying interest related dividends. For state individual income tax purposes, the fund hereby designates 51.08% of the ordinary income dividends paid during its fiscal year ended November 30, 2008 as attributable to interest income from direct obligations of the United States. Such dividends are currently exempt from taxation for individual income tax purposes in most states, including New York, California and the District of Columbia.
INFORMATION ABOUT THE REVIEW AND APPROVAL
OF THE FUND’S MANAGEMENT AGREEMENT (Unaudited) |
At a meeting of the Board of Directors held on July 22, 2008, the Board considered the re-approval for an annual period of the fund’s Management Agreement, pursuant to which the Manager provides the fund with investment advisory and administrative services. The Board members, none of whom are “interested persons” (as defined in the Investment Company Act of 1940, as amended) of the fund, were assisted in their review by independent legal counsel and met with counsel in executive session separate from representatives of the Manager.
Analysis of Nature, Extent and Quality of Services Provided to the Fund. The Board members considered information previously provided to them in a presentation from representatives of the Manager regarding services provided to the fund and other funds in the Dreyfus fund complex, and representatives of the Manager confirmed that there had been no material changes in this information. The Board also discussed the nature, extent and quality of the services provided to the fund pursuant to its Management Agreement. The Manager’s representatives reviewed the fund’s distribution of accounts and the relationships the Manager has with various intermediaries and the different needs of each.The Board noted that the fund’s shares are sold primarily through institutional channels and often serve as a “sweep vehicle” for use by third party broker-dealers for their cus-tomers.The Manager’s representatives noted the distribution channels for the fund as well as the diversity of distribution among the funds in the Dreyfus fund complex, and the Manager’s corresponding need for broad, deep, and diverse resources to be able to provide ongoing shareholder services in each distribution channel, including those of the fund.The Manager provided the number of shareholder accounts in the fund, as well as the fund’s asset size.
The Board members also considered the Manager’s research and portfolio management capabilities and that the Manager also provides oversight of day-to-day fund operations, including fund accounting and administration and assistance in meeting legal and regulatory requirements.The Board members also considered the Manager’s extensive administrative, accounting and compliance infrastructure.
26
Comparative Analysis of the Fund’s Performance, Management Fee and Expense Ratio. The Board members reviewed reports prepared by Lipper, Inc., an independent provider of investment company data, comparing the fund’s performance to a group of comparable funds (the “Performance Group”) and to a broader group of funds (the “Performance Universe”) selected by Lipper.The Board members had been provided with a description of the methodology Lipper used to select the Performance Group and Performance Universe, as well as the Expense Group and Expense Universe (discussed below). The Board members noted that the fund’s total return performance for various periods ended May 31, 2008 was equal to or above the Performance Group median during each reported time period, except the two-, three- and four-year periods, when it was slightly below (within three basis points) the Performance Group median for each of those periods. The Board also noted that the fund’s total return performance was lower than the Performance Universe median for each reported time period except the one-year period when it was equal to the median. The Board members noted the close proximity of the fund’s total return performance to the Performance Group and Performance Universe medians for the periods when the fund underperformed.
The Board members also discussed the fund’s management fee and expense ratio as compared to a comparable group of funds (the “Expense Group”) that was composed of the same funds included in the Performance Group and a broader group of funds (the “Expense Universe”), each selected and provided by Lipper. The Board noted that the fund’s management fee was higher than the Expense Group and Expense Universe medians and that the fund’s total expense ratio was slightly higher than the Expense Group median and lower than the Expense Universe median.
Representatives of the Manager reviewed with the Board members the fees paid to the Manager or its affiliates by the one mutual fund managed by the Manager or its affiliates with similar investment objec-
INFORMATION ABOUT THE REVIEW AND APPROVAL OF THE
FUND’S MANAGEMENT AGREEMENT (Unaudited) (continued) |
tives, policies and strategies, and included in the same Lipper category, as the fund (the “Similar Fund”).The Board members considered the relevance of the fee information provided for the Similar Fund to evaluate the appropriateness and reasonableness of the fund’s management fee. The Board acknowledged that differences in fees paid by the Similar Fund seemed to be consistent with the services provided. Representatives of the Manager informed the Board members that there were no separate accounts or wrap fee accounts managed by the Manager or its affiliates with similar investment objectives, policies and strategies as the fund.
Analysis of Profitability and Economies of Scale. The Manager’s representatives reviewed the dollar amount of expenses allocated and profit received by the Manager and the method used to determine such expenses and profit. The Board previously had been provided with information prepared by an independent consulting firm regarding the Manager’s approach to allocating costs to, and determining the profitability of, individual funds and the entire Dreyfus mutual fund complex. The Board members also had been informed that the methodology had also been reviewed by an independent registered public accounting firm which, like the consultant, found the methodology to be reasonable. The consulting firm also analyzed where any economies of scale might emerge in connection with the management of a fund. The Board members evaluated the profitability analysis in light of the relevant circumstances for the fund and the extent to which economies of scale would be realized if the fund grows and whether fee levels reflect these economies of scale for the benefit of fund shareholders.The Board members also considered potential benefits to the Manager and its affiliates from acting as investment adviser to the fund and noted that there were no soft dollar arrangements with respect to trading the fund’s portfolio.
28
It was noted that the Board members should consider the Manager’s profitability with respect to the fund as part of their evaluation of whether the fees under the Management Agreement bear a reasonable relationship to the mix of services provided by the Manager, including the nature, extent and quality of such services and that a discussion of economies of scale is predicated on increasing assets and that, if a fund’s assets had been decreasing, the possibility that the Manager may have realized any economies of scale would be less. It was also noted that the profitability percentage for managing the fund was within the range determined by appropriate court cases to be reasonable given the services rendered and generally superior service levels provided by the Manager.
At the conclusion of these discussions, the Board agreed that it had been furnished with sufficient information to make an informed business decision with respect to continuation of the fund’s Management Agreement. Based on the discussions and considerations as described above, the Board made the following conclusions and determinations.
- The Board concluded that the nature, extent and quality of the services provided by the Manager to the fund are adequate and appropriate.
- The Board was generally satisfied with the fund’s performance, noting the fund’s one-year comparative performance and the fund’s close proximity to the Performance Group and Performance Universe medians during the periods when the fund underperformed com- pared to those medians.
- The Board concluded that the fee paid to the Manager by the fund was reasonable in light of comparative performance and expense and management fee information, costs of the services provided and profits to be realized and benefits derived or to be derived by the Manager from its relationship with the fund.
INFORMATION ABOUT THE REVIEW AND APPROVAL OF THE
FUND’S MANAGEMENT AGREEMENT (Unaudited) (continued) |
- The Board determined that the economies of scale which may accrue to the Manager and its affiliates in connection with the management of the fund had been adequately considered by the Manager in con- nection with the management fee rate charged to the fund and that, to the extent in the future it were to be determined that material economies of scale had not been shared with the fund, the Board would seek to have those economies of scale shared with the fund.
The Board members considered these conclusions and determinations, along with the information received on a routine and regular basis throughout the year, and, without any one factor being dispositive, the Board determined that re-approval of the fund’s Management Agreement was in the best interests of the fund and its shareholders.
30
32
Once elected all Board Members serve for an indefinite term, but achieve Emeritus status upon reaching age 80.The address of the Board Members and Officers is in c/o The Dreyfus Corporation, 200 Park Avenue, NewYork, NewYork 10166. Additional information about the Board Members is available in the fund’s Statement of Additional Information which can be obtained from Dreyfus free of charge by calling this toll free number: 1-800-554-4611.
| | Saul B. Klaman, Emeritus Board Member
Jay I. Meltzer, Emeritus Board Member
Sander Vanocur, Emeritus Board Member |
OFFICERS OF THE FUND (Unaudited)
J. DAVID OFFICER, President since December 2006.
Chief Operating Officer,Vice Chairman and a Director of the Manager, and an officer of 77 investment companies (comprised of 180 portfolios) managed by the Manager. He is 60 years old and has been an employee of the Manager since April 1998.
PHILLIP N. MAISANO, Executive Vice President since July 2007.
Chief Investment Officer,Vice Chair and a director of the Manager, and an officer of 77 investment companies (comprised of 180 portfolios) managed by the Manager. Mr. Maisano also is an officer and/or Board member of certain other investment management subsidiaries of The Bank of New York Mellon Corporation, each of which is an affiliate of the Manager. He is 61 years old and has been an employee of the Manager since November 2006. Prior to joining the Manager, Mr. Maisano served as Chairman and Chief Executive Officer of EACM Advisors, an affiliate of the Manager, since August 2004, and served as Chief Executive Officer of Evaluation Associates, a leading institutional investment consulting firm, from 1988 until 2004.
MICHAEL A. ROSENBERG, Vice President and Secretary since August 2005.
Assistant General Counsel of BNY Mellon, and an officer of 78 investment companies (comprised of 201 portfolios) managed by the Manager. He is 48 years old and has been an employee of the Manager since October 1991.
JAMES BITETTO, Vice President and Assistant Secretary since August 2005.
Senior Counsel of BNY Mellon and Secretary of the Manager, and an officer of 78 investment companies (comprised of 201 portfolios) managed by the Manager. He is 42 years old and has been an employee of the Manager since December 1996.
JONI LACKS CHARATAN, Vice President and Assistant Secretary since August 2005.
Senior Counsel of BNY Mellon, and an officer of 78 investment companies (comprised of 201 portfolios) managed by the Manager. She is 53 years old and has been an employee of the Manager since October 1988.
JOSEPH M. CHIOFFI, Vice President and Assistant Secretary since August 2005.
Senior Counsel of BNY Mellon, and an officer of 78 investment companies (comprised of 201 portfolios) managed by the Manager. He is 47 years old and has been an employee of the Manager since June 2000.
JANETTE E. FARRAGHER, Vice President and Assistant Secretary since August 2005.
Assistant General Counsel of BNY Mellon, and an officer of 78 investment companies (comprised of 201 portfolios) managed by the Manager. She is 45 years old and has been an employee of the Manager since February 1984.
JOHN B. HAMMALIAN, Vice President and Assistant Secretary since August 2005.
Managing Counsel of BNY Mellon, and an officer of 78 investment companies (comprised of 201 portfolios) managed by the Manager. He is 45 years old and has been an employee of the Manager since February 1991.
ROBERT R. MULLERY, Vice President and Assistant Secretary since August 2005.
Managing Counsel of BNY Mellon, and an officer of 78 investment companies (comprised of 201 portfolios) managed by the Manager. He is 56 years old and has been an employee of the Manager since May 1986.
34
JEFF PRUSNOFSKY, Vice President and Assistant Secretary since August 2005.
Managing Counsel of BNY Mellon, and an officer of 78 investment companies (comprised of 201 portfolios) managed by the Manager. He is 43 years old and has been an employee of the Manager since October 1990.
JAMES WINDELS, Treasurer since November 2001.
Director – Mutual Fund Accounting of the Manager, and an officer of 78 investment companies (comprised of 201 portfolios) managed by the Manager. He is 49 years old and has been an employee of the Manager since April 1985.
RICHARD CASSARO, Assistant Treasurer since January 2008.
Senior Accounting Manager – Money Market and Municipal Bond Funds of the Manager, and an officer of 78 investment companies (comprised of 201 portfolios) managed by the Manager. He is 49 years old and has been an employee of the Manager since September 1982.
GAVIN C. REILLY, Assistant Treasurer since December 2005.
Tax Manager of the Investment Accounting and Support Department of the Manager, and an officer of 78 investment companies (comprised of 201 portfolios) managed by the Manager. He is 40 years old and has been an employee of the Manager since April 1991.
ROBERT ROBOL, Assistant Treasurer since August 2003.
Senior Accounting Manager – Fixed Income Funds of the Manager, and an officer of 78 investment companies (comprised of 201 portfolios) managed by the Manager. He is 44 years old and has been an employee of the Manager since October 1988.
ROBERT SALVIOLO, Assistant Treasurer since May 2007.
Senior Accounting Manager – Equity Funds of the Manager, and an officer of 78 investment companies (comprised of 201 portfolios) managed by the Manager. He is 41 years old and has been an employee of the Manager since June 1989.
ROBERT SVAGNA, Assistant Treasurer since August 2005.
Senior Accounting Manager – Equity Funds of the Manager, and an officer of 78 investment companies (comprised of 201 portfolios) managed by the Manager. He is 41 years old and has been an employee of the Manager since November 1990.
JOSEPH W. CONNOLLY, Chief Compliance Officer since October 2004.
Chief Compliance Officer of the Manager and The Dreyfus Family of Funds (78 investment companies, comprised of 201 portfolios). From November 2001 through March 2004, Mr. Connolly was first Vice-President, Mutual Fund Servicing for Mellon Global Securities Services. In that capacity, Mr. Connolly was responsible for managing Mellon’s Custody, Fund Accounting and Fund Administration services to third-party mutual fund clients. He is 51 years old and has served in various capacities with the Manager since 1980, including manager of the firm’s Fund Accounting Department from 1997 through October 2001.
WILLIAM GERMENIS, Anti-Money Laundering Compliance Officer since October 2002.
Vice President and Anti-Money Laundering Compliance Officer of the Distributor, and the Anti-Money Laundering Compliance Officer of 74 investment companies (comprised of 197 portfolios) managed by the Manager. He is 38 years old and has been an employee of the Distributor since October 1998.
NOTES
For More Information
Telephone 1-800-645-6561
Mail The Dreyfus Family of Funds, 144 Glenn Curtiss Boulevard, Uniondale, NY 11556-0144 E-mail Send your request to info@dreyfus.com Internet Information can be viewed online or downloaded at: http://www.dreyfus.com
The fund will disclose daily, on www.dreyfus.com, the fund’s complete schedule of holdings as of the end of the previous business day. The schedule of holdings will remain on the website until the fund files its Form N-Q or Form N-CSR for the period that includes the date of the posted holdings.
The fund files its complete schedule of portfolio holdings with the Securities and Exchange Commission (“SEC”) for the first and third quarters of each fiscal year on Form N-Q. The fund's Forms N-Q are available on the SEC’s website at http://www.sec.gov and may be reviewed and copied at the SEC’s Public Reference Room in Washington, DC. Information on the operation of the Public Reference Room may be obtained by calling 1-800-SEC-0330.
Information regarding how the fund voted proxies relating to portfolio securities for the 12-month period ended June 30, 2008, is available on the SEC’s website at http://www.sec.gov and without charge, upon request, by calling 1-800-645-6561.

| | General
Treasury Prime
Money Market Fund |
ANNUAL REPORT November 30, 2008

Save time. Save paper. View your next shareholder report online as soon as it’s available. Log into www.dreyfus.com and sign up for Dreyfus eCommunications. It’s simple and only takes a few minutes.
The views expressed in this report reflect those of the portfolio manager only through the end of the period covered and do not necessarily represent the views of Dreyfus or any other person in the Dreyfus organization. Any such views are subject to change at any time based upon market or other conditions and Dreyfus disclaims any responsibility to update such views.These views may not be relied on as investment advice and, because investment decisions for a Dreyfus fund are based on numerous factors, may not be relied on as an indication of trading intent on behalf of any Dreyfus fund.

| | | Contents |
| |
| | | THE FUND |
| |
|
| 2 | | A Letter from the CEO |
| 3 | | Discussion of Fund Performance |
| 6 | | Understanding Your Fund’s Expenses |
| 6 | | Comparing Your Fund’s Expenses |
| | | With Those of Other Funds |
| 7 | | Statement of Investments |
| 8 | | Statement of Assets and Liabilities |
| 9 | | Statement of Operations |
| 10 | | Statement of Changes in Net Assets |
| 11 | | Financial Highlights |
| 13 | | Notes to Financial Statements |
| 22 | | Report of Independent Registered |
| | | Public Accounting Firm |
| 23 | | Important Tax Information |
| 24 | | Information About the Review and Approval |
| | | of the Fund’s Management Agreement |
| 29 | | Board Members Information |
| 32 | | Officers of the Fund |
| | | FOR MORE INFORMATION |
| |
|
| | | Back Cover |
General Treasury Prime
Money Market Fund |

A LETTER FROM THE CEO
Dear Shareholder: |
We present to you this annual report for General Treasury Prime Money Market Fund, covering the 12-month period from December 1, 2007, through November 30, 2008.
The U.S.and global economies suffered during the reporting period amid a financial crisis that sparked declines in virtually all areas of the financial markets.According to our Chief Economist, four key elements fueled the crisis: a sharp decline in home prices; high leverage and an ambiguous private/public status at mortgage agencies Fannie Mae and Freddie Mac; high leverage among financial institutions,especially investment banks;and regulatory policies and behaviors that exacerbated financial stresses.
The federal government subsequently stepped in with a number of measures, including aTemporary Guarantee Program for Money Market Funds and a $700 billion rescue package intended to promote greater liquidity in the financial markets. However, the U.S. and global financial systems remain fragile, and economic weakness is likely to persist.
In our view, today’s investment environment is rife with near-term challenges and long-term opportunities. Now more than ever, it is important to ensure that your investments are aligned with your current needs, future goals and attitudes toward risk.We urge you to speak regularly with your financial advisor, who can recommend the course of action that is right for you.
For information about how the fund performed during the reporting period, as well as market perspectives, we have provided a Discussion of Fund Performance given by the fund’s Portfolio Manager.
Thank you for your continued confidence and support.
Jonathan R. Baum
Chief Executive Officer
The Dreyfus Corporation |

DISCUSSION OF FUND PERFORMANCE
For the period of December 1, 2007, through November 30, 2008, as provided by Bernard W. Kiernan, Jr., Senior Portfolio Manager
Fund and Market Performance Overview
For the 12-month period ended November 30, 2008, General Treasury Prime Money Market Fund’s Class A shares produced a yield of 1.27%, and its Class B shares produced a yield of 1.05% .Taking into account the effects of compounding, the fund’s Class A and Class B shares produced effective yields of 1.27% and 1.05%, respectively.1
Money market yields declined over the reporting period along with short-term interest rates in a weakening U.S. economy. The U.S. Treasury securities in which the fund invests also were influenced by robust demand as investors engaged in a “flight to quality,” which put additional downward pressure on yields.
The Fund’s Investment Approach
The fund seeks as high a level of current income as is consistent with the preservation of capital and the maintenance of liquidity.To pursue this goal, the fund normally invests substantially all of its assets in U.S. Treasury securities.
Interest Rates Fell as U.S. Economy Struggled
Slumping U.S. housing markets, sluggish consumer spending and resurgent energy prices already had produced a weaker U.S. economy by the start of the reporting period. As a result, the Federal Reserve Board (the “Fed”) had reduced the overnight federal funds rate in several moves from 5.25% to 4.25% with the start of the reporting period.
Evidence of economic weakness continued to mount through the first quarter of 2008, and the credit crisis intensified as institutional investors de-levered their portfolios to raise cash to meet margin calls and redemption requests. Despite aggressive easing by the Fed and an economic stimulus package from Congress in January 2008, job losses
The Fund 3
| DISCUSSION OF FUND PERFORMANCE (continued) |
and deleveraging pressures intensified. In March, the Fed participated in the rescue of investment bank Bear Stearns and made funds available toWall Street firms in an unprecedented program allowing the use of mortgage-backed securities as collateral.
Reports of additional write-downs by major banks in June and greater-than-expected losses by mortgage agencies Fannie Mae and Freddie Mac in July sparked renewed volatility in the stock and bond markets. The bad news continued to mount in August, including a jump in the unemployment rate to its highest level in five years.
September ranked as one of the most challenging months in memory, as financial institutions found themselves unable to obtain short-term funding for their operations. In the ensuing tumult, the U.S. government effectively nationalized Fannie Mae, Freddie Mac and insurer AIG, Lehman Brothers Holdings filed for bankruptcy, Washington Mutual was seized by regulators, and Merrill Lynch and Wachovia were sold to former rivals. The U.S. Treasury Department proposed and Congress passed a $700 billion rescue package for the nation’s banking system. It later was estimated that U.S. GDP contracted at a –0.5% annualized rate in the third quarter of the year.
Fund Suffered in the Financial Crisis
Although the fund was not among them,“prime” money market funds that invest in corporate-backed securities were not immune to the financial crisis. The Lehman Brothers bankruptcy led to challenging liquidity conditions in the commercial paper market, prompting investors to shift assets from prime money market funds to funds that invest solely in U.S. government securities. In an effort to curtail diminishing confidence and help restore liquidity and stability to the financial system, the Department of Treasury initiated several measures including the Temporary Guarantee Program specifically for money market funds. Consequently, the commercial paper market began to stabilize, as evidenced by rising trading activity and a resumption of inflows to prime money market funds.
4
In October, the Fed and other central banks around the world implemented a coordinated rate cut to combat spreading global economic weakness.The Fed followed up with another reduction later in the month, and the federal funds rate ended the reporting period at just 1.00% . In November,the National Bureau of Economic Research officially declared that the U.S. economy has been in a recession since December 2007, a pronouncement that appeared to be confirmed by another month of severe job losses and a rise in the unemployment rate to 6.7%, the highest since 1993.As the financial crisis persisted, the Fed reduced the federal funds rate further in December to a range of 0% – 0.25% in its latest effort to support the credit markets and economic activity.
Maintaining a Cautious Posture
For most of the reporting period, we maintained the fund’s current weighted average maturity in a position we considered longer than industry averages. This strategy enabled us to maintain higher yields while yields of U.S. Treasury securities declined. We intend to maintain this position for as long as we deem practical.
We currently expect reduced liquidity and tighter loan standards to dampen economic growth well into 2009. Therefore, we intend to maintain the fund’s conservative credit posture and a focus on liquidity.
December 16, 2008
An investment in the fund is not insured or guaranteed by the FDIC or any other government
agency. Although the fund seeks to preserve the value of your investment at $1.00 per share, it is
possible to lose money by investing in the fund.
1 Effective yield is based upon dividends declared daily and reinvested monthly. Past performance is
no guarantee of future results.Yields fluctuate.Yields provided for the fund’s Class A and Class B
shares reflect the absorption of certain fund expenses by The Dreyfus Corporation pursuant to an
undertaking in effect that may be extended, terminated or modified at any time. Had these
expenses not been absorbed, the fund’s Class A shares would have produced a yield of 1.25%
and an effective yield of 1.25%, and the fund’s Class B shares would have produced a yield of
0.94% and an effective yield of 0.94% . |
The Fund 5
UNDERSTANDING YOUR FUND’S EXPENSES (Unaudited)
As a mutual fund investor, you pay ongoing expenses, such as management fees and other expenses. Using the information below, you can estimate how these expenses affect your investment and compare them with the expenses of other funds.You also may pay one-time transaction expenses, including sales charges (loads) and redemption fees, which are not shown in this section and would have resulted in higher total expenses. For more information, see your fund’s prospectus or talk to your financial adviser.
Review your fund’s expenses
The table below shows the expenses you would have paid on a $1,000 investment in General Treasury Prime Money Market Fund from June 1, 2008 to November 30, 2008. It also shows how much a $1,000 investment would be worth at the close of the period, assuming actual returns and expenses.
| | Expenses and Value of a $1,000 Investment
assuming actual returns for the six months ended November 30, 2008 |
| | | Class A | | Class B |
| |
| |
|
| Expenses paid per $1,000† | | $ 3.86 | | $ 4.75 |
| Ending value (after expenses) | | $1,003.20 | | $1,002.10 |
| | COMPARING YOUR FUND’S EXPENSES
WITH THOSE OF OTHER FUNDS (Unaudited) |
Using the SEC’s method to compare expenses
The Securities and Exchange Commission (SEC) has established guidelines to help investors assess fund expenses. Per these guidelines, the table below shows your fund’s expenses based on a $1,000 investment, assuming a hypothetical 5% annualized return. You can use this information to compare the ongoing expenses (but not transaction expenses or total cost) of investing in the fund with those of other funds.All mutual fund shareholder reports will provide this information to help you make this comparison. Please note that you cannot use this information to estimate your actual ending account balance and expenses paid during the period.
| | Expenses and Value of a $1,000 Investment
assuming a hypothetical 5% annualized return for the six months ended November 30, 2008 |
| | | Class A | | Class B |
| |
| |
|
| Expenses paid per $1,000† | | $ 3.89 | | $ 4.80 |
| Ending value (after expenses) | | $1,021.15 | | $1,020.25 |
| | † Expenses are equal to the fund’s annualized expense ratio of .77% for Class A and .95% for Class B, multiplied
by the average account value over the period, multiplied by 183/366 (to reflect the one-half year period). |
6
STATEMENT OF INVESTMENTS
November 30, 2008 |
| | | Annualized | | | | |
| | | Yield on | | | | |
| | | Date of | | Principal | | |
| U.S. Treasury Bills—99.3% | | Purchase (%) | | Amount ($) | | Value ($) |
| |
| |
| |
|
| 12/4/08 | | 1.20 | | 162,400,000 | | 162,383,866 |
| 12/11/08 | | 0.81 | | 246,500,000 | | 246,444,665 |
| 12/18/08 | | 0.45 | | 508,500,000 | | 508,392,088 |
| 12/26/08 | | 1.02 | | 138,000,000 | | 137,902,611 |
| 1/2/09 | | 0.33 | | 46,000,000 | | 45,986,542 |
| 1/8/09 | | 1.17 | | 97,000,000 | | 96,880,216 |
| 1/15/09 | | 1.56 | | 35,000,000 | | 34,932,031 |
| 1/22/09 | | 0.42 | | 100,000,000 | | 99,939,333 |
| 1/29/09 | | 1.10 | | 145,000,000 | | 144,740,236 |
| 2/19/09 | | 0.10 | | 190,000,000 | | 189,957,778 |
| 2/26/09 | | 0.80 | | 61,000,000 | | 60,882,067 |
| 3/5/09 | | 1.86 | | 30,000,000 | | 29,855,475 |
| 3/12/09 | | 1.79 | | 34,000,000 | | 33,831,162 |
| 4/2/09 | | 1.46 | | 73,000,000 | | 72,642,523 |
| 5/7/09 | | 1.06 | | 50,000,000 | | 49,769,951 |
| 5/15/09 | | 0.72 | | 250,000,000 | | 249,177,292 |
| 6/4/09 | | 1.17 | | 50,000,000 | | 49,701,302 |
| |
| |
| |
|
| Total Investments (cost $2,213,419,138) | | | | 99.3% | | 2,213,419,138 |
| Cash and Receivables (Net) | | | | .7% | | 16,222,988 |
| Net Assets | | | | 100.0% | | 2,229,642,126 |
| Portfolio Summary (Unaudited)† | | |
| | | Value (%) |
| |
|
| U.S. Treasury Bills | | 99.3 |
| † Based on net assets. | | |
| See notes to financial statements. | | |
The Fund 7
STATEMENT OF ASSETS AND LIABILITIES
November 30, 2008 |
| | | Cost | | Value |
| |
| |
|
| Assets ($): | | | | |
| Investments in securities-See Statement of Investments | | 2,213,419,138 | | 2,213,419,138 |
| Cash | | | | 18,135,597 |
| Prepaid expenses | | | | 202,708 |
| | | | | 2,231,757,443 |
| |
| |
|
| Liabilities ($): | | | | |
| Due to The Dreyfus Corporation and affiliates—Note 2(c) | | | | 1,402,363 |
| Payable for shares of Common Stock redeemed | | | | 599,608 |
| Accrued expenses | | | | 113,346 |
| | | | | 2,115,317 |
| |
| |
|
| Net Assets ($) | | | | 2,229,642,126 |
| |
| |
|
| Composition of Net Assets ($): | | | | |
| Paid-in capital | | | | 2,229,633,694 |
| Accumulated net realized gain (loss) on investments | | | | 8,432 |
| |
| |
|
| Net Assets ($) | | | | 2,229,642,126 |
| |
| |
|
| |
| |
| Net Asset Value Per Share | | | | |
| | | Class A | | Class B |
| |
| |
|
| Net Assets ($) | | 78,292,606 | | 2,151,349,520 |
| Shares Outstanding | | 78,292,307 | | 2,151,341,387 |
| |
| |
|
| Net Asset Value Per Share ($) | | 1.00 | | 1.00 |
| |
| See notes to financial statements. | | | | |
8
| STATEMENT OF OPERATIONS | | |
| Year Ended November 30, 2008 | | |
| |
|
| |
| |
| |
| |
| Investment Income ($): | | |
| Interest Income | | 10,541,551 |
| Expenses: | | |
| Management fee—Note 2(a) | | 3,560,052 |
| Shareholder servicing costs—Note 2(c) | | 2,094,054 |
| Distribution, service and prospectus fees—Note 2(b) | | 1,428,005 |
| Registration fees | | 179,117 |
| Treasury insurance expense—Note 1(e) | | 108,970 |
| Custodian fees—Note 2(c) | | 61,015 |
| Professional fees | | 41,268 |
| Directors’ fees and expenses—Note 2(d) | | 25,884 |
| Shareholders’ reports | | 11,285 |
| Miscellaneous | | 15,687 |
| Total Expenses | | 7,525,337 |
| Less—reduction in expenses due to | | |
| undertaking—Note 2(a) | | (443,553) |
| Less—reduction in shareholder servicing | | |
| costs due to undertaking—Note 2(c) | | (237,346) |
| Less—reduction in fees due to earnings credits—Note 1(b) | | (37,032) |
| Net Expenses | | 6,807,406 |
| Investment Income—Net | | 3,734,145 |
| |
|
| Net Realized Gain (Loss) on Investments—Note 1(b) ($) | | 8,432 |
| Net Increase in Net Assets Resulting from Operations | | 3,742,577 |
| |
| See notes to financial statements. | | |
The Fund 9
STATEMENT OF CHANGES IN NET ASSETS
| | | Year Ended November 30, |
| | |
|
| | | 2008 | | 2007 |
| |
| |
|
| Operations ($): | | | | |
| Investment income—net | | 3,734,145 | | 3,298,384 |
| Net realized gain (loss) on investments | | 8,432 | | 6,980 |
| Net Increase (Decrease) in Net Assets | | | | |
| Resulting from Operations | | 3,742,577 | | 3,305,364 |
| |
| |
|
| Dividends to Shareholders from ($): | | | | |
| Investment income—net: | | | | |
| Class A Shares | | (117,987) | | (36,106) |
| Class B Shares | | (3,618,268) | | (3,262,278) |
| Total Dividends | | (3,736,255) | | (3,298,384) |
| |
| |
|
| Capital Stock Transactions ($1.00 per share): | | | | |
| Net proceeds from shares sold: | | | | |
| Class A Shares | | 119,245,145 | | 2,773,695 |
| Class B Shares | | 4,110,166,904 | | 427,529,203 |
| Dividends reinvested: | | | | |
| Class A Shares | | 116,715 | | 34,745 |
| Class B Shares | | 3,588,908 | | 3,242,581 |
| Cost of shares redeemed: | | | | |
| Class A Shares | | (42,089,384) | | (4,032,593) |
| Class B Shares | | (2,191,690,836) | | (274,782,385) |
| Increase (Decrease) in Net Assets | | | | |
| from Capital Stock Transactions | | 1,999,337,452 | | 154,765,246 |
| Total Increase (Decrease) in Net Assets | | 1,999,343,774 | | 154,772,226 |
| |
| |
|
| Net Assets ($): | | | | |
| Beginning of Period | | 230,298,352 | | 75,526,126 |
| End of Period | | 2,229,642,126 | | 230,298,352 |
| |
| See notes to financial statements. | | | | |
10
FINANCIAL HIGHLIGHTS
The following tables describe the performance for each share class for the fiscal periods indicated. All information reflects financial results for a single fund share. Total return shows how much your investment in the fund would have increased (or decreased) during each period, assuming you had reinvested all dividends and distributions.These figures have been derived from the fund’s financial statements.
| | | | | Year Ended November 30, | | |
| | |
| |
| |
|
| Class A Shares | | 2008 | | 2007 | | 2006 | | 2005 | | 2004 |
| |
| |
| |
| |
| |
|
| Per Share Data ($): | | | | | | | | | | |
| Net asset value, beginning of period | | 1.00 | | 1.00 | | 1.00 | | 1.00 | | 1.00 |
| Investment Operations: | | | | | | | | | | |
| Investment income—net | | .013 | | .039 | | .038 | | .020 | | .004 |
| Distributions: | | | | | | | | | | |
| Dividends from investment income—net | | (.013) | | (.039) | | (.038) | | (.020) | | (.004) |
| Net asset value, end of period | | 1.00 | | 1.00 | | 1.00 | | 1.00 | | 1.00 |
| |
| |
| |
| |
| |
|
| Total Return (%) | | 1.28 | | 4.01 | | 3.84 | | 2.00 | | .42 |
| |
| |
| |
| |
| |
|
| Ratios/Supplemental Data (%): | | | | | | | | | | |
| Ratio of total expenses | | | | | | | | | | |
| to average net assets | | .79 | | 1.09 | | 1.05 | | 1.03 | | .93 |
| Ratio of net expenses | | | | | | | | | | |
| to average net assets | | .77 | | .80 | | .80 | | .80 | | .80 |
| Ratio of net investment income | | | | | | | | | | |
| to average net assets | | .55 | | 3.88 | | 3.69 | | 2.08 | | .34 |
| |
| |
| |
| |
| |
|
| Net Assets, end of period ($ x 1,000) | | 78,293 | | 1,020 | | 2,244 | | 5,375 | | 4,848 |
| |
| See notes to financial statements. | | | | | | | | | | |
The Fund 11
| FINANCIAL HIGHLIGHTS (continued) |
| | | | | Year Ended November 30, | | |
| | |
| |
| |
|
| Class B Shares | | 2008 | | 2007 | | 2006 | | 2005 | | 2004 |
| |
| |
| |
| |
| |
|
| Per Share Data ($): | | | | | | | | | | |
| Net asset value, beginning of period | | 1.00 | | 1.00 | | 1.00 | | 1.00 | | 1.00 |
| Investment Operations: | | | | | | | | | | |
| Investment income—net | | .010 | | .037 | | .036 | | .018 | | .003 |
| Distributions: | | | | | | | | | | |
| Dividends from investment income—net | | (.010) | | (.037) | | (.036) | | (.018) | | (.003) |
| Net asset value, end of period | | 1.00 | | 1.00 | | 1.00 | | 1.00 | | 1.00 |
| |
| |
| |
| |
| |
|
| Total Return (%) | | 1.05 | | 3.80 | | 3.64 | | 1.80 | | .28 |
| |
| |
| |
| |
| |
|
| Ratios/Supplemental Data (%): | | | | | | | | | | |
| Ratio of total expenses | | | | | | | | | | |
| to average net assets | | 1.07 | | 1.20 | | 1.20 | | 1.27 | | 1.15 |
| Ratio of net expenses | | | | | | | | | | |
| to average net assets | | .96 | | 1.00 | | .99 | | 1.00 | | .92 |
| Ratio of net investment income | | | | | | | | | | |
| to average net assets | | .52 | | 3.60 | | 3.64 | | 1.88 | | .26 |
| |
| |
| |
| |
| |
|
| Net Assets, end of period ($ x 1,000) | | 2,151,350 | | 229,278 | | 73,282 | | 50,027 | | 29,806 |
| |
| See notes to financial statements. | | | | | | | | | | |
12
NOTES TO FINANCIAL STATEMENTS
NOTE 1—Significant Accounting Policies:
General Treasury Prime Money Market Fund (the “fund”) is a separate diversified series of General Government Securities Money Market Funds, Inc. (the “Company”), which is registered under the Investment Company Act of 1940, as amended (the “Act”), as an open-end management investment company and operates as a series company, currently offering two series, including the fund. The fund’s investment objective is to provide investors with as high a level of current income as is consistent with the preservation of capital and the maintenance of liquidity. The Dreyfus Corporation (the “Manager” or “Dreyfus”), a wholly-owned subsidiary of The Bank of New York Mellon Corporation (“BNY Mellon”), serves as the fund’s investment adviser.
Effective July 1, 2008, BNY Mellon has reorganized and consolidated a number of its banking and trust company subsidiaries. As a result of the reorganization, any services previously provided to the fund by Mellon Bank, N.A. or Mellon Trust of New England, N.A. are now provided by The Bank of New York, which has changed its name to The Bank of New York Mellon.
MBSC Securities Corporation (the “Distributor”), a wholly-owned subsidiary of the Manager, is the distributor of the fund’s shares. The fund is authorized to issue 4 billion shares of $.001 par value Common Stock.The fund currently offers two classes of shares: Class A (1 billion shares authorized) and Class B (3 billion shares authorized). Class A and Class B shares are identical except for the services offered to and the expenses borne by each class, the allocation of certain transfer agency costs and certain voting rights. Class A shares are subject to a Service Plan adopted pursuant to Rule 12b-1 under the Act, Class B shares are subject to a Distribution Plan adopted pursuant to Rule 12b-1 under the Act and Class A and Class B shares are subject to a Shareholder Services Plan. In addition, Class B shares are charged directly for sub-accounting services provided by Service Agents (a securities dealer, financial institution or other industry professional) at
The Fund 13
| NOTES TO FINANCIAL STATEMENTS (continued) |
an annual rate of .05% of the value of the average daily net assets of Class B shares. During the period ended November 30, 2008, sub-accounting service fees amounted to $345,200 for Class B shares and are included in shareholder servicing costs. Income, expenses (other than expenses attributable to a specific class), and realized and unrealized gains or losses on investments are allocated to each class of shares based on its relative net assets.
The Company accounts separately for the assets, liabilities and operations of each series. Expenses directly attributable to each series are charged to that series’ operations; expenses which are applicable to all series are allocated among them on a pro rata basis.
It is the fund’s policy to maintain a continuous net asset value per share of $1.00; the fund has adopted certain investment, portfolio valuation and dividend and distribution policies to enable it to do so.There is no assurance, however, that the fund will be able to maintain a stable net asset value per share of $1.00.
The fund’s financial statements are prepared in accordance with U.S. generally accepted accounting principles, which may require the use of management estimates and assumptions. Actual results could differ from those estimates.
The fund enters into contracts that contain a variety of indemnifications. The fund’s maximum exposure under these arrangements is unknown.The fund does not anticipate recognizing any loss related to these arrangements.
(a) Portfolio valuation: Investments in securities are valued at amortized cost in accordance with Rule 2a-7 of the Act, which has been determined by the Board of Directors to represent the fair value of the fund’s investments.
The fund adopted Statement of Financial Accounting Standards No. 157 “FairValue Measurements” (“FAS 157”). FAS 157 establishes an authoritative definition of fair value, sets out a framework for measuring fair value, and requires additional disclosures about fair-value measurements.
14
Various inputs are used in determining the value of the fund’s investments relating to FAS 157.These inputs are summarized in the three broad levels listed below.
Level 1—quoted prices in active markets for identical securities. Level 2—other significant observable inputs (including quoted prices for similar securities, interest rates, prepayment speeds, credit risk, etc.).
Level 3—significant unobservable inputs (including the fund’s own assumptions in determining the fair value of investments).
The inputs or methodology used for valuing securities are not necessarily an indication of the risk associated with investing in those securities. For example, money market securities are valued using amortized cost, in accordance with rules under the Act. Generally, amortized cost approximates the current fair value of a security, but since the value is not obtained from a quoted price in an active market, such securities are reflected as Level 2.
The following is a summary of the inputs used as of November 30, 2008 in valuing the fund’s investments carried at fair value:
| | | Investments in |
| Valuation Inputs | | Securities ($) |
| |
|
| Level 1—Quoted Prices | | 0 |
| Level 2—Other Significant Observable Inputs | | 2,213,419,138 |
| Level 3—Significant Unobservable Inputs | | 0 |
| Total | | 2,213,419,138 |
(b) Securities transactions and investment income: Securities transactions are recorded on a trade date basis. Interest income, adjusted for accretion of discount and amortization of premium on investments, is earned from settlement date and is recognized on the accrual basis. Realized gains and losses from securities transactions are recorded on the identified cost basis. Cost of investments represents amortized cost.
In March 2008, the Financial Accounting Standards Board (“FASB”) released Statement of Financial Accounting Standards No. 161,
The Fund 15
| NOTES TO FINANCIAL STATEMENTS (continued) |
“Disclosures about Derivative Instruments and Hedging Activities” (“FAS 161”). FAS 161 requires qualitative disclosures about objectives and strategies for using derivatives, quantitative disclosures about fair value amounts of gains and losses on derivative instruments, and disclosures about credit-risk-related contingent features in derivative agree-ments.The application of FAS 161 is required for fiscal years and interim periods beginning after November 15, 2008. At this time, management is evaluating the implications of FAS 161 and its impact on the financial statements and the accompanying notes has not yet been determined.
The fund has arrangements with the custodian and cash management banks whereby the fund may receive earnings credits when positive cash balances are maintained, which are used to offset custody and cash management fees. For financial reporting purposes, the fund includes net earnings credits as an expense offset in the Statement of Operations.
(c) Dividends to shareholders: It is the policy of the fund to declare dividends from investment income-net on each business day; such dividends are paid monthly. Dividends from net realized capital gains, if any, are normally declared and paid annually, but the fund may make distributions on a more frequent basis to comply with the distribution requirements of the Internal Revenue Code of 1986, as amended (the “Code”). To the extent that net realized capital gains can be offset by capital loss carryovers, it is the policy of the fund not to distribute such gains.
(d) Federal income taxes: It is the policy of the fund to continue to qualify as a regulated investment company, if such qualification is in the best interests of its shareholders, by complying with the applicable provisions of the Code, and to make distributions of taxable income sufficient to relieve it from substantially all federal income and excise taxes.
The fund adopted FASB Interpretation No. 48 “Accounting for Uncertainty in Income Taxes” (“FIN 48”). FIN 48 provides guidance for how uncertain tax positions should be recognized, measured, presented and disclosed in the financial statements. FIN 48 requires the evaluation of tax positions taken or expected to be taken in the course of preparing the fund’s tax returns to determine whether the tax positions are “more-likely-than-not” of being sustained by the applicable
16
tax authority. Liability for tax positions not deemed to meet the more-likely-than-not threshold would be recorded as a tax expense in the current year.The adoption of FIN 48 had no impact on the operations of the fund for the period ended November 30, 2008.
As of and during the period ended November 30, 2008, the fund did not have any liabilities for any unrecognized tax positions. The fund recognizes interest and penalties, if any, related to unrecognized tax positions as income tax expense in the Statement of Operations. During the period, the fund did not incur any interest or penalties.
Each of the tax years in the four-year period ended November 30, 2008 remains subject to examination by the Internal Revenue Service and state taxing authorities.
At November 30, 2008, the components of accumulated earnings on a tax basis were substantially the same as for financial reporting purposes.
The tax character of distributions paid to shareholders during the fiscal periods ended November 30, 2008 and November 30, 2007 were all ordinary income.
During the period ended November 30, 2008, as a result of permanent book to tax differences, primarily due to dividend reclassification, the fund increased accumulated undistributed investment income-net by $2,110 and decreased accumulated net realized gain (loss) on investments by the same amount. Net assets and net asset value per share were not affected by this reclassification.
At November 30, 2008, the cost of investments for federal income tax purposes was substantially the same as the cost for financial reporting purposes (see the Statement of Investments).
(e) Treasury’s Temporary Guarantee Program: The fund has entered into a Guarantee Agreement with the United States Department of the Treasury (the “Treasury”) to participate in the Treasury’s Temporary Guarantee Program for Money Market Funds (the “Program”).
Under the Program, the Treasury guarantees the share price of shares of the fund held by shareholders as of September 19, 2008 at $1.00 per
The Fund 17
| NOTES TO FINANCIAL STATEMENTS (continued) |
share if the fund’s net asset value per share falls below $0.995 (a “Guarantee Event”) and the fund liquidates. Recovery under the Program is subject to certain conditions and limitations.
Fund shares acquired by investors after September 19, 2008 that increase the number of fund shares the investor held at the close of business on September 19, 2008 are not eligible for protection under the Program. In addition, fund shares acquired by investors who did not hold fund shares at the close of business on September 19, 2008 are not eligible for protection under the Program.
The Program,which was originally set to expire on December 18,2008, has been extended by the Treasury until April 30, 2009, after which the Secretary of the Treasury will review the need for, and terms of, the Program. Participation in the initial term and the extended period of the Program required a payment to the Treasury in the amount of .01% and .015%, respectively, of the fund’s shares outstanding as of September 19, 2008 (valued at $1.00 per share). This expense is being borne by the fund without regard to any expense limitation currently in effect.
NOTE 2—Management Fee and Other Transactions with Affiliates:
(a) Pursuant to a management agreement (“Agreement”) with the Manager, the management fee is computed at the annual rate of .50% of the value of the fund’s average daily net assets and is payable monthly. The Agreement provides that if in any full fiscal year the aggregate expenses of the fund, exclusive of taxes, brokerage fees, interest on borrowings and extraordinary expenses, exceed 1 1 / 2% of the value of the fund’s average daily net assets, the fund may deduct from payments to be made to the Manager, or the Manager will bear, such excess expense. During the period ended November 30, 2008, there was no expense reimbursement pursuant to the Agreement.
The Manager has undertaken to limit fund expenses to maintain the minimum yield floor limit at .05%. Such expense limitations may fluctuate daily and are voluntary and temporary, not contractual, and may be terminated by the Manager at any time without notice. The
18
expense reimbursement, pursuant to the undertaking amounted to $622 for Class A and $442,931 for Class B shares during the period ended November 30, 2008.
(b) Under the Service Plan with respect to Class A (the “Plan”), adopted pursuant to Rule 12b-1 under the Act, Class A shares bear directly the cost of preparing, printing and distributing prospectuses and statements of additional information and implementing and operating the Plan,such aggregate amount not to exceed in any full fiscal year of the fund, the greater of $100,000 or .005% of the average daily net assets of Class A. In addition, Class A shares pay the Distributor for distributing their shares, servicing shareholder accounts (“Servicing”) and advertising and marketing relating to Class A shares at an aggregate annual rate of .20% of the value of the average daily net assets of Class A.The Distributor may pay one or more Service Agents a fee in respect of Class A shares owned by shareholders with whom the Service Agent has a Servicing relationship or for whom the Service Agent is the dealer or holder of record. The schedule of such fees and the basis upon which such fees will be paid shall be determined from time to time by the Distributor. If a holder of Class A shares ceases to be a client of a Service Agent, but continues to hold Class A shares, the Distributor will be permitted to act as a Service Agent in respect of such fund shareholders and receive payments under the Plan for Servicing.The fees payable for Servicing are payable without regard to actual expenses incurred. During the period ended November 30, 2008, Class A shares were charged $43,333 pursuant to the Plan.
Under the Distribution Plan with respect to Class B (“Class B Distribution Plan”) adopted pursuant to Rule 12b-1 under the Act, Class B shares bear directly the costs of preparing, printing and distributing prospectuses and statements of additional information and of implementing and operating the Class B Distribution Plan, such aggregate amount not to exceed in any fiscal year of the fund the greater of $100,000 or .005% of the average daily net assets of Class B. In addition, Class B shares reimburse the Distributor for payments made to third parties for distributing Class B shares at an annual rate not to exceed .20% of the value of the average daily net assets of Class B.
The Fund 19
| NOTES TO FINANCIAL STATEMENTS (continued) |
During the period ended November 30, 2008, Class B shares were charged $1,384,672 pursuant to the Class B Distribution Plan.
(c) Under the Shareholder Services Plan with respect to Class A (“Class A Shareholder Services Plan”), Class A shares reimburse the Distributor an amount not to exceed an annual rate of .25% of the value of the average daily net assets of Class A for certain allocated expenses of providing personal services and/or maintaining shareholder accounts.The services provided may include personal services relating to shareholder accounts, such as answering shareholder inquiries regarding Class A shares and providing reports and other information, and services related to the maintenance of shareholder accounts.The Manager had undertaken from December 1, 2007 through November 30, 2008, to reduce the expenses of Class A shares if the aggregate expenses of Class A shares, exclusive of taxes, brokerage fees, interest on borrowings and extraordinary expenses, exceed .80% of the value of the average daily net assets of Class A. Such expense limitations are voluntary, temporary and may be terminated at any time. During the period ended November 30, 2008, Class A shares were charged $4,935 pursuant to the Class A Shareholder Services Plan, of which $1,365 was reimbursed by the Manager, due to an undertaking.
Under the Shareholder Services Plan with respect to Class B (“Class B Shareholder Services Plan”), Class B shares pay the Distributor at an annual rate of .25% of the value of the average daily net assets of Class B shares for servicing shareholder accounts.The services provided may include personal services relating to shareholder accounts, such as answering shareholder inquiries regarding Class B shares and providing reports and other information, and services related to the maintenance of shareholder accounts.The Distributor may make payments to Service Agents in respect of these services.The Distributor determines the amounts to be paid to Service Agents.
The Manager had undertaken from December 1, 2007 through November 30, 2008, to reduce the expenses of Class B shares, if the aggregate expenses of Class B shares, exclusive of taxes, brokerage fees, interest on borrowings and extraordinary expenses, exceed an annual
20
rate of 1.02% of the value of the average daily net assets of Class B shares. Such expense limitations are voluntary, temporary and may be terminated at any time. During the period ended November 30, 2008, Class B shares were charged $1,726,003 pursuant to the Class B Shareholder Services Plan, of which $235,981 was reimbursed by the Manager.
The fund compensates Dreyfus Transfer, Inc., a wholly-owned subsidiary of the Manager, under a transfer agency agreement for providing personnel and facilities to perform transfer agency services for the fund. During the period ended November 30, 2008, the fund was charged $8,522 pursuant to the transfer agency agreement.
The fund compensates The Bank of New York Mellon, a subsidiary of BNY Mellon and an affiliate of Dreyfus, under a cash management agreement for performing cash management services related to fund subscriptions and redemptions. During the period ended November 30, 2008, the fund was charged $773 pursuant to the cash management agreement.
The fund compensates The Bank of New York Mellon under a custody agreement for providing custodial services for the fund. During the period ended November 30, 2008, the fund was charged $61,015 pursuant to the custody agreement.
During the period ended November 30, 2008, the fund was charged $6,086 for services performed by the Chief Compliance Officer.
The components of “Due to The Dreyfus Corporation and affiliates” in the Statement of Assets and Liabilities consist of: management fees $855,090, Rule 12b-1 distribution plan fees $358,644, shareholder services plan fees $520,605, custodian fees $5,529, chief compliance officer fees $2,466 and transfer agency per account fees $1,540, which are offset against an expense reimbursement currently in effect in the amount of $341,511.
(d) Each Board member also serves as a Board member of other funds within the Dreyfus complex. Annual retainer fees and attendance fees are allocated to each fund based on net assets.
The Fund 21
REPORT OF INDEPENDENT REGISTERED
PUBLIC ACCOUNTING FIRM |
Shareholders and Board of Directors General Treasury Prime Money Market Fund
We have audited the accompanying statement of assets and liabilities, including the statement of investments, of General Treasury Prime Money Market Fund (one of the series comprising General Government Securities Money Market Funds, Inc.) as of November 30, 2008, and the related statement of operations for the year then ended, the statement of changes in net assets for each of the two years in the period then ended, and financial highlights for each of the years indicated therein. These financial statements and financial highlights are the responsibility of the Fund’s management. Our responsibility is to express an opinion on these financial statements and financial highlights based on our audits.
We conducted our audits in accordance with the standards of the Public Company Accounting Oversight Board (United States).Those standards require that we plan and perform the audit to obtain reasonable assurance about whether the financial statements and financial highlights are free of material misstatement.We were not engaged to perform an audit of the Fund’s internal control over financial reporting. Our audits included consideration of internal control over financial reporting as a basis for designing audit procedures that are appropriate in the circumstances,but not for the purpose of expressing an opinion on the effectiveness of the Fund’s internal control over financial reporting.Accordingly, we express no such opinion.An audit also includes examining, on a test basis, evidence supporting the amounts and disclosures in the financial statements and financial highlights, assessing the accounting principles used and significant estimates made by management, and evaluating the overall financial statement presentation. Our procedures included confirmation of securities owned as of November 30, 2008 by correspondence with the custodian. We believe that our audits provide a reasonable basis for our opinion.
In our opinion, the financial statements and financial highlights referred to above present fairly, in all material respects, the financial position of General Treasury Prime Money Market Fund at November 30, 2008, the results of its operations for the year then ended, the changes in its net assets for each of the two years in the period then ended, and the financial highlights for each of the indicated years, in conformity with U.S. generally accepted accounting principles.
| New York, New York |
| January 20, 2009 |
22
IMPORTANT TAX INFORMATION ( U n a u d i t e d )
For federal tax purposes, the fund hereby designates 100% of ordinary income dividends paid during the fiscal year ended November 30, 2008 as qualifying interest related dividends. For state individual income tax purposes, the fund hereby designates 100% of the ordinary income dividends paid during its fiscal year ended November 30, 2008 as attributable to interest income from direct obligations of the United States. Such dividends are currently exempt from taxation for individual income tax purposes in most states, including NewYork, California and the District of Columbia.
The Fund 23
INFORMATION ABOUT THE REVIEW AND APPROVAL
OF THE FUND’S MANAGEMENT AGREEMENT (Unaudited) |
At a meeting of the Board of Directors held on July 22, 2008, the Board considered the re-approval for an annual period of the fund’s Management Agreement, pursuant to which the Manager provides the fund with investment advisory and administrative services. The Board members, none of whom are “interested persons” (as defined in the Investment Company Act of 1940, as amended) of the fund, were assisted in their review by independent legal counsel and met with counsel in executive session separate from representatives of the Manager.
Analysis of Nature, Extent and Quality of Services Provided to the Fund. The Board members considered information previously provided to them in a presentation from representatives of the Manager regarding services provided to the fund and other funds in the Dreyfus fund complex, and representatives of the Manager confirmed that there had been no material changes in this information. The Board also discussed the nature, extent and quality of the services provided to the fund pursuant to its Management Agreement.The Manager’s representatives reviewed the fund’s distribution of accounts and the relationships the Manager has with various intermediaries and the different needs of each.The Board noted that the fund’s shares are sold primarily through institutional channels and often serve as a “sweep vehicle” for use by third party broker-dealers for their customers.The Manager’s representatives noted the distribution channels for the fund as well as the diversity of distribution among the funds in the Dreyfus fund complex, and the Manager’s corresponding need for broad, deep, and diverse resources to be able to provide ongoing shareholder services in each distribution channel, including those of the fund. The Manager provided the number of shareholder accounts in the fund, as well as the fund’s asset size.
The Board members also considered the Manager’s research and portfolio management capabilities and that the Manager also provides oversight of day-to-day fund operations, including fund accounting and administration and assistance in meeting legal and regulatory requirements. The Board members also considered the Manager’s extensive administrative, accounting and compliance infrastructure.
24
Comparative Analysis of the Fund’s Performance, Management Fee and Expense Ratio. The Board members reviewed reports prepared by Lipper, Inc., an independent provider of investment company data, comparing the fund’s performance to a group of comparable funds (the “Performance Group”) and to a broader group of funds (the “Performance Universe”) selected by Lipper.The Board members had been provided with a description of the methodology Lipper used to select the Performance Group and Performance Universe, as well as the Expense Group and Expense Universe (discussed below). The Board members noted that the fund’s total return performance for various periods ended May 31, 2008 was below the Performance Group and Performance Universe medians for each reported time period, except the one-year period when it was equal to the Performance Group median. The Board members noted for each reported period the fund’s proximity to the Performance Group medians. The Board members discussed with representatives of the Manager the reasons for the fund’s underperformance compared to the Performance Group and Performance Universe medians during the applicable periods, and the Manager’s efforts to improve performance. Representatives of the Manager reviewed with the Board members the fund’s operational history, investment policies, client base and small asset size. The Board members also received a presentation from the fund’s primary portfolio manager during which he discussed the fund’s investment strategy and the factors that affected the fund’s performance.
The Board members also discussed the fund’s management fee and expense ratio as compared to a comparable group of funds (the “Expense Group”) that was composed of the same funds included in the Performance Group and a broader group of funds (the “Expense Universe”), each selected and provided by Lipper. The Board noted that the fund’s management fee was higher than the Expense Group and Expense Universe medians and that the fund’s total expense ratio was above the Expense Group median and below the Expense Universe median.
The Fund 25
INFORMATION ABOUT THE REVIEW AND APPROVAL OF THE
FUND’S MANAGEMENT AGREEMENT (Unaudited) (continued) |
Representatives of the Manager reviewed with the Board members the fees paid to the Manager or its affiliates by mutual funds managed by the Manager or its affiliates with similar investment objectives, policies and strategies, and included in the same Lipper category as the fund (the “Similar Funds”).The Board members considered the relevance of the fee information provided for the Similar Funds to evaluate the appropriateness and reasonableness of the fund’s management fee.The Board acknowledged that differences in fees paid by the Similar Funds seemed to be consistent with the services provided. Representatives of the Manager informed the Board members that there were no separate accounts or wrap fee accounts managed by the Manager or its affiliates with similar investment objectives, policies and strategies as the fund.
Analysis of Profitability and Economies of Scale. The Manager’s representatives reviewed the dollar amount of expenses allocated and profit received by the Manager and the method used to determine such expenses and profit. The Board previously had been provided with information prepared by an independent consulting firm regarding the Manager’s approach to allocating costs to, and determining the profitability of, individual funds and the entire Dreyfus mutual fund complex. The Board members also had been informed that the methodology also had been reviewed by an independent registered public accounting firm which, like the consultant, found the methodology to be reasonable. The consulting firm also analyzed where any economies of scale might emerge in connection with the management of a fund. The Board members evaluated the profitability analysis in light of the relevant circumstances for the fund, and the extent to which economies of scale would be realized if the fund grows and whether fee levels reflect these economies of scale for the benefit of fund shareholders.The Board members also considered potential benefits to the Manager and its affiliates from acting as investment adviser to the fund and noted that there were no soft dollar arrangements with respect to trading the fund’s portfolio.
26
It was noted that the Board members should consider the Manager’s profitability with respect to the fund as part of their evaluation of whether the fees under the Management Agreement bear a reasonable relationship to the mix of services provided by the Manager, including the nature, extent and quality of such services and that a discussion of economies of scale is predicated on increasing assets and that, if a fund’s assets had been decreasing, the possibility that the Manager may have realized any economies of scale would be less. It was also noted that the profitability percentage for managing the fund was within the range determined by appropriate court cases to be reasonable given the services rendered and generally superior service levels provided by the Manager.
At the conclusion of these discussions, the Board agreed that it had been furnished with sufficient information to make an informed business decision with respect to continuation of the fund’s Management Agreement. Based on the discussions and considerations as described above, the Board made the following conclusions and determinations.
- The Board concluded that the nature, extent and quality of the services provided by the Manager to the fund are adequate and appropriate.
- The Board was generally satisfied with the Manager’s efforts to improve performance as discussed at the meeting, noting the fund’s improved one-year performance relative to the Performance Group median, but concluded it was necessary to continue to closely mon- itor the performance of the fund and its portfolio management team.
- The Board concluded that the fee paid to the Manager by the fund was reasonable in light of comparative performance and expense and management fee information, costs of the services provided and profits to be realized and benefits derived or to be derived by the Manager from its relationship with the fund.
The Fund 27
INFORMATION ABOUT THE REVIEW AND APPROVAL OF THE
FUND’S MANAGEMENT AGREEMENT (Unaudited) (continued) |
- The Board determined that the economies of scale which may accrue to the Manager and its affiliates in connection with the man- agement of the fund had been adequately considered by the Manager in connection with the management fee rate charged to the fund and that, to the extent in the future it were to be determined that mate- rial economies of scale had not been shared with the fund, the Board would seek to have those economies of scale shared with the fund.
The Board members considered these conclusions and determinations, along with the information received on a routine and regular basis throughout the year, and, without any one factor being dispositive, the Board determined that re-approval of the fund’s Management Agreement was in the best interests of the fund and its shareholders.
28
BOARD MEMBERS INFORMATION ( U n a u d i t e d )
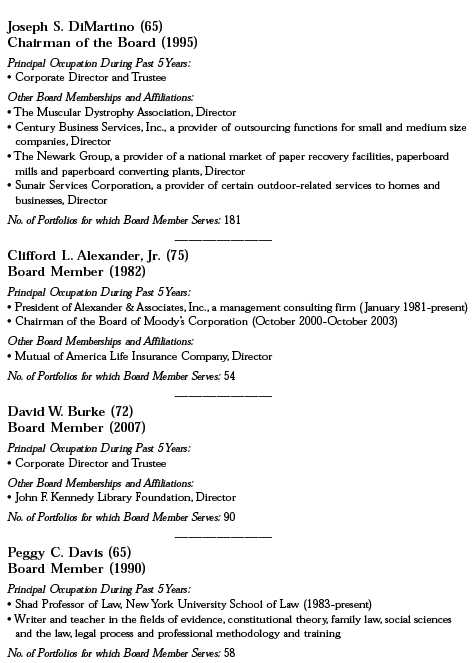
The Fund 29
BOARD MEMBERS INFORMATION (Unaudited) (continued)
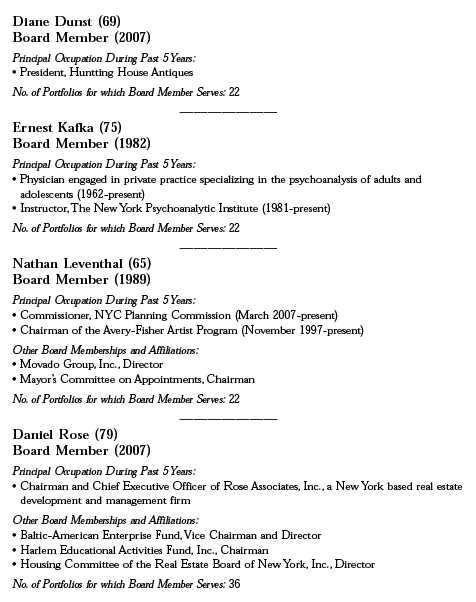
30
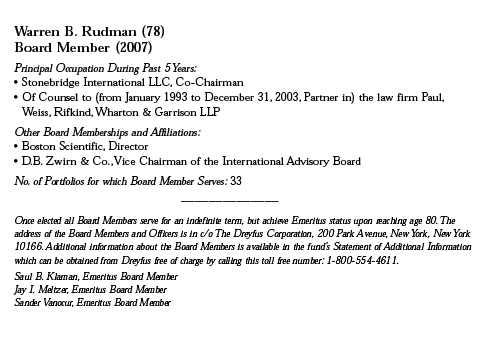
The Fund 31
OFFICERS OF THE FUND (Unaudited)
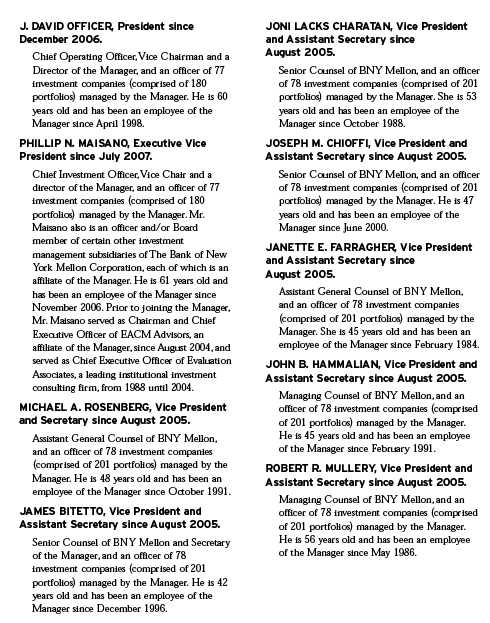
32
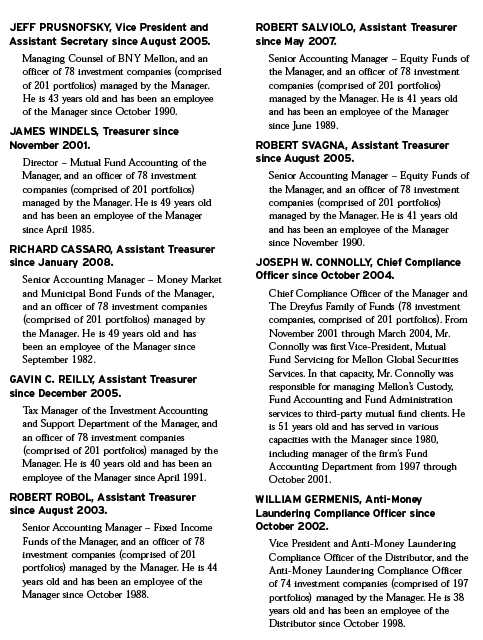
The Fund 33
For More Information
Telephone 1-800-645-6561
Mail The Dreyfus Family of Funds, 144 Glenn Curtiss Boulevard, Uniondale, NY 11556-0144 E-mail Send your request to info@dreyfus.com Internet Information can be viewed online or downloaded at: http://www.dreyfus.com
The fund will disclose daily, on www.dreyfus.com, the fund’s complete schedule of holdings as of the end of the previous business day. The schedule of holdings will remain on the website until the fund files its Form N-Q or Form N-CSR for the period that includes the date of the posted holdings.
The fund files its complete schedule of portfolio holdings with the Securities and Exchange Commission (“SEC”) for the first and third quarters of each fiscal year on Form N-Q. The fund's Forms N-Q are available on the SEC’s website at http://www.sec.gov and may be reviewed and copied at the SEC’s Public Reference Room in Washington, DC. Information on the operation of the Public Reference Room may be obtained by calling 1-800-SEC-0330.
Information regarding how the fund voted proxies relating to portfolio securities for the 12-month period ended June 30, 2008, is available on the SEC’s website at http://www.sec.gov and without charge, upon request, by calling 1-800-645-6561.
© 2009 MBSC Securities Corporation

Item 2. Code of Ethics.
The Registrant has adopted a code of ethics that applies to the Registrant's principal executive officer, principal financial officer, principal accounting officer or controller, or persons performing similar functions. There have been no amendments to, or waivers in connection with, the Code of Ethics during the period covered by this Report.
Item 3. Audit Committee Financial Expert.
The Registrant's Board has determined that Joseph S. DiMartino, a member of the Audit Committee of the Board, is an audit committee financial expert as defined by the Securities and Exchange Commission (the "SEC"). Mr. DiMartino is "independent" as defined by the SEC for purposes of audit committee financial expert determinations.
Item 4. Principal Accountant Fees and Services.
(a) Audit Fees. The aggregate fees billed for each of the last two fiscal years (the "Reporting Periods") for professional services rendered by the Registrant's principal accountant (the "Auditor") for the audit of the Registrant's annual financial statements or services that are normally provided by the Auditor in connection with the statutory and regulatory filings or engagements for the Reporting Periods, were $53,178 in 2007 and $54,773 in 2008.
(b) Audit-Related Fees. The aggregate fees billed in the Reporting Periods for assurance and related services by the Auditor that are reasonably related to the performance of the audit of the Registrant's financial statements and are not reported under paragraph (a) of this Item 4 were $0 in 2007 and $20,796 in 2008. These services consisted of security counts required by Rule 17f-2 under the Investment Company Act of 1940, as amended.
The aggregate fees billed in the Reporting Periods for non-audit assurance and related services by the Auditor to the Registrant's investment adviser (not including any sub-investment adviser whose role is primarily portfolio management and is subcontracted with or overseen by another investment adviser), and any entity controlling, controlled by or under common control with the investment adviser that provides ongoing services to the Registrant ("Service Affiliates"), that were reasonably related to the performance of the annual audit of the Service Affiliate, which required pre-approval by the Audit Committee were $0 in 2007 and $0 in 2008.
Note: For the second paragraph in each of (b) through (d) of this Item 4, certain of such services were not pre-approved prior to May 6, 2003, when such services were required to be pre-approved. On and after May 6, 2003, 100% of all services provided by the Auditor were pre-approved as required. For comparative purposes, the fees shown assume that all such services were pre-approved, including services that were not pre-approved prior to the compliance date of the pre-approval requirement.
(c) Tax Fees. The aggregate fees billed in the Reporting Periods for professional services rendered by the Auditor for tax compliance, tax advice, and tax planning ("Tax Services") were $5,082 in 2007 and $6,547 in 2008. These services consisted of: (i) review or preparation of U.S. federal, state, local and excise tax returns; (ii) U.S. federal, state and local tax planning, advice and assistance regarding statutory, regulatory or administrative developments; (iii) tax advice regarding tax qualification matters and/or treatment of various financial instruments held or proposed to be acquired or held. The aggregate fees billed in the Reporting Periods for Tax Services by the Auditor to Service Affiliates, which required pre-approval by the Audit Committee were $0 in 2007 and $0 in 2008.
-3-
(d) All Other Fees. The aggregate fees billed in the Reporting Periods for products and services provided by the Auditor, other than the services reported in paragraphs (a) through (c) of this Item, were $0 in 2007 and $643 in 2008. These services consisted of a review of the Registrant's anti-money laundering program.
The aggregate fees billed in the Reporting Periods for Non-Audit Services by the Auditor to Service Affiliates, other than the services reported in paragraphs (b) through (c) of this Item, which required pre-approval by the Audit Committee, were $0 in 2007 and $0 in 2008.
Audit Committee Pre-Approval Policies and Procedures. The Registrant's Audit Committee has established policies and procedures (the "Policy") for pre-approval (within specified fee limits) of the Auditor's engagements for non-audit services to the Registrant and Service Affiliates without specific case-by-case consideration. Pre-approval considerations include whether the proposed services are compatible with maintaining the Auditor's independence. Pre-approvals pursuant to the Policy are considered annually.
Non-Audit Fees. The aggregate non-audit fees billed by the Auditor for services rendered to the Registrant, and rendered to Service Affiliates, for the Reporting Periods were $1,890,737 in 2007 and $9,452,992 in 2008.
Auditor Independence. The Registrant's Audit Committee has considered whether the provision of non-audit services that were rendered to Service Affiliates, which were not pre-approved (not requiring pre-approval), is compatible with maintaining the Auditor's independence.
| Item 5. | | Audit Committee of Listed Registrants. |
| | | Not applicable. [CLOSED-END FUNDS ONLY] |
| Item 6. | | Investments. |
| (a) | | Not applicable. |
| Item 7. | | Disclosure of Proxy Voting Policies and Procedures for Closed-End Management |
| | | Investment Companies. |
| | | Not applicable. [CLOSED-END FUNDS ONLY] |
| Item 8. | | Portfolio Managers of Closed-End Management Investment Companies. |
| | | Not applicable. [CLOSED-END FUNDS ONLY, beginning with reports for periods ended |
| | | on and after December 31, 2005] |
| Item 9. | | Purchases of Equity Securities by Closed-End Management Investment Companies and |
| | | Affiliated Purchasers. |
| | | Not applicable. [CLOSED-END FUNDS ONLY] |
| Item 10. | | Submission of Matters to a Vote of Security Holders. |
The Registrant has a Nominating Committee (the "Committee"), which is responsible for selecting and nominating persons for election or appointment by the Registrant's Board as Board members. The
-4-
Committee has adopted a Nominating Committee Charter (the "Charter"). Pursuant to the Charter, the Committee will consider recommendations for nominees from shareholders submitted to the Secretary of the Registrant, c/o The Dreyfus Corporation Legal Department, 200 Park Avenue, 8th Floor East, New York, New York 10166. A nomination submission must include information regarding the recommended nominee as specified in the Charter. This information includes all information relating to a recommended nominee that is required to be disclosed in solicitations or proxy statements for the election of Board members, as well as information sufficient to evaluate the factors to be considered by the Committee, including character and integrity, business and professional experience, and whether the person has the ability to apply sound and independent business judgment and would act in the interests of the Registrant and its shareholders. Nomination submissions are required to be accompanied by a written consent of the individual to stand for election if nominated by the Board and to serve if elected by the shareholders, and such additional information must be provided regarding the recommended nominee as reasonably requested by the Committee.
| Item 11. | | Controls and Procedures. |
(a) The Registrant's principal executive and principal financial officers have concluded, based on their evaluation of the Registrant's disclosure controls and procedures as of a date within 90 days of the filing date of this report, that the Registrant's disclosure controls and procedures are reasonably designed to ensure that information required to be disclosed by the Registrant on Form N-CSR is recorded, processed, summarized and reported within the required time periods and that information required to be disclosed by the Registrant in the reports that it files or submits on Form N-CSR is accumulated and communicated to the Registrant's management, including its principal executive and principal financial officers, as appropriate to allow timely decisions regarding required disclosure.
(b) There were no changes to the Registrant's internal control over financial reporting that occurred during the second fiscal quarter of the period covered by this report that have materially affected, or are reasonably likely to materially affect, the Registrant's internal control over financial reporting.
(a)(1) Code of ethics referred to in Item 2.
(a)(2) Certifications of principal executive and principal financial officers as required by Rule 30a-2(a) under the Investment Company Act of 1940.
(a)(3) Not applicable.
(b) Certification of principal executive and principal financial officers as required by Rule 30a-2(b) under the Investment Company Act of 1940.
-5-
Pursuant to the requirements of the Securities Exchange Act of 1934 and the Investment Company Act of 1940, the Registrant has duly caused this Report to be signed on its behalf by the undersigned, thereunto duly authorized.
General Government Securities Money Market Funds, Inc.
| By: | | /s/ J. David Officer |
| | | J. David Officer, |
| | | President |
| |
| Date: | | January 26, 2009 |
Pursuant to the requirements of the Securities Exchange Act of 1934 and the Investment Company Act of 1940, this Report has been signed below by the following persons on behalf of the Registrant and in the capacities and on the dates indicated.
| By: | | /s/ J. David Officer |
| | | J. David Officer, |
| | | President |
| |
| Date: | | January 26, 2009 |
| |
| By: | | /s/ James Windels |
| | | James Windels, |
| | | Treasurer |
| |
| Date: | | January 26, 2009 |
EXHIBIT INDEX
(a)(1) Code of ethics referred to in Item 2.
(a)(2) Certifications of principal executive and principal financial officers as required by Rule 30a-2(a) under the Investment Company Act of 1940. (EX-99.CERT)
(b) Certification of principal executive and principal financial officers as required by Rule 30a-2(b) under the Investment Company Act of 1940. (EX-99.906CERT)
-6-