UNITED STATES
SECURITIES AND EXCHANGE COMMISSION
Washington, D.C. 20549
FORM N-CSR
CERTIFIED SHAREHOLDER REPORT OF REGISTERED MANAGEMENT
INVESTMENT COMPANIES
Investment Company Act file number | 811-3456 |
| |
| General Government Securities Money Market Funds, Inc. | |
| (Exact name of Registrant as specified in charter) | |
| | |
| c/o The Dreyfus Corporation 200 Park Avenue New York, New York 10166 | |
| (Address of principal executive offices) (Zip code) | |
| | |
| Michael A. Rosenberg, Esq. 200 Park Avenue New York, New York 10166 | |
| (Name and address of agent for service) | |
|
Registrant's telephone number, including area code: | (212) 922-6000 |
| |
Date of fiscal year end: | 11/30 | |
Date of reporting period: | 11/30/10 | |
| | | | | | |
FORM N-CSR
Item 1. Reports to Stockholders.
|
| General Government |
| Securities Money |
| Market Fund |
ANNUAL REPORT November 30, 2010

Save time. Save paper. View your next shareholder report online as soon as it’s available. Log into www.dreyfus.com and sign up for Dreyfus eCommunications. It’s simple and only takes a few minutes.
The views expressed in this report reflect those of the portfolio manager only through the end of the period covered and do not necessarily represent the views of Dreyfus or any other person in the Dreyfus organization. Any such views are subject to change at any time based upon market or other conditions and Dreyfus disclaims any responsibility to update such views.These views may not be relied on as investment advice and, because investment decisions for a Dreyfus fund are based on numerous factors, may not be relied on as an indication of trading intent on behalf of any Dreyfus fund.

| | Contents |
| | THE FUND |
| 2 | A Letter from the Chairman and CEO |
| 3 | Discussion of Fund Performance |
| 6 | Understanding Your Fund’s Expenses |
| 6 | Comparing Your Fund’s Expenses With Those of Other Funds |
| 7 | Statement of Investments |
| 10 | Statement of Assets and Liabilities |
| 11 | Statement of Operations |
| 12 | Statement of Changes in Net Assets |
| 13 | Financial Highlights |
| 15 | Notes to Financial Statements |
| 24 | Report of Independent Registered Public Accounting Firm |
| 25 | Important Tax Information |
| 26 | Proxy Results |
| 27 | Information About the Review and Approval of the Fund’s Management Agreement |
| 32 | Board Members Information |
| 34 | Officers of the Fund |
| | FOR MORE INFORMATION |
| | Back Cover |
General Government Securities
Money Market Fund
The Fund

A LETTER FROM THE CHAIRMAN AND CEO
Dear Shareholder:
We are pleased to present this annual report for General Government Securities Money Market Fund, covering the 12-month period from December 1, 2009, through November 30, 2010.
Although U.S. GDP growth was positive throughout the reporting period, the economic recovery has been milder than historical averages. As a result, the Federal Reserve Board has maintained an aggressively accommodative monetary policy in order to moderate stubbornly high levels of unemployment and persistent weakness in housing markets.
We are cautiously optimistic regarding the U.S. economy’s prospects in 2011.A weaker U.S. dollar is likely to support exports and limit imports, residential construction appears set to begin recovering from depressed levels, and employment growth has begun to expand enough to generate gains in wage and salary income. However, we expect inflationary pressures and short-term interest rates to remain low, potentially preventing any significant rise in money market yields over the foreseeable future. So is your overall portfolio positioned accordingly? Talk with your financial advisor, who can help you evaluate your current “liquid asset” needs and your future portfolio investment needs.
For information about how the fund performed during the reporting period, as well as general market perspectives, we provide a Discussion of Fund Performance on the pages that follow.
Thank you for your continued confidence and support.
Jonathan R. Baum
Chairman and Chief Executive Officer
The Dreyfus Corporation
December 15, 2010
2

DISCUSSION OF FUND PERFORMANCE
For the period of December 1, 2009, through November 30, 2010, as provided by Bernard W. Kiernan, Jr., Senior Portfolio Manager
Fund and Market Performance Overview
For the 12-month period ended November 30, 2010, General Government Securities Money Market Fund’s Class A shares produced a yield of 0.00%, and its Class B shares produced a yield of 0.00%.Taking into account the effects of compounding, the fund’s Class A and Class B shares produced effective yields of 0.00% and 0.00%, respectively.1
The Fund’s Investment Approach
The fund seeks as high a level of current income as is consistent with the preservation of capital and the maintenance of liquidity.
To pursue this goal, the fund invests in securities issued or guaranteed as to principal and interest by the U.S. government or its agencies or instrumentalities, and repurchase agreements (including tri-party repurchase agreements). The securities in which the fund invests include those backed by the full faith and credit of the U.S. government and those that are neither insured nor guaranteed by the U.S. government.
Monetary Policy Unchanged in Muted Recovery
The reporting period began in the midst of an economic recovery fueled, in part, by an overnight federal funds rate that has remained unchanged since December 2008 in a range between 0% and 0.25%.While the U.S. economy expanded in the first quarter of 2010 at a relatively mild 3.7% annualized rate, it was encouraging news nonetheless for investors eager to see an end to recession. In fact, job creation began to improve during the first quarter of the year after many months of losses.
The Fund 3
DISCUSSION OF FUND PERFORMANCE (continued)
Investors were further cheered in May, when 431,000 additional new jobs were created, although many were temporary government workers hired for the 2010 Census. However, the economic outlook soon took a turn for the worse when a resurgent sovereign debt crisis in Europe and a catastrophic oil spill in the Gulf of Mexico rattled investors. Indeed, U.S. industrial production moderated in June, and private-sector job growth proved more anemic than many analysts expected. U.S. GDP declined to an annualized 1.7% rate during the second quarter, appearing to confirm renewed economic concerns.
In July, the manufacturing and service sectors of the U.S. economy expanded for the twelfth and seventh consecutive months, respectively. Still, total nonfarm payroll employment fell by 131,000 jobs during the month, reflecting the end of temporary census hiring.The housing market remained moribund, as sales of new homes fell to a 47-year low in August, while purchases of existing homes plummeted to a 15-year low.
In August, the unemployment rate rose to 9.6%, as only 67,000 jobs were created in the private sector. Economic data released in September appeared to support the consensus view that economic recovery, while intact, remained uncertain; manufacturing activity continued to increase, but employment and housing data showed few, if any, signs of improvement. The U.S. Department of Commerce later announced that U.S. GDP grew at a 2.6% annualized rate in the third quarter of 2010.
In response to the sluggish rebound, the Federal Reserve Board announced in September that it would embark on a second round of quantitative easing of monetary policy by purchasing $600 billion of U.S. Treasury securities.This move, implemented in November, was designed to fight deflationary forces and encourage lending by injecting more cash into the financial system. Indeed, October brought better economic news. The private sector added 159,000 jobs, with much of the gain coming from the services sector. However, housing markets continued to disappoint when issues regarding the banking industry’s foreclosure process further clouded an already murky outlook for home values.
4
Economic data remained encouraging in November, except for one critical measure: the unemployment rate climbed to 9.8% after the economy created only 39,000 jobs during the month, below most analysts’ expectations.Yet, the manufacturing and service sectors continued to improve, and even the housing market posted better sales data. In addition, the national midterm elections helped bring greater clarity to economic and tax policies.
An Unwavering Focus on Quality
The low federal funds rate kept money market yields in the short-term credit markets near zero percent, and with narrow yield differences along the market’s maturity spectrum, it continued to make little sense to incur the additional credit and interest-rate risks that longer-dated instruments typically entail. Therefore, we maintained the fund’s weighted average maturity in a range that was roughly in line with industry averages.As always, we focused exclusively on money market instruments backed by the U.S. government or its agencies.
The economic recovery appears to be gathering momentum, and we are hopeful that money market yields will respond to a more constructive market environment in 2011. In the meantime, as we have for some time, we intend to maintain the fund’s focus on credit quality and liquidity.
December 15, 2010
| |
| | An investment in the fund is not insured or guaranteed by the FDIC or any other government |
| | agency.Although the fund seeks to preserve the value of your investment at $1.00 per share, it is |
| | possible to lose money by investing in the fund. |
| 1 | Effective yield is based upon dividends declared daily and reinvested monthly. Past performance is |
| | no guarantee of future results.Yields fluctuate.Yields provided for the fund’s Class A and Class B |
| | shares reflect the absorption of certain fund expenses by The Dreyfus Corporation pursuant to an |
| | undertaking in effect that may be extended, terminated or modified at any time. Had these |
| | expenses not been absorbed, fund yields would have been lower. |
UNDERSTANDING YOUR FUND’S EXPENSES (Unaudited)
As a mutual fund investor, you pay ongoing expenses, such as management fees and other expenses. Using the information below, you can estimate how these expenses affect your investment and compare them with the expenses of other funds.You also may pay one-time transaction expenses, including sales charges (loads) and redemption fees, which are not shown in this section and would have resulted in higher total expenses. For more information, see your fund’s prospectus or talk to your financial adviser.
Review your fund’s expenses
The table below shows the expenses you would have paid on a $1,000 investment in General Government Securities Money Market Fund from June 1, 2010 to November 30, 2010. It also shows how much a $1,000 investment would be worth at the close of the period, assuming actual returns and expenses.
Expenses and Value of a $1,000 Investment
assuming actual returns for the six months ended November 30, 2010
| | | | |
| | | Class A | | Class B |
| Expenses paid per $1,000† | $ | 1.25 | $ | 1.25 |
| Ending value (after expenses) | $ | 1,000.00 | $ | 1,000.00 |
COMPARING YOUR FUND’S EXPENSES
WITH THOSE OF OTHER FUNDS (Unaudited)
Using the SEC’s method to compare expenses
The Securities and Exchange Commission (SEC) has established guidelines to help investors assess fund expenses. Per these guidelines, the table below shows your fund’s expenses based on a $1,000 investment, assuming a hypothetical 5% annualized return. You can use this information to compare the ongoing expenses (but not transaction expenses or total cost) of investing in the fund with those of other funds.All mutual fund shareholder reports will provide this information to help you make this comparison. Please note that you cannot use this information to estimate your actual ending account balance and expenses paid during the period.
Expenses and Value of a $1,000 Investment
assuming a hypothetical 5% annualized return for the six months ended November 30, 2010
| | | | |
| | | Class A | | Class B |
| Expenses paid per $1,000† | $ | 1.27 | $ | 1.27 |
| Ending value (after expenses) | $ | 1,023.82 | $ | 1,023.82 |
|
| † Expenses are equal to the fund’s annualized expense ratio of .25% for Class A and .25% for Class B, multiplied |
| by the average account value over the period, multiplied by 183/365 (to reflect the one-half year period). |
6
|
| STATEMENT OF INVESTMENTS |
| November 30, 2010 |
| | | | | |
| | | Annualized | | | |
| | | Yield on | | | |
| | | Date of | Principal | | |
| | U.S. Government Agencies—61.2% | Purchase (%) | Amount ($) | | Value ($) |
| | Federal Home Loan Bank: | | | | |
| | 12/1/10 | 0.38 | 50,000,000 | a | 49,972,058 |
| | 1/18/11 | 0.42 | 40,000,000 | | 40,016,761 |
| | 5/27/11 | 0.25 | 150,000,000 | a | 150,000,000 |
| | Federal Home Loan Mortgage Corp.: | | | | |
| | 12/14/10 | 0.23 | 50,000,000 | b | 49,995,847 |
| | 12/21/10 | 0.30 | 50,000,000 | b | 49,991,667 |
| | 2/14/11 | 0.25 | 25,000,000 | b | 24,986,979 |
| | 4/4/11 | 0.19 | 100,000,000 | b | 99,934,555 |
| | 5/27/11 | 0.25 | 50,000,000 | b | 49,938,542 |
| | 6/21/11 | 0.22 | 100,000,000 | b | 99,879,361 |
| | 7/12/11 | 0.21 | 40,000,000 | b | 39,947,967 |
| | Federal National Mortgage Association: | | | | |
| | 12/6/10 | 0.42 | 50,000,000 | a,b | 49,979,835 |
| | 12/15/10 | 0.25 | 75,000,000 | b | 74,992,708 |
| | 12/29/10 | 0.23 | 50,000,000 | b | 49,991,056 |
| | 1/18/11 | 0.30 | 25,000,000 | b | 24,990,000 |
| | 1/21/11 | 0.29 | 100,000,000 | a,b | 99,997,293 |
| | Total U.S. Government Agencies | | | | |
| | (cost $954,614,629) | | | | 954,614,629 |
| |
| |
| | U.S. Treasury Notes—.7% | | | | |
| | 11/15/11 | | | | |
| | (cost $10,138,446) | 0.30 | 10,000,000 | | 10,138,446 |
| |
| |
| | Repurchase Agreements—41.2% | | | | |
| | Barclays Capital, Inc. | | | | |
| | dated 11/30/10, due 12/1/10 in the amount | | | | |
| | of $141,000,901 (fully collateralized by | | | | |
| $ | 12,175,500 U.S. Treasury Bonds, 6.25%, | | | | |
| | due 5/15/30, value $16,320,038 and | | | | |
| | $123,074,400 U.S. Treasury Notes, | | | | |
| | 2.75%-5%, due 8/15/11-2/15/19, | | | | |
| | value $127,500,058) | 0.23 | 141,000,000 | | 141,000,000 |
STATEMENT OF INVESTMENTS (continued)
| | | |
| | Annualized | | |
| | Yield on | | |
| | Date of | Principal | |
| Repurchase Agreements (continued) | Purchase (%) | Amount ($) | Value ($) |
| Credit Agricole Securities (USA) Inc. | | | |
| dated 11/30/10, due 12/1/10 in the | | | |
| amount of $150,001,000 (fully | | | |
| collateralized by $152,244,600 | | | |
| U.S. Treasury Notes, 0.625%, | | | |
| due 7/31/12, value $153,000,039) | 0.24 | 150,000,000 | 150,000,000 |
| Credit Suisse Securities LLC | | | |
| dated 11/30/10, due 12/1/10 in the | | | |
| amount of $70,000,467 (fully collateralized | | | |
| by $262,290,000 U.S. Treasury Strips, | | | |
| due 11/15/39, value $71,400,588) | 0.24 | 70,000,000 | 70,000,000 |
| Deutsche Bank Securities Inc. | | | |
| dated 11/30/10, due 12/1/10 in the | | | |
| amount of $150,001,000 (fully collateralized | | | |
| by $49,887,100 U.S. Treasury Inflation | | | |
| Protected Securities, 2%, due 7/15/14, | | | |
| value $63,147,270 and $85,472,300 U.S. | | | |
| Treasury Notes, 2.75%, due 11/30/16, | | | |
| value $89,852,756) | 0.24 | 150,000,000 | 150,000,000 |
| Goldman, Sachs & Co. | | | |
| dated 11/30/10, due 12/1/10 in the | | | |
| amount of $31,000,129 (fully collateralized | | | |
| by $30,787,400 U.S. Treasury Notes, | | | |
| 0.875%-3.875%, due 2/29/12-10/31/12, | | | |
| value $31,620,042) | 0.15 | 31,000,000 | 31,000,000 |
8
| | | | | |
| | Annualized | | | | |
| | Yield on | | | | |
| | Date of | Principal | | | |
| Repurchase Agreements (continued) | Purchase (%) | Amount ($) | | Value ($) | |
| HSBC USA Inc. | | | | | |
| dated 11/30/10, due 12/1/10 in the | | | | | |
| amount of $100,000,611 (fully collateralized | | | | | |
| by $102,070,000 U.S. Treasury Bills, | | | | | |
| due 4/7/11, value $102,004,672) | 0.22 | 100,000,000 | | 100,000,000 | |
| Total Repurchase Agreements | | | | | |
| (cost $642,000,000) | | | | 642,000,000 | |
| |
| Total Investments (cost $1,606,753,075) | | 103.1 | % | 1,606,753,075 | |
| |
| Liabilities, Less Cash and Receivables | | (3.1 | %) | (48,822,385 | ) |
| |
| Net Assets | | 100.0 | % | 1,557,930,690 | |
|
| a Variable rate security—interest rate subject to periodic change. |
| b The Federal Housing Finance Agency (“FHFA”) placed Federal Home Loan Mortgage Corporation and Federal |
| National Mortgage Association into conservatorship with FHFA as the conservator.As such, the FHFA oversees the |
| continuing affairs of these companies. |
| | | |
| Portfolio Summary (Unaudited)† | | |
| | Value (%) | | Value (%) |
| U.S. Government Agencies | 61.2 | U.S. Treasury Notes | .7 |
| Repurchase Agreements | 41.2 | | 103.1 |
| † Based on net assets. | | | |
| See notes to financial statements. | | | |
STATEMENT OF ASSETS AND LIABILITIES
November 30, 2010
| | | |
| | Cost | Value | |
| Assets ($): | | | |
| Investments in securities—See Statement of | | | |
| Investments (including repurchase agreements | | | |
| of $642,000,000)—Note 1(b) | 1,606,753,075 | 1,606,753,075 | |
| Cash | | 4,909,187 | |
| Interest receivable | | 184,943 | |
| Prepaid expenses | | 226,396 | |
| | | 1,612,073,601 | |
| Liabilities ($): | | | |
| Due to The Dreyfus Corporation and affiliates—Note 2(c) | | 268,726 | |
| Payable for investment securities purchased | | 49,979,835 | |
| Payable for shares of Common Stock redeemed | | 3,806,109 | |
| Accrued expenses | | 88,241 | |
| | | 54,142,911 | |
| Net Assets ($) | | 1,557,930,690 | |
| Composition of Net Assets ($): | | | |
| Paid-in capital | | 1,558,039,401 | |
| Accumulated net realized gain (loss) on investments | | (108,711 | ) |
| Net Assets ($) | | 1,557,930,690 | |
| |
| |
| Net Asset Value Per Share | | | |
| | Class A | Class B | |
| Net Assets ($) | 71,369,924 | 1,486,560,766 | |
| Shares Outstanding | 71,376,832 | 1,486,678,335 | |
| Net Asset Value Per Share ($) | 1.00 | 1.00 | |
| |
| See notes to financial statements. | | | |
10
STATEMENT OF OPERATIONS
Year Ended November 30, 2010
| | |
| Investment Income ($): | | |
| Interest Income | 4,257,548 | |
| Expenses: | | |
| Management fee—Note 2(a) | 8,363,168 | |
| Shareholder servicing costs—Notes 1 and 2(c) | 4,885,064 | |
| Distribution fees, service and prospectus fees—Note 2(b) | 3,387,215 | |
| Shareholders’ reports | 227,798 | |
| Custodian fees—Note 2(c) | 132,863 | |
| Directors’ fees and expenses—Note 2(d) | 100,765 | |
| Registration fees | 83,656 | |
| Professional fees | 65,088 | |
| Miscellaneous | 36,120 | |
| Total Expenses | 17,281,737 | |
| Less—reduction in expenses due to undertaking—Note 2(a) | (12,788,415 | ) |
| Less—reduction in shareholder servicing costs | | |
| due to undertaking—Note 2(c) | (234,441 | ) |
| Less—reduction in fees due to earnings credits—Note 2(c) | (1,905 | ) |
| Net Expenses | 4,256,976 | |
| Investment Income—Net | 572 | |
| Net Realized Gain (Loss) on Investments—Note 1(b) ($) | 14,541 | |
| Net Increase in Net Assets Resulting from Operations | 15,113 | |
| |
| See notes to financial statements. | | |
The Fund 11
STATEMENT OF CHANGES IN NET ASSETS
| | | | |
| | Year Ended November 30, | |
| | 2010 | | 2009 | |
| Operations ($): | | | | |
| Investment income—net | 572 | | 145,566 | |
| Net realized gain (loss) on investments | 14,541 | | — | |
| Net Increase (Decrease) in Net Assets | | | | |
| Resulting from Operations | 15,113 | | 145,566 | |
| Dividends to Shareholders from ($): | | | | |
| Investment income—net: | | | | |
| Class A Shares | (10 | ) | (46,209 | ) |
| Class B Shares | (562 | ) | (99,357 | ) |
| Total Dividends | (572 | ) | (145,566 | ) |
| Capital Stock Transactions ($1.00 per share): | | | | |
| Net proceeds from shares sold: | | | | |
| Class A Shares | 442,148,450 | | 1,033,162,674 | |
| Class B Shares | 2,973,880,756 | | 3,391,753,594 | |
| Dividends reinvested: | | | | |
| Class A Shares | 10 | | 44,762 | |
| Class B Shares | 561 | | 98,184 | |
| Cost of shares redeemed: | | | | |
| Class A Shares | (465,858,850 | ) | (1,059,264,378 | ) |
| Class B Shares | (3,188,485,736 | ) | (3,863,008,632 | ) |
| Increase (Decrease) in Net Assets | | | | |
| from Capital Stock Transactions | (238,314,809 | ) | (497,213,796 | ) |
| Total Increase (Decrease) in Net Assets | (238,300,268 | ) | (497,213,796 | ) |
| Net Assets ($): | | | | |
| Beginning of Period | 1,796,230,958 | | 2,293,444,754 | |
| End of Period | 1,557,930,690 | | 1,796,230,958 | |
| |
| See notes to financial statements. | | | | |
12
FINANCIAL HIGHLIGHTS
The following tables describe the performance for each share class for the fiscal periods indicated. All information reflects financial results for a single fund share. Total return shows how much your investment in the fund would have increased (or decreased) during each period, assuming you had reinvested all dividends and distributions.These figures have been derived from the fund’s financial statements.
| | | | | | | | | | |
| | | | Year Ended November 30, | | | |
| Class A Shares | 2010 | | 2009 | | 2008 | | 2007 | | 2006 | |
| Per Share Data ($): | | | | | | | | | | |
| Net asset value, beginning of period | 1.00 | | 1.00 | | 1.00 | | 1.00 | | 1.00 | |
| Investment Operations: | | | | | | | | | | |
| Investment income—net | .000 | a | .000 | a | .020 | | .043 | | .041 | |
| Distributions: | | | | | | | | | | |
| Dividends from investment income—net | (.000 | )a | (.000 | )a | (.020 | ) | (.043 | ) | (.041 | ) |
| Net asset value, end of period | 1.00 | | 1.00 | | 1.00 | | 1.00 | | 1.00 | |
| Total Return (%) | .00 | b | .04 | | 2.01 | | 4.44 | | 4.16 | |
| Ratios/Supplemental Data (%): | | | | | | | | | | |
| Ratio of total expenses | | | | | | | | | | |
| to average net assets | .82 | | .81 | | .81 | | .78 | | .80 | |
| Ratio of net expenses | | | | | | | | | | |
| to average net assets | .25 | | .52 | | .81 | | .78 | | .80 | |
| Ratio of net investment income | | | | | | | | | | |
| to average net assets | .00 | b | .04 | | 1.84 | | 4.45 | | 4.06 | |
| Net Assets, end of period ($ x 1,000) | 71,370 | | 95,080 | | 121,137 | | 66,357 | | 360,382 | |
| a | Amount represents less than $.001 per share. |
| b | Amount represents less than .01%. |
See notes to financial statements.
The Fund 13
FINANCIAL HIGHLIGHTS (continued)
| | | | | | | | | | |
| | | | Year Ended November 30, | | | |
| Class B Shares | 2010 | | 2009 | | 2008 | | 2007 | | 2006 | |
| Per Share Data ($): | | | | | | | | | | |
| Net asset value, | | | | | | | | | | |
| beginning of period | 1.00 | | 1.00 | | 1.00 | | 1.00 | | 1.00 | |
| Investment Operations: | | | | | | | | | | |
| Investment income—net | .000 | a | .000 | a | .018 | | .042 | | .039 | |
| Distributions: | | | | | | | | | | |
| Dividends from | | | | | | | | | | |
| investment income—net | (.000 | )a | (.000 | )a | (.018 | ) | (.042 | ) | (.039 | ) |
| Net asset value, end of period | 1.00 | | 1.00 | | 1.00 | | 1.00 | | 1.00 | |
| Total Return (%) | .00 | b | .01 | | 1.79 | | 4.25 | | 3.95 | |
| Ratios/Supplemental Data (%): | | | | | | | | | | |
| Ratio of total expenses | | | | | | | | | | |
| to average net assets | 1.04 | | 1.05 | | 1.04 | | 1.04 | | 1.03 | |
| Ratio of net expenses | | | | | | | | | | |
| to average net assets | .25 | | .56 | | 1.02 | | 1.01 | | 1.01 | |
| Ratio of net investment income | | | | | | | | | | |
| to average net assets | .00 | b | .01 | | 1.67 | | 4.16 | | 3.89 | |
| Net Assets, end of period | | | | | | | | | | |
| ($ x 1,000) | 1,486,561 | | 1,701,151 | | 2,172,308 | | 1,426,190 | | 1,089,717 | |
| a | Amount represents less than $.001 per share. |
| b | Amount represents less than .01%. |
See notes to financial statements.
14
NOTES TO FINANCIAL STATEMENTS
NOTE 1—Significant Accounting Policies:
General Government Securities Money Market Fund (the “fund”) is a separate diversified series of General Government Securities Money Market Funds, Inc. (the “Company”), which is registered under the Investment Company Act of 1940, as amended (the “Act”), as an open-end management investment company and operates as a series company, currently offering two series, including the fund.The fund’s investment objective is to seek as high a level of current income as is consistent with the preservation of capital and the maintenance of liquidity.The Dreyfus Corporation (the “Manager” or “Dreyfus”), a wholly-owned subsidiary of The Bank of New York Mellon Corporation (“BNY Mellon”), serves as the fund’s investment adviser.
MBSC Securities Corporation (the “Distributor”), a wholly-owned subsidiary of the Manager, is the distributor of the fund’s shares. The fund is authorized to issue 16 billion shares of $.001 par value Common Stock.The fund currently offers two classes of shares: Class A (10 billion shares authorized) and Class B (6 billion shares authorized). Class A shares and Class B shares are identical except for the services offered to and the expenses borne by each class, the allocation of certain transfer agency costs and certain voting rights. Class A shares are subject to a Service Plan adopted pursuant to Rule 12b-1 under the Act, Class B shares are subject to a Distribution Plan adopted pursuant to Rule 12b-1 under the Act and Class A and Class B shares are subject to a Shareholder Services Plan. In addition, Class B shares are charged directly for sub-accounting services provided by Service Agents (a sec urities dealer, financial institution or other industry professional) at an annual rate of .05% of the value of the average daily net assets of Class B shares. During the period ended November 30, 2010, sub-accounting service fees amounted to $793,533 for Class B shares and are included in Shareholder servicing costs in the Statement of Operations. Income, expenses (other than expenses attributable to a specific class), and realized and unrealized gains or losses on investments are allocated to each class of shares based on its relative net assets.
The Fund 15
NOTES TO FINANCIAL STATEMENTS (continued)
It is the fund’s policy to maintain a continuous net asset value per share of $1.00; the fund has adopted certain investment, portfolio valuation and dividend and distribution policies to enable it to do so.There is no assurance, however, that the fund will be able to maintain a stable net asset value per share of $1.00.
The Company accounts separately for the assets, liabilities and operations of each series. Expenses directly attributable to each series are charged to that series’ operations; expenses which are applicable to all series are allocated among them on a pro rata basis.
The Financial Accounting Standards Board (“FASB”) Accounting Standards Codification (“ASC”) is the exclusive reference of authoritative U.S. generally accepted accounting principles (“GAAP”) recognized by the FASB to be applied by nongovernmental entities. Rules and interpretive releases of the Securities and Exchange Commission (“SEC”) under authority of federal laws are also sources of authoritative GAAP for SEC registrants. The fund’s financial statements are prepared in accordance with GAAP, which may require the use of management estimates and assumptions.Actual results could differ from those estimates.
The Company enters into contracts that contain a variety of indemnifications.The fund’s maximum exposure under these arrangements is unknown.The fund does not anticipate recognizing any loss related to these arrangements.
(a) Portfolio valuation: Investments in securities are valued at amortized cost in accordance with Rule 2a-7 of the Act, which has been determined by the Board of Directors to represent the fair value of the fund’s investments.
The fair value of a financial instrument is the amount that would be received to sell an asset or paid to transfer a liability in an orderly transaction between market participants at the measurement date (i.e. the exit price). GAAP establishes a fair value hierarchy that prioritizes the inputs of valuation techniques used to measure fair value.This hierarchy gives the highest priority to unadjusted quoted prices in active markets for identical assets or liabilities (Level 1 measurements) and the lowest priority to unobservable inputs (Level 3 measurements).
16
Additionally, GAAP provides guidance on determining whether the volume and activity in a market has decreased significantly and whether such a decrease in activity results in transactions that are not orderly. GAAP requires enhanced disclosures around valuation inputs and techniques used during annual and interim periods.
Various inputs are used in determining the value of the fund’s investments relating to fair value measurements.These inputs are summarized in the three broad levels listed below:
Level 1—unadjusted quoted prices in active markets for identical investments.
Level 2—other significant observable inputs (including quoted prices for similar investments, interest rates, prepayment speeds, credit risk, etc.).
Level 3—significant unobservable inputs (including the fund’s own assumptions in determining the fair value of investments).
The inputs or methodology used for valuing securities are not necessarily an indication of the risk associated with investing in those securities. For example, money market securities are valued using amortized cost, in accordance with rules under the Act. Generally, amortized cost approximates the current fair value of a security, but since the value is not obtained from a quoted price in an active market, such securities are reflected as Level 2.
The following is a summary of the inputs used as of November 30, 2010 in valuing the fund’s investments:
| |
| | Short-Term |
| Valuation Inputs | Investments ($)† |
| Level 1—Unadjusted Quoted Prices | — |
| Level 2—Other Significant Observable Inputs | 1,606,753,075 |
| Level 3—Significant Unobservable Inputs | — |
| Total | 1,606,753,075 |
| |
| † | See Statement of Investments for additional detailed categorizations. |
NOTES TO FINANCIAL STATEMENTS (continued)
(b) Securities transactions and investment income: Securities transactions are recorded on a trade date basis. Interest income, adjusted for accretion of discount and amortization of premium on investments, is earned from settlement date and is recognized on the accrual basis. Realized gains and losses from securities transactions are recorded on the identified cost basis. Cost of investments represents amortized cost.
The fund may enter into repurchase agreements with financial institutions, deemed to be creditworthy by the fund’s Manager, subject to the seller’s agreement to repurchase and the fund’s agreement to resell such securities at a mutually agreed upon price. Securities purchased subject to repurchase agreements are deposited with the fund’s custodian and, pursuant to the terms of the repurchase agreement must have an aggregate market value greater than or equal to the repurchase price plus accrued interest at all times. If the value of the underlying securities falls below the value of the repurchase price plus accrued interest, the fund will require the seller to deposit additional collateral by the next business day. If the request for additional collateral is not met, or the seller defaults on its repurchase obligation, the fund maintains the right to sell the underlying securities at market va lue and may claim any resulting loss against the seller.
(c) Dividends to shareholders: It is the policy of the fund to declare dividends from investment income-net on each business day. Such dividends are paid monthly. Dividends from net realized capital gains, if any, are normally declared and paid annually, but the fund may make distributions on a more frequent basis to comply with the distribution requirements of the Internal Revenue Code of 1986, as amended (the “Code”).To the extent that net realized capital gains can be offset by capital loss carryovers, it is the policy of the fund not to distribute such gains.
(d) Federal income taxes: It is the policy of the fund to continue to qualify as a regulated investment company, if such qualification is in the best interests of its shareholders, by complying with the applicable provisions of the Code, and to make distributions of taxable income sufficient to relieve it from substantially all federal income and excise taxes.
18
As of and during the period ended November 30, 2010, the fund did not have any liabilities for any uncertain tax positions.The fund recognizes interest and penalties, if any, related to uncertain tax positions as income tax expense in the Statement of Operations. During the period, the fund did not incur any interest or penalties.
Each of the tax years in the four-year period ended November 30, 2010 remains subject to examination by the Internal Revenue Service and state taxing authorities.
At November 30, 2010, the components of accumulated earnings on a tax basis were substantially the same as for financial reporting purposes.
The accumulated capital loss carryover of $108,711 is available for federal income tax purposes to be applied against future net securities profits, if any, realized subsequent to November 30, 2010. If not applied, the carryover expires in fiscal 2013.
The tax character of distributions paid to shareholders during the fiscal periods ended November 30, 2010 and November 30, 2009 were all ordinary income.
At November 30, 2010, the cost of investments for federal income tax purposes was substantially the same as the cost for financial reporting purposes (See the Statement of Investments).
NOTE 2—Management Fee and Other Transactions With Affiliates:
(a) Pursuant to a management agreement (“Agreement”) with the Manager, the management fee is computed at the annual rate of .50% of the value of the fund’s average daily net assets and is payable monthly. The Agreement provides that if in any full fiscal year the aggregate expenses of the fund, exclusive of taxes, brokerage fees, interest on borrowings and extraordinary expenses, exceed 1 1 / 2% the value of the fund’s average daily net assets, the fund may deduct from payments to be made
The Fund 19
NOTES TO FINANCIAL STATEMENTS (continued)
to the Manager, or the Manager will bear such excess expense. During the period ended November 30, 2010, there was no expense reimbursement pursuant to the Agreement.
The Manager has undertaken to reimburse expenses in the event that current yields drop below a certain level. Such expense limitations may fluctuate daily, are voluntary and not contractual and may be terminated at any time. The reduction in expenses, pursuant to the undertaking, amounted to $484,708 for Class A and $12,303,707 for Class B shares during the period ended November 30, 2010.
(b) Under the Service Plan with respect to Class A (the “Plan”), adopted pursuant to Rule 12b-1 under the Act, Class A shares bear directly the costs of preparing, printing and distributing prospectuses and statements of additional information and of implementing and operating the Plan, such aggregate amount not to exceed in any fiscal year of the fund, the greater of $100,000 or .005% of the average daily net assets of Class A. In addition, Class A shares pay the Distributor for distributing Class A shares, servicing shareholder accounts (“Servicing”) and advertising and marketing relating to Class A shares at an aggregate annual rate of .20% of the value of the average daily net assets of Class A.The Distributor may pay one or more Service Agents a fee in respect of Class A shares owned by shareholders with whom the Service Agent has a Servicing relationship or for whom the Service Agent is the dealer or holder of record.The schedule of such fees and the basis upon which such fees will be paid shall be determined from time to time by the Distributor. If a holder of Class A shares ceases to be a client of a Service Agent, but continues to hold Class A shares, the Distributor will be permitted to act as a Service Agent in respect of such fund shareholders and receive payments under the Plan for Servicing.The fees payable for Servicing are payable without regard to actual expenses incurred. During the period ended November 30, 2010, Class A shares were charged $173,271 pursuant to the Plan.
20
Under the Distribution Plan with respect to Class B (“Class B Distribution Plan”), adopted pursuant to Rule 12b-1 under the Act, Class B shares bear directly the costs of preparing, printing and distributing prospectuses and statements of additional information and of implementing and operating the Class B Distribution Plan, such aggregate amount not to exceed in any fiscal year of the fund, the greater of $100,000 or .005% of the average daily net assets of Class B. In addition, Class B shares reimburse the Distributor for payments made to third parties for distributing Class B shares at an aggregate annual rate not to exceed .20% of the value of the average daily net assets of Class B. During the period ended November 30, 2010, Class B shares were charged $3,213,944 pursuant to the Class B Distribution Plan.
(c) Under the Shareholder Services Plan with respect to Class A (“Class A Shareholder Services Plan”),Class A shares reimburse the Distributor an amount not to exceed an annual rate of .25% of the value of the average daily net assets of Class A shares for certain allocated expenses of providing personal services and/or maintaining shareholder accounts.The services provided may include personal services relating to shareholder accounts, such as answering shareholder inquiries regarding Class A shares and providing reports and other information, and services related to the maintenance of shareholder accounts. During the period ended November 30, 2010, Class A shares were charged $36,040 pursuant to the Class A Shareholder Services Plan.
Under the Shareholder Services Plan with respect to Class B (“Class B Shareholder Services Plan”), Class B shares pay the Distributor at an annual rate of .25% of the value of the average daily net assets of Class B shares for servicing shareholder accounts.The services provided may include personal services relating to shareholder accounts, such as answering shareholder inquiries regarding Class B shares and providing reports and other information, and services related to the mainte-
NOTES TO FINANCIAL STATEMENTS (continued)
nance of shareholder accounts.The Distributor may make payments to Service Agents in respect of these services.The Distributor determines the amounts to be paid to Service Agents.
The Manager had undertaken from December 1, 2009 through November 30, 2010, to reduce the expenses of Class B shares, if the aggregate expenses of Class B shares of the fund, exclusive of taxes, brokerage fees, interest on borrowings and extraordinary expenses, exceed an annual rate of 1.03% of the value of the average daily net assets of Class B shares. Such expense limitations are voluntary, temporary and may be terminated at anytime. During the period ended November 30, 2010, Class B shares were charged $3,967,664 pursuant to the Class B Shareholder Services Plan, of which $234,441 was reimbursed by the Manager.
The fund compensates Dreyfus Transfer, Inc., a wholly-owned subsidiary of the Manager, under a transfer agency agreement for providing personnel and facilities to perform transfer agency services for the fund. During the period ended November 30, 2010, the fund was charged $52,772 pursuant to the transfer agency agreement, which is included in Shareholder servicing costs in the Statement of Operations.
The fund has arrangements with the custodian and cash management bank whereby the fund may receive earnings credits when positive cash balances are maintained, which are used to offset custody and cash management fees. For financial reporting purposes, the fund includes net earnings credits as an expense offset in the Statement of Operations.
The fund compensates The Bank of New York Mellon, a subsidiary of BNY Mellon and an affiliate of Dreyfus, under a cash management agreement for performing cash management services related to fund
22
subscriptions and redemptions. During the period ended November 30, 2010, the fund was charged $5,181 pursuant to the cash management agreement, which is included in Shareholder servicing costs in the Statement of Operations. These fees were partially offset by earnings credits of $1,905.
The fund also compensates The Bank of New York Mellon under a custody agreement for providing custodial services for the fund. During the period ended November 30, 2010, the fund was charged $132,863 pursuant to the custody agreement.
During the period ended November 30, 2010, the fund was charged $6,399 for services performed by the Chief Compliance Officer.
The components of “Due to The Dreyfus Corporation and affiliates” in the Statement of Assets and Liabilities consist of: management fees $635,433, Rule 12b-1 distribution plan fees $254,212, shareholder services plan fees $363,699, custodian fees $39,583, chief compliance officer fees $1,152 and transfer agency per account fees $13,185, which are offset against an expense reimbursement currently in effect in the amount of $1,038,538.
(d) Each Board member also serves as a Board member of other funds within the Dreyfus complex. Annual retainer fees and attendance fees are allocated to each fund based on net assets.
The Fund 23
|
| REPORT OF INDEPENDENT REGISTERED |
| PUBLIC ACCOUNTING FIRM |
Shareholders and Board of Directors
General Government Securities Money Market Fund
We have audited the accompanying statement of assets and liabilities, including the statement of investments, of General Government Securities Money Market Fund (one of the series comprising General Government Securities Money Market Funds, Inc.) as of November 30, 2010, and the related statement of operations for the year then ended, the statement of changes in net assets for each of the two years in the period then ended, and financial highlights for each of the years indicated therein. These financial statements and financial highlights are the responsibility of the Fund’s management. Our responsibility is to express an opinion on these financial statements and financial highlights based on our audits.
We conducted our audits in accordance with the standards of the Public Company Accounting Oversight Board (United States).Those standards require that we plan and perform the audit to obtain reasonable assurance about whether the financial statements and financial highlights are free of material misstatement.We were not engaged to perform an audit of the Fund’s internal control over financial reporting. Our audits included consideration of internal control over financial reporting as a basis for designing audit procedures that are appropriate in the circumstances, but not for the purpose of expressing an opinion on the effectiveness of the Fund’s internal control over financial reporting. Accordingly, we express no such opinion.An audit also includes examining, on a test basis, evidence supporting the amounts and disclosures in the financial statements and financial highlights, assessing the accounting p rinciples used and significant estimates made by management, and evaluating the overall financial statement presentation. Our procedures included confirmation of securities owned as of November 30, 2010 by correspondence with the custodian and others. We believe that our audits provide a reasonable basis for our opinion.
In our opinion, the financial statements and financial highlights referred to above present fairly, in all material respects, the financial position of General Government Securities Money Market Fund at November 30, 2010, the results of its operations for the year then ended, the changes in its net assets for each of the two years in the period then ended, and the financial highlights for each of the indicated years, in conformity with U.S. generally accepted accounting principles.

New York, New York
January 25, 2011
24
IMPORTANT TAX INFORMATION (Unaudited)
For federal tax purposes the fund hereby designates 100% of ordinary income dividends paid during the fiscal year ended November 30, 2010 as qualifying interest related dividends.
The Fund 25
PROXY RESULTS (Unaudited)
General Government Securities Money Market Fund held a special meeting of shareholders on June 9, 2010. The proposals considered at the meeting, and the results, are as follows:
| | | | | |
| | | | | Shares | |
| | | | For | Against | Abstain |
| 1 | . | To approve amending the fund’s | | | |
| | | policy regarding borrowing | 629,325,164 | 76,405,795 | 32,255,730 |
| 2 | . | To approve amending the fund’s | | | |
| | | policy regarding lending | 626,774,669 | 79,075,099 | 32,136,921 |
| 3 | . | To permit investment in other | | | |
| | | investment companies | 617,671,826 | 87,063,151 | 33,251,711 |
26
INFORMATION ABOUT THE REVIEW AND APPROVAL
OF THE FUND’S MANAGEMENT AGREEMENT (Unaudited)
At a meeting of the Board of Trustees held on July 20, 2010, the Board considered the re-approval for an annual period of the fund’s Management Agreement, pursuant to which the Manager provides the fund with investment advisory and administrative services. The Board members, none of whom are “interested persons” (as defined in the Investment Company Act of 1940, as amended) of the fund, were assisted in their review by independent legal counsel and met with counsel in executive session separate from representatives of the Manager.
Analysis of Nature, Extent and Quality of Services Provided to the Fund. The Board members considered information previously provided to them in a presentation from representatives of the Manager regarding services provided to the fund and other funds in the Dreyfus fund complex, and representatives of the Manager confirmed that there had been no material changes in this information.The Board also discussed the nature, extent and quality of the services provided to the fund by the Manager pursuant to the Management Agreement. The Manager’s representatives reviewed the fund’s distribution of accounts and the relationships the Manager has with various intermediaries and the different needs of each.The Board noted that the fund’s shares are sold primarily through institutional channels and often serve as a “sweep veh icle” for use by third party broker-dealers for their cus-tomers.The Manager’s representatives noted the distribution channels for the fund as well as the diversity of distribution among the funds in the Dreyfus fund complex, and the Manager’s corresponding need for broad, deep, and diverse resources to be able to provide ongoing shareholder services in each distribution channel, including those of the fund. The Manager provided the number of shareholder accounts in the fund, as well as the fund’s asset size.
The Board members also considered the Manager’s research and portfolio management capabilities and that the Manager also provides oversight of day-to-day fund operations, including fund accounting and administration and assistance in meeting legal and regulatory requirements. The Board members also considered the Manager’s extensive administrative, accounting and compliance infrastructure.
The Fund 27
INFORMATION ABOUT THE REVIEW AND APPROVAL OF THE
FUND’S MANAGEMENT AGREEMENT (Unaudited) (continued)
Comparative Analysis of the Fund’s Performance, Management Fee and Expense Ratio.The Board members reviewed the fund’s performance and comparisons to a group of comparable funds (the “Performance Group”) and to a broader group of funds (the “Performance Universe”), selected and provided by Lipper, Inc., an independent provider of investment company data.The Board was provided with a description of the methodology Lipper used to select the Performance Group and Performance Universe, as well as the Expense Group and Expense Universe (discussed below).The Board members discussed the results of the comparisons for various periods ended May 31, 2010 and noted that the fund’s total return performance was above the Performance Group medians for the three- and ten-year periods, equal to the median for the f our- and five-year periods, and below the median for the one- and two-year periods.The Board members noted the close proximity (within 1 basis point) of the fund’s total return performance to the Performance Group medians for the one- and two-year periods ended May 31, 2010. The Board members also noted that the fund’s total return performance was below the Performance Universe medians for each reported time period. The Board members noted the proximity of the fund’s total return to the Performance Universe medians during the periods, and discussed with representatives of the Manager the reasons for the fund’s underperformance compared to the Performance Universe for the applicable periods, and the Manager’s efforts to improve performance. The Board members also received a presentation from the fund’s primary portfolio manager during which he discussed the fund’s investment strategy and the factors that affected performance.
The Board members also discussed the fund’s contractual and actual management fee and total expense ratio as compared to a comparable group of funds (the “Expense Group”) that was composed of the same funds included in the Performance Group and a broader group of funds (the “Expense Universe”), each selected and provided by Lipper. The Board noted that the fund’s contractual management fee was above the Expense Group median, that the fund’s actual management
28
fee was below the Expense Group median and above the Expense Universe median and that the fund’s total expense ratio was below the Expense Group and Expense Universe medians.The Board members also discussed the Manager’s current undertaking to waive fees and/or reimburse fund expenses.
Representatives of the Manager reviewed with the Board members the fees paid to the Manager or its affiliates by mutual funds managed by the Manager or its affiliates with similar investment objectives, policies and strategies, and included in the same Lipper category, as the fund (the “Similar Funds”). The Board members considered the relevance of the fee information provided for the Similar Funds to evaluate the appropriateness and reasonableness of the fund’s management fee. Representatives of the Manager informed the Board members that there were no separate accounts or wrap fee accounts managed by the Manager or its affiliates with similar investment objectives, policies and strategies as the fund.
Analysis of Profitability and Economies of Scale.The Manager’s representatives reviewed the dollar amount of expenses allocated and profit received by the Manager and the method used to determine such expenses and profit.The Board previously had been provided with information prepared by an independent consulting firm regarding the Manager’s approach to allocating costs to, and determining the profitability of, individual funds and the entire Dreyfus mutual fund complex.The Board members also had been informed that the methodology also had been reviewed by an independent registered public accounting firm which, like the consultant, found the methodology to be reasonable.The consulting firm also analyzed where any economies of scale might emerge in connection with the management of a fund.The Board members evaluated the prof itability analysis in light of the relevant circumstances for the fund and the extent to which economies of scale would be realized if the fund grows and whether fee levels reflect these economies of scale for the benefit of fund shareholders.The Board mem-
The Fund 29
INFORMATION ABOUT THE REVIEW AND APPROVAL OF THE
FUND’S MANAGEMENT AGREEMENT (Unaudited) (continued)
bers also considered potential benefits to the Manager and its affiliates from acting as investment adviser to the fund and noted that there were no soft dollar arrangements with respect to trading the fund’s portfolio.
It was noted that the Board members should consider the Manager’s profitability with respect to the fund as part of their evaluation of whether the fees under the Management Agreement bear a reasonable relationship to the mix of services provided by the Manager, including the nature, extent and quality of such services and that a discussion of economies of scale is predicated on increasing assets and that, if a fund’s assets had been decreasing, the possibility that the Manager may have realized any economies of scale would be less. It was also noted that the profitability percentage for managing the fund was within the range determined by appropriate court cases to be reasonable given the services rendered and generally superior service levels provided by the Manager.The Board also noted the fee waiver and expense reimbursement arrangement and its effect on the Manager’s profitability.
At the conclusion of these discussions, the Board agreed that it had been furnished with sufficient information to make an informed business decision with respect to continuation of the fund’s Management Agreement. Based on the discussions and considerations as described above, the Board made the following conclusions and determinations.
- The Board concluded that the nature, extent and quality of the services provided by the Manager to the fund are adequate and appropriate.
- The Board was satisfied with management’s efforts to improve the fund’s performance as discussed at the meeting, and determined to closely monitor the performance of the fund.
- The Board concluded that the fee paid to the Manager by the fund was reasonable in light of the factors discussed above.
30
- The Board determined that the economies of scale which may accrue to the Manager and its affiliates in connection with the management of the fund had been adequately considered by the Manager in con- nection with the management fee rate charged to the fund, and that, to the extent in the future it were to be determined that material economies of scale had not been shared with the fund, the Board would seek to have those economies of scale shared with the fund.
The Board members considered these conclusions and determinations, along with the information received on a routine and regular basis throughout the year, and, without any one factor being dispositive, the Board determined that re-approval of the fund’s Management Agreement was in the best interests of the fund and its shareholders.
The Fund 31
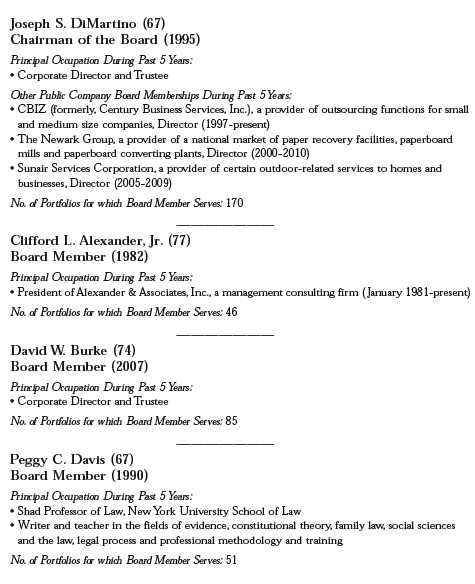
BOARD MEMBERS INFORMATION (Unaudited)
32

OFFICERS OF THE FUND (Unaudited)
BRADLEY J. SKAPYAK, President since
January 2010.
Chief Operating Officer and a director of the Manager since June 2009. From April 2003 to June 2009, Mr. Skapyak was the head of the Investment Accounting and Support Department of the Manager. He is an officer of 76 investment companies (comprised of 170 portfolios) managed by the Manager. He is 52 years old and has been an employee of the Manager since February 1988.
PHILLIP N. MAISANO, Executive Vice
President since July 2007.
Chief Investment Officer,Vice Chair and a director of the Manager, and an officer of 76 investment companies (comprised of 170 portfolios) managed by the Manager. Mr. Maisano also is an officer and/or Board member of certain other investment management subsidiaries of The Bank of New York Mellon Corporation, each of which is an affiliate of the Manager. He is 63 years old and has been an employee of the Manager since November 2006. Prior to joining the Manager, Mr. Maisano served as Chairman and Chief Executive Officer of EACM Advisors, an affiliate of the Manager, since August 2004.
MICHAEL A. ROSENBERG, Vice President
and Secretary since August 2005.
Assistant General Counsel of BNY Mellon, and an officer of 77 investment companies (comprised of 195 portfolios) managed by the Manager. He is 50 years old and has been an employee of the Manager since October 1991.
KIESHA ASTWOOD, Vice President and
Assistant Secretary since January 2010.
Counsel of BNY Mellon, and an officer of 77 investment companies (comprised of 195 portfolios) managed by the Manager. She is 37 years old and has been an employee of the Manager since July 1995.
JAMES BITETTO, Vice President and
Assistant Secretary since August 2005.
Senior Counsel of BNY Mellon and Secretary of the Manager, and an officer of 77 investment companies (comprised of 195 portfolios) managed by the Manager. He is 44 years old and has been an employee of the Manager since December 1996.
JONI LACKS CHARATAN, Vice President
and Assistant Secretary since
August 2005.
Senior Counsel of BNY Mellon, and an officer of 77 investment companies (comprised of 195 portfolios) managed by the Manager. She is 55 years old and has been an employee of the Manager since October 1988.
JOSEPH M. CHIOFFI, Vice President and
Assistant Secretary since August 2005.
Senior Counsel of BNY Mellon, and an officer of 77 investment companies (comprised of 195 portfolios) managed by the Manager. He is 49 years old and has been an employee of the Manager since June 2000.
KATHLEEN DENICHOLAS, Vice President
and Assistant Secretary since
January 2010.
Senior Counsel of BNY Mellon, and an officer of 77 investment companies (comprised of 195 portfolios) managed by the Manager. She is 36 years old and has been an employee of the Manager since February 2001.
JANETTE E. FARRAGHER, Vice President
and Assistant Secretary since
August 2005.
Assistant General Counsel of BNY Mellon, and an officer of 77 investment companies (comprised of 195 portfolios) managed by the Manager. She is 47 years old and has been an employee of the Manager since February 1984.
34
JOHN B. HAMMALIAN, Vice President and
Assistant Secretary since August 2005.
Managing Counsel of BNY Mellon, and an officer of 77 investment companies (comprised of 195 portfolios) managed by the Manager. He is 47 years old and has been an employee of the Manager since February 1991.
M. CRISTINA MEISER, Vice President and
Assistant Secretary since January 2010.
Senior Counsel of BNY Mellon, and an officer of 77 investment companies (comprised of 195 portfolios) managed by the Manager. She is 40 years old and has been an employee of the Manager since August 2001.
ROBERT R. MULLERY, Vice President and
Assistant Secretary since August 2005.
Managing Counsel of BNY Mellon, and an officer of 77 investment companies (comprised of 195 portfolios) managed by the Manager. He is 58 years old and has been an employee of the Manager since May 1986.
JEFF PRUSNOFSKY, Vice President and
Assistant Secretary since August 2005.
Managing Counsel of BNY Mellon, and an officer of 77 investment companies (comprised of 195 portfolios) managed by the Manager. He is 45 years old and has been an employee of the Manager since October 1990.
JAMES WINDELS, Treasurer since
November 2001.
Director – Mutual Fund Accounting of the Manager, and an officer of 77 investment companies (comprised of 195 portfolios) managed by the Manager. He is 52 years old and has been an employee of the Manager since April 1985.
RICHARD CASSARO, Assistant Treasurer
since January 2008.
Senior Accounting Manager – Money Market and Municipal Bond Funds of the Manager, and an officer of 77 investment companies (comprised of 195 portfolios) managed by the Manager. He is 51 years old and has been an employee of the Manager since September 1982.
GAVIN C. REILLY, Assistant Treasurer
since August 2005.
Tax Manager of the Investment Accounting and Support Department of the Manager, and an officer of 77 investment companies (comprised of 195 portfolios) managed by the Manager. He is 42 years old and has been an employee of the Manager since April 1991.
ROBERT ROBOL, Assistant Treasurer
since August 2003.
Senior Accounting Manager �� Fixed Income Funds of the Manager, and an officer of 77 investment companies (comprised of 195 portfolios) managed by the Manager. He is 46 years old and has been an employee of the Manager since October 1988.
ROBERT SALVIOLO, Assistant Treasurer
since May 2007.
Senior Accounting Manager – Equity Funds of the Manager, and an officer of 77 investment companies (comprised of 195 portfolios) managed by the Manager. He is 43 years old and has been an employee of the Manager since June 1989.
OFFICERS OF THE FUND (Unaudited) (continued)
ROBERT SVAGNA, Assistant Treasurer
since August 2005.
Senior Accounting Manager – Equity Funds of the Manager, and an officer of 77 investment companies (comprised of 195 portfolios) managed by the Manager. He is 43 years old and has been an employee of the Manager since November 1990.
JOSEPH W. CONNOLLY, Chief Compliance
Officer since October 2004.
Chief Compliance Officer of the Manager and The Dreyfus Family of Funds (77 investment companies, comprised of 195 portfolios). From November 2001 through March 2004, Mr. Connolly was first Vice-President, Mutual Fund Servicing for Mellon Global Securities Services. In that capacity, Mr. Connolly was responsible for managing Mellon’s Custody, Fund Accounting and Fund Administration services to third-party mutual fund clients. He is 53 years old and has served in various capacities with the Manager since 1980, including manager of the firm’s Fund Accounting Department from 1997 through October 2001.
NATALIA GRIBAS, Anti-Money Laundering
Compliance Officer since July 2010.
Anti-Money Laundering Compliance Officer of the Distributor, and the Anti-Money Laundering Compliance Officer of 73 investment companies (comprised of 191 portfolios) managed by the Manager. She is 40 years old and has been an employee of the Distributor since September 2008.
36
For More Information
Telephone 1-800-645-6561
Mail The Dreyfus Family of Funds, 144 Glenn Curtiss Boulevard, Uniondale, NY 11556-0144 E-mail Send your request to info@dreyfus.com Internet Information can be viewed online or downloaded at: http://www.dreyfus.com
The fund will disclose daily, on www.dreyfus.com, the fund’s complete schedule of holdings as of the end of the previous business day. The schedule of holdings will remain on the website until the fund files its Form N-Q or Form N-CSR for the period that includes the date of the posted holdings.
The fund files its complete schedule of portfolio holdings with the Securities and Exchange Commission (“SEC”) for the first and third quarters of each fiscal year on Form N-Q. The fund's Forms N-Q are available on the SEC’s website at http://www.sec.gov and may be reviewed and copied at the SEC’s Public Reference Room in Washington, DC. Information on the operation of the Public Reference Room may be obtained by calling 1-800-SEC-0330.
Information regarding how the fund voted proxies relating to portfolio securities for the most recent 12-month period ended June 30 is available on the SEC’s website at http://www.sec.gov and without charge, upon request, by calling 1-800-645-6561.

|
| General |
| Treasury Prime |
| Money Market Fund |
ANNUAL REPORT November 30, 2010

Save time. Save paper. View your next shareholder report online as soon as it’s available. Log into www.dreyfus.com and sign up for Dreyfus eCommunications. It’s simple and only takes a few minutes.
The views expressed in this report reflect those of the portfolio manager only through the end of the period covered and do not necessarily represent the views of Dreyfus or any other person in the Dreyfus organization. Any such views are subject to change at any time based upon market or other conditions and Dreyfus disclaims any responsibility to update such views.These views may not be relied on as investment advice and, because investment decisions for a Dreyfus fund are based on numerous factors, may not be relied on as an indication of trading intent on behalf of any Dreyfus fund.

| | Contents |
| | THE FUND |
| 2 | A Letter from the Chairman and CEO |
| 3 | Discussion of Fund Performance |
| 6 | Understanding Your Fund’s Expenses |
| 6 | Comparing Your Fund’s Expenses With Those of Other Funds |
| 7 | Statement of Investments |
| 8 | Statement of Assets and Liabilities |
| 9 | Statement of Operations |
| 10 | Statement of Changes in Net Assets |
| 11 | Financial Highlights |
| 13 | Notes to Financial Statements |
| 22 | Report of Independent Registered Public Accounting Firm |
| 23 | Important Tax Information |
| 24 | Proxy Results |
| 25 | Information About the Review and Approval of the Fund’s Management Agreement |
| 30 | Board Members Information |
| 32 | Officers of the Fund |
| | FOR MORE INFORMATION |
| | Back Cover |
General Treasury Prime
Money Market Fund
The Fund

A LETTER FROM THE CHAIRMAN AND CEO
Dear Shareholder:
We are pleased to present this annual report for General Treasury Prime Money Market Fund, covering the 12-month period from December 1, 2009, through November 30, 2010.
Although U.S. GDP growth was positive throughout the reporting period, the economic recovery has been milder than historical averages. As a result, the Federal Reserve Board has maintained an aggressively accommodative monetary policy in order to moderate stubbornly high levels of unemployment and persistent weakness in housing markets.
We are cautiously optimistic regarding the U.S. economy’s prospects in 2011.A weaker U.S. dollar is likely to support exports and limit imports, residential construction appears set to begin recovering from depressed levels, and employment growth has begun to expand enough to generate gains in wage and salary income. However, we expect inflationary pressures and short-term interest rates to remain low, potentially preventing any significant rise in money market yields over the foreseeable future. So is your overall portfolio positioned accordingly?Talk with your financial advisor, who can help you evaluate your current “liquid asset” needs and your future portfolio investment needs.
For information about how the fund performed during the reporting period, as well as general market perspectives, we provide a Discussion of Fund Performance on the pages that follow.

Jonathan R. Baum
Chairman and Chief Executive Officer
The Dreyfus Corporation
December 15, 2010
2

DISCUSSION OF FUND PERFORMANCE
For the period of December 1, 2009, through November 30, 2010, as provided by Bernard W. Kiernan, Jr., Senior Portfolio Manager
Fund and Market Performance Overview
For the 12-month period ended November 30, 2010, GeneralTreasury Prime Money Market Fund’s Class A shares produced a yield of 0.00%, and its Class B shares produced a yield of 0.00%. Taking into account the effects of compounding, the fund’s Class A and Class B shares produced effective yields of 0.00% and 0.00%, respectively.1
The Fund’s Investment Approach
The fund seeks as high a level of current income as is consistent with the preservation of capital and the maintenance of liquidity.To pursue this goal, the fund normally invests substantially all of its assets in U.S. Treasury securities.
Monetary Policy Unchanged in Muted Recovery
The reporting period began in the midst of an economic recovery fueled, in part, by an overnight federal funds rate that has remained unchanged since December 2008 in a historically low range between 0% and 0.25%. Indeed, the economic recovery appeared to remain on track, as reflected by an annualized U.S. GDP growth rate of 5.0% during the fourth quarter of 2009.
While U.S. economic growth moderated in the first quarter of 2010 to a relatively mild 3.7% annualized rate, it was encouraging news nonetheless for investors eager to see an end to recession. In fact, job creation began to improve during the first quarter of the year after many months of losses.
Investors were further cheered in May, when 431,000 additional new jobs were created, although many were temporary government workers hired for the 2010 Census. However, the economic outlook soon took a turn for the worse when a resurgent sovereign debt crisis in
DISCUSSION OF FUND PERFORMANCE (continued)
Europe and a catastrophic oil spill in the Gulf of Mexico rattled investors. Indeed, U.S. industrial production moderated in June, and private-sector job growth proved more anemic than many analysts expected. U.S. GDP declined to an annualized 1.7% rate during the second quarter, appearing to confirm renewed economic concerns.
In July, industrial production posted a relatively robust 1.0% gain after June’s mild setback, and the manufacturing and service sectors of the U.S. economy expanded for the twelfth and seventh consecutive months, respectively. Still, total nonfarm payroll employment fell by 131,000 jobs during the month, reflecting the end of temporary census hiring.The housing market remained moribund, as sales of new homes fell to a 47-year low in August, while purchases of existing homes plummeted to a 15-year low.
In August, the unemployment rate rose to 9.6%, as only 67,000 jobs were created in the private sector. In September, the National Bureau of Economic Research announced that the recession had ended in June 2009, but the ensuing recovery has been the slowest since World War II. Economic data released in September appeared to support the consensus view that economic recovery, while intact, remained uncertain; manufacturing activity continued to increase, but employment and housing data showed few, if any, signs of improvement.The U.S. Department of Commerce later announced that U.S. GDP grew at a 2.6% annualized rate in the third quarter of 2010.
In response to the sluggish rebound, the Federal Reserve Board announced in September that it would embark on a second round of quantitative easing of monetary policy by purchasing $600 billion of U.S. Treasury securities.This move, implemented in November, was designed to fight deflationary forces and encourage lending by injecting more cash into the financial system. Indeed, October brought better economic news. The private sector added 159,000 jobs, with much of the gain coming from the services sector. However, housing markets continued to disappoint when issues regarding the banking industry’s foreclosure process further clouded an already murky outlook for home values.
4
Economic data remained encouraging in November, except for one critical measure: the unemployment rate climbed to 9.8% after the economy created only 39,000 jobs during the month, below most analysts’ expectations.Yet, the manufacturing and service sectors continued to improve, and even the housing market posted better sales data. In addition, the national midterm elections helped bring greater clarity to economic and tax policies.
An Unwavering Focus on Quality
The low federal funds rate kept yields of U.S.Treasury bills near zero percent, and with narrow yield differences along the market’s maturity spectrum, it continued to make little sense to incur the additional credit and interest-rate risks that longer-dated securities typically entail.Therefore, we maintained the fund’s weighted average maturity in a range that was roughly in line with industry averages.
The economic recovery appears to be gathering momentum, and we are hopeful that money market yields will respond to a more constructive market environment in 2011. In the meantime, as we have for some time, we intend to maintain the fund’s focus on liquidity.
December 15, 2010
| |
| | An investment in the fund is not insured or guaranteed by the FDIC or any other government |
| | agency.Although the fund seeks to preserve the value of your investment at $1.00 per share, it is |
| | possible to lose money by investing in the fund. |
| 1 | Effective yield is based upon dividends declared daily and reinvested monthly. Past performance is |
| | no guarantee of future results.Yields fluctuate.Yields provided for the fund’s Class A and Class B |
| | shares reflect the absorption of certain fund expenses by The Dreyfus Corporation pursuant to an |
| | undertaking in effect that may be extended, terminated or modified at any time. Had these |
| | expenses not been absorbed, fund yields would have been lower. |
UNDERSTANDING YOUR FUND’S EXPENSES (Unaudited)
As a mutual fund investor, you pay ongoing expenses, such as management fees and other expenses. Using the information below, you can estimate how these expenses affect your investment and compare them with the expenses of other funds.You also may pay one-time transaction expenses, including sales charges (loads) and redemption fees, which are not shown in this section and would have resulted in higher total expenses. For more information, see your fund’s prospectus or talk to your financial adviser.
Review your fund’s expenses
The table below shows the expenses you would have paid on a $1,000 investment in General Treasury Prime Money Market Fund from June 1, 2010 to November 30, 2010. It also shows how much a $1,000 investment would be worth at the close of the period, assuming actual returns and expenses.
Expenses and Value of a $1,000 Investment
assuming actual returns for the six months ended November 30, 2010
| | | | |
| | | Class A | | Class B |
| Expenses paid per $1,000† | $ | 0.75 | $ | 0.75 |
| Ending value (after expenses) | $ | 1,000.00 | $ | 1,000.00 |
|
| COMPARING YOUR FUND’S EXPENSES |
| WITH THOSE OF OTHER FUNDS (Unaudited) |
Using the SEC’s method to compare expenses
The Securities and Exchange Commission (SEC) has established guidelines to help investors assess fund expenses. Per these guidelines, the table below shows your fund’s expenses based on a $1,000 investment, assuming a hypothetical 5% annualized return. You can use this information to compare the ongoing expenses (but not transaction expenses or total cost) of investing in the fund with those of other funds.All mutual fund shareholder reports will provide this information to help you make this comparison. Please note that you cannot use this information to estimate your actual ending account balance and expenses paid during the period.
Expenses and Value of a $1,000 Investment
assuming a hypothetical 5% annualized return for the six months ended November 30, 2010
| | | | |
| | | Class A | | Class B |
| Expenses paid per $1,000† | $ | 0.76 | $ | 0.76 |
| Ending value (after expenses) | $ | 1,024.32 | $ | 1,024.32 |
|
| † Expenses are equal to the fund’s annualized expense ratio of .15% for Class A and .15% for Class B, multiplied |
| by the average account value over the period, multiplied by 183/365 (to reflect the one-half year period). |
6
STATEMENT OF INVESTMENTS
November 30, 2010
| | | | | |
| | Annualized | | | | |
| | Yield on | | | | |
| | Date of | Principal | | | |
| U.S. Treasury Bills—77.5% | Purchase (%) | Amount ($) | | Value ($) | |
| 12/2/10 | 0.15 | 109,000,000 | | 108,999,544 | |
| 12/16/10 | 0.11 | 156,000,000 | | 155,992,758 | |
| 12/23/10 | 0.12 | 102,000,000 | | 101,992,483 | |
| 12/30/10 | 0.14 | 4,000,000 | | 3,999,549 | |
| 1/6/11 | 0.11 | 195,391,000 | | 195,369,278 | |
| 1/13/11 | 0.20 | 100,000,000 | | 99,976,708 | |
| 1/20/11 | 0.14 | 54,000,000 | | 53,989,695 | |
| 1/27/11 | 0.17 | 103,000,000 | | 102,972,231 | |
| 2/10/11 | 0.13 | 58,000,000 | | 57,985,208 | |
| 2/17/11 | 0.15 | 82,000,000 | | 81,973,068 | |
| 4/21/11 | 0.17 | 100,000,000 | | 99,933,417 | |
| Total U.S. Treasury Bills | | | | | |
| (cost $1,063,183,939) | | | | 1,063,183,939 | |
| |
| U.S. Treasury Notes—29.2% | | | | | |
| 12/15/10 | 0.14 | 237,000,000 | | 237,383,439 | |
| 12/31/10 | 0.16 | 50,000,000 | | 50,028,971 | |
| 5/2/11 | 0.21 | 60,000,000 | | 61,166,226 | |
| 6/30/11 | 0.14 | 50,000,000 | | 51,427,325 | |
| Total U.S. Treasury Notes | | | | | |
| (cost $400,005,961) | | | | 400,005,961 | |
| Total Investments (cost $1,463,189,900) | | 106.7 | % | 1,463,189,900 | |
| Liabilities, Less Cash and Receivables | | (6.7 | %) | (92,210,961 | ) |
| Net Assets | | 100.0 | % | 1,370,978,939 | |
| | | |
| Portfolio Summary (Unaudited)† | | |
| | Value (%) | | Value (%) |
| U.S. Treasury Bills | 77.5 | U.S. Treasury Notes | 29.2 |
| | | | 106.7 |
| † Based on net assets. | | | |
| See notes to financial statements. | | | |
|
| STATEMENT OF ASSETS AND LIABILITIES |
| November 30, 2010 |
| | |
| | Cost | Value |
| Assets ($): | | |
| Investments in securities—See Statement of Investments | 1,463,189,900 | 1,463,189,900 |
| Cash | | 5,907,423 |
| Interest receivable | | 6,284,262 |
| Prepaid expenses | | 144,480 |
| | | 1,475,526,065 |
| Liabilities ($): | | |
| Due to The Dreyfus Corporation and affiliates—Note 2(c) | | 104,920 |
| Payable for investment securities purchased | | 99,978,805 |
| Payable for shares of Common Stock redeemed | | 4,359,346 |
| Accrued expenses | | 104,055 |
| | | 104,547,126 |
| Net Assets ($) | | 1,370,978,939 |
| Composition of Net Assets ($): | | |
| Paid-in capital | | 1,370,969,693 |
| Accumulated net realized gain (loss) on investments | | 9,246 |
| Net Assets ($) | | 1,370,978,939 |
| |
| |
| Net Asset Value Per Share | | |
| | Class A | Class B |
| Net Assets ($) | 48,945,028 | 1,322,033,911 |
| Shares Outstanding | 48,944,838 | 1,322,024,855 |
| Net Asset Value Per Share ($) | 1.00 | 1.00 |
| |
| See notes to financial statements. | | |
8
STATEMENT OF OPERATIONS
Year Ended November 30, 2010
| | |
| Investment Income ($): | | |
| Interest Income | 2,070,425 | |
| Expenses: | | |
| Management fee—Note 2(a) | 7,200,678 | |
| Shareholder servicing costs—Notes 1 and 2(c) | 4,233,466 | |
| Distribution, service and prospectus fees—Note 2(b) | 2,909,124 | |
| Shareholders’ reports | 108,230 | |
| Registration fees | 101,748 | |
| Custodian fees—Note 2(c) | 92,213 | |
| Directors’ fees and expenses—Note 2(d) | 69,566 | |
| Professional fees | 36,283 | |
| Miscellaneous | 44,008 | |
| Total Expenses | 14,795,316 | |
| Less—reduction in expenses due to undertaking—Note 2(a) | (12,629,327 | ) |
| Less—reduction in shareholder servicing costs | | |
| due to undertaking—Note 2(c) | (95,100 | ) |
| Less—reduction in fees due to earnings credits—Note 2(c) | (924 | ) |
| Net Expenses | 2,069,965 | |
| Investment Income—Net | 460 | |
| Net Realized Gain (Loss) on Investments—Note 1(b) ($) | 9,246 | |
| Net Increase in Net Assets Resulting from Operations | 9,706 | |
| |
| See notes to financial statements. | | |
STATEMENT OF CHANGES IN NET ASSETS
| | | | |
| | Year Ended November 30, | |
| | 2010 | | 2009 | |
| Operations ($): | | | | |
| Investment income—net | 460 | | 23,443 | |
| Net realized gain (loss) on investments | 9,246 | | 39,331 | |
| Net Increase (Decrease) in Net Assets | | | | |
| Resulting from Operations | 9,706 | | 62,774 | |
| Dividends to Shareholders from ($): | | | | |
| Investment income—net: | | | | |
| Class A Shares | (458 | ) | (1,933 | ) |
| Class B Shares | (9,508 | ) | (59,767 | ) |
| Total Dividends | (9,966 | ) | (61,700 | ) |
| Capital Stock Transactions ($1.00 per share): | | | | |
| Net proceeds from shares sold: | | | | |
| Class A Shares | 151,366,043 | | 178,975,908 | |
| Class B Shares | 3,374,998,106 | | 3,987,840,547 | |
| Dividends reinvested: | | | | |
| Class A Shares | 458 | | 1,672 | |
| Class B Shares | 9,482 | | 59,024 | |
| Cost of shares redeemed: | | | | |
| Class A Shares | (154,577,078 | ) | (205,114,472 | ) |
| Class B Shares | (3,605,927,399 | ) | (4,586,296,292 | ) |
| Increase (Decrease) in Net Assets | | | | |
| from Capital Stock Transactions | (234,130,388 | ) | (624,533,613 | ) |
| Total Increase (Decrease) in Net Assets | (234,130,648 | ) | (624,532,539 | ) |
| Net Assets ($): | | | | |
| Beginning of Period | 1,605,109,587 | | 2,229,642,126 | |
| End of Period | 1,370,978,939 | | 1,605,109,587 | |
| |
| See notes to financial statements. | | | | |
10
FINANCIAL HIGHLIGHTS
The following tables describe the performance for each share class for the fiscal periods indicated. All information reflects financial results for a single fund share. Total return shows how much your investment in the fund would have increased (or decreased) during each period, assuming you had reinvested all dividends and distributions.These figures have been derived from the fund’s financial statements.
| | | | | | | | | | |
| | | | Year Ended November 30, | | | |
| Class A Shares | 2010 | | 2009 | | 2008 | | 2007 | | 2006 | |
| Per Share Data ($): | | | | | | | | | | |
| Net asset value, beginning of period | 1.00 | | 1.00 | | 1.00 | | 1.00 | | 1.00 | |
| Investment Operations: | | | | | | | | | | |
| Investment income—net | .000 | a | .000 | a | .013 | | .039 | | .038 | |
| Distributions: | | | | | | | | | | |
| Dividends from investment income—net | (.000 | )a | (.000 | )a | (.013 | ) | (.039 | ) | (.038 | ) |
| Net asset value, end of period | 1.00 | | 1.00 | | 1.00 | | 1.00 | | 1.00 | |
| Total Return (%) | .00 | b | .00 | b | 1.28 | | 4.01 | | 3.84 | |
| Ratios/Supplemental Data (%): | | | | | | | | | | |
| Ratio of total expenses | | | | | | | | | | |
| to average net assets | .75 | | .78 | | .79 | | 1.09 | | 1.05 | |
| Ratio of net expenses | | | | | | | | | | |
| to average net assets | .14 | | .36 | | .77 | | .80 | | .80 | |
| Ratio of net investment income | | | | | | | | | | |
| to average net assets | .00 | b | .00 | b | .55 | | 3.88 | | 3.69 | |
| Net Assets, end of period ($ x 1,000) | 48,945 | | 52,156 | | 78,293 | | 1,020 | | 2,244 | |
| |
| a | Amount represents less than $.001 per share. |
| b | Amount represents less than .01%. |
See notes to financial statements.
FINANCIAL HIGHLIGHTS (continued)
| | | | | | | | | | |
| | | | Year Ended November 30, | | | |
| Class B Shares | 2010 | | 2009 | | 2008 | | 2007 | | 2006 | |
| Per Share Data ($): | | | | | | | | | | |
| Net asset value, beginning of period | 1.00 | | 1.00 | | 1.00 | | 1.00 | | 1.00 | |
| Investment Operations: | | | | | | | | | | |
| Investment income—net | .000 | a | .000 | a | .010 | | .037 | | .036 | |
| Distributions: | | | | | | | | | | |
| Dividends from | | | | | | | | | | |
| investment income—net | (.000 | )a | (.000 | )a | (.010 | ) | (.037 | ) | (.036 | ) |
| Net asset value, end of period | 1.00 | | 1.00 | | 1.00 | | 1.00 | | 1.00 | |
| Total Return (%) | .00 | b | .00 | b | 1.05 | | 3.80 | | 3.64 | |
| Ratios/Supplemental Data (%): | | | | | | | | | | |
| Ratio of total expenses | | | | | | | | | | |
| to average net assets | 1.04 | | 1.05 | | 1.07 | | 1.20 | | 1.20 | |
| Ratio of net expenses | | | | | | | | | | |
| to average net assets | .14 | | .33 | | .96 | | 1.00 | | .99 | |
| Ratio of net investment income | | | | | | | | | | |
| to average net assets | .00 | b | .00 | b | .52 | | 3.60 | | 3.64 | |
| Net Assets, end of period | | | | | | | | | | |
| ($ x 1,000) | 1,322,034 | | 1,552,954 | | 2,151,350 | | 229,278 | | 73,282 | |
| |
| a | Amount represents less than $.001 per share. |
| b | Amount represents less than .01%. |
See notes to financial statements.
12
NOTES TO FINANCIAL STATEMENTS
NOTE 1—Significant Accounting Policies:
General Treasury Prime Money Market Fund (the “fund”) is a separate diversified series of General Government Securities Money Market Funds, Inc. (the “Company”), which is registered under the Investment Company Act of 1940, as amended (the “Act”), as an open-end management investment company and operates as a series company, currently offering two series, including the fund.The fund’s investment objective is to seek as high a level of current income as is consistent with the preservation of capital and the maintenance of liquidity.The Dreyfus Corporation (the “Manager” or “Dreyfus”), a wholly-owned subsidiary of The Bank of New York Mellon Corporation (“BNY Mellon”), serves as the fund’s investment adviser.
MBSC Securities Corporation (the “Distributor”), a wholly-owned subsidiary of the Manager, is the distributor of the fund’s shares. The fund is authorized to issue 4 billion shares of $.001 par value Common Stock.The fund currently offers two classes of shares: Class A (1 billion shares authorized) and Class B (3 billion shares authorized). Class A and Class B shares are identical except for the services offered to and the expenses borne by each class, the allocation of certain transfer agency costs and certain voting rights. Class A shares are subject to a Service Plan adopted pursuant to Rule 12b-1 under the Act. Class B shares are subject to a Distribution Plan adopted pursuant to Rule 12b-1 under the Act and Class A and Class B shares are subject to a Shareholder Services Plan. In addition, Class B shares are charged directly for sub-accounting services provided by Service Agents (a securities d ealer, financial institution or other industry professional) at an annual rate of .05% of the value of the average daily net assets of Class B shares. During the period ended November 30, 2010, sub-accounting service fees amounted to $695,191 for Class B shares and are included in Shareholder servicing costs in the Statement of Operations. Income, expenses (other than expenses attributable to a specific class), and realized and unrealized gains or losses on investments are allocated to each class of shares based on its relative net assets.
NOTES TO FINANCIAL STATEMENTS (continued)
It is the fund’s policy to maintain a continuous net asset value per share of $1.00; the fund has adopted certain investment, portfolio valuation and dividend and distribution policies to enable it to do so.There is no assurance, however, that the fund will be able to maintain a stable net asset value per share of $1.00.
The Company accounts separately for the assets, liabilities and operations of each series. Expenses directly attributable to each series are charged to that series’ operations; expenses which are applicable to all series are allocated among them on a pro rata basis.
The Financial Accounting Standards Board (“FASB”) Accounting Standards Codification (“ASC”) is the exclusive reference of authoritative U.S. generally accepted accounting principles (“GAAP”) recognized by the FASB to be applied by nongovernmental entities. Rules and interpretive releases of the Securities and Exchange Commission (“SEC”) under authority of federal laws are also sources of authoritative GAAP for SEC registrants. The fund’s financial statements are prepared in accordance with GAAP, which may require the use of management estimates and assumptions.Actual results could differ from those estimates.
The Company enters into contracts that contain a variety of indemnifications.The fund’s maximum exposure under these arrangements is unknown.The fund does not anticipate recognizing any loss related to these arrangements.
(a) Portfolio valuation: Investments in securities are valued at amortized cost in accordance with Rule 2a-7 of the Act, which has been determined by the Board of Directors to represent the fair value of the fund’s investments.
The fair value of a financial instrument is the amount that would be received to sell an asset or paid to transfer a liability in an orderly transaction between market participants at the measurement date (i.e. the exit price). GAAP establishes a fair value hierarchy that prioritizes the inputs of valuation techniques used to measure fair value.This hierarchy gives the highest priority to unadjusted quoted prices in active markets for identical assets or liabilities (Level 1 measurements) and the lowest priority to unobservable inputs (Level 3 measurements).
14
Additionally, GAAP provides guidance on determining whether the volume and activity in a market has decreased significantly and whether such a decrease in activity results in transactions that are not orderly. GAAP requires enhanced disclosures around valuation inputs and techniques used during annual and interim periods.
Various inputs are used in determining the value of the fund’s investments relating to fair value measurements.These inputs are summarized in the three broad levels listed below:
Level 1—unadjusted quoted prices in active markets for identical investments.
Level 2—other significant observable inputs (including quoted prices for similar investments, interest rates, prepayment speeds, credit risk, etc.).
Level 3—significant unobservable inputs (including the fund’s own assumptions in determining the fair value of investments).
The inputs or methodology used for valuing securities are not necessarily an indication of the risk associated with investing in those securities. For example, money market securities are valued using amortized cost, in accordance with rules under the Act. Generally, amortized cost approximates the current fair value of a security, but since the value is not obtained from a quoted price in an active market, such securities are reflected as Level 2.
The following is a summary of the inputs used as of November 30, 2010 in valuing the fund’s investments:
| |
| | Short-Term |
| Valuation Inputs | Investments ($)† |
| Level 1—Unadjusted Quoted Prices | — |
| Level 2—Other Significant Observable Inputs | 1,463,189,900 |
| Level 3—Significant Unobservable Inputs | — |
| Total | 1,463,189,900 |
| |
| † | See Statement of Investments for additional detailed categorizations. |
NOTES TO FINANCIAL STATEMENTS (continued)
(b) Securities transactions and investment income: Securities transactions are recorded on a trade date basis. Interest income, adjusted for accretion of discount and amortization of premium on investments, is earned from settlement date and is recognized on the accrual basis. Realized gains and losses from securities transactions are recorded on the identified cost basis. Cost of investments represents amortized cost.
(c) Dividends to shareholders: It is the policy of the fund to declare dividends from investment income-net on each business day. Such dividends are paid monthly. Dividends from net realized capital gains, if any, are normally declared and paid annually, but the fund may make distributions on a more frequent basis to comply with the distribution requirements of the Internal Revenue Code of 1986, as amended (the “Code”). To the extent that net realized capital gains can be offset by capital loss carryovers, it is the policy of the fund not to distribute such gains.
(d) Federal income taxes: It is the policy of the fund to continue to qualify as a regulated investment company, if such qualification is in the best interests of its shareholders, by complying with the applicable provisions of the Code, and to make distributions of taxable income sufficient to relieve it from substantially all federal income and excise taxes.
As of and during the period ended November 30, 2010, the fund did not have any liabilities for any uncertain tax positions.The fund recognizes interest and penalties, if any, related to uncertain tax positions as income tax expense in the Statement of Operations. During the period, the fund did not incur any interest or penalties.
Each of the tax years in the four-year period ended November 30, 2010 remains subject to examination by the Internal Revenue Service and state taxing authorities.
At November 30, 2010, the components of accumulated earnings on a tax basis were substantially the same as for financial reporting purposes.
The tax character of distributions paid to shareholders during the fiscal periods ended November 30, 2010 and November 30, 2009 were all ordinary income.
16
During the period ended November 30, 2010, as a result of permanent book to tax differences primarily due to dividend reclassification, the fund increased accumulated undistributed investment income-net by $9,506 and decreased accumulated net realized gain (loss) on investments by the same amount. Net assets and net asset value per share were not affected by this reclassification.
At November 30, 2010, the cost of investments for federal income tax purposes was substantially the same as the cost for financial reporting purposes (See the Statement of Investments).
NOTE 2—Management Fee and Other Transactions With Affiliates:
(a) Pursuant to a management agreement (“Agreement”) with the Manager, the management fee is computed at the annual rate of .50% of the value of the fund’s average daily net assets and is payable monthly. The Agreement provides that if in any full fiscal year the aggregate expenses of the fund, exclusive of taxes, brokerage fees, interest on borrowings and extraordinary expenses, exceed 1 1 / 2% of the value of the fund’s average daily net assets, the fund may deduct from payments to be made to the Manager, or the Manager will bear such excess expense. During the period ended November 30, 2010, there was no expense reimbursement pursua nt to the Agreement.
The Manager has undertaken to reimburse expenses in the event that current yields drop below a certain level. Such expense limitations may fluctuate daily, are voluntary and not contractual and may be terminated at any time. The reduction in expenses, pursuant to the undertaking, amounted to $303,490 for Class A and $12,325,837 for Class B shares during the period ended November 30, 2010.
(b) Under the Service Plan with respect to Class A (the “Plan”), adopted pursuant to Rule 12b-1 under the Act, Class A shares bear directly the cost of preparing, printing and distributing prospectuses and statements of additional information and implementing and oper-
NOTES TO FINANCIAL STATEMENTS (continued)
ating the Plan, such aggregate amount not to exceed in any full fiscal year of the fund, the greater of $100,000 or .005% of the average daily net assets of Class A. In addition, Class A shares pay the Distributor for distributing their shares, servicing shareholder accounts (“Servicing”) and advertising and marketing relating to Class A shares at an aggregate annual rate of .20% of the value of the average daily net assets of Class A.The Distributor may pay one or more Service Agents a fee in respect of Class A shares owned by shareholders with whom the Service Agent has a Servicing relationship or for whom the Service Agent is the dealer or holder of record.The schedule of such fees and the basis upon which such fees will be paid shall be determined from time to time by the Distributor. If a holder of Class A shares ceases to be a client of a Service Agent, but continues to hold Class A shares, the Dis tributor will be permitted to act as a Service Agent in respect of such fund shareholders and receive payments under the Plan for Servicing.The fees payable for Servicing are payable without regard to actual expenses incurred. During the period ended November 30, 2010, Class A shares were charged $100,405 pursuant to the Plan.
Under the Distribution Plan with respect to Class B (“Class B Distribution Plan”) adopted pursuant to Rule 12b-1 under the Act, Class B shares bear directly the costs of preparing, printing and distributing prospectuses and statements of additional information and of implementing and operating the Class B Distribution Plan, such aggregate amount not to exceed in any fiscal year of the fund the greater of $100,000 or .005% of the average daily net assets of Class B shares. In addition, Class B shares reimburse the Distributor for payments made to third parties for distributing Class B shares at an annual rate not to exceed .20% of the value of the average daily net assets of Class B. During the period ended November 30, 2010, Class B shares were charged $2,808,719 pursuant to the Class B Distribution Plan.
(c) Under the Shareholder Services Plan with respect to Class A (“Class A Shareholder Services Plan”),Class A shares reimburse the Distributor an amount not to exceed an annual rate of .25% of the value of the average daily net assets of Class A shares for certain allocated expenses
18
of providing personal services and/or maintaining shareholder accounts.The services provided may include personal services relating to shareholder accounts, such as answering shareholder inquiries regarding Class A shares and providing reports and other information, and services related to the maintenance of shareholder accounts. The Manager had undertaken from December 1, 2009 through November 30, 2010, to reduce the expenses of Class A shares if the aggregate expenses of Class A shares, exclusive of taxes, brokerage fees, interest on borrowings and extraordinary expenses, exceeded .80% of the value of the average daily net assets of Class A shares. Such expense limitations are voluntary, temporary and may be terminated at any time. During the period ended November 30, 2010, Class A shares were charged $4,296 pursuant to the Class A Shareholder Services Plan.
Under the Shareholder Services Plan with respect to Class B (“Class B Shareholder Services Plan”), Class B shares pay the Distributor at an annual rate of .25% of the value of the average daily net assets of Class B shares for servicing shareholder accounts.The services provided may include personal services relating to shareholder accounts, such as answering shareholder inquiries regarding Class B shares and providing reports and other information, and services related to the maintenance of shareholder accounts. The Distributor may make payments to Service Agents in respect of these services.The Distributor determines the amounts to be paid to Service Agents.
The Manager had undertaken from December 1, 2009 through November 30, 2010, to reduce the expenses of Class B shares, if the aggregate expenses of Class B shares, exclusive of taxes, brokerage fees, interest on borrowings and extraordinary expenses, exceeded an annual rate of 1.03% of the value of the average daily net assets of Class B shares. Such expense limitations are voluntary, temporary and may be terminated at any time. During the period ended November 30, 2010, Class B shares were charged $3,475,953 pursuant to the Class B Shareholder Services Plan, of which $95,100 was reimbursed by the Manager.
NOTES TO FINANCIAL STATEMENTS (continued)
The fund compensates Dreyfus Transfer, Inc., a wholly-owned subsidiary of the Manager, under a transfer agency agreement for providing personnel and facilities to perform transfer agency services for the fund. During the period ended November 30, 2010, the fund was charged $24,131 pursuant to the transfer agency agreement, which is included in Shareholder servicing costs in the Statement of Operations.
The fund has arrangements with the custodian and cash management bank whereby the fund may receive earnings credits when positive cash balances are maintained, which are used to offset custody and cash management fees. For financial reporting purposes, the fund includes net earnings credits as an expense offset in the Statement of Operations.
The fund compensates The Bank of New York Mellon, a subsidiary of BNY Mellon and an affiliate of Dreyfus, under a cash management agreement for performing cash management services related to fund subscriptions and redemptions. During the period ended November 30, 2010, the fund was charged $4,229 pursuant to the cash management agreement, which is included in Shareholder servicing costs in the Statement of Operations. These fees were partially offset by earnings credits of $924.
The fund also compensates The Bank of New York Mellon under a custody agreement for providing custodial services for the fund. During the period ended November 30, 2010, the fund was charged $92,213 pursuant to the custody agreement.
During the period ended November 30, 2010, the fund was charged $6,399 for services performed by the Chief Compliance Officer.
20
The components of “Due to The Dreyfus Corporation and affiliates” in the Statement of Assets and Liabilities consist of: management fees $525,223, Rule 12b-1 distribution plan fees $226,252, shareholder services plan fees $327,419, custodian fees $29,762, chief compliance officer fees $1,152 and transfer agency per account fees $5,100, which are offset against an expense reimbursement currently in effect in the amount of $1,009,988.
(d) Each Board member also serves as a Board member of other funds within the Dreyfus complex. Annual retainer fees and attendance fees are allocated to each fund based on net assets.
|
| REPORT OF INDEPENDENT REGISTERED |
| PUBLIC ACCOUNTING FIRM |
Shareholders and Board of Directors General Treasury Prime Money Market Fund
We have audited the accompanying statement of assets and liabilities, including the statement of investments, of General Treasury Prime Money Market Fund (one of the series comprising General Government Securities Money Market Funds, Inc.) as of November 30, 2010, and the related statement of operations for the year then ended, the statement of changes in net assets for each of the two years in the period then ended, and financial highlights for each of the years indicated therein. These financial statements and financial highlights are the responsibility of the Fund’s management. Our responsibility is to express an opinion on these financial statements and financial highlights based on our audits.
We conducted our audits in accordance with the standards of the Public Company Accounting Oversight Board (United States).Those standards require that we plan and perform the audit to obtain reasonable assurance about whether the financial statements and financial highlights are free of material misstatement.We were not engaged to perform an audit of the Fund’s internal control over financial reporting. Our audits included consideration of internal control over financial reporting as a basis for designing audit procedures that are appropriate in the circumstances, but not for the purpose of expressing an opinion on the effectiveness of the Fund’s internal control over financial reporting. Accordingly, we express no such opinion.An audit also includes examining, on a test basis, evidence supporting the amounts and disclosures in the financial statements and financial highlights, assessing the accounting p rinciples used and significant estimates made by management, and evaluating the overall financial statement presentation. Our procedures included confirmation of securities owned as of November 30, 2010 by correspondence with the custodian and others. We believe that our audits provide a reasonable basis for our opinion.
In our opinion, the financial statements and financial highlights referred to above present fairly, in all material respects, the financial position of General Treasury Prime Money Market Fund at November 30, 2010, the results of its operations for the year then ended, the changes in its net assets for each of the two years in the period then ended, and the financial highlights for each of the indicated years, in conformity with U.S. generally accepted accounting principles.
New York, New York
January 25, 2011
22
IMPORTANT TAX INFORMATION (Unaudited)
For federal tax purposes the fund hereby designates 100% of ordinary income dividends paid during the fiscal year ended November 30, 2010 as qualifying interest related dividends. For state individual income tax purposes, the fund hereby designates 100% of the ordinary income dividends paid during its fiscal year ended November 30, 2010 as attributable to interest income from direct obligations of the United States. Such dividends are currently exempt from taxation for individual income tax purposes in most states, including NewYork, California and the District of Columbia.
PROXY RESULTS (Unaudited)
GeneralTreasury Prime Money Market Fund held a special meeting of shareholders on June 9, 2010.The proposals considered at the meeting, and the results, are as follows:
| | | | | |
| | | | | Shares | |
| | | | For | Against | Abstain |
| 1 | . | To approve amending the fund’s | | | |
| | | policy regarding borrowing | 620,187,069 | 54,552,980 | 26,643,180 |
| 2 | . | To approve amending the fund’s | | | |
| | | policy regarding lending | 612,624,089 | 55,222,947 | 33,536,192 |
24
|
| INFORMATION ABOUT THE REVIEW AND APPROVAL |
| OF THE FUND’S MANAGEMENT AGREEMENT (Unaudited) |
At a meeting of the Board of Trustees held on July 20, 2010, the Board considered the re-approval for an annual period of the fund’s Management Agreement, pursuant to which the Manager provides the fund with investment advisory and administrative services. The Board members, none of whom are “interested persons” (as defined in the Investment Company Act of 1940, as amended) of the fund, were assisted in their review by independent legal counsel and met with counsel in executive session separate from representatives of the Manager.
Analysis of Nature, Extent and Quality of Services Provided to the Fund. The Board members considered information previously provided to them in a presentation from representatives of the Manager regarding services provided to the fund and other funds in the Dreyfus fund complex, and representatives of the Manager confirmed that there had been no material changes in this information.The Board also discussed the nature, extent and quality of the services provided to the fund by the Manager pursuant to the Management Agreement. The Manager’s representatives reviewed the fund’s distribution of accounts and the relationships the Manager has with various intermediaries and the different needs of each.The Board noted that the fund’s shares are sold primarily through institutional channels and often serve as a “sweep veh icle” for use by third party broker-dealers for their cus-tomers.The Manager’s representatives noted the distribution channels for the fund as well as the diversity of distribution among the funds in the Dreyfus fund complex, and the Manager’s corresponding need for broad, deep, and diverse resources to be able to provide ongoing shareholder services in each distribution channel, including those of the fund. The Manager provided the number of shareholder accounts in the fund, as well as the fund’s asset size.
The Board members also considered the Manager’s research and portfolio management capabilities and that the Manager also provides oversight of day-to-day fund operations, including fund accounting and administration and assistance in meeting legal and regulatory requirements.The Board members also considered the Manager’s extensive administrative, accounting and compliance infrastructure.
|
| INFORMATION ABOUT THE REVIEW AND APPROVAL OF THE |
| FUND’S MANAGEMENT AGREEMENT (Unaudited) (continued) |
Comparative Analysis of the Fund’s Performance, Management Fee and Expense Ratio.The Board members reviewed the fund’s performance and comparisons to a group of comparable funds (the “Performance Group”) and to a broader group of funds (the “Performance Universe”), selected and provided by Lipper, Inc., an independent provider of investment company data.The Board was provided with a description of the methodology Lipper used to select the Performance Group and Performance Universe, as well as the Expense Group and Expense Universe (discussed below).The Board members discussed the results of the comparisons for various periods ended May 31, 2010 and noted that the fund’s total return performance was below the Performance Group and Performance Universe medians for each reported time period.The Board m embers noted for each reported period the fund’s proximity to the medians, particularly the Performance Group medians.The Board members discussed with representatives of the Manager the reasons for the fund’s underperformance compared to the Performance Group and Performance Universe medians for the applicable periods, and the Manager’s efforts to improve performance. Representatives of the Manager reviewed with the Board members the fund’s operational history, investment policies, client base and asset size.The Board members also received a presentation from the fund’s primary portfolio manager during which he discussed the fund’s investment strategy and the factors that affected performance.
The Board members also discussed the fund’s contractual and actual management fee and total expense ratio as compared to a comparable group of funds (the “Expense Group”) that was composed of the same funds included in the Performance Group and a broader group of funds (the “Expense Universe”), each selected and provided by Lipper. The Board noted that the fund’s contractual management fee was above the Expense Group median and that the fund’s actual management fee and total expense ratio were below the Expense Group and Expense Universe medians. The Board members also discussed the Manager’s current undertaking to waive fees and/or reimburse fund expenses.
26
Representatives of the Manager reviewed with the Board members the fees paid to the Manager or its affiliates by mutual funds managed by the Manager or its affiliates with similar investment objectives, policies and strategies, and included in the same Lipper category, as the fund (the “Similar Funds”).The Board members considered the relevance of the fee information provided for the Similar Funds to evaluate the appropriateness and reasonableness of the fund’s management fee. Representatives of the Manager informed the Board members that there were no separate accounts or wrap fee accounts managed by the Manager or its affiliates with similar investment objectives, policies and strategies as the fund.
Analysis of Profitability and Economies of Scale.The Manager’s representatives reviewed the dollar amount of expenses allocated and profit received by the Manager and the method used to determine such expenses and profit. The Board previously had been provided with information prepared by an independent consulting firm regarding the Manager’s approach to allocating costs to, and determining the profitability of, individual funds and the entire Dreyfus mutual fund complex.The Board members also had been informed that the methodology also had been reviewed by an independent registered public accounting firm which, like the consultant, found the methodology to be reasonable.The consulting firm also analyzed where any economies of scale might emerge in connection with the management of a fund.The Board members evaluated the pro fitability analysis in light of the relevant circumstances for the fund and the extent to which economies of scale would be realized if the fund grows and whether fee levels reflect these economies of scale for the benefit of fund shareholders.The Board members also considered potential benefits to the Manager and its affiliates from acting as investment adviser to the fund and noted that there were no soft dollar arrangements with respect to trading the fund’s portfolio.
It was noted that the Board members should consider the Manager’s profitability with respect to the fund as part of their evaluation of whether the fees under the Management Agreement bear a reasonable
|
| INFORMATION ABOUT THE REVIEW AND APPROVAL OF THE |
| FUND’S MANAGEMENT AGREEMENT (Unaudited) (continued) |
relationship to the mix of services provided by the Manager, including the nature, extent and quality of such services and that a discussion of economies of scale is predicated on increasing assets and that, if a fund’s assets had been decreasing, the possibility that the Manager may have realized any economies of scale would be less. It was also noted that the profitability percentage for managing the fund was within the range determined by appropriate court cases to be reasonable given the services rendered and generally superior service levels provided by the Manager.The Board also noted the fee waiver and expense reimbursement arrangement and its effect on the Manager’s profitability.
At the conclusion of these discussions, the Board agreed that it had been furnished with sufficient information to make an informed business decision with respect to continuation of the fund’s Management Agreement. Based on the discussions and considerations as described above, the Board made the following conclusions and determinations.
- The Board concluded that the nature, extent and quality of the services provided by the Manager to the fund are adequate and appropriate.
- The Board was satisfied with management’s efforts to improve the fund’s performance as discussed at the meeting, and determined to closely monitor the performance of the fund.
- The Board concluded that the fee paid to the Manager by the fund was reasonable in light of the factors discussed above.
- The Board determined that the economies of scale which may accrue to the Manager and its affiliates in connection with the management of the fund had been adequately considered by the Manager in con- nection with the management fee rate charged to the fund, and that, to the extent in the future it were to be determined that material economies of scale had not been shared with the fund, the Board would seek to have those economies of scale shared with the fund.
28
The Board members considered these conclusions and determinations, along with the information received on a routine and regular basis throughout the year, and, without any one factor being dispositive, the Board determined that re-approval of the fund’s Management Agreement was in the best interests of the fund and its shareholders.
BOARD MEMBERS INFORMATION (Unaudited)
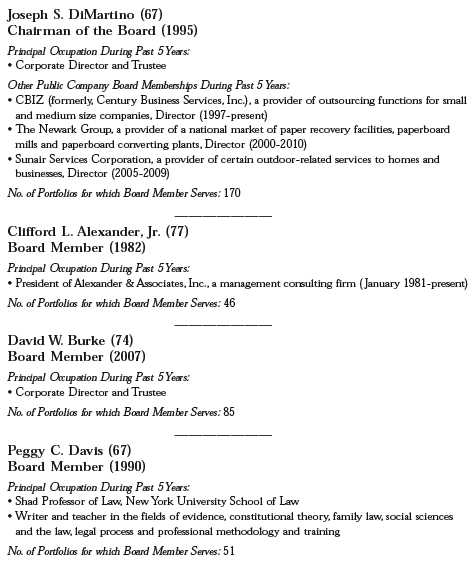
30
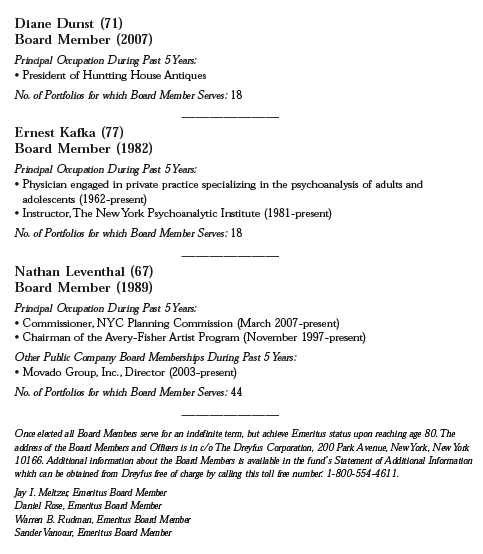
OFFICERS OF THE FUND (Unaudited)
BRADLEY J. SKAPYAK, President since
January 2010.
Chief Operating Officer and a director of the Manager since June 2009. From April 2003 to June 2009, Mr. Skapyak was the head of the Investment Accounting and Support Department of the Manager. He is an officer of 76 investment companies (comprised of 170 portfolios) managed by the Manager. He is 52 years old and has been an employee of the Manager since February 1988.
PHILLIP N. MAISANO, Executive Vice
President since July 2007.
Chief Investment Officer,Vice Chair and a director of the Manager, and an officer of 76 investment companies (comprised of 170 portfolios) managed by the Manager. Mr. Maisano also is an officer and/or Board member of certain other investment management subsidiaries of The Bank of New York Mellon Corporation, each of which is an affiliate of the Manager. He is 63 years old and has been an employee of the Manager since November 2006. Prior to joining the Manager, Mr. Maisano served as Chairman and Chief Executive Officer of EACM Advisors, an affiliate of the Manager, since August 2004.
MICHAEL A. ROSENBERG, Vice President
and Secretary since August 2005.
A ssistant General Counsel of BNY Mellon, and an officer of 77 investment companies (comprised of 195 portfolios) managed by the Manager. He is 50 years old and has been an employee of the Manager since October 1991.
KIESHA ASTWOOD, Vice President and
Assistant Secretary since January 2010.
Counsel of BNY Mellon, and an officer of 77 investment companies (comprised of 195 portfolios) managed by the Manager. She is 37 years old and has been an employee of the Manager since July 1995.
JAMES BITETTO, Vice President and
Assistant Secretary since August 2005.
Senior Counsel of BNY Mellon and Secretary of the Manager, and an officer of 77 investment companies (comprised of 195 portfolios) managed by the Manager. He is 44 years old and has been an employee of the Manager since December 1996.
JONI LACKS CHARATAN, Vice President
and Assistant Secretary since
August 2005.
Senior Counsel of BNY Mellon, and an officer of 77 investment companies (comprised of 195 portfolios) managed by the Manager. She is 55 years old and has been an employee of the Manager since October 1988.
JOSEPH M. CHIOFFI, Vice President and
Assistant Secretary since August 2005.
Senior Counsel of BNY Mellon, and an officer of 77 investment companies (comprised of 195 portfolios) managed by the Manager. He is 49 years old and has been an employee of the Manager since June 2000.
KATHLEEN DENICHOLAS, Vice President
and Assistant Secretary since
January 2010.
Senior Counsel of BNY Mellon, and an officer of 77 investment companies (comprised of 195 portfolios) managed by the Manager. She is 36 years old and has been an employee of the Manager since February 2001.
JANETTE E. FARRAGHER, Vice President
and Assistant Secretary since
August 2005.
Assistant General Counsel of BNY Mellon, and an officer of 77 investment companies (comprised of 195 portfolios) managed by the Manager. She is 47 years old and has been an employee of the Manager since February 1984.
32
JOHN B. HAMMALIAN, Vice President and
Assistant Secretary since August 2005.
Managing Counsel of BNY Mellon, and an officer of 77 investment companies (comprised of 195 portfolios) managed by the Manager. He is 47 years old and has been an employee of the Manager since February 1991.
M. CRISTINA MEISER, Vice President and
Assistant Secretary since January 2010.
Senior Counsel of BNY Mellon, and an officer of 77 investment companies (comprised of 195 portfolios) managed by the Manager. She is 40 years old and has been an employee of the Manager since August 2001.
ROBERT R. MULLERY, Vice President and
Assistant Secretary since August 2005.
Managing Counsel of BNY Mellon, and an officer of 77 investment companies (comprised of 195 portfolios) managed by the Manager. He is 58 years old and has been an employee of the Manager since May 1986.
JEFF PRUSNOFSKY, Vice President and
Assistant Secretary since August 2005.
Managing Counsel of BNY Mellon, and an officer of 77 investment companies (comprised of 195 portfolios) managed by the Manager. He is 45 years old and has been an employee of the Manager since October 1990.
JAMES WINDELS, Treasurer since
November 2001.
Director – Mutual Fund Accounting of the Manager, and an officer of 77 investment companies (comprised of 195 portfolios) managed by the Manager. He is 52 years old and has been an employee of the Manager since April 1985.
RICHARD CASSARO, Assistant Treasurer
since January 2008.
Senior Accounting Manager – Money Market and Municipal Bond Funds of the Manager, and an officer of 77 investment companies (comprised of 195 portfolios) managed by the Manager. He is 51 years old and has been an employee of the Manager since September 1982.
GAVIN C. REILLY, Assistant Treasurer
since August 2005.
Tax Manager of the Investment Accounting and Support Department of the Manager, and an officer of 77 investment companies (comprised of 195 portfolios) managed by the Manager. He is 42 years old and has been an employee of the Manager since April 1991.
ROBERT ROBOL, Assistant Treasurer
since August 2003.
Senior Accounting Manager – Fixed Income Funds of the Manager, and an officer of 77 investment companies (comprised of 195 portfolios) managed by the Manager. He is 46 years old and has been an employee of the Manager since October 1988.
ROBERT SALVIOLO, Assistant Treasurer
since May 2007.
Senior Accounting Manager – Equity Funds of the Manager, and an officer of 77 investment companies (comprised of 195 portfolios) managed by the Manager. He is 43 years old and has been an employee of the Manager since June 1989.
OFFICERS OF THE FUND (Unaudited) (continued)
ROBERT SVAGNA, Assistant Treasurer
since August 2005.
Senior Accounting Manager – Equity Funds of the Manager, and an officer of 77 investment companies (comprised of 195 portfolios) managed by the Manager. He is 43 years old and has been an employee of the Manager since November 1990.
JOSEPH W. CONNOLLY, Chief Compliance
Officer since October 2004.
Chief Compliance Officer of the Manager and The Dreyfus Family of Funds (77 investment companies, comprised of 195 portfolios). From November 2001 through March 2004, Mr. Connolly was first Vice-President, Mutual Fund Servicing for Mellon Global Securities Services. In that capacity, Mr. Connolly was responsible for managing Mellon’s Custody, Fund Accounting and Fund Administration services to third-party mutual fund clients. He is 53 years old and has served in various capacities with the Manager since 1980, including manager of the firm’s Fund Accounting Department from 1997 through October 2001.
NATALIA GRIBAS, Anti-Money Laundering
Compliance Officer since July 2010.
Anti-Money Laundering Compliance Officer of the Distributor, and the Anti-Money Laundering Compliance Officer of 73 investment companies (comprised of 191 portfolios) managed by the Manager. She is 40 years old and has been an employee of the Distributor since September 2008.
34
For More Information
Telephone 1-800-645-6561
Mail The Dreyfus Family of Funds, 144 Glenn Curtiss Boulevard, Uniondale, NY 11556-0144 E-mail Send your request to info@dreyfus.com Internet Information can be viewed online or downloaded at: http://www.dreyfus.com
The fund will disclose daily, on www.dreyfus.com, the fund’s complete schedule of holdings as of the end of the previous business day. The schedule of holdings will remain on the website until the fund files its Form N-Q or Form N-CSR for the period that includes the date of the posted holdings.
The fund files its complete schedule of portfolio holdings with the Securities and Exchange Commission (“SEC”) for the first and third quarters of each fiscal year on Form N-Q. The fund's Forms N-Q are available on the SEC’s website at http://www.sec.gov and may be reviewed and copied at the SEC’s Public Reference Room in Washington, DC. Information on the operation of the Public Reference Room may be obtained by calling 1-800-SEC-0330.
Information regarding how the fund voted proxies relating to portfolio securities for the most recent 12-month period ended June 30 is available on the SEC’s website at http://www.sec.gov and without charge, upon request, by calling 1-800-645-6561.

Item 2. Code of Ethics.
The Registrant has adopted a code of ethics that applies to the Registrant's principal executive officer, principal financial officer, principal accounting officer or controller, or persons performing similar functions. There have been no amendments to, or waivers in connection with, the Code of Ethics during the period covered by this Report.
Item 3. Audit Committee Financial Expert.
The Registrant's Board has determined that Joseph S. DiMartino, a member of the Audit Committee of the Board, is an audit committee financial expert as defined by the Securities and Exchange Commission (the "SEC"). Mr. DiMartino is "independent" as defined by the SEC for purposes of audit committee financial expert determinations.
Item 4. Principal Accountant Fees and Services.
(a) Audit Fees. The aggregate fees billed for each of the last two fiscal years (the "Reporting Periods") for professional services rendered by the Registrant's principal accountant (the "Auditor") for the audit of the Registrant's annual financial statements or services that are normally provided by the Auditor in connection with the statutory and regulatory filings or engagements for the Reporting Periods, were $ 55,870 in 2009 and $55,870 in 2010.
(b) Audit-Related Fees. The aggregate fees billed in the Reporting Periods for assurance and related services by the Auditor that are reasonably related to the performance of the audit of the Registrant's financial statements and are not reported under paragraph (a) of this Item 4 were $10,552 in 2009 and $10,764 in 2010. These services consisted of one or more of the following: (i) agreed upon procedures related to compliance with Internal Revenue Code section 817(h), (ii) security counts required by Rule 17f-2 under the Investment Company Act of 1940, as amended, (iii) advisory services as to the accounting or disclosure treatment of Registrant transactions or events and (iv) advisory service s to the accounting or disclosure treatment of the actual or potential impact to the Registrant of final or proposed rules, standards or interpretations by the Securities and Exchange Commission, the Financial Accounting Standards Boards or other regulatory or standard-setting bodies.
The aggregate fees billed in the Reporting Periods for non-audit assurance and related services by the Auditor to the Registrant's investment adviser (not including any sub-investment adviser whose role is primarily portfolio management and is subcontracted with or overseen by another investment adviser), and any entity controlling, controlled by or under common control with the investment adviser that provides ongoing services to the Registrant ("Service Affiliates"), that were reasonably related to the performance of the annual audit of the Service Affiliate, which required pre-approval by the Audit Committee were $0 in 2009 and $0 in 2010.
(c) Tax Fees. The aggregate fees billed in the Reporting Periods for professional services rendered by the Auditor for tax compliance, tax advice, and tax planning ("Tax Services") were $7,153 in 2009 and $6,993 in 2010. These services consisted of: (i) review or preparation of U.S. federal, state, local and excise tax returns; (ii) U.S. federal, state and local tax planning, advice and assistance regarding statutory, regulatory or administrative developments; (iii) tax advice regarding tax qualification matters and/or treatment of various financial instruments held or proposed to be acquired or held. The aggregate fees billed in the Reporting Periods for Tax Services by the Auditor to Service Affiliates, which require d pre-approval by the Audit Committee were $0 in 2009 and $0 in 2010.
(d) All Other Fees. The aggregate fees billed in the Reporting Periods for products and services provided by the Auditor, other than the services reported in paragraphs (a) through (c) of this Item, were $1,284 in 2009 and $993 in 2010. These services consisted of a review of the Registrant's anti-money laundering program.
The aggregate fees billed in the Reporting Periods for Non-Audit Services by the Auditor to Service Affiliates, other than the services reported in paragraphs (b) through (c) of this Item, which required pre-approval by the Audit Committee, were $0 in 2009 and $0 in 2010.
(e)(1) Audit Committee Pre-Approval Policies and Procedures. The Registrant's Audit Committee has established policies and procedures (the "Policy") for pre-approval (within specified fee limits) of the Auditor's engagements for non-audit services to the Registrant and Service Affiliates without specific case-by-case consideration. The pre-approved services in the Policy can include pre-approved audit services, pre-approved audit-related services, pre-approved tax services and pre-approved all other services. Pre-approval considerations include whether the proposed services are compatible with maintaining the Auditor's independence. Pre-approvals pursuant to the Policy are considered annually.
(e)(2) Note: None of the services described in paragraphs (b) through (d) of this Item 4 were approved by the Audit Committee pursuant to paragraph (c)(7)(i)(C) of Rule 2-01 of Regulation S-X.
(f) None of the hours expended on the principal accountant's engagement to audit the registrant's financial statements for the most recent fiscal year were attributed to work performed by persons other than the principal account's full-time, permanent employees.
Non-Audit Fees. The aggregate non-audit fees billed by the Auditor for services rendered to the Registrant, and rendered to Service Affiliates, for the Reporting Periods were $26,086,988 in 2009 and $33,851,490 in 2010.
Auditor Independence. The Registrant's Audit Committee has considered whether the provision of non-audit services that were rendered to Service Affiliates, which were not pre-approved (not requiring pre-approval), is compatible with maintaining the Auditor's independence.
Item 5. Audit Committee of Listed Registrants.
Not applicable. [CLOSED-END FUNDS ONLY]
Item 6. Investments.
(a) Not applicable.
Item 7. Disclosure of Proxy Voting Policies and Procedures for Closed-End Management Investment Companies.
Not applicable. [CLOSED-END FUNDS ONLY]
Item 8. Portfolio Managers of Closed-End Management Investment Companies.
Not applicable. [CLOSED-END FUNDS ONLY, beginning with reports for periods ended on and after December 31, 2005]
Item 9. Purchases of Equity Securities by Closed-End Management Investment Companies and Affiliated Purchasers.
Not applicable. [CLOSED-END FUNDS ONLY]
Item 10. Submission of Matters to a Vote of Security Holders.
There have been no material changes to the procedures applicable to Item 10.
Item 11. Controls and Procedures.
(a) The Registrant's principal executive and principal financial officers have concluded, based on their evaluation of the Registrant's disclosure controls and procedures as of a date within 90 days of the filing date of this report, that the Registrant's disclosure controls and procedures are reasonably designed to ensure that information required to be disclosed by the Registrant on Form N-CSR is recorded, processed, summarized and reported within the required time periods and that information required to be disclosed by the Registrant in the reports that it files or submits on Form N-CSR is accumulated and communicated to the Registrant's management, including its principal executive and principal financial officers, as appropriate to allow timely decisions regarding required disclosure.
(b) There were no changes to the Registrant's internal control over financial reporting that occurred during the second fiscal quarter of the period covered by this report that have materially affected, or are reasonably likely to materially affect, the Registrant's internal control over financial reporting.
Item 12. Exhibits.
(a)(1) Code of ethics referred to in Item 2.
(a)(2) Certifications of principal executive and principal financial officers as required by Rule 30a-2(a) under the Investment Company Act of 1940.
(a)(3) Not applicable.
(b) Certification of principal executive and principal financial officers as required by Rule 30a-2(b) under the Investment Company Act of 1940.
SIGNATURES
Pursuant to the requirements of the Securities Exchange Act of 1934 and the Investment Company Act of 1940, the Registrant has duly caused this Report to be signed on its behalf by the undersigned, thereunto duly authorized.
General Government Securities Money Market Funds, Inc.
By: /s/ Bradley J. Skapyak |
Bradley J. Skapyak, President |
Date: | January 24, 2011 |
|
Pursuant to the requirements of the Securities Exchange Act of 1934 and the Investment Company Act of 1940, this Report has been signed below by the following persons on behalf of the Registrant and in the capacities and on the dates indicated. |
|
By: /s/ Bradley J. Skapyak |
Bradley J. Skapyak, President |
Date: | January 24, 2011 |
|
By: /s/ James Windels |
James Windels, Treasurer |
Date: | January 24, 2011 |
|
EXHIBIT INDEX
(a)(1) Code of ethics referred to in Item 2.
(a)(2) Certifications of principal executive and principal financial officers as required by Rule 30a-2(a) under the Investment Company Act of 1940. (EX-99.CERT)
(b) Certification of principal executive and principal financial officers as required by Rule 30a-2(b) under the Investment Company Act of 1940. (EX-99.906CERT)