1 — Organization
Penn Series Funds, Inc. (“Penn Series”) was incorporated in Maryland on April 22, 1982. Penn Series is registered under the Investment Company Act of 1940, as amended, as an open-end, diversified management investment company. Penn Series is open only to purchasers of The Penn Mutual Life Insurance Company (“Penn Mutual”) and The Penn Insurance and Annuity Company insurance contracts and certain of Penn Mutual’s employee benefit plans.
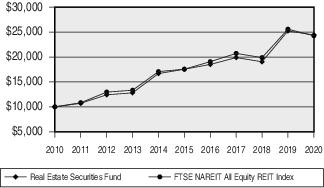
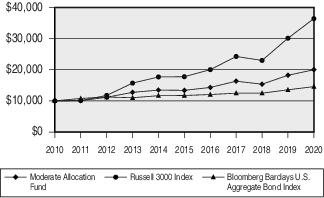
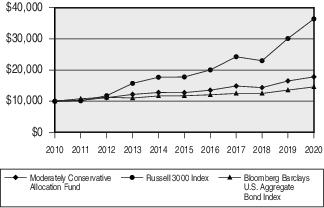
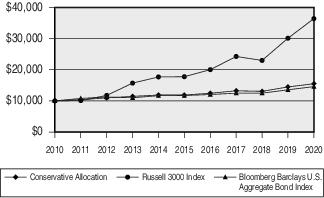
Penn Series is presently offering shares in its Money Market, Limited Maturity Bond, Quality Bond, High Yield Bond, Flexibly Managed, Balanced, Large Growth Stock, Large Cap Growth, Large Core Growth, Large Cap Value, Large Core Value, Index 500, Mid Cap Growth, Mid Cap Value, Mid Core Value, SMID Cap Growth, SMID Cap Value, Small Cap Growth, Small Cap Value, Small Cap Index, Developed International Index, International Equity, Emerging Markets Equity, Real Estate Securities, Aggressive Allocation, Moderately Aggressive Allocation, Moderate Allocation, Moderately Conservative Allocation and Conservative Allocation Funds (each a “Fund” and collectively, the “Funds”). Penn Series also has the authority to issue shares in three additional funds, each of which would have their own investment objective and policies.
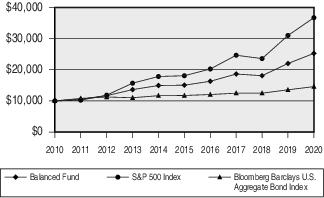
Fund of Funds (“FOFs”) – Each Penn Series FOF seeks to achieve its investment objective by investing in other Penn Series Funds (“Underlying Funds”) and uses asset allocation strategies to determine how much to invest in the Underlying Funds. Each of the following is a Penn Series FOFs: Balanced, Aggressive Allocation, Moderately Aggressive Allocation, Moderate Allocation, Moderately Conservative Allocation and Conservative Allocation Funds.
2 — Significant Accounting Policies
The following significant accounting policies are followed by Penn Series in the preparation of its financial statements. The preparation of financial statements in accordance with the accounting principles generally accepted in the United States (“U.S. GAAP”) requires management to make estimates and assumptions that affect the reported amounts and disclosures in the financial statements. Actual results could differ from those estimates and those differences could be material. The Funds are investment companies and follow the accounting and reporting guidance in Financial Accounting Standards Board (“FASB”) Accounting Standards Codification (“ASC”) Topic No. 946.
Security Valuation:
Money Market Fund — Investments in securities are valued using the amortized cost method as permitted by Rule 2a-7 under the Investment Company Act of 1940, which involves initially valuing investments at cost and thereafter assuming a constant amortization to maturity of any premium or discount. This method approximates market value.
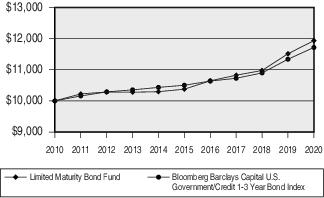
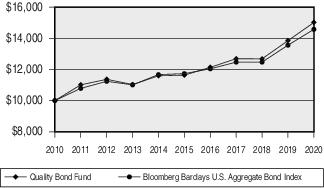
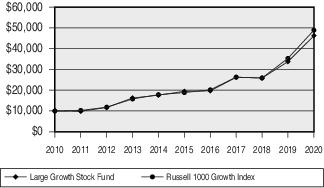
Limited Maturity Bond, Quality Bond, High Yield Bond, Flexibly Managed, Large Growth Stock, Large Cap Growth, Large Core Growth, Large Cap Value, Large Core Value, Index 500, Mid Cap Growth, Mid Cap Value, Mid Core Value, SMID Cap Growth, SMID Cap Value, Small Cap Growth, Small Cap Value, Small Cap Index, Developed International Index, International Equity, Emerging Markets Equity, Real Estate Securities Funds — Portfolio securities listed on a securities exchange or an automated quotation system for which quotations are readily available, including securities traded over the counter, are valued at the last quoted sale price on the principal exchange or market on which they are traded on the valuation date or, if there is no such reported sale on the valuation date, at the most recent quoted bid price. Securities valued according to these evaluation methods are categorized as Level 1 in the fair value hierarchy described below. Debt and fixed income securities are valued by recognized independent third-party valuation services, employing valuation methodologies that utilize actual market transactions, broker-dealer supplied valuations, and matrix pricing. Matrix pricing for corporate bonds, floating rate notes, municipal securities and U.S. government and government agency obligations considers yield or price of bonds of comparable quality, coupon, maturity and type and, for asset backed securities, commercial mortgage securities and U.S. government agency mortgage securities, also considers prepayment speed assumptions and attributes and performance of the underlying collateral. Securities valued according to these valuation methods are generally categorized as Level 2 in the fair value hierarchy described below. To the extent that bid prices are provided by the pricing service, the Funds will use the bid price. Debt obligations with remaining maturities of sixty days or less may be valued at their amortized cost, which approximates market value. The prices for foreign securities are reported in local currency and converted to U.S. dollars using currency exchange rates as of the valuation date.