UNITED STATES
SECURITIES AND EXCHANGE COMMISSION
Washington, D.C. 20549
FORM N-CSR
CERTIFIED SHAREHOLDER REPORT OF REGISTERED
MANAGEMENT INVESTMENT COMPANIES
Investment Company Act file number 811-03459
Penn Series Funds, Inc.
(Exact name of registrant as specified in charter)
600 Dresher Road
Horsham, PA 19044
(Address of principal executive offices) (Zip code)
Steven Viola
Penn Series Funds, Inc.
600 Dresher Road
Horsham, PA 19044
(Name and address of agent for service)
Registrant’s telephone number, including area code: (215) 956-8129
Date of fiscal year end: December 31
Date of reporting period: December 31, 2021
Form N-CSR is to be used by management investment companies to file reports with the Commission not later than 10 days after the transmission to stockholders of any report that is required to be transmitted to stockholders under Rule 30e-1 under the Investment Company Act of 1940 (17 CFR 270.30e-1). The Commission may use the information provided on Form N-CSR in its regulatory, disclosure review, inspection, and policymaking roles.
A registrant is required to disclose the information specified by Form N-CSR, and the Commission will make this information public. A registrant is not required to respond to the collection of information contained in Form N-CSR unless the Form displays a currently valid Office of Management and Budget (“OMB”) control number. Please direct comments concerning the accuracy of the information collection burden estimate and any suggestions for reducing the burden to Secretary, Securities and Exchange Commission, 100 F Street, NE, Washington, DC 20549. The OMB has reviewed this collection of information under the clearance requirements of 44 U.S.C. § 3507.
Item 1. Reports to Stockholders.
| | (a) | Include a copy of the report transmitted to stockholders pursuant to Rule 30e-1 under the Act (17 CFR 270.30e-1). |
The Report to Shareholders is attached herewith.
Penn Series
Funds, Inc.
■ 2021 Annual Report
Available through Penn Mutual Variable Products
[THIS PAGE INTENTIONALLY LEFT BLANK]
Dear Investor:
Thank you for your continued affiliation with The Penn Mutual Life Insurance Company. The confidence and trust you place in us reaffirms our commitment to helping policyholders take advantage of all life’s possibilities. We also take pride in being a financially strong mutual insurance company that delivers on our promises, and I’m very pleased to bring you the following capital markets summary. Please remember that regardless of what the markets may bring, short-term performance changes should not distract you from your long-term financial plan, and it’s a good idea to meet with your financial professional regularly to make sure that your asset allocation remains on target.
Despite moderating growth during the second half of 2021, the economic recovery in the U.S. has proven to be resilient to ongoing challenges from the COVID-19 pandemic. Household spending is likely to grow at the fastest pace since World War II. The U.S. consumer has been supported by record-high household wealth, ongoing fiscal assistance programs and tight labor markets helping to fuel wage gains.
Stocks continued to climb higher this year despite a growing wall of worry: inflation running at the hottest level in nearly four decades, new COVID-19 variants threatening the economic recovery and central bank policy likely to turn less accommodative. Investors have instead remained more focused on the strong corporate earnings picture and the lack of attractive alternatives across the fixed-income markets. Earnings and revenues have consistently exceeded estimates across all sectors. Full-year S&P 500 Index earnings are expected to register a nearly 50% gain over 2020, which was negatively impacted by the COVID-19 pandemic. The year started with investors moving away from growth stocks toward more economically sensitive reopening sectors, including cyclicals, energy and banks. However, the long-anticipated “great rotation” was short-lived. The first-quarter interest rate spike quickly reversed course, helping to bring growth stocks back into favor for the remainder of the year. Even though real gross domestic product (GDP) moderated during the third quarter, nominal GDP registered the strongest increase in decades. Inflation pressures are lasting longer than Federal Reserve (Fed) policymakers expected and have spread across key economic sectors such as food, energy and housing. Supply chain bottlenecks appear to be easing but demand drivers have kept price pressures elevated. In this very volatile environment, the U.S. stock market, as measured by the Wilshire 5000 Total Market Index, returned 26.70 percent for the full twelve-month period ending December 31.
On a relative basis, large-capitalization stocks provided higher returns than mid- and small-capitalization stocks during the year. Large-capitalization stocks, as measured by the Russell 1000 Index, returned 26.45 percent, while mid-capitalization stocks, as measured by the Russell Midcap Index returned 22.58 percent and small-capitalization stocks, as measured by the Russell 2000 Index, returned 14.82 percent. From a style perspective, value stocks outperformed growth stocks for the full year in most market capitalizations, with large-capitalization being the exception. The widest disparity was witnessed in the small-capitalization space. For instance, small-capitalization value stocks, as measured by the Russell 2000 Value Index returned 28.27 percent while small-capitalization growth stocks, as measured by the Russell 2000 Growth Index, returned 2.83 percent.
International markets were mixed during the year and failed to keep pace with the U.S. market performance. China’s regulatory crackdown on a wide range of businesses weighed heavily on emerging markets index performance. In sharp contrast to their U.S. counterparts, large-capitalization technology names in China such as Alibaba and Tencent were especially hard hit by the country’s policy actions. In this environment, emerging markets stocks ended the year with a -2.54 percent return, as measured by the MSCI Emerging Markets Index and developed international stocks returned a more favorable 11.26 percent, as measured by the MSCI EAFE Index.
Fixed-income markets closed the year mixed with investment-grade bonds, as measured by the Bloomberg U.S. Aggregate Bond Index, returning -1.54 percent and high-yield bonds, as measured by the Bloomberg U.S. Corporate High Yield Bond Index, returning 5.28 percent. During the November Federal Open Market Committee (FOMC) meeting, the Fed announced the beginning of the end for its ultra-accommodative monetary policies, starting with a plan to wind down its government bond purchases by $15 billion per month. This plan was quickly revised at the December FOMC meeting following new economic and inflation data coming in stronger than expected. The Fed doubled the pace of tapering to $30 billion every month and is now on a path to end new net asset purchases by the end of the first quarter in 2022. Treasury rates moved higher and the yield curve flattened as the year came to a close in response to the Fed’s abrupt U-turn in monetary policy to rein in high inflation.
Once again, we thank you for the privilege of serving your financial needs and encourage you to work closely with your financial professional to continue to explore your options throughout all life’s stages.
Sincerely,
Keith G. Huckerby
President
Penn Series Funds, Inc.
Source: This material is not intended to be relied upon as a forecast, research or investment advice, and is not a recommendation, offer or solicitation to buy or sell any securities or to adopt any investment strategy. The opinions expressed are subject to change as subsequent conditions vary. All economic and performance information is historical and not indicative of future results.
Table of Contents
Penn Series Funds, Inc. Annual Report
Management’s Discussion of Fund Performance (Unaudited)
| 2 |
| 3 |
| 4 |
| 5 |
| 7 |
| 8 |
| 10 |
| 12 |
| 14 |
| 16 |
| 18 |
| 20 |
| 22 |
| 24 |
| 26 |
| 28 |
| 30 |
| 32 |
| 34 |
| 36 |
| 38 |
| 40 |
| 42 |
| 44 |
| 46 |
| 48 |
| 50 |
| 52 |
| 53 |
| 56 |
| 168 |
| 176 |
| 183 |
| 191 |
| 220 |
| 243 |
| 244 |
| 245 |
| 245 |
| 246 |
Penn Series Funds, Inc.
Management’s Discussion of Fund Performance
Limited Maturity Bond Fund
The Penn Series Limited Maturity Bond Fund returned 0.38% for the twelve-month period ending December 31, 2021, compared to the -0.47% return for its benchmark, the Bloomberg U.S. Government/Credit 1-3 Year Bond Index, for the same period.
Short-term Treasury yields held steady for the majority of 2021 but moved materially higher during the fourth quarter after Federal Reserve (Fed) Chair Powell acknowledged more aggressive monetary policy tightening would be necessary to rein in higher inflation. The Treasury 2-year note rose more than 60 basis points during 2021 to finish the year at 0.73%.
The Fund’s underweight stance to duration or interest rate risk benefited results during 2021. We expect continued upward pressure on short-term interest rates as the Fed begins to normalize monetary policy. The Fund remains positioned conservatively with regards to duration entering 2022.
Fund results also benefited from outperformance across its holdings of corporate and structured securities as credit spreads moved gradually tighter during the year. We are currently maintaining our overweight to high- quality structured securities, including floating-rate collateralized loan obligations and student loan asset-backed securities, while opportunistically managing risk within the more fully valued corporate sector.
Penn Mutual Asset Management, LLC
Investment Adviser
Cumulative Performance Comparison
December 31, 2011 — December 31, 2021
An investment of $10,000 in the Limited Maturity Bond Fund on December 31, 2011 would have grown to $11,716. For the purpose of comparison, the graph also shows the change in the Fund’s benchmark, the Bloomberg U.S. Government/Credit 1–3 Year Bond Index, during the same period. A $10,000 investment in the Bloomberg U.S. Government/Credit 1–3 Year Bond Index on December 31, 2011 would have grown to $11,476.
| Average Annual Total Returns1 as of 12/31/21 |
| | 1 Year | | 5 Year | | 10 Year |
| Limited Maturity Bond Fund | 0.38% | | 2.39% | | 1.60% |
| Bloomberg U.S. Government/Credit 1-3 Year Bond Index | (0.47%) | | 1.85% | | 1.39% |
| 1 | The performance information shown here does not reflect variable account charges and fees. Past performance is not predictive of future performance. Shares may be worth more or less when redeemed than when purchased. Assumes reinvestment of all dividends. |
Portfolio Composition as of 12/31/21
| | Percent of
Total Investments1 |
| Corporate Bonds | 37.3 % |
| Asset Backed Securities | 31.9 % |
| Residential Mortgage Backed Securities | 15.1 % |
| Commercial Mortgage Backed Securities | 14.0% |
| U.S. Treasury Obligations | 1.7 % |
| | 100.0% |
| 1 | Portfolio holdings are presented as a percentage of total investments before short-term investments. |
Penn Series Funds, Inc.
Management’s Discussion of Fund Performance
Quality Bond Fund
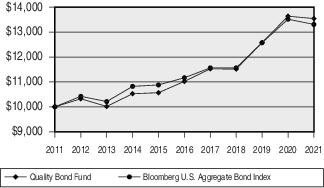
The Penn Series Quality Bond Fund returned -0.69% for the twelve-month period ending December 31, 2021, compared to the -1.54% return for its benchmark, the Bloomberg U.S. Aggregate Bond Index for the same time period.
The pace of the U.S. economic recovery from the COVID-19 pandemic accelerated during the first half of 2021 as progress on vaccinations and ongoing government stimulus boosted growth. Consumer spending grew at a very rapid pace with the support of strong household balance sheets and improving labor market conditions. Growth moderated during the second half of the year but remained in positive territory. The outbreak of new COVID-19 variants and intensifying supply chain disruption weighed on economic activity.
Supply chain disruptions also contributed to a broad-based pick-up in inflation throughout 2021. Federal Reserve (Fed) Chair Powell – who for most of the year argued higher inflation would be transitory – did an abrupt U-turn during his December congressional testimony, retiring the word transitory from his inflation forecast. The Fed is now prepared to conclude its bond purchase activity or quantitative easing by March and increase interest rates two to three times by the end of 2022.
Interest rates rose across the entire yield curve for the year with long-term yields initially under pressure. 10-year Treasury note yields peaked around 1.75% as the first quarter came to a close. Shorter-term Treasury yields were relatively stable until the fourth quarter when fixed income investors started to price in more aggressive Fed tightening to rein in inflation. Fund performance benefited from conservative duration or interest rate risk management relative to the benchmark.
Fund returns also benefited from outperformance among its corporate and structured bond holdings as credit spreads moved gradually tighter. Current overweight positioning includes multi-family commercial mortgage-backed securities, high-quality collateralized loan obligations and investment-grade corporate bonds. The Fund’s largest underweight remains agency residential mortgage-backed securities, where valuations remain elevated from Fed purchase activity.
Penn Mutual Asset Management, LLC
Investment Adviser
Cumulative Performance Comparison
December 31, 2011 — December 31, 2021
An investment of $10,000 in the Quality Bond Fund on December 31, 2011 would have grown to $13,543. For the purpose of comparison, the graph also shows the change in the Fund’s benchmark, the Bloomberg U.S. Aggregate Bond Index, during the same period. A $10,000 investment in the Bloomberg U.S. Aggregate Bond Index on December 31, 2011 would have grown to $13,307.
| Average Annual Total Returns1 as of 12/31/21 |
| | 1 Year | | 5 Year | | 10 Year |
| Quality Bond Fund | (0.69%) | | 4.21% | | 3.08% |
| Bloomberg U.S. Aggregate Bond Index | (1.54%) | | 3.57% | | 2.90% |
| 1 | The performance information shown here does not reflect variable account charges and fees. Past performance is not predictive of future performance. Shares may be worth more or less when redeemed than when purchased. Assumes reinvestment of all dividends. |
Portfolio Composition as of 12/31/21
| | Percent of
Total Investments1 |
| Corporate Bonds | 44.9 % |
| Commercial Mortgage Backed Securities | 17.5 % |
| Asset Backed Securities | 17.3 % |
| Residential Mortgage Backed Securities | 11.6 % |
| U.S. Treasury Obligations | 6.5 % |
| Preferred Stocks | 1.1 % |
| Municipal Bonds | 1.1 % |
| | 100.0% |
| 1 | Portfolio holdings are presented as a percentage of total investments before short-term investments. |
Penn Series Funds, Inc.
Management’s Discussion of Fund Performance
High Yield Bond Fund
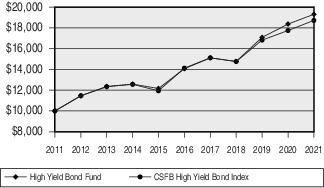
The Penn Series High Yield Bond Fund returned 5.12% for the twelve-month period ending December 31, 2021, compared to the 5.49% return for its benchmark, the CSFB High Yield Bond Index for the same time period.
2021 was a strong year for risk markets, particularly equities, as COVID-19 vaccine rollouts led to a reopening of the global economy and created a robust tailwind for earnings. Fixed-income total returns were largely in negative territory due to a 70 basis-point increase in 10-year Treasury rates, but the high-yield asset class returned approximately 5.5%. Credit fundamentals improved dramatically as most companies used free cash flow to reduce elevated debt levels and took advantage of wide-open capital markets to refinance near-term maturities. CCC-rated bonds outperformed BB-rated bonds by approximately 400 basis points as much of the distressed energy universe rallied sharply. The benign credit environment is reflected in current and projected default rates, which are at record-low levels, and spread levels were hovering around post-crisis tights at year-end. For 2022, macro risks center around the pace of the Federal Reserve rate-hiking cycle and the trajectory of inflation, as well as the potential for new COVID-19 variants to emerge, while company-specific risks relate to margin performance and debt-financed mergers and acquisitions.
During the year, the Fund added risk in the health care, airline, retail and auto sectors but still maintained its up-in-quality orientation. The Fund’s energy exposure was also increased in response to higher energy prices and a much better fundamental outlook, resulting in a modest overweight position by the end of the period.
Entering 2022, the Fund is market weight the energy sector, which remains the high-yield index’s largest and most volatile subsector. The Fund remains underweight lower-quality risk, based largely on valuation as we maintain a constructive view on earnings growth, default risk and market liquidity. The Fund’s duration and spread duration remain below benchmark levels as higher interest rate levels and market volatility are anticipated going forward.
Penn Mutual Asset Management, LLC
Investment Adviser
Cumulative Performance Comparison
December 31, 2011 — December 31, 2021
An investment of $10,000 in the High Yield Bond Fund on December 31, 2011 would have grown to $19,312. For the purpose of comparison, the graph also shows the change in the Fund’s benchmark, the CSFB High Yield Bond Index, during the same period. A $10,000 investment in the CSFB High Yield Bond Index on December 31, 2011 would have grown to $18,725.
| Average Annual Total Returns1 as of 12/31/21 |
| | 1 Year | | 5 Year | | 10 Year |
| High Yield Bond Fund | 5.12% | | 6.54% | | 6.80% |
| CSFB High Yield Bond Index | 5.49% | | 5.80% | | 6.47% |
| 1 | The performance information shown here does not reflect variable account charges and fees. Past performance is not predictive of future performance. Shares may be worth more or less when redeemed than when purchased. Assumes reinvestment of all dividends. |
Portfolio Composition as of 12/31/21
| | Percent of
Total Investments1 |
| BB/B Rated | 40.1 % |
| BBB/BB Rated & Above | 18.4 % |
| BB Rated | 15.3 % |
| B/CCC Rated | 11.4 % |
| B Rated | 6.6 % |
| Not Rated | 2.6 % |
| CCC and Below | 0.9 % |
| Loan Agreements | 3.3 % |
| Equity Securities | 1.4 % |
| | 100.0% |
| 1 | Portfolio holdings are presented as a percentage of total investments before short-term investments. |
Penn Series Funds, Inc.
Management’s Discussion of Fund Performance
Flexibly Managed Fund
The Penn Series Flexibly Managed Fund returned 18.29% for the twelve-month period ending December 31, 2021, compared to the 28.71% return of its benchmark, the S&P 500 Index for the same time period.
The portfolio posted a positive return but lagged its all-equity S&P 500 Index in the 2021 calendar year. The portfolio’s equity holdings posted a strong positive return but underperformed its S&P 500 Index benchmark. The portfolio’s fixed income holdings posted a positive return during the one-year period, strongly outperforming its benchmark, the Bloomberg U.S. Aggregate Index.
Even though the coronavirus pandemic continued, U.S. stocks climbed in 2021, extending the brisk rebound that started in March 2020. Equities advanced as the economy reopened and recovered—facilitated by the rollout of coronavirus vaccines and some federal fiscal relief—and as corporations reported robust earnings growth. Elevated inflation, which stemmed in part from shortages of some goods and materials and global supply chain disruptions; the emergence of variants of the coronavirus; and the Federal Reserve’s (Fed) decision to taper its monthly asset purchases starting in November, were among the factors that occasionally weighed on the financial markets.
As always, we remain committed to finding the best risk-adjusted opportunities across the asset class spectrum to help balance our goals of preserving invested capital and generating equity-like returns over the long term with less risk than the broader equity market.
Our overall fixed income weight reduced slightly over the year. Our largest exposure remains in bank loans, which we think at current levels offer compelling risk-adjusted return profiles. We also like that bank loans are at the top of the capital structure and are the only fixed income asset class that benefits from rising interest rates, so there could be optionality should rates rise over the next few years off of near-historic lows.
Within equities, the information technology sector detracted the most from relative performance, owing primarily to security selection, driven by Global Payments. Shares underperformed on disappointing revenue hampered by economic restrictions related to the pandemic combined with increased investor concern about disruptive competitors in the merchant acquirer space. The consumer discretionary sector also hindered relative performance due to adverse stock choices, such
as Amazon.com. Despite strong results from its cloud and advertising business segments, Amazon.com underperformed on deceleration in its e-commerce business, which faced tough year-over-year comparisons due to the coronavirus. Weak stock selection in industrials and business services also weighed on relative returns, driven by GE. Conversely, health care contributed the most to relative performance, due to stock choices such as Danaher. Shares of the company outperformed on strong revenue growth from its life sciences and diagnostics businesses, as tailwinds from coronavirus-related demand have proven durable. News of its acquisition of Aldevron, a manufacturer of high-quality plasmid DNA, mRNA, and proteins needed for a range of biotechnology and pharmaceutical applications, also contributed to the upside. The communication services sector also aided relative returns due to security picks, such as Alphabet. Shares of the company surged during the year driven by strong performance from its advertising business, owing to higher market expenditure from retail and other businesses.
After back-to-back years of remarkable gains, equity markets face more uncertain prospects in 2022. A protracted period of strong returns has left valuations extended across most market segments, with attractive opportunities harder to come by. We expect earnings growth to slow, particularly as the tailwind from fiscal stimulus fades and monetary policy begins to tighten. The Fed appears set to not only taper asset purchases, but also to end its bond-buying program early and raise rates in the New Year in an effort to curb inflation. Most sectors already face challenging comparables, and, in our view, diminished liquidity and weaker economic activity are likely to contribute to a regression in spending that will weigh on earnings in the intermediate term. We believe risks in the current market are modestly tilted to the downside and have positioned the portfolio accordingly.
Penn Mutual Asset Management, LLC
Investment Adviser
T. Rowe Price Associates, Inc.
Investment Sub-Adviser
Penn Series Funds, Inc.
Management’s Discussion of Fund Performance
Cumulative Performance Comparison
December 31, 2011 — December 31, 2021
An investment of $10,000 in the Flexibly Managed Fund on December 31, 2011 would have grown to $35,829. For the purpose of comparison, the graph also shows the change in the Fund’s benchmark, the S&P 500 Index, during the same period. A $10,000 investment in the S&P 500 Index on December 31, 2011 would have grown to $46,257.
| Average Annual Total Returns1 as of 12/31/21 |
| | 1 Year | | 5 Year | | 10 Year |
| Flexibly Managed Fund | 18.29% | | 14.93% | | 13.61% |
| S&P 500 Index | 28.71% | | 18.47% | | 16.55% |
| 1 | The performance information shown here does not reflect variable account charges and fees. Past performance is not predictive of future performance. Shares may be worth more or less when redeemed than when purchased. Assumes reinvestment of all dividends. |
Portfolio Composition as of 12/31/21
| | Percent of
Total Investments1 |
| Consumer, Non-cyclical | 23.2 % |
| Financial | 17.0% |
| Communications | 16.8 % |
| Technology | 15.0% |
| Consumer, Cyclical | 10.7 % |
| Industrial | 9.3 % |
| Utilities | 7.7 % |
| Asset Backed Securities | 0.3 % |
| Basic Materials | 0.0% 2 |
| | 100.0% |
| 1 | Portfolio holdings are presented as a percentage of total investments before short-term investments. |
| 2 | Less than 0.05%. |
Penn Series Funds, Inc.
Management’s Discussion of Fund Performance
Balanced Fund
The Penn Series Balanced Fund returned 15.77% for the twelve-month period ending December 31, 2021, compared to its benchmarks, the S&P 500 Index’s return of 28.71% and the Bloomberg U.S. Aggregate Bond Index’s return of -1.54% for the same time period.
The Balanced Fund is comprised of a target allocation of 60% to an equity fund and 40% to a fixed income fund. The equity allocation of the Fund is comprised of the Penn Series Index 500 Fund which seeks a total return that corresponds to that of the S&P 500 Index. The fixed income allocation of the Fund consists of an allocation to the Penn Series Quality Bond Fund.
At the broad asset class level, the Balanced Fund’s equity allocation performed inline with its broad equity benchmark, the S&P 500 Index, for the twelve-month period. The Fund’s fixed income allocation outperformed the Bloomberg U.S. Aggregate Bond Index for the same period.
Quality Bond Fund’s yield curve positioning, credit risk positioning and exposure in structured products contributed positively to the performance.
Penn Mutual Asset Management, LLC
Investment Adviser
Cumulative Performance Comparison
December 31, 2011 — December 31, 2021
An investment of $10,000 in the Balanced Fund on December 31, 2011 would have grown to $27,693. For the purpose of comparison, the graph also shows the change in the Fund’s benchmarks, the S&P 500 Index and the Bloomberg U.S. Aggregate Bond Index, during the same period. A $10,000 investment in the S&P 500 Index on December 31, 2011 would have grown to $46,257.
A $10,000 investment in the Bloomberg U.S. Aggregate Bond Index on December 31, 2011 would have grown to $13,307.
| Average Annual Total Returns1 as of 12/31/21 |
| | 1 Year | | 5 Year | | 10 Year |
| Balanced Fund | 15.77% | | 12.40% | | 10.72% |
| S&P 500 Index | 28.71% | | 18.47% | | 16.55% |
| Bloomberg U.S. Aggregate Bond Index | (1.54%) | | 3.57% | | 2.90% |
| 1 | The performance information shown here does not reflect variable account charges and fees. Past performance is not predictive of future performance. Shares may be worth more or less when redeemed than when purchased. Assumes reinvestment of all dividends. |
| Asset Allocation Target as of 12/31/21 | |
| Index 500 | 60.0% |
| Intermediate Bonds | 40.0% |
| | 100.0% |
Penn Series Funds, Inc.
Management’s Discussion of Fund Performance
Large Growth Stock Fund
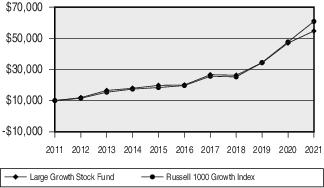
The Penn Series Large Growth Stock Fund returned 16.44% for the twelve-month period ending December 31, 2021, compared to the 27.60% return for its benchmark, the Russell 1000 Growth Index for the same time period.
The portfolio delivered positive returns for the 12 months ended December 31, 2021, but underperformed its benchmark Russell 1000 Growth Index. Overall, stock selection was responsible for relative underperformance. Information technology was the largest relative underperformer, followed by consumer discretionary and communication services. Consumer staples and health care were the major relative contributors.
Even though the coronavirus pandemic continued, major U.S. stock indexes climbed in 2021, extending the brisk rebound that started in March 2020. Many indexes repeatedly reached record highs throughout the year. Equities advanced as the economy reopened and recovered—facilitated by the rollout of coronavirus vaccines and some federal fiscal relief—and as corporations reported robust earnings growth. Elevated inflation, which stemmed in part from shortages of some goods and materials and global supply chain disruptions; the emergence of variants of the coronavirus; and the Federal Reserve’s decision to taper its monthly asset purchases starting in November were among the factors that occasionally weighed on the financial markets.
In information technology, stock choices detracted from relative results. Our underweight position in NVIDIA led to the underperformance. Shares of NVIDIA climbed higher during the year as the company’s data center business showed signs of reacceleration, underpinned by the demand for chips that can support artificial intelligence and deep learning applications. NVIDIA’s state-of-the-art graphics-processing units, combined with its embedded software intellectual property, have created an expanding moat behind which we believe NVIDIA should be able to continue to innovate and grow earnings. Security selection in consumer discretionary also weighed on relative performance, driven by holdings in Amazon.com.
Unfavorable stock choices in communication services hindered relative results. Shares of Snap Inc. sold off during the quarter as results were impacted by a one-two punch: Apple’s iOS platform changes caused a loss of signal for advertisers, and supply chain issues and labor shortages among advertisers weighed on their
ability to support the incremental demand from advertising spend.
In contrast, a lack of exposure to consumer staples benefited relative results as the defensive haven fell out of favor during the past 12 months, with risk-seeking behavior prevailing. The sector generally lacks compelling growth opportunities that meet our investment criteria. An underweight to health care further modestly contributed to relative performance as the largely defensive sector lagged the Index overall. Within the sector, adverse stock selection partially offset the positive impact.
After back-to-back years of strong performance across most equity and credit sectors, global markets face more uncertain prospects in 2022. Investors will need to use greater selectivity to identify potential opportunities. Higher inflation, a shift toward monetary tightening and new coronavirus variants all pose potential challenges for economic growth and earnings—at a time when valuations appear elevated across many asset categories. Many believe that as governments and central banks withdraw the massive stimulus applied during the pandemic, economic growth inevitably will slow sharply. But slower growth does not necessarily mean low growth. A number of tailwinds should sustain the recovery in 2022, including strong consumer and corporate balance sheets.
Penn Mutual Asset Management, LLC
Investment Adviser
T. Rowe Price Associates, Inc.
Investment Sub-Adviser
Cumulative Performance Comparison
December 31, 2011 — December 31, 2021
An investment of $10,000 in the Large Growth Stock Fund on December 31, 2011 would have grown to $54,678. For the purpose
Penn Series Funds, Inc.
Management’s Discussion of Fund Performance
of comparison, the graph also shows the change in the Fund’s benchmark, the Russell 1000 Growth Index, during the same period. A $10,000 investment in the Russell 1000 Growth Index on December 31, 2011 would have grown to $60,825.
| Average Annual Total Returns1 as of 12/31/21 |
| | 1 Year | | 5 Year | | 10 Year |
| Large Growth Stock Fund | 16.44% | | 22.28% | | 18.52% |
| Russell 1000 Growth Index | 27.60% | | 25.32% | | 19.79% |
| 1 | The performance information shown here does not reflect variable account charges and fees. Past performance is not predictive of future performance. Shares may be worth more or less when redeemed than when purchased. Assumes reinvestment of all dividends. |
Portfolio Composition as of 12/31/21
| | Percent of
Total Investments1 |
| Technology | 35.2 % |
| Communications | 35.1 % |
| Consumer, Non-cyclical | 11.7 % |
| Consumer, Cyclical | 11.5 % |
| Financial | 3.3 % |
| Industrial | 3.2 % |
| | 100.0% |
| 1 | Portfolio holdings are presented as a percentage of total investments before short-term investments. The categories shown represent broad industry sectors. Each industry sector consists of one or more specific industry classifications. |
Penn Series Funds, Inc.
Management’s Discussion of Fund Performance
Large Cap Growth Fund
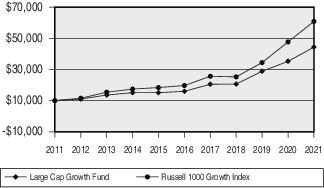
The Penn Series Large Cap Growth Fund returned 25.85% for the twelve-month period ending December 31, 2021, compared to the 27.60% return for its benchmark, the Russell 1000 Growth Index for the same time period.
Over the past year, the global economy was buffeted by an array of crosscurrents as it adjusted to the ebbs and flows of the pandemic. Among the supportive currents were ample fiscal stimulus, loose monetary policy and the rollout of several highly effective coronavirus vaccines. Negative currents included the rapid spread of several coronavirus variants, widespread global production bottlenecks and a surge in inflation. After experiencing a burst of exceptionally strong economic activity as the global economy began to reopen, activity became more muted in the second half of the period amid ongoing supply chain disruptions and a new wave of coronavirus infections, albeit a seemingly milder strain.
Amid rising inflation, markets anticipated a transition from an exceptionally accommodative environment to a more mixed monetary landscape ahead. Indeed, several central banks in emerging markets have already tightened policy and the U.S. Federal Reserve (Fed) reduced the pace of its asset purchases in November and again in December. However, the European Central Bank, the Bank of Japan and the People's Bank of China are expected to maintain accommodative policies. Sovereign bond yields moved modestly higher during the period amid higher inflation and on expectations of a tighter Fed but remain historically low.
A stricter Chinese regulatory environment toward industries such as online gaming, food delivery and education increased market volatility, as has stress in China's highly leveraged property development sector. Trade relations between the United States and China remained quite strained despite a change in presidential administrations.
Signs of excess investor enthusiasm continued to be seen in pockets of the market such as "meme stocks" popular with users of online message boards, cryptocurrencies and heavy retail participation in the market for short-dated options.
Stock selection and, to a lesser extent, an underweight position in the information technology sector weakened performance relative to the Russell 1000 Growth Index.
Within this sector, not holding shares of computer graphics processor maker NVIDIA and the portfolio's overweight position in financial technology services provider Fiserv held back relative returns. Additionally, holding shares of global banking and payment technologies provider Fidelity National Information Services further detracted from relative results.
Stock selection in the consumer discretionary sector also hindered relative performance. Within this sector, holding shares of online and mobile commerce company Alibaba Group Holding and sportswear and sports equipment manufacturer Adidas, and not holding shares of electric vehicle manufacturer Tesla, dampened relative results.
Elsewhere, the portfolio's overweight positions in video game maker Electronic Arts and global consumer products company Colgate-Palmolive, and holding shares of multinational technology conglomerate Tencent and medical technology company Becton, Dickinson and Company, detracted from relative results.
Stock selection and, to a lesser extent, an overweight position in the financials sector contributed to relative returns. Within this sector, holding shares of financial services provider Charles Schwab, the portfolio's overweight position in risk management and human capital consulting services provider Aon and the timing of the portfolio's ownership in shares of global alternative asset manager Blackstone Group helped relative performance.
Stock selection in the industrials sector also bolstered relative performance. However, there were no individual securities within this sector that were among the portfolio’s top relative contributors during the reporting period.
Stocks in other sectors that aided relative performance included not holding shares of internet retailer Amazon.com and digital payment technology developer PayPal and the portfolio's overweight positions in IT servicing firm Accenture, technology company Alphabet, outsourced clinical development services provider PRA Health Sciences and life sciences supply company Thermo Fisher Scientific. Additionally, holding shares of clinical research organization ICON further supported relative performance.
Penn Mutual Asset Management, LLC
Investment Adviser
Penn Series Funds, Inc.
Management’s Discussion of Fund Performance
MFS Investments
Investment Sub-Adviser
Cumulative Performance Comparison
December 31, 2011 — December 31, 2021
An investment of $10,000 in the Large Cap Growth Fund on December 31, 2011 would have grown to $44,309. For the purpose of comparison, the graph also shows the change in the Fund’s benchmark, the Russell 1000 Growth Index, during the same period. A $10,000 investment in the Russell 1000 Growth Index on December 31, 2011 would have grown to $60,825.
| Average Annual Total Returns1 as of 12/31/21 |
| | 1 Year | | 5 Year | | 10 Year |
| Large Cap Growth Fund | 25.85% | | 22.63% | | 16.05% |
| Russell 1000 Growth Index | 27.60% | | 25.32% | | 19.79% |
| 1 | The performance information shown here does not reflect variable account charges and fees. Past performance is not predictive of future performance. Shares may be worth more or less when redeemed than when purchased. Assumes reinvestment of all dividends. |
Portfolio Composition as of 12/31/21
| | Percent of
Total Investments1 |
| Technology | 30.1 % |
| Consumer, Non-cyclical | 26.2 % |
| Communications | 11.9 % |
| Financial | 11.7 % |
| Consumer, Cyclical | 9.4 % |
| Industrial | 8.7 % |
| Basic Materials | 1.1 % |
| Utilities | 0.9 % |
| | 100.0% |
| 1 | Portfolio holdings are presented as a percentage of total investments before short-term investments. The categories shown represent broad industry sectors. Each industry sector consists of one or more specific industry classifications. |
Penn Series Funds, Inc.
Management’s Discussion of Fund Performance
Large Core Growth Fund
The Penn Series Large Core Growth Fund returned -3.94% for the twelve-month period ending December 31, 2021, compared to the 27.60% return for its benchmark, the Russell 1000 Growth Index for the same time period.
U.S. equity markets saw increased short-term volatility in 2021 but ultimately overcame concerns about new COVID-19 variants, inflation, and fiscal and monetary policy uncertainties to end the year higher. The economic recovery progressed due to easing restrictions and increasing vaccinations, along with support from the federal government’s pandemic relief and accommodative monetary policy. Inflation persisted longer than expected, in part due to pandemic-related supply-side disruptions and labor shortages, leading the U.S. Federal Reserve and other central banks around the world to begin withdrawing monetary stimulus measures. The clarity on monetary policy and early evidence that the highly contagious omicron variant could be less deadly led markets to rally at year-end.
Large-cap growth equities, as measured by the Russell 1000 Growth Index, advanced over the period. All sectors in the Index had positive performance, led by energy. Utilities had the smallest gain and was the largest relative underperformer in the Index.
Counterpoint Global seeks high quality companies, which we define primarily as those with sustainable competitive advantages. We manage concentrated portfolios that are highly differentiated from the benchmark, with securities weighted on our assessment of the quality of the company and our conviction. The value added or detracted in any period of time will result from stock selection, given our philosophy and process.
The long-term investment horizon and conviction-weighted investment approach embraced by the team since 1998 can result in periods of performance deviation from the benchmark and peers. The Fund underperformed the Index in this reporting period largely due to adverse stock selection.
Greater market volatility and a widespread sell-off in high growth and high multiple equities was a significant headwind to Fund performance through much of 2021. We believe the sell-off was driven by a broad rotation out of such names and not due to company-specific fundamentals, which, across most of the Fund, remained largely robust.
The information technology and communication services sectors were the largest detractors from relative performance, primarily due to mixed stock selection. Consumer discretionary, health care, industrials, financials, materials, energy and consumer staples weighed on relative performance to a lesser extent, where either stock selection, relative sector weightings or both detracted across each position. Zero weight allocations to real estate and utilities also detracted slightly from relative performance.
At the sector level, there were no positive contributors for the period. A sector overweight in communication services and a sector underweight in consumer discretionary were modestly advantageous, but gains were more than offset by the underperformance of our stock selection in each sector. Marginally favorable stock selection in consumer staples was outweighed by the negative impact of a sector underweight there.
As a team, we believe having a market outlook can be an anchor. Our focus is on assessing company prospects over a five-year horizon, and owning a portfolio of unique companies whose market value we believe can increase significantly for underlying fundamental reasons.
Penn Mutual Asset Management, LLC
Investment Adviser
Morgan Stanley Investment Management
Investment Sub-Adviser
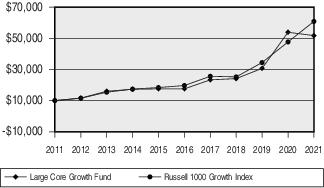
Cumulative Performance Comparison
December 31, 2011 — December 31, 2021
An investment of $10,000 in the Large Core Growth Fund on December 31, 2011 would have grown to $51,755. For the purpose of comparison, the graph also shows the change in the Fund’s benchmark, the Russell 1000 Growth Index, during the same
Penn Series Funds, Inc.
Management’s Discussion of Fund Performance
period. A $10,000 investment in the Russell 1000 Growth Index on December 31, 2011 would have grown to $60,825.
| Average Annual Total Returns1 as of 12/31/21 |
| | 1 Year | | 5 Year | | 10 Year |
| Large Core Growth Fund | (3.94%) | | 24.12% | | 17.87% |
| Russell 1000 Growth Index | 27.60% | | 25.32% | | 19.79% |
| 1 | The performance information shown here does not reflect variable account charges and fees. Past performance is not predictive of future performance. Shares may be worth more or less when redeemed than when purchased. Assumes reinvestment of all dividends. |
Portfolio Composition as of 12/31/21
| | Percent of
Total Investments1 |
| Technology | 44.2 % |
| Communications | 37.0% |
| Consumer, Non-cyclical | 11.5 % |
| Consumer, Cyclical | 3.7 % |
| Industrial | 2.6 % |
| Financial | 1.0% |
| | 100.0% |
| 1 | Portfolio holdings are presented as a percentage of total investments before short-term investments. The categories shown represent broad industry sectors. Each industry sector consists of one or more specific industry classifications. |
Penn Series Funds, Inc.
Management’s Discussion of Fund Performance
Large Cap Value Fund
The Penn Series Large Cap Value Fund returned 27.88% for the twelve-month period ending December 31, 2021, compared to the 25.16% return for its benchmark, the Russell 1000 Value Index for the same time period.
Global equities recorded double-digit returns and emerging markets lost ground during the 12-month period ended December 31, 2021. Global markets were supported by accommodative monetary policy and strong company earnings growth, while economic turbulence in China, geopolitical risks and inflation pressured emerging markets. Increased market volatility periodically sent risk assets lower, but investors continued to buy the dip. Toward the end of the period, global markets fell as the rapid spread of the coronavirus omicron variant triggered concern that new restrictions could derail the economic recovery. Encouraging developments in COVID-19 treatments and vaccines and a reluctance to reinstate shutdowns helped investors look past the potential impact of the omicron variant. Stock markets gave back gains, however, after the U.S. Federal Reserve (Fed) took a hawkish pivot and confirmed that it would accelerate the wind-down of its bond purchases and raise rates multiple times in 2022. After digesting the Fed’s comments, equity markets rose as investors appeared to adjust to the shift and remained focused on still generally supportive monetary policy. Growth outperformed value, in terms of style, and large-cap stocks outperformed their small-cap peers.
For the year 2021, the Portfolio rose in absolute terms and outperformed its benchmark, the Russell 1000 Value Index. Stock selection contributed to relative outperformance during the period, while sector selection detracted. Contributions from stock selection within consumer discretionary and industrials outweighed the underperformance from selection within financials and an underweight to energy.
Leading contributors to full-year relative returns included LKQ. The company continues to see revenue acceleration from economic reopening but its cost-management efforts in 2020 have helped to deliver improved profitability as well. CBRE also contributed to relative returns as it continues to see leasing and business services momentum confirmed by the company’s quarterly results. Wells Fargo contributed to relative performance after passing the Federal Reserve’s Comprehensive Capital Analysis and Review tests,
allowing for more meaningful capital return and bolstering confidence in the company’s turnaround under new leadership.
Leading detractors from full-year relative returns included Leidos, an engineering and technology services provider for defense, civil and health markets. The company reported earnings that missed expectations throughout the year. FLEETCOR Technologies also detracted from relative returns as the corporate payment business remained weak given persistent pandemic-related headwinds. Comcast detracted from relative performance after reporting weaker broadband subscriber growth than had been expected at a recent analyst day.
The boost from extraordinary monetary and fiscal stimulus is ebbing, but the inflationary pressures sparked by demand spikes and supply shocks have forced the Fed to concede that these pressures are no longer transitory due to base effects. Labor is tight and wages are responding, which, despite the challenges to profit margins and productivity, can help sustain the recovery on Main Street. As always, we believe that inflationary pressures are best managed at the company level. Companies that enjoy pricing power while continuing to invest in their key assets should be better equipped to retain and grow market share as they navigate this volatile transition from early- to mid-cycle. We seek to own attractively valued companies that are good businesses exhibiting signs of improving success. We believe the Fund’s holdings have attractive fundamentals that are consistent with our philosophy—high free-cash-flow yields, low earnings variability and low leverage. These well-managed companies deploy capital wisely, allowing them to grow dividends and enhance the long-term value of their shares.
Penn Mutual Asset Management, LLC
Investment Adviser
AllianceBernstein
Investment Sub-Adviser
Penn Series Funds, Inc.
Management’s Discussion of Fund Performance
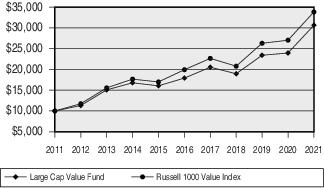
Cumulative Performance Comparison
December 31, 2011 — December 31, 2021
An investment of $10,000 in the Large Cap Value Fund on December 31, 2011 would have grown to $30,644. For the purpose of comparison, the graph also shows the change in the Fund’s benchmark, the Russell 1000 Value Index, during the same period. A $10,000 investment in the Russell 1000 Value Index on December 31, 2011 would have grown to $33,846.
| Average Annual Total Returns1 as of 12/31/21 |
| | 1 Year | | 5 Year | | 10 Year |
| Large Cap Value Fund | 27.88% | | 11.32% | | 11.85% |
| Russell 1000 Value Index | 25.16% | | 11.16% | | 12.97% |
| 1 | The performance information shown here does not reflect variable account charges and fees. Past performance is not predictive of future performance. Shares may be worth more or less when redeemed than when purchased. Assumes reinvestment of all dividends. |
Portfolio Composition as of 12/31/21
| | Percent of
Total Investments1 |
| Consumer, Non-cyclical | 23.4 % |
| Financial | 20.8 % |
| Industrial | 17.3 % |
| Consumer, Cyclical | 14.3 % |
| Communications | 11.5 % |
| Technology | 6.1 % |
| Energy | 3.1 % |
| Basic Materials | 2.5 % |
| Utilities | 1.0% |
| | 100.0% |
| 1 | Portfolio holdings are presented as a percentage of total investments before short-term investments. The categories shown represent broad industry sectors. Each industry sector consists of one or more specific industry classifications. |
Penn Series Funds, Inc.
Management’s Discussion of Fund Performance
Large Core Value Fund
The Penn Series Large Core Value Fund returned 24.46% for the twelve-month period ending December 31, 2021, compared to the 25.16% return for its benchmark, the Russell 1000 Value Index for the same time period.
In 2021, equity markets delivered robust gains despite the evolution of new and more transmissible strains of the COVID-19 virus and supply chain disruptions driving inflation increases over the period.
On the COVID-19 front, the U.S. benefited from a strong vaccine rollout program during the first half of the year. As investors looked forward to end of pandemic restrictions on work and play, industries that suffered due to the pandemic became the strong performers of 2021, including energy, financials, travel and entertainment. The emergence of the Delta variant, a more contagious stain of the COVID-19 virus, during the second quarter, and then later the Omicron variant during the fourth quarter, tempered investors’ ebullience to some degree as the end of the calendar year neared.
Supply chain disruptions arose during the period, which contributed to elevated inflation levels. Drivers of the disruptions included ramped up demand for goods from pandemic induced lows and surging COVID-19 cases across Asia, resulting in reduced factory and port capacity. From computer chips to shipping containers, scarcities of key items led to temporary factory shutdowns, empty store shelves and rising prices. The U.S. Federal Reserve (Fed) announced in the fourth quarter that it would begin tapering its $120 billion in monthly bond purchases that had bolstered the economy throughout the pandemic. The Fed’s actions to tamp down inflation were applauded by investors, with stocks gaining ground after the announcements that tapering would begin and that three rate hikes were forecast for 2022.
Despite the multitude of challenges investors faced in 2021, most equity markets delivered double-digit gains over the period. The S&P 500 Index returned 28.71%, the Russell 2000 Index posted a 14.82% gain, while in international markets, the MSCI EAFE Index notched a 11.26% return. Emerging markets were one of the few areas of weakness, with the MSCI Emerging Markets Index posting a return of -2.54%.
As has been the trend over the last several years, growth stocks once again outperformed their value counterparts, albeit by a smaller margin than in more recent years. The
Russell 1000 Growth Index outperformed the Russell 1000 Value Index, with the respective indices delivering returns of 27.60% and 25.16% respectively.
The Fund delivered strong absolute performance but underperformed its benchmark, the Russell 1000 Value Index. Sector allocation results modestly detracted from relative performance, while security selection aided results. All 11 of the economic sectors within the Index registered positive returns, with energy, real estate and financials delivering the strongest results.
Stock selection results were additive across seven of the 11 sectors, with the largest selection gains within communication services, industrials and real estate. Additionally, an overweight exposure to the strong-performing energy sector contributed to relative results. The top relative contributor for the period was an overweight position in hydrocarbon exploration company EOG Resources. Within information technology, the Fund’s position in Alphabet aided relative performance. In the real estate sector, overweight exposures to Mid-America Apartment Communities and EastGroup Properties were contributive. Elsewhere, positions in industrials firm Johnson Controls and materials company Steel Dynamic helped relative performance.
Stock selection results were negative across four of the 11 sectors for the period, with the most challenged selection results within information technology and health care. An overweight exposure to the utilities sector also detracted. Within information technology, the Fund’s positions in Fidelity National Information Services and Cognizant Technology Solutions hurt relative performance. In health care, positions in LHC Group, Neurocrine Biosciences and Medtronic detracted. The Fund’s avoidance of strong-performing Pfizer represented a drag on relative performance. Elsewhere, overweight positions in Walt Disney and Verizon Communications hurt relative results.
Penn Mutual Asset Management, LLC
Investment Adviser
Eaton Vance Management
Investment Sub-Adviser
Penn Series Funds, Inc.
Management’s Discussion of Fund Performance
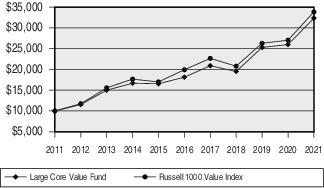
Cumulative Performance Comparison
December 31, 2011 — December 31, 2021
An investment of $10,000 in the Large Core Value Fund on December 31, 2011 would have grown to $32,343. For the purpose of comparison, the graph also shows the change in the Fund’s benchmark, the Russell 1000 Value Index, during the same period. A $10,000 investment in the Russell 1000 Value Index on December 31, 2011 would have grown to $33,846.
| Average Annual Total Returns1 as of 12/31/21 |
| | 1 Year | | 5 Year | | 10 Year |
| Large Core Value Fund | 24.46% | | 12.26% | | 12.45% |
| Russell 1000 Value Index | 25.16% | | 11.16% | | 12.97% |
| 1 | The performance information shown here does not reflect variable account charges and fees. Past performance is not predictive of future performance. Shares may be worth more or less when redeemed than when purchased. Assumes reinvestment of all dividends. |
Portfolio Composition as of 12/31/21
| | Percent of
Total Investments1 |
| Consumer, Non-cyclical | 26.4 % |
| Financial | 24.2 % |
| Industrial | 12.2 % |
| Communications | 10.7 % |
| Technology | 6.9 % |
| Energy | 6.3 % |
| Utilities | 6.0% |
| Consumer, Cyclical | 5.8 % |
| Basic Materials | 1.5 % |
| | 100.0% |
| 1 | Portfolio holdings are presented as a percentage of total investments before short-term investments. The categories shown represent broad industry sectors. Each industry sector consists of one or more specific industry classifications. |
Penn Series Funds, Inc.
Management’s Discussion of Fund Performance
Index 500 Fund
The Penn Series Index 500 Fund returned 28.29% for the twelve-month period ending December 31, 2021, compared to the 28.71% return for its benchmark, the S&P 500 Index for the same time period.
The investment objective of the Penn Series Index 500 Fund is to seek a total return (capital appreciation and income) which correspond to that of the S&P 500 Index.
The Fund and Index returns reflect the reinvestment of dividends and other income. The Fund’s performance reflects the expenses of managing the Fund, including brokerage and advisory expenses. The Index is unmanaged and Index returns do not reflect fees and expenses of any kind, which would have a negative impact on returns. As-of flows contributed to the difference between the Fund’s performance and that of the Index.
At the start of 2021, the Democratic Party’s victory in Georgia paved way for further stimulus measures, resulting in the S&P 500 Index gaining 6.17% during the first quarter. In addition, the COVID-19 infection rate continued to trend down and the vaccine rollout accelerated during the period with President Biden raising his vaccination goal from 100 million to 200 million. President Biden also announced a stimulus package worth 9% of U.S. GDP leading to upgrades in consensus forecasts for U.S. growth this year.
In the second quarter of 2021, the S&P 500 Index gained 8.55% as the pandemic was reined in, consumer spending increased, growth stocks rebounded, first-quarter earnings grew strongly and the prospects of fiscal stimulus improved in the context of President Biden concluding a bipartisan deal to boost infrastructure spending by $600 billion.
The S&P 500 Index delivered modest returns of 0.58% in the third quarter of 2021. In the U.S., the economic growth remained strong during the third quarter as the manufacturing and services sector contributed towards the economic progress. The job market improved with approximately 850,000 and 943,000 jobs being added in June and July respectively, which are the largest additions since August 2020.
In the last quarter of the year, President Biden made progress on his infrastructure spending proposals by signing the long-awaited Infrastructure Investment and
Jobs Act, which is a $1.2 trillion bipartisan infrastructure bill. The bill includes $550 billion of additional spending in order to upgrade roads, bridges and railways and deploy electric vehicle charging stations across the country. The S&P 500 index increased 11.03% during the fourth quarter.
The Fund used S&P 500 Index futures contracts in order to gain exposure to the Index during the reporting period. The Fund’s use of index futures helped the Fund track the Index.
On an individual security level, the top positive contributors to the Fund’s performance during the reporting period were Microsoft Corporation, Apple Inc., and NVIDIA Corporation. The top negative contributors to the Fund’s performance during the reporting period were Walt Disney Company, Global Payments Inc., and PayPal Holdings, Inc.
Penn Mutual Asset Management, LLC
Investment Adviser
State Street Global Advisors
Investment Sub-Adviser
Cumulative Performance Comparison
December 31, 2011 — December 31, 2021
An investment of $10,000 in the Index 500 Fund on December 31, 2011 would have grown to $44,811. For the purpose of comparison, the graph also shows the change in the Fund’s benchmark, the S&P 500 Index, during the same period. A $10,000 investment in the S&P 500 Index on December 31, 2011 would have grown to $46,257.
Penn Series Funds, Inc.
Management’s Discussion of Fund Performance
| Average Annual Total Returns1 as of 12/31/21 |
| | 1 Year | | 5 Year | | 10 Year |
| Index 500 Fund | 28.29% | | 18.15% | | 16.18% |
| S&P 500 Index | 28.71% | | 18.47% | | 16.55% |
| 1 | The performance information shown here does not reflect variable account charges and fees. Past performance is not predictive of future performance. Shares may be worth more or less when redeemed than when purchased. Assumes reinvestment of all dividends. |
Portfolio Composition as of 12/31/21
| | Percent of
Total Investments1 |
| Technology | 25.4 % |
| Consumer, Non-cyclical | 19.8 % |
| Communications | 15.1 % |
| Financial | 14.5 % |
| Consumer, Cyclical | 10.3 % |
| Industrial | 7.5 % |
| Energy | 2.8 % |
| Utilities | 2.5 % |
| Basic Materials | 2.1 % |
| | 100.0% |
| 1 | Portfolio holdings are presented as a percentage of total investments before short-term investments. The categories shown represent broad industry sectors. Each industry sector consists of one or more specific industry classifications. |
Penn Series Funds, Inc.
Management’s Discussion of Fund Performance
Mid Cap Growth Fund
The Penn Series Mid Cap Growth Fund returned 16.66% for the twelve-month period ending December 31, 2021, compared to the 12.73% return for its benchmark, the Russell Midcap Growth Index for the same time period.
For the period, the Fund had strong returns, outperforming its benchmark. Aside from communication services and materials, which experienced a bit of valuation retrenchment in the portfolio from the pull-forward effect of COVID-19, all sectors in the Fund posted positive returns for the fiscal year. The benchmark posted positive returns in all sectors, with the exception of communication services and consumer staples during the reporting period. Sector overweight and underweight allocations compared to the benchmark were a slight detractor to relative performance. Stock selection, as is expected from our bottom-up stock selection strategy, was the primary driver of overall performance compared to the benchmark.
The strongest contribution to relative performance where the Fund had exposure was in healthcare, followed by consumer discretionary, industrials, consumer staples, communication services and information technology. The Fund’s underexposure in utilities contributed to relative performance, as did the cash position.
Information technology remained the largest allocation within the Fund for the reporting period. Healthcare, a relative underweight position to the benchmark, added the most significant relative performance during the period.
Our exposure to materials was the only relative detractor to performance for the period where we had capital allocated. Other detractors to performance were generated from the rebounds in both energy and real estate by way of no holdings in small allocations within the benchmark. Equity options detracted from performance by way of exposure throughout the reporting period to portfolio insurance in lieu of raising excess cash. While there was continued uncertainty throughout the reporting period due to macro disruptions, the market largely shrugged off seemingly stretched valuation levels and thus, the portfolio insurance was not needed.
From a macro perspective, we are concerned with the confluence of inflationary pressures, the potential for
slowing earnings growth, and the seemingly stretched valuations embedded in the current market. As inflation continues to prove to be more fundamental than transitory, we are trying to assess how, when and to what degree interest rates will rise in the United States. Mid-cap stocks have historically performed well in a rising interest rate environment when there is above average gross domestic product growth, much like what we are projected to face in 2022 in the United States. However, a collision course appears to be imminent between rising real interest rates and slowing earnings growth, which the market could weather, were it not for the exuberant valuations levels that we are experiencing at present. As part of our overall strategy, we are mindful of the macro environment as it relates to portfolio construction and the current environment has us focusing much more intently on valuations of individual holdings.
As growth managers, we continue to look for opportunities to invest in companies that have sound capital structures and the ability to grow throughout the business and economic cycle, not because of the cycle. These business models appear to have a product and or service set that is durable, coupled with a capital structure and management team that should allow them to execute competitively in any market environment. We continue to seek opportunities in business and consumer technology, innovation in life sciences, the green energy revolution, and many other areas that we believe should continue to grow, regardless of the economic cycle.
Stock picking is always key to our process and performance but will be paramount in this environment as we seek to manage valuation risk in the portfolio, while investing in durable, secular growth companies.
Penn Mutual Asset Management, LLC
Investment Adviser
Delaware Investments Fund Advisers
Investment Sub-Adviser
Penn Series Funds, Inc.
Management’s Discussion of Fund Performance
Cumulative Performance Comparison
December 31, 2011 — December 31, 2021
An investment of $10,000 in the Mid Cap Growth Fund on December 31, 2011 would have grown to $48,815. For the purpose of comparison, the graph also shows the change in the Fund’s benchmark, the Russell Midcap Growth Index, during the same period. A $10,000 investment in the Russell Midcap Growth Index on December 31, 2011 would have grown to $46,550.
| Average Annual Total Returns1 as of 12/31/21 |
| | 1 Year | | 5 Year | | 10 Year |
| Mid Cap Growth Fund | 16.66% | | 25.11% | | 17.18% |
| Russell Midcap Growth Index | 12.73% | | 19.83% | | 16.63% |
| 1 | The performance information shown here does not reflect variable account charges and fees. Past performance is not predictive of future performance. Shares may be worth more or less when redeemed than when purchased. Assumes reinvestment of all dividends. |
Portfolio Composition as of 12/31/21
| | Percent of
Total Investments1 |
| Technology | 27.9 % |
| Consumer, Non-cyclical | 25.0% |
| Industrial | 18.6 % |
| Consumer, Cyclical | 16.2 % |
| Communications | 6.4 % |
| Financial | 4.5 % |
| Basic Materials | 1.4 % |
| | 100.0% |
| 1 | Portfolio holdings are presented as a percentage of total investments before short-term investments. The categories shown represent broad industry sectors. Each industry sector consists of one or more specific industry classifications. |
Penn Series Funds, Inc.
Management’s Discussion of Fund Performance
Mid Cap Value Fund
The Penn Series Mid Cap Value Fund returned 19.27% for the twelve-month period ending December 31, 2021, compared to the 28.34% return for its benchmark, the Russell Midcap Value Index for the same time period.
Stocks rose in the first half of 2021, as healthy economic and earnings growth and optimism around COVID-19 vaccines lifted investor sentiment. Accommodative monetary policy also supported the growth outlook. Stocks suffered downward volatility in the third quarter as the spread of the new Delta variant renewed pandemic concerns. Supply constraints and higher input costs also fueled inflation, which pushed interest rates higher. While rising interest rates initially favored value stocks, in the mid-cap market they underperformed growth for the quarter overall. In the fourth quarter, the identification of another highly transmissible COVID-19 variant, Omicron, contributed to market turbulence. The Federal Reserve (Fed) also indicated it would accelerate the withdrawal of its monetary stimulus. The prospect of higher interest rates in 2022 triggered a market rotation away from more speculative, high-valuation stocks and a move into value stocks, which outperformed growth in the fourth quarter.
The Portfolio delivered positive returns but underperformed its benchmark, the Russell Midcap Value Index, for the 12-month period ended December 31, 2021. Stock selection in industrials, financials and information technology detracted from relative performance, while selection in health care and utilities and an underweight in consumer staples contributed.
BWX Technologies, a supplier of nuclear components and fuel for the defense industry, was the Portfolio’s largest individual detractor on a relative basis. Over the period it faced continued uncertainty regarding the outlook for government defense spending, and the stock declined as the company reported disappointing revenue and profits growth. Relative performance also was dampened by our investment in Global Payments, a provider of financial technology that helps retailers process digital credit card payments. The stock was pressured by concerns that "buy now, pay later" alternatives may take market share away from traditional credit cards.
LabCorp, the leading global life sciences company, was the largest individual contributor over the year. The company outperformed due to continued strength in COVID-19 testing, non-COVID laboratory work –
particularly its expanded testing, treatment and clinical trial access for people with cancer – and activist involvement in the stock. Equity LifeStyle Properties, an owner and operator of manufactured housing communities and vacation sites, was also a top contributor, benefiting from the increased popularity of RV vacation parks as tourist destinations since the start of the pandemic.
While we have welcomed a renewed investor focus on fundamentals, we see potential sources of market risk as we head into 2022. The economic expansion appears to be on track, but higher input costs, supply chain bottlenecks and labor shortages could remain headwinds for growth and company profitability. From a historical perspective, valuations in some parts of the market still appear expensive and out of line with company fundamentals. The Fed also has a difficult task, dialing back its stimulus enough to contain inflation without derailing the economic recovery or market expansion. This task is further complicated by uncertainty around COVID-19 variants and global economic pressures. Higher inflation could push the Fed and other central banks to act more aggressively to slow the economy, which would result in higher interest rates and the potential for increased market volatility. Despite broader market risks, we believe this environment could work to our advantage. Periods of rising interest rates historically have favored value and higher-quality stocks over growth equities. We also believe market volatility could provide us with ample value opportunities, as we look to invest in companies whose potential may have yet to be fully appreciated by the market.
Penn Mutual Asset Management, LLC
Investment Adviser
Janus Capital Management, LLC
Investment Sub-Adviser
Penn Series Funds, Inc.
Management’s Discussion of Fund Performance
Cumulative Performance Comparison
December 31, 2011 — December 31, 2021
An investment of $10,000 in the Mid Cap Value Fund on December 31, 2011 would have grown to $23,449. For the purpose of comparison, the graph also shows the change in the Fund’s benchmark, the Russell Midcap Value Index, during the same period. A $10,000 investment in the Russell Midcap Value Index on December 31, 2011 would have grown to $35,286.
| Average Annual Total Returns1 as of 12/31/21 |
| | 1 Year | | 5 Year | | 10 Year |
| Mid Cap Value Fund | 19.27% | | 4.05% | | 8.90% |
| Russell Midcap Value Index | 28.34% | | 11.22% | | 13.44% |
| 1 | The performance information shown here does not reflect variable account charges and fees. Past performance is not predictive of future performance. Shares may be worth more or less when redeemed than when purchased. Assumes reinvestment of all dividends. |
Portfolio Composition as of 12/31/21
| | Percent of
Total Investments1 |
| Financial | 24.8 % |
| Industrial | 17.9 % |
| Consumer, Cyclical | 13.8 % |
| Consumer, Non-cyclical | 12.6 % |
| Technology | 10.7 % |
| Basic Materials | 5.6 % |
| Communications | 5.4 % |
| Utilities | 4.6 % |
| Energy | 4.6 % |
| | 100.0% |
| 1 | Portfolio holdings are presented as a percentage of total investments before short-term investments. The categories shown represent broad industry sectors. Each industry sector consists of one or more specific industry classifications. |
Penn Series Funds, Inc.
Management’s Discussion of Fund Performance
Mid Core Value Fund
The Penn Series Mid Core Value Fund returned 23.13% for the twelve-month period ending December 31, 2021, compared to the 28.34% return for its benchmark, the Russell Midcap Value Index for the same time period.
Broad U.S. equity markets delivered strong returns in 2021, buoyed by expanding vaccine availability, federal aid, positive economic news and strong corporate earnings reports. Stocks experienced some volatility throughout the year, due to the emergence of the delta and omicron variants of the coronavirus, supply chain constraints, inflation concerns and labor shortages.
Mid-cap stocks as measured by the Russell family of indices outperformed small caps but underperformed large caps. Value stocks outperformed growth within the mid-cap market.
Stock selection in materials hindered relative performance. Higher materials costs pressured container and packaging holdings such as Sonoco Products. A lack of exposure to metals and mining also dampened relative returns.
Security selection in financials weighed on relative returns against a backdrop of strong equity markets and continued reopenings. Our preference for higher-quality banks and our investments in insurance dampened performance. Not owning companies in the consumer finance industry also detracted.
Select holdings in the machinery and electrical equipment industries benefited performance. Electrical product provider nVent Electric was a top performer.
Medical device company, Zimmer Biomet Holdings, underperformed following strong performances in the second half of 2020, when elective surgeries began to be allowed during the pandemic. With the omicron surge late in the year, elective surgeries were delayed further by many providers. Pinnacle West Capital, Arizona-based utility, underperformed due to regulatory overhangs surrounding its pending general rate case in Arizona. While the Arizona Corporation Commission delivered a disappointing final determination on the case in early November, the stock rallied at the end of the year. Weak earnings in Universal Health Services management company’s behavioral health segment pressured shares. COVID-19 has caused a psychiatric nurse shortage, limiting Universal’s ability to fill beds and meet high
demand. However, we think this issue is transitory and the risk/reward profile remains attractive.
Exploration and production company, ConocoPhillips, outperformed due in part to its continued strong execution. During the third quarter, it unveiled what we think is an attractive 10-year financial plan and announced an attractively priced acquisition of assets from a competitor. The stock also benefited from stronger commodity prices. Electrical products provider nVent Electric, delivered strong results, executing well on pricing and productivity. We believe nVent has growing earnings power, supported by an end-market recovery and stronger demand for industrial products. Shares of Advance Auto Parts, a retailer of automotive aftermarket replacement parts, outperformed due to better-than-expected demand trends.
The portfolio seeks to invest in companies where we believe the valuation does not reflect the quality and normal earnings power of the company. Our process is based on individual security selection, but broad themes have emerged.
Easy monetary policy and generous fiscal spending have buoyed the market since mid-2020. Confident investors have been willing to take on risks, including bidding up the prices of lower-quality companies at the greatest risk from the economic downturn. We think this behavior has created an opportunity for investors who focus on overlooked higher-quality businesses. In the months ahead, we believe investors will assess risk more prudently as stimulus fades, economic growth moderates and interest rates and inflation rise. In our view, this creates an opening for quality-focused investors because certain high-quality stocks are now trading at a large discount to low-quality stocks, based on our analysis.
We believe long-term demographic trends support demand for companies in the health care sector. Through our bottom-up process, we are finding quality companies with attractive risk/reward profiles, particularly in the health care providers and services and health care equipment and supplies industries. We maintain a significant position in Zimmer Biomet Holdings. Over the last two years, the company has faced significant COVID-19 disruption, leading to a high patient backlog. We think this backlog should decline over time and result in a limited impact on its normalized earnings power.
The portfolio remains overweight in consumer staples. Despite a challenging environment from a cost inflation perspective, many consumer staples companies are
Penn Series Funds, Inc.
Management’s Discussion of Fund Performance
generating strong returns on capital, buying back stock and growing dividends. Moreover, industry consolidation over time has enabled the companies to pass cost increases to consumers. We believe actions to offset inflation, including fewer promotions and price increases, should support earnings and margins. The sector has underperformed significantly since the market bottom in 2020. Some consumer staples companies were not direct beneficiaries of the reopening and are perceived relative losers in an inflationary environment. We think these conditions are temporary and can lead to outperformance.
Our portfolio remains overweight in the financials sector, where we have identified higher-quality companies selling at attractive valuations. Our financials positions include holdings in the banking, capital markets and insurance industries. In the fourth quarter, we reduced or eliminated our positions in several individual holdings as their valuations moved higher, while also selectively adding to existing positions in companies with attractive risk/reward profiles.
The extended valuation of real estate stocks has led to a continued underweight position in the sector. While we are underweight the information technology sector, we have found select stocks that meet our investment criteria.
Penn Mutual Asset Management, LLC
Investment Adviser
American Century Investment Management
Investment Sub-Adviser
Cumulative Performance Comparison
December 31, 2011 — December 31, 2021
An investment of $10,000 in the Mid Core Value Fund on December 31, 2011 would have grown to $32,498. For the purpose of comparison, the graph also shows the change in the Fund’s
benchmark, the Russell Midcap Value Index, during the same period. A $10,000 investment in the Russell Midcap Value Index on December 31, 2011 would have grown to $35,286.
| Average Annual Total Returns1 as of 12/31/21 |
| | 1 Year | | 5 Year | | 10 Year |
| Mid Core Value Fund | 23.13% | | 9.33% | | 12.51% |
| Russell Midcap Value Index | 28.34% | | 11.22% | | 13.44% |
| 1 | The performance information shown here does not reflect variable account charges and fees. Past performance is not predictive of future performance. Shares may be worth more or less when redeemed than when purchased. Assumes reinvestment of all dividends. |
Portfolio Composition as of 12/31/21
| | Percent of
Total Investments1 |
| Financial | 26.7 % |
| Consumer, Non-cyclical | 23.9 % |
| Consumer, Cyclical | 13.3 % |
| Industrial | 11.8 % |
| Utilities | 7.9 % |
| Technology | 6.1 % |
| Energy | 4.6 % |
| Communications | 3.3 % |
| Basic Materials | 2.4 % |
| | 100.0% |
| 1 | Portfolio holdings are presented as a percentage of total investments before short-term investments. The categories shown represent broad industry sectors. Each industry sector consists of one or more specific industry classifications. |
Penn Series Funds, Inc.
Management’s Discussion of Fund Performance
SMID Cap Growth Fund
The Penn Series SMID Cap Growth Fund returned 7.73% for the twelve-month period ending December 31, 2021, compared to the 5.04% return for its benchmark, the Russell 2500 Growth Index for the same time period.
In 2021, the Fund outperformed the Russell 2500 Growth Index. Stock selection in the health care and information technology sectors contributed to returns, while holdings in consumer staples and an underweight to real estate detracted from performance.
Power storage company, Generac Holdings, Inc., was a top contributor to returns in 2021. Extreme weather events, such as those in Texas, spurred demand for generators and energy storage. Generac Holdings demonstrated its ability to grow the top line and execute accretive acquisitions during the year, driving the stock higher. We sold out of the position as the market cap became too big for the portfolio, allocating proceeds of the sale to better risk-reward opportunities elsewhere in the portfolio. Life sciences diagnostics company, PerkinElmer, Inc., was also a top contributor during the year. The stock’s strength was broadly due to the company’s exposure to COVID-19 testing and its PCR test’s accuracy despite the emergence of the Omicron variant. We continue to like this company, as a greater share of its revenue is recurring and its business mix shifts toward life sciences segments.
Vertex, Inc., a tax compliance software provider, detracted from returns. The market reacted negatively to consistently conservative guidance and to an increasingly difficult competitive environment. While we liked the stock and saw room for revenue and earnings growth, we sold out of the position in the second quarter, as we do not expect this stock to experience sufficient multiple expansion in the foreseeable future. Pet food company Freshpet, Inc. also detracted from performance. The stock’s weakness can largely be attributed to management commentary and lowered guidance related to supply chain issues. While input cost pressures may be a headwind in the short term, we believe the secular growth tailwinds driving Freshpet sales remain intact, and we expect earnings to grow and margins to expand over time.
The end of 2021 was cast with the development of the Omicron variant. We expect this to remain a major focus of the market in the first quarter of 2022, as entities around the world continue to navigate pockets of outbreaks and implement responses accordingly. Other
major themes such as the acceleration in the Federal Reserve’s winding down of its asset purchasing program and interest rate hikes, inflation readings, supply chain issues, and the global energy shortage may test the market again. The unclear future of the social spending bill will also be in play in 2022. We will stay true to our quality-first investment approach and seek to invest in businesses with healthy balance sheets, relatively stable cash flows, and differentiated business models aligned to secular tailwinds. We continue to test our models and re-evaluate our assumptions with increasing information, remain focused on the long-term investment horizon, and believe this fundamental approach will generate excess return in the long run for our clients.
Penn Mutual Asset Management, LLC
Investment Adviser
Goldman Sachs Asset Management
Investment Sub-Adviser
Cumulative Performance Comparison
December 31, 2011 — December 31, 2021
An investment of $10,000 in the SMID Cap Growth Fund on December 31, 2011 would have grown to $47,341. For the purpose of comparison, the graph also shows the change in the Fund’s benchmark, the Russell 2500 Growth Index, during the same period. A $10,000 investment in the Russell 2500 Growth Index on December 31, 2011 would have grown to $43,169.
| Average Annual Total Returns1 as of 12/31/21 |
| | 1 Year | | 5 Year | | 10 Year |
| SMID Cap Growth Fund | 7.73% | | 22.23% | | 16.82% |
| Russell 2500 Growth Index | 5.04% | | 17.65% | | 15.75% |
| 1 | The performance information shown here does not reflect variable account charges and fees. Past performance is not predictive of future performance. Shares may be worth more or less when redeemed than when purchased. Assumes reinvestment of all dividends. |
Penn Series Funds, Inc.
Management’s Discussion of Fund Performance
Portfolio Composition as of 12/31/21
| | Percent of
Total Investments1 |
| Technology | 27.3 % |
| Consumer, Non-cyclical | 24.4 % |
| Consumer, Cyclical | 21.9 % |
| Industrial | 16.8 % |
| Financial | 3.3 % |
| Basic Materials | 3.1 % |
| Communications | 1.2 % |
| Utilities | 1.0% |
| Energy | 1.0% |
| | 100.0% |
| 1 | Portfolio holdings are presented as a percentage of total investments before short-term investments. The categories shown represent broad industry sectors. Each industry sector consists of one or more specific industry classifications. |
Penn Series Funds, Inc.
Management’s Discussion of Fund Performance
SMID Cap Value Fund
The Penn Series SMID Cap Value Fund returned 35.58% for the twelve-month period ending December 31, 2021, compared to the 27.78% return for its benchmark, the Russell 2500 Value Index for the same time period.
Global markets were supported by accommodative monetary policy and strong company earnings growth, while economic turbulence in China, geopolitical risks and inflation pressured emerging markets. Increased market volatility periodically sent risk assets lower, but investors continued to buy the dip. Toward the end of the period, global markets fell as the rapid spread of the coronavirus omicron variant triggered concern that new restrictions could derail the economic recovery.
The Portfolio rose in absolute terms and outperformed its benchmark, the Russell 2500 Value Index, for the 12-month period. Security selection in consumer discretionary contributed, while selection in energy detracted. An underweight to healthcare contributed, while an underweight to energy detracted.
Textbook and education technology company Houghton Mifflin Harcourt (HMH) rose after agreeing to sell its HMH Books & Media trade publishing business for $349 million. Shares of ON Semiconductor rose on continued outperformance that began in early 2020. Management reported 3Q21 results exemplified by notable margin improvement, driven by an exit from lower profitability contracts combined with cyclically strong pricing.
Nomad Foods, a European manufacturer of frozen foods underperformed as end-market volumes declined after strong pandemic-driven increases in 2020. The Portfolio does not hold any shares in GameStop, and this lack of exposure detracted over the 12-month period as the stock was driven up by speculative fervor.
In 2021, value stocks enjoyed better performance relative to growth than any point over the past five years. We believe that the main driver of this stronger performance was and remains earnings growth. Investors’ view that the recession would destroy value profits was shown to be wrong, and they proved more resilient and grew dramatically faster than expected. Despite better performance, the valuation discount of value stocks relative to growth remains among the largest since the tech bubble. We continue to believe that the key to value closing this gap, in 2022 and beyond, will lie in sustained strong earnings and cash-flow growth. Investors remain
anxious. They see four obstacles to earnings growth for value stocks and remain concerned about the continuing effects of the pandemic, the severity of supply-chain disruptions, the impact of inflation and what the new normal will look like. Further challenges for companies relate to the environmental, social and governance (ESG) behaviors with companies likely focusing on improving their scores across a number of metrics. Value companies that wish to grow earnings and close the valuation gap with their growth peers will have to navigate each of these challenges. We remain convinced that the most interesting opportunities exist in companies that combine attractive free-cash-flow-based valuation, compelling company or niche industry catalysts, strong quality and a proactive approach to ESG issues.
Penn Mutual Asset Management, LLC
Investment Adviser
AllianceBernstein
Investment Sub-Adviser
Cumulative Performance Comparison
December 31, 2011 — December 31, 2021
An investment of $10,000 in the SMID Cap Value Fund on December 31, 2011 would have grown to $33,465. For the purpose of comparison, the graph also shows the change in the Fund’s benchmark, the Russell 2500 Value Index, during the same period. A $10,000 investment in the Russell 2500 Value Index on December 31, 2011 would have grown to $32,265.
Penn Series Funds, Inc.
Management’s Discussion of Fund Performance
| Average Annual Total Returns1 as of 12/31/21 |
| | 1 Year | | 5 Year | | 10 Year |
| SMID Cap Value Fund | 35.58% | | 9.59% | | 12.84% |
| Russell 2500 Value Index | 27.78% | | 9.88% | | 12.43% |
| 1 | The performance information shown here does not reflect variable account charges and fees. Past performance is not predictive of future performance. Shares may be worth more or less when redeemed than when purchased. Assumes reinvestment of all dividends. |
Portfolio Composition as of 12/31/21
| | Percent of
Total Investments1 |
| Financial | 27.2 % |
| Industrial | 21.6 % |
| Consumer, Cyclical | 19.7 % |
| Consumer, Non-cyclical | 13.0% |
| Technology | 8.0% |
| Basic Materials | 4.2 % |
| Utilities | 2.3 % |
| Energy | 2.2 % |
| Communications | 1.8 % |
| | 100.0% |
| 1 | Portfolio holdings are presented as a percentage of total investments before short-term investments. The categories shown represent broad industry sectors. Each industry sector consists of one or more specific industry classifications. |
Penn Series Funds, Inc.
Management’s Discussion of Fund Performance
Small Cap Growth Fund
The Penn Series Small Cap Growth Fund returned 8.70% for the twelve-month period ending December 31, 2021, compared to the 2.83% return for its benchmark, the Russell 2000 Growth Index for the same time period.
Small-cap stocks rose in the first half of 2021, as healthy economic and earnings growth and optimism around COVID-19 vaccines lifted investor sentiment. Accommodative monetary also supported the growth outlook. Stocks suffered downward volatility in the third quarter of 2021 as the spread of the new Delta variant led to renewed pandemic concerns. Supply constraints and higher input costs also fueled inflation, which pushed interest rates higher. In the fourth quarter, the identification of another highly transmissible COVID-19 variant, Omicron, contributed to market turbulence. The Federal Reserve (Fed) also indicated it would accelerate the withdrawal of its monetary stimulus. The prospect of higher interest rates in 2022 spurred a market rotation away from more speculative, high valuation growth stocks in the fourth quarter. Against this backdrop, the Russell 2000 Growth Index underperformed the broader mid-cap equity market for the 12-month period.
For the 12 months ending December 31, 2021, the Portfolio delivered positive returns and outperformed its benchmark, the Russell 2000 Growth Index. Stock selection in health care and industrials contributed to relative performance. Stock selection in consumer discretionary and consumer staples detracted.
We were encouraged to see a number of our moderate-growth companies rewarded during the period. These included ON Semiconductor, a leading global supplier of advanced semiconductors. The company has benefited from strong demand and pricing trends supporting high-growth areas such as electric vehicles and automation. It has also streamlined its cost structure under the guidance of a disciplined new management team.
Saia was another contributor. This less-than-truckload trucking company has benefited from strong demand and pricing trends, which supported its earnings performance. Many of its competitors have gone out of business in recent years, which has strengthened Saia’s competitive positioning and pricing power. It has also opened terminals in new locations to build out its transport network, helping it to better compete with regional and national carriers.
QuantumScape was a notable detractor. It is developing a next-generation, solid-state battery that could potentially allow electric vehicles to charge faster and travel farther. We invested in the company in 2020, and the stock initially rose on investor excitement over this potential game-changing technology. Following this run-up, we significantly reduced our position in light of the high stock valuation and the long time frame to commercialization. Unfortunately, our small position was affected by a pullback in the stock price, as excitement over this large potential opportunity was tempered by the reality of the manufacturing hurdles the company will need to overcome. It could be several years before the company sees any significant revenue acceleration. We continued to hold a small position in QuantumScape due to the large, long-term opportunity of its revolutionary technology potentially reaching commercialization.
Eargo, another detractor, is a disruptor in the hearing aid market. It sells hearing aids directly to consumers, charging substantially less than people would pay ordering through their audiologist. Eargo’s patented, aesthetically pleasing designs helped it gain market share relative to traditional hearing aids. Despite positive business trends, the stock sold off sharply on news that Eargo’s insurance billing practices were under investigation. Given uncertainty around this situation, we opted to exit the position.
We have been encouraged by signs we may be returning to an environment in which investors reward profitable companies with high returns on invested capital. At the same time, we recognize that the tug-of-war between high-growth pandemic beneficiaries and real-world stocks could continue in the short term as investors await more clarity on such issues as the outlook for the pandemic and the timing of Fed interest rate moves. We also recognize that the above-average market returns of the past few years may be hard to sustain in 2022. While interest rates remain low from a historic standpoint, they will likely move higher as the Fed withdraws its policy support. Companies face other sources of uncertainty, including supply chain bottlenecks, labor shortages and inflation pressures. International factors, including developments in China and tensions over Ukraine, could also impact the market. Despite these sources of uncertainty, we believe we will continue to find attractive investment opportunities that meet our qualifications. We continue to seek out disciplined, well-managed and reasonably valued growth companies with track records of innovation and profitability. We also favor companies with established supplier relationships and strong competitive positioning that may help them pass along
Penn Series Funds, Inc.
Management’s Discussion of Fund Performance
higher input costs without sacrificing profit margins. We believe these kinds of companies may be better able to navigate near-term market uncertainty while they capitalize on long-term trends.
Penn Mutual Asset Management, LLC
Investment Adviser
Janus Capital Management, LLC
Investment Sub-Adviser
Cumulative Performance Comparison
December 31, 2011 — December 31, 2021
An investment of $10,000 in the Small Cap Growth Fund on December 31, 2011 would have grown to $37,506. For the purpose of comparison, the graph also shows the change in the Fund’s benchmark, the Russell 2000 Growth Index, during the same period. A $10,000 investment in the Russell 2000 Growth Index on December 31, 2011 would have grown to $37,519.
| Average Annual Total Returns1 as of 12/31/21 |
| | 1 Year | | 5 Year | | 10 Year |
| Small Cap Growth Fund | 8.70% | | 16.99% | | 14.13% |
| Russell 2000 Growth Index | 2.83% | | 14.53% | | 14.14% |
| 1 | The performance information shown here does not reflect variable account charges and fees. Past performance is not predictive of future performance. Shares may be worth more or less when redeemed than when purchased. Assumes reinvestment of all dividends. |
Portfolio Composition as of 12/31/21
| | Percent of
Total Investments1 |
| Consumer, Non-cyclical | 30.0% |
| Technology | 24.8 % |
| Industrial | 19.4 % |
| Financial | 7.6 % |
| Communications | 7.1 % |
| Consumer, Cyclical | 6.8 % |
| Basic Materials | 2.4 % |
| Diversified | 1.1 % |
| Utilities | 0.6 % |
| Energy | 0.2 % |
| | 100.0% |
| 1 | Portfolio holdings are presented as a percentage of total investments before short-term investments. The categories shown represent broad industry sectors. Each industry sector consists of one or more specific industry classifications. |
Penn Series Funds, Inc.
Management’s Discussion of Fund Performance
Small Cap Value Fund
The Penn Series Small Cap Value Fund returned 26.67% for the twelve-month period ending December 31, 2021, compared to the 28.27% return for its benchmark, the Russell 2000 Value Index for the same time period.
In 2021, the Fund underperformed the Russell 2000 Value Index. Stock selection in the financials and consumer discretionary sectors detracted from performance, while holdings in the health care and industrials sectors contributed to returns.
Novavax, Inc., a developer of vaccines for infectious diseases, was a top detractor during the year. We initiated a position in the company following the announcement of strong efficacy data for its COVID-19 vaccine. We later sold our position as the fast-evolving regulatory, supply chain, and competitor dynamics of the industry proved a challenge for the company. Ovintiv, Inc., an oil and gas company, was also a top detractor over the one-year period. We initiated a position in the third quarter of 2021, as the company has benefited from the rally in commodity prices. We are optimistic on Ovintiv, as we believe sustainable free cash flows and continued de-levering of the balance sheet can drive return of capital to shareholders.
Herc Holdings, an equipment rental supplier, was a top contributor in 2021. In July, Herc Holdings announced strong second quarter earnings, which included top and bottom line beats and optimistic commentary from management. The stock’s upward moves continued on the back of the company’s investor day in September, as the market reacted favorably to new strategic initiatives and capital allocation plans. We exited our position in Herc Holdings in the fourth quarter following continued outperformance, and deployed the proceeds to what we felt were better opportunities elsewhere. Zurn Water Solutions was also a top contributor to returns during the year. The market reacted favorably to the announced combination of Rexnord’s Process & Motion Control Business with Regal Beloit, in which Rexnord retained its water management business as a standalone called Zurn Water Solutions Corp. The deal closed in early October 2021 and the standalone high growth water management business re-rated higher. We continue to like Zurn Water Solutions going forward, as the water management business was Rexnord’s highest growth segment and has higher growth and margins than other pure water plays.
The end of 2021 was cast with the development of the Omicron variant. We expect this to remain a major focus
of the market in the first quarter of 2022, as entities around the world continue to navigate pockets of outbreaks and implement responses accordingly. Other major themes such as the acceleration in the Federal Reserve’s winding down of its asset purchasing program and interest rate hikes, inflation readings, supply chain issues, and the global energy shortage may test the market again. The unclear future of the social spending bill will also be in play in 2022. We will stay true to our quality-first investment approach and seek to invest in businesses with healthy balance sheets, relatively stable cash flows, and differentiated business models aligned to secular tailwinds. We continue to test our models and re-evaluate our assumptions with increasing information, remain focused on the long-term investment horizon, and believe this fundamental approach will generate excess return in the long run for our clients.
Penn Mutual Asset Management, LLC
Investment Adviser
Goldman Sachs Asset Management
Investment Sub-Adviser
Cumulative Performance Comparison
December 31, 2011 — December 31, 2021
An investment of $10,000 in the Small Cap Value Fund on December 31, 2011 would have grown to $31,444. For the purpose of comparison, the graph also shows the change in the Fund’s benchmark, the Russell 2000 Value Index, during the same period. A $10,000 investment in the Russell 2000 Value Index on December 31, 2011 would have grown to $31,141.
Penn Series Funds, Inc.
Management’s Discussion of Fund Performance
| Average Annual Total Returns1 as of 12/31/21 |
| | 1 Year | | 5 Year | | 10 Year |
| Small Cap Value Fund | 26.67% | | 9.04% | | 12.14% |
| Russell 2000 Value Index | 28.27% | | 9.07% | | 12.03% |
| 1 | The performance information shown here does not reflect variable account charges and fees. Past performance is not predictive of future performance. Shares may be worth more or less when redeemed than when purchased. Assumes reinvestment of all dividends. |
Portfolio Composition as of 12/31/21
| | Percent of
Total Investments1 |
| Financial | 36.5 % |
| Consumer, Non-cyclical | 16.5 % |
| Consumer, Cyclical | 13.5 % |
| Industrial | 11.9 % |
| Energy | 6.2 % |
| Technology | 5.3 % |
| Utilities | 4.1 % |
| Communications | 3.6 % |
| Basic Materials | 2.4 % |
| | 100.0% |
| 1 | Portfolio holdings are presented as a percentage of total investments before short-term investments. The categories shown represent broad industry sectors. Each industry sector consists of one or more specific industry classifications. |
Penn Series Funds, Inc.
Management’s Discussion of Fund Performance
Small Cap Index Fund
The Penn Series Small Cap Index Fund returned 14.35% for the twelve-month period ending December 31, 2021, compared to the 14.82% return for its benchmark, the Russell 2000 Index for the same time period.
The investment objective of the Penn Series Small Cap Index Fund is to seek to replicate the returns and characteristics of a small cap index.
The Fund and Index returns reflect the reinvestment of dividends and other income. The Fund’s performance reflects the expenses of managing the Fund, including brokerage and advisory expenses. The Index is unmanaged and Index returns do not reflect fees and expenses of any kind, which would have a negative impact on returns. The cumulative effect of small weighting differences between the securities and the currencies in the Fund and the Index contributed to the difference between the Portfolio’s performance and that of the Index.
The Fund had positive performance in 2021. Despite the negative impact from multiple COVID-19 variants and inflation fears, positive performance was driven mostly by earnings growth, fiscal and monetary policy and the distribution of vaccines in response to the global pandemic. The first and second quarter of 2021 had positive performance due to vaccine rollouts, falling infection rates and the announcement of a stimulus package. Third quarter performance was negative on the back of ongoing supply chain issues and inflation worries even with the reopening of the economy. Performance in the fourth quarter was positive with the passage of a bipartisan infrastructure bill and strong earnings growth despite ongoing supply chain bottlenecks, hawkish sentiment from the Federal Reserve and the emergence of a new COVID-19 variant.
The Fund used Russell 2000 Index futures contracts in order to gain exposure to the Index during the reporting period. The Fund’s use of index futures helped the Fund track the Index.
On an individual security level, the top positive contributors to the Fund’s performance during the reporting period were GameStop Corp. Class A, Avis Budget Group, Inc., and Synaptics Incorporated. The top negative contributors to the Fund’s performance during the reporting period were Allakos, Inc., BridgeBio Pharma, Inc., and Invitae Corp.
Penn Mutual Asset Management, LLC
Investment Adviser
State Street Global Advisors
Investment Sub-Adviser
Cumulative Performance Comparison
December 31, 2011 — December 31, 2021
An investment of $10,000 in the Small Cap Index Fund on December 31, 2011 would have grown to $32,533. For the purpose of comparison, the graph also shows the change in the Fund’s benchmark, the Russell 2000 Index, during the same period. A $10,000 investment in the Russell 2000 Index on December 31, 2011 would have grown to $34,652.
| Average Annual Total Returns1 as of 12/31/21 |
| | 1 Year | | 5 Year | | 10 Year |
| Small Cap Index Fund | 14.35% | | 11.37% | | 12.52% |
| Russell 2000 Index | 14.82% | | 12.02% | | 13.23% |
| 1 | The performance information shown here does not reflect variable account charges and fees. Past performance is not predictive of future performance. Shares may be worth more or less when redeemed than when purchased. Assumes reinvestment of all dividends. |
Penn Series Funds, Inc.
Management’s Discussion of Fund Performance
Portfolio Composition as of 12/31/21
| | Percent of
Total Investments1 |
| Consumer, Non-cyclical | 24.1 % |
| Financial | 23.2 % |
| Consumer, Cyclical | 13.5 % |
| Industrial | 13.1 % |
| Technology | 11.6 % |
| Energy | 4.4 % |
| Communications | 4.3 % |
| Basic Materials | 3.2 % |
| Utilities | 2.6 % |
| Government | 0.0% 2 |
| Diversified | 0.0% 2 |
| | 100.0% |
| 1 | Portfolio holdings are presented as a percentage of total investments before short-term investments. The categories shown represent broad industry sectors. Each industry sector consists of one or more specific industry classifications. |
| 2 | Less than 0.05%. |
Penn Series Funds, Inc.
Management’s Discussion of Fund Performance
Developed International Index Fund
The Penn Series Developed International Index Fund returned 10.54% for the twelve-month period ending December 31, 2021, compared to the 11.26% return for its benchmark, the MSCI EAFE Index for the same time period.
The investment objective of the Fund is to seek to replicate the returns and characteristics of an international index comprised of securities from developed countries.
The Fund and Index returns reflect the reinvestment of dividends and other income. The Fund’s performance reflects the expenses of managing the Fund, including brokerage and advisory expenses. The Index is unmanaged and Index returns do not reflect fees and expenses of any kind, which would have a negative impact on returns. The cumulative effect of small weighting differences between the securities and the currencies in the Fund and the Index contributed to the difference between the Portfolio’s performance and that of the Index.
The Fund had positive performance in 2021. The MSCI EAFE Index gained almost 9% over the first six months of the year, as much of the developed world experienced economic recovery. Widespread COVID-19 vaccine availability and distribution, along with initiatives throughout Europe and Asia collectively contributed to the Index’s success. During the first quarter, the UK developed a £65 billion stimulus package and Japan approved a relatively large budget equivalent to $1 trillion to kickstart their respective economies. Following those plans, the second quarter brought recovery funding approvals for many European countries including Portugal, Spain and Greece. The second half of the year saw a more modest, but positive return of 2.24%. The third quarter produced a small dip in the Index of -0.45% as supply chain disruptions and the unfortunate reality of a new COVID-19 variant emerged. As the year closed, however, the Index righted the ship thanks to strong earnings announcements and healthy holiday spending.
The Fund used MSCI EAFE Index futures contracts in order to gain exposure to the Index during the reporting period. The Fund’s use of index futures helped the Fund track the Index.
On an individual security level, the top positive contributors to the Fund’s performance during the reporting period were Nestle S.A., Novo Nordisk A/S Class B and ASML Holding NV. The top negative contributors to the Fund’s performance during the reporting period were SoftBank Group Corp., AIA Group Limited and M3, Inc.
Penn Mutual Asset Management, LLC
Investment Adviser
State Street Global Advisors
Investment Sub-Adviser
Cumulative Performance Comparison
December 31, 2011 — December 31, 2021
An investment of $10,000 in the Developed International Index Fund on December 31, 2011 would have grown to $20,512. For the purpose of comparison, the graph also shows the change in the Fund’s benchmark, the MSCI EAFE Index, during the same period. A $10,000 investment in the MSCI EAFE Index on December 31, 2011 would have grown to $21,650.
| Average Annual Total Returns1 as of 12/31/21 |
| | 1 Year | | 5 Year | | 10 Year |
| Developed International Index Fund | 10.54% | | 9.06% | | 7.45% |
| MSCI EAFE Index | 11.26% | | 9.55% | | 8.03% |
| 1 | The performance information shown here does not reflect variable account charges and fees. Past performance is not predictive of future performance. Shares may be worth more or less when redeemed than when purchased. Assumes reinvestment of all dividends. |
Penn Series Funds, Inc.
Management’s Discussion of Fund Performance
Portfolio Composition as of 12/31/21
| | Percent of
Total Investments1 |
| Japan | 22.5 % |
| United Kingdom | 12.7 % |
| France | 11.3 % |
| Switzerland | 11.0% |
| Germany | 8.8 % |
| Australia | 7.1 % |
| Netherlands | 6.3 % |
| Sweden | 3.7 % |
| Hong Kong | 2.7 % |
| Denmark | 2.7 % |
| Spain | 2.3 % |
| Italy | 2.1 % |
| Finland | 1.3 % |
| Singapore | 1.2 % |
| Ireland | 1.1 % |
| Belgium | 0.8 % |
| Israel | 0.7 % |
| Norway | 0.7 % |
| New Zealand | 0.3 % |
| Luxembourg | 0.3 % |
| Austria | 0.2 % |
| Portugal | 0.2 % |
| Chile | 0.0% 2 |
| Macao | 0.0% 2 |
| Jordan | 0.0% 2 |
| Poland | 0.0% 2 |
| United Arab Emirates | 0.0% 2 |
| | 100.0% |
| 1 | Portfolio holdings are presented as a percentage of total investments before short-term investments. The categories shown represent the countries in which the securities are denominated. |
| 2 | Less than 0.05%. |
Penn Series Funds, Inc.
Management’s Discussion of Fund Performance
International Equity Fund
The Penn Series International Equity Fund returned 12.23% for the twelve-month period ending December 31, 2021, compared to the 7.82% return for its benchmark, the MSCI ACWI ex U.S. Index for the same time period.
Stocks that helped absolute performance included Constellation Software. Reporting strong 3Q2021 results, the stock followed the outperformance of technology stocks during the fourth quarter. Constellation Software is a Canadian based company specializing in vertical market solutions – back office/operational software in a wide range of verticals such as health care, law and public transit. Nestle was another top contributor that helped absolute performance. Nestle reported better than expected 3Q2021 growth and announced a trimming of its stake in L’Oreal and will use the proceeds for a buyback. Nestle is one of the largest food companies in the world with a vast product and geographic sales mix. Another holding that helped absolute performance was Diageo, a global leader in alcoholic beverages. Diageo, whose principal activity is manufacturing and distributing spirits and beer, held a Capital Markets Day where it increased its mid-term guidance.
Stocks that hurt absolute performance included CAE, a global leader in flying simulators and training for both commercial and military aircrafts. The company reported disappointing results on the defense segment during the third quarter because of limited access to customers' site due to Covid-19. Also, the outbreak of Omicron had a negative impact on air travel related stocks, including CAE. Flutter Entertainment, the largest global online betting platform, also hurt absolute performance. During the third quarter earnings report in November, Flutter guided down 2021’s EBITDA range by 5% due to non-recurring unexpected events (i.e. adverse sporting outcomes and a sudden change in Dutch regulation) and a deliberate downward management of UK online stakes in anticipation of upcoming regulation on online stakes. Lastly, Yum China (YUMC), the leading fast-food chain of KFC, Taco Bell and Pizza Hut within China, was another holding that hurt absolute performance. YUMC shares have been weighed by the spread of Omicron in China which is expected to result in restaurant traffic declines.
Markets continued to weigh positive economic growth and earnings recoveries from COVID-19 with the future economic impact of the new Omicron variant, further
regulatory crackdowns by the Chinese government and a slowing real estate sector in China, as well as a backdrop of more demanding valuations.
In buoyant markets, investors may be ignoring risks hiding in plain sight, such as high government debt, rising wages and inflation and supply chain issues. This could result in increased volatility and diverging company performance.
The merits of business models that can outperform against difficult backdrops are often underappreciated. For example, payments group Mastercard enjoys low capital intensity and high margins. It offers a degree of inflation protection by taking a percentage of value transacted and is positioned to capture changes in consumer spending. Another example is UK-based Rentokil, which should continue to see resilient growth thanks to its “essential” pest control services and can be a beneficiary of consolidation.
It takes time to diversify supply chains. One example is Taiwan Semiconductor Manufacturing Company, which is building capacity in Japan that will be ready in 2024. We believe companies that are less exposed to disruptions in supply chains, such as software and service-oriented companies, should perform better in the current environment, as will businesses that possess pricing power.
Gas shortages in Europe, along with rising commodity prices, are largely due to political decisions. In the energy transition, renewables are not yet able to meet the continent’s needs. Manufacturing and utilities will be hardest hit by rising costs and European consumers may not be prepared to pay higher prices for goods and energy.
EM currencies, excluding China’s renminbi, are the cheapest they have been since 2014, while current account deficits are in a better place than when we last saw tapering in key markets, such as India. Emerging markets stocks are trading at attractive valuations relative to developed market peers, underscoring the long-term opportunity of the emerging markets asset class.
The U.S. market has outperformed international over the last decade, but there have been periods in the past when international equities outperformed. International stocks can help U.S. investors diversify currency risk and provide diversification across sectors as some of the
Penn Series Funds, Inc.
Management’s Discussion of Fund Performance
world’s best consumer staples and luxury goods companies can be found in Europe.
Penn Mutual Asset Management, LLC
Investment Adviser
Vontobel Asset Management
Investment Sub-Adviser
Cumulative Performance Comparison
December 31, 2011 — December 31, 2021
An investment of $10,000 in the International Equity Fund on December 31, 2011 would have grown to $24,726. For the purpose of comparison, the graph also shows the change in the Fund’s benchmark, the MSCI ACWI ex-U.S. Index, during the same period. A $10,000 investment in the MSCI ACWI ex-U.S. Index on December 31, 2011 would have grown to $20,196.
| Average Annual Total Returns1 as of 12/31/21 |
| | 1 Year | | 5 Year | | 10 Year |
| International Equity Fund | 12.23% | | 13.76% | | 9.48% |
| MSCI ACWI ex-U.S. Index | 7.82% | | 9.61% | | 7.28% |
| 1 | The performance information shown here does not reflect variable account charges and fees. Past performance is not predictive of future performance. Shares may be worth more or less when redeemed than when purchased. Assumes reinvestment of all dividends. |
Portfolio Composition as of 12/31/21
| | Percent of
Total Investments1 |
| United Kingdom | 18.1 % |
| Canada | 12.9 % |
| Switzerland | 10.4 % |
| Japan | 9.9 % |
| France | 8.6 % |
| Netherlands | 7.2 % |
| United States | 6.9 % |
| South Korea | 4.8 % |
| Ireland | 4.5 % |
| India | 3.9 % |
| Luxembourg | 3.2 % |
| Mexico | 2.9 % |
| Sweden | 2.6 % |
| China | 2.1 % |
| Italy | 2.0% |
| | 100.0% |
| 1 | Portfolio holdings are presented as a percentage of total investments before short-term investments. The categories shown represent the countries in which the securities are denominated. |
Penn Series Funds, Inc.
Management’s Discussion of Fund Performance
Emerging Markets Equity Fund
The Penn Series Emerging Markets Equity Fund returned -5.69% for the twelve-month period ending December 31, 2021, compared to the -2.54% return for its benchmark, the MSCI Emerging Markets Index for the same time period.
Stocks that helped absolute performance included SK hynix, a leader in the memory semiconductor space. SK hynix reported record high third quarter sales/profits during its October quarterly results and shared a high conviction for strong chip demand in 4Q21. Its U.S. competitor, Micron, also reported strong quarterly results and shared positive guidance. The company is seeing early signs of a stabilization in demand from PC customers. End-demand from the solid growth drivers remains intact across end markets, particularly in datacenter, 5G smartphones and auto/industrial. Taiwan Semiconductor Manufacturing Company (TSMC), a Taiwanese logic chip maker, was another top contributor to absolute performance. TSMC has outgrown the global semiconductor market by an average of nine percentage points over the last 20 years. Semiconductor cycle and peak margins have been a key market concern recently due to rising capital expenditure spend. However, TSMC’s customers are willing to pay more for the value that TSMC delivers. Hence, the company expects long-term gross margins to achieve 50% or higher. Despite end-market softness for PC and smartphone, TSMC remains confident that its capacity will remain tight throughout 2022. ChaCha Food, a Chinese snack food maker, was another contributor that helped absolute performance. ChaCha is the leading player in roasted seeds, commanding roughly 40% market share. It is also the leading player in nuts, known for its high quality, fresh products and differentiated flavors. The company has seen solid volume growth continuing for its core seeds business and additionally has demonstrated strong pricing power after putting through 8-18% price increases.
Stocks that hurt absolute performance included Chinese e-commerce giant Alibaba. In November, Alibaba reported quarterly results that fell short of consensus expectations. Total revenue grew 29% year-on-year, 3% below expectations while EBITDA declined 27%, missing consensus by 13%, in part due to a step-up in investment in new areas. Additionally, Alibaba has been subsidizing merchants during this weaker economic period. Management lowered its FY22 revenue growth guidance to +20-23% (from +30%) seeing a more challenging
macroeconomic environment and increased competition. Yum China (YUMC), leading fast-food chain in China, was another holding that hurt absolute performance. YUMC shares have been weighed by the spread of Omicron in China, which is expected to result in restaurant traffic declines. YUMC has the exclusive right to operate and sublicense KFC, Pizza Hut and Taco Bell in China. Hindustan Unilever (HUL), the largest fast-moving consumer goods company in India, was another holding that hurt absolute performance. HUL traded down after reporting earnings in October due to missing consensus EPS estimates. Also, Nielsen in India pointed to a slowdown in rural consumptions during the quarter. While HUL did not experience a slowdown in their rural business, the Nielsen report increased investor hesitancy. Though the company missed consensus estimates, we believe HUL continues to benefit from the recovery in Indian consumer spending and are managing the key input cost inflation occurring across the country by leveraging their pricing power.
Select emerging markets are poised for an economic rebound. In general, emerging markets central banks have not stimulated as much as developed markets. Some emerging markets central banks have raised interest rates quickly to combat sharp increases in inflation. Brazil has been among the most aggressive in this regard, which could negatively impact its GDP growth in 2022. Inflation is picking up in India and Indonesia, but monetary policy there has been more supportive, particularly in India, and interest rate rises are likely to be gradual. Both countries are coming off periods of weak credit growth and relatively slow economic growth, even before COVID-19. We see a lot of pent-up demand on the credit side and potential for a strong economic recovery this year.
Emerging markets currencies, excluding China’s renminbi, are the cheapest they have been since 2014, while current account deficits are in a better place in key markets like India and Indonesia. Emerging markets stocks are trading at attractive valuations (12x 2022 forecast earnings vs 18x for developed market stocks), underscoring the long-term opportunity of the emerging markets asset class.
The speed and rate of regulatory action in China took markets by surprise. Some measures reflect Beijing’s concern about social issues, such as the price of education and minors playing online games. We approach China with caution and are avoiding sectors that may be under a longer-term cloud. Regulation on e-commerce, however, shows China catching up with
Penn Series Funds, Inc.
Management’s Discussion of Fund Performance
developed markets, and intervention could level the playing field for some companies such as JD.com, China’s second largest B2C online platform after Alibaba. The consumer staples space is less affected. For example, ChaCha Food is able to pursue volume growth and expansion opportunities with strong pricing coming through, and stationery maker Shanghai M&G has room for consolidation.
Retail investors in China have pushed up valuations of some stocks, particularly A-shares, although there are select quality names that are trading at reasonable valuations. As fundamental long-term investors, we can take advantage of this volatility by focusing on companies with leading industry positions and good volume growth that are taking market share.
Penn Mutual Asset Management, LLC
Investment Adviser
Vontobel Asset Management, Inc.
Investment Sub-Adviser
Cumulative Performance Comparison
December 31, 2011 — December 31, 2021
An investment of $10,000 in the Emerging Markets Equity Fund on December 31, 2011 would have grown to $14,606. For the purpose of comparison, the graph also shows the change in the Fund’s benchmark, the MSCI Emerging Markets Index, during the same period. A $10,000 investment in the MSCI Emerging Markets Index on December 31, 2011 would have grown to $17,062.
| Average Annual Total Returns1 as of 12/31/21 |
| | 1 Year | | 5 Year | | 10 Year |
| Emerging Markets Equity Fund | (5.69%) | | 6.62% | | 3.86% |
| MSCI Emerging Markets Index | (2.54%) | | 9.87% | | 5.49% |
| 1 | The performance information shown here does not reflect variable account charges and fees. Past performance is not predictive of future performance. Shares may be worth more or less when redeemed than when purchased. Assumes reinvestment of all dividends. |
Portfolio Composition as of 12/31/21
| | Percent of
Total Investments1 |
| China | 27.7 % |
| India | 21.3 % |
| Taiwan | 14.1 % |
| South Korea | 12.9 % |
| Indonesia | 7.0% |
| Mexico | 5.4 % |
| Hong Kong | 4.4 % |
| Brazil | 4.1 % |
| United Kingdom | 2.5 % |
| Thailand | 0.6 % |
| | 100.0% |
| 1 | Portfolio holdings are presented as a percentage of total investments before short-term investments. The categories shown represent the countries in which the securities are denominated. |
Penn Series Funds, Inc.
Management’s Discussion of Fund Performance
Real Estate Securities Fund
The Penn Series Real Estate Securities Fund returned 42.70% for the twelve-month period ending December 31, 2021, compared to the 41.30% return for its benchmark, the FTSE NAREIT All Equity REITs Index for the same time period.
U.S. real estate securities had a sizable gain in the year, as they continued to rally from their lows in early 2020. Progress in vaccine distribution allowed certain regions to begin lifting restrictions on public gatherings, business activities and travel, notwithstanding some fits and starts as new virus variants emerged. Economic reopenings and additional fiscal relief led to increasing activity, generating stronger demand for real estate. Supply growth in many property sectors slowed amid labor shortages and rising construction costs, giving landlords greater pricing power to negotiate rents. Borrowing costs for many public real estate companies remained near historical lows. These positive conditions drove improving investor optimism, resulting in lower cap rates (higher property values) and higher earnings multiples.
Returns were positive for all property types. Top performers included regional mall owners, aided by a strong recovery in retail fundamentals. Self storage, which had been one of the more resilient sectors through the pandemic, continued to see strong demand amid continued moving activity, driving rates for new customers up significantly from 2020 levels. Apartments also outperformed. Leasing trends for apartments in U.S. coastal markets have bounced back quickly, and Sunbelt markets remained exceptionally strong, fueled by strong housing demand. Office companies advanced but trailed the Index amid an uncertain demand outlook due to work-from-home trends.
The portfolio had a positive total return for the year and outperformed its benchmark. Factors that helped relative performance included our overweight in regional malls, specifically Simon Property Group, an owner of Class A properties that gained more than 90% in the year. Our overweight in the self storage sector also aided performance, as did stock selection in the diversified sector, where we had a beneficial out-of-index position in Jones Lang LaSalle. Stock selection in the data centers sector aided performance as well, due mostly to our overweight in CyrusOne, which outperformed. Our underweight in the office sector further helped performance.
Factors that detracted from relative performance included stock selection in the industrial sector. Our underweight in Prologis, which reflects our view on its relative valuation, detracted. Prologis continued to benefit from the widespread demand for warehouse and logistics facilities. Stock selection in apartments also hindered performance; we were underweight Mid-America Communities, which was a top performer in the sector.
Real estate market activity is strong, and construction starts in many sectors have been delayed by labor shortages and higher costs for building materials, reducing supply pressures. Long-term cash flow growth prospects are above average, and earnings estimates and asset values are rising. While a strengthening economy has led to greater inflation and has caused the market to price in interest rate hikes, we believe REITs are well positioned to tolerate an eventual increase in rates. A strong economic backdrop should lead to higher demand for many real estate property types, allowing landlords to raise rents. Meanwhile, REITs continue to offer attractive levels of income relative to traditional asset classes, and the “new-economy normal” could create sector opportunities for the next several years.
In terms of notable sector positioning, we are overweight hotels, with a preference for the regional gaming business, which is driven by consumers rather than corporate demand or air travel. Within retail, our allocation is concentrated in companies with high-quality assets that we believe may be long-term winners. Our substantial overweight in health care reflects our positive outlook for life science and senior housing properties. Self storage is also among our larger sector overweights given improving demand due to increased moving activity.
Penn Mutual Asset Management, LLC
Investment Adviser
Cohen & Steers Capital Management
Investment Sub-Adviser
Penn Series Funds, Inc.
Management’s Discussion of Fund Performance
Cumulative Performance Comparison
December 31, 2011 — December 31, 2021
An investment of $10,000 in the Real Estate Securities Fund on December 31, 2011 would have grown to $32,552. For the purpose of comparison, the graph also shows the change in the Fund’s benchmark, the FTSE NAREIT All Equity REITs Index, during the same period. A $10,000 investment in the FTSE NAREIT All Equity REITs Index on December 31, 2011 would have grown to $31,669.
| Average Annual Total Returns1 as of 12/31/21 |
| | 1 Year | | 5 Year | | 10 Year |
| Real Estate Securities Fund | 42.70% | | 13.49% | | 12.53% |
| FTSE NAREIT All Equity REITs Index | 41.30% | | 12.46% | | 12.22% |
| 1 | The performance information shown here does not reflect variable account charges and fees. Past performance is not predictive of future performance. Shares may be worth more or less when redeemed than when purchased. Assumes reinvestment of all dividends. |
Portfolio Composition as of 12/31/21
| | Percent of
Total Investments1 |
| Diversified | 32.4 % |
| Apartments | 14.8 % |
| Healthcare | 12.0% |
| Storage & Warehousing | 10.3 % |
| Regional Malls | 6.5 % |
| Single Tenant | 4.8 % |
| Industrial | 4.8 % |
| Strip Centers | 3.6 % |
| Hotels & Resorts | 2.9 % |
| Real Estate | 2.5 % |
| Manufactured Homes | 2.2 % |
| Office Property | 1.9 % |
| Lodging | 0.8 % |
| Entertainment | 0.5 % |
| | 100.0% |
| 1 | Portfolio holdings are presented as a percentage of total investments before short-term investments. |
Penn Series Funds, Inc.
Management’s Discussion of Fund Performance
Aggressive Allocation Fund
The Penn Series Aggressive Allocation Fund returned 16.42% for the twelve-month period ending December 31, 2021, compared to its benchmarks, the Russell 3000 Index’s return of 25.66% and the Bloomberg U.S. Aggregate Bond Index’s return of -1.54% for the same time period.
The Aggressive Allocation Fund is comprised of a target allocation of 90% equity funds and 10% fixed income funds. The equity allocation of the Fund is comprised of domestic equity funds ranging from large capitalization funds to small capitalization funds as well as developed international and emerging markets equity funds and the fixed income portion is primarily allocated to intermediate-term and short-term bond funds.
The asset allocation of the Aggressive Allocation Fund contributed negatively to its performance. During the period, the Fund’s allocation to large cap value stocks, small cap growth stocks, mid cap growth stocks, emerging markets and international equities underperformed the Russell 3000 Index. The allocation in large cap growth stocks, small cap value stocks, mid cap value stocks and REITs generated positive asset allocation performance. On the fixed income side, allocation to high yield bonds and short-term bonds contributed positively to performance.
Fund selection of the Aggressive Allocation Fund contributed negatively to its performance. During the period, our managers for the Penn Series Large Cap Value, Mid Cap Growth, SMID Cap Growth, SMID Cap Value, Small Cap Growth, Flexibly Managed and International Equity Funds outperformed their respective benchmark by more than 2%, while the Penn Series Large Growth Stock, Mid Core Value, Mid Cap Value and Emerging Markets Equity Funds underperformed their respective benchmarks by more than 2%. On the fixed income side, Penn Series Limited Maturity Bond outperformed its benchmark and the Penn Series High Yield Bond Fund underperformed its benchmark.
Looking ahead, interest rate policy is expected to tighten in response to rising inflation. The market is currently predicting three rate hikes throughout the course of 2022, along with the end of quantitative easing. We will continually review the Fund to help ensure that it remains consistent with its investment objective by making adjustments, when necessary.
Penn Mutual Asset Management, LLC
Investment Adviser
Cumulative Performance Comparison
December 31, 2011 — December 31, 2021
An investment of $10,000 in the Aggressive Allocation Fund on December 31, 2011 would have grown to $27,203. For the purpose of comparison, the graph also shows the change in the Fund’s benchmarks, the Russell 3000 Index and the Bloomberg U.S. Aggregate Bond Index, during the same period. A $10,000 investment in the Russell 3000 Index on December 31, 2011 would have grown to $45,285. A $10,000 investment in the Bloomberg U.S. Aggregate Bond Index on December 31, 2011 would have grown to $13,307.
| Average Annual Total Returns1 as of 12/31/21 |
| | 1 Year | | 5 Year | | 10 Year |
| Aggressive Allocation Fund | 16.42% | | 11.23% | | 10.53% |
| Russell 3000 Index | 25.66% | | 17.97% | | 16.30% |
| Bloomberg U.S. Aggregate Bond Index | (1.54%) | | 3.57% | | 2.90% |
| 1 | The performance information shown here does not reflect variable account charges and fees. Past performance is not predictive of future performance. Shares may be worth more or less when redeemed than when purchased. Assumes reinvestment of all dividends. |
Penn Series Funds, Inc.
Management’s Discussion of Fund Performance
| Asset Allocation Target as of 12/31/21 | |
| Large Cap Value Stocks | 26.0% |
| International Stocks | 24.0% |
| Large Cap Growth Stocks | 13.0% |
| Mid Cap Value Stocks | 8.0% |
| Emerging Markets Stocks | 6.0% |
| Short Term Bonds | 5.0% |
| Small Cap Growth Stocks | 5.0% |
| Domestic REITs | 3.0% |
| Mid Cap Growth Stocks | 3.0% |
| High Yield Bonds | 3.0% |
| Small Cap Value Stocks | 2.0% |
| Intermediate Bonds | 2.0% |
| | 100.0% |
Penn Series Funds, Inc.
Management’s Discussion of Fund Performance
Moderately Aggressive Allocation Fund
The Penn Series Moderately Aggressive Allocation Fund returned 15.33% for the twelve-month period ending December 31, 2021, compared to its benchmarks, the Russell 3000 Index’s return of 25.66% and the Bloomberg U.S. Aggregate Bond Index’s return of -1.54% for the same time period.
The Moderately Aggressive Allocation Fund is comprised of a target allocation of 80% equity funds and 20% fixed income funds. The equity allocation of the Fund is comprised of domestic equity funds ranging from large capitalization funds to small capitalization funds as well as developed international and emerging markets equity funds and the fixed income portion is primarily allocated to intermediate-term and short-term bond funds.
The asset allocation of the Moderately Aggressive Allocation Fund contributed negatively to its performance. During the period, the Fund’s allocation to large cap value stocks, small cap growth stocks, mid cap growth stocks, emerging markets and international equities underperformed the Russell 3000 Index. The allocation in large cap growth, small cap value stocks, mid cap value stocks and REITs generated positive asset allocation performance. On the fixed income side, allocation to high yield bonds and short-term bonds contributed positively to performance.
Fund selection of the Moderately Aggressive Allocation Fund contributed negatively to its performance. During the period, our managers for the Penn Series Large Cap Value, Mid Cap Growth, SMID Cap Growth, SMID Cap Value, Small Cap Growth, Flexibly Managed and International Equity Funds outperformed their respective benchmark by more than 2%, while the Penn Series Large Growth Stock, Mid Core Value, Mid Cap Value and Emerging Markets Equity Funds underperformed their respective benchmarks by more than 2%. On the fixed income side, Penn Series Quality Bond and Limited Maturity Bond Funds outperformed their respective benchmarks, while the Penn Series High Yield Bond Fund underperformed its benchmark.
Looking ahead, interest rate policy is expected to tighten in response to rising inflation. The market is currently predicting three rate hikes throughout the course of 2022, along with the end of quantitative easing. We will continually review the Fund to help ensure that it
remains consistent with its investment objective by making adjustments, when necessary.
Penn Mutual Asset Management, LLC
Investment Adviser
Cumulative Performance Comparison
December 31, 2011 — December 31, 2021
An investment of $10,000 in the Moderately Aggressive Allocation Fund on December 31, 2011 would have grown to $25,471. For the purpose of comparison, the graph also shows the change in the Fund’s benchmarks, the Russell 3000 Index and the Bloomberg U.S. Aggregate Bond Index, during the same period. A $10,000 investment in the Russell 3000 Index on December 31, 2011 would have grown to $45,285. A $10,000 investment in the Bloomberg U.S. Aggregate Bond Index on December 31, 2011 would have grown to $13,307.
| Average Annual Total Returns1 as of 12/31/21 |
| | 1 Year | | 5 Year | | 10 Year |
| Moderately Aggressive Allocation Fund | 15.33% | | 10.74% | | 9.80% |
| Russell 3000 Index | 25.66% | | 17.97% | | 16.30% |
| Bloomberg U.S. Aggregate Bond Index | (1.54%) | | 3.57% | | 2.90% |
| 1 | The performance information shown here does not reflect variable account charges and fees. Past performance is not predictive of future performance. Shares may be worth more or less when redeemed than when purchased. Assumes reinvestment of all dividends. |
Penn Series Funds, Inc.
Management’s Discussion of Fund Performance
| Asset Allocation Target as of 12/31/21 | |
| Large Cap Value Stocks | 24.0% |
| International Stocks | 19.0% |
| Large Cap Growth Stocks | 12.0% |
| Short Term Bonds | 10.0% |
| Mid Cap Value Stocks | 7.0% |
| Intermediate Bonds | 7.0% |
| Emerging Markets Stocks | 5.0% |
| Small Cap Growth Stocks | 4.0% |
| Small Cap Value Stocks | 3.0% |
| Domestic REITs | 3.0% |
| Mid Cap Growth Stocks | 3.0% |
| High Yield Bonds | 3.0% |
| | 100.0% |
Penn Series Funds, Inc.
Management’s Discussion of Fund Performance
Moderate Allocation Fund
The Penn Series Moderate Allocation Fund returned 11.32% for the twelve-month period ending December 31, 2021, compared to its benchmarks, the Russell 3000 Index’s return of 25.66% and the Bloomberg U.S. Aggregate Bond Index’s return of -1.54% for the same time period.
The Moderate Allocation Fund is comprised of a target allocation of 60% equity funds and 40% fixed income funds. The equity allocation of the Fund is comprised of domestic equity funds ranging from large capitalization funds to small capitalization funds as well as developed international and emerging markets equity funds and the fixed income portion is primarily allocated to intermediate-term and short-term bond funds.
The asset allocation of the Moderate Allocation Fund contributed negatively to its performance. During the period, the Fund’s allocation to large cap value stocks, small cap growth stocks, mid cap growth stocks, emerging markets and international equities underperformed the Russell 3000 Index. The allocation in large cap growth, small cap value stocks, mid cap value stocks and REITs generated positive asset allocation performance. On the fixed income side, allocation to high yield bonds and short-term bonds contributed positively to performance.
Fund selection of the Moderate Allocation Fund contributed negatively to its performance. During the period, our managers for the Penn Series Large Cap Value, Mid Cap Growth, SMID Cap Growth, SMID Cap Value, Flexibly Managed and International Equity Funds outperformed their respective benchmark by more than 2%, while the Penn Series Large Growth Stock, Mid Core Value and Emerging Markets Equity Funds underperformed their respective benchmarks by more than 2%. On the fixed income side, Penn Series Quality Bond and Limited Maturity Bond Funds outperformed their respective benchmarks, while the Penn Series High Yield Bond Fund underperformed its benchmark.
Looking ahead, interest rate policy is expected to tighten in response to rising inflation. The market is currently predicting three rate hikes throughout the course of 2022, along with the end of quantitative easing. We will continually review the Fund to help ensure that it remains consistent with its investment objective by making adjustments, when necessary.
Penn Mutual Asset Management, LLC
Investment Adviser
Cumulative Performance Comparison
December 31, 2011 — December 31, 2021
An investment of $10,000 in the Moderate Allocation Fund on December 31, 2011 would have grown to $22,120. For the purpose of comparison, the graph also shows the change in the Fund’s benchmarks, the Russell 3000 Index and the Bloomberg U.S. Aggregate Bond Index, during the same period. A $10,000 investment in the Russell 3000 Index on December 31, 2011 would have grown to $45,285. A $10,000 investment in the Bloomberg U.S. Aggregate Bond Index on December 31, 2010 would have grown to $13,307.
| Average Annual Total Returns1 as of 12/31/21 |
| | 1 Year | | 5 Year | | 10 Year |
| Moderate Allocation Fund | 11.32% | | 9.24% | | 8.26% |
| Russell 3000 Index | 25.66% | | 17.97% | | 16.30% |
| Bloomberg U.S. Aggregate Bond Index | (1.54%) | | 3.57% | | 2.90% |
| 1 | The performance information shown here does not reflect variable account charges and fees. Past performance is not predictive of future performance. Shares may be worth more or less when redeemed than when purchased. Assumes reinvestment of all dividends. |
Penn Series Funds, Inc.
Management’s Discussion of Fund Performance
| Asset Allocation Target as of 12/31/21 | |
| Intermediate Bonds | 22.0% |
| Large Cap Value Stocks | 19.0% |
| Short Term Bonds | 14.0% |
| International Stocks | 12.0% |
| Large Cap Growth Stocks | 10.0% |
| Mid Cap Value Stocks | 5.0% |
| Emerging Markets Stocks | 5.0% |
| High Yield Bonds | 4.0% |
| Mid Cap Growth Stocks | 3.0% |
| Small Cap Value Stocks | 2.0% |
| Small Cap Growth Stocks | 2.0% |
| Domestic REITs | 2.0% |
| | 100.0% |
Penn Series Funds, Inc.
Management’s Discussion of Fund Performance
Moderately Conservative Allocation Fund
The Penn Series Moderately Conservative Allocation Fund returned 8.58% for the twelve-month period ending December 31, 2021, compared to its benchmarks, the Russell 3000 Index’s return of 25.66% and the Bloomberg U.S. Aggregate Bond Index’s return of -1.54% for the same time period.
The Moderately Conservative Allocation Fund is comprised of a target allocation of 40% equity funds and 60% fixed income funds. The equity allocation of the Fund is comprised of domestic equity funds ranging from large capitalization funds to small capitalization funds as well as developed international and emerging markets equity funds and the fixed income portion is primarily allocated to intermediate-term and short-term bond funds.
Although the Moderately Conservative Allocation Fund’s allocation to large cap value stocks, small cap growth stocks, emerging markets and international equities underperformed the Russell 3000 Index, the allocation in large cap growth stocks, small cap value stocks, mid cap value stocks and REITs generated positive asset allocation performance. On the fixed income side, allocation to high yield bonds and short-term bonds contributed positively to performance.
Fund selection of the Moderately Conservative Allocation Fund contributed positively to its performance. During the period, our managers for the Penn Series Large Cap Value, SMID Cap Value, Flexibly Managed and International Equity Funds outperformed their respective benchmark by more than 2%, while the Penn Series Mid Core Value and Emerging Markets Equity Funds underperformed their respective benchmarks by more than 2%. On the fixed income side, Penn Series Quality Bond and Limited Maturity Bond Funds outperformed their respective benchmarks, while the Penn Series High Yield Bond Fund underperformed its benchmark.
Looking ahead, interest rate policy is expected to tighten in response to rising inflation. The market is currently predicting three rate hikes throughout the course of 2022, along with the end of quantitative easing. We will continually review the Fund to help ensure that it remains consistent with its investment objective by making adjustments, when necessary.
Penn Mutual Asset Management, LLC
Investment Adviser
Cumulative Performance Comparison
December 31, 2011 — December 31, 2021
An investment of $10,000 in the Moderately Conservative Allocation Fund on December 31, 2011 would have grown to $18,814. For the purpose of comparison, the graph also shows the change in the Fund’s benchmarks, the Russell 3000 Index and the Bloomberg U.S. Aggregate Bond Index, during the same period. A $10,000 investment in the Russell 3000 Index on December 31, 2011 would have grown to $45,285. A $10,000 investment in the Bloomberg U.S. Aggregate Bond Index on December 31, 2011 would have grown to $13,307.
| Average Annual Total Returns1 as of 12/31/21 |
| | 1 Year | | 5 Year | | 10 Year |
| Moderately Conservative Allocation Fund | 8.58% | | 7.41% | | 6.52% |
| Russell 3000 Index | 25.66% | | 17.97% | | 16.30% |
| Bloomberg U.S. Aggregate Bond Index | (1.54%) | | 3.57% | | 2.90% |
| 1 | The performance information shown here does not reflect variable account charges and fees. Past performance is not predictive of future performance. Shares may be worth more or less when redeemed than when purchased. Assumes reinvestment of all dividends. |
Penn Series Funds, Inc.
Management’s Discussion of Fund Performance
| Asset Allocation Target as of 12/31/21 | |
| Intermediate Bonds | 32.0% |
| Short Term Bonds | 23.0% |
| Large Cap Value Stocks | 15.0% |
| International Stocks | 8.0% |
| Large Cap Growth Stocks | 7.0% |
| High Yield Bonds | 5.0% |
| Mid Cap Value Stocks | 4.0% |
| Emerging Markets Stocks | 2.0% |
| Domestic REITs | 2.0% |
| Small Cap Value Stocks | 1.0% |
| Small Cap Growth Stocks | 1.0% |
| | 100.0% |
Penn Series Funds, Inc.
Management’s Discussion of Fund Performance
Conservative Allocation Fund
The Penn Series Conservative Allocation Fund returned 4.52% for the twelve-month period ending December 31, 2021, compared to its benchmarks, the Russell 3000 Index’s return of 25.66% and the Bloomberg U.S. Aggregate Bond Index’s return of -1.54% for the same time period.
The Conservative Allocation Fund is comprised of a target allocation of 20% equity funds and 80% fixed income funds. The equity allocation of the Fund is comprised of domestic equity funds ranging from large capitalization funds to small capitalization funds as well as developed international and emerging markets equity funds and the fixed income portion is primarily allocated to intermediate-term and short-term bond funds.
The asset allocation of the Conservative Allocation Fund contributed positively to its performance. During the period, the Fund’s allocation to large cap growth stocks, mid cap value stocks and REITs outperformed the Russell 3000 Index. However, allocations to large cap value stocks and international equities contributed negatively to performance. On the fixed income side, allocation to high yield bonds and short-term bonds contributed positively to performance.
Fund selection of the Conservative Allocation Fund contributed positively to its performance. During the period, our managers for the Penn Series Large Cap Value, Flexibly Managed and International Equity Funds outperformed their respective benchmark by more than 2%, while the Penn Series Mid Core Value Fund underperformed its respective benchmark by more than 2%. On the fixed income side, Penn Series Quality Bond and Limited Maturity Bond Funds outperformed their respective benchmarks, while the Penn Series High Yield Bond Fund underperformed its benchmark.
Looking ahead, interest rate policy is expected to tighten in response to rising inflation. The market is currently predicting three rate hikes throughout the course of 2022, along with the end of quantitative easing. We will continually review the Fund to help ensure that it remains consistent with its investment objective by making adjustments, when necessary.
Penn Mutual Asset Management, LLC
Investment Adviser
Cumulative Performance Comparison
December 31, 2011 — December 31, 2021
An investment of $10,000 in the Conservative Allocation Fund on December 31, 2011 would have grown to $15,589. For the purpose of comparison, the graph also shows the change in the Fund’s benchmarks, the Russell 3000 Index and the Bloomberg U.S. Aggregate Bond Index, during the same period. A $10,000 investment in the Russell 3000 Index on December 31, 2011 would have grown to $45,285. A $10,000 investment in the Bloomberg U.S. Aggregate Bond Index on December 31, 2011 would have grown to $13,307.
| Average Annual Total Returns1 as of 12/31/21 |
| | 1 Year | | 5 Year | | 10 Year |
| Conservative Allocation Fund | 4.52% | | 5.41% | | 4.54% |
| Russell 3000 Index | 25.66% | | 17.97% | | 16.30% |
| Bloomberg U.S. Aggregate Bond Index | (1.54%) | | 3.57% | | 2.90% |
| 1 | The performance information shown here does not reflect variable account charges and fees. Past performance is not predictive of future performance. Shares may be worth more or less when redeemed than when purchased. Assumes reinvestment of all dividends. |
| Asset Allocation Target as of 12/31/21 | |
| Intermediate Bonds | 42.0% |
| Short Term Bonds | 33.0% |
| Large Cap Value Stocks | 10.0% |
| High Yield Bonds | 5.0% |
| Large Cap Growth Stocks | 4.0% |
| International Stocks | 3.0% |
| Mid Cap Value Stocks | 2.0% |
| Domestic REITs | 1.0% |
| | 100.0% |
Important Information about Fund Expenses
Hypothetical Examples of a $1,000 Investment (Unaudited)
We believe that it is important for you to understand the effect of fees on your investment. All mutual funds have operating expenses. As a participant in any of the Penn Series Funds, you incur ongoing costs, which include costs for portfolio management, administrative services, and shareholder reports among others. Operating expenses, which are deducted from a fund’s gross income, directly reduce the investment return of the fund. A fund’s expenses are expressed as a percentage of its average net assets. This figure is known as the expense ratio.
The Penn Series Funds are the underlying investment vehicles for the variable life and variable annuity contracts issued by The Penn Mutual Life Insurance Company and its subsidiary, The Penn Insurance and Annuity Company. These contracts have transaction costs, additional administrative expense fees and mortality and expense risk charges. Because of these additional expenses, the costs to investors will be higher than the figures shown in the following expense examples. The expense examples below are intended to help you understand your ongoing costs (in dollars) of investing in each fund and to compare these costs with the ongoing costs of investing in other funds.
These examples are based on an investment of $1,000 invested for six months beginning July 1, 2021 and held through December 31, 2021. The examples illustrate your fund’s costs in two ways:
| • | Actual Fund Performance in the table below provides information about actual account values and actual expenses. The “Ending Value” shown is derived from the fund’s actual return, and “Expenses Paid During Period” shows the dollar amount that would have been paid by an investor who started with $1,000 in the fund. You may use this information, together with the amount you invested, to estimate the expenses that you paid over the period. To do so, simply divide your account value by $1,000 (for example, an $8,600 account value divided by $1,000 = 8.6), then multiply the result by the number given for your fund under the heading entitled “Expenses Paid During Period.” |
| • | Hypothetical 5% Annual Return is intended to help you compare your fund’s costs with those of other mutual funds. It assumes that the fund had a return of 5% before expenses during the period shown, but that the expense ratio is unchanged. In this case — because the return used is not the fund’s actual return — the results do not apply to your investment. The example is useful in making comparisons because the Securities and Exchange Commission requires all mutual funds to calculate expenses based on a 5% return. You can assess your fund’s cost by comparing this hypothetical example with the hypothetical examples that appear in shareholders reports of other funds. Because the return used is not an actual return, it may not be used to estimate the actual ending account value or expenses you paid for the period. |
Please note that the expenses shown in the table are only meant to highlight and help you compare your ongoing costs of investing in the funds and do not reflect any fees and charges deducted under your insurance contract. The “Annualized Expense Ratio” represents the actual expenses for the six-month period indicated and will be different from the expense ratio in the Financial Highlights which is for the year ended December 31, 2021.
Disclosure of Fund Expenses
For the Period July 1, 2021 to December 31, 2021
Expense Table
| | Beginning
Value
July 1,
2021 | Ending
Value
December 31,
2021 | Annualized
Expense
Ratio | Expenses
Paid During
Period* |
| Money Market Fund | | | | |
| Actual | $1,000.00 | $1,000.10 | 0.03% | $0.15 |
| Hypothetical | $1,000.00 | $ 1,025.05 | 0.03% | $0.15 |
| Limited Maturity Bond Fund | | | | |
| Actual | $1,000.00 | $ 997.80 | 0.69% | $ 3.47 |
| Hypothetical | $1,000.00 | $ 1,021.73 | 0.69% | $ 3.52 |
Important Information about Fund Expenses
Hypothetical Examples of a $1,000 Investment (Unaudited)
| | Beginning
Value
July 1,
2021 | Ending
Value
December 31,
2021 | Annualized
Expense
Ratio | Expenses
Paid During
Period* |
| Quality Bond Fund | | | | |
| Actual | $1,000.00 | $ 998.80 | 0.66% | $ 3.33 |
| Hypothetical | $1,000.00 | $ 1,021.88 | 0.66% | $ 3.36 |
| High Yield Bond Fund | | | | |
| Actual | $1,000.00 | $ 1,012.60 | 0.71% | $ 3.60 |
| Hypothetical | $1,000.00 | $ 1,021.63 | 0.71% | $ 3.62 |
| Flexibly Managed Fund | | | | |
| Actual | $1,000.00 | $ 1,076.60 | 0.86% | $ 4.50 |
| Hypothetical | $1,000.00 | $ 1,020.87 | 0.86% | $ 4.38 |
| Balanced Fund | | | | |
| Actual | $1,000.00 | $ 1,066.60 | 0.19% | $0.99 |
| Hypothetical | $1,000.00 | $ 1,024.25 | 0.19% | $0.97 |
| Large Growth Stock Fund | | | | |
| Actual | $1,000.00 | $ 1,035.00 | 0.93% | $ 4.77 |
| Hypothetical | $1,000.00 | $ 1,020.52 | 0.93% | $ 4.74 |
| Large Cap Growth Fund | | | | |
| Actual | $1,000.00 | $ 1,120.30 | 0.84% | $ 4.49 |
| Hypothetical | $1,000.00 | $ 1,020.97 | 0.84% | $ 4.28 |
| Large Core Growth Fund | | | | |
| Actual | $1,000.00 | $ 884.10 | 0.84% | $ 3.99 |
| Hypothetical | $1,000.00 | $ 1,020.97 | 0.84% | $ 4.28 |
| Large Cap Value Fund | | | | |
| Actual | $1,000.00 | $ 1,067.30 | 0.91% | $ 4.74 |
| Hypothetical | $1,000.00 | $ 1,020.62 | 0.91% | $ 4.63 |
| Large Core Value Fund | | | | |
| Actual | $1,000.00 | $ 1,073.70 | 0.93% | $ 4.86 |
| Hypothetical | $1,000.00 | $ 1,020.52 | 0.93% | $ 4.74 |
| Index 500 Fund | | | | |
| Actual | $1,000.00 | $ 1,114.80 | 0.34% | $ 1.81 |
| Hypothetical | $1,000.00 | $ 1,023.49 | 0.34% | $ 1.73 |
| Mid Cap Growth Fund | | | | |
| Actual | $1,000.00 | $ 1,048.10 | 1.01% | $ 5.21 |
| Hypothetical | $1,000.00 | $ 1,020.11 | 1.01% | $ 5.14 |
| Mid Cap Value Fund | | | | |
| Actual | $1,000.00 | $ 1,056.50 | 0.84% | $ 4.35 |
| Hypothetical | $1,000.00 | $ 1,020.97 | 0.84% | $ 4.28 |
| Mid Core Value Fund | | | | |
| Actual | $1,000.00 | $ 1,064.50 | 0.98% | $ 5.10 |
| Hypothetical | $1,000.00 | $ 1,020.27 | 0.98% | $ 4.99 |
| SMID Cap Growth Fund | | | | |
| Actual | $1,000.00 | $ 997.00 | 1.02% | $ 5.13 |
| Hypothetical | $1,000.00 | $ 1,020.06 | 1.02% | $ 5.19 |
| SMID Cap Value Fund | | | | |
| Actual | $1,000.00 | $ 1,069.30 | 1.16% | $ 6.05 |
| Hypothetical | $1,000.00 | $ 1,019.36 | 1.16% | $ 5.90 |
Important Information about Fund Expenses
Hypothetical Examples of a $1,000 Investment (Unaudited)
| | Beginning
Value
July 1,
2021 | Ending
Value
December 31,
2021 | Annualized
Expense
Ratio | Expenses
Paid During
Period* |
| Small Cap Growth Fund | | | | |
| Actual | $1,000.00 | $ 1,021.50 | 0.99% | $ 5.04 |
| Hypothetical | $1,000.00 | $ 1,020.21 | 0.99% | $ 5.04 |
| Small Cap Value Fund | | | | |
| Actual | $1,000.00 | $ 1,055.70 | 0.98% | $ 5.08 |
| Hypothetical | $1,000.00 | $ 1,020.27 | 0.98% | $ 4.99 |
| Small Cap Index Fund | | | | |
| Actual | $1,000.00 | $ 973.20 | 0.72% | $ 3.58 |
| Hypothetical | $1,000.00 | $ 1,021.58 | 0.72% | $ 3.67 |
| Developed International Index Fund | | | | |
| Actual | $1,000.00 | $ 1,018.50 | 0.87% | $ 4.43 |
| Hypothetical | $1,000.00 | $ 1,020.82 | 0.87% | $ 4.43 |
| International Equity Fund | | | | |
| Actual | $1,000.00 | $ 1,054.40 | 1.04% | $ 5.39 |
| Hypothetical | $1,000.00 | $ 1,019.96 | 1.04% | $ 5.30 |
| Emerging Markets Equity Fund | | | | |
| Actual | $1,000.00 | $ 904.30 | 1.23% | $ 5.90 |
| Hypothetical | $1,000.00 | $ 1,019.00 | 1.23% | $ 6.26 |
| Real Estate Securities Fund | | | | |
| Actual | $1,000.00 | $ 1,175.20 | 0.95% | $ 5.21 |
| Hypothetical | $1,000.00 | $ 1,020.42 | 0.95% | $ 4.84 |
| Aggressive Allocation Fund | | | | |
| Actual | $1,000.00 | $ 1,048.10 | 0.34% | $ 1.76 |
| Hypothetical | $1,000.00 | $ 1,023.49 | 0.34% | $ 1.73 |
| Moderately Aggressive Allocation Fund | | | | |
| Actual | $1,000.00 | $ 1,044.60 | 0.29% | $ 1.49 |
| Hypothetical | $1,000.00 | $ 1,023.74 | 0.29% | $ 1.48 |
| Moderate Allocation Fund | | | | |
| Actual | $1,000.00 | $ 1,032.40 | 0.29% | $ 1.49 |
| Hypothetical | $1,000.00 | $ 1,023.74 | 0.29% | $ 1.48 |
| Moderately Conservative Allocation Fund | | | | |
| Actual | $1,000.00 | $ 1,026.90 | 0.31% | $ 1.58 |
| Hypothetical | $1,000.00 | $ 1,023.64 | 0.31% | $ 1.58 |
| Conservative Allocation Fund | | | | |
| Actual | $1,000.00 | $ 1,015.20 | 0.33% | $ 1.68 |
| Hypothetical | $1,000.00 | $ 1,023.54 | 0.33% | $ 1.68 |
| * | Expenses are equal to the Fund’s annualized expense ratio multiplied by the average value over the period, multiplied by the number of days in the most recent fiscal half-year (184), then divided by 365. |
Penn Series Funds, Inc.
Schedule of Investments — December 31, 2021
Money Market Fund
| | Par
(000) | Value† |
| AGENCY OBLIGATIONS — 67.5% |
| Federal Farm Credit Banks | | |
| 0.530%, 01/18/22 | $ 1,425 | $ 1,425,318 |
| 2.600%, 01/18/22 | 1,500 | 1,501,776 |
| 1.600%, 01/21/22 | 1,000 | 1,000,845 |
| 0.050%, 01/31/22 | 10,000 | 9,999,583 |
| 0.040%, 02/10/22 | 5,000 | 4,999,778 |
| 0.040%, 02/24/22 | 2,000 | 1,999,967 |
| 0.375%, 04/08/22 | 6,961 | 6,966,773 |
| Federal Home Loan Banks | | |
| 0.040%, 01/12/22 | 2,000 | 1,999,975 |
| 0.025%, 01/19/22 | 10,000 | 9,999,875 |
| 2.430%, 02/28/22 | 10,000 | 10,036,980 |
| 2.500%, 03/11/22 | 12,145 | 12,201,899 |
| Federal Home Loan Mortgage Corp. | | |
| 2.375%, 01/13/22 | 10,715 | 10,723,120 |
| 0.250%, 06/08/22 | 1,875 | 1,876,281 |
| Federal National Mortgage Association | | |
| 2.000%, 01/05/22 | 8,468 | 8,469,791 |
| 2.625%, 01/11/22 | 3,728 | 3,730,612 |
| 0.035%, 01/12/22 | 10,000 | 9,999,893 |
| 2.250%, 04/12/22 | 5,607 | 5,640,998 |
Tennessee Valley Authority
0.030%, 01/05/22 | 7,000 | 6,999,977 |
TOTAL AGENCY OBLIGATIONS
(Cost $109,573,441) | | 109,573,441 |
|
| U.S. TREASURY OBLIGATIONS — 18.5% |
| U.S. Treasury Bills | | |
| 0.031%, 02/08/22 | 10,000 | 9,999,678 |
| 0.043%, 03/03/22 | 10,000 | 9,999,271 |
| 0.065%, 03/24/22 | 10,000 | 9,998,531 |
TOTAL U.S. TREASURY OBLIGATIONS
(Cost $29,997,480) | 29,997,480 |
| | Number of
Shares | |
| SHORT-TERM INVESTMENTS — 13.7% |
Goldman Sachs Financial Square Funds - Government Fund Institutional Shares (seven-day effective yield 0.020%)
(Cost $22,208,069) | 22,208,069 | 22,208,069 |
TOTAL INVESTMENTS — 99.7%
(Cost $161,778,990) | | $ 161,778,990 |
| Other Assets & Liabilities — 0.3% | 422,528 |
| TOTAL NET ASSETS — 100.0% | | $ 162,201,518 |
| † | See Security Valuation Note. |
Summary of inputs used to value the Fund’s investments as of 12/31/2021 are as follows (See Security Valuation Note):
| ASSETS TABLE |
| Description | Total
Market
Value at
12/31/2021 | Level 1
Quoted
Price | Level 2
Significant
Observable
Input | Level 3
Significant
Unobservable
Input |
| Agency Obligations | $109,573,441 | $ — | $109,573,441 | $— |
| U.S. Treasury Obligations | 29,997,480 | — | 29,997,480 | — |
| Short-Term Investments | 22,208,069 | 22,208,069 | — | — |
| Total Investments | $ 161,778,990 | $ 22,208,069 | $ 139,570,921 | $ — |
It is the Fund's practice to recognize transfers into and transfers out of Level 3 at the fair value hierarchy as of the beginning of period. The Fund did not have any transfers into and transfers out of Level 3 fair value hierarchy during the reporting period.
The accompanying notes are an integral part of these financial statements.
Penn Series Funds, Inc.
Schedule of Investments — December 31, 2021
Limited Maturity Bond Fund
| | Par
(000) | Value† |
| ASSET BACKED SECURITIES — 31.6% |
Anchorage Capital CLO Ltd., Series 2013-1A Class A2R (3 M ICE LIBOR + 1.650%), 144A
1.771%, 10/13/30@,• | $ 2,830 | $ 2,826,697 |
Arch Street CLO Ltd., Series 2016-2A Class BR2 (3 M ICE LIBOR + 1.700%, Floor 1.700%), 144A
1.832%, 10/20/28@,• | 1,000 | 1,000,051 |
ASSURANT CLO Ltd., Series 2018-2A Class A (3 M ICE LIBOR + 1.040%, Floor 1.040%), 144A
1.172%, 04/20/31@,• | 2,400 | 2,400,182 |
| Babson CLO Ltd., | | |
| Series 2014-IA Class BR (3 M ICE LIBOR + 2.200%), 144A, 2.332%, 07/20/25@,• | 546 | 546,248 |
| Series 2014-IA Class C (3 M ICE LIBOR + 3.450%), 144A, 3.582%, 07/20/25@,• | 1,500 | 1,500,480 |
Barings CLO Ltd., Series 2017-1A Class B1 (3 M ICE LIBOR + 1.700%), 144A
1.822%, 07/18/29@,• | 1,500 | 1,500,174 |
Benefit Street Partners CLO VIII Ltd., Series 2015-8A Class A1AR (3 M ICE LIBOR + 1.100%, Floor 1.100%), 144A
1.232%, 01/20/31@,• | 2,500 | 2,497,462 |
| BSPRT Issuer Ltd., | | |
| Series 2021-FL6 Class A (1 M ICE LIBOR + 1.100%, Floor 1.100%), 144A, 1.210%, 03/15/36@,• | 2,200 | 2,193,985 |
| Series 2021-FL6 Class B (1 M ICE LIBOR + 1.600%, Floor 1.600%), 144A, 1.710%, 03/15/36@,• | 2,500 | 2,489,949 |
CIFC Funding Ltd., Series 2014-2RA Class A1 (3 M ICE LIBOR + 1.050%, Floor 1.050%), 144A
1.174%, 04/24/30@,• | 2,000 | 2,000,250 |
Crestline Denali CLO XVI Ltd., Series 2018-1A Class A (3 M ICE LIBOR + 1.120%, Floor 1.120%), 144A
1.252%, 01/20/30@,• | 3,000 | 2,993,649 |
Deerpath Capital CLO Ltd., Series 2018-1A Class B (3 M ICE LIBOR + 2.500%, Floor 2.500%), 144A
2.624%, 01/15/31@,• | 2,000 | 2,000,486 |
| ECMC Group Student Loan Trust, | | |
| Series 2018-2A Class A (1 M ICE LIBOR + 0.800%, Floor 0.800%), 144A, 0.903%, 09/25/68@,• | 3,343 | 3,365,263 |
| Series 2019-1A Class A1A, 144A, 2.720%, 07/25/69@ | 1,696 | 1,736,880 |
| | Par
(000) | Value† |
| |
Edsouth Indenture No 4 LLC, Series 2013-1 Class A (1 M ICE LIBOR + 0.570%), 144A
0.673%, 02/26/29@,• | $ 2,984 | $ 2,976,816 |
First Eagle BSL CLO Ltd., Series 2019-1A Class B (3 M ICE LIBOR + 3.250%, Floor 3.250%), 144A
3.382%, 01/20/33@,• | 1,500 | 1,471,803 |
Gallatin CLO IX Ltd., Series 2018-1A Class C1 (3 M ICE LIBOR + 2.100%, Floor 2.100%), 144A
2.230%, 01/21/28@,• | 2,000 | 2,000,468 |
Halcyon Loan Advisors Funding Ltd., Series 2015-2A Class AR (3 M ICE LIBOR + 1.080%, Floor 1.080%), 144A
1.204%, 07/25/27@,• | 100 | 99,481 |
KVK CLO Ltd., Series 2018-1A Class D (3 M ICE LIBOR + 3.000%), 144A
3.160%, 05/20/29@,• | 2,000 | 1,985,098 |
| Navient Private Education Loan Trust, | | |
| Series 2015-AA Class A3 (1 M ICE LIBOR + 1.700%), 144A, 1.810%, 11/15/30@,• | 1,500 | 1,533,543 |
| Series 2014-AA Class A3 (1 M ICE LIBOR + 1.600%), 144A, 1.710%, 10/15/31@,• | 1,499 | 1,523,001 |
| Series 2015-BA Class A3 (1 M ICE LIBOR + 1.450%), 144A, 1.560%, 07/16/40@,• | 2,282 | 2,290,974 |
| Navient Private Education Refi Loan Trust, | | |
| Series 2020-EA Class A, 144A, 1.690%, 05/15/69@ | 2,416 | 2,414,848 |
| Series 2021-EA Class A, 144A, 0.970%, 12/16/69@ | 3,653 | 3,591,473 |
| Navient Student Loan Trust, | | |
| Series 2016-5A Class A (1 M ICE LIBOR + 1.250%), 144A, 1.353%, 06/25/65@,• | 4,732 | 4,837,777 |
| Series 2018-1A Class A2 (1 M ICE LIBOR + 0.350%) , 144A, 0.453%, 03/25/67@,• | 1,693 | 1,693,520 |
Ocean Trails CLO V, Series 2014-5A Class ARR (3 M ICE LIBOR + 1.280%, Floor 1.280%), 144A
1.402%, 10/13/31@,• | 1,966 | 1,965,884 |
OZLM XI Ltd., Series 2015-11A Class A2R (3 M ICE LIBOR + 1.750%), 144A
1.882%, 10/30/30@,• | 2,300 | 2,295,980 |
Signal Peak CLO Ltd., Series 2018-6A Class B (3 M ICE LIBOR + 1.680%), 144A
1.816%, 07/28/31@,• | 2,000 | 2,000,364 |
Penn Series Funds, Inc.
Schedule of Investments — December 31, 2021
Limited Maturity Bond Fund
| | Par
(000) | Value† |
| ASSET BACKED SECURITIES — (continued) |
SLM Private Education Loan Trust, Series 2014-A Class B, 144A
3.500%, 11/15/44@ | $ 727 | $ 727,943 |
SLM Student Loan Trust, Series 2014-2 Class A3 (1 M ICE LIBOR + 0.590%),
0.693%, 03/25/55• | 4,823 | 4,810,427 |
| SMB Private Education Loan Trust, | | |
| Series 2015-C Class A3 (1 M ICE LIBOR + 1.950%), 144A, 2.060%, 08/16/32@,• | 2,405 | 2,439,338 |
| Series 2021-C Class B, 144A, 2.300%, 01/15/53@ | 2,539 | 2,545,510 |
Sound Point CLO V-R Ltd., Series 2014-1RA Class B (3 M ICE LIBOR + 1.750%, Floor 1.750%), 144A
1.872%, 07/18/31@,• | 1,500 | 1,488,021 |
Steele Creek CLO Ltd., Series 2014-1RA Class B (3 M ICE LIBOR + 1.500%, Floor 1.500%), 144A
1.630%, 04/21/31@,• | 1,250 | 1,238,490 |
Towd Point Mortgage Trust, Series 2020-4 Class A2, 144A
2.500%, 10/25/60@ | 2,240 | 2,270,754 |
Trinitas CLO XII Ltd., Series 2020-12A Class C (3 M ICE LIBOR + 3.000%, Floor 3.000%), 144A
3.124%, 04/25/33@,• | 1,500 | 1,503,221 |
Trinitas CLO XIV Ltd., Series 2020-14A Class D (3 M ICE LIBOR + 4.300%, Floor 4.300%), 144A
4.424%, 01/25/34@,• | 2,000 | 2,007,954 |
Verizon Owner Trust, Series 2019-A Class A1A,
2.930%, 09/20/23 | 1,278 | 1,285,259 |
TOTAL ASSET BACKED SECURITIES
(Cost $82,133,375) | 82,049,703 |
|
| COMMERCIAL MORTGAGE BACKED SECURITIES — 13.8% |
BHMS, Series 2018-ATLS Class B (1 M ICE LIBOR + 1.500%, Floor 1.500%), 144A
1.610%, 07/15/35@,• | 2,000 | 1,992,446 |
| BX Commercial Mortgage Trust, | | |
| Series 2019-XL Class B (1 M ICE LIBOR + 1.080%, Floor 1.080%), 144A, 1.190%, 10/15/36@,• | 1,275 | 1,273,399 |
| Series 2020-BXLP Class A (1 M ICE LIBOR + 0.800%, Floor 0.800%), 144A, 0.910%, 12/15/36@,• | 2,505 | 2,503,616 |
| | Par
(000) | Value† |
| |
Citigroup Commercial Mortgage Trust, Series 2018-TBR Class D (1 M ICE LIBOR + 1.800%, Floor 1.800%), 144A
1.910%, 12/15/36@,• | $ 1,000 | $ 990,314 |
COMM Mortgage Trust, Series 2014-CR20 Class A3
3.326%, 11/10/47 | 2,715 | 2,794,636 |
| FHLMC Multifamily Structured Pass Through Certificates, | | |
| Series K019 Class X1, 1.581%, 03/25/22• | 19,268 | 193 |
| Series K021 Class A2, 2.396%, 06/25/22 | 1,460 | 1,468,031 |
| Series KC02 Class X3, 3.066%, 08/25/25• | 14,500 | 1,194,912 |
| FREMF Mortgage Trust, | | |
| Series 2017-K727 Class C, 144A, 3.743%, 07/25/24@,• | 3,500 | 3,619,107 |
| Series 2013-K25 Class C, 144A, 3.620%, 11/25/45@,• | 2,110 | 2,149,150 |
| Series 2013-K27 Class C, 144A, 3.496%, 01/25/46@,• | 2,000 | 2,039,750 |
| Series 2013-K35 Class B, 144A, 3.934%, 12/25/46@,• | 2,260 | 2,358,857 |
| Series 2014-K37 Class C, 144A, 4.560%, 01/25/47@,• | 2,550 | 2,689,947 |
| Series 2015-K44 Class B, 144A, 3.669%, 01/25/48@,• | 3,675 | 3,861,540 |
| Series 2016-K53 Class B, 144A, 4.021%, 03/25/49@,• | 3,220 | 3,458,670 |
GS Mortgage Securities Corp. Trust, Series 2018-HULA Class B (1 M ICE LIBOR + 1.250%, Floor 1.250%), 144A
1.360%, 07/15/25@,• | 1,846 | 1,839,126 |
GS Mortgage Securities Trust, Series 2010-C1 Class A2, 144A
4.592%, 08/10/43@ | 183 | 182,038 |
Hawaii Hotel Trust, Series 2019-MAUI Class C (1 M ICE LIBOR + 1.650%, Floor 1.650%), 144A
1.760%, 05/15/38@,• | 1,500 | 1,492,462 |
WFRBS Commercial Mortgage Trust, Series 2012-C7 Class XA, 144A
1.281%, 06/15/45@,• | 32,551 | 31,210 |
TOTAL COMMERCIAL MORTGAGE BACKED SECURITIES
(Cost $38,744,887) | 35,939,404 |
|
| CORPORATE BONDS — 36.9% |
| Aerospace & Defense — 2.2% |
| The Boeing Co. | | |
| 1.167%, 02/04/23 | 1,500 | 1,500,187 |
| 4.508%, 05/01/23 | 2,500 | 2,611,359 |
Penn Series Funds, Inc.
Schedule of Investments — December 31, 2021
Limited Maturity Bond Fund
| | Par
(000) | Value† |
| CORPORATE BONDS — (continued) |
| Aerospace & Defense — (continued) |
TransDigm, Inc., 144A
8.000%, 12/15/25@ | $ 1,500 | $ 1,582,500 |
| | | 5,694,046 |
| Airlines — 0.2% |
UAL Pass Through Trust, Series 2007-1 Class A
6.636%, 01/02/24 | 620 | 633,797 |
| Apparel — 0.4% |
VF Corp.
2.050%, 04/23/22 | 1,126 | 1,131,720 |
| Auto Manufacturers — 1.5% |
BMW US Capital LLC, 144A
3.800%, 04/06/23@ | 2,250 | 2,333,181 |
Volkswagen Group of America Finance LLC, 144A
3.125%, 05/12/23@ | 1,500 | 1,542,168 |
| | | 3,875,349 |
| Banks — 4.7% |
Bank of America Corp., Series L
3.950%, 04/21/25 | 2,010 | 2,149,251 |
First Maryland Capital II (3 M ICE LIBOR + 0.850%)
0.982%, 02/01/27• | 3,500 | 3,388,271 |
JPMorgan Chase & Co. (3 M ICE LIBOR + 3.470%)
3.599%µ,• | 1,022 | 1,027,110 |
State Street Corp. (3 M ICE LIBOR + 0.560%)
0.716%, 05/15/28• | 2,500 | 2,409,616 |
Wells Fargo & Co. (3 M ICE LIBOR + 1.000%)
1.124%, 04/15/27• | 3,250 | 3,167,112 |
| | | 12,141,360 |
| Beverages — 0.7% |
Coca-Cola Europacific Partners PLC, 144A
0.800%, 05/03/24@ | 1,750 | 1,721,380 |
| Biotechnology — 0.4% |
Gilead Sciences, Inc.
0.750%, 09/29/23 | 1,124 | 1,119,385 |
| Building Materials — 0.5% |
Builders FirstSource, Inc., 144A
6.750%, 06/01/27@ | 1,322 | 1,394,710 |
| Chemicals — 1.4% |
Westlake Chemical Corp.
0.875%, 08/15/24 | 1,500 | 1,477,564 |
WR Grace Holdings LLC, 144A
5.625%, 10/01/24@ | 2,000 | 2,105,280 |
| | | 3,582,844 |
| | Par
(000) | Value† |
| |
| Computers — 0.6% |
Hewlett Packard Enterprise Co.
1.450%, 04/01/24 | $ 1,500 | $ 1,509,862 |
| Diversified Financial Services — 2.3% |
AerCap Ireland Capital DAC
3.500%, 01/15/25 | 2,500 | 2,610,357 |
Intercontinental Exchange, Inc.
0.700%, 06/15/23 | 1,500 | 1,496,556 |
OneMain Finance Corp.
8.250%, 10/01/23 | 1,750 | 1,927,188 |
| | | 6,034,101 |
| Electric — 6.2% |
American Electric Power Co., Inc., Series M
0.750%, 11/01/23 | 2,500 | 2,483,051 |
CenterPoint Energy, Inc. (SOFR + 0.650%)
0.700%, 05/13/24• | 1,000 | 1,000,259 |
Edison International
3.125%, 11/15/22 | 1,000 | 1,015,626 |
Georgia Power Co., Series A
2.100%, 07/30/23 | 1,900 | 1,933,759 |
Niagara Mohawk Power Corp., 144A
3.508%, 10/01/24@ | 2,000 | 2,092,680 |
OGE Energy Corp.
0.703%, 05/26/23 | 3,000 | 2,986,421 |
Pacific Gas and Electric Co.
1.750%, 06/16/22 | 1,500 | 1,500,004 |
San Diego Gas & Electric Co., Series PPP
1.914%, 02/01/22 | 115 | 114,741 |
Southern California Edison Co., Series E
3.700%, 08/01/25 | 2,750 | 2,937,309 |
| | | 16,063,850 |
| Electronics — 0.6% |
TD SYNNEX Corp., 144A
1.250%, 08/09/24@ | 1,500 | 1,483,299 |
| Energy-Alternate Sources — 0.6% |
TerraForm Power Operating LLC, 144A
4.250%, 01/31/23@ | 1,500 | 1,533,750 |
| Food — 0.5% |
Albertsons Cos., Inc., 144A
3.500%, 02/15/23@ | 1,300 | 1,322,750 |
| Healthcare Products — 1.5% |
PerkinElmer, Inc.
0.850%, 09/15/24 | 1,000 | 985,982 |
Stryker Corp.
0.600%, 12/01/23 | 1,500 | 1,492,018 |
Penn Series Funds, Inc.
Schedule of Investments — December 31, 2021
Limited Maturity Bond Fund
| | Par
(000) | Value† |
| CORPORATE BONDS — (continued) |
| Healthcare Products — (continued) |
Zimmer Biomet Holdings, Inc.
1.450%, 11/22/24 | $ 1,500 | $ 1,496,045 |
| | | 3,974,045 |
| Lodging — 0.7% |
Hyatt Hotels Corp.
1.800%, 10/01/24 | 1,875 | 1,875,313 |
| Machinery — Diversified — 0.9% |
CNH Industrial Capital LLC
1.950%, 07/02/23 | 2,250 | 2,279,483 |
| Media — 0.6% |
Charter Communications Operating LLC
4.464%, 07/23/22 | 1,500 | 1,522,138 |
| Oil & Gas — 1.9% |
Phillips 66
0.900%, 02/15/24 | 2,000 | 1,985,488 |
Pioneer Natural Resources Co.
0.750%, 01/15/24 | 1,500 | 1,479,900 |
Southwestern Energy Co.
4.100%, 03/15/22 | 1,500 | 1,500,510 |
| | | 4,965,898 |
| Packaging and Containers — 0.9% |
Ball Corp.
4.000%, 11/15/23 | 2,250 | 2,348,437 |
| Pharmaceuticals — 1.6% |
AbbVie, Inc.
2.300%, 11/21/22 | 500 | 507,023 |
Bristol-Myers Squibb Co.
2.600%, 05/16/22 | 1,000 | 1,008,289 |
Elanco Animal Health, Inc.
5.272%, 08/28/23 | 1,645 | 1,750,305 |
Viatris, Inc., (effective yield 1.147%)
1.125%, 06/22/22 | 1,000 | 1,002,228 |
| | | 4,267,845 |
| Real Estate Investment Trusts — 1.4% |
SBA Tower Trust, 144A
1.884%, 07/15/50@ | 2,500 | 2,496,707 |
Simon Property Group LP
3.500%, 09/01/25 | 1,000 | 1,066,173 |
| | | 3,562,880 |
| Retail — 0.9% |
Yum! Brands, Inc., 144A
7.750%, 04/01/25@ | 2,250 | 2,370,937 |
| Semiconductors — 1.2% |
Qorvo, Inc., 144A
1.750%, 12/15/24@ | 1,500 | 1,500,964 |
Skyworks Solutions, Inc.
0.900%, 06/01/23 | 1,500 | 1,492,405 |
| | | 2,993,369 |
| | Par
(000) | Value† |
| |
| Software — 0.6% |
VMware, Inc.
1.000%, 08/15/24 | $ 1,500 | $ 1,485,827 |
| Telecommunications — 1.9% |
Sprint Corp.
7.875%, 09/15/23 | 2,000 | 2,202,500 |
T-Mobile USA, Inc.
3.500%, 04/15/25 | 1,500 | 1,589,846 |
Verizon Communications, Inc.
1.450%, 03/20/26 | 1,250 | 1,244,329 |
| | | 5,036,675 |
TOTAL CORPORATE BONDS
(Cost $95,726,769) | | 95,925,050 |
|
| RESIDENTIAL MORTGAGE BACKED SECURITIES — 15.0% |
| Collateralized Mortgage Obligations — 13.3% |
Angel Oak Mortgage Trust, Series 2020-1 Class A3, 144A
2.774%, 12/25/59@,• | 1,293 | 1,292,168 |
| Bunker Hill Loan Depositary Trust, | | |
| STEP, Series 2019-2 Class A3, 144A, 3.185%, 07/25/49@,• | 3,068 | 3,085,615 |
| Series 2020-1 Class M1, 144A, 4.353%, 02/25/55@,• | 2,250 | 2,308,522 |
Citigroup Mortgage Loan Trust, Series 2014-J1 Class A1, 144A
3.500%, 06/25/44@,• | 776 | 780,323 |
Flagstar Mortgage Trust, Series 2020-2 Class A4, 144A
3.000%, 08/25/50@,• | 1,806 | 1,811,921 |
GS Mortgage-Backed Securities Corp. Trust, Series 2020-PJ3 Class A13, 144A
2.500%, 10/25/50@,• | 1,683 | 1,686,955 |
GS Mortgage-Backed Securities Trust, Series 2021-PJ7 Class A8, 144A
2.500%, 01/25/52@,• | 4,712 | 4,770,757 |
| JP Morgan Mortgage Trust, | | |
| Series 2017-3 Class 1A13, 144A, 3.500%, 08/25/47@,• | 4,042 | 4,076,520 |
| Series 2019-9 Class A3, 144A, 3.500%, 05/25/50@,• | 1,916 | 1,946,744 |
OBX Trust, Series 2019-INV2 Class A5, 144A
4.000%, 05/27/49@,• | 419 | 423,881 |
Seasoned Loans Structured Transaction Trust Series, Series 2020-2 Class A1D
1.750%, 09/25/30 | 1,660 | 1,663,222 |
Sequoia Mortgage Trust, Series 2021-5 Class A5, 144A
2.000%, 07/25/51@,• | 2,749 | 2,761,752 |
Penn Series Funds, Inc.
Schedule of Investments — December 31, 2021
Limited Maturity Bond Fund
| | Par
(000) | Value† |
| RESIDENTIAL MORTGAGE BACKED SECURITIES — (continued) |
| Collateralized Mortgage Obligations — (continued) |
| Verus Securitization Trust, | | |
| Series 2019-INV2 Class A3, 144A, 3.219%, 07/25/59@,• | $ 2,531 | $ 2,541,962 |
| Series 2020-2 Class M1, 144A, 5.360%, 05/25/60@,• | 1,150 | 1,182,422 |
Visio Trust, Series 2020-1R Class M1, 144A
2.926%, 11/25/55@ | 2,500 | 2,498,709 |
Wells Fargo Mortgage Backed Securities Trust, Series 2020-2 Class A1, 144A
3.000%, 12/25/49@,• | 1,652 | 1,676,805 |
| | | 34,508,278 |
| Fannie Mae REMICS — 0.7% |
Series 2012-152 Class TA
2.500%, 09/25/42 | 1,952 | 1,958,700 |
| Freddie Mac REMICS — 1.0% |
| Series 4523 Class VB, 3.500%, 08/15/34 | 2,298 | 2,342,835 |
| Series 4895 Class C, 4.500%, 02/15/49 | 203 | 212,344 |
| | | 2,555,179 |
TOTAL RESIDENTIAL MORTGAGE BACKED SECURITIES
(Cost $39,356,347) | | 39,022,157 |
|
| U.S. TREASURY OBLIGATIONS — 1.7% |
U.S. Treasury Note
0.500%, 03/15/23
(Cost $4,501,050) | 4,500 | 4,501,758 |
| | Number of
Shares | |
| SHORT-TERM INVESTMENTS — 0.2% |
BlackRock Liquidity FedFund - Institutional Shares (seven-day effective yield 0.030%)
(Cost $452,671) | 452,671 | 452,671 |
TOTAL INVESTMENTS — 99.2%
(Cost $260,915,099) | | $ 257,890,743 |
| Other Assets & Liabilities — 0.8% | 2,093,668 |
| TOTAL NET ASSETS — 100.0% | | $ 259,984,411 |
| † | See Security Valuation Note. |
| @ | Security exempt from registration under Rule 144A of the Securities Act of 1933, as amended. At December 31, 2021, the aggregate value of Rule 144A securities was $162,761,011, which represents 62.6% of the Fund’s net assets. |
| • | Variable rate security. The rate disclosed is the rate in effect on the report date. The information in parenthesis represents the benchmark and reference rate for each relevant security and the rate floats based upon the reference rate and spread. The security may be further subject to interest rate floors and caps. For loan agreements, the rate shown may represent a weighted average interest rate. Certain variable rate securities are not based on a published reference rate and spread, but are determined by the issuer or agent and are based on current market conditions, or, for mortgage-backed securities, are impacted by the individual mortgages which are paying off over time. These securities do not indicate a reference rate and spread in their descriptions. |
| µ | Perpetual security with no stated maturity date. |
| CLO— Collateralized Loan Obligation. |
| FHLMC— Federal Home Loan Mortgage Corporation. |
| FREMF— Freddie Mac Multifamily Securities. |
| ICE— Intercontinental Exchange. |
| LIBOR— London Interbank Offered Rate. |
| LLC— Limited Liability Company. |
| LP— Limited Partnership. |
| M— Month. |
| PLC— Public Limited Company. |
| REMICS— Real Estate Mortgage Investment Conduits. |
| SOFR— Secured Overnight Financing Rate. |
| STEP— Step Coupon Bond. |
| Country Weightings as of 12/31/2021†† |
| United States | 82% |
| Cayman Islands | 16 |
| Ireland | 1 |
| United Kingdom | 1 |
| Total | 100% |
| †† | % of total investments as of December 31, 2021. |
Summary of inputs used to value the Fund’s investments as of 12/31/2021 are as follows (See Security Valuation Note):
| ASSETS TABLE |
| Description | Total
Market
Value at
12/31/2021 | Level 1
Quoted
Price | Level 2
Significant
Observable
Input | Level 3
Significant
Unobservable
Input |
| Asset Backed Securities | $ 82,049,703 | $ — | $ 82,049,703 | $— |
| Commercial Mortgage Backed Securities | 35,939,404 | — | 35,939,404 | — |
| Corporate Bonds | 95,925,050 | — | 95,925,050 | — |
| Residential Mortgage Backed Securities | 39,022,157 | — | 39,022,157 | — |
| U.S. Treasury Obligations | 4,501,758 | — | 4,501,758 | — |
| Short-Term Investments | 452,671 | 452,671 | — | — |
| Total Investments | $ 257,890,743 | $ 452,671 | $ 257,438,072 | $ — |
Penn Series Funds, Inc.
Schedule of Investments — December 31, 2021
Limited Maturity Bond Fund
| ASSETS TABLE |
| Description | Total
Market
Value at
12/31/2021 | Level 1
Quoted
Price | Level 2
Significant
Observable
Input | Level 3
Significant
Unobservable
Input |
| Other Financial Instruments(1) | | | | |
| Futures Contracts | $ 41,992 | $ 41,992 | $ — | $— |
| Total Assets—Other Financial Instruments | $ 41,992 | $ 41,992 | $ — | $ — |
| LIABILITIES TABLE |
| Description | Total
Market
Value at
12/31/2021 | Level 1
Quoted
Price | Level 2
Significant
Observable
Input | Level 3
Significant
Unobservable
Input |
| Other Financial Instruments(1) | | | | |
| Futures Contracts | $(24,973) | $(24,973) | $— | $— |
| Total Liabilities—Other Financial Instruments | $ (24,973) | $ (24,973) | $ — | $ — |
| (1) | Other financial instruments are derivative instruments not reflected in the value of total investments in securities in the Schedule of Investments such as future contracts and forward foreign currency contracts which are valued at the unrealized appreciation (depreciation) on the instrument. |
It is the Fund's practice to recognize transfers into and transfers out of Level 3 at the fair value hierarchy as of the beginning of period. The Fund did not have any transfers into and transfers out of Level 3 fair value hierarchy during the reporting period.
Futures contracts held by the Fund at December 31, 2021 are as follows:
Futures Contracts:
Exchange Traded |
| Type | | Futures Contract | | Expiration
Date | | Numbers
of
Contracts | | Units per
Contract | | Closing
Price | | Notional
Value | | Unrealized
Appreciation | | Unrealized
Depreciation |
| Long | | U.S. Treasury 2 Year Note | | 03/31/22 | | 197 | | 2,000 | | $109 | | $42,979,860 | | $ — | | $(24,973) |
| Long | | U.S. Treasury 10 Year Ultra Note | | 03/22/22 | | 20 | | 1,000 | | 146 | | 2,928,750 | | 41,992 | | — |
| | | | | | | | | | | | | | | $41,992 | | $(24,973) |
The accompanying notes are an integral part of these financial statements.
Penn Series Funds, Inc.
Schedule of Investments — December 31, 2021
Quality Bond Fund
| | Par
(000) | Value† |
| ASSET BACKED SECURITIES — 16.9% |
ALM Ltd., Series 2020-1A Class A2 (3 M ICE LIBOR + 1.850%), 144A
1.974%, 10/15/29@,• | $ 3,000 | $ 3,000,483 |
Arch Street CLO Ltd., Series 2016-2A Class BR2 (3 M ICE LIBOR + 1.700%, Floor 1.700%), 144A
1.832%, 10/20/28@,• | 4,000 | 4,000,204 |
Battalion CLO XV Ltd., Series 2020-15A Class A1 (3 M ICE LIBOR + 1.350%, Floor 1.350%), 144A
1.472%, 01/17/33@,• | 4,000 | 4,000,308 |
Black Diamond CLO Ltd., Series 2019-2A Class A1A (3 M ICE LIBOR + 1.430%, Floor 1.430%), 144A
1.554%, 07/23/32@,• | 2,761 | 2,759,901 |
Deerpath Capital CLO Ltd., Series 2020-1A Class A1 (3 M ICE LIBOR + 1.850%, Floor 1.850%), 144A
1.972%, 04/17/32@,• | 2,500 | 2,503,353 |
ECMC Group Student Loan Trust, Series 2018-2A Class A (1 M ICE LIBOR + 0.800%, Floor 0.800%), 144A
0.903%, 09/25/68@,• | 3,343 | 3,365,263 |
First Eagle BSL CLO Ltd., Series 2019-1A Class B (3 M ICE LIBOR + 3.250%, Floor 3.250%), 144A
3.382%, 01/20/33@,• | 4,000 | 3,924,808 |
Fortress Credit BSL III Ltd., Series 2015-1A Class B1R (3 M ICE LIBOR + 1.730%, Floor 1.730%), 144A
1.852%, 04/18/31@,• | 3,000 | 3,000,033 |
Highbridge Loan Management Ltd., Series 2015-7A Class A2R (3 M ICE LIBOR + 0.900%), 144A
1.056%, 03/15/27@,• | 2,000 | 1,999,996 |
Honda Auto Receivables Owner Trust, Series 2020-1 Class A4,
1.630%, 10/21/26 | 3,000 | 3,031,064 |
KVK CLO Ltd., Series 2018-1A Class D (3 M ICE LIBOR + 3.000%), 144A
3.160%, 05/20/29@,• | 3,000 | 2,977,647 |
Nassau Ltd., Series 2017-IA Class A1BR, 144A
2.730%, 10/15/29@ | 3,000 | 3,001,197 |
Ocean Trails CLO V, Series 2014-5A Class ARR (3 M ICE LIBOR + 1.280%, Floor 1.280%), 144A
1.402%, 10/13/31@,• | 2,457 | 2,457,355 |
| | Par
(000) | Value† |
| |
OZLM XI Ltd., Series 2015-11A Class A2R (3 M ICE LIBOR + 1.750%), 144A
1.882%, 10/30/30@,• | $4,000 | $ 3,993,008 |
| SLM Student Loan Trust, | | |
| Series 2012-6 Class B (1 M ICE LIBOR + 1.000%), 1.103%, 04/27/43• | 4,860 | 4,509,888 |
| Series 2014-2 Class A3 (1 M ICE LIBOR + 0.590%), 0.693%, 03/25/55• | 4,220 | 4,209,123 |
| SMB Private Education Loan Trust, | | |
| Series 2015-C Class A3 (1 M ICE LIBOR + 1.950%), 144A, 2.060%, 08/16/32@,• | 5,000 | 5,071,389 |
| Series 2014-A Class B, 144A, 4.000%, 09/15/42@ | 2,430 | 2,539,996 |
| Series 2015-C Class B, 144A, 3.500%, 09/15/43@ | 5,000 | 5,138,801 |
| Steele Creek CLO Ltd., | | |
| Series 2016-1A Class BR (3 M ICE LIBOR + 1.650%, Floor 1.650%), 144A, 1.853%, 06/15/31@,• | 3,250 | 3,180,226 |
| Series 2018-2A Class A (3 M ICE LIBOR + 1.200%, Floor 1.200%), 144A, 1.360%, 08/18/31@,• | 4,500 | 4,493,218 |
Telos CLO Ltd., Series 2013-3A Class BR (3 M ICE LIBOR + 2.000%), 144A
2.122%, 07/17/26@,• | 2,211 | 2,210,540 |
Trinitas CLO XII Ltd., Series 2020-12A Class C (3 M ICE LIBOR + 3.000%, Floor 3.000%), 144A
3.124%, 04/25/33@,• | 2,000 | 2,004,294 |
Trinitas CLO XIV Ltd., Series 2020-14A Class D (3 M ICE LIBOR + 4.300%, Floor 4.300%), 144A
4.424%, 01/25/34@,• | 2,500 | 2,509,943 |
TOTAL ASSET BACKED SECURITIES
(Cost $79,766,582) | 79,882,038 |
|
| COMMERCIAL MORTGAGE BACKED SECURITIES — 17.2% |
Benchmark Mortgage Trust, Series 2019-B9 Class A5
4.016%, 03/15/52 | 5,000 | 5,614,452 |
BHMS, Series 2018-ATLS Class B (1 M ICE LIBOR + 1.500%, Floor 1.500%), 144A
1.610%, 07/15/35@,• | 2,000 | 1,992,446 |
COMM Mortgage Trust, Series 2014-CR20 Class A3
3.326%, 11/10/47 | 4,525 | 4,657,727 |
Penn Series Funds, Inc.
Schedule of Investments — December 31, 2021
Quality Bond Fund
| | Par
(000) | Value† |
| COMMERCIAL MORTGAGE BACKED SECURITIES — (continued) |
| FHLMC Multifamily Structured Pass Through Certificates, | | |
| Series K019 Class X1, 1.581%, 03/25/22• | $34,761 | $ 348 |
| Series K043 Class A2, 3.062%, 12/25/24 | 3,000 | 3,150,695 |
| Series K094 Class A2, 2.903%, 06/25/29 | 2,000 | 2,162,871 |
| Series K107 Class A1, 1.228%, 10/25/29 | 7,337 | 7,275,073 |
Fontainebleau Miami Beach Trust, Series 2019-FBLU Class B, 144A
3.447%, 12/10/36@ | 2,500 | 2,551,643 |
| FREMF Mortgage Trust, | | |
| Series 2018-K731 Class B, 144A, 3.933%, 02/25/25@,• | 6,610 | 6,983,534 |
| Series 2019-K735 Class B, 144A, 4.019%, 05/25/26@,• | 6,000 | 6,461,956 |
| Series 2012-K19 Class C, 144A, 4.013%, 05/25/45@,• | 4,500 | 4,506,567 |
| Series 2012-K23 Class C, 144A, 3.656%, 10/25/45@,• | 5,000 | 5,071,064 |
| Series 2013-K27 Class C, 144A, 3.496%, 01/25/46@,• | 3,647 | 3,719,484 |
| Series 2015-K48 Class B, 144A, 3.642%, 08/25/48@,• | 5,000 | 5,273,252 |
| Series 2016-K52 Class B, 144A, 3.926%, 01/25/49@,• | 5,065 | 5,435,482 |
| Series 2017-K729 Class C, 144A, 3.673%, 11/25/49@,• | 2,460 | 2,544,778 |
| Series 2017-K63 Class B, 144A, 3.873%, 02/25/50@,• | 1,500 | 1,611,144 |
| Series 2018-K85 Class C, 144A, 4.320%, 12/25/50@,• | 3,500 | 3,793,464 |
| Series 2019-K102 Class B, 144A, 3.530%, 12/25/51@,• | 5,000 | 5,251,470 |
Government National Mortgage Association, Series 2011-77 Class D
4.309%, 10/16/45• | 3 | 2,549 |
Wells Fargo Commercial Mortgage Trust, Series 2019-C51 Class A3
3.055%, 06/15/52 | 3,000 | 3,144,027 |
TOTAL COMMERCIAL MORTGAGE BACKED SECURITIES
(Cost $79,610,484) | 81,204,026 |
| | Number of
Shares | |
| PREFERRED STOCKS — 1.1% |
| Banks — 0.3% |
| Wells Fargo & Co., Series Z | 60,000 | 1,551,600 |
| | Number of
Shares | Value† |
| |
| Electric — 0.8% |
| Duke Energy Corp. | 134,000 | $ 3,580,480 |
TOTAL PREFERRED STOCKS
(Cost $5,084,700) | | 5,132,080 |
| | Par
(000) | |
| CORPORATE BONDS — 44.0% |
| Aerospace & Defense — 1.5% |
General Dynamics Corp.
3.500%, 05/15/25 | $ 3,000 | 3,199,485 |
| The Boeing Co. | | |
| 2.196%, 02/04/26 | 2,000 | 2,000,074 |
| 3.250%, 02/01/35 | 1,950 | 1,967,734 |
| | | 7,167,293 |
| Agriculture — 0.7% |
Cargill, Inc., 144A
3.250%, 03/01/23@ | 3,000 | 3,086,660 |
| Airlines — 1.1% |
Delta Air Lines Pass Through Trust, Series 2015-1 Class B
4.250%, 01/30/25 | 1,809 | 1,868,453 |
UAL Pass Through Trust, Series 2007-1 Class A
6.636%, 01/02/24 | 2,226 | 2,273,711 |
United Airlines Pass Through Trust, Series 2014-1 Class B
4.750%, 10/11/23 | 1,198 | 1,210,067 |
| | | 5,352,231 |
| Apparel — 0.7% |
VF Corp.
2.800%, 04/23/27 | 3,000 | 3,139,319 |
| Auto Manufacturers — 1.3% |
BMW US Capital LLC, 144A
3.450%, 04/12/23@ | 4,000 | 4,125,108 |
Ford Motor Co.
4.750%, 01/15/43 | 2,000 | 2,207,500 |
| | | 6,332,608 |
| Banks — 3.8% |
Allfirst Preferred Capital Trust (3 M ICE LIBOR + 1.500%)
1.624%, 07/15/29• | 3,500 | 3,462,994 |
| JPMorgan Chase & Co. | | |
| (3 M ICE LIBOR + 0.500%), 0.632%, 02/01/27• | 3,200 | 3,120,111 |
| (3 M ICE LIBOR + 3.470%), 3.599%µ,• | 2,000 | 2,010,000 |
KeyCorp. Capital I (3 M ICE LIBOR + 0.740%)
0.954%, 07/01/28• | 2,640 | 2,540,524 |
Penn Series Funds, Inc.
Schedule of Investments — December 31, 2021
Quality Bond Fund
| | Par
(000) | Value† |
| CORPORATE BONDS — (continued) |
| Banks — (continued) |
State Street Corp. (3 M ICE LIBOR + 0.560%)
0.716%, 05/15/28• | $ 3,830 | $ 3,691,531 |
The Goldman Sachs Group, Inc. (SOFR + 1.248%)
2.383%, 07/21/32• | 3,000 | 2,957,239 |
| | | 17,782,399 |
| Beverages — 0.6% |
Constellation Brands, Inc.
2.250%, 08/01/31 | 3,000 | 2,935,553 |
| Biotechnology — 0.6% |
Gilead Sciences, Inc.
1.650%, 10/01/30 | 3,000 | 2,878,495 |
| Building Materials — 2.0% |
Builders FirstSource, Inc., 144A
6.750%, 06/01/27@ | 2,204 | 2,325,220 |
Martin Marietta Materials, Inc.
4.250%, 07/02/24 | 3,000 | 3,195,588 |
Vulcan Materials Co.
4.500%, 04/01/25 | 3,565 | 3,868,016 |
| | | 9,388,824 |
| Chemicals — 0.7% |
WR Grace Holdings LLC, 144A
5.625%, 10/01/24@ | 3,000 | 3,157,920 |
| Commercial Services — 1.8% |
IHS Markit Ltd., 144A
5.000%, 11/01/22@ | 2,500 | 2,571,250 |
The Georgetown University, Series B
4.315%, 04/01/49 | 2,485 | 3,054,147 |
University of Southern California
3.028%, 10/01/39 | 2,820 | 2,999,126 |
| | | 8,624,523 |
| Computers — 1.2% |
Apple, Inc.
3.850%, 08/04/46 | 4,000 | 4,755,855 |
Dell International LLC
5.450%, 06/15/23 | 800 | 843,980 |
| | | 5,599,835 |
| Diversified Financial Services — 1.3% |
AerCap Ireland Capital DAC
3.000%, 10/29/28 | 3,000 | 3,045,015 |
OneMain Finance Corp.
8.250%, 10/01/23 | 3,000 | 3,303,750 |
| | | 6,348,765 |
| Electric — 3.4% |
Edison International
3.550%, 11/15/24 | 2,000 | 2,092,428 |
Louisville Gas and Electric Co.
4.250%, 04/01/49 | 3,000 | 3,668,475 |
| | Par
(000) | Value† |
| |
| Electric — (continued) |
Monongahela Power Co., 144A
3.550%, 05/15/27@ | $ 2,500 | $ 2,675,337 |
Northern States Power Co.
3.600%, 09/15/47 | 4,000 | 4,512,442 |
Pacific Gas and Electric Co.
4.000%, 12/01/46 | 3,000 | 2,921,495 |
| | | 15,870,177 |
| Food — 2.9% |
Kellogg Co.
2.650%, 12/01/23 | 2,501 | 2,577,640 |
Land O' Lakes, Inc., 144A
6.000%, 11/15/22@ | 3,500 | 3,607,005 |
Mars, Inc., 144A
1.625%, 07/16/32@ | 3,000 | 2,835,300 |
The Hershey Co.
1.700%, 06/01/30 | 2,000 | 1,959,047 |
The J.M. Smucker Co.
3.375%, 12/15/27 | 2,750 | 2,940,441 |
| | | 13,919,433 |
| Gas — 0.6% |
The Brooklyn Union Gas Co., 144A
3.407%, 03/10/26@ | 2,500 | 2,628,589 |
| Healthcare Products — 0.4% |
PerkinElmer, Inc.
2.250%, 09/15/31 | 2,000 | 1,947,023 |
| Healthcare Services — 1.5% |
| Centene Corp. | | |
| 3.375%, 02/15/30 | 1,000 | 1,020,210 |
| 2.500%, 03/01/31 | 2,000 | 1,947,030 |
Health Care Service Corp. A Mutual Legal Reserve Co., 144A
2.200%, 06/01/30@ | 2,000 | 1,960,734 |
Molina Healthcare, Inc., 144A
3.875%, 05/15/32@ | 2,000 | 2,012,500 |
| | | 6,940,474 |
| Household Products & Wares — 1.1% |
Church & Dwight Co., Inc.
2.300%, 12/15/31 | 3,000 | 3,029,247 |
Kimberly-Clark Corp.
3.100%, 03/26/30 | 2,000 | 2,157,090 |
| | | 5,186,337 |
| Internet — 0.8% |
| Alibaba Group Holding Ltd. | | |
| 3.400%, 12/06/27 | 1,000 | 1,059,288 |
| 2.125%, 02/09/31 | 3,000 | 2,899,601 |
| | | 3,958,889 |
| Investment Companies — 0.7% |
Ares Capital Corp.
2.875%, 06/15/28 | 3,500 | 3,493,532 |
Penn Series Funds, Inc.
Schedule of Investments — December 31, 2021
Quality Bond Fund
| | Par
(000) | Value† |
| CORPORATE BONDS — (continued) |
| Media — 1.8% |
Charter Communications Operating LLC
4.464%, 07/23/22 | $ 3,000 | $ 3,044,277 |
Comcast Cable Holdings LLC
9.875%, 06/15/22 | 1,000 | 1,038,795 |
Comcast Corp.
3.250%, 11/01/39 | 4,000 | 4,231,308 |
| | | 8,314,380 |
| Oil & Gas — 0.5% |
BP Capital Markets PLC
2.500%, 11/06/22 | 2,500 | 2,540,243 |
| Packaging and Containers — 0.2% |
Graphic Packaging International LLC, 144A
3.750%, 02/01/30@ | 1,000 | 1,010,700 |
| Pharmaceuticals — 3.9% |
Becton Dickinson and Co.
3.700%, 06/06/27 | 1,956 | 2,132,925 |
Bristol-Myers Squibb Co.
3.400%, 07/26/29 | 3,000 | 3,288,104 |
GlaxoSmithKline Capital, Inc.
5.375%, 04/15/34 | 1,000 | 1,324,603 |
Johnson & Johnson
3.625%, 03/03/37 | 3,000 | 3,449,979 |
Mead Johnson Nutrition Co.
4.125%, 11/15/25 | 2,000 | 2,179,958 |
Merck & Co., Inc.
3.900%, 03/07/39 | 2,200 | 2,588,423 |
Zoetis, Inc.
4.500%, 11/13/25 | 3,000 | 3,303,990 |
| | | 18,267,982 |
| Real Estate Investment Trusts — 1.4% |
Alexandria Real Estate Equities, Inc.
2.000%, 05/18/32 | 2,000 | 1,912,457 |
Kimco Realty Corp.
2.800%, 10/01/26 | 3,000 | 3,119,800 |
SBA Tower Trust, 144A
1.884%, 07/15/50@ | 1,500 | 1,498,024 |
| | | 6,530,281 |
| Retail — 0.8% |
AutoNation, Inc.
1.950%, 08/01/28 | 1,500 | 1,468,000 |
The Home Depot, Inc.
2.750%, 09/15/51 | 2,357 | 2,350,250 |
| | | 3,818,250 |
| Semiconductors — 0.4% |
NPX BV, 144A
3.150%, 05/01/27@ | 2,000 | 2,104,405 |
| Software — 2.1% |
Microsoft Corp.
3.750%, 02/12/45 | 1,900 | 2,242,529 |
| | Par
(000) | Value† |
| |
| Software — (continued) |
Roper Technologies, Inc.
1.400%, 09/15/27 | $ 1,500 | $ 1,456,534 |
salesforce.com, Inc.
2.700%, 07/15/41 | 3,000 | 3,005,036 |
VMware, Inc.
2.950%, 08/21/22 | 3,000 | 3,035,247 |
| | | 9,739,346 |
| Telecommunications — 2.9% |
Crown Castle Towers LLC, 144A
3.663%, 05/15/45@ | 4,000 | 4,162,777 |
Sprint Corp.
7.875%, 09/15/23 | 3,000 | 3,303,750 |
T-Mobile USA, Inc.
2.625%, 04/15/26 | 3,000 | 3,015,000 |
Verizon Communications, Inc.
2.100%, 03/22/28 | 3,000 | 3,008,141 |
| | | 13,489,668 |
| Transportation — 1.3% |
BNSF Railway Co. Pass Through Trust, Series 2015-1, 144A
3.442%, 06/16/28@ | 2,266 | 2,466,343 |
Federal Express Corp. Pass Through Trust, Series 1999-1A
7.650%, 07/15/24 | 131 | 135,138 |
Union Pacific Corp.
3.375%, 02/01/35 | 3,336 | 3,651,194 |
| | | 6,252,675 |
TOTAL CORPORATE BONDS
(Cost $203,908,198) | | 207,806,809 |
|
| MUNICIPAL BONDS — 1.0% |
University of Massachusetts Building Authority, Series 3
2.417%, 11/01/28
(Cost $4,689,962) | 4,690 | 4,873,300 |
|
| RESIDENTIAL MORTGAGE BACKED SECURITIES — 11.4% |
| Collateralized Mortgage Obligations — 7.5% |
GS Mortgage-Backed Securities Corp. Trust, Series 2020-PJ3 Class A13, 144A
2.500%, 10/25/50@,• | 3,294 | 3,301,033 |
| JP Morgan Mortgage Trust, | | |
| Series 2021-1 Class A3, 144A, 2.500%, 06/25/51@,• | 5,899 | 5,900,600 |
| Series 2021-1 Class A15, 144A, 2.500%, 06/25/51@,• | 4,411 | 4,379,686 |
| Series 2021-7 Class A15, 144A, 2.500%, 11/25/51@,• | 5,565 | 5,501,414 |
Seasoned Credit Risk Transfer Trust, Series 2021-2 Class MBU
2.500%, 11/25/60 | 3,100 | 3,089,915 |
Penn Series Funds, Inc.
Schedule of Investments — December 31, 2021
Quality Bond Fund
| | Par
(000) | Value† |
| RESIDENTIAL MORTGAGE BACKED SECURITIES — (continued) |
| Collateralized Mortgage Obligations — (continued) |
| Sequoia Mortgage Trust, | | |
| Series 2017-5 Class A1, 144A, 3.500%, 08/25/47@,• | $ 1,021 | $ 1,030,494 |
| Series 2017-CH2 Class A1, 144A, 4.000%, 12/25/47@,• | 682 | 689,155 |
| Series 2020-4 Class A20, 144A, 2.500%, 11/25/50@,• | 3,424 | 3,412,067 |
| Series 2021-5 Class A5, 144A, 2.000%, 07/25/51@,• | 3,666 | 3,682,336 |
Verus Securitization Trust, Series 2019-INV2 Class A3, 144A
3.219%, 07/25/59@,• | 2,531 | 2,541,962 |
Wells Fargo Mortgage Backed Securities Trust, Series 2020-3 Class A1, 144A
3.000%, 06/25/50@,• | 1,716 | 1,744,513 |
| | | 35,273,175 |
| Fannie Mae Pool — 2.3% |
| 2.000%, 11/01/40 | 1,890 | 1,909,897 |
| 3.500%, 11/01/44 | 1,007 | 1,046,993 |
| 2.000%, 11/01/51 | 4,968 | 4,959,163 |
| 2.000%, 12/01/51 | 2,992 | 2,987,278 |
| | | 10,903,331 |
| Freddie Mac Pool — 1.1% |
| 2.000%, 10/01/51 | 4,936 | 4,927,669 |
| Freddie Mac REMICS — 0.5% |
Series 4523 Class VB
3.500%, 08/15/34 | 2,400 | 2,446,825 |
TOTAL RESIDENTIAL MORTGAGE BACKED SECURITIES
(Cost $54,129,839) | | 53,551,000 |
|
| U.S. TREASURY OBLIGATIONS — 6.4% |
| U.S. Treasury Bonds | | |
| 1.125%, 08/15/40 | 4,500 | 3,941,719 |
| 2.250%, 05/15/41 | 3,000 | 3,160,781 |
| 2.750%, 08/15/42 | 1,800 | 2,057,555 |
| 2.875%, 05/15/43 | 1,750 | 2,040,391 |
| U.S. Treasury Inflation Indexed Bonds | | |
| 0.125%, 07/15/30 | 2,589 | 2,897,839 |
| 1.000%, 02/15/46 | 2,043 | 2,792,984 |
| U.S. Treasury Notes | | |
| 2.000%, 07/31/22(a) | 600 | 606,164 |
| 0.500%, 03/15/23 | 4,500 | 4,501,758 |
| 0.500%, 05/31/27 | 1,500 | 1,437,363 |
| 0.500%, 06/30/27 | 4,000 | 3,830,469 |
| 1.625%, 08/15/29 | 2,950 | 2,995,517 |
TOTAL U.S. TREASURY OBLIGATIONS
(Cost $29,009,523) | 30,262,540 |
| | Number of
Shares | Value† |
| SHORT-TERM INVESTMENTS — 1.1% |
BlackRock Liquidity FedFund - Institutional Shares (seven-day effective yield 0.030%)
(Cost $4,908,937) | 4,908,937 | $ 4,908,937 |
TOTAL INVESTMENTS — 99.1%
(Cost $461,108,225) | | $ 467,620,730 |
| Other Assets & Liabilities — 0.9% | 4,445,642 |
| TOTAL NET ASSETS — 100.0% | | $ 472,066,372 |
| † | See Security Valuation Note. |
| @ | Security exempt from registration under Rule 144A of the Securities Act of 1933, as amended. At December 31, 2021, the aggregate value of Rule 144A securities was $197,739,379, which represents 41.9% of the Fund’s net assets. |
| • | Variable rate security. The rate disclosed is the rate in effect on the report date. The information in parenthesis represents the benchmark and reference rate for each relevant security and the rate floats based upon the reference rate and spread. The security may be further subject to interest rate floors and caps. For loan agreements, the rate shown may represent a weighted average interest rate. Certain variable rate securities are not based on a published reference rate and spread, but are determined by the issuer or agent and are based on current market conditions, or, for mortgage-backed securities, are impacted by the individual mortgages which are paying off over time. These securities do not indicate a reference rate and spread in their descriptions. |
| µ | Perpetual security with no stated maturity date. |
| (a) | All or portion of securities segregated as collateral for futures contracts. |
| CLO— Collateralized Loan Obligation. |
| FHLMC— Federal Home Loan Mortgage Corporation. |
| FREMF— Freddie Mac Multifamily Securities. |
| ICE— Intercontinental Exchange. |
| LIBOR— London Interbank Offered Rate. |
| LLC— Limited Liability Company. |
| M— Month. |
| PLC— Public Limited Company. |
| REMICS— Real Estate Mortgage Investment Conduits. |
| SOFR— Secured Overnight Financing Rate. |
| Country Weightings as of 12/31/2021†† |
| United States | 87% |
| Cayman Islands | 10 |
| United Kingdom | 1 |
| China | 1 |
| Ireland | 1 |
| Total | 100% |
| †† | % of total investments as of December 31, 2021. |
Penn Series Funds, Inc.
Schedule of Investments — December 31, 2021
Quality Bond Fund
Summary of inputs used to value the Fund’s investments as of 12/31/2021 are as follows (See Security Valuation Note):
| ASSETS TABLE |
| Description | Total
Market
Value at
12/31/2021 | Level 1
Quoted
Price | Level 2
Significant
Observable
Input | Level 3
Significant
Unobservable
Input |
| Asset Backed Securities | $ 79,882,038 | $ — | $ 79,882,038 | $— |
| Commercial Mortgage Backed Securities | 81,204,026 | — | 81,204,026 | — |
| Preferred Stocks | 5,132,080 | 5,132,080 | — | — |
| Corporate Bonds | 207,806,809 | — | 207,806,809 | — |
| Municipal Bonds | 4,873,300 | — | 4,873,300 | — |
| Residential Mortgage Backed Securities | 53,551,000 | — | 53,551,000 | — |
| U.S. Treasury Obligations | 30,262,540 | — | 30,262,540 | — |
| Short-Term Investments | 4,908,937 | 4,908,937 | — | — |
| Total Investments | $ 467,620,730 | $ 10,041,017 | $ 457,579,713 | $ — |
| Other Financial Instruments(1) | | | | |
| Futures Contracts | $ 558,140 | $ 558,140 | $ — | $— |
| Total Assets—Other Financial Instruments | $ 558,140 | $ 558,140 | $ — | $ — |
| LIABILITIES TABLE |
| Description | Total
Market
Value at
12/31/2021 | Level 1
Quoted
Price | Level 2
Significant
Observable
Input | Level 3
Significant
Unobservable
Input |
| Other Financial Instruments(1) | | | | |
| Futures Contracts | $(314,045) | $(314,045) | $— | $— |
| Total Liabilities—Other Financial Instruments | $ (314,045) | $ (314,045) | $ — | $ — |
| (1) | Other financial instruments are derivative instruments not reflected in the value of total investments in securities in the Schedule of Investments such as future contracts and forward foreign currency contracts which are valued at the unrealized appreciation (depreciation) on the instrument. |
It is the Fund's practice to recognize transfers into and transfers out of Level 3 at the fair value hierarchy as of the beginning of period. The Fund did not have any transfers into and transfers out of Level 3 fair value hierarchy during the reporting period.
Futures contracts held by the Fund at December 31, 2021 are as follows:
Futures Contracts:
Exchange Traded |
| Type | | Futures Contract | | Expiration
Date | | Numbers
of
Contracts | | Units per
Contract | | Closing
Price | | Notional
Value | | Unrealized
Appreciation | | Unrealized
Depreciation |
| Long | | U.S. Treasury 2 Year Note | | 03/31/22 | | 818 | | 2,000 | | $109 | | $178,464,595 | | $ — | | $(103,697) |
| Long | | U.S. Treasury 5 Year Note | | 03/31/22 | | 80 | | 1,000 | | 121 | | 9,678,125 | | 40,479 | | — |
| Long | | U.S. Treasury 10 Year Note | | 03/22/22 | | 40 | | 1,000 | | 130 | | 5,218,750 | | 51,173 | | — |
| Long | | U.S. Treasury Ultra Bond | | 03/22/22 | | 149 | | 1,000 | | 197 | | 29,371,625 | | 466,488 | | — |
| | | | | | | | | | | | | | | $ 558,140 | | $(103,697) |
| |
| Type | | Futures Contract | | Expiration
Date | | Numbers
of
Contracts | | Units per
Contract | | Closing
Price | | Notional
Value | | Unrealized
Appreciation | | Unrealized
Depreciation |
| Short | | U.S. Treasury 10 Year Ultra Note | | 03/22/22 | | (100) | | 1,000 | | $147 | | $(14,643,750) | | $ — | | $(210,348) |
| | | | | | | | | | | | | | | $ — | | $(210,348) |
| | | | | | | | | | | | | | | $558,140 | | $ (314,045) |
The accompanying notes are an integral part of these financial statements.
Penn Series Funds, Inc.
Schedule of Investments — December 31, 2021
High Yield Bond Fund
| | Par
(000) | Value† |
| ASSET BACKED SECURITIES — 3.2% |
Benefit Street Partners CLO II Ltd., Series 2013-IIA Class CR (3 M ICE LIBOR + 3.700%), 144A
3.824%, 07/15/29@,• | $ 1,050 | $ 1,022,850 |
CFIP CLO Ltd., Series 2018-1A Class E (3 M ICE LIBOR + 6.350%) , 144A
6.472%, 07/18/31@,• | 1,500 | 1,454,105 |
First Eagle BSL CLO Ltd., Series 2019-1A Class C (3 M ICE LIBOR + 4.350%, Floor 4.350%), 144A
4.482%, 01/20/33@,• | 1,500 | 1,500,092 |
OCP CLO Ltd., Series 2017-13A Class DR (3 M ICE LIBOR + 6.500%, Floor 6.500%) , 144A
6.624%, 07/15/30@,• | 1,400 | 1,381,563 |
TOTAL ASSET BACKED SECURITIES
(Cost $5,408,912) | 5,358,610 |
| | Number of
Shares | |
| COMMON STOCKS — 0.0% |
| Entertainment — 0.0% |
New Cotai Participation, Class B(1),*
(Cost $24,225) | 1 | 0 |
|
| PREFERRED STOCKS — 1.3% |
| Engineering & Construction — 0.5% |
| Fluor Corp. CONV | 700 | 922,880 |
| Packaging and Containers — 0.0% |
| Smurfit-Stone Container Corp. (Escrow) CONV.(1),* | 725 | 0 |
| Pipelines — 0.8% |
| Targa Resources Corp. CONV | 1,175 | 1,265,153 |
TOTAL PREFERRED STOCKS
(Cost $2,073,649) | | 2,188,033 |
| | Par
(000) | |
| CORPORATE BONDS — 83.0% |
| Advertising — 0.6% |
Midas OpCo Holdings LLC, 144A
5.625%, 08/15/29@ | $ 1,050 | 1,074,938 |
| Aerospace & Defense — 1.3% |
Howmet Aerospace, Inc.
6.875%, 05/01/25 | 700 | 804,233 |
TransDigm, Inc., 144A
6.250%, 03/15/26@ | 1,400 | 1,455,125 |
| | | 2,259,358 |
| | Par
(000) | Value† |
| |
| Airlines — 1.7% |
American Airlines, Inc. Pass Through Trust, Series 2021-1 Class B
3.950%, 01/11/32 | $ 700 | $ 693,570 |
Delta Air Lines, Inc./SkyMiles IP Ltd., 144A
4.750%, 10/20/28@ | 700 | 764,871 |
| United Airlines, Inc. Pass Through Trust, | | |
| Series 2020-1 Class B, 4.875%, 07/15/27 | 629 | 654,507 |
| Series 2020-1 Class A, 5.875%, 04/15/29 | 632 | 692,757 |
| | | 2,805,705 |
| Apparel — 0.4% |
The William Carter Co., 144A
5.500%, 05/15/25@ | 700 | 726,250 |
| Auto Manufacturers — 1.1% |
Ford Motor Co.
4.750%, 01/15/43 | 1,050 | 1,158,938 |
Ford Motor Credit Co., LLC
5.125%, 06/16/25 | 700 | 761,250 |
| | | 1,920,188 |
| Auto Parts & Equipment — 2.3% |
Adient U.S. LLC, 144A
9.000%, 04/15/25@ | 1,050 | 1,115,625 |
Clarios Global LP/Clarios US Finance Co., 144A
8.500%, 05/15/27@ | 1,050 | 1,113,000 |
Tenneco, Inc., 144A
7.875%, 01/15/29@ | 770 | 831,600 |
The Goodyear Tire & Rubber Co., 144A
5.000%, 07/15/29@ | 700 | 751,940 |
| | | 3,812,165 |
| Building Materials — 1.2% |
Builders FirstSource, Inc., 144A
6.750%, 06/01/27@ | 880 | 928,400 |
Summit Materials LLC/Summit Materials Finance Corp., 144A
6.500%, 03/15/27@ | 1,100 | 1,141,250 |
| | | 2,069,650 |
| Chemicals — 1.7% |
Axalta Coating Systems LLC/Axalta Coating Systems Dutch Holding B BV, 144A
4.750%, 06/15/27@ | 700 | 729,750 |
Olympus Water US Holding Corp., 144A
6.250%, 10/01/29@ | 700 | 682,500 |
Tronox, Inc., 144A
6.500%, 05/01/25@ | 700 | 739,830 |
Penn Series Funds, Inc.
Schedule of Investments — December 31, 2021
High Yield Bond Fund
| | Par
(000) | Value† |
| CORPORATE BONDS — (continued) |
| Chemicals — (continued) |
WR Grace Holdings LLC, 144A
5.625%, 08/15/29@ | $ 700 | $ 716,625 |
| | | 2,868,705 |
| Commercial Services — 4.7% |
Albion Financing 1 SARL / Aggreko Holdings, Inc., 144A
6.125%, 10/15/26@ | 700 | 707,000 |
ASGN, Inc., 144A
4.625%, 05/15/28@ | 700 | 724,710 |
Metis Merger Sub LLC, 144A
6.500%, 05/15/29@ | 700 | 687,533 |
NESCO Holdings II, Inc., 144A
5.500%, 04/15/29@ | 700 | 722,750 |
Nielsen Finance LLC/Nielsen Finance Co., 144A
5.625%, 10/01/28@ | 700 | 722,750 |
Service Corp. International
7.500%, 04/01/27 | 1,750 | 2,100,000 |
Sotheby's/Bidfair Holdings, Inc., 144A
5.875%, 06/01/29@ | 1,400 | 1,428,000 |
WASH Multifamily Acquisition, Inc., 144A
5.750%, 04/15/26@ | 875 | 919,581 |
| | | 8,012,324 |
| Computers — 0.9% |
| NCR Corp. | | |
| 144A, 5.750%, 09/01/27@ | 750 | 783,750 |
| 144A, 5.125%, 04/15/29@ | 700 | 724,640 |
| | | 1,508,390 |
| Cosmetics & Personal Care — 0.9% |
Coty Inc/HFC Prestige Products, Inc./HFC Prestige International US LLC, 144A
4.750%, 01/15/29@ | 700 | 711,375 |
Coty, Inc., 144A
5.000%, 04/15/26@ | 770 | 793,123 |
| | | 1,504,498 |
| Distribution & Wholesale — 0.8% |
IAA, Inc., 144A
5.500%, 06/15/27@ | 1,000 | 1,036,250 |
Ritchie Bros Holdings, Inc., 144A
4.750%, 12/15/31@ | 350 | 365,313 |
| | | 1,401,563 |
| Diversified Financial Services — 2.5% |
LFS Topco LLC, 144A
5.875%, 10/15/26@ | 700 | 722,750 |
Midcap Financial Issuer Trust, 144A
6.500%, 05/01/28@ | 875 | 912,188 |
Navient Corp.
5.500%, 03/15/29 | 700 | 698,250 |
OneMain Finance Corp.
8.250%, 10/01/23 | 1,050 | 1,156,312 |
| | Par
(000) | Value† |
| |
| Diversified Financial Services — (continued) |
PRA Group, Inc., 144A
5.000%, 10/01/29@ | $ 700 | $ 701,750 |
| | | 4,191,250 |
| Electric — 2.0% |
FirstEnergy Corp.
4.400%, 07/15/27 | 1,210 | 1,303,838 |
Vistra Corp. (UST Yield Curve CMT 5 Yr + 5.740%) , 144A
7.000%@,µ,• | 1,050 | 1,063,534 |
Vistra Operations Co., LLC, 144A
5.000%, 07/31/27@ | 1,050 | 1,089,711 |
| | | 3,457,083 |
| Electrical Components & Equipment — 0.4% |
| WESCO Distribution, Inc. | | |
| 144A, 7.125%, 06/15/25@ | 350 | 371,000 |
| 144A, 7.250%, 06/15/28@ | 350 | 383,688 |
| | | 754,688 |
| Electronics — 0.9% |
Imola Merger Corp., 144A
4.750%, 05/15/29@ | 1,400 | 1,434,461 |
| Entertainment — 3.1% |
Affinity Gaming, 144A
6.875%, 12/15/27@ | 1,200 | 1,248,000 |
Churchill Downs, Inc., 144A
5.500%, 04/01/27@ | 750 | 772,500 |
Everi Holdings, Inc., 144A
5.000%, 07/15/29@ | 700 | 707,000 |
Lions Gate Capital Holdings LLC, 144A
5.500%, 04/15/29@ | 700 | 712,250 |
Midwest Gaming Borrower LLC/Midwest Gaming Finance Corp., 144A
4.875%, 05/01/29@ | 700 | 703,500 |
Scientific Games International, Inc., 144A
7.000%, 05/15/28@ | 1,050 | 1,118,250 |
| | | 5,261,500 |
| Environmental Control — 1.5% |
| Clean Harbors, Inc. | | |
| 144A, 4.875%, 07/15/27@ | 750 | 772,500 |
| 144A, 5.125%, 07/15/29@ | 750 | 795,000 |
Waste Pro USA, Inc., 144A
5.500%, 02/15/26@ | 1,000 | 995,000 |
| | | 2,562,500 |
| Food — 3.9% |
Albertsons Cos., Inc./Safeway, Inc./New Albertsons LP/Albertsons LLC, 144A
4.625%, 01/15/27@ | 1,050 | 1,101,912 |
Penn Series Funds, Inc.
Schedule of Investments — December 31, 2021
High Yield Bond Fund
| | Par
(000) | Value† |
| CORPORATE BONDS — (continued) |
| Food — (continued) |
JBS USA LUX S.A./JBS USA Finance, Inc., 144A
6.750%, 02/15/28@ | $ 1,400 | $ 1,510,264 |
Performance Food Group, Inc., 144A
5.500%, 10/15/27@ | 1,105 | 1,153,344 |
Pilgrim's Pride Corp., 144A
3.500%, 03/01/32@ | 1,050 | 1,060,500 |
Post Holdings, Inc., 144A
5.750%, 03/01/27@ | 1,000 | 1,032,500 |
SEG Holding LLC/SEG Finance Corp., 144A
5.625%, 10/15/28@ | 700 | 733,250 |
| | | 6,591,770 |
| Food Service — 0.4% |
Aramark Services, Inc., 144A
6.375%, 05/01/25@ | 700 | 731,500 |
| Gas — 0.6% |
NiSource, Inc. (UST Yield Curve CMT 5 Yr + 2.843%)
5.650%µ | 1,000 | 1,027,500 |
| Healthcare Products — 1.6% |
Avantor Funding, Inc., 144A
4.625%, 07/15/28@ | 750 | 781,875 |
Mozart Debt Merger Sub, Inc., 144A
5.250%, 10/01/29@ | 700 | 709,548 |
Ortho-Clinical Diagnostics, Inc./Ortho-Clinical Diagnostics S.A., 144A
7.375%, 06/01/25@ | 1,120 | 1,181,600 |
| | | 2,673,023 |
| Healthcare Services — 6.1% |
Acadia Healthcare Co., Inc., 144A
5.500%, 07/01/28@ | 700 | 735,749 |
Catalent Pharma Solutions, Inc., 144A
5.000%, 07/15/27@ | 1,160 | 1,205,240 |
| Centene Corp. | | |
| 4.250%, 12/15/27 | 1,050 | 1,094,625 |
| 3.375%, 02/15/30 | 700 | 714,147 |
Charles River Laboratories International, Inc., 144A
4.250%, 05/01/28@ | 1,050 | 1,092,000 |
CHS/Community Health Systems, Inc., 144A
8.000%, 12/15/27@ | 1,050 | 1,134,000 |
HCA, Inc.
5.875%, 02/15/26 | 1,575 | 1,777,808 |
IQVIA, Inc., 144A
5.000%, 10/15/26@ | 1,000 | 1,026,250 |
| Tenet Healthcare Corp. | | |
| 144A, 4.375%, 01/15/30@ | 700 | 708,876 |
| 6.875%, 11/15/31 | 700 | 799,750 |
| | | 10,288,445 |
| | Par
(000) | Value† |
| |
| Home Builders — 0.9% |
Meritage Homes Corp., 144A
3.875%, 04/15/29@ | $ 700 | $ 735,000 |
Williams Scotsman International, Inc., 144A
4.625%, 08/15/28@ | 700 | 722,750 |
| | | 1,457,750 |
| Insurance — 0.4% |
AmWINS Group, Inc., 144A
4.875%, 06/30/29@ | 700 | 707,000 |
| Internet — 0.9% |
Go Daddy Operating Co., LLC/GD Finance Co., Inc., 144A
5.250%, 12/01/27@ | 1,400 | 1,447,250 |
| Investment Companies — 0.6% |
| Compass Group Diversified Holdings LLC | | |
| 144A, 5.250%, 04/15/29@ | 700 | 733,250 |
| 144A, 5.000%, 01/15/32@ | 350 | 358,750 |
| | | 1,092,000 |
| Iron & Steel — 0.8% |
Cleveland-Cliffs, Inc., 144A
9.875%, 10/17/25@ | 1,200 | 1,358,148 |
| Machinery — Construction & Mining — 0.4% |
Terex Corp., 144A
5.000%, 05/15/29@ | 700 | 719,250 |
| Machinery — Diversified — 1.4% |
Granite US Holdings Corp., 144A
11.000%, 10/01/27@ | 1,050 | 1,141,875 |
Stevens Holding Co., Inc., 144A
6.125%, 10/01/26@ | 1,200 | 1,279,500 |
| | | 2,421,375 |
| Media — 3.8% |
CCO Holdings LLC/CCO Holdings Capital Corp., 144A
5.125%, 05/01/27@ | 1,000 | 1,030,000 |
CSC Holdings LLC, 144A
6.500%, 02/01/29@ | 700 | 749,000 |
DISH DBS Corp., 144A
5.750%, 12/01/28@ | 700 | 707,000 |
Gray Escrow II, Inc., 144A
5.375%, 11/15/31@ | 1,050 | 1,080,187 |
Gray Television, Inc., 144A
7.000%, 05/15/27@ | 700 | 748,125 |
iHeartCommunications, Inc., 144A
5.250%, 08/15/27@ | 700 | 728,070 |
Nexstar Media, Inc., 144A
5.625%, 07/15/27@ | 700 | 731,500 |
Urban One, Inc., 144A
7.375%, 02/01/28@ | 700 | 721,000 |
| | | 6,494,882 |
Penn Series Funds, Inc.
Schedule of Investments — December 31, 2021
High Yield Bond Fund
| | Par
(000) | Value† |
| CORPORATE BONDS — (continued) |
| Mining — 1.0% |
Arconic Corp., 144A
6.125%, 02/15/28@ | $ 875 | $ 931,175 |
Freeport-McMoRan, Inc.
5.000%, 09/01/27 | 700 | 728,000 |
| | | 1,659,175 |
| Miscellaneous Manufacturing — 1.0% |
FXI Holdings, Inc., 144A
12.250%, 11/15/26@ | 1,468 | 1,649,738 |
| Oil & Gas — 8.0% |
Apache Corp.
4.875%, 11/15/27 | 705 | 768,450 |
Ascent Resources Utica Holdings LLC/ARU Finance Corp., 144A
8.250%, 12/31/28@ | 1,050 | 1,094,625 |
Chesapeake Energy Corp., 144A
5.875%, 02/01/29@ | 1,500 | 1,604,625 |
Comstock Resources, Inc., 144A
6.750%, 03/01/29@ | 1,050 | 1,137,433 |
CrownRock LP/CrownRock Finance, Inc., 144A
5.000%, 05/01/29@ | 700 | 726,250 |
Encino Acquisition Partners Holdings LLC, 144A
8.500%, 05/01/28@ | 1,050 | 1,090,688 |
Endeavor Energy Resources LP/EER Finance, Inc., 144A
5.750%, 01/30/28@ | 700 | 741,489 |
EQT Corp., 144A
3.625%, 05/15/31@ | 1,120 | 1,162,000 |
Northern Oil & Gas, Inc., 144A
8.125%, 03/01/28@ | 700 | 738,500 |
Occidental Petroleum Corp.
8.500%, 07/15/27 | 1,050 | 1,309,875 |
Parkland Corp., 144A
5.875%, 07/15/27@ | 1,150 | 1,213,250 |
| Southwestern Energy Co. | | |
| 8.375%, 09/15/28 | 1,400 | 1,562,750 |
| 4.750%, 02/01/32 | 350 | 368,452 |
| | | 13,518,387 |
| Oil & Gas Services — 0.4% |
Archrock Partners LP/Archrock Partners Finance Corp., 144A
6.875%, 04/01/27@ | 700 | 735,000 |
| Packaging and Containers — 2.3% |
Ardagh Packaging Finance PLC/Ardagh Holdings USA, Inc., 144A
5.250%, 08/15/27@ | 700 | 704,375 |
Berry Global, Inc., 144A
5.625%, 07/15/27@ | 750 | 784,688 |
Graham Packaging Co., Inc., 144A
7.125%, 08/15/28@ | 700 | 724,556 |
| | Par
(000) | Value† |
| |
| Packaging and Containers — (continued) |
Mauser Packaging Solutions Holding Co., 144A
8.500%, 04/15/24@ | $ 1,575 | $ 1,626,187 |
| | | 3,839,806 |
| Pharmaceuticals — 2.2% |
Elanco Animal Health, Inc.
5.900%, 08/28/28 | 1,050 | 1,218,000 |
Jazz Securities DAC, 144A
4.375%, 01/15/29@ | 1,400 | 1,449,616 |
Organon & Co./Organon Foreign Debt Co-Issuer BV, 144A
5.125%, 04/30/31@ | 1,050 | 1,096,914 |
| | | 3,764,530 |
| Pipelines — 3.5% |
Cheniere Energy, Inc.
4.625%, 10/15/28 | 1,400 | 1,480,500 |
Hess Midstream Operations LP, 144A
5.625%, 02/15/26@ | 1,050 | 1,081,500 |
New Fortress Energy, Inc., 144A
6.500%, 09/30/26@ | 700 | 694,750 |
| Tallgrass Energy Partners LP/Tallgrass Energy Finance Corp. | | |
| 144A, 7.500%, 10/01/25@ | 1,050 | 1,136,625 |
| 144A, 6.000%, 09/01/31@ | 700 | 692,696 |
Targa Resources Partners LP/Targa Resources Partners Finance Corp.
4.875%, 02/01/31 | 700 | 760,165 |
| | | 5,846,236 |
| Real Estate — 2.3% |
Greystar Real Estate Partners LLC, 144A
5.750%, 12/01/25@ | 750 | 763,290 |
| Realogy Group LLC/Realogy Co-Issuer Corp. | | |
| 144A, 7.625%, 06/15/25@ | 1,050 | 1,113,000 |
| 144A, 9.375%, 04/01/27@ | 1,050 | 1,134,000 |
The Howard Hughes Corp., 144A
5.375%, 08/01/28@ | 875 | 931,914 |
| | | 3,942,204 |
| Real Estate Investment Trusts — 1.3% |
MGM Growth Properties Operating Partnership LP/MGP Finance Co-Issuer, Inc.
5.750%, 02/01/27 | 1,000 | 1,130,000 |
MPT Operating Partnership LP/MPT Finance Corp.
5.000%, 10/15/27 | 1,050 | 1,098,562 |
| | | 2,228,562 |
| Retail — 5.1% |
Asbury Automotive Group, Inc.
4.750%, 03/01/30 | 1,050 | 1,067,062 |
Penn Series Funds, Inc.
Schedule of Investments — December 31, 2021
High Yield Bond Fund
| | Par
(000) | Value† |
| CORPORATE BONDS — (continued) |
| Retail — (continued) |
Bath & Body Works, Inc., 144A
6.625%, 10/01/30@ | $ 700 | $ 792,750 |
Ken Garff Automotive LLC, 144A
4.875%, 09/15/28@ | 700 | 700,875 |
LCM Investments Holdings II LLC, 144A
4.875%, 05/01/29@ | 700 | 719,376 |
Lithia Motors, Inc., 144A
3.875%, 06/01/29@ | 700 | 714,630 |
Murphy Oil USA, Inc.
5.625%, 05/01/27 | 1,050 | 1,092,000 |
QVC, Inc.
4.750%, 02/15/27 | 750 | 770,625 |
SRS Distribution, Inc., 144A
6.000%, 12/01/29@ | 700 | 703,500 |
Suburban Propane Partners LP/Suburban Energy Finance Corp., 144A
5.000%, 06/01/31@ | 775 | 783,719 |
Yum! Brands, Inc., 144A
7.750%, 04/01/25@ | 1,200 | 1,264,500 |
| | | 8,609,037 |
| Semiconductors — 0.7% |
Sensata Technologies BV, 144A
5.625%, 11/01/24@ | 1,000 | 1,099,300 |
| Software — 1.1% |
ACI Worldwide, Inc., 144A
5.750%, 08/15/26@ | 750 | 781,875 |
Consensus Cloud Solutions, Inc., 144A
6.500%, 10/15/28@ | 1,050 | 1,097,250 |
| | | 1,879,125 |
| Telecommunications — 3.9% |
Connect Finco SARL/Connect US Finco LLC, 144A
6.750%, 10/01/26@ | 1,050 | 1,103,812 |
Frontier Communications Holdings LLC, 144A
5.875%, 10/15/27@ | 1,400 | 1,480,500 |
Hughes Satellite Systems Corp.
5.250%, 08/01/26 | 1,000 | 1,093,750 |
Level 3 Financing, Inc., 144A
4.625%, 09/15/27@ | 1,050 | 1,071,000 |
T-Mobile USA, Inc., 144A
3.500%, 04/15/31@ | 700 | 728,000 |
Viasat, Inc., 144A
5.625%, 04/15/27@ | 1,050 | 1,081,500 |
| | | 6,558,562 |
| Transportation — 0.4% |
Seaspan Corp., 144A
5.500%, 08/01/29@ | 700 | 707,000 |
TOTAL CORPORATE BONDS
(Cost $136,645,585) | | 140,671,771 |
| | Par
(000) | Value† |
|
| LOAN AGREEMENTS‡ — 3.0% |
| Auto Parts & Equipment — 1.0% |
Adient U.S. LLC (3 M LIBOR + 3.500%)
3.590%, 04/10/28• | $ 697 | $ 695,775 |
Clarios Global LP (1 M LIBOR + 3.250%)
3.354%, 04/30/26• | 915 | 909,075 |
| | | 1,604,850 |
| Entertainment — 0.6% |
Scientific Games International, Inc. (1 M LIBOR + 2.750%)
2.854%, 08/14/24• | 1,039 | 1,034,818 |
| Insurance — 0.4% |
Asurion LLC (1 M LIBOR + 5.250%)
5.354%, 01/20/29• | 700 | 696,647 |
| Machinery — Diversified — 0.6% |
Granite US Holdings Corp. (3 M LIBOR + 4.000%)
4.224%, 09/30/26• | 1,027 | 1,025,931 |
| Media — 0.4% |
DIRECTV Financing LLC (3 M LIBOR + 5.000%)
5.750%, 08/02/27• | 684 | 684,448 |
TOTAL LOAN AGREEMENTS
(Cost $5,035,993) | | 5,046,694 |
| | Number of
Shares | |
| SHORT-TERM INVESTMENTS — 7.2% |
BlackRock Liquidity FedFund - Institutional Shares (seven-day effective yield 0.030%)
(Cost $12,261,095) | 12,261,095 | 12,261,095 |
TOTAL INVESTMENTS — 97.7%
(Cost $161,449,459) | | $ 165,526,203 |
| Other Assets & Liabilities — 2.3% | 3,905,235 |
| TOTAL NET ASSETS — 100.0% | | $ 169,431,438 |
Penn Series Funds, Inc.
Schedule of Investments — December 31, 2021
High Yield Bond Fund
| † | See Security Valuation Note. |
| @ | Security exempt from registration under Rule 144A of the Securities Act of 1933, as amended. At December 31, 2021, the aggregate value of Rule 144A securities was $116,144,705, which represents 68.5% of the Fund’s net assets. |
| • | Variable rate security. The rate disclosed is the rate in effect on the report date. The information in parenthesis represents the benchmark and reference rate for each relevant security and the rate floats based upon the reference rate and spread. The security may be further subject to interest rate floors and caps. For loan agreements, the rate shown may represent a weighted average interest rate. Certain variable rate securities are not based on a published reference rate and spread, but are determined by the issuer or agent and are based on current market conditions, or, for mortgage-backed securities, are impacted by the individual mortgages which are paying off over time. These securities do not indicate a reference rate and spread in their descriptions. |
| (1) | The value of this security was determined using significant unobservable inputs and is reported as a Level 3 security in the Valuation Hierarchy table located at the end of the Schedule of Investments. |
| * | Non-income producing security. |
| µ | Perpetual security with no stated maturity date. |
| ‡ | Loan Agreements in which the Fund invests generally pay interest at rates which are periodically predetermined by reference to a base lending rate plus a premium. These base lending rates are generally (i) the Prime Rate offered by one or more major U.S. banks, (ii) the lending rate offered by one or more European banks such as the London Interbank Offered Rate (“LIBOR”) or (iii) the Certificate of Deposit rate. Rate shown represents the actual rate at December 31, 2021. Loan Agreements, while exempt from registration under the Security Act of 1933, as amended (the “1933 Act”), contain certain restrictions on resale and cannot be sold publicly. Floating rate Loan Agreements often require repayments from excess cash flow or permit the borrower to repay at its election. The degree to which borrowers repay, whether as a contractual requirement or at their election, cannot be predicted with accuracy. As a result, the actual remaining maturity may be substantially less than the stated maturity shown. |
| CLO— Collateralized Loan Obligation. |
| CMT— Constant Maturity Treasury. |
| CONV— Convertible Security. |
| ICE— Intercontinental Exchange. |
| LIBOR— London Interbank Offered Rate. |
| LLC— Limited Liability Company. |
| LP— Limited Partnership. |
| M— Month. |
| PLC— Public Limited Company. |
| S.A.— Societe Anonyme. |
| UST— US Treasury. |
| Yr— Year. |
| Country Weightings as of 12/31/2021†† |
| United States | 94% |
| Cayman Islands | 4 |
| Ireland | 1 |
| Canada | 1 |
| Total | 100% |
| †† | % of total investments as of December 31, 2021. |
Summary of inputs used to value the Fund’s investments as of 12/31/2021 are as follows (See Security Valuation Note):
| ASSETS TABLE |
| Description | Total
Market
Value at
12/31/2021 | Level 1
Quoted
Price | Level 2
Significant
Observable
Input | Level 3
Significant
Unobservable
Input |
| Asset Backed Securities | $ 5,358,610 | $ — | $ 5,358,610 | $— |
| Common Stocks | — | — | — | — (1) |
| Preferred Stocks | 2,188,033 | 2,188,033 | — | — (1) |
| Corporate Bonds | 140,671,771 | — | 140,671,771 | — |
| Loan Agreements | 5,046,694 | — | 5,046,694 | — |
| Short-Term Investments | 12,261,095 | 12,261,095 | — | — |
| Total Investments | $ 165,526,203 | $ 14,449,128 | $ 151,077,075 | $ — |
| (1) | Includes internally fair valued securities currently priced at zero ($0). |
It is the Fund's practice to recognize transfers into and transfers out of Level 3 at the fair value hierarchy as of the beginning of period. The Fund did not have any transfers into and transfers out of Level 3 fair value hierarchy during the reporting period.
The accompanying notes are an integral part of these financial statements.
Penn Series Funds, Inc.
Schedule of Investments — December 31, 2021
Flexibly Managed Fund
| | Par
(000) | Value† |
| ASSET BACKED SECURITIES — 0.2% |
| Domino's Pizza Master Issuer LLC, | | |
| Series 2017-1A A23, 144A, 4.118%, 07/25/47@ | $4,827 | $ 5,051,216 |
| Series 2018-1A A2I, 144A, 4.116%, 07/25/48@ | 4,535 | 4,634,995 |
| Series 2019-1A A2, 144A, 3.668%, 10/25/49@ | 2,176 | 2,290,501 |
United Airlines Pass Through Trust, Series 2012-1, Class A,
4.150%, 10/11/25 | 1,285 | 1,332,570 |
TOTAL ASSET BACKED SECURITIES
(Cost $12,780,823) | 13,309,282 |
| | Number of
Shares | |
| COMMON STOCKS — 71.9% |
| Aerospace & Defense — 0.5% |
| Lockheed Martin Corp. | 28,800 | 10,235,808 |
| Northrop Grumman Corp. | 22,100 | 8,554,247 |
| Teledyne Technologies, Inc.* | 21,832 | 9,538,182 |
| | | 28,328,237 |
| Auto Parts & Equipment — 0.3% |
| Aurora Innovation, Inc.* | 900,000 | 10,134,000 |
| Aurora Innovation, Inc.*,# | 769,649 | 8,232,935 |
| | | 18,366,935 |
| Banks — 5.4% |
| Bank of America Corp. | 1,932,970 | 85,997,836 |
| The PNC Financial Services Group, Inc. | 1,052,860 | 211,119,487 |
| | | 297,117,323 |
| Beverages — 1.9% |
| Keurig Dr Pepper, Inc. | 2,220,185 | 81,836,019 |
| PepsiCo, Inc. | 58,400 | 10,144,664 |
| The Coca-Cola Co. | 196,100 | 11,611,081 |
| | | 103,591,764 |
| Commercial Services — 0.6% |
| FleetCor Technologies, Inc.* | 141,162 | 31,597,702 |
| TransUnion | 10,373 | 1,230,030 |
| | | 32,827,732 |
| Computers — 1.0% |
| Apple, Inc. | 297,158 | 52,766,346 |
| Diversified Financial Services — 2.7% |
| CME Group, Inc. | 41,400 | 9,458,244 |
| Intercontinental Exchange, Inc. | 540,524 | 73,927,468 |
| Mastercard, Inc., Class A | 24,900 | 8,947,068 |
| Visa, Inc., Class A | 266,800 | 57,818,228 |
| | | 150,151,008 |
| Electric — 6.2% |
| Ameren Corp. | 1,103,084 | 98,185,507 |
| American Electric Power Co., Inc. | 305,931 | 27,218,681 |
| | Number of
Shares | Value† |
| |
| Electric — (continued) |
| CMS Energy Corp. | 871,321 | $ 56,679,431 |
| Exelon Corp. | 1,217,714 | 70,335,160 |
| Public Service Enterprise Group, Inc. | 1,313,927 | 87,678,349 |
| | | 340,097,128 |
| Electronics — 0.9% |
| TE Connectivity Ltd. | 295,072 | 47,606,917 |
| Environmental Control — 1.0% |
| Waste Connections, Inc. | 376,675 | 51,329,502 |
| Waste Management, Inc. | 14,100 | 2,353,290 |
| | | 53,682,792 |
| Healthcare Products — 7.9% |
| Danaher Corp. | 373,132 | 122,764,159 |
| Hologic, Inc.* | 277,684 | 21,259,487 |
| Medtronic PLC | 41,800 | 4,324,210 |
| PerkinElmer, Inc. | 462,725 | 93,035,489 |
| Thermo Fisher Scientific, Inc. | 290,488 | 193,825,213 |
| | | 435,208,558 |
| Healthcare Services — 6.4% |
| Humana, Inc. | 327,089 | 151,723,504 |
| UnitedHealth Group, Inc. | 400,566 | 201,140,211 |
| | | 352,863,715 |
| Insurance — 2.5% |
| Marsh & McLennan Cos., Inc. | 779,899 | 135,562,044 |
| Internet — 11.8% |
| Alphabet, Inc., Class A* | 44,270 | 128,251,961 |
| Alphabet, Inc., Class C* | 60,549 | 175,203,981 |
| Amazon.com, Inc.* | 87,020 | 290,154,267 |
| Meta Platforms, Inc., Class A* | 166,559 | 56,022,119 |
| | | 649,632,328 |
| Lodging — 1.2% |
| Hilton Worldwide Holdings, Inc.* | 227,264 | 35,450,911 |
| Marriott International, Inc., Class A* | 167,761 | 27,720,828 |
| | | 63,171,739 |
| Machinery — Diversified — 0.7% |
| Ingersoll Rand, Inc. | 635,610 | 39,325,191 |
| Miscellaneous Manufacturing — 4.5% |
| General Electric Co. | 2,586,791 | 244,374,146 |
| Pharmaceuticals — 2.1% |
| Becton Dickinson and Co. | 448,568 | 112,805,881 |
| Retail — 4.0% |
| McDonald's Corp. | 53,408 | 14,317,083 |
| Ross Stores, Inc. | 20,200 | 2,308,456 |
| Yum! Brands, Inc. | 1,463,656 | 203,243,272 |
| | | 219,868,811 |
| Semiconductors — 0.2% |
| NXP Semiconductors N.V. | 51,600 | 11,753,448 |
Penn Series Funds, Inc.
Schedule of Investments — December 31, 2021
Flexibly Managed Fund
| | Number of
Shares | Value† |
| COMMON STOCKS — (continued) |
| Software — 9.7% |
| Fiserv, Inc.* | 140,445 | $ 14,576,787 |
| Microsoft Corp. | 1,243,457 | 418,199,458 |
| Roper Technologies, Inc. | 44,672 | 21,972,370 |
| salesforce.com, Inc.* | 311,234 | 79,093,896 |
| | | 533,842,511 |
| Telecommunications — 0.4% |
| Cisco Systems, Inc. | 322,200 | 20,417,814 |
TOTAL COMMON STOCKS
(Cost $2,888,624,749) | 3,943,362,368 |
|
| PREFERRED STOCKS — 1.3% |
| Auto Manufacturers — 0.4% |
| Waymo LLC, Series A-2, CONV(1),*,# | 245,568 | 22,523,988 |
| Diversified Financial Services — 0.0% |
| The Charles Schwab Corp., Series D | 12,000 | 305,760 |
| Electric — 0.7% |
| American Electric Power Co., Inc., CONV | 132,344 | 6,633,081 |
| CMS Energy Corp., 2078 | 348,783 | 9,329,945 |
| CMS Energy Corp., 2079 | 473,264 | 12,730,802 |
| SCE Trust IV, Series J (3 M ICE LIBOR + 3.132%) | 253,661 | 6,356,745 |
| | | 35,050,573 |
| Gas — 0.2% |
| NiSource, Inc., CONV | 70,356 | 7,879,168 |
| NiSource, Inc., Series B (UST Yield Curve CMT 5 Yr + 3.632%) | 161,830 | 4,405,013 |
| | | 12,284,181 |
TOTAL PREFERRED STOCKS
(Cost $65,949,798) | | 70,164,502 |
| | Par
(000) | |
| CORPORATE BONDS — 7.8% |
| Airlines — 0.3% |
| Delta Air Lines, Inc./SkyMiles IP Ltd. | | |
| 144A, 4.500%, 10/20/25@ | $ 7,490 | 7,874,458 |
| 144A, 4.750%, 10/20/28@ | 4,165 | 4,550,982 |
Mileage Plus Holdings LLC/Mileage Plus Intellectual Property Assets Ltd., 144A
6.500%, 06/20/27@ | 4,500 | 4,803,750 |
| U.S. Airways Pass Through Trust, | | |
| Series 2010-1 Class A, 6.250%, 10/22/24 | 796 | 814,911 |
| Series 2012-2 Class A, 4.625%, 12/03/26 | 140 | 139,099 |
| | Par
(000) | Value† |
| |
| Airlines — (continued) |
| Series 2013-1 Class B, 3.950%, 05/15/27 | $ 2 | $ 2,572 |
| | | 18,185,772 |
| Auto Parts & Equipment — 0.2% |
Clarios Global LP, 144A
6.750%, 05/15/25@ | 1,714 | 1,795,415 |
| Clarios Global LP/Clarios US Finance Co. | | |
| 144A, 6.250%, 05/15/26@ | 2,304 | 2,410,560 |
| 144A, 8.500%, 05/15/27@ | 3,995 | 4,234,700 |
| | | 8,440,675 |
| Banks — 0.0% |
State Street Corp., Series F (3 M ICE LIBOR + 3.597%)
3.800%µ | 1,454 | 1,457,464 |
| Building Materials — 0.0% |
Lennox International, Inc.
3.000%, 11/15/23 | 760 | 781,668 |
| Commercial Services — 0.0% |
Korn Ferry, 144A
4.625%, 12/15/27@ | 1,405 | 1,447,150 |
| Entertainment — 1.3% |
Cedar Fair LP
5.250%, 07/15/29 | 8,321 | 8,529,025 |
| Cedar Fair LP/Canada's Wonderland Co./Magnum Management Corp. | | |
| 144A, 5.500%, 05/01/25@ | 3,515 | 3,638,025 |
| 5.375%, 04/15/27 | 8,865 | 9,086,625 |
| 6.500%, 10/01/28 | 6,445 | 6,863,925 |
| Six Flags Entertainment Corp. | | |
| 144A, 4.875%, 07/31/24@ | 20,338 | 20,541,380 |
| 144A, 5.500%, 04/15/27@ | 13,244 | 13,707,540 |
Six Flags Theme Parks, Inc., 144A
7.000%, 07/01/25@ | 6,684 | 7,138,128 |
| | | 69,504,648 |
| Gas — 0.1% |
NiSource, Inc. (UST Yield Curve CMT 5 Yr + 2.843%)
5.650%µ | 5,825 | 5,985,187 |
| Healthcare Products — 0.1% |
Avantor Funding, Inc., 144A
4.625%, 07/15/28@ | 4,495 | 4,686,037 |
Teleflex, Inc.
4.625%, 11/15/27 | 2,880 | 2,995,200 |
| | | 7,681,237 |
| Healthcare Services — 0.2% |
Hadrian Merger Sub, Inc., 144A
8.500%, 05/01/26@ | 5,376 | 5,523,840 |
Surgery Center Holdings, Inc., 144A
10.000%, 04/15/27@ | 4,525 | 4,807,812 |
Penn Series Funds, Inc.
Schedule of Investments — December 31, 2021
Flexibly Managed Fund
| | Par
(000) | Value† |
| CORPORATE BONDS — (continued) |
| Healthcare Services — (continued) |
Tenet Healthcare Corp., 144A
4.625%, 09/01/24@ | $ 1,700 | $ 1,738,250 |
| | | 12,069,902 |
| Insurance — 0.9% |
Acrisure LLC/Acrisure Finance, Inc., 144A
7.000%, 11/15/25@ | 8,275 | 8,275,000 |
| Alliant Holdings Intermediate LLC/Alliant Holdings Co-Issuer | | |
| 144A, 4.250%, 10/15/27@ | 925 | 925,000 |
| 144A, 6.750%, 10/15/27@ | 1,025 | 1,063,438 |
| 144A, 5.875%, 11/01/29@ | 925 | 941,095 |
AmWINS Group, Inc., 144A
4.875%, 06/30/29@ | 1,475 | 1,489,750 |
| HUB International Ltd. | | |
| 144A, 7.000%, 05/01/26@ | 25,492 | 26,193,030 |
| 144A, 5.625%, 12/01/29@ | 1,735 | 1,787,432 |
USI, Inc., 144A
6.875%, 05/01/25@ | 9,529 | 9,600,467 |
| | | 50,275,212 |
| Internet — 1.8% |
| Netflix, Inc. | | |
| 5.500%, 02/15/22 | 1,100 | 1,106,050 |
| 5.875%, 02/15/25 | 6,510 | 7,315,938 |
| 4.375%, 11/15/26 | 15,365 | 17,016,737 |
| 4.875%, 04/15/28 | 18,975 | 21,631,500 |
| 5.875%, 11/15/28 | 25,660 | 30,856,150 |
| 6.375%, 05/15/29 | 13,850 | 17,208,625 |
| 144A, 4.875%, 06/15/30@ | 390 | 454,838 |
Photo Holdings Merger Sub, Inc., 144A
8.500%, 10/01/26@ | 4,635 | 4,821,420 |
| | | 100,411,258 |
| Leisure Time — 0.1% |
Life Time, Inc., 144A
5.750%, 01/15/26@ | 4,539 | 4,697,865 |
| Lodging — 0.0% |
Hilton Domestic Operating Co., Inc., 144A
5.375%, 05/01/25@ | 389 | 404,794 |
Marriott International, Inc.
3.125%, 06/15/26 | 1,290 | 1,340,391 |
| | | 1,745,185 |
| Machinery — Diversified — 0.1% |
TK Elevator US Newco, Inc., 144A
5.250%, 07/15/27@ | 1,345 | 1,413,931 |
Welbilt, Inc.
9.500%, 02/15/24 | 3,543 | 3,578,430 |
| | | 4,992,361 |
| | Par
(000) | Value† |
| |
| Media — 1.3% |
| CCO Holdings LLC/CCO Holdings Capital Corp. | | |
| 144A, 4.000%, 03/01/23@ | $ 5,250 | $ 5,250,210 |
| 144A, 5.125%, 05/01/27@ | 26,370 | 27,161,100 |
| 144A, 5.000%, 02/01/28@ | 28,336 | 29,469,440 |
Sirius XM Radio, Inc., 144A
5.000%, 08/01/27@ | 6,075 | 6,313,990 |
| | | 68,194,740 |
| Miscellaneous Manufacturing — 0.3% |
General Electric Co., Series D (3 M ICE LIBOR + 3.330%)
3.533%µ | 14,550 | 14,477,250 |
| Real Estate Investment Trusts — 0.0% |
SBA Communications Corp.
3.875%, 02/15/27 | 2,085 | 2,147,550 |
| Retail — 0.8% |
IRB Holding Corp., 144A
6.750%, 02/15/26@ | 280 | 285,250 |
KFC Holding Co./Pizza Hut Holdings LLC/Taco Bell of America LLC, 144A
4.750%, 06/01/27@ | 19,335 | 19,987,556 |
| Yum! Brands, Inc. | | |
| 3.875%, 11/01/23 | 4,905 | 5,107,331 |
| 144A, 7.750%, 04/01/25@ | 1,740 | 1,833,525 |
| 144A, 4.750%, 01/15/30@ | 1,300 | 1,407,250 |
| 6.875%, 11/15/37 | 3,540 | 4,478,100 |
| 5.350%, 11/01/43 | 8,185 | 9,023,963 |
| | | 42,122,975 |
| Semiconductors — 0.1% |
| Sensata Technologies BV | | |
| 144A, 4.875%, 10/15/23@ | 2,595 | 2,724,750 |
| 144A, 5.625%, 11/01/24@ | 880 | 967,384 |
| 144A, 5.000%, 10/01/25@ | 3,150 | 3,417,750 |
| | | 7,109,884 |
| Software — 0.1% |
| Clarivate Science Holdings Corp. | | |
| 144A, 3.875%, 07/01/28@ | 2,585 | 2,597,925 |
| 144A, 4.875%, 07/01/29@ | 795 | 807,319 |
| | | 3,405,244 |
| Telecommunications — 0.1% |
Altice France Holding S.A., 144A
10.500%, 05/15/27@ | 4,865 | 5,229,875 |
TOTAL CORPORATE BONDS
(Cost $401,929,052) | | 430,363,102 |
|
| LOAN AGREEMENTS‡ — 11.4% |
| Airlines — 0.7% |
Delta Air Lines, Inc. (3 M ICE LIBOR + 3.750%)
4.750%, 10/20/27• | 10,040 | 10,604,750 |
Penn Series Funds, Inc.
Schedule of Investments — December 31, 2021
Flexibly Managed Fund
| | Par
(000) | Value† |
| LOAN AGREEMENTS‡ — (continued) |
| Airlines — (continued) |
Mileage Plus Holdings LLC (3 M ICE LIBOR + 5.250%)
6.250%, 06/21/27• | $24,765 | $26,080,764 |
| | | 36,685,514 |
| Chemicals — 0.0% |
HB Fuller Co. (1 M ICE LIBOR + 2.000%)
2.104%, 10/20/24• | 1,139 | 1,138,488 |
| Commercial Services — 0.2% |
| CoreLogic, Inc. | | |
| (1 M ICE LIBOR + 3.500%), 4.000%, 06/02/28• | 11,232 | 11,209,386 |
| (1 M ICE LIBOR + 6.500%), 7.000%, 06/04/29• | 665 | 669,575 |
| | | 11,878,961 |
| Cosmetics & Personal Care — 0.3% |
Sunshine Luxembourg VII Sarl (3 M ICE LIBOR + 3.750%)
4.500%, 10/01/26• | 13,803 | 13,846,413 |
| Entertainment — 0.5% |
Alpha TopCo., Ltd. - Delta 2 (Lux) Sarl (1 M ICE LIBOR + 2.500%)
3.500%, 02/01/24• | 22,740 | 22,702,024 |
Cedar Fair LP (1 M ICE LIBOR + 1.750%)
1.854%, 04/13/24• | 210 | 205,473 |
SeaWorld Parks & Entertainment, Inc. (3 M ICE LIBOR + 3.000%)
3.500%, 08/25/28• | 5,046 | 5,021,168 |
| | | 27,928,665 |
| Environmental Control — 0.2% |
| Filtration Group Corp. | | |
| (1 M EURIBOR + 3.000%), 3.104%, 03/31/25• | 3,057 | 3,027,722 |
| (3 M ICE EURIBOR + 3.500%), 3.500%, 03/31/25• | 5,579 | 6,324,342 |
| (1 M ICE LIBOR + 3.500%), 4.000%, 10/21/28• | 1,721 | 1,716,747 |
| | | 11,068,811 |
| Healthcare Products — 0.7% |
Avantor Funding, Inc. (1 M ICE LIBOR + 2.000%)
2.500%, 11/21/24• | 610 | 608,025 |
Medline Borrower, LP (1 M ICE LIBOR + 3.250%)
3.750%, 10/23/28• | 34,675 | 34,659,743 |
| | | 35,267,768 |
| | Par
(000) | Value† |
| |
| Healthcare Services — 0.9% |
| ADMI Corp. | | |
| (6 M ICE LIBOR + 3.125%), 3.875%, 12/23/27• | $ 6,000 | $ 5,957,185 |
| (1 M ICE LIBOR + 3.500%), 4.000%, 12/23/27• | 6,918 | 6,899,261 |
| Eyecare Partners LLC | | |
| (3 M ICE LIBOR + 3.750%), 3.974%, 02/18/27• | 1,023 | 1,015,711 |
| (3 M ICE LIBOR + 3.750%), 4.250%, 11/15/28• | 220 | 218,955 |
| (3 M ICE LIBOR + 2.750%), 5.443%, 11/15/28• | 55 | 54,739 |
| Heartland Dental LLC | | |
| (1 M ICE LIBOR + 3.500%), 3.604%, 04/30/25• | 18,053 | 17,857,740 |
| (3 M ICE LIBOR + 4.000%), 4.104%, 04/30/25• | 1,766 | 1,761,710 |
Loire US Holdco 1, Inc. (1 M ICE LIBOR + 3.250%)
3.354%, 04/21/27(1),• | 12,279 | 12,125,700 |
Pacific Dental Services, Inc. (1 M ICE LIBOR + 3.250%)
4.000%, 05/05/28• | 1,552 | 1,550,741 |
| | | 47,441,742 |
| Insurance — 4.1% |
Acrisure LLC (3 M ICE LIBOR + 3.750%)
4.250%, 02/15/27• | 2,673 | 2,665,494 |
| Alliant Holdings Intermediate LLC | | |
| (1 M ICE LIBOR + 3.250%), 3.354%, 05/09/25• | 9,826 | 9,719,945 |
| (1 M ICE LIBOR + 3.250%), 3.354%, 05/09/25• | 5,219 | 5,162,732 |
| (1 M ICE LIBOR + 3.500%), 4.000%, 11/06/27• | 16,215 | 16,183,011 |
| HUB International Ltd. | | |
| (3 M ICE LIBOR + 2.750%), 2.875%, 04/25/25• | 79,394 | 78,419,434 |
| (3 M ICE LIBOR + 3.250%), 4.000%, 04/25/25• | 50,102 | 50,055,119 |
Hyperion Refinance Sarl (1 M ICE LIBOR + 3.250%)
4.000%, 11/12/27• | 15,411 | 15,330,792 |
Ryan Specialty Group LLC (1 M ICE LIBOR + 3.000%)
3.750%, 09/01/27• | 3,213 | 3,207,806 |
| USI, Inc. | | |
| (3 M ICE LIBOR + 3.000%), 3.224%, 05/16/24• | 30,160 | 29,907,486 |
| (3 M ICE LIBOR + 3.250%), 3.474%, 12/02/26• | 16,390 | 16,264,262 |
| | | 226,916,081 |
Penn Series Funds, Inc.
Schedule of Investments — December 31, 2021
Flexibly Managed Fund
| | Par
(000) | Value† |
| LOAN AGREEMENTS‡ — (continued) |
| Leisure Time — 0.0% |
Life Time, Inc. (3 M ICE LIBOR + 4.750%)
5.750%, 12/16/24• | $ 2,177 | $ 2,186,401 |
| Lodging — 0.1% |
Four Seasons Hotels Ltd. (1 M ICE LIBOR + 2.000%)
2.104%, 11/30/23• | 3,028 | 3,012,442 |
| Machinery — Diversified — 0.3% |
Vertical Midco (6 M ICE LIBOR + 3.500%)
4.000%, 07/30/27• | 16,344 | 16,341,869 |
Welbilt, Inc. (1 M ICE LIBOR + 2.500%)
2.604%, 10/23/25• | 1,970 | 1,960,977 |
| | | 18,302,846 |
| Pharmaceuticals — 0.2% |
Pathway Vet Alliance LLC (1 M ICE LIBOR + 3.750%)
3.854%, 03/31/27• | 1,312 | 1,306,296 |
Pearl Intermediate Parent LLC (1 M ICE LIBOR + 2.750%)
2.854%, 02/14/25• | 1,065 | 1,051,982 |
| PetVet Care Centers LLC | | |
| (1 M ICE LIBOR + 3.250%), 3.354%, 02/14/25• | 3,413 | 3,389,346 |
| (1 M ICE LIBOR + 3.500%), 4.250%, 02/14/25• | 6,843 | 6,834,914 |
| | | 12,582,538 |
| Retail — 0.3% |
| IRB Holding Corp. | | |
| (3 M ICE LIBOR + 2.750%), 3.750%, 02/05/25• | 6,766 | 6,750,160 |
| (3 M ICE LIBOR + 3.250%), 4.250%, 12/15/27• | 7,313 | 7,306,131 |
Woof Holdings, Inc. (3 M ICE LIBOR + 3.750%)
4.500%, 12/21/27• | 1,970 | 1,970,113 |
| | | 16,026,404 |
| Software — 2.9% |
| Applied Systems, Inc. | | |
| (1 M ICE LIBOR + 3.250%), 3.500%, 09/19/24• | 10,362 | 10,351,352 |
| (3 M ICE LIBOR + 5.500%), 6.250%, 09/19/25• | 1,085 | 1,091,791 |
| Ascend Learning LLC | | |
| 0.000%, 12/11/28× | 20,105 | 20,058,960 |
| (1 M ICE LIBOR + 5.750%), 6.250%, 11/16/29• | 2,855 | 2,859,768 |
| Azalea TopCo, Inc. | | |
| (3 M ICE LIBOR + 3.500%), 3.629%, 07/24/26• | 14,558 | 14,480,514 |
| | Par
(000) | Value† |
| |
| Software — (continued) |
| (3 M ICE LIBOR + 3.750%), 4.500%, 07/24/26• | $ 2,294 | $ 2,291,419 |
Camelot US Acquisition I Co. (1 M ICE LIBOR + 3.000%)
4.000%, 10/30/26• | 10,444 | 10,428,207 |
Polaris Newco LLC (3 M ICE LIBOR + 4.000%)
4.500%, 06/02/28• | 1,741 | 1,739,001 |
Project Boost Purchaser LLC (1 M ICE LIBOR + 3.500%)
4.000%, 06/01/26• | 1,657 | 1,655,524 |
| RealPage, Inc. | | |
| (1 M ICE LIBOR + 3.250%), 3.750%, 04/24/28• | 15,471 | 15,415,683 |
| (1 M ICE LIBOR + 6.500%), 7.250%, 04/23/29• | 700 | 708,050 |
| Sophia LP | | |
| 0.000%, 10/07/27× | 410 | 409,692 |
| (3 M ICE LIBOR + 3.500%), 3.724%, 10/07/27• | 2,883 | 2,880,613 |
The Ultimate Software Group, Inc. (1 M ICE LIBOR + 3.750%)
3.854%, 05/04/26• | 1,725 | 1,718,818 |
| UKG, Inc. | | |
| (3 M ICE LIBOR + 3.250%), 3.750%, 05/04/26• | 70,307 | 69,889,431 |
| (1 M ICE LIBOR + 5.250%), 5.750%, 05/03/27• | 3,010 | 3,015,659 |
| | | 158,994,482 |
| Telecommunications — 0.0% |
Eagle Broadband Investments LLC (3 M ICE LIBOR + 3.000%)
3.750%, 11/12/27• | 2,244 | 2,239,601 |
TOTAL LOAN AGREEMENTS
(Cost $622,009,066) | | 625,517,157 |
| | Number of
Shares | |
| SHORT-TERM INVESTMENTS — 10.0% |
| BlackRock Liquidity FedFund - Institutional Shares (seven-day effective yield 0.030%) | 43,694,768 | 43,694,768 |
| T. Rowe Price Government Reserve Investment Fund (seven-day effective yield 0.060%) | 502,978,840 | 502,978,840 |
TOTAL SHORT-TERM INVESTMENTS
(Cost $546,673,608) | | 546,673,608 |
TOTAL INVESTMENTS — 102.6%
(Cost $4,537,967,096) | | $ 5,629,390,019 |
| Other Assets & Liabilities — (2.6)% | (141,725,255) |
| TOTAL NET ASSETS — 100.0% | | $ 5,487,664,764 |
Penn Series Funds, Inc.
Schedule of Investments — December 31, 2021
Flexibly Managed Fund
| | Number of
Contracts | Value† |
| WRITTEN OPTIONS — (1.8)% |
| Call Options | | |
| TOTAL WRITTEN OPTIONS | | |
| (See open written options schedule) |
| (Premiums $(46,566,808)) | 59,152 | $ (98,318,051) |
| † | See Security Valuation Note. |
| @ | Security exempt from registration under Rule 144A of the Securities Act of 1933, as amended. At December 31, 2021, the aggregate value of Rule 144A securities was $270,396,123, which represents 4.9% of the Fund’s net assets. |
| * | Non-income producing security. |
| # | Restricted Security. These investments are in securities not registered under the Securities Act of 1933, as amended, and have certain restrictions on resale which may limit their liquidity. At December 31, 2021, the aggregate value of restricted securities was $30,756,923 which represented 0.6% of the Fund's net assets. The Fund has various registration rights (exercisable under a variety of circumstances) with respect to these securities. |
| Investment | Date of
Acquisition | Cost | | Value |
| Aurora Innovation, Inc. | 03/01/19 | $ 3,276,052 | | $ 8,232,935 |
| Waymo LLC, Series A-2 | 05/08/20 | 21,086,236 | | 22,523,988 |
| Total | | $24,362,288 | | $ 30,756,923 |
| (1) | The value of this security was determined using significant unobservable inputs and is reported as a Level 3 security in the Valuation Hierarchy table located at the end of the Schedule of Investments. |
| µ | Perpetual security with no stated maturity date. |
| ‡ | Loan Agreements in which the Fund invests generally pay interest at rates which are periodically predetermined by reference to a base lending rate plus a premium. These base lending rates are generally (i) the Prime Rate offered by one or more major U.S. banks, (ii) the lending rate offered by one or more European banks such as the London Interbank Offered Rate (“LIBOR”) or (iii) the Certificate of Deposit rate. Rate shown represents the actual rate at December 31, 2021. Loan Agreements, while exempt from registration under the Security Act of 1933, as amended (the “1933 Act”), contain certain restrictions on resale and cannot be sold publicly. Floating rate Loan Agreements often require repayments from excess cash flow or permit the borrower to repay at its election. The degree to which borrowers repay, whether as a contractual requirement or at their election, cannot be predicted with accuracy. As a result, the actual remaining maturity may be substantially less than the stated maturity shown. |
| • | Variable rate security. The rate disclosed is the rate in effect on the report date. The information in parenthesis represents the benchmark and reference rate for each relevant security and the rate floats based upon the reference rate and spread. The security may be further subject to interest rate floors and caps. For loan agreements, the rate shown may represent a weighted average interest rate. Certain variable rate securities are not based on a published reference rate and spread, but are determined by the issuer or agent and are based on current market conditions, or, for mortgage-backed securities, are impacted by the individual mortgages which are paying off over time. These securities do not indicate a reference rate and spread in their descriptions. |
| × | This loan will settle after December 31, 2021, at which time the interest rate, based on the LIBOR and the agreed upon spread on trade date, will be reflected. |
| CMT— Constant Maturity Treasury. |
| CONV— Convertible Security. |
| EURIBOR— Euro Interbank Offered Rate. |
| ICE— Intercontinental Exchange. |
| LIBOR— London Interbank Offered Rate. |
| LLC— Limited Liability Company. |
| LP— Limited Partnership. |
| M— Month. |
| N.V.— Naamloze Vennootschap. |
| PLC— Public Limited Company. |
| S.A.— Societe Anonyme. |
| UST— US Treasury. |
| Yr— Year. |
Penn Series Funds, Inc.
Schedule of Investments — December 31, 2021
Flexibly Managed Fund
Summary of inputs used to value the Fund’s investments as of 12/31/2021 are as follows (See Security Valuation Note):
| ASSETS TABLE |
| Description | Total
Market
Value at
12/31/2021 | Level 1
Quoted
Price | Level 2
Significant
Observable
Input | Level 3
Significant
Unobservable
Input^ |
| Asset Backed Securities | $ 13,309,282 | $ — | $ 13,309,282 | $ — |
| Common Stocks | | | | |
| Aerospace & Defense | 28,328,237 | 28,328,237 | — | — |
| Auto Parts & Equipment | 18,366,935 | 10,134,000 | 8,232,935 | — |
| Banks | 297,117,323 | 297,117,323 | — | — |
| Beverages | 103,591,764 | 103,591,764 | — | — |
| Commercial Services | 32,827,732 | 32,827,732 | — | — |
| Computers | 52,766,346 | 52,766,346 | — | — |
| Diversified Financial Services | 150,151,008 | 150,151,008 | — | — |
| Electric | 340,097,128 | 340,097,128 | — | — |
| Electronics | 47,606,917 | 47,606,917 | — | — |
| Environmental Control | 53,682,792 | 53,682,792 | — | — |
| Healthcare Products | 435,208,558 | 435,208,558 | — | — |
| Healthcare Services | 352,863,715 | 352,863,715 | — | — |
| Insurance | 135,562,044 | 135,562,044 | — | — |
| Internet | 649,632,328 | 649,632,328 | — | — |
| Lodging | 63,171,739 | 63,171,739 | — | — |
| Machinery — Diversified | 39,325,191 | 39,325,191 | — | — |
| Miscellaneous Manufacturing | 244,374,146 | 244,374,146 | — | — |
| Pharmaceuticals | 112,805,881 | 112,805,881 | — | — |
| Retail | 219,868,811 | 219,868,811 | — | — |
| Semiconductors | 11,753,448 | 11,753,448 | — | — |
| Software | 533,842,511 | 533,842,511 | — | — |
| Telecommunications | 20,417,814 | 20,417,814 | — | — |
| Total Common Stocks | 3,943,362,368 | 3,935,129,433 | 8,232,935 | — |
| Preferred Stocks | | | | |
| Auto Manufacturers | 22,523,988 | — | — | 22,523,988 |
| Diversified Financial Services | 305,760 | 305,760 | — | — |
| ASSETS TABLE |
| Description | Total
Market
Value at
12/31/2021 | Level 1
Quoted
Price | Level 2
Significant
Observable
Input | Level 3
Significant
Unobservable
Input^ |
| Electric | $ 35,050,573 | $ 35,050,573 | $ — | $ — |
| Gas | 12,284,181 | 12,284,181 | — | — |
| Total Preferred Stocks | 70,164,502 | 47,640,514 | — | 22,523,988 |
| Corporate Bonds | 430,363,102 | — | 430,363,102 | — |
| Loan Agreements | 625,517,157 | — | 613,391,457 | 12,125,700 |
| Short-Term Investments | 546,673,608 | 546,673,608 | — | — |
| Total Investments | $ 5,629,390,019 | $ 4,529,443,555 | $1,065,296,776 | $ 34,649,688 |
| LIABILITIES TABLE |
| Description | Total
Market
Value at
12/31/2021 | Level 1
Quoted
Price | Level 2
Significant
Observable
Input | Level 3
Significant
Unobservable
Input^ |
| Other Financial Instruments(1) | | | | |
| Written Options | $(98,318,051) | $(98,304,875) | $(13,176) | $— |
| Total Liabilities—Other Financial Instruments | $ (98,318,051) | $ (98,304,875) | $ (13,176) | $ — |
| (1) | Other financial instruments are derivative instruments not reflected in the value of total investments in securities in the Schedule of Investments such as future contracts and forward foreign currency contracts which are valued at the unrealized appreciation (depreciation) on the instrument and written options which are reported at their fair value at period end. |
| ^ | A reconciliation of Level 3 instruments is presented when the Fund has a significant amount of Level 3 investments at the beginning and/or end of the period in relation to the net assets. Management has concluded that Level 3 investments are not material in relation to net assets. |
It is the Fund's practice to recognize transfers into and transfers out of Level 3 at the fair value hierarchy as of the beginning of period.
An amount of $12,125,700 was transferred from Level 2 into Level 3 at 12/31/2021 due to decrease in trading activities at period end.
Open written options contracts held by the Fund at December 31, 2021 are as follows:
| Open Written Options |
| Exchange Traded |
| Call Options | | | | | | | | | | |
| Description | | # of
Contracts | | Notional | | Exercise
Price | | Expiration
Date | | Value |
| Alphabet, Inc. | | 50 | | $ 8,800,000 | | $ 1,760 | | 01/21/22 | | $ (5,636,000) |
| Alphabet, Inc. | | 50 | | 8,900,000 | | 1,780 | | 01/21/22 | | (5,538,500) |
| Alphabet, Inc. | | 50 | | 9,000,000 | | 1,800 | | 01/21/22 | | (5,435,000) |
Penn Series Funds, Inc.
Schedule of Investments — December 31, 2021
Flexibly Managed Fund
| Call Options | | | | | | | | | | |
| Description | | # of
Contracts | | Notional | | Exercise
Price | | Expiration
Date | | Value |
| Alphabet, Inc. | | 13 | | $ 2,574,000 | | $ 1,980 | | 06/17/22 | | $ (1,209,000) |
| Alphabet, Inc. | | 13 | | 2,600,000 | | 2,000 | | 06/17/22 | | (1,184,560) |
| Alphabet, Inc. | | 13 | | 2,730,000 | | 2,100 | | 06/17/22 | | (1,086,085) |
| Alphabet, Inc. | | 5 | | 1,275,000 | | 2,550 | | 06/17/22 | | (213,950) |
| Alphabet, Inc. | | 5 | | 1,300,000 | | 2,600 | | 06/17/22 | | (205,850) |
| Alphabet, Inc. | | 5 | | 1,325,000 | | 2,650 | | 06/17/22 | | (177,350) |
| Alphabet, Inc. | | 13 | | 2,548,000 | | 1,960 | | 09/16/22 | | (1,261,000) |
| Alphabet, Inc. | | 13 | | 2,574,000 | | 1,980 | | 09/16/22 | | (1,236,690) |
| Alphabet, Inc. | | 13 | | 2,600,000 | | 2,000 | | 09/16/22 | | (1,235,000) |
| Alphabet, Inc. | | 13 | | 2,730,000 | | 2,100 | | 09/16/22 | | (1,096,160) |
| Alphabet, Inc. | | 3 | | 735,000 | | 2,450 | | 09/16/22 | | (165,780) |
| Alphabet, Inc. | | 3 | | 750,000 | | 2,500 | | 09/16/22 | | (153,930) |
| Alphabet, Inc. | | 4 | | 1,020,000 | | 2,550 | | 09/16/22 | | (194,720) |
| Alphabet, Inc. | | 4 | | 1,040,000 | | 2,600 | | 09/16/22 | | (177,200) |
| Alphabet, Inc. | | 13 | | 4,160,000 | | 3,200 | | 01/20/23 | | (262,340) |
| Alphabet, Inc. | | 13 | | 4,290,000 | | 3,300 | | 01/20/23 | | (238,355) |
| Alphabet, Inc. | | 13 | | 4,420,000 | | 3,400 | | 01/20/23 | | (184,600) |
| Alphabet, Inc. | | 13 | | 4,550,000 | | 3,500 | | 01/20/23 | | (160,537) |
| Amazon.com, Inc. | | 23 | | 8,740,000 | | 3,800 | | 01/21/22 | | (6,555) |
| Amazon.com, Inc. | | 32 | | 12,480,000 | | 3,900 | | 01/21/22 | | (6,016) |
| Amazon.com, Inc. | | 46 | | 18,400,000 | | 4,000 | | 01/21/22 | | (6,026) |
| Amazon.com, Inc. | | 23 | | 9,430,000 | | 4,100 | | 01/21/22 | | (1,817) |
| Amazon.com, Inc. | | 23 | | 9,660,000 | | 4,200 | | 01/21/22 | | (1,702) |
| Amazon.com, Inc. | | 25 | | 10,750,000 | | 4,300 | | 01/21/22 | | (1,250) |
| Amazon.com, Inc. | | 6 | | 2,400,000 | | 4,000 | | 01/20/23 | | (109,800) |
| Amazon.com, Inc. | | 6 | | 2,460,000 | | 4,100 | | 01/20/23 | | (95,940) |
| Amazon.com, Inc. | | 6 | | 2,520,000 | | 4,200 | | 01/20/23 | | (85,830) |
| Amazon.com, Inc. | | 6 | | 2,580,000 | | 4,300 | | 01/20/23 | | (76,170) |
| Amazon.com, Inc. | | 6 | | 2,640,000 | | 4,400 | | 01/20/23 | | (65,460) |
| Amazon.com, Inc. | | 13 | | 5,850,000 | | 4,500 | | 01/20/23 | | (124,800) |
| Amazon.com, Inc. | | 7 | | 3,220,000 | | 4,600 | | 01/20/23 | | (63,455) |
| Amazon.com, Inc. | | 7 | | 3,290,000 | | 4,700 | | 01/20/23 | | (51,800) |
| Amazon.com, Inc. | | 7 | | 3,360,000 | | 4,800 | | 01/20/23 | | (47,040) |
| Amazon.com, Inc. | | 7 | | 3,430,000 | | 4,900 | | 01/20/23 | | (37,870) |
| Amazon.com, Inc. | | 7 | | 3,500,000 | | 5,000 | | 01/20/23 | | (35,000) |
| Amazon.com, Inc. | | 7 | | 3,570,000 | | 5,100 | | 01/20/23 | | (32,200) |
| American Electric Power Co., Inc. | | 868 | | 7,812,000 | | 90 | | 01/21/22 | | (65,100) |
| American Electric Power Co., Inc. | | 1,061 | | 10,079,500 | | 95 | | 01/21/22 | | (5,305) |
| American Electric Power Co., Inc. | | 337 | | 3,285,750 | | 98 | | 01/21/22 | | (674) |
| American Electric Power Co., Inc. | | 337 | | 3,370,000 | | 100 | | 01/21/22 | | (1,011) |
| Bank of America Corp. | | 2,797 | | 9,789,500 | | 35 | | 01/21/22 | | (2,643,165) |
| Bank of America Corp. | | 2,073 | | 7,670,100 | | 37 | | 01/21/22 | | (1,596,210) |
| Bank of America Corp. | | 568 | | 2,272,000 | | 40 | | 01/21/22 | | (263,552) |
| Bank of America Corp. | | 567 | | 2,551,500 | | 45 | | 01/21/22 | | (49,329) |
| Bank of America Corp. | | 7,354 | | 33,093,000 | | 45 | | 01/20/23 | | (3,456,380) |
| Bank of America Corp. | | 2,476 | | 12,380,000 | | 50 | | 01/20/23 | | (673,472) |
| Cisco Systems, Inc. | | 1,073 | | 4,828,500 | | 45 | | 01/21/22 | | (1,990,415) |
| Cisco Systems, Inc. | | 1,075 | | 5,106,250 | | 48 | | 01/21/22 | | (1,724,300) |
| Cisco Systems, Inc. | | 1,074 | | 5,370,000 | | 50 | | 01/21/22 | | (1,439,160) |
| CME Group, Inc. | | 207 | | 4,554,000 | | 220 | | 01/21/22 | | (215,280) |
| CME Group, Inc. | | 207 | | 4,761,000 | | 230 | | 01/21/22 | | (70,380) |
| Danaher Corp. | | 43 | | 1,161,000 | | 270 | | 01/21/22 | | (262,687) |
| Danaher Corp. | | 110 | | 3,080,000 | | 280 | | 01/21/22 | | (559,900) |
| Danaher Corp. | | 67 | | 1,943,000 | | 290 | | 01/21/22 | | (265,789) |
| Danaher Corp. | | 476 | | 14,280,000 | | 300 | | 01/21/22 | | (1,423,240) |
| Exelon Corp. | | 337 | | 1,685,000 | | 50 | | 01/21/22 | | (256,457) |
| Fiserv, Inc. | | 134 | | 1,742,000 | | 130 | | 01/21/22 | | (670) |
Penn Series Funds, Inc.
Schedule of Investments — December 31, 2021
Flexibly Managed Fund
| Call Options | | | | | | | | | | |
| Description | | # of
Contracts | | Notional | | Exercise
Price | | Expiration
Date | | Value |
| Fiserv, Inc. | | 134 | | $ 1,809,000 | | $ 135 | | 01/21/22 | | $ (402) |
| FleetCor Technologies, Inc. | | 50 | | 1,500,000 | | 300 | | 01/21/22 | | (250) |
| FleetCor Technologies, Inc. | | 33 | | 1,023,000 | | 310 | | 01/21/22 | | (1,650) |
| General Electric Co. | | 3,448 | | 4,137,600 | | 12 | | 01/21/22 | | (75,856) |
| General Electric Co. | | 10,359 | | 15,538,500 | | 15 | | 01/21/22 | | (10,359) |
| Hilton Worldwide Holdings, Inc. | | 179 | | 2,237,500 | | 125 | | 01/21/22 | | (563,850) |
| Hilton Worldwide Holdings, Inc. | | 316 | | 4,108,000 | | 130 | | 01/21/22 | | (818,440) |
| Hilton Worldwide Holdings, Inc. | | 543 | | 7,330,500 | | 135 | | 01/21/22 | | (1,186,455) |
| Hilton Worldwide Holdings, Inc. | �� | 406 | | 5,684,000 | | 140 | | 01/21/22 | | (682,080) |
| Intercontinental Exchange, Inc. | | 168 | | 2,100,000 | | 125 | | 01/21/22 | | (209,160) |
| Intercontinental Exchange, Inc. | | 341 | | 4,433,000 | | 130 | | 01/21/22 | | (255,750) |
| Intercontinental Exchange, Inc. | | 173 | | 2,335,500 | | 135 | | 01/21/22 | | (58,820) |
| Lockheed Martin Corp. | | 96 | | 3,264,000 | | 340 | | 01/21/22 | | (165,888) |
| Lockheed Martin Corp. | | 96 | | 3,456,000 | | 360 | | 01/21/22 | | (32,640) |
| Lockheed Martin Corp. | | 96 | | 3,600,000 | | 375 | | 01/21/22 | | (3,840) |
| Marriott International, Inc. | | 276 | | 4,002,000 | | 145 | | 01/21/22 | | (577,944) |
| Marriott International, Inc. | | 276 | | 4,140,000 | | 150 | | 01/21/22 | | (455,952) |
| Marriott International, Inc. | | 134 | | 2,077,000 | | 155 | | 01/21/22 | | (161,336) |
| Marriott International, Inc. | | 134 | | 2,144,000 | | 160 | | 01/21/22 | | (104,520) |
| Marriott International, Inc. | | 102 | | 1,683,000 | | 165 | | 01/21/22 | | (47,328) |
| Marriott International, Inc. | | 102 | | 1,734,000 | | 170 | | 01/21/22 | | (23,052) |
| McDonald's Corp. | | 69 | | 1,518,000 | | 220 | | 01/21/22 | | (337,065) |
| McDonald's Corp. | | 154 | | 3,542,000 | | 230 | | 01/21/22 | | (602,910) |
| McDonald's Corp. | | 152 | | 3,952,000 | | 260 | | 01/20/23 | | (396,720) |
| McDonald's Corp. | | 152 | | 4,104,000 | | 270 | | 01/20/23 | | (317,072) |
| Medtronic PLC | | 139 | | 1,598,500 | | 115 | | 01/21/22 | | (1,112) |
| Medtronic PLC | | 139 | | 1,737,500 | | 125 | | 01/21/22 | | (139) |
| Medtronic PLC | | 140 | | 1,820,000 | | 130 | | 01/21/22 | | (700) |
| Meta Platforms, Inc. | | 122 | | 4,148,000 | | 340 | | 01/21/22 | | (88,328) |
| Meta Platforms, Inc. | | 122 | | 4,209,000 | | 345 | | 01/21/22 | | (64,904) |
| Meta Platforms, Inc. | | 60 | | 2,280,000 | | 380 | | 01/21/22 | | (2,940) |
| Meta Platforms, Inc. | | 916 | | 36,640,000 | | 400 | | 01/21/22 | | (17,404) |
| Meta Platforms, Inc. | | 67 | | 2,311,500 | | 345 | | 09/16/22 | | (248,905) |
| Meta Platforms, Inc. | | 67 | | 2,412,000 | | 360 | | 09/16/22 | | (195,640) |
| Microsoft Corp. | | 228 | | 5,700,000 | | 250 | | 01/21/22 | | (1,995,456) |
| Microsoft Corp. | | 228 | | 5,814,000 | | 255 | | 01/21/22 | | (1,859,340) |
| Microsoft Corp. | | 228 | | 5,928,000 | | 260 | | 01/21/22 | | (1,770,420) |
| Microsoft Corp. | | 175 | | 4,637,500 | | 265 | | 01/21/22 | | (1,266,300) |
| Microsoft Corp. | | 275 | | 7,425,000 | | 270 | | 01/21/22 | | (1,853,775) |
| Microsoft Corp. | | 275 | | 7,562,500 | | 275 | | 01/21/22 | | (1,718,750) |
| Microsoft Corp. | | 796 | | 22,288,000 | | 280 | | 01/21/22 | | (4,573,020) |
| Microsoft Corp. | | 689 | | 20,670,000 | | 300 | | 01/20/23 | | (4,147,780) |
| Microsoft Corp. | | 237 | | 7,584,000 | | 320 | | 01/20/23 | | (1,125,750) |
| Microsoft Corp. | | 460 | | 15,180,000 | | 330 | | 01/20/23 | | (1,955,000) |
| Microsoft Corp. | | 699 | | 23,766,000 | | 340 | | 01/20/23 | | (2,616,357) |
| Microsoft Corp. | | 940 | | 32,900,000 | | 350 | | 01/20/23 | | (3,078,500) |
| Microsoft Corp. | | 240 | | 8,520,000 | | 355 | | 01/20/23 | | (726,000) |
| Microsoft Corp. | | 479 | | 17,244,000 | | 360 | | 01/20/23 | | (1,420,235) |
| Microsoft Corp. | | 164 | | 5,986,000 | | 365 | | 01/20/23 | | (434,600) |
| Northrop Grumman Corp. | | 110 | | 3,465,000 | | 315 | | 01/21/22 | | (774,400) |
| Northrop Grumman Corp. | | 111 | | 3,607,500 | | 325 | | 01/21/22 | | (649,350) |
| NXP Semiconductors N.V. | | 172 | | 3,354,000 | | 195 | | 01/21/22 | | (547,820) |
| NXP Semiconductors N.V. | | 172 | | 3,440,000 | | 200 | | 01/21/22 | | (479,020) |
| NXP Semiconductors N.V. | | 172 | | 3,612,000 | | 210 | | 01/21/22 | | (321,640) |
| PepsiCo, Inc. | | 292 | | 4,234,000 | | 145 | | 01/21/22 | | (803,000) |
| PepsiCo, Inc. | | 292 | | 4,526,000 | | 155 | | 01/21/22 | | (543,120) |
| Ross Stores, Inc. | | 68 | | 884,000 | | 130 | | 01/21/22 | | (544) |
Penn Series Funds, Inc.
Schedule of Investments — December 31, 2021
Flexibly Managed Fund
| Call Options | | | | | | | | | | |
| Description | | # of
Contracts | | Notional | | Exercise
Price | | Expiration
Date | | Value |
| Ross Stores, Inc. | | 101 | | $ 1,363,500 | | $ 135 | | 01/21/22 | | $ (1,515) |
| Ross Stores, Inc. | | 33 | | 462,000 | | 140 | | 01/21/22 | | (1,155) |
| The Coca-Cola Co. | | 980 | | 5,145,000 | | 53 | | 01/21/22 | | (666,400) |
| The Coca-Cola Co. | | 981 | | 5,395,500 | | 55 | | 01/21/22 | | (431,640) |
| The PNC Financial Services Group, Inc. | | 138 | | 2,415,000 | | 175 | | 01/21/22 | | (350,520) |
| The PNC Financial Services Group, Inc. | | 283 | | 5,094,000 | | 180 | | 01/21/22 | | (577,320) |
| The PNC Financial Services Group, Inc. | | 283 | | 5,235,500 | | 185 | | 01/21/22 | | (438,650) |
| The PNC Financial Services Group, Inc. | | 145 | | 2,755,000 | | 190 | | 01/21/22 | | (160,950) |
| The PNC Financial Services Group, Inc. | | 332 | | 7,304,000 | | 220 | | 01/20/23 | | (361,880) |
| The PNC Financial Services Group, Inc. | | 332 | | 7,636,000 | | 230 | | 01/20/23 | | (270,580) |
| Thermo Fisher Scientific, Inc. | | 76 | | 4,256,000 | | 560 | | 01/21/22 | | (817,000) |
| Thermo Fisher Scientific, Inc. | | 158 | | 9,164,000 | | 580 | | 01/21/22 | | (1,385,660) |
| Thermo Fisher Scientific, Inc. | | 82 | | 4,920,000 | | 600 | | 01/21/22 | | (598,600) |
| UnitedHealth Group, Inc. | | 69 | | 2,760,000 | | 400 | | 01/21/22 | | (724,707) |
| UnitedHealth Group, Inc. | | 69 | | 2,829,000 | | 410 | | 01/21/22 | | (648,600) |
| UnitedHealth Group, Inc. | | 69 | | 2,898,000 | | 420 | | 01/21/22 | | (602,853) |
| UnitedHealth Group, Inc. | | 33 | | 1,518,000 | | 460 | | 01/21/22 | | (155,100) |
| UnitedHealth Group, Inc. | | 33 | | 1,551,000 | | 470 | | 01/21/22 | | (122,760) |
| Visa, Inc. | | 202 | | 4,444,000 | | 220 | | 01/21/22 | | (56,560) |
| Visa, Inc. | | 729 | | 16,402,500 | | 225 | | 01/21/22 | | (98,415) |
| Visa, Inc. | | 728 | | 16,744,000 | | 230 | | 01/21/22 | | (43,680) |
| Visa, Inc. | | 235 | | 5,522,500 | | 235 | | 01/21/22 | | (6,815) |
| Visa, Inc. | | 137 | | 3,288,000 | | 240 | | 01/21/22 | | (2,055) |
| Visa, Inc. | | 139 | | 3,405,500 | | 245 | | 01/21/22 | | (1,112) |
| Visa, Inc. | | 462 | | 11,550,000 | | 250 | | 01/21/22 | | (2,772) |
| Waste Management, Inc. | | 141 | | 1,833,000 | | 130 | | 01/21/22 | | (516,060) |
| Yum! Brands, Inc. | | 76 | | 798,000 | | 105 | | 01/21/22 | | (249,280) |
| Yum! Brands, Inc. | | 76 | | 836,000 | | 110 | | 01/21/22 | | (212,800) |
| Yum! Brands, Inc. | | 671 | | 8,052,000 | | 120 | | 01/21/22 | | (1,201,090) |
| Yum! Brands, Inc. | | 276 | | 3,450,000 | | 125 | | 01/21/22 | | (378,120) |
| Total Written Options | | | | | | | | | | $(98,318,051) |
The accompanying notes are an integral part of these financial statements.
Penn Series Funds, Inc.
Schedule of Investments — December 31, 2021
Balanced Fund
| | Number of
Shares | Value† |
| AFFILIATED EQUITY FUNDS — 60.2% |
Penn Series Index 500 Fund*
(Cost $23,082,813) | 1,347,412 | $ 55,850,210 |
|
| AFFILIATED FIXED INCOME FUNDS — 39.7% |
Penn Series Quality Bond Fund*
(Cost $32,583,794) | 2,135,880 | 36,822,571 |
|
| SHORT-TERM INVESTMENTS — 0.3% |
BlackRock Liquidity FedFund - Institutional Shares (seven-day effective yield 0.030%)
(Cost $287,975) | 287,975 | 287,975 |
TOTAL INVESTMENTS — 100.2%
(Cost $55,954,582) | | $ 92,960,756 |
| Other Assets & Liabilities — (0.2)% | (207,847) |
| TOTAL NET ASSETS — 100.0% | | $ 92,752,909 |
| † | See Security Valuation Note. |
| * | Non-income producing security. |
Summary of inputs used to value the Fund’s investments as of 12/31/2021 are as follows (See Security Valuation Note):
| ASSETS TABLE |
| Description | Total
Market
Value at
12/31/2021 | Level 1
Quoted
Price | Level 2
Significant
Observable
Input | Level 3
Significant
Unobservable
Input |
| Affiliated Equity Funds | $55,850,210 | $55,850,210 | $— | $— |
| Affiliated Fixed Income Funds | 36,822,571 | 36,822,571 | — | — |
| Short-Term Investments | 287,975 | 287,975 | — | — |
| Total Investments | $ 92,960,756 | $ 92,960,756 | $ — | $ — |
It is the Fund's practice to recognize transfers into and transfers out of Level 3 at the fair value hierarchy as of the beginning of period. The Fund did not have any transfers into and transfers out of Level 3 fair value hierarchy during the reporting period.
The accompanying notes are an integral part of these financial statements.
Penn Series Funds, Inc.
Schedule of Investments — December 31, 2021
Large Growth Stock Fund
| | Number of
Shares | Value† |
| COMMON STOCKS — 98.2% |
| Advertising — 0.4% |
| The Trade Desk, Inc., Class A* | 17,800 | $ 1,631,192 |
| Aerospace & Defense — 1.5% |
| Airbus S.E.* | 22,105 | 2,827,713 |
| Teledyne Technologies, Inc.* | 7,988 | 3,489,877 |
| | | 6,317,590 |
| Apparel — 0.5% |
| NIKE, Inc., Class B | 13,318 | 2,219,711 |
| Auto Manufacturers — 6.3% |
| Ferrari N.V. | 13,698 | 3,545,316 |
| Rivian Automotive, Inc.*,> | 91,993 | 9,061,817 |
| Rivian Automotive, Inc., Class A* | 47,040 | 4,877,578 |
| Tesla, Inc.* | 9,004 | 9,515,247 |
| | | 26,999,958 |
| Auto Parts & Equipment — 0.1% |
| Aurora Innovation, Inc.*,> | 60,197 | 643,927 |
| Biotechnology — 0.2% |
| Argenx S.E., ADR* | 2,580 | 903,490 |
| Commercial Services — 3.6% |
| Affirm Holdings, Inc.* | 5,592 | 562,332 |
| Afterpay Ltd.* | 36,213 | 2,187,045 |
| Block, Inc., Class A* | 5,500 | 888,305 |
| Cintas Corp. | 4,687 | 2,077,138 |
| Global Payments, Inc. | 15,424 | 2,085,016 |
| MarketAxess Holdings, Inc. | 1,677 | 689,700 |
| PayPal Holdings, Inc.* | 10,539 | 1,987,445 |
| S&P Global, Inc. | 4,876 | 2,301,131 |
| Toast, Inc., Class A* | 1,744 | 60,534 |
| TransUnion | 21,766 | 2,581,012 |
| | | 15,419,658 |
| Computers — 6.0% |
| Apple, Inc. | 144,837 | 25,718,706 |
| Diversified Financial Services — 3.3% |
| Ant Group Co., Ltd.(1),*,# | 279,408 | 1,023,164 |
| Mastercard, Inc., Class A | 15,587 | 5,600,721 |
| Tradeweb Markets, Inc., Class A | 7,421 | 743,139 |
| Visa, Inc., Class A | 30,803 | 6,675,318 |
| | | 14,042,342 |
| Electrical Components & Equipment — 0.6% |
| Generac Holdings, Inc.* | 7,132 | 2,509,893 |
| Entertainment — 0.1% |
| DraftKings, Inc., Class A* | 23,430 | 643,622 |
| Healthcare Products — 3.3% |
| Align Technology, Inc.* | 1,447 | 950,940 |
| Avantor, Inc.* | 49,074 | 2,067,978 |
| Intuitive Surgical, Inc.* | 18,089 | 6,499,378 |
| Stryker Corp. | 17,755 | 4,748,042 |
| | | 14,266,338 |
| | Number of
Shares | Value† |
| |
| Healthcare Services — 2.4% |
| Anthem, Inc. | 3,975 | $ 1,842,572 |
| HCA Healthcare, Inc. | 15,741 | 4,044,178 |
| Humana, Inc. | 2,807 | 1,302,055 |
| UnitedHealth Group, Inc. | 5,938 | 2,981,707 |
| | | 10,170,512 |
| Internet — 34.0% |
| Airbnb, Inc., Class A* | 12,342 | 2,054,820 |
| Alphabet, Inc., Class A* | 6,748 | 19,549,226 |
| Alphabet, Inc., Class C* | 5,755 | 16,652,610 |
| Amazon.com, Inc.* | 12,365 | 41,229,114 |
| Booking Holdings, Inc.* | 1,138 | 2,730,324 |
| Coupang, Inc., Class A* | 45,547 | 1,338,171 |
| DoorDash, Inc., Class A* | 16,177 | 2,408,755 |
| Expedia Group, Inc.* | 11,496 | 2,077,557 |
| Farfetch Ltd., Class A* | 51,641 | 1,726,359 |
| IAC* | 1,724 | 225,344 |
| Kuaishou Technology* | 4,400 | 40,656 |
| Match Group, Inc.* | 19,863 | 2,626,882 |
| Meituan, Class B* | 29,400 | 849,852 |
| Meta Platforms, Inc., Class A* | 69,594 | 23,407,942 |
| Netflix, Inc.* | 13,530 | 8,151,013 |
| Pinduoduo, Inc., ADR* | 9,200 | 536,360 |
| Pinterest, Inc., Class A* | 22,146 | 805,007 |
| Sea Ltd., ADR* | 30,476 | 6,817,786 |
| Shopify, Inc., Class A* | 1,697 | 2,337,431 |
| Snap, Inc., Class A* | 126,744 | 5,960,770 |
| Spotify Technology S.A.* | 17,186 | 4,022,040 |
| Vimeo, Inc.* | 9,742 | 174,966 |
| | | 145,722,985 |
| Leisure Time — 0.2% |
| Peloton Interactive, Inc., Class A* | 21,586 | 771,915 |
| Lodging — 0.9% |
| Las Vegas Sands Corp.* | 33,290 | 1,253,036 |
| Wynn Resorts Ltd.* | 29,408 | 2,500,856 |
| | | 3,753,892 |
| Pharmaceuticals — 2.0% |
| AstraZeneca PLC, ADR | 38,799 | 2,260,042 |
| Cigna Corp. | 7,881 | 1,809,714 |
| Eli Lilly & Co. | 16,492 | 4,555,420 |
| | | 8,625,176 |
| Retail — 3.2% |
| Carvana Co.* | 7,114 | 1,648,954 |
| Chipotle Mexican Grill, Inc.* | 1,604 | 2,804,193 |
| Lululemon Athletica, Inc.* | 8,407 | 3,290,920 |
| Ross Stores, Inc. | 53,139 | 6,072,725 |
| | | 13,816,792 |
| Semiconductors — 4.9% |
| Advanced Micro Devices, Inc.* | 30,224 | 4,349,233 |
| ASML Holding N.V. | 7,977 | 6,350,809 |
| NVIDIA Corp. | 26,700 | 7,852,737 |
Penn Series Funds, Inc.
Schedule of Investments — December 31, 2021
Large Growth Stock Fund
| | Number of
Shares | Value† |
| COMMON STOCKS — (continued) |
| Semiconductors — (continued) |
| Taiwan Semiconductor Manufacturing Co., Ltd., ADR | 19,886 | $ 2,392,485 |
| | | 20,945,264 |
| Software — 23.8% |
| Activision Blizzard, Inc. | 18,341 | 1,220,227 |
| Atlassian Corp. PLC, Class A* | 3,000 | 1,143,870 |
| Avalara, Inc.* | 6,820 | 880,530 |
| Bill.com Holdings, Inc.* | 1,461 | 364,008 |
| Black Knight, Inc.* | 32,331 | 2,679,917 |
| Ceridian HCM Holding, Inc.* | 11,177 | 1,167,549 |
| Datadog, Inc., Class A* | 13,378 | 2,382,756 |
| Fiserv, Inc.* | 35,339 | 3,667,835 |
| HashiCorp, Inc., Class A* | 3,314 | 301,707 |
| Intuit, Inc. | 15,814 | 10,171,881 |
| Magic Leap, Inc., Class A(1),*,# | 1,353 | 25,980 |
| Microsoft Corp. | 136,498 | 45,907,007 |
| Monday.com Ltd.* | 1,410 | 435,295 |
| MongoDB, Inc.* | 5,657 | 2,994,533 |
| MSCI, Inc. | 986 | 604,112 |
| Paycom Software, Inc.* | 2,154 | 894,319 |
| ROBLOX Corp., Class A* | 24,898 | 2,568,478 |
| Roper Technologies, Inc. | 7,818 | 3,845,362 |
| salesforce.com, Inc.* | 20,991 | 5,334,443 |
| SentinelOne, Inc., Class A* | 37,100 | 1,873,179 |
| ServiceNow, Inc.* | 8,845 | 5,741,378 |
| Snowflake, Inc., Class A* | 3,193 | 1,081,629 |
| Stripe, Inc., Class B(1),*,# | 8,608 | 556,507 |
| Twilio, Inc., Class A* | 3,700 | 974,358 |
| UiPath, Inc., Class A* | 42,233 | 1,821,509 |
| Workday, Inc., Class A* | 4,378 | 1,195,982 |
| Zoom Video Communications, Inc., Class A* | 11,642 | 2,141,080 |
| | | 101,975,431 |
| Transportation — 0.9% |
| Didi Global, Inc.*,> | 11,920 | 225,574 |
| FedEx Corp. | 13,405 | 3,467,069 |
| | | 3,692,643 |
TOTAL COMMON STOCKS
(Cost $226,608,913) | 420,791,037 |
|
| PREFERRED STOCKS — 0.2% |
| Auto Manufacturers — 0.1% |
| Waymo LLC, Series A-2, CONV(1),*,# | 3,737 | 342,765 |
| Electronics — 0.1% |
| GM Cruise, Class F, CONV(1),*,# | 27,200 | 716,720 |
TOTAL PREFERRED STOCKS
(Cost $817,286) | | 1,059,485 |
| | Number ofShares | Value† |
| SHORT-TERM INVESTMENTS — 1.6% |
| BlackRock Liquidity FedFund - Institutional Shares (seven-day effective yield 0.030%) | 863,956 | $ 863,956 |
| T. Rowe Price Government Reserve Investment Fund (seven-day effective yield 0.060%) | 5,904,661 | 5,904,661 |
TOTAL SHORT-TERM INVESTMENTS
(Cost $6,768,617) | | 6,768,617 |
TOTAL INVESTMENTS — 100.0%
(Cost $234,194,816) | | $ 428,619,139 |
| Other Assets & Liabilities — 0.0% | 68,265 |
| TOTAL NET ASSETS — 100.0% | | $ 428,687,404 |
| † | See Security Valuation Note. |
| * | Non-income producing security. |
| > | Restricted Security. These investments are restricted due to a lock up provision which may limit their liquidity for 180 days after the effective date of registration under the Securities Act of 1933. At December 31, 2021, the aggregate value of restricted securities was $9,931,318 which represented 2.3% of the Fund's net assets. The Fund has various registration rights (exercisable under a variety of circumstances) with respect to these securities. |
| Investment | Date of
Acquisition | Cost | | Value |
| Aurora Innovation, Inc. | 03/01/19 | $ 256,232 | | $ 643,927 |
| Didi Global, Inc. | 10/19/15 | 326,920 | | 225,574 |
| Rivian Automotive, Inc. | 12/23/19 | 988,373 | | 9,061,817 |
| Total | | $1,571,525 | | $ 9,931,318 |
| (1) | The value of this security was determined using significant unobservable inputs and is reported as a Level 3 security in the Valuation Hierarchy table located at the end of the Schedule of Investments. |
| # | Restricted Security. These investments are in securities not registered under the Securities Act of 1933, as amended, and have certain restrictions on resale which may limit their liquidity. At December 31, 2021, the aggregate value of restricted securities was $2,665,136 which represented 0.6% of the Fund's net assets. The Fund has various registration rights (exercisable under a variety of circumstances) with respect to these securities. |
| Investment | Date of
Acquisition | Cost | | Value |
| Ant Group Co., Ltd. | 06/07/18 | $1,064,929 | | $ 1,023,164 |
| GM Cruise, Class F | 05/07/19 | 496,400 | | 716,720 |
| Magic Leap, Inc., Class A | 01/20/16 | 657,500 | | 25,980 |
| Stripe, Inc., Class B | 12/17/19 | 135,060 | | 556,507 |
| Waymo LLC, Series A-2 | 05/08/20 | 320,886 | | 342,765 |
| Total | | $ 2,674,775 | | $2,665,136 |
| ADR— American Depositary Receipt. |
Penn Series Funds, Inc.
Schedule of Investments — December 31, 2021
Large Growth Stock Fund
| CONV— Convertible Security. |
| LLC— Limited Liability Company. |
| N.V.— Naamloze Vennootschap. |
| PLC— Public Limited Company. |
| S.A.— Societe Anonyme. |
| S.E.— Societas Europaea. |
| Country Weightings as of 12/31/2021†† |
| United States | 90% |
| Netherlands | 2 |
| Singapore | 2 |
| Canada | 1 |
| Sweden | 1 |
| United Kingdom | 1 |
| Italy | 1 |
| Other | 2 |
| Total | 100% |
| †† | % of total investments as of December 31, 2021. |
Summary of inputs used to value the Fund’s investments as of 12/31/2021 are as follows (See Security Valuation Note):
| ASSETS TABLE |
| Description | Total
Market
Value at
12/31/2021 | Level 1
Quoted
Price | Level 2
Significant
Observable
Input | Level 3
Significant
Unobservable
Input^ |
| Common Stocks | | | | |
| Advertising | $ 1,631,192 | $ 1,631,192 | $ — | $ — |
| Aerospace & Defense | 6,317,590 | 6,317,590 | — | — |
| Apparel | 2,219,711 | 2,219,711 | — | — |
| Auto Manufacturers | 26,999,958 | 17,938,141 | 9,061,817 | — |
| Auto Parts & Equipment | 643,927 | — | 643,927 | — |
| Biotechnology | 903,490 | 903,490 | — | — |
| Commercial Services | 15,419,658 | 15,419,658 | — | — |
| Computers | 25,718,706 | 25,718,706 | — | — |
| Diversified Financial Services | 14,042,342 | 13,019,178 | — | 1,023,164 |
| Electrical Components & Equipment | 2,509,893 | 2,509,893 | — | — |
| Entertainment | 643,622 | 643,622 | — | — |
| Healthcare Products | 14,266,338 | 14,266,338 | — | — |
| Healthcare Services | 10,170,512 | 10,170,512 | — | — |
| Internet | 145,722,985 | 145,722,985 | — | — |
| Leisure Time | 771,915 | 771,915 | — | — |
| Lodging | 3,753,892 | 3,753,892 | — | — |
| Pharmaceuticals | 8,625,176 | 8,625,176 | — | — |
| Retail | 13,816,792 | 13,816,792 | — | — |
| Semiconductors | 20,945,264 | 20,945,264 | — | — |
| Software | 101,975,431 | 101,392,944 | — | 582,487 |
| Transportation | 3,692,643 | 3,467,069 | 225,574 | — |
| Total Common Stocks | 420,791,037 | 409,254,068 | 9,931,318 | 1,605,651 |
| Preferred Stocks | 1,059,485 | — | — | 1,059,485 |
| Short-Term Investments | 6,768,617 | 6,768,617 | — | — |
| Total Investments | $ 428,619,139 | $ 416,022,685 | $ 9,931,318 | $ 2,665,136 |
| ^ | A reconciliation of Level 3 instruments is presented when the Fund has a significant amount of Level 3 investments at the beginning and/or end of the period in relation to the net assets. Management has concluded that Level 3 investments are not material in relation to net assets. |
It is the Fund's practice to recognize transfers into and transfers out of Level 3 at the fair value hierarchy as of the beginning of period. The Fund did not have any transfers into and transfers out of Level 3 fair value hierarchy during the reporting period.
The accompanying notes are an integral part of these financial statements.
Penn Series Funds, Inc.
Schedule of Investments — December 31, 2021
Large Cap Growth Fund
| | Number of
Shares | Value† |
| COMMON STOCKS — 98.1% |
| Apparel — 4.1% |
| adidas AG | 3,743 | $ 1,078,988 |
| LVMH Moet Hennessy Louis Vuitton S.E. | 792 | 655,530 |
| NIKE, Inc., Class B | 9,198 | 1,533,031 |
| | | 3,267,549 |
| Beverages — 1.3% |
| PepsiCo, Inc. | 5,754 | 999,527 |
| Chemicals — 1.1% |
| The Sherwin-Williams Co. | 2,499 | 880,048 |
| Commercial Services — 3.4% |
| Equifax, Inc. | 3,417 | 1,000,463 |
| Moody's Corp. | 2,132 | 832,717 |
| Verisk Analytics, Inc. | 3,788 | 866,429 |
| | | 2,699,609 |
| Computers — 10.3% |
| Accenture PLC, Class A | 8,093 | 3,354,953 |
| Apple, Inc. | 23,699 | 4,208,231 |
| Cognizant Technology Solutions Corp., Class A | 6,869 | 609,418 |
| | | 8,172,602 |
| Cosmetics & Personal Care — 3.1% |
| Colgate-Palmolive Co. | 22,197 | 1,894,292 |
| The Estee Lauder Cos., Inc., Class A | 1,471 | 544,564 |
| | | 2,438,856 |
| Diversified Financial Services — 6.0% |
| Mastercard, Inc., Class A | 2,297 | 825,358 |
| The Charles Schwab Corp. | 20,304 | 1,707,567 |
| Visa, Inc., Class A | 10,275 | 2,226,695 |
| | | 4,759,620 |
| Electric — 0.9% |
| Xcel Energy, Inc. | 10,348 | 700,560 |
| Electronics — 6.2% |
| Agilent Technologies, Inc. | 3,836 | 612,417 |
| Amphenol Corp., Class A | 21,360 | 1,868,146 |
| Fortive Corp. | 15,320 | 1,168,763 |
| TE Connectivity Ltd. | 7,697 | 1,241,834 |
| | | 4,891,160 |
| Food — 1.1% |
| McCormick & Co., Inc. | 9,378 | 906,009 |
| Healthcare Products — 10.3% |
| Abbott Laboratories | 5,988 | 842,751 |
| Boston Scientific Corp.* | 39,954 | 1,697,246 |
| Danaher Corp. | 3,307 | 1,088,036 |
| Medtronic PLC | 5,473 | 566,182 |
| STERIS PLC | 3,748 | 912,301 |
| Stryker Corp. | 5,078 | 1,357,959 |
| Thermo Fisher Scientific, Inc. | 2,452 | 1,636,072 |
| | | 8,100,547 |
| | Number of
Shares | Value† |
| |
| Healthcare Services — 1.5% |
| ICON PLC* | 3,726 | $ 1,153,942 |
| Household Products & Wares — 2.9% |
| Church & Dwight Co., Inc. | 22,163 | 2,271,707 |
| Insurance — 3.2% |
| Aon PLC, Class A | 5,579 | 1,676,824 |
| Marsh & McLennan Cos., Inc. | 4,883 | 848,763 |
| | | 2,525,587 |
| Internet — 10.9% |
| Alibaba Group Holding Ltd.* | 65,652 | 1,001,087 |
| Alphabet, Inc., Class A* | 2,348 | 6,802,250 |
| Tencent Holdings Ltd. | 14,100 | 826,013 |
| | | 8,629,350 |
| Machinery — Diversified — 1.2% |
| Otis Worldwide Corp. | 10,561 | 919,546 |
| Media — 1.0% |
| Charter Communications, Inc., Class A* | 1,195 | 779,104 |
| Pharmaceuticals — 2.7% |
| Becton Dickinson and Co. | 4,870 | 1,224,708 |
| Cigna Corp. | 2,750 | 631,483 |
| Roche Holding AG | 681 | 283,326 |
| | | 2,139,517 |
| Private Equity — 0.5% |
| Blackstone, Inc. | 3,051 | 394,769 |
| Retail — 5.2% |
| Dollarama, Inc. | 27,446 | 1,373,656 |
| Ross Stores, Inc. | 8,544 | 976,408 |
| Starbucks Corp. | 8,413 | 984,069 |
| The TJX Cos., Inc. | 10,722 | 814,014 |
| | | 4,148,147 |
| Semiconductors — 2.8% |
| Analog Devices, Inc. | 4,689 | 824,186 |
| Taiwan Semiconductor Manufacturing Co., Ltd., ADR | 4,749 | 571,352 |
| Texas Instruments, Inc. | 4,288 | 808,159 |
| | | 2,203,697 |
| Software — 17.0% |
| Electronic Arts, Inc. | 10,339 | 1,363,714 |
| Fidelity National Information Services, Inc. | 10,015 | 1,093,138 |
| Fiserv, Inc.* | 14,956 | 1,552,283 |
| Microsoft Corp. | 28,138 | 9,463,372 |
| | | 13,472,507 |
| Transportation — 1.4% |
| Union Pacific Corp. | 4,250 | 1,070,702 |
TOTAL COMMON STOCKS
(Cost $43,604,084) | 77,524,662 |
Penn Series Funds, Inc.
Schedule of Investments — December 31, 2021
Large Cap Growth Fund
| | Number of
Shares | Value† |
|
| REAL ESTATE INVESTMENT TRUSTS — 2.0% |
| Diversified — 2.0% |
American Tower Corp.
(Cost $1,220,953) | 5,368 | $ 1,570,140 |
| | | |
| SHORT-TERM INVESTMENTS — 0.6% |
BlackRock Liquidity FedFund - Institutional Shares (seven-day effective yield 0.030%)
(Cost $490,402) | 490,402 | 490,402 |
TOTAL INVESTMENTS — 100.7%
(Cost $45,315,439) | | $ 79,585,204 |
| Other Assets & Liabilities — (0.7)% | (569,070) |
| TOTAL NET ASSETS — 100.0% | | $ 79,016,134 |
| † | See Security Valuation Note. |
| * | Non-income producing security. |
| ADR— American Depositary Receipt. |
| AG— Aktiengesellschaft. |
| PLC— Public Limited Company. |
| S.E.— Societas Europaea. |
| Country Weightings as of 12/31/2021†† |
| United States | 85% |
| Ireland | 6 |
| China | 2 |
| Switzerland | 2 |
| Canada | 2 |
| Germany | 1 |
| France | 1 |
| Taiwan | 1 |
| Total | 100% |
| †† | % of total investments as of December 31, 2021. |
Summary of inputs used to value the Fund’s investments as of 12/31/2021 are as follows (See Security Valuation Note):
| ASSETS TABLE |
| Description | Total
Market
Value at
12/31/2021 | Level 1
Quoted
Price | Level 2
Significant
Observable
Input | Level 3
Significant
Unobservable
Input |
| Common Stocks | $77,524,662 | $77,524,662 | $— | $— |
| Real Estate Investment Trusts | 1,570,140 | 1,570,140 | — | — |
| Short-Term Investments | 490,402 | 490,402 | — | — |
| Total Investments | $ 79,585,204 | $ 79,585,204 | $ — | $ — |
It is the Fund's practice to recognize transfers into and transfers out of Level 3 at the fair value hierarchy as of the beginning of period.
The Fund did not have any transfers into and transfers out of Level 3 fair value hierarchy during the reporting period.
The accompanying notes are an integral part of these financial statements.
Penn Series Funds, Inc.
Schedule of Investments — December 31, 2021
Large Core Growth Fund
| | Number of
Shares | Value† |
| COMMON STOCKS — 95.4% |
| Advertising — 2.5% |
| The Trade Desk, Inc., Class A* | 55,360 | $ 5,073,190 |
| Aerospace & Defense — 2.5% |
| HEICO Corp., Class A | 39,982 | 5,138,487 |
| Biotechnology — 2.8% |
| Royalty Pharma PLC, Class A | 145,917 | 5,814,792 |
| Commercial Services — 5.6% |
| Adyen N.V.* | 1,331 | 3,502,717 |
| Block, Inc., Class A* | 50,151 | 8,099,888 |
| | | 11,602,605 |
| Diversified Financial Services — 1.0% |
| Coinbase Global, Inc., Class A* | 7,888 | 1,990,695 |
| Healthcare Products — 2.5% |
| Intuitive Surgical, Inc.* | 14,265 | 5,125,414 |
| Internet — 32.8% |
| Airbnb, Inc., Class A* | 40,495 | 6,742,013 |
| Chewy, Inc., Class A* | 36,917 | 2,176,996 |
| Farfetch Ltd., Class A* | 80,547 | 2,692,686 |
| IAC* | 33,528 | 4,382,445 |
| Match Group, Inc.* | 16,165 | 2,137,821 |
| Pinterest, Inc., Class A* | 41,364 | 1,503,581 |
| Shopify, Inc., Class A* | 9,902 | 13,638,916 |
| Snap, Inc., Class A* | 108,632 | 5,108,963 |
| Spotify Technology S.A.* | 20,260 | 4,741,448 |
| Twitter, Inc.* | 194,913 | 8,424,140 |
| Uber Technologies, Inc.* | 263,522 | 11,049,477 |
| Vimeo, Inc.* | 54,432 | 977,599 |
| Wayfair, Inc., Class A* | 20,492 | 3,892,865 |
| | | 67,468,950 |
| Retail — 3.5% |
| Domino's Pizza, Inc. | 9,491 | 5,356,056 |
| Lululemon Athletica, Inc.* | 4,682 | 1,832,769 |
| | | 7,188,825 |
| Semiconductors — 4.2% |
| ASML Holding N.V. | 10,906 | 8,682,703 |
| Software — 38.0% |
| Cloudflare, Inc., Class A* | 16,554 | 2,176,851 |
| Coupa Software, Inc.* | 32,659 | 5,161,755 |
| Datadog, Inc., Class A* | 44,497 | 7,925,361 |
| ROBLOX Corp., Class A* | 105,387 | 10,871,723 |
| Snowflake, Inc., Class A* | 38,058 | 12,892,147 |
| Twilio, Inc., Class A* | 33,198 | 8,742,361 |
| Unity Software, Inc.* | 53,230 | 7,611,358 |
| Veeva Systems, Inc., Class A* | 38,300 | 9,784,884 |
| Workday, Inc., Class A* | 7,640 | 2,087,095 |
| Zoom Video Communications, Inc., Class A* | 28,609 | 5,261,481 |
| | Number of
Shares | Value† |
| |
| Software — (continued) |
| ZoomInfo Technologies, Inc.* | 86,745 | $ 5,569,029 |
| | | 78,084,045 |
TOTAL COMMON STOCKS
(Cost $168,339,124) | 196,169,706 |
| | | |
| SHORT-TERM INVESTMENTS — 3.3% |
BlackRock Liquidity FedFund - Institutional Shares (seven-day effective yield 0.030%)
(Cost $6,724,860) | 6,724,860 | 6,724,860 |
TOTAL INVESTMENTS — 98.7%
(Cost $175,063,984) | | $ 202,894,566 |
| Other Assets & Liabilities — 1.3% | 2,584,703 |
| TOTAL NET ASSETS — 100.0% | | $ 205,479,269 |
| † | See Security Valuation Note. |
| * | Non-income producing security. |
| N.V.— Naamloze Vennootschap. |
| PLC— Public Limited Company. |
| S.A.— Societe Anonyme. |
| Country Weightings as of 12/31/2021†† |
| United States | 82% |
| Canada | 8 |
| Netherlands | 6 |
| Sweden | 3 |
| United Kingdom | 1 |
| Total | 100% |
| †† | % of total investments as of December 31, 2021. |
Summary of inputs used to value the Fund’s investments as of 12/31/2021 are as follows (See Security Valuation Note):
| ASSETS TABLE |
| Description | Total
Market
Value at
12/31/2021 | Level 1
Quoted
Price | Level 2
Significant
Observable
Input | Level 3
Significant
Unobservable
Input |
| Common Stocks | $196,169,706 | $196,169,706 | $— | $— |
| Short-Term Investments | 6,724,860 | 6,724,860 | — | — |
| Total Investments | $ 202,894,566 | $ 202,894,566 | $ — | $ — |
It is the Fund's practice to recognize transfers into and transfers out of Level 3 at the fair value hierarchy as of the beginning of period. The Fund did not have any transfers into and transfers out of Level 3 fair value hierarchy during the reporting period.
The accompanying notes are an integral part of these financial statements.
Penn Series Funds, Inc.
Schedule of Investments — December 31, 2021
Large Cap Value Fund
| | Number of
Shares | Value† |
| COMMON STOCKS — 97.6% |
| Aerospace & Defense — 4.4% |
| Hexcel Corp.* | 34,106 | $ 1,766,691 |
| Raytheon Technologies Corp. | 81,830 | 7,042,290 |
| | | 8,808,981 |
| Agriculture — 3.6% |
| Philip Morris International, Inc. | 76,253 | 7,244,035 |
| Apparel — 0.3% |
| Deckers Outdoor Corp.* | 1,840 | 674,010 |
| Auto Parts & Equipment — 0.9% |
| BorgWarner, Inc. | 41,084 | 1,851,656 |
| Banks — 11.9% |
| Citigroup, Inc. | 57,416 | 3,467,352 |
| JPMorgan Chase & Co. | 27,718 | 4,389,145 |
| Northern Trust Corp. | 22,890 | 2,737,873 |
| The Goldman Sachs Group, Inc. | 15,147 | 5,794,485 |
| Wells Fargo & Co. | 161,567 | 7,751,985 |
| | | 24,140,840 |
| Biotechnology — 4.3% |
| Amgen, Inc. | 25,761 | 5,795,452 |
| Bio-Rad Laboratories, Inc., Class A* | 2,390 | 1,805,813 |
| Regeneron Pharmaceuticals, Inc.* | 1,850 | 1,168,312 |
| | | 8,769,577 |
| Chemicals — 1.0% |
| The Mosaic Co. | 49,640 | 1,950,356 |
| Commercial Services — 3.6% |
| FleetCor Technologies, Inc.* | 20,315 | 4,547,309 |
| Robert Half International, Inc. | 24,986 | 2,786,439 |
| | | 7,333,748 |
| Computers — 4.8% |
| Cognizant Technology Solutions Corp., Class A | 56,438 | 5,007,179 |
| Leidos Holdings, Inc. | 17,769 | 1,579,664 |
| Maximus, Inc. | 40,116 | 3,196,042 |
| | | 9,782,885 |
| Distribution & Wholesale — 2.5% |
| LKQ Corp. | 84,844 | 5,093,185 |
| Diversified Financial Services — 0.3% |
| Capital One Financial Corp. | 4,369 | 633,898 |
| Electric — 1.0% |
| IDACORP, Inc. | 17,400 | 1,971,594 |
| Electrical Components & Equipment — 2.5% |
| Acuity Brands, Inc. | 4,245 | 898,752 |
| Emerson Electric Co. | 43,661 | 4,059,163 |
| | | 4,957,915 |
| Electronics — 0.4% |
| Keysight Technologies, Inc.* | 3,754 | 775,239 |
| | Number of
Shares | Value† |
| |
| Engineering & Construction — 1.0% |
| EMCOR Group, Inc. | 15,080 | $ 1,921,041 |
| Healthcare Products — 1.1% |
| PerkinElmer, Inc. | 11,480 | 2,308,169 |
| Healthcare Services — 4.2% |
| Anthem, Inc. | 15,542 | 7,204,339 |
| Quest Diagnostics, Inc. | 8,020 | 1,387,540 |
| | | 8,591,879 |
| Home Builders — 2.2% |
| D.R. Horton, Inc. | 41,805 | 4,533,752 |
| Home Furnishings — 0.2% |
| Dolby Laboratories, Inc., Class A | 3,488 | 332,127 |
| Insurance — 5.1% |
| Aflac, Inc. | 25,272 | 1,475,632 |
| Berkshire Hathaway, Inc., Class B* | 20,743 | 6,202,157 |
| Fidelity National Financial, Inc. | 14,924 | 778,735 |
| The Allstate Corp. | 15,545 | 1,828,869 |
| | | 10,285,393 |
| Internet — 1.7% |
| eBay, Inc. | 9,650 | 641,725 |
| F5, Inc.* | 11,375 | 2,783,576 |
| | | 3,425,301 |
| Iron & Steel — 0.8% |
| Steel Dynamics, Inc. | 25,700 | 1,595,199 |
| Machinery — Diversified — 3.7% |
| Altra Industrial Motion Corp. | 13,080 | 674,536 |
| Curtiss-Wright Corp. | 14,435 | 2,001,701 |
| Flowserve Corp. | 22,766 | 696,640 |
| The Middleby Corp.* | 3,982 | 783,498 |
| Westinghouse Air Brake Technologies Corp. | 35,630 | 3,281,879 |
| | | 7,438,254 |
| Media — 3.5% |
| Comcast Corp., Class A | 141,294 | 7,111,327 |
| Mining — 0.7% |
| BHP Group Ltd., ADR | 24,145 | 1,457,151 |
| Miscellaneous Manufacturing — 2.4% |
| 3M Co. | 6,480 | 1,151,042 |
| Textron, Inc. | 47,802 | 3,690,315 |
| | | 4,841,357 |
| Oil & Gas — 3.0% |
| Chevron Corp. | 12,634 | 1,482,600 |
| ConocoPhillips | 20,470 | 1,477,525 |
| EOG Resources, Inc. | 27,213 | 2,417,331 |
| Helmerich & Payne, Inc. | 32,562 | 771,719 |
| | | 6,149,175 |
| Pharmaceuticals — 6.1% |
| Cigna Corp. | 14,991 | 3,442,383 |
Penn Series Funds, Inc.
Schedule of Investments — December 31, 2021
Large Cap Value Fund
| | Number of
Shares | Value† |
| COMMON STOCKS — (continued) |
| Pharmaceuticals — (continued) |
| Pfizer, Inc. | 60,109 | $ 3,549,436 |
| Roche Holding AG, ADR | 102,572 | 5,301,947 |
| | | 12,293,766 |
| Real Estate — 2.5% |
| CBRE Group, Inc., Class A* | 46,911 | 5,090,313 |
| Retail — 7.8% |
| AutoZone, Inc.* | 1,070 | 2,243,137 |
| MSC Industrial Direct Co., Inc., Class A | 25,417 | 2,136,553 |
| Murphy USA, Inc. | 3,986 | 794,171 |
| Target Corp. | 22,432 | 5,191,662 |
| Walmart, Inc. | 38,080 | 5,509,795 |
| | | 15,875,318 |
| Semiconductors — 1.2% |
| MKS Instruments, Inc. | 13,860 | 2,413,996 |
| Telecommunications — 6.1% |
| Ciena Corp.* | 37,726 | 2,903,770 |
| Cisco Systems, Inc. | 77,032 | 4,881,518 |
| Verizon Communications, Inc. | 87,457 | 4,544,266 |
| | | 12,329,554 |
| Transportation — 2.8% |
| Expeditors International of Washington, Inc. | 13,120 | 1,761,885 |
| Knight-Swift Transportation Holdings, Inc. | 65,194 | 3,972,922 |
| | | 5,734,807 |
TOTAL COMMON STOCKS
(Cost $154,715,153) | 197,715,798 |
|
| REAL ESTATE INVESTMENT TRUSTS — 0.6% |
| Diversified — 0.6% |
Weyerhaeuser Co.
(Cost $1,136,324) | 29,680 | 1,222,222 |
| | | |
| SHORT-TERM INVESTMENTS — 2.3% |
BlackRock Liquidity FedFund - Institutional Shares (seven-day effective yield 0.030%)
(Cost $4,632,607) | 4,632,607 | 4,632,607 |
TOTAL INVESTMENTS — 100.5%
(Cost $160,484,084) | | $ 203,570,627 |
| Other Assets & Liabilities — (0.5)% | (974,495) |
| TOTAL NET ASSETS — 100.0% | | $ 202,596,132 |
| † | See Security Valuation Note. |
| * | Non-income producing security. |
| ADR— American Depositary Receipt. |
Summary of inputs used to value the Fund’s investments as of 12/31/2021 are as follows (See Security Valuation Note):
| ASSETS TABLE |
| Description | Total
Market
Value at
12/31/2021 | Level 1
Quoted
Price | Level 2
Significant
Observable
Input | Level 3
Significant
Unobservable
Input |
| Common Stocks | $197,715,798 | $197,715,798 | $— | $— |
| Real Estate Investment Trusts | 1,222,222 | 1,222,222 | — | — |
| Short-Term Investments | 4,632,607 | 4,632,607 | — | — |
| Total Investments | $ 203,570,627 | $ 203,570,627 | $ — | $ — |
It is the Fund's practice to recognize transfers into and transfers out of Level 3 at the fair value hierarchy as of the beginning of period. The Fund did not have any transfers into and transfers out of Level 3 fair value hierarchy during the reporting period.
The accompanying notes are an integral part of these financial statements.
Penn Series Funds, Inc.
Schedule of Investments — December 31, 2021
Large Core Value Fund
| | Number of
Shares | Value† |
| COMMON STOCKS — 95.1% |
| Aerospace & Defense — 1.0% |
| Hexcel Corp.* | 36,496 | $ 1,890,493 |
| Agriculture — 1.3% |
| Philip Morris International, Inc. | 25,335 | 2,406,825 |
| Apparel — 1.4% |
| Capri Holdings Ltd.* | 39,552 | 2,567,320 |
| Auto Manufacturers — 2.3% |
| General Motors Co.* | 37,305 | 2,187,192 |
| PACCAR, Inc. | 24,942 | 2,201,381 |
| | | 4,388,573 |
| Banks — 9.3% |
| KeyCorp. | 140,741 | 3,255,339 |
| M&T Bank Corp. | 24,067 | 3,696,210 |
| State Street Corp. | 13,765 | 1,280,145 |
| The Goldman Sachs Group, Inc. | 9,353 | 3,577,990 |
| Wells Fargo & Co. | 120,406 | 5,777,080 |
| | | 17,586,764 |
| Beverages — 2.3% |
| Constellation Brands, Inc., Class A | 5,624 | 1,411,455 |
| PepsiCo, Inc. | 17,460 | 3,032,977 |
| | | 4,444,432 |
| Biotechnology — 0.5% |
| Royalty Pharma PLC, Class A | 24,638 | 981,824 |
| Building Materials — 1.6% |
| Johnson Controls International PLC | 36,162 | 2,940,332 |
| Chemicals — 1.5% |
| FMC Corp. | 25,756 | 2,830,327 |
| Commercial Services — 0.8% |
| Euronet Worldwide, Inc.* | 12,396 | 1,477,231 |
| Cosmetics & Personal Care — 3.1% |
| The Procter & Gamble Co. | 35,787 | 5,854,038 |
| Diversified Financial Services — 2.9% |
| The Charles Schwab Corp. | 65,555 | 5,513,176 |
| Electric — 6.0% |
| CMS Energy Corp. | 39,109 | 2,544,041 |
| Edison International | 51,621 | 3,523,133 |
| NextEra Energy, Inc. | 33,154 | 3,095,257 |
| Sempra Energy | 16,657 | 2,203,388 |
| | | 11,365,819 |
| Food — 1.4% |
| Mondelez International, Inc., Class A | 40,130 | 2,661,020 |
| Hand & Machine Tools — 1.5% |
| Stanley Black & Decker, Inc. | 14,569 | 2,748,005 |
| Healthcare Products — 4.6% |
| Thermo Fisher Scientific, Inc. | 8,810 | 5,878,384 |
| | Number of
Shares | Value† |
| |
| Healthcare Products — (continued) |
| Waters Corp.* | 7,670 | $ 2,857,842 |
| | | 8,736,226 |
| Healthcare Services — 4.0% |
| Charles River Laboratories International, Inc.* | 2,995 | 1,128,456 |
| UnitedHealth Group, Inc. | 12,742 | 6,398,268 |
| | | 7,526,724 |
| Insurance — 6.8% |
| American International Group, Inc. | 83,893 | 4,770,156 |
| Arch Capital Group Ltd.* | 81,591 | 3,626,720 |
| Reinsurance Group of America, Inc. | 11,178 | 1,223,879 |
| The Allstate Corp. | 28,338 | 3,333,966 |
| | | 12,954,721 |
| Internet — 2.9% |
| Alphabet, Inc., Class A* | 1,927 | 5,582,596 |
| Lodging — 1.1% |
| Hilton Worldwide Holdings, Inc.* | 13,606 | 2,122,400 |
| Machinery — Diversified — 1.8% |
| Westinghouse Air Brake Technologies Corp. | 36,655 | 3,376,292 |
| Media — 3.4% |
| Fox Corp., Class A | 46,888 | 1,730,167 |
| The Walt Disney Co.* | 30,001 | 4,646,855 |
| | | 6,377,022 |
| Miscellaneous Manufacturing — 1.7% |
| Eaton Corp. PLC | 18,477 | 3,193,195 |
| Oil & Gas — 6.3% |
| Chevron Corp. | 25,800 | 3,027,630 |
| ConocoPhillips | 50,673 | 3,657,577 |
| EOG Resources, Inc. | 38,972 | 3,461,883 |
| Pioneer Natural Resources Co. | 9,833 | 1,788,426 |
| | | 11,935,516 |
| Packaging and Containers — 1.4% |
| Packaging Corp. of America | 19,065 | 2,595,700 |
| Pharmaceuticals — 8.4% |
| AbbVie, Inc. | 21,067 | 2,852,472 |
| Bristol-Myers Squibb Co. | 36,064 | 2,248,590 |
| Johnson & Johnson | 33,270 | 5,691,499 |
| Neurocrine Biosciences, Inc.* | 26,181 | 2,229,836 |
| Sanofi, ADR | 59,012 | 2,956,501 |
| | | 15,978,898 |
| Retail — 1.0% |
| Best Buy Co., Inc. | 19,080 | 1,938,528 |
| Semiconductors — 3.5% |
| Micron Technology, Inc. | 33,621 | 3,131,796 |
| Texas Instruments, Inc. | 18,452 | 3,477,649 |
| | | 6,609,445 |
Penn Series Funds, Inc.
Schedule of Investments — December 31, 2021
Large Core Value Fund
| | Number of
Shares | Value† |
| COMMON STOCKS — (continued) |
| Shipbuilding — 1.5% |
| Huntington Ingalls Industries, Inc. | 14,838 | $ 2,770,848 |
| Software — 3.4% |
| Fidelity National Information Services, Inc. | 35,111 | 3,832,365 |
| VMware, Inc., Class A | 22,910 | 2,654,811 |
| | | 6,487,176 |
| Telecommunications — 4.4% |
| Cisco Systems, Inc. | 63,023 | 3,993,767 |
| Verizon Communications, Inc. | 84,861 | 4,409,378 |
| | | 8,403,145 |
| Transportation — 2.0% |
| C.H. Robinson Worldwide, Inc. | 34,342 | 3,696,230 |
TOTAL COMMON STOCKS
(Cost $148,292,675) | 179,940,841 |
|
| REAL ESTATE INVESTMENT TRUSTS — 5.3% |
| Apartments — 3.0% |
| Invitation Homes, Inc. | 63,759 | 2,890,833 |
| Mid-America Apartment Communities, Inc. | 12,342 | 2,831,749 |
| | | 5,722,582 |
| Healthcare — 0.9% |
| Healthpeak Properties, Inc. | 46,503 | 1,678,293 |
| Industrial — 1.4% |
| EastGroup Properties, Inc. | 11,388 | 2,594,756 |
TOTAL REAL ESTATE INVESTMENT TRUSTS
(Cost $6,850,600) | | 9,995,631 |
| | | |
| SHORT-TERM INVESTMENTS — 0.1% |
BlackRock Liquidity FedFund - Institutional Shares (seven-day effective yield 0.030%)
(Cost $209,504) | 209,504 | 209,504 |
TOTAL INVESTMENTS — 100.5%
(Cost $155,352,779) | | $ 190,145,976 |
| Other Assets & Liabilities — (0.5)% | (1,010,396) |
| TOTAL NET ASSETS — 100.0% | | $ 189,135,580 |
| † | See Security Valuation Note. |
| * | Non-income producing security. |
| ADR— American Depositary Receipt. |
| PLC— Public Limited Company. |
| Country Weightings as of 12/31/2021†† |
| United States | 95% |
| Bermuda | 2 |
| France | 2 |
| United Kingdom | 1 |
| Total | 100% |
| †† | % of total investments as of December 31, 2021. |
Summary of inputs used to value the Fund’s investments as of 12/31/2021 are as follows (See Security Valuation Note):
| ASSETS TABLE |
| Description | Total
Market
Value at
12/31/2021 | Level 1
Quoted
Price | Level 2
Significant
Observable
Input | Level 3
Significant
Unobservable
Input |
| Common Stocks | $179,940,841 | $179,940,841 | $— | $— |
| Real Estate Investment Trusts | 9,995,631 | 9,995,631 | — | — |
| Short-Term Investments | 209,504 | 209,504 | — | — |
| Total Investments | $ 190,145,976 | $ 190,145,976 | $ — | $ — |
It is the Fund's practice to recognize transfers into and transfers out of Level 3 at the fair value hierarchy as of the beginning of period. The Fund did not have any transfers into and transfers out of Level 3 fair value hierarchy during the reporting period.
The accompanying notes are an integral part of these financial statements.
Penn Series Funds, Inc.
Schedule of Investments — December 31, 2021
Index 500 Fund
| | Number of
Shares | Value† |
| COMMON STOCKS — 97.1% |
| Advertising — 0.1% |
| Omnicom Group, Inc. | 3,624 | $ 265,531 |
| The Interpublic Group of Cos., Inc. | 6,992 | 261,850 |
| | | 527,381 |
| Aerospace & Defense — 1.3% |
| General Dynamics Corp. | 3,972 | 828,043 |
| Howmet Aerospace, Inc. | 6,825 | 217,240 |
| L3Harris Technologies, Inc. | 3,419 | 729,067 |
| Lockheed Martin Corp. | 4,237 | 1,505,872 |
| Northrop Grumman Corp. | 2,585 | 1,000,576 |
| Raytheon Technologies Corp. | 25,966 | 2,234,634 |
| Teledyne Technologies, Inc.* | 765 | 334,221 |
| The Boeing Co.* | 9,485 | 1,909,520 |
| TransDigm Group, Inc.* | 900 | 572,652 |
| | | 9,331,825 |
| Agriculture — 0.7% |
| Altria Group, Inc. | 31,967 | 1,514,916 |
| Archer-Daniels-Midland Co. | 9,678 | 654,136 |
| Philip Morris International, Inc. | 26,964 | 2,561,580 |
| | | 4,730,632 |
| Airlines — 0.2% |
| Alaska Air Group, Inc.* | 2,219 | 115,610 |
| American Airlines Group, Inc.* | 11,517 | 206,845 |
| Delta Air Lines, Inc.* | 10,994 | 429,645 |
| Southwest Airlines Co.* | 10,226 | 438,082 |
| United Airlines Holdings, Inc.* | 5,556 | 243,242 |
| | | 1,433,424 |
| Apparel — 0.7% |
| NIKE, Inc., Class B | 22,093 | 3,682,240 |
| PVH Corp. | 1,321 | 140,885 |
| Ralph Lauren Corp. | 856 | 101,744 |
| Tapestry, Inc. | 4,955 | 201,173 |
| Under Armour, Inc., Class A* | 3,386 | 71,749 |
| Under Armour, Inc., Class C* | 3,927 | 70,843 |
| VF Corp. | 5,520 | 404,175 |
| | | 4,672,809 |
| Auto Manufacturers — 2.7% |
| Cummins, Inc. | 2,471 | 539,024 |
| Ford Motor Co. | 68,042 | 1,413,232 |
| General Motors Co.* | 25,165 | 1,475,424 |
| PACCAR, Inc. | 6,000 | 529,560 |
| Tesla, Inc.* | 14,082 | 14,881,576 |
| | | 18,838,816 |
| Auto Parts & Equipment — 0.1% |
| Aptiv PLC* | 4,636 | 764,708 |
| BorgWarner, Inc. | 4,082 | 183,976 |
| | | 948,684 |
| Banks — 4.9% |
| Bank of America Corp. | 124,593 | 5,543,143 |
| Citigroup, Inc. | 34,166 | 2,063,285 |
| Citizens Financial Group, Inc. | 7,338 | 346,720 |
| Comerica, Inc. | 2,216 | 192,792 |
| | Number of
Shares | Value† |
| |
| Banks — (continued) |
| Fifth Third Bancorp | 11,761 | $ 512,192 |
| First Republic Bank | 3,051 | 630,062 |
| Huntington Bancshares, Inc. | 25,356 | 390,990 |
| JPMorgan Chase & Co. | 51,126 | 8,095,802 |
| KeyCorp. | 16,916 | 391,267 |
| M&T Bank Corp. | 2,175 | 334,036 |
| Morgan Stanley | 24,731 | 2,427,595 |
| Northern Trust Corp. | 3,545 | 424,017 |
| Regions Financial Corp. | 16,177 | 352,659 |
| Signature Bank | 1,000 | 323,470 |
| State Street Corp. | 6,383 | 593,619 |
| SVB Financial Group* | 1,022 | 693,161 |
| The Bank of New York Mellon Corp. | 13,008 | 755,505 |
| The Goldman Sachs Group, Inc. | 5,874 | 2,247,099 |
| The PNC Financial Services Group, Inc. | 7,316 | 1,467,004 |
| Truist Financial Corp. | 23,073 | 1,350,924 |
| US Bancorp | 23,221 | 1,304,324 |
| Wells Fargo & Co. | 68,978 | 3,309,564 |
| Zions Bancorp NA | 2,900 | 183,164 |
| | | 33,932,394 |
| Beverages — 1.4% |
| Brown-Forman Corp., Class B | 3,268 | 238,107 |
| Constellation Brands, Inc., Class A | 2,935 | 736,597 |
| Molson Coors Beverage Co., Class B | 3,112 | 144,241 |
| Monster Beverage Corp.* | 6,409 | 615,520 |
| PepsiCo, Inc. | 23,886 | 4,149,237 |
| The Coca-Cola Co. | 67,147 | 3,975,774 |
| | | 9,859,476 |
| Biotechnology — 1.5% |
| Amgen, Inc. | 9,758 | 2,195,257 |
| Biogen, Inc.* | 2,551 | 612,036 |
| Bio-Rad Laboratories, Inc., Class A* | 400 | 302,228 |
| Corteva, Inc. | 12,533 | 592,560 |
| Gilead Sciences, Inc. | 21,593 | 1,567,868 |
| Illumina, Inc.* | 2,704 | 1,028,710 |
| Incyte Corp.* | 3,346 | 245,596 |
| Moderna, Inc.* | 6,100 | 1,549,278 |
| Regeneron Pharmaceuticals, Inc.* | 1,824 | 1,151,893 |
| Vertex Pharmaceuticals, Inc.* | 4,362 | 957,895 |
| | | 10,203,321 |
| Building Materials — 0.5% |
| Carrier Global Corp. | 14,963 | 811,593 |
| Fortune Brands Home & Security, Inc. | 2,304 | 246,297 |
| Johnson Controls International PLC | 12,210 | 992,795 |
| Martin Marietta Materials, Inc. | 1,057 | 465,630 |
| Masco Corp. | 4,262 | 299,278 |
| Vulcan Materials Co. | 2,276 | 472,452 |
| | | 3,288,045 |
| Chemicals — 1.7% |
| Air Products and Chemicals, Inc. | 3,791 | 1,153,450 |
| Albemarle Corp. | 1,985 | 464,033 |
| Celanese Corp. | 1,885 | 316,793 |
Penn Series Funds, Inc.
Schedule of Investments — December 31, 2021
Index 500 Fund
| | Number of
Shares | Value† |
| COMMON STOCKS — (continued) |
| Chemicals — (continued) |
| CF Industries Holdings, Inc. | 3,604 | $ 255,091 |
| Dow, Inc. | 12,874 | 730,213 |
| DuPont de Nemours, Inc. | 8,910 | 719,750 |
| Eastman Chemical Co. | 2,427 | 293,449 |
| Ecolab, Inc. | 4,246 | 996,069 |
| FMC Corp. | 2,141 | 235,274 |
| International Flavors & Fragrances, Inc. | 4,262 | 642,070 |
| Linde PLC | 8,886 | 3,078,377 |
| LyondellBasell Industries N.V., Class A | 4,434 | 408,948 |
| PPG Industries, Inc. | 4,120 | 710,453 |
| The Mosaic Co. | 6,108 | 239,983 |
| The Sherwin-Williams Co. | 4,173 | 1,469,564 |
| | | 11,713,517 |
| Commercial Services — 2.1% |
| Automatic Data Processing, Inc. | 7,329 | 1,807,185 |
| Cintas Corp. | 1,524 | 675,391 |
| Equifax, Inc. | 2,115 | 619,251 |
| FleetCor Technologies, Inc.* | 1,412 | 316,062 |
| Gartner, Inc.* | 1,426 | 476,740 |
| Global Payments, Inc. | 5,032 | 680,226 |
| IHS Markit Ltd. | 6,929 | 921,003 |
| MarketAxess Holdings, Inc. | 686 | 282,131 |
| Moody's Corp. | 2,812 | 1,098,311 |
| Nielsen Holdings PLC | 6,031 | 123,696 |
| PayPal Holdings, Inc.* | 20,309 | 3,829,871 |
| Quanta Services, Inc. | 2,481 | 284,472 |
| Robert Half International, Inc. | 1,870 | 208,542 |
| Rollins, Inc. | 4,204 | 143,819 |
| S&P Global, Inc. | 4,172 | 1,968,892 |
| United Rentals, Inc.* | 1,241 | 412,372 |
| Verisk Analytics, Inc. | 2,795 | 639,300 |
| | | 14,487,264 |
| Computers — 8.5% |
| Accenture PLC, Class A | 10,959 | 4,543,054 |
| Apple, Inc. | 269,233 | 47,807,704 |
| Cognizant Technology Solutions Corp., Class A | 9,152 | 811,965 |
| DXC Technology Co.* | 4,316 | 138,932 |
| EPAM Systems, Inc.* | 1,000 | 668,450 |
| Fortinet, Inc.* | 2,320 | 833,808 |
| Hewlett Packard Enterprise Co. | 22,385 | 353,012 |
| HP, Inc. | 20,510 | 772,612 |
| International Business Machines Corp. | 15,406 | 2,059,166 |
| Leidos Holdings, Inc. | 2,377 | 211,315 |
| NetApp, Inc. | 3,879 | 356,829 |
| Seagate Technology Holdings PLC | 3,505 | 395,995 |
| Western Digital Corp.* | 5,440 | 354,742 |
| | | 59,307,584 |
| Cosmetics & Personal Care — 1.4% |
| Colgate-Palmolive Co. | 14,504 | 1,237,771 |
| The Estee Lauder Cos., Inc., Class A | 3,991 | 1,477,468 |
| | Number of
Shares | Value† |
| |
| Cosmetics & Personal Care — (continued) |
| The Procter & Gamble Co. | 41,925 | $ 6,858,092 |
| | | 9,573,331 |
| Distribution & Wholesale — 0.3% |
| Copart, Inc.* | 3,600 | 545,832 |
| Fastenal Co. | 9,918 | 635,347 |
| LKQ Corp. | 4,551 | 273,196 |
| Pool Corp. | 700 | 396,200 |
| W.W. Grainger, Inc. | 769 | 398,527 |
| | | 2,249,102 |
| Diversified Financial Services — 3.6% |
| American Express Co. | 10,854 | 1,775,714 |
| Ameriprise Financial, Inc. | 1,927 | 581,299 |
| BlackRock, Inc. | 2,476 | 2,266,926 |
| Capital One Financial Corp. | 7,363 | 1,068,298 |
| Cboe Global Markets, Inc. | 1,775 | 231,460 |
| CME Group, Inc. | 6,177 | 1,411,197 |
| Discover Financial Services | 5,119 | 591,552 |
| Franklin Resources, Inc. | 5,190 | 173,813 |
| Intercontinental Exchange, Inc. | 9,669 | 1,322,429 |
| Invesco Ltd. | 6,199 | 142,701 |
| Mastercard, Inc., Class A | 15,050 | 5,407,766 |
| Nasdaq, Inc. | 1,961 | 411,830 |
| Raymond James Financial, Inc. | 3,285 | 329,814 |
| Synchrony Financial | 9,977 | 462,833 |
| T. Rowe Price Group, Inc. | 3,912 | 769,256 |
| The Charles Schwab Corp. | 25,986 | 2,185,423 |
| Visa, Inc., Class A | 28,941 | 6,271,804 |
| | | 25,404,115 |
| Electric — 2.3% |
| Alliant Energy Corp. | 4,369 | 268,562 |
| Ameren Corp. | 4,461 | 397,074 |
| American Electric Power Co., Inc. | 8,577 | 763,096 |
| CenterPoint Energy, Inc. | 10,475 | 292,357 |
| CMS Energy Corp. | 4,889 | 318,029 |
| Consolidated Edison, Inc. | 6,152 | 524,889 |
| Dominion Energy, Inc. | 13,804 | 1,084,442 |
| DTE Energy Co. | 3,351 | 400,578 |
| Duke Energy Corp. | 13,241 | 1,388,981 |
| Edison International | 6,456 | 440,622 |
| Entergy Corp. | 3,409 | 384,024 |
| Evergy, Inc. | 4,062 | 278,694 |
| Eversource Energy | 5,903 | 537,055 |
| Exelon Corp. | 16,836 | 972,447 |
| FirstEnergy Corp. | 9,222 | 383,543 |
| NextEra Energy, Inc. | 33,922 | 3,166,958 |
| NRG Energy, Inc. | 4,337 | 186,838 |
| Pinnacle West Capital Corp. | 1,859 | 131,227 |
| PPL Corp. | 13,087 | 393,395 |
| Public Service Enterprise Group, Inc. | 8,727 | 582,353 |
| Sempra Energy | 5,454 | 721,455 |
| The AES Corp. | 11,235 | 273,010 |
| The Southern Co. | 18,182 | 1,246,922 |
| WEC Energy Group, Inc. | 5,442 | 528,255 |
Penn Series Funds, Inc.
Schedule of Investments — December 31, 2021
Index 500 Fund
| | Number of
Shares | Value† |
| COMMON STOCKS — (continued) |
| Electric — (continued) |
| Xcel Energy, Inc. | 9,298 | $ 629,475 |
| | | 16,294,281 |
| Electrical Components & Equipment — 0.3% |
| AMETEK, Inc. | 3,980 | 585,219 |
| Emerson Electric Co. | 10,255 | 953,407 |
| Generac Holdings, Inc.* | 1,107 | 389,576 |
| | | 1,928,202 |
| Electronics — 1.1% |
| Agilent Technologies, Inc. | 5,156 | 823,155 |
| Allegion PLC | 1,496 | 198,130 |
| Amphenol Corp., Class A | 10,357 | 905,823 |
| Fortive Corp. | 6,275 | 478,720 |
| Garmin Ltd. | 2,676 | 364,391 |
| Honeywell International, Inc. | 11,945 | 2,490,652 |
| Keysight Technologies, Inc.* | 3,200 | 660,832 |
| Mettler-Toledo International, Inc.* | 398 | 675,490 |
| TE Connectivity Ltd. | 5,590 | 901,891 |
| Trimble, Inc.* | 4,300 | 374,917 |
| | | 7,874,001 |
| Energy-Alternate Sources — 0.1% |
| Enphase Energy, Inc.* | 2,300 | 420,762 |
| SolarEdge Technologies, Inc.* | 900 | 252,513 |
| | | 673,275 |
| Engineering & Construction — 0.0% |
| Jacobs Engineering Group, Inc. | 2,302 | 320,507 |
| Entertainment — 0.1% |
| Caesars Entertainment, Inc.* | 3,669 | 343,162 |
| Live Nation Entertainment, Inc.* | 2,200 | 263,318 |
| Penn National Gaming, Inc.* | 2,612 | 135,432 |
| | | 741,912 |
| Environmental Control — 0.3% |
| Pentair PLC | 2,923 | 213,467 |
| Republic Services, Inc. | 3,646 | 508,435 |
| Waste Management, Inc. | 6,648 | 1,109,551 |
| | | 1,831,453 |
| Food — 1.0% |
| Campbell Soup Co. | 3,301 | 143,461 |
| Conagra Brands, Inc. | 8,186 | 279,552 |
| General Mills, Inc. | 10,439 | 703,380 |
| Hormel Foods Corp. | 4,706 | 229,700 |
| Kellogg Co. | 4,558 | 293,626 |
| Lamb Weston Holdings, Inc. | 2,600 | 164,788 |
| McCormick & Co., Inc. | 4,233 | 408,950 |
| Mondelez International, Inc., Class A | 24,223 | 1,606,227 |
| Sysco Corp. | 8,762 | 688,255 |
| The Hershey Co. | 2,461 | 476,130 |
| The J.M. Smucker Co. | 1,836 | 249,366 |
| The Kraft Heinz Co. | 12,447 | 446,847 |
| The Kroger Co. | 11,676 | 528,456 |
| | Number of
Shares | Value† |
| |
| Food — (continued) |
| Tyson Foods, Inc., Class A | 5,067 | $ 441,640 |
| | | 6,660,378 |
| Forest Products & Paper — 0.0% |
| International Paper Co. | 6,646 | 312,229 |
| Gas — 0.1% |
| Atmos Energy Corp. | 2,319 | 242,962 |
| NiSource, Inc. | 6,920 | 191,061 |
| | | 434,023 |
| Hand & Machine Tools — 0.1% |
| Snap-on, Inc. | 901 | 194,057 |
| Stanley Black & Decker, Inc. | 2,788 | 525,873 |
| | | 719,930 |
| Healthcare Products — 4.1% |
| Abbott Laboratories | 30,638 | 4,311,992 |
| ABIOMED, Inc.* | 773 | 277,638 |
| Align Technology, Inc.* | 1,249 | 820,818 |
| Baxter International, Inc. | 8,505 | 730,069 |
| Bio-Techne Corp. | 700 | 362,138 |
| Boston Scientific Corp.* | 24,394 | 1,036,257 |
| Danaher Corp. | 10,984 | 3,613,846 |
| DENTSPLY SIRONA, Inc. | 3,666 | 204,526 |
| Edwards Lifesciences Corp.* | 10,710 | 1,387,481 |
| Henry Schein, Inc.* | 2,410 | 186,847 |
| Hologic, Inc.* | 4,393 | 336,328 |
| IDEXX Laboratories, Inc.* | 1,459 | 960,693 |
| Intuitive Surgical, Inc.* | 6,150 | 2,209,695 |
| Medtronic PLC | 23,253 | 2,405,523 |
| PerkinElmer, Inc. | 1,889 | 379,802 |
| ResMed, Inc. | 2,524 | 657,452 |
| STERIS PLC | 1,800 | 438,138 |
| Stryker Corp. | 5,752 | 1,538,200 |
| Teleflex, Inc. | 826 | 271,324 |
| The Cooper Cos., Inc. | 837 | 350,653 |
| Thermo Fisher Scientific, Inc. | 6,798 | 4,535,898 |
| Waters Corp.* | 1,045 | 389,367 |
| West Pharmaceutical Services, Inc. | 1,332 | 624,721 |
| Zimmer Biomet Holdings, Inc. | 3,612 | 458,869 |
| | | 28,488,275 |
| Healthcare Services — 2.3% |
| Anthem, Inc. | 4,222 | 1,957,066 |
| Catalent, Inc.* | 3,000 | 384,090 |
| Centene Corp.* | 9,966 | 821,198 |
| Charles River Laboratories International, Inc.* | 900 | 339,102 |
| DaVita, Inc.* | 1,114 | 126,729 |
| HCA Healthcare, Inc. | 4,110 | 1,055,941 |
| Humana, Inc. | 2,199 | 1,020,028 |
| IQVIA Holdings, Inc.* | 3,325 | 938,116 |
| Laboratory Corp. of America Holdings* | 1,681 | 528,187 |
| Quest Diagnostics, Inc. | 2,068 | 357,785 |
| UnitedHealth Group, Inc. | 16,282 | 8,175,843 |
Penn Series Funds, Inc.
Schedule of Investments — December 31, 2021
Index 500 Fund
| | Number of
Shares | Value† |
| COMMON STOCKS — (continued) |
| Healthcare Services — (continued) |
| Universal Health Services, Inc., Class B | 1,330 | $ 172,448 |
| | | 15,876,533 |
| Home Builders — 0.2% |
| D.R. Horton, Inc. | 5,648 | 612,526 |
| Lennar Corp., Class A | 4,757 | 552,573 |
| NVR, Inc.* | 53 | 313,170 |
| PulteGroup, Inc. | 4,322 | 247,045 |
| | | 1,725,314 |
| Home Furnishings — 0.0% |
| Whirlpool Corp. | 1,045 | 245,220 |
| Household Products & Wares — 0.3% |
| Avery Dennison Corp. | 1,404 | 304,064 |
| Church & Dwight Co., Inc. | 4,176 | 428,040 |
| Kimberly-Clark Corp. | 5,721 | 817,645 |
| Newell Brands, Inc. | 6,989 | 152,640 |
| The Clorox Co. | 2,124 | 370,341 |
| | | 2,072,730 |
| Insurance — 3.2% |
| Aflac, Inc. | 10,532 | 614,963 |
| American International Group, Inc. | 14,780 | 840,391 |
| Aon PLC, Class A | 3,856 | 1,158,959 |
| Arthur J. Gallagher & Co. | 3,523 | 597,747 |
| Assurant, Inc. | 984 | 153,366 |
| Berkshire Hathaway, Inc., Class B* | 31,682 | 9,472,918 |
| Brown & Brown, Inc. | 4,000 | 281,120 |
| Chubb Ltd. | 7,406 | 1,431,654 |
| Cincinnati Financial Corp. | 2,604 | 296,674 |
| Everest Re Group Ltd. | 725 | 198,592 |
| Globe Life, Inc. | 1,673 | 156,794 |
| Lincoln National Corp. | 3,150 | 215,019 |
| Loews Corp. | 3,414 | 197,193 |
| Marsh & McLennan Cos., Inc. | 8,721 | 1,515,884 |
| MetLife, Inc. | 12,491 | 780,563 |
| Principal Financial Group, Inc. | 4,406 | 318,686 |
| Prudential Financial, Inc. | 6,627 | 717,306 |
| The Allstate Corp. | 5,047 | 593,780 |
| The Hartford Financial Services Group, Inc. | 5,948 | 410,650 |
| The Progressive Corp. | 10,017 | 1,028,245 |
| The Travelers Cos., Inc. | 4,354 | 681,096 |
| W.R. Berkley Corp. | 2,300 | 189,497 |
| Willis Towers Watson PLC | 2,190 | 520,103 |
| | | 22,371,200 |
| Internet — 11.3% |
| Alphabet, Inc., Class A* | 5,197 | 15,055,917 |
| Alphabet, Inc., Class C* | 4,837 | 13,996,295 |
| Amazon.com, Inc.* | 7,533 | 25,117,583 |
| Booking Holdings, Inc.* | 707 | 1,696,256 |
| CDW Corp. | 2,400 | 491,472 |
| eBay, Inc. | 11,181 | 743,536 |
| Etsy, Inc.* | 2,200 | 481,668 |
| Expedia Group, Inc.* | 2,434 | 439,872 |
| | Number of
Shares | Value† |
| |
| Internet — (continued) |
| F5, Inc.* | 1,070 | $ 261,840 |
| Match Group, Inc.* | 4,800 | 634,800 |
| Meta Platforms, Inc., Class A* | 40,936 | 13,768,824 |
| Netflix, Inc.* | 7,648 | 4,607,461 |
| Nortonlifelock, Inc. | 10,440 | 271,231 |
| Twitter, Inc.* | 13,843 | 598,294 |
| VeriSign, Inc.* | 1,712 | 434,540 |
| | | 78,599,589 |
| Iron & Steel — 0.1% |
| Nucor Corp. | 5,020 | 573,033 |
| Leisure Time — 0.1% |
| Carnival Corp.* | 13,604 | 273,713 |
| Norwegian Cruise Line Holdings Ltd.* | 6,138 | 127,302 |
| Royal Caribbean Cruises Ltd.* | 3,857 | 296,603 |
| | | 697,618 |
| Lodging — 0.3% |
| Hilton Worldwide Holdings, Inc.* | 4,824 | 752,496 |
| Las Vegas Sands Corp.* | 5,905 | 222,264 |
| Marriott International, Inc., Class A* | 4,719 | 779,768 |
| MGM Resorts International | 6,802 | 305,274 |
| Wynn Resorts Ltd.* | 1,735 | 147,544 |
| | | 2,207,346 |
| Machinery — Construction & Mining — 0.3% |
| Caterpillar, Inc. | 9,311 | 1,924,956 |
| Machinery — Diversified — 0.7% |
| Deere & Co. | 4,918 | 1,686,333 |
| Dover Corp. | 2,461 | 446,918 |
| IDEX Corp. | 1,300 | 307,216 |
| Ingersoll Rand, Inc. | 7,057 | 436,616 |
| Otis Worldwide Corp. | 7,406 | 644,840 |
| Rockwell Automation, Inc. | 2,009 | 700,840 |
| Westinghouse Air Brake Technologies Corp. | 3,294 | 303,410 |
| Xylem, Inc. | 3,067 | 367,795 |
| | | 4,893,968 |
| Media — 1.7% |
| Charter Communications, Inc., Class A* | 2,170 | 1,414,775 |
| Comcast Corp., Class A | 79,168 | 3,984,526 |
| Discovery, Inc., Class A* | 2,889 | 68,007 |
| Discovery, Inc., Class C* | 5,277 | 120,843 |
| DISH Network Corp., Class A* | 4,152 | 134,691 |
| FactSet Research Systems, Inc. | 700 | 340,207 |
| Fox Corp., Class A | 5,368 | 198,079 |
| Fox Corp., Class B | 2,720 | 93,214 |
| News Corp., Class A | 6,937 | 154,765 |
| News Corp., Class B | 2,500 | 56,250 |
| The Walt Disney Co.* | 31,397 | 4,863,081 |
| ViacomCBS, Inc., Class B | 10,467 | 315,894 |
| | | 11,744,332 |
Penn Series Funds, Inc.
Schedule of Investments — December 31, 2021
Index 500 Fund
| | Number of
Shares | Value† |
| COMMON STOCKS — (continued) |
| Mining — 0.3% |
| Freeport-McMoRan, Inc. | 25,049 | $ 1,045,295 |
| Newmont Corp. | 13,609 | 844,030 |
| | | 1,889,325 |
| Miscellaneous Manufacturing — 1.1% |
| 3M Co. | 10,023 | 1,780,385 |
| A.O. Smith Corp. | 2,201 | 188,956 |
| Eaton Corp. PLC | 6,828 | 1,180,015 |
| General Electric Co. | 18,798 | 1,775,847 |
| Illinois Tool Works, Inc. | 4,927 | 1,215,984 |
| Parker-Hannifin Corp. | 2,242 | 713,225 |
| Textron, Inc. | 3,874 | 299,073 |
| Trane Technologies PLC | 4,134 | 835,192 |
| | | 7,988,677 |
| Office & Business Equipment — 0.1% |
| Zebra Technologies Corp., Class A* | 900 | 535,680 |
| Oil & Gas — 2.2% |
| APA Corp. | 6,242 | 167,847 |
| Chevron Corp. | 33,426 | 3,922,541 |
| ConocoPhillips | 22,920 | 1,654,365 |
| Coterra Energy, Inc. | 14,024 | 266,456 |
| Devon Energy Corp. | 11,035 | 486,092 |
| Diamondback Energy, Inc. | 2,900 | 312,765 |
| EOG Resources, Inc. | 10,011 | 889,277 |
| Exxon Mobil Corp. | 73,156 | 4,476,416 |
| Hess Corp. | 4,675 | 346,090 |
| Marathon Oil Corp. | 13,811 | 226,777 |
| Marathon Petroleum Corp. | 10,525 | 673,495 |
| Occidental Petroleum Corp. | 15,546 | 450,678 |
| Phillips 66 | 7,600 | 550,696 |
| Pioneer Natural Resources Co. | 3,876 | 704,967 |
| Valero Energy Corp. | 7,042 | 528,925 |
| | | 15,657,387 |
| Oil & Gas Services — 0.2% |
| Baker Hughes Co. | 14,584 | 350,891 |
| Halliburton Co. | 15,039 | 343,942 |
| Schlumberger Ltd. | 24,350 | 729,282 |
| | | 1,424,115 |
| Packaging and Containers — 0.2% |
| Amcor PLC | 26,132 | 313,845 |
| Ball Corp. | 5,636 | 542,578 |
| Packaging Corp. of America | 1,598 | 217,568 |
| Sealed Air Corp. | 2,463 | 166,179 |
| Westrock Co. | 4,676 | 207,427 |
| | | 1,447,597 |
| Pharmaceuticals — 5.2% |
| AbbVie, Inc. | 30,543 | 4,135,522 |
| AmerisourceBergen Corp. | 2,666 | 354,285 |
| Becton Dickinson and Co. | 4,983 | 1,253,125 |
| Bristol-Myers Squibb Co. | 38,453 | 2,397,545 |
| Cardinal Health, Inc. | 4,830 | 248,697 |
| Cigna Corp. | 5,664 | 1,300,624 |
| | Number of
Shares | Value† |
| |
| Pharmaceuticals — (continued) |
| CVS Health Corp. | 22,746 | $ 2,346,478 |
| Dexcom, Inc.* | 1,674 | 898,854 |
| Eli Lilly & Co. | 13,724 | 3,790,843 |
| Johnson & Johnson | 45,459 | 7,776,671 |
| McKesson Corp. | 2,660 | 661,196 |
| Merck & Co., Inc. | 43,766 | 3,354,226 |
| Organon & Co. | 4,605 | 140,222 |
| Pfizer, Inc. | 96,851 | 5,719,052 |
| Viatris, Inc. | 20,379 | 275,728 |
| Zoetis, Inc. | 8,207 | 2,002,754 |
| | | 36,655,822 |
| Pipelines — 0.2% |
| Kinder Morgan, Inc. | 33,758 | 535,402 |
| ONEOK, Inc. | 7,660 | 450,102 |
| The Williams Cos., Inc. | 21,013 | 547,178 |
| | | 1,532,682 |
| Real Estate — 0.1% |
| CBRE Group, Inc., Class A* | 5,793 | 628,598 |
| Retail — 5.3% |
| Advance Auto Parts, Inc. | 1,112 | 266,747 |
| AutoZone, Inc.* | 373 | 781,953 |
| Bath & Body Works, Inc. | 4,657 | 325,012 |
| Best Buy Co., Inc. | 3,909 | 397,154 |
| CarMax, Inc.* | 2,770 | 360,737 |
| Chipotle Mexican Grill, Inc.* | 477 | 833,915 |
| Costco Wholesale Corp. | 7,639 | 4,336,660 |
| Darden Restaurants, Inc. | 2,210 | 332,914 |
| Dollar General Corp. | 4,081 | 962,422 |
| Dollar Tree, Inc.* | 3,977 | 558,848 |
| Domino's Pizza, Inc. | 623 | 351,578 |
| Genuine Parts Co. | 2,449 | 343,350 |
| Lowe's Cos., Inc. | 11,979 | 3,096,332 |
| McDonald's Corp. | 12,911 | 3,461,052 |
| O'Reilly Automotive, Inc.* | 1,180 | 833,351 |
| Ross Stores, Inc. | 6,217 | 710,479 |
| Starbucks Corp. | 20,404 | 2,386,656 |
| Target Corp. | 8,500 | 1,967,240 |
| The Gap, Inc. | 3,512 | 61,987 |
| The Home Depot, Inc. | 18,216 | 7,559,822 |
| The TJX Cos., Inc. | 20,741 | 1,574,657 |
| Tractor Supply Co. | 1,958 | 467,179 |
| Ulta Beauty, Inc.* | 950 | 391,723 |
| Walgreens Boots Alliance, Inc. | 12,286 | 640,838 |
| Walmart, Inc. | 24,704 | 3,574,422 |
| Yum! Brands, Inc. | 5,094 | 707,353 |
| | | 37,284,381 |
| Savings & Loans — 0.0% |
| People's United Financial, Inc. | 7,929 | 141,295 |
| Semiconductors — 6.3% |
| Advanced Micro Devices, Inc.* | 18,466 | 2,657,257 |
| Analog Devices, Inc. | 9,319 | 1,638,001 |
| Applied Materials, Inc. | 15,553 | 2,447,420 |
Penn Series Funds, Inc.
Schedule of Investments — December 31, 2021
Index 500 Fund
| | Number of
Shares | Value† |
| COMMON STOCKS — (continued) |
| Semiconductors — (continued) |
| Broadcom, Inc. | 7,089 | $ 4,717,092 |
| Intel Corp. | 70,133 | 3,611,850 |
| IPG Photonics Corp.* | 667 | 114,817 |
| KLA Corp. | 2,614 | 1,124,308 |
| Lam Research Corp. | 2,454 | 1,764,794 |
| Microchip Technology, Inc. | 9,384 | 816,971 |
| Micron Technology, Inc. | 19,381 | 1,805,340 |
| Monolithic Power Systems, Inc. | 700 | 345,331 |
| NVIDIA Corp. | 43,250 | 12,720,258 |
| NXP Semiconductors N.V. | 4,591 | 1,045,738 |
| Qorvo, Inc.* | 1,932 | 302,145 |
| QUALCOMM, Inc. | 19,312 | 3,531,585 |
| Skyworks Solutions, Inc. | 2,852 | 442,459 |
| Teradyne, Inc. | 2,800 | 457,884 |
| Texas Instruments, Inc. | 15,964 | 3,008,735 |
| Xilinx, Inc. | 5,935 | 1,258,398 |
| | | 43,810,383 |
| Shipbuilding — 0.0% |
| Huntington Ingalls Industries, Inc. | 741 | 138,374 |
| Software — 10.5% |
| Activision Blizzard, Inc. | 13,341 | 887,577 |
| Adobe, Inc.* | 8,230 | 4,666,904 |
| Akamai Technologies, Inc.* | 2,841 | 332,511 |
| ANSYS, Inc.* | 1,499 | 601,279 |
| Autodesk, Inc.* | 3,777 | 1,062,055 |
| Broadridge Financial Solutions, Inc. | 1,970 | 360,155 |
| Cadence Design Systems, Inc.* | 4,777 | 890,194 |
| Ceridian HCM Holding, Inc.* | 2,300 | 240,258 |
| Cerner Corp. | 5,170 | 480,138 |
| Citrix Systems, Inc. | 2,201 | 208,193 |
| Electronic Arts, Inc. | 4,842 | 638,660 |
| Fidelity National Information Services, Inc. | 10,696 | 1,167,468 |
| Fiserv, Inc.* | 10,173 | 1,055,856 |
| Intuit, Inc. | 4,896 | 3,149,205 |
| Jack Henry & Associates, Inc. | 1,200 | 200,388 |
| Microsoft Corp. | 129,691 | 43,617,677 |
| MSCI, Inc. | 1,402 | 858,991 |
| Oracle Corp. | 27,792 | 2,423,740 |
| Paychex, Inc. | 5,557 | 758,530 |
| Paycom Software, Inc.* | 800 | 332,152 |
| PTC, Inc.* | 1,900 | 230,185 |
| Roper Technologies, Inc. | 1,816 | 893,218 |
| salesforce.com, Inc.* | 16,789 | 4,266,589 |
| ServiceNow, Inc.* | 3,399 | 2,206,325 |
| Synopsys, Inc.* | 2,619 | 965,101 |
| Take-Two Interactive Software, Inc.* | 1,968 | 349,753 |
| Tyler Technologies, Inc.* | 734 | 394,855 |
| | | 73,237,957 |
| Telecommunications — 2.1% |
| Arista Networks, Inc.* | 3,888 | 558,900 |
| AT&T, Inc. | 123,500 | 3,038,100 |
| Cisco Systems, Inc. | 72,824 | 4,614,857 |
| | Number of
Shares | Value† |
| |
| Telecommunications — (continued) |
| Corning, Inc. | 13,463 | $ 501,228 |
| Juniper Networks, Inc. | 5,811 | 207,511 |
| Lumen Technologies, Inc. | 17,500 | 219,625 |
| Motorola Solutions, Inc. | 2,902 | 788,473 |
| T-Mobile USA, Inc.* | 10,041 | 1,164,555 |
| Verizon Communications, Inc. | 71,567 | 3,718,621 |
| | | 14,811,870 |
| Textiles — 0.0% |
| Mohawk Industries, Inc.* | 967 | 176,168 |
| Toys, Games & Hobbies — 0.0% |
| Hasbro, Inc. | 2,270 | 231,041 |
| Transportation — 1.5% |
| C.H. Robinson Worldwide, Inc. | 2,288 | 246,257 |
| CSX Corp. | 38,130 | 1,433,688 |
| Expeditors International of Washington, Inc. | 2,864 | 384,607 |
| FedEx Corp. | 4,272 | 1,104,910 |
| J.B. Hunt Transport Services, Inc. | 1,395 | 285,138 |
| Norfolk Southern Corp. | 4,271 | 1,271,519 |
| Old Dominion Freight Line, Inc. | 1,630 | 584,159 |
| Union Pacific Corp. | 11,079 | 2,791,133 |
| United Parcel Service, Inc., Class B | 12,599 | 2,700,470 |
| | | 10,801,881 |
| Water — 0.1% |
| American Water Works Co., Inc. | 3,120 | 589,243 |
TOTAL COMMON STOCKS
(Cost $278,812,691) | 678,694,501 |
|
| REAL ESTATE INVESTMENT TRUSTS — 2.7% |
| Apartments — 0.3% |
| AvalonBay Communities, Inc. | 2,426 | 612,783 |
| Equity Residential | 5,850 | 529,425 |
| Essex Property Trust, Inc. | 1,109 | 390,623 |
| Mid-America Apartment Communities, Inc. | 1,948 | 446,949 |
| UDR, Inc. | 4,733 | 283,933 |
| | | 2,263,713 |
| Diversified — 1.1% |
| American Tower Corp. | 7,878 | 2,304,315 |
| Crown Castle International Corp. | 7,440 | 1,553,026 |
| Digital Realty Trust, Inc. | 4,845 | 856,935 |
| Duke Realty Corp. | 6,421 | 421,474 |
| Equinix, Inc. | 1,542 | 1,304,285 |
| SBA Communications Corp. | 1,876 | 729,802 |
| Weyerhaeuser Co. | 12,816 | 527,763 |
| | | 7,697,600 |
| Healthcare — 0.2% |
| Healthpeak Properties, Inc. | 9,163 | 330,692 |
| Ventas, Inc. | 6,740 | 344,549 |
Penn Series Funds, Inc.
Schedule of Investments — December 31, 2021
Index 500 Fund
| | Number of
Shares | Value† |
| REAL ESTATE INVESTMENT TRUSTS — (continued) |
| Healthcare — (continued) |
| Welltower, Inc. | 7,236 | $ 620,632 |
| | | 1,295,873 |
| Hotels & Resorts — 0.0% |
| Host Hotels & Resorts, Inc.* | 12,690 | 220,679 |
| Industrial — 0.3% |
| Prologis, Inc. | 12,736 | 2,144,233 |
| Office Property — 0.2% |
| Alexandria Real Estate Equities, Inc. | 2,424 | 540,455 |
| Boston Properties, Inc. | 2,423 | 279,081 |
| Vornado Realty Trust | 2,813 | 117,752 |
| | | 937,288 |
| Regional Malls — 0.1% |
| Simon Property Group, Inc. | 5,588 | 892,795 |
| Single Tenant — 0.1% |
| Realty Income Corp. | 9,493 | 679,604 |
| Storage & Warehousing — 0.3% |
| Extra Space Storage, Inc. | 2,279 | 516,718 |
| Iron Mountain, Inc. | 4,819 | 252,178 |
| Public Storage | 2,616 | 979,849 |
| | | 1,748,745 |
| Strip Centers — 0.1% |
| Federal Realty Investment Trust | 1,233 | 168,082 |
| Kimco Realty Corp. | 10,412 | 256,656 |
| Regency Centers Corp. | 2,676 | 201,637 |
| | | 626,375 |
TOTAL REAL ESTATE INVESTMENT TRUSTS
(Cost $9,522,444) | | 18,506,905 |
| | | |
| SHORT-TERM INVESTMENTS — 0.9% |
BlackRock Liquidity FedFund - Institutional Shares (seven-day effective yield 0.030%)
(Cost $6,530,804) | 6,530,804 | 6,530,804 |
TOTAL INVESTMENTS — 100.7%
(Cost $294,865,939) | | $ 703,732,210 |
| Other Assets & Liabilities — (0.7)% | (5,010,115) |
| TOTAL NET ASSETS — 100.0% | | $ 698,722,095 |
| † | See Security Valuation Note. |
| * | Non-income producing security. |
| N.V.— Naamloze Vennootschap. |
| NA— National Association. |
| PLC— Public Limited Company. |
| S&P— Standards & Poor's |
Summary of inputs used to value the Fund’s investments as of 12/31/2021 are as follows (See Security Valuation Note):
| ASSETS TABLE |
| Description | Total
Market
Value at
12/31/2021 | Level 1
Quoted
Price | Level 2
Significant
Observable
Input | Level 3
Significant
Unobservable
Input |
| Common Stocks | $678,694,501 | $678,694,501 | $— | $— |
| Real Estate Investment Trusts | 18,506,905 | 18,506,905 | — | — |
| Short-Term Investments | 6,530,804 | 6,530,804 | — | — |
| Total Investments | $ 703,732,210 | $ 703,732,210 | $ — | $ — |
| Other Financial Instruments(1) | | | | |
| Futures Contracts | $ 86,864 | $ 86,864 | $— | $— |
| Total Assets—Other Financial Instruments | $ 86,864 | $ 86,864 | $ — | $ — |
| (1) | Other financial instruments are derivative instruments not reflected in the value of total investments in securities in the Schedule of Investments such as future contracts and forward foreign currency contracts which are valued at the unrealized appreciation (depreciation) on the instrument. |
It is the Fund's practice to recognize transfers into and transfers out of Level 3 at the fair value hierarchy as of the beginning of period. The Fund did not have any transfers into and transfers out of Level 3 fair value hierarchy during the reporting period.
Penn Series Funds, Inc.
Schedule of Investments — December 31, 2021
Index 500 Fund
Futures contracts held by the Fund at December 31, 2021 are as follows:
Futures Contracts:
Exchange Traded |
| Type | | Futures Contract | | Expiration
Date | | Numbers
of
Contracts | | Units per
Contract | | Closing
Price | | Notional
Value | | Unrealized
Appreciation | | Unrealized
Depreciation |
| Long | | E-mini S&P 500 Index | | 03/18/22 | | 32 | | 50 | | $4,759 | | $7,613,600 | | $86,864 | | $— |
| | | | | | | | | | | | | | | $86,864 | | $— |
The accompanying notes are an integral part of these financial statements.
Penn Series Funds, Inc.
Schedule of Investments — December 31, 2021
Mid Cap Growth Fund
| | Number of
Shares | Value† |
| COMMON STOCKS — 98.8% |
| Aerospace & Defense — 2.0% |
| CAE, Inc.* | 35,888 | $ 905,813 |
| HEICO Corp., Class A | 26,119 | 3,356,814 |
| | | 4,262,627 |
| Apparel — 2.5% |
| Canada Goose Holdings, Inc.* | 52,984 | 1,963,587 |
| Levi Strauss & Co., Class A | 95,558 | 2,391,817 |
| On Holding AG, Class A* | 25,482 | 963,474 |
| | | 5,318,878 |
| Auto Parts & Equipment — 1.7% |
| BorgWarner, Inc. | 79,268 | 3,572,609 |
| Banks — 4.4% |
| First Republic Bank | 19,196 | 3,964,166 |
| Pinnacle Financial Partners, Inc. | 17,484 | 1,669,722 |
| SVB Financial Group* | 5,456 | 3,700,477 |
| | | 9,334,365 |
| Biotechnology — 4.4% |
| Genmab A/S, ADR* | 71,446 | 2,826,404 |
| Horizon Therapeutics PLC* | 30,886 | 3,328,275 |
| Seagen, Inc.* | 20,101 | 3,107,615 |
| | | 9,262,294 |
| Building Materials — 2.2% |
| Trex Co., Inc.* | 34,571 | 4,668,122 |
| Chemicals — 1.4% |
| RPM International, Inc. | 29,186 | 2,947,786 |
| Commercial Services — 5.6% |
| CoStar Group, Inc.* | 80,313 | 6,347,136 |
| MarketAxess Holdings, Inc. | 13,339 | 5,485,931 |
| | | 11,833,067 |
| Computers — 2.1% |
| Crowdstrike Holdings, Inc., Class A* | 15,167 | 3,105,443 |
| Genpact Ltd. | 24,228 | 1,286,022 |
| | | 4,391,465 |
| Distribution & Wholesale — 2.1% |
| Fastenal Co. | 69,490 | 4,451,529 |
| Electrical Components & Equipment — 2.0% |
| Novanta, Inc.* | 10,322 | 1,820,078 |
| Universal Display Corp. | 13,907 | 2,295,072 |
| | | 4,115,150 |
| Electronics — 6.9% |
| Agilent Technologies, Inc. | 15,725 | 2,510,496 |
| II-VI, Inc.* | 60,491 | 4,133,350 |
| Keysight Technologies, Inc.* | 23,381 | 4,828,411 |
| Trimble, Inc.* | 35,496 | 3,094,896 |
| | | 14,567,153 |
| Entertainment — 1.2% |
| Vail Resorts, Inc. | 7,487 | 2,454,987 |
| | Number of
Shares | Value† |
| |
| Food — 1.3% |
| The Hershey Co. | 14,303 | $ 2,767,201 |
| Healthcare Products — 10.0% |
| ABIOMED, Inc.* | 9,258 | 3,325,196 |
| Bio-Techne Corp. | 5,957 | 3,081,795 |
| Edwards Lifesciences Corp.* | 25,985 | 3,366,357 |
| Envista Holdings Corp.* | 65,497 | 2,951,295 |
| Intuitive Surgical, Inc.* | 8,556 | 3,074,171 |
| Masimo Corp.* | 9,070 | 2,655,514 |
| Repligen Corp.* | 9,330 | 2,470,957 |
| | | 20,925,285 |
| Housewares — 1.2% |
| The Scotts Miracle-Gro Co. | 16,101 | 2,592,261 |
| Internet — 3.0% |
| Pinterest, Inc., Class A* | 60,729 | 2,207,499 |
| Q2 Holdings, Inc.* | 16,342 | 1,298,208 |
| Shutterstock, Inc. | 9,627 | 1,067,442 |
| Twitter, Inc.* | 41,664 | 1,800,718 |
| | | 6,373,867 |
| Machinery — Diversified — 3.5% |
| IDEX Corp. | 13,043 | 3,082,322 |
| The Middleby Corp.* | 21,230 | 4,177,215 |
| | | 7,259,537 |
| Miscellaneous Manufacturing — 1.8% |
| A.O. Smith Corp. | 44,150 | 3,790,278 |
| Pharmaceuticals — 3.4% |
| Dexcom, Inc.* | 13,310 | 7,146,805 |
| Retail — 7.3% |
| Chipotle Mexican Grill, Inc.* | 3,375 | 5,900,344 |
| Lululemon Athletica, Inc.* | 6,460 | 2,528,767 |
| National Vision Holdings, Inc.* | 50,175 | 2,407,898 |
| Ulta Beauty, Inc.* | 10,655 | 4,393,483 |
| | | 15,230,492 |
| Semiconductors — 11.7% |
| Azenta, Inc. | 23,838 | 2,457,936 |
| Marvell Technology, Inc. | 65,054 | 5,691,575 |
| Microchip Technology, Inc. | 52,186 | 4,543,313 |
| Monolithic Power Systems, Inc. | 11,829 | 5,835,601 |
| SkyWater Technology, Inc.* | 18,099 | 293,566 |
| Teradyne, Inc. | 35,497 | 5,804,824 |
| | | 24,626,815 |
| Software — 13.8% |
| Cerner Corp. | 56,607 | 5,257,092 |
| Clarivate PLC* | 105,634 | 2,484,512 |
| DocuSign, Inc.* | 25,854 | 3,937,823 |
| Electronic Arts, Inc. | 24,315 | 3,207,149 |
| Five9, Inc.* | 21,635 | 2,970,918 |
| Guidewire Software, Inc.* | 27,355 | 3,105,613 |
| Paycom Software, Inc.* | 9,195 | 3,817,672 |
Penn Series Funds, Inc.
Schedule of Investments — December 31, 2021
Mid Cap Growth Fund
| | Number of
Shares | Value† |
| COMMON STOCKS — (continued) |
| Software — (continued) |
| Tyler Technologies, Inc.* | 7,656 | $ 4,118,545 |
| | | 28,899,324 |
| Telecommunications — 3.3% |
| Arista Networks, Inc.* | 47,692 | 6,855,725 |
TOTAL COMMON STOCKS
(Cost $114,350,520) | 207,647,622 |
| | Number of
Contracts | |
| PURCHASED OPTIONS — 0.0% |
| Call Options | | |
| TOTAL PURCHASED OPTIONS | | |
| (See open purchased options schedule) |
| (Cost $19,427) | 175 | 1,050 |
| | Number of
Shares | |
| SHORT-TERM INVESTMENTS — 1.4% |
BlackRock Liquidity FedFund - Institutional Shares (seven-day effective yield 0.030%)
(Cost $2,901,100) | 2,901,100 | 2,901,100 |
TOTAL INVESTMENTS — 100.2%
(Cost $117,271,047) | | $ 210,549,772 |
| Other Assets & Liabilities — (0.2)% | (503,155) |
| TOTAL NET ASSETS — 100.0% | | $ 210,046,617 |
| | Number of
Contracts | |
| WRITTEN OPTIONS — (0.2)% |
| Call Options | | |
| Put Options | | |
| TOTAL WRITTEN OPTIONS | | |
| (See open written options schedule) |
| (Premiums $(185,809)) | (503) | $ (315,649) |
| † | See Security Valuation Note. |
| * | Non-income producing security. |
| ADR— American Depositary Receipt. |
| AG— Aktiengesellschaft. |
| PLC— Public Limited Company. |
| Country Weightings as of 12/31/2021†† |
| United States | 94% |
| Canada | 3 |
| Denmark | 1 |
| United Kingdom | 1 |
| Switzerland | 1 |
| Total | 100% |
| †† | % of total investments as of December 31, 2021. |
Summary of inputs used to value the Fund’s investments as of 12/31/2021 are as follows (See Security Valuation Note):
| ASSETS TABLE |
| Description | Total
Market
Value at
12/31/2021 | Level 1
Quoted
Price | Level 2
Significant
Observable
Input | Level 3
Significant
Unobservable
Input |
| Common Stocks | $207,647,622 | $207,647,622 | $— | $— |
| Purchased Options | 1,050 | 1,050 | — | — |
| Short-Term Investments | 2,901,100 | 2,901,100 | — | — |
| Total Investments | $ 210,549,772 | $ 210,549,772 | $ — | $ — |
| LIABILITIES TABLE |
| Description | Total
Market
Value at
12/31/2021 | Level 1
Quoted
Price | Level 2
Significant
Observable
Input | Level 3
Significant
Unobservable
Input |
| Other Financial Instruments(1) | | | | |
| Written Options | $(315,649) | $(315,649) | $— | $— |
| Total Liabilities—Other Financial Instruments | $ (315,649) | $ (315,649) | $ — | $ — |
| (1) | Other financial instruments are derivative instruments not reflected in the value of total investments in securities in the Schedule of Investments such as future contracts and forward foreign currency contracts which are valued at the unrealized appreciation (depreciation) on the instrument and written options which are reported at their fair value at period end. |
It is the Fund's practice to recognize transfers into and transfers out of Level 3 at the fair value hierarchy as of the beginning of period. The Fund did not have any transfers into and transfers out of Level 3 fair value hierarchy during the reporting period.
Penn Series Funds, Inc.
Schedule of Investments — December 31, 2021
Mid Cap Growth Fund
Open purchased options contracts held by the Fund at December 31, 2021 are as follows:
| Open Purchased Options |
| Exchange Traded |
| Call Options | | | | | | | | | | |
| Description | | # of
Contracts | | Notional | | Exercise
Price | | Expiration
Date | | Value |
| Pinterest, Inc. | | 175 | | $1,006,250 | | $58 | | 01/21/22 | | $1,050 |
| Total Purchased Options | | | | | | | | | | $1,050 |
Open written options contracts held by the Fund at December 31, 2021 are as follows:
| Open Written Options |
| Exchange Traded |
| Call Options | | | | | | | | | | |
| Description | | # of
Contracts | | Notional | | Exercise
Price | | Expiration
Date | | Value |
| Pinterest, Inc. | | (175) | | $1,400,000 | | $80 | | 01/21/22 | | $(175) |
| Put Options | | | | | | | | | | |
| Description | | # of
Contracts | | Notional | | Exercise
Price | | Expiration
Date | | Value |
| Pinterest, Inc. | | (282) | | $1,339,500 | | $ 48 | | 01/21/22 | | $ (305,124) |
| Shutterstock, Inc. | | (46) | | 506,000 | | 110 | | 01/21/22 | | (10,350) |
| Total Put Options Written | | | | | | | | | | $ (315,474) |
| Total Written Options | | | | | | | | | | $(315,649) |
The accompanying notes are an integral part of these financial statements.
Penn Series Funds, Inc.
Schedule of Investments — December 31, 2021
Mid Cap Value Fund
| | Number of
Shares | Value† |
| COMMON STOCKS — 89.0% |
| Aerospace & Defense — 1.6% |
| BWX Technologies, Inc. | 35,617 | $ 1,705,342 |
| Apparel — 2.7% |
| Columbia Sportswear Co. | 5,583 | 544,007 |
| Hanesbrands, Inc. | 86,433 | 1,445,160 |
| Levi Strauss & Co., Class A | 34,501 | 863,560 |
| | | 2,852,727 |
| Auto Parts & Equipment — 2.6% |
| Aptiv PLC* | 6,754 | 1,114,073 |
| Autoliv, Inc. | 9,137 | 944,857 |
| Lear Corp. | 3,499 | 640,142 |
| | | 2,699,072 |
| Banks — 8.0% |
| Citizens Financial Group, Inc. | 35,446 | 1,674,824 |
| Fifth Third Bancorp | 35,742 | 1,556,564 |
| First Horizon Corp. | 97,606 | 1,593,906 |
| Regions Financial Corp. | 70,054 | 1,527,177 |
| State Street Corp. | 21,538 | 2,003,034 |
| | | 8,355,505 |
| Biotechnology — 1.3% |
| Corteva, Inc. | 27,552 | 1,302,659 |
| Building Materials — 1.7% |
| Fortune Brands Home & Security, Inc. | 6,152 | 657,649 |
| Martin Marietta Materials, Inc. | 2,429 | 1,070,023 |
| | | 1,727,672 |
| Chemicals — 5.6% |
| Axalta Coating Systems Ltd.* | 45,391 | 1,503,350 |
| DuPont de Nemours, Inc. | 18,367 | 1,483,686 |
| FMC Corp. | 11,708 | 1,286,592 |
| Westlake Chemical Corp. | 15,636 | 1,518,725 |
| | | 5,792,353 |
| Commercial Services — 1.5% |
| Global Payments, Inc. | 11,482 | 1,552,137 |
| Distribution & Wholesale — 1.5% |
| IAA, Inc.* | 31,132 | 1,575,902 |
| Electric — 4.5% |
| Alliant Energy Corp. | 34,778 | 2,137,804 |
| DTE Energy Co. | 9,959 | 1,190,499 |
| Entergy Corp. | 12,141 | 1,367,683 |
| | | 4,695,986 |
| Electrical Components & Equipment — 1.7% |
| AMETEK, Inc. | 11,801 | 1,735,219 |
| Electronics — 2.2% |
| Agilent Technologies, Inc. | 6,892 | 1,100,308 |
| Vontier Corp. | 38,783 | 1,191,801 |
| | | 2,292,109 |
| Engineering & Construction — 0.9% |
| EMCOR Group, Inc. | 7,598 | 967,909 |
| | Number of
Shares | Value† |
| |
| Environmental Control — 1.5% |
| Waste Connections, Inc. | 11,555 | $ 1,574,600 |
| Food — 1.4% |
| Lamb Weston Holdings, Inc. | 23,331 | 1,478,719 |
| Hand & Machine Tools — 1.5% |
| Lincoln Electric Holdings, Inc. | 11,367 | 1,585,355 |
| Healthcare Products — 4.3% |
| Envista Holdings Corp.* | 44,422 | 2,001,655 |
| Globus Medical, Inc., Class A* | 7,558 | 545,688 |
| Henry Schein, Inc.* | 24,495 | 1,899,097 |
| | | 4,446,440 |
| Healthcare Services — 2.7% |
| Laboratory Corp. of America Holdings* | 8,983 | 2,822,548 |
| Housewares — 0.4% |
| The Scotts Miracle-Gro Co. | 2,845 | 458,045 |
| Insurance — 6.9% |
| Globe Life, Inc. | 17,761 | 1,664,561 |
| Reinsurance Group of America, Inc. | 7,700 | 843,073 |
| RenaissanceRe Holdings Ltd. | 15,027 | 2,544,522 |
| The Hartford Financial Services Group, Inc. | 30,864 | 2,130,850 |
| | | 7,183,006 |
| Internet — 1.8% |
| F5, Inc.* | 7,815 | 1,912,409 |
| Machinery — Construction & Mining — 1.5% |
| Oshkosh Corp. | 13,867 | 1,562,950 |
| Machinery — Diversified — 1.0% |
| GrafTech International Ltd. | 90,437 | 1,069,870 |
| Media — 2.6% |
| Discovery, Inc., Class C* | 46,614 | 1,067,461 |
| Fox Corp., Class B | 48,860 | 1,674,432 |
| | | 2,741,893 |
| Miscellaneous Manufacturing — 1.0% |
| Carlisle Cos., Inc. | 4,368 | 1,083,788 |
| Oil & Gas — 3.4% |
| Coterra Energy, Inc. | 78,001 | 1,482,019 |
| Marathon Petroleum Corp. | 11,287 | 722,255 |
| Pioneer Natural Resources Co. | 7,095 | 1,290,439 |
| | | 3,494,713 |
| Oil & Gas Services — 1.2% |
| Baker Hughes Co. | 49,917 | 1,201,003 |
| Packaging and Containers — 1.3% |
| Graphic Packaging Holding Co. | 67,656 | 1,319,292 |
| Pharmaceuticals — 1.3% |
| Cardinal Health, Inc. | 26,198 | 1,348,935 |
Penn Series Funds, Inc.
Schedule of Investments — December 31, 2021
Mid Cap Value Fund
| | Number of
Shares | Value† |
| COMMON STOCKS — (continued) |
| Retail — 6.3% |
| AutoZone, Inc.* | 777 | $ 1,628,895 |
| Casey's General Stores, Inc. | 10,367 | 2,045,928 |
| MSC Industrial Direct Co., Inc., Class A | 12,918 | 1,085,887 |
| O'Reilly Automotive, Inc.* | 1,312 | 926,574 |
| Qurate Retail, Inc., Class A | 113,804 | 864,910 |
| | | 6,552,194 |
| Semiconductors — 4.7% |
| CMC Materials, Inc. | 6,607 | 1,266,496 |
| Microchip Technology, Inc. | 13,687 | 1,191,590 |
| MKS Instruments, Inc. | 8,043 | 1,400,849 |
| Teradyne, Inc. | 6,019 | 984,287 |
| | | 4,843,222 |
| Software — 5.9% |
| Activision Blizzard, Inc. | 16,121 | 1,072,530 |
| Black Knight, Inc.* | 17,417 | 1,443,695 |
| Cerner Corp. | 15,584 | 1,447,286 |
| ManTech International Corp., Class A | 12,673 | 924,242 |
| Synopsys, Inc.* | 3,320 | 1,223,420 |
| | | 6,111,173 |
| Telecommunications — 0.9% |
| Motorola Solutions, Inc. | 3,280 | 891,176 |
| Transportation — 0.7% |
| Canadian Pacific Railway Ltd. | 10,218 | 735,083 |
| Trucking and Leasing — 0.9% |
| GATX Corp. | 9,144 | 952,713 |
TOTAL COMMON STOCKS
(Cost $72,507,915) | 92,623,719 |
|
| REAL ESTATE INVESTMENT TRUSTS — 9.5% |
| Apartments — 1.3% |
| Equity Residential | 14,428 | 1,305,734 |
| Building & Real Estate — 2.9% |
| Equity LifeStyle Properties, Inc. | 34,101 | 2,989,294 |
| Diversified — 2.5% |
| Lamar Advertising Co., Class A | 10,029 | 1,216,517 |
| Weyerhaeuser Co. | 33,977 | 1,399,173 |
| | | 2,615,690 |
| Hotels & Resorts — 1.9% |
| Apple Hospitality REIT, Inc. | 122,899 | 1,984,819 |
| Industrial — 0.9% |
| Americold Realty Trust | 29,481 | 966,682 |
TOTAL REAL ESTATE INVESTMENT TRUSTS
(Cost $7,524,154) | | 9,862,219 |
| | Number ofShares | Value† |
| SHORT-TERM INVESTMENTS — 2.3% |
BlackRock Liquidity FedFund - Institutional Shares (seven-day effective yield 0.030%)
(Cost $2,401,023) | 2,401,023 | $ 2,401,023 |
TOTAL INVESTMENTS — 100.8%
(Cost $82,433,092) | | $ 104,886,961 |
| Other Assets & Liabilities — (0.8)% | (810,573) |
| TOTAL NET ASSETS — 100.0% | | $ 104,076,388 |
| † | See Security Valuation Note. |
| * | Non-income producing security. |
| PLC— Public Limited Company. |
| REIT— Real Estate Investment Trust. |
| Country Weightings as of 12/31/2021†† |
| United States | 95% |
| Bermuda | 2 |
| Ireland | 1 |
| Sweden | 1 |
| Canada | 1 |
| Total | 100% |
| †† | % of total investments as of December 31, 2021. |
Summary of inputs used to value the Fund’s investments as of 12/31/2021 are as follows (See Security Valuation Note):
| ASSETS TABLE |
| Description | Total
Market
Value at
12/31/2021 | Level 1
Quoted
Price | Level 2
Significant
Observable
Input | Level 3
Significant
Unobservable
Input |
| Common Stocks | $92,623,719 | $92,623,719 | $— | $— |
| Real Estate Investment Trusts | 9,862,219 | 9,862,219 | — | — |
| Short-Term Investments | 2,401,023 | 2,401,023 | — | — |
| Total Investments | $ 104,886,961 | $ 104,886,961 | $ — | $ — |
It is the Fund's practice to recognize transfers into and transfers out of Level 3 at the fair value hierarchy as of the beginning of period. The Fund did not have any transfers into and transfers out of Level 3 fair value hierarchy during the reporting period.
The accompanying notes are an integral part of these financial statements.
Penn Series Funds, Inc.
Schedule of Investments — December 31, 2021
Mid Core Value Fund
| | Number of
Shares | Value† |
| COMMON STOCKS — 91.6% |
| Aerospace & Defense — 2.4% |
| BAE Systems PLC | 132,783 | $ 988,147 |
| General Dynamics Corp. | 6,139 | 1,279,797 |
| | | 2,267,944 |
| Airlines — 1.8% |
| Southwest Airlines Co.* | 40,545 | 1,736,948 |
| Auto Manufacturers — 1.9% |
| Cummins, Inc. | 2,039 | 444,788 |
| Honda Motor Co., Ltd., ADR | 16,065 | 457,049 |
| PACCAR, Inc. | 9,932 | 876,598 |
| | | 1,778,435 |
| Auto Parts & Equipment — 1.9% |
| BorgWarner, Inc. | 30,383 | 1,369,362 |
| Bridgestone Corp. | 10,700 | 460,352 |
| | | 1,829,714 |
| Banks — 10.2% |
| Commerce Bancshares, Inc. | 2,373 | 163,120 |
| First Hawaiian, Inc. | 28,292 | 773,220 |
| M&T Bank Corp. | 7,153 | 1,098,558 |
| Northern Trust Corp. | 18,837 | 2,253,094 |
| Prosperity Bancshares, Inc. | 13,058 | 944,093 |
| State Street Corp. | 5,290 | 491,970 |
| The Bank of New York Mellon Corp. | 31,643 | 1,837,826 |
| Truist Financial Corp. | 24,940 | 1,460,237 |
| Westamerica BanCorp | 9,877 | 570,199 |
| | | 9,592,317 |
| Chemicals — 0.9% |
| Axalta Coating Systems Ltd.* | 25,659 | 849,826 |
| Commercial Services — 0.5% |
| Euronet Worldwide, Inc.* | 4,225 | 503,493 |
| Computers — 2.1% |
| Amdocs Ltd. | 8,293 | 620,648 |
| HP, Inc. | 34,875 | 1,313,741 |
| | | 1,934,389 |
| Diversified Financial Services — 2.2% |
| Ameriprise Financial, Inc. | 3,268 | 985,825 |
| T. Rowe Price Group, Inc. | 5,516 | 1,084,666 |
| | | 2,070,491 |
| Electric — 6.1% |
| Edison International | 26,914 | 1,836,881 |
| Evergy, Inc. | 9,608 | 659,205 |
| Eversource Energy | 7,098 | 645,776 |
| NorthWestern Corp. | 23,452 | 1,340,516 |
| Pinnacle West Capital Corp. | 12,444 | 878,422 |
| Xcel Energy, Inc. | 6,369 | 431,181 |
| | | 5,791,981 |
| Electrical Components & Equipment — 1.8% |
| Emerson Electric Co. | 17,927 | 1,666,673 |
| | Number of
Shares | Value† |
| |
| Electronics — 2.1% |
| Hubbell, Inc. | 2,520 | $ 524,840 |
| nVent Electric PLC | 37,609 | 1,429,142 |
| | | 1,953,982 |
| Environmental Control — 0.5% |
| Republic Services, Inc. | 3,635 | 506,901 |
| Food — 7.2% |
| Conagra Brands, Inc. | 57,042 | 1,947,984 |
| General Mills, Inc. | 10,566 | 711,937 |
| Kellogg Co. | 9,549 | 615,147 |
| Koninklijke Ahold Delhaize N.V. | 39,322 | 1,349,087 |
| Orkla ASA | 71,483 | 717,220 |
| Sysco Corp. | 8,909 | 699,802 |
| The J.M. Smucker Co. | 5,482 | 744,565 |
| | | 6,785,742 |
| Food Service — 1.0% |
| Sodexo S.A. | 10,618 | 931,547 |
| Forest Products & Paper — 1.4% |
| Mondi PLC | 54,060 | 1,336,137 |
| Gas — 1.6% |
| Atmos Energy Corp. | 8,384 | 878,392 |
| Spire, Inc. | 10,327 | 673,527 |
| | | 1,551,919 |
| Healthcare Products — 6.2% |
| Envista Holdings Corp.* | 19,113 | 861,232 |
| Henry Schein, Inc.* | 19,392 | 1,503,462 |
| Koninklijke Philips N.V. | 16,284 | 600,065 |
| Zimmer Biomet Holdings, Inc. | 22,917 | 2,911,376 |
| | | 5,876,135 |
| Healthcare Services — 4.0% |
| Centene Corp.* | 8,215 | 676,916 |
| Quest Diagnostics, Inc. | 8,438 | 1,459,859 |
| Universal Health Services, Inc., Class B | 12,673 | 1,643,181 |
| | | 3,779,956 |
| Household Products & Wares — 1.1% |
| Kimberly-Clark Corp. | 7,332 | 1,047,889 |
| Insurance — 6.9% |
| Aflac, Inc. | 27,603 | 1,611,739 |
| Arthur J. Gallagher & Co. | 2,188 | 371,238 |
| Chubb Ltd. | 7,422 | 1,434,747 |
| Reinsurance Group of America, Inc. | 14,036 | 1,536,802 |
| The Allstate Corp. | 8,689 | 1,022,261 |
| The Progressive Corp. | 4,977 | 510,889 |
| | | 6,487,676 |
| Internet — 1.0% |
| F5, Inc.* | 4,014 | 982,266 |
| Leisure Time — 0.7% |
| Polaris, Inc. | 6,130 | 673,748 |
Penn Series Funds, Inc.
Schedule of Investments — December 31, 2021
Mid Core Value Fund
| | Number of
Shares | Value† |
| COMMON STOCKS — (continued) |
| Machinery — Construction & Mining — 0.9% |
| Oshkosh Corp. | 7,869 | $ 886,915 |
| Machinery — Diversified — 0.1% |
| IMI PLC | 3,026 | 71,104 |
| Media — 1.4% |
| Fox Corp., Class B | 37,431 | 1,282,760 |
| Oil & Gas — 3.5% |
| ConocoPhillips | 18,149 | 1,309,995 |
| Devon Energy Corp. | 27,140 | 1,195,517 |
| Pioneer Natural Resources Co. | 4,602 | 837,012 |
| | | 3,342,524 |
| Oil & Gas Services — 1.0% |
| Baker Hughes Co. | 39,842 | 958,599 |
| Packaging and Containers — 3.2% |
| Amcor PLC | 29,547 | 354,859 |
| Packaging Corp. of America | 6,994 | 952,233 |
| Sonoco Products Co. | 28,794 | 1,666,885 |
| | | 2,973,977 |
| Pharmaceuticals — 4.4% |
| AmerisourceBergen Corp. | 5,046 | 670,563 |
| Becton Dickinson and Co. | 3,983 | 1,001,645 |
| Cardinal Health, Inc. | 20,403 | 1,050,550 |
| McKesson Corp. | 5,761 | 1,432,012 |
| | | 4,154,770 |
| Retail — 5.7% |
| Advance Auto Parts, Inc. | 7,665 | 1,838,680 |
| Beacon Roofing Supply, Inc.* | 8,819 | 505,770 |
| Cracker Barrel Old Country Store, Inc. | 3,712 | 477,512 |
| Dollar Tree, Inc.* | 8,455 | 1,188,096 |
| MSC Industrial Direct Co., Inc., Class A | 16,831 | 1,414,814 |
| | | 5,424,872 |
| Savings & Loans — 0.4% |
| Capitol Federal Financial, Inc. | 34,434 | 390,137 |
| Software — 4.0% |
| CDK Global, Inc. | 14,529 | 606,440 |
| Cerner Corp. | 23,571 | 2,189,039 |
| Open Text Corp. | 20,450 | 970,966 |
| | | 3,766,445 |
| Telecommunications — 0.8% |
| Corning, Inc. | 6,565 | 244,415 |
| Juniper Networks, Inc. | 15,273 | 545,399 |
| | | 789,814 |
| Transportation — 0.7% |
| Heartland Express, Inc. | 38,159 | 641,834 |
TOTAL COMMON STOCKS
(Cost $73,776,706) | 86,619,860 |
| | Number of
Shares | Value† |
|
| REAL ESTATE INVESTMENT TRUSTS — 6.6% |
| Apartments — 1.0% |
| Essex Property Trust, Inc. | 2,547 | $ 897,130 |
| Diversified — 1.2% |
| Equinix, Inc. | 975 | 824,694 |
| Weyerhaeuser Co. | 7,886 | 324,745 |
| | | 1,149,439 |
| Healthcare — 2.4% |
| Healthcare Trust of America, Inc., Class A | 29,863 | 997,126 |
| Healthpeak Properties, Inc. | 36,111 | 1,303,246 |
| | | 2,300,372 |
| Hotels & Resorts — 1.1% |
| MGM Growth Properties LLC, Class A | 24,367 | 995,392 |
| Strip Centers — 0.9% |
| Regency Centers Corp. | 11,708 | 882,198 |
TOTAL REAL ESTATE INVESTMENT TRUSTS
(Cost $4,876,760) | | 6,224,531 |
| | | |
| SHORT-TERM INVESTMENTS — 1.9% |
BlackRock Liquidity FedFund - Institutional Shares (seven-day effective yield 0.030%)
(Cost $1,831,015) | 1,831,015 | 1,831,015 |
TOTAL INVESTMENTS — 100.1%
(Cost $80,484,481) | | $ 94,675,406 |
| Other Assets & Liabilities — (0.1)% | (138,448) |
| TOTAL NET ASSETS — 100.0% | | $ 94,536,958 |
| † | See Security Valuation Note. |
| * | Non-income producing security. |
| ADR— American Depositary Receipt. |
| ASA— Allmennaksjeselskap. |
| LLC— Limited Liability Company. |
| N.V.— Naamloze Vennootschap. |
| PLC— Public Limited Company. |
| S.A.— Societe Anonyme. |
| Country Weightings as of 12/31/2021†† |
| United States | 88% |
| United Kingdom | 4 |
| Netherlands | 2 |
| Switzerland | 2 |
| Canada | 1 |
| France | 1 |
| Japan | 1 |
| Norway | 1 |
| Total | 100% |
| †† | % of total investments as of December 31, 2021. |
Penn Series Funds, Inc.
Schedule of Investments — December 31, 2021
Mid Core Value Fund
Summary of inputs used to value the Fund’s investments as of 12/31/2021 are as follows (See Security Valuation Note):
| ASSETS TABLE |
| Description | Total
Market
Value at
12/31/2021 | Level 1
Quoted
Price | Level 2
Significant
Observable
Input | Level 3
Significant
Unobservable
Input |
| Common Stocks | $86,619,860 | $86,619,860 | $ — | $— |
| Real Estate Investment Trusts | 6,224,531 | 6,224,531 | — | — |
| Short-Term Investments | 1,831,015 | 1,831,015 | — | — |
| Total Investments | $ 94,675,406 | $ 94,675,406 | $ — | $ — |
| Other Financial Instruments(1) | | | | |
| Forward Foreign Currency Contracts | $ 10,149 | $ — | $10,149 | $— |
| Total Assets—Other Financial Instruments | $ 10,149 | $ — | $ 10,149 | $ — |
| LIABILITIES TABLE |
| Description | Total
Market
Value at
12/31/2021 | Level 1
Quoted
Price | Level 2
Significant
Observable
Input | Level 3
Significant
Unobservable
Input |
| Other Financial Instruments(1) | | | | |
| Forward Foreign Currency Contracts | $(78,823) | $— | $(78,823) | $— |
| Total Liabilities—Other Financial Instruments | $ (78,823) | $ — | $ (78,823) | $ — |
| (1) | Other financial instruments are derivative instruments not reflected in the value of total investments in securities in the Schedule of Investments such as future contracts and forward foreign currency contracts which are valued at the unrealized appreciation (depreciation) on the instrument. |
It is the Fund's practice to recognize transfers into and transfers out of Level 3 at the fair value hierarchy as of the beginning of period. The Fund did not have any transfers into and transfers out of Level 3 fair value hierarchy during the reporting period.
Open forward foreign currency contracts held at December 31, 2021 were as follows:
| Open forward foreign currency contracts |
| | Currency | | Counterparty | | Settlement
Date | | Foreign
Currency
Contract | | Forward
Rate | | U.S.
Contract
Amount | | U.S.
Contract
Value | | Unrealized
Foreign
Exchange
Gain | | Unrealized
Foreign
Exchange
Loss |
| Buy | Japanese Yen | | Bank of America | | 03/31/22 | | 3,264,972 | | 114.93410 | | $28,744 | | $28,407 | | $— | | $(337) |
| Sell | Japanese Yen | | Bank of America | | 03/31/22 | | (93,268,201) | | 114.93410 | | (821,642) | | (811,493) | | 10,149 | | — |
| Sell | Euro | | Credit Suisse | | 03/31/22 | | (2,172,615) | | 0.87667 | | (2,460,397) | | (2,478,276) | | — | | (17,879) |
| Sell | Pound Sterling | | JPMorgan | | 03/31/22 | | (1,510,126) | | 0.73910 | | (1,997,653) | | (2,043,195) | | — | | (45,542) |
| Sell | Norwegian Krone | | UBS Securities | | 03/31/22 | | (5,363,941) | | 8.82154 | | (592,985) | | (608,050) | | — | | (15,065) |
| | Total | | | | | | | | | | | | | | $10,149 | | $(78,823) |
The accompanying notes are an integral part of these financial statements.
Penn Series Funds, Inc.
Schedule of Investments — December 31, 2021
SMID Cap Growth Fund
| | Number of
Shares | Value† |
| COMMON STOCKS — 97.9% |
| Aerospace & Defense — 1.6% |
| Teledyne Technologies, Inc.* | 3,800 | $ 1,660,182 |
| Apparel — 4.1% |
| Allbirds, Inc., Class A* | 14,179 | 213,819 |
| Crocs, Inc.* | 6,831 | 875,871 |
| Deckers Outdoor Corp.* | 3,907 | 1,431,173 |
| Levi Strauss & Co., Class A | 45,524 | 1,139,466 |
| On Holding AG, Class A* | 14,967 | 565,902 |
| | | 4,226,231 |
| Auto Parts & Equipment — 1.1% |
| Fox Factory Holding Corp.* | 6,827 | 1,161,273 |
| Biotechnology — 8.0% |
| Allogene Therapeutics, Inc.* | 9,676 | 144,366 |
| Alnylam Pharmaceuticals, Inc.* | 5,431 | 920,989 |
| Argenx S.E., ADR* | 2,671 | 935,357 |
| Beam Therapeutics, Inc.* | 12,559 | 1,000,827 |
| Certara, Inc.* | 21,274 | 604,607 |
| Exelixis, Inc.* | 38,282 | 699,795 |
| Guardant Health, Inc.* | 13,551 | 1,355,371 |
| Halozyme Therapeutics, Inc.* | 32,552 | 1,308,916 |
| Novavax, Inc.* | 1,703 | 243,648 |
| Twist Bioscience Corp.* | 3,082 | 238,516 |
| Ultragenyx Pharmaceutical, Inc.* | 9,785 | 822,821 |
| | | 8,275,213 |
| Building Materials — 2.1% |
| AAON, Inc. | 10,416 | 827,343 |
| The AZEK Co., Inc* | 28,786 | 1,331,065 |
| | | 2,158,408 |
| Chemicals — 3.0% |
| Ashland Global Holdings, Inc. | 13,972 | 1,504,225 |
| RPM International, Inc. | 15,910 | 1,606,910 |
| | | 3,111,135 |
| Commercial Services — 1.4% |
| GXO Logistics, Inc.* | 7,756 | 704,478 |
| Shift4 Payments, Inc., Class A* | 12,483 | 723,140 |
| | | 1,427,618 |
| Computers — 3.8% |
| Pure Storage, Inc., Class A* | 40,633 | 1,322,604 |
| Rapid7, Inc.* | 13,567 | 1,596,700 |
| Varonis Systems, Inc.* | 21,159 | 1,032,136 |
| | | 3,951,440 |
| Distribution & Wholesale — 3.8% |
| Core & Main, Inc., Class A* | 30,036 | 911,292 |
| Pool Corp. | 2,659 | 1,504,994 |
| SiteOne Landscape Supply, Inc.* | 6,190 | 1,499,713 |
| | | 3,915,999 |
| Diversified Financial Services — 2.8% |
| Evercore, Inc., Class A | 10,648 | 1,446,531 |
| Stifel Financial Corp. | 20,699 | 1,457,623 |
| | | 2,904,154 |
| | Number of
Shares | Value† |
| |
| Electric — 1.0% |
| Ameresco, Inc., Class A* | 12,846 | $ 1,046,178 |
| Electrical Components & Equipment — 2.0% |
| Novanta, Inc.* | 11,706 | 2,064,119 |
| Electronics — 1.2% |
| Allegion PLC | 9,814 | 1,299,766 |
| Energy-Alternate Sources — 1.0% |
| Enphase Energy, Inc.* | 2,232 | 408,322 |
| Shoals Technologies Group, Inc., Class A* | 24,276 | 589,907 |
| | | 998,229 |
| Engineering & Construction — 1.2% |
| Jacobs Engineering Group, Inc. | 8,974 | 1,249,450 |
| Entertainment — 1.5% |
| Vail Resorts, Inc. | 4,728 | 1,550,311 |
| Environmental Control — 1.7% |
| Evoqua Water Technologies Corp.* | 13,537 | 632,855 |
| Tetra Tech, Inc. | 6,533 | 1,109,303 |
| | | 1,742,158 |
| Food — 0.2% |
| Sweetgreen, Inc., Class A* | 5,714 | 182,848 |
| Healthcare Products — 9.7% |
| Axonics, Inc.* | 11,402 | 638,512 |
| Bio-Techne Corp. | 2,015 | 1,042,440 |
| Omnicell, Inc.* | 4,265 | 769,577 |
| Pacific Biosciences of California, Inc.* | 20,950 | 428,637 |
| PerkinElmer, Inc. | 10,321 | 2,075,140 |
| Quanterix Corp.* | 10,418 | 441,723 |
| Repligen Corp.* | 5,218 | 1,381,935 |
| Shockwave Medical, Inc.* | 2,911 | 519,119 |
| Stevanato Group SpA* | 30,716 | 689,574 |
| Tandem Diabetes Care, Inc.* | 13,784 | 2,074,768 |
| | | 10,061,425 |
| Healthcare Services — 1.2% |
| Molina Healthcare, Inc.* | 3,810 | 1,211,885 |
| Home Furnishings — 0.4% |
| Arhaus, Inc.* | 29,671 | 393,141 |
| Household Products & Wares — 1.2% |
| Avery Dennison Corp. | 5,793 | 1,254,590 |
| Housewares — 0.6% |
| The Scotts Miracle-Gro Co. | 4,215 | 678,615 |
| Insurance — 0.4% |
| Trupanion, Inc.* | 3,446 | 454,975 |
| Internet — 1.2% |
| Bumble, Inc., Class A* | 13,385 | 453,216 |
| Figs, Inc., Class A* | 7,983 | 220,012 |
Penn Series Funds, Inc.
Schedule of Investments — December 31, 2021
SMID Cap Growth Fund
| | Number of
Shares | Value† |
| COMMON STOCKS — (continued) |
| Internet — (continued) |
| Revolve Group, Inc.* | 10,511 | $ 589,036 |
| | | 1,262,264 |
| Leisure Time — 3.0% |
| Brunswick Corp. | 11,764 | 1,184,988 |
| Planet Fitness, Inc., Class A* | 12,009 | 1,087,775 |
| YETI Holdings, Inc.* | 9,830 | 814,219 |
| | | 3,086,982 |
| Lodging — 1.3% |
| Wyndham Hotels & Resorts, Inc. | 15,267 | 1,368,687 |
| Machinery — Diversified — 5.2% |
| Chart Industries, Inc.* | 9,788 | 1,561,088 |
| Colfax Corp.* | 27,184 | 1,249,648 |
| IDEX Corp. | 7,439 | 1,757,985 |
| The Toro Co. | 8,067 | 805,974 |
| | | 5,374,695 |
| Metal Fabricate/Hardware — 0.9% |
| RBC Bearings, Inc.* | 4,941 | 997,934 |
| Pharmaceuticals — 2.3% |
| Agios Pharmaceuticals, Inc.* | 20,729 | 681,362 |
| Intellia Therapeutics, Inc.* | 1,347 | 159,269 |
| Neurocrine Biosciences, Inc.* | 18,014 | 1,534,253 |
| | | 2,374,884 |
| Retail — 5.6% |
| Five Below, Inc.* | 5,886 | 1,217,755 |
| Floor & Decor Holdings, Inc., Class A* | 11,304 | 1,469,633 |
| Freshpet, Inc.* | 9,506 | 905,637 |
| RH* | 2,467 | 1,322,164 |
| Texas Roadhouse, Inc. | 10,112 | 902,799 |
| | | 5,817,988 |
| Semiconductors — 8.9% |
| Allegro MicroSystems, Inc.* | 36,894 | 1,334,825 |
| Entegris, Inc. | 15,022 | 2,081,748 |
| Lattice Semiconductor Corp.* | 21,854 | 1,684,069 |
| MACOM Technology Solutions Holdings, Inc.* | 12,453 | 975,070 |
| MKS Instruments, Inc. | 11,248 | 1,959,064 |
| Monolithic Power Systems, Inc. | 2,518 | 1,242,205 |
| | | 9,276,981 |
| Software — 14.0% |
| Alignment Healthcare, Inc.* | 28,721 | 403,817 |
| Avalara, Inc.* | 9,258 | 1,195,300 |
| Blackline, Inc.* | 10,771 | 1,115,229 |
| DigitalOcean Holdings, Inc.* | 12,235 | 982,838 |
| Dynatrace, Inc.* | 28,833 | 1,740,072 |
| Elastic N.V.* | 9,108 | 1,121,104 |
| EverCommerce, Inc.* | 35,201 | 554,416 |
| Monday.com Ltd.* | 2,264 | 698,942 |
| nCino, Inc.* | 16,711 | 916,765 |
| Olo, Inc., Class A* | 9,836 | 204,687 |
| Procore Technologies, Inc.* | 7,251 | 579,863 |
| | Number of
Shares | Value† |
| |
| Software — (continued) |
| Qualtrics International, Inc., Class A* | 15,605 | $ 552,417 |
| Sailpoint Technologies Holdings, Inc.* | 15,911 | 769,138 |
| Samsara, Inc., Class A* | 21,880 | 615,047 |
| Smartsheet, Inc., Class A* | 20,504 | 1,588,035 |
| Sprout Social, Inc., Class A* | 5,283 | 479,115 |
| Workiva, Inc.* | 7,725 | 1,008,035 |
| | | 14,524,820 |
| Transportation — 0.5% |
| Saia, Inc.* | 1,682 | 566,884 |
TOTAL COMMON STOCKS
(Cost $83,135,362) | 101,631,462 |
| | | |
| SHORT-TERM INVESTMENTS — 0.8% |
BlackRock Liquidity FedFund - Institutional Shares (seven-day effective yield 0.030%)
(Cost $798,600) | 798,600 | 798,600 |
TOTAL INVESTMENTS — 98.7%
(Cost $83,933,962) | | $ 102,430,062 |
| Other Assets & Liabilities — 1.3% | 1,349,777 |
| TOTAL NET ASSETS — 100.0% | | $ 103,779,839 |
| † | See Security Valuation Note. |
| * | Non-income producing security. |
| ADR— American Depositary Receipt. |
| AG— Aktiengesellschaft. |
| N.V.— Naamloze Vennootschap. |
| PLC— Public Limited Company. |
| S.E.— Societas Europaea. |
| SpA— Società per Azioni. |
Summary of inputs used to value the Fund’s investments as of 12/31/2021 are as follows (See Security Valuation Note):
| ASSETS TABLE |
| Description | Total
Market
Value at
12/31/2021 | Level 1
Quoted
Price | Level 2
Significant
Observable
Input | Level 3
Significant
Unobservable
Input |
| Common Stocks | $101,631,462 | $101,631,462 | $— | $— |
| Short-Term Investments | 798,600 | 798,600 | — | — |
| Total Investments | $ 102,430,062 | $ 102,430,062 | $ — | $ — |
It is the Fund's practice to recognize transfers into and transfers out of Level 3 at the fair value hierarchy as of the beginning of period. The Fund did not have any transfers into and transfers out of Level 3 fair value hierarchy during the reporting period.
The accompanying notes are an integral part of these financial statements.
Penn Series Funds, Inc.
Schedule of Investments — December 31, 2021
SMID Cap Value Fund
| | Number of
Shares | Value† |
| COMMON STOCKS — 90.8% |
| Aerospace & Defense — 1.4% |
| Spirit AeroSystems Holdings, Inc., Class A | 23,820 | $ 1,026,404 |
| Airlines — 1.0% |
| SkyWest, Inc.* | 17,740 | 697,182 |
| Apparel — 4.3% |
| Carter's, Inc. | 10,400 | 1,052,688 |
| Kontoor Brands, Inc. | 11,150 | 571,437 |
| Ralph Lauren Corp. | 7,100 | 843,906 |
| Tapestry, Inc. | 15,320 | 621,992 |
| | | 3,090,023 |
| Auto Parts & Equipment — 3.1% |
| Dana, Inc. | 21,952 | 500,945 |
| Lear Corp. | 3,273 | 598,795 |
| The Goodyear Tire & Rubber Co.* | 51,970 | 1,108,000 |
| | | 2,207,740 |
| Banks — 11.7% |
| BankUnited, Inc. | 16,945 | 716,943 |
| Comerica, Inc. | 11,915 | 1,036,605 |
| First Citizens BancShares, Inc., Class A | 1,291 | 1,071,323 |
| First Hawaiian, Inc. | 27,470 | 750,755 |
| Synovus Financial Corp. | 18,920 | 905,700 |
| Texas Capital Bancshares, Inc.* | 13,367 | 805,362 |
| Umpqua Holdings Corp. | 29,824 | 573,814 |
| Webster Financial Corp. | 15,082 | 842,179 |
| Wintrust Financial Corp. | 9,950 | 903,659 |
| Zions Bancorp NA | 12,681 | 800,932 |
| | | 8,407,272 |
| Building Materials — 1.0% |
| Masonite International Corp.* | 6,424 | 757,711 |
| Chemicals — 2.1% |
| GCP Applied Technologies, Inc.* | 2,062 | 65,283 |
| Innospec, Inc. | 5,080 | 458,927 |
| Orion Engineered Carbons S.A.* | 25,066 | 460,212 |
| Trinseo PLC | 9,917 | 520,246 |
| | | 1,504,668 |
| Commercial Services — 5.0% |
| ADT, Inc. | 80,580 | 677,678 |
| Herc Holdings, Inc. | 6,870 | 1,075,498 |
| Korn Ferry | 9,300 | 704,289 |
| Robert Half International, Inc. | 10,109 | 1,127,356 |
| | | 3,584,821 |
| Computers — 2.0% |
| Genpact Ltd. | 9,822 | 521,352 |
| Lumentum Holdings, Inc.* | 8,800 | 930,776 |
| | | 1,452,128 |
| Diversified Financial Services — 2.3% |
| Moelis & Co., Class A | 13,174 | 823,507 |
| Stifel Financial Corp. | 11,340 | 798,563 |
| | | 1,622,070 |
| | Number of
Shares | Value† |
| |
| Electric — 1.5% |
| IDACORP, Inc. | 9,619 | $1,089,929 |
| Electrical Components & Equipment — 1.2% |
| Belden, Inc. | 12,734 | 837,006 |
| Electronics — 1.5% |
| Avnet, Inc. | 20,670 | 852,224 |
| Sensata Technologies Holding PLC* | 3,210 | 198,025 |
| | | 1,050,249 |
| Engineering & Construction — 4.1% |
| AECOM* | 15,820 | 1,223,677 |
| Dycom Industries, Inc.* | 9,370 | 878,531 |
| WillScot Mobile Mini Holdings Corp.* | 20,160 | 823,335 |
| | | 2,925,543 |
| Entertainment — 0.8% |
| Scientific Games Corp.* | 8,935 | 597,126 |
| Food — 2.6% |
| Nomad Foods Ltd.* | 34,561 | 877,504 |
| The Hain Celestial Group, Inc.* | 23,118 | 985,058 |
| | | 1,862,562 |
| Gas — 0.8% |
| Southwest Gas Holdings, Inc. | 7,932 | 555,637 |
| Hand & Machine Tools — 1.7% |
| Regal Rexnord Corp. | 7,304 | 1,242,995 |
| Healthcare Products — 1.2% |
| Integra LifeSciences Holdings Corp.* | 12,490 | 836,705 |
| Healthcare Services — 4.2% |
| Acadia Healthcare Co., Inc.* | 15,370 | 932,959 |
| MEDNAX, Inc.* | 40,650 | 1,106,086 |
| Syneos Health, Inc.* | 9,400 | 965,192 |
| | | 3,004,237 |
| Home Builders — 3.6% |
| KB Home | 18,770 | 839,582 |
| PulteGroup, Inc. | 19,990 | 1,142,628 |
| Taylor Morrison Home Corp.* | 16,574 | 579,427 |
| | | 2,561,637 |
| Home Furnishings — 1.1% |
| MillerKnoll, Inc. | 19,500 | 764,205 |
| Insurance — 4.2% |
| American Financial Group, Inc. | 6,208 | 852,482 |
| Everest Re Group Ltd. | 2,287 | 626,455 |
| Kemper Corp. | 3,511 | 206,412 |
| Selective Insurance Group, Inc. | 7,300 | 598,162 |
| The Hanover Insurance Group, Inc. | 5,664 | 742,324 |
| | | 3,025,835 |
| Internet — 1.2% |
| Criteo S.A., ADR* | 21,508 | 836,016 |
Penn Series Funds, Inc.
Schedule of Investments — December 31, 2021
SMID Cap Value Fund
| | Number of
Shares | Value† |
| COMMON STOCKS — (continued) |
| Iron & Steel — 2.1% |
| Carpenter Technology Corp. | 21,627 | $ 631,292 |
| Reliance Steel & Aluminum Co. | 5,301 | 859,928 |
| | | 1,491,220 |
| Leisure Time — 0.5% |
| Brunswick Corp. | 3,697 | 372,399 |
| Lodging — 0.9% |
| Hilton Grand Vacations, Inc.* | 12,410 | 646,685 |
| Machinery — Construction & Mining — 2.2% |
| Oshkosh Corp. | 9,310 | 1,049,330 |
| Vertiv Holdings Co. | 21,460 | 535,856 |
| | | 1,585,186 |
| Machinery — Diversified — 2.6% |
| Applied Industrial Technologies, Inc. | 5,940 | 610,038 |
| Cactus, Inc., Class A | 17,660 | 673,376 |
| Crane Co. | 5,722 | 582,099 |
| | | 1,865,513 |
| Media — 0.7% |
| Houghton Mifflin Harcourt Co.* | 30,109 | 484,755 |
| Metal Fabricate/Hardware — 0.9% |
| The Timken Co. | 9,860 | 683,199 |
| Oil & Gas — 2.2% |
| Coterra Energy, Inc. | 43,534 | 827,146 |
| HollyFrontier Corp. | 23,661 | 775,608 |
| | | 1,602,754 |
| Packaging and Containers — 2.3% |
| Berry Global Group, Inc.* | 11,820 | 872,080 |
| Sealed Air Corp. | 11,992 | 809,100 |
| | | 1,681,180 |
| Retail — 4.4% |
| Dine Brands Global, Inc. | 10,990 | 833,152 |
| Papa John's International, Inc. | 6,760 | 902,257 |
| Sally Beauty Holdings, Inc.* | 34,880 | 643,885 |
| Williams-Sonoma, Inc. | 4,534 | 766,835 |
| | | 3,146,129 |
| Semiconductors — 3.1% |
| Kulicke & Soffa Industries, Inc. | 10,401 | 629,676 |
| MaxLinear, Inc.* | 4,908 | 370,014 |
| ON Semiconductor Corp.* | 17,590 | 1,194,713 |
| | | 2,194,403 |
| Software — 2.9% |
| ACI Worldwide, Inc.* | 18,260 | 633,622 |
| Change Healthcare, Inc.* | 36,940 | 789,777 |
| CommVault Systems, Inc.* | 9,943 | 685,272 |
| | | 2,108,671 |
| Transportation — 1.8% |
| Kirby Corp.* | 5,421 | 322,116 |
| | Number of
Shares | Value† |
| |
| Transportation — (continued) |
| Knight-Swift Transportation Holdings, Inc. | 16,352 | $ 996,491 |
| | | 1,318,607 |
| Trucking and Leasing — 0.6% |
| GATX Corp. | 4,460 | 464,687 |
TOTAL COMMON STOCKS
(Cost $50,631,854) | 65,185,089 |
|
| REAL ESTATE INVESTMENT TRUSTS — 8.9% |
| Apartments — 2.7% |
| American Campus Communities, Inc. | 13,042 | 747,176 |
| Camden Property Trust | 6,560 | 1,172,141 |
| | | 1,919,317 |
| Diversified — 0.7% |
| Broadstone Net Lease, Inc. | 22,230 | 551,749 |
| Healthcare — 1.3% |
| Physicians Realty Trust | 51,805 | 975,488 |
| Hotels & Resorts — 0.5% |
| MGM Growth Properties LLC, Class A | 8,539 | 348,818 |
| Industrial — 1.2% |
| STAG lndustrial, Inc. | 17,745 | 851,050 |
| Office Property — 1.1% |
| Cousins Properties, Inc. | 19,800 | 797,544 |
| Storage & Warehousing — 1.4% |
| CubeSmart | 17,304 | 984,771 |
TOTAL REAL ESTATE INVESTMENT TRUSTS
(Cost $4,820,601) | | 6,428,737 |
| | | |
| SHORT-TERM INVESTMENTS — 0.9% |
BlackRock Liquidity FedFund - Institutional Shares (seven-day effective yield 0.030%)
(Cost $662,669) | 662,669 | 662,669 |
TOTAL INVESTMENTS — 100.6%
(Cost $56,115,124) | | $ 72,276,495 |
| Other Assets & Liabilities — (0.6)% | (466,113) |
| TOTAL NET ASSETS — 100.0% | | $ 71,810,382 |
| † | See Security Valuation Note. |
| * | Non-income producing security. |
| ADR— American Depositary Receipt. |
| LLC— Limited Liability Company. |
| NA— National Association. |
| PLC— Public Limited Company. |
| S.A.— Societe Anonyme. |
Penn Series Funds, Inc.
Schedule of Investments — December 31, 2021
SMID Cap Value Fund
| Country Weightings as of 12/31/2021†† |
| United States | 95% |
| United Kingdom | 1 |
| France | 1 |
| Singapore | 1 |
| Bermuda | 1 |
| Luxembourg | 1 |
| Total | 100% |
| †† | % of total investments as of December 31, 2021. |
Summary of inputs used to value the Fund’s investments as of 12/31/2021 are as follows (See Security Valuation Note):
| ASSETS TABLE |
| Description | Total
Market
Value at
12/31/2021 | Level 1
Quoted
Price | Level 2
Significant
Observable
Input | Level 3
Significant
Unobservable
Input |
| Common Stocks | $65,185,089 | $65,185,089 | $— | $— |
| Real Estate Investment Trusts | 6,428,737 | 6,428,737 | — | — |
| Short-Term Investments | 662,669 | 662,669 | — | — |
| Total Investments | $ 72,276,495 | $ 72,276,495 | $ — | $ — |
It is the Fund's practice to recognize transfers into and transfers out of Level 3 at the fair value hierarchy as of the beginning of period. The Fund did not have any transfers into and transfers out of Level 3 fair value hierarchy during the reporting period.
The accompanying notes are an integral part of these financial statements.
Penn Series Funds, Inc.
Schedule of Investments — December 31, 2021
Small Cap Growth Fund
| | Number of
Shares | Value† |
| COMMON STOCKS — 96.6% |
| Advertising — 0.6% |
| The Trade Desk, Inc., Class A* | 9,231 | $ 845,929 |
| Auto Parts & Equipment — 0.9% |
| QuantumScape Corp.* | 16,158 | 358,546 |
| Visteon Corp.* | 8,222 | 913,793 |
| | | 1,272,339 |
| Banks — 1.0% |
| Walker & Dunlop, Inc. | 9,247 | 1,395,187 |
| Biotechnology — 4.3% |
| Ascendis Pharma A/S, ADR* | 3,999 | 537,985 |
| Bicycle Therapeutics PLC, ADR* | 5,197 | 316,341 |
| Emergent BioSolutions, Inc.* | 9,717 | 422,398 |
| Essa Pharma, Inc.* | 23,729 | 336,952 |
| EyePoint Pharmaceuticals, Inc.* | 22,136 | 270,945 |
| Fate Therapeutics, Inc.* | 9,596 | 561,462 |
| Global Blood Therapeutics, Inc.* | 13,336 | 390,345 |
| Insmed, Inc.* | 20,267 | 552,073 |
| Ligand Pharmaceuticals, Inc.* | 8,806 | 1,360,175 |
| NeoGenomics, Inc.* | 32,701 | 1,115,758 |
| Rocket Pharmaceuticals, Inc.* | 8,528 | 186,166 |
| | | 6,050,600 |
| Building Materials — 0.9% |
| Summit Materials, Inc., Class A* | 31,677 | 1,271,515 |
| Chemicals — 2.4% |
| Rogers Corp.* | 2,527 | 689,871 |
| Sensient Technologies Corp. | 26,278 | 2,629,377 |
| | | 3,319,248 |
| Commercial Services — 6.4% |
| Cimpress PLC* | 4,358 | 312,076 |
| Euronet Worldwide, Inc.* | 11,462 | 1,365,927 |
| HealthEquity, Inc.* | 11,845 | 524,023 |
| John Wiley & Sons, Inc., Class A | 10,797 | 618,344 |
| Mister Car Wash, Inc.* | 29,871 | 543,951 |
| Shift4 Payments, Inc., Class A* | 6,927 | 401,281 |
| Stride, Inc.* | 37,442 | 1,247,942 |
| Terminix Global Holdings, Inc.* | 41,061 | 1,857,189 |
| TriNet Group, Inc.* | 13,505 | 1,286,486 |
| WEX, Inc.* | 5,370 | 753,894 |
| | | 8,911,113 |
| Computers — 2.5% |
| Maximus, Inc. | 11,180 | 890,711 |
| NCR Corp.* | 20,642 | 829,808 |
| WNS Holdings Ltd., ADR* | 20,377 | 1,797,659 |
| | | 3,518,178 |
| Distribution & Wholesale — 1.2% |
| Core & Main, Inc., Class A* | 54,621 | 1,657,201 |
| Diversified Financial Services — 4.4% |
| Cboe Global Markets, Inc. | 9,746 | 1,270,878 |
| Focus Financial Partners, Inc., Class A* | 18,043 | 1,077,528 |
| Foresight Acquisition Corp. PIPE | 72,553 | 510,773 |
| | Number of
Shares | Value† |
| |
| Diversified Financial Services — (continued) |
| LendingTree, Inc.* | 4,385 | $ 537,601 |
| LPL Financial Holdings, Inc. | 17,109 | 2,738,980 |
| | | 6,135,760 |
| Electric — 0.6% |
| NRG Energy, Inc. | 18,882 | 813,436 |
| Electrical Components & Equipment — 1.4% |
| EnerSys | 12,601 | 996,235 |
| Novanta, Inc.* | 5,865 | 1,034,175 |
| | | 2,030,410 |
| Electronics — 2.9% |
| Brady Corp., Class A | 31,174 | 1,680,278 |
| Itron, Inc.* | 5,386 | 369,049 |
| National Instruments Corp. | 21,101 | 921,481 |
| OSI Systems, Inc.* | 11,754 | 1,095,473 |
| | | 4,066,281 |
| Energy-Alternate Sources — 0.2% |
| Stem, Inc.* | 18,462 | 350,224 |
| Engineering & Construction — 0.5% |
| Frontdoor, Inc.* | 19,050 | 698,182 |
| Entertainment — 0.3% |
| Manchester United PLC, Class A | 28,299 | 402,978 |
| Environmental Control — 0.4% |
| Montrose Environmental Group, Inc.* | 7,935 | 559,497 |
| Food — 2.3% |
| BellRing Brands, Inc., Class A* | 23,669 | 675,276 |
| Hostess Brands, Inc.* | 61,697 | 1,259,853 |
| Laird Superfood, Inc.* | 24,367 | 317,746 |
| Premium Brands Holdings Corp. | 9,244 | 923,998 |
| | | 3,176,873 |
| Hand & Machine Tools — 0.9% |
| Regal Rexnord Corp. | 7,815 | 1,329,957 |
| Healthcare Products — 8.4% |
| Alphatec Holdings, Inc.* | 51,175 | 584,930 |
| Bio-Techne Corp. | 3,151 | 1,630,138 |
| Bruker Corp. | 19,936 | 1,672,830 |
| Glaukos Corp.* | 12,557 | 558,033 |
| Globus Medical, Inc., Class A* | 22,818 | 1,647,460 |
| ICU Medical, Inc.* | 4,715 | 1,119,058 |
| Integra LifeSciences Holdings Corp.* | 34,618 | 2,319,060 |
| Paragon 28, Inc.* | 22,053 | 390,118 |
| STERIS PLC | 6,226 | 1,515,471 |
| Treace Medical Concepts, Inc.* | 19,946 | 371,793 |
| | | 11,808,891 |
| Healthcare Services — 4.4% |
| Catalent, Inc.* | 31,174 | 3,991,207 |
| Chemed Corp. | 2,408 | 1,273,928 |
| Inotiv, Inc.* | 20,979 | 882,587 |
| | | 6,147,722 |
Penn Series Funds, Inc.
Schedule of Investments — December 31, 2021
Small Cap Growth Fund
| | Number of
Shares | Value† |
| COMMON STOCKS — (continued) |
| Holding Companies — 1.0% |
| CM Life Sciences II, Inc. PIPE | 30,686 | $ 357,185 |
| GS Acquisitions Holdings PIPE | 103,971 | 1,088,576 |
| | | 1,445,761 |
| Home Builders — 0.7% |
| Thor Industries, Inc. | 9,200 | 954,684 |
| Home Furnishings — 1.6% |
| Purple Innovation, Inc.* | 40,007 | 530,893 |
| The Lovesac Co.* | 25,509 | 1,690,226 |
| | | 2,221,119 |
| Household Products & Wares — 0.9% |
| Helen of Troy Ltd.* | 4,885 | 1,194,236 |
| Insurance — 1.2% |
| RLI Corp. | 10,204 | 1,143,869 |
| Trean Insurance Group, Inc.* | 57,053 | 508,342 |
| | | 1,652,211 |
| Internet — 2.2% |
| CarParts.com, Inc.* | 43,730 | 489,776 |
| ChannelAdvisor Corp.* | 44,438 | 1,096,730 |
| Zendesk, Inc.* | 14,539 | 1,516,272 |
| | | 3,102,778 |
| Machinery — Diversified — 4.2% |
| CSW Industrials, Inc. | 10,592 | 1,280,149 |
| Gates Industrial Corp. PLC* | 39,412 | 627,045 |
| Hydrofarm Holdings Group, Inc.* | 14,776 | 418,013 |
| Kornit Digital Ltd.* | 6,664 | 1,014,594 |
| Nordson Corp. | 4,794 | 1,223,764 |
| Zurn Water Solutions Corp. | 37,916 | 1,380,143 |
| | | 5,943,708 |
| Miscellaneous Manufacturing — 2.2% |
| Carlisle Cos., Inc. | 7,276 | 1,805,321 |
| ITT, Inc. | 12,912 | 1,319,477 |
| | | 3,124,798 |
| Packaging and Containers — 3.0% |
| Crown Holdings, Inc. | 37,830 | 4,184,755 |
| Pharmaceuticals — 2.6% |
| Centessa Pharmaceuticals PLC, ADR* | 17,301 | 194,809 |
| Eagle Pharmaceuticals, Inc.* | 11,343 | 577,586 |
| Heska Corp.* | 3,113 | 568,092 |
| Neurocrine Biosciences, Inc.* | 13,313 | 1,133,868 |
| Sarepta Therapeutics, Inc.* | 7,717 | 694,916 |
| Vaxcyte, Inc.* | 21,103 | 502,040 |
| | | 3,671,311 |
| Retail — 2.0% |
| Casey's General Stores, Inc. | 4,259 | 840,514 |
| National Vision Holdings, Inc.* | 20,646 | 990,802 |
| Williams-Sonoma, Inc. | 5,873 | 993,300 |
| | | 2,824,616 |
| | Number of
Shares | Value† |
| |
| Semiconductors — 4.2% |
| Entegris, Inc. | 15,953 | $ 2,210,767 |
| ON Semiconductor Corp.* | 42,475 | 2,884,902 |
| Wolfspeed, Inc.* | 7,131 | 797,032 |
| | | 5,892,701 |
| Software — 17.5% |
| Aspen Technology, Inc.* | 4,561 | 694,184 |
| Avalara, Inc.* | 9,349 | 1,207,049 |
| AvidXchange Holdings, Inc.* | 16,107 | 242,572 |
| Blackbaud, Inc.* | 23,239 | 1,835,416 |
| Broadridge Financial Solutions, Inc. | 12,472 | 2,280,131 |
| Clarivate PLC* | 60,464 | 1,422,113 |
| Clear Secure, Inc., Class A* | 17,590 | 551,798 |
| Consensus Cloud Solutions, Inc.* | 7,821 | 452,601 |
| CoreCard Corp.* | 21,679 | 841,145 |
| Dynatrace, Inc.* | 23,054 | 1,391,309 |
| Enfusion, Inc., Class A* | 26,058 | 545,655 |
| Envestnet, Inc.* | 12,949 | 1,027,374 |
| Expensify, Inc., Class A* | 20,684 | 910,096 |
| Global-e Online Ltd.* | 6,660 | 422,177 |
| LivePerson, Inc.* | 26,820 | 958,011 |
| PagerDuty, Inc.* | 24,691 | 858,012 |
| Sailpoint Technologies Holdings, Inc.* | 31,246 | 1,510,432 |
| SS&C Technologies Holdings, Inc. | 35,565 | 2,915,619 |
| The Descartes Systems Group, Inc.* | 27,008 | 2,233,746 |
| Yext, Inc.* | 35,553 | 352,686 |
| Ziff Davis, Inc.* | 16,948 | 1,878,855 |
| | | 24,530,981 |
| Telecommunications — 4.1% |
| Nice Ltd., ADR* | 13,047 | 3,961,069 |
| Vonage Holdings Corp.* | 85,652 | 1,780,705 |
| | | 5,741,774 |
| Transportation — 2.3% |
| CryoPort, Inc.* | 19,745 | 1,168,312 |
| Saia, Inc.* | 6,164 | 2,077,453 |
| | | 3,245,765 |
TOTAL COMMON STOCKS
(Cost $78,793,468) | 135,492,719 |
|
| REAL ESTATE INVESTMENT TRUSTS — 0.8% |
| Diversified — 0.8% |
Lamar Advertising Co., Class A
(Cost $524,083) | 9,463 | 1,147,862 |
Penn Series Funds, Inc.
Schedule of Investments — December 31, 2021
Small Cap Growth Fund
| | Number ofShares | Value† |
| SHORT-TERM INVESTMENTS — 2.4% |
BlackRock Liquidity FedFund - Institutional Shares (seven-day effective yield 0.030%)
(Cost $3,326,892) | 3,326,892 | $ 3,326,892 |
TOTAL INVESTMENTS — 99.8%
(Cost $82,644,443) | | $ 139,967,473 |
| Other Assets & Liabilities — 0.2% | 242,963 |
| TOTAL NET ASSETS — 100.0% | | $ 140,210,436 |
| † | See Security Valuation Note. |
| * | Non-income producing security. |
| A/S— Aktieselskab. |
| ADR— American Depositary Receipt. |
| PIPE— Private Investments in Public Equity. |
| PLC— Public Limited Company. |
| Country Weightings as of 12/31/2021†† |
| United States | 90% |
| Israel | 4 |
| Canada | 3 |
| United Kingdom | 2 |
| India | 1 |
| Total | 100% |
| †† | % of total investments as of December 31, 2021. |
Summary of inputs used to value the Fund’s investments as of 12/31/2021 are as follows (See Security Valuation Note):
| ASSETS TABLE |
| Description | Total
Market
Value at
12/31/2021 | Level 1
Quoted
Price | Level 2
Significant
Observable
Input | Level 3
Significant
Unobservable
Input |
| Common Stocks | | | | |
| Advertising | $ 845,929 | $ 845,929 | $ — | $— |
| Auto Parts & Equipment | 1,272,339 | 1,272,339 | — | — |
| Banks | 1,395,187 | 1,395,187 | — | — |
| Biotechnology | 6,050,600 | 6,050,600 | — | — |
| Building Materials | 1,271,515 | 1,271,515 | — | — |
| Chemicals | 3,319,248 | 3,319,248 | — | — |
| Commercial Services | 8,911,113 | 8,911,113 | — | — |
| Computers | 3,518,178 | 3,518,178 | — | — |
| Distribution & Wholesale | 1,657,201 | 1,657,201 | — | — |
| Diversified Financial Services | 6,135,760 | 5,624,987 | 510,773 | — |
| Electric | 813,436 | 813,436 | — | — |
| Electrical Components & Equipment | 2,030,410 | 2,030,410 | — | — |
| Electronics | 4,066,281 | 4,066,281 | — | — |
| Energy-Alternate Sources | 350,224 | 350,224 | — | — |
| Engineering & Construction | 698,182 | 698,182 | — | — |
| Entertainment | 402,978 | 402,978 | — | — |
| ASSETS TABLE |
| Description | Total
Market
Value at
12/31/2021 | Level 1
Quoted
Price | Level 2
Significant
Observable
Input | Level 3
Significant
Unobservable
Input |
| Environmental Control | $ 559,497 | $ 559,497 | $ — | $— |
| Food | 3,176,873 | 3,176,873 | — | — |
| Hand & Machine Tools | 1,329,957 | 1,329,957 | — | — |
| Healthcare Products | 11,808,891 | 11,808,891 | — | — |
| Healthcare Services | 6,147,722 | 6,147,722 | — | — |
| Holding Companies | 1,445,761 | — | 1,445,761 | — |
| Home Builders | 954,684 | 954,684 | — | — |
| Home Furnishings | 2,221,119 | 2,221,119 | — | — |
| Household Products & Wares | 1,194,236 | 1,194,236 | — | — |
| Insurance | 1,652,211 | 1,652,211 | — | — |
| Internet | 3,102,778 | 3,102,778 | — | — |
| Machinery — Diversified | 5,943,708 | 5,943,708 | — | — |
| Miscellaneous Manufacturing | 3,124,798 | 3,124,798 | — | — |
| Packaging and Containers | 4,184,755 | 4,184,755 | — | — |
| Pharmaceuticals | 3,671,311 | 3,671,311 | — | — |
| Retail | 2,824,616 | 2,824,616 | — | — |
| Semiconductors | 5,892,701 | 5,892,701 | — | — |
| Software | 24,530,981 | 24,530,981 | — | — |
| Telecommunications | 5,741,774 | 5,741,774 | — | — |
| Transportation | 3,245,765 | 3,245,765 | — | — |
| Total Common Stocks | 135,492,719 | 133,536,185 | 1,956,534 | — |
| Real Estate Investment Trusts | 1,147,862 | 1,147,862 | — | — |
| Short-Term Investments | 3,326,892 | 3,326,892 | — | — |
| Total Investments | $ 139,967,473 | $ 138,010,939 | $ 1,956,534 | $ — |
It is the Fund's practice to recognize transfers into and transfers out of Level 3 at the fair value hierarchy as of the beginning of period. The Fund did not have any transfers into and transfers out of Level 3 fair value hierarchy during the reporting period.
The accompanying notes are an integral part of these financial statements.
Penn Series Funds, Inc.
Schedule of Investments — December 31, 2021
Small Cap Value Fund
| | Number of
Shares | Value† |
| COMMON STOCKS — 86.6% |
| Aerospace & Defense — 0.7% |
| AAR Corp.* | 24,643 | $ 961,816 |
| Ducommun, Inc.* | 8,685 | 406,198 |
| | | 1,368,014 |
| Airlines — 0.3% |
| Allegiant Travel Co.* | 3,295 | 616,297 |
| Apparel — 0.8% |
| Capri Holdings Ltd.* | 10,781 | 699,795 |
| Crocs, Inc.* | 6,892 | 883,692 |
| Deckers Outdoor Corp.* | 62 | 22,711 |
| | | 1,606,198 |
| Auto Parts & Equipment — 1.3% |
| Adient PLC* | 19,026 | 910,965 |
| The Goodyear Tire & Rubber Co.* | 76,517 | 1,631,342 |
| | | 2,542,307 |
| Banks — 16.0% |
| Alerus Financial Corp. | 5,682 | 166,369 |
| Amalgamated Financial Corp. | 11,227 | 188,277 |
| Ameris Bancorp | 23,154 | 1,150,291 |
| Associated Banc-Corp. | 36,070 | 814,821 |
| Atlantic Union Bankshares Corp. | 33,288 | 1,241,310 |
| Banner Corp. | 24,442 | 1,482,896 |
| Cadence Bank | 44,212 | 1,317,075 |
| Columbia Banking System, Inc. | 23,660 | 774,155 |
| Community Bank System, Inc. | 14,368 | 1,070,129 |
| ConnectOne Bancorp, Inc. | 33,153 | 1,084,435 |
| CVB Financial Corp. | 62,990 | 1,348,616 |
| Eastern Bankshares, Inc. | 57,281 | 1,155,358 |
| FB Financial Corp. | 21,846 | 957,292 |
| First Financial Bankshares, Inc. | 16,113 | 819,185 |
| First Merchants Corp. | 29,529 | 1,236,970 |
| German American Bancorp, Inc. | 14,721 | 573,825 |
| Glacier Bancorp, Inc. | 19,267 | 1,092,439 |
| Hancock Whitney Corp. | 34,209 | 1,711,134 |
| Heritage Financial Corp. | 22,426 | 548,091 |
| Home BancShares, Inc. | 46,262 | 1,126,480 |
| Independent Bank Corp. | 15,380 | 1,253,931 |
| Lakeland Financial Corp. | 17,915 | 1,435,708 |
| PacWest Bancorp | 25,875 | 1,168,774 |
| Pinnacle Financial Partners, Inc. | 9,101 | 869,145 |
| Renasant Corp. | 32,352 | 1,227,758 |
| SouthState Corp. | 13,981 | 1,120,018 |
| The First of Long Island Corp. | 6,206 | 133,988 |
| Towne Bank | 25,173 | 795,215 |
| TriCo Bancshares | 20,890 | 897,434 |
| United Community Banks, Inc. | 40,945 | 1,471,563 |
| Walker & Dunlop, Inc. | 10,933 | 1,649,571 |
| | | 31,882,253 |
| Beverages — 0.9% |
| Primo Water Corp. | 100,127 | 1,765,239 |
| Biotechnology — 1.7% |
| 2seventy bio, Inc.* | 5,809 | 148,885 |
| | Number of
Shares | Value† |
| |
| Biotechnology — (continued) |
| Allogene Therapeutics, Inc.* | 14,332 | $ 213,833 |
| Arena Pharmaceuticals, Inc.* | 10,669 | 991,577 |
| Bluebird Bio, Inc.* | 19,086 | 190,669 |
| Blueprint Medicines Corp.* | 2,607 | 279,236 |
| Inovio Pharmaceuticals, Inc.* | 27,751 | 138,477 |
| Mersana Therapeutics, Inc.* | 14,167 | 88,119 |
| Myriad Genetics, Inc.* | 23,620 | 651,912 |
| REVOLUTION Medicines, Inc.* | 12,439 | 313,090 |
| Turning Point Therapeutics, Inc.* | 8,238 | 392,952 |
| | | 3,408,750 |
| Building Materials — 0.8% |
| Griffon Corp. | 15,546 | 442,750 |
| Summit Materials, Inc., Class A* | 27,553 | 1,105,977 |
| | | 1,548,727 |
| Chemicals — 1.0% |
| Amyris, Inc.* | 11,336 | 61,328 |
| H.B. Fuller Co. | 9,421 | 763,101 |
| Kraton Corp.* | 4,472 | 207,143 |
| Tronox Holdings PLC, Class A | 40,592 | 975,426 |
| | | 2,006,998 |
| Commercial Services — 5.1% |
| AMN Healthcare Services, Inc.* | 7,145 | 874,048 |
| ASGN, Inc.* | 11,870 | 1,464,758 |
| Avis Budget Group, Inc.* | 5,226 | 1,083,716 |
| Deluxe Corp. | 28,648 | 919,887 |
| First Advantage Corp.* | 44,899 | 854,877 |
| Green Dot Corp., Class A* | 18,246 | 661,235 |
| ICF International, Inc. | 9,521 | 976,379 |
| John Wiley & Sons, Inc., Class A | 23,460 | 1,343,554 |
| LiveRamp Holdings, Inc.* | 24,582 | 1,178,707 |
| Rent-A-Center, Inc. | 17,406 | 836,184 |
| | | 10,193,345 |
| Computers — 1.1% |
| KBR, Inc. | 42,517 | 2,024,659 |
| Vocera Communications, Inc.* | 2,190 | 142,000 |
| | | 2,166,659 |
| Distribution & Wholesale — 3.2% |
| Avient Corp. | 50,813 | 2,842,987 |
| Resideo Technologies, Inc.* | 56,627 | 1,474,001 |
| WESCO International, Inc.* | 16,184 | 2,129,653 |
| | | 6,446,641 |
| Diversified Financial Services — 0.9% |
| Houlihan Lokey, Inc. | 4,451 | 460,767 |
| Oportun Financial Corp.* | 8,543 | 172,996 |
| PJT Partners, Inc., Class A | 7,337 | 543,598 |
| Stifel Financial Corp. | 9,866 | 694,764 |
| | | 1,872,125 |
| Electric — 2.3% |
| ALLETE, Inc. | 22,226 | 1,474,695 |
| IDACORP, Inc. | 14,757 | 1,672,116 |
Penn Series Funds, Inc.
Schedule of Investments — December 31, 2021
Small Cap Value Fund
| | Number of
Shares | Value† |
| COMMON STOCKS — (continued) |
| Electric — (continued) |
| MGE Energy, Inc. | 17,580 | $ 1,445,955 |
| | | 4,592,766 |
| Electronics — 1.6% |
| Brady Corp., Class A | 10,391 | 560,075 |
| FARO Technologies, Inc.* | 11,603 | 812,442 |
| Knowles Corp.* | 39,263 | 916,791 |
| TTM Technologies, Inc.* | 55,146 | 821,675 |
| | | 3,110,983 |
| Energy-Alternate Sources — 0.7% |
| Array Technologies, Inc.* | 13,512 | 212,003 |
| NextEra Energy Partners LP | 9,147 | 772,007 |
| Renewable Energy Group, Inc.* | 9,805 | 416,124 |
| | | 1,400,134 |
| Engineering & Construction — 1.1% |
| Arcosa, Inc. | 18,522 | 976,109 |
| Dycom Industries, Inc.* | 12,080 | 1,132,621 |
| | | 2,108,730 |
| Entertainment — 0.8% |
| AMC Entertainment Holdings, Inc., Class A* | 24,517 | 666,862 |
| SeaWorld Entertainment, Inc.* | 12,993 | 842,726 |
| | | 1,509,588 |
| Food — 2.3% |
| B&G Foods, Inc. | 13,428 | 412,642 |
| BellRing Brands, Inc., Class A* | 9,026 | 257,512 |
| Hostess Brands, Inc.* | 69,190 | 1,412,860 |
| Nomad Foods Ltd.* | 15,747 | 399,816 |
| Performance Food Group Co.* | 2,181 | 100,086 |
| The Simply Good Foods Co.* | 18,545 | 770,916 |
| United Natural Foods, Inc.* | 15,634 | 767,317 |
| Utz Brands, Inc. | 29,899 | 476,889 |
| | | 4,598,038 |
| Food Service — 0.1% |
| Sovos Brands, Inc.* | 14,952 | 225,028 |
| Gas — 1.4% |
| Chesapeake Utilities Corp. | 7,738 | 1,128,278 |
| ONE Gas, Inc. | 22,326 | 1,732,274 |
| | | 2,860,552 |
| Hand & Machine Tools — 0.7% |
| Kennametal, Inc. | 35,989 | 1,292,365 |
| Healthcare Products — 2.8% |
| Avanos Medical, Inc.* | 29,677 | 1,028,902 |
| CONMED Corp. | 9,854 | 1,396,903 |
| LivaNova PLC* | 8,870 | 775,504 |
| Merit Medical Systems, Inc.* | 16,613 | 1,034,990 |
| NuVasive, Inc.* | 17,550 | 921,024 |
| Ortho Clinical Diagnostics Holdings PLC* | 1,472 | 31,486 |
| | Number of
Shares | Value† |
| |
| Healthcare Products — (continued) |
| Pacific Biosciences of California, Inc.* | 22,192 | $ 454,048 |
| | | 5,642,857 |
| Healthcare Services — 1.7% |
| Acadia Healthcare Co., Inc.* | 18,946 | 1,150,022 |
| Invitae Corp.* | 17,090 | 260,964 |
| Tenet Healthcare Corp.* | 24,614 | 2,010,718 |
| | | 3,421,704 |
| Home Builders — 2.0% |
| Century Communities, Inc. | 18,861 | 1,542,641 |
| Installed Building Products, Inc. | 6,671 | 932,072 |
| Meritage Homes Corp.* | 12,454 | 1,520,136 |
| | | 3,994,849 |
| Housewares — 0.1% |
| Tupperware Brands Corp.* | 7,568 | 115,715 |
| Insurance — 3.6% |
| AMERISAFE, Inc. | 7,218 | 388,545 |
| BRP Group, Inc., Class A* | 9,678 | 349,473 |
| CNO Financial Group, Inc. | 54,027 | 1,288,004 |
| Enstar Group Ltd.* | 4,178 | 1,034,431 |
| MGIC Investment Corp. | 83,139 | 1,198,864 |
| NMI Holdings, Inc., Class A* | 30,807 | 673,133 |
| Primerica, Inc. | 3,376 | 517,439 |
| RLI Corp. | 4,721 | 529,224 |
| Selective Insurance Group, Inc. | 14,472 | 1,185,836 |
| | | 7,164,949 |
| Iron & Steel — 0.6% |
| Allegheny Technologies, Inc.* | 26,058 | 415,104 |
| Commercial Metals Co. | 20,524 | 744,816 |
| | | 1,159,920 |
| Leisure Time — 0.5% |
| Callaway Golf Co.* | 39,290 | 1,078,118 |
| Lodging — 0.6% |
| Boyd Gaming Corp.* | 8,464 | 554,985 |
| Travel + Leisure Co. | 12,134 | 670,646 |
| | | 1,225,631 |
| Machinery — Construction & Mining — 1.0% |
| Astec Industries, Inc. | 16,707 | 1,157,294 |
| Terex Corp. | 17,748 | 780,024 |
| | | 1,937,318 |
| Machinery — Diversified — 2.8% |
| Cactus, Inc., Class A | 17,250 | 657,742 |
| Chart Industries, Inc.* | 6,838 | 1,090,593 |
| Colfax Corp.* | 29,198 | 1,342,232 |
| Columbus McKinnon Corp. | 26,485 | 1,225,196 |
| Zurn Water Solutions Corp. | 34,542 | 1,257,329 |
| | | 5,573,092 |
| Media — 1.5% |
| Entravision Communications Corp., Class A | 55,553 | 376,649 |
Penn Series Funds, Inc.
Schedule of Investments — December 31, 2021
Small Cap Value Fund
| | Number of
Shares | Value† |
| COMMON STOCKS — (continued) |
| Media — (continued) |
| Gray Television, Inc. | 35,118 | $ 707,979 |
| iHeartMedia, Inc., Class A* | 29,487 | 620,407 |
| Nexstar Media Group, Inc., Class A | 5,395 | 814,537 |
| TEGNA, Inc. | 27,004 | 501,194 |
| | | 3,020,766 |
| Mining — 0.8% |
| Arconic Corp.* | 10,228 | 337,626 |
| Coeur Mining, Inc.* | 54,285 | 273,597 |
| Constellium S.E.* | 51,300 | 918,783 |
| | | 1,530,006 |
| Miscellaneous Manufacturing — 1.9% |
| EnPro Industries, Inc. | 9,961 | 1,096,407 |
| ESCO Technologies, Inc. | 9,496 | 854,545 |
| Federal Signal Corp. | 29,223 | 1,266,525 |
| Hillenbrand, Inc. | 12,135 | 630,899 |
| | | 3,848,376 |
| Oil & Gas — 4.5% |
| Antero Resources Corp.* | 59,348 | 1,038,590 |
| Brigham Minerals, Inc., Class A | 35,559 | 749,939 |
| Centennial Resource Development, Inc., Class A* | 150,133 | 897,795 |
| HollyFrontier Corp. | 16,883 | 553,425 |
| Magnolia Oil & Gas Corp., Class A | 52,558 | 991,769 |
| Oasis Petroleum, Inc. | 4,792 | 603,744 |
| Ovintiv, Inc. | 49,208 | 1,658,310 |
| PDC Energy, Inc. | 9,805 | 478,288 |
| SM Energy Co. | 35,574 | 1,048,722 |
| Viper Energy Partners LP | 44,733 | 953,260 |
| | | 8,973,842 |
| Oil & Gas Services — 1.0% |
| ChampionX Corp.* | 73,787 | 1,491,235 |
| Liberty Oilfield Services, Inc., Class A* | 21,009 | 203,788 |
| NexTier Oilfield Solutions, Inc.* | 59,884 | 212,588 |
| | | 1,907,611 |
| Pharmaceuticals — 1.7% |
| Agios Pharmaceuticals, Inc.* | 13,894 | 456,696 |
| Alkermes PLC* | 19,364 | 450,407 |
| Cytokinetics, Inc.* | 4,790 | 218,328 |
| Ironwood Pharmaceuticals, Inc.* | 43,205 | 503,770 |
| Option Care Health, Inc.* | 27,593 | 784,745 |
| Owens & Minor, Inc. | 24,194 | 1,052,439 |
| | | 3,466,385 |
| Private Equity — 0.2% |
| P10, Inc., Class A* | 28,921 | 404,316 |
| Real Estate — 0.5% |
| Kennedy-Wilson Holdings, Inc. | 43,340 | 1,034,959 |
| Retail — 3.6% |
| Academy Sports & Outdoors, Inc.* | 8,120 | 356,468 |
| Beacon Roofing Supply, Inc.* | 19,775 | 1,134,096 |
| BJ's Wholesale Club Holdings, Inc.* | 13,129 | 879,249 |
| | Number of
Shares | Value† |
| |
| Retail — (continued) |
| Citi Trends, Inc.* | 8,999 | $ 852,655 |
| Dillard's, Inc., Class A | 387 | 94,823 |
| FirstCash Holdings, Inc. | 7,694 | 575,588 |
| Group 1 Automotive, Inc. | 5,823 | 1,136,766 |
| Macy's, Inc. | 50,597 | 1,324,630 |
| Signet Jewelers Ltd. | 9,875 | 859,421 |
| | | 7,213,696 |
| Savings & Loans — 2.4% |
| Berkshire Hills Bancorp, Inc. | 10,719 | 304,741 |
| Brookline Bancorp, Inc. | 52,439 | 848,988 |
| OceanFirst Financial Corp. | 45,057 | 1,000,265 |
| Pacific Premier Bancorp, Inc. | 28,945 | 1,158,668 |
| Washington Federal, Inc. | 46,375 | 1,547,998 |
| | | 4,860,660 |
| Semiconductors — 2.7% |
| Cohu, Inc.* | 26,163 | 996,549 |
| CTS Corp. | 19,434 | 713,616 |
| MACOM Technology Solutions Holdings, Inc.* | 18,061 | 1,414,176 |
| Onto Innovation, Inc.* | 17,160 | 1,737,107 |
| Semtech Corp.* | 6,196 | 551,010 |
| | | 5,412,458 |
| Software — 1.5% |
| Allscripts Healthcare Solutions, Inc.* | 55,428 | 1,022,647 |
| Bottomline Technologies, Inc.* | 13,845 | 781,827 |
| Cerence, Inc.* | 6,293 | 482,295 |
| ManTech International Corp., Class A | 8,047 | 586,868 |
| | | 2,873,637 |
| Telecommunications — 2.0% |
| InterDigital, Inc. | 7,948 | 569,315 |
| Iridium Communications, Inc.* | 26,705 | 1,102,650 |
| Telephone and Data Systems, Inc. | 48,576 | 978,806 |
| Viavi Solutions, Inc.* | 79,470 | 1,400,261 |
| | | 4,051,032 |
| Transportation — 1.4% |
| ArcBest Corp. | 11,118 | 1,332,492 |
| Atlas Air Worldwide Holdings, Inc.* | 2,790 | 262,595 |
| Saia, Inc.* | 3,369 | 1,135,454 |
| | | 2,730,541 |
| Water — 0.4% |
| SJW Group | 10,473 | 766,624 |
TOTAL COMMON STOCKS
(Cost $141,427,160) | 172,530,799 |
|
| REAL ESTATE INVESTMENT TRUSTS — 12.0% |
| Diversified — 0.8% |
| DigitalBridge Group, Inc.* | 190,863 | 1,589,889 |
| Healthcare — 2.0% |
| Healthcare Realty Trust, Inc. | 67,007 | 2,120,101 |
| National Health Investors, Inc. | 10,538 | 605,619 |
Penn Series Funds, Inc.
Schedule of Investments — December 31, 2021
Small Cap Value Fund
| | Number of
Shares | Value† |
| REAL ESTATE INVESTMENT TRUSTS — (continued) |
| Healthcare — (continued) |
| Sabra Health Care REIT, Inc. | 89,289 | $ 1,208,973 |
| | | 3,934,693 |
| Hotels & Resorts — 2.6% |
| Pebblebrook Hotel Trust | 81,358 | 1,819,978 |
| RLJ Lodging Trust | 126,760 | 1,765,767 |
| Ryman Hospitality Properties, Inc.* | 17,148 | 1,576,930 |
| | | 5,162,675 |
| Industrial — 1.0% |
| STAG lndustrial, Inc. | 42,002 | 2,014,416 |
| Mortgage Banks — 1.6% |
| KKR Real Estate Finance Trust, Inc. | 45,396 | 945,599 |
| PennyMac Mortgage Investment Trust | 83,131 | 1,440,660 |
| TPG RE Finance Trust, Inc. | 7,462 | 91,932 |
| Two Harbors Investment Corp. | 130,847 | 754,987 |
| | | 3,233,178 |
| Office Property — 1.4% |
| Highwoods Properties, Inc. | 27,655 | 1,233,136 |
| Hudson Pacific Properties, Inc. | 65,818 | 1,626,363 |
| | | 2,859,499 |
| Storage & Warehousing — 1.3% |
| Terreno Realty Corp. | 30,210 | 2,576,611 |
| Strip Centers — 1.3% |
| Acadia Realty Trust | 54,592 | 1,191,743 |
| SITE Centers Corp. | 87,092 | 1,378,667 |
| | | 2,570,410 |
TOTAL REAL ESTATE INVESTMENT TRUSTS
(Cost $22,514,719) | | 23,941,371 |
|
| EXCHANGE TRADED FUNDS — 0.4% |
| Investment Companies — 0.4% |
iShares Russell 2000 Value ETF
(Cost $775,938) | 4,643 | 770,970 |
| | | |
| SHORT-TERM INVESTMENTS — 1.4% |
BlackRock Liquidity FedFund - Institutional Shares (seven-day effective yield 0.030%)
(Cost $2,720,664) | 2,720,664 | 2,720,664 |
TOTAL INVESTMENTS — 100.4%
(Cost $167,438,481) | | $ 199,963,804 |
| Other Assets & Liabilities — (0.4)% | (791,190) |
| TOTAL NET ASSETS — 100.0% | | $ 199,172,614 |
| † | See Security Valuation Note. |
| * | Non-income producing security. |
| ETF— Exchange-Traded Fund. |
| LP— Limited Partnership. |
| PLC— Public Limited Company. |
| REIT— Real Estate Investment Trust. |
| S.E.— Societas Europaea. |
Summary of inputs used to value the Fund’s investments as of 12/31/2021 are as follows (See Security Valuation Note):
| ASSETS TABLE |
| Description | Total
Market
Value at
12/31/2021 | Level 1
Quoted
Price | Level 2
Significant
Observable
Input | Level 3
Significant
Unobservable
Input |
| Common Stocks | $172,530,799 | $172,530,799 | $— | $— |
| Real Estate Investment Trusts | 23,941,371 | 23,941,371 | — | — |
| Exchange Traded Funds | 770,970 | 770,970 | — | — |
| Short-Term Investments | 2,720,664 | 2,720,664 | — | — |
| Total Investments | $ 199,963,804 | $ 199,963,804 | $ — | $ — |
It is the Fund's practice to recognize transfers into and transfers out of Level 3 at the fair value hierarchy as of the beginning of period. The Fund did not have any transfers into and transfers out of Level 3 fair value hierarchy during the reporting period.
The accompanying notes are an integral part of these financial statements.
Penn Series Funds, Inc.
Schedule of Investments — December 31, 2021
Small Cap Index Fund
| | Number of
Shares | Value† |
| COMMON STOCKS — 90.1% |
| Advertising — 0.1% |
| Advantage Solutions, Inc.* | 2,600 | $ 20,852 |
| Boston Omaha Corp., Class A* | 700 | 20,111 |
| Clear Channel Outdoor Holdings, Inc.* | 12,200 | 40,382 |
| Fluent, Inc.* | 1,700 | 3,383 |
| National CineMedia, Inc. | 1,874 | 5,266 |
| Quotient Technology, Inc.* | 2,700 | 20,034 |
| Stagwell, Inc.* | 2,400 | 20,808 |
| | | 130,836 |
| Aerospace & Defense — 0.6% |
| AAR Corp.* | 1,069 | 41,723 |
| Aerojet Rocketdyne Holdings, Inc. | 2,440 | 114,095 |
| AeroVironment, Inc.* | 718 | 44,538 |
| AerSale Corp.* | 400 | 7,096 |
| Astronics Corp.* | 795 | 9,540 |
| Barnes Group, Inc. | 1,565 | 72,913 |
| Ducommun, Inc.* | 300 | 14,031 |
| Kaman Corp. | 848 | 36,591 |
| Kratos Defense & Security Solutions, Inc.* | 3,922 | 76,087 |
| Moog, Inc., Class A | 991 | 80,241 |
| National Presto Industries, Inc. | 146 | 11,976 |
| Park Aerospace Corp. | 533 | 7,036 |
| Triumph Group, Inc.* | 2,200 | 40,766 |
| | | 556,633 |
| Agriculture — 0.3% |
| 22nd Century Group, Inc.* | 5,200 | 16,068 |
| AppHarvest, Inc.* | 2,600 | 10,114 |
| Cadiz, Inc.* | 800 | 3,088 |
| Fresh Del Monte Produce, Inc. | 1,016 | 28,042 |
| Limoneira Co. | 600 | 9,000 |
| Tejon Ranch Co.* | 525 | 10,017 |
| The Andersons, Inc. | 1,132 | 43,820 |
| Turning Point Brands, Inc. | 500 | 18,890 |
| Universal Corp. | 755 | 41,464 |
| Vector Group Ltd. | 4,857 | 55,758 |
| Vital Farms, Inc.* | 800 | 14,448 |
| | | 250,709 |
| Airlines — 0.3% |
| Allegiant Travel Co.* | 490 | 91,650 |
| Frontier Group Holdings, Inc.* | 1,200 | 16,284 |
| Hawaiian Holdings, Inc.* | 1,626 | 29,870 |
| Mesa Air Group, Inc.* | 900 | 5,040 |
| SkyWest, Inc.* | 1,681 | 66,063 |
| Spirit Airlines, Inc.* | 3,200 | 69,920 |
| Sun Country Airlines Holdings, Inc.* | 900 | 24,525 |
| | | 303,352 |
| Apparel — 0.7% |
| Crocs, Inc.* | 1,900 | 243,618 |
| Fossil Group, Inc.* | 1,700 | 17,493 |
| Kontoor Brands, Inc. | 1,700 | 87,125 |
| Oxford Industries, Inc. | 508 | 51,572 |
| PLBY Group, Inc.* | 800 | 21,312 |
| Rocky Brands, Inc. | 200 | 7,960 |
| | Number of
Shares | Value† |
| |
| Apparel — (continued) |
| Steven Madden Ltd. | 2,573 | $ 119,567 |
| Superior Group of Cos., Inc. | 400 | 8,776 |
| Torrid Holdings, Inc.* | 400 | 3,952 |
| Urban Outfitters, Inc.* | 2,200 | 64,592 |
| Wolverine World Wide, Inc. | 2,582 | 74,388 |
| | | 700,355 |
| Auto Manufacturers — 0.3% |
| Arcimoto, Inc.* | 1,000 | 7,780 |
| Blue Bird Corp.* | 392 | 6,131 |
| Canoo, Inc.* | 3,700 | 28,564 |
| Fisker, Inc.* | 5,400 | 84,942 |
| Hyliion Holdings Corp.* | 3,900 | 24,180 |
| Lordstown Motors Corp., Class A* | 3,700 | 12,765 |
| Nikola Corp.* | 7,400 | 73,038 |
| REV Group, Inc. | 1,000 | 14,150 |
| Wabash National Corp. | 1,600 | 31,232 |
| Workhorse Group, Inc.* | 4,000 | 17,440 |
| XL Fleet Corp.* | 1,400 | 4,634 |
| | | 304,856 |
| Auto Parts & Equipment — 1.5% |
| Adient PLC* | 3,100 | 148,428 |
| Aeva Technologies, Inc.* | 3,400 | 25,704 |
| American Axle & Manufacturing Holdings, Inc.* | 4,016 | 37,469 |
| Commercial Vehicle Group, Inc.* | 1,200 | 9,672 |
| Cooper-Standard Holdings, Inc.* | 600 | 13,446 |
| Dana, Inc. | 4,696 | 107,163 |
| Dorman Products, Inc.* | 857 | 96,850 |
| Douglas Dynamics, Inc. | 700 | 27,342 |
| Fox Factory Holding Corp.* | 1,397 | 237,630 |
| Gentherm, Inc.* | 1,068 | 92,809 |
| Meritor, Inc.* | 2,145 | 53,153 |
| Methode Electronics, Inc. | 1,260 | 61,954 |
| Miller Industries, Inc. | 343 | 11,456 |
| Modine Manufacturing Co.* | 1,577 | 15,912 |
| Motorcar Parts of America, Inc.* | 500 | 8,535 |
| Romeo Power, Inc.* | 4,100 | 14,965 |
| Standard Motor Products, Inc. | 700 | 36,673 |
| Tenneco, Inc., Class A* | 2,300 | 25,990 |
| The Goodyear Tire & Rubber Co.* | 9,195 | 196,037 |
| The Shyft Group, Inc. | 1,200 | 58,956 |
| Titan International, Inc.* | 1,800 | 19,728 |
| Velodyne Lidar, Inc.* | 2,400 | 11,136 |
| Visteon Corp.* | 900 | 100,026 |
| XPEL, Inc.* | 600 | 40,968 |
| | | 1,452,002 |
| Banks — 8.4% |
| 1st Source Corp. | 488 | 24,205 |
| Alerus Financial Corp. | 400 | 11,712 |
| Allegiance Bancshares, Inc. | 600 | 25,326 |
| Amalgamated Financial Corp. | 300 | 5,031 |
| American National Bankshares, Inc. | 400 | 15,072 |
| Ameris Bancorp | 2,212 | 109,892 |
Penn Series Funds, Inc.
Schedule of Investments — December 31, 2021
Small Cap Index Fund
| | Number of
Shares | Value† |
| COMMON STOCKS — (continued) |
| Banks — (continued) |
| Arrow Financial Corp. | 449 | $ 15,818 |
| Associated Banc-Corp. | 4,900 | 110,691 |
| Atlantic Capital Bancshares, Inc.* | 800 | 23,016 |
| Atlantic Union Bankshares Corp. | 2,507 | 93,486 |
| BancFirst Corp. | 620 | 43,747 |
| Banco Latinoamericano de Comercio Exterior S.A., Class E | 1,110 | 18,426 |
| Bank First Corp. | 200 | 14,448 |
| Bank of Marin Bancorp | 480 | 17,870 |
| BankUnited, Inc. | 3,000 | 126,930 |
| Banner Corp. | 1,100 | 66,737 |
| Bar Harbor Bankshares | 597 | 17,271 |
| Blue Foundry Bancorp* | 900 | 13,167 |
| Blue Ridge Bankshares, Inc. | 700 | 12,530 |
| Bridgewater Bancshares Inc.* | 700 | 12,383 |
| Bryn Mawr Bank Corp. | 632 | 28,446 |
| Business First Bancshares, Inc. | 700 | 19,817 |
| Byline Bancorp, Inc. | 700 | 19,145 |
| Cadence Bank | 6,183 | 184,192 |
| Cambridge Bancorp | 200 | 18,718 |
| Camden National Corp. | 539 | 25,958 |
| Capital Bancorp, Inc. | 400 | 10,480 |
| Capital City Bank Group, Inc. | 469 | 12,382 |
| Capstar Financial Holdings, Inc. | 600 | 12,618 |
| Carter Bankshares, Inc.* | 800 | 12,312 |
| Cathay General Bancorp | 2,450 | 105,325 |
| CBTX, Inc. | 500 | 14,500 |
| Central Pacific Financial Corp. | 900 | 25,353 |
| CIT Group, Inc. | 3,200 | 164,288 |
| Citizens & Northern Corp. | 556 | 14,523 |
| City Holding Co. | 485 | 39,668 |
| Civista Bancshares, Inc. | 400 | 9,760 |
| CNB Financial Corp. | 474 | 12,561 |
| Coastal Financial Corp.* | 300 | 15,186 |
| Columbia Banking System, Inc. | 2,468 | 80,753 |
| Community Bank System, Inc. | 1,737 | 129,372 |
| Community Trust Bancorp, Inc. | 483 | 21,064 |
| ConnectOne Bancorp, Inc. | 1,160 | 37,944 |
| CrossFirst Bankshares, Inc.* | 1,500 | 23,415 |
| Customers Bancorp, Inc.* | 980 | 64,063 |
| CVB Financial Corp. | 4,092 | 87,610 |
| Dime Community Bancshares, Inc. | 1,109 | 38,992 |
| Eagle Bancorp, Inc. | 1,073 | 62,599 |
| Eastern Bankshares, Inc. | 5,500 | 110,935 |
| Enterprise Bancorp, Inc. | 313 | 14,060 |
| Enterprise Financial Services Corp. | 1,180 | 55,566 |
| Equity Bancshares, Inc., Class A | 500 | 16,965 |
| Farmers National Banc Corp. | 1,100 | 20,405 |
| FB Financial Corp. | 1,086 | 47,589 |
| Fidelity D&D Bancorp, Inc. | 100 | 5,900 |
| Financial Institutions, Inc. | 440 | 13,992 |
| First Bancorp | 1,124 | 51,389 |
| First BanCorp | 6,800 | 93,704 |
| First Bank | 400 | 5,804 |
| First Busey Corp. | 1,713 | 46,457 |
| | Number of
Shares | Value† |
| |
| Banks — (continued) |
| First Commonwealth Financial Corp. | 3,321 | $ 53,435 |
| First Community Bankshares, Inc. | 626 | 20,921 |
| First Financial Bancorp | 3,082 | 75,139 |
| First Financial Bankshares, Inc. | 4,204 | 213,731 |
| First Financial Corp. | 380 | 17,210 |
| First Foundation, Inc. | 1,200 | 29,832 |
| First Internet Bancorp | 300 | 14,112 |
| First Interstate BancSystem, Inc., Class A | 1,387 | 56,409 |
| First Merchants Corp. | 1,730 | 72,470 |
| First Mid Bancshares, Inc. | 500 | 21,395 |
| First Midwest Bancorp, Inc. | 3,614 | 74,015 |
| Five Star Bancorp | 200 | 6,000 |
| Flagstar Bancorp, Inc. | 1,700 | 81,498 |
| Fulton Financial Corp. | 5,103 | 86,751 |
| German American Bancorp, Inc. | 738 | 28,767 |
| Glacier Bancorp, Inc. | 3,599 | 204,063 |
| Great Southern Bancorp, Inc. | 371 | 21,982 |
| Great Western Bancorp, Inc. | 1,900 | 64,524 |
| Guaranty Bancshares, Inc. | 330 | 12,401 |
| Hancock Whitney Corp. | 2,778 | 138,956 |
| Hanmi Financial Corp. | 913 | 21,620 |
| HarborOne Bancorp, Inc. | 1,577 | 23,403 |
| Hawthorn Bancshares, Inc. | 116 | 2,996 |
| HBT Financial, Inc. | 400 | 7,492 |
| Heartland Financial USA, Inc. | 1,317 | 66,653 |
| Heritage Commerce Corp. | 1,900 | 22,686 |
| Heritage Financial Corp. | 1,030 | 25,173 |
| Hilltop Holdings, Inc. | 2,142 | 75,270 |
| Home BancShares, Inc. | 4,935 | 120,167 |
| HomeStreet, Inc. | 600 | 31,200 |
| Hope Bancorp, Inc. | 3,767 | 55,413 |
| Horizon Bancorp, Inc. | 1,350 | 28,147 |
| Howard Bancorp, Inc.* | 500 | 10,895 |
| Independent Bank Corp. | 1,460 | 119,034 |
| Independent Bank Corp. | 800 | 19,096 |
| Independent Bank Group, Inc. | 1,250 | 90,187 |
| International Bancshares Corp. | 1,825 | 77,362 |
| Kearny Financial Corp. | 2,245 | 29,746 |
| Lakeland Bancorp, Inc. | 1,711 | 32,492 |
| Lakeland Financial Corp. | 791 | 63,391 |
| Live Oak Bancshares, Inc. | 1,000 | 87,290 |
| Luther Burbank Corp. | 800 | 11,232 |
| Macatawa Bank Corp. | 800 | 7,056 |
| Mercantile Bank Corp. | 500 | 17,515 |
| Merchants Bancorp | 400 | 18,932 |
| Meta Financial Group, Inc. | 1,000 | 59,660 |
| Metrocity Bankshares, Inc. | 600 | 16,518 |
| Metropolitan Bank Holding Corp.* | 300 | 31,959 |
| Mid Penn Bancorp, Inc. | 400 | 12,696 |
| Midland States Bancorp, Inc. | 700 | 17,353 |
| MidWestOne Financial Group, Inc. | 400 | 12,948 |
| MVB Financial Corp. | 400 | 16,608 |
| National Bank Holdings Corp., Class A | 900 | 39,546 |
| NBT Bancorp, Inc. | 1,469 | 56,586 |
Penn Series Funds, Inc.
Schedule of Investments — December 31, 2021
Small Cap Index Fund
| | Number of
Shares | Value† |
| COMMON STOCKS — (continued) |
| Banks — (continued) |
| Nicolet Bankshares, Inc.* | 400 | $ 34,300 |
| Northrim BanCorp, Inc. | 200 | 8,692 |
| OFG Bancorp | 1,610 | 42,762 |
| Old National Bancorp | 5,261 | 95,329 |
| Old Second Bancorp, Inc. | 800 | 10,072 |
| Origin Bancorp, Inc. | 800 | 34,336 |
| Orrstown Financial Services, Inc. | 400 | 10,080 |
| Park National Corp. | 486 | 66,733 |
| PCSB Financial Corp. | 500 | 9,520 |
| Peapack-Gladstone Financial Corp. | 636 | 22,514 |
| Peoples Bancorp, Inc. | 891 | 28,343 |
| Peoples Financial Services Corp. | 200 | 10,538 |
| Pioneer Bancorp, Inc.* | 500 | 5,660 |
| Preferred Bank | 500 | 35,895 |
| Premier Financial Corp. | 1,131 | 34,959 |
| Primis Financial Corp. | 600 | 9,024 |
| Provident Bancorp, Inc. | 404 | 7,514 |
| QCR Holdings, Inc. | 500 | 28,000 |
| RBB Bancorp | 600 | 15,720 |
| Red River Bancshares, Inc. | 200 | 10,700 |
| Reliant Bancorp, Inc. | 400 | 14,200 |
| Renasant Corp. | 1,735 | 65,843 |
| Republic Bancorp, Inc., Class A | 287 | 14,591 |
| Republic First Bancorp, Inc.* | 1,700 | 6,324 |
| S&T Bancorp, Inc. | 1,181 | 37,225 |
| Sandy Spring Bancorp, Inc. | 1,550 | 74,524 |
| Seacoast Banking Corp of Florida | 1,740 | 61,579 |
| ServisFirst Bancshares, Inc. | 1,600 | 135,904 |
| Sierra Bancorp | 412 | 11,186 |
| Silvergate Capital Corp., Class A* | 900 | 133,380 |
| Simmons First National Corp., Class A | 3,496 | 103,412 |
| SmartFinancial, Inc. | 400 | 10,944 |
| South Plains Financial, Inc. | 400 | 11,124 |
| Southern First Bancshares, Inc.* | 200 | 12,498 |
| Southside Bancshares, Inc. | 971 | 40,607 |
| SouthState Corp. | 2,311 | 185,134 |
| Spirit of Texas Bancshares, Inc. | 400 | 11,512 |
| Stock Yards Bancorp, Inc. | 767 | 48,996 |
| Summit Financial Group, Inc. | 400 | 10,980 |
| Texas Capital Bancshares, Inc.* | 1,700 | 102,425 |
| The Bancorp, Inc.* | 1,812 | 45,862 |
| The Bank of NT Butterfield & Son Ltd. | 1,600 | 60,976 |
| The First Bancorp, Inc. | 234 | 7,348 |
| The First Bancshares, Inc. | 700 | 27,034 |
| The First of Long Island Corp. | 689 | 14,876 |
| Tompkins Financial Corp. | 458 | 38,280 |
| Towne Bank | 2,277 | 71,930 |
| TriCo Bancshares | 998 | 42,874 |
| TriState Capital Holdings, Inc.* | 1,000 | 30,260 |
| Triumph Bancorp, Inc.* | 800 | 95,264 |
| TrustCo Bank Corp. | 650 | 21,652 |
| Trustmark Corp. | 2,030 | 65,894 |
| UMB Financial Corp. | 1,381 | 146,538 |
| United Bankshares, Inc. | 4,360 | 158,181 |
| United Community Banks, Inc. | 2,778 | 99,841 |
| | Number of
Shares | Value† |
| |
| Banks — (continued) |
| Univest Financial Corp. | 987 | $ 29,531 |
| Valley National Bancorp | 12,983 | 178,516 |
| Veritex Holdings, Inc. | 1,553 | 61,778 |
| Walker & Dunlop, Inc. | 972 | 146,655 |
| Washington Trust Bancorp, Inc. | 570 | 32,131 |
| WesBanco, Inc. | 2,130 | 74,529 |
| West BanCorp, Inc. | 478 | 14,851 |
| Westamerica BanCorp | 873 | 50,398 |
| | | 8,301,779 |
| Beverages — 0.4% |
| Celsius Holdings, Inc.* | 1,800 | 134,226 |
| Coca-Cola Consolidated, Inc. | 153 | 94,736 |
| MGP Ingredients, Inc. | 500 | 42,495 |
| National Beverage Corp. | 784 | 35,539 |
| NewAge, Inc.* | 2,800 | 2,884 |
| Primo Water Corp. | 5,100 | 89,913 |
| The Duckhorn Portfolio, Inc.* | 1,200 | 28,008 |
| Zevia PBC, Class A* | 300 | 2,115 |
| | | 429,916 |
| Biotechnology — 7.3% |
| 2seventy bio, Inc.* | 733 | 18,787 |
| 4D Molecular Therapeutics, Inc.* | 700 | 15,358 |
| 89bio, Inc.* | 400 | 5,228 |
| 9 Meters Biopharma, Inc.* | 8,200 | 8,025 |
| Absci Corp.* | 400 | 3,280 |
| ACADIA Pharmaceuticals, Inc.* | 3,900 | 91,026 |
| Acumen Pharmaceuticals, Inc.* | 300 | 2,028 |
| Adagio Therapeutics, Inc.* | 700 | 5,082 |
| Adicet Bio, Inc.* | 900 | 15,741 |
| Adverum Biotechnologies, Inc.* | 2,600 | 4,576 |
| Aerovate Therapeutics, Inc.* | 300 | 3,537 |
| Affimed N.V.* | 3,800 | 20,976 |
| Agenus, Inc.* | 6,600 | 21,252 |
| Akero Therapeutics, Inc.* | 900 | 19,035 |
| Akouos, Inc.* | 900 | 7,650 |
| Akoya Biosciences, Inc.* | 300 | 4,593 |
| Albireo Pharma, Inc.* | 500 | 11,645 |
| Aldeyra Therapeutics, Inc.* | 1,700 | 6,800 |
| Aligos Therapeutics, Inc.* | 700 | 8,309 |
| Allakos, Inc.* | 1,111 | 10,877 |
| Allogene Therapeutics, Inc.* | 2,200 | 32,824 |
| Allovir, Inc.* | 1,000 | 12,940 |
| Alpha Teknova, Inc.* | 200 | 4,096 |
| Alpine Immune Sciences, Inc.* | 600 | 8,310 |
| Altimmune, Inc.* | 1,100 | 10,076 |
| ALX Oncology Holdings, Inc.* | 600 | 12,894 |
| Amicus Therapeutics, Inc.* | 8,500 | 98,175 |
| AnaptysBio, Inc.* | 600 | 20,850 |
| Anavex Life Sciences Corp.* | 2,100 | 36,414 |
| Angion Biomedica Corp.* | 700 | 2,030 |
| ANI Pharmaceuticals, Inc.* | 300 | 13,824 |
| Annexon, Inc.* | 900 | 10,341 |
| Apellis Pharmaceuticals, Inc.* | 2,400 | 113,472 |
| Applied Molecular Transport, Inc.* | 700 | 9,786 |
Penn Series Funds, Inc.
Schedule of Investments — December 31, 2021
Small Cap Index Fund
| | Number of
Shares | Value† |
| COMMON STOCKS — (continued) |
| Biotechnology — (continued) |
| Applied Therapeutics, Inc.* | 500 | $ 4,475 |
| Arbutus Biopharma Corp.* | 3,100 | 12,059 |
| Arcturus Therapeutics Holdings, Inc.* | 700 | 25,907 |
| Arcus Biosciences, Inc.* | 1,500 | 60,705 |
| Arcutis Biotherapeutics, Inc.* | 900 | 18,666 |
| Ardelyx, Inc.* | 2,200 | 2,420 |
| Arena Pharmaceuticals, Inc.* | 2,050 | 190,527 |
| Arrowhead Pharmaceuticals, Inc.* | 3,300 | 218,790 |
| Atara Biotherapeutics, Inc.* | 2,928 | 46,145 |
| Atea Pharmaceuticals, Inc.* | 2,100 | 18,774 |
| Athersys, Inc.* | 5,000 | 4,513 |
| Athira Pharma, Inc.* | 1,200 | 15,636 |
| Atossa Therapeutics, Inc.* | 4,000 | 6,400 |
| Atreca, Inc., Class A* | 1,000 | 3,030 |
| Avalo Therapeutics, Inc.* | 1,000 | 1,700 |
| Avid Bioservices, Inc.* | 2,100 | 61,278 |
| Avidity Biosciences, Inc.* | 1,300 | 30,901 |
| Avrobio, Inc.* | 1,100 | 4,235 |
| Axsome Therapeutics, Inc.* | 900 | 34,002 |
| Beam Therapeutics, Inc.* | 1,600 | 127,504 |
| Berkeley Lights, Inc.* | 1,600 | 29,088 |
| BioAtla, Inc.* | 400 | 7,852 |
| BioCryst Pharmaceuticals, Inc.* | 5,700 | 78,945 |
| Biodesix, Inc.* | 500 | 2,645 |
| Biohaven Pharmaceutical Holding Co., Ltd.* | 1,800 | 248,058 |
| Biomea Fusion, Inc.* | 400 | 2,980 |
| Black Diamond Therapeutics, Inc.* | 582 | 3,102 |
| Bluebird Bio, Inc.* | 2,200 | 21,978 |
| Blueprint Medicines Corp.* | 1,900 | 203,509 |
| Bolt Biotherapeutics, Inc.* | 900 | 4,410 |
| Bridgebio Pharma, Inc.* | 3,455 | 57,629 |
| Brooklyn ImmunoTherapeutics, Inc.* | 900 | 3,753 |
| C4 Therapeutics, Inc.* | 1,300 | 41,860 |
| Cara Therapeutics, Inc.* | 1,500 | 18,270 |
| Cardiff Oncology, Inc.* | 1,400 | 8,414 |
| Caribou Biosciences, Inc.* | 600 | 9,054 |
| Cassava Sciences, Inc.* | 1,200 | 52,440 |
| Celldex Therapeutics, Inc.* | 1,500 | 57,960 |
| CEL-SCI Corp.* | 1,100 | 7,810 |
| Century Therapeutics, Inc.* | 400 | 6,344 |
| Cerevel Therapeutics Holdings, Inc.* | 1,300 | 42,146 |
| ChemoCentryx, Inc.* | 1,695 | 61,715 |
| Chinook Therapeutics, Inc.* | 1,160 | 18,920 |
| ChromaDex Corp.* | 1,400 | 5,236 |
| Clene, Inc.* | 900 | 3,690 |
| Codiak Biosciences, Inc.* | 300 | 3,342 |
| Cogent Biosciences, Inc.* | 1,400 | 12,012 |
| Cortexyme, Inc.* | 700 | 8,834 |
| Crinetics Pharmaceuticals, Inc.* | 1,400 | 39,774 |
| Cue Biopharma, Inc.* | 1,000 | 11,310 |
| Cullinan Oncology, Inc.* | 800 | 12,344 |
| Curis, Inc.* | 3,000 | 14,280 |
| Cymabay Therapeutics, Inc.* | 2,100 | 7,098 |
| Cyteir Therapeutics, Inc.* | 300 | 3,411 |
| | Number of
Shares | Value† |
| |
| Biotechnology — (continued) |
| Cytek Biosciences, Inc.* | 500 | $ 8,160 |
| CytomX Therapeutics, Inc.* | 2,400 | 10,392 |
| Day One Biopharmaceuticals, Inc.* | 400 | 6,740 |
| Deciphera Pharmaceuticals, Inc.* | 1,200 | 11,724 |
| Denali Therapeutics, Inc.* | 3,000 | 133,800 |
| Design Therapeutics, Inc.* | 500 | 10,705 |
| DICE Therapeutics, Inc.* | 500 | 12,655 |
| Dynavax Technologies Corp.* | 3,320 | 46,712 |
| Dyne Therapeutics, Inc.* | 1,000 | 11,890 |
| Edgewise Therapeutics, Inc.* | 1,300 | 19,864 |
| Editas Medicine, Inc.* | 2,200 | 58,410 |
| Eiger BioPharmaceuticals, Inc.* | 900 | 4,671 |
| Eliem Therapeutics, Inc.* | 200 | 2,092 |
| Emergent BioSolutions, Inc.* | 1,558 | 67,726 |
| Epizyme, Inc.* | 2,700 | 6,750 |
| Erasca, Inc.* | 700 | 10,906 |
| Esperion Therapeutics, Inc.* | 700 | 3,500 |
| Evelo Biosciences, Inc.* | 700 | 4,249 |
| Evolus, Inc.* | 1,200 | 7,812 |
| Exagen, Inc.* | 500 | 5,815 |
| EyePoint Pharmaceuticals, Inc.* | 900 | 11,016 |
| Fate Therapeutics, Inc.* | 2,700 | 157,977 |
| FibroGen, Inc.* | 2,900 | 40,890 |
| Finch Therapeutics Group, Inc.* | 400 | 3,988 |
| Forma Therapeutics Holdings, Inc.* | 1,000 | 14,220 |
| Forte Biosciences, Inc.* | 400 | 856 |
| Frequency Therapeutics, Inc.* | 800 | 4,104 |
| Gemini Therapeutics, Inc.* | 1,000 | 2,910 |
| Generation Bio Co.* | 1,300 | 9,204 |
| Geron Corp.* | 9,240 | 11,273 |
| Global Blood Therapeutics, Inc.* | 2,000 | 58,540 |
| Gossamer Bio, Inc.* | 1,800 | 20,358 |
| Graphite Bio, Inc.* | 500 | 6,215 |
| Greenwich Lifesciences, Inc.* | 200 | 4,866 |
| GT Biopharma, Inc.* | 900 | 2,745 |
| Halozyme Therapeutics, Inc.* | 4,589 | 184,524 |
| Harvard Bioscience, Inc.* | 1,700 | 11,985 |
| Homology Medicines, Inc.* | 1,200 | 4,368 |
| Humanigen, Inc.* | 1,500 | 5,580 |
| iBio, Inc.* | 5,300 | 2,910 |
| Icosavax, Inc.* | 400 | 9,152 |
| IGM Biosciences, Inc.* | 300 | 8,799 |
| Ikena Oncology, Inc.* | 900 | 11,286 |
| Imago Biosciences, Inc.* | 300 | 7,113 |
| Immunic, Inc.* | 700 | 6,699 |
| ImmunityBio, Inc.* | 2,300 | 13,984 |
| ImmunoGen, Inc.* | 6,563 | 48,697 |
| Immunovant, Inc.* | 1,100 | 9,372 |
| Infinity Pharmaceuticals, Inc.* | 3,400 | 7,650 |
| Inhibrx, Inc.* | 1,000 | 43,670 |
| Innoviva, Inc.* | 1,400 | 24,150 |
| Inovio Pharmaceuticals, Inc.* | 6,800 | 33,932 |
| Inozyme Pharma, Inc.* | 300 | 2,046 |
| Insmed, Inc.* | 3,800 | 103,512 |
| Instil Bio, Inc.* | 1,800 | 30,798 |
Penn Series Funds, Inc.
Schedule of Investments — December 31, 2021
Small Cap Index Fund
| | Number of
Shares | Value† |
| COMMON STOCKS — (continued) |
| Biotechnology — (continued) |
| Intercept Pharmaceuticals, Inc.* | 726 | $ 11,827 |
| Intra-Cellular Therapies, Inc.* | 2,300 | 120,382 |
| iTeos Therapeutics, Inc.* | 700 | 32,592 |
| IVERIC bio, Inc.* | 3,484 | 58,252 |
| Janux Therapeutics, Inc.* | 400 | 7,892 |
| Kaleido Biosciences, Inc.* | 600 | 1,434 |
| Karuna Therapeutics, Inc.* | 700 | 91,700 |
| Karyopharm Therapeutics, Inc.* | 1,900 | 12,217 |
| KemPharm, Inc.* | 1,000 | 8,710 |
| Keros Therapeutics, Inc.* | 600 | 35,106 |
| Kezar Life Sciences, Inc.* | 1,100 | 18,392 |
| Kiniksa Pharmaceuticals Ltd., Class A* | 1,000 | 11,770 |
| Kinnate Biopharma, Inc.* | 800 | 14,176 |
| Kodiak Sciences, Inc.* | 1,100 | 93,258 |
| Kronos Bio, Inc.* | 1,300 | 17,667 |
| Krystal Biotech, Inc.* | 600 | 41,970 |
| Kymera Therapeutics, Inc.* | 1,100 | 69,839 |
| Lexicon Pharmaceuticals, Inc.* | 2,560 | 10,086 |
| Ligand Pharmaceuticals, Inc.* | 506 | 78,157 |
| Lineage Cell Therapeutics, Inc.* | 4,500 | 11,025 |
| MacroGenics, Inc.* | 1,900 | 30,495 |
| Magenta Therapeutics, Inc.* | 600 | 2,658 |
| MaxCyte, Inc.* | 3,100 | 31,589 |
| MEI Pharma, Inc.* | 3,800 | 10,146 |
| MeiraGTx Holdings PLC* | 1,100 | 26,114 |
| Mersana Therapeutics, Inc.* | 2,300 | 14,306 |
| Mind Medicine MindMed, Inc.* | 10,800 | 14,904 |
| Molecular Templates, Inc.* | 800 | 3,136 |
| Monte Rosa Therapeutics, Inc.* | 400 | 8,168 |
| Mustang Bio, Inc.* | 1,500 | 2,490 |
| Myriad Genetics, Inc.* | 2,500 | 69,000 |
| NeoGenomics, Inc.* | 3,700 | 126,244 |
| NGM Biopharmaceuticals, Inc.* | 1,200 | 21,252 |
| Nkarta, Inc.* | 600 | 9,210 |
| Nurix Therapeutics, Inc.* | 1,000 | 28,950 |
| Nuvalent, Inc., Class A* | 300 | 5,712 |
| Nuvation Bio, Inc.* | 5,200 | 44,200 |
| Olema Pharmaceuticals, Inc.* | 800 | 7,488 |
| Omega Therapeutics, Inc.* | 200 | 2,266 |
| Omeros Corp.* | 1,800 | 11,574 |
| Oncocyte Corp.* | 1,800 | 3,906 |
| Oncorus, Inc.* | 800 | 4,216 |
| Oncternal Therapeutics, Inc.* | 1,800 | 4,086 |
| Organogenesis Holdings, Inc.* | 1,300 | 12,012 |
| Oyster Point Pharma, Inc.* | 200 | 3,652 |
| Phathom Pharmaceuticals, Inc.* | 700 | 13,769 |
| Pliant Therapeutics, Inc.* | 800 | 10,800 |
| Poseida Therapeutics, Inc.* | 1,400 | 9,534 |
| Praxis Precision Medicines, Inc.* | 900 | 17,730 |
| Precigen, Inc.* | 3,300 | 12,243 |
| Precision BioSciences, Inc.* | 1,900 | 14,060 |
| Prelude Therapeutics, Inc.* | 300 | 3,735 |
| Prothena Corp. PLC* | 1,100 | 54,340 |
| Provention Bio, Inc.* | 1,500 | 8,430 |
| PTC Therapeutics, Inc.* | 2,200 | 87,626 |
| | Number of
Shares | Value† |
| |
| Biotechnology — (continued) |
| Puma Biotechnology, Inc.* | 900 | $ 2,736 |
| Radius Health, Inc.* | 1,400 | 9,688 |
| Rain Therapeutics, Inc.* | 400 | 5,152 |
| Rallybio Corp.* | 400 | 3,816 |
| RAPT Therapeutics, Inc.* | 600 | 22,038 |
| Recursion Pharmaceuticals, Inc., Class A* | 3,700 | 63,381 |
| REGENXBIO, Inc.* | 1,300 | 42,510 |
| Relay Therapeutics, Inc.* | 2,300 | 70,633 |
| Replimune Group, Inc.* | 1,000 | 27,100 |
| REVOLUTION Medicines, Inc.* | 1,900 | 47,823 |
| Rigel Pharmaceuticals, Inc.* | 6,290 | 16,669 |
| Rocket Pharmaceuticals, Inc.* | 1,400 | 30,562 |
| Rubius Therapeutics, Inc.* | 1,300 | 12,584 |
| Sana Biotechnology, Inc.* | 2,800 | 43,344 |
| Sangamo Therapeutics, Inc.* | 4,103 | 30,773 |
| Scholar Rock Holding Corp.* | 900 | 22,356 |
| Seelos Therapeutics, Inc.* | 3,100 | 5,053 |
| Seer, Inc.* | 1,300 | 29,653 |
| Selecta Biosciences, Inc.* | 3,900 | 12,714 |
| Sensei Biotherapeutics, Inc.* | 700 | 4,060 |
| Sesen Bio, Inc.* | 5,900 | 4,809 |
| Shattuck Labs, Inc.* | 900 | 7,659 |
| Silverback Therapeutics, Inc.* | 400 | 2,664 |
| Singular Genomics Systems, Inc.* | 400 | 4,624 |
| Solid Biosciences, Inc.* | 400 | 700 |
| Sorrento Therapeutics, Inc.* | 8,700 | 40,455 |
| Springworks Therapeutics, Inc.* | 1,000 | 61,980 |
| SQZ Biotechnologies Co.* | 900 | 8,037 |
| Stoke Therapeutics, Inc.* | 700 | 16,793 |
| Surface Oncology, Inc.* | 1,300 | 6,214 |
| Sutro Biopharma, Inc.* | 1,434 | 21,338 |
| Syndax Pharmaceuticals, Inc.* | 1,500 | 32,835 |
| Talaris Therapeutics, Inc.* | 300 | 4,587 |
| Tarsus Pharmaceuticals, Inc.* | 200 | 4,500 |
| Taysha Gene Therapies, Inc.* | 800 | 9,320 |
| TCR2 Therapeutics, Inc.* | 800 | 3,728 |
| Tenaya Therapeutics, Inc.* | 400 | 7,580 |
| Terns Pharmaceuticals, Inc.* | 400 | 2,828 |
| TG Therapeutics, Inc.* | 4,100 | 77,900 |
| Theravance Biopharma, Inc.* | 2,200 | 24,310 |
| TransMedics Group, Inc.* | 900 | 17,244 |
| Travere Therapeutics, Inc.* | 1,800 | 55,872 |
| Turning Point Therapeutics, Inc.* | 1,466 | 69,928 |
| Twist Bioscience Corp.* | 1,524 | 117,942 |
| UroGen Pharma Ltd.* | 700 | 6,657 |
| Vaxart, Inc.* | 4,000 | 25,080 |
| VBI Vaccines, Inc.* | 6,200 | 14,508 |
| Vera Therapeutics, Inc.* | 200 | 5,344 |
| Veracyte, Inc.* | 2,200 | 90,640 |
| Verastem, Inc.* | 6,200 | 12,710 |
| Vericel Corp.* | 1,500 | 58,950 |
| Veru, Inc.* | 2,500 | 14,725 |
| Verve Therapeutics, Inc.* | 500 | 18,435 |
| Viking Therapeutics, Inc.* | 1,700 | 7,820 |
Penn Series Funds, Inc.
Schedule of Investments — December 31, 2021
Small Cap Index Fund
| | Number of
Shares | Value† |
| COMMON STOCKS — (continued) |
| Biotechnology — (continued) |
| Vincerx Pharma, Inc.* | 400 | $ 4,076 |
| Vir Biotechnology, Inc.* | 2,000 | 83,740 |
| Viracta Therapeutics, Inc.* | 1,300 | 4,745 |
| VistaGen Therapeutics, Inc.* | 6,800 | 13,260 |
| Vor BioPharma, Inc.* | 400 | 4,648 |
| WaVe Life Sciences Ltd.* | 700 | 2,198 |
| Werewolf Therapeutics, Inc.* | 900 | 10,719 |
| XBiotech, Inc. | 467 | 5,198 |
| Xencor, Inc.* | 1,900 | 76,228 |
| XOMA Corp.* | 200 | 4,170 |
| Y-mAbs Therapeutics, Inc.* | 1,200 | 19,452 |
| Zentalis Pharmaceuticals, Inc.* | 1,200 | 100,872 |
| ZIOPHARM Oncology, Inc.* | 5,927 | 6,460 |
| | | 7,205,299 |
| Building Materials — 1.4% |
| AAON, Inc. | 1,385 | 110,011 |
| American Woodmark Corp.* | 569 | 37,099 |
| Apogee Enterprises, Inc. | 843 | 40,590 |
| Boise Cascade Co. | 1,300 | 92,560 |
| Caesarstone Ltd. | 600 | 6,804 |
| Cornerstone Building Brands, Inc.* | 1,664 | 29,020 |
| Forterra, Inc.* | 1,000 | 23,780 |
| Gibraltar Industries, Inc.* | 1,101 | 73,415 |
| Griffon Corp. | 1,656 | 47,163 |
| JELD-WEN Holding, Inc.* | 2,700 | 71,172 |
| Masonite International Corp.* | 800 | 94,360 |
| Patrick Industries, Inc. | 775 | 62,535 |
| PGT Innovations, Inc.* | 2,000 | 44,980 |
| Simpson Manufacturing Co., Inc. | 1,443 | 200,678 |
| SPX Corp.* | 1,400 | 83,552 |
| Summit Materials, Inc., Class A* | 3,905 | 156,747 |
| UFP Industries, Inc. | 1,949 | 179,327 |
| View, Inc.* | 2,900 | 11,339 |
| | | 1,365,132 |
| Chemicals — 1.8% |
| AdvanSix, Inc. | 900 | 42,525 |
| American Vanguard Corp. | 878 | 14,390 |
| Amyris, Inc.* | 5,400 | 29,214 |
| Balchem Corp. | 1,041 | 175,513 |
| Cabot Corp. | 1,800 | 101,160 |
| Codexis, Inc.* | 2,000 | 62,540 |
| Danimer Scientific, Inc.* | 2,300 | 19,596 |
| Ecovyst, Inc. | 1,800 | 18,432 |
| Ferro Corp.* | 2,638 | 57,588 |
| GCP Applied Technologies, Inc.* | 1,700 | 53,822 |
| H.B. Fuller Co. | 1,680 | 136,080 |
| Hawkins, Inc. | 698 | 27,536 |
| Ingevity Corp.* | 1,300 | 93,210 |
| Innospec, Inc. | 800 | 72,272 |
| Intrepid Potash, Inc.* | 370 | 15,810 |
| Koppers Holdings, Inc.* | 620 | 19,406 |
| Kraton Corp.* | 1,041 | 48,219 |
| Kronos Worldwide, Inc. | 900 | 13,509 |
| Marrone Bio Innovations, Inc.* | 2,700 | 1,945 |
| | Number of
Shares | Value† |
| |
| Chemicals — (continued) |
| Minerals Technologies, Inc. | 1,128 | $ 82,513 |
| Oil-Dri Corp of America | 197 | 6,448 |
| Orion Engineered Carbons S.A.* | 1,800 | 33,048 |
| Quaker Chemical Corp. | 436 | 100,620 |
| Rayonier Advanced Materials, Inc.* | 1,900 | 10,849 |
| Rogers Corp.* | 617 | 168,441 |
| Sensient Technologies Corp. | 1,358 | 135,881 |
| Stepan Co. | 680 | 84,517 |
| Trinseo PLC | 1,300 | 68,198 |
| Tronox Holdings PLC, Class A | 3,900 | 93,717 |
| Unifi, Inc.* | 460 | 10,649 |
| Zymergen, Inc.* | 2,600 | 17,394 |
| | | 1,815,042 |
| Coal — 0.2% |
| Arch Resources, Inc. | 500 | 45,660 |
| CONSOL Energy, Inc.* | 1,000 | 22,710 |
| Peabody Energy Corp.* | 2,800 | 28,196 |
| SunCoke Energy, Inc. | 2,541 | 16,745 |
| Warrior Met Coal, Inc. | 1,700 | 43,707 |
| | | 157,018 |
| Commercial Services — 4.7% |
| 2U, Inc.* | 2,300 | 46,161 |
| ABM Industries, Inc. | 2,139 | 87,378 |
| Acacia Research Corp.* | 1,180 | 6,053 |
| Adtalem Global Education, Inc.* | 1,600 | 47,296 |
| Alarm.com Holdings, Inc.* | 1,500 | 127,215 |
| Alta Equipment Group, Inc.* | 700 | 10,248 |
| American Public Education, Inc.* | 655 | 14,574 |
| AMN Healthcare Services, Inc.* | 1,509 | 184,596 |
| API Group Corp.* | 6,400 | 164,928 |
| Arlo Technologies, Inc.* | 2,433 | 25,522 |
| ASGN, Inc.* | 1,652 | 203,857 |
| Avis Budget Group, Inc.* | 1,300 | 269,581 |
| Barrett Business Services, Inc. | 242 | 16,713 |
| BrightView Holdings, Inc.* | 1,315 | 18,515 |
| Carriage Services, Inc. | 500 | 32,220 |
| Cass Information Systems, Inc. | 498 | 19,581 |
| CBIZ, Inc.* | 1,640 | 64,157 |
| Cimpress PLC* | 529 | 37,882 |
| CoreCivic, Inc.* | 4,200 | 41,874 |
| CorVel Corp.* | 299 | 62,192 |
| Coursera, Inc.* | 2,400 | 58,656 |
| CRA International, Inc. | 274 | 25,581 |
| Cross Country Healthcare, Inc.* | 1,084 | 30,092 |
| Custom Truck One Source, Inc.* | 1,500 | 12,000 |
| Deluxe Corp. | 1,307 | 41,968 |
| Emerald Holding, Inc.* | 700 | 2,779 |
| Ennis, Inc. | 858 | 16,757 |
| European Wax Center, Inc., Class A* | 300 | 9,105 |
| EVERTEC, Inc. | 1,939 | 96,911 |
| Evo Payments, Inc., Class A* | 1,500 | 38,400 |
| First Advantage Corp.* | 1,600 | 30,464 |
| Forrester Research, Inc.* | 375 | 22,024 |
| Franklin Covey Co.* | 497 | 23,041 |
Penn Series Funds, Inc.
Schedule of Investments — December 31, 2021
Small Cap Index Fund
| | Number of
Shares | Value† |
| COMMON STOCKS — (continued) |
| Commercial Services — (continued) |
| Graham Holdings Co., Class B | 122 | $ 76,839 |
| Green Dot Corp., Class A* | 1,727 | 62,587 |
| GreenSky, Inc., Class A* | 2,300 | 26,128 |
| HealthEquity, Inc.* | 2,700 | 119,448 |
| Heidrick & Struggles International, Inc. | 569 | 24,882 |
| Herc Holdings, Inc. | 800 | 125,240 |
| Huron Consulting Group, Inc.* | 728 | 36,327 |
| ICF International, Inc. | 648 | 66,452 |
| Insperity, Inc. | 1,173 | 138,543 |
| John Wiley & Sons, Inc., Class A | 1,400 | 80,178 |
| Kelly Services, Inc., Class A | 1,014 | 17,005 |
| Kforce, Inc. | 686 | 51,601 |
| Korn Ferry | 1,790 | 135,557 |
| Laureate Education, Inc., Class A | 3,300 | 40,392 |
| LiveRamp Holdings, Inc.* | 2,167 | 103,908 |
| Marathon Digital Holdings, Inc.* | 3,100 | 101,866 |
| Medifast, Inc. | 376 | 78,746 |
| MoneyGram International, Inc.* | 3,000 | 23,670 |
| Monro, Inc. | 1,037 | 60,426 |
| Multiplan Corp.* | 12,400 | 54,932 |
| National Research Corp. | 387 | 16,068 |
| Paya Holdings, Inc.* | 2,800 | 17,752 |
| Perdoceo Education Corp.* | 2,300 | 27,048 |
| PROG Holdings, Inc.* | 2,167 | 97,753 |
| Progyny, Inc.* | 2,100 | 105,735 |
| R1 RCM, Inc.* | 3,800 | 96,862 |
| Remitly Global, Inc.* | 400 | 8,248 |
| Rent-A-Center, Inc. | 2,153 | 103,430 |
| Repay Holdings Corp.* | 2,700 | 49,329 |
| Resources Connection, Inc. | 922 | 16,448 |
| Riot Blockchain, Inc.* | 2,700 | 60,291 |
| RR Donnelley & Sons Co.* | 2,600 | 29,276 |
| ShotSpotter, Inc.* | 300 | 8,856 |
| SP Plus Corp.* | 693 | 19,556 |
| Strategic Education, Inc. | 859 | 49,685 |
| Stride, Inc.* | 1,252 | 41,729 |
| Team, Inc.* | 983 | 1,071 |
| Textainer Group Holdings Ltd. | 1,512 | 53,994 |
| The Aaron's Co., Inc. | 1,100 | 27,115 |
| The Brink's Co. | 1,610 | 105,568 |
| The Hackett Group, Inc. | 716 | 14,699 |
| Transcat, Inc.* | 200 | 18,486 |
| TriNet Group, Inc.* | 1,300 | 123,838 |
| Triton International Ltd. | 2,193 | 132,084 |
| TrueBlue, Inc.* | 1,076 | 29,773 |
| Vectrus, Inc.* | 400 | 18,308 |
| Viad Corp.* | 671 | 28,712 |
| Vivint Smart Home, Inc.* | 3,100 | 30,318 |
| Willdan Group, Inc.* | 300 | 10,560 |
| WW International, Inc.* | 1,700 | 27,421 |
| | | 4,683,061 |
| Computers — 2.2% |
| 3D Systems Corp.* | 3,900 | 84,006 |
| Cantaloupe, Inc.* | 2,000 | 17,760 |
| | Number of
Shares | Value† |
| |
| Computers — (continued) |
| Conduent, Inc.* | 5,800 | $ 30,972 |
| Corsair Gaming, Inc.* | 1,000 | 21,010 |
| Desktop Metal, Inc., Class A* | 6,184 | 30,611 |
| Diebold Nixdorf, Inc.* | 2,500 | 22,625 |
| ExlService Holdings, Inc.* | 1,100 | 159,247 |
| Grid Dynamics Holdings, Inc.* | 1,400 | 53,158 |
| iCAD, Inc.* | 500 | 3,600 |
| Insight Enterprises, Inc.* | 1,143 | 121,844 |
| Integral Ad Science Holding Corp.* | 500 | 11,105 |
| KBR, Inc. | 4,600 | 219,052 |
| Maximus, Inc. | 1,981 | 157,826 |
| Mitek Systems, Inc.* | 1,500 | 26,625 |
| NetScout Systems, Inc.* | 2,365 | 78,234 |
| OneSpan, Inc.* | 1,128 | 19,097 |
| PAE, Inc.* | 2,100 | 20,853 |
| PAR Technology Corp.* | 800 | 42,216 |
| Parsons Corp.* | 800 | 26,920 |
| Ping Identity Holding Corp.* | 2,000 | 45,760 |
| PlayAGS, Inc.* | 800 | 5,432 |
| Qualys, Inc.* | 1,100 | 150,942 |
| Quantum Corp.* | 1,300 | 7,176 |
| Rapid7, Inc.* | 1,800 | 211,842 |
| Rekor Systems, Inc.* | 1,200 | 7,860 |
| Rimini Street, Inc.* | 1,800 | 10,746 |
| SecureWorks Corp., Class A* | 500 | 7,985 |
| StarTek, Inc.* | 700 | 3,654 |
| Sterling Check Corp.* | 500 | 10,255 |
| Super Micro Computer, Inc.* | 1,400 | 61,530 |
| Telos Corp.* | 1,300 | 20,046 |
| Tenable Holdings, Inc.* | 3,000 | 165,210 |
| TTEC Holdings, Inc. | 607 | 54,964 |
| Unisys Corp.* | 2,324 | 47,805 |
| Varonis Systems, Inc.* | 3,420 | 166,827 |
| Vocera Communications, Inc.* | 1,100 | 71,324 |
| Vuzix Corp.* | 2,000 | 17,340 |
| | | 2,213,459 |
| Cosmetics & Personal Care — 0.3% |
| Edgewell Personal Care Co. | 1,800 | 82,278 |
| elf Beauty, Inc.* | 1,600 | 53,136 |
| Inter Parfums, Inc. | 624 | 66,705 |
| Revlon, Inc., Class A* | 270 | 3,062 |
| The Beauty Health Co.* | 2,800 | 67,648 |
| The Honest Co., Inc.* | 2,800 | 22,652 |
| | | 295,481 |
| Distribution & Wholesale — 0.8% |
| A-Mark Precious Metals, Inc. | 300 | 18,330 |
| Avient Corp. | 2,955 | 165,332 |
| EVI Industries, Inc.* | 200 | 6,246 |
| G-III Apparel Group Ltd.* | 1,508 | 41,681 |
| Global Industrial Co. | 362 | 14,806 |
| H&E Equipment Services, Inc. | 1,059 | 46,882 |
| Ideanomics, Inc.* | 13,600 | 16,320 |
| KAR Auction Services, Inc.* | 3,800 | 59,356 |
| Resideo Technologies, Inc.* | 4,700 | 122,341 |
Penn Series Funds, Inc.
Schedule of Investments — December 31, 2021
Small Cap Index Fund
| | Number of
Shares | Value† |
| COMMON STOCKS — (continued) |
| Distribution & Wholesale — (continued) |
| ScanSource, Inc.* | 881 | $ 30,905 |
| Titan Machinery, Inc.* | 723 | 24,358 |
| Veritiv Corp.* | 500 | 61,285 |
| VSE Corp. | 308 | 18,770 |
| WESCO International, Inc.* | 1,447 | 190,411 |
| | | 817,023 |
| Diversified Financial Services — 2.5% |
| Amerant Bancorp, Inc. | 900 | 31,095 |
| Artisan Partners Asset Management, Inc., Class A | 1,900 | 90,516 |
| AssetMark Financial Holdings, Inc.* | 500 | 13,105 |
| Associated Capital Group, Inc., Class A | 100 | 4,300 |
| Atlanticus Holdings Corp.* | 200 | 14,264 |
| B Riley Financial, Inc. | 700 | 62,202 |
| BGC Partners, Inc., Class A | 10,500 | 48,825 |
| Blucora, Inc.* | 1,596 | 27,643 |
| Brightsphere Investment Group, Inc. | 1,926 | 49,306 |
| Calamos Asset Management, Inc., Class A(1),* | 469 | 0 |
| Cohen & Steers, Inc. | 817 | 75,581 |
| Columbia Financial, Inc.* | 1,500 | 31,290 |
| Cowen, Inc., Class A | 947 | 34,187 |
| Curo Group Holdings Corp. | 900 | 14,409 |
| Diamond Hill Investment Group, Inc. | 107 | 20,783 |
| Enact Holdings, Inc. | 500 | 10,335 |
| Encore Capital Group, Inc.* | 997 | 61,924 |
| Enova International, Inc.* | 1,113 | 45,588 |
| EZCORP, Inc., Class A* | 1,766 | 13,015 |
| Federal Agricultural Mortgage Corp., Class C | 300 | 37,179 |
| Federated Hermes, Inc. | 3,000 | 112,740 |
| Finance Of America Cos., Inc., Class A* | 1,300 | 5,161 |
| Flywire Corp.* | 2,000 | 76,120 |
| Focus Financial Partners, Inc., Class A* | 1,900 | 113,468 |
| GAMCO Investors, Inc., Class A | 215 | 5,371 |
| GCM Grosvenor, Inc., Class A | 1,200 | 12,600 |
| Greenhill & Co., Inc. | 500 | 8,965 |
| Hamilton Lane, Inc., Class A | 1,100 | 113,982 |
| Houlihan Lokey, Inc. | 1,650 | 170,808 |
| I3 Verticals, Inc., Class A* | 800 | 18,232 |
| International Money Express, Inc.* | 900 | 14,364 |
| LendingClub Corp.* | 3,160 | 76,409 |
| LendingTree, Inc.* | 377 | 46,220 |
| Marlin Business Services Corp. | 200 | 4,656 |
| Moelis & Co., Class A | 2,000 | 125,020 |
| Mr. Cooper Group, Inc.* | 1,992 | 82,887 |
| Navient Corp. | 5,300 | 112,466 |
| Nelnet, Inc., Class A | 599 | 58,510 |
| Ocwen Financial Corp.* | 300 | 11,991 |
| Oportun Financial Corp.* | 700 | 14,175 |
| Oppenheimer Holdings, Inc., Class A | 238 | 11,036 |
| PennyMac Financial Services, Inc. | 1,000 | 69,780 |
| Piper Sandler Cos. | 587 | 104,785 |
| PJT Partners, Inc., Class A | 800 | 59,272 |
| | Number of
Shares | Value† |
| |
| Diversified Financial Services — (continued) |
| PRA Group, Inc.* | 1,448 | $ 72,704 |
| Pzena Investment Management, Inc., Class A | 830 | 7,860 |
| Regional Management Corp. | 300 | 17,238 |
| Sculptor Capital Management, Inc. | 600 | 12,810 |
| StepStone Group, Inc., Class A | 1,400 | 58,198 |
| StoneX Group, Inc.* | 593 | 36,321 |
| Velocity Financial, Inc.* | 400 | 5,480 |
| Virtus Investment Partners, Inc. | 236 | 70,116 |
| WisdomTree Investments, Inc. | 3,900 | 23,868 |
| World Acceptance Corp.* | 150 | 36,814 |
| | | 2,455,974 |
| Electric — 1.3% |
| ALLETE, Inc. | 1,751 | 116,179 |
| Ameresco, Inc., Class A* | 1,000 | 81,440 |
| Avista Corp. | 2,339 | 99,384 |
| Black Hills Corp. | 2,048 | 144,527 |
| Clearway Energy, Inc., Class A | 1,100 | 36,828 |
| Clearway Energy, Inc., Class C | 2,600 | 93,678 |
| FTC Solar, Inc.* | 800 | 6,048 |
| MGE Energy, Inc. | 1,242 | 102,154 |
| NorthWestern Corp. | 1,680 | 96,029 |
| Ormat Technologies, Inc. | 1,500 | 118,950 |
| Otter Tail Corp. | 1,392 | 99,417 |
| PNM Resources, Inc. | 2,810 | 128,164 |
| Portland General Electric Co. | 2,956 | 156,432 |
| Unitil Corp. | 463 | 21,293 |
| Via Renewables, Inc. | 400 | 4,572 |
| | | 1,305,095 |
| Electrical Components & Equipment — 0.7% |
| American Superconductor Corp.* | 900 | 9,792 |
| Belden, Inc. | 1,455 | 95,637 |
| Blink Charging Co.* | 1,200 | 31,812 |
| Encore Wire Corp. | 671 | 96,020 |
| Energizer Holdings, Inc. | 2,200 | 88,220 |
| EnerSys | 1,423 | 112,502 |
| Insteel Industries, Inc. | 691 | 27,509 |
| nLight, Inc.* | 1,300 | 31,135 |
| Novanta, Inc.* | 1,168 | 205,954 |
| Powell Industries, Inc. | 229 | 6,753 |
| | | 705,334 |
| Electronics — 1.7% |
| Advanced Energy Industries, Inc. | 1,193 | 108,635 |
| Akoustis Technologies, Inc.* | 1,100 | 7,348 |
| Allied Motion Technologies, Inc. | 300 | 10,947 |
| Atkore, Inc.* | 1,500 | 166,785 |
| Badger Meter, Inc. | 918 | 97,822 |
| Benchmark Electronics, Inc. | 1,313 | 35,582 |
| Brady Corp., Class A | 1,557 | 83,922 |
| Comtech Telecommunications Corp. | 952 | 22,553 |
| FARO Technologies, Inc.* | 620 | 43,412 |
| Fluidigm Corp.* | 2,500 | 9,800 |
| GoPro, Inc., Class A* | 4,300 | 44,333 |
Penn Series Funds, Inc.
Schedule of Investments — December 31, 2021
Small Cap Index Fund
| | Number of
Shares | Value† |
| COMMON STOCKS — (continued) |
| Electronics — (continued) |
| Identiv, Inc.* | 800 | $ 22,512 |
| II-VI, Inc.* | 3,418 | 233,552 |
| Itron, Inc.* | 1,500 | 102,780 |
| Kimball Electronics, Inc.* | 933 | 20,302 |
| Knowles Corp.* | 3,052 | 71,264 |
| Kopin Corp.* | 2,700 | 11,043 |
| Luna Innovations, Inc.* | 700 | 5,908 |
| Mesa Laboratories, Inc. | 175 | 57,416 |
| MicroVision, Inc.* | 5,100 | 25,551 |
| Napco Security Technologies, Inc.* | 500 | 24,990 |
| NVE Corp. | 109 | 7,445 |
| OSI Systems, Inc.* | 557 | 51,912 |
| Plexus Corp.* | 903 | 86,589 |
| Sanmina Corp.* | 2,026 | 83,998 |
| Stoneridge, Inc.* | 873 | 17,233 |
| TTM Technologies, Inc.* | 3,429 | 51,092 |
| Turtle Beach Corp.* | 500 | 11,130 |
| Vicor Corp.* | 722 | 91,680 |
| Vishay Intertechnology, Inc. | 4,300 | 94,041 |
| Vishay Precision Group, Inc.* | 500 | 18,560 |
| | | 1,720,137 |
| Energy-Alternate Sources — 0.6% |
| Advent Technologies Holdings, Inc.* | 700 | 4,907 |
| Aemetis, Inc.* | 900 | 11,070 |
| Alto Ingredients, Inc.* | 2,600 | 12,506 |
| Array Technologies, Inc.* | 4,200 | 65,898 |
| Beam Global* | 300 | 5,580 |
| Cleanspark, Inc.* | 1,200 | 11,424 |
| Eos Energy Enterprises, Inc.* | 1,400 | 10,528 |
| FuelCell Energy, Inc.* | 12,000 | 62,400 |
| FutureFuel Corp. | 800 | 6,112 |
| Gevo, Inc.* | 6,400 | 27,392 |
| Green Plains, Inc.* | 1,567 | 54,469 |
| Renewable Energy Group, Inc.* | 1,400 | 59,416 |
| REX American Resources Corp.* | 192 | 18,432 |
| Stem, Inc.* | 3,700 | 70,189 |
| Sunnova Energy International, Inc.* | 2,800 | 78,176 |
| SunPower Corp.* | 2,500 | 52,175 |
| TPI Composites, Inc.* | 1,100 | 16,456 |
| | | 567,130 |
| Engineering & Construction — 1.5% |
| 908 Devices, Inc.* | 500 | 12,935 |
| Arcosa, Inc. | 1,600 | 84,320 |
| Aris Water Solution, Inc., Class A* | 600 | 7,770 |
| Atlas Technical Consultants, Inc.* | 500 | 4,210 |
| Comfort Systems USA, Inc. | 1,127 | 111,505 |
| Concrete Pumping Holdings, Inc.* | 1,100 | 9,020 |
| Construction Partners, Inc., Class A* | 1,000 | 29,410 |
| Dycom Industries, Inc.* | 953 | 89,353 |
| EMCOR Group, Inc. | 1,763 | 224,589 |
| Exponent, Inc. | 1,680 | 196,106 |
| Fluor Corp.* | 4,700 | 116,419 |
| Granite Construction, Inc. | 1,433 | 55,457 |
| Great Lakes Dredge & Dock Corp.* | 1,951 | 30,670 |
| | Number of
Shares | Value† |
| |
| Engineering & Construction — (continued) |
| IES Holdings, Inc.* | 300 | $ 15,192 |
| Infrastructure and Energy Alternatives, Inc.* | 800 | 7,360 |
| INNOVATE Corp.* | 1,083 | 4,007 |
| Iteris, Inc.* | 1,200 | 4,800 |
| Latham Group, Inc.* | 800 | 20,024 |
| Mistras Group, Inc.* | 600 | 4,458 |
| MYR Group, Inc.* | 583 | 64,451 |
| NV5 Global, Inc.* | 400 | 55,248 |
| Primoris Services Corp. | 1,790 | 42,924 |
| Sterling Construction Co., Inc.* | 800 | 21,040 |
| Tutor Perini Corp.* | 1,397 | 17,281 |
| WillScot Mobile Mini Holdings Corp.* | 6,952 | 283,920 |
| | | 1,512,469 |
| Entertainment — 1.6% |
| Accel Entertainment, Inc.* | 2,000 | 26,040 |
| AMC Entertainment Holdings, Inc., Class A* | 16,855 | 458,456 |
| Bally's Corp.* | 1,050 | 39,963 |
| Chicken Soup For The Soul Entertainment, Inc.* | 400 | 5,536 |
| Cinemark Holdings, Inc.* | 3,500 | 56,420 |
| Eros STX Global Corp.* | 11,400 | 2,733 |
| Esports Technologies, Inc.* | 400 | 8,224 |
| Everi Holdings, Inc.* | 2,800 | 59,780 |
| GAN Ltd.* | 1,400 | 12,866 |
| Golden Entertainment, Inc.* | 600 | 30,318 |
| Golden Nugget Online Gaming, Inc.* | 1,200 | 11,940 |
| Hall of Fame Resort & Entertainment Co.* | 2,200 | 3,344 |
| IMAX Corp.* | 1,800 | 32,112 |
| International Game Technology PLC | 3,200 | 92,512 |
| Liberty Media Corp.-Liberty Braves, Class A* | 300 | 8,625 |
| Liberty Media Corp.-Liberty Braves, Class C* | 1,300 | 36,530 |
| Lions Gate Entertainment Corp., Class A* | 1,900 | 31,616 |
| Lions Gate Entertainment Corp., Class B* | 3,800 | 58,482 |
| Madison Square Garden Entertainment Corp.* | 837 | 58,874 |
| Monarch Casino & Resort, Inc.* | 385 | 28,471 |
| NEOGAMES S.A.* | 100 | 2,778 |
| RCI Hospitality Holdings, Inc. | 300 | 23,364 |
| Red Rock Resorts, Inc., Class A | 2,000 | 110,020 |
| Rush Street Interactive, Inc.* | 1,800 | 29,700 |
| Scientific Games Corp.* | 3,100 | 207,173 |
| SeaWorld Entertainment, Inc.* | 1,700 | 110,262 |
| | | 1,546,139 |
| Environmental Control — 0.9% |
| Casella Waste Systems, Inc., Class A* | 1,600 | 136,672 |
| CECO Environmental Corp.* | 1,309 | 8,155 |
| Centrus Energy Corp., Class A* | 400 | 19,964 |
Penn Series Funds, Inc.
Schedule of Investments — December 31, 2021
Small Cap Index Fund
| | Number of
Shares | Value† |
| COMMON STOCKS — (continued) |
| Environmental Control — (continued) |
| Energy Recovery, Inc.* | 1,500 | $ 32,235 |
| Evoqua Water Technologies Corp.* | 3,800 | 177,650 |
| Harsco Corp.* | 2,800 | 46,788 |
| Heritage-Crystal Clean, Inc.* | 600 | 19,212 |
| Montrose Environmental Group, Inc.* | 800 | 56,408 |
| Pure Cycle Corp.* | 800 | 11,680 |
| PureCycle Technologies, Inc.* | 1,100 | 10,527 |
| Sharps Compliance Corp.* | 600 | 4,278 |
| Tetra Tech, Inc. | 1,764 | 299,527 |
| US Ecology, Inc.* | 940 | 30,024 |
| | | 853,120 |
| Food — 1.5% |
| AquaBounty Technologies, Inc.* | 2,000 | 4,200 |
| B&G Foods, Inc. | 2,172 | 66,746 |
| BellRing Brands, Inc., Class A* | 1,300 | 37,089 |
| Calavo Growers, Inc. | 551 | 23,362 |
| Cal-Maine Foods, Inc. | 1,246 | 46,090 |
| HF Foods Group, Inc.* | 1,300 | 10,998 |
| Hostess Brands, Inc.* | 4,400 | 89,848 |
| Ingles Markets, Inc., Class A | 504 | 43,515 |
| J & J Snack Foods Corp. | 470 | 74,241 |
| John B Sanfilippo & Son, Inc. | 300 | 27,048 |
| Krispy Kreme, Inc. | 700 | 13,244 |
| Laird Superfood, Inc.* | 300 | 3,912 |
| Lancaster Colony Corp. | 604 | 100,022 |
| Landec Corp.* | 718 | 7,970 |
| Mission Produce, Inc.* | 1,300 | 20,410 |
| Nathan's Famous, Inc. | 100 | 5,839 |
| Natural Grocers by Vitamin Cottage, Inc. | 400 | 5,700 |
| Performance Food Group Co.* | 4,900 | 224,861 |
| Sanderson Farms, Inc. | 656 | 125,348 |
| Seneca Foods Corp., Class A* | 211 | 10,117 |
| SpartanNash Co. | 1,130 | 29,109 |
| Sprouts Farmers Market, Inc.* | 3,800 | 112,784 |
| Tattooed Chef, Inc.* | 1,600 | 24,864 |
| The Chefs' Warehouse, Inc.* | 950 | 31,635 |
| The Simply Good Foods Co.* | 2,800 | 116,396 |
| Tootsie Roll Industries, Inc. | 550 | 19,927 |
| TreeHouse Foods, Inc.* | 1,700 | 68,901 |
| United Natural Foods, Inc.* | 1,900 | 93,252 |
| Utz Brands, Inc. | 2,000 | 31,900 |
| Village Super Market, Inc., Class A | 268 | 6,269 |
| Weis Markets, Inc. | 566 | 37,288 |
| Whole Earth Brands, Inc.* | 1,300 | 13,962 |
| | | 1,526,847 |
| Food Service — 0.1% |
| Healthcare Services Group, Inc. | 2,580 | 45,898 |
| Sovos Brands, Inc.* | 800 | 12,040 |
| | | 57,938 |
| Forest Products & Paper — 0.1% |
| Clearwater Paper Corp.* | 578 | 21,195 |
| Glatfelter Corp. | 1,359 | 23,375 |
| | Number of
Shares | Value† |
| |
| Forest Products & Paper — (continued) |
| Neenah, Inc. | 574 | $ 26,565 |
| Schweitzer-Mauduit International, Inc. | 976 | 29,182 |
| Verso Corp., Class A | 1,000 | 27,020 |
| | | 127,337 |
| Gas — 0.9% |
| Brookfield Infrastructure Corp., Class A | 2,000 | 136,520 |
| Chesapeake Utilities Corp. | 535 | 78,008 |
| New Jersey Resources Corp. | 3,164 | 129,914 |
| Northwest Natural Holding Co. | 950 | 46,341 |
| ONE Gas, Inc. | 1,700 | 131,903 |
| South Jersey Industries, Inc. | 3,280 | 85,674 |
| Southwest Gas Holdings, Inc. | 1,973 | 138,209 |
| Spire, Inc. | 1,656 | 108,004 |
| | | 854,573 |
| Hand & Machine Tools — 0.3% |
| Franklin Electric Co., Inc. | 1,470 | 139,003 |
| Kennametal, Inc. | 2,700 | 96,957 |
| Luxfer Holdings PLC | 1,000 | 19,310 |
| | | 255,270 |
| Healthcare Products — 3.8% |
| Accelerate Diagnostics, Inc.* | 951 | 4,964 |
| Accuray, Inc.* | 2,738 | 13,060 |
| Acutus Medical, Inc.* | 300 | 1,023 |
| Alphatec Holdings, Inc.* | 2,300 | 26,289 |
| AngioDynamics, Inc.* | 1,158 | 31,938 |
| Apria, Inc.* | 500 | 16,300 |
| Apyx Medical Corp.* | 800 | 10,256 |
| Asensus Surgical, Inc.* | 8,000 | 8,880 |
| Aspira Women's Health, Inc.* | 2,100 | 3,717 |
| AtriCure, Inc.* | 1,500 | 104,295 |
| Atrion Corp. | 44 | 31,016 |
| Avanos Medical, Inc.* | 1,500 | 52,005 |
| Avita Medical, Inc.* | 800 | 9,584 |
| Axogen, Inc.* | 1,200 | 11,244 |
| Axonics, Inc.* | 1,500 | 84,000 |
| BioLife Solutions, Inc.* | 300 | 11,181 |
| Bionano Genomics, Inc.* | 9,200 | 27,508 |
| Bioventus, Inc., Class A* | 1,095 | 15,866 |
| Butterfly Network, Inc.* | 4,100 | 27,429 |
| Cardiovascular Systems, Inc.* | 1,200 | 22,536 |
| CareDx, Inc.* | 1,700 | 77,316 |
| Castle Biosciences, Inc.* | 700 | 30,009 |
| Celcuity, Inc.* | 300 | 3,957 |
| Cerus Corp.* | 5,300 | 36,093 |
| ClearPoint Neuro, Inc.* | 700 | 7,854 |
| CONMED Corp. | 935 | 132,546 |
| CryoLife, Inc.* | 1,199 | 24,400 |
| Cutera, Inc.* | 500 | 20,660 |
| CVRx, Inc.* | 300 | 3,669 |
| CytoSorbents Corp.* | 1,100 | 4,609 |
| DermTech, Inc.* | 800 | 12,640 |
| Eargo, Inc.* | 700 | 3,570 |
| Glaukos Corp.* | 1,453 | 64,571 |
Penn Series Funds, Inc.
Schedule of Investments — December 31, 2021
Small Cap Index Fund
| | Number of
Shares | Value† |
| COMMON STOCKS — (continued) |
| Healthcare Products — (continued) |
| Haemonetics Corp.* | 1,631 | $ 86,508 |
| Hanger, Inc.* | 1,100 | 19,943 |
| Inari Medical, Inc.* | 1,100 | 100,397 |
| InfuSystem Holdings, Inc.* | 600 | 10,218 |
| Inogen, Inc.* | 600 | 20,400 |
| Inspire Medical Systems, Inc.* | 868 | 199,692 |
| Integer Holdings Corp.* | 1,040 | 89,014 |
| Intersect ENT, Inc.* | 1,200 | 32,772 |
| Invacare Corp.* | 1,190 | 3,237 |
| iRadimed Corp.* | 200 | 9,242 |
| iRhythm Technologies, Inc.* | 987 | 116,160 |
| Lantheus Holdings, Inc.* | 2,206 | 63,731 |
| LeMaitre Vascular, Inc. | 700 | 35,161 |
| LivaNova PLC* | 1,700 | 148,631 |
| Meridian Bioscience, Inc.* | 1,360 | 27,744 |
| Merit Medical Systems, Inc.* | 1,675 | 104,352 |
| MiMedx Group, Inc.* | 3,700 | 22,348 |
| NanoString Technologies, Inc.* | 1,500 | 63,345 |
| Natus Medical, Inc.* | 1,075 | 25,510 |
| Neogen Corp.* | 3,538 | 160,660 |
| NeuroPace, Inc.* | 300 | 3,024 |
| Nevro Corp.* | 1,117 | 90,555 |
| NuVasive, Inc.* | 1,706 | 89,531 |
| Omnicell, Inc.* | 1,422 | 256,586 |
| OraSure Technologies, Inc.* | 2,201 | 19,127 |
| Ortho Clinical Diagnostics Holdings PLC* | 3,600 | 77,004 |
| Orthofix Medical, Inc.* | 571 | 17,752 |
| OrthoPediatrics Corp.* | 400 | 23,944 |
| Pacific Biosciences of California, Inc.* | 6,300 | 128,898 |
| Patterson Cos., Inc. | 2,800 | 82,180 |
| PAVmed, Inc.* | 2,900 | 7,134 |
| PROCEPT BioRobotics Corp.* | 200 | 5,002 |
| Pulmonx Corp.* | 800 | 25,656 |
| Pulse Biosciences, Inc.* | 494 | 7,316 |
| Quanterix Corp.* | 1,000 | 42,400 |
| Quotient Ltd.* | 2,200 | 5,698 |
| Rapid Micro Biosystems, Inc., Class A* | 300 | 3,192 |
| Retractable Technologies, Inc.* | 300 | 2,079 |
| SeaSpine Holdings Corp.* | 1,000 | 13,620 |
| Shockwave Medical, Inc.* | 1,090 | 194,380 |
| SI-BONE, Inc.* | 1,000 | 22,210 |
| Sientra, Inc.* | 1,900 | 6,973 |
| Silk Road Medical, Inc.* | 1,100 | 46,871 |
| STAAR Surgical Co.* | 1,523 | 139,050 |
| Stereotaxis, Inc.* | 1,700 | 10,540 |
| Surmodics, Inc.* | 473 | 22,775 |
| Tactile Systems Technology, Inc.* | 600 | 11,418 |
| Talis Biomedical Corp.* | 600 | 2,406 |
| Treace Medical Concepts, Inc.* | 1,000 | 18,640 |
| Utah Medical Products, Inc. | 100 | 10,000 |
| Varex Imaging Corp.* | 1,400 | 44,170 |
| ViewRay, Inc.* | 4,200 | 23,142 |
| Zynex, Inc.* | 600 | 5,982 |
| | | 3,733,305 |
| | Number of
Shares | Value† |
| |
| Healthcare Services — 2.0% |
| Accolade, Inc.* | 1,600 | $ 42,176 |
| Addus HomeCare Corp.* | 500 | 46,755 |
| Agiliti, Inc.* | 800 | 18,528 |
| American Well Corp., Class A* | 6,300 | 38,052 |
| Aveanna Healthcare Holdings, Inc.* | 1,400 | 10,360 |
| Brookdale Senior Living, Inc.* | 5,500 | 28,380 |
| Community Health Systems, Inc.* | 4,100 | 54,571 |
| Fulgent Genetics, Inc.* | 700 | 70,413 |
| Innovage Holding Corp.* | 700 | 3,500 |
| Inotiv, Inc.* | 500 | 21,035 |
| Invitae Corp.* | 6,500 | 99,255 |
| LHC Group, Inc.* | 986 | 135,309 |
| LifeStance Health Group, Inc.* | 1,500 | 14,280 |
| Magellan Health, Inc.* | 741 | 70,387 |
| MEDNAX, Inc.* | 2,500 | 68,025 |
| Medpace Holdings, Inc.* | 960 | 208,934 |
| ModivCare, Inc.* | 400 | 59,316 |
| National HealthCare Corp. | 406 | 27,584 |
| Neuronetics, Inc.* | 900 | 4,014 |
| Ontrak, Inc.* | 200 | 1,258 |
| OPKO Health, Inc.* | 14,001 | 67,345 |
| Personalis, Inc.* | 1,200 | 17,124 |
| RadNet, Inc.* | 1,600 | 48,176 |
| Select Medical Holdings Corp. | 3,600 | 105,840 |
| SOC Telemed, Inc.* | 1,600 | 2,048 |
| Surgery Partners, Inc.* | 1,000 | 53,410 |
| Tenet Healthcare Corp.* | 3,500 | 285,915 |
| The Ensign Group, Inc. | 1,680 | 141,053 |
| The Joint Corp.* | 500 | 32,845 |
| The Pennant Group, Inc.* | 740 | 17,079 |
| Tivity Health, Inc.* | 1,489 | 39,369 |
| Triple-S Management Corp.* | 831 | 29,650 |
| U.S. Physical Therapy, Inc. | 456 | 43,571 |
| Vapotherm, Inc.* | 800 | 16,568 |
| Viemed Healthcare, Inc.* | 1,300 | 6,786 |
| | | 1,928,911 |
| Home Builders — 1.5% |
| Beazer Homes USA, Inc.* | 924 | 21,455 |
| Cavco Industries, Inc.* | 298 | 94,660 |
| Century Communities, Inc. | 1,000 | 81,790 |
| Forestar Group, Inc.* | 460 | 10,005 |
| Green Brick Partners, Inc.* | 1,000 | 30,330 |
| Hovnanian Enterprises, Inc., Class A* | 200 | 25,458 |
| Installed Building Products, Inc. | 766 | 107,026 |
| KB Home | 2,600 | 116,298 |
| LCI Industries | 791 | 123,293 |
| LGI Homes, Inc.* | 700 | 108,136 |
| M/I Homes, Inc.* | 936 | 58,201 |
| MDC Holdings, Inc. | 1,859 | 103,788 |
| Meritage Homes Corp.* | 1,190 | 145,251 |
| Skyline Corp.* | 1,700 | 134,266 |
| Taylor Morrison Home Corp.* | 3,900 | 136,344 |
| Tri Pointe Homes, Inc.* | 3,600 | 100,404 |
Penn Series Funds, Inc.
Schedule of Investments — December 31, 2021
Small Cap Index Fund
| | Number of
Shares | Value† |
| COMMON STOCKS — (continued) |
| Home Builders — (continued) |
| Winnebago Industries, Inc. | 1,022 | $ 76,568 |
| | | 1,473,273 |
| Home Furnishings — 0.5% |
| Aterian, Inc.* | 700 | 2,877 |
| Casper Sleep, Inc.* | 1,100 | 7,348 |
| Daktronics, Inc.* | 1,209 | 6,106 |
| Ethan Allen Interiors, Inc. | 628 | 16,510 |
| Flexsteel Industries, Inc. | 300 | 8,058 |
| Hamilton Beach Brands Holding Co., Class A | 144 | 2,068 |
| Hooker Furnishings Corp. | 300 | 6,984 |
| iRobot Corp.* | 880 | 57,974 |
| MillerKnoll, Inc. | 2,528 | 99,072 |
| Purple Innovation, Inc.* | 1,700 | 22,559 |
| Sleep Number Corp.* | 772 | 59,135 |
| Snap One Holdings Corp.* | 400 | 8,432 |
| Sonos, Inc.* | 3,900 | 116,220 |
| The Lovesac Co.* | 400 | 26,504 |
| Traeger, Inc.* | 700 | 8,512 |
| Universal Electronics, Inc.* | 400 | 16,300 |
| VOXX International Corp.* | 500 | 5,085 |
| Weber, Inc., Class A | 500 | 6,465 |
| | | 476,209 |
| Household Products & Wares — 0.4% |
| ACCO Brands Corp. | 2,893 | 23,896 |
| Central Garden & Pet Co.* | 300 | 15,789 |
| Central Garden & Pet Co., Class A* | 1,402 | 67,086 |
| Helen of Troy Ltd.* | 778 | 190,198 |
| Quanex Building Products Corp. | 1,025 | 25,399 |
| WD-40 Co. | 437 | 106,908 |
| | | 429,276 |
| Housewares — 0.0% |
| Lifetime Brands, Inc. | 400 | 6,388 |
| Tupperware Brands Corp.* | 1,800 | 27,522 |
| | | 33,910 |
| Insurance — 2.3% |
| Ambac Financial Group, Inc.* | 1,500 | 24,075 |
| American Equity Investment Life Holding Co. | 2,676 | 104,150 |
| American National Group, Inc. | 227 | 42,867 |
| AMERISAFE, Inc. | 608 | 32,729 |
| Argo Group International Holdings Ltd. | 1,032 | 59,970 |
| BRP Group, Inc., Class A* | 1,500 | 54,165 |
| Citizens, Inc.* | 1,466 | 7,784 |
| CNO Financial Group, Inc. | 4,093 | 97,577 |
| Crawford & Co., Class A | 700 | 5,243 |
| Donegal Group, Inc., Class A | 283 | 4,044 |
| eHealth, Inc.* | 720 | 18,360 |
| Employers Holdings, Inc. | 882 | 36,497 |
| Enstar Group Ltd.* | 401 | 99,284 |
| Essent Group Ltd. | 3,600 | 163,908 |
| Genworth Financial, Inc., Class A* | 15,800 | 63,990 |
| Goosehead Insurance, Inc., Class A | 600 | 78,048 |
| | Number of
Shares | Value† |
| |
| Insurance — (continued) |
| Greenlight Capital Re Ltd., Class A* | 1,128 | $ 8,844 |
| HCI Group, Inc. | 200 | 16,708 |
| Heritage Insurance Holdings, Inc. | 800 | 4,704 |
| Horace Mann Educators Corp. | 1,280 | 49,536 |
| Independence Holding Co. | 100 | 5,668 |
| Investors Title Co. | 39 | 7,689 |
| James River Group Holdings Ltd. | 1,100 | 31,691 |
| Kinsale Capital Group, Inc. | 694 | 165,096 |
| Maiden Holdings Ltd.* | 2,800 | 8,568 |
| MBIA, Inc.* | 1,700 | 26,843 |
| MetroMile, Inc.* | 1,400 | 3,066 |
| National Western Life Group, Inc., Class A | 74 | 15,869 |
| NI Holdings, Inc.* | 200 | 3,782 |
| NMI Holdings, Inc., Class A* | 2,900 | 63,365 |
| Palomar Holdings, Inc.* | 800 | 51,816 |
| ProAssurance Corp. | 1,800 | 45,540 |
| Radian Group, Inc. | 6,003 | 126,843 |
| RLI Corp. | 1,292 | 144,833 |
| Safety Insurance Group, Inc. | 482 | 40,984 |
| Selective Insurance Group, Inc. | 1,975 | 161,831 |
| Selectquote, Inc.* | 4,300 | 38,958 |
| SiriusPoint Ltd.* | 3,300 | 26,829 |
| State Auto Financial Corp. | 576 | 29,773 |
| Stewart Information Services Corp. | 908 | 72,395 |
| Tiptree, Inc. | 600 | 8,298 |
| Trean Insurance Group, Inc.* | 500 | 4,455 |
| Trupanion, Inc.* | 1,200 | 158,436 |
| United Fire Group, Inc. | 680 | 15,769 |
| United Insurance Holdings Corp. | 800 | 3,472 |
| Universal Insurance Holdings, Inc. | 951 | 16,167 |
| | | 2,250,519 |
| Internet — 1.9% |
| 1-800-Flowers.com, Inc., Class A* | 937 | 21,897 |
| Bright Health Group, Inc.* | 1,700 | 5,848 |
| Cargurus, Inc.* | 3,200 | 107,648 |
| CarParts.com, Inc.* | 1,600 | 17,920 |
| Cars.com, Inc.* | 2,500 | 40,225 |
| ChannelAdvisor Corp.* | 900 | 22,212 |
| Cogent Communications Holdings, Inc. | 1,419 | 103,842 |
| comScore, Inc.* | 1,900 | 6,346 |
| Couchbase, Inc.* | 300 | 7,488 |
| ePlus, Inc.* | 952 | 51,294 |
| Eventbrite, Inc., Class A* | 2,500 | 43,600 |
| EverQuote, Inc., Class A* | 700 | 10,962 |
| fuboTV, Inc.* | 4,200 | 65,184 |
| Groupon, Inc.* | 850 | 19,686 |
| HealthStream, Inc.* | 900 | 23,724 |
| HyreCar, Inc.* | 600 | 2,826 |
| Lands' End, Inc.* | 500 | 9,815 |
| Limelight Networks, Inc.* | 4,172 | 14,310 |
| Liquidity Services, Inc.* | 735 | 16,229 |
| LiveOne, Inc.* | 1,500 | 1,920 |
| Magnite, Inc.* | 4,206 | 73,605 |
Penn Series Funds, Inc.
Schedule of Investments — December 31, 2021
Small Cap Index Fund
| | Number of
Shares | Value† |
| COMMON STOCKS — (continued) |
| Internet — (continued) |
| MediaAlpha, Inc., Class A* | 600 | $ 9,264 |
| Mimecast Ltd.* | 2,000 | 159,140 |
| Open Lending Corp., Class A* | 3,400 | 76,432 |
| Overstock.com, Inc.* | 1,400 | 82,614 |
| Perficient, Inc.* | 1,045 | 135,108 |
| Q2 Holdings, Inc.* | 1,800 | 142,992 |
| QuinStreet, Inc.* | 1,715 | 31,196 |
| Revolve Group, Inc.* | 1,200 | 67,248 |
| Shutterstock, Inc. | 800 | 88,704 |
| Stitch Fix, Inc., Class A* | 2,600 | 49,192 |
| TechTarget, Inc.* | 900 | 86,094 |
| The RealReal, Inc.* | 2,600 | 30,186 |
| TrueCar, Inc.* | 3,500 | 11,900 |
| Tucows, Inc., Class A* | 300 | 25,146 |
| Upwork, Inc.* | 3,900 | 133,224 |
| VirnetX Holding Corp.* | 2,283 | 5,936 |
| Yelp, Inc.* | 2,300 | 83,352 |
| | | 1,884,309 |
| Investment Companies — 0.0% |
| Altus Midstream Co., Class A | 100 | 6,131 |
| Iron & Steel — 0.3% |
| Allegheny Technologies, Inc.* | 4,000 | 63,720 |
| Carpenter Technology Corp. | 1,500 | 43,785 |
| Commercial Metals Co. | 3,900 | 141,531 |
| Schnitzer Steel Industries, Inc., Class A | 900 | 46,728 |
| | | 295,764 |
| Leisure Time — 0.5% |
| Acushnet Holdings Corp. | 1,200 | 63,696 |
| Callaway Golf Co.* | 3,746 | 102,790 |
| Camping World Holdings, Inc., Class A | 1,400 | 56,560 |
| Clarus Corp. | 702 | 19,460 |
| Drive Shack, Inc.* | 3,200 | 4,576 |
| Escalade, Inc. | 200 | 3,158 |
| F45 Training Holdings, Inc.* | 700 | 7,623 |
| Johnson Outdoors, Inc., Class A | 168 | 15,740 |
| Liberty TripAdvisor Holdings, Inc., Class A* | 2,400 | 5,208 |
| Life Time Group Holdings, Inc.* | 1,300 | 22,373 |
| Lindblad Expeditions Holdings, Inc.* | 1,100 | 17,160 |
| Malibu Boats, Inc., Class A* | 700 | 48,111 |
| Marine Products Corp. | 88 | 1,100 |
| MasterCraft Boat Holdings, Inc.* | 500 | 14,165 |
| Nautilus, Inc.* | 900 | 5,517 |
| OneSpaWorld Holdings Ltd.* | 1,600 | 16,032 |
| OneWater Marine, Inc., Class A | 400 | 24,388 |
| Vista Outdoor, Inc.* | 1,900 | 87,533 |
| Xponential Fitness, Inc., Class A* | 500 | 10,220 |
| | | 525,410 |
| Lodging — 0.2% |
| Bluegreen Vacations Holding Corp.* | 404 | 14,181 |
| Century Casinos, Inc.* | 1,100 | 13,398 |
| Full House Resorts, Inc.* | 1,200 | 14,532 |
| Hilton Grand Vacations, Inc.* | 2,800 | 145,908 |
| | Number of
Shares | Value† |
| |
| Lodging — (continued) |
| Target Hospitality Corp.* | 1,300 | $ 4,628 |
| The Marcus Corp.* | 733 | 13,091 |
| | | 205,738 |
| Machinery — Construction & Mining — 0.3% |
| Argan, Inc. | 436 | 16,869 |
| Astec Industries, Inc. | 698 | 48,350 |
| Babcock & Wilcox Enterprises, Inc.* | 2,000 | 18,040 |
| Bloom Energy Corp., Class A* | 4,500 | 98,685 |
| Hyster-Yale Materials Handling, Inc. | 344 | 14,138 |
| Terex Corp. | 2,300 | 101,085 |
| The Manitowoc Co., Inc.* | 1,025 | 19,055 |
| | | 316,222 |
| Machinery — Diversified — 1.9% |
| AgEagle Aerial Systems, Inc.* | 2,500 | 3,925 |
| Alamo Group, Inc. | 317 | 46,656 |
| Albany International Corp., Class A | 1,032 | 91,280 |
| Altra Industrial Motion Corp. | 2,103 | 108,452 |
| Applied Industrial Technologies, Inc. | 1,282 | 131,661 |
| Cactus, Inc., Class A | 1,700 | 64,821 |
| Chart Industries, Inc.* | 1,177 | 187,720 |
| CIRCOR International, Inc.* | 635 | 17,259 |
| Columbus McKinnon Corp. | 885 | 40,940 |
| CSW Industrials, Inc. | 482 | 58,255 |
| DXP Enterprises, Inc.* | 522 | 13,400 |
| Eastman Kodak Co.* | 1,600 | 7,488 |
| GrafTech International Ltd. | 6,600 | 78,078 |
| Hydrofarm Holdings Group, Inc.* | 1,300 | 36,777 |
| Ichor Holdings Ltd.* | 900 | 41,427 |
| Kadant, Inc. | 372 | 85,739 |
| Lindsay Corp. | 385 | 58,520 |
| Mueller Water Products, Inc., Class A | 5,392 | 77,645 |
| NN, Inc.* | 1,600 | 6,560 |
| Ranpak Holdings Corp.* | 1,200 | 45,096 |
| SPX FLOW, Inc. | 1,400 | 121,072 |
| Tennant Co. | 636 | 51,541 |
| The Gorman-Rupp Co. | 751 | 33,457 |
| Thermon Group Holdings, Inc.* | 1,100 | 18,623 |
| Watts Water Technologies, Inc., Class A | 888 | 172,423 |
| Welbilt, Inc.* | 4,200 | 99,834 |
| Zurn Water Solutions Corp. | 4,000 | 145,600 |
| | | 1,844,249 |
| Media — 0.7% |
| AMC Networks, Inc., Class A* | 1,000 | 34,440 |
| CuriosityStream, Inc.* | 1,000 | 5,930 |
| Entercom Communications Corp.* | 3,100 | 7,967 |
| Entravision Communications Corp., Class A | 2,500 | 16,950 |
| Gannett Co., Inc.* | 4,253 | 22,668 |
| Gray Television, Inc. | 2,700 | 54,432 |
| Hemisphere Media Group, Inc.* | 400 | 2,908 |
| Houghton Mifflin Harcourt Co.* | 4,200 | 67,620 |
| iHeartMedia, Inc., Class A* | 3,600 | 75,744 |
| Liberty Latin America Ltd., Class A* | 1,400 | 16,324 |
Penn Series Funds, Inc.
Schedule of Investments — December 31, 2021
Small Cap Index Fund
| | Number of
Shares | Value† |
| COMMON STOCKS — (continued) |
| Media — (continued) |
| Liberty Latin America Ltd., Class C* | 5,352 | $ 61,013 |
| Scholastic Corp. | 956 | 38,202 |
| Sinclair Broadcast Group, Inc., Class A | 1,400 | 37,002 |
| TEGNA, Inc. | 7,200 | 133,632 |
| The E.W. Scripps Co., Class A* | 2,029 | 39,261 |
| Thryv Holdings, Inc.* | 300 | 12,339 |
| WideOpenWest, Inc.* | 1,800 | 38,736 |
| | | 665,168 |
| Metal Fabricate/Hardware — 0.7% |
| AZZ, Inc. | 776 | 42,905 |
| Helios Technologies, Inc. | 1,059 | 111,375 |
| Lawson Products, Inc.* | 100 | 5,475 |
| Mayville Engineering Co., Inc.* | 300 | 4,473 |
| Mueller Industries, Inc. | 1,788 | 106,136 |
| Northwest Pipe Co.* | 300 | 9,540 |
| Olympic Steel, Inc. | 231 | 5,428 |
| Omega Flex, Inc. | 81 | 10,283 |
| Park-Ohio Holdings Corp. | 200 | 4,234 |
| Proto Labs, Inc.* | 866 | 44,469 |
| RBC Bearings, Inc.* | 913 | 184,399 |
| Ryerson Holding Corp. | 400 | 10,420 |
| Standex International Corp. | 400 | 44,264 |
| TimkenSteel Corp.* | 1,400 | 23,100 |
| Tredegar Corp. | 761 | 8,995 |
| Worthington Industries, Inc. | 1,084 | 59,251 |
| Xometry, Inc., Class A* | 300 | 15,375 |
| | | 690,122 |
| Mining — 0.9% |
| Arconic Corp.* | 3,600 | 118,836 |
| Century Aluminum Co.* | 1,954 | 32,358 |
| Coeur Mining, Inc.* | 8,628 | 43,485 |
| Compass Minerals International, Inc. | 1,100 | 56,188 |
| Constellium S.E.* | 4,000 | 71,640 |
| Energy Fuels, Inc.* | 4,800 | 36,624 |
| Ferroglobe PLC(1),* | 2,414 | 0 |
| Gatos Silver, Inc.* | 1,700 | 17,646 |
| Hecla Mining Co. | 17,191 | 89,737 |
| Kaiser Aluminum Corp. | 516 | 48,473 |
| Livent Corp.* | 5,400 | 131,652 |
| MP Materials Corp.* | 2,400 | 109,008 |
| Novagold Resources, Inc.* | 7,500 | 51,450 |
| Perpetua Resources Corp.* | 1,100 | 5,225 |
| United States Lime & Minerals, Inc. | 43 | 5,548 |
| Uranium Energy Corp.* | 8,100 | 27,135 |
| Ur-Energy, Inc.* | 7,000 | 8,540 |
| | | 853,545 |
| Miscellaneous Manufacturing — 1.0% |
| American Outdoor Brands, Inc.* | 469 | 9,347 |
| AMMO, Inc.* | 2,300 | 12,535 |
| Byrna Technologies, Inc.* | 700 | 9,345 |
| Chase Corp. | 261 | 25,985 |
| Enerpac Tool Group Corp. | 2,106 | 42,710 |
| EnPro Industries, Inc. | 717 | 78,920 |
| | Number of
Shares | Value† |
| |
| Miscellaneous Manufacturing — (continued) |
| ESCO Technologies, Inc. | 834 | $ 75,052 |
| Fabrinet* | 1,200 | 142,164 |
| Federal Signal Corp. | 1,943 | 84,210 |
| Haynes International, Inc. | 364 | 14,680 |
| Hillenbrand, Inc. | 2,344 | 121,865 |
| John Bean Technologies Corp. | 1,013 | 155,556 |
| Materion Corp. | 657 | 60,405 |
| Meta Materials, Inc.* | 7,050 | 17,343 |
| Myers Industries, Inc. | 1,125 | 22,511 |
| NL Industries, Inc. | 90 | 666 |
| Sight Sciences, Inc.* | 400 | 7,028 |
| Smith & Wesson Brands, Inc. | 1,579 | 28,106 |
| Sturm Ruger & Co., Inc. | 519 | 35,302 |
| Trinity Industries, Inc. | 2,500 | 75,500 |
| | | 1,019,230 |
| Office & Business Equipment — 0.0% |
| Pitney Bowes, Inc. | 6,000 | 39,780 |
| Office Furnishings — 0.1% |
| HNI Corp. | 1,443 | 60,678 |
| Interface, Inc. | 1,995 | 31,820 |
| Kimball International, Inc., Class B | 1,244 | 12,726 |
| Steelcase, Inc., Class A | 2,631 | 30,836 |
| | | 136,060 |
| Oil & Gas — 2.8% |
| Antero Resources Corp.* | 9,200 | 161,000 |
| Berry Corp. | 2,100 | 17,682 |
| Brigham Minerals, Inc., Class A | 1,500 | 31,635 |
| California Resources Corp. | 2,700 | 115,317 |
| Callon Petroleum Co.* | 1,500 | 70,875 |
| Centennial Resource Development, Inc., Class A* | 6,000 | 35,880 |
| Chesapeake Energy Corp. | 3,398 | 219,239 |
| Civitas Resources, Inc. | 1,394 | 68,264 |
| CNX Resources Corp.* | 7,100 | 97,625 |
| Cobalt International Energy, Inc.(1),* | 1 | 0 |
| Comstock Resources, Inc.* | 3,200 | 25,888 |
| Crescent Energy, Inc., Class A* | 1,020 | 12,934 |
| CVR Energy, Inc. | 1,000 | 16,810 |
| Delek US Holdings, Inc.* | 1,983 | 29,725 |
| Denbury, Inc.* | 1,700 | 130,203 |
| Earthstone Energy, Inc., Class A* | 700 | 7,658 |
| Falcon Minerals Corp. | 1,500 | 7,305 |
| Helmerich & Payne, Inc. | 3,400 | 80,580 |
| Kosmos Energy Ltd.* | 14,000 | 48,440 |
| Laredo Petroleum, Inc.* | 400 | 24,052 |
| Magnolia Oil & Gas Corp., Class A | 4,400 | 83,028 |
| Matador Resources Co. | 3,600 | 132,912 |
| Murphy Oil Corp. | 4,700 | 122,717 |
| Nabors Industries Ltd.* | 218 | 17,678 |
| Northern Oil & Gas, Inc. | 1,600 | 32,928 |
| Oasis Petroleum, Inc. | 600 | 75,594 |
| Ovintiv, Inc. | 8,500 | 286,450 |
| Par Pacific Holdings, Inc.* | 1,618 | 26,681 |
Penn Series Funds, Inc.
Schedule of Investments — December 31, 2021
Small Cap Index Fund
| | Number of
Shares | Value† |
| COMMON STOCKS — (continued) |
| Oil & Gas — (continued) |
| Patterson-UTI Energy, Inc. | 6,300 | $ 53,235 |
| PBF Energy, Inc., Class A* | 3,000 | 38,910 |
| PDC Energy, Inc. | 3,255 | 158,779 |
| Range Resources Corp.* | 7,700 | 137,291 |
| Ranger Oil Corp.* | 700 | 18,844 |
| SM Energy Co. | 4,000 | 117,920 |
| Southwestern Energy Co.* | 32,952 | 153,556 |
| Talos Energy, Inc.* | 1,300 | 12,740 |
| Tellurian, Inc.* | 12,200 | 37,576 |
| W&T Offshore, Inc.* | 3,543 | 11,444 |
| Whiting Petroleum Corp.* | 1,252 | 80,979 |
| | | 2,800,374 |
| Oil & Gas Services — 0.6% |
| Archrock, Inc. | 4,700 | 35,156 |
| Bristow Group, Inc.* | 766 | 24,259 |
| ChampionX Corp.* | 6,500 | 131,365 |
| DMC Global, Inc.* | 700 | 27,727 |
| Dril-Quip, Inc.* | 1,100 | 21,648 |
| Expro Group Holdings N.V.* | 1,116 | 16,015 |
| FTS International, Inc., Class A* | 400 | 10,500 |
| Helix Energy Solutions Group, Inc.* | 4,501 | 14,043 |
| Liberty Oilfield Services, Inc., Class A* | 3,200 | 31,040 |
| Matrix Service Co.* | 987 | 7,422 |
| MRC Global, Inc.* | 2,400 | 16,512 |
| National Energy Services Reunited Corp.* | 1,100 | 10,395 |
| Newpark Resources, Inc.* | 2,712 | 7,974 |
| NexTier Oilfield Solutions, Inc.* | 4,991 | 17,718 |
| NOW, Inc.* | 3,800 | 32,452 |
| Oceaneering International, Inc.* | 3,400 | 38,454 |
| Oil States International, Inc.* | 2,000 | 9,940 |
| ProPetro Holding Corp.* | 2,900 | 23,490 |
| RPC, Inc.* | 2,200 | 9,988 |
| Select Energy Services, Inc., Class A* | 2,100 | 13,083 |
| Solaris Oilfield Infrastructure, Inc., Class A | 1,100 | 7,205 |
| TETRA Technologies, Inc.* | 4,400 | 12,496 |
| Tidewater, Inc.* | 1,400 | 14,994 |
| US Silica Holdings, Inc.* | 2,700 | 25,380 |
| | | 559,256 |
| Packaging and Containers — 0.3% |
| Greif, Inc., Class A | 800 | 48,296 |
| Greif, Inc., Class B | 200 | 11,956 |
| Matthews International Corp., Class A | 1,105 | 40,520 |
| O-I Glass, Inc.* | 5,100 | 61,353 |
| Pactiv Evergreen, Inc. | 1,200 | 15,216 |
| TriMas Corp. | 1,495 | 55,315 |
| UFP Technologies, Inc.* | 200 | 14,052 |
| | | 246,708 |
| Pharmaceuticals — 2.8% |
| Aclaris Therapeutics, Inc.* | 1,500 | 21,810 |
| AdaptHealth Corp.* | 2,500 | 61,150 |
| Aeglea BioTherapeutics, Inc.* | 1,500 | 7,125 |
| | Number of
Shares | Value† |
| |
| Pharmaceuticals — (continued) |
| Aerie Pharmaceuticals, Inc.* | 1,600 | $ 11,232 |
| Agios Pharmaceuticals, Inc.* | 1,800 | 59,166 |
| Akebia Therapeutics, Inc.* | 4,510 | 10,193 |
| Alector, Inc.* | 1,900 | 39,235 |
| Alkermes PLC* | 5,200 | 120,952 |
| Amneal Pharmaceuticals, Inc.* | 2,937 | 14,068 |
| Amphastar Pharmaceuticals, Inc.* | 1,100 | 25,619 |
| Ampio Pharmaceuticals, Inc.* | 7,100 | 4,047 |
| Anika Therapeutics, Inc.* | 400 | 14,332 |
| Antares Pharma, Inc.* | 5,600 | 19,992 |
| Arvinas, Inc.* | 1,500 | 123,210 |
| Athenex, Inc.* | 1,900 | 2,584 |
| Beyondspring, Inc.* | 800 | 3,624 |
| BioDelivery Sciences International, Inc.* | 3,100 | 9,610 |
| Bioxcel Therapeutics, Inc.* | 600 | 12,198 |
| Catalyst Pharmaceuticals, Inc.* | 2,800 | 18,956 |
| Chimerix, Inc.* | 2,700 | 17,361 |
| Citius Pharmaceuticals, Inc.* | 4,100 | 6,314 |
| Clovis Oncology, Inc.* | 4,100 | 11,111 |
| Coherus Biosciences, Inc.* | 2,100 | 33,516 |
| Collegium Pharmaceutical, Inc.* | 1,000 | 18,680 |
| Corcept Therapeutics, Inc.* | 3,100 | 61,380 |
| CorMedix, Inc.* | 1,000 | 4,550 |
| Covetrus, Inc.* | 3,500 | 69,895 |
| Cytokinetics, Inc.* | 2,600 | 118,508 |
| Durect Corp.* | 7,200 | 7,098 |
| Eagle Pharmaceuticals, Inc.* | 400 | 20,368 |
| Enanta Pharmaceuticals, Inc.* | 600 | 44,868 |
| Endo International PLC* | 8,000 | 30,080 |
| Foghorn Therapeutics, Inc.* | 800 | 18,296 |
| Fortress Biotech, Inc.* | 2,400 | 6,000 |
| Fulcrum Therapeutics, Inc.* | 800 | 14,152 |
| G1 Therapeutics, Inc.* | 1,300 | 13,273 |
| Gritstone bio, Inc.* | 1,500 | 19,290 |
| Harmony Biosciences Holdings, Inc.* | 800 | 34,112 |
| Harpoon Therapeutics, Inc.* | 500 | 3,775 |
| Heron Therapeutics, Inc.* | 2,700 | 24,651 |
| Heska Corp.* | 312 | 56,937 |
| Hookipa Pharma, Inc.* | 500 | 1,165 |
| Ideaya Biosciences, Inc.* | 1,000 | 23,640 |
| Immuneering Corp., Class A* | 300 | 4,851 |
| Intellia Therapeutics, Inc.* | 2,274 | 268,878 |
| Ironwood Pharmaceuticals, Inc.* | 4,861 | 56,679 |
| Jounce Therapeutics, Inc.* | 1,600 | 13,360 |
| Kala Pharmaceuticals, Inc.* | 1,400 | 1,694 |
| KalVista Pharmaceuticals, Inc.* | 500 | 6,615 |
| Kura Oncology, Inc.* | 1,900 | 26,600 |
| Lyell Immunopharma, Inc.* | 800 | 6,192 |
| Madrigal Pharmaceuticals, Inc.* | 379 | 32,116 |
| MannKind Corp.* | 9,001 | 39,334 |
| Marinus Pharmaceuticals, Inc.* | 1,275 | 15,147 |
| Mirum Pharmaceuticals, Inc.* | 100 | 1,595 |
| Morphic Holding, Inc.* | 700 | 33,166 |
| Nature's Sunshine Products, Inc. | 500 | 9,250 |
| Neoleukin Therapeutics, Inc.* | 1,100 | 5,302 |
Penn Series Funds, Inc.
Schedule of Investments — December 31, 2021
Small Cap Index Fund
| | Number of
Shares | Value† |
| COMMON STOCKS — (continued) |
| Pharmaceuticals — (continued) |
| NexImmune, Inc.* | 600 | $ 2,766 |
| Ocugen, Inc.* | 6,100 | 27,755 |
| Ocular Therapeutix, Inc.* | 2,700 | 18,819 |
| Option Care Health, Inc.* | 5,202 | 147,945 |
| Oramed Pharmaceuticals, Inc.* | 1,000 | 14,280 |
| ORIC Pharmaceuticals, Inc.* | 1,000 | 14,700 |
| Outlook Therapeutics, Inc.* | 3,600 | 4,896 |
| Owens & Minor, Inc. | 2,376 | 103,356 |
| Pacira BioSciences, Inc.* | 1,400 | 84,238 |
| Paratek Pharmaceuticals, Inc.* | 1,100 | 4,939 |
| Passage Bio, Inc.* | 1,600 | 10,160 |
| PetIQ, Inc.* | 1,000 | 22,710 |
| Phibro Animal Health Corp., Class A | 700 | 14,294 |
| PMV Pharmaceuticals, Inc.* | 900 | 20,790 |
| Prestige Consumer Healthcare, Inc.* | 1,672 | 101,407 |
| Prometheus Biosciences, Inc.* | 1,000 | 39,540 |
| Protagonist Therapeutics, Inc.* | 1,400 | 47,880 |
| Reata Pharmaceuticals, Inc., Class A* | 884 | 23,311 |
| Relmada Therapeutics, Inc.* | 500 | 11,265 |
| Revance Therapeutics, Inc.* | 2,200 | 35,904 |
| Rhythm Pharmaceuticals, Inc.* | 1,300 | 12,974 |
| Senseonics Holdings, Inc.* | 13,700 | 36,579 |
| Seres Therapeutics, Inc.* | 2,300 | 19,159 |
| SIGA Technologies, Inc.* | 2,000 | 15,040 |
| Spectrum Pharmaceuticals, Inc.* | 5,014 | 6,368 |
| Spero Therapeutics, Inc.* | 860 | 13,769 |
| Summit Therapeutics, Inc.* | 1,000 | 2,690 |
| Supernus Pharmaceuticals, Inc.* | 1,500 | 43,740 |
| Syros Pharmaceuticals, Inc.* | 1,400 | 4,564 |
| TherapeuticsMD, Inc.* | 12,500 | 4,444 |
| Tonix Pharmaceuticals Holding Corp.* | 12,100 | 4,328 |
| Trevena, Inc.* | 6,200 | 3,611 |
| USANA Health Sciences, Inc.* | 348 | 35,218 |
| Vanda Pharmaceuticals, Inc.* | 1,941 | 30,454 |
| Vaxcyte, Inc.* | 1,500 | 35,685 |
| Verrica Pharmaceuticals, Inc.* | 600 | 5,496 |
| Zogenix, Inc.* | 1,975 | 32,094 |
| | | 2,816,070 |
| Pipelines — 0.2% |
| Equitrans Midstream Corp. | 13,200 | 136,488 |
| Golar LNG Ltd.* | 3,600 | 44,604 |
| | | 181,092 |
| Real Estate — 0.8% |
| Cushman & Wakefield PLC* | 4,500 | 100,080 |
| Douglas Elliman, Inc.* | 2,428 | 27,928 |
| eXp World Holdings, Inc. | 2,000 | 67,380 |
| Fathom Holdings, Inc.* | 100 | 2,046 |
| FRP Holdings, Inc.* | 169 | 9,768 |
| Kennedy-Wilson Holdings, Inc. | 3,881 | 92,678 |
| Legacy Housing Corp.* | 300 | 7,941 |
| Marcus & Millichap, Inc.* | 800 | 41,168 |
| McGrath RentCorp | 753 | 60,436 |
| Newmark Group, Inc., Class A | 4,700 | 87,890 |
| | Number of
Shares | Value† |
| |
| Real Estate — (continued) |
| Radius Global Infrastructure, Inc., Class A* | 2,000 | $ 32,200 |
| Rafael Holdings, Inc., Class B* | 300 | 1,530 |
| RE/MAX Holdings, Inc., Class A | 600 | 18,294 |
| Realogy Holdings Corp.* | 3,600 | 60,516 |
| Redfin Corp.* | 3,300 | 126,687 |
| The RMR Group, Inc., Class A | 467 | 16,196 |
| The St. Joe Co. | 1,100 | 57,255 |
| | | 809,993 |
| Retail — 4.9% |
| Abercrombie & Fitch Co., Class A* | 2,000 | 69,660 |
| Academy Sports & Outdoors, Inc.* | 2,500 | 109,750 |
| American Eagle Outfitters, Inc. | 4,900 | 124,068 |
| America's Car-Mart, Inc.* | 180 | 18,432 |
| Arko Corp.* | 3,900 | 34,203 |
| Asbury Automotive Group, Inc.* | 737 | 127,302 |
| Aspen Aerogels, Inc.* | 800 | 39,832 |
| Barnes & Noble Education, Inc.* | 1,400 | 9,534 |
| Bassett Furniture Industries, Inc. | 400 | 6,708 |
| Beacon Roofing Supply, Inc.* | 1,781 | 102,140 |
| Bed Bath & Beyond, Inc.* | 3,400 | 49,572 |
| Big 5 Sporting Goods Corp. | 700 | 13,307 |
| Big Lots, Inc. | 1,100 | 49,555 |
| Biglari Holdings, Inc., Class B* | 40 | 5,703 |
| BJ's Restaurants, Inc.* | 720 | 24,876 |
| BJ's Wholesale Club Holdings, Inc.* | 4,500 | 301,365 |
| Bloomin' Brands, Inc.* | 2,800 | 58,744 |
| BlueLinx Holdings, Inc.* | 300 | 28,728 |
| Boot Barn Holdings, Inc.* | 900 | 110,745 |
| Brinker International, Inc.* | 1,500 | 54,885 |
| Caleres, Inc. | 1,254 | 28,441 |
| Cannae Holdings, Inc.* | 2,800 | 98,420 |
| CarLotz, Inc.* | 1,700 | 3,859 |
| Carrols Restaurant Group, Inc. | 1,113 | 3,294 |
| Chico's FAS, Inc.* | 4,000 | 21,520 |
| Chuy's Holdings, Inc.* | 600 | 18,072 |
| Citi Trends, Inc.* | 303 | 28,709 |
| Clean Energy Fuels Corp.* | 5,400 | 33,102 |
| Conn's, Inc.* | 704 | 16,558 |
| Cracker Barrel Old Country Store, Inc. | 759 | 97,638 |
| Dave & Buster's Entertainment, Inc.* | 1,400 | 53,760 |
| Del Taco Restaurants, Inc. | 1,100 | 13,695 |
| Denny's Corp.* | 1,952 | 31,232 |
| Designer Brands, Inc., Class A* | 1,900 | 26,999 |
| Dillard's, Inc., Class A | 200 | 49,004 |
| Dine Brands Global, Inc. | 571 | 43,288 |
| Duluth Holdings, Inc., Class B* | 200 | 3,036 |
| El Pollo Loco Holdings, Inc.* | 600 | 8,514 |
| Fiesta Restaurant Group, Inc.* | 413 | 4,547 |
| FirstCash Holdings, Inc. | 1,339 | 100,171 |
| Franchise Group, Inc. | 1,000 | 52,160 |
| Genesco, Inc.* | 495 | 31,764 |
| GMS, Inc.* | 1,400 | 84,154 |
| Group 1 Automotive, Inc. | 568 | 110,885 |
Penn Series Funds, Inc.
Schedule of Investments — December 31, 2021
Small Cap Index Fund
| | Number of
Shares | Value† |
| COMMON STOCKS — (continued) |
| Retail — (continued) |
| GrowGeneration Corp.* | 1,800 | $ 23,490 |
| Guess?, Inc. | 1,200 | 28,416 |
| Haverty Furniture Cos., Inc. | 550 | 16,814 |
| Hibbett, Inc. | 455 | 32,728 |
| Jack in the Box, Inc. | 714 | 62,461 |
| JOANN, Inc. | 500 | 5,190 |
| Kirkland's, Inc.* | 500 | 7,465 |
| Kura Sushi USA, Inc., Class A* | 200 | 16,168 |
| La-Z-Boy, Inc. | 1,462 | 53,085 |
| Lazydays Holdings, Inc.* | 300 | 6,462 |
| Lumber Liquidators Holdings, Inc.* | 833 | 14,219 |
| Macy's, Inc. | 10,300 | 269,654 |
| MarineMax, Inc.* | 700 | 41,328 |
| MedAvail Holdings, Inc.* | 500 | 700 |
| Movado Group, Inc. | 460 | 19,242 |
| Murphy USA, Inc. | 781 | 155,606 |
| National Vision Holdings, Inc.* | 2,700 | 129,573 |
| Noodles & Co.* | 1,200 | 10,884 |
| Nu Skin Enterprises, Inc., Class A | 1,600 | 81,200 |
| OptimizeRx Corp.* | 600 | 37,266 |
| Papa John's International, Inc. | 1,110 | 148,152 |
| Party City Holdco, Inc.* | 3,700 | 20,609 |
| PC Connection, Inc. | 365 | 15,742 |
| PetMed Express, Inc. | 613 | 15,484 |
| Portillo's, Inc., Class A* | 800 | 30,032 |
| PriceSmart, Inc. | 731 | 53,487 |
| Red Robin Gourmet Burgers, Inc.* | 420 | 6,943 |
| Regis Corp.* | 732 | 1,274 |
| Rite Aid Corp.* | 1,610 | 23,651 |
| Rush Enterprises, Inc., Class A | 1,402 | 78,007 |
| Rush Enterprises, Inc., Class B | 250 | 13,493 |
| Ruth's Hospitality Group, Inc.* | 1,195 | 23,780 |
| Sally Beauty Holdings, Inc.* | 3,600 | 66,456 |
| Shake Shack, Inc., Class A* | 1,200 | 86,592 |
| Shift Technologies, Inc.* | 2,200 | 7,502 |
| Shoe Carnival, Inc. | 516 | 20,165 |
| Signet Jewelers Ltd. | 1,700 | 147,951 |
| Sonic Automotive, Inc., Class A | 734 | 36,296 |
| Sportsman's Warehouse Holdings, Inc.* | 1,300 | 15,340 |
| Texas Roadhouse, Inc. | 2,270 | 202,666 |
| The Buckle, Inc. | 1,049 | 44,383 |
| The Cato Corp., Class A | 704 | 12,081 |
| The Cheesecake Factory, Inc.* | 1,516 | 59,351 |
| The Children's Place, Inc.* | 494 | 39,169 |
| The Container Store Group, Inc.* | 1,200 | 11,976 |
| The ODP Corp.* | 1,570 | 61,670 |
| The ONE Group Hospitality, Inc.* | 800 | 10,088 |
| Tilly's, Inc., Class A | 800 | 12,888 |
| TravelCenters of America, Inc.* | 400 | 20,648 |
| Vera Bradley, Inc.* | 800 | 6,808 |
| Wingstop, Inc. | 964 | 166,579 |
| Winmark Corp. | 106 | 26,319 |
| World Fuel Services Corp. | 2,000 | 52,940 |
| Zumiez, Inc.* | 703 | 33,737 |
| | | 4,886,141 |
| | Number of
Shares | Value† |
| |
| Savings & Loans — 1.0% |
| Axos Financial, Inc.* | 1,900 | $ 106,229 |
| Banc of California, Inc. | 1,900 | 37,278 |
| Berkshire Hills Bancorp, Inc. | 1,642 | 46,682 |
| Brookline Bancorp, Inc. | 2,522 | 40,831 |
| Capitol Federal Financial, Inc. | 4,400 | 49,852 |
| Flushing Financial Corp. | 838 | 20,364 |
| FS Bancorp, Inc. | 200 | 6,726 |
| Home Bancorp, Inc. | 300 | 12,453 |
| HomeTrust Bancshares, Inc. | 500 | 15,490 |
| Investors Bancorp, Inc. | 7,355 | 111,428 |
| Northfield Bancorp, Inc. | 1,293 | 20,895 |
| Northwest Bancshares, Inc. | 4,155 | 58,835 |
| OceanFirst Financial Corp. | 1,910 | 42,402 |
| Pacific Premier Bancorp, Inc. | 3,046 | 121,931 |
| Provident Financial Services, Inc. | 2,474 | 59,920 |
| Southern Missouri Bancorp, Inc. | 300 | 15,651 |
| The Hingham Institution for Savings | 43 | 18,055 |
| Washington Federal, Inc. | 2,200 | 73,436 |
| Waterstone Financial, Inc. | 800 | 17,488 |
| WSFS Financial Corp. | 1,606 | 80,493 |
| | | 956,439 |
| Semiconductors — 3.6% |
| Alpha & Omega Semiconductor Ltd.* | 700 | 42,392 |
| Ambarella, Inc.* | 1,155 | 234,338 |
| Amkor Technology, Inc. | 3,311 | 82,080 |
| Atomera, Inc.* | 600 | 12,072 |
| Axcelis Technologies, Inc.* | 1,125 | 83,880 |
| AXT, Inc.* | 1,000 | 8,810 |
| CEVA, Inc.* | 671 | 29,014 |
| CMC Materials, Inc. | 922 | 176,738 |
| Cohu, Inc.* | 1,524 | 58,049 |
| CTS Corp. | 963 | 35,361 |
| Diodes, Inc.* | 1,399 | 153,624 |
| EMCORE Corp.* | 1,300 | 9,074 |
| FormFactor, Inc.* | 2,629 | 120,198 |
| Impinj, Inc.* | 600 | 53,220 |
| Kulicke & Soffa Industries, Inc. | 2,000 | 121,080 |
| Lattice Semiconductor Corp.* | 4,424 | 340,913 |
| MACOM Technology Solutions Holdings, Inc.* | 1,622 | 127,003 |
| MaxLinear, Inc.* | 2,343 | 176,639 |
| Onto Innovation, Inc.* | 1,547 | 156,603 |
| Ouster, Inc.* | 5,100 | 26,520 |
| Photronics, Inc.* | 2,092 | 39,434 |
| Power Integrations, Inc. | 1,950 | 181,136 |
| Rambus, Inc.* | 3,623 | 106,480 |
| Semtech Corp.* | 2,109 | 187,553 |
| Silicon Laboratories, Inc.* | 1,295 | 267,314 |
| SiTime Corp.* | 489 | 143,052 |
| SkyWater Technology, Inc.* | 300 | 4,866 |
| SMART Global Holdings, Inc.* | 600 | 42,594 |
| Synaptics, Inc.* | 1,272 | 368,257 |
| Ultra Clean Holdings, Inc.* | 1,400 | 80,304 |
Penn Series Funds, Inc.
Schedule of Investments — December 31, 2021
Small Cap Index Fund
| | Number of
Shares | Value† |
| COMMON STOCKS — (continued) |
| Semiconductors — (continued) |
| Veeco Instruments, Inc.* | 1,754 | $ 49,936 |
| | | 3,518,534 |
| Software — 5.5% |
| 1Life Healthcare, Inc.* | 3,800 | 66,766 |
| 8X8, Inc.* | 3,700 | 62,012 |
| ACI Worldwide, Inc.* | 3,827 | 132,797 |
| Agilysys, Inc.* | 676 | 30,055 |
| Alignment Healthcare, Inc.* | 2,600 | 36,556 |
| Alkami Technology, Inc.* | 900 | 18,054 |
| Allscripts Healthcare Solutions, Inc.* | 3,900 | 71,955 |
| Altair Engineering, Inc., Class A* | 1,500 | 115,980 |
| American Software, Inc., Class A | 1,093 | 28,604 |
| Apollo Medical Holdings, Inc.* | 1,200 | 88,176 |
| Appfolio, Inc., Class A* | 605 | 73,241 |
| Appian Corp.* | 1,262 | 82,295 |
| Asana, Inc., Class A* | 2,300 | 171,465 |
| Avaya Holdings Corp.* | 2,800 | 55,440 |
| Avid Technology, Inc.* | 1,100 | 35,827 |
| AvidXchange Holdings, Inc.* | 800 | 12,048 |
| Bandwidth, Inc., Class A* | 739 | 53,031 |
| Benefitfocus, Inc.* | 900 | 9,594 |
| BigCommerce Holdings, Inc.* | 1,600 | 56,592 |
| Blackbaud, Inc.* | 1,550 | 122,419 |
| Blackline, Inc.* | 1,778 | 184,094 |
| Bottomline Technologies, Inc.* | 1,445 | 81,599 |
| Box, Inc., Class A* | 4,600 | 120,474 |
| Brightcove, Inc.* | 1,200 | 12,264 |
| BTRS Holdings, Inc.* | 2,300 | 17,986 |
| Cardlytics, Inc.* | 1,000 | 66,090 |
| Castlight Health, Inc., Class B* | 4,700 | 7,238 |
| Cerence, Inc.* | 1,200 | 91,968 |
| CommVault Systems, Inc.* | 1,548 | 106,688 |
| Computer Programs and Systems, Inc.* | 447 | 13,097 |
| Consensus Cloud Solutions, Inc.* | 467 | 27,025 |
| Convey Health Solutions Holdings, Inc.* | 400 | 3,344 |
| CoreCard Corp.* | 200 | 7,760 |
| CS Disco, Inc.* | 200 | 7,150 |
| CSG Systems International, Inc. | 1,081 | 62,287 |
| Daily Journal Corp.* | 41 | 14,626 |
| DarioHealth Corp.* | 500 | 6,485 |
| Digi International, Inc.* | 1,257 | 30,885 |
| Digimarc Corp.* | 400 | 15,792 |
| Digital Turbine Inc* | 3,000 | 182,970 |
| DigitalOcean Holdings, Inc.* | 1,600 | 128,528 |
| Domo, Inc., Class B* | 900 | 44,640 |
| Donnelley Financial Solutions, Inc.* | 1,000 | 47,140 |
| E2open Parent Holdings, Inc.* | 6,500 | 73,190 |
| Ebix, Inc. | 936 | 28,454 |
| eGain Corp.* | 500 | 4,990 |
| Enfusion, Inc., Class A* | 700 | 14,658 |
| EngageSmart, Inc.* | 500 | 12,060 |
| Envestnet, Inc.* | 1,813 | 143,843 |
| EverCommerce, Inc.* | 500 | 7,875 |
| Evolent Health, Inc., Class A* | 2,600 | 71,942 |
| | Number of
Shares | Value† |
| |
| Software — (continued) |
| Forian, Inc.* | 700 | $ 6,314 |
| Genius Brands International, Inc.* | 9,900 | 10,395 |
| GreenBox POS* | 700 | 2,940 |
| GTY Technology Holdings, Inc.* | 1,200 | 8,040 |
| Health Catalyst, Inc.* | 1,600 | 63,392 |
| HireRight Holdings Corp.* | 700 | 11,200 |
| Inseego Corp.* | 2,800 | 16,324 |
| Instructure Holdings, Inc.* | 400 | 9,592 |
| Intapp, Inc.* | 300 | 7,548 |
| JFrog Ltd.* | 1,700 | 50,490 |
| Kaltura, Inc.* | 600 | 2,022 |
| LivePerson, Inc.* | 2,125 | 75,905 |
| ManTech International Corp., Class A | 939 | 68,481 |
| MeridianLink, Inc.* | 400 | 8,632 |
| MicroStrategy, Inc., Class A* | 275 | 149,735 |
| Model N, Inc.* | 1,200 | 36,036 |
| Momentive Global, Inc.* | 4,400 | 93,060 |
| NantHealth, Inc.* | 1,200 | 1,266 |
| NextGen Healthcare, Inc.* | 1,804 | 32,093 |
| ON24, Inc.* | 900 | 15,615 |
| Outbrain, Inc.* | 300 | 4,200 |
| Outset Medical, Inc.* | 1,500 | 69,135 |
| PagerDuty, Inc.* | 2,600 | 90,350 |
| PDF Solutions, Inc.* | 1,000 | 31,790 |
| Phreesia, Inc.* | 1,600 | 66,656 |
| Porch Group, Inc.* | 2,500 | 38,975 |
| PowerSchool Holdings, Inc., Class A* | 1,400 | 23,058 |
| Privia Health Group, Inc.* | 700 | 18,109 |
| Progress Software Corp. | 1,426 | 68,833 |
| PROS Holdings, Inc.* | 1,217 | 41,974 |
| Rackspace Technology, Inc.* | 1,800 | 24,246 |
| Sailpoint Technologies Holdings, Inc.* | 3,000 | 145,020 |
| Sapiens International Corp. N.V. | 1,100 | 37,895 |
| Schrodinger, Inc.* | 1,500 | 52,245 |
| Simulations Plus, Inc. | 500 | 23,650 |
| Smith Micro Software, Inc.* | 1,400 | 6,888 |
| Sprout Social, Inc., Class A* | 1,433 | 129,959 |
| SPS Commerce, Inc.* | 1,165 | 165,838 |
| Sumo Logic, Inc.* | 2,700 | 36,612 |
| Tabula Rasa HealthCare, Inc.* | 800 | 12,000 |
| Udemy, Inc.* | 500 | 9,770 |
| Upland Software, Inc.* | 900 | 16,146 |
| Verint Systems, Inc.* | 2,095 | 110,009 |
| Veritone, Inc.* | 800 | 17,984 |
| Verra Mobility Corp.* | 4,300 | 66,349 |
| Viant Technology, Inc., Class A* | 400 | 3,882 |
| Workiva, Inc.* | 1,400 | 182,686 |
| Xperi Holding Corp. | 3,653 | 69,078 |
| Yext, Inc.* | 3,400 | 33,728 |
| Ziff Davis, Inc.* | 1,403 | 155,537 |
| Zuora, Inc., Class A* | 3,500 | 65,380 |
| | | 5,447,111 |
| Telecommunications — 1.5% |
| A10 Networks, Inc. | 1,900 | 31,502 |
Penn Series Funds, Inc.
Schedule of Investments — December 31, 2021
Small Cap Index Fund
| | Number of
Shares | Value† |
| COMMON STOCKS — (continued) |
| Telecommunications — (continued) |
| ADTRAN, Inc. | 1,705 | $ 38,925 |
| Anterix, Inc.* | 400 | 23,504 |
| ATN International, Inc. | 398 | 15,900 |
| Aviat Networks, Inc.* | 400 | 12,832 |
| CalAmp Corp.* | 1,000 | 7,060 |
| Calix, Inc.* | 1,793 | 143,386 |
| Cambium Networks Corp.* | 400 | 10,252 |
| Casa Systems, Inc.* | 1,200 | 6,804 |
| Clearfield, Inc.* | 400 | 33,768 |
| Consolidated Communications Holdings, Inc.* | 2,571 | 19,231 |
| DZS, Inc.* | 600 | 9,732 |
| EchoStar Corp., Class A* | 1,200 | 31,620 |
| Extreme Networks, Inc.* | 4,247 | 66,678 |
| Globalstar, Inc.* | 20,300 | 23,548 |
| Gogo, Inc.* | 2,000 | 27,060 |
| Harmonic, Inc.* | 2,870 | 33,751 |
| IDT Corp., Class B* | 700 | 30,912 |
| Infinera Corp.* | 5,794 | 55,565 |
| InterDigital, Inc. | 994 | 71,200 |
| Iridium Communications, Inc.* | 3,800 | 156,902 |
| KVH Industries, Inc.* | 354 | 3,253 |
| Maxar Technologies, Inc. | 2,300 | 67,919 |
| NeoPhotonics Corp.* | 1,800 | 27,666 |
| NETGEAR, Inc.* | 929 | 27,136 |
| Ooma, Inc.* | 700 | 14,308 |
| Plantronics, Inc.* | 1,367 | 40,108 |
| Preformed Line Products Co. | 45 | 2,912 |
| Ribbon Communications, Inc.* | 1,843 | 11,150 |
| Shenandoah Telecommunications Co. | 1,518 | 38,709 |
| Telephone and Data Systems, Inc. | 3,300 | 66,495 |
| Telesat Corp.* | 446 | 12,787 |
| United States Cellular Corp.* | 500 | 15,760 |
| Viavi Solutions, Inc.* | 7,600 | 133,912 |
| Vonage Holdings Corp.* | 7,900 | 164,241 |
| | | 1,476,488 |
| Textiles — 0.1% |
| UniFirst Corp. | 481 | 101,202 |
| Toys, Games & Hobbies — 0.0% |
| Funko, Inc., Class A* | 900 | 16,920 |
| Transportation — 1.4% |
| Air Transport Services Group, Inc.* | 1,985 | 58,319 |
| ArcBest Corp. | 795 | 95,281 |
| Atlas Air Worldwide Holdings, Inc.* | 948 | 89,226 |
| Costamare, Inc. | 2,000 | 25,300 |
| Covenant Logistics Group, Inc.* | 400 | 10,572 |
| CryoPort, Inc.* | 1,300 | 76,921 |
| Daseke, Inc.* | 1,300 | 13,052 |
| DHT Holdings, Inc. | 4,900 | 25,431 |
| Dorian LPG Ltd. | 1,032 | 13,096 |
| Eagle Bulk Shipping, Inc. | 214 | 9,737 |
| Forward Air Corp. | 896 | 108,497 |
| Frontline Ltd.* | 4,100 | 28,987 |
| | Number of
Shares | Value† |
| |
| Transportation — (continued) |
| Genco Shipping & Trading Ltd. | 1,100 | $ 17,600 |
| Heartland Express, Inc. | 1,567 | 26,357 |
| Hub Group, Inc., Class A* | 1,043 | 87,862 |
| International Seaways, Inc. | 1,331 | 19,539 |
| Marten Transport Ltd. | 2,126 | 36,482 |
| Matson, Inc. | 1,400 | 126,042 |
| Nordic American Tankers Ltd. | 4,767 | 8,056 |
| PAM Transportation Services, Inc.* | 100 | 7,101 |
| Radiant Logistics, Inc.* | 1,000 | 7,290 |
| Safe Bulkers, Inc.* | 2,600 | 9,802 |
| Saia, Inc.* | 876 | 295,238 |
| Scorpio Tankers, Inc. | 1,440 | 18,447 |
| SFL Corp., Ltd. | 3,484 | 28,395 |
| Teekay Corp.* | 2,700 | 8,478 |
| Teekay Tankers Ltd., Class A* | 900 | 9,810 |
| Universal Logistics Holdings, Inc. | 300 | 5,658 |
| US Xpress Enterprises, Inc., Class A* | 1,100 | 6,457 |
| Werner Enterprises, Inc. | 2,052 | 97,798 |
| Yellow Corp.* | 1,900 | 23,921 |
| | | 1,394,752 |
| Trucking and Leasing — 0.2% |
| GATX Corp. | 1,100 | 114,609 |
| The Greenbrier Cos., Inc. | 1,047 | 48,047 |
| Willis Lease Finance Corp.* | 100 | 3,765 |
| | | 166,421 |
| Water — 0.4% |
| American States Water Co. | 1,179 | 121,956 |
| Artesian Resources Corp., Class A | 313 | 14,501 |
| California Water Service Group | 1,666 | 119,719 |
| Global Water Resources, Inc. | 500 | 8,550 |
| Middlesex Water Co. | 531 | 63,879 |
| SJW Group | 911 | 66,685 |
| The York Water Co. | 397 | 19,763 |
| | | 415,053 |
TOTAL COMMON STOCKS
(Cost $72,616,077) | 89,069,001 |
|
| REAL ESTATE INVESTMENT TRUSTS — 7.8% |
| Apartments — 0.3% |
| Apartment Investment and Management Co., Class A* | 5,000 | 38,600 |
| BRT Apartments Corp. | 200 | 4,798 |
| Centerspace | 461 | 51,125 |
| Independence Realty Trust, Inc. | 3,592 | 92,781 |
| NexPoint Residential Trust, Inc. | 700 | 58,681 |
| | | 245,985 |
| Diversified — 1.5% |
| Alexander & Baldwin, Inc. | 2,256 | 56,603 |
| American Finance Trust, Inc. | 4,100 | 37,433 |
| Armada Hoffler Properties, Inc. | 2,100 | 31,962 |
| Broadstone Net Lease, Inc. | 5,000 | 124,100 |
| CatchMark Timber Trust, Inc., Class A | 1,400 | 12,194 |
Penn Series Funds, Inc.
Schedule of Investments — December 31, 2021
Small Cap Index Fund
| | Number of
Shares | Value† |
| REAL ESTATE INVESTMENT TRUSTS — (continued) |
| Diversified — (continued) |
| Clipper Realty, Inc. | 600 | $ 5,964 |
| CorePoint Lodging, Inc.* | 1,550 | 24,335 |
| DigitalBridge Group, Inc.* | 16,100 | 134,113 |
| Farmland Partners, Inc. | 900 | 10,755 |
| Gladstone Commercial Corp. | 1,252 | 32,264 |
| Gladstone Land Corp. | 1,000 | 33,760 |
| Global Net Lease, Inc. | 3,133 | 47,872 |
| iStar, Inc. | 2,218 | 57,291 |
| LXP Industrial Trust | 8,815 | 137,690 |
| One Liberty Properties, Inc. | 510 | 17,993 |
| Outfront Media, Inc. | 4,700 | 126,054 |
| Postal Realty Trust, Inc., Class A | 500 | 9,900 |
| PotlatchDeltic Corp. | 2,137 | 128,690 |
| Preferred Apartment Communities, Inc. | 1,800 | 32,508 |
| PS Business Parks, Inc. | 640 | 117,869 |
| Safehold, Inc. | 600 | 47,910 |
| The GEO Group, Inc. | 3,752 | 29,078 |
| UMH Properties, Inc. | 1,468 | 40,121 |
| Uniti Group, Inc. | 6,500 | 91,065 |
| Washington Real Estate Investment Trust | 2,906 | 75,120 |
| | | 1,462,644 |
| Diversified Financial Services — 0.1% |
| Hannon Armstrong Sustainable Infrastructure Capital, Inc. | 2,500 | 132,800 |
| Healthcare — 0.7% |
| CareTrust REIT, Inc. | 3,295 | 75,225 |
| Community Healthcare Trust, Inc. | 800 | 37,816 |
| Diversified Healthcare Trust | 8,600 | 26,574 |
| Global Medical REIT, Inc. | 1,900 | 33,725 |
| Healthcare Realty Trust, Inc. | 4,772 | 150,986 |
| LTC Properties, Inc. | 1,217 | 41,548 |
| National Health Investors, Inc. | 1,457 | 83,734 |
| Physicians Realty Trust | 7,000 | 131,810 |
| Sabra Health Care REIT, Inc. | 7,393 | 100,101 |
| Universal Health Realty Income Trust | 420 | 24,978 |
| | | 706,497 |
| Hotels & Resorts — 0.8% |
| Apple Hospitality REIT, Inc. | 7,200 | 116,280 |
| Ashford Hospitality Trust, Inc.* | 390 | 3,744 |
| Braemar Hotels & Resorts, Inc.* | 1,700 | 8,670 |
| Chatham Lodging Trust* | 1,500 | 20,580 |
| DiamondRock Hospitality Co.* | 7,023 | 67,491 |
| Hersha Hospitality Trust* | 1,117 | 10,243 |
| Pebblebrook Hotel Trust | 4,193 | 93,797 |
| RLJ Lodging Trust | 5,680 | 79,122 |
| Ryman Hospitality Properties, Inc.* | 1,712 | 157,436 |
| Service Properties Trust | 5,500 | 48,345 |
| Summit Hotel Properties, Inc.* | 3,400 | 33,184 |
| Sunstone Hotel Investors, Inc.* | 7,447 | 87,353 |
| Xenia Hotels & Resorts, Inc.* | 3,700 | 67,007 |
| | | 793,252 |
| | Number of
Shares | Value† |
| |
| Industrial — 0.9% |
| EastGroup Properties, Inc. | 1,312 | $ 298,939 |
| Indus Realty Trust, Inc. | 101 | 8,187 |
| Innovative Industrial Properties, Inc. | 765 | 201,126 |
| Monmouth Real Estate Investment Corp. | 3,049 | 64,060 |
| STAG lndustrial, Inc. | 5,700 | 273,372 |
| | | 845,684 |
| Mortgage Banks — 1.1% |
| AFC Gamma, Inc. | 300 | 6,828 |
| Apollo Commercial Real Estate Finance, Inc. | 4,856 | 63,905 |
| Arbor Realty Trust, Inc. | 4,500 | 82,440 |
| Ares Commercial Real Estate Corp. | 1,500 | 21,810 |
| ARMOUR Residential REIT, Inc. | 2,875 | 28,204 |
| Blackstone Mortgage Trust, Inc., Class A | 5,200 | 159,224 |
| BrightSpire Capital, Inc. | 2,700 | 27,702 |
| Broadmark Realty Capital, Inc. | 3,900 | 36,777 |
| Chimera Investment Corp. | 7,800 | 117,624 |
| Dynex Capital, Inc. | 1,269 | 21,205 |
| Ellington Financial, Inc. | 1,600 | 27,344 |
| Franklin BSP Realty Trust, Inc. | 912 | 13,625 |
| Granite Point Mortgage Trust, Inc. | 1,700 | 19,907 |
| Great Ajax Corp. | 622 | 8,186 |
| Invesco Mortgage Capital, Inc. | 10,125 | 28,147 |
| KKR Real Estate Finance Trust, Inc. | 1,200 | 24,996 |
| Ladder Capital Corp. | 3,976 | 47,672 |
| MFA Financial, Inc. | 14,300 | 65,208 |
| New York Mortgage Trust, Inc. | 13,400 | 49,848 |
| Orchid Island Capital, Inc. | 4,400 | 19,800 |
| PennyMac Mortgage Investment Trust | 3,392 | 58,783 |
| Ready Capital Corp. | 1,782 | 27,853 |
| Redwood Trust, Inc. | 3,577 | 47,181 |
| TPG RE Finance Trust, Inc. | 1,700 | 20,944 |
| Two Harbors Investment Corp. | 10,200 | 58,854 |
| | | 1,084,067 |
| Office Property — 0.7% |
| American Assets Trust, Inc. | 1,700 | 63,801 |
| Brandywine Realty Trust | 5,500 | 73,810 |
| City Office REIT, Inc. | 1,400 | 27,608 |
| Corporate Office Properties Trust | 3,700 | 103,489 |
| Easterly Government Properties, Inc. | 2,700 | 61,884 |
| Empire State Realty Trust, Inc., Class A | 4,700 | 41,830 |
| Equity Commonwealth* | 3,800 | 98,420 |
| Franklin Street Properties Corp. | 3,145 | 18,713 |
| Office Properties Income Trust | 1,669 | 41,458 |
| Paramount Group, Inc. | 6,100 | 50,874 |
| Piedmont Office Realty Trust, Inc., Class A | 3,900 | 71,682 |
| Veris Residential, Inc.* | 3,100 | 56,978 |
| | | 710,547 |
| Real Estate — 0.0% |
| Angel Oak Mortgage, Inc. | 200 | 3,276 |
Penn Series Funds, Inc.
Schedule of Investments — December 31, 2021
Small Cap Index Fund
| | Number of
Shares | Value† |
| REAL ESTATE INVESTMENT TRUSTS — (continued) |
| Regional Malls — 0.2% |
| Tanger Factory Outlet Centers, Inc. | 3,200 | $ 61,696 |
| The Macerich Co. | 6,900 | 119,232 |
| | | 180,928 |
| Single Tenant — 0.4% |
| Agree Realty Corp. | 2,196 | 156,707 |
| CTO Realty Growth, Inc. | 153 | 9,397 |
| Essential Properties Realty Trust, Inc. | 3,800 | 109,554 |
| Four Corners Property Trust, Inc. | 2,500 | 73,525 |
| Getty Realty Corp. | 1,369 | 43,931 |
| | | 393,114 |
| Storage & Warehousing — 0.5% |
| Industrial Logistics Properties Trust | 2,258 | 56,563 |
| National Storage Affiliates Trust | 2,700 | 186,840 |
| Plymouth Industrial REIT, Inc. | 1,000 | 32,000 |
| Terreno Realty Corp. | 2,375 | 202,564 |
| | | 477,967 |
| Strip Centers — 0.6% |
| Acadia Realty Trust | 3,020 | 65,927 |
| Alexander's, Inc. | 69 | 17,961 |
| Kite Realty Group Trust | 7,149 | 155,705 |
| NETSTREIT Corp. | 1,300 | 29,770 |
| Phillips Edison & Co., Inc. | 600 | 19,824 |
| Retail Opportunity Investments Corp. | 4,100 | 80,360 |
| Retail Value, Inc. | 551 | 3,537 |
| RPT Realty | 2,641 | 35,336 |
| Saul Centers, Inc. | 351 | 18,610 |
| Seritage Growth Properties, Class A* | 1,100 | 14,597 |
| SITE Centers Corp. | 5,600 | 88,648 |
| Urban Edge Properties | 3,900 | 74,100 |
| Urstadt Biddle Properties, Inc., Class A | 916 | 19,511 |
| Whitestone REIT | 1,400 | 14,182 |
| | | 638,068 |
TOTAL REAL ESTATE INVESTMENT TRUSTS
(Cost $6,545,280) | | 7,674,829 |
|
| RIGHTS — 0.0% |
| Aduro Biotech CVR* | 560 | 73 |
| Chelsea Therapeutics International Ltd. CVR* | 1,600 | 0 |
| Cubist Pharmaceuticals, Inc.* | 1,200 | 0 |
| Durata Therapeutics CVR Shares* | 500 | 0 |
| Media General CVR* | 4,400 | 440 |
| Progenic Pharmaceuticals CVR* | 2,601 | 111 |
| Tobira Therapeutic, Inc. CVR* | 400 | 5,668 |
TOTAL RIGHTS
(Cost $152) | | 6,292 |
|
| WARRANTS — 0.0% |
| Whiting Petroleum Corp., Class A Expiration Date 12/31/25* | 204 | 2,827 |
| Whiting Petroleum Corp., Class B Expiration Date 12/31/25* | 102 | 1,204 |
| | Number of
Shares | Value† |
| |
| Nabors Industries Ltd. Expiration Date 06/11/26* | 87 | $ 324 |
TOTAL WARRANTS
(Cost $3,666) | | 4,355 |
| | | |
| SHORT-TERM INVESTMENTS — 1.4% |
BlackRock Liquidity FedFund - Institutional Shares (seven-day effective yield 0.030%)
(Cost $1,391,798) | 1,391,798 | 1,391,798 |
TOTAL INVESTMENTS — 99.3%
(Cost $80,556,973) | | $ 98,146,275 |
| Other Assets & Liabilities — 0.7% | 680,795 |
| TOTAL NET ASSETS — 100.0% | | $ 98,827,070 |
| † | See Security Valuation Note. |
| * | Non-income producing security. |
| (1) | The value of this security was determined using significant unobservable inputs and is reported as a Level 3 security in the Valuation Hierarchy table located at the end of the Schedule of Investments. |
| CVR— Contingent Valued Rights. |
| N.V.— Naamloze Vennootschap. |
| PLC— Public Limited Company. |
| REIT— Real Estate Investment Trust. |
| S.A.— Societe Anonyme. |
| S.E.— Societas Europaea. |
COMMON STOCKS
INDUSTRY DIVERSIFICATION | % of Market
Value | Value† |
| Advertising | 0.1% | $ 130,836 |
| Aerospace & Defense | 0.6% | 556,633 |
| Agriculture | 0.3% | 250,709 |
| Airlines | 0.3% | 303,352 |
| Apparel | 0.8% | 700,355 |
| Auto Manufacturers | 0.3% | 304,856 |
| Auto Parts & Equipment | 1.6% | 1,452,002 |
| Banks | 9.3% | 8,301,779 |
| Beverages | 0.5% | 429,916 |
| Biotechnology | 8.1% | 7,205,299 |
| Building Materials | 1.5% | 1,365,132 |
| Chemicals | 2.0% | 1,815,042 |
| Coal | 0.2% | 157,018 |
| Commercial Services | 5.3% | 4,683,061 |
| Computers | 2.5% | 2,213,459 |
| Cosmetics & Personal Care | 0.3% | 295,481 |
| Distribution & Wholesale | 0.9% | 817,023 |
| Diversified Financial Services | 2.8% | 2,455,974 |
| Electric | 1.5% | 1,305,095 |
| Electrical Components & Equipment | 0.8% | 705,334 |
| Electronics | 1.9% | 1,720,137 |
Penn Series Funds, Inc.
Schedule of Investments — December 31, 2021
Small Cap Index Fund
COMMON STOCKS
INDUSTRY DIVERSIFICATION | % of Market
Value | Value† |
| Energy-Alternate Sources | 0.6% | $ 567,130 |
| Engineering & Construction | 1.7% | 1,512,469 |
| Entertainment | 1.7% | 1,546,139 |
| Environmental Control | 1.0% | 853,120 |
| Food | 1.7% | 1,526,847 |
| Food Service | 0.1% | 57,938 |
| Forest Products & Paper | 0.1% | 127,337 |
| Gas | 1.0% | 854,573 |
| Hand & Machine Tools | 0.3% | 255,270 |
| Healthcare Products | 4.2% | 3,733,305 |
| Healthcare Services | 2.2% | 1,928,911 |
| Home Builders | 1.7% | 1,473,273 |
| Home Furnishings | 0.5% | 476,209 |
| Household Products & Wares | 0.5% | 429,276 |
| Housewares | 0.0% | 33,910 |
| Insurance | 2.5% | 2,250,519 |
| Internet | 2.1% | 1,884,309 |
| Investment Companies | 0.0% | 6,131 |
| Iron & Steel | 0.3% | 295,764 |
| Leisure Time | 0.6% | 525,410 |
| Lodging | 0.2% | 205,738 |
| Machinery — Construction & Mining | 0.4% | 316,222 |
| Machinery — Diversified | 2.1% | 1,844,249 |
| Media | 0.7% | 665,168 |
| Metal Fabricate/Hardware | 0.8% | 690,122 |
| Mining | 1.0% | 853,545 |
| Miscellaneous Manufacturing | 1.1% | 1,019,230 |
| Office & Business Equipment | 0.0% | 39,780 |
| Office Furnishings | 0.2% | 136,060 |
| Oil & Gas | 3.1% | 2,800,374 |
| Oil & Gas Services | 0.6% | 559,256 |
| Packaging and Containers | 0.3% | 246,708 |
| Pharmaceuticals | 3.2% | 2,816,070 |
| Pipelines | 0.2% | 181,092 |
| Real Estate | 0.9% | 809,993 |
| Retail | 5.5% | 4,886,141 |
| Savings & Loans | 1.1% | 956,439 |
| Semiconductors | 4.0% | 3,518,534 |
| Software | 6.1% | 5,447,111 |
| Telecommunications | 1.7% | 1,476,488 |
| Textiles | 0.1% | 101,202 |
COMMON STOCKS
INDUSTRY DIVERSIFICATION | % of Market
Value | | Value† |
| Toys, Games & Hobbies | 0.0% | | $ 16,920 |
| Transportation | 1.6% | | 1,394,752 |
| Trucking and Leasing | 0.2% | | 166,421 |
| Water | 0.5% | | 415,053 |
| | 100.0% | | $89,069,001 |
Summary of inputs used to value the Fund’s investments as of 12/31/2021 are as follows (See Security Valuation Note):
| ASSETS TABLE |
| Description | Total
Market
Value at
12/31/2021 | Level 1
Quoted
Price | Level 2
Significant
Observable
Input | Level 3
Significant
Unobservable
Input |
| Common Stocks | $89,069,001 | $89,069,001 | $ — | $— |
| Real Estate Investment Trusts | 7,674,829 | 7,674,829 | — | — |
| Rights | 6,292 | — | 6,292 | — |
| Warrants | 4,355 | 4,355 | — | — |
| Short-Term Investments | 1,391,798 | 1,391,798 | — | — |
| Total Investments | $ 98,146,275 | $ 98,139,983 | $ 6,292 | $ — |
| Other Financial Instruments(1) | | | | |
| Futures Contracts | $ 23,452 | $ 23,452 | $ — | $— |
| Total Assets—Other Financial Instruments | $ 23,452 | $ 23,452 | $ — | $ — |
| (1) | Other financial instruments are derivative instruments not reflected in the value of total investments in securities in the Schedule of Investments such as future contracts and forward foreign currency contracts which are valued at the unrealized appreciation (depreciation) on the instrument. |
It is the Fund's practice to recognize transfers into and transfers out of Level 3 at the fair value hierarchy as of the beginning of period. The Fund did not have any transfers into and transfers out of Level 3 fair value hierarchy during the reporting period.
Futures contracts held by the Fund at December 31, 2021 are as follows:
Futures Contracts:
Exchange Traded |
| Type | | Futures Contract | | Expiration
Date | | Numbers
of
Contracts | | Units per
Contract | | Closing
Price | | Notional
Value | | Unrealized
Appreciation | | Unrealized
Depreciation |
| Long | | E-Mini Russell 2000 Index | | 03/18/22 | | 14 | | 50 | | $2,243 | | $1,569,960 | | $23,452 | | $— |
| | | | | | | | | | | | | | | $23,452 | | $— |
The accompanying notes are an integral part of these financial statements.
Penn Series Funds, Inc.
Schedule of Investments — December 31, 2021
Developed International Index Fund
| | Number of
Shares | Value† |
| COMMON STOCKS — 96.1% |
| Australia — 6.9% |
| Afterpay Ltd.* | 1,413 | $ 85,337 |
| Ampol Ltd. | 1,380 | 29,779 |
| APA Group | 7,495 | 54,857 |
| Aristocrat Leisure Ltd. | 3,614 | 114,561 |
| ASX Ltd. | 1,293 | 87,393 |
| Aurizon Holdings Ltd. | 11,109 | 28,207 |
| AusNet Services Ltd. | 13,578 | 25,388 |
| Australia & New Zealand Banking Group Ltd. | 18,120 | 362,670 |
| BHP Group Ltd. | 18,952 | 572,224 |
| BHP Group PLC | 13,382 | 398,400 |
| BlueScope Steel Ltd. | 3,125 | 47,518 |
| Brambles Ltd. | 9,348 | 72,296 |
| Cochlear Ltd. | 418 | 65,726 |
| Coles Group Ltd. | 8,403 | 109,678 |
| Commonwealth Bank of Australia | 11,278 | 828,736 |
| Computershare Ltd. | 3,311 | 48,178 |
| Crown Resorts Ltd.* | 2,801 | 24,373 |
| CSL Ltd. | 3,047 | 644,481 |
| Dexus | 6,877 | 55,637 |
| Domino's Pizza Enterprises Ltd. | 429 | 36,839 |
| Endeavour Group Ltd. | 8,189 | 40,156 |
| Evolution Mining Ltd. | 11,549 | 34,114 |
| Fortescue Metals Group Ltd. | 11,074 | 154,773 |
| Goodman Group | 10,813 | 208,475 |
| IDP Education Ltd. | 1,331 | 33,554 |
| Insurance Australia Group Ltd. | 15,259 | 47,293 |
| Lendlease Corp. Ltd. | 4,333 | 33,700 |
| Macquarie Group Ltd. | 2,210 | 330,260 |
| Magellan Financial Group Ltd. | 818 | 12,641 |
| Medibank Pvt. Ltd. | 17,418 | 42,453 |
| Mirvac Group | 24,397 | 51,653 |
| National Australia Bank Ltd. | 21,146 | 443,697 |
| Newcrest Mining Ltd. | 5,206 | 92,721 |
| Northern Star Resources Ltd. | 7,569 | 51,819 |
| Orica Ltd. | 2,861 | 28,496 |
| Origin Energy Ltd. | 10,447 | 39,828 |
| Qantas Airways Ltd.* | 5,515 | 20,102 |
| QBE Insurance Group Ltd. | 9,279 | 76,623 |
| Ramsay Health Care Ltd. | 1,112 | 57,846 |
| REA Group Ltd. | 317 | 38,663 |
| Reece Ltd. | 2,060 | 40,511 |
| Rio Tinto Ltd. | 2,412 | 175,678 |
| Santos Ltd. | 19,013 | 87,286 |
| Scentre Group | 34,304 | 78,867 |
| SEEK Ltd. | 2,271 | 54,161 |
| Sonic Healthcare Ltd. | 2,969 | 100,725 |
| South32 Ltd. | 21,214 | 61,891 |
| South32 Ltd. | 9,351 | 27,466 |
| Stockland | 14,818 | 45,711 |
| Suncorp Group Ltd. | 8,248 | 66,429 |
| Sydney Airport* | 8,238 | 52,024 |
| Tabcorp Holdings Ltd. | 15,195 | 55,497 |
| Telstra Corp. Ltd. | 27,472 | 83,547 |
| The GPT Group | 11,476 | 45,254 |
| | Number of
Shares | Value† |
| |
| Australia — (continued) |
| The GPT Group-In Specie* | 16,419 | $ 0 |
| Transurban Group | 19,841 | 199,496 |
| Treasury Wine Estates Ltd. | 4,544 | 40,928 |
| Vicinity Centres | 25,092 | 30,852 |
| Washington H. Soul Pattinson & Co., Ltd. | 1,381 | 29,751 |
| Wesfarmers Ltd. | 7,261 | 313,267 |
| Westpac Banking Corp. | 23,432 | 363,974 |
| WiseTech Global Ltd. | 856 | 36,483 |
| Woodside Petroleum Ltd. | 6,168 | 98,412 |
| Woolworths Group Ltd. | 8,189 | 226,460 |
| | | 7,845,815 |
| Austria — 0.2% |
| Erste Group Bank AG | 2,193 | 103,240 |
| OMV AG | 924 | 52,546 |
| Raiffeisen Bank International AG | 837 | 24,662 |
| Verbund AG | 423 | 47,629 |
| voestalpine AG | 691 | 25,174 |
| | | 253,251 |
| Belgium — 0.8% |
| Ageas N.V. | 1,053 | 54,607 |
| Anheuser-Busch InBev N.V. | 4,838 | 292,864 |
| Elia Group S.A. | 220 | 28,979 |
| Etablissements Franz Colruyt N.V. | 375 | 15,908 |
| Groupe Bruxelles Lambert S.A. | 714 | 79,793 |
| KBC Group N.V. | 1,640 | 140,894 |
| Proximus SADP | 1,133 | 22,109 |
| Sofina S.A. | 94 | 46,232 |
| Solvay S.A. | 458 | 53,291 |
| UCB S.A. | 822 | 93,912 |
| Umicore S.A. | 1,237 | 50,348 |
| | | 878,937 |
| Chile — 0.0% |
| Antofagasta PLC | 2,581 | 46,761 |
| Denmark — 2.6% |
| A.P. Moller - Maersk A/S, Class A | 20 | 66,687 |
| A.P. Moller - Maersk A/S, Class B | 36 | 129,240 |
| Ambu A/S, Class B | 1,031 | 27,306 |
| Carlsberg AS, Class B | 626 | 108,246 |
| Chr Hansen Holding A/S | 695 | 54,838 |
| Coloplast A/S, Class B | 752 | 132,508 |
| Danske Bank A/S | 4,326 | 74,804 |
| Demant A/S* | 713 | 36,577 |
| DSV A/S | 1,300 | 304,001 |
| Genmab A/S* | 422 | 169,910 |
| GN Store Nord A/S | 818 | 51,507 |
| Novo Nordisk A/S, Class B | 10,715 | 1,205,674 |
| Novozymes A/S, Class B | 1,342 | 110,367 |
| Orsted A/S | 1,193 | 152,539 |
| Pandora A/S | 618 | 77,145 |
| ROCKWOOL International A/S, Class B | 55 | 24,081 |
| Tryg A/S | 2,090 | 51,674 |
Penn Series Funds, Inc.
Schedule of Investments — December 31, 2021
Developed International Index Fund
| | Number of
Shares | Value† |
| COMMON STOCKS — (continued) |
| Denmark — (continued) |
| Vestas Wind Systems A/S | 6,525 | $ 199,784 |
| | | 2,976,888 |
| Finland — 1.2% |
| Elisa OYJ | 882 | 54,345 |
| Fortum OYJ | 2,873 | 88,282 |
| Kesko OYJ, Class B | 1,700 | 56,786 |
| Kone OYJ, Class B | 2,219 | 159,260 |
| Neste OYJ | 2,763 | 136,396 |
| Nokia OYJ* | 34,728 | 220,384 |
| Nordea Bank Abp | 20,474 | 250,368 |
| Orion OYJ, Class B | 750 | 31,184 |
| Sampo OYJ, Class A | 3,183 | 159,667 |
| Stora Enso OYJ, Class R | 3,880 | 71,296 |
| UPM-Kymmene OYJ | 3,513 | 133,825 |
| Wartsila OYJ Abp | 3,006 | 42,300 |
| | | 1,404,093 |
| France — 10.9% |
| Accor S.A.* | 1,184 | 38,350 |
| Aeroports de Paris* | 215 | 27,733 |
| Air Liquide S.A. | 3,042 | 530,996 |
| Airbus S.E.* | 3,774 | 482,777 |
| Alstom S.A. | 1,895 | 67,356 |
| Amundi S.A. | 376 | 31,057 |
| Arkema S.A. | 377 | 53,158 |
| AXA S.A. | 12,391 | 369,396 |
| BioMerieux | 262 | 37,256 |
| BNP Paribas S.A. | 7,198 | 498,005 |
| Bollore S.A. | 5,730 | 32,096 |
| Bouygues S.A. | 1,412 | 50,622 |
| Bureau Veritas S.A. | 1,821 | 60,496 |
| Capgemini S.E. | 1,034 | 253,689 |
| Carrefour S.A. | 3,954 | 72,499 |
| Cie de Saint-Gobain | 3,268 | 230,195 |
| Cie Generale des Etablissements Michelin SCA | 1,100 | 180,526 |
| CNP Assurances | 1,195 | 29,591 |
| Covivio | 344 | 28,277 |
| Credit Agricole S.A. | 7,440 | 106,304 |
| Danone S.A. | 4,226 | 262,649 |
| Dassault Aviation S.A. | 180 | 19,468 |
| Dassault Systemes S.E. | 4,202 | 250,250 |
| Edenred | 1,545 | 71,362 |
| Eiffage S.A. | 567 | 58,395 |
| Electricite de France S.A. | 3,137 | 36,893 |
| Engie S.A. | 11,581 | 171,589 |
| EssilorLuxottica S.A. | 1,828 | 389,680 |
| Eurazeo S.E. | 255 | 22,296 |
| Faurecia S.E. | 683 | 32,527 |
| Faurecia S.E. | 126 | 5,893 |
| Gecina S.A. | 294 | 41,137 |
| Getlink S.E. | 2,692 | 44,624 |
| Hermes International | 204 | 356,742 |
| Ipsen S.A. | 217 | 19,888 |
| Kering S.A. | 475 | 382,283 |
| | Number of
Shares | Value† |
| |
| France — (continued) |
| Klepierre S.A.* | 1,415 | $ 33,589 |
| La Francaise des Jeux SAEM | 613 | 27,176 |
| Legrand S.A. | 1,731 | 202,789 |
| L'Oreal S.A. | 1,595 | 757,143 |
| LVMH Moet Hennessy Louis Vuitton S.E. | 1,767 | 1,462,527 |
| Orange S.A. | 12,986 | 139,167 |
| Orpea S.A. | 314 | 31,495 |
| Pernod Ricard S.A. | 1,337 | 321,940 |
| Publicis Groupe S.A. | 1,467 | 98,875 |
| Remy Cointreau S.A. | 160 | 38,982 |
| Renault S.A.* | 1,171 | 40,722 |
| Safran S.A. | 2,162 | 264,998 |
| Sanofi | 7,289 | 735,083 |
| Sartorius Stedim Biotech | 179 | 98,309 |
| Schneider Electric S.E. | 3,463 | 679,945 |
| SEB S.A. | 147 | 22,912 |
| Societe Generale S.A. | 5,212 | 179,232 |
| Sodexo S.A. | 562 | 49,306 |
| Suez S.A. | 2,325 | 52,437 |
| Teleperformance | 373 | 166,467 |
| Thales S.A. | 680 | 57,909 |
| TotalEnergies S.E. | 16,070 | 816,537 |
| Ubisoft Entertainment S.A.* | 622 | 30,500 |
| Unibail-Rodamco-Westfield* | 660 | 46,302 |
| Unibail-Rodamco-Westfield* | 2,500 | 8,676 |
| Valeo | 1,447 | 43,788 |
| Veolia Environnement S.A. | 4,306 | 158,151 |
| Vinci S.A. | 3,402 | 359,857 |
| Vivendi S.E. | 4,675 | 63,284 |
| Wendel S.E. | 185 | 22,200 |
| Worldline S.A.* | 1,504 | 83,920 |
| | | 12,440,273 |
| Germany — 8.0% |
| adidas AG | 1,217 | 350,822 |
| Allianz S.E. | 2,619 | 619,157 |
| BASF S.E. | 5,875 | 413,227 |
| Bayer AG | 6,223 | 332,990 |
| Bayerische Motoren Werke AG | 2,090 | 210,559 |
| Bechtle AG | 564 | 40,415 |
| Beiersdorf AG | 673 | 69,250 |
| Brenntag S.E. | 1,011 | 91,598 |
| Carl Zeiss Meditec AG | 250 | 52,613 |
| Commerzbank AG* | 6,847 | 52,143 |
| Continental AG* | 734 | 77,808 |
| Covestro AG | 1,214 | 74,912 |
| Daimler AG | 5,477 | 421,462 |
| Daimler Truck Holding AG* | 2,738 | 100,655 |
| Delivery Hero S.E.* | 1,001 | 111,685 |
| Deutsche Bank AG* | 13,202 | 165,606 |
| Deutsche Boerse AG | 1,210 | 202,643 |
| Deutsche Lufthansa AG* | 3,546 | 24,949 |
| Deutsche Post AG | 6,360 | 409,398 |
| Deutsche Telekom AG | 21,319 | 395,628 |
Penn Series Funds, Inc.
Schedule of Investments — December 31, 2021
Developed International Index Fund
| | Number of
Shares | Value† |
| COMMON STOCKS — (continued) |
| Germany — (continued) |
| E.ON S.E. | 14,614 | $ 202,851 |
| Evonik Industries AG | 1,328 | 43,045 |
| Fresenius Medical Care AG & Co., KGaA | 1,307 | 85,025 |
| Fresenius S.E. & Co., KGaA | 2,688 | 108,334 |
| GEA Group AG | 932 | 51,027 |
| Hannover Rueck S.E. | 392 | 74,598 |
| HeidelbergCement AG | 971 | 65,798 |
| HelloFresh S.E.* | 1,016 | 78,125 |
| Henkel AG & Co., KGaA | 685 | 53,577 |
| Infineon Technologies AG | 8,345 | 387,252 |
| KION Group AG | 441 | 48,440 |
| Knorr-Bremse AG | 447 | 44,224 |
| LANXESS AG | 503 | 31,210 |
| LEG Immobilien S.E. | 468 | 65,377 |
| Merck KGaA | 821 | 212,179 |
| MTU Aero Engines AG | 338 | 69,035 |
| Muenchener Rueckversicherungs-Gesellschaft AG in Muenchen | 900 | 266,921 |
| Nemetschek S.E. | 350 | 44,948 |
| Puma S.E. | 591 | 72,332 |
| Rational AG | 35 | 35,879 |
| RWE AG | 4,070 | 165,516 |
| SAP S.E. | 6,640 | 944,199 |
| Scout24 S.E. | 551 | 38,530 |
| Siemens AG | 4,864 | 845,491 |
| Siemens Energy AG* | 2,663 | 68,186 |
| Siemens Healthineers AG | 1,732 | 129,789 |
| Symrise AG | 817 | 121,199 |
| Telefonica Deutschland Holding AG | 5,808 | 16,141 |
| Uniper S.E. | 601 | 28,601 |
| United Internet AG | 668 | 26,572 |
| Vitesco Technologies Group AG, Class A* | 146 | 7,181 |
| Volkswagen AG | 205 | 60,309 |
| Vonovia S.E. | 4,631 | 255,711 |
| Zalando S.E.* | 1,430 | 115,820 |
| | | 9,080,942 |
| Hong Kong — 2.6% |
| AIA Group Ltd. | 77,000 | 776,167 |
| BOC Hong Kong Holdings Ltd. | 24,000 | 78,640 |
| Budweiser Brewing Co., APAC, Ltd. | 11,100 | 29,111 |
| Chow Tai Fook Jewellery Group Ltd.* | 14,600 | 26,251 |
| CK Asset Holdings Ltd. | 13,034 | 82,157 |
| CK Hutchison Holdings Ltd. | 17,128 | 110,488 |
| CK Infrastructure Holdings Ltd. | 4,000 | 25,470 |
| CLP Holdings Ltd. | 10,000 | 100,993 |
| ESR Cayman Ltd.* | 11,600 | 39,199 |
| Futu Holdings Ltd., ADR* | 300 | 12,990 |
| Galaxy Entertainment Group Ltd.* | 14,000 | 72,536 |
| Hang Lung Properties Ltd. | 14,000 | 28,799 |
| Hang Seng Bank Ltd. | 5,100 | 93,333 |
| Henderson Land Development Co., Ltd. | 8,891 | 37,856 |
| | Number of
Shares | Value† |
| |
| Hong Kong — (continued) |
| HK Electric Investments & HK Electric Investments Ltd. | 20,777 | $ 20,384 |
| HKT Trust & HKT Ltd. | 25,240 | 33,923 |
| Hong Kong & China Gas Co., Ltd. | 71,112 | 110,714 |
| Hong Kong Exchanges & Clearing Ltd. | 7,684 | 448,768 |
| Hongkong Land Holdings Ltd. | 7,400 | 38,480 |
| Jardine Matheson Holdings Ltd. | 1,400 | 77,014 |
| Link REIT | 13,702 | 120,636 |
| Melco Resorts & Entertainment Ltd., ADR* | 1,367 | 13,916 |
| MTR Corp. Ltd. | 9,671 | 51,905 |
| New World Development Co., Ltd. | 10,458 | 41,376 |
| Power Assets Holdings Ltd. | 9,500 | 59,211 |
| Sino Land Co., Ltd. | 18,095 | 22,533 |
| SITC International Holdings Co., Ltd. | 9,000 | 32,549 |
| Sun Hung Kai Properties Ltd. | 8,161 | 99,009 |
| Swire Pacific Ltd., Class A | 3,500 | 19,907 |
| Swire Properties Ltd. | 7,136 | 17,882 |
| Techtronic Industries Co., Ltd. | 8,500 | 169,181 |
| WH Group Ltd. | 46,372 | 29,081 |
| Wharf Real Estate Investment Co., Ltd. | 11,000 | 55,864 |
| Xinyi Glass Holdings Ltd. | 12,000 | 30,009 |
| | | 3,006,332 |
| Ireland — 1.1% |
| CRH PLC | 4,923 | 260,737 |
| DCC PLC | 613 | 50,199 |
| Experian PLC | 5,862 | 288,181 |
| Flutter Entertainment PLC* | 1,078 | 170,595 |
| James Hardie Industries PLC | 2,913 | 117,200 |
| Kerry Group PLC, Class A | 1,018 | 131,256 |
| Kingspan Group PLC | 981 | 117,271 |
| Smurfit Kappa Group PLC | 1,508 | 83,165 |
| | | 1,218,604 |
| Israel — 0.7% |
| Azrieli Group Ltd. | 283 | 27,035 |
| Bank Hapoalim BM | 7,162 | 73,948 |
| Bank Leumi Le-Israel BM | 9,130 | 98,232 |
| Check Point Software Technologies Ltd.* | 712 | 82,991 |
| CyberArk Software Ltd.* | 200 | 34,656 |
| Elbit Systems Ltd. | 186 | 32,247 |
| Fiverr International Ltd.* | 200 | 22,740 |
| ICL Group Ltd. | 4,391 | 42,385 |
| Inmode Ltd.* | 300 | 21,174 |
| Israel Discount Bank Ltd., Class A | 7,042 | 47,431 |
| Kornit Digital Ltd.* | 300 | 45,675 |
| Mizrahi Tefahot Bank Ltd. | 962 | 37,131 |
| Nice Ltd.* | 415 | 127,038 |
| Teva Pharmaceutical Industries Ltd.* | 6,350 | 55,045 |
| Teva Pharmaceutical Industries Ltd., ADR* | 500 | 4,005 |
| Wix.com Ltd.* | 359 | 56,647 |
| | | 808,380 |
Penn Series Funds, Inc.
Schedule of Investments — December 31, 2021
Developed International Index Fund
| | Number of
Shares | Value† |
| COMMON STOCKS — (continued) |
| Italy — 2.0% |
| Amplifon SpA | 856 | $ 46,243 |
| Assicurazioni Generali SpA | 6,950 | 147,411 |
| Atlantia SpA* | 3,017 | 59,955 |
| Davide Campari-Milano N.V. | 3,207 | 46,936 |
| DiaSorin SpA | 180 | 34,316 |
| Enel SpA | 51,567 | 413,664 |
| Eni SpA | 16,285 | 226,565 |
| Ferrari N.V. | 796 | 206,171 |
| FinecoBank Banca Fineco SpA | 3,910 | 68,709 |
| Infrastrutture Wireless Italiane SpA | 1,712 | 20,817 |
| Intesa Sanpaolo SpA | 105,143 | 272,210 |
| Mediobanca Banca di Credito Finanziario SpA | 3,828 | 44,061 |
| Moncler SpA | 1,251 | 91,181 |
| Nexi SpA* | 2,687 | 42,797 |
| Poste Italiane SpA | 3,626 | 47,639 |
| Prysmian SpA | 1,675 | 63,140 |
| Recordati Industria Chimica e Farmaceutica SpA | 726 | 46,700 |
| Snam SpA | 13,027 | 78,606 |
| Telecom Italia SpA | 60,149 | 29,734 |
| Terna - Rete Elettrica Nazionale | 8,790 | 71,193 |
| UniCredit SpA | 13,413 | 206,826 |
| | | 2,264,874 |
| Japan — 21.7% |
| Advantest Corp. | 1,300 | 123,185 |
| Aeon Co., Ltd. | 4,300 | 101,267 |
| AGC, Inc. | 1,200 | 57,272 |
| Aisin Corp. | 1,000 | 38,338 |
| Ajinomoto Co., Inc. | 3,000 | 91,202 |
| ANA Holdings, Inc.* | 800 | 16,723 |
| Asahi Group Holdings Ltd. | 2,900 | 112,793 |
| Asahi Intecc Co., Ltd. | 1,400 | 30,074 |
| Asahi Kasei Corp. | 8,100 | 76,120 |
| Astellas Pharma, Inc. | 11,800 | 191,879 |
| Azbil Corp. | 800 | 36,443 |
| Bandai Namco Holdings, Inc. | 1,300 | 101,645 |
| Benefit One, Inc. | 500 | 21,451 |
| Bridgestone Corp. | 3,600 | 154,885 |
| Brother Industries Ltd. | 1,500 | 28,832 |
| Canon, Inc. | 6,400 | 155,841 |
| Capcom Co., Ltd. | 1,200 | 28,250 |
| Central Japan Railway Co. | 900 | 120,060 |
| Chubu Electric Power Co., Inc. | 4,100 | 43,199 |
| Chugai Pharmaceutical Co., Ltd. | 4,300 | 139,620 |
| Concordia Financial Group Ltd. | 7,200 | 26,164 |
| Cosmos Pharmaceutical Corp. | 100 | 14,718 |
| CyberAgent, Inc. | 2,400 | 39,934 |
| Dai Nippon Printing Co., Ltd. | 1,400 | 35,210 |
| Daifuku Co., Ltd. | 600 | 49,031 |
| Dai-ichi Life Holdings, Inc. | 6,500 | 131,407 |
| Daiichi Sankyo Co., Ltd. | 11,100 | 282,252 |
| Daikin Industries Ltd. | 1,600 | 362,897 |
| Daito Trust Construction Co., Ltd. | 400 | 45,797 |
| | Number of
Shares | Value† |
| |
| Japan — (continued) |
| Daiwa House Industry Co., Ltd. | 3,600 | $ 103,528 |
| Daiwa House REIT Investment Corp. | 13 | 39,385 |
| Daiwa Securities Group, Inc. | 9,300 | 52,446 |
| Denso Corp. | 2,800 | 231,950 |
| Dentsu Group, Inc. | 1,300 | 46,336 |
| Disco Corp. | 200 | 61,114 |
| East Japan Railway Co. | 1,900 | 116,828 |
| Eisai Co., Ltd. | 1,500 | 85,165 |
| ENEOS Holdings, Inc. | 20,490 | 76,648 |
| FANUC Corp. | 1,200 | 254,334 |
| Fast Retailing Co., Ltd. | 400 | 227,106 |
| Fuji Electric Co., Ltd. | 800 | 43,676 |
| FUJIFILM Holdings Corp. | 2,300 | 170,475 |
| Fujitsu Ltd. | 1,200 | 205,825 |
| GLP J-Reit | 26 | 44,957 |
| GMO Payment Gateway, Inc. | 300 | 37,425 |
| Hakuhodo DY Holdings, Inc. | 1,500 | 24,985 |
| Hamamatsu Photonics K.K. | 900 | 57,428 |
| Hankyu Hanshin Holdings, Inc. | 1,400 | 39,737 |
| Hikari Tsushin, Inc. | 100 | 15,396 |
| Hino Motors Ltd. | 2,000 | 16,483 |
| Hirose Electric Co., Ltd. | 220 | 36,989 |
| Hitachi Construction Machinery Co., Ltd. | 700 | 20,234 |
| Hitachi Ltd. | 6,200 | 335,791 |
| Hitachi Metals Ltd.* | 1,400 | 25,936 |
| Honda Motor Co., Ltd. | 10,400 | 292,028 |
| Hoshizaki Corp. | 300 | 22,559 |
| Hoya Corp. | 2,300 | 342,111 |
| Hulic Co., Ltd. | 2,000 | 18,986 |
| Ibiden Co., Ltd. | 700 | 41,624 |
| Idemitsu Kosan Co., Ltd. | 1,356 | 34,622 |
| Iida Group Holdings Co., Ltd. | 1,000 | 23,263 |
| Inpex Corp. | 6,400 | 55,749 |
| Isuzu Motors Ltd. | 3,400 | 42,297 |
| Ito En Ltd. | 400 | 21,003 |
| ITOCHU Corp. | 7,500 | 229,375 |
| Itochu Techno-Solutions Corp. | 700 | 22,516 |
| Japan Airlines Co., Ltd.* | 800 | 15,273 |
| Japan Exchange Group, Inc. | 3,300 | 72,237 |
| Japan Metropolitan Fund Invest | 48 | 41,353 |
| Japan Post Bank Co., Ltd. | 3,000 | 27,515 |
| Japan Post Holdings Co., Ltd.* | 15,700 | 122,401 |
| Japan Post Insurance Co., Ltd. | 1,100 | 17,691 |
| Japan Real Estate Investment Corp. | 8 | 45,414 |
| Japan Tobacco, Inc. | 7,800 | 157,485 |
| JFE Holdings, Inc. | 3,000 | 38,260 |
| JSR Corp. | 1,200 | 45,640 |
| Kajima Corp. | 2,800 | 32,155 |
| Kakaku.com, Inc. | 900 | 24,020 |
| Kansai Paint Co., Ltd. | 1,100 | 23,907 |
| Kao Corp. | 3,100 | 162,209 |
| KDDI Corp. | 10,300 | 301,040 |
| Keio Corp. | 700 | 30,853 |
| Keisei Electric Railway Co., Ltd. | 800 | 21,629 |
Penn Series Funds, Inc.
Schedule of Investments — December 31, 2021
Developed International Index Fund
| | Number of
Shares | Value† |
| COMMON STOCKS — (continued) |
| Japan — (continued) |
| Keyence Corp. | 1,195 | $750,888 |
| Kikkoman Corp. | 900 | 75,658 |
| Kintetsu Group Holdings Co., Ltd.* | 1,100 | 30,744 |
| Kirin Holdings Co., Ltd. | 5,200 | 83,495 |
| Kobayashi Pharmaceutical Co., Ltd. | 300 | 23,576 |
| Kobe Bussan Co., Ltd. | 800 | 30,983 |
| Koei Tecmo Holdings Co., Ltd. | 390 | 15,342 |
| Koito Manufacturing Co., Ltd. | 700 | 37,060 |
| Komatsu Ltd. | 5,500 | 128,786 |
| Konami Holdings Corp. | 600 | 28,792 |
| Kose Corp. | 200 | 22,690 |
| Kubota Corp. | 6,500 | 144,291 |
| Kurita Water Industries Ltd. | 600 | 28,479 |
| Kyocera Corp. | 2,100 | 131,207 |
| Kyowa Kirin Co., Ltd. | 1,700 | 46,331 |
| Lasertec Corp. | 500 | 153,395 |
| Lawson, Inc. | 400 | 18,952 |
| Lion Corp. | 1,500 | 20,043 |
| Lixil Corp. | 1,700 | 45,297 |
| M3, Inc. | 2,800 | 141,010 |
| Makita Corp. | 1,400 | 59,430 |
| Marubeni Corp. | 9,700 | 94,403 |
| Mazda Motor Corp.* | 3,400 | 26,158 |
| McDonald's Holdings Co., Japan Ltd. | 400 | 17,700 |
| Medipal Holdings Corp. | 1,300 | 24,354 |
| MEIJI Holdings Co., Ltd. | 800 | 47,709 |
| Mercari, Inc.* | 600 | 30,566 |
| MINEBEA MITSUMI, Inc. | 2,300 | 65,283 |
| MISUMI Group, Inc. | 1,900 | 77,962 |
| Mitsubishi Chemical Holdings Corp. | 8,200 | 60,735 |
| Mitsubishi Corp. | 8,000 | 253,986 |
| Mitsubishi Electric Corp. | 11,900 | 150,884 |
| Mitsubishi Estate Co., Ltd. | 7,500 | 103,962 |
| Mitsubishi Gas Chemical Co., Inc. | 1,100 | 18,628 |
| Mitsubishi HC Capital, Inc. | 4,700 | 23,249 |
| Mitsubishi Heavy Industries Ltd. | 2,100 | 48,543 |
| Mitsubishi UFJ Financial Group, Inc. | 77,500 | 421,018 |
| Mitsui & Co., Ltd. | 9,700 | 229,661 |
| Mitsui Chemicals, Inc. | 1,100 | 29,549 |
| Mitsui Fudosan Co., Ltd. | 6,000 | 118,847 |
| Miura Co., Ltd. | 600 | 20,655 |
| Mizuho Financial Group, Inc. | 15,508 | 197,237 |
| MonotaRO Co., Ltd. | 1,600 | 28,834 |
| MS&AD Insurance Group Holdings, Inc. | 2,890 | 89,165 |
| Murata Manufacturing Co., Ltd. | 3,700 | 294,540 |
| NEC Corp. | 1,500 | 69,243 |
| Nexon Co., Ltd. | 3,200 | 61,869 |
| NGK Insulators Ltd. | 1,500 | 25,350 |
| Nidec Corp. | 2,800 | 329,097 |
| Nihon M&A Center Holdings, Inc. | 2,000 | 49,048 |
| Nintendo Co., Ltd. | 722 | 336,741 |
| Nippon Building Fund, Inc. | 10 | 58,246 |
| Nippon Express Co., Ltd. | 500 | 29,623 |
| Nippon Paint Holdings Co., Ltd. | 4,500 | 49,057 |
| | Number of
Shares | Value† |
| |
| Japan — (continued) |
| Nippon Prologis REIT, Inc. | 13 | $ 45,997 |
| Nippon Sanso Holdings Corp. | 1,000 | 21,846 |
| Nippon Shinyaku Co., Ltd. | 300 | 20,890 |
| Nippon Steel Corp. | 5,317 | 86,829 |
| Nippon Telegraph & Telephone Corp. | 8,300 | 227,288 |
| Nippon Yusen K.K. | 900 | 68,539 |
| Nissan Chemical Corp. | 800 | 46,457 |
| Nissan Motor Co., Ltd.* | 14,400 | 69,578 |
| Nisshin Seifun Group, Inc. | 1,315 | 18,954 |
| Nissin Foods Holdings Co., Ltd. | 400 | 29,175 |
| Nitori Holdings Co., Ltd. | 500 | 74,872 |
| Nitto Denko Corp. | 900 | 69,556 |
| Nomura Holdings, Inc. | 19,300 | 84,176 |
| Nomura Real Estate Holdings, Inc. | 600 | 13,807 |
| Nomura Real Estate Master Fund, Inc. | 28 | 39,384 |
| Nomura Research Institute Ltd. | 2,130 | 91,381 |
| NTT Data Corp. | 4,000 | 85,752 |
| Obayashi Corp. | 4,200 | 32,496 |
| Obic Co., Ltd. | 454 | 85,251 |
| Odakyu Electric Railway Co., Ltd. | 1,800 | 33,424 |
| Oji Holdings Corp. | 6,000 | 29,053 |
| Olympus Corp. | 6,900 | 158,928 |
| Omron Corp. | 1,200 | 119,551 |
| Ono Pharmaceutical Co., Ltd. | 2,500 | 62,071 |
| Open House Group Co., Ltd. | 500 | 26,167 |
| Oracle Corp. Japan | 200 | 15,196 |
| Oriental Land Co., Ltd. | 1,300 | 219,191 |
| ORIX Corp. | 7,700 | 157,139 |
| Orix JREIT, Inc. | 15 | 23,446 |
| Osaka Gas Co., Ltd. | 2,400 | 39,663 |
| Otsuka Corp. | 800 | 38,181 |
| Otsuka Holdings Co., Ltd. | 2,500 | 90,607 |
| Pan Pacific International Holdings Corp. | 2,700 | 37,250 |
| Panasonic Corp. | 14,400 | 158,359 |
| Persol Holdings Co., Ltd. | 1,000 | 29,036 |
| Pola Orbis Holdings, Inc. | 500 | 8,333 |
| Rakuten Group, Inc.* | 5,500 | 55,177 |
| Recruit Holdings Co., Ltd. | 8,700 | 527,309 |
| Renesas Electronics Corp.* | 8,100 | 100,203 |
| Resona Holdings, Inc. | 12,500 | 48,618 |
| Ricoh Co., Ltd. | 4,200 | 39,105 |
| Rinnai Corp. | 200 | 18,047 |
| Rohm Co., Ltd. | 500 | 45,510 |
| Ryohin Keikaku Co., Ltd. | 1,700 | 25,922 |
| Santen Pharmaceutical Co., Ltd. | 2,600 | 31,802 |
| SBI Holdings, Inc. | 1,710 | 46,604 |
| SCSK Corp. | 1,200 | 23,879 |
| Secom Co., Ltd. | 1,300 | 90,253 |
| Seiko Epson Corp. | 1,700 | 30,607 |
| Sekisui Chemical Co., Ltd. | 2,600 | 43,443 |
| Sekisui House Ltd. | 3,900 | 83,709 |
| Seven & i Holdings Co., Ltd. | 4,800 | 210,978 |
| SG Holdings Co., Ltd. | 2,200 | 51,505 |
| Sharp Corp. | 1,200 | 13,781 |
Penn Series Funds, Inc.
Schedule of Investments — December 31, 2021
Developed International Index Fund
| | Number of
Shares | Value† |
| COMMON STOCKS — (continued) |
| Japan — (continued) |
| Shimadzu Corp. | 1,400 | $ 59,089 |
| Shimano, Inc. | 500 | 133,270 |
| Shimizu Corp. | 4,000 | 24,793 |
| Shin-Etsu Chemical Co., Ltd. | 2,200 | 380,979 |
| Shionogi & Co., Ltd. | 1,700 | 120,077 |
| Shiseido Co., Ltd. | 2,600 | 144,974 |
| SMC Corp. | 368 | 248,223 |
| SoftBank Corp. | 18,200 | 230,130 |
| SoftBank Group Corp. | 7,700 | 363,747 |
| Sohgo Security Services Co., Ltd. | 500 | 19,864 |
| Sompo Holdings, Inc. | 2,025 | 85,538 |
| Sony Group Corp. | 8,000 | 1,006,694 |
| Square Enix Holdings Co., Ltd. | 600 | 30,775 |
| Stanley Electric Co., Ltd. | 800 | 20,023 |
| Subaru Corp. | 4,000 | 71,529 |
| SUMCO Corp. | 1,800 | 36,757 |
| Sumitomo Chemical Co., Ltd. | 9,200 | 43,349 |
| Sumitomo Corp. | 7,200 | 106,438 |
| Sumitomo Dainippon Pharma Co., Ltd. | 1,100 | 12,671 |
| Sumitomo Electric Industries Ltd. | 4,900 | 63,875 |
| Sumitomo Metal Mining Co., Ltd. | 1,500 | 56,724 |
| Sumitomo Mitsui Financial Group, Inc. | 8,300 | 284,507 |
| Sumitomo Mitsui Trust Holdings, Inc. | 2,143 | 71,595 |
| Sumitomo Realty & Development Co., Ltd. | 2,000 | 58,819 |
| Suntory Beverage & Food Ltd. | 800 | 28,932 |
| Suzuki Motor Corp. | 2,300 | 88,557 |
| Sysmex Corp. | 1,100 | 148,700 |
| T&D Holdings, Inc. | 3,700 | 47,348 |
| Taisei Corp. | 1,200 | 36,460 |
| Taisho Pharmaceutical Holdings Co., Ltd. | 200 | 9,198 |
| Takeda Pharmaceutical Co., Ltd. | 10,195 | 278,029 |
| TDK Corp. | 2,400 | 93,680 |
| Terumo Corp. | 4,100 | 173,224 |
| The Chiba Bank Ltd. | 3,700 | 21,197 |
| The Kansai Electric Power Co., Inc. | 4,900 | 45,750 |
| The Shizuoka Bank Ltd. | 3,200 | 22,867 |
| TIS, Inc. | 1,400 | 41,685 |
| Tobu Railway Co., Ltd. | 1,100 | 25,073 |
| Toho Co., Ltd. | 700 | 29,970 |
| Tokio Marine Holdings, Inc. | 4,000 | 222,272 |
| Tokyo Century Corp. | 300 | 14,553 |
| Tokyo Electric Power Co. Holdings, Inc.* | 10,800 | 27,885 |
| Tokyo Electron Ltd. | 900 | 518,578 |
| Tokyo Gas Co., Ltd. | 2,300 | 41,229 |
| Tokyu Corp. | 3,000 | 39,850 |
| TOPPAN Inc. | 1,500 | 28,114 |
| Toray Industries, Inc. | 8,800 | 52,159 |
| Toshiba Corp. | 2,600 | 106,911 |
| Tosoh Corp. | 1,800 | 26,696 |
| TOTO Ltd. | 900 | 41,389 |
| Toyo Suisan Kaisha Ltd. | 600 | 25,428 |
| Toyota Industries Corp. | 900 | 71,903 |
| | Number of
Shares | Value† |
| |
| Japan — (continued) |
| Toyota Motor Corp. | 67,440 | $ 1,234,416 |
| Toyota Tsusho Corp. | 1,400 | 64,505 |
| Trend Micro, Inc.* | 900 | 49,996 |
| Tsuruha Holdings, Inc. | 200 | 19,195 |
| Unicharm Corp. | 2,500 | 108,646 |
| USS Co., Ltd. | 1,500 | 23,420 |
| Welcia Holdings Co., Ltd. | 600 | 18,726 |
| West Japan Railway Co. | 1,400 | 58,541 |
| Yakult Honsha Co., Ltd. | 800 | 41,728 |
| Yamaha Corp. | 900 | 44,362 |
| Yamaha Motor Co., Ltd. | 1,700 | 40,775 |
| Yamato Holdings Co., Ltd. | 2,000 | 46,996 |
| Yaskawa Electric Corp. | 1,600 | 78,449 |
| Yokogawa Electric Corp. | 1,600 | 28,848 |
| Z Holdings Corp. | 16,800 | 97,473 |
| ZOZO, Inc. | 600 | 18,726 |
| | | 24,751,386 |
| Jordan — 0.0% |
| Hikma Pharmaceuticals PLC | 1,083 | 32,528 |
| Luxembourg — 0.3% |
| ArcelorMittal S.A. | 4,208 | 134,837 |
| Aroundtown S.A. | 6,382 | 38,655 |
| Eurofins Scientific S.E. | 870 | 107,766 |
| Tenaris S.A. | 2,782 | 29,171 |
| | | 310,429 |
| Macao — 0.0% |
| Sands China Ltd.* | 16,000 | 37,263 |
| Netherlands — 6.1% |
| ABN AMRO Bank N.V. | 2,635 | 38,747 |
| Adyen N.V.* | 127 | 334,219 |
| Aegon N.V. | 11,939 | 59,712 |
| Akzo Nobel N.V. | 1,217 | 133,706 |
| Argenx S.E.* | 290 | 104,101 |
| ASM International N.V. | 297 | 131,433 |
| ASML Holding N.V. | 2,632 | 2,117,649 |
| Euronext N.V. | 547 | 56,827 |
| EXOR N.V. | 691 | 62,118 |
| Heineken Holding N.V. | 727 | 67,167 |
| Heineken N.V. | 1,671 | 188,075 |
| IMCD N.V. | 363 | 80,465 |
| ING Groep N.V. | 25,125 | 350,180 |
| JDE Peet's N.V. | 515 | 15,889 |
| Just Eat Takeaway.com N.V.* | 1,183 | 65,282 |
| Koninklijke Ahold Delhaize N.V. | 6,743 | 231,343 |
| Koninklijke DSM N.V. | 1,104 | 248,867 |
| Koninklijke KPN N.V. | 21,105 | 65,596 |
| Koninklijke Philips N.V. | 5,905 | 220,274 |
| NN Group N.V. | 1,681 | 91,117 |
| Prosus N.V.* | 5,922 | 495,754 |
| QIAGEN N.V.* | 1,512 | 84,332 |
| Randstad N.V. | 823 | 56,257 |
| Royal Dutch Shell PLC, Class A | 26,261 | 576,478 |
Penn Series Funds, Inc.
Schedule of Investments — December 31, 2021
Developed International Index Fund
| | Number of
Shares | Value† |
| COMMON STOCKS — (continued) |
| Netherlands — (continued) |
| Royal Dutch Shell PLC, Class B | 23,372 | $ 513,249 |
| Stellantis N.V. | 5,622 | 106,750 |
| Stellantis N.V. | 7,408 | 140,730 |
| Universal Music Group N.V. | 4,675 | 131,891 |
| Wolters Kluwer N.V. | 1,720 | 202,872 |
| | | 6,971,080 |
| New Zealand — 0.3% |
| Auckland International Airport Ltd.* | 7,064 | 37,254 |
| Fisher & Paykel Healthcare Corp. Ltd. | 3,664 | 82,210 |
| Mercury NZ Ltd. | 5,143 | 21,557 |
| Meridian Energy Ltd. | 9,073 | 30,138 |
| Ryman Healthcare Ltd. | 2,831 | 23,752 |
| Spark New Zealand Ltd. | 12,240 | 37,892 |
| Xero Ltd.* | 835 | 85,926 |
| | | 318,729 |
| Norway — 0.6% |
| Adevinta ASA* | 1,674 | 22,297 |
| Aker BP ASA | 804 | 24,796 |
| DNB Bank ASA | 6,003 | 137,694 |
| Equinor ASA | 6,312 | 169,079 |
| Gjensidige Forsikring ASA | 1,242 | 30,181 |
| Mowi ASA | 2,898 | 68,677 |
| Norsk Hydro ASA | 8,484 | 66,974 |
| Orkla ASA | 4,885 | 49,013 |
| Schibsted ASA, Class A | 520 | 20,082 |
| Schibsted ASA, Class B | 588 | 19,830 |
| Telenor ASA | 4,471 | 70,366 |
| Yara International ASA | 1,012 | 51,137 |
| | | 730,126 |
| Poland — 0.0% |
| InPost S.A.* | 1,446 | 17,447 |
| Portugal — 0.2% |
| Banco Espirito Santo S.A.(1),* | 27,017 | 0 |
| EDP - Energias de Portugal S.A. | 17,315 | 95,254 |
| Galp Energia SGPS S.A. | 3,064 | 29,721 |
| Jeronimo Martins SGPS S.A. | 1,733 | 39,657 |
| | | 164,632 |
| Singapore — 1.2% |
| Ascendas Real Estate Investment Trust | 20,490 | 44,854 |
| CapitaLand Integrated Commercial Trust | 29,400 | 44,506 |
| Capitaland Investment Ltd.* | 16,607 | 42,023 |
| City Developments Ltd. | 3,000 | 15,160 |
| DBS Group Holdings Ltd. | 11,448 | 277,450 |
| Genting Singapore Ltd. | 36,200 | 20,818 |
| Keppel Corp. Ltd. | 10,300 | 39,133 |
| Mapletree Commercial Trust | 15,200 | 22,333 |
| Mapletree Logistics Trust | 20,077 | 28,307 |
| Oversea-Chinese Banking Corp. Ltd. | 21,691 | 183,495 |
| Sea Ltd., ADR* | 900 | 201,339 |
| Singapore Airlines Ltd.* | 7,900 | 29,253 |
| | Number of
Shares | Value† |
| |
| Singapore — (continued) |
| Singapore Exchange Ltd. | 5,000 | $ 34,506 |
| Singapore Technologies Engineering Ltd. | 9,500 | 26,506 |
| Singapore Telecommunications Ltd. | 52,200 | 89,866 |
| United Overseas Bank Ltd. | 7,437 | 148,453 |
| UOL Group Ltd. | 3,107 | 16,347 |
| Venture Corp. Ltd. | 1,700 | 23,098 |
| Wilmar International Ltd. | 11,600 | 35,637 |
| | | 1,323,084 |
| Spain — 2.2% |
| ACS Actividades de Construccion y Servicios S.A. | 1,556 | 41,755 |
| Aena SME S.A.* | 469 | 74,113 |
| Amadeus IT Group S.A.* | 2,864 | 194,466 |
| Banco Bilbao Vizcaya Argentaria S.A. | 42,639 | 254,859 |
| Banco Santander S.A. | 110,885 | 371,216 |
| CaixaBank S.A. | 27,810 | 76,431 |
| Cellnex Telecom S.A. | 3,268 | 190,421 |
| EDP Renovaveis S.A. | 2,000 | 49,866 |
| Enagas S.A. | 1,501 | 34,861 |
| Endesa S.A. | 2,006 | 46,133 |
| Ferrovial S.A. | 3,061 | 96,045 |
| Grifols S.A. | 1,885 | 36,215 |
| Iberdrola S.A. | 36,331 | 430,587 |
| Industria de Diseno Textil S.A. | 6,954 | 225,876 |
| Naturgy Energy Group S.A. | 1,138 | 37,094 |
| Red Electrica Corp. S.A. | 2,674 | 57,919 |
| Repsol S.A. | 9,155 | 108,774 |
| Siemens Gamesa Renewable Energy S.A.* | 1,562 | 37,470 |
| Telefonica S.A. | 34,415 | 150,927 |
| | | 2,515,028 |
| Sweden — 3.6% |
| Alfa Laval AB | 2,000 | 80,653 |
| Assa Abloy AB, Class B | 6,425 | 196,386 |
| Atlas Copco AB, Class A | 4,246 | 294,056 |
| Atlas Copco AB, Class B | 2,447 | 144,120 |
| Boliden AB | 1,749 | 67,744 |
| Electrolux AB, Class B | 1,401 | 34,032 |
| Embracer Group AB* | 2,650 | 28,303 |
| Epiroc AB, Class A | 4,193 | 106,354 |
| Epiroc AB, Class B | 2,471 | 52,421 |
| EQT AB | 1,887 | 102,952 |
| Essity AB, Class B | 3,911 | 127,853 |
| Evolution Gaming Group AB | 1,087 | 154,722 |
| Fastighets AB Balder, Class B* | 696 | 50,204 |
| Getinge AB, Class B | 1,459 | 63,794 |
| H & M Hennes & Mauritz AB, Class B | 4,799 | 94,576 |
| Hexagon AB, Class B | 12,559 | 199,653 |
| Husqvarna AB, Class B | 2,834 | 45,429 |
| Industrivarden AB, Class A | 877 | 27,990 |
| Industrivarden AB, Class C | 986 | 31,000 |
| Investment AB Latour, Class B | 1,056 | 43,088 |
| Investor AB, Class A | 3,181 | 83,994 |
Penn Series Funds, Inc.
Schedule of Investments — December 31, 2021
Developed International Index Fund
| | Number of
Shares | Value† |
| COMMON STOCKS — (continued) |
| Sweden — (continued) |
| Investor AB, Class B | 11,521 | $ 290,377 |
| Kinnevik AB, Class B* | 1,611 | 57,541 |
| L E Lundbergforetagen AB, Class B | 471 | 26,479 |
| Lifco AB, Class B | 1,487 | 44,546 |
| Lundin Energy AB | 1,292 | 46,397 |
| Nibe Industrier AB, Class B | 9,198 | 139,199 |
| Sagax AB, Class B | 1,027 | 34,664 |
| Sandvik AB | 7,183 | 200,795 |
| Securitas AB, Class B | 2,230 | 30,762 |
| Sinch AB* | 3,150 | 40,124 |
| Skandinaviska Enskilda Banken AB, Class A | 10,425 | 145,192 |
| Skanska AB, Class B | 2,121 | 54,972 |
| SKF AB, Class B | 2,369 | 56,235 |
| Svenska Cellulosa AB SCA, Class B | 3,887 | 69,148 |
| Svenska Handelsbanken AB, Class A | 9,287 | 100,576 |
| Swedbank AB, Class A | 5,671 | 114,284 |
| Swedish Match AB | 9,802 | 78,124 |
| Tele2 AB, Class B | 3,276 | 46,804 |
| Telefonaktiebolaget LM Ericsson, Class B | 18,737 | 206,919 |
| Telia Co., AB | 17,132 | 67,125 |
| Volvo AB, Class A | 1,410 | 33,174 |
| Volvo AB, Class B | 9,114 | 211,455 |
| | | 4,124,216 |
| Switzerland — 10.6% |
| ABB Ltd. | 10,409 | 398,677 |
| Adecco Group AG | 1,018 | 52,062 |
| Alcon, Inc. | 3,189 | 282,572 |
| Bachem Holding AG, Class B | 40 | 31,431 |
| Baloise Holding AG | 301 | 49,253 |
| Barry Callebaut AG | 22 | 53,503 |
| Chocoladefabriken Lindt & Spruengli AG | 1 | 134,109 |
| Chocoladefabriken Lindt & Spruengli AG, Participation Certificates | 7 | 97,026 |
| Cie Financiere Richemont S.A. | 3,313 | 497,932 |
| Clariant AG* | 1,199 | 25,001 |
| Coca-Cola HBC AG* | 1,222 | 42,261 |
| Credit Suisse Group AG | 16,223 | 157,957 |
| EMS-Chemie Holding AG | 43 | 48,182 |
| Geberit AG | 226 | 184,828 |
| Givaudan S.A. | 58 | 305,022 |
| Glencore PLC* | 64,295 | 326,306 |
| Holcim Ltd.* | 3,354 | 171,197 |
| Julius Baer Group Ltd.* | 1,376 | 92,388 |
| Kuehne + Nagel International AG | 354 | 114,374 |
| Logitech International S.A. | 1,098 | 92,641 |
| Lonza Group AG | 477 | 398,687 |
| Nestle S.A. | 17,928 | 2,507,402 |
| Novartis AG | 13,940 | 1,228,164 |
| Partners Group Holding AG | 147 | 244,005 |
| Roche Holding AG | 4,473 | 1,860,968 |
| Roche Holding AG | 213 | 95,560 |
| | Number of
Shares | Value† |
| |
| Switzerland — (continued) |
| Schindler Holding AG | 125 | $ 33,527 |
| Schindler Holding AG, Participation Certificates | 269 | 72,475 |
| SGS S.A. | 38 | 127,070 |
| Sika AG | 898 | 374,692 |
| Sonova Holding AG | 360 | 141,361 |
| STMicroelectronics N.V. | 4,365 | 215,529 |
| Straumann Holding AG | 65 | 138,175 |
| Swiss Life Holding AG | 200 | 122,695 |
| Swiss Prime Site AG | 484 | 47,619 |
| Swiss Re AG | 1,930 | 191,178 |
| Swisscom AG | 163 | 92,054 |
| Temenos AG | 430 | 59,484 |
| The Swatch Group AG | 185 | 56,645 |
| The Swatch Group AG | 298 | 17,480 |
| UBS Group AG | 22,297 | 401,796 |
| VAT Group AG | 172 | 85,773 |
| Vifor Pharma AG | 293 | 52,172 |
| Zurich Insurance Group AG | 965 | 424,041 |
| | | 12,145,274 |
| United Arab Emirates — 0.0% |
| NMC Health PLC* | 538 | 68 |
| United Kingdom — 12.3% |
| 3i Group PLC | 6,089 | 119,423 |
| abrdn PLC | 14,470 | 47,182 |
| Admiral Group PLC | 1,312 | 56,064 |
| Anglo American PLC | 8,181 | 333,974 |
| Ashtead Group PLC | 2,899 | 233,161 |
| Associated British Foods PLC | 2,278 | 61,914 |
| AstraZeneca PLC | 9,856 | 1,157,696 |
| Auto Trader Group PLC | 5,888 | 58,976 |
| AVEVA Group PLC | 707 | 32,575 |
| Aviva PLC | 25,020 | 138,985 |
| BAE Systems PLC | 20,679 | 153,889 |
| Barclays PLC | 108,104 | 273,626 |
| Barratt Developments PLC | 6,327 | 64,058 |
| Berkeley Group Holdings PLC | 697 | 45,049 |
| BP PLC | 127,784 | 571,640 |
| British American Tobacco PLC | 13,931 | 515,437 |
| BT Group PLC | 56,933 | 130,658 |
| Bunzl PLC | 2,198 | 85,832 |
| Burberry Group PLC | 2,621 | 64,479 |
| CNH Industrial N.V. | 6,662 | 129,471 |
| Coca-Cola Europacific Partners PLC | 1,276 | 71,300 |
| Compass Group PLC* | 11,455 | 255,986 |
| Croda International PLC | 875 | 119,857 |
| Diageo PLC | 14,836 | 810,480 |
| Entain PLC* | 3,735 | 85,084 |
| Evraz PLC | 2,983 | 24,290 |
| Ferguson PLC | 1,403 | 248,868 |
| GlaxoSmithKline PLC | 32,130 | 698,703 |
| Halma PLC | 2,365 | 102,437 |
| Hargreaves Lansdown PLC | 2,149 | 39,414 |
| HSBC Holdings PLC | 129,843 | 788,498 |
Penn Series Funds, Inc.
Schedule of Investments — December 31, 2021
Developed International Index Fund
| | Number of
Shares | Value† |
| COMMON STOCKS — (continued) |
| United Kingdom — (continued) |
| Imperial Brands PLC | 6,063 | $ 132,659 |
| Informa PLC* | 9,687 | 67,736 |
| InterContinental Hotels Group PLC* | 1,153 | 74,614 |
| Intertek Group PLC | 1,024 | 78,034 |
| J. Sainsbury PLC | 10,110 | 37,742 |
| JD Sports Fashion PLC | 17,935 | 52,873 |
| Johnson Matthey PLC | 1,361 | 37,691 |
| Kingfisher PLC | 14,253 | 65,265 |
| Land Securities Group PLC | 4,270 | 44,873 |
| Legal & General Group PLC | 38,445 | 154,811 |
| Lloyds Banking Group PLC | 456,109 | 295,101 |
| London Stock Exchange Group PLC | 2,107 | 197,639 |
| M&G PLC | 16,063 | 43,375 |
| Melrose Industries PLC | 28,464 | 61,605 |
| Mondi PLC | 3,079 | 76,100 |
| National Grid PLC | 22,701 | 325,644 |
| NatWest Group PLC | 37,325 | 114,026 |
| Next PLC | 863 | 95,201 |
| Ocado Group PLC* | 3,089 | 70,159 |
| Pearson PLC | 4,876 | 40,471 |
| Persimmon PLC | 2,126 | 82,186 |
| Phoenix Group Holdings PLC | 3,778 | 33,403 |
| Prudential PLC | 16,706 | 288,195 |
| Reckitt Benckiser Group PLC | 4,527 | 388,607 |
| RELX PLC | 6,807 | 221,311 |
| RELX PLC | 5,578 | 181,118 |
| Rentokil Initial PLC | 12,043 | 95,197 |
| Rio Tinto PLC | 7,215 | 477,746 |
| Rolls-Royce Holdings PLC* | 52,141 | 86,723 |
| Schroders PLC | 773 | 37,248 |
| Segro PLC | 7,740 | 150,495 |
| Severn Trent PLC | 1,547 | 61,708 |
| Smith & Nephew PLC | 5,814 | 101,793 |
| Smiths Group PLC | 2,596 | 55,501 |
| Spirax-Sarco Engineering PLC | 486 | 105,581 |
| SSE PLC | 6,568 | 146,598 |
| St. James's Place PLC | 3,331 | 75,904 |
| Standard Chartered PLC | 17,213 | 104,471 |
| Taylor Wimpey PLC | 22,936 | 54,484 |
| Tesco PLC | 49,064 | 192,524 |
| The British Land Co., PLC | 5,472 | 39,329 |
| The Sage Group PLC | 6,509 | 75,116 |
| Unilever PLC | 8,119 | 433,590 |
| Unilever PLC | 8,382 | 449,041 |
| United Utilities Group PLC | 4,259 | 62,778 |
| Vodafone Group PLC | 175,739 | 267,035 |
| Whitbread PLC* | 1,238 | 50,187 |
| WPP PLC | 7,516 | 113,890 |
| | | 14,016,384 |
TOTAL COMMON STOCKS
(Cost $72,533,645) | | 109,682,824 |
| | Number of
Shares | Value† |
|
| PREFERRED STOCKS — 0.5% |
| Germany — 0.5% |
| Bayerische Motoren Werke AG | 341 | $ 28,457 |
| FUCHS PETROLUB S.E. | 492 | 22,361 |
| Henkel AG & Co., KGaA | 1,122 | 90,874 |
| Porsche Automobil Holding S.E. | 999 | 94,902 |
| Sartorius AG | 172 | 116,553 |
| Volkswagen AG | 1,195 | 241,463 |
TOTAL PREFERRED STOCKS
(Cost $393,487) | | 594,610 |
|
| SHORT-TERM INVESTMENTS — 2.3% |
BlackRock Liquidity FedFund - Institutional Shares (seven-day effective yield 0.030%)
(Cost $2,617,785) | 2,617,785 | 2,617,785 |
TOTAL INVESTMENTS — 98.9%
(Cost $75,544,917) | | $ 112,895,219 |
| Other Assets & Liabilities — 1.1% | 1,262,809 |
| TOTAL NET ASSETS — 100.0% | | $ 114,158,028 |
| † | See Security Valuation Note. |
| * | Non-income producing security. |
| (1) | The value of this security was determined using significant unobservable inputs and is reported as a Level 3 security in the Valuation Hierarchy table located at the end of the Schedule of Investments. |
| A/S— Aktieselskab. |
| AB— Aktiebolag. |
| ADR— American Depositary Receipt. |
| AG— Aktiengesellschaft. |
| ASA— Allmennaksjeselskap. |
| K.K.— Kabushiki Kaisha |
| KGaA— Kommanditgesellschaft auf Aktien. |
| MSCI— Morgan Stanley Capital International. |
| N.V.— Naamloze Vennootschap. |
| OYJ— Julkinen Osakeyhtiö. |
| PLC— Public Limited Company. |
| REIT— Real Estate Investment Trust. |
| S.A.— Societe Anonyme. |
| S.E.— Societas Europaea. |
| SpA— Società per Azioni. |
| Country Weightings as of 12/31/2021†† |
| Japan | 23% |
| United Kingdom | 13 |
| France | 11 |
| Switzerland | 11 |
| Germany | 9 |
| Australia | 7 |
| Netherlands | 6 |
| Other | 20 |
| Total | 100% |
Penn Series Funds, Inc.
Schedule of Investments — December 31, 2021
Developed International Index Fund
| †† | % of total investments as of December 31, 2021. |
COMMON STOCKS
INDUSTRY DIVERSIFICATION | % of Market
Value | Value† |
| Advertising | 0.3% | $ 284,086 |
| Aerospace & Defense | 1.1% | 1,167,046 |
| Agriculture | 0.8% | 883,705 |
| Airlines | 0.1% | 106,300 |
| Apparel | 2.4% | 2,689,185 |
| Auto Manufacturers | 3.1% | 3,373,033 |
| Auto Parts & Equipment | 0.9% | 991,107 |
| Banks | 9.5% | 10,399,886 |
| Beverages | 2.2% | 2,360,558 |
| Biotechnology | 0.9% | 949,923 |
| Building Materials | 2.1% | 2,283,197 |
| Chemicals | 3.2% | 3,539,075 |
| Commercial Services | 3.1% | 3,438,761 |
| Computers | 1.2% | 1,341,065 |
| Cosmetics & Personal Care | 2.1% | 2,303,772 |
| Distribution & Wholesale | 1.3% | 1,393,533 |
| Diversified Financial Services | 1.7% | 1,827,004 |
| Electric | 2.7% | 2,974,070 |
| Electrical Components & Equipment | 1.3% | 1,373,383 |
| Electronics | 1.6% | 1,780,832 |
| Energy-Alternate Sources | 0.2% | 237,254 |
| Engineering & Construction | 1.2% | 1,314,721 |
| Entertainment | 0.9% | 1,009,505 |
| Environmental Control | 0.0% | 28,479 |
| Food | 4.8% | 5,234,230 |
| Food Service | 0.3% | 305,292 |
| Forest Products & Paper | 0.4% | 462,587 |
| Gas | 0.3% | 342,167 |
| Hand & Machine Tools | 0.4% | 439,403 |
| Healthcare Products | 2.4% | 2,657,981 |
| Healthcare Services | 0.9% | 993,407 |
| Holding Companies | 0.2% | 207,409 |
| Home Builders | 0.5% | 525,887 |
| Home Furnishings | 1.2% | 1,345,723 |
| Household Products & Wares | 0.4% | 442,184 |
| Insurance | 4.7% | 5,138,366 |
| Internet | 1.5% | 1,639,719 |
| Investment Companies | 0.7% | 819,080 |
| Iron & Steel | 0.5% | 537,617 |
| Leisure Time | 0.2% | 218,407 |
| Lodging | 0.3% | 326,399 |
| Machinery — Construction & Mining | 1.0% | 1,111,994 |
| Machinery — Diversified | 2.6% | 2,888,134 |
| Media | 0.4% | 446,371 |
| Metal Fabricate/Hardware | 0.2% | 249,141 |
| Mining | 2.5% | 2,790,542 |
| Miscellaneous Manufacturing | 1.2% | 1,274,272 |
| Office & Business Equipment | 0.4% | 396,028 |
| Oil & Gas | 3.4% | 3,704,873 |
| Pharmaceuticals | 8.5% | 9,363,431 |
| Pipelines | 0.0% | 54,857 |
| Private Equity | 0.5% | 530,699 |
| Real Estate | 1.3% | 1,397,648 |
| Real Estate Investment Trusts | 1.4% | 1,507,945 |
| Retail | 2.1% | 2,284,723 |
| Semiconductors | 3.5% | 3,886,919 |
COMMON STOCKS
INDUSTRY DIVERSIFICATION | % of Market
Value | | Value† |
| Shipbuilding | 0.0% | | $ 42,300 |
| Software | 1.7% | | 1,849,817 |
| Telecommunications | 3.2% | | 3,484,859 |
| Toys, Games & Hobbies | 0.4% | | 438,386 |
| Transportation | 1.8% | | 1,959,473 |
| Water | 0.3% | | 335,074 |
| | 100.0% | | $109,682,824 |
Summary of inputs used to value the Fund’s investments as of 12/31/2021 are as follows (See Security Valuation Note):
| ASSETS TABLE |
| Description | Total
Market
Value at
12/31/2021 | Level 1
Quoted
Price | Level 2
Significant
Observable
Input | Level 3
Significant
Unobservable
Input |
| Common Stocks | | | | |
| Australia | $ 7,845,815 | $ 7,845,815 | $ — | $— |
| Austria | 253,251 | 253,251 | — | — |
| Belgium | 878,937 | 878,937 | — | — |
| Chile | 46,761 | 46,761 | — | — |
| Denmark | 2,976,888 | 2,976,888 | — | — |
| Finland | 1,404,093 | 1,404,093 | — | — |
| France | 12,440,273 | 12,440,273 | — | — |
| Germany | 9,080,942 | 9,080,942 | — | — |
| Hong Kong | 3,006,332 | 3,006,332 | — | — |
| Ireland | 1,218,604 | 1,218,604 | — | — |
| Israel | 808,380 | 808,380 | — | — |
| Italy | 2,264,874 | 2,264,874 | — | — |
| Japan | 24,751,386 | 24,721,763 | 29,623 | — |
| Jordan | 32,528 | 32,528 | — | — |
| Luxembourg | 310,429 | 310,429 | — | — |
| Macao | 37,263 | 37,263 | — | — |
| Netherlands | 6,971,080 | 6,971,080 | — | — |
| New Zealand | 318,729 | 318,729 | — | — |
| Norway | 730,126 | 730,126 | — | — |
| Poland | 17,447 | 17,447 | — | — |
| Portugal | 164,632 | 164,632 | — | — |
| Singapore | 1,323,084 | 1,300,751 | 22,333 | — |
| Spain | 2,515,028 | 2,515,028 | — | — |
| Sweden | 4,124,216 | 4,124,216 | — | — |
| Switzerland | 12,145,274 | 12,145,274 | — | — |
| United Arab Emirates | 68 | — | 68 | — |
| United Kingdom | 14,016,384 | 14,016,384 | — | — |
| Total Common Stocks | $ 109,682,824 | $ 109,630,800 | $ 52,024 | $ — |
| Preferred Stocks | 594,610 | 594,610 | — | — |
| Short-Term Investments | 2,617,785 | 2,617,785 | — | — |
| Total Investments | $ 112,895,219 | $ 112,843,195 | $ 52,024 | $ — |
| Other Financial Instruments(1) | | | | |
| Futures Contracts | $ 52,114 | $ 52,114 | $ — | $— |
| Total Assets—Other Financial Instruments | $ 52,114 | $ 52,114 | $ — | $ — |
Penn Series Funds, Inc.
Schedule of Investments — December 31, 2021
Developed International Index Fund
| (1) | Other financial instruments are derivative instruments not reflected in the value of total investments in securities in the Schedule of Investments such as future contracts and forward foreign currency contracts which are valued at the unrealized appreciation (depreciation) on the instrument. |
It is the Fund's practice to recognize transfers into and transfers out of Level 3 at the fair value hierarchy as of the beginning of period. An amount of $0 was transferred from Level 2 into Level 3 at December 31, 2021 due to decrease in trading activities at period end.
Futures contracts held by the Fund at December 31, 2021 are as follows:
Futures Contracts:
Exchange Traded |
| Type | | Futures Contract | | Expiration
Date | | Numbers
of
Contracts | | Units per
Contract | | Closing
Price | | Notional
Value | | Unrealized
Appreciation | | Unrealized
Depreciation |
| Long | | MSCI EAFE Index | | 03/18/22 | | 32 | | 50 | | $2,322 | | $3,714,880 | | $52,114 | | $— |
| | | | | | | | | | | | | | | $52,114 | | $— |
The accompanying notes are an integral part of these financial statements.
Penn Series Funds, Inc.
Schedule of Investments — December 31, 2021
International Equity Fund
| | Number of
Shares | Value† |
| COMMON STOCKS — 96.1% |
| Canada — 12.4% |
| Boyd Group Services, Inc. | 40,865 | $ 6,448,849 |
| CAE, Inc.* | 386,531 | 9,750,745 |
| Canadian National Railway Co. | 52,363 | 6,432,004 |
| Constellation Software, Inc. | 11,446 | 21,236,472 |
| | | 43,868,070 |
| China — 2.0% |
| Yum China Holdings, Inc. | 143,432 | 7,037,734 |
| France — 8.3% |
| Air Liquide S.A. | 20,320 | 3,546,954 |
| LVMH Moet Hennessy Louis Vuitton S.E. | 10,555 | 8,736,263 |
| Sartorius Stedim Biotech | 14,331 | 7,870,763 |
| Teleperformance | 20,307 | 9,062,851 |
| | | 29,216,831 |
| India — 3.8% |
| Tata Consultancy Services Ltd. | 263,314 | 13,242,097 |
| Ireland — 4.3% |
| Experian PLC | 166,185 | 8,169,810 |
| Flutter Entertainment PLC* | 44,166 | 6,989,336 |
| | | 15,159,146 |
| Italy — 1.9% |
| Ferrari N.V. | 25,675 | 6,650,050 |
| Japan — 9.5% |
| Hoya Corp. | 66,956 | 9,959,290 |
| Keyence Corp. | 9,066 | 5,696,692 |
| Kobe Bussan Co., Ltd. | 183,965 | 7,124,785 |
| Obic Co., Ltd. | 57,839 | 10,860,840 |
| | | 33,641,607 |
| Luxembourg — 3.0% |
| Eurofins Scientific S.E. | 85,924 | 10,643,303 |
| Mexico — 2.8% |
| Wal-Mart de Mexico S.A.B. de C.V. | 2,647,193 | 9,854,170 |
| Netherlands — 6.9% |
| Adyen N.V.* | 1,937 | 5,097,492 |
| IMCD N.V. | 39,583 | 8,774,203 |
| Wolters Kluwer N.V. | 89,329 | 10,536,231 |
| | | 24,407,926 |
| South Korea — 4.6% |
| NAVER Corp.* | 29,864 | 9,508,748 |
| Samsung Electronics Co., Ltd. | 104,407 | 6,877,029 |
| | | 16,385,777 |
| Sweden — 2.5% |
| Epiroc AB, Class A | 346,819 | 8,796,940 |
| Switzerland — 10.0% |
| Alcon, Inc. | 172,982 | 15,327,663 |
| Lonza Group AG | 6,555 | 5,478,806 |
| | Number of
Shares | Value† |
| |
| Switzerland — (continued) |
| Nestle S.A. | 103,786 | $ 14,515,461 |
| | | 35,321,930 |
| United Kingdom — 17.4% |
| Ashtead Group PLC | 140,118 | 11,269,402 |
| Diageo PLC | 276,606 | 15,110,786 |
| Halma PLC | 213,507 | 9,247,757 |
| London Stock Exchange Group PLC | 39,916 | 3,744,161 |
| RELX PLC | 331,788 | 10,787,181 |
| Rentokil Initial PLC | 1,431,785 | 11,317,877 |
| | | 61,477,164 |
| United States — 6.7% |
| Mastercard, Inc., Class A | 40,375 | 14,507,545 |
| Mondelez International, Inc., Class A | 135,452 | 8,981,822 |
| | | 23,489,367 |
TOTAL COMMON STOCKS
(Cost $283,733,613) | | 339,192,112 |
|
| SHORT-TERM INVESTMENTS — 3.5% |
BlackRock Liquidity FedFund - Institutional Shares (seven-day effective yield 0.030%)
(Cost $12,271,947) | 12,271,947 | 12,271,947 |
TOTAL INVESTMENTS — 99.6%
(Cost $296,005,560) | | $ 351,464,059 |
| Other Assets & Liabilities — 0.4% | 1,540,623 |
| TOTAL NET ASSETS — 100.0% | | $ 353,004,682 |
| † | See Security Valuation Note. |
| * | Non-income producing security. |
| AB— Aktiebolag. |
| AG— Aktiengesellschaft. |
| N.V.— Naamloze Vennootschap. |
| PLC— Public Limited Company. |
| S.A.— Societe Anonyme. |
| S.A.B. de C.V.— Sociedad Anonima de Capital Variable. |
| S.E.— Societas Europaea. |
| Country Weightings as of 12/31/2021†† |
| United Kingdom | 18% |
| Canada | 13 |
| Switzerland | 10 |
| Japan | 10 |
| France | 9 |
| Netherlands | 7 |
| United States | 7 |
| Other | 26 |
| Total | 100% |
| †† | % of total investments as of December 31, 2021. |
Penn Series Funds, Inc.
Schedule of Investments — December 31, 2021
International Equity Fund
COMMON STOCKS
INDUSTRY DIVERSIFICATION | % of Market
Value | | Value† |
| Aerospace & Defense | 2.9% | | $ 9,750,745 |
| Apparel | 2.6% | | 8,736,263 |
| Auto Manufacturers | 2.0% | | 6,650,050 |
| Beverages | 4.4% | | 15,110,786 |
| Chemicals | 1.0% | | 3,546,954 |
| Commercial Services | 15.6% | | 53,090,611 |
| Computers | 9.8% | | 33,165,788 |
| Distribution & Wholesale | 2.6% | | 8,774,203 |
| Diversified Financial Services | 5.4% | | 18,251,706 |
| Electronics | 5.7% | | 19,207,047 |
| Entertainment | 2.1% | | 6,989,336 |
| Food | 9.0% | | 30,622,068 |
| Healthcare Products | 6.8% | | 23,198,426 |
| Healthcare Services | 4.7% | | 16,122,109 |
| Internet | 2.8% | | 9,508,748 |
| Machinery — Construction & Mining | 2.6% | | 8,796,940 |
| Machinery — Diversified | 1.7% | | 5,696,692 |
| Media | 3.1% | | 10,536,231 |
| Retail | 5.0% | | 16,891,904 |
| Semiconductors | 2.0% | | 6,877,029 |
| Software | 6.3% | | 21,236,472 |
| Transportation | 1.9% | | 6,432,004 |
| | 100.0% | | $ 339,192,112 |
Summary of inputs used to value the Fund’s investments as of 12/31/2021 are as follows (See Security Valuation Note):
| ASSETS TABLE |
| Description | Total
Market
Value at
12/31/2021 | Level 1
Quoted
Price | Level 2
Significant
Observable
Input | Level 3
Significant
Unobservable
Input |
| Common Stocks | | | | |
| Canada | $43,868,070 | $43,868,070 | $— | $— |
| China | 7,037,734 | 7,037,734 | — | — |
| France | 29,216,831 | 29,216,831 | — | — |
| India | 13,242,097 | 13,242,097 | — | — |
| Ireland | 15,159,146 | 15,159,146 | — | — |
| Italy | 6,650,050 | 6,650,050 | — | — |
| Japan | 33,641,607 | 33,641,607 | — | — |
| Luxembourg | 10,643,303 | 10,643,303 | — | — |
| Mexico | 9,854,170 | 9,854,170 | — | — |
| Netherlands | 24,407,926 | 24,407,926 | — | — |
| South Korea | 16,385,777 | 16,385,777 | — | — |
| Sweden | 8,796,940 | 8,796,940 | — | — |
| Switzerland | 35,321,930 | 35,321,930 | — | — |
| United Kingdom | 61,477,164 | 61,477,164 | — | — |
| United States | 23,489,367 | 23,489,367 | — | — |
| Short-Term Investments | 12,271,947 | 12,271,947 | — | — |
| Total Investments | $ 351,464,059 | $ 351,464,059 | $ — | $ — |
It is the Fund's practice to recognize transfers into and transfers out of Level 3 at the fair value hierarchy as of the beginning of period. The Fund did not have any transfers into and transfers out of Level 3 fair value hierarchy during the reporting period.
The accompanying notes are an integral part of these financial statements.
Penn Series Funds, Inc.
Schedule of Investments — December 31, 2021
Emerging Markets Equity Fund
| | Number of
Shares | Value† |
| COMMON STOCKS — 96.8% |
| Brazil — 4.0% |
| Magazine Luiza S.A. | 362,290 | $ 469,611 |
| Notre Dame Intermedica Participacoes S.A. | 130,586 | 1,414,877 |
| Raia Drogasil S.A. | 295,646 | 1,289,802 |
| TOTVS S.A. | 219,201 | 1,127,094 |
| WEG S.A. | 154,610 | 915,447 |
| | | 5,216,831 |
| China — 26.8% |
| Alibaba Group Holding Ltd.* | 124,621 | 1,900,268 |
| Baozun, Inc., ADR* | 19,915 | 276,819 |
| Chacha Food Co., Ltd., Class A | 244,199 | 2,351,048 |
| China Tourism Group Duty Free Corp. Ltd., Class A | 51,712 | 1,780,246 |
| ENN Energy Holdings Ltd. | 122,499 | 2,306,218 |
| Foshan Haitian Flavouring & Food Co., Ltd., Class A | 85,740 | 1,414,034 |
| JD.com, Inc., ADR* | 20,385 | 1,428,377 |
| JD.com, Inc., Class A* | 136,010 | 4,779,288 |
| Midea Group Co., Ltd., Class A | 121,339 | 1,405,232 |
| NetEase, Inc. | 8,533 | 172,355 |
| NetEase, Inc., ADR | 10,439 | 1,062,482 |
| Shanghai International Airport Co., Ltd., Class A* | 78,652 | 576,190 |
| Shanghai M&G Stationery, Inc., Class A | 240,292 | 2,432,196 |
| Shenzhen Inovance Technology Co., Ltd., Class A | 161,797 | 1,741,513 |
| Shenzhou International Group Holdings Ltd. | 130,547 | 2,509,634 |
| Tencent Holdings Ltd. | 33,148 | 1,941,893 |
| Toly Bread Co., Ltd., Class A | 437,290 | 1,948,589 |
| Wuliangye Yibin Co., Ltd., Class A | 47,538 | 1,660,792 |
| Yum China Holdings, Inc. | 16,273 | 811,046 |
| Yum China Holdings, Inc. | 50,475 | 2,476,641 |
| | | 34,974,861 |
| Hong Kong — 4.2% |
| Budweiser Brewing Co., APAC, Ltd. | 664,743 | 1,743,367 |
| Hong Kong Exchanges & Clearing Ltd. | 21,922 | 1,280,310 |
| Techtronic Industries Co., Ltd. | 125,146 | 2,490,867 |
| | | 5,514,544 |
| India — 20.6% |
| Eicher Motors Ltd. | 71,766 | 2,502,303 |
| HCL Technologies Ltd. | 339,536 | 6,025,130 |
| Hindustan Unilever Ltd. | 131,427 | 4,172,795 |
| Housing Development Finance Corp. Ltd. | 75,300 | 2,620,004 |
| Kotak Mahindra Bank Ltd. | 111,133 | 2,685,199 |
| Power Grid Corp. of India Ltd. | 792,987 | 2,180,468 |
| Reliance Industries Ltd. | 40,028 | 1,275,193 |
| Tata Consultancy Services Ltd. | 80,914 | 4,069,176 |
| Voltas Ltd. | 83,371 | 1,367,335 |
| | | 26,897,603 |
| | Number of
Shares | Value† |
| |
| Indonesia — 6.8% |
| Avia Avian Tbk PT* | 17,811,488 | $ 1,155,981 |
| Bank Central Asia Tbk PT | 4,562,641 | 2,336,943 |
| Bank Rakyat Indonesia Persero Tbk PT | 11,590,985 | 3,342,498 |
| Telekom Indonesia Persero Tbk PT | 7,269,415 | 2,060,581 |
| | | 8,896,003 |
| Mexico — 5.3% |
| Fomento Economico Mexicano S.A.B. de C.V., ADR | 20,433 | 1,587,848 |
| Wal-Mart de Mexico S.A.B. de C.V. | 1,419,710 | 5,284,867 |
| | | 6,872,715 |
| South Korea — 12.5% |
| LG Household & Health Care Ltd.* | 1,658 | 1,530,032 |
| NAVER Corp.* | 15,293 | 4,869,317 |
| Samsung Electronics Co., Ltd. | 53,718 | 3,538,271 |
| SK Hynix, Inc.* | 57,584 | 6,345,745 |
| | | 16,283,365 |
| Taiwan — 13.6% |
| Accton Technology Corp. | 189,960 | 1,785,145 |
| President Chain Store Corp. | 193,510 | 1,912,928 |
| Realtek Semiconductor Corp. | 39,212 | 822,025 |
| Taiwan Semiconductor Manufacturing Co., Ltd. | 516,811 | 11,488,010 |
| Win Semiconductors Corp. | 135,369 | 1,832,352 |
| | | 17,840,460 |
| Thailand — 0.6% |
| Airports of Thailand PCL* | 437,632 | 798,374 |
| United Kingdom — 2.4% |
| Unilever PLC | 58,857 | 3,153,094 |
TOTAL COMMON STOCKS
(Cost $114,802,229) | | 126,447,850 |
|
| SHORT-TERM INVESTMENTS — 2.1% |
BlackRock Liquidity FedFund - Institutional Shares (seven-day effective yield 0.030%)
(Cost $2,728,222) | 2,728,222 | 2,728,222 |
TOTAL INVESTMENTS — 98.9%
(Cost $117,530,451) | | $ 129,176,072 |
| Other Assets & Liabilities — 1.1% | 1,461,173 |
| TOTAL NET ASSETS — 100.0% | | $ 130,637,245 |
| † | See Security Valuation Note. |
| * | Non-income producing security. |
| ADR— American Depositary Receipt. |
| PCL— Public Company Limited. |
| PLC— Public Limited Company. |
| S.A.— Societe Anonyme. |
| S.A.B. de C.V.— Sociedad Anonima de Capital Variable. |
| Tbk PT— Terbuka Perseroan Terbatas. |
Penn Series Funds, Inc.
Schedule of Investments — December 31, 2021
Emerging Markets Equity Fund
| Country Weightings as of 12/31/2021†† |
| China | 28% |
| India | 21 |
| Taiwan | 14 |
| South Korea | 13 |
| Indonesia | 7 |
| Mexico | 5 |
| Hong Kong | 4 |
| Other | 8 |
| Total | 100% |
| †† | % of total investments as of December 31, 2021. |
COMMON STOCKS
INDUSTRY DIVERSIFICATION | % of Market
Value | | Value† |
| Apparel | 2.0% | | $ 2,509,634 |
| Auto Manufacturers | 2.0% | | 2,502,303 |
| Banks | 6.6% | | 8,364,640 |
| Beverages | 4.0% | | 4,992,007 |
| Building Materials | 1.1% | | 1,367,335 |
| Chemicals | 0.9% | | 1,155,981 |
| Computers | 3.2% | | 4,069,176 |
| Cosmetics & Personal Care | 3.7% | | 4,683,126 |
| Diversified Financial Services | 3.1% | | 3,900,314 |
| Electric | 1.7% | | 2,180,468 |
| Electronics | 1.4% | | 1,741,513 |
| Engineering & Construction | 1.1% | | 1,374,564 |
| Food | 4.5% | | 5,713,671 |
| Gas | 1.8% | | 2,306,218 |
| Hand & Machine Tools | 2.0% | | 2,490,867 |
| Healthcare Services | 1.1% | | 1,414,877 |
| Home Furnishings | 1.1% | | 1,405,232 |
| Household Products & Wares | 3.3% | | 4,172,795 |
| Internet | 12.0% | | 15,195,962 |
| Machinery — Diversified | 0.7% | | 915,447 |
| Oil & Gas | 1.0% | | 1,275,193 |
| Retail | 13.0% | | 16,457,337 |
| Semiconductors | 19.0% | | 24,026,403 |
| Software | 6.6% | | 8,387,061 |
| Telecommunications | 3.1% | | 3,845,726 |
| | 100.0% | | $126,447,850 |
Summary of inputs used to value the Fund’s investments as of 12/31/2021 are as follows (See Security Valuation Note):
| ASSETS TABLE |
| Description | Total
Market
Value at
12/31/2021 | Level 1
Quoted
Price | Level 2
Significant
Observable
Input | Level 3
Significant
Unobservable
Input |
| Common Stocks | | | | |
| Brazil | $ 5,216,831 | $ 5,216,831 | $ — | $— |
| China | 34,974,861 | 34,974,861 | — | — |
| Hong Kong | 5,514,544 | 5,514,544 | — | — |
| India | 26,897,603 | 26,897,603 | — | — |
| Indonesia | 8,896,003 | 8,896,003 | — | — |
| Mexico | 6,872,715 | 6,872,715 | — | — |
| South Korea | 16,283,365 | 16,283,365 | — | — |
| ASSETS TABLE |
| Description | Total
Market
Value at
12/31/2021 | Level 1
Quoted
Price | Level 2
Significant
Observable
Input | Level 3
Significant
Unobservable
Input |
| Taiwan | $ 17,840,460 | $ 17,840,460 | $ — | $— |
| Thailand | 798,374 | — | 798,374 | — |
| United Kingdom | 3,153,094 | 3,153,094 | — | — |
| Total Common Stocks | $ 126,447,850 | $ 125,649,476 | $ 798,374 | $ — |
| Short-Term Investments | 2,728,222 | 2,728,222 | — | — |
| Total Investments | $ 129,176,072 | $ 128,377,698 | $ 798,374 | $ — |
It is the Fund's practice to recognize transfers into and transfers out of Level 3 at the fair value hierarchy as of the beginning of period. The Fund did not have any transfers into and transfers out of Level 3 fair value hierarchy during the reporting period.
The accompanying notes are an integral part of these financial statements.
Penn Series Funds, Inc.
Schedule of Investments — December 31, 2021
Real Estate Securities Fund
| | Number of
Shares | Value† |
| COMMON STOCKS — 3.8% |
| Entertainment — 0.5% |
| Caesars Entertainment, Inc.* | 7,001 | $ 654,803 |
| Lodging — 0.8% |
| Boyd Gaming Corp.* | 17,233 | 1,129,968 |
| Real Estate — 2.5% |
| Jones Lang LaSalle, Inc.* | 13,302 | 3,582,761 |
TOTAL COMMON STOCKS
(Cost $2,634,499) | 5,367,532 |
|
| REAL ESTATE INVESTMENT TRUSTS — 97.8% |
| Apartments — 15.1% |
| Apartment Income REIT Corp. | 65,585 | 3,585,532 |
| Equity Residential | 15,232 | 1,378,496 |
| Essex Property Trust, Inc. | 14,082 | 4,960,103 |
| Invitation Homes, Inc. | 115,536 | 5,238,402 |
| UDR, Inc. | 98,402 | 5,903,136 |
| | | 21,065,669 |
| Diversified — 32.9% |
| American Tower Corp. | 36,136 | 10,569,780 |
| Crown Castle International Corp. | 21,374 | 4,461,609 |
| CyrusOne, Inc. | 7,713 | 692,010 |
| Digital Realty Trust, Inc. | 35,655 | 6,306,300 |
| Duke Realty Corp. | 138,477 | 9,089,630 |
| Equinix, Inc. | 4,186 | 3,540,686 |
| SBA Communications Corp. | 13,826 | 5,378,591 |
| VICI Properties, Inc. | 67,934 | 2,045,493 |
| Weyerhaeuser Co. | 98,286 | 4,047,417 |
| | | 46,131,516 |
| Healthcare — 12.2% |
| Healthcare Trust of America, Inc., Class A | 62,295 | 2,080,030 |
| Healthpeak Properties, Inc. | 183,737 | 6,631,068 |
| Ventas, Inc. | 26,355 | 1,347,268 |
| Welltower, Inc. | 81,989 | 7,032,197 |
| | | 17,090,563 |
| Hotels & Resorts — 2.9% |
| Host Hotels & Resorts, Inc.* | 197,632 | 3,436,820 |
| Park Hotels & Resorts, Inc.* | 35,393 | 668,220 |
| | | 4,105,040 |
| Industrial — 4.9% |
| Americold Realty Trust | 82,642 | 2,709,831 |
| Prologis, Inc. | 24,430 | 4,113,035 |
| | | 6,822,866 |
| Manufactured Homes — 2.2% |
| Sun Communities, Inc. | 14,944 | 3,137,792 |
| Office Property — 1.9% |
| Highwoods Properties, Inc. | 59,391 | 2,648,245 |
| Regional Malls — 6.6% |
| Simon Property Group, Inc. | 57,765 | 9,229,114 |
| | Number of
Shares | Value† |
| |
| Single Tenant — 4.9% |
| Realty Income Corp. | 75,929 | $ 5,435,757 |
| Spirit Realty Capital, Inc. | 29,874 | 1,439,628 |
| | | 6,875,385 |
| Storage & Warehousing — 10.5% |
| Extra Space Storage, Inc. | 13,095 | 2,969,029 |
| Public Storage | 31,201 | 11,686,647 |
| | | 14,655,676 |
| Strip Centers — 3.7% |
| Federal Realty Investment Trust | 11,915 | 1,624,253 |
| Kimco Realty Corp. | 104,569 | 2,577,626 |
| SITE Centers Corp. | 61,849 | 979,069 |
| | | 5,180,948 |
TOTAL REAL ESTATE INVESTMENT TRUSTS
(Cost $97,635,837) | | 136,942,814 |
| | | |
| SHORT-TERM INVESTMENTS — 0.6% |
BlackRock Liquidity FedFund - Institutional Shares (seven-day effective yield 0.030%)
(Cost $853,013) | 853,013 | 853,013 |
TOTAL INVESTMENTS — 102.2%
(Cost $101,123,349) | | $ 143,163,359 |
| Other Assets & Liabilities — (2.2)% | (3,102,544) |
| TOTAL NET ASSETS — 100.0% | | $ 140,060,815 |
| † | See Security Valuation Note. |
| * | Non-income producing security. |
| REIT— Real Estate Investment Trust. |
Penn Series Funds, Inc.
Schedule of Investments — December 31, 2021
Real Estate Securities Fund
Summary of inputs used to value the Fund’s investments as of 12/31/2021 are as follows (See Security Valuation Note):
| ASSETS TABLE |
| Description | Total
Market
Value at
12/31/2021 | Level 1
Quoted
Price | Level 2
Significant
Observable
Input | Level 3
Significant
Unobservable
Input |
| Common Stocks | $ 5,367,532 | $ 5,367,532 | $— | $— |
| Real Estate Investment Trusts | 136,942,814 | 136,942,814 | — | — |
| Short-Term Investments | 853,013 | 853,013 | — | — |
| Total Investments | $ 143,163,359 | $ 143,163,359 | $ — | $ — |
It is the Fund's practice to recognize transfers into and transfers out of Level 3 at the fair value hierarchy as of the beginning of period. The Fund did not have any transfers into and transfers out of Level 3 fair value hierarchy during the reporting period.
The accompanying notes are an integral part of these financial statements.
Penn Series Funds, Inc.
Schedule of Investments — December 31, 2021
Aggressive Allocation Fund
| | Number of
Shares | Value† |
| AFFILIATED EQUITY FUNDS — 61.6% |
| Penn Series Flexibly Managed Fund* | 45,661 | $ 4,165,160 |
| Penn Series Index 500 Fund* | 252,372 | 10,460,839 |
| Penn Series Large Cap Growth Fund* | 54,872 | 2,110,377 |
| Penn Series Large Cap Value Fund* | 133,143 | 5,642,609 |
| Penn Series Large Core Value Fund* | 195,463 | 5,639,110 |
| Penn Series Large Growth Stock Fund* | 8,282 | 688,346 |
| Penn Series Mid Cap Growth Fund* | 30,753 | 1,406,625 |
| Penn Series Mid Cap Value Fund* | 51,134 | 1,414,876 |
| Penn Series Mid Core Value Fund* | 105,196 | 3,545,116 |
| Penn Series Real Estate Securities Fund* | 57,375 | 2,159,022 |
| Penn Series Small Cap Growth Fund* | 20,632 | 1,405,228 |
| Penn Series Small Cap Index Fund* | 61,446 | 2,114,988 |
| Penn Series SMID Cap Growth Fund* | 24,797 | 1,399,268 |
| Penn Series SMID Cap Value Fund* | 36,055 | 1,406,866 |
TOTAL AFFILIATED EQUITY FUNDS
(Cost $29,850,480) | | 43,558,430 |
|
| AFFILIATED FIXED INCOME FUNDS — 7.8% |
| Penn Series High Yield Bond Fund* | 123,390 | 2,077,891 |
| Penn Series Limited Maturity Bond Fund* | 257,631 | 3,447,096 |
TOTAL AFFILIATED FIXED INCOME FUNDS
(Cost $5,108,601) | | 5,524,987 |
|
| AFFILIATED INTERNATIONAL EQUITY FUNDS — 29.9% |
| Penn Series Developed International Index Fund* | 478,466 | 8,430,576 |
| Penn Series Emerging Markets Equity Fund* | 296,086 | 4,168,887 |
| Penn Series International Equity Fund* | 194,045 | 8,497,242 |
TOTAL AFFILIATED INTERNATIONAL EQUITY FUNDS
(Cost $15,951,525) | | 21,096,705 |
|
| SHORT-TERM INVESTMENTS — 0.5% |
BlackRock Liquidity FedFund - Institutional Shares (seven-day effective yield 0.030%)
(Cost $307,239) | 307,239 | 307,239 |
TOTAL INVESTMENTS — 99.8%
(Cost $51,217,845) | | $ 70,487,361 |
| Other Assets & Liabilities — 0.2% | 169,338 |
| TOTAL NET ASSETS — 100.0% | | $ 70,656,699 |
| † | See Security Valuation Note. |
| * | Non-income producing security. |
Summary of inputs used to value the Fund’s investments as of 12/31/2021 are as follows (See Security Valuation Note):
| ASSETS TABLE |
| Description | Total
Market
Value at
12/31/2021 | Level 1
Quoted
Price | Level 2
Significant
Observable
Input | Level 3
Significant
Unobservable
Input |
| Affiliated Equity Funds | $43,558,430 | $43,558,430 | $— | $— |
| Affiliated Fixed Income Funds | 5,524,987 | 5,524,987 | — | — |
| Affiliated International Equity Funds | 21,096,705 | 21,096,705 | — | — |
| Short-Term Investments | 307,239 | 307,239 | — | — |
| Total Investments | $ 70,487,361 | $ 70,487,361 | $ — | $ — |
It is the Fund's practice to recognize transfers into and transfers out of Level 3 at the fair value hierarchy as of the beginning of period. The Fund did not have any transfers into and transfers out of Level 3 fair value hierarchy during the reporting period.
The accompanying notes are an integral part of these financial statements.
Penn Series Funds, Inc.
Schedule of Investments — December 31, 2021
Moderately Aggressive Allocation Fund
| | Number of
Shares | Value† |
| AFFILIATED EQUITY FUNDS — 57.9% |
| Penn Series Flexibly Managed Fund* | 159,914 | $ 14,587,377 |
| Penn Series Index 500 Fund* | 765,971 | 31,749,501 |
| Penn Series Large Cap Growth Fund* | 192,161 | 7,390,520 |
| Penn Series Large Cap Value Fund* | 466,271 | 19,760,562 |
| Penn Series Large Core Value Fund* | 684,523 | 19,748,491 |
| Penn Series Large Growth Stock Fund* | 29,005 | 2,410,629 |
| Penn Series Mid Cap Growth Fund* | 107,691 | 4,925,785 |
| Penn Series Mid Cap Value Fund* | 89,533 | 2,477,391 |
| Penn Series Mid Core Value Fund* | 368,395 | 12,414,906 |
| Penn Series Real Estate Securities Fund* | 200,916 | 7,560,457 |
| Penn Series Small Cap Growth Fund* | 36,125 | 2,460,462 |
| Penn Series Small Cap Index Fund* | 286,901 | 9,875,121 |
| Penn Series SMID Cap Growth Fund* | 43,418 | 2,450,063 |
| Penn Series SMID Cap Value Fund* | 126,260 | 4,926,657 |
TOTAL AFFILIATED EQUITY FUNDS
(Cost $90,459,840) | | 142,737,922 |
|
| AFFILIATED FIXED INCOME FUNDS — 17.6% |
| Penn Series High Yield Bond Fund* | 432,159 | 7,277,548 |
| Penn Series Limited Maturity Bond Fund* | 1,804,677 | 24,146,584 |
| Penn Series Quality Bond Fund* | 700,597 | 12,078,290 |
TOTAL AFFILIATED FIXED INCOME FUNDS
(Cost $39,558,465) | | 43,502,422 |
|
| AFFILIATED INTERNATIONAL EQUITY FUNDS — 24.0% |
| Penn Series Developed International Index Fund* | 1,256,722 | 22,143,448 |
| Penn Series Emerging Markets Equity Fund* | 864,177 | 12,167,611 |
| Penn Series International Equity Fund* | 566,284 | 24,797,590 |
TOTAL AFFILIATED INTERNATIONAL EQUITY FUNDS
(Cost $42,080,347) | | 59,108,649 |
|
| SHORT-TERM INVESTMENTS — 0.5% |
BlackRock Liquidity FedFund - Institutional Shares (seven-day effective yield 0.030%)
(Cost $1,182,388) | 1,182,388 | 1,182,388 |
TOTAL INVESTMENTS — 100.0%
(Cost $173,281,040) | | $ 246,531,381 |
| Other Assets & Liabilities — (0.0)% | (58,478) |
| TOTAL NET ASSETS — 100.0% | | $ 246,472,903 |
| † | See Security Valuation Note. |
| * | Non-income producing security. |
Summary of inputs used to value the Fund’s investments as of 12/31/2021 are as follows (See Security Valuation Note):
| ASSETS TABLE |
| Description | Total
Market
Value at
12/31/2021 | Level 1
Quoted
Price | Level 2
Significant
Observable
Input | Level 3
Significant
Unobservable
Input |
| Affiliated Equity Funds | $142,737,922 | $142,737,922 | $— | $— |
| Affiliated Fixed Income Funds | 43,502,422 | 43,502,422 | — | — |
| Affiliated International Equity Funds | 59,108,649 | 59,108,649 | — | — |
| Short-Term Investments | 1,182,388 | 1,182,388 | — | — |
| Total Investments | $ 246,531,381 | $ 246,531,381 | $ — | $ — |
It is the Fund's practice to recognize transfers into and transfers out of Level 3 at the fair value hierarchy as of the beginning of period. The Fund did not have any transfers into and transfers out of Level 3 fair value hierarchy during the reporting period.
The accompanying notes are an integral part of these financial statements.
Penn Series Funds, Inc.
Schedule of Investments — December 31, 2021
Moderate Allocation Fund
| | Number of
Shares | Value† |
| AFFILIATED EQUITY FUNDS — 45.1% |
| Penn Series Flexibly Managed Fund* | 187,844 | $ 17,135,094 |
| Penn Series Index 500 Fund* | 830,550 | 34,426,314 |
| Penn Series Large Cap Growth Fund* | 150,486 | 5,787,708 |
| Penn Series Large Cap Value Fund* | 342,325 | 14,507,719 |
| Penn Series Large Core Value Fund* | 502,560 | 14,498,853 |
| Penn Series Large Growth Stock Fund* | 34,072 | 2,831,694 |
| Penn Series Mid Cap Growth Fund* | 126,508 | 5,786,485 |
| Penn Series Mid Core Value Fund* | 432,752 | 14,583,756 |
| Penn Series Real Estate Securities Fund* | 157,349 | 5,921,055 |
| Penn Series Small Cap Index Fund* | 252,776 | 8,700,554 |
| Penn Series SMID Cap Growth Fund* | 51,004 | 2,878,159 |
| Penn Series SMID Cap Value Fund* | 74,159 | 2,893,667 |
TOTAL AFFILIATED EQUITY FUNDS
(Cost $80,155,664) | | 129,951,058 |
|
| AFFILIATED FIXED INCOME FUNDS — 37.4% |
| Penn Series High Yield Bond Fund* | 676,846 | 11,398,091 |
| Penn Series Limited Maturity Bond Fund* | 2,967,778 | 39,708,871 |
| Penn Series Quality Bond Fund* | 3,291,777 | 56,750,229 |
TOTAL AFFILIATED FIXED INCOME FUNDS
(Cost $95,367,897) | | 107,857,191 |
|
| AFFILIATED INTERNATIONAL EQUITY FUNDS — 17.1% |
| Penn Series Developed International Index Fund* | 820,144 | 14,450,945 |
| Penn Series Emerging Markets Equity Fund* | 1,015,110 | 14,292,746 |
| Penn Series International Equity Fund* | 465,653 | 20,390,937 |
TOTAL AFFILIATED INTERNATIONAL EQUITY FUNDS
(Cost $34,482,539) | | 49,134,628 |
|
| SHORT-TERM INVESTMENTS — 0.2% |
BlackRock Liquidity FedFund - Institutional Shares (seven-day effective yield 0.030%)
(Cost $575,495) | 575,495 | 575,495 |
TOTAL INVESTMENTS — 99.8%
(Cost $210,581,595) | | $ 287,518,372 |
| Other Assets & Liabilities — 0.2% | 542,742 |
| TOTAL NET ASSETS — 100.0% | | $ 288,061,114 |
| † | See Security Valuation Note. |
| * | Non-income producing security. |
Summary of inputs used to value the Fund’s investments as of 12/31/2021 are as follows (See Security Valuation Note):
| ASSETS TABLE |
| Description | Total
Market
Value at
12/31/2021 | Level 1
Quoted
Price | Level 2
Significant
Observable
Input | Level 3
Significant
Unobservable
Input |
| Affiliated Equity Funds | $129,951,058 | $129,951,058 | $— | $— |
| Affiliated Fixed Income Funds | 107,857,191 | 107,857,191 | — | — |
| Affiliated International Equity Funds | 49,134,628 | 49,134,628 | — | — |
| Short-Term Investments | 575,495 | 575,495 | — | — |
| Total Investments | $ 287,518,372 | $ 287,518,372 | $ — | $ — |
It is the Fund's practice to recognize transfers into and transfers out of Level 3 at the fair value hierarchy as of the beginning of period. The Fund did not have any transfers into and transfers out of Level 3 fair value hierarchy during the reporting period.
The accompanying notes are an integral part of these financial statements.
Penn Series Funds, Inc.
Schedule of Investments — December 31, 2021
Moderately Conservative Allocation Fund
| | Number of
Shares | Value† |
| AFFILIATED EQUITY FUNDS — 33.1% |
| Penn Series Flexibly Managed Fund* | 86,680 | $ 7,906,973 |
| Penn Series Index 500 Fund* | 143,720 | 5,957,187 |
| Penn Series Large Cap Growth Fund* | 52,080 | 2,002,998 |
| Penn Series Large Cap Value Fund* | 118,471 | 5,020,806 |
| Penn Series Large Core Value Fund* | 173,925 | 5,017,732 |
| Penn Series Mid Core Value Fund* | 89,859 | 3,028,250 |
| Penn Series Real Estate Securities Fund* | 54,454 | 2,049,087 |
| Penn Series Small Cap Index Fund* | 29,159 | 1,003,663 |
| Penn Series SMID Cap Value Fund* | 25,665 | 1,001,429 |
TOTAL AFFILIATED EQUITY FUNDS
(Cost $21,874,249) | | 32,988,125 |
|
| AFFILIATED FIXED INCOME FUNDS — 56.1% |
| Penn Series High Yield Bond Fund* | 292,810 | 4,930,926 |
| Penn Series Limited Maturity Bond Fund* | 1,687,411 | 22,577,566 |
| Penn Series Quality Bond Fund* | 1,651,916 | 28,479,024 |
TOTAL AFFILIATED FIXED INCOME FUNDS
(Cost $50,895,761) | | 55,987,516 |
|
| AFFILIATED INTERNATIONAL EQUITY FUNDS — 10.0% |
| Penn Series Developed International Index Fund* | 170,300 | 3,000,693 |
| Penn Series Emerging Markets Equity Fund* | 140,523 | 1,978,565 |
| Penn Series International Equity Fund* | 115,108 | 5,040,580 |
TOTAL AFFILIATED INTERNATIONAL EQUITY FUNDS
(Cost $7,627,816) | | 10,019,838 |
|
| SHORT-TERM INVESTMENTS — 0.8% |
BlackRock Liquidity FedFund - Institutional Shares (seven-day effective yield 0.030%)
(Cost $771,067) | 771,067 | 771,067 |
TOTAL INVESTMENTS — 100.0%
(Cost $81,168,893) | | $ 99,766,546 |
| Other Assets & Liabilities — 0.0% | 8,215 |
| TOTAL NET ASSETS — 100.0% | | $ 99,774,761 |
| † | See Security Valuation Note. |
| * | Non-income producing security. |
Summary of inputs used to value the Fund’s investments as of 12/31/2021 are as follows (See Security Valuation Note):
| ASSETS TABLE |
| Description | Total
Market
Value at
12/31/2021 | Level 1
Quoted
Price | Level 2
Significant
Observable
Input | Level 3
Significant
Unobservable
Input |
| Affiliated Equity Funds | $ 32,988,125 | $ 32,988,125 | $— | $— |
| Affiliated Fixed Income Funds | 55,987,516 | 55,987,516 | — | — |
| Affiliated International Equity Funds | 10,019,838 | 10,019,838 | — | — |
| Short-Term Investments | 771,067 | 771,067 | — | — |
| Total Investments | $ 99,766,546 | $ 99,766,546 | $ — | $ — |
It is the Fund's practice to recognize transfers into and transfers out of Level 3 at the fair value hierarchy as of the beginning of period. The Fund did not have any transfers into and transfers out of Level 3 fair value hierarchy during the reporting period.
The accompanying notes are an integral part of these financial statements.
Penn Series Funds, Inc.
Schedule of Investments — December 31, 2021
Conservative Allocation Fund
| | Number of
Shares | Value† |
| AFFILIATED EQUITY FUNDS — 19.9% |
| Penn Series Flexibly Managed Fund* | 51,202 | $ 4,670,678 |
| Penn Series Index 500 Fund* | 56,608 | 2,346,382 |
| Penn Series Large Cap Value Fund* | 28,001 | 1,186,693 |
| Penn Series Large Core Value Fund* | 61,660 | 1,778,879 |
| Penn Series Mid Core Value Fund* | 35,401 | 1,193,024 |
| Penn Series Real Estate Securities Fund* | 16,091 | 605,498 |
TOTAL AFFILIATED EQUITY FUNDS
(Cost $8,319,353) | | 11,781,154 |
|
| AFFILIATED FIXED INCOME FUNDS — 75.5% |
| Penn Series High Yield Bond Fund* | 172,956 | 2,912,574 |
| Penn Series Limited Maturity Bond Fund* | 1,429,877 | 19,131,755 |
| Penn Series Quality Bond Fund* | 1,312,020 | 22,619,234 |
TOTAL AFFILIATED FIXED INCOME FUNDS
(Cost $41,840,240) | | 44,663,563 |
|
| AFFILIATED INTERNATIONAL EQUITY FUNDS — 3.0% |
| Penn Series Developed International Index Fund* | 67,081 | 1,181,954 |
| Penn Series International Equity Fund* | 13,603 | 595,678 |
TOTAL AFFILIATED INTERNATIONAL EQUITY FUNDS
(Cost $1,369,736) | | 1,777,632 |
|
| SHORT-TERM INVESTMENTS — 1.5% |
BlackRock Liquidity FedFund - Institutional Shares (seven-day effective yield 0.030%)
(Cost $916,599) | 916,599 | 916,599 |
TOTAL INVESTMENTS — 99.9%
(Cost $52,445,928) | | $ 59,138,948 |
| Other Assets & Liabilities — 0.1% | 48,859 |
| TOTAL NET ASSETS — 100.0% | | $ 59,187,807 |
| † | See Security Valuation Note. |
| * | Non-income producing security. |
Summary of inputs used to value the Fund’s investments as of 12/31/2021 are as follows (See Security Valuation Note):
| ASSETS TABLE |
| Description | Total
Market
Value at
12/31/2021 | Level 1
Quoted
Price | Level 2
Significant
Observable
Input | Level 3
Significant
Unobservable
Input |
| Affiliated Equity Funds | $ 11,781,154 | $ 11,781,154 | $— | $— |
| Affiliated Fixed Income Funds | 44,663,563 | 44,663,563 | — | — |
| Affiliated International Equity Funds | 1,777,632 | 1,777,632 | — | — |
| Short-Term Investments | 916,599 | 916,599 | — | — |
| Total Investments | $ 59,138,948 | $ 59,138,948 | $ — | $ — |
It is the Fund's practice to recognize transfers into and transfers out of Level 3 at the fair value hierarchy as of the beginning of period. The Fund did not have any transfers into and transfers out of Level 3 fair value hierarchy during the reporting period.
The accompanying notes are an integral part of these financial statements.
Penn Series Funds, Inc.
Statements of Assets and Liabilities
December 31, 2021
| | Money
Market
Fund | | Limited
Maturity Bond
Fund | | Quality
Bond
Fund | | High Yield
Bond
Fund |
| ASSETS: | | | | | | | |
Investments at value
| $ 161,778,990 | | $ 257,890,743 | | $ 467,620,730 | | $ 165,526,203 |
Cash
| — | | — | | — | | 344,394 |
Initial margin held by broker for open futures
| — | | 162,275 | | 916,691 | | — |
Foreign currency at value
| — | | — | | — | | 116,461 |
Interest and dividends receivable
| 407,709 | | 1,148,046 | | 2,391,588 | | 2,091,147 |
Receivable for investment securities sold
| — | | — | | — | | 3,219 |
Receivable for capital stock sold
| — | | 1,075,417 | | 3,735,801 | | 1,519,430 |
Futures variation margin receivable
| — | | 14,547 | | 252,720 | | — |
Other assets
| 136,023 | | 6,337 | | 11,326 | | 4,004 |
Total Assets
| 162,322,722 | | 260,297,365 | | 474,928,856 | | 169,604,858 |
| LIABILITIES: | | | | | | | |
Payable for investment securities purchased
| — | | — | | 2,338,077 | | — |
Payable for capital stock redeemed
| — | | 94,039 | | 146,725 | | 28,533 |
Payable to investment adviser (See Note 3)
| 46,440 | | 100,503 | | 176,847 | | 65,452 |
Payable to the administrator (See Note 3)
| 12,619 | | 19,855 | | 35,749 | | 12,721 |
Other liabilities
| 62,145 | | 98,557 | | 165,086 | | 66,714 |
Total Liabilities
| 121,204 | | 312,954 | | 2,862,484 | | 173,420 |
NET ASSETS
| $162,201,518 | | $259,984,411 | | $472,066,372 | | $169,431,438 |
Investments at cost
| $ 161,778,990 | | $ 260,915,099 | | $ 461,108,225 | | $ 161,449,459 |
Foreign currency at cost
| $ — | | $ — | | $ — | | $ 112,601 |
| COMPONENTS OF NET ASSETS: | | | | | | | |
Paid-in capital
| $ 162,195,680 | | $ 263,153,539 | | $ 465,553,865 | | $ 165,397,629 |
Total distributable earnings (loss)
| 5,838 | | (3,169,128) | | 6,512,507 | | 4,033,809 |
NET ASSETS
| $162,201,518 | | $259,984,411 | | $472,066,372 | | $169,431,438 |
| |
Shares outstanding, $0.10 par value, 500 million shares authorized
| 162,183,160 | | | | | | |
Shares outstanding, $0.10 par value, 250 million shares authorized
| | | | | 27,382,484 | | 10,060,029 |
Shares outstanding, $0.0001 par value, 250 million shares authorized
| | | 19,429,173 | | | | |
NET ASSET VALUE, OFFERING AND
REDEMPTION PRICE PER SHARE
| $ 1.00 | | $ 13.38 | | $ 17.24 | | $ 16.84 |
The accompanying notes are an integral part of these financial statements.
Penn Series Funds, Inc.
Statements of Assets and Liabilities
December 31, 2021
| | Flexibly
Managed
Fund | | Balanced
Fund | | Large
Growth Stock
Fund | | Large Cap
Growth
Fund |
| ASSETS: | | | | | | | |
Investments of affiliated issuers at value
| $ — | | $ 92,672,781 | | $ — | | $ — |
Investments of unaffiliated issuers at value
| 5,629,390,019 | | 287,975 | | 428,619,139 | | 79,585,204 |
Cash
| 238,635 | | — | | — | | 500 |
Foreign currency at value
| 72,984 | | — | | — | | — |
Interest and dividends receivable
| 7,597,541 | | — | | 22,921 | | 36,387 |
Tax reclaims receivable
| 138,754 | | — | | 6,384 | | 31,310 |
Receivable for investment securities sold
| 5,338,932 | | 58,916 | | — | | — |
Receivable for capital stock sold
| — | | — | | 512,093 | | — |
Other assets
| 125,900 | | 2,116 | | 10,283 | | 1,792 |
Total Assets
| 5,642,902,765 | | 93,021,788 | | 429,170,820 | | 79,655,193 |
| LIABILITIES: | | | | | | | |
Written options at value
| 98,318,051 | | — | | — | | — |
Payable for investment securities purchased
| 49,091,478 | | — | | 122 | | — |
Payable for capital stock redeemed
| 2,592,973 | | 231,572 | | 9,762 | | 561,485 |
Payable to investment adviser (See Note 3)
| 3,140,643 | | — | | 255,084 | | 36,399 |
Payable to the administrator (See Note 3)
| 410,558 | | 6,947 | | 32,878 | | 5,818 |
Other liabilities
| 1,684,298 | | 30,360 | | 185,570 | | 35,357 |
Total Liabilities
| 155,238,001 | | 268,879 | | 483,416 | | 639,059 |
NET ASSETS
| $5,487,664,764 | | $92,752,909 | | $428,687,404 | | $79,016,134 |
Investments of affiliated issuers at cost
| $ — | | $ 55,666,607 | | $ — | | $ — |
Investments of unaffiliated issuers at cost
| $ 4,537,967,096 | | $ 287,975 | | $ 234,194,816 | | $ 45,315,439 |
Written options, premiums received
| $ (46,566,808) | | $ — | | $ — | | $ — |
Foreign currency at cost
| $ 72,643 | | $ — | | $ — | | $ — |
| COMPONENTS OF NET ASSETS: | | | | | | | |
Paid-in capital
| $ 4,456,002,255 | | $ 55,877,784 | | $ 235,230,565 | | $ 44,777,171 |
Total distributable earnings (loss)
| 1,031,662,509 | | 36,875,125 | | 193,456,839 | | 34,238,963 |
NET ASSETS
| $5,487,664,764 | | $92,752,909 | | $428,687,404 | | $79,016,134 |
| |
Shares outstanding, $0.10 par value, 250 million shares authorized
| 60,159,618 | | | | 5,158,188 | | |
Shares outstanding, $0.0001 par value, 250 million shares authorized
| | | 2,937,981 | | | | 2,054,292 |
NET ASSET VALUE, OFFERING AND
REDEMPTION PRICE PER SHARE
| $ 91.22 | | $ 31.57 | | $ 83.11 | | $ 38.46 |
The accompanying notes are an integral part of these financial statements.
Penn Series Funds, Inc.
Statements of Assets and Liabilities
December 31, 2021
| | Large Core
Growth
Fund | | Large Cap
Value
Fund | | Large Core
Value
Fund | | Index 500
Fund |
| ASSETS: | | | | | | | |
Investments at value
| $ 202,894,566 | | $ 203,570,627 | | $ 190,145,976 | | $ 703,732,210 |
Cash
| — | | 39,207 | | — | | — |
Initial margin held by broker for open futures
| — | | — | | — | | 367,997 |
Foreign currency at value
| 1,590 | | — | | — | | — |
Interest and dividends receivable
| 141 | | 171,211 | | 296,088 | | 417,956 |
Tax reclaims receivable
| 14,418 | | — | | 31,510 | | — |
Receivable for investment securities sold
| 166,101 | | — | | — | | — |
Receivable for capital stock sold
| 2,602,022 | | — | | — | | — |
Other assets
| 5,485 | | 4,628 | | 4,322 | | 15,430 |
Total Assets
| 205,684,323 | | 203,785,673 | | 190,477,896 | | 704,533,593 |
| LIABILITIES: | | | | | | | |
Payable for capital stock redeemed
| 69 | | 987,509 | | 1,154,050 | | 5,429,833 |
Futures variation margin payable
| — | | — | | — | | 22,000 |
Payable to investment adviser (See Note 3)
| 104,929 | | 112,298 | | 105,289 | | 73,862 |
Payable to the administrator (See Note 3)
| 16,852 | | 15,147 | | 14,170 | | 51,213 |
Other liabilities
| 83,204 | | 74,587 | | 68,807 | | 234,590 |
Total Liabilities
| 205,054 | | 1,189,541 | | 1,342,316 | | 5,811,498 |
NET ASSETS
| $205,479,269 | | $202,596,132 | | $189,135,580 | | $698,722,095 |
Investments at cost
| $ 175,063,984 | | $ 160,484,084 | | $ 155,352,779 | | $ 294,865,939 |
Foreign currency at cost
| $ 1,592 | | $ — | | $ — | | $ — |
| COMPONENTS OF NET ASSETS: | | | | | | | |
Paid-in capital
| $ 179,196,865 | | $ 160,214,105 | | $ 156,494,713 | | $ 297,181,423 |
Total distributable earnings (loss)
| 26,282,404 | | 42,382,027 | | 32,640,867 | | 401,540,672 |
NET ASSETS
| $205,479,269 | | $202,596,132 | | $189,135,580 | | $698,722,095 |
| |
Shares outstanding, $0.10 par value, 250 million shares authorized
| | | 4,780,090 | | | | |
Shares outstanding, $0.0001 par value, 250 million shares authorized
| 4,273,571 | | | | 6,555,358 | | 16,857,368 |
NET ASSET VALUE, OFFERING AND
REDEMPTION PRICE PER SHARE
| $ 48.08 | | $ 42.38 | | $ 28.85 | | $ 41.45 |
The accompanying notes are an integral part of these financial statements.
Penn Series Funds, Inc.
Statements of Assets and Liabilities
December 31, 2021
| | Mid Cap
Growth
Fund | | Mid Cap
Value
Fund | | Mid Core
Value
Fund | | SMID Cap
Growth
Fund |
| ASSETS: | | | | | | | |
Investments at value
| $ 210,549,772 | | $ 104,886,961 | | $ 94,675,406 | | $ 102,430,062 |
Cash
| — | | — | | 500 | | — |
Foreign currency at value
| — | | — | | 3 | | — |
Interest and dividends receivable
| 29,039 | | 143,924 | | 188,357 | | 8,134 |
Tax reclaims receivable
| — | | — | | 26,633 | | — |
Receivable for investment securities sold
| — | | — | | 144,239 | | 850,976 |
Receivable for capital stock sold
| 55,993 | | — | | — | | 612,956 |
Unrealized appreciation of forward foreign currency contracts
| — | | — | | 10,149 | | — |
Other assets
| 4,921 | | 2,341 | | 2,369 | | 2,486 |
Total Assets
| 210,639,725 | | 105,033,226 | | 95,047,656 | | 103,904,614 |
| LIABILITIES: | | | | | | | |
Written options at value
| 315,649 | | — | | — | | — |
Payable for investment securities purchased
| — | | 316,175 | | — | | — |
Payable for capital stock redeemed
| 60,890 | | 542,683 | | 316,413 | | 8,270 |
Payable to investment adviser (See Note 3)
| 122,206 | | 47,557 | | 57,398 | | 64,696 |
Payable to the administrator (See Note 3)
| 15,873 | | 7,734 | | 7,684 | | 7,983 |
Unrealized depreciation of forward foreign currency contracts
| — | | — | | 78,823 | | — |
Other liabilities
| 78,490 | | 42,689 | | 50,380 | | 43,826 |
Total Liabilities
| 593,108 | | 956,838 | | 510,698 | | 124,775 |
NET ASSETS
| $210,046,617 | | $104,076,388 | | $94,536,958 | | $103,779,839 |
Investments at cost
| $ 117,271,047 | | $ 82,433,092 | | $ 80,484,481 | | $ 83,933,962 |
Written options, premiums received
| $ (185,809) | | $ — | | $ — | | $ — |
Foreign currency at cost
| $ — | | $ — | | $ 3 | | $ — |
| COMPONENTS OF NET ASSETS: | | | | | | | |
Paid-in capital
| $ 117,434,384 | | $ 88,080,725 | | $ 81,668,913 | | $ 85,362,197 |
Total distributable earnings (loss)
| 92,612,233 | | 15,995,663 | | 12,868,045 | | 18,417,642 |
NET ASSETS
| $210,046,617 | | $104,076,388 | | $94,536,958 | | $103,779,839 |
| |
Shares outstanding, $0.0001 par value, 250 million shares authorized
| 4,592,197 | | 3,760,718 | | 2,804,860 | | 1,839,094 |
NET ASSET VALUE, OFFERING AND
REDEMPTION PRICE PER SHARE
| $ 45.74 | | $ 27.67 | | $ 33.70 | | $ 56.43 |
The accompanying notes are an integral part of these financial statements.
Penn Series Funds, Inc.
Statements of Assets and Liabilities
December 31, 2021
| | SMID Cap
Value
Fund | | Small Cap
Growth
Fund | | Small Cap
Value
Fund | | Small Cap
Index
Fund |
| ASSETS: | | | | | | | |
Investments at value
| $ 72,276,495 | | $ 139,967,473 | | $199,963,804 | | $ 98,146,275 |
Initial margin held by broker for open futures
| — | | — | | — | | 83,957 |
Foreign currency at value
| — | | 1,921 | | — | | — |
Interest and dividends receivable
| 64,703 | | 27,255 | | 257,828 | | 76,398 |
Tax reclaims receivable
| — | | 8,069 | | 685 | | — |
Receivable for investment securities sold
| 47,607 | | — | | — | | 17,600 |
Receivable for capital stock sold
| — | | 357,839 | | — | | 624,452 |
Other assets
| 1,580 | | 3,300 | | 4,399 | | 2,224 |
Total Assets
| 72,390,385 | | 140,365,857 | | 200,226,716 | | 98,950,906 |
| LIABILITIES: | | | | | | | |
Payable for investment securities purchased
| 237,476 | | 121 | | 10,127 | | — |
Payable for capital stock redeemed
| 251,445 | | 2,378 | | 820,700 | | 22,304 |
Futures variation margin payable
| — | | — | | — | | 2,870 |
Payable to investment adviser (See Note 3)
| 50,533 | | 84,966 | | 119,106 | | 24,563 |
Payable to the administrator (See Note 3)
| 5,377 | | 10,672 | | 15,026 | | 7,532 |
Other liabilities
| 35,172 | | 57,284 | | 89,143 | | 66,567 |
Total Liabilities
| 580,003 | | 155,421 | | 1,054,102 | | 123,836 |
NET ASSETS
| $ 71,810,382 | | $140,210,436 | | $ 199,172,614 | | $98,827,070 |
Investments at cost
| $ 56,115,124 | | $ 82,644,443 | | $ 167,438,481 | | $ 80,556,973 |
Foreign currency at cost
| $ — | | $ 2,006 | | $ — | | $ — |
| COMPONENTS OF NET ASSETS: | | | | | | | |
Paid-in capital
| $56,604,802 | | $ 83,050,188 | | $ 168,435,766 | | $ 81,609,189 |
Total distributable earnings (loss)
| 15,205,580 | | 57,160,248 | | 30,736,848 | | 17,217,881 |
NET ASSETS
| $ 71,810,382 | | $140,210,436 | | $ 199,172,614 | | $98,827,070 |
| |
Shares outstanding, $0.10 par value, 500 million shares authorized
| 1,840,259 | | | | 3,907,740 | | |
Shares outstanding, $0.0001 par value, 250 million shares authorized
| | | 2,058,554 | | | | 2,871,600 |
NET ASSET VALUE, OFFERING AND
REDEMPTION PRICE PER SHARE
| $ 39.02 | | $ 68.11 | | $ 50.97 | | $ 34.42 |
The accompanying notes are an integral part of these financial statements.
Penn Series Funds, Inc.
Statements of Assets and Liabilities
December 31, 2021
| | Developed
International
Index Fund | | International
Equity Fund | | Emerging
Markets
Equity Fund | | Real Estate
Securities
Fund |
| ASSETS: | | | | | | | |
Investments at value
| $ 112,895,219 | | $ 351,464,059 | | $ 129,176,072 | | $ 143,163,359 |
Initial margin held by broker for open futures
| 213,842 | | — | | — | | — |
Foreign currency at value
| 241,043 | | — | | 285,428 | | — |
Interest and dividends receivable
| 82,755 | | 156,891 | | 191,609 | | 259,077 |
Tax reclaims receivable
| 546,842 | | 1,227,638 | | 65,333 | | — |
Receivable for investment securities sold
| 16,656 | | — | | 505,683 | | — |
Receivable for capital stock sold
| 334,392 | | 997,563 | | 1,559,258 | | — |
Other assets
| 2,691 | | 8,668 | | 3,052 | | 3,160 |
Total Assets
| 114,333,440 | | 353,854,819 | | 131,786,435 | | 143,425,596 |
| LIABILITIES: | | | | | | | |
Cash overdraft
| — | | — | | 1 | | — |
Foreign currency overdraft
| — | | 6 | | — | | — |
Payable for investment securities purchased
| 2,737 | | — | | 302,591 | | — |
Payable for capital stock redeemed
| 45,186 | | 57,569 | | 37,545 | | 3,219,247 |
Futures variation margin payable
| 2,080 | | — | | — | | — |
Payable to investment adviser (See Note 3)
| 28,215 | | 221,566 | | 94,539 | | 82,042 |
Payable to the administrator (See Note 3)
| 8,452 | | 26,092 | | 9,857 | | 10,278 |
Deferred Indian capital gains tax
| — | | 385,196 | | 587,612 | | — |
Other liabilities
| 88,742 | | 159,708 | | 117,045 | | 53,214 |
Total Liabilities
| 175,412 | | 850,137 | | 1,149,190 | | 3,364,781 |
NET ASSETS
| $114,158,028 | | $353,004,682 | | $130,637,245 | | $140,060,815 |
Investments at cost
| $ 75,544,917 | | $ 296,005,560 | | $ 117,530,451 | | $ 101,123,349 |
Foreign currency at cost
| $ 238,865 | | $ — | | $ 285,751 | | $ — |
| COMPONENTS OF NET ASSETS: | | | | | | | |
Paid-in capital
| $ 78,880,577 | | $ 298,225,014 | | $ 119,836,153 | | $ 98,593,724 |
Total distributable earnings (loss)
| 35,277,451 | | 54,779,668 | | 10,801,092 | | 41,467,091 |
NET ASSETS
| $114,158,028 | | $353,004,682 | | $130,637,245 | | $140,060,815 |
| |
Shares outstanding, $0.10 par value, 250 million shares authorized
| | | 8,060,916 | | | | |
Shares outstanding, $0.0001 par value, 250 million shares authorized
| 6,478,008 | | | | 9,276,393 | | 3,721,884 |
NET ASSET VALUE, OFFERING AND
REDEMPTION PRICE PER SHARE
| $ 17.62 | | $ 43.79 | | $ 14.08 | | $ 37.63 |
The accompanying notes are an integral part of these financial statements.
Penn Series Funds, Inc.
Statements of Assets and Liabilities
December 31, 2021
| | Aggressive
Allocation
Fund | | Moderately
Aggressive
Allocation
Fund | | Moderate
Allocation
Fund | | Moderately
Conservative
Allocation
Fund |
| ASSETS: | | | | | | | |
Investments of affiliated issuers at value
| $ 70,180,122 | | $ 245,348,993 | | $ 286,942,877 | | $ 98,995,479 |
Investments of unaffiliated issuers at value
| 307,239 | | 1,182,388 | | 575,495 | | 771,067 |
Interest and dividends receivable
| — | | 2 | | 1 | | 4 |
Receivable for investment securities sold
| 99,230 | | 39,128 | | 589,413 | | 7,843 |
Receivable for capital stock sold
| 105,367 | | 15,192 | | 85,406 | | 54,120 |
Other assets
| 1,639 | | 5,760 | | 6,841 | | 2,254 |
Total Assets
| 70,693,597 | | 246,591,463 | | 288,200,033 | | 99,830,767 |
| LIABILITIES: | | | | | | | |
Payable for capital stock redeemed
| 1 | | 3 | | — | | 6,394 |
Payable to investment adviser (See Note 3)
| 7,095 | | 24,328 | | 28,388 | | 10,119 |
Payable to the administrator (See Note 3)
| 5,299 | | 18,452 | | 21,739 | | 7,402 |
Other liabilities
| 24,503 | | 75,777 | | 88,792 | | 32,091 |
Total Liabilities
| 36,898 | | 118,560 | | 138,919 | | 56,006 |
NET ASSETS
| $70,656,699 | | $246,472,903 | | $288,061,114 | | $99,774,761 |
Investments of affiliated issuers at cost
| $ 50,910,606 | | $ 172,098,652 | | $ 210,006,100 | | $ 80,397,826 |
Investments of unaffiliated issuers at cost
| $ 307,239 | | $ 1,182,388 | | $ 575,495 | | $ 771,067 |
| COMPONENTS OF NET ASSETS: | | | | | | | |
Paid-in capital
| $ 51,419,891 | | $ 173,343,422 | | $ 211,213,192 | | $ 81,219,145 |
Total distributable earnings (loss)
| 19,236,808 | | 73,129,481 | | 76,847,922 | | 18,555,616 |
NET ASSETS
| $70,656,699 | | $246,472,903 | | $288,061,114 | | $99,774,761 |
| |
Shares outstanding, $0.0001 par value, 250 million shares authorized
| 2,594,977 | | 8,853,451 | | 12,058,869 | | 4,837,592 |
NET ASSET VALUE, OFFERING AND
REDEMPTION PRICE PER SHARE
| $ 27.23 | | $ 27.84 | | $ 23.89 | | $ 20.62 |
The accompanying notes are an integral part of these financial statements.
Penn Series Funds, Inc.
Statements of Assets and Liabilities
December 31, 2021
| | Conservative
Allocation
Fund |
| ASSETS: | |
Investments of affiliated issuers at value
| $ 58,222,349 |
Investments of unaffiliated issuers at value
| 916,599 |
Cash
| 42 |
Interest and dividends receivable
| 1 |
Receivable for investment securities sold
| 2,554 |
Receivable for capital stock sold
| 76,856 |
Other assets
| 1,435 |
Total Assets
| 59,219,836 |
| LIABILITIES: | |
Payable for capital stock redeemed
| 1 |
Payable to investment adviser (See Note 3)
| 6,140 |
Payable to the administrator (See Note 3)
| 4,585 |
Other liabilities
| 21,303 |
Total Liabilities
| 32,029 |
NET ASSETS
| $59,187,807 |
Investments of affiliated issuers at cost
| $ 51,529,329 |
Investments of unaffiliated issuers at cost
| $ 916,599 |
| COMPONENTS OF NET ASSETS: | |
Paid-in capital
| $ 52,514,300 |
Total distributable earnings (loss)
| 6,673,507 |
NET ASSETS
| $59,187,807 |
| |
Shares outstanding, $0.0001 par value, 250 million shares authorized
| 3,410,594 |
NET ASSET VALUE, OFFERING AND
REDEMPTION PRICE PER SHARE
| $ 17.35 |
The accompanying notes are an integral part of these financial statements.
Penn Series Funds, Inc.
Statements of Operations
For The Year Ended December 31, 2021
| | Money
Market
Fund | | Limited
Maturity Bond
Fund | | Quality
Bond
Fund | | High Yield
Bond
Fund |
| INVESTMENT INCOME: | | | | | | | |
Dividends
| $ 6,168 | | $ 2,070 | | $ 255,259 | | $ 36,679 |
Interest
| 66,720 | | 5,584,689 | | 12,394,226 | | 8,134,097 |
Foreign taxes withheld
| — | | (2,651) | | — | | — |
Total Investment Income
| 72,888 | | 5,584,108 | | 12,649,485 | | 8,170,776 |
| EXPENSES: | | | | | | | |
Investment advisory fees (See Note 3)
| 551,705 | | 1,180,077 | | 2,105,560 | | 773,207 |
Shareholder servicing fees (See Note 3)
| 150,465 | | 233,198 | | 427,620 | | 151,280 |
Administration fees (See Note 3)
| 50,155 | | 77,733 | | 142,540 | | 50,427 |
Accounting fees (See Note 3)
| 103,592 | | 149,554 | | 222,540 | | 104,044 |
Directors’ fees and expenses
| 8,646 | | 13,580 | | 24,956 | | 8,748 |
Custodian fees and expenses
| 12,093 | | 18,524 | | 33,778 | | 12,186 |
Pricing fees
| 8,972 | | 23,130 | | 27,203 | | 22,582 |
Professional fees
| 13,297 | | 21,933 | | 40,187 | | 14,245 |
Printing fees
| 9,283 | | 13,648 | | 23,957 | | 9,352 |
Other expenses
| 38,477 | | 59,994 | | 81,947 | | 49,491 |
Total Expenses
| 946,685 | | 1,791,371 | | 3,130,288 | | 1,195,562 |
Less: Waivers and reimbursement from administrator (See Note 3)
| (338,808) | | — | | — | | — |
Less: Waivers and reimbursement from advisor (See Note 3)
| (551,705) | | — | | — | | — |
Net Expenses
| 56,172 | | 1,791,371 | | 3,130,288 | | 1,195,562 |
Net Investment Income (Loss)
| 16,716 | | 3,792,737 | | 9,519,197 | | 6,975,214 |
| NET REALIZED AND UNREALIZED GAIN (LOSS): | | | | | | | |
| Net realized gain (loss) on: | | | | | | | |
Investments
| 2,714 | | 401,176 | | 4,924,334 | | 6,054,606 |
Futures contracts
| — | | (628,258) | | (3,608,055) | | 464,892 |
Net realized gain (loss)
| 2,714 | | (227,082) | | 1,316,279 | | 6,519,498 |
| Net change in unrealized appreciation (depreciation) of: | | | | | | | |
Investments
| — | | (2,462,631) | | (14,363,297) | | (5,170,049) |
Futures contracts
| — | | (50,051) | | 164,822 | | 13,246 |
Foreign currencies
| — | | — | | — | | 947 |
Net change in unrealized appreciation (depreciation)
| — | | (2,512,682) | | (14,198,475) | | (5,155,856) |
Net Realized and Unrealized Gain (Loss)
| 2,714 | | (2,739,764) | | (12,882,196) | | 1,363,642 |
NET INCREASE (DECREASE) IN NET ASSETS RESULTING FROM OPERATIONS
| $ 19,430 | | $ 1,052,973 | | $ (3,362,999) | | $ 8,338,856 |
The accompanying notes are an integral part of these financial statements.
Penn Series Funds, Inc.
Statements of Operations
For The Year Ended December 31, 2021
| | Flexibly
Managed
Fund | | Balanced
Fund | | Large
Growth Stock
Fund | | Large Cap
Growth
Fund |
| INVESTMENT INCOME: | | | | | | | |
Dividends
| $ 42,972,665 | | $ — | | $ 1,395,715 | | $ 676,342 |
Interest
| 44,127,362 | | — | | — | | — |
Foreign taxes withheld
| (84,586) | | — | | (18,809) | | (7,939) |
Total Investment Income
| 87,015,441 | | — | | 1,376,906 | | 668,403 |
| EXPENSES: | | | | | | | |
Investment advisory fees (See Note 3)
| 35,694,020 | | — | | 2,993,996 | | 408,974 |
Shareholder servicing fees (See Note 3)
| 4,703,298 | | 80,182 | | 383,029 | | 66,923 |
Administration fees (See Note 3)
| 1,567,766 | | 26,727 | | 127,676 | | 22,308 |
Accounting fees (See Note 3)
| 1,185,177 | | 12,000 | | 207,676 | | 52,051 |
Directors’ fees and expenses
| 269,565 | | 4,593 | | 22,001 | | 3,824 |
Custodian fees and expenses
| 369,091 | | 6,246 | | 31,933 | | 6,203 |
Pricing fees
| 17,528 | | 3,279 | | 8,799 | | 5,655 |
Professional fees
| 472,133 | | 7,085 | | 70,958 | | 7,034 |
Printing fees
| 254,681 | | 5,607 | | 22,046 | | 4,933 |
Other expenses
| 680,412 | | 25,290 | | 103,166 | | 53,975 |
Total Expenses
| 45,213,671 | | 171,009 | | 3,971,280 | | 631,880 |
Net Investment Income (Loss)
| 41,801,770 | | (171,009) | | (2,594,374) | | 36,523 |
| NET REALIZED AND UNREALIZED GAIN (LOSS): | | | | | | | |
| Net realized gain (loss) on: | | | | | | | |
Affiliated Investments
| — | | 9,391,510 | | — | | — |
Unaffiliated investments
| 605,539,020 | | — | | 59,905,867 | | 8,403,981 |
Written options
| 7,234,302 | | — | | — | | — |
Foreign currencies
| (43,674) | | — | | (4,705) | | (550) |
Forward foreign currency contracts
| — | | — | | 128 | | — |
Net realized gain (loss)
| 612,729,648 | | 9,391,510 | | 59,901,290 | | 8,403,431 |
| Net change in unrealized appreciation (depreciation) of: | | | | | | | |
Affiliated Investments
| — | | 3,806,283 | | — | | — |
Unaffiliated Investments
| 243,318,962 | | — | | 7,107,707 | | 8,731,882 |
Written options
| (25,206,896) | | — | | — | | — |
Foreign currencies
| 13,045 | | — | | (187) | | (987) |
Net change in unrealized appreciation (depreciation)
| 218,125,111 | | 3,806,283 | | 7,107,520 | | 8,730,895 |
Net Realized and Unrealized Gain (Loss)
| 830,854,759 | | 13,197,793 | | 67,008,810 | | 17,134,326 |
NET INCREASE (DECREASE) IN NET ASSETS RESULTING FROM OPERATIONS
| $ 872,656,529 | | $13,026,784 | | $64,414,436 | | $17,170,849 |
The accompanying notes are an integral part of these financial statements.
Penn Series Funds, Inc.
Statements of Operations
For The Year Ended December 31, 2021
| | Large Core
Growth
Fund | | Large Cap
Value
Fund | | Large Core
Value
Fund | | Index 500
Fund |
| INVESTMENT INCOME: | | | | | | | |
Dividends
| $ 283,921 | | $ 3,388,851 | | $ 4,063,131 | | $ 8,930,680 |
Foreign taxes withheld
| (5,900) | | (51,896) | | (16,433) | | (1,213) |
Total Investment Income
| 278,021 | | 3,336,955 | | 4,046,698 | | 8,929,467 |
| EXPENSES: | | | | | | | |
Investment advisory fees (See Note 3)
| 1,358,155 | | 1,303,007 | | 1,260,322 | | 822,906 |
Shareholder servicing fees (See Note 3)
| 203,723 | | 176,262 | | 170,352 | | 583,430 |
Administration fees (See Note 3)
| 67,908 | | 58,754 | | 56,784 | | 194,477 |
Accounting fees (See Note 3)
| 133,180 | | 117,924 | | 114,640 | | 269,612 |
Directors’ fees and expenses
| 11,882 | | 10,064 | | 9,748 | | 33,207 |
Custodian fees and expenses
| 17,096 | | 13,893 | | 13,487 | | 46,127 |
Pricing fees
| 4,118 | | 7,616 | | 4,515 | | 12,162 |
Professional fees
| 20,078 | | 21,256 | | 35,762 | | 59,113 |
Printing fees
| 12,535 | | 10,880 | | 17,231 | | 32,922 |
Other expenses
| 68,728 | | 55,486 | | 52,358 | | 167,731 |
Total Expenses
| 1,897,403 | | 1,775,142 | | 1,735,199 | | 2,221,687 |
Net Investment Income (Loss)
| (1,619,382) | | 1,561,813 | | 2,311,499 | | 6,707,780 |
| NET REALIZED AND UNREALIZED GAIN (LOSS): | | | | | | | |
| Net realized gain (loss) on: | | | | | | | |
Investments
| 41,852,917 | | 32,298,494 | | 30,721,742 | | 44,059,134 |
Futures contracts
| — | | — | | — | | 1,641,098 |
Foreign currencies
| 81 | | — | | — | | — |
Net realized gain (loss)
| 41,852,998 | | 32,298,494 | | 30,721,742 | | 45,700,232 |
| Net change in unrealized appreciation (depreciation) of: | | | | | | | |
Investments
| (48,219,527) | | 13,408,379 | | 8,290,741 | | 108,593,912 |
Futures contracts
| — | | — | | — | | (78,623) |
Foreign currencies
| 68 | | — | | — | | — |
Net change in unrealized appreciation (depreciation)
| (48,219,459) | | 13,408,379 | | 8,290,741 | | 108,515,289 |
Net Realized and Unrealized Gain (Loss)
| (6,366,461) | | 45,706,873 | | 39,012,483 | | 154,215,521 |
NET INCREASE (DECREASE) IN NET ASSETS RESULTING FROM OPERATIONS
| $ (7,985,843) | | $47,268,686 | | $ 41,323,982 | | $160,923,301 |
The accompanying notes are an integral part of these financial statements.
Penn Series Funds, Inc.
Statements of Operations
For The Year Ended December 31, 2021
| | Mid Cap
Growth
Fund | | Mid Cap
Value
Fund | | Mid Core
Value
Fund | | SMID Cap
Growth
Fund |
| INVESTMENT INCOME: | | | | | | | |
Dividends
| $ 690,861 | | $ 1,379,805 | | $ 2,304,800 | | $ 257,043 |
Foreign taxes withheld
| — | | (3,068) | | (31,297) | | — |
Total Investment Income
| 690,861 | | 1,376,737 | | 2,273,503 | | 257,043 |
| EXPENSES: | | | | | | | |
Investment advisory fees (See Note 3)
| 1,435,700 | | 557,481 | | 696,900 | | 764,295 |
Shareholder servicing fees (See Note 3)
| 184,590 | | 91,224 | | 90,900 | | 91,715 |
Administration fees (See Note 3)
| 61,530 | | 30,408 | | 30,300 | | 30,572 |
Accounting fees (See Note 3)
| 122,550 | | 70,552 | | 70,319 | | 70,746 |
Directors’ fees and expenses
| 10,675 | | 5,236 | | 5,221 | | 5,297 |
Custodian fees and expenses
| 14,713 | | 7,194 | | 9,385 | | 7,342 |
Pricing fees
| 5,661 | | 5,784 | | 6,862 | | 5,133 |
Professional fees
| 33,478 | | 10,112 | | 11,729 | | 9,400 |
Printing fees
| 71,832 | | 6,232 | | 6,200 | | 6,245 |
Other expenses
| 67,035 | | 49,677 | | 83,073 | | 52,140 |
Total Expenses
| 2,007,764 | | 833,900 | | 1,010,889 | | 1,042,885 |
Net Investment Income (Loss)
| (1,316,903) | | 542,837 | | 1,262,614 | | (785,842) |
| NET REALIZED AND UNREALIZED GAIN (LOSS): | | | | | | | |
| Net realized gain (loss) on: | | | | | | | |
Investments
| 35,332,331 | | 14,042,856 | | 17,033,543 | | 17,862,730 |
Written options
| 177,984 | | — | | — | | — |
Purchased options
| (1,353,841) | | — | | — | | — |
Foreign currencies
| — | | — | | (949) | | — |
Forward foreign currency contracts
| — | | — | | 358,813 | | — |
Payment by affiliates
| — | | — | | 860 | | — |
Net realized gain (loss)
| 34,156,474 | | 14,042,856 | | 17,392,267 | | 17,862,730 |
| Net change in unrealized appreciation (depreciation) of: | | | | | | | |
Investments
| (1,512,627) | | 3,104,724 | | 1,934,628 | | (9,805,272) |
Written options
| (230,184) | | — | | — | | — |
Purchased options
| 304,108 | | — | | — | | — |
Foreign currencies
| — | | 16 | | (535) | | — |
Forward foreign currency contracts
| — | | — | | (19,996) | | — |
Net change in unrealized appreciation (depreciation)
| (1,438,703) | | 3,104,740 | | 1,914,097 | | (9,805,272) |
Net Realized and Unrealized Gain (Loss)
| 32,717,771 | | 17,147,596 | | 19,306,364 | | 8,057,458 |
NET INCREASE (DECREASE) IN NET ASSETS RESULTING FROM OPERATIONS
| $31,400,868 | | $17,690,433 | | $20,568,978 | | $ 7,271,616 |
The accompanying notes are an integral part of these financial statements.
Penn Series Funds, Inc.
Statements of Operations
For The Year Ended December 31, 2021
| | SMID Cap
Value
Fund | | Small Cap
Growth
Fund | | Small Cap
Value
Fund | | Small Cap
Index
Fund |
| INVESTMENT INCOME: | | | | | | | |
Dividends
| $ 1,184,673 | | $ 530,208 | | $ 2,331,778 | | $ 934,267 |
Foreign taxes withheld
| (880) | | (2,796) | | (2,386) | | (1,606) |
Total Investment Income
| 1,183,793 | | 527,412 | | 2,329,392 | | 932,661 |
| EXPENSES: | | | | | | | |
Investment advisory fees (See Note 3)
| 562,477 | | 1,027,056 | | 1,402,868 | | 280,322 |
Shareholder servicing fees (See Note 3)
| 60,265 | | 127,229 | | 175,547 | | 84,097 |
Administration fees (See Note 3)
| 20,089 | | 42,410 | | 58,516 | | 28,032 |
Accounting fees (See Note 3)
| 46,873 | | 90,682 | | 117,526 | | 65,346 |
Directors’ fees and expenses
| 3,386 | | 7,379 | | 10,008 | | 4,789 |
Custodian fees and expenses
| 4,612 | | 10,810 | | 13,833 | | 6,687 |
Pricing fees
| 5,001 | | 7,478 | | 8,499 | | 34,174 |
Professional fees
| 6,374 | | 13,247 | | 17,461 | | 13,115 |
Printing fees
| 4,570 | | 8,137 | | 10,735 | | 5,968 |
Recaptured advisory fee (See Note 3)
| — | | — | | — | | 90 |
Other expenses
| 59,447 | | 62,045 | | 102,835 | | 127,830 |
Total Expenses
| 773,094 | | 1,396,473 | | 1,917,828 | | 650,450 |
Net Investment Income (Loss)
| 410,699 | | (869,061) | | 411,564 | | 282,211 |
| NET REALIZED AND UNREALIZED GAIN (LOSS): | | | | | | | |
| Net realized gain (loss) on: | | | | | | | |
Investments
| 11,185,789 | | 21,339,645 | | 47,543,690 | | 12,394,096 |
Futures contracts
| — | | — | | — | | 197,906 |
Foreign currencies
| — | | 3 | | — | | — |
Forward foreign currency contracts
| — | | (26) | | — | | — |
Net realized gain (loss)
| 11,185,789 | | 21,339,622 | | 47,543,690 | | 12,592,002 |
| Net change in unrealized appreciation (depreciation) of: | | | | | | | |
Investments
| 8,043,754 | | (8,563,330) | | (1,680,539) | | (2,635,395) |
Futures contracts
| — | | — | | — | | (20,765) |
Foreign currencies
| — | | (621) | | — | | — |
Net change in unrealized appreciation (depreciation)
| 8,043,754 | | (8,563,951) | | (1,680,539) | | (2,656,160) |
Net Realized and Unrealized Gain (Loss)
| 19,229,543 | | 12,775,671 | | 45,863,151 | | 9,935,842 |
NET INCREASE (DECREASE) IN NET ASSETS RESULTING FROM OPERATIONS
| $19,640,242 | | $11,906,610 | | $46,274,715 | | $10,218,053 |
The accompanying notes are an integral part of these financial statements.
Penn Series Funds, Inc.
Statements of Operations
For The Year Ended December 31, 2021
| | Developed
International
Index Fund | | International
Equity Fund | | Emerging
Markets
Equity Fund | | Real Estate
Securities
Fund |
| INVESTMENT INCOME: | | | | | | | |
Dividends
| $ 3,168,520 | | $ 3,601,363 | | $ 2,141,032 | | $ 2,408,158 |
Foreign taxes withheld
| (339,613) | | (370,621) | | (289,351) | | — |
Total Investment Income
| 2,828,907 | | 3,230,742 | | 1,851,681 | | 2,408,158 |
| EXPENSES: | | | | | | | |
Investment advisory fees (See Note 3)
| 337,691 | | 2,633,936 | | 1,219,521 | | 915,876 |
Shareholder servicing fees (See Note 3)
| 101,307 | | 311,419 | | 126,157 | | 117,755 |
Administration fees (See Note 3)
| 33,769 | | 103,806 | | 42,053 | | 39,252 |
Accounting fees (See Note 3)
| 87,538 | | 227,613 | | 104,105 | | 85,420 |
Directors’ fees and expenses
| 5,840 | | 17,888 | | 7,422 | | 6,674 |
Custodian fees and expenses
| 27,880 | | 100,083 | | 66,577 | | 9,187 |
Pricing fees
| 94,465 | | 10,884 | | 11,553 | | 4,777 |
Professional fees
| 54,171 | | 44,620 | | 45,122 | | 11,176 |
Printing fees
| 6,744 | | 17,993 | | 7,984 | | 7,687 |
Other expenses
| 212,719 | | 101,771 | | 116,555 | | 48,847 |
Total Expenses
| 962,124 | | 3,570,013 | | 1,747,049 | | 1,246,651 |
Net Investment Income (Loss)
| 1,866,783 | | (339,271) | | 104,632 | | 1,161,507 |
| NET REALIZED AND UNREALIZED GAIN (LOSS): | | | | | | | |
| Net realized gain (loss) on: | | | | | | | |
Investments
| 2,584,103 | | 64,721,949 | | 19,678,634 | | 16,592,735 |
Futures contracts
| 309,134 | | — | | — | | — |
Foreign currencies
| (12,573) | | (731,670) | | (192,466) | | — |
Forward foreign currency contracts
| 1,716 | | — | | — | | — |
Net realized gain (loss)
| 2,882,380 | | 63,990,279 | | 19,486,168 | | 16,592,735 |
| Net change in unrealized appreciation (depreciation) of: | | | | | | | |
Investments
| 6,568,065 | | (23,133,902) | | (26,886,728) | | 28,759,376 |
Futures contracts
| 4,124 | | — | | — | | — |
Foreign currencies
| (32,866) | | (49,494) | | (4,208) | | — |
Net change in unrealized appreciation (depreciation)
| 6,539,323 | | (23,183,396) | | (26,890,936) | | 28,759,376 |
Net Realized and Unrealized Gain (Loss)
| 9,421,703 | | 40,806,883 | | (7,404,768) | | 45,352,111 |
NET INCREASE (DECREASE) IN NET ASSETS RESULTING FROM OPERATIONS
| $11,288,486 | | $ 40,467,612 | | $ (7,300,136) | | $46,513,618 |
The accompanying notes are an integral part of these financial statements.
Penn Series Funds, Inc.
Statements of Operations
For The Year Ended December 31, 2021
| | Aggressive
Allocation
Fund | | Moderately
Aggressive
Allocation
Fund | | Moderate
Allocation
Fund | | Moderately
Conservative
Allocation
Fund |
| INVESTMENT INCOME: | | | | | | | |
Dividends
| $ 92 | | $ 299 | | $ 186 | | $ 198 |
Total Investment Income
| 92 | | 299 | | 186 | | 198 |
| EXPENSES: | | | | | | | |
Investment advisory fees (See Note 3)
| 83,806 | | 285,278 | | 339,207 | | 115,892 |
Shareholder servicing fees (See Note 3)
| 62,855 | | 217,046 | | 261,170 | | 86,919 |
Administration fees (See Note 3)
| 20,952 | | 72,349 | | 87,057 | | 28,973 |
Accounting fees (See Note 3)
| 12,000 | | 24,116 | | 29,019 | | 12,000 |
Directors’ fees and expenses
| 3,645 | | 12,468 | | 15,091 | | 5,006 |
Custodian fees and expenses
| 4,946 | | 17,092 | | 20,431 | | 6,803 |
Pricing fees
| 3,278 | | 3,279 | | 3,278 | | 3,279 |
Professional fees
| 5,527 | | 19,140 | | 22,762 | | 7,587 |
Printing fees
| 4,671 | | 13,035 | | 15,249 | | 5,921 |
Other expenses
| 27,660 | | 42,593 | | 47,571 | | 26,535 |
Total Expenses
| 229,340 | | 706,396 | | 840,835 | | 298,915 |
Net Investment Income (Loss)
| (229,248) | | (706,097) | | (840,649) | | (298,717) |
| NET REALIZED AND UNREALIZED GAIN (LOSS): | | | | | | | |
Net realized gain (loss) on affiliated investments
| 8,475,044 | | 20,521,343 | | 25,886,652 | | 7,087,205 |
Net change in unrealized appreciation (depreciation) of affiliated investments
| 2,360,017 | | 14,233,495 | | 5,964,759 | | 1,139,596 |
Net Realized and Unrealized Gain (Loss)
| 10,835,061 | | 34,754,838 | | 31,851,411 | | 8,226,801 |
NET INCREASE (DECREASE) IN NET ASSETS RESULTING FROM OPERATIONS
| $10,605,813 | | $ 34,048,741 | | $ 31,010,762 | | $7,928,084 |
| | Conservative
Allocation
Fund |
| INVESTMENT INCOME: | |
Dividends
| $ 191 |
Total Investment Income
| 191 |
| EXPENSES: | |
Investment advisory fees (See Note 3)
| 72,985 |
Shareholder servicing fees (See Note 3)
| 54,739 |
Administration fees (See Note 3)
| 18,246 |
Accounting fees (See Note 3)
| 12,000 |
Directors’ fees and expenses
| 3,161 |
Custodian fees and expenses
| 4,312 |
Pricing fees
| 3,278 |
Professional fees
| 4,747 |
Printing fees
| 4,160 |
Other expenses
| 22,327 |
Total Expenses
| 199,955 |
Net Investment Income (Loss)
| (199,764) |
| NET REALIZED AND UNREALIZED GAIN (LOSS): | |
Net realized gain (loss) on affiliated investments
| 3,989,908 |
Net change in unrealized appreciation (depreciation) of affiliated investments
| (1,118,481) |
Net Realized and Unrealized Gain (Loss)
| 2,871,427 |
NET INCREASE (DECREASE) IN NET ASSETS RESULTING FROM OPERATIONS
| $ 2,671,663 |
The accompanying notes are an integral part of these financial statements.
Penn Series Funds, Inc.
Statements of Changes in Net Assets
| | Money Market Fund | | Limited Maturity Bond Fund |
| | Year
Ended
12/31/21 | | Year
Ended
12/31/20 | | Year
Ended
12/31/21 | | Year
Ended
12/31/20 |
| Increase (Decrease) in Net Assets Operations: | | | | | | | |
Net investment income (loss)
| $ 16,716 | | $ 280,486 | | $ 3,792,737 | | $ 4,549,641 |
Net realized gain (loss)
| 2,714 | | — | | (227,082) | | 4,071,621 |
Net change in unrealized appreciation (depreciation)
| — | | — | | (2,512,682) | | 107,453 |
Net Increase (Decrease) in Net Assets Resulting from Operations
| 19,430 | | 280,486 | | 1,052,973 | | 8,728,715 |
| Distributions from: | | | | | | | |
Distributable earnings
| (16,716) | | (277,283) | | — | | — |
Total Distributions
| (16,716) | | (277,283) | | — | | — |
| Capital Share Transactions (1): | | | | | | | |
Shares issued
| 135,442,747 | | 151,898,109 | | 54,991,956 | | 59,690,500 |
Shares issued in lieu of cash distributions
| 16,716 | | 280,485 | | — | | — |
Shares redeemed
| (133,727,825) | | (104,653,034) | | (50,938,391) | | (58,538,852) |
Net Increase (Decrease) in Net Assets from Capital Share Transactions
| 1,731,638 | | 47,525,560 | | 4,053,565 | | 1,151,648 |
Total Increase (Decrease)
| 1,734,352 | | 47,528,763 | | 5,106,538 | | 9,880,363 |
| Net Assets: | | | | | | | |
Beginning of period
| 160,467,166 | | 112,938,403 | | 254,877,873 | | 244,997,510 |
End of period
| $ 162,201,518 | | $ 160,467,166 | | $ 259,984,411 | | $ 254,877,873 |
| (1) Shares Issued and Redeemed: | | | | | | | |
Shares issued
| 135,442,747 | | 151,898,109 | | 4,107,612 | | 4,573,900 |
Shares issued in lieu of cash distributions
| 16,716 | | 280,485 | | — | | — |
Shares redeemed
| (133,727,825) | | (104,653,034) | | (3,805,410) | | (4,505,075) |
| | 1,731,638 | | 47,525,560 | | 302,202 | | 68,825 |
| | Quality Bond Fund | | High Yield Bond Fund |
| | Year
Ended
12/31/21 | | Year
Ended
12/31/20 | | Year
Ended
12/31/21 | | Year
Ended
12/31/20 |
| Increase (Decrease) in Net Assets Operations: | | | | | | | |
Net investment income (loss)
| $ 9,519,197 | | $ 9,544,582 | | $ 6,975,214 | | $ 7,123,014 |
Net realized gain (loss)
| 1,316,279 | | 14,152,559 | | 6,519,498 | | 795,032 |
Net change in unrealized appreciation (depreciation)
| (14,198,475) | | 12,407,581 | | (5,155,856) | | 2,311,510 |
Net Increase (Decrease) in Net Assets Resulting from Operations
| (3,362,999) | | 36,104,722 | | 8,338,856 | | 10,229,556 |
| Capital Share Transactions (1): | | | | | | | |
Shares issued
| 63,716,703 | | 110,626,763 | | 15,459,601 | | 22,749,256 |
Shares redeemed
| (72,761,498) | | (95,991,535) | | (21,758,474) | | (25,483,846) |
Net Increase (Decrease) in Net Assets from Capital Share Transactions
| (9,044,795) | | 14,635,228 | | (6,298,873) | | (2,734,590) |
Total Increase (Decrease)
| (12,407,794) | | 50,739,950 | | 2,039,983 | | 7,494,966 |
| Net Assets: | | | | | | | |
Beginning of period
| 484,474,166 | | 433,734,216 | | 167,391,455 | | 159,896,489 |
End of period
| $ 472,066,372 | | $484,474,166 | | $169,431,438 | | $ 167,391,455 |
| (1) Shares Issued and Redeemed: | | | | | | | |
Shares issued
| 3,710,167 | | 6,581,932 | | 936,393 | | 1,467,884 |
Shares redeemed
| (4,230,720) | | (5,773,085) | | (1,322,604) | | (1,754,814) |
| | (520,553) | | 808,847 | | (386,211) | | (286,930) |
The accompanying notes are an integral part of these financial statements.
Penn Series Funds, Inc.
Statements of Changes in Net Assets
| | Flexibly Managed Fund | | Balanced Fund |
| | Year
Ended
12/31/21 | | Year
Ended
12/31/20 | | Year
Ended
12/31/21 | | Year
Ended
12/31/20 |
| Increase (Decrease) in Net Assets Operations: | | | | | | | |
Net investment income (loss)
| $ 41,801,770 | | $ 46,949,584 | | $ (171,009) | | $ (158,423) |
Net realized gain (loss)
| 612,729,648 | | 559,438,503 | | 9,391,510 | | 11,783,833 |
Net change in unrealized appreciation (depreciation)
| 218,125,111 | | 135,399,398 | | 3,806,283 | | (530,549) |
Net Increase (Decrease) in Net Assets Resulting from Operations
| 872,656,529 | | 741,787,485 | | 13,026,784 | | 11,094,861 |
| Capital Share Transactions (1): | | | | | | | |
Shares issued
| 78,991,493 | | 79,440,355 | | 4,700,832 | | 4,125,924 |
Shares redeemed
| (350,338,635) | | (353,137,852) | | (9,322,437) | | (11,943,412) |
Net Increase (Decrease) in Net Assets from Capital Share Transactions
| (271,347,142) | | (273,697,497) | | (4,621,605) | | (7,817,488) |
Total Increase (Decrease)
| 601,309,387 | | 468,089,988 | | 8,405,179 | | 3,277,373 |
| Net Assets: | | | | | | | |
Beginning of period
| 4,886,355,377 | | 4,418,265,389 | | 84,347,730 | | 81,070,357 |
End of period
| $5,487,664,764 | | $ 4,886,355,377 | | $ 92,752,909 | | $ 84,347,730 |
| (1) Shares Issued and Redeemed: | | | | | | | |
Shares issued
| 929,618 | | 1,197,362 | | 162,133 | | 169,657 |
Shares redeemed
| (4,131,573) | | (5,345,786) | | (317,193) | | (488,438) |
| | (3,201,955) | | (4,148,424) | | (155,060) | | (318,781) |
| | Large Growth Stock Fund | | Large Cap Growth Fund |
| | Year
Ended
12/31/21 | | Year
Ended
12/31/20 | | Year
Ended
12/31/21 | | Year
Ended
12/31/20 |
| Increase (Decrease) in Net Assets Operations: | | | | | | | |
Net investment income (loss)
| $ (2,594,374) | | $ (1,752,986) | | $ 36,523 | | $ 114,472 |
Net realized gain (loss)
| 59,901,290 | | 34,810,689 | | 8,403,431 | | 8,618,889 |
Net change in unrealized appreciation (depreciation)
| 7,107,520 | | 81,003,169 | | 8,730,895 | | 4,193,440 |
Net Increase (Decrease) in Net Assets Resulting from Operations
| 64,414,436 | | 114,060,872 | | 17,170,849 | | 12,926,801 |
| Capital Share Transactions (1): | | | | | | | |
Shares issued
| 16,606,702 | | 16,475,289 | | 5,333,971 | | 4,993,757 |
Shares redeemed
| (58,120,448) | | (56,169,734) | | (12,024,711) | | (12,603,815) |
Net Increase (Decrease) in Net Assets from Capital Share Transactions
| (41,513,746) | | (39,694,445) | | (6,690,740) | | (7,610,058) |
Total Increase (Decrease)
| 22,900,690 | | 74,366,427 | | 10,480,109 | | 5,316,743 |
| Net Assets: | | | | | | | |
Beginning of period
| 405,786,714 | | 331,420,287 | | 68,536,025 | | 63,219,282 |
End of period
| $428,687,404 | | $ 405,786,714 | | $ 79,016,134 | | $ 68,536,025 |
| (1) Shares Issued and Redeemed: | | | | | | | |
Shares issued
| 213,275 | | 293,328 | | 159,695 | | 203,974 |
Shares redeemed
| (740,342) | | (968,934) | | (348,367) | | (488,080) |
| | (527,067) | | (675,606) | | (188,672) | | (284,106) |
The accompanying notes are an integral part of these financial statements.
Penn Series Funds, Inc.
Statements of Changes in Net Assets
| | Large Core Growth Fund | | Large Cap Value Fund |
| | Year
Ended
12/31/21 | | Year
Ended
12/31/20 | | Year
Ended
12/31/21 | | Year
Ended
12/31/20 |
| Increase (Decrease) in Net Assets Operations: | | | | | | | |
Net investment income (loss)
| $ (1,619,382) | | $ (1,006,421) | | $ 1,561,813 | | $ 1,996,769 |
Net realized gain (loss)
| 41,852,998 | | 44,658,734 | | 32,298,494 | | (5,261,376) |
Net change in unrealized appreciation (depreciation)
| (48,219,459) | | 53,224,451 | | 13,408,379 | | 6,098,668 |
Net Increase (Decrease) in Net Assets Resulting from Operations
| (7,985,843) | | 96,876,764 | | 47,268,686 | | 2,834,061 |
| Capital Share Transactions (1): | | | | | | | |
Shares issued
| 17,243,325 | | 18,312,376 | | 8,082,948 | | 12,636,650 |
Shares redeemed
| (25,806,226) | | (29,091,470) | | (30,566,489) | | (33,767,654) |
Net Increase (Decrease) in Net Assets from Capital Share Transactions
| (8,562,901) | | (10,779,094) | | (22,483,541) | | (21,131,004) |
Total Increase (Decrease)
| (16,548,744) | | 86,097,670 | | 24,785,145 | | (18,296,943) |
| Net Assets: | | | | | | | |
Beginning of period
| 222,028,013 | | 135,930,343 | | 177,810,987 | | 196,107,930 |
End of period
| $ 205,479,269 | | $ 222,028,013 | | $ 202,596,132 | | $ 177,810,987 |
| (1) Shares Issued and Redeemed: | | | | | | | |
Shares issued
| 338,124 | | 466,319 | | 208,887 | | 483,571 |
Shares redeemed
| (500,372) | | (796,839) | | (794,797) | | (1,172,172) |
| | (162,248) | | (330,520) | | (585,910) | | (688,601) |
| | Large Core Value Fund | | Index 500 Fund |
| | Year
Ended
12/31/21 | | Year
Ended
12/31/20 | | Year
Ended
12/31/21 | | Year
Ended
12/31/20 |
| Increase (Decrease) in Net Assets Operations: | | | | | | | |
Net investment income (loss)
| $ 2,311,499 | | $ 2,548,904 | | $ 6,707,780 | | $ 7,296,719 |
Net realized gain (loss)
| 30,721,742 | | (411,727) | | 45,700,232 | | 67,006,759 |
Net change in unrealized appreciation (depreciation)
| 8,290,741 | | 2,010,840 | | 108,515,289 | | 22,214,082 |
Net Increase (Decrease) in Net Assets Resulting from Operations
| 41,323,982 | | 4,148,017 | | 160,923,301 | | 96,517,560 |
| Capital Share Transactions (1): | | | | | | | |
Shares issued
| 9,614,251 | | 15,417,090 | | 38,832,262 | | 69,328,444 |
Shares redeemed
| (40,761,500) | | (33,565,078) | | (96,966,378) | | (64,452,708) |
Net Increase (Decrease) in Net Assets from Capital Share Transactions
| (31,147,249) | | (18,147,988) | | (58,134,116) | | 4,875,736 |
Total Increase (Decrease)
| 10,176,733 | | (13,999,971) | | 102,789,185 | | 101,393,296 |
| Net Assets: | | | | | | | |
Beginning of period
| 178,958,847 | | 192,958,818 | | 595,932,910 | | 494,539,614 |
End of period
| $ 189,135,580 | | $ 178,958,847 | | $ 698,722,095 | | $ 595,932,910 |
| (1) Shares Issued and Redeemed: | | | | | | | |
Shares issued
| 364,000 | | 818,126 | | 1,041,297 | | 2,685,017 |
Shares redeemed
| (1,529,299) | | (1,641,339) | | (2,630,019) | | (2,351,038) |
| | (1,165,299) | | (823,213) | | (1,588,722) | | 333,979 |
The accompanying notes are an integral part of these financial statements.
Penn Series Funds, Inc.
Statements of Changes in Net Assets
| | Mid Cap Growth Fund | | Mid Cap Value Fund |
| | Year
Ended
12/31/21 | | Year
Ended
12/31/20 | | Year
Ended
12/31/21 | | Year
Ended
12/31/20 |
| Increase (Decrease) in Net Assets Operations: | | | | | | | |
Net investment income (loss)
| $ (1,316,903) | | $ (615,728) | | $ 542,837 | | $ 1,005,951 |
Net realized gain (loss)
| 34,156,474 | | 23,290,242 | | 14,042,856 | | (17,957,467) |
Net change in unrealized appreciation (depreciation)
| (1,438,703) | | 45,974,753 | | 3,104,740 | | 3,457,789 |
Net Increase (Decrease) in Net Assets Resulting from Operations
| 31,400,868 | | 68,649,267 | | 17,690,433 | | (13,493,727) |
| Capital Share Transactions (1): | | | | | | | |
Shares issued
| 11,782,143 | | 12,631,402 | | 5,865,740 | | 8,736,702 |
Shares redeemed
| (30,128,689) | | (33,054,226) | | (14,241,668) | | (17,279,601) |
Net Increase (Decrease) in Net Assets from Capital Share Transactions
| (18,346,546) | | (20,422,824) | | (8,375,928) | | (8,542,899) |
Total Increase (Decrease)
| 13,054,322 | | 48,226,443 | | 9,314,505 | | (22,036,626) |
| Net Assets: | | | | | | | |
Beginning of period
| 196,992,295 | | 148,765,852 | | 94,761,883 | | 116,798,509 |
End of period
| $ 210,046,617 | | $ 196,992,295 | | $104,076,388 | | $ 94,761,883 |
| (1) Shares Issued and Redeemed: | | | | | | | |
Shares issued
| 276,197 | | 439,826 | | 226,526 | | 495,206 |
Shares redeemed
| (708,179) | | (1,086,670) | | (551,073) | | (826,237) |
| | (431,982) | | (646,844) | | (324,547) | | (331,031) |
| | Mid Core Value Fund | | SMID Cap Growth Fund |
| | Year
Ended
12/31/21 | | Year
Ended
12/31/20 | | Year
Ended
12/31/21 | | Year
Ended
12/31/20 |
| Increase (Decrease) in Net Assets Operations: | | | | | | | |
Net investment income (loss)
| $ 1,262,614 | | $ 1,279,235 | | $ (785,842) | | $ (501,975) |
Net realized gain (loss)
| 17,392,267 | | 33,554 | | 17,862,730 | | 18,619,401 |
Net change in unrealized appreciation (depreciation)
| 1,914,097 | | 673,573 | | (9,805,272) | | 16,408,442 |
Net Increase (Decrease) in Net Assets Resulting from Operations
| 20,568,978 | | 1,986,362 | | 7,271,616 | | 34,525,868 |
| Capital Share Transactions (1): | | | | | | | |
Shares issued
| 8,047,009 | | 10,033,128 | | 16,757,559 | | 11,570,298 |
Shares redeemed
| (28,155,842) | | (17,741,512) | | (16,259,146) | | (21,047,089) |
Net Increase (Decrease) in Net Assets from Capital Share Transactions
| (20,108,833) | | (7,708,384) | | 498,413 | | (9,476,791) |
Total Increase (Decrease)
| 460,145 | | (5,722,022) | | 7,770,029 | | 25,049,077 |
| Net Assets: | | | | | | | |
Beginning of period
| 94,076,813 | | 99,798,835 | | 96,009,810 | | 70,960,733 |
End of period
| $ 94,536,958 | | $ 94,076,813 | | $103,779,839 | | $ 96,009,810 |
| (1) Shares Issued and Redeemed: | | | | | | | |
Shares issued
| 256,449 | | 468,174 | | 298,608 | | 294,698 |
Shares redeemed
| (888,283) | | (736,216) | | (292,408) | | (525,103) |
| | (631,834) | | (268,042) | | 6,200 | | (230,405) |
The accompanying notes are an integral part of these financial statements.
Penn Series Funds, Inc.
Statements of Changes in Net Assets
| | SMID Cap Value Fund | | Small Cap Growth Fund |
| | Year
Ended
12/31/21 | | Year
Ended
12/31/20 | | Year
Ended
12/31/21 | | Year
Ended
12/31/20 |
| Increase (Decrease) in Net Assets Operations: | | | | | | | |
Net investment income (loss)
| $ 410,699 | | $ 455,150 | | $ (869,061) | | $ (700,286) |
Net realized gain (loss)
| 11,185,789 | | (7,927,747) | | 21,339,622 | | 7,981,795 |
Net change in unrealized appreciation (depreciation)
| 8,043,754 | | 3,067,672 | | (8,563,951) | | 29,384,904 |
Net Increase (Decrease) in Net Assets Resulting from Operations
| 19,640,242 | | (4,404,925) | | 11,906,610 | | 36,666,413 |
| Capital Share Transactions (1): | | | | | | | |
Shares issued
| 8,649,638 | | 4,828,741 | | 7,555,073 | | 8,523,305 |
Shares redeemed
| (14,151,233) | | (28,076,299) | | (21,846,222) | | (20,838,333) |
Net Increase (Decrease) in Net Assets from Capital Share Transactions
| (5,501,595) | | (23,247,558) | | (14,291,149) | | (12,315,028) |
Total Increase (Decrease)
| 14,138,647 | | (27,652,483) | | (2,384,539) | | 24,351,385 |
| Net Assets: | | | | | | | |
Beginning of period
| 57,671,735 | | 85,324,218 | | 142,594,975 | | 118,243,590 |
End of period
| $ 71,810,382 | | $ 57,671,735 | | $ 140,210,436 | | $142,594,975 |
| (1) Shares Issued and Redeemed: | | | | | | | |
Shares issued
| 241,807 | | 240,997 | | 114,121 | | 205,798 |
Shares redeemed
| (405,692) | | (1,244,791) | | (331,087) | | (422,367) |
| | (163,885) | | (1,003,794) | | (216,966) | | (216,569) |
| | Small Cap Value Fund | | Small Cap Index Fund |
| | Year
Ended
12/31/21 | | Year
Ended
12/31/20 | | Year
Ended
12/31/21 | | Year
Ended
12/31/20 |
| Increase (Decrease) in Net Assets Operations: | | | | | | | |
Net investment income (loss)
| $ 411,564 | | $ 938,773 | | $ 282,211 | | $ 270,954 |
Net realized gain (loss)
| 47,543,690 | | (3,944,641) | | 12,592,002 | | 7,931,929 |
Net change in unrealized appreciation (depreciation)
| (1,680,539) | | 5,454,924 | | (2,656,160) | | 5,341,756 |
Net Increase (Decrease) in Net Assets Resulting from Operations
| 46,274,715 | | 2,449,056 | | 10,218,053 | | 13,544,639 |
| Capital Share Transactions (1): | | | | | | | |
Shares issued
| 10,348,403 | | 12,924,725 | | 26,580,797 | | 5,753,101 |
Shares redeemed
| (37,362,659) | | (40,510,317) | | (13,823,850) | | (13,439,062) |
Net Increase (Decrease) in Net Assets from Capital Share Transactions
| (27,014,256) | | (27,585,592) | | 12,756,947 | | (7,685,961) |
Total Increase (Decrease)
| 19,260,459 | | (25,136,536) | | 22,975,000 | | 5,858,678 |
| Net Assets: | | | | | | | |
Beginning of period
| 179,912,155 | | 205,048,691 | | 75,852,070 | | 69,993,392 |
End of period
| $ 199,172,614 | | $ 179,912,155 | | $ 98,827,070 | | $ 75,852,070 |
| (1) Shares Issued and Redeemed: | | | | | | | |
Shares issued
| 215,026 | | 472,091 | | 757,555 | | 291,977 |
Shares redeemed
| (777,855) | | (1,216,186) | | (406,236) | | (546,994) |
| | (562,829) | | (744,095) | | 351,319 | | (255,017) |
The accompanying notes are an integral part of these financial statements.
Penn Series Funds, Inc.
Statements of Changes in Net Assets
| | Developed International Index Fund | | International Equity Fund |
| | Year
Ended
12/31/21 | | Year
Ended
12/31/20 | | Year
Ended
12/31/21 | | Year
Ended
12/31/20 |
| Increase (Decrease) in Net Assets Operations: | | | | | | | |
Net investment income (loss)
| $ 1,866,783 | | $ 1,380,818 | | $ (339,271) | | $ (436,043) |
Net realized gain (loss)
| 2,882,380 | | 2,551,030 | | 63,990,279 | | 28,666,007 |
Net change in unrealized appreciation (depreciation)
| 6,539,323 | | 4,269,987 | | (23,183,396) | | 15,284,371 |
Net Increase (Decrease) in Net Assets Resulting from Operations
| 11,288,486 | | 8,201,835 | | 40,467,612 | | 43,514,335 |
| Capital Share Transactions (1): | | | | | | | |
Shares issued
| 9,600,052 | | 8,402,011 | | 18,978,194 | | 12,617,143 |
Shares redeemed
| (16,026,129) | | (18,375,149) | | (42,714,865) | | (45,822,700) |
Net Increase (Decrease) in Net Assets from Capital Share Transactions
| (6,426,077) | | (9,973,138) | | (23,736,671) | | (33,205,557) |
Total Increase (Decrease)
| 4,862,409 | | (1,771,303) | | 16,730,941 | | 10,308,778 |
| Net Assets: | | | | | | | |
Beginning of period
| 109,295,619 | | 111,066,922 | | 336,273,741 | | 325,964,963 |
End of period
| $ 114,158,028 | | $109,295,619 | | $353,004,682 | | $ 336,273,741 |
| (1) Shares Issued and Redeemed: | | | | | | | |
Shares issued
| 559,616 | | 698,267 | | 468,705 | | 378,342 |
Shares redeemed
| (938,773) | | (1,351,452) | | (1,026,636) | | (1,361,532) |
| | (379,157) | | (653,185) | | (557,931) | | (983,190) |
| | Emerging Markets Equity Fund | | Real Estate Securities Fund |
| | Year
Ended
12/31/21 | | Year
Ended
12/31/20 | | Year
Ended
12/31/21 | | Year
Ended
12/31/20 |
| Increase (Decrease) in Net Assets Operations: | | | | | | | |
Net investment income (loss)
| $ 104,632 | | $ (248,068) | | $ 1,161,507 | | $ 1,834,014 |
Net realized gain (loss)
| 19,486,168 | | 1,179,133 | | 16,592,735 | | (4,286,440) |
Net change in unrealized appreciation (depreciation)
| (26,890,936) | | 12,950,444 | | 28,759,376 | | (2,339,070) |
Net Increase (Decrease) in Net Assets Resulting from Operations
| (7,300,136) | | 13,881,509 | | 46,513,618 | | (4,791,496) |
| Capital Share Transactions (1): | | | | | | | |
Shares issued
| 16,132,556 | | 7,422,502 | | 4,276,599 | | 9,621,300 |
Shares redeemed
| (23,530,604) | | (23,380,691) | | (31,792,613) | | (16,834,148) |
Net Increase (Decrease) in Net Assets from Capital Share Transactions
| (7,398,048) | | (15,958,189) | | (27,516,014) | | (7,212,848) |
Total Increase (Decrease)
| (14,698,184) | | (2,076,680) | | 18,997,604 | | (12,004,344) |
| Net Assets: | | | | | | | |
Beginning of period
| 145,335,429 | | 147,412,109 | | 121,063,211 | | 133,067,555 |
End of period
| $ 130,637,245 | | $ 145,335,429 | | $ 140,060,815 | | $ 121,063,211 |
| (1) Shares Issued and Redeemed: | | | | | | | |
Shares issued
| 1,095,679 | | 678,651 | | 132,791 | | 397,565 |
Shares redeemed
| (1,555,915) | | (1,841,803) | | (1,001,340) | | (689,608) |
| | (460,236) | | (1,163,152) | | (868,549) | | (292,043) |
The accompanying notes are an integral part of these financial statements.
Penn Series Funds, Inc.
Statements of Changes in Net Assets
| | Aggressive Allocation Fund | | Moderately Aggressive Allocation Fund |
| | Year
Ended
12/31/21 | | Year
Ended
12/31/20 | | Year
Ended
12/31/21 | | Year
Ended
12/31/20 |
| Increase (Decrease) in Net Assets Operations: | | | | | | | |
Net investment income (loss)
| $ (229,248) | | $ (210,535) | | $ (706,097) | | $ (618,332) |
Net realized gain (loss)
| 8,475,044 | | 4,861,836 | | 20,521,343 | | 17,087,542 |
Net change in unrealized appreciation (depreciation)
| 2,360,017 | | 1,151,393 | | 14,233,495 | | 2,135,312 |
Net Increase (Decrease) in Net Assets Resulting from Operations
| 10,605,813 | | 5,802,694 | | 34,048,741 | | 18,604,522 |
| Capital Share Transactions (1): | | | | | | | |
Shares issued
| 3,928,352 | | 1,765,540 | | 8,425,976 | | 5,009,104 |
Shares redeemed
| (13,951,031) | | (9,511,189) | | (23,086,058) | | (28,837,461) |
Net Increase (Decrease) in Net Assets from Capital Share Transactions
| (10,022,679) | | (7,745,649) | | (14,660,082) | | (23,828,357) |
Total Increase (Decrease)
| 583,134 | | (1,942,955) | | 19,388,659 | | (5,223,835) |
| Net Assets: | | | | | | | |
Beginning of period
| 70,073,565 | | 72,016,520 | | 227,084,244 | | 232,308,079 |
End of period
| $ 70,656,699 | | $ 70,073,565 | | $ 246,472,903 | | $ 227,084,244 |
| (1) Shares Issued and Redeemed: | | | | | | | |
Shares issued
| 151,870 | | 95,273 | | 319,365 | | 256,776 |
Shares redeemed
| (553,262) | | (462,948) | | (874,683) | | (1,380,078) |
| | (401,392) | | (367,675) | | (555,318) | | (1,123,302) |
| | Moderate Allocation Fund | | Moderately Conservative Allocation Fund |
| | Year
Ended
12/31/21 | | Year
Ended
12/31/20 | | Year
Ended
12/31/21 | | Year
Ended
12/31/20 |
| Increase (Decrease) in Net Assets Operations: | | | | | | | |
Net investment income (loss)
| $ (840,649) | | $ (813,737) | | $ (298,717) | | $ (280,823) |
Net realized gain (loss)
| 25,886,652 | | 25,510,932 | | 7,087,205 | | 6,352,159 |
Net change in unrealized appreciation (depreciation)
| 5,964,759 | | (149,120) | | 1,139,596 | | 708,025 |
Net Increase (Decrease) in Net Assets Resulting from Operations
| 31,010,762 | | 24,548,075 | | 7,928,084 | | 6,779,361 |
| Capital Share Transactions (1): | | | | | | | |
Shares issued
| 5,382,276 | | 4,351,087 | | 12,980,442 | | 8,395,170 |
Shares redeemed
| (34,241,634) | | (41,104,628) | | (15,618,874) | | (14,636,141) |
Net Increase (Decrease) in Net Assets from Capital Share Transactions
| (28,859,358) | | (36,753,541) | | (2,638,432) | | (6,240,971) |
Total Increase (Decrease)
| 2,151,404 | | (12,205,466) | | 5,289,652 | | 538,390 |
| Net Assets: | | | | | | | |
Beginning of period
| 285,909,710 | | 298,115,176 | | 94,485,109 | | 93,946,719 |
End of period
| $ 288,061,114 | | $ 285,909,710 | | $ 99,774,761 | | $ 94,485,109 |
| (1) Shares Issued and Redeemed: | | | | | | | |
Shares issued
| 237,623 | | 223,251 | | 650,921 | | 482,248 |
Shares redeemed
| (1,499,453) | | (2,153,883) | | (788,191) | | (851,613) |
| | (1,261,830) | | (1,930,632) | | (137,270) | | (369,365) |
The accompanying notes are an integral part of these financial statements.
Penn Series Funds, Inc.
Statements of Changes in Net Assets
| | Conservative Allocation Fund |
| | Year
Ended
12/31/21 | | Year
Ended
12/31/20 |
| Increase (Decrease) in Net Assets Operations: | | | |
Net investment income (loss)
| $ (199,764) | | $ (189,674) |
Net realized gain (loss)
| 3,989,908 | | 3,154,886 |
Net change in unrealized appreciation (depreciation)
| (1,118,481) | | 1,027,216 |
Net Increase (Decrease) in Net Assets Resulting from Operations
| 2,671,663 | | 3,992,428 |
| Capital Share Transactions (1): | | | |
Shares issued
| 11,180,718 | | 11,966,235 |
Shares redeemed
| (16,518,862) | | (13,936,211) |
Net Increase (Decrease) in Net Assets from Capital Share Transactions
| (5,338,144) | | (1,969,976) |
Total Increase (Decrease)
| (2,666,481) | | 2,022,452 |
| Net Assets: | | | |
Beginning of period
| 61,854,288 | | 59,831,836 |
End of period
| $ 59,187,807 | | $ 61,854,288 |
| (1) Shares Issued and Redeemed: | | | |
Shares issued
| 657,075 | | 756,114 |
Shares redeemed
| (972,219) | | (886,960) |
| | (315,144) | | (130,846) |
The accompanying notes are an integral part of these financial statements.
Penn Series Funds, Inc.
Financial Highlights
MONEY MARKET FUND
For a share outstanding throughout each period
| | Year Ended December 31, |
| | 2021 | | 2020 | | 2019 | | 2018 | | 2017 |
Net asset value, beginning of period
| $ 1.00 | | $ 1.00 | | $ 1.00 | | $ 1.00 | | $ 1.00 |
| Income (loss) from investment operations: | | | | | | | | | |
Net investment income (loss)1
| — (a) | | — (a) | | 0.02 | | 0.01 | | — (a) |
Total from investment operations
| — | | — | | 0.02 | | 0.01 | | — |
| Less distributions: | | | | | | | | | |
Net investment income
| — (a) | | — (a) | | (0.02) | | (0.01) | | — (a) |
Total distributions
| — | | — | | (0.02) | | (0.01) | | — |
Net asset value, end of period
| $ 1.00 | | $ 1.00 | | $ 1.00 | | $ 1.00 | | $ 1.00 |
Total return2
| 0.01% | | 0.24% | | 1.61% | | 0.55% | | 0.01% |
|
| Ratios/Supplemental data: | | | | | | | | | |
Net assets, end of period (in thousands)
| $ 162,202 | | $ 160,467 | | $ 112,938 | | $ 110,933 | | $ 91,567 |
Ratio of net expenses to average net assets3
| 0.03% | | 0.28% | | 0.59% | | 1.26% | | 0.85% |
Ratio of total expenses to average net assets4
| 0.57% | | 0.58% | | 0.59% | | 0.59% | | 0.59% |
Ratio of net investment income (loss) to average net assets
| 0.01% | | 0.21% | | 1.60% | | 0.55% | | 0.01% |
| 1 | The net investment income (loss) per share was calculated using the average shares outstanding method. |
| 2 | Total investment return is based on the change in net asset value of a share during the period and assumes reinvestment of dividends and distributions at net asset value. Total returns do not reflect expenses associated with variable contracts such as administrative fees, account charges and surrender charges, which if reflected would reduce the total returns for all periods presented. Total returns may reflect adjustments to conform with generally accepted accounting principles. |
| 3 | The ratio includes expenses waived/reimbursed net of amount recaptured and fees paid indirectly, where applicable; if expenses waived/ reimbursed net of amount recaptured and fees paid indirectly were excluded, the ratio would have been higher (lower), respectively, than the ratio shown. |
| 4 | The ratio excludes expenses waived/reimbursed net of amount recaptured and fees paid indirectly, where applicable; if expenses waived/ reimbursed net of amount recaptured and fees paid indirectly were included, the ratio would have been lower than the ratio shown. |
| (a) | Less than one penny per share. |
The accompanying notes are an integral part of these financial statements.
Penn Series Funds, Inc.
Financial Highlights
LIMITED MATURITY BOND FUND
For a share outstanding throughout each period
| | Year Ended December 31, |
| | 2021 | | 2020 | | 2019 | | 2018 | | 2017 |
Net asset value, beginning of period
| $ 13.33 | | $ 12.86 | | $ 12.26 | | $ 12.09 | | $ 11.89 |
| Income (loss) from investment operations: | | | | | | | | | |
Net investment income (loss)1
| 0.20 | | 0.24 | | 0.37 | | 0.32 | | 0.24 |
Net realized and unrealized gain (loss) on investment transactions
| (0.15) | | 0.23 | | 0.23 | | (0.15) | | (0.04) |
Total from investment operations
| 0.05 | | 0.47 | | 0.60 | | 0.17 | | 0.20 |
Net asset value, end of period
| $ 13.38 | | $ 13.33 | | $ 12.86 | | $ 12.26 | | $ 12.09 |
Total return2
| 0.38% | | 3.65% | | 4.89% | | 1.41% | | 1.68% |
|
| Ratios/Supplemental data: | | | | | | | | | |
Net assets, end of period (in thousands)
| $ 259,984 | | $ 254,878 | | $ 244,998 | | $ 233,216 | | $ 229,184 |
Ratio of total expenses to average net assets
| 0.69% | | 0.70% | | 0.70% | | 0.70% | | 0.70% |
Ratio of net investment income (loss) to average net assets
| 1.46% | | 1.86% | | 2.92% | | 2.61% | | 1.98% |
Portfolio turnover rate
| 73% | | 99% | | 54% | | 79% | | 97% |
| 1 | The net investment income (loss) per share was calculated using the average shares outstanding method. |
| 2 | Total investment return is based on the change in net asset value of a share during the period and assumes reinvestment of dividends and distributions at net asset value. Total returns do not reflect expenses associated with variable contracts such as administrative fees, account charges and surrender charges, which if reflected would reduce the total returns for all periods presented. Total returns may reflect adjustments to conform with generally accepted accounting principles. |
The accompanying notes are an integral part of these financial statements.
Penn Series Funds, Inc.
Financial Highlights
QUALITY BOND FUND
For a share outstanding throughout each period
| | Year Ended December 31, |
| | 2021 | | 2020 | | 2019 | | 2018 | | 2017 |
Net asset value, beginning of period
| $ 17.36 | | $ 16.01 | | $ 14.66 | | $ 14.68 | | $ 14.03 |
| Income (loss) from investment operations: | | | | | | | | | |
Net investment income (loss)1
| 0.34 | | 0.35 | | 0.45 | | 0.41 | | 0.36 |
Net realized and unrealized gain (loss) on investment transactions
| (0.46) | | 1.00 | | 0.90 | | (0.43) | | 0.29 |
Total from investment operations
| (0.12) | | 1.35 | | 1.35 | | (0.02) | | 0.65 |
Net asset value, end of period
| $ 17.24 | | $ 17.36 | | $ 16.01 | | $ 14.66 | | $ 14.68 |
Total return2
| (0.69%) | | 8.43% | | 9.21% | | (0.14%) | | 4.63% |
|
| Ratios/Supplemental data: | | | | | | | | | |
Net assets, end of period (in thousands)
| $ 472,066 | | $ 484,474 | | $ 433,734 | | $ 409,027 | | $ 485,598 |
Ratio of total expenses to average net assets
| 0.66% | | 0.67% | | 0.67% | | 0.66% | | 0.66% |
Ratio of net investment income (loss) to average net assets
| 2.00% | | 2.11% | | 2.92% | | 2.81% | | 2.48% |
Portfolio turnover rate
| 59% | | 75% | | 47% | | 59% | | 72% |
| 1 | The net investment income (loss) per share was calculated using the average shares outstanding method. |
| 2 | Total investment return is based on the change in net asset value of a share during the period and assumes reinvestment of dividends and distributions at net asset value. Total returns do not reflect expenses associated with variable contracts such as administrative fees, account charges and surrender charges, which if reflected would reduce the total returns for all periods presented. Total returns may reflect adjustments to conform with generally accepted accounting principles. |
The accompanying notes are an integral part of these financial statements.
Penn Series Funds, Inc.
Financial Highlights
HIGH YIELD BOND FUND
For a share outstanding throughout each period
| | Year Ended December 31, |
| | 2021 | | 2020 | | 2019 | | 2018 | | 2017 |
Net asset value, beginning of period
| $ 16.02 | | $ 14.90 | | $ 12.88 | | $ 13.18 | | $ 12.29 |
| Income (loss) from investment operations: | | | | | | | | | |
Net investment income (loss)1
| 0.68 | | 0.71 | | 0.68 | | 0.66 | | 0.69 |
Net realized and unrealized gain (loss) on investment transactions
| 0.14 | | 0.41 | | 1.34 | | (0.96) | | 0.20 |
Total from investment operations
| 0.82 | | 1.12 | | 2.02 | | (0.30) | | 0.89 |
Net asset value, end of period
| $ 16.84 | | $ 16.02 | | $ 14.90 | | $ 12.88 | | $ 13.18 |
Total return2
| 5.12% | | 7.52% | | 15.68% | | (2.35%) | | 7.42% |
|
| Ratios/Supplemental data: | | | | | | | | | |
Net assets, end of period (in thousands)
| $ 169,431 | | $ 167,391 | | $ 159,896 | | $ 150,324 | | $ 171,467 |
Ratio of total expenses to average net assets
| 0.71% | | 0.72% | | 0.71% | | 0.77% | | 0.86% |
Ratio of net investment income (loss) to average net assets
| 4.15% | | 4.73% | | 4.83% | | 5.02% | | 5.39% |
Portfolio turnover rate
| 94% | | 128% | | 133% | | 115% | | 78% |
| 1 | The net investment income (loss) per share was calculated using the average shares outstanding method. |
| 2 | Total investment return is based on the change in net asset value of a share during the period and assumes reinvestment of dividends and distributions at net asset value. Total returns do not reflect expenses associated with variable contracts such as administrative fees, account charges and surrender charges, which if reflected would reduce the total returns for all periods presented. Total returns may reflect adjustments to conform with generally accepted accounting principles. |
The accompanying notes are an integral part of these financial statements.
Penn Series Funds, Inc.
Financial Highlights
FLEXIBLY MANAGED FUND
For a share outstanding throughout each period
| | Year Ended December 31, |
| | 2021 | | 2020 | | 2019 | | 2018 | | 2017 |
Net asset value, beginning of period
| $ 77.12 | | $ 65.45 | | $ 52.56 | | $ 52.31 | | $ 45.44 |
| Income (loss) from investment operations: | | | | | | | | | |
Net investment income (loss)1
| 0.68 | | 0.72 | | 0.84 | | 1.22 | | 0.53 |
Net realized and unrealized gain (loss) on investment transactions
| 13.42 | | 10.95 | | 12.05 | | (0.97) | | 6.34 |
Total from investment operations
| 14.10 | | 11.67 | | 12.89 | | 0.25 | | 6.87 |
Net asset value, end of period
| $ 91.22 | | $ 77.12 | | $ 65.45 | | $ 52.56 | | $ 52.31 |
Total return2
| 18.29% | | 17.83% | | 24.53% | | 0.48% | | 15.12% |
|
| Ratios/Supplemental data: | | | | | | | | | |
Net assets, end of period (in thousands)
| $ 5,487,665 | | $ 4,886,355 | | $ 4,418,265 | | $ 3,698,250 | | $ 3,898,297 |
Ratio of total expenses to average net assets
| 0.87% | | 0.88% | | 0.88% | | 0.89% | | 0.89% |
Ratio of net investment income (loss) to average net assets
| 0.80% | | 1.07% | | 1.40% | | 2.28% | | 1.07% |
Portfolio turnover rate
| 51% | | 88% | | 45% | | 69% | | ���61% |
| 1 | The net investment income (loss) per share was calculated using the average shares outstanding method. |
| 2 | Total investment return is based on the change in net asset value of a share during the period and assumes reinvestment of dividends and distributions at net asset value. Total returns do not reflect expenses associated with variable contracts such as administrative fees, account charges and surrender charges, which if reflected would reduce the total returns for all periods presented. Total returns may reflect adjustments to conform with generally accepted accounting principles. |
The accompanying notes are an integral part of these financial statements.
Penn Series Funds, Inc.
Financial Highlights
BALANCED FUND
For a share outstanding throughout each period
| | Year Ended December 31, |
| | 2021 | | 2020 | | 2019 | | 2018 | | 2017 |
Net asset value, beginning of period
| $ 27.27 | | $ 23.76 | | $ 19.53 | | $ 20.12 | | $ 17.60 |
| Income (loss) from investment operations: | | | | | | | | | |
Net investment income (loss)1
| (0.06) | | (0.05) | | (0.04) | | (0.04) | | (0.04) |
Net realized and unrealized gain (loss) on investment transactions
| 4.36 | | 3.56 | | 4.27 | | (0.55) | | 2.56 |
Total from investment operations
| 4.30 | | 3.51 | | 4.23 | | (0.59) | | 2.52 |
Net asset value, end of period
| $ 31.57 | | $ 27.27 | | $ 23.76 | | $ 19.53 | | $ 20.12 |
Total return2
| 15.77% | | 14.77% | | 21.66% | | (2.93%) | | 14.32% |
|
| Ratios/Supplemental data: | | | | | | | | | |
Net assets, end of period (in thousands)
| $ 92,753 | | $ 84,348 | | $ 81,070 | | $ 74,832 | | $ 84,403 |
Ratio of total expenses to average net assets3
| 0.19% | | 0.20% | | 0.20% | | 0.20% | | 0.19% |
Ratio of net investment income (loss) to average net assets
| (0.19%) | | (0.20%) | | (0.20%) | | (0.19%) | | (0.19%) |
Portfolio turnover rate
| 11% | | 15% | | 6% | | 8% | | 9% |
| 1 | The net investment income (loss) per share was calculated using the average shares outstanding method. |
| 2 | Total investment return is based on the change in net asset value of a share during the period and assumes reinvestment of dividends and distributions at net asset value. Total returns do not reflect expenses associated with variable contracts such as administrative fees, account charges and surrender charges, which if reflected would reduce the total returns for all periods presented. Total returns may reflect adjustments to conform with generally accepted accounting principles. |
| 3 | The Fund also will indirectly bear its prorated share of expenses of the underlying funds. Such expenses are not included in the calculation of this ratio. |
The accompanying notes are an integral part of these financial statements.
Penn Series Funds, Inc.
Financial Highlights
LARGE GROWTH STOCK FUND
For a share outstanding throughout each period
| | Year Ended December 31, |
| | 2021 | | 2020 | | 2019 | | 2018 | | 2017 |
Net asset value, beginning of period
| $ 71.38 | | $ 52.10 | | $ 39.95 | | $ 40.48 | | $ 30.40 |
| Income (loss) from investment operations: | | | | | | | | | |
Net investment income (loss)1
| (0.48) | | (0.29) | | (0.08) | | (0.02) | | (0.03) |
Net realized and unrealized gain (loss) on investment transactions
| 12.21 | | 19.57 | | 12.23 | | (0.51) | | 10.11 |
Total from investment operations
| 11.73 | | 19.28 | | 12.15 | | (0.53) | | 10.08 |
Net asset value, end of period
| $ 83.11 | | $ 71.38 | | $ 52.10 | | $ 39.95 | | $ 40.48 |
Total return2
| 16.44% | | 37.01% | | 30.41% | | (1.31%) | | 33.16% |
|
| Ratios/Supplemental data: | | | | | | | | | |
Net assets, end of period (in thousands)
| $ 428,687 | | $ 405,787 | | $ 331,420 | | $ 282,675 | | $ 307,131 |
Ratio of total expenses to average net assets
| 0.93% | | 0.95% | | 0.95% | | 0.95% | | 0.96% |
Ratio of net investment income (loss) to average net assets
| (0.61%) | | (0.50%) | | (0.18%) | | (0.05%) | | (0.08%) |
Portfolio turnover rate
| 24% | | 35% | | 26% | | 42% | | 52% |
| 1 | The net investment income (loss) per share was calculated using the average shares outstanding method. |
| 2 | Total investment return is based on the change in net asset value of a share during the period and assumes reinvestment of dividends and distributions at net asset value. Total returns do not reflect expenses associated with variable contracts such as administrative fees, account charges and surrender charges, which if reflected would reduce the total returns for all periods presented. Total returns may reflect adjustments to conform with generally accepted accounting principles. |
The accompanying notes are an integral part of these financial statements.
Penn Series Funds, Inc.
Financial Highlights
LARGE CAP GROWTH FUND
For a share outstanding throughout each period
| | Year Ended December 31, |
| | 2021 | | 2020 | | 2019 | | 2018 | | 2017 |
Net asset value, beginning of period
| $ 30.56 | | $ 25.02 | | $ 17.90 | | $ 17.78 | | $ 13.87 |
| Income (loss) from investment operations: | | | | | | | | | |
Net investment income (loss)1
| 0.02 | | 0.05 | | 0.08 | | 0.08 | | 0.07 |
Net realized and unrealized gain (loss) on investment transactions
| 7.88 | | 5.49 | | 7.04 | | 0.04 | | 3.84 |
Total from investment operations
| 7.90 | | 5.54 | | 7.12 | | 0.12 | | 3.91 |
Net asset value, end of period
| $ 38.46 | | $ 30.56 | | $ 25.02 | | $ 17.90 | | $ 17.78 |
Total return2
| 25.85% | | 22.14% | | 39.78% | | 0.68% | | 28.19% |
|
| Ratios/Supplemental data: | | | | | | | | | |
Net assets, end of period (in thousands)
| $ 79,016 | | $ 68,536 | | $ 63,219 | | $ 53,444 | | $ 58,389 |
Ratio of total expenses to average net assets
| 0.85% | | 0.88% | | 0.88% | | 0.87% | | 0.89% |
Ratio of net investment income (loss) to average net assets
| 0.05% | | 0.19% | | 0.35% | | 0.40% | | 0.43% |
Portfolio turnover rate
| 16% | | 34% | | 24% | | 25% | | 28% |
| 1 | The net investment income (loss) per share was calculated using the average shares outstanding method. |
| 2 | Total investment return is based on the change in net asset value of a share during the period and assumes reinvestment of dividends and distributions at net asset value. Total returns do not reflect expenses associated with variable contracts such as administrative fees, account charges and surrender charges, which if reflected would reduce the total returns for all periods presented. Total returns may reflect adjustments to conform with generally accepted accounting principles. |
The accompanying notes are an integral part of these financial statements.
Penn Series Funds, Inc.
Financial Highlights
LARGE CORE GROWTH FUND
For a share outstanding throughout each period
| | Year Ended December 31, |
| | 2021 | | 2020 | | 2019 | | 2018 | | 2017 |
Net asset value, beginning of period
| $ 50.05 | | $ 28.52 | | $ 22.41 | | $ 21.67 | | $ 16.32 |
| Income (loss) from investment operations: | | | | | | | | | |
Net investment income (loss)1
| (0.37) | | (0.22) | | (0.07) | | (0.02) | | (0.03) |
Net realized and unrealized gain (loss) on investment transactions
| (1.60) | | 21.75 | | 6.18 | | 0.76 | | 5.38 |
Total from investment operations
| (1.97) | | 21.53 | | 6.11 | | 0.74 | | 5.35 |
Net asset value, end of period
| $ 48.08 | | $ 50.05 | | $ 28.52 | | $ 22.41 | | $ 21.67 |
Total return2
| (3.94%) | | 75.49% | | 27.27% | | 3.42% | | 32.78% |
|
| Ratios/Supplemental data: | | | | | | | | | |
Net assets, end of period (in thousands)
| $ 205,479 | | $ 222,028 | | $ 135,930 | | $ 118,365 | | $ 124,493 |
Ratio of total expenses to average net assets
| 0.84% | | 0.85% | | 0.86% | | 0.86% | | 0.86% |
Ratio of net investment income (loss) to average net assets
| (0.72%) | | (0.60%) | | (0.26%) | | (0.09%) | | (0.18%) |
Portfolio turnover rate
| 68% | | 74% | | 74% | | 72% | | 64% |
| 1 | The net investment income (loss) per share was calculated using the average shares outstanding method. |
| 2 | Total investment return is based on the change in net asset value of a share during the period and assumes reinvestment of dividends and distributions at net asset value. Total returns do not reflect expenses associated with variable contracts such as administrative fees, account charges and surrender charges, which if reflected would reduce the total returns for all periods presented. Total returns may reflect adjustments to conform with generally accepted accounting principles. |
The accompanying notes are an integral part of these financial statements.
Penn Series Funds, Inc.
Financial Highlights
LARGE CAP VALUE FUND
For a share outstanding throughout each period
| | Year Ended December 31, |
| | 2021 | | 2020 | | 2019 | | 2018 | | 2017 |
Net asset value, beginning of period
| $ 33.14 | | $ 32.39 | | $ 26.22 | | $ 28.41 | | $ 24.79 |
| Income (loss) from investment operations: | | | | | | | | | |
Net investment income (loss)1
| 0.31 | | 0.35 | | 0.31 | | 0.35 | | 0.41 |
Net realized and unrealized gain (loss) on investment transactions
| 8.93 | | 0.40 | | 5.86 | | (2.54) | | 3.21 |
Total from investment operations
| 9.24 | | 0.75 | | 6.17 | | (2.19) | | 3.62 |
Net asset value, end of period
| $ 42.38 | | $ 33.14 | | $ 32.39 | | $ 26.22 | | $ 28.41 |
Total return2
| 27.88% | | 2.32% | | 23.53% | | (7.71%) | | 14.60% |
|
| Ratios/Supplemental data: | | | | | | | | | |
Net assets, end of period (in thousands)
| $ 202,596 | | $ 177,811 | | $ 196,108 | | $ 179,441 | | $ 201,219 |
Ratio of total expenses to average net assets
| 0.91% | | 0.92% | | 0.91% | | 0.90% | | 0.90% |
Ratio of net investment income (loss) to average net assets
| 0.80% | | 1.20% | | 1.05% | | 1.22% | | 1.57% |
Portfolio turnover rate
| 49% | | 56% | | 62% | | 108% | | 17% |
| 1 | The net investment income (loss) per share was calculated using the average shares outstanding method. |
| 2 | Total investment return is based on the change in net asset value of a share during the period and assumes reinvestment of dividends and distributions at net asset value. Total returns do not reflect expenses associated with variable contracts such as administrative fees, account charges and surrender charges, which if reflected would reduce the total returns for all periods presented. Total returns may reflect adjustments to conform with generally accepted accounting principles. |
The accompanying notes are an integral part of these financial statements.
Penn Series Funds, Inc.
Financial Highlights
LARGE CORE VALUE FUND
For a share outstanding throughout each period
| | Year Ended December 31, |
| | 2021 | | 2020 | | 2019 | | 2018 | | 2017 |
Net asset value, beginning of period
| $ 23.18 | | $ 22.58 | | $ 17.41 | | $ 18.64 | | $ 16.18 |
| Income (loss) from investment operations: | | | | | | | | | |
Net investment income (loss)1
| 0.32 | | 0.31 | | 0.30 | | 0.26 | | 0.25 |
Net realized and unrealized gain (loss) on investment transactions
| 5.35 | | 0.29 | | 4.87 | | (1.49) | | 2.21 |
Total from investment operations
| 5.67 | | 0.60 | | 5.17 | | (1.23) | | 2.46 |
Net asset value, end of period
| $ 28.85 | | $ 23.18 | | $ 22.58 | | $ 17.41 | | $ 18.64 |
Total return2
| 24.46% | | 2.66% | | 29.70% | | (6.60%) | | 15.21% |
|
| Ratios/Supplemental data: | | | | | | | | | |
Net assets, end of period (in thousands)
| $ 189,136 | | $ 178,959 | | $ 192,959 | | $ 176,072 | | $ 216,214 |
Ratio of total expenses to average net assets
| 0.92% | | 0.91% | | 0.91% | | 0.90% | | 0.90% |
Ratio of net investment income (loss) to average net assets
| 1.22% | | 1.52% | | 1.48% | | 1.39% | | 1.44% |
Portfolio turnover rate
| 57% | | 80% | | 65% | | 76% | | 106% |
| 1 | The net investment income (loss) per share was calculated using the average shares outstanding method. |
| 2 | Total investment return is based on the change in net asset value of a share during the period and assumes reinvestment of dividends and distributions at net asset value. Total returns do not reflect expenses associated with variable contracts such as administrative fees, account charges and surrender charges, which if reflected would reduce the total returns for all periods presented. Total returns may reflect adjustments to conform with generally accepted accounting principles. |
The accompanying notes are an integral part of these financial statements.
Penn Series Funds, Inc.
Financial Highlights
INDEX 500 FUND
For a share outstanding throughout each period
| | Year Ended December 31, |
| | 2021 | | 2020 | | 2019 | | 2018 | | 2017 |
Net asset value, beginning of period
| $ 32.31 | | $ 27.30 | | $ 20.83 | | $ 21.87 | | $ 18.00 |
| Income (loss) from investment operations: | | | | | | | | | |
Net investment income (loss)1
| 0.38 | | 0.39 | | 0.40 | | 0.35 | | 0.33 |
Net realized and unrealized gain (loss) on investment transactions
| 8.76 | | 4.62 | | 6.07 | | (1.39) | | 3.54 |
Total from investment operations
| 9.14 | | 5.01 | | 6.47 | | (1.04) | | 3.87 |
Net asset value, end of period
| $ 41.45 | | $ 32.31 | | $ 27.30 | | $ 20.83 | | $ 21.87 |
Total return2
| 28.29% | | 18.35% | | 31.06% | | (4.76%) | | 21.50% |
|
| Ratios/Supplemental data: | | | | | | | | | |
Net assets, end of period (in thousands)
| $ 698,722 | | $ 595,933 | | $ 494,540 | | $ 416,864 | | $ 485,750 |
Ratio of total expenses to average net assets
| 0.34% | | 0.36% | | 0.36% | | 0.36% | | 0.36% |
Ratio of net investment income (loss) to average net assets
| 1.03% | | 1.44% | | 1.63% | | 1.56% | | 1.64% |
Portfolio turnover rate
| 3% | | 19% | | 3% | | 3% | | 2% |
| 1 | The net investment income (loss) per share was calculated using the average shares outstanding method. |
| 2 | Total investment return is based on the change in net asset value of a share during the period and assumes reinvestment of dividends and distributions at net asset value. Total returns do not reflect expenses associated with variable contracts such as administrative fees, account charges and surrender charges, which if reflected would reduce the total returns for all periods presented. Total returns may reflect adjustments to conform with generally accepted accounting principles. |
The accompanying notes are an integral part of these financial statements.
Penn Series Funds, Inc.
Financial Highlights
MID CAP GROWTH FUND
For a share outstanding throughout each period
| | Year Ended December 31, |
| | 2021 | | 2020 | | 2019 | | 2018 | | 2017 |
Net asset value, beginning of period
| $ 39.21 | | $ 26.23 | | $ 19.01 | | $ 18.96 | | $ 14.92 |
| Income (loss) from investment operations: | | | | | | | | | |
Net investment income (loss)1
| (0.28) | | (0.11) | | (0.07) | | (0.06) | | (0.03) |
Net realized and unrealized gain (loss) on investment transactions
| 6.81 | | 13.09 | | 7.29 | | 0.11 | | 4.07 |
Total from investment operations
| 6.53 | | 12.98 | | 7.22 | | 0.05 | | 4.04 |
Net asset value, end of period
| $ 45.74 | | $ 39.21 | | $ 26.23 | | $ 19.01 | | $ 18.96 |
Total return2
| 16.66% | | 49.48% | | 37.98% | | 0.26% | | 27.08% |
|
| Ratios/Supplemental data: | | | | | | | | | |
Net assets, end of period (in thousands)
| $ 210,047 | | $ 196,992 | | $ 148,766 | | $ 112,502 | | $ 121,288 |
Ratio of total expenses to average net assets
| 0.98% | | 0.95% | | 0.96% | | 0.96% | | 0.96% |
Ratio of net investment income (loss) to average net assets
| (0.64%) | | (0.38%) | | (0.32%) | | (0.28%) | | (0.20%) |
Portfolio turnover rate
| 25% | | 26% | | 22% | | 42% | | 25% |
| 1 | The net investment income (loss) per share was calculated using the average shares outstanding method. |
| 2 | Total investment return is based on the change in net asset value of a share during the period and assumes reinvestment of dividends and distributions at net asset value. Total returns do not reflect expenses associated with variable contracts such as administrative fees, account charges and surrender charges, which if reflected would reduce the total returns for all periods presented. Total returns may reflect adjustments to conform with generally accepted accounting principles. |
The accompanying notes are an integral part of these financial statements.
Penn Series Funds, Inc.
Financial Highlights
MID CAP VALUE FUND
For a share outstanding throughout each period
| | Year Ended December 31, |
| | 2021 | | 2020 | | 2019 | | 2018 | | 2017 |
Net asset value, beginning of period
| $ 23.20 | | $ 26.45 | | $ 22.60 | | $ 26.65 | | $ 22.69 |
| Income (loss) from investment operations: | | | | | | | | | |
Net investment income (loss)1
| 0.14 | | 0.23 | | 0.29 | | 0.23 | | 0.20 |
Net realized and unrealized gain (loss) on investment transactions
| 4.33 | | (3.48) | | 3.56 | | (4.28) | | 3.76 |
Total from investment operations
| 4.47 | | (3.25) | | 3.85 | | (4.05) | | 3.96 |
Net asset value, end of period
| $ 27.67 | | $ 23.20 | | $ 26.45 | | $ 22.60 | | $ 26.65 |
Total return2
| 19.27% | | (12.29%) | | 17.04% | | (15.20%) | | 17.45% |
|
| Ratios/Supplemental data: | | | | | | | | | |
Net assets, end of period (in thousands)
| $ 104,076 | | $ 94,762 | | $ 116,799 | | $ 141,771 | | $ 180,696 |
Ratio of total expenses to average net assets
| 0.82% | | 0.82% | | 0.80% | | 0.79% | | 0.78% |
Ratio of net investment income (loss) to average net assets
| 0.54% | | 1.13% | | 1.14% | | 0.85% | | 0.83% |
Portfolio turnover rate
| 59% | | 122% (a) | | 14% | | 33% | | 31% |
| 1 | The net investment income (loss) per share was calculated using the average shares outstanding method. |
| 2 | Total investment return is based on the change in net asset value of a share during the period and assumes reinvestment of dividends and distributions at net asset value. Total returns do not reflect expenses associated with variable contracts such as administrative fees, account charges and surrender charges, which if reflected would reduce the total returns for all periods presented. Total returns may reflect adjustments to conform with generally accepted accounting principles. |
| (a) | The Fund’s portfolio turnover rate increased substantially during the year ended December 31, 2020 due to a change in the Fund’s
sub-adviser and associated repositioning. |
The accompanying notes are an integral part of these financial statements.
Penn Series Funds, Inc.
Financial Highlights
MID CORE VALUE FUND
For a share outstanding throughout each period
| | Year Ended December 31, |
| | 2021 | | 2020 | | 2019 | | 2018 | | 2017 |
Net asset value, beginning of period
| $ 27.37 | | $ 26.94 | | $ 20.92 | | $ 24.06 | | $ 21.57 |
| Income (loss) from investment operations: | | | | | | | | | |
Net investment income (loss)1
| 0.39 | | 0.35 | | 0.35 | | 0.28 | | 0.33 |
Net realized and unrealized gain (loss) on investment transactions
| 5.94 | | 0.08 | | 5.67 | | (3.42) | | 2.16 |
Total from investment operations
| 6.33 | | 0.43 | | 6.02 | | (3.14) | | 2.49 |
Net asset value, end of period
| $ 33.70 | | $ 27.37 | | $ 26.94 | | $ 20.92 | | $ 24.06 |
Total return2
| 23.13% | | 1.60% | | 28.78% | | (13.05%) | | 11.55% |
|
| Ratios/Supplemental data: | | | | | | | | | |
Net assets, end of period (in thousands)
| $ 94,537 | | $ 94,077 | | $ 99,799 | | $ 79,292 | | $ 99,011 |
Ratio of total expenses to average net assets
| 1.00% | | 1.04% | | 1.05% | | 1.06% | | 1.02% |
Ratio of net investment income (loss) to average net assets
| 1.25% | | 1.46% | | 1.44% | | 1.16% | | 1.48% |
Portfolio turnover rate
| 51% | | 75% | | 50% | | 60% | | 45% |
| 1 | The net investment income (loss) per share was calculated using the average shares outstanding method. |
| 2 | Total investment return is based on the change in net asset value of a share during the period and assumes reinvestment of dividends and distributions at net asset value. Total returns do not reflect expenses associated with variable contracts such as administrative fees, account charges and surrender charges, which if reflected would reduce the total returns for all periods presented. Total returns may reflect adjustments to conform with generally accepted accounting principles. |
The accompanying notes are an integral part of these financial statements.
Penn Series Funds, Inc.
Financial Highlights
SMID CAP GROWTH FUND
For a share outstanding throughout each period
| | Year Ended December 31, |
| | 2021 | | 2020 | | 2019 | | 2018 | | 2017 |
Net asset value, beginning of period
| $ 52.38 | | $ 34.39 | | $ 24.93 | | $ 26.38 | | $ 20.68 |
| Income (loss) from investment operations: | | | | | | | | | |
Net investment income (loss)1
| (0.43) | | (0.25) | | (0.18) | | (0.10) | | (0.11) |
Net realized and unrealized gain (loss) on investment transactions
| 4.48 | | 18.24 | | 9.64 | | (1.35) | | 5.81 |
Total from investment operations
| 4.05 | | 17.99 | | 9.46 | | (1.45) | | 5.70 |
Net asset value, end of period
| $ 56.43 | | $ 52.38 | | $ 34.39 | | $ 24.93 | | $ 26.38 |
Total return2
| 7.73% | | 52.31% | | 37.95% | | (5.50%) | | 27.56% |
|
| Ratios/Supplemental data: | | | | | | | | | |
Net assets, end of period (in thousands)
| $ 103,780 | | $ 96,010 | | $ 70,961 | | $ 59,882 | | $ 64,783 |
Ratio of net expenses to average net assets3
| 1.02% | | 1.05% | | 1.04% | | 1.03% | | 1.05% |
Ratio of total expenses to average net assets4
| 1.02% | | 1.05% | | 1.04% | | 1.03% | | 1.04% |
Ratio of net investment income (loss) to average net assets3
| (0.77%) | | (0.65%) | | (0.59%) | | (0.35%) | | (0.47%) |
Portfolio turnover rate
| 65% | | 97% | | 70% | | 83% | | 68% |
| 1 | The net investment income (loss) per share was calculated using the average shares outstanding method. |
| 2 | Total investment return is based on the change in net asset value of a share during the period and assumes reinvestment of dividends and distributions at net asset value. Total returns do not reflect expenses associated with variable contracts such as administrative fees, account charges and surrender charges, which if reflected would reduce the total returns for all periods presented. Total returns may reflect adjustments to conform with generally accepted accounting principles. |
| 3 | The ratio includes expenses waived/reimbursed net of amount recaptured and fees paid indirectly, where applicable; if expenses waived/ reimbursed net of amount recaptured and fees paid indirectly were excluded, the ratio would have been higher (lower), respectively, than the ratio shown. |
| 4 | The ratio excludes expenses waived/reimbursed net of amount recaptured and fees paid indirectly, where applicable; if expenses waived/ reimbursed net of amount recaptured and fees paid indirectly were included, the ratio would have been lower than the ratio shown. |
The accompanying notes are an integral part of these financial statements.
Penn Series Funds, Inc.
Financial Highlights
SMID CAP VALUE FUND
For a share outstanding throughout each period
| | Year Ended December 31, |
| | 2021 | | 2020 | | 2019 | | 2018 | | 2017 |
Net asset value, beginning of period
| $ 28.78 | | $ 28.37 | | $ 23.67 | | $ 27.90 | | $ 24.69 |
| Income (loss) from investment operations: | | | | | | | | | |
Net investment income (loss)1
| 0.22 | | 0.18 | | 0.18 | | 0.10 | | 0.03 |
Net realized and unrealized gain (loss) on investment transactions
| 10.02 | | 0.23 | | 4.52 | | (4.33) | | 3.18 |
Total from investment operations
| 10.24 | | 0.41 | | 4.70 | | (4.23) | | 3.21 |
Net asset value, end of period
| $ 39.02 | | $ 28.78 | | $ 28.37 | | $ 23.67 | | $ 27.90 |
Total return2
| 35.58% | | 1.45% | | 19.86% | | (15.16%) | | 13.00% |
|
| Ratios/Supplemental data: | | | | | | | | | |
Net assets, end of period (in thousands)
| $ 71,810 | | $ 57,672 | | $ 85,324 | | $ 80,919 | | $ 85,323 |
Ratio of total expenses to average net assets
| 1.15% | | 1.17% | | 1.12% | | 1.10% | | 1.18% |
Ratio of net investment income (loss) to average net assets
| 0.61% | | 0.77% | | 0.66% | | 0.36% | | 0.11% |
Portfolio turnover rate
| 53% | | 55% | | 32% | | 47% | | 37% |
| 1 | The net investment income (loss) per share was calculated using the average shares outstanding method. |
| 2 | Total investment return is based on the change in net asset value of a share during the period and assumes reinvestment of dividends and distributions at net asset value. Total returns do not reflect expenses associated with variable contracts such as administrative fees, account charges and surrender charges, which if reflected would reduce the total returns for all periods presented. Total returns may reflect adjustments to conform with generally accepted accounting principles. |
The accompanying notes are an integral part of these financial statements.
Penn Series Funds, Inc.
Financial Highlights
SMALL CAP GROWTH FUND
For a share outstanding throughout each period
| | Year Ended December 31, |
| | 2021 | | 2020 | | 2019 | | 2018 | | 2017 |
Net asset value, beginning of period
| $ 62.66 | | $ 47.45 | | $ 37.00 | | $ 38.80 | | $ 31.08 |
| Income (loss) from investment operations: | | | | | | | | | |
Net investment income (loss)1
| (0.41) | | (0.28) | | (0.18) | | (0.15) | | (0.16) |
Net realized and unrealized gain (loss) on investment transactions
| 5.86 | | 15.49 | | 10.63 | | (1.65) | | 7.88 |
Total from investment operations
| 5.45 | | 15.21 | | 10.45 | | (1.80) | | 7.72 |
Net asset value, end of period
| $ 68.11 | | $ 62.66 | | $ 47.45 | | $ 37.00 | | $ 38.80 |
Total return2
| 8.70% | | 32.06% | | 28.24% | | (4.64%) | | 24.84% |
|
| Ratios/Supplemental data: | | | | | | | | | |
Net assets, end of period (in thousands)
| $ 140,210 | | $ 142,595 | | $ 118,244 | | $ 93,243 | | $ 102,380 |
Ratio of total expenses to average net assets
| 0.99% | | 1.01% | | 1.02% | | 1.00% | | 1.01% |
Ratio of net investment income (loss) to average net assets
| (0.61%) | | (0.60%) | | (0.40%) | | (0.36%) | | (0.46%) |
Portfolio turnover rate
| 19% | | 28% | | 21% | | 22% | | 25% |
| 1 | The net investment income (loss) per share was calculated using the average shares outstanding method. |
| 2 | Total investment return is based on the change in net asset value of a share during the period and assumes reinvestment of dividends and distributions at net asset value. Total returns do not reflect expenses associated with variable contracts such as administrative fees, account charges and surrender charges, which if reflected would reduce the total returns for all periods presented. Total returns may reflect adjustments to conform with generally accepted accounting principles. |
The accompanying notes are an integral part of these financial statements.
Penn Series Funds, Inc.
Financial Highlights
SMALL CAP VALUE FUND
For a share outstanding throughout each period
| | Year Ended December 31, |
| | 2021 | | 2020 | | 2019 | | 2018 | | 2017 |
Net asset value, beginning of period
| $ 40.24 | | $ 39.32 | | $ 31.96 | | $ 37.11 | | $ 33.06 |
| Income (loss) from investment operations: | | | | | | | | | |
Net investment income (loss)1
| 0.10 | | 0.19 | | 0.24 | | 0.17 | | 0.18 |
Net realized and unrealized gain (loss) on investment transactions
| 10.63 | | 0.73 | | 7.12 | | (5.32) | | 3.87 |
Total from investment operations
| 10.73 | | 0.92 | | 7.36 | | (5.15) | | 4.05 |
Net asset value, end of period
| $ 50.97 | | $ 40.24 | | $ 39.32 | | $ 31.96 | | $ 37.11 |
Total return2
| 26.67% | | 2.34% | | 23.03% | | (13.88%) | | 12.25% |
|
| Ratios/Supplemental data: | | | | | | | | | |
Net assets, end of period (in thousands)
| $ 199,173 | | $ 179,912 | | $ 205,049 | | $ 211,285 | | $ 262,728 |
Ratio of total expenses to average net assets
| 0.98% | | 1.02% | | 0.98% | | 0.97% | | 0.97% |
Ratio of net investment income (loss) to average net assets
| 0.21% | | 0.58% | | 0.65% | | 0.46% | | 0.56% |
Portfolio turnover rate
| 67% | | 84% | | 54% | | 55% | | 59% |
| 1 | The net investment income (loss) per share was calculated using the average shares outstanding method. |
| 2 | Total investment return is based on the change in net asset value of a share during the period and assumes reinvestment of dividends and distributions at net asset value. Total returns do not reflect expenses associated with variable contracts such as administrative fees, account charges and surrender charges, which if reflected would reduce the total returns for all periods presented. Total returns may reflect adjustments to conform with generally accepted accounting principles. |
The accompanying notes are an integral part of these financial statements.
Penn Series Funds, Inc.
Financial Highlights
SMALL CAP INDEX FUND
For a share outstanding throughout each period
| | Year Ended December 31, |
| | 2021 | | 2020 | | 2019 | | 2018 | | 2017 |
Net asset value, beginning of period
| $ 30.10 | | $ 25.22 | | $ 20.26 | | $ 22.86 | | $ 20.09 |
| Income (loss) from investment operations: | | | | | | | | | |
Net investment income (loss)1
| 0.10 | | 0.10 | | 0.13 | | 0.14 | | 0.13 |
Net realized and unrealized gain (loss) on investment transactions
| 4.22 | | 4.78 | | 4.83 | | (2.74) | | 2.64 |
Total from investment operations
| 4.32 | | 4.88 | | 4.96 | | (2.60) | | 2.77 |
Net asset value, end of period
| $ 34.42 | | $ 30.10 | | $ 25.22 | | $ 20.26 | | $ 22.86 |
Total return2
| 14.35% | | 19.35% | | 24.48% | | (11.37%) | | 13.79% |
|
| Ratios/Supplemental data: | | | | | | | | | |
Net assets, end of period (in thousands)
| $ 98,827 | | $ 75,852 | | $ 69,993 | | $ 70,724 | | $ 81,638 |
Ratio of net expenses to average net assets3
| 0.70% | | 0.74% | | 0.72% | | 0.65% | | 0.65% |
Ratio of total expenses to average net assets4
| 0.70% | | 0.75% | | 0.72% | | 0.65% | | 0.65% |
Ratio of net investment income (loss) to average net assets
| 0.30% | | 0.43% | | 0.55% | | 0.59% | | 0.62% |
Portfolio turnover rate
| 31% | | 27% | | 16% | | 14% | | 13% |
| 1 | The net investment income (loss) per share was calculated using the average shares outstanding method. |
| 2 | Total investment return is based on the change in net asset value of a share during the period and assumes reinvestment of dividends and distributions at net asset value. Total returns do not reflect expenses associated with variable contracts such as administrative fees, account charges and surrender charges, which if reflected would reduce the total returns for all periods presented. Total returns may reflect adjustments to conform with generally accepted accounting principles. |
| 3 | The ratio includes expenses waived/reimbursed net of amount recaptured and fees paid indirectly, where applicable; if expenses waived/ reimbursed net of amount recaptured and fees paid indirectly were excluded, the ratio would have been higher (lower), respectively, than the ratio shown. |
| 4 | The ratio excludes expenses waived/reimbursed net of amount recaptured and fees paid indirectly, where applicable; if expenses waived/ reimbursed net of amount recaptured and fees paid indirectly were included, the ratio would have been lower than the ratio shown. |
The accompanying notes are an integral part of these financial statements.
Penn Series Funds, Inc.
Financial Highlights
DEVELOPED INTERNATIONAL INDEX FUND
For a share outstanding throughout each period
| | Year Ended December 31, |
| | 2021 | | 2020 | | 2019 | | 2018 | | 2017 |
Net asset value, beginning of period
| $ 15.94 | | $ 14.79 | | $ 12.22 | | $ 14.22 | | $ 11.42 |
| Income (loss) from investment operations: | | | | | | | | | |
Net investment income (loss)1
| 0.28 | | 0.19 | | 0.33 | | 0.31 | | 0.27 |
Net realized and unrealized gain (loss) on investment transactions
| 1.40 | | 0.96 | | 2.24 | | (2.31) | | 2.53 |
Total from investment operations
| 1.68 | | 1.15 | | 2.57 | | (2.00) | | 2.80 |
Net asset value, end of period
| $ 17.62 | | $ 15.94 | | $ 14.79 | | $ 12.22 | | $ 14.22 |
Total return2
| 10.54% | | 7.78% | | 21.03% | | (14.07%) | | 24.52% |
|
| Ratios/Supplemental data: | | | | | | | | | |
Net assets, end of period (in thousands)
| $ 114,158 | | $ 109,296 | | $ 111,067 | | $ 98,471 | | $ 116,930 |
Ratio of total expenses to average net assets
| 0.85% | | 0.89% | | 0.82% | | 0.79% | | 0.82% |
Ratio of net investment income (loss) to average net assets
| 1.66% | | 1.39% | | 2.41% | | 2.24% | | 2.05% |
Portfolio turnover rate
| 3% | | 5% | | 6% | | 3% | | 4% |
| 1 | The net investment income (loss) per share was calculated using the average shares outstanding method. |
| 2 | Total investment return is based on the change in net asset value of a share during the period and assumes reinvestment of dividends and distributions at net asset value. Total returns do not reflect expenses associated with variable contracts such as administrative fees, account charges and surrender charges, which if reflected would reduce the total returns for all periods presented. Total returns may reflect adjustments to conform with generally accepted accounting principles. |
The accompanying notes are an integral part of these financial statements.
Penn Series Funds, Inc.
Financial Highlights
INTERNATIONAL EQUITY FUND
For a share outstanding throughout each period
| | Year Ended December 31, |
| | 2021 | | 2020 | | 2019 | | 2018 | | 2017 |
Net asset value, beginning of period
| $ 39.02 | | $ 33.95 | | $ 26.51 | | $ 30.26 | | $ 22.98 |
| Income (loss) from investment operations: | | | | | | | | | |
Net investment income (loss)1
| (0.04) | | (0.05) | | 0.20 | | 0.19 | | 0.15 |
Net realized and unrealized gain (loss) on investment transactions
| 4.81 | | 5.12 | | 7.24 | | (3.94) | | 7.13 |
Total from investment operations
| 4.77 | | 5.07 | | 7.44 | | (3.75) | | 7.28 |
Net asset value, end of period
| $ 43.79 | | $ 39.02 | | $ 33.95 | | $ 26.51 | | $ 30.26 |
Total return2
| 12.23% | | 14.93% | | 28.07% | | (12.39%) | | 31.68% |
|
| Ratios/Supplemental data: | | | | | | | | | |
Net assets, end of period (in thousands)
| $ 353,005 | | $ 336,274 | | $ 325,965 | | $ 296,892 | | $ 375,821 |
Ratio of total expenses to average net assets
| 1.03% | | 1.06% | | 1.08% | | 1.11% | | 1.12% |
Ratio of net investment income (loss) to average net assets
| (0.10%) | | (0.14%) | | 0.66% | | (0.66%) | | 0.56% |
Portfolio turnover rate
| 76% | | 75% | | 50% | | 50% | | 32% |
| 1 | The net investment income (loss) per share was calculated using the average shares outstanding method. |
| 2 | Total investment return is based on the change in net asset value of a share during the period and assumes reinvestment of dividends and distributions at net asset value. Total returns do not reflect expenses associated with variable contracts such as administrative fees, account charges and surrender charges, which if reflected would reduce the total returns for all periods presented. Total returns may reflect adjustments to conform with generally accepted accounting principles. |
The accompanying notes are an integral part of these financial statements.
Penn Series Funds, Inc.
Financial Highlights
EMERGING MARKETS EQUITY FUND
For a share outstanding throughout each period
| | Year Ended December 31, |
| | 2021 | | 2020 | | 2019 | | 2018 | | 2017 |
Net asset value, beginning of period
| $ 14.93 | | $ 13.52 | | $ 11.39 | | $ 13.80 | | $ 10.22 |
| Income (loss) from investment operations: | | | | | | | | | |
Net investment income (loss)1
| 0.01 | | (0.02) | | 0.14 | | 0.09 | | 0.03 |
Net realized and unrealized gain (loss) on investment transactions
| (0.86) | | 1.43 | | 1.99 | | (2.50) | | 3.55 |
Total from investment operations
| (0.85) | | 1.41 | | 2.13 | | (2.41) | | 3.58 |
Net asset value, end of period
| $ 14.08 | | $ 14.93 | | $ 13.52 | | $ 11.39 | | $ 13.80 |
Total return2
| (5.69%) | | 10.43% | | 18.70% | | (17.46%) | | 35.03% |
|
| Ratios/Supplemental data: | | | | | | | | | |
Net assets, end of period (in thousands)
| $ 130,637 | | $ 145,335 | | $ 147,412 | | $ 146,973 | | $ 184,357 |
Ratio of total expenses to average net assets
| 1.25% | | 1.32% | | 1.34% | | 1.32% | | 1.51% |
Ratio of net investment income (loss) to average net assets
| 0.07% | | (0.19%) | | 1.11% | | 0.73% | | 0.25% |
Portfolio turnover rate
| 68% | | 121% (a) | | 35% | | 45% | | 41% |
| 1 | The net investment income (loss) per share was calculated using the average shares outstanding method. |
| 2 | Total investment return is based on the change in net asset value of a share during the period and assumes reinvestment of dividends and distributions at net asset value. Total returns do not reflect expenses associated with variable contracts such as administrative fees, account charges and surrender charges, which if reflected would reduce the total returns for all periods presented. Total returns may reflect adjustments to conform with generally accepted accounting principles. |
| (a) | The Fund’s portfolio turnover rate increased substantially during the year ended December 31, 2020 due to a change in the Fund’s
sub-adviser and associated repositioning. |
The accompanying notes are an integral part of these financial statements.
Penn Series Funds, Inc.
Financial Highlights
REAL ESTATE SECURITIES FUND
For a share outstanding throughout each period
| | Year Ended December 31, |
| | 2021 | | 2020 | | 2019 | | 2018 | | 2017 |
Net asset value, beginning of period
| $ 26.37 | | $ 27.25 | | $ 20.57 | | $ 21.47 | | $ 19.99 |
| Income (loss) from investment operations: | | | | | | | | | |
Net investment income (loss)1
| 0.28 | | 0.39 | | 0.41 | | 0.43 | | 0.39 |
Net realized and unrealized gain (loss) on investment transactions
| 10.98 | | (1.27) | | 6.27 | | (1.33) | | 1.09 |
Total from investment operations
| 11.26 | | (0.88) | | 6.68 | | (0.90) | | 1.48 |
Net asset value, end of period
| $ 37.63 | | $ 26.37 | | $ 27.25 | | $ 20.57 | | $ 21.47 |
Total return2
| 42.70% | | (3.23%) | | 32.47% | | (4.19%) | | 7.40% |
|
| Ratios/Supplemental data: | | | | | | | | | |
Net assets, end of period (in thousands)
| $ 140,061 | | $ 121,063 | | $ 133,068 | | $ 114,366 | | $ 137,842 |
Ratio of total expenses to average net assets
| 0.95% | | 0.97% | | 0.96% | | 0.96% | | 0.95% |
Ratio of net investment income (loss) to average net assets
| 0.89% | | 1.59% | | 1.64% | | 2.05% | | 1.86% |
Portfolio turnover rate
| 34% | | 64% | | 74% | | 66% | | 75% |
| 1 | The net investment income (loss) per share was calculated using the average shares outstanding method. |
| 2 | Total investment return is based on the change in net asset value of a share during the period and assumes reinvestment of dividends and distributions at net asset value. Total returns do not reflect expenses associated with variable contracts such as administrative fees, account charges and surrender charges, which if reflected would reduce the total returns for all periods presented. Total returns may reflect adjustments to conform with generally accepted accounting principles. |
The accompanying notes are an integral part of these financial statements.
Penn Series Funds, Inc.
Financial Highlights
AGGRESSIVE ALLOCATION FUND
For a share outstanding throughout each period
| | Year Ended December 31, |
| | 2021 | | 2020 | | 2019 | | 2018 | | 2017 |
Net asset value, beginning of period
| $ 23.39 | | $ 21.41 | | $ 17.37 | | $ 19.20 | | $ 15.99 |
| Income (loss) from investment operations: | | | | | | | | | |
Net investment income (loss)1
| (0.08) | | (0.07) | | (0.06) | | (0.06) | | (0.05) |
Net realized and unrealized gain (loss) on investment transactions
| 3.92 | | 2.05 | | 4.10 | | (1.77) | | 3.26 |
Total from investment operations
| 3.84 | | 1.98 | | 4.04 | | (1.83) | | 3.21 |
Net asset value, end of period
| $ 27.23 | | $ 23.39 | | $ 21.41 | | $ 17.37 | | $ 19.20 |
Total return2
| 16.42% | | 9.25% | | 23.26% | | (9.53%) | | 20.08% |
|
| Ratios/Supplemental data: | | | | | | | | | |
Net assets, end of period (in thousands)
| $ 70,657 | | $ 70,074 | | $ 72,017 | | $ 64,604 | | $ 75,079 |
Ratio of total expenses to average net assets3
| 0.33% | | 0.33% | | 0.33% | | 0.32% | | 0.31% |
Ratio of net investment income (loss) to average net assets
| (0.33%) | | (0.33%) | | (0.33%) | | (0.32%) | | (0.31%) |
Portfolio turnover rate
| 18% | | 17% | | 14% | | 19% | | 20% |
| 1 | The net investment income (loss) per share was calculated using the average shares outstanding method. |
| 2 | Total investment return is based on the change in net asset value of a share during the period and assumes reinvestment of dividends and distributions at net asset value. Total returns do not reflect expenses associated with variable contracts such as administrative fees, account charges and surrender charges, which if reflected would reduce the total returns for all periods presented. Total returns may reflect adjustments to conform with generally accepted accounting principles. |
| 3 | The Fund also will indirectly bear its prorated share of expenses of the underlying funds. Such expenses are not included in the calculation of this ratio. |
The accompanying notes are an integral part of these financial statements.
Penn Series Funds, Inc.
Financial Highlights
MODERATELY AGGRESSIVE ALLOCATION FUND
For a share outstanding throughout each period
| | Year Ended December 31, |
| | 2021 | | 2020 | | 2019 | | 2018 | | 2017 |
Net asset value, beginning of period
| $ 24.14 | | $ 22.06 | | $ 18.12 | | $ 19.66 | | $ 16.72 |
| Income (loss) from investment operations: | | | | | | | | | |
Net investment income (loss)1
| (0.08) | | (0.06) | | (0.06) | | (0.06) | | (0.05) |
Net realized and unrealized gain (loss) on investment transactions
| 3.78 | | 2.14 | | 4.00 | | (1.48) | | 2.99 |
Total from investment operations
| 3.70 | | 2.08 | | 3.94 | | (1.54) | | 2.94 |
Net asset value, end of period
| $ 27.84 | | $ 24.14 | | $ 22.06 | | $ 18.12 | | $ 19.66 |
Total return2
| 15.33% | | 9.43% | | 21.75% | | (7.83%) | | 17.58% |
|
| Ratios/Supplemental data: | | | | | | | | | |
Net assets, end of period (in thousands)
| $ 246,473 | | $ 227,084 | | $ 232,308 | | $ 217,918 | | $ 266,699 |
Ratio of total expenses to average net assets3
| 0.29% | | 0.30% | | 0.30% | | 0.30% | | 0.29% |
Ratio of net investment income (loss) to average net assets
| (0.29%) | | (0.30%) | | (0.29%) | | (0.29%) | | (0.29%) |
Portfolio turnover rate
| 12% | | 17% | | 12% | | 14% | | 16% |
| 1 | The net investment income (loss) per share was calculated using the average shares outstanding method. |
| 2 | Total investment return is based on the change in net asset value of a share during the period and assumes reinvestment of dividends and distributions at net asset value. Total returns do not reflect expenses associated with variable contracts such as administrative fees, account charges and surrender charges, which if reflected would reduce the total returns for all periods presented. Total returns may reflect adjustments to conform with generally accepted accounting principles. |
| 3 | The Fund also will indirectly bear its prorated share of expenses of the underlying funds. Such expenses are not included in the calculation of this ratio. |
The accompanying notes are an integral part of these financial statements.
Penn Series Funds, Inc.
Financial Highlights
MODERATE ALLOCATION FUND
For a share outstanding throughout each period
| | Year Ended December 31, |
| | 2021 | | 2020 | | 2019 | | 2018 | | 2017 |
Net asset value, beginning of period
| $ 21.46 | | $ 19.55 | | $ 16.48 | | $ 17.51 | | $ 15.36 |
| Income (loss) from investment operations: | | | | | | | | | |
Net investment income (loss)1
| (0.07) | | (0.06) | | (0.05) | | (0.05) | | (0.05) |
Net realized and unrealized gain (loss) on investment transactions
| 2.50 | | 1.97 | | 3.12 | | (0.98) | | 2.20 |
Total from investment operations
| 2.43 | | 1.91 | | 3.07 | | (1.03) | | 2.15 |
Net asset value, end of period
| $ 23.89 | | $ 21.46 | | $ 19.55 | | $ 16.48 | | $ 17.51 |
Total return2
| 11.32% | | 9.77% | | 18.63% | | (5.88%) | | 14.00% |
|
| Ratios/Supplemental data: | | | | | | | | | |
Net assets, end of period (in thousands)
| $ 288,061 | | $ 285,910 | | $ 298,115 | | $ 291,618 | | $ 342,656 |
Ratio of total expenses to average net assets3
| 0.29% | | 0.30% | | 0.30% | | 0.29% | | 0.29% |
Ratio of net investment income (loss) to average net assets
| (0.29%) | | (0.30%) | | (0.30%) | | (0.29%) | | (0.29%) |
Portfolio turnover rate
| 12% | | 17% | | 9% | | 14% | | 12% |
| 1 | The net investment income (loss) per share was calculated using the average shares outstanding method. |
| 2 | Total investment return is based on the change in net asset value of a share during the period and assumes reinvestment of dividends and distributions at net asset value. Total returns do not reflect expenses associated with variable contracts such as administrative fees, account charges and surrender charges, which if reflected would reduce the total returns for all periods presented. Total returns may reflect adjustments to conform with generally accepted accounting principles. |
| 3 | The Fund also will indirectly bear its prorated share of expenses of the underlying funds. Such expenses are not included in the calculation of this ratio. |
The accompanying notes are an integral part of these financial statements.
Penn Series Funds, Inc.
Financial Highlights
MODERATELY CONSERVATIVE ALLOCATION FUND
For a share outstanding throughout each period
| | Year Ended December 31, |
| | 2021 | | 2020 | | 2019 | | 2018 | | 2017 |
Net asset value, beginning of period
| $ 18.99 | | $ 17.58 | | $ 15.31 | | $ 15.86 | | $ 14.42 |
| Income (loss) from investment operations: | | | | | | | | | |
Net investment income (loss)1
| (0.06) | | (0.05) | | (0.05) | | (0.05) | | (0.05) |
Net realized and unrealized gain (loss) on investment transactions
| 1.69 | | 1.46 | | 2.32 | | (0.50) | | 1.49 |
Total from investment operations
| 1.63 | | 1.41 | | 2.27 | | (0.55) | | 1.44 |
Net asset value, end of period
| $ 20.62 | | $ 18.99 | | $ 17.58 | | $ 15.31 | | $ 15.86 |
Total return2
| 8.58% | | 8.02% | | 14.83% | | (3.47%) | | 9.99% |
|
| Ratios/Supplemental data: | | | | | | | | | |
Net assets, end of period (in thousands)
| $ 99,775 | | $ 94,485 | | $ 93,947 | | $ 88,927 | | $ 98,414 |
Ratio of total expenses to average net assets3
| 0.31% | | 0.32% | | 0.32% | | 0.31% | | 0.30% |
Ratio of net investment income (loss) to average net assets
| (0.31%) | | (0.31%) | | (0.31%) | | (0.30%) | | (0.30%) |
Portfolio turnover rate
| 20% | | 23% | | 13% | | 17% | | 15% |
| 1 | The net investment income (loss) per share was calculated using the average shares outstanding method. |
| 2 | Total investment return is based on the change in net asset value of a share during the period and assumes reinvestment of dividends and distributions at net asset value. Total returns do not reflect expenses associated with variable contracts such as administrative fees, account charges and surrender charges, which if reflected would reduce the total returns for all periods presented. Total returns may reflect adjustments to conform with generally accepted accounting principles. |
| 3 | The Fund also will indirectly bear its prorated share of expenses of the underlying funds. Such expenses are not included in the calculation of this ratio. |
The accompanying notes are an integral part of these financial statements.
Penn Series Funds, Inc.
Financial Highlights
CONSERVATIVE ALLOCATION FUND
For a share outstanding throughout each period
| | Year Ended December 31, |
| | 2021 | | 2020 | | 2019 | | 2018 | | 2017 |
Net asset value, beginning of period
| $ 16.60 | | $ 15.51 | | $ 13.99 | | $ 14.18 | | $ 13.33 |
| Income (loss) from investment operations: | | | | | | | | | |
Net investment income (loss)1
| (0.06) | | (0.05) | | (0.05) | | (0.04) | | (0.04) |
Net realized and unrealized gain (loss) on investment transactions
| 0.81 | | 1.14 | | 1.57 | | (0.15) | | 0.89 |
Total from investment operations
| 0.75 | | 1.09 | | 1.52 | | (0.19) | | 0.85 |
Net asset value, end of period
| $ 17.35 | | $ 16.60 | | $ 15.51 | | $ 13.99 | | $ 14.18 |
Total return2
| 4.52% | | 7.03% | | 10.87% | | (1.34%) | | 6.38% |
|
| Ratios/Supplemental data: | | | | | | | | | |
Net assets, end of period (in thousands)
| $ 59,188 | | $ 61,854 | | $ 59,832 | | $ 57,092 | | $ 58,659 |
Ratio of total expenses to average net assets3
| 0.33% | | 0.33% | | 0.34% | | 0.33% | | 0.32% |
Ratio of net investment income (loss) to average net assets
| (0.33%) | | (0.33%) | | (0.31%) | | (0.31%) | | (0.31%) |
Portfolio turnover rate
| 23% | | 30% | | 18% | | 23% | | 23% |
| 1 | The net investment income (loss) per share was calculated using the average shares outstanding method. |
| 2 | Total investment return is based on the change in net asset value of a share during the period and assumes reinvestment of dividends and distributions at net asset value. Total returns do not reflect expenses associated with variable contracts such as administrative fees, account charges and surrender charges, which if reflected would reduce the total returns for all periods presented. Total returns may reflect adjustments to conform with generally accepted accounting principles. |
| 3 | The Fund also will indirectly bear its prorated share of expenses of the underlying funds. Such expenses are not included in the calculation of this ratio. |
The accompanying notes are an integral part of these financial statements.
Penn Series Funds, Inc.
Notes to Financial Statements — December 31, 2021
1 — Organization
Penn Series Funds, Inc. (“Penn Series”) was incorporated in Maryland on April 22, 1982. Penn Series is registered under the Investment Company Act of 1940, as amended, as an open-end, diversified management investment company. Penn Series is open only to purchasers of The Penn Mutual Life Insurance Company (“Penn Mutual”) and The Penn Insurance and Annuity Company insurance contracts and certain of Penn Mutual’s employee benefit plans.
Penn Series is presently offering shares in its Money Market, Limited Maturity Bond, Quality Bond, High Yield Bond, Flexibly Managed, Balanced, Large Growth Stock, Large Cap Growth, Large Core Growth, Large Cap Value, Large Core Value, Index 500, Mid Cap Growth, Mid Cap Value, Mid Core Value, SMID Cap Growth, SMID Cap Value, Small Cap Growth, Small Cap Value, Small Cap Index, Developed International Index, International Equity, Emerging Markets Equity, Real Estate Securities, Aggressive Allocation, Moderately Aggressive Allocation, Moderate Allocation, Moderately Conservative Allocation and Conservative Allocation Funds (each a “Fund” and collectively, the “Funds”). Penn Series also has the authority to issue shares in three additional funds, each of which would have their own investment objective and policies.
Fund of Funds (“FOFs”) – Each Penn Series FOF seeks to achieve its investment objective by investing in other Penn Series Funds (“Underlying Funds”) and uses asset allocation strategies to determine how much to invest in the Underlying Funds. Each of the following is a Penn Series FOFs: Balanced, Aggressive Allocation, Moderately Aggressive Allocation, Moderate Allocation, Moderately Conservative Allocation and Conservative Allocation Funds.
2 — Significant Accounting Policies
The following significant accounting policies are followed by Penn Series in the preparation of its financial statements. The preparation of financial statements in accordance with the accounting principles generally accepted in the United States (“U.S. GAAP”) requires management to make estimates and assumptions that affect the reported amounts and disclosures in the financial statements. Actual results could differ from those estimates and those differences could be material. The Funds are investment companies and follow the accounting and reporting guidance in Financial Accounting Standards Board (“FASB”) Accounting Standards Codification (“ASC”) Topic No. 946.
Security Valuation:
Money Market Fund — Investments in securities are valued using the amortized cost method as permitted by Rule 2a-7 under the Investment Company Act of 1940, which involves initially valuing investments at cost and thereafter assuming a constant amortization to maturity of any premium or discount. This method approximates market value.
Limited Maturity Bond, Quality Bond, High Yield Bond, Flexibly Managed, Large Growth Stock, Large Cap Growth, Large Core Growth, Large Cap Value, Large Core Value, Index 500, Mid Cap Growth, Mid Cap Value, Mid Core Value, SMID Cap Growth, SMID Cap Value, Small Cap Growth, Small Cap Value, Small Cap Index, Developed International Index, International Equity, Emerging Markets Equity, Real Estate Securities Funds — Portfolio securities listed on a securities exchange or an automated quotation system for which quotations are readily available, including securities traded over the counter, are valued at the last quoted sale price on the principal exchange or market on which they are traded on the valuation date or, if there is no such reported sale on the valuation date, at the most recent quoted bid price. Securities valued according to these valuation methods are categorized as Level 1 in the fair value hierarchy described below. Debt and fixed income securities are valued by recognized independent third-party valuation services, employing valuation methodologies that utilize actual market transactions, broker-dealer supplied valuations, and matrix pricing. Matrix pricing for corporate bonds, floating rate notes, municipal securities and U.S. government and government agency obligations considers yield or price of bonds of comparable quality, coupon, maturity and type and, for asset backed securities, commercial mortgage securities and U.S. government agency mortgage securities, also considers prepayment speed assumptions and attributes and performance of the underlying collateral. Securities valued according to these valuation methods are generally categorized as Level 2 in the fair value hierarchy described below. To the extent that bid prices are provided by the pricing service, the Funds will use the bid price. Debt obligations with remaining maturities of sixty days or less may be valued at their amortized cost, which approximates market value. The prices for foreign securities are reported in local currency and converted to U.S. dollars using currency exchange rates as of the valuation date.
Penn Series Funds, Inc.
Notes to Financial Statements — December 31, 2021
Options are valued at the last traded price on the market where such options are principally traded or, if there was no trade on such day, at the last bid quote. Futures contracts are valued at the last settlement price on the market where such futures contracts are principally traded. Although derivatives may be subject to netting provisions, as discussed further in Note 7, derivatives held are valued at their gross amounts.
To assess the continuing appropriateness of third-party pricing service security valuations, Penn Mutual Asset Management, LLC (“PMAM” or the “Adviser”), the investment adviser to each of the Funds, or the Fund’s sub-adviser, as applicable, or the fund accounting service provider, who is subject to oversight by the Administrator, regularly monitor the prices and compare prices to alternate sources where applicable. Price challenges are issued for valuation differences exceeding certain tolerances or when considered not reflective of the market by the Adviser or sub-adviser, as applicable.
Securities for which market quotations are not readily available are valued at fair value prices determined using methods approved by the Penn Series Board of Directors (the “Board of Directors”). The Penn Series Valuation Committee (the “Valuation Committee”), established by and subject to oversight by the Board of Directors, monitors pricing related policies and procedures and approves all fair value determinations. The Valuation Committee consists of representatives from PMAM and Penn Mutual, the administrator to the Funds (the “Administrator”). The Valuation Committee regularly makes good faith judgments, using sources and information obtained, including recommendations and supporting rationales and inputs from the Adviser or the applicable sub-adviser, to establish and /or adjust fair valuations of securities as events occur and circumstances warrant. The information and inputs may include but are not limited to cost of the security, last sale price, private transaction trading prices, comparable publicly traded security prices, discount rates, publicly disclosed news stories and regulatory filings, estimated cash flows and yield curves. As part of its procedures, the Valuation Committee monitors the fair valued securities, considers additional news or significant developments relative to the specific security, reviews the valuations with the Adviser or respective sub-adviser on a regular basis and applies back testing procedures to valuations as applicable. Reasons for which securities may be valued in this manner include, but are not limited to, trading on an exchange for a security has been halted, suspended or has not begun, a security has been de-listed from a national exchange, trading on a security’s primary market is temporarily closed at a time when, under normal conditions, it would be open, or valuation by a third party pricing service is currently not available or is no longer available.
Certain events may occur between the time that foreign markets close, on which securities held by the Fund principally trade, and the time at which the Fund’s NAV is calculated. These securities are valued at a fair value utilizing an independent third party valuation service in accordance with procedures adopted by the Fund’s Board of Directors. The methodology and procedures followed by the valuation service consider the correlation of the trading patterns of the foreign security to the intraday trading in the U.S. markets for investments such as ADRs, financial futures, ETFs, and certain indexes as well as prices for similar securities. Securities valued using such valuation service are classified as Level 2 of the fair value hierarchy as these adjustment factors are considered other observable inputs to the valuation. Values from the valuation service are applied in the event that there is a movement in the U.S. market that exceeds a specific threshold that has been established by the Valuation Committee. The Valuation Committee has also established a “confidence interval”, which is used to determine the level of historical correlation between the value of a specific foreign security and movements in the U.S. market before a particular security will be fair valued when the threshold is exceeded. In the event that the threshold established by the Valuation Committee is exceeded on a specific day, the Funds shall value the non-U.S. securities in their portfolios that exceed the applicable “confidence interval” based upon the adjusted prices provided by the fair valuation service.
The determination of a security’s fair value price often involves the consideration of a number of subjective factors, and is therefore subject to the unavoidable risk that the value assigned to a security may be higher or lower than the security’s value would be if a reliable market quotation for the security was readily available.
Balanced, Aggressive Allocation, Moderately Aggressive Allocation, Moderate Allocation, Moderately Conservative Allocation and Conservative Allocation Funds — The valuation of each Fund’s investment in its Underlying Funds is based on the net asset values of the Underlying Funds each business day.
Fair value measurements are determined within a framework that has established a fair value hierarchy based upon the various data inputs utilized in determining the value of the Funds’ investments. Inputs refer broadly to the assumptions that market participants would use in pricing an asset. Inputs may be observable or unobservable.
Penn Series Funds, Inc.
Notes to Financial Statements — December 31, 2021
Observable inputs are inputs that reflect the assumptions market participants would use in pricing the asset or liability based on market data obtained from sources independent of the reporting entity. Unobservable inputs are inputs that reflect the reporting entity’s own assumptions about the assumptions market participants would use in pricing the asset or liability based on the best information available in the circumstances. These inputs are summarized into three broad levels as follows:
| • | Level 1 — quoted prices in active markets for identical securities |
| • | Level 2 — other significant observable inputs (including quoted prices for similar securities, interest rates, prepayment speeds, credit risk, etc.) |
| • | Level 3 — significant unobservable inputs (including the Fund’s own assumptions in determining the fair value of investments) |
Level 3 items at December 31, 2021 consist of $22,523,988 and $2,665,136 of equities in the Flexibly Managed Fund and Large Growth Stock Fund, respectively which were not publicly trading. The unobservable inputs used in valuing these securities include new rounds of financing, negotiated transactions of significant size between other investors in the company, relevant market valuations of peer companies and strategic events affecting the company. Significant increases (decreases) in the valuation indicated by the new rounds of financing, valuations observed through negotiated transactions between other investors in the company or changes in the market valuation of relevant peer companies would result in directionally similar changes to the fair value. Fair value determinations are reviewed and updated on a regular basis and as information becomes available, including actual purchase and sale transactions of the issue. For certain loan agreements where observable inputs are limited, assumptions about market activity and risk are used and are categorized as Level 3 in the hierarchy.
Foreign Currency Translation — The books and records of the Funds are maintained in U.S. dollars. Foreign currency amounts are translated into U.S. dollars on the following basis: market value of investment securities, assets and liabilities at the current rate of exchange; purchases and sales of investment securities, income and expenses at the relevant rates of exchange prevailing on the respective dates of such transactions.
The Funds do not isolate the portion of realized and unrealized gains and losses on investments which is due to changes in the foreign exchange rate from that which is due to changes in market prices of all securities. Such fluctuations are included with net realized and unrealized gain or loss from investments.
Foreign security and currency transactions may involve certain considerations and risks not typically associated with those of U.S. dollar denominated transactions as a result of, among other factors, the level of governmental supervision and regulation of foreign securities markets and the possibility of political or economic instability.
Loan Agreements — Certain Funds may invest in loan agreements, also known as bank loans, which represent an interest in amounts owed by a borrower to a syndication of lenders. Bank loans may involve multiple loans with the same borrower under a single credit agreement (each loan, a tranche), and each tranche may have different terms and associated risks. A bank or other financial institution typically acts as the agent and administers a bank loan in accordance with the associated credit agreement. Bank loans are generally noninvestment grade and often involve borrowers whose financial condition is troubled or uncertain and companies that are highly leveraged. The Funds may buy and sell bank loans in the form of either loan assignments or loan participations. A loan assignment transfers all legal, beneficial, and economic rights to the buyer. Although loan assignments continue to be administered by the agent, the buyer acquires direct rights against the borrower. In many cases, a loan assignment requires the consent of both the borrower and the agent. In contrast, a loan participation generally entitles the buyer to receive the cash flows from principal, interest, and any fee payments that the seller is entitled to receive from the borrower; however, the seller continues to hold legal title to the loan. As a result, with loan participations, the buyer generally has no right to enforce compliance with terms of the credit agreement against the borrower, and the buyer is subject to the credit risk of both the borrower and the seller. Bank loans often have extended settlement periods, during which the Fund is subject to nonperformance by the counterparty.
Private Investments Issued by Special Purpose Acquisition Companies — Special purpose acquisition companies (SPACs) are shell companies that have no operations but are formed to raise capital with the intention of merging with or acquiring a company with the proceeds of the SPAC’s initial public offering (IPO). Certain Funds may acquire equity
Penn Series Funds, Inc.
Notes to Financial Statements — December 31, 2021
securitites of an issuer that are issued through a private investment in public equity (PIPE), including on a when-issued basis. PIPE transactions typically involve the purchase of securities directly from a publicly traded company or its affiliates in a private placement transaction, typically at a discount to the market price of the issuer’s common equity. Purchased PIPE shares will be restricted from trading until the registration statement for the shares is declared effective. Upon registration, the shares can be freely sold; however, in certain circumstances, the issuer may have the right to temporarily suspend trading of the shares in the first year after the merger or acquisition. The securities issued by a SPAC may be considered illiquid, more difficult to value, and/or be subject to restrictions on resale. PIPE are valued based upon valuations of the underlying SPACs.
Security Transactions, Investment Income and Expenses — Security transactions are accounted for on the trade date. Dividend income is recorded on the ex-dividend date and interest income is accrued as earned. Discounts and premiums on debt and fixed income securities are accreted and amortized using the effective interest method. Premiums on callable debt securities are amortized to interest income to the earliest call date using the effective interest method. The cost of investment securities sold is determined by using the specific identification method for both financial reporting and income tax purposes. Expenses directly attributable to a Fund are directly charged. Expenses included in the accompanying financial statements reflect the expenses of each Fund and do not include any expenses associated with the Underlying Funds of the FOFs. Other expenses attributable to the Funds are allocated in accordance with methodologies, which are reviewed with the Board of Directors no less than annually.
Dividends to Shareholders — Except for the Money Market Fund, all or a portion of each Fund’s undistributed net investment income and accumulated net realized gain on investment and foreign exchange transactions, if any, at December 31, 2021 were deemed distributed as consent dividends to each respective Fund’s shareholders in place of regular distributions. As consent dividends, shareholders of each Fund agree to treat their share of undistributed net investment income and accumulated net realized gain on investment and foreign exchange transactions, if any, at December 31, 2021, respectively, as dividend income and net capital gains for tax purposes. In the case of the Money Market Fund, dividends paid from undistributed net investment income and accumulated net realized gain on investments are declared daily and paid monthly.
Dividends from net investment income and distributions from net realized gains are determined in accordance with federal income tax regulations which may differ from net investment income and net realized capital gains recorded in accordance with accounting principles generally accepted in the United States. To the extent that these differences are permanent, such amounts are reclassified within the capital accounts based on their federal tax basis treatment; temporary differences do not require such reclassification. Distributions from net realized gains may involve short-term capital gains, which are included as ordinary income for tax purposes.
The character of distributions received from Real Estate Investment Trusts (“REITs”) held by a Fund is generally comprised of net investment income, capital gains, and return of capital. It is the policy of the Funds to estimate the character of distributions received from the underlying REITs based on historical data provided by the REITs.
Foreign Capital Gains Taxes— The International Equity Fund and Emerging Markets Equity Fund accrue capital gains tax on unrealized and realized gains for certain securities of issuers domiciled in India. At December 31, 2021, the Funds had accrued capital gains taxes of $385,196 and $587,612, respectively, which is reflected in the Statement of Assets and Liabilities. For the year ended December 31, 2021, the International Equity Fund and Emerging Markets Equity Fund had realized capital gains tax expense of $456,829 and $314,852, respectively, which is reflected in the Net realized gain (loss) on Investments line item in the Statement of Operations.
3 — Investment Advisory and Other Corporate Services
Investment Advisory Services
PMAM serves as investment adviser to each series of Penn Series. With the exception of the Money Market, Limited Maturity, Quality Bond, High Yield Bond, Balanced, Aggressive Allocation, Moderately Aggressive Allocation, Moderate Allocation, Moderately Conservative Allocation and Conservative Allocation Funds, PMAM has entered into sub-advisory agreements to provide investment management services to each of the Funds.
Penn Series Funds, Inc.
Notes to Financial Statements — December 31, 2021
Each of the Funds pay PMAM, on a monthly basis, an advisory fee accrued daily based on the average daily net assets of the Fund, at the following rates pursuant to the investment advisory agreements:
| Fund | | Sub-Adviser | | Investment Advisory Fees
(As a Percentage of the
Average Daily
Net Assets of the Fund) |
| Money Market Fund | | None | | 0.33% of the first $200,000,000;
0.31% of the next $150,000,000;
0.29% of the next $150,000,000;
0.27% over $500,000,000.
|
| Limited Maturity Bond Fund | | None | | 0.46% of the first $200,000,000;
0.44% of the next $150,000,000;
0.42% of the next $150,000,000;
0.40% over $500,000,000.
|
| Quality Bond Fund | | None | | 0.46% of the first $200,000,000;
0.44% of the next $150,000,000;
0.42% of the next $150,000,000;
0.40% over $500,000,000.
|
| High Yield Bond Fund | | None | | 0.46% of the first $200,000,000;
0.44% of the next $150,000,000;
0.42% of the next $150,000,000;
0.40% over $500,000,000.
|
| Flexibly Managed Fund | | T. Rowe Price Associates, Inc. | | 0.72% of the first $500,000,000;
0.70% of the next $2,000,000,000;
0.68% of the next $1,500,000,000;
0.65% of the next $1,000,000,000;
0.62% over $5,000,000,000.
|
| Balanced Fund | | None | | None
|
| Large Growth Stock Fund | | T. Rowe Price Associates, Inc. | | 0.72% of the first $250,000,000;
0.68% of the next $250,000,000;
0.65% over $500,000,000.
|
| Large Cap Growth Fund | | Massachusetts Financial Services
Company
| | 0.55% |
| Large Core Growth Fund | | Morgan Stanley Investment
Management Inc.
| | 0.60% |
| Large Cap Value Fund | | AllianceBernstein, LP | | 0.67% of the first $150,000,000;
0.65% over $150,000,000.
|
| Large Core Value Fund | | Eaton Vance Management | | 0.67% of the first $150,000,000;
0.65% of the next $250,000,000;
0.60% over $400,000,000.
|
Penn Series Funds, Inc.
Notes to Financial Statements — December 31, 2021
| Fund | | Sub-Adviser | | Investment Advisory Fees
(As a Percentage of the
Average Daily
Net Assets of the Fund) |
| Index 500 Fund | | SSgA Fund Management, Inc. | | 0.14% of the first $150,000,000;
0.13% of the next $150,000,000;
0.12% over $300,000,000.
|
| Mid Cap Growth Fund* | | Delaware Investments Fund
Advisers
| | 0.70% |
| Mid Cap Value Fund | | Janus Capital
Management LLC | | 0.55% of the first $250,000,000;
0.525% of the next $250,000,000;
0.50% of the next $250,000,000;
0.475% of the next $250,000,000;
0.45% of the next $500,000,000;
0.425% over $1,500,000,000.
|
| Mid Core Value Fund | | American Century Investment
Management, Inc.
| | 0.69% |
| SMID Cap Growth Fund | | Goldman Sachs Asset Management, LP
| | 0.75% |
| SMID Cap Value Fund | | AllianceBernstein, LP
| | 0.84% |
| Small Cap Growth Fund | | Janus Capital Management LLC | | 0.80% of the first $25,000,000;
0.75% of the next $25,000,000;
0.70% over $50,000,000.
|
| Small Cap Value Fund | | Goldman Sachs Asset Management, LP | | 0.75% of the first $50,000,000;
0.725% of the next $50,000,000;
0.70% over $100,000,000.
|
| Small Cap Index Fund | | SSgA Fund Management, Inc.
| | 0.30% |
| Developed International Index Fund | | SSgA Fund Management, Inc.
| | 0.30% |
| International Equity Fund | | Vontobel Asset Management, Inc. | | 0.83% of the first $227,000,000;
0.63% over $227,000,000.
|
| Emerging Markets Equity Fund | | Vontobel Asset Management, Inc.
| | 0.87% |
| Real Estate Securities Fund | | Cohen & Steers Capital Management,
Inc.
| | 0.70% |
| Aggressive Allocation Fund | | None | | 0.12% of the first $200,000,000;
0.11% of the next $150,000,000;
0.10% of the next $150,000,000;
0.09% over $500,000,000.
|
Penn Series Funds, Inc.
Notes to Financial Statements — December 31, 2021
| Fund | | Sub-Adviser | | Investment Advisory Fees
(As a Percentage of the
Average Daily
Net Assets of the Fund) |
| Moderately Aggressive Allocation Fund | | None | | 0.12% of the first $200,000,000;
0.11% of the next $150,000,000;
0.10% of the next $150,000,000;
0.09% over $500,000,000.
|
| Moderate Allocation Fund | | None | | 0.12% of the first $200,000,000;
0.11% of the next $150,000,000;
0.10% of the next $150,000,000;
0.09% over $500,000,000.
|
| Moderately Conservative Allocation Fund | | None | | 0.12% of the first $200,000,000;
0.11% of the next $150,000,000;
0.10% of the next $150,000,000;
0.09% over $500,000,000.
|
| Conservative Allocation Fund | | None | | 0.12% of the first $200,000,000;
0.11% of the next $150,000,000;
0.10% of the next $150,000,000;
0.09% over $500,000,000.
|
| * | On April 30, 2021, Waddell & Reed Financial, Inc., the parent company of Ivy Investment Management Company (“Ivy”), was acquired by Macquarie Group Limited. As part of the acquisition, sub-advisory services previously provided to the Mid Cap Growth Fund by Ivy transitioned from Ivy to Delaware Investments Fund Advisers. |
For providing investment management services to the Funds, PMAM pays each sub-adviser, on a monthly basis, a subadvisory fee.
Administrative and Corporate, Co-Administrative and Shareholder Services
Each of the Funds pays Penn Mutual, on a quarterly basis, 0.01% of the Fund’s average daily net assets under a revised administrative and corporate services agreement and 0.09% under a shareholder servicing agreement. Each of the Funds pays PMAM, on a quarterly basis, 0.02% of the Fund’s average daily assets under a co-administrative agreement. These fees are accrued daily.
Fund Administration and Accounting Services
Under a fund administration and accounting agreement, BNY Mellon Investment Servicing (US), Inc. (“BNY Mellon”) serves as accounting agent for Penn Series. Each of the Funds, except the FOFs, International Equity Fund, Emerging Markets Equity Fund and Developed International Index Fund, pays BNY Mellon, on a monthly basis, an annual fee accrued daily based on the average daily net assets of the Fund equal to 0.070% for the first $100 million, 0.050% for the next $200 million, 0.030% for the next $300 million and 0.020% thereafter. With the exception of the FOFs, International Equity Fund, Emerging Markets Equity Fund, Developed International Index Fund and Money Market Fund, the minimum annual fee each Fund must pay is $27,500. The annual accounting fee for each of the FOFs is an asset-based fee of 0.010% of FOF’s average daily net assets, exclusive of out-of-pocket expenses. Each FOF’s minimum annual fee is $12,000. The minimum annual fee is $48,000 for each of the International Equity Fund, Emerging Markets Equity Fund and Developed International Index Fund. The Money Market Fund pays no minimum annual fee. Each of the International Equity, Emerging Markets Equity and Developed International Index Funds pays BNY Mellon, on a monthly basis, an annual 0.080% for the first $100 million, 0.060% for the next $300 million, 0.040% for the next $200 million, and 0.030% thereafter. In addition, each of the Funds pays BNY Mellon approximately 0.010% of the Fund’s average daily net assets for tax and regulatory administration services.
Penn Series Funds, Inc.
Notes to Financial Statements — December 31, 2021
Transfer Agent Services
Under a transfer agency agreement, BNY Mellon serves as transfer agent for Penn Series.
Custodial Services
The Bank of New York Mellon, Inc., serves as custodian for Penn Series. In addition to transaction charges and out-of-pocket expenses, each of the Funds pay The Bank of New York Mellon, Inc., on a monthly basis, an annual custody fee of 0.007% for U.S. securities. The Bank of New York Mellon, Inc. serves as foreign custodian for Penn Series. There is a separate custody fee schedule for foreign securities.
Expenses and Limitations Thereon
Each Fund bears all expenses of its operations other than those incurred by PMAM and, if applicable its sub-adviser under its respective investment advisory agreement and those incurred by Penn Mutual under its administrative and corporate services agreement. PMAM and Penn Mutual have agreed to waive fees or reimburse expenses to the extent the Fund’s total expense ratio (excluding nonrecurring account fees, fees on portfolio transactions, such as exchange fees, dividends and interest on securities sold short, acquired fund fees and expenses, service fees, interest, taxes, brokerage commissions, other capitalized expenses and other non-routine expenses or extraordinary expenses not incurred in the ordinary course of a Fund’s business, but including investment advisory and administrative and corporate services fees) exceeds the applicable expense limitation for the Fund. The expense limitations for the Funds are as follows:
| Fund | | Expense Limitation |
| Money Market Fund | | 0.64% |
| Limited Maturity Bond Fund | | 0.74% |
| Quality Bond Fund | | 0.73% |
| High Yield Bond Fund | | 0.92% |
| Flexibly Managed Fund | | 0.94% |
| Balanced Fund | | 0.79% |
| Large Growth Stock Fund | | 1.02% |
| Large Cap Growth Fund | | 0.89% |
| Large Core Growth Fund | | 0.90% |
| Large Cap Value Fund | | 0.96% |
| Large Core Value Fund | | 0.96% |
| Index 500 Fund | | 0.42% |
| Mid Cap Growth Fund | | 1.00% |
| Mid Cap Value Fund | | 0.83% |
| Mid Core Value Fund | | 1.11% |
| SMID Cap Growth Fund | | 1.07% |
| Fund | | Expense Limitation |
| SMID Cap Value Fund | | 1.26% |
| Small Cap Growth Fund | | 1.13% |
| Small Cap Value Fund | | 1.02% |
| Small Cap Index Fund | | 0.74% |
| Developed International Index Fund | | 0.94% |
| International Equity Fund | | 1.20% |
| Emerging Markets Equity Fund | | 1.78% |
| Real Estate Securities Fund | | 1.02% |
| Aggressive Allocation Fund* | | 0.40% |
| Moderately Aggressive Allocation Fund* | | 0.34% |
| Moderate Allocation Fund* | | 0.34% |
| Moderately Conservative Allocation Fund* | | 0.35% |
| Conservative Allocation Fund* | | 0.38% |
| * | For FOFs, with the exception of the Balanced Fund, the operating expense limit applies only at the Fund level and does not limit the fees indirectly incurred by the FOFs through their investments in the Underlying Funds. |
Effective September 10, 2009, Penn Series, on behalf of its Money Market Fund, PMAM, and Penn Mutual, entered into an agreement whereby PMAM and Penn Mutual may temporarily and voluntarily waive fees and/or reimburse expenses in excess of their current fee waiver and expense reimbursement commitments in an effort to maintain a minimum net distribution yield for the Money Market Fund. Under the agreement, PMAM and Penn Mutual may, subject to certain minimum yield criteria, as well as a prospective three-year reimbursement period, recapture from the Money Market Fund any fees or expenses waived and/or reimbursed under this arrangement. These reimbursement payments by the Fund to PMAM and/or Penn Mutual are considered “extraordinary expenses” and are not subject to any net operating expense limitations in effect at the time of such payment. This recapture could negatively affect the Fund’s future yield.
If, at the end of each month, there is no liability of PMAM and Penn Mutual to pay the Funds such excess amount, and if payments of the advisory fee or administrative and corporate services fee at the end of prior months during the preceding three fiscal years have been reduced in excess of that required to maintain expenses within the expense
Penn Series Funds, Inc.
Notes to Financial Statements — December 31, 2021
limitation, such excess reduction is eligible to be recaptured by PMAM and Penn Mutual and, if recaptured, would become payable by the Funds to PMAM and Penn Mutual along with the advisory fee or administrative and corporate services fee for that month, as applicable. Penn Mutual and/or PMAM’s election not to recapture the amount of any reduction and reimbursement to which it is entitled in no way impairs the rights of Penn Mutual and/or PMAM to subsequently recapture such amount, provided that such amount remains eligible for recapture and would not cause the Fund to exceed its expense limit for that fee payment period.
As of December 31, 2021, the Money Market Fund waived and/or reimbursed administrative and corporate services fees that are subject to potential recapture by PMAM and Penn Mutual through the periods stated below. If not recaptured, the waiver and/or reimbursed administrative and corporate services fees will expire according to the table below:
| | December 31,
2023 | | December 31,
2024 | | Total |
| Money Market Fund | $ 108,890 | | $ 338,808 | | $ 447,698 |
As of December 31, 2021, the Money Market Fund had waived and/or reimbursed advisory fees that are subject to potential recapture by PMAM through the periods stated below. If not recaptured, the waived and/or reimbursed advisory fees will expire according to the table below:
| | December 31,
2023 | | December 31,
2024 | | Total |
| Money Market Fund | $294,197 | | $ 551,705 | | $ 845,902 |
During the year ended December 31, 2021, previously waived advisory fees were recaptured by PMAM. The recaptured fees are shown as Recaptured advisory fees on the statement of operations and are as follows:
Total fees of $550,000 were paid to Directors of Penn Series, who are not interested persons of Penn Series, for the year ended December 31, 2021. Directors who are also employees of PMAM or its affiliates and officers of the Company receive no compensation from the Company for their services.
4 — Related Party Transactions
Certain benefit plans of Penn Mutual own annuity contracts that are invested in the Penn Series Funds. The benefit plan assets that are invested in the Penn Series Funds at December 31, 2021 are as follows:
| | |
| Money Market Fund | $ 7,897,419 |
| Limited Maturity Bond Fund | 79,012,854 |
| Quality Bond Fund | 69,279,504 |
| Large Growth Stock Fund | 12,609,745 |
| Large Core Value Fund | 13,423,555 |
| Index 500 Fund | 13,633,264 |
| SMID Cap Growth Fund | 5,332,107 |
| SMID Cap Value Fund | 5,848,287 |
| Small Cap Index Fund | 4,896,150 |
| Developed International Index Fund | 4,555,625 |
| International Equity Fund | 7,774,074 |
Penn Series Funds, Inc.
Notes to Financial Statements — December 31, 2021
Certain Funds affect trades for security purchase and sale transactions through brokers that are affiliates of the Adviser or the sub-advisers. Commissions paid on those trades from the Funds for the year ended December 31, 2021 were as follows:
| | |
| SMID Cap Growth Fund | $ 4,293 |
| Small Cap Value Fund | 14,232 |
Cross trades for the year ended December 31, 2021, were executed by the Funds pursuant to procedures adopted by the Board of Directors designed to ensure compliance with Rule 17a-7 under the 1940 Act. Cross trading is the buying or selling of portfolio securities between funds of investment companies, or between a fund of an investment company and another entity, that are or could be considered affiliates by virtue of having a common investment advisor (or affiliated investment advisors), common directors/trustees and/or common officers. At its regularly scheduled meetings, the Board of Directors review such transactions for compliance with the procedures adopted by the Board of Directors. Pursuant to these procedures, for the year ended December 31, 2021,the following Funds engaged in Rule 17a-7 securities purchases and securities sales, which resulted in net realized gain (loss) as follows:
| | Purchases | | Sales | | Gain (Loss) |
| Large Growth Stock Fund | $ 63,849 | | $ 243,516 | | $ 46,058 |
| Large Cap Growth Fund | 38,971 | | 365,802 | | 114,354 |
A Summary of the FOF’s total long-term and short-term purchases and sales of the shares of the underlying Funds during the year ended December 31, 2021 as follows:
| Balanced Fund | | Total
Value at
12/31/20 | | Purchases | | Sales
Proceeds | | Realized
Gain (Loss) | | Net Change in
Unrealized
Appreciation
(Depreciation) | | Total
Value at
12/31/21 | | Number of
Shares | | Dividend
Income |
| Affiliated Equity Funds — 60.2% | | | | | | | | | | | | |
| Penn Series Index 500 Fund* | | $50,418,091 | | $ 2,650,791 | | $ 10,617,844 | | $8,448,096 | | $ 4,951,076 | | $55,850,210 | | 1,347,412 | | $— |
| Affiliated Fixed Income Funds — 39.7% | | | | | | | | | | | | |
| Penn Series Quality Bond Fund* | | 33,133,049 | | 7,288,556 | | 3,397,655 | | 943,414 | | (1,144,793) | | 36,822,571 | | 2,135,880 | | — |
| | | $ 83,551,140 | | $9,939,347 | | $14,015,499 | | $ 9,391,510 | | $ 3,806,283 | | $ 92,672,781 | | | | $— |
| * | Non-income producing security. |
| Aggressive Allocation Fund | | Total
Value at
12/31/20 | | Purchases | | Sales
Proceeds | | Realized
Gain (Loss) | | Net Change in
Unrealized
Appreciation
(Depreciation) | | Total
Value at
12/31/21 | | Number of
Shares | | Dividend
Income |
| Affiliated Equity Funds — 61.6% | | | | | | | | | | | | |
| Penn Series Flexibly Managed Fund* | | $ 2,091,920 | | $2,348,080 | | $ 790,609 | | $ 405,697 | | $ 110,072 | | $ 4,165,160 | | 45,661 | | $— |
| Penn Series Index 500 Fund* | | 9,108,655 | | 1,385,563 | | 2,337,951 | | 1,014,071 | | 1,290,501 | | 10,460,839 | | 252,372 | | — |
| Penn Series Large Cap Growth Fund* | | 2,105,718 | | 148,964 | | 632,767 | | 339,636 | | 148,826 | | 2,110,377 | | 54,872 | | — |
| Penn Series Large Cap Value Fund* | | 5,525,659 | | 334,808 | | 1,591,416 | | 630,651 | | 742,907 | | 5,642,609 | | 133,143 | | — |
| Penn Series Large Core Value Fund* | | 5,573,204 | | 393,573 | | 1,547,468 | | 589,689 | | 630,112 | | 5,639,110 | | 195,463 | | — |
| Penn Series Large Growth Stock Fund* | | 703,324 | | 59,694 | | 184,787 | | 118,799 | | (8,684) | | 688,346 | | 8,282 | | — |
| Penn Series Mid Cap Growth Fund* | | 1,406,780 | | 109,783 | | 331,877 | | 217,863 | | 4,076 | | 1,406,625 | | 30,753 | | — |
| Penn Series Mid Cap Value Fund* | | 1,390,827 | | 134,138 | | 354,464 | | (1,127) | | 245,502 | | 1,414,876 | | 51,134 | | — |
| Penn Series Mid Core Value Fund* | | 4,819,103 | | 454,644 | | 2,697,865 | | 1,018,806 | | (49,572) | | 3,545,116 | | 105,196 | | — |
| Penn Series Real Estate Securities Fund* | | 2,084,307 | | 100,526 | | 781,258 | | 296,897 | | 458,550 | | 2,159,022 | | 57,375 | | — |
| Penn Series Small Cap Growth Fund* | | 2,125,222 | | 177,965 | | 1,059,683 | | 577,370 | | (415,646) | | 1,405,228 | | 20,632 | | — |
| Penn Series Small Cap Index Fund* | | — | | 2,346,333 | | 175,865 | | (6,402) | | (49,078) | | 2,114,988 | | 61,446 | | — |
| Penn Series Small Cap Value Fund* | | 691,986 | | 2,340 | | 847,551 | | 294,624 | | (141,399) | | — | | — | | — |
| Penn Series SMID Cap Growth Fund* | | 1,405,496 | | 231,663 | | 353,179 | | 237,986 | | (122,698) | | 1,399,268 | | 24,797 | | — |
| Penn Series SMID Cap Value Fund* | | 1,379,173 | | 157,524 | | 573,102 | | 133,065 | | 310,206 | | 1,406,866 | | 36,055 | | — |
| Affiliated Fixed Income Funds — 7.8% | | | | | | | | | | | | |
| Penn Series High Yield Bond Fund* | | 2,077,767 | | 308,558 | | 412,411 | | 110,267 | | (6,290) | | 2,077,891 | | 123,390 | | — |
| Penn Series Limited Maturity Bond Fund* | | 4,135,698 | | 566,885 | | 1,271,902 | | 120,275 | | (103,860) | | 3,447,096 | | 257,631 | | — |
Penn Series Funds, Inc.
Notes to Financial Statements — December 31, 2021
| Aggressive Allocation Fund | | Total
Value at
12/31/20 | | Purchases | | Sales
Proceeds | | Realized
Gain (Loss) | | Net Change in
Unrealized
Appreciation
(Depreciation) | | Total
Value at
12/31/21 | | Number of
Shares | | Dividend
Income |
| Affiliated International Equity Funds — 29.9% | | | | | | | | | | | | |
| Penn Series Developed International Index Fund* | | $ 8,391,838 | | $ 1,039,005 | | $ 1,837,609 | | $ 632,564 | | $ 204,778 | | $ 8,430,576 | | 478,466 | | $— |
| Penn Series Emerging Markets Equity Fund* | | 6,266,040 | | 460,093 | | 2,408,369 | | 714,771 | | (863,648) | | 4,168,887 | | 296,086 | | — |
| Penn Series International Equity Fund* | | 8,458,497 | | 1,373,877 | | 2,340,036 | | 1,029,542 | | (24,638) | | 8,497,242 | | 194,045 | | — |
| | | $69,741,214 | | $ 12,134,016 | | $22,530,169 | | $8,475,044 | | $2,360,017 | | $ 70,180,122 | | | | $— |
| * | Non-income producing security. |
| Moderately Aggressive Allocation Fund | | Total
Value at
12/31/20 | | Purchases | | Sales
Proceeds | | Realized
Gain (Loss) | | Net Change in
Unrealized
Appreciation
(Depreciation) | | Total
Value at
12/31/21 | | Number of
Shares | | Dividend
Income |
| Affiliated Equity Funds — 57.9% | | | | | | | | | | | | |
| Penn Series Flexibly Managed Fund* | | $ 13,577,317 | | $ 704,813 | | $ 2,123,502 | | $ 1,173,682 | | $ 1,255,067 | | $ 14,587,377 | | 159,914 | | $— |
| Penn Series Index 500 Fund* | | 27,284,185 | | 1,908,702 | | 4,747,324 | | 3,373,938 | | 3,930,000 | | 31,749,501 | | 765,971 | | — |
| Penn Series Large Cap Growth Fund* | | 6,832,663 | | 341,486 | | 1,472,722 | | 888,650 | | 800,443 | | 7,390,520 | | 192,161 | | — |
| Penn Series Large Cap Value Fund* | | 17,932,855 | | 780,313 | | 3,677,127 | | 1,980,158 | | 2,744,363 | | 19,760,562 | | 466,271 | | — |
| Penn Series Large Core Value Fund* | | 18,086,695 | | 922,254 | | 3,457,228 | | 1,528,258 | | 2,668,512 | | 19,748,491 | | 684,523 | | — |
| Penn Series Large Growth Stock Fund* | | 2,281,886 | | 155,438 | | 401,455 | | 260,483 | | 114,277 | | 2,410,629 | | 29,005 | | — |
| Penn Series Mid Cap Growth Fund* | | 4,563,845 | | 268,194 | | 656,405 | | 445,102 | | 305,049 | | 4,925,785 | | 107,691 | | — |
| Penn Series Mid Cap Value Fund* | | 2,256,861 | | 177,538 | | 376,726 | | 3,278 | | 416,440 | | 2,477,391 | | 89,533 | | — |
| Penn Series Mid Core Value Fund* | | 13,405,724 | | 1,010,199 | | 4,909,081 | | 2,292,944 | | 615,120 | | 12,414,906 | | 368,395 | | — |
| Penn Series Real Estate Securities Fund* | | 6,764,666 | | 215,972 | | 2,030,805 | | 984,363 | | 1,626,261 | | 7,560,457 | | 200,916 | | — |
| Penn Series Small Cap Growth Fund* | | 4,596,502 | | 258,535 | | 2,724,840 | | 1,562,995 | | (1,232,730) | | 2,460,462 | | 36,125 | | — |
| Penn Series Small Cap Index Fund* | | 2,251,494 | | 8,152,564 | | 669,817 | | 270,138 | | (129,258) | | 9,875,121 | | 286,901 | | — |
| Penn Series Small Cap Value Fund* | | 2,245,777 | | 4,361 | | 2,768,631 | | 1,008,455 | | (489,962) | | — | | — | | — |
| Penn Series SMID Cap Growth Fund* | | 2,279,769 | | 351,730 | | 368,845 | | 246,521 | | (59,112) | | 2,450,063 | | 43,418 | | — |
| Penn Series SMID Cap Value Fund* | | 4,476,291 | | 437,057 | | 1,497,660 | | 355,431 | | 1,155,538 | | 4,926,657 | | 126,260 | | — |
| Affiliated Fixed Income Funds — 17.6% | | | | | | | | | | | | |
| Penn Series High Yield Bond Fund* | | 6,742,671 | | 857,159 | | 678,199 | | 221,984 | | 133,933 | | 7,277,548 | | 432,159 | | — |
| Penn Series Limited Maturity Bond Fund* | | 22,368,592 | | 3,952,930 | | 2,260,663 | | 219,326 | | (133,601) | | 24,146,584 | | 1,804,677 | | — |
| Penn Series Quality Bond Fund* | | 11,206,295 | | 2,059,871 | | 1,130,331 | | 201,432 | | (258,977) | | 12,078,290 | | 700,597 | | — |
| Affiliated International Equity Funds — 24.0% | | | | | | | | | | | | |
| Penn Series Developed International Index Fund* | | 20,422,519 | | 2,167,632 | | 2,594,836 | | 929,043 | | 1,219,090 | | 22,143,448 | | 1,256,722 | | — |
| Penn Series Emerging Markets Equity Fund* | | 13,555,460 | | 1,495,602 | | 2,096,077 | | 504,276 | | (1,291,650) | | 12,167,611 | | 864,177 | | — |
| Penn Series International Equity Fund* | | 22,869,659 | | 3,402,120 | | 4,389,767 | | 2,070,886 | | 844,692 | | 24,797,590 | | 566,284 | | — |
| | | $226,001,726 | | $29,624,470 | | $45,032,041 | | $20,521,343 | | $14,233,495 | | $245,348,993 | | | | $— |
| * | Non-income producing security. |
| Moderate Allocation Fund | | Total
Value at
12/31/20 | | Purchases | | Sales
Proceeds | | Realized
Gain (Loss) | | Net Change in
Unrealized
Appreciation
(Depreciation) | | Total
Value at
12/31/21 | | Number of
Shares | | Dividend
Income |
| Affiliated Equity Funds — 45.1% | | | | | | | | | | | | |
| Penn Series Flexibly Managed Fund* | | $ 17,101,758 | | $ 315,112 | | $ 3,225,880 | | $ 2,196,910 | | $ 747,194 | | $ 17,135,094 | | 187,844 | | $— |
| Penn Series Index 500 Fund* | | 28,639,156 | | 4,787,464 | | 6,413,634 | | 3,316,364 | | 4,096,964 | | 34,426,314 | | 830,550 | | — |
| Penn Series Large Cap Growth Fund* | | 5,737,635 | | 103,800 | | 1,411,939 | | 766,542 | | 591,670 | | 5,787,708 | | 150,486 | | — |
| Penn Series Large Cap Value Fund* | | 14,117,300 | | 386,185 | | 3,620,505 | | 875,878 | | 2,748,861 | | 14,507,719 | | 342,325 | | — |
| Penn Series Large Core Value Fund* | | 14,238,346 | | 451,719 | | 3,412,792 | | 1,240,338 | | 1,981,242 | | 14,498,853 | | 502,560 | | — |
| Penn Series Large Growth Stock Fund* | | 2,874,374 | | 88,816 | | 586,014 | | 408,391 | | 46,127 | | 2,831,694 | | 34,072 | | — |
| Penn Series Mid Cap Growth Fund* | | 5,748,860 | | 128,994 | | 999,845 | | 669,026 | | 239,450 | | 5,786,485 | | 126,508 | | — |
| Penn Series Mid Core Value Fund* | | 19,699,649 | | 993,374 | | 10,226,096 | | 4,488,674 | | (371,845) | | 14,583,756 | | 432,752 | | — |
| Penn Series Real Estate Securities Fund* | | 5,680,351 | | 103,800 | | 1,974,162 | | 1,294,796 | | 816,270 | | 5,921,055 | | 157,349 | | — |
Penn Series Funds, Inc.
Notes to Financial Statements — December 31, 2021
| Moderate Allocation Fund | | Total
Value at
12/31/20 | | Purchases | | Sales
Proceeds | | Realized
Gain (Loss) | | Net Change in
Unrealized
Appreciation
(Depreciation) | | Total
Value at
12/31/21 | | Number of
Shares | | Dividend
Income |
| Penn Series Small Cap Growth Fund* | | $ 2,895,045 | | $ 25,908 | | $ 3,085,205 | | $ 1,591,580 | | $ (1,427,328) | | $ — | | — | | $— |
| Penn Series Small Cap Index Fund* | | 2,835,996 | | 6,569,447 | | 868,283 | | 363,361 | | (199,967) | | 8,700,554 | | 252,776 | | — |
| Penn Series Small Cap Value Fund* | | 2,828,706 | | 25,908 | | 3,508,937 | | 1,352,124 | | (697,801) | | — | | — | | — |
| Penn Series SMID Cap Growth Fund* | | 2,871,760 | | 349,922 | | 574,593 | | 354,755 | | (123,685) | | 2,878,159 | | 51,004 | | — |
| Penn Series SMID Cap Value Fund* | | 2,819,070 | | 193,552 | | 1,056,203 | | 248,358 | | 688,890 | | 2,893,667 | | 74,159 | | — |
| Affiliated Fixed Income Funds — 37.4% | | | | | | | | | | | | |
| Penn Series High Yield Bond Fund* | | 11,324,074 | | 862,190 | | 1,364,125 | | 561,167 | | 14,785 | | 11,398,091 | | 676,846 | | — |
| Penn Series Limited Maturity Bond Fund* | | 39,445,589 | | 4,887,297 | | 4,774,438 | | 490,283 | | (339,860) | | 39,708,871 | | 2,967,778 | | — |
| Penn Series Quality Bond Fund* | | 56,461,745 | | 7,436,375 | | 6,820,625 | | 1,580,995 | | (1,908,261) | | 56,750,229 | | 3,291,777 | | — |
| Affiliated International Equity Funds — 17.1% | | | | | | | | | | | | |
| Penn Series Developed International Index Fund* | | 14,291,402 | | 1,013,226 | | 2,325,737 | | 1,098,990 | | 373,064 | | 14,450,945 | | 820,144 | | — |
| Penn Series Emerging Markets Equity Fund* | | 14,228,589 | | 2,647,074 | | 1,801,808 | | 557,857 | | (1,338,966) | | 14,292,746 | | 1,015,110 | | — |
| Penn Series International Equity Fund* | | 20,165,213 | | 2,192,459 | | 4,424,953 | | 2,430,263 | | 27,955 | | 20,390,937 | | 465,653 | | — |
| | | $284,004,618 | | $33,562,622 | | $ 62,475,774 | | $25,886,652 | | $ 5,964,759 | | $286,942,877 | | | | $— |
| * | Non-income producing security. |
| Moderately Conservative Allocation Fund | | Total
Value at
12/31/20 | | Purchases | | Sales
Proceeds | | Realized
Gain (Loss) | | Net Change in
Unrealized
Appreciation
(Depreciation) | | Total
Value at
12/31/21 | | Number of
Shares | | Dividend
Income |
| Affiliated Equity Funds — 33.1% | | | | | | | | | | | | |
| Penn Series Flexibly Managed Fund* | | $ 7,530,019 | | $ 1,032,396 | | $ 1,958,686 | | $ 1,337,045 | | $ (33,801) | | $ 7,906,973 | | 86,680 | | $— |
| Penn Series Index 500 Fund* | | 5,674,530 | | 774,297 | | 1,956,176 | | 625,657 | | 838,879 | | 5,957,187 | | 143,720 | | — |
| Penn Series Large Cap Growth Fund* | | 1,894,754 | | 258,099 | | 601,974 | | 322,977 | | 129,142 | | 2,002,998 | | 52,080 | | — |
| Penn Series Large Cap Value Fund* | | 4,661,923 | | 686,086 | | 1,535,786 | | 417,928 | | 790,655 | | 5,020,806 | | 118,471 | | — |
| Penn Series Large Core Value Fund* | | 4,701,901 | | 707,593 | | 1,470,751 | | 510,385 | | 568,604 | | 5,017,732 | | 173,925 | | — |
| Penn Series Mid Core Value Fund* | | 2,788,016 | | 475,560 | | 849,451 | | 290,173 | | 323,952 | | 3,028,250 | | 89,859 | | — |
| Penn Series Real Estate Securities Fund* | | 1,875,876 | | 258,099 | | 788,346 | | 411,763 | | 291,695 | | 2,049,087 | | 54,454 | | — |
| Penn Series Small Cap Index Fund* | | — | | 1,157,535 | | 110,623 | | (4,770) | | (38,479) | | 1,003,663 | | 29,159 | | — |
| Penn Series Small Cap Value Fund* | | 934,128 | | 32,716 | | 1,184,924 | | 409,416 | | (191,336) | | — | | — | | — |
| Penn Series SMID Cap Value Fund* | | 930,946 | | 173,993 | | 416,779 | | 93,762 | | 219,507 | | 1,001,429 | | 25,665 | | — |
| Affiliated Fixed Income Funds — 56.1% | | | | | | | | | | | | |
| Penn Series High Yield Bond Fund* | | 4,674,469 | | 803,170 | | 785,342 | | 315,195 | | (76,566) | | 4,930,926 | | 292,810 | | — |
| Penn Series Limited Maturity Bond Fund* | | 21,400,280 | | 4,710,533 | | 3,612,574 | | 401,941 | | (322,614) | | 22,577,566 | | 1,687,411 | | — |
| Penn Series Quality Bond Fund* | | 27,036,123 | | 6,171,693 | | 4,554,983 | | 1,050,439 | | (1,224,248) | | 28,479,024 | | 1,651,916 | | — |
| Affiliated International Equity Funds — 10.0% | | | | | | | | | | | | |
| Penn Series Developed International Index Fund* | | 2,831,601 | | 534,722 | | 658,384 | | 231,079 | | 61,675 | | 3,000,693 | | 170,300 | | — |
| Penn Series Emerging Markets Equity Fund* | | 1,879,472 | | 560,607 | | 357,941 | | 115,678 | | (219,251) | | 1,978,565 | | 140,523 | | — |
| Penn Series International Equity Fund* | | 4,756,528 | | 995,969 | | 1,292,236 | | 558,537 | | 21,782 | | 5,040,580 | | 115,108 | | — |
| | | $93,570,566 | | $19,333,068 | | $22,134,956 | | $ 7,087,205 | | $ 1,139,596 | | $98,995,479 | | | | $— |
| * | Non-income producing security. |
| Conservative Allocation Fund | | Total
Value at
12/31/20 | | Purchases | | Sales
Proceeds | | Realized
Gain (Loss) | | Net Change in
Unrealized
Appreciation
(Depreciation) | | Total
Value at
12/31/21 | | Number of
Shares | | Dividend
Income |
| Affiliated Equity Funds — 19.9% | | | | | | | | | | | | |
| Penn Series Flexibly Managed Fund* | | $ 4,871,864 | | $ 894,067 | | $ 1,914,735 | | $ 818,480 | | $ 1,002 | | $ 4,670,678 | | 51,202 | | $— |
| Penn Series Index 500 Fund* | | 2,447,580 | | 447,034 | | 1,160,935 | | 421,319 | | 191,384 | | 2,346,382 | | 56,608 | | — |
| Penn Series Large Cap Value Fund* | | 1,206,496 | | 231,281 | | 559,029 | | 151,557 | | 156,388 | | 1,186,693 | | 28,001 | | — |
| Penn Series Large Core Value Fund* | | 1,825,278 | | 353,943 | | 813,603 | | 232,644 | | 180,617 | | 1,778,879 | | 61,660 | | — |
Penn Series Funds, Inc.
Notes to Financial Statements — December 31, 2021
| Conservative Allocation Fund | | Total
Value at
12/31/20 | | Purchases | | Sales
Proceeds | | Realized
Gain (Loss) | | Net Change in
Unrealized
Appreciation
(Depreciation) | | Total
Value at
12/31/21 | | Number of
Shares | | Dividend
Income |
| Penn Series Mid Core Value Fund* | | $ 1,202,552 | | $ 257,089 | | $ 529,726 | | $ 143,630 | | $ 119,479 | | $ 1,193,024 | | 35,401 | | $— |
| Penn Series Real Estate Securities Fund* | | 606,835 | | 111,758 | | 333,345 | | 119,042 | | 101,208 | | 605,498 | | 16,091 | | — |
| Affiliated Fixed Income Funds — 75.5% | | | | | | | | | | | | |
| Penn Series High Yield Bond Fund* | | 3,024,248 | | 567,732 | | 828,366 | | 238,709 | | (89,749) | | 2,912,574 | | 172,956 | | — |
| Penn Series Limited Maturity Bond Fund* | | 19,864,980 | | 4,551,720 | | 5,357,413 | | 542,194 | | (469,726) | | 19,131,755 | | 1,429,877 | | — |
| Penn Series Quality Bond Fund* | | 23,523,026 | | 5,610,169 | | 6,331,486 | | 1,158,787 | | (1,341,262) | | 22,619,234 | | 1,312,020 | | — |
| Affiliated International Equity Funds — 3.0% | | | | | | | | | | | | |
| Penn Series Developed International Index Fund* | | 1,221,337 | | 277,607 | | 441,225 | | 94,128 | | 30,107 | | 1,181,954 | | 67,081 | | — |
| Penn Series International Equity Fund* | | 615,465 | | 145,170 | | 236,446 | | 69,418 | | 2,071 | | 595,678 | | 13,603 | | — |
| | | $60,409,661 | | $13,447,570 | | $18,506,309 | | $3,989,908 | | $ (1,118,481) | | $58,222,349 | | | | $— |
| * | Non-income producing security. |
5 — Purchases and Sales of Securities
During the year ended December 31, 2021, the Funds made the following purchases and sales of portfolio securities, other than short-term securities:
| | U.S. Government Securities | | Other Investment Securities |
| | Purchases | | Sales | | Purchases | | Sales |
| Limited Maturity Bond Fund | $ 23,543,342 | | $ 10,052,796 | | $ 189,737,996 | | $ 163,334,400 |
| Quality Bond Fund | 51,965,488 | | 69,949,628 | | 245,190,557 | | 205,238,138 |
| High Yield Bond Fund | — | | — | | 145,860,439 | | 145,656,125 |
| Flexibly Managed Fund | — | | — | | 2,407,020,316 | | 2,609,669,554 |
| Balanced Fund | — | | — | | 9,939,347 | | 14,015,499 |
| Large Growth Stock Fund | — | | — | | 101,086,253 | | 150,478,436 |
| Large Cap Growth Fund | — | | — | | 11,561,748 | | 17,819,894 |
| Large Core Growth Fund | — | | — | | 146,542,229 | | 153,713,721 |
| Large Cap Value Fund | — | | — | | 91,826,071 | | 113,023,396 |
| Large Core Value Fund | — | | — | | 106,754,293 | | 134,994,666 |
| Index 500 Fund | — | | — | | 20,855,031 | | 64,764,972 |
| Mid Cap Growth Fund | — | | — | | 50,850,129 | | 71,012,985 |
| Mid Cap Value Fund | — | | — | | 57,732,923 | | 65,863,893 |
| Mid Core Value Fund | — | | — | | 50,211,992 | | 69,605,720 |
| SMID Cap Growth Fund | — | | — | | 65,032,216 | | 67,716,474 |
| SMID Cap Value Fund | — | | — | | 34,725,428 | | 40,463,907 |
| Small Cap Growth Fund | — | | — | | 25,788,516 | | 46,791,428 |
| Small Cap Value Fund | — | | — | | 128,529,791 | | 160,012,746 |
| Small Cap Index Fund | — | | — | | 38,433,536 | | 28,617,068 |
| Developed International Index Fund | — | | — | | 3,485,330 | | 9,532,280 |
| International Equity Fund | — | | — | | 252,476,775 | | 283,909,443 |
| Emerging Markets Equity Fund | — | | — | | 92,103,235 | | 103,129,736 |
| Real Estate Securities Fund | — | | — | | 43,530,083 | | 63,887,936 |
| Aggressive Allocation Fund | — | | — | | 12,134,014 | | 22,530,170 |
| Moderately Aggressive Allocation Fund | — | | — | | 29,624,473 | | 45,032,041 |
| Moderate Allocation Fund | — | | — | | 33,562,625 | | 62,475,774 |
| Moderately Conservative Allocation Fund | — | | — | | 19,333,070 | | 22,134,956 |
| Conservative Allocation Fund | — | | — | | 13,447,570 | | 18,506,310 |
Penn Series Funds, Inc.
Notes to Financial Statements — December 31, 2021
6 — Federal Income Taxes
Each Fund has qualified and intends to continue to qualify as a regulated investment company (“RIC”) under Subchapter M of the Internal Revenue Code for federal income tax purposes. As such, each Fund is required to distribute all investment company taxable income and net capital gains, if any, to its shareholders in order to avoid the imposition of entity-level federal, state, and local income taxes as well as an entity-level excise tax. Except for the Money Market Fund, to the extent any Fund had undistributed investment company taxable income and net capital gains at December 31, 2021, such undistributed investment company taxable income and net capital gains were deemed distributed as consent dividends in place of regular distributions. Accordingly, no provision has been made for federal, state, or local income and excise taxes.
On December 22, 2010, The Regulated Investment Company Modernization Act of 2010 (the “Act”) was signed into law. The Act amended several tax rules impacting the Funds. Some highlights of the enacted provisions are as follows:
The Act allows for capital losses occurring in the taxable years beginning after December 22, 2010 (“post-enactment losses”) to be carried forward indefinitely. However, the Act requires any future gains to be first offset by post-enactment losses before using capital losses incurred in the taxable years beginning prior to the effective date of the Act (“pre-enactment losses”). As a result of this ordering rule, pre-enactment loss carryforwards have an increased likelihood to expire unused. Furthermore, post-enactment losses will retain their character as either long-term capital losses or short-term capital losses rather than being considered all short-term capital losses as under previous law.
The Act provides that a RIC may elect for any taxable year to treat any portion of any qualified late-year loss for such taxable year as arising on the first day of the following taxable year. The term “qualified late-year loss” means any post-October capital loss and any late-year ordinary loss.
The Act also contains simplification provisions, which are aimed at preventing disqualification of a RIC for “inadvertent” failures of the asset diversification and/or qualifying income tests.
Reclassification of Capital Accounts:
Dividends from net investment income and distributions from net realized capital gains are determined in accordance with U.S. federal income tax regulations, which may differ from those amounts determined under U.S. GAAP. These book/ tax differences are either temporary or permanent in nature. To the extent these differences are permanent, they are charged or credited to paid-in capital or accumulated net realized gain or net investment income, as appropriate, in the period that the differences arise. Accordingly, the following permanent differences as of December 31, 2021, primarily attributable to consent dividends, were reclassed between the following accounts:
| | Total
distributable
earnings
(loss) | | Increase
(Decrease)
Paid-in Capital |
| Limited Maturity Bond Fund | $ (3,660,374) | | $ 3,660,374 |
| Quality Bond Fund | (10,989,802) | | 10,989,802 |
| High Yield Bond Fund | (6,975,215) | | 6,975,215 |
| Flexibly Managed Fund | (649,518,380) | | 649,518,380 |
| Balanced Fund | (9,137,298) | | 9,137,298 |
| Large Growth Stock Fund | (57,314,055) | | 57,314,055 |
| Large Cap Growth Fund | (8,412,195) | | 8,412,195 |
| Large Core Growth Fund | (40,421,913) | | 40,421,913 |
| Large Cap Value Fund | (28,100,414) | | 28,100,414 |
| Large Core Value Fund | (32,219,479) | | 32,219,479 |
| Index 500 Fund | (51,688,064) | | 51,688,064 |
| Mid Cap Growth Fund | (33,041,972) | | 33,041,972 |
| Mid Cap Value Fund | (542,837) | | 542,837 |
| Mid Core Value Fund | (18,445,883) | | 18,445,883 |
| SMID Cap Growth Fund | (17,020,708) | | 17,020,708 |
| SMID Cap Value Fund | (2,864,642) | | 2,864,642 |
Penn Series Funds, Inc.
Notes to Financial Statements — December 31, 2021
| | Total
distributable
earnings
(loss) | | Increase
(Decrease)
Paid-in Capital |
| Small Cap Growth Fund | $ (20,549,656) | | $ 20,549,656 |
| Small Cap Value Fund | (44,935,608) | | 44,935,608 |
| Small Cap Index Fund | (12,768,316) | | 12,768,316 |
| Developed International Index Fund | (5,103,888) | | 5,103,888 |
| International Equity Fund | (63,412,357) | | 63,412,357 |
| Emerging Markets Equity Fund | (18,911,074) | | 18,911,074 |
| Real Estate Securities Fund | (14,029,621) | | 14,029,621 |
| Aggressive Allocation Fund | (8,200,854) | | 8,200,854 |
| Moderately Aggressive Allocation Fund | (19,725,435) | | 19,725,435 |
| Moderate Allocation Fund | (24,964,151) | | 24,964,151 |
| Moderately Conservative Allocation Fund | (6,770,428) | | 6,770,428 |
| Conservative Allocation Fund | (3,784,297) | | 3,784,297 |
These reclassifications had no effect on net assets or net asset value per share.
Tax character of distributions:
The tax character of dividends and distributions declared and paid or deemed distributed during the years ended December 31, 2021 and 2020 were as follows:
| | Ordinary Income and
Short-Term Capital Gains | | Long-Term Capital Gains | | Total |
| | 2021 | | 2020 | | 2021 | | 2020 | | 2021 | | 2020 |
| Money Market Fund | $ 21,353 | | $ 280,484 | | $ — | | $ — | | $ 21,353 | | $ 280,484 |
| Limited Maturity Bond Fund | 3,660,375 | | 7,034,384 | | — | | 1,567,406 | | 3,660,375 | | 8,601,790 |
| Quality Bond Fund | 10,408,652 | | 18,022,139 | | 581,151 | | 6,844,266 | | 10,989,803 | | 24,866,405 |
| High Yield Bond Fund | 6,975,214 | | 7,123,023 | | — | | — | | 6,975,214 | | 7,123,023 |
| Flexibly Managed Fund | 195,736,954 | | 170,953,177 | | 453,781,423 | | 441,249,176 | | 649,518,377 | | 612,202,353 |
| Balanced Fund | 1,241,162 | | 1,750,694 | | 12,884,778 | | 17,384,260 | | 14,125,940 | | 19,134,954 |
| Large Growth Stock Fund | 5,933,272 | | 4,837,204 | | 51,380,783 | | 28,538,979 | | 57,314,055 | | 33,376,183 |
| Large Cap Growth Fund | 872,268 | | 127,140 | | 7,539,927 | | 8,408,992 | | 8,412,195 | | 8,536,132 |
| Large Core Growth Fund | 4,420,923 | | 19,399,794 | | 36,000,990 | | 25,553,387 | | 40,421,913 | | 44,953,181 |
| Large Cap Value Fund | 7,212,972 | | 1,996,799 | | 20,887,442 | | — | | 28,100,414 | | 1,996,799 |
| Large Core Value Fund | 11,009,430 | | 2,825,057 | | 21,210,050 | | 1,542,840 | | 32,219,480 | | 4,367,897 |
| Index 500 Fund | 7,510,040 | | 7,995,616 | | 44,177,839 | | 66,750,489 | | 51,687,879 | | 74,746,105 |
| Mid Cap Growth Fund | — | | — | | 33,041,972 | | 23,161,228 | | 33,041,972 | | 23,161,228 |
| Mid Cap Value Fund | 542,837 | | 1,005,956 | | — | | — | | 542,837 | | 1,005,956 |
Penn Series Funds, Inc.
Notes to Financial Statements — December 31, 2021
| | Ordinary Income and
Short-Term Capital Gains | | Long-Term Capital Gains | | Total |
| | 2021 | | 2020 | | 2021 | | 2020 | | 2021 | | 2020 |
| Mid Core Value Fund | $ 6,948,194 | | $ 986,874 | | $ 11,497,689 | | $ 562,228 | | $ 18,445,883 | | $ 1,549,102 |
| SMID Cap Growth Fund | 2,306,213 | | 8,305,898 | | 14,714,496 | | 9,833,197 | | 17,020,709 | | 18,139,095 |
| SMID Cap Value Fund | 2,864,643 | | 455,151 | | — | | — | | 2,864,643 | | 455,151 |
| Small Cap Growth Fund | 3,001,820 | | — | | 17,548,296 | | 7,325,859 | | 20,550,116 | | 7,325,859 |
| Small Cap Value Fund | 20,918,874 | | 938,778 | | 24,016,729 | | — | | 44,935,603 | | 938,778 |
| Small Cap Index Fund | 1,856,813 | | 1,170,684 | | 10,911,503 | | 7,302,631 | | 12,768,316 | | 8,473,315 |
| Developed International Index Fund | 2,667,317 | | 1,986,014 | | 2,436,570 | | 1,907,408 | | 5,103,887 | | 3,893,422 |
| International Equity Fund | 5,989,745 | | 2,186,488 | | 57,422,610 | | 23,387,435 | | 63,412,355 | | 25,573,923 |
| Emerging Markets Equity Fund | 5,615,466 | | 1,149,422 | | 13,295,608 | | — | | 18,911,074 | | 1,149,422 |
| Real Estate Securities Fund | 1,161,507 | | 1,834,015 | | 12,868,114 | | — | | 14,029,621 | | 1,834,015 |
| Aggressive Allocation Fund | 1,681,712 | | 839,709 | | 14,115,541 | | 7,600,653 | | 15,797,253 | | 8,440,362 |
| Moderately Aggressive Allocation Fund | 6,036,323 | | 3,243,583 | | 39,308,858 | | 25,962,614 | | 45,345,181 | | 29,206,197 |
| Moderate Allocation Fund | 6,688,233 | | 5,393,187 | | 43,116,939 | | 35,292,752 | | 49,805,172 | | 40,685,939 |
| Moderately Conservative Allocation Fund | 2,238,079 | | 2,151,240 | | 11,019,657 | | 8,796,197 | | 13,257,736 | | 10,947,437 |
| Conservative Allocation Fund | 1,173,776 | | 1,699,850 | | 5,120,919 | | 4,372,679 | | 6,294,695 | | 6,072,529 |
Short-term gain distributions to shareholders are treated as ordinary income for tax purposes.
Capital loss carryforwards:
At December 31, 2021, the following Funds had capital loss carryforwards (post-enactment losses) available to offset future realized capital gains:
| | Short-Term
Capital Loss | | Long-Term
Capital Loss |
| Limited Maturity Bond Fund | $ — | | $ (137,497) |
Penn Series Funds, Inc.
Notes to Financial Statements — December 31, 2021
| | Short-Term
Capital Loss | | Long-Term
Capital Loss |
| High Yield Bond Fund | $— | | $ (46,730) |
| Mid Cap Value Fund | — | | (6,458,222) |
During the year ended December 31, 2021, the following Funds utilized capital loss carryforwards to offset realized capital gains for federal income tax purposes in the following approximate amounts:
| | |
| Money Market Fund | $ 80 |
| High Yield Bond Fund | 6,521,494 |
| Large Cap Value Fund | 4,960,377 |
| Mid Cap Value Fund | 13,954,491 |
| SMID Cap Value Fund | 8,005,009 |
| Small Cap Value Fund | 2,134,627 |
| Real Estate Securities Fund | 3,595,565 |
Tax cost of securities:
At December 31, 2021, the total cost of securities and net realized gains or losses on securities sold for federal income tax purposes were different from amounts reported for financial reporting purposes. The federal tax cost, aggregate gross unrealized appreciation and depreciation of securities held by each Fund at December 31, 2021 were as follows:
| | Federal
Tax Cost | | Unrealized
Appreciation | | Unrealized
Depreciation | | Net Unrealized
Appreciation/
Depreciation |
| Money Market Fund | $ 161,778,989 | | $ 1 | | $ — | | $ 1 |
| Limited Maturity Bond Fund | 260,922,373 | | 1,394,505 | | (4,426,136) | | (3,031,631) |
| Quality Bond Fund | 461,108,223 | | 9,792,601 | | (3,280,094) | | 6,512,507 |
| High Yield Bond Fund | 161,449,459 | | 4,288,778 | | (208,239) | | 4,080,539 |
| Flexibly Managed Fund | 4,499,404,725 | | 1,118,023,165 | | (86,360,656) | | 1,031,662,509 |
| Balanced Fund | 56,085,630 | | 37,006,173 | | (131,048) | | 36,875,125 |
| Large Growth Stock Fund | 235,162,164 | | 205,359,477 | | (11,902,638) | | 193,456,839 |
| Large Cap Growth Fund | 45,347,431 | | 34,850,274 | | (611,311) | | 34,238,963 |
| Large Core Growth Fund | 176,612,858 | | 39,487,865 | | (13,205,461) | | 26,282,404 |
| Large Cap Value Fund | 161,188,600 | | 44,979,605 | | (2,597,578) | | 42,382,027 |
| Large Core Value Fund | 157,505,109 | | 36,997,624 | | (4,356,757) | | 32,640,867 |
| Index 500 Fund | 302,191,538 | | 415,856,415 | | (14,315,743) | | 401,540,672 |
| Mid Cap Growth Fund | 117,281,383 | | 95,714,101 | | (2,761,361) | | 92,952,740 |
| Mid Cap Value Fund | 82,433,092 | | 24,059,022 | | (1,605,137) | | 22,453,885 |
| Mid Core Value Fund | 81,807,040 | | 15,481,191 | | (2,613,146) | | 12,868,045 |
| SMID Cap Growth Fund | 84,012,420 | | 22,655,956 | | (4,238,314) | | 18,417,642 |
| SMID Cap Value Fund | 57,070,915 | | 17,012,796 | | (1,807,216) | | 15,205,580 |
| Small Cap Growth Fund | 82,807,180 | | 61,157,130 | | (3,996,882) | | 57,160,248 |
| Small Cap Value Fund | 169,226,957 | | 39,565,086 | | (8,828,238) | | 30,736,848 |
| Small Cap Index Fund | 80,928,394 | | 28,343,122 | | (11,125,241) | | 17,217,881 |
| Developed International Index Fund | 77,628,843 | | 49,763,533 | | (14,486,082) | | 35,277,451 |
| International Equity Fund | 296,332,020 | | 66,511,211 | | (11,731,540) | | 54,779,671 |
| Emerging Markets Equity Fund | 117,789,305 | | 20,624,761 | | (9,823,669) | | 10,801,092 |
| Real Estate Securities Fund | 101,696,268 | | 42,245,005 | | (777,914) | | 41,467,091 |
| Aggressive Allocation Fund | 51,250,553 | | 19,322,607 | | (85,799) | | 19,236,808 |
| Moderately Aggressive Allocation Fund | 173,401,900 | | 73,250,342 | | (120,861) | | 73,129,481 |
| Moderate Allocation Fund | 210,670,450 | | 76,936,778 | | (88,856) | | 76,847,922 |
Penn Series Funds, Inc.
Notes to Financial Statements — December 31, 2021
| | Federal
Tax Cost | | Unrealized
Appreciation | | Unrealized
Depreciation | | Net Unrealized
Appreciation/
Depreciation |
| Moderately Conservative Allocation Fund | $ 81,210,930 | | $ 18,637,030 | | $ (81,414) | | $ 18,555,616 |
| Conservative Allocation Fund | 52,465,441 | | 6,693,020 | | (19,513) | | 6,673,507 |
The differences between book basis and tax basis appreciation are primarily due to wash sales, Passive Foreign Investment Companies, Partnership Investments, Trust Preferred Securities, real estate investment trust adjustments, and the treatment of certain corporate actions.
It is each Fund’s policy to continue to comply with the requirements of the Internal Revenue Code under Subchapter M, applicable to regulated investment companies, and to distribute all of its taxable income, including any net realized gains on investments, to its shareholders. Therefore, no provision is made for federal income taxes.
Management of the Funds has reviewed tax positions taken in tax years that remain subject to examination by all major tax jurisdictions, including federal (i.e., the last four tax year ends and the interim tax period since then, as applicable). Management believes that there is no tax liability resulting from unrecognized tax benefits related to uncertain tax positions taken.
7 — Derivative Financial Instruments
The Funds may trade derivative financial instruments in the normal course of investing activities to assist in managing exposure to market risks such as interest rates and foreign currency exchange rates. These financial instruments include purchase options, written options, forward foreign currency exchange contracts and futures contracts.
The notional or contractual amounts of these instruments represent the investment the Funds have in particular classes of financial instruments and do not necessarily represent the amounts potentially subject to risk. The measurement of the risks associated with these instruments is meaningful only when all related and offsetting transactions are considered.
Futures Contracts—A futures contract is a standardized contract between two parties to buy or sell a specified asset at a specified future date at a price agreed today (the future price). The party agreeing to buy the underlying asset in the future assumes a long position. The price is determined by the instantaneous equilibrium between the forces of supply and demand among competing buy and sell orders on the exchange at the time of the purchase or sale of the contract.
To the extent permitted by the investment objective, restrictions and policies set forth in the Funds’ Prospectus and Statement of Additional Information, the Funds may participate in various derivative-based transactions. The Index 500, Developed International Index and Small Cap Index Funds employ futures to maintain market exposure and otherwise assist in attempting to replicate the performance of their respective indices. These derivatives offer unique characteristics and risks that assist the Funds in meeting their investment objectives. The Funds typically use derivatives in two ways: cash equitization and return enhancement. Cash equitization is a technique that may be used by the Funds through the use of futures contracts to earn “market-like” returns with the Funds’ excess and liquidity reserve cash balances and receivables. Return enhancement can be accomplished through the use of derivatives in the Funds. By purchasing these instruments, the Funds may more effectively achieve the desired fund characteristics that assist in meeting the Funds’ investment objectives.
Futures contracts involve a number of risks, such as possible default by the counterparty to the transaction, credit risk with respect to initial and variation margins held in a brokerage account, market movement and the potential of greater loss than if these techniques had not been used by a Fund. These investments can also increase the Fund’s share price and expose the Fund to significant additional costs.
The Limited Maturity Bond, Quality Bond, Index 500, Small Cap Index and Developed International Index Funds have entered into futures contracts during the year ended December 31, 2021. Open futures contracts held by the
Penn Series Funds, Inc.
Notes to Financial Statements — December 31, 2021
Limited Maturity Bond, Quality Bond, Index 500, Small Cap Index and Developed International Index Funds at December 31, 2021 are listed after the Fund’s Schedule of Investments.
Options— An option establishes a contract between two parties concerning the buying or selling of an asset at a reference price. The buyer of the option gains the right, but not the obligation, to engage in some specific transaction on the asset, while the seller incurs the obligation to fulfill the transaction if so requested by the buyer. The price of an option derives from the difference between the reference price and the value of the underlying asset plus a premium based on the time remaining until the expiration of the option. The Funds may buy and sell options, or write options.
Options are valued daily based upon the last sale price on the principal exchange on which the option is traded. The difference between the premium received or paid, and market value of the option, is recorded as unrealized appreciation or depreciation. The net change in unrealized appreciation or depreciation is reported in the Statements of Operations. When an option is exercised, the cost of the security purchased or the proceeds of the security sale are adjusted by the amount of premium received or paid. Upon the expiration or closing of the option transaction, a gain or loss is reported in the Statements of Operations.
The Flexibly Managed and Mid Cap Growth Funds received premiums for options written. The risk in writing a call option is that the Funds give up the opportunity for profit if the market price of the security increases and the option is exercised. The risk in writing a put option is that the Funds may incur a loss if the market price of the security decreases and the option is exercised. The risk in buying an option is that the Funds pay a premium whether or not the option is exercised. The Funds also have the additional risk that there may be an illiquid market where the Funds are unable to close the contract.
The total market value of written options held in the Flexibly Managed Fund as of December 31, 2021 can be found on the Schedule of Investments.
Forward Foreign Currency Contracts—A forward currency contract involves an obligation to purchase or sell a specific currency at a future date, which may be any number of days from the date of the contract agreed upon by the parties, at a price set at the time of the contract. These contracts are traded directly between currency traders and their customers. The contract is marked-to-market daily and the change in market value is recorded by each Fund as an unrealized gain or loss. When the contract is closed or offset with the same counterparty, the Fund records a realized gain or loss equal to the change in the value of the contract when it was opened and the value at the time it was closed or offset.
The Mid Core Value Fund entered into forward currency contracts in conjunction with the planned purchase or sale of foreign denominated securities in order to hedge the U.S. dollar cost or proceeds. The Fund hedged currencies in times of base currency weakness in order to reduce the volatility of returns for the local securities which the Fund owns.
Foreign forward currency contracts involve a number of risks, including the possibility of default by the counterparty to the transaction and, to the extent the portfolio manager’s judgment as to certain market movements is incorrect, the risk of losses that are greater than if the investment technique had not been used. For example, there may be an imperfect correlation between the Fund’s portfolio holdings of securities denominated in a particular currency and the forward contracts entered into by the Fund. An imperfect correlation of this type may prevent the Fund from achieving the intended hedge or expose the Fund to the risk of currency exchange loss. These investment techniques also tend to limit any potential gain that might result from an increase in the value of the hedged position. These investments can also increase the volatility of the Fund’s share price and expose the Fund to significant additional costs. The forward foreign currency contracts outstanding are listed after the Fund’s Schedule of Investments.
The following is a summary of the location of derivatives on the Funds’ Statements of Assets and Liabilities as of December 31, 2021:
| | | Location on the Statements of Assets and Liabilities |
| Derivative Type | | Asset Derivatives | | Liability Derivatives |
| Equity contracts | | Investments at value
Futures variation margin receivable* | | Call options written, at value
Futures variation margin payable* |
Penn Series Funds, Inc.
Notes to Financial Statements — December 31, 2021
| | | Location on the Statements of Assets and Liabilities |
| Derivative Type | | Asset Derivatives | | Liability Derivatives |
| Foreign currency contracts | | Net unrealized appreciation of forward
foreign currency contracts | | Net unrealized depreciation of forward
foreign currency contracts |
| Interest rate contracts | | Futures variation margin receivable* | | Futures variation margin payable* |
* Includes cumulative appreciation/depreciation of futures contracts as reported in the footnotes. Only current day’s variation margin is reported within the Statements of Assets and Liabilities.
For financial reporting purposes, the Funds do not offset derivative assets and derivative liabilities that are subject to netting arrangements in the Statements of Assets and Liabilities. The following is a summary of the gross amount of each Fund’s derivative instrument holdings categorized by primary risk exposure as of December 31, 2021:
| | ASSET DERIVATIVE VALUE | | LIABILITY DERIVATIVE VALUE |
| | Equity
Contracts | | Foreign Currency
Contracts | | Interest Rate
Contracts | | Equity
Contracts | | Foreign Currency
Contracts | | Interest Rate
Contracts |
| Limited Maturity Bond Fund | $ — | | $ — | | $ 41,992 | | $ — | | $ — | | $ (24,973) |
| Quality Bond Fund | — | | — | | 558,140 | | — | | — | | (314,045) |
| Flexibly Managed Fund | — | | — | | — | | (98,318,051) | | — | | — |
| Index 500 Fund | 86,864 | | — | | — | | — | | — | | — |
| Mid Cap Growth Fund | — | | — | | — | | (315,649) | | — | | — |
| Mid Core Value Fund | — | | 10,149 | | — | | — | | (78,823) | | — |
| Small Cap Index Fund | 23,452 | | — | | — | | — | | — | | — |
| Developed International Index Fund | 52,114 | | — | | — | | — | | — | | — |
In order to better define their contractual rights and to secure rights that will help the Funds mitigate their counterparty risk, the Funds may participate in International Swaps and Derivatives Association, Inc. Master Agreements (“ISDA Master Agreement” or “ISDA”) with derivative contract counterparties or enter into similar agreements covering foreign exchange contracts (“Fx Letters”). An ISDA Master Agreement is a bilateral agreement between a Fund and a counterparty that governs over-the-counter (“OTC”) traded derivatives and foreign exchange contracts and typically contains, among other things, collateral posting terms and netting provisions in the event of a default and/or termination event. Under an ISDA Master Agreement, a Fund may, under certain circumstances, offset with the counterparty certain derivative financial instrument’s payables and/or receivables with collateral held and/or posted and create one single net payment. The provisions of the ISDA Master Agreement typically permit a single net payment in the event of default (closeout netting) including the bankruptcy or insolvency of the counterparty. Also, bankruptcy or insolvency laws of a particular jurisdiction may impose restrictions on or prohibitions against the right of offset in bankruptcy, insolvency or other events. An Fx Letter is also a bilateral agreement between a Fund and a counterparty and is limited to cover only foreign exchange contracts. Fx Letters typically contain netting provisions covering events of default and do not require collateral to be posted. ISDAs and Fx Letters containing netting provisions may be referred to as Master Netting Agreements (“MNA”).
Collateral and margin requirements differ by type of derivative. Margin requirements are established by the broker for OTC traded derivatives or by the clearing house for exchange traded derivatives. Brokers can ask for margining in excess of the minimum in certain circumstances. Collateral terms are contract specific for OTC derivatives (foreign currency exchange contracts and options). For derivatives traded under an ISDA Master Agreement, the collateral requirements are typically calculated by netting the mark to market amount for each transaction under such agreement and comparing that amount to the value of any collateral currently pledged by a Fund and the counterparty. Generally, the amount of collateral due from or to a party has to exceed a minimum transfer amount threshold before a transfer has to be made. To the extent amounts due to a Fund from its counterparties are not fully collateralized, contractually or otherwise, the Fund bears the risk of loss from counterparty non-performance. The Fund attempts to mitigate counterparty risk by only entering into agreements with counterparties that it believes have the financial resources to honor their obligations and by monitoring the financial stability of those counterparties.
Penn Series Funds, Inc.
Notes to Financial Statements — December 31, 2021
The following table presents derivative assets and liabilities net of amounts available for offset under a MNA and, as applicable, the related collateral and potential loss exposure to each Fund as of December 31, 2021:
| | | | | Gross Amounts Presented
on Statements of Assets
and Liabilities | |
| Fund and Counterparty | | Form of
Master
Netting
Agreement | | Value of
Assets | | Value of
Liabilities | | Net Amount
Due (to)/from
Counterparty | | Collateral Pledged
(Received by
Fund) | | Loss Exposure,
After Collateral |
| Flexibly Managed Fund | | | | | | | | | | | | |
| Bank of America | | ISDA | | $ — | | $ (1,893,986) | | $ (1,893,986) | | $— | | $ (1,893,986) |
| Citigroup | | ISDA | | — | | (19,154,186) | | (19,154,186) | | — | | (19,154,186) |
| Credit Suisse | | ISDA | | — | | (11,047,120) | | (11,047,120) | | — | | (11,047,120) |
| Goldman Sachs | | ISDA | | — | | (28,595,621) | | (28,595,621) | | — | | (28,595,621) |
| JP Morgan | | ISDA | | — | | (15,681,173) | | (15,681,173) | | — | | (15,681,173) |
| RBC Capital | | ISDA | | — | | (2,208,158) | | (2,208,158) | | — | | (2,208,158) |
| Susquehanna Financial Group, Lllp | | ISDA | | — | | (19,737,807) | | (19,737,807) | | — | | (19,737,807) |
| Total | | | | $ — | | $ (98,318,051) | | $ (98,318,051) | | $— | | $ (98,318,051) |
| Mid Cap Growth Fund | | | | | | | | | | | | |
| Morgan Stanley | | ISDA | | 1,050 | | (315,649) | | (314,599) | | — | | (314,599) |
| Total | | | | $ 1,050 | | $ (315,649) | | $ (314,599) | | $— | | $ (314,599) |
| Mid Core Value Fund | | | | | | | | | | | | |
| Bank of America | | Fx Letter | | 10,149 | | (337) | | 9,812 | | — | | 9,812 |
| Credit Suisse | | Fx Letter | | — | | (17,879) | | (17,879) | | — | | (17,879) |
| JP Morgan | | Fx Letter | | — | | (45,542) | | (45,542) | | — | | (45,542) |
| UBS Securities | | Fx Letter | | — | | (15,065) | | (15,065) | | — | | (15,065) |
| Total | | | | $10,149 | | $ (78,823) | | $ (68,674) | | $— | | $ (68,674) |
The following is a summary of the location of derivatives on the Funds’ Statements of Operations as of December 31, 2021:
| Derivative Type | | Location of Gain (Loss) on Derivatives Recognized in Income |
| Equity contracts | | Net realized gain (loss) on futures contracts
Net realized gain (loss) on purchased options
Net realized gain (loss) on written options
Net change in unrealized appreciation (depreciation) of futures contracts
Net change in unrealized appreciation (depreciation) of purchased options
Net change in unrealized appreciation (depreciation) of written options |
| Interest rate contracts | | Net realized gain (loss) on futures contracts
Net change in unrealized appreciation (depreciation) of futures contracts |
| Foreign currency contracts | | Net realized gain (loss) on forward foreign currency contracts
Net change in unrealized appreciation (depreciation) of forward foreign
currency contracts |
| | | Realized Gain (Loss) on Derivatives Recognized in Income |
| Fund | | Equity Contracts | | Foreign Currency
Contracts | | Interest Rate
Contracts |
| Limited Maturity Bond Fund | | $ — | | $ — | | $ (628,258) |
| Quality Bond Fund | | — | | — | | (3,608,055) |
| High Yield Bond Fund | | — | | — | | 464,892 |
| Flexibly Managed Fund | | 7,234,302 | | — | | — |
Penn Series Funds, Inc.
Notes to Financial Statements — December 31, 2021
| | | Realized Gain (Loss) on Derivatives Recognized in Income |
| Fund | | Equity Contracts | | Foreign Currency
Contracts | | Interest Rate
Contracts |
| Large Growth Stock Fund | | $ — | | $ 128 | | $ — |
| Index 500 Fund | | 1,641,098 | | — | | — |
| Mid Cap Growth Fund | | (1,175,857) | | — | | — |
| Mid Core Value Fund | | — | | 358,813 | | — |
| Small Cap Growth Fund | | — | | (26) | | — |
| Small Cap Index Fund | | 197,906 | | — | | — |
| Developed International Index Fund | | 309,134 | | — | | — |
| | | Change in Unrealized Appreciation (Depreciation) on Derivatives
Recognized in Income |
| Fund | | Equity Contracts | | Foreign Currency
Contracts | | Interest Rate
Contracts |
| Limited Maturity Bond Fund | | $ — | | $ — | | $ (50,051) |
| Quality Bond Fund | | — | | — | | 164,822 |
| High Yield Bond Fund | | — | | — | | 13,246 |
| Flexibly Managed Fund | | (25,206,896) | | — | | — |
| Large Growth Stock Fund | | — | | (187) | | — |
| Index 500 Fund | | (78,623) | | — | | — |
| Mid Cap Growth Fund | | 73,924 | | — | | — |
| Mid Core Value Fund | | — | | (19,996) | | — |
| Small Cap Index Fund | | (20,765) | | — | | — |
| Developed International Index Fund | | 4,124 | | — | | — |
The table below summarizes the average balance of derivative holdings by Fund during the year ended December 31, 2021. The average balance of derivatives held is indicative of the trading volume of each Fund.
| | | Average Derivative Volume |
| Fund | | Forward foreign
currency
contracts
(average cost) | | Futures
contracts
(average
notional
value)
long | | Futures
contracts
(average
notional
value)
short | | Purchased
options
(average
notional
cost) | | Written
options
(premiums
received) |
| Limited Maturity Bond Fund | | $ — | | $ 86,902,389 | | $ 13,442,935 | | $ — | | $ — |
| Quality Bond Fund | | — | | 193,346,404 | | 17,720,788 | | — | | — |
| Flexibly Managed Fund | | — | | — | | — | | — | | 41,636,205 |
| Large Growth Stock Fund | | (42,916) | | — | | — | | — | | — |
| Index 500 Fund | | — | | 6,422,866 | | — | | — | | — |
| Mid Cap Growth Fund | | — | | — | | — | | 78,045 | | 219,316 |
| Mid Core Value Fund | | (6,712,601) | | — | | — | | — | | — |
| Small Cap Growth Fund | | (544) | | — | | — | | — | | — |
| Small Cap Index Fund | | — | | 1,419,553 | | — | | — | | — |
| Developed International Index Fund | | — | | 2,606,211 | | — | | — | | — |
8 — Credit and Market Risk
Recently, the global pandemic outbreak of an infectious respiratory illness caused by a novel coronavirus known as COVID-19 has resulted in substantial market volatility and global business disruption, impacting the global economy and the financial health of individual companies in significant and unforeseen ways. The duration and future impact of COVID-19 are currently unknown, which may exacerbate other types of risks that apply to the Funds and negatively impact Fund performance.
Penn Series Funds, Inc.
Notes to Financial Statements — December 31, 2021
The Funds may invest a portion of their assets in illiquid securities, which may include securities with contractual restrictions on resale, securities exempt from registration under Rule 144A of the Securities Act of 1933, as amended, and other securities which may not be readily marketable. The relative illiquidity of these securities may impair the Funds’ ability to dispose of them in a timely manner and at a fair price when it is necessary or preferable to do so.
The high yield securities in which the High Yield Bond Fund may invest are predominantly speculative as to the issuer’s continuing ability to meet principal and interest payments. The value of the lower quality securities in which the High Yield Bond Fund may invest will be affected by the credit worthiness of individual issuers, general economic and specific industry conditions, and will fluctuate inversely with changes in interest rates. In addition, the secondary trading market for lower quality bonds may be less active and less liquid than the trading market for higher quality bonds.
The High Yield Bond, Flexibly Managed, Large Core Growth, Mid Core Value, Small Cap Growth, Developed International Index, International Equity and the Emerging Markets Equity Funds invest in securities of foreign issuers in various countries. These investments may involve certain considerations and risks not typically associated with investments in the United States, as a result of, among other factors, the possibility of future political and economic developments and the level of governmental supervision and regulation of securities markets in the respective countries.
Investment in privately placed securities may be less liquid than in publicly traded securities. Although these securities may be resold in privately negotiated transactions, the prices realized from these sales could be less than those originally paid by the Funds or less than what may be considered the fair value of such securities. Further, companies whose securities are not publicly traded may not be subject to the disclosure and other investor protection requirements that might be applicable if their securities were publicly traded.
9 — Contractual Obligations
In the general course of business, the Funds enter into contracts that contain a variety of representations and warranties and which provide general indemnification. The Funds’ maximum exposure under these arrangements is unknown as this would involve future claims that may be made against the Funds and/or its affiliates that have not yet occurred. However, based on experience, management of the Funds expects the risk of loss to be remote.
10 — Recent Accounting Pronoucements and Reporting Updates
In March 2020, the FASB issued ASU No. 2020-04 (“ASU 2020-04”), Reference Rate Reform (Topic 848)—Facilitation of the Effects of Reference Rate Reform on Financial Reporting. The amendments in ASU 2020-04 provides optional temporary financial reporting relief from the effect of certain types of contract modifications due to the planned discontinuation of the London Interbank Offered Rate (LIBOR) and other interbank-offered based reference rates as of the end of 2021. ASU 2020-04 is effective for certain reference rate-related contract modifications that occur during the period March 12, 2020 through December 31, 2022. Management is currently evaluating the impact, if any, of applying ASU 2020-04.
Management is also actively working with other financial institutions and counterparties to modify contracts as required by applicable regulation and within the regulatory deadlines.
11 — Subsequent Events
Except as disclosed below, Management has evaluated the impact of all subsequent events on the Funds through the date the financial statements were issued and has determined that no additional subsequent events require recognition or disclosure in the financial statements.
Effective upon the open of markets on January 1, 2022, Ms. Eileen McDonnell retired as an “interested” (as that term is defined by the Investment Company Act of 1940) Director of the Penn Series Funds, Inc.’s (the “Company”) Board of Directors (the “Board”). Effective January 1, 2022, Mr. David O’Malley was appointed to the Board as an “interested” Director. In addition, effective January 1, 2022, Mr. Keith Huckerby has assumed the role of President of the Company.
Report of Independent Registered Public Accounting Firm
To the Shareholders of the Funds and Board of Directors
Penn Series Funds, Inc.:
Opinion on the Financial Statements
We have audited the accompanying statements of assets and liabilities of Penn Series Funds, Inc., comprised of the Money Market Fund, Limited Maturity Bond Fund, Quality Bond Fund, High Yield Bond Fund, Flexibly Managed Fund, Balanced Fund, Large Growth Stock Fund, Large Cap Growth Fund, Large Core Growth Fund, Large Cap Value Fund, Large Core Value Fund, Index 500 Fund, Mid Cap Growth Fund, Mid Cap Value Fund, Mid Core Value Fund, SMID Cap Growth Fund, SMID Cap Value Fund, Small Cap Growth Fund, Small Cap Value Fund, Small Cap Index Fund, Developed International Index Fund, International Equity Fund, Emerging Markets Equity Fund, Real Estate Securities Fund, Aggressive Allocation Fund, Moderately Aggressive Allocation Fund, Moderate Allocation Fund, Moderately Conservative Allocation Fund, and Conservative Allocation Fund (collectively, the Funds), including the schedules of investments, as of December 31, 2021, the related statements of operations for the year then ended, the statements of changes in net assets for each of the years in the two-year period then ended, and the related notes (collectively, the financial statements) and the financial highlights for each of the years in the five-year period then ended. In our opinion, the financial statements and financial highlights present fairly, in all material respects, the financial position of each of the Funds as of December 31, 2021, the results of their operations for the year then ended, the changes in their net assets for each of the years in the two-year period then ended, and the financial highlights for each of the years in the five-year period then ended, in conformity with U.S. generally accepted accounting principles.
Basis for Opinion
These financial statements and financial highlights are the responsibility of the Funds’ management. Our responsibility is to express an opinion on these financial statements and financial highlights based on our audits. We are a public accounting firm registered with the Public Company Accounting Oversight Board (United States) (PCAOB) and are required to be independent with respect to the Funds in accordance with the U.S. federal securities laws and the applicable rules and regulations of the Securities and Exchange Commission and the PCAOB.
We conducted our audits in accordance with the standards of the PCAOB. Those standards require that we plan and perform the audit to obtain reasonable assurance about whether the financial statements and financial highlights are free of material misstatement, whether due to error or fraud. Our audits included performing procedures to assess the risks of material misstatement of the financial statements and financial highlights, whether due to error or fraud, and performing procedures that respond to those risks. Such procedures included examining, on a test basis, evidence regarding the amounts and disclosures in the financial statements and financial highlights. Such procedures also included confirmation of securities owned as of December 31, 2021, by correspondence with the custodian, transfer agent, underlying companies, agent banks and brokers, or by other appropriate auditing procedures when replies were not received. Our audits also included evaluating the accounting principles used and significant estimates made by management, as well as evaluating the overall presentation of the financial statements and financial highlights. We believe that our audits provide a reasonable basis for our opinion.

We have served as the auditor of one or more Penn Series Funds, Inc. investment companies since 2004.
Philadelphia, Pennsylvania
February 21, 2022
Penn Series Funds, Inc.
December 31, 2021
Tax Information (unaudited)
Each Fund reports the following amounts distributed during the year ended December 31, 2021 as capital gain dividends:
| Fund | | Long-Term
Capital Gains |
| Quality Bond Fund | | $ 581,151 |
| Flexibly Managed Fund | | 453,781,423 |
| Balanced Fund | | 12,884,778 |
| Large Growth Stock Fund | | 51,380,783 |
| Large Cap Growth Fund | | 7,539,927 |
| Large Core Growth Fund | | 36,000,990 |
| Large Cap Value Fund | | 20,887,442 |
| Large Core Value Fund | | 21,210,050 |
| Index 500 Fund | | 44,177,839 |
| Mid Cap Growth Fund | | 33,041,972 |
| Mid Core Value Fund | | 11,497,689 |
| SMID Cap Growth Fund | | 14,714,496 |
| Small Cap Growth Fund | | 17,548,296 |
| Small Cap Value Fund | | 24,016,729 |
| Small Cap Index Fund | | 10,911,503 |
| Developed International Index Fund | | 2,436,570 |
| International Equity Fund | | 57,422,610 |
| Emerging Markets Equity Fund | | 13,295,608 |
| Real Estate Securities Fund | | 12,868,114 |
| Aggressive Allocation Fund | | 14,115,541 |
| Moderately Aggressive Allocation Fund | | 39,308,858 |
| Moderate Allocation Fund | | 43,116,939 |
| Moderately Conservative Allocation Fund | | 11,019,657 |
| Conservative Allocation Fund | | 5,120,919 |
Each Fund reports the following percentages of ordinary income dividend paid during the year ended December 31, 2021 as being eligible for the dividends received deduction available to corporate shareholders:
| Fund | |
| Quality Bond Fund | 2.32% |
| High Yield Bond Fund | 0.47% |
| Flexibly Managed Fund | 23.51% |
| Balanced Fund | 49.88% |
| Large Growth Stock Fund | 20.49% |
| Large Cap Growth Fund | 59.02% |
| Large Core Growth Fund | 2.56% |
| Large Cap Value Fund | 42.47% |
| Large Core Value Fund | 51.81% |
| Index 500 Fund | 100.00% |
| Mid Cap Value Fund | 100.00% |
| Mid Core Value Fund | 21.54% |
| SMID Cap Growth Fund | 11.12% |
| SMID Cap Value Fund | 35.03% |
| Small Cap Growth Fund | 15.08% |
| Small Cap Value Fund | 8.23% |
| Small Cap Index Fund | 37.42% |
| International Equity Fund | 4.48% |
| Emerging Markets Equity Fund | 0.45% |
| Real Estate Securities Fund | 2.59% |
Penn Series Funds, Inc.
December 31, 2021
Tax Information (unaudited) continued
| Fund | |
| Aggressive Allocation Fund | 30.79% |
| Moderately Aggressive Allocation Fund | 26.77% |
| Moderate Allocation Fund | 21.34% |
| Moderately Conservative Allocation Fund | 20.23% |
| Conservative Allocation Fund | 14.28% |
Disclosure of Portfolio Holdings
Pursuant to applicable law, the Funds are required to disclose to the SEC their complete portfolio holdings monthly on Form N-PORT, within 60 days of the end of each month and within 5 days after the end of each month for the Money Market Fund on Form N-MFP. Portfolio holdings reported for the last month of each fiscal quarter are made publicly available by the SEC 60 days after the end of the fiscal quarter. Holdings reports filed with the SEC on Forms N-PORT and N-MFP are not distributed to Fund shareholders, but are available, free of charge, on the EDGAR database on the SEC’s website at http://www.sec.gov.
Voting Proxies on Fund Portfolio Securities
A description of the policies and procedures that the Fund uses to determine how to vote proxies relating to securities held in the Fund’s portfolios is available, without charge and upon request, on the Fund’s website at http://www.pennmutual.com or on the SEC’s website at http://www.sec.gov. Information regarding how the Fund voted proxies for the most recent twelve-month period ended December 31, 2021 is available on the Fund’s website at http://www.pennmutual.com and on the SEC’s website at http://www.sec.gov.
Penn Series Funds Management (Unaudited)
| Name and Year of Birth | | Position with
the Company;
Term of Office
and Length of
Time Served | | Principal Occupation
During Past 5 Years | | Number of
Funds
Overseen by
the Director | | Other Directorships
Held by Director
During Past 5 Years |
| INDEPENDENT DIRECTORS |
| Marie K. Karpinski (1949)* | | Director;
No set term;
served since
2015. | | Retired (2010 – Present). | | 29 | | None. |
| Joanne B. Mack (1946)* | | Director;
No set term;
served since
2013. | | Management Consultant, self-employed (2009 – 2012; 2013 – Present). | | 29 | | None. |
| Archie C. MacKinlay (1955)* | | Director;
No set term;
served since
2010. | | Professor of Finance, Wharton School, University of Pennsylvania (1984 – Present). | | 29 | | None. |
| Rebecca C. Matthias (1953)* | | Director;
No set term;
served since
2010. | | Retired (2010 – Present) | | 29 | | Director, CSS Industries
(2005-2020). |
| David B. Pudlin (1949)* | | Director;
No set term;
served since
2009. | | Chief Executive Officer, President and Attorney, Hangley Aronchick Segal Pudlin & Schiller (law firm) (1994 – Present). | | 29 | | None. |
| INTERESTED DIRECTORS |
| Eileen C. McDonnell (1962)* | | Director and
Chairman of
the Board;
No set term;
served since
2010. | | Chief Executive Officer (2011 – Present), Chairman of the Board (2013 – Present), Penn Mutual; Director, PMAM (2010 – Present); President and Director (2010 – Present), Chairman of the Board (2011 – Present), PIA. | | 29 | | Director, UHS of
Delaware, Inc. |
* The address of each Director is: Penn Series Funds, Inc. 600 Dresher Road, Horsham, Pennsylvania 19044.
| Name and Year of Birth | | Position with
the Company;
Term of Office
and Length of
Time Served | | Principal Occupation
During Past 5 Years |
| | | OFFICERS |
| David M. O’Malley (1974)* | | President;
One year;
served since
2014. | | Chairman and Chief Executive Officer, PMAM (2014 – Present); President and Chief Operating Officer (2016 – Present), Penn Mutual. |
| Steven Viola (1975)* | | Treasurer
One year;
served
since 2015. | | Assistant Treasurer (2016 – Present), Senior Fund Accounting Analyst (2016 – 2017), PMAM. |
| Tyler J. Thur (1984)* | | Assistant
Treasurer
One year;
served since
Feb. 2017. | | Controller and Treasurer, PMAM (2015 – Present); |
Penn Series Funds Management (Unaudited)
| Name and Year of Birth | | Position with
the Company;
Term of Office
and Length of
Time Served | | Principal Occupation
During Past 5 Years |
| Victoria Robinson (1965)* | | Chief
Compliance
Officer
One year;
served since
October 2021;
served 2014-2019.
Secretary
One year;
served
since 2019. AML Officer One year; served since 2019. | | Chief Ethics and Compliance Officer, Penn Mutual and insurance affiliates (May 2019 – Present); Chief Compliance Officer, PMAM (October 2021 –
Present; served 2008 – 2019); Chief Compliance Officer, HTK (August 2019 – Present). |
* The address of each Officer is: Penn Series Funds, Inc. 600 Dresher Road, Horsham, Pennsylvania 19044.
Additional information about the Fund’s Directors is available in the Fund’s Statement of Additional Information, which is available upon request, without charge, by calling 1-800-523-0650.
About The Penn Mutual Life Insurance Company
Penn Mutual helps people become stronger. Our expertly crafted life insurance is vital to long-term financial health and strengthens people’s ability to enjoy every day. Working with our trusted network of financial professionals, we take the long view, building customized solutions for individuals, their families, and their businesses. Penn Mutual supports its financial professionals with retirement and investment services through its wholly owned subsidiary Hornor, Townsend & Kent, LLC, member FINRA/SIPC.
Visit Penn Mutual at www.pennmutual.com.
THE PENN MUTUAL
LIFE INSURANCE COMPANY
© 2022 The Penn Mutual Life Insurance Company, Philadelphia, PA 19172, www.pennmutual.com
Item 2. Code of Ethics.
| | (a) | The registrant, as of the end of the period covered by this report, has adopted a code of ethics that applies to the registrant’s principal executive officer, principal financial officer, principal accounting officer or controller, or persons performing similar functions, regardless of whether these individuals are employed by the registrant or a third party. |
| | (c) | There have been no amendments, during the period covered by this report, to a provision of the code of ethics that applies to the registrant’s principal executive officer, principal financial officer, principal accounting officer or controller, or persons performing similar functions, regardless of whether these individuals are employed by the registrant or a third party, and that relates to any element of the code of ethics description. |
| | (d) | The registrant has not granted any waivers, including an implicit waiver, from a provision of the code of ethics that applies to the registrant’s principal executive officer, principal financial officer, principal accounting officer or controller, or persons performing similar functions, regardless of whether these individuals are employed by the registrant or a third party, that relates to one or more of the items set forth in paragraph (b) of this item’s instructions. |
Item 3. Audit Committee Financial Expert.
The Registrant’s Board of Directors has determined that Ms. Rebecca C. Matthias qualifies as an audit committee financial expert, as defined in Item 3 of Form N-CSR. Ms. Matthias is considered independent for purposes of Item 3 of Form N-CSR.
Item 4. Principal Accountant Fees and Services.
Audit Fees
| | (a) | The aggregate fees billed for each of the last two fiscal years for professional services rendered by the principal accountant for the audit of the registrant’s annual financial statements or services that are normally provided by the accountant in connection with statutory and regulatory filings or engagements for those fiscal years are $550,000 for 2021 and $550,000 for 2020. |
Audit-Related Fees
| | (b) | The aggregate fees billed in each of the last two fiscal years for assurance and related services by the principal accountant that are reasonably related to the performance of the audit of the registrant’s financial statements and are not reported under paragraph (a) of this Item are $0 for 2021 and $0 for 2020. |
Tax Fees
| | (c) | The aggregate fees billed in each of the last two fiscal years for professional services rendered by the principal accountant for tax compliance, tax advice, and tax planning are $0 for 2021 and $0 for 2020. |
All Other Fees
| | (d) | The aggregate fees billed in each of the last two fiscal years for products and services provided by the principal accountant, other than the services reported in paragraphs (a) through (c) of this Item are $0 for 2021 and $0 for 2020. |
| | (e) | Audit Committee’s pre-approval policies and procedures described in paragraph (c)(7) of Rule 2-01 of Regulation S-X. |
| | (e)(1) | Pre-Approval of Audit and Non-Audit Services Provided to the Funds of the Penn Series Funds, Inc. To the extent required by applicable law, pre-approval by the Audit Committee of the Penn Series Funds, Inc. (the “Company”) Board of Directors is required for all audit and permissible non-audit services rendered to the Company and all permissible non-audit services rendered to the investment adviser to the Company, Penn Mutual Asset Management, Inc. (“PMAM”), or any other service providers controlling, controlled by or under common control with PMAM that provide ongoing services to the Company (“Related Entities”) that relate directly to the operations and financial reporting of the Company’s Funds. The Audit and Non-Audit Services Pre-Approval Policy (the “Policy”) adopted by the Audit Committee sets forth the procedures and the conditions pursuant to which services performed by an independent auditor for the Company may be pre-approved. Services may be pre-approved specifically by the Audit Committee as a whole or by the Audit Committee Chairman or other member of the Audit Committee as designated by the Audit Committee. The Policy sets forth the audit, audit-related, tax and all other services that are subject to general or specific pre-approval by the Audit Committee subject to specified expense limitations. The Policy provides that the Audit Committee will annually review and pre-approve the services that may be provided by the independent auditor pursuant to the pre-approval provision of the Policy. Pursuant to the Policy, the Audit Committee will consider whether the services provided by an independent auditor are consistent with the Securities and Exchange Commission’s rules and related guidance concerning auditor independence. |
| | (e)(2) | No services included in (b)-(d) above were approved pursuant to paragraph (c)(7)(i)(C) of Rule 2-01 of Regulation S-X. |
| | (g) | The aggregate non-audit fees billed by the registrant’s accountant for services rendered to the registrant, and rendered to the registrant’s investment adviser (not including any sub-adviser whose role is primarily portfolio management and is subcontracted with or overseen by another investment adviser), and any entity controlling, controlled by, or under common control with the adviser that provides ongoing services to the registrant for each of the last two fiscal years of the registrant was $0 for 2021 and $0 for 2020. |
Item 5. Audit Committee of Listed Registrants.
Not applicable.
Item 6. Investments.
| (a) | Schedule of Investments in securities of unaffiliated issuers as of the close of the reporting period is included as part of the report to shareholders filed under Item 1(a) of this form. |
Item 7. Disclosure of Proxy Voting Policies and Procedures for Closed-End Management Investment Companies.
Not applicable.
Item 8. Portfolio Managers of Closed-End Management Investment Companies.
Not applicable.
Item 9. Purchases of Equity Securities by Closed-End Management Investment Company and Affiliated Purchasers.
Not applicable.
Item 10. Submission of Matters to a Vote of Security Holders.
The shareholder meeting voting results is included as part of the report to shareholders filed under Item 1 of this form.
Item 11. Controls and Procedures.
| | (a) | The registrant’s principal executive and principal financial officers, or persons performing similar functions, have concluded that the registrant’s disclosure controls and procedures (as defined in Rule 30a-3(c) under the Investment Company Act of 1940, as amended (the “1940 Act”) (17 CFR 270.30a-3(c))) are effective, as of a date within 90 days of the filing date of the report that includes the disclosure required by this paragraph, based on their evaluation of these controls and procedures required by Rule 30a-3(b) under the 1940 Act (17 CFR 270.30a-3(b)) and Rules 13a-15(b) or 15d-15(b) under the Securities Exchange Act of 1934, as amended (17 CFR 240.13a-15(b) or 240.15d-15(b)). |
| | (b) | There were no changes in the registrant’s internal control over financial reporting (as defined in Rule 30a-3(d) under the 1940 Act (17 CFR 270.30a-3(d)) that occurred during the period covered by this report that has materially affected, or is reasonably likely to materially affect, the registrant’s internal control over financial reporting. |
Item 12. Disclosure of Securities Lending Activities for Closed-End Management Investment Companies.
Not applicable.
Item 13. Exhibits.
SIGNATURES
Pursuant to the requirements of the Securities Exchange Act of 1934 and the Investment Company Act of 1940, the registrant has duly caused this report to be signed on its behalf by the undersigned, thereunto duly authorized.
| | | | |
| (Registrant) | | Penn Series Funds, Inc. | | |
| | | | |
| By (Signature and Title)* | | /s/ Keith G. Huckerby | | |
| | Keith G. Huckerby, President (principal executive officer) | | |
Date March 7, 2022
Pursuant to the requirements of the Securities Exchange Act of 1934 and the Investment Company Act of 1940, this report has been signed below by the following persons on behalf of the registrant and in the capacities and on the dates indicated.
| | | | |
| By (Signature and Title)* | | /s/ Keith G. Huckerby | | |
| | Keith G. Huckerby, President (principal executive officer) | | |
Date March 7, 2022
| | | | |
| By (Signature and Title)* | | /s/ Steven Viola | | |
| | Steven Viola, Treasurer (principal financial officer) | | |
Date March 7, 2022
| * | Print the name and title of each signing officer under his or her signature. |