| | | | | | | |
| | 2004 ANNUAL INFORMATION FORM
For the year ended December 31, 2004
March 10, 2005
| | 
| | |
| |
| Annual Information Form |  |
Attached to this Annual Information Form is the Annual Report to shareholders for the year ended December 31, 2004 of Shell Canada Limited (Annual Report) and the Management Proxy Circular of the Corporation dated March 10, 2005 (Proxy Circular). Copies of these documents can also be found on the Corporation’s website at www.shell.ca and under Shell Canada’s profile at www.sedar.com.
| |
| | Unless the contents indicate otherwise, the terms “Shell”, “Shell Canada”, “Shell Canada Limited”, “Corporation” and “Company” are used interchangeably in this Annual Information Form to refer to Shell Canada Limited and its consolidated subsidiaries. |
| |
| | Shell Canada Limited’s Report of the Audit Committee and information pertaining to the appointment of auditors appears on pages 29 to 31 and page 32, respectively, of the Proxy Circular. The information contained therein, together with those sections of the Annual Report and Proxy Circular referenced herein, is specifically incorporated by reference into this Annual Information Form. Any sections of the Annual Report or Proxy Circular not referenced herein do not form part of this Annual Information Form. |
INDEX
| |
| Corporate Structure | |
NAME AND INCORPORATION
| |
| | Shell Canada Limited was incorporated under the laws of Canada in 1925 as the successor to The Shell Company of Canada, Limited, which was incorporated in 1911. Supplementary Letters Patent subdividing the Class “A” and Class “B” common shares on a three-for-one basis were effective May 14, 1973. Shell Canada was continued under theCanada Business Corporations Act on May 1, 1978. The Corporation was amalgamated with a wholly owned subsidiary, Shell Canada Resources Limited by Articles of Amalgamation dated January 1, 1986. Articles of Amendment effecting the conversion of the Class “B” common shares to Class “A” common shares on a four-for-one basis and deleting the Series “A” preferred shares were effective June 1, 1989. Articles of Amendment splitting the Class “A” common shares on a three-for-one basis were effective May 20, 1997. The Corporation amalgamated with a wholly owned subsidiary, 177487 Canada Ltd., effective July 1, 1998. An Amendment to the Articles of the Corporation to effect a redesignation of the Class “A” common shares of the Corporation to common shares and to delete all references to Class “B” common shares was approved by special resolution of the shareholders at their Annual and Special Meeting held April 26, 2000. Articles of Amendment effecting the changes were issued May 2, 2000. Effective May 18, 2000, a restated Certificate of Incorporation was issued consolidating prior amendments. The head and registered office of the Corporation is located at 400 – 4th Avenue S.W., Calgary, Alberta, T2P 0J4. |
INTERCORPORATE RELATIONSHIPS
| |
| | The Corporation’s principal subsidiary, Shell Canada Products Limited, which is wholly owned and was incorporated under theCanada Business Corporations Act in 1982, began carrying on business in 1986. Until December 31, 2000, it was engaged in the manufacture, distribution and marketing of refined petroleum products. |
| |
| | Effective January 1, 2001, the business of Shell Canada Products Limited was transferred to Shell Canada Products, a partnership now governed by the laws of Alberta. Shell Canada Products Limited owns 99.99 per cent of the partnership units and is the managing partner. The balance of the partnership units are held by a wholly owned subsidiary of the Corporation. |
| |
| | The Corporation’s other operating subsidiaries, in the aggregate, represent less than 20 per cent of Shell’s total consolidated revenues or total consolidated assets. |
CAPITAL STRUCTURE
| |
| | The Corporation is authorized to issue an unlimited number of common shares, an unlimited number of four per cent cumulative redeemable preference shares and an unlimited number of preferred shares. |
| |
| General Development of the Business | |
Shell Canada, one of the largest integrated petroleum companies in Canada, operates principally in three industry segments: Resources, renamed in 2004 as Exploration & Production (E&P), Oil Sands and Oil Products. The E&P segment comprises exploration, production and marketing activities for natural gas, natural gas liquids, in situ bitumen and sulphur. Shell Canada is a major producer of natural gas liquids, a large producer of natural gas and the largest producer of sulphur in Canada. The Oil Sands segment extracts bitumen from Lease 13 in the Athabasca region of northern Alberta and processes the bitumen into a range of synthetic crude oils. The Oil Products segment includes the manufacture, distribution and marketing of refined petroleum products.
THREE-YEAR HISTORY
| |
| | 20021 Shell Canada reported earnings of $555 million or $2.01 per common share compared with earnings of $1,004 million or $3.65 per share in 2001. The return on average capital employed (ROACE) of 10.1 per cent was a reduction from the previous year’s exceptional high of 21.5 per cent. E&P earnings in 2002 were $382 million compared with $595 million in 2001. Lower prices for natural gas and natural gas liquids together with higher unit costs and a $41 million after-tax write-off for the deeper section of the Onondaga exploration well contributed to the decline in earnings. E&P capital and exploration expenditures were $389 million compared with $366 million in 2001. Oil Products earnings were $197 million in 2002, down from the record $400 million in 2001. The decrease in earnings was due mainly to lower refinery and marketing margins, increased operating costs and reduced throughputs. Refinery operating costs were higher than in the previous year due to twice the normal level of turnaround activity and related reductions in refinery utilization. Oil Products capital expenditures were $433 million, including $186 million for Oil Sands-related Scotford modifications. Oil Sands started operations at the very end of 2002 and reported a loss of $5 million due primarily to capital taxes on the related assets. The Athabasca Oil Sands Project (AOSP) started up in December 2002 with the first production and sale of bitumen from the Muskeg River Mine. |
| |
| | 20031 Shell Canada reported earnings of $810 million or $2.95 per common share compared with earnings of $555 million or $2.01 per share in 2002. The ROACE of 13.1 per cent was a slight improvement over the previous year’s 10.1 per cent. Excluding the impact of Oil Sands capital, ROACE was a strong 25.5 per cent. E&P earnings in 2003 were $619 million compared with $382 million in 2002. Strong commodity prices and a gain of $32 million from the revaluation of future income taxes helped E&P achieve its best ever year in earnings. E&P capital and exploration expenditures were $431 million compared with $389 million in 2002. Oil Products earnings were $344 million in 2003, up from $197 million in 2002. The increase in earnings was due mainly to improved refinery margins. High transaction, pension and turnaround costs continued to put pressure on financial performance in 2003. Oil Products capital expenditures were $194 million compared with $433 million in 2002. Oil Sands reported positive earnings of $31 million during the last half of 2003, but a loss of production from a fire that occurred in January and the expensing of start-up costs led to a loss for the full year of $142 million. By the fourth quarter of 2003, bitumen production averaged 130,000 barrels per day or 84 per cent of design capacity. Oil Sands capital expenditures were $123 million compared with $1,460 million in 2002. |
| |
| | 2004 For highlights of 2004, reference is made to the business sections in the Management’s Discussion and Analysis section of the Annual Report found on pages 9 to 46. |
TRENDS
| |
| | 2005 For a discussion of the significant initiatives planned by the Company for 2005, reference is made to the business sections in the Management’s Discussion and Analysis section of the Annual Report on pages 9 to 46. |
| |
| 1 | 2002 and 2003 earnings have been restated to reflect the retroactive adoption of the new Canadian accounting standard relating to asset retirement obligations. |
2 GENERAL DEVELOPMENT OF THE BUSINESS
| |
| Narrative Description of the Business | |
EXPLORATION & PRODUCTION
| |
| | Shell Canada has been engaged in the exploration and production of crude oil and natural gas in Canada since 1939. From 1976 to 1985, Shell Canada’s exploration and production operations were managed and operated through a wholly owned subsidiary of the Corporation, Shell Canada Resources Limited (Shell Resources). Shell Canada Limited was amalgamated with Shell Resources on January 1, 1986, and the Resources business of Shell Canada, renamed in 2004 as Exploration & Production (E&P), became part of the operations of Shell Canada Limited. In 1999, Shell Canada sold its conventional crude oil producing interests. |
| |
| | The Corporation’s conventional oil and gas reserves disclosure and related information have been prepared in reliance on a decision of the applicable Canadian securities regulatory authorities under National Instrument 51-101 –Standards of Disclosure for Oil and Gas Activities (NI 51-101), which permits the Corporation to present its reserve disclosure in accordance with the applicable requirements of the United States Financial Accounting Standards Board (FASB) and the United States Securities and Exchange Commission (SEC). This disclosure differs from the corresponding information required by NI 51-101. If Shell Canada had not received the decision, it would be required to disclose proved plus probable oil and gas reserves estimates based on forecasted prices and costs and information relating to future net revenue using forecasted prices and costs. |
| |
| | Additional information related to E&P may be found on pages 18 to 25 of the Annual Report and in Schedule I and Schedule III on pages 20 and 21 and pages 27 and 28, respectively, of this Annual Information Form. |
Principal Products
| |
| | Shell Canada’s E&P segment is a major producer of natural gas, natural gas liquids, in situ bitumen and sulphur in Canada. |
Principal Markets and Methods of Distribution
| |
| | Natural Gas Shell Canada sells the majority of its Western Canada natural gas production to 3095381 Nova Scotia Company, an affiliated company that operates as part of the Royal Dutch/ Shell Group’s global trading organization, at Alberta market-based prices (AECO reference price). |
| |
| | The Sable Offshore Energy Project (SOEP) started up late in December 1999. It is owned jointly by Shell Canada, ExxonMobil Canada Properties, Imperial Oil Resources, Pengrowth Corporation and Mosbacher Operating Ltd. Shell’s share of natural gas production from SOEP is 31.3 per cent and is marketed both directly to end use customers in North America and to an affiliate, Coral Energy Canada Inc. |
| |
| | Natural Gas Liquids Shell Canada is a major producer and marketer of natural gas liquids (ethane, propane, butane and condensate) in Canada. Ethane is used primarily as a petrochemical feedstock and is moved by pipelines to markets in Alberta. The major markets for propane are the transportation, space-heating, petrochemical and agricultural sectors. Butane is used primarily as a direct gasoline additive and in the manufacturing of oxygenated gasoline additives. Condensate is used mainly as a diluent for heavy crude oil and as a refinery feedstock. |
| |
| | Shell Canada has investments in shared infrastructure near major market centres in Edmonton, Alberta; Sarnia, Ontario; and Point Tupper, Nova Scotia; for the processing, storage and delivery of natural gas liquids to meet customer requirements. |
| |
| | Natural gas liquids production from these facilities is sold to both Canadian and U.S. markets. SOEP condensate production is shipped by marine tanker to the marketplace. |
| |
| NARRATIVE DESCRIPTION OF THE BUSINESS 3 |
| |
| | Bitumen Shell Canada sells its in situ bitumen production from the Peace River facilities to both Canadian and U.S. markets. Production is shipped through a number of pipelines from Shell’s producing location to the receiving markets. |
| |
| | Sulphur Shell Canada is one of the world’s largest sulphur producers and marketers with about 45 per cent of Canadian sulphur sales and over 16 per cent of world traded sulphur. Shell markets sulphur primarily to export markets. Market growth in China in recent years offset significantly reduced volumes being shipped to the United States. Most of Shell’s sulphur customers are in the fertilizer industry. Sulphur is shipped by rail to the United States primarily in liquid form and, for markets outside North America, it is moved in solid form by rail to the Port of Vancouver, British Columbia, for shipping in dry bulk cargo vessels to overseas markets. |
Revenues by Product
| |
| | Reference is made to the “Segmented Information” note to the consolidated financial statements on pages 56 to 59 of the Annual Report. |
| |
| | The following tables set out the percentage of revenue by customer: |
| | | | | | | | | | | | | |
| Natural Gas (%) | | 2004 | | | 2003 | | | 2002 | |
| |
| Sales to third parties | | | 13 | | | | 14 | | | | 18 | |
| Sales to related parties | | | 87 | | | | 86 | | | | 82 | |
| |
| Total natural gas sales | | | 100 | | | | 100 | | | | 100 | |
|
| | | | | | | | | | | | | |
| Natural Gas Liquids (%) | | 2004 | | | 2003 | | | 2002 | |
| |
| Sales to third parties | | | 96 | | | | 98 | | | | 97 | |
| Sales to related parties | | | 4 | | | | 2 | | | | 3 | |
| |
| Total natural gas liquids sales | | | 100 | | | | 100 | | | | 100 | |
|
Source and Availability of Raw Materials
| |
| | The source and availability of hydrocarbon reserves depends upon the success of Shell’s exploration and development programs. Shell’s development programs are focused in three areas: the existing deep foothills gas fields in Western Canada, the Peace River bitumen deposit, and the gas fields near Sable Island, offshore Nova Scotia. Shell’s exploration program continues to focus on exploring for new reserves in the Western Canada Sedimentary Basin (WCSB), and maintains exploration interests off the East and West coasts of Canada and in the Mackenzie Delta. In December 2004, the Company announced a major discovery in central Alberta, the Tay River exploration well, one of the largest gas discoveries in Western Canada in recent years. After disappointing exploration results in offshore Nova Scotia, the Company is reassessing the opportunities in this area. |
Seasonality
| |
| | Historically, natural gas sales prices have been higher in the first and fourth quarters of the year as a result of increased heating demand during the winter months. However, in 2004 prices for natural gas remained strong throughout the first three quarters, supported by record high crude oil prices. In the fourth quarter, with continued strong oil prices and in anticipation of winter demand, natural gas prices increased in line with historical patterns. |
Drilling Activity
| |
| | Reference is made to the “Exploration and Development Wells Drilled” table and as well the “Productive Wells” table on page 73 of the Annual Report. |
4 NARRATIVE DESCRIPTION OF THE BUSINESS
Present Activity
| |
| | Reference is made to the “Exploration and Development Wells Drilled” table on page 73 of the Annual Report. |
Location of Production
| |
| | Shell Canada operates and has substantial interests in natural gas plants in Alberta and Nova Scotia, which process approximately 79 per cent of its current sales volumes. The remaining sales volumes are processed in other natural gas processing plants in Alberta, in which Shell Canada has varying interests or to which it has access under long-term processing agreements. The following table sets out the capacity and utilization of Shell Canada’s major plants: |
Gas Plants
| | | | | | | | | | | | | |
| |
| | | Current | | Utilization | |
| | | Shell Canada’s | | Sales Gas | | of Current | |
| | | Interest | | Capacity 1 | | Capacity 2 | |
| | | (%) | | (millions of cubic feet per day) | | (%) | |
| |
| Waterton | | | 100 | | | | 165 | | | | 60 | |
| |
| Jumping Pound | | | 100 | | | | 151 | | | | 72 | |
| |
| Burnt Timber | | | 82 | | | | 95 | | | | 94 | |
| |
| Caroline | | | 72 | | | | 126 | | | | 91 | |
| |
| Wildcat Hills (outside operated) | | | 34 | | | | 113 | | | | 92 | |
| |
| Goldboro (outside operated) | | | 31 | | | | 565 | | | | 71 | |
|
| | |
| | 1 | Based on inlet gas composition, the current volume of sales gas that can be processed with all equipment running and feed gas optimized based on product prices. |
| |
| | 2 | Based on average daily sales relative to current capacity in 2004. |
| |
| | Shell also has interests in three natural gas liquids fractionation and storage facilities operated by Dow Chemical Canada Inc. (Dow), BP Canada Energy Inc. (BP Canada) and ExxonMobil Canada Properties (ExxonMobil). |
NGL Fractionation/Storage
| | | | | | | | | | | | | | |
| |
| | | Shell Canada’s | | Shell Share | | Shell Share | |
| | | Interest | | Capacity | | Utilization 1 | |
| | | (%) | | (thousands of barrels per day) | | (%) | |
| |
| Fort Saskatchewan, Alberta (Dow) | | | | | | | | | | | | |
| |
| | De-ethanizer | | | 44 | | | | 31 | | | | 64 | |
| |
| | Fractionator | | | 42 | | | | 13 | | | | 63 | |
| |
| Sarnia, Ontario (BP Canada) | | | | | | | | | | | | |
| |
| | Fractionator | | | 13 | | | | 15 | | | | 100 | |
| |
| Point Tupper, Nova Scotia (ExxonMobil) | | | | | | | | | | | | |
| |
| | Fractionator | | | 31 | | | | 10 | | | | 37 | |
| |
| | |
| | 1 | Based on average daily throughput relative to available capacity. |
| |
| NARRATIVE DESCRIPTION OF THE BUSINESS 5 |
| |
| | The significant fields in which Shell owns varying interests are: |
| | | | | |
| Natural Gas, Natural Gas Liquids and Sulphur Production | | In Situ Bitumen Production |
|
Alberta | | | | Alberta |
| |
| Burnt Timber | | Caroline | | Peace River |
| |
| Clearwater | | Jumping Pound | | |
| |
| Limestone | | Moose/ Whiskey | | |
| |
| Panther River | | Waterton | | |
| |
| Wildcat Hills | | | | |
| |
Nova Scotia | | | | |
| |
| Alma | | North Triumph | | |
| |
| Thebaud | | Venture | | |
| |
| South Venture | | | | |
| |
| |
| | A large quantity of the natural gas production comes from fields with natural gas containing significant amounts of liquids and hydrogen sulphide. Production from these fields requires complex treatment, which yields substantial volumes of natural gas liquids and sulphur, as well as marketable natural gas. |
Location of Wells
| |
| | Reference is made to the “Productive Wells” table on page 73 of the Annual Report. |
Interest in Material Properties
| |
| | Reference is made to the “Landholdings” table on page 78 of the Annual Report. |
Reserves Estimates
| |
| | Reference is made to the “Reserves” section on pages 74 and 75 of the Annual Report and to Schedule I on pages 20 and 21 of this Annual Information Form. |
Source of Reserves Estimates
| |
| | Reserves estimates are prepared by the Corporation’s internal qualified reserves evaluators. No independent qualified reserves evaluator or auditor was involved in the preparation of the Corporation’s reserves data. An external, independent petroleum consulting firm audited 100 per cent of the proved oil and gas estimates prepared by the Corporation’s internal reserves evaluators and verified compliance with applicable FASB and SEC requirements. |
| |
| | Shell’s Chief Reservoir Engineer is a qualified reserves evaluator, as defined by NI 51-101, and together with the Company’s internal team of reservoir engineers, evaluates the Company’s oil and gas reserves data. The reserves estimates prepared by the Chief Reservoir Engineer are reviewed by the Chief Executive Officer and members of senior management in the E&P segment and the Reserves Committee prior to submission of the estimates to the Board of Directors for approval. |
| |
| | The Reserves Committee has been delegated the responsibility by the Board of Directors to review the Corporation’s processes and related procedures for the disclosure of reserves data as permitted by NI 51-101. All members of the Reserves Committee are independent, outside directors and are not related to the Corporation or to its significant shareholder. |
6 NARRATIVE DESCRIPTION OF THE BUSINESS
| |
| | Reference is also made to Schedule III and Schedule V on pages 27 and 28 and pages 30 and 31 respectively, of this Annual Information Form. |
Reconciliation of Reserves
| |
| | Reference is made to the “Reserves” section on pages 74 and 75 of the Annual Report. |
History
| |
| | Reference is made to the “Production” table on page 72 of the Annual Report. |
REVENUE
Natural Gas($/mcf)
| | | | | | | | | | | | | | | | |
|
| | | 2003 | | | 2002 | | | |
| | | 2004 | | | (restated) | | | (restated) | | | |
|
| Average plant gate price | | | 6.49 | | | | 6.46 | | | | 4.01 | | | |
| Royalties | | | 1.19 | | | | 1.18 | | | | 0.70 | | | |
| Operating expenses | | | | | | | | | | | | | | |
| | Plant and field | | | 0.83 | | | | 0.80 | | | | 0.73 | | | |
| | Head office | | | 0.46 | | | | 0.26 | | | | 0.16 | | | |
| |
| Total operating expenses | | | 1.29 | | | | 1.06 | | | | 0.89 | | | |
| |
| Netback | | | 4.01 | | | | 4.22 | | | | 2.42 | | | |
|
Ethane, Propane and Butane($/bbl)
| | | | | | | | | | | | | | | | |
|
| | | 2003 | | | 2002 | | | |
| | | 2004 | | | (restated) | | | (restated) | | | |
|
| Average plant gate price | | | 28.71 | | | | 25.48 | | | | 19.53 | | | |
| Royalties | | | 5.41 | | | | 4.73 | | | | 2.71 | | | |
| Operating expenses | | | | | | | | | | | | | | |
| | Plant and field | | | 5.00 | | | | 4.82 | | | | 4.40 | | | |
| | Head office | | | 2.78 | | | | 1.56 | | | | 0.98 | | | |
| |
| Total operating expenses | | | 7.78 | | | | 6.38 | | | | 5.38 | | | |
| |
| Netback | | | 15.52 | | | | 14.37 | | | | 11.44 | | | |
|
Condensate($/bbl)
| | | | | | | | | | | | | | | | |
|
| | | 2003 | | | 2002 | | | |
| | | 2004 | | | (restated) | | | (restated) | | | |
|
| Average plant gate price | | | 50.46 | | | | 41.13 | | | | 37.72 | | | |
| Royalties | | | 11.07 | | | | 8.87 | | | | 7.07 | | | |
| Operating expenses | | | | | | | | | | | | | | |
| | Plant and field | | | 5.00 | | | | 4.82 | | | | 4.40 | | | |
| | Head office | | | 2.78 | | | | 1.56 | | | | 0.98 | | | |
| |
| Total operating expenses | | | 7.78 | | | | 6.38 | | | | 5.38 | | | |
| |
| Netback | | | 31.61 | | | | 25.88 | | | | 25.27 | | | |
|
| |
| NARRATIVE DESCRIPTION OF THE BUSINESS 7 |
Sales Commitments
| | | |
| Volume(millions of boe1) | | Source of Production |
|
| 182.43 | | Western Canada Sedimentary Basin |
| 30.92 | | Sable Offshore Energy Project |
| |
| | |
| | 1 | Barrels of oil equivalent (boe) may be misleading, particularly if used in isolation. A boe conversion of six thousand cubic feet of natural gas to one barrel of oil, as used in this Annual Information Form, is based on the energy equivalency conversion method primarily applicable at the burner tip and does not represent a value equivalency at the wellhead. |
| |
| | The sales commitments consist of long-term natural gas contracts. |
Exploration and Development
| |
| | Expenditures on exploration and development appear in Schedule I on pages 20 and 21 of this Annual Information Form. |
| |
| | Additional information related to exploration and development activities may be found on pages 18 to 25 of the Annual Report. |
OIL SANDS
| |
| | In 2004, the AOSP achieved its first full year of integrated operations. Under a joint venture agreement, Shell Canada has a 60 per cent interest in the project while Chevron Canada Limited and Western Oil Sands L.P. each hold 20 per cent. |
| |
| | The AOSP joint venture includes the Muskeg River Mine and the Scotford Upgrader. |
| |
| | The Muskeg River Mine, on Lease 13, is located 75 kilometres north of Fort McMurray, Alberta. The Muskeg River Mine uses trucks and shovels to excavate the oil sands, as well as advanced extraction technologies to separate the bitumen from the sands. Albian Sands Energy Inc. operates the mine and extraction plant. |
| |
| | The Scotford Upgrader is adjacent to Shell’s existing Scotford Refinery north of Fort Saskatchewan, Alberta. The Scotford Upgrader uses hydrogen-addition technology to process the bitumen from the Muskeg River Mine into a range of synthetic crude oils. Shell Canada operates the upgrader. |
| |
| | The AOSP is a fully integrated operation with the Corridor Pipeline carrying diluted bitumen from the Muskeg River Mine to the Scotford Upgrader where it is processed into synthetic crude oil products. The majority of the synthetic crude produced at the upgrader is supplied to Shell Canada’s Scotford Refinery, with the remainder moved by pipeline to markets throughout Canada and the United States. |
| |
| | Production was ramped up to near full design rate of 155,000 barrels per day (bpd) in the third quarter of 2004 including a record monthly production level of 182,000 bpd in August 2004. Shell Canada’s share of bitumen production for the year was 29.7 million barrels. |
| |
| | The primary objectives for the AOSP over the next few years will be volume growth by improving plant reliability and selective debottlenecking, and continuous improvement in unit operating costs and product values. |
| |
| | Shell has planned capital expenditures for 2005 of $350 million for Oil Sands base business and growth initiatives. Proposed investment includes $135 million for AOSP operations and profitability, including projects to reduce unit costs. Oil Sands will also invest $215 million in growth projects such as debottlenecking and front-end engineering for a 90,000 bpd expansion project. |
| |
| | The Corporation’s minable bitumen reserves disclosure and related information has been prepared in reliance on a decision of the applicable Canadian securities regulatory authorities under NI 51-101 which permits the Corporation to present this disclosure in accordance with the applicable requirements of FASB and the SEC. This disclosure differs from the corresponding information required by NI 51-101. If Shell Canada had not received the decision, the Corporation would be required to disclose reserves estimates based on forecasted prices and costs and information relating to future net revenue using constant and forecasted prices and costs. |
8 NARRATIVE DESCRIPTION OF THE BUSINESS
| |
| | Additional information related to Oil Sands may be found on pages 26 to 31 of the Annual Report and in Schedule II and Schedule IV on pages 22 to 26 and page 29, respectively, of this Annual Information Form. |
Revenue by Product
| |
| | Reference is made to the “Segmented Information” note to the consolidated financial statements on pages 56 to 59 of the Annual Report. |
| |
| | The following table, which excludes inter-segment transfers, sets out the percentage of revenue by customer: |
| | | | | | | | | | | | | |
| |
| Synthetic Crude Sales(%) | | 2004 | | | 2003 | | | 2002 | |
| |
| Sales to third parties | | | 95 | | | | 93 | | | | – | |
| Sales to related parties | | | 5 | | | | 7 | | | | – | |
|
| Total synthetic crude oil sales | | | 100 | | | | 100 | | | | – | |
|
Seasonality
| |
| | There were no significant seasonal fluctuations in the overall Oil Sands business. However, production rates may be lower during extremely cold weather conditions. |
Interest in Material Properties
| |
| | Reference is made to the “Landholdings” table on page 78 of the Annual Report. |
Reserves Estimates
| |
| | Reference is made to the “Reserves” section on page 77 of the Annual Report. |
Source of Reserves Estimates
| |
| | Minable bitumen reserves estimates are prepared by the Corporation’s internal qualified reserves evaluator. No independent qualified reserves evaluator or auditor was involved in the preparation of the Corporation’s reserves data. |
| |
| | Shell’s Chief Mining Engineer is a qualified reserves evaluator, as defined by NI 51-101, and together with the Company’s internal team of geological and mining professionals evaluates the Company’s minable bitumen reserves data. The reserves estimates prepared by the Chief Mining Engineer are reviewed by the Chief Executive Officer and members of senior management in the Oil Sands segment and the Reserves Committee prior to submission of the estimates to the Board of Directors for approval. |
| |
| | The Reserves Committee has been delegated the responsibility by the Board of Directors to review the Corporation’s processes and related procedures for the disclosure of reserves data as permitted by NI 51-101. All members of the Reserves Committee are independent, outside directors and are not related to the Corporation or to its significant shareholder. |
| |
| | Reference is also made to Schedule IV and Schedule V on page 29 and pages 30 and 31, respectively, of this Annual Information Form. |
Reconciliation of Reserves
| |
| | Reference is made to the “Reserves” section on page 77 of the Annual Report. |
| |
| NARRATIVE DESCRIPTION OF THE BUSINESS 9 |
History
| |
| | Reference is made to the “Production” table on page 76 of the Annual Report. |
| |
| | Gross production includes all production attributable to Shell’s interest before deduction of royalties. |
OIL PRODUCTS
| |
| | Shell Canada’s oil refining, supply, distribution and marketing businesses are managed and operated through Shell Canada Products, a partnership wholly owned indirectly by the Corporation. Shell manufactures and markets a full range of petroleum products, including automotive gasolines, diesel fuels, aviation fuels, heating oils, lubricating oils and greases, heavy fuel oils, solvents and asphalts. In addition to these products, many Shell Canada retail sites provide a variety of other services including a Select convenience store and a car wash. |
| |
| | Additional information related to Oil Products may be found on pages 32 to 39 of the Annual Report. |
Methods of Distribution
| |
| | Shell Canada uses various modes of transportation, including marine, pipeline, rail and truck, to transport crude oil and refined products. Shell arranges marine transportation, principally by charter, to transport petroleum products in the Great Lakes, the Gulf of St. Lawrence, the Arctic and the West Coast. Shell has minority ownership interests in various crude oil and refined product pipelines. Shell Canada’s transportation system for refined products also includes leased railway tank cars and contracted delivery services. |
Principal Markets
| |
| | Refined petroleum products, as well as specialty items for the automotive, commercial, farm and home markets, are marketed nationally, principally under Shell trademarks. Shell Canada is also a major supplier of aviation fuels and lubricants to international and domestic airlines, and of marine fuels and lubricants to ships in Canadian ports. The Shell Pecten trademark, which is owned in Canada by the Corporation, and related trademarks and brand names constitute a cornerstone of the Oil Products business. Shell’s retail market share for large urban markets in Canada was 17 per cent in 2004 (2003 – 17 per cent; 2002 –18 per cent). |
| |
| | The total number of Shell-branded retail sites at year-end 2004 was 1,661 (2003 – 1,693; 2002 – 1,705). The private-brand network consists of 101 retail sites (2003 – 116; 2002 – 133). |
| |
| | The integration and rationalization of the wholly owned private-brand network into Shell’s operations commenced in 1997 and continues as planned. In 2004, 15 private-brand retail sites were either converted or closed. |
Revenues by Product
| |
| | Reference is made to the “Segmented Information” note to the consolidated financial statements on pages 56 to 59 of the Annual Report. |
| |
| | Shell Canada sells 100 per cent of gasoline and middle distillates volumes to third parties. |
10 NARRATIVE DESCRIPTION OF THE BUSINESS
Source and Availability of Raw Materials
| |
| | Shell Canada’s crude oil requirements were supplied from three major sources as shown in the table below. The definition of crude oil includes Scotford Upgrader feedstocks from the AOSP. |
| | | | | | | | | | | | | |
| |
| Crude Oil Requirements(%) | | 2004 | | | 2003 | | | 2002 | |
| |
| Domestic industry production | | | 36 | | | | 39 | | | | 53 | |
| Shell Canada’s own production | | | 27 | | | | 15 | | | | – | |
| Imported production | | | 37 | | | | 46 | | | | 47 | |
| |
| Total crude oil requirements | | | 100 | | | | 100 | | | | 100 | |
|
Seasonality
| |
| | There are no significant seasonal fluctuations in the overall Oil Products business over the year and there are no multi-year cycles. |
Manufacturing
| |
| | Shell Canada’s three operating refineries located at Sarnia, Ontario; Montreal, Quebec; and Fort Saskatchewan, Alberta achieved average utilization rates of 89 per cent in 2004 (2003 – 90 per cent; 2002 – 87 per cent). A consistent focus on safe and reliable refinery operations, together with the ability of the sales and trading groups to balance domestic market requirements with export opportunities, has enabled Shell to operate these facilities at efficient utilization rates. |
| |
| | Shell Canada’s refineries continue to account for approximately 16 per cent (2003 – 16 per cent; 2002 – 16 per cent) of Canada’s operating refinery capacity in 2004. The location and rated capacity of each of Shell’s refineries at December 31, 2004 are shown below. |
| | | | | | | | | |
| |
| | | Daily Rated Capacity 1 | |
| Refinery | | (cubic metres) | | | (barrels) | |
| |
| Montreal East (Quebec) | | | 20 700 | | | | 130 000 | |
| Sarnia (Ontario) | | | 12 000 | | | | 76 000 | |
| Scotford (Alberta) | | | 17 700 | | | | 111 000 | |
| |
| Total | | | 50 400 | | | | 317 000 | |
|
| | |
| | 1 | Rated capacity is based on definite specifications as to types of crude oil and Scotford Upgrader feedstocks, the products to be obtained and the refinery processes, taking into consideration an estimated allowance for normal annual maintenance shutdowns. Accordingly, capacity under actual operating conditions may be higher or lower than rated capacity. |
| |
| | In 2004, Shell’s automated blending plant in Brockville, Ontario, produced 174 million litres of lubricants. This represents an increase of nine per cent over 2003 volumes. The Calgary grease manufacturing facility produced 3.0 million kilograms of soap-based and microgel-based greases in 2004, an increase of 10 per cent over 2003. |
COMPETITIVE CONDITIONS
| |
| | The oil and gas industry in Canada operates under federal, provincial and municipal legislation and regulations governing land tenure, royalties, production rates, environmental protection, exports, income and other matters. |
| |
| | The Canadian petroleum industry is highly competitive in all its aspects, including the exploration for and development of new sources of supply; the acquisition of oil and gas interests; the construction and operation of crude oil, natural gas and refined products pipelines; and the refining, distributing and marketing of petroleum products. |
| |
| NARRATIVE DESCRIPTION OF THE BUSINESS 11 |
| |
| | In the E&P segment, acquisitions of exploration rights on Crown-owned lands in Canada are subject to an open bidding process. Company-held exploration seismic and drilling data are generally considered trade secrets. Prices of all products are set by market conditions and are subject to international competition. |
| |
| | In the Oil Sands segment, the Company has extensive leaseholdings adjacent to the initial Muskeg River Mine development. The other joint venturers in the initial Muskeg River Mine development have the option to participate in future development involving Shell’s other existing Oil Sands leases. |
| |
| | TheInvestment Canada Act requires Shell Canada, a statutory non-Canadian and World Trade Organization investor, to notify Industry Canada of all investments resulting in acquisition of control of an existing Canadian business, or the establishment of a new Canadian business where the transaction is not a reviewable transaction. Any direct investment in excess of $237 million in 2004 was reviewable (2005 – $250 million), and an indirect acquisition is reviewable if the value of the assets of the business located in Canada amounts to more than 50 per cent of the asset value of the transaction. Additional thresholds apply for the acquisition or establishment of particular types of Canadian businesses. To date, Shell Canada has not been adversely impacted by this legislation. |
| |
| | In the Oil Products segment, market conditions and site economics of retail outlets suggest a continued asset rationalization program by the Company to improve operating efficiencies within its network. |
RESEARCH AND DEVELOPMENT
| |
| | Research and development expense was $28 million in 2004 (2003 – $10 million; 2002 – $6 million). |
ENVIRONMENTAL PROTECTION
| |
| | Shell Canada has a systematic approach to health, safety and environmental (HSE) management designed to ensure compliance with the law and to achieve continuous performance improvement. The HSE management system provides for identification and control of HSE-related risks arising from the Company’s operations and/or from the areas in which it operates. The Company’s E&P business has met the criteria for multi-site registration of its facilities and operations (including four gas complexes, the Peace River in situ bitumen facility and Wells, Approvals & Seismic Operations) to ISO 14001. All major facilities in the Oil Products business (three refineries and two lubricant plants) and the Oil Sands business (Muskeg River Mine and Scotford Upgrader) are also registered to this international environmental management standard. |
| |
| | Total environmental expenditures for Shell Canada in 2004 and the previous two years are shown in the following table: |
| | | | | | | | | | | | | |
| Environmental Expenditures($ millions) | | 2004 | | | 2003 | | | 2002 | |
| |
| Operating costs | | | 70 | | | | 80 | | | | 61 | |
| Capital costs | | | 168 | | | | 25 | | | | 137 | |
| Restoration and reclamation | | | 40 | | | | 52 | | | | 49 | |
|
| Total | | | 278 | | | | 157 | | | | 247 | |
|
| |
| | Operating costs These include waste disposal, environmental operating costs (such as cost of energy and chemicals for environmental systems), maintenance (of plant systems to ensure continued environmentally sound performance), studies to determine environmental impact, monitoring and reporting requirements, salaries, environmental association fees, hearings, and legal costs and fines. No environmental fines or penalties were incurred in 2004. |
| |
| | Capital costs These include cost of new equipment and associated construction costs for pollution prevention and controlling air emissions, water discharges and waste management. A significant portion of the capital spent in 2004 ($132 million) was on the ultra-low-sulphur diesel (ULSD) project at Shell’s Montreal East and Scotford refineries. The ULSD project is designed to provide product that can meet new legislated sulphur levels in automotive tailpipe emissions. |
12 NARRATIVE DESCRIPTION OF THE BUSINESS
| |
| | Restoration and reclamation This includes the costs of spill cleanup, decommissioning and restoration and the protection or restoration of wildlife and habitat. |
NUMBER OF EMPLOYEES
| |
| | The number of employees at the end of 2004 was 4,003 compared with 3,850 at the end of 2003. The number of employees in each segment is as follows: |
| | | | | | | | | | | | | |
| |
| As at December 31 (number of employees) | | 2004 | | | 2003 | | | 2002 | |
| |
| E&P | | | 904 | | | | 859 | | | | 834 | |
| Oil Products | | | 1 921 | | | | 1 930 | | | | 1 968 | |
| Oil Sands | | | 505 | | | | 434 | | | | 425 | |
Corporate1 | | | 673 | | | | 627 | | | | 598 | |
|
| Total | | | 4 003 | | | | 3 850 | | | | 3 825 | |
|
| | |
| | 1 | In 2003 HSE employees were centralized into the Corporate segment. |
FOREIGN OPERATIONS
| |
| | None of the Corporation’s segments depends upon foreign operations. |
| |
| NARRATIVE DESCRIPTION OF THE BUSINESS 13 |
| |
| Selected Consolidated Financial Information | |
ANNUAL INFORMATION
Total Revenue
| |
| | Reference is made to the “Consolidated Statement of Earnings and Retained Earnings” table, “Revenues” section on page 49 of the Annual Report. |
Earnings in Total and on a Per Equity Share and Diluted Equity Share Basis
| |
| | Reference is made to the “Consolidated Statement of Earnings and Retained Earnings” table on page 49 and the “Data Per Common Share” table on page 79 of the Annual Report. |
Total Assets
| |
| | Reference is made to the “Consolidated Balance Sheet” table on page 51 of the Annual Report. |
Long-Term Financial Liabilities
| |
| | Reference is made to the “Consolidated Balance Sheet” table on page 51 of the Annual Report. |
Cash Dividends Declared Per Share
| |
| | Reference is made to the “Data Per Common Share” table on page 79 of the Annual Report. |
Factors Affecting Comparability
| |
| | 2002 Earnings in the year included the $41 million after-tax write-off for the deeper section of Shell’s wholly-owned Onondaga natural gas well offshore Nova Scotia. Oil Products earnings included the impact of extensive shutdowns at each of its three refineries in the second quarter. Although these shutdowns were planned, they significantly reduced plant availability, increased operating costs and lowered yields, which reduced earnings by an estimated $20 million. Earnings in the year also included a benefit resulting from reductions in corporate income tax rates. The future income tax expense for the E&P and Oil Products segments decreased by $12 million and $5 million respectively. |
| |
| | 2003 Oil Sands became fully operational in June and reflected a full year loss of $142 million due mainly to start-up related costs. Total earnings in the year included a benefit resulting from a future income tax revaluation and the future income tax expense decreased by $36 million. The Company initiated the expensing of stock options, beginning with options granted in 2003. The total 2003 stock option expense was $12 million. |
| |
| | 2004 Shell Canada’s modification to the existing options under the Long Term Incentive Plan resulted in a non-cash charge of $71 million after tax where share appreciation rights were attached. In its first full year of production Oil Sands contributed $378 million to income. Due to the degree of uncertainty in terms of timing and realization of future benefits, the Company wrote off $32 million after tax of front-ended expenditures related to the Mackenzie Gas Project. The Company’s earnings were impacted by a |
14 SELECTED CONSOLIDATED FINANCIAL INFORMATION
| |
| | number of significant dry hole write-offs which included the Weymouth well for $28 million and the Onondaga well for $15 million. Oil Products earnings included a provision of $25 million for increased liability associated with the AIR MILES® Reward Miles program. |
Trading Price and Volume
| |
| | Reference is made to the “Stock-Trading Information” table on page 79 of the Annual Report. |
| |
| | The monthly financial and stock trading information as quoted on the Toronto Stock Exchange for 2004 is as follows: |
Share Price(dollars except as noted)
| | | | | | | | | | | | | | | | | | | | | | | | | | | | | | | | | | | | | | | | | | | | | | | | | | | | | |
| |
| | | Jan | | | Feb | | | Mar | | | Apr | | | May | | | Jun | | | Jul | | | Aug | | | Sep | | | Oct | | | Nov | | | Dec | | | Total | |
| |
| High | | | 65.85 | | | | 64.00 | | | | 65.00 | | | | 66.40 | | | | 66.00 | | | | 65.01 | | | | 68.50 | | | | 67.49 | | | | 69.46 | | | | 79.00 | | | | 80.03 | | | | 80.00 | | | | 80.03 | |
| Low | | | 57.70 | | | | 58.60 | | | | 58.51 | | | | 61.31 | | | | 62.50 | | | | 62.39 | | | | 62.05 | | | | 63.00 | | | | 64.40 | | | | 68.50 | | | | 73.25 | | | | 72.75 | | | | 57.70 | |
| Close | | | 59.01 | | | | 61.53 | | | | 62.05 | | | | 64.50 | | | | 63.92 | | | | 64.49 | | | | 66.26 | | | | 65.22 | | | | 69.00 | | | | 74.98 | | | | 79.24 | | | | 79.99 | | | | 79.99 | |
Volume (thousands) | | | 3 069 | | | | 2 640 | | | | 1 683 | | | | 1 588 | | | | 2 267 | | | | 2 662 | | | | 1 747 | | | | 2 159 | | | | 1 845 | | | | 2 857 | | | | 2 177 | | | | 2 037 | | | | 26 731 | |
|
Credit Ratings
| |
| | Reference is made to page 42 of the Annual Report. |
DIVIDENDS
| |
| | Dividends are declared at the discretion of the Board of Directors of the Corporation. In 2004, dividends of 22 cents per share were paid on March 15 and June 15. In July, the Board of Directors increased the quarterly dividend to 25 cents per share, and dividends of 25 cents per share were paid on September 15 and December 15. |
| |
| | Reference is made to the “Summary of Quarterly Results” table on page 11 of the Annual Report. |
UNITED STATES GENERALLY ACCEPTED ACCOUNTING PRINCIPLES
Oil and Gas Disclosure
| |
| | Disclosure, in accordance with Statement No. 69 of the U.S. FASB, appears in Schedule I on pages 20 and 21 of this Annual Information Form. |
United States Generally Accepted Accounting Principles
| |
| | The significant differences between Canadian and United States generally accepted accounting principles (GAAP) are identified on pages 32 and 33 of this Annual Information Form. |
Accounting Policy
| |
| | Exchange Transactions The Corporation enters into exchange transactions for inventory held for sale in the ordinary course of its business to balance regional supply and demand, increase transportation efficiencies and reduce overall cost of acquiring inventory. These transactions are accounted for using Accounting Principles Board Opinion No. 29,Accounting for Nonmonetary Transactions and are netted in cost of goods sold. These transactions do not have a material impact on the Corporation’s earnings. |
®Trademark of AIR MILES International Trading B.V. Used under licence by Loyalty Management Group Canada Inc. and Shell Canada Products.
| |
| SELECTED CONSOLIDATED FINANCIAL INFORMATION 15 |
| |
| | The Emerging Issues Task Force (EITF) is considering related matters in EITF Issue No. 04-13Accounting for Purchases and Sales of Inventory with the Same Counterparty. The issue being considered is whether there are circumstances under which nonmonetary exchanges of inventory within the same line of business should be recognized at fair value. A change from historical cost to fair value on nonmonetary exchanges of inventory would not have a material impact on the Corporation’s earnings. |
Exploratory Drilling Costs
| |
| | Pursuant to FASB Statement No. 19Financial Accounting Reporting by Oil and Gas Producing Companies, the Company’s exploratory drilling costs related to exploratory wells in an area that requires major capital expenditures are carried as an asset, provided that i) there have been sufficient oil and gas reserves found to justify completion as a producing well if the required capital expenditure is made, and ii) drilling of additional exploratory wells is underway or firmly planned for the near future. The determination of whether or not reserves are sufficient is subject to establishing, through a well test, the volume of hydrocarbons that can be economically produced. |
| |
| | The following table provides the net change in capitalized exploration well costs: |
| | | | | | | | | | | | | |
| |
| ($ thousands) | | 2004 | | | 2003 | | | 2002 | |
| |
| Beginning balance at January 1 | | | 68 102 | | | | 59 088 | | | | 44 038 | |
| Additions to exploratory well costs pending the determination of proved well reserves | | | 101 790 | | | | 72 295 | | | | 95 560 | |
| Reclassification to well, facilities, and equipment based on the determination of proved reserves | | | (11 157 | ) | | | (21 179 | ) | | | (7 615 | ) |
| Exploratory well costs charged to expense | | | (114 629 | ) | | | (42 102 | ) | | | (78 895 | ) |
| |
| Ending balance at December 31 | | | 44 106 | | | | 68 102 | | | | 59 088 | |
|
New United States Generally Accepted Accounting Principles
| |
| | In December 2004, FASB Statement No. 123(R)Stock-Based Payment was issued. Effective for 2005, all stock options will be accounted for using the fair value method. The impact of adopting this standard is dependent upon a number of valuation factors including the share price at December 31, 2005. Based on Shell Canada’s share price at December 31, 2004, it is estimated that there would be a decrease of approximately $5 million in the U.S. GAAP earnings. |
Management’s Discussion and Analysis
| |
| | Reference is made to pages 9 to 46 of the Annual Report. |
Off-Balance Sheet Arrangements
| |
| | The Corporation has entered into an operating lease for large mobile equipment in use at the Muskeg River Mine and has sold accounts receivable under an accounts receivable securitization program. Both of these arrangements are cost effective to the Corporation versus its alternatives. Reference is made to “Accounting Standards” on page 44 of the Annual Report and to the “Commitments and Contingencies” and “Sale of Accounts Receivable” notes on pages 69 and 70, respectively, of the Annual Report. |
Market for Securities and Transfer Agent
| |
| | Reference is made to “Investor Information” on page 84 of the Annual Report. |
16 SELECTED CONSOLIDATED FINANCIAL INFORMATION
| |
| Directors and Officers | |
| |
| | Reference is made to the “Corporate Directory and Board of Directors” table on pages 80 and 81 of the Annual Report, the “Statement of Corporate Governance Practices” on pages 82 and 83 of the Annual Report and pages 41 to 55 of the Proxy Circular and the “Information Concerning Nominees for Election to the Board of Directors” on pages 7 to 11 of the Proxy Circular. |
| |
| | The following were officers of the Corporation as at December 31, 2004: |
| | | |
|
| Name and Municipality of Residence | | Position and Office1 |
|
Clive Mather
Calgary, Alberta, Canada | | President and Chief Executive Officer |
| |
H. Ian Kilgour
Calgary, Alberta, Canada | | Senior Vice President,
Exploration & Production |
| |
Neil J. Camarta
Calgary, Alberta, Canada | | Senior Vice President,
Oil Sands |
| |
David M. Weston
Calgary, Alberta, Canada | | Senior Vice President,
Oil Products |
| |
Cathy L. Williams
Calgary, Alberta, Canada | | Chief Financial Officer |
| |
Simon A. Fish
Calgary, Alberta, Canada | | Vice President,
General Counsel and Secretary |
| |
Graham Bojé
Calgary, Alberta, Canada | | Vice President,
Manufacturing and Supply |
| |
Rob W.P. Symonds
Calgary, Alberta, Canada | | Vice President, Foothills |
| |
Timothy J. Bancroft
Calgary, Alberta, Canada | | Vice President, Sustainable Development,
Technology and Public Affairs |
| |
Sam Spanglet
Calgary, Alberta, Canada | | Vice President, Operations, Oil Sands |
| |
Matthew B. Haney
Calgary, Alberta, Canada | | Treasurer |
| |
Donna Tarka
Calgary, Alberta, Canada | | Controller |
| |
Susan S. Boughs
Toronto, Ontario, Canada | | Chief Compliance Officer, Associate General Counsel, Regulatory & Compliance and Assistant Secretary |
| |
Shannon L. Cosmescu
Calgary, Alberta, Canada | | Associate General Counsel, Corporate
and Assistant Secretary |
| |
John T.D. Courtright
Calgary, Alberta, Canada | | Associate General Counsel, Oil Sands
and Assistant Secretary |
| |
Leanne D. Geale
Calgary, Alberta, Canada | | Associate General Counsel, Oil Products
and Assistant Secretary |
| |
Richard W. Riegert
Calgary, Alberta, Canada | | Associate General Counsel, E&P
and Assistant Secretary |
|
| | |
| | 1 | All of these officers of the Corporation have, for the past five years, been actively engaged in executive or employee capacities with the Corporation or its affiliates, except for Leanne Geale who was previously employed during this period as Counsel and Assistant Secretary for Rio Algom Limited until 2002 and Senior Counsel with the Royal Bank of Canada from 2002 to 2003. |
| |
| | The percentage of common shares of the Corporation owned beneficially, directly or indirectly, or over which control or direction is exercised by the directors, senior officers and any expert whose report is contained in this Annual Information Form, as a group, is less than one per cent. |
| |
| DIRECTORS AND OFFICERS 17 |
| |
| | The Corporation has four committees of the Board of Directors. Reference is made to pages 82 and 83 of the Annual Report for discussion of the four Board committees and their membership. |
| |
| | Reference is made to “Interest of Informed Persons in Material Transaction” on page 12 of the Proxy Circular and Appendix 2 of the Proxy Circular for identification of other entities that transact business with the Corporation of which a director of the Corporation also serves as a director or officer. |
Majority Shareholder
| |
| | Royal Dutch Petroleum Company (Royal Dutch), a Netherlands company, and The “Shell” Transport and Trading Company, plc (Shell T&T), an English company, (together referred to as Royal Dutch/ Shell) hold, indirectly, approximately 78 per cent of the Corporation’s common shares. |
| |
| | On July 29, 2004, Royal Dutch/ Shell reached agreements in principle with the United Kingdom’s Financial Services Authority (FSA) and the staff of the United States Securities and Exchange Commission (SEC) to resolve their pending inquiries related to Royal Dutch/ Shell’s reserves recategorization. |
| |
| | In connection with the agreement in principle with the FSA, Royal Dutch/ Shell agreed, without admitting or denying the FSA’s findings or conclusions, to the entry of a Final Notice by the FSA finding that Royal Dutch/ Shell breached market abuse provisions of the United Kingdom’s Financial Services and Markets Act 2000 and the Listing Rules made thereunder. In connection with the proposed settlement, Royal Dutch/ Shell paid a penalty of £17 million. |
| |
| | In connection with the agreement in principle with the SEC staff, Royal Dutch/ Shell has consented, without admitting or denying the SEC’s findings or conclusions, to an administrative order finding that Royal Dutch/ Shell violated, and requiring Royal Dutch/ Shell to cease and desist from future violations of, the antifraud, reporting, recordkeeping and internal control provisions of the U.S. Federal securities laws and related SEC rules. In connection with the proposed settlement, Royal Dutch/ Shell will pay a U.S. $120 million civil penalty and has undertaken to spend an additional U.S. $5 million developing a comprehensive internal compliance program. The agreement in principle with the SEC staff is subject to final approval by the SEC. |
| |
| | On October 28, 2004, the Royal Dutch and Shell T&T Boards announced that they had unanimously agreed in principle to propose to their shareholders a transaction (the Transaction) through which each of Royal Dutch and Shell T&T will become a subsidiary of Royal Dutch Shell plc, a publicly-listed company incorporated in England and Wales and headquartered and tax resident in The Netherlands. Implementation of the Transaction will be subject to the satisfaction of certain conditions. It is currently expected that the Transaction will be completed in July 2005. |
18 DIRECTORS AND OFFICERS
| |
| Additional Information | |
AVAILABILITY OF DOCUMENTS
| |
| | Copies of the following documents are available upon request from the Corporation’s Secretary: the Annual Information Form for 2004, together with the documents incorporated by reference therein; the Proxy Circular for its most recent annual meeting of shareholders; the Corporation’s Annual Report containing comparative financial statements for 2004, together with the Auditors’ Report thereon; and the Management’s Discussion and Analysis and interim financial statements filed subsequent to December 31, 2004. |
| |
| | When securities of the Corporation are in the course of a distribution pursuant to a short form prospectus, or a preliminary short form prospectus, copies of the foregoing documents and any other documents that are incorporated by reference into the preliminary short form prospectus or short form prospectus may also be obtained from the Corporation’s Secretary upon request. |
| |
| | Additional information including directors’ and officers’ remuneration and indebtedness, principal holders of the Corporation’s securities and options to purchase securities is contained in the Proxy Circular. Additional financial information is provided in the Corporation’s comparative financial statements and Management’s Discussion and Analysis for its most recently completed financial year. |
| |
| | Additional information relating to Shell Canada filed with Canadian and U.S. securities regulatory authorities, including this Annual Information Form and the Form 40-F, can be found online under Shell Canada’s profile at www.sedar.com and www.sec.gov. |
| |
| ADDITIONAL INFORMATION 19 |
| |
| Schedule I | |
(UNAUDITED)
OIL AND GAS DISCLOSURE
| |
| | The following conventional oil and gas reserves disclosure has been prepared in reliance on a decision of the applicable Canadian securities regulatory authorities under National Instrument 51-101 –Standards of Disclosure for Oil and Gas Activities (NI 51-101) which permits the Corporation to present this disclosure in accordance with the applicable requirements of FASB Statement No. 69 (FAS 69),Disclosures about Oil and Gas Producing Activities. The United States Securities and Exchange Commission has adopted this standard as a comprehensive set of disclosure requirements for conventional oil and gas producing activities. The format of this disclosure adheres to the requirements outlined in paragraphs 10 to 34 of FAS 69. This information differs from the corresponding information required by NI 51-101. Reference is made to E&P on page 3 of this Annual Information Form for a discussion of these differences. |
| |
| | This disclosure is unaudited, no independent qualified reserves evaluator or auditor has been involved in its preparation and it does not include minable bitumen. |
| | | | | | | | | | | | | | | |
| | | | | 2003 | | | 2002 | | | |
| As at December 31 ($ millions) | | 2004 | | | (restated) | | | (restated) | | | |
|
CAPITALIZED COSTS | | | | | | | | | | | | | | |
| Unproved oil and gas reserves | | | 209 | | | | 191 | | | | 168 | | | |
| Proved oil and gas reserves | | | 4 877 | | | | 4 600 | | | | 4 314 | | | |
| |
| | | | 5 086 | | | | 4 791 | | | | 4 482 | | | |
| Accumulated depreciation, depletion and amortization | | | 3 016 | | | | 2 539 | | | | 2 265 | | | |
| |
Net capitalized costs | | | 2 070 | | | | 2 252 | | | | 2 217 | | | |
| |
| | | | | | | | | | | | | | | |
| Year ended December 31 ($ millions) | | 2004 | | | 2003 | | | 2002 | | | |
|
COSTS INCURRED | | | | | | | | | | | | | | |
| Property acquisition | | | 26 | | | | 12 | | | | 9 | | | |
| Exploration costs | | | 171 | | | | 118 | | | | 121 | | | |
| Development costs | | | 323 | | | | 301 | | | | 259 | | | |
| |
Total costs incurred | | | 520 | | | | 431 | | | | 389 | | | |
| |
| | | | | | | | | | | | | | | |
| Year ended December 31 ($ millions) | | | | | | | | |
|
RESULTS OF OPERATIONS FROM PRODUCING ACTIVITIES | | | | | | | | | | | | | | |
| Revenues | | | 2 361 | | | | 2 298 | | | | 1 715 | | | |
| Operating expenses | | | 749 | | | | 691 | | | | 545 | | | |
| Transportation expenses | | | 309 | | | | 270 | | | | 236 | | | |
| Exploration and predevelopment expenses | | | 221 | | | | 81 | | | | 123 | | | |
| Depreciation, depletion, amortization and retirements | | | 353 | | | | 282 | | | | 222 | | | |
| Income tax | | | 275 | | | | 346 | | | | 215 | | | |
| |
Results of operations from producing activities | | | 454 | | | | 628 | | | | 373 | | | |
| |
20 SCHEDULE I
Standardized Measure of Discounted Future Net Cash Flows
| |
| | The following future net revenue information, in management’s view, does not purport to represent an accurate estimate of the value of the Corporation’s conventional oil and gas operations. The information should be interpreted with considerable caution since actual future cash flows will differ from future net cash flows presented because of, among other things: |
| | |
| | (a) | future cash flows will be derived not only from proved reserves but also from probable and potential reserves that ultimately become proved; |
| |
| | (b) | future-year rather than current-year costs and prices will apply; |
| |
| | (c) | economic, regulatory and operating conditions will change; and |
| |
| | (d) | this computation excludes cash flows from minable bitumen activities. |
| |
| | The information includes cash flows related to the Peace River in situ bitumen operation but does not include minable bitumen. |
| | | | | | | | | | | | | | |
| As at December 31 ($millions) | | 2004 | | | 2003 | | | 2002 | |
| |
FUTURE NET CASH FLOWS 1 | | | | | | | | | | | | |
| Future cash inflow | | | 10 776 | | | | 13 892 | | | | 18 135 | |
| Future operating and development costs | | | 4 029 | | | | 5 858 | | | | 6 512 | |
| Future income taxes | | | 2 045 | | | | 2 500 | | | | 4 575 | |
|
Future net cash flows 2 | | | 4 702 | | | | 5 534 | | | | 7 048 | |
| 10% annual discount for estimated timing of cash flows | | | 1 720 | | | | 2 325 | | | | 3 359 | |
|
Standardized measure of discounted future net cash flows from proved oil and gas reserves | | | 2 982 | | | | 3 209 | | | | 3 689 | |
|
| |
CHANGES IN FUTURE NET CASH FLOWS 1 | | | | | | | | | | | | |
| Balance at beginning of year | | | 3 209 | | | | 3 689 | | | | 2 199 | |
| Changes resulting from: | | | | | | | | | | | | |
| | Sales, net of operating costs | | | (1 016 | ) | | | (1 073 | ) | | | (700 | ) |
| | Net changes in prices and operating costs | | | (226 | ) | | | (457 | ) | | | 3 195 | |
| | Extensions, discoveries and improved recoveries, less related costs | | | 597 | | | | 224 | | | | 49 | |
| | Development costs incurred during the period | | | 319 | | | | 295 | | | | 218 | |
| | Revisions of previous quantity estimates | | | (265 | ) | | | (809 | ) | | | (382 | ) |
| | Sales of reserves in place | | | (173 | ) | | | – | | | | – | |
| | Accretion of discount | | | 382 | | | | 499 | | | | 220 | |
| | Net changes in income taxes | | | 155 | | | | 841 | | | | (1 110 | ) |
|
| Net (decrease) increase for the year | | | (227 | ) | | | (480 | ) | | | 1 490 | |
|
Balance at end of year | | | 2 982 | | | | 3 209 | | | | 3 689 | |
|
| | |
| | 1 | 2002 future net cash flow amounts have been restated to reflect certain adjustments relating to that year’s standardized measure. 2003 changes in net cash flow have been adjusted to reflect the new closing balance for 2002. |
| |
| | 2 | Future net cash flows were computed using year-end prices and costs, and year-end statutory tax rates that relate to existing proved developed and undeveloped oil and gas reserves. |
| |
| | Within the past 12 months, the Company has not filed reserves estimates with any authority or agency of the United States other than the U.S. Securities and Exchange Commission. |
| |
| Schedule II | |
OIL SANDS MINING DISCLOSURE
Muskeg River Mine Development History
| |
| | Shell Canada holds a 60 per cent interest in the Athabasca Oil Sands Project (AOSP), a joint venture established in 1999 to recover oil sands ore from certain leasehold interests in the Athabasca region of northern Alberta and to process the ore into synthetic crude oil products. |
| |
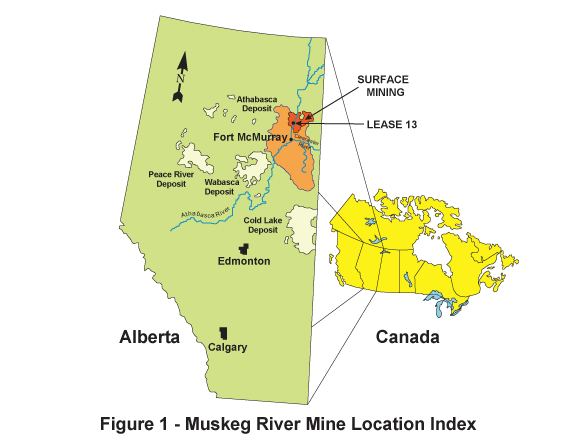
| | The AOSP’s Muskeg River Mine is located on the western portion of Bituminous Sands Lease No. 727708T13 (Lease 13) in northeastern Alberta approximately 75 kilometres north of the city of Fort McMurray and is readily accessible by public road. Figure 1 shows the location of the Muskeg River Mine. The Muskeg River Mine (MRM) is an integrated oil sands mining and mineral processing facility and achieved fully integrated operations in June 2003. The oil sands ore is open-pit mined using a conventional truck and shovel operation, and the mined ore is processed in an on-site bitumen extraction and clean-up facility to yield a bitumen product. Power and steam for the operation is provided from an on-site cogeneration facility which is owned and operated by a third party power company. The bitumen is transported from the site by pipeline to a bitumen upgrading facility located in the Edmonton area of central Alberta. The current facility design rate is 155,000 barrels per day of bitumen production, with opportunities to expand production to 225,000 barrels per day. These facilities are in new condition. The MRM is operated by Albian Sands Energy Inc., a company owned by the AOSP joint venture participants. |
| |
| | Shell Canada originally acquired the mineral rights to Lease 13 in 1956. The Lease 13 resource has since been thoroughly characterized in association with a variety of development studies, however the MRM is the first commercial operation on the lease. With the commencement of commercial mine operations on the western portion of Lease 13, the whole of Lease 13 is characterized as having “continued producing” status and the right to access the bitumen resource on the lease has been extended indefinitely for so long as production is continuing. After the establishment of the AOSP joint venture in 1999, Lease 13 was formally transferred to Albian Sands Energy Inc. to be held in trust for the AOSP joint venture participants. |
| |
| | Shell Canada also holds a number of other oil sands leases that are immediately adjacent to Lease 13. Leases 7288080T88 (Lease 88), 7288080T89 (Lease 89) and 7288080T90 (Lease 90) collectively have significant minable bitumen resources and each have a lease expiry date of August 31, 2008. During 2004 Shell Canada also acquired two additional minable oil sands leases in the general vicinity of the MRM development from EnCana Corporation. These are Leases 7400120009 (Lease 9) and 7401100017 (Lease 17). Both leases have lease expiry dates of December 31, 2015. All these leases may be extended by completing a minimum level of development prior to their expiry. There are no current, and no known previous, commercial operations on any of these leases. The MRM, together with Lease 13 and the adjacent oil sands leases, represent a multi-billion dollar investment for Shell Canada. |
| |
| | The MRM received its primary regulatory approvals in 1999. The regulatory application for the MRM was submitted to the Alberta Energy and Utilities Board (EUB) and Alberta Environment (AENV) in December 1997. The application provides significant background detail on the geology, mine planning features and development scheme, and formed the basis of the approval from the EUB in June 1999 and under the Environmental Protection and Enhancement Act in August 1999. |
| |
| | The following are the primary regulatory applications and approvals for the Muskeg River Mine: |
| | |
| | 1. | Application for Approval of Muskeg River Mine Project December 1997 (Application No. 9705888) submitted to the EUB and AENV (available at the EUB Library, 640 – 5th Avenue S.W., Calgary, Alberta – Tel: (403) 297-8311); |
| |
| | 2. | Supplemental Information for the Muskeg River Mine Project June 1998 (Application No. 970588) submitted to the EUB and AENV (available at the EUB Library, 640 – 5th Avenue S.W., Calgary, Alberta – Tel: (403) 297-8311); |
22 SCHEDULE II
| | |
| | 3. | Muskeg River Mine Project Decision Report 99-2 by the EUB dated February 12, 1999 (available on-line at www.eub.gov.ab.ca); |
| |
| | 4. | Muskeg River Mine Approval No. 8512 Order in Council by the EUB dated June 25, 1999 (available at the EUB Library, 640 – 5th Avenue S.W., Calgary, Alberta – Tel: (403) 297-8311); |
| |
| | 5. | Muskeg River Mine 10 year Environmental Protection and Enhancement Act Approval No. 20809-00-01 from AENV dated June 18, 1999 (available on-line at www.gov.ab.ca/env/water/approvalviewer.html search parameter – Albian Sands Energy Inc.); and |
| |
| | 6. | Muskeg River Mine Water Resources Act Approval No. 00071821-00-00, as amended, from AENV dated August 4, 1999 (available on-line at www.gov.ab.ca/env/water/approvalviewer.html search parameter – Albian Sands Energy Inc.). |
| |
| | The EUB has also provided Shell Canada with approval for Phase 1 of the proposed Jackpine Mine, a stand alone mining and extraction facility to be located on the eastern portion of Lease 13. The Jackpine Mine Approval No. 9756 Order in Council was issued by the EUB on February 25, 2004. The Jackpine Mine 10 year Environmental Protection and Enhancement Act Approval No. 153125-00-00 from AENV was issued on June 23, 2004. The planned development for the Jackpine Mine includes a proposal to extend development to Leases 88 and 89. This second phase of the Jackpine Mine will require additional regulatory approval. |
| |
| | On September 21, 2004, Shell Canada disclosed a description of plans to expand the capacity of the existing Muskeg River Mine. A regulatory application and environmental impact assessment for a Muskeg River Mine expansion is currently being prepared. |
Muskeg River Mine Geology
| |
| | Lease 13 is situated immediately east of the Athabasca River Valley. Most of the lease comprises gently undulating terrain that ranges in elevation from 330 metres above sea level in the southeast to 284 metres in the west. |
| |
| | The McMurray Formation is the geological unit containing the bitumen hydrocarbon resource. The McMurray Formation was laid down in a marine shoreline setting and is composed, generally, of a sequence of sediments that gets finer in an upward direction – from pebbles five millimetres in diameter, through sand, to silt and mud 0.06 millimetres in diameter and finer. When the McMurray Formation contains bitumen in a sand sized sediment coarser than approximately 0.12 millimetres, this is characterized as oil sands. |
| |
| | The McMurray Formation is present at varying depths beneath the ground over much of northern Alberta. Over 3,400 square kilometres of land has been classified by the EUB as surface minable. Within this area the McMurray Formation is near surface and can be excavated economically with existing mining equipment. The Devonian limestone which lies beneath the McMurray Formation is within 50 metres to 150 metres of surface. |
Muskeg River Mine Reserves
| |
| | Reference is made to the “Reserves” section on page 77 of the Annual Report and to Schedule IV on page 29 of this Annual Information Form. |
| |
| | The MRM development on Lease 13 was designed to access proved and probable reserves over 30 years of operation at the average design production level of 155,000 barrels per day, resulting in 1.7 billion barrels of recoverable bitumen over the project life. |
| |
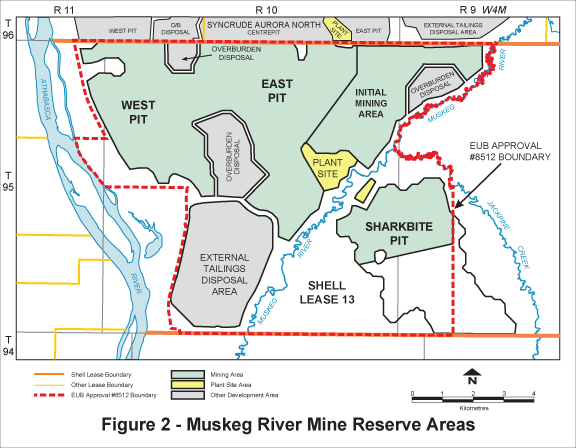
| | The ultimate pit limits and mine plans were updated in 2004 to incorporate the results from the development drilling since 1999. This represented an update relative to the original mine plans. The result was the identification of additional reserves in the combined East/ West pit area to the west of the Muskeg River. Total reserves continue to be defined based on the original premise of a 30-year development plan. |
| |
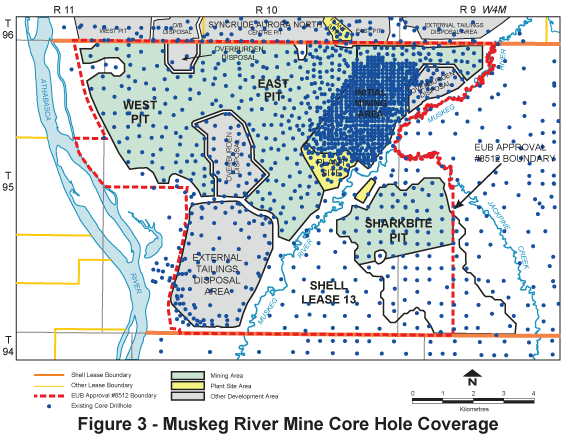
| | Figure 2 shows the mining areas associated with the designated reserves for the Muskeg River Mine. Figure 3 shows the core hole coverage for those same areas. |
Location of the Muskeg River Mine
| |
| |  |
| |
| | March 10, 2005 |
24 SCHEDULE II
Muskeg River Mine Development Areas
| |
| |  |
| |
| | March 10, 2005 |
Core Hole Coverage for Development Areas
| |
| |  |
| |
| | March 10, 2005 |
26 SCHEDULE II
| |
| Schedule III | |
FORM 51-101F2
Report on Oil and Gas Reserves Data by Qualified Reserves Evaluator
| |
| | To the Board of Directors of Shell Canada Limited (the Company): |
| | |
| | 1. | Together with my staff, I have evaluated the Company’s reserves data as at December 31, 2004. The reserves data consist of the following: |
| | |
| | (a) | proved oil and gas reserves estimated as at December 31, 2004, using constant prices and costs; and |
| |
| | (b) | the related estimated future net revenue. |
| | |
| | 2. | The reserves data are the responsibility of the Company’s management. Our responsibility is to express an opinion on the reserves data based on our evaluation. |
| |
| | 3. | We carried out our evaluation in accordance with standards set out in the Canadian Oil and Gas Evaluation Handbook (the COGE Handbook), modified to the extent necessary to reflect the terminology and standards of the U.S. Disclosure Requirements. We are not, however, independent of the Company, within the meaning of the term “independent” under those standards. |
| |
| | 4. | Those standards require that we plan and perform an evaluation to obtain reasonable assurance as to whether the reserves data are free of material misstatement. An evaluation also includes assessing whether the reserves data are in accordance with principles and definitions presented in the COGE Handbook and applicable U.S. Disclosure Requirements. |
| |
| | 5. | The following table sets forth the estimated future net revenue (after deduction of income taxes) attributed to proved oil and gas reserves, estimated using constant prices and costs and calculated using a discount rate of 10 per cent, included in the reserves data of the Company evaluated by us for the year ended December 31, 2004: |
| | | | | |
| | | | | Net Present Value of |
| | | Location of Reserves | | Future Net Revenue |
| Internal Qualified | | (country or foreign | | (after income taxes, |
| Reserves Evaluator | | geographic area) | | 10% discount rate) |
|
| Bruce Roberts | | Canada | | $2 982 million |
|
| | |
| | 6. | In our opinion, the reserves data evaluated by us have, in all material respects, been determined in accordance with the COGE Handbook, modified to the extent necessary to reflect the terminology and standards of the U.S. Disclosure Requirements. We express no opinion on the reserves data that we did not evaluate. |
| |
| | 7. | We have no responsibility to update our evaluation referred to in this report for events and circumstances occurring after the date of this report. |
| | |
| | 8. | Because the reserves data are based on judgments regarding future events, actual results will vary and the variations may be material. |
| |
| | Executed as to our report referred to above at Calgary, Alberta: |
| |
| | 
Bruce Roberts
Chief Reservoir Engineer
January 31, 2005 |
28 SCHEDULE III
| |
| Schedule IV | |
FORM 51-101F2
Report on Minable Bitumen Reserves Data by Qualified Reserves Evaluator
| |
| | To the Board of Directors of Shell Canada Limited (the Company): |
| | |
| | 1. | Together with my staff, I have evaluated the Company’s reserves data as at December 31, 2004. The reserves data consist of proved and probable minable bitumen reserves estimated as at December 31, 2004. |
| |
| | 2. | The reserves data are the responsibility of the Company’s management. Our responsibility is to express an opinion on the reserves data based on our evaluation. |
| |
| | 3. | We carried out our evaluation in accordance with the applicable standards set out in the Canadian Oil and Gas Evaluation Handbook (the COGE Handbook), modified to the extent necessary to reflect the terminology and standards of the U.S. Disclosure Requirements. We are not, however, independent of the Company, within the meaning of the term “independent” under those standards. |
| |
| | 4. | Those standards require that we plan and perform an evaluation to obtain reasonable assurance as to whether the reserves data are free of material misstatement. An evaluation also includes assessing whether the reserves data are in accordance with applicable principles and definitions presented in the COGE Handbook and applicable U.S. Disclosure Requirements. |
| |
| | 5. | In our opinion, the reserves data evaluated by us have, in all material respects, been determined in accordance with the applicable standards set out in the COGE Handbook, modified to the extent necessary to reflect the terminology and standards of the U.S. Disclosure Requirements. We express no opinion on the reserves data that we did not evaluate. |
| |
| | 6. | We have no responsibility to update our evaluation referred to in this report for events and circumstances occurring after the date of this report. |
| |
| | 7. | Because the reserves data are based on judgments regarding future events, actual results will vary and the variations may be material. |
| |
| | Executed as to our report referred to above at Calgary, Alberta: |
| |
| | 
Allen G. Vanderputten
Chief Mining Engineer
January 31, 2005 |
| |
| Schedule V | |
FORM 51-101F3
Report of Management and Directors on Oil and Gas Disclosure
| |
| | Management of Shell Canada Limited (the Company) are responsible for the preparation and disclosure of information with respect to the Company’s oil and gas activities in accordance with securities regulatory requirements. This information includes reserves data, which consist of the following: |
| | |
| | (a) (i) | proved oil and gas reserves estimated as at December 31, 2004, using constant prices and costs; and |
| | |
| | (ii) | the related estimated future net revenue; and |
| | |
| | (b) | proved and probable minable bitumen reserves estimated as at December 31, 2004. |
| |
| | Our Chief Reservoir Engineer and Chief Mining Engineer, who are each in an employment relationship with the Company, along with the Company’s internal teams of reservoir engineers and geological and mining professionals, have evaluated the Company’s reserves data. The reports of the internal qualified reserves evaluators will be filed with securities regulatory authorities concurrently with this report. |
| |
| | The Reserves Committee of the Board of Directors of the Company has: |
| | |
| | (a) | reviewed the Company’s procedures for providing information to the internal qualified reserves evaluators; |
| |
| | (b) | met with the internal qualified reserves evaluators to determine whether any restrictions placed by management affect the ability of the internal qualified reserves evaluators to report without reservation; |
| |
| | (c) | reviewed the reserves data with management and the internal qualified reserves evaluators; and |
| |
| | (d) | reviewed the report of an external, independent petroleum consulting firm on its audit of 100 per cent of the Company’s proved oil and gas reserves. |
| |
| | The Reserves Committee of the Board of Directors has reviewed the Company’s procedures for assembling and reporting other information associated with oil and gas activities and has reviewed that information with management. The Board of Directors has, on the recommendation of the Reserves Committee, approved the content and filing with securities regulatory authorities of the reserves data and other oil and gas information, the filing of the reports of the internal qualified reserves evaluators on the reserves data and the content and filing of this report. |
| |
| | The Company is relying on exemptive relief, which it sought and was granted by securities regulatory authorities, permitting it to use U.S.-style oil and gas disclosure and exempting it from the requirement under securities legislation to involve independent qualified reserves evaluators or independent qualified reserves auditors. |
| |
| | For 2004, notwithstanding this exemptive relief, the Company also received a report of an external, independent petroleum consulting firm on its audit of 100 per cent of the Company’s proved oil and gas reserves. This report reached a conclusion that is not materially different from the report prepared by our Chief Reservoir Engineer. |
| |
| | In our view, the reliability of the internally generated reserves data is not materially less than was afforded by our involving this firm or would be afforded by our involving any other independent qualified reserves evaluators or independent qualified reserves auditors to evaluate or audit and review the reserves data. The primary factors supporting the involvement of independent qualified reserves |
30 SCHEDULE V
| |
| | evaluators or independent qualified reserves auditors apply when (i) their knowledge of, and experience with, a reporting issuer’s reserves data are superior to that of the internal evaluators and (ii) the work of the independent qualified reserves evaluators or independent qualified reserves auditors is significantly less likely to be adversely influenced by self-interest or management of the reporting issuer than the work of internal reserves evaluation staff. In our view, neither of these factors applies in our circumstances. |
| |
| | Our view is based in large part on the following. Our reserves data were developed in accordance with the applicable standards set out in the Canadian Oil and Gas Evaluation Handbook. Our internal reserves evaluation staff includes 27 persons with an average of 13 years of relevant experience in evaluating reserves, of whom 13 are qualified reserves evaluators for purposes of securities regulatory requirements. Our internal reserves evaluation management personnel includes two persons with an average of 25 years of relevant experience in evaluating and managing the evaluation of reserves. Our procedures, records and controls relating to the accumulation of source data and preparation of reserves data by our internal reserves evaluation staff have been established, refined, documented and subjected to review by our internal financial auditors who have reported directly to the Reserves Committee of the Board of Directors. |
| |
| | Because the reserves data are based on judgments regarding future events, actual results will vary and the variations may be material. |
| |
| |  |
| | CLIVE MATHER |
| | President and Chief Executive Officer |
| |
| |  |
| | CATHY L. WILLIAMS |
| | Chief Financial Officer |
| |
| |  |
| | KERRY L. HAWKINS |
| | Director |
| |
| |  |
| | DAVID W. KERR |
| | Director |
| |
| | March 10, 2005 |
| |
| Schedule VI | |
United States Generally Accepted Accounting Principles and Reporting Practices
| |
| | The financial statements have been prepared in accordance with accounting principles generally accepted in Canada. They differ from those generally accepted in the United States in the following respects: |
| |
| | Capitalization of Interest Interest costs were expensed as incurred. U.S. accounting principles require capitalization and subsequent amortization of certain interest costs incurred on capital outlays. |
| |
| | Pension Expenses Prior to 2000, the application of the corridor method of accounting for pension expense used in the U.S. accounting principles resulted in the amortization of gains and losses only if a 10 per cent threshold was exceeded. On January 1, 2000, a new accounting standard was adopted, which harmonized Canadian and U.S. accounting standards. Adoption of the new Canadian standard gave rise to a transition asset, which is being amortized over the expected average remaining service life of the employee group. This amount is not recognized for U.S. reporting purposes. |
| |
| | Derivative Instruments and Hedging Activity U.S. accounting standard FAS 133 requires that hedging activity that does not qualify as a hedge, be mark-to-market and charged to earnings. |
| |
| | Transactions with Affiliated Companies U.S. accounting standards require the elimination of profit on transactions, which are not in the normal course of business, between two entities under common control (generally ownership greater than 50%). Canadian accounting standards only require the elimination of profit between two affiliated entities where common ownership is greater than 80 per cent. |
| |
| | Stock-Based Compensation U.S. accounting standard FAS 123 requires performance-based options to be charged to earnings. Shell Canada adopted the new Canadian standard requiring the expensing of stock options prospectively in 2003. |
| |
| | Variable Interest Entities Effective for 2004, U.S. FASB Interpretation Number 46R mandates that certain entities are consolidated by the primary beneficiary. The equivalent Canadian rules under Accounting Guideline 15 are effective for the first interim or annual reporting period beginning on or after November 1, 2004. |
| |
| | Asset Retirement Obligations The U.S. accounting standard FAS 143 became effective in 2003. This standard required the recognition of legal obligations associated with the retirement of tangible long-lived assets. The equivalent Canadian pronouncement was adopted in 2004. |
32 SCHEDULE VI
| |
| | If the Corporation’s financial statements had been presented on the basis of U.S. accounting principles, earnings and earnings per share would have been: |
| | | | | | | | | | | | | | |
| ($ millions) | | 2004 | | | 2003 | | | 2002 | |
| | | | | (restated) | | | (restated) | |
| |
| Earnings | | | 1 286 | | | | 810 | | | | 555 | |
| Increase (decrease): | | | | | | | | | | | | |
| | Capitalized interest amortized | | | (15 | ) | | | (14 | ) | | | (12 | ) |
| | Pension expense | | | (1 | ) | | | (31 | ) | | | (37 | ) |
| | Change in fair value of derivative instruments | | | 2 | | | | (7 | ) | | | 3 | |
| | Operating expense | | | 19 | | | | 13 | | | | 11 | |
| | Depreciation expense | | | (25 | ) | | | (13 | ) | | | (2 | ) |
| | Interest expense | | | (6 | ) | | | – | | | | – | |
| | Elimination of profit on transaction with affiliate | | | – | | | | – | | | | (24 | ) |
| | Stock-based compensation | | | 6 | | | | (3 | ) | | | (3 | ) |
| | Income taxes | | | 10 | | | | 12 | | | | 17 | |
|
| Adjusted earnings attributable to common shares | | | 1 276 | | | | 767 | | | | 502 | |
| Cumulative effect of change in accounting policy after tax | | | – | | | | (45 | ) | | | – | |
|
| Adjusted earnings after cumulative effect of accounting policy after tax | | | 1 276 | | | | 722 | | | | 502 | |
| Other comprehensive income | | | (3 | ) | | | (54 | ) | | | (103 | ) |
|
| Total comprehensive income | | | 1 273 | | | | 668 | | | | 399 | |
|
| Basic earnings per common share (dollars) | | | 4.64 | | | | 2.79 | | | | 1.82 | |
| Diluted earnings per common share (dollars) | | | 4.61 | | | | 2.78 | | | | 1.81 | |
| Basic earnings per common share after cumulative effect of change in accounting policy (dollars) | | | 4.64 | | | | 2.63 | | | | 1.82 | |
|
| |
| | In accordance with U.S. accounting standard FAS 130, a separate statement would be presented which discloses the components of other comprehensive income: |
| | | | | | | | | | | | | | |
| ($ millions) | | 2004 | | | 2002 | | | 2002 | |
| |
| Accumulated other comprehensive income (loss), beginning of year | | | (169 | ) | | | (115 | ) | | | (12 | ) |
| Increase (decrease): | | | | | | | | | | | | |
| | Cash flow hedge movements | | | – | | | | – | | | | 19 | |
| | Cash flow hedge movements – tax | | | – | | | | – | | | | (7 | ) |
| | Minimum additional pension liability | | | (2 | ) | | | (66 | ) | | | (192 | ) |
| | Minimum additional pension liability – tax | | | (1 | ) | | | 12 | | | | 77 | |
|
Accumulated other comprehensive income (loss), end of year | | | (172 | ) | | | (169 | ) | | | (115 | ) |
|
| |
| | There are no material differences on the Corporation’s Consolidated Statement of Cash Flows. |
| |
| | The net effect of the differences on the Corporation’s Consolidated Balance Sheet is not material except for the following: |
| |
| | From 1996, there is $225 million of retained earnings as a result of the sale of the Chemicals business. This would be classified as contributed surplus. |
| |
| | In 2004, to comply with FAS 87, the prepaid pension asset would be adjusted by an additional minimum liability amount. FAS 87 requires this adjustment to reflect the excess of the plan’s accumulated benefit obligation over the market value of the plan assets. This excess over market value was the result of weakening equity markets. The additional minimum liability of $260 million (2003 – $258 million; 2002 – $192 million) would be reflected as a reduction of pension assets, with a corresponding reduction of the Company’s future income tax liability of $88 million (2003 – $89 million, 2002 – $77 million). |
| |
| | In compliance with FAS 133, in 2004 there is no derivative net asset or liability (2003 – $2 million net liability; 2002 – $6 million net asset). |
| |
| | In compliance with FASB Interpretation Number 46R, assets for 2004 would increase by $200 million and liabilities would increase by $212 million. |
| |
| AUDITORS’ REPORTS | |
To the Shareholders of Shell Canada Limited:
| |
| | Under date of January 31, 2005, we reported on the consolidated balance sheets of Shell Canada Limited as at December 31, 2004, 2003 and 2002 and the consolidated statements of earnings and retained earnings and cash flows for each of the three years in the period ended December 31, 2004, as incorporated by reference in the Annual Information Form with respect to the year ended December 31, 2004. In connection with our audits of the aforementioned consolidated statements, we also have audited the related supplemental note entitled United States Generally Accepted Accounting Principles and Reporting Practices as set forth in the Annual Information Form. This supplemental note is the responsibility of the Company’s management. Our responsibility is to express an opinion on this supplemental note based on our audits. |
| |
| | In our opinion, such supplemental note, when considered in relation to the basic consolidated financial statements as a whole, presents fairly, in all material respects, the information set forth therein. |

| |
| | Chartered Accountants
Calgary, Alberta
January 31, 2005 |
To the Shareholders of Shell Canada Limited:
| |
| | In the United States, reporting standards for auditors require the addition of an explanatory paragraph (following the opinion paragraph) when there is a change in accounting principles that has a material effect on the comparability of the company’s financial statements, such as the change described in Note 1 to the financial statements. Our report to the shareholders dated January 31, 2005, is expressed in accordance with the Canadian reporting standards which do not require a reference to such a change in accounting principles in the auditors’ report when the change is properly accounted for and adequately disclosed in the financial statements. |
| |
| | Chartered Accountants
Calgary, Alberta
January 31, 2005 |
34 AUDITORS’ REPORT
FOR INFORMATION:
Investor Relations
Shell Canada Limited
Shell Centre
400 – 4th Avenue S.W.
Calgary, Alberta T2P 0J4
Telephone (403) 691-2175
www.shell.ca