Shell Canada Limited
Growth
Profitability
Sustainable Development

| | | | | | | | | |
| |
| 1 | | | HIGHLIGHTS |
| |
| 4 | | | PRESIDENT’S MESSAGE |
| |
| 9 | | | MANAGEMENT’S DISCUSSION AND ANALYSIS |
| | | | | 18 | | | Exploration & Production |
| | | | | 26 | | | Oil Sands |
| | | | | 32 | | | Oil Products |
| | | | | 40 | | | Corporate |
| |
| 47 | | | FINANCIAL INFORMATION |
| | | | | 47 | | | Management’s Report |
| | | | | 48 | | | Auditors’ Report |
| | | | | 49 | | | Consolidated Financial Statements |
| |
| 71 | | | SUPPLEMENTAL DISCLOSURE |
| | | | | 71 | | | Oil Products |
| | | | | 72 | | | Exploration & Production |
| | | | | 76 | | | Oil Sands |
| | | | | 78 | | | Landholdings |
| | | | | 79 | | | Financial Data and
Quarterly Stock-Trading Information |
| |
| 80 | | | CORPORATE INFORMATION |
| | | | | 80 | | | Corporate Directory and Board of Directors |
| | | | | 82 | | | Statement of Corporate Governance Practices |
| |
| 84 | | | INVESTOR INFORMATION |
| |

| | | | | | | | | | | | | | | |
| | | | | | | |
FINANCIAL HIGHLIGHTS | | | | 2004 | | | | | 2003 | | | | 2002 | |
| | | | | | | |
| | | | | | | | | (restated) | | | (restated) | |
Earnings($ millions) | | | | 1 286 | | | | | 810 | | | | 555 | |
| | | | | | | |
Cash flow from operations($ millions)1 | | | | 2 350 | | | | | 1 747 | | | | 1 227 | |
| | | | | | | |
Capital, exploration and predevelopment expenditures($ millions) | | | | 1 021 | | | | | 759 | | | | 2 289 | |
| | | | | | | |
Return on average common shareholders’ equity(%) | | | | 21.3 | | | | | 15.4 | | | | 11.5 | |
| | | | | | | |
Return on average capital employed(%)2 | | | | 19.9 | | | | | 13.1 | | | | 10.1 | |
| | | | | | | |
Per common share(dollars) | | | | | | | | | | | | | | |
| | | | | | | |
| Earnings – basic | | | | 4.68 | | | | | 2.95 | | | | 2.01 | |
| | | | | | | |
| Earnings – diluted | | | | 4.64 | | | | | 2.92 | | | | 2.00 | |
| | | | | | | |
| Dividends | | | | 0.94 | | | | | 0.82 | | | | 0.80 | |
| | | | | | | |
| | | | | | | | | | | | | | | |
| | | | | | | |
OPERATING HIGHLIGHTS | | | | 2004 | | | | | 2003 | | | | 2002 | |
| | | | | | | |
Production | | | | | | | | | | | | | | |
| | | | | | | |
Natural gas – gross(mmcf/d) | | | | 540 | | | | | 562 | | | | 610 | |
| | | | | | | |
Ethane, propane and butane – gross(bbls/d) | | | | 25 100 | | | | | 26 700 | | | | 27 900 | |
| | | | | | | |
Condensate – gross(bbls/d) | | | | 15 200 | | | | | 16 800 | | | | 19 700 | |
| | | | | | | |
Bitumen – gross(bbls/d) | | | | | | | | | | | | | | |
| | | | | | | |
| Exploration & Production | | | | 8 100 | | | | | 9 200 | | | | 8 900 | |
| | | | | | | |
| Oil Sands | | | | 81 300 | | | | | 46 300 | | | | – | |
| | | | | | | |
| Total bitumen | | | | 89 400 | | | | | 55 500 | | | | 8 900 | |
| | | | | | | |
Sulphur – gross(long tons/d) | | | | 5 600 | | | | | 5 900 | | | | 6 100 | |
| | | | | | | |
Crude oil processed by Shell refineries(m3/d) | | | | 45 100 | | | | | 42 900 | | | | 41 400 | |
| | | | | | | |
Sales | | | | | | | | | | | | | | |
| | | | | | | |
Synthetic crude sales excluding blend stocks(bbls/d) | | | | 83 700 | | | | | 46 100 | | | | – | |
| | | | | | | |
Purchased upgrader blend stocks(bbls/d) | | | | 38 200 | | | | | 17 700 | | | | – | |
| | | | | | | |
Total synthetic crude sales(bbls/d) | | | | 121 900 | | | | | 63 800 | | | | – | |
| | | | | | | |
Petroleum product sales(m3/d) | | | | 47 500 | | | | | 45 700 | | | | 44 400 | |
| | | | | | | |
Prices | | | | | | | | | | | | | | |
| | | | | | | |
Natural gas average plant gate netback price($/mcf) | | | | 6.49 | | | | | 6.46 | | | | 4.01 | |
| | | | | | | |
Ethane, propane and butane average field gate price($/bbl) | | | | 28.71 | | | | | 25.48 | | | | 19.53 | |
| | | | | | | |
Condensate average field gate price($/bbl) | | | | 50.46 | | | | | 41.13 | | | | 37.72 | |
| | | | | | | |
Synthetic crude average plant gate price($/bbl) | | | | 44.67 | | | | | 34.18 | | | | – | |
| | | | | | | |
| | | |
1 | | Cash flow from operations is a non-GAAP measure and is defined as cash flow from operating activities before movement in working capital and operating activities. |
2 | | Return on average capital employed is a non-GAAP measure and is defined as earnings plus after-tax interest expense on debt divided by the average of opening and closing common shareholders’ equity plus preferred shares, long-term debt and short-term borrowings. |
| |
| | | | | | |
| Highlights | | | SHELL CANADA LIMITED | | 1 |
| | | | | | |
RESULTS IN 2004
| • | RECORD EARNINGS AND CASH FLOW IN 2004 were mainly due to a combination of high commodity prices and refining margins, and strong operational performances across Shell’s business units. Shell Canada’s 2004 return on average capital employed was 19.9 per cent. |
| |
| • | COMMODITY PRICES REMAINED STRONG throughout 2004. Crude oil prices broke the $50 US per barrel barrier in the fall before softening in the last two months of the year. The annual average price of crude oil was $41.40 US per barrel (West Texas Intermediate). Natural gas prices at Henry Hub averaged $6.05 US per million cubic feet. Wide heavy oil market differentials and high prices for diluent condensate resulted in low values for Canadian bitumen at year-end. |
| |
| • | OIL PRODUCTS EARNINGS BENEFITEDfrom strong refining margins for most of 2004 as demand for crude oil increased and North American finished product inventories declined. Marketing margins remained depressed for most of the year. |
| |
| • | CAPITAL EXPENDITURESfor the year were $1,021 million compared with $759 million in 2003. |
This report contains “forward-looking statements” based upon current expectations, estimates and projections of future production, project startup and future capital spending. Forward-looking statements include, but are not limited to, references to future capital and other expenditures, drilling plans, construction activities, the submission of regulatory applications, refining margins, oil and gas production levels, resources and reserves estimates.
Readers are cautioned not to place undue reliance on forward-looking statements. Forward-looking statements involve numerous risks and uncertainties, which could cause actual results to differ materially from those anticipated by the Corporation. These risks and uncertainties include, but are not limited to, the risks of the oil and gas industry (including operating conditions and costs), demand for oil, gas and related products, disruptions in supply, project schedules, the uncertainties involving geology of oil and gas deposits, the uncertainty of reserves estimates, fluctuations in oil and gas prices and foreign currency exchange rates, general economic conditions, commercial negotiations, changes in law or government policy, and other factors, many of which are beyond the control of the Corporation.
| | | | | |
| | | | |
| | | COMMITMENTS
|
| | | | |
| | | | |
| | | | | |
| | | | | |
| | n | | GROWTH AND PROFITABILITYare the Company’s main goals. Pursuit of a strong and diverse portfolio of growth projects requires significant capital investment funded by robust and profitable base businesses. While the return on average capital employed may fall in times of heavy investment, the resulting growth will support future, long-term profitability in a continuing cycle. |
| | | | | |
| | n | | SUSTAINABLE DEVELOPMENTis the integration of economic, environmental and social considerations into the Company’s day-to-day activities. Shell Canada aims to provide value to its customers in ways that respect environmental and social concerns while contributing to the economic benefit of its shareholders, employees and society at large. |
| | | | | |
| | n | | A FOCUS ON OPERATIONAL EXCELLENCEmeans that all employees are accountable for what they can control in the areas of costs and operations. This includes the operational performance of each segment of the Company in terms of plant reliability, project execution, health, safety and the environment, customer satisfaction and stakeholder engagement. |
| | | | | |
| | n | | THE HEALTH AND SAFETY OF EMPLOYEESand contractors is one of Shell Canada’s top priorities. The Company’s safety goal is to cause “no harm to people.” |
| | | | | |
| | n | | POLICIES AND PROCEDURESare in place to facilitate compliance with applicable regulations governing every aspect of the Company’s business. All Shell employees are required to conduct business in accordance with them and with a set of business principles and code of ethics to uphold the integrity and reputation of the Company. |
| | | | | |
| |
| |
| |
| |
| |
| |
| |
| | | | | | |
| | | | | |
| | AT A GLANCE | | | Shell Canada Limited is one of the largest integrated petroleum companies in Canada, comprising three major business units supported by a number of Corporate departments.
|
| | | | |
| | | | |
| | | | |
| | | | | | |
| | | | |
PROFILE
|
| | | | |
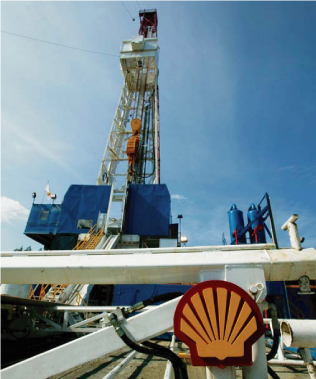
| |  | | | EXPLORATION & PRODUCTION (formerly Resources)explores for and produces natural gas, natural gas liquids, bitumen and sulphur. The upstream business operates four natural gas processing facilities in the Foothills of Alberta and an in situ bitumen facility near Peace River, Alberta. The Company also has a 31.3 per cent share of the Sable Offshore Energy Project, which produces natural gas and natural gas liquids off the coast of Nova Scotia. |
| | | | |
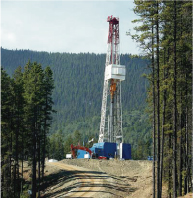
| | 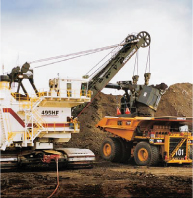 | | | SHELL CANADA HOLDS A 60 PER CENT INTERESTin the Athabasca Oil Sands Project, which includes the Muskeg River Mine and the Scotford Upgrader. During its first year of fully integrated operations, Oil Sands confirmed that the mine and upgrader can achieve the design rate of an average 155,000 barrels per day. Existing minable resources support possible future production of more than 500,000 barrels per day. |
| | | | |
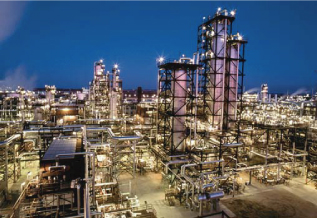
| |  | | | THE OIL PRODUCTS BUSINESSmanufactures, distributes and markets refined petroleum products across the country. Oil Products also procures crude oil and feedstocks for Shell’s refineries in Montreal, Quebec; Sarnia, Ontario; and Fort Saskatchewan, Alberta. The refineries convert crude oil into gasoline, diesel, aviation fuels, solvents, lubricants, asphalt and heavy fuel oils. Shell’s Canada-wide network of 1,762 retail sites includes convenience food stores and car wash facilities. |
| | | | |
| | | | |
| | | | |
| | | | | | |
| 2 | | SHELL CANADA LIMITED | | | Highlights |
| | | | | | |
Clive Mather
President and
Chief Executive Officer
| | | | |
| | | | |
| | | | |
| | | | For Shell Canada, 2004 was
a year of considerable achievement. |
| | | | |
| | | | |
When I moved to Shell Canada in August 2004, I was excited by the strength of the Company and the potential for growth. I have been impressed in particular by the quality of our people – their professionalism, enthusiasm and hard work. Shell Canada’s success is a tribute to previous leadership, not least my predecessor Linda Cook, who encouraged many new initiatives.
For Shell Canada, 2004 was a year of considerable achievement. In a business environment where crude oil prices reached $50 US per barrel, our traditional resource and products businesses both performed very well. And our new business, the Athabasca Oil Sands Project (AOSP), completed its first 12 months of fully integrated operations, making a significant contribution to our overall results. We received federal and provincial cabinet approvals for Jackpine Mine. In addition, regulatory applications were filed for the Mackenzie Gas Project and we filed our development plan for the Niglintgak field in the Mackenzie Delta. Peace River achieved its 50 millionth barrel of bitumen production, South Venture commenced production offshore Nova Scotia and we made a major gas discovery in the Foothills of Alberta.
| | | | | | |
| 4 | | SHELL CANADA LIMITED | | | President's Message |
| | | | | | |
FINANCIAL PERFORMANCE
The Company enjoyed an outstanding year in 2004 with record earnings of $1,286 million, or $4.68 per common share. This represents a 59 per cent increase from $810 million in 2003 or $2.95 per share, up significantly from our previous record in 2001. High commodity prices and strong refining margins provided favourable economic conditions for our business units. The 2004 results delivered a strong return on average capital employed of 19.9 per cent. Cash flow from operations in 2004 was a record $2,350 million compared with $1,747 million in 2003.
Total shareholder return for 2004 was 32.4 per cent, with quarterly declared dividends increasing to 25 cents per common share from 22 cents. This positioned the Company at the head of the table among the integrated oil companies. It is gratifying to note that, over the past five years, Shell’s quarterly dividends have increased by seven cents or 39 per cent thanks to strong cash flow from all three businesses.
OPERATIONAL PERFORMANCE
Total hydrocarbon production in 2004 broke the previous year’s record, as the AOSP moved closer to sustained production at the design rate of 155,000 barrels per day (bpd) of bitumen.
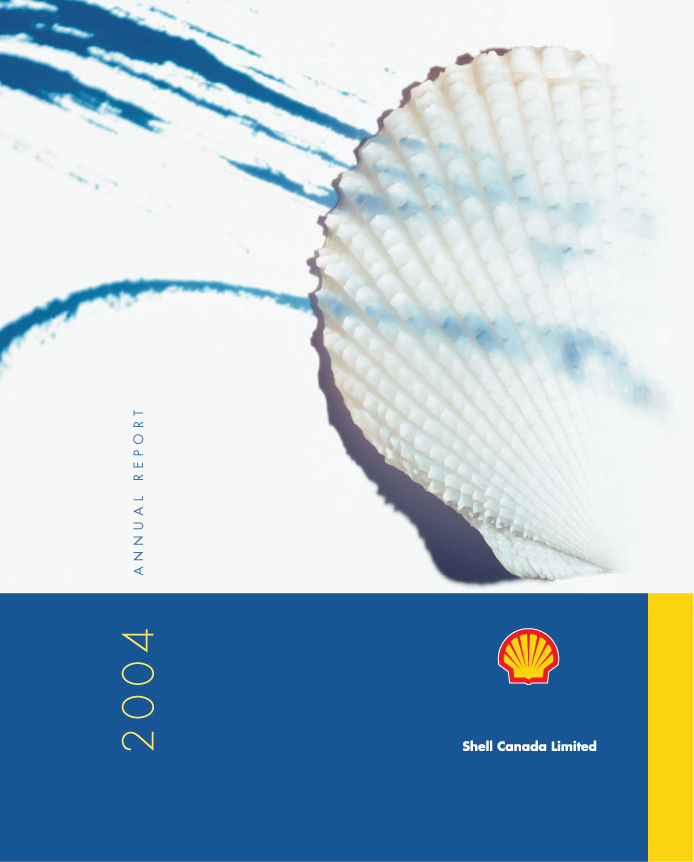
Exploration & Production (formerly Resources) continued to invest in natural gas fields in Western Canada. This investment combined with the technical skills and ingenuity of our Foothills team resulted in some impressive exploration successes in 2004, including a sizable natural gas discovery in the Tay River area of central Alberta. These successes will help offset the inevitable decline in volumes from our core fields in the Foothills of Alberta and will make an important contribution to the Company’s earnings. In addition, we drilled a number of wells to test the potential value of unconventional gas opportunities in Alberta and British Columbia and are currently assessing the results.
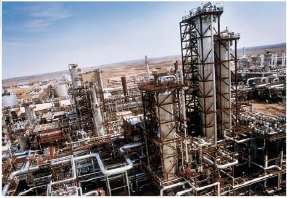
 |
| Shell Canada’s Scotford Upgrader upgrades bitumen from the Muskeg River Mine and provides feedstock for the adjacent Scotford Refinery. |
Offshore Nova Scotia, we continued to invest in the Sable project, where production from the Alma field helped offset declining natural gas volumes. The South Venture field, which began production late 2004, will do the same in 2005. Altogether, Sable contributed about 23 per cent of Shell Canada’s natural gas production in 2004. However, it was very disappointing that the Weymouth and Cree exploration wells offshore Nova Scotia failed to find commercial quantities of hydrocarbons. Both had to be written off as dry holes.
During its first full year of operation, the AOSP demonstrated its ability to produce at or above the design rates. Bitumen production averaged 92,500 bpd (Shell share) in the third quarter, which was a remarkable achievement in so short a time for a project of such size and complexity. However, operational problems at the Scotford Upgrader reduced fourth-quarter production and earnings. Meeting every challenge, from the extreme cold that hampered maintenance work in January 2004, to repairs to the froth treatment plant settlers at the mine and the reactors at the upgrader, increased our knowledge of and our confidence in this new and growing business.
| | | | | | |
| President's Message | | | SHELL CANADA LIMITED | | 5 |
| | | | | | |
A combination of political instability, increased demand and tight supply drove prices to very high levels. While high crude oil prices helped the profitability of the AOSP, they presented a challenge for our downstream oil business. In a fiercely competitive marketplace, it was simply impossible to pass along the full cost increase to customers.
Nevertheless, Oil Products had an outstanding year. Through operational reliability and customer focus, the business was able to benefit from strong refining margins, high benzene prices and less expensive feedstocks from the integration at Scotford of the refinery with the upgrader, to deliver top performance and record results.
An exploration well in the Tay River area of Alberta made a major natural gas discovery in 2004.
SUSTAINABLE DEVELOPMENT IN ACTION
Sustainable development is the umbrella under which Shell Canada conducts all its business activities. It is an integral part of all our planning, particularly for major growth projects such as the Athabasca Oil Sands and the Mackenzie Gas projects.
The AOSP became the first oil sands operation in Canada to have its environmental management system ISO 14001 certified. Certification means meeting internationally recognized standards of compliance with environmental legislation and continuously improving environmental performance. And Oil Sands continues to lead through environmental impact studies and public consultation with respect to its expansion projects.
In the same way, Exploration & Production has integrated the principles of sustainable development into the planning stages for its potential unconventional gas businesses. In the case of coalbed methane, for example, Shell has published an information package describing best practices with respect to health, safety, sustainability, public consultation and risk management.
In the downstream oil business, each Shell refinery developed a social performance plan. These plans include a framework for effective public consultation with stakeholders and guidelines for being a good neighbour in the communities where we operate.
I share with my predecessors a belief that sustainable development is fundamental to our licence to operate and to our licence to grow. We take pride in running our operations as efficiently as we can on the three principles of sustainability – economic, social and environmental. And we recognize that, unless we can demonstrate that our development of Canada’s resources is sustainable and beneficial to all Canadians, we will not obtain the necessary regulatory approvals and community support for the future. At the end of the day, it’s about being good neighbours, trusted corporate citizens and running a good business.
| | | | | | |
| 6 | | SHELL CANADA LIMITED | | | President’s Message |
| | | | | | |
Members of Shell Canada’s senior management team, from left:
Simon FishVice President, General Counsel and Secretary;Pat CreaghanDirector, Corporate Strategies;David WestonSenior Vice President, Oil Products;Cathy WilliamsChief Financial Officer;Clive MatherPresident and CEO;Ian KilgourSenior Vice President, E&P;Neil CamartaSenior Vice President, Oil Sands;David FultonGeneral Manager, Human Resources;Tim BancroftVice President, Sustainable Development, Technology and Public Affairs.
SAFETY PERFORMANCE
There were some notable achievements in 2004, including best-ever safety performance for Exploration & Production. In Oil Products, Montreal East Refinery logged four million hours without a lost-time incident, and both Scotford and Sarnia refineries recorded two million hours.
Nevertheless, we continue to fall short of our goal of no harm to people. Even one injury is one too many. In 2004, 14 people suffered work-related injuries severe enough to keep them off work for a while. Quite simply, I find this unacceptable and we must do even more to embed safety consciousness into the hearts and minds of every Shell employee and every contractor who works on our behalf. To this end, I have started to investigate personally every incident that results in someone needing time off work to recover.
CORPORATE GOVERNANCE AND COMPLIANCE
No matter how well a company performs financially and operationally, shareholders and other stakeholders have a low tolerance for poor corporate governance – and rightly so. Compliance and transparency are the bedrock of a company’s reputation, and challenge us to check constantly that our internal controls are appropriate and our culture encourages compliance.
Shell Canada has a solid reputation for regulatory compliance and we are working hard to address evolving Canadian and U.S. securities regulations, including the U.S. Sarbanes-Oxley Act. I believe we have sound internal controls in place with a firm foundation in our Statement of General Business Principles and Code of Ethics. Nevertheless, we must remain vigilant and continue to improve our processes. Hence, we have adopted the best-practice guidelines for reserves reporting developed by Shell internationally and established a new department of Corporate Governance in 2004 to coordinate the review of our internal controls and assess any potential impact on financial reporting. We have also created a new position of chief compliance officer.
| | | | | | |
| President's Message | | | SHELL CANADA LIMITED | | 7 |
| | | | | | |
LOOKING FORWARD
Shell Canada’s 2005 capital and exploration expenditure program of $1.8 billion is an increase of more than 60 per cent over the 2004 program and reflects our commitment to growth.
Exploration & Production will direct about 60 per cent of its spending program to the maintenance of natural gas production levels in the Foothills of Western Canada and the Sable gas project offshore Nova Scotia. The Foothills area particularly remains the core of our business and our profitability. The balance of the program will support growth opportunities, including the further evaluation of unconventional natural gas plays. We will continue to develop our Peace River in situ bitumen property in Western Canada and progress the Mackenzie Gas Project in the Far North.
| | | | |
| | | | |
| | | | |
| | | | We have a brand to be admired
and a company that is going places. |
| | | | |
| | | | |
The 2005 investment program for Oil Sands is divided between profitability and growth. Profitability projects will reduce unit costs and improve energy efficiency; growth projects will focus on debottlenecking existing operations and front-end engineering for future expansion.
Oil Products will invest in a number of manufacturing and distribution projects, including the distillate hydrotreater projects at our Montreal East and Scotford refineries. These major projects are on track to meet the deadline for producing and distributing ultra-low-sulphur diesel in 2006. The marketing investment program will be used to strengthen the retail network in major urban areas.
Crude oil prices steadily increased in 2004. They eventually reached $50 US per barrel before falling to the low $40 US per barrel range towards the end of the year. No one can predict with accuracy what future prices will be, but I believe market fundamentals have shifted upwards in recent years. For planning purposes, we test our investments at a number of different price levels and exchange rates to ensure robust profitability. This gives me confidence that we can look forward to ongoing profitable growth for some years to come.
Once again, our Board of Directors served the shareholders of Shell Canada well in 2004. I would like to thank the directors for their guidance and support. I look forward very much to working with them in the coming years. In particular, I would like to express my personal gratitude to Mr. Jeroen van der Veer for his contribution to the Board since his election in 2003. Mr. Van der Veer will not be standing for re-election in 2005. On behalf of Shell Canada, I wish him every success in his role as Chief Executive of Royal Dutch/Shell.
I am also grateful to our investors for their continuing support.
Finally, I thank each one of our employees for their warm welcome to me and for their contribution to the business results. The achievements of 2004 were fitting recognition of their skills and industry. The plans for 2005 are built upon their talent and commitment. We have a brand to be admired and a company that is going places. I am proud to be part of such a great team.
Clive Mather
President and
Chief Executive Officer
Calgary, Alberta,
March 10, 2005
| | | | | | |
| 8 | | SHELL CANADA LIMITED | | | President's Message |
| | | | | | |

MD&AMarch 10, 2005
Shell Canada’s reputation rests on the
honesty and integrity of all its business dealings.
MANAGEMENT’S DISCUSSION AND ANALYSIS
In this Management’s Discussion and Analysis:
| § | | All information is reported in Canadian dollars and in accordance with Canadian generally accepted accounting principles (GAAP) unless otherwise stated. |
| |
| § | | Certain financial measures are not prescribed by Canadian GAAP. These non-GAAP financial measures do not have any standardized meaning and, therefore, may not be comparable with the calculation of similar measures for other companies. The Company includes as non-GAAP measures return on average capital employed (ROACE), cash flow from operations and unit cash operating cost because they are key internal and external financial measures used to evaluate the performance of the Company. |
| |
| § | | All forward-looking statements are qualified by the cautionary note on page 1 of this report. |
| |
| § | | The Corporation’s reserves disclosure and related information have been prepared in reliance on a decision of the applicable Canadian securities regulatory authorities under National Instrument 51-101 – Standards of Disclosure for Oil and Gas Activities (NI 51-101), which permits the Corporation to present its reserves disclosure and related information in accordance with the applicable requirements of the United States Financial Accounting Standards Board (FASB) and the United States Securities and Exchange Commission (SEC). This disclosure differs from the corresponding information required by NI 51-101. If Shell Canada had not received the decision, it would be required to disclose (i) proved plus probable oil and gas reserves estimates based on forecast prices and costs and information relating to future net revenue using forecast prices and costs, and (ii) minable bitumen reserves estimates based on forecast prices and costs and information relating to future net revenue using constant and forecast prices and costs. The Corporation’s internal qualified reserves evaluators prepare the reserves estimates. |
| |
| § | | Certain volumes have been converted to barrels of oil equivalent (boe). Boe’s may be misleading, particularly if used in isolation. A conversion of six thousand cubic feet of natural gas to one barrel of oil, as used in this report, is based on the energy equivalency conversion method primarily applicable at the burner tip and does not represent a value equivalency at the wellhead. |
Additional information relating to Shell Canada Limited filed with Canadian and U.S. securities regulatory authorities, including the Annual Information Form and Form 40-F, can be found online under Shell Canada’s profile atwww.sedar.com andwww.sec.gov.
| | | | | | |
| Management’s Discussion and Analysis | | | SHELL CANADA LIMITED | | 9 |
| | | | | | |
| | | |
| | |
| | |
| | | MANAGEMENT’S DISCUSSION AND ANALYSIS |
FINANCIAL RESULTS
Shell Canada reported record earnings of $1,286 million or $4.68 per common share for the full year 2004 compared with $810 million or $2.95 per share for 2003. Total earnings included positive earnings of $8 million in the Corporate sector. Fourth-quarter 2004 earnings fell slightly to $182 million or $0.66 per common share from $190 million or $0.69 per share for the same period in 2003.
Return on average capital employed was 19.9 per cent in 2004 compared with 13.1 per cent the previous year. Cash flow from operations was $2,350 million in 2004, which broke the previous year’s record of $1,747 million.
The main reasons for the improvement in 2004 were high commodity prices and refining margins as well as a significant contribution from the Athabasca Oil Sands Project (AOSP). The increase also related to a record performance by Oil Products. In addition, the 2004 earnings benefited from favourable tax assessments related to prior years and lower interest costs. In its first complete year of fully integrated operations, the AOSP demonstrated that it can achieve the design rate of an average 155,000 barrels of bitumen per day and contributed to record hydrocarbon production. Fourth-quarter results reflected non-cash charges totalling $128 million, including a non-cash charge of $71 million after-tax related to changes to the Company’s Long Term Incentive Plan.
Capital and predevelopment expenditures totalled $1,021 million compared with $759 million in 2003. The increase related mainly to higher expenditures in Exploration & Production (E&P, formerly Resources) and Oil Products. In 2004, E&P invested $229 million in the Foothills and $212 million in frontier areas. The upstream business also invested in exploration for unconventional natural gas.
The 2004 capital spending by Oil Sands amounted to $179 million. About 56 per cent of the total supported projects to ramp up production and debottleneck processes in the base operation. Shell invested the balance in progressing growth opportunities.
Total capital expenditures by Oil Products reached $313 million. Of this total, $133 million was for projects at the Montreal East and Scotford refineries to achieve the legislated move towards ultra-low-sulphur diesel production. The balance was split between Distribution and Lubricants, and Marketing.
RESERVES
At the end of 2004, gross proved natural gas reserves totalled 1,595 billion cubic feet (bcf) after production of 198 bcf. This was a reduction of 180 bcf from 1,775 bcf at the end of 2003. Extensions, discoveries and additions from improved recovery totalled 164 bcf, which included an initial booking of 82 bcf for a discovery in the Tay River area of Alberta. However, a change in working interest of 48 bcf at Panther River and a net negative revision of 98 bcf contributed to the overall decrease of natural gas reserves. The net negative revision is the sum of technical reserves revisions for each field in the E&P portfolio and economic revisions due to the application of year-end prices and costs. Shell produced 15 million barrels of natural gas liquids in 2004. Together with negative technical and economic revisions, this production resulted in a 17 million barrel decrease in gross proved natural gas liquids reserves.
U.S. guidelines require Shell to use year-end pricing in oil and gas reserves calculations. Since prices for Canadian bitumen were unusually low at year-end 2004, Shell removed all of its remaining proved Peace River bitumen reserves from the books at December 31, 2004. Consequently, all 182 million barrels of gross proved bitumen reserves reported at the end of 2003, less 2004 production, were written off. This change will not have any material financial impact and Peace River remains a valuable part of the Company’s portfolio.
In 2004, gross proved minable bitumen reserves fell to 621 million barrels from 651 million barrels in 2003 as a result of producing 30 million barrels of minable bitumen. Total proved and probable minable bitumen reserves decreased by the same amount to 971 million barrels at the end of 2004.
| | | | | | |
| 10 | | SHELL CANADA LIMITED | | | Management’s Discussion and Analysis |
| | | | | | |
SUMMARY OF QUARTERLY RESULTS
| | | | | | | | | | | | | | | | | | | | | | | | | | | | | | | | | | | | | | | | | | | |
| | |
| (unaudited) | | | 2004 | | | | 2003(restated) | |
| | |
| | | | Quarter | | | Total | | | | Quarter | | | Total | |
| ($ millions except as noted) | | | 1st | | | 2nd | | | 3rd | | | 4th | | | Year | | | | 1st | | | 2nd | | | 3rd | | | 4th | | | Year | |
| | | | | | | |
| Earnings | | | | | | | | | | | | | | | | | | | | | | | | | | | | | | | | | | | | | | | | | | |
| Sales and other operating revenues | | | | 2 514 | | | | 2 640 | | | | 3 058 | | | | 3 076 | | | | 11 288 | | | | | 2 457 | | | | 2 073 | | | | 2 275 | | | | 2 312 | | | | 9 117 | |
| Expenses | | | | 1 971 | | | | 2 192 | | | | 2 441 | | | | 2 799 | | | | 9 403 | | | | | 2 103 | | | | 1 858 | | | | 1 899 | | | | 2 049 | | | | 7 909 | |
| | | | | | | |
| Earnings before income tax | | | | 543 | | | | 448 | | | | 617 | | | | 277 | | | | 1 885 | | | | | 354 | | | | 215 | | | | 376 | | | | 263 | | | | 1 208 | |
| Income tax | | | | 175 | | | | 163 | | | | 166 | | | | 95 | | | | 599 | | | | | 141 | | | | 40 | | | | 144 | | | | 73 | | | | 398 | |
| | | | | | | |
| Earnings | | | | 368 | | | | 285 | | | | 451 | | | | 182 | | | | 1 286 | | | | | 213 | | | | 175 | | �� | | 232 | | | | 190 | | | | 810 | |
| | | | | | | |
| Segmented Earnings | | | | | | | | | | | | | | | | | | | | | | | | | | | | | | | | | | | | | | | | | | |
| Exploration & Production | | | | 156 | | | | 91 | | | | 129 | | | | 73 | | | | 449 | | | | | 202 | | | | 200 | | | | 129 | | | | 88 | | | | 619 | |
| Oil Sands | | | | 96 | | | | 96 | | | | 173 | | | | 13 | | | | 378 | | | | | (105 | ) | | | (68 | ) | | | 12 | | | | 19 | | | | (142 | ) |
| Oil Products | | | | 118 | | | | 110 | | | | 114 | | | | 109 | | | | 451 | | | | | 117 | | | | 52 | | | | 103 | | | | 72 | | | | 344 | |
| Corporate | | | | (2 | ) | | | (12 | ) | | | 35 | | | | (13 | ) | | | 8 | | | | | (1 | ) | | | (9 | ) | | | (12 | ) | | | 11 | | | | (11 | ) |
| | | | | | | |
| Earnings | | | | 368 | | | | 285 | | | | 451 | | | | 182 | | | | 1 286 | | | | | 213 | | | | 175 | | | | 232 | | | | 190 | | | | 810 | |
| | | | | | | |
Per Common Share(dollars) | | | | | | | | | | | | | | | | | | | | | | | | | | | | | | | | | | | | | | | | | | |
Earnings – basic | | | | 1.34 | | | | 1.04 | | | | 1.64 | | | | 0.66 | | | | 4.68 | | | | | 0.77 | | | | 0.64 | | | | 0.84 | | | | 0.69 | | | | 2.95 | |
| Earnings – diluted | | | | 1.33 | | | | 1.03 | | | | 1.63 | | | | 0.66 | | | | 4.64 | | | | | 0.77 | | | | 0.63 | | | | 0.84 | | | | 0.69 | | | | 2.92 | |
| Cash dividends | | | | 0.22 | | | | 0.22 | | | | 0.25 | | | | 0.25 | | | | 0.94 | | | | | 0.20 | | | | 0.20 | | | | 0.20 | | | | 0.22 | | | | 0.82 | |
| | | | | | | |
Weighted average shares(millions) | | | | 275 | | | | 275 | | | | 275 | | | | 275 | | | | 275 | | | | | 276 | | | | 275 | | | | 275 | | | | 275 | | | | 275 | |
Dilutive securities(millions) | | | | 2 | | | | 2 | | | | 2 | | | | 2 | | | | 2 | | | | | 1 | | | | 2 | | | | 2 | | | | 2 | | | | 2 | |
| | | | | | | |
SELECTED ANNUAL FINANCIAL INFORMATION
| | | | | | | | | | | | | | | | | | | |
| | | | | |
| Year ended December 31 | | | | | | | | | | | | | | | |
| ($ millions except per share data) | | | 2004 | | | | 2003 | | | 2002 | | | | | |
| | | | | | | | | | | |
| | | | | | | | | | (restated) | | | (restated) | | | | |
| Revenues | | | | 11 288 | | | | | 9 117 | | | | 7 550 | | | | | |
| | | | | | | | | | | |
| Earnings | | | | 1 286 | | | | | 810 | | | | 555 | | | | | |
| | | | | | | | | | | |
| Total assets | | | | 10 906 | | | | | 9 613 | | | | 9 517 | | | | | |
| | | | | | | | | | | |
| Long-term debt | | | | 1 | | | | | 2 | | | | 523 | | | | | |
| | | | | | | | | | | |
Per common share(dollars) | | | | | | | | | | | | | | | | | | |
| Earnings – basic | | | | 4.68 | | | | | 2.95 | | | | 2.01 | | | | | |
| Earnings – diluted | | | | 4.64 | | | | | 2.92 | | | | 2.00 | | | | | |
| Cash dividends | | | | 0.94 | | | | | 0.82 | | | | 0.80 | | | | | |
| | | | | | | | | | | |
| | | | | | |
| Management's Discussion and Analysis | | | SHELL CANADA LIMITED | | 11 |
| | | | | | |
| | | | | | | | |
| | |
| | |
| | | MANAGEMENT’S DISCUSSION AND ANALYSIS |
| | | | | | | | |
| | |
| | |
| | |  |
| | |
| | | | | | | | |
| | | 12 | | SHELL CANADA LIMITED | | | Management’s Discussion and Analysis |
| | | | | | | | |
| | |
| | |
SHAREHOLDER RETURN
Total shareholder return in 2004 was 32.4 per cent. In the fourth quarter, the Company’s quarterly dividend was $0.25 per common share compared with $0.22 in the same period of 2003. Dividends paid for the year totalled $0.94 per common share, up from $0.82 per share in 2003.
BUSINESS ENVIRONMENT
Political instability in many parts of the world, hurricane damage in the Gulf of Mexico, rising producer costs and growing global oil demand prompted concerns about the stability of crude oil supply in 2004. The resulting market uncertainty led to volatile yet robust pricing for all commodities throughout most of the year.
Economic growth created a higher demand for light, refined oil products (gasoline and diesel). As a result, light sweet crude feedstocks were priced at a premium. At the same time, incremental production tended to be heavy, sour crude oil, which is less desirable to produce than light oil products. Therefore, the price differential between light and heavy crude widened during 2004.
Benchmark crude oil prices rose to historic highs in 2004, with West Texas Intermediate (WTI) reaching more than $50 US per barrel. The average oil price in 2004 was $41.40 US per barrel (WTI).
Concerns about supply and the high price of fuel oil supported strong natural gas prices through 2004. Seasonal demand was not a significant factor in 2004, as prices remained quite stable during the first three quarters of the year. In September, Hurricane Ivan shut in some production from the Gulf of Mexico and, with the expectation of production losses extending into the first quarter of 2005, natural gas prices rose in the fourth quarter of 2004.
The monthly index price for natural gas at Henry Hub, the largest trading point for natural gas in the United States, reached $7.78 US per million British thermal units (mmBtu). In Canada, prices tracked closely with Henry Hub and the monthly index peaked above $7.59 Cdn per gigajoule (at an average discount to Henry Hub of $0.83 per mmBtu). The Company realized an average plant gate price of $6.49 Cdn per thousand cubic feet (mcf), a slight increase over $6.46 per mcf in 2003.
Low inventories in the United States and a tight balance between supply and demand resulted in strong refining margins. At the retail level, oil product demand overall in Canada showed considerable strength. High product pricing in the marketplace depressed demand for premium gasoline, while intense competition, particularly in Ontario, compressed retail margins.
Natural gas liquids include ethane, propane, butane and condensate. Ethane prices in 2004 were marginally better than in 2003. Prices for propane increased slightly over 2003 while butane and condensate values improved by more than 20 per cent as they are more closely linked to crude oil pricing. Increased heavy oil production in the Western Canada Sedimentary Basin also led to high condensate and butane demand. These natural gas liquids are used to dilute bitumen and heavy crude oils so they can be transported by pipeline and used as a refinery feedstock for production of gasoline.
The international sulphur market experienced continued strong demand, particularly in China. Global production of sulphur remained stable. Robust international prices reflected a tight balance in worldwide supply and demand, and mitigated increases in ocean freight costs. In contrast, the North American liquid sulphur market weakened in the second half of 2004, reflecting pressure from rising energy costs in the fertilizer industry, which uses ammonia derived from natural gas.
| | | | | | |
| Management’s Discussion and Analysis | | | SHELL CANADA LIMITED | | 13 |
| | | | | | |
| | | | | | | | | | | | | | |
| | |
| | |
| | | MANAGEMENT’S DISCUSSION AND ANALYSIS |
| | | | | | | | | |
| | | | | | | | | |
| | | Sensitivity Analysis | | | | | | |
| | | | | | | | | |
| | | Fluctuations in commodity prices, margins and the foreign exchange rate can significantly affect the Company’s financial results, as shown in the table below. | |
| | | |
| | | 2004 OPERATING EARNINGS SENSITIVITIES(after-tax annualized) | | | | Increase (Decrease) | |
| | | Exploration & Production | | | | | | |
| | | Natural gas | | 10-cent US increase per million Btu (Henry Hub) | | $ | 8 million | |
| | | Condensate | | $1 US increase per barrel (West Texas Intermediate) | | $ | 3 million | |
| | | Bitumen | | $1 US increase per barrel (West Texas Intermediate) | | $ | 3 million | |
| | | Sulphur | | $1 Cdn increase per tonne | | $ | 1 million | |
| | | Foothills natural gas production | | Increase of 10 mmcf/day | | $ | 10 million | |
| | | | |
| | | Oil Sands | | | | | | |
| | | Crude oil | | $1 US increase per barrel (West Texas Intermediate) | | $ | 25 million | |
| | | Natural gas | | 10-cent US increase per million Btu (Henry Hub) | | $ | (2) million | |
| | | Equity production | | Increase of 1,000 bbls/day | | $ | 10 million | |
| | | | |
| | | Oil Products | | | | | | |
| | | Light oil sales margin | | 1/4-cent Cdn increase per litre | | $ | 24 million | |
| | | Natural gas | | 10-cent US increase per million Btu (Henry Hub) | | $ | (3) million | |
| | | | |
| | | Exchange Rate | | 1-cent improvement in $Cdn vs. $US | | $ | (24) million | |
| | | | |
| | |
| | |
| | |  |
| | |
| | | | | | | | | | | | | | |
| | | 14 | | SHELL CANADA LIMITED | | | Management’s Discussion and Analysis | | | | | | |
| | | | | | | | | | | | | | |
| | |
| | |
HEALTH, SAFETY, ENVIRONMENT AND
SUSTAINABLE DEVELOPMENT
Shell Canada measures its commitment to sustainable development by the economic, environmental and social performance of its businesses. The Company integrates these three aspects in the planning and implementation of its projects and in the management of its operations. In this way, the Company seeks to meet current energy needs and generate the profits necessary for investment in future growth. Shell also strives to safeguard the health and safety of people, protect the environment and contribute appropriately to the general well-being of the communities and the broader societies that grant Shell’s licence to operate.
The fourteenth annual Progress Toward Sustainable Development report details Shell’s environmental and social performance in 2004. The report will be available in print and onwww.shell.ca in April 2005.
Managing Resources and Protecting the Environment
Shell Canada is on track to meet its voluntary greenhouse gas reduction target of six per cent below 1990 levels by 2008 for its base businesses (E&P and Oil Products). Reductions are mostly due to improvements in energy efficiency.
Safeguarding People
The safety and well-being of employees, contractors and neighbours is of the greatest importance in Shell Canada’s management of its social performance.
Shell’s total recordable injury frequency for employees and contractors in 2004 was 0.96 for every 200,000 hours worked. This was lower than 1.05 in 2003. Shell continues to focus on health and safety and reaffirm its goal of “no harm to people.”
Wells, Approvals and Seismic Operations received the 2004 President’s Safety Award. This award recognizes the department or operating unit with the most outstanding safety performance and overall approach to safety management.
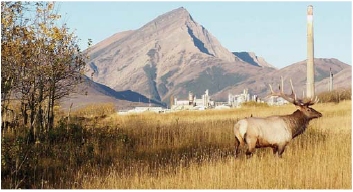 |
| Shell’s Waterton natural gas plant lies in the Foothills of the Rocky Mountains near the U.S. border in southwestern Alberta. |
Benefiting Communities
Shell donated a total of $6 million to not-for-profit organizations across Canada in 2004. The funds supported environmental and educational programs as well as local communities where employees, retirees and marketing associates live and work. In addition, thousands of Shell employees, retirees, retailers and even children of Shell employees volunteered over 10,000 hours through the Company’s United Way campaigns, Community Service Fund and United Way Days of Caring®program.
Shell Canada matched employee and retiree donations to United Way campaigns across Canada for a total contribution of $3.8 million. This includes a record-breaking $2.9 million donation to United Way of Calgary and Area. Shell’s donation was the largest in Alberta history and the biggest of any organization headquartered in Western Canada.
In April 2004, the Company relaunched the Shell Environmental Fund (SEF) with a stronger emphasis on results and environmental benefit. The SEF supports environmental improvement and protection across Canada through local, community-driven projects.
| | | |
| ® | | Trademark of the United Way of Canada. Used under licence by Shell Canada Limited. |
| | | | | | |
| Management’s Discussion and Analysis | | | SHELL CANADA LIMITED | | 15 |
| | | | | | |
| | | |
| | |
| | |
| | | MANAGEMENT’S DISCUSSION AND ANALYSIS |
Over the past 25 years, Shell Canada has donated nearly $4 million in financial resources, land and mineral rights to the Nature Conservancy of Canada (NCC). As part of the Shell Conservation Internship program, a $500,000 commitment by Shell Canada over three years, the NCC hired 16 students of environmental sciences at universities and colleges across Canada to undertake important stewardship work on NCC’s ecologically precious places in 2004.
Shell continues to work with Aboriginal communities in a spirit of trust, respect and understanding. The Company funds education and cross-cultural awareness initiatives that benefit Aboriginal communities that are home to Shell’s major facilities and exploration and production interests. In 2004, Shell continued its support of the National Aboriginal Achievement Foundation with a $100,000 per year scholarship program in the areas of business, science and engineering. A total of 36 Aboriginal students received Shell scholarships in 2004.
People
For the fifth consecutive year, Mediacorp selected Shell Canada as one of Canada’s Top 100 Employers. Shell Canada’s reputation as an employer of choice is critical given the shortages in a number of skill areas now facing the oil and gas industry.
Seventy per cent of Shell Canada employees participated in the 2004 global people survey administered by Royal Dutch/Shell and almost 70 per cent expressed their overall satisfaction with the Company.
Working with stakeholders
An important element of sustainable development is early and continuous dialogue with stakeholders. Shell representatives are in contact with elected officials and government administrators to help develop policies and standards that will benefit the industry and the people of Canada. The Company also works through its membership and representation in industry organizations.
Community consultation is tremendously important, particularly for major new projects. Shell’s model is to engage local communities at the start of the planning process and communicate with them through development, construction, startup and beyond.
Shell Canada also welcomes appropriate input from experts outside the oil and gas industry. The Shell Canada Climate Change Advisory Panel met twice in 2004 to provide an external perspective on the Company’s climate change activities. Panel members include Shell Canada’s president and representatives of Royal Dutch/Shell, local communities, and national and international environmental organizations.
CORPORATE GOVERNANCE AND INTERNAL CONTROLS
Shell Canada promotes strong financial, business and anti-fraud controls in its business processes and maintains high standards for financial reporting integrity. This provides an excellent framework to meet the requirements of the U.S. Sarbanes-Oxley Act of 2002 and similar Canadian standards. The Company has filed annual certifications in compliance with Section 302 of the Sarbanes-Oxley Act for the last three years.
Under Section 404 of the Sarbanes-Oxley Act (SOx404), management must report on the effectiveness of internal controls over financial reporting. Shell has put together a SOx404 team to coordinate compliance with the requirements of SOx404. The team comprises representatives from a number of areas in the organization and works closely with each of the business units to identify, document, assess and test the internal controls. In May 2004, the Company created the position of director, Corporate Governance. This position is responsible for implementing SOx404 requirements and similar evolving Canadian standards.
Effective November 1, 2004, Shell created the position of chief compliance officer. This position is responsible for advising directors, management and employees on legislative requirements, rules, regulations, and Company policies and procedures.
| | | | | | |
| 16 | | SHELL CANADA LIMITED | | | Management’s Discussion and Analysis |
| | | | | | |
RISK MANAGEMENT
Each year, Shell Canada assesses areas of risk and decides how to mitigate them to acceptable levels. The Board of Directors reviews the identified risks, which are consolidated for the overall Company. The areas of risk that apply to the entire organization include organizational capability, major project execution, corporate reputation and brand. Each business unit discusses the risks specific to its operations in its own section of this report.
Organizational Capability
The ability to achieve Shell Canada’s business objectives and strategies depends on attracting, retaining and developing highly skilled and motivated people in a very competitive environment.
As part of its business planning process, each business develops people plans, including recruitment targets for university and college graduates and for experienced staff, as well as employee training and development. In particular, the plans take into account higher levels of retirement anticipated over the next few years.
Shell Canada employees can take advantage of a wide range of in-house opportunities for training and development offered by the Company. World-class technical and leadership development programs are also available through Royal Dutch/Shell.
The senior management team and the Management Resources and Compensation Committee (MRCC) of the Board regularly assess the quality of future leadership talent. Shell Canada makes particular efforts to provide its future senior leaders with development opportunities in Royal Dutch/Shell’s businesses around the world. In 2004, the MRCC conducted a comprehensive review of the Company’s succession plans and leadership pool.
 |
| Shell employees helped renovate the Independent Living Resource Centre, a United Way-funded agency supporting independence for people with disabilities in Calgary. |
Major Project Execution
The Company has identified a number of major growth projects in the coming years that require highly efficient delivery to meet expected growth targets. Key risks in undertaking these projects include cost overruns and schedule delays. Mitigation measures include improving project management skills and processes between business units, and leveraging expertise residing in other areas of Royal Dutch/Shell.
Corporate Reputation
The strength of Shell Canada’s reputation and profile affects the Company’s ability to sustain and grow the business. A positive reputation and higher profile with the public, governments and other stakeholders will help Shell to obtain regulatory approvals and community support. It will also enable the Company to compete more effectively for employees. The basis of the corporate reputation management program is a continuing commitment to sustainable development.
Brand
A strong brand is the foundation of Shell Canada’s profile in the community. The possibility of brand value erosion and loss of market share are key risks. Efforts to strengthen the brand include upgrading the Retail network, strengthening brand representations and improving corporate identity in Company facilities, including Shell Centre.
| | | | | | |
| Management’s Discussion and Analysis | | | SHELL CANADA LIMITED | | 17 |
| | | | | | |
| | | | | | | | |
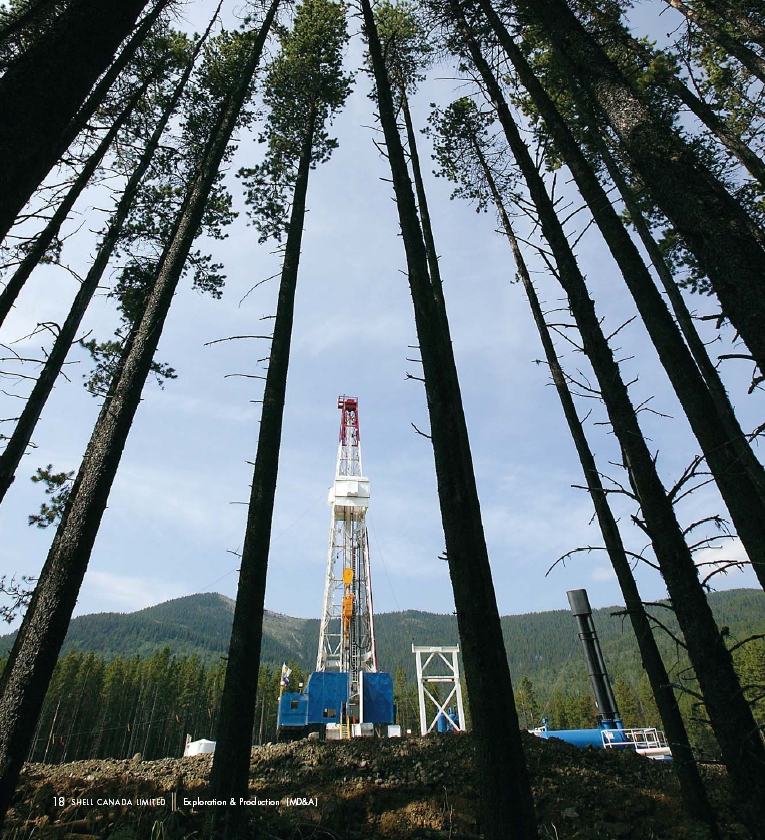
| | | Toy River exploration well in central Alberta |
| | |
| | | EXPLORATION & PRODUCTION (MD&A) |
| | | | | | | | |
Effective January 1, 2004, Shell renamed its Resources business unit Exploration & Production (E&P). E&P earnings for the year ended December 31, 2004, were $449 million compared with $619 million in 2003. Lower production volumes, higher exploration expenses due to increased activity and higher depreciation charges for the Sable Offshore Energy Project (SOEP) were the main reasons for the decrease.
Non-cash charges related to expensing costs for the Mackenzie Gas Project and changes related to the Company’s Long Term Incentive Plan also reduced 2004 earnings by $32 million and $24 million respectively. Earnings for 2003 had also benefited from a revaluation of future income taxes.
Fourth-quarter earnings decreased by $15 million to $73 million for the same period in 2003. In addition to the non-cash charges mentioned above, factors in the fourth-quarter decline also included lower volumes and a non-cash after-tax charge of $15 million for the writeoff of the remaining costs of the Onondaga exploration well.
Shell’s production volumes from Western Canada and SOEP declined from 2003 levels. However, a number of exploration successes in Western Canada, including the Tay River discovery in Alberta (75 per cent Shell share) and other discoveries in northeastern British Columbia and southern Alberta, will help offset natural field decline in the future. Production of natural gas sales volumes in 2004 was 540 million cubic feet per day (mmcf/d) compared with 562 mmcf/d the previous year. E&P benefited from strong commodity prices in 2004 and the Company realized a natural gas average price of $6.49 per thousand cubic feet (mcf) compared with $6.46 per mcf in 2003.
 |
| The Tay River exploration well is located about 30 kilometres southwest of Rocky Mountain House in central Alberta. |
Current E&P natural gas production is from the Foothills of Alberta and a 31.3 per cent share in SOEP offshore Nova Scotia. The focus of exploration and development activity in these areas is largely to offset natural field decline. Shell is also pursuing future growth opportunities in Peace River, the Mackenzie Delta and unconventional natural gas plays in Alberta and British Columbia.
EXPLORATION & PRODUCTION HIGHLIGHTS
| | | | | | | | | | | | | | |
| |
| ($ millions except as noted) | | | 2004 | | | | 2003 | | | 2002 | |
| | | | | | | |
| | | | | | | | | (restated) | | (restated) |
| Revenues | | | | 2 198 | | | | | 2 113 | | | | 1 620 | |
| | | | | | | |
| Earnings | | | | 449 | | | | | 619 | | | | 382 | |
| | | | | | | |
| Capital employed | | | | 1 523 | | | | | 1 648 | | | | 1 673 | |
| | | | | | | |
| Capital, exploration and | | | | | | | | | | | | | | |
| predevelopment | | | | | | | | | | | | | | |
| expenditures | | | | 521 | | | | | 431 | | | | 389 | |
| | | | | | | |
| Return on average | | | | | | | | | | | | | | |
capital employed(%) | | | | 28.3 | | | | | 37.3 | | | | 23.7 | |
| | | | | | | |
| | | | | | |
| EXPLORATION & PRODUCTION (MD&A) | | | SHELL CANADA LIMITED | | 19 |
| | | | | | |
| | | |
| | |
| | |
| | | EXPLORATION & PRODUCTION (MD&A) |
| | | |
| | | |  |
| | | | |
| | | | H. Ian Kilgour
Senior Vice President, Exploration & Production |
| | | | |
| | | | |
| | | | |
| | | | |
| | | | E&P has increased its land
inventory to include prospects for an
expanded exploration program. |
| | | | |
| | | | |
| | | | |
| | | | | | |
| 20 | | SHELL CANADA LIMITED | | | EXPLORATION & PRODUCTION (MD&A) |
| | | | | | |
FOOTHILLS
The Foothills business continued to make a significant contribution to the profitability of E&P and the Company overall. The business comprises numerous producing areas and four Shell-operated natural gas plants in southern and south-central Alberta. In 2004, Foothills natural gas operations produced 415 mmcf/d of sales gas, which accounted for 77 per cent of Shell’s natural gas production. In addition, they produced 23,300 barrels per day (bpd) of natural gas liquids, 12,700 bpd of condensate and 5,600 tonnes per day of sulphur.
Capital investment in Foothills was $229 million in 2004, of which $61 million was for exploration.
The Foothills exploration program identifies prospects around existing infrastructure and prospective play areas in northern Alberta and British Columbia with a view to offsetting production decline and adding new reserves to Shell’s portfolio. E&P has increased its land inventory to include prospects for an expanded exploration program in northeastern British Columbia. Exploration investment in 2004 included participation in eight exploration wells, which resulted in two wells being put into production in 2004. At year-end, three wells awaited tie-in and two wells were in progress. One of the wells awaiting tie-in is a major natural gas discovery, the Tay River exploration well located about 30 kilometres southwest of Rocky Mountain House in central Alberta. The Tay River discovery, in which Shell has a 75 per cent interest, is estimated to hold between 500 and 800 billion cubic feet of raw gas in place. Production from Tay River is expected to start mid-2005.
| | | |
| | | |
| | | |
| | | EXPLORATION & PRODUCTION (MD&A) |
In 2004, Shell invested approximately $100 million in development drilling and related facilities, mainly in the Limestone, Burnt Timber, Moose Mountain and Waterton areas. The Company also invested $17 million in compression projects to increase production. A joint venture program continued in the Panther area. The second and third wells came on stream in 2004 and early 2005, respectively, and drilling of the fourth well was still underway at year-end. When this final well is successfully completed, the other joint venture participant will have earned the right to a 50 per cent interest in future Panther investments.
Work continued on various opportunities to facilitate the efficient use of existing infrastructure and ensure the ongoing cost competitiveness of the Foothills assets. In 2004, construction began on a pipeline connection between the Moose Mountain area and the Jumping Pound plant, and from the Limestone field to the Caroline plant. Other opportunities include increased sulphur recovery at the Jumping Pound plant and plans to optimize the Waterton plant configuration. The Waterton optimization project involves reconfiguration of the facility to improve cost structure and maximize utilization. The project is in the front-end engineering phase and, if it proceeds, will be completed by the end of 2006.
A successful exploration and development program in 2004 generated enough extensions and discoveries of proved natural gas reserves to replace Foothills annual gas production. Included in the additions are reserves associated with Tay River. As more wells are drilled and a production history is established, Shell expects to book more reserves from the Tay River field. Tay River is the largest discovery in Western Canada in many years, but additional drilling and production information is necessary to determine the full extent of reserves that can be assigned to it.
UNCONVENTIONAL GAS
The E&P business is implementing entry strategies for two unconventional gas business opportunities – basin-centred gas and coalbed methane.
Exploration for basin-centred gas, also referred to as tight gas, targets reservoirs with very low permeability. In 2004, Shell established an initial land position and has a working interest in four wells drilled in the Chinook Ridge and Red Rock areas near the border of Alberta and British Columbia. Two of these wells were successful, one of which was tied in before year-end. Testing was not completed by December 31 on the other two wells. Plans are in place to drill follow-up development wells and conduct further exploratory tests in 2005.
With respect to coalbed methane opportunities, E&P completed test well programs in two areas of British Columbia in 2004. One program of three wells was at Klappan in northwestern British Columbia, the other comprises two wells at Sparwood in the southeast. Following evaluation of the results, the Company will make decisions on further exploration drilling or production piloting in 2005.
| | | | | | |
| 22 | | SHELL CANADA LIMITED | | | EXPLORATION & PRODUCTION (MD&A) |
| | | | | | |
FRONTIER
Sable Offshore Energy Project
SOEP contributes significant cash and earnings to overall E&P performance and accounts for 23 per cent of Shell Canada’s natural gas production. Sales gas production from SOEP averaged 125 mmcf/d (Shell share) in 2004 compared with 135 mmcf/d in 2003. The reduction was due to natural field decline in the project’s Tier 1 fields, which was partially offset by production from the Tier 2 Alma field.
Development of SOEP Tier 2 continued in 2004. The South Venture field started production from one well in December 2004. Two more wells will be drilled in the same field and brought on stream in 2005. A field compression project is under construction and expected to begin operation in 2006.
Shell continues to evaluate opportunities to improve the utilization of the SOEP infrastructure and sustain its financial performance, including tie-in of existing discoveries in the area.
East Coast Exploration
The Company participated in the drilling of the Weymouth deep water well and the shallow water Cree well. Neither well encountered commercial quantities of hydrocarbons and both were abandoned.
In 2002, Shell drilled the Onondaga B-84 exploration well, which encountered a natural gas reservoir in the shallower part of the well. The related costs were capitalized pending evaluation of development options. In the absence of a firm development plan for Onondaga at the end of 2004, the Company wrote off the previously capitalized well costs.
Based on recent drilling results and technical evaluation, Shell relinquished joint venture interests in about 270,000 gross (112,000 net) hectares of exploration licences in the shallow water Sable Basin and 474,000 gross (158,000 net) hectares of exploration licences in the deep water offshore Nova Scotia. The Company will continue to evaluate opportunities, but has no immediate plans for more exploration activity in this area.
 |
| A heavy lift vessel transports the topsides for the South Venture platform from Halifax Harbour to its SOEP field location offshore Nova Scotia. |
Northwest Territories
Shell continues to work with the other project proponents, including the Aboriginal Pipeline Group, to progress development of the Mackenzie Gas Project. The project includes the 100 per cent Shell-owned Niglintgak field.
The Company has decided to write off the front-end costs for long lead projects that involve a degree of uncertainty in timing and realization of benefits. As a result, the predevelopment costs of the Mackenzie Gas Project moved from capital to expense. Shell will continue to expense these costs until the timing of project startup is more certain. The effect on 2004 earnings was a reduction of $32 million.
In 2004, environmental work, preliminary engineering design, community consultation and commercial negotiations continued. The project reached a key milestone with the filing of the main regulatory applications in October 2004. Shell also filed its development plan application for the Niglintgak field in 2004. The regulatory hearings for the project are expected to start in 2005.
A favourable business environment, support from Aboriginal communities and an efficient regulatory process will be necessary to set the stage for an investment decision. First natural gas production from the Mackenzie Delta is targeted for the end of the decade.
| | | | | | |
| EXPLORATION & PRODUCTION (MD&A) | | | SHELL CANADA LIMITED | | 23 |
| | | | | | |
| | | |
| | | |
| | | |
| | | EXPLORATION & PRODUCTION (MD&A) |
Other Areas
Shell is conducting technical and commercial evaluations in other frontier basins that could provide medium- to long-term growth opportunities. These opportunities include offshore the West Coast, where Shell is the largest landholder. The federal and provincial governments are deliberating on whether or not to lift the existing moratorium on offshore oil and gas activity in this area.
PEACE RIVER
In 2004, bitumen production averaged 8,100 bpd, down by 1,100 bpd from 2003. As part of a plan to increase production to its current plant capacity of 12,000 bpd, drilling of two more pads of wells will begin in 2005. Production from these wells is expected to come on stream in 2006. Shell’s Peace River landholdings have potential for 100,000 bpd of recoverable bitumen for 30 years. Following completion of a strategic review, the Company awarded an engineering services contract for front-end engineering studies to advance planning and assessment of a potential 30,000 bpd expansion of the Peace River operation. Depending on the outcome of this work, construction of an expansion project could start in 2007.
HEALTH, SAFETY, ENVIRONMENT AND
SUSTAINABLE DEVELOPMENT
E&P achieved its best-ever safety performance in 2004 with a recordable injury frequency of 1.16 for every 200,000 hours worked.
Drilling and seismic operations reported a record safety performance in 2004, showing a 30 per cent improvement over 2003. This accomplishment is particularly noteworthy because of a large increase in work activity in this area of the business for both Shell and the industry.
All E&P operating sites are registered to the ISO 14001 environmental management standard. The standard requires demonstration of compliance with environmental legislation and continually improving environmental performance through the application of documented management systems. In 2004, four operating sites were reregistered to ISO 14001. In 2005, as part of the normal three-year renewal process, Shell Canada will be audited and evaluated as a multi-site registrar, since the Company administers its environmental management system similarly across all businesses.
In 2004, the Company conducted health, safety and environmental assessments, sustainability analysis, public consultation and risk assessment as part of its approach to integrating sustainable development into coalbed methane project planning. One outcome of this process was the distribution to interested parties of an information package describing the best practices Shell would adopt in this potential business venture.
2005 GOALS
E&P’s strategy is to pursue profitable investments to sustain and grow production in Canada. The key elements of the strategy are:
| § | | in the Foothills of Alberta and in British Columbia, continue to focus on operational excellence in existing assets, and explore and develop new opportunities to sustain production; |
| |
| § | | accelerate entry into unconventional gas business positions in basin-centred gas and coalbed methane if early results are encouraging; |
| |
| § | | progress engineering and front-end project design work to evaluate the opportunity to grow production for an initial 30,000 bpd expansion at Peace River; and |
| |
| § | | in the Frontier business, improve the profitability of SOEP; capture the value of discovered volumes onshore Mackenzie Delta by supporting the pipeline development and developing the Niglintgak field; invest in exploration to position Shell in other frontier basins. |
| | | | | | |
| 24 | | SHELL CANADA LIMITED | | | EXPLORATION & PRODUCTION (MD&A) |
| | | | | | |
2005 CAPITAL AND EXPLORATION INVESTMENT
The planned investment program for 2005 is $807 million compared with $521 million in 2004. About 40 per cent of the planned expenditures are for growth prospects in frontier areas, as well as for unconventional gas in Western Canada. The balance of the investment program is directed towards ongoing exploration and development opportunities around existing assets.
RISK MANAGEMENT
Organizational Capability
The Company has integrated the E&P People and Skills planning process into its five-year business plan. The plan includes recruitment targets for new graduates and experienced hires, and will assure the development of key skill pools, particularly technical subsurface and project management disciplines.
Major Project Execution
E&P has strengthened the organization’s capacity to develop and execute major projects. For example, the business unit has formed a team to manage the risk of cost overruns and schedule delays on major projects. E&P personnel are also working jointly with Oil Sands employees to improve the depth of project management skills and systems.
 |
| Shell Canada has expansion plans for its Peace River in situ bitumen plant in northern Alberta. |
Access to Resources
The challenges of exploring for and producing sour gas go beyond technical expertise to include societal expectations and Aboriginal rights and interests, which have the potential to prohibit or curtail access to resources (most notably Crown land). In 2004, E&P appointed a manager and staff of Regulatory Approvals and Compliance to represent Shell in these crucial areas of responsibility.
| | | | | | |
| EXPLORATION & PRODUCTION (MD&A) | | | SHELL CANADA LIMITED | | 25 |
| | | | | | |
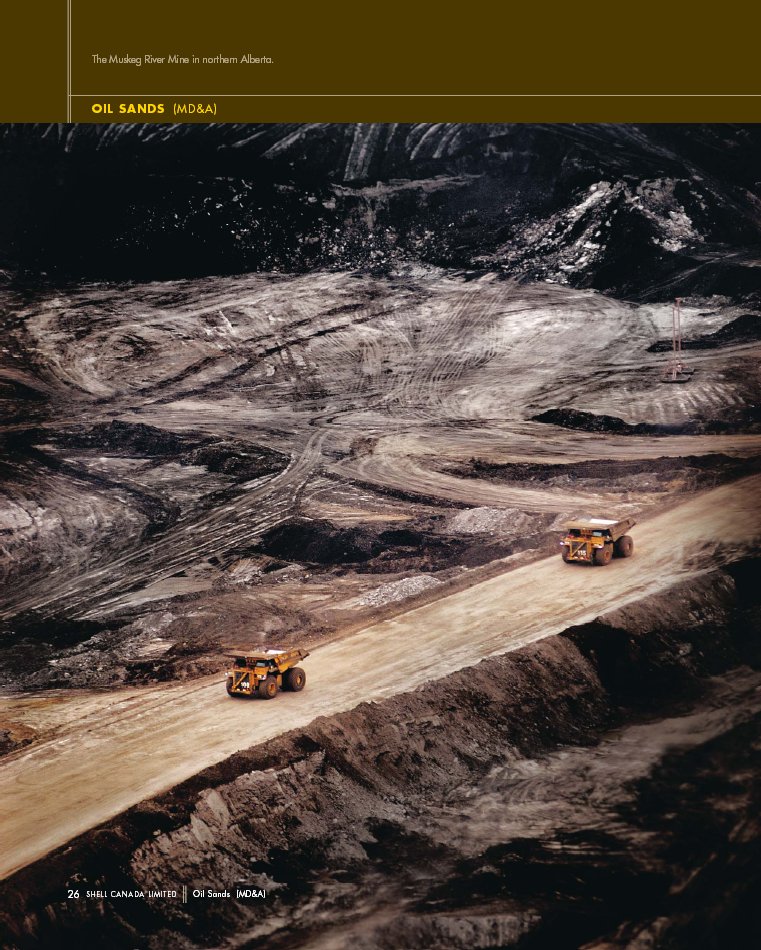
In its first full year of integrated operations, Oil Sands made a significant contribution to the Company’s record earnings and cash flow in 2004. Shell Canada, which owns 60 per cent of the Muskeg River Mine and the Scotford Upgrader, reported earnings of $378 million from Oil Sands compared with a loss of $142 million in 2003.
Revenues of $2,072 million in 2004 represented a 129 per cent increase over 2003 revenues of $906 million. Earnings included $19 million related to an insurance settlement, $31 million in tax adjustments and a non-cash charge of $11 million related to changes in the Company’s Long Term Incentive Plan. Oil Sands generated $711 million of cash flow from operations in 2004 compared with $233 million in 2003. Capital expenditures for 2004 totalled $179 million.
Fourth-quarter earnings decreased to $13 million compared with $19 million for the same period in 2003 and were significantly lower than the third quarter of 2004. In addition to the non-cash charge mentioned above, the main reasons for the fourth-quarter earnings decline were the effect of lower volumes and higher expenses, including a $10 million charge related to depreciation expenses for the Scotford Upgrader.
In 2004, the high crude oil prices had a positive effect on the Oil Sands business. Shell realized an average selling price of $44.67 per barrel on sales of 45 million barrels including blend stock. However, the average synthetic crude price realization relative to Edmonton light crude was weaker than anticipated due to additional heavy synthetic volumes in the overall sales mix and wide market differentials for heavy oil.
Unit cash operating costs for the year were $23.32 per barrel. Unit costs had shown continuous improvement over the first nine months of the year, but planned and unplanned maintenance in the fourth quarter had a negative impact. Higher natural gas prices also added to unit costs in 2004. Excluding natural gas, unit cash operating costs were $17.79 per barrel.
The Scotford Upgrader, located just outside the town of Fort Saskatchewan near Edmonton, Alberta, is an important component of Oil Sands integrated operations.
In 2004, Shell achieved a final settlement with insurers for recovery of costs resulting from the January 2003 fire at the Muskeg River Mine. Final proceeds of the settlement were recorded as revenue in the first quarter. Shell continues to pursue claims for loss of profits resulting from production delays caused by the fire.
OPERATIONS
Oil Sands produced 30 million barrels of bitumen in 2004 (Shell share). The mine ramped up production close to the full design rate of 155,000 barrels per day (bpd) in the third quarter and achieved a record monthly production level of 182,000 bpd in August.
Muskeg River Mine
Operational reliability at the mine steadily improved in 2004 as the business resolved technical and mechanical issues and gained operating experience. Most significant was the successful completion of repairs to the froth treatment settlers, which is expected to greatly improve operational performance.
OIL SANDS HIGHLIGHTS
| | | | | | | | | | | | | | | |
| | |
| ($ millions except as noted) | | | 2004 | | | | 2003 | | | 2002 | |
| | | | | | | | | (restated) | | | (restated) | |
| | | | | | | | | | | | | | | |
| Revenues | | | | 2 072 | | | | | 906 | | | | 3 | |
| | | | | | | |
| Earnings | | | | 378 | | | | | (142 | ) | | | (5 | ) |
| | | | | | | |
| Capital employed | | | | 2 860 | | | | | 3 092 | | | | 3 380 | |
| | | | | | | |
| Capital expenditures | | | | 179 | | | | | 123 | | | | 1 460 | |
| | | | | | | |
Return on average capital employed(%) | | | | 12.7 | | | | | (4.4 | ) | | | – | |
| | | | | | | |
| | | | | | |
| Oil Sands (MD&A) | | | SHELL CANADA LIMITED | | 27 |
| | | | | | |
| | | |
| | | |  |
| | | | |
| | | | Neil J. Camarta
Senior Vice President, Oil Sands |
| | | | |
| | | | |
| | | | |
| | | | |
| | | | In 2004, AOSP made good progress toward its long-term goal of producing more than 500,000 bpd of bitumen. |
| | | | |
| | | | |
| | | | |
| | | | | | |
| 28 | | SHELL CANADA LIMITED | | | Oil Sands (MD&A) |
| | | | | | |
Scotford Upgrader
The Scotford Upgrader ran well for the first three quarters of 2004, outpacing the availability of bitumen from the mine. However, planned and unplanned maintenance to one of the residual hydrocracker (RHC) units reduced throughput in the fourth quarter. Following planned maintenance work in the first two weeks of October, a catalyst pump in the train 1 RHC failed, requiring a complete shutdown of the unit. RHC1 was moving towards full production early in December, when a leak occurred in one of the aerial coolers. Subsequent inspections showed that five of the coolers on the RHC1 required extensive repairs to ensure the integrity of these assets, extending the shutdown into January. Shell used this as an opportunity to advance other maintenance activities, eliminating a planned turnaround on RHC1 in 2005. Operational factors – not design errors – caused both problems in the fourth quarter. Repairs were completed in January and the upgrader then returned to full, two-train operation.
GROWTH
In 2004, the Athabasca Oil Sands Project (AOSP) made good progress toward its long-term goal of producing more than 500,000 bpd of bitumen from Athabasca oil sands leases. Oil Sands growth plans include expansion of the existing Muskeg River Mine and the Scotford Upgrader, and construction of new facilities on the eastern portion of Shell’s Lease 13 (Jackpine Mine).
In April, the AOSP received provincial and federal government cabinet approvals for Jackpine Mine and continues to work on project development, including feasibility studies and community dialogue.
Shell acquired Athabasca oil sands leases 9 and 17 in July. Located approximately 20 kilometres north of the Muskeg River Mine, Shell estimates that Lease 9 contains about one billion barrels of recoverable bitumen and could support a mine producing up to 100,000 bpd. Additional drilling will be necessary to determine the feasibility of a mining project on Lease 17.

Debottlenecking
Shell advanced short-term plans to increase capacity at both the Muskeg River Mine and Scotford Upgrader by initiating debottlenecking projects to increase throughput to between 180,000 and 200,000 bpd. The Company announced these projects in September 2004 and expects to complete them over the next three years.
Expansions
In addition to the debottlenecking projects underway at the existing plants, plans are in place to expand production from the Scotford Upgrader and Muskeg River Mine by about 90,000 bpd to between 270,000 and 290,000 bpd. The mine expansion would include plans and equipment to recover bitumen from additional areas on leases 13 and 90, plus a new train for bitumen extraction and froth treatment. A third hydroconversion unit and associated utilities would be part of the upgrader expansion.
The preliminary cost estimate for these expansion projects is in the range of $4 billion. Expansion activities are expected to take place between 2006 and 2010 with full production at the expanded facilities planned for 2010.
Environmental and public consultation work, which includes Environmental Impact Assessments for the Scotford Upgrader and Muskeg River Mine expansions, is underway. Shell is working toward filing an application with the Alberta Energy and Utilities Board concerning the proposed expansions in the first half of 2005.
HEALTH, SAFETY, ENVIRONMENT
AND SUSTAINABLE DEVELOPMENT
Oil Sands maintained its excellent safety performance in 2004. The business achieved a lost-time injury frequency rate of 0.18 per 200,000 hours worked, incurring five lost-time incidents, none of which were severe. The total recordable injury frequency rate was 0.78, below the target of 1.0.
The AOSP’s commitment to sustainable development is integrated throughout the life of the project – from design and operations through reclamation.
In 2004, the AOSP became the first oil sands operation to have its environmental management system certified under ISO 14001. ISO 14001 is a voluntary, internationally recognized standard for environmental management systems, applicable to all kinds of industries worldwide. An environmental management system is a systematic approach to identifying and preventing or minimizing environmental impacts in any part of an organization’s activities, products or services.
Continuous improvement is essential to good environmental performance and Shell has produced several new technologies to reduce environmental impacts. These include the use of tailings thickeners and a non-caustic extraction process, both of which increase water recovery from tailings and reduce the volume of water withdrawn from the Athabasca River. The thickeners also reduce heat loss and, therefore, energy consumption.
In 2004, the Company submitted a mandatory greenhouse gas (GHG) report to the Alberta government and early indications are that the project is close to its design emissions targets. Shell’s voluntary commitment to reduce GHG emissions by 50 per cent of initial design (1.75 million tonnes per year) for the Muskeg River Mine and Scotford Upgrader is on track for the 2010 deadline. Oil Sands plans to achieve its GHG reductions through energy efficiency projects at both the Muskeg River Mine and the Scotford Upgrader, the purchase of offsets and, potentially, carbon sequestration.
The AOSP continues to support the communities where its employees live and the joint venture does business. To date, companies in the Regional Municipality of Wood Buffalo have received $179 million for contract services, with $40 million paid to local Aboriginal businesses. The AOSP has also contributed $1 million in community investments.
| | | | | | |
| 30 | | SHELL CANADA LIMITED | | | Oil Sands (MD&A) |
| | | | | | |
2005 GOALS
Oil Sands strategic long-term objectives are to be best in class operationally and to grow the business. In the near term, the key goals towards delivering these objectives are:
| | § | | increase production from the existing operations through improved reliability; |
| |
| | § | | reduce unit operating costs by increasing production while cutting absolute costs in key areas, particularly through improved energy efficiency; |
| |
| | § | | further improve product quality through hydrocarbon management initiatives at the upgrader; |
| |
| | § | | advance both the debottlenecking and expansion activities; and |
| |
| | § | | proactively engage with stakeholders and deliver on commitments made to them. |
CAPITAL INVESTMENT
Shell has planned capital expenditures for 2005 of $350 million for Oil Sands base business and growth initiatives. Proposed investment includes $135 million for AOSP operations and profitability, including projects to reduce unit costs. Oil Sands will also invest $215 million in growth projects such as debottlenecking and front-end engineering for the 90,000 bpd expansion project.
RISK MANAGEMENT
Organizational Capability
Shell’s ability to implement the Oil Sands business plan, specifically sustaining production, debottlenecking existing operations and profitably expanding the business, depends a great deal upon organizational capability. The key risks are the loss of critical people through attrition and the inability to recruit a sufficient quality and quantity of employees. To mitigate this risk, the Company has developed staffing plans for all expansion needs. It applies rigorous selection criteria and offers competitive remuneration and terms of employment.
Terri Czmuchalek, health, safety and environment coordinator, stands on the world’s largest conveyer at the Muskeg River Mine. The conveyer takes ore from the crushers to the ore silo.
Shell has also initiated several approaches to meet its need for skilled tradespeople, including an agreement with the federal and Alberta governments that they would support Shell’s contractors temporarily hiring foreign nationals if qualified Canadian tradespeople are not available.
Oil Sands Ramp-Up
During the early part of 2004, bringing the Oil Sands facilities up to expected production rates was identified as a risk. Having now demonstrated that the mine and upgrading processes can meet the original design targets, the challenge for Oil Sands is to achieve sustained production and continuously increase it through debottlenecking and improving the reliability of the existing plant.
Commodity Prices and Product Margins
The key risk to the base business is a sustained, low price environment resulting in narrow or negative margins. Oil Sands will mitigate this risk by applying the principles of operational excellence, particularly with respect to reducing costs and optimizing efficiency and reliability.
| | | | | | |
| Oil Sands (MD&A) | | | SHELL CANADA LIMITED | | 31 |
| | | | | | |
Oil Products earnings in 2004 were a record $451 million, a 31 per cent increase over $344 million in 2003. The improvement was due to strong refining margins, exceptionally high prices for benzene and improved feedstock volumes from the integrated Oil Sands operations.
High crude oil and product pricing boosted transaction and distribution costs as did increases in refinery turnaround, labour and maintenance costs. Earnings in 2004 also included a provision of $25 million for increased liability associated with the AIR MILES®Reward Miles program and a non-cash charge of $30 million relating to changes in the Company’s Long Term Incentive Plan (LTIP).
Fourth-quarter 2004 earnings were $109 million, an increase of $37 million from the $72 million reported for the same period in 2003. Increased operating costs, including the non-cash charges relating to the LTIP, partially offset strong refining margins.
Capital expenditures were $313 million, compared with $194 million in 2003. Most of the increase resulted from construction of facilities to produce ultra-low-sulphur diesel. Oil Products return on average capital employed (ROACE) was 21.3 per cent compared with 17.2 per cent in the previous year.
During the year, Oil Products continued to lead the industry in unit costs, unit profitability and ROACE. The business continues to focus on safely providing quality products and services to customers and operating its refineries reliably supported by steady sales through its marketing divisions.
| | ® | | Trademark of AIR MILES International Trading B.V. Used under licence by Loyalty Management Group Canada Inc. and Shell Canada Products. |
Construction of the ultra-low-sulphur diesel project at Shell’s Montreal East Refinery is on track for completion in 2006.
MANUFACTURING AND SUPPLY
Shell Canada’s three refineries delivered improved safety and environmental performance in 2004, along with high operational availability (approximately one per cent unplanned downtime) and improved yields and efficiency. This solid operational performance enabled the downstream oil business to capture most of the opportunity for profit offered by the strong refining margins that persisted throughout the year. The Oil Products business also benefited from less expensive feedstock afforded by the integration of the Oil Sands operation with the Scotford Refinery.
Ultra-low-sulphur diesel projects at the Scotford and Montreal East refineries are under construction. These projects are scheduled for completion in early 2006 at a total cost of $400 million. Shell signed a 20-year agreement with Suncor Energy Products Inc. for hydrotreatment of its Sarnia Refinery distillate at a unit to be built at Suncor’s nearby refinery. This will produce ultra-low-sulphur diesel for both companies.
OIL PRODUCTS HIGHLIGHTS
| | | | | | | | | | | | | | | |
| |
| ($ millions except as noted) | | | 2004 | | | | 2003 | | | 2002 | |
| | | | | | | | | (restated) | | | (restated) | |
| | | | | | | | | | | | | | | |
| Revenues | | | | 8 535 | | | | | 6 855 | | | | 6 071 | |
| | | | | | | |
| Earnings | | | | 451 | | | | | 344 | | | | 197 | |
| | | | | | | |
| Capital employed | | | | 2 130 | | | | | 2 113 | | | | 1 887 | |
| | | | | | | |
| Capital expenditures | | | | 313 | | | | | 194 | | | | 433 | |
| | | | | | | |
Return on average capital employed(%) | | | | 21.3 | | | | | 17.2 | | | | 10.8 | |
| | | | | | | |
| | | | | | |
| Oil Products (MD&A) | | | SHELL CANADA LIMITED | | 33 |
| | | | | | |
| | | |
| | | |  |
| | | | |
| | | | David M. Weston
Senior Vice President, Oil Products |
| | | | |
| | | | |
| | | | |
| | | | |
| | | | The core focus of the Retail business is to create value for customers through high quality fuels and related offerings with fast and efficient service. |
| | | | |
| | | | |
| | | | |
| | | | | | |
| 34 | | SHELL CANADA LIMITED | | | Oil Products (MD&A) |
| | | | | | |
In the second quarter, Montreal East Refinery completed a major 45-day, $23 million turnaround on time and on budget. Work was also completed on a continuous catalytic reformer unit, giving improved yields and efficiencies. Projects completed over the last three years have realized energy savings for Shell Canada’s refineries in the order of seven per cent over the last two years.
RETAIL
The retail gasoline market remained very competitive throughout 2004. Margins were generally compressed and volatile pricing became commonplace in a number of markets. In spite of this pressure, both high volume retailers and traditional competitors increased their presence in the marketplace with new investments and promotional activity in their networks. Increasing crude oil and wholesale prices further compressed margins, as did localized retail price wars. Shell’s retail market share fell slightly in 2004 to average 17.3 per cent from 17.4 per cent in 2003.
Customer Focus
The core focus of the Retail business is to create value for customers through high quality fuels and related offerings with fast and efficient service.
Among the many loyalty programs in the industry, the AIR MILES® Reward Miles program remains a mainstay of the Shell fuel offering. It has proved highly successful in building a loyal customer base and providing those customers with the opportunity to collect and redeem AIR MILES® Reward Miles from many different companies across the country.
In addition, Shell has made it even easier for customers to collect AIR MILES® Reward Miles on fuel and non-fuel purchases through the launch of easyPAY™ inside Shell-branded convenience food stores. This payment method allows customers to link their credit card of choice and their AIR MILES® collector account to purchases at more than 600 Shell-branded locations, greatly enhancing the speed and efficiency of transactions for Shell customers.
Shell launched its Ready for Business program in 2004 to create and sustain a culture of operational excellence and to provide a consistently positive customer experience. Retail’s Excellence Recognition and Reward program re-energizes Shell’s retailers and continues to assure a high level of customer satisfaction. A third party and “mystery shoppers” monitor the program.
Network
Recent network investment has focused mainly on Greater Toronto, upgrading both the image and the offering of many retail stations in this important market. In 2004, Shell built nine new retail stations across the country and completed 18 image conversions of existing stations. At year-end, there were 1,762 Shell retail sites compared with 1,809 in 2003. Average throughput per site increased to 4.10 million litres in 2004 from 3.97 million litres in 2003.
| | ™ | | Trademark of Shell Canada Limited. Used under licence by Shell Canada Products. |
Shell’s Rotella T has become one of the bestselling heavy-duty multigrade engine oils in North America.
In March 2004, Shell Canada Products announced an agreement with Canadian Tire Petroleum to rebrand and operate 10 Shell non-strategic locations. This innovative approach increased throughput while Shell maintained the fuel supply contract and, at the same time, reinforced the efficiency of the base network.
Non-Petroleum Products and Services
Non-petroleum products and services remain an important component of the Retail business, giving customers both value and convenience. In 2004, there was a slight increase in convenience food store sales as same-store sales rose by about one per cent over 2003. The year proved challenging for car wash sales, which fell 5.5 per cent from the previous year as cold, dry weather reduced demand, and competition for available business intensified.
| | | | | | |
| 36 | | SHELL CANADA LIMITED | | | Oil Products (MD&A) |
| | | | | | |
COMMERCIAL
The Commercial business sells branded products and services to aviation, agricultural, industrial, transportation, resource-based and home-heat sectors, plus private label lubricants to a number of retailers and commercial distributors.
The 2004 business environment was particularly challenging, as high crude oil and product pricing compressed light oil margins in most of these commercial sectors. Globalization, market efficiencies and advances in technology continue to drive consolidation in the marketplace and among Shell’s customers. The Company tries to help its customers meet these competitive challenges by leveraging its technical know-how and strong branding to bring the right solutions to market through appropriate and efficient sales channels. Independent surveys monitored Shell’s customer satisfaction throughout 2004 and reported record results for the year.
Aviation sales grew significantly through 2004 due to increased international and transborder traffic. Shell concluded a number of important contracts with large airline customers throughout the year.
In 2004, Shell upgraded many of its customers to the new FP Solutions™ card, which targets long-haul commercial road transport customers through an extensive network of truck stops and automated refuelling facilities across North America.
In conjunction with Shell Global Solutions International B.V., the Company continues to provide consulting services to industrial customers. This capability leverages Royal Dutch/Shell’s global technical skills, ability and experience.
| | ™ | | Trademark of FP Solutions Corporation. Used under licence by Shell Canada Products. |
Sales of Shell aviation gasoline improved as air traffic increased in 2004.
Agricultural, Small Commercial and Industrial
In 2004, Shell Canada Products entered into a new relationship with Finning (Canada) that will transform Shell’s traditional Commercial agricultural and small industrial business in Alberta and British Columbia. Finning has become Shell’s local authorized distributor, offering quality Shell-branded fuels and lubricants alongside Finning’s range of equipment-related products and services – an offer unmatched by others in the industry. Implementation of this arrangement, which began in 2004, will continue in 2005.
Discussions and negotiations are underway with other parties in different parts of Canada to make Shell-branded products more readily available to these important sectors.
| | | | | | |
| Oil Products (MD&A) | | | SHELL CANADA LIMITED | | 37 |
| | | | | | |
Lubricants
Lubricants blending and packaging volumes at the Brockville plant continued to increase in 2004. The relationship with Pennzoil-Quaker State Canada (an affiliate of Royal Dutch/ Shell) continues to grow and strengthen as the companies work together to lower supply chain and distribution costs as well as increase market share. The agreement also strengthens front-line support to existing and new customers and channels outlets for both Shell- and Pennzoil-Quaker-State-branded lubricants.
Branded lubricant sales, particularly Shell’s brand-led products such as Rotella T, increased in an otherwise flat to declining market. In 2004, Shell Canada reached agreement with the global aviation business of Royal Dutch/Shell to blend and package Aeroshell piston engine oils and greases for North America from its Brockville and Calgary lubricants plants.
E-Business
Oil Products continued to introduce electronic applications and business processes where the speed and reach of the Internet can improve efficiency and cost-effectiveness while improving communication with customers, suppliers, marketing associates, governments and employees. Among other initiatives in 2004 was the launch of Shell eStream™, which allows commercial customers the ability to manage every aspect of their purchase process online.
| | ™ | | Trademark of Shell Canada Limited. Used under licence by Shell Canada Products. |
HEALTH, SAFETY, ENVIRONMENT AND
SUSTAINABLE DEVELOPMENT
In 2004, both the Scotford and Sarnia refineries achieved two million hours worked without a lost-time incident. Montreal East Refinery recorded four million hours, a significant accomplishment, particularly given a high level of turnaround activity.
Oil Products reported a combined employee and contractor lost-time incident frequency rate of 0.13 per 200,000 hours worked, which was a great improvement over the prior year. The frequency rate for total recordable injuries was 1.07, also an improvement over the 1.11 recorded in 2003. This was the business unit’s best safety record in the last six years as Shell Canada Products strives for improved health, safety and environment (HSE) performance. Areas of focus in 2005 will include enhancements to the HSE management system, initiatives to improve the safety culture, risk management reviews and incident investigations, system upgrades and improved contractor management processes.
Although the business did not meet its spill frequency target in 2004, none of the spills damaged the external environment. Shell Canada Products was proud to receive an environmental award from the Department of National Defence for Shell’s involvement in the cleanup of 46 former military service station sites.
In 2004, Shell Canada’s three refineries developed social performance plans, which address the safety and well-being of employees, contractors and neighbours. The plans also include a framework for communicating and working with Shell’s stakeholders, as well as programs that support the Company’s commitment to benefit communities.
The 2005 capital investment plan includes energy reduction projects at Sarnia and Montreal East refineries. These projects and other strategic initiatives will reduce both greenhouse gas and sulphur emissions from the refineries, a long-standing commitment of Shell Canada Products.
| | | | | | |
| 38 | | SHELL CANADA LIMITED | | | Oil Products (MD&A) |
| | | | | | |
2005 GOALS
Oil Products integrated strategy emphasizes the need to:
| | § | | balance long-term shareholder value and competitive performance; |
| |
| | § | | deliver high, reliable, efficient and safe manufacturing throughput supported by secure branded sales; |
| |
| | § | | retain sales volumes through operational excellence within existing marketing channels and pursue opportunities to leverage synergies and create value through alliances; |
| |
| | § | | deliver capital projects safely, on time and within budget; |
| |
| | § | | provide a quality-assured, differentiated, fuel-centred offering, delivering the promise of the Shell brand; and |
| |
| | § | | improve information technology to provide system-to-system communication with customers and alliances as well as increased productivity. |
CAPITAL INVESTMENT
Oil Products planned capital expenditure for 2005 is $483 million, up from $313 million in 2004. Of this total, approximately 50 per cent is budgeted for the completion of the ultra-low-sulphur diesel projects. Half of the remainder will be invested in growth projects in both the manufacturing and marketing businesses, with the balance targeted for maintenance of the existing assets.
New facilities for the production of ultra-low-sulphur diesel at Montreal East Refinery (above) and Scotford Refinery represent a significant investment for Shell Canada.
RISK MANAGEMENT
Brand and Corporate Reputation
A strong brand is the foundation of Shell Canada’s profile in the community. Deterioration of brand value and loss of market share are key risks to be managed. The quality assurance process used to protect the Shell brand and corporate reputation for all fuel products in the market mitigates these risks. Oil Products has also strengthened its focus on consistency of the retail visual image standard and established a product application and quality assurance group to deliver start-to-finish product quality management processes.
| | | | | | |
| Oil Products (MD&A) | | | SHELL CANADA LIMITED | | 39 |
| | | | | | |
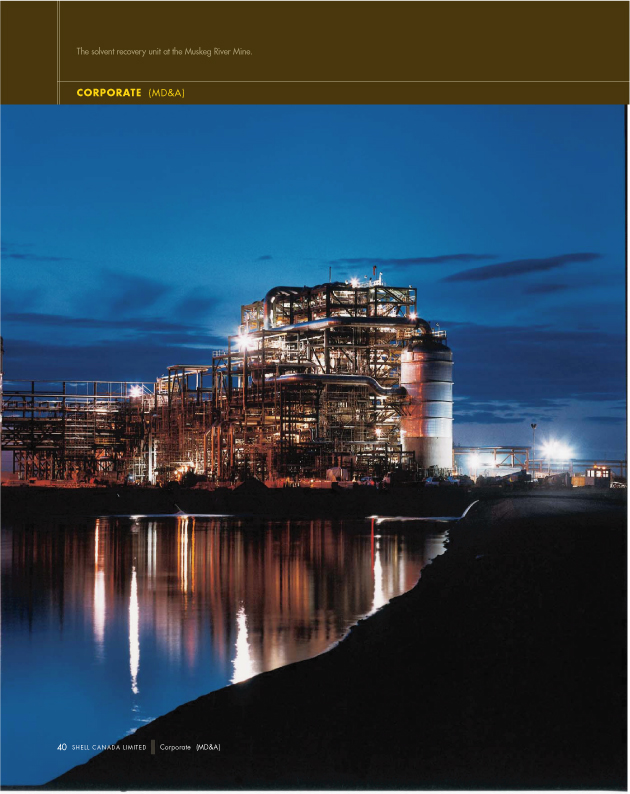
FINANCING ACTIVITIES
Shell’s financing program includes short-term commercial paper, medium-term notes and accounts receivable securitization. This combination provides cost-effective financing and repayment flexibility.
Record cash flows in 2004 allowed the Company to greatly reduce the combined level of debt and accounts receivable sales to $287 million from $1,466 million at the end of 2003. Shell repaid $149 million in commercial paper, leaving a zero balance at year-end, and repaid $598 million in medium-term notes, which reduced the balance to $134 million at year-end. The Company also reduced sales of receivables by $431 million to a balance of $150 million at December 31, 2004. The $1.5 billion commercial paper program and $600 million accounts receivable securitization program remain available to the Company.
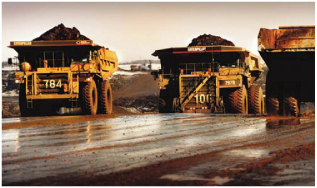 |
Strong cash flow has enabled Shell to undertake major capital expenditure programs such as the
Athabasca Oil Sands Project. |
All of Shell’s financing costs in 2004 were based on floating interest rates. Interest and other financing charges totalled $26 million compared with $66 million in 2003. Reductions in debt financing and accounts receivable sales during the year resulted in lower financing charges. Shell continued to benefit from attractive financing rates, which averaged around 2.5 per cent in 2004.
The reduction in the combined level of debt and accounts receivable sales further strengthened Shell’s financial position. The Company expects that cash flow from operations will be enough to fund its $1.8 billion 2005 capital program. The Company enjoys ready access to short-term debt capital markets in Canada and can obtain access to longer-term debt capital markets in both Canada and the United States should the need arise.
| | | | | | | | | | | | | | | | | | | | | |
| CONTRACTUAL OBLIGATIONS($ millions) | | | Payment due by period | |
| | | Total | | | Less than 1 year | | | 1-3 years | | | 4-5 years | | | More than 5 years | |
| |
| Long-term debt | | | 134 | | | | 134 | | | | – | | | | – | | | | – | |
| Capital lease obligations | | | 3 | | | | 2 | | | | 1 | | | | – | | | | – | |
| Operating leases | | | 570 | | | | 88 | | | | 142 | | | | 216 | | | | 124 | |
| Purchase obligations | | | 10 055 | | | | 847 | | | | 1 663 | | | | 1 366 | | | | 6 179 | |
| Other long-term obligations | | | – | | | | – | | | | – | | | | – | | | | – | |
| |
| Total | | | 10 762 | | | | 1 071 | | | | 1 806 | | | | 1 582 | | | | 6 303 | |
| |
| | | | | | |
| Corporate (MD&A) | | | SHELL CANADA LIMITED | | 41 |
| | | | | | |
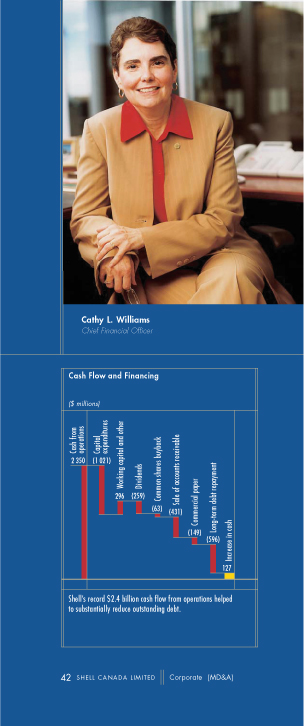
In April 2004, Shell Canada announced its intention to make a normal course issuer bid to repurchase for cancellation up to one per cent of its 275,287,340 common shares issued and outstanding as at April 27, 2004. The bid began on May 4, 2004, and will end on or before May 3, 2005. The bid is being used to counter dilution resulting from the issuance of common shares under Shell Canada’s employee stock option program. In 2004, a total of 783,800 common shares had been repurchased at market prices for a cost of $54 million, and cancelled.
Under an earlier normal course issuer bid, which commenced February 7, 2003, and ended February 6, 2004, Shell Canada repurchased 1,528,000 common shares at a total cost of $80 million, which includes $9 million of common shares repurchased in 2004.
On April 19, 2004, Standard & Poor’s Ratings Services (S&P) lowered its long-term corporate credit ratings on Shell Canada Limited from AA+ to AA. On February 4, 2005, S&P lowered its long-term corporate credit rating on Shell Canada from AA to AA-. These moves by S&P followed similar actions taken on the ratings of the Company’s majority shareholder, Royal Dutch/Shell. According to S&P, Shell Canada’s ratings are directly linked to those of its majority shareholder. As a result, any rating action taken against its majority shareholder affects the ratings of Shell Canada. These changes in S&P credit rating status have not affected the Company’s ability to access capital markets.
OUTSTANDING SHARES
At February 28, 2005, the Company had 275,060,662 common shares and 100 preference shares outstanding. There are 7,892,529 employee stock options outstanding at February 28, 2005, of which 4,095,459 are exercisable.
PENSION PLAN
Shell Canada bases its pension calculations on long-term rates of return. In 2004, Shell reduced its assumed long-term rate of return to 7.25 per cent from 7.5 per cent to reflect the expected market performance of plan assets. Also in 2004, the Company made cash contributions totalling $110 million to its defined benefit plan, which included a voluntary additional contribution of $60 million in the fourth quarter to help reduce the pension deficit.
STOCK-BASED COMPENSATION ACCOUNTING
At the annual and special meeting of shareholders in April 2004, shareholders approved various amendments to the Long Term Incentive Plan (LTIP). These amendments included, among others, increasing the number of common shares that may be reserved for issue under the LTIP by an additional 9,000,000 common shares and permitting the return of stock option shares to the LTIP upon the exercise of share appreciation rights (SARs). Under the amended LTIP, an option is surrendered when a SAR is exercised for cash, which reduces both share dilution and the need for future normal course issuer bids to counter dilution.
The attachment of SARs changes the basis for determining the required accounting expense for benefits under the LTIP. The Company’s obligation is recognized based on the market value of the common shares less the exercise price of outstanding options.
In September 2004, the Board approved a proposal to attach SARs to existing employee stock options granted but not exercised. The majority of option holders accepted this proposal, which became effective December 6, 2004. This resulted in an initial non-cash charge of $71 million after-tax to fourth-quarter 2004 earnings to reflect gains accrued to date on outstanding options. Starting in the first quarter of 2005, the Company’s expense for benefits under the LTIP will be mark-to-market and charged to earnings each quarter.
| | | | | | |
| Corporate (MD&A) | | | SHELL CANADA LIMITED | | 43 |
| | | | | | |
ACCOUNTING STANDARDS
Variable Interest Entities
In June 2003, the Accounting Standards Board issued Accounting Guideline 15, “Consolidation of Variable Interest Entities,” to be effective for the first interim or annual reporting period beginning on or after November 1, 2004. The standard mandates that certain entities should be consolidated by the primary beneficiary. Under the standard, restatement of prior periods is not required.
The Corporation has adopted this standard prospectively effective the first quarter of 2005. Accordingly, the Corporation will consolidate in the first quarter a lease arrangement for large mobile equipment (trucks, scrapers and shovels) used at the Athabasca Oil Sands Project’s Muskeg River Mine. The dollar amount for this equipment at year-end was $232 million. This arrangement is currently accounted for as an operating lease.
To secure attractive leasing terms on the mobile equipment lease, a guarantee has been provided to the lessor, which is payable when the equipment is returned to the lessor. At December 31, 2004, the Corporation’s share of the maximum payable under the guarantee was $118 million. Any proceeds received from the sale of the equipment would offset any payment required under the guarantee. The guarantee is in place for the term of the equipment lease, which will continue for the next one to six years, depending on the equipment.
In 2004, Shell Canada sold accounts receivable to an unrelated multi-seller trust under its accounts receivable securitization program. After receipt of the cash proceeds, the Company removed this amount from its balance sheet and relinquished all ownership in the sold receivables as part of the sale. Under the United States Financial Accounting Standards Board and Canadian Institute of Chartered Accountants standards, this program does not require consolidation because the Company is not the primary beneficiary of the multi-seller trust.
Asset Retirement Obligations
Effective January 1, 2004, the Corporation adopted the new Canadian accounting standard with respect to asset retirement obligations. Under the new standard, legal obligations associated with the retirement of tangible long-lived assets are recorded as liabilities. The liabilities are calculated using the net present value of the cash flows required to settle the obligations. A corresponding amount is capitalized to the related assets. Asset retirement costs are charged to earnings over the life of the assets.
Shell applied the new standard retroactively and restated financial statements of prior periods. The impact of this change on the December 31, 2004, consolidated balance sheet was an increase in property, plant and equipment of $74 million, an increase in asset retirement and other long-term obligations of $205 million, a reduction in future income taxes of $44 million and a reduction in retained earnings of $87 million. This new standard did not have a material impact on the Corporation’s earnings.
Hedging Relationships
Effective January 1, 2004, Shell Canada adopted Accounting Guideline 13, “Hedging Relationships.” This pronouncement establishes the criteria that must be met before an entity can apply hedge accounting to certain derivative financial instruments. This guideline has been applied on a prospective basis and did not have a material impact on the Corporation’s earnings.
| | | | | | |
| 44 | | SHELL CANADA LIMITED | | | Corporate (MD&A) |
| | | | | | |
CRITICAL ACCOUNTING ESTIMATES
In the compilation of the financial statements, some estimates reflect management’s best judgments. These estimates are based on historical experience and other factors that management deems appropriate. The Audit Committee of the Board of Directors reviews annually any significant changes in estimates. The following summary outlines the critical accounting estimates made by Shell management and should be read in conjunction with the “Accounting Policies” on pages 52 to 55 of the Notes to Consolidated Financial Statements.
Hydrocarbon Reserves
Reserves quantities are estimated in accordance with established guidelines of the Canadian securities regulators, United States Financial Accounting Standards Board and United States Securities Exchange Commission for conventional oil and gas and minable bitumen reserves. Determination of reserves within these guidelines is based on established geological and engineering principles and involves interpretation of geological data. Estimates are subject to revision as additional exploration and development data is collected and new information regarding producing operations and technology becomes available. Revisions could also occur as economic and operating conditions change, or as properties are divested or acquired. Although there is a reasonable certainty of recovering proved reserves, they are based on estimates that are subject to some variability.
Revisions to reserves estimates will affect the depreciation and depletion on Exploration & Production and Oil Sands assets that are provided on the unit-of-production basis.
Asset Retirement Obligations
Asset retirement obligations and other environmental liabilities are based on commercial engineering estimated costs and historical experience. Calculations take into account the anticipated method and extent of remediation consistent with legal requirements, current technology and the possible use of the location. Since these estimates are specific to the locations involved, there are many individual assumptions underlying the Company’s total asset retirement obligations and provision for other environmental liabilities. Significant changes to the assumptions behind these estimates and the timing may result in material changes to the obligation.
Asset retirement obligations are discounted using a credit-adjusted risk-free rate. Payments to settle these obligations occur on an ongoing basis and will continue over the life of the operating assets, which can exceed 25 years. The discount rate on incremental asset retirement obligation estimates will be adjusted as appropriate to reflect long-term changes in market rates and outlook.
Employee Future Benefits
An actuary determines Shell’s costs of pension and other retirement benefits using the projected benefit method. The calculation takes into account length of service and estimates of expected plan investment performance, salary increases, expected health care costs and the discount rate for the benefit obligation. Senior management reviews key pension assumptions annually and third party actuaries review them at least every three years. The assumed long-term rate of return used in 2004 was 7.25 per cent compared with an average of actual returns of 10.0 per cent annually over the last 10 years ending December 31, 2004. Shell’s exposure to changes in the underlying assumptions is summarized on page 67 of the Notes to Consolidated Financial Statements. The obligation and expense could increase or decrease if there were to be a change in these estimates. Pension expense represented less than one per cent of Shell’s total expenses in 2004.
| | | | | | |
| Corporate (MD&A) | | | SHELL CANADA LIMITED | | 45 |
| | | | | | |
RELATED PARTY TRANSACTIONS
In the course of regular business activities, Shell Canada enters into transactions with related parties, including affiliates of Royal Dutch/Shell. The products sold to affiliates include natural gas, petroleum products, chemicals and services. The main product purchased from affiliates is crude oil. All transactions are at commercial rates.
In December 2004, Shell Canada acquired an affiliate of Royal Dutch/Shell for $39 million. This transaction will result in beneficial tax consequences for Shell Canada.
TECHNOLOGY AND ASSET INTEGRITY
Technology experts provide technical and engineering support to secure the best possible performance from Shell’s assets and new business opportunities. Access to Royal Dutch/Shell’s worldwide research and technical support capabilities augments Shell Canada’s capabilities.
Shell regularly assesses asset integrity by reviewing management systems and conducting health, safety and environment and integrity assurance audits of the Company’s various facilities. These assessments in 2004 indicated an overall improvement compared with previous years.
RISK MANAGEMENT
Financial Risks
Currency risk increases when foreign currency rates fluctuate compared with the Canadian dollar. The risk grows in proportion to the volume of activity involving foreign currency. Shell makes some commodity transactions priced in another currency, mainly U.S. dollars. Netting foreign cash flows across the various businesses each month helps reduce the effect of these fluctuations for the Company overall. Shell Canada hedges significant foreign currency commitments on major capital projects.
Interest rate fluctuations affect Shell’s total interest expense. The strength of the Company’s balance sheet allowed it to continue with 100 per cent floating interest rate exposure in 2004.
To reduce the financial risk resulting from potential incidents, the Company purchases appropriate insurance against risks associated with all its operations and projects.
| | | | | | |
| 46 | | SHELL CANADA LIMITED | | | Corporate (MD&A) |
| | | | | | |
To the Shareholders of Shell Canada Limited
The management of Shell Canada Limited is responsible for the preparation of all information included in this Annual Report. The consolidated financial statements have been prepared in accordance with generally accepted accounting principles and necessarily include amounts based on management’s informed judgments and estimates. Financial information included elsewhere in this Annual Report is consistent with the consolidated financial statements.
To assist management in fulfilling its responsibilities, a system of internal accounting controls has been established to provide reasonable assurance that the consolidated financial statements are accurate and reliable and that assets are safeguarded. Management believes that this system of internal control has operated effectively for the year ended December 31, 2004.
PricewaterhouseCoopers LLP, Chartered Accountants, appointed by the shareholders, have audited the financial statements and conducted a review of internal accounting policies and procedures to the extent required by generally accepted auditing standards and performed such tests as they deemed necessary to enable them to express an opinion on the consolidated financial statements.
The Board of Directors, through its Audit Committee, is responsible for ensuring that management fulfills its financial reporting responsibilities. The Audit Committee is composed of independent directors who are not employees of the Corporation. The committee reviews the financial content of the Annual Report and meets regularly with management, internal audit and PricewaterhouseCoopers LLP to discuss internal controls, accounting, auditing and financial matters. The committee recommends the appointment of the external auditors. The committee reports its findings to the Board of Directors for its consideration in approving the consolidated financial statements for issuance to the shareholders.

| | | | | |
| Clive Mather | | Cathy L. Williams | | Donna Tarka |
President and
Chief Executive Officer | | Chief Financial Officer | | Controller |
January 31, 2005
| | | | | | |
| Management’s Report | | | SHELL CANADA LIMITED | | 47 |
| | | | | | |
To the Shareholders of Shell Canada Limited
We have audited the consolidated balance sheets of Shell Canada Limited as at December 31, 2004, 2003 and 2002 and the consolidated statements of earnings and retained earnings and cash flows for each of the years in the three-year period ended December 31, 2004. These consolidated financial statements are the responsibility of the Company’s management. Our responsibility is to express an opinion on these consolidated financial statements based on our audits.
We conducted our audits in accordance with Canadian generally accepted auditing standards. Those standards require that we plan and perform an audit to obtain reasonable assurance that the financial statements are free of material misstatement. An audit includes examining, on a test basis, evidence supporting the amounts and disclosures in the financial statements. An audit also includes assessing the accounting principles used and significant estimates made by management, as well as evaluating the overall financial statement presentation.
In our opinion, these consolidated financial statements present fairly, in all material respects, the financial position of the Company as at December 31, 2004, 2003 and 2002 and the results of its operations and its cash flows for each of the years in the three-year period ended December 31, 2004, in accordance with Canadian generally accepted accounting principles.
Chartered Accountants
Calgary, Alberta
January 31, 2005
| | | | | | |
| 48 | | SHELL CANADA LIMITED | | | Auditor’s Report |
| | | | | | |
CONSOLIDATED STATEMENT OF EARNINGS AND RETAINED EARNINGS
| | | | | | | | | | | | | | | |
| |
| Year ended December 31 ($ millions) | | | 2004 | | | | 2003 | | | 2002 | |
| | | | | | | | | (restated) | | | (restated) | | | |
| | | | | | | | | | | | | | |
REVENUES | | | | | | | | | | | | | | |
| Sales and other operating revenues | | | | 11 228 | | | | | 9 076 | | | | 7 468 | |
| Dividends, interest and other income | | | | 60 | | | | | 41 | | | | 82 | |
| | | | | | | |
Total revenues | | | | 11 288 | | | | | 9 117 | | | | 7 550 | |
| | | | | | | |
EXPENSES | | | | | | | | | | | | | | |
| Cost of goods sold | | | | 6 068 | | | | | 5 077 | | | | 4 661 | |
| Operating, selling and general | | | | 2 048 | | | | | 1 771 | | | | 1 233 | |
Transportation(Note 1) | | | | 309 | | | | | 270 | | | | 236 | |
| Exploration and predevelopment | | | | 230 | | | | | 88 | | | | 123 | |
| Depreciation, depletion, amortization and retirements | | | | 722 | | | | | 637 | | | | 388 | |
| Interest on long-term debt | | | | 16 | | | | | 31 | | | | 19 | |
| Other interest and financing charges | | | | 10 | | | | | 35 | | | | 30 | |
| | | | | | | |
Total expenses | | | | 9 403 | | | | | 7 909 | | | | 6 690 | |
| | | | | | | |
EARNINGS | | | | | | | | | | | | | | |
| Earnings before income tax | | | | 1 885 | | | | | 1 208 | | | | 860 | |
| | | | | | | |
| Current income tax | | | | 617 | | | | | 188 | | | | 135 | |
| Future income tax | | | | (18 | ) | | | | 210 | | | | 170 | |
| | | | | | | |
Total income tax(Note 4) | | | | 599 | | | | | 398 | | | | 305 | |
| | | | | | | |
Earnings | | | | 1 286 | | | | | 810 | | | | 555 | |
| | | | | | | |
Per common share(dollars) (Note 13) | | | | | | | | | | | | | | |
| Earnings – basic | | | | 4.68 | | | | | 2.95 | | | | 2.01 | |
| Earnings – diluted | | | | 4.64 | | | | | 2.92 | | | | 2.00 | |
| | | | | | | |
RETAINED EARNINGS | | | | | | | | | | | | | | |
| Balance at beginning of year | | | | 5 045 | | | | | 4 529 | | | | 4 268 | |
Implementation of accounting standard(Note 1) | | | | – | | | | | – | | | | (73 | ) |
| Earnings | | | | 1 286 | | | | | 810 | | | | 555 | |
| | | | | | | |
| | | | | 6 331 | | | | | 5 339 | | | | 4 750 | |
Common shares buyback(Note 3) | | | | 61 | | | | | 68 | | | | – | |
| Dividends | | | | 259 | | | | | 226 | | | | 221 | |
| | | | | | | |
Balance at end of year | | | | 6 011 | | | | | 5 045 | | | | 4 529 | |
| | | | | | | |
| | | | | | |
| Consolidated Financial Statements | | | SHELL CANADA LIMITED | | 49 |
| | | | | | |
CONSOLIDATED STATEMENT OF CASH FLOWS
| | | | | | | | | | | | | | | |
| |
| Year ended December 31 ($ millions) | | | 2004 | | | | 2003 | | | 2002 | |
| | | | | | | | | (restated) | | | (restated) | |
| | | | | | | | | | | | | | |
CASH FROM OPERATING ACTIVITIES | | | | | | | | | | | | | | |
| Earnings | | | | 1 286 | | | | | 810 | | | | 555 | |
| Exploration and predevelopment | | | | 230 | | | | | 88 | | | | 123 | |
Non-cash items
Depreciation, depletion, amortization and retirements | | | | 722 | | | | | 637 | | | | 388 | |
| Stock-based compensation | | | | 141 | | | | | 12 | | | | – | |
| Future income tax | | | | (18 | ) | | | | 210 | | | | 170 | |
| Other items | | | | (11 | ) | | | | (10 | ) | | | (9 | ) |
| | | | | | | |
| Cash flow from operations | | | | 2 350 | | | | | 1 747 | | | | 1 227 | |
| Movement in working capital and operating activities | | | | | | | | | | | | | | |
| Sales of accounts receivable securitization | | | | (431 | ) | | | | 61 | | | | 170 | |
| Other working capital items | | | | 349 | | | | | (24 | ) | | | 16 | |
| | | | | | | |
| | | | | 2 268 | | | | | 1 784 | | | | 1 413 | |
| | | | | | | |
CASH INVESTED | | | | | | | | | | | | | | |
| Capital, exploration and predevelopment expenditures | | | | (1 021 | ) | | | | (759 | ) | | | (2 289 | ) |
| Movement in working capital from investing activities | | | | (7 | ) | | | | (25 | ) | | | (67 | ) |
| | | | | | | |
| | | | | (1 028 | ) | | | | (784 | ) | | | (2 356 | ) |
| Proceeds on disposal of properties, plant and equipment | | | | 4 | | | | | 25 | | | | 3 | |
| Investments, long-term receivables and other | | | | (87 | ) | | | | (36 | ) | | | (87 | ) |
| | | | | | | |
| | | | | (1 111 | ) | | | | (795 | ) | | | (2 440 | ) |
| | | | | | | |
CASH FROM (USED IN) FINANCING ACTIVITIES | | | | | | | | | | | | | | |
Common shares buyback(Note 3) | | | | (63 | ) | | | | (71 | ) | | | – | |
| Proceeds from exercise of common share stock options | | | | 37 | | | | | 15 | | | | 10 | |
| Dividends paid | | | | (259 | ) | | | | (226 | ) | | | (221 | ) |
| Long-term debt and other | | | | (596 | ) | | | | (185 | ) | | | 804 | |
| Short-term financing | | | | (149 | ) | | | | (522 | ) | | | 459 | |
| | | | | | | |
| | | | | (1 030 | ) | | | | (989 | ) | | | 1 052 | |
| | | | | | | |
Increase in cash | | | | 127 | | | | | – | | | | 25 | |
Cash at beginning of year | | | | – | | | | | – | | | | (25 | ) |
Cash at end of year1 | | | | 127 | | | | | – | | | | – | |
| | | | | | | |
Supplemental disclosure of cash flow information | | | | | | | | | | | | | | |
| Dividends received | | | | 14 | | | | | 10 | | | | 15 | |
| Interest received | | | | 28 | | | | | 18 | | | | 35 | |
| Interest paid | | | | 28 | | | | | 70 | | | | 45 | |
| Income tax paid | | | | 303 | | | | | 271 | | | | 285 | |
| | | | | | | |
1Cash comprises cash and highly liquid short-term investments.
| | | | | | |
| 50 | | SHELL CANADA LIMITED | | | Consolidated Financial Statements |
| | | | | | |
CONSOLIDATED BALANCE SHEET
| | | | | | | | | | | | | | | |
| |
| As at December 31 ($ millions) | | | 2004 | | | | 2003 | | | 2002 | |
| | | | | | | | | (restated) | | | (restated) | |
| | | | | | | | | | | | | | |
ASSETS | | | | | | | | | | | | | | |
| Current assets | | | | | | | | | | | | | | |
| Cash and short-term investments | | | | 127 | | | | | – | | | | – | |
| Accounts receivable | | | | 1 213 | | | | | 495 | | | | 497 | |
| Inventories | | | | | | | | | | | | | | |
| Crude oil, products and merchandise | | | | 501 | | | | | 497 | | | | 440 | |
| Materials and supplies | | | | 83 | | | | | 83 | | | | 75 | |
| Prepaid expenses | | | | 85 | | | | | 81 | | | | 93 | |
Future income tax(Note 4) | | | | 314 | | | | | 65 | | | | 86 | |
| | | | | | | |
| | | | | 2 323 | | | | | 1 221 | | | | 1 191 | |
| Investments, long-term receivables and other | | | | 549 | | | | | 455 | | | | 414 | |
Properties, plant and equipment(Note 2) | | | | 8 034 | | | | | 7 937 | | | | 7 912 | |
| | | | | | | |
Total assets | | | | 10 906 | | | | | 9 613 | | | | 9 517 | |
| | | | | | | |
LIABILITIES | | | | | | | | | | | | | | |
| Current liabilities | | | | | | | | | | | | | | |
| Short-term borrowings | | | | – | | | | | 149 | | | | 671 | |
| Accounts payable and accrued liabilities and other | | | | 1 683 | | | | | 1 157 | | | | 1 223 | |
| Income and other taxes payable | | | | 657 | | | | | 255 | | | | 115 | |
| Current portion of asset retirement and other long-term obligations | | | | 35 | | | | | 17 | | | | 19 | |
| Current portion of long-term debt | | | | 136 | | | | | 734 | | | | 402 | |
| | | | | | | |
| | | | | 2 511 | | | | | 2 312 | | | | 2 430 | |
Asset retirement and other long-term obligations(Note 7) | | | | 417 | | | | | 395 | | | | 389 | |
Long-term debt(Note 6) | | | | 1 | | | | | 2 | | | | 523 | |
Future income tax(Note 4) | | | | 1 448 | | | | | 1 366 | | | | 1 177 | |
| | | | | | | |
Total liabilities | | | | 4 377 | | | | | 4 075 | | | | 4 519 | |
| | | | | | | |
Commitments and contingencies(Note 11) | | | | | | | | | | | | | | |
| | | | | | | |
SHAREHOLDERS’ EQUITY | | | | | | | | | | | | | | |
Capital stock(Note 3) | | | | | | | | | | | | | | |
| 100 4% preference shares | | | | 1 | | | | | 1 | | | | 1 | |
| 275 242 562 common shares | | | | | | | | | | | | | | |
| (2003 – 275 042 159; 2002 – 275 908 290) | | | | 517 | | | | | 480 | | | | 468 | |
| | | | | | | |
| | | | | 518 | | | | | 481 | | | | 469 | |
Contributed surplus(Note 3) | | | | – | | | | | 12 | | | | – | |
| Retained earnings | | | | 6 011 | | | | | 5 045 | | | | 4 529 | |
| | | | | | | |
Total shareholders’ equity | | | | 6 529 | | | | | 5 538 | | | | 4 998 | |
| | | | | | | |
Total liabilities and shareholders’ equity | | | | 10 906 | | | | | 9 613 | | | | 9 517 | |
| | | | | | | |
The consolidated financial statements have been approved by the Board of Directors.
| | | |
 |
Clive Mather | | Kerry L. Hawkins |
Director | | Director |
| | | | | | |
| Consolidated Financial Statements | | | SHELL CANADA LIMITED | | 51 |
| | | | | | |
NOTES TO CONSOLIDATED FINANCIAL STATEMENTS
Shell Canada’s consolidated financial statements are prepared in accordance with accounting principles generally accepted in Canada. The Corporation’s major accounting policies are summarized as follows:
NOTE 1. ACCOUNTING POLICIES
PRINCIPLES OF CONSOLIDATION
The consolidated financial statements include the accounts of Shell Canada Limited and its subsidiary companies. The financial statements reflect the Corporation’s proportionate interests in joint ventures.
INVENTORIES
Inventories of crude oil, products and merchandise are stated at the lower of cost, applied on the Last-In, First-Out (LIFO) basis, or net realizable value. Materials and supplies are stated at the lower of cost or estimated useful value.
INVESTMENTS
Investments in companies over which Shell Canada exercises significant influence are accounted for using the equity method. Accordingly, the book value of the investment in such companies equals the original cost of the investment, plus Shell Canada’s share of earnings since the investment date, less dividends received. Other long-term investments are recorded at cost. Short-term investments are carried at the lower of cost or market value and are highly liquid securities with a maturity of three months or less when purchased.
EXPLORATION AND DEVELOPMENT COSTS
The Corporation follows the successful efforts method of accounting for oil and gas exploration and development activities. Under this method, acquisition costs of properties are capitalized. Exploratory drilling costs are initially capitalized and costs relating to wells subsequently determined to be unsuccessful are charged to earnings. Exploratory drilling costs related to exploratory wells in an area that requires major capital expenditures are carried as an asset, provided that i) there have been sufficient oil and gas reserves found to justify completion as a producing well if the required capital expenditure is made, and ii) drilling of additional exploratory wells is underway or firmly planned for the near future. Other exploration costs are charged to earnings. All development costs are capitalized. For mining activities the property acquisition, exploration and development costs are capitalized.
DEPRECIATION, DEPLETION AND AMORTIZATION
Depreciation and depletion on oil and gas and mining assets are provided on the unit-of-production basis. Land and lease costs relating to producing properties and costs of gas plants are depleted and depreciated over remaining proved reserves. Oil and gas and mine development costs are depleted and depreciated over remaining proved developed reserves. The mine extraction plant and other facilities are depreciated over remaining proved and probable reserves. Amortization of unproved oil and gas properties is based on the estimated life of the asset and past experience. Costs relating to refinery, upgrader, mine equipment, mine and upgrader preproduction, distribution, marketing and non-resource assets are depreciated on the straight-line basis over each asset’s estimated useful life.
| | | | | | |
| 52 | | SHELL CANADA LIMITED | | | Notes to Consolidated Financial Statements |
| | | | | | |
ASSET RETIREMENT OBLIGATIONS
Legal obligations associated with site restoration on the retirement of assets with determinable useful lives are recognized when they are incurred, which is typically at the time the assets are installed. The obligations are initially measured at fair value and discounted to present value. A corresponding amount equal to that of the initial obligation is added to the capitalized costs of the related asset. Over time, the discounted asset retirement obligation amount will be accreted for the change in its present value, and the initial capitalized costs will be depreciated over the useful lives of the related assets.
Asset retirement obligations and other environmental liabilities are based on commercial engineering estimated costs and historical experience, taking into account the anticipated method and extent of remediation consistent with legal requirements and current technology.
INTEREST
Interest costs are expensed as incurred.
REVENUES
Revenues are recognized upon delivery. Inter-segment sales, which are accounted for at estimated market-related values, are included in revenues of the segment making the transfer. On consolidation, such inter-segment sales and any associated estimated profits in inventory are eliminated.
ROYALTIES AND MINERAL TAXES
All royalty entitlements and mineral taxes are reflected as reductions in sales and other operating revenues.
EMPLOYEE FUTURE BENEFITS
The costs of the defined benefit pension plan and other retirement benefits are actuarially determined using the projected benefit method prorated on service and management’s best estimate of expected plan investment performance, salary escalation, retirement ages of employees and expected health care costs. For the purpose of calculating the expected return on plan assets, those assets are valued at a market-related value. The excess of the net actuarial gain or loss over 10 per cent of the greater of the benefit obligation and the market-related value of plan assets is amortized over the expected average remaining service period of active employees. The cost of the Company’s portion of the defined contribution pension plan is expensed as incurred.
FOREIGN CURRENCY TRANSLATION
Monetary items are translated to Canadian dollars at rates of exchange in effect at the end of the period. The gains and losses on the translation of foreign denominated monetary items are charged to earnings.
| | | | | | |
| Notes to Consolidated Financial Statements | | | SHELL CANADA LIMITED | | 53 |
| | | | | | |
DERIVATIVE INSTRUMENTS
The Company uses derivative instruments in the management of its foreign currency, interest rate and commodity price exposures. The Company does not use derivative instruments for speculative purposes.
Derivative instruments that do not qualify as hedges, or are not designated as hedges, are recorded using the mark-to-market method of accounting, whereby derivative instruments are recorded on the Company’s balance sheet as either an asset or liability with changes in fair value recorded to net earnings.
Foreign exchange contracts are used to hedge certain foreign purchases and sales. Those foreign exchange contracts are revalued at the exchange rate in effect at the end of each reporting period. Foreign exchange gains and losses are recognized in earnings.
Interest rate swaps are mark-to-market and used to manage interest rate exposure. Differentials under interest rate swap arrangements are recognized by adjustments to interest expense.
Energy futures are used to reduce exposure to price fluctuations in some contractual energy purchases and sales. Those energy futures are mark-to-market at the end of each reporting period with the changes recognized in earnings.
USE OF ESTIMATES
The preparation of financial statements requires management to make estimates and assumptions that affect the reported amounts of assets and liabilities and disclosure of contingent assets and liabilities as at the date of the financial statements and the reported amounts of revenues and expenses during the reporting period. Actual results could differ from those estimates. Significant estimates used in the preparation of these financial statements include the estimate of proved and probable reserves, asset retirement obligations and employee future benefits.
STOCK-BASED COMPENSATION PLANS
The Corporation has stock-based compensation plans, which are described in Note 3. For options under the Long Term Incentive Plan (LTIP) that have share appreciation rights attached to them, a liability for expected cash settlements is accrued over the vesting period of the options based on the difference between the exercise price of the options and the market price of the Company’s common shares. The liability is revalued at the end of each reporting period to reflect changes in the market price of the Company’s common shares and the net change is recognized in earnings. When options are surrendered for cash, the cash settlement reduces the outstanding liability. When options are exercised for common shares, consideration paid by the option holders and the previously recognized liability associated with the option are recorded as share capital.
For options that do not have share appreciation rights attached to them, stock-based compensation is accounted for using the Black-Scholes valuation method. The Company records compensation expense over the vesting period for stock options granted to employees. Any consideration paid by employees on exercise of stock options or purchase of stock is credited to share capital. No compensation expense has been recorded for awards granted prior to 2003.
| | | | | | |
| 54 | | SHELL CANADA LIMITED | | | Notes to Consolidated Financial Statements |
| | | | | | |
CHANGE IN ACCOUNTING POLICY
Asset Retirement Obligations
Effective January 1, 2004, the Corporation adopted the new Canadian accounting standard with respect to asset retirement obligations. Under the new standard, legal obligations associated with the retirement of tangible long-lived assets are recorded as liabilities. The liabilities are calculated using the net present value of the cash flows required to settle the obligation. A corresponding amount is capitalized to the related asset. Asset retirement costs are charged to earnings over the life of the asset.
The new standard has been applied retroactively and financial statements of prior periods have been restated. The impact of this change on the December 31, 2004, Consolidated Balance Sheet is an increase in properties, plant and equipment of $74 million (2003 – $71 million; 2002 – $76 million), an increase in asset retirement and other long-term obligations of $205 million (2003 – $191 million; 2002 – $196 million), a reduction in future income taxes of $44 million (2003 – $41 million; 2002 – $41 million) and a reduction in retained earnings of $87 million (2003 – $79 million; 2002 – $79 million). This new standard did not have a material impact on the Corporation’s earnings.
Derivative Instruments
Effective January 1, 2004, the Corporation adopted Accounting Guideline 13, “Hedging Relationships.” This pronouncement establishes the criteria that must be met before an entity can apply hedge accounting to certain derivative financial instruments. The Corporation currently does not use hedge accounting for any of its foreign exchange, interest rate swaps or energy futures. These contracts are mark-to-market and recorded in the accounts. This guideline has been applied on a prospective basis and did not have a material impact on the Corporation’s earnings.
RECLASSIFICATION
Effective January 1, 2004, and consistent with the adoption of Canadian Institute of Chartered Accountants (CICA) Handbook Section 1100, transportation costs for the Exploration & Production segment charged to customers are classified as revenues with the related transportation cost classified as transportation expense. Previously, these costs were netted against revenue. Transportation costs for the Oil Sands and Oil Products segments continue to be reported as cost of goods sold or operating expense, consistent with prior years.
Certain other information provided for prior years has been reclassified to conform to the current presentation.
| | | | | | |
| Notes to Consolidated Financial Statements | | | SHELL CANADA LIMITED | | 55 |
| | | | | | |
NOTE 2. SEGMENTED INFORMATION
The operating segments are those adopted by senior management of the Corporation to determine resource allocations and assess performance. In all material respects, the segmented information is applied consistently in accordance with the Corporation’s significant accounting policies. The Corporation’s revenues are attributed principally to Canada where all of its major properties, plants and equipment are located.
Segmented financial results and properties, plant and equipment data are reported as if the segments were separate entities.
EARNINGS($ millions)
| | | | | | | | | | | | | | | |
| |
| | | | | | TOTAL | | | | | | |
| | 2004 | | | | 2003 | | | 2002 | | | |
| | | | | | (restated) | | | (restated) | | | |
| | | 1 306 | | | | | 1 354 | | | | 920 | | | Natural gas |
| | | 716 | | | | | 597 | | | | 574 | | | Natural gas liquids |
| | | 1 024 | | | | | 467 | | | | 77 | | | Crude oil and bitumen |
| | | (364 | ) | | | | (354 | ) | | | (234 | ) | | Royalties |
| | | 3 615 | | | | | 3 074 | | | | 2 848 | | | Gasolines |
| | | 3 047 | | | | | 2 374 | | | | 1 984 | | | Middle distillates |
| | | 1 600 | | | | | 1 293 | | | | 1 060 | | | Other products |
| | | 344 | | | | | 312 | | | | 321 | | | Other revenues |
| �� | | – | | | | | – | | | | – | | | Inter-segment sales |
| | | | | |
| | | 11 288 | | | | | 9 117 | | | | 7 550 | | | Total revenues |
| | | | | |
| | | 6 068 | | | | | 5 077 | | | | 4 661 | | | Cost of goods sold |
| | | – | | | | | – | | | | – | | | Inter-segment purchases |
| | | 2 048 | | | | | 1 771 | | | | 1 233 | | | Operating, selling and general |
| | | 309 | | | | | 270 | | | | 236 | | | Transportation |
| | | 230 | | | | | 88 | | | | 123 | | | Exploration and predevelopment |
| | | 722 | | | | | 637 | | | | 388 | | | Depreciation, depletion, amortization and retirements |
| | | 16 | | | | | 31 | | | | 19 | | | Interest on long-term debt |
| | | 10 | | | | | 35 | | | | 30 | | | Other interest and financing charges |
| | | | | |
| | | 9 403 | | | | | 7 909 | | | | 6 690 | | | Total expenses |
| | | | | |
| | | 1 885 | | | | | 1 208 | | | | 860 | | | Earnings (loss) before income tax |
| | | | | |
| | | 617 | | | | | 188 | | | | 135 | | | Current income tax |
| | | (18 | ) | | | | 210 | | | | 170 | | | Future income tax |
| | | | | |
| | | 599 | | | | | 398 | | | | 305 | | | Total income tax |
| | | | | |
| | | 1 286 | | | | | 810 | | | | 555 | | | Earnings (loss) |
| | | | | |
| | | | | | |
| 56 | | SHELL CANADA LIMITED | | | Notes to Consolidated Financial Statements |
| | | | | | |
The Corporation has the following segments:
Exploration & Productionincludes exploration, production and marketing activities for natural gas, natural gas liquids, in situ bitumen and sulphur.
Oil Sandsincludes mining and extraction of bitumen, upgrading of mined bitumen to synthetic crude oils and marketing of these products.
Oil Productsincludes the manufacturing, distribution and selling of the Corporation’s refined petroleum products.
Corporateincludes controllership, financing activities, administration and general corporate facility management.
| | | | | | | | | | | | | | | | | | | | | | | | | | | | | | | | | | | | | | | | | | | | | | | | | | | | | |
| |
| | EXPLORATION & PRODUCTION | | | | OIL SANDS | | | | OIL PRODUCTS | | | | CORPORATE | |
| | 2004 | | | 2003 | | | 2002 | | | | 2004 | | | | 2003 | | | 2002 | | | | 2004 | | | | 2003 | | | 2002 | | | | 2004 | | | | 2003 | | | 2002 | |
| | | | | (restated) | | | (restated) | | | | | | | | (restated) | | | (restated) | | | | | | | | (restated) | | | (restated) | | | | | | | | (restated) | | | (restated) | |
| | 1 306 | | | | 1 354 | | | | 920 | | | | | – | | | | | – | | | | – | | | | | – | | | | | – | | | | – | | | | | – | | | | | – | | | | – | |
| | 716 | | | | 597 | | | | 574 | | | | | – | | | | | – | | | | – | | | | | – | | | | | – | | | | – | | | | | – | | | | | – | | | | – | |
| | 77 | | | | 81 | | | | 74 | | | | | 947 | | | | | 386 | | | | 3 | | | | | – | | | | | – | | | | – | | | | | – | | | | | – | | | | – | |
| | (355 | ) | | | (350 | ) | | | (234 | ) | | | | (9 | ) | | | | (4 | ) | | | – | | | | | – | | | | | – | | | | – | | | | | – | | | | | – | | | | – | |
| | – | | | | – | | | | – | | | | | – | | | | | – | | | | – | | | | | 3 615 | | | | | 3 074 | | | | 2 848 | | | | | – | | | | | – | | | | – | |
| | – | | | | – | | | | – | | | | | – | | | | | – | | | | – | | | | | 3 047 | | | | | 2 374 | | | | 1 984 | | | | | – | | | | | – | | | | – | |
| | 329 | | | | 268 | | | | 165 | | | | | – | | | | | 46 | | | | – | | | | | 1 271 | | | | | 979 | | | | 895 | | | | | – | | | | | – | | | | – | |
| | 41 | | | | 28 | | | | 39 | | | | | 32 | | | | | – | | | | – | | | | | 216 | | | | | 218 | | | | 236 | | | | | 55 | | | | | 66 | | | | 46 | |
| | 84 | | | | 135 | | | | 82 | | | | | 1 102 | | | | | 478 | | | | – | | | | | 386 | | | | | 210 | | | | 108 | | | | | – | | | | | – | | | | – | |
| | | | | | | | | | | | | | | | | | | | | | | |
| | 2 198 | | | | 2 113 | | | | 1 620 | | | | | 2 072 | | | | | 906 | | | | 3 | | | | | 8 535 | | | | | 6 855 | | | | 6 071 | | | | | 55 | | | | | 66 | | | | 46 | |
| | | | | | | | | | | | | | | | | | | | | | | |
| | – | | | | – | | | | – | | | | | 544 | | | | | 306 | | | | (1 | ) | | | | 5 525 | | | | | 4 767 | | | | 4 665 | | | | | (1 | ) | | | | 4 | | | | (3 | ) |
| | 159 | | | | 148 | | | | 104 | | | | | 283 | | | | | 146 | | | | 1 | | | | | 1 130 | | | | | 529 | | | | 82 | | | | | – | | | | | – | | | | 3 | |
| | 422 | | | | 364 | | | | 333 | | | | | 542 | | | | | 478 | | | | 3 | | | | | 1 029 | | | | | 893 | | | | 870 | | | | | 55 | | | | | 36 | | | | 27 | |
| | 309 | | | | 270 | | | | 236 | | | | | – | | | | | – | | | | – | | | | | – | | | | | – | | | | – | | | | | – | | | | | – | | | | – | |
| | 230 | | | | 88 | | | | 123 | | | | | – | | | | | – | | | | – | | | | | – | | | | | – | | | | – | | | | | – | | | | | – | | | | – | |
| | 357 | | | | 282 | | | | 222 | | | | | 171 | | | | | 158 | | | | 1 | | | | | 193 | | | | | 196 | | | | 164 | | | | | 1 | | | | | 1 | | | | 1 | |
| | – | | | | – | | | | – | | | | | – | | | | | – | | | | – | | | | | – | | | | | – | | | | – | | | | | 16 | | | | | 31 | | | | 19 | |
| | – | | | | – | | | | – | | | | | – | | | | | – | | | | – | | | | | – | | | | | – | | | | – | | | | | 10 | | | | | 35 | | | | 30 | |
| | | | | | | | | | | | | | | | | | | | | | | |
| | 1 477 | | | | 1 152 | | | | 1 018 | | | | | 1 540 | | | | | 1 088 | | | | 4 | | | | | 7 877 | | | | | 6 385 | | | | 5 781 | | | | | 81 | | | | | 107 | | | | 77 | |
| | | | | | | | | | | | | | | | | | | | | | | |
| | 721 | | | | 961 | | | | 602 | | | | | 532 | | | | | (182 | ) | | | (1 | ) | | | | 658 | | | | | 470 | | | | 290 | | | | | (26 | ) | | | | (41 | ) | | | (31 | ) |
| | | | | | | | | | | | | | | | | | | | | | | |
| | 385 | | | | 382 | | | | 215 | | | | | 16 | | | | | (253 | ) | | | (193 | ) | | | | 249 | | | | | 95 | | | | 134 | | | | | (33 | ) | | | | (36 | ) | | | (21 | ) |
| | (113 | ) | | | (40 | ) | | | 5 | | | | | 138 | | | | | 213 | | | | 197 | | | | | (42 | ) | | | | 31 | | | | (41 | ) | | | | (1 | ) | | | | 6 | | | | 9 | |
| | | | | | | | | | | | | | | | | | | | | | | |
| | 272 | | | | 342 | | | | 220 | | | | | 154 | | | | | (40 | ) | | | 4 | | | | | 207 | | | | | 126 | | | | 93 | | | | | (34 | ) | | | | (30 | ) | | | (12 | ) |
| | | | | | | | | | | | | | | | | | | | | | | |
| | 449 | | | | 619 | | | | 382 | | | | | 378 | | | | | (142 | ) | | | (5 | ) | | | | 451 | | | | | 344 | | | | 197 | | | | | 8 | | | | | (11 | ) | | | (19 | ) |
| | | | | | | | | | | | | | | | | | | | | | | |
| | | | | | |
| Notes to Consolidated Financial Statements | | | SHELL CANADA LIMITED | | 57 |
| | | | | | |
NOTE 2. SEGMENTED INFORMATION(continued)
CASH FLOW($ millions)
| | | | | | | | | | | | | | | |
| |
| | | | | | TOTAL | | | | | | |
| | 2004 | | | | 2003 | | | 2002 | | | |
| | | | | | (restated) | | | (restated) | | | |
| | | 2 350 | | | | | 1 747 | | | | 1 227 | | | Cash flow from operations |
| | | (82 | ) | | | | 37 | | | | 186 | | | Movement in working capital and operating activities |
| | | | | |
| | | 2 268 | | | | | 1 784 | | | | 1 413 | | | Cash from operating activities |
| | | | | |
| | | (1 021 | ) | | | | (759 | ) | | | (2 289 | ) | | Capital, exploration and predevelopment expenditures |
| | | (7 | ) | | | | (25 | ) | | | (67 | ) | | Movement in working capital from investing activities |
| | | | | |
| | | (1 028 | ) | | | | (784 | ) | | | (2 356 | ) |
| | | (83 | ) | | | | (11 | ) | | | (84 | ) | | Other cash invested |
| | | (1 030 | ) | | | | (989 | ) | | | 1 052 | | | Cash from (used in) financing activities |
| | | | | |
| | | 127 | | | | | – | | | | 25 | | | Increase (decrease) in cash |
| | | | | |
CAPITAL EMPLOYED($ millions)
| | | | | | | | | | | | | | | |
| |
| | | | | | TOTAL | | | | | | |
| | 2004 | | | | 2003 | | | 2002 | | | |
| | | | | | (restated) | | | (restated) | | | |
| | | 2 323 | | | | | 1 221 | | | | 1 191 | | | Current assets |
| | | 549 | | | | | 455 | | | | 414 | | | Investments, long-term receivables and other |
| | | | | |
| | | 2 872 | | | | | 1 676 | | | | 1 605 | |
| | | | | |
| | | 13 843 | | | | | 13 101 | | | | 12 518 | | | Properties, plant and equipment at cost |
| | | (5 809 | ) | | | | (5 164 | ) | | | (4 606 | ) | | Accumulated depreciation, depletion and amortization |
| | | | | |
| | | 8 034 | | | | | 7 937 | | | | 7 912 | | | Net properties, plant and equipment |
| | | | | |
| | | 10 906 | | | | | 9 613 | | | | 9 517 | | | Total assets |
| | | (4 240 | ) | | | | (3 190 | ) | | | (2 923 | ) | | Total liabilities less long-term debt and short-term borrowings |
| | | | | |
| | | 6 666 | | | | | 6 423 | | | | 6 594 | | | Capital employed |
| | | | | |
| | | | | | |
| 58 | | SHELL CANADA LIMITED | | | Notes to Consolidated Financial Statements |
| | | | | | |
| | | | | | | | | | | | | | | | | | | | | | | | | | | | | | | | | | | | | | | | | | | | | | | | | | | | | |
| |
| | EXPLORATION & PRODUCTION | | | | OIL SANDS | | | | OIL PRODUCTS | | | | CORPORATE | |
| | 2004 | | | 2003 | | | 2002 | | | | 2004 | | | | 2003 | | | 2002 | | | | 2004 | | | | 2003 | | | 2002 | | | | 2004 | | | | 2003 | | | 2002 | |
| | | | | (restated) | | | (restated) | | | | | | | | (restated) | | | (restated) | | | | | | | | (restated) | | | (restated) | | | | | | | | (restated) | | | (restated) | |
| | 975 | | | | 959 | | | | 740 | | | | | 711 | | | | | 233 | | | | 193 | | | | | 639 | | | | | 555 | | | | 303 | | | | | 25 | | | | | – | | | | (9 | ) |
| | 116 | | | | 99 | | | | (33 | ) | | | | 117 | | | | | 73 | | | | (193 | ) | | | | 132 | | | | | (229 | ) | | | 297 | | | | | (447 | ) | | | | 94 | | | | 115 | |
| | | | | | | | | | | | | | | | | | | | | | | |
| | 1 091 | | | | 1 058 | | | | 707 | | | | | 828 | | | | | 306 | | | | – | | | | | 771 | | | | | 326 | | | | 600 | | | | | (422 | ) | | | | 94 | | | | 106 | |
| | | | | | | | | | | | | | | | | | | | | | | |
| | (521 | ) | | | (431 | ) | | | (389 | ) | | | | (179 | ) | | | | (123 | ) | | | (1 460 | ) | | | | (313 | ) | | | | (194 | ) | | | (433 | ) | | | | (8 | ) | | | | (11 | ) | | | (7 | ) |
| | 9 | | | | (6 | ) | | | (7 | ) | | | | (26 | ) | | | | (17 | ) | | | (38 | ) | | | | 11 | | | | | (3 | ) | | | (22 | ) | | | | (1 | ) | | | | 1 | | | | – | |
| | | | | | | | | | | | | | | | | | | | | | | |
| | (512 | ) | | | (437 | ) | | | (396 | ) | | | | (205 | ) | | | | (140 | ) | | | (1 498 | ) | | | | (302 | ) | | | | (197 | ) | | | (455 | ) | | | | (9 | ) | | | | (10 | ) | | | (7 | ) |
| | (8 | ) | | | 23 | | | | (19 | ) | | | | (14 | ) | | | | (23 | ) | | | (14 | ) | | | | (46 | ) | | | | 5 | | | | (77 | ) | | | | (15 | ) | | | | (16 | ) | | | 26 | |
| | 2 | | | | 1 | | | | (3 | ) | | | | 2 | | | | | 12 | | | | – | | | | | 3 | | | | | (4 | ) | | | 8 | | | | | (1 037 | ) | | | | (998 | ) | | | 1 047 | |
| | | | | | | | | | | | | | | | | | | | | | | |
| | 573 | | | | 645 | | | | 289 | | | | | 611 | | | | | 155 | | | | (1 512 | ) | | | | 426 | | | | | 130 | | | | 76 | | | | | (1 483 | ) | | | | (930 | ) | | | 1 172 | |
| | | | | | | | | | | | | | | | | | | | | | | |
| | | | | | | | | | | | | | | | | | | | | | | | | | | | | | | | | | | | | | | | | | | | | | | | | | | | | |
| |
| | EXPLORATION & PRODUCTION | | | | OIL SANDS | | | | OIL PRODUCTS | | | | CORPORATE | |
| | 2004 | | | 2003 | | | 2002 | | | | 2004 | | | | 2003 | | | 2002 | | | | 2004 | | | | 2003 | | | 2002 | | | | 2004 | | | | 2003 | | | 2002 | |
| | | | | (restated) | | | (restated) | | | | | | | | (restated) | | | (restated) | | | | | | | | (restated) | | | (restated) | | | | | | | | (restated) | | | (restated) | |
| | 542 | | | | 440 | | | | 408 | | | | | 198 | | | | | 193 | | | | 81 | | | | | 1 471 | | | | | 1 163 | | | | 1 214 | | | | | 112 | | | | | (575 | ) | | | (512 | ) |
| | 100 | | | | 87 | | | | 82 | | | | | 69 | | | | | 54 | | | | 32 | | | | | 304 | | | | | 254 | | | | 255 | | | | | 76 | | | | | 60 | | | | 45 | |
| | | | | | | | | | | | | | | | | | | | | | | |
| | 642 | | | | 527 | | | | 490 | | | | | 267 | | | | | 247 | | | | 113 | | | | | 1 775 | | | | | 1 417 | | | | 1 469 | | | | | 188 | | | | | (515 | ) | | | (467 | ) |
| | | | | | | | | | | | | | | | | | | | | | | |
| | 5 097 | | | | 4 802 | | | | 4 495 | | | | | 3 834 | | | | | 3 667 | | | | 3 549 | | | | | 4 802 | | | | | 4 528 | | | | 4 380 | | | | | 110 | | | | | 104 | | | | 94 | |
| | (2 886 | ) | | | (2 544 | ) | | | (2 272 | ) | | | | (315 | ) | | | | (161 | ) | | | (2 | ) | | | | (2 536 | ) | | | | (2 392 | ) | | | (2 269 | ) | | | | (72 | ) | | | | (67 | ) | | | (63 | ) |
| | | | | | | | | | | | | | | | | | | | | | | |
| | 2 211 | | | | 2 258 | | | | 2 223 | | | | | 3 519 | | | | | 3 506 | | | | 3 547 | | | | | 2 266 | | | | | 2 136 | | | | 2 111 | | | | | 38 | | | | | 37 | | | | 31 | |
| | | | | | | | | | | | | | | | | | | | | | | |
| | 2 853 | | | | 2 785 | | | | 2 713 | | | | | 3 786 | | | | | 3 753 | | | | 3 660 | | | | | 4 041 | | | | | 3 553 | | | | 3 580 | | | | | 226 | | | | | (478 | ) | | | (436 | ) |
| | (1 330 | ) | | | (1 137 | ) | | | (1 040 | ) | | | | (926 | ) | | | | (661 | ) | | | (280 | ) | | | | (1 911 | ) | | | | (1 440 | ) | | | (1 693 | ) | | | | (73 | ) | | | | 48 | | | | 90 | |
| | | | | | | | | | | | | | | | | | | | | | | |
| | 1 523 | | | | 1 648 | | | | 1 673 | | | | | 2 860 | �� | | | | 3 092 | | | | 3 380 | | | | | 2 130 | | | | | 2 113 | | | | 1 887 | | | | | 153 | | | | | (430 | ) | | | (346 | ) |
| | | | | | | | | | | | | | | | | | | | | | | |
| | | | | | |
| Notes to Consolidated Financial Statements | | | SHELL CANADA LIMITED | | 59 |
| | | | | | |
NOTE 3. CAPITAL STOCK AND STOCK-BASED COMPENSATION
Shell Canada Limited carries on business under the Canada Business Corporations Act. Common shares are without nominal or par value and are authorized in unlimited number.
The holder of the four per cent preference shares receives fixed, cumulative dividends of $40,000 per annum. The preference shares may be redeemed at the amount paid up thereon plus accrued dividends.
Under the LTIP, the Company may grant options to executives and other employees. The exercise price of each option equals the market price of the Company’s stock on the date of grant and the maximum term of an option is 10 years. Options may not be exercised during the one-year period following the date of grant, after which time one-third of the options may be exercised in each of the next three years on a cumulative basis. For executives, 50 per cent of the options are “performance-based” and their award is tied to the Company’s Total Shareholder Return (TSR). For the performance-based options to vest, the Company’s three-year TSR must exceed the average of the Corporation’s comparator group at the end of the three-year period after being granted. If the Corporation’s TSR does not meet the target, the Management Resources and Compensation Committee may determine, in its sole discretion, that all or a portion of the options granted shall vest. If these options vest, they must be exercised within seven years of the date of vesting.
In 2004, the Company granted 1,696,500 options with an exercise price of $62.55. Of the 2004 options, 281,000 are performance-based.
The Company approved a proposal, effective December 6, 2004, to attach share appreciation rights (SARs) to future and existing options as allowed under the LTIP. The majority of option holders accepted this proposal. The LTIP provides the option holders with the right to either purchase common shares at the exercise price or receive cash payments equal to the excess of the market value of the common shares over the exercise price. The modification to existing options under the LTIP was accounted for prospectively and for the year ended December 31, 2004, the Company recorded compensation expense of $123 million. This amount is net of $29 million of previously recognized compensation expense recorded in prior years as a result of the adoption of the Canadian Institute of Chartered Accountants’ amended Section 3870 “Stock-Based Compensation and Other Stock-Based Payments.” Contributed surplus related to unexercised options was transferred to liabilities.
As at December 31, 2004, the total liability for expected cash settlements with respect to those options attached with SARs under the LTIP is $151 million. During the year ended December 31, 2004, cash payments of $1 million were made for 33,375 SARs exercised.
The fair value of the options related to the option holders who did not accept attachment of SARs to their existing options was estimated using the Black-Scholes model with the following assumptions: risk-free interest rate of 3.82 per cent, expected life of six years, volatility of 19.4 per cent and a dividend yield of 1.61 per cent.
At December 31, 2004, the Company had 16,106,995 shares reserved to meet outstanding options for the purchase of common shares.
On April 30, 2004, the Company announced its intention to make a normal course issuer bid, to repurchase for cancellation up to one per cent of its 275,287,340 common shares issued and outstanding as at April 27, 2004. The bid began May 4, 2004, and will end on or before May 3, 2005. The bid is being used to counter dilution resulting from the issuance of common shares under the Company’s employee stock option program. At December 31, 2004, a total of 783,800 common shares had been repurchased at market prices for a total cost of $54 million (at an average price of $69.56 per share) and cancelled.
Under an earlier normal course issuer bid, which commenced February 7, 2003, and ended February 6, 2004, the Company purchased 1,528,000 shares at an average price of $52.29, for a total cost of $80 million, which includes $9 million of shares purchased in 2004.
| | | | | | |
| 60 | | SHELL CANADA LIMITED | | | Notes to Consolidated Financial Statements |
| | | | | | |
NOTE 3. CAPITAL STOCK AND STOCK-BASED COMPENSATION(continued)
COMMON SHARES
| | | | | | | | | | | | | | | | | | | | | | | | | | | |
| |
| | | | 2004 | | | | | | | | 2003 | | | | 2002 | |
| | | | Shares | | | ($ millions) | | | | Shares | | | ($ millions) | | | Shares | | | ($ millions) | |
| | | | | | | |
| Balance at beginning of year | | | | 275 042 159 | | | | 480 | | | | | 275 908 290 | | | | 468 | | | | 275 514 500 | | | | 459 | |
| Activity during year | | | | | | | | | | | | | | | | | | | | | | | | | | |
| Options exercised | | | | 1 141 303 | | | | 39 | | | | | 504 769 | | | | 15 | | | | 393 790 | | | | 9 | |
| Normal course issuer bid | | | | (940 900 | ) | | | (2 | ) | | | | (1 370 900 | ) | | | (3 | ) | | | – | | | | – | |
| | | | | | | |
| Balance at year-end | | | | 275 242 562 | | | | 517 | | | | | 275 042 159 | | | | 480 | | | | 275 908 290 | | | | 468 | |
| | | | | | | |
A summary of the status of the Company’s stock options as at December 31, 2004, 2003 and 2002, and changes during the years ending on those dates is presented below:
STOCK OPTIONS
| | | | | | | | | | | | | | | | | | | | | | | | | | | |
| |
| | | | 2004 | | | | | | | | 2003 | | | 2002 | |
| | | | | | | | Weighted | | | | | | | | Weighted | | | | | | | Weighted | |
| | | | | | | | Average | | | | | | | | Average | | | | | | | Average | |
| | | | | | | | Exercise | | | | | | | | Exercise | | | | | | | Exercise | |
| | | | Options | | | Price | | | | Options | | | Price | | | Options | | | Price | |
| | | | (thousands) | | | (dollars) | | | | (thousands) | | | (dollars) | | | (thousands) | | | (dollars) | |
| | | | | | | |
| Outstanding at beginning of year | | | | 5 873 | | | | 38.00 | | | | | 4 777 | | | | 34.22 | | | | 3 616 | | | | 28.48 | |
| Granted | | | | 1 697 | | | | 62.55 | | | | | 1 674 | | | | 46.03 | | | | 1 567 | | | | 44.70 | |
| Exercised – common shares | | | | (1 141 | ) | | | 32.40 | | | | | (505 | ) | | | 29.55 | | | | (394 | ) | | | 22.78 | |
| Exercised – SARs | | | | (33 | ) | | | 38.47 | | | | | – | | | | – | | | | – | | | | – | |
| Forfeited | | | | (286 | ) | | | 48.91 | | | | | (73 | ) | | | 33.61 | | | | (12 | ) | | | 39.73 | |
| | | | | | | |
| Outstanding at year-end | | | | 6 110 | | | | 45.35 | | | | | 5 873 | | | | 38.00 | | | | 4 777 | | | | 34.22 | |
| | | | | | | |
| Options exercisable at year-end | | | | 2 818 | | | | | | | | | 2 808 | | | | | | | | 1 958 | | | | | |
| | | | | | | |
Stock options outstanding at December 31, 2004:
| | | | | | | | | | | | | | | | | | | | | |
| | | Options Outstanding | | | Options Exercisable | |
| | | | | | | Weighted | | | Weighted | | | | | | | Weighted | |
| | | | | | | Average | | | Average | | | | | | | Average | |
| | | Number | | | Remaining | | | Exercise | | | Number | | | Exercise | |
| | | Outstanding | | | Contractual | | | Price | | | Exercisable | | | Price | |
| | | (thousands) | | | Life (years) | | | (dollars) | | | (thousands) | | | (dollars) | |
| |
| $12 – $21 | | | 186 | | | | 1.6 | | | | 15.92 | | | | 186 | | | | 15.92 | |
| $21 – $30 | | | 502 | | | | 3.6 | | | | 22.53 | | | | 502 | | | | 22.53 | |
| $30 – $40 | | | 973 | | | | 5.6 | | | | 34.82 | | | | 973 | | | | 34.82 | |
| $40 – $50 | | | 2 884 | | | | 7.6 | | | | 45.42 | | | | 1 157 | | | | 45.14 | |
| $50 – $63 | | | 1 565 | | | | 9.1 | | | | 62.55 | | | | – | | | | – | |
| |
| | | 6 110 | | | | 7.1 | | | | 45.35 | | | | 2 818 | | | | 35.63 | |
| |
| | | | | | |
| Notes to Consolidated Financial Statements | | | SHELL CANADA LIMITED | | 61 |
| | | | | | |
NOTE 4. INCOME TAX
The income tax provision included in the determination of earnings reflects an effective tax rate that is different from the Corporation’s statutory tax rate. The following table provides a reconciliation between the effective and statutory rates:
| | | | | | | | | | | | | | | |
| |
| ($ millions except as noted) | | | 2004 | | | | 2003 | | | 2002 | |
| | | | | | | | | (restated) | | | (restated) | |
| Earnings before income tax | | | | 1 885 | | | | | 1 208 | | | | 860 | |
Basic corporate tax rate(%) | | | | 37.5 | | | | | 38.4 | | | | 40.8 | |
| Income tax at basic rate | | | | 707 | | | | | 464 | | | | 351 | |
| Increase (decrease) resulting from: | | | | | | | | | | | | | | |
| Crown royalties and other payments to provinces | | | | 90 | | | | | 107 | | | | 83 | |
| Resource allowance and other abatement measures | | | | (105 | ) | | | | (82 | ) | | | (99 | ) |
| Manufacturing and processing credit | | | | (3 | ) | | | | (3 | ) | | | (14 | ) |
| Changes in income tax rates | | | | (40 | ) | | | | (68 | ) | | | (16 | ) |
| Capital losses not previously recognized | | | | (1 | ) | | | | (10 | ) | | | – | |
| Other, including revisions in previous tax estimates | | | | (49 | ) | | | | (10 | ) | | | – | |
Total | | | | 599 | | | | | 398 | | | | 305 | |
| | | | | | | |
Effective income tax rates on earnings(%) | | | | 31.8 | | | | | 32.9 | | | | 35.5 | |
| | | | | | | |
The Corporation’s future income tax asset (liability) is comprised of the following tax-affected temporary differences:
| | | | | | | | | | | | | | | |
| |
| ($ millions) | | | 2004 | | | | 2003 | | | 2002 | |
| | | | | | | | | (restated) | | | (restated) | |
| Current | | | | | | | | | | | | | | |
| LIFO inventory valuation | | | | 116 | | | | | 67 | | | | 85 | |
| Non-capital losses carryforward | | | | 149 | | | | | – | | | | – | |
| Long Term Incentive Plan | | | | 44 | | | | | – | | | | – | |
| Employee future benefits | | | | (5 | ) | | | | (5 | ) | | | (8 | ) |
| Asset retirement obligations | | | | 9 | | | | | 3 | | | | 4 | |
| Other | | | | 1 | | | | | – | | | | 5 | |
| | | | | | | |
| Total – current | | | | 314 | | | | | 65 | | | | 86 | |
| | | | | | | |
| Non-current | | | | | | | | | | | | | | |
| Properties, plant and equipment | | | | (1 433 | ) | | | | (1 360 | ) | | | (1 186 | ) |
| Employee future benefits | | | | (93 | ) | | | | (74 | ) | | | (62 | ) |
| Asset retirement obligations | | | | 87 | | | | | 89 | | | | 85 | |
| Long Term Incentive Plan | | | | 7 | | | | | – | | | | – | |
| Other | | | | (16 | ) | | | | (21 | ) | | | (14 | ) |
| | | | | | | |
| Total – non-current | | | | (1 448 | ) | | | | (1 366 | ) | | | (1 177 | ) |
| | | | | | | |
| Net future income tax liability | | | | (1 134 | ) | | | | (1 301 | ) | | | (1 091 | ) |
| | | | | | | |
The Corporation has approximately $612 million of non-capital losses, which may be offset against future taxable income. A future tax benefit has not been recognized on $220 million of these non-capital losses. The losses expire as follows:
| | | | | |
| |
| Year of Expiry | | ($ millions) | |
| |
| 2007 | | | 2 | |
| 2008 | | | 77 | |
| 2009 | | | 76 | |
| 2010 | | | 144 | |
| 2011 | | | 313 | |
| |
| Total non-capital losses | | | 612 | |
| |
The Corporation has $94 million in capital losses, which may be offset against future capital gains and may be carried forward indefinitely. The future tax benefit of capital losses has not been recognized.
| | | | | | |
| 62 | | SHELL CANADA LIMITED | | | Notes to Consolidated Financial Statements |
| | | | | | |
NOTE 5. TAXES, ROYALTIES AND OTHER
The following amounts were included in the determination of earnings:
| | | | | | | | | | | | | | | |
| |
| ($ millions) | | | 2004 | | | | 2003 | | | 2002 | |
| | | | | |
| | | | | | | | | (restated) | | | (restated) | |
| Items reported separately: | | | | | | | | | | | | | | |
| Income tax | | | | 599 | | | | | 398 | | | | 305 | |
Items included in sales or other operating revenues or in operating,
selling and general expenses: | | | | | | | | | | | | | | |
| Crown royalties and mineral taxes | | | | 304 | | | | | 289 | | | | 193 | |
| Royalties paid to private leaseholders | | | | 60 | | | | | 64 | | | | 41 | |
| Other taxes | | | | 108 | | | | | 84 | | | | 51 | |
| Research and development expense | | | | 28 | | | | | 10 | | | | 6 | |
| | | | | | | |
Total | | | | 1 099 | | | | �� | 845 | | | | 596 | |
| | | | | | | |
NOTE 6. LONG-TERM DEBT
| | | | | | | | | | | | | | | | | | | | | | | |
| |
| ($ millions) | | Issued | | | Maturity | | | 2004 | | | | 2003 | | | 2002 | |
| | | | | | | |
Medium-Term Notes | | | | | | | | | | | | | | | | | | |
Floating rate notes1 | | Feb 14, 2002 | | Dec 15, 2004 | | | | – | | | | | 237 | | | | 250 | |
Floating rate notes2 | | Mar 22, 2002 | | Mar 15, 2005 | | | | 134 | | | | | 140 | | | | 140 | |
Floating rate notes1 | | Mar 22, 2002 | | Jun 15, 2004 | | | | – | | | | | 105 | | | | 105 | |
Floating rate notes1 | | Sep 24, 2002 | | Sep 24, 2004 | | | | – | | | | | 250 | | | | 250 | |
Capital leases | | | | | | varying dates | | | | 3 | | | | | 4 | | | | 180 | |
| | | | | | | |
| | | | | | | | | | | | | 137 | | | | | 736 | | | | 925 | |
| Included in current liabilities | | | | | | | | | | | | (136 | ) | | | | (734 | ) | | | (402 | ) |
| | | | | | | |
| Total | | | | | | | | | | | | 1 | | | | | 2 | | | | 523 | |
| | | | | | | |
| 1 | | In 2004, floating rate notes totalling $592 million were repaid. |
| |
| 2 | | On March 15, 2004, floating rate notes totalling $134 million were extended for one year. |
Under the Medium-Term Note Shelf Prospectus filed in December 2001, the Corporation issued five tranches of floating rate notes totalling $745 million in 2002. In 2004, extension options for one tranche initially totalling $140 million were exercised, resulting in $134 million being extended for an additional year. Interest on the floating rate notes is paid quarterly at rates that range from 10 to 17 basis points above the three-month Canadian Dollar Offer Rate.
In 2003, repayment of the capital lease relating to the hydrogen manufacturing unit used in the Athabasca Oil Sands Project reduced capital leases by $184 million.
Repayments of obligations necessary during the next five years are as follows:
$ 136 million in 2005
$ 1 million in 2006
Nil in 2007
Nil in 2008
Nil in 2009
| | | | | | |
| Notes to Consolidated Financial Statements | | | SHELL CANADA LIMITED | | 63 |
| | | | | | |
NOTE 7. ASSET RETIREMENT AND OTHER LONG-TERM OBLIGATIONS
| | | | | | | | | | | | | | | |
| |
| ($ millions) | | | 2004 | | | | 2003 | | | 2002 | |
| | | | | |
| | | | | | | | | (restated) | | | (restated) | |
| | | | | | | |
| Asset retirement obligations | | | | 282 | | | | | 264 | | | | 261 | |
| Other employee future benefits | | | | 137 | | | | | 128 | | | | 121 | |
| Other obligations | | | | 33 | | | | | 20 | | | | 26 | |
| | | | | | | |
| | | | | 452 | | | | | 412 | | | | 408 | |
| Included in current liabilities | | | | (35 | ) | | | | (17 | ) | | | (19 | ) |
| | | | | | | |
Total | | | | 417 | | | | | 395 | | | | 389 | |
| | | | | | | |
The change in the asset retirement obligations is as follows:
| | | | | | | | | | | | | | | |
| |
| ($ millions) | | | 2004 | | | | 2003 | | | 2002 | |
| | | | | |
| | | | | | | | | (restated) | | | (restated) | |
| Asset retirement obligations at January 1 | | | | 264 | | | | | 261 | | | | 229 | |
| Additions | | | | 4 | | | | | – | | | | 29 | |
| Accretion | | | | 14 | | | | | 13 | | | | 11 | |
| Revisions in estimated cash flows | | | | 20 | | | | | – | | | | – | |
| Settlements | | | | (20 | ) | | | | (10 | ) | | | (8 | ) |
| | | | | | | |
Asset retirement obligations at December 31 | | | | 282 | | | | | 264 | | | | 261 | |
| | | | | | | |
The total undiscounted amount of the estimated cash flows required to settle the obligations is $475 million, which has been discounted using a credit-adjusted risk-free rate of six per cent. The requirement to settle the obligations can occur during the asset’s life but most of the obligations will not be settled until the end of the asset’s useful life, which can exceed 25 years in some circumstances.
| | | | | | |
| 64 | | SHELL CANADA LIMITED | | | Notes to Consolidated Financial Statements |
| | | | | | |
NOTE 8. FINANCIAL INSTRUMENTS
| | | | | | | | | | | | | | | | | | | | | | | | | | | | | |
| | | | Notional Fair Value1 | | | | Unrealized Gain (Loss)2 | |
| |
| ($ millions) | | | 2004 | | | | 2003 | | | 2002 | | | | 2004 | | | | 2003 | | | 2002 | |
| | | | | | | | | | | | | |
| Commodity contracts | | | | 43 | | | | | 37 | | | | 80 | | | | | – | | | | | 2 | | | | 1 | |
| Foreign exchange contracts | | | | 19 | | | | | 29 | | | | 11 | | | | | – | | | | | (2 | ) | | | – | |
| | | | | | | | | | | | | |
| | | | | | | | | | | | | | | | | | | | | | | | | | | | | |
| | | | Notional Fair Value1 | | | | Carrying Value | |
| |
| ($ millions) | | | 2004 | | | | 2003 | | | 2002 | | | | 2004 | | | | 2003 | | | 2002 | |
| | | | | | | | | | | | | |
Long-term debt3 | | | | 134 | | | | | 733 | | | | 745 | | | | | 134 | | | | | 732 | | | | 745 | |
| | | | | | | | | | | | | |
| 1 | | Notional fair value is the product of the contract volume and the mark-to-market forward price. Purchase and sales positions have not been offset. Amounts disclosed represent the sum of the absolute values of the positions. The reported amounts of financial instruments such as cash equivalents, marketable securities and short-term debt approximate fair value. |
| |
| 2 | | Unrealized gain or loss represents the gain or loss the Corporation would incur if the contract was liquidated at December 31. |
| |
| 3 | | Long-term debt includes the current portion. |
The Corporation uses commodity contracts to reduce the risk of price fluctuations of some commodities. Over-the-counter contracts with terms generally no longer than one year are used.
At December 31, commodity contracts outstanding were:
| | | | | | | | | | | | | | | | | | | | | | | | | | | |
| |
| | | | | 2004 | | | | 2003 | | | 2002 | |
| | | | | | | |
| ($ millions except as noted) | | | Face Value | | | Volume4 | | | | Face Value | | | Volume4 | | | Face Value | | | Volume4 | |
| | | | | | | |
| Crude oil and refined products commitments | | | | 43 | | | | 810 | | | | | 35 | | | | 943 | | | | 79 | | | | 1 683 | |
| Electricity commitments | | | | – | | | | – | | | | | – | | | | 3 | | | | – | | | | 3 | |
| | | | | | | |
| 4 | | Crude oil and refined products volumes are expressed as thousands of barrels and electricity is denoted in thousands of megawatt hours. |
A portion of the Corporation’s cash flow is in U.S. dollars. The U.S. dollar receipts are less than U.S. dollar disbursements primarily due to the cost of foreign crude cargoes exceeding U.S. dollar denominated product sales. The resulting net shortage of U.S. dollars is funded through U.S. dollar spot, forward and swap contracts. These instruments generally mature in less than 30 days. U.S. dollar requirements for significant capital projects and some marketing transactions are funded through forward contracts with maturities generally of less than one year.
Non-performance by the other parties to the financial instruments exposes the Corporation to credit loss. The counterparties for most of the commodity contracts are affiliates of Royal Dutch/Shell. Other financial instrument contracts are generally with domestic and international banks or corporations, all with credit ratings of A or better. There is no significant concentration of credit risk and Shell does not anticipate non-performance by the counterparties.
| | | | | | |
| Notes to Consolidated Financial Statements | | | SHELL CANADA LIMITED | | 65 |
| | | | | | |
NOTE 9. EMPLOYEE FUTURE BENEFITS
Employees initially participate in the defined contribution segment of the Corporation’s pension plan. After meeting certain service and age requirements, employees can elect to participate in the defined benefit segment of the pension plan. Benefits from these segments are either partially or fully paid by the Company and are based on years of service and final average earnings. Benefits from the defined benefit segment of the pension plan are indexed for inflation after retirement. In addition to the pension plan, life insurance and supplementary health and dental coverage benefits are provided to retirees. The effective date of the most recent actuarial valuation for funding purposes is December 31, 2004. The next actuarial valuation for funding purposes must be as of a date no later than December 31, 2007.
| | | | | | | | | | | | | | | | | | | | | | | | | | | |
| |
| ACCRUED BENEFIT OBLIGATION($ millions) | | | 2004 | | | | 2003 | | | 2002 | |
| | | | | | | |
| | | | Pension | | | Other | | | | Pension | | | Other | | | Pension | | | Other | |
| | | | Benefits | | | Benefits | | | | Benefits | | | Benefits | | | Benefits | | | Benefits | |
| | | | | | | |
| Accrued benefit obligation as at January 1 | | | | 1 998 | | | | 182 | | | | | 1 809 | | | | 163 | | | | 1 730 | | | | 150 | |
| Current service cost | | | | 32 | | | | 1 | | | | | 28 | | | | 1 | | | | 27 | | | | 2 | |
| Interest cost | | | | 118 | | | | 11 | | | | | 117 | | | | 10 | | | | 112 | | | | 10 | |
| Actuarial loss (gain) | | | | 25 | | | | (13 | ) | | | | 10 | | | | 3 | | | | 42 | | | | 1 | |
| Transfers | | | | 25 | | | | – | | | | | 19 | | | | – | | | | 16 | | | | – | |
| Benefits paid | | | | (129 | ) | | | (7 | ) | | | | (126 | ) | | | (7 | ) | | | (123 | ) | | | (7 | ) |
| Change in assumption | | | | 135 | | | | (9 | ) | | | | 141 | | | | 18 | | | | 5 | | | | 7 | |
| Plan amendments | | | | – | | | | 3 | | | | | – | | | | (6 | ) | | | – | | | | – | |
| | | | | | | |
Accrued benefit obligation as at December 31 | | | | 2 204 | | | | 168 | | | | | 1 998 | | | | 182 | | | | 1 809 | | | | 163 | |
| | | | | | | |
Included in the above pension benefits are unfunded amounts for the supplemental pension obligations of $143 million (2003 – $111 million; 2002 – $105 million) and $29 million (2003 – $30 million; 2002 – $30 million) for the spousal pension obligations.
| | | | | | | | | | | | | | | | | | | | | | | | | | | |
| |
| PLAN ASSETS($ millions) | | | 2004 | | | | 2003 | | | 2002 | |
| | | | | | | |
| Plan assets as at January 1 | | | | 1 782 | | | | – | | | | | 1 648 | | | | – | | | | 1 786 | | | | – | |
| Actual return on plan assets | | | | 182 | | | | – | | | | | 194 | | | | – | | | | (67 | ) | | | – | |
| Employer contributions | | | | 119 | | | | 7 | | | | | 51 | | | | 7 | | | | 33 | | | | 7 | |
| Employee contributions | | | | 3 | | | | – | | | | | 2 | | | | – | | | | 2 | | | | – | |
| Transfers | | | | 25 | | | | – | | | | | 19 | | | | – | | | | 22 | | | | – | |
| Benefits paid | | | | (129 | ) | | | (7 | ) | | | | (126 | ) | | | (7 | ) | | | (123 | ) | | | (7 | ) |
| Expenses | | | | (6 | ) | | | – | | | | | (6 | ) | | | – | | | | (5 | ) | | | – | |
| | | | | | | |
Fair value as at December 31 | | | | 1 976 | | | | – | | | | | 1 782 | | | | – | | | | 1 648 | | | | – | |
| | | | | | | |
| Funded status – deficit | | | | (228 | ) | | | (168 | ) | | | | (216 | ) | | | (182 | ) | | | (161 | ) | | | (163 | ) |
| Unamortized net losses | | | | 805 | | | | 12 | | | | | 761 | | | | 36 | | | | 710 | | | | 15 | |
| Unamortized past service cost | | | | – | | | | 3 | | | | | – | | | | – | | | | – | | | | – | |
Unamortized transitional (asset) obligation1 | | | | (143 | ) | | | 16 | | | | | (179 | ) | | | 18 | | | | (215 | ) | | | 27 | |
| | | | | | | |
Accrued benefit asset (obligation)2 | | | | 434 | | | | (137 | ) | | | | 366 | | | | (128 | ) | | | 334 | | | | (121 | ) |
| | | | | | | |
| 1 | | Unrecorded assets are amortized over the expected average remaining service period of active employees, which is currently nine years (2003 – eight years; 2002 – nine years). |
| |
| 2 | | The Accrued benefit asset (obligation) for pension benefits is included in the “Investments, long-term receivables and other” line and for other benefits in the “Asset retirement and other long-term obligations” line on the Consolidated Balance Sheet. |
The percentage of the fair value of total plan assets held at December 31 is as follows:
| | | | | | | | | | | | | | | |
| |
| (per cent) | | | 2004 | | | | 2003 | | | 2002 | |
| | | | | | | |
| Equity securities | | | | 46.9 | | | | | 44.4 | | | | 41.6 | |
| Debt securities | | | | 40.3 | | | | | 45.8 | | | | 45.2 | |
| Real estate | | | | 3.4 | | | | | 3.2 | | | | 4.0 | |
| Other | | | | 9.4 | | | | | 6.6 | | | | 9.2 | |
| | | | | | | |
Total | | | | 100 | | | | | 100 | | | | 100 | |
| | | | | | | |
| | | | | | |
| 66 | | SHELL CANADA LIMITED | | | Notes to Consolidated Financial Statements |
| | | | | | |
NOTE 9. EMPLOYEE FUTURE BENEFITS(continued)
| | | | | | | | | | | | | | | | | | | | | | | | | | | |
| |
| (INCOME) EXPENSE($ millions) | | | 2004 | | | | 2003 | | | 2002 | |
| | | | | | | |
| | | | Pension | | | Other | | | | Pension | | | Other | | | Pension | | | Other | |
| | | | Benefits | | | Benefits | | | | Benefits | | | Benefits | | | Benefits | | | Benefits | |
| | | | | | | |
| Current service cost | | | | 32 | | | | 1 | | | | | 28 | | | | 1 | | | | 27 | | | | 2 | |
| Employee contributions | | | | (3 | ) | | | – | | | | | (2 | ) | | | – | | | | (2 | ) | | | – | |
| Interest cost | | | | 118 | | | | 11 | | | | | 117 | | | | 10 | | | | 112 | | | | 10 | |
| Plan amendments | | | | – | | | | 3 | | | | | – | | | | (6 | ) | | | – | | | | – | |
| Actual (return) loss on plan assets | | | | (182 | ) | | | – | | | | | (194 | ) | | | – | | | | 67 | | | | – | |
| Actuarial loss (gain) on accrued benefit obligation | | | | 160 | | | | (22 | ) | | | | 151 | | | | 21 | | | | 47 | | | | 8 | |
| | | | | | | |
| Costs arising in the period | | | | 125 | | | | (7 | ) | | | | 100 | | | | 26 | | | | 251 | | | | 20 | |
| Differences between costs arising in the period and costs recognized in the period in respect of: | | | | | | | | | | | | | | | | | | | | | | | | | | |
| Return on plan assets | | | | 53 | | | | – | | | | | 63 | | | | – | | | | (212 | ) | | | – | |
| Actuarial loss (gain) | | | | (91 | ) | | | 24 | | | | | (108 | ) | | | (21 | ) | | | (31 | ) | | | (8 | ) |
| Plan amendments | | | | – | | | | (3 | ) | | | | – | | | | 6 | | | | – | | | | – | |
| Transitional obligation (asset) | | | | (36 | ) | | | 2 | | | | | (36 | ) | | | 3 | | | | (36 | ) | | | 3 | |
| | | | | | | |
| Net expense (income) for benefit plan | | | | 51 | | | | 16 | | | | | 19 | | | | 14 | | | | (28 | ) | | | 15 | |
| Defined contribution segment | | | | 13 | | | | – | | | | | 12 | | | | – | | | | 11 | | | | – | |
| | | | | | | |
Total | | | | 64 | | | | 16 | | | | | 31 | | | | 14 | | | | (17 | ) | | | 15 | |
| | | | | | | |
| | | | | | | | | | | | | | | | | | | | | | | | | | | |
| |
| ASSUMPTIONS(per cent) | | | 2004 | | | | 2003 | | | 2002 | |
| | | | | | | |
| Discount rate | | | | 5.80 | | | | 5.80 | | | | | 6.00 | | | | 6.00 | | | | 6.60 | | | | 6.60 | |
| Long-term rate of return on plan assets | | | | 7.25 | | | | – | | | | | 7.50 | | | | – | | | | 8.00 | | | | – | |
| Rate of compensation growth | | | | 4.70 | | | | 4.70 | | | | | 3.20 | | | | 3.20 | | | | 3.10 | | | | 3.10 | |
| | | | | | | |
For the purpose of measuring the expected cost of other benefit plans, a 7.6 per cent annual rate of increase in the per capita cost of covered health care benefits was assumed for 2005, decreasing each year to a rate of four per cent in 2012 and thereafter.
| | | | | | | | | |
| |
| ASSUMPTIONS SENSITIVITIES($ millions) | One per cent increase | | One per cent decrease | |
| |
| Discount rate | | | | | | | | |
| Effect on pension benefit expense | | | (27 | ) | | | 31 | |
| Effect on accrued benefit obligation | | | (267 | ) | | | 326 | |
| Long-term rate of return on plan assets | | | | | | | | |
| Effect on pension benefit expense | | | (20 | ) | | | 20 | |
| Rate of compensation growth | | | | | | | | |
| Effect on pension benefit expense | | | 8 | | | | (7 | ) |
| Effect on accrued benefit obligation | | | 51 | | | | (45 | ) |
| Health care cost trend rate | | | | | | | | |
| Effect on current service and interest cost | | | 2 | | | | (1 | ) |
| Effect on accrued benefit obligation | | | 17 | | | | (14 | ) |
| |
| | | | | | |
| Notes to Consolidated Financial Statements | | | SHELL CANADA LIMITED | | 67 |
| | | | | | |
NOTE 10. TRANSACTIONS WITH AFFILIATED COMPANIES
In the course of its regular business activities, Shell Canada enters into routine transactions with affiliates of the Company’s parents. Such transactions are at commercial rates. The amounts paid or received on transactions with Shell International Trading Company and other affiliates of Royal Dutch/Shell that are reflected in the Consolidated Statement of Earnings are shown in the table below:
| | | | | | | | | | | | | | | |
| |
| ($ millions) | | | 2004 | | | | 2003 | | | 2002 | |
| | | | | | | |
| Purchases of crude oil, petroleum products, chemicals and service agreements | | | | 3 961 | | | | | 2 707 | | | | 1 854 | |
| Amounts payable in respect of such purchases | | | | 393 | | | | | 228 | | | | 220 | |
| Sales of natural gas, petroleum products and chemicals | | | | 1 928 | | | | | 1 609 | | | | 1 154 | |
| Amounts receivable in respect of such sales | | | | 215 | | | | | 138 | | | | 133 | |
| | | | | | | |
Royal Dutch/Shell provides support and technology for operating locations to Shell Canada. Through these service agreements, Shell Canada has access and rights to research and development and technical expertise.
In December 2004, the Corporation purchased the shares of a related party, Coral Resources Canada ULC, for $39 million. The purchase price was established by negotiation with consideration given to comparable commercial transactions. As a result of this transaction, Shell Canada acquired non-capital losses to be used against future taxable income. The Company has recorded a future tax asset of $149 million and a deferred credit of $110 million, which is included with Accounts payable.
In December 2002, Shell Canada completed a transaction with Shell Global Solutions International B.V. regarding the global Oil Products manufacturing cost-sharing agreement. This transaction resulted in a $19 million after-tax gain.
| | | | | | |
| 68 | | SHELL CANADA LIMITED | | | Notes to Consolidated Financial Statements |
| | | | | | |
NOTE 11. COMMITMENTS AND CONTINGENCIES
At December 31, 2004, the Corporation had non-cancellable operating and other long-term commitments with an initial or remaining term of one year or more. Future minimum payments under such commitments are estimated to be:
| | | | | | | | | |
| |
| | | Operating | | | Other Long-Term | |
| ($ millions) | | Commitments | 1 | | Commitments | 2 |
| |
| 2005 | | | 88 | | | | 849 | |
| 2006 | | | 73 | | | | 833 | |
| 2007 | | | 69 | | | | 831 | |
| 2008 | | | 78 | | | | 696 | |
| 2009 | | | 138 | | | | 670 | |
| thereafter | | | 124 | | | | 6 179 | 3 |
| |
| |
| 1 | | These operating commitments cover leases of service stations, mine equipment, office space and other facilities. |
| |
| 2 | | The Corporation has substantial commitments for use of facilities or services and supply and processing of products all made in the normal course of business. |
| |
| 3 | | Based on current year pricing, this amount includes an Oil Products commitment to purchase $3.7 billion of certain feedstocks from the other joint venture participants in the Athabasca Oil Sands Project (AOSP), $1.3 billion for various pipeline charges and $0.9 billion of AOSP utilities and hydrogen commitments. |
The Corporation has a leasing arrangement for large mobile equipment (trucks, scrapers and shovels) in use at the Muskeg River Mine. In order to secure attractive leasing terms, a guarantee has been provided to the lessor, which is payable when the equipment is returned to the lessor. At December 31, 2004, the Corporation’s share of the maximum payable under the guarantee was $118 million. Any proceeds received from the sale of the equipment would offset any payment required under the guarantee. The guarantee is in place for the equipment lease term, which will continue for the next one to six years.
Various lawsuits are pending against the Corporation. Actual liability with respect to these lawsuits is not determinable, but management believes, based on counsels’ opinions, that any potential liability will not materially affect the Corporation’s financial position.
| | | | | | |
| Notes to Consolidated Financial Statements | | | SHELL CANADA LIMITED | | 69 |
| | | | | | |
NOTE 12. SALE OF ACCOUNTS RECEIVABLE
The Board of Directors has approved a $600 million accounts receivable securitization program. In 2004, the Corporation decreased the receivables sold under this program to $150 million by year-end.
The Corporation has not retained any beneficial ownership interest in the sold assets and received proceeds that approximated their fair value. The assets were sold on a fully serviced basis and the Corporation has estimated that the servicing liability is insignificant.
NOTE 13. EARNINGS PER SHARE
| | | | | | | | | | | | | | | |
| | | | | | | |
| | | | 2004 | | | | 2003 | | | 2002 | |
| | | | | | | |
| | | | | | | | | (restated) | | | (restated) | |
Earnings($ millions) | | | | 1 286 | | | | | 810 | | | | 555 | |
Weighted average number of common shares(millions) | | | | 275 | | | | | 275 | | | | 276 | |
Dilutive securities(millions) | | | | | | | | | | | | | | |
Options on Long Term Incentive Plan1 | | | | 2 | | | | | 2 | | | | 2 | |
Basic earnings per share(dollars)2 | | | | 4.68 | | | | | 2.95 | | | | 2.01 | |
Diluted earnings per share(dollars)3 | | | | 4.64 | | | | | 2.92 | | | | 2.00 | |
| | | | | | | |
| |
| 1 | | The amount shown is the net number of common shares outstanding after the notional exercise of the share options and the cancellation of the notionally repurchased common shares as per the treasury stock method. |
| |
| 2 | | Basic earnings per share is the earnings divided by the weighted average number of common shares. |
| |
| 3 | | Diluted earnings per share is the earnings divided by the aggregate of the weighted average number of common shares plus the dilutive securities. |
| | | | | | |
| 70 | | SHELL CANADA LIMITED | | | Notes to Consolidated Financial Statements |
| | | | | | |
SUPPLEMENTAL OIL PRODUCTS DISCLOSURE
Year ended December 31 (unaudited)
| | | | | | | | | | | | | | | |
| | | | | | | |
| PRODUCTION(thousands of cubic metres/day) | | | 2004 | | | | 2003 | | | 2002 | |
| | | | | | | |
Crude oil processed by Shell refineries | | | | | | | | | | | | | | |
Montreal East(Quebec) | | | | 17.6 | | | | | 18.2 | | | | 17.9 | |
Sarnia(Ontario) | | | | 10.9 | | | | | 10.1 | | | | 10.1 | |
Scotford(Alberta)1 | | | | 16.6 | | | | | 14.6 | | | | 13.4 | |
| | | | | | | |
Total | | | | 45.1 | | | | | 42.9 | | | | 41.4 | |
| | | | | | | |
Rated refinery capacity at year-end | | | | | | | | | | | | | | |
Montreal East(Quebec) | | | | 20.7 | | | | | 19.4 | | | | 20.7 | |
Sarnia(Ontario) | | | | 12.0 | | | | | 11.4 | | | | 11.4 | |
Scotford(Alberta) | | | | 17.7 | | | | | 18.2 | | | | 15.5 | |
| | | | | | | |
Total | | | | 50.4 | | | | | 49.0 | | | | 47.6 | |
| | | | | | | |
| | | | | | | | | | | | | | | |
| | | | | | | |
| SALES(thousands of cubic metres/day) | | | 2004 | | | | 2003 | | | 2002 | |
| | | | | | | |
| Gasolines | | | | 20.9 | | | | | 20.9 | | | | 20.8 | |
| Middle distillates | | | | 19.2 | | | | | 17.9 | | | | 16.7 | |
| Other products | | | | 7.4 | | | | | 6.9 | | | | 6.9 | |
| | | | | | | |
Total | | | | 47.5 | | | | | 45.7 | | | | 44.4 | |
| | | | | | | |
| | | | | | | | | | | | | | | |
| | | | | | | |
| | | | 2004 | | | | 2003 | | | 2002 | |
| | | | | | | |
Refinery utilization(per cent)2 | | | | 89 | | | | | 90 | | | | 87 | |
Earnings per litre(cents)3 | | | | 2.6 | | | | | 2.1 | | | | 1.2 | |
| | | | | | | |
| |
| 1 | | Crude oil processed by Shell refineries includes upgrader feedstock supplied to Scotford Refinery. |
| |
| 2 | | Refinery utilization equals crude oil processed by Shell refineries divided by total capacity of Shell refineries, including capacity uplifts at Scotford Refinery due to processing of various streams from the upgrader. |
| |
| 3 | | Oil Products earnings per litre equals Oil Products earnings after-tax divided by total Oil Products sales volumes. |
| | | | | | |
| Supplemental Oil Products Disclosure | | | SHELL CANADA LIMITED | | 71 |
| | | | | | |
SUPPLEMENTAL EXPLORATION & PRODUCTION DISCLOSURE
Year ended December 31 (unaudited)
| | | | | | | | | | | | | | | |
| |
| PRODUCTION1 | | | 2004 | | | | 2003 | | | 2002 | |
| | | | | | | |
Natural gas(millions of cubic feet/day) | | | | | | | | | | | | | | |
| Gross | | | | 540 | | | | | 562 | | | | 610 | |
| Net | | | | 449 | | | | | 467 | | | | 474 | |
Ethane, propane and butane(thousands of barrels/day) | | | | | | | | | | | | | | |
| Gross | | | | 25.1 | | | | | 26.7 | | | | 27.9 | |
| Net | | | | 19.9 | | | | | 21.3 | | | | 21.1 | |
Condensate(thousands of barrels/day) | | | | | | | | | | | | | | |
| Gross | | | | 15.2 | | | | | 16.8 | | | | 19.7 | |
| Net | | | | 11.8 | | | | | 13.1 | | | | 13.9 | |
Bitumen(thousands of barrels/day) | | | | | | | | | | | | | | |
| Gross | | | | 8.1 | | | | | 9.2 | | | | 8.9 | |
| Net | | | | 7.9 | | | | | 9.1 | | | | 8.7 | |
Sulphur(thousands of long tons/day) | | | | | | | | | | | | | | |
| Gross | | | | 5.6 | | | | | 5.9 | | | | 6.1 | |
| | | | | | | |
| 1 | | Gross production includes all production attributable to Shell’s interest before deduction of royalties; net production is determined by deducting royalties from gross production. |
| | | | | | | | | | | | | | | |
| |
| SALES2 | | | 2004 | | | | 2003 | | | 2002 | |
| | | | | | | |
Natural gas – gross(millions of cubic feet/day) | | | | 536 | | | | | 555 | | | | 598 | |
Ethane, propane and butane – gross(thousands of barrels/day) | | | | 44.0 | | | | | 44.5 | | | | 46.4 | |
Condensate – gross(thousands of barrels/day) | | | | 19.6 | | | | | 17.9 | | | | 22.0 | |
Bitumen – gross(thousands of barrels/day) | | | | 11.5 | | | | | 13.9 | | | | 12.8 | |
Sulphur – gross(thousands of long tons/day) | | | | 11.3 | | | | | 10.7 | | | | 9.5 | |
| | | | | | | |
| 2 | | Sales volumes include own production, inventory and brokered third party sales. |
| | | | | | | | | | | | | | | |
| |
| PRICES | | | 2004 | | | | 2003 | | | 2002 | |
| | | | | | | |
Natural gas average plant gate netback price($/mcf) | | | | 6.49 | | | | | 6.46 | | | | 4.01 | |
Ethane, propane and butane average field gate price($/bbl) | | | | 28.71 | | | | | 25.48 | | | | 19.53 | |
Condensate average field gate price($/bbl) | | | | 50.46 | | | | | 41.13 | | | | 37.72 | |
| | | | | | | |
| | | | | | |
| 72 | | SHELL CANADA LIMITED | | | Supplemental Exploration & Production Disclosure |
| | | | | | |
| | | | | | | | | | | | | | | | | | | | | | | | | | | |
| |
| EXPLORATION AND | | | | | | | | | | | |
| DEVELOPMENT WELLS DRILLED | | | 2004 | | | | 2003 | | | 2002 | |
| | | | | | | |
| | | | Gross | | | Net | | | | Gross | | | Net | | | Gross | | | Net | |
| Exploration | | | | | | | | | | | | | | | | | | | | | | | | | | |
| Gas | | | | 3 | | | | 1 | | | | | 3 | | | | 1 | | | | 2 | | | | 1 | |
| Dry | | | | 4 | | | | 2 | | | | | 5 | | | | 4 | | | | 3 | | | | 2 | |
| | | | | | | |
| | | | | 7 | | | | 3 | | | | | 8 | | | | 5 | | | | 5 | | | | 3 | |
| | | | | | | |
| Development | | | | | | | | | | | | | | | | | | | | | | | | | | |
| Gas | | | | 10 | | | | 8 | | | | | 7 | | | | 4 | | | | 11 | | | | 8 | |
| Bitumen | | | | – | | | | – | | | | | – | | | | – | | | | 17 | | | | 17 | |
| Dry | | | | 1 | | | | – | | | | | 1 | | | | 1 | | | | – | | | | – | |
| | | | | | | |
| | | | | 11 | | | | 8 | | | | | 8 | | | | 5 | | | | 28 | | | | 25 | |
| | | | | | | |
Total wells drilled | | | | 18 | | | | 11 | | | | | 16 | | | | 10 | | | | 33 | | | | 28 | |
| | | | | | | |
Wells in progress | | | | 19 | | | | 15 | | | | | 10 | | | | 7 | | | | 8 | | | | 5 | |
| | | | | | | |
Exploration wells – Wells drilled either in search of new and as yet undiscovered pools of oil or gas, or with the expectation of significantly extending the limits of established pools. All other wells are development wells.
| | | | | | | | | | | | | | | | | | | | | | | | | | | |
| |
| PRODUCTIVE WELLS | | | 2004 | | | | 2003 | | | 2002 | |
| | | | | | | |
| | | | Gross | | | Net | | | | Gross | | | Net | | | Gross | | | Net | |
| Gas wells | | | | | | | | | | | | | | | | | | | | | | | | | | |
| Alberta | | | | 303 | | | | 259 | | | | | 294 | | | | 252 | | | | 292 | | | | 248 | |
| British Columbia | | | | 1 | | | | 1 | | | | | 1 | | | | 1 | | | | – | | | | – | |
| Nova Scotia | | | | 15 | | | | 5 | | | | | 15 | | | | 5 | | | | 13 | | | | 4 | |
| | | | | | | |
| | | | | 319 | | | | 265 | | | | | 310 | | | | 258 | | | | 305 | | | | 252 | |
| | | | | | | |
| Bitumen wells | | | | | | | | | | | | | | | | | | | | | | | | | | |
| Alberta | | | | 58 | | | | 58 | | | | | 58 | | | | 58 | | | | 58 | | | | 58 | |
| | | | | | | |
Total productive wells | | | | 377 | | | | 323 | | | | | 368 | | | | 316 | | | | 363 | | | | 310 | |
| | | | | | | |
Productive wells – Producing and non-unitized wells capable of producing.
Gross wells – The number of wells in which Shell Canada has a working interest.
Net wells – The aggregate of the numbers obtained by multiplying each gross well by the percentage working interest of Shell Canada therein, rounded to the nearest whole number.
| | | | | | |
| Supplemental Exploration & Production Disclosure | | | SHELL CANADA LIMITED | | 73 |
| | | | | | |
RESERVES
The Corporation’s reserves disclosure and related information have been prepared in reliance on a decision of the applicable Canadian securities regulatory authorities under National Instrument 51-101– Standards of Disclosure for Oil and Gas Activities (NI 51-101), which permits the Corporation to present its reserves disclosure and related information in accordance with the applicable requirements of the United States Financial Accounting Standards Board (FASB) and the United States Securities and Exchange Commission (SEC). This disclosure differs from the corresponding information required by NI 51-101. If Shell Canada had not received the decision, it would be required to disclose proved plus probable oil and gas reserves estimates based on forecast prices and costs and information relating to future net revenue using forecast prices and costs.
Reserves estimates are prepared by the Corporation’s internal qualified reserves evaluators. No independent qualified reserves evaluator or auditor was involved in the preparation of the Corporation’s reserves data. An external, independent petroleum consulting firm audited 100 per cent of the proved oil and gas reserves estimates prepared by the Corporation’s internal reserves evaluators and verified compliance with applicable FASB and SEC requirements.
Reserves Quantity Information
Estimation of reserves quantities is based on established geological and engineering principles and involves judgmental interpretation of reservoir data. These estimates are subject to revision as additional information from drilling, seismic, production performance and technology becomes available, as economic and operating conditions change, or as properties are divested or acquired. The difference between the gross and net reserves is the volume dedicated to meet royalty payments over the life of the reserves. The net reserves in the table below have been calculated on the basis of royalty rates and economic conditions in place as at year-end. Shell Canada’s estimated proved reserves exclude quantities in the Mackenzie Delta and Arctic Islands, or that otherwise may have been discovered but not yet proved.
| | | | | | | | | | | | | | | |
| OIL, GAS AND OTHER RESERVES |
| | | | NATURAL GAS | |
| | | | (billions of cubic feet) | |
| |
| | | | 2004 | | | | 2003 | | | 2002 | |
| | | | | | | |
| Net proved developed and undeveloped reserves | | | | | | | | | | | | | | |
| Beginning of year | | | | 1 365 | | | | | 1 806 | | | | 2 067 | |
| Revisions of previous estimates | | | | (51 | ) | | | | (335 | ) | | | (97 | ) |
| Extensions, discoveries and other additions | | | | 122 | | | | | 34 | | | | 9 | |
| Improved recovery methods | | | | 4 | | | | | 30 | | | | – | |
| Purchases of reserves in place | | | | – | | | | | – | | | | – | |
| Sales of reserves in place | | | | (37 | ) | | | | – | | | | – | |
| Production | | | | (164 | ) | | | | (170 | ) | | | (173 | ) |
| | | | | | | |
End of year | | | | 1 239 | | | | | 1 365 | | | | 1 806 | |
| | | | | | | |
| Net proved developed reserves | | | | | | | | | | | | | | |
| | | | | | | |
End of year | | | | 893 | | | | | 1 082 | | | | 1 184 | |
| | | | | | | |
| Gross proved developed and undeveloped reserves | | | | | | | | | | | | | | |
| | | | | | | |
End of year | | | | 1 595 | | | | | 1 775 | | | | 2 198 | |
| | | | | | | |
| Gross proved developed reserves | | | | | | | | | | | | | | |
| | | | | | | |
End of year | | | | 1 160 | | | | | 1 415 | | | | 1 511 | |
| | | | | | | |
Proved reserves – Estimated quantities of natural gas, natural gas liquids, bitumen and sulphur that geological engineering data demonstrate with reasonable certainty to be recoverable in future years from known reservoirs. These estimates are based on existing economic and operating conditions (prices, costs, royalties and income taxes) as at year-end.
Proved developed reserves – Reserves that can be expected to be recovered through existing wells with existing equipment and operating methods.
| | | | | | |
| 74 | | SHELL CANADA LIMITED | | | Supplemental Exploration & Production Disclosure |
| | | | | | |
Natural Gas
Total net natural gas proved reserves decreased by 126 billion cubic feet (bcf) from 1,365 bcf in 2003 to 1,239 bcf in 2004. Extensions, discoveries and improved recovery additions of 126 bcf included an initial booking of 62 bcf for the Tay River discovery in central Alberta. Compliance with FASB and SEC requirements, which limit the area that may be considered in the evaluation of proved reserves in the absence of performance data, restricted the initial booking of proved reserves to only a portion of the expected recovery at Tay River. Additions to proved reserves are anticipated in future years as performance data is acquired and additional development wells are drilled. The balance of the additions results from exploration success in northeastern British Columbia, development drilling in the Foothills, and the development of additional sands for the Sable Offshore Energy Project (SOEP). These additions were offset by a reduction of 37 bcf due to a change in working interest in the Foothills, a net downward revision of 51 bcf resulting from new technical information and economic conditions, and production of 164 bcf.
Natural Gas Liquids
Net proved natural gas liquids reserves decreased by 15 millions barrels due mainly to production of 12 million barrels and a downward technical and economic revision of three million barrels.
Bitumen
Compliance with FASB and SEC requirements for the use of year-end (December 31) prices in the evaluation of proved reserves has led to the debooking of all bitumen reserves at Peace River. A combination of unusually wide heavy oil market differentials and high costs for condensate purchase for blending with the bitumen resulted in uneconomic conditions on December 31, 2004. Consequently, net proved bitumen reserves decreased by the full 167 million barrels. This change will not have any material financial impact and Peace River remains a valuable component of the Company’s portfolio.
Sulphur
Net sulphur reserves increased by one million long tons during 2004 due to positive reserves revisions and additions in the Foothills region partially offset by current year production.
| | | | | | | | | | | | | | | | | | | | | | | | | | | | | | | | | | | | | | | |
| |
| | NATURAL GAS LIQUIDS | | | | BITUMEN | | | | SULPHUR | |
| | (millions of barrels) | | | | (millions of barrels) | | | | (millions of long tons) | |
| | |
| | 2004 | | | 2003 | | | 2002 | | | | 2004 | | | | 2003 | | | 2002 | | | | 2004 | | | | 2003 | | | 2002 | |
| | | | | | | | | | | | | | | | | |
| | 77 | | | | 105 | | | | 123 | | | | | 167 | | | | | 183 | | | | 190 | | | | | 13 | | | | | 14 | | | | 16 | |
| | (4 | ) | | | (17 | ) | | | (5 | ) | | | | (164 | ) | | | | (13 | ) | | | (4 | ) | | | | 1 | | | | | 1 | | | | – | |
| | 1 | | | | 1 | | | | – | | | | | – | | | | | – | | | | – | | | | | 2 | | | | | – | | | | – | |
| | – | | | | 1 | | | | – | | | | | – | | | | | – | | | | – | | | | | – | | | | | – | | | | – | |
| | – | | | | – | | | | – | | | | | – | | | | | – | | | | – | | | | | – | | | | | – | | | | – | |
| | – | | | | – | | | | – | | | | | – | | | | | – | | | | – | | | | | – | | | | | – | | | | – | |
| | (12 | ) | | | (13 | ) | | | (13 | ) | | | | (3 | ) | | | | (3 | ) | | | (3 | ) | | | | (2 | ) | | | | (2 | ) | | | (2 | ) |
| | | | | | | | | | | | | | | | | |
| | 62 | | | | 77 | | | | 105 | | | | | – | | | | | 167 | | | | 183 | | | | | 14 | | | | | 13 | | | | 14 | |
| | | | | | | | | | | | | | | | | |
| | | | | | | | | | | | | | | | | | | | | | | | | | | | | | | | | | | | | | | |
| | | | | | | | | | | | | | | | | |
| | 54 | | | | 69 | | | | 83 | | | | | – | | | | | 27 | | | | 30 | | | | | 10 | | | | | 12 | | | | 14 | |
| | | | | | | | | | | | | | | | | |
| | | | | | | | | | | | | | | | | | | | | | | | | | | | | | | | | | | | | | | |
| | | | | | | | | | | | | | | | | |
| | 78 | | | | 95 | | | | 121 | | | | | – | | | | | 182 | | | | 188 | | | | | 14 | | | | | 15 | | | | 16 | |
| | | | | | | | | | | | | | | | | |
| | | | | | | | | | | | | | | | | | | | | | | | | | | | | | | | | | | | | | | |
| | | | | | | | | | | | | | | | | |
| | 68 | | | | 85 | | | | 99 | | | | | – | | | | | 27 | | | | 31 | | | | | 11 | | | | | 14 | | | | 15 | |
| | | | | | | | | | | | | | | | | |
Proved undeveloped reserves – Reserves that are expected to be recovered from new wells on undrilled acreage adjacent to producing acreage, or from existing wells where further significant expenditure is required.
Gross proved reserves – Reserves estimates before the deduction of royalty interests owned by others.
Net proved reserves – Reserves estimates after deduction of royalties and, therefore, only those quantities that Shell has a right to retain.
| | | | | | |
| Supplemental Exploration & Production Disclosure | | | SHELL CANADA LIMITED | | 75 |
| | | | | | |
SUPPLEMENTAL OIL SANDS DISCLOSURE
Year ended December 31 (unaudited)
| | | | | | | | | | | | | | | |
| |
| PRODUCTION1(thousands of barrels/day) | | | 2004 | | | | 2003 | | | 2002 | |
| | | | | | | |
| Bitumen | | | | | | | | | | | | | | |
| Gross | | | | 81.3 | | | | | 46.3 | | | | – | |
| Net | | | | 80.5 | | | | | 45.8 | | | | – | |
| | | | | | | |
| 1 | | Gross production includes all production attributable to Shell’s interest before deduction of royalties; net production is determined by deducting royalties from gross production. |
| | | | | | | | | | | | | | | |
| |
| SALES2(thousands of barrels/day) | | | 2004 | | | | 2003 | | | 2002 | |
| | | | | | | |
| Synthetic crude sales excluding blend stocks | | | | 83.7 | | | | | 46.1 | | | | – | |
| Purchased upgrader blend stocks | | | | 38.2 | | | | | 17.7 | | | | – | |
| | | | | | | |
| Total synthetic crude sales | | | | 121.9 | | | | | 63.8 | | | | – | |
| | | | | | | |
| 2 | | Sales volumes include third party and inter-segment sales. |
| | | | | | | | | | | | | | | |
| |
| UNIT COSTS3($/bbl) | | | 2004 | | | | 2003 | | | 2002 | |
| | | | | | | |
| Cash operating cost – excluding natural gas | | | | 17.79 | | | | | – | | | | – | |
| Cash operating cost – natural gas | | | | 5.53 | | | | | – | | | | – | |
| | | | | | | |
| Total cash operating cost | | | | 23.32 | | | | | – | | | | – | |
| Depreciation, depletion and amortization | | | | 5.59 | | | | | – | | | | – | |
| | | | | | | |
| Total unit cost | | | | 28.91 | | | | | – | | | | – | |
| | | | | | | |
| 3 | | Unit cash operating cost is a key internal and external measure used to evaluate the performance of the Oil Sands segment of the Company. Unit cash operating cost for Oil Sands is defined as: operating, selling and general expenses plus cash cost items included in cost of goods sold (COGS), divided by synthetic crude sales excluding blend stocks. Cash cost items included in COGS are $172 million in 2004. Unit cash operating cost in 2004 includes mobile equipment lease costs of $0.58 per barrel. |
| |
| | | Unit depreciation, depletion and amortization (DD&A) cost for Oil Sands is defined as: DD&A cost divided by synthetic crude sales excluding blend stocks. Unit DD&A cost includes preproduction costs, which are being written off over the first three years of the project life (2003-2005). In 2004, preproduction costs account for$1.90 per barrel of the total unit DD&A cost. |
| |
| | | Total unit cost (including unit cash operating and unit DD&A costs) does not have any standardized meaning prescribed by Canadian generally accepted accounting principles and therefore may not be comparable with the calculation of similar measures for other companies. |
| | | | | | | | | | | | | | | |
| |
| PRICES($/bbl) | | | 2004 | | | | 2003 | | | 2002 | |
| | | | | | | |
| Synthetic crude average plant gate price | | | | 44.67 | | | | | 34.18 | | | | – | |
| | | | | | | |
| | | | | | |
| 76 | | SHELL CANADA LIMITED | | | Supplemental Oil Sands Disclosure |
| | | | | | |
RESERVES
The Muskeg River Mine development on Lease 13 was designed to access proved and probable reserves of bitumen totalling 1.7 billion barrels (total project) over 30 years of operation commencing in 2003 at the average design production level of 155,000 barrels per day. The reserves base includes reserves from the areas to the west of the Muskeg River where mining operations were initiated as well as reserves located immediately to the east of the Muskeg River. No changes other than production were made to the reserves in 2004. Shell’s 60 per cent interest is 621 million barrels of proved and 350 million barrels of probable reserves. This estimate is before deduction of royalties. Under the Oil Sands Royalty Regime Regulation, royalties depend on project cash flows. Therefore, the calculation of royalties depends on price, production rates, capital costs and operating costs over the life of the Muskeg River Mine and future expansion projects. At 2004 year-end pricing, net reserves would not be materially different from gross reserves.
The reserves estimates are based upon a detailed geological assessment including drilling and laboratory tests. They also consider current mine plans, planned operating life and regulatory constraints. The current proved plus probable reserves estimate includes only the portion of Lease 13 that represents the development area approved by the Alberta Energy and Utilities Board. The reserves estimate is the actual barrels of bitumen to be shipped for processing at the Scotford Upgrader. No allowance for volume losses during upgrading is required because of the Scotford Upgrader’s hydroconversion upgrading process.
Drilling density is a factor in classifying reserves as either proved or probable. Proved reserves of bitumen are based on drill hole spacing less than 350 metres. Probable reserves of bitumen are based on drill hole spacing less than 700 metres. Classification of both proved and probable reserves of bitumen possesses a high degree of geological certainty and is predicated on the application of the existing proven technology.
The Corporation’s minable bitumen reserves disclosure and related information have been prepared in reliance on a decision of the applicable Canadian securities regulatory authorities under National Instrument NI 51-101 – Standards of Disclosure for Oil and Gas Activities (NI 51-101), which permits the Corporation to present its reserves disclosure and related information in accordance with the applicable requirements of the United States Financial Accounting Standards Board (FASB) and the United States Securities and Exchange Commission (SEC). If Shell Canada had not received the decision, it would be required to disclose minable bitumen reserves estimates based on forecast prices and costs and information relating to future net revenue using constant and forecast prices and costs.
Reserves estimates are prepared by the Corporation’s internal qualified reserves evaluators. No independent qualified reserves evaluator or auditor was involved in the preparation of the Corporation’s reserves data.
| | | | | | | | | | | | | | | |
| OIL SANDS RESERVES | |
| |
| | | | MINABLE BITUMEN | |
| | | | (millions of barrels) | |
| |
| | | | 2004 | | | | 2003 | | | 2002 | |
| | | | | | | |
| Gross proved reserves | | | | | | | | | | | | | | |
| Beginning of year | | | | 651 | | | | | 600 | | | | 600 | |
| Revisions of previous estimates | | | | – | | | | | – | | | | – | |
| Additions | | | | – | | | | | 68 | | | | – | |
| Production | | | | (30 | ) | | | | (17 | ) | | | – | |
| | | | | | | |
End of year | | | | 621 | | | | | 651 | | | | 600 | |
| | | | | | | |
| Gross probable reserves | | | | | | | | | | | | | | |
| Beginning of year | | | | 350 | | | | | 300 | | | | 300 | |
| Revisions of previous estimates | | | | – | | | | | – | | | | – | |
| Additions | | | | – | | | | | 50 | | | | – | |
| | | | | | | |
End of year | | | | 350 | | | | | 350 | | | | 300 | |
| | | | | | | |
| Gross proved and probable reserves | | | | 971 | | | | | 1 001 | | | | 900 | |
| | | | | | | |
| Net proved reserves | | | | 615 | | | | | 572 | | | | 517 | |
| Net probable reserves | | | | 347 | | | | | 307 | | | | 258 | |
| | | | | | | |
| Net proved and probable reserves | | | | 962 | | | | | 879 | | | | 775 | |
| | | | | | | |
| | | | | | |
| Supplemental Oil Sands Disclosure | | | SHELL CANADA LIMITED | | 77 |
| | | | | | |
SUPPLEMENTAL LANDHOLDINGS DISCLOSURE
As at December 31 (unaudited)
| | | | | | | | | | | | | | | | | | | | | | | | | | | | | | | | | | | | | |
| | | | UNDEVELOPED | | | | DEVELOPED | |
| | | | | | | | | | | | | |
| (thousands of acres) | | | 2004 | | | | 2003 | | | | 2004 | | | | 2003 | |
| | | | | | | | | | | | | |
| | | | Gross | | | Net | | | | Gross | | | Net | | | | Gross | | | Net | | | | Gross | | | Net | |
| | | | | | | | | | | | | |
| Onshore within the provinces | | | | | | | | | | | | | | | | | | | | | | | | | | | | | | | | | | | | |
| Conventional oil and gas: | | | | | | | | | | | | | | | | | | | | | | | | | | | | | | | | | | | | |
| Alberta | | | | 373 | | | | 211 | | | | | 319 | | | | 185 | | | | | 552 | | | | 384 | | | | | 552 | | | | 385 | |
| British Columbia | | | | 286 | | | | 220 | | | | | 152 | | | | 118 | | | | | – | | | | – | | | | | – | | | | – | |
| Quebec | | | | 5 | | | | – | | | | | 5 | | | | – | | | | | – | | | | – | | | | | – | | | | – | |
| Coalbed methane: | | | | | | | | | | | | | | | | | | | | | | | | | | | | | | | | | | | | |
| Alberta | | | | 24 | | | | 24 | | | | | 16 | | | | 16 | | | | | – | | | | – | | | | | – | | | | – | |
| British Columbia | | | | 1 018 | | | | 1 018 | | | | | – | | | | – | | | | | – | | | | – | | | | | – | | | | – | |
| Bitumen: | | | | | | | | | | | | | | | | | | | | | | | | | | | | | | | | | | | | |
| – mining | | | | 120 | | | | 105 | | | | | 90 | | | | 72 | | | | | 11 | | | | 7 | | | | | 5 | | | | 3 | |
| – in situ | | | | 85 | | | | 85 | | | | | 85 | | | | 85 | | | | | 7 | | | | 7 | | | | | 6 | | | | 6 | |
| | | | | | | | | | | | | |
| | | | | 1 911 | | | | 1 663 | | | | | 667 | | | | 476 | | | | | 570 | | | | 398 | | | | | 563 | | | | 394 | |
| | | | | | | | | | | | | |
| Canada Lands | | | | | | | | | | | | | | | | | | | | | | | | | | | | | | | | | | | | |
| Offshore Nova Scotia | | | | 840 | | | | 322 | | | | | 2 749 | | | | 953 | | | | | 109 | | | | 34 | | | | | 109 | | | | 34 | |
| Northwest Territories | | | | 262 | | | | 245 | | | | | 261 | | | | 245 | | | | | – | | | | – | | | | | – | | | | – | |
| Offshore West Coast | | | | 13 590 | | | | 12 845 | | | | | 13 590 | | | | 12 845 | | | | | – | | | | – | | | | | – | | | | – | |
| Nunavut Territory | | | | 5 801 | | | | 3 100 | | | | | 5 801 | | | | 3 100 | | | | | – | | | | – | | | | | – | | | | – | |
| | | | | | | | | | | | | |
| | | | | 20 493 | | | | 16 512 | | | | | 22 401 | | | | 17 143 | | | | | 109 | | | | 34 | | | | | 109 | | | | 34 | |
| | | | | | | | | | | | | |
| Total | | | | 22 404 | | | | 18 175 | | | | | 23 068 | | | | 17 619 | | | | | 679 | | | | 432 | | | | | 672 | | | | 428 | |
| | | | | | | | | | | | | |
Gross acres include the interests of others; net acres exclude the interests of others.
Developed lands are leases and other forms of title documents issued by owners or legislative authorities that contain a well, or are in close proximity to other lands that contain a well that has been drilled or completed to a point that would permit production of commercial quantities of oil and gas.
Undeveloped lands are all lands that are not developed and that retain exploration rights.
| | | | | | |
| 78 | | SHELL CANADA LIMITED | | | Supplemental Landholdings Disclosure |
| | | | | | |
SUPPLEMENTAL FINANCIAL DATA AND QUARTERLY STOCK-TRADING INFORMATION
Year ended December 31 (unaudited)
| | | | | | | | | | | | | | | |
| | | | | | | |
| DATA PER COMMON SHARE(dollars except as noted) | | | 2004 | | | | 2003 | | | 2002 | |
| | | | | | | |
| | | | | | | | | (restated) | | | (restated) | |
| Earnings – basic | | | | 4.68 | | | | | 2.95 | | | | 2.01 | |
| Earnings – diluted | | | | 4.64 | | | | | 2.92 | | | | 2.00 | |
| Dividends | | | | 0.94 | | | | | 0.82 | | | | 0.80 | |
| Common shareholders’ equity | | | | 23.74 | | | | | 20.13 | | | | 18.11 | |
Common shares outstanding at year-end(millions) | | | | 275 | | | | | 275 | | | | 276 | |
Registered shareholders(number at year-end) | | | | 2 454 | | | | | 2 554 | | | | 2 643 | |
| | | | | | | |
| | | | | | | | | | | | | | | |
| | | | | | | |
| RATIOS | | | 2004 | | | | 2003 | | | 2002 | |
| | | | | | | |
| | | | | | | | | (restated) | | | (restated) | |
Return on average common shareholders’ equity(%)1 | | | | 21.3 | | | | | 15.4 | | | | 11.5 | |
Return on average capital employed(%)2 | | | | 19.9 | | | | | 13.1 | | | | 10.1 | |
Common share dividends as a percentage of earnings3 | | | | 20.1 | | | | | 27.9 | | | | 39.8 | |
Price to earnings ratio4 | | | | 17.1 | | | | | 20.8 | | | | 24.5 | |
| Current assets to current liabilities | | | | 0.9 | | | | | 0.5 | | | | 0.5 | |
Interest coverage5 | | | | 73.5 | | | | | 19.3 | | | | 18.6 | |
Reinvestment ratio(%)6 | | | | 43.4 | | | | | 43.4 | | | | 186.3 | |
Total debt as a percentage of capital employed7 | | | | 2.1 | | | | | 13.8 | | | | 24.2 | |
Debt to cash flow(%)8 | | | | 5.8 | | | | | 50.7 | | | | 130.1 | |
| | | | | | | |
| 1 | | Earnings divided by average common shareholders’ equity. |
| |
| 2 | | Earnings plus after-tax interest expense divided by average of opening and closing capital employed. Capital employed is a total of equity, long-term debt and short-term borrowings. |
| |
| 3 | | Common share dividends paid divided by earnings. |
| |
| 4 | | Closing share price at December 31 divided by earnings per share. |
| |
| 5 | | Pretax earnings plus interest expense divided by interest expense. |
| |
| 6 | | Capital, exploration, predevelopment and investment expenditures divided by cash flow from operations. |
| |
| 7 | | Total debt divided by total debt plus equity. |
| |
| 8 | | Total debt divided by cash flow from operations. |
| | | | | | | | | | | | | | | |
| |
| EMPLOYEES | | | 2004 | | | | 2003 | | | 2002 | |
| | | | | | | |
Employees(number at year-end) | | | | 4 003 | | | | | 3 850 | | | | 3 825 | |
| | | | | | | |
| | | | | | | | | | | | | | | | | | | | | | | | | | | | | | | | | | | | | | | | | | | |
| | | | | | | |
| STOCK-TRADING INFORMATION | | | 2004 | | | | 2003 | |
| | | | | | | |
| | | | Quarter | | | Total | | | | Quarter | | | Total | |
| | | | 1st | | | 2nd | | | 3rd | | | 4th | | | Year | | | | 1st | | | 2nd | | | 3rd | | | 4th | | | Year | |
| | | | | | | |
Share prices(dollars)1 | | | | | | | | | | | | | | | | | | | | | | | | | | | | | | | | | | | | | | | | | | |
| High | | | | 65.85 | | | | 66.40 | | | | 69.46 | | | | 80.03 | | | | 80.03 | | | | | 50.15 | | | | 54.75 | | | | 54.60 | | | | 62.28 | | | | 62.28 | |
| Low | | | | 57.70 | | | | 61.31 | | | | 62.05 | | | | 68.50 | | | | 57.70 | | | | | 45.00 | | | | 46.58 | | | | 51.00 | | | | 50.68 | | | | 45.00 | |
Close(end of period) | | | | 62.05 | | | | 64.49 | | | | 69.00 | | | | 79.99 | | | | 79.99 | | | | | 49.25 | | | | 52.63 | | | | 53.31 | | | | 61.25 | | | | 61.25 | |
Shares traded(thousands)1 | | | | 7 392 | | | | 6 517 | | | | 5 751 | | | | 7 071 | | | | 26 731 | | | | | 10 076 | | | | 5 645 | | | | 4 772 | | | | 7 237 | | | | 27 730 | |
| | | | | | | |
| 1 | �� | Toronto Stock Exchange quotations. |
| | | | | | |
| Supplemental Financial Data and Quarterly Stock-Trading Information | | | SHELL CANADA LIMITED | | 79 |
| | | | | | |
CORPORATE DIRECTORY AND BOARD OF DIRECTORS
OFFICERS(all in Calgary)
Clive Mather
President and
Chief Executive Officer
Cathy L. Williams
Chief Financial Officer
VICE PRESIDENTS
Neil J. Camarta
Senior Vice President,
Oil Sands
H. Ian Kilgour
Senior Vice President,
Exploration & Production
David M. Weston
Senior Vice President,
Oil Products
Simon A. Fish
Vice President,
General Counsel and Secretary
Graham Bojé
Vice President,
Manufacturing and Supply
Rob W.P. Symonds
Vice President, Foothills
Timothy J. Bancroft
Vice President,
Sustainable Development,
Technology and Public Affairs
Sam Spanglet
Vice President,
Operations, Oil Sands
TREASURER
Matthew B. Haney
CONTROLLER
Donna Tarka
BOARD OF DIRECTORS
| | | |
| |  |
Derek H. Burney, O.C.(2)(3)(4) | | Ida J. Goodreau(1)(3) |
Ottawa, Ontario | | Vancouver, British Columbia |
On the Board of Directors since April 25, 2001. | | On the Board of Directors since April 24, 2003. |
| | | |
Since 2004, Mr. Burney has been Chairman of New Brunswick Power Corporation, a Crown corporation. New Brunswick Power Corporation is the largest electric utility in Atlantic Canada. From 1999 to 2004, Mr. Burney served as President and Chief Executive Officer of CAE Inc., a provider of simulation and control technologies used in the aerospace and defence sectors.
Mr. Burney also serves as a Director of Quebecor World Inc. and is an Advisory Board Member of Idelix Software Inc. He is a Senior Distinguished Fellow and Adjunct Professor of Carleton University. | | Ms. Goodreau has been President and Chief Executive Officer, Vancouver Coastal Health Authority since 2002. She also serves as a Director of Terasen Inc.
From 2000 to 2002, Ms. Goodreau was Senior Vice President, Global Optimization and Human Resources, Norske Skog Industries. |
| | | |
| |  |
Clive Mather | | Ronald W. Osborne(1)(3)(4) |
Calgary, Alberta | | Toronto, Ontario |
On the Board of Directors since August 1, 2004. | | On the Board of Directors since April 25, 2001. |
| | | |
Since August 1, 2004, Mr. Mather has been President and Chief Executive Officer of Shell Canada Limited.
Mr. Mather served as Chairman of Shell U.K. Limited and Head of Global Learning of Shell International Ltd. from 2002 to 2004. Before that, he was Special Advisor to the Chairman of the Committee of Managing Directors of Shell International Ltd. After serving as Director, International, of Shell International Ltd., Mr. Mather was Chief Executive Officer of Shell Services International Ltd. from 1999 to 2001.
Mr. Mather is a Director and President of Shell International Ltd. and a Director of Shell Chemicals Canada Ltd., Shell Canada Products Limited and Shell Canada Oil Products Inc. | | From 1999 to 2003, Mr. Osborne was President and Chief Executive Officer of Ontario Power Generation Inc., which owns the power generation assets supplying about 85 per cent of all electricity consumed in Ontario.
Mr. Osborne also serves as a Director of Sun Life Financial Inc., Torstar Corporation, St. Lawrence Cement Group Inc., Massachusetts Financial Services Company, Four Seasons Hotels Inc. and a Trustee of RioCan Real Estate Investment Trust. |
| | | | | | |
| 80 | | SHELL CANADA LIMITED | | | Corporate Directory and Board of Directors |
| | | | | | |
| | | | | |
| |  | |  |
Kerry L. Hawkins(1)(2)(4) | | David W. Kerr(1)(2)(4) | | W. Adrian Loader |
Winnipeg, Manitoba | | Toronto, Ontario | | Guildford, England |
On the Board of Directors since October 1, 1997. | | On the Board of Directors since April 24, 2003. | | On the Board of Directors since September 27, 2003. |
| | | | | |
Since 1982, Mr. Hawkins has been President of Cargill Limited, a Canadian agricultural company.
Mr. Hawkins also serves as a Director of TransCanada PipeLines Limited, TransCanada Corporation, Hudson’s Bay Company and Nova Chemicals Corporation. He is Chairman of the Board, Saskferco Products Inc. | | Since 2002, Mr. Kerr has been Chairman and Director of Noranda Inc., an international mining and metals company. From 2001 to 2002, Mr. Kerr was Chairman and Chief Executive Officer of Noranda Inc. and from 1990 to 2001, he served as the company’s President and Chief Executive Officer.
Mr. Kerr also serves as a Director of Sun Life Financial Inc. and Brascan Corp. | | Since June 2003, Mr. Loader has served as Director, Strategic Planning, Sustainable Development and External Affairs for Shell International Ltd. He was President, Shell Oil Products Europe from 1999 until June 2003. The main businesses of all Shell and Royal Dutch companies are oil, natural gas, chemicals and renewable resources.
Mr. Loader also serves as a Director of other Royal Dutch/Shell companies and Alliance Unichem p.l.c. |
| | | | | |
| |  | |  |
Raymond Royer O.C.(1)(3) | | Nancy C. Southern(2)(3) | | Jeroen van der Veer |
Ile Bizard, Quebec | | Calgary, Alberta | | Wassenaar, the Netherlands |
On the Board of Directors since April 26, 2000. | | On the Board of Directors since April 25, 2001. | | On the Board of Directors since April 24, 2003. |
| | | | | |
Since 1996, Mr. Royer has been President and Chief Executive Officer of Domtar Inc., a North American manufacturer of fine papers, pulp and forest products with a 50 per cent interest in Norampac Inc., which manufactures containerboard and corrugated containers.
Mr. Royer also serves as a Director of Domtar Inc. and Power Financial Corporation. | | Ms. Southern has been President and Chief Executive Officer of ATCO Ltd. and Canadian Utilities Limited since January, 2003. From 2000 to December 2002, Ms. Southern was Co-Chairman and Chief Executive Officer of ATCO Ltd. and Canadian Utilities Limited.
Ms. Southern also serves as Director and Chief Executive Officer of certain other subsidiaries of ATCO Ltd. and Canadian Utilities Limited. She is a Director of the Bank of Montreal and Executive Vice President of Spruce Meadows. | | Since 2004, Mr. Van der Veer has been Chief Executive of Royal Dutch/Shell. He has been a Managing Director of Royal Dutch Petroleum Company since 1997 and its President since 2000. Mr. Van der Veer joined Royal Dutch/Shell in 1971 and had an international career working in various roles in a number of countries.
Mr. Van der Veer also serves as a Non-Executive Director of Unilever. |
Member of the:
(1) Audit Committee
(2) Nominating and Governance Committee
(3) Management Resources and Compensation Committee
(4) Reserves Committee
| | | | | | |
| Corporate Directory and Board of Directors | | | SHELL CANADA LIMITED | | 81 |
| | | | | | |
STATEMENT OF CORPORATE GOVERNANCE PRACTICES
The Company’s corporate governance practices meet or exceed the guidelines recommended by the Toronto Stock Exchange (TSX) for effective corporate governance. These practices are consistent with proposed National Instrument 58-101 –Disclosure of Corporate Governance Practicesand the relevant provisions of the United States Sarbanes-Oxley Act of 2002 and the United States Securities and Exchange Commission regulations.
A complete description of the Company’s approach to corporate governance is set out in Appendix 2 to the Company’sManagement Proxy Circulardated March 10, 2005, entitled “Statement of Corporate Governance Practices,” a copy of which is posted on the Company’s website atwww.shell.ca.
Responsibilities
The Board of Directors supervises the business and affairs of the Company in a stewardship role. The day-to-day management is delegated to the officers of the Company. Any responsibilities that have not been delegated to the officers or to a committee of the Board remain with the Board.
Composition
The Board is composed of 10 directors. Seven of the 10 directors are independent. An independent director, as defined by Multilateral Instrument 52-110Audit Committees, is a director who has no direct or indirect material relationship with the issuer. C. Mather, President and Chief Executive Officer, is a non-independent director because of his executive office and J. van der Veer and W.A. Loader are considered non-independent directors because they are related to the majority shareholder. Seven of the 10 directors are independent directors who have no material relationship with either the Company or the majority shareholder. The Board believes this fairly reflects the investment of minority shareholders. Ten directors will be nominated for election at the annual and special meeting of shareholders in April 2005.
Independence
The Chairman of the meetings of the Board is a separate role from the President and Chief Executive Officer. All members of the committees are independent directors and not related to the Company or its majority shareholder.
Committees
The Board has four committees: the Audit Committee, the Nominating and Governance Committee, the Management Resources and Compensation Committee, and the Reserves Committee. The text of the Board and committee mandates appears in theManagement Proxy Circular, Appendix 1, and copies of the Board and committee charters can be found on the Company’s website atwww.shell.ca.
Compensation
The Nominating and Governance Committee reviews the adequacy and form of compensation of directors in light of the risks and responsibilities involved in being a director. Directors’ compensation includes minimum share ownership requirements. The Management Resources and Compensation Committee approves the annual compensation for the President and Chief Executive Officer and his senior executives, including stock option and incentive programs. Further details are set out in the Report on Executive Compensation in theManagement Proxy Circular.
Controls
The effectiveness of the Company’s internal control processes and management information systems is continually assessed. The Audit Committee is supported by a management assurance committee that oversees a range of appraisal mechanisms, including business control audits, health, safety and environment audits, asset integrity reviews and self assessments.
| | | | | | |
| 82 | | SHELL CANADA LIMITED | | | Statement of Corporate Governance Practices |
| | | | | | |
Conduct
The Board expects management to manage the business of the Company in a manner that enhances shareholder value, consistent with the highest level of integrity and within the law. The Board adopted aStatement of General Business PrinciplesandCode of Ethics, which apply to all employees in their conduct of the Company’s business. The text of theStatement of General Business PrinciplesandCode of Ethicshas been posted on the Company’s website at www.shell.ca. The Company has established procedures for reporting employee concerns regarding accounting or auditing matters or breaches of the Code of Ethics to management, the Company’s controller, the Audit Committee or, on an anonymous basis, to the Ombuds office.
Information
The Board has adopted a corporate disclosure policy based on the Canadian Securities Administrators’ National Policy 51-201 –Disclosure Standardsand the TSX’sPolicy Statement on Timely DisclosureandElectronic Communications Disclosure Guidelines. A copy of Shell Canada’s policy can be found on the Company’s website at www.shell.ca.
Communications
The Company issues quarterly financial press releases and various other releases throughout the year. Other means of communication include theAnnual Reportand the Company’s website. The Investor Relations manager and senior management communicate with shareholders, institutional investors and the financial community. The Company’s transfer agent or the Corporate Secretary’s department responds to shareholders’ account inquiries. Shareholders and the public receive a response from the Public Affairs department, the Investor Relations department, the Corporate Secretary’s department or the appropriate member of senior management.
Audit Committee
The members of the Audit Committee are:
K.L. Hawkins(Chairman),
I.J. Goodreau,
D.W Kerr,
R.W. Osborne, and
R. Royer.
The Audit Committee held nine meetings in 2004.
Nominating and Governance Committee
The members of the Nominating and Governance Committee are:
D.H. Burney(Chairman),
K.L. Hawkins,
D.W. Kerr, and
N.C. Southern.
The Nominating and Governance Committee held four meetings in 2004.
Management Resources and Compensation Committee
The members of the Management Resources and Compensation Committee are:
R.W. Osborne(Chairman),
D.H. Burney,
I.J. Goodreau,
R. Royer, and
N.C. Southern.
The Management Resources and Compensation Committee held seven meetings in 2004.
Reserves Committee
The members of the Reserves Committee are:
D.W. Kerr(Chairman),
D.H. Burney,
K.L. Hawkins, and
R.W. Osborne.
The Reserves Committee was established in September 2004 and held its first meeting in November 2004. The Audit Committee was responsible for overseeing the Company’s reserves disclosure until the establishment of the Reserves Committee.
| | | | | | |
| Statement of Governance Practices | | | SHELL CANADA LIMITED | | 83 |
| | | | | | |
SHELL CANADA LIMITED
(incorporated under the laws of Canada)
Head Office
Shell Centre
400 – 4th Avenue S.W.
Calgary, Alberta T2P 0J4
Telephone (403) 691-2175
Website www.shell.ca
Transfer Agent and Registrar
CIBC Mellon Trust Company
P.O. Box 7010 Adelaide Street Postal Station
Toronto, Ontario, Canada M5C 2W9
| | | |
| E-mail | | inquiries@cibcmellon.com |
| Website | | www.cibcmellon.com |
| Facsimile | | (416) 643-5501 |
| Answerline | | (416) 643-5500 or |
| | 1-800-387-0825 |
| | Toll-free throughout North America |
Stock Exchange Listings
The common shares of Shell Canada Limited are listed on the Toronto Stock Exchange (stock symbol SHC) and do not have an established public trading market in the United States.
Annual and Special Meeting
The annual and special meeting of shareholders will be held at 11:00 a.m., Friday, April 29, 2005, in the Wildrose Ballroom, Sheraton Suites Eau Claire, Calgary, Alberta.
Duplicate Reports
Shareholders who receive more than one copy of Shell Canada’sInterim Reportsand theAnnual Reportas a result of having their shareholdings represented by two or more share certificates may wish to contact the transfer agent to have their holdings consolidated. It will not be necessary to forward share certificates.
Annual Information Form and Progress Toward Sustainable Development
The Corporation’sAnnual Information Formfor 2004 and the publicationProgress Toward Sustainable Development are available to shareholders on request from the Corporation’s Secretary at Shell’s head office.
Ownership and Voting Rights of Shell Canada Limited
(as at December 31, 2004)
Ownership of Shell Canada Limited is divided between Shell Investments Limited and public shareholders. Shell Investments Limited holds approximately 78 per cent of the equity and voting rights.
The publicly held common shares (approximately 61 million) constitute about 22 per cent of the equity and voting rights in the Corporation.
Shell Investments Limited is a Canadian company, wholly owned by Shell Petroleum N.V. of the Netherlands, which, in turn, is owned 40 per cent by The “Shell” Transport and Trading Company, p.l.c., an English company, and 60 per cent by Royal Dutch Petroleum Company of the Netherlands.
Approximate Conversion Factors
| | | | | |
| 1 cubic metre of liquids | | = | | 6.29 barrels |
| 1 cubic metre of gases | | = | | 35.3 cubic feet |
| 1 barrel of oil equivalent | | = | | 6,000 cubic feet of gases |
| 1 tonne | | = | | 2,205 pounds |
| | = | | 0.984 long ton |
| | = | | 1.102 short tons |
| 1 kilometre | | = | | 0.621 mile |
| 1 hectare | | = | | 2.47 acres |
| 1 litre | | = | | 0.22 gallon |
| | | | | | |
| 84 | | SHELL CANADA LIMITED | | | Investor Information |
| | | | | | |
This annual report is recyclable and has been printed using vegetable-based inks.
The cover and text pages are elemental chlorine-free and acid-free.
The financial pages are 30 per cent post-consumer waste and are archival and acid-free.
FOR INFORMATION:
Investor Relations
Shell Canada Limited
Shell Centre
400 – 4th Avenue S.W.
Calgary, Alberta T2P 0J4
Telephone (403) 691-2175
www.shell.ca