First Farmers and Merchants (FFMH) Inactive
Filed: 25 Mar 16, 12:00am

Valuation Discussion for the
Board of Directors of
First Farmers and Merchants
Corporation

Columbia, Tennessee
November 17, 2015
Executive Summary
| Sheshunoff & Co. Investment Banking was engaged by First Farmers and Merchants Corporation (the “Company”) to determine the fair value of the Company’s common stock as of September 30, 2015 for the purpose of assisting the Board of Directors in:
| ||
| Determining the fair value merger consideration per share to be paid in connection with a proposed “going private,” SEC de-registration reorganization transaction. | ||
Fair Value information provided by General Counsel is defined inSection 48-23-101(4) of the Tennessee Code as:
“The fair value, with respect to a dissenter’s shares, means the value of theshares immediately before the effectuation2008of the corporate action to which the dissenter objects, including any appreciation or depreciation in anticipation of the corporate action. ”
| Page 2 |
|
Executive Summary
General Counsel also advised Sheshunoff that the Supreme Court of Tennessee has relied on the “Delaware Block Method” to determine fair value which requires the use of three different methods with appropriate weight given to each method based on the circumstances specific to the corporation. These methods include:
| 1) | the earnings value method; |
| 2) | the market value method; and |
| 3) | the asset value method |
Definition of Fair Value pending confirmation bylegal counsel.
| Page 3 |
|
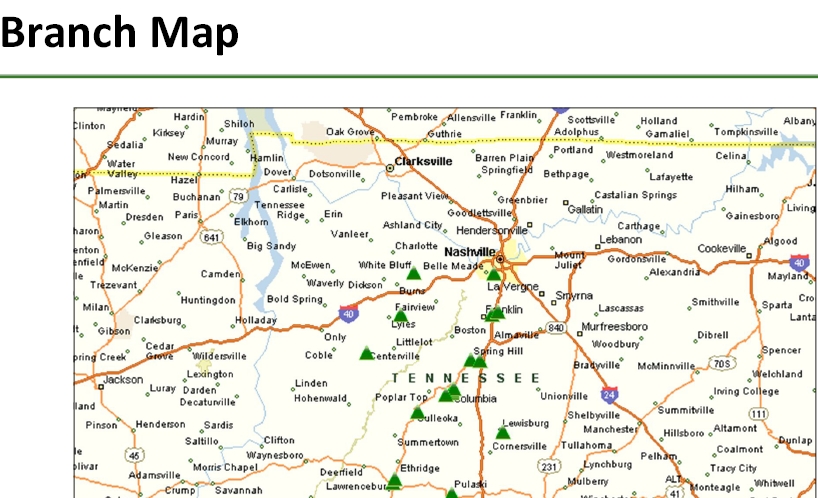
Demographic Overview
| Page 4 |
|
| Page 5 |
|
Market Demographics
| Projected | Median | Projected | |||||||
| Deposit | Percent of | Total | Population | Population | HH | HH Income | |||
| Market | State | Population | Change | Change | Income | Change | |||
| Number of | Share | Franchise | 2016 | 2010-2016 | 2016-2021 | 2016 | 2016-2021 | ||
| County | Branches | (% ) | (% ) | (Actual) | (% ) | (% ) | ($) | (% ) | |
| Maury | 8 | 49.14 | 57.97 | 87,820 | 8.48 | 6.71 | 48,303 | 12.26 | |
| Lawrence | 3 | 28.79 | 16.13 | 42,482 | 1.46 | 2.37 | 42,416 | 9.41 | |
| Marshall | 1 | 20.15 | 9.03 | 31,502 | 2.89 | 3.10 | 45,382 | 7.73 | |
| Hickman | 2 | 34.84 | 6.92 | 24,471 | (0.89 | ) | 1.45 | 39,363 | 5.51 |
| Williamson | 2 | 0.73 | 4.65 | 213,927 | 16.78 | 9.53 | 95,167 | 9.96 | |
| Dickson | 1 | 2.96 | 2.30 | 50,964 | 2.61 | 3.05 | 45,640 | 6.97 | |
| Giles | 1 | 3.59 | 2.25 | 28,747 | (2.50 | ) | 0.02 | 41,718 | 9.85 |
| Davidson | 1 | 0.03 | 0.75 | 683,236 | 9.02 | 6.30 | 49,502 | 11.87 | |
| TN Totals | 19 | 100 | 1,163,149 | ||||||
| Weighted Average: Tennessee Franchise | 6.20 | 5.22 | 48,447 | 10.64 | |||||
| Aggregate: Entire State of Tennessee | 6,623,654 | 4.37 | 3.82 | 46,781 | 7.13 | ||||
| Aggregate: National | 322,431,073 | 4.43 | 3.69 | 55,551 | 7.77 | ||||
| Page 6 |
|
| Market Unemployment Data | ||||||||||||||||||||||||
| Unemployment Rate | ||||||||||||||||||||||||
| County | Dec-11 | Mar-12 | Jun-12 | Sep-12 | Dec-12 | Mar-13 | Jun-13 | Sep-13 | ||||||||||||||||
| Maury | 10.6 | % | 9.6 | % | 10.0 | % | 8.9 | % | 8.8 | % | 8.9 | % | 9.6 | % | 9.0 | % | ||||||||
| Lawrence | 11.1 | % | 11.2 | % | 12.2 | % | 10.3 | % | 11.2 | % | 12.1 | % | 12.6 | % | 11.8 | % | ||||||||
| Marshall | 12.2 | % | 12.1 | % | 12.2 | % | 10.7 | % | 10.8 | % | 10.3 | % | 10.8 | % | 10.1 | % | ||||||||
| Hickman | 9.8 | % | 9.9 | % | 10.3 | % | 7.9 | % | 8.5 | % | 8.5 | % | 8.8 | % | 7.6 | % | ||||||||
| Williamson | 5.4 | % | 5.2 | % | 5.9 | % | 5.2 | % | 5.0 | % | 5.1 | % | 6.1 | % | 5.7 | % | ||||||||
| Dickson | 9.0 | % | 8.8 | % | 8.9 | % | 7.2 | % | 7.3 | % | 7.2 | % | 7.6 | % | 6.8 | % | ||||||||
| Giles | 9.4 | % | 9.2 | % | 10.0 | % | 8.8 | % | 9.2 | % | 9.6 | % | 10.3 | % | 9.4 | % | ||||||||
| Davidson | 6.9 | % | 6.6 | % | 7.3 | % | 6.6 | % | 6.2 | % | 6.3 | % | 7.1 | % | 6.7 | % | ||||||||
| Deposit Weighted Average | 10.4 | % | 9.9 | % | 10.3 | % | 9.0 | % | 9.1 | % | 9.3 | % | 9.9 | % | 9.2 | % | ||||||||
| State of Tennessee | 8.2 | % | 8.3 | % | 8.7 | % | 7.7 | % | 7.9 | % | 8.4 | % | 8.9 | % | 8.0 | % | ||||||||
| U.S. | 8.3 | % | 8.4 | % | 8.4 | % | 7.6 | % | 7.6 | % | 7.6 | % | 7.8 | % | 7.0 | % | ||||||||
| Unemployment Rate | ||||||||||||||||||||||||
| County | Dec-13 | Mar-14 | Jun-14 | Sep-14 | Dec-14 | Mar-15 | Jun-15 | Sep-15 | ||||||||||||||||
| Maury | 7.8 | % | 7.2 | % | 7.5 | % | 6.8 | % | 6.4 | % | 5.3 | % | 5.6 | % | 5.2 | % | ||||||||
| Lawrence | 10.6 | % | 10.4 | % | 10.4 | % | 9.1 | % | 9.2 | % | 7.1 | % | 7.3 | % | 6.5 | % | ||||||||
| Marshall | 8.6 | % | 8.1 | % | 8.5 | % | 7.5 | % | 7.4 | % | 5.5 | % | 6.3 | % | 5.9 | % | ||||||||
| Hickman | 7.2 | % | 6.9 | % | 7.6 | % | 6.4 | % | 6.8 | % | 6.0 | % | 6.3 | % | 5.6 | % | ||||||||
| Williamson | 4.8 | % | 4.6 | % | 5.4 | % | 4.8 | % | 4.4 | % | 3.9 | % | 4.6 | % | 4.1 | % | ||||||||
| Dickson | 6.0 | % | 6.5 | % | 6.6 | % | 5.6 | % | 5.7 | % | 5.8 | % | 6.0 | % | 5.5 | % | ||||||||
| Giles | 8.3 | % | 7.4 | % | 7.7 | % | 6.7 | % | 6.5 | % | 5.4 | % | 5.7 | % | 5.2 | % | ||||||||
| Davidson | 5.7 | % | 5.5 | % | 6.0 | % | 5.5 | % | 5.1 | % | 4.4 | % | 4.9 | % | 4.6 | % | ||||||||
| Deposit Weighted Average | 8.1 | % | 7.6 | % | 7.9 | % | 7.1 | % | 6.9 | % | 5.6 | % | 5.9 | % | 5.5 | % | ||||||||
| State of Tennessee | 7.3 | % | 7.0 | % | 7.4 | % | 6.6 | % | 6.4 | % | 5.8 | % | 6.3 | % | 5.7 | % | ||||||||
| U.S. | 6.5 | % | 6.8 | % | 6.3 | % | 5.7 | % | 5.4 | % | 5.6 | % | 5.5 | % | 4.9 | % | ||||||||
| Page 7 |
|
Maury, TN | 2015 | 2015 | 2014 | 2014 | ||||||||||
| Total | Total | Total | Total | |||||||||||
| 2015 | Deposits in | Market | Deposits in | Market | Deposit | |||||||||
| 2015 | 2014 | Number of | Market | Share | Market | Share | Growth | |||||||
| Rank | Rank | Institution (ST) | Branches | ($000 | ) | (% ) | ($000 | ) | (% ) | 2014-15 | ||||
| 1 | 1 | First Farmers Merchants Corp. (TN) | 8 | 612,635 | 49.14 | 558,181 | 45.33 | 9.8 | % | |||||
| 2 | 2 | Community First Inc. (TN) | 5 | 268,872 | 21.57 | 267,498 | 21.72 | 0.5 | % | |||||
| 3 | 3 | Regions Financial Corp. (AL) | 4 | 150,949 | 12.11 | 145,602 | 11.82 | 3.7 | % | |||||
| 4 | 5 | Heritage Bank & Trust (TN) | 2 | 90,810 | 7.28 | 92,210 | 7.49 | -1.5 | % | |||||
| 5 | 4 | First Horizon National Corp. (TN) | 2 | 64,037 | 5.14 | 113,224 | 9.20 | -43.4 | % | |||||
| 6 | 7 | TriStar Bancshares Inc. (TN) | 1 | 31,910 | 2.56 | 24,974 | 2.03 | 27.8 | % | |||||
| 7 | 6 | U.S. Bancorp (MN) | 2 | 27,481 | 2.20 | 29,646 | 2.41 | -7.3 | % | |||||
| 8 | NA | Simmons First National Corp. (AR) | 1 | 0 | 0.00 | NA | NA | NA | ||||||
| Total For Institutions In Market | 25 | 1,246,694 | 1,231,335 | 1.2 | % | |||||||||
| Lawrence, TN | 2015 | 2015 | 2014 | 2014 | ||||||||||
| Total | Total | Total | Total | |||||||||||
| 2015 | Deposits in | Market | Deposits in | Market | Deposit | |||||||||
| 2015 | 2014 | Number of | Market | Share | Market | Share | Growth | |||||||
| Rank | Rank | Institution (ST) | Branches | ($000 | ) | (% ) | ($000 | ) | (% ) | 2014-15 | ||||
| 1 | 1 | First Farmers Merchants Corp. (TN) | 3 | 170,521 | 28.79 | 154,005 | 26.58 | 10.7 | % | |||||
| 2 | 2 | Capital Bank Finl Corp (FL) | 2 | 80,572 | 13.60 | 80,878 | 13.96 | -0.4 | % | |||||
| 3 | 3 | SunTrust Banks Inc. (GA) | 1 | 74,675 | 12.61 | 75,162 | 12.97 | -0.6 | % | |||||
| 4 | 4 | First Horizon National Corp. (TN) | 2 | 70,261 | 11.86 | 73,367 | 12.66 | -4.2 | % | |||||
5 | 5 | First Volunteer Corp. (TN) | 2 | 63,305 | 10.69 | 62,289 | 10.75 | 1.6 | % | |||||
| 6 | 6 | FCB Corp. (TN) | 1 | 60,923 | 10.29 | 59,220 | 10.22 | 2.9 | % | |||||
| 7 | 7 | Lawrenceburg Federal Bank (TN) | 1 | 41,712 | 7.04 | 42,118 | 7.27 | -1.0 | % | |||||
| 8 | 8 | Frankewing Bancshares Inc. (TN) | 1 | 30,255 | 5.11 | 32,434 | 5.60 | -6.7 | % | |||||
| Total For Institutions In Market | 13 | 592,224 | 579,473 | 2.2 | % | |||||||||
| Page 8 |
|
Deposit Market Share, cont.
Marshall, TN | 2015 | 2015 | 2014 | 2014 | |||||||||
| Total | Total | Total | Total | ||||||||||
| 2015 | Deposits in | Market | Deposits in | Market | Deposit | ||||||||
| 2015 | 2014 | Number of | Market | Share | Market | Share | Growth | ||||||
| Rank | Rank | Institution (ST) | Branches | ($000 | ) | (% ) | ($000 | ) | (% ) | 2014-15 | |||
| 1 | 1 | First Commerce Bancorp Inc. (TN) | 3 | 223,254 | 47.13 | 214,374 | 47.44 | 4.1 | % | ||||
| 2 | 2 | First Farmers Merchants Corp. (TN) | 1 | 95,482 | 20.15 | 84,510 | 18.70 | 13.0 | % | ||||
| 3 | 3 | CBS Banc-Corp. (AL) | 2 | 47,556 | 10.04 | 48,515 | 10.74 | -2.0 | % | ||||
| 4 | 4 | First Pulaski National Corp. (TN) | 2 | 40,797 | 8.61 | 40,494 | 8.96 | 0.7 | % | ||||
| 5 | 5 | First Horizon National Corp. (TN) | 1 | 35,046 | 7.40 | 34,355 | 7.60 | 2.0 | % | ||||
| 6 | 6 | Clayton HC Inc. (TN) | 1 | 31,611 | 6.67 | 29,650 | 6.56 | 6.6 | % | ||||
| Total For Institutions In Market | 10 | 473,746 | 451,898 | 4.8 | % | ||||||||
Hickman, TN | 2015 | 2015 | 2014 | 2014 | |||||||||
| Total | Total | Total | Total | ||||||||||
| 2015 | Deposits in | Market | Deposits in | Market | Deposit | ||||||||
| 2015 | 2014 | Number of | Market | Share | Market | Share | Growth | ||||||
| Rank | Rank | Institution (ST) | Branches | ($000 | ) | (% ) | ($000 | ) | (% ) | 2014-15 | |||
| 1 | 1 | Community First Inc. (TN) | 2 | 110,175 | 52.48 | 109,120 | 52.86 | 1.0 | % | ||||
| 2 | 2 | First Farmers Merchants Corp. (TN) | 2 | 73,145 | 34.84 | 71,524 | 34.65 | 2.3 | % | ||||
| 3 | 3 | Southeastern Bancorp Inc. (TN) | 1 | 26,636 | 12.69 | 25,800 | 12.50 | 3.2 | % | ||||
| Total For Institutions In Market | 5 | 209,956 | 206,444 | 1.7 | % | ||||||||
| Page 9 |
|
Deposit Market Share, cont.
| Williamson, TN | 2015 | 2015 | 2014 | 2014 | ||||||||||
| Total | Total | Total | Total | |||||||||||
| 2015 | Deposits in | Market | Deposits in | Market | Deposit | |||||||||
| 2015 | 2014 | Number of | Market | Share | Market | Share | Growth | |||||||
| Rank | Rank | Institution (ST) | Branches | ($000 | ) | (% ) | ($000 | ) | (% ) | 2014-15 | ||||
| 1 | 1 | Franklin Financial Network Inc (TN) | 6 | 1,287,364 | 19.05 | 747,531 | 12.95 | 72.2 | % | |||||
| 2 | 2 | Regions Financial Corp. (AL) | 10 | 761,029 | 11.26 | 724,014 | 12.54 | 5.1 | % | |||||
| 3 | 3 | Bank of America Corp. (NC) | 5 | 741,101 | 10.97 | 594,949 | 10.31 | 24.6 | % | |||||
| 4 | 4 | Pinnacle Financial Partners (TN) | 4 | 622,522 | 9.21 | 557,733 | 9.66 | 11.6 | % | |||||
| 5 | 6 | First Horizon National Corp. (TN) | 10 | 560,102 | 8.29 | 503,471 | 8.72 | 11.2 | % | |||||
| 6 | 5 | Fifth Third Bancorp (OH) | 8 | 443,056 | 6.56 | 555,774 | 9.63 | -20.3 | % | |||||
| 7 | 7 | SunTrust Banks Inc. (GA) | 7 | 360,101 | 5.33 | 315,789 | 5.47 | 14.0 | % | |||||
| 8 | 8 | Commerce Union Bancshares Inc. (TN) | 3 | 322,752 | 4.78 | 314,382 | 5.45 | 2.7 | % | |||||
| 9 | 9 | U.S. Bancorp (MN) | 10 | 267,869 | 3.96 | 238,444 | 4.13 | 12.3 | % | |||||
| 10 | 10 | BancorpSouth Inc. (MS) | 2 | 176,468 | 2.61 | 171,776 | 2.98 | 2.7 | % | |||||
| 21 | 20 | First Farmers Merchants Corp. (TN) | 2 | 49,103 | 0.73 | 50,046 | 0.87 | -1.9 | % | |||||
| Total For Institutions In Market | 103 | 6,758,576 | 5,773,052 | 17.1 | % | |||||||||
| Dickson, TN | 2015 | 2015 | 2014 | 2014 | ||||||||||
| Total | Total | Total | Total | |||||||||||
| 2015 | Deposits in | Market | Deposits in | Market | Deposit | |||||||||
| 2015 | 2014 | Number of | Market | Share | Market | Share | Growth | |||||||
| Rank | Rank | Institution (ST) | Branches | ($000 | ) | (% ) | ($000 | ) | (% ) | 2014-15 | ||||
| 1 | 1 | Southeastern Bancorp Inc. (TN) | 7 | 249,552 | 30.42 | 246,139 | 31.73 | 1.4 | % | |||||
2 | 2 | Dickson Financial Corp. (TN) | 4 | 188,154 | 22.93 | 185,945 | 23.97 | 1.2 | % | |||||
| 3 | 3 | TriStar Bancshares Inc. (TN) | 4 | 152,544 | 18.59 | 141,457 | 18.24 | 7.8 | % | |||||
| 4 | 6 | Pinnacle Financial Partners (TN) | 1 | 51,218 | 6.24 | 33,938 | 4.38 | 50.9 | % | |||||
| 5 | 4 | U.S. Bancorp (MN) | 1 | 50,920 | 6.21 | 48,742 | 6.28 | 4.5 | % | |||||
| 6 | 5 | Traditions First Bank (TN) | 1 | 38,177 | 4.65 | 35,695 | 4.60 | 7.0 | % | |||||
| 7 | 7 | First South Bancorp Inc. (TN) | 1 | 32,878 | 4.01 | 33,310 | 4.29 | -1.3 | % | |||||
| 8 | 8 | Regions Financial Corp. (AL) | 1 | 32,737 | 3.99 | 28,092 | 3.62 | 16.5 | % | |||||
| 9 | 9 | First Farmers Merchants Corp. (TN) | 1 | 24,299 | 2.96 | 22,345 | 2.88 | 8.7 | % | |||||
| Total For Institutions In Market | 21 | 820,479 | 775,663 | 5.8 | % | |||||||||
| Page 10 |
|
Deposit Market Share, cont.
| Giles, TN | 2015 | 2015 | 2014 | 2014 | ||||||||||
| Total | Total | Total | Total | |||||||||||
| 2015 | Deposits in | Market | Deposits in | Market | Deposit | |||||||||
| 2015 | 2014 | Number of | Market | Share | Market | Share | Growth | |||||||
| Rank | Rank | Institution (ST) | Branches | ($000 | ) | (% ) | ($000 | ) | (% ) | 2014-15 | ||||
| 1 | 1 | First Pulaski National Corp. (TN) | 5 | 326,780 | 49.34 | 324,380 | 49.57 | 0.7 | % | |||||
| 2 | 2 | Frankewing Bancshares Inc. (TN) | 2 | 155,264 | 23.44 | 155,015 | 23.69 | 0.2 | % | |||||
| 3 | 3 | SunTrust Banks Inc. (GA) | 1 | 63,709 | 9.62 | 58,291 | 8.91 | 9.3 | % | |||||
| 4 | 4 | Commerce Bancshares Inc. (TN) | 1 | 50,603 | 7.64 | 48,598 | 7.43 | 4.1 | % | |||||
| 5 | 5 | CBS Banc-Corp. (AL) | 2 | 42,193 | 6.37 | 41,723 | 6.38 | 1.1 | % | |||||
| 6 | 6 | First Farmers Merchants Corp. (TN) | 1 | 23,805 | 3.59 | 26,405 | 4.03 | -9.8 | % | |||||
| Total For Institutions In Market | 12 | 662,354 | 654,412 | 1.2 | % | |||||||||
Davidson, TN | 2015 | 2015 | 2014 | 2014 | ||||||||||
| Total | Total | Total | Total | |||||||||||
| 2015 | Deposits in | Market | Deposits in | Market | Deposit | |||||||||
| 2015 | 2014 | Number of | Market | Share | Market | Share | Growth | |||||||
| Rank | Rank | Institution (ST) | Branches | ($000 | ) | (% ) | ($000 | ) | (% ) | 2014-15 | ||||
| 1 | 1 | Bank of America Corp. (NC) | 18 | 6,928,530 | 24.44 | 5,498,465 | 21.38 | 26.0 | % | |||||
| 2 | 3 | SunTrust Banks Inc. (GA) | 29 | 4,934,348 | 17.40 | 4,496,028 | 17.49 | 9.7 | % | |||||
| 3 | 2 | Regions Financial Corp. (AL) | 33 | 4,929,935 | 17.39 | 4,857,948 | 18.89 | 1.5 | % | |||||
| 4 | 4 | Pinnacle Financial Partners (TN) | 9 | 2,445,469 | 8.63 | 2,275,132 | 8.85 | 7.5 | % | |||||
| 5 | 5 | First Horizon National Corp. (TN) | 18 | 1,523,625 | 5.37 | 1,605,651 | 6.24 | -5.1 | % | |||||
| 6 | 6 | Wells Fargo & Co. (CA) | 8 | 1,147,366 | 4.05 | 1,200,344 | 4.67 | -4.4 | % | |||||
7 | 7 | U.S. Bancorp (MN) | 23 | 956,830 | 3.37 | 959,522 | 3.73 | -0.3 | % | |||||
| 8 | 8 | Fifth Third Bancorp (OH) | 18 | 817,974 | 2.89 | 794,072 | 3.09 | 3.0 | % | |||||
| 9 | 9 | Avenue Financial Holdings Inc. (TN) | 5 | 789,804 | 2.79 | 721,608 | 2.81 | 9.5 | % | |||||
| 10 | 10 | CapStar Bank (TN) | 2 | 760,520 | 2.68 | 671,260 | 2.61 | 13.3 | % | |||||
| 31 | NA | First Farmers Merchants Corp. (TN) | 1 | 7,898 | 0.03 | NA | NA | NA | ||||||
| Total For Institutions In Market | 207 | 28,350,723 | 25,713,459 | 10.3 | % | |||||||||
| Page11 |
|
Performance Overview
| Page12 |
|
Company Financial Summary
Balance Sheet
Changes 2013-2014 | CAGR | ||||||||||||||||||||||
| 2010 | 2011 | 2012 | 2013 | 2014 | Dollar | Percent | 2010-2014 | ||||||||||||||||
| Interest Bearing Deposits | $ | 4,238 | $ | 38,594 | $ | 31,953 | $ | 25,166 | $ | 10,087 | ($ | 15,079 | ) | -59.9 | % | 24.2 | % | ||||||
| Fed Funds Sold | 17,100 | 16,500 | 15,000 | 9,850 | 1,700 | (8,150 | ) | -82.7 | % | -43.8 | % | ||||||||||||
| Securities | 272,275 | 349,501 | 377,490 | 357,570 | 419,888 | 62,318 | 17.4 | % | 11.4 | % | |||||||||||||
| Loans & Leases | 562,283 | 520,307 | 569,615 | 606,605 | 652,406 | 45,801 | 7.6 | % | 3.8 | % | |||||||||||||
| TOTAL EARNING ASSETS | $ | 855,896 | $ | 924,902 | $ | 994,058 | $ | 999,191 | $ | 1,084,081 | $ | 84,890 | 8.5 | % | 6.1 | % | |||||||
| Allowance for Loan Losses | ($ | 9,420 | ) | ($ | 9,200 | ) | ($ | 8,809 | ) | ($ | 8,595 | ) | ($ | 7,934 | ) | $ | 661 | -7.7 | % | NA | |||
| Cash & Equivalents | 11,161 | 17,926 | 23,443 | 20,391 | 18,510 | (1,881 | ) | -9.2 | % | 13.5 | % | ||||||||||||
| Fixed Assets | 22,842 | 25,537 | 26,418 | 24,868 | 25,774 | 906 | 3.6 | % | 3.1 | % | |||||||||||||
| Other Real Estate Owned (OREO) | 7,927 | 8,827 | 5,678 | 1,438 | 5 | (1,433 | ) | -99.7 | % | -84.2 | % | ||||||||||||
| Goodwill | 9,018 | 9,018 | 9,018 | 9,018 | 9,018 | 0 | 0.0 | % | 0.0 | % | |||||||||||||
| Mortgage Servicing Rights | 0 | 0 | 0 | 0 | 0 | 0 | 0.0 | % | NA | ||||||||||||||
| Other Intangible Assets | 19 | 0 | 0 | 0 | 0 | 0 | 0.0 | % | NA | ||||||||||||||
| Other Assets | 44,266 | 40,798 | 41,682 | 46,075 | 41,542 | (4,533 | ) | -9.8 | % | -1.6 | % | ||||||||||||
| TOTAL ASSETS | $ | 941,709 | $ | 1,017,808 | $ | 1,091,488 | $ | 1,092,386 | $ | 1,170,996 | $ | 78,610 | 7.2 | % | 5.6 | % | |||||||
| Demand Deposits | $ | 78,133 | $ | 85,789 | $ | 106,488 | $ | 110,019 | $ | 125,336 | $ | 15,317 | 13.9 | % | 12.5 | % | |||||||
| NOW & Interest Bearing Deposits | 101,492 | 96,615 | 99,230 | 55,035 | 102,272 | 47,237 | 85.8 | % | 0.2 | % | |||||||||||||
| Money Market & Other Savings | 365,690 | 432,375 | 478,933 | 553,450 | 566,028 | 12,578 | 2.3 | % | 11.5 | % | |||||||||||||
| Certificate of Deposits < $100M | 140,566 | 133,149 | 128,040 | 116,056 | 105,072 | (10,984 | ) | -9.5 | % | -7.0 | % | ||||||||||||
| Certificate of Deposits > $100M | 105,947 | 108,507 | 120,161 | 122,777 | 121,246 | (1,531 | ) | -1.2 | % | 3.4 | % | ||||||||||||
| TOTAL DEPOSITS | $ | 791,828 | $ | 856,435 | $ | 932,852 | $ | 957,337 | $ | 1,019,954 | $ | 62,617 | 6.5 | % | 6.5 | % | |||||||
| Fed Funds & Repos | $ | 5,813 | $ | 16,347 | $ | 17,069 | $ | 18,095 | $ | 22,834 | $ | 4,739 | 26.2 | % | 40.8 | % | |||||||
| Short Term Borrowings | 7,372 | 7,000 | 10,100 | 0 | 0 | 0 | 0.0 | % | NA | ||||||||||||||
| Long Term Borrowings | 17,100 | 10,100 | 0 | 0 | 0 | 0 | 0.0 | % | NA | ||||||||||||||
| Other Liabilities | 13,374 | 15,777 | 18,672 | 12,750 | 13,623 | 873 | 6.8 | % | 0.5 | % | |||||||||||||
| TOTAL LIABILITIES | $ | 835,487 | $ | 905,659 | $ | 978,693 | $ | 988,182 | $ | 1,056,411 | $ | 68,229 | 6.9% | 6.0 | % | ||||||||
| Trust Preferred | 0 | 0 | 0 | 0 | 0 | $ | 0 | 0.0 | % | NA | |||||||||||||
| Minority Interest | 95 | 95 | 95 | 95 | 95 | 0 | 0.0 | % | 0.0 | % | |||||||||||||
| Preferred Stock | 0 | 0 | 0 | 0 | 0 | 0 | 0.0 | % | NA | ||||||||||||||
| Other Comprehensive Income | ($ | 809 | ) | $ | 3,208 | $ | 1,738 | ($ | 9,001 | ) | ($ | 2,125 | ) | $ | 6,876 | -76.4 | % | NA | |||||
| Common Equity | 106,936 | 108,846 | 110,962 | 113,110 | 116,615 | 3,505 | 3.1 | % | 2.2 | % | |||||||||||||
| TOTAL COMMON EQUITY | $ | 106,127 | $ | 112,054 | $ | 112,700 | $ | 104,109 | $ | 114,490 | $ | 10,381 | 10.0 | % | 1.9 | % | |||||||
| TOTAL EQUITY | $ | 106,222 | $ | 112,149 | $ | 112,795 | $ | 104,204 | $ | 114,585 | $ | 10,381 | 10.0 | % | 1.9 | % | |||||||
| TOTAL LIABS & EQUITY | $ | 941,709 | $ | 1,017,808 | $ | 1,091,488 | $ | 1,092,386 | $ | 1,170,996 | $ | 78,610 | 7.2 | % | 5.6 | % | |||||||
| Page13 |
|
Company Financial Summary
Common Sized Balance Sheet
| 2010 | 2011 | 2012 | 2013 | 2014 | Average | ||||||||
| Interest Bearing Deposits | 0.5 | % | 3.8 | % | 2.9 | % | 2.3 | % | 0.9 | % | 2.1 | % | |
| Fed Funds Sold | 1.8 | % | 1.6 | % | 1.4 | % | 0.9 | % | 0.1 | % | 1.2 | % | |
| Securities | 28.9 | % | 34.3 | % | 34.6 | % | 32.7 | % | 35.9 | % | 33.3 | % | |
| Loans & Leases | 59.7 | % | 51.1 | % | 52.2 | % | 55.5 | % | 55.7 | % | 54.9 | % | |
| TOTAL EARNINGASSETS | 90.9 | % | 90.9 | % | 91.1 | % | 91.5 | % | 92.6 | % | 91.4 | % | |
| Allowance for Loan Losses | -1.0 | % | -0.9 | % | -0.8 | % | -0.8 | % | -0.7 | % | -0.8 | % | |
| Cash & Equivalents | 1.2 | % | 1.8 | % | 2.1 | % | 1.9 | % | 1.6 | % | 1.7 | % | |
| Fixed Assets | 2.4 | % | 2.5 | % | 2.4 | % | 2.3 | % | 2.2 | % | 2.4 | % | |
| Other Real Estate Owned (OREO) | 0.8 | % | 0.9 | % | 0.5 | % | 0.1 | % | 0.0 | % | 0.5 | % | |
| Goodwill | 1.0 | % | 0.9 | % | 0.8 | % | 0.8 | % | 0.8 | % | 0.9 | % | |
| Mortgage Servicing Rights | 0.0 | % | 0.0 | % | 0.0 | % | 0.0 | % | 0.0 | % | 0.0 | % | |
| Other Intangible Assets | 0.0 | % | 0.0 | % | 0.0 | % | 0.0 | % | 0.0 | % | 0.0 | % | |
| Other Assets | 4.7 | % | 4.0 | % | 3.8 | % | 4.2 | % | 3.5 | % | 4.1 | % | |
| TOTAL ASSETS | 100.0 | % | 100.0 | % | 100.0 | % | 100.0 | % | 100.0 | % | 100.0 | % | |
| Demand Deposits | 8.3 | % | 8.4 | % | 9.8 | % | 10.1 | % | 10.7 | % | 9.5 | % | |
| NOW & Interest Bearing Deposits | 10.8 | % | 9.5 | % | 9.1 | % | 5.0 | % | 8.7 | % | 8.6 | % | |
| Money Market & Other Sav. Accts | 38.8 | % | 42.5 | % | 43.9 | % | 50.7 | % | 48.3 | % | 44.8 | % | |
| Certificate of Deposits < $100M | 14.9 | % | 13.1 | % | 11.7 | % | 10.6 | % | 9.0 | % | 11.9 | % | |
| Certificate of Deposits > $100M | 11.3 | % | 10.7 | % | 11.0 | % | 11.2 | % | 10.4 | % | 10.9 | % | |
| TOTAL DEPOSITS | 84.1 | % | 84.1 | % | 85.5 | % | 87.6 | % | 87.1 | % | 85.7 | % | |
| Fed Funds & Repos | 0.6 | % | 1.6 | % | 1.6 | % | 1.7 | % | 1.9 | % | 1.5 | % | |
| Short Term Borrowings | 0.8 | % | 0.7 | % | 0.9 | % | 0.0 | % | 0.0 | % | 0.5 | % | |
| Long Term Borrowings | 1.8 | % | 1.0 | % | 0.0 | % | 0.0 | % | 0.0 | % | 0.6 | % | |
| Other Liabilities | 1.4 | % | 1.6 | % | 1.7 | % | 1.2 | % | 1.2 | % | 1.4 | % | |
| TOTAL LIABILITIES | 88.7 | % | 89.0 | % | 89.7 | % | 90.5 | % | 90.2 | % | 89.6 | % | |
| Trust Preferred | 0.0 | % | 0.0 | % | 0.0 | % | 0.0 | % | 0.0 | % | 0.0 | % | |
| Minority Interest | 0.0 | % | 0.0 | % | 0.0 | % | 0.0 | % | 0.0 | % | 0.0 | % | |
| Preferred Stock | 0.0 | % | 0.0 | % | 0.0 | % | 0.0 | % | 0.0 | % | 0.0 | % | |
| Other Comprehensive Income | -0.1 | % | 0.3 | % | 0.2 | % | -0.8 | % | -0.2 | % | -0.1 | % | |
| Common Equity | 11.4 | % | 10.7 | % | 10.2 | % | 10.4 | % | 10.0 | % | 10.5 | % | |
| TOTAL COMMON EQUITY | 11.3 | % | 11.0 | % | 10.3 | % | 9.5 | % | 9.8 | % | 10.4 | % | |
| TOTAL EQUITY | 11.3 | % | 11.0 | % | 10.3 | % | 9.5 | % | 9.8 | % | 10.4 | % | |
| TOTAL LIABS & EQUITY | 100.0 | % | 100.0 | % | 100.0 | % | 100.0 | % | 100.0 | % | 100.0 | % | |
| Page14 |
|
Company Financial Summary – Interim
Balance Sheet
| CAGR | Regulatory Reports | Difference | ||||||||||||
2010 - 2014 | 2014 | 9/30/15 | Dollar | Percent | ||||||||||
| Interest Bearing Deposits | 24.2 | % | $ | 10,087 | $ | 8,956 | ($ | 1,131 | ) | -11.2 | % | |||
| Fed Funds Sold | -43.8 | % | 1,700 | 0 | (1,700 | ) | -100.0 | % | ||||||
| Securities | 11.4 | % | 419,888 | 406,593 | (13,295 | ) | -3.2 | % | ||||||
| Loans & Leases | 3.8 | % | 652,406 | 728,416 | 76,010 | 11.7 | % | |||||||
| TOTAL EARNING ASSETS | 6.1 | % | $ | 1,084,081 | $ | 1,143,965 | $ | 59,884 | 5.5 | % | ||||
| Allowance for Loan Losses | NA | ($ | 7,934 | ) | ($ | 8,585 | ) | ($ | 651 | ) | 8.2 | % | ||
| Cash & Equivalents | 13.5 | % | 18,510 | 20,302 | 1,792 | 9.7 | % | |||||||
| Fixed Assets | 3.1 | % | 25,774 | 25,741 | (33 | ) | -0.1 | % | ||||||
| Other Real Estate Owned (OREO) | -84.2 | % | 5 | 90 | 85 | 1700.0 | % | |||||||
| Goodwill | 0.0 | % | 9,018 | 9,018 | 0 | 0.0 | % | |||||||
| Mortgage Servicing Rights | NA | 0 | 0 | 0 | NA | |||||||||
| Other Intangible Assets | NA | 0 | 0 | 0 | NA | |||||||||
| Other Assets | -1.6 | % | 41,542 | 40,365 | (1,177 | ) | -2.8 | % | ||||||
| TOTAL ASSETS | 5.6 | % | $ | 1,170,996 | $ | 1,230,896 | $ | 59,900 | 5.1 | % | ||||
| Demand Deposits | 12.5 | % | $ | 125,336 | $ | 132,368 | $ | 7,032 | 5.6 | % | ||||
| NOW & Interest Bearing Deposits | 0.2 | % | 102,272 | 83,182 | (19,090 | ) | -18.7 | % | ||||||
| Money Market & Other Savings | 11.5 | % | 566,028 | 626,980 | 60,952 | 10.8 | % | |||||||
| Certificate of Deposits < $100M | -7.0 | % | 105,072 | 102,483 | (2,589 | ) | -2.5 | % | ||||||
| Certificate of Deposits > $100M | 3.4 | % | 121,246 | 116,188 | (5,058 | ) | -4.2 | % | ||||||
| TOTAL DEPOSITS | 6.5 | % | $ | 1,019,954 | $ | 1,061,201 | $ | 41,247 | 4.0 | % | ||||
| Fed Funds & Repos | 40.8 | % | $ | 22,834 | $ | 36,451 | $ | 13,617 | 59.6 | % | ||||
| Short Term Borrowings | NA | 0 | 0 | 0 | NA | |||||||||
| Long Term Borrowings | NA | 0 | 0 | 0 | NA | |||||||||
| Other Liabilities | 0.5 | % | 13,623 | 13,282 | (341 | ) | -2.5 | % | ||||||
| TOTAL LIABILITIES | 6.0 | % | $ | 1,056,411 | $ | 1,110,934 | $ | 54,523 | 5.2 | % | ||||
| Trust Preferred | NA | 0 | 0 | 0 | NA | |||||||||
| Minority Interest | 0.0 | % | 95 | 95 | 0 | 0.0 | % | |||||||
| Preferred Stock | NA | 0 | 0 | 0 | NA | |||||||||
| Other Comprehensive Income | NA | ($ | 2,125 | ) | $ | 239 | $ | 2,364 | -111.2 | % | ||||
| Common Equity | 2.2 | % | 116,615 | 119,628 | 3,013 | 2.6 | % | |||||||
| TOTAL COMMON EQUITY | 1.9 | % | $ | 114,490 | $ | 119,867 | $ | 5,377 | 4.7 | % | ||||
| TOTAL EQUITY | 1.9 | % | $ | 114,585 | $ | 119,962 | $ | 5,377 | 4.7 | % | ||||
| TOTAL LIABS & EQUITY | 5.6 | % | $ | 1,170,996 | $ | 1,230,896 | $ | 59,900 | 5.1 | % | ||||
| Page15 |
|
Company Financial Summary – Interim
Common Sized Balance Sheet
| Average | Regulatory Reports | |||||||
| 2010 - 2014 | 2014 | 9/30/15 | ||||||
| Interest Bearing Deposits | 2.1 | % | 0.9 | % | 0.7 | % | ||
| Fed Funds Sold | 1.2 | % | 0.1 | % | 0.0 | % | ||
| Securities | 33.3 | % | 35.9 | % | 33.0 | % | ||
| Loans & Leases | 54.9 | % | 55.7 | % | 59.2 | % | ||
| TOTAL EARNING ASSETS | 91.4 | % | 92.6 | % | 92.9 | % | ||
| Allowance for Loan Losses | -0.8 | % | -0.7 | % | -0.7 | % | ||
| Cash & Equivalents | 1.7 | % | 1.6 | % | 1.6 | % | ||
| Fixed Assets | 2.4 | % | 2.2 | % | 2.1 | % | ||
| Other Real Estate Owned (OREO) | 0.5 | % | 0.0 | % | 0.0 | % | ||
| Goodwill | 0.9 | % | 0.8 | % | 0.7 | % | ||
| Mortgage Servicing Rights | 0.0 | % | 0.0 | % | 0.0 | % | ||
| Other Intangible Assets | 0.0 | % | 0.0 | % | 0.0 | % | ||
| Other Assets | 4.1 | % | 3.5 | % | 3.3 | % | ||
| TOTAL ASSETS | 100.0 | % | 100.0 | % | 100.0 | % | ||
| Demand Deposits | 9.5 | % | 10.7 | % | 10.8 | % | ||
| NOW & Interest Bearing Deposits | 8.6 | % | 8.7 | % | 6.8 | % | ||
| Money Market & Other Sav. Accts | 44.8 | % | 48.3 | % | 50.9 | % | ||
| Certificate of Deposits < $100M | 11.9 | % | 9.0 | % | 8.3 | % | ||
| Certificate of Deposits > $100M | 10.9 | % | 10.4 | % | 9.4 | % | ||
| TOTAL DEPOSITS | 85.7 | % | 87.1 | % | 86.2 | % | ||
| Fed Funds & Repos | 1.5 | % | 1.9 | % | 3.0 | % | ||
| Short Term Borrowings | 0.5 | % | 0.0 | % | 0.0 | % | ||
| Long Term Borrowings | 0.6 | % | 0.0 | % | 0.0 | % | ||
| Other Liabilities | 1.4 | % | 1.2 | % | 1.1 | % | ||
| TOTAL LIABILITIES | 89.6 | % | 90.2 | % | 90.3 | % | ||
| Trust Preferred | 0.0 | % | 0.0 | % | 0.0 | % | ||
| Minority Interest | 0.0 | % | 0.0 | % | 0.0 | % | ||
| Preferred Stock | 0.0 | % | 0.0 | % | 0.0 | % | ||
| Other Comprehensive Income | -0.1 | % | -0.2 | % | 0.0 | % | ||
| Common Equity | 10.5 | % | 10.0 | % | 9.7 | % | ||
| TOTAL COMMON EQUITY | 10.4 | % | 9.8 | % | 9.7 | % | ||
| TOTAL EQUITY | 10.4 | % | 9.8 | % | 9.7 | % | ||
| TOTAL LIABS & EQUITY | 100.0 | % | 100.0 | % | 100.0 | % | ||
| Page16 |
|
Company Financial Summary
Income Statement
| Changes 2013-2014 | CAGR | ||||||||||||||||||||
| 2010 | 2011 | 2012 | 2013 | 2014 | Dollar | Percent | 2010-2014 | ||||||||||||||
| Interest Income - Tax Equivalent | $ | 42,303 | $ | 40,631 | $ | 38,738 | $ | 39,403 | $ | 38,624 | ($ | 779 | ) | -2.0 | % | -2.2 | % | ||||
| Interest Expense | 7,001 | 4,942 | 3,841 | 2,907 | 2,405 | (502 | ) | -17.3 | % | -23.4 | % | ||||||||||
| NET INTEREST INCOME | $ | 35,302 | $ | 35,689 | $ | 34,897 | $ | 36,496 | $ | 36,219 | ($ | 277 | ) | -0.8 | % | 0.6 | % | ||||
| Provision for Loan Losses | $ | 1,896 | $ | 3,125 | $ | 1,120 | $ | 0 | $ | 0 | $ | 0 | 0.0 | % | NA | ||||||
| Service Charges | $ | 5,358 | $ | 3,678 | $ | 3,366 | $ | 3,096 | $ | 3,006 | ($ | 90 | ) | -2.9 | % | -13.5 | % | ||||
| Fiduciary Fees | 1,965 | 1,999 | 2,119 | 2,298 | 2,490 | 192 | 8.4 | % | 6.1 | % | |||||||||||
| Insurance Commissions and Fees | 187 | 171 | 162 | 84 | 97 | 13 | 15.5 | % | -15.1 | % | |||||||||||
| Net Gain on Sale of OREO/Other Assets | (2,439 | ) | (994 | ) | (1,414 | ) | (323 | ) | 516 | 839 | -259.8 | % | NA | ||||||||
| Net Servicing Fees | 0 | 0 | 0 | 0 | 0 | 0 | 0.0 | % | NA | ||||||||||||
| Net Gain on Sale of Loans/Leases | 521 | 469 | 510 | 467 | 324 | (143 | ) | -30.6 | % | -11.2 | % | ||||||||||
| Other Fee Income | 0 | 36 | 231 | 361 | 410 | 49 | 13.6 | % | NA | ||||||||||||
| Other Non-Interest Income | 1,860 | 3,659 | 3,824 | 3,749 | 3,694 | (55 | ) | -1.5 | % | 18.7 | % | ||||||||||
| NON-INTEREST INCOME | $ | 7,452 | $ | 9,018 | $ | 8,798 | $ | 9,732 | $ | 10,537 | $ | 805 | 8.3 | % | 9.0 | % | |||||
| Securities Gains (Losses) | $ | 1,614 | $ | 1,458 | $ | 2,294 | $ | 829 | $ | 651 | ($ | 178 | ) | -21.5 | % | -20.3 | % | ||||
| Salaries & Benefits | $ | 15,888 | $ | 18,836 | $ | 16,485 | $ | 18,331 | $ | 17,557 | ($ | 774 | ) | -4.2 | % | 2.5 | % | ||||
| Fixed Assets | 3,684 | 3,711 | 3,861 | 3,977 | 3,924 | (53 | ) | -1.3 | % | 1.6 | % | ||||||||||
| Other Expense | 12,683 | 10,569 | 10,247 | 10,935 | 10,805 | (130 | ) | -1.2 | % | -3.9 | % | ||||||||||
| NON-INTEREST EXPENSE | $ | 32,255 | $ | 33,116 | $ | 30,593 | $ | 33,243 | $ | 32,286 | ($ | 957 | ) | -2.9 | % | 0.0 | % | ||||
| PRE-TAX INCOME | $ | 10,217 | $ | 9,924 | $ | 14,276 | $ | 13,814 | $ | 15,121 | $ | 1,307 | 9.5 | % | 10.3 | % | |||||
| Income Taxes | $ | 1,003 | $ | 744 | $ | 3,040 | $ | 2,700 | $ | 3,556 | $ | 856 | 31.7 | % | 37.2 | % | |||||
| Tax-Exempt Adjustment | 1,992 | 2,168 | 1,816 | 1,487 | 1,307 | (180 | ) | -12.1 | % | -10.0 | % | ||||||||||
| INCOME BEFORE EXTRAS | $ | 7,222 | $ | 7,012 | $ | 9,420 | $ | 9,627 | $ | 10,258 | $ | 451 | 6.6 | % | 9.2 | % | |||||
| Net Income:Noncontrolling Interests | 16 | 16 | 16 | 16 | 16 | 0 | 0.0 | % | 0.0 | % | |||||||||||
| Extraordinary Items | 0 | 0 | 0 | 0 | 0 | 0 | 0.0 | % | NA | ||||||||||||
| NET INCOME | $ | 7,206 | $ | 6,996 | $ | 9,404 | $ | 9,611 | $ | 10,242 | $ | 451 | 6.6 | % | 9.2 | % | |||||
| Preferred Dividends | $ | 0 | $ | 0 | $ | 0 | $ | 0 | $ | 0 | |||||||||||
| Common Dividends | $ | 4,039 | $ | 3,964 | $ | 3,888 | $ | 3,741 | $ | 3,640 | |||||||||||
| Page17 |
|
Company Financial Summary
Common Sized Income Statement
| 2010 | 2011 | 2012 | 2013 | 2014 | Average | |||||||||||||
| Interest Income - Tax Equivalent | 4.46 | % | 4.13 | % | 3.71 | % | 3.62 | % | 3.46 | % | 3.87 | % | ||||||
| Interest Expense | 0.74 | % | 0.50 | % | 0.37 | % | 0.27 | % | 0.22 | % | 0.42 | % | ||||||
| NET INTEREST INCOME | 3.72 | % | 3.63 | % | 3.34 | % | 3.35 | % | 3.24 | % | 3.46 | % | ||||||
| Provision for Loan Losses | 0.20 | % | 0.32 | % | 0.11 | % | 0.00 | % | 0.00 | % | 0.12 | % | ||||||
| Service Charges | 0.56 | % | 0.37 | % | 0.32 | % | 0.28 | % | 0.27 | % | 0.36 | % | ||||||
| Fiduciary Fees | 0.21 | % | 0.20 | % | 0.20 | % | 0.21 | % | 0.22 | % | 0.21 | % | ||||||
| Insurance Commissions and Fees | 0.02 | % | 0.02 | % | 0.02 | % | 0.01 | % | 0.01 | % | 0.01 | % | ||||||
| Net Gain on Sale of OREO/Other Assets | -0.26 | % | -0.10 | % | -0.14 | % | -0.03 | % | 0.05 | % | -0.10 | % | ||||||
| Net Servicing Fees | 0.00 | % | 0.00 | % | 0.00 | % | 0.00 | % | 0.00 | % | 0.00 | % | ||||||
| Net Gain on Sale of Loans/Leases | 0.05 | % | 0.05 | % | 0.05 | % | 0.04 | % | 0.03 | % | 0.04 | % | ||||||
| Other Fee Income | 0.00 | % | 0.00 | % | 0.02 | % | 0.03 | % | 0.04 | % | 0.02 | % | ||||||
| Other Non-Interest Income | 0.20 | % | 0.37 | % | 0.37 | % | 0.34 | % | 0.33 | % | 0.32 | % | ||||||
| NON-INTEREST INCOME | 0.79 | % | 0.92 | % | 0.84 | % | 0.89 | % | 0.94 | % | 0.88 | % | ||||||
| Security Gains (Losses) | 0.17 | % | 0.15 | % | 0.22 | % | 0.08 | % | 0.06 | % | 0.13 | % | ||||||
| Salaries & Benefits | 1.67 | % | 1.91 | % | 1.58 | % | 1.68 | % | 1.57 | % | 1.68 | % | ||||||
| Fixed Assets | 0.39 | % | 0.38 | % | 0.37 | % | 0.37 | % | 0.35 | % | 0.37 | % | ||||||
| Other Expense | 1.34 | % | 1.07 | % | 0.98 | % | 1.00 | % | 0.97 | % | 1.07 | % | ||||||
| NON-INTEREST EXPENSE | 3.40 | % | 3.37 | % | 2.93 | % | 3.05 | % | 2.89 | % | 3.13 | % | ||||||
| PRE-TAX INCOME | 1.08 | % | 1.01 | % | 1.37 | % | 1.27 | % | 1.35 | % | 1.21 | % | ||||||
| Income Taxes | 0.11 | % | 0.08 | % | 0.29 | % | 0.25 | % | 0.32 | % | 0.21 | % | ||||||
| Tax-Exempt Adjustment | 0.21 | % | 0.22 | % | 0.17 | % | 0.14 | % | 0.12 | % | 0.17 | % | ||||||
| INCOME BEFORE EXTRAS | 0.76 | % | 0.71 | % | 0.90 | % | 0.88 | % | 0.92 | % | 0.84 | % | ||||||
| Net Income:Noncontrolling Interests | 0.00 | % | 0.00 | % | 0.00 | % | 0.00 | % | 0.00 | % | 0.00 | % | ||||||
| Extraordinary Items | 0.00 | % | 0.00 | % | 0.00 | % | 0.00 | % | 0.00 | % | 0.00 | % | ||||||
| NET INCOME | 0.76 | % | 0.71 | % | 0.90 | % | 0.88 | % | 0.92 | % | 0.83 | % | ||||||
| Average Total Assets | $ | 948,881 | $ | 983,764 | $ | 1,044,583 | $ | 1,088,411 | $ | 1,117,829 | ||||||||
| Page18 |
|
Company Financial Summary– Interim
Income Statement
Regulatory Reports | |||||||||||
| CAGR | YTD | Last | |||||||||
2010 - 2014 | 2014 | 9/30/15 | Annual'ed | 12 months | |||||||
| Interest Income - Tax Equivalent | -2.2 | % | $ | 38,624 | $ | 30,385 | $ | 40,625 | $ | 40,110 | |
| Interest Expense | -23.4 | % | 2,405 | 1,678 | 2,243 | 2,235 | |||||
| NET INTEREST INCOME | 0.6 | % | $ | 36,219 | $ | 28,707 | $ | 38,381 | $ | 37,875 | |
| Provision for Loan Losses | NA | $ | 0 | $ | 0 | $ | 0 | $ | 0 | ||
| Service Charges | -13.5 | % | $ | 3,006 | $ | 2,428 | $ | 3,246 | $ | 3,161 | |
| Fiduciary Fees | 6.1 | % | 2,490 | 1,911 | 2,555 | 2,515 | |||||
| Insurance Commissions and Fees | -15.1 | % | 97 | 40 | 53 | 61 | |||||
| Net Gain on Sale of OREO/Other Assets | NA | 516 | 17 | 23 | 62 | ||||||
| Net Servicing Fees | NA | 0 | 0 | 0 | 0 | ||||||
| Net Gain on Sale of Loans/Leases | -11.2 | % | 324 | 190 | 254 | 315 | |||||
| Other Fee Income | NA | 410 | 442 | 591 | 527 | ||||||
| Other Non-Interest Income | 18.7 | % | 3,694 | 2,851 | 3,812 | 3,797 | |||||
| NON-INTEREST INCOME | 9.0 | % | $ | 10,537 | $ | 7,879 | $ | 10,534 | $ | 10,438 | |
| Securities Gains (Losses) | -20.3 | % | $ | 651 | $ | 405 | $ | 541 | $ | 516 | |
| Salaries & Benefits | 2.5 | % | $ | 17,557 | $ | 13,700 | $ | 18,317 | $ | 17,932 | |
| Fixed Assets | 1.6 | % | 3,924 | 3,098 | 4,142 | 4,169 | |||||
| Other Expense | -3.9 | % | 10,805 | 8,308 | 11,108 | 11,056 | |||||
| NON-INTEREST EXPENSE | 0.0 | % | $ | 32,286 | $ | 25,106 | $ | 33,567 | $ | 33,157 | |
| PRE-TAX INCOME | 10.3 | % | $ | 15,121 | $ | 11,885 | $ | 15,890 | $ | 15,672 | |
| Income Taxes | 37.2 | % | $ | 3,556 | $ | 2,577 | $ | 3,445 | $ | 3,448 | |
| Tax-Exempt Adjustment | -10.0 | % | 1,307 | 1,262 | 1,687 | 1,568 | |||||
| INCOME BEFORE EXTRAS | 9.2 | % | $ | 10,258 | $ | 8,046 | $ | 10,757 | $ | 10,656 | |
| Net Income:Noncontrolling Interests | 0.0 | % | 16 | 8 | 11 | 16 | |||||
| NET INCOME | 9.2 | % | $ | 10,242 | $ | 8,038 | $ | 10,747 | $ | 10,640 | |
| Preferred Dividends | $ | 0 | $ | 0 | $ | 0 | $ | 0 | |||
| Common Dividends | $ | 3,640 | $ | 1,781 | $ | 2,381 | $ | 3,594 | |||
| Page19 |
|
Company Financial Summary– Interim
Common Sized Income Statement
| Regulatory Reports | ||||||||||||
| Average | Last | |||||||||||
| 2010 - 2014 | 2014 | Annual'ed | 12 months | |||||||||
| Interest Income | 3.87 | % | 3.46 | % | 3.37 | % | 3.39 | % | ||||
| Interest Expense | 0.42 | % | 0.22 | % | 0.19 | % | 0.19 | % | ||||
| NET INTEREST INCOME | 3.46 | % | 3.24 | % | 3.18 | % | 3.20 | % | ||||
| Provision for Loan Losses | 0.12 | % | 0.00 | % | 0.00 | % | 0.00 | % | ||||
| Service Charges | 0.36 | % | 0.27 | % | 0.27 | % | 0.27 | % | ||||
| Fiduciary Fees | 0.21 | % | 0.22 | % | 0.21 | % | 0.21 | % | ||||
| Insurance Commissions and Fees | 0.01 | % | 0.01 | % | 0.00 | % | 0.01 | % | ||||
| Net Gain on Sale of OREO/Other Assets | -0.10 | % | 0.05 | % | 0.00 | % | 0.01 | % | ||||
| Net Servicing Fees | 0.00 | % | 0.00 | % | 0.00 | % | 0.00 | % | ||||
| Net Gain on Sale of Loans/Leases | 0.04 | % | 0.03 | % | 0.02 | % | 0.03 | % | ||||
| Other Fee Income | 0.02 | % | 0.04 | % | 0.05 | % | 0.04 | % | ||||
| Other Non-Interest Income | 0.32 | % | 0.33 | % | 0.32 | % | 0.32 | % | ||||
| NON-INTEREST INCOME | 0.88 | % | 0.94 | % | 0.87 | % | 0.88 | % | ||||
| Security Gains (Losses) | 0.13 | % | 0.06 | % | 0.04 | % | 0.04 | % | ||||
| Salaries & Benefits | 1.68 | % | 1.57 | % | 1.52 | % | 1.51 | % | ||||
| Fixed Assets | 0.37 | % | 0.35 | % | 0.34 | % | 0.35 | % | ||||
| Other Expense | 1.07 | % | 0.97 | % | 0.92 | % | 0.93 | % | ||||
| NON-INTEREST EXPENSE | 3.13 | % | 2.89 | % | 2.79 | % | 2.80 | % | ||||
| PRE-TAX INCOME | 1.21 | % | 1.35 | % | 1.32 | % | 1.32 | % | ||||
| Income Taxes | 0.21 | % | 0.32 | % | 0.29 | % | 0.29 | % | ||||
| Tax-Exempt Adjustment | 0.17 | % | 0.12 | % | 0.14 | % | 0.13 | % | ||||
| INCOME BEFORE EXTRAS | 0.84 | % | 0.92 | % | 0.89 | % | 0.90 | % | ||||
| Net Income:Noncontrolling Interests | 0.00 | % | 0.00 | % | 0.00 | % | 0.00 | % | ||||
| NET INCOME | 0.83 | % | 0.92 | % | 0.89 | % | 0.90 | % | ||||
| Average Total Assets | $ | 1,117,829 | $ | 1,205,100 | $ | 1,184,285 | ||||||
| Page 20 |
|
Company Financial Summary
Loan Portfolio
| Changes 2013-2014 | CAGR | ||||||||||||||||||||||
| 2010 | 2011 | 2012 | 2013 | 2014 | Dollar | Percent | 2010-14 | ||||||||||||||||
| Construction & Development | $ | 37,374 | $ | 33,270 | $ | 41,848 | $ | 35,066 | $ | 58,210 | $ | 23,144 | 66.0 | % | 11.7 | % | |||||||
| Commercial Real Estate | 156,393 | 143,966 | 171,867 | 185,901 | 172,599 | (13,302 | ) | -7.2 | % | 2.5 | % | ||||||||||||
| Commercial & Industrial | 56,364 | 57,762 | 82,857 | 93,658 | 98,964 | 5,306 | 5.7 | % | 15.1 | % | |||||||||||||
| Farmland | 31,129 | 27,940 | 27,401 | 29,637 | 31,688 | 2,051 | 6.9 | % | 0.4 | % | |||||||||||||
| Agricultural | 385 | 365 | 332 | 348 | 1,490 | 1,142 | 328.2 | % | 40.3 | % | |||||||||||||
| Residential Real Estate | 224,839 | 209,798 | 204,715 | 218,879 | 233,116 | 14,237 | 6.5 | % | 0.9 | % | |||||||||||||
| Consumer | 17,300 | 15,445 | 15,648 | 16,240 | 15,749 | (491 | ) | -3.0 | % | -2.3 | % | ||||||||||||
| Other Balances | 38,499 | 31,761 | 24,947 | 26,876 | 40,590 | 13,714 | 51.0 | % | 1.3 | % | |||||||||||||
TOTAL LOANS | $ | 562,283 | $ | 520,307 | $ | 569,615 | $ | 606,605 | $ | 652,406 | $ | 45,801 | 7.6 | % | 3.8 | % | |||||||
(% of Total Loans) | |||||||||||||||||||||||
| 2010 | 2011 | 2012 | 2013 | 2014 | Average | ||||||||||||||||||
| Construction & Development | 6.6 | % | 6.4 | % | 7.3 | % | 5.8 | % | 8.9 | % | 7.0 | % | |||||||||||
| Commercial Real Estate | 27.8 | % | 27.7 | % | 30.2 | % | 30.6 | % | 26.5 | % | 28.6 | % | |||||||||||
| Commercial & Industrial | 10.0 | % | 11.1 | % | 14.5 | % | 15.4 | % | 15.2 | % | 13.3 | % | |||||||||||
| Farmland | 5.5 | % | 5.4 | % | 4.8 | % | 4.9 | % | 4.9 | % | 5.1 | % | |||||||||||
| Agricultural | 0.1 | % | 0.1 | % | 0.1 | % | 0.1 | % | 0.2 | % | 0.1 | % | |||||||||||
| Residential Real Estate | 40.0 | % | 40.3 | % | 35.9 | % | 36.1 | % | 35.7 | % | 37.6 | % | |||||||||||
| Consumer | 3.1 | % | 3.0 | % | 2.7 | % | 2.7 | % | 2.4 | % | 2.8 | % | |||||||||||
| Other Balances | 6.8 | % | 6.1 | % | 4.4 | % | 4.4 | % | 6.2 | % | 5.6 | % | |||||||||||
TOTAL LOANS | 100.0 | % | 100.0 | % | 100.0 | % | 100.0 | % | 100.0 | % | 100.0 | % | |||||||||||
| Concentrations in Commercial RE Lending | |||||||||||||||||||||||
| 2010 | 2011 | 2012 | 2013 | 2014 | |||||||||||||||||||
| Total Construction & Development | $ | 37,374 | $ | 33,270 | $ | 41,848 | $ | 35,066 | $ | 58,210 | |||||||||||||
| Total Risk-Based Capital | $ | 106,147 | $ | 107,852 | $ | 110,719 | $ | 111,807 | $ | 115,532 | |||||||||||||
| % of Total Risk-Based Capital | 35.2 | % | 30.8 | % | 37.8 | % | 31.4 | % | 50.4 | % | |||||||||||||
| Const. & Develop and Comm Real Estate | $ | 111,114 | $ | 94,626 | $ | 132,872 | $ | 146,351 | $ | 161,631 | |||||||||||||
| % of Total Risk-Based Capital | 104.7 | % | 87.7 | % | 120.0 | % | 130.9 | % | 139.9 | % | |||||||||||||
| Page 21 |
|
Company Financial Summary – Interim
Loan Portfolio
| CAGR | Regulatory Reports | |||||||||
| 2010 - 2014 | 2014 | 9/30/15 | ||||||||
| Construction & Development | 11.7 | % | $ | 58,210 | $ | 63,421 | ||||
| Commercial Real Estate | 2.5 | % | 172,599 | 168,937 | ||||||
| Commercial & Industrial | 15.1 | % | 98,964 | 130,332 | ||||||
| Farmland | 0.4 | % | 31,688 | 31,109 | ||||||
| Agricultural | 40.3 | % | 1,490 | 1,011 | ||||||
| Residential Real Estate | 0.9 | % | 233,116 | 259,931 | ||||||
| Consumer | -2.3 | % | 15,749 | 17,982 | ||||||
| Other Balances | 1.3 | % | 40,590 | 55,693 | ||||||
TOTAL LOANS | 3.8 | % | $ | 652,406 | $ | 728,416 | ||||
(% of Total Loans) | Average | |||||||||
| 2010 - 2014 | 2014 | 9/30/15 | ||||||||
| Construction & Development | 7.0 | % | 8.9 | % | 8.7 | % | ||||
| Commercial Real Estate | 28.6 | % | 26.5 | % | 23.2 | % | ||||
| Commercial & Industrial | 13.3 | % | 15.2 | % | 17.9 | % | ||||
| Farmland | 5.1 | % | 4.9 | % | 4.3 | % | ||||
| Agricultural | 0.1 | % | 0.2 | % | 0.1 | % | ||||
| Residential Real Estate | 37.6 | % | 35.7 | % | 35.7 | % | ||||
| Consumer | 2.8 | % | 2.4 | % | 2.5 | % | ||||
| Other Balances | 5.6 | % | 6.2 | % | 7.6 | % | ||||
TOTAL LOANS | 100.0 | % | 100.0 | % | 100.0 | % | ||||
| Concentrations in Commercial RE Lending | ||||||||||
| 2014 | 9/30/15 | |||||||||
| Total Construction & Development | $ | 58,210 | $ | 63,421 | ||||||
| Total Risk-Based Capital | $ | 115,532 | $ | 119,195 | ||||||
| % of Total Risk-Based Capital | 50.4 | % | 53.2 | % | ||||||
| Const. & Develop and Comm Real Estate | $ | 161,631 | $ | 163,570 | ||||||
| % of Total Risk-Based Capital | 139.9 | % | 137.2 | % | ||||||
| Page 22 |
|
Company Financial Summary
Credit Quality
| Changes 2013-2014 | ||||||||||||||||||||||
| Asset Quality | 2010 | 2011 | 2012 | 2013 | 2014 | Dollar | Percent | |||||||||||||||
| Loans 90+ Past Due | $ | 0 | $ | 0 | $ | 28 | $ | 0 | $ | 97 | $ | 97 | NA | |||||||||
| Non-Accrual Loans | 8,260 | 11,469 | 8,074 | 5,396 | 5,380 | ($ | 16 | ) | -0.3 | % | ||||||||||||
| NON-PERFORMINGLOANS | $ | 8,260 | $ | 11,469 | $ | 8,102 | $ | 5,396 | $ | 5,477 | $ | 81 | 1.5 | % | ||||||||
| Other Real Estate Owned (OREO) | $ | 7,927 | $ | 8,827 | $ | 5,678 | $ | 1,438 | $ | 5 | ($ | 1,433 | ) | -99.7 | % | |||||||
| Other Assets 90+ Past Due | 0 | 0 | 0 | 0 | 0 | $ | 0 | NA | ||||||||||||||
| Other Non-Accrual Assets | 0 | 0 | 0 | 0 | 0 | $ | 0 | NA | ||||||||||||||
| NON-PERFORMINGASSETS | $ | 16,187 | $ | 20,296 | $ | 13,780 | $ | 6,834 | $ | 5,482 | ($ | 1,352 | ) | -19.8 | % | |||||||
| Asset Quality Ratios | Averages | |||||||||||||||||||||
| Loans 90+ Past Due, % of Loans | 0.00 | % | 0.00 | % | 0.00 | % | 0.00 | % | 0.01 | % | 0.00 | % | ||||||||||
| Non-Accrual Loans, % of Loans | 1.47 | % | 2.20 | % | 1.42 | % | 0.89 | % | 0.82 | % | 1.36 | % | ||||||||||
| NPL's, % OF TOTAL LOANS | 1.47 | % | 2.20 | % | 1.42 | % | 0.89 | % | 0.84 | % | 1.36 | % | ||||||||||
| NPAs, % of Loans and OREO | 2.84 | % | 3.84 | % | 2.40 | % | 1.12 | % | 0.84 | % | 2.21 | % | ||||||||||
| NPAs, % of Assets | 1.72 | % | 1.99 | % | 1.26 | % | 0.63 | % | 0.47 | % | 1.21 | % | ||||||||||
| Texas Ratio (1) | 15.18 | % | 18.07 | % | 12.24 | % | 6.59 | % | 4.83 | % | 11.38 | % | ||||||||||
| Loan Loss Allowance | ||||||||||||||||||||||
| Period-end | $ | 9,420 | $ | 9,200 | $ | 8,809 | $ | 8,595 | $ | 7,934 | $ | 8,792 | ||||||||||
| % of Non-Performing Assets | 58.19 | % | 45.33 | % | 63.93 | % | 125.77 | % | 144.73 | % | 87.59 | % | ||||||||||
| % of Non-Performing Loans | 114.04 | % | 80.22 | % | 108.73 | % | 159.28 | % | 144.86 | % | 121.43 | % | ||||||||||
| % of Loans | 1.68 | % | 1.77 | % | 1.55 | % | 1.42 | % | 1.22 | % | 1.52 | % |
| |||||||||
| Net Charge-Offs | ||||||||||||||||||||||
| Total Charge-Offs | $ | 2,232 | $ | 3,552 | $ | 1,885 | $ | 298 | $ | 790 | $ | 1,751 | ||||||||||
| Total Recoveries | 827 | 207 | 374 | 84 | 129 | $ | 324 | |||||||||||||||
| NET CHARGE-OFFS | $ | 1,405 | $ | 3,345 | $ | 1,511 | $ | 214 | $ | 661 | $ | 1,427 | ||||||||||
| Net Charge-Offs / Average Loans | 0.24 | % | 0.61 | % | 0.29 | % | 0.04 | % | 0.11 | % | 0.26 | % | ||||||||||
| (1) Texas Ratio defined as (Total NPAs)/(Tangible Equity Plus the Loan Loss Reserve) | ||||||||||||||||||||||
| Page 23 |
|
Company Financial Summary – Interim
Credit Quality
| Regulatory Reports | ||||||||||
| Asset Quality | 2014 | 9/30/15 | ||||||||
| Loans 90+ Past Due | $ | 97 | $ | 143 | ||||||
| Non-Accrual Loans | 5,380 | 1,985 | ||||||||
| NON-PERFORMING LOANS | $ | 5,477 | $ | 2,128 | ||||||
| Other Real Estate Owned (OREO) | $ | 5 | $ | 90 | ||||||
| Other Assets 90+ Past Due | 0 | 0 | ||||||||
| Other Non-Accrual Assets | 0 | 0 | ||||||||
| NON-PERFORMING ASSETS | $ | 5,482 | $ | 2,218 | ||||||
| Average | ||||||||||
| Asset Quality Ratios | 2010 - 2014 | |||||||||
| Loans 90+ Past Due, % of Loans | 0.00 | % | 0.01 | % | 0.02 | % | ||||
| Non-Accrual Loans, % of Loans | 1.36 | % | 0.82 | % | 0.27 | % | ||||
| NPL's, % OF TOTAL LOANS | 1.36 | % | 0.84 | % | 0.29 | % | ||||
| NPAs, % of Loans and OREO | 2.21 | % | 0.84 | % | 0.30 | % | ||||
| NPAs, % of Assets | 1.21 | % | 0.47 | % | 0.18 | % | ||||
| Texas Ratio (1) | 11.38 | % | 4.83 | % | 1.86 | % | ||||
| Loan Loss Allowance | ||||||||||
| Period-end | $ | 8,792 | $ | 7,934 | $ | 8,585 | ||||
| % of Non-Performing Assets | 87.59 | % | 144.73 | % | 387.06 | % | ||||
| % of Non-Performing Loans | 121.43 | % | 144.86 | % | 403.43 | % | ||||
| % of Loans | 1.52 | % | 1.22 | % | 1.18 | % | ||||
| Average | YTD | |||||||||
| Net Charge-Offs | 2010 - 2014 | 2014 | 9/30/15 | |||||||
| Total Charge-Offs | $ | 1,751 | $ | 790 | $ | 47 | ||||
| Total Recoveries | 324 | 129 | 698 | |||||||
| NET CHARGE-OFFS | $ | 1,427 | $ | 661 | ($ | 651 | ) | |||
| Net Charge-Offs / Average Loans | 0.26 | % | 0.10 | % | -0.09 | % | ||||
| (1) Texas Ratio defined as (Total NPAs)/(Tangible Equity Plus the Loan Loss Reserve) | ||||||||||
| Page 24 |
|
Company Financial Summary
Financial Ratios
| Balance Sheet | 2010 | 2011 | 2012 | 2013 | 2014 | Averages | |||||||||||||
| Full-Time Equivalent Employee | 253 | 260 | 259 | 245 | 239 | 251 | |||||||||||||
| Assets / FTE | $ | 3,722 | $ | 3,915 | $ | 4,214 | $ | 4,459 | $ | 4,900 | $ | 4,242 | |||||||
| Total Equity / Assets | 11.28 | % | 11.02 | % | 10.33 | % | 9.54 | % | 9.79 | % | 10.39 | % | |||||||
| Common Equity / Assets | 11.27 | % | 11.01 | % | 10.33 | % | 9.53 | % | 9.78 | % | 10.38 | % | |||||||
| Tangible Common Equity / Tang. Assets | 10.41 | % | 10.21 | % | 9.58 | % | 8.78 | % | 9.08 | % | 9.61 | % | |||||||
| Tier 1 Capital Ratio | 14.96 | % | 15.67 | % | 14.58 | % | 14.35 | % | 13.67 | % | 14.65 | % | |||||||
| Total Risk Based Capital Ratio | 16.21 | % | 16.91 | % | 15.82 | % | 15.55 | % | 14.67 | % | 15.83 | % | |||||||
*Includes Mortgage Servicing Rights | |||||||||||||||||||
| Loans / Deposits | 71.0 | % | 60.8 | % | 61.1 | % | 63.4 | % | 64.0 | % | 64.0 | % | |||||||
| Liquidity Ratio | 15.5 | % | 22.5 | % | 21.5 | % | 17.2 | % | 18.8 | % | 19.1 | % | |||||||
| Jumbo CDs / Total Deposits | 13.4 | % | 12.7 | % | 12.9 | % | 12.8 | % | 11.9 | % | 12.7 | % | |||||||
| Borrowings / Total Assets | 3.2 | % | 3.3 | % | 2.5 | % | 1.7 | % | 1.9 | % | 2.5 | % | |||||||
| NPAs, % of Loans and OREO | 2.84 | % | 3.84 | % | 2.40 | % | 1.12 | % | 0.84 | % | 2.21 | % | |||||||
| NPAs, % of Assets | 1.72 | % | 1.99 | % | 1.26 | % | 0.63 | % | 0.47 | % | 1.21 | % | |||||||
Income Statement | |||||||||||||||||||
| Yield on Earning Assets | 4.87 | % | 4.57 | % | 4.01 | % | 3.88 | % | 3.69 | % | 4.20 | % | |||||||
| Cost of Interest Bearing Liabilities | 0.91 | % | 0.64 | % | 0.46 | % | 0.33 | % | 0.27 | % | 0.52 | % | |||||||
YIELD / COST SPREAD | 3.96 | % | 3.93 | % | 3.55 | % | 3.55 | % | 3.42 | % | 3.68 | % | |||||||
| Net Interest Margin (Tax Equivalent) | 4.07 | % | 4.01 | % | 3.61 | % | 3.60 | % | 3.46 | % | 3.75 | % | |||||||
| Efficiency Ratio | 75.4 | % | 74.1 | % | 70.0 | % | 71.9 | % | 69.1 | % | 72.1 | % | |||||||
| Effective Tax Rate | 9.8 | % | 7.5 | % | 21.3 | % | 19.5 | % | 23.5 | % | 16.3 | % | |||||||
| ROAA | 0.76 | % | 0.71 | % | 0.90 | % | 0.88 | % | 0.92 | % | 0.83 | % | |||||||
| ROACE | 6.76 | % | 6.61 | % | 8.37 | % | 8.69 | % | 9.79 | % | 8.04 | % | |||||||
| ROAE | 6.76 | % | 6.61 | % | 8.37 | % | 8.69 | % | 9.79 | % | 8.04 | % | |||||||
| Dividend Payout Ratio | 56.1 | % | 56.7 | % | 41.3 | % | 38.9 | % | 35.5 | % | 45.7 | % | |||||||
| Page 25 |
|
Company Financial Summary – Interim
Financial Ratios
| Regulatory Reports | |||||||||||
| Average | LTM | ||||||||||
| Balance Sheet | 2010 - 2014 | 2014 | 9/30/15 | ||||||||
| Full-Time Equivalent Employee | 251 | 239 | 232 | ||||||||
| Assets / FTE | $ | 4,242 | $ | 4,900 | $ | 5,306 | |||||
| Total Equity / Assets | 10.39 | % | 9.79 | % | 9.75 | % | |||||
| Common Equity / Assets | 10.38 | % | 9.78 | % | 9.74 | % | |||||
| Tangible Common Equity / Tang. Assets | 9.61 | % | 9.08 | % | 9.07 | % | |||||
| Tier 1 Capital Ratio | 14.65 | % | 13.67 | % | 13.42 | % | |||||
| Total Risk Based Capital Ratio | 15.83 | % | 14.67 | % | 14.46 | % | |||||
*Includes Mortgage Servicing Rights | |||||||||||
| Loans / Deposits | 64.03 | % | 63.96 | % | 68.64 | % | |||||
| Liquidity Ratio | 19.12 | % | 18.83 | % | 13.56 | % | |||||
| Jumbo CDs / Total Deposits | 12.73 | % | 11.89 | % | 10.95 | % | |||||
| Borrowings / Total Assets | 2.5 | % | 1.9 | % | 3.0 | % | |||||
| NPAs, % of Loans and OREO | 2.21 | % | 0.84 | % | 0.30 | % | |||||
| NPAs, % of Assets | 1.21 | % | 0.47 | % | 0.18 | % | |||||
Income Statement | |||||||||||
| Yield on Earning Assets | 4.20 | % | 3.69 | % | 3.43 | % | |||||
| Cost of Interest Bearing Liabilities | 0.52 | % | 0.27 | % | 0.24 | % | |||||
YIELD / COST SPREAD | 3.68 | % | 3.42 | % | 3.20 | % | |||||
| Net Interest Margin (Tax Equivalent) | 3.75 | % | 3.46 | % | 3.37 | % | |||||
| Efficiency Ratio | 72.10 | % | 69.05 | % | 68.63 | % | |||||
| Effective Tax Rate | 16.33 | % | 23.52 | % | 22.00 | % | |||||
| ROAA | 0.83 | % | 0.92 | % | 0.90 | % | |||||
| ROACE | 8.04 | % | 9.79 | % | 9.28 | % | |||||
| ROAE | 8.04 | % | 9.79 | % | 9.28 | % | |||||
| Dividend Payout Ratio | 45.7 | % | 35.5 | % | 33.8 | % | |||||
| Page 26 |
|
Company Valuation –Going Concern
| Page 27 |
|
Levels of Value
| |
| Fair Value: pro rata going concern value
| |
| Page 28 |
|
Company Going Concern Fair Value: Assumptions
| Income Approach:
| ||
| Long Term Growth Rateof 5% (after year five) into perpetuity. The Company’s markets are expected to realize deposit weighted average population growth of 5.2% between 2016 and 2021.Additionally, the Congressional Budget Office projects an average nominal GDP estimates for 2020 through 2025 of 4.2%. The Company has posted a five-year compound annual growth rate on assets of 5.6% between 2010 and 2014 and posted 5.1% growth year- to date through September 30, 2015.
| ||
| Discount Rate of 12.75% - The projections provided by management indicate the Company’s ROAA will range from 0.89% in Year 1 to 0.94% in Year 5. Between 2010 and 2014, the Company averaged a 0.83% ROAA and 0.90% as of 9/30/15 on an LTM basis. ROAA is affected by asset quality that improved significantly resulting in zero provisions for loan losses since 2013. Sheshunoff applied a 12.75% discount rate which accounts for the risk associated with the Company achieving these projections. | ||
| Page 29 |
|
Company Going Concern Fair Value: Assumptions
| Discount Rate Calculation - September 30, 2015 | ||
| Risk-free rate (20yr Treasury Constant) | 2.62 | % |
| Equity Risk Premium (Duff & Phelps) * Beta1(7% * 0.769) | 5.38 | % |
| Size Premium (Duff & Phelps) | 3.74 | % |
| Company Specific Risk Premium | 0.50 | % |
| CALCULATED ROR | 12.24 | % |
| SELECTED ROR | 12.25 | % |
1Beta calculated as Median of banks between $1B and $2B in assets from 2012 through 2014
| Page 30 |
|
Company Going Concern Fair Value: Income Approach
| Base | ||||||||||||||||||
| Projected Assets, Net Income, Dividends | 9/30/15 | Year 1 | Year 2 | Year 3 | Year 4 | Year 5 | ||||||||||||
| Asset Growth | 1.09 | % | 2.42 | % | 1.42 | % | 2.02 | % | 2.46 | % | ||||||||
| Target Total Assets | $ | 1,230,896 | $ | 1,244,360 | $ | 1,274,496 | $ | 1,292,613 | $ | 1,318,723 | $ | 1,351,196 | ||||||
| Average Assets | $ | 1,184,285 | $ | 1,237,628 | $ | 1,259,428 | $ | 1,283,555 | $ | 1,305,668 | $ | 1,334,960 | ||||||
| Return on Assets (ROAA) | 0.90 | % | 0.89 | % | 0.92 | % | 0.94 | % | 0.94 | % | 0.94 | % | ||||||
| NET INCOME | $ | 10,640 | $ | 10,958 | $ | 11,544 | $ | 12,076 | $ | 12,287 | $ | 12,589 | ||||||
| Preferred Dividends | $ | 0 | $ | 0 | $ | 0 | $ | 0 | $ | 0 | $ | 0 | ||||||
| AVAILABLE TO COMMON | $ | 10,640 | $ | 10,958 | $ | 11,544 | $ | 12,076 | $ | 12,287 | $ | 12,589 | ||||||
| Retained Earnings | $ | 7,495 | $ | 8,155 | $ | 8,761 | $ | 9,046 | $ | 9,422 | ||||||||
| AVAILABLE FOR COMMON DIVIDENDS | $ | 3,463 | $ | 3,389 | $ | 3,315 | $ | 3,241 | $ | 3,167 | ||||||||
| Base | ||||||||||||||||||
| Projected Changes in Equity | 9/30/15 | Year 1 | Year 2 | Year 3 | Year 4 | Year 5 | ||||||||||||
| Beginning Common Equity | $ | 119,867 | $ | 124,485 | $ | 129,762 | $ | 135,646 | $ | 141,814 | ||||||||
| Net Income, Available to Common | 10,958 | 11,544 | 12,076 | 12,287 | 12,589 | |||||||||||||
| Common Stock Issued | 0 | 0 | 0 | 0 | 0 | |||||||||||||
| Treasury Purchases | (2,878 | ) | (2,878 | ) | (2,878 | ) | (2,878 | ) | (2,878 | ) | ||||||||
| Dividends Paid to Common | (3,463 | ) | (3,389 | ) | (3,315 | ) | (3,241 | ) | (3,167 | ) | ||||||||
| ENDING COMMON EQUITY | $ | 119,867 | $ | 124,485 | $ | 129,762 | $ | 135,646 | $ | 141,814 | $ | 148,359 | ||||||
| Goodwill | ($ | 9,018 | ) | ($ | 9,018 | ) | ($ | 9,018 | ) | ($ | 9,018 | ) | ($ | 9,018 | ) | ($ | 9,018 | ) |
| Other Intangibles | 0 | 0 | 0 | 0 | 0 | 0 | ||||||||||||
| TANGIBLE COMMON EQUITY | $ | 110,849 | $ | 115,467 | $ | 120,744 | $ | 126,628 | $ | 132,796 | $ | 139,341 | ||||||
| Ratios | ||||||||||||||||||
| Common Payout Ratio | NA | 31.60 | % | 29.36 | % | 27.45 | % | 26.38 | % | 25.16 | % | |||||||
| Tangible Common/Tangible Assets | 9.07 | % | 9.35 | % | 9.54 | % | 9.87 | % | 10.14 | % | 10.38 | % | ||||||
| Page 31 |
|
Company Going Concern Fair Value: Income Approach
| Terminal | ||||||||||||
| Year 1 | Year 2 | Year 3 | Year 4 | Year 5 | Value | |||||||
| Optimum Dividends | $ | 10,774 | $ | 11,159 | $ | 11,016 | $ | 6,631 | $ | 6,327 | $ | 170,935 |
| Discount Factors @ 12.25% | 0.9439 | 0.8409 | 0.7491 | 0.6673 | 0.5945 | 0.5611 | ||||||
| ANNUAL PRESENT VALUE | $ | 10,169 | $ | 9,383 | $ | 8,252 | $ | 4,425 | $ | 3,762 | $ | 95,918 |
| TOTAL PRESENT VALUE | $ | 131,908 | ||||||||||
| Page 32 |
|
Company Going Concern Fair Value: Assumptions
| Market Approach: Regional Guideline Companies | ||
| Sheshunoff reviewed regional publicly traded banks on either the NYSE, NYSE-AMEX, or NASDAQ exchange; | ||
| Headquartered in Tennessee, Kentucky, Alabama, or Mississippi; and with | ||
| Total assets less than $5 billion. | ||
| Sheshunoff focused on Publicly Traded companies that had performance similar to the Company with: | ||
| Tangible Equity to Assets Between 8.25% and 10% | ||
| NPAs/Assets less than 0.40% | ||
| Core ROAA between 0.80% and 0.95%
| ||
| Page 33 |
|
Company Going Concern Fair Value: Market Approach
| Pricing Multiples | Four-Year Growth Rates | |||||||||||||||||||||||||||||
| Number | Stock | Change | Core | |||||||||||||||||||||||||||
| of | Price as of | Since | Tangible | 8% Tg. | LTM | Core | ||||||||||||||||||||||||
| Company | City | ST | Branches | Ticker | 9/30/15 | 2014Q4 | Book | Book | Book | EPS | Assets | Deposits | Asset | Loan | Deposit | Income | ||||||||||||||
| Athens Bancshares Corporation | Athens | TN | 7 | AFCB | 29.99 | 18.1 | % | 1.21 | 1.21 | 1.38 | 18.8 | 17.2 | % | 21.4 | % | 2.1 | % | 4.5 | % | 3.6 | % | 34.8 | % | |||||||
| Auburn National Bancorp. | Auburn | AL | 10 | AUBN | 26.47 | 12.0 | % | 1.21 | 1.21 | 1.26 | 12.7 | 11.8 | % | 13.3 | % | 0.8 | % | 1.7 | % | 3.4 | % | 15.2 | % | |||||||
| Avenue Financial Holdings Inc. | Nashville | TN | 6 | AVNU | 13.20 | NA | 1.46 | 1.50 | 1.52 | 21.5 | 12.3 | % | 15.1 | % | 13.8 | % | NM | 13.7 | % | NM | ||||||||||
| Citizens First Corp. | Bowling Green | KY | 8 | CZFC | 12.66 | 6.4 | % | 0.80 | 0.93 | 0.95 | 9.1 | 5.9 | % | 6.9 | % | 4.2 | % | 4.4 | % | 4.3 | % | 5.8 | % | |||||||
| Citizens Holding Co. | Philadelphia | MS | 23 | CIZN | 22.25 | 14.5 | % | 1.29 | 1.34 | 1.36 | 15.7 | 11.3 | % | 14.5 | % | 3.0 | % | -1.9 | % | 6.7 | % | 0.7 | % | |||||||
| Commerce Union Bancshares Inc. | Brentwood | TN | 7 | CUBN | 13.30 | 2.3 | % | 1.00 | 1.16 | 1.20 | 15.6 | 11.1 | % | 15.5 | % | 12.1 | % | 19.4 | % | 14.3 | % | 37.9 | % | |||||||
| Community Trust Bancorp Inc. | Pikeville | KY | 81 | CTBI | 35.51 | -3.0 | % | 1.32 | 1.54 | 1.73 | 13.9 | 16.3 | % | 20.9 | % | 2.6 | % | 1.2 | % | 1.5 | % | 6.9 | % | |||||||
| Farmers Capital Bank Corp. | Frankfort | KY | 34 | FFKT | 24.85 | 6.7 | % | 1.11 | 1.11 | 1.13 | 12.5 | 10.6 | % | 13.7 | % | -2.0 | % | -6.0 | % | -1.3 | % | 71.2 | % | |||||||
| First Bancshares Inc. | Hattiesburg | MS | 28 | FBMS | 17.47 | 20.4 | % | 1.11 | 1.34 | 1.27 | 11.4 | 8.3 | % | 9.7 | % | 21.4 | % | 20.7 | % | 22.5 | % | 24.9 | % | |||||||
| Franklin Financial Network Inc | Franklin | TN | 11 | FSB | 22.35 | 29.2 | % | 1.32 | 1.41 | 1.43 | 15.2 | 11.7 | % | 13.7 | % | 40.3 | % | 42.1 | % | 39.9 | % | 145.0 | % | |||||||
| HopFed Bancorp Inc. | Hopkinsville | KY | 18 | HFBC | 11.95 | -6.1 | % | 0.93 | 0.93 | 0.91 | 26.8 | 9.4 | % | 11.7 | % | -3.6 | % | -2.7 | % | -3.0 | % | 1.2 | % | |||||||
| National Commerce Corp. | Birmingham | AL | 19 | NCOM | 23.98 | NA | 1.33 | 1.63 | 1.83 | 27.7 | 16.8 | % | 19.8 | % | NM | NM | NM | NM | ||||||||||||
| Peoples Financial Corp. | Biloxi | MS | 19 | PFBX | 9.70 | -22.1 | % | 0.54 | 0.54 | 0.21 | NM | 7.6 | % | 9.4 | % | -4.0 | % | -3.0 | % | 1.7 | % | NM | ||||||||
| Porter Bancorp Inc. | Louisville | KY | 17 | PBIB | 1.40 | 191.7 | % | 1.22 | 1.35 | 1.14 | NM | 4.0 | % | 4.3 | % | -12.3 | % | -16.5 | % | -10.9 | % | NM | ||||||||
| Republic Bancorp Inc. | Louisville | KY | 40 | RBCAA | 24.55 | -0.7 | % | 0.89 | 0.91 | 0.84 | 15.6 | 12.7 | % | 21.6 | % | 0.8 | % | 8.6 | % | -2.8 | % | -18.4 | % | |||||||
| ServisFirst Bancshares Inc. | Birmingham | AL | 18 | SFBS | 41.53 | 26.0 | % | 2.50 | 2.60 | 2.74 | 18.2 | 22.5 | % | 26.6 | % | 20.6 | % | 24.5 | % | 17.9 | % | 31.9 | % | |||||||
| Stock Yards Bancorp Inc. | Louisville | KY | 37 | SYBT | 36.35 | 9.0 | % | 1.92 | 1.94 | 2.25 | 14.9 | 20.6 | % | 25.2 | % | 7.7 | % | 5.3 | % | 9.2 | % | 11.3 | % | |||||||
| United Security Bancshares | Thomasville | AL | 21 | USBI | 8.13 | -8.0 | % | 0.64 | 0.64 | 0.38 | 19.2 | 8.9 | % | 10.6 | % | -2.0 | % | -10.2 | % | -1.0 | % | NM | ||||||||
| Note: Regional defined as headquartered in Tennessee, Kentucky, Alabama, or Mississippi | ||||||||||||||||||||||||||||||
| Maximum | 41.53 | 191.7 | % | 2.50 | 2.60 | 2.74 | 27.7 | 22.5 | % | 26.6 | % | 40.3 | % | 42.1 | % | 39.9 | % | 145.0 | % | |||||||||||
| Minimum | 1.40 | -22.1 | % | 0.54 | 0.54 | 0.21 | 9.1 | 4.0 | % | 4.3 | % | -12.3 | % | -16.5 | % | -10.9 | % | -18.4 | % | |||||||||||
| Average | 20.87 | 18.5 | % | 1.21 | 1.30 | 1.31 | 16.8 | 12.2 | % | 15.2 | % | 6.2 | % | 5.8 | % | 7.0 | % | 28.3 | % | |||||||||||
| Median | 22.30 | 7.9 | % | 1.21 | 1.27 | 1.26 | 15.6 | 11.5 | % | 14.1 | % | 2.6 | % | 3.0 | % | 3.6 | % | 15.2 | % | |||||||||||
First Farmers And Merchants Corporation | 19 | FFMH | 18.63 | -4.9 | % | 0.74 | 0.80 | 0.78 | 8.8 | 7.2 | % | 8.4 | % | 5.6 | % | 3.8 | % | 6.5 | % | 9.2 | % | |||||||||
| Page 34 |
|
Company Going Concern Fair Value: Market Approach
| Balance Sheet Ratios | Profitability Ratios | |||||||||||||||||||||||||||||||
Core | Core | |||||||||||||||||||||||||||||||
| Total | Common | T. Com | Total Risk | Return | Return | Net | ||||||||||||||||||||||||||
| Assets | Equity/ | Equity/ | Based | Loans/ | Jumbos/ | Borrs/ | on Avg | Avg Com | Efficiency | Interest | ||||||||||||||||||||||
| Company | ($000's) | Assets | T. Assets | Capital | Deposits | Deposits | Assets | Assets | Equity | Ratio | Margin | |||||||||||||||||||||
| Athens Bancshares Corporation | 314,400 | 14.23 | % | 14.21 | % | 17.26 | % | 101.5 | % | 5.5 | % | 4.1 | % | 0.93 | % | 6.59 | % | 74.8 | % | 4.37 | % | |||||||||||
| Auburn National Bancorp. | 817,994 | 9.73 | % | 9.73 | % | 17.78 | % | 58.1 | % | 18.2 | % | 1.3 | % | 0.96 | % | 9.90 | % | 57.8 | % | 3.17 | % | |||||||||||
| Avenue Financial Holdings Inc. | 1,108,211 | 8.42 | % | 8.18 | % | 13.03 | % | 91.1 | % | 2.4 | % | 9.5 | % | 0.58 | % | 7.11 | % | 70.3 | % | 3.30 | % | |||||||||||
| Citizens First Corp. | 424,281 | 7.32 | % | 6.36 | % | 13.54 | % | 88.9 | % | 3.0 | % | 4.8 | % | 0.84 | % | 11.61 | % | 69.8 | % | 3.84 | % | |||||||||||
| Citizens Holding Co. | 960,895 | 8.80 | % | 8.50 | % | 17.66 | % | 56.8 | % | 6.2 | % | 12.4 | % | 0.74 | % | 8.40 | % | 72.5 | % | 3.38 | % | |||||||||||
| Commerce Union Bancshares Inc. | 852,689 | 11.07 | % | 9.65 | % | 14.41 | % | 103.6 | % | 10.4 | % | 17.1 | % | 0.88 | % | 7.55 | % | 74.3 | % | 4.12 | % | |||||||||||
| Community Trust Bancorp Inc. | 3,808,148 | 12.36 | % | 10.82 | % | 17.76 | % | 93.7 | % | 21.3 | % | 8.6 | % | 1.18 | % | 9.70 | % | 57.4 | % | 3.85 | % | |||||||||||
| Farmers Capital Bank Corp. | 1,764,755 | 9.84 | % | 9.57 | % | 19.79 | % | 68.1 | % | 8.5 | % | 11.6 | % | 0.86 | % | 9.32 | % | 72.5 | % | 3.31 | % | |||||||||||
| First Bancshares Inc. | 1,137,849 | 7.43 | % | 6.23 | % | 12.15 | % | 76.9 | % | 11.1 | % | 6.1 | % | 0.78 | % | 11.03 | % | 69.7 | % | 3.71 | % | |||||||||||
| Franklin Financial Network Inc | 2,002,538 | 8.87 | % | 8.35 | % | 13.74 | % | 65.8 | % | 21.3 | % | 4.7 | % | 0.93 | % | 9.84 | % | 59.2 | % | 3.70 | % | |||||||||||
| HopFed Bancorp Inc. | 882,736 | 10.06 | % | 10.06 | % | 17.18 | % | 80.3 | % | 10.4 | % | 9.2 | % | 0.52 | % | 5.08 | % | 84.9 | % | 3.29 | % | |||||||||||
| National Commerce Corp. | 1,350,781 | 12.58 | % | 10.51 | % | 13.78 | % | 88.8 | % | 15.3 | % | 1.6 | % | 0.78 | % | 6.06 | % | 66.3 | % | 4.24 | % | |||||||||||
| Peoples Financial Corp. | 656,649 | 13.95 | % | 13.93 | % | 19.81 | % | 64.5 | % | 4.9 | % | 4.6 | % | -1.96 | % | -14.32 | % | 88.6 | % | 3.00 | % | |||||||||||
| Porter Bancorp Inc. | 951,480 | 3.26 | % | 2.72 | % | 10.25 | % | 69.5 | % | 28.4 | % | 3.0 | % | -0.80 | % | -34.20 | % | 92.5 | % | 3.21 | % | |||||||||||
| Republic Bancorp Inc. | 4,035,977 | 14.24 | % | 14.02 | % | 20.98 | % | 138.7 | % | 5.4 | % | 26.3 | % | 0.85 | % | 5.77 | % | 66.6 | % | 3.28 | % | |||||||||||
| ServisFirst Bancshares Inc. | 4,772,601 | 9.03 | % | 8.69 | % | 12.05 | % | 99.1 | % | 10.8 | % | 6.0 | % | 1.39 | % | 15.30 | % | 38.2 | % | 3.76 | % | |||||||||||
| Stock Yards Bancorp Inc. | 2,624,607 | 10.70 | % | 10.62 | % | 13.68 | % | 90.5 | % | 4.8 | % | 6.6 | % | 1.45 | % | 13.61 | % | 57.9 | % | 3.70 | % | |||||||||||
| United Security Bancshares | 548,537 | 13.91 | % | 13.91 | % | 24.79 | % | 51.3 | % | 3.2 | % | 0.2 | % | 0.47 | % | 3.49 | % | 85.0 | % | 5.34 | % | |||||||||||
| Maximum | 4,772,601 | 14.24 | % | 14.21 | % | 24.79 | % | 138.7 | % | 28.4 | % | 26.3 | % | 1.45 | % | 15.30 | % | 92.5 | % | 5.34 | % | |||||||||||
| Minimum | 314,400 | 3.26 | % | 2.72 | % | 10.25 | % | 51.3 | % | 2.4 | % | 0.2 | % | -1.96 | % | -34.20 | % | 38.2 | % | 3.00 | % | |||||||||||
| Average | 1,611,952 | 10.32 | % | 9.78 | % | 16.09 | % | 82.6 | % | 10.6 | % | 7.7 | % | 0.63 | % | 5.10 | % | 69.9 | % | 3.70 | % | |||||||||||
| Median | 1,034,553 | 9.95 | % | 9.69 | % | 15.80 | % | 84.5 | % | 9.4 | % | 6.0 | % | 0.84 | % | 7.97 | % | 70.0 | % | 3.70 | % | |||||||||||
First Farmers And Merchants Corporation | 1,230,896 | 9.74 | % | 9.07 | % | 14.46 | % | 68.6 | % | 10.9 | % | 3.0 | % | 0.87 | % | 8.99 | % | 68.6 | % | 3.37 | % | |||||||||||
| Page 35 |
|
Company Going Concern Fair Value: Market Approach
| Loan Composition (% of Total Loans) | Asset Quality | |||||||||||||||||||||||
| Constr & | Commercial | Commercial | Farm | Agricultural | Residential | Consumer | Other | NPAs / | NPLs/ | LLR/ | LLR/ | |||||||||||||
| Company | Development | Real Estate | & Industrial | Loans | Loans | Real Estate | Loans | Loans | Assets | Loans | NPLs | Loans | ||||||||||||
| Athens Bancshares Corporation | 11.4 | % | 33.3 | % | 7.5 | % | 1.0 | % | 0.0 | % | 41.8 | % | 5.0 | % | 0.0 | % | 0.91 | % | 0.46 | % | 322 | % | 1.49 | % |
| Auburn National Bancorp. | 8.8 | % | 41.4 | % | 13.5 | % | 0.5 | % | 0.1 | % | 28.8 | % | 3.3 | % | 3.7 | % | 0.49 | % | 0.88 | % | 136 | % | 1.20 | % |
| Avenue Financial Holdings Inc. | 9.8 | % | 36.9 | % | 34.1 | % | 0.0 | % | 0.0 | % | 18.3 | % | 0.9 | % | 0.1 | % | 0.12 | % | 0.04 | % | 3029 | % | 1.16 | % |
| Citizens First Corp. | 6.8 | % | 45.4 | % | 11.1 | % | 8.6 | % | 2.9 | % | 23.9 | % | 1.4 | % | 0.0 | % | 0.29 | % | 0.32 | % | 484 | % | 1.53 | % |
| Citizens Holding Co. | 11.2 | % | 39.7 | % | 9.1 | % | 5.9 | % | 0.3 | % | 26.0 | % | 6.1 | % | 1.8 | % | 1.96 | % | 3.54 | % | 45 | % | 1.58 | % |
| Commerce Union Bancshares Inc. | 10.6 | % | 30.7 | % | 18.5 | % | 4.0 | % | 1.8 | % | 31.2 | % | 2.3 | % | 0.9 | % | 0.67 | % | 0.69 | % | 174 | % | 1.21 | % |
| Community Trust Bancorp Inc. | 6.0 | % | 26.5 | % | 9.6 | % | 2.0 | % | 0.5 | % | 33.7 | % | 18.4 | % | 3.3 | % | 1.77 | % | 1.16 | % | 109 | % | 1.26 | % |
| Farmers Capital Bank Corp. | 11.4 | % | 37.2 | % | 5.6 | % | 2.3 | % | 0.3 | % | 37.8 | % | 1.3 | % | 4.0 | % | 1.76 | % | 0.88 | % | 138 | % | 1.21 | % |
| First Bancshares Inc. | 11.5 | % | 37.1 | % | 16.6 | % | 1.7 | % | 0.0 | % | 30.5 | % | 2.2 | % | 0.5 | % | 1.10 | % | 1.06 | % | 85 | % | 0.90 | % |
| Franklin Financial Network Inc | 30.4 | % | 28.2 | % | 14.9 | % | 0.1 | % | 0.4 | % | 25.7 | % | 0.4 | % | 0.0 | % | 0.07 | % | 0.08 | % | 1029 | % | 0.86 | % |
| HopFed Bancorp Inc. | 9.2 | % | 32.5 | % | 11.5 | % | 7.3 | % | 3.9 | % | 32.8 | % | 2.9 | % | 0.0 | % | 1.18 | % | 1.51 | % | 63 | % | 0.96 | % |
| National Commerce Corp. | 10.3 | % | 39.4 | % | 20.2 | % | 0.2 | % | 0.0 | % | 26.4 | % | 1.7 | % | 1.9 | % | 0.55 | % | 0.37 | % | 247 | % | 0.92 | % |
| Peoples Financial Corp. | 11.3 | % | 49.3 | % | 16.2 | % | 0.1 | % | 0.0 | % | 19.2 | % | 1.9 | % | 2.0 | % | 4.50 | % | 5.37 | % | 45 | % | 2.40 | % |
| Porter Bancorp Inc. | 6.0 | % | 31.6 | % | 12.1 | % | 12.0 | % | 4.7 | % | 31.9 | % | 1.5 | % | 0.1 | % | 4.85 | % | 2.72 | % | 84 | % | 2.27 | % |
| Republic Bancorp Inc. | 1.4 | % | 24.9 | % | 5.5 | % | 0.1 | % | 0.0 | % | 51.7 | % | 1.0 | % | 15.5 | % | 0.64 | % | 0.70 | % | 116 | % | 0.81 | % |
| ServisFirst Bancshares Inc. | 5.7 | % | 38.2 | % | 41.0 | % | 2.0 | % | 1.2 | % | 10.4 | % | 1.3 | % | 0.3 | % | 0.34 | % | 0.26 | % | 410 | % | 1.05 | % |
| Stock Yards Bancorp Inc. | 6.5 | % | 41.9 | % | 27.7 | % | 0.1 | % | 0.0 | % | 17.4 | % | 1.6 | % | 4.9 | % | 0.56 | % | 0.52 | % | 214 | % | 1.10 | % |
| United Security Bancshares | 4.8 | % | 38.0 | % | 4.9 | % | 0.0 | % | 0.0 | % | 19.1 | % | 31.0 | % | 2.3 | % | 1.96 | % | 1.58 | % | 114 | % | 1.80 | % |
| Maximum | 30.4 | % | 49.3 | % | 41.0 | % | 12.0 | % | 4.7 | % | 51.7 | % | 31.0 | % | 15.5 | % | 4.85 | % | 5.37 | % | 3029 | % | 2.40 | % |
| Minimum | 1.4 | % | 24.9 | % | 4.9 | % | 0.0 | % | 0.0 | % | 10.4 | % | 0.4 | % | 0.0 | % | 0.07 | % | 0.04 | % | 45 | % | 0.81 | % |
| Average | 9.6 | % | 36.2 | % | 15.5 | % | 2.7 | % | 0.9 | % | 28.1 | % | 4.7 | % | 2.3 | % | 1.32 | % | 1.23 | % | 380 | % | 1.32 | % |
| Median | 9.5 | % | 37.2 | % | 12.8 | % | 1.4 | % | 0.2 | % | 27.6 | % | 1.8 | % | 1.4 | % | 0.79 | % | 0.79 | % | 137 | % | 1.20 | % |
First Farmers And Merchants Corporation | 8.7 | % | 23.2 | % | 17.9 | % | 4.3 | % | 0.1 | % | 35.7 | % | 2.5 | % | 7.6 | % | 0.18 | % | 0.29 | % | 403 | % | 1.18 | % |
| Page 36 |
|
Company Going Concern Fair Value: Assumptions
| Tg. Equity/ | NPAs/ | Core | ||||
| Tg. Assets | Assets | ROAA | ||||
| Financial Criteria | 8.25%- 10% | <0.40% | 0.80% - 0.95% | |||
| Pricing Multiple of | Tg. Book | 8% Tg. Book | LTM Earnings | |||
| More than one similar financial criteria | ||||||
| Average | 1.57 | 1.71 | 13.1 | |||
| Median | 1.29 | 1.43 | 13.9 | |||
| Headquarted in Tennessee with similar financial criteria | ||||||
| Average | 1.29 | 1.47 | 16.5 | |||
| Median | 1.29 | 1.47 | 15.6 | |||
| Selected Multiple | 1.30 | 1.45 | 14.5 | |||
| Page 37 |
|
Company Going Concern Fair Value: Summary
| SUMMARY FINANCIALS AS OF SEPTEMBER 30, 2015 | (Thousands) | |
| Total Assets | $ | 1,230,896 |
| Tangible Assets | $ | 1,221,878 |
| Common Equity | $ | 119,867 |
| Tangible Common Equity | $ | 110,849 |
| 8.0% Tangible Common Equity | $ | 97,750 |
| LTM Core Net Income as of September 30, 2015 | $ | 10,307 |
| Year 1 Projected Net Income | $ | 10,958 |
VALUATION APPROACHES | ||
| Income Approach | ||
| Discounted Cash Flow Method (Discount Rate of 12.25%) | ||
| Optimum Equity Flows | $ | 131,908 |
| Market Approach | ||
| Price/Earnings Valuation at Estimated Price/Earnings Ratio | ||
| LTM Core Net Income as of September 30, 2015 of $10.3 MM x P/E of 14.50x | $ | 149,447 |
| Price/Tangible Book Valuation at Estimated Price/Tangible Book Ratio: | ||
| Tangible Book Value of $110.8 MM x Price/Book Multiple of 1.30x | $ | 144,104 |
| 8.0% Tang. Equity of $97.8 MM x Multiple of 1.45x + Excess Equity of $13.1 MM | $ | 154,837 |
| FFMH Market Capitalization (Grey Market) | $ | 89,046 |
| Note: Not considered in Average Market Value | ||
| Average Market Value | $ | 149,462 |
| Net Asset Value Approach | ||
| Book Value | $ | 119,867 |
| Off Balance Sheet Assets | $ | 1,867 |
| Net Asset Value | $ | 121,734 |
| Page 38 |
|
Company Going Concern Fair Value: Per Share Value Range
| September 30, 2015 | ||||||||||
| Value | Weight | |||||||||
| Income Approach | $ | 131,908 | 40 | % | $ | 52,763 | ||||
| Market Approach | $ | 149,462 | 40 | % | $ | 59,785 | ||||
| Net Asset Value Approach | $ | 121,734 | 20 | % | $ | 24,347 | ||||
| Estimated Fair Value | $ | 136,895 | ||||||||
| Estimated Fair Value Range | $ | 135,000 | - | $ | 140,000 | |||||
| Resulting | Resulting | |||||||||
| Market | Value | Value | ||||||||
| Median | Multiples @ | Multiples @ | ||||||||
COMPARATIVE MULTIPLES | Multiples | $ | 135,000 | $ | 140,000 | |||||
| Common Book | 1.21 | x | 1.13 | x | 1.17 | x | ||||
| Tangible Common Book | 1.27 | x | 1.22 | x | 1.26 | x | ||||
| 8.00% Tangible Book | 1.26 | x | 1.25 | x | 1.30 | x | ||||
| LTM Core Net Income as of September 30, 2015 | 15.6 | x | 13.1 | x | 13.6 | x | ||||
| Year 1 Projected Net Income | NA | 12.3 | x | 12.8 | x | |||||
| Total Assets | 11.5 | % | 11.0 | % | 11.5 | % | ||||
| Total Deposits | 14.1 | % | 12.7 | % | 13.2 | % | ||||
| PER SHARE CALCULATIONS AND ADJUSTMENTS | ||||||||||
| Estimated Fair Value | $ | 135,000,000 | $ | 140,000,000 | ||||||
| Shares Outstanding | 4,779,697 | 4,779,697 | ||||||||
| PRO RATA FAIR VALUE | $ | 28.24 | $ | 29.29 | ||||||
ROUNDED TO: | $ | 28.25 | $ | 29.30 | ||||||
| Page 39 |
|
Sheshunoff & Co
| Page 40 |
|

| Page 41 |
|

| Page 42 |
|

| Page 43 |
|
Sheshunoff Valuation Services
Our experts complete over 100 bank stock appraisals annually for public and private financial institutions in size from 20 million to $9.6 billion.

| Page 44 |
|
Sheshunoff Client Relationships
The Consistent Leader in Community
Bank Valuations and M&A