Washington, D.C. 20549
INTEGRATED DEVICE TECHNOLOGY, INC.
Indicate by check mark whether the registrant is a large accelerated filer, an accelerated filer, a non-accelerated filer or a smaller reporting company. See definition of “large accelerated filer”, “accelerated filer” and “smaller reporting company” in Rule 12b-2 of the Exchange Act.
The aggregate market value of the voting and non-voting common equity held by non-affiliates was approximately $939 million, computed by reference to the last sales price of $6.60 as reported by The NASDAQ Stock Market LLC, as of the last business day of the registrant’s most recently completed second fiscal quarter, September 25, 2009. Shares of common stock held by each executive officer and director and by each person who owns 5% or more of the outstanding common stock have been excluded in that such persons may be deemed affiliates. This determination of affiliate status is not necessarily a conclusive determination for other purposes.
The number of outstanding shares of the registrant's Common Stock, $.001 par value, as of April 25, 2010 was approximately 162,424,487.
Items 10, 11, 12, 13, and 14 of Part III incorporate information by reference from the registrant’s Proxy Statement for the 2010 Annual Meeting of Stockholders.
We have made statements in this Annual Report on Form 10-K in Item 1-“Business”, Item 1A-“Risk Factors”, Item 3-“Legal Proceedings”, Item 7-“Management’s Discussion and Analysis of Financial Condition and Results of Operation” and in other sections of this Annual Report on Form 10-K that are forward-looking statements within the meaning of Section 27A of the Securities Act of 1933, as amended and Section 21E of the Securities Exchange Act of 1934, as amended. These statements relate to future events and the future results of Integrated Device Technology, Inc. and are based on current expectations, estimates, forecasts and projections about the industry in which we operate and the beliefs and assumptions of our management. In addition, in this Annual Report on Form 10-K, the words ‘expects,’ ‘anticipates,’ ‘targets,’ ‘goals,’ ‘projects,’ ‘intends,’ ‘plans,’ ‘believes,’ ‘seeks,’ ‘estimates,’ and variations of such words and similar expressions, as they relate to us, our business and our management, are intended to identify such forward-looking statements. Forward-looking statements should not be read as a guarantee of future performance or results, and will not necessarily be accurate indications of the times at, or by, which such performance or results will be achieved. Forward-looking statements are based on information available at the time those statements are made and/or management’s good faith belief as of that time with respect to future events, and are subject to risks and uncertainties that could cause actual performance or results to differ materially from those expressed in or s uggested by the forward-looking statements. Factors that might cause or contribute to such differences include, but are not limited to, those discussed in this Report under the section entitled “Risk Factors” under Part I, Item 1A and elsewhere in this Report, and in other reports we file with the Securities and Exchange Commission (SEC), including our most recent reports on Form 10-Q.
Forward-looking statements speak only as of the date the statements are made. You should not put undue reliance on any forward-looking statements. We assume no obligation to update forward-looking statements to reflect actual results, changes in assumptions or changes in other factors affecting forward-looking information, except to the extent required by applicable securities laws. If we do update one or more forward-looking statements, no inference should be drawn that we will make additional updates with respect to those or other forward-looking statements.
We design, develop, manufacture and market a broad range of low-power, high-performance mixed signal semiconductor solutions for the advanced communications, computing and consumer industries. Our communications products target markets including the enterprise, data center and wireless markets. Our computing products are designed specifically for desktop, notebook, sub-notebook, storage and server applications while our consumer products are optimized primarily for gaming consoles, set-top boxes, digital TV and smart phones.
With best-in-class talent, technology and an innovative product-development philosophy targeted at digital media, IDT enables the industry to synchronize, transport, process and deliver digital media. We do this by developing deep systems-level knowledge and applying our fundamental semiconductor heritage to create essential solutions to the compelling technology challenges faced by our customers.
We market our products on a worldwide basis primarily to original equipment manufacturers (OEMs) through a variety of channels, including a direct sales force, distributors, electronic manufacturing suppliers (EMSs) and independent sales representatives.
We seek to differentiate our products from our competitors’ products through the following capabilities:
IDT was incorporated in California in 1980 and reincorporated in Delaware in 1987. The terms "the Company," "IDT," "our," "us" and "we" refer to Integrated Device Technology, Inc. and its consolidated subsidiaries.
We provide a broad portfolio of essential semiconductor solutions, including integrated circuits (ICs) that enable digital media to be synchronized, transported, processed and delivered in current and next-generation communications, computing and consumer applications. We serve equipment vendors by applying our advanced hardware, integrated software and heritage technologies to create flexible, highly integrated products that enhance the functionality and processing of digital media.
In the first quarter of fiscal 2010, as part of a refinement of our business strategy, we transferred multi-port products from the Communications segment into the Computing and Consumer segment. This change in segment reporting had no impact on our consolidated balance sheets, statements of operations, statements of cash flows or statements of stockholders’ equity for any periods. The segment information for the years ended March 29, 2009 and March 30, 2008 has been adjusted retrospectively to conform to the current period presentation.
In fiscal 2010, the Communications and Computing and Consumer segments accounted for approximately 46% and 54%, respectively, of our total revenues of $535.9 million. In fiscal 2009, these segments accounted for approximately 44% and 56%, respectively, of our total revenues of $663.2 million. During fiscal 2008, these segments accounted for approximately 45% and 55%, respectively, of our total revenues of $781.5 million.
We offer custom designed products, ASSPs and general purpose industry-standard products.
This segment includes clock generation and distribution products, high-performance server memory interfaces, PCI Express switching solutions, multi-port products, PC audio and video products.
We are a leading provider of timing solutions, offering a complete portfolio of products for clock generation, distribution, recovery and jitter attenuation to serve numerous computing, consumer and communications applications.
In June 2009, we acquired Tundra Semiconductor Corporation for approximately $104.3 million in cash and assumed options to purchase up to 0.8 million shares of IDT common stock with a fair value of $0.7 million for a total consideration of approximately $105.0 million. We expect that the Tundra technologies, combined with our mixed signal product portfolio and channel capabilities, will further reinforce our leadership in interconnect and switching solutions for the communication, computing and consumer segments.
In June 2009, we purchased certain sensor technology and related assets from Leadis Technology, Inc. along with members of its engineering team for a total consideration of $6.3 million in cash to complement our core competencies enabling the multimedia triumvirate of sight (video), sound (audio) and touch (sense). Leadis' patented single-ITO (Indium Tin Oxide) touch technology enables the integration of highly differentiated, value-added, ASSPs incorporating timing, audio, power management and touch, thereby providing an entry into new growth markets.
In January 2010, we acquired Mobius Microsystems, a leader in precision all-silicon quartz crystal oscillator replacement technology. The transaction was an all-cash agreement to purchase the outstanding shares of Mobius. The acquisition of Mobius Microsystems, a leading innovator in patented all-silicon oscillator technology, reinforces our commitment to our clock / timing segments and will enable us to develop high-accuracy, crystal oscillator replacements, thereby doubling our silicon timing SAM over the next several years.
On November 30, 2009, we completed the sale of certain assets and transferred certain liabilities related to our military business to Spectrum Control, Inc ("Spectrum Control") for approximately $12.8 million. As a result, in the third quarter of fiscal 2010, we recorded a loss of $4.3 million related to this divestiture. All employees in our military business were transferred to Spectrum Control as a result of the transaction. In addition, we signed a sublease agreement with Spectrum Control, which will expire in May 2010. Prior to divestiture, the military business was part of a larger cash-flow generating product group and did not, on its own, represent a separate operation of the Company. Therefore, discontinued operations reporting did not apply. See Note 3 of the Notes to Consolidated Financial Statements for further deta ils.
On December 4, 2009, we completed the sale of certain assets and transferred certain liabilities related to Tundra's Silicon Logic engineering business to Open Silicon, Inc (“OSI’) for $1 in cash. We recorded a loss of $0.2 million in fiscal 2010 related to this divestiture. In connection with the divestiture, we entered into a design service agreement with OSI, whereby they agreed to provide and we agreed to purchase design services from OSI through the end of calendar year 2010. The total commitment under this design service agreement was $0.8 million. We also signed a sublease agreement with OSI, which will expire in June 2012.
On July 17, 2009, we completed the sale of certain assets related to our network search engine business (the "NWD Assets") to NetLogic Microsystems, Inc ("Netlogic"). Upon closing of the transaction, NetLogic paid us $100 million in cash consideration, which included inventory valued at approximately $10 million, subject to adjustment. On September 27, 2009, the inventory we sold to Netlogic was valued at $8.2 million. Subsequently, in the third quarter of fiscal 2010, we reimbursed Netlogic the excess cash for the inventory in the amount of $1.8 million. Our NWD Assets were part of the Communications reportable segment. In the second quarter of fiscal 2010, we recorded a gain of $82.7 million related to the divestiture. See Note 3 – “Divestitures” in part II, Item 8 for further information.
One family of distributors, Maxtek and its affiliates, represented approximately 21% of our total revenues in both fiscal 2010 and 2009, respectively. Another distributor, Avnet, represented approximately 11% and 10% of our total revenues in fiscal 2010 and 2009, respectively. No single direct or consignment customer represented 10% or more of our total revenues in fiscal 2010, 2009, or 2008.
During fiscal 2010, sales within the Americas, Europe, APAC, and Japan represented approximately 17%, 8%, 65% and 10%, respectively, of our total revenues. Additional details regarding revenues are included in the Consolidated Financial Statements and Notes to Consolidated Financial Statements in Item 8 of this Annual Report.
We market our products on a worldwide basis, primarily to OEMs, who in turn, incorporate our products into the customers’ products marketed under their brands. We work closely with our OEM customers to design and integrate current and next generation products to meet the requirements of end users. Many of our end-customer OEMs have outsourced their manufacturing to a concentrated group of global EMSs and original design manufacturers (ODMs), who then buy product directly from us or through our distributors on behalf of the OEM. These EMSs and ODMs have achieved greater autonomy in design win, product qualification and product purchasing decisions, especially for commodity products. No direct OEM customer accounted for 10% or more of our total revenues in fiscal 2010, 2009 or 2008. However, when sales throu gh all channels are considered, we estimate that end-customer sales to Cisco represented approximately 12% and 15% of our revenues in fiscal 2009 and 2008, respectively. No customer accounted for 10% or more of our total revenues in fiscal 2010.
Certain of our subsidiaries derive revenue from contracts and subcontracts with agencies of, or prime contractors to, the U.S. government, including U.S. military agencies. Although former employees of Integrated Circuit Systems, Inc. (ICS) who work for us have experience contracting with agencies of the U.S. government, historically we have not contracted with agencies of the U.S. government. As a company engaged, in part, in supplying defense-related equipment to U.S. government agencies, we are subject to certain business risks that are particular to companies that contract with U.S. government agencies. These risks include the ability of the U.S. government or related contractors to unilaterally:
In addition, because we have defense industry contracts with respect to products that are sold both within and outside of the United States, we are subject to the following additional risks in connection with government contracts:
The revenue from, and activity with, contracts and subcontracts with agencies of, or prime contractors to, the U.S. government, has declined subsequent to the disposition of our military business to Spectrum Control, Inc.
In fiscal 2010, we assembled or packaged products at several different subcontractors in the APAC region. Utilizing several different subcontractors located in different countries enables us to negotiate lower prices and limits the risk associated with production concentration in one country or company. The criteria used to select assembly subcontractors include, but are not limited to cost, quality, delivery, and subcontractor financial stability.
We performed the vast majority of test operations at two company-owned test facilities located in Malaysia and Singapore. A relatively small amount of test operations are also performed at third party subcontractors in the APAC region. On February 1, 2010, we announced a plan to discontinue manufacturing operations in our Singapore facility and consolidate with our manufacturing operations in Malaysia.
Our backlog (which we define as all confirmed, unshipped direct orders) as of March 28, 2010 was $73.3 million compared to $37.7 million as of March 29, 2009. We offer custom designed products, as well as Industry-Standard Products and ASSPS. Sales are made primarily pursuant to standard purchase orders, which are frequently revised by customers as their requirements change. We have also entered into master purchase agreements, which do not require minimum purchase quantities, with many of our OEM and EMS customers. We schedule product deliveries upon receipt of purchase orders under the related customer agreements. Generally, these purchase orders and customer agreements, especially those for standard products, also allow customers to change the quantities, reschedule delivery dates and cancel purchase orders without significant penalties. In general, orders, especially for industry standard products, are often made with very short lead times and may be canceled, rescheduled, re-priced or otherwise revised prior to shipment. In addition, certain distributor orders are subject to price adjustments both before and after shipment. For all these reasons, we do not believe that our order backlog is a reliable indicator of future revenues.
Our research and development efforts emphasize the development and design of proprietary, differentiated high performance, low-power analog and mixed-signal semiconductor products. We believe that a sustained level of investment in research and development is necessary to maintain our competitive position. We operate research and development centers in San Jose and
Sunnyvale, California; Tempe, Arizona; Atlanta, Georgia; Austin, Texas; Warren, New Jersey; Worcester and Boston, Massachusetts; Ann Arbor, Michigan, Toronto and Ottawa, Canada; Shanghai, China and Singapore. Research and development expenses, as a percentage of revenues, were approximately 29%, 24% and 21% in fiscal 2010, 2009 and 2008, respectively.
Our product development activities are focused on the design of integrated circuits that provide differentiated features and enhanced performance primarily for communications, computing and consumer applications.
The semiconductor industry is characterized by rapid technological advances, cyclical market patterns, erosion of product sale prices and evolving industry standards. Many of our competitors have substantially greater technical, marketing, manufacturing or financial resources than we do. In addition, several foreign competitors receive financial assistance from their governments, which could give them a competitive advantage. We compete in different product areas to varying degrees on the basis of technical innovation and product performance, as well as product quality, availability and price.
Our competitive strategy is to use our applications expertise to develop a deep understanding of customers' systems and to use our unique combination of analog and digital technologies to develop complete product portfolios that solve our customers’ whole problem. We differentiate our products through innovative configurations, proprietary features, high performance, and breadth of offerings. Our ability to compete successfully and to expand our business will depend on a number of factors, including but not limited to:
We compete with product offerings from numerous companies, including LSI, Conexant Systems, Cypress Semiconductor, Exar, Freescale Semiconductor, Infineon Technologies, Integrated Silicon Solutions, Intel, Maxim Integrated Products, NEC, Parade Technologies, Pericom Semiconductor, Philips Electronics, PLX Technology, Realtek Semiconductor, Samsung Electronics, STMicroelectronics, Texas Instruments, Toshiba, Analog Devices, Inphi, Silicon Laboratories, Montage, Diablo and Zarlink Semiconductor.
We rely primarily on our patents, trade secrets, contractual provisions, licenses, copyrights, trademarks, and other proprietary rights mechanisms to protect our intellectual property. We believe that our intellectual property is a key corporate asset, and we continue to invest in intellectual property protection. We also intend to continue our efforts to increase the breadth of our patent portfolio. There can be no assurance that any patents issued to us will not be challenged, invalidated or circumvented, that the rights granted there under will provide competitive advantages to us or that our efforts to protect our intellectual property rights will be successful.
In recent years, there has been a growing trend of companies resorting to litigation to protect their semiconductor technology from unauthorized use by others. We are, and have been involved in patent litigation, which has adversely impacted our operating results. Although we have obtained patent licenses from certain semiconductor manufacturers, we do not have licenses from a number of semiconductor manufacturers with broad patent portfolios. While we are not knowingly infringing on any of their patents, these semiconductor manufacturers may resort to litigation or other means in an effort to find infringements and force us to obtain licenses to their patents. Our success will depend in part on our ability to obtain necessary intellectual property rights and protect our intellectual property rights. While we have filed patent applications, we cannot be certain that these applications will issue into patents or that we will be able to obtain the patent coverage and other intellectual property rights necessary to protect our technology. Further, we cannot be certain that once granted, the intellectual property rights covered by such patents will not be challenged by other parties.
We are committed to protecting the environment and the health and safety of our employees, customers and the public. We endeavor to adhere to the most stringent standards across all of our facilities, to encourage pollution prevention and to strive towards continual improvement. As an integral part of our total quality management system, we strive to exceed compliance with regulatory standards in order to achieve a standard of excellence in environmental, health and safety management practices.
Our manufacturing facilities are subject to numerous environmental laws and regulations, particularly with respect to the storage, handling, use, discharge and disposal of certain chemicals, gases and other substances used or produced in the semiconductor manufacturing process. Compliance with these laws and regulations has not had a material impact on our capital expenditures, earnings, financial condition or competitive position. Although we believe that we are fully compliant with all applicable environmental laws and regulations there can be no assurance that current or future environmental laws and regulations will not impose costly requirements upon us. Any failure by us to comply with applicable environmental laws and regulations could result in fines, suspension of production, alteration of fabrica tion processes and legal liability.
As of March 28, 2010, we had approximately 2,004 employees worldwide, with approximately 1,014 employees located in the United States. Our future success depends in part on our ability to attract and retain qualified personnel, particularly engineers, who are often in great demand. We have implemented policies enabling our employees to share in our success, including stock option, restricted stock unit, stock purchase and incentive bonus plans. We have never had a work stoppage related to labor issues. None of our employees are currently represented by a collective bargaining agreement, and we consider our relationship with our employees to be good.
We electronically file our annual reports on Form 10-K, quarterly reports on Form 10-Q and current reports on Form 8-K pursuant to Section 13(a) or 15(d) of the Securities Exchange Act of 1934, as amended with the SEC. The public may read or copy any materials we file with the SEC at the SEC’s Public Reference Room at 100 F Street, NE, Washington, DC 20549. The public may obtain information on the operation of the Public Reference Room by calling the SEC at 1-800-SEC-0330. The SEC maintains an Internet site that contains reports, proxy and information statements, and other information regarding issuers that file electronically with the SEC. The address of that site is http://www.sec.gov. You may obtain a free copy of our annual reports on Form 10-K, quarterly reports on Form 10-Q and current reports on Form 8-K and amendments to those reports with the SEC on our website on the World Wide Web at http://www.IDT.com, by contacting the Investor Relations Department at our corporate offices by calling (408) 284-8200 or by sending an e-mail message to ir@IDT.com.
Investing in our common stock involves a high degree of risk. You should carefully consider the risks and uncertainties described below and all information contained in this report before you decide to purchase our common stock. If any of the possible adverse events described below actually occurs, we may be unable to conduct our business as currently planned and our financial condition and operating results could be harmed. In addition, the trading price of our common stock could decline due to the occurrence of any of these risks, and you may lose all or part of your investment. The risks described below are not the only risks facing us. Additional risks not currently known to us or that we currently believe are immaterial may also impair our business operations, results, and financial condition.
Our operating results can fluctuate dramatically. Our operating results have fluctuated in the past and are likely to vary in the future. For example, we recorded net income of $40.0 million in fiscal 2010, a net loss of $1,045.2 million in fiscal 2009 and net income of $34.2 million in fiscal 2008. Fluctuations in operating results can result from a wide variety of factors, including:
| · | Global market and economic conditions, including those related to the credit markets, may adversely affect our business and results of operations; |
| · | The cyclicality of the semiconductor industry; |
| · | The availability of industry-wide wafer processing capacity; |
| · | The availability of industry-wide and package-specific assembly subcontract capacity and related raw materials; |
| · | Changes in the demand for and mix of products sold and in the markets we and our customers serve; |
| · | Competitive pricing pressures; |
| · | The success and timing of new product and process technology announcements and introductions from us or our competitors; |
| · | Potential loss of market share among a concentrated group of customers; |
| · | Difficulty in attracting and retaining key personnel; |
| · | Difficulty in predicting customer product requirements; |
| · | Production difficulties and interruptions caused by our complex manufacturing and logistics operations; |
| · | Difficulty in managing fixed costs of our manufacturing capability in the face of changes in demand; |
| · | Reduced control over our manufacturing and product delivery as a result of our increasing reliance on subcontractors, foundry and other manufacturing services; |
| · | Costs and other issues relating to future acquisitions; |
| · | Availability and costs of raw materials from a limited number of suppliers; |
| · | Political and economic conditions in various geographic areas; |
| · | Costs associated with other events, such as intellectual property disputes or other litigation; and |
| · | Legislative, tax, accounting, or regulatory changes or changes in their interpretation. |
Global Market and Economic Conditions, including those related to the credit markets, may adversely affect our business and results of operations.
Adverse changes in global financial markets and rapidly deteriorating business conditions in the world’s developed economies in late 2008 and the first half of calendar year 2009 resulted in a significant global economic recession. Concerns about the impact of high energy costs, geopolitical issues, the availability and cost of credit, the U.S. mortgage market, a declining real estate market in the U.S. and added concerns fueled by federal government interventions in the U.S. financial and credit markets contributed to instability in both U.S. and international capital and credit markets, reduced corporate profits and capital spending, weakened demand and diminished expectations for the U.S. and global economy. These conditions, and the resulting low business and consumer confidence and high unemployment have c ontributed to substantial volatility in global capital markets and uncertain demand for our products throughout fiscal 2010. It is difficult for our customers, our vendors and us to accurately forecast and plan future business activities in this economic environment.
As a result of these market and business conditions, the cost and availability of capital and credit have been and may continue to be adversely affected by illiquid credit markets and wider credit spreads. If these market conditions continue, they may limit our ability, and the ability of our customers, to timely borrow and access the capital and credit markets to meet liquidity needs, resulting in an adverse effect on our financial condition and results of operations. Poor credit market conditions and the
contraction of global economic activity may have an adverse effect on the financial condition of our customers or suppliers. Should one or more of our major customers become financially constrained, or insolvent, our revenues and results of operations may be adversely affected.
The economic slowdown resulted in reduced customer spending for semiconductors and weakened demand for our products which had a negative impact on our revenue, gross profit, results of operations and cash flows during fiscal 2010. Although business conditions improved during the second half of fiscal 2010, credit markets continue to be volatile and continued improvement in global economic activity is uncertain. Should the nascent global economic recovery falter, customer demand for our products may decline which is likely to have a negative impact on our revenue, gross profit, results of operations and cash flows. Reduced customer spending and weakened demand may drive the semiconductor industry to reduce product pricing, which would also have a negative impact on revenue, gross profit and results of opera tions. In addition, the semiconductor industry has traditionally been highly cyclical and has often experienced significant downturns in connection with, or in anticipation of, deterioration in general economic conditions and we cannot accurately predict how severe and prolonged any downturn might be.
The cyclicality of the semiconductor industry exacerbates the volatility of our operating results.
The semiconductor industry is highly cyclical. The semiconductor industry has experienced significant downturns, often in connection with product cycles of both semiconductor companies and their customers, but also related to declines in general economic conditions. These downturns have been characterized by volatile customer demand, high inventory levels and accelerated erosion of average selling prices. Any future downturns could significantly impact our business from one period to the next relative to demand and resulting selling price declines. In addition, the semiconductor industry has experienced periods of increased demand, during which we may experience internal and external manufacturing constraints. We may experience substantial changes in future operating results due to the cyclical nature of the semiconductor industry.
Demand for our products depends primarily on demand in the communications, enterprise computing, personal computer (PC), and consumer markets which can be significantly impacted by concerns over macroeconomic issues.
Our product portfolio consists predominantly of semiconductor solutions for the communications, computing, and consumer markets. Our strategy and resources will be directed at the development, production and marketing of products for these markets. The markets for our products will depend on continued and growing demand for communications equipment, servers, PCs and consumer electronics. These end-user markets may experience changes in demand that could adversely affect our business and could be greater in periods of economic uncertainty and contraction. To the extent demand for our products or markets for our products do not grow, our business could be adversely affected.
We build most of our products based on estimated demand forecasts.
Demand for our products can change rapidly and without advance notice. Demand can also be affected by changes in our customers’ levels of inventory and differences in the timing and pattern of orders from their end customers. A large percentage of our revenue in the Asia Pacific region is recognized upon shipment to our distributors. Consequently, we have less visibility over both inventory levels at our distributors and end customer demand for our products. Further, the distributors have assumed more risk associated with changes in end demand for our products. Accordingly, significant changes in end demand in the semiconductor business in general, or for our products in particular, may be difficult for us to detect or otherwise measure, which could cause us to incorrectly forecast end-mar ket demand for our products. If we are not able to accurately forecast end demand for our products, we may be left with large amounts of unsold products, may not be able to fill all actual orders, and may not be able to efficiently utilize our existing manufacturing capacity or make optimal investment and other business decisions. As a result, we may end up with excess and obsolete inventory or we may be unable to meet customer short-term demands, either of which could have an adverse impact on our operating results.
We are reliant upon subcontractors and third-party foundries.
Beginning in fiscal 2008, we do not perform assembly services in-house and are now totally dependent on subcontractors for assembly operations. We are also dependent on third-party outside foundries for the manufacture of a portion of our silicon wafers. Our increased reliance on subcontractors and third-party foundries for our current products increases certain risks because we will have less control over manufacturing quality and delivery schedules, maintenance of sufficient capacity to
meet our orders and generally, maintaining the manufacturing processes we require. We expect our use of subcontractors and third-party foundries to continue to increase. Due to production lead times and potential capacity constraints, any failure on our part to adequately forecast the mix of product demand and resulting foundry and subcontractor requirements could adversely affect our operating results. In addition, we cannot be certain that these foundries and subcontractors will continue to manufacture, assemble, package and test products for us on acceptable economic and quality terms, or at all, and it may be difficult for us to find alternatives in a timely and cost-effective manner if they do not do so.
We are dependent on a limited number of suppliers.
Our manufacturing operations depend upon obtaining adequate raw materials on a timely basis. The number of suppliers of certain raw materials, such as silicon wafers, ultra-pure metals and certain chemicals and gases needed for our products, is very limited. In addition, certain packages for our products require long lead times and are available from only a few suppliers. From time to time, suppliers have extended lead times or limited supply to us due to capacity constraints. Our results of operations would be materially and adversely affected if we were unable to obtain adequate supplies of raw materials in a timely manner or if there were significant increases in the costs of raw materials, or if foundry or assembly subcontractor capacity was not available, or was only available at uncompetitive prices.
We have made and may continue to make acquisitions and divestitures which could divert management’s attention, cause ownership dilution to our stockholders, be difficult to integrate and/or adversely affect our financial results.
Acquisitions and divestitures are commonplace in the semiconductor industry and we have and may continue to acquire or divest businesses or technologies. Integrating newly acquired businesses or technologies could put a strain on our resources, could be costly and time consuming, and might not be successful. Acquisitions or divestitures could divert our management’s attention from other business concerns. In addition, we might lose key employees while integrating new organizations. Acquisitions and divestitures could also result in customer dissatisfaction, performance problems with an acquired company or technology, dilutive or potentially dilutive issuances of equity securities, the incurrence of debt, the assumption or incurrence of contingent liabilities, or other unanticipated events or circumstances, any of which could harm ou r business. Consequently, we might not be successful in integrating any acquired businesses, products or technologies, and might not achieve anticipated revenues and cost benefits.
Intellectual property claims against and /or on behalf of the Company could adversely affect our business and operations.
The semiconductor industry is characterized by vigorous protection and pursuit of intellectual property rights, which has resulted in significant and often protracted and expensive litigation. We have been involved with patent litigation and asserted intellectual property claims in the past, both as a plaintiff and a defendant, which adversely affected our operating results. Although we have obtained patent licenses from certain semiconductor manufacturers, we do not have licenses from a number of semiconductor manufacturers that have broad patent portfolios. Claims alleging infringement of intellectual property rights have been asserted against us in the past and could be asserted against us in the future. These claims could result in our having to discontinue the use of certain processes; license certain technologies; cease the manufact ure, use and sale of infringing products; incur significant litigation costs and damages; and develop non-infringing technology. We might not be able to obtain such licenses on acceptable terms or to develop non-infringing technology. Further, the failure to renew or renegotiate existing licenses on favorable terms, or the inability to obtain a key license, could materially and adversely affect our business. Future litigation, either as a plaintiff or a defendant, could adversely affect our operating results, as a result of increased expenses, the cost of settled claims, and/or payment of damages.
Our results are dependent on the success of new products.
The markets we serve are characterized by competition, rapid technological change, evolving standards, short product life cycles and continuous erosion of average selling prices. Consequently, our future success will be highly dependent upon our ability to continually develop new products using the latest and most cost-effective technologies, introduce our products in commercial quantities to the marketplace ahead of the competition and have our products selected for inclusion in leading system manufacturers’ products. In addition, the development of new products will continue to require significant R&D expenditures. If we are unable to successfully develop, produce and market new products in a timely manner, have our products available in commercial quantities ahead of competitive products or have our products s elected for inclusion in products of systems manufacturers and sell them at gross margins comparable to or better than our current products, our future
results of operations could be adversely impacted. In addition, our future revenue growth is also partially dependent on our ability to penetrate new markets in which we have limited experience and where competitors are already entrenched. Even if we are able to develop, produce and successfully market new products in a timely manner, such new products may not achieve market acceptance.
We are dependent on a concentrated group of customers for a significant part of our revenues.
A large portion of our revenues depends on sales to a limited number of customers. If these relationships were to diminish, or if these customers were to develop their own solutions or adopt a competitor’s solution instead of buying our products, our results could be adversely affected. For example, any diminished relationship with one or more of our key customers could adversely affect our results.
Many of our end-customer OEMs have outsourced their manufacturing to a concentrated group of global EMSs and original design manufacturers (“ODMs”) who then buy product directly from us or from our distributors on behalf of the OEM. These EMSs and ODMs have achieved greater autonomy in the design win, product qualification and product purchasing decisions, especially for commodity products. Competition for the business of these EMSs and ODMs is intense and there is no assurance we can remain competitive and retain our existing market share with these customers. If these companies were to allocate a higher share of commodity or second-source business to our competitors instead of buying our products, our results would be adversely affected. Furthermore, as EMSs and ODMs have represented a growing percentage of o ur overall business, our concentration of credit and other business risks with these customers has increased. Competition among global EMSs and ODMs is intense as they operate on extremely thin margins. If any one or more of these global EMSs or ODMs were to file for bankruptcy or otherwise experience significantly adverse financial conditions, our business would be adversely impacted as well.
Finally, we utilize a relatively small number of global and regional distributors around the world, who buy product directly from us on behalf of their customers. For example, one family of distributors, Maxtek and its affiliates, represented approximately 21% of our total revenues for fiscal 2010 and represented approximately 23% of our gross accounts receivable as of March 28, 2010. If our business relationships were to diminish or any of these global distributors were to file for bankruptcy or otherwise experience significantly adverse financial conditions, our business could be adversely impacted. Because we continue to be dependent upon continued revenue from a small group of OEM end customers, global and regional distributors, any material delay, cancellation or reduction of orders from or loss of these or othe r major customers could cause our sales to decline significantly, and we may not be able to reduce the accompanying expenses at the same rate.
The costs associated with the legal proceedings in which we are involved can be substantial, specific costs are unpredictable and not completely within our control, and unexpected increases in litigation costs could adversely affect our operating results.
We are currently involved in legal proceedings, as described below in Part I, Item 3 "Legal Proceedings." The costs associated with legal proceedings are typically high, relatively unpredictable and are not completely within our control. While we do our best to forecast and control such costs, the costs may be materially more than expected, which could adversely affect our operating results. Moreover, we may become involved in unexpected litigation with additional companies at any time, which would increase our aggregate litigation costs and could adversely affect our operating results. We are not able to predict the outcome of any of our legal actions and an adverse decision in any of our legal actions could significantly harm our business and financial performance.
We are dependent on key personnel.
Our performance is substantially dependent on the performance of our executive officers and key employees. The loss of the services of any of our executive officers, technical personnel or other key employees could adversely affect our business. In addition, our future success depends on our ability to successfully compete with other technology firms in attracting and retaining specialized technical and management personnel. If we are unable to identify, hire and retain highly qualified technical and managerial personnel, our business could be harmed.
Our product manufacturing operations are complex and subject to interruption.
From time to time, we have experienced production difficulties, including lower manufacturing yields or products that do not meet our or our customers' specifications, which has resulted in delivery delays, quality problems and lost revenue opportunities. While delivery delays have been infrequent and generally short in duration, we could experience manufacturing problems, capacity constraints and/or product delivery delays in the future as a result of, among other things, the complexity of our manufacturing processes, changes to our process technologies (including die size reduction efforts), transfer to other facilities including the transfer of our internal wafer fabrication capability to third party wafer foundries and difficulties in ramping production in both our facilities and at third-party foundries and subcontractors and install ing new equipment at our facilities. In addition, any significant quality problems could damage our reputation with our customers and could take focus away from the development of new and enhanced products. These could have a significant negative impact on our financial results.
Substantially all of our revenues are derived from products manufactured at facilities which are exposed to the risk of natural disasters. If we are unable to use our facilities or those of our subcontractors and third party foundries as a result of a natural disaster or otherwise, our operations would be materially adversely affected. While we maintain certain levels of insurance against selected risks of business interruption, not all risks can be insured at a reasonable cost. For example, we do not insure our facilities for earthquake damage due to the costs involved. Even if we have purchased insurance, the adverse impact on our business, including both costs and lost revenue opportunities, could greatly exceed the amounts, if any, that we might recover from our insurers.
We are dependent upon electric power and water provided by public utilities where we operate our manufacturing facilities. We maintain limited backup generating capability, but the amount of electric power that we can generate on our own is insufficient to fully operate these facilities, and prolonged power interruptions and restrictions on our access to water could have a significant adverse impact on our business.
Our results of operations could vary as a result of the methods, estimates and judgments we use in applying our accounting policies.
The methods, estimates and judgments we use in applying our accounting policies have a significant impact on our results of operations (see “Significant Accounting Policies” in Part II, Item 8 of this Form 10-K). Such methods, estimates and judgments are, by their nature, subject to substantial risks, uncertainties and assumptions, and factors may arise over time that leads us to change our methods, estimates and judgments. Changes in those methods, estimates and judgments could significantly affect our results of operations. In particular, the calculation of stock-based compensation expense under the authoritative guidance requires us to use valuation methodologies that were not developed for use in valuing employee stock options and make a number of assumptions, estimates and conclusions regarding matters such as expected forfeitures, expected volatility of our share price and the exercise behavior of our employees. Changes in these variables could impact our stock-based compensation expense and have a significant impact on our gross margins, research and development and selling, general and administrative expenses.
Our financial results may be adversely impacted by higher than expected tax rates or exposure to additional tax liabilities.
As a global company, our effective tax rate is highly dependent upon the geographic composition of worldwide earnings and tax regulations governing each region. We are subject to income taxes in the United States and various foreign jurisdictions, and significant judgment is required to determine worldwide tax liabilities. Our effective tax rate could be adversely affected by changes in the mix of earnings between countries with differing statutory tax rates, in the valuation of deferred tax assets, in tax laws or by material audit assessments, which could affect our profitability. In particular, the carrying value of deferred tax assets, which are predominantly in the United States, is dependent upon our ability to generate future taxable income in the United States. In addition, the amount of income taxes we pay is subject to ongoing au dits in various jurisdictions, and a material assessment by a governing tax authority such as the United States Internal Revenue Service could affect our profitability.
Our reported financial results may be adversely affected by new accounting pronouncements or changes in existing accounting standards and practices.
We prepare our financial statements in conformity with accounting principles generally accepted in the United States. These accounting principles are subject to interpretation by the Financial Accounting Standards Board (FASB), the Securities and Exchange Commission (SEC) and various organizations formed to interpret and create appropriate accounting standards and practices. New accounting pronouncements and varying interpretations of accounting standards and practices have occurred
and may occur in the future. New accounting pronouncements or a change in the interpretation of existing accounting standards or practices may have a significant effect on our reported financial results and may even affect our reporting of transactions completed before the change is announced or effective.
We are exposed to potential impairment charges on certain assets.
Over the past several years, we have made several acquisitions. As a result of these acquisitions, we had over $1 billion of goodwill and over $204 million of intangible assets on our balance sheet at the beginning of fiscal 2009. As a result of our interim impairment analysis in the third quarter of 2009 and annual impairment analysis in the fourth quarter of fiscal 2009, we recorded a goodwill impairment charge of $946.3 million and an acquisition-related intangible asset impairment charge of $79.4 million in fiscal 2009. In determining fair value, we consider various factors including our market capitalization, forecasted revenue and costs, risk-adjusted discount rates, future economic and market conditions, determination of appropriate market comparables and expected periods over which our assets will be utilized and other variables.
If our assumptions regarding forecasted cash flow, revenue and margin growth rates of certain long-lived asset groups and reporting units are not achieved, it is reasonably possible that an impairment review may be triggered for the remaining balance of goodwill and long-lived assets prior to the next annual review in the fourth quarter of fiscal 2011, which could result in material charges that could impact our operating results and financial position. In addition, from time to time, we have made investments in other companies, both public and private. If the companies that we invest in are unable to execute their plans and succeed in their respective markets, we may not benefit from such investments, and we could potentially lose the amounts we invest. In addition, we evaluate our investment portfolio on a regular basis to determine if impairments have occurred. Impairment charges could have a material impact on our results of operations in any period.
Tax benefits we receive may be terminated or reduced in the future, which would increase our costs.
As a result of our international manufacturing operations, a significant portion of our worldwide profits are in jurisdictions outside the United States, including Bermuda, Singapore and Malaysia which offer significant reductions in tax rates. These lower tax rates allow us to record a relatively low tax expense on a worldwide basis. Under current Bermuda law, we are not subject to tax on our income and capital gains. If U.S. corporate income tax laws were to change regarding deferral of manufacturing profits or other issues impacting our operating structure, this would have a significant impact to our financial results. President Obama’s Administration recently announced new U.S. tax legislative proposals that, if enacted, may adversely impact our effective tax rate and overall tax payin g position in the U.S.
In addition, the Economic Development Board of Singapore granted Pioneer Status to our wholly-owned subsidiary in Singapore in 1997. Initially, this tax exemption was to expire after ten years, but the Economic Development Board in January 2008 agreed to extend the term to twelve years. As a result, a significant portion of the income we earn in Singapore during this period will be exempt from the Singapore income tax. We were required to meet several requirements as to investment, headcount and activities in Singapore to retain this status. If it is retroactively determined that we did not meet these requirements, or for other reasons beyond our control, our financial results could be negatively impacted. Also, in Malaysia, we have been granted a tax holiday related to certain profits. If we are unable to renew this tax holida y when it expires, we will be required to start paying income tax at the statutory tax rate on our operations, which will adversely impact our effective tax rate.
International operations add increased volatility to our operating results.
A substantial percentage of our total revenues are derived from international sales, as summarized below:
(percentage of total revenues) | | Fiscal 2010 | | | Fiscal 2009 | | | Fiscal 2008 | |
| Americas | | | 17 | % | | | 20 | % | | | 28 | % |
| Asia Pacific | | | 65 | % | | | 63 | % | | | 56 | % |
| Japan | | | 10 | % | | | 9 | % | | | 9 | % |
| Europe | | | 8 | % | | | 8 | % | | | 7 | % |
| Total | | | 100 | % | | | 100 | % | | | 100 | % |
In addition, our facilities in Malaysia and Singapore, our design centers in Canada and China, and our foreign sales offices incur payroll, facility and other expenses in local currencies. Accordingly, movements in foreign currency exchange rates can impact our revenues and costs of goods sold, as well as both pricing and demand for our products.
Our offshore sites and export sales are also subject to risks associated with foreign operations, including:
| · | Political instability and acts of war or terrorism, which could disrupt our manufacturing and logistical activities; |
| · | Regulations regarding use of local employees and suppliers; |
| · | Currency controls and fluctuations, devaluation of foreign currencies, hard currency shortages and exchange rate fluctuations; |
| · | Changes in local economic conditions; |
| · | Governmental regulation of taxation of our earnings and those of our personnel; and |
| · | Changes in tax laws, import and export controls, tariffs and freight rates. |
Contract pricing for raw materials and equipment used in the fabrication and assembly processes, as well as for foundry and subcontract assembly services, may also be impacted by currency controls, exchange rate fluctuations and currency devaluations. We sometimes hedge currency risk for currencies that are highly liquid and freely quoted, but may not enter into hedge contracts for currencies with limited trading volume.
In addition, as much of our revenues are generated outside the United States, a significant portion of our cash and investment portfolio accumulates offshore. At March 28, 2010, we had cash, cash equivalents and investments of approximately $249.8 million invested overseas in accounts belonging to various IDT foreign operating entities. While these amounts are primarily invested in U.S. dollars, a portion is held in foreign currencies, and all offshore balances are exposed to local political, banking, currency control and other risks. In addition, these amounts may be subject to tax and other transfer restrictions.
If the recent credit market conditions worsen, it could have a material adverse impact on our investment portfolio.
Although we manage our investment portfolio by purchasing only highly rated securities and diversifying our investments across various sectors, investment types, and underlying issuers, recent volatility in the short-term financial markets has been unprecedented. We have a nominal amount of securities in asset backed commercial paper and hold no auction rated or mortgage backed securities. However it is uncertain as to the full extent of the current credit and liquidity crisis and with possible further deterioration, particularly within one or several of the large financial institutions, the value of our investments could be negatively impacted.
We rely upon certain critical information systems for the operation of our business.
We maintain and rely upon certain critical information systems for the effective operation of our business. These information systems include telecommunications, the Internet, our corporate intranet, various computer hardware and software applications, network communications, and e-mail. These information systems are subject to attacks, failures, and access denials from a number of potential sources including viruses, destructive or inadequate code, power failures, and physical damage to computers, communication lines and networking equipment. To the extent that these information systems are under our control, we have implemented security procedures, such as virus protection software and emergency recovery processes, to address the outlined risks. While we believe that our information systems are appropriately controlled and that we have processes in place to adequately manage these risks, security procedures for information systems cannot be guaranteed to be failsafe and our inability to use or access these information systems at critical points in time could unfavorably impact the timely and efficient operation of our business.
We are subject to a variety of environmental and other regulations related to hazardous materials used in our manufacturing processes.
Any failure by us to adequately control the use or discharge of hazardous materials under present or future regulations could subject us to substantial costs or liabilities or cause our manufacturing operations to be suspended.
We have limited experience with government contracting, which entails differentiated business risks.
We derive some revenue from contracts and subcontracts with agencies of, or prime contractors to, the U.S. government, including U.S. military agencies. As a company engaged, in part, in supplying defense-related equipment to U.S. government agencies, we are subject to certain business risks that are particular to companies that contract with U.S. government agencies. These risks include the ability of the U.S. government or related contractors to unilaterally:
| · | Terminate contracts at its convenience; |
| · | Terminate, modify or reduce the value of existing contracts, if budgetary constraints or needs change; |
| · | Cancel multi-year contracts and related orders, if funds become unavailable; |
| · | Adjust contract costs and fees on the basis of audits performed by U.S. government agencies; |
| · | Control and potentially prohibit the export of our products; |
| · | Require that the company continue to supply products despite the expiration of a contract under certain circumstances; |
| · | Require that the company fill certain types of rated orders for the U.S. government prior to filling any orders for other customers; and |
| · | Suspend us from receiving new contracts pending resolution of any alleged violations of procurement laws or regulations. |
In addition, because we have defense industry contracts with respect to products that are sold both within and outside of the United States, we are subject to the following additional risks in connection with government contracts:
| · | The need to bid on programs prior to completing the necessary design, which may result in unforeseen technological difficulties, delays and/or cost overruns; |
| · | The difficulty in forecasting long-term costs and schedules and the potential obsolescence of products related to long-term fixed price contracts; and |
| · | The need to transfer and obtain security clearances and export licenses, as appropriate. |
Our common stock has experienced substantial price volatility.
Volatility in the price of our common stock may occur in the future, particularly as a result of the current economic downturn and quarter-to-quarter variations in our actual or anticipated financial results, or the financial results of other semiconductor companies or our customers. Stock price volatility may also result from product announcements by us or our competitors, or from changes in perceptions about the various types of products we manufacture and sell. In addition, our stock price may fluctuate due to price and volume fluctuations in the stock market, especially in the technology sector, and as a result of other considerations or events described in this section.
We depend on the ability of our personnel, raw materials, equipment and products to move reasonably unimpeded around the world.
Any political, military, world health or other issue which hinders the worldwide movement of our personnel, raw materials, equipment or products or restricts the import or export of materials could lead to significant business disruptions. Furthermore, any strike, economic failure, or other material disruption on the part of major airlines or other transportation companies could also adversely affect our ability to conduct business. If such disruptions result in cancellations of customer orders or contribute to a general decrease in economic activity or corporate spending on information technology, or directly impact our marketing, manufacturing, financial and logistics functions, our results of operations and financial condition could be materially and adversely affected.
ITEM 1B. UNRESOLVED STAFF COMMENTS
None.
We own and operate a wafer fabrication facility in Hillsboro, Oregon (approximately 245,000 square feet) and own and operate a test facility in Malaysia (approximately 145,000 square feet). As of March 28, 2010, we operated a test facility in Singapore
(approximately 37,000 square feet), which we discontinued in April 2010. See Note 11 – “Restructuring” in Part II, Item 8 for further discussion. Our Malaysian facility is subject to ground leases and our Singapore facility is subject to a leased space arrangement. For more information on our production facilities, please refer to Item 1, "Manufacturing," in this Report 10-K.
Our corporate headquarters, and various administrative, engineering and support functions are located in San Jose, California. We own and occupy approximately 263,000 square feet of space at our San Jose headquarters. We also lease various facilities throughout the world for research and development and sales and marketing functions, including design centers in the United States, Canada and China.
We believe that the facilities that we currently own or lease are suitable and adequate for our needs for the immediate future.
ITEM 3. LEGAL PROCEEDINGS
On October 24, 2006, we were served with a civil antitrust complaint filed by Reclaim Center, Inc., et. al. as plaintiffs in the U.S. District Court for the Northern District of California against the Company and 37 other entities on behalf of a purported class of indirect purchasers of Static Random Access Memory (SRAM) products. The Complaint alleges that we and other defendants conspired to raise the prices of SRAM, in violation of Section 1 of the Sherman Act, the California Cartwright Act, and several other states’ antitrust, unfair competition, and consumer protection statutes. Shortly thereafter, a number of other plaintiffs filed similar complaints on behalf of direct and indirect purchasers of SRAM products. Given the similarity of the complaints, the Judicial Panel on Multidistrict Litigation transferred the case s to a single judge in the Northern District of California and consolidated the cases for pretrial proceedings in February 2007. The consolidated cases are captioned In re Static Random Access Memory (SRAM) Antitrust Litigation. In August 2007, direct purchasers of SRAM products and indirect purchasers of SRAM products filed separate Consolidated Amended Complaints. We were not named as a defendant in either complaint. Pursuant to tolling agreements with the indirect and direct purchaser plaintiffs, the statute of limitations was tolled until January 10, 2009 as to potential claims against us. The tolling agreements have now expired and the statute of limitations is running on potential claims against us. Discovery has closed in both cases. We intend to vigorously defend ourselves against these claims.
In April 2008, LSI Corporation and its wholly owned subsidiary Agere Systems Inc. (collectively “LSI”) instituted an action in the United States International Trade Commission (ITC or “Commission”), naming us and several other respondents. The ITC action sought an exclusion order under section 337 of the Tariff Act to prevent importation into the U.S. of semiconductor integrated circuit devices and products made by methods alleged to infringe an LSI patent relating to tungsten metallization in semiconductor manufacturing. LSI also filed a companion case in the U.S. District Court for the Eastern District of Texas seeking an injunction and damages of an unspecified amount relating to such alleged infringement. Some of the defendants in the action have since settled the claims against them. The action in t he U.S. District Court is currently stayed pending the outcome of the ITC action. On September 21, 2009, the Administrative Law Judge (“ALJ”) for the ITC action issued an Initial Determination finding that the patent claims asserted by LSI were invalid in light of the prior art. Based on the finding of invalidity, the Court held that no violation of section 337 has occurred with respect to the asserted claims. On October 5, 2009, LSI filed a Petition to Review by the full Commission, and respondents filed a Common Contingent Petition for Review on common matters in the case. We separately filed a Contingent Petition for Review on Company-specific matters in the case. On November 23, 2009, the Commission issued a Notice of determination to review in-part the ALJ’s Initial Determination. The Commission further instructed the ALJ to consider on remand the merit of responden ts' arguments with respect to invalidity of one asserted claim for obviousness. On January 14, 2010, the ALJ issued a Remand Determination that respondents had not demonstrated by clear and convincing evidence that the claim at issue on remand was invalid due to obviousness. The Commission also extended the target date for completion of the investigation to March 22, 2010. Subsequently, briefing responsive to the Remand was filed by both parties. On March 22, 2010, the Commission issued its Notice of Decision indicating that it had found that the patent claims asserted by LSI were invalid and that there had been no violation of section 337 by us, and thereupon terminated its investigation.
In December 2009, Ring Technology Enterprises of Texas, LLC (“Ring”) filed a complaint in the Eastern District of Texas against 30 defendants alleging infringement of a Ring patent related to memory access technology. Ring filed another, separate complaint in the Eastern District of Texas in March of 2010 claiming infringement of the same patent by 43 additional defendants. We were not named as a defendant in either complaint, however, a number of the defendants are purchasers of our Advanced Memory Buffer (“AMB”) products, which may be relevant to the claims made against defendants in the complaints by Ring. Certain of these defendants have requested that we indemnify and provide a defense under the terms of purchase for
our AMB products. Based on a good-faith review of the claims by Ring, we have initially agreed to provide a defense for some of these defendants. We have reserved the right to withdraw our defense if, during the course of litigation it is determined that we have no liability for indemnification based on the claims made by Ring.
.
PART II
ITEM 5. MARKET FOR REGISTRANT'S COMMON EQUITY, RELATED STOCKHOLDER MATTERS AND ISSUER PURCHASES ON EQUITY SECURITIES
Price Range of Common Stock
Our Common Stock is traded on the NASDAQ Global Select Market under the symbol IDTI. The following table shows the high and low closing sales prices for our Common Stock as reported by the NASDAQ Global Select Market for the fiscal periods indicated:
| | | High | | | Low | |
| Fiscal 2010 | | | | | | |
| First Quarter | | $ | 6.62 | | | $ | 4.54 | |
| Second Quarter | | | 7.29 | | | | 5.80 | |
| Third Quarter | | | 6.81 | | | | 5.66 | |
| Fourth Quarter | | | 6.78 | | | | 5.36 | |
| | | | | | | | | |
| Fiscal 2009 | | | | | | | | |
| First Quarter | | $ | 12.51 | | | $ | 8.93 | |
| Second Quarter | | | 11.34 | | | | 8.26 | |
| Third Quarter | | | 7.82 | | | | 4.33 | |
| Fourth Quarter | | | 6.25 | | | | 4.12 | |
Stockholders
As of April 30, 2010, there were approximately 754 record holders of our Common Stock. A substantial majority of our shares are held by brokers and other institutions on behalf of individual stockholders.
Dividends
We have never paid cash dividends on our Common Stock. We currently plan to retain any future earnings for use in our business and do not currently anticipate paying cash dividends in the foreseeable future.
Issuer Purchases of Equity Securities
The following table sets forth information with respect to repurchases of our common stock during the fourth quarter of fiscal 2010:
| Period | | Total Number of Shares Purchased | | | Average Price Paid Per Share | | | Total Number of Shares Purchased as Part of Publicly Announced Plans or Programs | | | Approximate Dollar Value of Shares that May Yet Be Purchased Under the Plans or Programs | |
| December 28, 2009 – January 24, 2010 | | | 237,200 | | | $ | 6.48 | | | | 237,200 | | | $ | 73,010,468 | |
| January 25, 2010 – February 21, 2010 | | | 1,321,600 | | | $ | 5.68 | | | | 1,321,600 | | | $ | 65,476,001 | |
| February 22, 2010 – March 28, 2010 | | | 2,047,900 | | | $ | 5.82 | | | | 2,047,900 | | | $ | 53,524,736 | |
| Total | | | 3,606,700 | | | $ | 5.81 | | | | 3,606,700 | | | | | |
On January 18, 2007, our Board of Directors initiated a $200 million share repurchase program. During fiscal 2008, our Board of Directors approved a $200 million expansion of the share repurchase program to a total of $400 million. In fiscal 2008, we repurchased approximately 28.9 million shares at an average price of $11.60 per share for a total purchase price of $334.8 million. On April 30, 2008, our Board of Directors approved an additional $100 million expansion of the share repurchase program to a total of $500 million. In fiscal 2009, we repurchased approximately 8.4 million shares at an average price of $7.46 per share for a total purchase price of $62.3 million. In fiscal 2010, we repurchased approximately 4.2 million shares at an average price of $5.83 per share for a total purchase price of $24.3 millio n. As of March 28, 2010, approximately $53.5 million was available for future purchase under the share repurchase program. Share repurchases were recorded as treasury stock and resulted in a reduction of stockholders’ equity.
Stock Performance Graph
Set forth below is a line graph comparing the percentage change in the cumulative total stockholder return on our common stock against the cumulative total return of the S&P 500 Index and the S&P Electronics (Semiconductors) Index for a period of five fiscal years. Our fiscal year ends on a different day each year because our year ends at midnight on the Sunday nearest to March 31 of each calendar year. However, for convenience, the amounts shown below are based on a March 31 fiscal year end. “Total return,” for the purpose of this graph, assumes reinvestment of all dividends.
The performance of our stock price shown in the following graph is not necessarily indicative of future stock price performance.
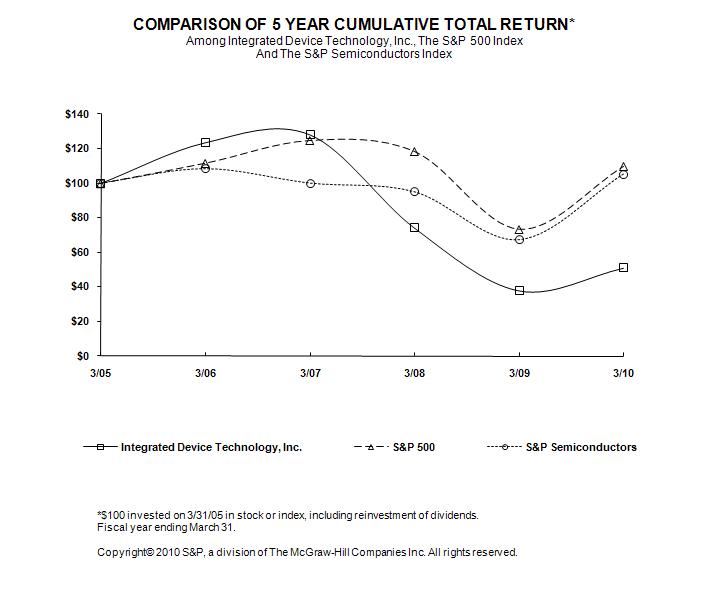
| Cumulative Total Return | |
| | | 2005 | | | 2006 | | | 2007 | | | 2008 | | | 2009 | | | 2010 | |
| Integrated Device Technology, Inc. | | $ | 100.00 | | | $ | 123.52 | | | $ | 128.18 | | | $ | 74.23 | | | $ | 37.82 | | | $ | 50.96 | |
| S&P 500 | | $ | 100.00 | | | $ | 111.73 | | | $ | 124.95 | | | $ | 118.60 | | | $ | 73.43 | | | $ | 109.97 | |
| S&P Semiconductor index | | $ | 100.00 | | | $ | 108.31 | | | $ | 99.99 | | | $ | 94.97 | | | $ | 67.27 | | | $ | 105.27 | |
ITEM 6. SELECTED FINANCIAL DATA
The data set forth below are qualified in their entirety by reference to, and should be read in conjunction with, "Management's Discussion and Analysis of Financial Condition and Results of Operations" and the Consolidated Financial Statements and related notes thereto included in this Annual Report on Form 10-K.
Statements of Operations Data
| | | Fiscal Year Ended | |
(in thousands, except per share data) | | March 28, 2010 | | | March 29, 2009 | | | March 30, 2008 | | | April 1, 2007 | | | April 2, 2006 | |
| Revenues | | $ | 535,906 | | | $ | 663,245 | | | $ | 781,467 | | | $ | 803,596 | | | $ | 527,778 | |
| Research and development expenses | | | 157,486 | | | | 161,192 | | | | 165,599 | | | | 166,433 | | | | 127,591 | |
| Selling, general and administrative | | | 107,037 | | | | 125,810 | | | | 161,708 | | | | 191,211 | | | | 142,518 | |
| Goodwill and intangible assets impairment | | | -- | | | | 1,025,685 | | | | -- | | | | -- | | | | -- | |
| Operating income (loss) | | | (39,616 | ) | | | (1,043,835 | ) | | | 12,025 | | | | (17,496 | ) | | | (94,842 | ) |
| Net Income (loss) | | $ | 40,019 | | | $ | (1,045,167 | ) | | $ | 34,179 | | | $ | (7,578 | ) | | $ | (81,708 | ) |
| Basic net income (loss) per share | | | 0.24 | | | | (6.22 | ) | | | 0.18 | | | | (0.04 | ) | | | (0.52 | ) |
| Diluted net income (loss) per share | | | 0.24 | | | | (6.22 | ) | | | 0.18 | | | | (0.04 | ) | | | (0.52 | ) |
| Shares used in computing net income (loss) per share: | | | | | | | | | | | | | | | | | | | | |
| Basic | | | 165,408 | | | | 168,114 | | | | 187,213 | | | | 198,106 | | | | 157,345 | |
| Diluted | | | 165,961 | | | | 168,114 | | | | 189,260 | | | | 198,106 | | | | 157,345 | |
Balance Sheets and Other Data
(in thousands, except employee data) | | March 28, 2010 | | | March 29, 2009 | | | March 30, 2008 | | | April 1, 2007 | | | April 2, 2006 | |
| Cash, cash equivalents and investments (1) | | $ | 343,189 | | | $ | 296,073 | | | $ | 239,191 | | | $ | 359,933 | | | $ | 295,973 | |
| Total assets | | | 750,945 | | | | 678,367 | | | | 1,783,253 | | | | 2,041,732 | | | | 2,037,691 | |
| Other long-term obligations | | | 21,833 | | | | 14,314 | | | | 18,364 | | | | 16,001 | | | | 15,581 | |
| Stockholders' equity | | $ | 599,740 | | | $ | 557,068 | | | $ | 1,620,822 | | | $ | 1,839,090 | | | $ | 1,858,199 | |
| Number of employees | | | 2,004 | | | | 2,112 | | | | 2,353 | | | | 2,400 | | | | 2,700 | |
(1) Cash, cash equivalents and investments exclude equity investments not classified as available for sale.
ITEM 7. MANAGEMENT'S DISCUSSION AND ANALYSIS OF FINANCIAL CONDITION AND RESULTS OF OPERATIONS
The following discussion and analysis should be read in conjunction with “Item 6. Selected Financial Data” and “Item 8. Financial Statements and Supplementary Data”, included elsewhere in this Annual Report on Form 10-K.
The information in this Annual Report contains forward looking statements within the meaning of Section 27A of the Securities Act of 1933, as amended, and Section 21E of the Securities Exchange Act of 1934, as amended. Any statements contained herein that are not statements of historical facts may be deemed to be forward-looking. Forward-looking statements are based upon current expectations that involve a number of risks and uncertainties. These risks and uncertainties include, but are not limited to: operating results; new product introductions and sales; competitive conditions; capital expenditures and resources; manufacturing capacity utilization; customer demand and inventory levels; intellectual property issues; and the risk factors set forth in the section “Risk Factors” in Part I, Item 1A, of this Annual Report on Form 10-K. As a result of these risks and uncertainties, actual results and timing of events could differ significantly from those anticipated in the forward-looking statements. We undertake no obligation to publicly release any revisions to the forward-looking statements for future events or new information after the date of this Annual Report on Form 10-K.
Critical Accounting Policies
Our consolidated financial statements have been prepared in accordance with accounting principles generally accepted in the U.S. The preparation of such statements requires us to make estimates and assumptions that affect the reported amounts of revenues and expenses during the reporting period and the reported amounts of assets and liabilities as of the date of the financial statements. Our estimates and assumptions are based on historical experience and other factors that we consider to be appropriate in the circumstances. However, actual future results may vary from our estimates and assumptions.
We believe that the following accounting policies are "critical", as defined by the SEC, in that they are both highly important to the portrayal of our financial condition and results, and they require difficult management judgments, estimates and assumptions about matters that are inherently uncertain.
Revenue Recognition. Our revenue results from semiconductors sold through three channels: direct sales to original equipment manufacturers (OEMs) and electronic manufacturing service providers (EMSs), consignment sales to OEMs and EMSs, and sales through distributors. We recognize revenue when persuasive evidence of an arrangement exists, delivery has occurred or services have been rendered, the price is fixed or determinable and our ability to collect is reasonably assured. For direct sales, we recognize revenue in accordance with the applicable shipping terms. Revenue related to the sale of consignment inventory is not recognized until the product is pulled from inventory stock by the customer.
For distributors in the North America and Europe regions, who have stock rotation, price protection and ship from stock pricing adjustment rights, we defer revenue and related cost of revenues on sales to these distributors until the product is sold through by the distributor to an end-customer. Subsequent to shipment to the distributor, we may reduce product pricing through price protection based on market conditions, competitive considerations and other factors. Price protection is granted to distributors on the inventory that they have on hand at the date the price protection is offered. We also grant certain credits to our distributors on specifically identified portions of the distributors’ business to allow them to earn a competitive gross margin on the sale of our products to their end-customers.&# 160; As a result of our inability to estimate these credits, we have determined that the sales price to these distributors is not fixed or determinable until the final sale to the end-customer.
In the Asia Pacific (“APAC”) region and Japan, we have distributors for which revenue is recognized upon shipment, with reserves recorded for the estimated return and pricing adjustment exposures. The determination of the amount of reserves to be recorded for stock rotation rights requires that we make estimates as to the amount of product which will be returned by customers within their limited contractual rights. We utilize historical return rates to estimate the exposure in accordance with authoritative guidance for Revenue Recognition When Right of Return Exists. In addition, from time to time, we can offer pricing adjus tments to distributors for product purchased in a given quarter that remains in their inventory. These amounts are estimated by management based on discussions with customers, assessment of market trends, as well as historical experience.
Based on the terms in the agreements with our distributors and the application of this policy, we recognize revenue once the distributor sells our products to an end-customer for North American and European distributors and recognize revenue upon shipment to Japanese and other Asian distributors.
Income Taxes. We account for income taxes under an asset and liability approach that requires the expected future tax consequences of temporary differences between book and tax bases of assets and liabilities be recognized as deferred tax assets and liabilities. Generally accepted accounting principles require us to evaluate the ability to realize the value of our net deferred tax assets on an ongoing basis. A valuation allowance is recorded to reduce the net deferred tax assets to an amount that will more likely than not be realized. Accordingly, we consider various tax planning strategies, forecasts of future taxable income and our most recent operating results in assessing the need for a valuation allowance. In consideration of the ability to re alize the value of net deferred tax assets, recent results must be given substantially more weight than any projections of future profitability. Since the fourth quarter of fiscal 2003, we have determined that, under applicable accounting principles, it is more likely than not that we will not realize the value of our net deferred tax assets. Our assumptions regarding the ultimate realization of these assets remained unchanged in fiscal 2010 and accordingly, we continue to record a valuation allowance to reduce our deferred tax assets to an amount that is more likely than not to be realized.
On April 2, 2007, we adopted FASB authoritative guidance which clarifies the accounting for uncertainty in income taxes recognized in an enterprise’s financial statements. This interpretation prescribes a recognition threshold and measurement attribute for the financial statement recognition and measurement of a tax position taken or expected to be taken in a tax return. As a result of the implementation of this guidance, we recognize the tax liability for uncertain income tax positions on the income tax return based on the two-step process prescribed in the interpretation. The first step is to determine whether it is more likely than not that each income tax position would be sustained upon audit. The second step is to estimate and measure the tax benefit as the amount that has a greater than 50% likelihood of being realized u pon ultimate settlement with the tax authority. Estimating these amounts requires us to determine the probability of various possible outcomes. We evaluate these uncertain tax positions on a quarterly basis. This evaluation is based on the consideration of several factors including changes in facts or circumstances, changes in applicable tax law, settlement of issues under audit, and new exposures. If we later determine that the exposure is lower or that the liability is not sufficient to cover our revised expectations, we adjust the liability and effect a related change in our tax provision during the period in which we make such determination.
Inventories. Inventories are recorded at the lower of standard cost (which approximates actual cost on a first-in, first-out basis) or market value. We record provisions for obsolete and excess inventory based on our forecasts of demand over specific future time horizons. We also record provisions to value our inventory at the lower of cost or market value, which rely on forecasts of average selling prices (ASPs) in future periods. Actual market conditions, demand and pricing levels in the volatile semiconductor markets that we serve may vary from our forecasts, potentially impacting our inventory reserves and resulting in material impacts to our gross margin.
Valuation of Long-Lived Assets and Goodwill. We own and operate our own manufacturing facilities (see Part I of this Form 10-K), and have also acquired certain businesses and product portfolios in recent years. As a result, we have property, plant and equipment, goodwill and other intangible assets. We evaluate these items for impairment on an annual basis, or sooner, if events or changes in circumstances indicate that carrying values may not be recoverable. Triggering events for impairment reviews may include adverse industry or economic trends, significant restructuring actions, significantly lowered projections of profitability, or a sustained decline in our market capitalization. Evaluations of possible impairment and if applicable, adjustments to c arrying values, require us to estimate among other factors, future cash flows, useful lives and fair market values of our reporting units and assets. Actual results may vary from our expectations.
We review goodwill for impairment annually and whenever events or changes in circumstances indicate the carrying value of goodwill may not be recoverable. Determining the fair value of a reporting unit is judgmental in nature and involves the use of significant estimates and assumptions. These estimates and assumptions include revenue growth rates and operating margins used to calculate projected future cash flows, risk-adjusted discount rates, future economic and market conditions and determination of appropriate market comparables. We utilize a discounted cash flow analysis to estimate the fair value of our reporting units. Actual future results may differ from those estimates. In addition, we make certain judgments and assumptions in allocating shared assets and liabilities to determine the carrying values for each of our reporting uni ts. As a result of our interim impairment analysis in the third quarter of fiscal 2009 and annual impairment analysis in the fourth quarter of fiscal
2009, we recorded goodwill impairment charges totaling $946.3 million in fiscal 2009. During fiscal 2009, we recorded impairment charges related to long-lived assets of $79.4 million. We completed our annual review of goodwill during the quarter ended March 28, 2010 and concluded there was no impairment.
Stock-based Compensation. In accordance with FASB guidance on share-based payments, we measure and recognize compensation expense for all stock-based payments awards, including employee stock options, restricted stock units and rights to purchase shares under employee stock purchase plans, based on their estimated fair value and recognize the costs in the financial statements over the employees’ requisite service period.
The fair value of employee restricted stock units is equal to the market value of our common stock on the date the award is granted. We estimate the fair value of employee stock options and the right to purchase shares under the employee stock purchase plan using the Black-Scholes valuation model. Option-pricing models require the input of highly subjective assumptions, including the expected term of options and the expected price volatility of the stock underlying such options. In addition, we are required to estimate the number of stock-based awards that will be forfeited due to employee turnover. We attribute the value of stock-based compensation to expense using an accelerated method. Finally, we capitalize into inventory a portion of the periodic stock-based compensation expense that relates to employees working in manufacturing activities.
We update the expected term of stock option grants annually based on our analysis of the stock option exercise behavior over a period of time. The interest rate is based on the average U.S. Treasury interest rate over the expected term during the applicable quarter. We believe that the implied volatility of our common stock is an important consideration of overall market conditions and a good indicator of the expected volatility of our common stock. However, due to the limited volume of options freely traded over the counter, we believe that implied volatility, by itself, is not representative of the expected volatility of our common stock. Therefore, upon the adoption of the FASB’s authoritative guidance for stock-based payments at the beginning of fiscal 2007, we revised the volatility f actor used to estimate the fair value of our stock-based awards which now reflects a blend of historical volatility of our common stock and implied volatility of call options and dealer quotes on call options, generally having a term of less than twelve months. We have not paid, nor do we have current plans to pay dividends on our common stock in the foreseeable future.
Overview
As part of our application specific product strategy targeted at larger, fast growing portions of the communications, computing and consumer electronics end markets, we capitalized on the economic downturn by making structural changes to our business. During fiscal 2010, we completed several strategic acquisitions and business divestitures to align our resources with strategic goals, which are highlighted below.
| · | In June 2009, we acquired Tundra Semiconductor Corporation which combined with our mixed signal product portfolio and channel capabilities, will further reinforce our leadership in interconnect and switching solutions for the communication, computing and embedded segments. |
| · | In June 2009, we purchased the touch sensor technology assets from Leadis Technology with strategic capability to complement our existing audio, video, timing and power smart technologies to enable us to address a broader range of multimedia applications with highly integrated processing, interfacing and connectivity solutions. |
| · | In July 2009, we divested our network search engine business to sharpen our focus on serving our customers” needs of developing mixed-signal solutions that solve the challenges inherent in the processing, transporting and delivering of digital media. |
| · | In August 2009, we entered into an agreement to transfer product fabrication processes and related activities currently running in our Oregon facility to Taiwan Semiconductor Manufacturing Company (“TSMC”) foundries. This agreement, which will combine our system expertise and architecture and the TSMC technology platform, expands our overall global manufacturing capability and begins our transition from a “fab-lite” to a fabless model. |
| · | During the third quarter of fiscal 2010, we divested our Micro Networks business to realign our focus on analog-intensive, mixed-signal solutions for the communications, computing and consumer markets. |
| · | In January 2010, we acquired Mobius Microsystems to extend our timing leadership into high accuracy, crystal oscillator replacements. |
| · | In February 2010, as part of strategic initiative to improve operational efficiency, we announced a plan to discontinue testing operations at our Singapore facility. |
| · | In April 2010, we acquired certain technologies of IKOR a manufacturer of VRM solutions for high-performance computing. IKOR's innovative power technology complements our growing power management initiative allows us to achieve higher levels of performance and integration. |
We believe these strategic and structural actions, together with our investments in organic growth initiatives, will strengthen IDT’s business model and position us to serve larger, faster growing available markets in the coming years.
The following table and discussion provide an overview of our operating results for fiscal 2010, 2009 and 2008:
| | | Fiscal Year Ended |
(in thousands) | | March 28, 2010 | | | % of Change | | | March 29, 2009 | | | % of Change | | | March 30, 2008 | |
| Revenues | | $ | 535,906 | | | $ | (19.2 | )% | | $ | 663,245 | | | | (15.1 | )% | | $ | 781,467 | |
| | | | | | | | | | | | | | | | | | | | | |
| Gross profit | | $ | 224,907 | | | | (18.1 | )% | | $ | 274,449 | | | | (19.1 | )% | | $ | 339,332 | |
| As a % of net revenues | | | 42 | % | | | 1 | % | | | 41 | % | | | 2 | % | | | 43 | % |
| | | | | | | | | | | | | | | | | | | | | |
| Operating income (loss) | | $ | (39,616 | ) | | | | | | $ | (1,043,835 | ) | | | | | | $ | 12,025 | |
| As a % of net revenues | | | (7.4 | )% | | | | | | | (157.4 | )% | | | | | | | 1.5 | % |
| | | | | | | | | | | | | | | | | | | | | |
| Net income (loss) | | $ | 40,019 | | | | | | | $ | (1,045,167 | ) | | | | | | $ | 34,179 | |
| As a % of net revenues | | | 7.5 | % | | | | | | | (157.6 | )% | | | | | | | 4.4 | % |
At the beginning of fiscal 2010, the global economy was in the midst of a deep recession. Our order rates in the last quarter of fiscal 2009 were at extremely low levels as customers dealt with falling demand in the wake of the global credit crisis. As a result, our order backlog at the beginning of fiscal 2010 was at a multi-year low and our first quarter revenues of $116.0 million were over 40% lower than the $200.5 million in revenue recorded in the September 2008 quarter. The decline in revenues was exacerbated by the transition away from Advanced Memory Buffer (AMB) products in Intel-based server platforms in the first half of calendar 2009 to lower priced memory interface devices. The resulting lower revenue level reduced profit margins and cash flows.
Overall customer demand improved slowly but steadily as fiscal 2010 progressed and normal seasonal shipment patterns emerged in the second half of the year. Revenues increased sequentially in the second and third quarters of fiscal 2010 despite our divestiture of the network search engine business at the beginning of the second fiscal quarter. Revenues in the fourth fiscal quarter typically decline sequentially due to reduced demand from computing and consumer end markets. However, customer order rates improved substantially in the fourth quarter of fiscal 2010 driven by improved demand from customers serving the communications and computing end markets. This resulted in a less than typical seasonal decline in fourth quarter 2010 revenues.
For the year, revenues were lower in fiscal 2010 compared to revenues in fiscal 2009, as we were negatively impacted by the slowdown in the global economy. Our performance in gross margin percentage is dependent on our sales mix, as well as manufacturing efficiencies and execution relative to the level of factory utilization. Our gross margin percentage increased slightly in fiscal 2010 from fiscal 2009, primarily as a result of lower costs for purchased wafers and higher factory utilization in our Hillsboro, Oregon wafer fabrication facility.
Net income in fiscal 2010 of $40.0 million includes a $78.3 million gain on the sale of our networking division, net of losses on the sale of certain assets; $43.6 million in acquisition related expenses; $20.5 million in restructuring and other related charges; and $16.7 million in stock-based compensation.
Net loss in fiscal 2009 includes $1,025.7 million of goodwill and acquisition-related intangible assets impairment and $5.6 million of acquired in-process research and development expense. The net loss in fiscal 2009 also includes $7.3 million for severance and restructuring expenses related to workforce reductions and closing of certain offices (see Note 11 to the Consolidated Financial Statements) and $32.4 million of stock-based compensation expense.
We generated cash from operating activities in each quarter of fiscal 2010 and generated $52.1 million in cash from operations for the year. As business conditions improved in the second half of fiscal 2010, we resumed the repurchase of our common stock. We repurchased a total of 4.2 million shares of our common stock for $24.3 million during fiscal 2010. These shares were repurchased in the open market in connection with the $500 million stock repurchase program initiated in January 2007 (see Part II, Item 5 "Market for Registrant’s Common Equity, Related Stockholder Matters and Issuer Purchases on Equity Securities" or Note 7 to the Consolidated Financial Statements). The stock repurchase activ ity is one element of our overall program to offset dilution from employee stock options and increase return on invested capital, which we believe improves shareholder value over time.
We continue to maintain a strong balance sheet. We ended fiscal 2010 with an investment portfolio of $343.2 million, consisting of cash and cash equivalents and short-term investments and have no outstanding debt.
Results of Operations
In the first quarter of fiscal 2010, as part of a refinement of our business strategy, we transferred multi-port products from the Communications segment into the Computing and Consumer segment. This change in segment reporting had no impact on our consolidated balance sheets, statements of operations, statements of cash flows or statements of stockholders’ equity for any years presented. The segment information for the years ended March 29, 2009 and March 30, 2008 has been adjusted retrospectively to conform to the current fiscal year presentation. The Chief Executive Officer has been identified as the Chief Operating Decision Maker.
Our reportable segments include the following:
| § | Communications segment: includes Rapid I/O switching solutions, flow-control management devices, FIFOs, integrated communications processors, high-speed SRAM, military application (divested in the second quarter of fiscal 2010), digital logic, telecommunications and network search engines (divested in the third quarter of fiscal 2010). |
| § | Computing and Consumer segment: includes clock generation and distribution products, PCI Express switching and bridging solutions, high-performance server memory interfaces, multi-port products, PC audio and video products. |
Revenues
| | | Fiscal Year Ended | |
| (in thousands) | | March 28, 2010 | | | March 29, 2009 | | | March 30, 2008 | |
| Communications | | $ | 245,438 | | | $ | 294,699 | | | $ | 349,820 | |
| Computing and Consumer | | | 290,468 | | | | 368,546 | | | | 431,647 | |
| Total | | $ | 535,906 | | | $ | 663,245 | | | $ | 781,467 | |
Communications Segment
Revenues in our Communications segment decreased $49.3 million, or 17% in fiscal 2010 compared to 2009 due to the overall weakness in our communications end market, which was negatively impacted by the economic downturn. In addition, the divestiture of our networking (“NWD”) assets and military (“MNC”) business, and lower revenues from SRAM, FIFO, and digital logic products contributed to the decrease in fiscal 2010. The decrease was partially offset by the increased sales of our flow control management products as a result of the Tundra acquisition.
Revenues in our Communications segment decreased $55.1 million, or 16% in fiscal 2009 compared to fiscal 2008. The decrease was primarily due to the overall weakness in our communications end market, which was negatively impacted by the economic downturn. The decrease was primarily driven by revenue declines in our networking division, related to decreased consumption from one of our largest customers. Revenues within our flow control management division decreased 12%, primarily related to our legacy products. Revenues from our SRAM and digital logic products decreased 15% year over year due to softness in the communications IC.
Computing and Consumer Segment
Revenues in our Computing and Consumer segment decreased $78.1 million, or 21% in fiscal 2010 compared to fiscal 2009 as a result of the global economic slowdown and increased competition in the consumer market, which resulted in broad demand
weakness from our personal computing and consumer products end markets. The decrease was partially offset by the growth in video products revenues as a result of the Silicon Optix acquisition and a ramp up of product shipments.
Revenues in our Computing and Consumer segment decreased $63.1 million, or 15% in fiscal 2009 compared to fiscal 2008 as a result of the global economic slowdown and increased competition in the consumer market. Revenues within our Computing and Multimedia division decreased 25%, driven by weaker demand for our personal computing and consumer products. Revenues within our Enterprise Computing division decreased 7%, driven by the continued ramp down of our Advanced Memory Buffer (AMB) products, which outpaced the growth in our PCI Express products. Partially offsetting these decreases was an increase in our Video and Display division as a result of the Silicon Optix acquisition.
Revenues in APAC, North America, Japan and Europe accounted for 65%, 17%, 10% and 8%, respectively, of our consolidated revenues in fiscal 2010 compared to 63%, 20%, 9% and 8%, respectively, in fiscal 2009. The Asia Pacific region continues to be our strongest region, as many of our largest customers utilize manufacturers in that region.
Included in the Balance Sheet caption “Deferred income on shipments to distributors” are amounts related to shipments to certain distributors for which revenue is not recognized until our product has been sold by the distributor to an end customer. The components as of March 28, 2010 and March 29, 2009 are as follows:
| | | Fiscal Year Ended | |
| (in thousands) | | March 28, 2010 | | | March 29, 2009 | |
| Gross deferred revenue | | $ | 22,008 | | | $ | 21,302 | |
| Gross deferred costs | | | 3,247 | | | | 4,764 | |
| Deferred income on shipments to distributors | | $ | 18,761 | | | $ | 16,538 | |
The gross deferred revenue represents the gross value of shipments to distributors at the list price billed to the distributor less any price protection credits provided to them in connection with reductions in list price while the products remain in their inventory. Based on our history, the amount ultimately recognized as revenue will be lower than this amount as a result of ship from stock pricing credits, which are issued in connection with the sell through of the product to an end customer. As the amount of price adjustments subsequent to shipment is dependent on the overall market conditions, the levels of these adjustments can fluctuate significantly from period to period. Historically, this amount has represented an average of approximately 25% of the list price billed to the customer. As these cre dits are issued, there is no impact to working capital as this reduces both accounts receivable and deferred revenue. The gross deferred costs represent the standard costs (which approximate actual costs) of products we sell to the distributors. The deferred income on shipments to distributors increased $0.7 million or 3% in fiscal 2010 compared to fiscal 2009. The increase was primarily attributable to the increased shipments to distributors and inclusion of higher margin Tundra shipments to distributors in the last three quarters of fiscal 2010.
Gross Profit
| | | Fiscal Year Ended | |
| (in thousands) | | March 28, 2010 | | | March 29, 2009 | | | March 30, 2008 | |
| Gross Profit | | $ | 224,907 | | | $ | 274,449 | | | $ | 339,332 | |
| Gross Profit Percentage | | | 42 | % | | | 41 | % | | | 43 | % |
Gross profit for fiscal 2010 was $224.9 million, a decrease of $49.5 million compared to $274.4 million in fiscal 2009 and gross profit percentage in fiscal 2010 was 42% compared to 41% in fiscal 2009. The decrease in gross profit was primarily driven by lower revenue. Our gross profit percentage was positively impacted by a higher utilization of our fabrication facility and a favorable shift in the mix of products sold. The utilization of our manufacturing capacity in Oregon increased from approximately 67% of equipped capacity in fiscal 2009 to 79% of equipped capacity in fiscal 2010. Our gross profit percentage benefited from a $41.3 million decrease in intangible asset amortization, as we wrote down the carrying value of certain intangible assets in fiscal 2009. In addition, a portion of the intangible assets are being amortized on an accelerated method, resulting in decreased amortization over time. Offsetting these decreases, our gross profit in 2010 was negatively impacted in the amount of $8.4 million related to the sale of inventory acquired and valued at fair value, less estimated selling costs, associated with our acquisition of Tundra and $5.7 million of restructuring costs in fiscal 2010.
Gross profit for fiscal 2009 was $274.4 million, a decrease of $64.9 million compared to $339.3 million in fiscal 2008 and gross profit percentage in fiscal 2009 was 41% as compared to 43% in fiscal 2008. The decrease in gross profit was primarily driven by lower revenue, primarily due to the overall lower unit sales resulting from the economic recession. Fiscal 2009 gross profit was negatively impacted by a $19.5 million increase in inventory excess and obsolescence reserves. The increase in inventory excess and obsolescence reserves was primarily due to higher levels of inventory compared to forecasted demand for such products resulting from the economic downturn. The increase in inventory reserves was partially offset by improved utilization of our fabrication facility. The utilization of our manufacturing capacity in Oregon increased from approximately 60% of equipped capacity in fiscal 2008 to 67% of equipped capacity in fiscal 2009. Our gross profit benefited from a $7.0 million decrease in intangible asset amortization as a portion is being amortized on an accelerated method, resulting in decreased amortization over time. In addition, our gross profit benefited from $1.6 million, $0.8 million and $0.8 million decreases in performance related bonuses, royalty expenses and equipment expenses, respectively. Finally, gross profit benefited in fiscal 2009 and 2008 by approximately $3.2 million and $2.8 million, respectively, from the sale of inventory previously written down.
Operating Expenses
The following table presents our operating expenses for fiscal years 2010, 2009 and 2008, respectively:
| | | March 28, 2010 | | | March 29, 2009 | | | March 30, 2008 | |
(in thousands) | | Dollar Amount | | | % of Net Revenues | | | Dollar Amount | | | % of Net Revenues | | | Dollar Amount | | | % of Net Revenues | |
| Research and development | | $ | 157,486 | | | | 29 | % | | $ | 161,192 | | | | 24 | % | | $ | 165,599 | | | | 21 | % |
| Selling, General and administrative | | $ | 107,037 | | | | 20 | % | | $ | 125,810 | | | | 19 | % | | $ | 161,708 | | | | 21 | % |
| In-process research and development | | $ | -- | | | | -- | % | | $ | 5,597 | | | | 1 | % | | $ | -- | | | | -- | % |
Research and Development (“R&D”)
R&D expenses decreased $3.7 million, or 2%, to $157.5 million in fiscal 2010 compared to fiscal 2009. The decrease was primarily attributable to lower stock-based compensation expense of $8.7 million, as a result of lower valuation of new grants compared to fiscal 2009, due to lower stock prices. These decreases were partially offset by higher equipment expense of $2.9 million and increased expense for outside services of $2.6 million.
R&D expenses decreased $4.4 million, or 3%, to $161.2 million in fiscal 2009 compared to fiscal 2008. The decrease was primarily attributable to a $5.6 million decrease in performance related bonus and a $4.0 million decrease in stock-based compensation expense as a result of lower valuation of new grants compared to fiscal 2008 due to lower stock prices. We also benefited from a $1.2 million incremental loss in the participant portfolio of the executive deferred compensation plan primarily due to sequential declines in the stock market. Equipment expenses decreased $1.2 million primarily attributable to a decrease in depreciation expense and our continuous efforts to control capital asset purchases. Partially offsetting these decreases was a $4.0 million increase in our core labor expenses as a result of additional Silicon Optix personnel expenses and a $2.1 million increase in severance payments related to our recent restructuring actions. Finally, medical expenses increased $1.5 million year over year.
Selling, general and administrative (“SG&A”)
SG&A expenses decreased $18.8 million, or 15%, to $107.0 million in fiscal 2010 compared to fiscal 2009. The decrease was primarily attributable to a $23.0 million reduction in amortization of intangible asset, a decrease of $8.3 million in sales representative commissions due to lower revenues and a $6.1 million decrease in stock-based compensation expense. The decrease was partially offset by an increase of $8.0 million in labor-related expenses as a result of the Tundra acquisition and restructuring actions, net of payroll expense savings from our divestitures and higher spending for legal and consulting services of $4.9 million and an increase in equipment and facilities expense of $1.2 million.
SG&A expenses decreased $35.9 million, or 22% to $125.8 million in fiscal 2009 compared to fiscal 2008. The decrease was primarily attributable to a $23.5 million decrease in intangible asset amortization, a portion of which is being amortized on an accelerated method, resulting in decreased amortization expense over time. Employee-related expenses decreased $7.7 million, primarily attributable to a $4.6 million decrease in stock-based compensation expense as a result of lower valuation of new grants compared to fiscal 2008 due to lower stock prices; $1.8 million reduction in performance related bonus; $1.2 million expense related to an executive transition agreement with our former CEO in fiscal 2008 which was not incurred in fiscal 2009; a $0.7 million incremental loss in the participant portfolio of the execut ive deferred compensation and a $0.5 million increase in medical expenses. We experienced a $3.3 million decrease in sales representative commissions attributable to lower revenues in fiscal 2009. Other decreases in SG&A expense included a $0.5 million decrease in travel and entertainment costs and $0.5 million in consulting service expenses primarily driven by our efforts to control costs. Partially offsetting these decreases was a $0.9 million increase in bad debt expense.
Acquired In-Process Research and Development (“IPR&D”)
In fiscal 2009, in connection with our acquisition of Silicon Optix’s video processing technology and related assets, we recorded a $5.6 million expense for IPR&D. For this transaction, the allocation of the purchase price to IPR&D was determined by identifying technologies that had not attained technological feasibility and that did not have future alternative uses. Technological feasibility is established when an enterprise has completed all planning, designing, coding and testing activities that are necessary to establish that a product can be produced to meet its design specifications, including functions, features and technical performance requirements. The value of IPR&D was determined by considering the importance of each project to our overall development plan, estimating costs to develop the purchased IPR&D into commercially viable products, estimating the resulting net cash flows from the projects when completed and discounting the net cash flows to their present value based on the percentage of completion of the IPR&D projects. We utilized a discounted cash flow (“DCF”) model to value the IPR&D, using a discount factor of 32% to determine the net present value of the IPR&D. As of March 28, 2010, the project was 98% complete and we have incurred total costs of approximately $9.0 million related to this project since the acquisition. We estimate that an additional investment of $0.2 million will be required to complete the project and expect to complete this project in the first quarter of fiscal 2011.
Goodwill and Intangible Assets Impairment
We performed our annual impairment review of goodwill during the fourth quarter of fiscal 2010 and concluded that there was no impairment.
Due to the extraordinary market and economic conditions that occurred in the third quarter of fiscal 2009, we experienced a decline in our stock price, resulting in our market capitalization falling below our net book value. In addition, due to the increased competitive pressure within certain of our markets, as well as the deteriorating macro-economic environment, which caused a decline in our revenue, operating income, and cash flow forecasts, we concluded that indicators existed requiring us to perform an interim goodwill impairment analysis at November 30, 2008. As a result of this analysis, we recognized a goodwill impairment charge of $326.4 million in the third quarter of fiscal 2009.
In the fourth quarter of fiscal 2009, we completed our annual impairment review of goodwill and concluded that due to increased deterioration in the macro-economic environment and significant downturn in semiconductor industry, our projected revenue for fiscal 2010 declined significantly from the amount we projected in the third quarter of fiscal 2009. Based on the results of our analysis, the carrying value of Communications (COM), Enterprise and Computing (ECD), and Computing and Multimedia (CMD) business units exceeded their fair values. Accordingly, we wrote down the carrying amount of goodwill to its implied fair values and recognized an impairment charge of $619.9 million in the fourth quarter of fiscal 2009.
In the third quarter of fiscal 2009, we performed an impairment analysis for our long-lived assets, including our intangible assets subject to amortization. The analysis indicated that some of the identified intangible assets were not recoverable as the sum of their estimated future undiscounted cash flows were below the asset’s carrying value and accordingly, we estimated the fair value of these identified assets using a DCF analysis to measure the impairment loss. As a result of this analysis, we wrote off the difference between the identified intangible assets’ estimated fair values and the carrying values and recognized an impairment charge of $12.7 million in the third quarter of fiscal 2009.
In the fourth quarter of 2009, in conjunction with our completion of goodwill impairment analysis, and also due to the revised lower revenue forecast for fiscal 2010, which we concluded there were additional impairment indicators, we performed an impairment analysis for our long-lived assets. As result of this impairment analysis, we recorded an impairment charge of approximately $66.7 million in the fourth quarter of fiscal 2009.
Other-Than-Temporary Impairment Loss on Investment
Our investment in non-marketable equity security of Best Elite International Limited (Best Elite) is accounted for by using the cost method and subject to a periodic impairment review. Based on our assessment at the end of fiscal 2010, the $2.0 million fair value of the investment was concluded to be recoverable and therefore, no impairment was recorded
In fiscal 2009, we determined an impairment indicator existed related to this investment. As a result, we performed a fair value analysis for this investment. As a result, we performed a fair value analysis for this investment. In determining whether a decline in value of our investment in Best Elite has occurred and is other than temporary, an assessment was made by considering available evidence, including the general market conditions in the wafer fabrication industry, Best Elite’s financial condition, near-term prospects, market comparables and subsequent rounds of financing. The valuation also takes into account the Best Elite’s capital structure, liquidation preferences for its capital and other economic variables. The valuation methodology for determining the decline in value of non-marketable equity securities is based on inputs that require management judgment. Based on the results, we recognized an other-than-temporary impairment charge of $3.0 million related to this investment in fiscal 2009 to write it down to its estimated fair value of $2.0 million.
Restructuring
As part of an effort to streamline operations with changing market conditions and to create a more efficient organization, we took restructuring actions through March 28, 2010, to reduce its workforce and consolidate facilities. Our restructuring expenses have been comprised primarily of: (i) severance and termination benefit costs related to the reduction of its workforce; and (ii) lease termination costs and costs associated with permanently vacating certain facilities.
In the fourth quarter of fiscal 2010, we initiated restructuring actions designed to improve operational efficiency. These actions included discontinuing manufacturing operations at our Singapore facility and a reduction in headcount in our Enterprise Computing division. In connection with those actions, as of March 28, 2010, we recorded a charge of $2.7 million primarily representing severance, retention and other benefits related to the terminated employees of which $0.7 million was paid prior to March 28, 2010. We expect to complete this restructuring action in the second quarter of fiscal 2011.
During the third quarter of fiscal 2010, we initiated restructuring actions intended to further adjust our skills mix to new strategic and product opportunities. The restructuring action included a reduction of approximately 61 positions within our Analog and Power group across multiple locations worldwide. As a result, we recorded restructuring expenses of $1.3 million for severance payments, payments under federal, state and province notice statutes and retention and other benefits associated with this restructuring action in the third quarter of fiscal 2010. As of March 28, 2010, we had made severance and retention payments totaling $1.3 million related to these restructuring actions. We completed these restructuring actions in the fourth quarter of fiscal 2010.
In addition, in connection with the divestitures in the third quarter of fiscal 2010, we reduced a total of 15 positions and exited certain leased facilities. In the third quarter of fiscal 2010, we recorded restructuring expenses of $0.9 million for lease impairment charges and $0.1 million for severance payments, payments under federal, state and province notice statutes and retention and other benefits associated with these restructuring actions. As of March 28, 2010, we had made severance and retention payments totaling $0.7 million related to these restructuring actions.
During the second quarter of fiscal 2010, we initiated a restructuring action following our acquisition of Tundra and an assessment of ongoing personnel needs in light of the acquisition. The restructuring action included a reduction of approximately 133 positions worldwide. In addition, we impaired some facilities due to vacating certain locations. As a result, we recorded restructuring expenses of $8.6 million for severance payments, payments under federal, state and province notice statutes and retention and other benefits associated with this restructuring action in the second quarter of fiscal 2010, of which $8.4 million was related to lease impairment charges, severance, retention and other benefits to the terminated employees and
$0.2 million was for facilities impairment charges, which was recorded as SG&A expense. In the third quarter of fiscal 2010, in connection with our divestiture of the Silicon Logic Engineering business, we transferred 24 employees to OSI and terminated 9 employees resulting in a reduction to its accrued restructuring expenses by $0.1 million. As of March 28, 2010, we made severance and retention payments totaling $7.5 million related to this restructuring action. We expect to complete this restructuring action in the second quarter of fiscal 2013. The facility lease charges will be paid off through the second quarter of fiscal 2011.
In addition, in connection with our plan to transition the manufacture of products to TSMC, our management approved a plan to exit wafer production operations at our Oregon fabrication facility. As a result, we accrued restructuring expenses of $4.8 million for severance payments and other benefits associated with this restructuring action in the second quarter of fiscal 2010. We expect to complete this restructuring action in the second quarter of fiscal 2012.
During the fourth quarter of fiscal 2009, we initiated a restructuring action intended to align our spending with demand that weakened in the slowing economy. The restructuring action included a reduction of approximately 124 positions across multiple divisions worldwide. In March 2009, after carefully considering the market, revenues and prices for search engines, we decided to restructure our Network Search Engine division. As part of this restructuring action, we reduced approximately 56 positions in this division and ceased investment in new search engine product development. In addition, we initiated restructuring actions, which affected our sales personnel in Germany and Japan. During fiscal 2010, we reduced an additional 12 positions related to these actions. As a result, we recorded rest ructuring expenses of $2.3 million and $5.3 million for severance payments, payments under federal, state and province notice statutes and retention and other benefits associated with these restructuring actions in fiscal 2010 and the fourth quarter of fiscal 2009. As of March 28, 2010, severance, retention and other benefits of $7.5 million were settled. We expect to complete these restructuring actions in the first quarter of fiscal 2011.
During the second quarter of fiscal 2006, we completed the consolidation of our Northern California workforce into our San Jose headquarters and exited a leased facility in Salinas, California. Upon exiting the building we recorded lease impairment charges of approximately $2.3 million, which represented the future rental payments under the agreement, reduced by an estimate of sublease income, and discounted to present value using an interest rate applicable to us. These charges were recorded as cost of revenues of $0.7 million, research and development expense (“R&D”) of $0.9 million and SG&A expense of $0.7 million. In fiscal 2008, we entered into a sublease agreement for this facility, resulting in a reduction to our accrued lease liabilities by $0.2 million. Since the initial restructuring, we have made lease payments of $1.3 million related to the vacated facility in Salinas. As of March 28, 2010, the remaining accrued lease liabilities were $0.9 million.
Divestitures
On November 30, 2009, we completed the sale of certain assets and transferred certain liabilities related to our MNC business to Spectrum Control, Inc ("Spectrum Control") for approximately $12.8 million. As a result, in the third quarter of fiscal 2010, we recorded a loss of $4.3 million related to the divestiture. All employees in our MNC business were transferred to Spectrum Control as a result of the transaction. In addition, we also signed a sublease agreement with Spectrum Control for the facility in Worcester, Massachusetts. The sublease will expire in May, 2010.
On December 4, 2009, we completed the sale of certain assets and transferred certain liabilities related to the SLE business to OSI for $1 in cash. In the third quarter of fiscal 2010, we recorded a loss of $0.2 million related to the divestiture. In connection with the divestiture, we entered into a design service agreement with OSI whereby they agreed to provide and the Company agreed to purchase design services from OSI through the end of calendar year 2010. The total commitment under this design service agreement is $0.8 million. We also signed a sublease agreement with OSI for office facilities in Eau Claire, Wisconsin, which will expire in June 2012.
On July 17, 2009, we completed the sale of certain assets related to the Networking Division (“NWD”) to NetLogic Microsystems, Inc ("Netlogic"), pursuant to an Asset Purchase Agreement by and between the Company and NetLogic dated April 30, 2009 (the "Agreement"). Upon closing of the transaction, NetLogic paid us $100 million in cash consideration, which included inventory valued at approximately $10 million (subject to adjustment). As of September 27, 2009, the inventory we sold to Netlogic was valued at $8.2 million. Subsequently, in the third quarter of fiscal 2010 we reimbursed Netlogic the excess cash for the inventory in the amount of $1.8 million. The NWD Assets are part of the Communications reportable segment. In connection with the divestiture, we entered into a supply agreement with NetLogic wh ereby they agreed to buy and we agreed to sell Netlogic certain network search engine products for a limited time following the closing of the
sale. According to the terms set forth in the agreement, we committed to sell certain products either at our standard costs or below our normal gross margins, which are lower than their estimated fair values. As a result, we recorded $3.0 million related to the estimated fair value of this agreement, of which $0.8 million was recognized as revenue in fiscal 2010. We expect to complete the sale under this agreement within 2 years. In the second quarter of fiscal 2010, we recorded a gain of $82.7 million related to the divestiture.
Interest Income and Other, Net
The components of interest income and other, net are summarized as follows:
| | | Fiscal Year Ended | |
| (in thousands) | | March 28, 2010 | | | March 29, 2009 | | | March 30, 2008 | |
| Interest income | | $ | 1,741 | | | $ | 5,456 | | | $ | 15,020 | |
| Other income (expense), net | | | 2,191 | | | | (4,148 | ) | | | 1,795 | |
| Interest income and other, net | | $ | 3,932 | | | $ | 1,308 | | | $ | 16,815 | |
Interest income decreased $3.7 million in fiscal 2010 compared to fiscal 2009, primarily attributable to lower interest rates. Other income (expense), net increased from a net expense of $4.1 million in fiscal 2009 to income of $2.2 million in fiscal 2010. The change is primarily attributable to gains recognized in the value of the deferred compensation plan assets.
Interest income decreased $9.6 million in fiscal 2009 compared to fiscal 2008. The decrease is primarily attributable to lower interest rates in the market during fiscal 2009 compared to fiscal 2008. Other income (expense), net changed by $5.9 million from a net income of $1.8 million in fiscal 2008 to a net expense of $4.1 million in fiscal 2009. The change is primarily attributable to a $2.3 million increase in loss in the value of the deferred compensation plan assets. Fiscal 2008 benefited from a gain of $1.8 million upon the sale of our equity investment in Maxtek, while we did not hold such shares in fiscal 2009. In addition, we incurred a currency loss of $1.6 million in fiscal 2009 while we recorded a gain of $0.3 million in fiscal 2008.
Income Tax Expense (Benefit)
We recorded an income tax provision of $2.5 million in fiscal 2010, compared to an income tax benefit of $0.4 million in fiscal 2009. The provision for income taxes in fiscal 2010 primarily reflects income tax provision for the sale of the NWD assets and MNC business, the true-up of the federal income tax returns for fiscal 2009, current U.S. and state taxes and foreign income taxes. This was offset by income tax benefits for the true-up of the state fiscal 2009 income tax returns and the U.S. refundable research and development credit. The income tax benefit for fiscal 2009 is primarily attributable to a refundable research and development tax credit in the United States, offset by foreign income taxes, withholding taxes and estimated U.S. and state taxes.
As of March 28, 2010, we continued to maintain a valuation allowance against our net U.S. deferred tax asset, as we could not conclude that it is more likely than not that we will be able to realize our U.S. deferred tax assets in the foreseeable future. We will continue to evaluate the release of the valuation allowance on a quarterly basis.
As of March 28, 2010, we are subject to examination in the U.S. federal tax jurisdiction for the fiscal years beginning with 2004. In February 2009, the IRS commenced a tax audit for fiscal years beginning 2006 through 2008. Although the final outcome is uncertain, based on currently available information, we believe that the ultimate outcome will not have a material adverse effect on our financial position, cash flows or results of operations.
Liquidity and Capital Resources
Our cash and available for sale investments were $343.2 million at March 28, 2010, an increase of $47.1 million compared to March 29, 2009. The increase is primarily attributable to $109.4 million cash received from our divestitures, $52.1 million in cash from operations, offset by the repurchase of approximately $24.4 million of common stock and net cash payments of $85.0 million relating to acquisitions of Tundra, Leadis and Mobius businesses in fiscal 2010. We had no outstanding debt at March 28, 2010 and March 29, 2009.
Cash equivalents are highly liquid investments with original maturities of three months or less at the time of purchase. We maintain the cash and cash equivalents with reputable major financial institutions. Deposits with these banks may exceed the Federal Deposit Insurance Corporation (FDIC) insurance limits or similar limits in foreign jurisdictions. These deposits typically may be redeemed upon demand and, therefore, bear minimal risk. In addition, a significant portion of cash equivalents is concentrated in money market funds which are invested in U.S. government treasuries only. While we monitor daily the cash balances in our operating accounts and adjust the balances as appropriate, these balances could be impacted if one or more of the financial institutions with which we deposit fails or is subject to other adverse conditions in t he financial markets. As of May 25, 2010, we have not experienced any loss or lack of access to our invested cash or cash equivalents in our operating accounts. However, we can provide no assurances that access to our invested cash and cash equivalents will not be impacted by adverse conditions in the financial markets. See Item 1A-“Risk Factors: Global Market and Economic Conditions, including those related to the credit markets, may adversely affect our business and results of operations.”
In addition, as much of our revenues are generated outside the U.S., a significant portion of our cash and investment portfolio accumulates offshore. At March 28, 2010, we had cash, cash equivalents and investments of approximately $249.8 million invested overseas in accounts belonging to various IDT foreign operating entities. While these amounts are primarily invested in U.S. dollars, a portion is held in foreign currencies, and all offshore balances are exposed to local political, banking, currency control and other risks. In addition, these amounts may be subject to tax and other transfer restrictions.
All of our available-for-sale investments are subject to a periodic impairment review. Investments are considered to be impaired when a decline in fair value is judged to be other-than-temporary. This determination requires significant judgment. For publicly traded investments, impairment is determined based upon the specific facts and circumstances present at the time, including a review of the closing price over the length of time, general market conditions and our intent and ability to hold the investment for a period of time sufficient to allow for recovery. Although we believe the portfolio continues to be comprised of sound investments due to high credit ratings and government guarantees of the underlying investments, a further decline in the capital and financial markets would adversely impact the market values of its investments a nd their liquidity. We continually monitor the credit risk in our portfolio and future developments in the credit markets and make appropriate changes to our investment policy as deemed necessary. We did not record any other-than-temporary impairment charges related to our short-term investments in fiscal 2010 and fiscal 2009.
Net cash provided by operating activities decreased $91.7 million, or 64%, to $52.1 million in fiscal 2010 compared to $143.8 million in fiscal 2009. A summary of the significant non-cash items included in net income and net loss are as follows:
| · | We recorded a $78.3 million gain in connection with our divestitures in fiscal 2010, but had no such gain in fiscal 2009. |
| · | Goodwill and intangible assets impairment charges, acquired IPR&D and other-than-temporary impairment loss on investments were $1,025.7 million, $5.6 million and $3.0 million, respectively, in fiscal 2009, compared to a note receivable impairment charge of $1.6 million in fiscal 2010. |
| · | Amortization of intangible assets was $21.1 million in fiscal 2010 compared to $79.4 million in fiscal 2009. The decrease was primarily attributable to the lower carrying value of intangible assets in fiscal 2010, as we recorded significant impairment charges in the third and fourth quarter of fiscal 2009 and due to a portion of intangible assets being amortized on an accelerated method, resulting in decreased amortization expense over time. |
| · | Stock-based compensation was $16.7 million in fiscal 2010 compared to $32.4 million in fiscal 2009. The decrease is due to lower valuation of new grants and lower headcount in fiscal 2010, compared to fiscal 2009. |
| · | Depreciation expense was $22.1 million in fiscal 2010 compared to $26.3 million in fiscal 2009. The decrease is primarily attributable to a large portion of our manufacturing equipment being fully depreciated and our continuous efforts to control capital asset purchases. |
Net cash provided by working capital related items increased $10.6 million, from a net $17.8 million provided by cash in fiscal 2009 to a net $28.4 million cash provided in fiscal 2010. A summary of significant working capital items providing relatively more cash in fiscal 2010 included:
| · | A decrease in inventory of $26.2 million in fiscal 2010 compared to a decrease of $10.2 million in fiscal 2009. The decrease in both periods is primarily attributable to our efforts to align our inventory levels to meet current demand. |
| · | A decrease in prepayments and other assets of $2.7 million in fiscal 2010 compared to a decrease of $11.7 million in fiscal 2009. The decrease in fiscal 2010 is primarily attributable to a reduction in the receivable from one of our foundries, VAT refund and normal recurring prepaid amortization, partially offset by additional software maintenance agreements signed and paid. The decrease in fiscal 2009 is primarily attributable to $3.1 million decrease in the fair value of our corporate owned life insurance, $1.2 million decrease in interest receivable primarily due to receipts of interest from the IRS for the tax settlement related to the ICS pre-acquisition income tax returns and $2.3 million reduction of VAT receivable, as we received VAT refunds from the foreig n government along with the normal recurring prepaid amortization. |
| · | An increase in accounts payable of $8.2 million in fiscal 2010 compared to a decrease of $17.9 million in fiscal 2009. The increase is primarily attributable to the timing of payments and increase in the volume of foundry and subcontractor activity. |
| · | An increase in other accrued liabilities and long-term liabilities of $3.7 million in fiscal 2010 compared to a decrease of $3.4 million in fiscal 2009. The increase in fiscal 2010 was primarily attributable to an increase in accruals related to our restructuring actions, deferred gain related to the agreement signed in connection with divestiture of our NWD assets and an increase in the fair value of our executive deferred compensation plan due to stock market performance improvement in fiscal 2010. The decrease in fiscal 2009 is primarily attributable to $1.9 million decease in the fair value of our executive deferred compensation plan due to the sequential decline in the stock market and a payment of $1.2 million related to the executive transition agreement signed with our former CEO, partially offset by additional reserve related to ou r restructuring actions. |
The above working capital items were partially offset by an increase in accounts receivable of $13.8 million in fiscal 2010 compared to a decrease of $28.2 million in fiscal 2009. The increase accounts receivable in fiscal 2010 is primarily attributable to the timing of shipments in the fourth quarter of both periods.
Net cash provided by operating activities in fiscal 2009 was $143.8 million compared to $186.7 million in fiscal 2008. The decrease was primarily attributable to non-cash items, including a decrease in the amortization of intangible assets and the reduction of stock-based compensation expense. In addition, working capital items provided $17.8 million in cash in fiscal 2009 compared to $19.3 million in cash used in fiscal 2008.
Net cash provided by investing activities was $52.7 million in fiscal 2010, compared to net cash used by investing activities of $88.7 million in fiscal 2009. In fiscal 2010, net cash proceeds from the divestiture activities were $109.4 million. Cash used to purchase short-term investments and non-marketable securities was $326.5 million, partially offset by cash proceeds from sale and maturity of short-term investments of $262.3 million. In addition, we paid approximately $85.0 million, net of cash acquired, in conjunction with the acquisitions in fiscal 2010. We used $12.9 million to purchase capital equipment. In fiscal 2009, cash used to purchase short-term investments was $239.6 million, partially offset by cash proceeds from sale and maturity of short-term investments of $187.6 million. Cash used to purchase of capital equipment totaled approximately $16.6 million. In addition, we used $20.1 million to purchase Silicon Optix’s assets in the third quarter of fiscal 2009.
Net cash used in investing activities was $9.5 million in fiscal 2008. In fiscal 2008, net cash used to purchase short-term investments was $170.9 million, partially offset by the proceeds from the sale and maturity of short-term investments of $178.4 million. The net cash used to purchase capital equipment were $16.9 million.
Net cash used in financing activities was $15.2 million in fiscal 2010, compared to $48.6 million in fiscal 2009. In fiscal 2010, we received approximately $7.3 million from the exercise of employee stock options and the issuance of stock under our employee stock purchase plan, partially offset by the repurchase of $24.4 million of common stock. In fiscal 2009, we repurchased approximately $62.3 million of common stock, partially offset by proceeds of approximately $13.5 million from the exercise of employee stock options and the issuance of stock under our employee stock purchase plan.
Net cash used in financing activities was $293.2 million in fiscal 2008. In fiscal 2008, we repurchased approximately $334.8 million of common stock, partially offset by proceeds of approximately $41.7 million from the exercise of employee stock options and the issuance of stock under our employee stock purchase plan.
We anticipate capital expenditures of approximately $25.8 million during fiscal 2011 to be financed through cash generated from operations and existing cash and investments.
The following table summarizes our contractual arrangements at March 28, 2010 and the expected timing and effects of these commitments on our liquidity and cash flow in future periods:
| | | Payments Due by Period | |
| | | | | | Less Than | | | 2-3 | | | 4-5 | | | | |
| (in thousands) | | Total | | | 1 Year | | | Years | | | Years | | | Thereafter | |
| Operating leases | | $ | 10,197 | | | $ | 3,583 | | | $ | 4,165 | | | $ | 1,613 | | | $ | 836 | |
| Other supplier obligations (1) | | | 15,337 | | | | 7,593 | | | | 7,744 | | | | -- | | | | -- | |
(1) Other supplier obligations represent payments due under various software design tool agreements.
As of March 28, 2010, our unrecognized tax benefits were $47.4 million, of which $21.1 million are classified as long-term liabilities, and $26.3 million which are netted against deferred tax assets. In addition, we have $13.0 million of amounts payable related to obligations under our deferred compensation plan, which are classified as long-term liabilities.At this time, we are unable to make a reasonably reliable estimate of the timing of payments, if any, in individual years due to uncertainties in the timing or outcomes of either actual or anticipated tax audits and the timing of employee departures. As a result, this amount is not included in the table above.
Purchase orders or contracts for the purchase of raw materials and other goods and services are not included in the table above. We are not able to determine the aggregate amount of such purchase orders that represent binding contractual obligations, as purchase orders often represent authorizations to purchase rather than binding agreements. Our purchase orders are based on our current manufacturing needs and are fulfilled by our vendors within short time horizons. We also enter into contracts for outsourced services, which generally contain clauses allowing for cancellation prior to services being performed without significant penalty. In addition, the table above excludes leases in which amounts have been accrued for impairment charges.
We believe that existing cash and investment balances, together with cash flows from operations, will be sufficient to meet our working capital and capital expenditure needs through at least fiscal 2011. We may choose to investigate other financing alternatives; however, we cannot be certain that additional financing will be available on satisfactory terms.
Off-Balance Sheet Arrangements
As of March 28, 2010, we did not have any off-balance sheet arrangements, as defined under SEC Regulation S-K Item 303(a)(4)(ii).
Subsequent Event
On April 16, 2010, we entered into an agreement to acquire certain assets of IKOR, a manufacturer of power module VRM solutions for high-performance computing and former subsidiary of iWatt Corporation, along with members of its engineering team. We paid approximately $9.0 million in cash. The acquisition is not significant to our consolidated results of operations.
Recent Accounting Pronouncements
In January 2010, the FASB issued updated guidance related to fair value measurements and disclosures, which requires a reporting entity to disclose separately the amounts of significant transfers in and out of Level 1 and Level 2 fair value measurements and to describe the reasons for the transfers. In addition, in the reconciliation for fair value measurements using significant unobservable inputs, or Level 3, a reporting entity should disclose separately information about purchases, sales, issuances and settlements (that is, on a gross basis rather than one net number). The updated guidance also requires that an entity should provide fair value measurement disclosures for each class of assets and liabilities and disclosures about the valuation techniques and inputs used to measure fair value for both recurring and non-recurring fair val ue measurements for Level 2 and Level 3 fair value measurements. The updated guidance is effective for interim or annual financial reporting periods beginning after December 15, 2009, except for the disclosures about purchases, sales, issuances and settlements in the roll forward activity in Level 3 fair value measurements, which are effective for fiscal years beginning after December 15, 2010 and for interim periods within those fiscal years. The adoption of this guidance did not have a significant impact on our consolidated financial statements or related footnotes.
In June 2009, the Financial Accounting Standard Board (FASB) issued the FASB Accounting Standards Codification and the Hierarchy of Generally Accepted Accounting Principles (“codification”). This authoritative guidance establishes the codification, which officially launched July 1, 2009, to become the source of authoritative U.S. generally accepted accounting principles (GAAP) recognized by the FASB to be applied by nongovernmental entities. Rules and interpretive releases of the Securities and Exchange Commission (SEC) under authority of federal securities laws are also sources of authoritative U.S. GAAP for SEC registrants. The subsequent issuances of new standards will be in the form of Accounting Standards Updates that will be included in the Codification. Generally, the Codification is not expected to change U.S. GAAP. All other accounting literature excluded from the Codification will be considered non-authoritative. This guidance is effective for financial statements issued for interim and annual periods ending after September 15, 2009. We adopted this guidance in the second quarter of fiscal 2010. The adoption of this guidance did not have a significant impact on our consolidated financial statements or related footnotes.
In April 2009, the FASB issued authoritative fair value disclosure guidance for financial instruments. This guidance requires an entity to provide interim disclosures about the fair value of all financial instruments as well as in annual financial statements. Additionally, this guidance requires disclosures of the methods and significant assumptions used in estimating the fair value of financial instruments on an interim basis as well as changes of the methods and significant assumptions from prior periods. This guidance is effective for interim and annual periods ending after June 15, 2009. We adopted this guidance in the first quarter of fiscal 2010. The adoption of this guidance did not have a significant impact on our consolidated financial position and results of operations.
In April 2009, the FASB issued the authoritative guidance for determining fair value when the volume and level of activity for the asset or liability have significantly decreased and identifying transactions that are not orderly. This standard provides guidance on how to determine the fair value of assets and liabilities. The guidance relates to determining fair values when there is no active market or where the price inputs being used represent distressed sales. It reaffirms that the objective of fair value measurement ––to reflect how much an asset would be sold for in an orderly transaction (as opposed to a distressed forced transaction) at the date of the financial statements under current market conditions. Specifically, it reaffirms the need to use judgment to ascertain if a formerly active market has become inactiv e and in determining fair values when markets have become inactive. The guidance is effective for interim and fiscal years beginning after June 15, 2009. We adopted this guidance in the first quarter of fiscal 2010. The adoption of this guidance did not have a significant impact on our consolidated financial position and results of operations.
In April 2009, the FASB amended the existing guidance on accounting for assets acquired and liabilities assumed in a business combination that arise from contingencies, including the initial recognition and measurement, subsequent measurement and accounting and disclosures for assets and liabilities arising from contingencies in business combinations. This guidance is effective for contingent assets and contingent liabilities acquired in business combinations for which the acquisition date is on or after the beginning of the fiscal year beginning after December 15, 2008. We adopted this guidance in the first quarter of fiscal 2010. See Note 2 – “Business Combinations” in Part II, Item 8 for further discussion.
In April 2009, the FASB amended the existing guidance on determining whether impairment for investments in debt securities is other-than-temporary. This guidance does not amend existing recognition and measurement guidance related to other-than-temporary impairments of equity securities. We adopted this guidance in the first quarter of fiscal 2010 and the adoption of this guidance did not have a material impact on our consolidated financial position and results of operations.
In June 2008, the FASB issued the authoritative guidance for determining whether instruments granted in share-based payment transactions are participating securities. This guidance states that unvested share-based payment awards that contain non-forfeitable rights to dividends or dividend equivalents (whether paid or unpaid) are participating securities and shall be included in the computation of earnings per share pursuant to the two-class method. This guidance is effective for fiscal years beginning after December 15, 2008. We adopted this guidance in the first quarter of fiscal 2010 and the adoption of this guidance did not have a material impact on our consolidated financial position and results of operations.
In April 2008, the FASB amended the existing guidance on determination of the useful life of intangible assets. This guidance amends the factors that should be considered in developing renewal or extension assumptions used to determine the useful life of a recognized intangible asset. The intent of the guidance is to improve the consistency between the useful life of a recognized intangible asset and the period of expected cash flows used to measure the fair value of the intangible asset. This guidance is effective for fiscal years beginning after December 15, 2008. We adopted this guidance in the first quarter of fiscal 2010.
In February 2008, the FASB amended the existing guidance on fair value measurements for purposes of lease classification to remove certain leasing transactions from its scope and was effective upon issuance. In addition, FASB issued authoritative guidance that provided a one year deferral for application of the new fair value measurement principles for all non-financial assets and non-financial liabilities, except for items that are recognized or disclosed at fair value in the financial statements on a recurring basis (at least annually), until the beginning of the first quarter of fiscal 2010. We adopted this guidance in the first quarter of fiscal year 2010. In October 2008, the FASB issued authoritative guidance on determining the fair value of a financial as set when the market for that asset is not active. This guidance was effective upon issuance. The adoption of this guidance did not have a material impact on our consolidated financial position and results of operations.
In December 2007, the FASB revised the authoritative guidance for business combinations. The guidance changes the accounting for business combinations including the measurement of acquirer shares issued in consideration for a business combination, the recognition of contingent consideration, the accounting for pre-acquisition gain and loss contingencies, the recognition of capitalized in-process research and development, the accounting for acquisition-related restructuring cost accruals, the treatment of acquisition related transaction costs and the recognition of changes in the acquirer’s income tax valuation allowance. This guidance is effective for fiscal years beginning after December 15, 2008, with early adoption prohibited. We adopted this guidance in the first quarter of fiscal 2010. See Note 2 – “ Business Combinations” in Part II, Item 8 for further discussion.
ITEM 7A. QUANTITATIVE AND QUALITATIVE DISCLOSURES ABOUT MARKET RISK
Our interest rate risk relates primarily to our short-term investments of $222.7 million as of March 28, 2010. By policy, we limit our exposure to long-term investments and mitigate the credit risk through diversification and adherence to a policy requiring the purchase of highly rated securities. As of March 28, 2010, the Company’s cash, cash equivalents and investment portfolio was concentrated in securities with same day liquidity and at the end of fiscal 2010, a substantial majority of securities in our investment portfolio had maturities of less than two years. Although a hypothetical 10% change in interest rates could have a material effect on the value of our investment portfolio at a given time, we normally hold these investments until maturity, which results in no realized impact on results of operations or cash flows. ; We do not currently use derivative financial instruments in our investment portfolio.
At March 28, 2010, we had no outstanding debt.
We are exposed to foreign currency exchange rate risk as a result of international sales, assets and liabilities of foreign subsidiaries, local operating expenses of our foreign entities and capital purchases denominated in foreign currencies. We may use derivative financial instruments to help manage our foreign currency exchange exposures. We do not enter into derivatives for speculative or trading purposes. We performed a sensitivity analysis as of March 28, 2010 and determined that, without hedging the exposure, a 10% change in the value of the U.S. dollar would result in an approximate 0.4% impact on gross profit margin percentage, as we operate manufacturing facilities in Malaysia and Singapore, and an approximate 0.8% impact to operating expenses (as a percentage of revenue) as we operate sales offices in Japa n and throughout Europe and design centers in the U.S., China, and Canada. At March 28, 2010 we had no outstanding foreign exchange contracts.
We did not have any currency exposure related to any outstanding capital purchases as of March 28, 2010.
ITEM 8. FINANCIAL STATEMENTS AND SUPPLEMENTARY DATA
Index to Consolidated Financial Statements
| | | | |
| Consolidated Financial Statements: | | | |
| | | 42 | |
| | | 43 | |
| | | 44 | |
| | | 45 | |
| | | 46 | |
| | | 47 | |
| | | | | |
| Financial Statement Schedule: | | | | |
| | | 91 | |
Report of Independent Registered Public Accounting Firm
To the Board of Directors and Stockholders of
Integrated Device Technology, Inc.:
In our opinion, the consolidated financial statements listed in the accompanying index, present fairly, in all material respects, the financial position of Integrated Device Technology, Inc. and its subsidiaries at March 28, 2010 and March 29, 2009, and the results of their operations and their cash flows for each of the three years in the period ended March 28, 2010 in conformity with accounting principles generally accepted in the United States of America. In addition, in our opinion, the financial statement schedule listed in the accompanying index presents fairly, in all material respects, the information set forth therein when read in conjunction with the related consolidated financial statements. Also in our opinion, the Company maintained, in all material respects, effective internal control over financial reporting as of March 28, 2010, based on criteria established in Internal Control - Integrated Framework issued by the Committee of Sponsoring Organizations of the Treadway Commission (COSO). The Company's management is responsible for these financial statements and financial statement schedule, for maintaining effective internal control over financial reporting and for its assessment of the effectiveness of internal control over financial reporting, included in Management's Report on Internal Control over Financial Reporting appearing under Item 9A. Our responsibility is to express opinions on these financial statements, on the financial statement schedule, and on the Company's internal control over financial reporting based on our integrated audits. We conduct ed our audits in accordance with the standards of the Public Company Accounting Oversight Board (United States). Those standards require that we plan and perform the audits to obtain reasonable assurance about whether the financial statements are free of material misstatement and whether effective internal control over financial reporting was maintained in all material respects. Our audits of the financial statements included examining, on a test basis, evidence supporting the amounts and disclosures in the financial statements, assessing the accounting principles used and significant estimates made by management, and evaluating the overall financial statement presentation. Our audit of internal control over financial reporting included obtaining an understanding of internal control over financial reporting, assessing the risk that a material weakness exists, and testing and evaluating the design and operating effectiveness of internal control based on the assessed risk. ; Our audits also included performing such other procedures as we considered necessary in the circumstances. We believe that our audits provide a reasonable basis for our opinions.
As discussed in Note 1 of the Notes to Consolidated Financial Statements, in fiscal 2010 the Company changed the manner in which it accounts for business combinations.
A company’s internal control over financial reporting is a process designed to provide reasonable assurance regarding the reliability of financial reporting and the preparation of financial statements for external purposes in accordance with generally accepted accounting principles. A company’s internal control over financial reporting includes those policies and procedures that (i) pertain to the maintenance of records that, in reasonable detail, accurately and fairly reflect the transactions and dispositions of the assets of the company; (ii) provide reasonable assurance that transactions are recorded as necessary to permit preparation of financial statements in accordance with generally accepted accounting principles, and that receipts and expenditures of the company are being made only in accordance wi th authorizations of management and directors of the company; and (iii) provide reasonable assurance regarding prevention or timely detection of unauthorized acquisition, use, or disposition of the company’s assets that could have a material effect on the financial statements.
Because of its inherent limitations, internal control over financial reporting may not prevent or detect misstatements. Also, projections of any evaluation of effectiveness to future periods are subject to the risk that controls may become inadequate because of changes in conditions, or that the degree of compliance with the policies or procedures may deteriorate.
/s/ PricewaterhouseCoopers LLP
San Jose, CA
May 25, 2010
INTEGRATED DEVICE TECHNOLOGY, INC. CONSOLIDATED BALANCE SHEETS
(in thousands, except per share amounts) | March 28, 2010 | | March 29, 2009 | |
| Assets | | | | | | |
| Current assets: | | | | | | |
| Cash and cash equivalents | | $ | 120,526 | | | $ | 136,036 | |
| Short-term investments | | | 222,663 | | | | 160,037 | |
| Accounts receivable, net of allowances of $6,656 and $7,351 | | | 68,957 | | | | 54,894 | |
| Inventories | | | 50,676 | | | | 69,722 | |
| Prepayments and other current assets | | | 25,086 | | | | 21,577 | |
| Total current assets | | | 487,908 | | | | 442,266 | |
| | | | | | | | | |
| Property, plant and equipment, net | | | 67,988 | | | | 71,561 | |
| Goodwill | | | 103,074 | | | | 89,404 | |
| Acquisition-related intangible assets, net | | | 65,242 | | | | 50,509 | |
| Other assets | | | 26,733 | | | | 24,627 | |
| Total assets | | $ | 750,945 | | | $ | 678,367 | |
| | | | | | | | | |
| Liabilities and stockholders' equity | | | | | | | | |
| Current liabilities: | | | | | | | | |
| Accounts payable | | $ | 34,717 | | | $ | 25,837 | |
| Accrued compensation and related expenses | | | 20,738 | | | | 18,820 | |
| Deferred income on shipments to distributors | | | 18,761 | | | | 16,538 | |
| Income taxes payable | | | 2,132 | | | | 457 | |
| Other accrued liabilities | | | 30,353 | | | | 21,206 | |
| Total current liabilities | | | 106,701 | | | | 82,858 | |
| | | | | | | | | |
| Deferred tax liabilities | | | 1,573 | | | | 3,220 | |
| Long-term income tax payable | | | 21,098 | | | | 20,907 | |
| Other long-term obligations | | | 21,833 | | | | 14,314 | |
| Total liabilities | | | 151,205 | | | | 121,299 | |
| | | | | | | | | |
| Commitments and contingencies (Notes 12 and 13) | | | | | | | | |
| Stockholders' equity: | | | | | | | | |
| Preferred stock: $.001 par value: 10,000 shares authorized; no shares issued | | | -- | | | | -- | |
| Common stock: $.001 par value: 350,000 shares authorized; 162,878 and 165,298 shares outstanding | | | 163 | | | | 165 | |
| Additional paid-in capital | | | 2,310,450 | | | | 2,283,601 | |
| Treasury stock (61,917 and 57,752 shares) at cost | | | (802,217 | ) | | | (777,847 | ) |
| Accumulated deficit | | | (909,702 | ) | | | (949,721 | ) |
| Accumulated other comprehensive income | | | 1,046 | | | | 870 | |
| Total stockholders' equity | | | 599,740 | | | | 557,068 | |
| Total liabilities and stockholders' equity | | $ | 750,945 | | | $ | 678,367 | |
| | | | | | | | | |
The accompanying notes are an integral part of these consolidated financial statements.
INTEGRATED DEVICE TECHNOLOGY, INC.
CONSOLIDATED STATEMENTS OF OPERATIONS
| | Fiscal Year Ended | |
(In thousands, except per share data) | March 28, 2010 | | March 29, 2009 | | March 30, 2008 | |
| Revenues | | $ | 535,906 | | | $ | 663,245 | | | $ | 781,467 | |
| Cost of revenues | | | 310,999 | | | | 388,796 | | | | 442,135 | |
| Gross profit | | | 224,907 | | | | 274,449 | | | | 339,332 | |
| | | | | | | | | | | | | |
| Operating expenses: | | | | | | | | | | | | |
| Research and development | | | 157,486 | | | | 161,192 | | | | 165,599 | |
| Selling, general and administrative | | | 107,037 | | | | 125,810 | | | | 161,708 | |
| Acquired in-process research and development | | | -- | | | | 5,597 | | | | -- | |
| Goodwill and acquisition-related intangible asset impairment | | | -- | | | | 1,025,685 | | | | -- | |
| Total operating expenses | | | 264,523 | | | | 1,318,284 | | | | 327,307 | |
| | | | | | | | | | | | | |
| Operating income (loss) | | | (39,616 | ) | | | (1,043,835 | ) | | | 12,025 | |
| Gain on divestiture | | | 78,306 | | | | -- | | | | -- | |
| Other-than-temporary impairment loss on investments | | | -- | | | | (3,000 | ) | | | -- | |
| Interest expense | | | (55 | ) | | | (60 | ) | | | (103 | ) |
| Interest income and other, net | | | 3,932 | | | | 1,308 | | | | 16,815 | |
| Income (loss) before income taxes | | | 42,567 | | | | (1,045,587 | ) | | | 28,737 | |
| Income tax expense (benefit) | | | 2,548 | | | | (420 | ) | | | (5,442 | ) |
| Net income (loss) | | $ | 40,019 | | | $ | (1,045,167 | ) | | $ | 34,179 | |
| | | | | | | | | | | | | |
| Basic net income (loss) per share | | $ | 0.24 | | | $ | (6.22 | ) | | $ | 0.18 | |
| Diluted net income (loss) per share | | $ | 0.24 | | | $ | (6.22 | ) | | $ | 0.18 | |
| Weighted average shares: | | | | | | | | | | | | |
| Basic | | | 165,408 | | | | 168,114 | | | | 187,213 | |
| Diluted | | | 165,961 | | | | 168,114 | | | | 189,260 | |
The accompanying notes are an integral part of these consolidated financial statements.
INTEGRATED DEVICE TECHNOLOGY, INC.
CONSOLIDATED STATEMENTS OF CASH FLOWS
| | Fiscal Year Ended | |
(in thousands) | March 28, 2010 | | March 29, 2009 | | March 30, 2008 | |
| Cash flows provided by operating activities: | | | | | | | | | |
| Net income (loss) | | $ | 40,019 | | | $ | (1,045,167 | ) | | $ | 34,179 | |
| Adjustments: | | | | | | | | | | | | |
| Depreciation | | | 22,118 | | | | 26,337 | | | | 29,881 | |
| Amortization of intangible assets | | | 21,073 | | | | 79,388 | | | | 109,995 | |
| Goodwill and acquisition-related intangible asset impairment | | | -- | | | | 1,025,685 | | | | -- | |
| Note receivable impairment | | | 1,602 | | | | -- | | | | -- | |
| Gain from divestitures | | | (78,306 | ) | | | -- | | | | -- | |
| Stock-based compensation expense, net of amounts capitalized in inventory | | | 16,674 | | | | 32,402 | | | | 41,242 | |
| Acquired in-process research and development | | | -- | | | | 5,597 | | | | -- | |
| Other-than temporary impairment loss on investments | | | -- | | | | 3,000 | | | | -- | |
| Gain on sale of investment in equity securities | | | -- | | | | -- | | | | (1,784 | ) |
| Deferred tax provision (benefit) | | | 58 | | | | (1,301 | ) | | | (7,501 | ) |
| Tax benefit from share based payment arrangements | | | 432 | | | | -- | | | | -- | |
| Changes in assets and liabilities (net of amounts acquired): | | | | | | | | | | | | |
| Accounts receivable, net | | | (13,826 | ) | | | 28,196 | | | | 6,895 | |
| Inventories | | | 26,244 | | | | 10,171 | | | | 5,001 | |
| Other assets | | | 2,686 | | | | 11,718 | | | | (15,297 | ) |
| Accounts payable | | | 8,231 | | | | (17,894 | ) | | | (5,003 | ) |
| Accrued compensation and related expenses | | | 211 | | | | (7,964 | ) | | | (4,261 | ) |
| Deferred income on shipments to distributors | | | (123 | ) | | | (7,774 | ) | | | (10,031 | ) |
| Income taxes payable and receivable | | | 1,296 | | | | 4,814 | | | | 5,798 | |
| Other accrued liabilities and long-term liabilities | | | 3,673 | | | | (3,433 | ) | | | (2,384 | ) |
| Net cash provided by operating activities | | | 52,062 | | | | 143,775 | | | | 186,730 | |
| | | | | | | | | | | | | |
| Cash flows provided by (used for) investing activities | | | | | | | | | | | | |
| Acquisitions, net of cash acquired | | | (85,000 | ) | | | (20,097 | ) | | | -- | |
| Proceeds from divestitures | | | 109,434 | | | | -- | | | | -- | |
| Purchases of property, plant and equipment | | | (12,927 | ) | | | (16,591 | ) | | | (16,938 | ) |
| Purchases of short-term investments | | | (325,510 | ) | | | (239,609 | ) | | | (170,882 | ) |
| Purchase from non-marketable security | | | (1,000 | ) | | | -- | | | | -- | |
| Proceeds from sales of short-term investments | | | 53,635 | | | | 25,166 | | | | 31,598 | |
| Proceeds from maturities of short-term investments | | | 208,639 | | | | 162,397 | | | | 146,761 | |
| Net cash used for investing activities | | | (52,729 | ) | | | (88,734 | ) | | | (9,461 | ) |
| | | | | | | | | | | | | |
| Cash flows provided by (used for) financing activities | | | | | | | | | | | | |
| Proceeds from issuance of common stock | | | 7,336 | | | | 13,513 | | | | 41,659 | |
| Repurchase of common stock | | | (24,370 | ) | | | (62,338 | ) | | | (334,831 | ) |
| Excess tax benefit from share based payment arrangements | | | 1,824 | | | | 192 | | | | 12 | |
| Net cash used for financing activities | | | (15,210 | ) | | | (48,633 | ) | | | (293,160 | ) |
| | | | | | | | | | | | | |
| Effect of exchange rates on cash and cash equivalents | | | 367 | | | | (2,358 | ) | | | 1,288 | |
| Net increase (decrease) in cash and cash equivalents | | | (15,510 | ) | | | 4,050 | | | | (114,603 | ) |
| Cash and cash equivalents at beginning of period | | | 136,036 | | | | 131,986 | | | | 246,589 | |
| Cash and cash equivalents at end of period | | $ | 120,526 | | | $ | 136,036 | | | $ | 131,986 | |
| | | | | | | | | | | | | |
| Supplemental disclosure of cash flow information | | | | | | | | | | | | |
| Cash paid for: | | | | | | | | | | | | |
| Interest | | $ | 7 | | | $ | 9 | | | $ | 5 | |
| Income taxes, net of refunds | | $ | 1,219 | | | $ | (4,072 | ) | | $ | (569 | ) |
| Noncash investing activities: | | | | | | | | | | | | |
| Common stock options assumed in connection with the Tundra acquisition | | $ | 721 | | | $ | -- | | | $ | -- | |
The accompanying notes are an integral part of these consolidated financial statements.
INTEGRATED DEVICE TECHNOLOGY, INC.
CONSOLIDATED STATEMENTS OF STOCKHOLDERS’ EQUITY
| | | Common Stock and Additional Paid-In Capital | | | Treasury Stock | | | Retained Earnings (Accumulated Deficit) | | | Accumulated Other Comprehensive Income (Loss) | | | Total Stockholders' Equity | |
| (in thousands, except share amounts) | | Shares | | | Dollars | | | | | | | | | | | | | |
| Balance, April 1, 2007 | | | 196,262,742 | | | $ | 2,155,013 | | | $ | (380,678 | ) | | $ | 61,206 | | | $ | 3,549 | | | $ | 1,839,090 | |
| Comprehensive income: | | | | | | | | | | | | | | | | | | | | | | | | |
| Net income | | | -- | | | | -- | | | | -- | | | | 34,179 | | | | -- | | | | 34,179 | |
| Translation adjustment | | | -- | | | | -- | | | | -- | | | | -- | | | | 1,025 | | | | 1,025 | |
| Net unrealized loss on investments | | | -- | | | | -- | | | | -- | | | | -- | | | | (1,494 | ) | | | (1,494 | ) |
| Total comprehensive loss | | | | | | | | | | | | | | | | | | | | | | | 33,710 | |
| Issuance of common stock | | | 3,871,796 | | | | 41,659 | | | | -- | | | | -- | | | | -- | | | | 41,659 | |
| Repurchase of common stock | | | (28,853,034 | ) | | | -- | | | | (334,831 | ) | | | -- | | | | -- | | | | (334,831 | ) |
| Adoption of uncertain tax positions accounting standards | | | -- | | | | -- | | | | -- | | | | 61 | | | | -- | | | | 61 | |
| Excess tax benefit from stock option | | | -- | | | | 12 | | | | -- | | | | -- | | | | -- | | | | 12 | |
| Stock-based compensation | | | -- | | | | 41,121 | | | | -- | | | | -- | | | | -- | | | | 41,121 | |
| Balance, March 30, 2008 | | | 171,281,504 | | | | 2,237,805 | | | | (715,509 | ) | | | 95,446 | | | | 3,080 | | | | 1,620,822 | |
| Comprehensive income: | | | | | | | | | | | | | | | | | | | | | | | | |
| Net loss | | | -- | | | | -- | | | | -- | | | | (1,045,167 | ) | | | -- | | | | (1,045,167 | ) |
| Translation adjustment | | | -- | | | | -- | | | | -- | | | | -- | | | | (2,082 | ) | | | (2,082 | ) |
| Net unrealized loss on investments | | | -- | | | | -- | | | | -- | | | | -- | | | | (128 | ) | | | (128 | ) |
| Total comprehensive loss | | | | | | | | | | | | | | | | | | | | | | | (1,047,377 | ) |
| Issuance of common stock | | | 2,373,937 | | | | 13,513 | | | | -- | | | | -- | | | | -- | | | | 13,513 | |
| Repurchase of common stock | | | (8,357,300 | ) | | | -- | | | | (62,338 | ) | | | -- | | | | -- | | | | (62,338 | ) |
| Excess tax benefit from stock option | | | -- | | | | 192 | | | | -- | | | | -- | | | | -- | | | | 192 | |
| Stock-based compensation | | | -- | | | | 32,256 | | | | -- | | | | -- | | | | -- | | | | 32,256 | |
| Balance, March 29, 2009 | | | 165,298,141 | | | | 2,283,766 | | | | (777,847 | ) | | | (949,721 | ) | | | 870 | | | | 557,068 | |
| Comprehensive income: | | | | | | | | | | | | | | | | | | | | | | | | |
| Net income | | | -- | | | | -- | | | | -- | | | | 40,019 | | | | -- | | | | 40,019 | |
| Translation adjustment | | | -- | | | | -- | | | | -- | | | | -- | | | | 287 | | | | 287 | |
| Net unrealized loss on investments | | | -- | | | | -- | | | | -- | | | | -- | | | | (111 | ) | | | (111 | ) |
| Total comprehensive loss | | | | | | | | | | | | | | | | | | | | | | | 40,195 | |
| Issuance of common stock | | | 1,744,625 | | | | 7,336 | | | | -- | | | | -- | | | | -- | | | | 7,336 | |
| Common stock options assumed | | | -- | | | | 721 | | | | -- | | | | -- | | | | -- | | | | 721 | |
| Repurchase of common stock | | | (4,164,900 | ) | | | -- | | | | (24,370 | ) | | | -- | | | | -- | | | | (24,370 | ) |
| Excess tax benefit from stock option | | | -- | | | | 2,256 | | | | -- | | | | -- | | | | -- | | | | 2,256 | |
| Stock-based compensation | | | -- | | | | 16,534 | | | | -- | | | | -- | | | | -- | | | | 16,534 | |
| Balance, March 28, 2010 | | | 162,877,866 | | | $ | 2,310,613 | | | $ | (802,217 | ) | | $ | (909,702 | ) | | $ | 1,046 | | | $ | 599,740 | |
The accompanying notes are an integral part of these consolidated financial statements.
INTEGRATED DEVICE TECHNOLOGY, INC. Notes to Consolidated Financial Statements
Note 1
Summary of Significant Accounting Policies
Nature of Business. Integrated Device Technology, Inc. (IDT or the Company) designs, develops, manufactures and markets a broad range of integrated circuits for the advanced communications, computing and consumer industries.
Basis of Presentation. The Company's fiscal year ends on the Sunday nearest March 31. Fiscal 2010, 2009 and 2008 each included 52 weeks and ended on March 28, 2010, March 29, 2009 and March 30, 2008, respectively.
Reclassifications. Certain fiscal 2009 and 2008 amounts in the accompanying consolidated financial statements have been reclassified to conform to the fiscal 2010 presentation. These reclassifications had no effect on previously reported consolidated statements of operations or stockholders’ equity.
Principles of Consolidation. The consolidated financial statements include the accounts of the Company and its wholly-owned subsidiaries. All inter-company accounts and transactions have been eliminated.
Use of Estimates. The preparation of financial statements in conformity with generally accepted accounting principles requires management to make estimates and assumptions that affect the amounts reported in the financial statements and accompanying notes. Actual results could differ from those estimates.
Cash & Cash Equivalents. Cash equivalents are highly liquid investments with remaining maturities of three months or less at the time of purchase.
Investments
Available-for-Sale Investments. Investments designated as available-for-sale include marketable debt and equity securities. Available-for-sale investments are classified as short-term, as these investments generally consist of highly marketable securities that are intended to be available to meet near-term cash requirements. Marketable securities classified as available-for-sale are reported at market value, with net unrealized gains or losses recorded in accumulated other comprehensive income, a separate component of stockholders' equity, until realized. Realized gains and losses on investments are computed based upon specific identification and are included in in terest income and other, net.
Non-Marketable Equity Securities. Non-marketable equity securities are accounted for at historical cost or, if the Company has significant influence over the investee, using the equity method of accounting.
Other-Than-Temporary Impairment. All of the Company’s available-for-sale investments and non-marketable equity securities are subject to a periodic impairment review. Investments are considered to be impaired when a decline in fair value is judged to be other-than-temporary. This determination requires significant judgment. For publicly traded investments, impairment is determined based upon the specific facts and circumstances present at the time, including a review of the closing price over the previous six months, general market conditions and the Company’s intent and ability to hold the investment for a period of time sufficient to allow for recover y. For non-marketable equity securities, the impairment analysis requires the identification of events or circumstances that would likely have a significant adverse effect on the fair value of the investment, including revenue and earnings trends, overall business prospects and general market conditions in the investees’ industry or geographic area. Investments identified as having an indicator of impairment are subject to further analysis to determine if the investment is other-than-temporarily impaired, in which case the investment is written down to its impaired value.
Inventories. Inventories are recorded at the lower of standard cost (which approximates actual cost on a first-in, first-out basis) or market value. Inventory held at consignment locations is included in finished goods inventory as the Company retains full title and rights to the product. Inventory valuation includes provisions for obsolete and excess inventory based on management’s forecasts of demand over specific future time horizons and reserves to value our inventory at the lower of cost or market which rely on forecasts of average selling prices (ASPs) in future periods.
Property, Plant and Equipment. Property, plant and equipment are stated at cost. Property, plant and equipment acquired in conjunction with mergers or acquisitions are stated at estimated fair value at the time of acquisition. For financial reporting purposes, depreciation is computed using the straight-line method over estimated useful lives of the assets. Estimated useful lives for major asset categories are as follows: machinery and equipment, 3 to 5 years; and buildings and improvements, 10 to 30 years. Leasehold improvements are amortized over the shorter of the estimated useful lives of the assets or the remaining term of the lease.
Long-Lived Assets and Goodwill. The carrying values of long-lived assets, including purchased intangibles are evaluated whenever events or circumstances indicate that the carrying values may not be recoverable. If estimated undiscounted cash flows are not sufficient to recover the carrying values, the affected assets are considered impaired and are written down to their estimated fair value, which is generally determined on the basis of discounted cash flows or outside appraisals.
The Company tests for impairment of goodwill and other indefinite-lived assets on an annual basis, or more frequently if indicators of impairment are present. These tests are performed at the reporting unit level using a two-step, fair-value based approach. The first step, used to determine if impairment possibly exists, is to compare the carrying amount of a reporting unit, including goodwill, to its fair value. If the carrying amount of the reporting unit exceeds the fair value, the second step is to determine the amount of a possible impairment by comparing the implied fair value of the reporting unit’s goodwill to the carrying amount of that goodwill.
Income Taxes. The Company accounts for income taxes under an asset and liability approach that requires the expected future tax consequences of temporary differences between book and tax bases of assets and liabilities be recognized as deferred tax assets and liabilities. Generally accepted accounting principles require the Company to evaluate its ability to realize the value of its net deferred tax assets on an ongoing basis. A valuation allowance is recorded to reduce the net deferred tax assets to an amount that will more likely than not be realized. Accordingly, the Company considers various tax planning strategies, forecasts of future taxable income and its most recent operating results in assessing the need for a valuation allowance. In the consid eration of the ability to realize the value of net deferred tax assets, recent results must be given substantially more weight than any projections of future profitability. Since the fourth quarter of fiscal 2003, the Company determined that, under applicable accounting principles, it could not conclude that it was more likely than not that the Company would realize the value of its net deferred tax assets. The Company’s assumptions regarding the ultimate realization of these assets remained unchanged in fiscal 2010 and accordingly, the Company continues to record a valuation allowance to reduce its deferred tax assets to the amount that is more likely than not to be realized.
On April 2, 2007, the Company adopted the Financial Accounting Standards Board’s (“FASB”) authoritative guidance which clarifies the accounting for uncertainty in income taxes recognized in an enterprise’s financial statements. This interpretation prescribes a recognition threshold and measurement attribute for the financial statement recognition and measurement of a tax position taken or expected to be taken in a tax return. As a result of the implementation of this guidance, the Company recognizes the tax liability for uncertain income tax positions on the income tax return based on the two-step process prescribed in the interpretation. The first step is to determine whether it is more likely than not that each income tax position would be sustained upon audit. The second step is to estimate and measure the tax benefit as the amount that has a greater than 50% likelihood of being realized upon ultimate settlement with the tax authority. Estimating these amounts requires the Company to determine the probability of various possible outcomes. The Company evaluates these uncertain tax positions on a quarterly basis. This evaluation is based on the consideration of several factors including changes in facts or circumstances, changes in applicable tax law, settlement of issues under audit, and new exposures. If the Company later determines that the exposure is lower or that the liability is not sufficient to cover its revised expectations, the Company adjusts the liability and effect a related change in its tax provision during the period in which the Company makes such determination.
Revenue Recognition. The Company’s revenue results from semiconductor products sold through three channels: direct sales to original equipment manufacturers (“OEMs”) and electronic manufacturing service providers (“EMSs”), consignment sales to OEMs and EMSs, and sales through distributors. The Company recognizes revenue when persuasive evidence of an arrangement exists, delivery has occurred or services have been rendered, the price is fixed or determinable, and its ability to collect is reasonably assured.
For distributors in North America and Europe regions, who have stock rotation, price protection and ship from stock pricing adjustment rights, the Company defers revenue and related cost of revenues on sales to these distributors until the product is sold through by the distributor to an end-customer. Subsequent to shipment to the distributor, the Company may reduce
product pricing through price protection based on market conditions, competitive considerations and other factors. Price protection is granted to distributors on the inventory that they have on hand at the date the price protection is offered. The Company also grants certain credits to its distributors on specifically identified portions of the distributors’ business to allow them to earn a competitive gross margin on the sale of the Company’s products to their end customers. As a result of its inability to estimate these credits, the Company has determined that the sales price to these distributors is not fixed or determinable until the final sale to the end-customer.
In the Asia Pacific (“APAC”) region and Japan, the Company has distributors for which revenue is recognized upon shipment, with reserves recorded for the estimated return and pricing adjustment exposures. The determination of the amount of reserves to be recorded for stock rotation rights requires the Company to make estimates as to the amount of product which will be returned by customers within their limited contractual rights. The Company utilizes historical return rates to estimate the exposure in accordance with authoritative guidance for Revenue Recognition When Right of Return Exists. In addition, on occasion, t he Company can offer pricing adjustments to distributors for product purchased in a given quarter that remains in their inventory. These amounts are estimated by management based on discussions with customers, assessment of market trends, as well as historical practice.
Based on the terms in the agreements with its distributors and the application of this policy, the Company recognizes revenue once the distributor sells its products to an end-customer for North American and European distributors and recognizes revenue upon shipment to Japanese and other Asian distributors.
Shipping and Handling Costs. The Company includes shipping and handling costs billed to customers in net revenue. The Company’s shipping and handling costs are included in cost of revenue.
Stock-based Compensation. The fair value of employee restricted stock units is equal to the market value of the Company’s common stock on the date the award is granted. The Company estimates the fair value of employee stock options and the right to purchase shares under the employee stock purchase plan using the Black-Scholes valuation model, consistent with the FASB’s authoritative guidance for share-based payments. Option-pricing models require the input of highly subjective assumptions, including the expected term of options and the expected price volatility of the stock underlying such options. In addition, the Company is required to estimate the number of sto ck-based awards that will be forfeited due to employee turnover. The Company attributes the value of stock-based compensation to expense on an accelerated method. Finally, the Company capitalizes into inventory a portion of the periodic stock-based compensation expense that relates to employees working in manufacturing activities.
The Company updates the expected term of stock option grants annually based on its analysis of the stock option exercise behavior over a period of time. The interest rate is based on the average U.S. Treasury interest rate over the expected term during the applicable quarter. The Company believes that the implied volatility of its common stock is an important consideration of overall market conditions and a good indicator of the expected volatility of its common stock. However, due to the limited volume of options freely traded over the counter, the Company believes that implied volatility, by itself, is not representative of the expected volatility of its common stock. Therefore, upon the adoption of FASB authoritative guidance for stock-based payment at the beginning of fiscal 2007, the Compan y revised the volatility factor used to estimate the fair value of its stock-based awards which now reflects a blend of historical volatility of its common stock and implied volatility of call options and dealer quotes on call options, generally having a term of less than twelve months. The Company has not paid, nor does it have current plans to pay dividends on its common stock in the foreseeable future.
Net Income (Loss) Per Share. Basic net income (loss) per share is computed using the weighted-average number of common shares outstanding during the period. Diluted net income (loss) per share is computed using the weighted-average number of common and dilutive potential common shares outstanding during the period. Potential common shares include employee stock options and restricted stock units.
The following table sets forth the computation of basic and diluted net income (loss) per share:
| | | Fiscal Year Ended | |
(in thousands, except per share amounts) | | March 28, 2010 | | | March 29, 2009 | | | March 30, 2008 | |
| Net income (loss) | | $ | 40,019 | | | $ | (1,045,167 | ) | | $ | 34,179 | |
| | | | | | | | | | | | | |
| Weighted average common shares outstanding, basic | | | 165,408 | | | | 168,114 | | | | 187,213 | |
| Dilutive effect of employee stock options and awards | | | 553 | | | | -- | | | | 2,047 | |
| Weighted average common shares outstanding, diluted | | | 165,961 | | | | 168,114 | | | | 189,260 | |
| Basic earnings per common share | | $ | 0.24 | | | $ | (6.22 | ) | | $ | 0.18 | |
| Diluted earnings per common share | | | 0.24 | | | | (6.22 | ) | | | 0.18 | |
Employee stock options and restricted stock units of 27.0 million, 29.9 million and 12.7 million shares for the fiscal years ended March 28, 2010, March 29, 2009 and March 30, 2008, respectively, were outstanding, but were excluded from the calculation of diluted earnings per share because they were anti-dilutive.
Accumulated Other Comprehensive Income. The components of accumulated other comprehensive income were as follows:
(in thousands) | | March 28, 2010 | | | March 29, 2009 | |
| Cumulative translation adjustments | | $ | 733 | | | $ | 446 | |
| Unrealized gain on available-for-sale investments | | | 313 | | | | 424 | |
| Total accumulated other comprehensive income | | $ | 1,046 | | | $ | 870 | |
Translation of Foreign Currencies. For subsidiaries in which the functional currency is the local currency, gains and losses resulting from translation of foreign currency financial statements into U.S. dollars are recorded as a component of accumulated other comprehensive income. For subsidiaries where the functional currency is the U.S. dollar, gains and losses resulting from the process of remeasuring foreign currency financial statements into U.S. dollars are included in interest income and other, net.
Certain Risk and Concentrations. The Company's most significant potential exposure to credit concentration risk includes debt-security investments, foreign exchange contracts and trade accounts receivable. The Company’s investment policy addresses sector and industry concentrations, credit ratings and maturity dates. The Company invests its excess cash primarily in money market instruments, diversifies its investments and, by policy, invests only in highly rated securities to minimize credit risk.
The Company sells integrated circuits to OEMs, distributors and EMSs primarily in the U.S., Europe and Asia. The Company monitors the financial condition of its major customers, including performing credit evaluations of those accounts which management considers to be high risk, and generally does not require collateral from its customers. When deemed necessary, the Company may limit the credit extended to certain customers. The Company’s relationship with the customer, and the customer��s past and current payment experience, are also factored into the evaluation in instances in which limited financial information is available. The Company maintains an allowance for doubtful accounts for probable credit losses, including reserves based upon a percentage of total receivables. When the Company becomes aware that a specific customer may default on its financial obligation, a specific amount, which takes into account the level of risk and the customer’s outstanding accounts receivable balance, is reserved. These reserved amounts are classified within selling, general and administrative expenses. Write-offs of accounts receivable balances were not significant in each of the three fiscal years presented.
One family of distributors, Maxtek and its affiliates, represented approximately 21%, 21% and 25% of the Company’s revenues in fiscal 2010, 2009 and 2008, respectively, and 23% and 21% of its gross accounts receivable balance as of March 28, 2010 and March 29, 2009, respectively. Another distributor, Avnet represented approximately 11% and 10% of the Company’s revenues in fiscal 2010 and 2009, respectively.
For foreign exchange contracts, the Company manages its potential credit exposure primarily by restricting transactions to only high-credit quality counterparties.
The semiconductor industry is characterized by rapid technological change, competitive pricing pressures, and cyclical market patterns. The Company's results of operations are affected by a wide variety of factors, including general economic conditions, both at home and abroad; economic conditions specific to the semiconductor industry; demand for the Company's products; the timely introduction of new products; implementation of new manufacturing technologies; manufacturing capacity; the availability and cost of materials and supplies; competition; the ability to safeguard patents and intellectual property in a rapidly evolving market; and reliance on assembly and manufacturing foundries, independent distributors and sales representatives. As a result, the Company may expe rience substantial period-to-period fluctuations in future operating results due to the factors mentioned above or other factors.
Product Warranty. The Company maintains a reserve for obligations it incurs under its product warranty program. The standard warranty period offered is one year, though in certain instances the warranty period may be extended to as long as two years. Management estimates the fair value of its warranty liability based on actual past warranty claims experience, its policies regarding customer warranty returns and other estimates about the timing and disposition of product returned under the program.
Recent Accounting Pronouncements.
In January 2010, the FASB issued updated guidance related to fair value measurements and disclosures, which requires a reporting entity to disclose separately the amounts of significant transfers in and out of Level 1 and Level 2 fair value measurements and to describe the reasons for the transfers. In addition, in the reconciliation for fair value measurements using significant unobservable inputs, or Level 3, a reporting entity should disclose separately information about purchases, sales, issuances and settlements (that is, on a gross basis rather than one net number). The updated guidance also requires that an entity should provide fair value measurement disclosures for each class of assets and liabilities and disclosures about the valuation techniques and inputs used to measure fair value for both recurring and non-recurring fair val ue measurements for Level 2 and Level 3 fair value measurements. The updated guidance is effective for interim or annual financial reporting periods beginning after December 15, 2009, except for the disclosures about purchases, sales, issuances and settlements in the roll forward activity in Level 3 fair value measurements, which are effective for fiscal years beginning after December 15, 2010 and for interim periods within those fiscal years. The adoption of this guidance did not have a significant impact on the Company’s consolidated financial statements or related footnotes.
In June 2009, the FASB issued the FASB Accounting Standards Codification and the Hierarchy of Generally Accepted Accounting Principles (“codification”). This authoritative guidance establishes the codification, which officially launched July 1, 2009, to become the source of authoritative U.S. generally accepted accounting principles (GAAP) recognized by the FASB to be applied by nongovernmental entities. Rules and interpretive releases of the Securities and Exchange Commission (SEC) under authority of federal securities laws are also sources of authoritative U.S. GAAP for SEC registrants. The subsequent issuances of new standards will be in the form of Accounting Standards Updates that will be included in the Codification. Generally, the Codification is not expected to c hange U.S. GAAP. All other accounting literature excluded from the Codification will be considered non-authoritative. This guidance is effective for financial statements issued for interim and annual periods ending after September 15, 2009. The Company adopted this guidance in the second quarter of fiscal 2010. The adoption of this guidance did not have a significant impact on the Company’s consolidated financial statements or related footnotes.
In April 2009, the FASB issued authoritative fair value disclosure guidance for financial instruments. This guidance requires an entity to provide interim disclosures about the fair value of all financial instruments as well as in annual financial statements. Additionally, this guidance requires disclosures of the methods and significant assumptions used in estimating the fair value of financial instruments on an interim basis as well as changes of the methods and significant assumptions from prior periods. This guidance is effective for interim and annual periods ending after June 15, 2009. The Company adopted this guidance in the first quarter of fiscal 2010. The adoption of this guidance did not have a significant impact on the Company consolidated financial position and results of operations.
In April 2009, the FASB issued the authoritative guidance for determining fair value when the volume and level of activity for the asset or liability have significantly decreased and identifying transactions that are not orderly. This standard provides guidance on how to determine the fair value of assets and liabilities. The guidance relates to determining fair values when there is no active market or where the price inputs being used represent distressed sales. It reaffirms that the objective of fair value
measurement ––to reflect how much an asset would be sold for in an orderly transaction (as opposed to a distressed forced transaction) at the date of the financial statements under current market conditions. Specifically, it reaffirms the need to use judgment to ascertain if a formerly active market has become inactive and in determining fair values when markets have become inactive. The guidance is effective for interim and fiscal years beginning after June 15, 2009. The Company adopted this guidance in the first quarter of fiscal 2010. The adoption of this guidance did not have a significant impact on the Company’s consolidated financial position and results of operations.
In April 2009, the FASB amended the existing guidance on accounting for assets acquired and liabilities assumed in a business combination that arise from contingencies, including the initial recognition and measurement, subsequent measurement and accounting and disclosures for assets and liabilities arising from contingencies in business combinations. This guidance is effective for contingent assets and contingent liabilities acquired in business combinations for which the acquisition date is on or after the beginning of the fiscal year beginning after December 15, 2008. The Company adopted this guidance in the first quarter of fiscal 2010. See Note 2 – “Business Combinations” for further discussion.
In April 2009, the FASB amended the existing guidance on determining whether impairment for investments in debt securities is other-than-temporary. This guidance does not amend existing recognition and measurement guidance related to other-than-temporary impairments of equity securities. The Company adopted this guidance in the first quarter of fiscal 2010 and the adoption of this guidance did not have a material impact on the Company’s consolidated financial position and results of operations.
In June 2008, the FASB issued the authoritative guidance for determining whether instruments granted in share-based payment transactions are participating securities. This guidance states that unvested share-based payment awards that contain non-forfeitable rights to dividends or dividend equivalents (whether paid or unpaid) are participating securities and shall be included in the computation of earnings per share pursuant to the two-class method. This guidance is effective for fiscal years beginning after December 15, 2008. The Company adopted this guidance in the first quarter of fiscal 2010 and the adoption of this guidance did not have a material impact on the Company’s consolidated financial position and results of operations.
In April 2008, the FASB amended the existing guidance on determination of the useful life of intangible assets. This guidance amends the factors that should be considered in developing renewal or extension assumptions used to determine the useful life of a recognized intangible asset. The intent of the guidance is to improve the consistency between the useful life of a recognized intangible asset and the period of expected cash flows used to measure the fair value of the intangible asset. This guidance is effective for fiscal years beginning after December 15, 2008. The Company adopted this guidance in the first quarter of fiscal 2010.
In February 2008, the FASB amended the existing guidance on fair value measurements for purposes of lease classification to remove certain leasing transactions from its scope and was effective upon issuance. In addition, FASB issued authoritative guidance that provided a one year deferral for application of the new fair value measurement principles for all non-financial assets and non-financial liabilities, except for items that are recognized or disclosed at fair value in the financial statements on a recurring basis (at least annually), until the beginning of the first quarter of fiscal 2010. The Company adopted this guidance in the first quarter of fiscal year 2010. In October 2008, the FASB issued authoritative guidance on determining the fair value of a fin ancial asset when the market for that asset is not active. This guidance was effective upon issuance. The adoption of this guidance did not have a material impact on the Company’s consolidated financial position and results of operations.
In December 2007, the FASB revised the authoritative guidance for business combinations. The guidance changes the accounting for business combinations including the measurement of acquirer shares issued in consideration for a business combination, the recognition of contingent consideration, the accounting for pre-acquisition gain and loss contingencies, the recognition of capitalized in-process research and development, the accounting for acquisition-related restructuring cost accruals, the treatment of acquisition related transaction costs and the recognition of changes in the acquirer’s income tax valuation allowance. This guidance is effective for fiscal years beginning after December 15, 2008, with early adoption prohibited. The Company adopted this guidance in the first quarter of fiscal 2010. See Note 2 – ; “Business Combinations” for further discussion.
Note 2
Business Combinations
Acquisition of Mobius Microsystems (“Mobius”)
On January 14, 2010, the Company completed its acquisition of Mobius, a privately-held, fabless semiconductor company based in Sunnyvale, California, acquiring all of Mobius’ outstanding shares of common stock for approximately $21 million in cash. Pursuant to the agreement and upon closing the transaction, the Company acquired patented all-silicon oscillator technology and related assets along with members of Mobius’ engineering team. As part of the agreement, the Company is liable to certain employees of Mobius for contingent payments totaling $4.3 million due upon achievement of certain employment milestones. As of March 28, 2010, $1.7 million had been disbursed.
A summary of the total purchase price is as follows:
| (in thousands) | | | |
| Cash paid | | $ | 20,188 | |
| Acquisition-related costs assumed by the Company | | | 500 | |
| Total purchase price | | $ | 20,688 | |
The Company allocated the purchase price to the tangible and intangible assets acquired, including in-process research and development (“IPR&D”), based on their estimated fair values. The excess purchase price over those fair values is recorded as goodwill. The acquisition is expected to extend the Company’s leadership into high accuracy, crystal oscillator replacements. The all-silicon timing technology will provide the Company with power, size and time-to-market advantages. The fair values assigned to tangible and intangible assets acquired are based on management estimates and assumptions. Goodwill is not expected to be deductible for tax purposes.
The Company incurred approximately $0.5 million of acquisition-related costs, which were included in selling, general and administrative (“SG&A”) expenses on the Consolidated Statements of Operations for fiscal 2010.
The purchase price has been allocated as follows:
| (in thousands) | | Fair Value | |
| Cash | | $ | 170 | |
| Property, plant and equipment, net | | | 237 | |
| Other assets | | | 44 | |
| Developed technology | | | 15,768 | |
| In-process research and development | | | 3,536 | |
| Goodwill | | | 2,105 | |
| Liabilities assumed | | | (1,172 | ) |
| Total purchase price | | $ | 20,688 | |
Net tangible assets were reviewed and adjusted, if necessary, to their estimated fair value.
Developed technology consists of products that have reached technological feasibility. The Company used a discounted cash flow (“DCF”) model with a discount rate of 30% to determine the fair value of the developed technology and is amortizing it on a straight-line basis over 7 years.
Projects that qualify as IPR&D represent those at the development stage and require further research and development to determine technical feasibility and commercial viability. Technological feasibility is established when an enterprise has completed all planning, designing, coding, and testing activities that are necessary to establish that a product can be produced to meet its design specifications, including functions, features, and technical performance requirements. The value of IPR&D was determined by considering the importance of each project to the Company’s overall development plan, estimating costs to develop the purchased IPR&D into commercially viable products, estimating the resulting net cash flows from the projects when completed and discounting the net cash flows to their present value based on the perce ntage of completion of the IPR&D projects. The Company utilized the DCF method to value the IPR&D, using a discount factor of 33% and will amortize this
intangible asset once the projects are complete. There are two IPR&D projects underway at Mobius at the acquisition date and the fair value assigned to each project is $2.4 million and $1.1 million, respectively. As of March 28, 2010, both projects were 17% complete and approximately $1.4 million of costs have been incurred in connection with both projects. The Company estimates that an additional investment of $8.0 million will be required to complete the projects with an estimated completion date during the second quarter of fiscal 2012. Pro forma earnings information has not been presented because the effect of the acquisition is not material to the Company’s historical results of operations.
Acquisition of Tundra Semiconductor Corporation (“Tundra”)
On June 29, 2009, the Company completed its acquisition of Tundra, pursuant to which the Company acquired 100% of the voting common stock of Tundra at a price of CDN$6.25 per share, or an aggregate purchase price of approximately CDN$120.8 million. The Company paid approximately $104.3 million in cash. In addition, as part of the consideration in the acquisition, the Company assumed options to purchase up to 0.8 million shares of its common stock. As a result, the acquisition resulted in the issuance of approximately 0.8 million stock options with a fair value of $0.7 million. The total consideration was approximately $105.0 million. The options were valued using the Black-Scholes option pricing model. Approximately $3.4 million of acquisition-related costs were included SG&A expenses on the Consolidated Statements of Operations for fiscal 2010. A summary of the total purchase price is as follows:
| (in thousands) | | | |
| Cash paid | | $ | 104,316 | |
| Assumed stock options | | | 721 | |
| Total purchase price | | $ | 105,037 | |
The Company allocated the purchase price to the tangible and intangible assets acquired and liabilities assumed, based on their estimated fair values. The excess purchase price over those fair values was recorded as goodwill. Tundra’s technology and development capabilities are complementary to the Company’s existing product portfolios for RapidIO and PCI Express. This strategic combination will provide customers with a broader product offering, as well as improved service, support and a future roadmap for serial connectivity. These are the significant contributing factors to the establishment of the purchase price, resulting in the recognition of goodwill. The fair values assigned to tangible and intangible assets acquired and liabilities assumed are based on management’s estimates and a ssumptions. Goodwill is not expected to be deductible for tax purposes. Goodwill is not amortized but will be reviewed at least annually for impairment. Purchased intangibles with finite lives are amortized over their respective estimated useful lives on a straight-line basis.
The purchase price has been allocated as follows:
| (in thousands) | | Fair Value | |
| Identifiable tangible assets acquired | | | |
| Cash and cash equivalents | | $ | 46,085 | |
| Accounts receivable | | | 1,260 | |
| Inventories | | | 19,881 | |
| Prepayments and other current assets | | | 6,119 | |
| Property, plant and equipment, net | | | 7,692 | |
| Other assets | | | 4,025 | |
| Accounts payable and accruals | | | (11,877 | ) |
| Other long-term obligations | | | (3,549 | ) |
| Net identifiable tangible assets acquired | | | 69,636 | |
| Amortizable intangible assets | | | 19,979 | |
| Goodwill | | | 15,422 | |
| Total purchase price | | $ | 105,037 | |
A summary of the allocation of amortizable intangible assets is as follows:
(in thousands) | | Fair Value | |
| Amortizable intangible assets: | | | |
| Developed Technology | | $ | 8,476 | |
| Customer Relationships | | | 7,973 | |
| Trade name | | | 2,911 | |
| In-process research and development | | | 619 | |
| Total | | $ | 19,979 | |
Useful lives are primarily based on the underlying assumptions used in the DCF model.
Identifiable Tangible Assets
Tundra’s assets and liabilities were reviewed and adjusted, if required, to their estimated fair value.
Inventories – The value allocated to inventories reflects the estimated fair value of the acquired inventory based on the expected sales price of the inventory, less a reasonable selling margin.
Property, plant and equipment – The fair value was determined under the continued use premise as the assets were valued as part of a going concern. This premise assumes that the assets will remain “as-is, where is” and continue to be used at their present location for the continuation of business operations. Value in use includes all direct and indirect costs necessary to acquire, install, fabricated and make the assets operational. The fair value was estimated using a cost approach methodology.
Amortizable Intangible Assets
Developed technology consists of products that have reached technological feasibility. The Company valued the developed technology utilizing a DCF model, which uses forecasts of future revenues and expenses related to the intangible asset. The Company utilized discount factors of 20% - 22% for the developed technology and is amortizing the intangible assets over 5 years on a straight-line basis.
Customer relationship values were estimated utilizing a DCF model, which uses forecasts of future revenues and expenses related to the intangible asset. The Company utilized discount factors of 20%-22% for each of these intangible assets and is amortizing the intangible assets over 5 years on a straight-line basis.
The Tundra trade name was determined using the relief from royalty method, which represents the benefit of owning this intangible asset rather than paying royalties for its use. The Company utilized a discount rate of 20% for the trade name and is amortizing this intangible asset over 7 years on a straight-line basis.
The Company utilized the DCF method to value the IPR&D, using a discount factor of 22%-24% and will amortize this intangible asset once the projects are complete. There were two IPR&D projects underway at Tundra at the acquisition date. As of March 28, 2010, one of the projects was 100% complete and the other project was 98% complete. Approximately $4.8 million of costs were incurred in connection with both projects. The Company estimates that an additional investment of less than $0.1 million will be required to complete the project with an estimated completion date during the first quarter of fiscal 2011.
Pro Forma Financial Information (unaudited)
The following unaudited pro forma financial information presents the combined results of operations of the Company and Tundra as if the acquisition had occurred as of the beginning of fiscal 2010 and fiscal 2009.
| | | Fiscal Year Ended | |
(in thousands, except per share amounts) | | March 28 2010 | | | March 29 2009 | |
| Revenues | | $ | 546,145 | | | $ | 724,326 | |
| Net income (loss) | | | 36,537 | | | | (1,048,540 | ) |
| Basic income (loss) per share | | $ | 0.22 | | | $ | (6.24 | ) |
| Diluted income (loss) per share | | $ | 0.22 | | | $ | (6.24 | ) |
The unaudited pro forma financial information should not be taken as representative of the Company’s future consolidated results operations or financial condition. Tundra product related revenues from the date of acquisition were $29.8 million.
Acquisition of certain assets of Leadis Technology, Inc. (“Leadis”)
On June 10, 2009, the Company completed its acquisition of certain sensor technology and related assets from Leadis, along with members of Leadis’ engineering team. The total purchase price of approximately $6.3 million was paid in cash. Approximately $0.2 million of acquisition-related costs was included in SG&A expenses on the Consolidated Statements of Operations for the year ended March 28, 2010.
The Company has allocated the purchase price to the tangible and intangible assets acquired and liabilities assumed, based on their estimated fair values. The excess purchase price over those fair values is recorded as goodwill. The acquisition provided the Company with a touch sensor technology, team of engineers, certain assets and a product line involving touch sensor technology. The Company believes that these technologies will allow it to address a broader range of multimedia applications with highly integrated processing, interfacing and connectivity solutions. This transaction is intended to enable the Company to provide OEMs and ODMs with lower power, higher functionality Application-Specific Standard Products (ASSPs) that will enable them to provide consumers with a richer, more complete digital media experience. These opportunit ies, along with the ability to sell touch sensor products to the Company’s existing customer base, were significant contributing factors to the establishment of the purchase price. The fair values assigned to tangible and intangible assets acquired and liabilities assumed are based on management estimates and assumptions. The goodwill as a result of this acquisition is expected to be deductible for tax purposes over 15 years. Goodwill is not amortized but will be reviewed at least annually for impairment. Purchased intangibles with finite lives are being amortized over their respective estimated useful lives on a straight line basis.
The purchase price has been allocated as follows:
| (in thousands) | | Fair Value | |
| Net tangible assets acquired | | $ | 151 | |
| Amortizable intangible assets | | | 6,040 | |
| Goodwill | | | 59 | |
| Total purchase price | | $ | 6,250 | |
A summary of the allocation of amortizable intangible assets is as follows:
| (in thousands) | | Fair Value | |
| Amortizable intangible assets: | | | |
| Developed Technology | | $ | 4,670 | |
| Customer Relationships | | | 1,092 | |
| In-process research and development | | | 278 | |
| Total | | $ | 6,040 | |
Useful lives are primarily based on the underlying assumptions used in the DCF models.
Net Tangible Assets
Assets were reviewed and adjusted, if required, to their estimated fair value.
Amortizable Intangible Assets
Developed technology consists of products that have reached technological feasibility. The Company valued the developed technology utilizing a DCF model, which used forecasts of future revenues and expenses related to the intangible assets. The Company utilized discount factors of 42% and 44% for developed technology and is amortizing the intangible assets on a straight-line basis over 7 years.
The value of the customer relationships intangible asset was estimated using a DCF model, which used forecasts of future revenues and expenses related to the intangible assets. The Company utilized discount factors of 42%-45% and is amortizing this intangible asset on a straight-line basis over 5 years.
Projects that qualify as IPR&D represent those at the development stage and require further research and development to determine technical feasibility and commercial viability. The value of IPR&D was determined by considering the importance of each project to the Company’s overall development plan, estimating costs to develop the purchased IPR&D into commercially viable products, estimating the resulting net cash flows from the projects when completed and discounting the net cash flows to their present value based on the percentage of completion of the IPR&D projects. The Company utilized the DCF method to value the IPR&D, using discount factors of 45% and 46% and will amortize this intangible asset once the projects are completed. There were two IPR&D projects underway at Leadis at the acquisition date.� 0; As of March 28, 2010, the projects were 39% and 30% complete and approximately $1.0 million and $1.7 million of costs were incurred. The Company estimates that additional investment of $1.2 million and $2.0 million will be required to complete the projects with estimated completion dates during the third and fourth quarter of fiscal 2011.
Leadis acquisition related financial results have been included in the Company’s Consolidated Statements of Operations from the closing date of the acquisition on June 28, 2009. Pro forma earnings information has not been presented because the effect of the acquisition is not material to the Company’s historical results of operations.
Acquisition of certain assets of Silicon Optix
On October 20, 2008, the Company completed its acquisition of certain video signal processing technology and related assets along with members of the Silicon Optix’s engineering teams. The total purchase price was approximately $20.1 million, including approximately $0.7 million of acquisition-related transaction costs. A summary of the total purchase price is as follows:
| (in thousands) | | | |
| Cash paid | | $ | 19,406 | |
| Acquisition-related transaction costs | | | 691 | |
| Total purchase price | | $ | 20,097 | |
In accordance with authoritative guidance for business combinations, the Company has allocated the purchase price to the tangible and intangible assets acquired and liabilities assumed, including in-process research and development, based on their estimated fair values. The excess purchase price over those fair values is recorded as goodwill. The acquisition provided the Company with a video signal processing technology, team of engineers, certain assets and a product line involving video technologies. The Company believes these technologies will allow it to pursue expanded opportunities, particularly in the emerging high-definition video market. These opportunities, along with the ability to sell video products to the existing base of IDT customers, were significant contributing factors to the establishment of the purchase price. The fai r values assigned to tangible and intangible assets acquired and liabilities assumed are based on management estimates and assumptions. As of March 28, 2010, approximately $0.9 million of the total goodwill is expected to be deductible for tax purposes over 15 years. Goodwill is not amortized but will be reviewed at least annually for impairment. Purchased intangibles with finite lives are being amortized over their respective estimated useful lives on a straight line basis. The purchase price has been allocated as follows:
| (in thousands) | | Fair Value | |
| Net tangible assets acquired | | $ | 537 | |
| Amortizable intangible assets | | | 4,746 | |
| In-process research and development | | | 5,597 | |
| Goodwill | | | 9,217 | |
| Total purchase price | | $ | 20,097 | |
A summary of the allocation of amortizable intangible assets is as follows:
| (in thousands) | | Fair Value | |
| Amortizable intangible assets: | | | |
| Existing Technologies | | $ | 3,654 | |
| Customer Relationships | | | 582 | |
| Trade Name | | | 510 | |
| Total | | $ | 4,746 | |
Useful lives are primarily based on the underlying assumptions used in the DCF models.
Net Tangible Assets
Assets were reviewed and adjusted, if required, to their estimated fair value.
Amortizable Intangible Assets
Existing technologies consists of products that have reached technological feasibility. The Company valued the existing technologies utilizing a DCF model, which used forecasts of future revenues and expenses related to the intangible assets. The Company utilized discount factors of 24% and 32% for existing technologies and is amortizing the intangible assets on a straight-line basis over 3 to 7 years.
The value of the customer relationships intangible asset was estimated using a DCF model, which used forecasts of future revenues and expenses related to the intangible assets. The Company utilized a discount factor of 24% and is amortizing this intangible asset on a straight-line basis over 3 years.
The Silicon Optix’s trade names were valued using the relief from royalty method, which represents the benefit of owning this intangible asset rather than paying royalties for its use. The Company utilized a discount factor of 27% and is amortizing this intangible asset on a straight-line basis over 7 years.
IPR&D
Of the total purchase price, $5.6 million was allocated to IPR&D. Projects that qualify as IPR&D represent those that have not yet reached technological feasibility and which have no alternative future use. The Company utilized the DCF method to value the IPR&D, using a discount factor of 32%. As of March 28, 2010, the project was 98% complete and approximately $9.0 million of costs were incurred since the acquisition. The Company estimates that additional investment of $0.2 million will be required to complete the project with estimated completion date during the first quarter of fiscal 2011.
Useful lives are primarily based on the underlying assumptions used in the DCF models.
Note 3
Divestitures
Military business
On November 30, 2009, the Company completed the sale of certain assets and transferred certain liabilities related to its military business to Spectrum Control, Inc ("Spectrum Control") for approximately $12.8 million. As a result, the Company recorded a loss of $4.3 million in fiscal 2010 related to the divestiture. All employees in the Company’s military business were transferred to Spectrum Control as a result of the transaction. In addition, the Company also signed a sublease agreement with Spectrum Control for the facility in Worcester, Massachusetts, which will expire in May, 2010. Prior to the divestiture, the military business was part of a larger cash-flow generating product group and did not, on its own, represent a separate operation of the Company. Therefore, this sale did not qualify as discontinue d operations.
The following table summarizes the components of the loss:
| (in thousands) | | | |
| Cash proceeds from sale | | $ | 12,800 | |
| Assets sold: | | | | |
| Accounts receivable, net | | | (1,022 | ) |
| Inventory, net | | | (5,027 | ) |
| Fixed assets, net | | | (982 | ) |
| Intangible assets, net | | | (9,517 | ) |
| Other assets | | | (46 | ) |
| Liabilities transferred | | | 572 | |
| Transaction and other costs | | | (1,051 | ) |
| Loss on divestiture | | $ | (4,273 | ) |
Silicon Logic engineering business
On December 4, 2009, the Company completed the sale of certain assets and transferred certain liabilities related to its Silicon Logic engineering business to Open Silicon, Inc (“OSI’) for $1 in cash. The Company recorded a loss of $0.2 million in fiscal 2010 related to the divestiture. In connection with the divestiture, the Company entered into a design service agreement with OSI, whereby they agreed to provide and the Company agreed to purchase design services from OSI through the end of calendar year 2010. The total commitment under this design service agreement was $0.8 million. The Company also signed a sublease agreement with OSI for office facilities in Eau Claire, Wisconsin, which will expire in June 2012. The sale of the SLE business did not qualify as discontinued operations as the Company continues to have cash flo ws associated with the design service agreement that the Company signed with OSI.
The following table summarizes the components of the loss:
| (in thousands) | | | |
| Cash proceeds from sale | | $ | -- | |
| Assets sold: | | | | |
| Fixed assets, net | | | (120 | ) |
| Other assets | | | (24 | ) |
| Liabilities transferred | | | 17 | |
| Transaction and other costs | | | (40 | ) |
| Loss on divestiture | | $ | (167 | ) |
Network search engine business
On July 17, 2009, the Company completed the sale of certain assets related to its network search engine business (the "NWD Assets") to NetLogic Microsystems, Inc ("Netlogic"), pursuant to an Asset Purchase Agreement by and between the Company and NetLogic dated April 30, 2009 (the "Agreement"). Upon closing of the transaction, NetLogic paid the Company $100 million in cash consideration, which included inventory valued at approximately $10 million, subject to adjustment. At September 27, 2009, the inventory the Company sold to Netlogic was valued at $8.2 million. Subsequently, in the third quarter of fiscal 2010, the Company reimbursed Netlogic the excess cash for the inventory in the amount of $1.8 million. The Company’s NWD Assets are part of the Communications reportable segment. In connectio n with the divestiture, the Company entered into a supply agreement with NetLogic, whereby they agreed to buy and the Company agreed to sell Netlogic certain network search engine products for a limited time following the closing of the sale. According to the terms set forth in the agreement, the Company has committed to supply certain products either at its standard costs or below its normal gross margins for such products, which are lower than their estimated fair values. As a result, the Company recorded $3.0 million related to the estimated fair value of this agreement, of which $0.8 million was recognized as revenue in fiscal 2010. The Company expects to complete sales under this Agreement within two years. In fiscal 2010, the Company recorded a gain of $82.7 million related to sale of NWM assets to NetLogic. The sale of the NWD business did not qualify as discontinued operations as the Company continues to generate cash flows associated with the supply agreement that the Company s igned with Netlogic.
The following table summarizes the components of the gain:
| (in thousands) | | | |
| Cash proceeds from sale | | $ | 98,183 | |
| Assets sold: | | | | |
| Net inventory | | | (7,593 | ) |
| Fixed Assets and license transferred | | | (583 | ) |
| Goodwill write off | | | (3,701 | ) |
| Transaction and other costs | | | (579 | ) |
| Fair market value of the supply agreement with Netlogic | | | (2,980 | ) |
| Gain on divestiture | | $ | 82,747 | |
Note 4
Fair Value Measurement
Fair value measurement is the price that would be received from selling an asset or paid to transfer a liability in an orderly transaction between market participants at the measurement date. As such, fair value is a market-based measurement that should be determined based on assumptions that market participants would use in pricing assets or liabilities. When determining the fair value measurements for assets and liabilities required or permitted to be recorded at fair value, the Company considers the principal or most advantageous market in which it would transact.
Fair Value Hierarchy
The three levels of inputs that may be used to measure fair value are as follows::
Level 1: Quoted market prices for identical assets or liabilities in active markets at the measure date.
Level 2: Observable inputs other than quoted prices included in Level 1, such as quoted prices for similar assets and liabilities in active markets; quoted prices for identical or similar assets and liabilities in markets that are not active; or other inputs that are observable or can be corroborated by observable market data.
Level 3: Inputs reflect management’s best estimate of what market participants would use in pricing the asset or liability at the measurement date. The inputs are unobservable in the market and significant to the instrument’s valuation.
The following table summarizes the Company’s financial assets and liabilities measured at fair value on a recurring basis as of March 28, 2010:
| | | Fair Value at Reporting Date Using | |
(in thousands) | | Quoted Prices in Active Markets for Identical Assets (Level 1) | | | Significant Other Observable Inputs (Level 2) | | | Total | |
| Cash Equivalents and Short Term Investments: | | | | | | | | | |
| U.S. government treasuries | | $ | 34,983 | | | $ | -- | | | $ | 34,983 | |
| U.S. government agency securities | | | 110,173 | | | | -- | | | | 110,173 | |
| Money market funds | | | 43,476 | | | | -- | | | | 43,476 | |
| Corporate bonds | | | -- | | | | 82,678 | | | | 82,678 | |
| Corporate commercial paper | | | -- | | | | 46,339 | | | | 46,339 | |
| Bank deposits | | | -- | | | | 3,685 | | | | 3,685 | |
| Total assets measured at fair value | | $ | 188,632 | | | $ | 132,702 | | | $ | 321,334 | |
The following table summarizes the Company’s financial assets and liabilities measured at fair value on a recurring basis as of March 29, 2009:
| | | Fair Value at Reporting Date Using | |
(in thousands) | | Quoted Prices in Active Markets for Identical Assets (Level 1) | | | Significant Other Observable Inputs (Level 2) | | | Total | |
| Cash Equivalents and Short Term Investments: | | | | | | | | | |
| Money market funds | | $ | 75,531 | | | $ | -- | | | $ | 75,531 | |
| U.S. government treasuries | | | 5,409 | | | | -- | | | | 5,409 | |
| U.S. government agency securities | | | 103,526 | | | | -- | | | | 103,526 | |
| Corporate bonds | | | -- | | | | 47,436 | | | | 47,436 | |
| Corporate commercial paper | | | -- | | | | 39,637 | | | | 39,637 | |
| Bank deposits | | | -- | | | | 10,110 | | | | 10,110 | |
| Municipal bonds | | | -- | | | | 1,056 | | | | 1,056 | |
| Asset-backed securities | | | -- | | | | 146 | | | | 146 | |
| Total assets measured at fair value | | $ | 184,466 | | | $ | 98,385 | | | $ | 282,851 | |
U.S. treasuries and U.S. government agency securities as of March 28, 2010 and March 29, 2009 do not include any U.S. government guaranteed bank issued paper. Corporate bonds include bank-issued securities that are guaranteed by the Federal Deposit Insurance Corporation (FDIC).
The securities in Level 1 are highly liquid and actively traded in exchange markets or over-the-counter markets. Level 2 fixed income securities are priced using quoted market prices for similar instruments or nonbinding market prices that are corroborated by observable market data.
Cash equivalents are highly liquid investments with original maturities of three months or less at the time of purchase. The Company maintains its cash and cash equivalents with reputable major financial institutions. Deposits with these banks may exceed the FDIC insurance limits or similar limits in foreign jurisdictions. These deposits typically may be redeemed upon demand and, therefore, bear minimal risk. While the Company monitors daily the cash balances in its operating accounts and adjusts the balances as appropriate, these balances could be impacted if one or more of the financial institutions with which the Company deposits fails or is subject to other adverse conditions in the financial markets. As of March 28, 2010, the Company has not experienced any losses in its operating accounts.
All of the Company’s available-for-sale investments are subject to a periodic impairment review. Investments are considered to be impaired when a decline in fair value is judged to be other-than-temporary. This determination requires significant judgment. For publicly traded investments, impairment is determined based upon the specific facts and circumstances present at the time, including a review of the closing price over the length of time, general market conditions and the Company’s intent and ability to hold the investment for a period of time sufficient to allow for recovery. Although the Company believes its portfolio continues to be comprised of sound investments due to high credit ratings and government guarantees of the underlying investments, a further decline in the capital and financial markets would adversely imp act the market values of its investments and their liquidity. The Company continually monitors the credit risk in its portfolio and future developments in the credit markets and makes appropriate changes to its investment policy as deemed necessary. The Company did not record any impairment charges related to its available-for-sale investments in fiscal 2010 and fiscal 2009.
Note 5
Investments
Available-for-Sale Securities
Available-for-sale investments at March 28, 2010 were as follows:
(in thousands) | | Cost | | | Gross Unrealized Gains | | | Gross Unrealized Losses | | | Estimated Fair Value | |
| U.S. government treasuries and agency securities | | $ | 145,074 | | | $ | 84 | | | $ | (2 | ) | | $ | 145,156 | |
| Money market funds | | | 43,476 | | | | -- | | | | -- | | | | 43,476 | |
| Corporate bonds | | | 82,447 | | | | 266 | | | | (35 | ) | | | 82,678 | |
| Corporate commercial paper | | | 46,339 | | | | -- | | | | -- | | | | 46,339 | |
| Bank deposits | | | 3,685 | | | | -- | | | | -- | | | | 3,685 | |
| Total available-for-sale investments | | | 321,021 | | | | 350 | | | | (37 | ) | | | 321,334 | |
| Less amounts classified as cash equivalents | | | (98,671 | ) | | | -- | | | | -- | | | | (98,671 | ) |
| Short-term investments | | $ | 222,350 | | | $ | 350 | | | $ | (37 | ) | | $ | 222,663 | |
Available-for-sale investments at March 29, 2009 were as follows:
(in thousands) | | Cost | | | Gross Unrealized Gains | | | Gross Unrealized Losses | | | Estimated Fair Value | |
| U.S. government treasuries and agency securities | | $ | 108,528 | | | $ | 445 | | | $ | (38 | ) | | $ | 108,935 | |
| Money market funds | | | 75,531 | | | | -- | | | | -- | | | | 75,531 | |
| Corporate bonds | | | 47,452 | | | | 102 | | | | (118 | ) | | | 47,436 | |
| Corporate commercial paper | | | 39,634 | | | | 3 | | | | -- | | | | 39,637 | |
| Bank deposits | | | 10,110 | | | | -- | | | | -- | | | | 10,110 | |
| Municipal bonds | | | 1,027 | | | | 29 | | | | -- | | | | 1,056 | |
| Asset-backed securities | | | 145 | | | | 1 | | | | -- | | | | 146 | |
| Total available-for-sale investments | | | 282,427 | | | | 580 | | | | (156 | ) | | | 282,851 | |
| Less amounts classified as cash equivalents | | | (122,818 | ) | | | (1 | ) | | | 5 | | | | (122,814 | ) |
| Short-term investments | | $ | 159,609 | | | $ | 579 | | | $ | (151 | ) | | $ | 160,037 | |
The cost and estimated fair value of available-for-sale debt securities at March 28, 2010, by contractual maturity, were as follows:
(in thousands) | | Amortized Cost | | | Estimated Fair Value | |
| Due in 1 year or less | | $ | 297,765 | | | $ | 297,938 | |
| Due in 1-2 years | | | 22,858 | | | | 22,995 | |
| Due in 2-5 years | | | 399 | | | | 401 | |
| Total investments in available-for-sale debt securities | | $ | 321,022 | | | $ | 321,334 | |
The following table shows the gross unrealized losses and fair value of the Company’s investments with unrealized losses as of March 28, 2010, aggregated by length of time that individual securities have been in a continuous loss position.
| | | Less Than 12 Months | | | 12 Months or Greater | | | Total | |
| (in thousands) | | Fair Value | | | Unrealized Loss | | | Fair Value | | | Unrealized Loss | | | Fair Value | | | Unrealized Loss | |
| Corporate bonds | | $ | 39,680 | | | $ | (35 | ) | | $ | -- | | | $ | -- | | | $ | 39,680 | | | $ | (35 | ) |
| U.S. government agency securities | | | 6,099 | | | | (2 | ) | | | -- | | | | -- | | | | 6,099 | | | | (2 | ) |
| Total | | $ | 45,779 | | | $ | (37 | ) | | $ | -- | | | $ | -- | | | $ | 45,779 | | | $ | (37 | ) |
The following table shows the gross unrealized losses and fair value of the Company’s investments with unrealized losses, aggregated by investment category and length of time that individual securities have been in a continuous unrealized loss position at March 29, 2009.
| | | Less Than 12 Months | | | 12 Months or Greater | | | Total | |
| (in thousands) | | Fair Value | | | Unrealized Loss | | | Fair Value | | | Unrealized Loss | | | Fair Value | | | Unrealized Loss | |
| Corporate bonds | | $ | 28,629 | | | $ | (105 | ) | | $ | 795 | | | $ | (13 | ) | | $ | 29,424 | | | $ | (118 | ) |
| Municipal bonds | | | 19,212 | | | | (38 | ) | | | -- | | | | -- | | | | 19,212 | | | | (38 | ) |
| Total | | $ | 47,841 | | | $ | (143 | ) | | $ | 795 | | | $ | (13 | ) | | $ | 48,636 | | | $ | (156 | ) |
Currently, a significant portion of the Company’s available-for-sale investments that it holds are all high grade instruments. As of March 28, 2010, the unrealized losses on the Company’s available-for-sale investments represented an insignificant amount in relation to its total available-for-sale portfolio. Substantially all of the Company’s unrealized losses on its available-for-sale marketable debt instruments can be attributed to fair value fluctuations in an unstable credit environment that resulted in a decrease in the market liquidity for debt instruments. Because the Company has the ability to hold these investments until a recovery of fair value, which may be maturity, the Company did not consider these investments to be other-than-temporarily impaired at March 28, 2010 and March 29, 2009.
Non-Marketable Equity Securities
In conjunction with the merger with Integrated Circuit Systems, Inc. (“ICS”), the Company acquired an investment in Best Elite International Limited (“Best Elite”). Best Elite is a private company, which owns a wafer fabrication facility in Suzhou, China. The Company purchases insignificant quantities of wafers from Best Elite’s wafer fabrication facility for certain legacy ICS products. In accordance with authoritative guidance for the equity method of accounting for investment in common stock, the Company accounts for this investment under the cost method. This investment is subject to periodic impairment review. In determining whether a decline in value of its investment in Best Elite has occurred and is other than temporary, an assessment was made by considering available evidence, including the general market conditions in the wafer fabrication industry, Best Elite’s financial condition, near-term prospects, market comparables and subsequent rounds of financing. The valuation also takes into account the Best Elite’s capital structure, liquidation preferences for its capital and other economic variables. The valuation methodology for determining the decline in value of non-marketable equity securities is based on inputs that require management judgment. The carrying value of the Company’s investment in Best Elite at March 28, 2010 was approximately $2.0 million and is classified within other assets on the Company’s Consolidated Balance Sheets as of March 28, 2010 and March 29, 2009. There were no impairment charges recorded in fiscal 2010.
Note 6
Stock-Based Employee Compensation
Compensation Expense
The following table summarizes stock-based compensation expense by line items appearing in the Company’s Consolidated Statement of Operations:
| | | Fiscal Year Ended | |
| (in thousands) | | March 28, 2010 | | | March 29, 2009 | | | March 30, 2008 | |
| Cost of revenue | | $ | 2,762 | | | $ | 3,702 | | | $ | 3,936 | |
| Research and development | | | 10,200 | | | | 18,927 | | | | 22,919 | |
| Selling, general and administrative | | | 3,713 | | | | 9,773 | | | | 14,387 | |
| Total stock-based compensation expense | | | 16,675 | | | | 32,402 | | | | 41,242 | |
| Tax effect on stock-based compensation expense (1) | | | -- | | | | -- | | | | -- | |
| Total stock-based compensation expense, net of related tax effects | | $ | 16,675 | | | $ | 32,402 | | | $ | 41,242 | |
| | | | | | | | | | | | | |
| (1) | Assumes a zero tax rate for each period presented as the Company has a valuation allowance. |
Stock-based compensation expense recognized in the Consolidated Statements of Operations is based on awards ultimately expected to vest. The authoritative guidance for stock-based compensation requires forfeitures to be estimated at the time of
grant and revised, if necessary, in subsequent periods if actual forfeitures differ from those estimates. The Company attributes the value of stock-based compensation to expense on an accelerated method.
The following table summarizes stock-based compensation expense associated with each type of award:
| | | Fiscal Year Ended | |
| (in thousands) | | March 28, 2010 | | | March 29, 2009 | | | March 30, 2008 | |
| Employee stock options | | $ | 9,575 | | | $ | 23,155 | | | $ | 35,146 | |
| Employee stock purchase plan (“ESPP”) | | | 2,007 | | | | 2,940 | | | | 2,599 | |
| Restricted stock units (“RSUs”) | | | 4,952 | | | | 6,161 | | | | 3,376 | |
| Change in amounts capitalized in inventory | | | 141 | | | | 146 | | | | 121 | |
| Total stock-based compensation expense | | $ | 16,675 | | | $ | 32,402 | | | $ | 41,242 | |
Valuation Assumptions
The Company uses the Black-Scholes option-pricing model as its method of valuation for stock-based awards. The Company’s determination of the fair value of stock-based payment awards on the date of grant using an option-pricing model is affected by the Company’s stock price, as well as assumptions regarding a number of subjective variables. These variables include, but are not limited to the Company’s expected stock price volatility over the term of the awards, as well as the expected term of the awards.
| | | Fiscal Year Ended | |
| | | March 28, 2010 | | | March 29, 2009 | | | March 30, 2008 | |
| Stock option plans: | | | | | | | | | |
| Expected Term | | 4.65 years | | | 4.60 years | | | 4.66 years | |
| Risk-free interest rate | | | 2.12 | % | | | 2.67 | % | | | 4.57 | % |
| Volatility | | | 44.7 | % | | | 42.5 | % | | | 43.1 | % |
| Dividend Yield | | | 0.0 | % | | | 0.0 | % | | | 0.0 | % |
| Weighted-average grant-date fair value | | $ | 2.16 | | | $ | 3.66 | | | $ | 6.13 | |
| ESPP: | | | | | | | | | | | | |
| Expected Term | | 0.25 years | | | 0.25 years | | | 0.25 years | |
| Risk-free interest rate | | | 0.14 | % | | | 0.94 | % | | | 4.30 | % |
| Volatility | | | 42.7 | % | | | 48.3 | % | | | 30.5 | % |
| Dividend Yield | | | 0.0 | % | | | 0.0 | % | | | 0.0 | % |
| Weighted-average grant-date fair value | | $ | 1.48 | | | $ | 1.87 | | | $ | 2.82 | |
| | | | | | | | | | | | | |
On September 17, 2009, at the 2009 Annual Meeting of Stockholders, the Company’s stockholders approved a one-time stock option exchange program (“option exchange”) for the employees other than members of its Board of Directors and executive officers subject to the provisions of Section 16 of the Exchange Act, which allowed employees to surrender certain outstanding stock options for cancellation in exchange for the grant of new replacement options to purchase a lesser number of shares having an exercise price equal to the fair market value of the Company’s common stock on the replacement grant date.
On October 30, 2009, the Company completed an offer to exchange certain options to purchase shares of its common stock, par value $0.001 per share. A total of 992 eligible employees participated in the option exchange. Pursuant to the terms and conditions of the option exchange, the Company accepted for exchange options totaling 9,992,195, representing 61% of the total number of options eligible for exchange. All surrendered options were cancelled effective as of the expiration of the option exchange, and immediately thereafter, in exchange therefore, the Company granted new options with an exercise price of $5.88 per share (representing the per share closing price of its common stock on October 30, 2009, as reported on the NASDAQ Global Select Market) to purchase an aggregate of 3,329,036 shares of common stock under the 2004 Plan. New options have a contractual term of five years, based on the weighted-average remaining contractual term of options eligible for
exchange as determined at the tender offer date and generally will vest over a three-year period from the date of grant, with one-third of the shares vesting on the one-year anniversary of the grant date and the remaining shares vesting monthly for the
24 months thereafter. The fair value of the new options granted was measured as the total of the unrecognized compensation cost of the original options tendered and the incremental compensation cost of the new options granted. The incremental compensation cost of the new options granted was measured as the excess of the fair value of the new options granted over the fair value of the original options immediately before cancellation. The total remaining unrecognized compensation expense related to the original options will be recognized over the remaining requisite service period of the original options while the incremental compensation cost of the new options granted will be recognized over the three years service period.
As a result of the option exchange, the total incremental compensation expense of the new options was approximately $1.8 million, of which $0.4 million was recognized in fiscal 2010.
Equity Incentive Programs
The Company currently issues awards under three equity based plans in order to provide additional incentive and retention to directors and employees who are considered to be essential to the long-range success of the Company. These plans are further described below.
1994 Stock Option Plan (“1994 Plan”)
In May 1994, the Company’s shareholders approved the 1994 Plan, under which 13,500,000 shares of common stock have been made available for issuance as stock options to employees, officers, directors, consultants, independent contractors and advisors of the Company and its affiliates. Shares issuable upon exercise of stock options granted pursuant to the Company’s 1985 Incentive and Nonqualified Stock Option Plan that expire or become unexercisable for any reason without having been exercised in full are also available for distribution under the 1994 Plan (not to exceed 10,000,000 shares). Options granted by the Company under the 1994 Plan generally expire seven years from the date of grant and generally vest over a four-year period from the date of grant. The exercise price of the options grant ed by the Company under the 1994 Plan shall not be less than 100% of the fair market value for a common share subject to such option on the date the option is granted. As of March 28, 2010, 977,505 shares remain available for future grant under the 1994 Plan.
2004 Equity Plan (“2004 Plan”)
In September 2004, the Company’s shareholders approved the 2004 Plan. Under the 2004 Plan, 28,500,000 shares of common stock have been made available for issuance as stock options, restricted stock awards, stock appreciation rights, performance awards, restricted stock unit awards, and stock-based awards to employees, directors and consultants, of which a maximum of 4,000,000 shares are eligible for non-option, “full value” awards. The 2004 Plan allows for time-based and performance-based vesting for the awards. Options granted by the Company under the 2004 Plan generally expire seven years from the date of grant and generally vest over a four-year period from the date of grant, with one-quarter of the shares of common stock vesting on the one-year anniversary of the grant date and the remaining sha res vesting monthly for the 36 months thereafter. The exercise price of the options granted by the Company under the 2004 Plan shall not be less than 100% of the fair market value for a common share subject to such option on the date the option is granted. Full value awards made under the 2004 Plan shall become vested over a period of not less than three years (or, if vesting is performance-based, over a period of not less than one year) following the date such award is made; provided, however, that full value awards that result in the issuance of an aggregate of up to 5% of common stock available under the 2004 Plan may be granted to any one or more participants without respect to such minimum vesting provisions. As of March 28, 2010, 8,946,741 shares remain available for future grant under the 2004 Plan.
Restricted stock units available for grant by the Company under the 2004 Plan generally vest over at least a 36-month period from the grant date. Prior to vesting, participants holding restricted stock units do not have shareholder rights. Shares are issued on or as soon as administratively practicable following the vesting date of the restricted stock units and upon issuance, recordation and delivery, the participant will have all the rights of a shareholder of the Company. As of March 28, 2010, 1,873,629 restricted stock unit awards were outstanding under the 2004 Plan.
The following is a summary of the Company's stock option activity and related weighted average exercise prices for each category:
| | | Fiscal 2010 | |
| (shares in thousands) | | Shares | | | Price | |
| Beginning options outstanding | | | 27,544 | | | $ | 12.30 | |
| Granted | | | 8,395 | | | | 6.21 | |
| Exercised (1) | | | (13 | ) | | | 4.46 | |
| Canceled | | | (13,636 | ) | | | 12.79 | |
| Ending options outstanding | | | 22,290 | | | $ | 9.72 | |
| | | | | | | | | |
| Ending options exercisable | | | 13,439 | | | $ | 11.98 | |
| (1) | Upon exercise, the Company issues new shares of common stock. |
The following is a summary of information about stock options outstanding at March 28, 2010:
| (shares in thousands) | | Options Outstanding | | Options Exercisable |
| | | | | Weighted- Average Remaining Contractual Life (in years) | | | | |
| Range of Exercise Prices | | Number Outstanding | | Weighted- Average Exercise Price | | Number Exercisable | | Weighted- Average Exercise Price |
| $3.00 - $4.95 | | 320 | | 5.16 | | $ | 4.77 | | 117 | | $ | 4.49 |
| $5.05 - $5.05 | | 2,351 | | 6.12 | | | 5.05 | | 1 | | | 5.05 |
| $5.14 - $5.58 | | 1,110 | | 6.09 | | | 5.30 | | 240 | | | 5.14 |
| $5.64 - $5.88 | | 3,289 | | 4.62 | | | 5.87 | | 63 | | | 5.76 |
| $5.99 - $10.00 | | 2,239 | | 5.31 | | | 7.58 | | 640 | | | 9.18 |
| $10.13 - $10.69 | | 123 | | 2.01 | | | 10.38 | | 111 | | | 10.37 |
| $10.80 - $10.80 | | 2,448 | | 0.21 | | | 10.80 | | 2,448 | | | 10.80 |
| $10.85 - $11.20 | | 660 | | 0.37 | | | 11.04 | | 654 | | | 11.04 |
| $11.23 - $11.23 | | 4,863 | | 2.21 | | | 11.23 | | 4,863 | | | 11.23 |
| $11.34 - $20.67 | | 4,887 | | 2.14 | | | 14.61 | | 4,302 | | | 14.78 |
| | | 22,290 | | 3.23 | | $ | 9.72 | | 13,439 | | $ | 11.98 |
As of March 28, 2010, March 29, 2009 and March 30, 2008, the weighted-average remaining contractual life of options outstanding was 3.2 years, 3.5 years and 3.8 years, respectively, and the aggregate intrinsic value was $4.4 million, $0.1 million and $0.4 million, respectively. The weighted-average remaining contractual life of options exercisable was 1.8 years, 2.9 years and 3.2 years, respectively, and the aggregate intrinsic value was $0.4 million, $0.1 million and $0.4 million, respectively, as of March 28, 2010, March 29, 2009 and March 30, 2008. Unrecognized compensation cost related to nonvested stock options, net of estimated forfeitures, was $8.0 million as of ended March 28, 2010, and will be recognized over a weighted-average period of 1.8 years.
As of March 28, 2010, March 29, 2009 and March 30, 2008, stock options vested and expected to vest totaled approximately 20.9 million, 26.6 million and 29.0 million shares, respectively, with a weighted-average exercise price of $9.97, $12.35 and $12.96 per share, respectively and a weighted-average remaining contractual life of 3.1 years, 3.4 years and 3.7 years,
respectively. The aggregate intrinsic value as of March 28, 2010, March 29, 2009 and March 30, 2008 was approximately $3.7 million, $0.1 million and $0.4 million, respectively.
| | | Fiscal Year Ended | |
(in thousands) | | March 28, 2010 | | | March 29, 2009 | | | March 30, 2008 | |
| Cash proceeds from options exercised | | $ | 56 | | | $ | 3,226 | | | $ | 30,500 | |
| Total intrinsic value of options exercised | | | 22 | | | | 734 | | | | 11,796 | |
| Realized excess tax benefits from option exercised (1) | | | 2,256 | | | | 192 | | | | 12 | |
(1) In fiscal years 2010, 2009 and 2008, approximately $2.3 million, $192,000 and $12,000, respectively, of U.S. income tax benefits related to the exercise of certain employee stock options decreased income taxes payable and were credited to additional paid-in capital.
The following table summarizes the Company’s restricted stock unit activity and related weighted-average exercise prices for each category:
| | | Fiscal 2010 | |
| (shares in thousands) | | Shares | | Weighted- Average Grant Date Fair Value Per Share | |
| Beginning RSU’s outstanding | | | 1,238 | | | $ | 12.09 | |
| Granted | | | 1,222 | | | | 5.35 | |
| Released | | | (337 | ) | | | 12.27 | |
| Forfeited | | | (249 | ) | | | 9.31 | |
| Ending RSU’s outstanding | | | 1,874 | | | $ | 8.04 | |
| | | | | | | | | |
As of March 28, 2010, the unrecognized compensation cost related to restricted stock units granted under the Company’s equity incentive plans was approximately $4.9 million, net of estimated forfeitures, and is expected to be recognized over a weighted-average period of 1.5 years.
As of March 28, 2010, March 29, 2009 and March 30, 2008, restricted stock units vested and expected to vest totaled approximately 1.5 million, 1.0 million and 0.5 million shares, respectively, with a weighted-average remaining contract life of 1.3 years, 1.4 years and 1.5 years, respectively. The aggregate intrinsic value was approximately $9.4 million, $4.8 million and $4.1 million, respectively.
1984 ESPP
In July 1984, the Company’s stockholders approved the 1984 Employee Stock Purchase Plan (“1984 ESPP”) under which eligible employees could purchase shares of the Company’s common stock through payroll deductions (not to exceed 15% of such employee’s compensation) at no lower than 85% of the fair market value of the common stock on the first day or the last day of each fiscal quarter, whichever was lower. Under the 1984 ESPP, 15,100,000 shares of common stock were made available for issuance. The 1984 ESPP, as amended, expired in accordance with its terms on March 29, 2009. Therefore, no stock was issued under the plan in the first quarter of fiscal 2010.
2009 Employee Stock Purchase Plan (“2009 ESPP")
On June 18, 2009, the Company’s Board of Directors approved implementation of the 2009 Employee Stock Purchase Plan and authorized the reservation and issuance of up to 9,000,000 shares of the Company’s common stock, subject to stockholder approval. On September 17, 2009, the Company’s stockholders approved the plan at the 2009 Annual Meeting of Stockholders. Under the 2009 ESPP, eligible employees may purchase shares of the Company’s common stock through payroll deductions (not to exceed 15% of such employee’s compensation) at no lower than 85% of the fair market value of the common stock on the first day or the last day of each fiscal quarter, whichever is lower. The 2009 ESPP is intended to be implemented in successive quarterly purchase periods commencing on the first day of each fiscal quarter of the Company’s fiscal year.
Activity under the Company’s ESPP is summarized in the following table:
| (shares in thousands) | | Fiscal 2010 | | | Fiscal 2009 | | | Fiscal 2008 | |
| Number of shares issued | | | 1,395 | | | | 1,860 | | | | 1,085 | |
| Average issuance price | | $ | 5.22 | | | $ | 5.53 | | | $ | 10.29 | |
| Number of shares available at year-end | | | 7,605 | | | | 867 | | | | 2,727 | |
Note 7
Stockholders' Equity
Stock Repurchase Program. On January 18, 2007, the Company’s Board of Directors initiated a $200 million share repurchase program. During fiscal 2008, the Company’s Board of Directors approved a $200 million expansion of the share repurchase program to a total $400 million. In fiscal 2007, the Company repurchased approximately 1.6 million shares at an average price of $15.95 per share for a total purchase price of $25.0 million. In fiscal 2008, the Company repurchased approximately 28.9 million shares at an average price of $11.60 per share for a total purchase price of $334.8 million. On April 30, 2008, the Company’s Board of Directors approved an addi tional $100 million expansion of the share repurchase program to a total $500 million. In fiscal 2009, the Company repurchased approximately 8.4 million shares at an average price of $7.46 per share for a total purchase price of $62.3 million. In fiscal 2010, the Company repurchased approximately 4.2 million shares at an average price of $5.83 per share for a total purchase price of $24.3 million. As of March 28, 2010, approximately $53.5 million was available for future purchase under the share repurchase program. Share repurchases were recorded as treasury stock and resulted in a reduction of stockholders’ equity. The program is intended to reduce the number of outstanding shares of Common Stock to offset dilution from employee equity grants and increase stockholder value.
Stockholder Rights Plan. In December 1998, the Board of Directors adopted a plan designed to protect the rights of IDT stockholders in the event of a future, unsolicited takeover attempt. Under the plan, each outstanding share of IDT common stock bears one preferred share purchase right. Under certain circumstances, each purchase right entitles its holder to acquire one-hundredth of a share of a newly designated junior participating preferred stock at a price of $45.00 per share. The preferred stock is structured so that the value of one-hundredth of a share of such preferred stock will approximate the value of one share of common stock. The Stockholder rights Plan was allowed to expire in accordance with the Plan’s terms on December 21, 2008. On October 27, 2008, the Company adopted Amended and Restated Bylaws which provide, in relevant part, that the Company will not adopt or extend a stockholder rights plan, rights agreement or any other form of “poison pill” which is designed to make, or has the effect of making, the acquisition of large holdings of the corporation’s stock more difficult or expensive (a “Stockholder Rights Plan”) without obtaining the prior approval of the stockholders of the Corporation by the affirmative vote of a majority of the votes cast with respect to the matter by the shares represented and entitled to vote thereon at an annual or special meeting of the stockholders at which a quorum is present; provided, however, that the corporation may adopt a Stockholder Rights Plan without such prior approval if a majority of the independent directors (as determined in accordance with applicable NASDAQ rules and listing requirements and any additional criteria set forth in the corporation’s Corporate Governance Guidelines), in the exercise of their fiduciary duties, determines that adoption of a Stockholder Rights Plan is in the best interest of stockholders under the circumstances. If a Stockholder Rights Plan is adopted without prior stockholder approval as contemplated by the preceding sentence, such plan shall expire within twelve (12) months from the date of adoption unless, prior to such date, it is approved by the affirmative vote of a majority of the votes cast with respect to the matter by the shares represented and entitled to vote thereon at an annual or special meeting of the stockholders at which a quorum is present.
Note 8
Balance Sheet Detail
| (in thousands) | | March 28, 2010 | | | March 29, 2009 | |
| Inventories | | | | | | |
| Raw materials | | $ | 3,903 | | | $ | 6,876 | |
| Work-in-process | | | 28,715 | | | | 35,252 | |
| Finished goods | | | 18,058 | | | | 27,594 | |
| Total inventories | | $ | 50,676 | | | $ | 69,722 | |
| | | | | | | | | |
| Property, Plant and Equipment, Net | | | | | | | | |
| Land | | $ | 15,598 | | | $ | 14,533 | |
| Machinery and equipment | | | 775,043 | | | | 796,387 | |
| Building and leasehold improvements | | | 134,711 | | | | 134,358 | |
| | | | 925,352 | | | | 945,278 | |
| Less: accumulated depreciation | | | (857,364 | ) | | | (873,717 | ) |
| Total property, plant and equipment, net | | $ | 67,988 | | | $ | 71,561 | |
| | | | | | | | | |
| Other Long-Term Obligations | | | | | | | | |
| Deferred compensation related liabilities | | $ | 13,050 | | | $ | 10,946 | |
| Long-term portion of deferred gain on equipment sales | | | 171 | | | | 940 | |
| Long-term portion of lease impairment obligations | | | 893 | | | | 890 | |
| Long-term portion of supplier obligations | | | 2,694 | | | | 1,384 | |
| Long-term portion of restructuring liability | | | 4,773 | | | | -- | |
| Other | | | 252 | | | | 154 | |
| Total other long-term obligations | | $ | 21,833 | | | $ | 14,314 | |
Note 9
Deferred Income on Shipments to Distributors
Included in the caption “Deferred income on shipments to distributors” on the Consolidated Balance Sheets are amounts related to shipments to certain distributors for which revenue is not recognized until our product has been sold by the distributor to an end customer. The components of deferred income on shipments to distributors as of March 28, 2010 and March 29, 2009 are as follows:
| | | Fiscal Year Ended | |
| (in thousands) | | March 28, 2010 | | | March 29, 2009 | |
| Gross deferred revenue | | $ | 22,008 | | | $ | 21,302 | |
| Gross deferred costs | | | (3,247 | ) | | | (4,764 | ) |
| Deferred income on shipments to distributors | | $ | 18,761 | | | $ | 16,538 | |
The gross deferred revenue represents the gross value of shipments to distributors at the list price billed to the distributor less any price protection credits provided to them in connection with reductions in list price while the products remain in their inventory. The amount ultimately recognized as revenue will be lower than this amount as a result of ship from stock pricing credits which are issued in connection with the sell through of our products to end customers. Historically, this amount represents on average approximately 25% of the list price billed to the customer. The gross deferred costs represent the standard costs (which approximate actual costs) of products the Company sells to the distributors. Although we monitor the levels and quality of inventory in the distribution channel, our exper ience is that products returned from these distributors may be sold to a different distributor or in a different region of the world. As such, inventory write-downs for products in the distribution channel have not been significant.
Note 10
Goodwill and Acquisition-related Intangible Assets, Net
Goodwill activity for fiscal 2010 and 2009 is as follows:
| | | Reportable Segment | | | | |
(in thousands) | | Communications | | | Computing and Consumer | | | Total | |
| Balance as of March 30, 2008: | | | | | | | | | |
| Goodwill | | $ | 323,331 | | | $ | 704,107 | | | $ | 1,027,438 | |
| Accumulated impairment losses | | | -- | | | | -- | | | | -- | |
| | | | 323,331 | | | | 704,107 | | | | 1,027,438 | |
| Goodwill acquired during the year, net of adjustments | | | 119 | | | | 8,194 | | | | 8,313 | |
| Impairment losses | | | (260,246 | ) | | | (686,101 | ) | | | (946,347 | ) |
| Balance as of March 29, 2009: | | | | | | | | | | | | |
| Goodwill | | | 323,450 | | | | 712,301 | | | | 1,035,751 | |
| Accumulated impairment losses | | | (260,246 | ) | | | (686,101 | ) | | | (946,347 | ) |
| | | | 63,204 | | | | 26,200 | | | | 89,404 | |
| Goodwill acquired during the year, net of adjustments (1) | | | 15,369 | | | | 2,201 | | | | 17,570 | |
| Goodwill related to sale of business (2) | | | (3,900 | ) | | | -- | | | | (3,900 | ) |
| Balance as of March 28, 2010: | | | | | | | | | | | | |
| Goodwill | | | 334,919 | | | | 714,502 | | | | 1,049,421 | |
| Accumulated impairment losses | | | (260,246 | ) | | | (686,101 | ) | | | (946,347 | ) |
| | | $ | 74,673 | | | $ | 28,401 | | | $ | 103,074 | |
| (1) | Additions were from the Leadis, Tundra and Mobius acquisitions. |
| (2) | Adjustments primarily represent the write off of goodwill associated with the divestiture of networking assets and adjustments related to the Tundra acquisition. |
Identified acquisition-related intangible asset balances are summarized as follows:
| | | March 28, 2010 | |
| (in thousands) | | Gross Assets | | | Accumulated Amortization | | | Net Assets | |
| Identified intangible assets: | | | | | | | | | |
| Existing technology | | $ | 258,336 | | | $ | (212,554 | ) | | $ | 45,782 | |
| Trademarks | | | 12,271 | | | | (9,262 | ) | | | 3,009 | |
| Customer relationships | | | 145,485 | | | | (132,848 | ) | | | 12,637 | |
| Foundry and assembler relationships | | | 64,380 | | | | (64,380 | ) | | | -- | |
| Non-compete agreements | | | 52,958 | | | | (52,958 | ) | | | -- | |
| IPR&D | | | 3,814 | | | | -- | | | | 3,814 | |
| Other | | | 31,053 | | | | (31,053 | ) | | | -- | |
| Total | | $ | 568,297 | | | $ | (503,055 | ) | | $ | 65,242 | |
| | | March 29, 2009 | |
| (in thousands) | | Gross Assets | | | Accumulated Amortization | | | Net Assets | |
| Identified intangible assets: | | | | | | | | | |
| Existing technology | | $ | 236,423 | | | $ | (198,133 | ) | | $ | 38,290 | |
| Trademarks | | | 9,360 | | | | (8,878 | ) | | | 482 | |
| Customer relationships | | | 138,317 | | | | (126,586 | ) | | | 11,731 | |
| Foundry and assembler relationships | | | 64,380 | | | | (64,374 | ) | | | 6 | |
| Non-compete agreements | | | 52,958 | | | | (52,958 | ) | | | -- | |
| Other | | | 31,053 | | | | (31,053 | ) | | | -- | |
| Total | | $ | 532,491 | | | $ | (481,982 | ) | | $ | 50,509 | |
In accordance with authoritative accounting guidance related to goodwill and other intangible assets, goodwill is reviewed for impairment annually and whenever events or changes in circumstances indicate the carrying value of goodwill may not be recoverable. These tests are performed at the reporting unit level using a two-step method. The first step, used to determine if impairment possibly exists, is to compare the carrying amount of a reporting unit, including goodwill, to its fair value. If the carrying amount of the reporting unit exceeds the fair value, the second step is to determine the amount of a possible impairment by comparing the implied fair value of the reporting unit goodwill with the carrying amount of that goodwill. The Company completed its annual review of the go odwill during the fourth quarter ended March 28, 2010 and concluded that there was no impairment.
In accordance with authoritative accounting guidance for the impairment or disposal of long-lived assets, long-lived assets are reviewed whenever events or changes in circumstances indicate the carrying amount of such assets may not be recoverable. Recoverability of long-lived assets is measured by a comparison of the carrying amount of the asset group to the future undiscounted net cash flows expected to be generated by those assets. If such assets are considered to be impaired, the impairment charge recognized is the amount by which the carrying amounts of the assets exceed the fair value of the assets.
Amortization expense for identified intangibles is summarized below:
| | | Fiscal Year Ended | |
| (in thousands) | | March 28, 2010 | | | March 29, 2009 | | | March 30, 2008 | |
| Existing technology | | $ | 14,423 | | | $ | 53,563 | | | $ | 56,756 | |
| Trademarks | | | 384 | | | | 1,162 | | | | 1,917 | |
| Customer relationships | | | 6,261 | | | | 23,080 | | | | 33,704 | |
| Foundry and assembler relationships | | | 5 | | | | 1,155 | | | | 4,241 | |
| Non-compete agreements | | | -- | | | | 270 | | | | 11,668 | |
| Other | | | -- | | | | 158 | | | | 1,709 | |
| Total | | $ | 21,073 | | | $ | 79,388 | | | $ | 109,995 | |
The intangible assets are being amortized over estimated useful lives of two to ten years.
As of March 28, 2010, the estimated future amortization expense of identified intangibles was as follows (in thousands):
| Fiscal Year | | Amount | |
| 2011 | | $ | 19,069 | |
| 2012 | | | 14,748 | |
| 2013 | | | 9,852 | |
| 2014 | | | 7,401 | |
| 2015 | | | 4,737 | |
| Thereafter | | | 5,621 | |
| Total | | $ | 61,428 | |
Note 11
Restructuring
The following table shows the provision of the restructuring charges and the liability remaining as of March 28, 2010:
| (in thousands) | | Cost of Goods Sold | | | Operating Expenses | | | Total | |
| Balance as of April 1, 2007 | | $ | 1,272 | | | $ | 2,468 | | | $ | 3,740 | |
| Provision | | | (39 | ) | | | 511 | | | | 472 | |
| Cash payments | | | (800 | ) | | | (1,847 | ) | | | (2,647 | ) |
| Balance as of March 30, 2008 | | | 433 | | | | 1,132 | | | | 1,565 | |
| Provision | | | 1,938 | | | | 5,338 | | | | 7,276 | |
| Cash payments | | | (1,796 | ) | | | (2,821 | ) | | | (4,617 | ) |
| Balance as of March 29 2009 | | | 575 | | | | 3,649 | | | | 4,224 | |
| Provision | | | 7,988 | | | | 12,526 | | | | 20,514 | |
| Cash payments | | | (1,499 | ) | | | (13,808 | ) | | | (15,307 | ) |
| Balance as of March 28, 2010 | | $ | 7,064 | | | $ | 2,367 | | | $ | 9,431 | |
Restructuring Actions
As part of an effort to streamline operations with changing market conditions and to create a more efficient organization, the Company took restructuring actions through March 28, 2010, to reduce its workforce and consolidate facilities. The Company’s restructuring expenses have been comprised primarily of: (i) severance and termination benefit costs related to the reduction of its workforce; and (ii) lease termination costs and costs associated with permanently vacating certain facilities.
In the fourth quarter of fiscal 2010, the Company initiated restructuring actions designed to improve operational efficiency. These actions included discontinuing manufacturing operations at its Singapore facility and a reduction in headcount in its Enterprise Computing division. In connection with those actions, as of March 28, 2010, the Company recorded a charge of $2.7 million primarily representing severance, retention and other benefits related to the terminated employees, of which $0.7 million was paid prior to March 28, 2010. The Company expects to complete this restructuring action in the second quarter of fiscal 2011.
During the third quarter of fiscal 2010, the Company initiated restructuring actions intended to further adjust its skills mix to new strategic and product opportunities. The restructuring action included a reduction of approximately 61 positions within its Analog and Power group across multiple locations worldwide. As a result, the Company recorded restructuring expenses of $1.3 million for severance payments, payments under federal, state and province notice statutes and retention and other benefits associated with this restructuring action in the third quarter of fiscal 2010. As of March 28, 2010, the Company made severance and retention payments totaling $1.3 million related to these restructuring actions. The Company completed these restructuring actions in the fourth quarter of fiscal 2010. In addition, the Company reduced a total o f 15 positions and exited certain leased facilities related to its divestitures in the third quarter of fiscal 2010. In the third quarter of fiscal 2010, the Company recorded restructuring expenses of $0.9 million for lease impairment charges and $0.1 million for severance payments, payments under federal, state and province notice statutes and retention and other benefits associated with these
restructuring actions. As of March 28, 2010, the Company made restructuring-related payments totaling $0.7 million related to these restructuring actions.
During the second quarter of fiscal 2010, the Company initiated a restructuring action following its acquisition of Tundra and an assessment of ongoing personnel needs in light of the acquisition. The restructuring action included a reduction of approximately 133 positions worldwide. In addition, the Company impaired some facilities due to vacating certain locations. As a result, the Company recorded restructuring expenses of $8.6 million for severance payments, payments under federal, state and province notice statutes and retention and other benefits associated with this restructuring action in the second quarter of fiscal 2010, of which $8.4 million was related to lease impairment charges, severance, retention and other benefits to the terminated employees and $0.2 million was for facilities impairment charges, which wa s recorded as SG&A expense. In the third quarter of fiscal 2010, in connection with its divestiture of the Silicon Logic Engineering business, the Company transferred 24 employees to OSI and terminated 9 employees resulting in a reduction to its accrued restructuring expenses by $0.1 million. As of March 28, 2010, the Company made severance and retention payments totaling $7.5 million related to this restructuring action. The Company expects to complete this restructuring action in the second quarter of fiscal 2013. The facility lease charges will be paid off through the second quarter of fiscal 2011.
In addition, in connection with its plan to transition the manufacture of products to TSMC, the Company’s management approved a plan to exit wafer production operations at its Oregon fabrication facility. As a result, the Company accrued restructuring expenses of $4.8 million for severance payments and other benefits associated with this restructuring action in the second quarter of fiscal 2010. The Company expects to complete this restructuring action in the second quarter of fiscal 2012.
During the fourth quarter of fiscal 2009, the Company initiated a restructuring action intended to align its spending with demand that weakened in the slowing economy. The restructuring action included a reduction of approximately 124 positions across multiple divisions worldwide. In March 2009, after carefully considering the market, revenues and prices for search engines, the Company decided to restructure its Network Search Engine division. As part of this restructuring action, the Company reduced approximately 56 positions in this division and ceased investment in new search engine product development. In addition, the Company initiated restructuring actions, which affected its sales personnel in Germany and Japan. During fiscal 2010, the Company reduced an additional 12 positions related to these acti ons. As a result, the Company recorded restructuring expenses of $2.3 million and $5.3 million for severance payments, payments under federal, state and province notice statutes and retention and other benefits associated with these restructuring actions in fiscal 2010 and the fourth quarter of fiscal 2009. As of March 28, 2010, severance, retention and other benefits of $7.5 million were settled. The Company expects to complete these restructuring actions in the first quarter of fiscal 2011.
During the second quarter of fiscal 2006, the Company completed the consolidation of its Northern California workforce into its San Jose headquarters and exited a leased facility in Salinas, California. Upon exiting the building the Company recorded lease impairment charges of approximately $2.3 million, which represented the future rental payments under the agreement, reduced by an estimate of sublease income, and discounted to present value using an interest rate applicable to the Company. These charges were recorded as cost of revenues of $0.7 million, research and development expense (“R&D”) of $0.9 million and SG&A expense of $0.7 million. In fiscal 2008, the Company entered into a sublease agreement for this facility, resulting in a reduction to its accrued lease liabilities by $0.2 million. Since the initial restructuring, the Company has made lease payments of $1.3 million related to the vacated facility in Salinas. As of March 28, 2010, the remaining accrued lease liabilities were $0.9 million.
Note 12
Commitments and Contingencies
Guarantees
As of March 28, 2010, the Company’s financial guarantees consisted of guarantees and standby letters of credit, which are primarily related to the Company’s electrical utilities in Malaysia, utilization of non-country nationals in Malaysia and Singapore, consumption tax in Japan and value-added tax obligations in Singapore and Holland, and a workers’ compensation plan in the United States. The maximum amount of potential future payments under these arrangements is approximately $2.2 million. The Company also has foreign exchange facilities used for hedging arrangements with banks that allow the Company to enter into foreign exchange contracts totaling approximately $20 million, all of which was available at March 28, 2010.
Commitments
Although the Company owns its corporate headquarters in San Jose, California, the Company leases various administrative facilities under operating leases which expire at various dates through fiscal 2015.
As of March 28, 2010, aggregate future minimum commitments for the next five fiscal years and thereafter under all operating leases, excluding leases in which amounts have been accrued for impairment charges, were as follows (in thousands):
| Fiscal Year | | | |
| 2011 | | $ | 3,583 | |
| 2012 | | | 2,494 | |
| 2013 | | | 1,671 | |
| 2014 | | | 1,011 | |
| 2015 | | | 602 | |
| Thereafter | | | 836 | |
| Total | | $ | 10,197 | |
Rent expense for the fiscal years ended March 28, 2010, March 29, 2009 and March 30, 2008 totaled approximately $4.8 million, $4.2 million and $4.3 million, respectively. Other long-term supplier obligations including payments due under various software design tool agreements totaled $2.7 million and $1.4 million as of March 28, 2010 and March 29, 2009, respectively.
Indemnification
The Company indemnifies certain customers, distributors, and subcontractors for attorney fees and damages awarded against these parties in certain circumstances in which the Company’s products are alleged to infringe third party intellectual property rights, including patents, registered trademarks, or copyrights. The terms of the Company’s indemnification obligations are generally perpetual from the effective date of the agreement. In certain cases, there are limits on and exceptions to the Company’s potential liability for indemnification relating to intellectual property infringement claims. The Company cannot estimate the amount of potential future payments, if any, that we might be required to make as a result of these agreements. The Company has not paid any claim or been required to defend any claim related to our indemnification obligations, and accordingly, the Company has not accrued any amounts for our indemnification obligations. However, there can be no assurances that the Company will not have any future financial exposure under these indemnification obligations.
The Company maintains an accrual for obligations it incurs under its standard product warranty program and customer, part, or process specific matters. The Company’s standard warranty period is one year, however in certain instances the warranty period may be extended to as long as two years. Management estimates the fair value of the Company’s warranty liability based on actual past warranty claims experience, its policies regarding customer warranty returns and other estimates about the timing and disposition of product returned under the standard program. Customer, part, or process specific accruals are estimated using a specific identification method. Historical profit and loss impact related to warranty returns activity has been minimal. The total warranty accrual was $0.4 million and $0.5 million as of March 28, 2010 and March 29, 2009, respectively.
Note 13
Litigation
On October 24, 2006, the Company was served with a civil antitrust complaint filed by Reclaim Center, Inc., et. al. as plaintiffs in the U.S. District Court for the Northern District of California against the Company and 37 other entities on behalf of a purported class of indirect purchasers of Static Random Access Memory (SRAM) products. The Complaint alleges that the Company and other defendants conspired to raise the prices of SRAM, in violation of Section 1 of the Sherman Act, the California Cartwright Act, and several other states’ antitrust, unfair competition, and consumer protection statutes. Shortly thereafter, a number of other plaintiffs filed similar complaints on behalf of direct and indirect purchasers of SRAM products. Given the similarity of the complaints, the Judicial Panel on Multidistrict Litigation tra nsferred the cases to a single judge in the Northern District of California and consolidated the cases for pretrial proceedings in February 2007. The consolidated cases are captioned In re Static Random Access Memory (SRAM) Antitrust Litigation. In August 2007, direct purchasers of SRAM products and indirect purchasers of SRAM products filed separate Consolidated Amended Complaints. The Company was not named as a defendant in either complaint. Pursuant to tolling agreements with the indirect and direct purchaser plaintiffs, the statute of limitations was tolled until January 10, 2009 as to potential claims against the Company. The tolling agreements
have now expired and the statute of limitations is running on potential claims against the Company. Discovery has closed in both cases. The Company intends to vigorously defend itself against these claims.
In April 2008, LSI Corporation and its wholly owned subsidiary Agere Systems Inc. (collectively “LSI”) instituted an action in the United States International Trade Commission (ITC or “Commission”), naming the Company and several other respondents. The ITC action sought an exclusion order under section 337 of the Tariff Act to prevent importation into the U.S. of semiconductor integrated circuit devices and products made by methods alleged to infringe an LSI patent relating to tungsten metallization in semiconductor manufacturing. LSI also filed a companion case in the U.S. District Court for the Eastern District of Texas seeking an injunction and damages of an unspecified amount relating to such alleged infringement. Some of the defendants in the action have since settled the claims against them. The ac tion in the U.S. District Court is currently stayed pending the outcome of the ITC action. On September 21, 2009, the Administrative Law Judge (“ALJ”) for the ITC action issued an Initial Determination finding that the patent claims asserted by LSI were invalid in light of the prior art. Based on the finding of invalidity, the Court held that no violation of section 337 has occurred with respect to the asserted claims. On October 5, 2009, LSI filed a Petition to Review by the full Commission, and respondents filed a Common Contingent Petition for Review on common matters in the case. The Company separately filed a Contingent Petition for Review on Company-specific matters in the case. On November 23, 2009, the Commission issued a Notice of determination to review in-part the ALJ’s Initial Determination. The Commission further instructed the ALJ to consider on remand the merit of respondents' arguments with respect to invalidity of one asserted claim for obviousness. On January 14, 2010, the ALJ issued a Remand Determination that respondents had not demonstrated by clear and convincing evidence that the claim at issue on remand was invalid due to obviousness. The Commission also extended the target date for completion of the investigation to March 22, 2010. Subsequently, briefing responsive to the Remand was filed by both parties. On March 22, 2010, the Commission issued its Notice of Decision indicating that it had found that the patent claims asserted by LSI were invalid and that there had been no violation of section 337 by the Company, and thereupon terminated its investigation.
In December 2009, Ring Technology Enterprises of Texas, LLC (“Ring”) filed a complaint in the Eastern District of Texas against 30 defendants alleging infringement of a Ring patent related to memory access technology. Ring filed another, separate complaint in the Eastern District of Texas in March of 2010 claiming infringement of the same patent by 43 additional defendants. The Company was not named as a defendant in either complaint, however, a number of the defendants are purchasers of the Company’s Advanced Memory Buffer (“AMB”) products, which may be relevant to the claims made against defendants in the complaints by Ring. Certain of these defendants have requested that the Company indemnify and provide a defense under the terms of purchase for the Company’s AMB prod ucts. Based on a good-faith review of the claims by Ring, the Company has initially agreed to provide a defense for some of these defendants. The Company has reserved the right to withdraw its defense if, during the course of litigation it is determined that the Company has no liability for indemnification based on the claims made by Ring.
Note 14
Employee Benefit Plans
The Company sponsors a 401(k) retirement matching plan for qualified domestic employees. The Company recorded expenses of approximately $0.2 million, $3.9 million and $4.0 million in matching contributions under the plan in fiscal 2010, 2009 and 2008, respectively. Due to poor economic conditions, the Company suspended its matching contributions to qualified 401(k) participants effective April 1, 2009 but reinstated the matching contributions effective in the fourth quarter of fiscal 2010.
Effective November 1, 2000, the Company established an unfunded deferred compensation plan to provide benefits to executive officers and other key employees. Under the plan, participants can defer any portion of their salary and bonus compensation into the plan and may choose from a portfolio of funds from which earnings are measured. Participant balances are always 100% vested. As of March 28, 2010 and March 29, 2009, obligations under the plan totaled approximately $13.0 million and $10.9 million, respectively. Additionally, the Company has set aside assets in a separate trust that is invested in corporate owned life insurance intended to substantially fund the liability under the plan. As of March 28, 2010 and March 29, 2009, the deferred compensation plan assets were a pproximately $12.7 and $9.7 million, respectively. The Company incurred costs for this plan for insurance, administration and other support of $0.3 million, $0.4 million and $0.3 million in fiscal 2010, 2009 and 2008, respectively.
Note 15
Income Taxes
The components of income (loss) before income taxes and the provision (benefit) for income taxes were as follows:
| | | Fiscal Year Ended | |
| (in thousands) | | March 28, 2010 | | | March 29, 2009 | | | March 30, 2008 | |
| Income (loss) before income taxes: | | | | | | | | | |
| United States | | $ | 9,393 | | | $ | (1,045,608 | ) | | $ | (29,409 | ) |
| Foreign | | | 33,174 | | | | 21 | | | | 58,146 | |
| Income (loss) before income taxes | | $ | 42,567 | | | $ | (1,045,587 | ) | | $ | 28,737 | |
| | | | | | | | | | | | | |
| Income tax expense (benefit): | | | | | | | | | | | | |
| Current: | | | | | | | | | | | | |
| United States | | $ | 1,904 | | | $ | 1,074 | | | $ | 156 | |
| State | | | (4 | ) | | | (95 | ) | | | 642 | |
| Foreign | | | 458 | | | | (208 | ) | | | 1,261 | |
| | | | 2,358 | | | | 771 | | | | 2,059 | |
| Deferred: | | | | | | | | | | | | |
| United States | | | 154 | | | | (839 | ) | | | 3,358 | |
| State | | | 1 | | | | (62 | ) | | | 73 | |
| Foreign | | | 35 | | | | (290 | ) | | | (10,932 | ) |
| | | | 190 | | | | (1,191 | ) | | | (7,501 | ) |
| Provision (benefit) for income tax: | | $ | 2,548 | | | $ | (420 | ) | | $ | (5,442 | ) |
In fiscal years 2010, 2009 and 2008, approximately $2.3 million, $192,000 and $12,000, respectively, of U.S. income tax benefits related to the exercise of certain employee stock options decreased income taxes payable and were credited to additional paid-in capital.
Deferred income taxes reflect the net tax effects of temporary differences between the carrying amounts of assets and liabilities for financial reporting purposes and the amounts used for income tax purposes. Significant components of deferred tax assets and liabilities at year-ends were as follows:
| | | | | | | |
| (in thousands) | | March 28, 2010 | | | March 29, 2009 | |
| Deferred tax assets: | | | | | | |
| Deferred income on shipments to distributors | | $ | 4,553 | | | $ | 4,888 | |
| Non-deductible accruals and reserves | | | 9,272 | | | | 9,987 | |
| Inventory related and other expenses | | | 358 | | | | 3,473 | |
| Net operating losses and credit carryforwards | | | 68,911 | | | | 64,405 | |
| Depreciation and amortization | | | 15,050 | | | | 17,388 | |
| Stock options | | | 11,640 | | | | 13,303 | |
| Other | | | 2,069 | | | | 5,841 | |
| | | | 111,853 | | | | 119,285 | |
| | | | | | | | | |
| Deferred tax liabilities: | | | | | | | | |
| Purchased intangibles | | | (32 | ) | | | (13 | ) |
| U.S. tax on earnings of foreign subsidiaries not indefinitely reinvested | | | (657 | ) | | | (676 | ) |
| Other | | | (3,400 | ) | | | (2,531 | ) |
| | | | (4,089 | ) | | | (3,220 | ) |
| | | | | | | | | |
| Valuation allowance | | | (109,346 | ) | | | (117,589 | ) |
| | | | | | | | | |
| Net deferred tax liabilities | | $ | (1,582 | ) | | $ | (1,524 | ) |
The Company established a valuation allowance against its deferred tax assets because management could not conclude it was more likely than not that these deferred tax assets would be realized. The Company reached this decision based on judgment, which included consideration of historical losses and projections of future profits with substantially more weight being placed on recent losses than any projections of future profitability. The Company will continue to monitor the need for the valuation allowance on a quarterly basis and may, with further evidence, determine that the valuation allowance is no longer required. The valuation allowance is based on the Company’s analysis that it is more likely than not that certain deferred tax assets will be realized in the foreseeable future. The net deferred tax liability of $1.6 million relates primarily to book to tax basis differences in various foreign jurisdictions.
The valuation allowance for deferred tax assets decreased by $8.2 million and increased by $26.7 million during fiscal 2010 and 2009, respectively.
As of March 28, 2010, the Company had federal and state net operating loss carryforwards, of approximately $114.3 million and $193.4 million, respectively, which include excess tax benefits related to stock option exercises. The Company has approximately $29.5 million of net tax benefits related to excess stock compensation benefits, which are not recorded as deferred tax assets. These excess stock compensation benefits will be credited to additional paid-in capital when recognized. The federal net operating loss carryforwards will expire in various fiscal years from 2024 through 2029, if not utilized. The state net operating loss carryforwards will expire in various fiscal years through 2025, if not utilized. The utilization of NOLs created by acquired companies is subject to annual limitations unde r Section 382 of the Internal Revenue Code. However, we do not expect that such annual limitation will impair the realization of these NOLs.
As of March 28, 2010, the Company had approximately $50.2 million of federal research and development tax credit carryforwards, and $8.5 million of foreign tax credit carryforwards. The federal research tax credit carryforwards will expire infrom fiscal years 2011 through 2030, if not utilized and the foreign tax credit carryforwards will expire from fiscal years 2011 to 2020, if not utilized. The Company also had available, as of March 28, 2010, approximately $51.1 million of state income tax credit carryforwards, $2.7 million of which will expire in various years through 2014, if not utilized.
Reconciliation between the statutory U.S. income tax rate of 35% and the effective rate is as follows:
| | | Fiscal Year Ended | |
| (in thousands) | | March 28 2010 | | | March 29 2009 | | | March 30 2008 | |
| Rate Reconciliation: | | | | | | | | | |
| | | | | | | | | | |
| Provision (benefit) at 35% U.S. statutory rate | | $ | 14,898 | | | $ | (365,955 | ) | | $ | 10,058 | |
| State tax, net of federal benefit | | | (49 | ) | | | (229 | ) | | | 688 | |
| Foreign income taxed at lower rates | | | (16,144 | ) | | | 554 | | | | (17,317 | ) |
| Impact of rate change and extension of incentive in foreign jurisdiction | | | (94 | ) | | | (864 | ) | | | (11,408 | ) |
| Repatriation of foreign earnings | | | 254 | | | | 1,056 | | | | 2,680 | |
| Net operating losses and tax credits (benefited) not benefited | | | (802 | ) | | | 36,213 | | | | 1,648 | |
| Goodwill and intangible assets impairment | | | -- | | | | 321,798 | | | | -- | |
| Stock-based compensation related to foreign jurisdictions and incentive stock options | | | 2,989 | | | | 6,533 | | | | 6,873 | |
| Other | | | 1,496 | | | | 474 | | | | 1,336 | |
| Income tax expense (benefit) | | $ | 2,548 | | | $ | (420 | ) | | $ | (5,442 | ) |
The Company benefits from tax incentives granted by local tax authorities in certain foreign jurisdictions. All non-passive income earned in its Bermuda subsidiary is not subject to tax. In addition, through December 31, 2009, the results reflect a zero tax rate on non-passive income earned in its Singapore subsidiary, which was granted pioneer status, or exemption of taxes on non-passive income, from the Economic Development Board of Singapore until December 31, 2009. The impact of this tax holiday was to increase in net income/decrease in net loss of approximately $2.7 million in fiscal 2010 ($0.02 per diluted share), $4.3 million in fiscal 2009 ($0.03 per diluted share) and $5.1 ($0.03 per diluted share) in fiscal 2008. The Company also was granted a tax holiday in Malaysia during fiscal 2009. The tax holiday is contingent upon the Company continuing to meet specified investment criteria in fixed assets, and to operate as an APAC regional headquarters center. The tax holiday granted by the Malaysian Industrial Development Authority will last for 10 years commencing April 1, 2006. The impact of this tax holiday was a decrease in income tax expense and an increase in income tax benefit of approximately $0.6 million in fiscal 2010 and $0.8 million in fiscal 2009, respectively.
U.S. taxes have not been provided on approximately $333.4 million of indefinitely reinvested foreign subsidiary earnings. Due to the Company’s full valuation allowance, the calculation of the tax impact of remitting these earnings is not practicable at this time.
The amount of unrecognized tax benefits that would impact the effective tax rate were approximately $19.6 million and $18.8 million as of March 28, 2010 and March 29, 2009, respectively. As of March 28, 2010, the recognition of approximately $35.1 million of unrecognized tax benefits would be offset by a change in valuation allowance. The Company recognizes potential interest and penalties as a component of income tax expense. Accrued interest and penalties relating to the income tax on the unrecognized tax benefit as of March 28, 2010 and March 29, 2009 were approximately $1.4 million and $1.3 million, respectively. In addition, deferred tax assets of approximately $3.6 million were recorded to account for the federal benefit of the state liabilities.
As of March 28, 2010, the Company was subject to examination in the U.S. federal tax jurisdiction for the fiscal years beginning with 2004. In February 2009, the Internal Revenue Service (IRS) commenced a tax audit for fiscal years beginning 2006 through 2008. Although the final outcome is uncertain, based on currently available information, the Company believes that the ultimate outcome will not have a material adverse effect on its financial position, cash flows or results of operations.
As of March 28, 2010, the Company was subject to examination in various state and foreign jurisdictions for tax years 2004 forward, none of which were individually material.
During the twelve months beginning March 29, 2010, the Company does not expect its unrecognized tax benefits will materially change from March 28, 2010 balances. However, the Company notes that the resolution and/or closure on open audits are highly uncertain.
The following tables summarize the activities of gross unrecognized tax benefits (in thousands):
(in thousands) | | Fiscal 2010 | | | Fiscal 2009 | | | Fiscal 2008 | |
| Beginning balance | | $ | 44,972 | | | $ | 42,896 | | | $ | 47,211 | |
| Increases related to prior year tax positions | | | 3,480 | | | | -- | | | | -- | |
| Decreases related to prior year tax positions | | | (862 | ) | | | (20 | ) | | | (6,943 | ) |
| Increases related to current year tax positions | | | 6,227 | | | | 2,096 | | | | 3,690 | |
| Decreases related to the lapsing of statute of limitations | | | (22 | ) | | | -- | | | | (1,062 | ) |
| Ending balance | | $ | 53,795 | | | $ | 44,972 | | | $ | 42,896 | |
Note 16
Segments
In the first quarter of fiscal 2010, as part of a refinement of its business strategy, the Company transferred multi-port products from the Communications segment into the Computing and Consumer segment. This change in segment reporting had no impact on the Company’s consolidated balance sheets, statements of operations, statements of cash flows or statements of stockholders’ equity for any periods. The segment information for fiscal years 2010, 2009 and 2008 have been adjusted retrospectively to conform to the current period presentation.
The Chief Operating Decision Maker is the Company’s President and Chief Executive Officer.
The segment information for fiscal 2009 and 2008 have been adjusted retrospectively to conform to the current period presentation. These two reportable business segments are as follows:
| § | Communications segment: includes high-performance timing products, Rapid I/O switching solutions, flow-control management devices, FIFOs, integrated communications processors, high-speed SRAM, military application (divested in the second quarter of fiscal 2010), digital logic, telecommunications and network search engines (divested in the third quarter of fiscal 2010). |
| § | Computing and Consumer segment: includes timing products, PCI Express switching and bridging solutions, high-performance server memory interfaces, multi-port products, touch controller, signal integrity products, and PC audio and video products. |
The tables below provide information about these segments:
| | | Fiscal Year End | |
| (in thousands) | | March 28, 2010 | | | March 29, 2009 | | | March 30 2008 | |
| Revenues | | | | | | | | | |
| Communications | | $ | 245,438 | | | $ | 294,698 | | | $ | 349,820 | |
| Computing and Consumer | | | 290,468 | | | | 368,547 | | | | 431,647 | |
| Total revenues | | $ | 535,906 | | | $ | 663,245 | | | $ | 781,467 | |
Income (Loss) by Segment
| | | Fiscal Year Ended | |
(in thousands) | | March 28, 2010 | | | March 29, 2009 | | | March 30, 2008 | |
| Communications | | $ | 83,291 | | | $ | 92,101 | | | $ | 102,980 | |
| Computing and Consumer | | | (36,388 | ) | | | 11,918 | | | | 64,921 | |
| Amortization of intangible assets | | | (21,073 | ) | | | (79,388 | ) | | | (109,995 | ) |
| Inventory FMV adjustment | | | (16,058 | ) | | | -- | | | | -- | |
| Goodwill and intangible assets impairment | | | -- | | | | (1,025,684 | ) | | | -- | |
| Gain on divestiture | | | 78,306 | | | | -- | | | | -- | |
| Fabrication production transfer costs | | | (2,344 | ) | | | -- | | | | -- | |
| Note receivable impairment | | | (1,602 | ) | | | -- | | | | -- | |
| Amortization of stock-based compensation | | | (16,674 | ) | | | (32,402 | ) | | | (41,242 | ) |
| Severance and retention costs | | | (21,120 | ) | | | (7,484 | ) | | | (2,884 | ) |
| Acquired in-process research and development | | | -- | | | | (5,597 | ) | | | -- | |
| Acquisition-related costs and other | | | (4,822 | ) | | | 11 | | | | (2,290 | ) |
| Deferred compensation plan expense (benefit) | | | (2,892 | ) | | | 2,690 | | | | 535 | |
| Other-than-temporary loss on investments | | | -- | | | | (3,000 | ) | | | -- | |
| Interest expense | | | (55 | ) | | | (60 | ) | | | (103 | ) |
| Interest income and other, net | | | 3,998 | | | | 1,308 | | | | 16,815 | |
| Income (loss) before income taxes | | $ | 42,567 | | | $ | (1,045,587 | ) | | $ | 28,737 | |
The Company does not allocate goodwill and intangible assets impairment charge, IPR&D, severance and retention costs, acquisition-related costs, stock-based compensation, interest income and other, and interest expense to its segments. In addition, the Company does not allocate assets to its segments. The Company excludes these items consistent with the manner in which it internally evaluates its results of operations.
The Company’s significant operations outside of the United States include manufacturing facilities in Malaysia and Singapore, design centers in the U.S., Canada and China, and sales subsidiaries in Japan, Asia Pacific and Europe. Revenues from unaffiliated customers by geographic area, based on the customers' shipment locations, were as follows:
| | Fiscal Year Ended | |
| (in thousands) | March 28, 2010 | | March 29, 2009 | | March 30, 2008 | |
| Asia Pacific | | $ | 348,914 | | | $ | 416,815 | | | $ | 436,491 | |
| Americas | | | 93,451 | | | | 131,836 | | | | 216,570 | |
| Japan | | | 51,465 | | | | 61,098 | | | | 70,729 | |
| Europe | | | 42,076 | | | | 53,496 | | | | 57,677 | |
| Total revenues | | $ | 535,906 | | | $ | 663,245 | | | $ | 781,467 | |
The Company’s financial reporting systems track revenue based upon the regions presented in the table above. However, the data for individual countries is not at a precise enough level to determine these amounts with certainty. The Company estimates that the largest individual countries not separately disclosed above are the U.S. and Taiwan.
The Company's net property, plant and equipment are summarized below by geographic area:
(in thousands) | | March 28 2010 | | | March 29, 2009 | |
| United States | | $ | 52,979 | | | $ | 60,836 | |
| Canada | | | 6,437 | | | | 700 | |
| Malaysia | | | 6,446 | | | | 4,888 | |
| Singapore | | | 1,233 | | | | 2,918 | |
| All other countries | | | 893 | | | | 2,219 | |
| Total property, plant and equipment, net | | $ | 67,988 | | | $ | 71,561 | |
Note 17
Derivative Financial Instruments
As a result of its international operations, sales and purchase transactions, the Company is subject to risks associated with fluctuating currency exchange rates. The Company may use derivative financial instruments to hedge these risks when instruments are available and cost effective, in an attempt to minimize the impact of currency exchange rate movements on its operating results and on the cost of capital equipment purchases. The Company may enter into hedges of forecasted transactions when the underlying transaction is highly probable and reasonably certain to occur within the subsequent twelve months. Examples of these exposures would include forecasted expenses of a foreign manufacturing plant, design center or sales office. The Company may additionally enter into a derivative to hedge the foreign currency risk of a capi tal equipment purchase if the capital equipment purchase order is executed and designated as a firm commitment.
The Company may also utilize currency forward contracts to hedge currency exchange rate fluctuations related to certain short- term foreign currency assets and liabilities. As of March 28, 2010 and March 29, 2009, the Company did not have any outstanding foreign currency contracts that were designated as hedges of forecasted cash flows or capital equipment purchases. The Company does not enter into derivative financial instruments for speculative or trading purposes.
Gains and losses on these undesignated derivatives substantially offset gains and losses on the assets and liabilities being hedged and the net amount is included in interest income and other (expense), net in the Consolidated Statements of Operations. The Company did not have any outstanding foreign currency contracts that were designated as hedges of certain short term foreign currency assets and liabilities at the end of fiscal 2010. An immaterial amount of net gains and losses were included in interest income and other (expense), net during fiscal years 2010 and 2009.
Besides foreign exchange rate exposure, the Company’s cash and investment portfolios are subject to risks associated with fluctuations in interest rates. While the Company’s policies allow for the use of derivative financial instruments to hedge the fair values of such investments, the Company has yet to enter into this type of hedging arrangement.
Note 18
Related Party Transaction
On December 4, 2009, in line with the Company’s strategy to exit engineering services business acquired as part of Tundra acquisition, the Company completed the sale of certain assets and transferred certain liabilities related to its Silicon Logic Engineering business to Open Silicon, Inc (“OSI’) for $1 in cash. See Note 3 – “Divestitures” for further discussion. Richard D. Crowley, Jr., the Company’s Vice President and Chief Financial Officer, is a member of the board of directors of OSI. During fiscal 2010, the Company paid approximately $0.4 million for services from OSI.
Note 19
Subsequent Events
On April 16, 2010, the Company entered into an agreement to acquire certain assets of IKOR, a manufacturer of power module VRM solutions for high-performance computing and former subsidiary of iWatt Corporation, along with members of its engineering team. The Company paid approximately $9.0 million in cash. The acquisition is not significant to the Company’s consolidated results of operations.
SUPPLEMENTARY FINANCIAL INFORMATION (UNAUDITED)
QUARTERLY RESULTS OF OPERATIONS
(in thousands, except per share data)
| | | Fiscal Year Ended March 28, 2010 | |
| | | First Quarter | | Second Quarter | | Third Quarter | | Fourth Quarter | |
| | | | | | |
| Revenues | | $ | 115,954 | | | $ | 139,504 | | | $ | 142,480 | | | $ | 137,968 | |
| Gross profit | | | 47,165 | | | | 51,131 | | | | 59,729 | | | | 66,882 | |
| Net income (loss) | | | (14,121 | ) | | | 60,540 | | | | (7,367 | ) | | | 967 | |
| Basic net income (loss) per share | | | (0.09 | ) | | | 0.37 | | | | (0.04 | ) | | | 0.01 | |
| Diluted net income (loss) per share | | $ | (0.09 | ) | | $ | 0.36 | | | $ | (0.04 | ) | | $ | 0.01 | |
| | | Fiscal Year Ended March 29, 2009 | |
| | | First Quarter | | Second Quarter | | Third Quarter | | Fourth Quarter | |
| | | | | | |
| Revenues | | $ | 188,208 | | | $ | 200,541 | | | $ | 167,079 | | | $ | 107,417 | |
| Gross profit | | | 84,459 | | | | 87,153 | | | | 69,669 | | | | 33,168 | |
| Net income (loss) | | | 9,154 | | | | 11,675 | | | | (345,259 | ) | | | (720,737 | ) |
| Basic net income (loss) per share | | | 0.05 | | | | 0.07 | | | | (2.06 | ) | | | (4.38 | ) |
| Diluted net income (loss) per share | | $ | 0.05 | | | $ | 0.07 | | | $ | (2.06 | ) | | $ | (4.38 | ) |
In the second quarter of fiscal 2010, the Company recorded a gain of $78.3 million related to the divestiture of certain businesses.
During fiscal 2009, the Company recorded goodwill and intangible assets impairment charge of $339.1 million and $686.6 million in the third and fourth quarter, respectively.
ITEM 9. CHANGES IN AND DISAGREEMENTS WITH ACCOUNTANTS ON ACCOUNTING AND FINANCIAL DISCLOSURE
None.
ITEM 9A. CONTROLS AND PROCEDURES
Evaluation of Disclosure Controls and Procedures
We maintain “disclosure controls and procedures,” as such term is defined in Rule 13a-15(e) under the Securities Exchange Act of 1934, as amended (the “Exchange Act”), that are designed to ensure that information required to be disclosed by us in reports that we file or submit under the Exchange Act is recorded, processed, summarized, and reported within the time periods specified in Securities and Exchange Commission rules and forms, and that such information is accumulated and communicated to our management, including our Chief Executive Officer and Chief Financial Officer, as appropriate, to allow timely decisions regarding required disclosure. Our management, including the Chief Executive Officer and Chief Financial Officer, is engaged in a comprehensive effort to review, evaluate and improve our controls; howe ver, management does not expect that our disclosure controls will prevent all errors and all fraud. A control system, no matter how well designed and operated, can provide only reasonable, not absolute, assurance that the control systems’ objectives are met. Additionally, in designing disclosure controls and procedures, our management necessarily was required to apply its judgment in evaluating the cost-benefit relationship of possible disclosure controls and procedures. The design of any disclosure controls and procedures also is based in part upon certain assumptions about the likelihood of future events, and there can be no assurance that any design will succeed in achieving its stated goals under all potential future conditions.
Based on their evaluation as of the end of the period covered by this Annual Report on Form 10-K, our Chief Executive Officer and Chief Financial Officer have concluded that our disclosure controls and procedures were effective at the reasonable assurance level.
Changes in Internal Control over Financial Reporting
There was no change in our internal control over financial reporting that occurred during our last fiscal quarter that has materially affected, or is reasonably likely to materially affect, our internal control over financial reporting.
Management’s Report on Internal Control over Financial Reporting
Our management is responsible for establishing and maintaining adequate internal control over financial reporting as defined in Rule 13a-15(f) of the Securities Exchange Act of 1934. Because of its inherent limitations, internal control over financial reporting may not prevent or detect misstatements. Also, projections of any evaluation of effectiveness to future periods are subject to the risk that controls may become inadequate because of changes in conditions or that the degree of compliance with the policies or procedures may deteriorate.
We assessed the effectiveness of our internal control over financial reporting as of March 28, 2010. In making this assessment, we used the criteria set forth by the Committee of Sponsoring Organizations of the Treadway Commission in Internal Control—Integrated Framework.
Based on our assessment using those criteria, we concluded that our internal control over financial reporting was effective as of March 28, 2010.
The effectiveness of our internal control over financial reporting as of March 28, 2010 has been audited by PricewaterhouseCoopers LLP, our independent registered public accounting firm, as stated in their report which appears under Item 8 of this Annual Report on Form 10-K.
ITEM 9B. OTHER INFORMATION
None.
ITEM 10. DIRECTORS, EXECUTIVE OFFICERS AND CORPORATE GOVERNANCE
Our executive officers, and their respective ages as of March 28, 2010, are as follows:
| Name | | Age | | Position |
| Ted Tewksbury | | | 53 | | President and Chief Executive Officer |
| Richard D. Crowley, Jr. | | | 53 | | Vice President, Chief Financial Officer |
| Mike Hunter | | | 58 | | Vice President, Worldwide Manufacturing |
| Mansour Izadinia | | | 47 | | Senior Vice President, Analog Technology and Strategy |
| Chuen-Der Lien | | | 53 | | Vice President, Chief Technical Officer, Circuit and Process Design |
| Mario Montana | | | 48 | | Vice President, Enterprise Computing Division |
| Arman Naghavi | | | 47 | | Vice President and General Manager, Audio and Power Division |
| Ji Park | | | 37 | | Vice President and General Manager, Video and Display Division |
| Paul Rolls | | | 47 | | Senior Vice President, Worldwide Sales and Marketing |
| Kelley Steven-Waiss | | | 40 | | Vice President, Worldwide Human Resources |
| Vince Tortolano | | | 60 | | Vice President, General Counsel and Secretary |
| Chad Taggard | | | 45 | | Vice President, Strategic Business Development |
| Fred Zust | | | 40 | | Vice President and General Manager, Communications Division |
Mr. Tewksbury joined IDT as President and Chief Executive Officer in March 2008. Prior to joining IDT, Mr. Tewksbury served as the President and Chief Operating Officer of AMI Semiconductor from October 2006 to February 2008. Prior to August 2006, Mr. Tewksbury held a managing director position at Maxim Integrated Products, a semiconductor company.
Mr. Crowley joined IDT as Vice President and Chief Financial Officer in October 2008. Prior to joining IDT, Mr. Crowley served as the Vice President, Finance and Chief Financial Officer of Micrel Inc., a semiconductor company, from 1999 to September 2008. From 1998 to 1999, Mr. Crowley served as Vice President and Chief Financial Officer of Vantis Corporation. From 1980 to 1998, Mr. Crowley was employed by National Semiconductor Corporation, where his last position was Vice President and Corporate Controller.
Mr. Hunter has been with IDT since 1996 and was appointed Vice President, Worldwide Manufacturing in February 1998. Prior to joining IDT, Mr. Hunter held management positions at Chartered Semiconductor Manufacturing Ltd., Fujitsu Personal Systems, Fairchild Semiconductor and Texas Instruments Incorporated, a semiconductor company.
Mr. Izadinia joined IDT as Senior Vice President, Analog Technology and Strategy in July 2009. Prior to joining IDT, Mr. Izadinia served as Vice President of the System and Power Management (SPM) business unit at Maxim Integrated Products, a semiconductor company. Prior to Maxim, Mr. Izadinia held various engineering and management positions at National Semiconductor.
Dr. Lien joined IDT in 1987 and was appointed to his current position in 1996. Prior to joining IDT, he held engineering positions at Digital Equipment Corporation, a computer company and AMD, a semiconductor company.
Mr. Montana joined IDT in 1997 and became General Manager, Enterprise Computing Division (formerly Serial Switching Division) in 2005. Mr. Montana was promoted to Vice President in February 2007. Prior to his current role, Mr. Montana was Director, IDT Serial-Switching Division. Before transitioning to the Enterprise Computing Division, Montana was Director, IDT Strategic Marketing Group. Mr. Montana also served as Product Line Director, IDT Telecommunications, FIFO, Logic and Timing groups, respectively.
Mr. Naghavi joined IDT as Vice President and General Manager, Audio and Power Division in 2009. Prior to joining IDT Mr. Naghavi served as Vice President and General Manager of the Analog, Mixed-signal, and Power Division at Freescale Semiconductor. Prior to Freescale, Mr. Naghavi held various engineering and management positions at Intersil Corporation, a semiconductor company, and Analog Devices, Inc., a semiconductor company.
Mr. Park joined IDT in 2005 as a result of our merger with ICS and was promoted from Director of Memory Timing Products to his current position in 2008. Prior to IDT, Mr. Park held various management positions in product engineering, design and marketing at Texas Instruments Incorporated and Applied Materials Inc., a semiconductor company.
Mr. Rolls joined IDT in January 2010 as Senior Vice President, Worldwide Sales and Marketing. Prior to joining IDT, Mr. Rolls served as Senior Vice President of Worldwide Sales at International Rectifier, a semiconductor company, and held a variety of operations and logistics management roles at Compaq Computer.
Ms. Steven-Waiss joined IDT in November 2009 as Vice President, Worldwide Human Resources. Prior to joining IDT, Ms. Steven-Waiss was Vice President, Worldwide Human Resources at PMC-Sierra, Inc., a semiconductor company. Prior to PMC, Ms. Steven-Waiss was on the leadership team of a boutique communications consulting firm, ROI Communication, Inc.
Mr. Tortolano joined IDT in 2009 as Vice President, General Counsel and Secretary. Prior to joining IDT, Mr. Tortolano held the position of General Counsel at Micrel, Inc. from 2000 to 2009. Prior to Micrel, Mr. Tortolano held the position of Vice President, Co-General Counsel of Lattice Semiconductor Corporation.
Mr. Taggard joined IDT in August 2006. Mr. Taggard joined IDT from Intel Corporation where we held various product marketing, manufacturing operations, business development and investor relations positions. Prior to Intel, Mr. Taggard worked at Hewlett Packard Corporation as a software engineer.
Mr. Zust joined IDT in 2003 as a result of our merger with ICS. At ICS, he served as vice president for the NetCom Timing Division. Prior to ICS, Mr. Zust held various leadership and technical positions at Texas Instruments and AT&T/NCR Corporation.
The information required by this item concerning our directors is incorporated by reference from the information set forth in the sections titled “Proposal One—Election of Directors” and “Section 16(a) Beneficial Ownership Reporting Compliance” in our Proxy Statement for the 2010 Annual Meeting of Stockholders.
The information required by this item concerning our executive officers is incorporated by reference from the information set forth in this section and “Section 16(a) Beneficial Ownership Reporting Compliance” in our Proxy Statement for the 2010 Annual Meeting of Stockholders.
The information required by this item concerning our audit committee and its financial expert is incorporated by reference from the information set forth in the section titled “Board Structure and Compensation” in our Proxy Statement for the 2010 Annual Meeting of Stockholders.
We have adopted a written code of business ethics that applies to all of our employees and to our Board of Directors. A copy of the code is available on our website at http://www.IDT.com. If we make any substantive amendments to the code of business ethics or grant any waiver from a provision of the code of business ethics to any of our directors or officers, we will promptly disclose the nature of the amendment or waiver on our website.
The information required by this Item concerning recommendations of director nominees by security holders is incorporated by reference from the information set forth in the section titled “Board Structure and Compensation” in our Proxy Statement for the 2010 Annual Meeting of Stockholders.
ITEM 11. EXECUTIVE COMPENSATION
The information required by this Item is incorporated herein by reference from the Company's Proxy Statement for the 2010 Annual Meeting of Stockholders.
ITEM 12. SECURITY OWNERSHIP OF CERTAIN BENEFICIAL OWNERS AND MANAGEMENT AND RELATED STOCKHOLDER MATTERS
The information required by this Item is incorporated herein by reference from the Company's Proxy Statement for the 2010 Annual Meeting of Stockholders.
ITEM 13. CERTAIN RELATIONSHIPS AND RELATED TRANSACTIONS AND DIRECTOR INDEPENDENCE
The information required by this Item is incorporated herein by reference from the Company's Proxy Statement for the 2010 Annual Meeting of Stockholders.
ITEM 14. PRINCIPAL ACCOUNTANT FEES AND SERVICES
The information required by this Item is incorporated herein by reference from the Company’s Proxy Statement for the 2010 Annual Meeting of Stockholders.
ITEM 15. EXHIBITS AND FINANCIAL STATEMENT SCHEDULES
| | (a) | 1. Financial Statements. See “Index to Consolidated Financial Statements” under Item 8 of this Annual Report. |
2. Financial Statement Schedules. See Schedule II, “Valuation and Qualifying Accounts,” included with this Annual Report.
3. Exhibits. The exhibits listed in the Exhibit Index below are filed or incorporated by reference as part of this Annual Report.
| Exhibit Number | | Exhibit Description | Incorporated by Reference |
| | From | | File Number | | Exhibit | | Filing Date | | Filed Herewith |
| 2.1* | | Agreement and Plan of Merger by and among Integrated Device Technology, Inc., Integrated Circuit Systems, Inc., and Colonial Merger Sub I, Inc. | | 8-K | | 00-12695 | | 2.1 | | 6/20/05 | | |
| 2.2* | | Asset Purchase Agreement, dated as of April 30, 2009 between the Company and NetLogic Microsystems, Inc. | | 8-K | | 00-12695 | | 2.1 | | 5/9/09 | | |
| 2.3* | | Arrangement Agreement, dated as of April 30, 2009, by and among Integrated Device Technology, Inc., 4440471 Canada Inc., and Tundra Semiconductor Corporation. | | 8-K | | 00-12695 | | 2.1 | | 4/30/09 | | |
| 3.1* | | Restated Certificate of Incorporation. | | 10-Q | | 00-12695 | | 3.1 | | 11/7/00 | | |
| 3.2* | | Certificate of Amendment of Restated Certificate of Incorporation. | | 8 | | 00-12695 | | 3(a) | | 3/28/89 | | |
| 3.3* | | Certificate of Amendment of Restated Certificate of Incorporation. | | S-8 | | 33-63133 | | 4.3 | | 10/2/95 | | |
| 3.4* | | Certificate of Designations specifying the terms of the Series A Junior Participating Preferred Stock of IDT, as filed with the Secretary of State of Delaware. | | 8-A | | 00-12695 | | 3.6 | | 12/23/98 | | |
| 3.5* | | Certificate of Amendment of Restated Certificate of Incorporation. | | 10-Q | | 00-12695 | | 3.5 | | 11/7/07 | | |
| 3.6* | | Amended and Restated Bylaws of the Company, as amended and restated effective July 22, 2009. | | 8-K | | 00-12695 | | 3.1 | | 7/28/09 | | |
| 4.1* | | Rights Agreement dated December 21, 1998 between the Company and BankBoston, N.A., as Rights Agent. | | 8-A | | 00-12695 | | 4.1 | | 12/23/98 | | |
| 10.5* | | 1994 Stock Option Plan, as amended as of September 22, 2000.** | | 10-Q | | 00-12695 | | 10.1 | | 10/1/00 | | |
| 10.6* | | 1994 Directors Stock Option Plan and related documents.** | | 10-Q | | 00-12695 | | 10.18 | | 10/2/94 | | |
| | | | | | | | | | | | | |
| Exhibit Number | | Exhibit Description | Incorporated by Reference |
| | From | | File Number | | Exhibit | | Filing Date | | Filed Herewith |
| 10.7* | | Form of Indemnification Agreement between the Company and its directors and officers.** | | 10-K | | 00-12695 | | 10.68 | | 4/2/89 | | |
| 10.8* | | Technology License Agreement between the Company and MIPS Technologies, Inc. (Confidential Treatment Granted). | | 10-K | | 00-12695 | | 10.8 | | 03/28/99 | | |
| 10.10* | | Master Distributor Agreement dated August 26, 1985 between the Company and Hamilton/Avnet Electronics, Division of Avnet, Inc. | | S-1 | | 33-3189 | | 10.54 | | | | |
| 10.12* | | Incentive Compensation Plan.** | | 10-Q | | 00-12695 | | 10.27 | | 7/3/05 | | |
| 10.13* | | Form of Change of Control Agreement between the Company and certain of its officers.** | | | | | | | | | | |
| 10.14* | | Lease dated December 2002 between the Company and LaGuardia Associates relating to 710 LaGuardia Street, Salinas, California. | | | | | | | | | | |
| 10.16* | | 1997 Stock Option Plan.** | | 10-Q | | 00-12695 | | 10.23 | | 06/30/02 | | |
| 10.17* | | Purchase and Sale Agreement and Joint Escrow Instructions between the Company and Cadence Design Systems, Inc., dated December 1998. | | S-4 | | 00-12695 | | 10.27 | | 03/24/99 | | |
| 10.18* | | Distributor Agreement dated June 22, 2000 between the Company and Arrow Electronics, Inc.*** | | 10-K | | 00-12695 | | 10.18 | | 4/1/01 | | |
| 10.19* | | Agreement For Purchase And Sale Of Real Property Between Baccarat Silicon, Inc. and Dan Caputo Co. dated August 5, 2003. | | 10-Q | | 00-12695 | | 10.19 | | 6/23/03 | | |
| 10.20* | | Lease between the Company and S.I. Hahn, LLC dated February 2000 relating to 2901 Coronado Drive, Santa Clara, California. | | 10-K | | 00-12695 | | 10.20 | | 4/2/00 | | |
| 10.21* | | Non-Qualified Deferred Compensation Plan effective November 1, 2000.** | | 10-K | | 00-12695 | | 10.21 | | 4/1/01 | | |
| 10.22* | | Transition Agreement, dated March 30, 2006, by and between Integrated Device Technology, Inc. and Hock E. Tan.** | | 8-K | | 00-12695 | | 10.1 | | 3/30/06 | | |
| 10.23* | | Master purchase agreement between Cisco Systems, Inc. and Integrated Device Technology, Inc. dated May 7, 2003.*** | | 10-Q | | 00-12695 | | 10.24 | | 9/28/03 | | |
| 10.24* | | 1984 Employee Stock Purchase Plan, as amended and restated effective September 29, 2003.** | | 10-Q | | 00-12695 | | 10.25 | | 9/28/03 | | |
| | | | Incorporated by Reference |
| Exhibit Number | | Exhibit Description | | From | | File Number | | Exhibit | | Filing Date | | Filed Herewith |
| 10.25* | | 2004 Equity Plan, as amended and restated, effective July 28, 2008.** | | DEF 14A | | 00-12695 | | 10.25 | | 7/28/08 | | |
| 10.26* | | Agreement For Purchase And Sale of Real Property Between the Company and Electroglas, Inc. dated December 16, 2004. | | 10-K | | 00-12695 | | 10.26 | | 6/14/05 | | |
| 10.27* | | Executive Transition Agreement, dated November 13, 2007, by and between Registrant and Gregory S. Lang.** | | 8-K | | 00-12695 | | 10.1 | | 11/16/07 | | |
| 10.28* | | Executive Compensation Agreement, dated February 12, 2008, by and between Registrant and its President and CEO, Ted Tewksbury.** | | 8-K | | 00-12695 | | 10.1 | | 2/20/08 | | |
| 10.29* | | Offer Letter between the Company and Richard D. Crowley, Jr., entered into on September 15, 2008.** | | 8-K | | 00-12695 | | 10.1 | | 9/23/08 | | |
| 10.30 | | 2009 Employee Stock Purchase Plan.** | | DEF 14A | | 00-12695 | | | | 8/07/09 | | |
| 21.1 | | Subsidiaries of the Company. | | | | | | | | | | X |
| 23.1 | | Consent of PricewaterhouseCoopers LLP. | | | | | | | | | | X |
| 31.1 | | Certification of Chief Executive Officer as required by Rule 13a-14(a) of the Securities Exchange Act of 1934, as amended, dated May 19, 2008. | | | | | | | | | | X |
| 31.2 | | Certification of Chief Financial Officer as required by Rule 13a-14(a) of the Securities Exchange Act of 1934, as amended, dated May 19, 2008. | | | | | | | | | | X |
| 32.1 | | Certification of Chief Executive Officer pursuant to Section 906 of the Sarbanes-Oxley Act of 2002. | | | | | | | | | | X |
| 32.2 | | Certificate of Chief Financial Officer pursuant to Section 906 of the Sarbanes-Oxley Act of 2002. | | | | | | | | | | X |
*This exhibit was previously filed with the Commission as indicated and is incorporated herein by reference.
**This exhibit is a management contract or compensatory plan or arrangement.
***Confidential treatment has been requested for certain portions of this document pursuant to an application for confidential treatment sent to the Securities and Exchange Commission (SEC). Such portions have been redacted and marked with a triple asterisk. The non-redacted version of this document has been sent to the SEC.
Pursuant to the requirements of Section 13 or 15(d) of the Securities Exchange Act of 1934, the registrant has duly caused this report to be signed on its behalf by the undersigned, thereunto duly authorized.
| | | INTEGRATED DEVICE TECHNOLOGY, INC. Registrant |
| | | By: | /s/ THEODORE L. TEWKSBURY III |
May 25, 2010 | | | Theodore L.Tewksbury III President and Chief Executive Officer |
Pursuant to the requirements of the Securities Exchange Act of 1934, this report has been signed below by the following persons on behalf of the registrant and in the capacities and on the date indicated.
| Signature | | Title | | Date |
| | | | | |
| /s/ THEODORE L. TEWKSBURY III | | Chief Executive Officer , President and Director | | May 25, 2010 |
| Theodore L. Tewksbury III | | (Principal Executive Officer) | | |
| | | | | |
| /s/ RICHARD D. CROWLEY, JR. | | Vice President, Chief Financial Officer | | May 25, 2010 |
| Richard D. Crowley, JR. | | (Principal Financial and Accounting Officer) | | |
| | | | | |
| /s/ JOHN SCHOFIELD | | Chairman of the Board | | May 25, 2010 |
| John Schofield | | | | |
| | | | | |
| /s/ GORDON PARNELL | | Director | | May 25, 2010 |
| Gordon Parnell | | | | |
| | | | | |
| /s/ LEWIS EGGEBRECHT | | Director | | May 25, 2010 |
| Lewis Eggebrecht | | | | |
| | | | | |
| /s/ RON SMITH | | Director | | May 25, 2010 |
| Ron Smith | | | | |
| | | | | |
| /s/ DONALD SCHROCK | | Director | | May 25, 2010 |
| Donald Schrock | | | | |
| | | | | |
| /s/ UMESH PADVAL | | Director | | May 25, 2010 |
| Umesh Padval | | | | |
INTEGRATED DEVICE TECHNOLOGY, INC.
VALUATION AND QUALIFYING ACCOUNTS
(in thousands) | | Balance at Beginning of Period | | | Additions Charged (Credited) to Revenues, Costs and Expenses | | | Charged (Credited) to Other Accounts | | | Deductions and Write-offs | | | Balance at End of Period | |
| Allowance for returns, pricing credits and doubtful accounts | | | | | | | | | | | | | | | |
| Year ended March 30, 2008 | | $ | 8,000 | | | $ | 16,837 | | | $ | 1,416 | | | $ | (17,041 | ) | | $ | 9,212 | |
| Year ended March 29, 2009 | | $ | 9,212 | | | $ | 14,669 | | | $ | -- | | | $ | (16,530 | ) | | $ | 7,351 | |
| Year ended March 28, 2010 | | $ | 7,351 | | | $ | 8,706 | | | $ | 1,466 | | | $ | (10,867 | ) | | $ | 6,656 | |
| Tax valuation allowance | | | | | | | | | | | | | | | | | | | | |
| Year ended March 30, 2008 | | $ | 174,671 | | | $ | (73,374 | ) | | $ | (2,789 | ) | | $ | (8,246 | ) | | $ | 90,262 | |
| Year ended March 29, 2009 | | $ | 90,262 | | | $ | 27,392 | | | $ | (65 | ) | | $ | -- | | | $ | 117,589 | |
| Year ended March 28, 2010 | | $ | 117,589 | | | $ | (10,197 | ) | | $ | -- | | | $ | 1,954 | | | $ | 109,346 | |
EXHIBIT INDEX
| Exhibit Number | | Exhibit Description | Incorporated by Reference |
| | From | | File Number | | Exhibit | | Filing Date | | Filed Herewith |
| 2.1* | | Agreement and Plan of Merger by and among Integrated Device Technology, Inc., Integrated Circuit Systems, Inc., and Colonial Merger Sub I, Inc. | | 8-K | | 00-12695 | | 2.1 | | 6/20/05 | | |
| 2.2* | | Asset Purchase Agreement, dated as of April 30, 2009 between the Company and NetLogic Microsystems, Inc. | | 8-K | | 00-12695 | | 2.1 | | 5/9/09 | | |
| 2.3* | | Arrangement Agreement, dated as of April 30, 2009, by and among Integrated Device Technology, Inc., 4440471 Canada Inc., and Tundra Semiconductor Corporation. | | 8-K | | 00-12695 | | 2.1 | | 4/30/09 | | |
| 3.1* | | Restated Certificate of Incorporation. | | 10-Q | | 00-12695 | | 3.1 | | 11/7/00 | | |
| 3.2* | | Certificate of Amendment of Restated Certificate of Incorporation. | | 8 | | 00-12695 | | 3(a) | | 3/28/89 | | |
| 3.3* | | Certificate of Amendment of Restated Certificate of Incorporation. | | S-8 | | 33-63133 | | 4.3 | | 10/2/95 | | |
| 3.4* | | Certificate of Designations specifying the terms of the Series A Junior Participating Preferred Stock of IDT, as filed with the Secretary of State of Delaware. | | 8-A | | 00-12695 | | 3.6 | | 12/23/98 | | |
| 3.5* | | Certificate of Amendment of Restated Certificate of Incorporation. | | 10-Q | | 00-12695 | | 3.5 | | 11/7/07 | | |
| 3.6* | | Amended and Restated Bylaws of the Company, as amended and restated effective July 22, 2009. | | 8-K | | 00-12695 | | 3.1 | | 7/28/09 | | |
| 4.1* | | Rights Agreement dated December 21, 1998 between the Company and BankBoston, N.A., as Rights Agent. | | 8-A | | 00-12695 | | 4.1 | | 12/23/98 | | |
| 10.5* | | 1994 Stock Option Plan, as amended as of September 22, 2000.** | | 10-Q | | 00-12695 | | 10.1 | | 10/1/00 | | |
| 10.6* | | 1994 Directors Stock Option Plan and related documents.** | | 10-Q | | 00-12695 | | 10.18 | | 10/2/94 | | |
| 10.7* | | Form of Indemnification Agreement between the Company and its directors and officers.** | | 10-K | | 00-12695 | | 10.68 | | 4/2/89 | | |
| 10.8* | | Technology License Agreement between the Company and MIPS Technologies, Inc. (Confidential Treatment Granted). | | 10-K | | 00-12695 | | 10.8 | | 03/28/99 | | |
| Exhibit Number | | Exhibit Description | Incorporated by Reference |
| | From | | File Number | | Exhibit | | Filing Date | | Filed Herewith |
| 10.10* | | Master Distributor Agreement dated August 26, 1985 between the Company and Hamilton/Avnet Electronics, Division of Avnet, Inc. | | S-1 | | 33-3189 | | 10.54 | | | | |
| 10.12* | | Incentive Compensation Plan.** | | 10-Q | | 00-12695 | | 10.27 | | 7/3/05 | | |
| 10.13* | | Form of Change of Control Agreement between the Company and certain of its officers.** | | | | | | | | | | |
| 10.14* | | Lease dated December 2002 between the Company and LaGuardia Associates relating to 710 LaGuardia Street, Salinas, California. | | | | | | | | | | |
| 10.16* | | 1997 Stock Option Plan.** | | 10-Q | | 00-12695 | | 10.23 | | 06/30/02 | | |
| 10.17* | | Purchase and Sale Agreement and Joint Escrow Instructions between the Company and Cadence Design Systems, Inc., dated December 1998. | | S-4 | | 00-12695 | | 10.27 | | 03/24/99 | | |
| 10.18* | | Distributor Agreement dated June 22, 2000 between the Company and Arrow Electronics, Inc.*** | | 10-K | | 00-12695 | | 10.18 | | 4/1/01 | | |
| 10.19* | | Agreement For Purchase And Sale Of Real Property Between Baccarat Silicon, Inc. and Dan Caputo Co. dated August 5, 2003. | | 10-Q | | 00-12695 | | 10.19 | | 6/23/03 | | |
| 10.20* | | Lease between the Company and S.I. Hahn, LLC dated February 2000 relating to 2901 Coronado Drive, Santa Clara, California. | | 10-K | | 00-12695 | | 10.20 | | 4/2/00 | | |
| 10.21* | | Non-Qualified Deferred Compensation Plan effective November 1, 2000.** | | 10-K | | 00-12695 | | 10.21 | | 4/1/01 | | |
| 10.22* | | Transition Agreement, dated March 30, 2006, by and between Integrated Device Technology, Inc. and Hock E. Tan.** | | 8-K | | 00-12695 | | 10.1 | | 3/30/06 | | |
| 10.23* | | Master purchase agreement between Cisco Systems, Inc. and Integrated Device Technology, Inc. dated May 7, 2003.*** | | 10-Q | | 00-12695 | | 10.24 | | 9/28/03 | | |
| 10.24* | | 1984 Employee Stock Purchase Plan, as amended and restated effective September 29, 2003.** | | 10-Q | | 00-12695 | | 10.25 | | 9/28/03 | | |
| 10.25* | | 2004 Equity Plan, as amended and restated, effective July 28, 2008.** | | DEF 14A. | | 00-12695 | | 10.25 | | 7/28/08 | | |
| | | | Incorporated by Reference |
| Exhibit Number | | Exhibit Description | | From | | File Number | | Exhibit | | Filing Date | | Filed Herewith |
| 10.26* | | Agreement For Purchase And Sale of Real Property Between the Company and Electroglas, Inc. dated December 16, 2004. | | 10-K | | 00-12695 | | 10.26 | | 6/14/05 | | |
| 10.27* | | Executive Transition Agreement, dated November 13, 2007, by and between Registrant and Gregory S. Lang.** | | 8-K | | 00-12695 | | 10.1 | | 11/16/07 | | |
| 10.28* | | Executive Compensation Agreement, dated February 12, 2008, by and between Registrant and its President and CEO, Ted Tewksbury.** | | 8-K | | 00-12695 | | 10.1 | | 2/20/08 | | |
| 10.29* | | Offer Letter between the Company and Richard D. Crowley, Jr., entered into on September 15, 2008 ** | | 8-K | | 00-12695 | | 10.1 | | 9/23/08 | | |
| 10.30 | | 2009 Employee Stock Purchase Plan.** | | DEF 14A | | 00-12695 | | | | 8/07/09 | | |
| 21.1 | | Subsidiaries of the Company. | | | | | | | | | | X |
| 23.1 | | Consent of PricewaterhouseCoopers LLP. | | | | | | | | | | X |
| 31.1 | | Certification of Chief Executive Officer as required by Rule 13a-14(a) of the Securities Exchange Act of 1934, as amended, dated May 19, 2008. | | | | | | | | | | X |
| 31.2 | | Certification of Chief Financial Officer as required by Rule 13a-14(a) of the Securities Exchange Act of 1934, as amended, dated May 19, 2008. | | | | | | | | | | X |
| 32.1 | | Certification of Chief Executive Officer pursuant to Section 906 of the Sarbanes-Oxley Act of 2002. | | | | | | | | | | X |
| 32.2 | | Certificate of Chief Financial Officer pursuant to Section 906 of the Sarbanes-Oxley Act of 2002. | | | | | | | | | | X |
*This exhibit was previously filed with the Commission as indicated and is incorporated herein by reference.
**This exhibit is a management contract or compensatory plan or arrangement.
***Confidential treatment has been requested for certain portions of this document pursuant to an application for confidential treatment sent to the Securities and Exchange Commission (SEC). Such portions have been redacted and marked with a triple asterisk. The non-redacted version of this document has been sent to the SEC.