
© 2015 Lawson Products, Inc. • Confidential Material, Reproduction, In Whole or in Part, Prohibited. Investor Presentation May 2017
© 2015 Lawson Products, Inc. • Confidential Material, Reproduction, In Whole or in Part, Prohibited. Lawson Products, Inc. "Safe Harbor" Statement under the Securities Litigation Reform Act of 1995: This presentation contains certain forward-looking statements within the meaning of the Private Securities Litigation Reform Act of 1995 that involve risks and uncertainties. The terms “may,” “should,” “could,” “anticipate,” “believe,” “continues,” “estimate,” “expect,” “intend,” “objective,” “plan,” “potential,” “project” and similar expressions are intended to identify forward-looking statements. These statements are not guarantees of future performance and involve risks, uncertainties and assumptions that are difficult to predict. These statements are based on management’s current expectations, intentions or beliefs and are subject to a number of factors, assumptions and uncertainties that could cause actual results to differ materially from those described in the forward-looking statements. Factors that could cause or contribute to such differences or that might otherwise impact the business include: failure to retain a talented workforce including productive sales representatives; the inability of management to successfully implement strategic initiatives; failure to manage change; the ability to adequately fund our operating and working capital needs through cash generated from operations; the ability to meet the covenant requirements of our line of credit; disruptions of the Company’s information and communication systems; the effect of general economic and market conditions; inventory obsolescence; work stoppages and other disruptions at transportation centers or shipping ports; changing customer demand and product mixes; increases in commodity prices; violations of environmental protection regulations; a negative outcome related to tax matters; and, all other factors discussed in the Company’s “Risk Factors” set forth in its Annual Report on Form 10-K for the year ended December 31, 2016. The Company undertakes no obligation to update any such factors or to publicly announce the results of any revisions to any forward-looking statements contained herein whether as a result of new information, future events or otherwise.
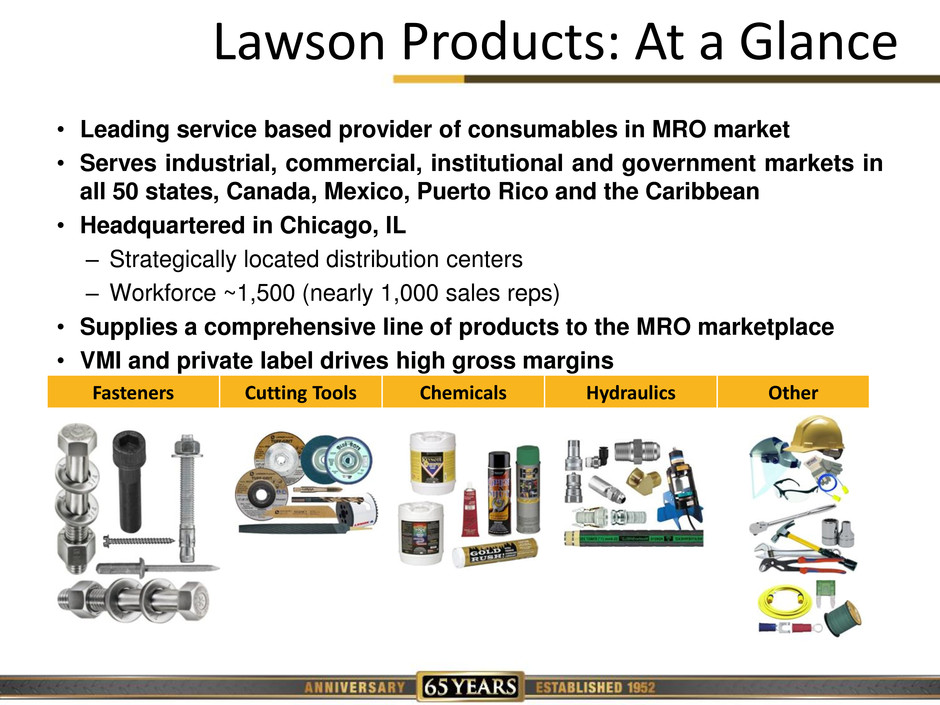
© 2015 Lawson Products, Inc. • Confidential Material, Reproduction, In Whole or in Part, Prohibited. Lawson Products: At a Glance Fasteners Cutting Tools Chemicals Hydraulics Other • Leading service based provider of consumables in MRO market • Serves industrial, commercial, institutional and government markets in all 50 states, Canada, Mexico, Puerto Rico and the Caribbean • Headquartered in Chicago, IL – Strategically located distribution centers – Workforce ~1,500 (nearly 1,000 sales reps) • Supplies a comprehensive line of products to the MRO marketplace • VMI and private label drives high gross margins
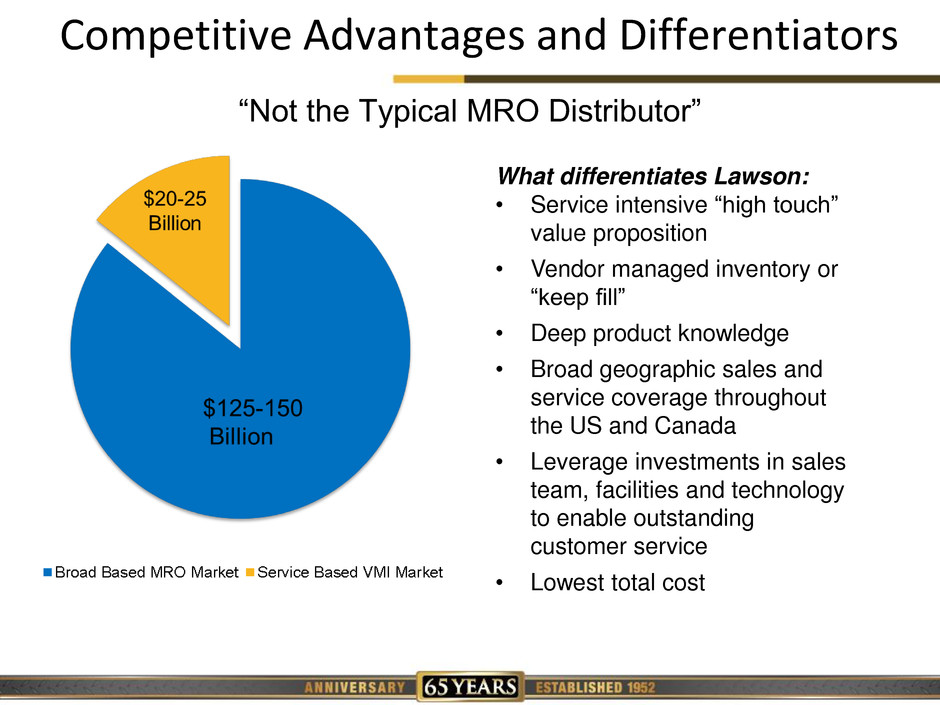
© 2015 Lawson Products, Inc. • Confidential Material, Reproduction, In Whole or in Part, Prohibited. Competitive Advantages and Differentiators What differentiates Lawson: • Service intensive ―high touch‖ value proposition • Vendor managed inventory or ―keep fill‖ • Deep product knowledge • Broad geographic sales and service coverage throughout the US and Canada • Leverage investments in sales team, facilities and technology to enable outstanding customer service • Lowest total cost ―Not the Typical MRO Distributor‖
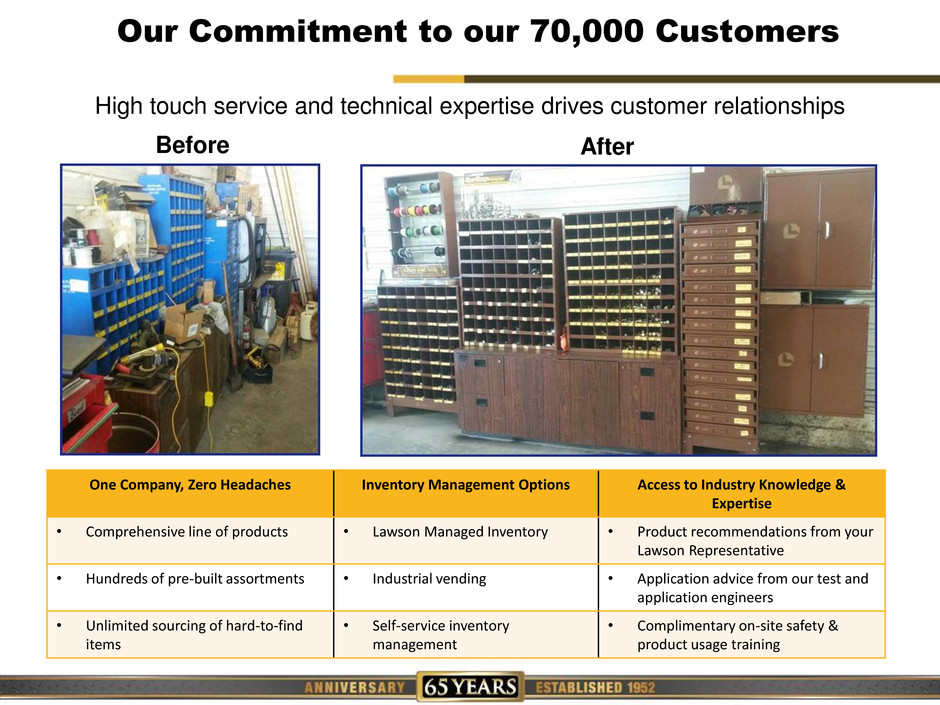
© 2015 Lawson Products, Inc. • Confidential Material, Reproduction, In Whole or in Part, Prohibited. Our Commitment to our 70,000 Customers High touch service and technical expertise drives customer relationships One Company, Zero Headaches Inventory Management Options Access to Industry Knowledge & Expertise • Comprehensive line of products • Lawson Managed Inventory • Product recommendations from your Lawson Representative • Hundreds of pre-built assortments • Industrial vending • Application advice from our test and application engineers • Unlimited sourcing of hard-to-find items • Self-service inventory management • Complimentary on-site safety & product usage training Before After
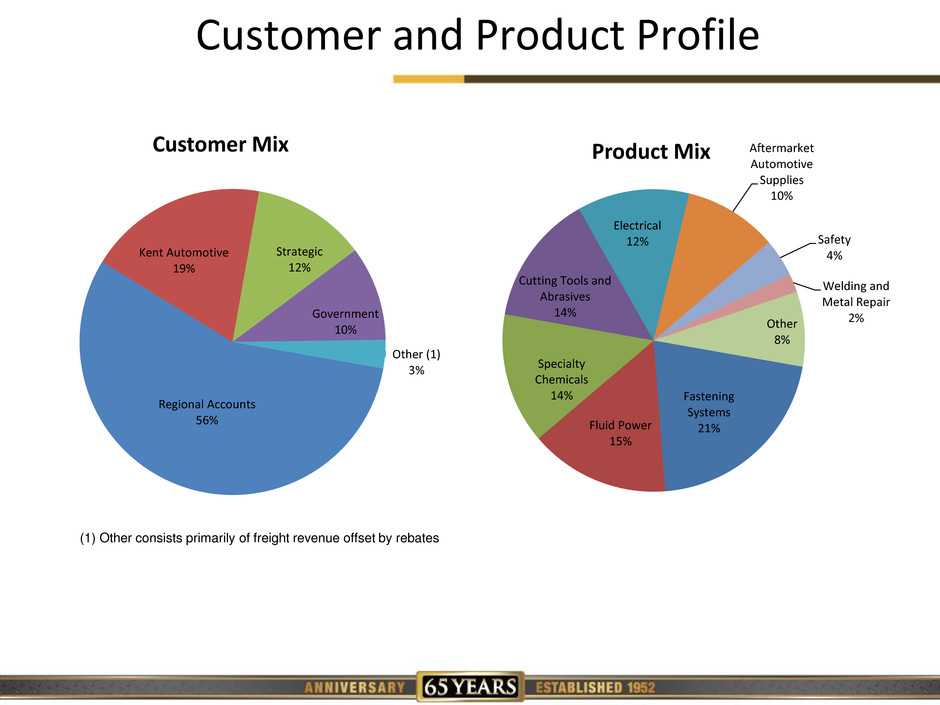
© 2015 Lawson Products, Inc. • Confidential Material, Reproduction, In Whole or in Part, Prohibited. Customer and Product Profile (1) Other consists primarily of freight revenue offset by rebates Fastening Systems 21% Fluid Power 15% Specialty Chemicals 14% Cutting Tools and Abrasives 14% Electrical 12% Aftermarket Automotive Supplies 10% Safety 4% Welding and Metal Repair 2% Other 8% Product Mix Regional Accounts 56% Kent Automotive 19% Strategic 12% Government 10% Other (1) 3% Customer Mix
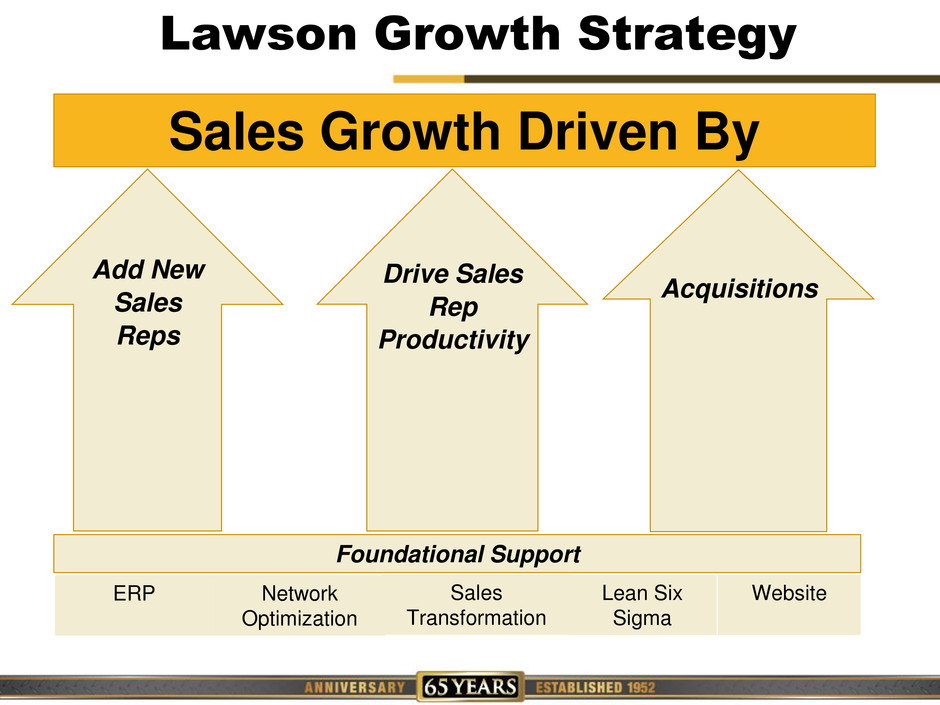
© 2015 Lawson Products, Inc. • Confidential Material, Reproduction, In Whole or in Part, Prohibited. Lawson Growth Strategy Sales Growth Driven By Foundational Support ERP Network Optimization Sales Transformation Lean Six Sigma Website Add New Sales Reps Drive Sales Rep Productivity Acquisitions
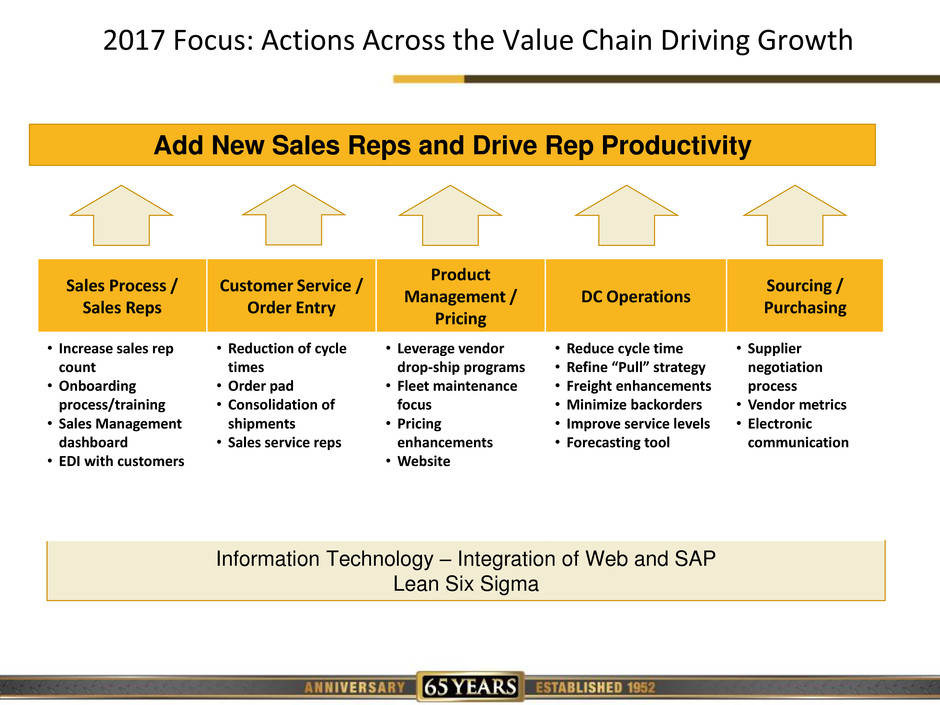
© 2015 Lawson Products, Inc. • Confidential Material, Reproduction, In Whole or in Part, Prohibited. 2017 Focus: Actions Across the Value Chain Driving Growth Information Technology – Integration of Web and SAP Lean Six Sigma Add New Sales Reps and Drive Rep Productivity Sales Process / Sales Reps Customer Service / Order Entry Product Management / Pricing DC Operations Sourcing / Purchasing • Increase sales rep count • Onboarding process/training • Sales Management dashboard • EDI with customers • Reduction of cycle times • Order pad • Consolidation of shipments • Sales service reps • Leverage vendor drop-ship programs • Fleet maintenance focus • Pricing enhancements • Website • Reduce cycle time • Refine “Pull” strategy • Freight enhancements • Minimize backorders • Improve service levels • Forecasting tool • Supplier negotiation process • Vendor metrics • Electronic communication

© 2015 Lawson Products, Inc. • Confidential Material, Reproduction, In Whole or in Part, Prohibited. Longer Sales Rep Tenure Drives Rep Productivity $0 $50,000 $100,000 $150,000 $200,000 $250,000 $300,000 $350,000 $400,000 $450,000 0 50 100 150 200 250 300 350 400 < 12 Mos. 1 - 2 Yrs. 3 - 5 Yrs. 5 - 10 Yrs. > 10 Yrs. A ve ra ge A n n u al Sal e s in T h o u sa n d s N u m b er o f Sales R ep s Tenure with Lawson (as of 3/31/17) Number of Reps Average Annual Sales
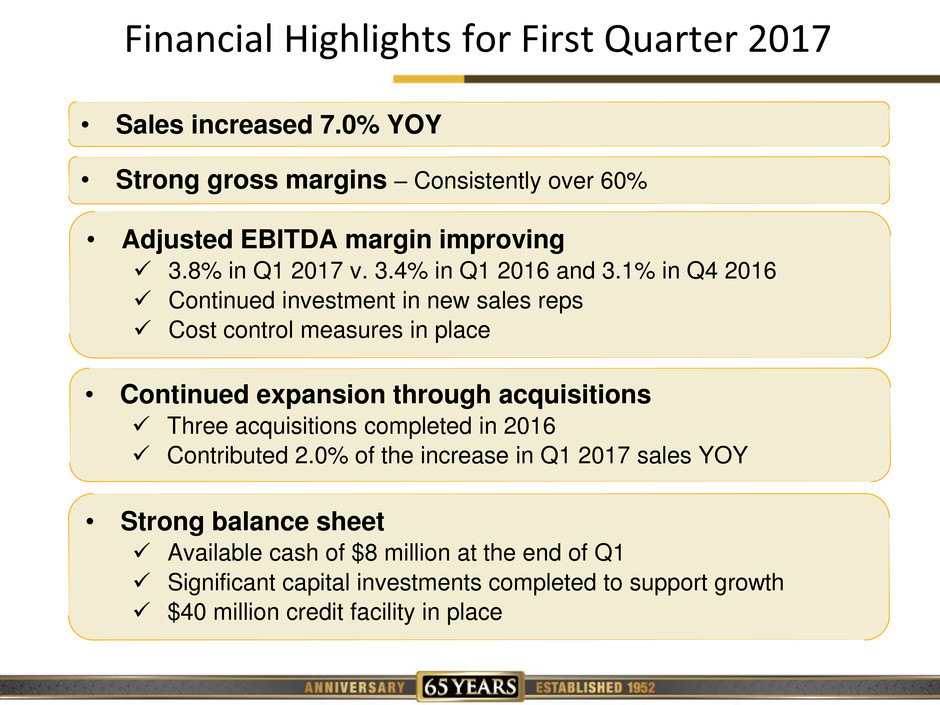
© 2015 Lawson Products, Inc. • Confidential Material, Reproduction, In Whole or in Part, Prohibited. Financial Highlights for First Quarter 2017 • Sales increased 7.0% YOY • Strong gross margins – Consistently over 60% • Adjusted EBITDA margin improving 3.8% in Q1 2017 v. 3.4% in Q1 2016 and 3.1% in Q4 2016 Continued investment in new sales reps Cost control measures in place • Continued expansion through acquisitions Three acquisitions completed in 2016 Contributed 2.0% of the increase in Q1 2017 sales YOY • Strong balance sheet Available cash of $8 million at the end of Q1 Significant capital investments completed to support growth $40 million credit facility in place
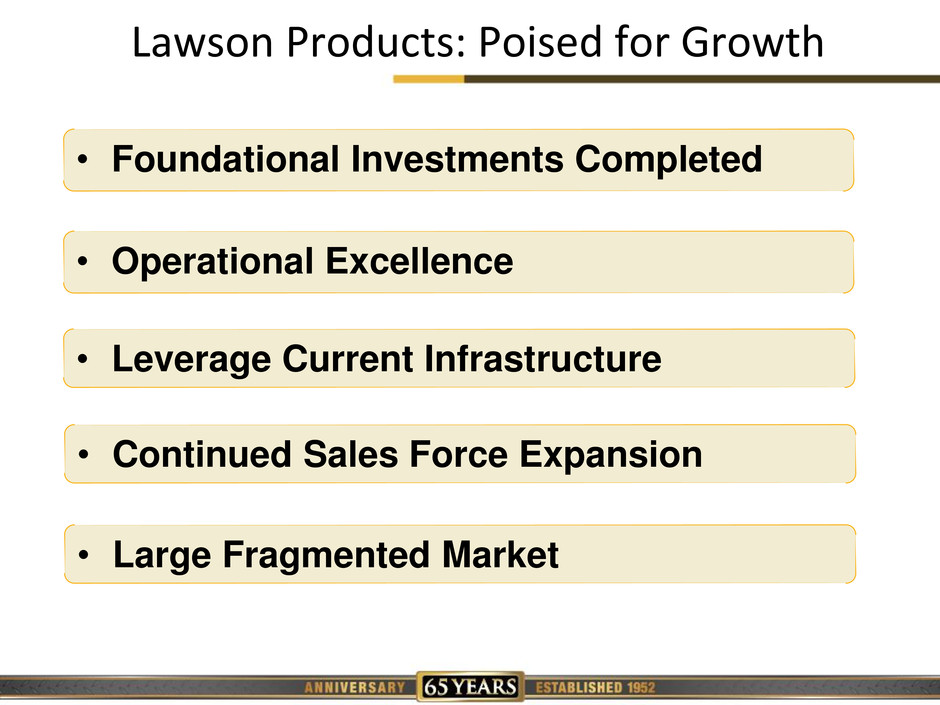
© 2015 Lawson Products, Inc. • Confidential Material, Reproduction, In Whole or in Part, Prohibited. Lawson Products: Poised for Growth • Foundational Investments Completed • Operational Excellence • Leverage Current Infrastructure • Continued Sales Force Expansion • Large Fragmented Market
© 2015 Lawson Products, Inc. • Confidential Material, Reproduction, In Whole or in Part, Prohibited. For More Information Contact: Ronald J. Knutson EVP, CFO Investor Relations (773) 304-5665 ron.knutson@lawsonproducts.com And see our Website at http://www.lawsonproducts.com/company-info/investor-relations.jsp
© 2015 Lawson Products, Inc. • Confidential Material, Reproduction, In Whole or in Part, Prohibited. Appendices
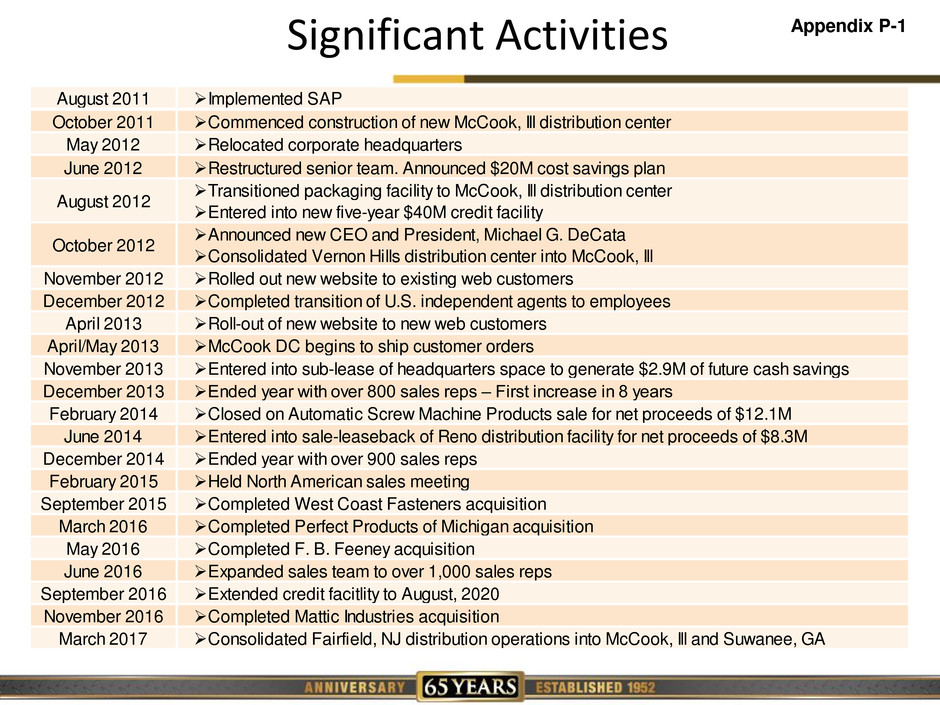
© 2015 Lawson Products, Inc. • Confidential Material, Reproduction, In Whole or in Part, Prohibited. Significant Activities Appendix P-1 August 2011 Implemented SAP October 2011 Commenced construction of new McCook, Ill distribution center May 2012 Relocated corporate headquarters June 2012 Restructured senior team. Announced $20M cost savings plan Transitioned packaging facility to McCook, Ill distribution center Entered into new five-year $40M credit facility Announced new CEO and President, Michael G. DeCata Consolidated Vernon Hills distribution center into McCook, Ill November 2012 Rolled out new website to existing web customers December 2012 Completed transition of U.S. independent agents to employees April 2013 Roll-out of new website to new web customers April/May 2013 McCook DC begins to ship customer orders November 2013 Entered into sub-lease of headquarters space to generate $2.9M of future cash savings December 2013 Ended year with over 800 sales reps – First increase in 8 years February 2014 Closed on Automatic Screw Machine Products sale for net proceeds of $12.1M June 2014 Entered into sale-leaseback of Reno distribution facility for net proceeds of $8.3M December 2014 Ended year with over 900 sales reps February 2015 Held North American sales meeting September 2015 Completed West Coast Fasteners acquisition March 2016 Completed Perfect Products of Michigan acquisition May 2016 Completed F. B. Feeney acquisition June 2016 Expanded sales team to over 1,000 sales reps September 2016 Extended credit facitlity to August, 2020 November 2016 Completed Mattic Industries acquisition March 2017 Consolidated Fairfield, NJ distribution operations into McCook, Ill and Suwanee, GA August 2012 October 2012
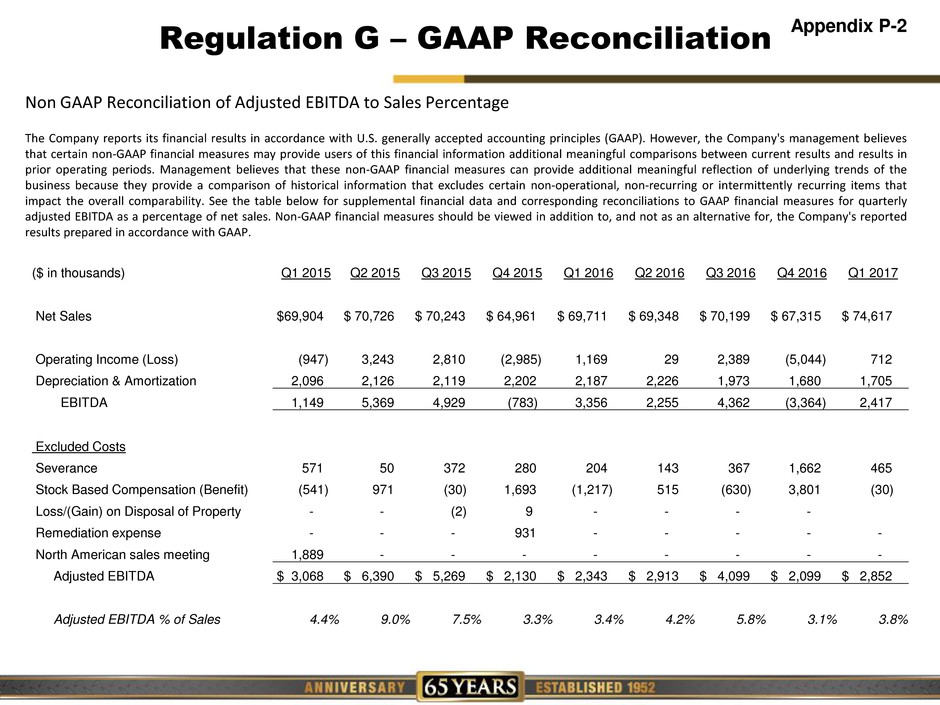
© 2015 Lawson Products, Inc. • Confidential Material, Reproduction, In Whole or in Part, Prohibited. Regulation G – GAAP Reconciliation Appendix P-2 Non GAAP Reconciliation of Adjusted EBITDA to Sales Percentage The Company reports its financial results in accordance with U.S. generally accepted accounting principles (GAAP). However, the Company's management believes that certain non-GAAP financial measures may provide users of this financial information additional meaningful comparisons between current results and results in prior operating periods. Management believes that these non-GAAP financial measures can provide additional meaningful reflection of underlying trends of the business because they provide a comparison of historical information that excludes certain non-operational, non-recurring or intermittently recurring items that impact the overall comparability. See the table below for supplemental financial data and corresponding reconciliations to GAAP financial measures for quarterly adjusted EBITDA as a percentage of net sales. Non-GAAP financial measures should be viewed in addition to, and not as an alternative for, the Company's reported results prepared in accordance with GAAP. ($ in thousands) Q1 2015 Q2 2015 Q3 2015 Q4 2015 Q1 2016 Q2 2016 Q3 2016 Q4 2016 Q1 2017 Net Sales $69,904 $ 70,726 $ 70,243 $ 64,961 $ 69,711 $ 69,348 $ 70,199 $ 67,315 $ 74,617 Operating Income (Loss) (947) 3,243 2,810 (2,985) 1,169 29 2,389 (5,044) 712 Depreciation & Amortization 2,096 2,126 2,119 2,202 2,187 2,226 1,973 1,680 1,705 EBITDA 1,149 5,369 4,929 (783) 3,356 2,255 4,362 (3,364) 2,417 Excluded Costs Severance 571 50 372 280 204 143 367 1,662 465 Stock Based Compensation (Benefit) (541) 971 (30) 1,693 (1,217) 515 (630) 3,801 (30) Loss/(Gain) on Disposal of Property - - (2) 9 - - - - Remediation expense - - - 931 - - - - - North American sales meeting 1,889 - - - - - - - - Adjusted EBITDA $ 3,068 $ 6,390 $ 5,269 $ 2,130 $ 2,343 $ 2,913 $ 4,099 $ 2,099 $ 2,852 Adjusted EBITDA % of Sales 4.4% 9.0% 7.5% 3.3% 3.4% 4.2% 5.8% 3.1% 3.8%
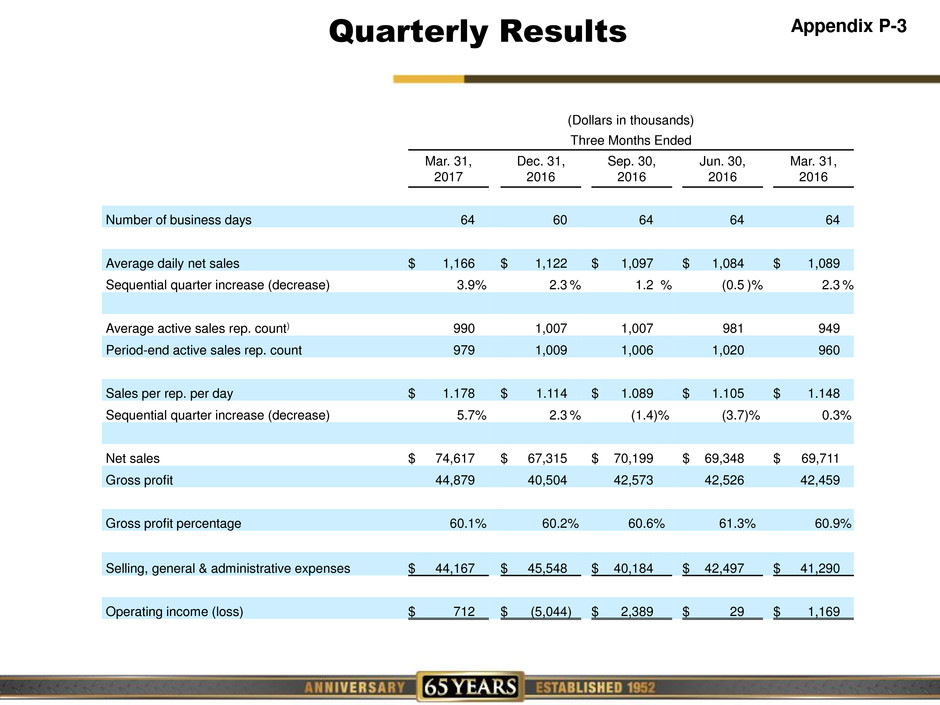
© 2015 Lawson Products, Inc. • Confidential Material, Reproduction, In Whole or in Part, Prohibited. Quarterly Results Appendix P-3 (Dollars in thousands) Three Months Ended Mar. 31, 2017 Dec. 31, 2016 Sep. 30, 2016 Jun. 30, 2016 Mar. 31, 2016 Number of business days 64 60 64 64 64 Average daily net sales $ 1,166 $ 1,122 $ 1,097 $ 1,084 $ 1,089 Sequential quarter increase (decrease) 3.9 % 2.3 % 1.2 % (0.5 )% 2.3 % Average active sales rep. count) 990 1,007 1,007 981 949 Period-end active sales rep. count 979 1,009 1,006 1,020 960 Sales per rep. per day $ 1.178 $ 1.114 $ 1.089 $ 1.105 $ 1.148 Sequential quarter increase (decrease) 5.7 % 2.3 % (1.4 )% (3.7 )% 0.3 % Net sales $ 74,617 $ 67,315 $ 70,199 $ 69,348 $ 69,711 Gross profit 44,879 40,504 42,573 42,526 42,459 Gross profit percentage 60.1 % 60.2 % 60.6 % 61.3 % 60.9 % Selling, general & administrative expenses $ 44,167 $ 45,548 $ 40,184 $ 42,497 $ 41,290 Operating income (loss) $ 712 $ (5,044 ) $ 2,389 $ 29 $ 1,169
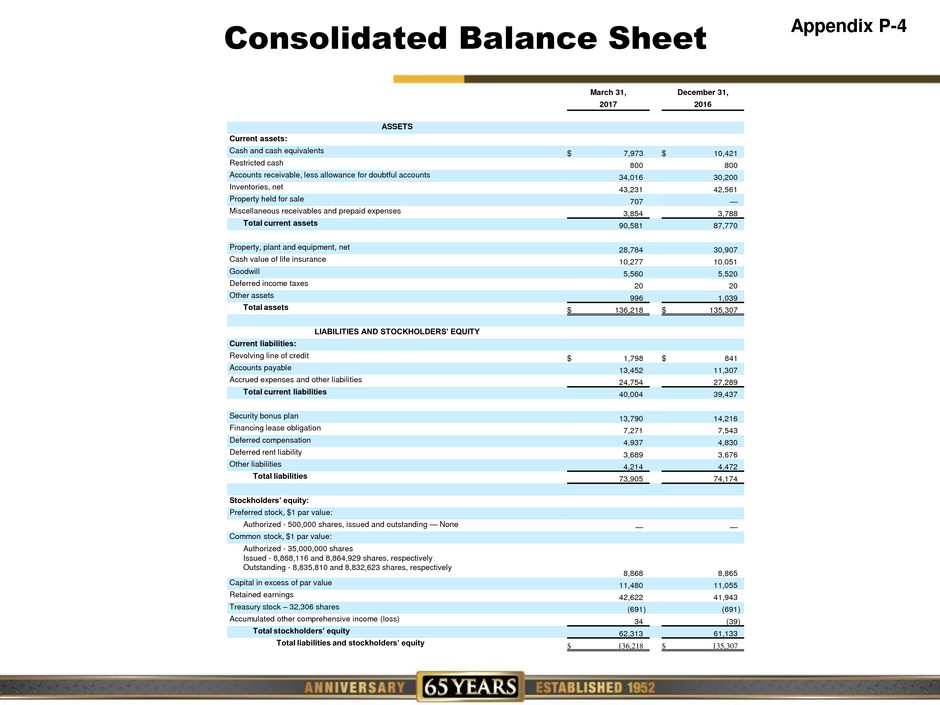
© 2015 Lawson Products, Inc. • Confidential Material, Reproduction, In Whole or in Part, Prohibited. Appendix P-4 Consolidated Balance Sheet March 31, December 31, 2017 2016 ASSETS Current assets: Cash and cash equivalents $ 7,973 $ 10,421 Restricted cash 800 800 Accounts receivable, less allowance for doubtful accounts 34,016 30,200 Inventories, net 43,231 42,561 Property held for sale 707 — Miscellaneous receivables and prepaid expenses 3,854 3,788 Total current assets 90,581 87,770 Property, plant and equipment, net 28,784 30,907 Cash value of life insurance 10,277 10,051 Goodwill 5,560 5,520 Deferred income taxes 20 20 Other assets 996 1,039 Total assets $ 136,218 $ 135,307 LIABILITIES AND STOCKHOLDERS’ EQUITY Current liabilities: Revolving line of credit $ 1,798 $ 841 Accounts payable 13,452 11,307 Accrued expenses and other liabilities 24,754 27,289 Total current liabilities 40,004 39,437 Security bonus plan 13,790 14,216 Financing lease obligation 7,271 7,543 Deferred compensation 4,937 4,830 Deferred rent liability 3,689 3,676 Other liabilities 4,214 4,472 Total liabilities 73,905 74,174 Stockholders’ equity: Preferred stock, $1 par value: Authorized - 500,000 shares, issued and outstanding — None — — Common stock, $1 par value: Authorized - 35,000,000 shares Issued - 8,868,116 and 8,864,929 shares, respectively Outstanding - 8,835,810 and 8,832,623 shares, respectively 8,868 8,865 Capital in excess of par value 11,480 11,055 Retained earnings 42,622 41,943 Treasury stock – 32,306 shares (691 ) (691 ) Accumulated other comprehensive income (loss) 34 (39 ) Total stockholders’ equity 62,313 61,133 Total liabilities and stockholders’ equity $ 136,218 $ 135,307