UNITED STATES
SECURITIES AND EXCHANGE COMMISSION
Washington, D.C. 20549
|
FORM N-CSR
CERTIFIED SHAREHOLDER REPORT OF REGISTERED
MANAGEMENT INVESTMENT COMPANIES
|
Investment Company Act file number: (811- 03512)
Exact name of registrant as specified in charter: Putnam OTC & Emerging Growth Fund
Address of principal executive offices: One Post Office Square, Boston, Massachusetts 02109
| Name and address of agent for service: | Beth S. Mazor, Vice President |
| | One Post Office Square |
| | Boston, Massachusetts 02109 |
| |
| Copy to: | John W. Gerstmayr, Esq. |
| | Ropes & Gray LLP |
| | One International Place |
| | Boston, Massachusetts 02110 |
| |
| Registrant’s telephone number, including area code: | (617) 292-1000 |
Date of fiscal year end: July 31, 2006
Date of reporting period: August 1, 2005—January 31, 2006
Item 1. Report to Stockholders:
The following is a copy of the report transmitted to stockholders pursuant to Rule 30e-1 under the Investment Company Act of 1940:
What makes Putnam different?

In 1830, Massachusetts Supreme Judicial Court Justice Samuel Putnam established The Prudent Man Rule, a legal foundation for responsible money management.
THE PRUDENT MAN RULE
All that can be required of a trustee to invest is that he shall conduct himself faithfully and exercise a sound discretion. He is to observe how men of prudence, discretion, and intelligence manage their own affairs, not in regard to speculation, but in regard to the permanent disposition of their funds, considering the probable income, as well as the probable safety of the capital to be invested.

A time-honored tradition in money management
Since 1937, our values have been rooted in a profound sense of responsibility for the money entrusted to us.
A prudent approach to investing
We use a research-driven team approach to seek consistent, dependable, superior investment results over time, although there is no guarantee a fund will meet its objectives.
Funds for every investment goal
We offer a broad range of mutual funds and other financial products so investors and their financial representatives can build diversified portfolios.
A commitment to doing what’s right for investors
We have below-average expenses and stringent investor protections, and provide a wealth of information about the Putnam funds.
Industry-leading service
We help investors, along with their financial representatives, make informed investment decisions with confidence.
| Putnam | |
| |
| OTC & Emerging | |
| |
| Growth Fund | |
| |
| |
| 1 | 31 | 06 | |
| Semiannual Report | |
| |
| Message from the Trustees | 2 |
| About the fund | 4 |
| Report from the fund managers | 7 |
| Performance | 13 |
| Expenses | 16 |
| Portfolio turnover | 18 |
| Risk | 19 |
| Your fund’s management | 20 |
| Terms and definitions | 23 |
| Trustee approval of management contract | 25 |
| Other information for shareholders | 30 |
| Financial statements | 31 |
| Brokerage commissions | 57 |
Cover photograph: Vineyard, Napa County, California © Charles O’Rear
Message from the Trustees
|
Dear Fellow Shareholder
The performance of U.S. financial markets in the early weeks of 2006 suggests that investors remain generally optimistic this year. Stocks have advanced briskly while bonds have remained subdued. We consider these results typical of an expanding economy capable of generating both profits and inflation. As is often the case, the fundamental data painted a more conflicted picture than the market’s movements. In the final months of 2005, the economic growth rate slipped to a low level of 1.1%, according to initial estimates. Nevertheless, labor market conditions have strengthened, and energy prices, though elevated, did not spike in the winter months, thanks in part to mild winter weather in many regions of the country. Inflationary pressures remain contained, to borrow the terminology of the U.S. Federal Reserve Board (the Fed). At its January 31 meeting, marking the end of former Chairman Alan Greenspan’s 18 years of service, the Fed again raised interest rates, but hinted that the end of this tightening cycle might not be far away. Whatever the course the economy and monetary policy take in coming months, in our view it is fortunate that the Fed’s new Chairman, Ben Bernanke, like his predecessor, regards the Fed’s role in pursuing both price stability and economic growth as essential to encouraging investment.
Although there is no guarantee a fund will achieve its objectives, we believe that the professional research, diversification, and active management that mutual funds provide continue to make them an intelligent choice for investors. We want you to know that Putnam Investments, under the leadership of Chief Executive Officer Ed Haldeman, continues to focus on delivering consistent, dependable, superior investment performance over time.
2
In the following pages, members of your fund’s management team discuss the fund’s performance and strategies, and their outlook for the months ahead. We thank you for your support of the Putnam funds.
Putnam OTC & Emerging Growth Fund: seeking
growth from small and midsize companies
|
Growth stocks are issued by companies that analysts believe are growing faster than the economy overall, or have the potential to do so. Growth in a company’s earnings, for instance, could lead to an increase in its stock price over time. Companies classified as growth candidates can be start-ups or seasoned veterans, and can be found in many industries.
Putnam OTC & Emerging Growth Fund is an aggressive fund that targets the stocks of small and midsize companies. Through intensive research, the fund’s management team looks for businesses that have a leading or proprietary position in a growing industry. The team may also target companies that are gaining market share within an established industry. Smaller companies can be more flexible than larger, more established firms; they can move quickly to develop new products or services that capture a customer base with little or no immediate competition.
Small- and mid-cap stocks react differently to economic conditions than do their large-cap counterparts, so including more than one type in your portfolio is a way to diversify your holdings. Remember, however, that stocks held in an aggressive fund like Putnam OTC & Emerging Growth Fund come with inherent risks, since markets for rapidly growing companies can be volatile.
Unlike larger, blue-chip companies that are carefully tracked by Wall Street analysts, smaller companies often are not subject to close attention. Reduced coverage means that in-house research, like the work of Putnam’s analysts, is key to uncovering companies that
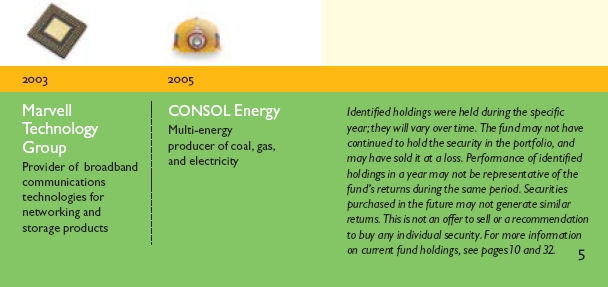
Putnam OTC & Emerging Growth Fund holdings have
spanned many sectors and industries over time.
|

are likely to grow over time. Since the fund’s inception in late 1982, Putnam OTC & Emerging Growth Fund’s management team has worked closely with Putnam analysts to uncover opportunities in the small- and mid-cap stock universe that meet their criteria for growth.
This fund invests
some or all of its
assets in small
and/or midsize
companies. Such
investments
increase the risk
of fluctuations in
the value of your
investment.
|

In-depth analysis is key to
successful stock selection.
|
Drawing on the expertise of a dedicated team of stock analysts, the fund’s management team seeks attractive growth stocks. Once a stock is selected for the portfolio, it is regularly assessed by members of the team to ensure that it continues to meet its criteria, including:
Growth They examine each company’s financials, including its sales and earnings, and target those believed to offer growth potential.
Quality They look for high-quality companies, seeking characteristics such as solid management teams, sound business models, a record of strong performance, and high levels of free-cash flow.
Valuation They carefully consider how each stock is valued, seeking stocks whose valuations are attractive relative to the company’s growth potential.
Putnam OTC & Emerging Growth Fund seeks capital appreciation
by investing mainly in stocks of U.S. companies traded in the over-the-counter market and in emerging growth companies listed on securities exchanges. The fund targets small and midsize companies whose earnings management expects to grow rapidly. The fund may be appropriate for investors who are seeking above-average growth potential and are willing to assume above-average risk in pursuit of this goal.
Highlights
* For the six months ended January 31, 2006, Putnam OTC & Emerging Growth Fund’s class A
shares returned 11.24% without sales charges.
* The fund’s benchmark, the Russell 2500 Growth Index, gained 10.29% .
* The average return for the fund’s Lipper category, Mid-Cap Growth Funds, was 10.69% .
* Additional fund performance, comparative performance, and Lipper data can be found in the
performance section beginning on page 13.
|
Performance
Total return for class A shares for periods ended 1/31/06
|
| Since the fund’s inception (11/1/82), average annual return is 11.05% at NAV and 10.79% at POP. | |
|
| | Annualized return | Cumulative return |
| | NAV | POP | NAV | POP |
|
| 10 years | –1.19% | –1.72% | -11.26% | -15.91% |
|
| 5 years | –10.61 | –11.57 | -42.92 | -45.93 |
|
| 3 years | 19.32 | 17.17 | 69.86 | 60.87 |
|
| 1 year | 19.35 | 13.02 | 19.35 | 13.02 |
|
| 6 months | — | — | 11.24 | 5.45 |
|
Data is historical. Past performance does not guarantee future results. More recent returns may be less or more than those shown. Investment return and principal value will fluctuate, and you may have a gain or a loss when you sell your shares. Performance assumes reinvestment of distributions and does not account for taxes. Returns at NAV do not reflect a sales charge of 5.25% . For the most recent month-end performance, visit www.putnam.com. For a portion of the period, this fund limited expenses, without which returns would have been lower. A short-term trading fee of up to 2% may apply.
6
Report from the fund managers
|
The period in review
In a period of solid though somewhat unremarkable performance for stocks overall, we are pleased to report that your fund delivered strong returns at net asset value (NAV, or without sales charges) for the six months ended January 31, 2006. Based on results at NAV, the fund finished ahead of its benchmark, the Russell 2500 Growth Index, and the average for its Lipper category, Mid-Cap Growth Funds.
We believe that our stock selection in the energy, health-care, and financial sectors enabled the fund to exceed the benchmark’s return. Nevertheless, certain holdings in the consumer, health-care, and financial sectors detracted from returns to some extent. We sold some of these positions but kept those that we felt had the potential to recover.
Market overview
Equity markets continued to move higher over the past six months, although their course was uneven and marked by periods of volatility. For the most part, investors focused on the period’s many favorable trends, which included continued economic expansion, improving job creation, and robust corporate earnings and balance sheets. Stocks in many different business sectors showed comparable strength, as energy stocks relinquished the position among the top-performing sectors that they had held in the first half of 2005. Returns from small- and mid-cap stocks outpaced those of large-cap issues for the sixth year in a row.
At times, however, investor attention strayed to the twin challenges of rising energy prices and rising interest rates. The Federal Reserve Board (the Fed) continued to tighten short-term interest rates at a measured pace throughout the period, which put pressure on interest-rate-sensitive market sectors, including financials, consumer cyclicals, and staples. Meanwhile, the price of a barrel of crude oil, as measured on the New York Mercantile Exchange, moved from the mid-forty-dollar range
7
to historic highs, exceeding $70 per barrel near the end of August, before dropping back somewhat by the end of January.
Financial markets also reacted to the devastation to the Gulf Coast caused by hurricanes Rita and Katrina. October was a particularly tough month for the markets; major stock indexes declined as investors grew increasingly concerned about inflation and slowing economic growth. These concerns receded somewhat at the end of October, when the Commerce Department reported that U.S. gross domestic product had grown at a faster-than-expected rate for the third calendar quarter. Stocks ended the period on a strong note, amid indications that the economy remained fundamentally strong despite its recent challenges.
Strategy overview
The most important factors in our investment strategy are those that influ-ence individual stock selection for the portfolio. While your management team certainly weighs macroeconomic considerations — including the outlook for the economy, sector and market trends, and the anticipated direction of interest rates — we rely mainly on bottom-up stock selection to manage the fund. We believe that if we choose the right stocks, the fund should perform well over time.
| Market sector performance | |
These indexes provide an overview of performance in different market sectors for the | |
| six months ended 1/31/06. | |
|
| |
| Equities | |
| Russell 2500 Growth Index (growth stocks of small and midsize companies) | 10.29% |
|
| Russell Midcap Growth Index (midsize-company growth stocks) | 10.38% |
|
| MSCI EAFE Index (international stocks) | 18.31% |
|
| S&P 500 Index (broad stock market) | 4.68% |
|
| Bonds | |
| Lehman Aggregate Bond Index (broad bond market) | 0.84% |
|
| Lehman Government Bond Index (U.S. Treasury and agency securities) | 0.77% |
|
| Citigroup World Government Bond Index (global government bonds) | -0.80% |
|
8
Our investment process combines proprietary quantitative tools with fundamental analysis. We evaluate hundreds of small- and mid-cap growth stocks on an ongoing basis to gauge the potential appropriateness of each stock for this portfolio. Regardless of how the economy or markets are behaving, we look for companies whose earnings we expect to grow rapidly — in other words, companies that we believe are well-positioned to deliver strong stock price appreciation.
In sifting through the small- and mid-cap stock universe for opportunities, our quantitative system examines long-term historical fundamentals including earnings, cash flow, and enterprise value. It also scrutinizes the quality of those earnings and any revisions that have been made over time. We then subject the highest-ranking companies to rigorous fundamental analysis, seeking to identify those with skilled management teams and solid business models. Wherever possible, we try to focus on companies that occupy well-defined niches in rapidly growing industries. The final part of our analysis is to select stocks that we believe are attractively priced relative to their potential. We also have risk controls in place that call for selling stocks at certain thresholds in order to maximize profits and keep the portfolio broadly diversified among industries and sectors.
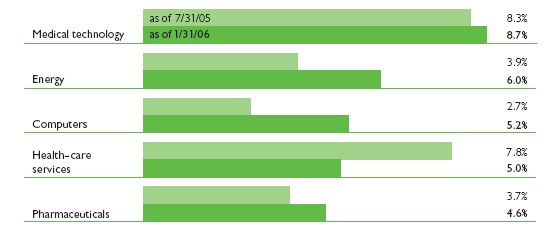
Comparison of top sector weightings
This chart shows how the fund’s top weightings have changed over the last six months. Weightings are shown as a percentage of net assets. Holdings will vary over time.
9
Your fund’s holdings
In keeping with our consistent focus on bottom-up stock picking, we made no large, top-down sector allocations over the past six months. In fact, holdings in a variety of sectors contributed positively to performance. With energy prices staying quite high, it is no surprise that energy holdings enhanced returns for the period. Coal producer Peabody Energy delivered superior returns as high oil prices drove many utility companies to satisfy their fuel needs with less expensive coal instead. Peabody produces high BTU anthracite coal, which is among the cleaner-burning varieties of coal and thus is in greater demand than other types. Oil service provider Cal Dive was another strong contributor to fund returns. Cal Dive services and maintains oil pumping rigs in the Gulf of Mexico, among other areas. In the wake of damage done by hurricanes Rita and Katrina, many oil companies are taking a more proactive approach to maintenance, which has boosted demand for Cal Dive’s services.
Health care was another strong area for the fund. Varian Medical Devices was one of the fund’s top contributors for the period. This company’s integrated cancer care system has enabled doctors to treat many previously inoperable tumors. The stock of biotech firm Celgene Corporation advanced on news of several favorable Federal Drug Administration (FDA) trials of its cancer drugs, including one to combat melanoma. We
Top holdings
This table shows the fund’s top holdings, and the percentage of the fund’s net assets that each comprised, as of 1/31/06. The fund’s holdings will change over time.
| Holding (percent of fund’s net assets) | Industry |
| Varian Medical Systems, Inc. (1.7%) | Medical technology |
|
| MedImmune, Inc. (1.6%) | Biotechnology |
|
| Lam Research Corp. (1.5%) | Semiconductor |
|
| Freeport-McMoRan Copper & Gold, Inc. Class B (1.5%) | Metals |
|
| Hospira, Inc. (1.4%) | Pharmaceuticals |
|
| R. H. Donnelley Corp. (1.3%) | Publishing |
|
| Manpower, Inc. (1.3%) | Commercial and consumer services |
|
| Sunoco, Inc. (1.3%) | Oil and gas |
|
| Seagate Technology (Cayman Islands) (1.3%) | Computers |
|
| Parker-Hannifin Corp. (1.2%) | Machinery |
|
10
took profits by selling Celgene from the portfolio by period-end.
Although many stocks in the financial sector felt the pressure of rising interest rates, insurance company W.R. Berkley Corporation was one of the fund’s top performers. Hurricanes Katrina and Rita dampened returns from many insurance companies, but W.R. Berkley did not have a lot of exposure to damage claims from the hurricanes and was still able to raise rates along with the rest of the industry.
International mining company Freeport-McMoran Copper and Gold was another strong performer. The company’s stock rose on rising demand for its products from the accelerating infrastructure-building activities of China, India, Malaysia, and Russia. While some technology holdings dampened returns, semiconductor equipment manufacturer Lam Research was a major contributor as the company announced a large new contract with Intel.
Consumer staples holdings provided some disappointments over the period. These included Ameristar Casinos, whose Louisiana properties suffered extensive short-term damage from hurricane Katrina; online education provider Career Education Corporation, whose stock fell on news of a Department of Education investigation; and Red Robin Gourmet Burgers, a restaurant chain in the West and Midwest that expanded too quickly. We sold the Red Robin position by the period’s end, but believe the market has overestimated the impact of Katrina on Ameristar Casinos’ bottom line and that Career Education is in a stronger position now that the investigation has concluded with a favorable outcome. Consequently, we have maintained both positions.
Other holdings that dampened relative returns included global manufacturer and distributor of eye care products Bausch and Lomb, which had international accounting issues; medical device maker Kinetics Concepts, which had patent infringement issues; and Asset Acceptance Capital Corporation, a firm that buys credit card receivables and attempts to collect some portion of delinquent payments. This company’s collections fell significantly short of its goals, and we sold the position by the end of the period. However, we believe Kinetics Concepts will resolve its patent issues successfully, and Bausch and Lomb’s accounting problems have now been resolved; both stocks remain in the portfolio.
Please note that the holdings discussed in this report may not have been held by the fund for the entire period. Portfolio composition is subject to review in accordance with the fund’s investment strategy and may vary in the future.
11
The outlook for your fund
|
The following commentary reflects anticipated developments that could affect your fund over the next six months, as well as your management team’s plans for responding to them.
With the economy still growing, corporate balance sheets strong, and many analysts expecting the end of the Fed’s interest-rate tightening cycle to come soon, we anticipate solid equity performance in the months ahead.
As noted earlier in this report, small- and mid-cap equities have outperformed large-cap equities for approximately six years. However, large-cap equities, particularly growth issues, have become quite attractively priced. Many of these companies have put their fiscal houses in order, and if the economy slows as many analysts expect, investors may well favor these stocks over small caps as investors have historically done during periods of slower growth. Regardless of the direction that markets take in the months ahead, we will maintain our focus on disciplined, bottom-up stock selection and continue to believe that this approach best serves investors over the long term.
The views expressed in this report are exclusively those of Putnam Management. They are not meant as investment advice.
The fund invests some or all of its assets in small and/or midsize companies. Such investments increase the risk of fluctuations in the value of your investment.
12
This section shows your fund’s performance during the first half of its fiscal year, which ended January 31, 2006. In accordance with regulatory requirements for mutual funds, we also include performance for the most recent calendar quarter-end. Performance should always be considered in light of a fund’s investment strategy. Data represents past performance. Past performance does not guarantee future results. More recent returns may be less or more than those shown. Investment return and principal value will fluctuate, and you may have a gain or a loss when you sell your shares. For the most recent month-end performance, please visit www.putnam.com or call Putnam at 1-800-225-1581. Class Y shares are generally only available to corporate and institutional clients. See the Terms and Definitions section in this report for definitions of the share classes offered by your fund.
| Fund performance | | | | | | | | |
Total return for periods ended 1/31/06 | | | | | | | |
|
| |
| | Class A | | Class B | | Class C | | Class M | | Class R | Class Y |
| (inception dates) | (11/1/82) | | (7/15/93) | | (7/26/99) | | (12/2/94) | | (12/1/03) | (7/12/96) |
| | NAV | POP | NAV | CDSC | NAV | CDSC | NAV | POP | NAV | NAV |
|
| Annual average | | | | | | | | | | |
| (life of fund) | 11.05% | 10.79% | 10.12% | 10.12% | 10.22% | 10.22% | 10.39% | 10.23% | 10.76% | 11.17% |
|
| 10 years | -11.26 | -15.91 | -17.66 | -17.66 | -17.64 | -17.64 | -15.60 | -18.35 | -13.49 | -8.90 |
| Annual average | -1.19 | -1.72 | -1.92 | -1.92 | -1.92 | -1.92 | -1.68 | -2.01 | –1.44 | -0.93 |
|
| 5 years | -42.92 | -45.93 | -45.06 | -46.15 | -45.07 | -45.07 | -44.34 | -46.16 | -43.68 | –42.20 |
| Annual average | -10.61 | -11.57 | -11.29 | -11.65 | -11.29 | -11.29 | -11.06 | -11.65 | -10.85 | -10.38 |
|
| 3 years | 69.86 | 60.87 | 65.93 | 62.93 | 65.91 | 65.91 | 67.44 | 61.96 | 68.53 | 71.15 |
| Annual average | 19.32 | 17.17 | 18.39 | 17.67 | 18.38 | 18.38 | 18.75 | 17.44 | 19.00 | 19.62 |
|
| 1 year | 19.35 | 13.02 | 18.30 | 13.30 | 18.30 | 17.30 | 18.74 | 14.95 | 18.99 | 19.46 |
|
| 6 months | 11.24 | 5.45 | 10.78 | 5.78 | 10.69 | 9.69 | 10.92 | 7.32 | 11.02 | 11.42 |
|
Performance assumes reinvestment of distributions and does not account for taxes. Returns at public offering price (POP) for class A and M shares reflect a sales charge of 5.25% and 3.25%, respectively. Class B share returns reflect the applicable contingent deferred sales charge (CDSC), which is 5% in the first year, declining to 1% in the sixth year, and is eliminated thereafter. Class C shares reflect a 1% CDSC the first year that is eliminated thereafter. Class R and Y shares have no initial sales charge or CDSC. Performance for class B, C, M, R, and Y shares before their inception is derived from the historical performance of class A shares, adjusted for the applicable sales charge (or CDSC) and, except for class Y shares, the higher operating expenses for such shares.
For a portion of the period, this fund limited expenses, without which returns would have been lower.
A 2% short-term trading fee may be applied to shares exchanged or sold within 5 days of purchase.
13
| Comparative index returns | | |
For periods ended 1/31/06 | | |
|
| |
| | Russell 2500 | Lipper Mid-Cap |
| | Growth | Growth Funds |
| | Index* | category average† |
|
| Annual average | | |
| (life of fund) | — | 11.19% |
|
| 10 years | 118.41% | 139.51 |
| Annual average | 8.13 | 8.72 |
|
| 5 years | 15.85 | 5.35 |
| Annual average | 2.99 | 0.48 |
|
| 3 years | 99.45 | 82.24 |
| Annual average | 25.88 | 22.03 |
|
| 1 year | 20.62 | 20.50 |
|
| 6 months | 10.29 | 10.69 |
|
Index and Lipper results should be compared to fund performance at net asset value.
* The inception date of the Russell 2500 Growth Index was 12/31/85.
† Over the 6-month and 1-, 3-, 5-, and 10-year periods ended 1/31/06, there were 583, 555, 462, 353, and 127 funds, respectively,
in this Lipper category.
|
Fund price and distribution* information
For the six-month period ended 1/31/06
| | Class A | Class B | Class C | Class M | Class R | Class Y |
| Share value: | NAV | POP | NAV | NAV | NAV | POP | NAV | NAV |
|
| 7/31/05 | $7.65 | $8.07 | $6.77 | $7.30 | $7.14 | $7.38 | $7.62 | $7.88 |
|
| 1/31/06 | 8.51 | 8.98 | 7.50 | 8.08 | 7.92 | 8.19 | 8.46 | 8.78 |
|
* The fund made no distributions during the period.
14
| Fund performance for most recent calendar quarter | | |
| Total return for periods ended 12/31/05 | | | | | | | |
|
| |
| | Class A | | Class B | | Class C | | Class M | | Class R | Class Y |
| (inception dates) | (11/1/82) | | (7/15/93) | | (7/26/99) | | (12/2/94) | | (12/1/03) | (7/12/96) |
| | NAV | POP | NAV | CDSC | NAV | CDSC | NAV | POP | NAV | NAV |
|
| Annual average | | | | | | | | | | |
| (life of fund) | 10.74% | 10.49% | 9.82% | 9.82% | 9.93% | 9.93% | 10.09% | 9.93% | 10.46% | 10.87% |
|
| 10 years | -19.50 | -23.71 | -25.35 | -25.35 | -25.25 | -25.25 | -23.51 | -25.99 | -21.46 | -17.38 |
| Annual average | -2.15 | -2.67 | -2.88 | -2.88 | -2.87 | -2.87 | -2.64 | -2.96 | -2.39 | -1.89 |
|
| 5 years | -43.10 | -46.09 | -45.26 | -46.35 | -45.20 | -45.20 | -44.54 | -46.36 | -43.79 | -42.34 |
| Annual average | -10.67 | -11.62 | -11.35 | -11.71 | -11.33 | -11.33 | -11.12 | -11.71 | -10.88 | -10.43 |
|
| 3 years | 57.14 | 48.87 | 53.41 | 50.41 | 53.36 | 53.36 | 54.51 | 49.49 | 56.04 | 58.03 |
| Annual average | 16.26 | 14.18 | 15.33 | 14.57 | 15.32 | 15.32 | 15.61 | 14.34 | 15.99 | 16.48 |
|
| 1 year | 7.76 | 2.06 | 6.89 | 1.89 | 6.96 | 5.96 | 7.28 | 3.80 | 7.50 | 8.07 |
|
| 6 months | 8.35 | 2.59 | 7.88 | 2.88 | 8.03 | 7.03 | 8.07 | 4.54 | 8.24 | 8.50 |
|
15
As a mutual fund investor, you pay ongoing expenses, such as management fees, distribution fees (12b-1 fees), and other expenses. In the most recent six-month period, your fund limited these expenses; had it not done so, expenses would have been higher. Using the information below, you can estimate how these expenses affect your investment and compare them with the expenses of other funds. You may also pay one-time transaction expenses, including sales charges (loads) and redemption fees, which are not shown in this section and would have resulted in higher total expenses. For more information, see your fund’s prospectus or talk to your financial advisor.
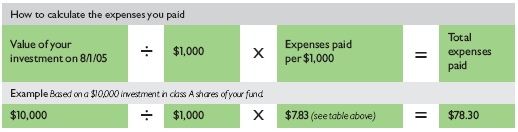
Review your fund’s expenses
The table below shows the expenses you would have paid on a $1,000 investment in Putnam OTC & Emerging Growth Fund from August 1, 2005, to January 31, 2006. It also shows how much a $1,000 investment would be worth at the close of the period, assuming actual returns and expenses.
| | Class A | Class B | Class C | Class M | Class R | Class Y |
|
| Expenses paid per $1,000* | $ 7.83 | $ 11.79 | $ 11.79 | $ 10.47 | $ 9.15 | $ 6.50 |
|
| Ending value (after expenses) | $1,112.40 | $1,107.80 | $1,106.90 | $1,109.20 | $1,110.20 | $1,114.20 |
|
* Expenses for each share class are calculated using the fund’s annualized expense ratio for each class, which represents the ongoing expenses as a percentage of net assets for the six months ended 1/31/06. The expense ratio may differ for each share class (see the table at the bottom of the next page). Expenses are calculated by multiplying the expense ratio by the average account value for the period; then multiplying the result by the number of days in the period; and then dividing that result by the number of days in the year.
Estimate the expenses you paid
To estimate the ongoing expenses you paid for the six months ended January 31, 2006, use the calculation method below. To find the value of your investment on August 1, 2005, go to www.putnam.com and log on to your account. Click on the “Transaction History” tab in your Daily Statement and enter 08/01/2005 in both the “from” and “to” fields. Alternatively, call Putnam at 1-800-225-1581.
16
Compare expenses using the SEC’s method
The Securities and Exchange Commission (SEC) has established guidelines to help investors assess fund expenses. Per these guidelines, the table below shows your fund’s expenses based on a $1,000 investment, assuming a hypothetical 5% annualized return. You can use this information to compare the ongoing expenses (but not transaction expenses or total costs) of investing in the fund with those of other funds. All mutual fund shareholder reports will provide this information to help you make this comparison. Please note that you cannot use this information to estimate your actual ending account balance and expenses paid during the period.
| | Class A | Class B | Class C | Class M | Class R | Class Y |
|
| Expenses paid per $1,000* | $ 7.48 | $ 11.27 | $ 11.27 | $ 10.01 | $ 8.74 | $ 6.21 |
|
| Ending value (after expenses) | $1,017.80 | $1,014.01 | $1,014.01 | $1,015.27 | $1,016.53 | $1,019.06 |
|
* Expenses for each share class are calculated using the fund’s annualized expense ratio for each class, which represents the ongoing expenses as a percentage of net assets for the six months ended 1/31/06. The expense ratio may differ for each share class (see the table at the bottom of this page). Expenses are calculated by multiplying the expense ratio by the average account value for the period; then multiplying the result by the number of days in the period; and then dividing that result by the number of days in the year.
Compare expenses using industry averages
You can also compare your fund’s expenses with the average of its peer group, as defined by Lipper, an independent fund-rating agency that ranks funds relative to others that Lipper considers to have similar investment styles or objectives. The expense ratio for each share class shown below indicates how much of your fund’s net assets have been used to pay ongoing expenses during the period.
| | Class A | Class B | Class C | Class M | Class R | Class Y |
|
| Your fund’s annualized | | | | | | |
| expense ratio | 1.47% | 2.22% | 2.22% | 1.97% | 1.72% | 1.22% |
|
| Average annualized expense | | | | | | |
| ratio for Lipper peer group* | 1.51% | 2.26% | 2.26% | 2.01% | 1.76% | 1.26% |
|
* Simple average of the expenses of all front-end load funds in the fund’s Lipper peer group, calculated in accordance with Lipper’s standard method for comparing fund expenses (excluding 12b-1 fees and without giving effect to any expense offset and brokerage service arrangements that may reduce fund expenses). This average reflects each fund’s expenses for its most recent fiscal year available to Lipper as of 12/31/05. To facilitate comparison, Putnam has adjusted this average to reflect the 12b-1 fees carried by each class of shares other than class Y shares, which do not incur 12b-1 fees. The peer group may include funds that are significantly smaller or larger than the fund, which may limit the comparability of the fund’s expenses to the simple average, which typically is higher than the asset-weighted average.
17
Your fund’s
portfolio turnover
|
Putnam funds are actively managed by teams of experts who buy and sell securities based on intensive analysis of companies, industries, economies, and markets. Portfolio turnover is a measure of how often a fund’s managers buy and sell securities for your fund. A portfolio turnover of 100%, for example, means that the managers sold and replaced securities valued at 100% of a fund’s assets within a one-year period. Funds with high turnover may be more likely to generate capital gains and dividends that must be distributed to shareholders as taxable income. High turnover may also cause a fund to pay more brokerage commissions and other transaction costs, which may detract from performance.
| Turnover comparisons | | | | | |
| Percentage of holdings that change every year | | | |
|
| |
| | 2005 | 2004 | 2003 | 2002 | 2001 |
| Putnam OTC & Emerging | | | | | |
| Growth Fund | 163% | 63% | 55% | 80% | 99% |
|
| Lipper Mid-Cap Growth | | | | | |
| Funds category average | 117% | 126% | 138% | 169% | 167% |
|
Turnover data for the fund is calculated based on the fund’s fiscal-year period, which ends on July 31. Turnover data for the fund’s Lipper category is calculated based on the average of the turnover of each fund in the category for its fiscal year ended during the indicated year. Fiscal years vary across funds in the Lipper category, which may limit the comparability of the fund’s portfolio turnover rate to the Lipper average. Comparative data for 2005 is based on information available as of 12/31/05.
18
This risk comparison is designed to help you understand how your fund compares with other funds. The comparison utilizes a risk measure developed by Morningstar, an independent fund-rating agency. This risk measure is referred to as the fund’s Overall Morningstar Risk.
Your fund’s Overall Morningstar Risk
|

Your fund’s Overall Morningstar Risk is shown alongside that of the average fund in its broad asset class, as determined by Morningstar. The risk bar broadens the comparison by translating the fund’s Overall Morningstar Risk into a percentile, which is based on the fund’s ranking among all funds rated by Morningstar as of December 31, 2005. A higher Overall Morningstar Risk generally indicates that a fund’s monthly returns have varied more widely.
Morningstar determines a fund’s Overall Morningstar Risk by assessing variations in the fund’s monthly returns — with an emphasis on downside variations — over 3-, 5-, and 10-year periods, if available. Those measures are weighted and averaged to produce the fund’s Overall Morningstar Risk. The information shown is provided for the fund’s class A shares only; information for other classes may vary. Overall Morningstar Risk is based on historical data and does not indicate future results. Morningstar does not purport to measure the risk associated with a current investment in a fund, either on an absolute basis or on a relative basis. Low Overall Morningstar Risk does not mean that you cannot lose money on an investment in a fund. Copyright 2006 Morningstar, Inc. All Rights Reserved. The information contained herein (1) is proprietary to Morningstar and/or its content providers; (2) may not be copied or distributed; and (3) is not warranted to be accurate, complete, or timely. Neither Morningstar nor its content providers are responsible for any damages or losses arising from any use of this information.
19
Your fund is managed by the members of the Putnam Small and Emerging Growth Team. Richard Weed is the Portfolio Leader and Raymond Haddad is a Portfolio Member of your fund. The Portfolio Leader and Portfolio Member coordinate the team’s management of the fund.
For a complete listing of the members of the Putnam Small and Emerging Growth Team, including those who are not Portfolio Leaders or Portfolio Members of your fund, visit Putnam’s Individual Investor Web site at www.putnam.com.
Fund ownership by the Portfolio Leader and Portfolio Member
The table below shows how much the fund’s current Portfolio Leader and Portfolio Member have invested in the fund (in dollar ranges). Information shown is as of January 31, 2006, and January 31, 2005.
| | | | $1 – | $10,001 – | $50,001 – | $100,001 – | $500,001 – | $1,000,001 |
| | Year | $0 | $10,000 | $50,000 | $100,000 | $500,000 | $1,000,000 | and over |
|
| Richard Weed | 2006 | | | | * | | | |
|
|
| Portfolio Leader | 2005 | | | * | | | | |
|
| Raymond Haddad | 2006 | | | | * | | | |
|
|
| Portfolio Member | 2005 | * | | | | | | |
|
20
Fund manager compensation
|
The total 2005 fund manager compensation that is attributable to your fund is approximately $1,300,000. This amount includes a portion of 2005 compensation paid by Putnam Management to the fund managers listed in this section for their portfolio management responsibilities, calculated based on the fund assets they manage taken as a percentage of the total assets they manage. The compensation amount also includes a portion of the 2005 compensation paid to the Group Chief Investment Officer of the fund’s broader investment category for his oversight responsibilities, calculated based on the fund assets he oversees taken as a percentage of the total assets he oversees. This amount does not include compensation of other personnel involved in research, trading, administration, systems, compliance, or fund operations; nor does it include non-compensation costs. These percentages are determined as of the fund’s fiscal period-end. For personnel who joined Putnam Management during or after 2005, the calculation reflects annualized 2005 compensation or an estimate of 2006 compensation, as applicable.
Other Putnam funds managed by the Portfolio Leader and Portfolio Member
Richard Weed is also a Portfolio Leader of Putnam Discovery Growth Fund and Putnam Small Cap Growth Fund, and a Portfolio Member of Putnam New Opportunities Fund.
Raymond Haddad is also a Portfolio Member of Putnam Discovery Growth Fund.
Richard Weed and Raymond Haddad may also manage other accounts and variable trust funds advised by Putnam Management or an affiliate.
Changes in your fund’s Portfolio Leader and Portfolio Member
Your fund’s Portfolio Leader and Portfolio Member did not change during the year ended January 31, 2006.
21
Fund ownership by Putnam’s Executive Board
The table below shows how much the members of Putnam’s Executive Board have invested in the fund (in dollar ranges). Information shown is as of January 31, 2006, and January 31, 2005.
| | | | | $1 – | $10,001 – | $50,001– | $100,001 |
| | Year | | $0 | $10,000 | $50,000 | $100,000 | and over |
|
| Philippe Bibi | 2006 | | * | | | | |
|
|
| Chief Technology Officer | 2005 | | * | | | | |
|
| Joshua Brooks | 2006 | | * | | | | |
|
|
| Deputy Head of Investments | N/A | | | | | | |
|
| William Connolly | 2006 | | * | | | | |
|
|
| Head of Retail Management | N/A | | | | | | |
|
| Kevin Cronin | 2006 | | * | | | | |
|
|
| Head of Investments | 2005 | | * | | | | |
|
| Charles Haldeman, Jr. | 2006 | | | | * | | |
|
|
| President and CEO | 2005 | | | | * | | |
|
| Amrit Kanwal | 2006 | | | | * | | |
|
|
| Chief Financial Officer | 2005 | | | | * | | |
|
| Steven Krichmar | 2006 | | * | | | | |
|
|
| Chief of Operations | 2005 | | * | | | | |
|
| Francis McNamara, III | 2006 | | | * | | | |
|
|
| General Counsel | 2005 | | | * | | | |
|
| Richard Robie, III | 2006 | | * | | | | |
|
|
| Chief Administrative Officer | 2005 | | * | | | | |
|
| Edward Shadek | 2006 | | * | | | | |
|
|
| Deputy Head of Investments | N/A | | | | | | |
|
| Sandra Whiston | 2006 | | * | | | | |
|
|
| Head of Institutional Management | N/A | | | | | | |
|
N/A indicates the individual was not a member of Putnam’s Executive Board as of 1/31/05.
22
Total return shows how the value of the fund’s shares changed over time, assuming you held the shares through the entire period and reinvested all distributions in the fund.
Net asset value (NAV) is the price, or value, of one share of a mutual fund, without a sales charge. NAVs fluctuate with market conditions. NAV is calculated by dividing the net assets of each class of shares by the number of outstanding shares in the class.
Public offering price (POP) is the price of a mutual fund share plus the maximum sales charge levied at the time of purchase. POP performance figures shown here assume the 5.25% maximum sales charge for class A shares and 3.25% for class M shares.
Contingent deferred sales charge (CDSC) is a charge applied at the time of the redemption of class B or C shares and assumes redemption at the end of the period. Your fund’s class B CDSC declines from a 5% maximum during the first year to 1% during the sixth year. After the sixth year, the CDSC no longer applies. The CDSC for class C shares is 1% for one year after purchase.
Class A shares are generally subject to an initial sales charge and no sales charge on redemption (except on certain redemptions of shares bought without an initial sales charge).
Class B shares may be subject to a sales charge upon redemption.
Class C shares are not subject to an initial sales charge and are subject to a contingent deferred sales charge only if the shares are redeemed during the first year.
Class M shares have a lower initial sales charge and a higher 12b-1 fee than class A shares and no sales charge on redemption (except on certain redemptions of shares bought without an initial sales charge).
Class R shares are not subject to an initial sales charge or CDSC and are available only to certain defined contribution plans.
Class Y shares are not subject to an initial sales charge or CDSC, and carry no 12b-1 fee. They are only available to eligible purchasers, including eligible defined contribution plans or corporate IRAs.
23
Citigroup World Government Bond Index is an unmanaged index of global investment-grade fixed-income securities.
Lehman Aggregate Bond Index is an unmanaged index of U.S. investment-grade fixed-income securities.
Lehman Government Bond Index is an unmanaged index of U.S. Treasury and agency securities.
Morgan Stanley Capital International (MSCI) EAFE Index is an unmanaged index of equity securities from developed countries in Western Europe, the Far East, and Australasia.
Russell 2500 Growth Index is an unmanaged index of those companies in the small-mid-cap Russell 2500 Index chosen for their growth orientation.
Russell Midcap Growth Index is an unmanaged index of those companies in the Russell Midcap Index chosen for their growth orientation.
S&P 500 Index is an unmanaged index of common stock performance.
Indexes assume reinvestment of all distributions and do not account for fees. Securities and performance of a fund and an index will differ. You cannot invest directly in an index.
Lipper is a third-party industry-ranking entity that ranks mutual funds. Lipper rankings are based on total return at net asset value and do not reflect sales charges. Funds are ranked among other funds with similar current investment styles or objectives as determined by Lipper. Lipper may change a fund’s category assignment at its discretion. Lipper category averages reflect performance trends for funds within a category.
24
Trustee approval of
management contract
|
The Board of Trustees of the Putnam funds oversees the management of each fund and, as required by law, determines annually whether to approve the continuance of your fund’s management contract. In this regard, the Board of Trustees, with the assistance of its Contract Committee consisting solely of Trustees who are not “interested persons” (as such term is defined in the Investment Company Act of 1940, as amended) of the Putnam funds (the “Independent Trustees”), requests and evaluates all information it deems reasonably necessary under the circumstances. Over the course of several months beginning in March and ending in June 2005, the Contract Committee met five times to consider the information provided by Putnam Management and other information developed with the assistance of the Board’s independent counsel and independent staff. The Contract Committee reviewed and discussed key aspects of this information with all of the Independent Trustees. Upon completion of this review, the Contract Committee recommended and the Independent Trustees approved the continuance of your fund’s management contract, effective July 1, 2005.
This approval was based on the following conclusions:
* That the fee schedule currently in effect for your fund represents reasonable compensation in light of the nature and quality of the services being provided to the fund, the fees paid by competitive funds and the costs incurred by Putnam Management in providing such services, and
* That such fee schedule represents an appropriate sharing between fund shareholders and Putnam Management of such economies of scale as may exist in the management of the fund at current asset levels.
These conclusions were based on a comprehensive consideration of all information provided to the Trustees and were not the result of any single factor. Some of the factors that figured particularly in the Trustees’ deliberations and how the Trustees considered these factors are described below, although individual Trustees may have evaluated the information presented differently, giving different weights to various factors. It is also important to recognize that the fee arrangements for your fund and the other Putnam funds are the result of many years of review and discussion between the Independent Trustees and Putnam Management, that certain aspects of such arrangements may receive greater scrutiny in some years than others, and that the Trustees’ conclusions may be based, in part, on their consideration of these same arrangements in prior years.
25
Model fee schedules and categories; total expenses
The Trustees’ review of the management fees and total expenses of the Putnam funds focused on three major themes:
* Consistency. The Trustees, working in cooperation with Putnam Management, have developed and implemented a series of model fee schedules for the Putnam funds designed to ensure that each fund’s management fee is consistent with the fees for similar funds in the Putnam family of funds and compares favorably with fees paid by competitive funds sponsored by other investment advisors. Under this approach, each Putnam fund is assigned to one of several fee categories based on a combination of factors, including competitive fees and perceived difficulty of management, and a common fee schedule is implemented for all funds in a given fee category. The Trustees reviewed the model fee schedule then in effect for your fund, including fee levels and breakpoints, and the assignment of the fund to a particular fee category under this structure. (“Breakpoints” refer to reductions in fee rates that apply to additional assets once specified asset levels are reached.) The Trustees concluded that no changes should be made in the fund’s current fee schedule at this time.
* Competitiveness. The Trustees also reviewed comparative fee and expense information for competitive funds, which indicated that, in a custom peer group of competitive funds selected by Lipper Inc., your fund ranked in the 21st percentile in management fees and in the 36th percentile in total expenses (less any applicable 12b-1 fees) as of December 31, 2004 (the first percentile being the least expensive funds and the 100th percentile being the most expensive funds). (Because the fund’s custom peer group is smaller than the fund’s broad Lipper Inc. peer group, this expense comparison may differ from the Lipper peer expense information found elsewhere in this report.) The Trustees noted that expense ratios for a number of Putnam funds, which show the percentage of fund assets used to pay for management and administrative services, distribution (12b-1) fees and other expenses, had been increasing recently as a result of declining net assets and the natural operation of fee breakpoints. They noted that such expense ratio increases were currently being controlled by expense limitations implemented in January 2004 and which Putnam Management, in consultation with the Contract Committee, has committed to maintain at least through 2006. The Trustees expressed their intention to monitor this information closely to ensure that fees and expenses of the Putnam funds continue to meet evolving competitive standards.
* Economies of scale. The Trustees concluded that the fee schedule currently in effect for your fund represents an appropriate sharing of economies of scale at current asset levels. Your fund currently has the benefit of breakpoints in its management fee that provide shareholders with significant economies of scale, which means that the effective management fee rate of a fund (as a percentage of fund assets) declines as a fund grows in size and crosses specified asset thresholds. The Trustees examined the existing breakpoint structure of the Putnam funds’ management fees in light of competitive industry practices. The Trustees considered various possible modifications to the Putnam Funds’ current breakpoint structure, but
26
ultimately concluded that the current breakpoint structure continues to serve the interests of fund shareholders. Accordingly, the Trustees continue to believe that the fee schedules currently in effect for the funds represent an appropriate sharing of economies of scale at current asset levels. The Trustees noted that significant redemptions in many Putnam funds, together with significant changes in the cost structure of Putnam Management, have altered the economics of Putnam Management’s business in significant ways. In view of these changes, the Trustees intend to consider whether a greater sharing of the economies of scale by fund shareholders would be appropriate if and when aggregate assets in the Putnam funds begin to experience meaningful growth.
In connection with their review of the management fees and total expenses of the Putnam funds, the Trustees also reviewed the costs of the services to be provided and profits to be realized by Putnam Management and its affiliates from the relationship with the funds. This information included trends in revenues, expenses and profitability of Putnam Management and its affiliates relating to the investment management and distribution services provided to the funds. In this regard, the Trustees also reviewed an analysis of Putnam Management’s revenues, expenses, and profitability with respect to the funds’ management contracts, allocated on a fund-by-fund basis.
The quality of the investment process provided by Putnam Management represented a major factor in the Trustees’ evaluation of the quality of services provided by Putnam Management under your fund’s management contract. The Trustees were assisted in their review of the funds’ investment process and performance by the work of the Investment Oversight Committees of the Trustees, which meet on a regular monthly basis with the funds’ portfolio teams throughout the year. The Trustees concluded that Putnam Management generally provides a high-quality investment process — as measured by the experience and skills of the individuals assigned to the management of fund portfolios, the resources made available to such personnel, and in general the ability of Putnam Management to attract and retain high-quality personnel — but also recognize that this does not guarantee favorable investment results for every fund in every time period. The Trustees considered the investment performance of each fund over multiple time periods and considered information comparing the fund’s performance with various benchmarks and with the performance of competitive funds. The Trustees noted the satisfactory investment performance of many Putnam funds. They also noted the disappointing investment performance of certain funds in recent years and continued to discuss with senior management of Putnam Management the factors contributing to such underperformance and actions being taken to improve performance. The Trustees recognized that, in recent years, Putnam Management has made significant changes in its investment personnel and processes and in the fund product line to address areas of underperformance. The Trustees indicated their intention to continue to monitor performance trends to assess the effectiveness of these changes and to evaluate whether additional remedial changes are warranted.
27
In the case of your fund, the Trustees considered that your fund’s class A share cumulative total return performance at net asset value was in the following percentiles of its Lipper Inc. peer group (Lipper Mid-Cap Growth Funds) for the one-, three- and five-year periods ended December 31, 2004 (the first percentile being the best-performing funds and the 100th percentile being the worst-performing funds):
| One-year period | Three-year period | Five-year period |
|
| 85th | 84th | 98th |
(Because of the passage of time, these performance results may differ from the performance results for more recent periods shown elsewhere in this report. Over the one-, three-, and five-year periods ended December 31, 2004, there were 529, 425, and 282 funds, respectively, in your fund’s Lipper peer group.* Past performance is no guarantee of future performance.)
The Trustees noted the disappointing performance for your fund for the one-, three- and five- year periods ended December 31, 2004. In this regard, the Trustees considered that over the last year, Putnam Management has clarified the fund’s investment philosophy and made substantial changes to the investment team. In addition, the fund has adopted a redesigned investment process which incorporates a blend of quantitative techniques and fundamental analysis.
As a general matter, the Trustees believe that cooperative efforts between the Trustees and Putnam Management represent the most effective way to address investment performance problems. The Trustees believe that investors in the Putnam funds have, in effect, placed their trust in the Putnam organization, under the oversight of the funds’ Trustees, to make appropriate decisions regarding the management of the funds. Based on the responsiveness of Putnam Management in the recent past to Trustee concerns about investment performance, the Trustees believe that it is preferable to seek change within Putnam Management to address performance shortcomings. In the Trustees’ view, the alternative of terminating a management contract and engaging a new investment advisor for an underperforming fund would entail significant disruptions and would not provide any greater assurance of improved investment performance.
Brokerage and soft-dollar allocations; other benefits
The Trustees considered various potential benefits that Putnam Management may receive in connection with the services it provides under the management contract with your fund. These include principally benefits related to brokerage and soft-dollar allocations, whereby a portion of the commissions paid by a fund for brokerage is earmarked to pay for research services that
* The percentile rankings for your fund’s class A share annualized total return performance in the Lipper Mid-Cap Growth Funds category for the one-, five-, and ten-year periods ended December 31, 2005, were 71st, 98th, and 98th respectively. Over the one-, five, and ten-year periods ended December 31, 2005, the fund ranked 389th out of 553, 342nd out of 348, and 124th out of 126 funds, respectively. Note that this more recent information was not available when the Trustees approved the continuance of your fund’s management contract.
28
may be utilized by a fund’s investment advisor, subject to the obligation to seek best execution. The Trustees believe that soft-dollar credits and other potential benefits associated with the allocation of fund brokerage, which pertains mainly to funds investing in equity securities, represent assets of the funds that should be used for the benefit of fund shareholders. This area has been marked by significant change in recent years. In July 2003, acting upon the Contract Committee’s recommendation, the Trustees directed that allocations of brokerage to reward firms that sell fund shares be discontinued no later than December 31, 2003. In addition, commencing in 2004, the allocation of brokerage commissions by Putnam Management to acquire research services from third-party service providers has been significantly reduced, and continues at a modest level only to acquire research that is customarily not available for cash. The Trustees will continue to monitor the allocation of the funds’ brokerage to ensure that the principle of “best price and execution” remains paramount in the portfolio trading process.
The Trustees’ annual review of your fund’s management contract also included the review of its distributor’s contract and distribution plan with Putnam Retail Management Limited Partnership and the custodian agreement and investor servicing agreement with Putnam Fiduciary Trust Company, all of which provide benefits to affiliates of Putnam Management.
Comparison of retail and institutional fee schedules
The information examined by the Trustees as part of their annual contract review has included for many years information regarding fees charged by Putnam Management and its affiliates to institutional clients such as defined benefit pension plans, college endowments, etc. This information included comparison of such fees with fees charged to the funds, as well as a detailed assessment of the differences in the services provided to these two types of clients. The Trustees observed, in this regard, that the differences in fee rates between institutional clients and the mutual funds are by no means uniform when examined by individual asset sectors, suggesting that differences in the pricing of investment management services to these types of clients reflect to a substantial degree historical competitive forces operating in separate market places. The Trustees considered the fact that fee rates across all asset sectors are higher on average for mutual funds than for institutional clients, as well as the differences between the services that Putnam Management provides to the Putnam funds and those that it provides to institutional clients of the firm, but have not relied on such comparisons to any significant extent in concluding that the management fees paid by your fund are reasonable.
29
Other information
for shareholders
|
Important notice regarding delivery of shareholder documents
In accordance with SEC regulations, Putnam sends a single copy of annual and semiannual shareholder reports, prospectuses, and proxy statements to Putnam shareholders who share the same address. If you prefer to receive your own copy of these documents, please call Putnam at 1-800-225-1581, and Putnam will begin sending individual copies within 30 days.
Putnam is committed to managing our mutual funds in the best interests of our shareholders. The Putnam funds’ proxy voting guidelines and procedures, as well as information regarding how your fund voted proxies relating to portfolio securities during the 12-month period ended June 30, 2005, are available on the Putnam Individual Investor Web site, www.putnam.com/individual, and on the SEC’s Web site, www.sec.gov. If you have questions about finding forms on the SEC’s Web site, you may call the SEC at 1-800-SEC-0330. You may also obtain the Putnam funds’ proxy voting guidelines and procedures at no charge by calling Putnam’s Shareholder Services at 1-800-225-1581.
The fund will file a complete schedule of its portfolio holdings with the SEC for the first and third quarters of each fiscal year on Form N-Q. Shareholders may obtain the fund’s Forms N-Q on the SEC’s Web site at www.sec.gov. In addition, the fund’s Forms N-Q may be reviewed and copied at the SEC’s public reference room in Washington, D.C. You may call the SEC at 1-800-SEC-0330 for information about the SEC’s Web site or the operation of the public reference room.
30
A guide to financial statements
|
These sections of the report, as well as the accompanying Notes, constitute the fund’s financial statements.
The fund’s portfolio lists all the fund’s investments and their values as of the last day of the reporting period. Holdings are organized by asset type and industry sector, country, or state to show areas of concentration and diversification.
Statement of assets and liabilities shows how the fund’s net assets and share price are determined. All investment and noninvestment assets are added together. Any unpaid expenses and other liabilities are subtracted from this total. The result is divided by the number of shares to determine the net asset value per share, which is calculated separately for each class of shares. (For funds with preferred shares, the amount subtracted from total assets includes the liquidation preference of preferred shares.)
Statement of operations shows the fund’s net investment gain or loss. This is done by first adding up all the fund’s earnings — from dividends and interest income — and subtracting its operating expenses to determine net investment income (or loss). Then, any net gain or loss the fund realized on the sales of its holdings — as well as any unrealized gains or losses over the period — is added to or subtracted from the net investment result to determine the fund’s net gain or loss for the fiscal period.
Statement of changes in net assets shows how the fund’s net assets were affected by the fund’s net investment gain or loss, by distributions to shareholders, and by changes in the number of the fund’s shares. It lists distributions and their sources (net investment income or realized capital gains) over the current reporting period and the most recent fiscal year-end. The distributions listed here may not match the sources listed in the Statement of operations because the distributions are determined on a tax basis and may be paid in a different period from the one in which they were earned. Dividend sources are estimated at the time of declaration. Actual results may vary. Any non-taxable return of capital cannot be determined until final tax calculations are completed after the end of the fund’s fiscal year.
Financial highlights provide an overview of the fund’s investment results, per-share distributions, expense ratios, net investment income ratios, and portfolio turnover in one summary table, reflecting the five most recent reporting periods. In a semiannual report, the highlight table also includes the current reporting period. For open-end funds, a separate table is provided for each share class.
31
| The fund’s portfolio 1/31/06 (Unaudited) | | | |
|
| |
| |
| |
| COMMON STOCKS (94.8%)* | | | |
|
| | Shares | | Value |
| |
| Aerospace and Defense (3.2%) | | | |
| Aeroflex, Inc. † | 605,300 | $ | 7,318,077 |
| Alliant Techsystems, Inc. † | 151,900 | | 11,772,250 |
| DRS Technologies, Inc. | 179,000 | | 8,894,510 |
| L-3 Communications Holdings, Inc. | 134,500 | | 10,897,190 |
| | | | 38,882,027 |
|
| |
| Automotive (0.9%) | | | |
| Oshkosh Truck Corp. | 209,600 | | 10,335,376 |
|
| |
| Banking (2.7%) | | | |
| Commerce Bancorp, Inc. | 249,298 | | 8,336,525 |
| Corus Bankshares, Inc. | 144,600 | | 9,284,766 |
| UnionBanCal Corp. | 210,800 | | 14,142,572 |
| | | | 31,763,863 |
|
| |
| Biotechnology (2.2%) | | | |
| Invitrogen Corp. † | 111,400 | | 7,673,232 |
| MedImmune, Inc. † | 548,800 | | 18,725,056 |
| | | | 26,398,288 |
|
| |
| Building Materials (1.1%) | | | |
| Sherwin Williams Co. | 254,900 | | 13,484,210 |
|
| |
| Coal (1.5%) | | | |
| CONSOL Energy, Inc. | 125,600 | | 9,156,240 |
| Peabody Energy Corp. | 83,000 | | 8,259,330 |
| | | | 17,415,570 |
|
| |
| Commercial and Consumer Services (3.4%) | | | |
| ARAMARK Corp. Class B | 235,300 | | 6,270,745 |
| Consolidated Graphics, Inc. † | 117,700 | | 6,045,072 |
| John H. Harland Co. | 135,800 | | 5,069,414 |
| Manpower, Inc. | 293,200 | | 15,782,956 |
| West Corp. † | 196,600 | | 8,027,178 |
| | | | 41,195,365 |
|
| |
| Computers (5.2%) | | | |
| Intergraph Corp. † | 187,000 | | 7,145,270 |
| j2 Global Communications, Inc. † | 53,200 | | 2,540,300 |
| NCR Corp. † | 189,100 | | 7,025,065 |
| Netgear, Inc. † | 484,300 | | 8,775,516 |
| Palm, Inc. † | 286,000 | | 11,291,280 |
| Seagate Technology (Cayman Islands) † | 575,000 | | 14,996,000 |
| Western Digital Corp. † | 465,201 | | 10,169,294 |
| | | | 61,942,725 |
32
| COMMON STOCKS (94.8%)* continued | | | |
|
| | Shares | | Value |
| |
| Consumer Cyclicals (0.8%) | | | |
| Tupperware Corp. | 456,900 | $ | 10,143,180 |
|
| |
| Consumer Goods (1.0%) | | | |
| American Greetings Corp. Class A | 80,100 | | 1,634,841 |
| Blyth Industries, Inc. | 24,200 | | 525,140 |
| Weight Watchers International, Inc. † | 197,600 | | 9,295,104 |
| | | | 11,455,085 |
|
| |
| Consumer Services (1.9%) | | | |
| Interline Brands, Inc. † | 462,400 | | 11,744,960 |
| Labor Ready, Inc. † | 435,600 | | 10,145,124 |
| Talx Corp. | 33,150 | | 1,038,921 |
| | | | 22,929,005 |
|
| |
| Electrical Equipment (1.7%) | | | |
| Lincoln Electric Holdings, Inc. | 91,300 | | 4,063,763 |
| Rofin-Sinar Technologies, Inc. † | 61,200 | | 2,922,300 |
| WESCO International, Inc. † | 274,500 | | 13,156,785 |
| | | | 20,142,848 |
|
| |
| Electronics (4.5%) | | | |
| Amphenol Corp. Class A | 225,400 | | 11,457,082 |
| Atmel Corp. † | 2,300,300 | | 9,086,185 |
| CiDRA Corp. (acquired 1/28/04, cost $816) (Private) ‡ † (F) | 229,701 | | 230 |
| Freescale Semiconductor, Inc. Class A † | 505,500 | | 12,718,380 |
| General Cable Corp. † | 344,500 | | 8,440,250 |
| Microchip Technology, Inc. | 330,200 | | 12,385,802 |
| | | | 54,087,929 |
|
| |
| Energy (6.0%) | | | |
| Cal Dive International, Inc. † | 215,200 | | 9,034,096 |
| Cooper Cameron Corp. † | 224,500 | | 10,863,555 |
| Hercules Offshore, Inc. † | 123,208 | | 4,412,078 |
| Patterson-UTI Energy, Inc. | 213,600 | | 8,035,632 |
| Pride International, Inc. † | 318,900 | | 11,260,359 |
| Rowan Cos., Inc. | 205,500 | | 9,212,565 |
| Unit Corp. † | 163,100 | | 9,737,070 |
| Veritas DGC, Inc. † | 215,500 | | 9,710,430 |
| | | | 72,265,785 |
|
| |
| Energy (Oil Field) (0.1%) | | | |
| Suntech Power Holdings Co., Ltd. ADR (China) † | 32,190 | | 1,367,753 |
|
| |
| Financial (0.5%) | | | |
| WFS Financial, Inc. † | 74,900 | | 5,954,550 |
|
| |
| Forest Products and Packaging (0.9%) | | | |
| Crown Holdings, Inc. † | 588,300 | | 11,007,093 |
33
| COMMON STOCKS (94.8%)* continued | | | |
|
| | Shares | | Value |
| |
| Gaming & Lottery (0.5%) | | | |
| Ameristar Casinos, Inc. | 282,900 | $ | 6,362,421 |
|
| |
| Health Care Services (5.0%) | | | |
| Bio-Rad Laboratories, Inc. Class A † | 55,500 | | 3,740,700 |
| Cerner Corp. † | 269,800 | | 12,141,000 |
| Henry Schein, Inc. † | 131,900 | | 6,151,816 |
| Laboratory Corp. of America Holdings † | 211,700 | | 12,416,205 |
| Pediatrix Medical Group, Inc. † | 146,600 | | 12,853,888 |
| Sierra Health Services, Inc. † | 308,400 | | 12,218,808 |
| | | | 59,522,417 |
|
| |
| Homebuilding (0.6%) | | | |
| Desarrolladora Homex SA de CV ADR (Mexico) † | 189,500 | | 6,577,545 |
|
| |
| Insurance (2.1%) | | | |
| AmerUs Group Co. | 103,000 | | 6,321,110 |
| Safety Insurance Group, Inc. | 130,100 | | 5,217,010 |
| W.R. Berkley Corp. | 265,300 | | 13,105,820 |
| | | | 24,643,940 |
|
| |
| Investment Banking/Brokerage (1.0%) | | | |
| Calamos Asset Management, Inc. Class A | 172,100 | | 5,978,754 |
| Nuveen Investments, Inc. Class A | 133,791 | | 6,070,098 |
| | | | 12,048,852 |
|
| |
| Leisure (0.6%) | | | |
| Brunswick Corp. | 175,500 | | 6,597,045 |
|
| |
| Machinery (4.6%) | | | |
| Cummins, Inc. | 77,200 | | 7,511,560 |
| JLG Industries, Inc. | 209,300 | | 11,402,664 |
| Parker-Hannifin Corp. | 194,600 | | 14,744,842 |
| Timken Co. | 328,400 | | 11,878,228 |
| Wabtec Corp. | 292,400 | | 9,231,068 |
| | | | 54,768,362 |
|
| |
| Manufacturing (1.0%) | | | |
| Dover Corp. | 269,100 | | 12,359,763 |
|
| |
| Medical Technology (8.7%) | | | |
| Bausch & Lomb, Inc. | 143,900 | | 9,720,445 |
| C.R. Bard, Inc. | 177,300 | | 11,244,366 |
| Charles River Laboratories International, Inc. † | 193,100 | | 8,907,703 |
| Dade Behring Holdings, Inc. | 326,800 | | 12,787,684 |
| Illumina, Inc. - escrow (acquired 6/7/05, cost $5,523) | | | |
| (Private) ‡ † (F) | 2,400 | | 12,864 |
| Kinetic Concepts, Inc. † | 270,100 | | 9,774,919 |
| LCA-Vision, Inc. | 230,500 | | 12,947,185 |
34
| COMMON STOCKS (94.8%)* continued | | | |
|
| | Shares | | Value |
| |
| Medical Technology continued | | | |
| Mentor Corp. | 157,000 | $ | 7,065,000 |
| Sybron Dental Specialties, Inc. † | 255,800 | | 10,897,080 |
| Varian Medical Systems, Inc. † | 340,200 | | 20,483,442 |
| | | | 103,840,688 |
|
| |
| Metals (2.9%) | | | |
| Agnico-Eagle Mines, Ltd. (Canada) | 396,800 | | 9,729,536 |
| Freeport-McMoRan Copper & Gold, Inc. Class B | 270,800 | | 17,398,900 |
| Steel Dynamics, Inc. | 160,200 | | 7,436,484 |
| | | | 34,564,920 |
|
| |
| Oil & Gas (4.0%) | | | |
| Bronco Drilling Co., Inc. † | 88,810 | | 2,809,060 |
| Giant Industries, Inc. † | 137,730 | | 9,625,950 |
| Noble Energy, Inc. | 255,100 | | 11,806,028 |
| Sunoco, Inc. | 162,400 | | 15,460,480 |
| Universal Compression Holdings, Inc. † | 124,900 | | 5,995,200 |
| Western Refining, Inc. † | 116,162 | | 2,178,038 |
| | | | 47,874,756 |
|
| |
| Pharmaceuticals (4.6%) | | | |
| Barr Pharmaceuticals, Inc. † | 205,900 | | 13,502,922 |
| Cephalon, Inc. † | 194,700 | | 13,802,283 |
| Endo Pharmaceuticals Holdings, Inc. † | 184,500 | | 5,295,150 |
| Hospira, Inc. † | 382,000 | | 17,094,500 |
| Watson Pharmaceuticals, Inc. † | 155,600 | | 5,148,804 |
| | | | 54,843,659 |
|
| |
| Publishing (1.3%) | | | |
| R. H. Donnelley Corp. † | 241,100 | | 15,820,982 |
|
| |
| Real Estate (1.2%) | | | |
| CB Richard Ellis Group, Inc. Class A † | 219,700 | | 13,867,464 |
|
| |
| Restaurants (0.8%) | | | |
| Domino’s Pizza, Inc. | 376,800 | | 9,386,088 |
|
| |
| Retail (3.6%) | | | |
| Advance Auto Parts, Inc. † | 50 | | 2,179 |
| Aeropostale, Inc. † | 370,000 | | 11,185,100 |
| American Eagle Outfitters, Inc. | 187,800 | | 5,066,844 |
| Michaels Stores, Inc. | 237,700 | | 7,993,851 |
| New York & Company, Inc. † | 373,200 | | 7,232,616 |
| Pacific Sunwear of California, Inc. † | 261,900 | | 6,419,169 |
| Stein Mart, Inc. | 275,000 | | 4,559,500 |
| | | | 42,459,259 |
35
| COMMON STOCKS (94.8%)* continued | | |
|
| | Shares | Value |
| |
| Schools (0.9%) | | |
| Career Education Corp. † | 314,600 | $ 10,221,354 |
| UNEXT.com, LLC (acquired 4/14/00, cost $10,451,238) | | |
| (Private) ‡ † (F) | 125,000 | 1,250 |
| | | 10,222,604 |
|
| |
| Semiconductor (1.9%) | | |
| Lam Research Corp. † | 379,900 | 17,638,757 |
| Sigmatel, Inc. † | 438,700 | 5,606,586 |
| | | 23,245,343 |
|
| |
| Shipping (0.7%) | | |
| J. B. Hunt Transport Services, Inc. | 368,700 | 8,775,060 |
|
| |
| Software (3.9%) | | |
| Blackboard, Inc. † | 269,600 | 6,942,200 |
| Cadence Design Systems, Inc. † | 432,900 | 7,645,014 |
| Epicor Software Corp. † | 439,000 | 5,838,700 |
| FileNET Corp. † | 190,800 | 5,353,848 |
| MarketSoft Software Corp. (acquired 8/12/04, | | |
| cost $2,446) (Private) ‡ † (F) | 42,985 | 4 |
| Parametric Technology Corp. † | 1,079,500 | 6,757,670 |
| Progress Software Corp. † | 292,900 | 8,423,804 |
| SSA Global Technologies, Inc. † | 329,100 | 5,726,340 |
| | | 46,687,580 |
|
| |
| Technology Services (4.5%) | | |
| Covansys Corp. † | 557,755 | 8,477,876 |
| CSG Systems International, Inc. † | 477,100 | 10,863,567 |
| Fair Isaac Corp. | 269,000 | 11,922,080 |
| Fiserv, Inc. † | 201,600 | 8,866,368 |
| Global Payments, Inc. | 119,100 | 6,065,763 |
| Transaction Systems Architects, Inc. † | 237,900 | 7,848,321 |
| | | 54,043,975 |
|
| |
| Textiles (1.9%) | | |
| Armor Holdings, Inc. † | 258,000 | 12,298,860 |
| K-Swiss, Inc. Class A | 19,900 | 629,835 |
| Phillips-Van Heusen Corp. | 281,800 | 10,181,434 |
| | | 23,110,129 |
|
| |
| Toys (0.4%) | | |
| Jakks Pacific, Inc. † | 222,300 | 5,048,433 |
|
| |
| Transportation (0.5%) | | |
| Hornbeck Offshore Services, Inc. † | 159,300 | 6,337,196 |
|
| |
| Total common stocks (cost $976,343,136) | | $1,133,779,133 |
36
| CONVERTIBLE PREFERRED STOCKS (1.0%)* | | | |
|
| | Shares | | Value |
| |
| Bowstreet Inc. Series A1, zero % cv. pfd. | | | |
| (acquired 11/23/04, cost $81,935) | | | |
| (Private) ‡ † (F) | 133,946 | $ | 92,772 |
| Bowstreet Inc. Series A2 (acquired 10/25/00, | | | |
| cost $5,959,992) (Private) ‡ † (F) | 258,397 | | 178,968 |
| Capella Education Co., Inc. Series G, zero % cv. pfd. | | | |
| (acquired 2/14/02, cost $2,500,003) (Private) ‡ † (F) | 224,820 | | 4,496,408 |
| CiDRA Corp. Ser. D, $7.70 cv. pfd. (acquired | | | |
| various dates from 1/28/04 to 6/29/05, | | | |
| cost $3,255,851) (Private) ‡ † (F) | 44,729 | | 916,050 |
| CiDRA Corp. red. pfd. (acquired 1/28/04, | | | |
| cost $548,140) (Private) ‡ † (F) | 6,776 | | 154,222 |
| CommVault Systems zero % cv. pfd. (acquired | | | |
| various dates from 1/30/02 to 9/04/03, | | | |
| cost $4,749,999) (Private) ‡ † (F) | 1,517,087 | | 4,748,482 |
| Hyper Energy, Inc. zero % cv. pfd. (acquired | | | |
| 9/5/00, cost $9,352,296) (Private) ‡ † (F) | 268,379 | | 2,684 |
| MarketSoft Software Corp. Ser. D, zero % cv. pfd. | | | |
| (acquired various dates from 12/07/00 to 8/12/04, | | | |
| cost $8,247,554) (Private) ‡ † (F) | 1,354,608 | | 1,251,956 |
| Totality Corp. Ser. D, $0.346 cum. cv. pfd. | | | |
| (acquired 6/26/00, cost $2,423,378) (Private) ‡ † (F) | 878,186 | | 43,909 |
|
| |
| Total convertible preferred stocks (cost $37,119,148) | | $ | 11,885,451 |
|
| |
| |
| SHORT-TERM INVESTMENTS (4.2%)* | | | |
|
| | Principal amount/shares | | Value |
| |
| Interest in $450,000,000 joint tri-party repurchase | | | |
| agreement dated January 31, 2006 with Bank | | | |
| of America Securities, LLC due February 1, 2006 | | | |
| with respect to various U.S. Government | | | |
| obligations — maturity value of $27,195,346 for | | | |
| an effective yield of 4.43% (collaterized by | | | |
| Fannie Mae and Freddie Mac with yields ranging | | | |
| 5.00% to 5.50% and due dates ranging from | | | |
| May 1, 2019 to December 1, 2035, valued | | | |
| at $459,000,000) | $27,192,000 | $ | 27,192,000 |
| Putnam Prime Money Market Fund (e) | 23,398,800 | | 23,398,800 |
|
| |
| Total short-term investments (cost $50,590,800) | | $ | 50,590,800 |
|
| |
| |
| TOTAL INVESTMENTS | | | |
| Total investments (cost $1,064,053,084) | | $1,196,255,384 |
37
* Percentages indicated are based on net assets of $1,196,576,581.
† Non-income-producing security.
‡ Restricted, excluding 144A securities, as to public resale. The total market value of restricted securities held at January 31, 2006 was $11,899,799 or 1.0% of net assets.
(e) See Note 5 to the financial statements regarding investments in Putnam Prime Money Market Fund.
(F) Security is valued at fair value following procedures approved by the Trustees.
At January 31, 2006, liquid assets totaling $5,404,427 have been designated as collateral for open forward commitments and written options.
ADR after the name of a foreign holding stands for American Depository Receipts, representing ownership of foreign securities on deposit with a custodian bank.
| WRITTEN OPTIONS OUTSTANDING at 1/31/06 (premiums received $79,566) (Unaudited) | |
|
| | Contract | Expiration date/ | |
| | amount | strike price | Value |
|
| Bausch & Lomb Inc. (Put) | $11,722 | Feb-06/ 65.00 | $ 5,099 |
| Cal Dive International, Inc. (Call) | 18,701 | Feb-06/ 48.22 | 2,785 |
| Cephalon Inc. (Call) | 19,225 | Feb-06/ 79.41 | 8,117 |
| Rowan Cos. (Call) | 19,337 | Feb-06/ 46.64 | 15,721 |
| Sigmatel Inc. (Put) | 41,776 | Feb-06/ 12.47 | 25,855 |
|
| Total | | | $57,577 |
The accompanying notes are an integral part of these financial statements.
38
| Statement of assets and liabilities 1/31/06 (Unaudited) | |
|
| |
| ASSETS | |
| Investment in securities, at value (Note 1): | |
| Unaffiliated issuers (identified cost $1,040,654,284) | $ 1,172,856,584 |
| Affiliated issuers (identified cost $23,398,800) (Note 5) | 23,398,800 |
|
| Cash | 691 |
|
| Dividends, interest and other receivables | 462,492 |
|
| Receivable for shares of the fund sold | 340,645 |
|
| Receivable for securities sold | 31,939,602 |
|
| Total assets | 1,228,998,814 |
|
| |
| LIABILITIES | |
| Payable for securities purchased | 23,551,921 |
|
| Payable for shares of the fund repurchased | 6,085,415 |
|
| Payable for compensation of Manager (Notes 2 and 5) | 1,259,817 |
|
| Payable for investor servicing and custodian fees (Note 2) | 434,228 |
|
| Payable for Trustee compensation and expenses (Note 2) | 308,349 |
|
| Payable for administrative services (Note 2) | 2,218 |
|
| Payable for distribution fees (Note 2) | 445,944 |
|
| Written options outstanding, at value (premiums received $79,566) (Note 1) | 57,577 |
|
| Other accrued expenses | 276,764 |
|
| Total liabilities | 32,422,233 |
|
| Net assets | $ 1,196,576,581 |
|
| |
| REPRESENTED BY | |
| Paid-in capital (Unlimited shares authorized) (Notes 1 and 4) | $ 6,450,080,450 |
|
| Accumulated net investment loss (Note 1) | (6,433,387) |
|
| Accumulated net realized loss on investments (Note 1) | (5,379,294,771) |
|
| Net unrealized appreciation of investments | 132,224,289 |
|
| Total — Representing net assets applicable to capital shares outstanding | $ 1,196,576,581 |
| |
| (Continued on next page) | |
39
| Statement of assets and liabilities (Continued) | |
|
| |
| COMPUTATION OF NET ASSET VALUE AND OFFERING PRICE | |
| Net asset value and redemption price per class A share | |
| ($759,765,168 divided by 89,303,694 shares) | $8.51 |
|
| Offering price per class A share | |
| (100/94.75 of $8.51)* | $8.98 |
|
| Net asset value and offering price per class B share | |
| ($177,969,530 divided by 23,731,159 shares)** | $7.50 |
|
| Net asset value and offering price per class C share | |
| ($14,977,194 divided by 1,852,536 shares)** | $8.08 |
|
| Net asset value and redemption price per class M share | |
| ($197,634,541 divided by 24,955,826 shares) | $7.92 |
|
| Offering price per class M share | |
| (100/96.75 of $7.92)* | $8.19 |
|
| Net asset value, offering price and redemption price per class R share | |
| ($112,152 divided by 13,254 shares) | $8.46 |
|
| Net asset value, offering price and redemption price per class Y share | |
| ($46,117,996 divided by 5,251,314 shares) | $8.78 |
* On single retail sales of less than $50,000. On sales of $50,000 or more and on group sales, the offering price is reduced.
** Redemption price per share is equal to net asset value less any applicable contingent deferred sales charge.
The accompanying notes are an integral part of these financial statements.
40
| Statement of operations Six months ended 1/31/06 (Unaudited) | |
|
| |
| INVESTMENT INCOME | |
| Dividends | $ 2,645,976 |
|
| Interest (including interest income of $241,073 | |
| from investments in affiliated issuers) (Note 5) | 286,951 |
|
| Total investment income | 2,932,927 |
|
| |
| EXPENSES | |
| Compensation of Manager (Note 2) | 3,711,351 |
|
| Investor servicing fees (Note 2) | 3,025,128 |
|
| Custodian fees (Note 2) | 90,152 |
|
| Trustee compensation and expenses (Note 2) | 14,040 |
|
| Administrative services (Note 2) | 12,194 |
|
| Distribution fees — Class A (Note 2) | 917,719 |
|
| Distribution fees — Class B (Note 2) | 904,422 |
|
| Distribution fees — Class C (Note 2) | 72,647 |
|
| Distribution fees — Class M (Note 2) | 723,781 |
|
| Distribution fees — Class R (Note 2) | 227 |
|
| Other | 330,166 |
|
| Non-recurring costs (Note 6) | 11,310 |
|
| Costs assumed by Manager (Note 6) | (11,310) |
|
| Fees waived and reimbursed by Manager (Notes 2 and 5) | (82,004) |
|
| Total expenses | 9,719,823 |
|
| Expense reduction (Note 2) | (353,509) |
|
| Net expenses | 9,366,314 |
|
| Net investment loss | (6,433,387) |
|
| Net realized gain on investments (Notes 1 and 3) | 113,773,497 |
|
| Net realized gain on written options (Notes 1 and 3) | 375,971 |
|
| Net unrealized appreciation of investments | |
| and written options during the period | 13,647,171 |
|
| Net gain on investments | 127,796,639 |
|
| Net increase in net assets resulting from operations | $121,363,252 |
The accompanying notes are an integral part of these financial statements.
41
| Statement of changes in net assets | |
|
| |
| DECREASE IN NET ASSETS | | |
|
| | Six months ended | Year ended |
| | 1/31/06* | 7/31/05 |
|
| Operations: | | |
| Net investment loss | $ (6,433,387) | $ (13,778,643) |
|
| Net realized gain on investments | 114,149,468 | 146,188,427 |
|
| Net unrealized appreciation of investments | 13,647,171 | 118,726,880 |
|
| Net increase in net assets resulting from operations | 121,363,252 | 251,136,664 |
|
| Redemption fees (Note 1) | 1,759 | 6,230 |
|
| Decrease from capital share transactions (Note 4) | (142,530,137) | (521,003,214) |
|
| Total decrease in net assets | (21,165,126) | (269,860,320) |
|
| |
| NET ASSETS | | |
| Beginning of period | 1,217,741,707 | 1,487,602,027 |
|
| End of period (including accumulated net investment | | |
| loss of $6,433,387 and $—, respectively) | $1,196,576,581 | $1,217,741,707 |
| * Unaudited | | |
The accompanying notes are an integral part of these financial statements.
42
Financial highlights (For a common share outstanding throughout the period)
| CLASS A | | | | | | | |
|
| PER-SHARE OPERATING PERFORMANCE | | | | | |
|
| | Six months ended** | | | | Year ended | | |
| | 1/31/06 | 7/31/05 | | 7/31/04 | 7/31/03 | 7/31/02 | 7/31/01 |
|
| Net asset value, | | | | | | | |
| beginning of period | $7.65 | $6.36 | | $6.13 | $5.27 | $8.52 | $29.96 |
|
| Investment operations: | | | | | | | |
| Net investment loss (a) | (.04)(d) | (.06)(d,f ) | (.07)(d) | (.06) | (.07) | (.13) |
|
| Net realized and unrealized | | | | | | | |
| gain (loss) on investments | .90 | 1.35 | | .30 | .92 | (3.18) | (16.72) |
|
| Total from | | | | | | | |
| investment operations: | .86 | 1.29 | | .23 | .86 | (3.25) | (16.85) |
|
| Less distributions: | | | | | | | |
| From net realized | | | | | | | |
| gain on investments | — | — | | — | — | — | (4.59) |
|
| Total distributions | — | — | | — | — | — | (4.59) |
|
| Redemption fees | —(e) | —(e) | — | — | — | — |
|
| Net asset value, | | | | | | | |
| end of period | $8.51 | $7.65 | | $6.36 | $6.13 | $5.27 | $8.52 |
|
| Total return at | | | | | | | |
| net asset value (%)(b) | 11.24* | 20.28 | | 3.75 | 16.32 | (38.15) | (63.15) |
|
| |
| RATIOS AND SUPPLEMENTAL DATA | | | | | | |
| Net assets, end of period | | | | | | | |
| (in thousands) | $759,765 | $765,195 | | $906,748 | $1,120,364 | $1,166,011 | $2,207,311 |
|
| Ratio of expenses to | | | | | | | |
| average net assets (%)(c) | .74* (d) | 1.40(d) | 1.34(d) | 1.38 | 1.24 | 1.04 |
|
| Ratio of net investment loss | | | | | | | |
| to average net assets (%) | (.46)* (d) | (.82)(d,f ) | (1.00)(d) | (1.18) | (1.09) | (.84) |
|
| Portfolio turnover (%) | 78.04* | 163.45 | | 62.51 | 55.11 | 79.54 | 99.14 |
* Not annualized.
** Unaudited.
(a) Per share net investment loss has been determined on the basis of the weighted average number of shares outstanding during the period.
(b) Total return assumes dividend reinvestment and does not reflect the effect of sales charges.
(c) Includes amounts paid through expense offset and brokerage service arrangements (Note 2).
(d) Reflects an involuntary contractual expense limitation and waivers of certain fund expenses in connection with investments in Putnam Prime Money Market Fund during the period. As a result of such limitation and waivers, the expenses of the fund for the periods ended January 31, 2006, July 31, 2005 and July 31, 2004 reflect a reduction of 0.01%, 0.01% and less than 0.01%, respectively, of average net assets for class A shares (Notes 2 and 5).
(e) Amount represents less than $0.01 per share.
(f) Reflects a non-recurring accrual related to Putnam Management’s settlement with the SEC regarding brokerage allocation practices, which amounted to less than $0.01 per share and 0.04% of average net assets for class A shares (Note 6).
The accompanying notes are an integral part of these financial statements.
43
Financial highlights (For a common share outstanding throughout the period)
| CLASS B | | | | | | | |
|
| PER-SHARE OPERATING PERFORMANCE | | | | | |
|
| | Six months ended** | | | | Year ended | | |
| | 1/31/06 | 7/31/05 | | 7/31/04 | 7/31/03 | 7/31/02 | 7/31/01 |
|
| Net asset value, | | | | | | | |
| beginning of period | $6.77 | $5.67 | | $5.51 | $4.77 | $7.77 | $28.10 |
|
| Investment operations: | | | | | | | |
| Net investment loss (a) | (.06)(d) | (.10)(d,f ) | (.11)(d) | (.09) | (.11) | (.23) |
|
| Net realized and unrealized | | | | | | | |
| gain (loss) on investments | .79 | 1.20 | | .27 | .83 | (2.89) | (15.51) |
|
| Total from | | | | | | | |
| investment operations: | .73 | 1.10 | | .16 | .74 | (3.00) | (15.74) |
|
| Less distributions: | | | | | | | |
| From net realized | | | | | | | |
| gain on investments | — | — | | — | — | — | (4.59) |
|
| Total distributions | — | — | | — | — | — | (4.59) |
|
| Redemption fees | —(e) | —(e) | — | — | — | — |
|
| Net asset value, | | | | | | | |
| end of period | $7.50 | $6.77 | | $5.67 | $5.51 | $4.77 | $7.77 |
|
| Total return at | | | | | | | |
| net asset value (%)(b) | 10.78* | 19.40 | | 2.90 | 15.51 | (38.61) | (63.43) |
|
| |
| RATIOS AND SUPPLEMENTAL DATA | | | | | | |
| Net assets, end of period | | | | | | | |
| (in thousands) | $177,970 | $197,584 | | $272,144 | $399,189 | $411,843 | $872,627 |
|
| Ratio of expenses to | | | | | | | |
| average net assets (%)(c) | 1.12* (d) | 2.15(d) | 2.09(d) | 2.13 | 1.99 | 1.79 |
|
| Ratio of net investment loss | | | | | | | |
| to average net assets (%) | (.83)* (d) | (1.57)(d,f ) | (1.75)(d) | (1.93) | (1.84) | (1.58) |
|
| Portfolio turnover (%) | 78.04* | 163.45 | | 62.51 | 55.11 | 79.54 | 99.14 |
* Not annualized.
** Unaudited.
(a) Per share net investment loss has been determined on the basis of the weighted average number of shares outstanding during the period.
(b) Total return assumes dividend reinvestment and does not reflect the effect of sales charges.
(c) Includes amounts paid through expense offset and brokerage service arrangements (Note 2).
(d) Reflects an involuntary contractual expense limitation and waivers of certain fund expenses in connection with investments in Putnam Prime Money Market Fund during the period. As a result of such limitation and waivers, the expenses of the fund for the periods ended January 31, 2006, July 31, 2005 and July 31, 2004 reflect a reduction of 0.01%, 0.01% and less than 0.01%, respectively, of average net assets for class B shares (Notes 2 and 5).
(e) Amount represents less than $0.01 per share.
(f) Reflects a non-recurring accrual related to Putnam Management’s settlement with the SEC regarding brokerage allocation practices, which amounted to less than $0.01 per share and 0.04% of average net assets for class B shares (Note 6).
The accompanying notes are an integral part of these financial statements.
44
Financial highlights (For a common share outstanding throughout the period)
| CLASS C | | | | | | |
|
| PER-SHARE OPERATING PERFORMANCE | | | | |
|
| | Six months ended** | | | Year ended | | |
| | 1/31/06 | 7/31/05 | 7/31/04 | 7/31/03 | 7/31/02 | 7/31/01 |
|
| Net asset value, | | | | | | |
| beginning of period | $7.30 | $6.11 | $5.94 | $5.14 | $8.37 | $29.75 |
|
| Investment operations: | | | | | | |
| Net investment loss (a) | (.06)(d) | (.10)(d,f ) | (.11)(d) | (.10) | (.12) | (.24) |
|
| Net realized and unrealized | | | | | | |
| gain (loss) on investments | .84 | 1.29 | .28 | .90 | (3.11) | (16.55) |
|
| Total from | | | | | | |
| investment operations | .78 | 1.19 | .17 | .80 | (3.23) | (16.79) |
|
| Less distributions: | | | | | | |
| From net realized | | | | | | |
| gain on investments | — | — | — | — | — | (4.59) |
|
| Total distributions | — | — | — | — | — | (4.59) |
|
| Redemption fees | —(e) | —(e) | — | — | — | — |
|
| Net asset value, | | | | | | |
| end of period | $8.08 | $7.30 | $6.11 | $5.94 | $5.14 | $8.37 |
|
| Total return at | | | | | | |
| net asset value (%)(b) | 10.69* | 19.48 | 2.86 | 15.56 | (38.59) | (63.44) |
|
| |
| RATIOS AND SUPPLEMENTAL DATA | | | | | |
| Net assets, end of period | | | | | | |
| (in thousands) | $14,977 | $15,276 | $17,558 | $25,779 | $26,540 | $51,023 |
|
| Ratio of expenses to | | | | | | |
| average net assets (%)(c) | 1.12* (d) | 2.15(d) | 2.09(d) | 2.13 | 1.99 | 1.79 |
|
| Ratio of net investment loss | | | | | | |
| to average net assets (%) | (.83)* (d) | (1.57)(d,f ) | (1.75)(d) | (1.93) | (1.84) | (1.59) |
|
| Portfolio turnover (%) | 78.04* | 163.45 | 62.51 | 55.11 | 79.54 | 99.14 |
* Not annualized.
** Unaudited.
(a) Per share net investment loss has been determined on the basis of the weighted average number of shares outstanding during the period.
(b) Total return assumes dividend reinvestment and does not reflect the effect of sales charges.
(c) Includes amounts paid through expense offset and brokerage service arrangements (Note 2).
(d) Reflects an involuntary contractual expense limitation and waivers of certain fund expenses in connection with investments in Putnam Prime Money Market Fund during the period. As a result of such limitation and waivers, the expenses of the fund for the periods ended January 31, 2006, July 31, 2005 and July 31, 2004 reflect a reduction of 0.01%, 0.01% and less than 0.01%, respectively, of average net assets for class C shares (Notes 2 and 5).
(e) Amount represents less than $0.01 per share.
(f) Reflects a non-recurring accrual related to Putnam Management’s settlement with the SEC regarding brokerage allocation practices, which amounted to less than $0.01 per share and 0.04% of average net assets for class C shares (Note 6).
The accompanying notes are an integral part of these financial statements.
45
Financial highlights (For a common share outstanding throughout the period)
| CLASS M | | | | | | |
|
| PER-SHARE OPERATING PERFORMANCE | | | | |
|
| | Six months ended** | | | Year ended | | |
| | 1/31/06 | 7/31/05 | 7/31/04 | 7/31/03 | 7/31/02 | 7/31/01 |
|
| Net asset value, | | | | | | |
| beginning of period | $7.14 | $5.97 | $5.78 | $4.99 | $8.11 | $28.98 |
|
| Investment operations: | | | | | | |
| Net investment loss (a) | (.05)(d) | (.08)(d,f ) | (.09)(d) | (.08) | (.10) | (.19) |
|
| Net realized and unrealized | | | | | | |
| gain (loss) on investments | .83 | 1.25 | .28 | .87 | (3.02) | (16.09) |
|
| Total from | | | | | | |
| investment operations | .78 | 1.17 | .19 | .79 | (3.12) | (16.28) |
|
| Less distributions: | | | | | | |
| From net realized | | | | | | |
| gain on investments | — | — | — | — | — | (4.59) |
|
| Total distributions | — | — | — | — | — | (4.59) |
|
| Redemption fees | —(e) | —(e) | — | — | — | — |
|
| Net asset value, | | | | | | |
| end of period | $7.92 | $7.14 | $5.97 | $5.78 | $4.99 | $8.11 |
|
| Total return at | | | | | | |
| net asset value (%)(b) | 10.92* | 19.60 | 3.29 | 15.83 | (38.47) | (63.35) |
|
| |
| RATIOS AND SUPPLEMENTAL DATA | | | | | |
| Net assets, end of period | | | | | | |
| (in thousands) | $197,635 | $195,693 | $197,632 | $220,723 | $190,171 | $289,934 |
|
| Ratio of expenses to | | | | | | |
| average net assets (%)(c) | .99* (d) | 1.90(d) | 1.84(d) | 1.88 | 1.74 | 1.54 |
|
| Ratio of net investment loss | | | | | | |
| to average net assets (%) | (.71)* (d) | (1.31)(d,f ) | (1.50)(d) | (1.68) | (1.59) | (1.34) |
|
| Portfolio turnover (%) | 78.04* | 163.45 | 62.51 | 55.11 | 79.54 | 99.14 |
* Not annualized.
** Unaudited.
(a) Per share net investment loss has been determined on the basis of the weighted average number of shares outstanding during the period.
(b) Total return assumes dividend reinvestment and does not reflect the effect of sales charges.
(c) Includes amounts paid through expense offset and brokerage service arrangements (Note 2).
(d) Reflects an involuntary contractual expense limitation and waivers of certain fund expenses in connection with investments in Putnam Prime Money Market Fund during the period. As a result of such limitation and waivers, the expenses of the fund for the periods ended January 31, 2006, July 31, 2005 and July 31, 2004 reflect a reduction of 0.01%, 0.01% and less than 0.01%, respectively, of average net assets for class M shares (Notes 2 and 5).
(e) Amount represents less than $0.01 per share.
(f) Reflects a non-recurring accrual related to Putnam Management’s settlement with the SEC regarding brokerage allocation practices, which amounted to less than $0.01 per share and 0.04% of average net assets for class M shares (Note 6).
The accompanying notes are an integral part of these financial statements.
46
Financial highlights (For a common share outstanding throughout the period)
| CLASS R | | | |
|
| PER-SHARE OPERATING PERFORMANCE | | |
|
| | Six months ended** | Year ended | Period |
| | 1/31/06 | 7/31/05 | 12/1/03†-7/31/04 |
|
| Net asset value, | | | |
| beginning of period | $7.62 | $6.35 | $6.97 |
|
| Investment operations: | | | |
| Net investment loss (a,d) | (.04) | (.07)(f ) | (.05) |
|
| Net realized and unrealized | | | |
| gain (loss) on investments | .88 | 1.34 | (.57) |
|
| Total from | | | |
| investment operations | .84 | 1.27 | (.62) |
|
| Redemption fees | —(e) | —(e) | — |
|
| Net asset value, | | | |
| end of period | $8.46 | $7.62 | $6.35 |
|
| Total return at | | | |
| net asset value (%)(b) | 11.02* | 20.00 | (8.90)* |
|
| |
| RATIOS AND SUPPLEMENTAL DATA | | |
| Net assets, end of period | | | |
| (in thousands) | $112 | $80 | $10 |
|
| Ratio of expenses to | | | |
| average net assets (%)(c,d) | .87* | 1.65 | 1.06* |
|
| Ratio of net investment loss | | | |
| to average net assets (%)(d) | (.58)* | (1.04)(f ) | (.84)* |
|
| Portfolio turnover (%) | 78.04* | 163.45 | 62.51 |
† Commencement of operations.
|
* Not annualized.** Unaudited.
(a) Per share net investment income has been determined on the basis of the weighted average number of shares outstanding during the period.
(b) Total return assumes dividend reinvestment and does not reflect the effect of sales charges.
(c) Includes amounts paid through expense offset and broker service arrangements (Note 2).
(d) Reflects an involuntary contractual expense limitation and waivers of certain fund expenses in connection with investments in Putnam Prime Money Market Fund during the period. As a result of such limitation and waivers, the expenses of the fund for the periods ended January 31, 2006, July 31, 2005 and July 31, 2004 reflect a reduction of 0.01%, 0.01% and less than 0.01%, respectively, of average net assets for class R shares (Notes 2 and 5).
(e) Amount represents less than $0.01 per share.
(f) Reflects a non-recurring accrual related to Putnam Management’s settlement with the SEC regarding brokerage allocation practices, which amounted to less than $0.01 per share and 0.05% of average net assets for class R shares (Note 6).
The accompanying notes are an integral part of these financial statements.
47
Financial highlights (For a common share outstanding throughout the period)
| CLASS Y | | | | | | |
|
| PER-SHARE OPERATING PERFORMANCE | | | | |
|
| | Six months ended** | | | Year ended | | |
| | 1/31/06 | 7/31/05 | 7/31/04 | 7/31/03 | 7/31/02 | 7/31/01 |
|
| Net asset value, | | | | | | |
| beginning of period | $7.88 | $6.54 | $6.29 | $5.39 | $8.69 | $30.35 |
|
| Investment operations: | | | | | | |
| Net investment loss (a) | (.03)(d) | (.04)(d,f ) | (.06)(d) | (.05) | (.06) | (.09) |
|
| Net realized and unrealized | | | | | | |
| gain (loss) on investments | .93 | 1.38 | .31 | .95 | (3.24) | (16.98) |
|
| Total from | | | | | | |
| investment operations: | .90 | 1.34 | .25 | .90 | (3.30) | (17.07) |
|
| Less distributions: | | | | | | |
| From net realized | | | | | | |
| gain on investments | — | — | — | — | — | (4.59) |
|
| Total distributions | — | — | — | — | — | (4.59) |
|
| Redemption fees | —(e) | —(e) | — | — | — | — |
|
| Net asset value, | | | | | | |
| end of period | $8.78 | $7.88 | $6.54 | $6.29 | $5.39 | $8.69 |
|
| Total return at | | | | | | |
| net asset value (%)(b) | 11.42* | 20.49 | 3.98 | 16.70 | (37.97) | (63.05) |
|
| |
| RATIOS AND SUPPLEMENTAL DATA | | | | | |
| Net assets, end of period | | | | | | |
| (in thousands) | $46,118 | $43,914 | $93,510 | $273,803 | $241,480 | $398,264 |
|
| Ratio of expenses to | | | | | | |
| average net assets (%)(c) | .61* (d) | 1.15(d) | 1.09(d) | 1.13 | .99 | .79 |
|
| Ratio of net investment loss | | | | | | |
| to average net assets (%) | (.33)* (d) | (.57)(d,f ) | (.75)(d) | (.93) | (.84) | (.59) |
|
| Portfolio turnover (%) | 78.04* | 163.45 | 62.51 | 55.11 | 79.54 | 99.14 |
* Not annualized.
** Unaudited.
(a) Per share net investment loss has been determined on the basis of the weighted average number of shares outstanding during the period.
(b) Total return assumes dividend reinvestment and does not reflect the effect of sales charges.
(c) Includes amounts paid through expense offset and brokerage service arrangements (Note 2).
(d) Reflects an involuntary contractual expense limitation and waivers of certain fund expenses in connection with investments in Putnam Prime Money Market Fund during the period. As a result of such limitation and waivers, the expenses of the fund for the periods ended January 31, 2006, July 31, 2005 and July 31, 2004 reflect a reduction of 0.01%, 0.01% and less than 0.01%, respectively, of average net assets for class Y shares (Notes 2 and 5).
(e) Amount represents less than $0.01 per share.
(f) Reflects a non-recurring accrual related to Putnam Management’s settlement with the SEC regarding brokerage allocation practices, which amounted to less than $0.01 per share and 0.04% of average net assets for class Y shares (Note 6).
The accompanying notes are an integral part of these financial statements.
48
Notes to financial statements 1/31/06 (Unaudited)
Note 1: Significant accounting policies
Putnam OTC & Emerging Growth Fund (the “fund”), a Massachusetts business trust, is registered under the Investment Company Act of 1940, as amended, as a diversified, open-end management investment company. The fund seeks capital appreciation through investments in common stocks of small to medium-sized emerging growth companies traded in the over-the-counter (OTC) market and common stocks of “emerging growth” companies listed on securities exchanges.
The fund offers class A, class B, class C, class M, class R and class Y shares. Class A and class M shares are sold with a maximum front-end sales charge of 5.25% and 3.25%, respectively, and generally do not pay a contingent deferred sales charge. Class B shares, which convert to class A shares after approximately eight years, do not pay a front-end sales charge and are subject to a contingent deferred sales charge, if those shares are redeemed within six years of purchase. Class C shares have a one-year 1.00% contingent deferred sales charge and do not convert to class A shares. Class R shares, which are offered to qualified employee-benefit plans are sold without a front-end sales charge or a contingent deferred sales charge. The expenses for class A, class B, class C, class M and class R shares may differ based on the distribution fee of each class, which is identified in Note 2. Class Y shares, which are sold at net asset value, are generally subject to the same expenses as class A, class B, class C, class M and class R shares, but do not bear a distribution fee. Class Y shares are sold to certain eligible purchasers including certain defined contribution plans (including corporate IRAs), bank trust departments and trust companies.
A 2.00% redemption fee may apply to any shares that are redeemed (either by selling or exchanging into another fund) within 5 days of purchase. The redemption fee is accounted for as an addition to paid-in-capital.
Investment income, realized and unrealized gains and losses and expenses of the fund are borne pro-rata based on the relative net assets of each class to the total net assets of the fund, except that each class bears expenses unique to that class (including the distribution fees applicable to such classes). Each class votes as a class only with respect to its own distribution plan or other matters on which a class vote is required by law or determined by the Trustees. Shares of each class would receive their pro-rata share of the net assets of the fund, if the fund were liquidated. In addition, the Trustees declare separate dividends on each class of shares.In the normal course of business, the fund enters into contracts that may include agreements to indemnify another party under given circumstances. The fund’s maximum exposure under these arrangements is unknown as this would involve future claims that may be, but have not yet been, made against the fund. However, the fund expects the risk of material loss to be remote.
The following is a summary of significant accounting policies consistently followed by the fund in the preparation of its financial statements. The preparation of financial statements is in conformity with accounting principles generally accepted in the United States of America and requires management to make estimates and assumptions that affect the reported amounts of assets and liabilities in the financial statements and the reported amounts of increases and decreases in net assets from operations during the reporting period. Actual results could differ from those estimates.
A) Security valuation Investments for which market quotations are readily available are valued at the last reported sales price on their principal exchange, or official closing price for certain markets. If no sales are reported — as in the case of some securities traded over-the-counter — a security is valued at its last reported bid price. Many securities markets and exchanges outside the U.S. close prior to the close of the New York Stock Exchange and therefore the closing prices for securities in such markets or on such
49
exchanges may not fully reflect events that occur after such close but before the close of the New York Stock Exchange. Accordingly, on certain days, the fund will fair value foreign equity securities taking into account multiple factors, including movements in the U.S. securities markets. The number of days on which fair value prices will be used will depend on market activity and it is possible that fair value prices will be used by the fund to a significant extent. Securities quoted in foreign currencies, if any, are translated into U.S. dollars at the current exchange rate. Other investments, including certain restricted securities, are valued at fair value following procedures approved by the Trustees. Such valuations and procedures are reviewed periodically by the Trustees.
B) Joint trading account Pursuant to an exemptive order from the Securities and Exchange Commission, the fund may transfer uninvested cash balances, including cash collateral received under security lending arrangements, into a joint trading account along with the cash of other registered investment companies and certain other accounts managed by Putnam Investment Management, LLC (“Putnam Management”), the fund’s manager, an indirect wholly-owned subsidiary of Putnam, LLC. These balances may be invested in issues of high-grade short-term investments having maturities of up to 397 days for collateral received under security lending arrangements and up to 90 days for other cash investments.
C) Repurchase agreements The fund, or any joint trading account, through its custodian, receives delivery of the underlying securities, the market value of which at the time of purchase is required to be in an amount at least equal to the resale price, including accrued interest. Collateral for certain tri-party repurchase agreements is held at the counterparty’s custodian in a segregated account for the benefit of the fund and the coun-terparty. Putnam Management is responsible for determining that the value of these underlying securities is at all times at least equal to the resale price, including accrued interest.
D) Security transactions and related investment income Security transactions are recorded on the trade date (date the order to buy or sell is executed). Gains or losses on securities sold are determined on the identified cost basis.
Interest income is recorded on the accrual basis. Dividend income, net of applicable withholding taxes, is recognized on the ex-dividend date except that certain dividends from foreign securities are recognized as soon as the fund is informed of the ex-dividend date. Non-cash dividends, if any, are recorded at the fair market value of the securities received.
E) Futures and options contracts The fund may use futures and options contracts to hedge against changes in the values of securities the fund owns or expects to purchase, or for other investment purposes. The fund may also write options on swaps or securities it owns or in which it may invest to increase its current returns.
The potential risk to the fund is that the change in value of futures and options contracts may not correspond to the change in value of the hedged instruments. In addition, losses may arise from changes in the value of the underlying instruments, if there is an illiquid secondary market for the contracts, or if the counterparty to the contract is unable to perform. Risks may exceed amounts recognized on the statement of assets and liabilities. When the contract is closed, the fund records a realized gain or loss equal to the difference between the value of the contract at the time it was opened and the value at the time it was closed. Realized gains and losses on purchased options are included in realized gains and losses on investment securities. If a written call option is exercised, the premium originally received is recorded as an addition to sales proceeds. If a written put option is exercised, the premium originally received is recorded as a reduction to the cost of investments.
Futures contracts are valued at the quoted daily settlement prices established by the exchange on which they trade. The fund and the broker agree
50
to exchange an amount of cash equal to the daily fluctuation in the value of the futures contract. Such receipts or payments are known as “variation margin.” Exchange traded options are valued at the last sale price, or if no sales are reported, the last bid price for purchased options and the last ask price for written options. Options traded over-the-counter are valued using prices supplied by dealers. Futures and written option contracts outstanding at period end, if any, are listed after the fund’s portfolio.
F) Federal taxes It is the policy of the fund to distribute all of its taxable income within the prescribed time and otherwise comply with the provisions of the Internal Revenue Code of 1986 (the “Code”) applicable to regulated investment companies. It is also the intention of the fund to distribute an amount sufficient to avoid imposition of any excise tax under Section 4982 of the Code, as amended. Therefore, no provision has been made for federal taxes on income, capital gains or unrealized appreciation on securities held nor for excise tax on income and capital gains.
At July 31, 2005, the fund had a capital loss carryover of $5,492,575,566 available to the extent allowed by the Code to offset future net capital gain, if any. The amount of the carryover and the expiration dates are:
| Loss Carryover | Expiration |
| $ 101,898,918 | July 31, 2009 |
|
| 4,367,146,683 | July 31, 2010 |
|
| 985,045,539 | July 31, 2011 |
|
| 38,484,426 | July 31, 2012 |
|
The aggregate identified cost on a tax basis is $1,064,921,757, resulting in gross unrealized appreciation and depreciation of $183,983,733 and $52,650,106, respectively, or net unrealized appreciation of $131,333,627.
G) Distributions to shareholders Distributions to shareholders from net investment income are recorded by the fund on the ex-dividend date. Distributions from capital gains, if any, are recorded on the ex-dividend date and paid at least annually. The amount and character of income and gains to be distributed are determined in accordance with income tax regulations, which may differ from generally accepted accounting principles. Dividend sources are estimated at the time of declaration. Actual results may vary. Any non-taxable return of capital cannot be determined until final tax calculations are completed after the end of the fund’s fiscal year. Reclassifications are made to the fund’s capital accounts to reflect income and gains available for distribution (or available capital loss carryovers) under income tax regulations.
Note 2: Management fee, administrative services and other transactions
Putnam Management is paid for management and investment advisory services quarterly based on the average net assets of the fund. Such fee is based on the following annual rates: 0.70% of the first $500 million of average net assets, 0.60% of the next $500 million, 0.55% of the next $500 million, 0.50% of the next $5 billion, 0.475% of the next $5 billion, 0.455% of the next $5 billion, 0.44% of the next $5 billion and 0.43% thereafter.
Putnam Management has agreed to waive fees and reimburse expenses of the fund through July 31, 2006 to the extent necessary to ensure that the fund’s expenses do not exceed the simple average of the expenses of all front-end load funds viewed by Lipper Inc. as having the same investment classification or objective as the fund. The expense reimbursement is based on a comparison of the fund’s expenses with the average annualized operating expenses of the funds in its Lipper peer group for each calendar quarter during the fund’s last fiscal year, excluding 12b-1 fees and without giving effect to any expense offset and brokerage service arrangements that may reduce fund expenses. For the period ended January 31, 2006, Putnam Management waived $74,211 of its management fee from the fund.
51
For the period ended January 31, 2006, Putnam Management has assumed $11,310 of legal, shareholder servicing and communication, audit and Trustee fees incurred by the fund in connection with certain legal and regulatory matters (including those described in Note 6).
The fund reimburses Putnam Management an allocated amount for the compensation and related expenses of certain officers of the fund and their staff who provide administrative services to the fund. The aggregate amount of all such reimbursements is determined annually by the Trustees.
Custodial functions for the fund’s assets are provided by Putnam Fiduciary Trust Company (“PFTC”), a subsidiary of Putnam, LLC. PFTC receives fees for custody services based on the fund’s asset level, the number of its security holdings and transaction volumes. Putnam Investor Services, a division of PFTC, provides investor servicing agent functions to the fund. Putnam Investor Services receives fees for investor servicing based on the number of shareholder accounts in the fund and the level of defined contribution plan assets in the fund. During the period ended January 31, 2006, the fund incurred $3,115,280 for these services.
The fund has entered into an arrangement with PFTC whereby credits realized as a result of uninvested cash balances are used to reduce a portion of the fund’s expenses. The fund also reduced expenses through brokerage service arrangements. For the six months ended, January 31, 2006 the fund’s expenses were reduced by $353,509 under these arrangements.
Each independent Trustee of the fund receives an annual Trustee fee, of which $455, as a quarterly retainer, has been allocated to the fund, and an additional fee for each Trustees meeting attended. Trustees receive additional fees for attendance at certain committee meetings, industry seminars and for certain compliance-related matters. Trustees also are reimbursed for expenses they incur relating to their services as Trustees. George Putnam, III, who is not an independent Trustee, also receives the foregoing fees for his services as Trustee.
The fund has adopted a Trustee Fee Deferral Plan (the “Deferral Plan”) which allows the Trustees to defer the receipt of all or a portion of Trustees fees payable on or after July 1, 1995. The deferred fees remain invested in certain Putnam funds until distribution in accordance with the Deferral Plan.
The fund has adopted an unfunded noncontributory defined benefit pension plan (the “Pension Plan”) covering all Trustees of the fund who have served as a Trustee for at least five years and were first elected prior to 2004. Benefits under the Pension Plan are equal to 50% of the Trustee’s average total retainer and meeting fees for the three years ended December 31, 2005. Pension expense for the fund is included in Trustee compensation and expenses in the statement of operations. Accrued pension liability is included in Payable for Trustee compensation and expenses in the statement of assets and liabilities. The Trustees have terminated the Pension Plan with respect to any Trustee first elected after 2003.
The fund has adopted distribution plans (the “Plans”) with respect to its class A, class B, class C, class M and class R shares pursuant to Rule 12b-1 under the Investment Company Act of 1940. The purpose of the Plans is to compensate Putnam Retail Management, a wholly-owned subsidiary of Putnam, LLC and Putnam Retail Management GP, Inc., for services provided and expenses incurred in distributing shares of the fund. The Plans provide for payments by the fund to Putnam Retail Management at an annual rate of up to 0.35%, 1.00%, 1.00% ,1.00% and 1.00% of the average net assets attributable to class A, class B, class C, class M and class R shares, respectively. The Trustees have approved payment by the fund at an annual rate of 0.25%, 1.00%, 1.00%, 0.75% and 0.50% of the average net assets attributable to class A, class B, class C, class M and class R shares, respectively.
52
For the six months ended January 31, 2006, Putnam Retail Management, acting as underwriter, received net commissions of $14,111 and $316 from the sale of class A and class M shares, respectively, and received $151,005 and $398 in contingent deferred sales charges from redemptions of class B and class C shares, respectively. A deferred sales charge of up to 1.00% and 0.65% is assessed on certain redemptions of class A and class M shares, respectively. For the six months ended January 31, 2006, Putnam Retail Management, acting as underwriter, received $35 and no monies on class A and class M redemptions, respectively.
Note 3: Purchases and sales of securities
During the six months ended January 31, 2006, cost of purchases and proceeds from sales of investment securities other than short-term investments aggregated $900,378,173 and $1,091,318,676, respectively. There were no purchases or sales of U.S. government securities. Written option transactions during the period are summarized as follows:
| | Contract | Premiums |
| | Amounts | Received |
|
| Written options | | |
| outstanding at | | |
| beginning of period | 130,683 | $ 67,641 |
|
| Options opened | 936,156 | 588,959 |
| Options exercised | (287,425) | (182,825) |
| Options expired | (527,996) | (249,346) |
| Options closed | (140,657) | (144,863) |
|
| Written options | | |
| outstanding at | | |
| end of period | 110,761 | $ 79,566 |
|
Note 4: Capital shares
At January 31, 2006, there was an unlimited number of shares of beneficial interest authorized. Transactions in capital shares were as follows:
| CLASS A | Shares | Amount |
| Six months ended 1/31/06: | |
| Shares sold | 4,304,042 | $ 33,090,125 |
|
| Shares issued | | |
| in connection | | |
| with reinvestment | | |
| of distributions | — | — |
|
| | 4,304,042 | 33,090,125 |
|
| Shares | | |
| repurchased | (15,049,999) | (116,055,109) |
|
| Net decrease | (10,745,957) | $ (82,964,984) |
| |
| Year ended 7/31/05: | | |
| Shares sold | 16,697,458 | $ 115,010,634 |
|
| Shares issued | | |
| in connection | | |
| with reinvestment | | |
| of distributions | — | - |
|
| | 16,697,458 | 115,010,634 |
|
| Shares | | |
| repurchased | (59,163,267) | (412,544,092) |
|
| Net decrease | (42,465,809) | $(297,533,458) |
|
| |
| CLASS B | Shares | Amount |
| Six months ended 1/31/06: | |
| Shares sold | 688,886 | $ 4,670,507 |
|
| Shares issued | | |
| in connection | | |
| with reinvestment | | |
| of distributions | — | — |
|
| | 688,886 | 4,670,507 |
|
| Shares | | |
| repurchased | (6,155,002) | (41,794,606) |
|
| Net decrease | (5,466,116) | $ (37,124,099) |
| |
| Year ended 7/31/05: | | |
| Shares sold | 1,869,976 | $ 11,536,716 |
|
| Shares issued | | |
| in connection | | |
| with reinvestment | | |
| of distributions | — | — |
|
| | 1,869,976 | 11,536,716 |
|
| Shares | | |
| repurchased | (20,664,991) | (126,724,287) |
|
| Net decrease | (18,795,015) | $(115,187,571) |
53
| CLASS C | Shares | | Amount |
| Six months ended 1/31/06: | | |
| Shares sold | 110,002 | $ | 814,425 |
|
| Shares issued | | | |
| in connection | | | |
| with reinvestment | | | |
| of distributions | — | | — |
|
| | 110,002 | | 814,425 |
|
| Shares | | | |
| repurchased | (351,427) | | (2,587,424) |
|
| Net decrease | (241,425) | $ | (1,772,999) |
| |
| Year ended 7/31/05: | | | |
| Shares sold | 237,589 | $ | 1,584,091 |
|
| Shares issued | | | |
| in connection | | | |
| with reinvestment | | | |
| |of distributions | — | | — |
|
| | 237,589 | | 1,584,091 |
|
| Shares | | | |
| repurchased | (1,015,515) | | (6,768,198) |
|
| Net decrease | (777,926) | $ | (5,184,107) |
|
| |
| CLASS M | Shares | | Amount |
| Six months ended 1/31/06: | | |
| Shares sold | 1,269,192 | $ | 9,177,799 |
|
| Shares issued | | | |
| in connection | | | |
| with reinvestment | | | |
| of distributions | — | | — |
|
| | 1,269,192 | | 9,177,799 |
|
| Shares | | | |
| repurchased | (3,734,217) | | (27,327,087) |
|
| Net decrease | (2,465,025) | | $(18,149,288) |
| |
| Year ended 7/31/05: | | | |
| Shares sold | 5,604,066 | | $ 36,063,345 |
|
| Shares issued | | | |
| in connection | | | |
| with reinvestment | | | |
| of distributions | — | | — |
|
| | 5,604,066 | | 36,063,345 |
|
| Shares | | | |
| repurchased | (11,310,749) | | (73,939,863) |
|
| Net decrease | (5,706,683) | | $(37,876,518) |
| CLASS R | Shares | | Amount |
| Six months ended 1/31/06: | | |
| Shares sold | 3,640 | $ | 27,934 |
|
| Shares issued | | | |
| in connection | | | |
| with reinvestment | | | |
| of distributions | — | | — |
|
| | 3,640 | | 27,934 |
|
| Shares | | | |
| repurchased | (831) | | (6,172) |
|
| Net increase | 2,809 | $ | 21,762 |
| |
| Year ended 7/31/05: | | | |
| Shares sold | 10,149 | $ | 73,185 |
|
| Shares issued | | | |
| in connection | | | |
| with reinvestment | | | |
| of distributions | — | | — |
|
| | 10,149 | | 73,185 |
|
| Shares | | | |
| repurchased | (1,233) | | (8,899) |
|
| Net increase | 8,916 | $ | 64,286 |
|
| |
| CLASS Y | Shares | | Amount |
| Six months ended 1/31/06: | | |
| Shares sold | 410,827 | $ | 3,319,405 |
|
| Shares issued | | | |
| in connection | | | |
| with reinvestment | | | |
| of distributions | — | | — |
|
| | 410,827 | | 3,319,405 |
|
| Shares | | | |
| repurchased | (731,696) | | (5,859,934) |
|
| Net decrease | (320,869) | | $ (2,540,529) |
| |
| Year ended 7/31/05: | | | |
| Shares sold | 3,919,337 | | $ 28,345,792 |
|
| Shares issued | | | |
| in connection | | | |
| with reinvestment | | | |
| of distributions | — | | — |
|
| | 3,919,337 | | 28,345,792 |
|
| Shares | | | |
| repurchased | (12,641,494) | | (93,631,638) |
|
| Net decrease | (8,722,157) | | $(65,285,846) |
54
Note 5: Investment in Putnam Prime Money Market Fund
Pursuant to an exemptive order from the Securities and Exchange Commission, the fund invests in Putnam Prime Money Market Fund, an open-end management investment company managed by Putnam Management. Management fees paid by the fund are reduced by an amount equal to the management and administrative services fees paid by Putnam Prime Money Market Fund with respect to assets invested by the fund in Putnam Prime Money Market Fund. For the period ended January 31, 2006, management fees paid were reduced by $7,793 relating to the fund’s investment in Putnam Prime Money Market Fund. Income distributions earned by the fund are recorded as income in the statement of operations and totaled $241,073 for the period ended January 31, 2006. During the period ended January 31, 2006, cost of purchases and cost of sales of investments in Putnam Prime Money Market Fund aggregated $246,595,438 and $265,157,138, respectively.
Note 6: Regulatory matters and litigation
Putnam Management has entered into agreements with the Securities and Exchange Commission and the Massachusetts Securities Division settling charges connected with excessive short-term trading by Putnam employees and, in the case of the charges brought by the Massachusetts Securities Division, by participants in some Putnam-administered 401(k) plans. Pursuant to these settlement agreements, Putnam Management will pay a total of $193.5 million in penalties and restitution, with $153.5 million being paid to certain open-end funds and their shareholders. The amount will be allocated to shareholders and funds pursuant to a plan developed by an independent consultant, and will be paid following approval of the plan by the SEC and the Massachusetts Securities Division.
The Securities and Exchange Commission’s and Massachusetts Securities Division’s allegations and related matters also serve as the general basis for numerous lawsuits, including purported class action lawsuits filed against Putnam Management and certain related parties, including certain Putnam funds. Putnam Management will bear any costs incurred by Putnam funds in connection with these lawsuits. Putnam Management believes that the likelihood that the pending private lawsuits and purported class action lawsuits will have a material adverse financial impact on the fund is remote, and the pending actions are not likely to materially affect its ability to provide investment management services to its clients, including the Putnam funds.
Pursuant to a settlement with the Securities and Exchange Commission relating to Putnam Management’s brokerage allocation practices, on October 13, 2005 the fund received $503,757 in proceeds paid by Putnam Management. The fund had accrued a receivable for this amount in the prior fiscal year.
Putnam Investments has recorded a charge of $30 million for the estimated cost, excluding interest, that it believes will be necessary to address issues relating to the calculation of certain amounts paid by the Putnam mutual funds in previous years. The previous payments were cost reimbursements by the Putnam funds to Putnam for transfer agent services relating to defined contribution operations. In March 2006, the fund recorded a receivable of $1,155,483 from Putnam Investments in connection with this matter. Review of the matter is ongoing and the amount received by the fund may be adjusted in the future. Such adjustment is not expected to be material.
Putnam Management and Putnam Retail Management are named as defendants in a civil suit in which the plaintiffs allege that the management and distribution fees paid by certain Putnam funds were excessive and seek recovery under the Investment Company Act of 1940. Putnam
55
Management and Putnam Retail Management have contested the plaintiffs’ claims and the matter is currently pending in the U.S. District Court for the District of Massachusetts. Based on currently available information, Putnam Management believes that this action is without merit and that it is unlikely to have a material effect on Putnam Management’s and Putnam Retail Management’s ability to provide services to their clients, including the fund.
56
Brokerage commissions
(Unaudited)
|
Brokerage commissions are paid to firms that execute trades on behalf of your fund. When choosing these firms, Putnam is required by law to seek the best execution of the trades, taking all relevant factors into consideration, including expected quality of execution and commission rate. Listed below are the largest relationships based upon brokerage commissions for your fund and the other funds in Putnam’s U.S. Small- and Mid-Cap group for the year ended January 31, 2006. The other Putnam mutual funds in this group are Putnam Capital Opportunities Fund, Putnam Discovery Growth Fund, Putnam Mid Cap Value Fund, Putnam New Opportunities Fund, Putnam Small Cap Growth Fund, Putnam Small Cap Value Fund, Putnam Vista Fund, Putnam VT Capital Opportunities Fund, Putnam VT Discovery Growth Fund, Putnam VT Mid Cap Value Fund, Putnam VT New Opportunities Fund, Putnam VT OTC & Emerging Growth Fund, Putnam VT Small Cap Value Fund, and Putnam VT Vista Fund.
The top five firms that received brokerage commissions for trades executed for the U.S. Small-and Mid-Cap group are (in descending order) Citigroup Global Markets, Goldman Sachs, Lehman Brothers, Bank of America, and Bear Stearns & Company. Commissions paid to these firms together represented approximately 37% of the total brokerage commissions paid for the year ended January 31, 2006.
Commissions paid to the next 10 firms together represented approximately 36% of the total brokerage commissions paid during the period. These firms are (in alphabetical order) CIBC World Markets, Credit Suisse First Boston, Deutsche Bank Securities, Instinet, JP Morgan Clearing, Merrill Lynch, Morgan Stanley Dean Witter, RBC Capital Markets, SG Cowen, and UBS Warburg.
Additional information about brokerage commissions is available on the Securities and Exchange Commission (SEC) Web site at www.sec.gov. Putnam funds disclose commissions by firm to the SEC in semiannual filings on Form N-SAR.
57
The Putnam
family of funds
|
The following is a complete list of Putnam’s open-end mutual funds. Investors should carefully consider the investment objective, risks, charges, and expenses of a fund before investing. For a prospectus containing this and other information for any Putnam fund or product, call your financial advisor at 1-800-225-1581 and ask for a prospectus. Please read the prospectus carefully before investing.
| Growth funds | Value funds |
| Discovery Growth Fund | Classic Equity Fund |
| Growth Opportunities Fund | Convertible Income-Growth Trust |
| Health Sciences Trust | Equity Income Fund |
| International New Opportunities Fund* | The George Putnam Fund of Boston |
| New Opportunities Fund | The Putnam Fund for Growth |
| OTC & Emerging Growth Fund | and Income |
| Small Cap Growth Fund | International Growth and Income Fund* |
| Vista Fund | Mid Cap Value Fund |
| Voyager Fund | New Value Fund |
| | Small Cap Value Fund† |
| |
| Blend funds | Income funds |
| Capital Appreciation Fund | American Government Income Fund |
| Capital Opportunities Fund | Diversified Income Trust |
| Europe Equity Fund* | Floating Rate Income Fund |
| Global Equity Fund* | Global Income Trust* |
| Global Natural Resources Fund* | High Yield Advantage Fund*† |
| International Capital | High Yield Trust* |
| Opportunities Fund* | Income Fund |
| International Equity Fund* | Limited Duration Government |
| Investors Fund | Income Fund‡ |
| Research Fund | Money Market Fund§ |
| Tax Smart Equity Fund® | U.S. Government Income Trust |
| Utilities Growth and Income Fund | |
* A 1% redemption fee on total assets redeemed or exchanged between 6 and 90 days of purchase may be imposed for all share classes of these funds.
† Closed to new investors.
|
‡ Formerly Putnam Intermediate U.S. Government Income Fund.
§ An investment in a money market fund is not insured or guaranteed by the Federal Deposit Insurance Corporation or any other government agency. Although the fund seeks to preserve your investment at $1.00 per share, it is possible to lose money by investing in the fund.
58
Tax-free income funds
AMT-Free Insured Municipal Fund**
Tax Exempt Income Fund
Tax Exempt Money Market Fund§
Tax-Free High Yield Fund
|
State tax-free income funds:
Arizona, California, Florida, Massachusetts,
Michigan, Minnesota, New Jersey, New York,
Ohio, and Pennsylvania
|
Asset allocation funds
Income Strategies Fund
|
Putnam Asset Allocation Funds — three investment portfolios that spread your money across a variety of stocks, bonds, and money market investments.
The three portfolios:
Asset Allocation: Balanced Portfolio
Asset Allocation: Conservative Portfolio
Asset Allocation: Growth Portfolio
|
Putnam RetirementReady® Funds
Putnam RetirementReady Funds — ten investment portfolios that offer diversifica-tion among stocks, bonds, and money market instruments and adjust to become more conservative over time based on a target date for withdrawing assets.
| The ten funds: |
| Putnam RetirementReady 2050 Fund |
| Putnam RetirementReady 2045 Fund |
| Putnam RetirementReady 2040 Fund |
| Putnam RetirementReady 2035 Fund |
| Putnam RetirementReady 2030 Fund |
| Putnam RetirementReady 2025 Fund |
| Putnam RetirementReady 2020 Fund |
| Putnam RetirementReady 2015 Fund |
| Putnam RetirementReady 2010 Fund |
| Putnam RetirementReady Maturity Fund |
** Formerly Putnam Tax-Free Insured Fund.
With the exception of money market funds, a 2% redemption fee may be applied to shares exchanged or sold within 5 days of purchase.
Check your account balances and the most recent month-end performance at www.putnam.com.
59
Founded over 65 years ago, Putnam Investments was built around the concept that a balance between risk and reward is the hallmark of a well-rounded financial program. We manage over 100 mutual funds in growth, value, blend, fixed income, and international.
Investment Manager
Putnam Investment
Management, LLC
One Post Office Square
Boston, MA 02109
Marketing Services
Putnam Retail Management
One Post Office Square
Boston, MA 02109
Custodian
Putnam Fiduciary
Trust Company
Legal Counsel
Ropes & Gray LLP
Trustees
John A. Hill, Chairman
Jameson Adkins Baxter,
Vice Chairman
Charles B. Curtis
Myra R. Drucker
Charles E. Haldeman, Jr.
Paul L. Joskow
Elizabeth T. Kennan
John H. Mullin, III
Robert E. Patterson
George Putnam, III
W. Thomas Stephens
Richard B. Worley |
Officers
George Putnam, III
President
Charles E. Porter
Executive Vice President,
Associate Treasurer and
Principal Executive Officer
Jonathan S. Horwitz
Senior Vice President
and Treasurer
Steven D. Krichmar
Vice President and
Principal Financial Officer
Michael T. Healy
Assistant Treasurer and
Principal Accounting Officer
Daniel T. Gallagher
Senior Vice President,
Staff Counsel and
Compliance Liaison
Beth S. Mazor
Vice President
James P. Pappas
Vice President
Richard S. Robie, III
Vice President |
Francis J. McNamara, III
Vice President and
Chief Legal Officer
Charles A. Ruys de Perez
Vice President and
Chief Compliance Officer
Mark C. Trenchard
Vice President and
BSA Compliance Officer
Judith Cohen
Vice President, Clerk and
Assistant Treasurer
Wanda M. McManus
Vice President, Senior Associate
Treasurer and Assistant Clerk
Nancy E. Florek
Vice President, Assistant Clerk,
Assistant Treasurer and
Proxy Manager
|
This report is for the information of shareholders of Putnam OTC & Emerging Growth Fund. It may also be used as sales literature when preceded or accompanied by the current prospectus, the most recent copy of Putnam’s Quarterly Performance Summary, and Putnam’s Quarterly Ranking Summary. For more recent performance, please visit www.putnam.com. Investors should carefully consider the investment objective, risks, charges, and expenses of a fund, which are described in its prospectus. For this and other information or to request a prospectus, call 1-800-225-1581 toll free. Please read the prospectus carefully before investing. The fund’s Statement of Additional Information contains additional information about the fund’s Trustees and is available without charge upon request by calling 1-800-225-1581.
60

Item 2. Code of Ethics:
Not applicable
Item 3. Audit Committee Financial Expert:
Not applicable
Item 4. Principal Accountant Fees and Services:
Not applicable
Item 5. Audit Committee of Listed Registrants
Not applicable
Item 6. Schedule of Investments:
The registrant’s schedule of investments in unaffiliated issuers is included in the report to shareholders in Item 1 above.
Item 7. Disclosure of Proxy Voting Policies and Procedures For Closed-End Management
Investment Companies:
|
Not applicable
Item 8. Portfolio Managers of Closed-End Investment Companies
Not Applicable
Item 9. Purchases of Equity Securities by Closed-End Management Investment Companies and
Affiliated Purchasers:
|
Not applicable
Item 10. Submission of Matters to a Vote of Security Holders:
Not applicable
Item 11. Controls and Procedures:
(a) The registrant's principal executive officer and principal financial officer have concluded, based on their evaluation of the effectiveness of the design and operation of the registrant's disclosure controls and procedures as of a date within 90 days of the filing date of this report, that the design and operation of such procedures are generally effective to provide reasonable assurance that information required to be disclosed by the registrant in this report is recorded, processed, summarized and reported within the time periods specified in the Commission's rules and forms.
(b) Changes in internal control over financial reporting: Not applicable
Item 12. Exhibits:
(a)(1) Not applicable
(a)(2) Separate certifications for the principal executive officer and principal financial officer of the registrant as required by Rule 30a-2(a) under the Investment Company Act of 1940, as amended, are filed herewith.
(b) The certifications required by Rule 30a-2(b) under the Investment Company Act of 1940, as amended, are filed herewith.
SIGNATURES
Pursuant to the requirements of the Securities Exchange Act of 1934 and the Investment Company Act of 1940, the registrant has duly caused this report to be signed on its behalf by the undersigned, thereunto duly authorized.
Putnam OTC & Emerging Growth Fund
By (Signature and Title):
/s/Michael T. Healy
Michael T. Healy
Principal Accounting Officer
|
Date: March 29, 2006
Pursuant to the requirements of the Securities Exchange Act of 1934 and the Investment Company Act of 1940, this report has been signed below by the following persons on behalf of the registrant and in the capacities and on the dates indicated.
By (Signature and Title):
/s/Charles E. Porter
Charles E. Porter
Principal Executive Officer
|
Date: March 29, 2006
By (Signature and Title):
/s/Steven D. Krichmar
Steven D. Krichmar
Principal Financial Officer
|
Date: March 29, 2006