Item 1: Report to Shareholders| Growth & Income Fund | June 30, 2005 |
The views and opinions in this report were current as of June 30, 2005. They are not guarantees of performance or investment results and should not be taken as investment advice. Investment decisions reflect a variety of factors, and the managers reserve the right to change their views about individual stocks, sectors, and the markets at any time. As a result, the views expressed should not be relied upon as a forecast of the fund’s future investment intent. The report is certified under the Sarbanes-Oxley Act of 2002, which requires mutual funds and other public companies to affirm that, to the best of their knowledge, the information in their financial reports is fairly and accurately stated in all material respects.
REPORTS ON THE WEB
Sign up for our E-mail Program, and you can begin to receive updated fund reports and prospectuses online rather than through the mail. Log in to your account at troweprice.com for more information.
Fellow Shareholders
U.S. equity markets sputtered in the first half of 2005, with most major indices fluctuating within a relatively narrow trading band. In the end, the large-cap S&P 500 Stock Index declined a little less than 1%. In the large-cap universe, energy and utilities outpaced other sectors by a wide margin. Health care stocks showed some strength, with most of the group’s favorable performance coming from providers and services. Technology was the worst-performing sector during the six months but showed signs of life in the second quarter. Financials ended flat despite the Federal Reserve’s short-term interest rate hikes as investors appeared to anticipate fewer remaining rate increases. One major trend remained in place: Despite a pickup in growth sectors during the second quarter, large-cap value stocks continued to dominate their growth counterparts.
| PERFORMANCE COMPARISON |
| | | |
| Periods Ended 6/30/05 | 6 Months | 12 Months |
| Growth & Income Fund | -2.31% | 5.86% |
| S&P 500 Stock Index | -0.81 | 6.32 |
| Lipper Large-Cap Core | | |
| Funds Index | -1.01 | 4.85 |
Your fund recorded a -2.31% return during the first half of the year, trailing both the S&P 500 Index and our Lipper peer group. Twelve-month results were better, as our 5.86% return was a full percentage point ahead of our average competitor, though still narrowly behind the S&P 500. One poor stock pick accounted for nearly half of our underperformance so far this year. It was a health care company that we researched thoroughly, and we were quite optimistic about the firm’s prospects, but negative news caused a dramatic drop in the stock’s price during the first quarter. We’ll talk more about this in the Portfolio Review section of this report.
Although results in the first half were disappointing, the fund’s performance relative to its competitors remains good over the longer term. Lipper ranked the fund in the top 9% of the Lipper large-cap core funds universe for the five-year period ended June 30, 2005. (Based on cumulative total return, Lipper ranked the Growth & Income Fund 342 out of 908, 217 out of 774, 54 out of 618, and 98 out of 231 funds for the 1-, 3-, 5-, and 10-year periods ended June 30, 2005, respectively. (Past performance cannot guarantee future results.)
MARKET ENVIRONMENT
First-half equity returns were generally lackluster following a strong fourth quarter in 2004. This comes despite a stable economy and GDP growth that has slightly exceeded expectations. Perhaps the biggest surprise—a “conundrum,” according to Federal Reserve Chairman Alan Greenspan—was that long-term interest rates remained quite low even though the Fed raised its short-term target rate from 2.25% to 3.25% . Mortgage rates consequently stayed at very low levels, and the housing market maintained its buoyancy. Low borrowing rates helped spur a booming real estate sector, which is showing signs of the kind of speculative bubble that we experienced in technology stocks in the late ’90s. With so many people seemingly flipping real estate rather than stocks, one has to wonder when this housing mania will end—and how this will affect the economy.
The rebounding U.S. dollar supplied another surprise. After declining for the past two years, the greenback strengthened against most major currencies, including 9% versus the euro and 5% versus the yen. The U.S. budget and trade deficits should be keeping the dollar in check, but interest rate differentials—rising interest rates in the U.S. versus flat and possibly lower rates elsewhere—have made the dollar more attractive. Disappointing economic growth in Europe and political uncertainty in the wake of French and Dutch voters’ rejection of the proposed European Union constitution also hurt foreign currencies. The stronger dollar could put pressure on some of our holdings as many U.S.-based multinational companies have been helped by the weaker dollar over the past few years.
The pace of mergers and acquisitions also became somewhat frenzied, as many public and private companies are anxious to deploy their excess cash. Surprisingly, some of the usual players—such as fund holdings Citigroup, Viacom, and General Electric—are not participating in the mating ritual this time around. Instead, these companies have realized that size can become a hindrance to generating above-average returns and so are slimming down and simplifying their corporate structures. (Please see the financial statements of this report for a complete listing of the fund’s holdings and the amount each represents of the portfolio.)
PORTFOLIO REVIEW
Our first-half winners were uncharacteristically clustered in one sector—energy, which significantly outperformed every other sector.
Normally we expect favorable returns to come from a more diverse set of market segments, since our approach places stock selection ahead of sector allocations. Oil prices increased from the low $40s per barrel at the beginning of the year to more than $60 in late June, and this price strength provided a strong tailwind for energy stocks. As oil companies continue to spend at higher levels, demand for equipment and services is increasing. For the second report in a row, the fund’s top contributor was longtime holding Transocean, a leading provider of high-specification drilling rigs used for deepwater gas and oil wells. As mentioned in our last report, high demand for Transocean’s rigs allowed it to significantly raise its day rates (the company’s key source of revenue) for the first time in years. Other energy positions that did well included a relatively newer position, Canadian Natural Resources, along with longtime holding Baker Hughes and its much larger oilfield services peer Schlumberger. Royal Dutch Petroleum and the energy titan ExxonMobil were also quite strong.
Some of our relatively newer positions also thrived in the first half of 2005. The semiconductor giant Intel performed stoically as earnings estimates inched higher. Telus, a Canadian telecommunications company, benefited from strong cellular phone penetration rates. The company’s strong emphasis on shareholder returns, including a rather large share repurchase, also helped the stock. Diversified insurance company Assurant was a solid contributor. We sold the stock last year but repurchased it after evaluating its new stock offering, and so far the company has successfully executed on its post-IPO game plan. A final top 10 performer was utility company Duke Energy, which recently announced plans to merge with Cinergy.
As noted earlier, the fund suffered a large setback early in the period. One of our more speculative ideas, Elan Pharmaceuticals, plunged more than 75% after Tysabri, a promising multiple sclerosis drug, was voluntarily pulled from the market after a surprise adverse side effect. Given the speculative nature of the investment and Elan’s dependence on this one drug, our position was relatively small. Nevertheless, it was our largest detractor, and we were quite humbled because we spent many hours of investment research on this company and its product. We eliminated our position.
We also lost money on New York Times and International Paper. Both companies are experiencing secular and cyclical pressures. While it may take a while to see improvement, we are willing to be patient because we think their low valuations should lend support to the stocks. Another disappointment was International Gaming Technology, a dominant slot machine maker. IGT declined as results fell short of expectations on intense competition coupled with slower-than-expected rollouts of some new gaming sites. We still like IGT’s growth prospects and have held on to our position. UPS was hampered by cyclical weakness and intense competition from FedEx.
Medical technology firm Boston Scientific suffered from a series of legal and pipeline setbacks in addition to market share loss for its key product, Taxus, a drug-coated stent used to unclog arteries. Insurance broker Marsh & McLennan’s stock continued to disappoint. It was caught up in New York Attorney General Eliot Spitzer’s industry probe, but we think the worst regulatory problems are now behind the company. Our research also indicates that the sum of the company’s parts is worth more than the whole. While we are not expecting or counting on a breakup of the company, its present operating structure makes selling pieces a feasible option.
| SECTOR DIVERSIFICATION |
| | | |
| | Percent of | Percent of |
| | Net Assets | Net Assets |
| | 12/31/04 | 6/30/05 |
| Financials | 23.6% | 22.4% |
| Information Technology | 12.4 | 18.0 |
| Consumer Discretionary | 14.2 | 14.8 |
| Health Care | 9.0 | 9.3 |
| Industrials and Business Services | 13.4 | 8.7 |
| Energy | 7.9 | 8.5 |
| Consumer Staples | 6.8 | 6.5 |
| Utilities | 2.6 | 4.3 |
| Telecommunication Services | 3.3 | 2.7 |
| Materials | 6.2 | 2.5 |
| Other and Reserves | 0.6 | 2.3 |
| Total | 100.0% | 100.0% |
| Historical weightings reflect current industry/sector |
| classifications. | | |
Because of our long-term strategy, the fund tends to have a low turnover rate, but it ticked up slightly (to a still-low 53.1% at the end of the period) as we made some adjustments to the portfolio. During the most recent period, we continued to add to our technology holdings, but at a slower pace as some tech segments have begun to rebound. We purchased Linear Technology, a maker of high-performance semiconductors that has a strong research backbone. We also added EMC and IBM. EMC is a storage hardware provider that should benefit from corporate America’s need to store data to meet regulatory compliance requirements. We have long avoided IBM, but we think that negative news has been more than priced into the stock.
We started a position in Boston Scientific, mentioned earlier. It’s one of the country’s largest medical technology companies and has been trading at a large valuation discount to its peers because of some near-term issues. We repurchased business services company First Data, a holding of many years ago, as sentiment and earnings expectations have moderated to more reasonable levels. In the case of cable giant Comcast, we think the risks of telephone companies competing in the data and video arenas are reflected in the share price and that its valuation is now reasonable given the company’s growth prospects and the predictability of its business. The company is also committed to returning cash to shareholders through stock repurchases. We also added our first new bank in some time—Cincinnati-based Fifth Third. The company no longer trades at a premium to its peers, appears to be past its regulatory issues, and offers an attractive yield of over 3%.
We eliminated a few of our recent winners whose current valuations exceeded our price targets: fertilizer producer Potash Corp./ Saskatchewan, railroad companies CSX and Burlington Northern Santa Fe, and Dow Chemical. We eliminated three other positions to make room for new ideas: Lockheed Martin as the stock rebounded from fears of defense spending cuts; Maxim Integrated Products; and American Express as the stock’s premium valuation reflected favorable recent events at the company.
SUMMARY AND OUTLOOK
The economic outlook remains positive, but in some sectors, earnings expectations—a key driver of stock price performance—reflect a lot of optimism. In the second quarter, the mood of bearishness lifted even from the technology sector. Consequently, we are no longer adding to our technology exposure, although our allocation to the sector is now above its weighting in the S&P 500 for the first time in many years. The fund is still balanced between growth and value stocks, but we will likely shift more toward growth if value continues to dominate.
| FINANCIAL PROFILE |
| | | |
| | Growth & | S&P 500 |
| As of 6/30/05 | Income Fund | Stock Index |
| Average Company Yield | 1.7% | 1.9% |
| Price/Book Ratio | 3.0X | 3.3X |
| Price/Earnings Ratio | | |
| (2005 estimated EPS)* | 11.9X | 11.2X |
| Historical Beta | | |
| (based on monthly | | |
| returns for five years)* | 0.94 | 1.00 |
| *Source for data: IBES. Forecasts are in no way indicative of |
| future investment returns. | | |
| Just as we started the year, we believe the fund is favorably positioned |
| for the rest of 2005: |
| |
| • | The fund’s holdings remain well diversified, giving us an |
| | opportunity to participate in further economic growth, yet |
| | offering some downside protection should the strength of the |
| | recovery recede. |
| • | Valuations for many large-cap, dividend-paying companies |
| | are still reasonable, especially when compared with small- |
| | and mid-cap companies. |
| • | Many of the companies we own generate substantial free cash |
| | flow and are focused more than ever on using this cash to |
| | improve their balance sheets or return cash to shareholders, |
| | rather than funding speculative internal or external growth |
| | initiatives. |
We appreciate your confidence in T. Rowe Price and your continued support.
Respectfully submitted,

Anna M. Dopkin
Chairman of the fund’s Investment Advisory Committee
July 18, 2005
The committee chairman has day-to-day responsibility for managing the portfolio and works with committee members in developing and executing the fund’s investment program.
RISKS OF STOCK INVESTING
The fund’s share price can fall because of weakness in the stock markets, a particular industry, or specific holdings. Stock markets can decline for many reasons, including adverse political or economic developments, changes in investor psychology, or heavy institutional selling. The prospects for an industry or company may deteriorate because of a variety of factors, including disappointing earnings or changes in the competitive environment. In addition, the investment manager’s assessment of companies held in a fund may prove incorrect, resulting in losses or poor performance even in rising markets. While the fund will seek dividend-paying stocks, the overall income level is not expected to play a meaningful role in cushioning its share price against market declines.
GLOSSARY
Beta: A measure of the market risk of a portfolio showing how responsive the fund is to a given market index. By definition, the beta of the benchmark index is 1.00. Usually, higher betas represent riskier investments.
Dividend yield: The annual dividend of a stock divided by the stock’s price.
Lipper indexes: Fund benchmarks that consist of a small number of the largest mutual funds in a particular category as tracked by Lipper Inc.
Price/book ratio: A valuation measure that compares a stock’s market price to its book value, i.e., the company’s net worth divided by the number of outstanding shares.
Price/earnings ratio (P/E): A valuation measure calculated by dividing the price of a stock by its current or projected earnings per share. This ratio gives investors an idea of how much they are paying for current or future earnings power.
S&P 500 Stock Index: An unmanaged index that tracks the stocks of 500 primarily large-cap U.S. companies.
| PORTFOLIO HIGHLIGHTS |
| |
TWENTY-FIVE LARGEST HOLDINGS | |
| | Percent of |
| | Net Assets |
| | 6/30/05 |
| |
| GE | 3.0% |
| Citigroup | 2.6 |
| Microsoft | 2.4 |
| Time Warner | 1.5 |
| Boston Scientific | 1.5 |
| St. Paul Companies | 1.4 |
| Dell | 1.4 |
| Honeywell International | 1.3 |
| Duke Energy | 1.3 |
| Royal Dutch Petroleum | 1.3 |
| ExxonMobil | 1.3 |
| Marsh & McLennan | 1.3 |
| BP | 1.3 |
| Analog Devices | 1.3 |
| Viacom | 1.3 |
| Coca-Cola | 1.3 |
| Morgan Stanley | 1.2 |
| Cisco Systems | 1.2 |
| News Corp | 1.2 |
| American International Group | 1.2 |
| Sprint | 1.2 |
| Intel | 1.1 |
| Flextronics | 1.1 |
| Altria Group | 1.1 |
| Baker Hughes | 1.1 |
| Total | 35.9% |
| |
| Note: Table excludes investments in the T. Rowe Price Reserve Investment Fund. | |
| PORTFOLIO HIGHLIGHTS |
| |
| MAJOR PORTFOLIO CHANGES | |
| Listed in descending order of size | |
| |
| 6 Months Ended 6/30/05 | |
| |
| Largest Purchases | Largest Sales |
| |
| Boston Scientific* | Potash Corp./Saskatchewan** |
| IBM* | CSX** |
| Linear Technology* | Lockheed Martin** |
| Fifth Third Bancorp* | Burlington Northern Santa Fe** |
| First Data* | American Express** |
| Comcast* | Transocean |
| EMC* | Fortune Brands** |
| NiSource* | Dow Chemical** |
| Assurant* | Maxim Integrated Products** |
| Merrill Lynch | Deere** |
| |
| ** Position added | |
| ** Position eliminated | |
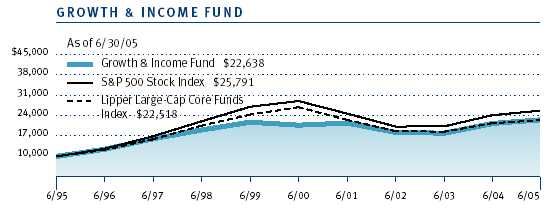
This chart shows the value of a hypothetical $10,000 investment in the fund over the past 10 fiscal year periods or since inception (for funds lacking 10-year records). The result is compared with benchmarks, which may include a broad-based market index and a peer group average or index. Market indexes do not include expenses, which are deducted from fund returns as well as mutual fund averages and indexes.
| AVERAGE ANNUAL COMPOUND TOTAL RETURN |
|
| |
| This table shows how the fund and its benchmarks would have performed if their actual (or |
| cumulative) returns for the periods shown had been earned at a constant rate. |
|
| | | | |
| Periods Ended 6/30/05 | 1 Year | 5 Years | 10 Years |
| |
| Growth & Income Fund | 5.86% | 1.73% | 8.51% |
| |
| S&P 500 Stock Index | 6.32 | -2.37 | 9.94 |
| |
| Lipper Large-Cap Core | | | |
| Funds Index | 4.85 | -3.54 | 8.46 |
| |
| Current performance may be higher or lower than the quoted past performance, which can- |
| not guarantee future results. Share price, principal value, and return will vary, and you may |
| have a gain or loss when you sell your shares. For the most recent month-end performance |
| information, please visit our Web site (troweprice.com) or contact a T. Rowe Price repre- |
| sentative at 1-800-225-5132. |
| |
| Average annual total return figures include changes in principal value, reinvested dividends, and capi- |
| tal gain distributions. Returns do not reflect taxes that the shareholder may pay on fund distributions |
| or the redemption of fund shares. |
Fund Expense Example
As a mutual fund shareholder, you may incur two types of costs: (1) transaction costs such as redemption fees or sales loads and (2) ongoing costs, including management fees, distribution and service (12b-1) fees, and other fund expenses. The following example is intended to help you understand your ongoing costs (in dollars) of investing in the fund and to compare these costs with the ongoing costs of investing in other mutual funds. The example is based on an investment of $1,000 invested at the beginning of the most recent six-month period and held for the entire period.
Actual Expenses
The first line of the following table (“Actual”) provides information about actual account values and actual expenses. You may use the information in this line, together with your account balance, to estimate the expenses that you paid over the period. Simply divide your account value by $1,000 (for example, an $8,600 account value divided by $1,000 = 8.6), then multiply the result by the number in the first line under the heading “Expenses Paid During Period” to estimate the expenses you paid on your account during this period.
Hypothetical Example for Comparison Purposes
The information on the second line of the table (“Hypothetical”) is based on hypothetical account values and expenses derived from the fund’s actual expense ratio and an assumed 5% per year rate of return before expenses (not the fund’s actual return). You may compare the ongoing costs of investing in the fund with other funds by contrasting this 5% hypothetical example and the 5% hypothetical examples that appear in the shareholder reports of the other funds. The hypothetical account values and expenses may not be used to estimate the actual ending account balance or expenses you paid for the period.
Note: T. Rowe Price charges an annual small-account maintenance fee of $10, generally for accounts with less than $2,000 ($500 for UGMA/UTMA). The fee is waived for any investor whose T. Rowe Price mutual fund accounts total $25,000 or more, accounts employing automatic investing, and IRAs and other retirement plan accounts that utilize a prototype plan sponsored by T. Rowe Price (although a separate custodial or administrative fee may apply to such accounts). This fee is not included in the accompanying table. If you are subject to the fee, keep it in mind when you are estimating the ongoing expenses of investing in the fund and when comparing the expenses of this fund with other funds. You should also be aware that the expenses shown in the table highlight only your ongoing costs and do not reflect any transaction costs, such as redemption fees or sales loads. Therefore, the second line of the table is useful in comparing ongoing costs only and will not help you determine the relative total costs of owning different funds. To the extent a fund charges transaction costs, however, the total cost of owning that fund is higher.
| T. ROWE PRICE GROWTH & INCOME FUND |
| |
| | Beginning | Ending | Expenses Paid |
| | Account Value | Account Value | During Period* |
| | 1/1/05 | 6/30/05 | 1/1/05 to 6/30/05 |
| Actual | $1,000.00 | $ 976.90 | $3.82 |
| Hypothetical (assumes 5% | | | |
| return before expenses) | 1,000.00 | 1,020.93 | 3.91 |
| * Expenses are equal to the fund’s annualized expense ratio for the six-month period (0.78%), multi- |
| * plied by the average account value over the period, multiplied by the number of days in the most |
| * recent fiscal half year (181) divided by the days in the year (365) to reflect the half-year period. |
Unaudited
| FINANCIAL HIGHLIGHTS | | | | For a share outstanding throughout each period |
| |
| | | 6 Months | | Year | | | | | | | | |
| | | Ended | | Ended | | | | | | | | |
| | | 6/30/05** | | 12/31/04 | | 12/31/03 | | 12/31/02 | | 12/31/01 | | 12/31/00 |
| NET ASSET VALUE | | | | | | | | | | | | |
| Beginning of period | $ | 22.51 | $ | 21.72 | $ | 17.11 | $ | 22.82 | $ | 24.44 | $ | 24.44 |
|
|
| |
| Investment activities | | | | | | | | | | | | |
| Net investment income (loss) | | 0.11 | | 0.26 | | 0.19 | | 0.17 | | 0.25 | | 0.34 |
| Net realized and | | | | | | | | | | | | |
| unrealized gain (loss) | | (0.64) | | 2.06 | | 4.61 | | (5.57) | | (0.83) | | 1.83 |
|
|
| Total from | | | | | | | | | | | | |
| investment activities | | (0.53) | | 2.32 | | 4.80 | | (5.40) | | (0.58) | | 2.17 |
|
|
| |
| Distributions | | | | | | | | | | | | |
| Net investment income | | (0.11) | | (0.26) | | (0.19) | | (0.16) | | (0.26) | | (0.34) |
| Net realized gain | | (0.39) | | (1.27) | | – | | (0.15) | | (0.78) | | (1.83) |
|
|
| Total distributions | | (0.50) | | (1.53) | | (0.19) | | (0.31) | | (1.04) | | (2.17) |
|
|
| |
| NET ASSET VALUE | | | | | | | | | | | | |
| End of period | $ | 21.48 | $ | 22.51 | $ | 21.72 | $ | 17.11 | $ | 22.82 | $ | 24.44 |
|
|
| |
| |
| Ratios/Supplemental Data | | | | | | | | | | | | |
| Total return^ | | (2.31)% | | 10.82% | | 28.22% | | (23.84)% | | (2.17)% | | 8.97% |
| Ratio of total expenses to | | | | | | | | | | | | |
| average net assets | | 0.78%† | | 0.78% | | 0.82% | | 0.81% | | 0.81% | | 0.77% |
| Ratio of net investment | | | | | | | | | | | | |
| income (loss) to average | | | | | | | | | | | | |
| net assets | | 0.99%† | | 1.15%+ | | 1.02% | | 0.84% | | 1.08% | | 1.35% |
| Portfolio turnover rate | | 53.1%† | | 36.4% | | 40.5% | | 44.7% | | 65.9% | | 80.3% |
| Net assets, end of period | | | | | | | | | | | | |
| (in millions) | $ | 1,761 | $ | 1,881 | $ | 1,964 | $ | 1,675 | $ | 2,394 | $ | 2,989 |
| |
| ^ | Total return reflects the rate that an investor would have earned on an investment in the fund during each |
| period, assuming reinvestment of all distributions. |
| † | Annualized |
| ** | Per share amounts calculated using average shares outstanding method. |
| + | Includes the effect of a one-time special dividend (0.24% of average net assets) that is not expected to recur. |
| |
| The accompanying notes are an integral part of these financial statements. |
Unaudited
| PORTFOLIO OF INVESTMENTS (1) | Shares | Value |
| (Cost and value in $ 000s) | | |
| | | |
| COMMON STOCKS 97.7% | | |
| |
| CONSUMER DISCRETIONARY 14.8% | | |
| Hotels, Restaurants & Leisure 2.3% | | |
| International Game Technology | 647,000 | 18,213 |
| Royal Caribbean Cruises | 260,000 | 12,574 |
| Station Casinos | 60,000 | 3,984 |
| Wynn Resorts * | 115,000 | 5,436 |
| | | 40,207 |
| Internet & Catalog Retail 0.5% | | |
| Amazon.com * | 280,000 | 9,262 |
| | | 9,262 |
| Media 8.0% | | |
| Clear Channel Communications | 586,000 | 18,125 |
| Comcast, Special Class A * | 540,000 | 16,173 |
| Disney | 350,000 | 8,813 |
| New York Times, Class A | 328,000 | 10,217 |
| News Corp., Class A | 1,304,000 | 21,099 |
| Scripps, Class A | 252,000 | 12,298 |
| Time Warner * | 1,585,000 | 26,485 |
| Viacom, Class B | 695,000 | 22,254 |
| Washington Post, Class B | 7,400 | 6,179 |
| | | 141,643 |
| Multiline Retail 1.9% | | |
| Family Dollar Stores | 689,000 | 17,983 |
| Kohl's * | 275,000 | 15,375 |
| | | 33,358 |
| Specialty Retail 2.1% | | |
| Home Depot | 205,000 | 7,975 |
| RadioShack | 500,000 | 11,585 |
| TJX | 680,000 | 16,558 |
| | | 36,118 |
| Total Consumer Discretionary | | 260,588 |
| | | |
| CONSUMER STAPLES 6.5% | | |
| Beverages 2.3% | | |
| Coca-Cola | 530,000 | 22,128 |
| PepsiCo | 340,000 | 18,336 |
| | | 40,464 |
| Food & Staples Retailing 1.8% | | |
| Sysco | 400,000 | 14,476 |
| Wal-Mart | 360,000 | 17,352 |
| | | 31,828 |
| Food Products 0.9% | | |
| General Mills | 325,000 | 15,207 |
| | | 15,207 |
| Household Products 0.4% | | |
| Colgate-Palmolive | 130,000 | 6,488 |
| | | 6,488 |
| Tobacco 1.1% | | |
| Altria Group | 305,000 | 19,721 |
| | | 19,721 |
| Total Consumer Staples | | 113,708 |
| |
| ENERGY 8.5% | | |
| Energy Equipment & Services 2.9% | | |
| Baker Hughes | 385,000 | 19,696 |
| Schlumberger | 235,000 | 17,846 |
| Transocean * | 245,000 | 13,223 |
| | | 50,765 |
| Oil, Gas & Consumable Fuels 5.6% | | |
| BP ADR | 360,000 | 22,457 |
| Canadian Natural Resources | 290,000 | 10,550 |
| Chevron | 170,000 | 9,506 |
| ExxonMobil | 395,000 | 22,701 |
| Royal Dutch Petroleum ADS | 350,000 | 22,715 |
| Total ADR | 90,000 | 10,517 |
| | | 98,446 |
| Total Energy | | 149,211 |
| | | |
| FINANCIALS 22.4% | | |
| Capital Markets 7.6% | | |
| AmeriTrade * | 150,000 | 2,789 |
| Bank of New York | 615,000 | 17,700 |
| Charles Schwab | 1,265,000 | 14,269 |
| Franklin Resources | 215,000 | 16,551 |
| Goldman Sachs | 115,000 | 11,732 |
| Mellon Financial | 420,000 | 12,050 |
| Merrill Lynch | 310,000 | 17,053 |
| Morgan Stanley | 411,000 | 21,565 |
| Northern Trust | 90,000 | 4,103 |
| State Street | 325,000 | 15,681 |
| | | 133,493 |
| Commercial Banks 2.7% | | |
| Fifth Third Bancorp | 430,000 | 17,720 |
| Royal Bank of Scotland (GBP) | 445,000 | 13,408 |
| U.S. Bancorp | 580,000 | 16,936 |
| | | 48,064 |
| Diversified Financial Services 3.2% | | |
| Citigroup | 990,000 | 45,767 |
| J.P. Morgan Chase | 271,000 | 9,572 |
| | | 55,339 |
| Insurance 7.1% | | |
| AFLAC | 185,000 | 8,007 |
| American International Group | 350,000 | 20,335 |
| Assurant | 432,600 | 15,617 |
| Berkshire Hathaway, Class A * | 130 | 10,855 |
| Marsh & McLennan | 815,000 | 22,575 |
| SAFECO | 140,000 | 7,608 |
| St. Paul Companies | 637,000 | 25,181 |
| Willis Group Holdings | 110,000 | 3,599 |
| XL Capital | 160,000 | 11,907 |
| | | 125,684 |
| Real Estate 0.9% | | |
| Equity Residential, REIT | 445,000 | 16,385 |
| | | 16,385 |
| Thrifts & Mortgage Finance 0.9% | | |
| Fannie Mae | 150,000 | 8,760 |
| Freddie Mac | 117,000 | 7,632 |
| | | 16,392 |
| Total Financials | | 395,357 |
| |
| HEALTH CARE 9.3% | | |
| Biotechnology 0.8% | | |
| MedImmune * | 525,200 | 14,033 |
| | | 14,033 |
| Health Care Equipment & Supplies 3.1% | | |
| Baxter International | 346,000 | 12,836 |
| Biomet | 75,000 | 2,598 |
| Boston Scientific * | 970,000 | 26,190 |
| Medtronic | 254,000 | 13,155 |
| | | 54,779 |
| Health Care Providers & Services 0.7% | | |
| Tenet Healthcare * | 1,000,000 | 12,240 |
| | | 12,240 |
| Pharmaceuticals 4.7% | | |
| Barr Pharmaceuticals * | 125,000 | 6,093 |
| Forest Laboratories * | 240,000 | 9,324 |
| Johnson & Johnson | 165,000 | 10,725 |
| Merck | 532,000 | 16,386 |
| Schering-Plough | 370,000 | 7,052 |
| Teva Pharmaceutical ADR | 506,000 | 15,757 |
| Wyeth | 375,000 | 16,687 |
| | | 82,024 |
| Total Health Care | | 163,076 |
| |
| INDUSTRIALS & BUSINESS SERVICES 8.7% | | |
| Aerospace & Defense 1.3% | | |
| Honeywell International | 635,000 | 23,260 |
| | | 23,260 |
| Air Freight & Logistics 0.7% | | |
| UPS, Class B | 175,000 | 12,103 |
| | | 12,103 |
| Airlines 1.0% | | |
| Southwest Airlines | 1,270,000 | 17,691 |
| | | 17,691 |
| Commercial Services & Supplies 0.6% | | |
| Cintas | 260,000 | 10,036 |
| | | 10,036 |
| Industrial Conglomerates 3.9% | | |
| GE | 1,515,000 | 52,495 |
| Tyco International | 585,000 | 17,082 |
| | | 69,577 |
| Machinery 0.4% | | |
| Danaher | 135,000 | 7,066 |
| | | 7,066 |
| Road & Rail 0.8% | | |
| Union Pacific | 221,000 | 14,321 |
| | | 14,321 |
| Total Industrials & Business Services | | 154,054 |
| |
| INFORMATION TECHNOLOGY 18.0% | | |
| Communications Equipment 2.5% | | |
| Cisco Systems * | 1,125,000 | 21,499 |
| Juniper Networks * | 612,900 | 15,433 |
| Nokia ADR | 480,000 | 7,987 |
| | | 44,919 |
| Computers & Peripherals 4.0% | | |
| Dell * | 605,000 | 23,903 |
| EMC * | 1,255,000 | 17,206 |
| Hewlett-Packard | 427,000 | 10,039 |
| IBM | 260,000 | 19,292 |
| | | 70,440 |
| Electronic Equipment & Instruments 1.8% | | |
| Agilent Technologies * | 480,000 | 11,049 |
| Flextronics * | 1,500,000 | 19,815 |
| | | 30,864 |
| IT Services 1.0% | | |
| First Data | 435,000 | 17,461 |
| | | 17,461 |
| Semiconductor & Semiconductor Equipment 4.7% | | |
| Analog Devices | 600,000 | 22,386 |
| Intel | 770,000 | 20,066 |
| KLA-Tencor | 177,000 | 7,735 |
| Linear Technology | 485,000 | 17,795 |
| Xilinx | 600,000 | 15,300 |
| | | 83,282 |
| Software 4.0% | | |
| Adobe Systems | 110,000 | 3,148 |
| Microsoft | 1,705,000 | 42,353 |
| Oracle * | 1,151,000 | 15,193 |
| Symantec * | 438,000 | 9,522 |
| | | 70,216 |
| Total Information Technology | | 317,182 |
| |
| MATERIALS 2.5% | | |
| Chemicals 0.5% | | |
| DuPont | 230,000 | 9,892 |
| | | 9,892 |
| Metals & Mining 1.2% | | |
| Alcoa | 561,000 | 14,659 |
| Newmont Mining | 160,000 | 6,245 |
| | | 20,904 |
| Paper & Forest Products 0.8% | | |
| International Paper | 470,000 | 14,199 |
| | | 14,199 |
| Total Materials | | 44,995 |
| | | |
| TELECOMMUNICATION SERVICES 2.7% | | |
| Diversified Telecommunication Services 2.7% | | |
| Sprint | 810,000 | 20,323 |
| Telus (Non-voting shares) | 480,000 | 16,325 |
| Verizon Communications | 310,000 | 10,710 |
| Total Telecommunication Services | | 47,358 |
| |
| UTILITIES 4.3% | | |
| Electric Utilities 2.1% | | |
| Edison International | 337,000 | 13,665 |
| Pinnacle West Capital | 215,000 | 9,557 |
| PPL | 222,000 | 13,182 |
| | | 36,404 |
| Gas Utilities 0.9% | | |
| NiSource | 642,000 | 15,877 |
| | | 15,877 |
| Independent Power Producers & Energy Traders 1.3% | | |
| Duke Energy | 767,000 | 22,803 |
| | | 22,803 |
| Total Utilities | | 75,084 |
| Total Common Stocks (Cost $1,462,531) | | 1,720,613 |
| |
| SHORT-TERM INVESTMENTS 2.9% | | |
| | | |
| Money Market Fund 2.9% | | |
| T. Rowe Price Reserve Investment Fund, 3.14% #† | 50,761,963 | 50,762 |
| Total Short-Term Investments (Cost $50,762) | | 50,762 |
| |
| Total Investments in Securities | | |
| 100.6% of Net Assets (Cost $1,513,293) | $ | 1,771,375 |
| (1) | Denominated in U.S. dollars unless other- | | |
| | wise noted | ADR | American Depository Receipts |
| # | Seven-day yield | ADS | American Depository Shares |
| * | Non-income producing | GBP | British pound |
| † | Affiliated company – See Note 4. | REIT | Real Estate Investment Trust |
| |
| The accompanying notes are an integral part of these financial statements. |
Unaudited
| STATEMENT OF ASSETS AND LIABILITIES |
| (In thousands except shares and per share amounts) | | |
| Assets | | |
| Investments in securities, at value | | |
| Affiliated companies (cost $50,762) | $ | 50,762 |
| Non-affiliated companies (cost $1,462,531) | | 1,720,613 |
|
|
| Total investments in securities | | 1,771,375 |
| Dividends receivable | | 2,458 |
| Receivable for investment securities sold | | 9,797 |
| Receivable for shares sold | | 522 |
| Other assets | | 17 |
|
|
| Total assets | | 1,784,169 |
|
|
| |
| Liabilities | | |
| Investment management fees payable | | 822 |
| Payable for investment securities purchased | | 18,727 |
| Payable for shares redeemed | | 3,164 |
| Due to affiliates | | 331 |
| Other liabilities | | 279 |
|
|
| Total liabilities | | 23,323 |
|
|
| |
| NET ASSETS | $ | 1,760,846 |
|
|
| Net Assets Consist of: | | |
| Undistributed net investment income (loss) | $ | 556 |
| Undistributed net realized gain (loss) | | 116,379 |
| Net unrealized gain (loss) | | 258,083 |
| Paid-in-capital applicable to 81,969,861 shares of | | |
| $0.01 par value capital stock outstanding; | | |
| 500,000,000 shares authorized | | 1,385,828 |
|
|
| |
| NET ASSETS | $ | 1,760,846 |
|
|
| |
| NET ASSET VALUE PER SHARE | $ | 21.48 |
|
|
| |
| The accompanying notes are an integral part of these financial statements. | | |
Unaudited
| STATEMENT OF OPERATIONS |
| ($ 000s) | | |
| | | 6 Months |
| | | Ended |
| | | 6/30/05 |
| Investment Income (Loss) | | |
| Income | | |
| Dividend | $ | 15,583 |
| Securities lending | | 21 |
|
|
| Total income | | 15,604 |
|
|
| Expenses | | |
| Investment management | | 4,976 |
| Shareholder servicing | | 1,715 |
| Custody and accounting | | 82 |
| Prospectus and shareholder reports | | 47 |
| Registration | | 16 |
| Proxy and annual meeting | | 13 |
| Legal and audit | | 8 |
| Directors | | 5 |
| Miscellaneous | | 2 |
|
|
| Total expenses | | 6,864 |
| Expenses paid indirectly | | (2) |
|
|
| Net expenses | | 6,862 |
|
|
| Net investment income (loss) | | 8,742 |
|
|
| |
| Realized and Unrealized Gain (Loss) | | |
| Net realized gain (loss) | | |
| Securities | | 115,729 |
| Foreign currency transactions | | (31) |
|
|
| Net realized gain (loss) | | 115,698 |
|
|
| Change in net unrealized gain (loss) | | |
| Securities | | (167,267) |
| Other assets and liabilities | | |
| denominated in foreign currencies | | 2 |
|
|
| Change in net unrealized gain (loss) | | (167,265) |
|
|
| Net realized and unrealized gain (loss) | | (51,567) |
|
|
| |
| INCREASE (DECREASE) IN NET | | |
| ASSETS FROM OPERATIONS | $ | (42,825) |
|
|
| |
| The accompanying notes are an integral part of these financial statements. | | |
Unaudited
| STATEMENT OF CHANGES IN NET ASSETS |
| ($ 000s) | | | | |
| | | 6 Months | | Year |
| | | Ended | | Ended |
| | | 6/30/05 | | 12/31/04 |
| |
| Increase (Decrease) in Net Assets | | | | |
| Operations | | | | |
| Net investment income (loss) | $ | 8,742 | $ | 22,020 |
| Net realized gain (loss) | | 115,698 | | 171,618 |
| Change in net unrealized gain (loss) | | (167,265) | | (2,679) |
|
|
| Increase (decrease) in net assets from operations | | (42,825) | | 190,959 |
|
|
| |
| Distributions to shareholders | | | | |
| Net investment income | | (8,998) | | (21,977) |
| Net realized gain | | (31,610) | | (102,156) |
|
|
| Decrease in net assets from distributions | | (40,608) | | (124,133) |
|
|
| |
| Capital share transactions * | | | | |
| Shares sold | | 78,459 | | 164,672 |
| Distributions reinvested | | 39,300 | | 120,301 |
| Shares redeemed | | (154,435) | | (434,590) |
|
|
| Increase (decrease) in net assets from capital | | | | |
| share transactions | | (36,676) | | (149,617) |
|
|
| |
| Net Assets | | | | |
| Increase (decrease) during period | | (120,109) | | (82,791) |
| Beginning of period | | 1,880,955 | | 1,963,746 |
|
|
| |
| End of period | $ | 1,760,846 | $ | 1,880,955 |
|
|
| (Including undistributed net investment income of | | | | |
| $556 at 6/30/05 and $812 at 12/31/04) | | | | |
| |
| *Share information | | | | |
| Shares sold | | 3,615 | | 7,476 |
| Distributions reinvested | | 1,858 | | 5,416 |
| Shares redeemed | | (7,078) | | (19,742) |
|
|
| Increase (decrease) in shares outstanding | | (1,605) | | (6,850) |
| |
| The accompanying notes are an integral part of these financial statements. |
Unaudited
| NOTES TO FINANCIAL STATEMENTS |
NOTE 1 - SIGNIFICANT ACCOUNTING POLICIES
T. Rowe Price Growth & Income Fund, Inc. (the fund) is registered under the Investment Company Act of 1940 (the 1940 Act) as a diversified, open-end management investment company. The fund commenced operations on December 21, 1982. The fund seeks to provide long-term capital growth, a reasonable level of current income, and increasing future income through investments primarily in dividend-paying common stocks.
The accompanying financial statements were prepared in accordance with accounting principles generally accepted in the United States of America, which require the use of estimates made by fund management. Fund management believes that estimates and security valuations are appropriate; however actual results may differ from those estimates, and the security valuations reflected in the financial statements may differ from the value the fund receives upon sale of the securities.
Valuation The fund values its investments and computes its net asset value per share at the close of the New York Stock Exchange (NYSE), normally 4 p.m. ET, each day that the NYSE is open for business. Equity securities listed or regularly traded on a securities exchange or in the over-the-counter market are valued at the last quoted sale price or, for certain markets, the official closing price at the time the valuations are made, except for OTC Bulletin Board securities, which are valued at the mean of the latest bid and asked prices. A security that is listed or traded on more than one exchange is valued at the quotation on the exchange determined to be the primary market for such security. Listed securities not traded on a particular day are valued at the mean of the latest bid and asked prices for domestic securities and the last quoted sale price for international securities.
Investments in mutual funds are valued at the mutual fund’s closing net asset value per share on the day of valuation.
Other investments, including restricted securities, and those for which the above valuation procedures are inappropriate or are deemed not to reflect fair value are stated at fair value as determined in good faith by the T. Rowe Price Valuation Committee, established by the fund’s Board of Directors.
Most foreign markets close before the close of trading on the NYSE. If the fund determines that developments between the close of a foreign market and the close of the NYSE will, in its judgment, materially affect the value of some or all of its portfolio securities, which in turn will affect the fund’s share price, the fund will adjust the previous closing prices to reflect the fair value of the securities as of the close of the NYSE, as determined in good faith by the T. Rowe Price Valuation Committee, established by the fund’s Board of Directors. A fund may also fair value securities in other situations, such as when a particular foreign market is closed but the fund is open. In deciding whether to make fair value adjustments, the fund reviews a variety of factors, including developments in foreign markets, the performance of U.S. securities markets, and the performance of instruments trading in U.S. markets that represent foreign securities and baskets of foreign securities. The fund uses outside pricing services to provide it with closing market prices and information used for adjusting those prices. The fund cannot predict when and how often it will use closing prices and when it will adjust those prices to reflect fair value. As a means of evaluating its fair value process, the fund routinely compares closing market prices, the next day’s opening prices in the same markets, and adjusted prices.
Currency Translation Assets, including investments, and liabilities denominated in foreign currencies are translated into U.S. dollar values each day at the prevailing exchange rate, using the mean of the bid and asked prices of such currencies against U.S. dollars as quoted by a major bank. Purchases and sales of securities, income, and expenses are translated into U.S. dollars at the prevailing exchange rate on the date of the transaction. The effect of changes in foreign currency exchange rates on realized and unrealized security gains and losses is reflected as a component of security gains and losses.
Rebates and Credits Subject to best execution, the fund may direct certain security trades to brokers who have agreed to rebate a portion of the related brokerage commission to the fund in cash. Commission rebates are included in realized gain on securities in the accompanying financial statements and totaled $101,000 for the six months ended June 30, 2005. Additionally, the fund earns credits on temporarily uninvested cash balances at the custodian that reduce the fund’s custody charges. Custody expense in the accompanying financial statements is presented before reduction for credits, which are reflected as expenses paid indirectly.
Investment Transactions, Investment Income, and Distributions Income and expenses are recorded on the accrual basis. Dividends received from mutual fund investments are reflected as dividend income; capital gain distributions are reflected as realized gain/loss. Dividend income and capital gain distributions are recorded on the ex-dividend date. Investment transactions are accounted for on the trade date. Realized gains and losses are reported on the identified cost basis. Distributions to shareholders are recorded on the ex-dividend date. Income distributions are declared and paid on a quarterly basis. Capital gain distributions, if any, are declared and paid by the fund, typically on an annual basis.
NOTE 2 - INVESTMENT TRANSACTIONS
Consistent with its investment objective, the fund engages in the following practices to manage exposure to certain risks or enhance performance. The investment objective, policies, program, and risk factors of the fund are described more fully in the fund’s prospectus and Statement of Additional Information.
Securities Lending The fund lends its securities to approved brokers to earn additional income. It receives as collateral cash and U.S. government securities valued at 102% to 105% of the value of the securities on loan. Cash collateral is invested in a money market pooled trust managed by the fund’s lending agent in accordance with investment guidelines approved by fund management. Collateral is maintained over the life of the loan in an amount not less than the value of loaned securities, as determined at the close of fund business each day; any additional collateral required due to changes in security values is delivered to the fund the next business day. Although risk is mitigated by the collateral, the fund could experience a delay in recovering its securities and a possible loss of income or value if the borrower fails to return the securities. Securities lending revenue recognized by the fund consists of earnings on invested collateral and borrowing fees, net of any rebates to the borrower and compensation to the lending agent. At June 30, 2005, there were no securities on loan.
Other Purchases and sales of portfolio securities, other than short-term securities, aggregated $465,556,000 and $563,410,000, respectively, for the six months ended June 30, 2005.
NOTE 3 - FEDERAL INCOME TAXES
No provision for federal income taxes is required since the fund intends to continue to qualify as a regulated investment company under Subchapter M of the Internal Revenue Code and distribute to shareholders all of its taxable income and gains. Federal income tax regulations differ from generally accepted accounting principles; therefore, distributions determined in accordance with tax regulations may differ in amount or character from net investment income and realized gains for financial reporting purposes. Financial reporting records are adjusted for permanent book/tax differences to reflect tax character. Financial records are not adjusted for temporary differences. The amount and character of tax-basis distributions and composition of net assets are finalized at fiscal year-end; accordingly, tax-basis balances have not been determined as of June 30, 2005.
At June 30, 2005, the cost of investments for federal income tax purposes was $1,513,293,000. Net unrealized gain aggregated $258,083,000 at period-end, of which $346,275,000 related to appreciated investments and $88,192,000 related to depreciated investments.
NOTE 4 - RELATED PARTY TRANSACTIONS
The fund is managed by T. Rowe Price Associates, Inc. (the manager or Price Associates), a wholly owned subsidiary of T. Rowe Price Group, Inc. The investment management agreement between the fund and the manager provides for an annual investment management fee, which is computed daily and paid monthly. The fee consists of an individual fund fee, equal to 0.25% of the fund’s average daily net assets, and a group fee. The group fee rate is calculated based on the combined net assets of certain mutual funds sponsored by Price Associates (the group) applied to a graduated fee schedule, with rates ranging from 0.48% for the first $1 billion of assets to 0.29% for assets in excess of $160 billion. Prior to May 1, 2005, the maximum group fee rate in the graduated fee schedule had been 0.295% for assets in excess of $120 billion. The fund’s group fee is determined by applying the group fee rate to the fund’s average daily net assets. At June 30, 2005, the effective annual group fee rate was 0.31% .
In addition, the fund has entered into service agreements with Price Associates and two wholly owned subsidiaries of Price Associates (collectively, Price). Price Associates computes the daily share price and maintains the financial records of the fund. T. Rowe Price Services, Inc., provides shareholder and administrative services in its capacity as the fund’s transfer and dividend disbursing agent. T. Rowe Price Retirement Plan Services, Inc., provides subaccounting and recordkeeping services for certain retirement accounts invested in the fund. For the six months ended June 30, 2005, expenses incurred pursuant to these service agreements were $32,000 for Price Associates, $582,000 for T. Rowe Price Services, Inc., and $807,000 for T. Rowe Price Retirement Plan Services, Inc. The total amount payable at period end pursuant to these service agreements is reflected as due to affiliates in the accompanying financial statements.
The fund is also one of several mutual funds sponsored by Price Associates (underlying Price funds) in which the T. Rowe Price Spectrum Funds (Spectrum Funds) have invested. The Spectrum Funds do not invest in the underlying Price funds for the purpose of exercising management or control. Pursuant to a special servicing agreement, expenses associated with the operation of the Spectrum Funds are borne by each underlying Price fund to the extent of estimated savings to it and in proportion to the average daily value of its shares owned by the Spectrum Funds. Expenses allocated under this agreement are reflected as shareholder servicing expense in the accompanying financial statements. For the six months ended June 30, 2005, the fund was allocated $9,000 of Spectrum Funds’ expenses, of which $6,000 related to services provided by Price. The amount payable at period end pursuant to this agreement is included in due to affiliates in the accompanying financial statements.
The fund may invest in the T. Rowe Price Reserve Investment Fund and the T. Rowe Price Government Reserve Investment Fund (collectively, the Reserve Funds), open-end management investment companies managed by Price Associates and affiliates of the fund. The Reserve Funds are offered as cash management options to mutual funds, trusts, and other accounts managed by Price Associates and/or its affiliates, and are not available for direct purchase by members of the public. The Reserve Funds pay no investment management fees. During the six months ended June 30, 2005, dividend income from the Reserve Funds totaled $521,000, and the value of shares of the Reserve Funds held at June 30, 2005 and December 31, 2004 was $50,762,000 and $30,483,000, respectively.
As of June 30, 2005, T. Rowe Price Group, Inc. and/or its wholly owned subsidiaries owned 113,070 shares of the fund, representing less than 1% of the fund’s net assets.
| INFORMATION ON PROXY VOTING POLICIES, PROCEDURES, AND RECORDS |
A description of the policies and procedures used by T. Rowe Price funds and portfolios to determine how to vote proxies relating to portfolio securities is available in each fund’s Statement of Additional Information, which you may request by calling 1-800-225-5132 or by accessing the SEC’s Web site, www.sec.gov. The description of our proxy voting policies and procedures is also available on our Web site, www.troweprice.com. To access it, click on the words “Company Info” at the top of our homepage for individual investors. Then, in the window that appears, click on the “Proxy Voting Policy” navigation button in the top left corner.
Each fund’s most recent annual proxy voting record is available on our Web site and through the SEC’s Web site. To access it through our Web site, follow the directions above, then click on the words “Proxy Voting Record” at the bottom of the Proxy Voting Policy page.
| HOW TO OBTAIN QUARTERLY PORTFOLIO HOLDINGS |
The fund files a complete schedule of portfolio holdings with the Securities and Exchange Commission for the first and third quarters of each fiscal year on Form N-Q. The fund’s Form N-Q is available electronically on the SEC’s Web site (www.sec.gov); hard copies may be reviewed and copied at the SEC’s Public Reference Room, 450 Fifth St. N.W., Washington, DC 20549. For more information on the Public Reference Room, call 1-800-SEC-0330.
| APPROVAL OF INVESTMENT MANAGEMENT AGREEMENT |
On March 2, 2005, the fund’s Board of Directors unanimously approved the investment advisory contract (“Contract”) between the fund and its investment manager, T. Rowe Price Associates, Inc. (“Manager”). The Board considered a variety of factors in connection with its review of the Contract, also taking into account information provided by the Manager during the course of the year, as discussed below:
Services Provided by the Manager
The Board considered the nature, quality, and extent of the services provided to the fund by the Manager. These services included, but were not limited to, management of the fund’s portfolio and a variety of activities related to portfolio management. The Board also reviewed the background and experience of the Manager’s senior management team and investment personnel involved in the management of the fund. The Board concluded that it was satisfied with the nature, quality, and extent of the services provided by the Manager.
Investment Performance of the Fund
The Board reviewed the fund’s average annual total return over the 1-, 3-, 5-, and 10-year periods as well as the fund’s year-by-year returns and compared these returns to previously agreed upon comparable performance measures and market data, including those supplied by Lipper and Morningstar, which are independent providers of mutual fund data. On the basis of this evaluation and the Board’s ongoing review of investment results, the Board concluded that the fund’s performance was satisfactory.
Costs, Benefits, Profits, and Economies of Scale
The Board reviewed detailed information regarding the revenues received by the Manager under the Contract and other benefits that the Manager (and its affiliates) may have realized from its relationship with the fund, including research received under “soft dollar” agreements. The Board also received information on the estimated costs incurred and profits realized by the Manager and its affiliates from advising T. Rowe Price mutual funds, as well as estimates of the gross profits realized from managing the fund in particular. The Board concluded that the Manager’s profits were reasonable in light of the services provided to the fund. The Board also considered whether the fund or other funds benefit under the fee levels set forth in the Contract from any economies of scale realized by the Manager. Under the Contract, the fund pays a fee to the Manager composed of two components—a group fee rate based on the aggregate assets of certain T. Rowe Price mutual funds (including the fund) that declines at certain asset levels, and an individual fund fee rate that is assessed on the assets of the fund. The Board concluded that an additional breakpoint should be added to the group fee component of the fees paid by the fund under the Contract at a level of $160 billion. The Board further concluded that, with this change, the advisory fee structure for the fund continued to provide for a reasonable sharing of benefits from any economies of scale with the fund’s investors.
Fees
The Board reviewed the fund’s management fee rate, operating expenses, and total expense ratio and compared them to fees and expenses of other comparable funds based on information and data supplied by Lipper. The information provided to the Board indicated that the fund’s management fee rate and expense ratio were generally at or below the median for comparable funds. The Board also reviewed the fee schedules for comparable privately managed accounts of the Manager and its affiliates. Management informed the Board that the Manager’s responsibilities for privately managed accounts are more limited than its responsibilities for the fund and other T. Rowe Price mutual funds that it or its affiliates advise. On the basis of the information provided, the Board concluded that the fees paid by the fund under the Contract were reasonable.
Approval of the Contract
As noted, the Board approved the continuation of the Contract as amended to add an additional breakpoint to the group fee rate. No single factor was considered in isolation or to be determinative to the decision. Rather, the Board concluded, in light of a weighting and balancing of all factors considered, that it was in the best interests of the fund to approve the continuation of the Contract, including the fees to be charged for services thereunder.
Item 2. Code of Ethics.
A code of ethics, as defined in Item 2 of Form N-CSR, applicable to its principal executive officer, principal financial officer, principal accounting officer or controller, or persons performing similar functions is filed as an exhibit to the registrant’s annual Form N-CSR. No substantive amendments were approved or waivers were granted to this code of ethics during the registrant’s most recent fiscal half-year.
Item 3. Audit Committee Financial Expert.
Disclosure required in registrant’s annual Form N-CSR.
Item 4. Principal Accountant Fees and Services.
Disclosure required in registrant’s annual Form N-CSR.
Item 5. Audit Committee of Listed Registrants.
Not applicable.
Item 6. Schedule of Investments.
Not applicable. The complete schedule of investments is included in Item 1 of this Form N-CSR.
Item 7. Disclosure of Proxy Voting Policies and Procedures for Closed-End Management Investment Companies.
Not applicable.
Item 8. Portfolio Managers of Closed-End Management Investment Companies.
Not applicable.
Item 9. Purchases of Equity Securities by Closed-End Management Investment Company and Affiliated Purchasers.
Not applicable.
Item 10. Submission of Matters to a Vote of Security Holders.
Not applicable.
Item 11. Controls and Procedures.
(a) The registrant’s principal executive officer and principal financial officer have evaluated the registrant’s disclosure controls and procedures within 90 days of this filing and have concluded that the registrant’s disclosure controls and procedures were effective, as of that date, in ensuring that information required to be disclosed by the registrant in this Form N-CSR was recorded, processed, summarized, and reported timely.
(b) The registrant’s principal executive officer and principal financial officer are aware of no change in the registrant’s internal control over financial reporting that occurred during the registrant’s second fiscal quarter covered by this report that has materially affected, or is reasonably likely to materially affect, the registrant’s internal control over financial reporting.
Item 12. Exhibits.
(a)(1) The registrant’s code of ethics pursuant to Item 2 of Form N-CSR is filed with the registrant’s annual Form N-CSR.
(2) Separate certifications by the registrant's principal executive officer and principal financial officer, pursuant to Section 302 of the Sarbanes-Oxley Act of 2002 and required by Rule 30a-2(a) under the Investment Company Act of 1940, are attached.
(3) Written solicitation to repurchase securities issued by closed-end companies: not applicable.
(b) A certification by the registrant's principal executive officer and principal financial officer, pursuant to Section 906 of the Sarbanes-Oxley Act of 2002 and required by Rule 30a-2(b) under the Investment Company Act of 1940, is attached.
| | |
SIGNATURES |
| |
| | Pursuant to the requirements of the Securities Exchange Act of 1934 and the Investment |
| Company Act of 1940, the registrant has duly caused this report to be signed on its behalf by the |
| undersigned, thereunto duly authorized. |
| |
| T. Rowe Price Growth & Income Fund, Inc. |
| |
| By | /s/ James S. Riepe |
| | James S. Riepe |
| | Principal Executive Officer |
| |
| Date | August 18, 2005 |
| |
| |
| | Pursuant to the requirements of the Securities Exchange Act of 1934 and the Investment |
| Company Act of 1940, this report has been signed below by the following persons on behalf of |
| the registrant and in the capacities and on the dates indicated. |
| |
| |
| By | /s/ James S. Riepe |
| | James S. Riepe |
| | Principal Executive Officer |
| |
| Date | August 18, 2005 |
| |
| |
| |
| By | /s/ Joseph A. Carrier |
| | Joseph A. Carrier |
| | Principal Financial Officer |
| |
| Date | August 18, 2005 |