Item 1: Report to Shareholders| Growth & Income Fund | June 30, 2006 |
The views and opinions in this report were current as of June 30, 2006. They are not guarantees of performance or investment results and should not be taken as investment advice. Investment decisions reflect a variety of factors, and the managers reserve the right to change their views about individual stocks, sectors, and the markets at any time. As a result, the views expressed should not be relied upon as a forecast of the fund’s future investment intent. The report is certified under the Sarbanes-Oxley Act of 2002, which requires mutual funds and other public companies to affirm that, to the best of their knowledge, the information in their financial reports is fairly and accurately stated in all material respects.
REPORTS ON THE WEB
Sign up for our E-mail Program, and you can begin to receive updated fund reports and prospectuses online rather than through the mail. Log in to your account at troweprice.com for more information.
Fellow Shareholders
Good economic data and strong earnings growth were not enough to lift stocks significantly higher in the first half of 2006. The S&P 500 returned a stingy 1.8%, excluding dividends. This came despite strong margins and profits for many companies and a market that looked—and still looks—reasonably priced at just 14.2 times 2006 earnings estimates, as of June 30. Meanwhile large-caps remained frustratingly in a rut, especially those with high growth rates or highly diversified business mixes.
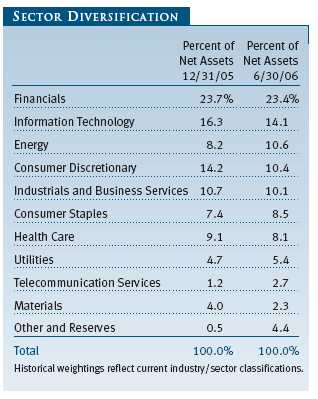
Energy was yet again the best-performing sector, while telecommunication services posted surprisingly strong returns. High oil prices continued to pad the bottom line of many energy companies, and consolidation helped the telecom sector. In contrast, health care and information technology fared the worst. Many of last year’s best health care stocks experienced a reversal of fortune, particularly in the biotechnology, health care equipment, and managed care industries. As for technology, more negative earnings revisions, new rules on the expensing of stock options, and investigations into the use of stock options weighed heavily on the group. Financial stocks, the largest sector weighting in the fund, performed in line with the S&P 500 despite four more quarter-point short-term rate hikes by the Federal Reserve.
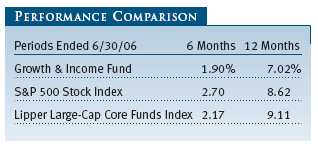
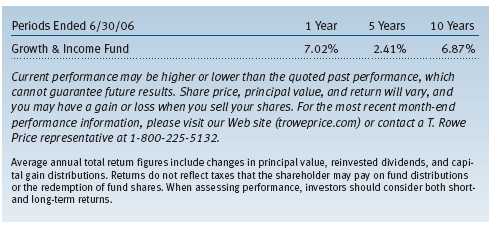
Your fund returned 1.90% and 7.02% for the 6- and 12-month periods, respectively, as shown in the table. Returns lagged the broad market index and our Lipper group of similarly managed funds, due largely to stock selection. For both periods, our technology holdings performed particularly poorly but were partially offset by good stock picking in energy, health care, and financials. Nevertheless, we think our investment process remains sound and consistent. As part of our strategy, we regularly review our holdings to see if our investment thesis is still viable and eliminate those stocks where the story has changed. We’ll talk more about our individual holdings in the Portfolio Review section.
Despite a rocky 2005, the fund’s performance relative to its competitors remains good over the longer term. Lipper ranked the fund in the top 29% of the Lipper large-cap core funds universe for the five-year period ended June 30, 2006. (Based on cumulative total return, Lipper ranked the Growth & Income Fund 461 out of 848, 275 out of 725, 171 out of 609, and 125 out of 241 funds for the 1-, 3-, 5-, and 10-year periods ended June 30, 2006, respectively. Past performance cannot guarantee future results.)
MARKET ENVIRONMENT
The economy remains strong, although signs indicate that the Fed’s rate hikes are beginning to take hold. U.S. gross domestic product grew at a healthy 5.6% annualized rate in the first quarter. Intermediate- and long-term yields remained relatively low, but mortgage rates have started to creep up and the housing market is starting to cool off after years of strong house price appreciation. This could have many negative reverberations, and we are watching sectors tied to the housing market carefully. At the same time, the prices of many housing-related stocks dipped to 52-week lows, creating buying opportunities for us.
The pace of mergers and acquisitions remained frenetic. Companies no longer seem satisfied in acquiring just one company at a time. Recently, two S&P 500 companies each announced plans to purchase two companies on the same day! This definitely marks the beginning of merger mania, a trend we doubt is positive unless you are an investment banker. Few companies can successfully integrate one large company at a time, so we doubt that two mergers at once will make for a pretty sight. Fortunately, we do not own either stock in our fund.
PORTFOLIO REVIEW
Our first-half winners came from a variety of industries. Two of our longtime energy holdings, oil field services stocks Schlumberger and Baker Hughes, continued to fare exceptionally well as oil prices remained firm. The fund also benefited from well-timed purchases of newer holding Murphy Oil, a diversified oil and gas company with worldwide exploration and production activities as well as refining and marketing operations. You may have noticed some of Murphy’s gas stations at Wal-Mart. Our third-best stock was slot machine maker International Game Technology (IGT), another longtime holding, which rose on consecutive better-than-expected quarterly results.
Domestic slot sales appear to have bottomed, and IGT’s other business lines and locations showed strength. Retailer Kohl’s had a very strong first half. The company’s fundamentals improved along with a moderately better competitive environment. (Please refer to our portfolio of investments for a complete listing of the fund’s holdings and the amount each represents of the portfolio.)
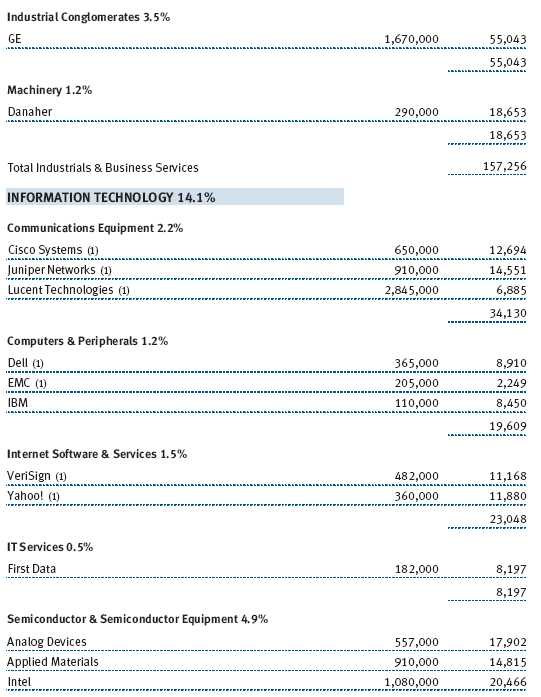
Tech holding Cisco Systems was a top contributor. Its deal to purchase Scientific Atlanta has proceeded smoothly. Sales growth has accelerated modestly in part because of the acquisition, and margins on the whole have remained fairly stable. Two of our older industrials and business services positions also delivered strong returns. Honeywell International reported better-than-expected results due to good fundamental performance in its aerospace and automation and control segments, which account for the majority of earnings. In addition, the company has used its excess cash flow prudently. Danaher’s stock advanced thanks to the return of accelerating internal revenue growth after a few disappointing quarters. Consequently, the company modestly raised its earnings projections for the year. We still like Danaher as the stock appears reasonably priced.
Other top contributors included longtime holding Equity Residential Properties and a newer holding, AMVESCAP. Equity Residential is a real estate investment trust with high-quality apartments in its portfolio. It benefited from investors’ belief that rising interest rates would boost the cost for home ownership and spur increased rental demand. AMVESCAP is a money management company with a new chief executive officer, Marty Flanagan. We first met Mr. Flanagan when he was a senior executive at Franklin Resources (another money manager and former fund holding). AMVESCAP’s stock suffered when the equity bubble burst a few years ago since several of its portfolios were invested in aggressive growth stocks, which performed particularly poorly during that bear market. Recently, the company made several moves (including a large restructuring) that we think can improve its profit margins and drive the stock price upward.
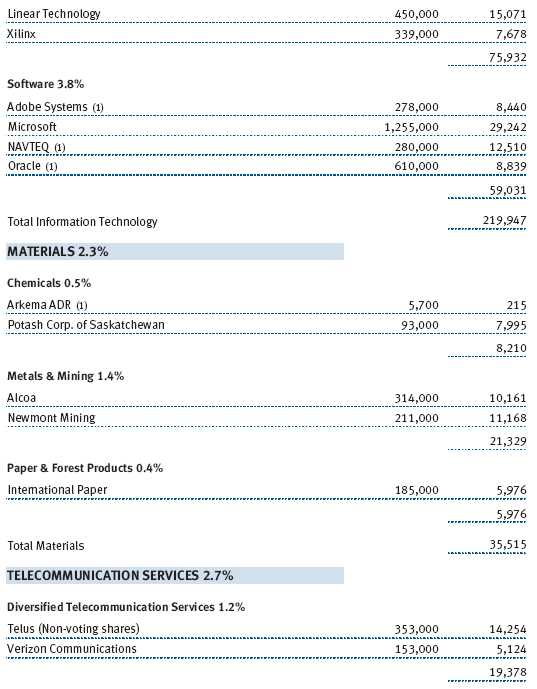
As for the disappointments, some of the biggest came from our technology holdings. The most disappointing was a setback in Microsoft. We expected the second half of 2006 to be spectacular for Microsoft since several new products were set to be released. Unfortunately, there were delays for some of these products. More importantly, the company reduced its near-term earnings growth rate targets because it perceived a need to spend more to support some of its new efforts.
Similarly, Dell and Intel also had to reset their earnings projections due to higher spending. Unlike Microsoft, however, the revenue picture at Dell and Intel also appears to be clouded by a much more competitive operating environment. The final tech laggard was Juniper Networks, Cisco’s largest competitor. Investors remain concerned about the company’s returns from recent acquisitions, general industry competition, and the pace of enterprise spending, which drives Juniper’s growth. We still like Juniper because of its exposure to multiple secular trends in enterprise and broadband networks (wireless and wireline), its tremendous return on capital, and probably the best multiyear growth outlook in telecom equipment.
Our worst contributor was Boston Scientific, which has performed quite poorly for some time. At the beginning of the year we trimmed some Boston Scientific but kept some of the position due to the stock’s low valuation. The company’s acquisition of Guidant proved ill-timed as the market for implantable cardioverter defibrillators—which treat life-threatening, abnormally fast heart rhythms—slowed considerably following several product recalls. In addition, competition and safety issues have raised some concerns about Boston’s key product, Taxus, a drug-coated stent used to keep arteries unclogged.
Other weak holdings in the first half included insurer Marsh & McLennan, generic drug maker Teva Pharmaceutical, GE, American International Group (AIG), and homebuilder Lennar. Marsh’s stock suffered as the pace of recovery in its insurance brokerage business and its Putnam asset management division—two businesses hit hard due to investigations by the New York attorney general—was slower than expected. Its security business also underperformed. We still think that Marsh’s franchises have potential to improve over the coming years. Teva suffered as investors became nervous about the growth prospects of the U.S. generic business. Competition has intensified, both from other generic manufacturers in India and China and from big pharmaceutical companies, which appear to be altering their strategies as their highly profitable drugs go off patent protection. As for GE and AIG, investor malaise continued to weigh on these stocks and other conglomerates despite both companies putting up decent results for the last few quarters.
Lennar was our largest purchase. It is one of the country’s largest homebuilders, and the industry’s stocks have struggled since the start of the year on fears of a hard landing after years of soaring home price appreciation. While we have cautioned about such a cool down in prior letters, we think homebuilder stocks now reflect extreme pessimism on how the cycle might unwind. While our initial purchases in Lennar were perhaps premature, we feel good about our investment as Lennar has a solid balance sheet, a strong management team, and a diverse portfolio.
Because of our long-term strategy, the fund continues to have a stable turnover rate of about 48%, making our average holding period around two years. As usual, given our wide investment charter, our list of new purchases was quite diverse. Our second-largest purchase was Bed Bath & Beyond, a multi-billion dollar retailer of home furnishings and accessories with almost 800 stores, including Christmas Tree Shops and Harmon stores. The company’s stock has been treading water for several years as the company’s growth rate has decelerated. We think it is reasonably priced at current levels given our earnings growth assumptions. In addition, the company has an aggressive share-repurchase program, which should help support the stock price.
We added two tech holdings in the period—Applied Materials and Yahoo!. Applied Materials is the world’s largest semiconductor capital equipment company. The market has recently punished many semiconductor-related stocks, leaving them at much more reasonable valuations. Furthermore, many of these companies, including Applied Materials, have large cash positions that we think are not completely accounted for in the stock price. Earlier in the year we slowly dipped our toe in Yahoo!, currently our only pure-play Internet stock. While most of the holdings in the fund provide some income or sport a low valuation, occasionally we are intrigued by higher-growth companies with a large market share that appear to be temporarily out of favor. So far, Yahoo! has continued to stumble, and we are monitoring it closely.
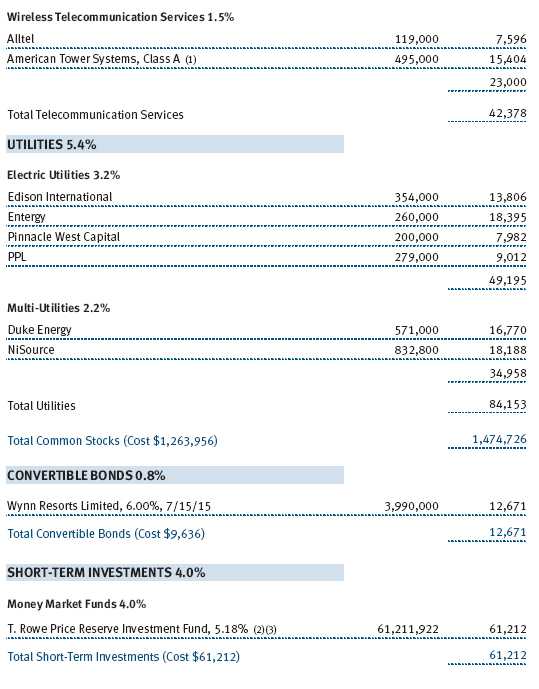
Rounding out newer purchases were cell phone tower company American Tower Systems, mid-size bank First Horizon National, and medical supply company Baxter International. American Tower offered a way to invest in the mobile phone segment while avoiding carriers. Competitive threats in the tower business are lower than in the wireless carrier companies, and pricing is more rational. Our thesis on First Horizon is that the mortgage business will not contract as much as people fear, that the company’s retail and commercial bank will continue gaining market share, and that the capital markets business will recover as weak operating conditions improve. In the meantime, the company offered an almost 4.5% dividend yield. We repurchased Baxter on the belief that it remains well positioned to capitalize on increasing demand for plasma products and has a be tter outlook in its medication delivery business. With among the lowest margins in medical technology, Baxter appears capable of improving its profitability closer to industry norms, which should help the stock’s valuation. The company should also continue to benefit from the moves of new management, which is focused on cash flow and sustainable returns.
We said bon voyage to Royal Caribbean Cruises, medical device company Medtronic, insurer St. Paul Travelers Companies, diversified chemicals company DuPont, trust bank Northern Trust, rail company Union Pacific, and Family Dollar Stores. With Royal Caribbean, Medtronic, and DuPont, we were no longer confident that our investment theses would materialize, but the others simply reached our price targets.
Significant sales included Microsoft, IBM, and EMC. While we have liked Microsoft for some time and still hold a meaningful stake, we no longer felt such a large position was prudent after the negatives mentioned earlier. We reduced our position in IBM as the progress on the hardware cycle was more muted than expected, and we were disappointed in new service-contract growth. We sold a material amount of our EMC during the second quarter on concerns that the company would miss its earnings expectations, which it eventually did.
SUMMARY AND OUTLOOK
The economic outlook has grown a little less rosy since our last shareholder letter, but we still expect decent earnings growth for the remainder of 2006. Evidence is creeping in that the resilient consumer is starting to weaken as sales at retailers and restaurants seem to be slowing faster than one would have hoped. Perhaps the cooling housing market has made consumers aware that spending down home equity is not sustainable. Meanwhile, the debate continues about how fast and significant inflation is and exactly what should be done about it. In the end, the Federal Reserve will have the last word.
Your fund remains balanced between growth and value stocks and should be well positioned for many environments. Valuations for many large-cap, dividend-paying companies are still reasonable, especially when compared with small- and mid-cap companies. Yes, we have been saying this for some time, but it continues to be the case, especially among the largest of companies. Finally, many of the companies we own generate substantial free cash flow and are focused more than ever on using this cash to improve their balance sheets or return cash to shareholders, rather than funding speculative internal or external growth initiatives.
We appreciate your confidence in T. Rowe Price and your continued support.
Respectfully submitted,

Anna M. Dopkin
Chairman of the fund’s Investment Advisory Committee
July 21, 2006
The committee chairman has day-to-day responsibility for managing the portfolio and works with committee members in developing and executing the fund’s investment program.
RISKS OF STOCK INVESTING
The fund’s share price can fall because of weakness in the stock markets, a particular industry, or specific holdings. Stock markets can decline for many reasons, including adverse political or economic developments, changes in investor psychology, or heavy institutional selling. The prospects for an industry or company may deteriorate because of a variety of factors, including disappointing earnings or changes in the competitive environment. In addition, the investment manager’s assessment of companies held in a fund may prove incorrect, resulting in losses or poor performance even in rising markets. While the fund will seek dividend-paying stocks, the overall income level is not expected to play a meaningful role in cushioning its share price against market declines.
GLOSSARY
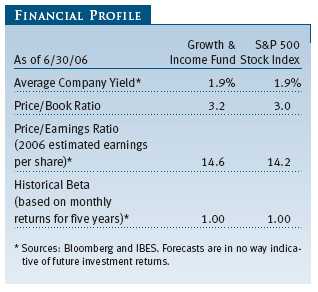
Beta: A measure of the market risk of a portfolio showing how responsive the fund is to a given market index. By definition, the beta of the benchmark index is 1.00. Usually, higher betas represent riskier investments.
Dividend yield: The annual dividend of a stock divided by the stock’s price.
Lipper indexes: Fund benchmarks that consist of a small number of the largest mutual funds in a particular category as tracked by Lipper Inc.
Price/book ratio: A valuation measure that compares a stock’s market price with its book value, i.e., the company’s net worth divided by the number of outstanding shares.
Price/earnings ratio (P/E): A valuation measure calculated by dividing the price of a stock by its current or projected earnings per share. This ratio gives investors an idea of how much they are paying for current or future earnings power.
S&P 500 Stock Index: An unmanaged index that tracks the stocks of 500 primarily large-cap U.S. companies.


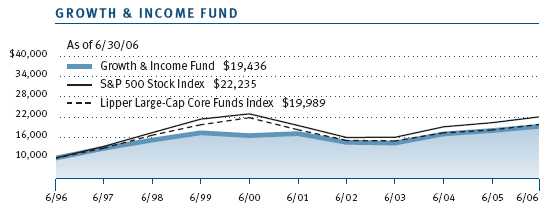
This chart shows the value of a hypothetical $10,000 investment in the fund over the past 10 fiscal year periods or since inception (for funds lacking 10-year records). The result is compared with benchmarks, which may include a broad-based market index and a peer group average or index. Market indexes do not include expenses, which are deducted from fund returns as well as mutual fund averages and indexes.
| AVERAGE ANNUAL COMPOUND TOTAL RETURN |
This table shows how the fund would have performed each year if its actual (or cumulative) returns had been earned at a constant rate.
As a mutual fund shareholder, you may incur two types of costs: (1) transaction costs, such as redemption fees or sales loads, and (2) ongoing costs, including management fees, distribution and service (12b-1) fees, and other fund expenses. The following example is intended to help you understand your ongoing costs (in dollars) of investing in the fund and to compare these costs with the ongoing costs of investing in other mutual funds. The example is based on an investment of $1,000 invested at the beginning of the most recent six-month period and held for the entire period.
Actual Expenses
The first line of the following table (“Actual”) provides information about actual account values and actual expenses. You may use the information in this line, together with your account balance, to estimate the expenses that you paid over the period. Simply divide your account value by $1,000 (for example, an $8,600 account value divided by $1,000 = 8.6), then multiply the result by the number in the first line under the heading “Expenses Paid During Period” to estimate the expenses you paid on your account during this period.
Hypothetical Example for Comparison Purposes
The information on the second line of the table (“Hypothetical”) is based on hypothetical account values and expenses derived from the fund’s actual expense ratio and an assumed 5% per year rate of return before expenses (not the fund’s actual return). You may compare the ongoing costs of investing in the fund with other funds by contrasting this 5% hypothetical example and the 5% hypothetical examples that appear in the shareholder reports of the other funds. The hypothetical account values and expenses may not be used to estimate the actual ending account balance or expenses you paid for the period.
Note: T. Rowe Price charges an annual small-account maintenance fee of $10, generally for accounts with less than $2,000 ($500 for UGMA/UTMA). The fee is waived for any investor whose T. Rowe Price mutual fund accounts total $25,000 or more, accounts employing automatic investing, and IRAs and other retirement plan accounts that utilize a prototype plan sponsored by T. Rowe Price (although a separate custodial or administrative fee may apply to such accounts). This fee is not included in the accompanying table. If you are subject to the fee, keep it in mind when you are estimating the ongoing expenses of investing in the fund and when comparing the expenses of this fund with other funds.
You should also be aware that the expenses shown in the table highlight only your ongoing costs and do not reflect any transaction costs, such as redemption fees or sales loads. Therefore, the second line of the table is useful in comparing ongoing costs only and will not help you determine the relative total costs of owning different funds. To the extent a fund charges transaction costs, however, the total cost of owning that fund is higher.

Unaudited

The accompanying notes are an integral part of these financial statements.
Unaudited


The accompanying notes are an integral part of these financial statements.
Unaudited
The accompanying notes are an integral part of these financial statements.
Unaudited

The accompanying notes are an integral part of these financial statements.
Unaudited
The accompanying notes are an integral part of these financial statements.
Unaudited
| NOTES TO FINANCIAL STATEMENTS |
NOTE 1 - SIGNIFICANT ACCOUNTING POLICIES
T. Rowe Price Growth & Income Fund Inc. (the fund), is registered under the Investment Company Act of 1940 (the 1940 Act) as a diversified, open-end management investment company. The fund commenced operations on December 21, 1982. The fund seeks to provide long-term capital growth, a reasonable level of current income, and increasing future income through investments primarily in dividend-paying common stocks.
The accompanying financial statements were prepared in accordance with accounting principles generally accepted in the United States of America, which require the use of estimates made by fund management. Fund management believes that estimates and security valuations are appropriate; however, actual results may differ from those estimates, and the security valuations reflected in the financial statements may differ from the value the fund ultimately realizes upon sale of the securities.
Valuation The fund values its investments and computes its net asset value per share at the close of the New York Stock Exchange (NYSE), normally 4 p.m. ET, each day that the NYSE is open for business. Equity securities listed or regularly traded on a securities exchange or in the over-the-counter (OTC) market are valued at the last quoted sale price or, for certain markets, the official closing price at the time the valuations are made, except for OTC Bulletin Board securities, which are valued at the mean of the latest bid and asked prices. A security that is listed or traded on more than one exchange is valued at the quotation on the exchange determined to be the primary market for such security. Listed securities not traded on a particular day are valued at the mean of the latest bid and asked prices for domestic securities and the last quoted sale price for international securities.
Debt securities are generally traded in the over-the-counter market. Securities with original maturities of one year or more are valued at prices furnished by dealers who make markets in such securities or by an independent pricing service, which considers yield or price of bonds of comparable quality, coupon, maturity, and type, as well as prices quoted by dealers who make markets in such securities. Securities with original maturities of less than one year are valued at amortized cost in local currency, which approximates fair value when combined with accrued interest.
Investments in mutual funds are valued at the mutual fund’s closing net asset value per share on the day of valuation.
Other investments, including restricted securities, and those for which the above valuation procedures are inappropriate or are deemed not to reflect fair value are stated at fair value as determined in good faith by the T. Rowe Price Valuation Committee, established by the fund’s Board of Directors.
Most foreign markets close before the close of trading on the NYSE. If the fund determines that developments between the close of a foreign market and the close of the NYSE will, in its judgment, materially affect the value of some or all of its portfolio securities, which in turn will affect the fund’s share price, the fund will adjust the previous closing prices to reflect the fair value of the securities as of the close of the NYSE, as determined in good faith by the T. Rowe Price Valuation Committee, established by the fund’s Board of Directors. A fund may also fair value securities in other situations, such as when a particular foreign market is closed but the fund is open. In deciding whether to make fair value adjustments, the fund reviews a variety of factors, including developments in foreign markets, the performance of U.S. securities markets, and the performance of instruments trading in U.S. markets that represent foreign securities and baskets of foreign securities. The fund uses outside pricing services to provide it with closing market prices and information used for adjusting those prices. The fund cannot predict when and how often it will use closing prices and when it will adjust those prices to reflect fair value. As a means of evaluating its fair value process, the fund routinely compares closing market prices, the next day’s opening prices in the same markets, and adjusted prices.
Currency Translation Assets, including investments, and liabilities denominated in foreign currencies are translated into U.S. dollar values each day at the prevailing exchange rate, using the mean of the bid and asked prices of such currencies against U.S. dollars as quoted by a major bank. Purchases and sales of securities, income, and expenses are translated into U.S. dollars at the prevailing exchange rate on the date of the transaction. The effect of changes in foreign currency exchange rates on realized and unrealized security gains and losses is reflected as a component of security gains and losses.
Rebates and Credits Subject to best execution, the fund may direct certain security trades to brokers who have agreed to rebate a portion of the related brokerage commission to the fund in cash. Commission rebates are reflected as realized gain on securities in the accompanying financial statements and totaled $21,000 for the six months ended June 30, 2006. Additionally, the fund earns credits on temporarily uninvested cash balances at the custodian that reduce the fund’s custody charges. Custody expense in the accompanying financial statements is presented before reduction for credits.
In-Kind Redemptions In accordance with guidelines described in the fund’s prospectus, the fund may distribute portfolio securities rather than cash as payment for a redemption of fund shares (in-kind redemption). For financial reporting purposes, the fund recognizes a gain on in-kind redemptions to the extent the value of the distributed securities on the date of redemption exceeds the cost of those securities. Gains and losses realized on in-kind redemptions are not recognized for tax purposes and are reclassified from undistributed realized gain (loss) to paid-in capital. During the six month ended June 30, 2006, the fund realized $36,940,000 of net gain on $123,013,000 of in-kind redemptions.
Investment Transactions, Investment Income, and Distributions Income and expenses are recorded on the accrual basis. Premiums and discounts on debt securities are amortized for financial reporting purposes. Dividends received from mutual fund investments are reflected as dividend income; capital gain distributions are reflected as realized gain/loss. Dividend income and capital gain distributions are recorded on the ex-dividend date. Investment transactions are accounted for on the trade date. Realized gains and losses are reported on the identified cost basis. Distributions to shareholders are recorded on the ex-dividend date. Income distributions are declared and paid on a quarterly basis. Capital gain distributions, if any, are declared and paid by the fund, typically on an annual basis.
NOTE 2 - INVESTMENT TRANSACTIONS
Consistent with its investment objective, the fund engages in the following practices to manage exposure to certain risks or to enhance performance. The investment objective, policies, program, and risk factors of the fund are described more fully in the fund’s prospectus and Statement of Additional Information.
Securities Lending The fund lends its securities to approved brokers to earn additional income. It receives as collateral cash and U.S. government securities valued at 102% to 105% of the value of the securities on loan. Cash collateral is invested in a money market pooled trust managed by the fund’s lending agent in accordance with investment guidelines approved by fund management.
Collateral is maintained over the life of the loan in an amount not less than the value of loaned securities, as determined at the close of fund business each day; any additional collateral required due to changes in security values is delivered to the fund the next business day. Although risk is mitigated by the collateral, the fund could experience a delay in recovering its securities and a possible loss of income or value if the borrower fails to return the securities. Securities lending revenue recognized by the fund consists of earnings on invested collateral and borrowing fees, net of any rebates to the borrower and compensation to the lending agent. At June 30, 2006, there were no securities on loan.
Other Purchases and sales of portfolio securities, other than short-term securities, aggregated $392,032,000 and $643,353,000, respectively, for the six months ended June 30, 2006.
NOTE 3 - FEDERAL INCOME TAXES
No provision for federal income taxes is required since the fund intends to continue to qualify as a regulated investment company under Subchapter M of the Internal Revenue Code and distribute to shareholders all of its taxable income and gains. Federal income tax regulations differ from generally accepted accounting principles; therefore, distributions determined in accordance with tax regulations may differ in amount or character from net investment income and realized gains for financial reporting purposes. Financial reporting records are adjusted for permanent book/tax differences to reflect tax character. Financial records are not adjusted for temporary differences. The amount and character of tax-basis distributions and composition of net assets are finalized at fiscal year-end; accordingly, tax-basis balances have not been determined as of June 30, 2006.
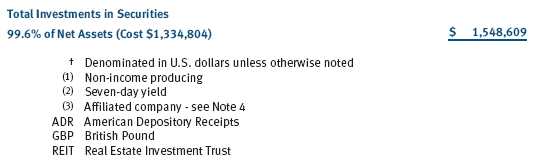
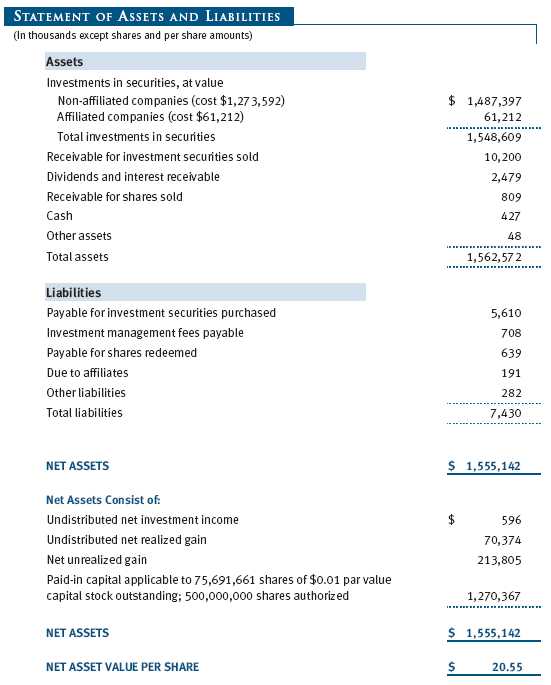
At June 30 2006, the cost of investments for federal income tax purposes was $1,334,804,000. Net unrealized gain aggregated $213,805,000 at period-end, of which $287,187,000 related to appreciated investments and $73,382,000 related to depreciated investments.
NOTE 4 - RELATED PARTY TRANSACTIONS
The fund is managed by T. Rowe Price Associates, Inc. (the manager or Price Associates), a wholly owned subsidiary of T. Rowe Price Group, Inc. The investment management agreement between the fund and the manager provides for an annual investment management fee, which is computed daily and paid monthly. The fee consists of an individual fund fee, equal to 0.25% of the fund’s average daily net assets, and a group fee. The group fee rate is calculated based on the combined net assets of certain mutual funds sponsored by Price Associates (the group) applied to a graduated fee schedule, with rates ranging from 0.48% for the first $1 billion of assets to 0.29% for assets in excess of $160 billion. The fund’s group fee is determined by applying the group fee rate to the fund’s average daily net assets. At June 30, 2006, the effective annual group fee rate was 0.31% .
In addition, the fund has entered into service agreements with Price Associates and two wholly owned subsidiaries of Price Associates (collectively, Price). Price Associates computes the daily share price and provides certain other administrative services to the fund. T. Rowe Price Services, Inc., provides shareholder and administrative services in its capacity as the fund’s transfer and dividend disbursing agent. T. Rowe Price Retirement Plan Services, Inc., provides subaccounting and recordkeeping services for certain retirement accounts invested in the fund. For the six months ended June 30, 2006, expenses incurred pursuant to these service agreements were $34,000 for Price Associates, $580,000 for T. Rowe Price Services, Inc., and $504,000 for T. Rowe Price Retirement Plan Services, Inc. The total amount payable at period-end pursuant to these service agreements is reflected as Due to Affiliates in the accompanying financial statements.
The fund may invest in the T. Rowe Price Reserve Investment Fund and the T. Rowe Price Government Reserve Investment Fund (collectively, the T. Rowe Price Reserve Funds), open-end management investment companies managed by Price Associates and affiliates of the fund. The T. Rowe Price Reserve Funds are offered as cash management options to mutual funds, trusts, and other accounts managed by Price Associates and/or its affiliates, and are not available for direct purchase by members of the public. The T. Rowe Price Reserve Funds pay no investment management fees. During the six months ended June 30, 2006, dividend income from the T. Rowe Price Reserve Funds totaled $570,000, and the value of shares of the T. Rowe Price Reserve Funds held at June 30, 2006, and December 31, 2005, was $61,212,000 and $16,740,000, respectively.
As of June 30, 2006, T. Rowe Price Group, Inc. and/or its wholly owned subsidiaries owned 125,084 shares of the fund, representing less than 1% of the fund’s net assets.
| INFORMATION ON PROXY VOTING POLICIES, PROCEDURES, AND RECORDS |
A description of the policies and procedures used by T. Rowe Price funds and portfolios to determine how to vote proxies relating to portfolio securities is available in each fund’s Statement of Additional Information, which you may request by calling 1-800-225-5132 or by accessing the SEC’s Web site, www.sec.gov. The description of our proxy voting policies and procedures is also available on our Web site, www.troweprice.com. To access it, click on the words “Company Info” at the top of our homepage for individual investors. Then, in the window that appears, click on the “Proxy Voting Policy” navigation button in the top left corner.
Each fund’s most recent annual proxy voting record is available on our Web site and through the SEC’s Web site. To access it through our Web site, follow the directions above, then click on the words “Proxy Voting Record” at the bottom of the Proxy Voting Policy page.
| HOW TO OBTAIN QUARTERLY PORTFOLIO HOLDINGS |
The fund files a complete schedule of portfolio holdings with the Securities and Exchange Commission for the first and third quarters of each fiscal year on Form N-Q. The fund’s Form N-Q is available electronically on the SEC’s Web site (www.sec.gov); hard copies may be reviewed and copied at the SEC’s Public Reference Room, 450 Fifth St. N.W., Washington, DC 20549. For more information on the Public Reference Room, call 1-800-SEC-0330.
| APPROVAL OF INVESTMENT MANAGEMENT AGREEMENT |
On March 8, 2006, the fund’s Board of Directors unanimously approved the investment advisory contract (Contract) between the fund and its investment manager, T. Rowe Price Associates, Inc. (Manager). The Board considered a variety of factors in connection with its review of the Contract, also taking into account information provided by the Manager during the course of the year, as discussed below:
Services Provided by the Manager
The Board considered the nature, quality, and extent of the services provided to the fund by the Manager. These services included, but were not limited to, management of the fund’s portfolio and a variety of activities related to portfolio management. The Board also reviewed the background and experience of the Manager’s senior management team and investment personnel involved in the management of the fund. The Board concluded that it was satisfied with the nature, quality, and extent of the services provided by the Manager.
Investment Performance of the Fund
The Board reviewed the fund’s average annual total return over the 1-, 3-, 5-, and 10-year periods as well as the fund’s year-by-year returns and compared these returns with previously agreed upon comparable performance measures and market data, including those supplied by Lipper and Morningstar, which are independent providers of mutual fund data. On the basis of this evaluation and the Board’s ongoing review of investment results, the Board concluded that the fund’s performance was satisfactory.
Costs, Benefits, Profits, and Economies of Scale
The Board reviewed detailed information regarding the revenues received by the Manager under the Contract and other benefits that the Manager (and its affiliates) may have realized from its relationship with the fund, including research received under “soft dollar” agreements. The Board noted that the use of soft dollars as a means of paying for third-party, non-broker research had been eliminated. The Board also received information on the estimated costs incurred and profits realized by the Manager and its affiliates from advising T. Rowe Price mutual funds, as well as estimates of the gross profits realized from managing the fund in particular. The Board concluded that the Manager’s profits were reasonable in light of the services provided to the fund. The Board also considered whether the fund or other funds benefit under the fee levels set forth in the Contract from any economies of scale realized by the Manager. Under the Contract, the fund pays a fee to the Manager composed of two components—a group fee rate based on the aggregate assets of certain T. Rowe Price mutual funds (including the fund) that declines at certain asset levels, and an individual fund fee rate that is assessed on the assets of the fund. The Board concluded that the advisory fee structure for the fund continued to provide for a reasonable sharing of benefits from any economies of scale with the fund’s investors.
Fees
The Board reviewed the fund’s management fee rate, operating expenses, and total expense ratio and compared them with fees and expenses of other comparable funds based on information and data supplied by Lipper. The information provided to the Board indicated that the fund’s management fee rate was above the median for certain groups of comparable funds but below the median for other groups of comparable funds. The information also indicated that the fund’s expense ratio was below the median for comparable funds. The Board also reviewed the fee schedules for comparable privately managed accounts of the Manager and its affiliates. Management informed the Board that the Manager’s responsibilities for privately managed accounts are more limited than its responsibilities for the fund and other T. Rowe Price mutual funds that it or its affiliates advise. On the basis of the information provided, the Board concluded that the fees paid by the fund under the Contract were reasonable.
Approval of the Contract
As noted, the Board approved the continuation of the Contract. No single factor was considered in isolation or to be determinative to the decision. Rather, the Board concluded, in light of a weighting and balancing of all factors considered, that it was in the best interests of the fund to approve the continuation of the Contract, including the fees to be charged for services thereunder.
 Item 2. Code of Ethics.
A code of ethics, as defined in Item 2 of Form N-CSR, applicable to its principal executive officer, principal financial officer, principal accounting officer or controller, or persons performing similar functions is filed as an exhibit to the registrant’s annual Form N-CSR. No substantive amendments were approved or waivers were granted to this code of ethics during the registrant’s most recent fiscal half-year.
Item 3. Audit Committee Financial Expert.
Disclosure required in registrant’s annual Form N-CSR.
Item 4. Principal Accountant Fees and Services.
Disclosure required in registrant’s annual Form N-CSR.
Item 5. Audit Committee of Listed Registrants.
Not applicable.
Item 6. Schedule of Investments.
Not applicable. The complete schedule of investments is included in Item 1 of this Form N-CSR.
Item 7. Disclosure of Proxy Voting Policies and Procedures for Closed-End Management Investment Companies.
Not applicable.
Item 8. Portfolio Managers of Closed-End Management Investment Companies.
Not applicable.
Item 9. Purchases of Equity Securities by Closed-End Management Investment Company and Affiliated Purchasers.
Not applicable.
Item 10. Submission of Matters to a Vote of Security Holders.
Not applicable.
Item 11. Controls and Procedures.
(a) The registrant’s principal executive officer and principal financial officer have evaluated the registrant’s disclosure controls and procedures within 90 days of this filing and have concluded that the registrant’s disclosure controls and procedures were effective, as of that date, in ensuring that information required to be disclosed by the registrant in this Form N-CSR was recorded, processed, summarized, and reported timely.
(b) The registrant’s principal executive officer and principal financial officer are aware of no change in the registrant’s internal control over financial reporting that occurred during the registrant’s second fiscal quarter covered by this report that has materially affected, or is reasonably likely to materially affect, the registrant’s internal control over financial reporting.
Item 12. Exhibits.(a)(1) The registrant’s code of ethics pursuant to Item 2 of Form N-CSR is filed with the registrant’s annual Form N-CSR.
(2) Separate certifications by the registrant's principal executive officer and principal financial officer, pursuant to Section 302 of the Sarbanes-Oxley Act of 2002 and required by Rule 30a-2(a) under the Investment Company Act of 1940, are attached.
(3) Written solicitation to repurchase securities issued by closed-end companies: not applicable.
(b) A certification by the registrant's principal executive officer and principal financial officer, pursuant to Section 906 of the Sarbanes-Oxley Act of 2002 and required by Rule 30a-2(b) under the Investment Company Act of 1940, is attached.
| |
SIGNATURES |
| |
| | Pursuant to the requirements of the Securities Exchange Act of 1934 and the Investment |
| Company Act of 1940, the registrant has duly caused this report to be signed on its behalf by the |
| undersigned, thereunto duly authorized. |
| |
| T. Rowe Price Growth & Income Fund, Inc. |
| |
| |
| By | /s/ Edward C. Bernard |
| | Edward C. Bernard |
| | Principal Executive Officer |
| |
| Date | August 18, 2006 |
| |
| |
| | Pursuant to the requirements of the Securities Exchange Act of 1934 and the Investment |
| Company Act of 1940, this report has been signed below by the following persons on behalf of |
| the registrant and in the capacities and on the dates indicated. |
| |
| |
| By | /s/ Edward C. Bernard |
| | Edward C. Bernard |
| | Principal Executive Officer |
| |
| Date | August 18, 2006 |
| |
| |
| By | /s/ Joseph A. Carrier |
| | Joseph A. Carrier |
| | Principal Financial Officer |
| |
| Date | August 18, 2006 |