UNITED STATES
SECURITIES AND EXCHANGE COMMISSION
Washington, D.C. 20549
FORM N-CSR
CERTIFIED SHAREHOLDER REPORT OF REGISTERED
MANAGEMENT INVESTMENT COMPANIES
Investment Company Act File Number: 811-03566
| T. Rowe Price Growth & Income Fund, Inc. |
|
| (Exact name of registrant as specified in charter) |
| |
| 100 East Pratt Street, Baltimore, MD 21202 |
|
| (Address of principal executive offices) |
| |
| David Oestreicher |
| 100 East Pratt Street, Baltimore, MD 21202 |
|
| (Name and address of agent for service) |
Registrant’s telephone number, including area code: (410) 345-2000
Date of fiscal year end: December 31
Date of reporting period: June 30, 2012
Item 1. Report to Shareholders
| Growth & Income Fund | June 30, 2012 |
The views and opinions in this report were current as of June 30, 2012. They are not guarantees of performance or investment results and should not be taken as investment advice. Investment decisions reflect a variety of factors, and the managers reserve the right to change their views about individual stocks, sectors, and the markets at any time. As a result, the views expressed should not be relied upon as a forecast of the fund’s future investment intent. The report is certified under the Sarbanes-Oxley Act, which requires mutual funds and other public companies to affirm that, to the best of their knowledge, the information in their financial reports is fairly and accurately stated in all material respects.
REPORTS ON THE WEB
Sign up for our E-mail Program, and you can begin to receive updated fund reports and prospectuses online rather than through the mail. Log in to your account at troweprice.com for more information.
Manager’s Letter
Fellow Shareholders
After a very strong first quarter, U.S. stocks gave back some of their gains in a volatile second quarter amid heightened investor concerns about the European debt crisis, slower growth in China, and a weak U.S. labor market. The bulk of the losses came in May against the backdrop of deterioration in the eurozone, where government bond yields in peripheral countries rose and Spain sought tens of billions of euros to bail out its banking sector. Shares bottomed in early June and then produced solid gains for the month, but these were not enough to offset losses earlier in the quarter. Despite the second-quarter losses, equities finished firmly in positive territory for the year-to-date period.
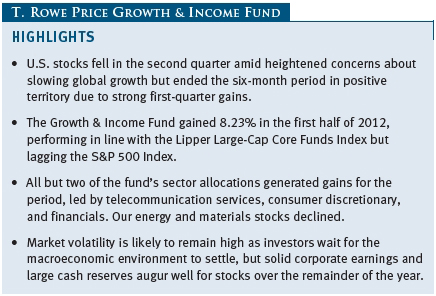
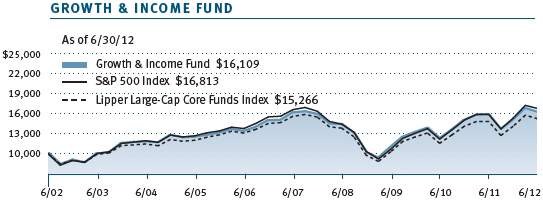
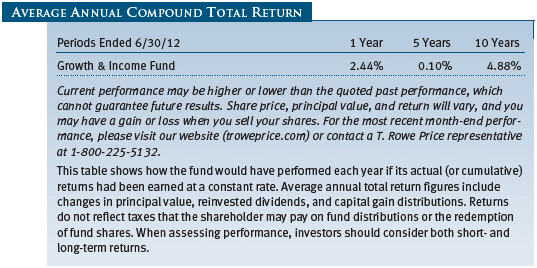
As shown in the Performance Comparison table, the Growth & Income Fund gained 8.23% for the six months ended June 30, 2012. The fund performed in line with the Lipper Large-Cap Core Funds Index but lagged the broad market S&P 500 Index. All but two of the fund’s sector allocations generated gains for the period, led by telecommunication services, consumer discretionary, and financials. Health care and information technology also posted solid gains. Energy and materials declined. Stock selection weighed modestly on results versus the S&P 500, and our sector weights had minimal impact.

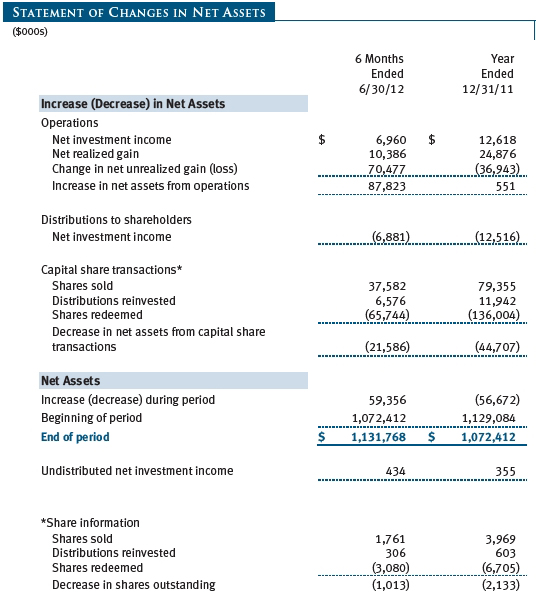
Your fund’s Board of Directors declared a second-quarter dividend of $0.07 per share on June 26, 2012, bringing total dividend distributions through the first half of 2012 to $0.13 per share. The second-quarter dividend was paid on June 28, 2012. Shareholders should have received a check or statement reflecting the most recent distribution.
ECONOMIC AND MARKET ENVIRONMENT
The first half of 2012 was a tale of two periods. Investor sentiment was decidedly upbeat through the first three months of the year and equity markets posted strong gains, buoyed by a number of positive economic and political developments. The U.S. economic recovery was progressing nicely, driven by unexpected strength in the manufacturing sector and an improving jobs market. The European Central Bank’s two long-term refinancing operations (LTROs) signaled that policymakers were finally moving to resolve the eurozone’s long-running debt crisis, while China’s economy seemed to be cooling in an orderly manner to more sustainable growth rates.
Risk aversion returned and stocks weakened in the second quarter, however, as signs of a slowing global economy sapped investor confidence. Mixed economic data in the U.S., including stubbornly high unemployment, indicated that the previously resilient recovery was starting to falter. Much of Europe remained mired in recession, and election results in Greece and France revealed widespread discontent over fiscal austerity measures that further weakened many of the region’s economies. China’s economy slowed more than expected, with commodity-intensive fixed-asset investment lagging last year’s growth substantially and consumer spending starting to struggle.
U.S. equity markets ended the period with solid gains despite the volatility, as second-quarter losses were not enough to overcome strong first-quarter gains. The large-cap S&P 500 Index gained 9.49%, led by double-digit gains in the telecommunication services, financials, information technology, health care, and consumer discretionary sectors. Consumer staples performed in line with the broader market. Industrials and business services, materials, and utilities also rose but underperformed the broader market. Energy was the only sector to post a loss for the period. Large-cap stocks outperformed small- and mid-cap shares, and growth stocks outpaced value across all market capitalizations.
PORTFOLIO PERFORMANCE AND POSITIONING
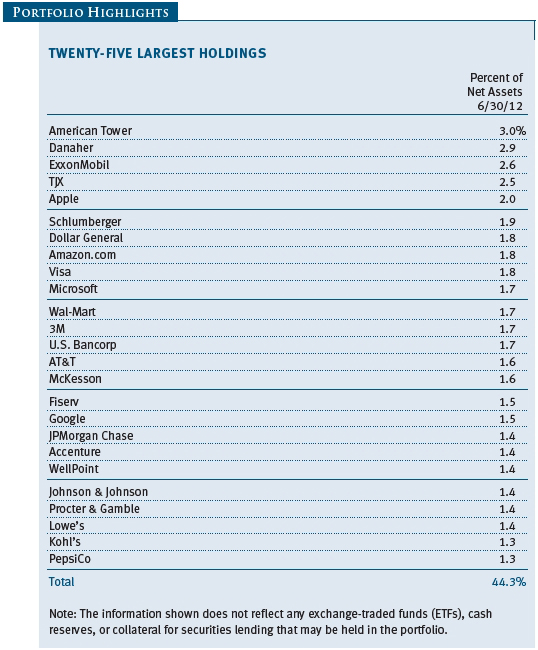
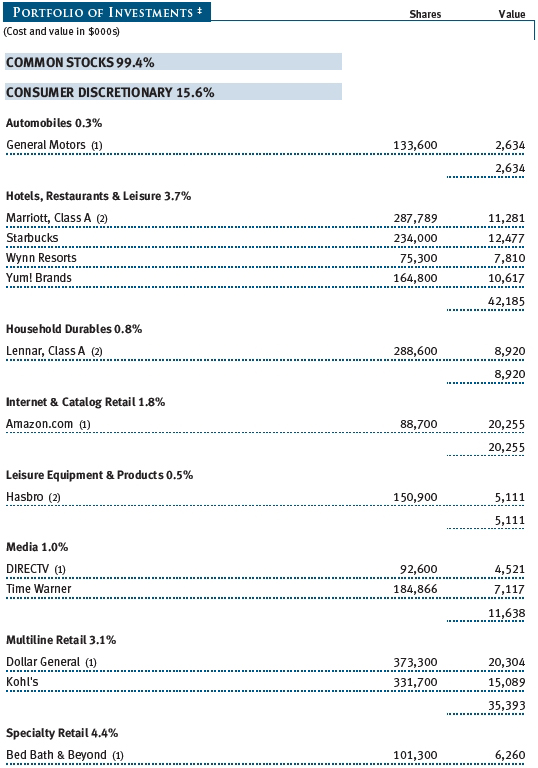
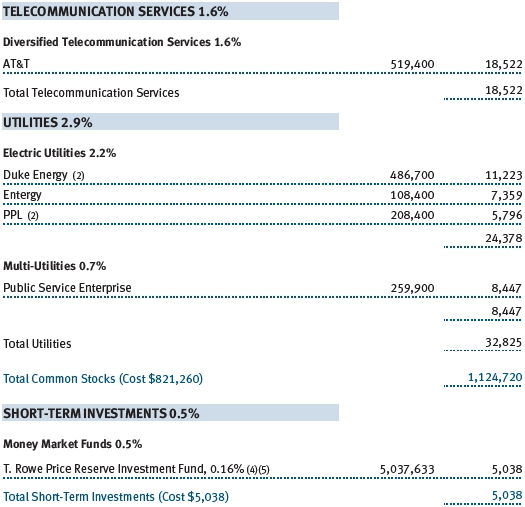
The telecommunication services sector generated the fund’s biggest absolute gains. Telecommunication companies tend to generate steady earnings and cash flow due to the contractual nature of their business—a quality that benefited AT&T and tower operator American Tower over a volatile six-month period. (Although American Tower is classified as a real estate investment trust, its business revolves around ownership and operation of cell towers.) AT&T’s attractive dividend payment also appealed to investors in a low-yield environment. Our modest allocation to the sector continues to focus on companies that should benefit from the growing demand for wireless voice and data transmission. (Please refer to the fund’s portfolio of investments for a complete list of holdings and the amount each represents in the portfolio.)
The fund’s consumer discretionary allocation also posted solid double-digit gains and outpaced the broader market. TJX, which operates T.J. Maxx and Marshall stores, is a good example of our focus in this sector—companies that provide good products or services at a good value. The discount apparel and home fashions retailer continues to take market share from more traditional retailers, and the stock posted strong six-month returns. Signs of modest improvement in the housing market helped shares of home improvement company Lowe’s. Amazon.com was another of the fund’s top contributors. We are bullish on Amazon.com’s long-term growth potential in e-commerce, as its increasingly attractive offerings drive ongoing and sustainable share gains from retail stores. Over the near term, anemic job and income growth will continue to weigh on the sector, but lower gas prices should provide consumers with some financial flexibility.
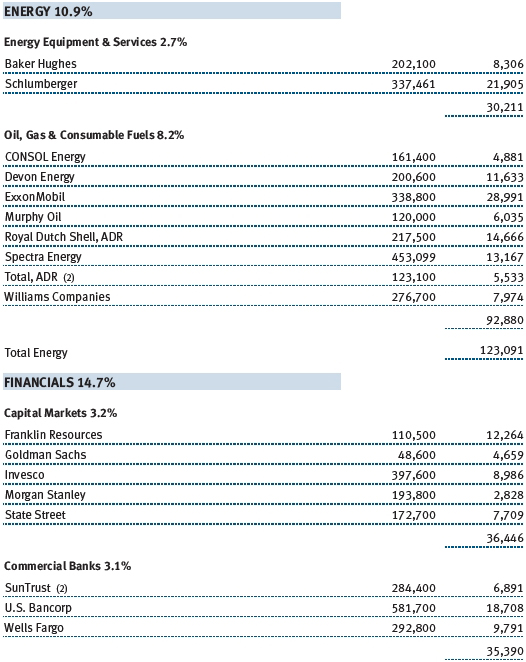
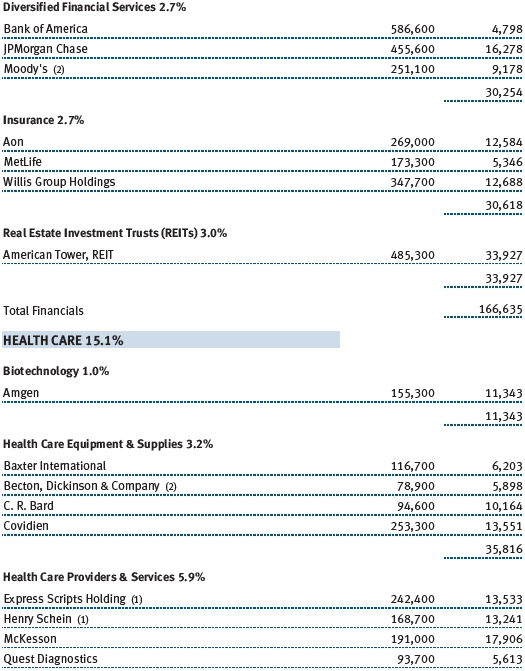
The financials sector represents one of our larger sector allocations, and our holdings outpaced the broader market with solid gains. Several factors combined to drive the sector’s performance, including improving credit, greater regulatory clarity, modest economic growth, attractive yields, and favorable valuations. Expectations of recovery in the housing market were a big positive for the banking sector, and commercial banks were particularly strong. Wells Fargo and, to a lesser extent, U.S. Bancorp benefited from a surge in mortgage refinancing against a backdrop of record-low interest rates. We increased our position in JPMorgan Chase, which was a solid performer despite recent publicity concerning trading losses. Although we are mindful of the company’s recent stumble, the stock remains a high-conviction holding. Shares of insurance brokers Willis Group and Aon fell as both companies failed to meet earnings expectations. We continue to hold both companies, however, as we expect the brokerage pricing model to improve going forward. We remain focused on higher-quality financial companies with management teams capable of navigating a difficult economic and regulatory environment.
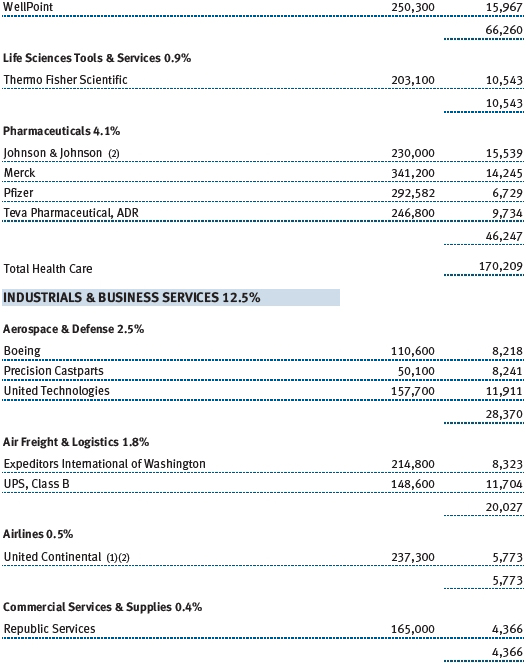
Our health care holdings also generated nice gains as investors favored the sector’s defensive qualities and attractive valuations and were less concerned about the impact of health care reform. We increased our sector position during the period, favoring firms that offer innovative solutions-driven health care or unique therapeutic benefits. We also believe that opportunities exist for companies that provide products or services that reduce health care costs. Pharmaceutical firms are a relatively new area of focus for the fund, and Merck and Pfizer were strong contributors during the period. Many major pharmaceuticals have been trading at depresssed valuations for some time, due in part to the expiration of key patents and perceived lack of growth opportunities. Nevertheless, patent cliff concerns are receding, and investors are attracted to the pharmaceutical industry’s strong cash flows and recent movement to a more shareholder-friendly approach to capital deployment. We established a position in laboratory equipment maker Thermo Fisher Scientific. Although the company has some exposure to budget cutbacks from the National Institutes of Health (NIH), Thermo Fisher has ample opportunity to improve its margin profile. The company recently instituted its first dividend payment, and its shares are attractively valued.
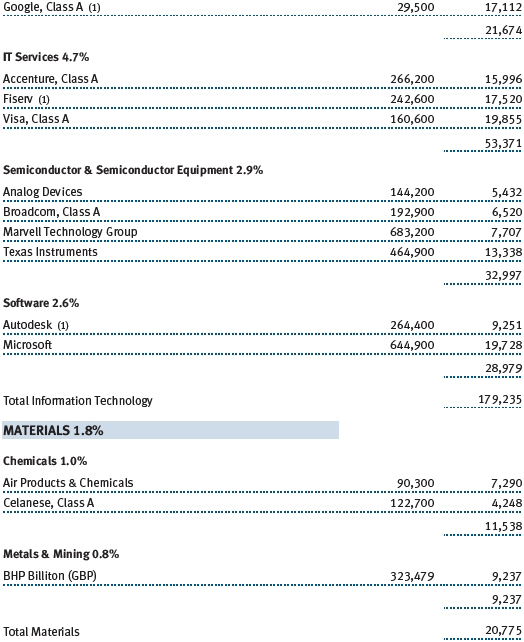
The fund’s information technology stocks posted solid gains and outperformed the broader equity markets by a slim margin. Our holdings are largely concentrated in semiconductors and IT services, including companies such as Visa, Fiserv, and Accenture. These stocks performed well during the period as investors were attracted to their defensive business models. Apple was one of the fund’s top performers after the company announced plans to spend $45 billion over the next three years on share repurchases and newly initiated dividend payments. Despite the proposed payout, Apple should continue to build enormous amounts of cash on its balance sheet over the next few years. The company is a star player in the global mobile computing market, and, with a solid product pipeline and world-class management team, we believe the company is poised for more strong performance. While shares of Internet search giant Google declined, the company continues to push the boundaries of technology, and its suite of innovations and products should continue to drive attractive growth.
Our energy stocks fell during the period. Sector performance struggled as signs of weakening global economic growth weighed heavily on energy prices. Softness in energy prices may continue, driven by production growth in North America and non-OPEC countries. As a result, we remain selective in our energy holdings, seeking names with low cost structures, access to reliable and high-quality energy sources, and solid production growth. Midstream operator Williams Companies and ExxonMobil were among the few bright spots. Shares of natural gas and coal producer CONSOL Energy weighed heavily on results. Steel production is not likely to grow until global growth improves, resulting in a weak pricing environment for metallurgical coal. Furthermore, North America experienced its warmest winter in the last 50 years, putting U.S. thermal coal on its heels just as natural gas prices fell to decade lows. Oil equipment and services firms Schlumberger and Baker Hughes slid on expectations of weaker oil prices resulting from the slowing global economy and increasing U.S. production.
Our materials holdings also lost ground. The big news in the sector was our addition of Celanese. Shares of this global chemical company swooned due to exposure to the slowing economies of Europe and Asia. However, Celanese is a market leader in the acetyls chain of chemicals (25% market share) and makes acid, resins, adhesives, and emulsions for paint, automotives, industrial uses, construction, cigarette filters, and other end markets. We viewed the depressed valuations as an opportunity to own a high-quality company poised to grow once global economic growth improves.
OUTLOOK
We expect market volatility to remain high in the face of ongoing economic and political uncertainties around the world. In the U.S., we anticipate a low-growth environment but not a recession. Persistently high unemployment, household deleveraging, and fiscal retrenchment at the local, state, and federal government levels are keeping a lid on a robust recovery. The dollar is likely to continue to benefit from its safe-haven status in an unsettled environment, pressuring profits for multinational companies. Despite its recent strength, the trade-weighted dollar remains historically low, a positive for U.S. manufacturing. Much of Europe is in recession and plagued by unsustainable debt loads. The popular will to implement and maintain austerity programs on the Continent is low, and the region’s incremental approach to policymaking continues to allow the contagion risk to linger. Policymakers in China are walking a fine line as they try to encourage a more consumer-driven economy, promote growth, and contain inflation.
The market’s resilience in the face of all the negative headlines is a bit concerning. The environment certainly “feels” worse than the S&P 500’s 9.49% first-half return. Although valuations have fallen in some of the more cyclical sectors of the market such as energy, the correction has, so far, not offered obvious buying opportunities. Some of the more defensive, higher-yielding sectors, including telecommunications, utilities, and real estate investments trusts, appear expensive. There is no question that the desire for yield—not valuation—is driving the performance of these sectors. This will likely continue until we see interest rates turn higher. In terms of price-to-earnings ratio, the market does not look particularly expensive. However, we are aware that margins for the S&P 500 Index are at cyclical highs, suggesting that current earnings estimates are particularly vulnerable in an environment of slowing revenue growth.
While “complacency” may be too strong a term, the market seems to be reflecting a positive outcome on issues in the U.S., Europe, and elsewhere. A debt crisis that first surfaced in the private sector (households and businesses) has shifted to the public sector (governments). Steps were taken to address the health of household and corporate balance sheets, but the question remains whether governments have the stomach to address their profound problems. While the track record of the world’s leading politicians doesn’t inspire confidence, we are hopeful that the severity of the problems causes real action and reform sooner rather than later.
Despite the cloudy environment, we continue to find good companies to add to the portfolio. Market volatility often provides us with an opportunity to buy good businesses under some form of temporary stress. What we find are well-capitalized businesses, operating efficiently, generating healthy cash flow, and, in many cases, returning a portion of it to us as shareholders. The things management teams can control—such as, business execution—are being done well.
Respectfully submitted,

Thomas J. Huber
President of the fund and chairman of its Investment Advisory Committee
July 26, 2012
The committee chairman has day-to-day responsibility for managing the portfolio and works with committee members in developing and executing the fund’s investment program.
RISKS OF STOCK INVESTING
As with all stock and bond mutual funds, a fund’s share price can fall because of weakness in the stock or bond markets, a particular industry, or specific holdings. Stock markets can decline for many reasons, including adverse political or economic developments, changes in investor psychology, or heavy institutional selling. The prospects for an industry or company may deteriorate because of a variety of factors, including disappointing earnings or changes in the competitive environment. In addition, the investment manager’s assessment of companies held in a fund may prove incorrect, resulting in losses or poor performance even in rising markets. Funds investing in stocks with a dividend orientation may have a somewhat lower potential for price appreciation than those concentrating on rapidly growing firms. Also, a company may reduce or eliminate its dividend.
GLOSSARY
Dividend yield: The annual dividend of a stock divided by the stock’s price.
Free cash flow: The excess cash a company generates from its operations that can be taken out of the business for the benefit of shareholders, such as dividends, share repurchases, investments, and acquisitions.
Lipper indexes: Fund benchmarks that consist of a small number (10 to 30) of the largest mutual funds in a particular category as tracked by Lipper Inc.
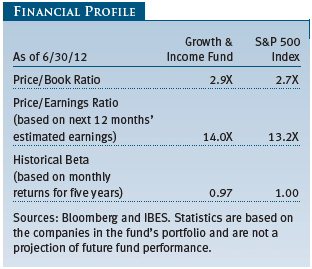
Price-to-earnings (P/E) ratio: A valuation measure calculated by dividing the price of a stock by its reported earnings per share. The ratio is a measure of how much investors are willing to pay for the company’s earnings.
Price/book ratio: A valuation measure that compares a stock’s market price with its book value; i.e., the company’s net worth divided by the number of outstanding shares.
S&P 500 Index: An unmanaged index that tracks the stocks of 500 primarily large-capitalization U.S. companies.

Performance and Expenses
This chart shows the value of a hypothetical $10,000 investment in the fund over the past 10 fiscal year periods or since inception (for funds lacking 10-year records). The result is compared with benchmarks, which may include a broad-based market index and a peer group average or index. Market indexes do not include expenses, which are deducted from fund returns as well as mutual fund averages and indexes.
As a mutual fund shareholder, you may incur two types of costs: (1) transaction costs, such as redemption fees or sales loads, and (2) ongoing costs, including management fees, distribution and service (12b-1) fees, and other fund expenses. The following example is intended to help you understand your ongoing costs (in dollars) of investing in the fund and to compare these costs with the ongoing costs of investing in other mutual funds. The example is based on an investment of $1,000 invested at the beginning of the most recent six-month period and held for the entire period.
Actual Expenses
The first line of the following table (Actual) provides information about actual account values and expenses based on the fund’s actual returns. You may use the information on this line, together with your account balance, to estimate the expenses that you paid over the period. Simply divide your account value by $1,000 (for example, an $8,600 account value divided by $1,000 = 8.6), then multiply the result by the number on the first line under the heading “Expenses Paid During Period” to estimate the expenses you paid on your account during this period.
Hypothetical Example for Comparison Purposes
The information on the second line of the table (Hypothetical) is based on hypothetical account values and expenses derived from the fund’s actual expense ratio and an assumed 5% per year rate of return before expenses (not the fund’s actual return). You may compare the ongoing costs of investing in the fund with other funds by contrasting this 5% hypothetical example and the 5% hypothetical examples that appear in the shareholder reports of the other funds. The hypothetical account values and expenses may not be used to estimate the actual ending account balance or expenses you paid for the period.
Note: T. Rowe Price charges an annual account service fee of $20, generally for accounts with less than $10,000. The fee is waived for any investor whose T. Rowe Price mutual fund accounts total $50,000 or more; accounts electing to receive electronic delivery of account statements, transaction confirmations, prospectuses, and shareholder reports; or accounts of an investor who is a T. Rowe Price Preferred Services, Personal Services, or Enhanced Personal Services client (enrollment in these programs generally requires T. Rowe Price assets of at least $100,000). This fee is not included in the accompanying table. If you are subject to the fee, keep it in mind when you are estimating the ongoing expenses of investing in the fund and when comparing the expenses of this fund with other funds.
You should also be aware that the expenses shown in the table highlight only your ongoing costs and do not reflect any transaction costs, such as redemption fees or sales loads. Therefore, the second line of the table is useful in comparing ongoing costs only and will not help you determine the relative total costs of owning different funds. To the extent a fund charges transaction costs, however, the total cost of owning that fund is higher.

Unaudited

The accompanying notes are an integral part of these financial statements.
Unaudited


The accompanying notes are an integral part of these financial statements.
Unaudited
The accompanying notes are an integral part of these financial statements.
Unaudited

The accompanying notes are an integral part of these financial statements.
Unaudited
The accompanying notes are an integral part of these financial statements.
Unaudited
| Notes to Financial Statements |
T. Rowe Price Growth & Income Fund, Inc. (the fund), is registered under the Investment Company Act of 1940 (the 1940 Act) as a diversified, open-end management investment company. The fund commenced operations on December 21, 1982. The fund seeks to provide long-term capital growth, a reasonable level of current income, and increasing future income through investments primarily in dividend-paying common stocks.
NOTE 1 - SIGNIFICANT ACCOUNTING POLICIES
Basis of Preparation The accompanying financial statements were prepared in accordance with accounting principles generally accepted in the United States of America (GAAP), which require the use of estimates made by management. Management believes that estimates and valuations are appropriate; however, actual results may differ from those estimates, and the valuations reflected in the accompanying financial statements may differ from the value ultimately realized upon sale or maturity.
Investment Transactions, Investment Income, and Distributions Income and expenses are recorded on the accrual basis. Dividends received from mutual fund investments are reflected as dividend income; capital gain distributions are reflected as realized gain/loss. Dividend income and capital gain distributions are recorded on the ex-dividend date. Income tax-related interest and penalties, if incurred, would be recorded as income tax expense. Investment transactions are accounted for on the trade date. Realized gains and losses are reported on the identified cost basis. Distributions to shareholders are recorded on the ex-dividend date. Income distributions are declared and paid quarterly. Capital gain distributions, if any, are generally declared and paid by the fund annually.
Currency Translation Assets, including investments, and liabilities denominated in foreign currencies are translated into U.S. dollar values each day at the prevailing exchange rate, using the mean of the bid and asked prices of such currencies against U.S. dollars as quoted by a major bank. Purchases and sales of securities, income, and expenses are translated into U.S. dollars at the prevailing exchange rate on the date of the transaction. The effect of changes in foreign currency exchange rates on realized and unrealized security gains and losses is reflected as a component of security gains and losses.
Rebates and Credits Subject to best execution, the fund may direct certain security trades to brokers who have agreed to rebate a portion of the related brokerage commission to the fund in cash. Commission rebates are reflected as realized gain on securities in the accompanying financial statements and totaled $3,000 for the six months ended June 30, 2012. Additionally, the fund earns credits on temporarily uninvested cash balances held at the custodian, which reduce the fund’s custody charges. Custody expense in the accompanying financial statements is presented before reduction for credits.
New Accounting Pronouncements In May 2011, the Financial Accounting Standards Board (FASB) issued amended guidance to align fair value measurement and disclosure requirements in U.S. GAAP with International Financial Reporting Standards. The guidance is effective for fiscal years and interim periods beginning on or after December 15, 2011. Adoption had no effect on net assets or results of operations.
In December 2011, the FASB issued amended guidance to enhance disclosure for offsetting assets and liabilities. The guidance is effective for fiscal years and interim periods beginning on or after January 1, 2013. Adoption will have no effect on the fund’s net assets or results of operations.
NOTE 2 - VALUATION
The fund’s financial instruments are reported at fair value as defined by GAAP. The fund determines the values of its assets and liabilities and computes its net asset value per share at the close of the New York Stock Exchange (NYSE), normally 4 p.m. ET, each day that the NYSE is open for business.
Valuation Methods Equity securities listed or regularly traded on a securities exchange or in the over-the-counter (OTC) market are valued at the last quoted sale price or, for certain markets, the official closing price at the time the valuations are made, except for OTC Bulletin Board securities, which are valued at the mean of the latest bid and asked prices. A security that is listed or traded on more than one exchange is valued at the quotation on the exchange determined to be the primary market for such security. Listed securities not traded on a particular day are valued at the mean of the latest bid and asked prices for domestic securities and the last quoted sale price for international securities.
Investments in mutual funds are valued at the mutual fund’s closing net asset value per share on the day of valuation.
Other investments, including restricted securities and private placements, and those financial instruments for which the above valuation procedures are inappropriate or are deemed not to reflect fair value, are stated at fair value as determined in good faith by the T. Rowe Price Valuation Committee, established by the fund’s Board of Directors (the Board). Subject to oversight by the Board, the Valuation Committee develops pricing-related policies and procedures and approves all fair-value determinations. The Valuation Committee regularly makes good faith judgments, using a wide variety of sources and information, to establish and adjust valuations of certain securities as events occur and circumstances warrant. For instance, in determining the fair value of private-equity instruments, the Valuation Committee considers a variety of factors, including the company’s business prospects, its financial performance, strategic events impacting the company, relevant valuations of similar companies, new rounds of financing, and any negotiated transactions of significant size between other investors in the company. Because any fair-value determination involves a significant amount of judgment, there is a degree of subjectivity inherent in such pricing decisions.
For valuation purposes, the last quoted prices of non-U.S. equity securities may be adjusted under the circumstances described below. If the fund determines that developments between the close of a foreign market and the close of the NYSE will, in its judgment, materially affect the value of some or all of its portfolio securities, the fund will adjust the previous closing prices to reflect what it believes to be the fair value of the securities as of the close of the NYSE. In deciding whether it is necessary to adjust closing prices to reflect fair value, the fund reviews a variety of factors, including developments in foreign markets, the performance of U.S. securities markets, and the performance of instruments trading in U.S. markets that represent foreign securities and baskets of foreign securities. A fund may also fair value securities in other situations, such as when a particular foreign market is closed but the fund is open. The fund uses outside pricing services to provide it with closing prices and information to evaluate and/or adjust those prices. The fund cannot predict how often it will use closing prices and how often it will determine it necessary to adjust those prices to reflect fair value. As a means of evaluating its security valuation process, the fund routinely compares closing prices, the next day’s opening prices in the same markets, and adjusted prices. Additionally, trading in the underlying securities of the fund may take place in various foreign markets on certain days when the fund is not open for business and does not calculate a net asset value. As a result, net asset values may be significantly affected on days when shareholders cannot make transactions.
Valuation Inputs Various inputs are used to determine the value of the fund’s financial instruments. These inputs are summarized in the three broad levels listed below:
Level 1 – quoted prices in active markets for identical financial instruments
Level 2 – observable inputs other than Level 1 quoted prices (including, but not limited to, quoted prices for similar financial instruments, interest rates, prepayment speeds, and credit risk)
Level 3 – unobservable inputs
Observable inputs are those based on market data obtained from sources independent of the fund, and unobservable inputs reflect the fund’s own assumptions based on the best information available. The input levels are not necessarily an indication of the risk or liquidity associated with financial instruments at that level. For example, non-U.S. equity securities actively traded in foreign markets generally are reflected in Level 2 despite the availability of closing prices because the fund evaluates and determines whether those closing prices reflect fair value at the close of the NYSE or require adjustment, as described above. The following table summarizes the fund’s financial instruments, based on the inputs used to determine their values on June 30, 2012:
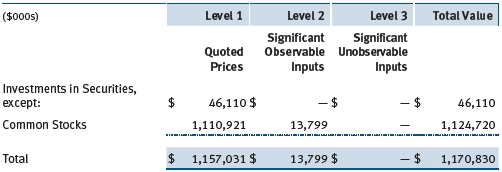
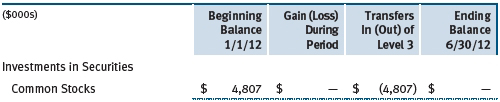
Following is a reconciliation of the fund’s Level 3 holdings for the six months ended June 30, 2012. Transfers into and out of Level 3 are reflected at the value of the financial instrument at the beginning of the period. Gain (loss) reflects both realized and change in unrealized gain (loss) on Level 3 holdings during the period, if any, and is included on the accompanying Statement of Operations. The change in unrealized gain (loss) on Level 3 instruments held at June 30, 2012, totaled $0 for the six months ended June 30, 2012.
NOTE 3 - OTHER INVESTMENT TRANSACTIONS
Consistent with its investment objective, the fund engages in the following practices to manage exposure to certain risks and/or to enhance performance. The investment objective, policies, program, and risk factors of the fund are described more fully in the fund’s prospectus and Statement of Additional Information.
Restricted Securities The fund may invest in securities that are subject to legal or contractual restrictions on resale. Prompt sale of such securities at an acceptable price may be difficult and may involve substantial delays and additional costs.
Securities Lending The fund lends its securities to approved brokers to earn additional income. It receives as collateral cash and U.S. government securities valued at 102% to 105% of the value of the securities on loan. Collateral is maintained over the life of the loan in an amount not less than the value of loaned securities as determined at the close of fund business each day; any additional collateral required due to changes in security values is delivered to the fund the next business day. Cash collateral is invested by the fund’s lending agent(s) in accordance with investment guidelines approved by management. Although risk is mitigated by the collateral, the fund could experience a delay in recovering its securities and a possible loss of income or value if the borrower fails to return the securities or if collateral investments decline in value. Securities lending revenue recognized by the fund consists of earnings on invested collateral and borrowing fees, net of any rebates to the borrower and compensation to the lending agent. In accordance with GAAP, investments made with cash collateral are reflected in the accompanying financial statements, but collateral received in the form of securities are not. On June 30, 2012, the value of cash collateral investments was $41,072,000, and the value of loaned securities was $41,127,000.
Other Purchases and sales of portfolio securities other than short-term securities aggregated $49,271,000 and $66,512,000, respectively, for the six months ended June 30, 2012.
NOTE 4 - FEDERAL INCOME TAXES
No provision for federal income taxes is required since the fund intends to continue to qualify as a regulated investment company under Subchapter M of the Internal Revenue Code and distribute to shareholders all of its taxable income and gains. Distributions determined in accordance with federal income tax regulations may differ in amount or character from net investment income and realized gains for financial reporting purposes. Financial reporting records are adjusted for permanent book/tax differences to reflect tax character but are not adjusted for temporary differences. The amount and character of tax-basis distributions and composition of net assets are finalized at fiscal year-end; accordingly, tax-basis balances have not been determined as of the date of this report.
The fund intends to retain realized gains to the extent of available capital loss carryforwards. As a result of the Regulated Investment Company Modernization Act of 2010, net capital losses realized on or after January 1, 2011 (effective date) may be carried forward indefinitely to offset future realized capital gains; however, post-effective losses must be used before pre-effective capital loss carryforwards with expiration dates. Accordingly, it is possible that all or a portion of the fund’s pre-effective capital loss carryforwards could expire unused. As of December 31, 2011, the fund had $80,319,000 of available capital loss carryforwards, which expire as follows: $79,955,000 in fiscal 2017; $364,000 have no expiration.
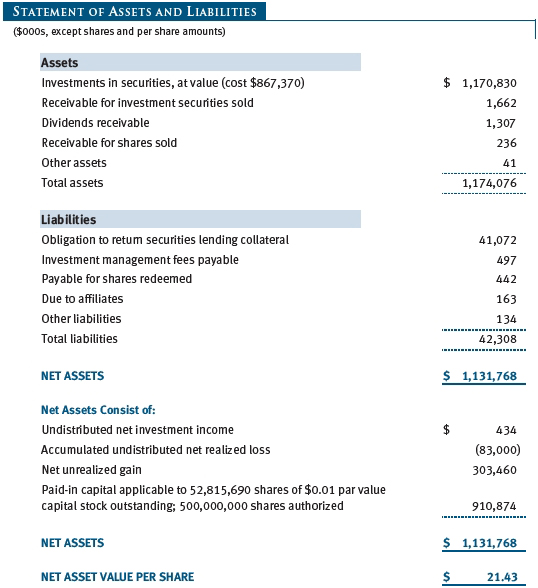
At June 30, 2012, the cost of investments for federal income tax purposes was $880,341,000. Net unrealized gain aggregated $290,489,000 at period-end, of which $336,628,000 related to appreciated investments and $46,139,000 related to depreciated investments.
NOTE 5 - RELATED PARTY TRANSACTIONS
The fund is managed by T. Rowe Price Associates, Inc. (Price Associates), a wholly owned subsidiary of T. Rowe Price Group, Inc. (Price Group). The investment management agreement between the fund and Price Associates provides for an annual investment management fee, which is computed daily and paid monthly. The fee consists of an individual fund fee, equal to 0.25% of the fund’s average daily net assets, and a group fee. The group fee rate is calculated based on the combined net assets of certain mutual funds sponsored by Price Associates (the group) applied to a graduated fee schedule, with rates ranging from 0.48% for the first $1 billion of assets to 0.28% for assets in excess of $300 billion. The fund’s group fee is determined by applying the group fee rate to the fund’s average daily net assets. At June 30, 2012, the effective annual group fee rate was 0.30%.
In addition, the fund has entered into service agreements with Price Associates and two wholly owned subsidiaries of Price Associates (collectively, Price). Price Associates computes the daily share price and provides certain other administrative services to the fund. T. Rowe Price Services, Inc., provides shareholder and administrative services in its capacity as the fund’s transfer and dividend disbursing agent. T. Rowe Price Retirement Plan Services, Inc., provides subaccounting and recordkeeping services for certain retirement accounts invested in the fund. For the six months ended June 30, 2012, expenses incurred pursuant to these service agreements were $50,000 for Price Associates; $336,000 for T. Rowe Price Services, Inc.; and $121,000 for T. Rowe Price Retirement Plan Services, Inc. The total amount payable at period-end pursuant to these service agreements is reflected as Due to Affiliates in the accompanying financial statements.
The fund may invest in the T. Rowe Price Reserve Investment Fund and the T. Rowe Price Government Reserve Investment Fund (collectively, the T. Rowe Price Reserve Investment Funds), open-end management investment companies managed by Price Associates and considered affiliates of the fund. The T. Rowe Price Reserve Investment Funds are offered as cash management options to mutual funds, trusts, and other accounts managed by Price Associates and/or its affiliates and are not available for direct purchase by members of the public. The T. Rowe Price Reserve Investment Funds pay no investment management fees.
| Information on Proxy Voting Policies, Procedures, and Records |
A description of the policies and procedures used by T. Rowe Price funds and portfolios to determine how to vote proxies relating to portfolio securities is available in each fund’s Statement of Additional Information, which you may request by calling 1-800-225-5132 or by accessing the SEC’s website, sec.gov. The description of our proxy voting policies and procedures is also available on our website, troweprice.com. To access it, click on the words “Our Company” at the top of our corporate homepage. Then, when the next page appears, click on the words “Proxy Voting Policies” on the left side of the page.
Each fund’s most recent annual proxy voting record is available on our website and through the SEC’s website. To access it through our website, follow the directions above, then click on the words “Proxy Voting Records” on the right side of the Proxy Voting Policies page.
| How to Obtain Quarterly Portfolio Holdings |
The fund files a complete schedule of portfolio holdings with the Securities and Exchange Commission for the first and third quarters of each fiscal year on Form N-Q. The fund’s Form N-Q is available electronically on the SEC’s website (sec.gov); hard copies may be reviewed and copied at the SEC’s Public Reference Room, 100 F St. N.E., Washington, DC 20549. For more information on the Public Reference Room, call 1-800-SEC-0330.
| Approval of Investment Management Agreement |
On March 6, 2012, the fund’s Board of Directors (Board), including a majority of the fund’s independent directors, approved the continuation of the investment management agreement (Advisory Contract) between the fund and its investment advisor, T. Rowe Price Associates, Inc. (Advisor). In connection with its deliberations, the Board requested, and the Advisor provided, such information as the Board (with advice from independent legal counsel) deemed reasonably necessary. The Board considered a variety of factors in connection with its review of the Advisory Contract, also taking into account information provided by the Advisor during the course of the year, as discussed below:
Services Provided by the Advisor
The Board considered the nature, quality, and extent of the services provided to the fund by the Advisor. These services included, but were not limited to, directing the fund’s investments in accordance with its investment program and the overall management of the fund’s portfolio, as well as a variety of related activities such as financial, investment operations, and administrative services; compliance; maintaining the fund’s records and registrations; and shareholder communications. The Board also reviewed the background and experience of the Advisor’s senior management team and investment personnel involved in the management of the fund, as well as the Advisor’s compliance record. The Board concluded that it was satisfied with the nature, quality, and extent of the services provided by the Advisor.
Investment Performance of the Fund
The Board reviewed the fund’s average annual total returns over the three-month and 1-, 3-, 5-, and 10-year periods, as well as the fund’s year-by-year returns, and compared these returns with a wide variety of previously agreed upon comparable performance measures and market data, including those supplied by Lipper and Morningstar, which are independent providers of mutual fund data.
On the basis of this evaluation and the Board’s ongoing review of investment results, and factoring in the relative market conditions during certain of the performance periods, the Board concluded that the fund’s performance was satisfactory.
Costs, Benefits, Profits, and Economies of Scale
The Board reviewed detailed information regarding the revenues received by the Advisor under the Advisory Contract and other benefits that the Advisor (and its affiliates) may have realized from its relationship with the fund, including any research received under “soft dollar” agreements and commission-sharing arrangements with broker-dealers. The Board considered that the Advisor may receive some benefit from soft-dollar arrangements pursuant to which research is received from broker-dealers that execute the applicable fund’s portfolio transactions. The Board received information on the estimated costs incurred and profits realized by the Advisor from managing T. Rowe Price mutual funds. The Board also reviewed estimates of the profits realized from managing the fund in particular, and the Board concluded that the Advisor’s profits were reasonable in light of the services provided to the fund.
The Board also considered whether the fund benefits under the fee levels set forth in the Advisory Contract from any economies of scale realized by the Advisor. Under the Advisory Contract, the fund pays a fee to the Advisor for investment management services composed of two components—a group fee rate based on the combined average net assets of most of the T. Rowe Price mutual funds (including the fund) that declines at certain asset levels and an individual fund fee rate based on the fund’s average daily net assets—and the fund pays its own expenses of operations. The Board concluded that the advisory fee structure for the fund continued to provide for a reasonable sharing of benefits from any economies of scale with the fund’s investors.
Fees
The Board was provided with information regarding industry trends in management fees and expenses, and the Board reviewed the fund’s management fee rate, operating expenses, and total expense ratio in comparison with fees and expenses of other comparable funds based on information and data supplied by Lipper. The information provided to the Board indicated that the fund’s management fee rate was above the median for certain groups of comparable funds but at or below the median for other groups of comparable funds. The information provided to the Board also indicated that the fund’s total expense ratio was below the median for comparable funds.
The Board also reviewed the fee schedules for institutional accounts and private accounts with similar mandates that are advised or subadvised by the Advisor and its affiliates. Management provided the Board with information about the Advisor’s responsibilities and services provided to institutional account clients, including information about how the requirements and economics of the institutional business are fundamentally different from those of the mutual fund business. The Board considered information showing that the mutual fund business is generally more complex from a business and compliance perspective than the institutional business and that the Advisor generally performs significant additional services and assumes greater risk in managing the fund and other T. Rowe Price mutual funds than it does for institutional account clients.
On the basis of the information provided and the factors considered, the Board concluded that the fees paid by the fund under the Advisory Contract are reasonable.
Approval of the Advisory Contract
As noted, the Board approved the continuation of the Advisory Contract. No single factor was considered in isolation or to be determinative to the decision. Rather, the Board concluded, in light of a weighting and balancing of all factors considered, that it was in the best interests of the fund and its shareholders for the Board to approve the continuation of the Advisory Contract (including the fees to be charged for services thereunder). The independent directors were advised throughout the process by independent legal counsel.
Item 2. Code of Ethics.
A code of ethics, as defined in Item 2 of Form N-CSR, applicable to its principal executive officer, principal financial officer, principal accounting officer or controller, or persons performing similar functions is filed as an exhibit to the registrant’s annual Form N-CSR. No substantive amendments were approved or waivers were granted to this code of ethics during the registrant’s most recent fiscal half-year.
Item 3. Audit Committee Financial Expert.
Disclosure required in registrant’s annual Form N-CSR.
Item 4. Principal Accountant Fees and Services.
Disclosure required in registrant’s annual Form N-CSR.
Item 5. Audit Committee of Listed Registrants.
Not applicable.
Item 6. Investments.
(a) Not applicable. The complete schedule of investments is included in Item 1 of this Form N-CSR.
(b) Not applicable.
Item 7. Disclosure of Proxy Voting Policies and Procedures for Closed-End Management Investment Companies.
Not applicable.
Item 8. Portfolio Managers of Closed-End Management Investment Companies.
Not applicable.
Item 9. Purchases of Equity Securities by Closed-End Management Investment Company and Affiliated Purchasers.
Not applicable.
Item 10. Submission of Matters to a Vote of Security Holders.
Not applicable.
Item 11. Controls and Procedures.
(a) The registrant’s principal executive officer and principal financial officer have evaluated the registrant’s disclosure controls and procedures within 90 days of this filing and have concluded that the registrant’s disclosure controls and procedures were effective, as of that date, in ensuring that information required to be disclosed by the registrant in this Form N-CSR was recorded, processed, summarized, and reported timely.
(b) The registrant’s principal executive officer and principal financial officer are aware of no change in the registrant’s internal control over financial reporting that occurred during the registrant’s second fiscal quarter covered by this report that has materially affected, or is reasonably likely to materially affect, the registrant’s internal control over financial reporting.
Item 12. Exhibits.
(a)(1) The registrant’s code of ethics pursuant to Item 2 of Form N-CSR is filed with the registrant’s annual Form N-CSR.
(2) Separate certifications by the registrant's principal executive officer and principal financial officer, pursuant to Section 302 of the Sarbanes-Oxley Act of 2002 and required by Rule 30a-2(a) under the Investment Company Act of 1940, are attached.
(3) Written solicitation to repurchase securities issued by closed-end companies: not applicable.
(b) A certification by the registrant's principal executive officer and principal financial officer, pursuant to Section 906 of the Sarbanes-Oxley Act of 2002 and required by Rule 30a-2(b) under the Investment Company Act of 1940, is attached.
SIGNATURES
Pursuant to the requirements of the Securities Exchange Act of 1934 and the Investment Company Act of 1940, the registrant has duly caused this report to be signed on its behalf by the undersigned, thereunto duly authorized.
T. Rowe Price Growth & Income Fund, Inc.
| By | /s/ Edward C. Bernard |
| | Edward C. Bernard |
| | Principal Executive Officer |
| | |
| Date August 16, 2012 | | |
Pursuant to the requirements of the Securities Exchange Act of 1934 and the Investment Company Act of 1940, this report has been signed below by the following persons on behalf of the registrant and in the capacities and on the dates indicated.
| By | /s/ Edward C. Bernard |
| | Edward C. Bernard |
| | Principal Executive Officer |
| | |
| Date August 16, 2012 | | |
| | |
| | |
| By | /s/ Gregory K. Hinkle |
| | Gregory K. Hinkle |
| | Principal Financial Officer |
| | |
| Date August 16, 2012 | | |