| UNITED STATES |
| SECURITIES AND EXCHANGE COMMISSION |
| Washington, D.C. 20549 |
| |
FORM N-CSR |
| |
CERTIFIED SHAREHOLDER REPORT OF REGISTERED |
MANAGEMENT INVESTMENT COMPANIES |
| |
| |
| |
| Investment Company Act File Number: 811-3566 |
|
| |
| T. Rowe Price Growth & Income Fund, Inc. |
|
| (Exact name of registrant as specified in charter) |
| |
| 100 East Pratt Street, Baltimore, MD 21202 |
|
| (Address of principal executive offices) |
| |
| David Oestreicher |
| 100 East Pratt Street, Baltimore, MD 21202 |
|
| (Name and address of agent for service) |
| |
| |
| Registrant’s telephone number, including area code: (410) 345-2000 |
| |
| |
| Date of fiscal year end: December 31 |
| |
| |
| Date of reporting period: June 30, 2011 |
Item 1: Report to Shareholders| Growth & Income Fund | June 30, 2011 |
The views and opinions in this report were current as of June 30, 2011. They are not guarantees of performance or investment results and should not be taken as investment advice. Investment decisions reflect a variety of factors, and the managers reserve the right to change their views about individual stocks, sectors, and the markets at any time. As a result, the views expressed should not be relied upon as a forecast of the fund’s future investment intent. The report is certified under the Sarbanes-Oxley Act, which requires mutual funds and other public companies to affirm that, to the best of their knowledge, the information in their financial reports is fairly and accurately stated in all material respects.
REPORTS ON THE WEB
Sign up for our E-mail Program, and you can begin to receive updated fund reports and prospectuses online rather than through the mail. Log in to your account at troweprice.com for more information.
Manager’s Letter
Fellow Shareholders
U.S. equities generated good gains over the six months ended June 30, 2011, although it was anything but a smooth ride. Stocks extended last year’s rally into the early months of 2011, helped by accommodative monetary policies and healthy consumer sentiment. However, investor optimism wilted in March amid ongoing sovereign debt problems in Europe, turmoil in the oil-rich Middle East and North Africa (MENA) region, and a tragic earthquake and tsunami in Japan. Strong corporate earnings and brisk merger activity lifted stocks in April, before disappointing U.S. economic data and Greek debt problems once again sapped investors’ appetite for risk. New austerity measures in Greece buoyed markets and led to a strong rally in the quarter’s closing days.
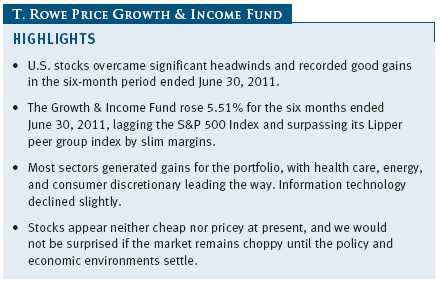
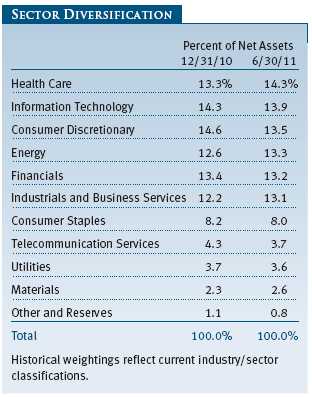
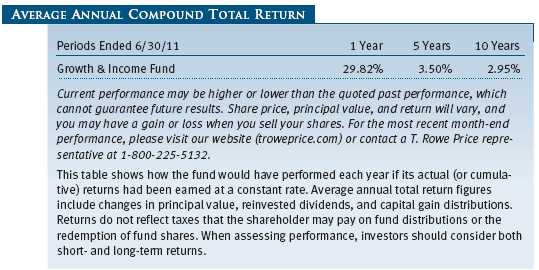
As shown in the accompanying Performance Comparison table, the Growth & Income Fund rose 5.51% for the six-month period ended June 30, 2011, lagging the S&P 500 Index and surpassing its Lipper peer group index by slim margins. Nearly all sectors generated positive absolute returns for the fund, although not at the torrid pace set in the latter half of 2010. Our health care, energy, and consumer discretionary shares led the way, while consumer staples and small positions in utilities and telecommunication services managed more modest gains. Our information technology shares declined slightly and were the lone detractor from absolute returns. Stock selection weighed on returns relative to the S&P 500 Index, but a boost from our sector allocations offset much of the impact. Security selection in financials was strong, but it was either neutral or negative in other sectors.

ECONOMIC AND MARKET ENVIRONMENT
The U.S. economy entered 2011 with positive momentum, helped by extensive monetary and fiscal stimulus. Business activity expanded, and consumer income and spending showed gradual improvement. However, growth failed to meet expectations in the first quarter of 2011 as the European sovereign debt crisis continued to simmer and political instability in the MENA region stoked fears of oil supply disruptions. A devastating earthquake and tsunami struck northeastern Japan in March, raising questions about the impact on global manufacturing supply chains.
Equities proved resilient, however, and reached new highs for the year in late April amid robust corporate earnings and brisk merger and acquisition activity. Stocks retreated in May and early June as risk aversion returned in the wake of mixed U.S. economic data and renewed worries that Greek debt challenges could spread to other vulnerable markets in Europe. Markets rallied in the period’s closing days as the Greek parliament approved a new round of austerity measures necessary to secure further financial aid from the European Union and the International Monetary Fund.
Most sectors in the S&P 500 Index generated positive returns. Health care stocks led the way as markets achieved greater clarity about the ultimate impact of health care reform. Investors were also attracted by the sector’s defensive attributes and inexpensive valuations. Energy shares rose nicely through the first half of the period but fell sharply in May and June as oil prices retreated. Consumer discretionary, industrials and business services, consumer staples, and telecommunication services shares were less robust but still outperformed the broader market. Materials and information technology shares lagged with modest gains, while financials declined amid continued housing market weakness and as new regulations weighed on banks’ earnings. Growth stocks outperformed value across all market capitalization ranges.
PERFORMANCE REVIEW
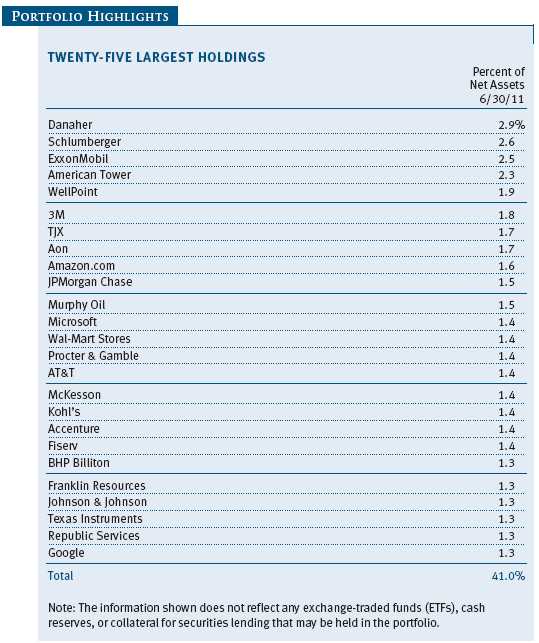
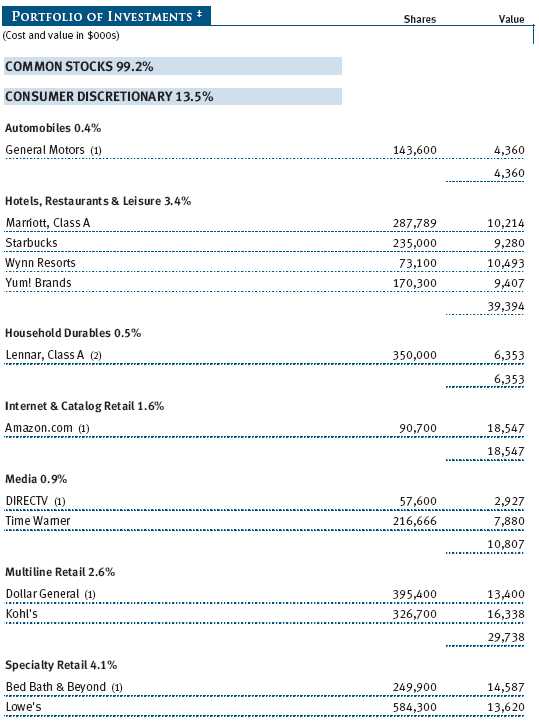
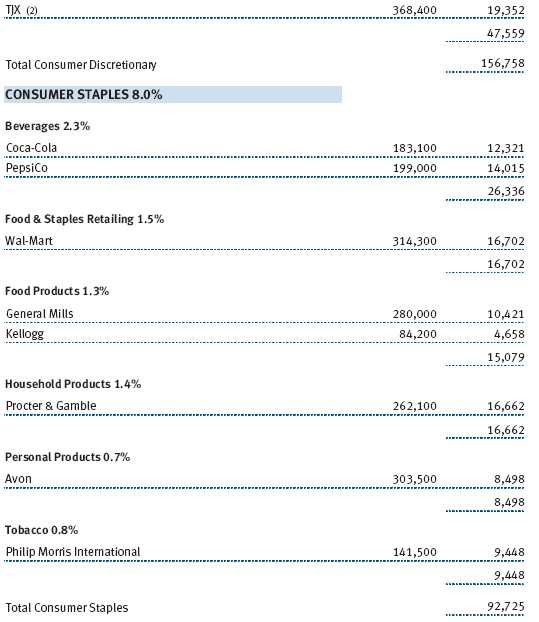
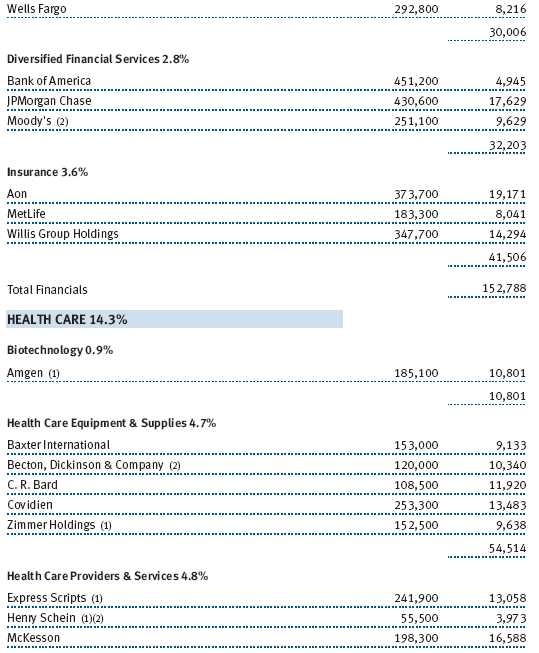
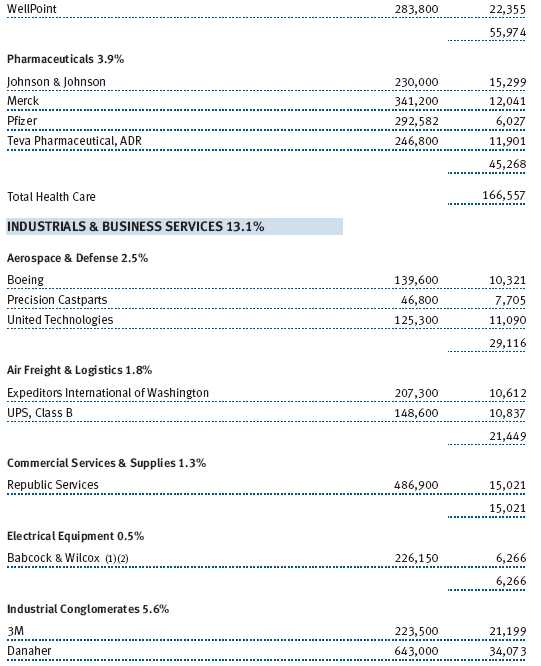
Health care stocks were the fund’s biggest contributors as investors favored the sector’s defensive attributes and became less concerned about the impact of health care reform and regulation. WellPoint was the fund’s top contributor. This managed care provider benefited from lower patient utilization of health care services, relieving additional pressure on operating margins from changes due to health care reform. Pfizer was another strong contributor. The pharmaceutical giant is in the midst of a transition. The company is focused on cost reduction, in particular, reducing its massive research and development budget. Management is also considering selling or spinning off pieces of the business where value is not being recognized, such as nutritionals and animal health. Also attractive to investors are the intriguing commercial prospects of several late-stage new medicines filed for approval with the FDA, as is management’s commitment to returning capital to shareholders via dividend increases and share repurchases. Drug distributor McKesson was another strong performer. McKesson will benefit greatly from the enormous wave of drugs coming off patent during the next few years as the company makes more money on generics than branded drugs. We added to our health care allocation over the period. Reform initiatives in the U.S. and austerity measures in Europe should have a negative overall impact on the health care sector’s future growth and profitability. However, opportunities remain in stocks whose valuations account for the risks (Pfizer) or remain less affected by regulation and have a bright outlook (McKesson). (Please refer to the fund’s portfolio of investments for a complete list of holdings and the amount each represents in the portfolio.)
Our energy shares also performed well. Integrated oil and gas producer ExxonMobil was among our stronger performers, due in large part to robust returns early in the period, when oil prices were rising. A recently established position in El Paso Corporation was also among the fund’s top contributors. El Paso is the largest pipeline operator in the U.S., delivering 30% of all natural gas via its pipelines. Midstream pipeline companies such as El Paso have stable business models that helped them weather the second-quarter downturn nicely. The firm’s exploration and production unit has some exciting opportunities for oil discovery in several onshore locations in the U.S. In addition, the company announced plans to split off certain regulated units from its nonregulated oil and gas producing units, unlocking significant value for shareholders. Murphy Oil, which produces oil and operates refineries, weighed heavily on returns as the company dealt with falling oil prices in the latter half of the period and the announcement that its Aracari well in Suriname was dry. We believe that energy costs, particularly for oil, will rise over time, and we continue to look for investments where management teams are good stewards of capital (ExxonMobil) or where we believe asset value is unrecognized by the market (El Paso).
Our consumer discretionary holdings rose nicely, led by the specialty retailers. TJX, whose outlets include T.J.Maxx, Marshalls, and HomeGoods, enjoyed a nice run as the company continued to gain market share. Amazon.com also excelled during the past six months. The Internet retailing giant’s Kindle electronic book reader is helping to provide solid growth—the company now sells more e-books than print editions—despite the entry of Apple’s iPad into the space. Amazon continues to invest heavily in new businesses, laying the foundation for strong growth in the future. Shares of Marriott pulled back after a strong rally as the company announced conservative earnings guidance and was negatively affected by the steady rise in energy prices and the softening of business activity in a few of its major markets. We believe Marriott will continue to be an industry leader with sustainable competitive advantages, good management, and an attractive core business model that should benefit from improving conditions in the hotel industry. Given the uncertain economic backdrop, we are monitoring our investments in the consumer sector carefully. Low-end consumers, in particular, appear vulnerable to rising energy prices as higher oil and gas costs eat up more of their discretionary budget. Improvement in the employment situation should increase the attractiveness of consumer discretionary stocks. In the meantime, however, we are finding attractive opportunities such as Kohl’s. Kohl’s is a leading department store operator offering good products at reasonable prices to the consumer. The valuation is attractive, and the company’s industry-leading management team recently committed to the return of capital via dividends and aggressive share repurchases.
The fund’s financial stocks managed a modest absolute gain, and stock selection boosted returns relative to the S&P 500. International property and casualty insurance broker Aon achieved organic growth, improved margins in its brokerage business, and posted attractive margins in its consulting operations following its recent acquisition of Hewitt. In addition, the company continues to buy back stock. Global credit rating agency Moody’s also boosted returns. The company benefited from solid earnings and expectations for significant improvements in operating margins over the next couple of years. The company is unlikely to be greatly affected by regulatory reforms, and many lawsuits stemming from the global financial crisis have been dismissed or settled favorably. Goldman Sachs and Morgan Stanley hurt returns amid a lack of robust capital markets activity, particularly in the fixed income segment, which accounts for a large share of their revenues. The financials sector continues to be difficult. To be sure, banks have largely recapitalized their balance sheets, the credit environment has improved dramatically, and we are beginning to see the reinitiation of dividend payments. However, trouble spots remain. A weak domestic economy hurts the sector’s fundamentals, while greater regulation is likely to hinder the sector’s ability to generate the returns seen in the past. Our larger positions, including Wells Fargo and U.S. Bancorp, are all well-managed companies that we believe can navigate the changed landscape successfully.
Our information technology shares declined slightly. Stock selection weighed on relative returns, but an underweight position versus the S&P 500 proved beneficial. Accenture, a geographically diverse company with a good business mix of consulting and outsourcing, is improving margins through growth in offshore locations. Its balance sheet and cash flow are strong, enabling consistent return of cash to shareholders. Google was among our weakest performers over the past six months. The search engine giant exceeded revenue estimates in the first quarter, but investors remained concerned about aggressive spending and the company’s efforts to compete in social networking. Antitrust investigations launched by the U.S. government also weighed on the stock. While we are concerned about these issues, we feel that the company has been disciplined in its investments and will be able to replicate past successes. After strong performance in the first quarter, shares of Juniper Networks fell 25% in the second quarter. Although earnings met expectations, investors were concerned about weakness in the firm’s enterprise business and the possibility of a negative impact in its supply chain from the Japanese earthquake.
OUTLOOK
Corporations are generally in solid shape and have recovered from the economic crisis with flying colors. Cash as a percentage of corporate assets is at an all-time high. However, it is generating little value for shareholders so far, and we are paying close attention to how companies might deploy their cash. We are witnessing an uptick in merger and acquisition activity, and since most of our holdings are large-cap, we tend to own more buyers than sellers. As a result, we are watching these deals carefully, assessing their benefits—or lack thereof—for shareholders.
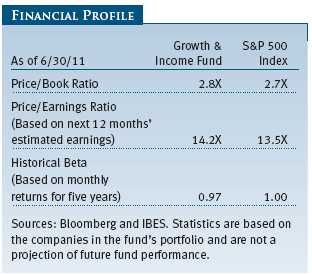
Although the equity market does not look particularly cheap, it does not look particularly expensive, either. We are now in the third year of solidly positive market returns, and we would not be surprised if the market remains choppy until the policy and economic environments clarify. On balance, we remain positive on the longer-term outlook for stocks. While the economic and fiscal challenges facing the country are significant, corporate earnings at select companies should continue to be strong, interest rates and inflation should remain at acceptable levels, and the valuations of many high-quality companies are quite reasonable.
In an uneven economic environment, the identification of attractive long-term investment opportunities will depend on strong fundamental research, disciplined security selection, and careful attention to risk. These attributes have always formed the core of our investment approach, and we believe they will continue to add value for shareholders over the long term.
Respectfully submitted,

Thomas J. Huber
President of the fund and chairman of its Investment Advisory Committee
July 22, 2011
The committee chairman has day-to-day responsibility for managing the portfolio and works with committee members in developing and executing the fund’s investment program.
RISKS OF STOCK INVESTING
As with all stock and bond mutual funds, a fund’s share price can fall because of weakness in the stock or bond markets, a particular industry, or specific holdings. Stock markets can decline for many reasons, including adverse political or economic developments, changes in investor psychology, or heavy institutional selling. The prospects for an industry or company may deteriorate because of a variety of factors, including disappointing earnings or changes in the competitive environment. In addition, the investment manager’s assessment of companies held in a fund may prove incorrect, resulting in losses or poor performance even in rising markets. Funds investing in stocks with a dividend orientation may have somewhat lower potential for price appreciation than those concentrating on rapidly growing firms. Also, a company may reduce or eliminate its dividend.
GLOSSARY
Dividend yield: The annual dividend of a stock divided by the stock’s price.
Free cash flow: The excess cash a company generates from its operations that can be taken out of the business for the benefit of shareholders, such as dividends, share repurchases, investments, and acquisitions.
Lipper indexes: Fund benchmarks that consist of a small number (10 to 30) of the largest mutual funds in a particular category as tracked by Lipper Inc.
Price-to-earnings (P/E) ratio: A valuation measure calculated by dividing the price of a stock by its reported earnings per share. The ratio is a measure of how much investors are willing to pay for the company’s earnings.
S&P 500 Index: An unmanaged index that tracks the stocks of 500 primarily large-capitalization U.S. companies.

Performance and Expenses
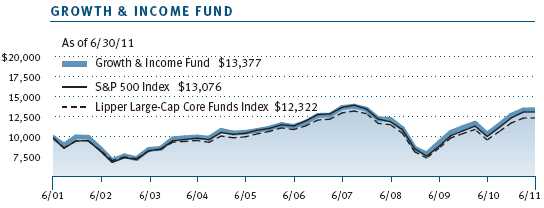
This chart shows the value of a hypothetical $10,000 investment in the fund over the past 10 fiscal year periods or since inception (for funds lacking 10-year records). The result is compared with benchmarks, which may include a broad-based market index and a peer group average or index. Market indexes do not include expenses, which are deducted from fund returns as well as mutual fund averages and indexes.
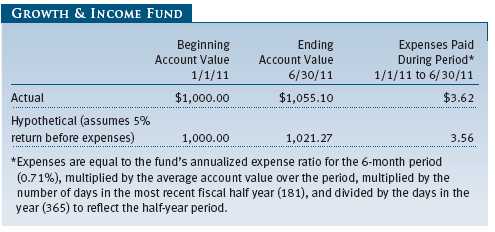
As a mutual fund shareholder, you may incur two types of costs: (1) transaction costs, such as redemption fees or sales loads, and (2) ongoing costs, including management fees, distribution and service (12b-1) fees, and other fund expenses. The following example is intended to help you understand your ongoing costs (in dollars) of investing in the fund and to compare these costs with the ongoing costs of investing in other mutual funds. The example is based on an investment of $1,000 invested at the beginning of the most recent six-month period and held for the entire period.
Actual Expenses
The first line of the following table (“Actual”) provides information about actual account values and expenses based on the fund’s actual returns. You may use the information on this line, together with your account balance, to estimate the expenses that you paid over the period. Simply divide your account value by $1,000 (for example, an $8,600 account value divided by $1,000 = 8.6), then multiply the result by the number on the first line under the heading “Expenses Paid During Period” to estimate the expenses you paid on your account during this period.
Hypothetical Example for Comparison Purposes
The information on the second line of the table (“Hypothetical”) is based on hypothetical account values and expenses derived from the fund’s actual expense ratio and an assumed 5% per year rate of return before expenses (not the fund’s actual return). You may compare the ongoing costs of investing in the fund with other funds by contrasting this 5% hypothetical example and the 5% hypothetical examples that appear in the shareholder reports of the other funds. The hypothetical account values and expenses may not be used to estimate the actual ending account balance or expenses you paid for the period.
Note: T. Rowe Price charges an annual account service fee of $20, generally for accounts with less than $10,000 ($1,000 for UGMA/UTMA). The fee is waived for any investor whose T. Rowe Price mutual fund accounts total $50,000 or more; accounts employing automatic investing; accounts electing to receive electronic delivery of account statements, transaction confirmations, and prospectuses and shareholder reports; accounts of an investor who is a T. Rowe Price Preferred Services, Personal Services, or Enhanced Personal Services client (enrollment in these programs generally requires T. Rowe Price assets of at least $100,000); and IRAs and other retirement plan accounts that utilize a prototype plan sponsored by T. Rowe Price (although a separate custodial or administrative fee may apply to such accounts). This fee is not included in the accompanying table. If you are subject to the fee, keep it in mind when you are estimating the ongoing expenses of investing in the fund and when comparing the expenses of this fund with other funds.
You should also be aware that the expenses shown in the table highlight only your ongoing costs and do not reflect any transaction costs, such as redemption fees or sales loads. Therefore, the second line of the table is useful in comparing ongoing costs only and will not help you determine the relative total costs of owning different funds. To the extent a fund charges transaction costs, however, the total cost of owning that fund is higher.
Unaudited

The accompanying notes are an integral part of these financial statements.
Unaudited


The accompanying notes are an integral part of these financial statements.
Unaudited

The accompanying notes are an integral part of these financial statements.
Unaudited
The accompanying notes are an integral part of these financial statements.
Unaudited
The accompanying notes are an integral part of these financial statements.
Unaudited
| NOTES TO FINANCIAL STATEMENTS |
T. Rowe Price Growth & Income Fund, Inc. (the fund), is registered under the Investment Company Act of 1940 (the 1940 Act) as a diversified, open-end management investment company. The fund commenced operations on December 21, 1982. The fund seeks to provide long-term capital growth, a reasonable level of current income, and increasing future income through investments primarily in dividend-paying common stocks.
NOTE 1 - SIGNIFICANT ACCOUNTING POLICIES
Basis of Preparation The accompanying financial statements were prepared in accordance with accounting principles generally accepted in the United States of America (GAAP), which require the use of estimates made by management. Management believes that estimates and valuations are appropriate; however, actual results may differ from those estimates, and the valuations reflected in the accompanying financial statements may differ from the value ultimately realized upon sale or maturity.
Investment Transactions, Investment Income, and Distributions Income and expenses are recorded on the accrual basis. Dividends received from mutual fund investments are reflected as dividend income; capital gain distributions are reflected as realized gain/loss. Dividend income and capital gain distributions are recorded on the ex-dividend date. Income tax-related interest and penalties, if incurred, would be recorded as income tax expense. Investment transactions are accounted for on the trade date. Realized gains and losses are reported on the identified cost basis. Distributions to shareholders are recorded on the ex-dividend date. Income distributions are declared and paid quarterly. Capital gain distributions, if any, are generally declared and paid by the fund annually.
Currency Translation Assets, including investments, and liabilities denominated in foreign currencies are translated into U.S. dollar values each day at the prevailing exchange rate, using the mean of the bid and asked prices of such currencies against U.S. dollars as quoted by a major bank. Purchases and sales of securities, income, and expenses are translated into U.S. dollars at the prevailing exchange rate on the date of the transaction. The effect of changes in foreign currency exchange rates on realized and unrealized security gains and losses is reflected as a component of security gains and losses.
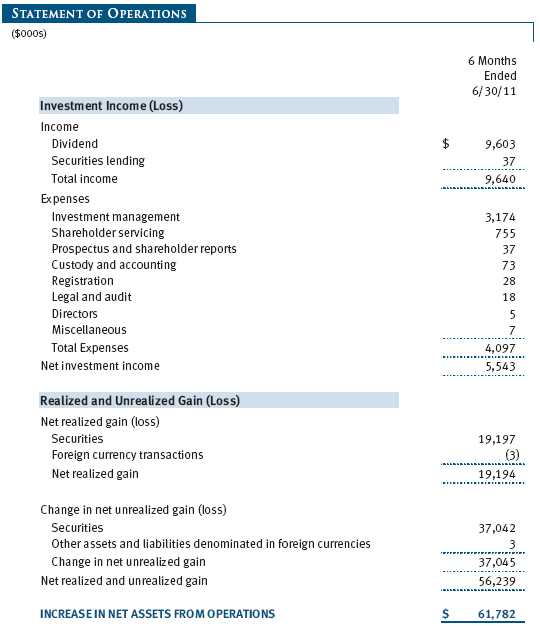
Rebates and Credits Subject to best execution, the fund may direct certain security trades to brokers who have agreed to rebate a portion of the related brokerage commission to the fund in cash. Commission rebates are reflected as realized gain on securities in the accompanying financial statements and totaled $6,000 for the six months ended June 30, 2011. Additionally, the fund earns credits on temporarily uninvested cash balances held at the custodian, which reduce the fund’s custody charges. Custody expense in the accompanying financial statements is presented before reduction for credits.
NOTE 2 - VALUATION
The fund’s financial instruments are reported at fair value as defined by GAAP. The fund determines the values of its assets and liabilities and computes its net asset value per share at the close of the New York Stock Exchange (NYSE), normally 4 p.m. ET, each day that the NYSE is open for business.
Valuation Methods Equity securities listed or regularly traded on a securities exchange or in the over-the-counter (OTC) market are valued at the last quoted sale price or, for certain markets, the official closing price at the time the valuations are made, except for OTC Bulletin Board securities, which are valued at the mean of the latest bid and asked prices. A security that is listed or traded on more than one exchange is valued at the quotation on the exchange determined to be the primary market for such security. Listed securities not traded on a particular day are valued at the mean of the latest bid and asked prices for domestic securities and the last quoted sale price for international securities.
Investments in mutual funds are valued at the mutual fund’s closing net asset value per share on the day of valuation.
Other investments, including restricted securities, and those financial instruments for which the above valuation procedures are inappropriate or are deemed not to reflect fair value are stated at fair value as determined in good faith by the T. Rowe Price Valuation Committee, established by the fund’s Board of Directors.
For valuation purposes, the last quoted prices of non-U.S. equity securities may be adjusted under the circumstances described below. If the fund determines that developments between the close of a foreign market and the close of the NYSE will, in its judgment, materially affect the value of some or all of its portfolio securities, the fund will adjust the previous closing prices to reflect what it believes to be the fair value of the securities as of the close of the NYSE. In deciding whether it is necessary to adjust closing prices to reflect fair value, the fund reviews a variety of factors, including developments in foreign markets, the performance of U.S. securities markets, and the performance of instruments trading in U.S. markets that represent foreign securities and baskets of foreign securities. A fund may also fair value securities in other situations, such as when a particular foreign market is closed but the fund is open. The fund uses outside pricing services to provide it with closing prices and information to evaluate and/or adjust those prices. The fund cannot predict how often it will use closing prices and how often it will determine it necessary to adjust those prices to reflect fair value. As a means of evaluating its security valuation process, the fund routinely compares closing prices, the next day’s opening prices in the same markets, and adjusted prices.
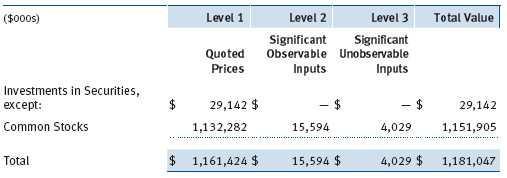
Valuation Inputs Various inputs are used to determine the value of the fund’s financial instruments. These inputs are summarized in the three broad levels listed below:
Level 1 – quoted prices in active markets for identical financial instruments
Level 2 – observable inputs other than Level 1 quoted prices (including, but not limited to, quoted prices for similar financial instruments, interest rates, prepayment speeds, and credit risk)
Level 3 – unobservable inputs
Observable inputs are those based on market data obtained from sources independent of the fund, and unobservable inputs reflect the fund’s own assumptions based on the best information available. The input levels are not necessarily an indication of the risk or liquidity associated with financial instruments at that level. For example, non-U.S. equity securities actively traded in foreign markets generally are reflected in Level 2 despite the availability of closing prices because the fund evaluates and determines whether those closing prices reflect fair value at the close of the NYSE or require adjustment, as described above. The following table summarizes the fund’s financial instruments, based on the inputs used to determine their values on June 30, 2011:
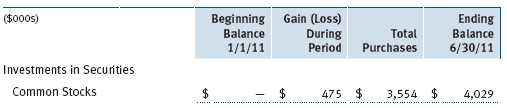
Following is a reconciliation of the fund’s Level 3 holdings for the six months ended June 30, 2011. Gain (loss) reflects both realized and change in unrealized gain (loss) on Level 3 holdings during the period, if any, and is included on the accompanying Statement of Operations. The change in unrealized gain (loss) on Level 3 instruments held at June 30, 2011, totaled $475,000 for the six months ended June 30, 2011.
NOTE 3 - OTHER INVESTMENT TRANSACTIONS
Consistent with its investment objective, the fund engages in the following practices to manage exposure to certain risks and/or to enhance performance. The investment objective, policies, program, and risk factors of the fund are described more fully in the fund’s prospectus and Statement of Additional Information.
Restricted Securities The fund may invest in securities that are subject to legal or contractual restrictions on resale. Prompt sale of such securities at an acceptable price may be difficult and may involve substantial delays and additional costs.
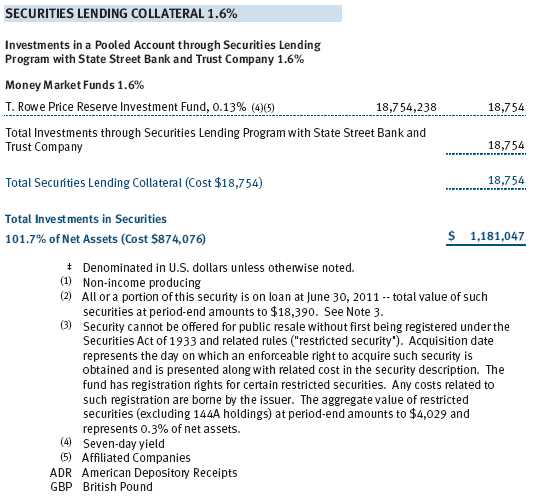
Securities Lending The fund lends its securities to approved brokers to earn additional income. It receives as collateral cash and U.S. government securities valued at 102% to 105% of the value of the securities on loan. Cash collateral is invested by the fund’s lending agent(s) in accordance with investment guidelines approved by management. Although risk is mitigated by the collateral, the fund could experience a delay in recovering its securities and a possible loss of income or value if the borrower fails to return the securities or if collateral investments decline in value. Securities lending revenue recognized by the fund consists of earnings on invested collateral and borrowing fees, net of any rebates to the borrower and compensation to the lending agent. In accordance with GAAP, investments made with cash collateral are reflected in the accompanying financial statements, but collateral received in the form of securities are not. On June 30, 2011, the value of loaned securities was $18,390,000 and cash collateral investments totaled $18,754,000.
American and Global Depository Receipts The fund may invest in American Depository Receipts (ADRs) and/or Global Depository Receipts (GDRs), certificates issued by U.S. and international banks that represent ownership of foreign securities held by the issuing bank. ADRs and GDRs are transferable, trade on established markets, and entitle the holder to all dividends and capital gains paid by the underlying foreign security. Issuing banks generally charge a security administration fee. Such fees are included in custody and accounting expense in the accompanying Statement of Operations and totaled $1,000 for the six months ended June 30, 2011.
Other Purchases and sales of portfolio securities other than short-term securities aggregated $57,017,000 and $77,364,000, respectively, for the six months ended June 30, 2011.
NOTE 4 - FEDERAL INCOME TAXES
No provision for federal income taxes is required since the fund intends to continue to qualify as a regulated investment company under Subchapter M of the Internal Revenue Code and distribute to shareholders all of its taxable income and gains. Distributions determined in accordance with federal income tax regulations may differ in amount or character from net investment income and realized gains for financial reporting purposes. Financial reporting records are adjusted for permanent book/tax differences to reflect tax character but are not adjusted for temporary differences. The amount and character of tax-basis distributions and composition of net assets are finalized at fiscal year-end; accordingly, tax-basis balances have not been determined as of the date of this report.
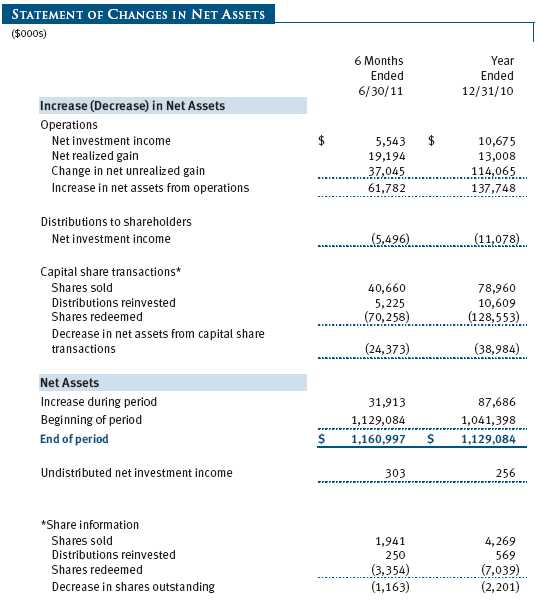
The fund intends to retain realized gains to the extent of available capital loss carryforwards. As of December 31, 2010, the fund had $105,180,000 of unused capital loss carryforwards, which expire: $18,715,000 in fiscal 2016 and $86,465,000 in fiscal 2017.
At June 30, 2011, the cost of investments for federal income tax purposes was $874,076,000. Net unrealized gain aggregated $306,971,000 at period-end, of which $328,265,000 related to appreciated investments and $21,294,000 related to depreciated investments.
NOTE 5 - RELATED PARTY TRANSACTIONS
The fund is managed by T. Rowe Price Associates, Inc. (Price Associates), a wholly owned subsidiary of T. Rowe Price Group, Inc. (Price Group). The investment management agreement between the fund and Price Associates provides for an annual investment management fee, which is computed daily and paid monthly. The fee consists of an individual fund fee, equal to 0.25% of the fund’s average daily net assets, and a group fee. The group fee rate is calculated based on the combined net assets of certain mutual funds sponsored by Price Associates (the group) applied to a graduated fee schedule, with rates ranging from 0.48% for the first $1 billion of assets to 0.28% for assets in excess of $300 billion. The fund’s group fee is determined by applying the group fee rate to the fund’s average daily net assets. At June 30, 2011, the effective annual group fee rate was 0.30%.
In addition, the fund has entered into service agreements with Price Associates and two wholly owned subsidiaries of Price Associates (collectively, Price). Price Associates computes the daily share price and provides certain other administrative services to the fund. T. Rowe Price Services, Inc., provides shareholder and administrative services in its capacity as the fund’s transfer and dividend disbursing agent. T. Rowe Price Retirement Plan Services, Inc., provides subaccounting and recordkeeping services for certain retirement accounts invested in the fund. For the six months ended June 30, 2011, expenses incurred pursuant to these service agreements were $48,000 for Price Associates; $437,000 for T. Rowe Price Services, Inc.; and $124,000 for T. Rowe Price Retirement Plan Services, Inc. The total amount payable at period-end pursuant to these service agreements is reflected as Due to Affiliates in the accompanying financial statements.
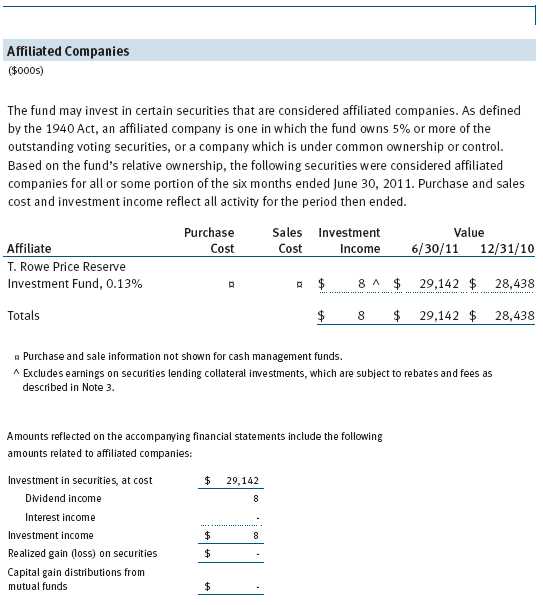
The fund may invest in the T. Rowe Price Reserve Investment Fund and the T. Rowe Price Government Reserve Investment Fund (collectively, the T. Rowe Price Reserve Investment Funds), open-end management investment companies managed by Price Associates and considered affiliates of the fund. The T. Rowe Price Reserve Investment Funds are offered as cash management options to mutual funds, trusts, and other accounts managed by Price Associates and/or its affiliates and are not available for direct purchase by members of the public. The T. Rowe Price Reserve Investment Funds pay no investment management fees.
| INFORMATION ON PROXY VOTING POLICIES, PROCEDURES, AND RECORDS |
A description of the policies and procedures used by T. Rowe Price funds and portfolios to determine how to vote proxies relating to portfolio securities is available in each fund’s Statement of Additional Information, which you may request by calling 1-800-225-5132 or by accessing the SEC’s website, sec.gov. The description of our proxy voting policies and procedures is also available on our website, troweprice.com. To access it, click on the words “Our Company” at the top of our corporate homepage. Then, when the next page appears, click on the words “Proxy Voting Policies” on the left side of the page.
Each fund’s most recent annual proxy voting record is available on our website and through the SEC’s website. To access it through our website, follow the directions above, then click on the words “Proxy Voting Records” on the right side of the Proxy Voting Policies page.
| HOW TO OBTAIN QUARTERLY PORTFOLIO HOLDINGS |
The fund files a complete schedule of portfolio holdings with the Securities and Exchange Commission for the first and third quarters of each fiscal year on Form N-Q. The fund’s Form N-Q is available electronically on the SEC’s website (sec.gov); hard copies may be reviewed and copied at the SEC’s Public Reference Room, 450 Fifth St. N.W., Washington, DC 20549. For more information on the Public Reference Room, call 1-800-SEC-0330.
| APPROVAL OF INVESTMENT MANAGEMENT AGREEMENT |
On March 9, 2011, the fund’s Board of Directors (Board) unanimously approved the continuation of the investment advisory contract (Contract) between the fund and its investment advisor, T. Rowe Price Associates, Inc. (Advisor). The Board considered a variety of factors in connection with its review of the Contract, also taking into account information provided by the Advisor during the course of the year, as discussed below:
Services Provided by the Advisor
The Board considered the nature, quality, and extent of the services provided to the fund by the Advisor. These services included, but were not limited to, management of the fund’s portfolio and a variety of related activities, as well as financial and administrative services, reporting, and communications. The Board also reviewed the background and experience of the Advisor’s senior management team and investment personnel involved in the management of the fund. The Board concluded that it was satisfied with the nature, quality, and extent of the services provided by the Advisor.
Investment Performance of the Fund
The Board reviewed the fund’s average annual total returns over the 1-, 3-, 5-, and 10-year periods, as well as the fund’s year-by-year returns, and compared these returns with a wide variety of previously agreed upon comparable performance measures and market data, including those supplied by Lipper and Morningstar, which are independent providers of mutual fund data. On the basis of this evaluation and the Board’s ongoing review of investment results, and factoring in the relative market conditions during certain of the performance periods, the Board concluded that the fund’s performance was satisfactory.
Costs, Benefits, Profits, and Economies of Scale
The Board reviewed detailed information regarding the revenues received by the Advisor under the Contract and other benefits that the Advisor (and its affiliates) may have realized from its relationship with the fund, including research received under “soft dollar” agreements and commission-sharing arrangements with broker-dealers. The Board considered that the Advisor may receive some benefit from soft-dollar arrangements pursuant to which research is received from broker-dealers that execute the applicable fund’s portfolio transactions. The Board also received information on the estimated costs incurred and profits realized by the Advisor and its affiliates from advising T. Rowe Price mutual funds, as well as estimates of the gross profits realized from managing the fund in particular. The Board concluded that the Advisor’s profits were reasonable in light of the services provided to the fund. The Board also considered whether the fund or other funds benefit under the fee levels set forth in the Contract from any economies of scale realized by the Advisor. Under the Contract, the fund pays a fee to the Advisor composed of two components—a group fee rate based on the aggregate assets of certain T. Rowe Price mutual funds (including the fund) that declines at certain asset levels and an individual fund fee rate that is assessed on the assets of the fund. The Board determined that it would be appropriate to introduce another breakpoint into the group fee rate, effective May 1, 2011, to allow fund shareholders to participate in additional economies of scale. The Board concluded that the advisory fee structure for the fund continued to provide for a reasonable sharing of benefits from any economies of scale with the fund’s investors.
Fees
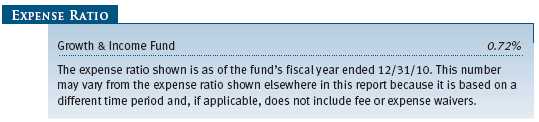
The Board reviewed the fund’s management fee rate, operating expenses, and total expense ratio and compared them with fees and expenses of other comparable funds based on information and data supplied by Lipper. The information provided to the Board indicated that the fund’s management fee rate was above the median for certain groups of comparable funds but at or below the median for other groups of comparable funds. The information also indicated that the fund’s total expense ratio was below the median for comparable funds. The Board also reviewed the fee schedules for institutional accounts of the Advisor and its affiliates with similar mandates. Management provided the Board with information about the Advisor’s responsibilities and services provided to institutional account clients, which are more limited than its responsibilities for the fund and other T. Rowe Price mutual funds that it advises, and showing that the Advisor performs significant additional services and assumes greater risk for the fund and other T. Rowe Price mutual funds that it advises than it does for institutional account clients. On the basis of the information provided, the Board concluded that the fees paid by the fund under the Contract were reasonable.
Approval of the Contract
As noted, the Board approved the continuation of the Contract. No single factor was considered in isolation or to be determinative to the decision. Rather, the Board was assisted by the advice of independent legal counsel and concluded, in light of a weighting and balancing of all factors considered, that it was in the best interests of the fund to approve the continuation of the Contract (including the fees to be charged for services thereunder).
Item 2. Code of Ethics.
A code of ethics, as defined in Item 2 of Form N-CSR, applicable to its principal executive officer, principal financial officer, principal accounting officer or controller, or persons performing similar functions is filed as an exhibit to the registrant’s annual Form N-CSR. No substantive amendments were approved or waivers were granted to this code of ethics during the registrant’s most recent fiscal half-year.
Item 3. Audit Committee Financial Expert.
Disclosure required in registrant’s annual Form N-CSR.
Item 4. Principal Accountant Fees and Services.
Disclosure required in registrant’s annual Form N-CSR.
Item 5. Audit Committee of Listed Registrants.
Not applicable.
Item 6. Investments.
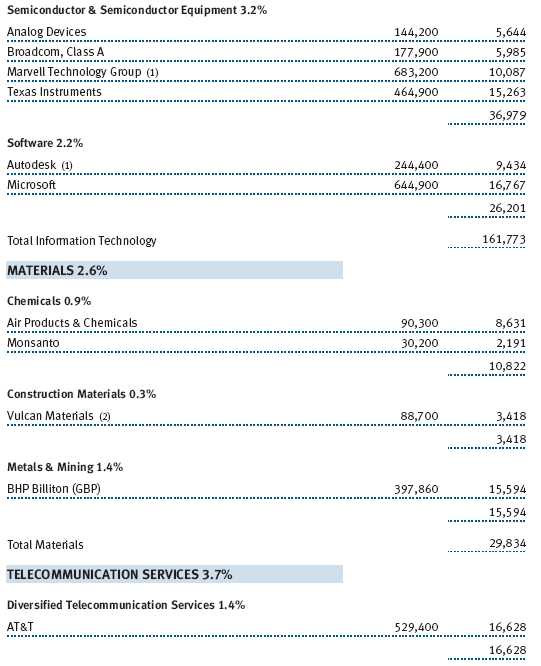
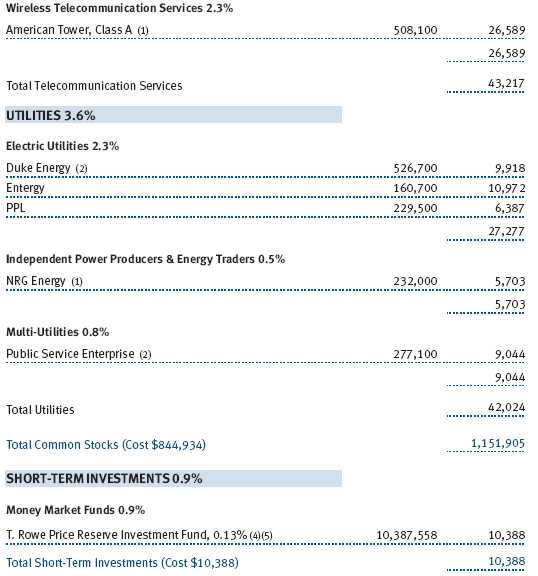
(a) Not applicable. The complete schedule of investments is included in Item 1 of this Form N-CSR.
(b) Not applicable.
Item 7. Disclosure of Proxy Voting Policies and Procedures for Closed-End Management Investment Companies.
Not applicable.
Item 8. Portfolio Managers of Closed-End Management Investment Companies.
Not applicable.
Item 9. Purchases of Equity Securities by Closed-End Management Investment Company and Affiliated Purchasers.
Not applicable.
Item 10. Submission of Matters to a Vote of Security Holders.
Not applicable.
Item 11. Controls and Procedures.
(a) The registrant’s principal executive officer and principal financial officer have evaluated the registrant’s disclosure controls and procedures within 90 days of this filing and have concluded that the registrant’s disclosure controls and procedures were effective, as of that date, in ensuring that information required to be disclosed by the registrant in this Form N-CSR was recorded, processed, summarized, and reported timely.
(b) The registrant’s principal executive officer and principal financial officer are aware of no change in the registrant’s internal control over financial reporting that occurred during the registrant’s second fiscal quarter covered by this report that has materially affected, or is reasonably likely to materially affect, the registrant’s internal control over financial reporting.
Item 12. Exhibits.
(a)(1) The registrant’s code of ethics pursuant to Item 2 of Form N-CSR is filed with the registrant’s annual Form N-CSR.
(2) Separate certifications by the registrant's principal executive officer and principal financial officer, pursuant to Section 302 of the Sarbanes-Oxley Act of 2002 and required by Rule 30a-2(a) under the Investment Company Act of 1940, are attached.
(3) Written solicitation to repurchase securities issued by closed-end companies: not applicable.
(b) A certification by the registrant's principal executive officer and principal financial officer, pursuant to Section 906 of the Sarbanes-Oxley Act of 2002 and required by Rule 30a-2(b) under the Investment Company Act of 1940, is attached.
| | |
SIGNATURES |
| |
| | Pursuant to the requirements of the Securities Exchange Act of 1934 and the Investment |
| Company Act of 1940, the registrant has duly caused this report to be signed on its behalf by the |
| undersigned, thereunto duly authorized. |
| |
| T. Rowe Price Growth & Income Fund, Inc. |
| |
| |
| |
| By | /s/ Edward C. Bernard |
| | Edward C. Bernard |
| | Principal Executive Officer |
| |
| Date | August 17, 2011 |
| |
| |
| |
| | Pursuant to the requirements of the Securities Exchange Act of 1934 and the Investment |
| Company Act of 1940, this report has been signed below by the following persons on behalf of |
| the registrant and in the capacities and on the dates indicated. |
| |
| |
| By | /s/ Edward C. Bernard |
| | Edward C. Bernard |
| | Principal Executive Officer |
| |
| Date | August 17, 2011 |
| |
| |
| |
| By | /s/ Gregory K. Hinkle |
| | Gregory K. Hinkle |
| | Principal Financial Officer |
| |
| Date | August 17, 2011 |