UNITED STATES
SECURITIES AND EXCHANGE COMMISSION
Washington, D.C. 20549
FORM N-CSR
CERTIFIED SHAREHOLDER REPORT OF REGISTERED
MANAGEMENT INVESTMENT COMPANIES
Investment Company Act file number 811-03583
Fidelity Mt. Vernon Street Trust
(Exact name of registrant as specified in charter)
245 Summer St., Boston, MA 02210
(Address of principal executive offices) (Zip code)
Margaret Carey, Secretary
245 Summer St.
Boston, Massachusetts 02210
(Name and address of agent for service)
Registrant's telephone number, including area code:
617-563-7000
| |
Date of fiscal year end: | November 30 |
|
|
Date of reporting period: | May 31, 2023 |
Item 1.
Reports to Stockholders
Fidelity® Growth Strategies K6 Fund
Semi-Annual Report
May 31, 2023
Contents
To view a fund's proxy voting guidelines and proxy voting record for the 12-month period ended June 30, visit http://www.fidelity.com/proxyvotingresults or visit the Securities and Exchange Commission's (SEC) web site at http://www.sec.gov.
You may also call 1-800-835-5092 to request a free copy of the proxy voting guidelines.
Standard & Poor's, S&P and S&P 500 are registered service marks of The McGraw-Hill Companies, Inc. and have been licensed for use by Fidelity Distributors Corporation.
Other third-party marks appearing herein are the property of their respective owners.
All other marks appearing herein are registered or unregistered trademarks or service marks of FMR LLC or an affiliated company. © 2023 FMR LLC. All rights reserved.
This report and the financial statements contained herein are submitted for the general information of the shareholders of the Fund. This report is not authorized for distribution to prospective investors in the Fund unless preceded or accompanied by an effective prospectus.
A fund files its complete schedule of portfolio holdings with the SEC for the first and third quarters of each fiscal year on Form N-PORT. Forms N-PORT are available on the SEC's web site at http://www.sec.gov. A fund's Forms N-PORT may be reviewed and copied at the SEC's Public Reference Room in Washington, DC. Information regarding the operation of the SEC's Public Reference Room may be obtained by calling 1-800-SEC-0330.
For a complete list of a fund's portfolio holdings, view the most recent holdings listing, semiannual report, or annual report on Fidelity's web site at http://www.fidelity.com, http://www.institutional.fidelity.com, or http://www.401k.com, as applicable.
NOT FDIC INSURED •MAY LOSE VALUE •NO BANK GUARANTEE
Neither the Fund nor Fidelity Distributors Corporation is a bank.
Top Holdings (% of Fund's net assets) |
| |
| onsemi | 3.1 | |
| AutoZone, Inc. | 3.1 | |
| Synopsys, Inc. | 2.9 | |
| Mettler-Toledo International, Inc. | 2.8 | |
| DexCom, Inc. | 2.4 | |
| Copart, Inc. | 2.4 | |
| Cadence Design Systems, Inc. | 2.3 | |
| ResMed, Inc. | 2.3 | |
| MSCI, Inc. | 2.3 | |
| Old Dominion Freight Lines, Inc. | 2.1 | |
| | 25.7 | |
| |
| Market Sectors (% of Fund's net assets) |
| |
| Information Technology | 23.9 | |
| Industrials | 22.5 | |
| Health Care | 17.1 | |
| Consumer Discretionary | 13.0 | |
| Financials | 8.2 | |
| Energy | 4.6 | |
| Consumer Staples | 3.2 | |
| Communication Services | 3.1 | |
| Materials | 1.2 | |
| Real Estate | 1.1 | |
| |
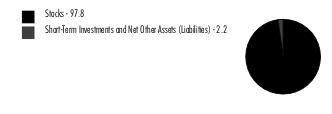
Asset Allocation (% of Fund's net assets) |
|
|
Showing Percentage of Net Assets
| Common Stocks - 97.9% |
| | | Shares | Value ($) |
| COMMUNICATION SERVICES - 3.1% | | | |
| Interactive Media & Services - 1.1% | | | |
| Pinterest, Inc. Class A (a) | | 57,700 | 1,381,338 |
| Media - 2.0% | | | |
| The Trade Desk, Inc. (a) | | 37,900 | 2,656,032 |
TOTAL COMMUNICATION SERVICES | | | 4,037,370 |
| CONSUMER DISCRETIONARY - 13.0% | | | |
| Automobile Components - 0.5% | | | |
| Atmus Filtration Technologies, Inc. | | 6,500 | 134,810 |
| Mobileye Global, Inc. (b) | | 13,000 | 579,410 |
| | | | 714,220 |
| Distributors - 1.5% | | | |
| Genuine Parts Co. | | 5,935 | 883,900 |
| Pool Corp. (b) | | 3,420 | 1,081,507 |
| | | | 1,965,407 |
| Diversified Consumer Services - 0.5% | | | |
| Duolingo, Inc. (a) | | 4,200 | 628,194 |
| Hotels, Restaurants & Leisure - 3.2% | | | |
| Chipotle Mexican Grill, Inc. (a) | | 470 | 975,950 |
| Choice Hotels International, Inc. (b) | | 7,700 | 873,873 |
| Churchill Downs, Inc. | | 9,800 | 1,331,036 |
| Domino's Pizza, Inc. | | 3,274 | 948,969 |
| | | | 4,129,828 |
| Household Durables - 0.6% | | | |
| NVR, Inc. (a) | | 100 | 555,422 |
| PulteGroup, Inc. | | 3,100 | 204,848 |
| | | | 760,270 |
| Specialty Retail - 6.6% | | | |
| AutoZone, Inc. (a) | | 1,680 | 4,009,891 |
| Foot Locker, Inc. | | 12,600 | 319,032 |
| Murphy U.S.A., Inc. | | 200 | 55,284 |
| O'Reilly Automotive, Inc. (a) | | 3,017 | 2,725,286 |
| Tractor Supply Co. | | 7,200 | 1,509,048 |
| | | | 8,618,541 |
| Textiles, Apparel & Luxury Goods - 0.1% | | | |
| Deckers Outdoor Corp. (a) | | 304 | 144,400 |
TOTAL CONSUMER DISCRETIONARY | | | 16,960,860 |
| CONSUMER STAPLES - 3.2% | | | |
| Beverages - 0.7% | | | |
| Brown-Forman Corp. Class B (non-vtg.) | | 10,378 | 641,049 |
| Celsius Holdings, Inc. (a) | | 1,700 | 213,401 |
| | | | 854,450 |
| Consumer Staples Distribution & Retail - 0.3% | | | |
| Dollar General Corp. | | 1,810 | 363,973 |
| Food Products - 2.1% | | | |
| Bunge Ltd. | | 7,041 | 652,278 |
| Darling Ingredients, Inc. (a) | | 11,064 | 701,236 |
| Lamb Weston Holdings, Inc. | | 12,700 | 1,412,240 |
| | | | 2,765,754 |
| Personal Care Products - 0.1% | | | |
| Estee Lauder Companies, Inc. Class A | | 939 | 172,804 |
| Kenvue, Inc. | | 170 | 4,265 |
| | | | 177,069 |
TOTAL CONSUMER STAPLES | | | 4,161,246 |
| ENERGY - 4.6% | | | |
| Oil, Gas & Consumable Fuels - 4.6% | | | |
| Cheniere Energy, Inc. | | 12,100 | 1,691,217 |
| Hess Corp. | | 10,058 | 1,274,047 |
| Marathon Petroleum Corp. | | 2,000 | 209,820 |
| Occidental Petroleum Corp. | | 7,900 | 455,514 |
| PDC Energy, Inc. | | 24,700 | 1,694,914 |
| Valero Energy Corp. | | 6,500 | 695,760 |
| | | | 6,021,272 |
| FINANCIALS - 8.2% | | | |
| Capital Markets - 6.2% | | | |
| Ameriprise Financial, Inc. | | 6,800 | 2,029,596 |
| LPL Financial | | 3,900 | 759,642 |
| MarketAxess Holdings, Inc. | | 2,918 | 794,892 |
| Moody's Corp. | | 705 | 223,400 |
| MSCI, Inc. | | 6,336 | 2,981,278 |
| State Street Corp. | | 10,800 | 734,616 |
| T. Rowe Price Group, Inc. | | 3,420 | 366,487 |
| Tradeweb Markets, Inc. Class A | | 1,769 | 118,435 |
| | | | 8,008,346 |
| Financial Services - 0.0% | | | |
| Adyen BV (a)(c) | | 8 | 13,103 |
| Insurance - 2.0% | | | |
| Arthur J. Gallagher & Co. | | 6,538 | 1,309,758 |
| Everest Re Group Ltd. | | 2,300 | 782,046 |
| Globe Life, Inc. | | 3,500 | 361,130 |
| Hartford Financial Services Group, Inc. | | 2,700 | 185,004 |
| | | | 2,637,938 |
TOTAL FINANCIALS | | | 10,659,387 |
| HEALTH CARE - 17.1% | | | |
| Health Care Equipment & Supplies - 8.7% | | | |
| Baxter International, Inc. | | 18,000 | 732,960 |
| DexCom, Inc. (a) | | 26,900 | 3,154,294 |
| Edwards Lifesciences Corp. (a) | | 3,670 | 309,124 |
| Haemonetics Corp. (a) | | 1,700 | 143,820 |
| IDEXX Laboratories, Inc. (a) | | 704 | 327,198 |
| Insulet Corp. (a) | | 7,300 | 2,002,025 |
| Intuitive Surgical, Inc. (a) | | 815 | 250,890 |
| Penumbra, Inc. (a) | | 1,100 | 338,074 |
| ResMed, Inc. | | 14,282 | 3,010,503 |
| Shockwave Medical, Inc. (a) | | 3,800 | 1,045,342 |
| | | | 11,314,230 |
| Health Care Providers & Services - 2.0% | | | |
| Laboratory Corp. of America Holdings | | 2,314 | 491,794 |
| McKesson Corp. | | 2,800 | 1,094,352 |
| Molina Healthcare, Inc. (a) | | 3,800 | 1,040,820 |
| | | | 2,626,966 |
| Health Care Technology - 0.9% | | | |
| Doximity, Inc. (a)(b) | | 15,800 | 484,586 |
| Veeva Systems, Inc. Class A (a) | | 4,426 | 733,388 |
| | | | 1,217,974 |
| Life Sciences Tools & Services - 5.5% | | | |
| Agilent Technologies, Inc. | | 1,200 | 138,804 |
| Charles River Laboratories International, Inc. (a) | | 7,500 | 1,450,350 |
| Mettler-Toledo International, Inc. (a) | | 2,715 | 3,588,877 |
| West Pharmaceutical Services, Inc. | | 5,835 | 1,952,566 |
| | | | 7,130,597 |
TOTAL HEALTH CARE | | | 22,289,767 |
| INDUSTRIALS - 22.5% | | | |
| Aerospace & Defense - 1.1% | | | |
| TransDigm Group, Inc. | | 1,888 | 1,460,651 |
| Building Products - 2.7% | | | |
| Builders FirstSource, Inc. (a) | | 5,000 | 579,750 |
| Carrier Global Corp. | | 34,400 | 1,406,960 |
| Trane Technologies PLC | | 9,000 | 1,469,070 |
| | | | 3,455,780 |
| Commercial Services & Supplies - 4.9% | | | |
| Cintas Corp. | | 5,300 | 2,502,342 |
| Copart, Inc. (a) | | 35,503 | 3,109,708 |
| GFL Environmental, Inc. | | 15,489 | 559,772 |
| Tetra Tech, Inc. | | 1,408 | 193,558 |
| | | | 6,365,380 |
| Construction & Engineering - 1.7% | | | |
| EMCOR Group, Inc. | | 2,300 | 379,132 |
| Quanta Services, Inc. | | 10,000 | 1,775,800 |
| | | | 2,154,932 |
| Electrical Equipment - 1.7% | | | |
| AMETEK, Inc. | | 8,550 | 1,240,349 |
| Atkore, Inc. (a) | | 8,046 | 939,531 |
| | | | 2,179,880 |
| Ground Transportation - 2.2% | | | |
| Lyft, Inc. (a) | | 17,250 | 155,595 |
| Old Dominion Freight Lines, Inc. | | 8,951 | 2,778,748 |
| | | | 2,934,343 |
| Machinery - 4.2% | | | |
| Cummins, Inc. | | 3,800 | 776,758 |
| IDEX Corp. | | 3,520 | 701,043 |
| Otis Worldwide Corp. | | 9,555 | 759,718 |
| PACCAR, Inc. | | 10,900 | 749,702 |
| Parker Hannifin Corp. | | 4,200 | 1,345,848 |
| Toro Co. | | 11,821 | 1,156,448 |
| | | | 5,489,517 |
| Professional Services - 2.2% | | | |
| Booz Allen Hamilton Holding Corp. Class A | | 3,970 | 399,303 |
| Paychex, Inc. | | 9,600 | 1,007,328 |
| Paycom Software, Inc. | | 4,000 | 1,120,520 |
| SS&C Technologies Holdings, Inc. | | 5,900 | 324,264 |
| | | | 2,851,415 |
| Trading Companies & Distributors - 1.8% | | | |
| W.W. Grainger, Inc. | | 3,600 | 2,336,472 |
TOTAL INDUSTRIALS | | | 29,228,370 |
| INFORMATION TECHNOLOGY - 23.9% | | | |
| Communications Equipment - 1.6% | | | |
| Arista Networks, Inc. (a) | | 12,600 | 2,095,884 |
| Electronic Equipment, Instruments & Components - 2.3% | | | |
| Amphenol Corp. Class A | | 24,700 | 1,863,615 |
| Keysight Technologies, Inc. (a) | | 6,600 | 1,067,880 |
| | | | 2,931,495 |
| IT Services - 1.6% | | | |
| EPAM Systems, Inc. (a) | | 4,200 | 1,077,804 |
| Twilio, Inc. Class A (a) | | 14,400 | 1,002,528 |
| | | | 2,080,332 |
| Semiconductors & Semiconductor Equipment - 7.1% | | | |
| Broadcom, Inc. | | 450 | 363,582 |
| Enphase Energy, Inc. (a) | | 4,100 | 712,908 |
| KLA Corp. | | 900 | 398,691 |
| Lam Research Corp. | | 503 | 310,200 |
| Lattice Semiconductor Corp. (a) | | 15,991 | 1,300,228 |
| Monolithic Power Systems, Inc. | | 3,400 | 1,665,694 |
| NXP Semiconductors NV | | 2,414 | 432,347 |
| onsemi (a) | | 48,579 | 4,061,206 |
| | | | 9,244,856 |
| Software - 11.3% | | | |
| Atlassian Corp. PLC (a) | | 1,509 | 272,812 |
| Autodesk, Inc. (a) | | 1,911 | 381,034 |
| Cadence Design Systems, Inc. (a) | | 13,100 | 3,024,921 |
| DocuSign, Inc. (a) | | 13,900 | 783,960 |
| Dynatrace, Inc. (a) | | 22,900 | 1,167,671 |
| Fortinet, Inc. (a) | | 38,500 | 2,630,705 |
| HubSpot, Inc. (a) | | 1,812 | 938,598 |
| Intuit, Inc. | | 800 | 335,296 |
| Roper Technologies, Inc. | | 816 | 370,644 |
| Synopsys, Inc. (a) | | 8,200 | 3,730,672 |
| Zoom Video Communications, Inc. Class A (a) | | 17,000 | 1,141,210 |
| | | | 14,777,523 |
TOTAL INFORMATION TECHNOLOGY | | | 31,130,090 |
| MATERIALS - 1.2% | | | |
| Metals & Mining - 1.2% | | | |
| Steel Dynamics, Inc. | | 16,900 | 1,553,110 |
| REAL ESTATE - 1.1% | | | |
| Equity Real Estate Investment Trusts (REITs) - 1.1% | | | |
| SBA Communications Corp. Class A | | 834 | 184,965 |
| VICI Properties, Inc. | | 38,200 | 1,181,526 |
| | | | 1,366,491 |
| TOTAL COMMON STOCKS (Cost $84,037,337) | | | 127,407,963 |
| | | | |
| Money Market Funds - 4.6% |
| | | Shares | Value ($) |
| Fidelity Cash Central Fund 5.14% (d) | | 2,881,540 | 2,882,117 |
| Fidelity Securities Lending Cash Central Fund 5.14% (d)(e) | | 3,126,912 | 3,127,225 |
| TOTAL MONEY MARKET FUNDS (Cost $6,009,342) | | | 6,009,342 |
| | | | |
| TOTAL INVESTMENT IN SECURITIES - 102.5% (Cost $90,046,679) | 133,417,305 |
NET OTHER ASSETS (LIABILITIES) - (2.5)% | (3,222,387) |
| NET ASSETS - 100.0% | 130,194,918 |
| | |
Legend
| (b) | Security or a portion of the security is on loan at period end. |
| (c) | Security exempt from registration under Rule 144A of the Securities Act of 1933. These securities may be resold in transactions exempt from registration, normally to qualified institutional buyers. At the end of the period, the value of these securities amounted to $13,103 or 0.0% of net assets. |
| (d) | Affiliated fund that is generally available only to investment companies and other accounts managed by Fidelity Investments. The rate quoted is the annualized seven-day yield of the fund at period end. A complete unaudited listing of the fund's holdings as of its most recent quarter end is available upon request. In addition, each Fidelity Central Fund's financial statements are available on the SEC's website or upon request. |
| (e) | Investment made with cash collateral received from securities on loan. |
Affiliated Central Funds
Fiscal year to date information regarding the Fund's investments in Fidelity Central Funds, including the ownership percentage, is presented below.
| Affiliate | Value, beginning of period ($) | Purchases ($) | Sales Proceeds ($) | Dividend Income ($) | Realized Gain (loss) ($) | Change in Unrealized appreciation (depreciation) ($) | Value, end of period ($) | % ownership, end of period |
| Fidelity Cash Central Fund 5.14% | 2,816,993 | 25,702,825 | 25,637,701 | 64,430 | - | - | 2,882,117 | 0.0% |
| Fidelity Securities Lending Cash Central Fund 5.14% | 1,108,800 | 12,454,305 | 10,435,880 | 6,327 | - | - | 3,127,225 | 0.0% |
| Total | 3,925,793 | 38,157,130 | 36,073,581 | 70,757 | - | - | 6,009,342 | |
| | | | | | | | | |
Amounts in the dividend income column in the above table include any capital gain distributions from underlying funds, which are presented in the corresponding line item in the Statement of Operations, if applicable.
Amounts in the dividend income column for Fidelity Securities Lending Cash Central Fund represents the income earned on investing cash collateral, less rebates paid to borrowers and any lending agent fees associated with the loan, plus any premium payments received for lending certain types of securities.
Amounts included in the purchases and sales proceeds columns may include in-kind transactions, if applicable.
Investment Valuation
The following is a summary of the inputs used, as of May 31, 2023, involving the Fund's assets and liabilities carried at fair value. The inputs or methodology used for valuing securities may not be an indication of the risk associated with investing in those securities. For more information on valuation inputs, and their aggregation into the levels used below, please refer to the Investment Valuation section in the accompanying Notes to Financial Statements.
| Valuation Inputs at Reporting Date: |
| Description | Total ($) | Level 1 ($) | Level 2 ($) | Level 3 ($) |
Investments in Securities: | | | | |
|
| Equities: | | | | |
Communication Services | 4,037,370 | 4,037,370 | - | - |
Consumer Discretionary | 16,960,860 | 16,960,860 | - | - |
Consumer Staples | 4,161,246 | 4,161,246 | - | - |
Energy | 6,021,272 | 6,021,272 | - | - |
Financials | 10,659,387 | 10,646,284 | 13,103 | - |
Health Care | 22,289,767 | 22,289,767 | - | - |
Industrials | 29,228,370 | 29,228,370 | - | - |
Information Technology | 31,130,090 | 31,130,090 | - | - |
Materials | 1,553,110 | 1,553,110 | - | - |
Real Estate | 1,366,491 | 1,366,491 | - | - |
|
| Money Market Funds | 6,009,342 | 6,009,342 | - | - |
| Total Investments in Securities: | 133,417,305 | 133,404,202 | 13,103 | - |
| Statement of Assets and Liabilities |
| | | | May 31, 2023 (Unaudited) |
| | | | | |
| Assets | | | | |
| Investment in securities, at value (including securities loaned of $2,994,178) - See accompanying schedule: | | | | |
Unaffiliated issuers (cost $84,037,337) | $ | 127,407,963 | | |
Fidelity Central Funds (cost $6,009,342) | | 6,009,342 | | |
| | | | | |
| | | | | |
| Total Investment in Securities (cost $90,046,679) | | | $ | 133,417,305 |
| Receivable for investments sold | | | | 192,387 |
| Receivable for fund shares sold | | | | 7,509 |
| Dividends receivable | | | | 74,324 |
| Distributions receivable from Fidelity Central Funds | | | | 12,916 |
| Other receivables | | | | 1,191 |
Total assets | | | | 133,705,632 |
| Liabilities | | | | |
| Payable for investments purchased | $ | 312,589 | | |
| Payable for fund shares redeemed | | 21,504 | | |
| Accrued management fee | | 49,396 | | |
| Collateral on securities loaned | | 3,127,225 | | |
| Total Liabilities | | | | 3,510,714 |
| Net Assets | | | $ | 130,194,918 |
| Net Assets consist of: | | | | |
| Paid in capital | | | $ | 93,752,251 |
| Total accumulated earnings (loss) | | | | 36,442,667 |
| Net Assets | | | $ | 130,194,918 |
Net Asset Value , offering price and redemption price per share ($130,194,918 ÷ 9,848,753 shares) | | | $ | 13.22 |
| Statement of Operations |
| | | | Six months ended May 31, 2023 (Unaudited) |
| Investment Income | | | | |
| Dividends | | | $ | 440,765 |
| Income from Fidelity Central Funds (including $6,327 from security lending) | | | | 70,757 |
| Total Income | | | | 511,522 |
| Expenses | | | | |
| Management fee | $ | 294,812 | | |
| Independent trustees' fees and expenses | | 416 | | |
| Total expenses before reductions | | 295,228 | | |
| Expense reductions | | (46) | | |
| Total expenses after reductions | | | | 295,182 |
| Net Investment income (loss) | | | | 216,340 |
| Realized and Unrealized Gain (Loss) | | | | |
| Net realized gain (loss) on: | | | | |
| Investment Securities: | | | | |
| Unaffiliated issuers | | 2,861,902 | | |
| Total net realized gain (loss) | | | | 2,861,902 |
| Change in net unrealized appreciation (depreciation) on investment securities | | | | (3,786,905) |
| Net gain (loss) | | | | (925,003) |
| Net increase (decrease) in net assets resulting from operations | | | $ | (708,663) |
| Statement of Changes in Net Assets |
| |
| | Six months ended May 31, 2023 (Unaudited) | | Year ended November 30, 2022 |
| Increase (Decrease) in Net Assets | | | | |
| Operations | | | | |
| Net investment income (loss) | $ | 216,340 | $ | 294,767 |
| Net realized gain (loss) | | 2,861,902 | | (9,951,615) |
| Change in net unrealized appreciation (depreciation) | | (3,786,905) | | (23,147,836) |
| Net increase (decrease) in net assets resulting from operations | | (708,663) | | (32,804,684) |
| Distributions to shareholders | | (324,034) | | (34,673,946) |
| Share transactions | | | | |
| Proceeds from sales of shares | | 10,880,260 | | 35,472,984 |
| Reinvestment of distributions | | 324,034 | | 34,673,946 |
| Cost of shares redeemed | | (11,306,149) | | (28,706,740) |
Net increase (decrease) in net assets resulting from share transactions | | (101,855) | | 41,440,190 |
| Total increase (decrease) in net assets | | (1,134,552) | | (26,038,440) |
| | | | | |
| Net Assets | | | | |
| Beginning of period | | 131,329,470 | | 157,367,910 |
| End of period | $ | 130,194,918 | $ | 131,329,470 |
| | | | | |
| Other Information | | | | |
| Shares | | | | |
| Sold | | 822,468 | | 2,415,188 |
| Issued in reinvestment of distributions | | 26,069 | | 2,051,713 |
| Redeemed | | (858,260) | | (2,139,490) |
| Net increase (decrease) | | (9,723) | | 2,327,411 |
| | | | | |
Financial Highlights
| Fidelity® Growth Strategies K6 Fund |
| |
| | Six months ended (Unaudited) May 31, 2023 | | Years ended November 30, 2022 | | 2021 | | 2020 | | 2019 | | 2018 |
Selected Per-Share Data | | | | | | | | | | | | |
| Net asset value, beginning of period | $ | 13.32 | $ | 20.90 | $ | 17.06 | $ | 13.69 | $ | 11.21 | $ | 10.95 |
| Income from Investment Operations | | | | | | | | | | | | |
Net investment income (loss) A,B | | .02 | | .03 | | (.01) | | .04 C | | .06 D | | .09 E |
| Net realized and unrealized gain (loss) | | (.09) | | (3.21) | | 4.29 | | 3.40 | | 2.51 | | .20 |
| Total from investment operations | | (.07) | | (3.18) | | 4.28 | | 3.44 | | 2.57 | | .29 |
| Distributions from net investment income | | (.03) | | - | | (.02) | | (.07) | | (.09) | | (.03) |
| Distributions from net realized gain | | - | | (4.40) | | (.42) | | - | | - | | - |
| Total distributions | | (.03) | | (4.40) | | (.44) | | (.07) | | (.09) | | (.03) |
| Net asset value, end of period | $ | 13.22 | $ | 13.32 | $ | 20.90 | $ | 17.06 | $ | 13.69 | $ | 11.21 |
Total Return F,G | | (.49)% | | (19.67)% | | 25.64% | | 25.24% | | 23.18% | | 2.68% |
Ratios to Average Net Assets B,H,I | | | | | | | | | | | | |
| Expenses before reductions | | .45% J | | .45% | | .45% | | .45% | | .45% | | .45% |
| Expenses net of fee waivers, if any | | .45% J | | .45% | | .45% | | .45% | | .45% | | .45% |
| Expenses net of all reductions | | .45% J | | .45% | | .45% | | .45% | | .45% | | .45% |
| Net investment income (loss) | | .33% J | | .22% | | (.06)% | | .25% C | | .49% D | | .76% E |
| Supplemental Data | | | | | | | | | | | | |
| Net assets, end of period (000 omitted) | $ | 130,195 | $ | 131,329 | $ | 157,368 | $ | 182,192 | $ | 165,691 | $ | 132,993 |
Portfolio turnover rate K | | 72% J,L | | 78% L | | 51% | | 73% | | 66% L | | 51% L |
A Calculated based on average shares outstanding during the period.
B Net investment income (loss) is affected by the timing of the declaration of dividends by any underlying mutual funds or exchange-traded funds (ETFs). Net investment income (loss) of any mutual funds or ETFs is not included in the Fund's net investment income (loss) ratio.
C Net investment income per share reflects one or more large, non-recurring dividend(s) which amounted to $.01 per share. Excluding such non-recurring dividend(s), the ratio of net investment income (loss) to average net assets would have been .15%.
D Net investment income per share reflects one or more large, non-recurring dividend(s) which amounted to $.01 per share. Excluding such non-recurring dividend(s), the ratio of net investment income (loss) to average net assets would have been .39%.
E Net investment income per share reflects one or more large, non-recurring dividend(s) which amounted to $.03 per share. Excluding such non-recurring dividend(s), the ratio of net investment income (loss) to average net assets would have been .52%.
F Total returns for periods of less than one year are not annualized.
G Total returns would have been lower if certain expenses had not been reduced during the applicable periods shown.
H Fees and expenses of any underlying mutual funds or exchange-traded funds (ETFs) are not included in the Fund's expense ratio. The Fund indirectly bears its proportionate share of these expenses. For additional expense information related to investments in Fidelity Central Funds, please refer to the "Investments in Fidelity Central Funds" note found in the Notes to Financial Statements section of the most recent Annual or Semi-Annual report.
I Expense ratios reflect operating expenses of the class. Expenses before reductions do not reflect amounts reimbursed, waived, or reduced through arrangements with the investment adviser, brokerage services, or other offset arrangements, if applicable, and do not represent the amount paid by the class during periods when reimbursements, waivers or reductions occur.
J Annualized.
K Amount does not include the portfolio activity of any underlying mutual funds or exchange-traded funds (ETFs).
L Portfolio turnover rate excludes securities received or delivered in-kind.
For the period ended May 31, 2023
1. Organization.
Fidelity Growth Strategies K6 Fund (the Fund) is a fund of Fidelity Mt. Vernon Street Trust (the Trust) and is authorized to issue an unlimited number of shares. Share transactions on the Statement of Changes in Net Assets may contain exchanges between affiliated funds. The Trust is registered under the Investment Company Act of 1940, as amended (the 1940 Act), as an open-end management investment company organized as a Massachusetts business trust. Shares generally are available only to employer-sponsored retirement plans that are recordkept by Fidelity, or to certain employer-sponsored retirement plans that are not recordkept by Fidelity.
2. Investments in Fidelity Central Funds.
Funds may invest in Fidelity Central Funds, which are open-end investment companies generally available only to other investment companies and accounts managed by the investment adviser and its affiliates. The Schedule of Investments lists any Fidelity Central Funds held as an investment as of period end, but does not include the underlying holdings of each Fidelity Central Fund. An investing fund indirectly bears its proportionate share of the expenses of the underlying Fidelity Central Funds.
Based on its investment objective, each Fidelity Central Fund may invest or participate in various investment vehicles or strategies that are similar to those of the investing fund. These strategies are consistent with the investment objectives of the investing fund and may involve certain economic risks which may cause a decline in value of each of the Fidelity Central Funds and thus a decline in the value of the investing fund.
| Fidelity Central Fund | Investment Manager | Investment Objective | Investment Practices | Expense Ratio A |
| Fidelity Money Market Central Funds | Fidelity Management & Research Company LLC (FMR) | Each fund seeks to obtain a high level of current income consistent with the preservation of capital and liquidity. | Short-term Investments | Less than .005% |
A Expenses expressed as a percentage of average net assets and are as of each underlying Central Fund's most recent annual or semi-annual shareholder report.
A complete unaudited list of holdings for each Fidelity Central Fund is available upon request or at the Securities and Exchange Commission website at www.sec.gov. In addition, the financial statements of the Fidelity Central Funds which contain the significant accounting policies (including investment valuation policies) of those funds, and are not covered by the Report of Independent Registered Public Accounting Firm, are available on the Securities and Exchange Commission website or upon request.
3. Significant Accounting Policies.
The Fund is an investment company and applies the accounting and reporting guidance of the Financial Accounting Standards Board (FASB) Accounting Standards Codification Topic 946 Financial Services - Investment Companies . The financial statements have been prepared in conformity with accounting principles generally accepted in the United States of America (GAAP), which require management to make certain estimates and assumptions at the date of the financial statements. Actual results could differ from those estimates. Subsequent events, if any, through the date that the financial statements were issued have been evaluated in the preparation of the financial statements. The Fund's Schedule of Investments lists any underlying mutual funds or exchange-traded funds (ETFs) but does not include the underlying holdings of these funds. The following summarizes the significant accounting policies of the Fund:
Investment Valuation. Investments are valued as of 4:00 p.m. Eastern time on the last calendar day of the period. The Board of Trustees (the Board) has designated the Fund's investment adviser as the valuation designee responsible for the fair valuation function and performing fair value determinations as needed. The investment adviser has established a Fair Value Committee (the Committee) to carry out the day-to-day fair valuation responsibilities and has adopted policies and procedures to govern the fair valuation process and the activities of the Committee. In accordance with these fair valuation policies and procedures, which have been approved by the Board, the Fund attempts to obtain prices from one or more third party pricing services or brokers to value its investments. When current market prices, quotations or currency exchange rates are not readily available or reliable, investments will be fair valued in good faith by the Committee, in accordance with the policies and procedures. Factors used in determining fair value vary by investment type and may include market or investment specific events, transaction data, estimated cash flows, and market observations of comparable investments. The frequency that the fair valuation procedures are used cannot be predicted and they may be utilized to a significant extent. The Committee manages the Fund's fair valuation practices and maintains the fair valuation policies and procedures. The Fund's investment adviser reports to the Board information regarding the fair valuation process and related material matters.
The Fund categorizes the inputs to valuation techniques used to value its investments into a disclosure hierarchy consisting of three levels as shown below:
Level 1 - unadjusted quoted prices in active markets for identical investments
Level 2 - other significant observable inputs (including quoted prices for similar investments, interest rates, prepayment speeds, etc.)
Level 3 - unobservable inputs (including the Fund's own assumptions based on the best information available)
Valuation techniques used to value the Fund's investments by major category are as follows:
Equity securities, including restricted securities, for which market quotations are readily available, are valued at the last reported sale price or official closing price as reported by a third party pricing service on the primary market or exchange on which they are traded and are categorized as Level 1 in the hierarchy. In the event there were no sales during the day or closing prices are not available, securities are valued at the last quoted bid price or may be valued using the last available price and are generally categorized as Level 2 in the hierarchy. For foreign equity securities, when market or security specific events arise, comparisons to the valuation of American Depositary Receipts (ADRs), futures contracts, ETFs and certain indexes as well as quoted prices for similar securities may be used and would be categorized as Level 2 in the hierarchy. For equity securities, including restricted securities, where observable inputs are limited, assumptions about market activity and risk are used and these securities may be categorized as Level 3 in the hierarchy.
Investments in open-end mutual funds, including the Fidelity Central Funds, are valued at their closing net asset value (NAV) each business day and are categorized as Level 1 in the hierarchy.
Changes in valuation techniques may result in transfers in or out of an assigned level within the disclosure hierarchy. The aggregate value of investments by input level as of May 31, 2023 is included at the end of the Fund's Schedule of Investments.
Investment Transactions and Income. For financial reporting purposes, the Fund's investment holdings and NAV include trades executed through the end of the last business day of the period. The NAV per share for processing shareholder transactions is calculated as of the close of business of the New York Stock Exchange (NYSE), normally 4:00 p.m. Eastern time and includes trades executed through the end of the prior business day. Gains and losses on securities sold are determined on the basis of identified cost. Commissions paid to certain brokers with whom the investment adviser, or its affiliates, places trades on behalf of a fund include an amount in addition to trade execution, which may be rebated back to a fund. Any such rebates are included in net realized gain (loss) on investments in the Statement of Operations. Dividend income is recorded on the ex-dividend date, except for certain dividends from foreign securities where the ex-dividend date may have passed, which are recorded as soon as the Fund is informed of the ex-dividend date. Non-cash dividends included in dividend income, if any, are recorded at the fair market value of the securities received. Income and capital gain distributions from Fidelity Central Funds, if any, are recorded on the ex-dividend date. Certain distributions received by the Fund represent a return of capital or capital gain. The Fund determines the components of these distributions subsequent to the ex-dividend date, based upon receipt of tax filings or other correspondence relating to the underlying investment. These distributions are recorded as a reduction of cost of investments and/or as a realized gain.
Expenses. Expenses directly attributable to a fund are charged to that fund. Expenses attributable to more than one fund are allocated among the respective funds on the basis of relative net assets or other appropriate methods. Expenses included in the accompanying financial statements reflect the expenses of that fund and do not include any expenses associated with any underlying mutual funds or exchange-traded funds. Although not included in a fund's expenses, a fund indirectly bears its proportionate share of these expenses through the net asset value of each underlying mutual fund or exchange-traded fund. Expense estimates are accrued in the period to which they relate and adjustments are made when actual amounts are known.
Income Tax Information and Distributions to Shareholders. Each year, the Fund intends to qualify as a regulated investment company under Subchapter M of the Internal Revenue Code, including distributing substantially all of its taxable income and realized gains. As a result, no provision for U.S. Federal income taxes is required. The Fund files a U.S. federal tax return, in addition to state and local tax returns as required. The Fund's federal income tax returns are subject to examination by the Internal Revenue Service (IRS) for a period of three fiscal years after they are filed. State and local tax returns may be subject to examination for an additional fiscal year depending on the jurisdiction.
Distributions are declared and recorded on the ex-dividend date. Income and capital gain distributions are determined in accordance with income tax regulations, which may differ from GAAP.
Capital accounts within the financial statements are adjusted for permanent book-tax differences. These adjustments have no impact on net assets or the results of operations. Capital accounts are not adjusted for temporary book-tax differences which will reverse in a subsequent period.
Book-tax differences are primarily due to foreign currency transactions, capital loss carryforwards and losses deferred due to wash sales.
As of period end, the cost and unrealized appreciation (depreciation) in securities, and derivatives if applicable, for federal income tax purposes were as follows:
| Gross unrealized appreciation | $44,847,923 |
| Gross unrealized depreciation | (1,514,540) |
| Net unrealized appreciation (depreciation) | $43,333,383 |
| Tax cost | $90,083,922 |
Capital loss carryforwards are only available to offset future capital gains of the Fund to the extent provided by regulations and may be limited. The capital loss carryforward information presented below, including any applicable limitation, is estimated as of prior fiscal period end and is subject to adjustment.
| Short-term | $(9,927,305) |
| Total capital loss carryforward | $(9,927,305) |
Restricted Securities (including Private Placements). Funds may invest in securities that are subject to legal or contractual restrictions on resale. These securities generally may be resold in transactions exempt from registration or to the public if the securities are registered. Disposal of these securities may involve time-consuming negotiations and expense, and prompt sale at an acceptable price may be difficult. Information regarding restricted securities held at period end is included at the end of the Schedule of Investments, if applicable.
4. Purchases and Sales of Investments.
Purchases and sales of securities, other than short-term securities and in-kind transactions, as applicable, are noted in the table below.
| | Purchases ($) | Sales ($) |
| Fidelity Growth Strategies K6 Fund | 47,002,708 | 45,928,743 |
Unaffiliated Exchanges In-Kind. Shares that were exchanged for investments, including accrued interest and cash, if any, are shown in the table below. The amount of in-kind exchanges is included in share transactions in the accompanying Statement of Changes in Net Assets.
| | Shares | Total Proceeds ($) |
| Fidelity Growth Strategies K6 Fund | 57,451 | 734,795 |
Prior Year Unaffiliated Exchanges In-Kind. Shares that were exchanged for investments, including accrued interest and cash, if any, are shown in the table below. The amount of in-kind exchanges is included in share transactions in the accompanying Statement of Changes in Net Assets.
| | Shares | Total Proceeds ($) |
| Fidelity Growth Strategies K6 Fund | 324,690 | 4,286,560 |
5. Fees and Other Transactions with Affiliates.
Management Fee. Fidelity Management & Research Company LLC (the investment adviser) and its affiliates provide the Fund with investment management related services for which the Fund pays a monthly management fee that is based on an annual rate of .45% of average net assets. Under the management contract, the investment adviser or an affiliate pays all other expenses of the Fund, excluding fees and expenses of the independent Trustees, and certain miscellaneous expenses such as proxy and shareholder meeting expenses.
Brokerage Commissions. A portion of portfolio transactions were placed with brokerage firms which are affiliates of the investment adviser. Brokerage commissions are included in net realized gain (loss) and change in net unrealized appreciation (depreciation) in the Statement of Operations. The commissions paid to these affiliated firms were as follows:
| | Amount |
| Fidelity Growth Strategies K6 Fund | $677 |
Interfund Trades. Funds may purchase from or sell securities to other Fidelity Funds under procedures adopted by the Board. The procedures have been designed to ensure these interfund trades are executed in accordance with Rule 17a-7 of the 1940 Act. Any interfund trades are included within the respective purchases and sales amounts shown in the Purchases and Sales of Investments note. Interfund trades during the period are noted in the table below.
| | Purchases ($) | Sales ($) | Realized Gain (Loss) ($) |
| Fidelity Growth Strategies K6 Fund | 1,431,404 | 1,153,685 | 38,403 |
6. Committed Line of Credit.
Certain Funds participate with other funds managed by the investment adviser or an affiliate in a $4.25 billion credit facility (the "line of credit") to be utilized for temporary or emergency purposes to fund shareholder redemptions or for other short-term liquidity purposes. The commitment fees on the pro-rata portion of the line of credit are borne by the investment adviser. During the period, there were no borrowings on this line of credit.
7. Security Lending.
Funds lend portfolio securities from time to time in order to earn additional income. Lending agents are used, including National Financial Services (NFS), an affiliate of the investment adviser. Pursuant to a securities lending agreement, NFS will receive a fee, which is capped at 9.9% of a fund's daily lending revenue, for its services as lending agent. A fund may lend securities to certain qualified borrowers, including NFS. On the settlement date of the loan, a fund receives collateral (in the form of U.S. Treasury obligations, letters of credit and/or cash) against the loaned securities and maintains collateral in an amount not less than 100% of the market value of the loaned securities during the period of the loan. The market value of the loaned securities is determined at the close of business of a fund and any additional required collateral is delivered to a fund on the next business day. A fund or borrower may terminate the loan at any time, and if the borrower defaults on its obligation to return the securities loaned because of insolvency or other reasons, a fund may apply collateral received from the borrower against the obligation. A fund may experience delays and costs in recovering the securities loaned. Any cash collateral received is invested in the Fidelity Securities Lending Cash Central Fund. Any loaned securities are identified as such in the Schedule of Investments, and the value of loaned securities and cash collateral at period end, as applicable, are presented in the Statement of Assets and Liabilities. Security lending income represents the income earned on investing cash collateral, less rebates paid to borrowers and any lending agent fees associated with the loan, plus any premium payments received for lending certain types of securities. Security lending income is presented in the Statement of Operations as a component of income from Fidelity Central Funds. Affiliated security lending activity, if any, was as follows:
| | Total Security Lending Fees Paid to NFS | Security Lending Income From Securities Loaned to NFS | Value of Securities Loaned to NFS at Period End |
| Fidelity Growth Strategies K6 Fund | $695 | $- | $- |
8. Expense Reductions.
Through arrangements with the Fund's custodian, credits realized as a result of certain uninvested cash balances were used to reduce the Fund's expenses by $46.
9. Other.
A fund's organizational documents provide former and current trustees and officers with a limited indemnification against liabilities arising in connection with the performance of their duties to the fund. In the normal course of business, a fund may also enter into contracts that provide general indemnifications. A fund's maximum exposure under these arrangements is unknown as this would be dependent on future claims that may be made against a fund. The risk of material loss from such claims is considered remote.
10. Risk and Uncertainties.
Many factors affect a fund's performance. Developments that disrupt global economies and financial markets, such as pandemics, epidemics, outbreaks of infectious diseases, war, terrorism, and environmental disasters, may significantly affect a fund's investment performance. The effects of these developments to a fund will be impacted by the types of securities in which a fund invests, the financial condition, industry, economic sector, and geographic location of an issuer, and a fund's level of investment in the securities of that issuer. Significant concentrations in security types, issuers, industries, sectors, and geographic locations may magnify the factors that affect a fund's performance.
As a shareholder, you incur two types of costs: (1) transaction costs, which may include sales charges (loads) on purchase payments or redemption proceeds, as applicable and (2) ongoing costs, which generally include management fees, distribution and/or service (12b-1) fees and other Fund expenses. This Example is intended to help you understand your ongoing costs (in dollars) of investing in a fund and to compare these costs with the ongoing costs of investing in other mutual funds.
| The Example is based on an investment of $1,000 invested at the beginning of the period and held for the entire period (December 1, 2022 to May 31, 2023). |
Actual Expenses
The first line of the accompanying table provides information about actual account values and actual expenses. You may use the information in this line, together with the amount you invested, to estimate the expenses that you paid over the period. Simply divide your account value by $1,000.00 (for example, an $8,600 account value divided by $1,000.00 = 8.6), then multiply the result by the number in the first line for a class/Fund under the heading entitled "Expenses Paid During Period" to estimate the expenses you paid on your account during this period. If any fund is a shareholder of any underlying mutual funds or exchange-traded funds (ETFs) (the Underlying Funds), such fund indirectly bears its proportional share of the expenses of the Underlying Funds in addition to the direct expenses incurred presented in the table. These fees and expenses are not included in the annualized expense ratio used to calculate the expense estimate in the table below.
Hypothetical Example for Comparison Purposes
The second line of the accompanying table provides information about hypothetical account values and hypothetical expenses based on the actual expense ratio and an assumed rate of return of 5% per year before expenses, which is not the actual return. The hypothetical account values and expenses may not be used to estimate the actual ending account balance or expenses you paid for the period. You may use this information to compare the ongoing costs of investing in the Fund and other funds. To do so, compare this 5% hypothetical example with the 5% hypothetical examples that appear in the shareholder reports of the other funds. If any fund is a shareholder of any Underlying Funds, such fund indirectly bears its proportional share of the expenses of the Underlying Funds in addition to the direct expenses as presented in the table. These fees and expenses are not included in the annualized expense ratio used to calculate the expense estimate in the table below.
Please note that the expenses shown in the table are meant to highlight your ongoing costs only and do not reflect any transaction costs. Therefore, the second line of the table is useful in comparing ongoing costs only, and will not help you determine the relative total costs of owning different funds. In addition, if these transactional costs were included, your costs would have been higher.
| | | | | Annualized Expense Ratio- A | | Beginning Account Value December 1, 2022 | | Ending Account Value May 31, 2023 | | Expenses Paid During Period- C December 1, 2022 to May 31, 2023 |
| | | | | | | | | | |
| Fidelity® Growth Strategies K6 Fund | | | | .45% | | | | | | |
| Actual | | | | | | $ 1,000 | | $ 995.10 | | $ 2.24 |
Hypothetical- B | | | | | | $ 1,000 | | $ 1,022.69 | | $ 2.27 |
| |
A Annualized expense ratio reflects expenses net of applicable fee waivers.
B 5% return per year before expenses
C Expenses are equal to the annualized expense ratio, multiplied by the average account value over the period, multiplied by 182/ 365 (to reflect the one-half year period). The fees and expenses of any Underlying Funds are not included in each annualized expense ratio.
Board Approval of Investment Advisory Contracts
Fidelity Growth Strategies K6 Fund
At its May 2023 meeting, the Board of Trustees, including the Independent Trustees (together, the Board), voted to continue the management contract with Fidelity Management & Research Company LLC (FMR), and the sub-advisory agreements and sub-subadvisory agreements, in each case, where applicable (together, the Advisory Contracts) for the fund for two months from June 1, 2023 through July 31, 2023. The Board determined that it will consider the annual renewal of the fund's Advisory Contracts for a full one year period in July 2023, following its review of additional materials provided by FMR.
The Board considered that the approval of the fund's Advisory Contracts will not result in any changes in (i) the investment process or strategies employed in the management of the fund's assets; (ii) the fees and expenses paid by shareholders; (iii) the nature, extent or quality of services provided under the fund's Advisory Contracts; or (iv) the day-to-day management of the fund or the persons primarily responsible for such management. The Board also considered that since its last approval of the fund's Advisory Contracts, FMR had provided additional information on the fund in support of the annual contract renewal process, including competitive analyses on total expenses and management fees and in-depth reviews of fund performance and fund profitability information. The Board concluded that the fund's Advisory Contracts are fair and reasonable, and that the fund's Advisory Contracts should be renewed, without modification, through July 31, 2023, with the understanding that the Board will consider the annual renewal for a full one year period in July 2023.
In connection with its consideration of future renewals of the fund's Advisory Contracts, the Board will consider: (i) the nature, extent and quality of services provided to the fund, including shareholder and administrative services and investment performance; (ii) the competitiveness of the management fee and total expenses for the fund; (iii) the costs of the services and profitability, including the revenues earned and the expenses incurred in conducting the business of developing, marketing, distributing, managing, administering, and servicing the fund and its shareholders, to the extent applicable; and (iv) whether there have been economies of scale in respect of the Fidelity funds, whether the Fidelity funds (including the fund) have appropriately benefited from any such economies of scale, and whether there is the potential for realization of any further economies.
Based on its evaluation of all of the conclusions noted above, and after considering all factors it believed relevant, the Board ultimately concluded that the fund's management fee structure is fair and reasonable, and that the continuation of the fund's Advisory Contracts should be approved for two months from June 1, 2023 through July 31, 2023.
The Securities and Exchange Commission adopted Rule 22e-4 under the Investment Company Act of 1940 (the Liquidity Rule) to promote effective liquidity risk management throughout the open-end investment company industry, thereby reducing the risk that funds will be unable to meet their redemption obligations and mitigating dilution of the interests of fund shareholders.
The Fund has adopted and implemented a liquidity risk management program (the Program) reasonably designed to assess and manage the Fund's liquidity risk and to comply with the requirements of the Liquidity Rule. The Fund's Board of Trustees (the Board) has designated the Fund's investment adviser as administrator of the Program. The Fidelity advisers have established a Liquidity Risk Management Committee (the LRM Committee) to manage the Program for each of the Fidelity Funds. The LRM Committee monitors the adequacy and effectiveness of implementation of the Program and on a periodic basis assesses each Fund's liquidity risk based on a variety of factors including (1) the Fund's investment strategy, (2) portfolio liquidity and cash flow projections during normal and reasonably foreseeable stressed conditions, (3) shareholder redemptions, (4) borrowings and other funding sources and (5) certain factors specific to ETFs including the effect of the Fund's prices and spreads, market participants, and basket compositions on the overall liquidity of the Fund's portfolio, as applicable.
In accordance with the Program, each of the Fund's portfolio investments is classified into one of four defined liquidity categories based on a determination of a reasonable expectation for how long it would take to convert the investment to cash (or sell or dispose of the investment) without significantly changing its market value.
- Highly liquid investments - cash or convertible to cash within three business days or less
- Moderately liquid investments - convertible to cash in three to seven calendar days
- Less liquid investments - can be sold or disposed of, but not settled, within seven calendar days
- Illiquid investments - cannot be sold or disposed of within seven calendar days
Liquidity classification determinations take into account a variety of factors including various market, trading and investment-specific considerations, as well as market depth, and generally utilize analysis from a third-party liquidity metrics service.
The Liquidity Rule places a 15% limit on a fund's illiquid investments and requires funds that do not primarily hold assets that are highly liquid investments to determine and maintain a minimum percentage of the fund's net assets to be invested in highly liquid investments (highly liquid investment minimum or HLIM). The Program includes provisions reasonably designed to comply with the 15% limit on illiquid investments and for determining, periodically reviewing and complying with the HLIM requirement as applicable.
At a recent meeting of the Fund's Board of Trustees, the LRM Committee provided a written report to the Board pertaining to the operation, adequacy, and effectiveness of the Program for the period December 1, 2021 through November 30, 2022. The report concluded that the Program is operating effectively and is reasonably designed to assess and manage the Fund's liquidity risk.
1.9883994.106
FEGK6-SANN-0723
Fidelity® Growth Strategies Fund
Semi-Annual Report
May 31, 2023
Contents
To view a fund's proxy voting guidelines and proxy voting record for the 12-month period ended June 30, visit http://www.fidelity.com/proxyvotingresults or visit the Securities and Exchange Commission's (SEC) web site at http://www.sec.gov.
You may also call 1-800-544-8544 if you're an individual investing directly with Fidelity, call 1-800-835-5092 if you're a plan sponsor or participant with Fidelity as your recordkeeper or call 1-877-208-0098 on institutional accounts or if you're an advisor or invest through one to request a free copy of the proxy voting guidelines.
Standard & Poor's, S&P and S&P 500 are registered service marks of The McGraw-Hill Companies, Inc. and have been licensed for use by Fidelity Distributors Corporation.
Other third-party marks appearing herein are the property of their respective owners.
All other marks appearing herein are registered or unregistered trademarks or service marks of FMR LLC or an affiliated company. © 2023 FMR LLC. All rights reserved.
This report and the financial statements contained herein are submitted for the general information of the shareholders of the Fund. This report is not authorized for distribution to prospective investors in the Fund unless preceded or accompanied by an effective prospectus.
A fund files its complete schedule of portfolio holdings with the SEC for the first and third quarters of each fiscal year on Form N-PORT. Forms N-PORT are available on the SEC's web site at http://www.sec.gov. A fund's Forms N-PORT may be reviewed and copied at the SEC's Public Reference Room in Washington, DC. Information regarding the operation of the SEC's Public Reference Room may be obtained by calling 1-800-SEC-0330.
For a complete list of a fund's portfolio holdings, view the most recent holdings listing, semiannual report, or annual report on Fidelity's web site at http://www.fidelity.com, http://www.institutional.fidelity.com, or http://www.401k.com, as applicable.
NOT FDIC INSURED •MAY LOSE VALUE •NO BANK GUARANTEE
Neither the Fund nor Fidelity Distributors Corporation is a bank.
Top Holdings (% of Fund's net assets) |
| |
| onsemi | 3.1 | |
| AutoZone, Inc. | 3.0 | |
| Synopsys, Inc. | 2.9 | |
| Mettler-Toledo International, Inc. | 2.7 | |
| DexCom, Inc. | 2.4 | |
| Copart, Inc. | 2.4 | |
| Cadence Design Systems, Inc. | 2.3 | |
| ResMed, Inc. | 2.3 | |
| MSCI, Inc. | 2.3 | |
| Old Dominion Freight Lines, Inc. | 2.1 | |
| | 25.5 | |
| |
| Market Sectors (% of Fund's net assets) |
| |
| Information Technology | 23.9 | |
| Industrials | 22.3 | |
| Health Care | 17.2 | |
| Consumer Discretionary | 13.0 | |
| Financials | 8.2 | |
| Energy | 4.6 | |
| Consumer Staples | 3.2 | |
| Communication Services | 3.1 | |
| Materials | 1.2 | |
| Real Estate | 1.1 | |
| |
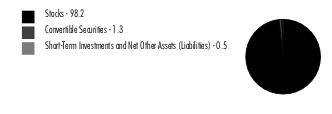
Asset Allocation (% of Fund's net assets) |
|
|
Showing Percentage of Net Assets
| Common Stocks - 97.8% |
| | | Shares | Value ($) (000s) |
| COMMUNICATION SERVICES - 3.1% | | | |
| Interactive Media & Services - 1.1% | | | |
| Pinterest, Inc. Class A (a) | | 1,282,300 | 30,698 |
| Media - 2.0% | | | |
| The Trade Desk, Inc. (a) | | 827,000 | 57,956 |
TOTAL COMMUNICATION SERVICES | | | 88,654 |
| CONSUMER DISCRETIONARY - 13.0% | | | |
| Automobile Components - 0.6% | | | |
| Atmus Filtration Technologies, Inc. | | 144,500 | 2,997 |
| Mobileye Global, Inc. (b) | | 300,000 | 13,371 |
| | | | 16,368 |
| Distributors - 1.5% | | | |
| Genuine Parts Co. | | 132,765 | 19,773 |
| Pool Corp. (b) | | 76,075 | 24,057 |
| | | | 43,830 |
| Diversified Consumer Services - 0.5% | | | |
| Duolingo, Inc. (a) | | 96,125 | 14,377 |
| Hotels, Restaurants & Leisure - 3.2% | | | |
| Chipotle Mexican Grill, Inc. (a) | | 10,530 | 21,865 |
| Choice Hotels International, Inc. (b) | | 172,459 | 19,572 |
| Churchill Downs, Inc. | | 214,000 | 29,065 |
| Domino's Pizza, Inc. | | 73,000 | 21,159 |
| | | | 91,661 |
| Household Durables - 0.6% | | | |
| NVR, Inc. (a) | | 2,342 | 13,008 |
| PulteGroup, Inc. | | 70,000 | 4,626 |
| | | | 17,634 |
| Specialty Retail - 6.5% | | | |
| AutoZone, Inc. (a) | | 37,000 | 88,313 |
| Foot Locker, Inc. | | 282,200 | 7,145 |
| Murphy U.S.A., Inc. | | 2,600 | 719 |
| O'Reilly Automotive, Inc. (a) | | 66,383 | 59,964 |
| Tractor Supply Co. (b) | | 160,800 | 33,702 |
| | | | 189,843 |
| Textiles, Apparel & Luxury Goods - 0.1% | | | |
| Deckers Outdoor Corp. (a) | | 4,687 | 2,226 |
TOTAL CONSUMER DISCRETIONARY | | | 375,939 |
| CONSUMER STAPLES - 3.2% | | | |
| Beverages - 0.6% | | | |
| Brown-Forman Corp. Class B (non-vtg.) | | 214,622 | 13,257 |
| Celsius Holdings, Inc. (a) | | 38,800 | 4,871 |
| | | | 18,128 |
| Consumer Staples Distribution & Retail - 0.3% | | | |
| Dollar General Corp. | | 38,590 | 7,760 |
| Food Products - 2.1% | | | |
| Bunge Ltd. | | 157,959 | 14,633 |
| Darling Ingredients, Inc. (a) | | 246,936 | 15,651 |
| Lamb Weston Holdings, Inc. | | 283,000 | 31,470 |
| | | | 61,754 |
| Personal Care Products - 0.2% | | | |
| Estee Lauder Companies, Inc. Class A | | 21,261 | 3,913 |
| Kenvue, Inc. | | 2,986 | 75 |
| | | | 3,988 |
TOTAL CONSUMER STAPLES | | | 91,630 |
| ENERGY - 4.6% | | | |
| Oil, Gas & Consumable Fuels - 4.6% | | | |
| Cheniere Energy, Inc. | | 269,600 | 37,682 |
| Hess Corp. | | 223,742 | 28,341 |
| Marathon Petroleum Corp. | | 47,821 | 5,017 |
| Occidental Petroleum Corp. | | 170,000 | 9,802 |
| PDC Energy, Inc. | | 552,642 | 37,922 |
| Valero Energy Corp. | | 143,800 | 15,392 |
| | | | 134,156 |
| FINANCIALS - 8.2% | | | |
| Capital Markets - 6.1% | | | |
| Ameriprise Financial, Inc. | | 146,003 | 43,578 |
| LPL Financial | | 85,200 | 16,595 |
| MarketAxess Holdings, Inc. | | 67,344 | 18,345 |
| Moody's Corp. | | 16,995 | 5,385 |
| MSCI, Inc. | | 139,882 | 65,819 |
| State Street Corp. | | 243,100 | 16,536 |
| T. Rowe Price Group, Inc. | | 78,080 | 8,367 |
| Tradeweb Markets, Inc. Class A | | 38,831 | 2,600 |
| | | | 177,225 |
| Financial Services - 0.1% | | | |
| Adyen BV (a)(c) | | 1,392 | 2,280 |
| Insurance - 2.0% | | | |
| Arthur J. Gallagher & Co. | | 146,962 | 29,441 |
| Everest Re Group Ltd. | | 50,697 | 17,238 |
| Globe Life, Inc. | | 69,400 | 7,161 |
| Hartford Financial Services Group, Inc. | | 55,300 | 3,789 |
| | | | 57,629 |
TOTAL FINANCIALS | | | 237,134 |
| HEALTH CARE - 17.2% | | | |
| Health Care Equipment & Supplies - 8.7% | | | |
| Baxter International, Inc. | | 425,000 | 17,306 |
| DexCom, Inc. (a) | | 602,100 | 70,602 |
| Edwards Lifesciences Corp. (a) | | 82,854 | 6,979 |
| Haemonetics Corp. (a) | | 36,900 | 3,122 |
| IDEXX Laboratories, Inc. (a) | | 15,996 | 7,434 |
| Insulet Corp. (a) | | 159,500 | 43,743 |
| Intuitive Surgical, Inc. (a) | | 17,969 | 5,532 |
| Penumbra, Inc. (a) | | 25,500 | 7,837 |
| ResMed, Inc. | | 313,632 | 66,110 |
| Shockwave Medical, Inc. (a) | | 84,700 | 23,300 |
| | | | 251,965 |
| Health Care Providers & Services - 2.2% | | | |
| Laboratory Corp. of America Holdings | | 51,486 | 10,942 |
| McKesson Corp. | | 74,000 | 28,922 |
| Molina Healthcare, Inc. (a) | | 83,000 | 22,734 |
| | | | 62,598 |
| Health Care Technology - 0.9% | | | |
| Doximity, Inc. (a)(b) | | 349,300 | 10,713 |
| Veeva Systems, Inc. Class A (a) | | 99,974 | 16,566 |
| | | | 27,279 |
| Life Sciences Tools & Services - 5.4% | | | |
| Agilent Technologies, Inc. | | 28,200 | 3,262 |
| Charles River Laboratories International, Inc. (a) | | 162,700 | 31,463 |
| Mettler-Toledo International, Inc. (a) | | 59,700 | 78,916 |
| West Pharmaceutical Services, Inc. | | 132,558 | 44,358 |
| | | | 157,999 |
TOTAL HEALTH CARE | | | 499,841 |
| INDUSTRIALS - 22.3% | | | |
| Aerospace & Defense - 1.1% | | | |
| TransDigm Group, Inc. | | 43,147 | 33,381 |
| Building Products - 2.7% | | | |
| Builders FirstSource, Inc. (a) | | 121,500 | 14,088 |
| Carrier Global Corp. | | 750,000 | 30,675 |
| Trane Technologies PLC | | 202,600 | 33,070 |
| | | | 77,833 |
| Commercial Services & Supplies - 4.9% | | | |
| Cintas Corp. | | 121,568 | 57,397 |
| Copart, Inc. (a) | | 782,697 | 68,556 |
| GFL Environmental, Inc. | | 343,123 | 12,400 |
| Tetra Tech, Inc. | | 31,992 | 4,398 |
| | | | 142,751 |
| Construction & Engineering - 1.5% | | | |
| EMCOR Group, Inc. | | 39,050 | 6,437 |
| Quanta Services, Inc. | | 218,200 | 38,748 |
| | | | 45,185 |
| Electrical Equipment - 1.7% | | | |
| AMETEK, Inc. | | 190,850 | 27,687 |
| Atkore, Inc. (a) | | 177,954 | 20,780 |
| | | | 48,467 |
| Ground Transportation - 2.2% | | | |
| Lyft, Inc. (a) | | 234,028 | 2,111 |
| Old Dominion Freight Lines, Inc. | | 196,834 | 61,105 |
| | | | 63,216 |
| Machinery - 4.2% | | | |
| Cummins, Inc. | | 82,700 | 16,905 |
| IDEX Corp. | | 76,680 | 15,272 |
| Otis Worldwide Corp. | | 212,545 | 16,899 |
| PACCAR, Inc. | | 234,800 | 16,150 |
| Parker Hannifin Corp. | | 94,000 | 30,121 |
| Toro Co. | | 263,038 | 25,733 |
| | | | 121,080 |
| Professional Services - 2.2% | | | |
| Booz Allen Hamilton Holding Corp. Class A | | 82,930 | 8,341 |
| Paychex, Inc. | | 206,900 | 21,710 |
| Paycom Software, Inc. | | 89,800 | 25,156 |
| SS&C Technologies Holdings, Inc. | | 136,000 | 7,475 |
| | | | 62,682 |
| Trading Companies & Distributors - 1.8% | | | |
| W.W. Grainger, Inc. | | 80,000 | 51,922 |
TOTAL INDUSTRIALS | | | 646,517 |
| INFORMATION TECHNOLOGY - 23.9% | | | |
| Communications Equipment - 1.6% | | | |
| Arista Networks, Inc. (a) | | 282,400 | 46,974 |
| Electronic Equipment, Instruments & Components - 2.2% | | | |
| Amphenol Corp. Class A | | 530,000 | 39,989 |
| Keysight Technologies, Inc. (a) | | 145,000 | 23,461 |
| | | | 63,450 |
| IT Services - 1.6% | | | |
| EPAM Systems, Inc. (a) | | 93,300 | 23,943 |
| Twilio, Inc. Class A (a) | | 322,000 | 22,418 |
| | | | 46,361 |
| Semiconductors & Semiconductor Equipment - 7.1% | | | |
| Broadcom, Inc. | | 11,997 | 9,693 |
| Enphase Energy, Inc. (a) | | 91,100 | 15,840 |
| KLA Corp. | | 19,000 | 8,417 |
| Lam Research Corp. | | 11,574 | 7,138 |
| Lattice Semiconductor Corp. (a) | | 351,709 | 28,597 |
| Monolithic Power Systems, Inc. | | 74,300 | 36,400 |
| NXP Semiconductors NV | | 54,386 | 9,741 |
| onsemi (a) | | 1,071,815 | 89,604 |
| | | | 205,430 |
| Software - 11.4% | | | |
| Atlassian Corp. PLC (a) | | 33,991 | 6,145 |
| Autodesk, Inc. (a) | | 40,989 | 8,173 |
| Cadence Design Systems, Inc. (a) | | 293,856 | 67,854 |
| DocuSign, Inc. (a) | | 295,900 | 16,689 |
| Dynatrace, Inc. (a) | | 500,000 | 25,495 |
| Fortinet, Inc. (a) | | 862,300 | 58,921 |
| HubSpot, Inc. (a) | | 44,005 | 22,794 |
| Intuit, Inc. | | 17,995 | 7,542 |
| Roper Technologies, Inc. | | 19,666 | 8,933 |
| Synopsys, Inc. (a) | | 183,400 | 83,440 |
| Zoom Video Communications, Inc. Class A (a) | | 373,900 | 25,100 |
| | | | 331,086 |
TOTAL INFORMATION TECHNOLOGY | | | 693,301 |
| MATERIALS - 1.2% | | | |
| Metals & Mining - 1.2% | | | |
| Steel Dynamics, Inc. | | 376,000 | 34,554 |
| REAL ESTATE - 1.1% | | | |
| Equity Real Estate Investment Trusts (REITs) - 1.1% | | | |
| SBA Communications Corp. Class A | | 19,466 | 4,317 |
| VICI Properties, Inc. | | 847,600 | 26,216 |
| | | | 30,533 |
| TOTAL COMMON STOCKS (Cost $1,816,257) | | | 2,832,259 |
| | | | |
| Money Market Funds - 4.5% |
| | | Shares | Value ($) (000s) |
| Fidelity Cash Central Fund 5.14% (d) | | 67,687,508 | 67,701 |
| Fidelity Securities Lending Cash Central Fund 5.14% (d)(e) | | 63,276,694 | 63,283 |
| TOTAL MONEY MARKET FUNDS (Cost $130,983) | | | 130,984 |
| | | | |
| TOTAL INVESTMENT IN SECURITIES - 102.3% (Cost $1,947,240) | 2,963,243 |
NET OTHER ASSETS (LIABILITIES) - (2.3)% | (66,154) |
| NET ASSETS - 100.0% | 2,897,089 |
| | |
Any values shown as $0 in the Schedule of Investments may reflect amounts less than $500.
Legend
| (b) | Security or a portion of the security is on loan at period end. |
| (c) | Security exempt from registration under Rule 144A of the Securities Act of 1933. These securities may be resold in transactions exempt from registration, normally to qualified institutional buyers. At the end of the period, the value of these securities amounted to $2,280,000 or 0.1% of net assets. |
| (d) | Affiliated fund that is generally available only to investment companies and other accounts managed by Fidelity Investments. The rate quoted is the annualized seven-day yield of the fund at period end. A complete unaudited listing of the fund's holdings as of its most recent quarter end is available upon request. In addition, each Fidelity Central Fund's financial statements are available on the SEC's website or upon request. |
| (e) | Investment made with cash collateral received from securities on loan. |
Affiliated Central Funds
Fiscal year to date information regarding the Fund's investments in Fidelity Central Funds, including the ownership percentage, is presented below.
| Affiliate (Amounts in thousands) | Value, beginning of period ($) | Purchases ($) | Sales Proceeds ($) | Dividend Income ($) | Realized Gain (loss) ($) | Change in Unrealized appreciation (depreciation) ($) | Value, end of period ($) | % ownership, end of period |
| Fidelity Cash Central Fund 5.14% | 63,334 | 456,165 | 451,798 | 1,336 | - | - | 67,701 | 0.2% |
| Fidelity Securities Lending Cash Central Fund 5.14% | 30,126 | 432,841 | 399,684 | 164 | - | - | 63,283 | 0.2% |
| Total | 93,460 | 889,006 | 851,482 | 1,500 | - | - | 130,984 | |
| | | | | | | | | |
Amounts in the dividend income column in the above table include any capital gain distributions from underlying funds, which are presented in the corresponding line item in the Statement of Operations, if applicable.
Amounts in the dividend income column for Fidelity Securities Lending Cash Central Fund represents the income earned on investing cash collateral, less rebates paid to borrowers and any lending agent fees associated with the loan, plus any premium payments received for lending certain types of securities.
Amounts included in the purchases and sales proceeds columns may include in-kind transactions, if applicable.
Investment Valuation
The following is a summary of the inputs used, as of May 31, 2023, involving the Fund's assets and liabilities carried at fair value. The inputs or methodology used for valuing securities may not be an indication of the risk associated with investing in those securities. For more information on valuation inputs, and their aggregation into the levels used below, please refer to the Investment Valuation section in the accompanying Notes to Financial Statements.
| Valuation Inputs at Reporting Date: |
Description (Amounts in thousands) | Total ($) | Level 1 ($) | Level 2 ($) | Level 3 ($) |
Investments in Securities: | | | | |
|
| Equities: | | | | |
Communication Services | 88,654 | 88,654 | - | - |
Consumer Discretionary | 375,939 | 375,939 | - | - |
Consumer Staples | 91,630 | 91,630 | - | - |
Energy | 134,156 | 134,156 | - | - |
Financials | 237,134 | 234,854 | 2,280 | - |
Health Care | 499,841 | 499,841 | - | - |
Industrials | 646,517 | 646,517 | - | - |
Information Technology | 693,301 | 693,301 | - | - |
Materials | 34,554 | 34,554 | - | - |
Real Estate | 30,533 | 30,533 | - | - |
|
| Money Market Funds | 130,984 | 130,984 | - | - |
| Total Investments in Securities: | 2,963,243 | 2,960,963 | 2,280 | - |
| Statement of Assets and Liabilities |
| Amounts in thousands (except per-share amounts) | | | | May 31, 2023 (Unaudited) |
| | | | | |
| Assets | | | | |
| Investment in securities, at value (including securities loaned of $60,508) - See accompanying schedule: | | | | |
Unaffiliated issuers (cost $1,816,257) | $ | 2,832,259 | | |
Fidelity Central Funds (cost $130,983) | | 130,984 | | |
| | | | | |
| | | | | |
| Total Investment in Securities (cost $1,947,240) | | | $ | 2,963,243 |
| Receivable for investments sold | | | | 4,101 |
| Receivable for fund shares sold | | | | 1,262 |
| Dividends receivable | | | | 1,652 |
| Distributions receivable from Fidelity Central Funds | | | | 298 |
| Other receivables | | | | 40 |
Total assets | | | | 2,970,596 |
| Liabilities | | | | |
| Payable for investments purchased | $ | 6,307 | | |
| Payable for fund shares redeemed | | 2,087 | | |
| Accrued management fee | | 1,351 | | |
| Other affiliated payables | | 432 | | |
| Other payables and accrued expenses | | 48 | | |
| Collateral on securities loaned | | 63,282 | | |
| Total Liabilities | | | | 73,507 |
| Net Assets | | | $ | 2,897,089 |
| Net Assets consist of: | | | | |
| Paid in capital | | | $ | 1,982,140 |
| Total accumulated earnings (loss) | | | | 914,949 |
| Net Assets | | | $ | 2,897,089 |
| | | | | |
| Net Asset Value and Maximum Offering Price | | | | |
| Growth Strategies : | | | | |
Net Asset Value , offering price and redemption price per share ($2,704,701 ÷ 54,563 shares) | | | $ | 49.57 |
| Class K : | | | | |
Net Asset Value , offering price and redemption price per share ($192,388 ÷ 3,830 shares) | | | $ | 50.23 |
| Statement of Operations |
| Amounts in thousands | | | | Six months ended May 31, 2023 (Unaudited) |
| Investment Income | | | | |
| Dividends | | | $ | 9,826 |
| Income from Fidelity Central Funds (including $164 from security lending) | | | | 1,500 |
| Total Income | | | | 11,326 |
| Expenses | | | | |
| Management fee | | | | |
| Basic fee | $ | 7,635 | | |
| Performance adjustment | | 164 | | |
| Transfer agent fees | | 2,213 | | |
| Accounting fees | | 377 | | |
| Custodian fees and expenses | | 16 | | |
| Independent trustees' fees and expenses | | 9 | | |
| Registration fees | | 43 | | |
| Audit | | 41 | | |
| Legal | | 3 | | |
| Miscellaneous | | 6 | | |
| Total expenses before reductions | | 10,507 | | |
| Expense reductions | | (68) | | |
| Total expenses after reductions | | | | 10,439 |
| Net Investment income (loss) | | | | 887 |
| Realized and Unrealized Gain (Loss) | | | | |
| Net realized gain (loss) on: | | | | |
| Investment Securities: | | | | |
| Unaffiliated issuers | | 70,964 | | |
| Redemptions in-kind | | 305 | | |
| Total net realized gain (loss) | | | | 71,269 |
| Change in net unrealized appreciation (depreciation) on investment securities | | | | (90,958) |
| Net gain (loss) | | | | (19,689) |
| Net increase (decrease) in net assets resulting from operations | | | $ | (18,802) |
| Statement of Changes in Net Assets |
| |
| Amount in thousands | | Six months ended May 31, 2023 (Unaudited) | | Year ended November 30, 2022 |
| Increase (Decrease) in Net Assets | | | | |
| Operations | | | | |
| Net investment income (loss) | $ | 887 | $ | (4,490) |
| Net realized gain (loss) | | 71,269 | | (154,437) |
| Change in net unrealized appreciation (depreciation) | | (90,958) | | (557,710) |
| Net increase (decrease) in net assets resulting from operations | | (18,802) | | (716,637) |
| Distributions to shareholders | | - | | (458,304) |
| Share transactions - net increase (decrease) | | (54,951) | | 513,523 |
| Total increase (decrease) in net assets | | (73,753) | | (661,418) |
| | | | | |
| Net Assets | | | | |
| Beginning of period | | 2,970,842 | | 3,632,260 |
| End of period | $ | 2,897,089 | $ | 2,970,842 |
| | | | | |
| | | | | |
Financial Highlights
| Fidelity® Growth Strategies Fund |
| |
| | Six months ended (Unaudited) May 31, 2023 | | Years ended November 30, 2022 | | 2021 | | 2020 | | 2019 | | 2018 |
Selected Per-Share Data | | | | | | | | | | | | |
| Net asset value, beginning of period | $ | 49.87 | $ | 71.14 | $ | 61.57 | $ | 50.98 | $ | 41.90 | $ | 40.96 |
| Income from Investment Operations | | | | | | | | | | | | |
Net investment income (loss) A,B | | .01 | | (.08) | | (.15) | | .04 C | | .30 | | .25 D |
| Net realized and unrealized gain (loss) | | (.31) | | (12.20) | | 14.72 | | 12.31 | | 9.13 | | .87 |
| Total from investment operations | | (.30) | | (12.28) | | 14.57 | | 12.35 | | 9.43 | | 1.12 |
| Distributions from net investment income | | - | | - | | - | | (.22) | | (.28) | | (.16) |
| Distributions from net realized gain | | - | | (8.99) | | (5.00) | | (1.55) | | (.06) | | (.02) |
| Total distributions | | - | | (8.99) | | (5.00) | | (1.76) E | | (.35) E | | (.18) |
| Net asset value, end of period | $ | 49.57 | $ | 49.87 | $ | 71.14 | $ | 61.57 | $ | 50.98 | $ | 41.90 |
Total Return F,G | | (.60)% | | (19.98)% | | 25.31% | | 25.02% | | 22.76% | | 2.74% |
Ratios to Average Net Assets B,H,I | | | | | | | | | | | | |
| Expenses before reductions | | .73% J | | .83% | | .63% | | .63% | | .56% | | .59% |
| Expenses net of fee waivers, if any | | .73% J | | .83% | | .63% | | .63% | | .56% | | .59% |
| Expenses net of all reductions | | .73% J | | .83% | | .63% | | .63% | | .55% | | .59% |
| Net investment income (loss) | | .05% J | | (.16)% | | (.23)% | | .07% C | | .67% | | .59% D |
| Supplemental Data | | | | | | | | | | | | |
| Net assets, end of period (in millions) | $ | 2,705 | $ | 2,773 | $ | 3,381 | $ | 3,011 | $ | 2,860 | $ | 2,349 |
Portfolio turnover rate K | | 68% J,L | | 74% L | | 49% | | 67% | | 66% L | | 43% L |
A Calculated based on average shares outstanding during the period.
B Net investment income (loss) is affected by the timing of the declaration of dividends by any underlying mutual funds or exchange-traded funds (ETFs). Net investment income (loss) of any mutual funds or ETFs is not included in the Fund's net investment income (loss) ratio.
C Net investment income per share reflects one or more large, non-recurring dividend(s) which amounted to $.05 per share. Excluding such non-recurring dividend(s), the ratio of net investment income (loss) to average net assets would have been (.03)%.
D Net investment income per share reflects one or more large, non-recurring dividend(s) which amounted to $.09 per share. Excluding such non-recurring dividend(s), the ratio of net investment income (loss) to average net assets would have been .38%.
E Total distributions per share do not sum due to rounding.
F Total returns for periods of less than one year are not annualized.
G Total returns would have been lower if certain expenses had not been reduced during the applicable periods shown.
H Fees and expenses of any underlying mutual funds or exchange-traded funds (ETFs) are not included in the Fund's expense ratio. The Fund indirectly bears its proportionate share of these expenses. For additional expense information related to investments in Fidelity Central Funds, please refer to the "Investments in Fidelity Central Funds" note found in the Notes to Financial Statements section of the most recent Annual or Semi-Annual report.
I Expense ratios reflect operating expenses of the class. Expenses before reductions do not reflect amounts reimbursed, waived, or reduced through arrangements with the investment adviser, brokerage services, or other offset arrangements, if applicable, and do not represent the amount paid by the class during periods when reimbursements, waivers or reductions occur.
J Annualized.
K Amount does not include the portfolio activity of any underlying mutual funds or exchange-traded funds (ETFs).
L Portfolio turnover rate excludes securities received or delivered in-kind.
| Fidelity® Growth Strategies Fund Class K |
| |
| | Six months ended (Unaudited) May 31, 2023 | | Years ended November 30, 2022 | | 2021 | | 2020 | | 2019 | | 2018 |
Selected Per-Share Data | | | | | | | | | | | | |
| Net asset value, beginning of period | $ | 50.50 | $ | 71.85 | $ | 62.08 | $ | 51.38 | $ | 42.23 | $ | 41.29 |
| Income from Investment Operations | | | | | | | | | | | | |
Net investment income (loss) A,B | | .04 | | (.02) | | (.08) | | .10 C | | .36 | | .31 D |
| Net realized and unrealized gain (loss) | | (.31) | | (12.34) | | 14.85 | | 12.42 | | 9.20 | | .86 |
| Total from investment operations | | (.27) | | (12.36) | | 14.77 | | 12.52 | | 9.56 | | 1.17 |
| Distributions from net investment income | | - | | - | | - | | (.27) | | (.34) | | (.21) |
| Distributions from net realized gain | | - | | (8.99) | | (5.00) | | (1.55) | | (.06) | | (.02) |
| Total distributions | | - | | (8.99) | | (5.00) | | (1.82) | | (.41) E | | (.23) |
| Net asset value, end of period | $ | 50.23 | $ | 50.50 | $ | 71.85 | $ | 62.08 | $ | 51.38 | $ | 42.23 |
Total Return F,G | | (.53)% | | (19.89)% | | 25.44% | | 25.17% | | 22.94% | | 2.84% |
Ratios to Average Net Assets B,H,I | | | | | | | | | | | | |
| Expenses before reductions | | .61% J | | .72% | | .52% | | .52% | | .43% | | .46% |
| Expenses net of fee waivers, if any | | .61% J | | .71% | | .52% | | .52% | | .43% | | .46% |
| Expenses net of all reductions | | .61% J | | .71% | | .52% | | .51% | | .43% | | .46% |
| Net investment income (loss) | | .17% J | | (.05)% | | (.13)% | | .19% C | | .79% | | .72% D |
| Supplemental Data | | | | | | | | | | | | |
| Net assets, end of period (in millions) | $ | 192 | $ | 198 | $ | 251 | $ | 236 | $ | 236 | $ | 205 |
Portfolio turnover rate K | | 68% J,L | | 74% L | | 49% | | 67% | | 66% L | | 43% L |
A Calculated based on average shares outstanding during the period.
B Net investment income (loss) is affected by the timing of the declaration of dividends by any underlying mutual funds or exchange-traded funds (ETFs). Net investment income (loss) of any mutual funds or ETFs is not included in the Fund's net investment income (loss) ratio.
C Net investment income per share reflects one or more large, non-recurring dividend(s) which amounted to $.05 per share. Excluding such non-recurring dividend(s), the ratio of net investment income (loss) to average net assets would have been .08%.
D Net investment income per share reflects one or more large, non-recurring dividend(s) which amounted to $.09 per share. Excluding such non-recurring dividend(s), the ratio of net investment income (loss) to average net assets would have been .51%.
E Total distributions per share do not sum due to rounding.
F Total returns for periods of less than one year are not annualized.
G Total returns would have been lower if certain expenses had not been reduced during the applicable periods shown.
H Fees and expenses of any underlying mutual funds or exchange-traded funds (ETFs) are not included in the Fund's expense ratio. The Fund indirectly bears its proportionate share of these expenses. For additional expense information related to investments in Fidelity Central Funds, please refer to the "Investments in Fidelity Central Funds" note found in the Notes to Financial Statements section of the most recent Annual or Semi-Annual report.
I Expense ratios reflect operating expenses of the class. Expenses before reductions do not reflect amounts reimbursed, waived, or reduced through arrangements with the investment adviser, brokerage services, or other offset arrangements, if applicable, and do not represent the amount paid by the class during periods when reimbursements, waivers or reductions occur.
J Annualized.
K Amount does not include the portfolio activity of any underlying mutual funds or exchange-traded funds (ETFs).
L Portfolio turnover rate excludes securities received or delivered in-kind.
For the period ended May 31, 2023
( Amounts in thousands except percentages)
1. Organization.
Fidelity Growth Strategies Fund (the Fund) is a fund of Fidelity Mt. Vernon Street Trust (the Trust) and is authorized to issue an unlimited number of shares. The Trust is registered under the Investment Company Act of 1940, as amended (the 1940 Act), as an open-end management investment company organized as a Massachusetts business trust. The Fund offers Growth Strategies and Class K shares, each of which has equal rights as to assets and voting privileges. Each class has exclusive voting rights with respect to matters that affect that class.
2. Investments in Fidelity Central Funds.
Funds may invest in Fidelity Central Funds, which are open-end investment companies generally available only to other investment companies and accounts managed by the investment adviser and its affiliates. The Schedule of Investments lists any Fidelity Central Funds held as an investment as of period end, but does not include the underlying holdings of each Fidelity Central Fund. An investing fund indirectly bears its proportionate share of the expenses of the underlying Fidelity Central Funds.
Based on its investment objective, each Fidelity Central Fund may invest or participate in various investment vehicles or strategies that are similar to those of the investing fund. These strategies are consistent with the investment objectives of the investing fund and may involve certain economic risks which may cause a decline in value of each of the Fidelity Central Funds and thus a decline in the value of the investing fund.
| Fidelity Central Fund | Investment Manager | Investment Objective | Investment Practices | Expense Ratio A |
| Fidelity Money Market Central Funds | Fidelity Management & Research Company LLC (FMR) | Each fund seeks to obtain a high level of current income consistent with the preservation of capital and liquidity. | Short-term Investments | Less than .005% |
A Expenses expressed as a percentage of average net assets and are as of each underlying Central Fund's most recent annual or semi-annual shareholder report.
A complete unaudited list of holdings for each Fidelity Central Fund is available upon request or at the Securities and Exchange Commission website at www.sec.gov. In addition, the financial statements of the Fidelity Central Funds which contain the significant accounting policies (including investment valuation policies) of those funds, and are not covered by the Report of Independent Registered Public Accounting Firm, are available on the Securities and Exchange Commission website or upon request.
3. Significant Accounting Policies.
The Fund is an investment company and applies the accounting and reporting guidance of the Financial Accounting Standards Board (FASB) Accounting Standards Codification Topic 946 Financial Services - Investment Companies . The financial statements have been prepared in conformity with accounting principles generally accepted in the United States of America (GAAP), which require management to make certain estimates and assumptions at the date of the financial statements. Actual results could differ from those estimates. Subsequent events, if any, through the date that the financial statements were issued have been evaluated in the preparation of the financial statements. The Fund's Schedule of Investments lists any underlying mutual funds or exchange-traded funds (ETFs) but does not include the underlying holdings of these funds. The following summarizes the significant accounting policies of the Fund:
Investment Valuation. Investments are valued as of 4:00 p.m. Eastern time on the last calendar day of the period. The Board of Trustees (the Board) has designated the Fund's investment adviser as the valuation designee responsible for the fair valuation function and performing fair value determinations as needed. The investment adviser has established a Fair Value Committee (the Committee) to carry out the day-to-day fair valuation responsibilities and has adopted policies and procedures to govern the fair valuation process and the activities of the Committee. In accordance with these fair valuation policies and procedures, which have been approved by the Board, the Fund attempts to obtain prices from one or more third party pricing services or brokers to value its investments. When current market prices, quotations or currency exchange rates are not readily available or reliable, investments will be fair valued in good faith by the Committee, in accordance with the policies and procedures. Factors used in determining fair value vary by investment type and may include market or investment specific events, transaction data, estimated cash flows, and market observations of comparable investments. The frequency that the fair valuation procedures are used cannot be predicted and they may be utilized to a significant extent. The Committee manages the Fund's fair valuation practices and maintains the fair valuation policies and procedures. The Fund's investment adviser reports to the Board information regarding the fair valuation process and related material matters.
The Fund categorizes the inputs to valuation techniques used to value its investments into a disclosure hierarchy consisting of three levels as shown below:
Level 1 - unadjusted quoted prices in active markets for identical investments
Level 2 - other significant observable inputs (including quoted prices for similar investments, interest rates, prepayment speeds, etc.)
Level 3 - unobservable inputs (including the Fund's own assumptions based on the best information available)
Valuation techniques used to value the Fund's investments by major category are as follows:
Equity securities, including restricted securities, for which market quotations are readily available, are valued at the last reported sale price or official closing price as reported by a third party pricing service on the primary market or exchange on which they are traded and are categorized as Level 1 in the hierarchy. In the event there were no sales during the day or closing prices are not available, securities are valued at the last quoted bid price or may be valued using the last available price and are generally categorized as Level 2 in the hierarchy. For foreign equity securities, when market or security specific events arise, comparisons to the valuation of American Depositary Receipts (ADRs), futures contracts, ETFs and certain indexes as well as quoted prices for similar securities may be used and would be categorized as Level 2 in the hierarchy. For equity securities, including restricted securities, where observable inputs are limited, assumptions about market activity and risk are used and these securities may be categorized as Level 3 in the hierarchy.
Investments in open-end mutual funds, including the Fidelity Central Funds, are valued at their closing net asset value (NAV) each business day and are categorized as Level 1 in the hierarchy.
Changes in valuation techniques may result in transfers in or out of an assigned level within the disclosure hierarchy. The aggregate value of investments by input level as of May 31, 2023 is included at the end of the Fund's Schedule of Investments.
Investment Transactions and Income. For financial reporting purposes, the Fund's investment holdings and NAV include trades executed through the end of the last business day of the period. The NAV per share for processing shareholder transactions is calculated as of the close of business of the New York Stock Exchange (NYSE), normally 4:00 p.m. Eastern time and includes trades executed through the end of the prior business day. Gains and losses on securities sold are determined on the basis of identified cost and include proceeds received from litigation. Commissions paid to certain brokers with whom the investment adviser, or its affiliates, places trades on behalf of a fund include an amount in addition to trade execution, which may be rebated back to a fund. Any such rebates are included in net realized gain (loss) on investments in the Statement of Operations. Dividend income is recorded on the ex-dividend date, except for certain dividends from foreign securities where the ex-dividend date may have passed, which are recorded as soon as the Fund is informed of the ex-dividend date. Non-cash dividends included in dividend income, if any, are recorded at the fair market value of the securities received. Income and capital gain distributions from Fidelity Central Funds, if any, are recorded on the ex-dividend date. Certain distributions received by the Fund represent a return of capital or capital gain. The Fund determines the components of these distributions subsequent to the ex-dividend date, based upon receipt of tax filings or other correspondence relating to the underlying investment. These distributions are recorded as a reduction of cost of investments and/or as a realized gain.
Class Allocations and Expenses. Investment income, realized and unrealized capital gains and losses, common expenses of a fund, and certain fund-level expense reductions, if any, are allocated daily on a pro-rata basis to each class based on the relative net assets of each class to the total net assets of a fund. Each class differs with respect to transfer agent and distribution and service plan fees incurred, as applicable. Certain expense reductions may also differ by class, if applicable. For the reporting period, the allocated portion of income and expenses to each class as a percent of its average net assets may vary due to the timing of recording these transactions in relation to fluctuating net assets of the classes. Expenses directly attributable to a fund are charged to that fund. Expenses attributable to more than one fund are allocated among the respective funds on the basis of relative net assets or other appropriate methods. Expenses included in the accompanying financial statements reflect the expenses of that fund and do not include any expenses associated with any underlying mutual funds or exchange-traded funds. Although not included in a fund's expenses, a fund indirectly bears its proportionate share of these expenses through the net asset value of each underlying mutual fund or exchange-traded fund. Expense estimates are accrued in the period to which they relate and adjustments are made when actual amounts are known.
Deferred Trustee Compensation. Under a Deferred Compensation Plan (the Plan) for certain Funds, certain independent Trustees have elected to defer receipt of a portion of their annual compensation. Deferred amounts are invested in affiliated mutual funds, are marked-to-market and remain in a fund until distributed in accordance with the Plan. The investment of deferred amounts and the offsetting payable to the Trustees presented below are included in the accompanying Statement of Assets and Liabilities in other receivables and other payables and accrued expenses, as applicable.
| Fidelity Growth Strategies Fund | $13 |
Income Tax Information and Distributions to Shareholders. Each year, the Fund intends to qualify as a regulated investment company under Subchapter M of the Internal Revenue Code, including distributing substantially all of its taxable income and realized gains. As a result, no provision for U.S. Federal income taxes is required. The Fund files a U.S. federal tax return, in addition to state and local tax returns as required. The Fund's federal income tax returns are subject to examination by the Internal Revenue Service (IRS) for a period of three fiscal years after they are filed. State and local tax returns may be subject to examination for an additional fiscal year depending on the jurisdiction.
Distributions are declared and recorded on the ex-dividend date. Income and capital gain distributions are declared separately for each class. Income and capital gain distributions are determined in accordance with income tax regulations, which may differ from GAAP.
Capital accounts within the financial statements are adjusted for permanent book-tax differences. These adjustments have no impact on net assets or the results of operations. Capital accounts are not adjusted for temporary book-tax differences which will reverse in a subsequent period.
Book-tax differences are primarily due to foreign currency transactions, redemptions in-kind, deferred Trustee compensation, net operating losses, capital loss carryforwards and losses deferred due to wash sales and excise tax regulations.
As of period end, the cost and unrealized appreciation (depreciation) in securities, and derivatives if applicable, for federal income tax purposes were as follows:
| Gross unrealized appreciation | $1,047,770 |
| Gross unrealized depreciation | (31,789) |
| Net unrealized appreciation (depreciation) | $1,015,981 |
| Tax cost | $1,947,262 |
Capital loss carryforwards are only available to offset future capital gains of the Fund to the extent provided by regulations and may be limited. The capital loss carryforward information presented below, including any applicable limitation, is estimated as of prior fiscal period end and is subject to adjustment.
The Fund elected to defer to its next fiscal year approximately $3,640 of ordinary losses recognized during the period January 1, 2022 to November 30, 2022.
Restricted Securities (including Private Placements). Funds may invest in securities that are subject to legal or contractual restrictions on resale. These securities generally may be resold in transactions exempt from registration or to the public if the securities are registered. Disposal of these securities may involve time-consuming negotiations and expense, and prompt sale at an acceptable price may be difficult. Information regarding restricted securities held at period end is included at the end of the Schedule of Investments, if applicable.
4. Purchases and Sales of Investments.
Purchases and sales of securities, other than short-term securities and in-kind transactions, as applicable, are noted in the table below.
| | Purchases ($) | Sales ($) |
| Fidelity Growth Strategies Fund | 966,522 | 985,538 |
Unaffiliated Redemptions In-Kind. Shares that were redeemed in-kind for investments, including accrued interest and cash, if any, are shown in the table below. The net realized gain or loss on investments delivered through in-kind redemptions is included in the "Net realized gain (loss) on: Redemptions in-kind" line in the accompanying Statement of Operations. The amount of the in-kind redemptions is included in share transactions in the accompanying Statement of Changes in Net Assets. There was no gain or loss for federal income tax purposes.
| | Shares | Total net realized gain or loss ($) | Total Proceeds ($) | Participating classes |
| Fidelity Growth Strategies Fund | 15 | 305 | 735 | Class K |
Prior Fiscal Year Unaffiliated Redemptions In-Kind. Shares that were redeemed in-kind for investments, including accrued interest and cash, if any, are shown in the table below; along with realized gain or loss on investments delivered through in-kind redemptions. The amount of the in-kind redemptions is included in share transactions in the accompanying Statement of Changes in Net Assets. There was no gain or loss for federal income tax purposes.
| | Shares | Total net realized gain or loss ($) | Total Proceeds ($) | Participating classes |
| Fidelity Growth Strategies Fund | 377 | 15,128 | 25,077 | Growth Strategies, Class K |
5. Fees and Other Transactions with Affiliates.
Management Fee. Fidelity Management & Research Company LLC (the investment adviser) and its affiliates provide the Fund with investment management related services for which the Fund pays a monthly management fee. The management fee is the sum of an individual fund fee rate that is based on an annual rate of .30% of the Fund's average net assets and an annualized group fee rate that averaged .23% during the period. The group fee rate is based upon the monthly average net assets of a group of registered investment companies with which the investment adviser has management contracts. The group fee rate decreases as assets under management increase and increases as assets under management decrease. In addition, the management fee is subject to a performance adjustment (up to a maximum of +/- .20% of the Fund's average net assets over a 36 month performance period). The upward or downward adjustment to the management fee is based on the relative investment performance of Growth Strategies as compared to its benchmark index, the Russell Midcap Growth Index, over the same 36 month performance period. For the reporting period, the total annualized management fee rate, including the performance adjustment, was .54% of the Fund's average net assets. The performance adjustment included in the management fee rate may be higher or lower than the maximum performance adjustment rate due to the difference between the average net assets for the reporting and performance periods.
Transfer Agent Fees. Fidelity Investments Institutional Operations Company LLC (FIIOC), an affiliate of the investment adviser, is the transfer, dividend disbursing and shareholder servicing agent for each class of the Fund. FIIOC receives account fees and asset-based fees that vary according to the account size and type of account of the shareholders of Growth Strategies, except for Class K. FIIOC receives an asset-based fee of Class K's average net assets. FIIOC pays for typesetting, printing and mailing of shareholder reports, except proxy statements.
For the period, transfer agent fees for each class were as follows:
| | Amount | % of Class-Level Average Net Assets A |
| Growth Strategies | $2,173 | .16 |
| Class K | 40 | .04 |
| | $2,213 | |
A Annualized
Accounting Fees. Fidelity Service Company, Inc. (FSC), an affiliate of the investment adviser, maintains the Fund's accounting records. The accounting fee is based on the level of average net assets for each month. For the period, the fees were equivalent to the following annualized rates:
| | % of Average Net Assets |
| Fidelity Growth Strategies Fund | .03 |
Brokerage Commissions. A portion of portfolio transactions were placed with brokerage firms which are affiliates of the investment adviser. Brokerage commissions are included in net realized gain (loss) and change in net unrealized appreciation (depreciation) in the Statement of Operations. The commissions paid to these affiliated firms were as follows:
| | Amount |
| Fidelity Growth Strategies Fund | $15 |
Interfund Trades. Funds may purchase from or sell securities to other Fidelity Funds under procedures adopted by the Board. The procedures have been designed to ensure these interfund trades are executed in accordance with Rule 17a-7 of the 1940 Act. Any interfund trades are included within the respective purchases and sales amounts shown in the Purchases and Sales of Investments note. Interfund trades during the period are noted in the table below.
| | Purchases ($) | Sales ($) | Realized Gain (Loss) ($) |
| Fidelity Growth Strategies Fund | 33,091 | 22,190 | 1,824 |
6. Committed Line of Credit.
Certain Funds participate with other funds managed by the investment adviser or an affiliate in a $4.25 billion credit facility (the "line of credit") to be utilized for temporary or emergency purposes to fund shareholder redemptions or for other short-term liquidity purposes. The participating funds have agreed to pay commitment fees on their pro-rata portion of the line of credit, which are reflected in Miscellaneous expenses on the Statement of Operations, and are listed below. During the period, there were no borrowings on this line of credit.
| | Amount |
| Fidelity Growth Strategies Fund | $3 |
7. Security Lending.
Funds lend portfolio securities from time to time in order to earn additional income. Lending agents are used, including National Financial Services (NFS), an affiliate of the investment adviser. Pursuant to a securities lending agreement, NFS will receive a fee, which is capped at 9.9% of a fund's daily lending revenue, for its services as lending agent. A fund may lend securities to certain qualified borrowers, including NFS. On the settlement date of the loan, a fund receives collateral (in the form of U.S. Treasury obligations, letters of credit and/or cash) against the loaned securities and maintains collateral in an amount not less than 100% of the market value of the loaned securities during the period of the loan. The market value of the loaned securities is determined at the close of business of a fund and any additional required collateral is delivered to a fund on the next business day. A fund or borrower may terminate the loan at any time, and if the borrower defaults on its obligation to return the securities loaned because of insolvency or other reasons, a fund may apply collateral received from the borrower against the obligation. A fund may experience delays and costs in recovering the securities loaned. Any cash collateral received is invested in the Fidelity Securities Lending Cash Central Fund. Any loaned securities are identified as such in the Schedule of Investments, and the value of loaned securities and cash collateral at period end, as applicable, are presented in the Statement of Assets and Liabilities. Security lending income represents the income earned on investing cash collateral, less rebates paid to borrowers and any lending agent fees associated with the loan, plus any premium payments received for lending certain types of securities. Security lending income is presented in the Statement of Operations as a component of income from Fidelity Central Funds. Affiliated security lending activity, if any, was as follows:
| | Total Security Lending Fees Paid to NFS | Security Lending Income From Securities Loaned to NFS | Value of Securities Loaned to NFS at Period End |
| Fidelity Growth Strategies Fund | $18 | $- | $- |
8. Expense Reductions.
Through arrangements with the Fund's custodian, credits realized as a result of certain uninvested cash balances were used to reduce the Fund's expenses. During the period, custodian credits reduced the Fund's expenses by $1.
In addition, during the period the investment adviser or an affiliate reimbursed and/or waived a portion of fund-level operating expenses in the amount of $67.
9. Distributions to Shareholders.
Distributions to shareholders of each class were as follows:
| | Six months ended May 31, 2023 | Year ended November 30, 2022 |
| Fidelity Growth Strategies Fund | | |
| Distributions to shareholders | | |
| Growth Strategies | $- | $426,994 |
| Class K | - | 31,310 |
Total | $- | $458,304 |
10. Share Transactions.
Share transactions for each class were as follows and may contain in-kind transactions, automatic conversions between classes or exchanges between affiliated funds:
| | Shares | Shares | Dollars | Dollars |
| | Six months ended May 31, 2023 | Year ended November 30, 2022 | Six months ended May 31, 2023 | Year ended November 30, 2022 |
| Fidelity Growth Strategies Fund | | | | |
| Growth Strategies | | | | |
| Shares sold | 2,369 | 9,491 | $116,577 | $484,754 |
| Reinvestment of distributions | - | 6,391 | - | 406,035 |
| Shares redeemed | (3,410) | (7,802) | (167,167) | (404,797) |
| Net increase (decrease) | (1,041) | 8,080 | $(50,590) | $485,992 |
| Class K | | | | |
| Shares sold | 418 | 808 | $21,111 | $40,950 |
| Reinvestment of distributions | - | 487 | - | 31,310 |
| Shares redeemed | (506) | (876) | (25,472) | (44,729) |
| Net increase (decrease) | (88) | 419 | $(4,361) | $27,531 |
11. Other.
A fund's organizational documents provide former and current trustees and officers with a limited indemnification against liabilities arising in connection with the performance of their duties to the fund. In the normal course of business, a fund may also enter into contracts that provide general indemnifications. A fund's maximum exposure under these arrangements is unknown as this would be dependent on future claims that may be made against a fund. The risk of material loss from such claims is considered remote.
12. Risk and Uncertainties.
Many factors affect a fund's performance. Developments that disrupt global economies and financial markets, such as pandemics, epidemics, outbreaks of infectious diseases, war, terrorism, and environmental disasters, may significantly affect a fund's investment performance. The effects of these developments to a fund will be impacted by the types of securities in which a fund invests, the financial condition, industry, economic sector, and geographic location of an issuer, and a fund's level of investment in the securities of that issuer. Significant concentrations in security types, issuers, industries, sectors, and geographic locations may magnify the factors that affect a fund's performance.
As a shareholder, you incur two types of costs: (1) transaction costs, which may include sales charges (loads) on purchase payments or redemption proceeds, as applicable and (2) ongoing costs, which generally include management fees, distribution and/or service (12b-1) fees and other Fund expenses. This Example is intended to help you understand your ongoing costs (in dollars) of investing in a fund and to compare these costs with the ongoing costs of investing in other mutual funds.
| The Example is based on an investment of $1,000 invested at the beginning of the period and held for the entire period (December 1, 2022 to May 31, 2023). |
Actual Expenses
The first line of the accompanying table provides information about actual account values and actual expenses. You may use the information in this line, together with the amount you invested, to estimate the expenses that you paid over the period. Simply divide your account value by $1,000.00 (for example, an $8,600 account value divided by $1,000.00 = 8.6), then multiply the result by the number in the first line for a class/Fund under the heading entitled "Expenses Paid During Period" to estimate the expenses you paid on your account during this period. If any fund is a shareholder of any underlying mutual funds or exchange-traded funds (ETFs) (the Underlying Funds), such fund indirectly bears its proportional share of the expenses of the Underlying Funds in addition to the direct expenses incurred presented in the table. These fees and expenses are not included in the annualized expense ratio used to calculate the expense estimate in the table below.
Hypothetical Example for Comparison Purposes
The second line of the accompanying table provides information about hypothetical account values and hypothetical expenses based on the actual expense ratio and an assumed rate of return of 5% per year before expenses, which is not the actual return. The hypothetical account values and expenses may not be used to estimate the actual ending account balance or expenses you paid for the period. You may use this information to compare the ongoing costs of investing in the Fund and other funds. To do so, compare this 5% hypothetical example with the 5% hypothetical examples that appear in the shareholder reports of the other funds. If any fund is a shareholder of any Underlying Funds, such fund indirectly bears its proportional share of the expenses of the Underlying Funds in addition to the direct expenses as presented in the table. These fees and expenses are not included in the annualized expense ratio used to calculate the expense estimate in the table below.
Please note that the expenses shown in the table are meant to highlight your ongoing costs only and do not reflect any transaction costs. Therefore, the second line of the table is useful in comparing ongoing costs only, and will not help you determine the relative total costs of owning different funds. In addition, if these transactional costs were included, your costs would have been higher.
| | | | | Annualized Expense Ratio- A | | Beginning Account Value December 1, 2022 | | Ending Account Value May 31, 2023 | | Expenses Paid During Period- C December 1, 2022 to May 31, 2023 |
| Fidelity® Growth Strategies Fund | | | | | | | | | | |
| Fidelity® Growth Strategies Fund | | | | .73% | | | | | | |
| Actual | | | | | | $ 1,000 | | $ 994.00 | | $ 3.63 |
Hypothetical- B | | | | | | $ 1,000 | | $ 1,021.29 | | $ 3.68 |
| Class K | | | | .61% | | | | | | |
| Actual | | | | | | $ 1,000 | | $ 994.70 | | $ 3.03 |
Hypothetical- B | | | | | | $ 1,000 | | $ 1,021.89 | | $ 3.07 |
| |
A Annualized expense ratio reflects expenses net of applicable fee waivers.
B 5% return per year before expenses
C Expenses are equal to the annualized expense ratio, multiplied by the average account value over the period, multiplied by 182/ 365 (to reflect the one-half year period). The fees and expenses of any Underlying Funds are not included in each annualized expense ratio.
Board Approval of Investment Advisory Contracts
Fidelity Growth Strategies Fund
At its May 2023 meeting, the Board of Trustees, including the Independent Trustees (together, the Board), voted to continue the management contract with Fidelity Management & Research Company LLC (FMR), and the sub-advisory agreements and sub-subadvisory agreements, in each case, where applicable (together, the Advisory Contracts) for the fund for two months from June 1, 2023 through July 31, 2023. The Board determined that it will consider the annual renewal of the fund's Advisory Contracts for a full one year period in July 2023, following its review of additional materials provided by FMR.
The Board considered that the approval of the fund's Advisory Contracts will not result in any changes in (i) the investment process or strategies employed in the management of the fund's assets; (ii) the fees and expenses paid by shareholders; (iii) the nature, extent or quality of services provided under the fund's Advisory Contracts; or (iv) the day-to-day management of the fund or the persons primarily responsible for such management. The Board also considered that since its last approval of the fund's Advisory Contracts, FMR had provided additional information on the fund in support of the annual contract renewal process, including competitive analyses on total expenses and management fees and in-depth reviews of fund performance and fund profitability information. The Board concluded that the fund's Advisory Contracts are fair and reasonable, and that the fund's Advisory Contracts should be renewed, without modification, through July 31, 2023, with the understanding that the Board will consider the annual renewal for a full one year period in July 2023.
In connection with its consideration of future renewals of the fund's Advisory Contracts, the Board will consider: (i) the nature, extent and quality of services provided to the fund, including shareholder and administrative services and investment performance; (ii) the competitiveness of the management fee and total expenses for the fund; (iii) the costs of the services and profitability, including the revenues earned and the expenses incurred in conducting the business of developing, marketing, distributing, managing, administering, and servicing the fund and its shareholders, to the extent applicable; and (iv) whether there have been economies of scale in respect of the Fidelity funds, whether the Fidelity funds (including the fund) have appropriately benefited from any such economies of scale, and whether there is the potential for realization of any further economies.
Based on its evaluation of all of the conclusions noted above, and after considering all factors it believed relevant, the Board ultimately concluded that the fund's management fee structure is fair and reasonable, and that the continuation of the fund's Advisory Contracts should be approved for two months from June 1, 2023 through July 31, 2023.
The Securities and Exchange Commission adopted Rule 22e-4 under the Investment Company Act of 1940 (the Liquidity Rule) to promote effective liquidity risk management throughout the open-end investment company industry, thereby reducing the risk that funds will be unable to meet their redemption obligations and mitigating dilution of the interests of fund shareholders.
The Fund has adopted and implemented a liquidity risk management program (the Program) reasonably designed to assess and manage the Fund's liquidity risk and to comply with the requirements of the Liquidity Rule. The Fund's Board of Trustees (the Board) has designated the Fund's investment adviser as administrator of the Program. The Fidelity advisers have established a Liquidity Risk Management Committee (the LRM Committee) to manage the Program for each of the Fidelity Funds. The LRM Committee monitors the adequacy and effectiveness of implementation of the Program and on a periodic basis assesses each Fund's liquidity risk based on a variety of factors including (1) the Fund's investment strategy, (2) portfolio liquidity and cash flow projections during normal and reasonably foreseeable stressed conditions, (3) shareholder redemptions, (4) borrowings and other funding sources and (5) certain factors specific to ETFs including the effect of the Fund's prices and spreads, market participants, and basket compositions on the overall liquidity of the Fund's portfolio, as applicable.
In accordance with the Program, each of the Fund's portfolio investments is classified into one of four defined liquidity categories based on a determination of a reasonable expectation for how long it would take to convert the investment to cash (or sell or dispose of the investment) without significantly changing its market value.
- Highly liquid investments - cash or convertible to cash within three business days or less
- Moderately liquid investments - convertible to cash in three to seven calendar days
- Less liquid investments - can be sold or disposed of, but not settled, within seven calendar days
- Illiquid investments - cannot be sold or disposed of within seven calendar days
Liquidity classification determinations take into account a variety of factors including various market, trading and investment-specific considerations, as well as market depth, and generally utilize analysis from a third-party liquidity metrics service.
The Liquidity Rule places a 15% limit on a fund's illiquid investments and requires funds that do not primarily hold assets that are highly liquid investments to determine and maintain a minimum percentage of the fund's net assets to be invested in highly liquid investments (highly liquid investment minimum or HLIM). The Program includes provisions reasonably designed to comply with the 15% limit on illiquid investments and for determining, periodically reviewing and complying with the HLIM requirement as applicable.
At a recent meeting of the Fund's Board of Trustees, the LRM Committee provided a written report to the Board pertaining to the operation, adequacy, and effectiveness of the Program for the period December 1, 2021 through November 30, 2022. The report concluded that the Program is operating effectively and is reasonably designed to assess and manage the Fund's liquidity risk.
1.704532.125
FEG-SANN-0723
Fidelity® Series Growth Company Fund
Semi-Annual Report
May 31, 2023
Contents
To view a fund's proxy voting guidelines and proxy voting record for the 12-month period ended June 30, visit http://www.fidelity.com/proxyvotingresults or visit the Securities and Exchange Commission's (SEC) web site at http://www.sec.gov.
You may also call 1-800-544-8544 to request a free copy of the proxy voting guidelines.
Standard & Poor's, S&P and S&P 500 are registered service marks of The McGraw-Hill Companies, Inc. and have been licensed for use by Fidelity Distributors Corporation.
Other third-party marks appearing herein are the property of their respective owners.
All other marks appearing herein are registered or unregistered trademarks or service marks of FMR LLC or an affiliated company. © 2023 FMR LLC. All rights reserved.
This report and the financial statements contained herein are submitted for the general information of the shareholders of the Fund. This report is not authorized for distribution to prospective investors in the Fund unless preceded or accompanied by an effective prospectus.
A fund files its complete schedule of portfolio holdings with the SEC for the first and third quarters of each fiscal year on Form N-PORT. Forms N-PORT are available on the SEC's web site at http://www.sec.gov. A fund's Forms N-PORT may be reviewed and copied at the SEC's Public Reference Room in Washington, DC. Information regarding the operation of the SEC's Public Reference Room may be obtained by calling 1-800-SEC-0330.
For a complete list of a fund's portfolio holdings, view the most recent holdings listing, semiannual report, or annual report on Fidelity's web site at http://www.fidelity.com, http://www.institutional.fidelity.com, or http://www.401k.com, as applicable.
NOT FDIC INSURED •MAY LOSE VALUE •NO BANK GUARANTEE
Neither the Fund nor Fidelity Distributors Corporation is a bank.
Top Holdings (% of Fund's net assets) |
| |
| NVIDIA Corp. | 14.1 | |
| Apple, Inc. | 11.4 | |
| Microsoft Corp. | 7.2 | |
| Amazon.com, Inc. | 5.8 | |
| Alphabet, Inc. Class A | 4.7 | |
| lululemon athletica, Inc. | 3.5 | |
| Alphabet, Inc. Class C | 2.4 | |
| Salesforce, Inc. | 1.5 | |
| Tesla, Inc. | 1.3 | |
| Oracle Corp. | 1.1 | |
| | 53.0 | |
| |
| Market Sectors (% of Fund's net assets) |
| |
| Information Technology | 44.9 | |
| Consumer Discretionary | 17.5 | |
| Health Care | 14.6 | |
| Communication Services | 9.2 | |
| Industrials | 4.6 | |
| Consumer Staples | 3.0 | |
| Financials | 2.9 | |
| Energy | 1.4 | |
| Materials | 0.8 | |
| Real Estate | 0.1 | |
| Utilities | 0.1 | |
| |
Asset Allocation (% of Fund's net assets) |
|
|
Showing Percentage of Net Assets
| Common Stocks - 97.0% |
| | | Shares | Value ($) |
| COMMUNICATION SERVICES - 9.0% | | | |
| Entertainment - 0.8% | | | |
| Electronic Arts, Inc. | | 3,954 | 506,112 |
| Netflix, Inc. (a) | | 224,229 | 88,622,028 |
| Roblox Corp. (a) | | 3,300 | 138,138 |
| Roku, Inc. Class A (a) | | 102,576 | 5,969,923 |
| The Walt Disney Co. (a) | | 52,976 | 4,659,769 |
| | | | 99,895,970 |
| Interactive Media & Services - 7.8% | | | |
| Alphabet, Inc.: | | | |
| Class A (a) | | 4,973,180 | 611,054,627 |
| Class C (a) | | 2,562,460 | 316,130,690 |
| Epic Games, Inc. (a)(b)(c) | | 11,800 | 8,306,728 |
| IAC, Inc. (a) | | 9,900 | 552,816 |
| Meta Platforms, Inc. Class A (a) | | 263,130 | 69,655,774 |
| Snap, Inc. Class A (a) | | 550,281 | 5,612,866 |
| | | | 1,011,313,501 |
| Media - 0.0% | | | |
| The Trade Desk, Inc. (a) | | 8,800 | 616,704 |
| Wireless Telecommunication Services - 0.4% | | | |
| T-Mobile U.S., Inc. (a) | | 390,553 | 53,603,399 |
TOTAL COMMUNICATION SERVICES | | | 1,165,429,574 |
| CONSUMER DISCRETIONARY - 17.2% | | | |
| Automobile Components - 0.0% | | | |
| Mobileye Global, Inc. (d) | | 77,100 | 3,436,347 |
| Automobiles - 1.5% | | | |
| Neutron Holdings, Inc. (a)(b)(c) | | 438,358 | 11,222 |
| Rad Power Bikes, Inc. (a)(b)(c) | | 249,183 | 523,284 |
| Rivian Automotive, Inc. (a)(d) | | 1,733,319 | 25,531,789 |
| Tesla, Inc. (a) | | 845,755 | 172,474,817 |
| | | | 198,541,112 |
| Broadline Retail - 6.2% | | | |
| Alibaba Group Holding Ltd. sponsored ADR (a) | | 96,300 | 7,660,665 |
| Amazon.com, Inc. (a) | | 6,254,460 | 754,162,787 |
| Etsy, Inc. (a) | | 23,581 | 1,911,240 |
| Ollie's Bargain Outlet Holdings, Inc. (a) | | 816,387 | 44,999,251 |
| PDD Holdings, Inc. ADR (a) | | 21,100 | 1,378,252 |
| Vipshop Holdings Ltd. ADR (a) | | 266,300 | 3,813,416 |
| | | | 813,925,611 |
| Hotels, Restaurants & Leisure - 1.3% | | | |
| Airbnb, Inc. Class A (a) | | 51,800 | 5,686,086 |
| Booking Holdings, Inc. (a) | | 22,072 | 55,373,571 |
| Chipotle Mexican Grill, Inc. (a) | | 10,340 | 21,470,907 |
| Dutch Bros, Inc. (a)(d) | | 32,800 | 930,208 |
| Expedia, Inc. (a) | | 61,900 | 5,924,449 |
| Hyatt Hotels Corp. Class A (d) | | 6,083 | 653,801 |
| Marriott International, Inc. Class A | | 91,650 | 15,377,954 |
| McDonald's Corp. | | 4,325 | 1,233,101 |
| Penn Entertainment, Inc. (a) | | 776,000 | 19,431,040 |
| Shake Shack, Inc. Class A (a)(d) | | 26,336 | 1,742,653 |
| Sonder Holdings, Inc.: | | | |
| rights (a)(c) | | 14,240 | 997 |
| rights (a)(c) | | 14,240 | 712 |
| rights (a)(c) | | 14,239 | 570 |
| rights (a)(c) | | 14,239 | 427 |
| rights (a)(c) | | 14,238 | 285 |
| rights (a)(c) | | 14,238 | 285 |
| Starbucks Corp. | | 131,753 | 12,864,363 |
| Sweetgreen, Inc. Class A (a) | | 474,051 | 4,517,706 |
| Trip.com Group Ltd. ADR (a) | | 186,800 | 5,899,144 |
| Yum China Holdings, Inc. | | 158,012 | 8,921,358 |
| Zomato Ltd. (a) | | 3,744,500 | 3,126,832 |
| | | | 163,156,449 |
| Household Durables - 0.4% | | | |
| Lennar Corp. Class A | | 379,219 | 40,621,939 |
| Purple Innovation, Inc. (d) | | 1,119,087 | 3,872,041 |
| Toll Brothers, Inc. | | 26,300 | 1,780,510 |
| | | | 46,274,490 |
| Leisure Products - 0.0% | | | |
| Peloton Interactive, Inc. Class A (a) | | 32,142 | 233,994 |
| Specialty Retail - 2.3% | | | |
| Fanatics, Inc. Class A (a)(b)(c) | | 180,405 | 12,998,180 |
| Farfetch Ltd. Class A (a)(d) | | 142,100 | 700,553 |
| Five Below, Inc. (a) | | 49,300 | 8,505,236 |
| Floor & Decor Holdings, Inc. Class A (a)(d) | | 65,800 | 6,008,198 |
| Lowe's Companies, Inc. | | 310,423 | 62,435,378 |
| Revolve Group, Inc. (a) | | 470,005 | 7,153,476 |
| RH (a) | | 28,629 | 7,013,532 |
| Ross Stores, Inc. | | 84,300 | 8,735,166 |
| RumbleON, Inc. Class B (a) | | 190,500 | 2,080,260 |
| The Home Depot, Inc. | | 248,477 | 70,430,806 |
| TJX Companies, Inc. | | 984,272 | 75,582,247 |
| Tractor Supply Co. | | 1,400 | 293,426 |
| Wayfair LLC Class A (a) | | 925,580 | 37,319,386 |
| | | | 299,255,844 |
| Textiles, Apparel & Luxury Goods - 5.5% | | | |
| Canada Goose Holdings, Inc. (a)(d) | | 511,015 | 8,134,832 |
| Crocs, Inc. (a) | | 125,600 | 14,102,368 |
| Deckers Outdoor Corp. (a) | | 157,770 | 74,940,750 |
| Li Ning Co. Ltd. | | 522,700 | 2,803,594 |
| lululemon athletica, Inc. (a) | | 1,376,458 | 456,887,704 |
| NIKE, Inc. Class B | | 304,154 | 32,015,250 |
| On Holding AG (a) | | 1,438,706 | 39,492,480 |
| Skechers U.S.A., Inc. Class A (sub. vtg.) (a) | | 1,672,962 | 85,940,058 |
| Tory Burch LLC (a)(b)(c)(e) | | 248,840 | 7,218,848 |
| | | | 721,535,884 |
TOTAL CONSUMER DISCRETIONARY | | | 2,246,359,731 |
| CONSUMER STAPLES - 3.0% | | | |
| Beverages - 1.2% | | | |
| Celsius Holdings, Inc. (a) | | 103,600 | 13,004,908 |
| Constellation Brands, Inc. Class A (sub. vtg.) | | 12,000 | 2,915,640 |
| Keurig Dr. Pepper, Inc. | | 463,871 | 14,435,666 |
| Monster Beverage Corp. | | 634,270 | 37,180,907 |
| PepsiCo, Inc. | | 174,764 | 31,868,215 |
| The Coca-Cola Co. | | 1,035,507 | 61,778,348 |
| | | | 161,183,684 |
| Consumer Staples Distribution & Retail - 0.8% | | | |
| Costco Wholesale Corp. | | 89,344 | 45,704,817 |
| Dollar General Corp. | | 88,040 | 17,703,964 |
| Dollar Tree, Inc. (a) | | 81,244 | 10,958,191 |
| Kroger Co. | | 164,240 | 7,444,999 |
| Ocado Group PLC (a) | | 25,320 | 116,223 |
| Performance Food Group Co. (a) | | 9,768 | 540,073 |
| Sysco Corp. | | 107,200 | 7,498,640 |
| Target Corp. | | 58,113 | 7,608,735 |
| Walmart, Inc. | | 84,300 | 12,381,141 |
| | | | 109,956,783 |
| Food Products - 0.3% | | | |
| Archer Daniels Midland Co. | | 1,800 | 127,170 |
| Bunge Ltd. | | 123,454 | 11,436,779 |
| Kellogg Co. | | 88,300 | 5,895,791 |
| Mondelez International, Inc. | | 74,617 | 5,477,634 |
| The Hershey Co. | | 54,600 | 14,179,620 |
| The Real Good Food Co. LLC: | | | |
| Class B (a)(c) | | 131,479 | 1 |
| Class B unit (f) | | 131,479 | 464,121 |
| The Real Good Food Co., Inc. (a) | | 15,500 | 54,715 |
| | | | 37,635,831 |
| Household Products - 0.3% | | | |
| Church & Dwight Co., Inc. | | 41,921 | 3,875,596 |
| Colgate-Palmolive Co. | | 72,891 | 5,421,633 |
| Procter & Gamble Co. | | 177,778 | 25,333,365 |
| The Clorox Co. | | 2,300 | 363,814 |
| | | | 34,994,408 |
| Personal Care Products - 0.1% | | | |
| Kenvue, Inc. | | 84,800 | 2,127,632 |
| Olaplex Holdings, Inc. (a) | | 570,100 | 1,801,516 |
| The Beauty Health Co. (a) | | 155,898 | 1,253,420 |
| The Beauty Health Co. (a)(b) | | 553,828 | 4,452,777 |
| | | | 9,635,345 |
| Tobacco - 0.3% | | | |
| JUUL Labs, Inc. Class A (a)(b)(c) | | 13,297 | 125,657 |
| Philip Morris International, Inc. | | 419,000 | 37,714,190 |
| | | | 37,839,847 |
TOTAL CONSUMER STAPLES | | | 391,245,898 |
| ENERGY - 1.4% | | | |
| Energy Equipment & Services - 0.2% | | | |
| Baker Hughes Co. Class A | | 238,200 | 6,490,950 |
| Halliburton Co. | | 622,500 | 17,834,625 |
| Schlumberger Ltd. | | 50,000 | 2,141,500 |
| | | | 26,467,075 |
| Oil, Gas & Consumable Fuels - 1.2% | | | |
| Cameco Corp. (d) | | 499,400 | 13,903,296 |
| Devon Energy Corp. | | 22,400 | 1,032,640 |
| EOG Resources, Inc. | | 111,400 | 11,952,106 |
| EQT Corp. | | 94,200 | 3,275,334 |
| Exxon Mobil Corp. | | 7,000 | 715,260 |
| Hess Corp. | | 640,806 | 81,170,896 |
| Range Resources Corp. | | 834,800 | 22,848,476 |
| Reliance Industries Ltd. | | 654,259 | 19,542,318 |
| Valero Energy Corp. | | 39,600 | 4,238,784 |
| | | | 158,679,110 |
TOTAL ENERGY | | | 185,146,185 |
| FINANCIALS - 2.7% | | | |
| Banks - 0.4% | | | |
| Bank of America Corp. | | 647,217 | 17,986,160 |
| HDFC Bank Ltd. sponsored ADR | | 300,422 | 19,347,177 |
| JPMorgan Chase & Co. | | 87,123 | 11,823,462 |
| Wells Fargo & Co. | | 42,000 | 1,672,020 |
| | | | 50,828,819 |
| Capital Markets - 0.3% | | | |
| BlackRock, Inc. Class A | | 30,997 | 20,382,077 |
| Charles Schwab Corp. | | 250,551 | 13,201,532 |
| | | | 33,583,609 |
| Financial Services - 2.0% | | | |
| Ant International Co. Ltd. Class C (a)(b)(c) | | 617,086 | 950,312 |
| Block, Inc. Class A (a) | | 38,985 | 2,354,304 |
| MasterCard, Inc. Class A | | 281,449 | 102,734,514 |
| PayPal Holdings, Inc. (a) | | 99,727 | 6,182,077 |
| Saluda Medical, Inc. warrants 1/20/27 (a)(b)(c) | | 16,498 | 42,565 |
| Toast, Inc. (a)(d) | | 1,350,800 | 28,326,276 |
| Visa, Inc. Class A | | 575,612 | 127,227,520 |
| | | | 267,817,568 |
TOTAL FINANCIALS | | | 352,229,996 |
| HEALTH CARE - 13.9% | | | |
| Biotechnology - 7.6% | | | |
| 4D Pharma PLC (a)(c)(d) | | 596,200 | 123,558 |
| AbbVie, Inc. | | 92,349 | 12,740,468 |
| Absci Corp. (a) | | 974,272 | 1,851,117 |
| ACADIA Pharmaceuticals, Inc. (a) | | 464,971 | 10,926,819 |
| Acelyrin, Inc. (a) | | 110,300 | 1,996,430 |
| Akouos, Inc. (CVR) (c) | | 200,563 | 154,434 |
| Alector, Inc. (a) | | 497,376 | 3,700,477 |
| Allovir, Inc. (a)(d) | | 341,410 | 1,287,116 |
| Alnylam Pharmaceuticals, Inc. (a) | | 481,231 | 89,032,547 |
| Amgen, Inc. | | 88,804 | 19,594,603 |
| Apellis Pharmaceuticals, Inc. (a) | | 48,500 | 4,163,725 |
| Arcutis Biotherapeutics, Inc. (a) | | 114,600 | 860,646 |
| Argenx SE ADR (a) | | 208,860 | 81,183,882 |
| Arrowhead Pharmaceuticals, Inc. (a) | | 29,259 | 1,006,802 |
| Ars Pharmaceuticals, Inc. (a) | | 173,284 | 1,206,057 |
| Ascendis Pharma A/S sponsored ADR (a) | | 9,489 | 825,258 |
| aTyr Pharma, Inc. (a) | | 534,987 | 1,214,420 |
| Avidity Biosciences, Inc. (a) | | 335,600 | 3,564,072 |
| Axcella Health, Inc. (a) | | 949,347 | 371,954 |
| Beam Therapeutics, Inc. (a)(d) | | 191,900 | 6,121,610 |
| BeiGene Ltd. ADR (a)(d) | | 131,816 | 29,122,109 |
| Biogen, Inc. (a) | | 1,242 | 368,141 |
| Biomea Fusion, Inc. (a) | | 509,600 | 17,306,016 |
| BioNTech SE ADR | | 15,402 | 1,618,442 |
| BioXcel Therapeutics, Inc. (a) | | 382,224 | 6,857,099 |
| Calyxt, Inc. (a) | | 8,700 | 54,810 |
| Caris Life Sciences, Inc. (b)(c) | | 396,011 | 2,217,662 |
| Century Therapeutics, Inc. (a) | | 244,000 | 775,920 |
| Cerevel Therapeutics Holdings (a) | | 1,663,859 | 54,241,803 |
| Codiak Biosciences, Inc. warrants 9/15/27 (a) | | 104,600 | 1 |
| CRISPR Therapeutics AG (a)(d) | | 221,500 | 14,184,860 |
| Cyclerion Therapeutics, Inc. (a) | | 3,910 | 17,009 |
| Cyclerion Therapeutics, Inc. (a)(b) | | 7,527 | 32,742 |
| Day One Biopharmaceuticals, Inc. (a) | | 215,600 | 2,867,480 |
| Denali Therapeutics, Inc. (a) | | 33,474 | 1,011,584 |
| Deverra Therapeutics, Inc. (a)(c) | | 20,487 | 0 |
| Disc Medicine, Inc. rights (a)(c) | | 16,600 | 0 |
| EQRx, Inc. (a) | | 1,953,149 | 3,437,542 |
| EQRx, Inc.: | | | |
| rights (a)(c) | | 90,566 | 28,075 |
| rights (a)(c) | | 38,814 | 7,375 |
| Evelo Biosciences, Inc. (a)(d) | | 1,050,216 | 143,354 |
| Foghorn Therapeutics, Inc. (a) | | 225,383 | 1,417,659 |
| Generation Bio Co. (a) | | 529,042 | 1,851,647 |
| Geron Corp. (a) | | 589,600 | 1,927,992 |
| Idorsia Ltd. (a)(d) | | 123,094 | 1,007,593 |
| Immunocore Holdings PLC ADR (a) | | 70,270 | 3,877,499 |
| ImmunoGen, Inc. (a) | | 278,800 | 3,802,832 |
| Immunovant, Inc. (a) | | 378,300 | 7,948,083 |
| Inhibrx, Inc. (a)(d) | | 129,100 | 3,054,506 |
| Intarcia Therapeutics, Inc. warrants 12/6/24 (a)(c) | | 7,022 | 0 |
| Invivyd, Inc. (a)(d) | | 1,501,117 | 2,702,011 |
| Ionis Pharmaceuticals, Inc. (a) | | 2,194,369 | 89,749,692 |
| Janux Therapeutics, Inc. (a) | | 73,700 | 856,394 |
| Karuna Therapeutics, Inc. (a) | | 403,699 | 91,458,008 |
| Legend Biotech Corp. ADR (a) | | 642,200 | 41,209,974 |
| Lexicon Pharmaceuticals, Inc. (a) | | 137,922 | 455,143 |
| Lyell Immunopharma, Inc. (a)(d) | | 394,200 | 1,257,498 |
| Madrigal Pharmaceuticals, Inc. (a) | | 2,300 | 640,343 |
| Magenta Therapeutics, Inc. (c)(g) | | 269,190 | 1,205,971 |
| Moderna, Inc. (a) | | 198,741 | 25,381,213 |
| Monte Rosa Therapeutics, Inc. (a) | | 285,800 | 2,109,204 |
| Moonlake Immunotherapeutics (a)(d) | | 1,900 | 51,699 |
| Morphic Holding, Inc. (a) | | 386,114 | 22,201,555 |
| Nuvalent, Inc. Class A (a) | | 377,325 | 15,885,383 |
| Omega Therapeutics, Inc. (a) | | 476,879 | 3,619,512 |
| ORIC Pharmaceuticals, Inc. (a) | | 96,908 | 488,416 |
| Poseida Therapeutics, Inc. (a) | | 796,559 | 1,808,189 |
| Prothena Corp. PLC (a) | | 690,364 | 45,860,881 |
| PTC Therapeutics, Inc. (a) | | 233,230 | 9,788,663 |
| RAPT Therapeutics, Inc. (a) | | 200,300 | 4,012,009 |
| Recursion Pharmaceuticals, Inc. (a)(d) | | 479,500 | 4,205,215 |
| Regeneron Pharmaceuticals, Inc. (a) | | 64,821 | 47,679,735 |
| Relay Therapeutics, Inc. (a)(d) | | 216,892 | 2,416,177 |
| Roivant Sciences Ltd. (a) | | 2,592,028 | 23,561,535 |
| Sage Therapeutics, Inc. (a) | | 685,861 | 33,950,120 |
| Sana Biotechnology, Inc. (a)(d) | | 361,000 | 2,173,220 |
| Scholar Rock Holding Corp. (a) | | 507,934 | 2,956,176 |
| Scholar Rock Holding Corp. warrants 12/31/25 (a)(b) | | 44,550 | 69,639 |
| Seres Therapeutics, Inc. (a) | | 1,513,600 | 7,492,320 |
| Shattuck Labs, Inc. (a) | | 323,200 | 843,552 |
| Sigilon Therapeutics, Inc. (a) | | 3,192 | 13,406 |
| SpringWorks Therapeutics, Inc. (b) | | 125,200 | 3,085,178 |
| SpringWorks Therapeutics, Inc. (a)(d) | | 780,149 | 21,360,480 |
| Synlogic, Inc. (a) | | 599,500 | 314,738 |
| Tango Therapeutics, Inc. (a) | | 295,756 | 798,541 |
| TG Therapeutics, Inc. (a) | | 351,400 | 9,357,782 |
| Tyra Biosciences, Inc. (a) | | 20,200 | 292,294 |
| uniQure B.V. (a) | | 37,249 | 718,533 |
| UNITY Biotechnology, Inc. warrants 8/22/27 (a) | | 700,000 | 33,413 |
| Vaxcyte, Inc. (a) | | 308,780 | 15,290,786 |
| Vera Therapeutics, Inc. (a) | | 152,482 | 1,273,225 |
| Vertex Pharmaceuticals, Inc. (a) | | 65,393 | 21,159,213 |
| Verve Therapeutics, Inc. (a) | | 83,900 | 1,298,772 |
| Viking Therapeutics, Inc. (a) | | 997,058 | 21,895,394 |
| Vor Biopharma, Inc. (a) | | 368,745 | 1,733,102 |
| Zai Lab Ltd. ADR (a) | | 100,686 | 3,271,288 |
| Zentalis Pharmaceuticals, Inc. (a) | | 188,444 | 4,907,082 |
| | | | 993,998,504 |
| Health Care Equipment & Supplies - 2.7% | | | |
| Abbott Laboratories | | 13,701 | 1,397,502 |
| Blink Health LLC Series A1 (a)(b)(c) | | 8,589 | 411,327 |
| Boston Scientific Corp. (a) | | 7,100 | 365,508 |
| DexCom, Inc. (a) | | 250,684 | 29,395,206 |
| Figs, Inc. Class A (a)(d) | | 90,600 | 746,544 |
| Inspire Medical Systems, Inc. (a) | | 4,855 | 1,420,039 |
| Insulet Corp. (a) | | 390,260 | 107,028,805 |
| Intuitive Surgical, Inc. (a) | | 147,573 | 45,428,872 |
| Novocure Ltd. (a) | | 1,434,664 | 103,023,222 |
| Oddity Tech Ltd. (a)(b)(c) | | 2,226 | 1,007,065 |
| Outset Medical, Inc. (a) | | 430,828 | 8,974,147 |
| Penumbra, Inc. (a) | | 800 | 245,872 |
| Presbia PLC (a)(c) | | 454,926 | 5 |
| PROCEPT BioRobotics Corp. (a) | | 380,885 | 12,740,603 |
| Shockwave Medical, Inc. (a) | | 122,869 | 33,800,033 |
| | | | 345,984,750 |
| Health Care Providers & Services - 0.9% | | | |
| Alignment Healthcare, Inc. (a) | | 461,922 | 2,711,482 |
| Guardant Health, Inc. (a) | | 84,100 | 2,465,812 |
| Humana, Inc. | | 56,143 | 28,176,487 |
| McKesson Corp. | | 21,100 | 8,246,724 |
| The Oncology Institute, Inc. (a)(b) | | 377,375 | 161,328 |
| UnitedHealth Group, Inc. | | 168,954 | 82,321,147 |
| | | | 124,082,980 |
| Health Care Technology - 0.0% | | | |
| DNA Script (a)(b)(c) | | 85 | 59,885 |
| DNA Script (a)(b)(c) | | 324 | 228,269 |
| | | | 288,154 |
| Life Sciences Tools & Services - 0.6% | | | |
| 10X Genomics, Inc. Class B (a)(f) | | 640,857 | 33,619,358 |
| Akoya Biosciences, Inc. (a) | | 800 | 4,504 |
| Danaher Corp. | | 24,433 | 5,610,305 |
| Gerresheimer AG | | 19,700 | 2,164,694 |
| Olink Holding AB ADR (a) | | 353,535 | 6,886,862 |
| Seer, Inc. (a) | | 251,317 | 924,847 |
| Thermo Fisher Scientific, Inc. | | 30,574 | 15,545,656 |
| WuXi AppTec Co. Ltd. (H Shares) (f) | | 217,040 | 1,787,775 |
| Wuxi Biologics (Cayman), Inc. (a)(f) | | 1,409,810 | 7,210,683 |
| | | | 73,754,684 |
| Pharmaceuticals - 2.1% | | | |
| Adimab LLC (a)(b)(c)(e) | | 762,787 | 30,397,062 |
| Arvinas Holding Co. LLC (a) | | 38,600 | 842,638 |
| Atea Pharmaceuticals, Inc. (a) | | 748,712 | 2,987,361 |
| Bristol-Myers Squibb Co. | | 81,465 | 5,249,605 |
| DICE Therapeutics, Inc. (a) | | 66,800 | 2,111,548 |
| Dragonfly Therapeutics, Inc. (a)(b)(c) | | 126,113 | 2,806,014 |
| Eli Lilly & Co. | | 225,900 | 97,015,014 |
| Fulcrum Therapeutics, Inc. (a) | | 378,501 | 1,029,523 |
| GH Research PLC (a) | | 218,700 | 2,449,440 |
| Harmony Biosciences Holdings, Inc. (a)(d) | | 496,114 | 17,155,622 |
| Intra-Cellular Therapies, Inc. (a) | | 785,756 | 46,658,191 |
| Merck & Co., Inc. | | 34,600 | 3,820,186 |
| Novo Nordisk A/S Series B sponsored ADR | | 155,600 | 24,967,576 |
| Nuvation Bio, Inc. (a) | | 1,391,839 | 2,254,779 |
| OptiNose, Inc. (a) | | 1,676,467 | 2,095,584 |
| OptiNose, Inc. warrants (a) | | 206,400 | 63,597 |
| Pfizer, Inc. | | 18,100 | 688,162 |
| Pharvaris BV (a) | | 43,300 | 370,215 |
| Pliant Therapeutics, Inc. (a) | | 369,000 | 7,981,470 |
| Sienna Biopharmaceuticals, Inc. (a)(c) | | 589,618 | 6 |
| Skyhawk Therapeutics, Inc. (a)(b)(c) | | 126,063 | 1,448,464 |
| Theravance Biopharma, Inc. (a)(d) | | 119,445 | 1,335,395 |
| UCB SA | | 153,500 | 13,375,488 |
| Ventyx Biosciences, Inc. (a) | | 80,200 | 2,764,494 |
| | | | 269,867,434 |
TOTAL HEALTH CARE | | | 1,807,976,506 |
| INDUSTRIALS - 4.3% | | | |
| Aerospace & Defense - 1.2% | | | |
| AeroVironment, Inc. (a) | | 37,400 | 3,493,534 |
| Lockheed Martin Corp. | | 48,950 | 21,734,290 |
| Raytheon Technologies Corp. | | 121,100 | 11,158,154 |
| Space Exploration Technologies Corp. Class A (a)(b)(c) | | 1,375,690 | 105,928,130 |
| The Boeing Co. (a) | | 87,586 | 18,016,440 |
| | | | 160,330,548 |
| Air Freight & Logistics - 0.1% | | | |
| Delhivery Private Ltd. | | 646,600 | 2,730,593 |
| United Parcel Service, Inc. Class B | | 51,684 | 8,631,228 |
| | | | 11,361,821 |
| Construction & Engineering - 0.1% | | | |
| Fluor Corp. (a) | | 322,900 | 8,576,224 |
| MasTec, Inc. (a) | | 35,100 | 3,557,736 |
| Quanta Services, Inc. | | 31,200 | 5,540,496 |
| | | | 17,674,456 |
| Electrical Equipment - 0.3% | | | |
| Eaton Corp. PLC | | 63,424 | 11,156,282 |
| Emerson Electric Co. | | 150,849 | 11,717,950 |
| Generac Holdings, Inc. (a) | | 87,600 | 9,541,392 |
| Nextracker, Inc. Class A (d) | | 38,100 | 1,457,325 |
| NuScale Power Corp. (a)(d) | | 238,100 | 1,785,750 |
| | | | 35,658,699 |
| Ground Transportation - 1.4% | | | |
| Avis Budget Group, Inc. (a) | | 494,700 | 83,005,713 |
| Bird Global, Inc.: | | | |
| Stage 1 rights (a)(c) | | 28,568 | 0 |
| Stage 2 rights (a)(c) | | 28,568 | 0 |
| Stage 3 rights (a)(c) | | 28,567 | 0 |
| Lyft, Inc. (a) | | 737,378 | 6,651,150 |
| Uber Technologies, Inc. (a) | | 1,563,204 | 59,292,328 |
| Union Pacific Corp. | | 192,161 | 36,994,836 |
| | | | 185,944,027 |
| Industrial Conglomerates - 0.1% | | | |
| 3M Co. | | 16,480 | 1,537,749 |
| General Electric Co. | | 7,100 | 720,863 |
| Honeywell International, Inc. | | 24,983 | 4,786,743 |
| | | | 7,045,355 |
| Machinery - 0.4% | | | |
| Caterpillar, Inc. | | 83,260 | 17,130,745 |
| Deere & Co. | | 70,852 | 24,513,375 |
| Fortive Corp. | | 25,100 | 1,634,261 |
| Illinois Tool Works, Inc. | | 42,453 | 9,285,745 |
| Ingersoll Rand, Inc. | | 61,344 | 3,475,751 |
| | | | 56,039,877 |
| Passenger Airlines - 0.6% | | | |
| Delta Air Lines, Inc. (a) | | 498,490 | 18,110,142 |
| JetBlue Airways Corp. (a) | | 71,414 | 487,758 |
| Ryanair Holdings PLC sponsored ADR (a) | | 6,178 | 649,184 |
| Southwest Airlines Co. (d) | | 493,137 | 14,730,002 |
| Spirit Airlines, Inc. | | 475,233 | 7,228,294 |
| United Airlines Holdings, Inc. (a) | | 352,325 | 16,723,106 |
| Wheels Up Experience, Inc.: | | | |
| rights (a)(c) | | 23,018 | 1,381 |
| rights (a)(c) | | 23,018 | 921 |
| rights (a)(c) | | 23,018 | 691 |
| Wizz Air Holdings PLC (a)(f) | | 601,240 | 20,762,051 |
| | | | 78,693,530 |
| Professional Services - 0.1% | | | |
| LegalZoom.com, Inc. (a) | | 167,400 | 1,873,206 |
| Paycom Software, Inc. | | 10,300 | 2,885,339 |
| Paylocity Holding Corp. (a) | | 19,597 | 3,385,382 |
| | | | 8,143,927 |
TOTAL INDUSTRIALS | | | 560,892,240 |
| INFORMATION TECHNOLOGY - 44.6% | | | |
| Communications Equipment - 0.5% | | | |
| Arista Networks, Inc. (a) | | 98,982 | 16,464,666 |
| Ciena Corp. (a) | | 681,897 | 31,871,866 |
| Infinera Corp. (a)(d) | | 3,340,853 | 16,370,180 |
| | | | 64,706,712 |
| Electronic Equipment, Instruments & Components - 0.0% | | | |
| Coherent Corp. (a) | | 100,990 | 3,732,590 |
| TE Connectivity Ltd. | | 1,441 | 176,494 |
| | | | 3,909,084 |
| IT Services - 1.2% | | | |
| Accenture PLC Class A | | 85,200 | 26,064,384 |
| Cloudflare, Inc. (a)(d) | | 936,381 | 64,760,110 |
| IBM Corp. | | 99,195 | 12,755,485 |
| MongoDB, Inc. Class A (a) | | 6,541 | 1,921,680 |
| Okta, Inc. (a) | | 90,481 | 8,224,723 |
| Shopify, Inc. Class A (a) | | 614,790 | 35,175,499 |
| Snowflake, Inc. (a) | | 53,425 | 8,834,358 |
| Twilio, Inc. Class A (a) | | 7,500 | 522,150 |
| X Holdings Corp. Class A (c) | | 22,630 | 790,692 |
| | | | 159,049,081 |
| Semiconductors & Semiconductor Equipment - 18.0% | | | |
| Advanced Micro Devices, Inc. (a) | | 724,236 | 85,611,938 |
| Allegro MicroSystems LLC (a) | | 12,300 | 483,759 |
| Applied Materials, Inc. | | 342,885 | 45,706,571 |
| ASML Holding NV (depository receipt) | | 19,835 | 14,339,317 |
| Broadcom, Inc. | | 31,125 | 25,147,755 |
| Cirrus Logic, Inc. (a) | | 525,216 | 40,798,779 |
| Enphase Energy, Inc. (a) | | 57,800 | 10,050,264 |
| First Solar, Inc. (a) | | 161,400 | 32,757,744 |
| GlobalFoundries, Inc. (a) | | 70,700 | 4,123,931 |
| Impinj, Inc. (a) | | 72,000 | 7,368,480 |
| KLA Corp. | | 42,186 | 18,687,976 |
| Lam Research Corp. | | 11,650 | 7,184,555 |
| Lattice Semiconductor Corp. (a) | | 46,600 | 3,789,046 |
| Marvell Technology, Inc. | | 958,741 | 56,076,761 |
| Micron Technology, Inc. | | 143,031 | 9,754,714 |
| Monolithic Power Systems, Inc. | | 29,800 | 14,599,318 |
| NVIDIA Corp. | | 4,859,240 | 1,838,444,844 |
| onsemi (a) | | 149,800 | 12,523,280 |
| Qualcomm, Inc. | | 115,809 | 13,133,899 |
| Silicon Laboratories, Inc. (a) | | 376,039 | 52,897,406 |
| SiTime Corp. (a) | | 132,435 | 13,133,579 |
| SolarEdge Technologies, Inc. (a) | | 6,700 | 1,908,361 |
| Taiwan Semiconductor Manufacturing Co. Ltd. sponsored ADR | | 107,168 | 10,565,693 |
| Teradyne, Inc. | | 59,450 | 5,956,296 |
| Texas Instruments, Inc. | | 109,594 | 19,056,205 |
| Wolfspeed, Inc. (a)(d) | | 89,029 | 4,276,953 |
| | | | 2,348,377,424 |
| Software - 12.4% | | | |
| Adobe, Inc. (a) | | 143,112 | 59,790,762 |
| Atlassian Corp. PLC (a) | | 7,126 | 1,288,310 |
| Autodesk, Inc. (a) | | 93,842 | 18,711,156 |
| Bill Holdings, Inc. (a) | | 25,600 | 2,651,648 |
| Clear Secure, Inc. | | 1,000 | 24,710 |
| Confluent, Inc. (a) | | 96,500 | 3,062,910 |
| Crowdstrike Holdings, Inc. (a) | | 76,733 | 12,287,255 |
| Datadog, Inc. Class A (a) | | 62,130 | 5,896,758 |
| Elastic NV (a) | | 35,694 | 2,599,237 |
| Freshworks, Inc. (a) | | 42,500 | 669,800 |
| HubSpot, Inc. (a) | | 41,267 | 21,375,893 |
| Intuit, Inc. | | 60,844 | 25,500,937 |
| Microsoft Corp. | | 2,863,936 | 940,487,943 |
| Nutanix, Inc. Class A (a) | | 3,655,491 | 108,275,643 |
| Oracle Corp. | | 1,352,604 | 143,294,868 |
| Palantir Technologies, Inc. (a) | | 36,900 | 542,799 |
| Palo Alto Networks, Inc. (a) | | 1,600 | 341,424 |
| RingCentral, Inc. (a) | | 35,942 | 1,247,187 |
| Salesforce, Inc. (a) | | 880,749 | 196,741,712 |
| Samsara, Inc. (a)(d) | | 38,400 | 739,200 |
| SentinelOne, Inc. (a) | | 35,500 | 758,990 |
| ServiceNow, Inc. (a) | | 45,500 | 24,787,490 |
| Stripe, Inc. Class B (a)(b)(c) | | 43,500 | 875,655 |
| UiPath, Inc. Class A (a)(d) | | 1,136,848 | 20,338,211 |
| Workday, Inc. Class A (a) | | 25,132 | 5,327,733 |
| Zoom Video Communications, Inc. Class A (a) | | 163,103 | 10,949,104 |
| Zscaler, Inc. (a) | | 57,165 | 7,744,714 |
| | | | 1,616,312,049 |
| Technology Hardware, Storage & Peripherals - 12.5% | | | |
| Apple, Inc. | | 8,404,828 | 1,489,755,763 |
| Pure Storage, Inc. Class A (a) | | 4,417,986 | 127,193,817 |
| Samsung Electronics Co. Ltd. | | 101,633 | 5,486,843 |
| | | | 1,622,436,423 |
TOTAL INFORMATION TECHNOLOGY | | | 5,814,790,773 |
| MATERIALS - 0.7% | | | |
| Chemicals - 0.4% | | | |
| Albemarle Corp. | | 33,200 | 6,425,196 |
| CF Industries Holdings, Inc. | | 143,600 | 8,832,836 |
| Cibus Corp.: | | | |
| Series C (a)(b)(c)(e) | | 1,142,857 | 2,285,714 |
| Series D (a)(b)(c)(e) | | 750,960 | 1,501,920 |
| Series E (a)(b)(c)(e) | | 123,690 | 247,380 |
| Series F (a)(b)(c)(e) | | 293,503 | 587,006 |
| Corteva, Inc. | | 358,700 | 19,186,863 |
| The Mosaic Co. | | 243,700 | 7,788,652 |
| | | | 46,855,567 |
| Containers & Packaging - 0.0% | | | |
| Sealed Air Corp. | | 54,100 | 2,047,685 |
| Metals & Mining - 0.3% | | | |
| Barrick Gold Corp. (Canada) | | 263,700 | 4,456,190 |
| Freeport-McMoRan, Inc. | | 1,097,300 | 37,681,282 |
| Rio Tinto PLC sponsored ADR | | 32,900 | 1,942,745 |
| | | | 44,080,217 |
TOTAL MATERIALS | | | 92,983,469 |
| REAL ESTATE - 0.1% | | | |
| Equity Real Estate Investment Trusts (REITs) - 0.1% | | | |
| American Tower Corp. | | 60,198 | 11,102,919 |
| Equinix, Inc. | | 5,000 | 3,727,750 |
| | | | 14,830,669 |
| Real Estate Management & Development - 0.0% | | | |
| CBRE Group, Inc. (a) | | 31,500 | 2,359,980 |
TOTAL REAL ESTATE | | | 17,190,649 |
| UTILITIES - 0.1% | | | |
| Electric Utilities - 0.1% | | | |
| ORSTED A/S (f) | | 62,400 | 5,463,745 |
| TOTAL COMMON STOCKS (Cost $5,223,716,716) | | | 12,639,708,766 |
| | | | |
| Preferred Stocks - 1.9% |
| | | Shares | Value ($) |
| Convertible Preferred Stocks - 1.8% | | | |
| COMMUNICATION SERVICES - 0.2% | | | |
| Interactive Media & Services - 0.2% | | | |
| ByteDance Ltd. Series E1 (a)(b)(c) | | 84,766 | 17,986,498 |
| Reddit, Inc.: | | | |
| Series B(a)(b)(c) | | 37,935 | 1,278,789 |
| Series E(a)(b)(c) | | 5,127 | 172,831 |
| Series F(a)(b)(c) | | 40,428 | 1,362,828 |
| | | | 20,800,946 |
| CONSUMER DISCRETIONARY - 0.1% | | | |
| Automobiles - 0.0% | | | |
| Rad Power Bikes, Inc.: | | | |
| Series A(a)(b)(c) | | 32,487 | 68,223 |
| Series C(a)(b)(c) | | 127,831 | 268,445 |
| Series D(a)(b)(c) | | 215,900 | 453,390 |
| | | | 790,058 |
| Broadline Retail - 0.0% | | | |
| Meesho Series F (a)(b)(c) | | 62,461 | 4,323,550 |
| | | | |
| Hotels, Restaurants & Leisure - 0.1% | | | |
| Discord, Inc. Series I (a)(b)(c) | | 1,400 | 408,842 |
| MOD Super Fast Pizza Holdings LLC: | | | |
| Series 3(a)(b)(c)(e) | | 16,248 | 4,584,044 |
| Series 4(a)(b)(c)(e) | | 1,483 | 400,959 |
| Series 5(a)(b)(c)(e) | | 5,955 | 1,513,701 |
| | | | 6,907,546 |
| Textiles, Apparel & Luxury Goods - 0.0% | | | |
| Freenome, Inc.: | | | |
| Series C(a)(b)(c) | | 190,858 | 1,486,784 |
| Series D(a)(b)(c) | | 91,538 | 748,781 |
| Laronde, Inc. Series B (a)(b)(c) | | 66,432 | 1,247,593 |
| | | | 3,483,158 |
TOTAL CONSUMER DISCRETIONARY | | | 15,504,312 |
| | | | |
| CONSUMER STAPLES - 0.0% | | | |
| Consumer Staples Distribution & Retail - 0.0% | | | |
| GoBrands, Inc.: | | | |
| Series G(a)(b)(c) | | 26,833 | 2,309,785 |
| Series H(a)(b)(c) | | 21,372 | 1,839,702 |
| Instacart, Inc.: | | | |
| Series H(a)(b)(c) | | 13,904 | 569,369 |
| Series I(a)(b)(c) | | 6,341 | 259,664 |
| | | | 4,978,520 |
| Food Products - 0.0% | | | |
| AgBiome LLC: | | | |
| Series C(a)(b)(c) | | 338,565 | 1,736,838 |
| Series D(a)(b)(c) | | 126,371 | 640,701 |
| Bowery Farming, Inc. Series C1 (a)(b)(c) | | 27,136 | 252,908 |
| | | | 2,630,447 |
| Tobacco - 0.0% | | | |
| JUUL Labs, Inc. Series E (a)(b)(c) | | 6,648 | 62,824 |
| | | | |
TOTAL CONSUMER STAPLES | | | 7,671,791 |
| | | | |
| FINANCIALS - 0.1% | | | |
| Financial Services - 0.1% | | | |
| Paragon Biosciences Emalex Capital, Inc.: | | | |
| Series B(a)(b)(c) | | 198,234 | 2,115,157 |
| Series C(a)(b)(c) | | 115,792 | 1,251,712 |
| Series D1(b)(c) | | 214,900 | 2,329,516 |
| Series D2(b)(c) | | 44,427 | 455,377 |
| Saluda Medical, Inc.: | | | |
| Series D(b)(c) | | 109,988 | 1,276,961 |
| Series E(b)(c) | | 289,149 | 2,330,541 |
| | | | 9,759,264 |
| HEALTH CARE - 0.7% | | | |
| Biotechnology - 0.5% | | | |
| Altos Labs, Inc. Series B (b)(c) | | 122,084 | 2,337,909 |
| Ankyra Therapeutics Series B (a)(b)(c) | | 257,347 | 1,078,284 |
| Apogee Therapeutics Series B (b)(c) | | 565,933 | 1,867,579 |
| Asimov, Inc. Series B (a)(b)(c) | | 15,783 | 763,739 |
| Bright Peak Therapeutics AG Series B (a)(b)(c) | | 239,403 | 665,540 |
| Caris Life Sciences, Inc. Series D (a)(b)(c) | | 255,590 | 1,431,304 |
| Castle Creek Biosciences, Inc.: | | | |
| Series D1(a)(b)(c) | | 4,460 | 946,546 |
| Series D2(a)(b)(c) | | 1,412 | 266,247 |
| Cleerly, Inc. Series C (b)(c) | | 272,438 | 3,182,076 |
| Deep Genomics, Inc. Series C (a)(b)(c) | | 129,534 | 1,357,516 |
| Dianthus Therapeutics, Inc. Series A (a)(b)(c) | | 287,993 | 1,281,569 |
| Element Biosciences, Inc.: | | | |
| Series B(a)(b)(c) | | 250,956 | 4,128,226 |
| Series C(a)(b)(c) | | 101,911 | 1,676,436 |
| ElevateBio LLC Series C (a)(b)(c) | | 332,500 | 1,396,500 |
| Fog Pharmaceuticals, Inc. Series D (b)(c) | | 247,595 | 2,691,358 |
| Generate Biomedicines Series B (a)(b)(c) | | 157,390 | 1,584,917 |
| Inscripta, Inc.: | | | |
| Series D(a)(b)(c) | | 308,833 | 1,306,364 |
| Series E(a)(b)(c) | | 222,357 | 940,570 |
| Intarcia Therapeutics, Inc. Series EE (a)(b)(c) | | 116,544 | 1 |
| Korro Bio, Inc.: | | | |
| Series B1(a)(b)(c) | | 241,420 | 533,538 |
| Series B2(a)(b)(c) | | 226,657 | 509,978 |
| LifeMine Therapeutics, Inc. Series C (a)(b)(c) | | 1,780,790 | 3,276,654 |
| National Resilience, Inc.: | | | |
| Series B(a)(b)(c) | | 251,448 | 15,270,437 |
| Series C(a)(b)(c) | | 44,850 | 2,723,741 |
| Odyssey Therapeutics, Inc. Series B (b)(c) | | 468,023 | 2,962,586 |
| Quell Therapeutics Ltd. Series B (a)(b)(c) | | 760,965 | 1,537,149 |
| SalioGen Therapeutics, Inc. Series B (a)(b)(c) | | 8,766 | 591,004 |
| Sonoma Biotherapeutics, Inc.: | | | |
| Series B(a)(b)(c) | | 481,325 | 1,246,632 |
| Series B1(a)(b)(c) | | 256,702 | 759,838 |
| T-Knife Therapeutics, Inc. Series B (a)(b)(c) | | 199,356 | 785,463 |
| Treeline Biosciences: | | | |
| Series A(a)(b)(c) | | 289,700 | 2,259,660 |
| Series A1(b)(c) | | 143,637 | 1,150,532 |
| | | | 62,509,893 |
| Health Care Equipment & Supplies - 0.1% | | | |
| Blink Health LLC Series C (a)(b)(c) | | 197,068 | 9,437,587 |
| Kardium, Inc. Series D6 (a)(b)(c) | | 1,136,853 | 1,125,484 |
| | | | 10,563,071 |
| Health Care Providers & Services - 0.0% | | | |
| Boundless Bio, Inc.: | | | |
| Series B(a)(b)(c) | | 616,102 | 529,848 |
| Series C(b)(c) | | 2,572,461 | 1,800,723 |
| Conformal Medical, Inc.: | | | |
| Series C(a)(b)(c) | | 240,750 | 1,054,485 |
| Series D(b)(c) | | 55,260 | 280,721 |
| Scorpion Therapeutics, Inc. Series B (a)(b)(c) | | 242,077 | 428,476 |
| | | | 4,094,253 |
| Health Care Technology - 0.1% | | | |
| Aledade, Inc.: | | | |
| Series B1(a)(b)(c) | | 22,992 | 1,152,359 |
| Series E1(b)(c) | | 17,916 | 897,950 |
| DNA Script: | | | |
| Series B(a)(b)(c) | | 4 | 2,818 |
| Series C(a)(b)(c) | | 2,060 | 1,451,339 |
| Omada Health, Inc. Series E (a)(b)(c) | | 435,062 | 1,409,601 |
| PrognomIQ, Inc.: | | | |
| Series A5(a)(b)(c) | | 83,544 | 146,202 |
| Series B(a)(b)(c) | | 198,721 | 486,866 |
| Series C(a)(b)(c) | | 66,506 | 184,887 |
| Wugen, Inc. Series B (a)(b)(c) | | 96,718 | 483,590 |
| | | | 6,215,612 |
| Pharmaceuticals - 0.0% | | | |
| Castle Creek Pharmaceutical Holdings, Inc.: | | | |
| Series B(a)(b)(c) | | 4,910 | 966,926 |
| Series C(a)(b)(c) | | 2,570 | 601,843 |
| Galvanize Therapeutics Series B (a)(b)(c) | | 1,018,908 | 1,721,955 |
| Nohla Therapeutics, Inc. Series B (a)(b)(c) | | 3,126,919 | 31 |
| | | | 3,290,755 |
TOTAL HEALTH CARE | | | 86,673,584 |
| | | | |
| INDUSTRIALS - 0.3% | | | |
| Aerospace & Defense - 0.3% | | | |
| Space Exploration Technologies Corp. Series G (a)(b)(c) | | 53,937 | 41,531,490 |
| | | | |
| Construction & Engineering - 0.0% | | | |
| Beta Technologies, Inc.: | | | |
| Series A(a)(b)(c) | | 10,986 | 901,291 |
| Series B, 6.00%(a)(b)(c) | | 17,147 | 1,492,132 |
| | | | 2,393,423 |
TOTAL INDUSTRIALS | | | 43,924,913 |
| | | | |
| INFORMATION TECHNOLOGY - 0.3% | | | |
| Electronic Equipment, Instruments & Components - 0.0% | | | |
| Enevate Corp. Series E (a)(b)(c) | | 814,561 | 472,445 |
| Menlo Micro, Inc. Series C (a)(b)(c) | | 959,784 | 892,599 |
| | | | 1,365,044 |
| Semiconductors & Semiconductor Equipment - 0.1% | | | |
| Alif Semiconductor Series C (a)(b)(c) | | 43,548 | 806,944 |
| Astera Labs, Inc.: | | | |
| Series A(b)(c) | | 85,993 | 764,478 |
| Series B(b)(c) | | 14,642 | 130,167 |
| Series C(a)(b)(c) | | 371,500 | 3,302,635 |
| Series D(b)(c) | | 291,891 | 2,594,911 |
| GaN Systems, Inc.: | | | |
| Series F1(a)(b)(c) | | 50,937 | 566,929 |
| Series F2(a)(b)(c) | | 26,897 | 299,364 |
| Retym, Inc. Series C (b)(c) | | 165,887 | 1,290,899 |
| SiMa.ai: | | | |
| Series B(a)(b)(c) | | 338,113 | 2,025,297 |
| Series B1(a)(b)(c) | | 22,648 | 160,121 |
| Xsight Labs Ltd. Series D (a)(b)(c) | | 167,386 | 1,175,050 |
| | | | 13,116,795 |
| Software - 0.2% | | | |
| Bolt Technology OU Series E (a)(b)(c) | | 13,569 | 1,753,812 |
| Databricks, Inc.: | | | |
| Series G(a)(b)(c) | | 53,226 | 2,569,219 |
| Series H(a)(b)(c) | | 56,454 | 2,725,035 |
| Dataminr, Inc. Series D (a)(b)(c) | | 442,241 | 6,080,814 |
| Evozyne LLC Series A (a)(b)(c) | | 101,400 | 1,748,136 |
| Skyryse, Inc. Series B (a)(b)(c) | | 117,170 | 2,466,429 |
| Stripe, Inc. Series H (a)(b)(c) | | 19,200 | 386,496 |
| Tenstorrent, Inc. Series C1 (a)(b)(c) | | 21,000 | 1,185,240 |
| | | | 18,915,181 |
| Technology Hardware, Storage & Peripherals - 0.0% | | | |
| Lightmatter, Inc. Series C (b)(c) | | 121,541 | 2,000,176 |
| | | | |
TOTAL INFORMATION TECHNOLOGY | | | 35,397,196 |
| | | | |
| MATERIALS - 0.1% | | | |
| Chemicals - 0.0% | | | |
| Farmers Business Network, Inc. Series G (a)(b)(c) | | 36,990 | 1,272,826 |
| | | | |
| Metals & Mining - 0.1% | | | |
| Diamond Foundry, Inc. Series C (a)(b)(c) | | 355,446 | 12,607,670 |
| | | | |
TOTAL MATERIALS | | | 13,880,496 |
| | | | |
| UTILITIES - 0.0% | | | |
| Independent Power and Renewable Electricity Producers - 0.0% | | | |
| Redwood Materials Series C (a)(b)(c) | | 16,253 | 745,850 |
| | | | |
| TOTAL CONVERTIBLE PREFERRED STOCKS | | | 234,358,352 |
| Nonconvertible Preferred Stocks - 0.1% | | | |
| CONSUMER DISCRETIONARY - 0.0% | | | |
| Automobiles - 0.0% | | | |
| Neutron Holdings, Inc. Series 1D (a)(b)(c) | | 5,678,726 | 145,375 |
| Waymo LLC Series A2 (a)(b)(c) | | 10,731 | 494,699 |
| | | | 640,074 |
| FINANCIALS - 0.1% | | | |
| Financial Services - 0.1% | | | |
| Circle Internet Financial Ltd. Series E (a)(b)(c) | | 137,221 | 3,363,287 |
| | | | |
| HEALTH CARE - 0.0% | | | |
| Pharmaceuticals - 0.0% | | | |
| Castle Creek Pharmaceutical Holdings, Inc. Series A4 (a)(b)(c) | | 13,511 | 2,759,352 |
| Faraday Pharmaceuticals, Inc. Series B (a)(b)(c) | | 219,824 | 244,005 |
| | | | 3,003,357 |
| TOTAL NONCONVERTIBLE PREFERRED STOCKS | | | 7,006,718 |
| TOTAL PREFERRED STOCKS (Cost $212,021,625) | | | 241,365,070 |
| | | | |
| Convertible Bonds - 0.2% |
| | | Principal Amount (h) | Value ($) |
| CONSUMER DISCRETIONARY - 0.2% | | | |
| Automobiles - 0.0% | | | |
| Neutron Holdings, Inc.: | | | |
| 4% 5/22/27 (b)(c) | | 857,900 | 883,465 |
| 4% 6/12/27 (b)(c) | | 25,455 | 26,214 |
| 4.5% 10/27/25 (b)(c)(i) | | 1,429,216 | 1,411,637 |
| | | | 2,321,316 |
| Specialty Retail - 0.2% | | | |
| Wayfair LLC 0.625% 10/1/25 | | 19,000,000 | 15,580,000 |
TOTAL CONSUMER DISCRETIONARY | | | 17,901,316 |
| HEALTH CARE - 0.0% | | | |
| Health Care Equipment & Supplies - 0.0% | | | |
| Blink Health LLC 5% 1/15/24 (b)(c) | | 3,000,000 | 3,327,900 |
| TOTAL CONVERTIBLE BONDS (Cost $20,538,743) | | | 21,229,216 |
| | | | |
| Preferred Securities - 0.0% |
| | | Principal Amount (h) | Value ($) |
| HEALTH CARE - 0.0% | | | |
| Biotechnology - 0.0% | | | |
| Intarcia Therapeutics, Inc. 6% 7/18/23 (b)(c)(j) | | 614,446 | 0 |
| Health Care Equipment & Supplies - 0.0% | | | |
| Kardium, Inc. 0% (b)(c)(k) | | 1,612,660 | 1,572,344 |
TOTAL HEALTH CARE | | | 1,572,344 |
| INFORMATION TECHNOLOGY - 0.0% | | | |
| Semiconductors & Semiconductor Equipment - 0.0% | | | |
| GaN Systems, Inc. 0% (b)(c)(k) | | 1,193,899 | 1,473,630 |
| Software - 0.0% | | | |
| Tenstorrent, Inc. 0% (b)(c)(k) | | 1,170,000 | 1,110,330 |
TOTAL INFORMATION TECHNOLOGY | | | 2,583,960 |
| TOTAL PREFERRED SECURITIES (Cost $4,591,005) | | | 4,156,304 |
| | | | |
| Money Market Funds - 1.5% |
| | | Shares | Value ($) |
Fidelity Securities Lending Cash Central Fund 5.14% (l)(m) (Cost $197,086,118) | | 197,066,411 | 197,086,118 |
| | | | |
| TOTAL INVESTMENT IN SECURITIES - 100.6% (Cost $5,657,954,207) | 13,103,545,474 |
NET OTHER ASSETS (LIABILITIES) - (0.6)% | (74,959,253) |
| NET ASSETS - 100.0% | 13,028,586,221 |
| | |
Legend
| (b) | Restricted securities (including private placements) - Investment in securities not registered under the Securities Act of 1933 (excluding 144A issues). At the end of the period, the value of restricted securities (excluding 144A issues) amounted to $439,150,603 or 3.4% of net assets. |
| (d) | Security or a portion of the security is on loan at period end. |
| (e) | Investment is owned by a wholly-owned subsidiary (Subsidiary) that is treated as a corporation for U.S. tax purposes. |
| (f) | Security exempt from registration under Rule 144A of the Securities Act of 1933. These securities may be resold in transactions exempt from registration, normally to qualified institutional buyers. At the end of the period, the value of these securities amounted to $69,307,733 or 0.5% of net assets. |
| (g) | Security or a portion of the security purchased on a delayed delivery or when-issued basis. |
| (h) | Amount is stated in United States dollars unless otherwise noted. |
| (i) | Security initially issued at one coupon which converts to a higher coupon at a specified date. The rate shown is the rate at period end. |
| (j) | Non-income producing - Security is in default. |
| (k) | Security is perpetual in nature with no stated maturity date. |
| (l) | Affiliated fund that is generally available only to investment companies and other accounts managed by Fidelity Investments. The rate quoted is the annualized seven-day yield of the fund at period end. A complete unaudited listing of the fund's holdings as of its most recent quarter end is available upon request. In addition, each Fidelity Central Fund's financial statements are available on the SEC's website or upon request. |
| (m) | Investment made with cash collateral received from securities on loan. |
| Additional information on each restricted holding is as follows: |
| Security | Acquisition Date | Acquisition Cost ($) |
| Adimab LLC | 9/17/14 - 6/05/15 | 11,583,995 |
| | | |
| AgBiome LLC Series C | 6/29/18 | 2,144,369 |
| | | |
| AgBiome LLC Series D | 9/03/21 | 749,101 |
| | | |
| Aledade, Inc. Series B1 | 5/07/21 | 880,380 |
| | | |
| Aledade, Inc. Series E1 | 5/20/22 | 892,475 |
| | | |
| Alif Semiconductor Series C | 3/08/22 | 883,961 |
| | | |
| Altos Labs, Inc. Series B | 7/22/22 | 2,337,713 |
| | | |
| Ankyra Therapeutics Series B | 8/26/21 | 1,449,327 |
| | | |
| Ant International Co. Ltd. Class C | 5/16/18 | 2,351,948 |
| | | |
| Apogee Therapeutics Series B | 11/15/22 | 1,870,160 |
| | | |
| Asimov, Inc. Series B | 10/29/21 | 1,462,779 |
| | | |
| Astera Labs, Inc. Series A | 5/17/22 | 874,506 |
| | | |
| Astera Labs, Inc. Series B | 5/17/22 | 148,902 |
| | | |
| Astera Labs, Inc. Series C | 8/24/21 | 1,248,909 |
| | | |
| Astera Labs, Inc. Series D | 5/17/22 | 2,968,386 |
| | | |
| Beta Technologies, Inc. Series A | 4/09/21 | 804,944 |
| | | |
| Beta Technologies, Inc. Series B, 6.00% | 4/04/22 | 1,769,056 |
| | | |
| Blink Health LLC Series A1 | 12/30/20 | 232,676 |
| | | |
| Blink Health LLC Series C | 11/07/19 - 7/14/21 | 7,523,268 |
| | | |
| Blink Health LLC 5% 1/15/24 | 7/15/22 | 3,000,000 |
| | | |
| Bolt Technology OU Series E | 1/03/22 | 3,525,179 |
| | | |
| Boundless Bio, Inc. Series B | 4/23/21 | 831,738 |
| | | |
| Boundless Bio, Inc. Series C | 4/05/23 | 1,800,723 |
| | | |
| Bowery Farming, Inc. Series C1 | 5/18/21 | 1,634,925 |
| | | |
| Bright Peak Therapeutics AG Series B | 5/14/21 | 935,108 |
| | | |
| ByteDance Ltd. Series E1 | 11/18/20 | 9,288,165 |
| | | |
| Caris Life Sciences, Inc. | 10/06/22 | 2,217,662 |
| | | |
| Caris Life Sciences, Inc. Series D | 5/11/21 | 2,070,279 |
| | | |
| Castle Creek Biosciences, Inc. Series D1 | 4/19/22 | 959,034 |
| | | |
| Castle Creek Biosciences, Inc. Series D2 | 6/28/21 | 242,100 |
| | | |
| Castle Creek Pharmaceutical Holdings, Inc. Series A4 | 9/29/16 | 4,471,547 |
| | | |
| Castle Creek Pharmaceutical Holdings, Inc. Series B | 10/09/18 | 2,022,184 |
| | | |
| Castle Creek Pharmaceutical Holdings, Inc. Series C | 12/09/19 | 1,058,455 |
| | | |
| Cibus Corp. Series C | 2/16/18 | 2,400,000 |
| | | |
| Cibus Corp. Series D | 5/10/19 | 938,700 |
| | | |
| Cibus Corp. Series E | 6/23/21 | 217,694 |
| | | |
| Cibus Corp. Series F | 12/02/22 | 587,006 |
| | | |
| Circle Internet Financial Ltd. Series E | 5/11/21 | 2,227,100 |
| | | |
| Cleerly, Inc. Series C | 7/08/22 | 3,209,483 |
| | | |
| Conformal Medical, Inc. Series C | 7/24/20 | 882,846 |
| | | |
| Conformal Medical, Inc. Series D | 5/26/23 | 280,702 |
| | | |
| Cyclerion Therapeutics, Inc. | 4/02/19 | 2,229,495 |
| | | |
| Databricks, Inc. Series G | 2/01/21 | 3,146,861 |
| | | |
| Databricks, Inc. Series H | 8/31/21 | 4,148,473 |
| | | |
| Dataminr, Inc. Series D | 2/18/15 - 3/06/15 | 5,638,573 |
| | | |
| Deep Genomics, Inc. Series C | 7/21/21 | 1,878,398 |
| | | |
| Diamond Foundry, Inc. Series C | 3/15/21 | 8,530,704 |
| | | |
| Dianthus Therapeutics, Inc. Series A | 4/06/22 | 1,251,762 |
| | | |
| Discord, Inc. Series I | 9/15/21 | 770,874 |
| | | |
| DNA Script | 12/17/21 | 327,504 |
| | | |
| DNA Script Series B | 12/17/21 | 3,203 |
| | | |
| DNA Script Series C | 10/01/21 | 1,791,891 |
| | | |
| Dragonfly Therapeutics, Inc. | 12/19/19 | 3,336,950 |
| | | |
| Element Biosciences, Inc. Series B | 12/13/19 | 1,315,160 |
| | | |
| Element Biosciences, Inc. Series C | 6/21/21 | 2,094,954 |
| | | |
| ElevateBio LLC Series C | 3/09/21 | 1,394,838 |
| | | |
| Enevate Corp. Series E | 1/29/21 | 903,092 |
| | | |
| Epic Games, Inc. | 7/13/20 - 7/30/20 | 6,785,000 |
| | | |
| Evozyne LLC Series A | 4/09/21 | 2,278,458 |
| | | |
| Fanatics, Inc. Class A | 8/13/20 - 10/24/22 | 6,002,415 |
| | | |
| Faraday Pharmaceuticals, Inc. Series B | 12/30/19 | 288,996 |
| | | |
| Farmers Business Network, Inc. Series G | 9/15/21 | 2,299,217 |
| | | |
| Fog Pharmaceuticals, Inc. Series D | 11/17/22 | 2,664,890 |
| | | |
| Freenome, Inc. Series C | 8/14/20 | 1,262,201 |
| | | |
| Freenome, Inc. Series D | 11/22/21 | 690,407 |
| | | |
| Galvanize Therapeutics Series B | 3/29/22 | 1,764,020 |
| | | |
| GaN Systems, Inc. Series F1 | 11/30/21 | 431,946 |
| | | |
| GaN Systems, Inc. Series F2 | 11/30/21 | 228,087 |
| | | |
| GaN Systems, Inc. 0% | 11/30/21 | 1,193,899 |
| | | |
| Generate Biomedicines Series B | 11/02/21 | 1,865,072 |
| | | |
| GoBrands, Inc. Series G | 3/02/21 | 6,700,664 |
| | | |
| GoBrands, Inc. Series H | 7/22/21 | 8,302,821 |
| | | |
| Inscripta, Inc. Series D | 11/13/20 | 1,411,367 |
| | | |
| Inscripta, Inc. Series E | 3/30/21 | 1,963,412 |
| | | |
| Instacart, Inc. Series H | 11/13/20 | 834,240 |
| | | |
| Instacart, Inc. Series I | 2/26/21 | 792,625 |
| | | |
| Intarcia Therapeutics, Inc. Series EE | 9/02/16 | 6,992,640 |
| | | |
| Intarcia Therapeutics, Inc. 6% 7/18/23 | 2/26/19 | 614,446 |
| | | |
| JUUL Labs, Inc. Class A | 7/06/18 | 392,042 |
| | | |
| JUUL Labs, Inc. Series E | 7/06/18 | 196,006 |
| | | |
| Kardium, Inc. Series D6 | 12/30/20 | 1,154,861 |
| | | |
| Kardium, Inc. 0% | 12/30/20 | 1,612,660 |
| | | |
| Korro Bio, Inc. Series B1 | 12/17/21 | 630,106 |
| | | |
| Korro Bio, Inc. Series B2 | 12/17/21 | 630,106 |
| | | |
| Laronde, Inc. Series B | 8/13/21 | 1,860,096 |
| | | |
| LifeMine Therapeutics, Inc. Series C | 2/15/22 | 3,626,739 |
| | | |
| Lightmatter, Inc. Series C | 5/19/23 | 2,000,176 |
| | | |
| Meesho Series F | 9/21/21 | 4,789,029 |
| | | |
| Menlo Micro, Inc. Series C | 2/09/22 | 1,272,194 |
| | | |
| MOD Super Fast Pizza Holdings LLC Series 3 | 11/03/16 | 2,225,976 |
| | | |
| MOD Super Fast Pizza Holdings LLC Series 4 | 12/14/17 | 207,516 |
| | | |
| MOD Super Fast Pizza Holdings LLC Series 5 | 5/15/19 | 848,707 |
| | | |
| National Resilience, Inc. Series B | 12/01/20 | 3,434,780 |
| | | |
| National Resilience, Inc. Series C | 6/28/21 | 1,991,789 |
| | | |
| Neutron Holdings, Inc. | 2/04/21 | 4,384 |
| | | |
| Neutron Holdings, Inc. Series 1D | 1/25/19 | 1,377,091 |
| | | |
| Neutron Holdings, Inc. 4% 5/22/27 | 6/04/20 | 857,900 |
| | | |
| Neutron Holdings, Inc. 4% 6/12/27 | 6/12/20 | 25,455 |
| | | |
| Neutron Holdings, Inc. 4.5% 10/27/25 | 10/29/21 - 4/27/23 | 1,429,216 |
| | | |
| Nohla Therapeutics, Inc. Series B | 5/01/18 | 1,096,231 |
| | | |
| Oddity Tech Ltd. | 1/06/22 | 958,093 |
| | | |
| Odyssey Therapeutics, Inc. Series B | 9/30/22 | 2,955,958 |
| | | |
| Omada Health, Inc. Series E | 12/22/21 | 2,608,284 |
| | | |
| Paragon Biosciences Emalex Capital, Inc. Series B | 9/18/19 | 2,020,004 |
| | | |
| Paragon Biosciences Emalex Capital, Inc. Series C | 2/26/21 | 1,238,974 |
| | | |
| Paragon Biosciences Emalex Capital, Inc. Series D1 | 10/21/22 | 2,327,367 |
| | | |
| Paragon Biosciences Emalex Capital, Inc. Series D2 | 5/18/22 | 382,943 |
| | | |
| PrognomIQ, Inc. Series A5 | 8/20/20 | 50,461 |
| | | |
| PrognomIQ, Inc. Series B | 9/11/20 | 454,100 |
| | | |
| PrognomIQ, Inc. Series C | 2/16/22 | 203,508 |
| | | |
| Quell Therapeutics Ltd. Series B | 11/24/21 | 1,438,224 |
| | | |
| Rad Power Bikes, Inc. | 1/21/21 | 1,202,019 |
| | | |
| Rad Power Bikes, Inc. Series A | 1/21/21 | 156,712 |
| | | |
| Rad Power Bikes, Inc. Series C | 1/21/21 | 616,636 |
| | | |
| Rad Power Bikes, Inc. Series D | 9/17/21 | 2,069,142 |
| | | |
| Reddit, Inc. Series B | 7/26/17 | 538,544 |
| | | |
| Reddit, Inc. Series E | 5/18/21 | 217,765 |
| | | |
| Reddit, Inc. Series F | 8/11/21 | 2,498,224 |
| | | |
| Redwood Materials Series C | 5/28/21 | 770,449 |
| | | |
| Retym, Inc. Series C | 5/17/23 | 1,290,899 |
| | | |
| SalioGen Therapeutics, Inc. Series B | 12/10/21 | 928,004 |
| | | |
| Saluda Medical, Inc. warrants 1/20/27 | 1/20/22 | 0 |
| | | |
| Saluda Medical, Inc. Series D | 1/20/22 | 1,402,995 |
| | | |
| Saluda Medical, Inc. Series E | 4/06/23 | 2,334,531 |
| | | |
| Scholar Rock Holding Corp. warrants 12/31/25 | 6/17/22 | 0 |
| | | |
| Scorpion Therapeutics, Inc. Series B | 1/08/21 | 585,688 |
| | | |
| SiMa.ai Series B | 5/10/21 | 1,733,641 |
| | | |
| SiMa.ai Series B1 | 4/25/22 | 160,595 |
| | | |
| Skyhawk Therapeutics, Inc. | 5/21/21 | 2,069,954 |
| | | |
| Skyryse, Inc. Series B | 10/21/21 | 2,891,752 |
| | | |
| Sonoma Biotherapeutics, Inc. Series B | 7/26/21 | 951,243 |
| | | |
| Sonoma Biotherapeutics, Inc. Series B1 | 7/26/21 | 760,993 |
| | | |
| Space Exploration Technologies Corp. Class A | 10/16/15 - 4/06/17 | 12,876,729 |
| | | |
| Space Exploration Technologies Corp. Series G | 1/20/15 | 4,177,960 |
| | | |
| SpringWorks Therapeutics, Inc. | 9/07/22 | 3,256,452 |
| | | |
| Stripe, Inc. Class B | 5/18/21 | 1,745,585 |
| | | |
| Stripe, Inc. Series H | 3/15/21 | 770,400 |
| | | |
| T-Knife Therapeutics, Inc. Series B | 6/30/21 | 1,150,045 |
| | | |
| Tenstorrent, Inc. Series C1 | 4/23/21 | 1,248,540 |
| | | |
| Tenstorrent, Inc. 0% | 4/23/21 | 1,170,000 |
| | | |
| The Beauty Health Co. | 12/08/20 | 5,538,280 |
| | | |
| The Oncology Institute, Inc. | 6/28/21 | 3,773,750 |
| | | |
| Tory Burch LLC | 5/14/15 | 17,704,966 |
| | | |
| Treeline Biosciences Series A | 7/30/21 - 10/27/22 | 2,267,627 |
| | | |
| Treeline Biosciences Series A1 | 10/27/22 | 1,236,758 |
| | | |
| Waymo LLC Series A2 | 5/08/20 | 921,441 |
| | | |
| Wugen, Inc. Series B | 7/09/21 | 750,038 |
| | | |
| Xsight Labs Ltd. Series D | 2/16/21 | 1,338,418 |
| | | |
Affiliated Central Funds
Fiscal year to date information regarding the Fund's investments in Fidelity Central Funds, including the ownership percentage, is presented below.
| Affiliate | Value, beginning of period ($) | Purchases ($) | Sales Proceeds ($) | Dividend Income ($) | Realized Gain (loss) ($) | Change in Unrealized appreciation (depreciation) ($) | Value, end of period ($) | % ownership, end of period |
| Fidelity Cash Central Fund 5.14% | 53,644,011 | 1,393,710,497 | 1,447,354,508 | 1,501,555 | - | - | - | 0.0% |
| Fidelity Securities Lending Cash Central Fund 5.14% | 137,224,592 | 603,703,650 | 543,842,124 | 420,257 | - | - | 197,086,118 | 0.7% |
| Total | 190,868,603 | 1,997,414,147 | 1,991,196,632 | 1,921,812 | - | - | 197,086,118 | |
| | | | | | | | | |
Amounts in the dividend income column in the above table include any capital gain distributions from underlying funds, which are presented in the corresponding line item in the Statement of Operations, if applicable.
Amounts in the dividend income column for Fidelity Securities Lending Cash Central Fund represents the income earned on investing cash collateral, less rebates paid to borrowers and any lending agent fees associated with the loan, plus any premium payments received for lending certain types of securities.
Amounts included in the purchases and sales proceeds columns may include in-kind transactions, if applicable.
Investment Valuation
The following is a summary of the inputs used, as of May 31, 2023, involving the Fund's assets and liabilities carried at fair value. The inputs or methodology used for valuing securities may not be an indication of the risk associated with investing in those securities. For more information on valuation inputs, and their aggregation into the levels used below, please refer to the Investment Valuation section in the accompanying Notes to Financial Statements.
| Valuation Inputs at Reporting Date: |
| Description | Total ($) | Level 1 ($) | Level 2 ($) | Level 3 ($) |
Investments in Securities: | | | | |
|
| Equities: | | | | |
Communication Services | 1,186,230,520 | 1,157,122,846 | - | 29,107,674 |
Consumer Discretionary | 2,262,504,117 | 2,225,604,921 | - | 36,899,196 |
Consumer Staples | 398,917,689 | 391,120,240 | - | 7,797,449 |
Energy | 185,146,185 | 185,146,185 | - | - |
Financials | 365,352,547 | 351,237,119 | - | 14,115,428 |
Health Care | 1,897,653,447 | 1,764,629,506 | 3,251,828 | 129,772,113 |
Industrials | 604,817,153 | 454,961,117 | - | 149,856,036 |
Information Technology | 5,850,187,969 | 5,813,124,426 | - | 37,063,543 |
Materials | 106,863,965 | 88,361,449 | - | 18,502,516 |
Real Estate | 17,190,649 | 17,190,649 | - | - |
Utilities | 6,209,595 | 5,463,745 | - | 745,850 |
|
| Corporate Bonds | 21,229,216 | - | 15,580,000 | 5,649,216 |
|
| Preferred Securities | 4,156,304 | - | - | 4,156,304 |
|
| Money Market Funds | 197,086,118 | 197,086,118 | - | - |
| Total Investments in Securities: | 13,103,545,474 | 12,651,048,321 | 18,831,828 | 433,665,325 |
The following is a reconciliation of Investments in Securities for which Level 3 inputs were used in determining value:
| |
| Investments in Securities: | |
| Industrials | | | |
| Beginning Balance | $ | 136,400,352 | |
| Net Realized Gain (Loss) on Investment Securities | | - | |
| Net Unrealized Gain (Loss) on Investment Securities | | 13,455,684 | |
| Cost of Purchases | | - | |
| Proceeds of Sales | | - | |
| Amortization/Accretion | | - | |
| Transfers into Level 3 | | - | |
| Transfers out of Level 3 | | - | |
| Ending Balance | $ | 149,856,036 | |
| The change in unrealized gain (loss) for the period attributable to Level 3 securities held at May 31, 2023 | $ | 13,455,684 | |
| Other Investments in Securities | | | |
| Beginning Balance | $ | 274,414,732 | |
| Net Realized Gain (Loss) on Investment Securities | | 4,573 | |
| Net Unrealized Gain (Loss) on Investment Securities | | (6,991,772) | |
| Cost of Purchases | | 9,991,699 | |
| Proceeds of Sales | | (351,377) | |
| Amortization/Accretion | | - | |
| Transfers into Level 3 | | 6,741,434 | |
| Transfers out of Level 3 | | - | |
| Ending Balance | $ | 283,809,289 | |
| The change in unrealized gain (loss) for the period attributable to Level 3 securities held at May 31, 2023 | $ | (7,005,667) | |
| The information used in the above reconciliation represents fiscal year to date activity for any Investments in Securities identified as using Level 3 inputs at either the beginning or the end of the current fiscal period. Cost of purchases and proceeds of sales may include securities received and/or delivered through in-kind transactions, corporate actions or exchanges. Transfers into Level 3 were attributable to a lack of observable market data resulting from decreases in market activity, decreases in liquidity, security restructurings or corporate actions. Transfers out of Level 3 were attributable to observable market data becoming available for those securities. Transfers in or out of Level 3 represent the beginning value of any Security or Instrument where a change in the pricing level occurred from the beginning to the end of the period. Realized and unrealized gains (losses) disclosed in the reconciliation are included in Net Gain (Loss) on the Fund's Statement of Operations. | |
| Statement of Assets and Liabilities |
| | | | May 31, 2023 (Unaudited) |
| | | | | |
| Assets | | | | |
| Investment in securities, at value (including securities loaned of $193,915,394) - See accompanying schedule: | | | | |
Unaffiliated issuers (cost $5,460,868,089) | $ | 12,906,459,356 | | |
Fidelity Central Funds (cost $197,086,118) | | 197,086,118 | | |
| | | | | |
| | | | | |
| Total Investment in Securities (cost $5,657,954,207) | | | $ | 13,103,545,474 |
| Segregated cash with brokers for derivative instruments | | | | 50,489,600 |
| Restricted cash | | | | 158,441 |
| Foreign currency held at value (cost $13,930) | | | | 14,293 |
| Receivable for investments sold | | | | 1,310,285,788 |
| Receivable for fund shares sold | | | | 410 |
| Dividends receivable | | | | 6,660,288 |
| Interest receivable | | | | 264,239 |
| Distributions receivable from Fidelity Central Funds | | | | 221,218 |
| Other receivables | | | | 157,600 |
Total assets | | | | 14,471,797,351 |
| Liabilities | | | | |
| Payable to custodian bank | $ | 41,134 | | |
| Payable for investments purchased | | | | |
Regular delivery | | 1,066,141 | | |
Delayed delivery | | 1,376,180 | | |
| Payable for fund shares redeemed | | 1,238,066,028 | | |
| Payable for daily variation margin on futures contracts | | 4,815,799 | | |
| Other payables and accrued expenses | | 770,117 | | |
| Collateral on securities loaned | | 197,075,731 | | |
| Total Liabilities | | | | 1,443,211,130 |
| Net Assets | | | $ | 13,028,586,221 |
| Net Assets consist of: | | | | |
| Paid in capital | | | $ | 5,874,440,378 |
| Total accumulated earnings (loss) | | | | 7,154,145,843 |
| Net Assets | | | $ | 13,028,586,221 |
Net Asset Value , offering price and redemption price per share ($13,028,586,221 ÷ 760,162,876 shares) | | | $ | 17.14 |
| Statement of Operations |
| | | | Six months ended May 31, 2023 (Unaudited) |
| Investment Income | | | | |
| Dividends | | | $ | 38,017,343 |
| Interest | | | | 724,746 |
| Income from Fidelity Central Funds (including $420,257 from security lending) | | | | 1,921,812 |
| Total Income | | | | 40,663,901 |
| Expenses | | | | |
| Custodian fees and expenses | $ | 108,480 | | |
| Independent trustees' fees and expenses | | 38,839 | | |
| Interest | | 44,860 | | |
| Miscellaneous | | 770 | | |
| Total expenses before reductions | | 192,949 | | |
| Expense reductions | | (2,158) | | |
| Total expenses after reductions | | | | 190,791 |
| Net Investment income (loss) | | | | 40,473,110 |
| Realized and Unrealized Gain (Loss) | | | | |
| Net realized gain (loss) on: | | | | |
| Investment Securities: | | | | |
| Unaffiliated issuers (net of foreign taxes of $342,573) | | (136,187,356) | | |
| Foreign currency transactions | | 35,259 | | |
| Futures contracts | | 1,617,457 | | |
| Total net realized gain (loss) | | | | (134,534,640) |
| Change in net unrealized appreciation (depreciation) on: | | | | |
| Investment Securities: | | | | |
| Unaffiliated issuers (net of decrease in deferred foreign taxes of $682,387) | | 1,926,231,861 | | |
| Assets and liabilities in foreign currencies | | (28,601) | | |
| Futures contracts | | (202,903) | | |
| Total change in net unrealized appreciation (depreciation) | | | | 1,926,000,357 |
| Net gain (loss) | | | | 1,791,465,717 |
| Net increase (decrease) in net assets resulting from operations | | | $ | 1,831,938,827 |
| Statement of Changes in Net Assets |
| |
| | Six months ended May 31, 2023 (Unaudited) | | Year ended November 30, 2022 |
| Increase (Decrease) in Net Assets | | | | |
| Operations | | | | |
| Net investment income (loss) | $ | 40,473,110 | $ | 72,635,984 |
| Net realized gain (loss) | | (134,534,640) | | (141,822,120) |
| Change in net unrealized appreciation (depreciation) | | 1,926,000,357 | | (3,990,673,968) |
| Net increase (decrease) in net assets resulting from operations | | 1,831,938,827 | | (4,059,860,104) |
| Distributions to shareholders | | (69,434,650) | | (3,620,786,672) |
| Share transactions | | | | |
| Proceeds from sales of shares | | 1,113,376,293 | | 5,783,530,379 |
| Reinvestment of distributions | | 69,434,650 | | 3,620,786,672 |
| Cost of shares redeemed | | (2,464,384,400) | | (2,354,119,124) |
Net increase (decrease) in net assets resulting from share transactions | | (1,281,573,457) | | 7,050,197,927 |
| Total increase (decrease) in net assets | | 480,930,720 | | (630,448,849) |
| | | | | |
| Net Assets | | | | |
| Beginning of period | | 12,547,655,501 | | 13,178,104,350 |
| End of period | $ | 13,028,586,221 | $ | 12,547,655,501 |
| | | | | |
| Other Information | | | | |
| Shares | | | | |
| Sold | | 77,421,265 | | 351,665,953 |
| Issued in reinvestment of distributions | | 4,752,543 | | 176,279,780 |
| Redeemed | | (153,432,834) | | (146,981,386) |
| Net increase (decrease) | | (71,259,026) | | 380,964,347 |
| | | | | |
Financial Highlights
| Fidelity® Series Growth Company Fund |
| |
| | Six months ended (Unaudited) May 31, 2023 | | Years ended November 30, 2022 | | 2021 | | 2020 | | 2019 | | 2018 |
Selected Per-Share Data | | | | | | | | | | | | |
| Net asset value, beginning of period | $ | 15.09 | $ | 29.25 | $ | 29.01 | $ | 19.16 | $ | 17.61 | $ | 18.19 |
| Income from Investment Operations | | | | | | | | | | | | |
Net investment income (loss) A,B | | .05 | | .10 | | .10 C | | .09 | | .11 | | .15 D |
| Net realized and unrealized gain (loss) | | 2.08 | | (6.37) | | 7.43 | | 11.72 | | 3.31 | | 1.02 |
| Total from investment operations | | 2.13 | | (6.27) | | 7.53 | | 11.81 | | 3.42 | | 1.17 |
| Distributions from net investment income | | (.08) | | (.12) | | (.16) | | (.13) | | (.15) | | (.09) |
| Distributions from net realized gain | | - | | (7.77) | | (7.13) | | (1.84) | | (1.72) | | (1.66) |
| Total distributions | | (.08) | | (7.89) | | (7.29) | | (1.96) E | | (1.87) | | (1.75) |
| Net asset value, end of period | $ | 17.14 | $ | 15.09 | $ | 29.25 | $ | 29.01 | $ | 19.16 | $ | 17.61 |
Total Return F,G | | 14.24% | | (28.60)% | | 33.42% | | 68.41% | | 23.24% | | 6.96% |
Ratios to Average Net Assets A,H,I | | | | | | | | | | | | |
Expenses before reductions J | | -% K | | -% | | -% | | -% | | -% | | -% |
Expenses net of fee waivers, if any J | | -% K | | -% | | -% | | -% | | -% | | -% |
Expenses net of all reductions J | | -% K | | -% | | -% | | -% | | -% | | -% |
| Net investment income (loss) | | .63% K | | .60% | | .40% C | | .41% | | .64% | | .79% D |
| Supplemental Data | | | | | | | | | | | | |
| Net assets, end of period (000 omitted) | $ | 13,028,586 | $ | 12,547,656 | $ | 13,178,104 | $ | 12,836,920 | $ | 11,173,659 | $ | 11,276,470 |
Portfolio turnover rate L | | 20% K | | 29% | | 34% | | 18% | | 19% M | | 23% |
A Net investment income (loss) is affected by the timing of the declaration of dividends by any underlying mutual funds or exchange-traded funds (ETFs). Net investment income (loss) of any mutual funds or ETFs is not included in the Fund's net investment income (loss) ratio.
B Calculated based on average shares outstanding during the period.
C Net investment income per share reflects one or more large, non-recurring dividend(s) which amounted to $.01 per share. Excluding such non-recurring dividend(s), the ratio of net investment income (loss) to average net assets would have been .35%.
D Net investment income per share reflects one or more large, non-recurring dividend(s) which amounted to $.03 per share. Excluding such non-recurring dividend(s), the ratio of net investment income (loss) to average net assets would have been .65%.
E Total distributions per share do not sum due to rounding.
F Total returns for periods of less than one year are not annualized.
G Total returns would have been lower if certain expenses had not been reduced during the applicable periods shown.
H Expense ratios reflect operating expenses of the class. Expenses before reductions do not reflect amounts reimbursed, waived, or reduced through arrangements with the investment adviser, brokerage services, or other offset arrangements, if applicable, and do not represent the amount paid by the class during periods when reimbursements, waivers or reductions occur.
I Fees and expenses of any underlying mutual funds or exchange-traded funds (ETFs) are not included in the Fund's expense ratio. The Fund indirectly bears its proportionate share of these expenses. For additional expense information related to investments in Fidelity Central Funds, please refer to the "Investments in Fidelity Central Funds" note found in the Notes to Financial Statements section of the most recent Annual or Semi-Annual report.
J Amount represents less than .005%.
K Annualized.
L Amount does not include the portfolio activity of any underlying mutual funds or exchange-traded funds (ETFs).
M Portfolio turnover rate excludes securities received or delivered in-kind.
For the period ended May 31, 2023
1. Organization.
Fidelity Series Growth Company Fund (the Fund) is a non-diversified fund of Fidelity Mt. Vernon Street Trust (the Trust) and is authorized to issue an unlimited number of shares. Shares are offered only to certain other Fidelity funds, Fidelity managed 529 plans, and Fidelity managed collective investment trusts. The Trust is registered under the Investment Company Act of 1940, as amended (the 1940 Act), as an open-end management investment company organized as a Massachusetts business trust.
2. Investments in Fidelity Central Funds.
Funds may invest in Fidelity Central Funds, which are open-end investment companies generally available only to other investment companies and accounts managed by the investment adviser and its affiliates. The Schedule of Investments lists any Fidelity Central Funds held as an investment as of period end, but does not include the underlying holdings of each Fidelity Central Fund. An investing fund indirectly bears its proportionate share of the expenses of the underlying Fidelity Central Funds.
Based on its investment objective, each Fidelity Central Fund may invest or participate in various investment vehicles or strategies that are similar to those of the investing fund. These strategies are consistent with the investment objectives of the investing fund and may involve certain economic risks which may cause a decline in value of each of the Fidelity Central Funds and thus a decline in the value of the investing fund.
| Fidelity Central Fund | Investment Manager | Investment Objective | Investment Practices | Expense Ratio A |
| Fidelity Money Market Central Funds | Fidelity Management & Research Company LLC (FMR) | Each fund seeks to obtain a high level of current income consistent with the preservation of capital and liquidity. | Short-term Investments | Less than .005% |
A Expenses expressed as a percentage of average net assets and are as of each underlying Central Fund's most recent annual or semi-annual shareholder report.
A complete unaudited list of holdings for each Fidelity Central Fund is available upon request or at the Securities and Exchange Commission website at www.sec.gov. In addition, the financial statements of the Fidelity Central Funds which contain the significant accounting policies (including investment valuation policies) of those funds, and are not covered by the Report of Independent Registered Public Accounting Firm, are available on the Securities and Exchange Commission website or upon request.
3. Significant Accounting Policies.
The Fund is an investment company and applies the accounting and reporting guidance of the Financial Accounting Standards Board (FASB) Accounting Standards Codification Topic 946 Financial Services - Investment Companies . The financial statements have been prepared in conformity with accounting principles generally accepted in the United States of America (GAAP), which require management to make certain estimates and assumptions at the date of the financial statements. Actual results could differ from those estimates. Subsequent events, if any, through the date that the financial statements were issued have been evaluated in the preparation of the financial statements. The Fund's Schedule of Investments lists any underlying mutual funds or exchange-traded funds (ETFs) but does not include the underlying holdings of these funds. The following summarizes the significant accounting policies of the Fund:
Investment Valuation. Investments are valued as of 4:00 p.m. Eastern time on the last calendar day of the period. The Board of Trustees (the Board) has designated the Fund's investment adviser as the valuation designee responsible for the fair valuation function and performing fair value determinations as needed. The investment adviser has established a Fair Value Committee (the Committee) to carry out the day-to-day fair valuation responsibilities and has adopted policies and procedures to govern the fair valuation process and the activities of the Committee. In accordance with these fair valuation policies and procedures, which have been approved by the Board, the Fund attempts to obtain prices from one or more third party pricing services or brokers to value its investments. When current market prices, quotations or currency exchange rates are not readily available or reliable, investments will be fair valued in good faith by the Committee, in accordance with the policies and procedures. Factors used in determining fair value vary by investment type and may include market or investment specific events, transaction data, estimated cash flows, and market observations of comparable investments. The frequency that the fair valuation procedures are used cannot be predicted and they may be utilized to a significant extent. The Committee manages the Fund's fair valuation practices and maintains the fair valuation policies and procedures. The Fund's investment adviser reports to the Board information regarding the fair valuation process and related material matters.
The Fund categorizes the inputs to valuation techniques used to value its investments into a disclosure hierarchy consisting of three levels as shown below:
Level 1 - unadjusted quoted prices in active markets for identical investments
Level 2 - other significant observable inputs (including quoted prices for similar investments, interest rates, prepayment speeds, etc.)
Level 3 - unobservable inputs (including the Fund's own assumptions based on the best information available)
Valuation techniques used to value the Fund's investments by major category are as follows:
Equity securities, including restricted securities, for which market quotations are readily available, are valued at the last reported sale price or official closing price as reported by a third party pricing service on the primary market or exchange on which they are traded and are categorized as Level 1 in the hierarchy. In the event there were no sales during the day or closing prices are not available, securities are valued at the last quoted bid price or may be valued using the last available price and are generally categorized as Level 2 in the hierarchy. For foreign equity securities, when market or security specific events arise, comparisons to the valuation of American Depositary Receipts (ADRs), futures contracts, ETFs and certain indexes as well as quoted prices for similar securities may be used and would be categorized as Level 2 in the hierarchy. For equity securities, including restricted securities, where observable inputs are limited, assumptions about market activity and risk are used and these securities may be categorized as Level 3 in the hierarchy. Securities, including private placements or other restricted securities, for which observable inputs are not available are valued using alternate valuation approaches, including the market approach, the income approach and cost approach, and are categorized as Level 3 in the hierarchy. The market approach considers factors including the price of recent investments in the same or a similar security or financial metrics of comparable securities. The income approach considers factors including expected future cash flows, security specific risks and corresponding discount rates. The cost approach considers factors including the value of the security's underlying assets and liabilities.
Debt securities, including restricted securities, are valued based on evaluated prices received from third party pricing services or from brokers who make markets in such securities. Corporate bonds and preferred securities are valued by pricing services who utilize matrix pricing which considers yield or price of bonds of comparable quality, coupon, maturity and type or by broker-supplied prices. When independent prices are unavailable or unreliable, debt securities may be valued utilizing pricing methodologies which consider similar factors that would be used by third party pricing services. Debt securities are generally categorized as Level 2 in the hierarchy but may be Level 3 depending on the circumstances.
Futures contracts are valued at the settlement price established each day by the board of trade or exchange on which they are traded and are categorized as Level 1 in the hierarchy. Investments in open-end mutual funds, including the Fidelity Central Funds, are valued at their closing net asset value (NAV) each business day and are categorized as Level 1 in the hierarchy.
The following provides information on Level 3 securities held by the Fund that were valued at period end based on unobservable inputs. These amounts exclude valuations provided by a broker.
| Asset Type | Fair Value | Valuation Technique(s) | Unobservable Input | Amount or Range/Weighted Average | Impact to Valuation from an Increase in Input A |
| Equities | 423,859,805 | Market comparable | Enterprise value/EBITDA multiple (EV/EBITDA) | 6.0 - 26.0 / 14.1 | Increase |
| | | | Enterprise value/Revenue multiple (EV/R) | 2.1 - 25.0 / 6.9 | Increase |
| | | | Enterprise value/Gross profit multiple (EV/GP) | 5.0 | Increase |
| | | | Probability rate | 25.0% - 75.0% / 50.0% | Increase |
| | | | Liquidity preference | $254.19 - $282.13 / $268.90 | Increase |
| | | Recovery value | Recovery value | $0.00 - $0.31 / $0.22 | Increase |
| | | Market approach | Transaction price | $0.70 - $215.03 / $33.05 | Increase |
| | | | Discount rate | 5.0% - 52.3% / 23.1% | Decrease |
| | | Book value | Book value multiple | 1.4 | Increase |
| | | Discounted cash flow | Discount rate | 8.0% - 14.1% / 14.1% | Decrease |
| | | | Weighted average cost of capital (WACC) | 20.5% - 38.4% / 31.3% | Decrease |
| | | | Exit multiple | 2.0 - 7.3 / 2.4 | Increase |
| | | | Probability rate | 10.0% - 70.0% / 40.0% | Increase |
| | | Black scholes | Discount rate | 3.5% - 5.3% / 4.1% | Increase |
| | | | Volatility | 45.0% - 100.0% / 77.6% | Increase |
| | | | Term | 1.0 - 5.0 / 3.0 | Increase |
| Corporate Bonds | 5,649,216 | Market comparable | Enterprise value/Revenue multiple (EV/R) | 2.5 - 5.5 / 4.3 | Increase |
| | | | Discount rate | 29.2% | Decrease |
| | | | Probability rate | 10.0% - 50.0% / 33.3% | Increase |
| | | Black scholes | Volatility | 75.0% | Increase |
| | | | Term | 0.6 | Increase |
| Preferred Securities | 4,156,304 | Market comparable | Enterprise value/Revenue multiple (EV/R) | 5.0 | Increase |
| | | Recovery value | Recovery value | $0.00 | Increase |
| | | Market approach | Transaction price | $59.45 - $100.00 / $83.22 | Increase |
| | | Discounted cash flow | Discount rate | 20.0% | Decrease |
| | | Black scholes | Discount rate | 4.0% - 4.2% / 4.1% | Increase |
| | | | Volatility | 70.0% | Increase |
| | | | Term | 2.0 - 3.0 / 2.6 | Increase |
A Represents the directional change in the fair value of the Level 3 investments that could have resulted from an increase in the corresponding input as of period end. A decrease to the unobservable input would have had the opposite effect. Significant changes in these inputs may have resulted in a significantly higher or lower fair value measurement at period end.
Changes in valuation techniques may result in transfers in or out of an assigned level within the disclosure hierarchy. The aggregate value of investments by input level as of May 31, 2023, as well as a roll forward of Level 3 investments, is included at the end of the Fund's Schedule of Investments.
Foreign Currency. Certain Funds may use foreign currency contracts to facilitate transactions in foreign-denominated securities. Gains and losses from these transactions may arise from changes in the value of the foreign currency or if the counterparties do not perform under the contracts' terms.
Foreign-denominated assets, including investment securities, and liabilities are translated into U.S. dollars at the exchange rates at period end. Purchases and sales of investment securities, income and dividends received, and expenses denominated in foreign currencies are translated into U.S. dollars at the exchange rate in effect on the transaction date.
The effects of exchange rate fluctuations on investments are included with the net realized and unrealized gain (loss) on investment securities. Other foreign currency transactions resulting in realized and unrealized gain (loss) are disclosed separately.
Investment Transactions and Income. For financial reporting purposes, the Fund's investment holdings and NAV include trades executed through the end of the last business day of the period. The NAV per share for processing shareholder transactions is calculated as of the close of business of the New York Stock Exchange (NYSE), normally 4:00 p.m. Eastern time and includes trades executed through the end of the prior business day. Gains and losses on securities sold are determined on the basis of identified cost and include proceeds received from litigation. Commissions paid to certain brokers with whom the investment adviser, or its affiliates, places trades on behalf of a fund include an amount in addition to trade execution, which may be rebated back to a fund. Any such rebates are included in net realized gain (loss) on investments in the Statement of Operations. Dividend income is recorded on the ex-dividend date, except for certain dividends from foreign securities where the ex-dividend date may have passed, which are recorded as soon as the Fund is informed of the ex-dividend date. Non-cash dividends included in dividend income, if any, are recorded at the fair market value of the securities received. Income and capital gain distributions from Fidelity Central Funds, if any, are recorded on the ex-dividend date. Certain distributions received by the Fund represent a return of capital or capital gain. The Fund determines the components of these distributions subsequent to the ex-dividend date, based upon receipt of tax filings or other correspondence relating to the underlying investment. These distributions are recorded as a reduction of cost of investments and/or as a realized gain. Interest income is accrued as earned and includes coupon interest and amortization of premium and accretion of discount on debt securities as applicable. Investment income is recorded net of foreign taxes withheld where recovery of such taxes is uncertain. Funds may file withholding tax reclaims in certain jurisdictions to recover a portion of amounts previously withheld. Any withholding tax reclaims income is included in the Statement of Operations in dividends. Any receivables for withholding tax reclaims are included in the Statement of Assets and Liabilities in dividends receivable.
Expenses. Expenses directly attributable to a fund are charged to that fund. Expenses attributable to more than one fund are allocated among the respective funds on the basis of relative net assets or other appropriate methods. Expenses included in the accompanying financial statements reflect the expenses of that fund and do not include any expenses associated with any underlying mutual funds or exchange-traded funds. Although not included in a fund's expenses, a fund indirectly bears its proportionate share of these expenses through the net asset value of each underlying mutual fund or exchange-traded fund. Expense estimates are accrued in the period to which they relate and adjustments are made when actual amounts are known.
Income Tax Information and Distributions to Shareholders. Each year, the Fund intends to qualify as a regulated investment company under Subchapter M of the Internal Revenue Code, including distributing substantially all of its taxable income and realized gains. As a result, no provision for U.S. Federal income taxes is required. The Fund files a U.S. federal tax return, in addition to state and local tax returns as required. The Fund's federal income tax returns are subject to examination by the Internal Revenue Service (IRS) for a period of three fiscal years after they are filed. State and local tax returns may be subject to examination for an additional fiscal year depending on the jurisdiction. Foreign taxes are provided for based on the Fund's understanding of the tax rules and rates that exist in the foreign markets in which it invests. The Fund is subject to a tax imposed on capital gains by certain countries in which it invests. An estimated deferred tax liability for net unrealized appreciation on the applicable securities is included in Other payables and accrued expenses on the Statement of Assets & Liabilities.
Distributions are declared and recorded on the ex-dividend date. Income and capital gain distributions are determined in accordance with income tax regulations, which may differ from GAAP.
Capital accounts within the financial statements are adjusted for permanent book-tax differences. These adjustments have no impact on net assets or the results of operations. Capital accounts are not adjusted for temporary book-tax differences which will reverse in a subsequent period.
Book-tax differences are primarily due to futures contracts, foreign currency transactions, certain foreign taxes, passive foreign investment companies (PFIC), capital loss carryforwards, partnerships and losses deferred due to wash sales.
As of period end, the cost and unrealized appreciation (depreciation) in securities, and derivatives if applicable, for federal income tax purposes were as follows:
| Gross unrealized appreciation | $7,839,701,840 |
| Gross unrealized depreciation | (428,971,758) |
| Net unrealized appreciation (depreciation) | $7,410,730,082 |
| Tax cost | $5,692,815,392 |
Capital loss carryforwards are only available to offset future capital gains of the Fund to the extent provided by regulations and may be limited. The capital loss carryforward information presented below, including any applicable limitation, is estimated as of prior fiscal period end and is subject to adjustment.
Delayed Delivery Transactions and When-Issued Securities. During the period, certain Funds transacted in securities on a delayed delivery or when-issued basis. Payment and delivery may take place after the customary settlement period for that security. The price of the underlying securities and the date when the securities will be delivered and paid for are fixed at the time the transaction is negotiated. Securities purchased on a delayed delivery or when-issued basis are identified as such in the Schedule of Investments. Compensation for interest forgone in the purchase of a delayed delivery or when-issued debt security may be received. With respect to purchase commitments, each applicable Fund identifies securities as segregated in its records with a value at least equal to the amount of the commitment. Payables and receivables associated with the purchases and sales of delayed delivery securities having the same coupon, settlement date and broker are offset. Delayed delivery or when-issued securities that have been purchased from and sold to different brokers are reflected as both payables and receivables in the Statement of Assets and Liabilities under the caption "Delayed delivery", as applicable. Losses may arise due to changes in the value of the underlying securities or if the counterparty does not perform under the contract's terms, or if the issuer does not issue the securities due to political, economic, or other factors.
Restricted Securities (including Private Placements). Funds may invest in securities that are subject to legal or contractual restrictions on resale. These securities generally may be resold in transactions exempt from registration or to the public if the securities are registered. Disposal of these securities may involve time-consuming negotiations and expense, and prompt sale at an acceptable price may be difficult. Information regarding restricted securities held at period end is included at the end of the Schedule of Investments, if applicable.
Consolidated Subsidiary. The Funds included in the table below hold certain investments through a wholly-owned subsidiary ("Subsidiary"), which may be subject to federal and state taxes upon disposition.
As of period end, investments in Subsidiaries were as follows:
| | $ Amount | % of Net Assets |
| Fidelity Series Growth Company Fund | 48,895,075 | .38 |
The financial statements have been consolidated to include the Subsidiary accounts where applicable. Accordingly, all inter-company transactions and balances have been eliminated.
At period end, any estimated tax liability for these investments is presented as "Deferred taxes" in the Statement of Assets and Liabilities and included in "Change in net unrealized appreciation (depreciation) on investment securities" in the Statement of Operations. The tax liability incurred may differ materially depending on conditions when these investments are disposed. Any cash held by a Subsidiary is restricted as to its use and is presented as "Restricted cash" in the Statement of Assets and Liabilities, if applicable.
New Accounting Pronouncement. In June 2022, the Financial Accounting Standards Board (FASB) issued Accounting Standards Update (ASU) 2022-03 Fair Value Measurement (Topic 820): Fair Value Measurement of Equity Securities Subject to Contractual Sale Restrictions. The amendments in this ASU clarify that a contractual restriction on the sale of an equity security is not considered part of the unit of account of the equity security and, therefore, is not considered in measuring fair value. They also clarify that an entity cannot, as a separate unit of account, recognize and measure a contractual sale restriction. They also require additional disclosures for equity securities subject to contractual sale restrictions. ASU 2022-03 will be effective for fiscal years, including interim periods within those fiscal years, beginning after December 15, 2023, and allows for early adoption. ASU 2022-03 will only be applicable to an equity security in which the contractual arrangement that restricts its sale is executed or modified on or after the adoption date. Management is currently evaluating the potential impact of ASU 2022-03 to the financial statements.
4. Derivative Instruments.
Risk Exposures and the Use of Derivative Instruments. The Fund's investment objectives allow for various types of derivative instruments, including futures contracts. Derivatives are investments whose value is primarily derived from underlying assets, indices or reference rates and may be transacted on an exchange or over-the-counter (OTC). Derivatives may involve a future commitment to buy or sell a specified asset based on specified terms, to exchange future cash flows at periodic intervals based on a notional principal amount, or for one party to make one or more payments upon the occurrence of specified events in exchange for periodic payments from the other party.
Derivatives were used to increase returns and to manage exposure to certain risks as defined below. The success of any strategy involving derivatives depends on analysis of numerous economic factors, and if the strategies for investment do not work as intended, the objectives may not be achieved.
Derivatives were used to increase or decrease exposure to the following risk(s):
| | |
| Equity Risk | Equity risk relates to the fluctuations in the value of financial instruments as a result of changes in market prices (other than those arising from interest rate risk or foreign exchange risk), whether caused by factors specific to an individual investment, its issuer, or all factors affecting all instruments traded in a market or market segment. |
Funds are also exposed to additional risks from investing in derivatives, such as liquidity risk and counterparty credit risk. Liquidity risk is the risk that a fund will be unable to close out the derivative in the open market in a timely manner. Counterparty credit risk is the risk that the counterparty will not be able to fulfill its obligation to a fund. Counterparty credit risk related to exchange-traded contracts may be mitigated by the protection provided by the exchange on which they trade.
Investing in derivatives may involve greater risks than investing in the underlying assets directly and, to varying degrees, may involve risk of loss in excess of any initial investment and collateral received and amounts recognized in the Statement of Assets and Liabilities. In addition, there may be the risk that the change in value of the derivative contract does not correspond to the change in value of the underlying instrument.
Futures Contracts. A futures contract is an agreement between two parties to buy or sell a specified underlying instrument for a fixed price at a specified future date. Futures contracts were used to manage exposure to the stock market.
Upon entering into a futures contract, a fund is required to deposit either cash or securities (initial margin) with a clearing broker in an amount equal to a certain percentage of the face value of the contract. Futures contracts are marked-to-market daily and subsequent daily payments are made or received by a fund depending on the daily fluctuations in the value of the futures contracts and are recorded as unrealized appreciation or (depreciation). This receivable and/or payable, if any, is included in daily variation margin on futures contracts in the Statement of Assets and Liabilities. Realized gain or (loss) is recorded upon the expiration or closing of a futures contract. The net realized gain (loss) and change in net unrealized appreciation (depreciation) on futures contracts during the period is presented in the Statement of Operations.
Any open futures contracts at period end are presented in the Schedule of Investments under the caption "Futures Contracts". The notional amount at value reflects each contract's exposure to the underlying instrument or index at period end, and is representative of volume of activity during the period unless an average notional amount is presented. Any securities deposited to meet initial margin requirements are identified in the Schedule of Investments. Any cash deposited to meet initial margin requirements is presented as segregated cash with brokers for derivative instruments in the Statement of Assets and Liabilities.
5. Purchases and Sales of Investments.
Purchases and sales of securities, other than short-term securities and in-kind transactions, as applicable, are noted in the table below.
| | Purchases ($) | Sales ($) |
| Fidelity Series Growth Company Fund | 1,301,129,064 | 2,595,071,072 |
6. Fees and Other Transactions with Affiliates.
Management Fee. Fidelity Management & Research Company LLC (the investment adviser) and its affiliates provide the Fund with investment management related services for which the Fund does not pay a management fee. Under the management contract, the investment adviser or an affiliate pays all ordinary operating expenses of the Fund, except custody fees, fees and expenses of the independent Trustees, and certain miscellaneous expenses such as proxy and shareholder meeting expenses.
Brokerage Commissions. A portion of portfolio transactions were placed with brokerage firms which are affiliates of the investment adviser. Brokerage commissions are included in net realized gain (loss) and change in net unrealized appreciation (depreciation) in the Statement of Operations. The commissions paid to these affiliated firms were as follows:
| | Amount |
| Fidelity Series Growth Company Fund | $ 47,193 |
Interfund Lending Program. Pursuant to an Exemptive Order issued by the Securities and Exchange Commission (the SEC), the Fund, along with other registered investment companies having management contracts with Fidelity Management & Research Company LLC (FMR), or other affiliated entities of FMR, may participate in an interfund lending program. This program provides an alternative credit facility allowing the Fund to borrow from, or lend money to, other participating affiliated funds. At period end, there were no interfund loans outstanding. Activity in this program during the period for which loans were outstanding was as follows:
| | Borrower or Lender | Average Loan Balance | Weighted Average Interest Rate | Interest Expense |
| Fidelity Series Growth Company Fund | Borrower | $ 108,896,333 | 4.94% | $44,860 |
Interfund Trades. Funds may purchase from or sell securities to other Fidelity Funds under procedures adopted by the Board. The procedures have been designed to ensure these interfund trades are executed in accordance with Rule 17a-7 of the 1940 Act. Any interfund trades are included within the respective purchases and sales amounts shown in the Purchases and Sales of Investments note. Interfund trades during the period are noted in the table below.
| | Purchases ($) | Sales ($) | Realized Gain (Loss) ($) |
| Fidelity Series Growth Company Fund | 236,732,249 | 148,741,413 | (1,740,803) |
7. Committed Line of Credit.
Certain Funds participate with other funds managed by the investment adviser or an affiliate in a $4.25 billion credit facility (the "line of credit") to be utilized for temporary or emergency purposes to fund shareholder redemptions or for other short-term liquidity purposes. The commitment fees on the pro-rata portion of the line of credit are borne by the investment adviser. During the period, there were no borrowings on this line of credit.
8. Security Lending.
Funds lend portfolio securities from time to time in order to earn additional income. Lending agents are used, including National Financial Services (NFS), an affiliate of the investment adviser. Pursuant to a securities lending agreement, NFS will receive a fee, which is capped at 9.9% of a fund's daily lending revenue, for its services as lending agent. A fund may lend securities to certain qualified borrowers, including NFS. On the settlement date of the loan, a fund receives collateral (in the form of U.S. Treasury obligations, letters of credit and/or cash) against the loaned securities and maintains collateral in an amount not less than 100% of the market value of the loaned securities during the period of the loan. The market value of the loaned securities is determined at the close of business of a fund and any additional required collateral is delivered to a fund on the next business day. A fund or borrower may terminate the loan at any time, and if the borrower defaults on its obligation to return the securities loaned because of insolvency or other reasons, a fund may apply collateral received from the borrower against the obligation. A fund may experience delays and costs in recovering the securities loaned. Any cash collateral received is invested in the Fidelity Securities Lending Cash Central Fund. Any loaned securities are identified as such in the Schedule of Investments, and the value of loaned securities and cash collateral at period end, as applicable, are presented in the Statement of Assets and Liabilities. Security lending income represents the income earned on investing cash collateral, less rebates paid to borrowers and any lending agent fees associated with the loan, plus any premium payments received for lending certain types of securities. Security lending income is presented in the Statement of Operations as a component of income from Fidelity Central Funds. Affiliated security lending activity, if any, was as follows:
| | Total Security Lending Fees Paid to NFS | Security Lending Income From Securities Loaned to NFS | Value of Securities Loaned to NFS at Period End |
| Fidelity Series Growth Company Fund | $44,334 | $31,180 | $890,334 |
9. Expense Reductions.
Through arrangements with the Fund's custodian, credits realized as a result of certain uninvested cash balances were used to reduce the Fund's expenses by $2,158.
10. Other.
A fund's organizational documents provide former and current trustees and officers with a limited indemnification against liabilities arising in connection with the performance of their duties to the fund. In the normal course of business, a fund may also enter into contracts that provide general indemnifications. A fund's maximum exposure under these arrangements is unknown as this would be dependent on future claims that may be made against a fund. The risk of material loss from such claims is considered remote.
At the end of the period, mutual funds and accounts managed by the investment adviser or its affiliates were the owners of record of all of the outstanding shares of the Fund.
11. Risk and Uncertainties.
Many factors affect a fund's performance. Developments that disrupt global economies and financial markets, such as pandemics, epidemics, outbreaks of infectious diseases, war, terrorism, and environmental disasters, may significantly affect a fund's investment performance. The effects of these developments to a fund will be impacted by the types of securities in which a fund invests, the financial condition, industry, economic sector, and geographic location of an issuer, and a fund's level of investment in the securities of that issuer. Significant concentrations in security types, issuers, industries, sectors, and geographic locations may magnify the factors that affect a fund's performance.
As a shareholder, you incur two types of costs: (1) transaction costs, which may include sales charges (loads) on purchase payments or redemption proceeds, as applicable and (2) ongoing costs, which generally include management fees, distribution and/or service (12b-1) fees and other Fund expenses. This Example is intended to help you understand your ongoing costs (in dollars) of investing in a fund and to compare these costs with the ongoing costs of investing in other mutual funds.
| The Example is based on an investment of $1,000 invested at the beginning of the period and held for the entire period (December 1, 2022 to May 31, 2023). |
Actual Expenses
The first line of the accompanying table provides information about actual account values and actual expenses. You may use the information in this line, together with the amount you invested, to estimate the expenses that you paid over the period. Simply divide your account value by $1,000.00 (for example, an $8,600 account value divided by $1,000.00 = 8.6), then multiply the result by the number in the first line for a class/Fund under the heading entitled "Expenses Paid During Period" to estimate the expenses you paid on your account during this period. If any fund is a shareholder of any underlying mutual funds or exchange-traded funds (ETFs) (the Underlying Funds), such fund indirectly bears its proportional share of the expenses of the Underlying Funds in addition to the direct expenses incurred presented in the table. These fees and expenses are not included in the annualized expense ratio used to calculate the expense estimate in the table below.
Hypothetical Example for Comparison Purposes
The second line of the accompanying table provides information about hypothetical account values and hypothetical expenses based on the actual expense ratio and an assumed rate of return of 5% per year before expenses, which is not the actual return. The hypothetical account values and expenses may not be used to estimate the actual ending account balance or expenses you paid for the period. You may use this information to compare the ongoing costs of investing in the Fund and other funds. To do so, compare this 5% hypothetical example with the 5% hypothetical examples that appear in the shareholder reports of the other funds. If any fund is a shareholder of any Underlying Funds, such fund indirectly bears its proportional share of the expenses of the Underlying Funds in addition to the direct expenses as presented in the table. These fees and expenses are not included in the annualized expense ratio used to calculate the expense estimate in the table below.
Please note that the expenses shown in the table are meant to highlight your ongoing costs only and do not reflect any transaction costs. Therefore, the second line of the table is useful in comparing ongoing costs only, and will not help you determine the relative total costs of owning different funds. In addition, if these transactional costs were included, your costs would have been higher.
| | | | | Annualized Expense Ratio- A | | Beginning Account Value December 1, 2022 | | Ending Account Value May 31, 2023 | | Expenses Paid During Period- C December 1, 2022 to May 31, 2023 |
| | | | | | | | | | |
| Fidelity® Series Growth Company Fund | | | | -%- D | | | | | | |
| Actual | | | | | | $ 1,000 | | $ 1,142.40 | | $- E |
Hypothetical- B | | | | | | $ 1,000 | | $ 1,024.93 | | $- E |
| |
A Annualized expense ratio reflects expenses net of applicable fee waivers.
B 5% return per year before expenses
C Expenses are equal to the annualized expense ratio, multiplied by the average account value over the period, multiplied by 182/ 365 (to reflect the one-half year period). The fees and expenses of any Underlying Funds are not included in each annualized expense ratio.
D Amount represents less than .005%.
E Amount represents less than $.005.
Board Approval of Investment Advisory Contracts
Fidelity Series Growth Company Fund
At its May 2023 meeting, the Board of Trustees, including the Independent Trustees (together, the Board), voted to continue the management contract with Fidelity Management & Research Company LLC (FMR), and the sub-advisory agreements and sub-subadvisory agreements, in each case, where applicable (together, the Advisory Contracts) for the fund for two months from June 1, 2023 through July 31, 2023. The Board determined that it will consider the annual renewal of the fund's Advisory Contracts for a full one year period in July 2023, following its review of additional materials provided by FMR.
The Board considered that the approval of the fund's Advisory Contracts will not result in any changes in (i) the investment process or strategies employed in the management of the fund's assets; (ii) the fees and expenses paid by shareholders; (iii) the nature, extent or quality of services provided under the fund's Advisory Contracts; or (iv) the day-to-day management of the fund or the persons primarily responsible for such management. The Board also considered that since its last approval of the fund's Advisory Contracts, FMR had provided additional information on the fund in support of the annual contract renewal process, including competitive analyses on total expenses and management fees and in-depth reviews of fund performance and fund profitability information. The Board concluded that the fund's Advisory Contracts are fair and reasonable, and that the fund's Advisory Contracts should be renewed, without modification, through July 31, 2023, with the understanding that the Board will consider the annual renewal for a full one year period in July 2023.
In connection with its consideration of future renewals of the fund's Advisory Contracts, the Board will consider: (i) the nature, extent and quality of services provided to the fund, including shareholder and administrative services and investment performance; (ii) the competitiveness of the management fee and total expenses for the fund; (iii) the costs of the services and profitability, including the revenues earned and the expenses incurred in conducting the business of developing, marketing, distributing, managing, administering, and servicing the fund and its shareholders, to the extent applicable; and (iv) whether there have been economies of scale in respect of the Fidelity funds, whether the Fidelity funds (including the fund) have appropriately benefited from any such economies of scale, and whether there is the potential for realization of any further economies.
Based on its evaluation of all of the conclusions noted above, and after considering all factors it believed relevant, the Board ultimately concluded that the fund's management fee structure is fair and reasonable, and that the continuation of the fund's Advisory Contracts should be approved for two months from June 1, 2023 through July 31, 2023.
The Securities and Exchange Commission adopted Rule 22e-4 under the Investment Company Act of 1940 (the Liquidity Rule) to promote effective liquidity risk management throughout the open-end investment company industry, thereby reducing the risk that funds will be unable to meet their redemption obligations and mitigating dilution of the interests of fund shareholders.
The Fund has adopted and implemented a liquidity risk management program (the Program) reasonably designed to assess and manage the Fund's liquidity risk and to comply with the requirements of the Liquidity Rule. The Fund's Board of Trustees (the Board) has designated the Fund's investment adviser as administrator of the Program. The Fidelity advisers have established a Liquidity Risk Management Committee (the LRM Committee) to manage the Program for each of the Fidelity Funds. The LRM Committee monitors the adequacy and effectiveness of implementation of the Program and on a periodic basis assesses each Fund's liquidity risk based on a variety of factors including (1) the Fund's investment strategy, (2) portfolio liquidity and cash flow projections during normal and reasonably foreseeable stressed conditions, (3) shareholder redemptions, (4) borrowings and other funding sources and (5) certain factors specific to ETFs including the effect of the Fund's prices and spreads, market participants, and basket compositions on the overall liquidity of the Fund's portfolio, as applicable.
In accordance with the Program, each of the Fund's portfolio investments is classified into one of four defined liquidity categories based on a determination of a reasonable expectation for how long it would take to convert the investment to cash (or sell or dispose of the investment) without significantly changing its market value.
- Highly liquid investments - cash or convertible to cash within three business days or less
- Moderately liquid investments - convertible to cash in three to seven calendar days
- Less liquid investments - can be sold or disposed of, but not settled, within seven calendar days
- Illiquid investments - cannot be sold or disposed of within seven calendar days
Liquidity classification determinations take into account a variety of factors including various market, trading and investment-specific considerations, as well as market depth, and generally utilize analysis from a third-party liquidity metrics service.
The Liquidity Rule places a 15% limit on a fund's illiquid investments and requires funds that do not primarily hold assets that are highly liquid investments to determine and maintain a minimum percentage of the fund's net assets to be invested in highly liquid investments (highly liquid investment minimum or HLIM). The Program includes provisions reasonably designed to comply with the 15% limit on illiquid investments and for determining, periodically reviewing and complying with the HLIM requirement as applicable.
At a recent meeting of the Fund's Board of Trustees, the LRM Committee provided a written report to the Board pertaining to the operation, adequacy, and effectiveness of the Program for the period December 1, 2021 through November 30, 2022. The report concluded that the Program is operating effectively and is reasonably designed to assess and manage the Fund's liquidity risk.
| A special meeting of shareholders was held on April 19, 2023. The results of votes taken among shareholders on the proposal before them are reported below. Each vote reported represents one dollar of net asset value held on the record date for the meeting. |
| Proposal 1 |
| To reclassify the diversification status of the fund from diversified to non-diversified by eliminating the following fundamental policy: The fund may not with respect to 75% of fund's total assets, purchase the securities of any issuer (other than securities issued or guaranteed by the U.S. Government or any of its agencies or instrumentalities, or securities of other investment companies) if, as a result, (a) more than 5% of fund's total assets would be invested in the securities of that issuer, or (b) the fund would hold more than 10% of outstanding voting securities of issuer. |
| | # of Votes | % of Votes |
| Affirmative | 12,596,252,354.420 | 100.000 |
| Against | 0.000 | 0.000 |
| Abstain | 0.000 | 0.000 |
| TOTAL | 12,596,252,354.420 | 100.000 |
| | | |
1.968010.109
XS7-SANN-0723
Fidelity® Growth Company Fund
Semi-Annual Report
May 31, 2023
Contents
To view a fund's proxy voting guidelines and proxy voting record for the 12-month period ended June 30, visit http://www.fidelity.com/proxyvotingresults or visit the Securities and Exchange Commission's (SEC) web site at http://www.sec.gov.
You may also call 1-800-544-8544 if you're an individual investing directly with Fidelity, call 1-800-835-5092 if you're a plan sponsor or participant with Fidelity as your recordkeeper or call 1-877-208-0098 on institutional accounts or if you're an advisor or invest through one to request a free copy of the proxy voting guidelines.
Standard & Poor's, S&P and S&P 500 are registered service marks of The McGraw-Hill Companies, Inc. and have been licensed for use by Fidelity Distributors Corporation.
Other third-party marks appearing herein are the property of their respective owners.
All other marks appearing herein are registered or unregistered trademarks or service marks of FMR LLC or an affiliated company. © 2023 FMR LLC. All rights reserved.
This report and the financial statements contained herein are submitted for the general information of the shareholders of the Fund. This report is not authorized for distribution to prospective investors in the Fund unless preceded or accompanied by an effective prospectus.
A fund files its complete schedule of portfolio holdings with the SEC for the first and third quarters of each fiscal year on Form N-PORT. Forms N-PORT are available on the SEC's web site at http://www.sec.gov. A fund's Forms N-PORT may be reviewed and copied at the SEC's Public Reference Room in Washington, DC. Information regarding the operation of the SEC's Public Reference Room may be obtained by calling 1-800-SEC-0330.
For a complete list of a fund's portfolio holdings, view the most recent holdings listing, semiannual report, or annual report on Fidelity's web site at http://www.fidelity.com, http://www.institutional.fidelity.com, or http://www.401k.com, as applicable.
NOT FDIC INSURED •MAY LOSE VALUE •NO BANK GUARANTEE
Neither the Fund nor Fidelity Distributors Corporation is a bank.
Top Holdings (% of Fund's net assets) |
| |
| NVIDIA Corp. | 13.0 | |
| Apple, Inc. | 12.5 | |
| Microsoft Corp. | 7.2 | |
| Amazon.com, Inc. | 5.6 | |
| Alphabet, Inc. Class A | 4.6 | |
| lululemon athletica, Inc. | 3.3 | |
| Alphabet, Inc. Class C | 2.5 | |
| Salesforce, Inc. | 1.8 | |
| Tesla, Inc. | 1.6 | |
| Visa, Inc. Class A | 1.1 | |
| | 53.2 | |
| |
| Market Sectors (% of Fund's net assets) |
| |
| Information Technology | 45.0 | |
| Consumer Discretionary | 17.6 | |
| Health Care | 14.7 | |
| Communication Services | 9.1 | |
| Industrials | 4.6 | |
| Consumer Staples | 3.2 | |
| Financials | 3.2 | |
| Energy | 1.5 | |
| Materials | 0.8 | |
| Real Estate | 0.1 | |
| Utilities | 0.1 | |
| |
Asset Allocation (% of Fund's net assets) |
|
|
Showing Percentage of Net Assets
| Common Stocks - 97.5% |
| | | Shares | Value ($) (000s) |
| COMMUNICATION SERVICES - 8.9% | | | |
| Entertainment - 0.7% | | | |
| Netflix, Inc. (a) | | 780,128 | 308,330 |
| Roku, Inc. Class A (a)(b) | | 423,243 | 24,633 |
| The Walt Disney Co. (a) | | 140,401 | 12,350 |
| | | | 345,313 |
| Interactive Media & Services - 7.7% | | | |
| Alphabet, Inc.: | | | |
| Class A (a) | | 17,380,951 | 2,135,597 |
| Class C (a) | | 9,640,566 | 1,189,357 |
| Epic Games, Inc. (a)(c)(d) | | 51,800 | 36,465 |
| Meta Platforms, Inc. Class A (a) | | 879,358 | 232,784 |
| Snap, Inc. Class A (a) | | 1,254,271 | 12,794 |
| | | | 3,606,997 |
| Media - 0.0% | | | |
| The Trade Desk, Inc. (a) | | 53,241 | 3,731 |
| Wireless Telecommunication Services - 0.5% | | | |
| T-Mobile U.S., Inc. (a) | | 1,605,317 | 220,330 |
TOTAL COMMUNICATION SERVICES | | | 4,176,371 |
| CONSUMER DISCRETIONARY - 17.5% | | | |
| Automobile Components - 0.0% | | | |
| Mobileye Global, Inc. (b) | | 306,190 | 13,647 |
| Automobiles - 1.8% | | | |
| Neutron Holdings, Inc. (a)(c)(d) | | 1,546,251 | 40 |
| Rad Power Bikes, Inc. (a)(c)(d) | | 1,182,568 | 2,483 |
| Rivian Automotive, Inc. (a)(b) | | 6,424,913 | 94,639 |
| Tesla, Inc. (a) | | 3,522,239 | 718,290 |
| | | | 815,452 |
| Broadline Retail - 6.0% | | | |
| Alibaba Group Holding Ltd. sponsored ADR (a) | | 348,476 | 27,721 |
| Amazon.com, Inc. (a) | | 21,553,723 | 2,598,948 |
| Etsy, Inc. (a) | | 80,903 | 6,557 |
| Ollie's Bargain Outlet Holdings, Inc. (a) | | 2,372,090 | 130,750 |
| Ozon Holdings PLC ADR (a)(b)(d) | | 20,942 | 180 |
| PDD Holdings, Inc. ADR (a) | | 85,124 | 5,560 |
| Vipshop Holdings Ltd. ADR (a) | | 1,115,355 | 15,972 |
| | | | 2,785,688 |
| Hotels, Restaurants & Leisure - 1.3% | | | |
| Airbnb, Inc. Class A (a) | | 251,090 | 27,562 |
| Booking Holdings, Inc. (a) | | 87,807 | 220,288 |
| Chipotle Mexican Grill, Inc. (a) | | 38,278 | 79,484 |
| Dutch Bros, Inc. (a)(b) | | 127,517 | 3,616 |
| Expedia, Inc. (a) | | 180,523 | 17,278 |
| Marriott International, Inc. Class A | | 336,909 | 56,530 |
| McDonald's Corp. | | 2,739 | 781 |
| Penn Entertainment, Inc. (a) | | 2,284,880 | 57,213 |
| Shake Shack, Inc. Class A (a) | | 62,982 | 4,168 |
| Sonder Holdings, Inc.: | | | |
| rights (a)(d) | | 53,749 | 4 |
| rights (a)(d) | | 53,749 | 3 |
| rights (a)(d) | | 53,749 | 2 |
| rights (a)(d) | | 53,749 | 2 |
| rights (a)(d) | | 53,749 | 1 |
| rights (a)(d) | | 53,748 | 1 |
| Starbucks Corp. | | 474,148 | 46,296 |
| Sweetgreen, Inc. Class A (a) | | 1,321,505 | 12,594 |
| Trip.com Group Ltd. ADR (a) | | 692,119 | 21,857 |
| Yum China Holdings, Inc. | | 502,672 | 28,381 |
| Zomato Ltd. (a) | | 12,137,800 | 10,136 |
| | | | 586,197 |
| Household Durables - 0.4% | | | |
| Lennar Corp. Class A | | 1,469,990 | 157,465 |
| Purple Innovation, Inc. (b) | | 3,416,406 | 11,821 |
| Toll Brothers, Inc. | | 100,353 | 6,794 |
| | | | 176,080 |
| Specialty Retail - 2.5% | | | |
| Fanatics, Inc. Class A (a)(c)(d) | | 730,532 | 52,635 |
| Farfetch Ltd. Class A (a)(b) | | 715,500 | 3,527 |
| Five Below, Inc. (a) | | 196,707 | 33,936 |
| Floor & Decor Holdings, Inc. Class A (a) | | 162,039 | 14,796 |
| Lowe's Companies, Inc. | | 1,277,646 | 256,973 |
| Revolve Group, Inc. (a)(b) | | 1,845,413 | 28,087 |
| RH (a) | | 123,676 | 30,298 |
| Ross Stores, Inc. | | 190,731 | 19,764 |
| RumbleON, Inc. Class B (a) | | 564,959 | 6,169 |
| The Home Depot, Inc. | | 1,020,294 | 289,202 |
| TJX Companies, Inc. | | 4,022,813 | 308,912 |
| Tractor Supply Co. | | 7,700 | 1,614 |
| Wayfair LLC Class A (a) | | 3,463,654 | 139,655 |
| | | | 1,185,568 |
| Textiles, Apparel & Luxury Goods - 5.5% | | | |
| Canada Goose Holdings, Inc. (a)(b) | | 1,672,844 | 26,630 |
| Crocs, Inc. (a) | | 465,470 | 52,263 |
| Deckers Outdoor Corp. (a) | | 597,293 | 283,714 |
| Li Ning Co. Ltd. | | 1,591,643 | 8,537 |
| lululemon athletica, Inc. (a) | | 4,695,960 | 1,558,730 |
| NIKE, Inc. Class B | | 1,176,817 | 123,872 |
| On Holding AG (a)(b) | | 4,857,758 | 133,345 |
| Skechers U.S.A., Inc. Class A (sub. vtg.) (a) | | 7,003,239 | 359,756 |
| Tory Burch LLC: | | | |
| Class A (a)(c)(d)(e) | | 950,844 | 27,583 |
| Class B (a)(c)(d)(e) | | 324,840 | 10,190 |
| | | | 2,584,620 |
TOTAL CONSUMER DISCRETIONARY | | | 8,147,252 |
| CONSUMER STAPLES - 3.1% | | | |
| Beverages - 1.3% | | | |
| Celsius Holdings, Inc. (a) | | 384,999 | 48,329 |
| Keurig Dr. Pepper, Inc. | | 1,845,872 | 57,444 |
| Monster Beverage Corp. | | 2,578,307 | 151,140 |
| PepsiCo, Inc. | | 617,743 | 112,645 |
| The Coca-Cola Co. | | 4,092,453 | 244,156 |
| | | | 613,714 |
| Consumer Staples Distribution & Retail - 0.8% | | | |
| Costco Wholesale Corp. | | 345,835 | 176,915 |
| Dollar General Corp. | | 281,504 | 56,608 |
| Dollar Tree, Inc. (a) | | 284,004 | 38,306 |
| Kroger Co. | | 601,990 | 27,288 |
| Sysco Corp. | | 323,975 | 22,662 |
| Target Corp. | | 157,434 | 20,613 |
| Walmart, Inc. | | 294,790 | 43,296 |
| | | | 385,688 |
| Food Products - 0.3% | | | |
| Bunge Ltd. | | 505,666 | 46,845 |
| Kellogg Co. | | 313,830 | 20,954 |
| Mondelez International, Inc. | | 246,095 | 18,066 |
| The Hershey Co. | | 158,966 | 41,283 |
| The Real Good Food Co. LLC: | | | |
| Class B (a)(d) | | 616,906 | 0 |
| Class B unit (f) | | 616,906 | 2,178 |
| The Real Good Food Co., Inc. (a) | | 60,776 | 215 |
| | | | 129,541 |
| Household Products - 0.3% | | | |
| Church & Dwight Co., Inc. | | 164,345 | 15,194 |
| Colgate-Palmolive Co. | | 276,757 | 20,585 |
| Procter & Gamble Co. | | 644,054 | 91,778 |
| The Clorox Co. | | 12,000 | 1,898 |
| | | | 129,455 |
| Personal Care Products - 0.1% | | | |
| Kenvue, Inc. | | 316,800 | 7,949 |
| Olaplex Holdings, Inc. (a) | | 3,815,695 | 12,058 |
| The Beauty Health Co. (a)(b) | | 649,977 | 5,226 |
| The Beauty Health Co. (a)(c) | | 2,884,717 | 23,193 |
| | | | 48,426 |
| Tobacco - 0.3% | | | |
| JUUL Labs, Inc. Class A (a)(c)(d) | | 44,067 | 416 |
| Philip Morris International, Inc. | | 1,698,974 | 152,925 |
| | | | 153,341 |
TOTAL CONSUMER STAPLES | | | 1,460,165 |
| ENERGY - 1.5% | | | |
| Energy Equipment & Services - 0.2% | | | |
| Baker Hughes Co. Class A | | 730,698 | 19,912 |
| Halliburton Co. | | 2,353,922 | 67,440 |
| Schlumberger Ltd. | | 315,399 | 13,509 |
| | | | 100,861 |
| Oil, Gas & Consumable Fuels - 1.3% | | | |
| Cameco Corp. | | 1,550,659 | 43,170 |
| Devon Energy Corp. | | 64,810 | 2,988 |
| EOG Resources, Inc. | | 348,005 | 37,337 |
| EQT Corp. (b) | | 359,641 | 12,505 |
| Hess Corp. | | 2,631,086 | 333,280 |
| Pioneer Natural Resources Co. | | 12,513 | 2,496 |
| Range Resources Corp. | | 3,086,085 | 84,466 |
| Reliance Industries Ltd. | | 2,336,538 | 69,791 |
| Valero Energy Corp. | | 171,807 | 18,390 |
| | | | 604,423 |
TOTAL ENERGY | | | 705,284 |
| FINANCIALS - 3.0% | | | |
| Banks - 0.4% | | | |
| Bank of America Corp. | | 2,375,025 | 66,002 |
| HDFC Bank Ltd. sponsored ADR | | 1,119,505 | 72,096 |
| JPMorgan Chase & Co. | | 254,653 | 34,559 |
| Wells Fargo & Co. | | 87,789 | 3,495 |
| | | | 176,152 |
| Capital Markets - 0.3% | | | |
| BlackRock, Inc. Class A | | 113,992 | 74,955 |
| Charles Schwab Corp. | | 892,673 | 47,035 |
| | | | 121,990 |
| Financial Services - 2.3% | | | |
| Ant International Co. Ltd. Class C (a)(c)(d) | | 2,440,816 | 3,759 |
| Block, Inc. Class A (a) | | 102,666 | 6,200 |
| MasterCard, Inc. Class A | | 1,153,652 | 421,106 |
| PayPal Holdings, Inc. (a) | | 374,623 | 23,223 |
| Saluda Medical, Inc. warrants 1/20/27 (a)(c)(d) | | 87,212 | 225 |
| Toast, Inc. (a)(b) | | 5,370,127 | 112,612 |
| Visa, Inc. Class A | | 2,382,348 | 526,570 |
| | | | 1,093,695 |
TOTAL FINANCIALS | | | 1,391,837 |
| HEALTH CARE - 13.8% | | | |
| Biotechnology - 7.3% | | | |
| 4D Pharma PLC (a)(b)(d) | | 2,450,213 | 508 |
| AbbVie, Inc. | | 368,981 | 50,905 |
| Absci Corp. (a) | | 3,979,617 | 7,561 |
| ACADIA Pharmaceuticals, Inc. (a) | | 1,753,832 | 41,215 |
| Acelyrin, Inc. (a)(b) | | 477,300 | 8,639 |
| Akouos, Inc. (CVR) (d) | | 1,254,446 | 966 |
| Alector, Inc. (a) | | 1,827,872 | 13,599 |
| Allovir, Inc. (a)(b) | | 2,006,206 | 7,563 |
| Alnylam Pharmaceuticals, Inc. (a) | | 2,012,490 | 372,331 |
| Ambrx Biopharma, Inc. ADR (a) | | 8,243 | 122 |
| Amgen, Inc. | | 335,961 | 74,130 |
| Apellis Pharmaceuticals, Inc. (a) | | 232,028 | 19,920 |
| Arcutis Biotherapeutics, Inc. (a) | | 350,795 | 2,634 |
| Argenx SE ADR (a) | | 681,258 | 264,805 |
| Arrowhead Pharmaceuticals, Inc. (a) | | 87,546 | 3,012 |
| Ars Pharmaceuticals, Inc. (a)(b) | | 1,306,645 | 9,094 |
| Ascendis Pharma A/S sponsored ADR (a) | | 57,765 | 5,024 |
| aTyr Pharma, Inc. (a) | | 1,933,536 | 4,389 |
| Avidity Biosciences, Inc. (a) | | 1,307,524 | 13,886 |
| Axcella Health, Inc. (a)(b) | | 3,129,933 | 1,226 |
| Beam Therapeutics, Inc. (a)(b) | | 702,130 | 22,398 |
| BeiGene Ltd. ADR (a) | | 505,220 | 111,618 |
| Biomea Fusion, Inc. (a)(b) | | 1,646,549 | 55,917 |
| BioNTech SE ADR | | 65,813 | 6,916 |
| BioXcel Therapeutics, Inc. (a)(b) | | 1,336,179 | 23,971 |
| Calyxt, Inc. (a) | | 28,416 | 179 |
| Caris Life Sciences, Inc. (c)(d) | | 926,826 | 5,190 |
| Century Therapeutics, Inc. (a) | | 1,181,012 | 3,756 |
| Cerevel Therapeutics Holdings (a) | | 5,662,274 | 184,590 |
| Codiak Biosciences, Inc. warrants 9/15/27 (a) | | 380,700 | 0 |
| CRISPR Therapeutics AG (a)(b) | | 577,961 | 37,013 |
| Cyclerion Therapeutics, Inc. (a) | | 21,323 | 93 |
| Cyclerion Therapeutics, Inc. (a)(c) | | 27,184 | 118 |
| Day One Biopharmaceuticals, Inc. (a) | | 409,941 | 5,452 |
| Denali Therapeutics, Inc. (a) | | 220,551 | 6,665 |
| Deverra Therapeutics, Inc. (a)(d) | | 59,780 | 0 |
| Disc Medicine, Inc. rights (a)(d) | | 128,509 | 0 |
| EQRx, Inc. (a)(g) | | 7,908,645 | 13,919 |
| EQRx, Inc.: | | | |
| rights (a)(d)(g) | | 441,931 | 137 |
| rights (a)(d)(g) | | 189,399 | 36 |
| Evelo Biosciences, Inc. (a)(b) | | 2,020,976 | 276 |
| Foghorn Therapeutics, Inc. (a) | | 921,297 | 5,795 |
| Generation Bio Co. (a) | | 2,199,843 | 7,699 |
| Geron Corp. (a) | | 926,655 | 3,030 |
| Idorsia Ltd. (a)(b) | | 511,733 | 4,189 |
| Immunocore Holdings PLC ADR (a) | | 175,308 | 9,673 |
| ImmunoGen, Inc. (a) | | 1,189,600 | 16,226 |
| Immunovant, Inc. (a) | | 1,557,625 | 32,726 |
| Inhibrx, Inc. (a)(b) | | 380,762 | 9,009 |
| Intarcia Therapeutics, Inc. warrants 12/6/24 (a)(d) | | 156,370 | 0 |
| Invivyd, Inc. (a)(b) | | 4,344,494 | 7,820 |
| Ionis Pharmaceuticals, Inc. (a) | | 6,869,725 | 280,972 |
| Janux Therapeutics, Inc. (a) | | 477,845 | 5,553 |
| Karuna Therapeutics, Inc. (a) | | 1,230,750 | 278,826 |
| Kineta, Inc. (b) | | 30,601 | 92 |
| Legend Biotech Corp. ADR (a) | | 1,683,757 | 108,047 |
| Lexicon Pharmaceuticals, Inc. (a) | | 1,737,974 | 5,735 |
| Lyell Immunopharma, Inc. (a)(b) | | 909,761 | 2,902 |
| Madrigal Pharmaceuticals, Inc. (a) | | 12,300 | 3,424 |
| Magenta Therapeutics, Inc. (d)(h) | | 954,166 | 4,275 |
| Moderna, Inc. (a) | | 749,634 | 95,736 |
| Monte Rosa Therapeutics, Inc. (a) | | 851,336 | 6,283 |
| Moonlake Immunotherapeutics (a)(b) | | 10,800 | 294 |
| Morphic Holding, Inc. (a) | | 1,258,540 | 72,366 |
| Nuvalent, Inc. Class A (a) | | 1,248,461 | 52,560 |
| Omega Therapeutics, Inc. (a) | | 1,577,224 | 11,971 |
| ORIC Pharmaceuticals, Inc. (a)(b) | | 937,503 | 4,725 |
| Poseida Therapeutics, Inc. (a) | | 2,734,605 | 6,208 |
| Prothena Corp. PLC (a) | | 2,073,735 | 137,758 |
| PTC Therapeutics, Inc. (a) | | 981,740 | 41,204 |
| RAPT Therapeutics, Inc. (a) | | 828,701 | 16,599 |
| Recursion Pharmaceuticals, Inc. (a)(b) | | 1,418,371 | 12,439 |
| Regeneron Pharmaceuticals, Inc. (a) | | 262,780 | 193,290 |
| Relay Therapeutics, Inc. (a)(b) | | 695,783 | 7,751 |
| Roivant Sciences Ltd. (a) | | 8,653,176 | 78,657 |
| Sage Therapeutics, Inc. (a) | | 2,406,427 | 119,118 |
| Sana Biotechnology, Inc. (a)(b) | | 1,655,031 | 9,963 |
| Scholar Rock Holding Corp. (a) | | 1,629,251 | 9,482 |
| Scholar Rock Holding Corp. warrants 12/31/25 (a)(c) | | 167,100 | 261 |
| Seres Therapeutics, Inc. (a)(b) | | 5,817,600 | 28,797 |
| Shattuck Labs, Inc. (a) | | 1,221,414 | 3,188 |
| Sigilon Therapeutics, Inc. (a)(b) | | 28,234 | 119 |
| SpringWorks Therapeutics, Inc. (c) | | 457,500 | 11,274 |
| SpringWorks Therapeutics, Inc. (a)(b) | | 2,582,738 | 70,715 |
| Synlogic, Inc. (a) | | 2,150,765 | 1,129 |
| Tango Therapeutics, Inc. (a) | | 974,314 | 2,631 |
| TG Therapeutics, Inc. (a)(b) | | 1,397,421 | 37,213 |
| Tyra Biosciences, Inc. (a) | | 150,836 | 2,183 |
| uniQure B.V. (a) | | 262,392 | 5,062 |
| UNITY Biotechnology, Inc. warrants 8/22/27 (a) | | 1,915,466 | 91 |
| Vaxcyte, Inc. (a) | | 843,135 | 41,752 |
| Vera Therapeutics, Inc. (a) | | 798,092 | 6,664 |
| Vertex Pharmaceuticals, Inc. (a) | | 168,207 | 54,427 |
| Verve Therapeutics, Inc. (a) | | 402,957 | 6,238 |
| Viking Therapeutics, Inc. (a) | | 3,236,012 | 71,063 |
| Vor Biopharma, Inc. (a) | | 1,442,609 | 6,780 |
| Zai Lab Ltd. ADR (a) | | 187,418 | 6,089 |
| Zentalis Pharmaceuticals, Inc. (a) | | 661,204 | 17,218 |
| | | | 3,415,064 |
| Health Care Equipment & Supplies - 2.8% | | | |
| Abbott Laboratories | | 49,120 | 5,010 |
| Blink Health LLC Series A1 (a)(c)(d) | | 173,460 | 8,307 |
| Boston Scientific Corp. (a) | | 35,000 | 1,802 |
| DexCom, Inc. (a) | | 891,659 | 104,556 |
| Figs, Inc. Class A (a) | | 387,767 | 3,195 |
| Inspire Medical Systems, Inc. (a) | | 19,700 | 5,762 |
| Insulet Corp. (a) | | 1,644,686 | 451,055 |
| Intuitive Surgical, Inc. (a) | | 611,372 | 188,205 |
| Novocure Ltd. (a) | | 4,663,609 | 334,894 |
| Oddity Tech Ltd. (a)(c)(d) | | 10,306 | 4,663 |
| Outset Medical, Inc. (a) | | 1,467,024 | 30,558 |
| Penumbra, Inc. (a) | | 9,003 | 2,767 |
| Presbia PLC (a)(d)(g) | | 1,099,338 | 0 |
| PROCEPT BioRobotics Corp. (a) | | 1,101,188 | 36,835 |
| Shockwave Medical, Inc. (a) | | 477,942 | 131,477 |
| | | | 1,309,086 |
| Health Care Providers & Services - 1.0% | | | |
| Alignment Healthcare, Inc. (a) | | 1,553,399 | 9,118 |
| Guardant Health, Inc. (a) | | 308,977 | 9,059 |
| Humana, Inc. | | 218,098 | 109,457 |
| McKesson Corp. | | 67,974 | 26,567 |
| The Oncology Institute, Inc. (a)(c) | | 1,815,080 | 776 |
| UnitedHealth Group, Inc. | | 612,167 | 298,272 |
| | | | 453,249 |
| Health Care Technology - 0.0% | | | |
| DNA Script (a)(c)(d) | | 463 | 326 |
| DNA Script (a)(c)(d) | | 1,769 | 1,246 |
| | | | 1,572 |
| Life Sciences Tools & Services - 0.6% | | | |
| 10X Genomics, Inc. Class B (a)(f) | | 2,070,040 | 108,594 |
| Akoya Biosciences, Inc. (a) | | 55,078 | 310 |
| Danaher Corp. | | 74,549 | 17,118 |
| Gerresheimer AG | | 62,100 | 6,824 |
| Olink Holding AB ADR (a) | | 1,444,969 | 28,148 |
| Seer, Inc. (a) | | 847,473 | 3,119 |
| Thermo Fisher Scientific, Inc. | | 117,041 | 59,511 |
| WuXi AppTec Co. Ltd. (H Shares) (f) | | 1,057,844 | 8,714 |
| Wuxi Biologics (Cayman), Inc. (a)(f) | | 5,488,728 | 28,073 |
| | | | 260,411 |
| Pharmaceuticals - 2.1% | | | |
| Adimab LLC (a)(c)(d)(e) | | 3,162,765 | 126,036 |
| Arvinas Holding Co. LLC (a) | | 171,249 | 3,738 |
| Atea Pharmaceuticals, Inc. (a) | | 2,690,529 | 10,735 |
| Bristol-Myers Squibb Co. | | 329,887 | 21,258 |
| DICE Therapeutics, Inc. (a) | | 259,832 | 8,213 |
| Dragonfly Therapeutics, Inc. (a)(c)(d) | | 481,725 | 10,718 |
| Eli Lilly & Co. | | 785,948 | 337,533 |
| Fulcrum Therapeutics, Inc. (a) | | 1,131,306 | 3,077 |
| GH Research PLC (a) | | 794,034 | 8,893 |
| Harmony Biosciences Holdings, Inc. (a) | | 1,765,884 | 61,064 |
| Intra-Cellular Therapies, Inc. (a) | | 2,933,339 | 174,182 |
| Merck & Co., Inc. | | 100,184 | 11,061 |
| Novo Nordisk A/S Series B sponsored ADR | | 600,760 | 96,398 |
| Nuvation Bio, Inc. (a) | | 5,365,339 | 8,692 |
| OptiNose, Inc. (a) | | 4,749,009 | 5,936 |
| OptiNose, Inc. warrants (a) | | 706,724 | 218 |
| Pfizer, Inc. | | 82,735 | 3,146 |
| Pharvaris BV (a) | | 129,632 | 1,108 |
| Pliant Therapeutics, Inc. (a) | | 1,343,783 | 29,066 |
| Sienna Biopharmaceuticals, Inc. (a)(d) | | 1,424,370 | 0 |
| Skyhawk Therapeutics, Inc. (a)(c)(d) | | 603,195 | 6,931 |
| Theravance Biopharma, Inc. (a)(b) | | 346,922 | 3,879 |
| UCB SA | | 620,251 | 54,047 |
| Ventyx Biosciences, Inc. (a) | | 380,675 | 13,122 |
| | | | 999,051 |
TOTAL HEALTH CARE | | | 6,438,433 |
| INDUSTRIALS - 4.2% | | | |
| Aerospace & Defense - 1.1% | | | |
| AeroVironment, Inc. (a) | | 113,052 | 10,560 |
| Lockheed Martin Corp. | | 203,756 | 90,470 |
| Raytheon Technologies Corp. | | 431,643 | 39,772 |
| Space Exploration Technologies Corp. Class A (a)(c)(d) | | 4,182,100 | 322,022 |
| The Boeing Co. (a) | | 314,047 | 64,599 |
| | | | 527,423 |
| Air Freight & Logistics - 0.1% | | | |
| Delhivery Private Ltd. | | 2,269,100 | 9,582 |
| United Parcel Service, Inc. Class B | | 164,609 | 27,490 |
| | | | 37,072 |
| Construction & Engineering - 0.1% | | | |
| Fluor Corp. (a) | | 1,278,692 | 33,962 |
| MasTec, Inc. (a) | | 144,086 | 14,605 |
| Quanta Services, Inc. | | 113,932 | 20,232 |
| | | | 68,799 |
| Electrical Equipment - 0.3% | | | |
| Eaton Corp. PLC | | 200,458 | 35,261 |
| Emerson Electric Co. | | 542,745 | 42,160 |
| Fluence Energy, Inc. (a)(b) | | 96,704 | 2,398 |
| Generac Holdings, Inc. (a) | | 333,593 | 36,335 |
| Nextracker, Inc. Class A (b) | | 168,461 | 6,444 |
| NuScale Power Corp. (a)(b) | | 849,079 | 6,368 |
| | | | 128,966 |
| Ground Transportation - 1.4% | | | |
| Avis Budget Group, Inc. (a) | | 1,618,219 | 271,521 |
| Bird Global, Inc.: | | | |
| Stage 1 rights (a)(d) | | 133,323 | 0 |
| Stage 2 rights (a)(d) | | 133,322 | 0 |
| Stage 3 rights (a)(d) | | 133,322 | 0 |
| Hertz Global Holdings, Inc. (a)(b) | | 119,324 | 1,871 |
| Lyft, Inc. (a) | | 1,838,307 | 16,582 |
| Uber Technologies, Inc. (a) | | 6,511,104 | 246,966 |
| Union Pacific Corp. | | 749,288 | 144,253 |
| | | | 681,193 |
| Industrial Conglomerates - 0.0% | | | |
| General Electric Co. | | 35,000 | 3,554 |
| Honeywell International, Inc. | | 89,890 | 17,223 |
| | | | 20,777 |
| Machinery - 0.5% | | | |
| Caterpillar, Inc. | | 303,135 | 62,370 |
| Deere & Co. | | 313,446 | 108,446 |
| Fortive Corp. | | 94,001 | 6,120 |
| Illinois Tool Works, Inc. | | 136,018 | 29,751 |
| Ingersoll Rand, Inc. | | 181,090 | 10,261 |
| | | | 216,948 |
| Passenger Airlines - 0.6% | | | |
| Delta Air Lines, Inc. (a) | | 1,760,608 | 63,963 |
| Ryanair Holdings PLC sponsored ADR (a) | | 22,613 | 2,376 |
| Southwest Airlines Co. (b) | | 1,751,022 | 52,303 |
| Spirit Airlines, Inc. | | 1,666,271 | 25,344 |
| United Airlines Holdings, Inc. (a) | | 1,177,214 | 55,876 |
| Wheels Up Experience, Inc.: | | | |
| rights (a)(d) | | 80,889 | 5 |
| rights (a)(d) | | 80,889 | 3 |
| rights (a)(d) | | 80,890 | 2 |
| Wizz Air Holdings PLC (a)(f) | | 1,984,956 | 68,545 |
| | | | 268,417 |
| Professional Services - 0.1% | | | |
| LegalZoom.com, Inc. (a) | | 401,951 | 4,498 |
| Paycom Software, Inc. | | 47,486 | 13,302 |
| Paylocity Holding Corp. (a) | | 75,272 | 13,003 |
| | | | 30,803 |
TOTAL INDUSTRIALS | | | 1,980,398 |
| INFORMATION TECHNOLOGY - 44.6% | | | |
| Communications Equipment - 0.5% | | | |
| Arista Networks, Inc. (a) | | 387,365 | 64,434 |
| Ciena Corp. (a) | | 2,669,881 | 124,790 |
| Infinera Corp. (a)(b) | | 10,555,702 | 51,723 |
| | | | 240,947 |
| Electronic Equipment, Instruments & Components - 0.0% | | | |
| Coherent Corp. (a)(b) | | 345,268 | 12,761 |
| TE Connectivity Ltd. | | 12,074 | 1,479 |
| | | | 14,240 |
| IT Services - 1.3% | | | |
| Accenture PLC Class A | | 334,884 | 102,448 |
| Cloudflare, Inc. (a)(b) | | 3,728,520 | 257,864 |
| IBM Corp. | | 329,332 | 42,349 |
| MongoDB, Inc. Class A (a) | | 23,538 | 6,915 |
| Okta, Inc. (a) | | 318,325 | 28,936 |
| Shopify, Inc. Class A (a) | | 1,923,511 | 110,055 |
| Snowflake, Inc. (a)(b) | | 210,825 | 34,862 |
| Twilio, Inc. Class A (a) | | 44,091 | 3,070 |
| X Holdings Corp. Class A (d) | | 90,280 | 3,154 |
| | | | 589,653 |
| Semiconductors & Semiconductor Equipment - 16.9% | | | |
| Advanced Micro Devices, Inc. (a) | | 2,374,552 | 280,696 |
| Allegro MicroSystems LLC (a) | | 57,806 | 2,274 |
| Applied Materials, Inc. | | 1,356,911 | 180,876 |
| ASML Holding NV (depository receipt) | | 66,982 | 48,423 |
| Broadcom, Inc. | | 116,012 | 93,733 |
| Cirrus Logic, Inc. (a) | | 1,619,918 | 125,835 |
| Enphase Energy, Inc. (a) | | 218,860 | 38,055 |
| First Solar, Inc. (a) | | 593,664 | 120,490 |
| GlobalFoundries, Inc. (a) | | 224,800 | 13,113 |
| Impinj, Inc. (a) | | 300,820 | 30,786 |
| KLA Corp. | | 171,067 | 75,781 |
| Lam Research Corp. | | 42,192 | 26,020 |
| Lattice Semiconductor Corp. (a) | | 180,055 | 14,640 |
| Marvell Technology, Inc. | | 3,095,405 | 181,050 |
| Micron Technology, Inc. | | 428,882 | 29,250 |
| Monolithic Power Systems, Inc. | | 108,105 | 52,962 |
| NVIDIA Corp. | | 16,025,650 | 6,063,142 |
| onsemi (a) | | 481,531 | 40,256 |
| Qualcomm, Inc. | | 442,793 | 50,217 |
| Silicon Laboratories, Inc. (a) | | 1,573,794 | 221,386 |
| SiTime Corp. (a) | | 520,522 | 51,620 |
| SolarEdge Technologies, Inc. (a) | | 28,087 | 8,000 |
| Taiwan Semiconductor Manufacturing Co. Ltd. sponsored ADR | | 336,387 | 33,164 |
| Teradyne, Inc. | | 208,247 | 20,864 |
| Texas Instruments, Inc. | | 384,033 | 66,776 |
| Wolfspeed, Inc. (a)(b) | | 361,118 | 17,348 |
| | | | 7,886,757 |
| Software - 12.5% | | | |
| Adobe, Inc. (a) | | 594,691 | 248,456 |
| Atlassian Corp. PLC (a) | | 22,884 | 4,137 |
| Autodesk, Inc. (a) | | 336,145 | 67,024 |
| Bill Holdings, Inc. (a) | | 91,774 | 9,506 |
| Clear Secure, Inc. (b) | | 2,298 | 57 |
| Confluent, Inc. (a) | | 449,900 | 14,280 |
| Crowdstrike Holdings, Inc. (a) | | 283,711 | 45,431 |
| Datadog, Inc. Class A (a) | | 174,092 | 16,523 |
| Elastic NV (a) | | 155,365 | 11,314 |
| Freshworks, Inc. (a) | | 233,000 | 3,672 |
| HubSpot, Inc. (a) | | 154,652 | 80,108 |
| Intuit, Inc. | | 231,253 | 96,923 |
| Microsoft Corp. | | 10,243,861 | 3,363,982 |
| Nutanix, Inc. Class A (a)(g) | | 11,919,987 | 353,070 |
| Oracle Corp. | | 3,569,908 | 378,196 |
| Palantir Technologies, Inc. (a) | | 120,600 | 1,774 |
| Palo Alto Networks, Inc. (a) | | 11,300 | 2,411 |
| Pine Labs Private Ltd. (a)(c)(d) | | 4,120 | 2,060 |
| RingCentral, Inc. (a)(b) | | 149,516 | 5,188 |
| Salesforce, Inc. (a) | | 3,746,931 | 836,989 |
| Samsara, Inc. (a)(b) | | 201,172 | 3,873 |
| SentinelOne, Inc. (a)(b) | | 237,158 | 5,070 |
| ServiceNow, Inc. (a) | | 200,820 | 109,403 |
| Stripe, Inc. Class B (a)(c)(d) | | 205,500 | 4,137 |
| UiPath, Inc. Class A (a) | | 4,120,895 | 73,723 |
| Workday, Inc. Class A (a) | | 96,130 | 20,379 |
| Zoom Video Communications, Inc. Class A (a) | | 592,865 | 39,799 |
| Zscaler, Inc. (a)(b) | | 224,953 | 30,477 |
| | | | 5,827,962 |
| Technology Hardware, Storage & Peripherals - 13.4% | | | |
| Apple, Inc. | | 32,922,435 | 5,835,502 |
| Pure Storage, Inc. Class A (a) | | 13,657,668 | 393,204 |
| Samsung Electronics Co. Ltd. | | 412,305 | 22,259 |
| | | | 6,250,965 |
TOTAL INFORMATION TECHNOLOGY | | | 20,810,524 |
| MATERIALS - 0.7% | | | |
| Chemicals - 0.3% | | | |
| Albemarle Corp. (b) | | 99,348 | 19,227 |
| CF Industries Holdings, Inc. | | 418,791 | 25,760 |
| Cibus Corp.: | | | |
| Series C (a)(c)(d)(e) | | 4,523,810 | 9,048 |
| Series D (a)(c)(d)(e) | | 2,741,040 | 5,482 |
| Series E (a)(c)(d)(e) | | 412,624 | 825 |
| Series F (a)(c)(d)(e) | | 1,093,220 | 2,186 |
| Corteva, Inc. | | 1,410,253 | 75,434 |
| The Mosaic Co. (b) | | 766,032 | 24,482 |
| | | | 162,444 |
| Containers & Packaging - 0.0% | | | |
| Sealed Air Corp. | | 192,503 | 7,286 |
| Metals & Mining - 0.4% | | | |
| Barrick Gold Corp. (Canada) | | 463,979 | 7,841 |
| Freeport-McMoRan, Inc. | | 4,685,996 | 160,917 |
| Rio Tinto PLC sponsored ADR | | 174,029 | 10,276 |
| | | | 179,034 |
TOTAL MATERIALS | | | 348,764 |
| REAL ESTATE - 0.1% | | | |
| Equity Real Estate Investment Trusts (REITs) - 0.1% | | | |
| American Tower Corp. | | 214,472 | 39,557 |
| Equinix, Inc. | | 14,439 | 10,765 |
| | | | 50,322 |
| Real Estate Management & Development - 0.0% | | | |
| CBRE Group, Inc. (a) | | 61,534 | 4,610 |
TOTAL REAL ESTATE | | | 54,932 |
| UTILITIES - 0.1% | | | |
| Electric Utilities - 0.1% | | | |
| ORSTED A/S (f) | | 258,657 | 22,648 |
| TOTAL COMMON STOCKS (Cost $16,916,028) | | | 45,536,608 |
| | | | |
| Preferred Stocks - 2.3% |
| | | Shares | Value ($) (000s) |
| Convertible Preferred Stocks - 2.2% | | | |
| COMMUNICATION SERVICES - 0.2% | | | |
| Interactive Media & Services - 0.2% | | | |
| ByteDance Ltd. Series E1 (a)(c)(d) | | 403,450 | 85,608 |
| Reddit, Inc.: | | | |
| Series B(a)(c)(d) | | 384,303 | 12,955 |
| Series E(a)(c)(d) | | 24,203 | 816 |
| Series F(a)(c)(d) | | 114,996 | 3,877 |
| | | | 103,256 |
| CONSUMER DISCRETIONARY - 0.1% | | | |
| Automobiles - 0.0% | | | |
| Rad Power Bikes, Inc.: | | | |
| Series A(a)(c)(d) | | 154,174 | 324 |
| Series C(a)(c)(d) | | 606,658 | 1,274 |
| Series D(a)(c)(d) | | 1,071,300 | 2,250 |
| | | | 3,848 |
| Broadline Retail - 0.0% | | | |
| Meesho Series F (a)(c)(d) | | 309,354 | 21,413 |
| | | | |
| Hotels, Restaurants & Leisure - 0.1% | | | |
| Discord, Inc. Series I (a)(c)(d) | | 7,000 | 2,044 |
| MOD Super Fast Pizza Holdings LLC: | | | |
| Series 3(a)(c)(d)(e) | | 56,343 | 15,896 |
| Series 4(a)(c)(d)(e) | | 5,142 | 1,390 |
| Series 5(a)(c)(d)(e) | | 20,652 | 5,250 |
| | | | 24,580 |
| Textiles, Apparel & Luxury Goods - 0.0% | | | |
| Freenome, Inc.: | | | |
| Series C(a)(c)(d) | | 900,884 | 7,018 |
| Series D(a)(c)(d) | | 502,404 | 4,110 |
| Laronde, Inc. Series B (a)(c)(d) | | 344,496 | 6,470 |
| | | | 17,598 |
TOTAL CONSUMER DISCRETIONARY | | | 67,439 |
| | | | |
| CONSUMER STAPLES - 0.1% | | | |
| Consumer Staples Distribution & Retail - 0.1% | | | |
| GoBrands, Inc.: | | | |
| Series G(a)(c)(d) | | 125,688 | 10,819 |
| Series H(a)(c)(d) | | 104,311 | 8,979 |
| Instacart, Inc.: | | | |
| Series H(a)(c)(d) | | 72,310 | 2,961 |
| Series I(a)(c)(d) | | 32,756 | 1,341 |
| | | | 24,100 |
| Food Products - 0.0% | | | |
| AgBiome LLC: | | | |
| Series C(a)(c)(d) | | 1,060,308 | 5,439 |
| Series D(a)(c)(d) | | 852,431 | 4,322 |
| Bowery Farming, Inc. Series C1 (a)(c)(d) | | 130,916 | 1,220 |
| | | | 10,981 |
| Tobacco - 0.0% | | | |
| JUUL Labs, Inc. Series E (a)(c)(d) | | 22,033 | 208 |
| | | | |
TOTAL CONSUMER STAPLES | | | 35,289 |
| | | | |
| FINANCIALS - 0.1% | | | |
| Financial Services - 0.1% | | | |
| Paragon Biosciences Emalex Capital, Inc.: | | | |
| Series B(a)(c)(d) | | 416,094 | 4,440 |
| Series C(a)(c)(d) | | 559,977 | 6,053 |
| Series D1(c)(d) | | 754,242 | 8,176 |
| Series D2(c)(d) | | 138,091 | 1,415 |
| Saluda Medical, Inc.: | | | |
| Series D(c)(d) | | 581,414 | 6,750 |
| Series E(c)(d) | | 799,565 | 6,444 |
| | | | 33,278 |
| HEALTH CARE - 0.9% | | | |
| Biotechnology - 0.7% | | | |
| Altos Labs, Inc. Series B (c)(d) | | 485,428 | 9,296 |
| Ankyra Therapeutics Series B (a)(c)(d) | | 1,356,730 | 5,685 |
| Apogee Therapeutics Series B (c)(d) | | 1,648,084 | 5,439 |
| Asimov, Inc. Series B (a)(c)(d) | | 82,174 | 3,976 |
| Bright Peak Therapeutics AG Series B (a)(c)(d) | | 1,272,915 | 3,539 |
| Caris Life Sciences, Inc. Series D (a)(c)(d) | | 1,235,035 | 6,916 |
| Castle Creek Biosciences, Inc.: | | | |
| Series D1(a)(c)(d) | | 19,720 | 4,185 |
| Series D2(a)(c)(d) | | 6,341 | 1,196 |
| Cleerly, Inc. Series C (c)(d) | | 983,054 | 11,482 |
| Deep Genomics, Inc. Series C (a)(c)(d) | | 682,293 | 7,150 |
| Dianthus Therapeutics, Inc. Series A (a)(c)(d) | | 1,162,827 | 5,175 |
| Element Biosciences, Inc.: | | | |
| Series B(a)(c)(d) | | 1,096,312 | 18,034 |
| Series C(a)(c)(d) | | 480,109 | 7,898 |
| ElevateBio LLC Series C (a)(c)(d) | | 1,534,100 | 6,443 |
| Fog Pharmaceuticals, Inc. Series D (c)(d) | | 883,504 | 9,604 |
| Generate Biomedicines Series B (a)(c)(d) | | 820,747 | 8,265 |
| Inscripta, Inc.: | | | |
| Series D(a)(c)(d) | | 1,690,173 | 7,149 |
| Series E(a)(c)(d) | | 1,086,476 | 4,596 |
| Intarcia Therapeutics, Inc.: | | | |
| Series CC(a)(c)(d) | | 1,051,411 | 0 |
| Series DD(a)(c)(d) | | 1,543,687 | 0 |
| Korro Bio, Inc.: | | | |
| Series B1(a)(c)(d) | | 1,436,500 | 3,175 |
| Series B2(a)(c)(d) | | 1,348,657 | 3,034 |
| LifeMine Therapeutics, Inc. Series C (a)(c)(d) | | 7,794,524 | 14,342 |
| National Resilience, Inc.: | | | |
| Series B(a)(c)(d) | | 1,277,345 | 77,573 |
| Series C(a)(c)(d) | | 379,000 | 23,017 |
| Odyssey Therapeutics, Inc. Series B (c)(d) | | 1,298,749 | 8,221 |
| Quell Therapeutics Ltd. Series B (a)(c)(d) | | 3,870,630 | 7,819 |
| SalioGen Therapeutics, Inc. Series B (a)(c)(d) | | 51,683 | 3,484 |
| Sonoma Biotherapeutics, Inc.: | | | |
| Series B(a)(c)(d) | | 2,497,760 | 6,469 |
| Series B1(a)(c)(d) | | 1,332,116 | 3,943 |
| T-Knife Therapeutics, Inc. Series B (a)(c)(d) | | 995,165 | 3,921 |
| Treeline Biosciences: | | | |
| Series A(a)(c)(d) | | 1,347,260 | 10,509 |
| Series A1(c)(d) | | 464,216 | 3,718 |
| | | | 295,253 |
| Health Care Equipment & Supplies - 0.1% | | | |
| Blink Health LLC Series C (a)(c)(d) | | 927,374 | 44,412 |
| Kardium, Inc. Series D6 (a)(c)(d) | | 5,899,008 | 5,840 |
| | | | 50,252 |
| Health Care Providers & Services - 0.0% | | | |
| Boundless Bio, Inc.: | | | |
| Series B(a)(c)(d) | | 2,899,016 | 2,493 |
| Series C(c)(d) | | 7,224,897 | 5,057 |
| Conformal Medical, Inc.: | | | |
| Series C(a)(c)(d) | | 1,067,180 | 4,674 |
| Series D(c)(d) | | 82,803 | 421 |
| Scorpion Therapeutics, Inc. Series B (a)(c)(d) | | 1,325,354 | 2,346 |
| | | | 14,991 |
| Health Care Technology - 0.1% | | | |
| Aledade, Inc.: | | | |
| Series B1(a)(c)(d) | | 101,470 | 5,086 |
| Series E1(c)(d) | | 66,006 | 3,308 |
| DNA Script: | | | |
| Series B(a)(c)(d) | | 22 | 15 |
| Series C(a)(c)(d) | | 10,882 | 7,667 |
| Omada Health, Inc. Series E (a)(c)(d) | | 2,558,060 | 8,288 |
| PrognomIQ, Inc.: | | | |
| Series A5(a)(c)(d) | | 372,687 | 652 |
| Series B(a)(c)(d) | | 1,111,446 | 2,723 |
| Series C(a)(c)(d) | | 290,995 | 809 |
| Wugen, Inc. Series B (a)(c)(d) | | 493,529 | 2,468 |
| | | | 31,016 |
| Pharmaceuticals - 0.0% | | | |
| Castle Creek Pharmaceutical Holdings, Inc.: | | | |
| Series B(a)(c)(d) | | 16,803 | 3,309 |
| Series C(a)(c)(d) | | 13,100 | 3,068 |
| Galvanize Therapeutics Series B (a)(c)(d) | | 4,342,265 | 7,338 |
| Nohla Therapeutics, Inc. Series B (a)(c)(d) | | 9,124,200 | 0 |
| | | | 13,715 |
TOTAL HEALTH CARE | | | 405,227 |
| | | | |
| INDUSTRIALS - 0.4% | | | |
| Aerospace & Defense - 0.4% | | | |
| Space Exploration Technologies Corp. Series G (a)(c)(d) | | 216,276 | 166,533 |
| | | | |
| Construction & Engineering - 0.0% | | | |
| Beta Technologies, Inc.: | | | |
| Series A(a)(c)(d) | | 54,111 | 4,439 |
| Series B, 6.00%(a)(c)(d) | | 71,156 | 6,192 |
| | | | 10,631 |
TOTAL INDUSTRIALS | | | 177,164 |
| | | | |
| INFORMATION TECHNOLOGY - 0.3% | | | |
| Electronic Equipment, Instruments & Components - 0.0% | | | |
| Enevate Corp. Series E (a)(c)(d) | | 4,067,736 | 2,359 |
| Menlo Micro, Inc. Series C (a)(c)(d) | | 4,423,488 | 4,114 |
| | | | 6,473 |
| Semiconductors & Semiconductor Equipment - 0.1% | | | |
| Alif Semiconductor Series C (a)(c)(d) | | 190,608 | 3,532 |
| Astera Labs, Inc.: | | | |
| Series A(c)(d) | | 316,595 | 2,815 |
| Series B(c)(d) | | 53,906 | 479 |
| Series C(a)(c)(d) | | 1,811,000 | 16,100 |
| Series D(c)(d) | | 1,074,629 | 9,553 |
| GaN Systems, Inc.: | | | |
| Series F1(a)(c)(d) | | 287,190 | 3,196 |
| Series F2(a)(c)(d) | | 151,648 | 1,688 |
| Retym, Inc. Series C (c)(d) | | 546,059 | 4,249 |
| SiMa.ai: | | | |
| Series B(a)(c)(d) | | 1,596,216 | 9,561 |
| Series B1(a)(c)(d) | | 106,922 | 756 |
| Xsight Labs Ltd. Series D (a)(c)(d) | | 787,863 | 5,531 |
| | | | 57,460 |
| Software - 0.2% | | | |
| Bolt Technology OU Series E (a)(c)(d) | | 72,621 | 9,386 |
| Databricks, Inc.: | | | |
| Series G(a)(c)(d) | | 250,296 | 12,082 |
| Series H(a)(c)(d) | | 273,171 | 13,186 |
| Dataminr, Inc. Series D (a)(c)(d) | | 1,773,901 | 24,391 |
| Evozyne LLC Series A (a)(c)(d) | | 444,700 | 7,667 |
| Skyryse, Inc. Series B (a)(c)(d) | | 568,445 | 11,966 |
| Stripe, Inc. Series H (a)(c)(d) | | 88,200 | 1,775 |
| Tenstorrent, Inc. Series C1 (a)(c)(d) | | 92,100 | 5,198 |
| | | | 85,651 |
| Technology Hardware, Storage & Peripherals - 0.0% | | | |
| Lightmatter, Inc. Series C (c)(d) | | 407,933 | 6,713 |
| | | | |
TOTAL INFORMATION TECHNOLOGY | | | 156,297 |
| | | | |
| MATERIALS - 0.1% | | | |
| Chemicals - 0.0% | | | |
| Farmers Business Network, Inc. Series G (a)(c)(d) | | 186,833 | 6,429 |
| | | | |
| Metals & Mining - 0.1% | | | |
| Diamond Foundry, Inc. Series C (a)(c)(d) | | 1,704,625 | 60,463 |
| | | | |
TOTAL MATERIALS | | | 66,892 |
| | | | |
| UTILITIES - 0.0% | | | |
| Independent Power and Renewable Electricity Producers - 0.0% | | | |
| Redwood Materials Series C (a)(c)(d) | | 80,057 | 3,674 |
| | | | |
| TOTAL CONVERTIBLE PREFERRED STOCKS | | | 1,048,516 |
| Nonconvertible Preferred Stocks - 0.1% | | | |
| CONSUMER DISCRETIONARY - 0.0% | | | |
| Automobiles - 0.0% | | | |
| Neutron Holdings, Inc. Series 1D (a)(c)(d) | | 17,893,728 | 458 |
| Waymo LLC Series A2 (a)(c)(d) | | 44,767 | 2,064 |
| | | | 2,522 |
| FINANCIALS - 0.1% | | | |
| Financial Services - 0.1% | | | |
| Circle Internet Financial Ltd. Series E (a)(c)(d) | | 604,608 | 14,819 |
| | | | |
| HEALTH CARE - 0.0% | | | |
| Pharmaceuticals - 0.0% | | | |
| Castle Creek Pharmaceutical Holdings, Inc. Series A4 (a)(c)(d) | | 46,864 | 9,571 |
| Faraday Pharmaceuticals, Inc. Series B (a)(c)(d) | | 641,437 | 712 |
| | | | 10,283 |
| INFORMATION TECHNOLOGY - 0.0% | | | |
| Software - 0.0% | | | |
| Pine Labs Private Ltd.: | | | |
| Series 1(a)(c)(d) | | 9,846 | 4,923 |
| Series A(a)(c)(d) | | 2,460 | 1,230 |
| Series B(a)(c)(d) | | 2,677 | 1,339 |
| Series B2(a)(c)(d) | | 2,165 | 1,083 |
| Series C(a)(c)(d) | | 4,028 | 2,014 |
| Series C1(a)(c)(d) | | 848 | 424 |
| Series D(a)(c)(d) | | 907 | 454 |
| | | | 11,467 |
| TOTAL NONCONVERTIBLE PREFERRED STOCKS | | | 39,091 |
| TOTAL PREFERRED STOCKS (Cost $993,955) | | | 1,087,607 |
| | | | |
| Convertible Bonds - 0.0% |
| | | Principal Amount (i) (000s) | Value ($) (000s) |
| CONSUMER DISCRETIONARY - 0.0% | | | |
| Automobiles - 0.0% | | | |
| Neutron Holdings, Inc.: | | | |
| 4% 5/22/27 (c)(d) | | 3,596 | 3,704 |
| 4% 6/12/27 (c)(d) | | 743 | 765 |
| 4.5% 10/27/25 (c)(d)(j) | | 7,960 | 7,863 |
| (Cost $12,299) | | | 12,332 |
| | | | |
| Preferred Securities - 0.1% |
| | | Principal Amount (i) (000s) | Value ($) (000s) |
| HEALTH CARE - 0.0% | | | |
| Biotechnology - 0.0% | | | |
| Intarcia Therapeutics, Inc. 6% 7/18/23 (c)(d)(k) | | 13,682 | 0 |
| Health Care Equipment & Supplies - 0.0% | | | |
| Kardium, Inc. 0% (c)(d)(l) | | 8,368 | 8,159 |
TOTAL HEALTH CARE | | | 8,159 |
| INFORMATION TECHNOLOGY - 0.1% | | | |
| Semiconductors & Semiconductor Equipment - 0.1% | | | |
| GaN Systems, Inc. 0% (c)(d)(l) | | 6,731 | 8,308 |
| Software - 0.0% | | | |
| Tenstorrent, Inc. 0% (c)(d)(l) | | 5,120 | 4,859 |
TOTAL INFORMATION TECHNOLOGY | | | 13,167 |
| TOTAL PREFERRED SECURITIES (Cost $33,901) | | | 21,326 |
| | | | |
| Money Market Funds - 0.9% |
| | | Shares | Value ($) (000s) |
| Fidelity Cash Central Fund 5.14% (m) | | 61,234,400 | 61,247 |
| Fidelity Securities Lending Cash Central Fund 5.14% (m)(n) | | 332,061,801 | 332,095 |
| TOTAL MONEY MARKET FUNDS (Cost $393,338) | | | 393,342 |
| | | | |
| TOTAL INVESTMENT IN SECURITIES - 100.8% (Cost $18,349,521) | 47,051,215 |
NET OTHER ASSETS (LIABILITIES) - (0.8)% | (358,243) |
| NET ASSETS - 100.0% | 46,692,972 |
| | |
Any values shown as $0 in the Schedule of Investments may reflect amounts less than $500.
Legend
| (b) | Security or a portion of the security is on loan at period end. |
| (c) | Restricted securities (including private placements) - Investment in securities not registered under the Securities Act of 1933 (excluding 144A issues). At the end of the period, the value of restricted securities (excluding 144A issues) amounted to $1,799,860,000 or 3.9% of net assets. |
| (e) | Investment is owned by a wholly-owned subsidiary (Subsidiary) that is treated as a corporation for U.S. tax purposes. |
| (f) | Security exempt from registration under Rule 144A of the Securities Act of 1933. These securities may be resold in transactions exempt from registration, normally to qualified institutional buyers. At the end of the period, the value of these securities amounted to $238,752,000 or 0.5% of net assets. |
| (h) | Security or a portion of the security purchased on a delayed delivery or when-issued basis. |
| (i) | Amount is stated in United States dollars unless otherwise noted. |
| (j) | Security initially issued at one coupon which converts to a higher coupon at a specified date. The rate shown is the rate at period end. |
| (k) | Non-income producing - Security is in default. |
| (l) | Security is perpetual in nature with no stated maturity date. |
| (m) | Affiliated fund that is generally available only to investment companies and other accounts managed by Fidelity Investments. The rate quoted is the annualized seven-day yield of the fund at period end. A complete unaudited listing of the fund's holdings as of its most recent quarter end is available upon request. In addition, each Fidelity Central Fund's financial statements are available on the SEC's website or upon request. |
| (n) | Investment made with cash collateral received from securities on loan. |
| Additional information on each restricted holding is as follows: |
| Security | Acquisition Date | Acquisition Cost ($) (000s) |
| Adimab LLC | 9/17/14 - 6/05/15 | 47,869 |
| | | |
| AgBiome LLC Series C | 6/29/18 | 6,716 |
| | | |
| AgBiome LLC Series D | 9/03/21 | 5,053 |
| | | |
| Aledade, Inc. Series B1 | 5/07/21 | 3,885 |
| | | |
| Aledade, Inc. Series E1 | 5/20/22 | 3,288 |
| | | |
| Alif Semiconductor Series C | 3/08/22 | 3,869 |
| | | |
| Altos Labs, Inc. Series B | 7/22/22 | 9,295 |
| | | |
| Ankyra Therapeutics Series B | 8/26/21 | 7,641 |
| | | |
| Ant International Co. Ltd. Class C | 5/16/18 | 9,303 |
| | | |
| Apogee Therapeutics Series B | 11/15/22 | 5,446 |
| | | |
| Asimov, Inc. Series B | 10/29/21 | 7,616 |
| | | |
| Astera Labs, Inc. Series A | 5/17/22 | 3,220 |
| | | |
| Astera Labs, Inc. Series B | 5/17/22 | 548 |
| | | |
| Astera Labs, Inc. Series C | 8/24/21 | 6,088 |
| | | |
| Astera Labs, Inc. Series D | 5/17/22 | 10,928 |
| | | |
| Beta Technologies, Inc. Series A | 4/09/21 | 3,965 |
| | | |
| Beta Technologies, Inc. Series B, 6.00% | 4/04/22 | 7,341 |
| | | |
| Blink Health LLC Series A1 | 12/30/20 | 4,699 |
| | | |
| Blink Health LLC Series C | 11/07/19 - 7/14/21 | 35,403 |
| | | |
| Bolt Technology OU Series E | 1/03/22 | 18,867 |
| | | |
| Boundless Bio, Inc. Series B | 4/23/21 | 3,914 |
| | | |
| Boundless Bio, Inc. Series C | 4/05/23 | 5,057 |
| | | |
| Bowery Farming, Inc. Series C1 | 5/18/21 | 7,888 |
| | | |
| Bright Peak Therapeutics AG Series B | 5/14/21 | 4,972 |
| | | |
| ByteDance Ltd. Series E1 | 11/18/20 | 44,208 |
| | | |
| Caris Life Sciences, Inc. | 10/06/22 | 5,190 |
| | | |
| Caris Life Sciences, Inc. Series D | 5/11/21 | 10,004 |
| | | |
| Castle Creek Biosciences, Inc. Series D1 | 4/19/22 | 4,240 |
| | | |
| Castle Creek Biosciences, Inc. Series D2 | 6/28/21 | 1,087 |
| | | |
| Castle Creek Pharmaceutical Holdings, Inc. Series A4 | 9/29/16 | 15,506 |
| | | |
| Castle Creek Pharmaceutical Holdings, Inc. Series B | 10/09/18 | 6,920 |
| | | |
| Castle Creek Pharmaceutical Holdings, Inc. Series C | 12/09/19 | 5,395 |
| | | |
| Cibus Corp. Series C | 2/16/18 | 9,500 |
| | | |
| Cibus Corp. Series D | 5/10/19 | 3,426 |
| | | |
| Cibus Corp. Series E | 6/23/21 | 726 |
| | | |
| Cibus Corp. Series F | 12/02/22 | 2,186 |
| | | |
| Circle Internet Financial Ltd. Series E | 5/11/21 | 9,813 |
| | | |
| Cleerly, Inc. Series C | 7/08/22 | 11,581 |
| | | |
| Conformal Medical, Inc. Series C | 7/24/20 | 3,913 |
| | | |
| Conformal Medical, Inc. Series D | 5/26/23 | 421 |
| | | |
| Cyclerion Therapeutics, Inc. | 4/02/19 | 8,052 |
| | | |
| Databricks, Inc. Series G | 2/01/21 | 14,798 |
| | | |
| Databricks, Inc. Series H | 8/31/21 | 20,074 |
| | | |
| Dataminr, Inc. Series D | 2/18/15 - 3/06/15 | 22,617 |
| | | |
| Deep Genomics, Inc. Series C | 7/21/21 | 9,894 |
| | | |
| Diamond Foundry, Inc. Series C | 3/15/21 | 40,911 |
| | | |
| Dianthus Therapeutics, Inc. Series A | 4/06/22 | 5,054 |
| | | |
| Discord, Inc. Series I | 9/15/21 | 3,854 |
| | | |
| DNA Script | 12/17/21 | 1,788 |
| | | |
| DNA Script Series B | 12/17/21 | 18 |
| | | |
| DNA Script Series C | 10/01/21 | 9,466 |
| | | |
| Dragonfly Therapeutics, Inc. | 12/19/19 | 12,746 |
| | | |
| Element Biosciences, Inc. Series B | 12/13/19 | 5,745 |
| | | |
| Element Biosciences, Inc. Series C | 6/21/21 | 9,869 |
| | | |
| ElevateBio LLC Series C | 3/09/21 | 6,436 |
| | | |
| Enevate Corp. Series E | 1/29/21 | 4,510 |
| | | |
| Epic Games, Inc. | 7/13/20 - 7/30/20 | 29,786 |
| | | |
| Evozyne LLC Series A | 4/09/21 | 9,992 |
| | | |
| Fanatics, Inc. Class A | 8/13/20 - 10/24/22 | 21,636 |
| | | |
| Faraday Pharmaceuticals, Inc. Series B | 12/30/19 | 843 |
| | | |
| Farmers Business Network, Inc. Series G | 9/15/21 | 11,613 |
| | | |
| Fog Pharmaceuticals, Inc. Series D | 11/17/22 | 9,509 |
| | | |
| Freenome, Inc. Series C | 8/14/20 | 5,958 |
| | | |
| Freenome, Inc. Series D | 11/22/21 | 3,789 |
| | | |
| Galvanize Therapeutics Series B | 3/29/22 | 7,518 |
| | | |
| GaN Systems, Inc. Series F1 | 11/30/21 | 2,435 |
| | | |
| GaN Systems, Inc. Series F2 | 11/30/21 | 1,286 |
| | | |
| GaN Systems, Inc. 0% | 11/30/21 | 6,731 |
| | | |
| Generate Biomedicines Series B | 11/02/21 | 9,726 |
| | | |
| GoBrands, Inc. Series G | 3/02/21 | 31,386 |
| | | |
| GoBrands, Inc. Series H | 7/22/21 | 40,524 |
| | | |
| Inscripta, Inc. Series D | 11/13/20 | 7,724 |
| | | |
| Inscripta, Inc. Series E | 3/30/21 | 9,594 |
| | | |
| Instacart, Inc. Series H | 11/13/20 | 4,339 |
| | | |
| Instacart, Inc. Series I | 2/26/21 | 4,095 |
| | | |
| Intarcia Therapeutics, Inc. Series CC | 11/14/12 | 14,331 |
| | | |
| Intarcia Therapeutics, Inc. Series DD | 3/17/14 | 50,000 |
| | | |
| Intarcia Therapeutics, Inc. 6% 7/18/23 | 2/26/19 | 13,682 |
| | | |
| JUUL Labs, Inc. Class A | 7/06/18 | 1,299 |
| | | |
| JUUL Labs, Inc. Series E | 7/06/18 | 650 |
| | | |
| Kardium, Inc. Series D6 | 12/30/20 | 5,992 |
| | | |
| Kardium, Inc. 0% | 12/30/20 | 8,368 |
| | | |
| Korro Bio, Inc. Series B1 | 12/17/21 | 3,749 |
| | | |
| Korro Bio, Inc. Series B2 | 12/17/21 | 3,749 |
| | | |
| Laronde, Inc. Series B | 8/13/21 | 9,646 |
| | | |
| LifeMine Therapeutics, Inc. Series C | 2/15/22 | 15,874 |
| | | |
| Lightmatter, Inc. Series C | 5/19/23 | 6,713 |
| | | |
| Meesho Series F | 9/21/21 | 23,719 |
| | | |
| Menlo Micro, Inc. Series C | 2/09/22 | 5,863 |
| | | |
| MOD Super Fast Pizza Holdings LLC Series 3 | 11/03/16 | 7,719 |
| | | |
| MOD Super Fast Pizza Holdings LLC Series 4 | 12/14/17 | 720 |
| | | |
| MOD Super Fast Pizza Holdings LLC Series 5 | 5/15/19 | 2,943 |
| | | |
| National Resilience, Inc. Series B | 12/01/20 | 17,449 |
| | | |
| National Resilience, Inc. Series C | 6/28/21 | 16,831 |
| | | |
| Neutron Holdings, Inc. | 2/04/21 | 15 |
| | | |
| Neutron Holdings, Inc. Series 1D | 1/25/19 | 4,339 |
| | | |
| Neutron Holdings, Inc. 4% 5/22/27 | 6/04/20 | 3,596 |
| | | |
| Neutron Holdings, Inc. 4% 6/12/27 | 6/12/20 | 743 |
| | | |
| Neutron Holdings, Inc. 4.5% 10/27/25 | 10/29/21 - 4/27/23 | 7,960 |
| | | |
| Nohla Therapeutics, Inc. Series B | 5/01/18 | 3,209 |
| | | |
| Oddity Tech Ltd. | 1/06/22 | 4,436 |
| | | |
| Odyssey Therapeutics, Inc. Series B | 9/30/22 | 8,203 |
| | | |
| Omada Health, Inc. Series E | 12/22/21 | 15,336 |
| | | |
| Paragon Biosciences Emalex Capital, Inc. Series B | 9/18/19 | 4,240 |
| | | |
| Paragon Biosciences Emalex Capital, Inc. Series C | 2/26/21 | 5,992 |
| | | |
| Paragon Biosciences Emalex Capital, Inc. Series D1 | 10/21/22 | 8,168 |
| | | |
| Paragon Biosciences Emalex Capital, Inc. Series D2 | 5/18/22 | 1,190 |
| | | |
| Pine Labs Private Ltd. | 6/30/21 | 1,536 |
| | | |
| Pine Labs Private Ltd. Series 1 | 6/30/21 | 3,671 |
| | | |
| Pine Labs Private Ltd. Series A | 6/30/21 | 917 |
| | | |
| Pine Labs Private Ltd. Series B | 6/30/21 | 998 |
| | | |
| Pine Labs Private Ltd. Series B2 | 6/30/21 | 807 |
| | | |
| Pine Labs Private Ltd. Series C | 6/30/21 | 1,502 |
| | | |
| Pine Labs Private Ltd. Series C1 | 6/30/21 | 316 |
| | | |
| Pine Labs Private Ltd. Series D | 6/30/21 | 338 |
| | | |
| PrognomIQ, Inc. Series A5 | 8/20/20 | 225 |
| | | |
| PrognomIQ, Inc. Series B | 9/11/20 | 2,540 |
| | | |
| PrognomIQ, Inc. Series C | 2/16/22 | 890 |
| | | |
| Quell Therapeutics Ltd. Series B | 11/24/21 | 7,315 |
| | | |
| Rad Power Bikes, Inc. | 1/21/21 | 5,705 |
| | | |
| Rad Power Bikes, Inc. Series A | 1/21/21 | 744 |
| | | |
| Rad Power Bikes, Inc. Series C | 1/21/21 | 2,926 |
| | | |
| Rad Power Bikes, Inc. Series D | 9/17/21 | 10,267 |
| | | |
| Reddit, Inc. Series B | 7/26/17 | 5,456 |
| | | |
| Reddit, Inc. Series E | 5/18/21 | 1,028 |
| | | |
| Reddit, Inc. Series F | 8/11/21 | 7,106 |
| | | |
| Redwood Materials Series C | 5/28/21 | 3,795 |
| | | |
| Retym, Inc. Series C | 5/17/23 | 4,249 |
| | | |
| SalioGen Therapeutics, Inc. Series B | 12/10/21 | 5,471 |
| | | |
| Saluda Medical, Inc. warrants 1/20/27 | 1/20/22 | 0 |
| | | |
| Saluda Medical, Inc. Series D | 1/20/22 | 7,416 |
| | | |
| Saluda Medical, Inc. Series E | 4/06/23 | 6,456 |
| | | |
| Scholar Rock Holding Corp. warrants 12/31/25 | 6/17/22 | 0 |
| | | |
| Scorpion Therapeutics, Inc. Series B | 1/08/21 | 3,207 |
| | | |
| SiMa.ai Series B | 5/10/21 | 8,184 |
| | | |
| SiMa.ai Series B1 | 4/25/22 | 758 |
| | | |
| Skyhawk Therapeutics, Inc. | 5/21/21 | 9,904 |
| | | |
| Skyryse, Inc. Series B | 10/21/21 | 14,029 |
| | | |
| Sonoma Biotherapeutics, Inc. Series B | 7/26/21 | 4,936 |
| | | |
| Sonoma Biotherapeutics, Inc. Series B1 | 7/26/21 | 3,949 |
| | | |
| Space Exploration Technologies Corp. Class A | 10/16/15 - 4/06/17 | 38,201 |
| | | |
| Space Exploration Technologies Corp. Series G | 1/20/15 | 16,753 |
| | | |
| SpringWorks Therapeutics, Inc. | 9/07/22 | 11,900 |
| | | |
| Stripe, Inc. Class B | 5/18/21 | 8,246 |
| | | |
| Stripe, Inc. Series H | 3/15/21 | 3,539 |
| | | |
| T-Knife Therapeutics, Inc. Series B | 6/30/21 | 5,741 |
| | | |
| Tenstorrent, Inc. Series C1 | 4/23/21 | 5,476 |
| | | |
| Tenstorrent, Inc. 0% | 4/23/21 | 5,120 |
| | | |
| The Beauty Health Co. | 12/08/20 | 28,847 |
| | | |
| The Oncology Institute, Inc. | 6/28/21 | 18,151 |
| | | |
| Tory Burch LLC Class A | 5/14/15 | 67,653 |
| | | |
| Tory Burch LLC Class B | 12/31/12 | 17,505 |
| | | |
| Treeline Biosciences Series A | 7/30/21 - 10/27/22 | 10,545 |
| | | |
| Treeline Biosciences Series A1 | 10/27/22 | 3,997 |
| | | |
| Waymo LLC Series A2 | 5/08/20 | 3,844 |
| | | |
| Wugen, Inc. Series B | 7/09/21 | 3,827 |
| | | |
| Xsight Labs Ltd. Series D | 2/16/21 | 6,300 |
| | | |
Affiliated Central Funds
Fiscal year to date information regarding the Fund's investments in Fidelity Central Funds, including the ownership percentage, is presented below.
| Affiliate (Amounts in thousands) | Value, beginning of period ($) | Purchases ($) | Sales Proceeds ($) | Dividend Income ($) | Realized Gain (loss) ($) | Change in Unrealized appreciation (depreciation) ($) | Value, end of period ($) | % ownership, end of period |
| Fidelity Cash Central Fund 5.14% | 93,313 | 1,067,664 | 1,099,730 | 1,611 | - | - | 61,247 | 0.1% |
| Fidelity Securities Lending Cash Central Fund 5.14% | 302,714 | 1,115,300 | 1,085,919 | 1,122 | - | - | 332,095 | 1.2% |
| Total | 396,027 | 2,182,964 | 2,185,649 | 2,733 | - | - | 393,342 | |
| | | | | | | | | |
Amounts in the dividend income column in the above table include any capital gain distributions from underlying funds, which are presented in the corresponding line item in the Statement of Operations, if applicable.
Amounts in the dividend income column for Fidelity Securities Lending Cash Central Fund represents the income earned on investing cash collateral, less rebates paid to borrowers and any lending agent fees associated with the loan, plus any premium payments received for lending certain types of securities.
Amounts included in the purchases and sales proceeds columns may include in-kind transactions, if applicable.
Other Affiliated Issuers
An affiliated company is a company in which the Fund has ownership of at least 5% of the voting securities. Fiscal year to date transactions with companies which are or were affiliates are presented in the table below. Certain corporate actions, such as mergers, are excluded from the amounts in this table if applicable. A dash in the Value end of period ($) column means either the issuer is no longer held at period end, or the issuer is held at period end but is no longer an affiliate.
| Affiliate (Amounts in thousands) | Value, beginning of period ($) | Purchases ($) | Sales Proceeds ($) | Dividend Income ($) | Realized Gain (loss) ($) | Change in Unrealized appreciation (depreciation) ($) | Value, end of period ($) |
| EQRx, Inc. | 24,324 | 4,200 | 586 | - | (380) | (13,639) | 13,919 |
| EQRx, Inc. rights | 1,445 | - | - | - | - | (1,308) | 137 |
| EQRx, Inc. rights | 504 | - | - | - | - | (468) | 36 |
| Kineta, Inc. | 1,011 | - | 255 | 802 | (3,653) | 2,989 | - |
| Nutanix, Inc. Class A | 336,414 | 12,100 | 10,828 | - | 1,771 | 13,613 | 353,070 |
| Presbia PLC | 16 | - | - | - | - | (16) | - |
| Silicon Laboratories, Inc. | 246,398 | 825 | 20,657 | - | 12,113 | (17,293) | - |
| Total | 610,112 | 17,125 | 32,326 | 802 | 9,851 | (16,122) | 367,162 |
Amounts included in the purchases and sales proceeds columns may include in-kind transactions, if applicable.
Investment Valuation
The following is a summary of the inputs used, as of May 31, 2023, involving the Fund's assets and liabilities carried at fair value. The inputs or methodology used for valuing securities may not be an indication of the risk associated with investing in those securities. For more information on valuation inputs, and their aggregation into the levels used below, please refer to the Investment Valuation section in the accompanying Notes to Financial Statements.
| Valuation Inputs at Reporting Date: |
Description (Amounts in thousands) | Total ($) | Level 1 ($) | Level 2 ($) | Level 3 ($) |
Investments in Securities: | | | | |
|
| Equities: | | | | |
Communication Services | 4,279,627 | 4,139,906 | - | 139,721 |
Consumer Discretionary | 8,217,213 | 8,054,128 | - | 163,085 |
Consumer Staples | 1,495,454 | 1,459,749 | - | 35,705 |
Energy | 705,284 | 705,284 | - | - |
Financials | 1,439,934 | 1,387,853 | - | 52,081 |
Health Care | 6,853,943 | 6,257,250 | 11,844 | 584,849 |
Industrials | 2,157,562 | 1,658,366 | - | 499,196 |
Information Technology | 20,978,288 | 20,801,173 | - | 177,115 |
Materials | 415,656 | 331,223 | - | 84,433 |
Real Estate | 54,932 | 54,932 | - | - |
Utilities | 26,322 | 22,648 | - | 3,674 |
|
| Corporate Bonds | 12,332 | - | - | 12,332 |
|
| Preferred Securities | 21,326 | - | - | 21,326 |
|
| Money Market Funds | 393,342 | 393,342 | - | - |
| Total Investments in Securities: | 47,051,215 | 45,265,854 | 11,844 | 1,773,517 |
The following is a reconciliation of Investments in Securities for which Level 3 inputs were used in determining value:
| (Amounts in thousands) | |
| Investments in Securities: | |
| Health Care | | | |
| Beginning Balance | $ | 418,957 | |
| Net Realized Gain (Loss) on Investment Securities | | (366) | |
| Net Unrealized Gain (Loss) on Investment Securities | | 155,385 | |
| Cost of Purchases | | 10,890 | |
| Proceeds of Sales | | (17) | |
| Amortization/Accretion | | - | |
| Transfers into Level 3 | | - | |
| Transfers out of Level 3 | | - | |
| Ending Balance | $ | 584,849 | |
| The change in unrealized gain (loss) for the period attributable to Level 3 securities held at May 31, 2023 | $ | 155,453 | |
| Industrials | | | |
| Beginning Balance | $ | 454,564 | |
| Net Realized Gain (Loss) on Investment Securities | | - | |
| Net Unrealized Gain (Loss) on Investment Securities | | 44,632 | |
| Cost of Purchases | | - | |
| Proceeds of Sales | | - | |
| Amortization/Accretion | | - | |
| Transfers into Level 3 | | - | |
| Transfers out of Level 3 | | - | |
| Ending Balance | $ | 499,196 | |
| The change in unrealized gain (loss) for the period attributable to Level 3 securities held at May 31, 2023 | $ | 44,632 | |
| Other Investments in Securities | | | |
| Beginning Balance | $ | 826,638 | |
| Net Realized Gain (Loss) on Investment Securities | | 20 | |
| Net Unrealized Gain (Loss) on Investment Securities | | (185,257) | |
| Cost of Purchases | | 20,120 | |
| Proceeds of Sales | | (1,752) | |
| Amortization/Accretion | | - | |
| Transfers into Level 3 | | 29,703 | |
| Transfers out of Level 3 | | - | |
| Ending Balance | $ | 689,472 | |
| The change in unrealized gain (loss) for the period attributable to Level 3 securities held at May 31, 2023 | $ | (179,209) | |
| The information used in the above reconciliation represents fiscal year to date activity for any Investments in Securities identified as using Level 3 inputs at either the beginning or the end of the current fiscal period. Cost of purchases and proceeds of sales may include securities received and/or delivered through in-kind transactions, corporate actions or exchanges. Transfers into Level 3 were attributable to a lack of observable market data resulting from decreases in market activity, decreases in liquidity, security restructurings or corporate actions. Transfers out of Level 3 were attributable to observable market data becoming available for those securities. Transfers in or out of Level 3 represent the beginning value of any Security or Instrument where a change in the pricing level occurred from the beginning to the end of the period. Realized and unrealized gains (losses) disclosed in the reconciliation are included in Net Gain (Loss) on the Fund's Statement of Operations. | |
| Statement of Assets and Liabilities |
| Amounts in thousands (except per-share amounts) | | | | May 31, 2023 (Unaudited) |
| | | | | |
| Assets | | | | |
| Investment in securities, at value (including securities loaned of $319,113) - See accompanying schedule: | | | | |
Unaffiliated issuers (cost $17,477,461) | $ | 46,290,711 | | |
Fidelity Central Funds (cost $393,338) | | 393,342 | | |
Other affiliated issuers (cost $478,722) | | 367,162 | | |
| | | | | |
| | | | | |
| Total Investment in Securities (cost $18,349,521) | | | $ | 47,051,215 |
| Cash | | | | 111 |
| Restricted cash | | | | 702 |
| Foreign currency held at value (cost $10) | | | | 10 |
| Receivable for investments sold | | | | 111,507 |
| Receivable for fund shares sold | | | | 13,066 |
| Dividends receivable | | | | 24,671 |
| Interest receivable | | | | 553 |
| Distributions receivable from Fidelity Central Funds | | | | 449 |
| Prepaid expenses | | | | 8 |
| Other receivables | | | | 2,194 |
Total assets | | | | 47,204,486 |
| Liabilities | | | | |
| Payable for investments purchased | | | | |
Regular delivery | $ | 60,203 | | |
Delayed delivery | | 4,878 | | |
| Payable for fund shares redeemed | | 76,921 | | |
| Accrued management fee | | 27,261 | | |
| Other affiliated payables | | 3,685 | | |
| Other payables and accrued expenses | | 6,528 | | |
| Collateral on securities loaned | | 332,038 | | |
| Total Liabilities | | | | 511,514 |
| Net Assets | | | $ | 46,692,972 |
| Net Assets consist of: | | | | |
| Paid in capital | | | $ | 16,723,235 |
| Total accumulated earnings (loss) | | | | 29,969,737 |
| Net Assets | | | $ | 46,692,972 |
| | | | | |
| Net Asset Value and Maximum Offering Price | | | | |
| Growth Company : | | | | |
Net Asset Value , offering price and redemption price per share ($39,199,244 ÷ 1,379,785 shares) | | | $ | 28.41 |
| Class K : | | | | |
Net Asset Value , offering price and redemption price per share ($7,493,728 ÷ 262,497 shares) | | | $ | 28.55 |
| Statement of Operations |
| Amounts in thousands | | | | Six months ended May 31, 2023 (Unaudited) |
| Investment Income | | | | |
| Dividends (including $802 earned from affiliated issuers) | | | $ | 113,376 |
| Interest | | | | 1,100 |
| Income from Fidelity Central Funds (including $1,122 from security lending) | | | | 2,733 |
| Total Income | | | | 117,209 |
| Expenses | | | | |
| Management fee | | | | |
| Basic fee | $ | 110,977 | | |
| Performance adjustment | | 51,370 | | |
| Transfer agent fees | | 20,340 | | |
| Accounting fees | | 1,053 | | |
| Custodian fees and expenses | | 264 | | |
| Independent trustees' fees and expenses | | 140 | | |
| Registration fees | | 142 | | |
| Audit | | 147 | | |
| Legal | | 26 | | |
| Interest | | 60 | | |
| Miscellaneous | | 465 | | |
| Total expenses before reductions | | 184,984 | | |
| Expense reductions | | (959) | | |
| Total expenses after reductions | | | | 184,025 |
| Net Investment income (loss) | | | | (66,816) |
| Realized and Unrealized Gain (Loss) | | | | |
| Net realized gain (loss) on: | | | | |
| Investment Securities: | | | | |
| Unaffiliated issuers (net of foreign taxes of $1,707) | | 1,030,452 | | |
| Redemptions in-kind | | 599,008 | | |
| Affiliated issuers | | 9,851 | | |
| Foreign currency transactions | | 358 | | |
| Total net realized gain (loss) | | | | 1,639,669 |
| Change in net unrealized appreciation (depreciation) on: | | | | |
| Investment Securities: | | | | |
| Unaffiliated issuers (net of decrease in deferred foreign taxes of $2,494) | | 4,569,400 | | |
| Affiliated issuers | | (16,122) | | |
| Assets and liabilities in foreign currencies | | (209) | | |
| Total change in net unrealized appreciation (depreciation) | | | | 4,553,069 |
| Net gain (loss) | | | | 6,192,738 |
| Net increase (decrease) in net assets resulting from operations | | | $ | 6,125,922 |
| Statement of Changes in Net Assets |
| |
| Amount in thousands | | Six months ended May 31, 2023 (Unaudited) | | Year ended November 30, 2022 |
| Increase (Decrease) in Net Assets | | | | |
| Operations | | | | |
| Net investment income (loss) | $ | (66,816) | $ | (151,861) |
| Net realized gain (loss) | | 1,639,669 | | 4,914,313 |
| Change in net unrealized appreciation (depreciation) | | 4,553,069 | | (24,910,772) |
| Net increase (decrease) in net assets resulting from operations | | 6,125,922 | | (20,148,320) |
| Distributions to shareholders | | (2,600,954) | | (6,433,347) |
| Share transactions - net increase (decrease) | | 492,272 | | (581,831) |
| Total increase (decrease) in net assets | | 4,017,240 | | (27,163,498) |
| | | | | |
| Net Assets | | | | |
| Beginning of period | | 42,675,732 | | 69,839,230 |
| End of period | $ | 46,692,972 | $ | 42,675,732 |
| | | | | |
| | | | | |
Financial Highlights
| Fidelity® Growth Company Fund |
| |
| | Six months ended (Unaudited) May 31, 2023 | | Years ended November 30, 2022 | | 2021 | | 2020 | | 2019 | | 2018 A |
Selected Per-Share Data | | | | | | | | | | | | |
| Net asset value, beginning of period | $ | 26.47 | $ | 41.75 | $ | 34.49 | $ | 21.54 | $ | 18.79 | $ | 18.53 |
| Income from Investment Operations | | | | | | | | | | | | |
Net investment income (loss) B,C | | (.04) | | (.09) | | (.14) D | | (.10) | | (.04) | | (.01) E |
| Net realized and unrealized gain (loss) | | 3.60 | | (11.30) | | 10.31 | | 13.87 | | 3.81 | | 1.12 |
| Total from investment operations | | 3.56 | | (11.39) | | 10.17 | | 13.77 | | 3.77 | | 1.11 |
| Distributions from net realized gain | | (1.62) | | (3.89) | | (2.91) | | (.82) | | (1.02) | | (.85) |
| Total distributions | | (1.62) | | (3.89) | | (2.91) | | (.82) | | (1.02) | | (.85) |
| Net asset value, end of period | $ | 28.41 | $ | 26.47 | $ | 41.75 | $ | 34.49 | $ | 21.54 | $ | 18.79 |
Total Return F,G | | 15.15% | | (29.90)% | | 31.76% | | 66.23% | | 22.05% | | 6.19% |
Ratios to Average Net Assets C,H,I | | | | | | | | | | | | |
| Expenses before reductions | | .89% J | | .86% | | .79% | | .83% | | .83% | | .85% |
| Expenses net of fee waivers, if any | | .88% J | | .86% | | .79% | | .83% | | .83% | | .85% |
| Expenses net of all reductions | | .88% J | | .86% | | .79% | | .83% | | .83% | | .85% |
| Net investment income (loss) | | (.33)% J | | (.32)% | | (.38)% D | | (.41)% | | (.20)% | | (.07)% E |
| Supplemental Data | | | | | | | | | | | | |
| Net assets, end of period (in millions) | $ | 39,199 | $ | 34,900 | $ | 53,845 | $ | 43,533 | $ | 28,861 | $ | 25,615 |
Portfolio turnover rate K,L | | 11% J | | 14% | | 16% | | 18% | | 16% | | 18% |
A Per share amounts have been adjusted to reflect the impact of the 10 for 1 share split that occurred on August 10, 2018.
B Calculated based on average shares outstanding during the period.
C Net investment income (loss) is affected by the timing of the declaration of dividends by any underlying mutual funds or exchange-traded funds (ETFs). Net investment income (loss) of any mutual funds or ETFs is not included in the Fund's net investment income (loss) ratio.
D Net investment income per share reflects one or more large, non-recurring dividend(s) which amounted to $.02 per share. Excluding such non-recurring dividend(s), the ratio of net investment income (loss) to average net assets would have been (.43)%.
E Net investment income per share reflects one or more large, non-recurring dividend(s) which amounted to $.03 per share. Excluding such non-recurring dividend(s), the ratio of net investment income (loss) to average net assets would have been (.19)%.
F Total returns for periods of less than one year are not annualized.
G Total returns would have been lower if certain expenses had not been reduced during the applicable periods shown.
H Fees and expenses of any underlying mutual funds or exchange-traded funds (ETFs) are not included in the Fund's expense ratio. The Fund indirectly bears its proportionate share of these expenses. For additional expense information related to investments in Fidelity Central Funds, please refer to the "Investments in Fidelity Central Funds" note found in the Notes to Financial Statements section of the most recent Annual or Semi-Annual report.
I Expense ratios reflect operating expenses of the class. Expenses before reductions do not reflect amounts reimbursed, waived, or reduced through arrangements with the investment adviser, brokerage services, or other offset arrangements, if applicable, and do not represent the amount paid by the class during periods when reimbursements, waivers or reductions occur.
J Annualized.
K Amount does not include the portfolio activity of any underlying mutual funds or exchange-traded funds (ETFs).
L Portfolio turnover rate excludes securities received or delivered in-kind.
| Fidelity® Growth Company Fund Class K |
| |
| | Six months ended (Unaudited) May 31, 2023 | | Years ended November 30, 2022 | | 2021 | | 2020 | | 2019 | | 2018 A |
Selected Per-Share Data | | | | | | | | | | | | |
| Net asset value, beginning of period | $ | 26.59 | $ | 41.89 | $ | 34.57 | $ | 21.57 | $ | 18.80 | $ | 18.52 |
| Income from Investment Operations | | | | | | | | | | | | |
Net investment income (loss) B,C | | (.03) | | (.07) | | (.12) D | | (.08) | | (.02) | | - E,F |
| Net realized and unrealized gain (loss) | | 3.61 | | (11.34) | | 10.35 | | 13.90 | | 3.81 | | 1.13 |
| Total from investment operations | | 3.58 | | (11.41) | | 10.23 | | 13.82 | | 3.79 | | 1.13 |
| Distributions from net investment income | | - | | - | | - | | - | | - | | - F |
| Distributions from net realized gain | | (1.62) | | (3.89) | | (2.91) | | (.82) | | (1.02) | | (.85) |
| Total distributions | | (1.62) | | (3.89) | | (2.91) | | (.82) | | (1.02) | | (.85) |
| Net asset value, end of period | $ | 28.55 | $ | 26.59 | $ | 41.89 | $ | 34.57 | $ | 21.57 | $ | 18.80 |
Total Return G,H | | 15.16% | | (29.85)% | | 31.87% | | 66.37% | | 22.15% | | 6.28% |
Ratios to Average Net Assets C,I,J | | | | | | | | | | | | |
| Expenses before reductions | | .82% K | | .79% | | .73% | | .75% | | .75% | | .76% |
| Expenses net of fee waivers, if any | | .82% K | | .79% | | .72% | | .75% | | .75% | | .76% |
| Expenses net of all reductions | | .82% K | | .79% | | .72% | | .75% | | .75% | | .76% |
| Net investment income (loss) | | (.26)% K | | (.26)% | | (.32)% D | | (.33)% | | (.12)% | | .02% E |
| Supplemental Data | | | | | | | | | | | | |
| Net assets, end of period (in millions) | $ | 7,494 | $ | 7,776 | $ | 15,994 | $ | 18,449 | $ | 14,772 | $ | 15,468 |
Portfolio turnover rate L,M | | 11% K | | 14% | | 16% | | 18% | | 16% | | 18% |
A Per share amounts have been adjusted to reflect the impact of the 10 for 1 share split that occurred on August 10, 2018.
B Calculated based on average shares outstanding during the period.
C Net investment income (loss) is affected by the timing of the declaration of dividends by any underlying mutual funds or exchange-traded funds (ETFs). Net investment income (loss) of any mutual funds or ETFs is not included in the Fund's net investment income (loss) ratio.
D Net investment income per share reflects one or more large, non-recurring dividend(s) which amounted to $.02 per share. Excluding such non-recurring dividend(s), the ratio of net investment income (loss) to average net assets would have been (.37)%.
E Net investment income per share reflects one or more large, non-recurring dividend(s) which amounted to $.03 per share. Excluding such non-recurring dividend(s), the ratio of net investment income (loss) to average net assets would have been (.11)%.
F Amount represents less than $.005 per share.
G Total returns for periods of less than one year are not annualized.
H Total returns would have been lower if certain expenses had not been reduced during the applicable periods shown.
I Fees and expenses of any underlying mutual funds or exchange-traded funds (ETFs) are not included in the Fund's expense ratio. The Fund indirectly bears its proportionate share of these expenses. For additional expense information related to investments in Fidelity Central Funds, please refer to the "Investments in Fidelity Central Funds" note found in the Notes to Financial Statements section of the most recent Annual or Semi-Annual report.
J Expense ratios reflect operating expenses of the class. Expenses before reductions do not reflect amounts reimbursed, waived, or reduced through arrangements with the investment adviser, brokerage services, or other offset arrangements, if applicable, and do not represent the amount paid by the class during periods when reimbursements, waivers or reductions occur.
K Annualized.
L Amount does not include the portfolio activity of any underlying mutual funds or exchange-traded funds (ETFs).
M Portfolio turnover rate excludes securities received or delivered in-kind.
For the period ended May 31, 2023
( Amounts in thousands except percentages)
1. Organization.
Fidelity Growth Company Fund (the Fund) is a non-diversified fund of Fidelity Mt. Vernon Street Trust (the Trust) and is authorized to issue an unlimited number of shares. The Trust is registered under the Investment Company Act of 1940, as amended (the 1940 Act), as an open-end management investment company organized as a Massachusetts business trust. The Fund offers Growth Company and Class K shares, each of which has equal rights as to assets and voting privileges. Each class has exclusive voting rights with respect to matters that affect that class.
2. Investments in Fidelity Central Funds.
Funds may invest in Fidelity Central Funds, which are open-end investment companies generally available only to other investment companies and accounts managed by the investment adviser and its affiliates. The Schedule of Investments lists any Fidelity Central Funds held as an investment as of period end, but does not include the underlying holdings of each Fidelity Central Fund. An investing fund indirectly bears its proportionate share of the expenses of the underlying Fidelity Central Funds.
Based on its investment objective, each Fidelity Central Fund may invest or participate in various investment vehicles or strategies that are similar to those of the investing fund. These strategies are consistent with the investment objectives of the investing fund and may involve certain economic risks which may cause a decline in value of each of the Fidelity Central Funds and thus a decline in the value of the investing fund.
| Fidelity Central Fund | Investment Manager | Investment Objective | Investment Practices | Expense Ratio A |
| Fidelity Money Market Central Funds | Fidelity Management & Research Company LLC (FMR) | Each fund seeks to obtain a high level of current income consistent with the preservation of capital and liquidity. | Short-term Investments | Less than .005% |
A Expenses expressed as a percentage of average net assets and are as of each underlying Central Fund's most recent annual or semi-annual shareholder report.
A complete unaudited list of holdings for each Fidelity Central Fund is available upon request or at the Securities and Exchange Commission website at www.sec.gov. In addition, the financial statements of the Fidelity Central Funds which contain the significant accounting policies (including investment valuation policies) of those funds, and are not covered by the Report of Independent Registered Public Accounting Firm, are available on the Securities and Exchange Commission website or upon request.
3. Significant Accounting Policies.
The Fund is an investment company and applies the accounting and reporting guidance of the Financial Accounting Standards Board (FASB) Accounting Standards Codification Topic 946 Financial Services - Investment Companies . The financial statements have been prepared in conformity with accounting principles generally accepted in the United States of America (GAAP), which require management to make certain estimates and assumptions at the date of the financial statements. Actual results could differ from those estimates. Subsequent events, if any, through the date that the financial statements were issued have been evaluated in the preparation of the financial statements. The Fund's Schedule of Investments lists any underlying mutual funds or exchange-traded funds (ETFs) but does not include the underlying holdings of these funds. The following summarizes the significant accounting policies of the Fund:
Investment Valuation. Investments are valued as of 4:00 p.m. Eastern time on the last calendar day of the period. The Board of Trustees (the Board) has designated the Fund's investment adviser as the valuation designee responsible for the fair valuation function and performing fair value determinations as needed. The investment adviser has established a Fair Value Committee (the Committee) to carry out the day-to-day fair valuation responsibilities and has adopted policies and procedures to govern the fair valuation process and the activities of the Committee. In accordance with these fair valuation policies and procedures, which have been approved by the Board, the Fund attempts to obtain prices from one or more third party pricing services or brokers to value its investments. When current market prices, quotations or currency exchange rates are not readily available or reliable, investments will be fair valued in good faith by the Committee, in accordance with the policies and procedures. Factors used in determining fair value vary by investment type and may include market or investment specific events, transaction data, estimated cash flows, and market observations of comparable investments. The frequency that the fair valuation procedures are used cannot be predicted and they may be utilized to a significant extent. The Committee manages the Fund's fair valuation practices and maintains the fair valuation policies and procedures. The Fund's investment adviser reports to the Board information regarding the fair valuation process and related material matters.
The Fund categorizes the inputs to valuation techniques used to value its investments into a disclosure hierarchy consisting of three levels as shown below:
Level 1 - unadjusted quoted prices in active markets for identical investments
Level 2 - other significant observable inputs (including quoted prices for similar investments, interest rates, prepayment speeds, etc.)
Level 3 - unobservable inputs (including the Fund's own assumptions based on the best information available)
Valuation techniques used to value the Fund's investments by major category are as follows:
Equity securities, including restricted securities, for which market quotations are readily available, are valued at the last reported sale price or official closing price as reported by a third party pricing service on the primary market or exchange on which they are traded and are categorized as Level 1 in the hierarchy. In the event there were no sales during the day or closing prices are not available, securities are valued at the last quoted bid price or may be valued using the last available price and are generally categorized as Level 2 in the hierarchy. For foreign equity securities, when market or security specific events arise, comparisons to the valuation of American Depositary Receipts (ADRs), futures contracts, ETFs and certain indexes as well as quoted prices for similar securities may be used and would be categorized as Level 2 in the hierarchy. For equity securities, including restricted securities, where observable inputs are limited, assumptions about market activity and risk are used and these securities may be categorized as Level 3 in the hierarchy. Securities, including private placements or other restricted securities, for which observable inputs are not available are valued using alternate valuation approaches, including the market approach, the income approach and cost approach, and are categorized as Level 3 in the hierarchy. The market approach considers factors including the price of recent investments in the same or a similar security or financial metrics of comparable securities. The income approach considers factors including expected future cash flows, security specific risks and corresponding discount rates. The cost approach considers factors including the value of the security's underlying assets and liabilities.
Debt securities, including restricted securities, are valued based on evaluated prices received from third party pricing services or from brokers who make markets in such securities. Corporate bonds and preferred securities are valued by pricing services who utilize matrix pricing which considers yield or price of bonds of comparable quality, coupon, maturity and type or by broker-supplied prices. When independent prices are unavailable or unreliable, debt securities may be valued utilizing pricing methodologies which consider similar factors that would be used by third party pricing services. Debt securities are generally categorized as Level 2 in the hierarchy but may be Level 3 depending on the circumstances.
Investments in open-end mutual funds, including the Fidelity Central Funds, are valued at their closing net asset value (NAV) each business day and are categorized as Level 1 in the hierarchy.
The following provides information on Level 3 securities held by the Fund that were valued at period end based on unobservable inputs. These amounts exclude valuations provided by a broker.
| Asset Type | Fair Value | Valuation Technique(s) | Unobservable Input | Amount or Range/Weighted Average | Impact to Valuation from an Increase in Input A |
| Equities | $1,739,859 | Market comparable | Enterprise value/EBITDA multiple (EV/EBITDA) | 6.0 - 26.0 / 13.8 | Increase |
| | | | Enterprise value/Revenue multiple (EV/R) | 2.2 - 25.0 / 7.3 | Increase |
| | | | Enterpirse value/Revenue multiple (EV/R) | 2.1 | Increase |
| | | | Enterprise value/Gross profit multiple (EV/GP) | 5.0 | Increase |
| | | | Probability rate | 25.0% - 75.0% / 50.0% | Increase |
| | | | Liquidity preference | $254.19 - $282.13 / $268.90 | Increase |
| | | Recovery value | Recovery value | $0.00 - $0.31 / $0.24 | Increase |
| | | Market approach | Transaction price | $0.70 - $215.03 / $33.99 | Increase |
| | | | Discount rate | 5.0% - 52.5% / 23.8% | Decrease |
| | | Book value | Book value multiple | 1.4 | Increase |
| | | Discounted cash flow | Discount rate | 8.0% - 14.1% / 14.1% | Decrease |
| | | | Weighted average cost of capital (WACC) | 20.5% - 38.4% / 30.9% | Decrease |
| | | | Exit multiple | 2.0% - 7.3% / 3.8% | Increase |
| | | | Probability rate | 10.0% - 70.0% / 40.0% | Increase |
| | | Black scholes | Discount rate | 3.5% - 5.3% / 4.1% | Increase |
| | | | Volatility | 45.0% - 100.0% / 76.7% | Increase |
| | | | Term | 1.0 - 5.0 / 2.9 | Increase |
| Corporate Bonds | $12,332 | Market comparable | Enterprise value/Revenue multiple (EV/R) | 2.5 | Increase |
| | | | Discount rate | 29.2% | Decrease |
| | | | Probability rate | 10.0% - 50.0% / 33.3% | Increase |
| | | Black scholes | Volatility | 75.0% | Increase |
| | | | Term | 0.6 | Increase |
| Preferred Securities | $21,326 | Market comparable | Enterprise value/Revenue multiple (EV/R) | 5.0 | Increase |
| | | Recovery value | Recovery value | $0.00 | Increase |
| | | Market approach | Transaction price | $59.45 - $100.00 / $84.87 | Increase |
| | | Discounted cash flow | Discount rate | 20.0% | Decrease |
| | | Black scholes | Discount rate | 4.0% - 4.2% / 4.1% | Increase |
| | | | Volatility | 70.0% | Increase |
| | | | Term | 2.0 - 3.0 / 2.6 | Increase |
A Represents the directional change in the fair value of the Level 3 investments that could have resulted from an increase in the corresponding input as of period end. A decrease to the unobservable input would have had the opposite effect. Significant changes in these inputs may have resulted in a significantly higher or lower fair value measurement at period end.
Changes in valuation techniques may result in transfers in or out of an assigned level within the disclosure hierarchy. The aggregate value of investments by input level as of May 31, 2023, as well as a roll forward of Level 3 investments, is included at the end of the Fund's Schedule of Investments.
Foreign Currency. Certain Funds may use foreign currency contracts to facilitate transactions in foreign-denominated securities. Gains and losses from these transactions may arise from changes in the value of the foreign currency or if the counterparties do not perform under the contracts' terms.
Foreign-denominated assets, including investment securities, and liabilities are translated into U.S. dollars at the exchange rates at period end. Purchases and sales of investment securities, income and dividends received, and expenses denominated in foreign currencies are translated into U.S. dollars at the exchange rate in effect on the transaction date.
The effects of exchange rate fluctuations on investments are included with the net realized and unrealized gain (loss) on investment securities. Other foreign currency transactions resulting in realized and unrealized gain (loss) are disclosed separately.
Investment Transactions and Income. For financial reporting purposes, the Fund's investment holdings and NAV include trades executed through the end of the last business day of the period. The NAV per share for processing shareholder transactions is calculated as of the close of business of the New York Stock Exchange (NYSE), normally 4:00 p.m. Eastern time and includes trades executed through the end of the prior business day. Gains and losses on securities sold are determined on the basis of identified cost and include proceeds received from litigation. Commissions paid to certain brokers with whom the investment adviser, or its affiliates, places trades on behalf of a fund include an amount in addition to trade execution, which may be rebated back to a fund. Any such rebates are included in net realized gain (loss) on investments in the Statement of Operations. Dividend income is recorded on the ex-dividend date, except for certain dividends from foreign securities where the ex-dividend date may have passed, which are recorded as soon as the Fund is informed of the ex-dividend date. Non-cash dividends included in dividend income, if any, are recorded at the fair market value of the securities received. Income and capital gain distributions from Fidelity Central Funds, if any, are recorded on the ex-dividend date. Certain distributions received by the Fund represent a return of capital or capital gain. The Fund determines the components of these distributions subsequent to the ex-dividend date, based upon receipt of tax filings or other correspondence relating to the underlying investment. These distributions are recorded as a reduction of cost of investments and/or as a realized gain. Interest income is accrued as earned and includes coupon interest and amortization of premium and accretion of discount on debt securities as applicable. Investment income is recorded net of foreign taxes withheld where recovery of such taxes is uncertain. Funds may file withholding tax reclaims in certain jurisdictions to recover a portion of amounts previously withheld. Any withholding tax reclaims income is included in the Statement of Operations in dividends. Any receivables for withholding tax reclaims are included in the Statement of Assets and Liabilities in dividends receivable.
Class Allocations and Expenses. Investment income, realized and unrealized capital gains and losses, common expenses of a fund, and certain fund-level expense reductions, if any, are allocated daily on a pro-rata basis to each class based on the relative net assets of each class to the total net assets of a fund. Each class differs with respect to transfer agent and distribution and service plan fees incurred, as applicable. Certain expense reductions may also differ by class, if applicable. For the reporting period, the allocated portion of income and expenses to each class as a percent of its average net assets may vary due to the timing of recording these transactions in relation to fluctuating net assets of the classes. Expenses directly attributable to a fund are charged to that fund. Expenses attributable to more than one fund are allocated among the respective funds on the basis of relative net assets or other appropriate methods. Expenses included in the accompanying financial statements reflect the expenses of that fund and do not include any expenses associated with any underlying mutual funds or exchange-traded funds. Although not included in a fund's expenses, a fund indirectly bears its proportionate share of these expenses through the net asset value of each underlying mutual fund or exchange-traded fund. Expense estimates are accrued in the period to which they relate and adjustments are made when actual amounts are known.
Deferred Trustee Compensation. Under a Deferred Compensation Plan (the Plan) for certain Funds, certain independent Trustees have elected to defer receipt of a portion of their annual compensation. Deferred amounts are invested in affiliated mutual funds, are marked-to-market and remain in a fund until distributed in accordance with the Plan. The investment of deferred amounts and the offsetting payable to the Trustees presented below are included in the accompanying Statement of Assets and Liabilities in other receivables and other payables and accrued expenses, as applicable.
| Fidelity Growth Company Fund | $1,628 |
Income Tax Information and Distributions to Shareholders. Each year, the Fund intends to qualify as a regulated investment company under Subchapter M of the Internal Revenue Code, including distributing substantially all of its taxable income and realized gains. As a result, no provision for U.S. Federal income taxes is required. The Fund files a U.S. federal tax return, in addition to state and local tax returns as required. The Fund's federal income tax returns are subject to examination by the Internal Revenue Service (IRS) for a period of three fiscal years after they are filed. State and local tax returns may be subject to examination for an additional fiscal year depending on the jurisdiction. Foreign taxes are provided for based on the Fund's understanding of the tax rules and rates that exist in the foreign markets in which it invests. The Fund is subject to a tax imposed on capital gains by certain countries in which it invests. An estimated deferred tax liability for net unrealized appreciation on the applicable securities is included in Other payables and accrued expenses on the Statement of Assets & Liabilities.
Distributions are declared and recorded on the ex-dividend date. Income and capital gain distributions are declared separately for each class. Income and capital gain distributions are determined in accordance with income tax regulations, which may differ from GAAP.
Capital accounts within the financial statements are adjusted for permanent book-tax differences. These adjustments have no impact on net assets or the results of operations. Capital accounts are not adjusted for temporary book-tax differences which will reverse in a subsequent period.
Book-tax differences are primarily due to foreign currency transactions, passive foreign investment companies (PFIC), redemptions in-kind, partnerships, net operating losses and losses deferred due to wash sales and excise tax regulations.
As of period end, the cost and unrealized appreciation (depreciation) in securities, and derivatives if applicable, for federal income tax purposes were as follows:
| Gross unrealized appreciation | $31,418,614 |
| Gross unrealized depreciation | (2,838,184) |
| Net unrealized appreciation (depreciation) | $28,580,430 |
| Tax cost | $18,470,785 |
The Fund intended to elect to defer to its next fiscal year $137,099 of ordinary losses recognized during the period January 1, 2022 to November 30, 2022.
Delayed Delivery Transactions and When-Issued Securities. During the period, certain Funds transacted in securities on a delayed delivery or when-issued basis. Payment and delivery may take place after the customary settlement period for that security. The price of the underlying securities and the date when the securities will be delivered and paid for are fixed at the time the transaction is negotiated. Securities purchased on a delayed delivery or when-issued basis are identified as such in the Schedule of Investments. Compensation for interest forgone in the purchase of a delayed delivery or when-issued debt security may be received. With respect to purchase commitments, each applicable Fund identifies securities as segregated in its records with a value at least equal to the amount of the commitment. Payables and receivables associated with the purchases and sales of delayed delivery securities having the same coupon, settlement date and broker are offset. Delayed delivery or when-issued securities that have been purchased from and sold to different brokers are reflected as both payables and receivables in the Statement of Assets and Liabilities under the caption "Delayed delivery", as applicable. Losses may arise due to changes in the value of the underlying securities or if the counterparty does not perform under the contract's terms, or if the issuer does not issue the securities due to political, economic, or other factors.
Restricted Securities (including Private Placements). Funds may invest in securities that are subject to legal or contractual restrictions on resale. These securities generally may be resold in transactions exempt from registration or to the public if the securities are registered. Disposal of these securities may involve time-consuming negotiations and expense, and prompt sale at an acceptable price may be difficult. Information regarding restricted securities held at period end is included at the end of the Schedule of Investments, if applicable.
Consolidated Subsidiary. The Funds included in the table below hold certain investments through a wholly-owned subsidiary ("Subsidiary"), which may be subject to federal and state taxes upon disposition.
As of period end, investments in Subsidiaries were as follows:
| | $ Amount | % of Net Assets |
| Fidelity Growth Company Fund | 204,588 | .44 |
The financial statements have been consolidated to include the Subsidiary accounts where applicable. Accordingly, all inter-company transactions and balances have been eliminated.
At period end, any estimated tax liability for these investments is presented as "Deferred taxes" in the Statement of Assets and Liabilities and included in "Change in net unrealized appreciation (depreciation) on investment securities" in the Statement of Operations. The tax liability incurred may differ materially depending on conditions when these investments are disposed. Any cash held by a Subsidiary is restricted as to its use and is presented as "Restricted cash" in the Statement of Assets and Liabilities, if applicable.
New Accounting Pronouncement. In June 2022, the Financial Accounting Standards Board (FASB) issued Accounting Standards Update (ASU) 2022-03 Fair Value Measurement (Topic 820): Fair Value Measurement of Equity Securities Subject to Contractual Sale Restrictions. The amendments in this ASU clarify that a contractual restriction on the sale of an equity security is not considered part of the unit of account of the equity security and, therefore, is not considered in measuring fair value. They also clarify that an entity cannot, as a separate unit of account, recognize and measure a contractual sale restriction. They also require additional disclosures for equity securities subject to contractual sale restrictions. ASU 2022-03 will be effective for fiscal years, including interim periods within those fiscal years, beginning after December 15, 2023, and allows for early adoption. ASU 2022-03 will only be applicable to an equity security in which the contractual arrangement that restricts its sale is executed or modified on or after the adoption date. Management is currently evaluating the potential impact of ASU 2022-03 to the financial statements.
4. Purchases and Sales of Investments.
Purchases and sales of securities, other than short-term securities and in-kind transactions, as applicable, are noted in the table below.
| | Purchases ($) | Sales ($) |
| Fidelity Growth Company Fund | 2,322,326 | 3,478,217 |
Unaffiliated Redemptions In-Kind. Shares that were redeemed in-kind for investments, including accrued interest and cash, if any, are shown in the table below. The net realized gain or loss on investments delivered through in-kind redemptions is included in the "Net realized gain (loss) on: Redemptions in-kind" line in the accompanying Statement of Operations. The amount of the in-kind redemptions is included in share transactions in the accompanying Statement of Changes in Net Assets. There was no gain or loss for federal income tax purposes.
| | Shares | Total net realized gain or loss ($) | Total Proceeds ($) | Participating classes |
| Fidelity Growth Company Fund | 37,477 | 599,008 | 927,859 | Class K |
Prior Fiscal Year Unaffiliated Redemptions In-Kind. Shares that were redeemed in-kind for investments, including accrued interest and cash, if any, are shown in the table below; along with realized gain or loss on investments delivered through in-kind redemptions. The amount of the in-kind redemptions is included in share transactions in the accompanying Statement of Changes in Net Assets. There was no gain or loss for federal income tax purposes.
| | Shares | Total net realized gain or loss ($) | Total Proceeds ($) | Participating classes | |
| Fidelity Growth Company Fund | 94,219 | 1,682,202 | 2,666,231 | Growth Company and Class K | |
5. Fees and Other Transactions with Affiliates.
Management Fee. Fidelity Management & Research Company LLC (the investment adviser) and its affiliates provide the Fund with investment management related services for which the Fund pays a monthly management fee. The management fee is the sum of an individual fund fee rate that is based on an annual rate of .30% of the Fund's average net assets and an annualized group fee rate that averaged .23% during the period. The group fee rate is based upon the monthly average net assets of a group of registered investment companies with which the investment adviser has management contracts. The group fee rate decreases as assets under management increase and increases as assets under management decrease. In addition, the management fee is subject to a performance adjustment (up to a maximum of +/- .20% of the Fund's average net assets over a 36 month performance period). The upward or downward adjustment to the management fee is based on the relative investment performance of Growth Company as compared to its benchmark index, the Russell 3000 Growth Index, over the same 36 month performance period. For the reporting period, the total annualized management fee rate, including the performance adjustment, was .77% of the Fund's average net assets. The performance adjustment included in the management fee rate may be higher or lower than the maximum performance adjustment rate due to the difference between the average net assets for the reporting and performance periods.
Transfer Agent Fees. Fidelity Investments Institutional Operations Company LLC (FIIOC), an affiliate of the investment adviser, is the transfer, dividend disbursing and shareholder servicing agent for each class of the Fund. FIIOC receives account fees and asset-based fees that vary according to the account size and type of account of the shareholders of Growth Company, except for Class K. FIIOC receives an asset-based fee of Class K's average net assets. FIIOC pays for typesetting, printing and mailing of shareholder reports, except proxy statements.
For the period, transfer agent fees for each class were as follows:
| | Amount | % of Class-Level Average Net Assets A |
| Growth Company | $18,832 | .11 |
| Class K | 1,508 | .04 |
| | $20,340 | |
A Annualized
Accounting Fees. Fidelity Service Company, Inc. (FSC), an affiliate of the investment adviser, maintains the Fund's accounting records. The accounting fee is based on the level of average net assets for each month. For the period, the fees were equivalent to the following annualized rates:
| | % of Average Net Assets |
| Fidelity Growth Company Fund | - A |
A Amount represents less than .005%.
Brokerage Commissions. A portion of portfolio transactions were placed with brokerage firms which are affiliates of the investment adviser. Brokerage commissions are included in net realized gain (loss) and change in net unrealized appreciation (depreciation) in the Statement of Operations. The commissions paid to these affiliated firms were as follows:
| | Amount |
| Fidelity Growth Company Fund | $94 |
Interfund Lending Program. Pursuant to an Exemptive Order issued by the Securities and Exchange Commission (the SEC), the Fund, along with other registered investment companies having management contracts with Fidelity Management & Research Company LLC (FMR), or other affiliated entities of FMR, may participate in an interfund lending program. This program provides an alternative credit facility allowing the Fund to borrow from, or lend money to, other participating affiliated funds. At period end, there were no interfund loans outstanding. Activity in this program during the period for which loans were outstanding was as follows:
| | Borrower or Lender | Average Loan Balance | Weighted Average Interest Rate | Interest Expense |
| Fidelity Growth Company Fund | Borrower | $52,612 | 4.57% | $60 |
Interfund Trades. Funds may purchase from or sell securities to other Fidelity Funds under procedures adopted by the Board. The procedures have been designed to ensure these interfund trades are executed in accordance with Rule 17a-7 of the 1940 Act. Any interfund trades are included within the respective purchases and sales amounts shown in the Purchases and Sales of Investments note. Interfund trades during the period are noted in the table below.
| | Purchases ($) | Sales ($) | Realized Gain (Loss) ($) |
| Fidelity Growth Company Fund | 321,081 | 335,423 | 107,094 |
6. Committed Line of Credit.
Certain Funds participate with other funds managed by the investment adviser or an affiliate in a $4.25 billion credit facility (the "line of credit") to be utilized for temporary or emergency purposes to fund shareholder redemptions or for other short-term liquidity purposes. The participating funds have agreed to pay commitment fees on their pro-rata portion of the line of credit, which are reflected in Miscellaneous expenses on the Statement of Operations, and are listed below. During the period, there were no borrowings on this line of credit.
| | Amount |
| Fidelity Growth Company Fund | $41 |
7. Security Lending.
Funds lend portfolio securities from time to time in order to earn additional income. Lending agents are used, including National Financial Services (NFS), an affiliate of the investment adviser. Pursuant to a securities lending agreement, NFS will receive a fee, which is capped at 9.9% of a fund's daily lending revenue, for its services as lending agent. A fund may lend securities to certain qualified borrowers, including NFS. On the settlement date of the loan, a fund receives collateral (in the form of U.S. Treasury obligations, letters of credit and/or cash) against the loaned securities and maintains collateral in an amount not less than 100% of the market value of the loaned securities during the period of the loan. The market value of the loaned securities is determined at the close of business of a fund and any additional required collateral is delivered to a fund on the next business day. A fund or borrower may terminate the loan at any time, and if the borrower defaults on its obligation to return the securities loaned because of insolvency or other reasons, a fund may apply collateral received from the borrower against the obligation. A fund may experience delays and costs in recovering the securities loaned. Any cash collateral received is invested in the Fidelity Securities Lending Cash Central Fund. Any loaned securities are identified as such in the Schedule of Investments, and the value of loaned securities and cash collateral at period end, as applicable, are presented in the Statement of Assets and Liabilities. Security lending income represents the income earned on investing cash collateral, less rebates paid to borrowers and any lending agent fees associated with the loan, plus any premium payments received for lending certain types of securities. Security lending income is presented in the Statement of Operations as a component of income from Fidelity Central Funds. Affiliated security lending activity, if any, was as follows:
| | Total Security Lending Fees Paid to NFS | Security Lending Income From Securities Loaned to NFS | Value of Securities Loaned to NFS at Period End |
| Fidelity Growth Company Fund | $122 | $46 | $6,113 |
8. Expense Reductions.
Through arrangements with the Fund's custodian, credits realized as a result of certain uninvested cash balances were used to reduce the Fund's expenses. During the period, custodian credits reduced the Fund's expenses by $5.
In addition, during the period the investment adviser or an affiliate reimbursed and/or waived a portion of fund-level operating expenses in the amount of $954.
9. Distributions to Shareholders.
Distributions to shareholders of each class were as follows:
| | Six months ended May 31, 2023 | Year ended November 30, 2022 |
| Fidelity Growth Company Fund | | |
| Distributions to shareholders | | |
| Growth Company | $2,142,375 | $4,986,906 |
| Class K | 458,579 | 1,446,441 |
Total | $2,600,954 | $6,433,347 |
10. Share Transactions.
Share transactions for each class were as follows and may contain in-kind transactions, automatic conversions between classes or exchanges between affiliated funds:
| | Shares | Shares | Dollars | Dollars |
| | Six months ended May 31, 2023 | Year ended November 30, 2022 | Six months ended May 31, 2023 | Year ended November 30, 2022 |
| Fidelity Growth Company Fund | | | | |
| Growth Company | | | | |
| Shares sold | 57,481 | 159,105 | $1,427,986 | $4,503,361 |
| Reinvestment of distributions | 88,689 | 123,271 | 1,971,548 | 4,540,077 |
| Shares redeemed | (84,619) | (253,813) | (2,103,313) | (7,313,072) |
| Net increase (decrease) | 61,551 | 28,563 | $1,296,221 | $1,730,366 |
| Class K | | | | |
| Shares sold | 19,518 | 40,502 | $497,495 | $1,203,828 |
| Reinvestment of distributions | 20,509 | 39,098 | 458,166 | 1,445,449 |
| Shares redeemed | (69,992) | (168,994) | (1,759,610) | (4,961,474) |
| Net increase (decrease) | (29,965) | (89,394) | $(803,949) | $(2,312,197) |
11. Other.
A fund's organizational documents provide former and current trustees and officers with a limited indemnification against liabilities arising in connection with the performance of their duties to the fund. In the normal course of business, a fund may also enter into contracts that provide general indemnifications. A fund's maximum exposure under these arrangements is unknown as this would be dependent on future claims that may be made against a fund. The risk of material loss from such claims is considered remote.
At the end of the period, the following mutual funds managed by the investment adviser or its affiliates were the owners of record of 10% or more of the total outstanding shares.
| | Strategic Advisers Fidelity U.S. Total Stock Fund |
| Fidelity Growth Company Fund | 17% |
Mutual funds managed by the investment adviser or its affiliates, in aggregate, were the owners of record of more than 20% of the total outstanding shares.
| Fund | % of shares held |
| Fidelity Growth Company Fund | 23% |
12. Risk and Uncertainties.
Many factors affect a fund's performance. Developments that disrupt global economies and financial markets, such as pandemics, epidemics, outbreaks of infectious diseases, war, terrorism, and environmental disasters, may significantly affect a fund's investment performance. The effects of these developments to a fund will be impacted by the types of securities in which a fund invests, the financial condition, industry, economic sector, and geographic location of an issuer, and a fund's level of investment in the securities of that issuer. Significant concentrations in security types, issuers, industries, sectors, and geographic locations may magnify the factors that affect a fund's performance.
As a shareholder, you incur two types of costs: (1) transaction costs, which may include sales charges (loads) on purchase payments or redemption proceeds, as applicable and (2) ongoing costs, which generally include management fees, distribution and/or service (12b-1) fees and other Fund expenses. This Example is intended to help you understand your ongoing costs (in dollars) of investing in a fund and to compare these costs with the ongoing costs of investing in other mutual funds.
| The Example is based on an investment of $1,000 invested at the beginning of the period and held for the entire period (December 1, 2022 to May 31, 2023). |
Actual Expenses
The first line of the accompanying table provides information about actual account values and actual expenses. You may use the information in this line, together with the amount you invested, to estimate the expenses that you paid over the period. Simply divide your account value by $1,000.00 (for example, an $8,600 account value divided by $1,000.00 = 8.6), then multiply the result by the number in the first line for a class/Fund under the heading entitled "Expenses Paid During Period" to estimate the expenses you paid on your account during this period. If any fund is a shareholder of any underlying mutual funds or exchange-traded funds (ETFs) (the Underlying Funds), such fund indirectly bears its proportional share of the expenses of the Underlying Funds in addition to the direct expenses incurred presented in the table. These fees and expenses are not included in the annualized expense ratio used to calculate the expense estimate in the table below.
Hypothetical Example for Comparison Purposes
The second line of the accompanying table provides information about hypothetical account values and hypothetical expenses based on the actual expense ratio and an assumed rate of return of 5% per year before expenses, which is not the actual return. The hypothetical account values and expenses may not be used to estimate the actual ending account balance or expenses you paid for the period. You may use this information to compare the ongoing costs of investing in the Fund and other funds. To do so, compare this 5% hypothetical example with the 5% hypothetical examples that appear in the shareholder reports of the other funds. If any fund is a shareholder of any Underlying Funds, such fund indirectly bears its proportional share of the expenses of the Underlying Funds in addition to the direct expenses as presented in the table. These fees and expenses are not included in the annualized expense ratio used to calculate the expense estimate in the table below.
Please note that the expenses shown in the table are meant to highlight your ongoing costs only and do not reflect any transaction costs. Therefore, the second line of the table is useful in comparing ongoing costs only, and will not help you determine the relative total costs of owning different funds. In addition, if these transactional costs were included, your costs would have been higher.
| | | | | Annualized Expense Ratio- A | | Beginning Account Value December 1, 2022 | | Ending Account Value May 31, 2023 | | Expenses Paid During Period- C December 1, 2022 to May 31, 2023 |
| Fidelity® Growth Company Fund | | | | | | | | | | |
| Fidelity® Growth Company Fund | | | | .88% | | | | | | |
| Actual | | | | | | $ 1,000 | | $ 1,151.50 | | $ 4.72 |
Hypothetical- B | | | | | | $ 1,000 | | $ 1,020.54 | | $ 4.43 |
| Class K | | | | .82% | | | | | | |
| Actual | | | | | | $ 1,000 | | $ 1,151.60 | | $ 4.40 |
Hypothetical- B | | | | | | $ 1,000 | | $ 1,020.84 | | $ 4.13 |
| |
A Annualized expense ratio reflects expenses net of applicable fee waivers.
B 5% return per year before expenses
C Expenses are equal to the annualized expense ratio, multiplied by the average account value over the period, multiplied by 182/ 365 (to reflect the one-half year period). The fees and expenses of any Underlying Funds are not included in each annualized expense ratio.
Board Approval of Investment Advisory Contracts
Fidelity Growth Company Fund
At its May 2023 meeting, the Board of Trustees, including the Independent Trustees (together, the Board), voted to continue the management contract with Fidelity Management & Research Company LLC (FMR), and the sub-advisory agreements and sub-subadvisory agreements, in each case, where applicable (together, the Advisory Contracts) for the fund for two months from June 1, 2023 through July 31, 2023. The Board determined that it will consider the annual renewal of the fund's Advisory Contracts for a full one year period in July 2023, following its review of additional materials provided by FMR.
The Board considered that the approval of the fund's Advisory Contracts will not result in any changes in (i) the investment process or strategies employed in the management of the fund's assets; (ii) the fees and expenses paid by shareholders; (iii) the nature, extent or quality of services provided under the fund's Advisory Contracts; or (iv) the day-to-day management of the fund or the persons primarily responsible for such management. The Board also considered that since its last approval of the fund's Advisory Contracts, FMR had provided additional information on the fund in support of the annual contract renewal process, including competitive analyses on total expenses and management fees and in-depth reviews of fund performance and fund profitability information. The Board concluded that the fund's Advisory Contracts are fair and reasonable, and that the fund's Advisory Contracts should be renewed, without modification, through July 31, 2023, with the understanding that the Board will consider the annual renewal for a full one year period in July 2023.
In connection with its consideration of future renewals of the fund's Advisory Contracts, the Board will consider: (i) the nature, extent and quality of services provided to the fund, including shareholder and administrative services and investment performance; (ii) the competitiveness of the management fee and total expenses for the fund; (iii) the costs of the services and profitability, including the revenues earned and the expenses incurred in conducting the business of developing, marketing, distributing, managing, administering, and servicing the fund and its shareholders, to the extent applicable; and (iv) whether there have been economies of scale in respect of the Fidelity funds, whether the Fidelity funds (including the fund) have appropriately benefited from any such economies of scale, and whether there is the potential for realization of any further economies.
Based on its evaluation of all of the conclusions noted above, and after considering all factors it believed relevant, the Board ultimately concluded that the fund's management fee structure is fair and reasonable, and that the continuation of the fund's Advisory Contracts should be approved for two months from June 1, 2023 through July 31, 2023.
The Securities and Exchange Commission adopted Rule 22e-4 under the Investment Company Act of 1940 (the Liquidity Rule) to promote effective liquidity risk management throughout the open-end investment company industry, thereby reducing the risk that funds will be unable to meet their redemption obligations and mitigating dilution of the interests of fund shareholders.
The Fund has adopted and implemented a liquidity risk management program (the Program) reasonably designed to assess and manage the Fund's liquidity risk and to comply with the requirements of the Liquidity Rule. The Fund's Board of Trustees (the Board) has designated the Fund's investment adviser as administrator of the Program. The Fidelity advisers have established a Liquidity Risk Management Committee (the LRM Committee) to manage the Program for each of the Fidelity Funds. The LRM Committee monitors the adequacy and effectiveness of implementation of the Program and on a periodic basis assesses each Fund's liquidity risk based on a variety of factors including (1) the Fund's investment strategy, (2) portfolio liquidity and cash flow projections during normal and reasonably foreseeable stressed conditions, (3) shareholder redemptions, (4) borrowings and other funding sources and (5) certain factors specific to ETFs including the effect of the Fund's prices and spreads, market participants, and basket compositions on the overall liquidity of the Fund's portfolio, as applicable.
In accordance with the Program, each of the Fund's portfolio investments is classified into one of four defined liquidity categories based on a determination of a reasonable expectation for how long it would take to convert the investment to cash (or sell or dispose of the investment) without significantly changing its market value.
- Highly liquid investments - cash or convertible to cash within three business days or less
- Moderately liquid investments - convertible to cash in three to seven calendar days
- Less liquid investments - can be sold or disposed of, but not settled, within seven calendar days
- Illiquid investments - cannot be sold or disposed of within seven calendar days
Liquidity classification determinations take into account a variety of factors including various market, trading and investment-specific considerations, as well as market depth, and generally utilize analysis from a third-party liquidity metrics service.
The Liquidity Rule places a 15% limit on a fund's illiquid investments and requires funds that do not primarily hold assets that are highly liquid investments to determine and maintain a minimum percentage of the fund's net assets to be invested in highly liquid investments (highly liquid investment minimum or HLIM). The Program includes provisions reasonably designed to comply with the 15% limit on illiquid investments and for determining, periodically reviewing and complying with the HLIM requirement as applicable.
At a recent meeting of the Fund's Board of Trustees, the LRM Committee provided a written report to the Board pertaining to the operation, adequacy, and effectiveness of the Program for the period December 1, 2021 through November 30, 2022. The report concluded that the Program is operating effectively and is reasonably designed to assess and manage the Fund's liquidity risk.
| A special meeting of shareholders was held on April 19, 2023. The results of votes taken among shareholders on the proposal before them are reported below. Each vote reported represents one dollar of net asset value held on the record date for the meeting. |
| Proposal 1 |
| To reclassify the diversification status of the fund from diversified to non-diversified by eliminating the following fundamental policy: The fund may not with respect to 75% of fund's total assets, purchase the securities of any issuer (other than securities issued or guaranteed by the U.S. Government or any of its agencies or instrumentalities, or securities of other investment companies) if, as a result, (a) more than 5% of fund's total assets would be invested in the securities of that issuer, or (b) the fund would hold more than 10% of outstanding voting securities of issuer. |
| | # of Votes | % of Votes |
| Affirmative | 22,429,549,752.490 | 84.230 |
| Against | 3,153,408,865.270 | 11.840 |
| Abstain | 1,046,057,621.270 | 3.930 |
| TOTAL | 26,629,016,239.030 | 100.000 |
| | | |
1.704741.125
GCF-SANN-0723
Fidelity® Growth Company K6 Fund
Semi-Annual Report
May 31, 2023
Contents
To view a fund's proxy voting guidelines and proxy voting record for the 12-month period ended June 30, visit http://www.fidelity.com/proxyvotingresults or visit the Securities and Exchange Commission's (SEC) web site at http://www.sec.gov.
You may also call 1-800-835-5092 to request a free copy of the proxy voting guidelines.
Standard & Poor's, S&P and S&P 500 are registered service marks of The McGraw-Hill Companies, Inc. and have been licensed for use by Fidelity Distributors Corporation.
Other third-party marks appearing herein are the property of their respective owners.
All other marks appearing herein are registered or unregistered trademarks or service marks of FMR LLC or an affiliated company. © 2023 FMR LLC. All rights reserved.
This report and the financial statements contained herein are submitted for the general information of the shareholders of the Fund. This report is not authorized for distribution to prospective investors in the Fund unless preceded or accompanied by an effective prospectus.
A fund files its complete schedule of portfolio holdings with the SEC for the first and third quarters of each fiscal year on Form N-PORT. Forms N-PORT are available on the SEC's web site at http://www.sec.gov. A fund's Forms N-PORT may be reviewed and copied at the SEC's Public Reference Room in Washington, DC. Information regarding the operation of the SEC's Public Reference Room may be obtained by calling 1-800-SEC-0330.
For a complete list of a fund's portfolio holdings, view the most recent holdings listing, semiannual report, or annual report on Fidelity's web site at http://www.fidelity.com, http://www.institutional.fidelity.com, or http://www.401k.com, as applicable.
NOT FDIC INSURED •MAY LOSE VALUE •NO BANK GUARANTEE
Neither the Fund nor Fidelity Distributors Corporation is a bank.
Top Holdings (% of Fund's net assets) |
| |
| NVIDIA Corp. | 13.0 | |
| Apple, Inc. | 9.2 | |
| Microsoft Corp. | 6.1 | |
| Amazon.com, Inc. | 5.4 | |
| Alphabet, Inc. Class A | 3.9 | |
| lululemon athletica, Inc. | 3.4 | |
| Salesforce, Inc. | 1.8 | |
| Tesla, Inc. | 1.6 | |
| Oracle Corp. | 1.6 | |
| Alphabet, Inc. Class C | 1.5 | |
| | 47.5 | |
| |
| Market Sectors (% of Fund's net assets) |
| |
| Information Technology | 43.0 | |
| Consumer Discretionary | 18.3 | |
| Health Care | 16.0 | |
| Communication Services | 7.6 | |
| Industrials | 4.4 | |
| Consumer Staples | 3.7 | |
| Financials | 3.5 | |
| Energy | 1.7 | |
| Materials | 1.0 | |
| Real Estate | 0.2 | |
| Utilities | 0.1 | |
| |
Asset Allocation (% of Fund's net assets) |
|
|
Showing Percentage of Net Assets
| Common Stocks - 98.2% |
| | | Shares | Value ($) |
| COMMUNICATION SERVICES - 7.5% | | | |
| Diversified Telecommunication Services - 0.0% | | | |
| Verizon Communications, Inc. | | 8,592 | 306,133 |
| Entertainment - 0.8% | | | |
| Netflix, Inc. (a) | | 254,488 | 100,581,292 |
| Roblox Corp. (a) | | 19,917 | 833,726 |
| Roku, Inc. Class A (a) | | 150,958 | 8,785,756 |
| The Walt Disney Co. (a) | | 58,467 | 5,142,757 |
| | | | 115,343,531 |
| Interactive Media & Services - 6.2% | | | |
| Alphabet, Inc.: | | | |
| Class A (a) | | 4,505,269 | 553,562,402 |
| Class C (a) | | 1,725,574 | 212,884,064 |
| Epic Games, Inc. (a)(b)(c) | | 5,000 | 3,519,800 |
| Meta Platforms, Inc. Class A (a) | | 389,792 | 103,185,738 |
| Snap, Inc. Class A (a) | | 704,513 | 7,186,033 |
| | | | 880,338,037 |
| Media - 0.0% | | | |
| Comcast Corp. Class A | | 27,662 | 1,088,500 |
| The Trade Desk, Inc. (a) | | 25,735 | 1,803,509 |
| | | | 2,892,009 |
| Wireless Telecommunication Services - 0.5% | | | |
| T-Mobile U.S., Inc. (a) | | 539,788 | 74,085,903 |
TOTAL COMMUNICATION SERVICES | | | 1,072,965,613 |
| CONSUMER DISCRETIONARY - 18.2% | | | |
| Automobile Components - 0.0% | | | |
| Mobileye Global, Inc. (d) | | 104,719 | 4,667,326 |
| Automobiles - 1.9% | | | |
| Rad Power Bikes, Inc. (a)(b)(c) | | 171,416 | 359,974 |
| Rivian Automotive, Inc. (a)(d) | | 2,202,142 | 32,437,552 |
| Tesla, Inc. (a) | | 1,137,805 | 232,032,574 |
| | | | 264,830,100 |
| Broadline Retail - 5.9% | | | |
| Alibaba Group Holding Ltd. sponsored ADR (a) | | 138,648 | 11,029,448 |
| Amazon.com, Inc. (a) | | 6,405,064 | 772,322,617 |
| Etsy, Inc. (a) | | 32,416 | 2,627,317 |
| Ollie's Bargain Outlet Holdings, Inc. (a) | | 775,841 | 42,764,356 |
| Ozon Holdings PLC ADR (a)(c)(d) | | 6,684 | 57,482 |
| PDD Holdings, Inc. ADR (a) | | 46,983 | 3,068,930 |
| Vipshop Holdings Ltd. ADR (a) | | 359,147 | 5,142,985 |
| | | | 837,013,135 |
| Hotels, Restaurants & Leisure - 1.5% | | | |
| Airbnb, Inc. Class A (a) | | 78,630 | 8,631,215 |
| Booking Holdings, Inc. (a) | | 31,505 | 79,038,799 |
| Chipotle Mexican Grill, Inc. (a) | | 13,999 | 29,068,784 |
| Dutch Bros, Inc. (a)(d) | | 54,552 | 1,547,095 |
| Expedia, Inc. (a) | | 101,248 | 9,690,446 |
| Marriott International, Inc. Class A | | 124,444 | 20,880,459 |
| McDonald's Corp. | | 910 | 259,450 |
| Penn Entertainment, Inc. (a) | | 812,128 | 20,335,685 |
| Shake Shack, Inc. Class A (a) | | 19,902 | 1,316,915 |
| Sonder Holdings, Inc.: | | | |
| rights (a)(c) | | 5,104 | 357 |
| rights (a)(c) | | 5,104 | 255 |
| rights (a)(c) | | 5,104 | 204 |
| rights (a)(c) | | 5,104 | 153 |
| rights (a)(c) | | 5,103 | 102 |
| rights (a)(c) | | 5,102 | 102 |
| Starbucks Corp. | | 199,108 | 19,440,905 |
| Sweetgreen, Inc. Class A (a) | | 441,758 | 4,209,954 |
| Trip.com Group Ltd. ADR (a) | | 268,480 | 8,478,598 |
| Yum China Holdings, Inc. | | 212,154 | 11,978,215 |
| Zomato Ltd. (a) | | 2,105,200 | 1,757,940 |
| | | | 216,635,633 |
| Household Durables - 0.4% | | | |
| Lennar Corp. Class A | | 503,683 | 53,954,523 |
| PulteGroup, Inc. | | 190 | 12,555 |
| Purple Innovation, Inc. (d) | | 1,290,602 | 4,465,483 |
| Toll Brothers, Inc. | | 40,912 | 2,769,742 |
| | | | 61,202,303 |
| Specialty Retail - 2.8% | | | |
| Fanatics, Inc. Class A (a)(b)(c) | | 204,775 | 14,754,039 |
| Farfetch Ltd. Class A (a)(d) | | 270,300 | 1,332,579 |
| Five Below, Inc. (a) | | 79,303 | 13,681,354 |
| Floor & Decor Holdings, Inc. Class A (a)(d) | | 93,215 | 8,511,462 |
| Lowe's Companies, Inc. | | 432,677 | 87,024,325 |
| Revolve Group, Inc. (a)(d) | | 594,584 | 9,049,568 |
| RH (a) | | 45,073 | 11,041,984 |
| Ross Stores, Inc. | | 127,369 | 13,197,976 |
| RumbleON, Inc. Class B (a)(d) | | 200,450 | 2,188,914 |
| The Home Depot, Inc. | | 326,363 | 92,507,592 |
| TJX Companies, Inc. | | 1,330,477 | 102,167,329 |
| Tractor Supply Co. | | 2,400 | 503,016 |
| Wayfair LLC Class A (a)(d) | | 1,094,343 | 44,123,910 |
| | | | 400,084,048 |
| Textiles, Apparel & Luxury Goods - 5.7% | | | |
| Canada Goose Holdings, Inc. (a)(d) | | 457,389 | 7,281,161 |
| Crocs, Inc. (a) | | 180,453 | 20,261,263 |
| Deckers Outdoor Corp. (a) | | 199,857 | 94,932,075 |
| Li Ning Co. Ltd. | | 482,180 | 2,586,257 |
| lululemon athletica, Inc. (a) | | 1,480,327 | 491,364,941 |
| NIKE, Inc. Class B | | 405,091 | 42,639,879 |
| On Holding AG (a) | | 1,592,489 | 43,713,823 |
| Skechers U.S.A., Inc. Class A (sub. vtg.) (a) | | 2,141,154 | 109,991,081 |
| | | | 812,770,480 |
TOTAL CONSUMER DISCRETIONARY | | | 2,597,203,025 |
| CONSUMER STAPLES - 3.7% | | | |
| Beverages - 1.5% | | | |
| Celsius Holdings, Inc. (a) | | 158,787 | 19,932,532 |
| Constellation Brands, Inc. Class A (sub. vtg.) | | 9,986 | 2,426,298 |
| Keurig Dr. Pepper, Inc. | | 598,303 | 18,619,189 |
| Monster Beverage Corp. | | 836,593 | 49,041,082 |
| PepsiCo, Inc. | | 242,159 | 44,157,694 |
| The Coca-Cola Co. | | 1,376,776 | 82,138,456 |
| | | | 216,315,251 |
| Consumer Staples Distribution & Retail - 1.0% | | | |
| Costco Wholesale Corp. | | 117,084 | 59,895,491 |
| Dollar General Corp. | | 115,821 | 23,290,445 |
| Dollar Tree, Inc. (a) | | 115,289 | 15,550,180 |
| Kroger Co. | | 224,296 | 10,167,338 |
| Performance Food Group Co. (a) | | 16,490 | 911,732 |
| Sysco Corp. | | 150,593 | 10,533,980 |
| Target Corp. | | 91,213 | 11,942,518 |
| Walmart, Inc. | | 90,810 | 13,337,265 |
| | | | 145,628,949 |
| Food Products - 0.4% | | | |
| Bunge Ltd. | | 164,059 | 15,198,426 |
| Kellogg Co. | | 134,683 | 8,992,784 |
| Mondelez International, Inc. | | 101,252 | 7,432,909 |
| The Hershey Co. | | 76,845 | 19,956,647 |
| The Real Good Food Co. LLC: | | | |
| Class B (a)(c) | | 149,688 | 2 |
| Class B unit (e) | | 149,688 | 528,399 |
| The Real Good Food Co., Inc. (a) | | 17,974 | 63,448 |
| | | | 52,172,615 |
| Household Products - 0.3% | | | |
| Church & Dwight Co., Inc. | | 62,700 | 5,796,615 |
| Colgate-Palmolive Co. | | 138,271 | 10,284,597 |
| Procter & Gamble Co. | | 233,635 | 33,292,988 |
| The Clorox Co. | | 3,400 | 537,812 |
| | | | 49,912,012 |
| Personal Care Products - 0.1% | | | |
| Kenvue, Inc. | | 144,500 | 3,625,505 |
| Olaplex Holdings, Inc. (a) | | 1,720,660 | 5,437,286 |
| The Beauty Health Co. (a)(b) | | 428,643 | 3,446,290 |
| The Beauty Health Co. (a)(d) | | 400,276 | 3,218,219 |
| | | | 15,727,300 |
| Tobacco - 0.4% | | | |
| Philip Morris International, Inc. | | 585,761 | 52,724,348 |
TOTAL CONSUMER STAPLES | | | 532,480,475 |
| ENERGY - 1.7% | | | |
| Energy Equipment & Services - 0.2% | | | |
| Baker Hughes Co. Class A | | 322,462 | 8,787,090 |
| Halliburton Co. | | 814,979 | 23,349,148 |
| Schlumberger Ltd. | | 108,664 | 4,654,079 |
| | | | 36,790,317 |
| Oil, Gas & Consumable Fuels - 1.5% | | | |
| Cameco Corp. (d) | | 608,949 | 16,953,140 |
| Devon Energy Corp. | | 64,747 | 2,984,837 |
| EOG Resources, Inc. | | 145,866 | 15,649,963 |
| EQT Corp. | | 144,401 | 5,020,823 |
| Hess Corp. | | 840,008 | 106,403,813 |
| Range Resources Corp. | | 1,200,871 | 32,867,839 |
| Reliance Industries Ltd. | | 768,646 | 22,958,988 |
| Valero Energy Corp. | | 61,111 | 6,541,321 |
| | | | 209,380,724 |
TOTAL ENERGY | | | 246,171,041 |
| FINANCIALS - 3.4% | | | |
| Banks - 0.5% | | | |
| Bank of America Corp. | | 878,663 | 24,418,045 |
| HDFC Bank Ltd. sponsored ADR | | 423,311 | 27,261,228 |
| JPMorgan Chase & Co. | | 121,484 | 16,486,594 |
| Wells Fargo & Co. | | 116,759 | 4,648,176 |
| | | | 72,814,043 |
| Capital Markets - 0.3% | | | |
| BlackRock, Inc. Class A | | 44,679 | 29,378,676 |
| Charles Schwab Corp. | | 357,005 | 18,810,593 |
| | | | 48,189,269 |
| Financial Services - 2.6% | | | |
| Block, Inc. Class A (a) | | 55,341 | 3,342,043 |
| MasterCard, Inc. Class A | | 399,834 | 145,947,407 |
| PayPal Holdings, Inc. (a) | | 161,659 | 10,021,241 |
| Saluda Medical, Inc. warrants 1/20/27 (a)(b)(c) | | 23,230 | 59,933 |
| Toast, Inc. (a)(d) | | 1,768,310 | 37,081,461 |
| Visa, Inc. Class A | | 757,286 | 167,382,925 |
| | | | 363,835,010 |
TOTAL FINANCIALS | | | 484,838,322 |
| HEALTH CARE - 15.4% | | | |
| Biotechnology - 8.1% | | | |
| 4D Pharma PLC (a)(c)(d) | | 1,031,336 | 213,736 |
| AbbVie, Inc. | | 139,107 | 19,191,202 |
| Absci Corp. (a) | | 1,383,493 | 2,628,637 |
| ACADIA Pharmaceuticals, Inc. (a) | | 746,443 | 17,541,411 |
| Acelyrin, Inc. (a) | | 144,800 | 2,620,880 |
| Akouos, Inc. (CVR) (c) | | 338,256 | 260,457 |
| Alector, Inc. (a) | | 585,328 | 4,354,840 |
| Allovir, Inc. (a)(d) | | 729,621 | 2,750,671 |
| Alnylam Pharmaceuticals, Inc. (a) | | 666,136 | 123,241,821 |
| Ambrx Biopharma, Inc. ADR (a) | | 167 | 2,465 |
| Amgen, Inc. | | 128,272 | 28,303,217 |
| Apellis Pharmaceuticals, Inc. (a) | | 75,370 | 6,470,515 |
| Arcutis Biotherapeutics, Inc. (a) | | 117,039 | 878,963 |
| Argenx SE ADR (a) | | 218,122 | 84,784,021 |
| Arrowhead Pharmaceuticals, Inc. (a) | | 48,725 | 1,676,627 |
| Ars Pharmaceuticals, Inc. (a) | | 402,549 | 2,801,741 |
| Ascendis Pharma A/S sponsored ADR (a) | | 15,846 | 1,378,127 |
| aTyr Pharma, Inc. (a) | | 687,021 | 1,559,538 |
| Avidity Biosciences, Inc. (a) | | 536,809 | 5,700,912 |
| Axcella Health, Inc. (a)(d) | | 1,045,116 | 409,476 |
| Beam Therapeutics, Inc. (a)(d) | | 270,560 | 8,630,864 |
| BeiGene Ltd. ADR (a)(d) | | 166,363 | 36,754,578 |
| Biomea Fusion, Inc. (a) | | 585,679 | 19,889,659 |
| BioNTech SE ADR | | 30,715 | 3,227,532 |
| BioXcel Therapeutics, Inc. (a)(d) | | 463,100 | 8,308,014 |
| Calyxt, Inc. (a) | | 8,652 | 54,508 |
| Caris Life Sciences, Inc. (b)(c) | | 362,791 | 2,031,630 |
| Century Therapeutics, Inc. (a) | | 682,629 | 2,170,760 |
| Cerevel Therapeutics Holdings (a) | | 1,829,327 | 59,636,060 |
| Codiak Biosciences, Inc. warrants 9/15/27 (a) | | 95,000 | 1 |
| CRISPR Therapeutics AG (a)(d) | | 223,990 | 14,344,320 |
| Cyclerion Therapeutics, Inc. (a) | | 10,061 | 43,765 |
| Day One Biopharmaceuticals, Inc. (a) | | 308,798 | 4,107,013 |
| Denali Therapeutics, Inc. (a) | | 100,669 | 3,042,217 |
| Disc Medicine, Inc. rights (a)(c) | | 50,893 | 1 |
| EQRx, Inc. (a)(d) | | 2,666,944 | 4,693,821 |
| EQRx, Inc.: | | | |
| rights (a)(c) | | 65,872 | 20,420 |
| rights (a)(c) | | 28,231 | 5,364 |
| Evelo Biosciences, Inc. (a)(d) | | 594,216 | 81,110 |
| Foghorn Therapeutics, Inc. (a)(d) | | 287,171 | 1,806,306 |
| Generation Bio Co. (a) | | 597,344 | 2,090,704 |
| Geron Corp. (a) | | 627,975 | 2,053,478 |
| Icosavax, Inc. (a) | | 1,510 | 15,160 |
| Idorsia Ltd. (a)(d) | | 163,543 | 1,338,691 |
| Immunocore Holdings PLC ADR (a) | | 43,072 | 2,376,713 |
| ImmunoGen, Inc. (a) | | 430,600 | 5,873,384 |
| Immunovant, Inc. (a) | | 547,874 | 11,510,833 |
| Inhibrx, Inc. (a)(d) | | 150,752 | 3,566,792 |
| Invivyd, Inc. (a)(d) | | 921,282 | 1,658,308 |
| Ionis Pharmaceuticals, Inc. (a)(d) | | 2,177,010 | 89,039,709 |
| Janux Therapeutics, Inc. (a) | | 149,843 | 1,741,176 |
| Karuna Therapeutics, Inc. (a) | | 387,953 | 87,890,752 |
| Kineta, Inc. | | 5,211 | 15,685 |
| Legend Biotech Corp. ADR (a) | | 657,640 | 42,200,759 |
| Lexicon Pharmaceuticals, Inc. (a) | | 471,472 | 1,555,858 |
| Lyell Immunopharma, Inc. (a)(d) | | 332,538 | 1,060,796 |
| Madrigal Pharmaceuticals, Inc. (a) | | 4,000 | 1,113,640 |
| Magenta Therapeutics, Inc. (c)(f) | | 346,245 | 1,551,178 |
| Moderna, Inc. (a) | | 267,354 | 34,143,779 |
| Monte Rosa Therapeutics, Inc. (a) | | 312,481 | 2,306,110 |
| Moonlake Immunotherapeutics (a)(d) | | 2,700 | 73,467 |
| Morphic Holding, Inc. (a) | | 360,557 | 20,732,028 |
| Nuvalent, Inc. Class A (a) | | 468,369 | 19,718,335 |
| Omega Therapeutics, Inc. (a) | | 665,033 | 5,047,600 |
| ORIC Pharmaceuticals, Inc. (a) | | 270,098 | 1,361,294 |
| Poseida Therapeutics, Inc. (a) | | 736,765 | 1,672,457 |
| Protagonist Therapeutics, Inc. (a) | | 3,506 | 91,401 |
| Prothena Corp. PLC (a) | | 673,659 | 44,751,167 |
| PTC Therapeutics, Inc. (a) | | 371,264 | 15,581,950 |
| RAPT Therapeutics, Inc. (a) | | 264,381 | 5,295,551 |
| Recursion Pharmaceuticals, Inc. (a)(d) | | 673,262 | 5,904,508 |
| Regeneron Pharmaceuticals, Inc. (a) | | 87,810 | 64,589,524 |
| Relay Therapeutics, Inc. (a)(d) | | 314,267 | 3,500,934 |
| Roivant Sciences Ltd. (a) | | 2,854,252 | 25,945,151 |
| Sage Therapeutics, Inc. (a) | | 855,144 | 42,329,628 |
| Sana Biotechnology, Inc. (a)(d) | | 505,878 | 3,045,386 |
| Scholar Rock Holding Corp. (a) | | 450,011 | 2,619,064 |
| Scholar Rock Holding Corp. warrants 12/31/25 (a)(b) | | 39,325 | 61,471 |
| Seres Therapeutics, Inc. (a)(d) | | 1,917,803 | 9,493,125 |
| Shattuck Labs, Inc. (a) | | 322,243 | 841,054 |
| Sigilon Therapeutics, Inc. (a) | | 8,839 | 37,124 |
| SpringWorks Therapeutics, Inc. (b) | | 113,900 | 2,806,724 |
| SpringWorks Therapeutics, Inc. (a)(d) | | 811,529 | 22,219,664 |
| Synlogic, Inc. (a) | | 639,040 | 335,496 |
| Tango Therapeutics, Inc. (a) | | 409,889 | 1,106,700 |
| Taysha Gene Therapies, Inc. (a) | | 178,669 | 124,872 |
| TG Therapeutics, Inc. (a) | | 484,338 | 12,897,921 |
| Tyra Biosciences, Inc. (a) | | 46,685 | 675,532 |
| uniQure B.V. (a) | | 110,724 | 2,135,866 |
| UNITY Biotechnology, Inc. warrants 8/22/27 (a) | | 664,077 | 31,698 |
| Vaxcyte, Inc. (a) | | 312,215 | 15,460,887 |
| Vera Therapeutics, Inc. (a) | | 227,996 | 1,903,767 |
| Vertex Pharmaceuticals, Inc. (a) | | 68,837 | 22,273,588 |
| Verve Therapeutics, Inc. (a)(d) | | 138,552 | 2,144,785 |
| Viking Therapeutics, Inc. (a) | | 1,002,975 | 22,025,331 |
| Vor Biopharma, Inc. (a) | | 517,426 | 2,431,902 |
| Zai Lab Ltd. ADR (a) | | 144,151 | 4,683,466 |
| Zentalis Pharmaceuticals, Inc. (a) | | 204,367 | 5,321,717 |
| | | | 1,159,992,840 |
| Health Care Equipment & Supplies - 3.0% | | | |
| Abbott Laboratories | | 15,648 | 1,596,096 |
| Blink Health LLC Series A1 (a)(b)(c) | | 65,933 | 3,157,531 |
| Boston Scientific Corp. (a) | | 10,100 | 519,948 |
| DexCom, Inc. (a) | | 317,160 | 37,190,182 |
| Figs, Inc. Class A (a) | | 124,819 | 1,028,509 |
| Inspire Medical Systems, Inc. (a) | | 7,300 | 2,135,177 |
| Insulet Corp. (a) | | 522,904 | 143,406,422 |
| Intuitive Surgical, Inc. (a) | | 201,095 | 61,905,085 |
| Novocure Ltd. (a)(d) | | 1,506,389 | 108,173,794 |
| Oddity Tech Ltd. (a)(b)(c) | | 3,704 | 1,675,727 |
| Outset Medical, Inc. (a) | | 455,304 | 9,483,982 |
| Penumbra, Inc. (a) | | 7,370 | 2,265,096 |
| Presbia PLC (a)(c) | | 96,997 | 1 |
| PROCEPT BioRobotics Corp. (a) | | 386,532 | 12,929,495 |
| Shockwave Medical, Inc. (a) | | 171,188 | 47,092,107 |
| | | | 432,559,152 |
| Health Care Providers & Services - 1.2% | | | |
| Alignment Healthcare, Inc. (a) | | 391,093 | 2,295,716 |
| Guardant Health, Inc. (a) | | 150,602 | 4,415,651 |
| Humana, Inc. | | 77,449 | 38,869,330 |
| McKesson Corp. | | 32,480 | 12,694,483 |
| The Oncology Institute, Inc. (a)(b) | | 446,788 | 191,002 |
| UnitedHealth Group, Inc. | | 221,230 | 107,792,105 |
| | | | 166,258,287 |
| Health Care Technology - 0.0% | | | |
| DNA Script (a)(b)(c) | | 115 | 81,021 |
| DNA Script (a)(b)(c) | | 439 | 309,290 |
| | | | 390,311 |
| Life Sciences Tools & Services - 0.6% | | | |
| 10X Genomics, Inc. (a) | | 563,697 | 29,571,545 |
| Akoya Biosciences, Inc. (a) | | 17,491 | 98,474 |
| Danaher Corp. | | 36,029 | 8,272,979 |
| Gerresheimer AG | | 19,700 | 2,164,694 |
| Olink Holding AB ADR (a) | | 455,652 | 8,876,101 |
| Seer, Inc. (a) | | 246,109 | 905,681 |
| Thermo Fisher Scientific, Inc. | | 42,237 | 21,475,825 |
| WuXi AppTec Co. Ltd. (H Shares) (e) | | 338,482 | 2,788,101 |
| Wuxi Biologics (Cayman), Inc. (a)(e) | | 2,200,461 | 11,254,585 |
| | | | 85,407,985 |
| Pharmaceuticals - 2.5% | | | |
| Adimab LLC (a)(b)(c)(g) | | 196,899 | 7,846,425 |
| Arvinas Holding Co. LLC (a) | | 58,793 | 1,283,451 |
| Atea Pharmaceuticals, Inc. (a) | | 1,170,755 | 4,671,312 |
| Bristol-Myers Squibb Co. | | 131,721 | 8,488,101 |
| DICE Therapeutics, Inc. (a) | | 98,004 | 3,097,906 |
| Dragonfly Therapeutics, Inc. (a)(b)(c) | | 31,376 | 698,116 |
| Eli Lilly & Co. | | 355,343 | 152,605,605 |
| Fulcrum Therapeutics, Inc. (a) | | 449,502 | 1,222,645 |
| GH Research PLC (a) | | 356,088 | 3,988,186 |
| Harmony Biosciences Holdings, Inc. (a)(d) | | 629,557 | 21,770,081 |
| Intra-Cellular Therapies, Inc. (a) | | 997,553 | 59,234,697 |
| Merck & Co., Inc. | | 42,279 | 4,668,024 |
| Novo Nordisk A/S Series B sponsored ADR | | 224,435 | 36,012,840 |
| Nuvation Bio, Inc. (a) | | 1,585,161 | 2,567,961 |
| OptiNose, Inc. (a) | | 1,708,485 | 2,135,606 |
| OptiNose, Inc. warrants (a) | | 213,862 | 65,897 |
| Pfizer, Inc. | | 26,448 | 1,005,553 |
| Pharvaris BV (a) | | 31,500 | 269,325 |
| Pliant Therapeutics, Inc. (a) | | 490,779 | 10,615,550 |
| Sienna Biopharmaceuticals, Inc. (a)(c) | | 364,498 | 4 |
| Skyhawk Therapeutics, Inc. (a)(b)(c) | | 127,580 | 1,465,894 |
| Theravance Biopharma, Inc. (a)(d) | | 122,995 | 1,375,084 |
| UCB SA | | 254,348 | 22,163,053 |
| Ventyx Biosciences, Inc. (a) | | 117,151 | 4,038,195 |
| | | | 351,289,511 |
TOTAL HEALTH CARE | | | 2,195,898,086 |
| INDUSTRIALS - 4.3% | | | |
| Aerospace & Defense - 0.7% | | | |
| AeroVironment, Inc. (a) | | 49,826 | 4,654,247 |
| Lockheed Martin Corp. | | 64,753 | 28,750,980 |
| Raytheon Technologies Corp. | | 160,583 | 14,796,118 |
| Space Exploration Technologies Corp. Class A (a)(b)(c) | | 324,714 | 25,002,978 |
| The Boeing Co. (a) | | 133,321 | 27,424,130 |
| | | | 100,628,453 |
| Air Freight & Logistics - 0.1% | | | |
| Delhivery Private Ltd. | | 486,000 | 2,052,379 |
| United Parcel Service, Inc. Class B | | 67,974 | 11,351,658 |
| | | | 13,404,037 |
| Construction & Engineering - 0.2% | | | |
| Fluor Corp. (a) | | 477,758 | 12,689,252 |
| MasTec, Inc. (a) | | 35,004 | 3,548,005 |
| Quanta Services, Inc. | | 47,021 | 8,349,989 |
| | | | 24,587,246 |
| Electrical Equipment - 0.3% | | | |
| Eaton Corp. PLC | | 84,558 | 14,873,752 |
| Emerson Electric Co. | | 213,846 | 16,611,557 |
| Fluence Energy, Inc. (a) | | 4,550 | 112,840 |
| Generac Holdings, Inc. (a) | | 117,010 | 12,744,729 |
| Nextracker, Inc. Class A (d) | | 51,099 | 1,954,537 |
| NuScale Power Corp. (a)(d) | | 290,952 | 2,182,140 |
| | | | 48,479,555 |
| Ground Transportation - 1.6% | | | |
| Avis Budget Group, Inc. (a) | | 534,211 | 89,635,264 |
| Bird Global, Inc.: | | | |
| Stage 1 rights (a)(c) | | 27,377 | 0 |
| Stage 2 rights (a)(c) | | 27,377 | 0 |
| Stage 3 rights (a)(c) | | 27,377 | 0 |
| Hertz Global Holdings, Inc. (a)(d) | | 86,110 | 1,350,205 |
| Lyft, Inc. (a) | | 802,808 | 7,241,328 |
| Uber Technologies, Inc. (a) | | 2,157,119 | 81,819,524 |
| Union Pacific Corp. | | 262,023 | 50,444,668 |
| | | | 230,490,989 |
| Industrial Conglomerates - 0.1% | | | |
| General Electric Co. | | 18,200 | 1,847,846 |
| Honeywell International, Inc. | | 45,163 | 8,653,231 |
| | | | 10,501,077 |
| Machinery - 0.5% | | | |
| Caterpillar, Inc. | | 109,009 | 22,428,602 |
| Deere & Co. | | 102,709 | 35,535,260 |
| Fortive Corp. | | 32,342 | 2,105,788 |
| Illinois Tool Works, Inc. | | 58,347 | 12,762,239 |
| Ingersoll Rand, Inc. | | 81,578 | 4,622,209 |
| | | | 77,454,098 |
| Passenger Airlines - 0.7% | | | |
| Delta Air Lines, Inc. (a) | | 640,196 | 23,258,321 |
| Ryanair Holdings PLC sponsored ADR (a) | | 6,687 | 702,670 |
| Southwest Airlines Co. | | 714,033 | 21,328,166 |
| Spirit Airlines, Inc. | | 629,515 | 9,574,923 |
| United Airlines Holdings, Inc. (a) | | 478,132 | 22,694,535 |
| Wizz Air Holdings PLC (a)(e) | | 716,316 | 24,735,861 |
| | | | 102,294,476 |
| Professional Services - 0.1% | | | |
| LegalZoom.com, Inc. (a) | | 144,416 | 1,616,015 |
| Paycom Software, Inc. | | 18,249 | 5,112,092 |
| Paylocity Holding Corp. (a) | | 26,427 | 4,565,264 |
| | | | 11,293,371 |
TOTAL INDUSTRIALS | | | 619,133,302 |
| INFORMATION TECHNOLOGY - 42.8% | | | |
| Communications Equipment - 0.6% | | | |
| Arista Networks, Inc. (a) | | 142,690 | 23,735,055 |
| Ciena Corp. (a) | | 942,003 | 44,029,220 |
| Infinera Corp. (a)(d) | | 3,838,899 | 18,810,605 |
| | | | 86,574,880 |
| Electronic Equipment, Instruments & Components - 0.0% | | | |
| Coherent Corp. (a)(d) | | 128,130 | 4,735,685 |
| TE Connectivity Ltd. | | 3,543 | 433,947 |
| | | | 5,169,632 |
| IT Services - 1.5% | | | |
| Accenture PLC Class A | | 115,125 | 35,219,040 |
| Cloudflare, Inc. (a)(d) | | 1,256,084 | 86,870,769 |
| IBM Corp. | | 132,871 | 17,085,882 |
| MongoDB, Inc. Class A (a) | | 8,861 | 2,603,273 |
| Okta, Inc. (a) | | 124,568 | 11,323,231 |
| Shopify, Inc. Class A (a) | | 700,201 | 40,062,329 |
| Snowflake, Inc. (a) | | 74,435 | 12,308,572 |
| Twilio, Inc. Class A (a) | | 12,993 | 904,573 |
| X Holdings Corp. Class A (c) | | 26,890 | 939,537 |
| | | | 207,317,206 |
| Semiconductors & Semiconductor Equipment - 17.8% | | | |
| Advanced Micro Devices, Inc. (a) | | 989,132 | 116,925,294 |
| Allegro MicroSystems LLC (a) | | 19,881 | 781,920 |
| Applied Materials, Inc. | | 474,843 | 63,296,572 |
| ASML Holding NV (depository receipt) | | 31,028 | 22,431,072 |
| Broadcom, Inc. | | 44,525 | 35,974,419 |
| Cirrus Logic, Inc. (a) | | 554,762 | 43,093,912 |
| Enphase Energy, Inc. (a) | | 92,829 | 16,141,107 |
| First Solar, Inc. (a) | | 233,104 | 47,310,788 |
| GlobalFoundries, Inc. (a) | | 112,673 | 6,572,216 |
| Impinj, Inc. (a) | | 123,480 | 12,636,943 |
| KLA Corp. | | 64,858 | 28,731,445 |
| Lam Research Corp. | | 18,377 | 11,333,096 |
| Lattice Semiconductor Corp. (a) | | 68,050 | 5,533,146 |
| Marvell Technology, Inc. | | 1,002,532 | 58,638,097 |
| Micron Technology, Inc. | | 196,520 | 13,402,664 |
| Monolithic Power Systems, Inc. | | 39,666 | 19,432,770 |
| NVIDIA Corp. | | 4,896,658 | 1,852,601,578 |
| onsemi (a) | | 197,390 | 16,501,804 |
| Qualcomm, Inc. | | 168,439 | 19,102,667 |
| Silicon Laboratories, Inc. (a) | | 526,399 | 74,048,547 |
| SiTime Corp. (a) | | 184,350 | 18,281,990 |
| SolarEdge Technologies, Inc. (a) | | 9,730 | 2,771,396 |
| Taiwan Semiconductor Manufacturing Co. Ltd. sponsored ADR | | 135,375 | 13,346,621 |
| Teradyne, Inc. | | 84,891 | 8,505,229 |
| Texas Instruments, Inc. | | 157,840 | 27,445,219 |
| Wolfspeed, Inc. (a)(d) | | 133,895 | 6,432,316 |
| | | | 2,541,272,828 |
| Software - 12.8% | | | |
| Adobe, Inc. (a) | | 194,240 | 81,151,530 |
| Atlassian Corp. PLC (a) | | 11,482 | 2,075,831 |
| Autodesk, Inc. (a) | | 116,939 | 23,316,467 |
| Bill Holdings, Inc. (a) | | 31,658 | 3,279,136 |
| Clear Secure, Inc. | | 644 | 15,913 |
| Confluent, Inc. (a) | | 165,900 | 5,265,666 |
| Crowdstrike Holdings, Inc. (a) | | 115,688 | 18,525,119 |
| Datadog, Inc. Class A (a) | | 85,775 | 8,140,905 |
| Elastic NV (a) | | 53,045 | 3,862,737 |
| Freshworks, Inc. (a) | | 71,000 | 1,118,960 |
| HubSpot, Inc. (a) | | 57,466 | 29,766,813 |
| Intuit, Inc. | | 86,127 | 36,097,548 |
| Microsoft Corp. | | 2,635,264 | 865,394,345 |
| Nutanix, Inc. Class A (a) | | 3,775,929 | 111,843,017 |
| Oracle Corp. | | 2,177,509 | 230,685,303 |
| Palantir Technologies, Inc. (a) | | 36,900 | 542,799 |
| Palo Alto Networks, Inc. (a) | | 7,300 | 1,557,747 |
| RingCentral, Inc. (a) | | 43,953 | 1,525,169 |
| Salesforce, Inc. (a) | | 1,181,301 | 263,879,017 |
| Samsara, Inc. (a)(d) | | 71,905 | 1,384,171 |
| SentinelOne, Inc. (a)(d) | | 80,483 | 1,720,727 |
| ServiceNow, Inc. (a) | | 122,827 | 66,913,693 |
| Stripe, Inc. Class B (a)(b)(c) | | 38,500 | 775,005 |
| UiPath, Inc. Class A (a) | | 1,519,173 | 27,178,005 |
| Workday, Inc. Class A (a) | | 46,952 | 9,953,354 |
| Zoom Video Communications, Inc. Class A (a) | | 234,756 | 15,759,170 |
| Zscaler, Inc. (a)(d) | | 84,323 | 11,424,080 |
| | | | 1,823,152,227 |
| Technology Hardware, Storage & Peripherals - 10.1% | | | |
| Apple, Inc. | | 7,430,839 | 1,317,116,213 |
| Pure Storage, Inc. Class A (a) | | 4,274,445 | 123,061,272 |
| Samsung Electronics Co. Ltd. | | 167,855 | 9,061,958 |
| | | | 1,449,239,443 |
TOTAL INFORMATION TECHNOLOGY | | | 6,112,726,216 |
| MATERIALS - 0.9% | | | |
| Chemicals - 0.4% | | | |
| Albemarle Corp. | | 44,584 | 8,628,342 |
| CF Industries Holdings, Inc. | | 172,899 | 10,635,017 |
| Cibus Corp.: | | | |
| Series E (a)(b)(c)(g) | | 2,065,675 | 4,131,350 |
| Series F (a)(b)(c)(g) | | 290,474 | 580,948 |
| Corteva, Inc. | | 508,910 | 27,221,596 |
| The Mosaic Co. | | 333,575 | 10,661,057 |
| | | | 61,858,310 |
| Containers & Packaging - 0.0% | | | |
| Sealed Air Corp. | | 78,564 | 2,973,647 |
| Metals & Mining - 0.5% | | | |
| Barrick Gold Corp. (Canada) (d) | | 413,404 | 6,985,995 |
| Freeport-McMoRan, Inc. | | 1,628,436 | 55,920,492 |
| Rio Tinto PLC sponsored ADR | | 69,449 | 4,100,963 |
| | | | 67,007,450 |
TOTAL MATERIALS | | | 131,839,407 |
| REAL ESTATE - 0.2% | | | |
| Equity Real Estate Investment Trusts (REITs) - 0.2% | | | |
| American Tower Corp. | | 91,193 | 16,819,637 |
| Equinix, Inc. | | 7,658 | 5,709,422 |
| | | | 22,529,059 |
| Real Estate Management & Development - 0.0% | | | |
| CBRE Group, Inc. (a) | | 67,729 | 5,074,257 |
TOTAL REAL ESTATE | | | 27,603,316 |
| UTILITIES - 0.1% | | | |
| Electric Utilities - 0.1% | | | |
| ORSTED A/S (e) | | 120,835 | 10,580,315 |
| TOTAL COMMON STOCKS (Cost $10,863,343,480) | | | 14,031,439,118 |
| | | | |
| Preferred Stocks - 1.3% |
| | | Shares | Value ($) |
| Convertible Preferred Stocks - 1.3% | | | |
| COMMUNICATION SERVICES - 0.1% | | | |
| Interactive Media & Services - 0.1% | | | |
| ByteDance Ltd. Series E1 (a)(b)(c) | | 49,039 | 10,405,585 |
| Reddit, Inc.: | | | |
| Series E(a)(b)(c) | | 4,501 | 151,729 |
| Series F(a)(b)(c) | | 88,486 | 2,982,863 |
| | | | 13,540,177 |
| CONSUMER DISCRETIONARY - 0.1% | | | |
| Automobiles - 0.0% | | | |
| Rad Power Bikes, Inc.: | | | |
| Series A(a)(b)(c) | | 22,348 | 46,931 |
| Series C(a)(b)(c) | | 87,936 | 184,666 |
| Series D(a)(b)(c) | | 219,600 | 461,160 |
| | | | 692,757 |
| Broadline Retail - 0.1% | | | |
| Meesho Series F (a)(b)(c) | | 66,982 | 4,636,494 |
| | | | |
| Hotels, Restaurants & Leisure - 0.0% | | | |
| Discord, Inc. Series I (a)(b)(c) | | 1,400 | 408,842 |
| | | | |
| Textiles, Apparel & Luxury Goods - 0.0% | | | |
| Freenome, Inc.: | | | |
| Series C(a)(b)(c) | | 141,369 | 1,101,265 |
| Series D(a)(b)(c) | | 125,665 | 1,027,940 |
| Laronde, Inc. Series B (a)(b)(c) | | 81,282 | 1,526,476 |
| | | | 3,655,681 |
TOTAL CONSUMER DISCRETIONARY | | | 9,393,774 |
| | | | |
| CONSUMER STAPLES - 0.0% | | | |
| Consumer Staples Distribution & Retail - 0.0% | | | |
| GoBrands, Inc.: | | | |
| Series G(a)(b)(c) | | 19,907 | 1,713,595 |
| Series H(a)(b)(c) | | 20,720 | 1,783,578 |
| Instacart, Inc.: | | | |
| Series H(a)(b)(c) | | 12,458 | 510,155 |
| Series I(a)(b)(c) | | 6,009 | 246,069 |
| | | | 4,253,397 |
| Food Products - 0.0% | | | |
| AgBiome LLC Series D (a)(b)(c) | | 511,821 | 2,594,932 |
| Bowery Farming, Inc. Series C1 (a)(b)(c) | | 27,155 | 253,085 |
| | | | 2,848,017 |
TOTAL CONSUMER STAPLES | | | 7,101,414 |
| | | | |
| FINANCIALS - 0.1% | | | |
| Financial Services - 0.1% | | | |
| Paragon Biosciences Emalex Capital, Inc.: | | | |
| Series C(a)(b)(c) | | 109,967 | 1,188,743 |
| Series D1(b)(c) | | 190,900 | 2,069,356 |
| Series D2(b)(c) | | 15,557 | 159,459 |
| Saluda Medical, Inc.: | | | |
| Series D(b)(c) | | 154,870 | 1,798,041 |
| Series E(b)(c) | | 287,593 | 2,318,000 |
| | | | 7,533,599 |
| HEALTH CARE - 0.6% | | | |
| Biotechnology - 0.4% | | | |
| Altos Labs, Inc. Series B (b)(c) | | 124,464 | 2,383,486 |
| Ankyra Therapeutics Series B (a)(b)(c) | | 329,325 | 1,379,872 |
| Apogee Therapeutics Series B (b)(c) | | 532,865 | 1,758,455 |
| Asimov, Inc. Series B (a)(b)(c) | | 19,920 | 963,929 |
| Bright Peak Therapeutics AG Series B (a)(b)(c) | | 282,257 | 784,674 |
| Caris Life Sciences, Inc. Series D (a)(b)(c) | | 258,638 | 1,448,373 |
| Castle Creek Biosciences, Inc.: | | | |
| Series D1(a)(b)(c) | | 4,476 | 949,941 |
| Series D2(a)(b)(c) | | 1,254 | 236,454 |
| Cleerly, Inc. Series C (b)(c) | | 294,888 | 3,444,292 |
| Deep Genomics, Inc. Series C (a)(b)(c) | | 155,443 | 1,629,043 |
| Dianthus Therapeutics, Inc. Series A (a)(b)(c) | | 333,765 | 1,485,254 |
| Element Biosciences, Inc.: | | | |
| Series B(a)(b)(c) | | 125,057 | 2,057,188 |
| Series C(a)(b)(c) | | 114,255 | 1,879,495 |
| ElevateBio LLC Series C (a)(b)(c) | | 247,600 | 1,039,920 |
| Fog Pharmaceuticals, Inc. Series D (b)(c) | | 272,597 | 2,963,129 |
| Generate Biomedicines Series B (a)(b)(c) | | 191,856 | 1,931,990 |
| Inscripta, Inc.: | | | |
| Series D(a)(b)(c) | | 277,957 | 1,175,758 |
| Series E(a)(b)(c) | | 215,182 | 910,220 |
| Korro Bio, Inc.: | | | |
| Series B1(a)(b)(c) | | 379,289 | 838,229 |
| Series B2(a)(b)(c) | | 356,095 | 801,214 |
| LifeMine Therapeutics, Inc. Series C (a)(b)(c) | | 1,759,782 | 3,237,999 |
| National Resilience, Inc.: | | | |
| Series B(a)(b)(c) | | 182,315 | 11,071,990 |
| Series C(a)(b)(c) | | 74,748 | 4,539,446 |
| Odyssey Therapeutics, Inc. Series B (b)(c) | | 458,024 | 2,899,292 |
| Quell Therapeutics Ltd. Series B (a)(b)(c) | | 822,639 | 1,661,731 |
| SalioGen Therapeutics, Inc. Series B (a)(b)(c) | | 14,028 | 945,768 |
| Sonoma Biotherapeutics, Inc.: | | | |
| Series B(a)(b)(c) | | 587,934 | 1,522,749 |
| Series B1(a)(b)(c) | | 313,559 | 928,135 |
| T-Knife Therapeutics, Inc. Series B (a)(b)(c) | | 241,456 | 951,337 |
| Treeline Biosciences: | | | |
| Series A(a)(b)(c) | | 283,817 | 2,213,773 |
| Series A1(b)(c) | | 151,334 | 1,212,185 |
| | | | 61,245,321 |
| Health Care Equipment & Supplies - 0.1% | | | |
| Blink Health LLC Series C (a)(b)(c) | | 145,007 | 6,944,385 |
| Kardium, Inc. Series D6 (a)(b)(c) | | 1,087,032 | 1,076,162 |
| | | | 8,020,547 |
| Health Care Providers & Services - 0.0% | | | |
| Boundless Bio, Inc.: | | | |
| Series B(a)(b)(c) | | 756,226 | 650,354 |
| Series C(b)(c) | | 1,833,120 | 1,283,184 |
| Conformal Medical, Inc.: | | | |
| Series C(a)(b)(c) | | 140,186 | 614,015 |
| Series D(b)(c) | | 153,658 | 780,583 |
| Scorpion Therapeutics, Inc. Series B (a)(b)(c) | | 260,848 | 461,701 |
| | | | 3,789,837 |
| Health Care Technology - 0.1% | | | |
| Aledade, Inc.: | | | |
| Series B1(a)(b)(c) | | 26,096 | 1,307,932 |
| Series E1(b)(c) | | 21,357 | 1,070,413 |
| DNA Script: | | | |
| Series B(a)(b)(c) | | 6 | 4,227 |
| Series C(a)(b)(c) | | 2,549 | 1,795,856 |
| Omada Health, Inc. Series E (a)(b)(c) | | 636,551 | 2,062,425 |
| PrognomIQ, Inc.: | | | |
| Series A5(a)(b)(c) | | 37,950 | 66,413 |
| Series B(a)(b)(c) | | 196,968 | 482,572 |
| Series C(a)(b)(c) | | 65,704 | 182,657 |
| Wugen, Inc. Series B (a)(b)(c) | | 121,894 | 609,470 |
| | | | 7,581,965 |
| Pharmaceuticals - 0.0% | | | |
| Castle Creek Pharmaceutical Holdings, Inc. Series C (a)(b)(c) | | 582 | 136,293 |
| Galvanize Therapeutics Series B (a)(b)(c) | | 1,125,997 | 1,902,935 |
| | | | 2,039,228 |
TOTAL HEALTH CARE | | | 82,676,898 |
| | | | |
| INDUSTRIALS - 0.1% | | | |
| Aerospace & Defense - 0.1% | | | |
| Space Exploration Technologies Corp. Series N (a)(b)(c) | | 19,900 | 15,323,000 |
| | | | |
| Construction & Engineering - 0.0% | | | |
| Beta Technologies, Inc.: | | | |
| Series A(a)(b)(c) | | 10,545 | 865,112 |
| Series B, 6.00%(a)(b)(c) | | 20,919 | 1,820,371 |
| | | | 2,685,483 |
TOTAL INDUSTRIALS | | | 18,008,483 |
| | | | |
| INFORMATION TECHNOLOGY - 0.2% | | | |
| Electronic Equipment, Instruments & Components - 0.0% | | | |
| Enevate Corp. Series E (a)(b)(c) | | 754,820 | 437,796 |
| Menlo Micro, Inc. Series C (a)(b)(c) | | 993,699 | 924,140 |
| | | | 1,361,936 |
| Semiconductors & Semiconductor Equipment - 0.1% | | | |
| Alif Semiconductor Series C (a)(b)(c) | | 43,034 | 797,420 |
| Astera Labs, Inc.: | | | |
| Series A(b)(c) | | 80,597 | 716,507 |
| Series B(b)(c) | | 13,723 | 121,997 |
| Series C(a)(b)(c) | | 372,400 | 3,310,636 |
| Series D(b)(c) | | 273,573 | 2,432,064 |
| GaN Systems, Inc.: | | | |
| Series F1(a)(b)(c) | | 63,044 | 701,680 |
| Series F2(a)(b)(c) | | 33,289 | 370,507 |
| Retym, Inc. Series C (b)(c) | | 165,860 | 1,290,689 |
| SiMa.ai: | | | |
| Series B(a)(b)(c) | | 299,482 | 1,793,897 |
| Series B1(a)(b)(c) | | 167,848 | 1,186,685 |
| Xsight Labs Ltd. Series D (a)(b)(c) | | 122,201 | 857,851 |
| | | | 13,579,933 |
| Software - 0.1% | | | |
| Bolt Technology OU Series E (a)(b)(c) | | 17,815 | 2,302,613 |
| Databricks, Inc.: | | | |
| Series G(a)(b)(c) | | 37,815 | 1,825,330 |
| Series H(a)(b)(c) | | 56,085 | 2,707,223 |
| Evozyne LLC Series A (a)(b)(c) | | 78,000 | 1,344,720 |
| Skyryse, Inc. Series B (a)(b)(c) | | 117,653 | 2,476,596 |
| Stripe, Inc. Series H (a)(b)(c) | | 14,400 | 289,872 |
| Tenstorrent, Inc. Series C1 (a)(b)(c) | | 16,900 | 953,836 |
| | | | 11,900,190 |
| Technology Hardware, Storage & Peripherals - 0.0% | | | |
| Lightmatter, Inc. Series C (b)(c) | | 136,712 | 2,249,842 |
| | | | |
TOTAL INFORMATION TECHNOLOGY | | | 29,091,901 |
| | | | |
| MATERIALS - 0.1% | | | |
| Chemicals - 0.0% | | | |
| Farmers Business Network, Inc. Series G (a)(b)(c) | | 42,859 | 1,474,778 |
| | | | |
| Metals & Mining - 0.1% | | | |
| Diamond Foundry, Inc. Series C (a)(b)(c) | | 301,038 | 10,677,818 |
| | | | |
TOTAL MATERIALS | | | 12,152,596 |
| | | | |
| UTILITIES - 0.0% | | | |
| Independent Power and Renewable Electricity Producers - 0.0% | | | |
| Redwood Materials Series C (a)(b)(c) | | 20,469 | 939,322 |
| | | | |
| TOTAL CONVERTIBLE PREFERRED STOCKS | | | 180,438,164 |
| Nonconvertible Preferred Stocks - 0.0% | | | |
| CONSUMER DISCRETIONARY - 0.0% | | | |
| Automobiles - 0.0% | | | |
| Waymo LLC Series A2 (a)(b)(c) | | 6,592 | 303,891 |
| | | | |
| FINANCIALS - 0.0% | | | |
| Financial Services - 0.0% | | | |
| Circle Internet Financial Ltd. Series E (a)(b)(c) | | 127,757 | 3,131,324 |
| | | | |
| TOTAL NONCONVERTIBLE PREFERRED STOCKS | | | 3,435,215 |
| TOTAL PREFERRED STOCKS (Cost $184,621,817) | | | 183,873,379 |
| | | | |
| Convertible Bonds - 0.0% |
| | | Principal Amount (h) | Value ($) |
| CONSUMER DISCRETIONARY - 0.0% | | | |
| Automobiles - 0.0% | | | |
| Neutron Holdings, Inc.: | | | |
| 4% 5/22/27 (b)(c) | | 310,600 | 319,856 |
| 4% 6/12/27 (b)(c) | | 82,200 | 84,650 |
| 4.5% 10/27/25 (b)(c)(i) | | 2,076,728 | 2,051,184 |
| | | | 2,455,690 |
| HEALTH CARE - 0.0% | | | |
| Health Care Equipment & Supplies - 0.0% | | | |
| Blink Health LLC 5% 1/15/24 (b)(c) | | 2,000,000 | 2,218,600 |
| TOTAL CONVERTIBLE BONDS (Cost $4,469,528) | | | 4,674,290 |
| | | | |
| Preferred Securities - 0.0% |
| | | Principal Amount (h) | Value ($) |
| HEALTH CARE - 0.0% | | | |
| Health Care Equipment & Supplies - 0.0% | | | |
| Kardium, Inc. 0% (b)(c)(j) | | 1,541,987 | 1,503,437 |
| INFORMATION TECHNOLOGY - 0.0% | | | |
| Semiconductors & Semiconductor Equipment - 0.0% | | | |
| GaN Systems, Inc. 0% (b)(c)(j) | | 1,477,665 | 1,823,882 |
| Software - 0.0% | | | |
| Tenstorrent, Inc. 0% (b)(c)(j) | | 940,000 | 892,060 |
TOTAL INFORMATION TECHNOLOGY | | | 2,715,942 |
| TOTAL PREFERRED SECURITIES (Cost $3,959,652) | | | 4,219,379 |
| | | | |
| Money Market Funds - 3.1% |
| | | Shares | Value ($) |
| Fidelity Cash Central Fund 5.14% (k) | | 64,464,597 | 64,477,490 |
| Fidelity Securities Lending Cash Central Fund 5.14% (k)(l) | | 374,192,896 | 374,230,315 |
| TOTAL MONEY MARKET FUNDS (Cost $438,707,805) | | | 438,707,805 |
| | | | |
| TOTAL INVESTMENT IN SECURITIES - 102.6% (Cost $11,495,102,282) | 14,662,913,971 |
NET OTHER ASSETS (LIABILITIES) - (2.6)% | (378,035,191) |
| NET ASSETS - 100.0% | 14,284,878,780 |
| | |
Legend
| (b) | Restricted securities (including private placements) - Investment in securities not registered under the Securities Act of 1933 (excluding 144A issues). At the end of the period, the value of restricted securities (excluding 144A issues) amounted to $265,722,196 or 1.9% of net assets. |
| (d) | Security or a portion of the security is on loan at period end. |
| (e) | Security exempt from registration under Rule 144A of the Securities Act of 1933. These securities may be resold in transactions exempt from registration, normally to qualified institutional buyers. At the end of the period, the value of these securities amounted to $49,887,261 or 0.3% of net assets. |
| (f) | Security or a portion of the security purchased on a delayed delivery or when-issued basis. |
| (g) | Investment is owned by a wholly-owned subsidiary (Subsidiary) that is treated as a corporation for U.S. tax purposes. |
| (h) | Amount is stated in United States dollars unless otherwise noted. |
| (i) | Security initially issued at one coupon which converts to a higher coupon at a specified date. The rate shown is the rate at period end. |
| (j) | Security is perpetual in nature with no stated maturity date. |
| (k) | Affiliated fund that is generally available only to investment companies and other accounts managed by Fidelity Investments. The rate quoted is the annualized seven-day yield of the fund at period end. A complete unaudited listing of the fund's holdings as of its most recent quarter end is available upon request. In addition, each Fidelity Central Fund's financial statements are available on the SEC's website or upon request. |
| (l) | Investment made with cash collateral received from securities on loan. |
| Additional information on each restricted holding is as follows: |
| Security | Acquisition Date | Acquisition Cost ($) |
| Adimab LLC | 1/19/21 | 10,000,008 |
| | | |
| AgBiome LLC Series D | 9/03/21 | 3,033,967 |
| | | |
| Aledade, Inc. Series B1 | 5/07/21 | 999,234 |
| | | |
| Aledade, Inc. Series E1 | 5/20/22 | 1,063,886 |
| | | |
| Alif Semiconductor Series C | 3/08/22 | 873,527 |
| | | |
| Altos Labs, Inc. Series B | 7/22/22 | 2,383,286 |
| | | |
| Ankyra Therapeutics Series B | 8/26/21 | 1,854,693 |
| | | |
| Apogee Therapeutics Series B | 11/15/22 | 1,760,884 |
| | | |
| Asimov, Inc. Series B | 10/29/21 | 1,846,200 |
| | | |
| Astera Labs, Inc. Series A | 5/17/22 | 819,631 |
| | | |
| Astera Labs, Inc. Series B | 5/17/22 | 139,556 |
| | | |
| Astera Labs, Inc. Series C | 8/24/21 | 1,251,934 |
| | | |
| Astera Labs, Inc. Series D | 5/17/22 | 2,782,101 |
| | | |
| Beta Technologies, Inc. Series A | 4/09/21 | 772,632 |
| | | |
| Beta Technologies, Inc. Series B, 6.00% | 4/04/22 | 2,158,213 |
| | | |
| Blink Health LLC Series A1 | 12/30/20 | 1,786,125 |
| | | |
| Blink Health LLC Series C | 11/07/19 - 7/14/21 | 5,535,788 |
| | | |
| Blink Health LLC 5% 1/15/24 | 7/15/22 | 2,000,000 |
| | | |
| Bolt Technology OU Series E | 1/03/22 | 4,628,275 |
| | | |
| Boundless Bio, Inc. Series B | 4/23/21 | 1,020,905 |
| | | |
| Boundless Bio, Inc. Series C | 4/05/23 | 1,283,184 |
| | | |
| Bowery Farming, Inc. Series C1 | 5/18/21 | 1,636,070 |
| | | |
| Bright Peak Therapeutics AG Series B | 5/14/21 | 1,102,496 |
| | | |
| ByteDance Ltd. Series E1 | 11/18/20 | 5,373,408 |
| | | |
| Caris Life Sciences, Inc. | 10/06/22 | 2,031,630 |
| | | |
| Caris Life Sciences, Inc. Series D | 5/11/21 | 2,094,968 |
| | | |
| Castle Creek Biosciences, Inc. Series D1 | 4/19/22 | 962,474 |
| | | |
| Castle Creek Biosciences, Inc. Series D2 | 6/28/21 | 215,100 |
| | | |
| Castle Creek Pharmaceutical Holdings, Inc. Series C | 12/09/19 | 239,697 |
| | | |
| Cibus Corp. Series E | 6/23/21 | 3,635,588 |
| | | |
| Cibus Corp. Series F | 12/02/22 | 580,948 |
| | | |
| Circle Internet Financial Ltd. Series E | 5/11/21 | 2,073,500 |
| | | |
| Cleerly, Inc. Series C | 7/08/22 | 3,473,958 |
| | | |
| Conformal Medical, Inc. Series C | 7/24/20 | 514,071 |
| | | |
| Conformal Medical, Inc. Series D | 5/26/23 | 780,530 |
| | | |
| Databricks, Inc. Series G | 2/01/21 | 2,235,722 |
| | | |
| Databricks, Inc. Series H | 8/31/21 | 4,121,358 |
| | | |
| Deep Genomics, Inc. Series C | 7/21/21 | 2,254,110 |
| | | |
| Diamond Foundry, Inc. Series C | 3/15/21 | 7,224,912 |
| | | |
| Dianthus Therapeutics, Inc. Series A | 4/06/22 | 1,450,710 |
| | | |
| Discord, Inc. Series I | 9/15/21 | 770,874 |
| | | |
| DNA Script | 12/17/21 | 443,611 |
| | | |
| DNA Script Series B | 12/17/21 | 4,804 |
| | | |
| DNA Script Series C | 10/01/21 | 2,217,248 |
| | | |
| Dragonfly Therapeutics, Inc. | 12/19/19 | 830,209 |
| | | |
| Element Biosciences, Inc. Series B | 12/13/19 | 655,374 |
| | | |
| Element Biosciences, Inc. Series C | 6/21/21 | 2,348,706 |
| | | |
| ElevateBio LLC Series C | 3/09/21 | 1,038,682 |
| | | |
| Enevate Corp. Series E | 1/29/21 | 836,858 |
| | | |
| Epic Games, Inc. | 7/13/20 - 7/30/20 | 2,875,000 |
| | | |
| Evozyne LLC Series A | 4/09/21 | 1,752,660 |
| | | |
| Fanatics, Inc. Class A | 8/13/20 - 10/24/22 | 7,298,410 |
| | | |
| Farmers Business Network, Inc. Series G | 9/15/21 | 2,664,021 |
| | | |
| Fog Pharmaceuticals, Inc. Series D | 11/17/22 | 2,933,989 |
| | | |
| Freenome, Inc. Series C | 8/14/20 | 934,916 |
| | | |
| Freenome, Inc. Series D | 11/22/21 | 947,803 |
| | | |
| Galvanize Therapeutics Series B | 3/29/22 | 1,949,422 |
| | | |
| GaN Systems, Inc. Series F1 | 11/30/21 | 534,613 |
| | | |
| GaN Systems, Inc. Series F2 | 11/30/21 | 282,291 |
| | | |
| GaN Systems, Inc. 0% | 11/30/21 | 1,477,665 |
| | | |
| Generate Biomedicines Series B | 11/02/21 | 2,273,494 |
| | | |
| GoBrands, Inc. Series G | 3/02/21 | 4,971,122 |
| | | |
| GoBrands, Inc. Series H | 7/22/21 | 8,049,525 |
| | | |
| Inscripta, Inc. Series D | 11/13/20 | 1,270,263 |
| | | |
| Inscripta, Inc. Series E | 3/30/21 | 1,900,057 |
| | | |
| Instacart, Inc. Series H | 11/13/20 | 747,480 |
| | | |
| Instacart, Inc. Series I | 2/26/21 | 751,125 |
| | | |
| Kardium, Inc. Series D6 | 12/30/20 | 1,104,251 |
| | | |
| Kardium, Inc. 0% | 12/30/20 | 1,541,987 |
| | | |
| Korro Bio, Inc. Series B1 | 12/17/21 | 989,944 |
| | | |
| Korro Bio, Inc. Series B2 | 12/17/21 | 989,944 |
| | | |
| Laronde, Inc. Series B | 8/13/21 | 2,275,896 |
| | | |
| LifeMine Therapeutics, Inc. Series C | 2/15/22 | 3,583,954 |
| | | |
| Lightmatter, Inc. Series C | 5/19/23 | 2,249,842 |
| | | |
| Meesho Series F | 9/21/21 | 5,135,664 |
| | | |
| Menlo Micro, Inc. Series C | 2/09/22 | 1,317,148 |
| | | |
| National Resilience, Inc. Series B | 12/01/20 | 2,490,423 |
| | | |
| National Resilience, Inc. Series C | 6/28/21 | 3,319,559 |
| | | |
| Neutron Holdings, Inc. 4% 5/22/27 | 6/04/20 | 310,600 |
| | | |
| Neutron Holdings, Inc. 4% 6/12/27 | 6/12/20 | 82,200 |
| | | |
| Neutron Holdings, Inc. 4.5% 10/27/25 | 10/29/21 - 4/27/23 | 2,076,728 |
| | | |
| Oddity Tech Ltd. | 1/06/22 | 1,594,239 |
| | | |
| Odyssey Therapeutics, Inc. Series B | 9/30/22 | 2,892,806 |
| | | |
| Omada Health, Inc. Series E | 12/22/21 | 3,816,251 |
| | | |
| Paragon Biosciences Emalex Capital, Inc. Series C | 2/26/21 | 1,176,647 |
| | | |
| Paragon Biosciences Emalex Capital, Inc. Series D1 | 10/21/22 | 2,067,447 |
| | | |
| Paragon Biosciences Emalex Capital, Inc. Series D2 | 5/18/22 | 134,101 |
| | | |
| PrognomIQ, Inc. Series A5 | 8/20/20 | 22,922 |
| | | |
| PrognomIQ, Inc. Series B | 9/11/20 | 450,094 |
| | | |
| PrognomIQ, Inc. Series C | 2/16/22 | 201,054 |
| | | |
| Quell Therapeutics Ltd. Series B | 11/24/21 | 1,554,788 |
| | | |
| Rad Power Bikes, Inc. | 1/21/21 | 826,883 |
| | | |
| Rad Power Bikes, Inc. Series A | 1/21/21 | 107,803 |
| | | |
| Rad Power Bikes, Inc. Series C | 1/21/21 | 424,189 |
| | | |
| Rad Power Bikes, Inc. Series D | 9/17/21 | 2,104,602 |
| | | |
| Reddit, Inc. Series E | 5/18/21 | 191,176 |
| | | |
| Reddit, Inc. Series F | 8/11/21 | 5,467,939 |
| | | |
| Redwood Materials Series C | 5/28/21 | 970,302 |
| | | |
| Retym, Inc. Series C | 5/17/23 | 1,290,689 |
| | | |
| SalioGen Therapeutics, Inc. Series B | 12/10/21 | 1,485,060 |
| | | |
| Saluda Medical, Inc. warrants 1/20/27 | 1/20/22 | 0 |
| | | |
| Saluda Medical, Inc. Series D | 1/20/22 | 1,975,505 |
| | | |
| Saluda Medical, Inc. Series E | 4/06/23 | 2,321,968 |
| | | |
| Scholar Rock Holding Corp. warrants 12/31/25 | 6/17/22 | 0 |
| | | |
| Scorpion Therapeutics, Inc. Series B | 1/08/21 | 631,103 |
| | | |
| SiMa.ai Series B | 5/10/21 | 1,535,564 |
| | | |
| SiMa.ai Series B1 | 4/25/22 - 10/17/22 | 1,190,194 |
| | | |
| Skyhawk Therapeutics, Inc. | 5/21/21 | 2,094,864 |
| | | |
| Skyryse, Inc. Series B | 10/21/21 | 2,903,673 |
| | | |
| Sonoma Biotherapeutics, Inc. Series B | 7/26/21 | 1,161,934 |
| | | |
| Sonoma Biotherapeutics, Inc. Series B1 | 7/26/21 | 929,546 |
| | | |
| Space Exploration Technologies Corp. Class A | 2/16/21 - 5/24/22 | 21,637,941 |
| | | |
| Space Exploration Technologies Corp. Series N | 8/04/20 | 5,373,000 |
| | | |
| SpringWorks Therapeutics, Inc. | 9/07/22 | 2,962,539 |
| | | |
| Stripe, Inc. Class B | 5/18/21 | 1,544,943 |
| | | |
| Stripe, Inc. Series H | 3/15/21 | 577,800 |
| | | |
| T-Knife Therapeutics, Inc. Series B | 6/30/21 | 1,392,911 |
| | | |
| Tenstorrent, Inc. Series C1 | 4/23/21 | 1,004,778 |
| | | |
| Tenstorrent, Inc. 0% | 4/23/21 | 940,000 |
| | | |
| The Beauty Health Co. | 12/08/20 | 4,286,430 |
| | | |
| The Oncology Institute, Inc. | 6/28/21 | 4,467,880 |
| | | |
| Treeline Biosciences Series A | 7/30/21 - 10/27/22 | 2,221,578 |
| | | |
| Treeline Biosciences Series A1 | 10/27/22 | 1,303,031 |
| | | |
| Waymo LLC Series A2 | 5/08/20 | 566,037 |
| | | |
| Wugen, Inc. Series B | 7/09/21 | 945,276 |
| | | |
| Xsight Labs Ltd. Series D | 2/16/21 | 977,119 |
| | | |
Affiliated Central Funds
Fiscal year to date information regarding the Fund's investments in Fidelity Central Funds, including the ownership percentage, is presented below.
| Affiliate | Value, beginning of period ($) | Purchases ($) | Sales Proceeds ($) | Dividend Income ($) | Realized Gain (loss) ($) | Change in Unrealized appreciation (depreciation) ($) | Value, end of period ($) | % ownership, end of period |
| Fidelity Cash Central Fund 5.14% | 22,944,514 | 647,851,786 | 606,318,810 | 1,335,311 | - | - | 64,477,490 | 0.2% |
| Fidelity Securities Lending Cash Central Fund 5.14% | 347,584,554 | 936,177,834 | 909,532,073 | 530,826 | - | - | 374,230,315 | 1.3% |
| Total | 370,529,068 | 1,584,029,620 | 1,515,850,883 | 1,866,137 | - | - | 438,707,805 | |
| | | | | | | | | |
Amounts in the dividend income column in the above table include any capital gain distributions from underlying funds, which are presented in the corresponding line item in the Statement of Operations, if applicable.
Amounts in the dividend income column for Fidelity Securities Lending Cash Central Fund represents the income earned on investing cash collateral, less rebates paid to borrowers and any lending agent fees associated with the loan, plus any premium payments received for lending certain types of securities.
Amounts included in the purchases and sales proceeds columns may include in-kind transactions, if applicable.
Investment Valuation
The following is a summary of the inputs used, as of May 31, 2023, involving the Fund's assets and liabilities carried at fair value. The inputs or methodology used for valuing securities may not be an indication of the risk associated with investing in those securities. For more information on valuation inputs, and their aggregation into the levels used below, please refer to the Investment Valuation section in the accompanying Notes to Financial Statements.
| Valuation Inputs at Reporting Date: |
| Description | Total ($) | Level 1 ($) | Level 2 ($) | Level 3 ($) |
Investments in Securities: | | | | |
|
| Equities: | | | | |
Communication Services | 1,086,505,790 | 1,069,445,813 | - | 17,059,977 |
Consumer Discretionary | 2,606,900,690 | 2,582,030,357 | - | 24,870,333 |
Consumer Staples | 539,581,889 | 532,480,473 | - | 7,101,416 |
Energy | 246,171,041 | 246,171,041 | - | - |
Financials | 495,503,245 | 484,778,389 | - | 10,724,856 |
Health Care | 2,278,574,984 | 2,173,615,500 | 2,965,791 | 101,993,693 |
Industrials | 637,141,785 | 594,130,324 | - | 43,011,461 |
Information Technology | 6,141,818,117 | 6,111,011,674 | - | 30,806,443 |
Materials | 143,992,003 | 127,127,109 | - | 16,864,894 |
Real Estate | 27,603,316 | 27,603,316 | - | - |
Utilities | 11,519,637 | 10,580,315 | - | 939,322 |
|
| Corporate Bonds | 4,674,290 | - | - | 4,674,290 |
|
| Preferred Securities | 4,219,379 | - | - | 4,219,379 |
|
| Money Market Funds | 438,707,805 | 438,707,805 | - | - |
| Total Investments in Securities: | 14,662,913,971 | 14,397,682,116 | 2,965,791 | 262,266,064 |
The following is a reconciliation of Investments in Securities for which Level 3 inputs were used in determining value:
| |
| Investments in Securities: | |
| Beginning Balance | $ | 246,494,517 | |
| Net Realized Gain (Loss) on Investment Securities | | 250 | |
| Net Unrealized Gain (Loss) on Investment Securities | | (679,541) | |
| Cost of Purchases | | 10,500,351 | |
| Proceeds of Sales | | (325,997) | |
| Amortization/Accretion | | - | |
| Transfers into Level 3 | | 6,276,484 | |
| Transfers out of Level 3 | | - | |
| Ending Balance | $ | 262,266,064 | |
| The change in unrealized gain (loss) for the period attributable to Level 3 securities held at May 31, 2023 | $ | (698,502) | |
| The information used in the above reconciliation represents fiscal year to date activity for any Investments in Securities identified as using Level 3 inputs at either the beginning or the end of the current fiscal period. Cost of purchases and proceeds of sales may include securities received and/or delivered through in-kind transactions, corporate actions or exchanges. Transfers into Level 3 were attributable to a lack of observable market data resulting from decreases in market activity, decreases in liquidity, security restructurings or corporate actions. Transfers out of Level 3 were attributable to observable market data becoming available for those securities. Transfers in or out of Level 3 represent the beginning value of any Security or Instrument where a change in the pricing level occurred from the beginning to the end of the period. Realized and unrealized gains (losses) disclosed in the reconciliation are included in Net Gain (Loss) on the Fund's Statement of Operations. | |
| Statement of Assets and Liabilities |
| | | | May 31, 2023 (Unaudited) |
| | | | | |
| Assets | | | | |
| Investment in securities, at value (including securities loaned of $363,680,621) - See accompanying schedule: | | | | |
Unaffiliated issuers (cost $11,056,394,477) | $ | 14,224,206,166 | | |
Fidelity Central Funds (cost $438,707,805) | | 438,707,805 | | |
| | | | | |
| | | | | |
| Total Investment in Securities (cost $11,495,102,282) | | | $ | 14,662,913,971 |
| Cash | | | | 30,326 |
| Foreign currency held at value (cost $249) | | | | 249 |
| Receivable for investments sold | | | | 30,812,681 |
| Receivable for fund shares sold | | | | 7,942,584 |
| Dividends receivable | | | | 6,824,435 |
| Interest receivable | | | | 144,237 |
| Distributions receivable from Fidelity Central Funds | | | | 400,670 |
| Other receivables | | | | 32,538 |
Total assets | | | | 14,709,101,691 |
| Liabilities | | | | |
| Payable for investments purchased | | | | |
Regular delivery | $ | 37,792,941 | | |
Delayed delivery | | 1,770,108 | | |
| Payable for fund shares redeemed | | 4,482,670 | | |
| Accrued management fee | | 5,126,915 | | |
| Other payables and accrued expenses | | 822,507 | | |
| Collateral on securities loaned | | 374,227,770 | | |
| Total Liabilities | | | | 424,222,911 |
| Net Assets | | | $ | 14,284,878,780 |
| Net Assets consist of: | | | | |
| Paid in capital | | | $ | 11,907,288,032 |
| Total accumulated earnings (loss) | | | | 2,377,590,748 |
| Net Assets | | | $ | 14,284,878,780 |
Net Asset Value , offering price and redemption price per share ($14,284,878,780 ÷ 746,155,043 shares) | | | $ | 19.14 |
| Statement of Operations |
| | | | Six months ended May 31, 2023 (Unaudited) |
| Investment Income | | | | |
| Dividends | | | $ | 36,566,006 |
| Interest | | | | 138,882 |
| Income from Fidelity Central Funds (including $530,826 from security lending) | | | | 1,866,137 |
| Total Income | | | | 38,571,025 |
| Expenses | | | | |
| Management fee | $ | 27,254,653 | | |
| Independent trustees' fees and expenses | | 36,557 | | |
| Miscellaneous | | 265,714 | | |
| Total expenses before reductions | | 27,556,924 | | |
| Expense reductions | | (1,445) | | |
| Total expenses after reductions | | | | 27,555,479 |
| Net Investment income (loss) | | | | 11,015,546 |
| Realized and Unrealized Gain (Loss) | | | | |
| Net realized gain (loss) on: | | | | |
| Investment Securities: | | | | |
| Unaffiliated issuers (net of foreign taxes of $281,119) | | (172,477,060) | | |
| Redemptions in-kind | | 62,745,278 | | |
| Foreign currency transactions | | 40,495 | | |
| Futures contracts | | 803,529 | | |
| Total net realized gain (loss) | | | | (108,887,758) |
| Change in net unrealized appreciation (depreciation) on: | | | | |
| Investment Securities: | | | | |
| Unaffiliated issuers (net of decrease in deferred foreign taxes of $583,463) | | 1,815,853,442 | | |
| Assets and liabilities in foreign currencies | | (45,340) | | |
| Total change in net unrealized appreciation (depreciation) | | | | 1,815,808,102 |
| Net gain (loss) | | | | 1,706,920,344 |
| Net increase (decrease) in net assets resulting from operations | | | $ | 1,717,935,890 |
| Statement of Changes in Net Assets |
| |
| | Six months ended May 31, 2023 (Unaudited) | | Year ended November 30, 2022 |
| Increase (Decrease) in Net Assets | | | | |
| Operations | | | | |
| Net investment income (loss) | $ | 11,015,546 | $ | 17,841,827 |
| Net realized gain (loss) | | (108,887,758) | | (391,467,265) |
| Change in net unrealized appreciation (depreciation) | | 1,815,808,102 | | (3,952,492,614) |
| Net increase (decrease) in net assets resulting from operations | | 1,717,935,890 | | (4,326,118,052) |
| Distributions to shareholders | | (18,540,597) | | (380,672,676) |
| Share transactions | | | | |
| Proceeds from sales of shares | | 2,009,160,862 | | 4,035,985,469 |
| Reinvestment of distributions | | 17,792,720 | | 379,380,027 |
| Cost of shares redeemed | | (1,053,075,062) | | (3,067,304,400) |
Net increase (decrease) in net assets resulting from share transactions | | 973,878,520 | | 1,348,061,096 |
| Total increase (decrease) in net assets | | 2,673,273,813 | | (3,358,729,632) |
| | | | | |
| Net Assets | | | | |
| Beginning of period | | 11,611,604,967 | | 14,970,334,599 |
| End of period | $ | 14,284,878,780 | $ | 11,611,604,967 |
| | | | | |
| Other Information | | | | |
| Shares | | | | |
| Sold | | 117,499,083 | | 224,328,843 |
| Issued in reinvestment of distributions | | 1,171,344 | | 16,416,271 |
| Redeemed | | (62,538,903) | | (167,608,003) |
| Net increase (decrease) | | 56,131,524 | | 73,137,111 |
| | | | | |
Financial Highlights
| Fidelity® Growth Company K6 Fund |
| |
| | Six months ended (Unaudited) May 31, 2023 | | Years ended November 30, 2022 | | 2021 | | 2020 | | 2019 A |
Selected Per-Share Data | | | | | | | | | | |
| Net asset value, beginning of period | $ | 16.83 | $ | 24.27 | $ | 18.67 | $ | 11.19 | $ | 10.00 |
| Income from Investment Operations | | | | | | | | | | |
Net investment income (loss) B,C | | .02 | | .03 | | - D,E | | - D | | .01 |
| Net realized and unrealized gain (loss) | | 2.32 | | (6.87) | | 5.78 | | 7.49 | | 1.18 |
| Total from investment operations | | 2.34 | | (6.84) | | 5.78 | | 7.49 | | 1.19 |
| Distributions from net investment income | | (.03) | | - | | (.02) | | (.01) | | - |
| Distributions from net realized gain | | - | | (.60) | | (.16) | | - | | - |
| Total distributions | | (.03) | | (.60) | | (.18) | | (.01) | | - |
| Net asset value, end of period | $ | 19.14 | $ | 16.83 | $ | 24.27 | $ | 18.67 | $ | 11.19 |
Total Return F,G | | 13.93% | | (28.85)% | | 31.20% | | 66.95% | | 11.90% |
Ratios to Average Net Assets C,H,I | | | | | | | | | | |
| Expenses before reductions | | .45% J | | .45% | | .45% | | .45% | | .45% J |
| Expenses net of fee waivers, if any | | .45% J | | .45% | | .45% | | .45% | | .45% J |
| Expenses net of all reductions | | .45% J | | .45% | | .45% | | .45% | | .45% J |
| Net investment income (loss) | | .18% J | | .15% | | (.01)% E | | .01% | | .29% J |
| Supplemental Data | | | | | | | | | | |
| Net assets, end of period (000 omitted) | $ | 14,284,879 | $ | 11,611,605 | $ | 14,970,335 | $ | 8,000,089 | $ | 1,853,643 |
Portfolio turnover rate K,L | | 12% J | | 23% | | 22% | | 18% | | 16% M |
A For the period June 13, 2019 (commencement of operations) through November 30, 2019.
B Calculated based on average shares outstanding during the period.
C Net investment income (loss) is affected by the timing of the declaration of dividends by any underlying mutual funds or exchange-traded funds (ETFs). Net investment income (loss) of any mutual funds or ETFs is not included in the Fund's net investment income (loss) ratio.
D Amount represents less than $.005 per share.
E Net investment income per share reflects one or more large, non-recurring dividend(s) which amounted to $.01 per share. Excluding such non-recurring dividend(s), the ratio of net investment income (loss) to average net assets would have been (.07)%.
F Total returns for periods of less than one year are not annualized.
G Total returns would have been lower if certain expenses had not been reduced during the applicable periods shown.
H Fees and expenses of any underlying mutual funds or exchange-traded funds (ETFs) are not included in the Fund's expense ratio. The Fund indirectly bears its proportionate share of these expenses. For additional expense information related to investments in Fidelity Central Funds, please refer to the "Investments in Fidelity Central Funds" note found in the Notes to Financial Statements section of the most recent Annual or Semi-Annual report.
I Expense ratios reflect operating expenses of the class. Expenses before reductions do not reflect amounts reimbursed, waived, or reduced through arrangements with the investment adviser, brokerage services, or other offset arrangements, if applicable, and do not represent the amount paid by the class during periods when reimbursements, waivers or reductions occur.
J Annualized.
K Amount does not include the portfolio activity of any underlying mutual funds or exchange-traded funds (ETFs).
L Portfolio turnover rate excludes securities received or delivered in-kind.
M Amount not annualized.
For the period ended May 31, 2023
1. Organization.
Fidelity Growth Company K6 Fund (the Fund) is a fund of Fidelity Mt. Vernon Street Trust (the Trust) and is authorized to issue an unlimited number of shares. Share transactions on the Statement of Changes in Net Assets may contain exchanges between affiliated funds. The Trust is registered under the Investment Company Act of 1940, as amended (the 1940 Act), as an open-end management investment company organized as a Massachusetts business trust. Shares generally are available only to employer-sponsored retirement plans that are recordkept by Fidelity, or to certain employer-sponsored retirement plans that are not recordkept by Fidelity.
2. Investments in Fidelity Central Funds.
Funds may invest in Fidelity Central Funds, which are open-end investment companies generally available only to other investment companies and accounts managed by the investment adviser and its affiliates. The Schedule of Investments lists any Fidelity Central Funds held as an investment as of period end, but does not include the underlying holdings of each Fidelity Central Fund. An investing fund indirectly bears its proportionate share of the expenses of the underlying Fidelity Central Funds.
Based on its investment objective, each Fidelity Central Fund may invest or participate in various investment vehicles or strategies that are similar to those of the investing fund. These strategies are consistent with the investment objectives of the investing fund and may involve certain economic risks which may cause a decline in value of each of the Fidelity Central Funds and thus a decline in the value of the investing fund.
| Fidelity Central Fund | Investment Manager | Investment Objective | Investment Practices | Expense Ratio A |
| Fidelity Money Market Central Funds | Fidelity Management & Research Company LLC (FMR) | Each fund seeks to obtain a high level of current income consistent with the preservation of capital and liquidity. | Short-term Investments | Less than .005% |
A Expenses expressed as a percentage of average net assets and are as of each underlying Central Fund's most recent annual or semi-annual shareholder report.
A complete unaudited list of holdings for each Fidelity Central Fund is available upon request or at the Securities and Exchange Commission website at www.sec.gov. In addition, the financial statements of the Fidelity Central Funds which contain the significant accounting policies (including investment valuation policies) of those funds, and are not covered by the Report of Independent Registered Public Accounting Firm, are available on the Securities and Exchange Commission website or upon request.
3. Significant Accounting Policies.
The Fund is an investment company and applies the accounting and reporting guidance of the Financial Accounting Standards Board (FASB) Accounting Standards Codification Topic 946 Financial Services - Investment Companies . The financial statements have been prepared in conformity with accounting principles generally accepted in the United States of America (GAAP), which require management to make certain estimates and assumptions at the date of the financial statements. Actual results could differ from those estimates. Subsequent events, if any, through the date that the financial statements were issued have been evaluated in the preparation of the financial statements. The Fund's Schedule of Investments lists any underlying mutual funds or exchange-traded funds (ETFs) but does not include the underlying holdings of these funds. The following summarizes the significant accounting policies of the Fund:
Investment Valuation. Investments are valued as of 4:00 p.m. Eastern time on the last calendar day of the period. The Board of Trustees (the Board) has designated the Fund's investment adviser as the valuation designee responsible for the fair valuation function and performing fair value determinations as needed. The investment adviser has established a Fair Value Committee (the Committee) to carry out the day-to-day fair valuation responsibilities and has adopted policies and procedures to govern the fair valuation process and the activities of the Committee. In accordance with these fair valuation policies and procedures, which have been approved by the Board, the Fund attempts to obtain prices from one or more third party pricing services or brokers to value its investments. When current market prices, quotations or currency exchange rates are not readily available or reliable, investments will be fair valued in good faith by the Committee, in accordance with the policies and procedures. Factors used in determining fair value vary by investment type and may include market or investment specific events, transaction data, estimated cash flows, and market observations of comparable investments. The frequency that the fair valuation procedures are used cannot be predicted and they may be utilized to a significant extent. The Committee manages the Fund's fair valuation practices and maintains the fair valuation policies and procedures. The Fund's investment adviser reports to the Board information regarding the fair valuation process and related material matters.
The Fund categorizes the inputs to valuation techniques used to value its investments into a disclosure hierarchy consisting of three levels as shown below:
Level 1 - unadjusted quoted prices in active markets for identical investments
Level 2 - other significant observable inputs (including quoted prices for similar investments, interest rates, prepayment speeds, etc.)
Level 3 - unobservable inputs (including the Fund's own assumptions based on the best information available)
Valuation techniques used to value the Fund's investments by major category are as follows:
Equity securities, including restricted securities, for which market quotations are readily available, are valued at the last reported sale price or official closing price as reported by a third party pricing service on the primary market or exchange on which they are traded and are categorized as Level 1 in the hierarchy. In the event there were no sales during the day or closing prices are not available, securities are valued at the last quoted bid price or may be valued using the last available price and are generally categorized as Level 2 in the hierarchy. For foreign equity securities, when market or security specific events arise, comparisons to the valuation of American Depositary Receipts (ADRs), futures contracts, ETFs and certain indexes as well as quoted prices for similar securities may be used and would be categorized as Level 2 in the hierarchy. For equity securities, including restricted securities, where observable inputs are limited, assumptions about market activity and risk are used and these securities may be categorized as Level 3 in the hierarchy. Securities, including private placements or other restricted securities, for which observable inputs are not available are valued using alternate valuation approaches, including the market approach, the income approach and cost approach, and are categorized as Level 3 in the hierarchy. The market approach considers factors including the price of recent investments in the same or a similar security or financial metrics of comparable securities. The income approach considers factors including expected future cash flows, security specific risks and corresponding discount rates. The cost approach considers factors including the value of the security's underlying assets and liabilities.
Debt securities, including restricted securities, are valued based on evaluated prices received from third party pricing services or from brokers who make markets in such securities. Corporate bonds and preferred securities are valued by pricing services who utilize matrix pricing which considers yield or price of bonds of comparable quality, coupon, maturity and type or by broker-supplied prices. When independent prices are unavailable or unreliable, debt securities may be valued utilizing pricing methodologies which consider similar factors that would be used by third party pricing services. Debt securities are generally categorized as Level 2 in the hierarchy but may be Level 3 depending on the circumstances.
Investments in open-end mutual funds, including the Fidelity Central Funds, are valued at their closing net asset value (NAV) each business day and are categorized as Level 1 in the hierarchy.
The following provides information on Level 3 securities held by the Fund that were valued at period end based on unobservable inputs. These amounts exclude valuations provided by a broker.
| Asset Type | Fair Value | Valuation Technique(s) | Unobservable Input | Amount or Range/Weighted Average | Impact to Valuation from an Increase in Input A |
| | | | | | |
| Equities | $253,372,395 | Market comparable | Enterprise value/EBITDA multiple (EV/EBITDA) | 6.0 - 26.0 / 12.1 | Increase |
| | | | Enterprise value/Revenue multiple (EV/R) | 2.2 - 25.0 / 6.9 | Increase |
| | | | Enterprise value/Gross profit multiple (EV/GP) | 5.0 | Increase |
| | | Recovery value | Recovery value | $0.00 - $0.31 / $0.28 | Increase |
| | | Market approach | Transaction price | $0.70 - $215.03 / $22.17 | Increase |
| | | | Discount rate | 5.0% - 52.5% / 23.4% | Decrease |
| | | Discounted cash flow | Discount rate | 8.0% - 14.1% / 13.9% | Decrease |
| | | | Weighted average cost of capital (WACC) | 20.5% - 38.4% / 31.0% | Decrease |
| | | | Exit multiple | 2.0 - 7.3 / 3.8 | Increase |
| | | | Probability rate | 10.0% - 70.0% / 40.0% | Increase |
| | | Black scholes | Discount rate | 3.5% - 5.3% / 4.2% | Increase |
| | | | Volatility | 45.0% - 100.0% / 75.7% | Increase |
| | | | Term | 1.0 - 5.0 / 3.1 | Increase |
| Corporate Bonds | $4,674,290 | Market comparable | Enterprise value/Revenue multiple (EV/R) | 2.5 - 5.5 / 3.9 | Increase |
| | | | Discount rate | 29.2% | Decrease |
| | | | Probability rate | 10.0% - 50.0% / 33.3% | Increase |
| | | Black scholes | Volatility | 75.0% | Increase |
| | | | Term | 0.6 | Increase |
| Preferred Securities | $4,219,379 | Market comparable | Enterprise value/Revenue multiple (EV/R) | 5.0 | Increase |
| | | Market approach | Transaction price | $59.45 - $100.00 / $84.90 | Increase |
| | | Discounted cash flow | Discount rate | 20.0% | Decrease |
| | | Black scholes | Discount rate | 4.0% - 4.2% / 4.1% | Increase |
| | | | Volatility | 70.0% | Increase |
| | | | Term | 2.0 - 3.0 / 2.6 | Increase |
A Represents the directional change in the fair value of the Level 3 investments that could have resulted from an increase in the corresponding input as of period end. A decrease to the unobservable input would have had the opposite effect. Significant changes in these inputs may have resulted in a significantly higher or lower fair value measurement at period end.
Changes in valuation techniques may result in transfers in or out of an assigned level within the disclosure hierarchy. The aggregate value of investments by input level as of May 31, 2023, as well as a roll forward of Level 3 investments, is included at the end of the Fund's Schedule of Investments.
Foreign Currency. Certain Funds may use foreign currency contracts to facilitate transactions in foreign-denominated securities. Gains and losses from these transactions may arise from changes in the value of the foreign currency or if the counterparties do not perform under the contracts' terms.
Foreign-denominated assets, including investment securities, and liabilities are translated into U.S. dollars at the exchange rates at period end. Purchases and sales of investment securities, income and dividends received, and expenses denominated in foreign currencies are translated into U.S. dollars at the exchange rate in effect on the transaction date.
The effects of exchange rate fluctuations on investments are included with the net realized and unrealized gain (loss) on investment securities. Other foreign currency transactions resulting in realized and unrealized gain (loss) are disclosed separately.
Investment Transactions and Income. For financial reporting purposes, the Fund's investment holdings and NAV include trades executed through the end of the last business day of the period. The NAV per share for processing shareholder transactions is calculated as of the close of business of the New York Stock Exchange (NYSE), normally 4:00 p.m. Eastern time and includes trades executed through the end of the prior business day. Gains and losses on securities sold are determined on the basis of identified cost and include proceeds received from litigation. Commissions paid to certain brokers with whom the investment adviser, or its affiliates, places trades on behalf of a fund include an amount in addition to trade execution, which may be rebated back to a fund. Any such rebates are included in net realized gain (loss) on investments in the Statement of Operations. Dividend income is recorded on the ex-dividend date, except for certain dividends from foreign securities where the ex-dividend date may have passed, which are recorded as soon as the Fund is informed of the ex-dividend date. Non-cash dividends included in dividend income, if any, are recorded at the fair market value of the securities received. Income and capital gain distributions from Fidelity Central Funds, if any, are recorded on the ex-dividend date. Certain distributions received by the Fund represent a return of capital or capital gain. The Fund determines the components of these distributions subsequent to the ex-dividend date, based upon receipt of tax filings or other correspondence relating to the underlying investment. These distributions are recorded as a reduction of cost of investments and/or as a realized gain. Interest income is accrued as earned and includes coupon interest and amortization of premium and accretion of discount on debt securities as applicable. Investment income is recorded net of foreign taxes withheld where recovery of such taxes is uncertain. Funds may file withholding tax reclaims in certain jurisdictions to recover a portion of amounts previously withheld. Any withholding tax reclaims income is included in the Statement of Operations in dividends. Any receivables for withholding tax reclaims are included in the Statement of Assets and Liabilities in dividends receivable.
Expenses. Expenses directly attributable to a fund are charged to that fund. Expenses attributable to more than one fund are allocated among the respective funds on the basis of relative net assets or other appropriate methods. Expenses included in the accompanying financial statements reflect the expenses of that fund and do not include any expenses associated with any underlying mutual funds or exchange-traded funds. Although not included in a fund's expenses, a fund indirectly bears its proportionate share of these expenses through the net asset value of each underlying mutual fund or exchange-traded fund. Expense estimates are accrued in the period to which they relate and adjustments are made when actual amounts are known.
Income Tax Information and Distributions to Shareholders. Each year, the Fund intends to qualify as a regulated investment company under Subchapter M of the Internal Revenue Code, including distributing substantially all of its taxable income and realized gains. As a result, no provision for U.S. Federal income taxes is required. The Fund files a U.S. federal tax return, in addition to state and local tax returns as required. The Fund's federal income tax returns are subject to examination by the Internal Revenue Service (IRS) for a period of three fiscal years after they are filed. State and local tax returns may be subject to examination for an additional fiscal year depending on the jurisdiction. Foreign taxes are provided for based on the Fund's understanding of the tax rules and rates that exist in the foreign markets in which it invests. The Fund is subject to a tax imposed on capital gains by certain countries in which it invests. An estimated deferred tax liability for net unrealized appreciation on the applicable securities is included in Other payables and accrued expenses on the Statement of Assets & Liabilities.
Distributions are declared and recorded on the ex-dividend date. Income and capital gain distributions are determined in accordance with income tax regulations, which may differ from GAAP.
Capital accounts within the financial statements are adjusted for permanent book-tax differences. These adjustments have no impact on net assets or the results of operations. Capital accounts are not adjusted for temporary book-tax differences which will reverse in a subsequent period.
Book-tax differences are primarily due to futures contracts, foreign currency transactions, certain foreign taxes, passive foreign investment companies (PFIC), redemptions in-kind, partnerships, capital loss carryforwards and losses deferred due to wash sales.
As of period end, the cost and unrealized appreciation (depreciation) in securities, and derivatives if applicable, for federal income tax purposes were as follows:
| Gross unrealized appreciation | $4,345,480,945 |
| Gross unrealized depreciation | (1,216,176,698) |
| Net unrealized appreciation (depreciation) | $3,129,304,247 |
| Tax cost | $11,533,609,724 |
Capital loss carryforwards are only available to offset future capital gains of the Fund to the extent provided by regulations and may be limited. The capital loss carryforward information presented below, including any applicable limitation, is estimated as of prior fiscal period end and is subject to adjustment.
| Short-term | $(477,411,298) |
| Long-term | (174,724,987) |
| Total capital loss carryforward | $(652,136,285) |
Delayed Delivery Transactions and When-Issued Securities. During the period, certain Funds transacted in securities on a delayed delivery or when-issued basis. Payment and delivery may take place after the customary settlement period for that security. The price of the underlying securities and the date when the securities will be delivered and paid for are fixed at the time the transaction is negotiated. Securities purchased on a delayed delivery or when-issued basis are identified as such in the Schedule of Investments. Compensation for interest forgone in the purchase of a delayed delivery or when-issued debt security may be received. With respect to purchase commitments, each applicable Fund identifies securities as segregated in its records with a value at least equal to the amount of the commitment. Payables and receivables associated with the purchases and sales of delayed delivery securities having the same coupon, settlement date and broker are offset. Delayed delivery or when-issued securities that have been purchased from and sold to different brokers are reflected as both payables and receivables in the Statement of Assets and Liabilities under the caption "Delayed delivery", as applicable. Losses may arise due to changes in the value of the underlying securities or if the counterparty does not perform under the contract's terms, or if the issuer does not issue the securities due to political, economic, or other factors.
Restricted Securities (including Private Placements). Funds may invest in securities that are subject to legal or contractual restrictions on resale. These securities generally may be resold in transactions exempt from registration or to the public if the securities are registered. Disposal of these securities may involve time-consuming negotiations and expense, and prompt sale at an acceptable price may be difficult. Information regarding restricted securities held at period end is included at the end of the Schedule of Investments, if applicable.
Consolidated Subsidiary. The Funds included in the table below hold certain investments through a wholly-owned subsidiary ("Subsidiary"), which may be subject to federal and state taxes upon disposition.
As of period end, investments in Subsidiaries were as follows:
| | $ Amount | % of Net Assets |
| Fidelity Growth Company K6 Fund | 12,558,723 | .09 |
The financial statements have been consolidated to include the Subsidiary accounts where applicable. Accordingly, all inter-company transactions and balances have been eliminated.
At period end, any estimated tax liability for these investments is presented as "Deferred taxes" in the Statement of Assets and Liabilities and included in "Change in net unrealized appreciation (depreciation) on investment securities" in the Statement of Operations. The tax liability incurred may differ materially depending on conditions when these investments are disposed. Any cash held by a Subsidiary is restricted as to its use and is presented as "Restricted cash" in the Statement of Assets and Liabilities, if applicable.
New Accounting Pronouncement. In June 2022, the Financial Accounting Standards Board (FASB) issued Accounting Standards Update (ASU) 2022-03 Fair Value Measurement (Topic 820): Fair Value Measurement of Equity Securities Subject to Contractual Sale Restrictions. The amendments in this ASU clarify that a contractual restriction on the sale of an equity security is not considered part of the unit of account of the equity security and, therefore, is not considered in measuring fair value. They also clarify that an entity cannot, as a separate unit of account, recognize and measure a contractual sale restriction. They also require additional disclosures for equity securities subject to contractual sale restrictions. ASU 2022-03 will be effective for fiscal years, including interim periods within those fiscal years, beginning after December 15, 2023, and allows for early adoption. ASU 2022-03 will only be applicable to an equity security in which the contractual arrangement that restricts its sale is executed or modified on or after the adoption date. Management is currently evaluating the potential impact of ASU 2022-03 to the financial statements.
4. Derivative Instruments.
Risk Exposures and the Use of Derivative Instruments. The Fund's investment objectives allow for various types of derivative instruments, including futures contracts. Derivatives are investments whose value is primarily derived from underlying assets, indices or reference rates and may be transacted on an exchange or over-the-counter (OTC). Derivatives may involve a future commitment to buy or sell a specified asset based on specified terms, to exchange future cash flows at periodic intervals based on a notional principal amount, or for one party to make one or more payments upon the occurrence of specified events in exchange for periodic payments from the other party.
Derivatives were used to increase returns and to manage exposure to certain risks as defined below. The success of any strategy involving derivatives depends on analysis of numerous economic factors, and if the strategies for investment do not work as intended, the objectives may not be achieved.
Derivatives were used to increase or decrease exposure to the following risk(s):
| | |
| Equity Risk | Equity risk relates to the fluctuations in the value of financial instruments as a result of changes in market prices (other than those arising from interest rate risk or foreign exchange risk), whether caused by factors specific to an individual investment, its issuer, or all factors affecting all instruments traded in a market or market segment. |
Funds are also exposed to additional risks from investing in derivatives, such as liquidity risk and counterparty credit risk. Liquidity risk is the risk that a fund will be unable to close out the derivative in the open market in a timely manner. Counterparty credit risk is the risk that the counterparty will not be able to fulfill its obligation to a fund. Counterparty credit risk related to exchange-traded contracts may be mitigated by the protection provided by the exchange on which they trade.
Investing in derivatives may involve greater risks than investing in the underlying assets directly and, to varying degrees, may involve risk of loss in excess of any initial investment and collateral received and amounts recognized in the Statement of Assets and Liabilities. In addition, there may be the risk that the change in value of the derivative contract does not correspond to the change in value of the underlying instrument.
Futures Contracts. A futures contract is an agreement between two parties to buy or sell a specified underlying instrument for a fixed price at a specified future date. Futures contracts were used to manage exposure to the stock market.
Upon entering into a futures contract, a fund is required to deposit either cash or securities (initial margin) with a clearing broker in an amount equal to a certain percentage of the face value of the contract. Futures contracts are marked-to-market daily and subsequent daily payments are made or received by a fund depending on the daily fluctuations in the value of the futures contracts and are recorded as unrealized appreciation or (depreciation). This receivable and/or payable, if any, is included in daily variation margin on futures contracts in the Statement of Assets and Liabilities. Realized gain or (loss) is recorded upon the expiration or closing of a futures contract. The net realized gain (loss) and change in net unrealized appreciation (depreciation) on futures contracts during the period is presented in the Statement of Operations.
Any open futures contracts at period end are presented in the Schedule of Investments under the caption "Futures Contracts". The notional amount at value reflects each contract's exposure to the underlying instrument or index at period end, and is representative of volume of activity during the period unless an average notional amount is presented. Any securities deposited to meet initial margin requirements are identified in the Schedule of Investments. Any cash deposited to meet initial margin requirements is presented as segregated cash with brokers for derivative instruments in the Statement of Assets and Liabilities.
5. Purchases and Sales of Investments.
Purchases and sales of securities, other than short-term securities and in-kind transactions, as applicable, are noted in the table below.
| | Purchases ($) | Sales ($) |
| Fidelity Growth Company K6 Fund | 1,237,712,958 | 738,443,301 |
Unaffiliated Redemptions In-Kind. Shares that were redeemed in-kind for investments, including accrued interest and cash, if any, are shown in the table below. The net realized gain or loss on investments delivered through in-kind redemptions is included in the "Net realized gain (loss) on: Redemptions in-kind" line in the accompanying Statement of Operations. The amount of the in-kind redemptions is included in share transactions in the accompanying Statement of Changes in Net Assets. There was no gain or loss for federal income tax purposes.
| | Shares | Total net realized gain or loss ($) | Total Proceeds ($) |
| Fidelity Growth Company K6 Fund | 10,848,744 | 62,745,278 | 176,254,786 |
Unaffiliated Exchanges In-Kind. Shares that were exchanged for investments, including accrued interest and cash, if any, are shown in the table below. The amount of in-kind exchanges is included in share transactions in the accompanying Statement of Changes in Net Assets.
| | Shares | Total Proceeds ($) |
| Fidelity Growth Company K6 Fund | 36,252,195 | 617,389,453 |
Prior Fiscal Year Unaffiliated Redemptions In-Kind. Shares that were redeemed in-kind for investments, including accrued interest and cash, if any, are shown in the table below; along with realized gain or loss on investments delivered through in-kind redemptions. The amount of the in-kind redemptions is included in share transactions in the accompanying Statement of Changes in Net Assets. There was no gain or loss for federal income tax purposes.
| | Shares | Total net realized gain or loss ($) | Total Proceeds ($) |
| Fidelity Growth Company K6 Fund | 37,569,308 | 275,040,157 | 687,087,050 |
Prior Year Unaffiliated Exchanges In-Kind. Shares that were exchanged for investments, including accrued interest and cash, if any, are shown in the table below. The amount of in-kind exchanges is included in share transactions in the accompanying Statement of Changes in Net Assets.
| | Shares | Total Proceeds ($) |
| Fidelity Growth Company K6 Fund | 92,411,202 | 1,624,959,544 |
6. Fees and Other Transactions with Affiliates.
Management Fee. Fidelity Management & Research Company LLC (the investment adviser) and its affiliates provide the Fund with investment management related services for which the Fund pays a monthly management fee that is based on an annual rate of .45% of average net assets. Under the management contract, the investment adviser or an affiliate pays all other expenses of the Fund, excluding fees and expenses of the independent Trustees, and certain miscellaneous expenses such as proxy and shareholder meeting expenses.
Brokerage Commissions. A portion of portfolio transactions were placed with brokerage firms which are affiliates of the investment adviser. Brokerage commissions are included in net realized gain (loss) and change in net unrealized appreciation (depreciation) in the Statement of Operations. The commissions paid to these affiliated firms were as follows:
| | Amount |
| Fidelity Growth Company K6 Fund | $27,020 |
Interfund Trades. Funds may purchase from or sell securities to other Fidelity Funds under procedures adopted by the Board. The procedures have been designed to ensure these interfund trades are executed in accordance with Rule 17a-7 of the 1940 Act. Any interfund trades are included within the respective purchases and sales amounts shown in the Purchases and Sales of Investments note. Interfund trades during the period are noted in the table below.
| | Purchases ($) | Sales ($) | Realized Gain (Loss) ($) |
| Fidelity Growth Company K6 Fund | 170,908,784 | 57,074,766 | (9,533,859) |
7. Committed Line of Credit.
Certain Funds participate with other funds managed by the investment adviser or an affiliate in a $4.25 billion credit facility (the "line of credit") to be utilized for temporary or emergency purposes to fund shareholder redemptions or for other short-term liquidity purposes. The commitment fees on the pro-rata portion of the line of credit are borne by the investment adviser. During the period, there were no borrowings on this line of credit.
8. Security Lending.
Funds lend portfolio securities from time to time in order to earn additional income. Lending agents are used, including National Financial Services (NFS), an affiliate of the investment adviser. Pursuant to a securities lending agreement, NFS will receive a fee, which is capped at 9.9% of a fund's daily lending revenue, for its services as lending agent. A fund may lend securities to certain qualified borrowers, including NFS. On the settlement date of the loan, a fund receives collateral (in the form of U.S. Treasury obligations, letters of credit and/or cash) against the loaned securities and maintains collateral in an amount not less than 100% of the market value of the loaned securities during the period of the loan. The market value of the loaned securities is determined at the close of business of a fund and any additional required collateral is delivered to a fund on the next business day. A fund or borrower may terminate the loan at any time, and if the borrower defaults on its obligation to return the securities loaned because of insolvency or other reasons, a fund may apply collateral received from the borrower against the obligation. A fund may experience delays and costs in recovering the securities loaned. Any cash collateral received is invested in the Fidelity Securities Lending Cash Central Fund. Any loaned securities are identified as such in the Schedule of Investments, and the value of loaned securities and cash collateral at period end, as applicable, are presented in the Statement of Assets and Liabilities. Security lending income represents the income earned on investing cash collateral, less rebates paid to borrowers and any lending agent fees associated with the loan, plus any premium payments received for lending certain types of securities. Security lending income is presented in the Statement of Operations as a component of income from Fidelity Central Funds. Affiliated security lending activity, if any, was as follows:
| | Total Security Lending Fees Paid to NFS | Security Lending Income From Securities Loaned to NFS | Value of Securities Loaned to NFS at Period End |
| Fidelity Growth Company K6 Fund | $57,115 | $6,057 | $1,647,495 |
9. Expense Reductions.
Through arrangements with the Fund's custodian, credits realized as a result of certain uninvested cash balances were used to reduce the Fund's expenses by $1,445.
10. Other.
A fund's organizational documents provide former and current trustees and officers with a limited indemnification against liabilities arising in connection with the performance of their duties to the fund. In the normal course of business, a fund may also enter into contracts that provide general indemnifications. A fund's maximum exposure under these arrangements is unknown as this would be dependent on future claims that may be made against a fund. The risk of material loss from such claims is considered remote.
11. Risk and Uncertainties.
Many factors affect a fund's performance. Developments that disrupt global economies and financial markets, such as pandemics, epidemics, outbreaks of infectious diseases, war, terrorism, and environmental disasters, may significantly affect a fund's investment performance. The effects of these developments to a fund will be impacted by the types of securities in which a fund invests, the financial condition, industry, economic sector, and geographic location of an issuer, and a fund's level of investment in the securities of that issuer. Significant concentrations in security types, issuers, industries, sectors, and geographic locations may magnify the factors that affect a fund's performance.
As a shareholder, you incur two types of costs: (1) transaction costs, which may include sales charges (loads) on purchase payments or redemption proceeds, as applicable and (2) ongoing costs, which generally include management fees, distribution and/or service (12b-1) fees and other Fund expenses. This Example is intended to help you understand your ongoing costs (in dollars) of investing in a fund and to compare these costs with the ongoing costs of investing in other mutual funds.
| The Example is based on an investment of $1,000 invested at the beginning of the period and held for the entire period (December 1, 2022 to May 31, 2023). |
Actual Expenses
The first line of the accompanying table provides information about actual account values and actual expenses. You may use the information in this line, together with the amount you invested, to estimate the expenses that you paid over the period. Simply divide your account value by $1,000.00 (for example, an $8,600 account value divided by $1,000.00 = 8.6), then multiply the result by the number in the first line for a class/Fund under the heading entitled "Expenses Paid During Period" to estimate the expenses you paid on your account during this period. If any fund is a shareholder of any underlying mutual funds or exchange-traded funds (ETFs) (the Underlying Funds), such fund indirectly bears its proportional share of the expenses of the Underlying Funds in addition to the direct expenses incurred presented in the table. These fees and expenses are not included in the annualized expense ratio used to calculate the expense estimate in the table below.
Hypothetical Example for Comparison Purposes
The second line of the accompanying table provides information about hypothetical account values and hypothetical expenses based on the actual expense ratio and an assumed rate of return of 5% per year before expenses, which is not the actual return. The hypothetical account values and expenses may not be used to estimate the actual ending account balance or expenses you paid for the period. You may use this information to compare the ongoing costs of investing in the Fund and other funds. To do so, compare this 5% hypothetical example with the 5% hypothetical examples that appear in the shareholder reports of the other funds. If any fund is a shareholder of any Underlying Funds, such fund indirectly bears its proportional share of the expenses of the Underlying Funds in addition to the direct expenses as presented in the table. These fees and expenses are not included in the annualized expense ratio used to calculate the expense estimate in the table below.
Please note that the expenses shown in the table are meant to highlight your ongoing costs only and do not reflect any transaction costs. Therefore, the second line of the table is useful in comparing ongoing costs only, and will not help you determine the relative total costs of owning different funds. In addition, if these transactional costs were included, your costs would have been higher.
| | | | | Annualized Expense Ratio- A | | Beginning Account Value December 1, 2022 | | Ending Account Value May 31, 2023 | | Expenses Paid During Period- C December 1, 2022 to May 31, 2023 |
| | | | | | | | | | |
| Fidelity® Growth Company K6 Fund | | | | .45% | | | | | | |
| Actual | | | | | | $ 1,000 | | $ 1,139.30 | | $ 2.40 |
Hypothetical- B | | | | | | $ 1,000 | | $ 1,022.69 | | $ 2.27 |
| |
A Annualized expense ratio reflects expenses net of applicable fee waivers.
B 5% return per year before expenses
C Expenses are equal to the annualized expense ratio, multiplied by the average account value over the period, multiplied by 182/ 365 (to reflect the one-half year period). The fees and expenses of any Underlying Funds are not included in each annualized expense ratio.
Board Approval of Investment Advisory Contracts
Fidelity Growth Company K6 Fund
At its May 2023 meeting, the Board of Trustees, including the Independent Trustees (together, the Board), voted to continue the management contract with Fidelity Management & Research Company LLC (FMR), and the sub-advisory agreements and sub-subadvisory agreements, in each case, where applicable (together, the Advisory Contracts) for the fund for two months from June 1, 2023 through July 31, 2023. The Board determined that it will consider the annual renewal of the fund's Advisory Contracts for a full one year period in July 2023, following its review of additional materials provided by FMR.
The Board considered that the approval of the fund's Advisory Contracts will not result in any changes in (i) the investment process or strategies employed in the management of the fund's assets; (ii) the fees and expenses paid by shareholders; (iii) the nature, extent or quality of services provided under the fund's Advisory Contracts; or (iv) the day-to-day management of the fund or the persons primarily responsible for such management. The Board also considered that since its last approval of the fund's Advisory Contracts, FMR had provided additional information on the fund in support of the annual contract renewal process, including competitive analyses on total expenses and management fees and in-depth reviews of fund performance and fund profitability information. The Board concluded that the fund's Advisory Contracts are fair and reasonable, and that the fund's Advisory Contracts should be renewed, without modification, through July 31, 2023, with the understanding that the Board will consider the annual renewal for a full one year period in July 2023.
In connection with its consideration of future renewals of the fund's Advisory Contracts, the Board will consider: (i) the nature, extent and quality of services provided to the fund, including shareholder and administrative services and investment performance; (ii) the competitiveness of the management fee and total expenses for the fund; (iii) the costs of the services and profitability, including the revenues earned and the expenses incurred in conducting the business of developing, marketing, distributing, managing, administering, and servicing the fund and its shareholders, to the extent applicable; and (iv) whether there have been economies of scale in respect of the Fidelity funds, whether the Fidelity funds (including the fund) have appropriately benefited from any such economies of scale, and whether there is the potential for realization of any further economies.
Based on its evaluation of all of the conclusions noted above, and after considering all factors it believed relevant, the Board ultimately concluded that the fund's management fee structure is fair and reasonable, and that the continuation of the fund's Advisory Contracts should be approved for two months from June 1, 2023 through July 31, 2023.
The Securities and Exchange Commission adopted Rule 22e-4 under the Investment Company Act of 1940 (the Liquidity Rule) to promote effective liquidity risk management throughout the open-end investment company industry, thereby reducing the risk that funds will be unable to meet their redemption obligations and mitigating dilution of the interests of fund shareholders.
The Fund has adopted and implemented a liquidity risk management program (the Program) reasonably designed to assess and manage the Fund's liquidity risk and to comply with the requirements of the Liquidity Rule. The Fund's Board of Trustees (the Board) has designated the Fund's investment adviser as administrator of the Program. The Fidelity advisers have established a Liquidity Risk Management Committee (the LRM Committee) to manage the Program for each of the Fidelity Funds. The LRM Committee monitors the adequacy and effectiveness of implementation of the Program and on a periodic basis assesses each Fund's liquidity risk based on a variety of factors including (1) the Fund's investment strategy, (2) portfolio liquidity and cash flow projections during normal and reasonably foreseeable stressed conditions, (3) shareholder redemptions, (4) borrowings and other funding sources and (5) certain factors specific to ETFs including the effect of the Fund's prices and spreads, market participants, and basket compositions on the overall liquidity of the Fund's portfolio, as applicable.
In accordance with the Program, each of the Fund's portfolio investments is classified into one of four defined liquidity categories based on a determination of a reasonable expectation for how long it would take to convert the investment to cash (or sell or dispose of the investment) without significantly changing its market value.
- Highly liquid investments - cash or convertible to cash within three business days or less
- Moderately liquid investments - convertible to cash in three to seven calendar days
- Less liquid investments - can be sold or disposed of, but not settled, within seven calendar days
- Illiquid investments - cannot be sold or disposed of within seven calendar days
Liquidity classification determinations take into account a variety of factors including various market, trading and investment-specific considerations, as well as market depth, and generally utilize analysis from a third-party liquidity metrics service.
The Liquidity Rule places a 15% limit on a fund's illiquid investments and requires funds that do not primarily hold assets that are highly liquid investments to determine and maintain a minimum percentage of the fund's net assets to be invested in highly liquid investments (highly liquid investment minimum or HLIM). The Program includes provisions reasonably designed to comply with the 15% limit on illiquid investments and for determining, periodically reviewing and complying with the HLIM requirement as applicable.
At a recent meeting of the Fund's Board of Trustees, the LRM Committee provided a written report to the Board pertaining to the operation, adequacy, and effectiveness of the Program for the period December 1, 2021 through November 30, 2022. The report concluded that the Program is operating effectively and is reasonably designed to assess and manage the Fund's liquidity risk.
1.9893923.103
GCF-K6-SANN-0723
Fidelity® New Millennium Fund®
Semi-Annual Report
May 31, 2023
Contents
To view a fund's proxy voting guidelines and proxy voting record for the 12-month period ended June 30, visit http://www.fidelity.com/proxyvotingresults or visit the Securities and Exchange Commission's (SEC) web site at http://www.sec.gov.
You may also call 1-800-544-8544 to request a free copy of the proxy voting guidelines.
Standard & Poor's, S&P and S&P 500 are registered service marks of The McGraw-Hill Companies, Inc. and have been licensed for use by Fidelity Distributors Corporation.
Other third-party marks appearing herein are the property of their respective owners.
All other marks appearing herein are registered or unregistered trademarks or service marks of FMR LLC or an affiliated company. © 2023 FMR LLC. All rights reserved.
This report and the financial statements contained herein are submitted for the general information of the shareholders of the Fund. This report is not authorized for distribution to prospective investors in the Fund unless preceded or accompanied by an effective prospectus.
A fund files its complete schedule of portfolio holdings with the SEC for the first and third quarters of each fiscal year on Form N-PORT. Forms N-PORT are available on the SEC's web site at http://www.sec.gov. A fund's Forms N-PORT may be reviewed and copied at the SEC's Public Reference Room in Washington, DC. Information regarding the operation of the SEC's Public Reference Room may be obtained by calling 1-800-SEC-0330.
For a complete list of a fund's portfolio holdings, view the most recent holdings listing, semiannual report, or annual report on Fidelity's web site at http://www.fidelity.com, http://www.institutional.fidelity.com, or http://www.401k.com, as applicable.
NOT FDIC INSURED •MAY LOSE VALUE •NO BANK GUARANTEE
Neither the Fund nor Fidelity Distributors Corporation is a bank.
Top Holdings (% of Fund's net assets) |
| |
| Microsoft Corp. | 5.9 | |
| Apple, Inc. | 5.8 | |
| Alphabet, Inc. Class A | 2.2 | |
| Eli Lilly & Co. | 2.0 | |
| Meta Platforms, Inc. Class A | 2.0 | |
| Exxon Mobil Corp. | 1.9 | |
| NVIDIA Corp. | 1.9 | |
| Visa, Inc. Class A | 1.7 | |
| Amazon.com, Inc. | 1.7 | |
| UnitedHealth Group, Inc. | 1.6 | |
| | 26.7 | |
| |
| Market Sectors (% of Fund's net assets) |
| |
| Information Technology | 26.4 | |
| Industrials | 13.9 | |
| Health Care | 12.9 | |
| Financials | 10.0 | |
| Consumer Discretionary | 10.0 | |
| Communication Services | 8.3 | |
| Energy | 5.4 | |
| Consumer Staples | 4.2 | |
| Materials | 3.9 | |
| Real Estate | 1.8 | |
| Utilities | 1.8 | |
| |
Asset Allocation (% of Fund's net assets) |
|
|
Showing Percentage of Net Assets
| Common Stocks - 97.7% |
| | | Shares | Value ($) (000s) |
| COMMUNICATION SERVICES - 8.3% | | | |
| Entertainment - 2.9% | | | |
| Activision Blizzard, Inc. | | 90,600 | 7,266 |
| Endeavor Group Holdings, Inc. (a) | | 628,117 | 14,145 |
| Netflix, Inc. (a) | | 83,900 | 33,160 |
| Sea Ltd. ADR (a) | | 63,200 | 3,628 |
| Spotify Technology SA (a) | | 79,700 | 11,867 |
| Universal Music Group NV (b) | | 514,800 | 10,212 |
| Universal Music Group NV rights (a) | | 514,800 | 149 |
| World Wrestling Entertainment, Inc. Class A | | 27,500 | 2,786 |
| | | | 83,213 |
| Interactive Media & Services - 4.2% | | | |
| Alphabet, Inc. Class A (a) | | 510,900 | 62,774 |
| Meta Platforms, Inc. Class A (a) | | 219,100 | 58,000 |
| | | | 120,774 |
| Media - 1.2% | | | |
| Comcast Corp. Class A | | 925,300 | 36,411 |
TOTAL COMMUNICATION SERVICES | | | 240,398 |
| CONSUMER DISCRETIONARY - 10.0% | | | |
| Automobile Components - 0.5% | | | |
| Aptiv PLC (a) | | 159,900 | 14,084 |
| Broadline Retail - 1.7% | | | |
| Amazon.com, Inc. (a) | | 396,900 | 47,858 |
| Hotels, Restaurants & Leisure - 3.0% | | | |
| Airbnb, Inc. Class A (a) | | 68,900 | 7,563 |
| Amadeus IT Holding SA Class A | | 209,500 | 15,035 |
| Booking Holdings, Inc. (a) | | 7,000 | 17,561 |
| Chipotle Mexican Grill, Inc. (a) | | 5,100 | 10,590 |
| Churchill Downs, Inc. | | 133,400 | 18,118 |
| Hilton Worldwide Holdings, Inc. | | 93,200 | 12,686 |
| Yum! Brands, Inc. | | 52,400 | 6,743 |
| | | | 88,296 |
| Household Durables - 1.0% | | | |
| Lennar Corp. Class A | | 157,000 | 16,818 |
| NVR, Inc. (a) | | 2,310 | 12,830 |
| | | | 29,648 |
| Specialty Retail - 1.6% | | | |
| Dick's Sporting Goods, Inc. | | 69,800 | 8,900 |
| Floor & Decor Holdings, Inc. Class A (a)(c) | | 48,600 | 4,438 |
| Industria de Diseno Textil SA | | 409,600 | 13,703 |
| TJX Companies, Inc. | | 258,600 | 19,858 |
| | | | 46,899 |
| Textiles, Apparel & Luxury Goods - 2.2% | | | |
| Brunello Cucinelli SpA | | 309,800 | 26,723 |
| NIKE, Inc. Class B | | 173,700 | 18,284 |
| Ralph Lauren Corp. | | 64,300 | 6,836 |
| Tapestry, Inc. | | 273,100 | 10,929 |
| | | | 62,772 |
TOTAL CONSUMER DISCRETIONARY | | | 289,557 |
| CONSUMER STAPLES - 4.1% | | | |
| Beverages - 2.4% | | | |
| Boston Beer Co., Inc. Class A (a) | | 32,200 | 10,868 |
| Constellation Brands, Inc. Class A (sub. vtg.) | | 30,800 | 7,483 |
| Diageo PLC sponsored ADR (c) | | 44,700 | 7,510 |
| Keurig Dr. Pepper, Inc. | | 300,300 | 9,345 |
| The Coca-Cola Co. | | 540,800 | 32,264 |
| | | | 67,470 |
| Consumer Staples Distribution & Retail - 1.5% | | | |
| Alimentation Couche-Tard, Inc. Class A (multi-vtg.) | | 147,500 | 7,142 |
| BJ's Wholesale Club Holdings, Inc. (a) | | 237,900 | 14,904 |
| Dollar General Corp. | | 17,600 | 3,539 |
| Performance Food Group Co. (a) | | 163,000 | 9,012 |
| Target Corp. | | 70,200 | 9,191 |
| | | | 43,788 |
| Personal Care Products - 0.2% | | | |
| Kenvue, Inc. | | 254,500 | 6,385 |
TOTAL CONSUMER STAPLES | | | 117,643 |
| ENERGY - 5.4% | | | |
| Energy Equipment & Services - 1.4% | | | |
| Baker Hughes Co. Class A | | 368,000 | 10,028 |
| Halliburton Co. | | 176,300 | 5,051 |
| Schlumberger Ltd. | | 421,300 | 18,044 |
| TechnipFMC PLC (a) | | 552,900 | 7,265 |
| | | | 40,388 |
| Oil, Gas & Consumable Fuels - 4.0% | | | |
| Antero Resources Corp. (a) | | 311,400 | 6,356 |
| Canadian Natural Resources Ltd. | | 253,400 | 13,651 |
| Cheniere Energy, Inc. | | 87,900 | 12,286 |
| Exxon Mobil Corp. | | 551,900 | 56,393 |
| Hess Corp. | | 138,000 | 17,480 |
| Valero Energy Corp. | | 101,700 | 10,886 |
| | | | 117,052 |
TOTAL ENERGY | | | 157,440 |
| FINANCIALS - 10.0% | | | |
| Banks - 2.8% | | | |
| Bank of America Corp. | | 1,042,800 | 28,979 |
| JPMorgan Chase & Co. | | 134,800 | 18,294 |
| PNC Financial Services Group, Inc. | | 81,200 | 9,405 |
| Wells Fargo & Co. | | 659,300 | 26,247 |
| | | | 82,925 |
| Capital Markets - 1.0% | | | |
| Coinbase Global, Inc. (a)(c) | | 40,500 | 2,519 |
| Morgan Stanley | | 241,000 | 19,704 |
| State Street Corp. | | 118,900 | 8,088 |
| | | | 30,311 |
| Financial Services - 3.5% | | | |
| Block, Inc. Class A (a) | | 183,400 | 11,076 |
| Fiserv, Inc. (a) | | 232,501 | 26,084 |
| Radian Group, Inc. | | 226,123 | 5,775 |
| Shift4 Payments, Inc. (a) | | 138,200 | 8,668 |
| Visa, Inc. Class A | | 220,600 | 48,759 |
| | | | 100,362 |
| Insurance - 2.7% | | | |
| Arch Capital Group Ltd. (a) | | 165,000 | 11,501 |
| Chubb Ltd. | | 180,909 | 33,613 |
| First American Financial Corp. | | 121,700 | 6,685 |
| Hiscox Ltd. | | 639,207 | 9,319 |
| Marsh & McLennan Companies, Inc. | | 57,500 | 9,958 |
| RenaissanceRe Holdings Ltd. | | 34,400 | 6,480 |
| | | | 77,556 |
TOTAL FINANCIALS | | | 291,154 |
| HEALTH CARE - 12.4% | | | |
| Biotechnology - 1.2% | | | |
| Gilead Sciences, Inc. | | 136,700 | 10,518 |
| Legend Biotech Corp. ADR (a) | | 95,200 | 6,109 |
| Regeneron Pharmaceuticals, Inc. (a) | | 22,500 | 16,550 |
| | | | 33,177 |
| Health Care Equipment & Supplies - 2.9% | | | |
| Boston Scientific Corp. (a) | | 551,000 | 28,365 |
| GE Healthcare Holding LLC | | 125,137 | 9,950 |
| Hologic, Inc. (a) | | 141,200 | 11,139 |
| Masimo Corp. (a) | | 104,500 | 16,912 |
| Stryker Corp. | | 63,500 | 17,499 |
| | | | 83,865 |
| Health Care Providers & Services - 2.8% | | | |
| agilon health, Inc. (a) | | 504,200 | 10,023 |
| Centene Corp. (a) | | 154,500 | 9,642 |
| Cigna Group | | 49,400 | 12,222 |
| LifeStance Health Group, Inc. (a) | | 343,654 | 2,815 |
| UnitedHealth Group, Inc. | | 95,900 | 46,726 |
| | | | 81,428 |
| Health Care Technology - 0.1% | | | |
| Evolent Health, Inc. (d) | | 142,400 | 3,942 |
| Life Sciences Tools & Services - 1.9% | | | |
| Danaher Corp. | | 54,400 | 12,491 |
| IQVIA Holdings, Inc. (a) | | 47,800 | 9,412 |
| Thermo Fisher Scientific, Inc. | | 43,600 | 22,169 |
| West Pharmaceutical Services, Inc. | | 35,800 | 11,980 |
| | | | 56,052 |
| Pharmaceuticals - 3.5% | | | |
| AstraZeneca PLC (United Kingdom) | | 115,300 | 16,794 |
| Eli Lilly & Co. | | 135,100 | 58,020 |
| Merck & Co., Inc. | | 120,400 | 13,293 |
| Novo Nordisk A/S Series B | | 30,500 | 4,908 |
| UCB SA | | 77,100 | 6,718 |
| | | | 99,733 |
TOTAL HEALTH CARE | | | 358,197 |
| INDUSTRIALS - 13.6% | | | |
| Aerospace & Defense - 4.3% | | | |
| BWX Technologies, Inc. | | 110,700 | 6,677 |
| Howmet Aerospace, Inc. | | 364,900 | 15,599 |
| Lockheed Martin Corp. | | 46,200 | 20,513 |
| Northrop Grumman Corp. | | 32,800 | 14,284 |
| Space Exploration Technologies Corp.: | | | |
| Class A (a)(d)(e) | | 585,890 | 45,114 |
| Class C (a)(d)(e) | | 8,180 | 630 |
| The Boeing Co. (a) | | 108,400 | 22,298 |
| | | | 125,115 |
| Building Products - 0.7% | | | |
| Builders FirstSource, Inc. (a) | | 101,000 | 11,711 |
| Fortune Brands Home & Security, Inc. | | 131,600 | 7,955 |
| | | | 19,666 |
| Construction & Engineering - 1.1% | | | |
| Quanta Services, Inc. | | 102,200 | 18,149 |
| Willscot Mobile Mini Holdings (a) | | 288,300 | 12,420 |
| | | | 30,569 |
| Electrical Equipment - 1.4% | | | |
| Eaton Corp. PLC | | 99,900 | 17,572 |
| Generac Holdings, Inc. (a) | | 87,800 | 9,563 |
| Regal Rexnord Corp. | | 107,300 | 13,937 |
| | | | 41,072 |
| Ground Transportation - 0.9% | | | |
| Uber Technologies, Inc. (a) | | 720,200 | 27,317 |
| Industrial Conglomerates - 0.9% | | | |
| General Electric Co. | | 258,012 | 26,196 |
| Machinery - 2.4% | | | |
| Caterpillar, Inc. | | 74,200 | 15,267 |
| Fortive Corp. | | 105,500 | 6,869 |
| Ingersoll Rand, Inc. | | 284,520 | 16,121 |
| ITT, Inc. | | 159,600 | 12,155 |
| Parker Hannifin Corp. | | 61,800 | 19,803 |
| | | | 70,215 |
| Professional Services - 1.5% | | | |
| FTI Consulting, Inc. (a) | | 73,220 | 13,766 |
| KBR, Inc. | | 266,200 | 15,711 |
| WNS Holdings Ltd. sponsored ADR (a) | | 176,000 | 13,675 |
| | | | 43,152 |
| Trading Companies & Distributors - 0.4% | | | |
| RS GROUP PLC | | 533,300 | 5,285 |
| United Rentals, Inc. | | 15,000 | 5,007 |
| | | | 10,292 |
TOTAL INDUSTRIALS | | | 393,594 |
| INFORMATION TECHNOLOGY - 26.4% | | | |
| Communications Equipment - 1.1% | | | |
| Cisco Systems, Inc. | | 638,500 | 31,714 |
| Electronic Equipment, Instruments & Components - 1.9% | | | |
| Flex Ltd. (a) | | 898,400 | 22,810 |
| Jabil, Inc. | | 186,200 | 16,669 |
| Keysight Technologies, Inc. (a) | | 91,200 | 14,756 |
| | | | 54,235 |
| IT Services - 0.7% | | | |
| MongoDB, Inc. Class A (a) | | 52,200 | 15,336 |
| Shopify, Inc. Class A (a) | | 102,900 | 5,885 |
| | | | 21,221 |
| Semiconductors & Semiconductor Equipment - 7.5% | | | |
| Advanced Micro Devices, Inc. (a) | | 354,700 | 41,929 |
| Analog Devices, Inc. | | 114,300 | 20,310 |
| Marvell Technology, Inc. | | 156,054 | 9,128 |
| NVIDIA Corp. | | 144,100 | 54,519 |
| NXP Semiconductors NV | | 134,800 | 24,143 |
| onsemi (a) | | 294,700 | 24,637 |
| SolarEdge Technologies, Inc. (a) | | 31,100 | 8,858 |
| Taiwan Semiconductor Manufacturing Co. Ltd. sponsored ADR | | 209,200 | 20,625 |
| Teradyne, Inc. | | 140,700 | 14,097 |
| | | | 218,246 |
| Software - 9.4% | | | |
| Adobe, Inc. (a) | | 60,000 | 25,067 |
| Dynatrace, Inc. (a) | | 386,000 | 19,682 |
| Microsoft Corp. | | 523,400 | 171,888 |
| Oracle Corp. | | 253,900 | 26,898 |
| Salesforce, Inc. (a) | | 71,500 | 15,972 |
| Workday, Inc. Class A (a) | | 62,500 | 13,249 |
| | | | 272,756 |
| Technology Hardware, Storage & Peripherals - 5.8% | | | |
| Apple, Inc. | | 943,000 | 167,147 |
TOTAL INFORMATION TECHNOLOGY | | | 765,319 |
| MATERIALS - 3.9% | | | |
| Chemicals - 1.1% | | | |
| Cabot Corp. | | 92,100 | 6,307 |
| Celanese Corp. Class A | | 70,700 | 7,354 |
| Element Solutions, Inc. | | 351,700 | 6,306 |
| LG Chemical Ltd. | | 12,310 | 6,450 |
| Westlake Corp. | | 62,600 | 6,507 |
| | | | 32,924 |
| Construction Materials - 0.4% | | | |
| Martin Marietta Materials, Inc. | | 25,100 | 9,991 |
| Containers & Packaging - 0.7% | | | |
| Avery Dennison Corp. | | 56,500 | 9,104 |
| O-I Glass, Inc. (a) | | 533,200 | 11,048 |
| | | | 20,152 |
| Metals & Mining - 1.7% | | | |
| Agnico Eagle Mines Ltd. (Canada) | | 73,200 | 3,725 |
| Commercial Metals Co. | | 94,800 | 4,053 |
| Franco-Nevada Corp. | | 137,000 | 19,910 |
| Freeport-McMoRan, Inc. | | 649,000 | 22,287 |
| | | | 49,975 |
TOTAL MATERIALS | | | 113,042 |
| REAL ESTATE - 1.8% | | | |
| Equity Real Estate Investment Trusts (REITs) - 1.5% | | | |
| Essex Property Trust, Inc. | | 29,500 | 6,374 |
| Gaming & Leisure Properties | | 205,383 | 9,887 |
| Prologis (REIT), Inc. | | 166,000 | 20,675 |
| Spirit Realty Capital, Inc. | | 162,060 | 6,330 |
| | | | 43,266 |
| Real Estate Management & Development - 0.3% | | | |
| CBRE Group, Inc. (a) | | 122,200 | 9,155 |
TOTAL REAL ESTATE | | | 52,421 |
| UTILITIES - 1.8% | | | |
| Electric Utilities - 1.2% | | | |
| Constellation Energy Corp. | | 159,700 | 13,418 |
| Southern Co. | | 315,200 | 21,985 |
| | | | 35,403 |
| Independent Power and Renewable Electricity Producers - 0.6% | | | |
| The AES Corp. | | 482,800 | 9,530 |
| Vistra Corp. | | 305,300 | 7,318 |
| | | | 16,848 |
TOTAL UTILITIES | | | 52,251 |
| TOTAL COMMON STOCKS (Cost $2,256,928) | | | 2,831,016 |
| | | | |
| Convertible Preferred Stocks - 0.9% |
| | | Shares | Value ($) (000s) |
| CONSUMER DISCRETIONARY - 0.0% | | | |
| Textiles, Apparel & Luxury Goods - 0.0% | | | |
| Bolt Threads, Inc.: | | | |
| Series D (a)(d)(e) | | 390,327 | 113 |
| Series E (a)(d)(e) | | 522,488 | 178 |
| | | | 291 |
| CONSUMER STAPLES - 0.1% | | | |
| Food Products - 0.1% | | | |
| Bowery Farming, Inc. Series C1 (a)(d)(e) | | 161,754 | 1,508 |
| HEALTH CARE - 0.5% | | | |
| Biotechnology - 0.5% | | | |
| National Resilience, Inc. Series B (a)(d)(e) | | 243,347 | 14,778 |
| INDUSTRIALS - 0.3% | | | |
| Aerospace & Defense - 0.2% | | | |
| Space Exploration Technologies Corp. Series H (a)(d)(e) | | 7,570 | 5,829 |
| Construction & Engineering - 0.1% | | | |
| Beta Technologies, Inc. Series B, 6.00% (a)(d)(e) | | 49,853 | 4,338 |
TOTAL INDUSTRIALS | | | 10,167 |
| TOTAL CONVERTIBLE PREFERRED STOCKS (Cost $34,720) | | | 26,744 |
| | | | |
| Money Market Funds - 1.6% |
| | | Shares | Value ($) (000s) |
| Fidelity Cash Central Fund 5.14% (f) | | 31,329,945 | 31,336 |
| Fidelity Securities Lending Cash Central Fund 5.14% (f)(g) | | 14,367,534 | 14,369 |
| TOTAL MONEY MARKET FUNDS (Cost $45,705) | | | 45,705 |
| | | | |
| TOTAL INVESTMENT IN SECURITIES - 100.2% (Cost $2,337,353) | 2,903,465 |
NET OTHER ASSETS (LIABILITIES) - (0.2)% | (5,808) |
| NET ASSETS - 100.0% | 2,897,657 |
| | |
Any values shown as $0 in the Schedule of Investments may reflect amounts less than $500.
Legend
| (b) | Security or a portion of the security purchased on a delayed delivery or when-issued basis. |
| (c) | Security or a portion of the security is on loan at period end. |
| (d) | Restricted securities (including private placements) - Investment in securities not registered under the Securities Act of 1933 (excluding 144A issues). At the end of the period, the value of restricted securities (excluding 144A issues) amounted to $76,430,000 or 2.6% of net assets. |
| (f) | Affiliated fund that is generally available only to investment companies and other accounts managed by Fidelity Investments. The rate quoted is the annualized seven-day yield of the fund at period end. A complete unaudited listing of the fund's holdings as of its most recent quarter end is available upon request. In addition, each Fidelity Central Fund's financial statements are available on the SEC's website or upon request. |
| (g) | Investment made with cash collateral received from securities on loan. |
| Additional information on each restricted holding is as follows: |
| Security | Acquisition Date | Acquisition Cost ($) (000s) |
| Beta Technologies, Inc. Series B, 6.00% | 4/04/22 | 5,143 |
| | | |
| Bolt Threads, Inc. Series D | 12/13/17 | 6,261 |
| | | |
| Bolt Threads, Inc. Series E | 2/07/20 - 9/02/21 | 9,224 |
| | | |
| Bowery Farming, Inc. Series C1 | 5/18/21 | 9,746 |
| | | |
| Evolent Health, Inc. | 3/28/23 | 4,130 |
| | | |
| National Resilience, Inc. Series B | 12/01/20 | 3,324 |
| | | |
| Space Exploration Technologies Corp. Class A | 4/08/16 - 9/11/17 | 5,980 |
| | | |
| Space Exploration Technologies Corp. Class C | 9/11/17 | 110 |
| | | |
| Space Exploration Technologies Corp. Series H | 8/04/17 | 1,022 |
| | | |
Affiliated Central Funds
Fiscal year to date information regarding the Fund's investments in Fidelity Central Funds, including the ownership percentage, is presented below.
| Affiliate (Amounts in thousands) | Value, beginning of period ($) | Purchases ($) | Sales Proceeds ($) | Dividend Income ($) | Realized Gain (loss) ($) | Change in Unrealized appreciation (depreciation) ($) | Value, end of period ($) | % ownership, end of period |
| Fidelity Cash Central Fund 5.14% | 117,908 | 520,792 | 607,363 | 1,189 | - | (1) | 31,336 | 0.1% |
| Fidelity Securities Lending Cash Central Fund 5.14% | 54,894 | 134,011 | 174,536 | 35 | - | - | 14,369 | 0.0% |
| Total | 172,802 | 654,803 | 781,899 | 1,224 | - | (1) | 45,705 | |
| | | | | | | | | |
Amounts in the dividend income column in the above table include any capital gain distributions from underlying funds, which are presented in the corresponding line item in the Statement of Operations, if applicable.
Amounts in the dividend income column for Fidelity Securities Lending Cash Central Fund represents the income earned on investing cash collateral, less rebates paid to borrowers and any lending agent fees associated with the loan, plus any premium payments received for lending certain types of securities.
Amounts included in the purchases and sales proceeds columns may include in-kind transactions, if applicable.
Investment Valuation
The following is a summary of the inputs used, as of May 31, 2023, involving the Fund's assets and liabilities carried at fair value. The inputs or methodology used for valuing securities may not be an indication of the risk associated with investing in those securities. For more information on valuation inputs, and their aggregation into the levels used below, please refer to the Investment Valuation section in the accompanying Notes to Financial Statements.
| Valuation Inputs at Reporting Date: |
Description (Amounts in thousands) | Total ($) | Level 1 ($) | Level 2 ($) | Level 3 ($) |
Investments in Securities: | | | | |
|
| Equities: | | | | |
Communication Services | 240,398 | 230,037 | 10,361 | - |
Consumer Discretionary | 289,848 | 260,819 | 28,738 | 291 |
Consumer Staples | 119,151 | 117,643 | - | 1,508 |
Energy | 157,440 | 157,440 | - | - |
Financials | 291,154 | 291,154 | - | - |
Health Care | 372,975 | 332,553 | 25,644 | 14,778 |
Industrials | 403,761 | 347,850 | - | 55,911 |
Information Technology | 765,319 | 765,319 | - | - |
Materials | 113,042 | 113,042 | - | - |
Real Estate | 52,421 | 52,421 | - | - |
Utilities | 52,251 | 52,251 | - | - |
|
| Money Market Funds | 45,705 | 45,705 | - | - |
| Total Investments in Securities: | 2,903,465 | 2,766,234 | 64,743 | 72,488 |
The following is a reconciliation of Investments in Securities for which Level 3 inputs were used in determining value:
| (Amounts in thousands) | |
| Investments in Securities: | |
| Other Investments in Securities | | | |
| Beginning Balance | $ | 27,140 | |
| Net Realized Gain (Loss) on Investment Securities | | - | |
| Net Unrealized Gain (Loss) on Investment Securities | | (10,563) | |
| Cost of Purchases | | - | |
| Proceeds of Sales | | - | |
| Amortization/Accretion | | - | |
| Transfers into Level 3 | | - | |
| Transfers out of Level 3 | | - | |
| Ending Balance | $ | 16,577 | |
| The change in unrealized gain (loss) for the period attributable to Level 3 securities held at May 31, 2023 | $ | (10,563) | |
| Industrials | | | |
| Beginning Balance | $ | 54,360 | |
| Net Realized Gain (Loss) on Investment Securities | | (10,120) | |
| Net Unrealized Gain (Loss) on Investment Securities | | 14,266 | |
| Cost of Purchases | | - | |
| Proceeds of Sales | | (2,595) | |
| Amortization/Accretion | | - | |
| Transfers into Level 3 | | - | |
| Transfers out of Level 3 | | - | |
| Ending Balance | $ | 55,911 | |
| The change in unrealized gain (loss) for the period attributable to Level 3 securities held at May 31, 2023 | $ | 4,918 | |
| The information used in the above reconciliation represents fiscal year to date activity for any Investments in Securities identified as using Level 3 inputs at either the beginning or the end of the current fiscal period. Cost of purchases and proceeds of sales may include securities received and/or delivered through in-kind transactions, corporate actions or exchanges. Transfers into Level 3 were attributable to a lack of observable market data resulting from decreases in market activity, decreases in liquidity, security restructurings or corporate actions. Transfers out of Level 3 were attributable to observable market data becoming available for those securities. Transfers in or out of Level 3 represent the beginning value of any Security or Instrument where a change in the pricing level occurred from the beginning to the end of the period. Realized and unrealized gains (losses) disclosed in the reconciliation are included in Net Gain (Loss) on the Fund's Statement of Operations. | |
| Statement of Assets and Liabilities |
| Amounts in thousands (except per-share amount) | | | | May 31, 2023 (Unaudited) |
| | | | | |
| Assets | | | | |
| Investment in securities, at value (including securities loaned of $13,952) - See accompanying schedule: | | | | |
Unaffiliated issuers (cost $2,291,648) | $ | 2,857,760 | | |
Fidelity Central Funds (cost $45,705) | | 45,705 | | |
| | | | | |
| | | | | |
| Total Investment in Securities (cost $2,337,353) | | | $ | 2,903,465 |
| Restricted cash | | | | 2,519 |
| Foreign currency held at value (cost $162) | | | | 161 |
| Receivable for investments sold | | | | 9,125 |
| Receivable for fund shares sold | | | | 1,839 |
| Dividends receivable | | | | 3,543 |
| Distributions receivable from Fidelity Central Funds | | | | 148 |
| Other receivables | | | | 77 |
Total assets | | | | 2,920,877 |
| Liabilities | | | | |
| Payable for investments purchased | | | | |
Regular delivery | $ | 4,993 | | |
Delayed delivery | | 149 | | |
| Payable for fund shares redeemed | | 1,570 | | |
| Accrued management fee | | 1,681 | | |
| Other affiliated payables | | 416 | | |
| Other payables and accrued expenses | | 52 | | |
| Collateral on securities loaned | | 14,359 | | |
| Total Liabilities | | | | 23,220 |
| Net Assets | | | $ | 2,897,657 |
| Net Assets consist of: | | | | |
| Paid in capital | | | $ | 2,049,368 |
| Total accumulated earnings (loss) | | | | 848,289 |
| Net Assets | | | $ | 2,897,657 |
Net Asset Value , offering price and redemption price per share ($2,897,657 ÷ 67,814 shares) | | | $ | 42.73 |
| Statement of Operations |
| Amounts in thousands | | | | Six months ended May 31, 2023 (Unaudited) |
| Investment Income | | | | |
| Dividends | | | $ | 17,692 |
| Income from Fidelity Central Funds (including $35 from security lending) | | | | 1,224 |
| Total Income | | | | 18,916 |
| Expenses | | | | |
| Management fee | | | | |
| Basic fee | $ | 7,124 | | |
| Performance adjustment | | 2,095 | | |
| Transfer agent fees | | 2,065 | | |
| Accounting fees | | 354 | | |
| Custodian fees and expenses | | 30 | | |
| Independent trustees' fees and expenses | | 8 | | |
| Registration fees | | 48 | | |
| Audit | | 43 | | |
| Legal | | 3 | | |
| Miscellaneous | | 8 | | |
| Total expenses before reductions | | 11,778 | | |
| Expense reductions | | (62) | | |
| Total expenses after reductions | | | | 11,716 |
| Net Investment income (loss) | | | | 7,200 |
| Realized and Unrealized Gain (Loss) | | | | |
| Net realized gain (loss) on: | | | | |
| Investment Securities: | | | | |
| Unaffiliated issuers | | 159,833 | | |
| Redemptions in-kind | | 129,509 | | |
| Foreign currency transactions | | 208 | | |
| Total net realized gain (loss) | | | | 289,550 |
| Change in net unrealized appreciation (depreciation) on: | | | | |
| Investment Securities: | | | | |
| Unaffiliated issuers | | (201,491) | | |
| Fidelity Central Funds | | (1) | | |
| Assets and liabilities in foreign currencies | | (83) | | |
| Total change in net unrealized appreciation (depreciation) | | | | (201,575) |
| Net gain (loss) | | | | 87,975 |
| Net increase (decrease) in net assets resulting from operations | | | $ | 95,175 |
| Statement of Changes in Net Assets |
| |
| Amount in thousands | | Six months ended May 31, 2023 (Unaudited) | | Year ended November 30, 2022 |
| Increase (Decrease) in Net Assets | | | | |
| Operations | | | | |
| Net investment income (loss) | $ | 7,200 | $ | 45,770 |
| Net realized gain (loss) | | 289,550 | | 64,754 |
| Change in net unrealized appreciation (depreciation) | | (201,575) | | 97,056 |
| Net increase (decrease) in net assets resulting from operations | | 95,175 | | 207,580 |
| Distributions to shareholders | | (98,478) | | (214,586) |
| Share transactions | | | | |
| Proceeds from sales of shares | | 607,463 | | 141,891 |
| Reinvestment of distributions | | 92,606 | | 203,394 |
| Cost of shares redeemed | | (379,185) | | (387,959) |
Net increase (decrease) in net assets resulting from share transactions | | 320,884 | | (42,674) |
| Total increase (decrease) in net assets | | 317,581 | | (49,680) |
| | | | | |
| Net Assets | | | | |
| Beginning of period | | 2,580,076 | | 2,629,756 |
| End of period | $ | 2,897,657 | $ | 2,580,076 |
| | | | | |
| Other Information | | | | |
| Shares | | | | |
| Sold | | 14,429 | | 3,525 |
| Issued in reinvestment of distributions | | 2,343 | | 4,871 |
| Redeemed | | (9,064) | | (9,529) |
| Net increase (decrease) | | 7,708 | | (1,133) |
| | | | | |
Financial Highlights
| Fidelity® New Millennium Fund® |
| |
| | Six months ended (Unaudited) May 31, 2023 | | Years ended November 30, 2022 | | 2021 | | 2020 | | 2019 | | 2018 |
Selected Per-Share Data | | | | | | | | | | | | |
| Net asset value, beginning of period | $ | 42.93 | $ | 42.94 | $ | 37.77 | $ | 38.43 | $ | 40.52 | $ | 42.70 |
| Income from Investment Operations | | | | | | | | | | | | |
Net investment income (loss) A,B | | .11 | | .75 | | .62 | | .54 | | .62 | | .43 |
| Net realized and unrealized gain (loss) | | 1.27 | | 2.77 | | 7.70 | | .45 | | 3.11 | | .87 |
| Total from investment operations | | 1.38 | | 3.52 | | 8.32 | | .99 | | 3.73 | | 1.30 |
| Distributions from net investment income | | (.64) | | (.85) | | (.58) | | (.36) | | (.39) | | (.36) |
| Distributions from net realized gain | | (.94) | | (2.68) | | (2.56) | | (1.29) | | (5.43) | | (3.12) |
| Total distributions | | (1.58) | | (3.53) | | (3.15) C | | (1.65) | | (5.82) | | (3.48) |
| Net asset value, end of period | $ | 42.73 | $ | 42.93 | $ | 42.94 | $ | 37.77 | $ | 38.43 | $ | 40.52 |
Total Return D,E | | 3.52% | | 8.45% | | 23.56% | | 2.60% | | 12.82% | | 3.19% |
Ratios to Average Net Assets B,F,G | | | | | | | | | | | | |
| Expenses before reductions | | .87% H | | .54% | | .49% | | .46% | | .61% | | .64% |
| Expenses net of fee waivers, if any | | .86% H | | .54% | | .48% | | .46% | | .61% | | .64% |
| Expenses net of all reductions | | .86% H | | .54% | | .48% | | .45% | | .61% | | .63% |
| Net investment income (loss) | | .53% H | | 1.83% | | 1.46% | | 1.61% | | 1.72% | | 1.03% |
| Supplemental Data | | | | | | | | | | | | |
| Net assets, end of period (in millions) | $ | 2,898 | $ | 2,580 | $ | 2,630 | $ | 2,331 | $ | 2,991 | $ | 3,206 |
Portfolio turnover rate I | | 87% H,J | | 12% | | 19% | | 22% | | 34% | | 37% |
A Calculated based on average shares outstanding during the period.
B Net investment income (loss) is affected by the timing of the declaration of dividends by any underlying mutual funds or exchange-traded funds (ETFs). Net investment income (loss) of any mutual funds or ETFs is not included in the Fund's net investment income (loss) ratio.
C Total distributions per share do not sum due to rounding.
D Total returns for periods of less than one year are not annualized.
E Total returns would have been lower if certain expenses had not been reduced during the applicable periods shown.
F Fees and expenses of any underlying mutual funds or exchange-traded funds (ETFs) are not included in the Fund's expense ratio. The Fund indirectly bears its proportionate share of these expenses. For additional expense information related to investments in Fidelity Central Funds, please refer to the "Investments in Fidelity Central Funds" note found in the Notes to Financial Statements section of the most recent Annual or Semi-Annual report.
G Expense ratios reflect operating expenses of the class. Expenses before reductions do not reflect amounts reimbursed, waived, or reduced through arrangements with the investment adviser, brokerage services, or other offset arrangements, if applicable, and do not represent the amount paid by the class during periods when reimbursements, waivers or reductions occur.
H Annualized.
I Amount does not include the portfolio activity of any underlying mutual funds or exchange-traded funds (ETFs).
J Portfolio turnover rate excludes securities received or delivered in-kind.
For the period ended May 31, 2023
( Amounts in thousands except percentages)
1. Organization.
Fidelity New Millennium Fund (the Fund) is a fund of Fidelity Mt. Vernon Street Trust (the Trust) and is authorized to issue an unlimited number of shares. Share transactions on the Statement of Changes in Net Assets may contain exchanges between affiliated funds. The Trust is registered under the Investment Company Act of 1940, as amended (the 1940 Act), as an open-end management investment company organized as a Massachusetts business trust.
2. Investments in Fidelity Central Funds.
Funds may invest in Fidelity Central Funds, which are open-end investment companies generally available only to other investment companies and accounts managed by the investment adviser and its affiliates. The Schedule of Investments lists any Fidelity Central Funds held as an investment as of period end, but does not include the underlying holdings of each Fidelity Central Fund. An investing fund indirectly bears its proportionate share of the expenses of the underlying Fidelity Central Funds.
Based on its investment objective, each Fidelity Central Fund may invest or participate in various investment vehicles or strategies that are similar to those of the investing fund. These strategies are consistent with the investment objectives of the investing fund and may involve certain economic risks which may cause a decline in value of each of the Fidelity Central Funds and thus a decline in the value of the investing fund.
| Fidelity Central Fund | Investment Manager | Investment Objective | Investment Practices | Expense Ratio A |
| Fidelity Money Market Central Funds | Fidelity Management & Research Company LLC (FMR) | Each fund seeks to obtain a high level of current income consistent with the preservation of capital and liquidity. | Short-term Investments | Less than .005% |
A Expenses expressed as a percentage of average net assets and are as of each underlying Central Fund's most recent annual or semi-annual shareholder report.
A complete unaudited list of holdings for each Fidelity Central Fund is available upon request or at the Securities and Exchange Commission website at www.sec.gov. In addition, the financial statements of the Fidelity Central Funds which contain the significant accounting policies (including investment valuation policies) of those funds, and are not covered by the Report of Independent Registered Public Accounting Firm, are available on the Securities and Exchange Commission website or upon request.
3. Significant Accounting Policies.
The Fund is an investment company and applies the accounting and reporting guidance of the Financial Accounting Standards Board (FASB) Accounting Standards Codification Topic 946 Financial Services - Investment Companies . The financial statements have been prepared in conformity with accounting principles generally accepted in the United States of America (GAAP), which require management to make certain estimates and assumptions at the date of the financial statements. Actual results could differ from those estimates. Subsequent events, if any, through the date that the financial statements were issued have been evaluated in the preparation of the financial statements. The Fund's Schedule of Investments lists any underlying mutual funds or exchange-traded funds (ETFs) but does not include the underlying holdings of these funds. The following summarizes the significant accounting policies of the Fund:
Investment Valuation. Investments are valued as of 4:00 p.m. Eastern time on the last calendar day of the period. The Board of Trustees (the Board) has designated the Fund's investment adviser as the valuation designee responsible for the fair valuation function and performing fair value determinations as needed. The investment adviser has established a Fair Value Committee (the Committee) to carry out the day-to-day fair valuation responsibilities and has adopted policies and procedures to govern the fair valuation process and the activities of the Committee. In accordance with these fair valuation policies and procedures, which have been approved by the Board, the Fund attempts to obtain prices from one or more third party pricing services or brokers to value its investments. When current market prices, quotations or currency exchange rates are not readily available or reliable, investments will be fair valued in good faith by the Committee, in accordance with the policies and procedures. Factors used in determining fair value vary by investment type and may include market or investment specific events, transaction data, estimated cash flows, and market observations of comparable investments. The frequency that the fair valuation procedures are used cannot be predicted and they may be utilized to a significant extent. The Committee manages the Fund's fair valuation practices and maintains the fair valuation policies and procedures. The Fund's investment adviser reports to the Board information regarding the fair valuation process and related material matters.
The Fund categorizes the inputs to valuation techniques used to value its investments into a disclosure hierarchy consisting of three levels as shown below:
Level 1 - unadjusted quoted prices in active markets for identical investments
Level 2 - other significant observable inputs (including quoted prices for similar investments, interest rates, prepayment speeds, etc.)
Level 3 - unobservable inputs (including the Fund's own assumptions based on the best information available)
Valuation techniques used to value the Fund's investments by major category are as follows:
Equity securities, including restricted securities, for which market quotations are readily available, are valued at the last reported sale price or official closing price as reported by a third party pricing service on the primary market or exchange on which they are traded and are categorized as Level 1 in the hierarchy. In the event there were no sales during the day or closing prices are not available, securities are valued at the last quoted bid price or may be valued using the last available price and are generally categorized as Level 2 in the hierarchy. For foreign equity securities, when market or security specific events arise, comparisons to the valuation of American Depositary Receipts (ADRs) ADRs, futures contracts, ETFs and certain indexes as well as quoted prices for similar securities may be used and would be categorized as Level 2 in the hierarchy. For equity securities, including restricted securities, where observable inputs are limited, assumptions about market activity and risk are used and these securities may be categorized as Level 3 in the hierarchy. Securities, including private placements or other restricted securities, for which observable inputs are not available are valued using alternate valuation approaches, including the market approach, the income approach and cost approach, and are categorized as Level 3 in the hierarchy. The market approach considers factors including the price of recent investments in the same or a similar security or financial metrics of comparable securities. The income approach considers factors including expected future cash flows, security specific risks and corresponding discount rates. The cost approach considers factors including the value of the security's underlying assets and liabilities.
Investments in open-end mutual funds ,including the Fidelity Central Funds, are valued at their closing net asset value (NAV) each business day and are categorized as Level 1 in the hierarchy.
The following provides information on Level 3 securities held by the Fund that were valued at period end based on unobservable inputs. These amounts exclude valuations provided by a broker.
| Asset Type | Fair Value | Valuation Technique(s) | Unobservable Input | Amount or Range/Weighted Average | Impact to Valuation from an Increase in Input A |
| Equities | $72,488 | Market comparable | Enterprise value/EBITDA multiple (EV/EBITDA) | 15.8 | Increase |
| | | | Enterprise value/Revenue multiple (EV/R) | 1.5 - 9.0 / 6.9 | Increase |
| | | Recovery value | Recovery value | $0.00 | Increase |
| | | Market approach | Transaction price | $60.73 | Increase |
| | | | | | | |
A Represents the directional change in the fair value of the Level 3 investments that could have resulted from an increase in the corresponding input as of period end. A decrease to the unobservable input would have had the opposite effect. Significant changes in these inputs may have resulted in a significantly higher or lower fair value measurement at period end.
Changes in valuation techniques may result in transfers in or out of an assigned level within the disclosure hierarchy. The aggregate value of investments by input level as of May 31, 2023, as well as a roll forward of Level 3 investments, is included at the end of the Fund's Schedule of Investments.
Foreign Currency. Certain Funds may use foreign currency contracts to facilitate transactions in foreign-denominated securities. Gains and losses from these transactions may arise from changes in the value of the foreign currency or if the counterparties do not perform under the contracts' terms.
Foreign-denominated assets, including investment securities, and liabilities are translated into U.S. dollars at the exchange rates at period end. Purchases and sales of investment securities, income and dividends received, and expenses denominated in foreign currencies are translated into U.S. dollars at the exchange rate in effect on the transaction date.
The effects of exchange rate fluctuations on investments are included with the net realized and unrealized gain (loss) on investment securities. Other foreign currency transactions resulting in realized and unrealized gain (loss) are disclosed separately.
Investment Transactions and Income. For financial reporting purposes, the Fund's investment holdings and NAV include trades executed through the end of the last business day of the period. The NAV per share for processing shareholder transactions is calculated as of the close of business of the New York Stock Exchange (NYSE), normally 4:00 p.m. Eastern time and includes trades executed through the end of the prior business day. Gains and losses on securities sold are determined on the basis of identified cost and include proceeds received from litigation. Commissions paid to certain brokers with whom the investment adviser, or its affiliates, places trades on behalf of a fund include an amount in addition to trade execution, which may be rebated back to a fund. Any such rebates are included in net realized gain (loss) on investments in the Statement of Operations. Dividend income is recorded on the ex-dividend date, except for certain dividends from foreign securities where the ex-dividend date may have passed, which are recorded as soon as the Fund is informed of the ex-dividend date. Non-cash dividends included in dividend income, if any, are recorded at the fair market value of the securities received. Income and capital gain distributions from Fidelity Central Funds, if any, are recorded on the ex-dividend date. Certain distributions received by the Fund represent a return of capital or capital gain. The Fund determines the components of these distributions subsequent to the ex-dividend date, based upon receipt of tax filings or other correspondence relating to the underlying investment. These distributions are recorded as a reduction of cost of investments and/or as a realized gain. Investment income is recorded net of foreign taxes withheld where recovery of such taxes is uncertain. Funds may file withholding tax reclaims in certain jurisdictions to recover a portion of amounts previously withheld. Any withholding tax reclaims income is included in the Statement of Operations in dividends. Any receivables for withholding tax reclaims are included in the Statement of Assets and Liabilities in dividends receivable.
Expenses. Expenses directly attributable to a fund are charged to that fund. Expenses attributable to more than one fund are allocated among the respective funds on the basis of relative net assets or other appropriate methods. Expenses included in the accompanying financial statements reflect the expenses of that fund and do not include any expenses associated with any underlying mutual funds or exchange-traded funds. Although not included in a fund's expenses, a fund indirectly bears its proportionate share of these expenses through the net asset value of each underlying mutual fund or exchange-traded fund. Expense estimates are accrued in the period to which they relate and adjustments are made when actual amounts are known.
Income Tax Information and Distributions to Shareholders. Each year, the Fund intends to qualify as a regulated investment company under Subchapter M of the Internal Revenue Code, including distributing substantially all of its taxable income and realized gains. As a result, no provision for U.S. Federal income taxes is required. The Fund files a U.S. federal tax return, in addition to state and local tax returns as required. The Fund's federal income tax returns are subject to examination by the Internal Revenue Service (IRS) for a period of three fiscal years after they are filed. State and local tax returns may be subject to examination for an additional fiscal year depending on the jurisdiction. Foreign taxes are provided for based on the Fund's understanding of the tax rules and rates that exist in the foreign markets in which it invests.
Distributions are declared and recorded on the ex-dividend date. Income and capital gain distributions are determined in accordance with income tax regulations, which may differ from GAAP.
Capital accounts within the financial statements are adjusted for permanent book-tax differences. These adjustments have no impact on net assets or the results of operations. Capital accounts are not adjusted for temporary book-tax differences which will reverse in a subsequent period.
Book-tax differences are primarily due to foreign currency transactions, passive foreign investment companies (PFIC), partnerships and losses deferred due to wash sales.
As of period end, the cost and unrealized appreciation (depreciation) in securities, and derivatives if applicable, for federal income tax purposes were as follows:
| Gross unrealized appreciation | $673,948 |
| Gross unrealized depreciation | (107,968) |
| Net unrealized appreciation (depreciation) | $565,980 |
| Tax cost | $2,337,485 |
Delayed Delivery Transactions and When-Issued Securities. During the period, certain Funds transacted in securities on a delayed delivery or when-issued basis. Payment and delivery may take place after the customary settlement period for that security. The price of the underlying securities and the date when the securities will be delivered and paid for are fixed at the time the transaction is negotiated. Securities purchased on a delayed delivery or when-issued basis are identified as such in the Schedule of Investments. Compensation for interest forgone in the purchase of a delayed delivery or when-issued debt security may be received. With respect to purchase commitments, each applicable Fund identifies securities as segregated in its records with a value at least equal to the amount of the commitment. Payables and receivables associated with the purchases and sales of delayed delivery securities having the same coupon, settlement date and broker are offset. Delayed delivery or when-issued securities that have been purchased from and sold to different brokers are reflected as both payables and receivables in the Statement of Assets and Liabilities under the caption "Delayed delivery", as applicable. Losses may arise due to changes in the value of the underlying securities or if the counterparty does not perform under the contract's terms, or if the issuer does not issue the securities due to political, economic, or other factors.
Restricted Securities (including Private Placements). Funds may invest in securities that are subject to legal or contractual restrictions on resale. These securities generally may be resold in transactions exempt from registration or to the public if the securities are registered. Disposal of these securities may involve time-consuming negotiations and expense, and prompt sale at an acceptable price may be difficult. Information regarding restricted securities held at period end is included at the end of the Schedule of Investments, if applicable.
New Accounting Pronouncement. In June 2022, the Financial Accounting Standards Board (FASB) issued Accounting Standards Update (ASU) 2022-03 Fair Value Measurement (Topic 820): Fair Value Measurement of Equity Securities Subject to Contractual Sale Restrictions. The amendments in this ASU clarify that a contractual restriction on the sale of an equity security is not considered part of the unit of account of the equity security and, therefore, is not considered in measuring fair value. They also clarify that an entity cannot, as a separate unit of account, recognize and measure a contractual sale restriction. They also require additional disclosures for equity securities subject to contractual sale restrictions. ASU 2022-03 will be effective for fiscal years, including interim periods within those fiscal years, beginning after December 15, 2023, and allows for early adoption. ASU 2022-03 will only be applicable to an equity security in which the contractual arrangement that restricts its sale is executed or modified on or after the adoption date. Management is currently evaluating the potential impact of ASU 2022-03 to the financial statements.
4. Purchases and Sales of Investments.
Purchases and sales of securities, other than short-term securities and in-kind transactions, as applicable, are noted in the table below.
| | Purchases ($) | Sales ($) |
| Fidelity New Millennium Fund | 1,720,710 | 1,162,736 |
Unaffiliated Redemptions In-Kind. Shares that were redeemed in-kind for investments, including accrued interest and cash, if any, are shown in the table below. The net realized gain or loss on investments delivered through in-kind redemptions is included in the "Net realized gain (loss) on: Redemptions in-kind" line in the accompanying Statement of Operations. The amount of the in-kind redemptions is included in share transactions in the accompanying Statement of Changes in Net Assets. There was no gain or loss for federal income tax purposes.
| | Shares | Total net realized gain or loss ($) | Total Proceeds ($) |
| Fidelity New Millennium Fund | 5,655 | 129,509 | 237,208 |
5. Fees and Other Transactions with Affiliates.
Management Fee. Fidelity Management & Research Company LLC (the investment adviser) and its affiliates provide the Fund with investment management related services for which the Fund pays a monthly management fee. The management fee is the sum of an individual fund fee rate that is based on an annual rate of .30% of the Fund's average net assets and an annualized group fee rate that averaged .23% during the period. The group fee rate is based upon the monthly average net assets of a group of registered investment companies with which the investment adviser has management contracts. The group fee rate decreases as assets under management increase and increases as assets under management decrease. In addition, the management fee is subject to a performance adjustment (up to a maximum of +/- .20 % of the Fund's average net assets over a 36 month performance period). The upward or downward adjustment to the management fee is based on the Fund's relative investment performance as compared to its benchmark index, the S&P 500 Index, over the same 36 month performance period. For the reporting period, the total annualized management fee rate, including the performance adjustment, was .68% of the Fund's average net assets. The performance adjustment included in the management fee rate may be higher or lower than the maximum performance adjustment rate due to the difference between the average net assets for the reporting and performance periods.
Transfer Agent Fees. Fidelity Investments Institutional Operations Company LLC (FIIOC), an affiliate of the investment adviser, is the Fund's transfer, dividend disbursing and shareholder servicing agent. FIIOC receives account fees and asset-based fees that vary according to account size and type of account. FIIOC pays for typesetting, printing and mailing of shareholder reports, except proxy statements. For the period, the transfer agent fees were equivalent to an annualized rate of .15% of average net assets.
Accounting Fees. Fidelity Service Company, Inc. (FSC), an affiliate of the investment adviser, maintains the Fund's accounting records. The accounting fee is based on the level of average net assets for each month. For the period, the fees were equivalent to the following annualized rates:
| | % of Average Net Assets |
| Fidelity New Millennium Fund | .03 |
Brokerage Commissions. A portion of portfolio transactions were placed with brokerage firms which are affiliates of the investment adviser. Brokerage commissions are included in net realized gain (loss) and change in net unrealized appreciation (depreciation) in the Statement of Operations. The commissions paid to these affiliated firms were as follows:
| | Amount |
| Fidelity New Millennium Fund | $39 |
Interfund Trades. Funds may purchase from or sell securities to other Fidelity Funds under procedures adopted by the Board. The procedures have been designed to ensure these interfund trades are executed in accordance with Rule 17a-7 of the 1940 Act. Any interfund trades are included within the respective purchases and sales amounts shown in the Purchases and Sales of Investments note. Interfund trades during the period are noted in the table below.
| | Purchases ($) | Sales ($) | Realized Gain (Loss) ($) |
| Fidelity New Millennium Fund | 153,691 | 31,538 | 7,806 |
6. Committed Line of Credit.
Certain Funds participate with other funds managed by the investment adviser or an affiliate in a $4.25 billion credit facility (the "line of credit") to be utilized for temporary or emergency purposes to fund shareholder redemptions or for other short-term liquidity purposes. The participating funds have agreed to pay commitment fees on their pro-rata portion of the line of credit, which are reflected in Miscellaneous expenses on the Statement of Operations, and are listed below. During the period, there were no borrowings on this line of credit.
| | Amount |
| Fidelity New Millennium Fund | $3 |
7. Security Lending.
Funds lend portfolio securities from time to time in order to earn additional income. Lending agents are used, including National Financial Services (NFS), an affiliate of the investment adviser. Pursuant to a securities lending agreement, NFS will receive a fee, which is capped at 9.9% of a fund's daily lending revenue, for its services as lending agent. A fund may lend securities to certain qualified borrowers, including NFS. On the settlement date of the loan, a fund receives collateral (in the form of U.S. Treasury obligations, letters of credit and/or cash) against the loaned securities and maintains collateral in an amount not less than 100% of the market value of the loaned securities during the period of the loan. The market value of the loaned securities is determined at the close of business of a fund and any additional required collateral is delivered to a fund on the next business day. A fund or borrower may terminate the loan at any time, and if the borrower defaults on its obligation to return the securities loaned because of insolvency or other reasons, a fund may apply collateral received from the borrower against the obligation. A fund may experience delays and costs in recovering the securities loaned. Any cash collateral received is invested in the Fidelity Securities Lending Cash Central Fund. Any loaned securities are identified as such in the Schedule of Investments, and the value of loaned securities and cash collateral at period end, as applicable, are presented in the Statement of Assets and Liabilities. Security lending income represents the income earned on investing cash collateral, less rebates paid to borrowers and any lending agent fees associated with the loan, plus any premium payments received for lending certain types of securities. Security lending income is presented in the Statement of Operations as a component of income from Fidelity Central Funds. Affiliated security lending activity, if any, was as follows:
| | Total Security Lending Fees Paid to NFS | Security Lending Income From Securities Loaned to NFS | Value of Securities Loaned to NFS at Period End |
| Fidelity New Millennium Fund | $4 | $- | $- |
8. Expense Reductions.
Through arrangements with the Fund's custodian, credits realized as a result of certain uninvested cash balances were used to reduce the Fund's expenses by $1.
During the period the investment adviser or an affiliate reimbursed and/or waived a portion of operating expenses in the amount of $61.
9. Other.
A fund's organizational documents provide former and current trustees and officers with a limited indemnification against liabilities arising in connection with the performance of their duties to the fund. In the normal course of business, a fund may also enter into contracts that provide general indemnifications. A fund's maximum exposure under these arrangements is unknown as this would be dependent on future claims that may be made against a fund. The risk of material loss from such claims is considered remote.
10. Risk and Uncertainties.
Many factors affect a fund's performance. Developments that disrupt global economies and financial markets, such as pandemics, epidemics, outbreaks of infectious diseases, war, terrorism, and environmental disasters, may significantly affect a fund's investment performance. The effects of these developments to a fund will be impacted by the types of securities in which a fund invests, the financial condition, industry, economic sector, and geographic location of an issuer, and a fund's level of investment in the securities of that issuer. Significant concentrations in security types, issuers, industries, sectors, and geographic locations may magnify the factors that affect a fund's performance.
As a shareholder, you incur two types of costs: (1) transaction costs, which may include sales charges (loads) on purchase payments or redemption proceeds, as applicable and (2) ongoing costs, which generally include management fees, distribution and/or service (12b-1) fees and other Fund expenses. This Example is intended to help you understand your ongoing costs (in dollars) of investing in a fund and to compare these costs with the ongoing costs of investing in other mutual funds.
| The Example is based on an investment of $1,000 invested at the beginning of the period and held for the entire period (December 1, 2022 to May 31, 2023). |
Actual Expenses
The first line of the accompanying table provides information about actual account values and actual expenses. You may use the information in this line, together with the amount you invested, to estimate the expenses that you paid over the period. Simply divide your account value by $1,000.00 (for example, an $8,600 account value divided by $1,000.00 = 8.6), then multiply the result by the number in the first line for a class/Fund under the heading entitled "Expenses Paid During Period" to estimate the expenses you paid on your account during this period. If any fund is a shareholder of any underlying mutual funds or exchange-traded funds (ETFs) (the Underlying Funds), such fund indirectly bears its proportional share of the expenses of the Underlying Funds in addition to the direct expenses incurred presented in the table. These fees and expenses are not included in the annualized expense ratio used to calculate the expense estimate in the table below.
Hypothetical Example for Comparison Purposes
The second line of the accompanying table provides information about hypothetical account values and hypothetical expenses based on the actual expense ratio and an assumed rate of return of 5% per year before expenses, which is not the actual return. The hypothetical account values and expenses may not be used to estimate the actual ending account balance or expenses you paid for the period. You may use this information to compare the ongoing costs of investing in the Fund and other funds. To do so, compare this 5% hypothetical example with the 5% hypothetical examples that appear in the shareholder reports of the other funds. If any fund is a shareholder of any Underlying Funds, such fund indirectly bears its proportional share of the expenses of the Underlying Funds in addition to the direct expenses as presented in the table. These fees and expenses are not included in the annualized expense ratio used to calculate the expense estimate in the table below.
Please note that the expenses shown in the table are meant to highlight your ongoing costs only and do not reflect any transaction costs. Therefore, the second line of the table is useful in comparing ongoing costs only, and will not help you determine the relative total costs of owning different funds. In addition, if these transactional costs were included, your costs would have been higher.
| | | | | Annualized Expense Ratio- A | | Beginning Account Value December 1, 2022 | | Ending Account Value May 31, 2023 | | Expenses Paid During Period- C December 1, 2022 to May 31, 2023 |
| | | | | | | | | | |
| Fidelity® New Millennium Fund® | | | | .86% | | | | | | |
| Actual | | | | | | $ 1,000 | | $ 1,035.20 | | $ 4.36 |
Hypothetical- B | | | | | | $ 1,000 | | $ 1,020.64 | | $ 4.33 |
| |
A Annualized expense ratio reflects expenses net of applicable fee waivers.
B 5% return per year before expenses
C Expenses are equal to the annualized expense ratio, multiplied by the average account value over the period, multiplied by 182/ 365 (to reflect the one-half year period). The fees and expenses of any Underlying Funds are not included in each annualized expense ratio.
Board Approval of Investment Advisory Contracts
Fidelity New Millennium Fund
At its May 2023 meeting, the Board of Trustees, including the Independent Trustees (together, the Board), voted to continue the management contract with Fidelity Management & Research Company LLC (FMR), and the sub-advisory agreements and sub-subadvisory agreements, in each case, where applicable (together, the Advisory Contracts) for the fund for two months from June 1, 2023 through July 31, 2023. The Board determined that it will consider the annual renewal of the fund's Advisory Contracts for a full one year period in July 2023, following its review of additional materials provided by FMR.
The Board considered that the approval of the fund's Advisory Contracts will not result in any changes in (i) the investment process or strategies employed in the management of the fund's assets; (ii) the fees and expenses paid by shareholders; (iii) the nature, extent or quality of services provided under the fund's Advisory Contracts; or (iv) the day-to-day management of the fund or the persons primarily responsible for such management. The Board also considered that since its last approval of the fund's Advisory Contracts, FMR had provided additional information on the fund in support of the annual contract renewal process, including competitive analyses on total expenses and management fees and in-depth reviews of fund performance and fund profitability information. The Board concluded that the fund's Advisory Contracts are fair and reasonable, and that the fund's Advisory Contracts should be renewed, without modification, through July 31, 2023, with the understanding that the Board will consider the annual renewal for a full one year period in July 2023.
In connection with its consideration of future renewals of the fund's Advisory Contracts, the Board will consider: (i) the nature, extent and quality of services provided to the fund, including shareholder and administrative services and investment performance; (ii) the competitiveness of the management fee and total expenses for the fund; (iii) the costs of the services and profitability, including the revenues earned and the expenses incurred in conducting the business of developing, marketing, distributing, managing, administering, and servicing the fund and its shareholders, to the extent applicable; and (iv) whether there have been economies of scale in respect of the Fidelity funds, whether the Fidelity funds (including the fund) have appropriately benefited from any such economies of scale, and whether there is the potential for realization of any further economies.
Based on its evaluation of all of the conclusions noted above, and after considering all factors it believed relevant, the Board ultimately concluded that the fund's management fee structure is fair and reasonable, and that the continuation of the fund's Advisory Contracts should be approved for two months from June 1, 2023 through July 31, 2023.
The Securities and Exchange Commission adopted Rule 22e-4 under the Investment Company Act of 1940 (the Liquidity Rule) to promote effective liquidity risk management throughout the open-end investment company industry, thereby reducing the risk that funds will be unable to meet their redemption obligations and mitigating dilution of the interests of fund shareholders.
The Fund has adopted and implemented a liquidity risk management program (the Program) reasonably designed to assess and manage the Fund's liquidity risk and to comply with the requirements of the Liquidity Rule. The Fund's Board of Trustees (the Board) has designated the Fund's investment adviser as administrator of the Program. The Fidelity advisers have established a Liquidity Risk Management Committee (the LRM Committee) to manage the Program for each of the Fidelity Funds. The LRM Committee monitors the adequacy and effectiveness of implementation of the Program and on a periodic basis assesses each Fund's liquidity risk based on a variety of factors including (1) the Fund's investment strategy, (2) portfolio liquidity and cash flow projections during normal and reasonably foreseeable stressed conditions, (3) shareholder redemptions, (4) borrowings and other funding sources and (5) certain factors specific to ETFs including the effect of the Fund's prices and spreads, market participants, and basket compositions on the overall liquidity of the Fund's portfolio, as applicable.
In accordance with the Program, each of the Fund's portfolio investments is classified into one of four defined liquidity categories based on a determination of a reasonable expectation for how long it would take to convert the investment to cash (or sell or dispose of the investment) without significantly changing its market value.
- Highly liquid investments - cash or convertible to cash within three business days or less
- Moderately liquid investments - convertible to cash in three to seven calendar days
- Less liquid investments - can be sold or disposed of, but not settled, within seven calendar days
- Illiquid investments - cannot be sold or disposed of within seven calendar days
Liquidity classification determinations take into account a variety of factors including various market, trading and investment-specific considerations, as well as market depth, and generally utilize analysis from a third-party liquidity metrics service.
The Liquidity Rule places a 15% limit on a fund's illiquid investments and requires funds that do not primarily hold assets that are highly liquid investments to determine and maintain a minimum percentage of the fund's net assets to be invested in highly liquid investments (highly liquid investment minimum or HLIM). The Program includes provisions reasonably designed to comply with the 15% limit on illiquid investments and for determining, periodically reviewing and complying with the HLIM requirement as applicable.
At a recent meeting of the Fund's Board of Trustees, the LRM Committee provided a written report to the Board pertaining to the operation, adequacy, and effectiveness of the Program for the period December 1, 2021 through November 30, 2022. The report concluded that the Program is operating effectively and is reasonably designed to assess and manage the Fund's liquidity risk.
1.704547.125
NMF-SANN-0723
Item 2.
Code of Ethics
Not applicable.
Item 3.
Audit Committee Financial Expert
Not applicable.
Item 4.
Principal Accountant Fees and Services
Not applicable.
Item 5.
Audit Committee of Listed Registrants
Not applicable.
Item 6.
Investments
(a)
Not applicable.
(b)
Not applicable
Item 7.
Disclosure of Proxy Voting Policies and Procedures for Closed-End Management Investment Companies
Not applicable.
Item 8.
Portfolio Managers of Closed-End Management Investment Companies
Not applicable.
Item 9.
Purchase of Equity Securities by Closed-End Management Investment Company and Affiliated Purchasers
Not applicable.
Item 10.
Submission of Matters to a Vote of Security Holders
There were no material changes to the procedures by which shareholders may recommend nominees to the Fidelity Mt. Vernon Street Trust’s Board of Trustees.
Item 11.
Controls and Procedures
(a)(i) The President and Treasurer and the Chief Financial Officer have concluded that the Fidelity Mt. Vernon Street Trust’s (the “Trust”) disclosure controls and procedures
(as defined in Rule 30a-3(c) under the Investment Company Act) provide reasonable assurances that material information relating to the Trust is made known to them by the appropriate persons, based on their evaluation of these controls and procedures as of a date within 90 days of the filing date of this report.
(a)(ii) There was no change in the Trust’s internal control over financial reporting (as defined in Rule 30a-3(d) under the Investment Company Act) that occurred during the period covered by this report that has materially affected, or is reasonably likely to materially affect, the Trust’s internal control over financial reporting.
Item 12.
Disclosure of Securities Lending Activities for Closed-End Management
Investment Companies
Not applicable.
Item 13.
Exhibits
SIGNATURES
Pursuant to the requirements of the Securities Exchange Act of 1934 and the Investment Company Act of 1940, the registrant has duly caused this report to be signed on its behalf by the undersigned, thereunto duly authorized.
Fidelity Mt. Vernon Street Trust
| |
By: | /s/Stacie M. Smith |
| Stacie M. Smith |
| President and Treasurer |
|
|
Date: | July 20, 2023 |
Pursuant to the requirements of the Securities Exchange Act of 1934 and the Investment Company Act of 1940, this report has been signed below by the following persons on behalf of the registrant and in the capacities and on the dates indicated.
| |
By: | /s/Stacie M. Smith |
| Stacie M. Smith |
| President and Treasurer |
|
|
Date: | July 20, 2023 |
| |
By: | /s/John J. Burke III |
| John J. Burke III |
| Chief Financial Officer |
|
|
Date: | July 20, 2023 |