UNITED STATES
SECURITIES AND EXCHANGE COMMISSION
Washington, D.C. 20549
FORM N-CSR
CERTIFIED SHAREHOLDER REPORT OF REGISTERED
MANAGEMENT INVESTMENT COMPANIES
Investment Company Act file number 811-03583
Fidelity Mt. Vernon Street Trust
(Exact name of registrant as specified in charter)
245 Summer St., Boston, MA 02210
(Address of principal executive offices) (Zip code)
Cynthia Lo Bessette, Secretary
245 Summer St.
Boston, Massachusetts 02210
(Name and address of agent for service)
Registrant's telephone number, including area code:
617-563-7000
Date of fiscal year end: | November 30 |
Date of reporting period: | May 31, 2021 |
Item 1.
Reports to Stockholders
Fidelity® Growth Company Fund
Semi-Annual Report
May 31, 2021

Contents
Board Approval of Investment Advisory Contracts and Management Fees | |
To view a fund's proxy voting guidelines and proxy voting record for the 12-month period ended June 30, visit http://www.fidelity.com/proxyvotingresults or visit the Securities and Exchange Commission's (SEC) web site at http://www.sec.gov.
You may also call 1-800-544-8544 if you’re an individual investing directly with Fidelity, call 1-800-835-5092 if you’re a plan sponsor or participant with Fidelity as your recordkeeper or call 1-877-208-0098 on institutional accounts or if you’re an advisor or invest through one to request a free copy of the proxy voting guidelines.
Standard & Poor's, S&P and S&P 500 are registered service marks of The McGraw-Hill Companies, Inc. and have been licensed for use by Fidelity Distributors Corporation.
Other third-party marks appearing herein are the property of their respective owners.
All other marks appearing herein are registered or unregistered trademarks or service marks of FMR LLC or an affiliated company. © 2021 FMR LLC. All rights reserved.
This report and the financial statements contained herein are submitted for the general information of the shareholders of the Fund. This report is not authorized for distribution to prospective investors in the Fund unless preceded or accompanied by an effective prospectus.
A fund files its complete schedule of portfolio holdings with the SEC for the first and third quarters of each fiscal year on Form N-PORT. Forms N-PORT are available on the SEC’s web site at http://www.sec.gov. A fund's Forms N-PORT may be reviewed and copied at the SEC’s Public Reference Room in Washington, DC. Information regarding the operation of the SEC's Public Reference Room may be obtained by calling 1-800-SEC-0330.
For a complete list of a fund's portfolio holdings, view the most recent holdings listing, semiannual report, or annual report on Fidelity's web site at http://www.fidelity.com, http://www.institutional.fidelity.com, or http://www.401k.com, as applicable.
NOT FDIC INSURED •MAY LOSE VALUE •NO BANK GUARANTEE
Neither the Fund nor Fidelity Distributors Corporation is a bank.
Note to Shareholders:
Early in 2020, the outbreak and spread of a new coronavirus emerged as a public health emergency that had a major influence on financial markets, primarily based on its impact on the global economy and the outlook for corporate earnings. The virus causes a respiratory disease known as COVID-19. On March 11, 2020 the World Health Organization declared the COVID-19 outbreak a pandemic, citing sustained risk of further global spread.
In the weeks following, as the crisis worsened, we witnessed an escalating human tragedy with wide-scale social and economic consequences from coronavirus-containment measures. The outbreak of COVID-19 prompted a number of measures to limit the spread, including travel and border restrictions, quarantines, and restrictions on large gatherings. In turn, these resulted in lower consumer activity, diminished demand for a wide range of products and services, disruption in manufacturing and supply chains, and – given the wide variability in outcomes regarding the outbreak – significant market uncertainty and volatility. Amid the turmoil, global governments and central banks took unprecedented action to help support consumers, businesses, and the broader economies, and to limit disruption to financial systems.
The situation continues to unfold, and the extent and duration of its impact on financial markets and the economy remain highly uncertain. Extreme events such as the coronavirus crisis are “exogenous shocks” that can have significant adverse effects on mutual funds and their investments. Although multiple asset classes may be affected by market disruption, the duration and impact may not be the same for all types of assets.
Fidelity is committed to helping you stay informed amid news about COVID-19 and during increased market volatility, and we’re taking extra steps to be responsive to customer needs. We encourage you to visit our websites, where we offer ongoing updates, commentary, and analysis on the markets and our funds.
Investment Summary (Unaudited)
Top Ten Stocks as of May 31, 2021
| % of fund's net assets | |
| NVIDIA Corp. | 8.2 |
| Apple, Inc. | 6.7 |
| Amazon.com, Inc. | 6.3 |
| Microsoft Corp. | 4.1 |
| Alphabet, Inc. Class A | 4.1 |
| lululemon athletica, Inc. | 3.1 |
| Salesforce.com, Inc. | 2.5 |
| Alphabet, Inc. Class C | 2.4 |
| Facebook, Inc. Class A | 1.9 |
| Wayfair LLC Class A | 1.9 |
| 41.2 |
Top Five Market Sectors as of May 31, 2021
| % of fund's net assets | |
| Information Technology | 35.9 |
| Consumer Discretionary | 22.2 |
| Health Care | 15.8 |
| Communication Services | 12.9 |
| Industrials | 6.0 |
Asset Allocation (% of fund's net assets)
| As of May 31, 2021* | ||
| Stocks | 97.9% | |
| Convertible Securities | 1.7% | |
| Other Investments | 0.1% | |
| Short-Term Investments and Net Other Assets (Liabilities) | 0.3% | |

* Foreign investments - 9.7%
Schedule of Investments May 31, 2021 (Unaudited)
Showing Percentage of Net Assets
| Common Stocks - 97.8% | |||
| Shares | Value (000s) | ||
| COMMUNICATION SERVICES - 12.8% | |||
| Entertainment - 3.3% | |||
| Activision Blizzard, Inc. | 2,029,343 | $197,354 | |
| Electronic Arts, Inc. | 375,354 | 53,649 | |
| NetEase, Inc. ADR | 420,963 | 49,644 | |
| Netflix, Inc. (a) | 728,492 | 366,293 | |
| Roblox Corp. (a)(b) | 1,053,663 | 98,802 | |
| Roku, Inc. Class A (a) | 2,390,965 | 828,971 | |
| Sea Ltd. ADR (a) | 1,497,460 | 379,217 | |
| The Walt Disney Co. (a) | 284,137 | 50,761 | |
| Zynga, Inc. (a) | 1,076,757 | 11,672 | |
| 2,036,363 | |||
| Interactive Media & Services - 8.9% | |||
| Alphabet, Inc.: | |||
| Class A (a) | 1,081,144 | 2,548,094 | |
| Class C (a) | 615,745 | 1,484,906 | |
| Bumble, Inc. | 206,142 | 9,837 | |
| Facebook, Inc. Class A (a) | 3,586,829 | 1,179,098 | |
| IAC (a) | 46,878 | 7,476 | |
| Kuaishou Technology Class B (c) | 563,149 | 14,098 | |
| Match Group, Inc. (a) | 58,631 | 8,407 | |
| Pinterest, Inc. Class A (a) | 220,032 | 14,368 | |
| Snap, Inc. Class A (a) | 1,888,601 | 117,320 | |
| Tencent Holdings Ltd. | 501,616 | 40,005 | |
| Twitter, Inc. (a) | 613,318 | 35,572 | |
| Vimeo, Inc. (a) | 76,106 | 3,196 | |
| Zillow Group, Inc. Class C (a)(b) | 551,537 | 64,706 | |
| 5,527,083 | |||
| Media - 0.0% | |||
| Comcast Corp. Class A | 175,851 | 10,083 | |
| Wireless Telecommunication Services - 0.6% | |||
| T-Mobile U.S., Inc. | 2,713,096 | 383,767 | |
| TOTAL COMMUNICATION SERVICES | 7,957,296 | ||
| CONSUMER DISCRETIONARY - 21.8% | |||
| Automobiles - 1.9% | |||
| Arrival Group (d) | 3,325,053 | 60,617 | |
| Lordstown Motors Corp. (d) | 1,126,864 | 10,040 | |
| Neutron Holdings, Inc. (e) | 1,546,251 | 21 | |
| Rad Power Bikes, Inc. (d)(e) | 1,182,568 | 5,705 | |
| Tesla, Inc. (a) | 1,705,911 | 1,066,570 | |
| XPeng, Inc. ADR (a)(b) | 857,233 | 27,543 | |
| 1,170,496 | |||
| Hotels, Restaurants & Leisure - 1.6% | |||
| Airbnb, Inc. Class A | 25,100 | 3,524 | |
| Chipotle Mexican Grill, Inc. (a) | 48,846 | 67,016 | |
| Hyatt Hotels Corp. Class A (a)(b) | 116,700 | 9,112 | |
| Marriott International, Inc. Class A (a) | 1,266,305 | 181,816 | |
| McDonald's Corp. | 3,246 | 759 | |
| Penn National Gaming, Inc. (a) | 2,213,905 | 181,474 | |
| Planet Fitness, Inc. (a) | 57,989 | 4,568 | |
| Rush Street Interactive, Inc. (a)(b) | 1,360,891 | 16,889 | |
| Rush Street Interactive, Inc. (d) | 447,095 | 5,548 | |
| Shake Shack, Inc. Class A (a)(b) | 77,450 | 7,279 | |
| Starbucks Corp. | 1,930,830 | 219,883 | |
| The Booking Holdings, Inc. (a) | 78,760 | 185,996 | |
| Vail Resorts, Inc. (a) | 197,427 | 64,535 | |
| Yum China Holdings, Inc. (b) | 565,290 | 38,236 | |
| 986,635 | |||
| Household Durables - 0.9% | |||
| D.R. Horton, Inc. | 1,222,874 | 116,528 | |
| KB Home | 1,225,157 | 57,350 | |
| Lennar Corp. Class A | 2,928,264 | 289,927 | |
| PulteGroup, Inc. | 244,916 | 14,154 | |
| Toll Brothers, Inc. | 1,293,156 | 84,365 | |
| Vizio Holding Corp. (a)(b) | 478,078 | 10,441 | |
| 572,765 | |||
| Internet & Direct Marketing Retail - 9.0% | |||
| Alibaba Group Holding Ltd. sponsored ADR (a) | 442,365 | 94,648 | |
| Amazon.com, Inc. (a) | 1,220,716 | 3,934,453 | |
| Coupang, Inc. Class A (a)(b) | 235,190 | 9,593 | |
| Deliveroo Holdings PLC (a)(c) | 2,167,231 | 7,741 | |
| Etsy, Inc. (a) | 164,530 | 27,103 | |
| Farfetch Ltd. Class A (a) | 1,067,965 | 49,479 | |
| JD.com, Inc. sponsored ADR (a) | 1,498,177 | 110,775 | |
| Ocado Group PLC (a) | 1,216,841 | 32,656 | |
| Ozon Holdings PLC ADR (b) | 224,937 | 11,937 | |
| Pinduoduo, Inc. ADR (a) | 167,894 | 20,967 | |
| Revolve Group, Inc. (a) | 1,363,159 | 75,574 | |
| The Honest Co., Inc. | 422,774 | 6,004 | |
| The RealReal, Inc. (a) | 1,263,828 | 22,079 | |
| THG PLC | 1,617,517 | 13,995 | |
| thredUP, Inc. (a)(b) | 653,152 | 15,408 | |
| Wayfair LLC Class A (a)(b) | 3,812,126 | 1,168,569 | |
| Zomato Pvt Ltd. (d)(e) | 31,811,600 | 25,534 | |
| 5,626,515 | |||
| Leisure Products - 0.3% | |||
| Callaway Golf Co. | 766,932 | 28,315 | |
| Peloton Interactive, Inc. Class A (a) | 1,289,779 | 142,276 | |
| 170,591 | |||
| Multiline Retail - 0.4% | |||
| Dollar General Corp. | 196,449 | 39,871 | |
| Dollar Tree, Inc. (a) | 290,933 | 28,366 | |
| Ollie's Bargain Outlet Holdings, Inc. (a) | 1,867,514 | 161,428 | |
| Target Corp. | 42,890 | 9,733 | |
| 239,398 | |||
| Specialty Retail - 2.8% | |||
| Auto1 Group SE (c) | 282,343 | 15,161 | |
| Carvana Co. Class A (a) | 896,928 | 237,767 | |
| Cazoo Holdings Ltd. (d) | 224,106 | 6,840 | |
| Five Below, Inc. (a) | 222,387 | 40,946 | |
| Floor & Decor Holdings, Inc. Class A (a) | 994,036 | 97,724 | |
| Lowe's Companies, Inc. | 1,918,160 | 373,715 | |
| MYT Netherlands Parent BV ADR (b) | 108,603 | 3,421 | |
| RH (a) | 630,767 | 404,353 | |
| The Home Depot, Inc. | 1,182,605 | 377,145 | |
| TJX Companies, Inc. | 2,339,255 | 157,993 | |
| Williams-Sonoma, Inc. | 269,387 | 45,672 | |
| 1,760,737 | |||
| Textiles, Apparel & Luxury Goods - 4.9% | |||
| adidas AG | 570,599 | 208,176 | |
| Allbirds, Inc. (a)(d)(e) | 307,430 | 3,314 | |
| Canada Goose Holdings, Inc. (a)(b) | 1,401,218 | 56,165 | |
| Deckers Outdoor Corp. (a) | 405,016 | 135,859 | |
| Dr. Martens Ltd. (a) | 4,561,363 | 31,780 | |
| Figs, Inc. Class A (a) | 101,300 | 3,459 | |
| lululemon athletica, Inc. (a) | 5,873,777 | 1,897,994 | |
| NIKE, Inc. Class B | 1,776,787 | 242,460 | |
| On Holding AG (a)(d)(e) | 900 | 18,063 | |
| Skechers U.S.A., Inc. Class A (sub. vtg.) (a) | 8,183,127 | 388,699 | |
| Tory Burch LLC: | |||
| Class A (d)(e)(f) | 950,844 | 41,288 | |
| Class B (d)(e)(f) | 324,840 | 15,047 | |
| Under Armour, Inc. Class C (non-vtg.) (a) | 906,728 | 17,282 | |
| VF Corp. | 119,965 | 9,564 | |
| 3,069,150 | |||
| TOTAL CONSUMER DISCRETIONARY | 13,596,287 | ||
| CONSUMER STAPLES - 2.2% | |||
| Beverages - 1.0% | |||
| Boston Beer Co., Inc. Class A (a) | 19,355 | 20,481 | |
| Fever-Tree Drinks PLC | 939,310 | 34,096 | |
| Keurig Dr. Pepper, Inc. | 2,662,188 | 98,394 | |
| Monster Beverage Corp. (a) | 2,394,424 | 225,722 | |
| PepsiCo, Inc. | 279,708 | 41,380 | |
| The Coca-Cola Co. | 3,838,540 | 212,233 | |
| 632,306 | |||
| Food & Staples Retailing - 0.3% | |||
| Blink Health, Inc. Series A1 (d)(e) | 173,460 | 5,662 | |
| Costco Wholesale Corp. | 410,870 | 155,420 | |
| Kroger Co. | 40,413 | 1,494 | |
| Oatly Group AB ADR (a) | 393,201 | 9,323 | |
| Performance Food Group Co. (a) | 896,249 | 44,929 | |
| Sweetgreen, Inc. warrants 1/21/26 (a)(d)(e) | 168,563 | 666 | |
| 217,494 | |||
| Food Products - 0.4% | |||
| AppHarvest, Inc. (d) | 1,675,778 | 26,507 | |
| Archer Daniels Midland Co. | 478,247 | 31,818 | |
| Beyond Meat, Inc. (a)(b) | 33,869 | 4,925 | |
| Bunge Ltd. | 1,057,408 | 91,804 | |
| Darling Ingredients, Inc. (a) | 796,849 | 54,552 | |
| Freshpet, Inc. (a) | 71,077 | 12,568 | |
| JDE Peet's BV | 5,490 | 217 | |
| Laird Superfood, Inc. | 396,285 | 12,951 | |
| Mondelez International, Inc. | 133,323 | 8,470 | |
| 243,812 | |||
| Household Products - 0.2% | |||
| Church & Dwight Co., Inc. | 212,311 | 18,201 | |
| Colgate-Palmolive Co. | 363,329 | 30,440 | |
| Procter & Gamble Co. | 618,746 | 83,438 | |
| 132,079 | |||
| Personal Products - 0.0% | |||
| Unilever PLC (Netherlands) | 116,828 | 6,967 | |
| Tobacco - 0.3% | |||
| Altria Group, Inc. | 2,926,413 | 144,038 | |
| JUUL Labs, Inc. Class A (a)(d)(e) | 44,067 | 2,463 | |
| Philip Morris International, Inc. | 228,866 | 22,070 | |
| 168,571 | |||
| TOTAL CONSUMER STAPLES | 1,401,229 | ||
| ENERGY - 0.9% | |||
| Energy Equipment & Services - 0.2% | |||
| Halliburton Co. | 2,023,791 | 45,434 | |
| Schlumberger Ltd. | 1,901,987 | 59,589 | |
| 105,023 | |||
| Oil, Gas & Consumable Fuels - 0.7% | |||
| EOG Resources, Inc. | 121,537 | 9,764 | |
| Hess Corp. | 3,245,545 | 272,042 | |
| Pioneer Natural Resources Co. | 130,341 | 19,837 | |
| Reliance Industries Ltd. | 268,958 | 4,516 | |
| Reliance Industries Ltd. | 4,034,380 | 120,183 | |
| 426,342 | |||
| TOTAL ENERGY | 531,365 | ||
| FINANCIALS - 2.1% | |||
| Banks - 1.1% | |||
| Bank of America Corp. | 4,224,438 | 179,074 | |
| First Republic Bank | 351,162 | 67,226 | |
| HDFC Bank Ltd. sponsored ADR (a) | 1,557,763 | 119,216 | |
| JPMorgan Chase & Co. | 1,137,603 | 186,840 | |
| Wells Fargo & Co. | 2,018,535 | 94,306 | |
| 646,662 | |||
| Capital Markets - 0.6% | |||
| Aspirational Consumer Lifestyle Corp. Class A (a)(b) | 160,682 | 1,605 | |
| B3 SA - Brasil Bolsa Balcao | 18,143,100 | 60,734 | |
| BlackRock, Inc. Class A | 148,005 | 129,806 | |
| Charles Schwab Corp. | 2,016,685 | 148,932 | |
| Coinbase Global, Inc. (a)(b) | 39,375 | 9,314 | |
| Edelweiss Financial Services Ltd. | 1,770,164 | 1,592 | |
| The Beauty Health Co. (a) | 392,571 | 5,590 | |
| The Beauty Health Co. (d) | 2,884,717 | 36,971 | |
| 394,544 | |||
| Consumer Finance - 0.0% | |||
| American Express Co. | 25,498 | 4,083 | |
| Discover Financial Services | 87,511 | 10,262 | |
| 14,345 | |||
| Diversified Financial Services - 0.4% | |||
| Adimab LLC (a)(d)(e)(f) | 3,162,765 | 160,629 | |
| Ant International Co. Ltd. Class C (a)(d)(e) | 1,658,265 | 4,544 | |
| BowX Acquisition Corp. (a)(b) | 1,925,686 | 23,647 | |
| CM Life Sciences II, Inc. unit (a) | 20,174 | 268 | |
| Decarbonization Plus Acquisition Corp. Class A (a)(b) | 198,962 | 1,990 | |
| Social Finance, Inc. (d) | 1,031,232 | 18,701 | |
| 209,779 | |||
| Insurance - 0.0% | |||
| Oscar Health, Inc. Class A | 936,103 | 21,265 | |
| TOTAL FINANCIALS | 1,286,595 | ||
| HEALTH CARE - 15.2% | |||
| Biotechnology - 7.8% | |||
| 4D Molecular Therapeutics, Inc. | 191,941 | 5,098 | |
| AbbVie, Inc. | 398,243 | 45,081 | |
| ACADIA Pharmaceuticals, Inc. (a) | 6,359,826 | 142,079 | |
| ADC Therapeutics SA (a) | 839,182 | 18,168 | |
| Akouos, Inc. (a) | 1,059,339 | 13,835 | |
| Akouos, Inc. (c) | 362,038 | 4,728 | |
| Akoya Biosciences, Inc. (a) | 164,797 | 3,431 | |
| Alector, Inc. (a) | 1,193,576 | 21,246 | |
| Allovir, Inc. (a)(b) | 2,104,331 | 49,326 | |
| Alnylam Pharmaceuticals, Inc. (a) | 3,829,671 | 543,775 | |
| ALX Oncology Holdings, Inc. (a) | 122,395 | 6,923 | |
| Amgen, Inc. | 612,279 | 145,686 | |
| Annexon, Inc. (a) | 201,528 | 4,256 | |
| Arcutis Biotherapeutics, Inc. (a) | 718,036 | 18,920 | |
| Argenx SE ADR (a) | 526,558 | 146,904 | |
| Arrowhead Pharmaceuticals, Inc. (a) | 88,283 | 6,409 | |
| Ascendis Pharma A/S sponsored ADR (a) | 68,506 | 9,206 | |
| aTyr Pharma, Inc. (a) | 351,728 | 1,597 | |
| Avidity Biosciences, Inc. (b) | 1,043,826 | 24,780 | |
| Axcella Health, Inc. (a)(g) | 2,069,031 | 6,600 | |
| BeiGene Ltd. ADR (a) | 1,465,225 | 525,298 | |
| BioAtla, Inc. | 882,056 | 37,973 | |
| BioNTech SE ADR (a)(b) | 482,793 | 98,490 | |
| BioXcel Therapeutics, Inc. (a)(b) | 738,257 | 24,385 | |
| Bolt Biotherapeutics, Inc. | 241,692 | 4,232 | |
| BridgeBio Pharma, Inc. (a)(b) | 186,186 | 11,022 | |
| Burning Rock Biotech Ltd. ADR | 42,036 | 1,138 | |
| Calyxt, Inc. (a) | 1,244,937 | 5,366 | |
| Cerevel Therapeutics Holdings (a) | 1,881,384 | 24,684 | |
| ChemoCentryx, Inc. (a) | 3,014,132 | 30,593 | |
| Cibus Corp.: | |||
| Series C (a)(d)(e)(f) | 4,523,810 | 7,962 | |
| Series D (d)(e)(f) | 2,741,040 | 4,824 | |
| Codiak Biosciences, Inc. (g) | 1,245,011 | 28,162 | |
| Connect Biopharma Holdings Ltd. ADR (a) | 486,288 | 7,236 | |
| CRISPR Therapeutics AG (a)(b) | 50,642 | 5,985 | |
| Cyclerion Therapeutics, Inc. (a) | 280,154 | 908 | |
| Cyclerion Therapeutics, Inc. (a)(d) | 543,695 | 1,762 | |
| Day One Biopharmaceuticals, Inc. (a) | 203,400 | 4,819 | |
| Denali Therapeutics, Inc. (a) | 348,718 | 22,175 | |
| Evelo Biosciences, Inc. (a)(g) | 2,768,238 | 37,150 | |
| Exact Sciences Corp. (a) | 153,411 | 16,957 | |
| Exelixis, Inc. (a) | 191,811 | 4,325 | |
| Fate Therapeutics, Inc. (a) | 1,884,242 | 144,333 | |
| Foghorn Therapeutics, Inc. (c) | 361,607 | 3,764 | |
| Foghorn Therapeutics, Inc. | 428,709 | 4,463 | |
| Fusion Pharmaceuticals, Inc. (a) | 269,195 | 2,210 | |
| Gemini Therapeutics, Inc. (b) | 179,863 | 2,212 | |
| Gemini Therapeutics, Inc. (d) | 658,627 | 8,101 | |
| Generation Bio Co. | 2,405,853 | 82,425 | |
| Immunocore Holdings PLC | 368,095 | 14,337 | |
| Immunocore Holdings PLC ADR | 241,691 | 9,909 | |
| Inhibrx, Inc. (a)(b) | 609,297 | 12,893 | |
| Instil Bio, Inc. (a) | 506,726 | 9,020 | |
| Intarcia Therapeutics, Inc. warrants 12/6/24 (a)(e) | 156,370 | 0 | |
| Ionis Pharmaceuticals, Inc. (a)(g) | 7,800,364 | 290,564 | |
| iTeos Therapeutics, Inc. (a) | 212,410 | 4,363 | |
| Karuna Therapeutics, Inc. (a) | 1,433,194 | 160,260 | |
| Keros Therapeutics, Inc. (a) | 300,413 | 16,391 | |
| Kinnate Biopharma, Inc. | 289,080 | 6,788 | |
| Kronos Bio, Inc. (b) | 29,744 | 726 | |
| Kronos Bio, Inc. (c) | 284,978 | 6,956 | |
| Kura Oncology, Inc. (a) | 202,923 | 4,515 | |
| Kymera Therapeutics, Inc. (a) | 130,143 | 6,259 | |
| Lexicon Pharmaceuticals, Inc. (a)(b) | 2,919,429 | 12,816 | |
| Moderna, Inc. (a) | 1,523,306 | 281,827 | |
| Morphic Holding, Inc. (a) | 1,058,135 | 52,230 | |
| Novavax, Inc. (a) | 331,857 | 48,989 | |
| Olema Pharmaceuticals, Inc. (b) | 240,077 | 6,713 | |
| ORIC Pharmaceuticals, Inc. (a) | 1,122,625 | 25,652 | |
| Passage Bio, Inc. (a) | 614,782 | 8,146 | |
| PMV Pharmaceuticals, Inc. (b) | 111,580 | 3,838 | |
| Poseida Therapeutics, Inc. (a) | 1,224,743 | 10,349 | |
| Poseida Therapeutics, Inc. (c) | 906,572 | 7,661 | |
| Praxis Precision Medicines, Inc. | 1,659,128 | 32,502 | |
| Protagonist Therapeutics, Inc. (a) | 737,866 | 25,906 | |
| Prothena Corp. PLC (a) | 800,905 | 23,362 | |
| PTC Therapeutics, Inc. (a) | 750,688 | 29,480 | |
| Recursion Pharmaceuticals, Inc. (a) | 231,997 | 6,115 | |
| Regeneron Pharmaceuticals, Inc. (a) | 336,422 | 169,029 | |
| Relay Therapeutics, Inc. (a) | 513,091 | 16,480 | |
| Repare Therapeutics, Inc. | 79,728 | 2,577 | |
| Repligen Corp. (a) | 155,073 | 28,318 | |
| Revolution Medicines, Inc. (a) | 840,923 | 25,152 | |
| Rigel Pharmaceuticals, Inc. (a)(b)(g) | 9,984,034 | 37,141 | |
| Rubius Therapeutics, Inc. (a)(b)(g) | 4,972,001 | 121,466 | |
| Sage Therapeutics, Inc. (a) | 2,503,392 | 174,236 | |
| Sana Biotechnology, Inc. (b) | 56,403 | 1,183 | |
| Sarepta Therapeutics, Inc. (a) | 177,516 | 13,429 | |
| Scholar Rock Holding Corp. (a) | 1,111,610 | 29,869 | |
| Seagen, Inc. (a) | 51,073 | 7,934 | |
| Seres Therapeutics, Inc. (a)(b) | 4,549,387 | 96,038 | |
| Shattuck Labs, Inc. | 1,146,257 | 31,109 | |
| Sigilon Therapeutics, Inc. | 321,145 | 3,748 | |
| Silverback Therapeutics, Inc. (b) | 1,453,037 | 40,002 | |
| Silverback Therapeutics, Inc. | 168,380 | 4,589 | |
| Springworks Therapeutics, Inc. (a) | 1,236,128 | 100,794 | |
| Spruce Biosciences, Inc. | 202,244 | 2,858 | |
| Stoke Therapeutics, Inc. (a) | 710 | 28 | |
| Synlogic, Inc. (a) | 1,703,034 | 6,369 | |
| Syros Pharmaceuticals, Inc. (a) | 1,290,332 | 8,323 | |
| Syros Pharmaceuticals, Inc. (a)(c) | 938,007 | 6,050 | |
| Syros Pharmaceuticals, Inc. warrants 10/10/22 (a) | 108,605 | 93 | |
| Taysha Gene Therapies, Inc. | 1,363,282 | 30,674 | |
| TG Therapeutics, Inc. (a) | 1,277,185 | 44,535 | |
| Translate Bio, Inc. (a) | 2,824,328 | 50,866 | |
| Turning Point Therapeutics, Inc. (a) | 99,500 | 6,585 | |
| Twist Bioscience Corp. (a) | 104,673 | 11,232 | |
| Ultragenyx Pharmaceutical, Inc. (a) | 75,902 | 7,720 | |
| uniQure B.V. (a) | 883,277 | 30,676 | |
| UNITY Biotechnology, Inc. (a)(b) | 1,686,158 | 7,554 | |
| Vaxcyte, Inc. | 1,106,045 | 23,304 | |
| Vertex Pharmaceuticals, Inc. (a) | 157,238 | 32,805 | |
| Vor Biopharma, Inc. (a)(b) | 10,059 | 212 | |
| Vor Biopharma, Inc. | 404,932 | 8,117 | |
| Xencor, Inc. (a) | 910,862 | 35,032 | |
| Yumanity Therapeutics, Inc. (d) | 106,446 | 1,637 | |
| Yumanity Therapeutics, Inc. | 281,898 | 4,119 | |
| Zai Lab Ltd. ADR (a) | 724,528 | 128,720 | |
| Zentalis Pharmaceuticals, Inc. (a) | 397,969 | 22,227 | |
| 4,862,399 | |||
| Health Care Equipment & Supplies - 3.4% | |||
| Abbott Laboratories | 364,270 | 42,492 | |
| Danaher Corp. | 777,891 | 199,249 | |
| DexCom, Inc. (a) | 409,811 | 151,380 | |
| Insulet Corp. (a) | 1,724,188 | 464,962 | |
| Intuitive Surgical, Inc. (a) | 271,121 | 228,333 | |
| Novocure Ltd. (a) | 3,335,407 | 680,423 | |
| Outset Medical, Inc. | 1,448,125 | 69,901 | |
| Penumbra, Inc. (a) | 363,168 | 90,469 | |
| Presbia PLC (a)(e)(g) | 1,099,338 | 143 | |
| Shockwave Medical, Inc. (a) | 1,049,504 | 188,806 | |
| Treace Medical Concepts, Inc. (a) | 252,985 | 8,209 | |
| 2,124,367 | |||
| Health Care Providers & Services - 1.4% | |||
| 1Life Healthcare, Inc. (a) | 1,106,030 | 40,923 | |
| Alignment Healthcare, Inc. (a) | 634,015 | 15,996 | |
| Alignment Healthcare, Inc. | 1,307,238 | 29,683 | |
| Centene Corp. (a) | 702,527 | 51,706 | |
| Clover Health Investments Corp. Class B | 1,665,851 | 12,091 | |
| Guardant Health, Inc. (a) | 83,333 | 10,343 | |
| Humana, Inc. | 113,201 | 49,548 | |
| Ikena Oncology, Inc. (a) | 148,158 | 2,667 | |
| Oak Street Health, Inc. (a) | 890,298 | 53,765 | |
| Progyny, Inc. (a) | 305,447 | 19,561 | |
| Signify Health, Inc. | 152,885 | 3,868 | |
| UnitedHealth Group, Inc. | 1,328,583 | 547,270 | |
| 837,421 | |||
| Health Care Technology - 0.0% | |||
| Castlight Health, Inc. Class B (a) | 1,146,243 | 2,086 | |
| Life Sciences Tools & Services - 1.6% | |||
| 10X Genomics, Inc. (a) | 662,137 | 119,185 | |
| 10X Genomics, Inc. Class B (a)(c) | 2,870,040 | 516,607 | |
| AbCellera Biologics, Inc. (b) | 26,828 | 720 | |
| Berkeley Lights, Inc. (a) | 2,889 | 126 | |
| Bruker Corp. | 256,744 | 17,828 | |
| Nanostring Technologies, Inc. (a) | 470,019 | 26,081 | |
| Olink Holding AB ADR (a) | 603,104 | 21,308 | |
| Sartorius Stedim Biotech | 427 | 185 | |
| Seer, Inc. (b) | 1,075,050 | 31,800 | |
| Seer, Inc. | 696,611 | 20,400 | |
| Seer, Inc. Class A (d) | 398,162 | 11,778 | |
| Sotera Health Co. | 28,550 | 688 | |
| Thermo Fisher Scientific, Inc. | 170,173 | 79,896 | |
| WuXi AppTec Co. Ltd. (H Shares) (c) | 1,315,635 | 28,172 | |
| Wuxi Biologics (Cayman), Inc. (a)(c) | 9,340,861 | 145,984 | |
| 1,020,758 | |||
| Pharmaceuticals - 1.0% | |||
| 4D Pharma PLC (a)(b) | 1,842,366 | 2,570 | |
| Arvinas Holding Co. LLC (a) | 212,979 | 15,492 | |
| Atea Pharmaceuticals, Inc. (b)(g) | 4,476,750 | 91,415 | |
| Bristol-Myers Squibb Co. | 470,141 | 30,898 | |
| Dragonfly Therapeutics, Inc. (a)(d)(e) | 481,725 | 13,320 | |
| Fulcrum Therapeutics, Inc. (a) | 844,274 | 7,539 | |
| Hansoh Pharmaceutical Group Co. Ltd. (c) | 2,302,900 | 10,044 | |
| Harmony Biosciences Holdings, Inc. (a) | 1,823,640 | 58,284 | |
| Harmony Biosciences Holdings, Inc. (c) | 38,073 | 1,217 | |
| Intra-Cellular Therapies, Inc. (a) | 3,534,062 | 139,277 | |
| Jiangsu Hengrui Medicine Co. Ltd. (A Shares) | 253,084 | 3,429 | |
| Kaleido Biosciences, Inc. (a)(b)(g) | 2,446,507 | 17,566 | |
| Longboard Pharmaceuticals, Inc. (a) | 216,973 | 1,792 | |
| Nektar Therapeutics (a) | 1,574,095 | 28,444 | |
| Nuvation Bio, Inc. (d) | 2,125,093 | 28,708 | |
| Nuvation Bio, Inc. | 2,556,752 | 34,539 | |
| OptiNose, Inc. (a)(b)(g) | 2,696,611 | 8,602 | |
| Pharvaris BV | 153,724 | 3,151 | |
| Pliant Therapeutics, Inc. | 607,247 | 18,254 | |
| Royalty Pharma PLC (a)(d)(e) | 9,467 | 0 | |
| Royalty Pharma PLC (c) | 1,213,800 | 48,698 | |
| Sienna Biopharmaceuticals, Inc. (a)(g) | 1,712,642 | 39 | |
| Skyhawk Therapeutics, Inc. (d)(e) | 603,195 | 9,904 | |
| Stemcentrx, Inc. rights 12/31/21 (a)(e) | 2,065,715 | 0 | |
| Theravance Biopharma, Inc. (a) | 1,804,152 | 31,176 | |
| UCB SA | 116,385 | 10,890 | |
| Vera Therapeutics, Inc. | 309,992 | 4,813 | |
| Vera Therapeutics, Inc. (a) | 263,686 | 4,549 | |
| 624,610 | |||
| TOTAL HEALTH CARE | 9,471,641 | ||
| INDUSTRIALS - 5.8% | |||
| Aerospace & Defense - 0.3% | |||
| Space Exploration Technologies Corp. Class A (a)(d)(e) | 418,210 | 175,644 | |
| The Boeing Co. (a) | 86,431 | 21,350 | |
| 196,994 | |||
| Air Freight & Logistics - 0.2% | |||
| FedEx Corp. | 71,997 | 22,665 | |
| United Parcel Service, Inc. Class B | 379,072 | 81,349 | |
| 104,014 | |||
| Airlines - 1.8% | |||
| Delta Air Lines, Inc. (a) | 3,349,671 | 159,712 | |
| Frontier Group Holdings, Inc. (a) | 823,108 | 17,549 | |
| JetBlue Airways Corp. (a) | 8,865,621 | 178,199 | |
| Ryanair Holdings PLC sponsored ADR (a) | 216,231 | 25,245 | |
| Southwest Airlines Co. (a) | 5,384,161 | 330,911 | |
| Spirit Airlines, Inc. (a) | 1,345,408 | 48,045 | |
| Sun Country Airlines Holdings, Inc. (a)(b) | 107,448 | 3,997 | |
| United Airlines Holdings, Inc. (a) | 1,978,803 | 115,463 | |
| Wheels Up Partners LLC: | |||
| Series B (a)(d)(f) | 6,703,518 | 26,211 | |
| Series C (d)(f) | 3,466,281 | 13,553 | |
| Series D (d)(f) | 2,655,848 | 10,384 | |
| Wizz Air Holdings PLC (a)(c) | 2,476,113 | 169,664 | |
| 1,098,933 | |||
| Building Products - 0.2% | |||
| Resideo Technologies, Inc. (a) | 558,740 | 16,706 | |
| The AZEK Co., Inc. | 336,314 | 14,640 | |
| Trane Technologies PLC | 430,589 | 80,262 | |
| 111,608 | |||
| Construction & Engineering - 0.2% | |||
| MasTec, Inc. (a) | 1,319,893 | 153,543 | |
| Electrical Equipment - 0.3% | |||
| AMETEK, Inc. | 188,405 | 25,454 | |
| Eaton Corp. PLC | 213,502 | 31,011 | |
| Emerson Electric Co. | 373,260 | 35,717 | |
| Generac Holdings, Inc. (a) | 142,853 | 46,959 | |
| Rockwell Automation, Inc. | 127,050 | 33,506 | |
| Shoals Technologies Group, Inc. | 77,096 | 2,128 | |
| 174,775 | |||
| Industrial Conglomerates - 0.3% | |||
| 3M Co. | 526,661 | 106,933 | |
| Honeywell International, Inc. | 482,711 | 111,463 | |
| 218,396 | |||
| Machinery - 0.9% | |||
| Caterpillar, Inc. | 435,566 | 105,006 | |
| Cummins, Inc. | 197,035 | 50,693 | |
| Deere & Co. | 470,782 | 169,999 | |
| Fortive Corp. | 459,703 | 33,338 | |
| Illinois Tool Works, Inc. | 225,934 | 52,362 | |
| Ingersoll Rand, Inc. (a) | 314,471 | 15,610 | |
| Xylem, Inc. | 876,076 | 103,482 | |
| 530,490 | |||
| Professional Services - 0.0% | |||
| CoStar Group, Inc. (a) | 6,214 | 5,307 | |
| YourPeople, Inc. (a)(e) | 17,485,119 | 143 | |
| 5,450 | |||
| Road & Rail - 1.6% | |||
| Avis Budget Group, Inc. (a) | 3,382,779 | 297,076 | |
| CSX Corp. | 402,248 | 40,273 | |
| Kansas City Southern | 146,913 | 43,733 | |
| Lyft, Inc. (a) | 1,912,671 | 109,194 | |
| Uber Technologies, Inc. (a) | 5,619,688 | 285,649 | |
| Union Pacific Corp. | 991,450 | 222,809 | |
| 998,734 | |||
| TOTAL INDUSTRIALS | 3,592,937 | ||
| INFORMATION TECHNOLOGY - 35.6% | |||
| Communications Equipment - 0.5% | |||
| Arista Networks, Inc. (a) | 42,390 | 14,386 | |
| Ciena Corp. (a) | 2,255,559 | 119,251 | |
| Infinera Corp. (a)(b)(g) | 11,931,454 | 114,542 | |
| Lumentum Holdings, Inc. (a) | 374,115 | 30,442 | |
| 278,621 | |||
| Electronic Equipment & Components - 0.2% | |||
| 908 Devices, Inc. (b) | 149,999 | 6,319 | |
| Arlo Technologies, Inc. (a) | 980,624 | 6,580 | |
| II-VI, Inc. (a)(b) | 1,011,927 | 68,174 | |
| TE Connectivity Ltd. | 15,051 | 2,042 | |
| Trimble, Inc. (a) | 798,834 | 62,141 | |
| Vontier Corp. | 91,927 | 3,225 | |
| 148,481 | |||
| IT Services - 5.8% | |||
| Accenture PLC Class A | 110,014 | 31,042 | |
| Actua Corp. (a)(e) | 1,410,510 | 71 | |
| Black Knight, Inc. (a) | 385,658 | 28,303 | |
| MasterCard, Inc. Class A | 1,398,912 | 504,420 | |
| MongoDB, Inc. Class A (a) | 21,573 | 6,298 | |
| Nuvei Corp. (a)(c) | 157,646 | 11,805 | |
| Okta, Inc. (a) | 177,537 | 39,491 | |
| PayPal Holdings, Inc. (a) | 3,665,675 | 953,149 | |
| Riskified Ltd. (a)(d)(e) | 719,400 | 8,273 | |
| Riskified Ltd. warrants (a)(d)(e) | 4,733 | 0 | |
| Shopify, Inc. Class A (a) | 943,862 | 1,157,596 | |
| Snowflake Computing, Inc. | 39,186 | 9,327 | |
| Square, Inc. (a) | 1,146,403 | 255,098 | |
| Twilio, Inc. Class A (a) | 17,614 | 5,918 | |
| Visa, Inc. Class A | 2,481,962 | 564,150 | |
| Wix.com Ltd. (a) | 110,343 | 28,674 | |
| Worldline SA (a)(c) | 293,213 | 28,068 | |
| 3,631,683 | |||
| Semiconductors & Semiconductor Equipment - 11.8% | |||
| Advanced Micro Devices, Inc. (a) | 4,306,512 | 344,865 | |
| Applied Materials, Inc. | 1,785,075 | 246,572 | |
| ASML Holding NV | 335,224 | 226,434 | |
| Broadcom, Inc. | 117,277 | 55,393 | |
| Cirrus Logic, Inc. (a) | 1,614,356 | 126,033 | |
| Cree, Inc. (a) | 290,652 | 29,068 | |
| First Solar, Inc. (a) | 457,692 | 34,835 | |
| Intel Corp. | 385,308 | 22,009 | |
| KLA Corp. | 240,167 | 76,107 | |
| Marvell Technology, Inc. | 2,693,247 | 130,084 | |
| Micron Technology, Inc. (a) | 1,585,935 | 133,441 | |
| NVIDIA Corp. | 7,893,675 | 5,129,136 | |
| Qualcomm, Inc. | 828,657 | 111,488 | |
| Silicon Laboratories, Inc. (a)(g) | 2,643,997 | 361,064 | |
| Taiwan Semiconductor Manufacturing Co. Ltd. sponsored ADR | 1,145,047 | 134,383 | |
| Teradyne, Inc. | 263,478 | 34,871 | |
| Texas Instruments, Inc. | 536,637 | 101,864 | |
| Xilinx, Inc. | 207,734 | 26,382 | |
| 7,324,029 | |||
| Software - 10.4% | |||
| ACV Auctions, Inc. Class A (a) | 27,108 | 703 | |
| Adobe, Inc. (a) | 714,213 | 360,378 | |
| Alkami Technology, Inc. (a) | 32,526 | 1,082 | |
| Atlassian Corp. PLC (a) | 79,899 | 18,639 | |
| Autodesk, Inc. (a) | 478,424 | 136,762 | |
| BTRS Holdings, Inc. (a) | 9,000 | 129 | |
| BTRS Holdings, Inc. (d) | 608,023 | 8,695 | |
| Cloudflare, Inc. (a) | 5,605,944 | 460,024 | |
| Coupa Software, Inc. (a) | 6,278 | 1,495 | |
| Crowdstrike Holdings, Inc. (a) | 133,250 | 29,601 | |
| Datadog, Inc. Class A (a) | 46,907 | 4,271 | |
| DocuSign, Inc. (a) | 69,522 | 14,017 | |
| DoubleVerify Holdings, Inc. (a) | 162,330 | 5,988 | |
| Elastic NV (a) | 149,595 | 17,684 | |
| Epic Games, Inc. (d)(e) | 51,800 | 45,843 | |
| HubSpot, Inc. (a) | 362,735 | 182,956 | |
| Intuit, Inc. | 337,727 | 148,293 | |
| Lightspeed POS, Inc. (b) | 355,710 | 25,608 | |
| LivePerson, Inc. (a) | 832,187 | 45,729 | |
| Microsoft Corp. | 10,275,635 | 2,565,621 | |
| Nutanix, Inc. Class A (a) | 11,730,539 | 369,629 | |
| Oracle Corp. | 1,590,440 | 125,231 | |
| Paycom Software, Inc. (a) | 59,055 | 19,465 | |
| Paylocity Holding Corp. (a) | 93,472 | 15,874 | |
| Privia Health Group, Inc. (a) | 248,228 | 8,125 | |
| Procore Technologies, Inc. (a)(b) | 62,108 | 5,367 | |
| RingCentral, Inc. (a) | 33,951 | 8,911 | |
| Salesforce.com, Inc. (a) | 6,457,137 | 1,537,444 | |
| Slack Technologies, Inc. Class A (a) | 228,379 | 10,058 | |
| Stripe, Inc. Class B (a)(d)(e) | 205,500 | 8,246 | |
| The Trade Desk, Inc. (a) | 7,395 | 4,349 | |
| Tuya, Inc. ADR (a)(b) | 185,575 | 4,428 | |
| UiPath, Inc. | 761,967 | 54,738 | |
| UiPath, Inc. Class A (a)(b) | 165,293 | 13,194 | |
| Workday, Inc. Class A (a) | 108,911 | 24,910 | |
| Zendesk, Inc. (a) | 860,697 | 117,623 | |
| Zoom Video Communications, Inc. Class A (a) | 177,704 | 58,914 | |
| Zscaler, Inc. (a) | 163,995 | 31,848 | |
| 6,491,872 | |||
| Technology Hardware, Storage & Peripherals - 6.9% | |||
| Apple, Inc. | 33,461,942 | 4,169,693 | |
| Pure Storage, Inc. Class A (a) | 6,295,510 | 119,929 | |
| Samsung Electronics Co. Ltd. | 432,375 | 31,401 | |
| 4,321,023 | |||
| TOTAL INFORMATION TECHNOLOGY | 22,195,709 | ||
| MATERIALS - 1.1% | |||
| Chemicals - 0.4% | |||
| Albemarle Corp. U.S. | 49,136 | 8,210 | |
| Corteva, Inc. | 2,714,894 | 123,528 | |
| Dow, Inc. | 348,228 | 23,826 | |
| DuPont de Nemours, Inc. | 777,599 | 65,777 | |
| The Mosaic Co. | 322,226 | 11,645 | |
| 232,986 | |||
| Containers & Packaging - 0.1% | |||
| Ball Corp. | 763,053 | 62,692 | |
| Sealed Air Corp. | 632,848 | 35,984 | |
| 98,676 | |||
| Metals & Mining - 0.6% | |||
| Barrick Gold Corp. (Canada) | 2,306,477 | 54,729 | |
| Freeport-McMoRan, Inc. | 6,535,405 | 279,193 | |
| Newmont Corp. | 146,629 | 10,774 | |
| Rio Tinto PLC sponsored ADR (b) | 436,719 | 38,182 | |
| 382,878 | |||
| TOTAL MATERIALS | 714,540 | ||
| REAL ESTATE - 0.3% | |||
| Equity Real Estate Investment Trusts (REITs) - 0.2% | |||
| American Tower Corp. | 242,262 | 61,888 | |
| Simon Property Group, Inc. | 589,684 | 75,768 | |
| 137,656 | |||
| Real Estate Management & Development - 0.1% | |||
| Compass, Inc. (a) | 503,223 | 6,763 | |
| KE Holdings, Inc. ADR (a) | 236,934 | 12,295 | |
| 19,058 | |||
| TOTAL REAL ESTATE | 156,714 | ||
| TOTAL COMMON STOCKS | |||
| (Cost $18,609,858) | 60,904,313 | ||
| Preferred Stocks - 1.8% | |||
| Convertible Preferred Stocks - 1.7% | |||
| COMMUNICATION SERVICES - 0.1% | |||
| Diversified Telecommunication Services - 0.1% | |||
| Starry, Inc.: | |||
| Series B (a)(d)(e) | 9,869,159 | 16,580 | |
| Series C (a)(d)(e) | 5,234,614 | 8,794 | |
| Series D (a)(d)(e) | 10,743,446 | 18,049 | |
| Series E3 (d)(e) | 4,422,051 | 7,429 | |
| 50,852 | |||
| CONSUMER DISCRETIONARY - 0.4% | |||
| Automobiles - 0.3% | |||
| Bird Rides, Inc. (d) | 1,973,049 | 14,752 | |
| Bird Rides, Inc.: | |||
| Series C1 (d) | 348,328 | 2,604 | |
| Series D (d) | 415,100 | 3,104 | |
| Rad Power Bikes, Inc.: | |||
| Series A (d)(e) | 154,174 | 744 | |
| Series C (d)(e) | 606,658 | 2,926 | |
| Rivian Automotive, Inc.: | |||
| Series E (d)(e) | 2,713,913 | 100,008 | |
| Series F (d)(e) | 1,133,878 | 41,783 | |
| 165,921 | |||
| Hotels, Restaurants & Leisure - 0.0% | |||
| MOD Super Fast Pizza Holdings LLC: | |||
| Series 3 (a)(d)(e)(f) | 56,343 | 11,064 | |
| Series 4 (d)(e)(f) | 5,142 | 948 | |
| Series 5 (d)(e)(f) | 20,652 | 3,565 | |
| 15,577 | |||
| Internet & Direct Marketing Retail - 0.1% | |||
| GoBrands, Inc. Series G (d)(e) | 125,688 | 31,386 | |
| Instacart, Inc.: | |||
| Series H (d)(e) | 72,310 | 9,039 | |
| Series I (d)(e) | 32,756 | 4,095 | |
| Reddit, Inc.: | |||
| Series B (a)(d)(e) | 384,303 | 16,323 | |
| Series E (d)(e) | 24,203 | 1,028 | |
| 61,871 | |||
| Specialty Retail - 0.0% | |||
| Fanatics, Inc. Series E (d)(e) | 558,178 | 19,464 | |
| Textiles, Apparel & Luxury Goods - 0.0% | |||
| Allbirds, Inc.: | |||
| Series A (a)(d)(e) | 121,335 | 1,308 | |
| Series B (a)(d)(e) | 21,315 | 230 | |
| Series C (a)(d)(e) | 203,730 | 2,196 | |
| Series D (a)(d)(e) | 260,897 | 2,812 | |
| Series Seed (a)(d)(e) | 406,151 | 4,378 | |
| Freenome, Inc. Series C (d)(e) | 900,884 | 7,072 | |
| Nuvalent, Inc. Series B (d)(e) | 1,875,595 | 3,882 | |
| 21,878 | |||
| TOTAL CONSUMER DISCRETIONARY | 284,711 | ||
| CONSUMER STAPLES - 0.1% | |||
| Food & Staples Retailing - 0.1% | |||
| Blink Health, Inc. Series C (a)(d)(e) | 848,988 | 27,711 | |
| Sweetgreen, Inc.: | |||
| Series C (a)(d)(e) | 5,291 | 70 | |
| Series D (a)(d)(e) | 85,105 | 1,119 | |
| Series H (a)(d)(e) | 705,259 | 9,274 | |
| Series I (a)(d)(e) | 200,582 | 2,638 | |
| Series J (d)(e) | 168,563 | 2,217 | |
| 43,029 | |||
| Food Products - 0.0% | |||
| Agbiome LLC Series C (a)(d)(e) | 1,060,308 | 6,716 | |
| Bowery Farming, Inc. Series C1 (d)(e) | 130,916 | 7,888 | |
| 14,604 | |||
| Tobacco - 0.0% | |||
| JUUL Labs, Inc. Series E (a)(d)(e) | 22,033 | 1,231 | |
| TOTAL CONSUMER STAPLES | 58,864 | ||
| FINANCIALS - 0.1% | |||
| Diversified Financial Services - 0.1% | |||
| Paragon Biosciences Emalex Capital, Inc.: | |||
| Series B (a)(d)(e) | 416,094 | 4,452 | |
| Series C (d)(e) | 559,977 | 5,992 | |
| Sonder Holdings, Inc.: | |||
| Series D1 (d) | 965,896 | 13,657 | |
| Series E (a)(d) | 1,478,345 | 20,902 | |
| 45,003 | |||
| HEALTH CARE - 0.4% | |||
| Biotechnology - 0.3% | |||
| 23andMe, Inc. Series F (a)(d) | 590,383 | 11,903 | |
| Adagio Theraputics, Inc.: | |||
| Series A (d)(e) | 413,930 | 32,322 | |
| Series B (d)(e) | 149,500 | 11,674 | |
| Series C (d)(e) | 237,437 | 18,540 | |
| Ambrx, Inc.: | |||
| Series A (d)(e) | 1,353,862 | 2,789 | |
| Series B (d)(e) | 1,218,475 | 2,510 | |
| Bright Peak Therapeutics AG Series B (d)(e) | 1,272,915 | 4,972 | |
| Caris Life Sciences, Inc. Series D (d)(e) | 1,235,035 | 10,004 | |
| Element Biosciences, Inc. Series B (a)(d)(e) | 1,096,312 | 8,244 | |
| ElevateBio LLC Series C (d)(e) | 1,534,100 | 6,436 | |
| EQRx, Inc. Series B (d)(e) | 6,908,598 | 22,937 | |
| Inscripta, Inc.: | |||
| Series D (d)(e) | 1,690,173 | 14,924 | |
| Series E (d)(e) | 1,086,476 | 9,594 | |
| Intarcia Therapeutics, Inc.: | |||
| Series CC (a)(d)(e) | 1,051,411 | 0 | |
| Series DD (a)(d)(e) | 1,543,687 | 0 | |
| National Resilience, Inc. Series B (d)(e) | 1,277,345 | 17,449 | |
| Omega Therapeutics, Inc. Series C (d)(e) | 1,698,709 | 5,096 | |
| 179,394 | |||
| Health Care Equipment & Supplies - 0.0% | |||
| Kardium, Inc. Series D6 (d)(e) | 5,899,008 | 5,992 | |
| Health Care Providers & Services - 0.0% | |||
| Boundless Bio, Inc. Series B (d)(e) | 2,899,016 | 3,914 | |
| Conformal Medical, Inc. Series C (d)(e) | 1,067,180 | 4,664 | |
| Scorpion Therapeutics, Inc. Series B (d)(e) | 1,325,354 | 3,207 | |
| 11,785 | |||
| Health Care Technology - 0.0% | |||
| Aledade, Inc. Series B1 (d)(e) | 101,470 | 3,885 | |
| PrognomIQ, Inc.: | |||
| Series A5 (d)(e) | 372,687 | 1,245 | |
| Series B (d)(e) | 1,111,446 | 3,712 | |
| 8,842 | |||
| Pharmaceuticals - 0.1% | |||
| Castle Creek Pharmaceutical Holdings, Inc.: | |||
| Series B (a)(d)(e) | 16,803 | 11,009 | |
| Series C (a)(d)(e) | 13,100 | 8,583 | |
| Nohla Therapeutics, Inc. Series B (a)(d)(e) | 9,124,200 | 0 | |
| 19,592 | |||
| TOTAL HEALTH CARE | 225,605 | ||
| INDUSTRIALS - 0.2% | |||
| Aerospace & Defense - 0.2% | |||
| Space Exploration Technologies Corp. Series G (a)(d)(e) | 216,276 | 90,834 | |
| Construction & Engineering - 0.0% | |||
| Beta Technologies, Inc. Series A (d)(e) | 54,111 | 3,965 | |
| Transportation Infrastructure - 0.0% | |||
| Delhivery Pvt Ltd. Series H (d)(e) | 29,691 | 14,598 | |
| TOTAL INDUSTRIALS | 109,397 | ||
| INFORMATION TECHNOLOGY - 0.3% | |||
| Communications Equipment - 0.0% | |||
| Xsight Labs Ltd. Series D (d)(e) | 787,863 | 6,300 | |
| Electronic Equipment & Components - 0.0% | |||
| Enevate Corp. Series E (d)(e) | 4,067,736 | 4,510 | |
| IT Services - 0.1% | |||
| AppNexus, Inc. Series E (Escrow) (a)(d)(e) | 923,523 | 29 | |
| ByteDance Ltd. Series E1 (d)(e) | 403,450 | 44,208 | |
| Riskified Ltd.: | |||
| Series D (d)(e) | 157,100 | 1,807 | |
| Series E (a)(d)(e) | 564,050 | 6,487 | |
| 52,531 | |||
| Semiconductors & Semiconductor Equipment - 0.0% | |||
| SiMa Ai Series B (d)(e) | 1,596,216 | 8,184 | |
| Tenstorrent, Inc. Series C1 (d)(e) | 92,100 | 5,476 | |
| 13,660 | |||
| Software - 0.2% | |||
| Databricks, Inc. Series G (d)(e) | 83,432 | 14,798 | |
| Dataminr, Inc. Series D (a)(d)(e) | 1,773,901 | 78,052 | |
| Evozyne LLC Series A (d)(e) | 444,700 | 9,992 | |
| Jet.Com, Inc. Series B1 (Escrow) (a)(d)(e) | 7,578,338 | 0 | |
| Nuvia, Inc. Series B (d) | 1,235,787 | 1,010 | |
| Stripe, Inc. Series H (d)(e) | 88,200 | 3,539 | |
| Taboola.com Ltd. Series E (a)(d) | 1,337,420 | 31,015 | |
| 138,406 | |||
| TOTAL INFORMATION TECHNOLOGY | 215,407 | ||
| MATERIALS - 0.1% | |||
| Metals & Mining - 0.1% | |||
| Diamond Foundry, Inc. Series C (d)(e) | 1,704,625 | 40,911 | |
| UTILITIES - 0.0% | |||
| Independent Power and Renewable Electricity Producers - 0.0% | |||
| Redwood Materials Series C (d)(e) | 80,057 | 3,795 | |
| TOTAL CONVERTIBLE PREFERRED STOCKS | 1,034,545 | ||
| Nonconvertible Preferred Stocks - 0.1% | |||
| COMMUNICATION SERVICES - 0.0% | |||
| Diversified Telecommunication Services - 0.0% | |||
| Starry, Inc. Series E1 (d)(e) | 1,350,488 | 2,269 | |
| CONSUMER DISCRETIONARY - 0.0% | |||
| Automobiles - 0.0% | |||
| Neutron Holdings, Inc. Series 1D (d)(e) | 17,893,728 | 245 | |
| Waymo LLC Series A2 (d)(e) | 44,767 | 3,844 | |
| 4,089 | |||
| Specialty Retail - 0.0% | |||
| Cazoo Holdings Ltd.: | |||
| Series A (d) | 7,316 | 223 | |
| Series B (d) | 128,092 | 3,910 | |
| Series C (d) | 2,600 | 79 | |
| Series D (d) | 457,593 | 13,966 | |
| 18,178 | |||
| TOTAL CONSUMER DISCRETIONARY | 22,267 | ||
| HEALTH CARE - 0.1% | |||
| Pharmaceuticals - 0.1% | |||
| Castle Creek Pharmaceutical Holdings, Inc. Series A4 (a)(d)(e) | 46,864 | 30,705 | |
| Faraday Pharmaceuticals, Inc. Series B (a)(d)(e) | 641,437 | 1,328 | |
| 32,033 | |||
| TOTAL NONCONVERTIBLE PREFERRED STOCKS | 56,569 | ||
| TOTAL PREFERRED STOCKS | |||
| (Cost $818,159) | 1,091,114 | ||
| Principal Amount (000s) | Value (000s) | ||
| Convertible Bonds - 0.0% | |||
| CONSUMER DISCRETIONARY - 0.0% | |||
| Automobiles - 0.0% | |||
| Neutron Holdings, Inc.: | |||
| 4% 5/22/27 (d)(e) | 3,596 | 3,596 | |
| 4% 6/12/27 (d)(e) | 743 | 743 | |
| 4,339 | |||
| Textiles, Apparel & Luxury Goods - 0.0% | |||
| AbSci Corp. 6% (e)(h) | 10,113 | 10,113 | |
| TOTAL CONSUMER DISCRETIONARY | 14,452 | ||
| CONSUMER STAPLES - 0.0% | |||
| Food & Staples Retailing - 0.0% | |||
| The Real Good Food Co. LLC 1% (d)(e)(h) | 5,922 | 5,922 | |
| FINANCIALS - 0.0% | |||
| Diversified Financial Services - 0.0% | |||
| Sonder Holdings, Inc. 0% (d)(e)(h) | 7,909 | 7,909 | |
| TOTAL CONVERTIBLE BONDS | |||
| (Cost $28,283) | 28,283 | ||
| Preferred Securities - 0.1% | |||
| CONSUMER DISCRETIONARY - 0.0% | |||
| Internet & Direct Marketing Retail - 0.0% | |||
| Circle Internet Financial Ltd. 0% (d)(e)(h) | 9,813 | 9,813 | |
| HEALTH CARE - 0.1% | |||
| Biotechnology - 0.1% | |||
| Intarcia Therapeutics, Inc. 6% 7/18/21 (d)(e) | 13,682 | 19,262 | |
| Health Care Equipment & Supplies - 0.0% | |||
| Kardium, Inc. 0% (d)(e)(h) | 8,368 | 8,368 | |
| TOTAL HEALTH CARE | 27,630 | ||
| INFORMATION TECHNOLOGY - 0.0% | |||
| Electronic Equipment & Components - 0.0% | |||
| Enevate Corp. 0% 1/29/23 (d)(e) | 1,732 | 1,732 | |
| Semiconductors & Semiconductor Equipment - 0.0% | |||
| Tenstorrent, Inc. 0% (d)(e)(h) | 5,120 | 5,120 | |
| TOTAL INFORMATION TECHNOLOGY | 6,852 | ||
| TOTAL PREFERRED SECURITIES | |||
| (Cost $38,715) | 44,295 | ||
| Shares | Value (000s) | ||
| Money Market Funds - 1.4% | |||
| Fidelity Cash Central Fund 0.03% (i) | 138,273,234 | 138,301 | |
| Fidelity Securities Lending Cash Central Fund 0.03% (i)(j) | 757,411,579 | 757,487 | |
| TOTAL MONEY MARKET FUNDS | |||
| (Cost $895,784) | 895,788 | ||
| TOTAL INVESTMENT IN SECURITIES - 101.1% | |||
| (Cost $20,390,799) | 62,963,793 | ||
| NET OTHER ASSETS (LIABILITIES) - (1.1)% | (694,204) | ||
| NET ASSETS - 100% | $62,269,589 |
Values shown as $0 in the Schedule of Investments may reflect amounts less than $500.
Legend
(a) Non-income producing
(b) Security or a portion of the security is on loan at period end.
(c) Security exempt from registration under Rule 144A of the Securities Act of 1933. These securities may be resold in transactions exempt from registration, normally to qualified institutional buyers. At the end of the period, the value of these securities amounted to $1,026,418,000 or 1.6% of net assets.
(d) Restricted securities (including private placements) - Investment in securities not registered under the Securities Act of 1933 (excluding 144A issues). At the end of the period, the value of restricted securities (excluding 144A issues) amounted to $1,986,557,000 or 3.2% of net assets.
(e) Level 3 security
(f) Investment is owned by a wholly-owned subsidiary (Subsidiary) that is treated as a corporation for U.S. tax purposes.
(g) Affiliated company
(h) Security is perpetual in nature with no stated maturity date.
(i) Affiliated fund that is generally available only to investment companies and other accounts managed by Fidelity Investments. The rate quoted is the annualized seven-day yield of the fund at period end. A complete unaudited listing of the fund's holdings as of its most recent quarter end is available upon request. In addition, each Fidelity Central Fund's financial statements, which are not covered by the Fund's Report of Independent Registered Public Accounting Firm, are available on the SEC's website or upon request.
(j) Investment made with cash collateral received from securities on loan.
Additional information on each restricted holding is as follows:
| Security | Acquisition Date | Acquisition Cost (000s) |
| 23andMe, Inc. Series F | 8/31/17 | $8,197 |
| Adagio Theraputics, Inc. Series A | 7/15/20 | $3,311 |
| Adagio Theraputics, Inc. Series B | 11/4/20 | $8,480 |
| Adagio Theraputics, Inc. Series C | 4/16/21 | $18,540 |
| Adimab LLC | 9/17/14 - 6/5/15 | $47,869 |
| Agbiome LLC Series C | 6/29/18 | $6,716 |
| Aledade, Inc. Series B1 | 5/7/21 | $3,885 |
| Allbirds, Inc. | 10/9/18 | $3,372 |
| Allbirds, Inc. Series A | 10/9/18 | $1,331 |
| Allbirds, Inc. Series B | 10/9/18 | $234 |
| Allbirds, Inc. Series C | 10/9/18 | $2,234 |
| Allbirds, Inc. Series D | 12/23/19 | $3,362 |
| Allbirds, Inc. Series Seed | 10/9/18 - 1/23/20 | $4,077 |
| Ambrx, Inc. Series A | 11/6/20 | $2,116 |
| Ambrx, Inc. Series B | 11/6/20 | $2,116 |
| Ant International Co. Ltd. Class C | 5/16/18 | $9,303 |
| AppHarvest, Inc. | 1/29/21 | $16,758 |
| AppNexus, Inc. Series E (Escrow) | 8/1/14 | $0 |
| Arrival Group | 3/24/21 | $33,251 |
| Beta Technologies, Inc. Series A | 4/9/21 | $3,965 |
| Bird Rides, Inc. | 2/12/21 - 4/20/21 | $10,139 |
| Bird Rides, Inc. Series C1 | 12/21/18 | $4,091 |
| Bird Rides, Inc. Series D | 9/30/19 | $5,362 |
| Blink Health, Inc. Series A1 | 12/30/20 | $4,699 |
| Blink Health, Inc. Series C | 11/7/19 - 1/21/21 | $32,410 |
| Boundless Bio, Inc. Series B | 4/23/21 | $3,914 |
| Bowery Farming, Inc. Series C1 | 5/18/21 | $7,888 |
| Bright Peak Therapeutics AG Series B | 5/14/21 | $4,972 |
| BTRS Holdings, Inc. | 1/12/21 | $6,080 |
| ByteDance Ltd. Series E1 | 11/18/20 | $44,208 |
| Caris Life Sciences, Inc. Series D | 5/11/21 | $10,004 |
| Castle Creek Pharmaceutical Holdings, Inc. Series A4 | 9/29/16 | $15,506 |
| Castle Creek Pharmaceutical Holdings, Inc. Series B | 10/9/18 | $6,920 |
| Castle Creek Pharmaceutical Holdings, Inc. Series C | 12/9/19 | $5,395 |
| Cazoo Holdings Ltd. | 9/30/20 | $3,072 |
| Cazoo Holdings Ltd. Series A | 9/30/20 | $100 |
| Cazoo Holdings Ltd. Series B | 9/30/20 | $1,756 |
| Cazoo Holdings Ltd. Series C | 9/30/20 | $36 |
| Cazoo Holdings Ltd. Series D | 9/30/20 | $6,274 |
| Cibus Corp. Series C | 2/16/18 | $9,500 |
| Cibus Corp. Series D | 5/10/19 | 3,426 |
| Circle Internet Financial Ltd. 0% | 5/11/21 | $9,813 |
| Conformal Medical, Inc. Series C | 7/24/20 | $3,913 |
| Cyclerion Therapeutics, Inc. | 4/2/19 | $8,052 |
| Databricks, Inc. Series G | 2/1/21 | $14,798 |
| Dataminr, Inc. Series D | 2/18/15 - 3/6/15 | $22,617 |
| Delhivery Pvt Ltd. Series H | 5/20/21 | $14,493 |
| Diamond Foundry, Inc. Series C | 3/15/21 | $40,911 |
| Dragonfly Therapeutics, Inc. | 12/19/19 | $12,746 |
| Element Biosciences, Inc. Series B | 12/13/19 | $5,745 |
| ElevateBio LLC Series C | 3/9/21 | $6,436 |
| Enevate Corp. Series E | 1/29/21 | $4,510 |
| Enevate Corp. 0% 1/29/23 | 1/29/21 | $1,732 |
| Epic Games, Inc. | 7/13/20 - 7/30/20 | $29,785 |
| EQRx, Inc. Series B | 11/19/20 | $18,943 |
| Evozyne LLC Series A | 4/9/21 | $9,992 |
| Fanatics, Inc. Series E | 8/13/20 | $9,651 |
| Faraday Pharmaceuticals, Inc. Series B | 12/30/19 | $843 |
| Freenome, Inc. Series C | 8/14/20 | $5,958 |
| Gemini Therapeutics, Inc. | 2/5/21 | $6,586 |
| GoBrands, Inc. Series G | 3/2/21 | $31,386 |
| Inscripta, Inc. Series D | 11/13/20 | $7,724 |
| Inscripta, Inc. Series E | 3/30/21 | $9,594 |
| Instacart, Inc. Series H | 11/13/20 | $4,339 |
| Instacart, Inc. Series I | 2/26/21 | $4,095 |
| Intarcia Therapeutics, Inc. Series CC | 11/14/12 | $14,331 |
| Intarcia Therapeutics, Inc. Series DD | 3/17/14 | $50,000 |
| Intarcia Therapeutics, Inc. 6% 7/18/21 | 2/26/19 | $13,682 |
| Jet.Com, Inc. Series B1 (Escrow) | 3/19/18 | $0 |
| JUUL Labs, Inc. Class A | 7/6/18 | $1,299 |
| JUUL Labs, Inc. Series E | 7/6/18 | $650 |
| Kardium, Inc. Series D6 | 12/30/20 | $5,992 |
| Kardium, Inc. 0% | 12/30/20 | $8,368 |
| Lordstown Motors Corp. | 10/23/20 | $11,269 |
| MOD Super Fast Pizza Holdings LLC Series 3 | 11/3/16 | $7,719 |
| MOD Super Fast Pizza Holdings LLC Series 4 | 12/14/17 | 720 |
| MOD Super Fast Pizza Holdings LLC Series 5 | 5/15/19 | 2,943 |
| National Resilience, Inc. Series B | 12/1/20 | $17,449 |
| Neutron Holdings, Inc. Series 1D | 1/25/19 | $4,339 |
| Neutron Holdings, Inc. 4% 5/22/27 | 6/4/20 | $3,596 |
| Neutron Holdings, Inc. 4% 6/12/27 | 6/12/20 | $743 |
| Nohla Therapeutics, Inc. Series B | 5/1/18 | $4,161 |
| Nuvalent, Inc. Series B | 4/30/21 | $3,882 |
| Nuvation Bio, Inc. | 2/10/21 | $21,251 |
| Nuvia, Inc. Series B | 3/16/21 | $1,010 |
| Omega Therapeutics, Inc. Series C | 3/17/21 | $5,096 |
| On Holding AG | 2/6/20 | $8,202 |
| Paragon Biosciences Emalex Capital, Inc. Series B | 9/18/19 | $4,240 |
| Paragon Biosciences Emalex Capital, Inc. Series C | 2/26/21 | $5,992 |
| PrognomIQ, Inc. Series A5 | 8/20/20 | $225 |
| PrognomIQ, Inc. Series B | 9/11/20 | $2,540 |
| Rad Power Bikes, Inc. | 1/21/21 | $5,705 |
| Rad Power Bikes, Inc. Series A | 1/21/21 | $744 |
| Rad Power Bikes, Inc. Series C | 1/21/21 | $2,926 |
| Reddit, Inc. Series B | 7/26/17 | $5,456 |
| Reddit, Inc. Series E | 5/18/21 | $1,028 |
| Redwood Materials Series C | 5/28/21 | $3,795 |
| Riskified Ltd. | 12/20/19 - 4/15/20 | $6,506 |
| Riskified Ltd. Series D | 11/18/20 | $1,807 |
| Riskified Ltd. Series E | 10/28/19 | $5,367 |
| Riskified Ltd. warrants | 10/28/19 | $0 |
| Rivian Automotive, Inc. Series E | 7/10/20 | $42,039 |
| Rivian Automotive, Inc. Series F | 1/19/21 | $41,783 |
| Royalty Pharma PLC | 5/21/15 | $1,116 |
| Rush Street Interactive, Inc. | 12/29/20 | $4,471 |
| Scorpion Therapeutics, Inc. Series B | 1/8/21 | $3,207 |
| Seer, Inc. Class A | 12/8/20 | $7,565 |
| SiMa Ai Series B | 5/10/21 | $8,184 |
| Skyhawk Therapeutics, Inc. | 5/21/21 | $9,904 |
| Social Finance, Inc. | 1/7/21 | $10,312 |
| Sonder Holdings, Inc. Series D1 | 12/20/19 | $10,138 |
| Sonder Holdings, Inc. Series E | 4/3/20 - 5/6/20 | $15,917 |
| Sonder Holdings, Inc. 0% | 3/18/21 | $7,909 |
| Space Exploration Technologies Corp. Class A | 10/16/15 - 4/6/17 | $38,201 |
| Space Exploration Technologies Corp. Series G | 1/20/15 | $16,753 |
| Starry, Inc. Series B | 12/1/16 | $5,339 |
| Starry, Inc. Series C | 12/8/17 | $4,826 |
| Starry, Inc. Series D | 3/6/19 - 7/30/20 | $15,363 |
| Starry, Inc. Series E1 | 9/4/20 | $1,900 |
| Starry, Inc. Series E3 | 3/31/21 | $7,429 |
| Stripe, Inc. Class B | 5/18/21 | $8,246 |
| Stripe, Inc. Series H | 3/15/21 | $3,539 |
| Sweetgreen, Inc. warrants 1/21/26 | 1/21/21 | $0 |
| Sweetgreen, Inc. Series C | 9/13/19 | $90 |
| Sweetgreen, Inc. Series D | 9/13/19 | $1,455 |
| Sweetgreen, Inc. Series H | 11/9/18 | $9,197 |
| Sweetgreen, Inc. Series I | 9/13/19 | $3,430 |
| Sweetgreen, Inc. Series J | 1/21/21 | $2,882 |
| Taboola.com Ltd. Series E | 12/22/14 | $13,943 |
| Tenstorrent, Inc. Series C1 | 4/23/21 | $5,476 |
| Tenstorrent, Inc. 0% | 4/23/21 | $5,120 |
| The Beauty Health Co. | 12/8/20 | $28,847 |
| The Real Good Food Co. LLC 1% | 5/7/21 | $5,922 |
| Tory Burch LLC Class A | 5/14/15 | 67,653 |
| Tory Burch LLC Class B | 12/31/12 | $17,505 |
| Waymo LLC Series A2 | 5/8/20 | $3,844 |
| Wheels Up Partners LLC Series B | 9/8/15 | $19,040 |
| Wheels Up Partners LLC Series C | 6/22/17 | 10,815 |
| Wheels Up Partners LLC Series D | 5/16/19 | 9,242 |
| Xsight Labs Ltd. Series D | 2/16/21 | $6,300 |
| Yumanity Therapeutics, Inc. | 12/22/20 | $2,448 |
| Zomato Pvt Ltd. | 12/9/20 - 2/10/21 | $22,350 |
Affiliated Central Funds
Information regarding fiscal year to date income earned by the Fund from investments in Fidelity Central Funds is as follows:
| Fund | Income earned |
| (Amounts in thousands) | |
| Fidelity Cash Central Fund | $35 |
| Fidelity Securities Lending Cash Central Fund | 2,193 |
| Total | $2,228 |
Amounts in the income column in the above table include any capital gain distributions from underlying funds, which are presented in the corresponding line-item in the Statement of Operations, if applicable. Amount for Fidelity Securities Lending Cash Central Fund represents the income earned on investing cash collateral, less rebates paid to borrowers and any lending agent fees associated with the loan, plus any premium payments received for lending certain types of securities.
Other Affiliated Issuers
An affiliated company is a company in which the Fund has ownership of at least 5% of the voting securities. Fiscal year to date transactions with companies which are or were affiliates are as follows:
| Affiliate (Amounts in thousands) | Value, beginning of period | Purchases | Sales Proceeds(a) | Dividend Income | Realized Gain (loss) | Change in Unrealized appreciation (depreciation) | Value, end of period |
| Atea Pharmaceuticals, Inc. | $63,032 | $165,631 | $11,061 | $-- | $5,363 | $(131,550) | $91,415 |
| Axcella Health, Inc. | 12,628 | 47 | 753 | -- | 68 | (5,390) | 6,600 |
| Codiak Biosciences, Inc. | 4,834 | 3,961 | 963 | -- | 555 | 3,252 | 28,162 |
| Codiak Biosciences, Inc. | 8,610 | -- | -- | -- | -- | 7,913 | -- |
| Evelo Biosciences, Inc. | 11,502 | 8,358 | 2,612 | -- | 1,617 | 18,285 | 37,150 |
| Infinera Corp. | 106,561 | 2,211 | 8,827 | -- | 2,967 | 11,630 | 114,542 |
| Ionis Pharmaceuticals, Inc. | 407,063 | 14,013 | 29,120 | -- | 19,246 | (120,638) | 290,564 |
| Kaleido Biosciences, Inc. | 12,184 | 12,138 | 1,389 | -- | 208 | (5,575) | 17,566 |
| Karuna Therapeutics, Inc. | 153,778 | -- | 11,909 | -- | 10,649 | 7,742 | -- |
| OptiNose, Inc. | 11,589 | 131 | 785 | -- | (311) | (2,022) | 8,602 |
| Presbia PLC | 12 | -- | -- | -- | -- | 131 | 143 |
| QuantumScape Corp. | 73,528 | -- | -- | -- | -- | (56,145) | -- |
| Rigel Pharmaceuticals, Inc. | 28,642 | 6,415 | 2,934 | -- | 248 | 4,770 | 37,141 |
| Rubius Therapeutics, Inc. | 27,590 | 16,545 | 5,980 | -- | 3,485 | 79,826 | 121,466 |
| Rush Street Interactive, Inc. | 23,402 | -- | 1,841 | -- | 738 | (5,411) | -- |
| Sienna Biopharmaceuticals, Inc. | 11 | -- | 3 | -- | (1,055) | 1,086 | 39 |
| Silicon Laboratories, Inc. | 329,384 | 10,238 | 32,886 | -- | 18,206 | 36,122 | 361,064 |
| Total | $1,274,350 | $239,688 | $111,063 | $-- | $61,984 | $(155,974) | $1,114,454 |
(a) Includes the value of securities received through in-kind transactions, if applicable.
Investment Valuation
The following is a summary of the inputs used, as of May 31, 2021, involving the Fund's assets and liabilities carried at fair value. The inputs or methodology used for valuing securities may not be an indication of the risk associated with investing in those securities. For more information on valuation inputs, and their aggregation into the levels used below, please refer to the Investment Valuation section in the accompanying Notes to Financial Statements.
| Valuation Inputs at Reporting Date: | ||||
| Description | Total | Level 1 | Level 2 | Level 3 |
| (Amounts in thousands) | ||||
| Investments in Securities: | ||||
| Equities: | ||||
| Communication Services | $8,010,417 | $7,957,296 | $-- | $53,121 |
| Consumer Discretionary | 13,903,265 | 13,403,814 | 122,139 | 377,312 |
| Consumer Staples | 1,460,093 | 1,365,931 | 26,507 | 67,655 |
| Energy | 531,365 | 526,849 | 4,516 | -- |
| Financials | 1,331,598 | 1,044,485 | 111,496 | 175,617 |
| Health Care | 9,729,279 | 9,273,999 | 173,392 | 281,888 |
| Industrials | 3,702,334 | 3,367,002 | 50,148 | 285,184 |
| Information Technology | 22,411,116 | 22,079,548 | 85,753 | 245,815 |
| Materials | 755,451 | 714,540 | -- | 40,911 |
| Real Estate | 156,714 | 156,714 | -- | -- |
| Utilities | 3,795 | -- | -- | 3,795 |
| Corporate Bonds | 28,283 | -- | -- | 28,283 |
| Preferred Securities | 44,295 | -- | -- | 44,295 |
| Money Market Funds | 895,788 | 895,788 | -- | -- |
| Total Investments in Securities: | $62,963,793 | $60,785,966 | $573,951 | $1,603,876 |
| Net unrealized appreciation on unfunded commitments | $5,248 | $-- | $5,248 | $-- |
The following is a reconciliation of Investments in Securities for which Level 3 inputs were used in determining value:
| (Amounts in thousands) | |
| Investments in Securities: | |
| Beginning Balance | $1,187,293 |
| Net Realized Gain (Loss) on Investment Securities | 475 |
| Net Unrealized Gain (Loss) on Investment Securities | 243,208 |
| Cost of Purchases | 422,871 |
| Proceeds of Sales | (8,344) |
| Amortization/Accretion | -- |
| Transfers into Level 3 | 15,866 |
| Transfers out of Level 3 | (257,493) |
| Ending Balance | $1,603,876 |
| The change in unrealized gain (loss) for the period attributable to Level 3 securities held at May 31, 2021 | $240,687 |
The information used in the above reconciliation represents fiscal year to date activity for any Investments in Securities identified as using Level 3 inputs at either the beginning or the end of the current fiscal period. Cost of purchases and proceeds of sales may include securities received and/or delivered through in-kind transactions. Transfers in or out of Level 3 represent the beginning value of any Security or Instrument where a change in the pricing level occurred from the beginning to the end of the period. The cost of purchases and the proceeds of sales may include securities received or delivered through corporate actions or exchanges. Realized and unrealized gains (losses) disclosed in the reconciliation are included in Net Gain (Loss) on the Fund's Statement of Operations.
See accompanying notes which are an integral part of the financial statements.
Financial Statements
Statement of Assets and Liabilities
| Amounts in thousands (except per-share amounts) | May 31, 2021 (Unaudited) | |
| Assets | ||
| Investment in securities, at value (including securities loaned of $721,283) — See accompanying schedule: Unaffiliated issuers (cost $18,287,328) | $60,953,551 | |
| Fidelity Central Funds (cost $895,784) | 895,788 | |
| Other affiliated issuers (cost $1,207,687) | 1,114,454 | |
| Total Investment in Securities (cost $20,390,799) | $62,963,793 | |
| Cash | 243 | |
| Restricted cash | 100 | |
| Foreign currency held at value (cost $1,781) | 1,781 | |
| Receivable for investments sold | 101,938 | |
| Receivable for fund shares sold | 20,899 | |
| Dividends receivable | 21,870 | |
| Interest receivable | 300 | |
| Distributions receivable from Fidelity Central Funds | 166 | |
| Prepaid expenses | 11 | |
| Net unrealized appreciation on unfunded commitments | 15,355 | |
| Other receivables | 3,119 | |
| Total assets | 63,129,575 | |
| Liabilities | ||
| Payable for investments purchased | $13,928 | |
| Payable for fund shares redeemed | 30,975 | |
| Accrued management fee | 34,791 | |
| Net unrealized depreciation on unfunded commitments | 10,107 | |
| Other affiliated payables | 5,118 | |
| Other payables and accrued expenses | 7,637 | |
| Collateral on securities loaned | 757,430 | |
| Total liabilities | 859,986 | |
| Net Assets | $62,269,589 | |
| Net Assets consist of: | ||
| Paid in capital | $12,133,870 | |
| Total accumulated earnings (loss) | 50,135,719 | |
| Net Assets | $62,269,589 | |
| Net Asset Value and Maximum Offering Price | ||
| Growth Company: | ||
| Net Asset Value, offering price and redemption price per share ($46,466,734 ÷ 1,311,981 shares) | $35.42 | |
| Class K: | ||
| Net Asset Value, offering price and redemption price per share ($15,802,855 ÷ 444,897 shares) | $35.52 |
See accompanying notes which are an integral part of the financial statements.
Statement of Operations
| Amounts in thousands | Six months ended May 31, 2021 (Unaudited) | |
| Investment Income | ||
| Dividends | $122,293 | |
| Interest | 215 | |
| Income from Fidelity Central Funds (including $2,193 from security lending) | 2,228 | |
| Total income | 124,736 | |
| Expenses | ||
| Management fee | ||
| Basic fee | $165,588 | |
| Performance adjustment | 47,133 | |
| Transfer agent fees | 29,301 | |
| Accounting fees | 1,311 | |
| Custodian fees and expenses | 434 | |
| Independent trustees' fees and expenses | 124 | |
| Registration fees | 219 | |
| Audit | 95 | |
| Legal | 47 | |
| Interest | 16 | |
| Miscellaneous | 128 | |
| Total expenses before reductions | 244,396 | |
| Expense reductions | (666) | |
| Total expenses after reductions | 243,730 | |
| Net investment income (loss) | (118,994) | |
| Realized and Unrealized Gain (Loss) | ||
| Net realized gain (loss) on: | ||
| Investment securities: | ||
| Unaffiliated issuers (net of foreign taxes of $31) | 7,848,893 | |
| Fidelity Central Funds | 1 | |
| Other affiliated issuers | 61,984 | |
| Total net realized gain (loss) | 7,910,878 | |
| Change in net unrealized appreciation (depreciation) on: | ||
| Investment securities: | ||
| Unaffiliated issuers (net of increase in deferred foreign taxes of $1,564) | (688,736) | |
| Affiliated issuers | (155,974) | |
| Unfunded commitments | 5,248 | |
| Assets and liabilities in foreign currencies | 118 | |
| Total change in net unrealized appreciation (depreciation) | (839,344) | |
| Net gain (loss) | 7,071,534 | |
| Net increase (decrease) in net assets resulting from operations | $6,952,540 |
See accompanying notes which are an integral part of the financial statements.
Statement of Changes in Net Assets
| Amounts in thousands | Six months ended May 31, 2021 (Unaudited) | Year ended November 30, 2020 |
| Increase (Decrease) in Net Assets | ||
| Operations | ||
| Net investment income (loss) | $(118,994) | $(187,229) |
| Net realized gain (loss) | 7,910,878 | 7,974,239 |
| Change in net unrealized appreciation (depreciation) | (839,344) | 17,941,115 |
| Net increase (decrease) in net assets resulting from operations | 6,952,540 | 25,728,125 |
| Distributions to shareholders | (5,205,937) | (1,648,937) |
| Share transactions - net increase (decrease) | (1,458,443) | (5,730,222) |
| Total increase (decrease) in net assets | 288,160 | 18,348,966 |
| Net Assets | ||
| Beginning of period | 61,981,429 | 43,632,463 |
| End of period | $62,269,589 | $61,981,429 |
See accompanying notes which are an integral part of the financial statements.
Financial Highlights
Fidelity Growth Company Fund
| Six months ended (Unaudited) May 31, | Years endedNovember 30, | |||||
| 2021 | 2020 | 2019 | 2018 A | 2017 A | 2016 A | |
| Selected Per–Share Data | ||||||
| Net asset value, beginning of period | $34.49 | $21.54 | $18.79 | $18.53 | $14.28 | $14.35 |
| Income from Investment Operations | ||||||
| Net investment income (loss)B | (.07) | (.10) | (.04) | (.01)C | (.01) | .01 |
| Net realized and unrealized gain (loss) | 3.91 | 13.87 | 3.81 | 1.12 | 5.08 | .47 |
| Total from investment operations | 3.84 | 13.77 | 3.77 | 1.11 | 5.07 | .48 |
| Distributions from net investment income | – | – | – | – | (.01) | – |
| Distributions from net realized gain | (2.91) | (.82) | (1.02) | (.85) | (.81) | (.55) |
| Total distributions | (2.91) | (.82) | (1.02) | (.85) | (.82) | (.55) |
| Net asset value, end of period | $35.42 | $34.49 | $21.54 | $18.79 | $18.53 | $14.28 |
| Total ReturnD,E | 11.79% | 66.23% | 22.05% | 6.19% | 37.34% | 3.48% |
| Ratios to Average Net AssetsF,G | ||||||
| Expenses before reductions | .80%H | .83% | .83% | .85% | .85% | .77% |
| Expenses net of fee waivers, if any | .80%H | .83% | .83% | .85% | .85% | .77% |
| Expenses net of all reductions | .79%H | .83% | .83% | .85% | .85% | .77% |
| Net investment income (loss) | (.40)%H | (.41)% | (.20)% | (.07)%C | (.04)% | .07% |
| Supplemental Data | ||||||
| Net assets, end of period (in millions) | $46,467 | $43,533 | $28,861 | $25,615 | $25,256 | $21,114 |
| Portfolio turnover rateI,J | 18%H | 18% | 16% | 18% | 15% | 19% |
A Per share amounts have been adjusted to reflect the impact of the 10 for 1 share split that occurred on August 10, 2018.
B Calculated based on average shares outstanding during the period.
C Net investment income per share reflects one or more large, non-recurring dividend(s) which amounted to $.03 per share. Excluding such non-recurring dividend(s), the ratio of net investment income (loss) to average net assets would have been (.19) %.
D Total returns for periods of less than one year are not annualized.
E Total returns would have been lower if certain expenses had not been reduced during the applicable periods shown.
F Fees and expenses of any underlying mutual funds or exchange-traded funds (ETFs) are not included in the Fund's expense ratio. The Fund indirectly bears its proportionate share of these expenses. For additional expense information related to investments in Fidelity Central Funds, please refer to the "Investments in Fidelity Central Funds" note found in the Notes to Financial Statements section of the most recent Annual or Semi-Annual report.
G Expense ratios reflect operating expenses of the class. Expenses before reductions do not reflect amounts reimbursed, waived, or reduced through arrangements with the investment adviser, brokerage services, or other offset arrangements, if applicable, and do not represent the amount paid by the class during periods when reimbursements, waivers or reductions occur.
H Annualized
I Portfolio turnover rate excludes securities received or delivered in-kind.
J Amount does not include the portfolio activity of any underlying mutual funds or exchange-traded funds (ETFs).
See accompanying notes which are an integral part of the financial statements.
Fidelity Growth Company Fund Class K
| Six months ended (Unaudited) May 31, | Years endedNovember 30, | |||||
| 2021 | 2020 | 2019 | 2018 A | 2017 A | 2016 A | |
| Selected Per–Share Data | ||||||
| Net asset value, beginning of period | $34.57 | $21.57 | $18.80 | $18.52 | $14.27 | $14.34 |
| Income from Investment Operations | ||||||
| Net investment income (loss)B | (.06) | (.08) | (.02) | –C,D | .01 | .02 |
| Net realized and unrealized gain (loss) | 3.92 | 13.90 | 3.81 | 1.13 | 5.07 | .47 |
| Total from investment operations | 3.86 | 13.82 | 3.79 | 1.13 | 5.08 | .49 |
| Distributions from net investment income | – | – | – | –D | (.02) | (.01) |
| Distributions from net realized gain | (2.91) | (.82) | (1.02) | (.85) | (.81) | (.55) |
| Total distributions | (2.91) | (.82) | (1.02) | (.85) | (.83) | (.56) |
| Net asset value, end of period | $35.52 | $34.57 | $21.57 | $18.80 | $18.52 | $14.27 |
| Total ReturnE,F | 11.82% | 66.37% | 22.15% | 6.28% | 37.47% | 3.59% |
| Ratios to Average Net AssetsG,H | ||||||
| Expenses before reductions | .73%I | .75% | .75% | .76% | .75% | .66% |
| Expenses net of fee waivers, if any | .73%I | .75% | .75% | .76% | .75% | .66% |
| Expenses net of all reductions | .73%I | .75% | .75% | .76% | .75% | .66% |
| Net investment income (loss) | (.33)%I | (.33)% | (.12)% | .02%C | .06% | .17% |
| Supplemental Data | ||||||
| Net assets, end of period (in millions) | $15,803 | $18,449 | $14,772 | $15,468 | $16,416 | $14,739 |
| Portfolio turnover rateJ,K | 18%I | 18% | 16% | 18% | 15% | 19% |
A Per share amounts have been adjusted to reflect the impact of the 10 for 1 share split that occurred on August 10, 2018.
B Calculated based on average shares outstanding during the period.
C Net investment income per share reflects one or more large, non-recurring dividend(s) which amounted to $.03 per share. Excluding such non-recurring dividend(s), the ratio of net investment income (loss) to average net assets would have been (.11) %.
D Amount represents less than $.005 per share.
E Total returns for periods of less than one year are not annualized.
F Total returns would have been lower if certain expenses had not been reduced during the applicable periods shown.
G Fees and expenses of any underlying mutual funds or exchange-traded funds (ETFs) are not included in the Fund's expense ratio. The Fund indirectly bears its proportionate share of these expenses. For additional expense information related to investments in Fidelity Central Funds, please refer to the "Investments in Fidelity Central Funds" note found in the Notes to Financial Statements section of the most recent Annual or Semi-Annual report.
H Expense ratios reflect operating expenses of the class. Expenses before reductions do not reflect amounts reimbursed, waived, or reduced through arrangements with the investment adviser, brokerage services, or other offset arrangements, if applicable, and do not represent the amount paid by the class during periods when reimbursements, waivers or reductions occur.
I Annualized
J Portfolio turnover rate excludes securities received or delivered in-kind.
K Amount does not include the portfolio activity of any underlying mutual funds or exchange-traded funds (ETFs).
See accompanying notes which are an integral part of the financial statements.
Notes to Financial Statements (Unaudited)
For the period ended May 31, 2021
(Amounts in thousands except percentages)
1. Organization.
Fidelity Growth Company Fund (the Fund) is a fund of Fidelity Mt. Vernon Street Trust (the Trust) and is authorized to issue an unlimited number of shares. The Trust is registered under the Investment Company Act of 1940, as amended (the 1940 Act), as an open-end management investment company organized as a Massachusetts business trust. The Fund offers Growth Company and Class K shares, each of which has equal rights as to assets and voting privileges. Each class has exclusive voting rights with respect to matters that affect that class.
2. Investments in Fidelity Central Funds.
Funds may invest in Fidelity Central Funds, which are open-end investment companies generally available only to other investment companies and accounts managed by the investment adviser and its affiliates. The Schedule of Investments lists any Fidelity Central Funds held as an investment as of period end, but does not include the underlying holdings of each Fidelity Central Fund. An investing fund indirectly bears its proportionate share of the expenses of the underlying Fidelity Central Funds.
Based on its investment objective, each Fidelity Central Fund may invest or participate in various investment vehicles or strategies that are similar to those of the investing fund. These strategies are consistent with the investment objectives of the investing fund and may involve certain economic risks which may cause a decline in value of each of the Fidelity Central Funds and thus a decline in the value of the investing fund.
| Fidelity Central Fund | Investment Manager | Investment Objective | Investment Practices | Expense Ratio(a) |
| Fidelity Money Market Central Funds | Fidelity Management & Research Company LLC (FMR) | Each fund seeks to obtain a high level of current income consistent with the preservation of capital and liquidity. | Short-term Investments | Less than .005% to .01% |
(a) Expenses expressed as a percentage of average net assets and are as of each underlying Central Fund's most recent annual or semi-annual shareholder report.
A complete unaudited list of holdings for each Fidelity Central Fund is available upon request or at the Securities and Exchange Commission website at www.sec.gov. In addition, the financial statements of the Fidelity Central Funds which contain the significant accounting policies (including investment valuation policies) of those funds, and are not covered by the Report of Independent Registered Public Accounting Firm, are available on the Securities and Exchange Commission website or upon request.
3. Significant Accounting Policies.
The Fund is an investment company and applies the accounting and reporting guidance of the Financial Accounting Standards Board (FASB) Accounting Standards Codification Topic 946 Financial Services - Investment Companies. The financial statements have been prepared in conformity with accounting principles generally accepted in the United States of America (GAAP), which require management to make certain estimates and assumptions at the date of the financial statements. Actual results could differ from those estimates. Subsequent events, if any, through the date that the financial statements were issued have been evaluated in the preparation of the financial statements. The Fund's Schedule of Investments lists any underlying mutual funds or exchange-traded funds (ETFs) but does not include the underlying holdings of these funds. The following summarizes the significant accounting policies of the Fund:
Investment Valuation. Investments are valued as of 4:00 p.m. Eastern time on the last calendar day of the period. The Board of Trustees (the Board) has delegated the day to day responsibility for the valuation of the Fund's investments to the Fair Value Committee (the Committee) established by the Fund's investment adviser. In accordance with valuation policies and procedures approved by the Board, the Fund attempts to obtain prices from one or more third party pricing vendors or brokers to value its investments. When current market prices, quotations or currency exchange rates are not readily available or reliable, investments will be fair valued in good faith by the Committee, in accordance with procedures adopted by the Board. Factors used in determining fair value vary by investment type and may include market or investment specific events, changes in interest rates and credit quality. The frequency with which these procedures are used cannot be predicted and they may be utilized to a significant extent. The Committee oversees the Fund's valuation policies and procedures and reports to the Board on the Committee's activities and fair value determinations. The Board monitors the appropriateness of the procedures used in valuing the Fund's investments and ratifies the fair value determinations of the Committee.
The Fund categorizes the inputs to valuation techniques used to value its investments into a disclosure hierarchy consisting of three levels as shown below:
- Level 1 – quoted prices in active markets for identical investments
- Level 2 – other significant observable inputs (including quoted prices for similar investments, interest rates, prepayment speeds, etc.)
- Level 3 – unobservable inputs (including the Fund's own assumptions based on the best information available)
Valuation techniques used to value the Fund's investments by major category are as follows:
Equity securities, including restricted securities, for which market quotations are readily available, are valued at the last reported sale price or official closing price as reported by a third party pricing vendor on the primary market or exchange on which they are traded and are categorized as Level 1 in the hierarchy. In the event there were no sales during the day or closing prices are not available, securities are valued at the last quoted bid price or may be valued using the last available price and are generally categorized as Level 2 in the hierarchy. For foreign equity securities, when market or security specific events arise, comparisons to the valuation of American Depositary Receipts (ADRs), futures contracts, Exchange-Traded Funds (ETFs) and certain indexes as well as quoted prices for similar securities may be used and would be categorized as Level 2 in the hierarchy. For equity securities, including restricted securities, where observable inputs are limited, assumptions about market activity and risk are used and these securities may be categorized as Level 3 in the hierarchy. Securities, including private placements or other restricted securities, for which observable inputs are not available are valued using alternate valuation approaches, including the market approach, the income approach and cost approach, and are categorized as Level 3 in the hierarchy. The market approach considers factors including the price of recent investments in the same or a similar security or financial metrics of comparable securities. The income approach considers factors including expected future cash flows, security specific risks and corresponding discount rates. The cost approach considers factors including the value of the security's underlying assets and liabilities.
Debt securities, including restricted securities, are valued based on evaluated prices received from third party pricing vendors or from brokers who make markets in such securities. Corporate bonds are valued by pricing vendors who utilize matrix pricing which considers yield or price of bonds of comparable quality, coupon, maturity and type or by broker-supplied prices. When independent prices are unavailable or unreliable, debt securities may be valued utilizing pricing methodologies which consider similar factors that would be used by third party pricing vendors. Debt securities are generally categorized as Level 2 in the hierarchy but may be Level 3 depending on the circumstances.
Investments in open-end mutual funds, including the Fidelity Central Funds, are valued at their closing net asset value (NAV) each business day and are categorized as Level 1 in the hierarchy.
The following provides information on Level 3 securities held by the Fund that were valued at period end based on unobservable inputs. These amounts exclude valuations provided by a broker.
| Asset Type | Fair Value | Valuation Technique(s) | Unobservable Input | Amount or Range/Weighted Average | Impact to Valuation from an Increase in Input(a) |
| Equities | $1,531,185 | Market comparable | Enterprise value/Sales multiple (EV/S) | 1.0 – 5.7 /3.9 | Increase |
| Discount Rate | 52.9% - 85.7% / 53.6% | Decrease | |||
| Premium Rate | 7.8% - 45.9% / 29.1% | Increase | |||
| Discount for lack of marketability | 10.0% - 15.0% / 12.8% | Decrease | |||
| Price/Earnings multiple (P/E) | 12.6 | Increase | |||
| Recovery value | Recovery value | $100.00 | Increase | ||
| Market Approach | Transaction price Premium rate | $0.00 - $885.00 / $148.78 4.5% - 59.0% / 35.6% | Increase Increase | ||
| Corporate Bonds | $28,283 | Market approach | Transaction price | $100.00 | Increase |
| Preferred Securities | $42,436 | Recovery value Market approach | Recovery value Transaction price | 127.2% $100.00 | Increase Increase |
(a) Represents the directional change in the fair value of the Level 3 investments that could have resulted from an increase in the corresponding input as of period end. A decrease to the unobservable input would have had the opposite effect. Significant changes in these inputs may have resulted in a significantly higher or lower fair value measurement at period end.
Changes in valuation techniques may result in transfers in or out of an assigned level within the disclosure hierarchy. The aggregate value of investments by input level as of May 31, 2021, as well as a roll forward of Level 3 investments, is included at the end of the Fund's Schedule of Investments.
Foreign Currency. Certain Funds may use foreign currency contracts to facilitate transactions in foreign-denominated securities. Gains and losses from these transactions may arise from changes in the value of the foreign currency or if the counterparties do not perform under the contracts' terms.
Foreign-denominated assets, including investment securities, and liabilities are translated into U.S. dollars at the exchange rates at period end. Purchases and sales of investment securities, income and dividends received, and expenses denominated in foreign currencies are translated into U.S. dollars at the exchange rate in effect on the transaction date.
The effects of exchange rate fluctuations on investments are included with the net realized and unrealized gain (loss) on investment securities. Other foreign currency transactions resulting in realized and unrealized gain (loss) are disclosed separately.
Investment Transactions and Income. For financial reporting purposes, the Fund's investment holdings and NAV include trades executed through the end of the last business day of the period. The NAV per share for processing shareholder transactions is calculated as of the close of business of the New York Stock Exchange (NYSE), normally 4:00 p.m. Eastern time and includes trades executed through the end of the prior business day. Gains and losses on securities sold are determined on the basis of identified cost and include proceeds received from litigation. Dividend income is recorded on the ex-dividend date, except for certain dividends from foreign securities where the ex-dividend date may have passed, which are recorded as soon as the Fund is informed of the ex-dividend date. Non-cash dividends included in dividend income, if any, are recorded at the fair market value of the securities received. Income and capital gain distributions from Fidelity Central Funds, if any, are recorded on the ex-dividend date. Certain distributions received by the Fund represent a return of capital or capital gain. The Fund determines the components of these distributions subsequent to the ex-dividend date, based upon receipt of tax filings or other correspondence relating to the underlying investment. These distributions are recorded as a reduction of cost of investments and/or as a realized gain. Interest income is accrued as earned and includes coupon interest and amortization of premium and accretion of discount on debt securities as applicable. Investment income is recorded net of foreign taxes withheld where recovery of such taxes is uncertain.
Class Allocations and Expenses. Investment income, realized and unrealized capital gains and losses, common expenses of a fund, and certain fund-level expense reductions, if any, are allocated daily on a pro-rata basis to each class based on the relative net assets of each class to the total net assets of a fund. Each class differs with respect to transfer agent and distribution and service plan fees incurred, as applicable. Certain expense reductions may also differ by class, if applicable. For the reporting period, the allocated portion of income and expenses to each class as a percent of its average net assets may vary due to the timing of recording these transactions in relation to fluctuating net assets of the classes. Expenses directly attributable to a fund are charged to that fund. Expenses attributable to more than one fund are allocated among the respective funds on the basis of relative net assets or other appropriate methods. Expenses included in the accompanying financial statements reflect the expenses of that fund and do not include any expenses associated with any underlying mutual funds or exchange-traded funds. Although not included in a fund's expenses, a fund indirectly bears its proportionate share of these expenses through the net asset value of each underlying mutual fund or exchange-traded fund. Expense estimates are accrued in the period to which they relate and adjustments are made when actual amounts are known.
Deferred Trustee Compensation. Under a Deferred Compensation Plan (the Plan) for certain Funds, certain independent Trustees have elected to defer receipt of a portion of their annual compensation. Deferred amounts are invested in affiliated mutual funds, are marked-to-market and remain in a fund until distributed in accordance with the Plan. The investment of deferred amounts and the offsetting payable to the Trustees presented below are included in the accompanying Statement of Assets and Liabilities in other receivables and other payables and accrued expenses, as applicable.
| Fidelity Growth Company Fund | $2,875 |
Income Tax Information and Distributions to Shareholders. Each year, the Fund intends to qualify as a regulated investment company under Subchapter M of the Internal Revenue Code, including distributing substantially all of its taxable income and realized gains. As a result, no provision for U.S. Federal income taxes is required. The Fund files a U.S. federal tax return, in addition to state and local tax returns as required. The Fund's federal income tax returns are subject to examination by the Internal Revenue Service (IRS) for a period of three fiscal years after they are filed. State and local tax returns may be subject to examination for an additional fiscal year depending on the jurisdiction. Foreign taxes are provided for based on the Fund's understanding of the tax rules and rates that exist in the foreign markets in which it invests. The Fund is subject to a tax imposed on capital gains by certain countries in which it invests. An estimated deferred tax liability for net unrealized appreciation on the applicable securities is included in Other payables and accrued expenses on the Statement of Assets & Liabilities.
Distributions are declared and recorded on the ex-dividend date. Income and capital gain distributions are declared separately for each class. Income and capital gain distributions are determined in accordance with income tax regulations, which may differ from GAAP.
Capital accounts within the financial statements are adjusted for permanent book-tax differences. These adjustments have no impact on net assets or the results of operations. Capital accounts are not adjusted for temporary book-tax differences which will reverse in a subsequent period.
Book-tax differences are primarily due to foreign currency transactions, passive foreign investment companies (PFIC), redemptions in-kind, net operating losses, certain deemed distributions, partnerships, deferred Trustees compensation, losses deferred due to wash sales and excise tax regulations.
As of period end, the cost and unrealized appreciation (depreciation) in securities, and derivatives if applicable, for federal income tax purposes were as follows:
| Gross unrealized appreciation | $43,806,100 |
| Gross unrealized depreciation | (1,416,952) |
| Net unrealized appreciation (depreciation) | $42,389,148 |
| Tax cost | $20,574,645 |
Restricted Securities (including Private Placements). Funds may invest in securities that are subject to legal or contractual restrictions on resale. These securities generally may be resold in transactions exempt from registration or to the public if the securities are registered. Disposal of these securities may involve time-consuming negotiations and expense, and prompt sale at an acceptable price may be difficult. Information regarding restricted securities held at period end is included at the end of the Schedule of Investments, if applicable.
Special Purpose Acquisition Companies. Funds may invest in stock, warrants, and other securities of special purpose acquisition companies (SPACs) or similar special purpose entities. A SPAC is a publicly traded company that raises investment capital via an initial public offering (IPO) for the purpose of acquiring the equity securities of one or more existing companies via merger, business combination, acquisition or other similar transactions within a designated time frame.
Private Investment in Public Equity. Funds may acquire equity securities of an issuer through a private investment in a public equity (PIPE) transaction, including through commitments to purchase securities on a when-issued basis. A PIPE typically involves the purchase of securities directly from a publicly traded company in a private placement transaction. Securities purchased through PIPE transactions will be restricted from trading and considered illiquid until a resale registration statement for the shares is filed and declared effective.
At period end, the Fund had commitments to purchase when-issued securities through PIPE transactions with SPACs. The commitments are contingent upon the SPACs acquiring the securities of target companies. Unrealized appreciation (depreciation) on these commitments is separately presented in the Statements of Assets and Liabilities as Unrealized appreciation (depreciation) on unfunded commitments, and in the Statement of Operations as Change in unrealized appreciation (depreciation) on unfunded commitments.
Consolidated Subsidiary. The Funds included in the table below hold certain investments through a wholly-owned subsidiary ("Subsidiary"), which may be subject to federal and state taxes upon disposition.
As of period end, investments in Subsidiaries were as follows:
| $ Amount | % of Net Assets | |
| Fidelity Growth Company Fund | 295,575 | .47 |
The financial statements have been consolidated to include the Subsidiary accounts where applicable. Accordingly, all inter-company transactions and balances have been eliminated.
At period end, any estimated tax liability for these investments is presented as "Deferred taxes" in the Statement of Assets and Liabilities and included in "Change in net unrealized appreciation (depreciation) on investment securities" in the Statement of Operations. The tax liability incurred may differ materially depending on conditions when these investments are disposed. Any cash held by a Subsidiary is restricted as to its use and is presented as "Restricted cash" in the Statement of Assets and Liabilities, if applicable.
4. Purchases and Sales of Investments.
Purchases and sales of securities, other than short-term securities and in-kind transactions, are noted in the table below.
| Purchases ($) | Sales ($) | |
| Fidelity Growth Company Fund | 5,615,887 | 8,689,130 |
Unaffiliated Redemptions In-Kind. During the period, 114,530 shares of the Fund were redeemed in-kind for investments and cash with a value of $3,874,955. The net realized gain of $3,064,109 on investments delivered through in-kind redemptions is included in the accompanying Statement of Operations. The amount of the in-kind redemptions is included in share transactions in the accompanying Statement of Changes in Net Assets as well as the Notes to Financial Statements. The Fund recognized no gain or loss for federal income tax purposes.
Prior Fiscal Year Unaffiliated Redemptions In-Kind. During the prior period, 112,516 shares of the Fund were redeemed in-kind for investments and cash, with a value of $2,738,777. The Fund had a net realized gain of $2,099,949 on investments delivered through in-kind redemptions. The amount of the in-kind redemptions is included in share transactions in the accompanying Statement of Changes in Net Assets as well as the Notes to Financial Statements. The Fund recognized no gain or loss for federal income tax purposes.
5. Fees and Other Transactions with Affiliates.
Management Fee. Fidelity Management & Research Company LLC (the investment adviser) and its affiliates provide the Fund with investment management related services for which the Fund pays a monthly management fee. The management fee is the sum of an individual fund fee rate that is based on an annual rate of .30% of the Fund's average net assets and an annualized group fee rate that averaged .23% during the period. The group fee rate is based upon the monthly average net assets of a group of registered investment companies with which the investment adviser has management contracts. The group fee rate decreases as assets under management increase and increases as assets under management decrease. In addition, the management fee is subject to a performance adjustment (up to a maximum of +/- .20% of the Fund's average net assets over a 36 month performance period). The upward or downward adjustment to the management fee is based on the relative investment performance of the Fund as compared to its benchmark index, the Russell 3000 Growth Index, over the same 36 month performance period. For the reporting period, the total annualized management fee rate, including the performance adjustment, was .68% of the Fund's average net assets. The performance adjustment included in the management fee rate may be higher or lower than the maximum performance adjustment rate due to the difference between the average net assets for the reporting and performance periods.
Transfer Agent Fees. Fidelity Investments Institutional Operations Company LLC (FIIOC), an affiliate of the investment adviser, is the transfer, dividend disbursing and shareholder servicing agent for each class of the Fund. FIIOC receives account fees and asset-based fees that vary according to the account size and type of account of the shareholders of the respective classes of the Fund, except for Class K. FIIOC receives an asset-based fee of Class K's average net assets. FIIOC pays for typesetting, printing and mailing of shareholder reports, except proxy statements.
For the period, transfer agent fees for each class were as follows:
| Amount | % of Class-Level Average Net Assets(a) | |
| Growth Company | $25,625 | .11 |
| Class K | 3,676 | .04 |
| $29,301 |
(a) Annualized
Accounting Fees. Fidelity Service Company, Inc. (FSC), an affiliate of the investment adviser, maintains the Fund's accounting records. The accounting fee is based on the level of average net assets for each month. For the period, the fees were equivalent to the following annualized rates:
| % of Average Net Assets | |
| Fidelity Growth Company Fund | –(a) |
(a) Amount represents less than .005%.
Brokerage Commissions. A portion of portfolio transactions were placed with brokerage firms which are affiliates of the investment adviser. Brokerage commissions are included in net realized gain (loss) and change in net unrealized appreciation (depreciation) in the Statement of Operations. The commissions paid to these affiliated firms were as follows:
| Amount | |
| Fidelity Growth Company Fund | $129 |
Interfund Lending Program. Pursuant to an Exemptive Order issued by the Securities and Exchange Commission (the SEC), the Fund, along with other registered investment companies having management contracts with Fidelity Management & Research Company LLC (FMR), or other affiliated entities of FMR, may participate in an interfund lending program. This program provides an alternative credit facility allowing the Fund to borrow from, or lend money to, other participating affiliated funds. At period end, there were no interfund loans outstanding. Activity in this program during the period for which loans were outstanding was as follows:
| Borrower or Lender | Average Loan Balance | Weighted Average Interest Rate | Interest Expense | |
| Fidelity Growth Company Fund | Borrower | $55,122 | .33% | $15 |
Interfund Trades. Funds may purchase from or sell securities to other Fidelity Funds under procedures adopted by the Board. The procedures have been designed to ensure these interfund trades are executed in accordance with Rule 17a-7 of the 1940 Act. Any interfund trades are included within the respective purchases and sales amounts shown in the Purchases and Sales of Investments note and are noted in the table below.
| Purchases ($) | Sales ($) | |
| Fidelity Growth Company Fund | 540,619 | 761,954 |
6. Committed Line of Credit.
Certain Funds participate with other funds managed by the investment adviser or an affiliate in a $4.25 billion credit facility (the "line of credit") to be utilized for temporary or emergency purposes to fund shareholder redemptions or for other short-term liquidity purposes. The participating funds have agreed to pay commitment fees on their pro-rata portion of the line of credit, which are reflected in Miscellaneous expenses on the Statement of Operations, and are listed below. During the period, there were no borrowings on this line of credit.
| Amount | |
| Fidelity Growth Company Fund | $62 |
7. Security Lending.
Funds lend portfolio securities from time to time in order to earn additional income. Lending agents are used, including National Financial Services (NFS), an affiliate of the investment adviser. Pursuant to a securities lending agreement, NFS will receive a fee, which is capped at 9.9% of a fund's daily lending revenue, for its services as lending agent. A fund may lend securities to certain qualified borrowers, including NFS. On the settlement date of the loan, a fund receives collateral (in the form of U.S. Treasury obligations, letters of credit and/or cash) against the loaned securities and maintains collateral in an amount not less than 100% of the market value of the loaned securities during the period of the loan. The market value of the loaned securities is determined at the close of business of a fund and any additional required collateral is delivered to a fund on the next business day. A fund or borrower may terminate the loan at any time, and if the borrower defaults on its obligation to return the securities loaned because of insolvency or other reasons, a fund may apply collateral received from the borrower against the obligation. A fund may experience delays and costs in recovering the securities loaned. Any cash collateral received is invested in the Fidelity Securities Lending Cash Central Fund. Any loaned securities are identified as such in the Schedule of Investments, and the value of loaned securities and cash collateral at period end, as applicable, are presented in the Statement of Assets and Liabilities. Security lending income represents the income earned on investing cash collateral, less rebates paid to borrowers and any lending agent fees associated with the loan, plus any premium payments received for lending certain types of securities. Security lending income is presented in the Statement of Operations as a component of income from Fidelity Central Funds. Affiliated security lending activity, if any, was as follows:
| Total Security Lending Fees Paid to NFS | Security Lending Income From Securities Loaned to NFS | Value of Securities Loaned to NFS at Period End | |
| Fidelity Growth Company Fund | $231 | $71 | $394 |
8. Bank Borrowings.
The Fund is permitted to have bank borrowings for temporary or emergency purposes to fund shareholder redemptions or for other short-term liquidity requirements. The Fund has established borrowing arrangements with certain banks. The interest rate on the borrowings is the bank's base rate, as revised from time to time. Any open loans, including accrued interest, at period end are presented under the caption "Notes payable" in the Statement of Assets and Liabilities, if applicable. Activity in this program during the period for which loans were outstanding was as follows:
| Average Loan Balance | Weighted Average Interest Rate | Interest Expense | |
| Fidelity Growth Company Fund | $35,670 | .59% | $1 |
9. Expense Reductions.
Commissions paid to certain brokers with whom the investment adviser, or its affiliates, places trades on behalf of the Fund include an amount in addition to trade execution, which may be rebated back to the Fund to offset expenses. This amount totaled $570 for the period. In addition, through arrangements with the Fund's custodian, credits realized as a result of certain uninvested cash balances were used to reduce the Fund's expenses. During the period, custodian credits reduced the Fund's expenses by $1.
In addition, during the period the investment adviser or an affiliate reimbursed and/or waived a portion of fund-level operating expenses in the amount of $95.
10. Distributions to Shareholders.
Distributions to shareholders of each class were as follows:
| Six months ended May 31, 2021 | Year ended November 30, 2020 | |
| Fidelity Growth Company Fund | ||
| Distributions to shareholders | ||
| Growth Company | $3,659,612 | $1,096,909 |
| Class K | 1,546,325 | 552,028 |
| Total | $5,205,937 | $1,648,937 |
11. Share Transactions.
Share transactions for each class were as follows and may contain automatic conversions between classes or exchanges between affiliated funds:
| Shares | Shares | Dollars | Dollars | |
| Six months ended May 31, 2021 | Year ended November 30, 2020 | Six months ended May 31, 2021 | Year ended November 30, 2020 | |
| Fidelity Growth Company Fund | ||||
| Growth Company | ||||
| Shares sold | 68,336 | 143,233 | $2,357,967 | $3,580,444 |
| Reinvestment of distributions | 101,682 | 46,565 | 3,344,306 | 1,001,606 |
| Shares redeemed | (120,195)(a) | (267,601)(b) | (4,119,294)(a) | (6,549,853)(b) |
| Net increase (decrease) | 49,823 | (77,803) | $1,582,979 | $(1,967,803) |
| Class K | ||||
| Shares sold | 49,350 | 159,559 | $1,713,523 | $3,999,040 |
| Reinvestment of distributions | 46,864 | 25,606 | 1,545,583 | 551,818 |
| Shares redeemed | (184,955)(a) | (336,337)(b) | (6,300,528)(a) | (8,313,277)(b) |
| Net increase (decrease) | (88,741) | (151,172) | $(3,041,422) | $(3,762,419) |
(a) Amount includes in-kind redemptions (see the Unaffiliated Redemptions In-Kind note for additional details).
(b) Amount includes in-kind redemptions (see the Prior Fiscal Year Unaffiliated Redemptions In-Kind note for additional details).
12. Other.
Fund's organizational documents provide former and current trustees and officers with a limited indemnification against liabilities arising in connection with the performance of their duties to the fund. In the normal course of business, the fund may also enter into contracts that provide general indemnifications. The fund's maximum exposure under these arrangements is unknown as this would be dependent on future claims that may be made against the fund. The risk of material loss from such claims is considered remote.
13. Coronavirus (COVID-19) Pandemic.
An outbreak of COVID-19 first detected in China during December 2019 has since spread globally and was declared a pandemic by the World Health Organization during March 2020. Developments that disrupt global economies and financial markets, such as the COVID-19 pandemic, may magnify factors that affect the Fund's performance.
Shareholder Expense Example
As a shareholder, you incur two types of costs: (1) transaction costs, which may include sales charges (loads) on purchase payments or redemption proceeds, as applicable and (2) ongoing costs, which generally include management fees, distribution and/or service (12b-1) fees and other Fund expenses. This Example is intended to help you understand your ongoing costs (in dollars) of investing in a fund and to compare these costs with the ongoing costs of investing in other mutual funds.
The Example is based on an investment of $1,000 invested at the beginning of the period and held for the entire period (December 1, 2020 to May 31, 2021).
Actual Expenses
The first line of the accompanying table provides information about actual account values and actual expenses. You may use the information in this line, together with the amount you invested, to estimate the expenses that you paid over the period. Simply divide your account value by $1,000.00 (for example, an $8,600 account value divided by $1,000.00 = 8.6), then multiply the result by the number in the first line for a class/Fund under the heading entitled "Expenses Paid During Period" to estimate the expenses you paid on your account during this period. If any fund is a shareholder of any underlying mutual funds or exchange-traded funds (ETFs) (the Underlying Funds), such fund indirectly bears its proportional share of the expenses of the Underlying Funds in addition to the direct expenses incurred presented in the table. These fees and expenses are not included in the annualized expense ratio used to calculate the expense estimate in the table below.
Hypothetical Example for Comparison Purposes
The second line of the accompanying table provides information about hypothetical account values and hypothetical expenses based on the actual expense ratio and an assumed rate of return of 5% per year before expenses, which is not the actual return. The hypothetical account values and expenses may not be used to estimate the actual ending account balance or expenses you paid for the period. You may use this information to compare the ongoing costs of investing in the Fund and other funds. To do so, compare this 5% hypothetical example with the 5% hypothetical examples that appear in the shareholder reports of the other funds. If any fund is a shareholder of any Underlying Funds, such fund indirectly bears its proportional share of the expenses of the Underlying Funds in addition to the direct expenses as presented in the table. These fees and expenses are not included in the annualized expense ratio used to calculate the expense estimate in the table below.
Please note that the expenses shown in the table are meant to highlight your ongoing costs only and do not reflect any transaction costs. Therefore, the second line of the table is useful in comparing ongoing costs only, and will not help you determine the relative total costs of owning different funds.
| Annualized Expense Ratio-A | Beginning Account Value December 1, 2020 | Ending Account Value May 31, 2021 | Expenses Paid During Period-B December 1, 2020 to May 31, 2021 | |
| Fidelity Growth Company Fund | ||||
| Growth Company | .80% | |||
| Actual | $1,000.00 | $1,117.90 | $4.22 | |
| Hypothetical-C | $1,000.00 | $1,020.94 | $4.03 | |
| Class K | .73% | |||
| Actual | $1,000.00 | $1,118.20 | $3.86 | |
| Hypothetical-C | $1,000.00 | $1,021.29 | $3.68 |
A Annualized expense ratio reflects expenses net of applicable fee waivers.
B Expenses are equal to the annualized expense ratio, multiplied by the average account value over the period, multiplied by 182/ 365 (to reflect the one-half year period). The fees and expenses of any Underlying Funds are not included in each annualized expense ratio.
C 5% return per year before expenses
Board Approval of Investment Advisory Contracts and Management Fees
Fidelity Growth Company Fund
Each year, the Board of Trustees, including the Independent Trustees (together, the Board), votes on the renewal of the management contract with Fidelity Management & Research Company LLC (FMR) and the sub-advisory agreements (together, the Advisory Contracts) for the fund. FMR and the sub-advisers are referred to herein as the Investment Advisers. The Board, assisted by the advice of fund counsel and Independent Trustees' counsel, requests and considers a broad range of information relevant to the renewal of the Advisory Contracts throughout the year.The Board meets regularly and, at each of its meetings, covers an extensive agenda of topics and materials and considers factors that are relevant to its annual consideration of the renewal of the fund's Advisory Contracts, including the services and support provided to the fund and its shareholders. The Board has established various standing committees (Committees), each composed of and chaired by Independent Trustees with varying backgrounds, to which the Board has assigned specific subject matter responsibilities in order to enhance effective decision-making by the Board. The Board, acting directly and through its Committees, requests and receives information concerning the annual consideration of the renewal of the fund's Advisory Contracts. The Board also meets as needed to review matters specifically related to the Board's annual consideration of the renewal of the Advisory Contracts. Members of the Board may also meet with trustees of other Fidelity funds through joint ad hoc committees to discuss certain matters relevant to all of the Fidelity funds.Approval of Stub Period Continuation. At its January 2021 meeting, the Board of Trustees voted to continue the fund's management contract with FMR, and the sub-advisory agreements and sub-subadvisory agreements, in each case, where applicable (together, the Advisory Contracts), without modification, for four months from February 1, 2021 through May 31, 2021, in connection with changes to the Board's meeting calendar. The Board considered that the approval of the fund's Advisory Contracts will not result in any changes in (i) the investment process or strategies employed in the management of the fund's assets; (ii) the fees and expenses paid by shareholders; (iii) the nature, extent or quality of services provided under the fund's Advisory Contracts; or (iv) the day-to-day management of the fund or the persons primarily responsible for such management. The Board also considered that since its last approval of the fund's Advisory Contracts, FMR had provided additional information on the fund in support of the annual contract renewal process, including competitive analyses on total expenses and management fees and in-depth reviews of fund performance and fund profitability information. The Board also considered the findings of certain ad hoc committees that had been previously formed to discuss matters relevant to all of the Fidelity funds, including economies of scale, fall-out benefits and retail vs. institutional funds. The Board concluded that the fund's Advisory Contracts are fair and reasonable, and that the fund's Advisory Contracts should be renewed, without modification, through May 31, 2021, with the understanding that the Board will consider the annual renewal for a full one year period in May 2021.At its May 2021 meeting, the Board unanimously determined to renew the fund's Advisory Contracts. In reaching its determination, the Board considered all factors it believed relevant, including (i) the nature, extent, and quality of the services provided to the fund and its shareholders (including the investment performance of the fund); (ii) the competitiveness of the fund's management fee and total expense ratio relative to peer funds; (iii) the total costs of the services provided by and the profits realized by Fidelity from its relationships with the fund; and (iv) the extent to which, if any, economies of scale exist and are realized as the fund grows, and whether any economies of scale are appropriately shared with fund shareholders.In considering whether to renew the Advisory Contracts for the fund, the Board reached a determination, with the assistance of fund counsel and Independent Trustees' counsel and through the exercise of its business judgment, that the renewal of the Advisory Contracts was in the best interests of the fund and its shareholders and that the compensation payable under the Advisory Contracts was fair and reasonable. The Board's decision to renew the Advisory Contracts was not based on any single factor, but rather was based on a comprehensive consideration of all the information provided to the Board at its meetings throughout the year. The Board, in reaching its determination to renew the Advisory Contracts, was aware that shareholders of the fund have a broad range of investment choices available to them, including a wide choice among funds offered by Fidelity's competitors, and that the fund's shareholders, who have the opportunity to review and weigh the disclosure provided by the fund in its prospectus and other public disclosures, have chosen to invest in this fund, which is part of the Fidelity family of funds.Nature, Extent, and Quality of Services Provided. The Board considered Fidelity's staffing as it relates to the fund, including the backgrounds of investment personnel of Fidelity, and also considered the fund's investment objective, strategies, and related investment philosophy. The Independent Trustees also had discussions with senior management of Fidelity's investment operations and investment groups. The Board considered the structure of the investment personnel compensation program and whether this structure provides appropriate incentives to act in the best interests of the fund. Additionally, the Board considered the portfolio managers' investments, if any, in the funds that they manage.Resources Dedicated to Investment Management and Support Services. The Board and the Fund Oversight and Research Committees reviewed the general qualifications and capabilities of Fidelity's investment staff, including its size, education, experience, and resources, as well as Fidelity's approach to recruiting, training, managing, and compensating investment personnel. The Board noted that Fidelity has continued to increase the resources devoted to non-U.S. offices, including expansion of Fidelity's global investment organization. The Board also noted that Fidelity's analysts have extensive resources, tools and capabilities that allow them to conduct sophisticated quantitative and fundamental analysis, as well as credit analysis of issuers, counterparties and guarantors. Further, the Board considered that Fidelity's investment professionals have sufficient access to global information and data so as to provide competitive investment results over time, and that those professionals also have access to sophisticated tools that permit them to assess portfolio construction and risk and performance attribution characteristics continuously, as well as to transmit new information and research conclusions rapidly around the world. Additionally, in its deliberations, the Board considered Fidelity's trading, risk management, compliance, and technology and operations capabilities and resources, which are integral parts of the investment management process. The Board also considered Fidelity's investments in business continuity planning, and its success in continuously providing services to the fund notwithstanding the severe disruptions caused by the COVID-19 pandemic.Shareholder and Administrative Services. The Board considered (i) the nature, extent, quality, and cost of advisory, administrative, and shareholder services performed by the Investment Advisers and their affiliates under the Advisory Contracts and under separate agreements covering transfer agency, pricing and bookkeeping, and securities lending services for the fund; (ii) the nature and extent of the supervision of third party service providers, principally custodians, subcustodians, and pricing vendors; and (iii) the resources devoted to, and the record of compliance with, the fund's compliance policies and procedures. The Board also reviewed the allocation of fund brokerage, including allocations to brokers affiliated with the Investment Advisers, the use of brokerage commissions to pay fund expenses, and the use of "soft" commission dollars to pay for research services.The Board noted that the growth of fund assets over time across the complex allows Fidelity to reinvest in the development of services designed to enhance the value and convenience of the Fidelity funds as investment vehicles. These services include 24-hour access to account information and market information over the Internet and through telephone representatives, investor education materials and asset allocation tools, and the expanded availability of Fidelity Investor Centers.The Board noted that, in the past, it and the boards of certain other Fidelity funds had formed an ad hoc Committee on Transfer Agency Fees to review the variety of transfer agency fee structures throughout the industry and Fidelity's competitive positioning with respect to industry participants.Investment in a Large Fund Family. The Board considered the benefits to shareholders of investing in a Fidelity fund, including the benefits of investing in a fund that is part of a large family of funds offering a variety of investment disciplines and providing a large variety of mutual fund investor services. The Board noted that Fidelity had taken, or had made recommendations that resulted in the Fidelity funds taking, a number of actions over the previous year that benefited particular funds, including: (i) continuing to dedicate additional resources to Fidelity's investment research process, which includes meetings with management of issuers of securities in which the funds invest, and to the support of the senior management team that oversees asset management; (ii) continuing efforts to enhance Fidelity's global research capabilities; (iii) launching new funds and ETFs with innovative structures, strategies and pricing and making other enhancements to meet client needs; (iv) launching new share classes of existing funds; (v) eliminating purchase minimums and broadening eligibility requirements for certain funds and share classes; (vi) approving the reduction in the holding period for the Class C to Class A conversion policy; (vii) reducing management fees and total expenses for certain target date funds and classes and index funds; (viii) lowering expenses for certain existing funds and classes by implementing or lowering expense caps; (ix) rationalizing product lines and gaining increased efficiencies from fund mergers, liquidations, and share class consolidations; (x) continuing to develop, acquire and implement systems and technology to improve services to the funds and shareholders, strengthen information security, and increase efficiency; and (xi) continuing to implement enhancements to further strengthen Fidelity's product line to increase investors' probability of success in achieving their investment goals, including retirement income goals.Investment Performance. The Board considered whether the fund has operated in accordance with its investment objective, as well as its record of compliance with its investment restrictions and its performance history.The Board took into account discussions that occur at Board meetings throughout the year with representatives of the Investment Advisers about fund investment performance. In this regard the Board noted that as part of regularly scheduled fund reviews and other reports to the Board on fund performance, the Board considers annualized return information for the fund for different time periods, measured against an appropriate securities market index (benchmark index) and an appropriate peer group of funds with similar objectives (peer group). In its evaluation of fund investment performance, the Board gave particular attention to information indicating changes in performance of certain Fidelity funds for specific time periods and discussed with the Investment Advisers the reasons for any overperformance or underperformance.In addition to reviewing absolute and relative fund performance, the Independent Trustees periodically consider the appropriateness of fund performance metrics in evaluating the results achieved. In general, the Independent Trustees believe that fund performance should be evaluated based on net performance (after fees and expenses) of both the highest performing and lowest performing fund share classes, where applicable, compared to appropriate benchmark indices, over appropriate time periods that may include full market cycles, and compared to peer groups, as applicable, over the same periods, taking into account relevant factors including the following: general market conditions; issuer-specific information; and fund cash flows and other factors.The Independent Trustees recognize that shareholders evaluate performance on a net basis over their own holding periods, for which one-, three-, and five-year periods are often used as a proxy. For this reason, the performance information reviewed by the Board also included net cumulative total return information for the fund and an appropriate benchmark index and peer group for the most recent one-, three-, and five-year periods ended September 30, 2020, as shown below. Returns are shown compared to the 25th percentile (top of box, 75% beaten) and 75th percentile (bottom of box, 25% beaten) of the peer universe.Fidelity Growth Company Fund

Fidelity Growth Company Fund

Liquidity Risk Management Program
The Securities and Exchange Commission adopted Rule 22e-4 under the Investment Company Act of 1940 (the Liquidity Rule) to promote effective liquidity risk management throughout the open-end investment company industry, thereby reducing the risk that funds will be unable to meet their redemption obligations and mitigating dilution of the interests of fund shareholders.
The Fund has adopted and implemented a liquidity risk management program pursuant to the Liquidity Rule (the Program) effective December 1, 2018. The Program is reasonably designed to assess and manage the Fund’s liquidity risk and to comply with the requirements of the Liquidity Rule. The Fund’s Board of Trustees (the Board) has designated the Fund’s investment adviser as administrator of the Program. The Fidelity advisers have established a Liquidity Risk Management Committee (the LRM Committee) to manage the Program for each of the Fidelity Funds. The LRM Committee monitors the adequacy and effectiveness of implementation of the Program and on a periodic basis assesses each Fund’s liquidity risk based on a variety of factors including (1) the Fund’s investment strategy, (2) portfolio liquidity and cash flow projections during normal and reasonably foreseeable stressed conditions, (3) shareholder redemptions, (4) borrowings and other funding sources and (5) in the case of exchange-traded funds, certain additional factors including the effect of the Fund’s prices and spreads, market participants, and basket compositions on the overall liquidity of the Fund’s portfolio, as applicable.
In accordance with the Program, each of the Fund’s portfolio investments is classified into one of four liquidity categories described below based on a determination of a reasonable expectation for how long it would take to convert the investment to cash (or sell or dispose of the investment) without significantly changing its market value.
- Highly liquid investments – cash or convertible to cash within three business days or less
- Moderately liquid investments – convertible to cash in three to seven calendar days
- Less liquid investments – can be sold or disposed of, but not settled, within seven calendar days
- Illiquid investments – cannot be sold or disposed of within seven calendar days
Liquidity classification determinations take into account a variety of factors including various market, trading and investment-specific considerations, as well as market depth, and generally utilize analysis from a third-party liquidity metrics service.
The Liquidity Rule places a 15% limit on a fund’s illiquid investments and requires funds that do not primarily hold assets that are highly liquid investments to determine and maintain a minimum percentage of the fund’s net assets to be invested in highly liquid investments (highly liquid investment minimum or HLIM). The Program includes provisions reasonably designed to comply with the 15% limit on illiquid investments and for determining, periodically reviewing and complying with the HLIM requirement as applicable.
At a recent meeting of the Fund’s Board of Trustees, the LRM Committee provided a written report to the Board pertaining to the operation, adequacy, and effectiveness of implementation of the Program for the annual period from December 1, 2019 through November 30, 2020. The report concluded that the Program has been implemented and is operating effectively and is reasonably designed to assess and manage the Fund’s liquidity risk.
![]()
GCF-SANN-0721
1.704741.123
Fidelity® New Millennium Fund®
Semi-Annual Report
May 31, 2021
Contents
Board Approval of Investment Advisory Contracts and Management Fees | |
To view a fund's proxy voting guidelines and proxy voting record for the 12-month period ended June 30, visit http://www.fidelity.com/proxyvotingresults or visit the Securities and Exchange Commission's (SEC) web site at http://www.sec.gov.
You may also call 1-800-544-8544 to request a free copy of the proxy voting guidelines.
Standard & Poor's, S&P and S&P 500 are registered service marks of The McGraw-Hill Companies, Inc. and have been licensed for use by Fidelity Distributors Corporation.
Other third-party marks appearing herein are the property of their respective owners.
All other marks appearing herein are registered or unregistered trademarks or service marks of FMR LLC or an affiliated company. © 2021 FMR LLC. All rights reserved.
This report and the financial statements contained herein are submitted for the general information of the shareholders of the Fund. This report is not authorized for distribution to prospective investors in the Fund unless preceded or accompanied by an effective prospectus.
A fund files its complete schedule of portfolio holdings with the SEC for the first and third quarters of each fiscal year on Form N-PORT. Forms N-PORT are available on the SEC’s web site at http://www.sec.gov. A fund's Forms N-PORT may be reviewed and copied at the SEC’s Public Reference Room in Washington, DC. Information regarding the operation of the SEC's Public Reference Room may be obtained by calling 1-800-SEC-0330.
For a complete list of a fund's portfolio holdings, view the most recent holdings listing, semiannual report, or annual report on Fidelity's web site at http://www.fidelity.com, http://www.institutional.fidelity.com, or http://www.401k.com, as applicable.
NOT FDIC INSURED •MAY LOSE VALUE •NO BANK GUARANTEE
Neither the Fund nor Fidelity Distributors Corporation is a bank.
Note to Shareholders:
Early in 2020, the outbreak and spread of a new coronavirus emerged as a public health emergency that had a major influence on financial markets, primarily based on its impact on the global economy and the outlook for corporate earnings. The virus causes a respiratory disease known as COVID-19. On March 11, 2020 the World Health Organization declared the COVID-19 outbreak a pandemic, citing sustained risk of further global spread.
In the weeks following, as the crisis worsened, we witnessed an escalating human tragedy with wide-scale social and economic consequences from coronavirus-containment measures. The outbreak of COVID-19 prompted a number of measures to limit the spread, including travel and border restrictions, quarantines, and restrictions on large gatherings. In turn, these resulted in lower consumer activity, diminished demand for a wide range of products and services, disruption in manufacturing and supply chains, and – given the wide variability in outcomes regarding the outbreak – significant market uncertainty and volatility. Amid the turmoil, global governments and central banks took unprecedented action to help support consumers, businesses, and the broader economies, and to limit disruption to financial systems.
The situation continues to unfold, and the extent and duration of its impact on financial markets and the economy remain highly uncertain. Extreme events such as the coronavirus crisis are “exogenous shocks” that can have significant adverse effects on mutual funds and their investments. Although multiple asset classes may be affected by market disruption, the duration and impact may not be the same for all types of assets.
Fidelity is committed to helping you stay informed amid news about COVID-19 and during increased market volatility, and we’re taking extra steps to be responsive to customer needs. We encourage you to visit our websites, where we offer ongoing updates, commentary, and analysis on the markets and our funds.
Investment Summary (Unaudited)
Top Ten Stocks as of May 31, 2021
| % of fund's net assets | |
| General Electric Co. | 4.6 |
| Wells Fargo & Co. | 3.4 |
| Bristol-Myers Squibb Co. | 2.3 |
| Comcast Corp. Class A | 2.2 |
| Exxon Mobil Corp. | 2.2 |
| Bank of America Corp. | 2.1 |
| PNC Financial Services Group, Inc. | 1.9 |
| American International Group, Inc. | 1.8 |
| Hess Corp. | 1.6 |
| UnitedHealth Group, Inc. | 1.4 |
| 23.5 |
Top Five Market Sectors as of May 31, 2021
| % of fund's net assets | |
| Financials | 18.2 |
| Health Care | 15.5 |
| Industrials | 14.4 |
| Consumer Discretionary | 13.6 |
| Energy | 9.4 |
Asset Allocation (% of fund's net assets)
| As of May 31, 2021* | ||
| Stocks | 96.8% | |
| Convertible Securities | 0.9% | |
| Other Investments | 0.1% | |
| Short-Term Investments and Net Other Assets (Liabilities) | 2.2% | |

* Foreign investments - 17.8%
Schedule of Investments May 31, 2021 (Unaudited)
Showing Percentage of Net Assets
| Common Stocks - 95.8% | |||
| Shares | Value (000s) | ||
| COMMUNICATION SERVICES - 5.7% | |||
| Diversified Telecommunication Services - 1.2% | |||
| Verizon Communications, Inc. | 610,600 | $34,493 | |
| Media - 4.5% | |||
| Comcast Corp. Class A | 1,114,400 | 63,900 | |
| Endeavor Group Holdings, Inc. (a) | 758,230 | 20,233 | |
| Interpublic Group of Companies, Inc. | 670,000 | 22,572 | |
| Omnicom Group, Inc. | 264,500 | 21,752 | |
| 128,457 | |||
| TOTAL COMMUNICATION SERVICES | 162,950 | ||
| CONSUMER DISCRETIONARY - 12.3% | |||
| Auto Components - 0.4% | |||
| Faurecia SA (b) | 18,369 | 994 | |
| Magna International, Inc. Class A | 99,400 | 9,999 | |
| 10,993 | |||
| Automobiles - 1.9% | |||
| Aston Martin Lagonda Global Holdings PLC (a)(b)(c) | 511,679 | 15,309 | |
| General Motors Co. (a) | 389,900 | 23,125 | |
| Stellantis NV | 750,900 | 14,695 | |
| 53,129 | |||
| Hotels, Restaurants & Leisure - 1.3% | |||
| Churchill Downs, Inc. | 57,100 | 11,393 | |
| Elior SA (a)(c) | 908,700 | 7,184 | |
| The Booking Holdings, Inc. (a) | 8,000 | 18,892 | |
| 37,469 | |||
| Household Durables - 1.9% | |||
| D.R. Horton, Inc. | 250,900 | 23,908 | |
| Mohawk Industries, Inc. (a) | 79,300 | 16,707 | |
| NVR, Inc. (a) | 3,010 | 14,711 | |
| 55,326 | |||
| Internet & Direct Marketing Retail - 1.5% | |||
| Coupang Corp. unit (d) | 734,506 | 26,964 | |
| Coupang, Inc. Class A (a)(b) | 22,600 | 922 | |
| eBay, Inc. | 138,300 | 8,420 | |
| Farfetch Ltd. Class A (a) | 152,100 | 7,047 | |
| 43,353 | |||
| Leisure Products - 0.5% | |||
| Allstar Co-Invest Blocker LP (a)(d) | 30,774 | 7,074 | |
| Peloton Interactive, Inc. Class A (a) | 58,816 | 6,488 | |
| 13,562 | |||
| Specialty Retail - 1.9% | |||
| AutoZone, Inc. (a) | 9,900 | 13,925 | |
| Best Buy Co., Inc. | 115,100 | 13,379 | |
| Industria de Diseno Textil SA | 371,000 | 14,377 | |
| National Vision Holdings, Inc. (a) | 124,300 | 6,174 | |
| Vroom, Inc. (b) | 137,300 | 6,070 | |
| 53,925 | |||
| Textiles, Apparel & Luxury Goods - 2.9% | |||
| Allbirds, Inc. (a)(d)(e) | 22,235 | 240 | |
| Brunello Cucinelli SpA | 545,800 | 34,406 | |
| PVH Corp. (a) | 117,100 | 13,445 | |
| Ralph Lauren Corp. | 64,300 | 7,978 | |
| Tapestry, Inc. (a) | 360,800 | 16,196 | |
| Under Armour, Inc. Class A (sub. vtg.) (a) | 393,700 | 8,890 | |
| 81,155 | |||
| TOTAL CONSUMER DISCRETIONARY | 348,912 | ||
| CONSUMER STAPLES - 3.8% | |||
| Beverages - 1.7% | |||
| Diageo PLC sponsored ADR | 72,300 | 13,972 | |
| Molson Coors Beverage Co. Class B (a) | 154,800 | 9,028 | |
| The Coca-Cola Co. | 457,200 | 25,279 | |
| 48,279 | |||
| Food & Staples Retailing - 1.0% | |||
| BJ's Wholesale Club Holdings, Inc. (a) | 237,400 | 10,633 | |
| Kroger Co. | 473,900 | 17,525 | |
| 28,158 | |||
| Food Products - 0.4% | |||
| Greencore Group PLC (a) | 5,092,161 | 10,193 | |
| Tobacco - 0.7% | |||
| Altria Group, Inc. | 430,500 | 21,189 | |
| TOTAL CONSUMER STAPLES | 107,819 | ||
| ENERGY - 9.3% | |||
| Energy Equipment & Services - 1.2% | |||
| Oceaneering International, Inc. (a) | 504,852 | 7,204 | |
| Odfjell Drilling Ltd. (a) | 3,848,024 | 10,208 | |
| Schlumberger Ltd. | 432,100 | 13,538 | |
| Technip Energies NV ADR (a) | 58,160 | 875 | |
| TechnipFMC PLC (a) | 291,100 | 2,501 | |
| 34,326 | |||
| Oil, Gas & Consumable Fuels - 8.1% | |||
| Canadian Natural Resources Ltd. | 686,200 | 24,082 | |
| Cheniere Energy, Inc. (a) | 358,500 | 30,437 | |
| Energy Transfer LP | 699,300 | 6,923 | |
| EQT Corp. (a) | 306,000 | 6,389 | |
| Exxon Mobil Corp. | 1,090,900 | 63,676 | |
| Golar LNG Ltd. (a) | 762,800 | 9,688 | |
| Hess Corp. | 538,100 | 45,104 | |
| Range Resources Corp. (a) | 421,700 | 5,718 | |
| The Williams Companies, Inc. | 942,997 | 24,839 | |
| Valero Energy Corp. | 166,700 | 13,403 | |
| 230,259 | |||
| TOTAL ENERGY | 264,585 | ||
| FINANCIALS - 18.2% | |||
| Banks - 8.3% | |||
| Bank of America Corp. | 1,396,000 | 59,176 | |
| Comerica, Inc. | 170,000 | 13,343 | |
| HDFC Bank Ltd. sponsored ADR (a) | 144,800 | 11,082 | |
| PNC Financial Services Group, Inc. | 275,000 | 53,537 | |
| Wells Fargo & Co. | 2,097,800 | 98,009 | |
| 235,147 | |||
| Capital Markets - 2.9% | |||
| Goldman Sachs Group, Inc. | 81,800 | 30,431 | |
| Morgan Stanley | 309,600 | 28,158 | |
| Sixth Street Specialty Lending, Inc. | 1,043,239 | 23,285 | |
| 81,874 | |||
| Insurance - 5.4% | |||
| American International Group, Inc. | 973,000 | 51,413 | |
| Arch Capital Group Ltd. (a) | 602,500 | 24,034 | |
| Chubb Ltd. | 196,709 | 33,439 | |
| First American Financial Corp. | 125,500 | 8,071 | |
| Hiscox Ltd. (a) | 639,207 | 7,121 | |
| MetLife, Inc. | 353,100 | 23,079 | |
| RenaissanceRe Holdings Ltd. | 33,000 | 5,086 | |
| 152,243 | |||
| Thrifts & Mortgage Finance - 1.6% | |||
| Housing Development Finance Corp. Ltd. | 329,468 | 11,598 | |
| Radian Group, Inc. | 1,499,623 | 35,016 | |
| 46,614 | |||
| TOTAL FINANCIALS | 515,878 | ||
| HEALTH CARE - 15.4% | |||
| Biotechnology - 1.1% | |||
| Amgen, Inc. | 93,800 | 22,319 | |
| Regeneron Pharmaceuticals, Inc. (a) | 16,800 | 8,441 | |
| 30,760 | |||
| Health Care Equipment & Supplies - 3.8% | |||
| Becton, Dickinson & Co. | 89,800 | 21,722 | |
| Boston Scientific Corp. (a) | 596,400 | 25,377 | |
| Butterfly Network, Inc. (d) | 557,178 | 6,547 | |
| Butterfly Network, Inc. | 1,101,048 | 12,290 | |
| Butterfly Network, Inc. Class A (a)(b) | 279,000 | 3,278 | |
| Danaher Corp. | 110,300 | 28,252 | |
| Hologic, Inc. (a) | 170,400 | 10,745 | |
| 108,211 | |||
| Health Care Providers & Services - 4.4% | |||
| Centene Corp. (a) | 292,700 | 21,543 | |
| Cigna Corp. | 103,700 | 26,843 | |
| Guardant Health, Inc. (a) | 73,400 | 9,110 | |
| Oak Street Health, Inc. (a) | 270,133 | 16,313 | |
| UnitedHealth Group, Inc. | 96,000 | 39,544 | |
| Universal Health Services, Inc. Class B | 69,300 | 11,062 | |
| 124,415 | |||
| Life Sciences Tools & Services - 0.8% | |||
| Bruker Corp. | 347,922 | 24,160 | |
| Pharmaceuticals - 5.3% | |||
| Bristol-Myers Squibb Co. | 1,009,200 | 66,325 | |
| Eli Lilly & Co. | 174,600 | 34,875 | |
| Roche Holding AG (participation certificate) | 57,910 | 20,146 | |
| Sanofi SA | 133,300 | 14,177 | |
| Viatris, Inc. | 1,054,400 | 16,069 | |
| 151,592 | |||
| TOTAL HEALTH CARE | 439,138 | ||
| INDUSTRIALS - 14.3% | |||
| Aerospace & Defense - 4.0% | |||
| BWX Technologies, Inc. | 218,100 | 13,640 | |
| General Dynamics Corp. | 127,100 | 24,138 | |
| Huntington Ingalls Industries, Inc. | 118,700 | 25,664 | |
| Kratos Defense & Security Solutions, Inc. (a) | 1,096 | 27 | |
| Northrop Grumman Corp. | 70,800 | 25,904 | |
| Space Exploration Technologies Corp.: | |||
| Class A (a)(d)(e) | 58,589 | 24,607 | |
| Class C (a)(d)(e) | 818 | 344 | |
| 114,324 | |||
| Air Freight & Logistics - 0.5% | |||
| XPO Logistics, Inc. (a) | 104,800 | 15,398 | |
| Airlines - 0.3% | |||
| JetBlue Airways Corp. (a) | 478,400 | 9,616 | |
| Building Products - 0.7% | |||
| Fortune Brands Home & Security, Inc. | 135,300 | 13,958 | |
| Jeld-Wen Holding, Inc. (a) | 254,700 | 7,134 | |
| 21,092 | |||
| Commercial Services & Supplies - 0.5% | |||
| Stericycle, Inc. (a) | 149,600 | 11,753 | |
| U.S. Ecology, Inc. (a) | 89,235 | 3,536 | |
| 15,289 | |||
| Construction & Engineering - 0.6% | |||
| AECOM (a) | 122,500 | 7,964 | |
| Argan, Inc. | 164,600 | 8,082 | |
| 16,046 | |||
| Electrical Equipment - 0.5% | |||
| Sensata Technologies, Inc. PLC (a) | 235,100 | 13,972 | |
| Industrial Conglomerates - 5.0% | |||
| General Electric Co. | 9,207,300 | 129,450 | |
| Melrose Industries PLC | 4,646,228 | 11,400 | |
| 140,850 | |||
| Machinery - 0.6% | |||
| Donaldson Co., Inc. | 121,700 | 7,496 | |
| Pentair PLC | 143,200 | 9,877 | |
| 17,373 | |||
| Marine - 0.4% | |||
| Goodbulk Ltd. (a)(e) | 959,290 | 10,498 | |
| Professional Services - 0.6% | |||
| Leidos Holdings, Inc. | 95,700 | 9,833 | |
| Science Applications International Corp. | 72,000 | 6,470 | |
| 16,303 | |||
| Road & Rail - 0.6% | |||
| Knight-Swift Transportation Holdings, Inc. Class A | 357,886 | 17,082 | |
| TOTAL INDUSTRIALS | 407,843 | ||
| INFORMATION TECHNOLOGY - 6.8% | |||
| Communications Equipment - 1.9% | |||
| Cisco Systems, Inc. | 722,600 | 38,226 | |
| Ericsson (B Shares) | 1,266,000 | 16,793 | |
| 55,019 | |||
| Electronic Equipment & Components - 0.6% | |||
| Keysight Technologies, Inc. (a) | 119,300 | 16,986 | |
| IT Services - 2.7% | |||
| Akamai Technologies, Inc. (a) | 132,000 | 15,076 | |
| Euronet Worldwide, Inc. (a) | 58,700 | 8,784 | |
| Fidelity National Information Services, Inc. | 123,300 | 18,369 | |
| Fiserv, Inc. (a) | 1 | 0 | |
| Visa, Inc. Class A | 147,900 | 33,618 | |
| 75,847 | |||
| Semiconductors & Semiconductor Equipment - 1.6% | |||
| Analog Devices, Inc. (b) | 92,500 | 15,226 | |
| Intel Corp. | 514,200 | 29,371 | |
| 44,597 | |||
| TOTAL INFORMATION TECHNOLOGY | 192,449 | ||
| MATERIALS - 5.2% | |||
| Chemicals - 1.7% | |||
| LG Chemical Ltd. | 28,050 | 20,726 | |
| Nutrien Ltd. | 170,120 | 10,481 | |
| Olin Corp. | 324,300 | 15,855 | |
| 47,062 | |||
| Containers & Packaging - 1.3% | |||
| Avery Dennison Corp. | 59,000 | 13,011 | |
| O-I Glass, Inc. (a) | 1,266,700 | 23,345 | |
| 36,356 | |||
| Metals & Mining - 2.2% | |||
| Franco-Nevada Corp. | 133,400 | 19,717 | |
| Freeport-McMoRan, Inc. | 479,700 | 20,493 | |
| Newcrest Mining Ltd. | 407,095 | 8,922 | |
| Novagold Resources, Inc. (a) | 1,424,280 | 14,538 | |
| 63,670 | |||
| TOTAL MATERIALS | 147,088 | ||
| REAL ESTATE - 2.6% | |||
| Equity Real Estate Investment Trusts (REITs) - 2.6% | |||
| Cousins Properties, Inc. | 186,288 | 6,909 | |
| Gaming & Leisure Properties | 286,083 | 13,263 | |
| Healthcare Trust of America, Inc. | 235,700 | 6,461 | |
| Simon Property Group, Inc. | 82,100 | 10,549 | |
| Spirit Realty Capital, Inc. | 284,060 | 13,425 | |
| VEREIT, Inc. | 151,500 | 7,207 | |
| VICI Properties, Inc. (b) | 485,500 | 15,114 | |
| 72,928 | |||
| UTILITIES - 2.2% | |||
| Electric Utilities - 1.8% | |||
| Duke Energy Corp. | 254,400 | 25,496 | |
| FirstEnergy Corp. | 226,100 | 8,571 | |
| Southern Co. | 284,800 | 18,204 | |
| 52,271 | |||
| Independent Power and Renewable Electricity Producers - 0.4% | |||
| The AES Corp. | 445,100 | 11,310 | |
| TOTAL UTILITIES | 63,581 | ||
| TOTAL COMMON STOCKS | |||
| (Cost $1,889,774) | 2,723,171 | ||
| Preferred Stocks - 1.8% | |||
| Convertible Preferred Stocks - 0.8% | |||
| CONSUMER DISCRETIONARY - 0.2% | |||
| Textiles, Apparel & Luxury Goods - 0.2% | |||
| Allbirds, Inc.: | |||
| Series A (a)(d)(e) | 8,775 | 95 | |
| Series B (a)(d)(e) | 1,540 | 17 | |
| Series C (a)(d)(e) | 14,735 | 159 | |
| Series D (a)(d)(e) | 28,273 | 305 | |
| Series Seed (a)(d)(e) | 41,664 | 449 | |
| Bolt Threads, Inc. Series D (a)(d)(e) | 390,327 | 4,672 | |
| 5,697 | |||
| CONSUMER STAPLES - 0.4% | |||
| Food & Staples Retailing - 0.0% | |||
| Sweetgreen, Inc.: | |||
| Series C (a)(d)(e) | 1,587 | 21 | |
| Series D (a)(d)(e) | 25,534 | 336 | |
| Series I (a)(d)(e) | 60,179 | 791 | |
| 1,148 | |||
| Food Products - 0.4% | |||
| Bowery Farming, Inc. Series C1 (d)(e) | 161,754 | 9,746 | |
| TOTAL CONSUMER STAPLES | 10,894 | ||
| HEALTH CARE - 0.1% | |||
| Biotechnology - 0.1% | |||
| National Resilience, Inc. Series B (d)(e) | 243,347 | 3,324 | |
| INDUSTRIALS - 0.1% | |||
| Aerospace & Defense - 0.1% | |||
| Space Exploration Technologies Corp. Series H (a)(d)(e) | 7,570 | 3,179 | |
| TOTAL CONVERTIBLE PREFERRED STOCKS | 23,094 | ||
| Nonconvertible Preferred Stocks - 1.0% | |||
| CONSUMER DISCRETIONARY - 1.0% | |||
| Automobiles - 1.0% | |||
| Porsche Automobil Holding SE (Germany) | 235,100 | 26,593 | |
| TOTAL PREFERRED STOCKS | |||
| (Cost $41,576) | 49,687 | ||
| Principal Amount (000s) | Value (000s) | ||
| Corporate Bonds - 0.1% | |||
| Convertible Bonds - 0.1% | |||
| CONSUMER DISCRETIONARY - 0.1% | |||
| Textiles, Apparel & Luxury Goods - 0.1% | |||
| Bolt Threads, Inc. 3% 2/7/23 (d)(e) | 2,915 | 2,915 | |
| Nonconvertible Bonds - 0.0% | |||
| ENERGY - 0.0% | |||
| Energy Equipment & Services - 0.0% | |||
| Pacific Drilling SA 12% 4/1/24 pay-in-kind (c)(e)(f)(g) | 214 | 9 | |
| TOTAL CORPORATE BONDS | |||
| (Cost $3,131) | 2,924 | ||
| Shares | Value (000s) | ||
| Other - 0.1% | |||
| ENERGY – 0.1% | |||
| Oil, Gas & Consumable Fuels – 0.1% | |||
| Utica Shale Drilling Program (non-operating revenue interest) (d)(e)(h) | |||
| (Cost $8,368) | 8,367,654 | 3,715 | |
| Money Market Funds - 3.1% | |||
| Fidelity Cash Central Fund 0.03% (i) | 60,548,353 | 60,560 | |
| Fidelity Securities Lending Cash Central Fund 0.03% (i)(j) | 27,610,240 | 27,613 | |
| TOTAL MONEY MARKET FUNDS | |||
| (Cost $88,173) | 88,173 | ||
| TOTAL INVESTMENT IN SECURITIES - 100.9% | |||
| (Cost $2,031,022) | 2,867,670 | ||
| NET OTHER ASSETS (LIABILITIES) - (0.9)% | (25,995) | ||
| NET ASSETS - 100% | $2,841,675 |
Values shown as $0 in the Schedule of Investments may reflect amounts less than $500.
Legend
(a) Non-income producing
(b) Security or a portion of the security is on loan at period end.
(c) Security exempt from registration under Rule 144A of the Securities Act of 1933. These securities may be resold in transactions exempt from registration, normally to qualified institutional buyers. At the end of the period, the value of these securities amounted to $22,502,000 or 0.8% of net assets.
(d) Restricted securities (including private placements) - Investment in securities not registered under the Securities Act of 1933 (excluding 144A issues). At the end of the period, the value of restricted securities (excluding 144A issues) amounted to $95,498,000 or 3.4% of net assets.
(e) Level 3 security
(f) Non-income producing - Security is in default.
(g) Coupon rates for floating and adjustable rate securities reflect the rates in effect at period end.
(h) Investment is owned by a wholly-owned subsidiary (Subsidiary) that is treated as a corporation for U.S. tax purposes.
(i) Affiliated fund that is generally available only to investment companies and other accounts managed by Fidelity Investments. The rate quoted is the annualized seven-day yield of the fund at period end. A complete unaudited listing of the fund's holdings as of its most recent quarter end is available upon request. In addition, each Fidelity Central Fund's financial statements are available on the SEC's website or upon request.
(j) Investment made with cash collateral received from securities on loan.
Additional information on each restricted holding is as follows:
| Security | Acquisition Date | Acquisition Cost (000s) |
| Allbirds, Inc. | 10/9/18 | $244 |
| Allbirds, Inc. Series A | 10/9/18 | $96 |
| Allbirds, Inc. Series B | 10/9/18 | $17 |
| Allbirds, Inc. Series C | 10/9/18 | $162 |
| Allbirds, Inc. Series D | 12/23/19 | $364 |
| Allbirds, Inc. Series Seed | 10/9/18 - 1/23/20 | $416 |
| Allstar Co-Invest Blocker LP | 8/1/11 | $3,873 |
| Bolt Threads, Inc. Series D | 12/13/17 | $6,261 |
| Bolt Threads, Inc. 3% 2/7/23 | 2/7/20 | $2,915 |
| Bowery Farming, Inc. Series C1 | 5/18/21 | $9,746 |
| Butterfly Network, Inc. | 2/12/21 | $5,572 |
| Coupang Corp. unit | 6/12/20 | $5,509 |
| National Resilience, Inc. Series B | 12/1/20 | $3,324 |
| Space Exploration Technologies Corp. Class A | 4/8/16 - 9/11/17 | $5,981 |
| Space Exploration Technologies Corp. Class C | 9/11/17 | $110 |
| Space Exploration Technologies Corp. Series H | 8/4/17 | $1,022 |
| Sweetgreen, Inc. Series C | 9/13/19 | $27 |
| Sweetgreen, Inc. Series D | 9/13/19 | $437 |
| Sweetgreen, Inc. Series I | 9/13/19 | $1,029 |
| Utica Shale Drilling Program (non-operating revenue interest) | 10/5/16 - 9/1/17 | $8,368 |
Affiliated Central Funds
Information regarding fiscal year to date income earned by the Fund from investments in Fidelity Central Funds is as follows:
| Fund | Income earned |
| (Amounts in thousands) | |
| Fidelity Cash Central Fund | $11 |
| Fidelity Securities Lending Cash Central Fund | 235 |
| Total | $246 |
Amounts in the income column in the above table include any capital gain distributions from underlying funds, which are presented in the corresponding line-item in the Statement of Operations, if applicable. Amount for Fidelity Securities Lending Cash Central Fund represents the income earned on investing cash collateral, less rebates paid to borrowers and any lending agent fees associated with the loan, plus any premium payments received for lending certain types of securities.
Investment Valuation
The following is a summary of the inputs used, as of May 31, 2021, involving the Fund's assets and liabilities carried at fair value. The inputs or methodology used for valuing securities may not be an indication of the risk associated with investing in those securities. For more information on valuation inputs, and their aggregation into the levels used below, please refer to the Investment Valuation section in the accompanying Notes to Financial Statements.
| Valuation Inputs at Reporting Date: | ||||
| Description | Total | Level 1 | Level 2 | Level 3 |
| (Amounts in thousands) | ||||
| Investments in Securities: | ||||
| Equities: | ||||
| Communication Services | $162,950 | $142,717 | $20,233 | $-- |
| Consumer Discretionary | 381,202 | 341,227 | 34,038 | 5,937 |
| Consumer Staples | 118,713 | 107,819 | -- | 10,894 |
| Energy | 264,585 | 264,585 | -- | -- |
| Financials | 515,878 | 515,878 | -- | -- |
| Health Care | 442,462 | 426,848 | 12,290 | 3,324 |
| Industrials | 411,022 | 372,394 | -- | 38,628 |
| Information Technology | 192,449 | 192,449 | -- | -- |
| Materials | 147,088 | 147,088 | -- | -- |
| Real Estate | 72,928 | 72,928 | -- | -- |
| Utilities | 63,581 | 63,581 | -- | -- |
| Corporate Bonds | 2,924 | -- | -- | 2,924 |
| Other | 3,715 | -- | -- | 3,715 |
| Money Market Funds | 88,173 | 88,173 | -- | -- |
| Total Investments in Securities: | $2,867,670 | $2,735,687 | $66,561 | $65,422 |
The following is a reconciliation of Investments in Securities for which Level 3 inputs were used in determining value:
| (Amounts in thousands) | |
| Investments in Securities: | |
| Equities - Industrials | |
| Beginning Balance | $29,574 |
| Net Realized Gain (Loss) on Investment Securities | -- |
| Net Unrealized Gain (Loss) on Investment Securities | 9,054 |
| Cost of Purchases | -- |
| Proceeds of Sales | -- |
| Amortization/Accretion | -- |
| Transfers into Level 3 | -- |
| Transfers out of Level 3 | -- |
| Ending Balance | $38,628 |
| The change in unrealized gain (loss) for the period attributable to Level 3 securities held at May 31, 2021 | $9,054 |
| Other Investments in Securities | |
| Beginning Balance | $29,812 |
| Net Realized Gain (Loss) on Investment Securities | 46 |
| Net Unrealized Gain (Loss) on Investment Securities | (700) |
| Cost of Purchases | 18,648 |
| Proceeds of Sales | (4,080) |
| Amortization/Accretion | (5,577) |
| Transfers into Level 3 | 9 |
| Transfers out of Level 3 | (11,364) |
| Ending Balance | $26,794 |
| The change in unrealized gain (loss) for the period attributable to Level 3 securities held at May 31, 2021 | $(696) |
The information used in the above reconciliations represents fiscal year to date activity for any Investments in Securities identified as using Level 3 inputs at either the beginning or the end of the current fiscal period. Cost of purchases and proceeds of sales may include securities received and/or delivered through in-kind transactions. Transfers in or out of Level 3 represent the beginning value of any Security or Instrument where a change in the pricing level occurred from the beginning to the end of the period. The cost of purchases and the proceeds of sales may include securities received or delivered through corporate actions or exchanges. Realized and unrealized gains (losses) disclosed in the reconciliations are included in Net Gain (Loss) on the Fund's Statement of Operations.
Other Information
Distribution of investments by country or territory of incorporation, as a percentage of Total Net Assets, is as follows (Unaudited):
| United States of America | 82.2% |
| Canada | 2.9% |
| Bermuda | 2.4% |
| United Kingdom | 2.1% |
| Switzerland | 1.9% |
| Korea (South) | 1.7% |
| Italy | 1.2% |
| Germany | 1.0% |
| Others (Individually Less Than 1%) | 4.6% |
| 100.0% |
See accompanying notes which are an integral part of the financial statements.
Financial Statements
Statement of Assets and Liabilities
| Amounts in thousands (except per-share amount) | May 31, 2021 (Unaudited) | |
| Assets | ||
| Investment in securities, at value (including securities loaned of $27,075) — See accompanying schedule: Unaffiliated issuers (cost $1,942,849) | $2,779,497 | |
| Fidelity Central Funds (cost $88,173) | 88,173 | |
| Total Investment in Securities (cost $2,031,022) | $2,867,670 | |
| Cash | 2,760 | |
| Restricted cash | 20 | |
| Receivable for investments sold | 559 | |
| Receivable for fund shares sold | 371 | |
| Dividends receivable | 4,286 | |
| Interest receivable | 41 | |
| Distributions receivable from Fidelity Central Funds | 4 | |
| Prepaid expenses | 1 | |
| Other receivables | 25 | |
| Total assets | 2,875,737 | |
| Liabilities | ||
| Payable for investments purchased | $4,454 | |
| Payable for fund shares redeemed | 820 | |
| Accrued management fee | 766 | |
| Other affiliated payables | 369 | |
| Other payables and accrued expenses | 50 | |
| Collateral on securities loaned | 27,603 | |
| Total liabilities | 34,062 | |
| Net Assets | $2,841,675 | |
| Net Assets consist of: | ||
| Paid in capital | $1,847,657 | |
| Total accumulated earnings (loss) | 994,018 | |
| Net Assets | $2,841,675 | |
| Net Asset Value, offering price and redemption price per share ($2,841,675 ÷ 63,581 shares) | $44.69 |
See accompanying notes which are an integral part of the financial statements.
Statement of Operations
| Amounts in thousands | Six months ended May 31, 2021 (Unaudited) | |
| Investment Income | ||
| Dividends | $24,256 | |
| Non-Cash dividends | 1,876 | |
| Income from Fidelity Central Funds (including $235 from security lending) | 246 | |
| Total income | 26,378 | |
| Expenses | ||
| Management fee | ||
| Basic fee | $6,810 | |
| Performance adjustment | (2,818) | |
| Transfer agent fees | 1,706 | |
| Accounting fees | 384 | |
| Custodian fees and expenses | 29 | |
| Independent trustees' fees and expenses | 5 | |
| Registration fees | 37 | |
| Audit | 43 | |
| Legal | 5 | |
| Interest | 1 | |
| Miscellaneous | 4 | |
| Total expenses before reductions | 6,206 | |
| Expense reductions | (85) | |
| Total expenses after reductions | 6,121 | |
| Net investment income (loss) | 20,257 | |
| Realized and Unrealized Gain (Loss) | ||
| Net realized gain (loss) on: | ||
| Investment securities: | ||
| Unaffiliated issuers | 139,294 | |
| Fidelity Central Funds | (10) | |
| Foreign currency transactions | 45 | |
| Total net realized gain (loss) | 139,329 | |
| Change in net unrealized appreciation (depreciation) on: | ||
| Investment securities: | ||
| Unaffiliated issuers | 484,376 | |
| Fidelity Central Funds | (1) | |
| Assets and liabilities in foreign currencies | 9 | |
| Total change in net unrealized appreciation (depreciation) | 484,384 | |
| Net gain (loss) | 623,713 | |
| Net increase (decrease) in net assets resulting from operations | $643,970 |
See accompanying notes which are an integral part of the financial statements.
Statement of Changes in Net Assets
| Amounts in thousands | Six months ended May 31, 2021 (Unaudited) | Year ended November 30, 2020 |
| Increase (Decrease) in Net Assets | ||
| Operations | ||
| Net investment income (loss) | $20,257 | $38,292 |
| Net realized gain (loss) | 139,329 | 182,154 |
| Change in net unrealized appreciation (depreciation) | 484,384 | (239,605) |
| Net increase (decrease) in net assets resulting from operations | 643,970 | (19,159) |
| Distributions to shareholders | (190,997) | (127,086) |
| Share transactions | ||
| Proceeds from sales of shares | 180,358 | 68,685 |
| Reinvestment of distributions | 181,627 | 120,699 |
| Cost of shares redeemed | (304,083) | (703,298) |
| Net increase (decrease) in net assets resulting from share transactions | 57,902 | (513,914) |
| Total increase (decrease) in net assets | 510,875 | (660,159) |
| Net Assets | ||
| Beginning of period | 2,330,800 | 2,990,959 |
| End of period | $2,841,675 | $2,330,800 |
| Other Information | ||
| Shares | ||
| Sold | 4,580 | 2,085 |
| Issued in reinvestment of distributions | 5,013 | 3,211 |
| Redeemed | (7,722) | (21,417) |
| Net increase (decrease) | 1,871 | (16,121) |
See accompanying notes which are an integral part of the financial statements.
Financial Highlights
Fidelity New Millennium Fund
| Six months ended (Unaudited) May 31, | Years endedNovember 30, | |||||
| 2021 | 2020 | 2019 | 2018 | 2017 | 2016 | |
| Selected Per–Share Data | ||||||
| Net asset value, beginning of period | $37.77 | $38.43 | $40.52 | $42.70 | $37.56 | $38.99 |
| Income from Investment Operations | ||||||
| Net investment income (loss)A | .32 | .54 | .62 | .43 | .38 | .43 |
| Net realized and unrealized gain (loss) | 9.75 | .45B | 3.11 | .87 | 7.01 | 2.31 |
| Total from investment operations | 10.07 | .99 | 3.73 | 1.30 | 7.39 | 2.74 |
| Distributions from net investment income | (.58) | (.36) | (.39) | (.36) | (.43) | (.35) |
| Distributions from net realized gain | (2.56) | (1.29) | (5.43) | (3.12) | (1.82) | (3.82) |
| Total distributions | (3.15)C | (1.65) | (5.82) | (3.48) | (2.25) | (4.17) |
| Net asset value, end of period | $44.69 | $37.77 | $38.43 | $40.52 | $42.70 | $37.56 |
| Total ReturnD,E | 28.60% | 2.60% | 12.82% | 3.19% | 20.69% | 8.57% |
| Ratios to Average Net AssetsF,G | ||||||
| Expenses before reductions | .48%H | .46% | .61% | .64% | .54% | .57% |
| Expenses net of fee waivers, if any | .48%H | .46% | .61% | .64% | .54% | .57% |
| Expenses net of all reductions | .47%H | .45% | .61% | .63% | .54% | .57% |
| Net investment income (loss) | 1.56%H | 1.61% | 1.72% | 1.03% | .98% | 1.25% |
| Supplemental Data | ||||||
| Net assets, end of period (in millions) | $2,842 | $2,331 | $2,991 | $3,206 | $3,288 | $3,045 |
| Portfolio turnover rateI | 32%H | 22% | 34% | 37% | 31% | 44% |
A Calculated based on average shares outstanding during the period.
B The amount shown for a share outstanding does not correspond with the aggregate net gain (loss) on investments for the period due to the timing of sales and repurchases of shares in relation to fluctuating market values of the investments of the Fund.
C Total distributions per share do not sum due to rounding.
D Total returns for periods of less than one year are not annualized.
E Total returns would have been lower if certain expenses had not been reduced during the applicable periods shown.
F Fees and expenses of any underlying mutual funds or exchange-traded funds (ETFs) are not included in the Fund's expense ratio. The Fund indirectly bears its proportionate share of these expenses. For additional expense information related to investments in Fidelity Central Funds, please refer to the "Investments in Fidelity Central Funds" note found in the Notes to Financial Statements section of the most recent Annual or Semi-Annual report.
G Expense ratios reflect operating expenses of the class. Expenses before reductions do not reflect amounts reimbursed, waived, or reduced through arrangements with the investment advisor, brokerage services, or other offset arrangements, if applicable, and do not represent the amount paid by the class during periods when reimbursements, waivers or reductions occur.
H Annualized
I Amount does not include the portfolio activity of any underlying mutual funds or exchange-traded funds (ETFs).
See accompanying notes which are an integral part of the financial statements.
Notes to Financial Statements (Unaudited)
For the period ended May 31, 2021
(Amounts in thousands except percentages)
1. Organization.
Fidelity New Millennium Fund (the Fund) is a fund of Fidelity Mt. Vernon Street Trust (the Trust) and is authorized to issue an unlimited number of shares. Share transactions on the Statement of Changes in Net Assets may contain exchanges between affiliated funds. The Trust is registered under the Investment Company Act of 1940, as amended (the 1940 Act), as an open-end management investment company organized as a Massachusetts business trust.
2. Investments in Fidelity Central Funds.
Funds may invest in Fidelity Central Funds, which are open-end investment companies generally available only to other investment companies and accounts managed by the investment adviser and its affiliates. The Schedule of Investments lists any Fidelity Central Funds held as an investment as of period end, but does not include the underlying holdings of each Fidelity Central Fund. An investing fund indirectly bears its proportionate share of the expenses of the underlying Fidelity Central Funds.
Based on its investment objective, each Fidelity Central Fund may invest or participate in various investment vehicles or strategies that are similar to those of the investing fund. These strategies are consistent with the investment objectives of the investing fund and may involve certain economic risks which may cause a decline in value of each of the Fidelity Central Funds and thus a decline in the value of the investing fund.
| Fidelity Central Fund | Investment Manager | Investment Objective | Investment Practices | Expense Ratio(a) |
| Fidelity Money Market Central Funds | Fidelity Management & Research Company LLC (FMR) | Each fund seeks to obtain a high level of current income consistent with the preservation of capital and liquidity. | Short-term Investments | Less than .005% to .01% |
(a) Expenses expressed as a percentage of average net assets and are as of each underlying Central Fund's most recent annual or semi-annual shareholder report.
A complete unaudited list of holdings for each Fidelity Central Fund is available upon request or at the Securities and Exchange Commission website at www.sec.gov. In addition, the financial statements of the Fidelity Central Funds which contain the significant accounting policies (including investment valuation policies) of those funds, and are not covered by the Report of Independent Registered Public Accounting Firm, are available on the Securities and Exchange Commission website or upon request.
3. Significant Accounting Policies.
The Fund is an investment company and applies the accounting and reporting guidance of the Financial Accounting Standards Board (FASB) Accounting Standards Codification Topic 946 Financial Services - Investment Companies. The financial statements have been prepared in conformity with accounting principles generally accepted in the United States of America (GAAP), which require management to make certain estimates and assumptions at the date of the financial statements. Actual results could differ from those estimates. Subsequent events, if any, through the date that the financial statements were issued have been evaluated in the preparation of the financial statements. The Fund's Schedule of Investments lists any underlying mutual funds or exchange-traded funds (ETFs) but does not include the underlying holdings of these funds. The following summarizes the significant accounting policies of the Fund:
Investment Valuation. Investments are valued as of 4:00 p.m. Eastern time on the last calendar day of the period. The Board of Trustees (the Board) has delegated the day to day responsibility for the valuation of the Fund's investments to the Fair Value Committee (the Committee) established by the Fund's investment adviser. In accordance with valuation policies and procedures approved by the Board, the Fund attempts to obtain prices from one or more third party pricing vendors or brokers to value its investments. When current market prices, quotations or currency exchange rates are not readily available or reliable, investments will be fair valued in good faith by the Committee, in accordance with procedures adopted by the Board. Factors used in determining fair value vary by investment type and may include market or investment specific events, changes in interest rates and credit quality. The frequency with which these procedures are used cannot be predicted and they may be utilized to a significant extent. The Committee oversees the Fund's valuation policies and procedures and reports to the Board on the Committee's activities and fair value determinations. The Board monitors the appropriateness of the procedures used in valuing the Fund's investments and ratifies the fair value determinations of the Committee.
The Fund categorizes the inputs to valuation techniques used to value its investments into a disclosure hierarchy consisting of three levels as shown below:
- Level 1 – quoted prices in active markets for identical investments
- Level 2 – other significant observable inputs (including quoted prices for similar investments, interest rates, prepayment speeds, etc.)
- Level 3 – unobservable inputs (including the Fund's own assumptions based on the best information available)
Valuation techniques used to value the Fund's investments by major category are as follows:
Equity securities, including restricted securities, for which market quotations are readily available, are valued at the last reported sale price or official closing price as reported by a third party pricing vendor on the primary market or exchange on which they are traded and are categorized as Level 1 in the hierarchy. In the event there were no sales during the day or closing prices are not available, securities are valued at the last quoted bid price or may be valued using the last available price and are generally categorized as Level 2 in the hierarchy. For foreign equity securities, when market or security specific events arise, comparisons to the valuation of American Depositary Receipts (ADRs), futures contracts, Exchange-Traded Funds (ETFs) and certain indexes as well as quoted prices for similar securities may be used and would be categorized as Level 2 in the hierarchy. For equity securities, including restricted securities, where observable inputs are limited, assumptions about market activity and risk are used and these securities may be categorized as Level 3 in the hierarchy. Securities, including private placements or other restricted securities, for which observable inputs are not available are valued using alternate valuation approaches, including the market approach, the income approach and cost approach, and are categorized as Level 3 in the hierarchy. The market approach considers factors including the price of recent investments in the same or a similar security or financial metrics of comparable securities. The income approach considers factors including expected future cash flows, security specific risks and corresponding discount rates. The cost approach considers factors including the value of the security's underlying assets and liabilities.
Debt securities, including restricted securities, are valued based on evaluated prices received from third party pricing vendors or from brokers who make markets in such securities. Corporate bonds are valued by pricing vendors who utilize matrix pricing which considers yield or price of bonds of comparable quality, coupon, maturity and type or by broker-supplied prices. When independent prices are unavailable or unreliable, debt securities may be valued utilizing pricing methodologies which consider similar factors that would be used by third party pricing vendors. Debt securities are generally categorized as Level 2 in the hierarchy but may be Level 3 depending on the circumstances.
Investments in open-end mutual funds, including the Fidelity Central Funds, are valued at their closing net asset value (NAV) each business day and are categorized as Level 1 in the hierarchy.
The following provides information on Level 3 securities held by the Fund that were valued at period end based on unobservable inputs. These amounts exclude valuations provided by a broker.
| Asset Type | Fair Value | Valuation Technique(s) | Unobservable Input | Amount or Range/Weighted Average | Impact to Valuation from an Increase in Input(a) |
| Equities | $48,285 | Market comparable | Enterprise value/Sales multiple (EV/S) | 4.0 - 11.3 / 9.7 | Increase |
| Premium rate | 7.8% - 129.6% / 103.7% | Increase | |||
| Market approach | Transaction price | $3.95 - $419.99 / $279.68 | Increase | ||
| Corporate Bonds | $2,924 | Market approach | Transaction price | $100.00 | Increase |
| Indicative market bid | Evaluated bid | $4.00 | Increase | ||
| Other | $3,715 | Discounted cash flow | Discount rate | 15.7% | Decrease |
(a) Represents the directional change in the fair value of the Level 3 investments that could have resulted from an increase in the corresponding input as of period end. A decrease to the unobservable input would have had the opposite effect. Significant changes in these inputs may have resulted in a significantly higher or lower fair value measurement at period end.
Changes in valuation techniques may result in transfers in or out of an assigned level within the disclosure hierarchy. The aggregate value of investments by input level as of May 31, 2021, as well as a roll forward of Level 3 investments, is included at the end of the Fund's Schedule of Investments.
Foreign Currency. Certain Funds may use foreign currency contracts to facilitate transactions in foreign-denominated securities. Gains and losses from these transactions may arise from changes in the value of the foreign currency or if the counterparties do not perform under the contracts' terms.
Foreign-denominated assets, including investment securities, and liabilities are translated into U.S. dollars at the exchange rates at period end. Purchases and sales of investment securities, income and dividends received, and expenses denominated in foreign currencies are translated into U.S. dollars at the exchange rate in effect on the transaction date.
The effects of exchange rate fluctuations on investments are included with the net realized and unrealized gain (loss) on investment securities. Other foreign currency transactions resulting in realized and unrealized gain (loss) are disclosed separately.
Investment Transactions and Income. For financial reporting purposes, the Fund's investment holdings and NAV include trades executed through the end of the last business day of the period. The NAV per share for processing shareholder transactions is calculated as of the close of business of the New York Stock Exchange (NYSE), normally 4:00 p.m. Eastern time and includes trades executed through the end of the prior business day. Gains and losses on securities sold are determined on the basis of identified cost and include proceeds received from litigation. Dividend income is recorded on the ex-dividend date, except for certain dividends from foreign securities where the ex-dividend date may have passed, which are recorded as soon as the Fund is informed of the ex-dividend date. Non-cash dividends included in dividend income, if any, are recorded at the fair market value of the securities received. Income and capital gain distributions from Fidelity Central Funds, if any, are recorded on the ex-dividend date. Certain distributions received by the Fund represent a return of capital or capital gain. The Fund determines the components of these distributions subsequent to the ex-dividend date, based upon receipt of tax filings or other correspondence relating to the underlying investment. These distributions are recorded as a reduction of cost of investments and/or as a realized gain. Investment income is recorded net of foreign taxes withheld where recovery of such taxes is uncertain.
Expenses. Expenses directly attributable to a fund are charged to that fund. Expenses attributable to more than one fund are allocated among the respective funds on the basis of relative net assets or other appropriate methods. Expenses included in the accompanying financial statements reflect the expenses of that fund and do not include any expenses associated with any underlying mutual funds or exchange-traded funds. Although not included in a fund's expenses, a fund indirectly bears its proportionate share of these expenses through the net asset value of each underlying mutual fund or exchange-traded fund. Expense estimates are accrued in the period to which they relate and adjustments are made when actual amounts are known.
Income Tax Information and Distributions to Shareholders. Each year, the Fund intends to qualify as a regulated investment company under Subchapter M of the Internal Revenue Code, including distributing substantially all of its taxable income and realized gains. As a result, no provision for U.S. Federal income taxes is required. The Fund files a U.S. federal tax return, in addition to state and local tax returns as required. The Fund's federal income tax returns are subject to examination by the Internal Revenue Service (IRS) for a period of three fiscal years after they are filed. State and local tax returns may be subject to examination for an additional fiscal year depending on the jurisdiction. Foreign taxes are provided for based on the Fund's understanding of the tax rules and rates that exist in the foreign markets in which it invests.
Distributions are declared and recorded on the ex-dividend date. Income and capital gain distributions are determined in accordance with income tax regulations, which may differ from GAAP.
Capital accounts within the financial statements are adjusted for permanent book-tax differences. These adjustments have no impact on net assets or the results of operations. Capital accounts are not adjusted for temporary book-tax differences which will reverse in a subsequent period.
Book-tax differences are primarily due to the short-term gain distributions from the underlying mutual funds or exchange-traded funds (ETFs), foreign currency transactions, passive foreign investment companies (PFIC), partnerships and losses deferred due to wash sales.
As of period end, the cost and unrealized appreciation (depreciation) in securities, and derivatives if applicable, for federal income tax purposes were as follows:
| Gross unrealized appreciation | $943,344 |
| Gross unrealized depreciation | (107,708) |
| Net unrealized appreciation (depreciation) | $835,636 |
| Tax cost | $2,032,034 |
Restricted Securities (including Private Placements). Funds may invest in securities that are subject to legal or contractual restrictions on resale. These securities generally may be resold in transactions exempt from registration or to the public if the securities are registered. Disposal of these securities may involve time-consuming negotiations and expense, and prompt sale at an acceptable price may be difficult. Information regarding restricted securities held at period end is included at the end of the Schedule of Investments, if applicable.
Consolidated Subsidiary. The Funds included in the table below hold certain investments through a wholly-owned subsidiary ("Subsidiary"), which may be subject to federal and state taxes upon disposition.
As of period end, investments in Subsidiaries were as follows:
| $ Amount | % of Net Assets | |
| Fidelity New Millennium Fund | 3,735 | .13 |
The financial statements have been consolidated to include the Subsidiary accounts where applicable. Accordingly, all inter-company transactions and balances have been eliminated.
At period end, any estimated tax liability for these investments is presented as "Deferred taxes" in the Statement of Assets and Liabilities and included in "Change in net unrealized appreciation (depreciation) on investment securities" in the Statement of Operations. The tax liability incurred may differ materially depending on conditions when these investments are disposed. Any cash held by a Subsidiary is restricted as to its use and is presented as "Restricted cash" in the Statement of Assets and Liabilities, if applicable.
4. Purchases and Sales of Investments.
Purchases and sales of securities, other than short-term securities, are noted in the table below.
| Purchases ($) | Sales ($) | |
| Fidelity New Millennium Fund | 398,716 | 570,847 |
5. Fees and Other Transactions with Affiliates.
Management Fee. Fidelity Management & Research Company LLC (the investment adviser) and its affiliates provide the Fund with investment management related services for which the Fund pays a monthly management fee. The management fee is the sum of an individual fund fee rate that is based on an annual rate of .30% of the Fund's average net assets and an annualized group fee rate that averaged 23% during the period. The group fee rate is based upon the monthly average net assets of a group of registered investment companies with which the investment adviser has management contracts. The group fee rate decreases as assets under management increase and increases as assets under management decrease. In addition, the management fee is subject to a performance adjustment (up to a maximum of +/-.20% of the Fund's average net assets over a 36 month performance period). The upward or downward adjustment to the management fee is based on the Fund's relative investment performance as compared to its benchmark index, the S&P 500 Index, over the same 36 month performance period. For the reporting period, the total annualized management fee rate, including the performance adjustment, was .31% of the Fund's average net assets. The performance adjustment included in the management fee rate may be higher or lower than the maximum performance adjustment rate due to the difference between the average net assets for the reporting and performance periods.
Transfer Agent Fees. Fidelity Investments Institutional Operations Company LLC (FIIOC), an affiliate of the investment adviser, is the Fund's transfer, dividend disbursing and shareholder servicing agent. FIIOC receives account fees and asset-based fees that vary according to account size and type of account. FIIOC pays for typesetting, printing and mailing of shareholder reports, except proxy statements. For the period, the transfer agent fees were equivalent to an annualized rate of .13% of average net assets.
Accounting Fees. Fidelity Service Company, Inc. (FSC), an affiliate of the investment adviser, maintains the Fund's accounting records. The accounting fee is based on the level of average net assets for each month. For the period, the fees were equivalent to the following annualized rates:
| % of Average Net Assets | |
| Fidelity New Millennium Fund | .03 |
Brokerage Commissions. A portion of portfolio transactions were placed with brokerage firms which are affiliates of the investment adviser. Brokerage commissions are included in net realized gain (loss) and change in net unrealized appreciation (depreciation) in the Statement of Operations. The commissions paid to these affiliated firms were as follows:
| Amount | |
| Fidelity New Millennium Fund | $15 |
Interfund Lending Program. Pursuant to an Exemptive Order issued by the Securities and Exchange Commission (the SEC), the Fund, along with other registered investment companies having management contracts with Fidelity Management & Research Company LLC (FMR), or other affiliated entities of FMR, may participate in an interfund lending program. This program provides an alternative credit facility allowing the Fund to borrow from, or lend money to, other participating affiliated funds. At period end, there were no interfund loans outstanding. Activity in this program during the period for which loans were outstanding was as follows:
| Borrower or Lender | Average Loan Balance | Weighted Average Interest Rate | Interest Expense | |
| Fidelity New Millennium Fund | Borrower | $6,320 | .33% | $1 |
Interfund Trades. Funds may purchase from or sell securities to other Fidelity Funds under procedures adopted by the Board. The procedures have been designed to ensure these interfund trades are executed in accordance with Rule 17a-7 of the 1940 Act. Any interfund trades are included within the respective purchases and sales amounts shown in the Purchases and Sales of Investments note and are noted in the table below.
| Purchases ($) | Sales ($) | |
| Fidelity New Millennium Fund | 14,233 | 42,098 |
6. Committed Line of Credit.
Certain Funds participate with other funds managed by the investment adviser or an affiliate in a $4.25 billion credit facility (the "line of credit") to be utilized for temporary or emergency purposes to fund shareholder redemptions or for other short-term liquidity purposes. The participating funds have agreed to pay commitment fees on their pro-rata portion of the line of credit, which are reflected in Miscellaneous expenses on the Statement of Operations, and are listed below. During the period, there were no borrowings on this line of credit.
| Amount | |
| Fidelity New Millennium Fund | $2 |
7. Security Lending.
Funds lend portfolio securities from time to time in order to earn additional income. Lending agents are used, including National Financial Services (NFS), an affiliate of the investment adviser. Pursuant to a securities lending agreement, NFS will receive a fee, which is capped at 9.9% of a fund's daily lending revenue, for its services as lending agent. A fund may lend securities to certain qualified borrowers, including NFS. On the settlement date of the loan, a fund receives collateral (in the form of U.S. Treasury obligations, letters of credit and/or cash) against the loaned securities and maintains collateral in an amount not less than 100% of the market value of the loaned securities during the period of the loan. The market value of the loaned securities is determined at the close of business of a fund and any additional required collateral is delivered to a fund on the next business day. A fund or borrower may terminate the loan at any time, and if the borrower defaults on its obligation to return the securities loaned because of insolvency or other reasons, a fund may apply collateral received from the borrower against the obligation. A fund may experience delays and costs in recovering the securities loaned. Any cash collateral received is invested in the Fidelity Securities Lending Cash Central Fund. Any loaned securities are identified as such in the Schedule of Investments, and the value of loaned securities and cash collateral at period end, as applicable, are presented in the Statement of Assets and Liabilities. Security lending income represents the income earned on investing cash collateral, less rebates paid to borrowers and any lending agent fees associated with the loan, plus any premium payments received for lending certain types of securities. Security lending income is presented in the Statement of Operations as a component of income from Fidelity Central Funds. Affiliated security lending activity, if any, was as follows:
| Total Security Lending Fees Paid to NFS | Security Lending Income From Securities Loaned to NFS | Value of Securities Loaned to NFS at Period End | |
| Fidelity New Millennium Fund | $6 | $– | $– |
8. Expense Reductions.
Commissions paid to certain brokers with whom the investment adviser, or its affiliates, places trades on behalf of the Fund include an amount in addition to trade execution, which may be rebated back to the Fund to offset expenses. This amount totaled $81 for the period.
In addition, during the period the investment adviser or an affiliate reimbursed and/or waived a portion of operating expenses in the amount of $4.
9. Other.
Fund's organizational documents provide former and current trustees and officers with a limited indemnification against liabilities arising in connection with the performance of their duties to the fund. In the normal course of business, the fund may also enter into contracts that provide general indemnifications. The fund's maximum exposure under these arrangements is unknown as this would be dependent on future claims that may be made against the fund. The risk of material loss from such claims is considered remote.
10. Coronavirus (COVID-19) Pandemic.
An outbreak of COVID-19 first detected in China during December 2019 has since spread globally and was declared a pandemic by the World Health Organization during March 2020. Developments that disrupt global economies and financial markets, such as the COVID-19 pandemic, may magnify factors that affect the Fund's performance.
Shareholder Expense Example
As a shareholder, you incur two types of costs: (1) transaction costs, which may include sales charges (loads) on purchase payments or redemption proceeds, as applicable and (2) ongoing costs, which generally include management fees, distribution and/or service (12b-1) fees and other Fund expenses. This Example is intended to help you understand your ongoing costs (in dollars) of investing in a fund and to compare these costs with the ongoing costs of investing in other mutual funds.
The Example is based on an investment of $1,000 invested at the beginning of the period and held for the entire period (December 1, 2020 to May 31, 2021).
Actual Expenses
The first line of the accompanying table provides information about actual account values and actual expenses. You may use the information in this line, together with the amount you invested, to estimate the expenses that you paid over the period. Simply divide your account value by $1,000.00 (for example, an $8,600 account value divided by $1,000.00 = 8.6), then multiply the result by the number in the first line for a class/Fund under the heading entitled "Expenses Paid During Period" to estimate the expenses you paid on your account during this period. If any fund is a shareholder of any underlying mutual funds or exchange-traded funds (ETFs) (the Underlying Funds), such fund indirectly bears its proportional share of the expenses of the Underlying Funds in addition to the direct expenses incurred presented in the table. These fees and expenses are not included in the annualized expense ratio used to calculate the expense estimate in the table below.
Hypothetical Example for Comparison Purposes
The second line of the accompanying table provides information about hypothetical account values and hypothetical expenses based on the actual expense ratio and an assumed rate of return of 5% per year before expenses, which is not the actual return. The hypothetical account values and expenses may not be used to estimate the actual ending account balance or expenses you paid for the period. You may use this information to compare the ongoing costs of investing in the Fund and other funds. To do so, compare this 5% hypothetical example with the 5% hypothetical examples that appear in the shareholder reports of the other funds. If any fund is a shareholder of any Underlying Funds, such fund indirectly bears its proportional share of the expenses of the Underlying Funds in addition to the direct expenses as presented in the table. These fees and expenses are not included in the annualized expense ratio used to calculate the expense estimate in the table below.
Please note that the expenses shown in the table are meant to highlight your ongoing costs only and do not reflect any transaction costs. Therefore, the second line of the table is useful in comparing ongoing costs only, and will not help you determine the relative total costs of owning different funds.
| Annualized Expense Ratio-A | Beginning Account Value December 1, 2020 | Ending Account Value May 31, 2021 | Expenses Paid During Period-B December 1, 2020 to May 31, 2021 | |
| Fidelity New Millennium Fund | .48% | |||
| Actual | $1,000.00 | $1,286.00 | $2.74 | |
| Hypothetical-C | $1,000.00 | $1,022.54 | $2.42 |
A Annualized expense ratio reflects expenses net of applicable fee waivers.
B Expenses are equal to the annualized expense ratio, multiplied by the average account value over the period, multiplied by 182/ 365 (to reflect the one-half year period). The fees and expenses of any Underlying Funds are not included in each annualized expense ratio.
C 5% return per year before expenses
Board Approval of Investment Advisory Contracts and Management Fees
Fidelity New Millennium Fund
Each year, the Board of Trustees, including the Independent Trustees (together, the Board), votes on the renewal of the management contract with Fidelity Management & Research Company LLC (FMR) and the sub-advisory agreements (together, the Advisory Contracts) for the fund. FMR and the sub-advisers are referred to herein as the Investment Advisers. The Board, assisted by the advice of fund counsel and Independent Trustees' counsel, requests and considers a broad range of information relevant to the renewal of the Advisory Contracts throughout the year.The Board meets regularly and, at each of its meetings, covers an extensive agenda of topics and materials and considers factors that are relevant to its annual consideration of the renewal of the fund's Advisory Contracts, including the services and support provided to the fund and its shareholders. The Board has established various standing committees (Committees), each composed of and chaired by Independent Trustees with varying backgrounds, to which the Board has assigned specific subject matter responsibilities in order to enhance effective decision-making by the Board. The Board, acting directly and through its Committees, requests and receives information concerning the annual consideration of the renewal of the fund's Advisory Contracts. The Board also meets as needed to review matters specifically related to the Board's annual consideration of the renewal of the Advisory Contracts. Members of the Board may also meet with trustees of other Fidelity funds through joint ad hoc committees to discuss certain matters relevant to all of the Fidelity funds.Approval of Stub Period Continuation. At its January 2021 meeting, the Board of Trustees voted to continue the fund's management contract with FMR, and the sub-advisory agreements and sub-subadvisory agreements, in each case, where applicable (together, the Advisory Contracts), without modification, for four months from February 1, 2021 through May 31, 2021, in connection with changes to the Board's meeting calendar. The Board considered that the approval of the fund's Advisory Contracts will not result in any changes in (i) the investment process or strategies employed in the management of the fund's assets; (ii) the fees and expenses paid by shareholders; (iii) the nature, extent or quality of services provided under the fund's Advisory Contracts; or (iv) the day-to-day management of the fund or the persons primarily responsible for such management. The Board also considered that since its last approval of the fund's Advisory Contracts, FMR had provided additional information on the fund in support of the annual contract renewal process, including competitive analyses on total expenses and management fees and in-depth reviews of fund performance and fund profitability information. The Board also considered the findings of certain ad hoc committees that had been previously formed to discuss matters relevant to all of the Fidelity funds, including economies of scale, fall-out benefits and retail vs. institutional funds. The Board concluded that the fund's Advisory Contracts are fair and reasonable, and that the fund's Advisory Contracts should be renewed, without modification, through May 31, 2021, with the understanding that the Board will consider the annual renewal for a full one year period in May 2021.At its May 2021 meeting, the Board unanimously determined to renew the fund's Advisory Contracts. In reaching its determination, the Board considered all factors it believed relevant, including (i) the nature, extent, and quality of the services provided to the fund and its shareholders (including the investment performance of the fund); (ii) the competitiveness of the fund's management fee and total expense ratio relative to peer funds; (iii) the total costs of the services provided by and the profits realized by Fidelity from its relationships with the fund; and (iv) the extent to which, if any, economies of scale exist and are realized as the fund grows, and whether any economies of scale are appropriately shared with fund shareholders.In considering whether to renew the Advisory Contracts for the fund, the Board reached a determination, with the assistance of fund counsel and Independent Trustees' counsel and through the exercise of its business judgment, that the renewal of the Advisory Contracts was in the best interests of the fund and its shareholders and that the compensation payable under the Advisory Contracts was fair and reasonable. The Board's decision to renew the Advisory Contracts was not based on any single factor, but rather was based on a comprehensive consideration of all the information provided to the Board at its meetings throughout the year. The Board, in reaching its determination to renew the Advisory Contracts, was aware that shareholders of the fund have a broad range of investment choices available to them, including a wide choice among funds offered by Fidelity's competitors, and that the fund's shareholders, who have the opportunity to review and weigh the disclosure provided by the fund in its prospectus and other public disclosures, have chosen to invest in this fund, which is part of the Fidelity family of funds.Nature, Extent, and Quality of Services Provided. The Board considered Fidelity's staffing as it relates to the fund, including the backgrounds of investment personnel of Fidelity, and also considered the fund's investment objective, strategies, and related investment philosophy. The Independent Trustees also had discussions with senior management of Fidelity's investment operations and investment groups. The Board considered the structure of the investment personnel compensation program and whether this structure provides appropriate incentives to act in the best interests of the fund. Additionally, the Board considered the portfolio managers' investments, if any, in the funds that they manage.Resources Dedicated to Investment Management and Support Services. The Board and the Fund Oversight and Research Committees reviewed the general qualifications and capabilities of Fidelity's investment staff, including its size, education, experience, and resources, as well as Fidelity's approach to recruiting, training, managing, and compensating investment personnel. The Board noted that Fidelity has continued to increase the resources devoted to non-U.S. offices, including expansion of Fidelity's global investment organization. The Board also noted that Fidelity's analysts have extensive resources, tools and capabilities that allow them to conduct sophisticated quantitative and fundamental analysis, as well as credit analysis of issuers, counterparties and guarantors. Further, the Board considered that Fidelity's investment professionals have sufficient access to global information and data so as to provide competitive investment results over time, and that those professionals also have access to sophisticated tools that permit them to assess portfolio construction and risk and performance attribution characteristics continuously, as well as to transmit new information and research conclusions rapidly around the world. Additionally, in its deliberations, the Board considered Fidelity's trading, risk management, compliance, and technology and operations capabilities and resources, which are integral parts of the investment management process. The Board also considered Fidelity's investments in business continuity planning, and its success in continuously providing services to the fund notwithstanding the severe disruptions caused by the COVID-19 pandemic.Shareholder and Administrative Services. The Board considered (i) the nature, extent, quality, and cost of advisory, administrative, and shareholder services performed by the Investment Advisers and their affiliates under the Advisory Contracts and under separate agreements covering transfer agency, pricing and bookkeeping, and securities lending services for the fund; (ii) the nature and extent of the supervision of third party service providers, principally custodians, subcustodians, and pricing vendors; and (iii) the resources devoted to, and the record of compliance with, the fund's compliance policies and procedures. The Board also reviewed the allocation of fund brokerage, including allocations to brokers affiliated with the Investment Advisers, the use of brokerage commissions to pay fund expenses, and the use of "soft" commission dollars to pay for research services.The Board noted that the growth of fund assets over time across the complex allows Fidelity to reinvest in the development of services designed to enhance the value and convenience of the Fidelity funds as investment vehicles. These services include 24-hour access to account information and market information over the Internet and through telephone representatives, investor education materials and asset allocation tools, and the expanded availability of Fidelity Investor Centers.The Board noted that, in the past, it and the boards of certain other Fidelity funds had formed an ad hoc Committee on Transfer Agency Fees to review the variety of transfer agency fee structures throughout the industry and Fidelity's competitive positioning with respect to industry participants.Investment in a Large Fund Family. The Board considered the benefits to shareholders of investing in a Fidelity fund, including the benefits of investing in a fund that is part of a large family of funds offering a variety of investment disciplines and providing a large variety of mutual fund investor services. The Board noted that Fidelity had taken, or had made recommendations that resulted in the Fidelity funds taking, a number of actions over the previous year that benefited particular funds, including: (i) continuing to dedicate additional resources to Fidelity's investment research process, which includes meetings with management of issuers of securities in which the funds invest, and to the support of the senior management team that oversees asset management; (ii) continuing efforts to enhance Fidelity's global research capabilities; (iii) launching new funds and ETFs with innovative structures, strategies and pricing and making other enhancements to meet client needs; (iv) launching new share classes of existing funds; (v) eliminating purchase minimums and broadening eligibility requirements for certain funds and share classes; (vi) approving the reduction in the holding period for the Class C to Class A conversion policy; (vii) reducing management fees and total expenses for certain target date funds and classes and index funds; (viii) lowering expenses for certain existing funds and classes by implementing or lowering expense caps; (ix) rationalizing product lines and gaining increased efficiencies from fund mergers, liquidations, and share class consolidations; (x) continuing to develop, acquire and implement systems and technology to improve services to the funds and shareholders, strengthen information security, and increase efficiency; and (xi) continuing to implement enhancements to further strengthen Fidelity's product line to increase investors' probability of success in achieving their investment goals, including retirement income goals.Investment Performance. The Board considered whether the fund has operated in accordance with its investment objective, as well as its record of compliance with its investment restrictions and its performance history.The Board took into account discussions that occur at Board meetings throughout the year with representatives of the Investment Advisers about fund investment performance. In this regard the Board noted that as part of regularly scheduled fund reviews and other reports to the Board on fund performance, the Board considers annualized return information for the fund for different time periods, measured against an appropriate securities market index (benchmark index) and an appropriate peer group of funds with similar objectives (peer group). In its evaluation of fund investment performance, the Board gave particular attention to information indicating changes in performance of certain Fidelity funds for specific time periods and discussed with the Investment Advisers the reasons for any overperformance or underperformance.In addition to reviewing absolute and relative fund performance, the Independent Trustees periodically consider the appropriateness of fund performance metrics in evaluating the results achieved. In general, the Independent Trustees believe that fund performance should be evaluated based on net performance (after fees and expenses) of both the highest performing and lowest performing fund share classes, where applicable, compared to appropriate benchmark indices, over appropriate time periods that may include full market cycles, and compared to peer groups, as applicable, over the same periods, taking into account relevant factors including the following: general market conditions; issuer-specific information; and fund cash flows and other factors.The Independent Trustees recognize that shareholders evaluate performance on a net basis over their own holding periods, for which one-, three-, and five-year periods are often used as a proxy. For this reason, the performance information reviewed by the Board also included net cumulative total return information for the fund and an appropriate benchmark index and peer group for the most recent one-, three-, and five-year periods ended September 30, 2020, as shown below. Returns are shown compared to the 25th percentile (top of box, 75% beaten) and 75th percentile (bottom of box, 25% beaten) of the peer universe.Fidelity New Millennium Fund

Fidelity New Millennium Fund
The Board considered that effective February 1, 2017, the fund's individual fund fee rate was reduced from 0.35% to 0.30%. The Board considered that the chart below reflects the fund's management rate for 2016, as if the lower fee rate were in effect for the entire year.

Liquidity Risk Management Program
The Securities and Exchange Commission adopted Rule 22e-4 under the Investment Company Act of 1940 (the Liquidity Rule) to promote effective liquidity risk management throughout the open-end investment company industry, thereby reducing the risk that funds will be unable to meet their redemption obligations and mitigating dilution of the interests of fund shareholders.
The Fund has adopted and implemented a liquidity risk management program pursuant to the Liquidity Rule (the Program) effective December 1, 2018. The Program is reasonably designed to assess and manage the Fund’s liquidity risk and to comply with the requirements of the Liquidity Rule. The Fund’s Board of Trustees (the Board) has designated the Fund’s investment adviser as administrator of the Program. The Fidelity advisers have established a Liquidity Risk Management Committee (the LRM Committee) to manage the Program for each of the Fidelity Funds. The LRM Committee monitors the adequacy and effectiveness of implementation of the Program and on a periodic basis assesses each Fund’s liquidity risk based on a variety of factors including (1) the Fund’s investment strategy, (2) portfolio liquidity and cash flow projections during normal and reasonably foreseeable stressed conditions, (3) shareholder redemptions, (4) borrowings and other funding sources and (5) in the case of exchange-traded funds, certain additional factors including the effect of the Fund’s prices and spreads, market participants, and basket compositions on the overall liquidity of the Fund’s portfolio, as applicable.
In accordance with the Program, each of the Fund’s portfolio investments is classified into one of four liquidity categories described below based on a determination of a reasonable expectation for how long it would take to convert the investment to cash (or sell or dispose of the investment) without significantly changing its market value.
- Highly liquid investments – cash or convertible to cash within three business days or less
- Moderately liquid investments – convertible to cash in three to seven calendar days
- Less liquid investments – can be sold or disposed of, but not settled, within seven calendar days
- Illiquid investments – cannot be sold or disposed of within seven calendar days
Liquidity classification determinations take into account a variety of factors including various market, trading and investment-specific considerations, as well as market depth, and generally utilize analysis from a third-party liquidity metrics service.
The Liquidity Rule places a 15% limit on a fund’s illiquid investments and requires funds that do not primarily hold assets that are highly liquid investments to determine and maintain a minimum percentage of the fund’s net assets to be invested in highly liquid investments (highly liquid investment minimum or HLIM). The Program includes provisions reasonably designed to comply with the 15% limit on illiquid investments and for determining, periodically reviewing and complying with the HLIM requirement as applicable.
At a recent meeting of the Fund’s Board of Trustees, the LRM Committee provided a written report to the Board pertaining to the operation, adequacy, and effectiveness of implementation of the Program for the annual period from December 1, 2019 through November 30, 2020. The report concluded that the Program has been implemented and is operating effectively and is reasonably designed to assess and manage the Fund’s liquidity risk.
![]()
NMF-SANN-0721
1.704547.123
Fidelity® Growth Strategies Fund
Semi-Annual Report
May 31, 2021
Contents
Board Approval of Investment Advisory Contracts and Management Fees | |
To view a fund's proxy voting guidelines and proxy voting record for the 12-month period ended June 30, visit http://www.fidelity.com/proxyvotingresults or visit the Securities and Exchange Commission's (SEC) web site at http://www.sec.gov.
You may also call 1-800-544-8544 if you’re an individual investing directly with Fidelity, call 1-800-835-5092 if you’re a plan sponsor or participant with Fidelity as your recordkeeper or call 1-877-208-0098 on institutional accounts or if you’re an advisor or invest through one to request a free copy of the proxy voting guidelines.
Standard & Poor's, S&P and S&P 500 are registered service marks of The McGraw-Hill Companies, Inc. and have been licensed for use by Fidelity Distributors Corporation.
Other third-party marks appearing herein are the property of their respective owners.
All other marks appearing herein are registered or unregistered trademarks or service marks of FMR LLC or an affiliated company. © 2021 FMR LLC. All rights reserved.
This report and the financial statements contained herein are submitted for the general information of the shareholders of the Fund. This report is not authorized for distribution to prospective investors in the Fund unless preceded or accompanied by an effective prospectus.
A fund files its complete schedule of portfolio holdings with the SEC for the first and third quarters of each fiscal year on Form N-PORT. Forms N-PORT are available on the SEC’s web site at http://www.sec.gov. A fund's Forms N-PORT may be reviewed and copied at the SEC’s Public Reference Room in Washington, DC. Information regarding the operation of the SEC's Public Reference Room may be obtained by calling 1-800-SEC-0330.
For a complete list of a fund's portfolio holdings, view the most recent holdings listing, semiannual report, or annual report on Fidelity's web site at http://www.fidelity.com, http://www.institutional.fidelity.com, or http://www.401k.com, as applicable.
NOT FDIC INSURED •MAY LOSE VALUE •NO BANK GUARANTEE
Neither the Fund nor Fidelity Distributors Corporation is a bank.
Note to Shareholders:
Early in 2020, the outbreak and spread of a new coronavirus emerged as a public health emergency that had a major influence on financial markets, primarily based on its impact on the global economy and the outlook for corporate earnings. The virus causes a respiratory disease known as COVID-19. On March 11, 2020 the World Health Organization declared the COVID-19 outbreak a pandemic, citing sustained risk of further global spread.
In the weeks following, as the crisis worsened, we witnessed an escalating human tragedy with wide-scale social and economic consequences from coronavirus-containment measures. The outbreak of COVID-19 prompted a number of measures to limit the spread, including travel and border restrictions, quarantines, and restrictions on large gatherings. In turn, these resulted in lower consumer activity, diminished demand for a wide range of products and services, disruption in manufacturing and supply chains, and – given the wide variability in outcomes regarding the outbreak – significant market uncertainty and volatility. Amid the turmoil, global governments and central banks took unprecedented action to help support consumers, businesses, and the broader economies, and to limit disruption to financial systems.
The situation continues to unfold, and the extent and duration of its impact on financial markets and the economy remain highly uncertain. Extreme events such as the coronavirus crisis are “exogenous shocks” that can have significant adverse effects on mutual funds and their investments. Although multiple asset classes may be affected by market disruption, the duration and impact may not be the same for all types of assets.
Fidelity is committed to helping you stay informed amid news about COVID-19 and during increased market volatility, and we’re taking extra steps to be responsive to customer needs. We encourage you to visit our websites, where we offer ongoing updates, commentary, and analysis on the markets and our funds.
Investment Summary (Unaudited)
Top Ten Stocks as of May 31, 2021
| % of fund's net assets | |
| KLA Corp. | 3.0 |
| EPAM Systems, Inc. | 2.6 |
| MSCI, Inc. | 2.6 |
| Charles River Laboratories International, Inc. | 2.3 |
| Mettler-Toledo International, Inc. | 2.3 |
| Cadence Design Systems, Inc. | 2.2 |
| ResMed, Inc. | 2.1 |
| Entegris, Inc. | 2.0 |
| IDEXX Laboratories, Inc. | 1.9 |
| West Pharmaceutical Services, Inc. | 1.9 |
| 22.9 |
Top Five Market Sectors as of May 31, 2021
| % of fund's net assets | |
| Information Technology | 36.0 |
| Health Care | 20.3 |
| Industrials | 17.3 |
| Consumer Discretionary | 9.8 |
| Financials | 6.6 |
Asset Allocation (% of fund's net assets)
| As of May 31, 2021* | ||
| Stocks | 98.8% | |
| Short-Term Investments and Net Other Assets (Liabilities) | 1.2% | |

* Foreign investments – 3.8%
Schedule of Investments May 31, 2021 (Unaudited)
Showing Percentage of Net Assets
| Common Stocks - 98.8% | |||
| Shares | Value (000s) | ||
| COMMUNICATION SERVICES - 3.4% | |||
| Entertainment - 1.9% | |||
| Electronic Arts, Inc. | 83,000 | $11,863 | |
| Take-Two Interactive Software, Inc. (a) | 271,300 | 50,342 | |
| 62,205 | |||
| Interactive Media & Services - 1.5% | |||
| Match Group, Inc. (a) | 324,300 | 46,498 | |
| TOTAL COMMUNICATION SERVICES | 108,703 | ||
| CONSUMER DISCRETIONARY - 9.8% | |||
| Distributors - 1.5% | |||
| Pool Corp. | 108,000 | 47,147 | |
| Hotels, Restaurants & Leisure - 0.9% | |||
| Churchill Downs, Inc. | 25,600 | 5,108 | |
| Domino's Pizza, Inc. | 55,900 | 23,862 | |
| 28,970 | |||
| Household Durables - 2.1% | |||
| D.R. Horton, Inc. | 56,200 | 5,355 | |
| Lennar Corp. Class A | 244,300 | 24,188 | |
| NVR, Inc. (a) | 1,650 | 8,064 | |
| Tempur Sealy International, Inc. | 753,540 | 29,011 | |
| 66,618 | |||
| Internet & Direct Marketing Retail - 1.3% | |||
| eBay, Inc. | 241,900 | 14,727 | |
| Etsy, Inc. (a) | 175,600 | 28,927 | |
| 43,654 | |||
| Multiline Retail - 0.8% | |||
| Dollar General Corp. | 130,000 | 26,385 | |
| Specialty Retail - 3.2% | |||
| AutoZone, Inc. (a) | 13,000 | 18,286 | |
| Best Buy Co., Inc. | 257,200 | 29,897 | |
| RH (a) | 35,800 | 22,950 | |
| Tractor Supply Co. | 63,003 | 11,448 | |
| Williams-Sonoma, Inc. | 133,600 | 22,651 | |
| 105,232 | |||
| TOTAL CONSUMER DISCRETIONARY | 318,006 | ||
| CONSUMER STAPLES - 4.0% | |||
| Beverages - 1.6% | |||
| Boston Beer Co., Inc. Class A (a) | 27,300 | 28,888 | |
| Brown-Forman Corp. Class B (non-vtg.) | 303,099 | 24,357 | |
| 53,245 | |||
| Food Products - 1.2% | |||
| Bunge Ltd. | 161,000 | 13,978 | |
| Darling Ingredients, Inc. (a) | 361,900 | 24,776 | |
| 38,754 | |||
| Household Products - 1.0% | |||
| Church & Dwight Co., Inc. | 380,000 | 32,577 | |
| Personal Products - 0.2% | |||
| Estee Lauder Companies, Inc. Class A | 22,200 | 6,805 | |
| TOTAL CONSUMER STAPLES | 131,381 | ||
| ENERGY - 0.5% | |||
| Oil, Gas & Consumable Fuels - 0.5% | |||
| PDC Energy, Inc. | 352,500 | 14,883 | |
| FINANCIALS - 6.6% | |||
| Capital Markets - 5.5% | |||
| Ameriprise Financial, Inc. | 49,001 | 12,732 | |
| LPL Financial | 48,400 | 7,157 | |
| MarketAxess Holdings, Inc. | 84,900 | 39,609 | |
| Moody's Corp. | 33,600 | 11,268 | |
| MSCI, Inc. | 177,000 | 82,859 | |
| Nordnet AB | 560,000 | 10,430 | |
| S&P Global, Inc. | 28,800 | 10,929 | |
| Tradeweb Markets, Inc. Class A | 38,900 | 3,259 | |
| 178,243 | |||
| Insurance - 1.1% | |||
| Arthur J. Gallagher & Co. | 158,200 | 23,194 | |
| Progressive Corp. | 118,000 | 11,691 | |
| 34,885 | |||
| TOTAL FINANCIALS | 213,128 | ||
| HEALTH CARE - 20.3% | |||
| Biotechnology - 0.6% | |||
| Avid Bioservices, Inc. (a) | 284,137 | 6,046 | |
| Natera, Inc. (a) | 146,000 | 13,744 | |
| 19,790 | |||
| Health Care Equipment & Supplies - 9.5% | |||
| DexCom, Inc. (a) | 137,131 | 50,655 | |
| Edwards Lifesciences Corp. (a) | 95,000 | 9,111 | |
| Hologic, Inc. (a) | 390,000 | 24,593 | |
| IDEXX Laboratories, Inc. (a) | 113,600 | 63,401 | |
| Intuitive Surgical, Inc. (a) | 6,901 | 5,812 | |
| Masimo Corp. (a) | 104,700 | 22,573 | |
| ResMed, Inc. | 339,200 | 69,824 | |
| West Pharmaceutical Services, Inc. | 181,000 | 62,899 | |
| 308,868 | |||
| Health Care Providers & Services - 1.5% | |||
| Guardant Health, Inc. (a) | 129,328 | 16,052 | |
| Laboratory Corp. of America Holdings (a) | 84,000 | 23,056 | |
| Tenet Healthcare Corp. (a) | 126,722 | 8,479 | |
| 47,587 | |||
| Health Care Technology - 1.9% | |||
| Veeva Systems, Inc. Class A (a) | 214,000 | 62,347 | |
| Life Sciences Tools & Services - 5.3% | |||
| 10X Genomics, Inc. (a) | 24,900 | 4,482 | |
| Bio-Rad Laboratories, Inc. Class A (a) | 22,600 | 13,614 | |
| Charles River Laboratories International, Inc. (a) | 220,800 | 74,628 | |
| Maravai LifeSciences Holdings, Inc. | 27,405 | 1,029 | |
| Mettler-Toledo International, Inc. (a) | 57,000 | 74,154 | |
| Waters Corp. (a) | 11,100 | 3,577 | |
| 171,484 | |||
| Pharmaceuticals - 1.5% | |||
| Horizon Therapeutics PLC (a) | 312,400 | 28,635 | |
| Royalty Pharma PLC (b) | 490,000 | 19,659 | |
| 48,294 | |||
| TOTAL HEALTH CARE | 658,370 | ||
| INDUSTRIALS - 17.3% | |||
| Aerospace & Defense - 1.2% | |||
| TransDigm Group, Inc. (a) | 61,000 | 39,579 | |
| Airlines - 0.5% | |||
| Southwest Airlines Co. (a) | 252,400 | 15,513 | |
| Building Products - 3.2% | |||
| Carrier Global Corp. | 850,000 | 39,041 | |
| Fortune Brands Home & Security, Inc. | 191,000 | 19,704 | |
| The AZEK Co., Inc. | 495,000 | 21,547 | |
| Trane Technologies PLC | 41,600 | 7,754 | |
| Trex Co., Inc. (a) | 168,100 | 16,375 | |
| 104,421 | |||
| Commercial Services & Supplies - 3.0% | |||
| Cintas Corp. | 120,000 | 42,425 | |
| Copart, Inc. (a) | 396,624 | 51,168 | |
| Tetra Tech, Inc. | 39,000 | 4,659 | |
| 98,252 | |||
| Construction & Engineering - 0.3% | |||
| Quanta Services, Inc. | 116,878 | 11,144 | |
| Electrical Equipment - 3.3% | |||
| AMETEK, Inc. | 184,100 | 24,872 | |
| Atkore, Inc. (a) | 227,700 | 17,578 | |
| Generac Holdings, Inc. (a) | 124,300 | 40,860 | |
| Rockwell Automation, Inc. | 87,600 | 23,102 | |
| 106,412 | |||
| Industrial Conglomerates - 0.4% | |||
| Roper Technologies, Inc. | 27,500 | 12,375 | |
| Machinery - 2.4% | |||
| IDEX Corp. | 75,000 | 16,700 | |
| Otis Worldwide Corp. | 380,700 | 29,820 | |
| Toro Co. | 270,000 | 29,994 | |
| 76,514 | |||
| Professional Services - 1.3% | |||
| Booz Allen Hamilton Holding Corp. Class A | 99,000 | 8,408 | |
| CoStar Group, Inc. (a) | 22,000 | 18,788 | |
| Verisk Analytics, Inc. | 83,000 | 14,345 | |
| 41,541 | |||
| Road & Rail - 1.7% | |||
| Old Dominion Freight Lines, Inc. | 187,300 | 49,719 | |
| Ryder System, Inc. | 30,597 | 2,503 | |
| TuSimple Holdings, Inc. (a) | 63,100 | 2,419 | |
| 54,641 | |||
| TOTAL INDUSTRIALS | 560,392 | ||
| INFORMATION TECHNOLOGY - 36.0% | |||
| Electronic Equipment & Components - 3.3% | |||
| Amphenol Corp. Class A | 525,709 | 35,359 | |
| Keysight Technologies, Inc. (a) | 153,000 | 21,784 | |
| Zebra Technologies Corp. Class A (a) | 100,900 | 50,152 | |
| 107,295 | |||
| IT Services - 5.0% | |||
| Adyen BV (a)(c) | 1,394 | 3,222 | |
| EPAM Systems, Inc. (a) | 177,200 | 84,631 | |
| Global Payments, Inc. | 35,000 | 6,780 | |
| Okta, Inc. (a)(b) | 186,500 | 41,485 | |
| Twilio, Inc. Class A (a) | 73,700 | 24,763 | |
| 160,881 | |||
| Semiconductors & Semiconductor Equipment - 10.7% | |||
| Analog Devices, Inc. | 50,888 | 8,376 | |
| ASM International NV (Netherlands) | 9,306 | 2,927 | |
| Broadcom, Inc. | 16,900 | 7,982 | |
| Enphase Energy, Inc. (a) | 80,000 | 11,444 | |
| Entegris, Inc. | 574,000 | 65,694 | |
| KLA Corp. | 310,500 | 98,396 | |
| Lam Research Corp. | 50,000 | 32,493 | |
| Marvell Technology, Inc. | 472,000 | 22,798 | |
| MKS Instruments, Inc. | 23,400 | 4,405 | |
| NXP Semiconductors NV | 72,300 | 15,286 | |
| Qorvo, Inc. (a) | 131,400 | 24,009 | |
| Skyworks Solutions, Inc. | 91,500 | 15,555 | |
| SolarEdge Technologies, Inc. (a) | 147,700 | 38,108 | |
| 347,473 | |||
| Software - 17.0% | |||
| Adobe, Inc. (a) | 16,600 | 8,376 | |
| ANSYS, Inc. (a) | 154,200 | 52,110 | |
| Atlassian Corp. PLC (a) | 107,252 | 25,020 | |
| Cadence Design Systems, Inc. (a) | 569,100 | 72,270 | |
| Coupa Software, Inc. (a) | 35,700 | 8,504 | |
| Crowdstrike Holdings, Inc. (a) | 68,000 | 15,106 | |
| DocuSign, Inc. (a) | 110,843 | 22,348 | |
| Duck Creek Technologies, Inc. (a)(b) | 152,200 | 5,983 | |
| Dynatrace, Inc. (a) | 407,600 | 21,089 | |
| Elastic NV (a) | 130,400 | 15,415 | |
| Fair Isaac Corp. (a) | 5,000 | 2,530 | |
| Five9, Inc. (a) | 172,294 | 30,513 | |
| Fortinet, Inc. (a) | 282,000 | 61,628 | |
| HubSpot, Inc. (a) | 32,100 | 16,191 | |
| Intuit, Inc. | 20,400 | 8,957 | |
| Paycom Software, Inc. (a) | 78,100 | 25,742 | |
| Qualtrics International, Inc. | 15,100 | 520 | |
| RingCentral, Inc. (a) | 170,700 | 44,804 | |
| Synopsys, Inc. (a) | 217,000 | 55,192 | |
| The Trade Desk, Inc. (a) | 88,238 | 51,896 | |
| Zscaler, Inc. (a) | 30,000 | 5,826 | |
| 550,020 | |||
| TOTAL INFORMATION TECHNOLOGY | 1,165,669 | ||
| MATERIALS - 0.7% | |||
| Chemicals - 0.3% | |||
| Corbion NV | 32,991 | 1,920 | |
| Sherwin-Williams Co. | 36,801 | 10,434 | |
| 12,354 | |||
| Containers & Packaging - 0.1% | |||
| O-I Glass, Inc. (a) | 149,793 | 2,761 | |
| Paper & Forest Products - 0.3% | |||
| Louisiana-Pacific Corp. | 136,000 | 9,141 | |
| TOTAL MATERIALS | 24,256 | ||
| REAL ESTATE - 0.2% | |||
| Equity Real Estate Investment Trusts (REITs) - 0.2% | |||
| SBA Communications Corp. Class A | 19,500 | 5,813 | |
| TOTAL COMMON STOCKS | |||
| (Cost $1,812,212) | 3,200,601 | ||
| Money Market Funds - 2.0% | |||
| Fidelity Cash Central Fund 0.03% (d) | 38,563,665 | 38,571 | |
| Fidelity Securities Lending Cash Central Fund 0.03% (d)(e) | 26,561,140 | 26,564 | |
| TOTAL MONEY MARKET FUNDS | |||
| (Cost $65,134) | 65,135 | ||
| TOTAL INVESTMENT IN SECURITIES - 100.8% | |||
| (Cost $1,877,346) | 3,265,736 | ||
| NET OTHER ASSETS (LIABILITIES) - (0.8)% | (24,901) | ||
| NET ASSETS - 100% | $3,240,835 |
Legend
(a) Non-income producing
(b) Security or a portion of the security is on loan at period end.
(c) Security exempt from registration under Rule 144A of the Securities Act of 1933. These securities may be resold in transactions exempt from registration, normally to qualified institutional buyers. At the end of the period, the value of these securities amounted to $3,222,000 or 0.1% of net assets.
(d) Affiliated fund that is generally available only to investment companies and other accounts managed by Fidelity Investments. The rate quoted is the annualized seven-day yield of the fund at period end. A complete unaudited listing of the fund's holdings as of its most recent quarter end is available upon request. In addition, each Fidelity Central Fund's financial statements are available on the SEC's website or upon request.
(e) Investment made with cash collateral received from securities on loan.
Affiliated Central Funds
Information regarding fiscal year to date income earned by the Fund from investments in Fidelity Central Funds is as follows:
| Fund | Income earned |
| (Amounts in thousands) | |
| Fidelity Cash Central Fund | $12 |
| Fidelity Securities Lending Cash Central Fund | 11 |
| Total | $23 |
Amounts in the income column in the above table include any capital gain distributions from underlying funds, which are presented in the corresponding line-item in the Statement of Operations, if applicable. Amount for Fidelity Securities Lending Cash Central Fund represents the income earned on investing cash collateral, less rebates paid to borrowers and any lending agent fees associated with the loan, plus any premium payments received for lending certain types of securities.
Investment Valuation
The following is a summary of the inputs used, as of May 31, 2021, involving the Fund's assets and liabilities carried at fair value. The inputs or methodology used for valuing securities may not be an indication of the risk associated with investing in those securities. For more information on valuation inputs, and their aggregation into the levels used below, please refer to the Investment Valuation section in the accompanying Notes to Financial Statements.
| Valuation Inputs at Reporting Date: | ||||
| Description | Total | Level 1 | Level 2 | Level 3 |
| (Amounts in thousands) | ||||
| Investments in Securities: | ||||
| Equities: | ||||
| Communication Services | $108,703 | $108,703 | $-- | $-- |
| Consumer Discretionary | 318,006 | 318,006 | -- | -- |
| Consumer Staples | 131,381 | 131,381 | -- | -- |
| Energy | 14,883 | 14,883 | -- | -- |
| Financials | 213,128 | 213,128 | -- | -- |
| Health Care | 658,370 | 658,370 | -- | -- |
| Industrials | 560,392 | 560,392 | -- | -- |
| Information Technology | 1,165,669 | 1,165,669 | -- | -- |
| Materials | 24,256 | 24,256 | -- | -- |
| Real Estate | 5,813 | 5,813 | -- | -- |
| Money Market Funds | 65,135 | 65,135 | -- | -- |
| Total Investments in Securities: | $3,265,736 | $3,265,736 | $-- | $-- |
See accompanying notes which are an integral part of the financial statements.
Financial Statements
Statement of Assets and Liabilities
| Amounts in thousands (except per-share amounts) | May 31, 2021 (Unaudited) | |
| Assets | ||
| Investment in securities, at value (including securities loaned of $26,063) — See accompanying schedule: Unaffiliated issuers (cost $1,812,212) | $3,200,601 | |
| Fidelity Central Funds (cost $65,134) | 65,135 | |
| Total Investment in Securities (cost $1,877,346) | $3,265,736 | |
| Receivable for investments sold | 10,902 | |
| Receivable for fund shares sold | 420 | |
| Dividends receivable | 1,360 | |
| Distributions receivable from Fidelity Central Funds | 3 | |
| Prepaid expenses | 1 | |
| Other receivables | 53 | |
| Total assets | 3,278,475 | |
| Liabilities | ||
| Payable for investments purchased | $7,239 | |
| Payable for fund shares redeemed | 2,273 | |
| Accrued management fee | 1,023 | |
| Other affiliated payables | 472 | |
| Other payables and accrued expenses | 70 | |
| Collateral on securities loaned | 26,563 | |
| Total liabilities | 37,640 | |
| Net Assets | $3,240,835 | |
| Net Assets consist of: | ||
| Paid in capital | $1,578,618 | |
| Total accumulated earnings (loss) | 1,662,217 | |
| Net Assets | $3,240,835 | |
| Net Asset Value and Maximum Offering Price | ||
| Growth Strategies: | ||
| Net Asset Value, offering price and redemption price per share ($3,021,321 ÷ 48,441.1 shares) | $62.37 | |
| Class K: | ||
| Net Asset Value, offering price and redemption price per share ($219,514 ÷ 3,486.3 shares) | $62.96 |
See accompanying notes which are an integral part of the financial statements.
Statement of Operations
| Amounts in thousands | Six months ended May 31, 2021 (Unaudited) | |
| Investment Income | ||
| Dividends | $6,598 | |
| Income from Fidelity Central Funds (including $11 from security lending) | 23 | |
| Total income | 6,621 | |
| Expenses | ||
| Management fee | ||
| Basic fee | $8,547 | |
| Performance adjustment | (2,697) | |
| Transfer agent fees | 2,340 | |
| Accounting fees | 475 | |
| Custodian fees and expenses | 22 | |
| Independent trustees' fees and expenses | 7 | |
| Registration fees | 40 | |
| Audit | 29 | |
| Legal | 5 | |
| Miscellaneous | 6 | |
| Total expenses before reductions | 8,774 | |
| Expense reductions | (68) | |
| Total expenses after reductions | 8,706 | |
| Net investment income (loss) | (2,085) | |
| Realized and Unrealized Gain (Loss) | ||
| Net realized gain (loss) on: | ||
| Investment securities: | ||
| Unaffiliated issuers | 278,000 | |
| Foreign currency transactions | 2 | |
| Total net realized gain (loss) | 278,002 | |
| Change in net unrealized appreciation (depreciation) on: | ||
| Investment securities: | ||
| Unaffiliated issuers | 28,770 | |
| Total change in net unrealized appreciation (depreciation) | 28,770 | |
| Net gain (loss) | 306,772 | |
| Net increase (decrease) in net assets resulting from operations | $304,687 |
See accompanying notes which are an integral part of the financial statements.
Statement of Changes in Net Assets
| Amounts in thousands | Six months ended May 31, 2021 (Unaudited) | Year ended November 30, 2020 |
| Increase (Decrease) in Net Assets | ||
| Operations | ||
| Net investment income (loss) | $(2,085) | $2,464 |
| Net realized gain (loss) | 278,002 | 255,015 |
| Change in net unrealized appreciation (depreciation) | 28,770 | 448,696 |
| Net increase (decrease) in net assets resulting from operations | 304,687 | 706,175 |
| Distributions to shareholders | (254,989) | (107,380) |
| Share transactions - net increase (decrease) | (55,601) | (447,946) |
| Total increase (decrease) in net assets | (5,903) | 150,849 |
| Net Assets | ||
| Beginning of period | 3,246,738 | 3,095,889 |
| End of period | $3,240,835 | $3,246,738 |
See accompanying notes which are an integral part of the financial statements.
Financial Highlights
Fidelity Growth Strategies Fund
| Six months ended (Unaudited) May 31, | Years endedNovember 30, | |||||
| 2021 | 2020 | 2019 | 2018 | 2017 | 2016 | |
| Selected Per–Share Data | ||||||
| Net asset value, beginning of period | $61.57 | $50.98 | $41.90 | $40.96 | $33.87 | $33.91 |
| Income from Investment Operations | ||||||
| Net investment income (loss)A | (.04) | .04B | .30 | .25C | .16D | .16E |
| Net realized and unrealized gain (loss) | 5.84 | 12.31 | 9.13 | .87 | 7.13 | (.16) |
| Total from investment operations | 5.80 | 12.35 | 9.43 | 1.12 | 7.29 | – |
| Distributions from net investment income | – | (.22) | (.28) | (.16) | (.18) | (.04) |
| Distributions from net realized gain | (5.00) | (1.55) | (.06) | (.02) | (.02) | – |
| Total distributions | (5.00) | (1.76)F | (.35)F | (.18) | (.20) | (.04) |
| Redemption fees added to paid in capitalA | – | – | – | – | –G | –G |
| Net asset value, end of period | $62.37 | $61.57 | $50.98 | $41.90 | $40.96 | $33.87 |
| Total ReturnH,I | 9.86% | 25.02% | 22.76% | 2.74% | 21.63% | .02% |
| Ratios to Average Net AssetsJ,K | ||||||
| Expenses before reductions | .55%L | .63% | .56% | .59% | .78% | .94% |
| Expenses net of fee waivers, if any | .55%L | .63% | .56% | .59% | .78% | .94% |
| Expenses net of all reductions | .54%L | .63% | .55% | .59% | .78% | .94% |
| Net investment income (loss) | (.14)%L | .07%B | .67% | .59%C | .43%D | .49%E |
| Supplemental Data | ||||||
| Net assets, end of period (in millions) | $3,021 | $3,011 | $2,860 | $2,349 | $2,455 | $2,080 |
| Portfolio turnover rateM | 44%L | 67% | 66%N | 43%N | 73%N | 63% |
A Calculated based on average shares outstanding during the period.
B Net investment income per share reflects one or more large, non-recurring dividend(s) which amounted to $.05 per share. Excluding such non-recurring dividend(s), the ratio of net investment income (loss) to average net assets would have been (.03) %.
C Net investment income per share reflects one or more large, non-recurring dividend(s) which amounted to $.09 per share. Excluding such non-recurring dividend(s), the ratio of net investment income (loss) to average net assets would have been .38%.
D Net investment income per share reflects one or more large, non-recurring dividend(s) which amounted to $.06 per share. Excluding such non-recurring dividend(s), the ratio of net investment income (loss) to average net assets would have been .27%.
E Net investment income per share reflects one or more large, non-recurring dividend(s) which amounted to $.05 per share. Excluding such non-recurring dividend(s), the ratio of net investment income (loss) to average net assets would have been .34%.
F Total distributions per share do not sum due to rounding.
G Amount represents less than $.005 per share.
H Total returns for periods of less than one year are not annualized.
I Total returns would have been lower if certain expenses had not been reduced during the applicable periods shown.
J Fees and expenses of any underlying mutual funds or exchange-traded funds (ETFs) are not included in the Fund's expense ratio. The Fund indirectly bears its proportionate share of these expenses. For additional expense information related to investments in Fidelity Central Funds, please refer to the "Investments in Fidelity Central Funds" note found in the Notes to Financial Statements section of the most recent Annual or Semi-Annual report.
K Expense ratios reflect operating expenses of the class. Expenses before reductions do not reflect amounts reimbursed, waived, or reduced through arrangements with the investment adviser, brokerage services, or other offset arrangements, if applicable, and do not represent the amount paid by the class during periods when reimbursements, waivers or reductions occur.
L Annualized
M Amount does not include the portfolio activity of any underlying mutual funds or exchange-traded funds (ETFs).
N Portfolio turnover rate excludes securities received or delivered in-kind.
See accompanying notes which are an integral part of the financial statements.
Fidelity Growth Strategies Fund Class K
| Six months ended (Unaudited) May 31, | Years endedNovember 30, | |||||
| 2021 | 2020 | 2019 | 2018 | 2017 | 2016 | |
| Selected Per–Share Data | ||||||
| Net asset value, beginning of period | $62.08 | $51.38 | $42.23 | $41.29 | $34.14 | $34.17 |
| Income from Investment Operations | ||||||
| Net investment income (loss)A | (.01) | .10B | .36 | .31C | .21D | .21E |
| Net realized and unrealized gain (loss) | 5.89 | 12.42 | 9.20 | .86 | 7.19 | (.14) |
| Total from investment operations | 5.88 | 12.52 | 9.56 | 1.17 | 7.40 | .07 |
| Distributions from net investment income | – | (.27) | (.34) | (.21) | (.23) | (.10) |
| Distributions from net realized gain | (5.00) | (1.55) | (.06) | (.02) | (.02) | – |
| Total distributions | (5.00) | (1.82) | (.41)F | (.23) | (.25) | (.10) |
| Redemption fees added to paid in capitalA | – | – | – | – | –G | –G |
| Net asset value, end of period | $62.96 | $62.08 | $51.38 | $42.23 | $41.29 | $34.14 |
| Total ReturnH,I | 9.92% | 25.17% | 22.94% | 2.84% | 21.81% | .20% |
| Ratios to Average Net AssetsJ,K | ||||||
| Expenses before reductions | .44%L | .52% | .43% | .46% | .63% | .78% |
| Expenses net of fee waivers, if any | .44%L | .52% | .43% | .46% | .63% | .78% |
| Expenses net of all reductions | .44%L | .51% | .43% | .46% | .63% | .78% |
| Net investment income (loss) | (.03)%L | .19%B | .79% | .72%C | .57%D | .64%E |
| Supplemental Data | ||||||
| Net assets, end of period (in millions) | $220 | $236 | $236 | $205 | $272 | $475 |
| Portfolio turnover rateM | 44%L | 67% | 66%N | 43%N | 73%N | 63% |
A Calculated based on average shares outstanding during the period.
B Net investment income per share reflects one or more large, non-recurring dividend(s) which amounted to $.05 per share. Excluding such non-recurring dividend(s), the ratio of net investment income (loss) to average net assets would have been .08%.
C Net investment income per share reflects one or more large, non-recurring dividend(s) which amounted to $.09 per share. Excluding such non-recurring dividend(s), the ratio of net investment income (loss) to average net assets would have been .51%.
D Net investment income per share reflects one or more large, non-recurring dividend(s) which amounted to $.06 per share. Excluding such non-recurring dividend(s), the ratio of net investment income (loss) to average net assets would have been .42%.
E Net investment income per share reflects one or more large, non-recurring dividend(s) which amounted to $.05 per share. Excluding such non-recurring dividend(s), the ratio of net investment income (loss) to average net assets would have been .50%.
F Total distributions per share do not sum due to rounding.
G Amount represents less than $.005 per share.
H Total returns for periods of less than one year are not annualized.
I Total returns would have been lower if certain expenses had not been reduced during the applicable periods shown.
J Fees and expenses of any underlying mutual funds or exchange-traded funds (ETFs) are not included in the Fund's expense ratio. The Fund indirectly bears its proportionate share of these expenses. For additional expense information related to investments in Fidelity Central Funds, please refer to the "Investments in Fidelity Central Funds" note found in the Notes to Financial Statements section of the most recent Annual or Semi-Annual report.
K Expense ratios reflect operating expenses of the class. Expenses before reductions do not reflect amounts reimbursed, waived, or reduced through arrangements with the investment adviser, brokerage services, or other offset arrangements, if applicable, and do not represent the amount paid by the class during periods when reimbursements, waivers or reductions occur.
L Annualized
M Amount does not include the portfolio activity of any underlying mutual funds or exchange-traded funds (ETFs).
N Portfolio turnover rate excludes securities received or delivered in-kind.
See accompanying notes which are an integral part of the financial statements.
Notes to Financial Statements (Unaudited)
For the period ended May 31, 2021
(Amounts in thousands except percentages)
1. Organization.
Fidelity Growth Strategies Fund (the Fund) is a fund of Fidelity Mt. Vernon Street Trust (the Trust) and is authorized to issue an unlimited number of shares. The Trust is registered under the Investment Company Act of 1940, as amended (the 1940 Act), as an open-end management investment company organized as a Massachusetts business trust. The Fund offers Growth Strategies and Class K shares, each of which has equal rights as to assets and voting privileges. Each class has exclusive voting rights with respect to matters that affect that class.
2. Investments in Fidelity Central Funds.
Funds may invest in Fidelity Central Funds, which are open-end investment companies generally available only to other investment companies and accounts managed by the investment adviser and its affiliates. The Schedule of Investments lists any Fidelity Central Funds held as an investment as of period end, but does not include the underlying holdings of each Fidelity Central Fund. An investing fund indirectly bears its proportionate share of the expenses of the underlying Fidelity Central Funds.
Based on its investment objective, each Fidelity Central Fund may invest or participate in various investment vehicles or strategies that are similar to those of the investing fund. These strategies are consistent with the investment objectives of the investing fund and may involve certain economic risks which may cause a decline in value of each of the Fidelity Central Funds and thus a decline in the value of the investing fund.
| Fidelity Central Fund | Investment Manager | Investment Objective | Investment Practices | Expense Ratio(a) |
| Fidelity Money Market Central Funds | Fidelity Management & Research Company LLC (FMR) | Each fund seeks to obtain a high level of current income consistent with the preservation of capital and liquidity. | Short-term Investments | Less than .005% to .01% |
(a) Expenses expressed as a percentage of average net assets and are as of each underlying Central Fund's most recent annual or semi-annual shareholder report.
A complete unaudited list of holdings for each Fidelity Central Fund is available upon request or at the Securities and Exchange Commission website at www.sec.gov. In addition, the financial statements of the Fidelity Central Funds which contain the significant accounting policies (including investment valuation policies) of those funds, and are not covered by the Report of Independent Registered Public Accounting Firm, are available on the Securities and Exchange Commission website or upon request.
3. Significant Accounting Policies.
The Fund is an investment company and applies the accounting and reporting guidance of the Financial Accounting Standards Board (FASB) Accounting Standards Codification Topic 946 Financial Services - Investment Companies. The financial statements have been prepared in conformity with accounting principles generally accepted in the United States of America (GAAP), which require management to make certain estimates and assumptions at the date of the financial statements. Actual results could differ from those estimates. Subsequent events, if any, through the date that the financial statements were issued have been evaluated in the preparation of the financial statements. The Fund's Schedule of Investments lists any underlying mutual funds or exchange-traded funds (ETFs) but does not include the underlying holdings of these funds. The following summarizes the significant accounting policies of the Fund:
Investment Valuation. Investments are valued as of 4:00 p.m. Eastern time on the last calendar day of the period. The Board of Trustees (the Board) has delegated the day to day responsibility for the valuation of the Fund's investments to the Fair Value Committee (the Committee) established by the Fund's investment adviser. In accordance with valuation policies and procedures approved by the Board, the Fund attempts to obtain prices from one or more third party pricing vendors or brokers to value its investments. When current market prices, quotations or currency exchange rates are not readily available or reliable, investments will be fair valued in good faith by the Committee, in accordance with procedures adopted by the Board. Factors used in determining fair value vary by investment type and may include market or investment specific events. The frequency with which these procedures are used cannot be predicted and they may be utilized to a significant extent. The Committee oversees the Fund's valuation policies and procedures and reports to the Board on the Committee's activities and fair value determinations. The Board monitors the appropriateness of the procedures used in valuing the Fund's investments and ratifies the fair value determinations of the Committee.
The Fund categorizes the inputs to valuation techniques used to value its investments into a disclosure hierarchy consisting of three levels as shown below:
- Level 1 – quoted prices in active markets for identical investments
- Level 2 – other significant observable inputs (including quoted prices for similar investments, interest rates, prepayment speeds, etc.)
- Level 3 – unobservable inputs (including the Fund's own assumptions based on the best information available)
Valuation techniques used to value the Fund's investments by major category are as follows:
Equity securities, including restricted securities, for which market quotations are readily available, are valued at the last reported sale price or official closing price as reported by a third party pricing vendor on the primary market or exchange on which they are traded and are categorized as Level 1 in the hierarchy. In the event there were no sales during the day or closing prices are not available, securities are valued at the last quoted bid price or may be valued using the last available price and are generally categorized as Level 2 in the hierarchy. For foreign equity securities, when market or security specific events arise, comparisons to the valuation of American Depositary Receipts (ADRs), futures contracts, ETFs and certain indexes as well as quoted prices for similar securities may be used and would be categorized as Level 2 in the hierarchy. For equity securities, including restricted securities, where observable inputs are limited, assumptions about market activity and risk are used and these securities may be categorized as Level 3 in the hierarchy.
Investments in open-end mutual funds, including the Fidelity Central Funds, are valued at their closing net asset value (NAV) each business day and are categorized as Level 1 in the hierarchy.
Changes in valuation techniques may result in transfers in or out of an assigned level within the disclosure hierarchy. The aggregate value of investments by input level as of May 31, 2021 is included at the end of the Fund's Schedule of Investments.
Foreign Currency. Certain Funds may use foreign currency contracts to facilitate transactions in foreign-denominated securities. Gains and losses from these transactions may arise from changes in the value of the foreign currency or if the counterparties do not perform under the contracts' terms.
Foreign-denominated assets, including investment securities, and liabilities are translated into U.S. dollars at the exchange rates at period end. Purchases and sales of investment securities, income and dividends received, and expenses denominated in foreign currencies are translated into U.S. dollars at the exchange rate in effect on the transaction date.
The effects of exchange rate fluctuations on investments are included with the net realized and unrealized gain (loss) on investment securities. Other foreign currency transactions resulting in realized and unrealized gain (loss) are disclosed separately.
Investment Transactions and Income. For financial reporting purposes, the Fund's investment holdings and NAV include trades executed through the end of the last business day of the period. The NAV per share for processing shareholder transactions is calculated as of the close of business of the New York Stock Exchange (NYSE), normally 4:00 p.m. Eastern time and includes trades executed through the end of the prior business day. Gains and losses on securities sold are determined on the basis of identified cost and include proceeds received from litigation. Dividend income is recorded on the ex-dividend date, except for certain dividends from foreign securities where the ex-dividend date may have passed, which are recorded as soon as the Fund is informed of the ex-dividend date. Non-cash dividends included in dividend income, if any, are recorded at the fair market value of the securities received. Income and capital gain distributions from Fidelity Central Funds, if any, are recorded on the ex-dividend date. Certain distributions received by the Fund represent a return of capital or capital gain. The Fund determines the components of these distributions subsequent to the ex-dividend date, based upon receipt of tax filings or other correspondence relating to the underlying investment. These distributions are recorded as a reduction of cost of investments and/or as a realized gain. Investment income is recorded net of foreign taxes withheld where recovery of such taxes is uncertain.
Class Allocations and Expenses. Investment income, realized and unrealized capital gains and losses, common expenses of a fund, and certain fund-level expense reductions, if any, are allocated daily on a pro-rata basis to each class based on the relative net assets of each class to the total net assets of a fund. Each class differs with respect to transfer agent and distribution and service plan fees incurred, as applicable. Certain expense reductions may also differ by class, if applicable. For the reporting period, the allocated portion of income and expenses to each class as a percent of its average net assets may vary due to the timing of recording these transactions in relation to fluctuating net assets of the classes. Expenses directly attributable to a fund are charged to that fund. Expenses attributable to more than one fund are allocated among the respective funds on the basis of relative net assets or other appropriate methods. Expenses included in the accompanying financial statements reflect the expenses of that fund and do not include any expenses associated with any underlying mutual funds or exchange-traded funds. Although not included in a fund's expenses, a fund indirectly bears its proportionate share of these expenses through the net asset value of each underlying mutual fund or exchange-traded fund. Expense estimates are accrued in the period to which they relate and adjustments are made when actual amounts are known.
Deferred Trustee Compensation. Under a Deferred Compensation Plan (the Plan) for certain Funds, certain independent Trustees have elected to defer receipt of a portion of their annual compensation. Deferred amounts are invested in affiliated mutual funds, are marked-to-market and remain in a fund until distributed in accordance with the Plan. The investment of deferred amounts and the offsetting payable to the Trustees presented below are included in the accompanying Statement of Assets and Liabilities in other receivables and other payables and accrued expenses, as applicable.
| Fidelity Growth Strategies Fund | $29 |
Income Tax Information and Distributions to Shareholders. Each year, the Fund intends to qualify as a regulated investment company under Subchapter M of the Internal Revenue Code, including distributing substantially all of its taxable income and realized gains. As a result, no provision for U.S. Federal income taxes is required. The Fund files a U.S. federal tax return, in addition to state and local tax returns as required. The Fund's federal income tax returns are subject to examination by the Internal Revenue Service (IRS) for a period of three fiscal years after they are filed. State and local tax returns may be subject to examination for an additional fiscal year depending on the jurisdiction. Foreign taxes are provided for based on the Fund's understanding of the tax rules and rates that exist in the foreign markets in which it invests.
Distributions are declared and recorded on the ex-dividend date. Income and capital gain distributions are declared separately for each class. Income and capital gain distributions are determined in accordance with income tax regulations, which may differ from GAAP.
Capital accounts within the financial statements are adjusted for permanent book-tax differences. These adjustments have no impact on net assets or the results of operations. Capital accounts are not adjusted for temporary book-tax differences which will reverse in a subsequent period.
Book-tax differences are primarily due to foreign currency transactions, passive foreign investment companies (PFIC), deferred Trustees compensation and losses deferred due to wash sales and excise tax regulations.
As of period end, the cost and unrealized appreciation (depreciation) in securities, and derivatives if applicable, for federal income tax purposes were as follows:
| Gross unrealized appreciation | $1,396,057 |
| Gross unrealized depreciation | (7,734) |
| Net unrealized appreciation (depreciation) | $1,388,323 |
| Tax cost | $1,877,413 |
At the prior fiscal period end, the Fund was required to defer approximately $896 of ordinary losses recognized during the period January 1, 2020 to November 30, 2020.
Restricted Securities (including Private Placements). Funds may invest in securities that are subject to legal or contractual restrictions on resale. These securities generally may be resold in transactions exempt from registration or to the public if the securities are registered. Disposal of these securities may involve time-consuming negotiations and expense, and prompt sale at an acceptable price may be difficult. Information regarding restricted securities held at period end is included at the end of the Schedule of Investments, if applicable.
4. Purchases and Sales of Investments.
Purchases and sales of securities, other than short-term securities, are noted in the table below.
| Purchases ($) | Sales ($) | |
| Fidelity Growth Strategies Fund | 701,326 | 1,085,711 |
5. Fees and Other Transactions with Affiliates.
Management Fee. Fidelity Management & Research Company LLC (the investment adviser) and its affiliates provide the Fund with investment management related services for which the Fund pays a monthly management fee. The management fee is the sum of an individual fund fee rate that is based on an annual rate of .30% of the Fund's average net assets and an annualized group fee rate that averaged .23% during the period. The group fee rate is based upon the monthly average net assets of a group of registered investment companies with which the investment adviser has management contracts. The group fee rate decreases as assets under management increase and increases as assets under management decrease. In addition, the management fee is subject to a performance adjustment (up to a maximum of +/- .20% of the Fund's average net assets over a 36 month performance period). The upward or downward adjustment to the management fee is based on the relative investment performance of Growth Strategies as compared to its benchmark index, the Russell Midcap Growth Index, over the same 36 month performance period. For the reporting period, the total annualized management fee rate, including the performance adjustment, was .36% of the Fund's average net assets. The performance adjustment included in the management fee rate may be higher or lower than the maximum performance adjustment rate due to the difference between the average net assets for the reporting and performance periods.
Transfer Agent Fees. Fidelity Investments Institutional Operations Company LLC (FIIOC), an affiliate of the investment adviser, is the transfer, dividend disbursing and shareholder servicing agent for each class of the Fund. FIIOC receives account fees and asset-based fees that vary according to the account size and type of account of the shareholders of Growth Strategies, except for Class K. FIIOC receives an asset-based fee of Class K's average net assets. FIIOC pays for typesetting, printing and mailing of shareholder reports, except proxy statements.
For the period, transfer agent fees for each class were as follows:
| Amount | % of Class-Level Average Net Assets(a) | |
| Growth Strategies | $2,291 | .15 |
| Class K | 49 | .04 |
| $2,340 |
(a) Annualized
Accounting Fees. Fidelity Service Company, Inc. (FSC), an affiliate of the investment adviser, maintains the Fund's accounting records. The accounting fee is based on the level of average net assets for each month. For the period, the fees were equivalent to the following annualized rates:
| % of Average Net Assets | |
| Fidelity Growth Strategies Fund | .03 |
Brokerage Commissions. A portion of portfolio transactions were placed with brokerage firms which are affiliates of the investment adviser. Brokerage commissions are included in net realized gain (loss) and change in net unrealized appreciation (depreciation) in the Statement of Operations. The commissions paid to these affiliated firms were as follows:
| Amount | |
| Fidelity Growth Strategies Fund | $7 |
Interfund Trades. Funds may purchase from or sell securities to other Fidelity Funds under procedures adopted by the Board. The procedures have been designed to ensure these interfund trades are executed in accordance with Rule 17a-7 of the 1940 Act. Any interfund trades are included within the respective purchases and sales amounts shown in the Purchases and Sales of Investments note and are noted in the table below.
| Purchases ($) | Sales ($) | |
| Fidelity Growth Strategies Fund | 62,641 | 40,182 |
6. Committed Line of Credit.
Certain Funds participate with other funds managed by the investment adviser or an affiliate in a $4.25 billion credit facility (the "line of credit") to be utilized for temporary or emergency purposes to fund shareholder redemptions or for other short-term liquidity purposes. The participating funds have agreed to pay commitment fees on their pro-rata portion of the line of credit, which are reflected in Miscellaneous expenses on the Statement of Operations, and are listed below. During the period, there were no borrowings on this line of credit.
| Amount | |
| Fidelity Growth Strategies Fund | $3 |
7. Security Lending.
Funds lend portfolio securities from time to time in order to earn additional income. Lending agents are used, including National Financial Services (NFS), an affiliate of the investment adviser. Pursuant to a securities lending agreement, NFS will receive a fee, which is capped at 9.9% of a fund's daily lending revenue, for its services as lending agent. A fund may lend securities to certain qualified borrowers, including NFS. On the settlement date of the loan, a fund receives collateral (in the form of U.S. Treasury obligations, letters of credit and/or cash) against the loaned securities and maintains collateral in an amount not less than 100% of the market value of the loaned securities during the period of the loan. The market value of the loaned securities is determined at the close of business of a fund and any additional required collateral is delivered to a fund on the next business day. A fund or borrower may terminate the loan at any time, and if the borrower defaults on its obligation to return the securities loaned because of insolvency or other reasons, a fund may apply collateral received from the borrower against the obligation. A fund may experience delays and costs in recovering the securities loaned. Any cash collateral received is invested in the Fidelity Securities Lending Cash Central Fund. Any loaned securities are identified as such in the Schedule of Investments, and the value of loaned securities and cash collateral at period end, as applicable, are presented in the Statement of Assets and Liabilities. Security lending income represents the income earned on investing cash collateral, less rebates paid to borrowers and any lending agent fees associated with the loan, plus any premium payments received for lending certain types of securities. Security lending income is presented in the Statement of Operations as a component of income from Fidelity Central Funds. Affiliated security lending activity, if any, was as follows:
| Total Security Lending Fees Paid to NFS | Security Lending Income From Securities Loaned to NFS | Value of Securities Loaned to NFS at Period End | |
| Fidelity Growth Strategies Fund | $1 | $–(a) | $– |
(a) In the amount of less than five hundred dollars.
8. Expense Reductions.
Commissions paid to certain brokers with whom the investment adviser, or its affiliates, places trades on behalf of the Fund include an amount in addition to trade execution, which may be rebated back to the Fund to offset expenses. This amount totaled $63 for the period.
In addition, during the period the investment adviser or an affiliate reimbursed and/or waived a portion of fund-level operating expenses in the amount of $5.
9. Distributions to Shareholders.
Distributions to shareholders of each class were as follows:
| Six months ended May 31, 2021 | Year ended November 30, 2020 | |
| Fidelity Growth Strategies Fund | ||
| Distributions to shareholders | ||
| Growth Strategies | $236,172 | $99,083 |
| Class K | 18,817 | 8,297 |
| Total | $254,989 | $107,380 |
10. Share Transactions.
Share transactions for each class were as follows and may contain automatic conversions between classes or exchanges between affiliated funds:
| Shares | Shares | Dollars | Dollars | |
| Six months ended May 31, 2021 | Year ended November 30, 2020 | Six months ended May 31, 2021 | Year ended November 30, 2020 | |
| Fidelity Growth Strategies Fund | ||||
| Growth Strategies | ||||
| Shares sold | 2,037 | 7,710 | $125,048 | $395,448 |
| Reinvestment of distributions | 3,814 | 1,884 | 225,526 | 94,591 |
| Shares redeemed | (6,307) | (16,794) | (386,455) | (894,236) |
| Net increase (decrease) | (456) | (7,200) | $(35,881) | $(404,197) |
| Class K | ||||
| Shares sold | 247 | 1,194 | $15,269 | $61,966 |
| Reinvestment of distributions | 315 | 164 | 18,817 | 8,297 |
| Shares redeemed | (880) | (2,150) | (53,806) | (114,012) |
| Net increase (decrease) | (318) | (792) | $(19,720) | $(43,749) |
11. Other.
Fund's organizational documents provide former and current trustees and officers with a limited indemnification against liabilities arising in connection with the performance of their duties to the fund. In the normal course of business, the fund may also enter into contracts that provide general indemnifications. The fund's maximum exposure under these arrangements is unknown as this would be dependent on future claims that may be made against the fund. The risk of material loss from such claims is considered remote.
12. Coronavirus (COVID-19) Pandemic.
An outbreak of COVID-19 first detected in China during December 2019 has since spread globally and was declared a pandemic by the World Health Organization during March 2020. Developments that disrupt global economies and financial markets, such as the COVID-19 pandemic, may magnify factors that affect the Fund's performance.
Shareholder Expense Example
As a shareholder, you incur two types of costs: (1) transaction costs, which may include sales charges (loads) on purchase payments or redemption proceeds, as applicable and (2) ongoing costs, which generally include management fees, distribution and/or service (12b-1) fees and other Fund expenses. This Example is intended to help you understand your ongoing costs (in dollars) of investing in a fund and to compare these costs with the ongoing costs of investing in other mutual funds.
The Example is based on an investment of $1,000 invested at the beginning of the period and held for the entire period (December 1, 2020 to May 31, 2021).
Actual Expenses
The first line of the accompanying table provides information about actual account values and actual expenses. You may use the information in this line, together with the amount you invested, to estimate the expenses that you paid over the period. Simply divide your account value by $1,000.00 (for example, an $8,600 account value divided by $1,000.00 = 8.6), then multiply the result by the number in the first line for a class/Fund under the heading entitled "Expenses Paid During Period" to estimate the expenses you paid on your account during this period. If any fund is a shareholder of any underlying mutual funds or exchange-traded funds (ETFs) (the Underlying Funds), such fund indirectly bears its proportional share of the expenses of the Underlying Funds in addition to the direct expenses incurred presented in the table. These fees and expenses are not included in the annualized expense ratio used to calculate the expense estimate in the table below.
Hypothetical Example for Comparison Purposes
The second line of the accompanying table provides information about hypothetical account values and hypothetical expenses based on the actual expense ratio and an assumed rate of return of 5% per year before expenses, which is not the actual return. The hypothetical account values and expenses may not be used to estimate the actual ending account balance or expenses you paid for the period. You may use this information to compare the ongoing costs of investing in the Fund and other funds. To do so, compare this 5% hypothetical example with the 5% hypothetical examples that appear in the shareholder reports of the other funds. If any fund is a shareholder of any Underlying Funds, such fund indirectly bears its proportional share of the expenses of the Underlying Funds in addition to the direct expenses as presented in the table. These fees and expenses are not included in the annualized expense ratio used to calculate the expense estimate in the table below.
Please note that the expenses shown in the table are meant to highlight your ongoing costs only and do not reflect any transaction costs. Therefore, the second line of the table is useful in comparing ongoing costs only, and will not help you determine the relative total costs of owning different funds.
| Annualized Expense Ratio-A | Beginning Account Value December 1, 2020 | Ending Account Value May 31, 2021 | Expenses Paid During Period-B December 1, 2020 to May 31, 2021 | |
| Fidelity Growth Strategies Fund | ||||
| Growth Strategies | .55% | |||
| Actual | $1,000.00 | $1,098.60 | $2.88 | |
| Hypothetical-C | $1,000.00 | $1,022.19 | $2.77 | |
| Class K | .44% | |||
| Actual | $1,000.00 | $1,099.20 | $2.30 | |
| Hypothetical-C | $1,000.00 | $1,022.74 | $2.22 |
A Annualized expense ratio reflects expenses net of applicable fee waivers.
B Expenses are equal to the annualized expense ratio, multiplied by the average account value over the period, multiplied by 182/ 365 (to reflect the one-half year period). The fees and expenses of any Underlying Funds are not included in each annualized expense ratio.
C 5% return per year before expenses
Board Approval of Investment Advisory Contracts and Management Fees
Fidelity Growth Strategies Fund
Each year, the Board of Trustees, including the Independent Trustees (together, the Board), votes on the renewal of the management contract with Fidelity Management & Research Company LLC (FMR) and the sub-advisory agreements (together, the Advisory Contracts) for the fund. FMR and the sub-advisers are referred to herein as the Investment Advisers. The Board, assisted by the advice of fund counsel and Independent Trustees' counsel, requests and considers a broad range of information relevant to the renewal of the Advisory Contracts throughout the year.The Board meets regularly and, at each of its meetings, covers an extensive agenda of topics and materials and considers factors that are relevant to its annual consideration of the renewal of the fund's Advisory Contracts, including the services and support provided to the fund and its shareholders. The Board has established various standing committees (Committees), each composed of and chaired by Independent Trustees with varying backgrounds, to which the Board has assigned specific subject matter responsibilities in order to enhance effective decision-making by the Board. The Board, acting directly and through its Committees, requests and receives information concerning the annual consideration of the renewal of the fund's Advisory Contracts. The Board also meets as needed to review matters specifically related to the Board's annual consideration of the renewal of the Advisory Contracts. Members of the Board may also meet with trustees of other Fidelity funds through joint ad hoc committees to discuss certain matters relevant to all of the Fidelity funds.Approval of Stub Period Continuation. At its January 2021 meeting, the Board of Trustees voted to continue the fund's management contract with FMR, and the sub-advisory agreements and sub-subadvisory agreements, in each case, where applicable (together, the Advisory Contracts), without modification, for four months from February 1, 2021 through May 31, 2021, in connection with changes to the Board's meeting calendar. The Board considered that the approval of the fund's Advisory Contracts will not result in any changes in (i) the investment process or strategies employed in the management of the fund's assets; (ii) the fees and expenses paid by shareholders; (iii) the nature, extent or quality of services provided under the fund's Advisory Contracts; or (iv) the day-to-day management of the fund or the persons primarily responsible for such management. The Board also considered that since its last approval of the fund's Advisory Contracts, FMR had provided additional information on the fund in support of the annual contract renewal process, including competitive analyses on total expenses and management fees and in-depth reviews of fund performance and fund profitability information. The Board also considered the findings of certain ad hoc committees that had been previously formed to discuss matters relevant to all of the Fidelity funds, including economies of scale, fall-out benefits and retail vs. institutional funds. The Board concluded that the fund's Advisory Contracts are fair and reasonable, and that the fund's Advisory Contracts should be renewed, without modification, through May 31, 2021, with the understanding that the Board will consider the annual renewal for a full one year period in May 2021.At its May 2021 meeting, the Board unanimously determined to renew the fund's Advisory Contracts. In reaching its determination, the Board considered all factors it believed relevant, including (i) the nature, extent, and quality of the services provided to the fund and its shareholders (including the investment performance of the fund); (ii) the competitiveness of the fund's management fee and total expense ratio relative to peer funds; (iii) the total costs of the services provided by and the profits realized by Fidelity from its relationships with the fund; and (iv) the extent to which, if any, economies of scale exist and are realized as the fund grows, and whether any economies of scale are appropriately shared with fund shareholders.In considering whether to renew the Advisory Contracts for the fund, the Board reached a determination, with the assistance of fund counsel and Independent Trustees' counsel and through the exercise of its business judgment, that the renewal of the Advisory Contracts was in the best interests of the fund and its shareholders and that the compensation payable under the Advisory Contracts was fair and reasonable. The Board's decision to renew the Advisory Contracts was not based on any single factor, but rather was based on a comprehensive consideration of all the information provided to the Board at its meetings throughout the year. The Board, in reaching its determination to renew the Advisory Contracts, was aware that shareholders of the fund have a broad range of investment choices available to them, including a wide choice among funds offered by Fidelity's competitors, and that the fund's shareholders, who have the opportunity to review and weigh the disclosure provided by the fund in its prospectus and other public disclosures, have chosen to invest in this fund, which is part of the Fidelity family of funds.Nature, Extent, and Quality of Services Provided. The Board considered Fidelity's staffing as it relates to the fund, including the backgrounds of investment personnel of Fidelity, and also considered the fund's investment objective, strategies, and related investment philosophy. The Independent Trustees also had discussions with senior management of Fidelity's investment operations and investment groups. The Board considered the structure of the investment personnel compensation program and whether this structure provides appropriate incentives to act in the best interests of the fund. Additionally, the Board considered the portfolio managers' investments, if any, in the funds that they manage.Resources Dedicated to Investment Management and Support Services. The Board and the Fund Oversight and Research Committees reviewed the general qualifications and capabilities of Fidelity's investment staff, including its size, education, experience, and resources, as well as Fidelity's approach to recruiting, training, managing, and compensating investment personnel. The Board noted that Fidelity has continued to increase the resources devoted to non-U.S. offices, including expansion of Fidelity's global investment organization. The Board also noted that Fidelity's analysts have extensive resources, tools and capabilities that allow them to conduct sophisticated quantitative and fundamental analysis, as well as credit analysis of issuers, counterparties and guarantors. Further, the Board considered that Fidelity's investment professionals have sufficient access to global information and data so as to provide competitive investment results over time, and that those professionals also have access to sophisticated tools that permit them to assess portfolio construction and risk and performance attribution characteristics continuously, as well as to transmit new information and research conclusions rapidly around the world. Additionally, in its deliberations, the Board considered Fidelity's trading, risk management, compliance, and technology and operations capabilities and resources, which are integral parts of the investment management process. The Board also considered Fidelity's investments in business continuity planning, and its success in continuously providing services to the fund notwithstanding the severe disruptions caused by the COVID-19 pandemic.Shareholder and Administrative Services. The Board considered (i) the nature, extent, quality, and cost of advisory, administrative, and shareholder services performed by the Investment Advisers and their affiliates under the Advisory Contracts and under separate agreements covering transfer agency, pricing and bookkeeping, and securities lending services for the fund; (ii) the nature and extent of the supervision of third party service providers, principally custodians, subcustodians, and pricing vendors; and (iii) the resources devoted to, and the record of compliance with, the fund's compliance policies and procedures. The Board also reviewed the allocation of fund brokerage, including allocations to brokers affiliated with the Investment Advisers, the use of brokerage commissions to pay fund expenses, and the use of "soft" commission dollars to pay for research services.The Board noted that the growth of fund assets over time across the complex allows Fidelity to reinvest in the development of services designed to enhance the value and convenience of the Fidelity funds as investment vehicles. These services include 24-hour access to account information and market information over the Internet and through telephone representatives, investor education materials and asset allocation tools, and the expanded availability of Fidelity Investor Centers.The Board noted that, in the past, it and the boards of certain other Fidelity funds had formed an ad hoc Committee on Transfer Agency Fees to review the variety of transfer agency fee structures throughout the industry and Fidelity's competitive positioning with respect to industry participants.Investment in a Large Fund Family. The Board considered the benefits to shareholders of investing in a Fidelity fund, including the benefits of investing in a fund that is part of a large family of funds offering a variety of investment disciplines and providing a large variety of mutual fund investor services. The Board noted that Fidelity had taken, or had made recommendations that resulted in the Fidelity funds taking, a number of actions over the previous year that benefited particular funds, including: (i) continuing to dedicate additional resources to Fidelity's investment research process, which includes meetings with management of issuers of securities in which the funds invest, and to the support of the senior management team that oversees asset management; (ii) continuing efforts to enhance Fidelity's global research capabilities; (iii) launching new funds and ETFs with innovative structures, strategies and pricing and making other enhancements to meet client needs; (iv) launching new share classes of existing funds; (v) eliminating purchase minimums and broadening eligibility requirements for certain funds and share classes; (vi) approving the reduction in the holding period for the Class C to Class A conversion policy; (vii) reducing management fees and total expenses for certain target date funds and classes and index funds; (viii) lowering expenses for certain existing funds and classes by implementing or lowering expense caps; (ix) rationalizing product lines and gaining increased efficiencies from fund mergers, liquidations, and share class consolidations; (x) continuing to develop, acquire and implement systems and technology to improve services to the funds and shareholders, strengthen information security, and increase efficiency; and (xi) continuing to implement enhancements to further strengthen Fidelity's product line to increase investors' probability of success in achieving their investment goals, including retirement income goals.Investment Performance. The Board considered whether the fund has operated in accordance with its investment objective, as well as its record of compliance with its investment restrictions and its performance history.The Board took into account discussions that occur at Board meetings throughout the year with representatives of the Investment Advisers about fund investment performance. In this regard the Board noted that as part of regularly scheduled fund reviews and other reports to the Board on fund performance, the Board considers annualized return information for the fund for different time periods, measured against an appropriate securities market index (benchmark index) and an appropriate peer group of funds with similar objectives (peer group). In its evaluation of fund investment performance, the Board gave particular attention to information indicating changes in performance of certain Fidelity funds for specific time periods and discussed with the Investment Advisers the reasons for any overperformance or underperformance.In addition to reviewing absolute and relative fund performance, the Independent Trustees periodically consider the appropriateness of fund performance metrics in evaluating the results achieved. In general, the Independent Trustees believe that fund performance should be evaluated based on net performance (after fees and expenses) of both the highest performing and lowest performing fund share classes, where applicable, compared to appropriate benchmark indices, over appropriate time periods that may include full market cycles, and compared to peer groups, as applicable, over the same periods, taking into account relevant factors including the following: general market conditions; issuer-specific information; and fund cash flows and other factors.The Independent Trustees recognize that shareholders evaluate performance on a net basis over their own holding periods, for which one-, three-, and five-year periods are often used as a proxy. For this reason, the performance information reviewed by the Board also included net cumulative total return information for the fund and an appropriate benchmark index and peer group for the most recent one-, three-, and five-year periods ended September 30, 2020, as shown below. Returns are shown compared to the 25th percentile (top of box, 75% beaten) and 75th percentile (bottom of box, 25% beaten) of the peer universe.Fidelity Growth Strategies Fund

Fidelity Growth Strategies Fund
The Board considered that effective February 1, 2017, the fund's individual fund fee rate was reduced from 0.35% to 0.30%. The Board considered that the chart below reflects the fund's lower management fee rate for 2016, as if the lower fee rate were in effect for the entire year.
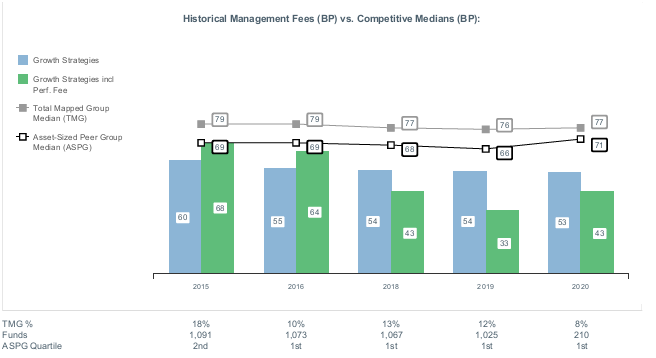
Liquidity Risk Management Program
The Securities and Exchange Commission adopted Rule 22e-4 under the Investment Company Act of 1940 (the Liquidity Rule) to promote effective liquidity risk management throughout the open-end investment company industry, thereby reducing the risk that funds will be unable to meet their redemption obligations and mitigating dilution of the interests of fund shareholders.
The Fund has adopted and implemented a liquidity risk management program pursuant to the Liquidity Rule (the Program) effective December 1, 2018. The Program is reasonably designed to assess and manage the Fund’s liquidity risk and to comply with the requirements of the Liquidity Rule. The Fund’s Board of Trustees (the Board) has designated the Fund’s investment adviser as administrator of the Program. The Fidelity advisers have established a Liquidity Risk Management Committee (the LRM Committee) to manage the Program for each of the Fidelity Funds. The LRM Committee monitors the adequacy and effectiveness of implementation of the Program and on a periodic basis assesses each Fund’s liquidity risk based on a variety of factors including (1) the Fund’s investment strategy, (2) portfolio liquidity and cash flow projections during normal and reasonably foreseeable stressed conditions, (3) shareholder redemptions, (4) borrowings and other funding sources and (5) in the case of exchange-traded funds, certain additional factors including the effect of the Fund’s prices and spreads, market participants, and basket compositions on the overall liquidity of the Fund’s portfolio, as applicable.
In accordance with the Program, each of the Fund’s portfolio investments is classified into one of four liquidity categories described below based on a determination of a reasonable expectation for how long it would take to convert the investment to cash (or sell or dispose of the investment) without significantly changing its market value.
- Highly liquid investments – cash or convertible to cash within three business days or less
- Moderately liquid investments – convertible to cash in three to seven calendar days
- Less liquid investments – can be sold or disposed of, but not settled, within seven calendar days
- Illiquid investments – cannot be sold or disposed of within seven calendar days
Liquidity classification determinations take into account a variety of factors including various market, trading and investment-specific considerations, as well as market depth, and generally utilize analysis from a third-party liquidity metrics service.
The Liquidity Rule places a 15% limit on a fund’s illiquid investments and requires funds that do not primarily hold assets that are highly liquid investments to determine and maintain a minimum percentage of the fund’s net assets to be invested in highly liquid investments (highly liquid investment minimum or HLIM). The Program includes provisions reasonably designed to comply with the 15% limit on illiquid investments and for determining, periodically reviewing and complying with the HLIM requirement as applicable.
At a recent meeting of the Fund’s Board of Trustees, the LRM Committee provided a written report to the Board pertaining to the operation, adequacy, and effectiveness of implementation of the Program for the annual period from December 1, 2019 through November 30, 2020. The report concluded that the Program has been implemented and is operating effectively and is reasonably designed to assess and manage the Fund’s liquidity risk.
![]()
FEG-SANN-0721
1.704532.123
Fidelity® Series Growth Company Fund
Semi-Annual Report
May 31, 2021
Contents
Board Approval of Investment Advisory Contracts and Management Fees | |
To view a fund's proxy voting guidelines and proxy voting record for the 12-month period ended June 30, visit http://www.fidelity.com/proxyvotingresults or visit the Securities and Exchange Commission's (SEC) web site at http://www.sec.gov.
You may also call 1-800-544-8544 to request a free copy of the proxy voting guidelines.
Standard & Poor's, S&P and S&P 500 are registered service marks of The McGraw-Hill Companies, Inc. and have been licensed for use by Fidelity Distributors Corporation.
Other third-party marks appearing herein are the property of their respective owners.
All other marks appearing herein are registered or unregistered trademarks or service marks of FMR LLC or an affiliated company. © 2021 FMR LLC. All rights reserved.
This report and the financial statements contained herein are submitted for the general information of the shareholders of the Fund. This report is not authorized for distribution to prospective investors in the Fund unless preceded or accompanied by an effective prospectus.
A fund files its complete schedule of portfolio holdings with the SEC for the first and third quarters of each fiscal year on Form N-PORT. Forms N-PORT are available on the SEC’s web site at http://www.sec.gov. A fund's Forms N-PORT may be reviewed and copied at the SEC’s Public Reference Room in Washington, DC. Information regarding the operation of the SEC's Public Reference Room may be obtained by calling 1-800-SEC-0330.
For a complete list of a fund's portfolio holdings, view the most recent holdings listing, semiannual report, or annual report on Fidelity's web site at http://www.fidelity.com, http://www.institutional.fidelity.com, or http://www.401k.com, as applicable.
NOT FDIC INSURED •MAY LOSE VALUE •NO BANK GUARANTEE
Neither the Fund nor Fidelity Distributors Corporation is a bank.
Note to Shareholders:
Early in 2020, the outbreak and spread of a new coronavirus emerged as a public health emergency that had a major influence on financial markets, primarily based on its impact on the global economy and the outlook for corporate earnings. The virus causes a respiratory disease known as COVID-19. On March 11, 2020 the World Health Organization declared the COVID-19 outbreak a pandemic, citing sustained risk of further global spread.
In the weeks following, as the crisis worsened, we witnessed an escalating human tragedy with wide-scale social and economic consequences from coronavirus-containment measures. The outbreak of COVID-19 prompted a number of measures to limit the spread, including travel and border restrictions, quarantines, and restrictions on large gatherings. In turn, these resulted in lower consumer activity, diminished demand for a wide range of products and services, disruption in manufacturing and supply chains, and – given the wide variability in outcomes regarding the outbreak – significant market uncertainty and volatility. Amid the turmoil, global governments and central banks took unprecedented action to help support consumers, businesses, and the broader economies, and to limit disruption to financial systems.
The situation continues to unfold, and the extent and duration of its impact on financial markets and the economy remain highly uncertain. Extreme events such as the coronavirus crisis are “exogenous shocks” that can have significant adverse effects on mutual funds and their investments. Although multiple asset classes may be affected by market disruption, the duration and impact may not be the same for all types of assets.
Fidelity is committed to helping you stay informed amid news about COVID-19 and during increased market volatility, and we’re taking extra steps to be responsive to customer needs. We encourage you to visit our websites, where we offer ongoing updates, commentary, and analysis on the markets and our funds.
Investment Summary (Unaudited)
Top Ten Stocks as of May 31, 2021
| % of fund's net assets | |
| NVIDIA Corp. | 8.2 |
| Apple, Inc. | 6.7 |
| Amazon.com, Inc. | 6.4 |
| Microsoft Corp. | 4.2 |
| Alphabet, Inc. Class A | 3.9 |
| lululemon athletica, Inc. | 2.9 |
| Salesforce.com, Inc. | 2.4 |
| Alphabet, Inc. Class C | 2.3 |
| Shopify, Inc. Class A | 2.0 |
| Wayfair LLC Class A | 1.8 |
| 40.8 |
Top Five Market Sectors as of May 31, 2021
| % of fund's net assets | |
| Information Technology | 35.7 |
| Consumer Discretionary | 22.3 |
| Health Care | 15.9 |
| Communication Services | 12.5 |
| Industrials | 6.0 |
Asset Allocation (% of fund's net assets)
| As of May 31, 2021* | ||
| Stocks | 97.7% | |
| Convertible Securities | 1.7% | |
| Short-Term Investments and Net Other Assets (Liabilities) | 0.6% | |

* Foreign investments - 9.6%
Schedule of Investments May 31, 2021 (Unaudited)
Showing Percentage of Net Assets
| Common Stocks - 97.6% | |||
| Shares | Value | ||
| COMMUNICATION SERVICES - 12.4% | |||
| Entertainment - 3.2% | |||
| Activision Blizzard, Inc. | 426,628 | $41,489,573 | |
| Electronic Arts, Inc. | 72,254 | 10,327,264 | |
| NetEase, Inc. ADR | 80,520 | 9,495,724 | |
| Netflix, Inc. (a) | 155,429 | 78,151,255 | |
| Roblox Corp. (a)(b) | 243,700 | 22,851,749 | |
| Roku, Inc. Class A (a) | 519,476 | 180,107,524 | |
| Sea Ltd. ADR (a) | 333,185 | 84,375,769 | |
| The Walt Disney Co. (a) | 61,276 | 10,946,957 | |
| Zynga, Inc. (a) | 201,000 | 2,178,840 | |
| 439,924,655 | |||
| Interactive Media & Services - 8.6% | |||
| Alphabet, Inc.: | |||
| Class A (a) | 230,199 | 542,544,513 | |
| Class C (a) | 130,343 | 314,329,965 | |
| Bumble, Inc. | 38,100 | 1,818,132 | |
| Facebook, Inc. Class A (a) | 754,330 | 247,970,901 | |
| IAC (a) | 20,600 | 3,285,082 | |
| Kuaishou Technology Class B (c) | 114,800 | 2,873,901 | |
| Match Group, Inc. (a) | 9,753 | 1,398,385 | |
| Pinterest, Inc. Class A (a) | 37,600 | 2,455,280 | |
| Snap, Inc. Class A (a) | 426,881 | 26,517,848 | |
| Tencent Holdings Ltd. | 107,190 | 8,548,739 | |
| Twitter, Inc. (a) | 161,781 | 9,383,298 | |
| Vimeo, Inc. (a) | 33,420 | 1,403,640 | |
| Zillow Group, Inc. Class C (a)(b) | 171,000 | 20,061,720 | |
| 1,182,591,404 | |||
| Media - 0.0% | |||
| Comcast Corp. Class A | 40,510 | 2,322,843 | |
| Wireless Telecommunication Services - 0.6% | |||
| T-Mobile U.S., Inc. | 568,253 | 80,379,387 | |
| TOTAL COMMUNICATION SERVICES | 1,705,218,289 | ||
| CONSUMER DISCRETIONARY - 21.9% | |||
| Automobiles - 1.9% | |||
| Arrival Group (d) | 714,028 | 13,017,087 | |
| Lordstown Motors Corp. (d) | 265,864 | 2,368,848 | |
| Neutron Holdings, Inc. (e) | 438,358 | 6,006 | |
| Rad Power Bikes, Inc. (d)(e) | 249,183 | 1,202,019 | |
| Tesla, Inc. (a) | 384,485 | 240,387,712 | |
| XPeng, Inc. ADR (a)(b) | 165,100 | 5,304,663 | |
| 262,286,335 | |||
| Hotels, Restaurants & Leisure - 1.6% | |||
| Airbnb, Inc. Class A | 4,100 | 575,640 | |
| Chipotle Mexican Grill, Inc. (a) | 9,770 | 13,404,245 | |
| Hyatt Hotels Corp. Class A (a) | 26,883 | 2,099,025 | |
| Marriott International, Inc. Class A (a) | 282,050 | 40,496,739 | |
| McDonald's Corp. | 9,125 | 2,134,246 | |
| Penn National Gaming, Inc. (a) | 478,200 | 39,198,054 | |
| Planet Fitness, Inc. (a) | 15,632 | 1,231,333 | |
| Rush Street Interactive, Inc. (a) | 285,400 | 3,541,814 | |
| Rush Street Interactive, Inc. (d) | 102,555 | 1,272,708 | |
| Shake Shack, Inc. Class A (a)(b) | 14,336 | 1,347,297 | |
| Starbucks Corp. | 403,253 | 45,922,452 | |
| The Booking Holdings, Inc. (a) | 19,672 | 46,456,412 | |
| Vail Resorts, Inc. (a) | 41,400 | 13,532,832 | |
| Yum China Holdings, Inc. | 122,112 | 8,259,656 | |
| 219,472,453 | |||
| Household Durables - 0.9% | |||
| D.R. Horton, Inc. | 289,810 | 27,615,995 | |
| KB Home | 252,250 | 11,807,823 | |
| Lennar Corp. Class A | 631,069 | 62,482,142 | |
| PulteGroup, Inc. | 46,900 | 2,710,351 | |
| Toll Brothers, Inc. | 315,300 | 20,570,172 | |
| Vizio Holding Corp. (a) | 103,500 | 2,260,440 | |
| 127,446,923 | |||
| Internet & Direct Marketing Retail - 9.1% | |||
| Alibaba Group Holding Ltd. sponsored ADR (a) | 152,029 | 32,528,125 | |
| Amazon.com, Inc. (a) | 272,918 | 879,633,818 | |
| Coupang, Inc. Class A (a)(b) | 43,000 | 1,753,970 | |
| Deliveroo Holdings PLC (a)(c) | 702,600 | 2,509,434 | |
| Etsy, Inc. (a) | 42,281 | 6,964,949 | |
| Farfetch Ltd. Class A (a) | 86,850 | 4,023,761 | |
| JD.com, Inc. sponsored ADR (a) | 350,229 | 25,895,932 | |
| Ocado Group PLC (a) | 279,720 | 7,506,852 | |
| Ozon Holdings PLC ADR (b) | 44,100 | 2,340,387 | |
| Pinduoduo, Inc. ADR (a) | 41,300 | 5,157,544 | |
| Revolve Group, Inc. (a) | 320,776 | 17,783,821 | |
| The Honest Co., Inc. | 106,126 | 1,507,201 | |
| The RealReal, Inc. (a) | 266,118 | 4,649,081 | |
| THG PLC | 341,400 | 2,953,814 | |
| thredUP, Inc. (a)(b) | 148,723 | 3,508,376 | |
| Wayfair LLC Class A (a)(b) | 816,270 | 250,219,406 | |
| Zomato Pvt Ltd. (d)(e) | 6,700,000 | 5,377,944 | |
| 1,254,314,415 | |||
| Leisure Products - 0.3% | |||
| Callaway Golf Co. | 229,846 | 8,485,914 | |
| Peloton Interactive, Inc. Class A (a) | 283,442 | 31,266,487 | |
| 39,752,401 | |||
| Multiline Retail - 0.4% | |||
| Dollar General Corp. | 36,940 | 7,497,342 | |
| Dollar Tree, Inc. (a) | 48,194 | 4,698,915 | |
| Ollie's Bargain Outlet Holdings, Inc. (a) | 422,389 | 36,511,305 | |
| Target Corp. | 18,113 | 4,110,202 | |
| 52,817,764 | |||
| Specialty Retail - 2.8% | |||
| Auto1 Group SE (c) | 57,600 | 3,092,852 | |
| Carvana Co. Class A (a) | 170,324 | 45,151,189 | |
| Cazoo Holdings Ltd. (d) | 48,980 | 1,494,929 | |
| Five Below, Inc. (a) | 46,300 | 8,524,756 | |
| Floor & Decor Holdings, Inc. Class A (a) | 222,800 | 21,903,468 | |
| Lowe's Companies, Inc. | 398,123 | 77,566,304 | |
| MYT Netherlands Parent BV ADR (b) | 28,200 | 888,300 | |
| RH (a)(b) | 172,134 | 110,346,501 | |
| The Home Depot, Inc. | 253,277 | 80,772,568 | |
| TJX Companies, Inc. | 497,772 | 33,619,521 | |
| Williams-Sonoma, Inc. | 52,100 | 8,833,034 | |
| 392,193,422 | |||
| Textiles, Apparel & Luxury Goods - 4.9% | |||
| adidas AG | 131,498 | 47,975,375 | |
| Allbirds, Inc. (a)(d)(e) | 81,240 | 875,767 | |
| Canada Goose Holdings, Inc. (a) | 366,771 | 14,701,227 | |
| Deckers Outdoor Corp. (a) | 91,570 | 30,716,241 | |
| Dr. Martens Ltd. (a) | 976,100 | 6,800,599 | |
| Figs, Inc. Class A (a) | 22,800 | 778,620 | |
| lululemon athletica, Inc. (a) | 1,250,180 | 403,970,663 | |
| NIKE, Inc. Class B | 362,354 | 49,446,827 | |
| On Holding AG (a)(d)(e) | 288 | 5,780,138 | |
| Paymentus Holdings, Inc. (a) | 26,200 | 799,100 | |
| Skechers U.S.A., Inc. Class A (sub. vtg.) (a) | 1,877,479 | 89,180,253 | |
| Tory Burch LLC (a)(d)(e)(f) | 248,840 | 10,804,633 | |
| Under Armour, Inc. Class C (non-vtg.) (a) | 253,472 | 4,831,176 | |
| VF Corp. | 24,399 | 1,945,088 | |
| 668,605,707 | |||
| TOTAL CONSUMER DISCRETIONARY | 3,016,889,420 | ||
| CONSUMER STAPLES - 2.3% | |||
| Beverages - 1.0% | |||
| Boston Beer Co., Inc. Class A (a) | 3,758 | 3,976,565 | |
| Fever-Tree Drinks PLC | 223,977 | 8,130,115 | |
| Keurig Dr. Pepper, Inc. | 561,371 | 20,748,272 | |
| Monster Beverage Corp. (a) | 515,635 | 48,608,911 | |
| PepsiCo, Inc. | 65,764 | 9,729,126 | |
| The Coca-Cola Co. | 847,407 | 46,853,133 | |
| 138,046,122 | |||
| Food & Staples Retailing - 0.4% | |||
| Blink Health, Inc. Series A1 (d)(e) | 8,589 | 280,345 | |
| Costco Wholesale Corp. | 91,244 | 34,514,868 | |
| Kroger Co. | 9,640 | 356,487 | |
| Oatly Group AB ADR (a)(b) | 88,500 | 2,098,335 | |
| Performance Food Group Co. (a) | 151,468 | 7,593,091 | |
| 44,843,126 | |||
| Food Products - 0.4% | |||
| AppHarvest, Inc. (d) | 379,476 | 6,002,362 | |
| Archer Daniels Midland Co. | 82,400 | 5,482,072 | |
| Beyond Meat, Inc. (a)(b) | 3,100 | 450,802 | |
| Bunge Ltd. | 296,254 | 25,720,772 | |
| Darling Ingredients, Inc. (a) | 191,569 | 13,114,814 | |
| Freshpet, Inc. (a) | 12,950 | 2,289,819 | |
| JDE Peet's BV | 7,500 | 295,869 | |
| Laird Superfood, Inc. | 79,600 | 2,601,328 | |
| Mondelez International, Inc. | 22,517 | 1,430,505 | |
| 57,388,343 | |||
| Household Products - 0.2% | |||
| Church & Dwight Co., Inc. | 37,121 | 3,182,383 | |
| Colgate-Palmolive Co. | 71,991 | 6,031,406 | |
| Procter & Gamble Co. | 139,278 | 18,781,638 | |
| 27,995,427 | |||
| Personal Products - 0.0% | |||
| Unilever PLC (Netherlands) | 28,436 | 1,695,877 | |
| Tobacco - 0.3% | |||
| Altria Group, Inc. | 682,750 | 33,604,955 | |
| JUUL Labs, Inc. Class A (a)(d)(e) | 13,297 | 743,169 | |
| Philip Morris International, Inc. | 53,900 | 5,197,577 | |
| 39,545,701 | |||
| TOTAL CONSUMER STAPLES | 309,514,596 | ||
| ENERGY - 0.9% | |||
| Energy Equipment & Services - 0.2% | |||
| Halliburton Co. | 583,200 | 13,092,840 | |
| Schlumberger Ltd. | 564,700 | 17,692,051 | |
| 30,784,891 | |||
| Oil, Gas & Consumable Fuels - 0.7% | |||
| EOG Resources, Inc. | 21,900 | 1,759,446 | |
| Hess Corp. | 692,506 | 58,045,853 | |
| Pioneer Natural Resources Co. | 23,100 | 3,515,589 | |
| Reliance Industries Ltd. | 948,431 | 28,253,418 | |
| Reliance Industries Ltd. | 63,228 | 1,061,567 | |
| 92,635,873 | |||
| TOTAL ENERGY | 123,420,764 | ||
| FINANCIALS - 2.2% | |||
| Banks - 1.1% | |||
| Bank of America Corp. | 994,617 | 42,161,815 | |
| First Republic Bank | 100,300 | 19,201,432 | |
| HDFC Bank Ltd. sponsored ADR (a) | 346,822 | 26,542,288 | |
| JPMorgan Chase & Co. | 256,723 | 42,164,186 | |
| Wells Fargo & Co. | 488,400 | 22,818,048 | |
| 152,887,769 | |||
| Capital Markets - 0.7% | |||
| Aspirational Consumer Lifestyle Corp. Class A (a)(b) | 61,500 | 614,385 | |
| B3 SA - Brasil Bolsa Balcao | 3,612,400 | 12,092,581 | |
| BlackRock, Inc. Class A | 29,497 | 25,870,049 | |
| Charles Schwab Corp. | 572,451 | 42,275,506 | |
| Coinbase Global, Inc. (a) | 13,100 | 3,098,674 | |
| Edelweiss Financial Services Ltd. | 635,787 | 571,624 | |
| The Beauty Health Co. (d) | 553,828 | 7,097,860 | |
| The Beauty Health Co. (a) | 98,100 | 1,396,944 | |
| 93,017,623 | |||
| Consumer Finance - 0.0% | |||
| American Express Co. | 12,000 | 1,921,560 | |
| Discover Financial Services | 14,882 | 1,745,063 | |
| 3,666,623 | |||
| Diversified Financial Services - 0.4% | |||
| Adimab LLC (a)(d)(e)(f) | 762,787 | 38,740,045 | |
| Ant International Co. Ltd. Class C (a)(d)(e) | 419,242 | 1,148,723 | |
| BowX Acquisition Corp. (a)(b) | 468,900 | 5,758,092 | |
| CM Life Sciences II, Inc. unit (a) | 4,100 | 54,530 | |
| Decarbonization Plus Acquisition Corp. Class A (a)(b) | 75,100 | 751,000 | |
| Flywire Corp. (a) | 12,800 | 439,552 | |
| Social Finance, Inc. (d) | 192,954 | 3,499,221 | |
| 50,391,163 | |||
| Insurance - 0.0% | |||
| Oscar Health, Inc. Class A | 262,865 | 5,971,241 | |
| TOTAL FINANCIALS | 305,934,419 | ||
| HEALTH CARE - 15.4% | |||
| Biotechnology - 8.0% | |||
| 4D Molecular Therapeutics, Inc. | 37,600 | 998,656 | |
| AbbVie, Inc. | 82,149 | 9,299,267 | |
| ACADIA Pharmaceuticals, Inc. (a) | 1,354,871 | 30,267,818 | |
| ADC Therapeutics SA (a) | 166,500 | 3,604,725 | |
| Akouos, Inc. (a) | 195,600 | 2,554,536 | |
| Akouos, Inc. (c) | 113,263 | 1,479,215 | |
| Akoya Biosciences, Inc. (a) | 34,500 | 718,290 | |
| Alector, Inc. (a) | 284,360 | 5,061,608 | |
| Allovir, Inc. (a)(b) | 509,310 | 11,938,226 | |
| Alnylam Pharmaceuticals, Inc. (a) | 873,631 | 124,046,866 | |
| ALX Oncology Holdings, Inc. (a) | 23,200 | 1,312,192 | |
| Amgen, Inc. | 131,604 | 31,313,856 | |
| Annexon, Inc. (a) | 39,300 | 830,016 | |
| Arcutis Biotherapeutics, Inc. (a) | 191,800 | 5,053,930 | |
| Argenx SE ADR (a) | 113,060 | 31,542,609 | |
| Arrowhead Pharmaceuticals, Inc. (a) | 21,559 | 1,565,183 | |
| Ascendis Pharma A/S sponsored ADR (a) | 24,489 | 3,290,832 | |
| aTyr Pharma, Inc. (a) | 98,879 | 448,911 | |
| Avidity Biosciences, Inc. (b) | 200,100 | 4,750,374 | |
| Axcella Health, Inc. (a) | 560,401 | 1,787,679 | |
| BeiGene Ltd. ADR (a) | 306,182 | 109,769,309 | |
| BioAtla, Inc. | 204,965 | 8,823,743 | |
| Biogen, Inc. (a) | 2,642 | 706,682 | |
| BioNTech SE ADR (a) | 110,102 | 22,460,808 | |
| BioXcel Therapeutics, Inc. (a)(b) | 197,798 | 6,533,268 | |
| Bolt Biotherapeutics, Inc. | 50,100 | 877,251 | |
| BridgeBio Pharma, Inc. (a) | 35,802 | 2,119,478 | |
| Burning Rock Biotech Ltd. ADR | 11,800 | 319,426 | |
| Calyxt, Inc. (a) | 230,181 | 992,080 | |
| Cerevel Therapeutics Holdings (a) | 384,700 | 5,047,264 | |
| ChemoCentryx, Inc. (a) | 707,639 | 7,182,536 | |
| Cibus Corp.: | |||
| Series C (a)(d)(e)(f) | 1,142,857 | 2,011,428 | |
| Series D (a)(d)(e)(f) | 750,960 | 1,321,690 | |
| Codiak Biosciences, Inc. (b) | 309,262 | 6,995,506 | |
| Connect Biopharma Holdings Ltd. ADR (a) | 99,710 | 1,483,685 | |
| CRISPR Therapeutics AG (a) | 9,800 | 1,158,164 | |
| Cyclerion Therapeutics, Inc. (a) | 65,747 | 213,020 | |
| Cyclerion Therapeutics, Inc. (a)(d) | 150,550 | 487,782 | |
| Day One Biopharmaceuticals, Inc. (a) | 45,800 | 1,085,002 | |
| Denali Therapeutics, Inc. (a) | 69,874 | 4,443,288 | |
| Evelo Biosciences, Inc. (a) | 617,214 | 8,283,012 | |
| Exact Sciences Corp. (a) | 26,539 | 2,933,356 | |
| Exelixis, Inc. (a) | 40,873 | 921,686 | |
| Fate Therapeutics, Inc. (a) | 475,616 | 36,432,186 | |
| Foghorn Therapeutics, Inc. (c) | 78,183 | 813,885 | |
| Foghorn Therapeutics, Inc. | 66,500 | 692,265 | |
| Fusion Pharmaceuticals, Inc. (a) | 78,080 | 641,037 | |
| Gemini Therapeutics, Inc. (b) | 20,800 | 255,840 | |
| Gemini Therapeutics, Inc. (d) | 132,041 | 1,624,104 | |
| Generation Bio Co. (b) | 610,060 | 20,900,656 | |
| Immunocore Holdings PLC | 101,170 | 3,940,572 | |
| Immunocore Holdings PLC ADR | 49,700 | 2,037,700 | |
| Inhibrx, Inc. (a) | 108,700 | 2,300,092 | |
| Instil Bio, Inc. (a) | 109,200 | 1,943,760 | |
| Intarcia Therapeutics, Inc. warrants 12/6/24 (a)(e) | 7,022 | 1 | |
| Ionis Pharmaceuticals, Inc. (a) | 1,741,447 | 64,868,901 | |
| iTeos Therapeutics, Inc. (a) | 40,600 | 833,924 | |
| Karuna Therapeutics, Inc. (a)(b) | 385,399 | 43,095,316 | |
| Keros Therapeutics, Inc. (a) | 55,700 | 3,038,992 | |
| Kinnate Biopharma, Inc. | 56,100 | 1,317,228 | |
| Kronos Bio, Inc. (c) | 59,071 | 1,441,923 | |
| Kronos Bio, Inc. | 2,900 | 70,789 | |
| Kura Oncology, Inc. (a) | 37,900 | 843,275 | |
| Kymera Therapeutics, Inc. (a) | 26,300 | 1,264,767 | |
| Lexicon Pharmaceuticals, Inc. (a) | 513,922 | 2,256,118 | |
| Moderna, Inc. (a) | 339,141 | 62,744,476 | |
| Morphic Holding, Inc. (a) | 283,151 | 13,976,333 | |
| Novavax, Inc. (a) | 107,100 | 15,810,102 | |
| Olema Pharmaceuticals, Inc. | 48,100 | 1,344,876 | |
| ORIC Pharmaceuticals, Inc. (a) | 156,808 | 3,583,063 | |
| Passage Bio, Inc. (a) | 135,890 | 1,800,543 | |
| Poseida Therapeutics, Inc. (a) | 304,608 | 2,573,938 | |
| Poseida Therapeutics, Inc. (c) | 214,051 | 1,808,731 | |
| Praxis Precision Medicines, Inc. | 353,200 | 6,919,188 | |
| Protagonist Therapeutics, Inc. (a) | 245,395 | 8,615,818 | |
| Prothena Corp. PLC (a) | 162,205 | 4,731,520 | |
| PTC Therapeutics, Inc. (a) | 146,730 | 5,762,087 | |
| Recursion Pharmaceuticals, Inc. (a) | 53,900 | 1,420,804 | |
| Regeneron Pharmaceuticals, Inc. (a) | 68,221 | 34,276,277 | |
| Relay Therapeutics, Inc. (a) | 97,600 | 3,134,912 | |
| Repare Therapeutics, Inc. | 20,800 | 672,256 | |
| Repligen Corp. (a) | 28,000 | 5,113,080 | |
| Revolution Medicines, Inc. (a) | 206,860 | 6,187,183 | |
| Rigel Pharmaceuticals, Inc. (a)(b) | 2,058,599 | 7,657,988 | |
| Rubius Therapeutics, Inc. (a) | 1,095,917 | 26,773,252 | |
| Sage Therapeutics, Inc. (a) | 605,013 | 42,108,905 | |
| Sana Biotechnology, Inc. (b) | 13,100 | 274,707 | |
| Sarepta Therapeutics, Inc. (a) | 31,037 | 2,347,949 | |
| Scholar Rock Holding Corp. (a)(b) | 310,534 | 8,344,049 | |
| Seagen, Inc. (a) | 8,900 | 1,382,615 | |
| Seres Therapeutics, Inc.(a) | 983,226 | 20,755,901 | |
| Shattuck Labs, Inc. | 262,339 | 7,119,880 | |
| Sigilon Therapeutics, Inc. (b) | 61,800 | 721,206 | |
| Silverback Therapeutics, Inc. (b) | 301,013 | 8,286,888 | |
| Silverback Therapeutics, Inc. | 34,299 | 934,809 | |
| Springworks Therapeutics, Inc. (a) | 291,800 | 23,793,372 | |
| Spruce Biosciences, Inc. | 41,800 | 590,634 | |
| Stoke Therapeutics, Inc. (a) | 600 | 23,796 | |
| Synlogic, Inc. (a) | 398,800 | 1,491,512 | |
| Syros Pharmaceuticals, Inc. (a)(c) | 301,001 | 1,941,456 | |
| Syros Pharmaceuticals, Inc. (a) | 702,838 | 4,533,305 | |
| Syros Pharmaceuticals, Inc. warrants 10/10/22 (a) | 35,253 | 30,085 | |
| Taysha Gene Therapies, Inc. | 277,408 | 6,241,680 | |
| TG Therapeutics, Inc. (a) | 259,100 | 9,034,817 | |
| Translate Bio, Inc. (a) | 715,099 | 12,878,933 | |
| Turning Point Therapeutics, Inc. (a) | 18,390 | 1,217,050 | |
| Twist Bioscience Corp. (a) | 18,300 | 1,963,773 | |
| Ultragenyx Pharmaceutical, Inc. (a) | 13,352 | 1,358,032 | |
| uniQure B.V. (a) | 208,249 | 7,232,488 | |
| UNITY Biotechnology, Inc. (a)(b) | 365,207 | 1,636,127 | |
| Vaxcyte, Inc. | 238,380 | 5,022,667 | |
| Vertex Pharmaceuticals, Inc. (a) | 30,693 | 6,403,481 | |
| Vor Biopharma, Inc. (a)(b) | 21,395 | 451,435 | |
| Vor Biopharma, Inc. | 92,011 | 1,844,361 | |
| Xencor, Inc. (a) | 242,462 | 9,325,089 | |
| Yumanity Therapeutics, Inc. (d) | 19,530 | 300,371 | |
| Yumanity Therapeutics, Inc. | 73,696 | 1,076,772 | |
| Zai Lab Ltd. ADR (a) | 148,886 | 26,451,087 | |
| Zentalis Pharmaceuticals, Inc. (a) | 73,160 | 4,085,986 | |
| 1,094,759,229 | |||
| Health Care Equipment & Supplies - 3.4% | |||
| Abbott Laboratories | 71,701 | 8,363,922 | |
| Danaher Corp. | 167,933 | 43,014,359 | |
| DexCom, Inc. (a) | 90,921 | 33,585,308 | |
| Insulet Corp. (a) | 397,883 | 107,297,109 | |
| Intuitive Surgical, Inc. (a) | 56,341 | 47,449,263 | |
| Novocure Ltd. (a) | 708,507 | 144,535,428 | |
| Outset Medical, Inc. | 351,257 | 16,955,175 | |
| Penumbra, Inc. (a) | 85,152 | 21,212,215 | |
| Presbia PLC (a)(e) | 454,926 | 59,140 | |
| Shockwave Medical, Inc. (a) | 244,767 | 44,033,583 | |
| Treace Medical Concepts, Inc. (a) | 55,800 | 1,810,710 | |
| 468,316,212 | |||
| Health Care Providers & Services - 1.3% | |||
| 1Life Healthcare, Inc. (a) | 230,200 | 8,517,400 | |
| Alignment Healthcare, Inc. (a) | 110,800 | 2,795,484 | |
| Alignment Healthcare, Inc. | 351,322 | 7,977,469 | |
| Centene Corp. (a) | 150,190 | 11,053,984 | |
| Clover Health Investments Corp. Class B | 509,299 | 3,696,492 | |
| Guardant Health, Inc. (a) | 17,900 | 2,221,748 | |
| Humana, Inc. | 30,643 | 13,412,441 | |
| Ikena Oncology, Inc. (a) | 41,800 | 752,400 | |
| Oak Street Health, Inc. (a) | 215,256 | 12,999,310 | |
| Progyny, Inc. (a) | 52,900 | 3,387,716 | |
| Signify Health, Inc. | 33,000 | 834,900 | |
| UnitedHealth Group, Inc. | 282,154 | 116,224,876 | |
| 183,874,220 | |||
| Health Care Technology - 0.0% | |||
| Castlight Health, Inc. Class B (a) | 505,360 | 919,755 | |
| Life Sciences Tools & Services - 1.6% | |||
| 10X Genomics, Inc. (a) | 128,101 | 23,058,180 | |
| 10X Genomics, Inc. Class B (a)(c) | 640,857 | 115,354,260 | |
| AbCellera Biologics, Inc. (b) | 10,000 | 268,300 | |
| Berkeley Lights, Inc. (a) | 800 | 34,800 | |
| Bruker Corp. | 58,023 | 4,029,117 | |
| Nanostring Technologies, Inc. (a) | 126,834 | 7,038,019 | |
| Olink Holding AB ADR (a) | 128,100 | 4,525,773 | |
| Sartorius Stedim Biotech | 5,400 | 2,340,241 | |
| Seer, Inc. (b) | 241,383 | 7,140,109 | |
| Seer, Inc. | 156,157 | 4,572,933 | |
| Seer, Inc. Class A (d) | 75,433 | 2,231,308 | |
| Sotera Health Co. | 8,900 | 214,490 | |
| Thermo Fisher Scientific, Inc. | 38,974 | 18,298,293 | |
| WuXi AppTec Co. Ltd. (H Shares) (c) | 250,840 | 5,371,368 | |
| Wuxi Biologics (Cayman), Inc. (a)(c) | 2,048,810 | 32,019,874 | |
| 226,497,065 | |||
| Pharmaceuticals - 1.1% | |||
| 4D Pharma PLC (a) | 340,600 | 475,180 | |
| Arvinas Holding Co. LLC (a) | 34,600 | 2,516,804 | |
| Atea Pharmaceuticals, Inc. (b) | 1,044,243 | 21,323,442 | |
| Bristol-Myers Squibb Co. | 95,765 | 6,293,676 | |
| Dragonfly Therapeutics, Inc. (a)(d)(e) | 126,113 | 3,487,024 | |
| Fulcrum Therapeutics, Inc. (a)(b) | 164,455 | 1,468,583 | |
| Hansoh Pharmaceutical Group Co. Ltd. (c) | 474,400 | 2,069,000 | |
| Harmony Biosciences Holdings, Inc. (a) | 391,407 | 12,509,368 | |
| Harmony Biosciences Holdings, Inc. (c) | 9,716 | 310,523 | |
| Intra-Cellular Therapies, Inc. (a) | 925,509 | 36,474,310 | |
| Jiangsu Hengrui Medicine Co. Ltd. (A Shares) | 37,576 | 509,079 | |
| Kaleido Biosciences, Inc. (a) | 492,848 | 3,538,649 | |
| Longboard Pharmaceuticals, Inc. (a) | 49,500 | 408,870 | |
| Nektar Therapeutics (a) | 301,122 | 5,441,275 | |
| Nuvation Bio, Inc. (d) | 423,184 | 5,716,793 | |
| Nuvation Bio, Inc. | 678,953 | 9,171,976 | |
| OptiNose, Inc. (a)(b) | 678,975 | 2,165,930 | |
| Pharvaris BV | 37,400 | 766,700 | |
| Pliant Therapeutics, Inc. | 159,036 | 4,780,622 | |
| Royalty Pharma PLC (a)(d)(e) | 2,548 | 0 | |
| Royalty Pharma PLC (c) | 326,720 | 13,108,006 | |
| Sienna Biopharmaceuticals, Inc. (a) | 589,618 | 13,561 | |
| Skyhawk Therapeutics, Inc. (d)(e) | 126,063 | 2,069,954 | |
| Stemcentrx, Inc. rights 12/31/21 (a)(e) | 568,100 | 6 | |
| Theravance Biopharma, Inc. (a) | 508,345 | 8,784,202 | |
| UCB SA | 21,000 | 1,965,022 | |
| Vera Therapeutics, Inc. | 54,482 | 845,833 | |
| Vera Therapeutics, Inc. (a) | 56,400 | 972,900 | |
| 147,187,288 | |||
| TOTAL HEALTH CARE | 2,121,553,769 | ||
| INDUSTRIALS - 5.8% | |||
| Aerospace & Defense - 0.4% | |||
| Space Exploration Technologies Corp. Class A (a)(d)(e) | 137,569 | 57,777,604 | |
| The Boeing Co. (a) | 16,236 | 4,010,617 | |
| 61,788,221 | |||
| Air Freight & Logistics - 0.2% | |||
| FedEx Corp. | 33,000 | 10,388,730 | |
| United Parcel Service, Inc. Class B | 77,384 | 16,606,606 | |
| 26,995,336 | |||
| Airlines - 1.8% | |||
| Delta Air Lines, Inc. (a) | 716,290 | 34,152,707 | |
| Frontier Group Holdings, Inc. (a) | 167,300 | 3,566,836 | |
| JetBlue Airways Corp. (a) | 1,912,314 | 38,437,511 | |
| Ryanair Holdings PLC sponsored ADR (a) | 43,378 | 5,064,382 | |
| Southwest Airlines Co. (a) | 1,152,237 | 70,816,486 | |
| Spirit Airlines, Inc. (a) | 320,433 | 11,442,662 | |
| Sun Country Airlines Holdings, Inc. (a)(b) | 53,900 | 2,005,080 | |
| United Airlines Holdings, Inc. (a) | 454,025 | 26,492,359 | |
| Wheels Up Partners LLC: | |||
| Series B (a)(d)(f) | 1,843,115 | 7,206,580 | |
| Series C (a)(d)(f) | 670,590 | 2,622,007 | |
| Series D (a)(d)(f) | 1,135,960 | 4,441,604 | |
| Wizz Air Holdings PLC (a)(c) | 538,183 | 36,876,493 | |
| 243,124,707 | |||
| Building Products - 0.2% | |||
| Carrier Global Corp. | 1,400 | 64,302 | |
| Resideo Technologies, Inc. (a) | 116,000 | 3,468,400 | |
| The AZEK Co., Inc. | 63,760 | 2,775,473 | |
| Trane Technologies PLC | 85,722 | 15,978,581 | |
| 22,286,756 | |||
| Construction & Engineering - 0.2% | |||
| MasTec, Inc. (a) | 291,900 | 33,956,727 | |
| Electrical Equipment - 0.2% | |||
| AMETEK, Inc. | 28,907 | 3,905,336 | |
| Eaton Corp. PLC | 36,724 | 5,334,161 | |
| Emerson Electric Co. | 44,849 | 4,291,601 | |
| Generac Holdings, Inc. (a) | 34,000 | 11,176,480 | |
| Rockwell Automation, Inc. | 23,000 | 6,065,560 | |
| Shoals Technologies Group, Inc. | 30,400 | 839,040 | |
| 31,612,178 | |||
| Industrial Conglomerates - 0.4% | |||
| 3M Co. | 107,180 | 21,761,827 | |
| Honeywell International, Inc. | 118,483 | 27,358,910 | |
| 49,120,737 | |||
| Machinery - 0.7% | |||
| Caterpillar, Inc. | 75,860 | 18,288,329 | |
| Cummins, Inc. | 38,700 | 9,956,736 | |
| Deere & Co. | 95,252 | 34,395,497 | |
| Fortive Corp. | 83,708 | 6,070,504 | |
| Illinois Tool Works, Inc. | 41,853 | 9,699,851 | |
| Ingersoll Rand, Inc. (a) | 49,544 | 2,459,364 | |
| Xylem, Inc. | 184,517 | 21,795,148 | |
| 102,665,429 | |||
| Professional Services - 0.0% | |||
| CoStar Group, Inc. (a) | 1,628 | 1,390,312 | |
| YourPeople, Inc. (a)(e) | 4,577,258 | 37,534 | |
| 1,427,846 | |||
| Road & Rail - 1.7% | |||
| Avis Budget Group, Inc. (a) | 779,900 | 68,490,818 | |
| CSX Corp. | 120,800 | 12,094,496 | |
| Kansas City Southern | 29,200 | 8,692,256 | |
| Lyft, Inc. (a) | 409,068 | 23,353,692 | |
| Uber Technologies, Inc. (a) | 1,220,704 | 62,048,384 | |
| Union Pacific Corp. | 235,161 | 52,847,732 | |
| 227,527,378 | |||
| TOTAL INDUSTRIALS | 800,505,315 | ||
| INFORMATION TECHNOLOGY - 35.3% | |||
| Communications Equipment - 0.5% | |||
| Arista Networks, Inc. (a) | 12,133 | 4,117,698 | |
| Ciena Corp. (a) | 542,197 | 28,665,955 | |
| Infinera Corp. (a)(b) | 2,737,275 | 26,277,840 | |
| Lumentum Holdings, Inc. (a) | 65,480 | 5,328,108 | |
| 64,389,601 | |||
| Electronic Equipment & Components - 0.2% | |||
| 908 Devices, Inc. (b) | 30,900 | 1,301,817 | |
| Arlo Technologies, Inc. (a) | 215,711 | 1,447,421 | |
| II-VI, Inc. (a)(b) | 222,590 | 14,995,888 | |
| TE Connectivity Ltd. | 3,141 | 426,171 | |
| Trimble, Inc. (a) | 173,200 | 13,473,228 | |
| Vontier Corp. | 19,763 | 693,286 | |
| 32,337,811 | |||
| IT Services - 5.8% | |||
| Accenture PLC Class A | 23,900 | 6,743,624 | |
| Actua Corp. (a)(e) | 562,258 | 28,113 | |
| Black Knight, Inc. (a) | 72,270 | 5,303,895 | |
| IBM Corp. | 5,595 | 804,225 | |
| MasterCard, Inc. Class A | 289,549 | 104,405,578 | |
| MongoDB, Inc. Class A (a) | 4,641 | 1,354,894 | |
| Nuvei Corp. (a)(c) | 30,500 | 2,283,840 | |
| Okta, Inc. (a) | 40,781 | 9,071,326 | |
| PayPal Holdings, Inc. (a) | 783,927 | 203,836,699 | |
| Riskified Ltd. (a)(d)(e) | 196,150 | 2,255,725 | |
| Riskified Ltd. warrants (a)(d)(e) | 1,301 | 1 | |
| Shopify, Inc. Class A (a) | 219,049 | 268,651,711 | |
| Snowflake Computing, Inc. | 8,525 | 2,029,206 | |
| Square, Inc. (a) | 252,985 | 56,294,222 | |
| Twilio, Inc. Class A (a) | 1,200 | 403,200 | |
| Visa, Inc. Class A | 521,312 | 118,494,218 | |
| Wix.com Ltd. (a) | 21,668 | 5,630,646 | |
| Worldline SA (a)(c) | 57,200 | 5,475,453 | |
| 793,066,576 | |||
| Semiconductors & Semiconductor Equipment - 11.6% | |||
| Advanced Micro Devices, Inc. (a) | 860,493 | 68,908,279 | |
| Applied Materials, Inc. | 400,685 | 55,346,619 | |
| ASML Holding NV | 70,385 | 47,542,956 | |
| Broadcom, Inc. | 25,225 | 11,914,524 | |
| Cirrus Logic, Inc. (a) | 342,066 | 26,705,093 | |
| Cree, Inc. (a)(b) | 67,829 | 6,783,578 | |
| First Solar, Inc. (a) | 91,300 | 6,948,843 | |
| Intel Corp. | 81,762 | 4,670,245 | |
| KLA Corp. | 53,386 | 16,917,490 | |
| Marvell Technology, Inc. | 619,441 | 29,919,000 | |
| Micron Technology, Inc. (a) | 341,531 | 28,736,418 | |
| NVIDIA Corp. | 1,735,435 | 1,127,650,954 | |
| Qualcomm, Inc. | 160,809 | 21,635,243 | |
| Silicon Laboratories, Inc. (a) | 603,889 | 82,467,082 | |
| Taiwan Semiconductor Manufacturing Co. Ltd. sponsored ADR | 258,968 | 30,392,484 | |
| Teradyne, Inc. | 48,750 | 6,452,063 | |
| Texas Instruments, Inc. | 106,594 | 20,233,673 | |
| Xilinx, Inc. | 23,800 | 3,022,600 | |
| 1,596,247,144 | |||
| Software - 10.3% | |||
| ACV Auctions, Inc. Class A (a) | 7,500 | 194,400 | |
| Adobe, Inc. (a) | 154,312 | 77,862,749 | |
| Alkami Technology, Inc. (a) | 6,900 | 229,563 | |
| Atlassian Corp. PLC (a) | 14,426 | 3,365,297 | |
| Autodesk, Inc. (a) | 112,642 | 32,199,842 | |
| Avalara, Inc. (a) | 19,004 | 2,511,759 | |
| Bill.Com Holdings, Inc. (a) | 4,800 | 714,816 | |
| BTRS Holdings, Inc. (a) | 1,900 | 27,170 | |
| BTRS Holdings, Inc. (d) | 123,361 | 1,764,062 | |
| Cloudflare, Inc. (a) | 1,190,381 | 97,682,665 | |
| Coupa Software, Inc. (a) | 12,104 | 2,883,173 | |
| Crowdstrike Holdings, Inc. (a) | 26,733 | 5,938,736 | |
| Datadog, Inc. Class A (a) | 9,630 | 876,812 | |
| DocuSign, Inc. (a) | 11,691 | 2,357,139 | |
| DoubleVerify Holdings, Inc. (a) | 35,700 | 1,316,973 | |
| Elastic NV (a) | 36,894 | 4,361,240 | |
| Epic Games, Inc. (d)(e) | 11,800 | 10,443,000 | |
| HubSpot, Inc. (a) | 61,717 | 31,128,820 | |
| Intuit, Inc. | 68,994 | 30,294,575 | |
| Lightspeed POS, Inc. | 96,400 | 6,939,836 | |
| LivePerson, Inc. (a) | 164,544 | 9,041,693 | |
| Microsoft Corp. | 2,299,736 | 574,198,084 | |
| Nutanix, Inc. Class A (a) | 2,669,743 | 84,123,602 | |
| Oracle Corp. | 320,104 | 25,204,989 | |
| Paycom Software, Inc. (a) | 11,200 | 3,691,520 | |
| Paylocity Holding Corp. (a) | 15,097 | 2,563,924 | |
| Privia Health Group, Inc. (a) | 57,900 | 1,895,067 | |
| Procore Technologies, Inc. (a) | 14,000 | 1,209,880 | |
| RingCentral, Inc. (a) | 8,142 | 2,137,031 | |
| Salesforce.com, Inc. (a) | 1,361,084 | 324,074,100 | |
| Slack Technologies, Inc. Class A (a) | 45,200 | 1,990,608 | |
| Stripe, Inc. Class B (a)(d)(e) | 43,500 | 1,745,438 | |
| The Trade Desk, Inc. (a) | 1,800 | 1,058,652 | |
| Tuya, Inc. ADR (a)(b) | 41,800 | 997,348 | |
| UiPath, Inc. | 203,748 | 14,636,849 | |
| UiPath, Inc. Class A (a)(b) | 30,700 | 2,450,474 | |
| Workday, Inc. Class A (a) | 19,132 | 4,375,871 | |
| Zendesk, Inc. (a) | 174,895 | 23,901,151 | |
| Zoom Video Communications, Inc. Class A (a) | 56,253 | 18,649,557 | |
| Zscaler, Inc. (a) | 48,065 | 9,334,223 | |
| 1,420,372,688 | |||
| Technology Hardware, Storage & Peripherals - 6.9% | |||
| Apple, Inc. | 7,390,328 | 920,908,772 | |
| Pure Storage, Inc. Class A (a) | 1,349,758 | 25,712,890 | |
| Samsung Electronics Co. Ltd. | 86,543 | 6,285,207 | |
| 952,906,869 | |||
| TOTAL INFORMATION TECHNOLOGY | 4,859,320,689 | ||
| MATERIALS - 1.2% | |||
| Chemicals - 0.4% | |||
| Albemarle Corp. U.S. | 8,800 | 1,470,304 | |
| Corteva, Inc. | 717,700 | 32,655,350 | |
| Dow, Inc. | 59,259 | 4,054,501 | |
| DuPont de Nemours, Inc. | 174,546 | 14,764,846 | |
| The Mosaic Co. | 82,900 | 2,996,006 | |
| 55,941,007 | |||
| Containers & Packaging - 0.2% | |||
| Ball Corp. | 160,200 | 13,162,032 | |
| Sealed Air Corp. | 95,500 | 5,430,130 | |
| 18,592,162 | |||
| Metals & Mining - 0.6% | |||
| Barrick Gold Corp. (Canada) | 568,200 | 13,482,393 | |
| Freeport-McMoRan, Inc. | 1,392,300 | 59,479,056 | |
| Newmont Corp. | 43,000 | 3,159,640 | |
| Rio Tinto PLC sponsored ADR | 106,600 | 9,320,038 | |
| 85,441,127 | |||
| TOTAL MATERIALS | 159,974,296 | ||
| REAL ESTATE - 0.2% | |||
| Equity Real Estate Investment Trusts (REITs) - 0.2% | |||
| American Tower Corp. | 46,698 | 11,929,471 | |
| Simon Property Group, Inc. | 125,500 | 16,125,495 | |
| 28,054,966 | |||
| Real Estate Management & Development - 0.0% | |||
| Compass, Inc. (a) | 114,500 | 1,538,880 | |
| KE Holdings, Inc. ADR (a) | 74,800 | 3,881,372 | |
| 5,420,252 | |||
| TOTAL REAL ESTATE | 33,475,218 | ||
| TOTAL COMMON STOCKS | |||
| (Cost $4,523,336,373) | 13,435,806,775 | ||
| Preferred Stocks - 1.8% | |||
| Convertible Preferred Stocks - 1.7% | |||
| COMMUNICATION SERVICES - 0.1% | |||
| Diversified Telecommunication Services - 0.1% | |||
| Starry, Inc.: | |||
| Series B (a)(d)(e) | 2,961,147 | 4,974,727 | |
| Series C (a)(d)(e) | 1,339,018 | 2,249,550 | |
| Series D (a)(d)(e) | 1,344,355 | 2,258,516 | |
| Series E3 (d)(e) | 975,268 | 1,638,450 | |
| 11,121,243 | |||
| CONSUMER DISCRETIONARY - 0.4% | |||
| Automobiles - 0.3% | |||
| Bird Rides, Inc. (d) | 386,551 | 2,890,103 | |
| Bird Rides, Inc.: | |||
| Series C1 (d) | 117,022 | 874,931 | |
| Series D (d) | 104,900 | 784,300 | |
| Rad Power Bikes, Inc.: | |||
| Series A (d)(e) | 32,487 | 156,712 | |
| Series C (d)(e) | 127,831 | 616,636 | |
| Rivian Automotive, Inc.: | |||
| Series E (d)(e) | 625,451 | 23,047,869 | |
| Series F (d)(e) | 232,868 | 8,581,186 | |
| 36,951,737 | |||
| Hotels, Restaurants & Leisure - 0.0% | |||
| MOD Super Fast Pizza Holdings LLC: | |||
| Series 3 (a)(d)(e)(f) | 16,248 | 3,190,622 | |
| Series 4 (a)(d)(e)(f) | 1,483 | 273,287 | |
| Series 5 (a)(d)(e)(f) | 5,955 | 1,027,833 | |
| 4,491,742 | |||
| Internet & Direct Marketing Retail - 0.1% | |||
| GoBrands, Inc. Series G (d)(e) | 26,833 | 6,700,664 | |
| Instacart, Inc.: | |||
| Series H (d)(e) | 13,904 | 1,738,000 | |
| Series I (d)(e) | 6,341 | 792,625 | |
| Reddit, Inc.: | |||
| Series B (a)(d)(e) | 37,935 | 1,611,259 | |
| Series E (d)(e) | 5,127 | 217,765 | |
| 11,060,313 | |||
| Specialty Retail - 0.0% | |||
| Fanatics, Inc. Series E (d)(e) | 127,722 | 4,453,666 | |
| Textiles, Apparel & Luxury Goods - 0.0% | |||
| Allbirds, Inc.: | |||
| Series A (a)(d)(e) | 32,065 | 345,661 | |
| Series B (a)(d)(e) | 5,635 | 60,745 | |
| Series C (a)(d)(e) | 53,835 | 580,341 | |
| Series D (a)(d)(e) | 62,760 | 676,553 | |
| Series Seed (a)(d)(e) | 99,244 | 1,069,850 | |
| Freenome, Inc. Series C (d)(e) | 190,858 | 1,498,235 | |
| Nuvalent, Inc. Series B (d)(e) | 401,171 | 830,344 | |
| 5,061,729 | |||
| TOTAL CONSUMER DISCRETIONARY | 62,019,187 | ||
| CONSUMER STAPLES - 0.1% | |||
| Food & Staples Retailing - 0.1% | |||
| Blink Health, Inc. Series C (a)(d)(e) | 182,443 | 5,954,940 | |
| Sweetgreen, Inc.: | |||
| Series C (a)(d)(e) | 1,331 | 17,503 | |
| Series D (a)(d)(e) | 21,414 | 281,594 | |
| Series H (a)(d)(e) | 168,337 | 2,213,632 | |
| Series I (a)(d)(e) | 50,469 | 663,667 | |
| 9,131,336 | |||
| Food Products - 0.0% | |||
| Agbiome LLC Series C (a)(d)(e) | 338,565 | 2,144,369 | |
| Bowery Farming, Inc. Series C1 (d)(e) | 27,136 | 1,634,925 | |
| 3,779,294 | |||
| Tobacco - 0.0% | |||
| JUUL Labs, Inc. Series E (a)(d)(e) | 6,648 | 371,557 | |
| TOTAL CONSUMER STAPLES | 13,282,187 | ||
| FINANCIALS - 0.1% | |||
| Diversified Financial Services - 0.1% | |||
| Paragon Biosciences Emalex Capital, Inc.: | |||
| Series B (a)(d)(e) | 198,234 | 2,121,104 | |
| Series C (d)(e) | 115,792 | 1,238,974 | |
| Sonder Holdings, Inc.: | |||
| Series D1 (d) | 265,415 | 3,752,636 | |
| Series E (a)(d) | 420,126 | 5,940,056 | |
| 13,052,770 | |||
| HEALTH CARE - 0.4% | |||
| Biotechnology - 0.3% | |||
| 23andMe, Inc. Series F (a)(d) | 164,720 | 3,321,121 | |
| Adagio Theraputics, Inc.: | |||
| Series A (d)(e) | 90,362 | 7,055,987 | |
| Series B (d)(e) | 28,136 | 2,197,022 | |
| Series C (d)(e) | 53,288 | 4,161,035 | |
| Ambrx, Inc.: | |||
| Series A (d)(e) | 238,688 | 491,697 | |
| Series B (d)(e) | 214,819 | 442,527 | |
| Bright Peak Therapeutics AG Series B (d)(e) | 239,403 | 935,108 | |
| Caris Life Sciences, Inc. Series D (d)(e) | 255,590 | 2,070,279 | |
| Element Biosciences, Inc. Series B (a)(d)(e) | 250,956 | 1,887,189 | |
| ElevateBio LLC Series C (d)(e) | 332,500 | 1,394,838 | |
| EQRx, Inc. Series B (d)(e) | 1,415,792 | 4,700,429 | |
| Inscripta, Inc.: | |||
| Series D (d)(e) | 308,833 | 2,726,995 | |
| Series E (d)(e) | 222,357 | 1,963,412 | |
| Intarcia Therapeutics, Inc. Series EE (a)(d)(e) | 116,544 | 2,117,604 | |
| National Resilience, Inc. Series B (d)(e) | 251,448 | 3,434,780 | |
| Omega Therapeutics, Inc. Series C (d)(e) | 343,492 | 1,030,476 | |
| 39,930,499 | |||
| Health Care Equipment & Supplies - 0.0% | |||
| Kardium, Inc. Series D6 (d)(e) | 1,136,853 | 1,154,861 | |
| Health Care Providers & Services - 0.0% | |||
| Boundless Bio, Inc. Series B (d)(e) | 616,102 | 831,738 | |
| Conformal Medical, Inc. Series C (d)(e) | 240,750 | 1,052,078 | |
| Scorpion Therapeutics, Inc. Series B (d)(e) | 242,077 | 585,688 | |
| 2,469,504 | |||
| Health Care Technology - 0.0% | |||
| Aledade, Inc. Series B1 (d)(e) | 22,992 | 880,380 | |
| PrognomIQ, Inc.: | |||
| Series A5 (d)(e) | 83,544 | 279,037 | |
| Series B (d)(e) | 198,721 | 663,728 | |
| 1,823,145 | |||
| Pharmaceuticals - 0.1% | |||
| Castle Creek Pharmaceutical Holdings, Inc.: | |||
| Series B (a)(d)(e) | 4,910 | 3,216,983 | |
| Series C (a)(d)(e) | 2,570 | 1,683,838 | |
| Nohla Therapeutics, Inc. Series B (a)(d)(e) | 3,126,919 | 31 | |
| 4,900,852 | |||
| TOTAL HEALTH CARE | 50,278,861 | ||
| INDUSTRIALS - 0.2% | |||
| Aerospace & Defense - 0.2% | |||
| Space Exploration Technologies Corp. Series G (a)(d)(e) | 53,937 | 22,653,001 | |
| Construction & Engineering - 0.0% | |||
| Beta Technologies, Inc. Series A (d)(e) | 10,986 | 804,944 | |
| Transportation Infrastructure - 0.0% | |||
| Delhivery Pvt Ltd. Series H (d)(e) | 6,466 | 3,179,124 | |
| TOTAL INDUSTRIALS | 26,637,069 | ||
| INFORMATION TECHNOLOGY - 0.4% | |||
| Communications Equipment - 0.0% | |||
| Xsight Labs Ltd. Series D (d)(e) | 167,386 | 1,338,418 | |
| Electronic Equipment & Components - 0.0% | |||
| Enevate Corp. Series E (d)(e) | 814,561 | 903,091 | |
| IT Services - 0.1% | |||
| AppNexus, Inc. Series E (Escrow) (a)(d)(e) | 209,665 | 6,567 | |
| ByteDance Ltd. Series E1 (d)(e) | 84,766 | 9,288,165 | |
| Riskified Ltd.: | |||
| Series D (d)(e) | 34,100 | 392,150 | |
| Series E (a)(d)(e) | 155,000 | 1,782,500 | |
| 11,469,382 | |||
| Semiconductors & Semiconductor Equipment - 0.0% | |||
| SiMa Ai Series B (d)(e) | 338,113 | 1,733,641 | |
| Tenstorrent, Inc. Series C1 (d)(e) | 21,000 | 1,248,540 | |
| 2,982,181 | |||
| Software - 0.3% | |||
| Databricks, Inc. Series G (d)(e) | 17,742 | 3,146,861 | |
| Dataminr, Inc. Series D (a)(d)(e) | 442,241 | 19,458,604 | |
| Evozyne LLC Series A (d)(e) | 101,400 | 2,278,458 | |
| Jet.Com, Inc. Series B1 (Escrow) (a)(d)(e) | 2,105,094 | 21 | |
| Nuvia, Inc. Series B (d) | 239,670 | 195,863 | |
| Stripe, Inc. Series H (d)(e) | 19,200 | 770,400 | |
| Taboola.com Ltd. Series E (a)(d) | 331,426 | 7,685,769 | |
| 33,535,976 | |||
| TOTAL INFORMATION TECHNOLOGY | 50,229,048 | ||
| MATERIALS - 0.0% | |||
| Metals & Mining - 0.0% | |||
| Diamond Foundry, Inc. Series C (d)(e) | 355,446 | 8,530,704 | |
| UTILITIES - 0.0% | |||
| Independent Power and Renewable Electricity Producers - 0.0% | |||
| Redwood Materials Series C (d)(e) | 16,253 | 770,449 | |
| TOTAL CONVERTIBLE PREFERRED STOCKS | 235,921,518 | ||
| Nonconvertible Preferred Stocks - 0.1% | |||
| CONSUMER DISCRETIONARY - 0.0% | |||
| Automobiles - 0.0% | |||
| Neutron Holdings, Inc. Series 1D (d)(e) | 5,678,726 | 77,799 | |
| Waymo LLC Series A2 (d)(e) | 10,731 | 921,441 | |
| 999,240 | |||
| Specialty Retail - 0.0% | |||
| Cazoo Holdings Ltd.: | |||
| Series A (d) | 1,599 | 48,803 | |
| Series B (d) | 27,995 | 854,441 | |
| Series C (d) | 568 | 17,336 | |
| Series D (d) | 100,010 | 3,052,426 | |
| 3,973,006 | |||
| TOTAL CONSUMER DISCRETIONARY | 4,972,246 | ||
| HEALTH CARE - 0.1% | |||
| Pharmaceuticals - 0.1% | |||
| Castle Creek Pharmaceutical Holdings, Inc. Series A4 (a)(d)(e) | 13,511 | 8,852,272 | |
| Faraday Pharmaceuticals, Inc. Series B (a)(d)(e) | 219,824 | 455,036 | |
| 9,307,308 | |||
| TOTAL NONCONVERTIBLE PREFERRED STOCKS | 14,279,554 | ||
| TOTAL PREFERRED STOCKS | |||
| (Cost $175,812,806) | 250,201,072 | ||
| Principal Amount | Value | ||
| Convertible Bonds - 0.0% | |||
| CONSUMER DISCRETIONARY - 0.0% | |||
| Automobiles - 0.0% | |||
| Neutron Holdings, Inc.: | |||
| 4% 5/22/27 (d)(e) | 857,900 | 857,900 | |
| 4% 6/12/27 (d)(e) | 25,455 | 25,455 | |
| 883,355 | |||
| Textiles, Apparel & Luxury Goods - 0.0% | |||
| AbSci Corp. 6% (e)(g) | 2,059,700 | 2,059,700 | |
| TOTAL CONSUMER DISCRETIONARY | 2,943,055 | ||
| CONSUMER STAPLES - 0.0% | |||
| Food & Staples Retailing - 0.0% | |||
| The Real Good Food Co. LLC 1% (d)(e)(g) | 1,262,200 | 1,262,200 | |
| FINANCIALS - 0.0% | |||
| Diversified Financial Services - 0.0% | |||
| Sonder Holdings, Inc. 0% (d)(e)(g) | 1,610,776 | 1,610,776 | |
| TOTAL CONVERTIBLE BONDS | |||
| (Cost $5,816,031) | 5,816,031 | ||
| Preferred Securities - 0.0% | |||
| CONSUMER DISCRETIONARY - 0.0% | |||
| Internet & Direct Marketing Retail - 0.0% | |||
| Circle Internet Financial Ltd. 0% (d)(e)(g) | 2,227,100 | 2,227,100 | |
| HEALTH CARE - 0.0% | |||
| Biotechnology - 0.0% | |||
| Intarcia Therapeutics, Inc. 6% 7/18/21 (d)(e) | 614,446 | 865,103 | |
| Health Care Equipment & Supplies - 0.0% | |||
| Kardium, Inc. 0% (d)(e)(g) | 1,612,660 | 1,612,660 | |
| TOTAL HEALTH CARE | 2,477,763 | ||
| INFORMATION TECHNOLOGY - 0.0% | |||
| Electronic Equipment & Components - 0.0% | |||
| Enevate Corp. 0% 1/29/23 (d)(e) | 346,804 | 346,804 | |
| Semiconductors & Semiconductor Equipment - 0.0% | |||
| Tenstorrent, Inc. 0% (d)(e)(g) | 1,170,000 | 1,170,000 | |
| TOTAL INFORMATION TECHNOLOGY | 1,516,804 | ||
| TOTAL PREFERRED SECURITIES | |||
| (Cost $5,971,010) | 6,221,667 | ||
| Shares | Value | ||
| Money Market Funds - 1.6% | |||
| Fidelity Cash Central Fund 0.03% (h) | 19,371,617 | 19,375,492 | |
| Fidelity Securities Lending Cash Central Fund 0.03% (h)(i) | 196,460,822 | 196,480,468 | |
| TOTAL MONEY MARKET FUNDS | |||
| (Cost $215,855,960) | 215,855,960 | ||
| TOTAL INVESTMENT IN SECURITIES - 101.0% | |||
| (Cost $4,926,792,180) | 13,913,901,505 | ||
| NET OTHER ASSETS (LIABILITIES) - (1.0)% | (142,622,814) | ||
| NET ASSETS - 100% | $13,771,278,691 |
Legend
(a) Non-income producing
(b) Security or a portion of the security is on loan at period end.
(c) Security exempt from registration under Rule 144A of the Securities Act of 1933. These securities may be resold in transactions exempt from registration, normally to qualified institutional buyers. At the end of the period, the value of these securities amounted to $228,830,214 or 1.7% of net assets.
(d) Restricted securities (including private placements) - Investment in securities not registered under the Securities Act of 1933 (excluding 144A issues). At the end of the period, the value of restricted securities (excluding 144A issues) amounted to $467,391,343 or 3.4% of net assets.
(e) Level 3 security
(f) Investment is owned by a wholly-owned subsidiary (Subsidiary) that is treated as a corporation for U.S. tax purposes.
(g) Security is perpetual in nature with no stated maturity date.
(h) Affiliated fund that is generally available only to investment companies and other accounts managed by Fidelity Investments. The rate quoted is the annualized seven-day yield of the fund at period end. A complete unaudited listing of the fund's holdings as of its most recent quarter end is available upon request. In addition, each Fidelity Central Fund's financial statements are available on the SEC's website or upon request.
(i) Investment made with cash collateral received from securities on loan.
Additional information on each restricted holding is as follows:
| Security | Acquisition Date | Acquisition Cost |
| 23andMe, Inc. Series F | 8/31/17 | $2,287,005 |
| Adagio Theraputics, Inc. Series A | 7/15/20 | $722,896 |
| Adagio Theraputics, Inc. Series B | 11/4/20 | $1,595,874 |
| Adagio Theraputics, Inc. Series C | 4/16/21 | $4,161,035 |
| Adimab LLC | 9/17/14 - 6/5/15 | $11,583,995 |
| Agbiome LLC Series C | 6/29/18 | $2,144,369 |
| Aledade, Inc. Series B1 | 5/7/21 | $880,380 |
| Allbirds, Inc. | 10/9/18 | $890,972 |
| Allbirds, Inc. Series A | 10/9/18 | $351,662 |
| Allbirds, Inc. Series B | 10/9/18 | $61,800 |
| Allbirds, Inc. Series C | 10/9/18 | $590,417 |
| Allbirds, Inc. Series D | 12/23/19 | $808,713 |
| Allbirds, Inc. Series Seed | 10/9/18 - 1/23/20 | $997,616 |
| Ambrx, Inc. Series A | 11/6/20 | $373,112 |
| Ambrx, Inc. Series B | 11/6/20 | $373,112 |
| Ant International Co. Ltd. Class C | 5/16/18 | $2,351,948 |
| AppHarvest, Inc. | 1/29/21 | $3,794,760 |
| AppNexus, Inc. Series E (Escrow) | 8/1/14 | $0 |
| Arrival Group | 3/24/21 | $7,140,280 |
| Beta Technologies, Inc. Series A | 4/9/21 | $804,944 |
| Bird Rides, Inc. | 2/12/21 - 4/20/21 | $1,980,341 |
| Bird Rides, Inc. Series C1 | 12/21/18 | $1,374,482 |
| Bird Rides, Inc. Series D | 9/30/19 | $1,355,067 |
| Blink Health, Inc. Series A1 | 12/30/20 | $232,676 |
| Blink Health, Inc. Series C | 11/7/19 - 1/21/21 | $6,964,944 |
| Boundless Bio, Inc. Series B | 4/23/21 | $831,738 |
| Bowery Farming, Inc. Series C1 | 5/18/21 | $1,634,925 |
| Bright Peak Therapeutics AG Series B | 5/14/21 | $935,108 |
| BTRS Holdings, Inc. | 1/12/21 | $1,233,610 |
| ByteDance Ltd. Series E1 | 11/18/20 | $9,288,165 |
| Caris Life Sciences, Inc. Series D | 5/11/21 | $2,070,279 |
| Castle Creek Pharmaceutical Holdings, Inc. Series A4 | 9/29/16 | $4,471,547 |
| Castle Creek Pharmaceutical Holdings, Inc. Series B | 10/9/18 | $2,022,184 |
| Castle Creek Pharmaceutical Holdings, Inc. Series C | 12/9/19 | $1,058,455 |
| Cazoo Holdings Ltd. | 9/30/20 | $671,514 |
| Cazoo Holdings Ltd. Series A | 9/30/20 | $21,922 |
| Cazoo Holdings Ltd. Series B | 9/30/20 | $383,811 |
| Cazoo Holdings Ltd. Series C | 9/30/20 | $7,787 |
| Cazoo Holdings Ltd. Series D | 9/30/20 | $1,371,134 |
| Cibus Corp. Series C | 2/16/18 | $2,400,000 |
| Cibus Corp. Series D | 5/10/19 | $938,700 |
| Circle Internet Financial Ltd. 0% | 5/11/21 | $2,227,100 |
| Conformal Medical, Inc. Series C | 7/24/20 | $882,846 |
| Cyclerion Therapeutics, Inc. | 4/2/19 | $2,229,495 |
| Databricks, Inc. Series G | 2/1/21 | $3,146,861 |
| Dataminr, Inc. Series D | 2/18/15 - 3/6/15 | $5,638,573 |
| Delhivery Pvt Ltd. Series H | 5/20/21 | $3,156,208 |
| Diamond Foundry, Inc. Series C | 3/15/21 | $8,530,704 |
| Dragonfly Therapeutics, Inc. | 12/19/19 | $3,336,950 |
| Element Biosciences, Inc. Series B | 12/13/19 | $1,315,160 |
| ElevateBio LLC Series C | 3/9/21 | $1,394,838 |
| Enevate Corp. Series E | 1/29/21 | $903,092 |
| Enevate Corp. 0% 1/29/23 | 1/29/21 | $346,804 |
| Epic Games, Inc. | 7/13/20 - 7/30/20 | $6,785,000 |
| EQRx, Inc. Series B | 11/19/20 | $3,881,960 |
| Evozyne LLC Series A | 4/9/21 | $2,278,458 |
| Fanatics, Inc. Series E | 8/13/20 | $2,208,313 |
| Faraday Pharmaceuticals, Inc. Series B | 12/30/19 | $288,996 |
| Freenome, Inc. Series C | 8/14/20 | $1,262,201 |
| Gemini Therapeutics, Inc. | 2/5/21 | $1,320,410 |
| GoBrands, Inc. Series G | 3/2/21 | $6,700,664 |
| Inscripta, Inc. Series D | 11/13/20 | $1,411,367 |
| Inscripta, Inc. Series E | 3/30/21 | $1,963,412 |
| Instacart, Inc. Series H | 11/13/20 | $834,240 |
| Instacart, Inc. Series I | 2/26/21 | $792,625 |
| Intarcia Therapeutics, Inc. Series EE | 9/2/16 | $6,992,640 |
| Intarcia Therapeutics, Inc. 6% 7/18/21 | 2/26/19 | $614,446 |
| Jet.Com, Inc. Series B1 (Escrow) | 3/19/18 | $0 |
| JUUL Labs, Inc. Class A | 7/6/18 | $392,042 |
| JUUL Labs, Inc. Series E | 7/6/18 | $196,006 |
| Kardium, Inc. Series D6 | 12/30/20 | $1,154,861 |
| Kardium, Inc. 0% | 12/30/20 | $1,612,660 |
| Lordstown Motors Corp. | 10/23/20 | $2,658,640 |
| MOD Super Fast Pizza Holdings LLC Series 3 | 11/3/16 | $2,225,976 |
| MOD Super Fast Pizza Holdings LLC Series 4 | 12/14/17 | $207,516 |
| MOD Super Fast Pizza Holdings LLC Series 5 | 5/15/19 | $848,707 |
| National Resilience, Inc. Series B | 12/1/20 | $3,434,780 |
| Neutron Holdings, Inc. Series 1D | 1/25/19 | $1,377,091 |
| Neutron Holdings, Inc. 4% 5/22/27 | 6/4/20 | $857,900 |
| Neutron Holdings, Inc. 4% 6/12/27 | 6/12/20 | $25,455 |
| Nohla Therapeutics, Inc. Series B | 5/1/18 | $1,123,581 |
| Nuvalent, Inc. Series B | 4/30/21 | $830,344 |
| Nuvation Bio, Inc. | 2/10/21 | $4,231,840 |
| Nuvia, Inc. Series B | 3/16/21 | $195,862 |
| Omega Therapeutics, Inc. Series C | 3/17/21 | $1,030,476 |
| On Holding AG | 2/6/20 | $2,624,466 |
| Paragon Biosciences Emalex Capital, Inc. Series B | 9/18/19 | $2,020,004 |
| Paragon Biosciences Emalex Capital, Inc. Series C | 2/26/21 | $1,238,974 |
| PrognomIQ, Inc. Series A5 | 8/20/20 | $50,461 |
| PrognomIQ, Inc. Series B | 9/11/20 | $454,100 |
| Rad Power Bikes, Inc. | 1/21/21 | $1,202,019 |
| Rad Power Bikes, Inc. Series A | 1/21/21 | $156,712 |
| Rad Power Bikes, Inc. Series C | 1/21/21 | $616,636 |
| Reddit, Inc. Series B | 7/26/17 | $538,544 |
| Reddit, Inc. Series E | 5/18/21 | $217,765 |
| Redwood Materials Series C | 5/28/21 | $770,449 |
| Riskified Ltd. | 12/20/19 - 4/15/20 | $1,773,844 |
| Riskified Ltd. Series D | 11/18/20 | $392,150 |
| Riskified Ltd. Series E | 10/28/19 | $1,474,732 |
| Riskified Ltd. warrants | 10/28/19 | $1 |
| Rivian Automotive, Inc. Series E | 7/10/20 | $9,688,236 |
| Rivian Automotive, Inc. Series F | 1/19/21 | $8,581,186 |
| Royalty Pharma PLC | 5/21/15 | $300,409 |
| Rush Street Interactive, Inc. | 12/29/20 | $1,025,550 |
| Scorpion Therapeutics, Inc. Series B | 1/8/21 | $585,688 |
| Seer, Inc. Class A | 12/8/20 | $1,433,227 |
| SiMa Ai Series B | 5/10/21 | $1,733,641 |
| Skyhawk Therapeutics, Inc. | 5/21/21 | $2,069,954 |
| Social Finance, Inc. | 1/7/21 | $1,929,540 |
| Sonder Holdings, Inc. Series D1 | 12/20/19 | $2,785,793 |
| Sonder Holdings, Inc. Series E | 4/3/20 - 5/6/20 | $4,523,454 |
| Sonder Holdings, Inc. 0% | 3/18/21 | $1,610,776 |
| Space Exploration Technologies Corp. Class A | 10/16/15 - 4/6/17 | $12,876,729 |
| Space Exploration Technologies Corp. Series G | 1/20/15 | $4,177,960 |
| Starry, Inc. Series B | 12/1/16 | $1,601,981 |
| Starry, Inc. Series C | 12/8/17 | $1,234,575 |
| Starry, Inc. Series D | 3/6/19 | $1,922,428 |
| Starry, Inc. Series E3 | 3/31/21 | $1,638,450 |
| Stripe, Inc. Class B | 5/18/21 | $1,745,585 |
| Stripe, Inc. Series H | 3/15/21 | $770,400 |
| Sweetgreen, Inc. Series C | 9/13/19 | $22,760 |
| Sweetgreen, Inc. Series D | 9/13/19 | $366,179 |
| Sweetgreen, Inc. Series H | 11/9/18 | $2,195,114 |
| Sweetgreen, Inc. Series I | 9/13/19 | $863,020 |
| Taboola.com Ltd. Series E | 12/22/14 | $3,455,249 |
| Tenstorrent, Inc. Series C1 | 4/23/21 | $1,248,540 |
| Tenstorrent, Inc. 0% | 4/23/21 | $1,170,000 |
| The Beauty Health Co. | 12/8/20 | $5,538,280 |
| The Real Good Food Co. LLC 1% | 5/7/21 | $1,262,200 |
| Tory Burch LLC | 5/14/15 | $17,704,966 |
| Waymo LLC Series A2 | 5/8/20 | $921,441 |
| Wheels Up Partners LLC Series B | 9/18/15 | $5,235,000 |
| Wheels Up Partners LLC Series C | 6/22/17 | $2,092,241 |
| Wheels Up Partners LLC Series D | 5/15/19 - 8/2/19 | $3,953,141 |
| Xsight Labs Ltd. Series D | 2/16/21 | $1,338,418 |
| Yumanity Therapeutics, Inc. | 12/22/20 | $449,190 |
| Zomato Pvt Ltd. | 12/9/20 - 2/10/21 | $4,714,002 |
Affiliated Central Funds
Information regarding fiscal year to date income earned by the Fund from investments in Fidelity Central Funds is as follows:
| Fund | Income earned |
| Fidelity Cash Central Fund | $53,608 |
| Fidelity Securities Lending Cash Central Fund | 687,993 |
| Total | $741,601 |
Amounts in the income column in the above table include any capital gain distributions from underlying funds, which are presented in the corresponding line-item in the Statement of Operations, if applicable. Amount for Fidelity Securities Lending Cash Central Fund represents the income earned on investing cash collateral, less rebates paid to borrowers and any lending agent fees associated with the loan, plus any premium payments received for lending certain types of securities.
Investment Valuation
The following is a summary of the inputs used, as of May 31, 2021, involving the Fund's assets and liabilities carried at fair value. The inputs or methodology used for valuing securities may not be an indication of the risk associated with investing in those securities. For more information on valuation inputs, and their aggregation into the levels used below, please refer to the Investment Valuation section in the accompanying Notes to Financial Statements.
| Valuation Inputs at Reporting Date: | ||||
| Description | Total | Level 1 | Level 2 | Level 3 |
| Investments in Securities: | ||||
| Equities: | ||||
| Communication Services | $1,716,339,532 | $1,705,218,289 | $-- | $11,121,243 |
| Consumer Discretionary | 3,083,880,853 | 2,974,454,848 | 26,910,405 | 82,515,600 |
| Consumer Staples | 322,796,783 | 302,488,720 | 6,002,362 | 14,305,701 |
| Energy | 123,420,764 | 122,359,197 | 1,061,567 | -- |
| Financials | 318,987,189 | 249,477,329 | 26,261,014 | 43,248,846 |
| Health Care | 2,181,139,938 | 2,072,796,431 | 43,129,216 | 65,214,291 |
| Industrials | 827,142,384 | 728,419,986 | 14,270,191 | 84,452,207 |
| Information Technology | 4,909,549,737 | 4,830,407,426 | 22,322,618 | 56,819,693 |
| Materials | 168,505,000 | 159,974,296 | -- | 8,530,704 |
| Real Estate | 33,475,218 | 33,475,218 | -- | -- |
| Utilities | 770,449 | -- | -- | 770,449 |
| Corporate Bonds | 5,816,031 | -- | -- | 5,816,031 |
| Preferred Securities | 6,221,667 | -- | -- | 6,221,667 |
| Money Market Funds | 215,855,960 | 215,855,960 | -- | -- |
| Total Investments in Securities: | $13,913,901,505 | $13,394,927,700 | $139,957,373 | $379,016,432 |
| Net unrealized appreciation on unfunded commitments | $1,173,708 | $-- | $1,173,708 | $-- |
The following is a reconciliation of Investments in Securities for which Level 3 inputs were used in determining value:
| Investments in Securities: | |
| Beginning Balance | $294,336,731 |
| Net Realized Gain (Loss) on Investment Securities | 119,936 |
| Net Unrealized Gain (Loss) on Investment Securities | 64,053,387 |
| Cost of Purchases | 87,691,846 |
| Proceeds of Sales | (5,372,990) |
| Amortization/Accretion | -- |
| Transfers into Level 3 | 3,654,307 |
| Transfers out of Level 3 | (65,466,785) |
| Ending Balance | $379,016,432 |
| The change in unrealized gain (loss) for the period attributable to Level 3 securities held at May 31, 2021 | $63,587,680 |
The information used in the above reconciliation represents fiscal year to date activity for any Investments in Securities identified as using Level 3 inputs at either the beginning or the end of the current fiscal period. Cost of purchases and proceeds of sales may include securities received and/or delivered through in-kind transactions. Transfers in or out of Level 3 represent the beginning value of any Security or Instrument where a change in the pricing level occurred from the beginning to the end of the period. The cost of purchases and the proceeds of sales may include securities received or delivered through corporate actions or exchanges. Realized and unrealized gains (losses) disclosed in the reconciliation are included in Net Gain (Loss) on the Fund's Statement of Operations.
See accompanying notes which are an integral part of the financial statements.
Financial Statements
Statement of Assets and Liabilities
| May 31, 2021 (Unaudited) | ||
| Assets | ||
| Investment in securities, at value (including securities loaned of $190,008,907) — See accompanying schedule: Unaffiliated issuers (cost $4,710,936,220) | $13,698,045,545 | |
| Fidelity Central Funds (cost $215,855,960) | 215,855,960 | |
| Total Investment in Securities (cost $4,926,792,180) | $13,913,901,505 | |
| Restricted cash | 50,000 | |
| Foreign currency held at value (cost $378,840) | 378,924 | |
| Receivable for investments sold | 678,994 | |
| Net unrealized appreciation on unfunded commitments | 3,268,931 | |
| Receivable for fund shares sold | 423,260,676 | |
| Dividends receivable | 3,842,940 | |
| Interest receivable | 62,184 | |
| Distributions receivable from Fidelity Central Funds | 42,729 | |
| Other receivables | 130,577 | |
| Total assets | 14,345,617,460 | |
| Liabilities | ||
| Payable for investments purchased | $373,669,515 | |
| Net unrealized depreciation on unfunded commitments | 2,095,223 | |
| Payable for fund shares redeemed | 724,099 | |
| Other payables and accrued expenses | 1,379,850 | |
| Collateral on securities loaned | 196,470,082 | |
| Total liabilities | 574,338,769 | |
| Net Assets | $13,771,278,691 | |
| Net Assets consist of: | ||
| Paid in capital | $3,118,699,616 | |
| Total accumulated earnings (loss) | 10,652,579,075 | |
| Net Assets | $13,771,278,691 | |
| Net Asset Value, offering price and redemption price per share ($13,771,278,691 ÷ 559,064,395 shares) | $24.63 |
See accompanying notes which are an integral part of the financial statements.
Statement of Operations
| Six months ended May 31, 2021 (Unaudited) | ||
| Investment Income | ||
| Dividends | $25,184,016 | |
| Interest | 44,338 | |
| Income from Fidelity Central Funds (including $687,993 from security lending) | 741,601 | |
| Total income | 25,969,955 | |
| Expenses | ||
| Custodian fees and expenses | $141,552 | |
| Independent trustees' fees and expenses | 26,848 | |
| Interest | 533 | |
| Total expenses before reductions | 168,933 | |
| Expense reductions | (219) | |
| Total expenses after reductions | 168,714 | |
| Net investment income (loss) | 25,801,241 | |
| Realized and Unrealized Gain (Loss) | ||
| Net realized gain (loss) on: | ||
| Investment securities: | ||
| Unaffiliated issuers (net of foreign taxes of $7,803) | 1,687,561,929 | |
| Fidelity Central Funds | (105) | |
| Foreign currency transactions | 4,433 | |
| Futures contracts | 5,062,315 | |
| Total net realized gain (loss) | 1,692,628,572 | |
| Change in net unrealized appreciation (depreciation) on: | ||
| Investment securities: | ||
| Unaffiliated issuers (net of increase in deferred foreign taxes of $342,216) | (133,320,029) | |
| Unfunded commitments | 1,173,708 | |
| Assets and liabilities in foreign currencies | (22,740) | |
| Total change in net unrealized appreciation (depreciation) | (132,169,061) | |
| Net gain (loss) | 1,560,459,511 | |
| Net increase (decrease) in net assets resulting from operations | $1,586,260,752 |
See accompanying notes which are an integral part of the financial statements.
Statement of Changes in Net Assets
| Six months ended May 31, 2021 (Unaudited) | Year ended November 30, 2020 | |
| Increase (Decrease) in Net Assets | ||
| Operations | ||
| Net investment income (loss) | $25,801,241 | $46,932,727 |
| Net realized gain (loss) | 1,692,628,572 | 3,178,978,384 |
| Change in net unrealized appreciation (depreciation) | (132,169,061) | 2,867,334,103 |
| Net increase (decrease) in net assets resulting from operations | 1,586,260,752 | 6,093,245,214 |
| Distributions to shareholders | (3,221,895,370) | (1,132,911,379) |
| Share transactions | ||
| Proceeds from sales of shares | 1,368,852,688 | 499,706,790 |
| Reinvestment of distributions | 3,221,895,370 | 1,132,911,380 |
| Cost of shares redeemed | (2,020,754,268) | (4,929,691,968) |
| Net increase (decrease) in net assets resulting from share transactions | 2,569,993,790 | (3,297,073,798) |
| Total increase (decrease) in net assets | 934,359,172 | 1,663,260,037 |
| Net Assets | ||
| Beginning of period | 12,836,919,519 | 11,173,659,482 |
| End of period | $13,771,278,691 | $12,836,919,519 |
| Other Information | ||
| Shares | ||
| Sold | 57,041,899 | 24,734,345 |
| Issued in reinvestment of distributions | 142,941,232 | 64,811,864 |
| Redeemed | (83,414,147) | (230,314,457) |
| Net increase (decrease) | 116,568,984 | (140,768,248) |
See accompanying notes which are an integral part of the financial statements.
Financial Highlights
Fidelity Series Growth Company Fund
| Six months ended (Unaudited) May 31, | Years endedNovember 30, | |||||
| 2021 | 2020 | 2019 | 2018 | 2017 | 2016 | |
| Selected Per–Share Data | ||||||
| Net asset value, beginning of period | $29.01 | $19.16 | $17.61 | $18.19 | $13.49 | $13.08 |
| Income from Investment Operations | ||||||
| Net investment income (loss)A | .05 | .09 | .11 | .15B | .07 | .01 |
| Net realized and unrealized gain (loss) | 2.86 | 11.72 | 3.31 | 1.02 | 4.96 | .43 |
| Total from investment operations | 2.91 | 11.81 | 3.42 | 1.17 | 5.03 | .44 |
| Distributions from net investment income | (.16) | (.13) | (.15) | (.09) | (.02) | (.03) |
| Distributions from net realized gain | (7.13) | (1.84) | (1.72) | (1.66) | (.31) | – |
| Total distributions | (7.29) | (1.96)C | (1.87) | (1.75) | (.33) | (.03) |
| Net asset value, end of period | $24.63 | $29.01 | $19.16 | $17.61 | $18.19 | $13.49 |
| Total ReturnD,E | 12.34% | 68.41% | 23.24% | 6.96% | 38.10% | 3.38% |
| Ratios to Average Net AssetsF,G | ||||||
| Expenses before reductions | - %H,I | - %I | - %I | - %I | .38% | .74% |
| Expenses net of fee waivers, if any | - %H,I | - %I | - %I | - %I | .38% | .74% |
| Expenses net of all reductions | - %H,I | - %I | - %I | - %I | .37% | .74% |
| Net investment income (loss) | .38%H | .41% | .64% | .79%B | .43% | .11% |
| Supplemental Data | ||||||
| Net assets, end of period (000 omitted) | $13,771,279 | $12,836,920 | $11,173,659 | $11,276,470 | $11,622,162 | $4,032,151 |
| Portfolio turnover rateJ | 44%H | 18% | 19%K | 23% | 15% | 20% |
A Calculated based on average shares outstanding during the period.
B Net investment income per share reflects one or more large, non-recurring dividend(s) which amounted to $.03 per share. Excluding such non-recurring dividend(s), the ratio of net investment income (loss) to average net assets would have been .65%.
C Total distributions per share do not sum due to rounding.
D Total returns for periods of less than one year are not annualized.
E Total returns would have been lower if certain expenses had not been reduced during the applicable periods shown.
F Fees and expenses of any underlying mutual funds or exchange-traded funds (ETFs) are not included in the Fund's expense ratio. The Fund indirectly bears its proportionate share of these expenses. For additional expense information related to investments in Fidelity Central Funds, please refer to the "Investments in Fidelity Central Funds" note found in the Notes to Financial Statements section of the most recent Annual or Semi-Annual report.
G Expense ratios reflect operating expenses of the class. Expenses before reductions do not reflect amounts reimbursed, waived, or reduced through arrangements with the investment advisor, brokerage services, or other offset arrangements, if applicable, and do not represent the amount paid by the class during periods when reimbursements, waivers or reductions occur.
H Annualized
I Amount represents less than $.005 per share.
J Amount does not include the portfolio activity of any underlying mutual funds or exchange-traded funds (ETFs).
K Portfolio turnover rate excludes securities received or delivered in-kind.
See accompanying notes which are an integral part of the financial statements.
Notes to Financial Statements (Unaudited)
For the period ended May 31, 2021
1. Organization.
Fidelity Series Growth Company Fund (the Fund) is a fund of Fidelity Mt. Vernon Street Trust (the Trust) and is authorized to issue an unlimited number of shares. Shares are offered only to certain other Fidelity funds and Fidelity managed 529 plans. The Trust is registered under the Investment Company Act of 1940, as amended (the 1940 Act), as an open-end management investment company organized as a Massachusetts business trust.
2. Investments in Fidelity Central Funds.
Funds may invest in Fidelity Central Funds, which are open-end investment companies generally available only to other investment companies and accounts managed by the investment adviser and its affiliates. The Schedule of Investments lists any Fidelity Central Funds held as an investment as of period end, but does not include the underlying holdings of each Fidelity Central Fund. An investing fund indirectly bears its proportionate share of the expenses of the underlying Fidelity Central Funds.
Based on its investment objective, each Fidelity Central Fund may invest or participate in various investment vehicles or strategies that are similar to those of the investing fund. These strategies are consistent with the investment objectives of the investing fund and may involve certain economic risks which may cause a decline in value of each of the Fidelity Central Funds and thus a decline in the value of the investing fund.
| Fidelity Central Fund | Investment Manager | Investment Objective | Investment Practices | Expense Ratio(a) |
| Fidelity Money Market Central Funds | Fidelity Management & Research Company LLC (FMR) | Each fund seeks to obtain a high level of current income consistent with the preservation of capital and liquidity. | Short-term Investments | Less than .005% to .01% |
(a) Expenses expressed as a percentage of average net assets and are as of each underlying Central Fund's most recent annual or semi-annual shareholder report.
A complete unaudited list of holdings for each Fidelity Central Fund is available upon request or at the Securities and Exchange Commission website at www.sec.gov. In addition, the financial statements of the Fidelity Central Funds which contain the significant accounting policies (including investment valuation policies) of those funds, and are not covered by the Report of Independent Registered Public Accounting Firm, are available on the Securities and Exchange Commission website or upon request.
3. Significant Accounting Policies.
The Fund is an investment company and applies the accounting and reporting guidance of the Financial Accounting Standards Board (FASB) Accounting Standards Codification Topic 946 Financial Services - Investment Companies. The financial statements have been prepared in conformity with accounting principles generally accepted in the United States of America (GAAP), which require management to make certain estimates and assumptions at the date of the financial statements. Actual results could differ from those estimates. Subsequent events, if any, through the date that the financial statements were issued have been evaluated in the preparation of the financial statements. The Fund's Schedule of Investments lists any underlying mutual funds or exchange-traded funds (ETFs) but does not include the underlying holdings of these funds. The following summarizes the significant accounting policies of the Fund:
Investment Valuation. Investments are valued as of 4:00 p.m. Eastern time on the last calendar day of the period. The Board of Trustees (the Board) has delegated the day to day responsibility for the valuation of the Fund's investments to the Fair Value Committee (the Committee) established by the Fund's investment adviser. In accordance with valuation policies and procedures approved by the Board, the Fund attempts to obtain prices from one or more third party pricing vendors or brokers to value its investments. When current market prices, quotations or currency exchange rates are not readily available or reliable, investments will be fair valued in good faith by the Committee, in accordance with procedures adopted by the Board. Factors used in determining fair value vary by investment type and may include market or investment specific events, changes in interest rates and credit quality. The frequency with which these procedures are used cannot be predicted and they may be utilized to a significant extent. The Committee oversees the Fund's valuation policies and procedures and reports to the Board on the Committee's activities and fair value determinations. The Board monitors the appropriateness of the procedures used in valuing the Fund's investments and ratifies the fair value determinations of the Committee.
The Fund categorizes the inputs to valuation techniques used to value its investments into a disclosure hierarchy consisting of three levels as shown below:
- Level 1 – quoted prices in active markets for identical investments
- Level 2 – other significant observable inputs (including quoted prices for similar investments, interest rates, prepayment speeds, etc.)
- Level 3 – unobservable inputs (including the Fund's own assumptions based on the best information available)
Valuation techniques used to value the Fund's investments by major category are as follows:
Equity securities, including restricted securities, for which market quotations are readily available, are valued at the last reported sale price or official closing price as reported by a third party pricing vendor on the primary market or exchange on which they are traded and are categorized as Level 1 in the hierarchy. In the event there were no sales during the day or closing prices are not available, securities are valued at the last quoted bid price or may be valued using the last available price and are generally categorized as Level 2 in the hierarchy. For foreign equity securities, when market or security specific events arise, comparisons to the valuation of American Depositary Receipts (ADRs), futures contracts, Exchange-Traded Funds (ETFs) and certain indexes as well as quoted prices for similar securities may be used and would be categorized as Level 2 in the hierarchy. For equity securities, including restricted securities, where observable inputs are limited, assumptions about market activity and risk are used and these securities may be categorized as Level 3 in the hierarchy. Securities, including private placements or other restricted securities, for which observable inputs are not available are valued using alternate valuation approaches, including the market approach, the income approach and cost approach are categorized as Level 3 in the hierarchy. The market approach considers factors including the price of recent investments in the same or a similar security or financial metrics of comparable securities. The income approach considers factors including expected future cash flows, security specific risks and corresponding discount rates. The cost approach considers factors including the value of the security's underlying assets and liabilities.
Debt securities, including restricted securities, are valued based on evaluated prices received from third party pricing vendors or from brokers who make markets in such securities. Corporate bonds and preferred securities are valued by pricing vendors who utilize matrix pricing which considers yield or price of bonds of comparable quality, coupon, maturity and type or by broker-supplied prices. When independent prices are unavailable or unreliable, debt securities may be valued utilizing pricing methodologies which consider similar factors that would be used by third party pricing vendors. Debt securities are generally categorized as Level 2 in the hierarchy but may be Level 3 depending on the circumstances.
Investments in open-end mutual funds, including the Fidelity Central Funds, are valued at their closing net asset value (NAV) each business day and are categorized as Level 1 in the hierarchy.
The following provides information on Level 3 securities held by the Fund that were valued at period end based on unobservable inputs. These amounts exclude valuations provided by a broker.
| Asset Type | Fair Value | Valuation Technique(s) | Unobservable Input | Amount or Range/Weighted Average | Impact to Valuation from an Increase in Input(a) |
| Equities | $366,919,594 | Market comparable | Enterprise value/Sales multiple (EV/S) | 1.0 - 5.7 / 4.0 | Increase |
| Discount rate | 52.9% - 85.7% / 53.6% | Decrease | |||
| Premium rate | 7.8% - 45.9% / 31.3% | Increase | |||
| Discount for lack of marketability | 10.0% - 15.0% / 12.5% | Decrease | |||
| Price/Earnings multiple (P/E) | 12.6 | Increase | |||
| Recovery value | Recovery value | 0.0% - 18.2% / 17.9% | Increase | ||
| Market approach | Transaction price | $0.0 - $885.00 / $172.05 | Increase | ||
| Premium rate | 4.5% - 59.0% / 36.4% | Increase | |||
| Corporate Bonds | $5,816,031 | Market approach | Transaction price | $100.00 | Increase |
| Preferred Securities | $6,221,667 | Recovery value | Recovery value | 127.2% | Increase |
| Market approach | Transaction price | $100.00 | Increase |
(a) Represents the directional change in the fair value of the Level 3 investments that could have resulted from an increase in the corresponding input as of period end. A decrease to the unobservable input would have had the opposite effect. Significant changes in these inputs may have resulted in a significantly higher or lower fair value measurement at period end.
Changes in valuation techniques may result in transfers in or out of an assigned level within the disclosure hierarchy. The aggregate value of investments by input level as of May 31, 2021, as well as a roll forward of Level 3 investments, is included at the end of the Fund's Schedule of Investments.
Foreign Currency. Certain Funds may use foreign currency contracts to facilitate transactions in foreign-denominated securities. Gains and losses from these transactions may arise from changes in the value of the foreign currency or if the counterparties do not perform under the contracts' terms.
Foreign-denominated assets, including investment securities, and liabilities are translated into U.S. dollars at the exchange rates at period end. Purchases and sales of investment securities, income and dividends received, and expenses denominated in foreign currencies are translated into U.S. dollars at the exchange rate in effect on the transaction date.
The effects of exchange rate fluctuations on investments are included with the net realized and unrealized gain (loss) on investment securities. Other foreign currency transactions resulting in realized and unrealized gain (loss) are disclosed separately.
Investment Transactions and Income. For financial reporting purposes, the Fund's investment holdings and NAV include trades executed through the end of the last business day of the period. The NAV per share for processing shareholder transactions is calculated as of the close of business of the New York Stock Exchange (NYSE), normally 4:00 p.m. Eastern time and includes trades executed through the end of the prior business day. Gains and losses on securities sold are determined on the basis of identified cost and include proceeds received from litigation. Dividend income is recorded on the ex-dividend date, except for certain dividends from foreign securities where the ex-dividend date may have passed, which are recorded as soon as the Fund is informed of the ex-dividend date. Non-cash dividends included in dividend income, if any, are recorded at the fair market value of the securities received. Income and capital gain distributions from Fidelity Central Funds, if any, are recorded on the ex-dividend date. Certain distributions received by the Fund represent a return of capital or capital gain. The Fund determines the components of these distributions subsequent to the ex-dividend date, based upon receipt of tax filings or other correspondence relating to the underlying investment. These distributions are recorded as a reduction of cost of investments and/or as a realized gain. Interest income is accrued as earned and includes coupon interest and amortization of premium and accretion of discount on debt securities as applicable. Investment income is recorded net of foreign taxes withheld where recovery of such taxes is uncertain.
Expenses. Expenses directly attributable to a fund are charged to that fund. Expenses attributable to more than one fund are allocated among the respective funds on the basis of relative net assets or other appropriate methods. Expenses included in the accompanying financial statements reflect the expenses of that fund and do not include any expenses associated with any underlying mutual funds or exchange-traded funds. Although not included in a fund's expenses, a fund indirectly bears its proportionate share of these expenses through the net asset value of each underlying mutual fund or exchange-traded fund. Expense estimates are accrued in the period to which they relate and adjustments are made when actual amounts are known.
Income Tax Information and Distributions to Shareholders. Each year, the Fund intends to qualify as a regulated investment company under Subchapter M of the Internal Revenue Code, including distributing substantially all of its taxable income and realized gains. As a result, no provision for U.S. Federal income taxes is required. The Fund files a U.S. federal tax return, in addition to state and local tax returns as required. The Fund's federal income tax returns are subject to examination by the Internal Revenue Service (IRS) for a period of three fiscal years after they are filed. State and local tax returns may be subject to examination for an additional fiscal year depending on the jurisdiction. Foreign taxes are provided for based on the Fund's understanding of the tax rules and rates that exist in the foreign markets in which it invests. The Fund is subject to a tax imposed on capital gains by certain countries in which it invests. An estimated deferred tax liability for net unrealized appreciation on the applicable securities is included in Other payables and accrued expenses on the Statement of Assets & Liabilities.
Distributions are declared and recorded on the ex-dividend date. Income and capital gain distributions are determined in accordance with income tax regulations, which may differ from GAAP.
Capital accounts within the financial statements are adjusted for permanent book-tax differences. These adjustments have no impact on net assets or the results of operations. Capital accounts are not adjusted for temporary book-tax differences which will reverse in a subsequent period.
Book-tax differences are primarily due to futures contracts, foreign currency transactions, partnerships, passive foreign investment companies (PFIC), certain deemed distributions, and losses deferred due to wash sales.
As of period end, the cost and unrealized appreciation (depreciation) in securities, and derivatives if applicable, for federal income tax purposes were as follows:
| Gross unrealized appreciation | $9,157,709,260 |
| Gross unrealized depreciation | (214,634,756) |
| Net unrealized appreciation (depreciation) | $8,943,074,504 |
| Tax cost | $4,972,000,709 |
Restricted Securities (including Private Placements). Funds may invest in securities that are subject to legal or contractual restrictions on resale. These securities generally may be resold in transactions exempt from registration or to the public if the securities are registered. Disposal of these securities may involve time-consuming negotiations and expense, and prompt sale at an acceptable price may be difficult. Information regarding restricted securities held at period end is included at the end of the Schedule of Investments, if applicable.
Special Purpose Acquisition Companies. Funds may invest in stock, warrants, and other securities of special purpose acquisition companies (SPACs) or similar special purpose entities. A SPAC is a publicly traded company that raises investment capital via an initial public offering (IPO) for the purpose of acquiring the equity securities of one or more existing companies via merger, business combination, acquisition or other similar transactions within a designated time frame.
Private Investment in Public Equity. Funds may acquire equity securities of an issuer through a private investment in a public equity (PIPE) transaction, including through commitments to purchase securities on a when-issued basis. A PIPE typically involves the purchase of securities directly from a publicly traded company in a private placement transaction. Securities purchased through PIPE transactions will be restricted from trading and considered illiquid until a resale registration statement for the shares is filed and declared effective.
At period end, the Fund had commitments to purchase when-issued securities through PIPE transactions with SPACs. The commitments are contingent upon the SPACs acquiring the securities of target companies. Unrealized appreciation (depreciation) on these commitments is separately presented in the Statements of Assets and Liabilities as Unrealized appreciation (depreciation) on unfunded commitments, and in the Statement of Operations as Change in unrealized appreciation (depreciation) on unfunded commitments.
Consolidated Subsidiary. The Funds included in the table below hold certain investments through a wholly-owned subsidiary ("Subsidiary"), which may be subject to federal and state taxes upon disposition.
As of period end, investments in Subsidiaries were as follows:
| $ Amount | % of Net Assets | |
| Fidelity Series Growth Company Fund | 71,689,729 | .52 |
The financial statements have been consolidated to include the Subsidiary accounts where applicable. Accordingly, all inter-company transactions and balances have been eliminated.
At period end, any estimated tax liability for these investments is presented as "Deferred taxes" in the Statement of Assets and Liabilities and included in "Change in net unrealized appreciation (depreciation) on investment securities" in the Statement of Operations. The tax liability incurred may differ materially depending on conditions when these investments are disposed. Any cash held by a Subsidiary is restricted as to its use and is presented as "Restricted cash" in the Statement of Assets and Liabilities, if applicable.
4. Derivative Instruments.
Risk Exposures and the Use of Derivative Instruments. The Fund's investment objective allows the Fund to enter into various types of derivative contracts, including futures contracts. Derivatives are investments whose value is primarily derived from underlying assets, indices or reference rates and may be transacted on an exchange or over-the-counter (OTC). Derivatives may involve a future commitment to buy or sell a specified asset based on specified terms, to exchange future cash flows at periodic intervals based on a notional principal amount, or for one party to make one or more payments upon the occurrence of specified events in exchange for periodic payments from the other party.
The Fund used derivatives to increase returns and to manage exposure to certain risks as defined below. The success of any strategy involving derivatives depends on analysis of numerous economic factors, and if the strategies for investment do not work as intended, the Fund may not achieve its objectives.
The Fund's use of derivatives increased or decreased its exposure to the following risk:
| Equity Risk | Equity risk relates to the fluctuations in the value of financial instruments as a result of changes in market prices (other than those arising from interest rate risk or foreign exchange risk), whether caused by factors specific to an individual investment, its issuer, or all factors affecting all instruments traded in a market or market segment. |
The Fund is also exposed to additional risks from investing in derivatives, such as liquidity risk and counterparty credit risk. Liquidity risk is the risk that the Fund will be unable to close out the derivative in the open market in a timely manner. Counterparty credit risk is the risk that the counterparty will not be able to fulfill its obligation to the Fund. Counterparty credit risk related to exchange-traded futures contracts may be mitigated by the protection provided by the exchange on which they trade.
Investing in derivatives may involve greater risks than investing in the underlying assets directly and, to varying degrees, may involve risk of loss in excess of any initial investment and collateral received and amounts recognized in the Statement of Assets and Liabilities. In addition, there may be the risk that the change in value of the derivative contract does not correspond to the change in value of the underlying instrument.
Futures Contracts. A futures contract is an agreement between two parties to buy or sell a specified underlying instrument for a fixed price at a specified future date. The Fund used futures contracts to manage its exposure to the stock market.
Upon entering into a futures contract, a fund is required to deposit either cash or securities (initial margin) with a clearing broker in an amount equal to a certain percentage of the face value of the contract. Futures contracts are marked-to-market daily and subsequent daily payments (variation margin) are made or received by a fund depending on the daily fluctuations in the value of the futures contracts and are recorded as unrealized appreciation or (depreciation). This receivable and/or payable, if any, is included in daily variation margin on futures contracts in the Statement of Assets and Liabilities. Realized gain or (loss) is recorded upon the expiration or closing of a futures contract. The net realized gain (loss) and change in net unrealized appreciation (depreciation) on futures contracts during the period is presented in the Statement of Operations.
Any open futures contracts at period end are presented in the Schedule of Investments under the caption "Futures Contracts". The notional amount at value reflects each contract's exposure to the underlying instrument or index at period end.
5. Purchases and Sales of Investments.
Purchases and sales of securities, other than short-term securities, are noted in the table below.
| Purchases ($) | Sales ($) | |
| Fidelity Series Growth Company Fund | 2,880,621,076 | 3,535,798,803 |
6. Fees and Other Transactions with Affiliates.
Management Fee. Fidelity Management & Research Company LLC (the investment adviser) and its affiliates provide the Fund with investment management related services for which the Fund does not pay a management fee. Under the management contract, the investment adviser or an affiliate pays all ordinary operating expenses of the Fund, except custody fees, fees and expenses of the independent Trustees, and certain miscellaneous expenses such as proxy and shareholder meeting expenses.
Brokerage Commissions. A portion of portfolio transactions were placed with brokerage firms which are affiliates of the investment adviser. Brokerage commissions are included in net realized gain (loss) and change in net unrealized appreciation (depreciation) in the Statement of Operations. The commissions paid to these affiliated firms were as follows:
| Amount | |
| Fidelity Series Growth Company Fund | $47,534 |
Interfund Lending Program. Pursuant to an Exemptive Order issued by the Securities and Exchange Commission (the SEC), the Fund, along with other registered investment companies having management contracts with Fidelity Management & Research Company LLC (FMR), or other affiliated entities of FMR, may participate in an interfund lending program. This program provides an alternative credit facility allowing the Fund to borrow from, or lend money to, other participating affiliated funds. At period end, there were no interfund loans outstanding. Activity in this program during the period for which loans were outstanding was as follows:
| Borrower or Lender | Average Loan Balance | Weighted Average Interest Rate | Interest Expense | |
| Fidelity Series Growth Company Fund | Borrower | $34,003,000 | .28% | $533 |
Interfund Trades. Funds may purchase from or sell securities to other Fidelity Funds under procedures adopted by the Board. The procedures have been designed to ensure these interfund trades are executed in accordance with Rule 17a-7 of the 1940 Act. Any interfund trades are included within the respective purchases and sales amounts shown in the Purchases and Sales of Investments note and are noted in the table below.
| Purchases ($) | Sales ($) | |
| Fidelity Series Growth Company Fund | 370,263,210 | 263,977,132 |
Other. During the period, the investment adviser reimbursed the Fund for certain losses as follows:
| Amount ($) | |
| Fidelity Series Growth Company Fund | 2,531 |
7. Committed Line of Credit.
Certain Funds participate with other funds managed by the investment adviser or an affiliate in a $4.25 billion credit facility (the "line of credit") to be utilized for temporary or emergency purposes to fund shareholder redemptions or for other short-term liquidity purposes. The commitment fees on the pro-rata portion of the line of credit are borne by the investment adviser. During the period, there were no borrowings on this line of credit.
8. Security Lending.
Funds lend portfolio securities from time to time in order to earn additional income. Lending agents are used, including National Financial Services (NFS), an affiliate of the investment adviser. Pursuant to a securities lending agreement, NFS will receive a fee, which is capped at 9.9% of a fund's daily lending revenue, for its services as lending agent. A fund may lend securities to certain qualified borrowers, including NFS. On the settlement date of the loan, a fund receives collateral (in the form of U.S. Treasury obligations, letters of credit and/or cash) against the loaned securities and maintains collateral in an amount not less than 100% of the market value of the loaned securities during the period of the loan. The market value of the loaned securities is determined at the close of business of a fund and any additional required collateral is delivered to a fund on the next business day. A fund or borrower may terminate the loan at any time, and if the borrower defaults on its obligation to return the securities loaned because of insolvency or other reasons, a fund may apply collateral received from the borrower against the obligation. A fund may experience delays and costs in recovering the securities loaned. Any cash collateral received is invested in the Fidelity Securities Lending Cash Central Fund. Any loaned securities are identified as such in the Schedule of Investments, and the value of loaned securities and cash collateral at period end, as applicable, are presented in the Statement of Assets and Liabilities. Security lending income represents the income earned on investing cash collateral, less rebates paid to borrowers and any lending agent fees associated with the loan, plus any premium payments received for lending certain types of securities. Security lending income is presented in the Statement of Operations as a component of income from Fidelity Central Funds. Affiliated security lending activity, if any, was as follows:
| Total Security Lending Fees Paid to NFS | Security Lending Income From Securities Loaned to NFS | Value of Securities Loaned to NFS at Period End | |
| Fidelity Series Growth Company Fund | $70,874 | $95,450 | $7,011,891 |
9. Expense Reductions.
Through arrangements with the Fund's custodian, credits realized as a result of certain uninvested cash balances were used to reduce the Fund's expenses by $219.
10. Other.
Fund's organizational documents provide former and current trustees and officers with a limited indemnification against liabilities arising in connection with the performance of their duties to the fund. In the normal course of business, the fund may also enter into contracts that provide general indemnifications. The fund's maximum exposure under these arrangements is unknown as this would be dependent on future claims that may be made against the fund. The risk of material loss from such claims is considered remote.
At the end of the period, mutual funds and accounts managed by the investment adviser or its affiliates were the owners of record of all of the outstanding shares of the Fund.
11. Coronavirus (COVID-19) Pandemic.
An outbreak of COVID-19 first detected in China during December 2019 has since spread globally and was declared a pandemic by the World Health Organization during March 2020. Developments that disrupt global economies and financial markets, such as the COVID-19 pandemic, may magnify factors that affect the Fund's performance.
Shareholder Expense Example
As a shareholder, you incur two types of costs: (1) transaction costs, which may include sales charges (loads) on purchase payments or redemption proceeds, as applicable and (2) ongoing costs, which generally include management fees, distribution and/or service (12b-1) fees and other Fund expenses. This Example is intended to help you understand your ongoing costs (in dollars) of investing in a fund and to compare these costs with the ongoing costs of investing in other mutual funds.
The Example is based on an investment of $1,000 invested at the beginning of the period and held for the entire period (December 1, 2020 to May 31, 2021).
Actual Expenses
The first line of the accompanying table provides information about actual account values and actual expenses. You may use the information in this line, together with the amount you invested, to estimate the expenses that you paid over the period. Simply divide your account value by $1,000.00 (for example, an $8,600 account value divided by $1,000.00 = 8.6), then multiply the result by the number in the first line for a class/Fund under the heading entitled "Expenses Paid During Period" to estimate the expenses you paid on your account during this period. If any fund is a shareholder of any underlying mutual funds or exchange-traded funds (ETFs) (the Underlying Funds), such fund indirectly bears its proportional share of the expenses of the Underlying Funds in addition to the direct expenses incurred presented in the table. These fees and expenses are not included in the annualized expense ratio used to calculate the expense estimate in the table below.
Hypothetical Example for Comparison Purposes
The second line of the accompanying table provides information about hypothetical account values and hypothetical expenses based on the actual expense ratio and an assumed rate of return of 5% per year before expenses, which is not the actual return. The hypothetical account values and expenses may not be used to estimate the actual ending account balance or expenses you paid for the period. You may use this information to compare the ongoing costs of investing in the Fund and other funds. To do so, compare this 5% hypothetical example with the 5% hypothetical examples that appear in the shareholder reports of the other funds. If any fund is a shareholder of any Underlying Funds, such fund indirectly bears its proportional share of the expenses of the Underlying Funds in addition to the direct expenses as presented in the table. These fees and expenses are not included in the annualized expense ratio used to calculate the expense estimate in the table below.
Please note that the expenses shown in the table are meant to highlight your ongoing costs only and do not reflect any transaction costs. Therefore, the second line of the table is useful in comparing ongoing costs only, and will not help you determine the relative total costs of owning different funds.
| Annualized Expense Ratio-A | Beginning Account Value December 1, 2020 | Ending Account Value May 31, 2021 | Expenses Paid During Period-B December 1, 2020 to May 31, 2021 | |
| Fidelity Series Growth Company Fund | - %-C | |||
| Actual | $1,000.00 | $1,123.40 | $--D | |
| Hypothetical-E | $1,000.00 | $1,024.93 | $--D |
A Annualized expense ratio reflects expenses net of applicable fee waivers.
B Expenses are equal to the annualized expense ratio, multiplied by the average account value over the period, multiplied by 182/ 365 (to reflect the one-half year period). The fees and expenses of any Underlying Funds are not included in each annualized expense ratio.
C Amount represents less than .005%.
D Amount represents less than $.005.
E 5% return per year before expenses
Board Approval of Investment Advisory Contracts and Management Fees
Fidelity Series Growth Company Fund
Each year, the Board of Trustees, including the Independent Trustees (together, the Board), votes on the renewal of the management contract with Fidelity Management & Research Company LLC (FMR) and the sub-advisory agreements (together, the Advisory Contracts) for the fund. FMR and the sub-advisers are referred to herein as the Investment Advisers. The Board, assisted by the advice of fund counsel and Independent Trustees' counsel, requests and considers a broad range of information relevant to the renewal of the Advisory Contracts throughout the year.The Board meets regularly and, at each of its meetings, covers an extensive agenda of topics and materials and considers factors that are relevant to its annual consideration of the renewal of the fund's Advisory Contracts, including the services and support provided to the fund and its shareholders. The Board has established various standing committees (Committees), each composed of and chaired by Independent Trustees with varying backgrounds, to which the Board has assigned specific subject matter responsibilities in order to enhance effective decision-making by the Board. The Board, acting directly and through its Committees, requests and receives information concerning the annual consideration of the renewal of the fund's Advisory Contracts. The Board also meets as needed to review matters specifically related to the Board's annual consideration of the renewal of the Advisory Contracts. Members of the Board may also meet with trustees of other Fidelity funds through joint ad hoc committees to discuss certain matters relevant to all of the Fidelity funds.Approval of Stub Period Continuation. At its January 2021 meeting, the Board of Trustees voted to continue the fund's management contract with FMR, and the sub-advisory agreements and sub-subadvisory agreements, in each case, where applicable (together, the Advisory Contracts), without modification, for four months from February 1, 2021 through May 31, 2021, in connection with changes to the Board's meeting calendar. The Board considered that the approval of the fund's Advisory Contracts will not result in any changes in (i) the investment process or strategies employed in the management of the fund's assets; (ii) the fees and expenses paid by shareholders; (iii) the nature, extent or quality of services provided under the fund's Advisory Contracts; or (iv) the day-to-day management of the fund or the persons primarily responsible for such management. The Board also considered that since its last approval of the fund's Advisory Contracts, FMR had provided additional information on the fund in support of the annual contract renewal process, including competitive analyses on total expenses and management fees and in-depth reviews of fund performance and fund profitability information. The Board also considered the findings of certain ad hoc committees that had been previously formed to discuss matters relevant to all of the Fidelity funds, including economies of scale, fall-out benefits and retail vs. institutional funds. The Board concluded that the fund's Advisory Contracts are fair and reasonable, and that the fund's Advisory Contracts should be renewed, without modification, through May 31, 2021, with the understanding that the Board will consider the annual renewal for a full one year period in May 2021.At its May 2021 meeting, the Board unanimously determined to renew the fund's Advisory Contracts. In considering whether to renew the Advisory Contracts for the fund, the Board considered all factors it believed relevant and reached a determination, with the assistance of fund counsel and Independent Trustees' counsel and through the exercise of its business judgment, that the renewal of the Advisory Contracts was in the best interests of the fund and its shareholders and the fact that no fee is payable under the management contract was fair and reasonable.Nature, Extent, and Quality of Services Provided. The Board considered Fidelity's staffing as it relates to the fund, including the backgrounds of investment personnel of Fidelity, and also considered the fund's investment objective, strategies, and related investment philosophy. The Independent Trustees also had discussions with senior management of Fidelity's investment operations and investment groups. The Board considered the structure of the investment personnel compensation program and whether this structure provides appropriate incentives to act in the best interests of the fund.Resources Dedicated to Investment Management and Support Services. The Board and the Fund Oversight and Research Committees reviewed the general qualifications and capabilities of Fidelity's investment staff, including its size, education, experience, and resources, as well as Fidelity's approach to recruiting, training, managing, and compensating investment personnel. The Board noted that Fidelity has continued to increase the resources devoted to non-U.S. offices, including expansion of Fidelity's global investment organization. The Board also noted that Fidelity's analysts have extensive resources, tools and capabilities that allow them to conduct sophisticated quantitative and fundamental analysis, as well as credit analysis of issuers, counterparties and guarantors. Further, the Board considered that Fidelity's investment professionals have sufficient access to global information and data so as to provide competitive investment results over time, and that those professionals also have access to sophisticated tools that permit them to assess portfolio construction and risk and performance attribution characteristics continuously, as well as to transmit new information and research conclusions rapidly around the world. Additionally, in its deliberations, the Board considered Fidelity's trading, risk management, compliance, and technology and operations capabilities and resources, which are integral parts of the investment management process. The Board also considered Fidelity's investments in business continuity planning, and its success in continuously providing services to the fund notwithstanding the severe disruptions caused by the COVID-19 pandemic.Administrative Services. The Board considered (i) the nature, extent, quality, and cost of advisory and administrative services performed by the Investment Advisers and their affiliates under the Advisory Contracts and under separate agreements covering transfer agency, pricing and bookkeeping, and securities lending services for the fund; (ii) the nature and extent of the supervision of third party service providers, principally custodians, subcustodians, and pricing vendors; and (iii) the resources devoted to, and the record of compliance with, the fund's compliance policies and procedures. The Board also reviewed the allocation of fund brokerage, including allocations to brokers affiliated with the Investment Advisers, the use of brokerage commissions to pay fund expenses, and the use of "soft" commission dollars to pay for research services.Investment Performance. The Board considered whether the fund has operated in accordance with its investment objective, as well as its record of compliance with its investment restrictions. The Board reviewed the fund's absolute investment performance, as well as the fund's relative investment performance, but did not consider performance to be a material factor in its decision to renew the fund's Advisory Contracts, as the fund is not publicly offered as a stand-alone investment product. In this regard, the Board noted that the fund is designed to offer an investment option for other investment companies and 529 plans managed by Fidelity and ultimately to enhance the performance of those investment companies and 529 plans.Based on its review, the Board concluded that the nature, extent, and quality of services provided to the fund under the Advisory Contracts should continue to benefit the shareholders of the fund.Competitiveness of Management Fee and Total Expense Ratio. The Board considered that the fund does not pay FMR a management fee for investment advisory services, but that FMR receives fees for providing services to funds that invest in the fund. The Board noted that FMR or an affiliate undertakes to pay all operating expenses of the fund, except transfer agent fees, 12b-1 fees, Independent Trustee fees and expenses, custodian fees and expenses, proxy and shareholder meeting expenses, interest, taxes, and extraordinary expenses (such as litigation expenses). The Board further noted that the fund pays its non-operating expenses, including brokerage commissions and fees and expenses associated with the fund's securities lending program, if applicable.The Board further considered that FMR has contractually agreed to reimburse the fund to the extent that total operating expenses, with certain exceptions, as a percentage of its average net assets, exceed 0.003% through March 31, 2024.Based on its review, the Board considered that the fund does not pay a management fee and concluded that the total expense ratio of the fund was reasonable in light of the services that the fund and its shareholders receive and the other factors considered.Costs of the Services and Profitability. The Board considered the level of Fidelity's profits in respect of all the Fidelity funds.A public accounting firm has been engaged annually by the Board as part of the Board's assessment of Fidelity's profitability analysis. The engagement includes the review and assessment of the methodologies used by Fidelity in determining the revenues and expenses attributable to Fidelity's mutual fund business, and completion of agreed-upon procedures in respect of the mathematical accuracy of certain fund profitability information and its conformity to established allocation methodologies. After considering the reports issued under the engagement and information provided by Fidelity, the Board concluded that while other allocation methods may also be reasonable, Fidelity's profitability methodologies are reasonable in all material respects.The Board also reviewed Fidelity's non-fund businesses and potential indirect benefits such businesses may have received as a result of their association with Fidelity's mutual fund business (i.e., fall-out benefits) as well as cases where Fidelity's affiliates may benefit from the funds' business. The Board considered areas where potential indirect benefits to the Fidelity funds from their relationships with Fidelity may exist. The Board also considered that in 2019 a joint ad hoc committee created by it and the boards of other Fidelity funds evaluated potential fall-out benefits (PFOB Committee). The Board noted that it considered the PFOB Committee's findings in connection with its consideration of the renewal of the Advisory Contracts.The Board concluded that the costs of the services provided by and the profits realized by Fidelity in connection with the operation of the fund were not relevant to the renewal of the Advisory Contracts because the fund pays no advisory fees and FMR bears all expenses of the fund with certain exceptions.Economies of Scale. The Board concluded that because the fund pays no advisory fees and FMR bears all expenses of the fund with certain exceptions, the realization of economies of scale was not a material factor in the Board's decision to renew the fund's Advisory Contracts.Additional Information Requested by the Board. In order to develop fully the factual basis for consideration of the Fidelity funds' advisory contracts, the Board requested and received additional information on certain topics, including: (i) fund flow and performance trends, in particular the underperformance of certain funds and strategies, and Fidelity's long-term strategies for certain funds; (ii) consideration of expanding the use of performance fees for additional funds; (iii) Fidelity's pricing philosophy compared to competitors; (iv) metrics for evaluating index fund and ETF performance and information about ETF trading characteristics; (v) the methodology with respect to evaluating competitive fund data and peer group classifications and fee and expense comparisons; (vi) the expense structures for different funds and classes and information about the differences between various expense structures; (vii) group fee breakpoints; (viii) information regarding other accounts managed by Fidelity and sub-advisory arrangements; and (ix) Fidelity's philosophies and strategies for evaluating funds and classes with lower or declining asset levels.Based on its evaluation of all of the conclusions noted above, and after considering all factors it believed relevant, the Board concluded that the advisory fee arrangements are fair and reasonable, and that the fund's Advisory Contracts should be renewed.Liquidity Risk Management Program
The Securities and Exchange Commission adopted Rule 22e-4 under the Investment Company Act of 1940 (the Liquidity Rule) to promote effective liquidity risk management throughout the open-end investment company industry, thereby reducing the risk that funds will be unable to meet their redemption obligations and mitigating dilution of the interests of fund shareholders.
The Fund has adopted and implemented a liquidity risk management program pursuant to the Liquidity Rule (the Program) effective December 1, 2018. The Program is reasonably designed to assess and manage the Fund’s liquidity risk and to comply with the requirements of the Liquidity Rule. The Fund’s Board of Trustees (the Board) has designated the Fund’s investment adviser as administrator of the Program. The Fidelity advisers have established a Liquidity Risk Management Committee (the LRM Committee) to manage the Program for each of the Fidelity Funds. The LRM Committee monitors the adequacy and effectiveness of implementation of the Program and on a periodic basis assesses each Fund’s liquidity risk based on a variety of factors including (1) the Fund’s investment strategy, (2) portfolio liquidity and cash flow projections during normal and reasonably foreseeable stressed conditions, (3) shareholder redemptions, (4) borrowings and other funding sources and (5) in the case of exchange-traded funds, certain additional factors including the effect of the Fund’s prices and spreads, market participants, and basket compositions on the overall liquidity of the Fund’s portfolio, as applicable.
In accordance with the Program, each of the Fund’s portfolio investments is classified into one of four liquidity categories described below based on a determination of a reasonable expectation for how long it would take to convert the investment to cash (or sell or dispose of the investment) without significantly changing its market value.
- Highly liquid investments – cash or convertible to cash within three business days or less
- Moderately liquid investments – convertible to cash in three to seven calendar days
- Less liquid investments – can be sold or disposed of, but not settled, within seven calendar days
- Illiquid investments – cannot be sold or disposed of within seven calendar days
Liquidity classification determinations take into account a variety of factors including various market, trading and investment-specific considerations, as well as market depth, and generally utilize analysis from a third-party liquidity metrics service.
The Liquidity Rule places a 15% limit on a fund’s illiquid investments and requires funds that do not primarily hold assets that are highly liquid investments to determine and maintain a minimum percentage of the fund’s net assets to be invested in highly liquid investments (highly liquid investment minimum or HLIM). The Program includes provisions reasonably designed to comply with the 15% limit on illiquid investments and for determining, periodically reviewing and complying with the HLIM requirement as applicable.
At a recent meeting of the Fund’s Board of Trustees, the LRM Committee provided a written report to the Board pertaining to the operation, adequacy, and effectiveness of implementation of the Program for the annual period from December 1, 2019 through November 30, 2020. The report concluded that the Program has been implemented and is operating effectively and is reasonably designed to assess and manage the Fund’s liquidity risk.
![]()
XS7-SANN-0721
1.968010.107
Fidelity Flex® Funds
Fidelity Flex® Mid Cap Growth Fund
Semi-Annual Report
May 31, 2021
Contents
Board Approval of Investment Advisory Contracts and Management Fees | |
To view a fund's proxy voting guidelines and proxy voting record for the 12-month period ended June 30, visit http://www.fidelity.com/proxyvotingresults or visit the Securities and Exchange Commission's (SEC) web site at http://www.sec.gov.
You may also call 1-800-544-3455 (for managed account clients) or 1-800-835-5092 (for retirement plan participants) to request a free copy of the proxy voting guidelines.
Standard & Poor's, S&P and S&P 500 are registered service marks of The McGraw-Hill Companies, Inc. and have been licensed for use by Fidelity Distributors Corporation.
Other third-party marks appearing herein are the property of their respective owners.
All other marks appearing herein are registered or unregistered trademarks or service marks of FMR LLC or an affiliated company. © 2021 FMR LLC. All rights reserved.
This report and the financial statements contained herein are submitted for the general information of the shareholders of the Fund. This report is not authorized for distribution to prospective investors in the Fund unless preceded or accompanied by an effective prospectus.
A fund files its complete schedule of portfolio holdings with the SEC for the first and third quarters of each fiscal year on Form N-PORT. Forms N-PORT are available on the SEC’s web site at http://www.sec.gov. A fund's Forms N-PORT may be reviewed and copied at the SEC’s Public Reference Room in Washington, DC. Information regarding the operation of the SEC's Public Reference Room may be obtained by calling 1-800-SEC-0330.
For a complete list of a fund's portfolio holdings, view the most recent holdings listing, semiannual report, or annual report on Fidelity's web site at http://www.fidelity.com, http://www.institutional.fidelity.com, or http://www.401k.com, as applicable.
NOT FDIC INSURED •MAY LOSE VALUE •NO BANK GUARANTEE
Neither the Fund nor Fidelity Distributors Corporation is a bank.
Note to Shareholders:
Early in 2020, the outbreak and spread of a new coronavirus emerged as a public health emergency that had a major influence on financial markets, primarily based on its impact on the global economy and the outlook for corporate earnings. The virus causes a respiratory disease known as COVID-19. On March 11, 2020 the World Health Organization declared the COVID-19 outbreak a pandemic, citing sustained risk of further global spread.
In the weeks following, as the crisis worsened, we witnessed an escalating human tragedy with wide-scale social and economic consequences from coronavirus-containment measures. The outbreak of COVID-19 prompted a number of measures to limit the spread, including travel and border restrictions, quarantines, and restrictions on large gatherings. In turn, these resulted in lower consumer activity, diminished demand for a wide range of products and services, disruption in manufacturing and supply chains, and – given the wide variability in outcomes regarding the outbreak – significant market uncertainty and volatility. Amid the turmoil, global governments and central banks took unprecedented action to help support consumers, businesses, and the broader economies, and to limit disruption to financial systems.
The situation continues to unfold, and the extent and duration of its impact on financial markets and the economy remain highly uncertain. Extreme events such as the coronavirus crisis are “exogenous shocks” that can have significant adverse effects on mutual funds and their investments. Although multiple asset classes may be affected by market disruption, the duration and impact may not be the same for all types of assets.
Fidelity is committed to helping you stay informed amid news about COVID-19 and during increased market volatility, and we’re taking extra steps to be responsive to customer needs. We encourage you to visit our websites, where we offer ongoing updates, commentary, and analysis on the markets and our funds.
Investment Summary (Unaudited)
Top Ten Stocks as of May 31, 2021
| % of fund's net assets | |
| KLA Corp. | 2.8 |
| EPAM Systems, Inc. | 2.5 |
| MSCI, Inc. | 2.5 |
| Charles River Laboratories International, Inc. | 2.3 |
| Cadence Design Systems, Inc. | 2.2 |
| ResMed, Inc. | 2.2 |
| Mettler-Toledo International, Inc. | 2.0 |
| IDEXX Laboratories, Inc. | 1.9 |
| Veeva Systems, Inc. Class A | 1.9 |
| Fortinet, Inc. | 1.9 |
| 22.2 |
Top Five Market Sectors as of May 31, 2021
| % of fund's net assets | |
| Information Technology | 37.4 |
| Health Care | 19.7 |
| Industrials | 17.0 |
| Consumer Discretionary | 10.0 |
| Financials | 6.3 |
Asset Allocation (% of fund's net assets)
| As of May 31, 2021* | ||
| Stocks | 98.9% | |
| Short-Term Investments and Net Other Assets (Liabilities) | 1.1% | |

* Foreign investments - 3.8%
Schedule of Investments May 31, 2021 (Unaudited)
Showing Percentage of Net Assets
| Common Stocks - 98.9% | |||
| Shares | Value | ||
| COMMUNICATION SERVICES - 3.3% | |||
| Entertainment - 1.9% | |||
| Electronic Arts, Inc. | 30 | $4,288 | |
| Take-Two Interactive Software, Inc. (a) | 97 | 17,999 | |
| 22,287 | |||
| Interactive Media & Services - 1.4% | |||
| Match Group, Inc. (a) | 113 | 16,202 | |
| TOTAL COMMUNICATION SERVICES | 38,489 | ||
| CONSUMER DISCRETIONARY - 10.0% | |||
| Distributors - 1.4% | |||
| Pool Corp. | 38 | 16,589 | |
| Hotels, Restaurants & Leisure - 1.1% | |||
| Airbnb, Inc. Class A | 20 | 2,808 | |
| Churchill Downs, Inc. | 9 | 1,796 | |
| Domino's Pizza, Inc. | 18 | 7,684 | |
| 12,288 | |||
| Household Durables - 2.2% | |||
| D.R. Horton, Inc. | 20 | 1,906 | |
| Lennar Corp. Class A | 86 | 8,515 | |
| NVR, Inc. (a) | 1 | 4,887 | |
| Tempur Sealy International, Inc. | 273 | 10,511 | |
| 25,819 | |||
| Internet & Direct Marketing Retail - 1.3% | |||
| eBay, Inc. | 89 | 5,418 | |
| Etsy, Inc. (a) | 60 | 9,884 | |
| 15,302 | |||
| Multiline Retail - 0.8% | |||
| Dollar General Corp. | 47 | 9,539 | |
| Specialty Retail - 3.2% | |||
| AutoZone, Inc. (a) | 5 | 7,033 | |
| Best Buy Co., Inc. | 83 | 9,648 | |
| RH (a) | 12 | 7,693 | |
| Tractor Supply Co. | 20 | 3,634 | |
| Williams-Sonoma, Inc. | 50 | 8,477 | |
| 36,485 | |||
| TOTAL CONSUMER DISCRETIONARY | 116,022 | ||
| CONSUMER STAPLES - 3.8% | |||
| Beverages - 1.5% | |||
| Boston Beer Co., Inc. Class A (a) | 10 | 10,582 | |
| Brown-Forman Corp. Class B (non-vtg.) | 88 | 7,072 | |
| 17,654 | |||
| Food Products - 1.1% | |||
| Bunge Ltd. | 60 | 5,209 | |
| Darling Ingredients, Inc. (a) | 114 | 7,804 | |
| 13,013 | |||
| Household Products - 1.0% | |||
| Church & Dwight Co., Inc. | 133 | 11,402 | |
| Personal Products - 0.2% | |||
| Estee Lauder Companies, Inc. Class A | 7 | 2,146 | |
| TOTAL CONSUMER STAPLES | 44,215 | ||
| ENERGY - 0.5% | |||
| Oil, Gas & Consumable Fuels - 0.5% | |||
| PDC Energy, Inc. | 126 | 5,320 | |
| FINANCIALS - 6.3% | |||
| Capital Markets - 5.5% | |||
| Ameriprise Financial, Inc. | 18 | 4,677 | |
| LPL Financial | 18 | 2,662 | |
| MarketAxess Holdings, Inc. | 30 | 13,996 | |
| Moody's Corp. | 16 | 5,366 | |
| MSCI, Inc. | 62 | 29,024 | |
| Nordnet AB | 199 | 3,707 | |
| S&P Global, Inc. | 10 | 3,795 | |
| Tradeweb Markets, Inc. Class A | 14 | 1,173 | |
| 64,400 | |||
| Insurance - 0.8% | |||
| Arthur J. Gallagher & Co. | 42 | 6,158 | |
| Progressive Corp. | 31 | 3,071 | |
| 9,229 | |||
| TOTAL FINANCIALS | 73,629 | ||
| HEALTH CARE - 19.7% | |||
| Biotechnology - 0.6% | |||
| Avid Bioservices, Inc. (a) | 119 | 2,532 | |
| Natera, Inc. (a) | 52 | 4,895 | |
| 7,427 | |||
| Health Care Equipment & Supplies - 9.3% | |||
| DexCom, Inc. (a) | 49 | 18,100 | |
| Edwards Lifesciences Corp. (a) | 34 | 3,261 | |
| Hologic, Inc. (a) | 141 | 8,891 | |
| IDEXX Laboratories, Inc. (a) | 40 | 22,324 | |
| Intuitive Surgical, Inc. (a) | 2 | 1,684 | |
| Masimo Corp. (a) | 37 | 7,977 | |
| ResMed, Inc. | 122 | 25,114 | |
| West Pharmaceutical Services, Inc. | 59 | 20,503 | |
| 107,854 | |||
| Health Care Providers & Services - 1.5% | |||
| Guardant Health, Inc. (a) | 51 | 6,330 | |
| Laboratory Corp. of America Holdings (a) | 28 | 7,685 | |
| Tenet Healthcare Corp. (a) | 51 | 3,412 | |
| 17,427 | |||
| Health Care Technology - 1.9% | |||
| Veeva Systems, Inc. Class A (a) | 76 | 22,142 | |
| Life Sciences Tools & Services - 5.0% | |||
| 10X Genomics, Inc. (a) | 9 | 1,620 | |
| Bio-Rad Laboratories, Inc. Class A (a) | 8 | 4,819 | |
| Charles River Laboratories International, Inc. (a) | 79 | 26,701 | |
| Maravai LifeSciences Holdings, Inc. | 9 | 338 | |
| Mettler-Toledo International, Inc. (a) | 18 | 23,417 | |
| Waters Corp. (a) | 4 | 1,289 | |
| 58,184 | |||
| Pharmaceuticals - 1.4% | |||
| Horizon Therapeutics PLC (a) | 103 | 9,441 | |
| Royalty Pharma PLC | 176 | 7,061 | |
| 16,502 | |||
| TOTAL HEALTH CARE | 229,536 | ||
| INDUSTRIALS - 17.0% | |||
| Aerospace & Defense - 1.2% | |||
| TransDigm Group, Inc. (a) | 21 | 13,626 | |
| Airlines - 0.5% | |||
| Southwest Airlines Co. (a) | 90 | 5,531 | |
| Building Products - 3.1% | |||
| Carrier Global Corp. | 305 | 14,009 | |
| Fortune Brands Home & Security, Inc. | 69 | 7,118 | |
| The AZEK Co., Inc. | 172 | 7,487 | |
| Trane Technologies PLC | 16 | 2,982 | |
| Trex Co., Inc. (a) | 53 | 5,163 | |
| 36,759 | |||
| Commercial Services & Supplies - 3.0% | |||
| Cintas Corp. | 42 | 14,849 | |
| Copart, Inc. (a) | 140 | 18,061 | |
| Tetra Tech, Inc. | 14 | 1,673 | |
| 34,583 | |||
| Construction & Engineering - 0.4% | |||
| Quanta Services, Inc. | 45 | 4,291 | |
| Electrical Equipment - 3.2% | |||
| AMETEK, Inc. | 55 | 7,431 | |
| Atkore, Inc. (a) | 88 | 6,794 | |
| Generac Holdings, Inc. (a) | 45 | 14,792 | |
| Rockwell Automation, Inc. | 31 | 8,175 | |
| 37,192 | |||
| Industrial Conglomerates - 0.4% | |||
| Roper Technologies, Inc. | 10 | 4,500 | |
| Machinery - 2.2% | |||
| IDEX Corp. | 28 | 6,234 | |
| Otis Worldwide Corp. | 137 | 10,731 | |
| Toro Co. | 75 | 8,332 | |
| 25,297 | |||
| Professional Services - 1.4% | |||
| Booz Allen Hamilton Holding Corp. Class A | 35 | 2,973 | |
| CoStar Group, Inc. (a) | 10 | 8,540 | |
| Verisk Analytics, Inc. | 30 | 5,185 | |
| 16,698 | |||
| Road & Rail - 1.6% | |||
| Old Dominion Freight Lines, Inc. | 67 | 17,785 | |
| Ryder System, Inc. | 14 | 1,145 | |
| 18,930 | |||
| TOTAL INDUSTRIALS | 197,407 | ||
| INFORMATION TECHNOLOGY - 37.4% | |||
| Electronic Equipment & Components - 3.2% | |||
| Amphenol Corp. Class A | 186 | 12,510 | |
| Keysight Technologies, Inc. (a) | 46 | 6,549 | |
| Zebra Technologies Corp. Class A (a) | 36 | 17,894 | |
| 36,953 | |||
| IT Services - 6.2% | |||
| Adyen BV (a)(b) | 1 | 2,312 | |
| EPAM Systems, Inc. (a) | 62 | 29,611 | |
| Global Payments, Inc. | 13 | 2,518 | |
| Okta, Inc. (a) | 67 | 14,903 | |
| Snowflake Computing, Inc. | 60 | 14,282 | |
| Twilio, Inc. Class A (a) | 26 | 8,736 | |
| 72,362 | |||
| Semiconductors & Semiconductor Equipment - 10.3% | |||
| Analog Devices, Inc. | 16 | 2,634 | |
| ASM International NV (Netherlands) | 4 | 1,258 | |
| Broadcom, Inc. | 6 | 2,834 | |
| Enphase Energy, Inc. (a) | 29 | 4,148 | |
| Entegris, Inc. | 190 | 21,746 | |
| KLA Corp. | 104 | 32,954 | |
| Lam Research Corp. | 18 | 11,697 | |
| Marvell Technology, Inc. | 166 | 8,018 | |
| MKS Instruments, Inc. | 9 | 1,694 | |
| NXP Semiconductors NV | 26 | 5,497 | |
| Qorvo, Inc. (a) | 48 | 8,771 | |
| Skyworks Solutions, Inc. | 33 | 5,610 | |
| SolarEdge Technologies, Inc. (a) | 52 | 13,417 | |
| 120,278 | |||
| Software - 17.7% | |||
| Adobe, Inc. (a) | 6 | 3,027 | |
| ANSYS, Inc. (a) | 53 | 17,911 | |
| Atlassian Corp. PLC (a) | 34 | 7,932 | |
| Cadence Design Systems, Inc. (a) | 203 | 25,779 | |
| Coupa Software, Inc. (a) | 14 | 3,335 | |
| Crowdstrike Holdings, Inc. (a) | 24 | 5,332 | |
| DocuSign, Inc. (a) | 42 | 8,468 | |
| Duck Creek Technologies, Inc. (a) | 100 | 3,931 | |
| Dynatrace, Inc. (a) | 140 | 7,244 | |
| Elastic NV (a) | 47 | 5,556 | |
| Fair Isaac Corp. (a) | 10 | 5,061 | |
| Five9, Inc. (a) | 63 | 11,157 | |
| Fortinet, Inc. (a) | 100 | 21,854 | |
| HubSpot, Inc. (a) | 11 | 5,548 | |
| Intuit, Inc. | 7 | 3,074 | |
| Paycom Software, Inc. (a) | 28 | 9,229 | |
| Qualtrics International, Inc. | 200 | 6,888 | |
| RingCentral, Inc. (a) | 61 | 16,011 | |
| Synopsys, Inc. (a) | 73 | 18,567 | |
| The Trade Desk, Inc. (a) | 30 | 17,644 | |
| Zscaler, Inc. (a) | 11 | 2,136 | |
| 205,684 | |||
| TOTAL INFORMATION TECHNOLOGY | 435,277 | ||
| MATERIALS - 0.7% | |||
| Chemicals - 0.3% | |||
| Corbion NV | 14 | 815 | |
| Sherwin-Williams Co. | 12 | 3,402 | |
| 4,217 | |||
| Containers & Packaging - 0.1% | |||
| O-I Glass, Inc. (a) | 68 | 1,253 | |
| Paper & Forest Products - 0.3% | |||
| Louisiana-Pacific Corp. | 48 | 3,226 | |
| TOTAL MATERIALS | 8,696 | ||
| REAL ESTATE - 0.2% | |||
| Equity Real Estate Investment Trusts (REITs) - 0.2% | |||
| SBA Communications Corp. Class A | 7 | 2,087 | |
| TOTAL COMMON STOCKS | |||
| (Cost $714,778) | 1,150,678 | ||
| Money Market Funds - 0.3% | |||
| Fidelity Cash Central Fund 0.03% (c) | |||
| (Cost $3,900) | 3,899 | 3,900 | |
| TOTAL INVESTMENT IN SECURITIES - 99.2% | |||
| (Cost $718,678) | 1,154,578 | ||
| NET OTHER ASSETS (LIABILITIES) - 0.8% | 9,465 | ||
| NET ASSETS - 100% | $1,164,043 |
Legend
(a) Non-income producing
(b) Security exempt from registration under Rule 144A of the Securities Act of 1933. These securities may be resold in transactions exempt from registration, normally to qualified institutional buyers. At the end of the period, the value of these securities amounted to $2,312 or 0.2% of net assets.
(c) Affiliated fund that is generally available only to investment companies and other accounts managed by Fidelity Investments. The rate quoted is the annualized seven-day yield of the fund at period end. A complete unaudited listing of the fund's holdings as of its most recent quarter end is available upon request. In addition, each Fidelity Central Fund's financial statements are available on the SEC's website or upon request.
Affiliated Central Funds
Information regarding fiscal year to date income earned by the Fund from investments in Fidelity Central Funds is as follows:
| Fund | Income earned |
| Fidelity Cash Central Fund | $1 |
| Total | $1 |
Amounts in the income column in the above table include any capital gain distributions from underlying funds, which are presented in the corresponding line-item in the Statement of Operations, if applicable.
Investment Valuation
The following is a summary of the inputs used, as of May 31, 2021, involving the Fund's assets and liabilities carried at fair value. The inputs or methodology used for valuing securities may not be an indication of the risk associated with investing in those securities. For more information on valuation inputs, and their aggregation into the levels used below, please refer to the Investment Valuation section in the accompanying Notes to Financial Statements.
| Valuation Inputs at Reporting Date: | ||||
| Description | Total | Level 1 | Level 2 | Level 3 |
| Investments in Securities: | ||||
| Equities: | ||||
| Communication Services | $38,489 | $38,489 | $-- | $-- |
| Consumer Discretionary | 116,022 | 116,022 | -- | -- |
| Consumer Staples | 44,215 | 44,215 | -- | -- |
| Energy | 5,320 | 5,320 | -- | -- |
| Financials | 73,629 | 73,629 | -- | -- |
| Health Care | 229,536 | 229,536 | -- | -- |
| Industrials | 197,407 | 197,407 | -- | -- |
| Information Technology | 435,277 | 435,277 | -- | -- |
| Materials | 8,696 | 8,696 | -- | -- |
| Real Estate | 2,087 | 2,087 | -- | -- |
| Money Market Funds | 3,900 | 3,900 | -- | -- |
| Total Investments in Securities: | $1,154,578 | $1,154,578 | $-- | $-- |
See accompanying notes which are an integral part of the financial statements.
Financial Statements
Statement of Assets and Liabilities
| May 31, 2021 (Unaudited) | ||
| Assets | ||
| Investment in securities, at value — See accompanying schedule: Unaffiliated issuers (cost $714,778) | $1,150,678 | |
| Fidelity Central Funds (cost $3,900) | 3,900 | |
| Total Investment in Securities (cost $718,678) | $1,154,578 | |
| Cash | 8,591 | |
| Receivable for investments sold | 2,307 | |
| Dividends receivable | 477 | |
| Total assets | 1,165,953 | |
| Liabilities | ||
| Payable for investments purchased | $1,910 | |
| Total liabilities | 1,910 | |
| Net Assets | $1,164,043 | |
| Net Assets consist of: | ||
| Paid in capital | $643,201 | |
| Total accumulated earnings (loss) | 520,842 | |
| Net Assets | $1,164,043 | |
| Net Asset Value, offering price and redemption price per share ($1,164,043 ÷ 155,255 shares) | $7.50 |
See accompanying notes which are an integral part of the financial statements.
Statement of Operations
| Six months ended May 31, 2021 (Unaudited) | ||
| Investment Income | ||
| Dividends | $2,193 | |
| Income from Fidelity Central Funds | 1 | |
| Total income | 2,194 | |
| Expenses | ||
| Independent trustees' fees and expenses | $2 | |
| Total expenses | 2 | |
| Net investment income (loss) | 2,192 | |
| Realized and Unrealized Gain (Loss) | ||
| Net realized gain (loss) on: | ||
| Investment securities: | ||
| Unaffiliated issuers | 87,531 | |
| Foreign currency transactions | 2 | |
| Total net realized gain (loss) | 87,533 | |
| Change in net unrealized appreciation (depreciation) on investment securities | 58,764 | |
| Net gain (loss) | 146,297 | |
| Net increase (decrease) in net assets resulting from operations | $148,489 |
See accompanying notes which are an integral part of the financial statements.
Statement of Changes in Net Assets
| Six months ended May 31, 2021 (Unaudited) | Year ended November 30, 2020 | |
| Increase (Decrease) in Net Assets | ||
| Operations | ||
| Net investment income (loss) | $2,192 | $5,399 |
| Net realized gain (loss) | 87,533 | 117,104 |
| Change in net unrealized appreciation (depreciation) | 58,764 | 167,395 |
| Net increase (decrease) in net assets resulting from operations | 148,489 | 289,898 |
| Distributions to shareholders | (119,224) | (469,928) |
| Share transactions | ||
| Proceeds from sales of shares | – | – |
| Reinvestment of distributions | 119,224 | 469,928 |
| Cost of shares redeemed | – | – |
| Net increase (decrease) in net assets resulting from share transactions | 119,224 | 469,928 |
| Total increase (decrease) in net assets | 148,489 | 289,898 |
| Net Assets | ||
| Beginning of period | 1,015,554 | 725,656 |
| End of period | $1,164,043 | $1,015,554 |
| Other Information | ||
| Shares | ||
| Sold | – | – |
| Issued in reinvestment of distributions | 17,105 | 87,347 |
| Redeemed | – | – |
| Net increase (decrease) | 17,105 | 87,347 |
See accompanying notes which are an integral part of the financial statements.
Financial Highlights
Fidelity Flex Mid Cap Growth Fund
| Six months ended (Unaudited) May 31, | Years endedNovember 30, | ||||
| 2021 | 2020 | 2019 | 2018 | 2017 A | |
| Selected Per–Share Data | |||||
| Net asset value, beginning of period | $7.35 | $14.28 | $11.64 | $11.25 | $10.00 |
| Income from Investment Operations | |||||
| Net investment income (loss)B | .01 | .04C | .12 | .13D | .10E |
| Net realized and unrealized gain (loss) | 1.00 | 2.28 | 2.60 | .35 | 1.15 |
| Total from investment operations | 1.01 | 2.32 | 2.72 | .48 | 1.25 |
| Distributions from net investment income | (.05) | (1.53) | (.08) | (.09) | – |
| Distributions from net realized gain | (.81) | (7.72) | – | – | – |
| Total distributions | (.86) | (9.25) | (.08) | (.09) | – |
| Net asset value, end of period | $7.50 | $7.35 | $14.28 | $11.64 | $11.25 |
| Total ReturnF | 14.68% | 39.97% | 23.66% | 4.29% | 12.50% |
| Ratios to Average Net AssetsG,H | |||||
| Expenses before reductionsI | - %J | -% | -% | -% | - %J |
| Expenses net of fee waivers, if anyI | - %J | -% | -% | -% | - %J |
| Expenses net of all reductionsI | - %J | -% | -% | -% | - %J |
| Net investment income (loss) | .39%J | .68%C | .98% | 1.11%D | 1.29%E,J |
| Supplemental Data | |||||
| Net assets, end of period (000 omitted) | $1,164 | $1,016 | $726 | $15,447 | $711 |
| Portfolio turnover rateK | 77%J | 94% | 83% | 88% | 38%J |
A For the period March 8, 2017 (commencement of operations) to November 30, 2017.
B Calculated based on average shares outstanding during the period.
C Net investment income per share reflects one or more large, non-recurring dividend(s) which amounted to $.01 per share. Excluding such non-recurring dividend(s), the ratio of net investment income (loss) to average net assets would have been .58%.
D Net investment income per share reflects one or more large, non-recurring dividend(s) which amounted to $.02 per share. Excluding such non-recurring dividend(s), the ratio of net investment income (loss) to average net assets would have been .93%.
E Net investment income per share reflects one or more large, non-recurring dividend(s) which amounted to $.02 per share. Excluding such non-recurring dividend(s), the ratio of net investment income (loss) to average net assets would have been 1.14%.
F Total returns for periods of less than one year are not annualized.
G Fees and expenses of any underlying mutual funds or exchange-traded funds (ETFs) are not included in the Fund's expense ratio. The Fund indirectly bears its proportionate share of these expenses. For additional expense information related to investments in Fidelity Central Funds, please refer to the "Investments in Fidelity Central Funds" note found in the Notes to Financial Statements section of the most recent Annual or Semi-Annual report.
H Expense ratios reflect operating expenses of the class. Expenses before reductions do not reflect amounts reimbursed, waived, or reduced through arrangements with the investment advisor, brokerage services, or other offset arrangements, if applicable, and do not represent the amount paid by the class during periods when reimbursements, waivers or reductions occur.
I Amount represents less than .005%.
J Annualized
K Amount does not include the portfolio activity of any underlying mutual funds or exchange-traded funds (ETFs).
See accompanying notes which are an integral part of the financial statements.
Notes to Financial Statements (Unaudited)
For the period ended May 31, 2021
1. Organization.
Fidelity Flex Mid Cap Growth Fund (the Fund) is a fund of Fidelity Mt. Vernon Street Trust (the Trust) and is authorized to issue an unlimited number of shares. Share transactions on the Statement of Changes in Net Assets may contain exchanges between affiliated funds. The Trust is registered under the Investment Company Act of 1940, as amended (the 1940 Act), as an open-end management investment company organized as a Massachusetts business trust. The Fund is available only to certain fee-based accounts and advisory programs offered by Fidelity.
2. Investments in Fidelity Central Funds.
Funds may invest in Fidelity Central Funds, which are open-end investment companies generally available only to other investment companies and accounts managed by the investment adviser and its affiliates. The Schedule of Investments lists any Fidelity Central Funds held as an investment as of period end, but does not include the underlying holdings of each Fidelity Central Fund. An investing fund indirectly bears its proportionate share of the expenses of the underlying Fidelity Central Funds.
Based on its investment objective, each Fidelity Central Fund may invest or participate in various investment vehicles or strategies that are similar to those of the investing fund. These strategies are consistent with the investment objectives of the investing fund and may involve certain economic risks which may cause a decline in value of each of the Fidelity Central Funds and thus a decline in the value of the investing fund.
| Fidelity Central Fund | Investment Manager | Investment Objective | Investment Practices | Expense Ratio(a) |
| Fidelity Money Market Central Funds | Fidelity Management & Research Company LLC (FMR) | Each fund seeks to obtain a high level of current income consistent with the preservation of capital and liquidity. | Short-term Investments | .005% to .01% |
(a) Expenses expressed as a percentage of average net assets and are as of each underlying Central Fund's most recent annual or semi-annual shareholder report.
A complete unaudited list of holdings for each Fidelity Central Fund is available upon request or at the Securities and Exchange Commission website at www.sec.gov. In addition, the financial statements of the Fidelity Central Funds which contain the significant accounting policies (including investment valuation policies) of those funds, and are not covered by the Report of Independent Registered Public Accounting Firm, are available on the Securities and Exchange Commission website or upon request.
3. Significant Accounting Policies.
The Fund is an investment company and applies the accounting and reporting guidance of the Financial Accounting Standards Board (FASB) Accounting Standards Codification Topic 946 Financial Services - Investment Companies. The financial statements have been prepared in conformity with accounting principles generally accepted in the United States of America (GAAP), which require management to make certain estimates and assumptions at the date of the financial statements. Actual results could differ from those estimates. Subsequent events, if any, through the date that the financial statements were issued have been evaluated in the preparation of the financial statements. The Fund's Schedule of Investments lists any underlying mutual funds or exchange-traded funds (ETFs) but does not include the underlying holdings of these funds. The following summarizes the significant accounting policies of the Fund:
Investment Valuation. Investments are valued as of 4:00 p.m. Eastern time on the last calendar day of the period. The Board of Trustees (the Board) has delegated the day to day responsibility for the valuation of the Fund's investments to the Fair Value Committee (the Committee) established by the Fund's investment adviser. In accordance with valuation policies and procedures approved by the Board, the Fund attempts to obtain prices from one or more third party pricing vendors or brokers to value its investments. When current market prices, quotations or currency exchange rates are not readily available or reliable, investments will be fair valued in good faith by the Committee, in accordance with procedures adopted by the Board. Factors used in determining fair value vary by investment type and may include market or investment specific events. The frequency with which these procedures are used cannot be predicted and they may be utilized to a significant extent. The Committee oversees the Fund's valuation policies and procedures and reports to the Board on the Committee's activities and fair value determinations. The Board monitors the appropriateness of the procedures used in valuing the Fund's investments and ratifies the fair value determinations of the Committee.
The Fund categorizes the inputs to valuation techniques used to value its investments into a disclosure hierarchy consisting of three levels as shown below:
- Level 1 – quoted prices in active markets for identical investments
- Level 2 – other significant observable inputs (including quoted prices for similar investments, interest rates, prepayment speeds, etc.)
- Level 3 – unobservable inputs (including the Fund's own assumptions based on the best information available)
Valuation techniques used to value the Fund's investments by major category are as follows:
Equity securities, including restricted securities, for which market quotations are readily available, are valued at the last reported sale price or official closing price as reported by a third party pricing vendor on the primary market or exchange on which they are traded and are categorized as Level 1 in the hierarchy. In the event there were no sales during the day or closing prices are not available, securities are valued at the last quoted bid price or may be valued using the last available price and are generally categorized as Level 2 in the hierarchy. For foreign equity securities, when market or security specific events arise, comparisons to the valuation of American Depositary Receipts (ADRs), futures contracts, Exchange-Traded Funds (ETFs) and certain indexes as well as quoted prices for similar securities may be used and would be categorized as Level 2 in the hierarchy. For equity securities, including restricted securities, where observable inputs are limited, assumptions about market activity and risk are used and these securities may be categorized as Level 3 in the hierarchy.
Investments in open-end mutual funds, including the Fidelity Central Funds, are valued at their closing net asset value (NAV) each business day and are categorized as Level 1 in the hierarchy.
Changes in valuation techniques may result in transfers in or out of an assigned level within the disclosure hierarchy. The aggregate value of investments by input level as of May 31, 2021 is included at the end of the Fund's Schedule of Investments.
Foreign Currency. Certain Funds may use foreign currency contracts to facilitate transactions in foreign-denominated securities. Gains and losses from these transactions may arise from changes in the value of the foreign currency or if the counterparties do not perform under the contracts' terms.
Foreign-denominated assets, including investment securities, and liabilities are translated into U.S. dollars at the exchange rates at period end. Purchases and sales of investment securities, income and dividends received, and expenses denominated in foreign currencies are translated into U.S. dollars at the exchange rate in effect on the transaction date.
The effects of exchange rate fluctuations on investments are included with the net realized and unrealized gain (loss) on investment securities. Other foreign currency transactions resulting in realized and unrealized gain (loss) are disclosed separately.
Investment Transactions and Income. For financial reporting purposes, the Fund's investment holdings and NAV include trades executed through the end of the last business day of the period. The NAV per share for processing shareholder transactions is calculated as of the close of business of the New York Stock Exchange (NYSE), normally 4:00 p.m. Eastern time and includes trades executed through the end of the prior business day. Gains and losses on securities sold are determined on the basis of identified cost and include proceeds received from litigation. Dividend income is recorded on the ex-dividend date, except for certain dividends from foreign securities where the ex-dividend date may have passed, which are recorded as soon as the Fund is informed of the ex-dividend date. Non-cash dividends included in dividend income, if any, are recorded at the fair market value of the securities received. Income and capital gain distributions from Fidelity Central Funds, if any, are recorded on the ex-dividend date. Certain distributions received by the Fund represent a return of capital or capital gain. The Fund determines the components of these distributions subsequent to the ex-dividend date, based upon receipt of tax filings or other correspondence relating to the underlying investment. These distributions are recorded as a reduction of cost of investments and/or as a realized gain. Investment income is recorded net of foreign taxes withheld where recovery of such taxes is uncertain.
Expenses. Expenses directly attributable to a fund are charged to that fund. Expenses attributable to more than one fund are allocated among the respective funds on the basis of relative net assets or other appropriate methods. Expenses included in the accompanying financial statements reflect the expenses of that fund and do not include any expenses associated with any underlying mutual funds or exchange-traded funds. Although not included in a fund's expenses, a fund indirectly bears its proportionate share of these expenses through the net asset value of each underlying mutual fund or exchange-traded fund. Expense estimates are accrued in the period to which they relate and adjustments are made when actual amounts are known.
Income Tax Information and Distributions to Shareholders. Each year, the Fund intends to qualify as a regulated investment company under Subchapter M of the Internal Revenue Code, including distributing substantially all of its taxable income and realized gains. As a result, no provision for U.S. Federal income taxes is required. The Fund files a U.S. federal tax return, in addition to state and local tax returns as required. The Fund's federal income tax returns are subject to examination by the Internal Revenue Service (IRS) for a period of three fiscal years after they are filed. State and local tax returns may be subject to examination for an additional fiscal year depending on the jurisdiction. Foreign taxes are provided for based on the Fund's understanding of the tax rules and rates that exist in the foreign markets in which it invests.
Distributions are declared and recorded on the ex-dividend date. Income and capital gain distributions are determined in accordance with income tax regulations, which may differ from GAAP.
Capital accounts within the financial statements are adjusted for permanent book-tax differences. These adjustments have no impact on net assets or the results of operations. Capital accounts are not adjusted for temporary book-tax differences which will reverse in a subsequent period.
Book-tax differences are primarily due to foreign currency transactions, passive foreign investment companies (PFIC)and losses deferred due to wash sales.
As of period end, the cost and unrealized appreciation (depreciation) in securities, and derivatives if applicable, for federal income tax purposes were as follows:
| Gross unrealized appreciation | $439,178 |
| Gross unrealized depreciation | (5,600) |
| Net unrealized appreciation (depreciation) | $433,578 |
| Tax cost | $721,000 |
Restricted Securities (including Private Placements). Funds may invest in securities that are subject to legal or contractual restrictions on resale. These securities generally may be resold in transactions exempt from registration or to the public if the securities are registered. Disposal of these securities may involve time-consuming negotiations and expense, and prompt sale at an acceptable price may be difficult. Information regarding restricted securities held at period end is included at the end of the Schedule of Investments, if applicable.
4. Purchases and Sales of Investments.
Purchases and sales of securities, other than short-term securities, are noted in the table below.
| Purchases ($) | Sales ($) | |
| Fidelity Flex Mid Cap Growth Fund | 428,759 | 421,072 |
5. Fees and Other Transactions with Affiliates.
Management Fee. Fidelity Management & Research Company LLC (the investment adviser) and its affiliates provide the Fund with investment management related services and the Fund does not pay any fees for these services. Under the management contract, the investment adviser or an affiliate pays all other expenses of the Fund, excluding fees and expenses of the independent Trustees, and certain miscellaneous expenses such as proxy and shareholder meeting expenses.
Brokerage Commissions. A portion of portfolio transactions were placed with brokerage firms which are affiliates of the investment adviser. Brokerage commissions are included in net realized gain (loss) and change in net unrealized appreciation (depreciation) in the Statement of Operations. The commissions paid to these affiliated firms were as follows:
| Amount | |
| Fidelity Flex Mid Cap Growth Fund | $6 |
Interfund Trades. Funds may purchase from or sell securities to other Fidelity Funds under procedures adopted by the Board. The procedures have been designed to ensure these interfund trades are executed in accordance with Rule 17a-7 of the 1940 Act. Any interfund trades are included within the respective purchases and sales amounts shown in the Purchases and Sales of Investments note and are noted in the table below.
| Purchases ($) | Sales ($) | |
| Fidelity Flex Mid Cap Growth Fund | 23,413 | 47,016 |
6. Committed Line of Credit.
Certain Funds participate with other funds managed by the investment adviser or an affiliate in a $4.25 billion credit facility (the "line of credit") to be utilized for temporary or emergency purposes to fund shareholder redemptions or for other short-term liquidity purposes. The commitment fees on the pro-rata portion of the line of credit are borne by the investment adviser. During the period, there were no borrowings on this line of credit.
7. Other.
Fund's organizational documents provide former and current trustees and officers with a limited indemnification against liabilities arising in connection with the performance of their duties to the fund. In the normal course of business, the fund may also enter into contracts that provide general indemnifications. The fund's maximum exposure under these arrangements is unknown as this would be dependent on future claims that may be made against the fund. The risk of material loss from such claims is considered remote.
At the end of the period, the investment adviser or its affiliates were owners of record of more than 10% of the outstanding shares as follows:
| Fund | Affiliated % |
| Fidelity Flex Mid Cap Growth Fund | 100% |
8. Coronavirus (COVID-19) Pandemic.
An outbreak of COVID-19 first detected in China during December 2019 has since spread globally and was declared a pandemic by the World Health Organization during March 2020. Developments that disrupt global economies and financial markets, such as the COVID-19 pandemic, may magnify factors that affect the Fund's performance.
Shareholder Expense Example
As a shareholder, you incur two types of costs: (1) transaction costs, which may include sales charges (loads) on purchase payments or redemption proceeds, as applicable and (2) ongoing costs, which generally include management fees, distribution and/or service (12b-1) fees and other Fund expenses. This Example is intended to help you understand your ongoing costs (in dollars) of investing in a fund and to compare these costs with the ongoing costs of investing in other mutual funds.
The Example is based on an investment of $1,000 invested at the beginning of the period and held for the entire period (December 1, 2020 to May 31, 2021).
Actual Expenses
The first line of the accompanying table provides information about actual account values and actual expenses. You may use the information in this line, together with the amount you invested, to estimate the expenses that you paid over the period. Simply divide your account value by $1,000.00 (for example, an $8,600 account value divided by $1,000.00 = 8.6), then multiply the result by the number in the first line for a class/Fund under the heading entitled "Expenses Paid During Period" to estimate the expenses you paid on your account during this period. If any fund is a shareholder of any underlying mutual funds or exchange-traded funds (ETFs) (the Underlying Funds), such fund indirectly bears its proportional share of the expenses of the Underlying Funds in addition to the direct expenses incurred presented in the table. These fees and expenses are not included in the annualized expense ratio used to calculate the expense estimate in the table below.
Hypothetical Example for Comparison Purposes
The second line of the accompanying table provides information about hypothetical account values and hypothetical expenses based on the actual expense ratio and an assumed rate of return of 5% per year before expenses, which is not the actual return. The hypothetical account values and expenses may not be used to estimate the actual ending account balance or expenses you paid for the period. You may use this information to compare the ongoing costs of investing in the Fund and other funds. To do so, compare this 5% hypothetical example with the 5% hypothetical examples that appear in the shareholder reports of the other funds. If any fund is a shareholder of any Underlying Funds, such fund indirectly bears its proportional share of the expenses of the Underlying Funds in addition to the direct expenses as presented in the table. These fees and expenses are not included in the annualized expense ratio used to calculate the expense estimate in the table below.
Please note that the expenses shown in the table are meant to highlight your ongoing costs only and do not reflect any transaction costs. Therefore, the second line of the table is useful in comparing ongoing costs only, and will not help you determine the relative total costs of owning different funds.
| Annualized Expense Ratio-A | Beginning Account Value December 1, 2020 | Ending Account Value May 31, 2021 | Expenses Paid During Period-B December 1, 2020 to May 31, 2021 | |
| Fidelity Flex Mid Cap Growth Fund | - %C | |||
| Actual | $1,000.00 | $1,146.80 | $–D | |
| Hypothetical-E | $1,000.00 | $1,024.93 | $–D |
A Annualized expense ratio reflects expenses net of applicable fee waivers.
B Expenses are equal to the annualized expense ratio, multiplied by the average account value over the period, multiplied by 182/ 365 (to reflect the one-half year period). The fees and expenses of any Underlying Funds are not included in each annualized expense ratio.
C Amount represents less than .005%.
D Amount Represents less than $.005.
E 5% return per year before expenses
Board Approval of Investment Advisory Contracts and Management Fees
Fidelity Flex Mid Cap Growth Fund
Each year, the Board of Trustees, including the Independent Trustees (together, the Board), votes on the renewal of the management contract with Fidelity Management & Research Company LLC (FMR) and the sub-advisory agreements (together, the Advisory Contracts) for the fund. FMR and the sub-advisers are referred to herein as the Investment Advisers. The Board, assisted by the advice of fund counsel and Independent Trustees' counsel, requests and considers a broad range of information relevant to the renewal of the Advisory Contracts throughout the year.The Board meets regularly and, at each of its meetings, covers an extensive agenda of topics and materials and considers factors that are relevant to its annual consideration of the renewal of the fund's Advisory Contracts, including the services and support provided to the fund and its shareholders. The Board has established various standing committees (Committees), each composed of and chaired by Independent Trustees with varying backgrounds, to which the Board has assigned specific subject matter responsibilities in order to enhance effective decision-making by the Board. The Board, acting directly and through its Committees, requests and receives information concerning the annual consideration of the renewal of the fund's Advisory Contracts. The Board also meets as needed to review matters specifically related to the Board's annual consideration of the renewal of the Advisory Contracts. Members of the Board may also meet with trustees of other Fidelity funds through joint ad hoc committees to discuss certain matters relevant to all of the Fidelity funds.Approval of Stub Period Continuation. At its January 2021 meeting, the Board of Trustees voted to continue the fund's management contract with FMR, and the sub-advisory agreements and sub-subadvisory agreements, in each case, where applicable (together, the Advisory Contracts), without modification, for four months from February 1, 2021 through May 31, 2021, in connection with changes to the Board's meeting calendar. The Board considered that the approval of the fund's Advisory Contracts will not result in any changes in (i) the investment process or strategies employed in the management of the fund's assets; (ii) the fees and expenses paid by shareholders; (iii) the nature, extent or quality of services provided under the fund's Advisory Contracts; or (iv) the day-to-day management of the fund or the persons primarily responsible for such management. The Board also considered that since its last approval of the fund's Advisory Contracts, FMR had provided additional information on the fund in support of the annual contract renewal process, including competitive analyses on total expenses and management fees and in-depth reviews of fund performance and fund profitability information. The Board also considered the findings of certain ad hoc committees that had been previously formed to discuss matters relevant to all of the Fidelity funds, including economies of scale, fall-out benefits and retail vs. institutional funds. The Board concluded that the fund's Advisory Contracts are fair and reasonable, and that the fund's Advisory Contracts should be renewed, without modification, through May 31, 2021, with the understanding that the Board will consider the annual renewal for a full one year period in May 2021.At its May 2021 meeting, the Board unanimously determined to renew the fund's Advisory Contracts. In considering whether to renew the Advisory Contracts for the fund, the Board considered all factors it believed relevant and reached a determination, with the assistance of fund counsel and Independent Trustees' counsel and through the exercise of its business judgment, that the renewal of the Advisory Contracts was in the best interests of the fund and its shareholders and the fact that no fee is payable under the management contract was fair and reasonable.Nature, Extent, and Quality of Services Provided. The Board considered Fidelity's staffing as it relates to the fund, including the backgrounds of investment personnel of Fidelity, and also considered the fund's investment objective, strategies, and related investment philosophy. The Independent Trustees also had discussions with senior management of Fidelity's investment operations and investment groups. The Board considered the structure of the investment personnel compensation program and whether this structure provides appropriate incentives to act in the best interests of the fund. Additionally, the Board considered the portfolio managers' investments, if any, in the funds that they manage.Resources Dedicated to Investment Management and Support Services. The Board and the Fund Oversight and Research Committees reviewed the general qualifications and capabilities of Fidelity's investment staff, including its size, education, experience, and resources, as well as Fidelity's approach to recruiting, training, managing, and compensating investment personnel. The Board noted that Fidelity has continued to increase the resources devoted to non-U.S. offices, including expansion of Fidelity's global investment organization. The Board also noted that Fidelity's analysts have extensive resources, tools and capabilities that allow them to conduct sophisticated quantitative and fundamental analysis, as well as credit analysis of issuers, counterparties and guarantors. Further, the Board considered that Fidelity's investment professionals have sufficient access to global information and data so as to provide competitive investment results over time, and that those professionals also have access to sophisticated tools that permit them to assess portfolio construction and risk and performance attribution characteristics continuously, as well as to transmit new information and research conclusions rapidly around the world. Additionally, in its deliberations, the Board considered Fidelity's trading, risk management, compliance, and technology and operations capabilities and resources, which are integral parts of the investment management process. The Board also considered Fidelity's investments in business continuity planning, and its success in continuously providing services to the fund notwithstanding the severe disruptions caused by the COVID-19 pandemic.Shareholder and Administrative Services. The Board considered (i) the nature, extent, quality, and cost of advisory, administrative, and shareholder services performed by the Investment Advisers and their affiliates under the Advisory Contracts and under separate agreements covering transfer agency, pricing and bookkeeping, and securities lending services for the fund; (ii) the nature and extent of the supervision of third party service providers, principally custodians, subcustodians, and pricing vendors; and (iii) the resources devoted to, and the record of compliance with, the fund's compliance policies and procedures. The Board also reviewed the allocation of fund brokerage, including allocations to brokers affiliated with the Investment Advisers, the use of brokerage commissions to pay fund expenses, and the use of "soft" commission dollars to pay for research services.The Board noted that the growth of fund assets over time across the complex allows Fidelity to reinvest in the development of services designed to enhance the value and convenience of the Fidelity funds as investment vehicles. These services include 24-hour access to account information and market information over the Internet and through telephone representatives, investor education materials and asset allocation tools, and the expanded availability of Fidelity Investor Centers.Investment in a Large Fund Family. The Board considered the benefits to shareholders of investing in a Fidelity fund, including the benefits of investing in a fund that is part of a large family of funds offering a variety of investment disciplines and providing a large variety of mutual fund investor services. The Board noted that Fidelity had taken, or had made recommendations that resulted in the Fidelity funds taking, a number of actions over the previous year that benefited particular funds, including: (i) continuing to dedicate additional resources to Fidelity's investment research process, which includes meetings with management of issuers of securities in which the funds invest, and to the support of the senior management team that oversees asset management; (ii) continuing efforts to enhance Fidelity's global research capabilities; (iii) launching new funds and ETFs with innovative structures, strategies and pricing and making other enhancements to meet client needs; (iv) launching new share classes of existing funds; (v) eliminating purchase minimums and broadening eligibility requirements for certain funds and share classes; (vi) approving the reduction in the holding period for the Class C to Class A conversion policy; (vii) reducing management fees and total expenses for certain target date funds and classes and index funds; (viii) lowering expenses for certain existing funds and classes by implementing or lowering expense caps; (ix) rationalizing product lines and gaining increased efficiencies from fund mergers, liquidations, and share class consolidations; (x) continuing to develop, acquire and implement systems and technology to improve services to the funds and shareholders, strengthen information security, and increase efficiency; and (xi) continuing to implement enhancements to further strengthen Fidelity's product line to increase investors' probability of success in achieving their investment goals, including retirement income goals.Investment Performance. The Board considered whether the fund has operated in accordance with its investment objective, as well as its record of compliance with its investment restrictions. The Board reviewed the fund's absolute investment performance, as well as the fund's relative investment performance. The Board did not consider performance to be a material factor in its decision to renew the fund's Advisory Contracts, as the fund is not publicly offered as a stand-alone investment product. In this regard, the Board noted that the fund is available exclusively to certain fee-based accounts and advisor programs offered by Fidelity, including certain employer-sponsored plans and discretionary investment programs.Based on its review, the Board concluded that the nature, extent, and quality of services provided to the fund under the Advisory Contracts should continue to benefit the shareholders of the fund.Competitiveness of Management Fee and Total Expense Ratio. The Board noted that the fund is available exclusively through certain Fidelity fee-based accounts and advisory programs. The Board considered that the fund does not pay FMR a management fee for investment advisory services, but that FMR is indirectly compensated for its services out of Fidelity fee-based account and advisory program fees. The Board also noted that FMR or an affiliate undertakes to pay all operating expenses of the fund, except Independent Trustee fees and expenses, proxy and shareholder meeting expenses, interest, taxes, and extraordinary expenses (such as litigation expenses). The Board further noted that the fund pays its non-operating expenses, including brokerage commissions and fees and expenses associated with the fund's securities lending program, if applicable.Based on its review, the Board considered that the fund does not pay a management fee and concluded that the total expense ratio of the fund was reasonable in light of the services that the fund and its shareholders receive and the other factors considered.Costs of the Services and Profitability. The Board considered the level of Fidelity's profits in respect of all the Fidelity funds.A public accounting firm has been engaged annually by the Board as part of the Board's assessment of Fidelity's profitability analysis. The engagement includes the review and assessment of the methodologies used by Fidelity in determining the revenues and expenses attributable to Fidelity's mutual fund business, and completion of agreed-upon procedures in respect of the mathematical accuracy of certain fund profitability information and its conformity to established allocation methodologies. After considering the reports issued under the engagement and information provided by Fidelity, the Board concluded that while other allocation methods may also be reasonable, Fidelity's profitability methodologies are reasonable in all material respects.The Board also reviewed Fidelity's non-fund businesses and potential indirect benefits such businesses may have received as a result of their association with Fidelity's mutual fund business (i.e., fall-out benefits) as well as cases where Fidelity's affiliates may benefit from the funds' business. The Board considered areas where potential indirect benefits to the Fidelity funds from their relationships with Fidelity may exist. The Board also considered that in 2019 a joint ad hoc committee created by it and the boards of other Fidelity funds evaluated potential fall-out benefits (PFOB Committee). The Board noted that it considered the PFOB Committee's findings in connection with its consideration of the renewal of the Advisory Contracts.The Board concluded that the costs of the services provided by and the profits realized by Fidelity in connection with the operation of the fund were not relevant to the renewal of the Advisory Contracts because the fund pays no advisory fees and FMR or an affiliate bears all expenses of the fund with limited exceptions.Economies of Scale. The Board concluded that because the fund pays no advisory fees and FMR or an affiliate bears all expenses of the fund with limited exceptions, the realization of economies of scale was not a material factor in the Board's decision to renew the fund's Advisory Contracts.Additional Information Requested by the Board. In order to develop fully the factual basis for consideration of the Fidelity funds' advisory contracts, the Board requested and received additional information on certain topics, including: (i) fund flow and performance trends, in particular the underperformance of certain funds and strategies, and Fidelity's long-term strategies for certain funds; (ii) consideration of expanding the use of performance fees for additional funds; (iii) Fidelity's pricing philosophy compared to competitors; (iv) metrics for evaluating index fund and ETF performance and information about ETF trading characteristics; (v) the methodology with respect to evaluating competitive fund data and peer group classifications and fee and expense comparisons; (vi) the expense structures for different funds and classes and information about the differences between various expense structures; (vii) group fee breakpoints; (viii) information regarding other accounts managed by Fidelity and sub-advisory arrangements; and (ix) Fidelity's philosophies and strategies for evaluating funds and classes with lower or declining asset levels.Based on its evaluation of all of the conclusions noted above, and after considering all factors it believed relevant, the Board concluded that the advisory fee arrangements are fair and reasonable, and that the fund's Advisory Contracts should be renewed.Liquidity Risk Management Program
The Securities and Exchange Commission adopted Rule 22e-4 under the Investment Company Act of 1940 (the Liquidity Rule) to promote effective liquidity risk management throughout the open-end investment company industry, thereby reducing the risk that funds will be unable to meet their redemption obligations and mitigating dilution of the interests of fund shareholders.
The Fund has adopted and implemented a liquidity risk management program pursuant to the Liquidity Rule (the Program) effective December 1, 2018. The Program is reasonably designed to assess and manage the Fund’s liquidity risk and to comply with the requirements of the Liquidity Rule. The Fund’s Board of Trustees (the Board) has designated the Fund’s investment adviser as administrator of the Program. The Fidelity advisers have established a Liquidity Risk Management Committee (the LRM Committee) to manage the Program for each of the Fidelity Funds. The LRM Committee monitors the adequacy and effectiveness of implementation of the Program and on a periodic basis assesses each Fund’s liquidity risk based on a variety of factors including (1) the Fund’s investment strategy, (2) portfolio liquidity and cash flow projections during normal and reasonably foreseeable stressed conditions, (3) shareholder redemptions, (4) borrowings and other funding sources and (5) in the case of exchange-traded funds, certain additional factors including the effect of the Fund’s prices and spreads, market participants, and basket compositions on the overall liquidity of the Fund’s portfolio, as applicable.
In accordance with the Program, each of the Fund’s portfolio investments is classified into one of four liquidity categories described below based on a determination of a reasonable expectation for how long it would take to convert the investment to cash (or sell or dispose of the investment) without significantly changing its market value.
- Highly liquid investments – cash or convertible to cash within three business days or less
- Moderately liquid investments – convertible to cash in three to seven calendar days
- Less liquid investments – can be sold or disposed of, but not settled, within seven calendar days
- Illiquid investments – cannot be sold or disposed of within seven calendar days
Liquidity classification determinations take into account a variety of factors including various market, trading and investment-specific considerations, as well as market depth, and generally utilize analysis from a third-party liquidity metrics service.
The Liquidity Rule places a 15% limit on a fund’s illiquid investments and requires funds that do not primarily hold assets that are highly liquid investments to determine and maintain a minimum percentage of the fund’s net assets to be invested in highly liquid investments (highly liquid investment minimum or HLIM). The Program includes provisions reasonably designed to comply with the 15% limit on illiquid investments and for determining, periodically reviewing and complying with the HLIM requirement as applicable.
At a recent meeting of the Fund’s Board of Trustees, the LRM Committee provided a written report to the Board pertaining to the operation, adequacy, and effectiveness of implementation of the Program for the annual period from December 1, 2019 through November 30, 2020. The report concluded that the Program has been implemented and is operating effectively and is reasonably designed to assess and manage the Fund’s liquidity risk.
![]()
ZDG-SANN-0721
1.9881578.104
Fidelity® Growth Strategies K6 Fund
Semi-Annual Report
May 31, 2021
Contents
Board Approval of Investment Advisory Contracts and Management Fees | |
To view a fund's proxy voting guidelines and proxy voting record for the 12-month period ended June 30, visit http://www.fidelity.com/proxyvotingresults or visit the Securities and Exchange Commission's (SEC) web site at http://www.sec.gov.
You may also call 1-800-835-5092 to request a free copy of the proxy voting guidelines.
Standard & Poor's, S&P and S&P 500 are registered service marks of The McGraw-Hill Companies, Inc. and have been licensed for use by Fidelity Distributors Corporation.
Other third-party marks appearing herein are the property of their respective owners.
All other marks appearing herein are registered or unregistered trademarks or service marks of FMR LLC or an affiliated company. © 2021 FMR LLC. All rights reserved.
This report and the financial statements contained herein are submitted for the general information of the shareholders of the Fund. This report is not authorized for distribution to prospective investors in the Fund unless preceded or accompanied by an effective prospectus.
A fund files its complete schedule of portfolio holdings with the SEC for the first and third quarters of each fiscal year on Form N-PORT. Forms N-PORT are available on the SEC’s web site at http://www.sec.gov. A fund's Forms N-PORT may be reviewed and copied at the SEC’s Public Reference Room in Washington, DC. Information regarding the operation of the SEC's Public Reference Room may be obtained by calling 1-800-SEC-0330.
For a complete list of a fund's portfolio holdings, view the most recent holdings listing, semiannual report, or annual report on Fidelity's web site at http://www.fidelity.com, http://www.institutional.fidelity.com, or http://www.401k.com, as applicable.
NOT FDIC INSURED •MAY LOSE VALUE •NO BANK GUARANTEE
Neither the Fund nor Fidelity Distributors Corporation is a bank.
Note to Shareholders:
Early in 2020, the outbreak and spread of a new coronavirus emerged as a public health emergency that had a major influence on financial markets, primarily based on its impact on the global economy and the outlook for corporate earnings. The virus causes a respiratory disease known as COVID-19. On March 11, 2020 the World Health Organization declared the COVID-19 outbreak a pandemic, citing sustained risk of further global spread.
In the weeks following, as the crisis worsened, we witnessed an escalating human tragedy with wide-scale social and economic consequences from coronavirus-containment measures. The outbreak of COVID-19 prompted a number of measures to limit the spread, including travel and border restrictions, quarantines, and restrictions on large gatherings. In turn, these resulted in lower consumer activity, diminished demand for a wide range of products and services, disruption in manufacturing and supply chains, and – given the wide variability in outcomes regarding the outbreak – significant market uncertainty and volatility. Amid the turmoil, global governments and central banks took unprecedented action to help support consumers, businesses, and the broader economies, and to limit disruption to financial systems.
The situation continues to unfold, and the extent and duration of its impact on financial markets and the economy remain highly uncertain. Extreme events such as the coronavirus crisis are “exogenous shocks” that can have significant adverse effects on mutual funds and their investments. Although multiple asset classes may be affected by market disruption, the duration and impact may not be the same for all types of assets.
Fidelity is committed to helping you stay informed amid news about COVID-19 and during increased market volatility, and we’re taking extra steps to be responsive to customer needs. We encourage you to visit our websites, where we offer ongoing updates, commentary, and analysis on the markets and our funds.
Investment Summary (Unaudited)
Top Ten Stocks as of May 31, 2021
| % of fund's net assets | |
| KLA Corp. | 3.0 |
| EPAM Systems, Inc. | 2.6 |
| MSCI, Inc. | 2.5 |
| Mettler-Toledo International, Inc. | 2.4 |
| Charles River Laboratories International, Inc. | 2.3 |
| Cadence Design Systems, Inc. | 2.3 |
| ResMed, Inc. | 2.2 |
| Entegris, Inc. | 2.0 |
| West Pharmaceutical Services, Inc. | 1.9 |
| IDEXX Laboratories, Inc. | 1.9 |
| 23.1 |
Top Five Market Sectors as of May 31, 2021
| % of fund's net assets | |
| Information Technology | 36.1 |
| Health Care | 20.6 |
| Industrials | 17.6 |
| Consumer Discretionary | 9.9 |
| Financials | 6.5 |
Asset Allocation (% of fund's net assets)
| As of May 31, 2021* | ||
| Stocks | 99.4% | |
| Short-Term Investments and Net Other Assets (Liabilities) | 0.6% | |

* Foreign investments – 3.9%
Schedule of Investments May 31, 2021 (Unaudited)
Showing Percentage of Net Assets
| Common Stocks - 99.4% | |||
| Shares | Value | ||
| COMMUNICATION SERVICES - 3.3% | |||
| Entertainment - 1.9% | |||
| Electronic Arts, Inc. | 3,800 | $543,134 | |
| Take-Two Interactive Software, Inc. (a) | 12,100 | 2,245,276 | |
| 2,788,410 | |||
| Interactive Media & Services - 1.4% | |||
| Match Group, Inc. (a) | 14,000 | 2,007,320 | |
| TOTAL COMMUNICATION SERVICES | 4,795,730 | ||
| CONSUMER DISCRETIONARY - 9.9% | |||
| Distributors - 1.4% | |||
| Pool Corp. | 4,800 | 2,095,440 | |
| Hotels, Restaurants & Leisure - 0.9% | |||
| Churchill Downs, Inc. | 1,100 | 219,483 | |
| Domino's Pizza, Inc. | 2,400 | 1,024,488 | |
| 1,243,971 | |||
| Household Durables - 2.2% | |||
| D.R. Horton, Inc. | 2,700 | 257,283 | |
| Lennar Corp. Class A | 10,900 | 1,079,209 | |
| NVR, Inc. (a) | 100 | 488,723 | |
| Tempur Sealy International, Inc. | 33,602 | 1,293,677 | |
| 3,118,892 | |||
| Internet & Direct Marketing Retail - 1.4% | |||
| eBay, Inc. | 11,700 | 712,296 | |
| Etsy, Inc. (a) | 7,600 | 1,251,948 | |
| 1,964,244 | |||
| Multiline Retail - 0.8% | |||
| Dollar General Corp. | 5,900 | 1,197,464 | |
| Specialty Retail - 3.2% | |||
| AutoZone, Inc. (a) | 600 | 843,960 | |
| Best Buy Co., Inc. | 11,600 | 1,348,384 | |
| RH (a) | 1,500 | 961,575 | |
| Tractor Supply Co. | 2,500 | 454,250 | |
| Williams-Sonoma, Inc. | 6,300 | 1,068,102 | |
| 4,676,271 | |||
| TOTAL CONSUMER DISCRETIONARY | 14,296,282 | ||
| CONSUMER STAPLES - 4.0% | |||
| Beverages - 1.7% | |||
| Boston Beer Co., Inc. Class A (a) | 1,300 | 1,375,608 | |
| Brown-Forman Corp. Class B (non-vtg.) | 12,300 | 988,428 | |
| 2,364,036 | |||
| Food Products - 1.1% | |||
| Bunge Ltd. | 6,900 | 599,058 | |
| Darling Ingredients, Inc. (a) | 14,700 | 1,006,362 | |
| 1,605,420 | |||
| Household Products - 1.0% | |||
| Church & Dwight Co., Inc. | 16,900 | 1,448,837 | |
| Personal Products - 0.2% | |||
| Estee Lauder Companies, Inc. Class A | 1,000 | 306,520 | |
| TOTAL CONSUMER STAPLES | 5,724,813 | ||
| ENERGY - 0.5% | |||
| Oil, Gas & Consumable Fuels - 0.5% | |||
| PDC Energy, Inc. | 16,300 | 688,186 | |
| FINANCIALS - 6.5% | |||
| Capital Markets - 5.5% | |||
| Ameriprise Financial, Inc. | 2,400 | 623,616 | |
| LPL Financial | 2,192 | 324,153 | |
| MarketAxess Holdings, Inc. | 3,700 | 1,726,198 | |
| Moody's Corp. | 1,700 | 570,095 | |
| MSCI, Inc. | 7,600 | 3,557,788 | |
| Nordnet AB | 26,000 | 484,267 | |
| S&P Global, Inc. | 1,300 | 493,311 | |
| Tradeweb Markets, Inc. Class A | 1,700 | 142,426 | |
| 7,921,854 | |||
| Insurance - 1.0% | |||
| Arthur J. Gallagher & Co. | 6,800 | 996,948 | |
| Progressive Corp. | 5,200 | 515,216 | |
| 1,512,164 | |||
| TOTAL FINANCIALS | 9,434,018 | ||
| HEALTH CARE - 20.6% | |||
| Biotechnology - 0.7% | |||
| Avid Bioservices, Inc. (a) | 17,700 | 376,656 | |
| Natera, Inc. (a) | 6,700 | 630,738 | |
| 1,007,394 | |||
| Health Care Equipment & Supplies - 9.6% | |||
| DexCom, Inc. (a) | 6,400 | 2,364,096 | |
| Edwards Lifesciences Corp. (a) | 4,200 | 402,780 | |
| Hologic, Inc. (a) | 17,500 | 1,103,550 | |
| IDEXX Laboratories, Inc. (a) | 5,000 | 2,790,550 | |
| Intuitive Surgical, Inc. (a) | 300 | 252,654 | |
| Masimo Corp. (a) | 4,700 | 1,013,320 | |
| ResMed, Inc. | 15,300 | 3,149,505 | |
| West Pharmaceutical Services, Inc. | 8,100 | 2,814,831 | |
| 13,891,286 | |||
| Health Care Providers & Services - 1.5% | |||
| Guardant Health, Inc. (a) | 6,000 | 744,720 | |
| Laboratory Corp. of America Holdings (a) | 3,800 | 1,043,024 | |
| Tenet Healthcare Corp. (a) | 6,092 | 407,616 | |
| 2,195,360 | |||
| Health Care Technology - 1.9% | |||
| Veeva Systems, Inc. Class A (a) | 9,300 | 2,709,462 | |
| Life Sciences Tools & Services - 5.4% | |||
| 10X Genomics, Inc. (a) | 1,100 | 198,000 | |
| Bio-Rad Laboratories, Inc. Class A (a) | 1,000 | 602,370 | |
| Charles River Laboratories International, Inc. (a) | 9,900 | 3,346,101 | |
| Maravai LifeSciences Holdings, Inc. | 1,200 | 45,048 | |
| Mettler-Toledo International, Inc. (a) | 2,598 | 3,379,868 | |
| Waters Corp. (a) | 600 | 193,350 | |
| 7,764,737 | |||
| Pharmaceuticals - 1.5% | |||
| Horizon Therapeutics PLC (a) | 13,500 | 1,237,410 | |
| Royalty Pharma PLC (b) | 23,000 | 922,760 | |
| 2,160,170 | |||
| TOTAL HEALTH CARE | 29,728,409 | ||
| INDUSTRIALS - 17.6% | |||
| Aerospace & Defense - 1.2% | |||
| TransDigm Group, Inc. (a) | 2,600 | 1,686,984 | |
| Airlines - 0.5% | |||
| Southwest Airlines Co. (a) | 11,400 | 700,644 | |
| Building Products - 3.3% | |||
| Carrier Global Corp. | 39,000 | 1,791,270 | |
| Fortune Brands Home & Security, Inc. | 8,800 | 907,808 | |
| The AZEK Co., Inc. | 22,000 | 957,660 | |
| Trane Technologies PLC | 2,100 | 391,440 | |
| Trex Co., Inc. (a) | 7,300 | 711,093 | |
| 4,759,271 | |||
| Commercial Services & Supplies - 3.0% | |||
| Cintas Corp. | 5,200 | 1,838,408 | |
| Copart, Inc. (a) | 17,500 | 2,257,675 | |
| Tetra Tech, Inc. | 1,900 | 226,993 | |
| 4,323,076 | |||
| Construction & Engineering - 0.4% | |||
| Quanta Services, Inc. | 5,500 | 524,425 | |
| Electrical Equipment - 3.4% | |||
| AMETEK, Inc. | 8,200 | 1,107,820 | |
| Atkore, Inc. (a) | 11,200 | 864,640 | |
| Generac Holdings, Inc. (a) | 5,600 | 1,840,832 | |
| Rockwell Automation, Inc. | 3,900 | 1,028,508 | |
| 4,841,800 | |||
| Industrial Conglomerates - 0.4% | |||
| Roper Technologies, Inc. | 1,300 | 585,013 | |
| Machinery - 2.3% | |||
| IDEX Corp. | 3,400 | 757,044 | |
| Otis Worldwide Corp. | 16,900 | 1,323,777 | |
| Toro Co. | 11,800 | 1,310,862 | |
| 3,391,683 | |||
| Professional Services - 1.4% | |||
| Booz Allen Hamilton Holding Corp. Class A | 4,400 | 373,692 | |
| CoStar Group, Inc. (a) | 1,200 | 1,024,800 | |
| Verisk Analytics, Inc. | 4,000 | 691,320 | |
| 2,089,812 | |||
| Road & Rail - 1.7% | |||
| Old Dominion Freight Lines, Inc. | 8,400 | 2,229,780 | |
| Ryder System, Inc. | 1,600 | 130,864 | |
| TuSimple Holdings, Inc. (a) | 2,700 | 103,518 | |
| 2,464,162 | |||
| TOTAL INDUSTRIALS | 25,366,870 | ||
| INFORMATION TECHNOLOGY - 36.1% | |||
| Electronic Equipment & Components - 3.3% | |||
| Amphenol Corp. Class A | 23,500 | 1,580,610 | |
| Keysight Technologies, Inc. (a) | 6,600 | 939,708 | |
| Zebra Technologies Corp. Class A (a) | 4,532 | 2,252,631 | |
| 4,772,949 | |||
| IT Services - 4.9% | |||
| Adyen BV (a)(c) | 6 | 13,870 | |
| EPAM Systems, Inc. (a) | 7,900 | 3,773,040 | |
| Global Payments, Inc. | 1,600 | 309,936 | |
| Okta, Inc. (a) | 8,400 | 1,868,496 | |
| Twilio, Inc. Class A (a) | 3,300 | 1,108,800 | |
| 7,074,142 | |||
| Semiconductors & Semiconductor Equipment - 10.7% | |||
| Analog Devices, Inc. | 2,200 | 362,120 | |
| ASM International NV (Netherlands) | 400 | 125,807 | |
| Broadcom, Inc. | 700 | 330,631 | |
| Enphase Energy, Inc. (a) | 3,900 | 557,895 | |
| Entegris, Inc. | 24,800 | 2,838,360 | |
| KLA Corp. | 13,600 | 4,309,701 | |
| Lam Research Corp. | 2,200 | 1,429,670 | |
| Marvell Technology, Inc. | 21,310 | 1,029,273 | |
| MKS Instruments, Inc. | 1,100 | 207,053 | |
| NXP Semiconductors NV | 3,500 | 739,970 | |
| Qorvo, Inc. (a) | 6,300 | 1,151,136 | |
| Skyworks Solutions, Inc. | 4,300 | 731,000 | |
| SolarEdge Technologies, Inc. (a) | 6,300 | 1,625,463 | |
| 15,438,079 | |||
| Software - 17.2% | |||
| Adobe, Inc. (a) | 800 | 403,664 | |
| ANSYS, Inc. (a) | 6,900 | 2,331,786 | |
| Atlassian Corp. PLC (a) | 4,860 | 1,133,741 | |
| Cadence Design Systems, Inc. (a) | 25,600 | 3,250,944 | |
| Coupa Software, Inc. (a) | 1,800 | 428,760 | |
| Crowdstrike Holdings, Inc. (a) | 3,100 | 688,665 | |
| DocuSign, Inc. (a) | 5,300 | 1,068,586 | |
| Duck Creek Technologies, Inc. (a) | 8,500 | 334,135 | |
| Dynatrace, Inc. (a) | 17,800 | 920,972 | |
| Elastic NV (a) | 5,800 | 685,618 | |
| Fair Isaac Corp. (a) | 248 | 125,503 | |
| Five9, Inc. (a) | 7,800 | 1,381,380 | |
| Fortinet, Inc. (a) | 12,600 | 2,753,604 | |
| HubSpot, Inc. (a) | 1,500 | 756,570 | |
| Intuit, Inc. | 895 | 392,986 | |
| Paycom Software, Inc. (a) | 3,500 | 1,153,600 | |
| Qualtrics International, Inc. | 700 | 24,108 | |
| RingCentral, Inc. (a) | 7,600 | 1,994,772 | |
| Synopsys, Inc. (a) | 9,700 | 2,467,098 | |
| The Trade Desk, Inc. (a) | 3,800 | 2,234,932 | |
| Zscaler, Inc. (a) | 1,300 | 252,460 | |
| 24,783,884 | |||
| TOTAL INFORMATION TECHNOLOGY | 52,069,054 | ||
| MATERIALS - 0.7% | |||
| Chemicals - 0.4% | |||
| Corbion NV | 1,463 | 85,158 | |
| Sherwin-Williams Co. | 1,600 | 453,648 | |
| 538,806 | |||
| Containers & Packaging - 0.1% | |||
| O-I Glass, Inc. (a) | 7,100 | 130,853 | |
| Paper & Forest Products - 0.2% | |||
| Louisiana-Pacific Corp. | 5,800 | 389,818 | |
| TOTAL MATERIALS | 1,059,477 | ||
| REAL ESTATE - 0.2% | |||
| Equity Real Estate Investment Trusts (REITs) - 0.2% | |||
| SBA Communications Corp. Class A | 900 | 268,308 | |
| TOTAL COMMON STOCKS | |||
| (Cost $84,413,413) | 143,431,147 | ||
| Money Market Funds - 1.3% | |||
| Fidelity Cash Central Fund 0.03% (d) | 938,110 | 938,298 | |
| Fidelity Securities Lending Cash Central Fund 0.03% (d)(e) | 938,872 | 938,966 | |
| TOTAL MONEY MARKET FUNDS | |||
| (Cost $1,877,264) | 1,877,264 | ||
| TOTAL INVESTMENT IN SECURITIES - 100.7% | |||
| (Cost $86,290,677) | 145,308,411 | ||
| NET OTHER ASSETS (LIABILITIES) - (0.7)% | (1,010,150) | ||
| NET ASSETS - 100% | $144,298,261 |
Legend
(a) Non-income producing
(b) Security or a portion of the security is on loan at period end.
(c) Security exempt from registration under Rule 144A of the Securities Act of 1933. These securities may be resold in transactions exempt from registration, normally to qualified institutional buyers. At the end of the period, the value of these securities amounted to $13,870 or 0.0% of net assets.
(d) Affiliated fund that is generally available only to investment companies and other accounts managed by Fidelity Investments. The rate quoted is the annualized seven-day yield of the fund at period end. A complete unaudited listing of the fund's holdings as of its most recent quarter end is available upon request. In addition, each Fidelity Central Fund's financial statements are available on the SEC's website or upon request.
(e) Investment made with cash collateral received from securities on loan.
Affiliated Central Funds
Information regarding fiscal year to date income earned by the Fund from investments in Fidelity Central Funds is as follows:
| Fund | Income earned |
| Fidelity Cash Central Fund | $643 |
| Fidelity Securities Lending Cash Central Fund | 121 |
| Total | $764 |
Amounts in the income column in the above table include any capital gain distributions from underlying funds, which are presented in the corresponding line-item in the Statement of Operations, if applicable. Amount for Fidelity Securities Lending Cash Central Fund represents the income earned on investing cash collateral, less rebates paid to borrowers and any lending agent fees associated with the loan, plus any premium payments received for lending certain types of securities.
Investment Valuation
The following is a summary of the inputs used, as of May 31, 2021, involving the Fund's assets and liabilities carried at fair value. The inputs or methodology used for valuing securities may not be an indication of the risk associated with investing in those securities. For more information on valuation inputs, and their aggregation into the levels used below, please refer to the Investment Valuation section in the accompanying Notes to Financial Statements.
| Valuation Inputs at Reporting Date: | ||||
| Description | Total | Level 1 | Level 2 | Level 3 |
| Investments in Securities: | ||||
| Equities: | ||||
| Communication Services | $4,795,730 | $4,795,730 | $-- | $-- |
| Consumer Discretionary | 14,296,282 | 14,296,282 | -- | -- |
| Consumer Staples | 5,724,813 | 5,724,813 | -- | -- |
| Energy | 688,186 | 688,186 | -- | -- |
| Financials | 9,434,018 | 9,434,018 | -- | -- |
| Health Care | 29,728,409 | 29,728,409 | -- | -- |
| Industrials | 25,366,870 | 25,366,870 | -- | -- |
| Information Technology | 52,069,054 | 52,069,054 | -- | -- |
| Materials | 1,059,477 | 1,059,477 | -- | -- |
| Real Estate | 268,308 | 268,308 | -- | -- |
| Money Market Funds | 1,877,264 | 1,877,264 | -- | -- |
| Total Investments in Securities: | $145,308,411 | $145,308,411 | $-- | $-- |
See accompanying notes which are an integral part of the financial statements.
Financial Statements
Statement of Assets and Liabilities
| May 31, 2021 (Unaudited) | ||
| Assets | ||
| Investment in securities, at value (including securities loaned of $918,748) — See accompanying schedule: Unaffiliated issuers (cost $84,413,413) | $143,431,147 | |
| Fidelity Central Funds (cost $1,877,264) | 1,877,264 | |
| Total Investment in Securities (cost $86,290,677) | $145,308,411 | |
| Receivable for investments sold | 185,361 | |
| Receivable for fund shares sold | 41,205 | |
| Dividends receivable | 60,510 | |
| Distributions receivable from Fidelity Central Funds | 69 | |
| Other receivables | 1,077 | |
| Total assets | 145,596,633 | |
| Liabilities | ||
| Payable for investments purchased | $295,916 | |
| Payable for fund shares redeemed | 10,497 | |
| Accrued management fee | 53,059 | |
| Collateral on securities loaned | 938,900 | |
| Total liabilities | 1,298,372 | |
| Net Assets | $144,298,261 | |
| Net Assets consist of: | ||
| Paid in capital | $59,650,716 | |
| Total accumulated earnings (loss) | 84,647,545 | |
| Net Assets | $144,298,261 | |
| Net Asset Value, offering price and redemption price per share ($144,298,261 ÷ 7,889,279 shares) | $18.29 |
See accompanying notes which are an integral part of the financial statements.
Statement of Operations
| Six months ended May 31, 2021 (Unaudited) | ||
| Investment Income | ||
| Dividends | $297,074 | |
| Income from Fidelity Central Funds (including $121 from security lending) | 764 | |
| Total income | 297,838 | |
| Expenses | ||
| Management fee | $334,253 | |
| Independent trustees' fees and expenses | 328 | |
| Total expenses before reductions | 334,581 | |
| Expense reductions | (2,950) | |
| Total expenses after reductions | 331,631 | |
| Net investment income (loss) | (33,793) | |
| Realized and Unrealized Gain (Loss) | ||
| Net realized gain (loss) on: | ||
| Investment securities: | ||
| Unaffiliated issuers | 25,813,855 | |
| Fidelity Central Funds | 84 | |
| Foreign currency transactions | 390 | |
| Total net realized gain (loss) | 25,814,329 | |
| Change in net unrealized appreciation (depreciation) on: | ||
| Investment securities: | ||
| Unaffiliated issuers | (10,280,221) | |
| Assets and liabilities in foreign currencies | 1 | |
| Total change in net unrealized appreciation (depreciation) | (10,280,220) | |
| Net gain (loss) | 15,534,109 | |
| Net increase (decrease) in net assets resulting from operations | $15,500,316 |
See accompanying notes which are an integral part of the financial statements.
Statement of Changes in Net Assets
| Six months ended May 31, 2021 (Unaudited) | Year ended November 30, 2020 | |
| Increase (Decrease) in Net Assets | ||
| Operations | ||
| Net investment income (loss) | $(33,793) | $430,984 |
| Net realized gain (loss) | 25,814,329 | 9,104,248 |
| Change in net unrealized appreciation (depreciation) | (10,280,220) | 30,244,188 |
| Net increase (decrease) in net assets resulting from operations | 15,500,316 | 39,779,420 |
| Distributions to shareholders | (4,603,993) | (856,685) |
| Share transactions | ||
| Proceeds from sales of shares | 12,562,393 | 45,481,751 |
| Reinvestment of distributions | 4,603,992 | 856,685 |
| Cost of shares redeemed | (65,956,399) | (68,760,423) |
| Net increase (decrease) in net assets resulting from share transactions | (48,790,014) | (22,421,987) |
| Total increase (decrease) in net assets | (37,893,691) | 16,500,748 |
| Net Assets | ||
| Beginning of period | 182,191,952 | 165,691,204 |
| End of period | $144,298,261 | $182,191,952 |
| Other Information | ||
| Shares | ||
| Sold | 703,794 | 3,226,490 |
| Issued in reinvestment of distributions | 265,973 | 61,676 |
| Redeemed | (3,761,314) | (4,707,176) |
| Net increase (decrease) | (2,791,547) | (1,419,010) |
See accompanying notes which are an integral part of the financial statements.
Financial Highlights
Fidelity Growth Strategies K6 Fund
| Six months ended (Unaudited) May 31, | Years endedNovember 30, | ||||
| 2021 | 2020 | 2019 | 2018 | 2017 A | |
| Selected Per–Share Data | |||||
| Net asset value, beginning of period | $17.06 | $13.69 | $11.21 | $10.95 | $10.00 |
| Income from Investment Operations | |||||
| Net investment income (loss)B | –C | .04D | .06E | .09F | .04 |
| Net realized and unrealized gain (loss) | 1.67 | 3.40 | 2.51 | .20 | .91 |
| Total from investment operations | 1.67 | 3.44 | 2.57 | .29 | .95 |
| Distributions from net investment income | (.02) | (.07) | (.09) | (.03) | – |
| Distributions from net realized gain | (.42) | – | – | – | – |
| Total distributions | (.44) | (.07) | (.09) | (.03) | – |
| Net asset value, end of period | $18.29 | $17.06 | $13.69 | $11.21 | $10.95 |
| Total ReturnG,H | 9.95% | 25.24% | 23.18% | 2.68% | 9.50% |
| Ratios to Average Net AssetsI,J | |||||
| Expenses before reductions | .45%K | .45% | .45% | .45% | .45%K |
| Expenses net of fee waivers, if any | .45%K | .45% | .45% | .45% | .45%K |
| Expenses net of all reductions | .45%K | .45% | .45% | .45% | .45%K |
| Net investment income (loss) | (.05)%K | .25%D | .49%E | .76%F | .81%K |
| Supplemental Data | |||||
| Net assets, end of period (000 omitted) | $144,298 | $182,192 | $165,691 | $132,993 | $80,512 |
| Portfolio turnover rateL | 50%K | 73% | 66%M | 51%M | 56%K,M |
A For the period May 25, 2017 (commencement of operations) to November 30, 2017.
B Calculated based on average shares outstanding during the period.
C Amount represents less than $.005 per share.
D Net investment income per share reflects one or more large, non-recurring dividend(s) which amounted to $.01 per share. Excluding such non-recurring dividend(s), the ratio of net investment income (loss) to average net assets would have been .15%.
E Net investment income per share reflects one or more large, non-recurring dividend(s) which amounted to $.01 per share. Excluding such non-recurring dividend(s), the ratio of net investment income (loss) to average net assets would have been .39%.
F Net investment income per share reflects one or more large, non-recurring dividend(s) which amounted to $.03 per share. Excluding such non-recurring dividend(s), the ratio of net investment income (loss) to average net assets would have been .52%.
G Total returns for periods of less than one year are not annualized.
H Total returns would have been lower if certain expenses had not been reduced during the applicable periods shown.
I Fees and expenses of any underlying mutual funds or exchange-traded funds (ETFs) are not included in the Fund's expense ratio. The Fund indirectly bears its proportionate share of these expenses. For additional expense information related to investments in Fidelity Central Funds, please refer to the "Investments in Fidelity Central Funds" note found in the Notes to Financial Statements section of the most recent Annual or Semi-Annual report.
J Expense ratios reflect operating expenses of the class. Expenses before reductions do not reflect amounts reimbursed, waived, or reduced through arrangements with the investment advisor, brokerage services, or other offset arrangements, if applicable, and do not represent the amount paid by the class during periods when reimbursements, waivers or reductions occur.
K Annualized
L Amount does not include the portfolio activity of any underlying mutual funds or exchange-traded funds (ETFs).
M Portfolio turnover rate excludes securities received or delivered in-kind.
See accompanying notes which are an integral part of the financial statements.
Notes to Financial Statements (Unaudited)
For the period ended May 31, 2021
1. Organization.
Fidelity Growth Strategies K6 Fund (the Fund) is a fund of Fidelity Mt. Vernon Street Trust (the Trust) and is authorized to issue an unlimited number of shares. Share transactions on the Statement of Changes in Net Assets may contain exchanges between affiliated funds. The Trust is registered under the Investment Company Act of 1940, as amended (the 1940 Act), as an open-end management investment company organized as a Massachusetts business trust. Shares generally are available only to employer-sponsored retirement plans that are recordkept by Fidelity, or to certain employer-sponsored retirement plans that are not recordkept by Fidelity.
2. Investments in Fidelity Central Funds.
Funds may invest in Fidelity Central Funds, which are open-end investment companies generally available only to other investment companies and accounts managed by the investment adviser and its affiliates. The Schedule of Investments lists any Fidelity Central Funds held as an investment as of period end, but does not include the underlying holdings of each Fidelity Central Fund. An investing fund indirectly bears its proportionate share of the expenses of the underlying Fidelity Central Funds.
Based on its investment objective, each Fidelity Central Fund may invest or participate in various investment vehicles or strategies that are similar to those of the investing fund. These strategies are consistent with the investment objectives of the investing fund and may involve certain economic risks which may cause a decline in value of each of the Fidelity Central Funds and thus a decline in the value of the investing fund.
| Fidelity Central Fund | Investment Manager | Investment Objective | Investment Practices | Expense Ratio(a) |
| Fidelity Money Market Central Funds | Fidelity Management & Research Company LLC (FMR) | Each fund seeks to obtain a high level of current income consistent with the preservation of capital and liquidity. | Short-term Investments | Less than .005% to .01% |
(a) Expenses expressed as a percentage of average net assets and are as of each underlying Central Fund's most recent annual or semi-annual shareholder report.
A complete unaudited list of holdings for each Fidelity Central Fund is available upon request or at the Securities and Exchange Commission website at www.sec.gov. In addition, the financial statements of the Fidelity Central Funds which contain the significant accounting policies (including investment valuation policies) of those funds, and are not covered by the Report of Independent Registered Public Accounting Firm, are available on the Securities and Exchange Commission website or upon request.
3. Significant Accounting Policies.
The Fund is an investment company and applies the accounting and reporting guidance of the Financial Accounting Standards Board (FASB) Accounting Standards Codification Topic 946 Financial Services - Investment Companies. The financial statements have been prepared in conformity with accounting principles generally accepted in the United States of America (GAAP), which require management to make certain estimates and assumptions at the date of the financial statements. Actual results could differ from those estimates. Subsequent events, if any, through the date that the financial statements were issued have been evaluated in the preparation of the financial statements. The Fund's Schedule of Investments lists any underlying mutual funds or exchange-traded funds (ETFs) but does not include the underlying holdings of these funds. The following summarizes the significant accounting policies of the Fund:
Investment Valuation. Investments are valued as of 4:00 p.m. Eastern time on the last calendar day of the period. The Board of Trustees (the Board) has delegated the day to day responsibility for the valuation of the Fund's investments to the Fair Value Committee (the Committee) established by the Fund's investment adviser. In accordance with valuation policies and procedures approved by the Board, the Fund attempts to obtain prices from one or more third party pricing vendors or brokers to value its investments. When current market prices, quotations or currency exchange rates are not readily available or reliable, investments will be fair valued in good faith by the Committee, in accordance with procedures adopted by the Board. Factors used in determining fair value vary by investment type and may include market or investment specific events. The frequency with which these procedures are used cannot be predicted and they may be utilized to a significant extent. The Committee oversees the Fund's valuation policies and procedures and reports to the Board on the Committee's activities and fair value determinations. The Board monitors the appropriateness of the procedures used in valuing the Fund's investments and ratifies the fair value determinations of the Committee.
The Fund categorizes the inputs to valuation techniques used to value its investments into a disclosure hierarchy consisting of three levels as shown below:
- Level 1 – quoted prices in active markets for identical investments
- Level 2 – other significant observable inputs (including quoted prices for similar investments, interest rates, prepayment speeds, etc.)
- Level 3 – unobservable inputs (including the Fund's own assumptions based on the best information available)
Valuation techniques used to value the Fund's investments by major category are as follows:
Equity securities, including restricted securities, for which market quotations are readily available, are valued at the last reported sale price or official closing price as reported by a third party pricing vendor on the primary market or exchange on which they are traded and are categorized as Level 1 in the hierarchy. In the event there were no sales during the day or closing prices are not available, securities are valued at the last quoted bid price or may be valued using the last available price and are generally categorized as Level 2 in the hierarchy. For foreign equity securities, when market or security specific events arise, comparisons to the valuation of American Depositary Receipts (ADRs), futures contracts, ETFs and certain indexes as well as quoted prices for similar securities may be used and would be categorized as Level 2 in the hierarchy. For equity securities, including restricted securities, where observable inputs are limited, assumptions about market activity and risk are used and these securities may be categorized as Level 3 in the hierarchy.
Investments in open-end mutual funds, including the Fidelity Central Funds, are valued at their closing net asset value (NAV) each business day and are categorized as Level 1 in the hierarchy.
Changes in valuation techniques may result in transfers in or out of an assigned level within the disclosure hierarchy. The aggregate value of investments by input level as of May 31, 2021 is included at the end of the Fund's Schedule of Investments.
Foreign Currency. Certain Funds may use foreign currency contracts to facilitate transactions in foreign-denominated securities. Gains and losses from these transactions may arise from changes in the value of the foreign currency or if the counterparties do not perform under the contracts' terms.
Foreign-denominated assets, including investment securities, and liabilities are translated into U.S. dollars at the exchange rates at period end. Purchases and sales of investment securities, income and dividends received, and expenses denominated in foreign currencies are translated into U.S. dollars at the exchange rate in effect on the transaction date.
The effects of exchange rate fluctuations on investments are included with the net realized and unrealized gain (loss) on investment securities. Other foreign currency transactions resulting in realized and unrealized gain (loss) are disclosed separately.
Investment Transactions and Income. For financial reporting purposes, the Fund's investment holdings and NAV include trades executed through the end of the last business day of the period. The NAV per share for processing shareholder transactions is calculated as of the close of business of the New York Stock Exchange (NYSE), normally 4:00 p.m. Eastern time and includes trades executed through the end of the prior business day. Gains and losses on securities sold are determined on the basis of identified cost. Dividend income is recorded on the ex-dividend date, except for certain dividends from foreign securities where the ex-dividend date may have passed, which are recorded as soon as the Fund is informed of the ex-dividend date. Non-cash dividends included in dividend income, if any, are recorded at the fair market value of the securities received. Income and capital gain distributions from Fidelity Central Funds, if any, are recorded on the ex-dividend date. Certain distributions received by the Fund represent a return of capital or capital gain. The Fund determines the components of these distributions subsequent to the ex-dividend date, based upon receipt of tax filings or other correspondence relating to the underlying investment. These distributions are recorded as a reduction of cost of investments and/or as a realized gain. Investment income is recorded net of foreign taxes withheld where recovery of such taxes is uncertain.
Expenses. Expenses directly attributable to a fund are charged to that fund. Expenses attributable to more than one fund are allocated among the respective funds on the basis of relative net assets or other appropriate methods. Expenses included in the accompanying financial statements reflect the expenses of that fund and do not include any expenses associated with any underlying mutual funds or exchange-traded funds. Although not included in a fund's expenses, a fund indirectly bears its proportionate share of these expenses through the net asset value of each underlying mutual fund or exchange-traded fund. Expense estimates are accrued in the period to which they relate and adjustments are made when actual amounts are known.
Income Tax Information and Distributions to Shareholders. Each year, the Fund intends to qualify as a regulated investment company under Subchapter M of the Internal Revenue Code, including distributing substantially all of its taxable income and realized gains. As a result, no provision for U.S. Federal income taxes is required. The Fund files a U.S. federal tax return, in addition to state and local tax returns as required. The Fund's federal income tax returns are subject to examination by the Internal Revenue Service (IRS) for a period of three fiscal years after they are filed. State and local tax returns may be subject to examination for an additional fiscal year depending on the jurisdiction. Foreign taxes are provided for based on the Fund's understanding of the tax rules and rates that exist in the foreign markets in which it invests.
Distributions are declared and recorded on the ex-dividend date. Income and capital gain distributions are determined in accordance with income tax regulations, which may differ from GAAP.
Capital accounts within the financial statements are adjusted for permanent book-tax differences. These adjustments have no impact on net assets or the results of operations. Capital accounts are not adjusted for temporary book-tax differences which will reverse in a subsequent period.
Book-tax differences are primarily due to foreign currency transactions, passive foreign investment companies (PFIC), capital loss carryforwards and losses deferred due to wash sales.
As of period end, the cost and unrealized appreciation (depreciation) in securities, and derivatives if applicable, for federal income tax purposes were as follows:
| Gross unrealized appreciation | $59,410,916 |
| Gross unrealized depreciation | (415,072) |
| Net unrealized appreciation (depreciation) | $58,995,844 |
| Tax cost | $86,312,567 |
Restricted Securities (including Private Placements). Funds may invest in securities that are subject to legal or contractual restrictions on resale. These securities generally may be resold in transactions exempt from registration or to the public if the securities are registered. Disposal of these securities may involve time-consuming negotiations and expense, and prompt sale at an acceptable price may be difficult. Information regarding restricted securities held at period end is included at the end of the Schedule of Investments, if applicable.
4. Purchases and Sales of Investments.
Purchases and sales of securities, other than short-term securities, are noted in the table below.
| Purchases ($) | Sales ($) | |
| Fidelity Growth Strategies K6 Fund | 36,211,024 | 88,028,953 |
5. Fees and Other Transactions with Affiliates.
Management Fee. Fidelity Management & Research Company LLC (the investment adviser) and its affiliates provide the Fund with investment management related services for which the Fund pays a monthly management fee that is based on an annual rate of .45% of average net assets. Under the management contract, the investment adviser or an affiliate pays all other expenses of the Fund, excluding fees and expenses of the independent Trustees, and certain miscellaneous expenses such as proxy and shareholder meeting expenses.
Brokerage Commissions. A portion of portfolio transactions were placed with brokerage firms which are affiliates of the investment adviser. Brokerage commissions are included in net realized gain (loss) and change in net unrealized appreciation (depreciation) in the Statement of Operations. The commissions paid to these affiliated firms were as follows:
| Amount | |
| Fidelity Growth Strategies K6 Fund | $317 |
Interfund Trades. Funds may purchase from or sell securities to other Fidelity Funds under procedures adopted by the Board. The procedures have been designed to ensure these interfund trades are executed in accordance with Rule 17a-7 of the 1940 Act. Any interfund trades are included within the respective purchases and sales amounts shown in the Purchases and Sales of Investments note and are noted in the table below.
| Purchases ($) | Sales ($) | |
| Fidelity Growth Strategies K6 Fund | 2,907,477 | 1,531,701 |
6. Committed Line of Credit.
Certain Funds participate with other funds managed by the investment adviser or an affiliate in a $4.25 billion credit facility (the "line of credit") to be utilized for temporary or emergency purposes to fund shareholder redemptions or for other short-term liquidity purposes. The commitment fees on the pro-rata portion of the line of credit are borne by the investment adviser. During the period, there were no borrowings on this line of credit.
7. Security Lending.
Funds lend portfolio securities from time to time in order to earn additional income. Lending agents are used, including National Financial Services (NFS), an affiliate of the investment adviser. Pursuant to a securities lending agreement, NFS will receive a fee, which is capped at 9.9% of a fund's daily lending revenue, for its services as lending agent. A fund may lend securities to certain qualified borrowers, including NFS. On the settlement date of the loan, a fund receives collateral (in the form of U.S. Treasury obligations, letters of credit and/or cash) against the loaned securities and maintains collateral in an amount not less than 100% of the market value of the loaned securities during the period of the loan. The market value of the loaned securities is determined at the close of business of a fund and any additional required collateral is delivered to a fund on the next business day. A fund or borrower may terminate the loan at any time, and if the borrower defaults on its obligation to return the securities loaned because of insolvency or other reasons, a fund may apply collateral received from the borrower against the obligation. A fund may experience delays and costs in recovering the securities loaned. Any cash collateral received is invested in the Fidelity Securities Lending Cash Central Fund. Any loaned securities are identified as such in the Schedule of Investments, and the value of loaned securities and cash collateral at period end, as applicable, are presented in the Statement of Assets and Liabilities. Security lending income represents the income earned on investing cash collateral, less rebates paid to borrowers and any lending agent fees associated with the loan, plus any premium payments received for lending certain types of securities. Security lending income is presented in the Statement of Operations as a component of income from Fidelity Central Funds. Affiliated security lending activity, if any, was as follows:
| Total Security Lending Fees Paid to NFS | Security Lending Income From Securities Loaned to NFS | Value of Securities Loaned to NFS at Period End | |
| Fidelity Growth Strategies K6 Fund | $12 | $1 | $– |
8. Expense Reductions.
Commissions paid to certain brokers with whom the investment adviser, or its affiliates, places trades on behalf of the Fund include an amount in addition to trade execution, which may be rebated back to the Fund to offset expenses. This amount totaled $2,949 for the period. In addition, through arrangements with the Fund's custodian, credits realized as a result of certain uninvested cash balances were used to reduce the Fund's expenses by $1.
9. Other.
Fund's organizational documents provide former and current trustees and officers with a limited indemnification against liabilities arising in connection with the performance of their duties to the fund. In the normal course of business, the fund may also enter into contracts that provide general indemnifications. The fund's maximum exposure under these arrangements is unknown as this would be dependent on future claims that may be made against the fund. The risk of material loss from such claims is considered remote.
10. Coronavirus (COVID-19) Pandemic.
An outbreak of COVID-19 first detected in China during December 2019 has since spread globally and was declared a pandemic by the World Health Organization during March 2020. Developments that disrupt global economies and financial markets, such as the COVID-19 pandemic, may magnify factors that affect the Fund's performance.
Shareholder Expense Example
As a shareholder, you incur two types of costs: (1) transaction costs, which may include sales charges (loads) on purchase payments or redemption proceeds, as applicable and (2) ongoing costs, which generally include management fees, distribution and/or service (12b-1) fees and other Fund expenses. This Example is intended to help you understand your ongoing costs (in dollars) of investing in a fund and to compare these costs with the ongoing costs of investing in other mutual funds.
The Example is based on an investment of $1,000 invested at the beginning of the period and held for the entire period (December 1, 2020 to May 31, 2021).
Actual Expenses
The first line of the accompanying table provides information about actual account values and actual expenses. You may use the information in this line, together with the amount you invested, to estimate the expenses that you paid over the period. Simply divide your account value by $1,000.00 (for example, an $8,600 account value divided by $1,000.00 = 8.6), then multiply the result by the number in the first line for a class/Fund under the heading entitled "Expenses Paid During Period" to estimate the expenses you paid on your account during this period. If any fund is a shareholder of any underlying mutual funds or exchange-traded funds (ETFs) (the Underlying Funds), such fund indirectly bears its proportional share of the expenses of the Underlying Funds in addition to the direct expenses incurred presented in the table. These fees and expenses are not included in the annualized expense ratio used to calculate the expense estimate in the table below.
Hypothetical Example for Comparison Purposes
The second line of the accompanying table provides information about hypothetical account values and hypothetical expenses based on the actual expense ratio and an assumed rate of return of 5% per year before expenses, which is not the actual return. The hypothetical account values and expenses may not be used to estimate the actual ending account balance or expenses you paid for the period. You may use this information to compare the ongoing costs of investing in the Fund and other funds. To do so, compare this 5% hypothetical example with the 5% hypothetical examples that appear in the shareholder reports of the other funds. If any fund is a shareholder of any Underlying Funds, such fund indirectly bears its proportional share of the expenses of the Underlying Funds in addition to the direct expenses as presented in the table. These fees and expenses are not included in the annualized expense ratio used to calculate the expense estimate in the table below.
Please note that the expenses shown in the table are meant to highlight your ongoing costs only and do not reflect any transaction costs. Therefore, the second line of the table is useful in comparing ongoing costs only, and will not help you determine the relative total costs of owning different funds.
| Annualized Expense Ratio-A | Beginning Account Value December 1, 2020 | Ending Account Value May 31, 2021 | Expenses Paid During Period-B December 1, 2020 to May 31, 2021 | |
| Fidelity Growth Strategies K6 Fund | .45% | |||
| Actual | $1,000.00 | $1,099.50 | $2.36 | |
| Hypothetical-C | $1,000.00 | $1,022.69 | $2.27 |
A Annualized expense ratio reflects expenses net of applicable fee waivers.
B Expenses are equal to the annualized expense ratio, multiplied by the average account value over the period, multiplied by 182/ 365 (to reflect the one-half year period). The fees and expenses of any Underlying Funds are not included in each annualized expense ratio.
C 5% return per year before expenses
Board Approval of Investment Advisory Contracts and Management Fees
Fidelity Growth Strategies K6 Fund
Each year, the Board of Trustees, including the Independent Trustees (together, the Board), votes on the renewal of the management contract with Fidelity Management & Research Company LLC (FMR) and the sub-advisory agreements (together, the Advisory Contracts) for the fund. FMR and the sub-advisers are referred to herein as the Investment Advisers. The Board, assisted by the advice of fund counsel and Independent Trustees' counsel, requests and considers a broad range of information relevant to the renewal of the Advisory Contracts throughout the year.The Board meets regularly and, at each of its meetings, covers an extensive agenda of topics and materials and considers factors that are relevant to its annual consideration of the renewal of the fund's Advisory Contracts, including the services and support provided to the fund and its shareholders. The Board has established various standing committees (Committees), each composed of and chaired by Independent Trustees with varying backgrounds, to which the Board has assigned specific subject matter responsibilities in order to enhance effective decision-making by the Board. The Board, acting directly and through its Committees, requests and receives information concerning the annual consideration of the renewal of the fund's Advisory Contracts. The Board also meets as needed to review matters specifically related to the Board's annual consideration of the renewal of the Advisory Contracts. Members of the Board may also meet with trustees of other Fidelity funds through joint ad hoc committees to discuss certain matters relevant to all of the Fidelity funds.Approval of Stub Period Continuation. At its January 2021 meeting, the Board of Trustees voted to continue the fund's management contract with FMR, and the sub-advisory agreements and sub-subadvisory agreements, in each case, where applicable (together, the Advisory Contracts), without modification, for four months from February 1, 2021 through May 31, 2021, in connection with changes to the Board's meeting calendar. The Board considered that the approval of the fund's Advisory Contracts will not result in any changes in (i) the investment process or strategies employed in the management of the fund's assets; (ii) the fees and expenses paid by shareholders; (iii) the nature, extent or quality of services provided under the fund's Advisory Contracts; or (iv) the day-to-day management of the fund or the persons primarily responsible for such management. The Board also considered that since its last approval of the fund's Advisory Contracts, FMR had provided additional information on the fund in support of the annual contract renewal process, including competitive analyses on total expenses and management fees and in-depth reviews of fund performance and fund profitability information. The Board also considered the findings of certain ad hoc committees that had been previously formed to discuss matters relevant to all of the Fidelity funds, including economies of scale, fall-out benefits and retail vs. institutional funds. The Board concluded that the fund's Advisory Contracts are fair and reasonable, and that the fund's Advisory Contracts should be renewed, without modification, through May 31, 2021, with the understanding that the Board will consider the annual renewal for a full one year period in May 2021.At its May 2021 meeting, the Board unanimously determined to renew the fund's Advisory Contracts. In reaching its determination, the Board considered all factors it believed relevant, including (i) the nature, extent, and quality of the services provided to the fund and its shareholders (including the investment performance of the fund); (ii) the competitiveness of the fund's management fee and total expense ratio relative to peer funds; (iii) the total costs of the services provided by and the profits realized by Fidelity from its relationships with the fund; and (iv) the extent to which, if any, economies of scale exist and are realized as the fund grows, and whether any economies of scale are appropriately shared with fund shareholders.In considering whether to renew the Advisory Contracts for the fund, the Board reached a determination, with the assistance of fund counsel and Independent Trustees' counsel and through the exercise of its business judgment, that the renewal of the Advisory Contracts was in the best interests of the fund and its shareholders and that the compensation payable under the Advisory Contracts was fair and reasonable. The Board's decision to renew the Advisory Contracts was not based on any single factor, but rather was based on a comprehensive consideration of all the information provided to the Board at its meetings throughout the year. The Board, in reaching its determination to renew the Advisory Contracts, was aware that shareholders of the fund have a broad range of investment choices available to them, including a wide choice among funds offered by Fidelity's competitors, and that the fund's shareholders, who have the opportunity to review and weigh the disclosure provided by the fund in its prospectus and other public disclosures, have chosen to invest in this fund, which is part of the Fidelity family of funds.Nature, Extent, and Quality of Services Provided. The Board considered Fidelity's staffing as it relates to the fund, including the backgrounds of investment personnel of Fidelity, and also considered the fund's investment objective, strategies, and related investment philosophy. The Independent Trustees also had discussions with senior management of Fidelity's investment operations and investment groups. The Board considered the structure of the investment personnel compensation program and whether this structure provides appropriate incentives to act in the best interests of the fund. Additionally, the Board considered the portfolio managers' investments, if any, in the funds that they manage.Resources Dedicated to Investment Management and Support Services. The Board and the Fund Oversight and Research Committees reviewed the general qualifications and capabilities of Fidelity's investment staff, including its size, education, experience, and resources, as well as Fidelity's approach to recruiting, training, managing, and compensating investment personnel. The Board noted that Fidelity has continued to increase the resources devoted to non-U.S. offices, including expansion of Fidelity's global investment organization. The Board also noted that Fidelity's analysts have extensive resources, tools and capabilities that allow them to conduct sophisticated quantitative and fundamental analysis, as well as credit analysis of issuers, counterparties and guarantors. Further, the Board considered that Fidelity's investment professionals have sufficient access to global information and data so as to provide competitive investment results over time, and that those professionals also have access to sophisticated tools that permit them to assess portfolio construction and risk and performance attribution characteristics continuously, as well as to transmit new information and research conclusions rapidly around the world. Additionally, in its deliberations, the Board considered Fidelity's trading, risk management, compliance, and technology and operations capabilities and resources, which are integral parts of the investment management process. The Board also considered Fidelity's investments in business continuity planning, and its success in continuously providing services to the fund notwithstanding the severe disruptions caused by the COVID-19 pandemic.Shareholder and Administrative Services. The Board considered (i) the nature, extent, quality, and cost of advisory, administrative, and shareholder services performed by the Investment Advisers and their affiliates under the Advisory Contracts and under separate agreements covering transfer agency, pricing and bookkeeping, and securities lending services for the fund; (ii) the nature and extent of the supervision of third party service providers, principally custodians, subcustodians, and pricing vendors; and (iii) the resources devoted to, and the record of compliance with, the fund's compliance policies and procedures. The Board also reviewed the allocation of fund brokerage, including allocations to brokers affiliated with the Investment Advisers, the use of brokerage commissions to pay fund expenses, and the use of "soft" commission dollars to pay for research services.The Board noted that the growth of fund assets over time across the complex allows Fidelity to reinvest in the development of services designed to enhance the value and convenience of the Fidelity funds as investment vehicles. These services include 24-hour access to account information and market information over the Internet and through telephone representatives, investor education materials and asset allocation tools, and the expanded availability of Fidelity Investor Centers.The Board noted that, in the past, it and the boards of certain other Fidelity funds had formed an ad hoc Committee on Transfer Agency Fees to review the variety of transfer agency fee structures throughout the industry and Fidelity's competitive positioning with respect to industry participants.Investment in a Large Fund Family. The Board considered the benefits to shareholders of investing in a Fidelity fund, including the benefits of investing in a fund that is part of a large family of funds offering a variety of investment disciplines and providing a large variety of mutual fund investor services. The Board noted that Fidelity had taken, or had made recommendations that resulted in the Fidelity funds taking, a number of actions over the previous year that benefited particular funds, including: (i) continuing to dedicate additional resources to Fidelity's investment research process, which includes meetings with management of issuers of securities in which the funds invest, and to the support of the senior management team that oversees asset management; (ii) continuing efforts to enhance Fidelity's global research capabilities; (iii) launching new funds and ETFs with innovative structures, strategies and pricing and making other enhancements to meet client needs; (iv) launching new share classes of existing funds; (v) eliminating purchase minimums and broadening eligibility requirements for certain funds and share classes; (vi) approving the reduction in the holding period for the Class C to Class A conversion policy; (vii) reducing management fees and total expenses for certain target date funds and classes and index funds; (viii) lowering expenses for certain existing funds and classes by implementing or lowering expense caps; (ix) rationalizing product lines and gaining increased efficiencies from fund mergers, liquidations, and share class consolidations; (x) continuing to develop, acquire and implement systems and technology to improve services to the funds and shareholders, strengthen information security, and increase efficiency; and (xi) continuing to implement enhancements to further strengthen Fidelity's product line to increase investors' probability of success in achieving their investment goals, including retirement income goals.Investment Performance. The Board considered whether the fund has operated in accordance with its investment objective, as well as its record of compliance with its investment restrictions and its performance history.The Board took into account discussions that occur at Board meetings throughout the year with representatives of the Investment Advisers about fund investment performance. In this regard the Board noted that as part of regularly scheduled fund reviews and other reports to the Board on fund performance, the Board considers annualized return information for the fund for different time periods, measured against an appropriate securities market index (benchmark index) and an appropriate peer group of funds with similar objectives (peer group). In its evaluation of fund investment performance, the Board gave particular attention to information indicating changes in performance of certain Fidelity funds for specific time periods and discussed with the Investment Advisers the reasons for any overperformance or underperformance.In addition to reviewing absolute and relative fund performance, the Independent Trustees periodically consider the appropriateness of fund performance metrics in evaluating the results achieved. In general, the Independent Trustees believe that fund performance should be evaluated based on net performance (after fees and expenses) of both the highest performing and lowest performing fund share classes, where applicable, compared to appropriate benchmark indices, over appropriate time periods that may include full market cycles, and compared to peer groups, as applicable, over the same periods, taking into account relevant factors including the following: general market conditions; issuer-specific information; and fund cash flows and other factors.The Independent Trustees recognize that shareholders evaluate performance on a net basis over their own holding periods, for which one-, three-, and five-year periods are often used as a proxy. For this reason, the performance information reviewed by the Board also included net cumulative total return information for the fund and an appropriate benchmark index and peer group for the most recent one- and three-year periods ended September 30, 2020, as shown below. Returns are shown compared to the 25th percentile (top of box, 75% beaten) and 75th percentile (bottom of box, 25% beaten) of the peer universe.Fidelity Growth Strategies K6 Fund

Fidelity Growth Strategies K6 Fund
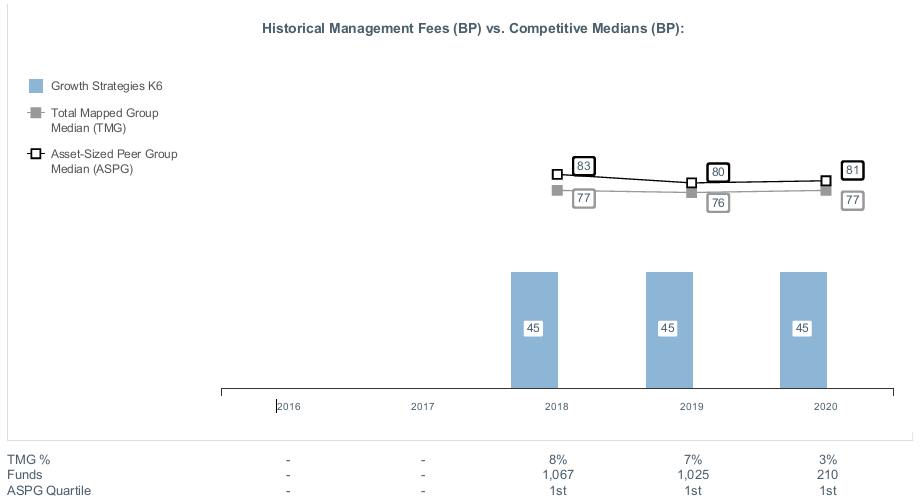
Liquidity Risk Management Program
The Securities and Exchange Commission adopted Rule 22e-4 under the Investment Company Act of 1940 (the Liquidity Rule) to promote effective liquidity risk management throughout the open-end investment company industry, thereby reducing the risk that funds will be unable to meet their redemption obligations and mitigating dilution of the interests of fund shareholders.
The Fund has adopted and implemented a liquidity risk management program pursuant to the Liquidity Rule (the Program) effective December 1, 2018. The Program is reasonably designed to assess and manage the Fund’s liquidity risk and to comply with the requirements of the Liquidity Rule. The Fund’s Board of Trustees (the Board) has designated the Fund’s investment adviser as administrator of the Program. The Fidelity advisers have established a Liquidity Risk Management Committee (the LRM Committee) to manage the Program for each of the Fidelity Funds. The LRM Committee monitors the adequacy and effectiveness of implementation of the Program and on a periodic basis assesses each Fund’s liquidity risk based on a variety of factors including (1) the Fund’s investment strategy, (2) portfolio liquidity and cash flow projections during normal and reasonably foreseeable stressed conditions, (3) shareholder redemptions, (4) borrowings and other funding sources and (5) in the case of exchange-traded funds, certain additional factors including the effect of the Fund’s prices and spreads, market participants, and basket compositions on the overall liquidity of the Fund’s portfolio, as applicable.
In accordance with the Program, each of the Fund’s portfolio investments is classified into one of four liquidity categories described below based on a determination of a reasonable expectation for how long it would take to convert the investment to cash (or sell or dispose of the investment) without significantly changing its market value.
- Highly liquid investments – cash or convertible to cash within three business days or less
- Moderately liquid investments – convertible to cash in three to seven calendar days
- Less liquid investments – can be sold or disposed of, but not settled, within seven calendar days
- Illiquid investments – cannot be sold or disposed of within seven calendar days
Liquidity classification determinations take into account a variety of factors including various market, trading and investment-specific considerations, as well as market depth, and generally utilize analysis from a third-party liquidity metrics service.
The Liquidity Rule places a 15% limit on a fund’s illiquid investments and requires funds that do not primarily hold assets that are highly liquid investments to determine and maintain a minimum percentage of the fund’s net assets to be invested in highly liquid investments (highly liquid investment minimum or HLIM). The Program includes provisions reasonably designed to comply with the 15% limit on illiquid investments and for determining, periodically reviewing and complying with the HLIM requirement as applicable.
At a recent meeting of the Fund’s Board of Trustees, the LRM Committee provided a written report to the Board pertaining to the operation, adequacy, and effectiveness of implementation of the Program for the annual period from December 1, 2019 through November 30, 2020. The report concluded that the Program has been implemented and is operating effectively and is reasonably designed to assess and manage the Fund’s liquidity risk.
![]()
FEGK6-SANN-0721
1.9883994.104
Fidelity® Growth Company K6 Fund
Semi-Annual Report
May 31, 2021
Contents
Board Approval of Investment Advisory Contracts and Management Fees | |
To view a fund's proxy voting guidelines and proxy voting record for the 12-month period ended June 30, visit http://www.fidelity.com/proxyvotingresults or visit the Securities and Exchange Commission's (SEC) web site at http://www.sec.gov.
You may also call 1-800-835-5092 to request a free copy of the proxy voting guidelines.
Standard & Poor's, S&P and S&P 500 are registered service marks of The McGraw-Hill Companies, Inc. and have been licensed for use by Fidelity Distributors Corporation.
Other third-party marks appearing herein are the property of their respective owners.
All other marks appearing herein are registered or unregistered trademarks or service marks of FMR LLC or an affiliated company. © 2021 FMR LLC. All rights reserved.
This report and the financial statements contained herein are submitted for the general information of the shareholders of the Fund. This report is not authorized for distribution to prospective investors in the Fund unless preceded or accompanied by an effective prospectus.
A fund files its complete schedule of portfolio holdings with the SEC for the first and third quarters of each fiscal year on Form N-PORT. Forms N-PORT are available on the SEC’s web site at http://www.sec.gov. A fund's Forms N-PORT may be reviewed and copied at the SEC’s Public Reference Room in Washington, DC. Information regarding the operation of the SEC's Public Reference Room may be obtained by calling 1-800-SEC-0330.
For a complete list of a fund's portfolio holdings, view the most recent holdings listing, semiannual report, or annual report on Fidelity's web site at http://www.fidelity.com, http://www.institutional.fidelity.com, or http://www.401k.com, as applicable.
NOT FDIC INSURED •MAY LOSE VALUE •NO BANK GUARANTEE
Neither the Fund nor Fidelity Distributors Corporation is a bank.
Note to Shareholders:
Early in 2020, the outbreak and spread of a new coronavirus emerged as a public health emergency that had a major influence on financial markets, primarily based on its impact on the global economy and the outlook for corporate earnings. The virus causes a respiratory disease known as COVID-19. On March 11, 2020 the World Health Organization declared the COVID-19 outbreak a pandemic, citing sustained risk of further global spread.
In the weeks following, as the crisis worsened, we witnessed an escalating human tragedy with wide-scale social and economic consequences from coronavirus-containment measures. The outbreak of COVID-19 prompted a number of measures to limit the spread, including travel and border restrictions, quarantines, and restrictions on large gatherings. In turn, these resulted in lower consumer activity, diminished demand for a wide range of products and services, disruption in manufacturing and supply chains, and – given the wide variability in outcomes regarding the outbreak – significant market uncertainty and volatility. Amid the turmoil, global governments and central banks took unprecedented action to help support consumers, businesses, and the broader economies, and to limit disruption to financial systems.
The situation continues to unfold, and the extent and duration of its impact on financial markets and the economy remain highly uncertain. Extreme events such as the coronavirus crisis are “exogenous shocks” that can have significant adverse effects on mutual funds and their investments. Although multiple asset classes may be affected by market disruption, the duration and impact may not be the same for all types of assets.
Fidelity is committed to helping you stay informed amid news about COVID-19 and during increased market volatility, and we’re taking extra steps to be responsive to customer needs. We encourage you to visit our websites, where we offer ongoing updates, commentary, and analysis on the markets and our funds.
Investment Summary (Unaudited)
Top Ten Stocks as of May 31, 2021
| % of fund's net assets | |
| NVIDIA Corp. | 7.3 |
| Apple, Inc. | 6.1 |
| Amazon.com, Inc. | 5.8 |
| Microsoft Corp. | 4.5 |
| Alphabet, Inc. Class A | 3.5 |
| lululemon athletica, Inc. | 2.6 |
| Salesforce.com, Inc. | 2.5 |
| Alphabet, Inc. Class C | 2.1 |
| Facebook, Inc. Class A | 2.0 |
| Shopify, Inc. Class A | 1.9 |
| 38.3 |
Top Five Market Sectors as of May 31, 2021
| % of fund's net assets | |
| Information Technology | 35.6 |
| Consumer Discretionary | 21.7 |
| Health Care | 16.1 |
| Communication Services | 12.5 |
| Industrials | 6.4 |
Asset Allocation (% of fund's net assets)
| As of May 31, 2021 * | ||
| Stocks | 98.7% | |
| Convertible Securities | 1.1% | |
| Short-Term Investments and Net Other Assets (Liabilities) | 0.2% | |

* Foreign investments - 10.3%
Schedule of Investments May 31, 2021 (Unaudited)
Showing Percentage of Net Assets
| Common Stocks - 98.6% | |||
| Shares | Value | ||
| COMMUNICATION SERVICES - 12.4% | |||
| Diversified Telecommunication Services - 0.0% | |||
| Verizon Communications, Inc. | 9,758 | $551,229 | |
| Entertainment - 3.5% | |||
| Activision Blizzard, Inc. | 406,642 | 39,545,935 | |
| Electronic Arts, Inc. | 79,247 | 11,326,774 | |
| NetEase, Inc. ADR | 102,806 | 12,123,912 | |
| Netflix, Inc. (a) | 148,935 | 74,886,007 | |
| Roblox Corp. (a)(b) | 217,233 | 20,369,938 | |
| Roku, Inc. Class A (a) | 467,589 | 162,117,782 | |
| Sea Ltd. ADR (a) | 317,833 | 80,488,029 | |
| The Walt Disney Co. (a) | 82,758 | 14,784,717 | |
| Zynga, Inc. (a) | 236,955 | 2,568,592 | |
| 418,211,686 | |||
| Interactive Media & Services - 8.2% | |||
| Alphabet, Inc.: | |||
| Class A (a) | 177,992 | 419,500,445 | |
| Class C (a) | 101,697 | 245,248,417 | |
| Bumble, Inc. | 41,227 | 1,967,352 | |
| Facebook, Inc. Class A (a) | 730,604 | 240,171,453 | |
| IAC (a) | 12,420 | 1,980,617 | |
| Kuaishou Technology Class B (c) | 110,205 | 2,758,870 | |
| Match Group, Inc. (a) | 9,685 | 1,388,635 | |
| Pinterest, Inc. Class A (a) | 55,550 | 3,627,415 | |
| Snap, Inc. Class A (a) | 477,237 | 29,645,962 | |
| Tencent Holdings Ltd. | 103,451 | 8,250,542 | |
| Twitter, Inc. (a) | 179,910 | 10,434,780 | |
| Vimeo, Inc. (a) | 20,163 | 846,846 | |
| Zillow Group, Inc. Class C (a)(b) | 146,272 | 17,160,631 | |
| 982,981,965 | |||
| Media - 0.0% | |||
| Comcast Corp. Class A | 85,972 | 4,929,634 | |
| Wireless Telecommunication Services - 0.7% | |||
| T-Mobile U.S., Inc. | 568,670 | 80,438,372 | |
| TOTAL COMMUNICATION SERVICES | 1,487,112,886 | ||
| CONSUMER DISCRETIONARY - 21.4% | |||
| Automobiles - 1.9% | |||
| Arrival Group (d) | 404,442 | 7,373,180 | |
| Lordstown Motors Corp. (d) | 130,689 | 1,164,439 | |
| Lordstown Motors Corp. (a)(b) | 3,400 | 33,660 | |
| Rad Power Bikes, Inc. (d)(e) | 171,416 | 826,883 | |
| Tesla, Inc. (a) | 333,086 | 208,252,029 | |
| XPeng, Inc. ADR (a)(b) | 175,540 | 5,640,100 | |
| 223,290,291 | |||
| Hotels, Restaurants & Leisure - 1.8% | |||
| Airbnb, Inc. Class A | 5,497 | 771,779 | |
| Chipotle Mexican Grill, Inc. (a) | 10,198 | 13,991,452 | |
| Hyatt Hotels Corp. Class A (a) | 23,417 | 1,828,399 | |
| Marriott International, Inc. Class A (a) | 268,317 | 38,524,955 | |
| McDonald's Corp. | 733 | 171,441 | |
| Penn National Gaming, Inc. (a) | 503,262 | 41,252,386 | |
| Planet Fitness, Inc. (a) | 13,992 | 1,102,150 | |
| Rush Street Interactive, Inc. (d) | 44,874 | 556,886 | |
| Rush Street Interactive, Inc. (a)(b) | 260,057 | 3,227,307 | |
| Shake Shack, Inc. Class A (a) | 14,966 | 1,406,505 | |
| Starbucks Corp. | 395,996 | 45,096,024 | |
| The Booking Holdings, Inc. (a) | 17,447 | 41,201,963 | |
| Vail Resorts, Inc. (a) | 46,852 | 15,314,982 | |
| Yum China Holdings, Inc. (b) | 145,092 | 9,814,023 | |
| 214,260,252 | |||
| Household Durables - 1.0% | |||
| D.R. Horton, Inc. | 251,317 | 23,947,997 | |
| KB Home | 262,308 | 12,278,637 | |
| Lennar Corp. Class A | 607,638 | 60,162,238 | |
| PulteGroup, Inc. | 46,670 | 2,697,059 | |
| Toll Brothers, Inc. | 290,358 | 18,942,956 | |
| Vizio Holding Corp. (a)(b) | 104,708 | 2,286,823 | |
| 120,315,710 | |||
| Internet & Direct Marketing Retail - 8.5% | |||
| Alibaba Group Holding Ltd. sponsored ADR (a) | 126,323 | 27,028,069 | |
| Amazon.com, Inc. (a) | 217,328 | 700,463,357 | |
| Coupang, Inc. Class A (a)(b) | 47,224 | 1,926,267 | |
| Deliveroo Holdings PLC (a)(c) | 554,516 | 1,980,531 | |
| Etsy, Inc. (a) | 34,967 | 5,760,114 | |
| Farfetch Ltd. Class A (a)(b) | 234,113 | 10,846,455 | |
| JD.com, Inc. sponsored ADR (a) | 342,541 | 25,327,482 | |
| Ocado Group PLC (a) | 237,855 | 6,383,320 | |
| Ozon Holdings PLC ADR (b) | 42,968 | 2,280,312 | |
| Pinduoduo, Inc. ADR (a) | 43,800 | 5,469,744 | |
| Revolve Group, Inc. (a) | 244,652 | 13,563,507 | |
| The RealReal, Inc. (a) | 307,530 | 5,372,549 | |
| THG PLC | 337,519 | 2,920,236 | |
| thredUP, Inc. (a)(b) | 129,558 | 3,056,273 | |
| Wayfair LLC Class A (a) | 667,867 | 204,727,950 | |
| Zomato Pvt Ltd. (d)(e) | 4,462,200 | 3,581,710 | |
| 1,020,687,876 | |||
| Leisure Products - 0.3% | |||
| Callaway Golf Co. | 118,492 | 4,374,725 | |
| Peloton Interactive, Inc. Class A (a) | 278,577 | 30,729,829 | |
| 35,104,554 | |||
| Multiline Retail - 0.4% | |||
| Dollar General Corp. | 45,012 | 9,135,636 | |
| Dollar Tree, Inc. (a) | 61,880 | 6,033,300 | |
| Ollie's Bargain Outlet Holdings, Inc. (a) | 385,886 | 33,355,986 | |
| Target Corp. | 10,477 | 2,377,441 | |
| 50,902,363 | |||
| Specialty Retail - 3.1% | |||
| Auto1 Group SE (c) | 55,030 | 2,954,855 | |
| Carvana Co. Class A (a) | 180,131 | 47,750,927 | |
| Cazoo Holdings Ltd. (d) | 25,520 | 778,901 | |
| Five Below, Inc. (a) | 48,889 | 9,001,443 | |
| Floor & Decor Holdings, Inc. Class A (a) | 212,312 | 20,872,393 | |
| Lowe's Companies, Inc. | 398,109 | 77,563,576 | |
| MYT Netherlands Parent BV ADR (b) | 23,780 | 749,070 | |
| RH (a) | 144,442 | 92,594,544 | |
| The Home Depot, Inc. | 236,032 | 75,272,965 | |
| TJX Companies, Inc. | 522,948 | 35,319,908 | |
| Williams-Sonoma, Inc. | 54,095 | 9,171,266 | |
| 372,029,848 | |||
| Textiles, Apparel & Luxury Goods - 4.4% | |||
| adidas AG | 122,423 | 44,664,476 | |
| Canada Goose Holdings, Inc. (a) | 211,287 | 8,468,985 | |
| Deckers Outdoor Corp. (a) | 88,877 | 29,812,901 | |
| Dr. Martens Ltd. (a) | 930,647 | 6,483,923 | |
| Figs, Inc. Class A (a) | 19,500 | 665,925 | |
| lululemon athletica, Inc. (a) | 955,139 | 308,634,065 | |
| NIKE, Inc. Class B | 360,634 | 49,212,116 | |
| On Holding AG (a)(d)(e) | 128 | 2,568,950 | |
| Paymentus Holdings, Inc. (a) | 22,400 | 683,200 | |
| Skechers U.S.A., Inc. Class A (sub. vtg.) (a) | 1,567,306 | 74,447,035 | |
| Under Armour, Inc. Class C (non-vtg.) (a) | 190,676 | 3,634,285 | |
| VF Corp. | 27,761 | 2,213,107 | |
| 531,488,968 | |||
| TOTAL CONSUMER DISCRETIONARY | 2,568,079,862 | ||
| CONSUMER STAPLES - 2.7% | |||
| Beverages - 1.2% | |||
| Boston Beer Co., Inc. Class A (a) | 8,060 | 8,528,770 | |
| Fever-Tree Drinks PLC | 188,554 | 6,844,300 | |
| Keurig Dr. Pepper, Inc. | 570,662 | 21,091,668 | |
| Monster Beverage Corp. (a) | 485,297 | 45,748,948 | |
| PepsiCo, Inc. | 65,570 | 9,700,426 | |
| The Coca-Cola Co. | 872,706 | 48,251,915 | |
| 140,166,027 | |||
| Food & Staples Retailing - 0.5% | |||
| Blink Health, Inc. Series A1 (d)(e) | 65,933 | 2,152,053 | |
| Costco Wholesale Corp. | 91,168 | 34,486,119 | |
| Grocery Outlet Holding Corp. (a)(b) | 59,809 | 2,037,693 | |
| Kroger Co. | 130,052 | 4,809,323 | |
| Oatly Group AB ADR (a) | 76,453 | 1,812,701 | |
| Performance Food Group Co. (a) | 219,802 | 11,018,674 | |
| Sweetgreen, Inc. warrants 1/21/26 (a)(d)(e) | 130,426 | 515,183 | |
| 56,831,746 | |||
| Food Products - 0.5% | |||
| AppHarvest, Inc. (d) | 248,018 | 3,923,025 | |
| Archer Daniels Midland Co. | 115,971 | 7,715,551 | |
| Beyond Meat, Inc. (a)(b) | 5,611 | 815,952 | |
| Bunge Ltd. | 252,586 | 21,929,517 | |
| Darling Ingredients, Inc. (a) | 166,226 | 11,379,832 | |
| Freshpet, Inc. (a) | 22,496 | 3,977,743 | |
| JDE Peet's BV | 19,440 | 766,891 | |
| Laird Superfood, Inc. (b) | 146,170 | 4,776,836 | |
| Mondelez International, Inc. | 23,267 | 1,478,153 | |
| 56,763,500 | |||
| Household Products - 0.2% | |||
| Church & Dwight Co., Inc. | 45,418 | 3,893,685 | |
| Colgate-Palmolive Co. | 90,399 | 7,573,628 | |
| Procter & Gamble Co. | 140,631 | 18,964,090 | |
| 30,431,403 | |||
| Personal Products - 0.0% | |||
| Unilever PLC (Netherlands) | 45,570 | 2,717,722 | |
| Tobacco - 0.3% | |||
| Altria Group, Inc. | 619,665 | 30,499,911 | |
| Philip Morris International, Inc. | 56,934 | 5,490,146 | |
| 35,990,057 | |||
| TOTAL CONSUMER STAPLES | 322,900,455 | ||
| ENERGY - 0.9% | |||
| Energy Equipment & Services - 0.2% | |||
| Halliburton Co. | 519,240 | 11,656,938 | |
| Schlumberger Ltd. | 481,312 | 15,079,505 | |
| 26,736,443 | |||
| Oil, Gas & Consumable Fuels - 0.7% | |||
| EOG Resources, Inc. | 27,322 | 2,195,049 | |
| Hess Corp. | 671,512 | 56,286,136 | |
| Pioneer Natural Resources Co. | 25,124 | 3,823,622 | |
| Reliance Industries Ltd. | 648,700 | 19,324,539 | |
| Reliance Industries Ltd. | 33,246 | 558,184 | |
| 82,187,530 | |||
| TOTAL ENERGY | 108,923,973 | ||
| FINANCIALS - 2.0% | |||
| Banks - 1.2% | |||
| Bank of America Corp. | 925,250 | 39,221,348 | |
| First Republic Bank | 81,409 | 15,584,939 | |
| HDFC Bank Ltd. sponsored ADR (a) | 342,114 | 26,181,984 | |
| JPMorgan Chase & Co. | 226,576 | 37,212,842 | |
| Wells Fargo & Co. | 475,338 | 22,207,791 | |
| 140,408,904 | |||
| Capital Markets - 0.7% | |||
| Aspirational Consumer Lifestyle Corp. Class A (a)(b) | 57,505 | 574,475 | |
| B3 SA - Brasil Bolsa Balcao | 3,014,400 | 10,090,764 | |
| BlackRock, Inc. Class A | 30,404 | 26,665,524 | |
| Charles Schwab Corp. | 507,461 | 37,475,995 | |
| Coinbase Global, Inc. (a) | 9,520 | 2,251,861 | |
| Edelweiss Financial Services Ltd. | 293,900 | 264,240 | |
| The Beauty Health Co. (a) | 133,095 | 1,895,273 | |
| The Beauty Health Co. (d) | 428,643 | 5,493,489 | |
| 84,711,621 | |||
| Consumer Finance - 0.0% | |||
| American Express Co. | 9,691 | 1,551,820 | |
| Discover Financial Services | 20,909 | 2,451,789 | |
| 4,003,609 | |||
| Diversified Financial Services - 0.1% | |||
| BowX Acquisition Corp. (a)(b) | 403,766 | 4,958,246 | |
| CM Life Sciences II, Inc. unit (a) | 3,886 | 51,684 | |
| Decarbonization Plus Acquisition Corp. Class A (a)(b) | 39,559 | 395,590 | |
| Flywire Corp. (a) | 6,000 | 206,040 | |
| Social Finance, Inc. (d) | 180,833 | 3,279,406 | |
| 8,890,966 | |||
| TOTAL FINANCIALS | 238,015,100 | ||
| HEALTH CARE - 15.7% | |||
| Biotechnology - 8.2% | |||
| 4D Molecular Therapeutics, Inc. | 36,918 | 980,542 | |
| AbbVie, Inc. | 93,427 | 10,575,936 | |
| ACADIA Pharmaceuticals, Inc. (a) | 1,296,907 | 28,972,902 | |
| ADC Therapeutics SA (a) | 150,156 | 3,250,877 | |
| Akouos, Inc. (c) | 54,474 | 711,430 | |
| Akouos, Inc. (a) | 250,289 | 3,268,774 | |
| Akoya Biosciences, Inc. (a) | 30,360 | 632,095 | |
| Alector, Inc. (a)(b) | 277,123 | 4,932,789 | |
| Allovir, Inc. (a)(b) | 495,163 | 11,606,621 | |
| Alnylam Pharmaceuticals, Inc. (a) | 762,762 | 108,304,576 | |
| ALX Oncology Holdings, Inc. (a) | 21,180 | 1,197,941 | |
| Amgen, Inc. | 126,136 | 30,012,800 | |
| Annexon, Inc. (a) | 34,928 | 737,679 | |
| Arcutis Biotherapeutics, Inc. (a) | 115,690 | 3,048,432 | |
| Argenx SE ADR (a) | 116,465 | 32,492,570 | |
| Arrowhead Pharmaceuticals, Inc. (a) | 16,706 | 1,212,856 | |
| Ascendis Pharma A/S sponsored ADR (a) | 11,554 | 1,552,627 | |
| aTyr Pharma, Inc. (a)(b) | 157,556 | 715,304 | |
| Avidity Biosciences, Inc. (b) | 243,429 | 5,779,004 | |
| Axcella Health, Inc. (a) | 414,375 | 1,321,856 | |
| BeiGene Ltd. ADR (a) | 294,926 | 105,733,920 | |
| BioAtla, Inc. | 169,567 | 7,299,859 | |
| BioNTech SE ADR (a)(b) | 134,898 | 27,519,192 | |
| BioXcel Therapeutics, Inc. (a)(b) | 158,863 | 5,247,245 | |
| Bolt Biotherapeutics, Inc. | 47,833 | 837,556 | |
| BridgeBio Pharma, Inc. (a) | 42,450 | 2,513,040 | |
| Burning Rock Biotech Ltd. ADR | 9,391 | 254,214 | |
| Calyxt, Inc. (a)(b) | 197,603 | 851,669 | |
| Cerevel Therapeutics Holdings (a) | 415,649 | 5,453,315 | |
| ChemoCentryx, Inc. (a) | 454,680 | 4,615,002 | |
| Codiak Biosciences, Inc. (b) | 147,626 | 3,339,300 | |
| Connect Biopharma Holdings Ltd. ADR (a) | 90,641 | 1,348,738 | |
| CRISPR Therapeutics AG (a) | 14,379 | 1,699,310 | |
| Cyclerion Therapeutics, Inc. (a) | 43,223 | 140,043 | |
| Day One Biopharmaceuticals, Inc. (a) | 39,200 | 928,648 | |
| Denali Therapeutics, Inc. (a) | 63,370 | 4,029,698 | |
| Evelo Biosciences, Inc. (a) | 628,907 | 8,439,932 | |
| Exact Sciences Corp. (a) | 34,190 | 3,779,021 | |
| Exelixis, Inc. (a) | 64,510 | 1,454,701 | |
| Fate Therapeutics, Inc. (a) | 447,321 | 34,264,789 | |
| Foghorn Therapeutics, Inc. (c) | 59,955 | 624,132 | |
| Foghorn Therapeutics, Inc. | 84,548 | 880,145 | |
| Fusion Pharmaceuticals, Inc. (a) | 46,851 | 384,647 | |
| Gemini Therapeutics, Inc. (d) | 96,363 | 1,185,265 | |
| Gemini Therapeutics, Inc. | 42,952 | 528,310 | |
| Generation Bio Co. | 313,783 | 10,750,206 | |
| Immunocore Holdings PLC ADR | 47,934 | 1,965,294 | |
| Inhibrx, Inc. (a)(b) | 114,272 | 2,417,996 | |
| Instil Bio, Inc. (a) | 95,214 | 1,694,809 | |
| Ionis Pharmaceuticals, Inc. (a) | 1,586,181 | 59,085,242 | |
| iTeos Therapeutics, Inc. (a) | 36,914 | 758,214 | |
| Karuna Therapeutics, Inc. (a) | 206,581 | 23,099,887 | |
| Keros Therapeutics, Inc. (a) | 48,019 | 2,619,917 | |
| Kinnate Biopharma, Inc. | 55,473 | 1,302,506 | |
| Kronos Bio, Inc. (c) | 49,578 | 1,210,199 | |
| Kronos Bio, Inc. (b) | 22,345 | 545,441 | |
| Kura Oncology, Inc. (a) | 38,669 | 860,385 | |
| Kymera Therapeutics, Inc. (a) | 23,220 | 1,116,650 | |
| Lexicon Pharmaceuticals, Inc. (a) | 542,204 | 2,380,276 | |
| Mirati Therapeutics, Inc. (a) | 4,508 | 712,940 | |
| Moderna, Inc. (a) | 309,630 | 57,284,646 | |
| Morphic Holding, Inc. (a) | 174,325 | 8,604,682 | |
| Novavax, Inc. (a) | 110,314 | 16,284,553 | |
| Olema Pharmaceuticals, Inc. (b) | 45,756 | 1,279,338 | |
| ORIC Pharmaceuticals, Inc. (a) | 183,964 | 4,203,577 | |
| Passage Bio, Inc. (a) | 138,557 | 1,835,880 | |
| PMV Pharmaceuticals, Inc. (b) | 20,111 | 691,818 | |
| Poseida Therapeutics, Inc. (c) | 110,056 | 929,973 | |
| Poseida Therapeutics, Inc. (a)(b) | 203,577 | 1,720,226 | |
| Praxis Precision Medicines, Inc. | 360,870 | 7,069,443 | |
| Prelude Therapeutics, Inc. | 54,870 | 1,907,281 | |
| Protagonist Therapeutics, Inc. (a) | 141,975 | 4,984,742 | |
| Prothena Corp. PLC (a) | 152,897 | 4,460,005 | |
| PTC Therapeutics, Inc. (a) | 132,040 | 5,185,211 | |
| Recursion Pharmaceuticals, Inc. (a) | 49,115 | 1,294,671 | |
| Regeneron Pharmaceuticals, Inc. (a) | 69,662 | 35,000,279 | |
| Relay Therapeutics, Inc. (a) | 122,371 | 3,930,557 | |
| Repare Therapeutics, Inc. | 12,420 | 401,414 | |
| Repligen Corp. (a) | 31,578 | 5,766,459 | |
| Revolution Medicines, Inc. (a) | 161,608 | 4,833,695 | |
| Rigel Pharmaceuticals, Inc. (a)(b) | 2,126,275 | 7,909,743 | |
| Rubius Therapeutics, Inc. (a)(b) | 1,108,097 | 27,070,810 | |
| Sage Therapeutics, Inc. (a) | 408,905 | 28,459,788 | |
| Sana Biotechnology, Inc. (b) | 11,360 | 238,219 | |
| Sarepta Therapeutics, Inc. (a) | 35,251 | 2,666,738 | |
| Scholar Rock Holding Corp. (a) | 168,036 | 4,515,127 | |
| Seagen, Inc. (a) | 16,273 | 2,528,011 | |
| Seres Therapeutics, Inc. (a)(b) | 997,614 | 21,059,632 | |
| Shattuck Labs, Inc. | 198,113 | 5,376,787 | |
| Sigilon Therapeutics, Inc. (b) | 61,482 | 717,495 | |
| Silverback Therapeutics, Inc. | 30,816 | 839,881 | |
| Silverback Therapeutics, Inc. (b) | 272,852 | 7,511,616 | |
| Springworks Therapeutics, Inc. (a) | 296,674 | 24,190,798 | |
| Spruce Biosciences, Inc. | 36,563 | 516,635 | |
| Stoke Therapeutics, Inc. (a) | 2,102 | 83,365 | |
| Synlogic, Inc. (a) | 322,933 | 1,207,769 | |
| Syros Pharmaceuticals, Inc. (a) | 377,575 | 2,435,359 | |
| Syros Pharmaceuticals, Inc. warrants 10/10/22 (a) | 8,675 | 7,403 | |
| Taysha Gene Therapies, Inc. | 216,229 | 4,865,153 | |
| TG Therapeutics, Inc. (a) | 291,961 | 10,180,680 | |
| Translate Bio, Inc. (a) | 607,118 | 10,934,195 | |
| Turning Point Therapeutics, Inc. (a) | 17,167 | 1,136,112 | |
| Twist Bioscience Corp. (a) | 20,359 | 2,184,724 | |
| Ultragenyx Pharmaceutical, Inc. (a) | 17,789 | 1,809,319 | |
| uniQure B.V. (a) | 187,723 | 6,519,620 | |
| UNITY Biotechnology, Inc. (a)(b) | 343,422 | 1,538,531 | |
| Vaxcyte, Inc. | 221,267 | 4,662,096 | |
| Vertex Pharmaceuticals, Inc. (a) | 28,244 | 5,892,546 | |
| Vor Biopharma, Inc. | 53,738 | 1,077,178 | |
| Vor Biopharma, Inc. (a)(b) | 41,050 | 866,155 | |
| Xencor, Inc. (a) | 207,896 | 7,995,680 | |
| Yumanity Therapeutics, Inc. (d) | 19,318 | 297,111 | |
| Yumanity Therapeutics, Inc. | 13,229 | 193,289 | |
| Zai Lab Ltd. ADR (a) | 142,184 | 25,260,409 | |
| Zentalis Pharmaceuticals, Inc. (a) | 54,932 | 3,067,952 | |
| 978,663,640 | |||
| Health Care Equipment & Supplies - 3.4% | |||
| Abbott Laboratories | 73,586 | 8,583,807 | |
| Danaher Corp. | 167,784 | 42,976,194 | |
| DexCom, Inc. (a) | 87,599 | 32,358,195 | |
| Insulet Corp. (a) | 292,424 | 78,857,980 | |
| Intuitive Surgical, Inc. (a) | 55,370 | 46,631,507 | |
| Novocure Ltd. (a) | 672,919 | 137,275,476 | |
| Outset Medical, Inc. | 204,807 | 9,886,034 | |
| Penumbra, Inc. (a) | 72,392 | 18,033,571 | |
| Presbia PLC (a)(e) | 96,997 | 12,610 | |
| Shockwave Medical, Inc. (a) | 210,078 | 37,793,032 | |
| Treace Medical Concepts, Inc. (a) | 47,992 | 1,557,340 | |
| 413,965,746 | |||
| Health Care Providers & Services - 1.5% | |||
| 1Life Healthcare, Inc. (a) | 253,454 | 9,377,798 | |
| Alignment Healthcare, Inc. (a) | 124,390 | 3,138,360 | |
| Alignment Healthcare, Inc. | 140,694 | 3,194,739 | |
| Centene Corp. (a) | 183,932 | 13,537,395 | |
| Guardant Health, Inc. (a) | 22,068 | 2,739,080 | |
| Humana, Inc. | 29,451 | 12,890,703 | |
| Ikena Oncology, Inc. (a) | 42,215 | 759,870 | |
| Oak Street Health, Inc. (a) | 325,149 | 19,635,748 | |
| Progyny, Inc. (a) | 62,866 | 4,025,939 | |
| Signify Health, Inc. | 30,455 | 770,512 | |
| UnitedHealth Group, Inc. | 262,686 | 108,205,617 | |
| 178,275,761 | |||
| Health Care Technology - 0.0% | |||
| Castlight Health, Inc. Class B (a) | 174,468 | 317,532 | |
| Teladoc Health, Inc. (a)(b) | 3,128 | 471,014 | |
| 788,546 | |||
| Life Sciences Tools & Services - 1.7% | |||
| 10X Genomics, Inc. (a) | 692,229 | 124,601,220 | |
| AbCellera Biologics, Inc.(b) | 7,742 | 207,718 | |
| Berkeley Lights, Inc. (a) | 835 | 36,323 | |
| Bruker Corp. | 47,443 | 3,294,442 | |
| Nanostring Technologies, Inc. (a) | 75,854 | 4,209,138 | |
| Olink Holding AB ADR (a) | 118,615 | 4,190,668 | |
| Sartorius Stedim Biotech | 5,458 | 2,365,377 | |
| Seer, Inc. (b) | 201,786 | 5,968,830 | |
| Seer, Inc. | 70,934 | 2,077,245 | |
| Seer, Inc. Class A (d) | 60,937 | 1,802,516 | |
| Sotera Health Co. | 6,402 | 154,288 | |
| Thermo Fisher Scientific, Inc. | 36,691 | 17,226,425 | |
| WuXi AppTec Co. Ltd. (H Shares) (c) | 259,348 | 5,553,555 | |
| Wuxi Biologics (Cayman), Inc. (a)(c) | 1,884,627 | 29,453,936 | |
| 201,141,681 | |||
| Pharmaceuticals - 0.9% | |||
| 4D Pharma PLC (a)(b) | 472,103 | 658,644 | |
| Adimab LLC (d)(e)(f) | 196,899 | 10,000,008 | |
| Arvinas Holding Co. LLC (a) | 43,048 | 3,131,312 | |
| Atea Pharmaceuticals, Inc. (b) | 872,986 | 17,826,374 | |
| Bristol-Myers Squibb Co. | 105,924 | 6,961,325 | |
| Dragonfly Therapeutics, Inc. (a)(d)(e) | 31,376 | 867,546 | |
| Fulcrum Therapeutics, Inc. (a)(b) | 215,339 | 1,922,977 | |
| Hansoh Pharmaceutical Group Co. Ltd. (c) | 388,204 | 1,693,074 | |
| Harmony Biosciences Holdings, Inc. (a) | 103,246 | 3,299,742 | |
| Intra-Cellular Therapies, Inc. (a) | 650,238 | 25,625,880 | |
| Jiangsu Hengrui Medicine Co. Ltd. (A Shares) | 5,080 | 68,824 | |
| Kaleido Biosciences, Inc. (a)(b) | 540,278 | 3,879,196 | |
| Longboard Pharmaceuticals, Inc. (a) | 42,723 | 352,892 | |
| Nektar Therapeutics (a) | 396,757 | 7,169,399 | |
| Nuvation Bio, Inc. (d) | 312,840 | 4,226,156 | |
| Nuvation Bio, Inc. (a)(b) | 96,397 | 1,370,765 | |
| OptiNose, Inc. (a) | 388,198 | 1,238,352 | |
| Pharvaris BV | 31,611 | 648,026 | |
| Pliant Therapeutics, Inc. | 93,847 | 2,821,041 | |
| Sienna Biopharmaceuticals, Inc. (a) | 254,062 | 5,843 | |
| Skyhawk Therapeutics, Inc. (d)(e) | 127,580 | 2,094,864 | |
| Theravance Biopharma, Inc. (a) | 272,963 | 4,716,801 | |
| UCB SA | 32,833 | 3,072,265 | |
| Vera Therapeutics, Inc. (a) | 51,143 | 882,217 | |
| Vera Therapeutics, Inc. | 52,917 | 821,536 | |
| 105,355,059 | |||
| TOTAL HEALTH CARE | 1,878,190,433 | ||
| INDUSTRIALS - 6.3% | |||
| Aerospace & Defense - 0.1% | |||
| Space Exploration Technologies Corp. Class A (a)(d)(e) | 3,900 | 1,637,961 | |
| The Boeing Co. (a) | 28,882 | 7,134,432 | |
| 8,772,393 | |||
| Air Freight & Logistics - 0.2% | |||
| FedEx Corp. | 16,471 | 5,185,236 | |
| United Parcel Service, Inc. Class B | 80,728 | 17,324,229 | |
| 22,509,465 | |||
| Airlines - 1.9% | |||
| Delta Air Lines, Inc. (a) | 791,327 | 37,730,471 | |
| Frontier Group Holdings, Inc. (a) | 156,787 | 3,342,699 | |
| JetBlue Airways Corp. (a) | 1,915,746 | 38,506,495 | |
| Ryanair Holdings PLC sponsored ADR (a) | 51,399 | 6,000,833 | |
| Southwest Airlines Co. (a) | 1,091,358 | 67,074,863 | |
| Spirit Airlines, Inc. (a) | 359,484 | 12,837,174 | |
| Sun Country Airlines Holdings, Inc. (a)(b) | 47,941 | 1,783,405 | |
| United Airlines Holdings, Inc. (a) | 472,981 | 27,598,441 | |
| Wizz Air Holdings PLC (a)(c) | 544,201 | 37,288,849 | |
| 232,163,230 | |||
| Building Products - 0.2% | |||
| Resideo Technologies, Inc. (a) | 112,272 | 3,356,933 | |
| The AZEK Co., Inc. | 92,198 | 4,013,379 | |
| Trane Technologies PLC | 78,216 | 14,579,462 | |
| 21,949,774 | |||
| Construction & Engineering - 0.2% | |||
| MasTec, Inc. (a) | 272,475 | 31,697,017 | |
| Electrical Equipment - 0.3% | |||
| AMETEK, Inc. | 37,913 | 5,122,046 | |
| Eaton Corp. PLC | 44,848 | 6,514,172 | |
| Emerson Electric Co. | 95,450 | 9,133,611 | |
| Generac Holdings, Inc. (a) | 32,387 | 10,646,255 | |
| Rockwell Automation, Inc. | 27,081 | 7,141,801 | |
| Shoals Technologies Group, Inc. | 25,710 | 709,596 | |
| 39,267,481 | |||
| Industrial Conglomerates - 0.5% | |||
| 3M Co. | 122,394 | 24,850,878 | |
| Honeywell International, Inc. | 134,791 | 31,124,590 | |
| 55,975,468 | |||
| Machinery - 1.0% | |||
| Caterpillar, Inc. | 109,268 | 26,342,329 | |
| Cummins, Inc. | 39,069 | 10,051,672 | |
| Deere & Co. | 101,514 | 36,656,705 | |
| Fortive Corp. | 98,549 | 7,146,773 | |
| Illinois Tool Works, Inc. (b) | 49,928 | 11,571,313 | |
| Ingersoll Rand, Inc. (a) | 56,851 | 2,822,084 | |
| Xylem, Inc. | 179,957 | 21,256,521 | |
| 115,847,397 | |||
| Professional Services - 0.0% | |||
| CoStar Group, Inc. (a) | 1,269 | 1,083,726 | |
| Road & Rail - 1.9% | |||
| Avis Budget Group, Inc. (a)(b) | 691,606 | 60,736,839 | |
| CSX Corp. | 91,487 | 9,159,678 | |
| Kansas City Southern | 51,668 | 15,380,530 | |
| Lyft, Inc. (a) | 518,587 | 29,606,132 | |
| Uber Technologies, Inc. (a) | 1,228,120 | 62,425,340 | |
| Union Pacific Corp. | 223,173 | 50,153,668 | |
| 227,462,187 | |||
| TOTAL INDUSTRIALS | 756,728,138 | ||
| INFORMATION TECHNOLOGY - 35.5% | |||
| Communications Equipment - 0.5% | |||
| Arista Networks, Inc. (a) | 10,681 | 3,624,918 | |
| Ciena Corp. (a) | 532,924 | 28,175,692 | |
| Infinera Corp. (a)(b) | 2,533,055 | 24,317,328 | |
| Lumentum Holdings, Inc. (a) | 74,279 | 6,044,082 | |
| 62,162,020 | |||
| Electronic Equipment & Components - 0.3% | |||
| 908 Devices, Inc. (b) | 29,105 | 1,226,194 | |
| Arlo Technologies, Inc. (a) | 174,101 | 1,168,218 | |
| II-VI, Inc. (a)(b) | 226,907 | 15,286,725 | |
| TE Connectivity Ltd. | 2,560 | 347,341 | |
| Trimble, Inc. (a) | 184,066 | 14,318,494 | |
| Vontier Corp. | 17,743 | 622,424 | |
| 32,969,396 | |||
| IT Services - 6.1% | |||
| Accenture PLC Class A | 26,849 | 7,575,714 | |
| Actua Corp. (a)(e) | 200,563 | 10,028 | |
| Black Knight, Inc. (a) | 81,059 | 5,948,920 | |
| IBM Corp. | 3,515 | 505,246 | |
| MasterCard, Inc. Class A | 275,432 | 99,315,271 | |
| MongoDB, Inc. Class A (a) | 3,193 | 932,164 | |
| Nuvei Corp. (a)(c) | 28,225 | 2,113,488 | |
| Okta, Inc. (a) | 48,712 | 10,835,497 | |
| PayPal Holdings, Inc. (a) | 747,076 | 194,254,702 | |
| Riskified Ltd. (a)(d)(e) | 27,950 | 321,425 | |
| Riskified Ltd. warrants (a)(d)(e) | 168 | 0 | |
| Shopify, Inc. Class A (a) | 189,222 | 232,070,515 | |
| Snowflake Computing, Inc. | 3,120 | 742,654 | |
| Square, Inc. (a) | 224,796 | 50,021,606 | |
| Twilio, Inc. Class A (a) | 13,632 | 4,580,352 | |
| Visa, Inc. Class A | 487,406 | 110,787,384 | |
| Wix.com Ltd. (a) | 43,113 | 11,203,344 | |
| Worldline SA (a)(c) | 58,033 | 5,555,191 | |
| 736,773,501 | |||
| Semiconductors & Semiconductor Equipment - 11.0% | |||
| Advanced Micro Devices, Inc. (a) | 842,357 | 67,455,949 | |
| Applied Materials, Inc. | 377,461 | 52,138,688 | |
| ASML Holding NV | 68,768 | 46,450,721 | |
| Broadcom, Inc. | 23,991 | 11,331,669 | |
| Cirrus Logic, Inc. (a) | 316,419 | 24,702,831 | |
| Cree, Inc. (a)(b) | 64,009 | 6,401,540 | |
| First Solar, Inc. (a) | 104,545 | 7,956,920 | |
| Intel Corp. | 104,018 | 5,941,508 | |
| KLA Corp. | 55,511 | 17,590,881 | |
| Marvell Technology, Inc. | 561,511 | 27,120,981 | |
| Micron Technology, Inc. (a) | 333,169 | 28,032,840 | |
| NVIDIA Corp. | 1,339,922 | 870,654,508 | |
| Qualcomm, Inc. | 183,159 | 24,642,212 | |
| Silicon Laboratories, Inc. (a) | 547,357 | 74,747,072 | |
| Taiwan Semiconductor Manufacturing Co. Ltd. sponsored ADR | 233,337 | 27,384,430 | |
| Teradyne, Inc. | 55,547 | 7,351,645 | |
| Texas Instruments, Inc. | 106,618 | 20,238,229 | |
| Xilinx, Inc. | 37,986 | 4,824,222 | |
| 1,324,966,846 | |||
| Software - 11.2% | |||
| ACV Auctions, Inc. Class A (a)(b) | 5,404 | 140,072 | |
| Adobe, Inc. (a) | 143,282 | 72,297,232 | |
| Alkami Technology, Inc. (a) | 6,349 | 211,231 | |
| Atlassian Corp. PLC (a) | 17,863 | 4,167,081 | |
| Autodesk, Inc. (a) | 97,986 | 28,010,278 | |
| Avalara, Inc. (a) | 17,133 | 2,264,469 | |
| BTRS Holdings, Inc. (d) | 78,632 | 1,124,438 | |
| BTRS Holdings, Inc. (a) | 1,700 | 24,310 | |
| Cloudflare, Inc. (a)(b) | 1,139,237 | 93,485,788 | |
| Coupa Software, Inc. (a) | 7,754 | 1,847,003 | |
| Crowdstrike Holdings, Inc. (a) | 30,627 | 6,803,788 | |
| Datadog, Inc. Class A (a) | 9,473 | 862,517 | |
| DocuSign, Inc. (a) | 14,415 | 2,906,352 | |
| DoubleVerify Holdings, Inc. (a) | 29,844 | 1,100,945 | |
| Elastic NV (a) | 23,523 | 2,780,654 | |
| Epic Games, Inc. (d)(e) | 5,000 | 4,425,000 | |
| HubSpot, Inc. (a) | 66,529 | 33,555,897 | |
| Intuit, Inc. | 68,804 | 30,211,148 | |
| Lightspeed POS, Inc. (b) | 69,124 | 4,976,237 | |
| LivePerson, Inc. (a) | 167,790 | 9,220,061 | |
| Microsoft Corp. | 2,158,669 | 538,976,476 | |
| Nutanix, Inc. Class A (a)(b) | 2,355,578 | 74,224,263 | |
| Olo, Inc. (a)(b) | 22,776 | 770,968 | |
| Oracle Corp. | 322,495 | 25,393,256 | |
| Paycom Software, Inc. (a) | 12,926 | 4,260,410 | |
| Paylocity Holding Corp. (a) | 18,888 | 3,207,749 | |
| Privia Health Group, Inc. (a) | 47,670 | 1,560,239 | |
| Procore Technologies, Inc. (a) | 12,093 | 1,045,077 | |
| RingCentral, Inc. (a) | 6,096 | 1,600,017 | |
| Salesforce.com, Inc. (a) | 1,276,383 | 303,906,792 | |
| Slack Technologies, Inc. Class A (a) | 148,378 | 6,534,567 | |
| Stripe, Inc. Class B (a)(d)(e) | 38,500 | 1,544,813 | |
| The Trade Desk, Inc. (a) | 18,396 | 10,819,423 | |
| Tuya, Inc. ADR (a)(b) | 36,638 | 874,183 | |
| UiPath, Inc. Class A (a)(b) | 33,061 | 2,638,929 | |
| Workday, Inc. Class A (a) | 21,791 | 4,984,038 | |
| Zendesk, Inc. (a) | 183,390 | 25,062,077 | |
| Zoom Video Communications, Inc. Class A (a) | 52,628 | 17,447,761 | |
| Zscaler, Inc. (a) | 86,603 | 16,818,303 | |
| 1,342,083,842 | |||
| Technology Hardware, Storage & Peripherals - 6.4% | |||
| Apple, Inc. | 5,864,402 | 730,763,133 | |
| Pure Storage, Inc. Class A (a)(b) | 1,352,255 | 25,760,458 | |
| Samsung Electronics Co. Ltd. | 100,405 | 7,291,938 | |
| 763,815,529 | |||
| TOTAL INFORMATION TECHNOLOGY | 4,262,771,134 | ||
| MATERIALS - 1.4% | |||
| Chemicals - 0.5% | |||
| Albemarle Corp. U.S. | 17,144 | 2,864,420 | |
| Corteva, Inc. | 653,655 | 29,741,303 | |
| Dow, Inc. | 99,599 | 6,814,564 | |
| DuPont de Nemours, Inc. | 193,496 | 16,367,827 | |
| The Mosaic Co. | 107,569 | 3,887,544 | |
| 59,675,658 | |||
| Containers & Packaging - 0.2% | |||
| Ball Corp. | 188,164 | 15,459,554 | |
| Sealed Air Corp. | 142,741 | 8,116,253 | |
| 23,575,807 | |||
| Metals & Mining - 0.7% | |||
| Barrick Gold Corp. (Canada) | 540,438 | 12,823,649 | |
| Freeport-McMoRan, Inc. | 1,479,446 | 63,201,933 | |
| Newmont Corp. | 54,091 | 3,974,607 | |
| Rio Tinto PLC sponsored ADR (b) | 100,729 | 8,806,736 | |
| 88,806,925 | |||
| TOTAL MATERIALS | 172,058,390 | ||
| REAL ESTATE - 0.3% | |||
| Equity Real Estate Investment Trusts (REITs) - 0.2% | |||
| American Tower Corp. | 50,368 | 12,867,009 | |
| Simon Property Group, Inc. | 126,236 | 16,220,064 | |
| 29,087,073 | |||
| Real Estate Management & Development - 0.1% | |||
| Compass, Inc. (a)(b) | 111,789 | 1,502,444 | |
| KE Holdings, Inc. ADR (a) | 91,302 | 4,737,661 | |
| 6,240,105 | |||
| TOTAL REAL ESTATE | 35,327,178 | ||
| TOTAL COMMON STOCKS | |||
| (Cost $8,325,576,877) | 11,830,107,549 | ||
| Preferred Stocks - 1.2% | |||
| Convertible Preferred Stocks - 1.1% | |||
| COMMUNICATION SERVICES - 0.0% | |||
| Diversified Telecommunication Services - 0.0% | |||
| Starry, Inc.: | |||
| Series D (a)(d)(e) | 574,100 | 964,488 | |
| Series E3 (d)(e) | 767,218 | 1,288,926 | |
| 2,253,414 | |||
| CONSUMER DISCRETIONARY - 0.3% | |||
| Automobiles - 0.2% | |||
| Bird Rides, Inc. (d) | 499,751 | 3,736,458 | |
| Bird Rides, Inc. Series D (d) | 4,500 | 33,645 | |
| Rad Power Bikes, Inc.: | |||
| Series A (d)(e) | 22,348 | 107,803 | |
| Series C (d)(e) | 87,936 | 424,189 | |
| Rivian Automotive, Inc.: | |||
| Series E (d)(e) | 338,639 | 12,478,847 | |
| Series F (d)(e) | 222,207 | 8,188,328 | |
| 24,969,270 | |||
| Internet & Direct Marketing Retail - 0.1% | |||
| GoBrands, Inc. Series G (d)(e) | 19,907 | 4,971,122 | |
| Instacart, Inc.: | |||
| Series H (d)(e) | 12,458 | 1,557,250 | |
| Series I (d)(e) | 6,009 | 751,125 | |
| Reddit, Inc. Series E (d)(e) | 4,501 | 191,176 | |
| 7,470,673 | |||
| Specialty Retail - 0.0% | |||
| Fanatics, Inc.: | |||
| Series E (d)(e) | 83,710 | 2,918,968 | |
| Series F (d)(e) | 74,688 | 2,604,371 | |
| 5,523,339 | |||
| Textiles, Apparel & Luxury Goods - 0.0% | |||
| Allbirds, Inc.: | |||
| Series D (a)(d)(e) | 19,989 | 215,481 | |
| Series Seed (a)(d)(e) | 26,124 | 281,617 | |
| Freenome, Inc. Series C (d)(e) | 141,369 | 1,109,747 | |
| Nuvalent, Inc. Series B (d)(e) | 506,797 | 1,048,968 | |
| 2,655,813 | |||
| TOTAL CONSUMER DISCRETIONARY | 40,619,095 | ||
| CONSUMER STAPLES - 0.1% | |||
| Food & Staples Retailing - 0.1% | |||
| Blink Health, Inc. Series C (a)(d)(e) | 125,782 | 4,105,524 | |
| Sweetgreen, Inc.: | |||
| Series C (a)(d)(e) | 54 | 710 | |
| Series D (a)(d)(e) | 862 | 11,335 | |
| Series I (a)(d)(e) | 2,032 | 26,721 | |
| Series J (d)(e) | 130,426 | 1,715,102 | |
| 5,859,392 | |||
| Food Products - 0.0% | |||
| Bowery Farming, Inc. Series C1 (d)(e) | 27,155 | 1,636,070 | |
| TOTAL CONSUMER STAPLES | 7,495,462 | ||
| FINANCIALS - 0.0% | |||
| Diversified Financial Services - 0.0% | |||
| Paragon Biosciences Emalex Capital, Inc. Series C (d)(e) | 109,967 | 1,176,647 | |
| Sonder Holdings, Inc. Series E (a)(d) | 168,483 | 2,382,139 | |
| 3,558,786 | |||
| HEALTH CARE - 0.4% | |||
| Biotechnology - 0.3% | |||
| Adagio Theraputics, Inc.: | |||
| Series A (d)(e) | 55,836 | 4,359,998 | |
| Series B (d)(e) | 18,173 | 1,419,053 | |
| Series C (d)(e) | 97,444 | 7,608,991 | |
| Ambrx, Inc.: | |||
| Series A (d)(e) | 236,166 | 486,502 | |
| Series B (d)(e) | 212,549 | 437,851 | |
| Bright Peak Therapeutics AG Series B (d)(e) | 282,257 | 1,102,496 | |
| Caris Life Sciences, Inc. Series D (d)(e) | 258,638 | 2,094,968 | |
| Century Therapeutics, Inc. Series C (d)(e) | 772,563 | 5,000,002 | |
| Element Biosciences, Inc. Series B (a)(d)(e) | 125,057 | 940,429 | |
| ElevateBio LLC Series C (d)(e) | 247,600 | 1,038,682 | |
| EQRx, Inc. Series B (d)(e) | 1,029,769 | 3,418,833 | |
| Inscripta, Inc.: | |||
| Series D (d)(e) | 277,957 | 2,454,360 | |
| Series E (d)(e) | 215,182 | 1,900,057 | |
| National Resilience, Inc. Series B (d)(e) | 182,315 | 2,490,423 | |
| Omega Therapeutics, Inc. Series C (d)(e) | 316,793 | 950,379 | |
| 35,703,024 | |||
| Health Care Equipment & Supplies - 0.0% | |||
| Kardium, Inc. Series D6 (d)(e) | 1,087,032 | 1,104,251 | |
| Health Care Providers & Services - 0.1% | |||
| Boundless Bio, Inc. Series B (d)(e) | 756,226 | 1,020,905 | |
| Conformal Medical, Inc. Series C (d)(e) | 140,186 | 612,613 | |
| Scorpion Therapeutics, Inc. Series B (d)(e) | 260,848 | 631,103 | |
| 2,264,621 | |||
| Health Care Technology - 0.0% | |||
| Aledade, Inc. Series B1 (d)(e) | 26,096 | 999,234 | |
| PrognomIQ, Inc.: | |||
| Series A5 (d)(e) | 37,950 | 126,753 | |
| Series B (d)(e) | 196,968 | 657,873 | |
| 1,783,860 | |||
| Pharmaceuticals - 0.0% | |||
| Castle Creek Pharmaceutical Holdings, Inc. Series C (a)(d)(e) | 582 | 381,321 | |
| TOTAL HEALTH CARE | 41,237,077 | ||
| INDUSTRIALS - 0.1% | |||
| Aerospace & Defense - 0.1% | |||
| Space Exploration Technologies Corp. Series N (d)(e) | 19,900 | 8,357,801 | |
| Construction & Engineering - 0.0% | |||
| Beta Technologies, Inc. Series A (d)(e) | 10,545 | 772,632 | |
| Transportation Infrastructure - 0.0% | |||
| Delhivery Pvt Ltd. Series H (d)(e) | 4,860 | 2,389,505 | |
| TOTAL INDUSTRIALS | 11,519,938 | ||
| INFORMATION TECHNOLOGY - 0.1% | |||
| Communications Equipment - 0.0% | |||
| Xsight Labs Ltd. Series D (d)(e) | 122,201 | 977,119 | |
| Electronic Equipment & Components - 0.0% | |||
| Enevate Corp. Series E (d)(e) | 754,820 | 836,857 | |
| IT Services - 0.1% | |||
| ByteDance Ltd. Series E1 (d)(e) | 49,039 | 5,373,408 | |
| Riskified Ltd.: | |||
| Series D (d)(e) | 16,900 | 194,350 | |
| Series E (a)(d)(e) | 20,000 | 230,000 | |
| 5,797,758 | |||
| Semiconductors & Semiconductor Equipment - 0.0% | |||
| SiMa Ai Series B (d)(e) | 299,482 | 1,535,564 | |
| Tenstorrent, Inc. Series C1 (d)(e) | 16,900 | 1,004,778 | |
| 2,540,342 | |||
| Software - 0.0% | |||
| Databricks, Inc. Series G (d)(e) | 12,605 | 2,235,722 | |
| Evozyne LLC Series A (d)(e) | 78,000 | 1,752,660 | |
| Nuvia, Inc. Series B (d) | 212,200 | 173,414 | |
| Stripe, Inc. Series H (d)(e) | 14,400 | 577,800 | |
| 4,739,596 | |||
| TOTAL INFORMATION TECHNOLOGY | 14,891,672 | ||
| MATERIALS - 0.1% | |||
| Metals & Mining - 0.1% | |||
| Diamond Foundry, Inc. Series C (d)(e) | 301,038 | 7,224,912 | |
| UTILITIES - 0.0% | |||
| Independent Power and Renewable Electricity Producers - 0.0% | |||
| Redwood Materials Series C (d)(e) | 20,469 | 970,302 | |
| TOTAL CONVERTIBLE PREFERRED STOCKS | 129,770,658 | ||
| Nonconvertible Preferred Stocks - 0.1% | |||
| COMMUNICATION SERVICES - 0.1% | |||
| Diversified Telecommunication Services - 0.1% | |||
| Starry, Inc. Series E1 (d)(e) | 2,971,163 | 4,991,554 | |
| CONSUMER DISCRETIONARY - 0.0% | |||
| Automobiles - 0.0% | |||
| Waymo LLC Series A2 (d)(e) | 6,592 | 566,037 | |
| Specialty Retail - 0.0% | |||
| Cazoo Holdings Ltd.: | |||
| Series A (d) | 833 | 25,424 | |
| Series B (d) | 14,586 | 445,182 | |
| Series C (d) | 296 | 9,034 | |
| Series D (d) | 52,108 | 1,590,399 | |
| 2,070,039 | |||
| TOTAL CONSUMER DISCRETIONARY | 2,636,076 | ||
| TOTAL NONCONVERTIBLE PREFERRED STOCKS | 7,627,630 | ||
| TOTAL PREFERRED STOCKS | |||
| (Cost $115,011,333) | 137,398,288 | ||
| Principal Amount | Value | ||
| Convertible Bonds - 0.0% | |||
| CONSUMER DISCRETIONARY - 0.0% | |||
| Automobiles - 0.0% | |||
| Neutron Holdings, Inc.: | |||
| 4% 5/22/27 (d)(e) | 310,600 | 310,600 | |
| 4% 6/12/27 (d)(e) | 82,200 | 82,200 | |
| 392,800 | |||
| Textiles, Apparel & Luxury Goods - 0.0% | |||
| AbSci Corp. 6% (e)(g) | 1,881,500 | 1,881,500 | |
| TOTAL CONSUMER DISCRETIONARY | 2,274,300 | ||
| CONSUMER STAPLES - 0.0% | |||
| Food & Staples Retailing - 0.0% | |||
| The Real Good Food Co. LLC 1% (d)(e)(g) | 1,437,000 | 1,437,000 | |
| FINANCIALS - 0.0% | |||
| Diversified Financial Services - 0.0% | |||
| Sonder Holdings, Inc. 0% (d)(e)(g) | 1,561,474 | 1,561,474 | |
| TOTAL CONVERTIBLE BONDS | |||
| (Cost $5,272,774) | 5,272,774 | ||
| Preferred Securities - 0.0% | |||
| CONSUMER DISCRETIONARY - 0.0% | |||
| Internet & Direct Marketing Retail - 0.0% | |||
| Circle Internet Financial Ltd. 0% (d)(e)(g) | 2,073,500 | 2,073,500 | |
| HEALTH CARE - 0.0% | |||
| Health Care Equipment & Supplies - 0.0% | |||
| Kardium, Inc. 0% (d)(e)(g) | 1,541,987 | 1,541,987 | |
| INFORMATION TECHNOLOGY - 0.0% | |||
| Electronic Equipment & Components - 0.0% | |||
| Enevate Corp. 0% 1/29/23 (d)(e) | 321,369 | 321,369 | |
| Semiconductors & Semiconductor Equipment - 0.0% | |||
| Tenstorrent, Inc. 0% (d)(e)(g) | 940,000 | 940,000 | |
| TOTAL INFORMATION TECHNOLOGY | 1,261,369 | ||
| TOTAL PREFERRED SECURITIES | |||
| (Cost $4,876,856) | 4,876,856 | ||
| Shares | Value | ||
| Money Market Funds - 2.1% | |||
| Fidelity Cash Central Fund 0.03% (h) | 25,584,513 | 25,589,630 | |
| Fidelity Securities Lending Cash Central Fund 0.03% (h)(i) | 224,111,353 | 224,133,764 | |
| TOTAL MONEY MARKET FUNDS | |||
| (Cost $249,723,394) | 249,723,394 | ||
| TOTAL INVESTMENT IN SECURITIES - 101.9% | |||
| (Cost $8,700,461,234) | 12,227,378,861 | ||
| NET OTHER ASSETS (LIABILITIES) - (1.9)% | (223,026,082) | ||
| NET ASSETS - 100% | $12,004,352,779 |
Legend
(a) Non-income producing
(b) Security or a portion of the security is on loan at period end.
(c) Security exempt from registration under Rule 144A of the Securities Act of 1933. These securities may be resold in transactions exempt from registration, normally to qualified institutional buyers. At the end of the period, the value of these securities amounted to $92,828,083 or 0.8% of net assets.
(d) Restricted securities (including private placements) - Investment in securities not registered under the Securities Act of 1933 (excluding 144A issues). At the end of the period, the value of restricted securities (excluding 144A issues) amounted to $207,407,626 or 1.7% of net assets.
(e) Level 3 security
(f) Investment is owned by a wholly-owned subsidiary (Subsidiary) that is treated as a corporation for U.S. tax purposes.
(g) Security is perpetual in nature with no stated maturity date.
(h) Affiliated fund that is generally available only to investment companies and other accounts managed by Fidelity Investments. The rate quoted is the annualized seven-day yield of the fund at period end. A complete unaudited listing of the fund's holdings as of its most recent quarter end is available upon request. In addition, each Fidelity Central Fund's financial statements are available on the SEC's website or upon request.
(i) Investment made with cash collateral received from securities on loan.
Additional information on each restricted holding is as follows:
| Security | Acquisition Date | Acquisition Cost |
| Adagio Theraputics, Inc. Series A | 7/15/20 | $446,688 |
| Adagio Theraputics, Inc. Series B | 11/4/20 | $1,030,773 |
| Adagio Theraputics, Inc. Series C | 4/16/21 | $7,608,991 |
| Adimab LLC | 1/19/21 | $10,000,008 |
| Aledade, Inc. Series B1 | 5/7/21 | $999,234 |
| Allbirds, Inc. Series D | 12/23/19 | $257,574 |
| Allbirds, Inc. Series Seed | 1/23/20 | $257,583 |
| Ambrx, Inc. Series A | 11/6/20 | $369,170 |
| Ambrx, Inc. Series B | 11/6/20 | $369,169 |
| AppHarvest, Inc. | 1/29/21 | $2,480,180 |
| Arrival Group | 3/24/21 | $4,044,420 |
| Beta Technologies, Inc. Series A | 4/9/21 | $772,632 |
| Bird Rides, Inc. | 2/12/21 - 4/20/21 | $2,583,262 |
| Bird Rides, Inc. Series D | 9/30/19 | $58,130 |
| Blink Health, Inc. Series A1 | 12/30/20 | $1,786,125 |
| Blink Health, Inc. Series C | 11/7/19 - 1/21/21 | $4,801,854 |
| Boundless Bio, Inc. Series B | 4/23/21 | $1,020,905 |
| Bowery Farming, Inc. Series C1 | 5/18/21 | $1,636,070 |
| Bright Peak Therapeutics AG Series B | 5/14/21 | $1,102,496 |
| BTRS Holdings, Inc. | 1/12/21 | $786,320 |
| ByteDance Ltd. Series E1 | 11/18/20 | $5,373,408 |
| Caris Life Sciences, Inc. Series D | 5/11/21 | $2,094,968 |
| Castle Creek Pharmaceutical Holdings, Inc. Series C | 12/9/19 | $239,697 |
| Cazoo Holdings Ltd. | 9/30/20 | $349,878 |
| Cazoo Holdings Ltd. Series A | 9/30/20 | $11,420 |
| Cazoo Holdings Ltd. Series B | 9/30/20 | $199,974 |
| Cazoo Holdings Ltd. Series C | 9/30/20 | $4,058 |
| Cazoo Holdings Ltd. Series D | 9/30/20 | $714,399 |
| Century Therapeutics, Inc. Series C | 2/25/21 | $5,000,002 |
| Circle Internet Financial Ltd. 0% | 5/11/21 | $2,073,500 |
| Conformal Medical, Inc. Series C | 7/24/20 | $514,071 |
| Databricks, Inc. Series G | 2/1/21 | $2,235,722 |
| Delhivery Pvt Ltd. Series H | 5/20/21 | $2,372,281 |
| Diamond Foundry, Inc. Series C | 3/15/21 | $7,224,912 |
| Dragonfly Therapeutics, Inc. | 12/19/19 | $830,209 |
| Element Biosciences, Inc. Series B | 12/13/19 | $655,374 |
| ElevateBio LLC Series C | 3/9/21 | $1,038,682 |
| Enevate Corp. Series E | 1/29/21 | $836,858 |
| Enevate Corp. 0% 1/29/23 | 1/29/21 | $321,369 |
| Epic Games, Inc. | 7/13/20 - 7/30/20 | $2,875,000 |
| EQRx, Inc. Series B | 11/19/20 | $2,823,524 |
| Evozyne LLC Series A | 4/9/21 | $1,752,660 |
| Fanatics, Inc. Series E | 8/13/20 | $1,447,346 |
| Fanatics, Inc. Series F | 3/22/21 | $2,604,371 |
| Freenome, Inc. Series C | 8/14/20 | $934,916 |
| Gemini Therapeutics, Inc. | 2/5/21 | $963,630 |
| GoBrands, Inc. Series G | 3/2/21 | $4,971,122 |
| Inscripta, Inc. Series D | 11/13/20 | $1,270,263 |
| Inscripta, Inc. Series E | 3/30/21 | $1,900,057 |
| Instacart, Inc. Series H | 11/13/20 | $747,480 |
| Instacart, Inc. Series I | 2/26/21 | $751,125 |
| Kardium, Inc. Series D6 | 12/30/20 | $1,104,251 |
| Kardium, Inc. 0% | 12/30/20 | $1,541,987 |
| Lordstown Motors Corp. | 10/23/20 | $1,306,890 |
| National Resilience, Inc. Series B | 12/1/20 | $2,490,423 |
| Neutron Holdings, Inc. 4% 5/22/27 | 6/4/20 | $310,600 |
| Neutron Holdings, Inc. 4% 6/12/27 | 6/12/20 | $82,200 |
| Nuvalent, Inc. Series B | 4/30/21 | $1,048,968 |
| Nuvation Bio, Inc. | 2/10/21 | $3,128,400 |
| Nuvia, Inc. Series B | 3/16/21 | $173,413 |
| Omega Therapeutics, Inc. Series C | 3/17/21 | $950,379 |
| On Holding AG | 2/6/20 | $1,166,429 |
| Paragon Biosciences Emalex Capital, Inc. Series C | 2/26/21 | $1,176,647 |
| PrognomIQ, Inc. Series A5 | 8/20/20 | $22,922 |
| PrognomIQ, Inc. Series B | 9/11/20 | $450,094 |
| Rad Power Bikes, Inc. | 1/21/21 | $826,883 |
| Rad Power Bikes, Inc. Series A | 1/21/21 | $107,803 |
| Rad Power Bikes, Inc. Series C | 1/21/21 | $424,189 |
| Reddit, Inc. Series E | 5/18/21 | $191,176 |
| Redwood Materials Series C | 5/28/21 | $970,302 |
| Riskified Ltd. | 12/20/19 - 4/15/20 | $252,754 |
| Riskified Ltd. Series D | 11/18/20 | $194,350 |
| Riskified Ltd. Series E | 10/28/19 | $190,288 |
| Riskified Ltd. warrants | 10/28/19 | $0 |
| Rivian Automotive, Inc. Series E | 7/10/20 | $5,245,518 |
| Rivian Automotive, Inc. Series F | 1/19/21 | $8,188,328 |
| Rush Street Interactive, Inc. | 12/29/20 | $448,740 |
| Scorpion Therapeutics, Inc. Series B | 1/8/21 | $631,103 |
| Seer, Inc. Class A | 12/8/20 | $1,157,803 |
| SiMa Ai Series B | 5/10/21 | $1,535,564 |
| Skyhawk Therapeutics, Inc. | 5/21/21 | $2,094,864 |
| Social Finance, Inc. | 1/7/21 | $1,808,330 |
| Sonder Holdings, Inc. Series E | 4/3/20 - 5/6/20 | $1,814,040 |
| Sonder Holdings, Inc. 0% | 3/18/21 | $1,561,474 |
| Space Exploration Technologies Corp. Class A | 2/16/21 | $1,637,961 |
| Space Exploration Technologies Corp. Series N | 8/4/20 | $5,373,000 |
| Starry, Inc. Series D | 7/30/20 | $820,963 |
| Starry, Inc. Series E1 | 9/4/20 | $4,179,036 |
| Starry, Inc. Series E3 | 3/31/21 | $1,288,926 |
| Stripe, Inc. Class B | 5/18/21 | $1,544,943 |
| Stripe, Inc. Series H | 3/15/21 | $577,800 |
| Sweetgreen, Inc. warrants 1/21/26 | 1/21/21 | $0 |
| Sweetgreen, Inc. Series C | 9/13/19 | $923 |
| Sweetgreen, Inc. Series D | 9/13/19 | $14,740 |
| Sweetgreen, Inc. Series I | 9/13/19 | $34,747 |
| Sweetgreen, Inc. Series J | 1/21/21 | $2,230,285 |
| Tenstorrent, Inc. Series C1 | 4/23/21 | $1,004,778 |
| Tenstorrent, Inc. 0% | 4/23/21 | $940,000 |
| The Beauty Health Co. | 12/8/20 | $4,286,430 |
| The Real Good Food Co. LLC 1% | 5/7/21 | $1,437,000 |
| Waymo LLC Series A2 | 5/8/20 | $566,037 |
| Xsight Labs Ltd. Series D | 2/16/21 | $977,119 |
| Yumanity Therapeutics, Inc. | 12/22/20 | $444,314 |
| Zomato Pvt Ltd. | 12/9/20 - 2/10/21 | $3,169,182 |
Affiliated Central Funds
Information regarding fiscal year to date income earned by the Fund from investments in Fidelity Central Funds is as follows:
| Fund | Income earned |
| Fidelity Cash Central Fund | $14,284 |
| Fidelity Securities Lending Cash Central Fund | 581,585 |
| Total | $595,869 |
Amounts in the income column in the above table include any capital gain distributions from underlying funds, which are presented in the corresponding line-item in the Statement of Operations, if applicable. Amount for Fidelity Securities Lending Cash Central Fund represents the income earned on investing cash collateral, less rebates paid to borrowers and any lending agent fees associated with the loan, plus any premium payments received for lending certain types of securities.
Investment Valuation
The following is a summary of the inputs used, as of May 31, 2021, involving the Fund's assets and liabilities carried at fair value. The inputs or methodology used for valuing securities may not be an indication of the risk associated with investing in those securities. For more information on valuation inputs, and their aggregation into the levels used below, please refer to the Investment Valuation section in the accompanying Notes to Financial Statements.
| Valuation Inputs at Reporting Date: | ||||
| Description | Total | Level 1 | Level 2 | Level 3 |
| Investments in Securities: | ||||
| Equities: | ||||
| Communication Services | $1,494,357,854 | $1,487,112,886 | $-- | $7,244,968 |
| Consumer Discretionary | 2,611,335,033 | 2,551,785,799 | 15,156,662 | 44,392,572 |
| Consumer Staples | 330,395,917 | 316,310,194 | 3,923,025 | 10,162,698 |
| Energy | 108,923,973 | 108,365,789 | 558,184 | -- |
| Financials | 241,573,886 | 229,242,205 | 11,155,034 | 1,176,647 |
| Health Care | 1,919,427,510 | 1,852,777,978 | 12,437,427 | 54,212,105 |
| Industrials | 768,248,076 | 755,090,177 | -- | 13,157,899 |
| Information Technology | 4,277,662,806 | 4,256,643,282 | -- | 21,019,524 |
| Materials | 179,283,302 | 172,058,390 | -- | 7,224,912 |
| Real Estate | 35,327,178 | 35,327,178 | -- | -- |
| Utilities | 970,302 | -- | -- | 970,302 |
| Corporate Bonds | 5,272,774 | -- | -- | 5,272,774 |
| Preferred Securities | 4,876,856 | -- | -- | 4,876,856 |
| Money Market Funds | 249,723,394 | 249,723,394 | -- | -- |
| Total Investments in Securities: | $12,227,378,861 | $12,014,437,272 | $43,230,332 | $169,711,257 |
| Net unrealized depreciation on unfunded commitments | $(770,025) | $-- | $(770,025) | $-- |
The following is a reconciliation of Investments in Securities for which Level 3 inputs were used in determining value:
| Investments in Securities: | |
| Beginning Balance | $51,146,817 |
| Net Realized Gain (Loss) on Investment Securities | 94 |
| Net Unrealized Gain (Loss) on Investment Securities | 20,349,533 |
| Cost of Purchases | 104,618,143 |
| Proceeds of Sales | (104) |
| Amortization/Accretion | -- |
| Transfers into Level 3 | 4,210,531 |
| Transfers out of Level 3 | (10,613,757) |
| Ending Balance | $169,711,257 |
| The change in unrealized gain (loss) for the period attributable to Level 3 securities held at May 31, 2021 | $20,349,533 |
The information used in the above reconciliation represents fiscal year to date activity for any Investments in Securities identified as using Level 3 inputs at either the beginning or the end of the current fiscal period. Cost of purchases and proceeds of sales may include securities received and/or delivered through in-kind transactions. Transfers in or out of Level 3 represent the beginning value of any Security or Instrument where a change in the pricing level occurred from the beginning to the end of the period. The cost of purchases and the proceeds of sales may include securities received or delivered through corporate actions or exchanges. Realized and unrealized gains (losses) disclosed in the reconciliation are included in Net Gain (Loss) on the Fund's Statement of Operations.
Other Information
Distribution of investments by country or territory of incorporation, as a percentage of Total Net Assets, is as follows (Unaudited):
| United States of America | 89.7% |
| Cayman Islands | 3.1% |
| Canada | 2.2% |
| Bailiwick of Jersey | 1.4% |
| Others (Individually Less Than 1%) | 3.6% |
| 100.0% |
See accompanying notes which are an integral part of the financial statements.
Financial Statements
Statement of Assets and Liabilities
| May 31, 2021 (Unaudited) | ||
| Assets | ||
| Investment in securities, at value (including securities loaned of $217,675,354) — See accompanying schedule: Unaffiliated issuers (cost $8,450,737,840) | $11,977,655,467 | |
| Fidelity Central Funds (cost $249,723,394) | 249,723,394 | |
| Total Investment in Securities (cost $8,700,461,234) | $12,227,378,861 | |
| Foreign currency held at value (cost $226,921) | 226,923 | |
| Receivable for investments sold | 7,912,393 | |
| Receivable for fund shares sold | 12,413,590 | |
| Net unrealized appreciation on unfunded commitments | 2,441,361 | |
| Dividends receivable | 3,635,204 | |
| Interest receivable | 40,025 | |
| Distributions receivable from Fidelity Central Funds | 58,155 | |
| Other receivables | 30,388 | |
| Total assets | 12,254,136,900 | |
| Liabilities | ||
| Payable for investments purchased | $7,403,386 | |
| Payable for fund shares redeemed | 10,059,199 | |
| Net unrealized depreciation on unfunded commitments | 3,211,386 | |
| Accrued management fee | 4,314,921 | |
| Other payables and accrued expenses | 664,011 | |
| Collateral on securities loaned | 224,131,218 | |
| Total liabilities | 249,784,121 | |
| Net Assets | $12,004,352,779 | |
| Net Assets consist of: | ||
| Paid in capital | $8,216,932,073 | |
| Total accumulated earnings (loss) | 3,787,420,706 | |
| Net Assets | $12,004,352,779 | |
| Net Asset Value, offering price and redemption price per share ($12,004,352,779 ÷ 578,099,582 shares) | $20.77 |
See accompanying notes which are an integral part of the financial statements.
Statement of Operations
| Six months ended May 31, 2021 (Unaudited) | ||
| Investment Income | ||
| Dividends | $20,720,888 | |
| Interest | 32,200 | |
| Income from Fidelity Central Funds (including $581,585 from security lending) | 595,869 | |
| Total income | 21,348,957 | |
| Expenses | ||
| Management fee | $22,897,264 | |
| Independent trustees' fees and expenses | 17,754 | |
| Total expenses before reductions | 22,915,018 | |
| Expense reductions | (93,936) | |
| Total expenses after reductions | 22,821,082 | |
| Net investment income (loss) | (1,472,125) | |
| Realized and Unrealized Gain (Loss) | ||
| Net realized gain (loss) on: | ||
| Investment securities: | ||
| Unaffiliated issuers (net of foreign taxes of $4,924) | 285,565,796 | |
| Fidelity Central Funds | (262) | |
| Foreign currency transactions | 8,027 | |
| Total net realized gain (loss) | 285,573,561 | |
| Change in net unrealized appreciation (depreciation) on: | ||
| Investment securities: | ||
| Unaffiliated issuers (net of increase in deferred foreign taxes of $142,929) | 807,035,549 | |
| Change in net unrealilzed appreciation (depreciation) on unfunded commitments | (770,025) | |
| Assets and liabilities in foreign currencies | 812 | |
| Total change in net unrealized appreciation (depreciation) | 806,266,336 | |
| Net gain (loss) | 1,091,839,897 | |
| Net increase (decrease) in net assets resulting from operations | $1,090,367,772 |
See accompanying notes which are an integral part of the financial statements.
Statement of Changes in Net Assets
| Six months ended May 31, 2021 (Unaudited) | Year ended November 30, 2020 | |
| Increase (Decrease) in Net Assets | ||
| Operations | ||
| Net investment income (loss) | $(1,472,125) | $609,818 |
| Net realized gain (loss) | 285,573,561 | 59,564,376 |
| Change in net unrealized appreciation (depreciation) | 806,266,336 | 2,540,884,124 |
| Net increase (decrease) in net assets resulting from operations | 1,090,367,772 | 2,601,058,318 |
| Distributions to shareholders | (77,746,793) | (1,201,125) |
| Share transactions | ||
| Proceeds from sales of shares | 4,162,297,104 | 4,741,067,060 |
| Reinvestment of distributions | 77,746,793 | 1,201,125 |
| Cost of shares redeemed | (1,248,400,948) | (1,195,679,272) |
| Net increase (decrease) in net assets resulting from share transactions | 2,991,642,949 | 3,546,588,913 |
| Total increase (decrease) in net assets | 4,004,263,928 | 6,146,446,106 |
| Net Assets | ||
| Beginning of period | 8,000,088,851 | 1,853,642,745 |
| End of period | $12,004,352,779 | $8,000,088,851 |
| Other Information | ||
| Shares | ||
| Sold | 208,068,076 | 348,526,504 |
| Issued in reinvestment of distributions | 4,040,894 | 103,635 |
| Redeemed | (62,555,017) | (85,772,122) |
| Net increase (decrease) | 149,553,953 | 262,858,017 |
See accompanying notes which are an integral part of the financial statements.
Financial Highlights
Fidelity Growth Company K6 Fund
| Six months ended (Unaudited) May 31, | Years endedNovember 30, | ||
| 2021 | 2020 | 2019 A | |
| Selected Per–Share Data | |||
| Net asset value, beginning of period | $18.67 | $11.19 | $10.00 |
| Income from Investment Operations | |||
| Net investment income (loss)B | –C | –C | .01 |
| Net realized and unrealized gain (loss) | 2.28 | 7.49 | 1.18 |
| Total from investment operations | 2.28 | 7.49 | 1.19 |
| Distributions from net investment income | (.02) | (.01) | – |
| Distributions from net realized gain | (.16) | – | – |
| Total distributions | (.18) | (.01) | – |
| Net asset value, end of period | $20.77 | $18.67 | $11.19 |
| Total ReturnD,E | 12.28% | 66.95% | 11.90% |
| Ratios to Average Net AssetsF,G | |||
| Expenses before reductions | .45%H | .45% | .45%H |
| Expenses net of fee waivers, if any | .45%H | .45% | .45%H |
| Expenses net of all reductions | .45%H | .45% | .45%H |
| Net investment income (loss) | (.03)%H | .01% | .29%H |
| Supplemental Data | |||
| Net assets, end of period (000 omitted) | $12,004,353 | $8,000,089 | $1,853,643 |
| Portfolio turnover rateI | 23%H,J | 18%J | 16%J,K |
A For the period June 13, 2019 (commencement of operations) to November 30, 2019.
B Calculated based on average shares outstanding during the period.
C Amount represents less than $.005 per share.
D Total returns for periods of less than one year are not annualized.
E Total returns would have been lower if certain expenses had not been reduced during the applicable periods shown.
F Fees and expenses of any underlying mutual funds or exchange-traded funds (ETFs) are not included in the Fund's expense ratio. The Fund indirectly bears its proportionate share of these expenses. For additional expense information related to investments in Fidelity Central Funds, please refer to the "Investments in Fidelity Central Funds" note found in the Notes to Financial Statements section of the most recent Annual or Semi-Annual report.
G Expense ratios reflect operating expenses of the class. Expenses before reductions do not reflect amounts reimbursed, waived, or reduced through arrangements with the investment advisor, brokerage services, or other offset arrangements, if applicable, and do not represent the amount paid by the class during periods when reimbursements, waivers or reductions occur.
H Annualized
I Amount does not include the portfolio activity of any underlying mutual funds or exchange-traded funds (ETFs).
J Portfolio turnover rate excludes securities received or delivered in-kind.
K Amount not annualized.
See accompanying notes which are an integral part of the financial statements.
Notes to Financial Statements (Unaudited)
For the period ended May 31, 2021
1. Organization.
Fidelity Growth Company K6 Fund (the Fund) is a fund of Fidelity Mt. Vernon Street Trust (the Trust) and is authorized to issue an unlimited number of shares. Share transactions on the Statement of Changes in Net Assets may contain exchanges between affiliated funds. The Trust is registered under the Investment Company Act of 1940, as amended (the 1940 Act), as an open-end management investment company organized as a Massachusetts business trust. Shares generally are available only to employer-sponsored retirement plans that are recordkept by Fidelity, or to certain employer-sponsored retirement plans that are not recordkept by Fidelity.
2. Investments in Fidelity Central Funds.
Funds may invest in Fidelity Central Funds, which are open-end investment companies generally available only to other investment companies and accounts managed by the investment adviser and its affiliates. The Schedule of Investments lists any Fidelity Central Funds held as an investment as of period end, but does not include the underlying holdings of each Fidelity Central Fund. An investing fund indirectly bears its proportionate share of the expenses of the underlying Fidelity Central Funds.
Based on its investment objective, each Fidelity Central Fund may invest or participate in various investment vehicles or strategies that are similar to those of the investing fund. These strategies are consistent with the investment objectives of the investing fund and may involve certain economic risks which may cause a decline in value of each of the Fidelity Central Funds and thus a decline in the value of the investing fund.
| Fidelity Central Fund | Investment Manager | Investment Objective | Investment Practices | Expense Ratio(a) |
| Fidelity Money Market Central Funds | Fidelity Management & Research Company LLC (FMR) | Each fund seeks to obtain a high level of current income consistent with the preservation of capital and liquidity. | Short-term Investments | Less than .005% to .01% |
(a) Expenses expressed as a percentage of average net assets and are as of each underlying Central Fund's most recent annual or semi-annual shareholder report.
A complete unaudited list of holdings for each Fidelity Central Fund is available upon request or at the Securities and Exchange Commission website at www.sec.gov. In addition, the financial statements of the Fidelity Central Funds which contain the significant accounting policies (including investment valuation policies) of those funds, and are not covered by the Report of Independent Registered Public Accounting Firm, are available on the Securities and Exchange Commission website or upon request.
3. Significant Accounting Policies.
The Fund is an investment company and applies the accounting and reporting guidance of the Financial Accounting Standards Board (FASB) Accounting Standards Codification Topic 946 Financial Services - Investment Companies. The financial statements have been prepared in conformity with accounting principles generally accepted in the United States of America (GAAP), which require management to make certain estimates and assumptions at the date of the financial statements. Actual results could differ from those estimates. Subsequent events, if any, through the date that the financial statements were issued have been evaluated in the preparation of the financial statements. The Fund's Schedule of Investments lists any underlying mutual funds or exchange-traded funds (ETFs) but does not include the underlying holdings of these funds. The following summarizes the significant accounting policies of the Fund:
Investment Valuation. Investments are valued as of 4:00 p.m. Eastern time on the last calendar day of the period. The Board of Trustees (the Board) has delegated the day to day responsibility for the valuation of the Fund's investments to the Fair Value Committee (the Committee) established by the Fund's investment adviser. In accordance with valuation policies and procedures approved by the Board, the Fund attempts to obtain prices from one or more third party pricing vendors or brokers to value its investments. When current market prices, quotations or currency exchange rates are not readily available or reliable, investments will be fair valued in good faith by the Committee, in accordance with procedures adopted by the Board. Factors used in determining fair value vary by investment type and may include market or investment specific events, changes in interest rates and credit quality. The frequency with which these procedures are used cannot be predicted and they may be utilized to a significant extent. The Committee oversees the Fund's valuation policies and procedures and reports to the Board on the Committee's activities and fair value determinations. The Board monitors the appropriateness of the procedures used in valuing the Fund's investments and ratifies the fair value determinations of the Committee.
The Fund categorizes the inputs to valuation techniques used to value its investments into a disclosure hierarchy consisting of three levels as shown below:
- Level 1 – quoted prices in active markets for identical investments
- Level 2 – other significant observable inputs (including quoted prices for similar investments, interest rates, prepayment speeds, etc.)
- Level 3 – unobservable inputs (including the Fund's own assumptions based on the best information available)
Valuation techniques used to value the Fund's investments by major category are as follows:
Equity securities, including restricted securities, for which market quotations are readily available, are valued at the last reported sale price or official closing price as reported by a third party pricing vendor on the primary market or exchange on which they are traded and are categorized as Level 1 in the hierarchy. In the event there were no sales during the day or closing prices are not available, securities are valued at the last quoted bid price or may be valued using the last available price and are generally categorized as Level 2 in the hierarchy. For foreign equity securities, when market or security specific events arise, comparisons to the valuation of American Depositary Receipts (ADRs), futures contracts, ETFs and certain indexes as well as quoted prices for similar securities may be used and would be categorized as Level 2 in the hierarchy. For equity securities, including restricted securities, where observable inputs are limited, assumptions about market activity and risk are used and these securities may be categorized as Level 3 in the hierarchy. Securities, including private placements or other restricted securities, for which observable inputs are not available are valued using alternate valuation approaches, including the market approach, the income approach and cost approach, and are categorized as Level 3 in the hierarchy. The market approach considers factors including the price of recent investments in the same or a similar security or financial metrics of comparable securities. The income approach considers factors including expected future cash flows, security specific risks and corresponding discount rates. The cost approach considers factors including the value of the security's underlying assets and liabilities.
Debt securities, including restricted securities, are valued based on evaluated prices received from third party pricing vendors or from brokers who make markets in such securities. Corporate bonds and preferred securities are valued by pricing vendors who utilize matrix pricing which considers yield or price of bonds of comparable quality, coupon, maturity and type or by broker-supplied prices. When independent prices are unavailable or unreliable, debt securities may be valued utilizing pricing methodologies which consider similar factors that would be used by third party pricing vendors. Debt securities are generally categorized as Level 2 in the hierarchy but may be Level 3 depending on the circumstances.
Investments in open-end mutual funds, including the Fidelity Central Funds, are valued at their closing net asset value (NAV) each business day and are categorized as Level 1 in the hierarchy.
The following provides information on Level 3 securities held by the Fund that were valued at period end based on unobservable inputs. These amounts exclude valuations provided by a broker.
| Asset Type | Fair Value | Valuation Technique(s) | Unobservable Input | Amount or Range/Weighted Average | Impact to Valuation from an Increase in Input(a) |
| Equities | $159,549,017 | Market comparable | Enterprise value/Sales multiple (EV/S) | 4.5 – 5.7 / 5.5 | Increase |
| Premium rate | 7.8% - 45.9% / 39.7% | Increase | |||
| Recovery value | Recovery value | 0.1% | Increase | ||
| Market approach | Transaction price | $0.00 - $885.00 / $97.44 | Increase | ||
| Premium rate | 4.5% - 59.0% / 23.2% | Increase | |||
| Corporate Bonds | $5,272,774 | Market approach | Transaction price | $100.00 | Increase |
| Preferred Securities | $4,876,856 | Market approach | Transaction price | $100.00 | Increase |
(a) Represents the directional change in the fair value of the Level 3 investments that could have resulted from an increase in the corresponding input as of period end. A decrease to the unobservable input would have had the opposite effect. Significant changes in these inputs may have resulted in a significantly higher or lower fair value measurement at period end.
Changes in valuation techniques may result in transfers in or out of an assigned level within the disclosure hierarchy. The aggregate value of investments by input level as of May 31, 2021, as well as a roll forward of Level 3 investments, is included at the end of the Fund's Schedule of Investments.
Foreign Currency. Certain Funds may use foreign currency contracts to facilitate transactions in foreign-denominated securities. Gains and losses from these transactions may arise from changes in the value of the foreign currency or if the counterparties do not perform under the contracts' terms.
Foreign-denominated assets, including investment securities, and liabilities are translated into U.S. dollars at the exchange rates at period end. Purchases and sales of investment securities, income and dividends received, and expenses denominated in foreign currencies are translated into U.S. dollars at the exchange rate in effect on the transaction date.
The effects of exchange rate fluctuations on investments are included with the net realized and unrealized gain (loss) on investment securities. Other foreign currency transactions resulting in realized and unrealized gain (loss) are disclosed separately.
Investment Transactions and Income. For financial reporting purposes, the Fund's investment holdings and NAV include trades executed through the end of the last business day of the period. The NAV per share for processing shareholder transactions is calculated as of the close of business of the New York Stock Exchange (NYSE), normally 4:00 p.m. Eastern time and includes trades executed through the end of the prior business day. Gains and losses on securities sold are determined on the basis of identified cost. Dividend income is recorded on the ex-dividend date, except for certain dividends from foreign securities where the ex-dividend date may have passed, which are recorded as soon as the Fund is informed of the ex-dividend date. Non-cash dividends included in dividend income, if any, are recorded at the fair market value of the securities received. Income and capital gain distributions from Fidelity Central Funds, if any, are recorded on the ex-dividend date. Certain distributions received by the Fund represent a return of capital or capital gain. The Fund determines the components of these distributions subsequent to the ex-dividend date, based upon receipt of tax filings or other correspondence relating to the underlying investment. These distributions are recorded as a reduction of cost of investments and/or as a realized gain. Interest income is accrued as earned and includes coupon interest and amortization of premium and accretion of discount on debt securities as applicable. Investment income is recorded net of foreign taxes withheld where recovery of such taxes is uncertain.
Expenses. Expenses directly attributable to a fund are charged to that fund. Expenses attributable to more than one fund are allocated among the respective funds on the basis of relative net assets or other appropriate methods. Expenses included in the accompanying financial statements reflect the expenses of that fund and do not include any expenses associated with any underlying mutual funds or exchange-traded funds. Although not included in a fund's expenses, a fund indirectly bears its proportionate share of these expenses through the net asset value of each underlying mutual fund or exchange-traded fund. Expense estimates are accrued in the period to which they relate and adjustments are made when actual amounts are known.
Income Tax Information and Distributions to Shareholders. Each year, the Fund intends to qualify as a regulated investment company under Subchapter M of the Internal Revenue Code, including distributing substantially all of its taxable income and realized gains. As a result, no provision for U.S. Federal income taxes is required. The Fund files a U.S. federal tax return, in addition to state and local tax returns as required. The Fund's federal income tax returns are subject to examination by the Internal Revenue Service (IRS) for a period of three fiscal years after they are filed. State and local tax returns may be subject to examination for an additional fiscal year depending on the jurisdiction. Foreign taxes are provided for based on the Fund's understanding of the tax rules and rates that exist in the foreign markets in which it invests. The Fund is subject to a tax imposed on capital gains by certain countries in which it invests. An estimated deferred tax liability for net unrealized appreciation on the applicable securities is included in Other payables and accrued expenses on the Statement of Assets & Liabilities.
Distributions are declared and recorded on the ex-dividend date. Income and capital gain distributions are determined in accordance with income tax regulations, which may differ from GAAP.
Capital accounts within the financial statements are adjusted for permanent book-tax differences. These adjustments have no impact on net assets or the results of operations. Capital accounts are not adjusted for temporary book-tax differences which will reverse in a subsequent period.
Book-tax differences are primarily due to foreign currency transactions, passive foreign investment companies (PFIC), capital loss carryforwards, certain deemed distributions and losses deferred due to wash sales.
As of period end, the cost and unrealized appreciation (depreciation) in securities, and derivatives if applicable, for federal income tax purposes were as follows:
| Gross unrealized appreciation | $3,774,428,200 |
| Gross unrealized depreciation | (267,788,500) |
| Net unrealized appreciation (depreciation) | $3,506,639,700 |
| Tax cost | $8,720,739,161 |
Restricted Securities (including Private Placements). Funds may invest in securities that are subject to legal or contractual restrictions on resale. These securities generally may be resold in transactions exempt from registration or to the public if the securities are registered. Disposal of these securities may involve time-consuming negotiations and expense, and prompt sale at an acceptable price may be difficult. Information regarding restricted securities held at period end is included at the end of the Schedule of Investments, if applicable.
Special Purpose Acquisition Companies. Funds may invest in stock, warrants, and other securities of special purpose acquisition companies (SPACs) or similar special purpose entities. A SPAC is a publicly traded company that raises investment capital via an initial public offering (IPO) for the purpose of acquiring the equity securities of one or more existing companies via merger, business combination, acquisition or other similar transactions within a designated time frame.
Private Investment in Public Equity. Funds may acquire equity securities of an issuer through a private investment in a public equity (PIPE) transaction, including through commitments to purchase securities on a when-issued basis. A PIPE typically involves the purchase of securities directly from a publicly traded company in a private placement transaction. Securities purchased through PIPE transactions will be restricted from trading and considered illiquid until a resale registration statement for the shares is filed and declared effective.
At period end, the Fund had commitments to purchase when-issued securities through PIPE transactions with SPACs. The commitments are contingent upon the SPACs acquiring the securities of target companies. Unrealized appreciation (depreciation) on these commitments is separately presented in the Statements of Assets and Liabilities as Unrealized appreciation (depreciation) on unfunded commitments, and in the Statement of Operations as Change in unrealized appreciation (depreciation) on unfunded commitments.
Consolidated Subsidiary. The Funds included in the table below hold certain investments through a wholly-owned subsidiary ("Subsidiary"), which may be subject to federal and state taxes upon disposition.
As of period end, investments in Subsidiaries were as follows:
| $ Amount | % of Net Assets | |
| Fidelity Growth Company K6 Fund | 10,000,008 | .08 |
The financial statements have been consolidated to include the Subsidiary accounts where applicable. Accordingly, all inter-company transactions and balances have been eliminated.
At period end, any estimated tax liability for these investments is presented as "Deferred taxes" in the Statement of Assets and Liabilities and included in "Change in net unrealized appreciation (depreciation) on investment securities" in the Statement of Operations. The tax liability incurred may differ materially depending on conditions when these investments are disposed. Any cash held by a Subsidiary is restricted as to its use and is presented as "Restricted cash" in the Statement of Assets and Liabilities, if applicable.
4. Purchases and Sales of Investments.
Purchases and sales of securities, other than short-term securities and in-kind transactions are noted in the table below.
| Purchases ($) | Sales ($) | |
| Fidelity Growth Company K6 Fund | 2,022,663,498 | 1,125,490,621 |
Unaffiliated Redemptions In-Kind. During the period, 5,341,171 shares of the Fund were redeemed in-kind for investments and cash with a value of $108,973,891. The net realized gain of $62,366,537 on investments delivered through in-kind redemptions is included in the accompanying Statement of Operations. The amount of the in-kind redemptions is included in share transactions in the accompanying Statement of Changes in Net Assets. The Fund recognized no gain or loss for federal income tax purposes.
Unaffiliated Exchanges In-Kind. During the period, the Fund received investments and cash valued at $2,145,604,841 in exchange for 106,584,664 shares of the Fund. The amount of in-kind exchanges is included in share transactions in the accompanying Statement of Changes in Net Assets.
Prior Fiscal Year Unaffiliated Exchanges In-Kind. During the prior period, the Fund received investments and cash valued at $2,022,673,601 in exchange for 157,433,950 shares of the Fund. The amount of in-kind exchanges is included in share transactions in the accompanying Statement of Changes in Net Assets.
5. Fees and Other Transactions with Affiliates.
Management Fee. Fidelity Management & Research Company LLC (the investment adviser) and its affiliates provide the Fund with investment management related services for which the Fund pays a monthly management fee that is based on an annual rate of .45% of average net assets. Under the management contract, the investment adviser or an affiliate pays all other expenses of the Fund, excluding fees and expenses of the independent Trustees, and certain miscellaneous expenses such as proxy and shareholder meeting expenses.
Brokerage Commissions. A portion of portfolio transactions were placed with brokerage firms which are affiliates of the investment adviser. Brokerage commissions are included in net realized gain (loss) and change in net unrealized appreciation (depreciation) in the Statement of Operations. The commissions paid to these affiliated firms were as follows:
| Amount | |
| Fidelity Growth Company K6 Fund | $25,357 |
Interfund Trades. Funds may purchase from or sell securities to other Fidelity Funds under procedures adopted by the Board. The procedures have been designed to ensure these interfund trades are executed in accordance with Rule 17a-7 of the 1940 Act. Any interfund trades are included within the respective purchases and sales amounts shown in the Purchases and Sales of Investments note.
| Purchases ($) | Sales ($) | |
| Fidelity Growth Company K6 Fund | 514,582,748 | 39,530,135 |
6. Committed Line of Credit.
Certain Funds participate with other funds managed by the investment adviser or an affiliate in a $4.25 billion credit facility (the "line of credit") to be utilized for temporary or emergency purposes to fund shareholder redemptions or for other short-term liquidity purposes. The commitment fees on the pro-rata portion of the line of credit are borne by the investment adviser. During the period, there were no borrowings on this line of credit.
7. Security Lending.
Funds lend portfolio securities from time to time in order to earn additional income. Lending agents are used, including National Financial Services (NFS), an affiliate of the investment adviser. Pursuant to a securities lending agreement, NFS will receive a fee, which is capped at 9.9% of a fund's daily lending revenue, for its services as lending agent. A fund may lend securities to certain qualified borrowers, including NFS. On the settlement date of the loan, a fund receives collateral (in the form of U.S. Treasury obligations, letters of credit and/or cash) against the loaned securities and maintains collateral in an amount not less than 100% of the market value of the loaned securities during the period of the loan. The market value of the loaned securities is determined at the close of business of a fund and any additional required collateral is delivered to a fund on the next business day. A fund or borrower may terminate the loan at any time, and if the borrower defaults on its obligation to return the securities loaned because of insolvency or other reasons, a fund may apply collateral received from the borrower against the obligation. A fund may experience delays and costs in recovering the securities loaned. Any cash collateral received is invested in the Fidelity Securities Lending Cash Central Fund. Any loaned securities are identified as such in the Schedule of Investments, and the value of loaned securities and cash collateral at period end, as applicable, are presented in the Statement of Assets and Liabilities. Security lending income represents the income earned on investing cash collateral, less rebates paid to borrowers and any lending agent fees associated with the loan, plus any premium payments received for lending certain types of securities. Security lending income is presented in the Statement of Operations as a component of income from Fidelity Central Funds. Affiliated security lending activity, if any, was as follows:
| Total Security Lending Fees Paid to NFS | Security Lending Income From Securities Loaned to NFS | Value of Securities Loaned to NFS at Period End | |
| Fidelity Growth Company K6 Fund | $62,879 | $23,859 | $812,135 |
8. Expense Reductions.
Commissions paid to certain brokers with whom the investment adviser, or its affiliates, places trades on behalf of the Fund include an amount in addition to trade execution, which may be rebated back to the Fund to offset expenses. This amount totaled $93,684 for the period. In addition, through arrangements with the Fund's custodian, credits realized as a result of certain uninvested cash balances were used to reduce the Fund's expenses by $252.
9. Other.
Fund's organizational documents provide former and current trustees and officers with a limited indemnification against liabilities arising in connection with the performance of their duties to the fund. In the normal course of business, the fund may also enter into contracts that provide general indemnifications. The fund's maximum exposure under these arrangements is unknown as this would be dependent on future claims that may be made against the fund. The risk of material loss from such claims is considered remote.
10. Coronavirus (COVID-19) Pandemic.
An outbreak of COVID-19 first detected in China during December 2019 has since spread globally and was declared a pandemic by the World Health Organization during March 2020. Developments that disrupt global economies and financial markets, such as the COVID-19 pandemic, may magnify factors that affect the Fund's performance.
Shareholder Expense Example
As a shareholder, you incur two types of costs: (1) transaction costs, which may include sales charges (loads) on purchase payments or redemption proceeds, as applicable and (2) ongoing costs, which generally include management fees, distribution and/or service (12b-1) fees and other Fund expenses. This Example is intended to help you understand your ongoing costs (in dollars) of investing in a fund and to compare these costs with the ongoing costs of investing in other mutual funds.
The Example is based on an investment of $1,000 invested at the beginning of the period and held for the entire period (December 1, 2020 to May 31, 2021).
Actual Expenses
The first line of the accompanying table provides information about actual account values and actual expenses. You may use the information in this line, together with the amount you invested, to estimate the expenses that you paid over the period. Simply divide your account value by $1,000.00 (for example, an $8,600 account value divided by $1,000.00 = 8.6), then multiply the result by the number in the first line for a class/Fund under the heading entitled "Expenses Paid During Period" to estimate the expenses you paid on your account during this period. If any fund is a shareholder of any underlying mutual funds or exchange-traded funds (ETFs) (the Underlying Funds), such fund indirectly bears its proportional share of the expenses of the Underlying Funds in addition to the direct expenses incurred presented in the table. These fees and expenses are not included in the annualized expense ratio used to calculate the expense estimate in the table below.
Hypothetical Example for Comparison Purposes
The second line of the accompanying table provides information about hypothetical account values and hypothetical expenses based on the actual expense ratio and an assumed rate of return of 5% per year before expenses, which is not the actual return. The hypothetical account values and expenses may not be used to estimate the actual ending account balance or expenses you paid for the period. You may use this information to compare the ongoing costs of investing in the Fund and other funds. To do so, compare this 5% hypothetical example with the 5% hypothetical examples that appear in the shareholder reports of the other funds. If any fund is a shareholder of any Underlying Funds, such fund indirectly bears its proportional share of the expenses of the Underlying Funds in addition to the direct expenses as presented in the table. These fees and expenses are not included in the annualized expense ratio used to calculate the expense estimate in the table below.
Please note that the expenses shown in the table are meant to highlight your ongoing costs only and do not reflect any transaction costs. Therefore, the second line of the table is useful in comparing ongoing costs only, and will not help you determine the relative total costs of owning different funds.
| Annualized Expense Ratio-A | Beginning Account Value December 1, 2020 | Ending Account Value May 31, 2021 | Expenses Paid During Period-B December 1, 2020 to May 31, 2021 | |
| Fidelity Growth Company K6 Fund | .45% | |||
| Actual | $1,000.00 | $1,122.80 | $2.38 | |
| Hypothetical-C | $1,000.00 | $1,022.69 | $2.27 |
A Annualized expense ratio reflects expenses net of applicable fee waivers.
B Expenses are equal to the annualized expense ratio, multiplied by the average account value over the period, multiplied by 182/ 365 (to reflect the one-half year period). The fees and expenses of any Underlying Funds are not included in each annualized expense ratio.
C 5% return per year before expenses
Board Approval of Investment Advisory Contracts and Management Fees
Fidelity Growth Company K6 Fund
Each year, the Board of Trustees, including the Independent Trustees (together, the Board), votes on the renewal of the management contract with Fidelity Management & Research Company LLC (FMR) and the sub-advisory agreements (together, the Advisory Contracts) for the fund. FMR and the sub-advisers are referred to herein as the Investment Advisers. The Board, assisted by the advice of fund counsel and Independent Trustees' counsel, requests and considers a broad range of information relevant to the renewal of the Advisory Contracts throughout the year.The Board meets regularly and, at each of its meetings, covers an extensive agenda of topics and materials and considers factors that are relevant to its annual consideration of the renewal of the fund's Advisory Contracts, including the services and support provided to the fund and its shareholders. The Board has established various standing committees (Committees), each composed of and chaired by Independent Trustees with varying backgrounds, to which the Board has assigned specific subject matter responsibilities in order to enhance effective decision-making by the Board. The Board, acting directly and through its Committees, requests and receives information concerning the annual consideration of the renewal of the fund's Advisory Contracts. The Board also meets as needed to review matters specifically related to the Board's annual consideration of the renewal of the Advisory Contracts. Members of the Board may also meet with trustees of other Fidelity funds through joint ad hoc committees to discuss certain matters relevant to all of the Fidelity funds.Approval of Stub Period Continuation. At its January 2021 meeting, the Board of Trustees voted to continue the fund's management contract with FMR, and the sub-advisory agreements and sub-subadvisory agreements, in each case, where applicable (together, the Advisory Contracts), without modification, for four months from February 1, 2021 through May 31, 2021, in connection with changes to the Board's meeting calendar. The Board considered that the approval of the fund's Advisory Contracts will not result in any changes in (i) the investment process or strategies employed in the management of the fund's assets; (ii) the fees and expenses paid by shareholders; (iii) the nature, extent or quality of services provided under the fund's Advisory Contracts; or (iv) the day-to-day management of the fund or the persons primarily responsible for such management. The Board also considered that since its last approval of the fund's Advisory Contracts, FMR had provided additional information on the fund in support of the annual contract renewal process, including competitive analyses on total expenses and management fees and in-depth reviews of fund performance and fund profitability information. The Board also considered the findings of certain ad hoc committees that had been previously formed to discuss matters relevant to all of the Fidelity funds, including economies of scale, fall-out benefits and retail vs. institutional funds. The Board concluded that the fund's Advisory Contracts are fair and reasonable, and that the fund's Advisory Contracts should be renewed, without modification, through May 31, 2021, with the understanding that the Board will consider the annual renewal for a full one year period in May 2021.At its May 2021 meeting, the Board unanimously determined to renew the fund's Advisory Contracts. In reaching its determination, the Board considered all factors it believed relevant, including (i) the nature, extent, and quality of the services provided to the fund and its shareholders (including the investment performance of the fund); (ii) the competitiveness of the fund's management fee and total expense ratio relative to peer funds; (iii) the total costs of the services provided by and the profits realized by Fidelity from its relationships with the fund; and (iv) the extent to which, if any, economies of scale exist and are realized as the fund grows, and whether any economies of scale are appropriately shared with fund shareholders.In considering whether to renew the Advisory Contracts for the fund, the Board reached a determination, with the assistance of fund counsel and Independent Trustees' counsel and through the exercise of its business judgment, that the renewal of the Advisory Contracts was in the best interests of the fund and its shareholders and that the compensation payable under the Advisory Contracts was fair and reasonable. The Board's decision to renew the Advisory Contracts was not based on any single factor, but rather was based on a comprehensive consideration of all the information provided to the Board at its meetings throughout the year. The Board, in reaching its determination to renew the Advisory Contracts, was aware that shareholders of the fund have a broad range of investment choices available to them, including a wide choice among funds offered by Fidelity's competitors, and that the fund's shareholders, who have the opportunity to review and weigh the disclosure provided by the fund in its prospectus and other public disclosures, have chosen to invest in this fund, which is part of the Fidelity family of funds.Nature, Extent, and Quality of Services Provided. The Board considered Fidelity's staffing as it relates to the fund, including the backgrounds of investment personnel of Fidelity, and also considered the fund's investment objective, strategies, and related investment philosophy. The Independent Trustees also had discussions with senior management of Fidelity's investment operations and investment groups. The Board considered the structure of the investment personnel compensation program and whether this structure provides appropriate incentives to act in the best interests of the fund. Additionally, the Board considered the portfolio managers' investments, if any, in the funds that they manage.Resources Dedicated to Investment Management and Support Services. The Board and the Fund Oversight and Research Committees reviewed the general qualifications and capabilities of Fidelity's investment staff, including its size, education, experience, and resources, as well as Fidelity's approach to recruiting, training, managing, and compensating investment personnel. The Board noted that Fidelity has continued to increase the resources devoted to non-U.S. offices, including expansion of Fidelity's global investment organization. The Board also noted that Fidelity's analysts have extensive resources, tools and capabilities that allow them to conduct sophisticated quantitative and fundamental analysis, as well as credit analysis of issuers, counterparties and guarantors. Further, the Board considered that Fidelity's investment professionals have sufficient access to global information and data so as to provide competitive investment results over time, and that those professionals also have access to sophisticated tools that permit them to assess portfolio construction and risk and performance attribution characteristics continuously, as well as to transmit new information and research conclusions rapidly around the world. Additionally, in its deliberations, the Board considered Fidelity's trading, risk management, compliance, and technology and operations capabilities and resources, which are integral parts of the investment management process. The Board also considered Fidelity's investments in business continuity planning, and its success in continuously providing services to the fund notwithstanding the severe disruptions caused by the COVID-19 pandemic.Shareholder and Administrative Services. The Board considered (i) the nature, extent, quality, and cost of advisory, administrative, and shareholder services performed by the Investment Advisers and their affiliates under the Advisory Contracts and under separate agreements covering transfer agency, pricing and bookkeeping, and securities lending services for the fund; (ii) the nature and extent of the supervision of third party service providers, principally custodians, subcustodians, and pricing vendors; and (iii) the resources devoted to, and the record of compliance with, the fund's compliance policies and procedures. The Board also reviewed the allocation of fund brokerage, including allocations to brokers affiliated with the Investment Advisers, the use of brokerage commissions to pay fund expenses, and the use of "soft" commission dollars to pay for research services.The Board noted that the growth of fund assets over time across the complex allows Fidelity to reinvest in the development of services designed to enhance the value and convenience of the Fidelity funds as investment vehicles. These services include 24-hour access to account information and market information over the Internet and through telephone representatives, investor education materials and asset allocation tools, and the expanded availability of Fidelity Investor Centers.The Board noted that, in the past, it and the boards of certain other Fidelity funds had formed an ad hoc Committee on Transfer Agency Fees to review the variety of transfer agency fee structures throughout the industry and Fidelity's competitive positioning with respect to industry participants.Investment in a Large Fund Family. The Board considered the benefits to shareholders of investing in a Fidelity fund, including the benefits of investing in a fund that is part of a large family of funds offering a variety of investment disciplines and providing a large variety of mutual fund investor services. The Board noted that Fidelity had taken, or had made recommendations that resulted in the Fidelity funds taking, a number of actions over the previous year that benefited particular funds, including: (i) continuing to dedicate additional resources to Fidelity's investment research process, which includes meetings with management of issuers of securities in which the funds invest, and to the support of the senior management team that oversees asset management; (ii) continuing efforts to enhance Fidelity's global research capabilities; (iii) launching new funds and ETFs with innovative structures, strategies and pricing and making other enhancements to meet client needs; (iv) launching new share classes of existing funds; (v) eliminating purchase minimums and broadening eligibility requirements for certain funds and share classes; (vi) approving the reduction in the holding period for the Class C to Class A conversion policy; (vii) reducing management fees and total expenses for certain target date funds and classes and index funds; (viii) lowering expenses for certain existing funds and classes by implementing or lowering expense caps; (ix) rationalizing product lines and gaining increased efficiencies from fund mergers, liquidations, and share class consolidations; (x) continuing to develop, acquire and implement systems and technology to improve services to the funds and shareholders, strengthen information security, and increase efficiency; and (xi) continuing to implement enhancements to further strengthen Fidelity's product line to increase investors' probability of success in achieving their investment goals, including retirement income goals.Investment Performance. The Board considered whether the fund has operated in accordance with its investment objective, as well as its record of compliance with its investment restrictions and its performance history.The Board took into account discussions that occur at Board meetings throughout the year with representatives of the Investment Advisers about fund investment performance. In this regard the Board noted that as part of regularly scheduled fund reviews and other reports to the Board on fund performance, the Board considers annualized return information for the fund for different time periods, measured against an appropriate securities market index (benchmark index) and an appropriate peer group of funds with similar objectives (peer group). In its evaluation of fund investment performance, the Board gave particular attention to information indicating changes in performance of certain Fidelity funds for specific time periods and discussed with the Investment Advisers the reasons for any overperformance or underperformance.In addition to reviewing absolute and relative fund performance, the Independent Trustees periodically consider the appropriateness of fund performance metrics in evaluating the results achieved. In general, the Independent Trustees believe that fund performance should be evaluated based on net performance (after fees and expenses) of both the highest performing and lowest performing fund share classes, where applicable, compared to appropriate benchmark indices, over appropriate time periods that may include full market cycles, and compared to peer groups, as applicable, over the same periods, taking into account relevant factors including the following: general market conditions; issuer-specific information; and fund cash flows and other factors.The Independent Trustees recognize that shareholders evaluate performance on a net basis over their own holding periods, for which one-, three-, and five-year periods are often used as a proxy. For this reason, the performance information reviewed by the Board also included net total return information for the fund and an appropriate benchmark index and peer group for the most recent one-year period ended September 30, 2020, as shown below. Returns are shown compared to the 25th percentile (top of box, 75% beaten) and 75th percentile (bottom of box, 25% beaten) of the peer universe.Fidelity Growth Company K6
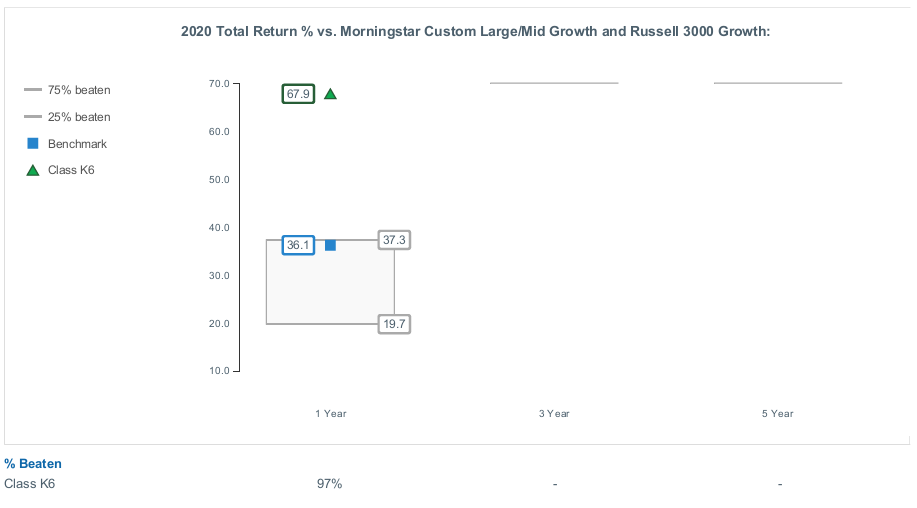
Fidelity Growth Company K6 Fund

Liquidity Risk Management Program
The Securities and Exchange Commission adopted Rule 22e-4 under the Investment Company Act of 1940 (the Liquidity Rule) to promote effective liquidity risk management throughout the open-end investment company industry, thereby reducing the risk that funds will be unable to meet their redemption obligations and mitigating dilution of the interests of fund shareholders.
The Fund has adopted and implemented a liquidity risk management program pursuant to the Liquidity Rule (the Program) effective December 1, 2018. The Program is reasonably designed to assess and manage the Fund’s liquidity risk and to comply with the requirements of the Liquidity Rule. The Fund’s Board of Trustees (the Board) has designated the Fund’s investment adviser as administrator of the Program. The Fidelity advisers have established a Liquidity Risk Management Committee (the LRM Committee) to manage the Program for each of the Fidelity Funds. The LRM Committee monitors the adequacy and effectiveness of implementation of the Program and on a periodic basis assesses each Fund’s liquidity risk based on a variety of factors including (1) the Fund’s investment strategy, (2) portfolio liquidity and cash flow projections during normal and reasonably foreseeable stressed conditions, (3) shareholder redemptions, (4) borrowings and other funding sources and (5) in the case of exchange-traded funds, certain additional factors including the effect of the Fund’s prices and spreads, market participants, and basket compositions on the overall liquidity of the Fund’s portfolio, as applicable.
In accordance with the Program, each of the Fund’s portfolio investments is classified into one of four liquidity categories described below based on a determination of a reasonable expectation for how long it would take to convert the investment to cash (or sell or dispose of the investment) without significantly changing its market value.
- Highly liquid investments – cash or convertible to cash within three business days or less
- Moderately liquid investments – convertible to cash in three to seven calendar days
- Less liquid investments – can be sold or disposed of, but not settled, within seven calendar days
- Illiquid investments – cannot be sold or disposed of within seven calendar days
Liquidity classification determinations take into account a variety of factors including various market, trading and investment-specific considerations, as well as market depth, and generally utilize analysis from a third-party liquidity metrics service.
The Liquidity Rule places a 15% limit on a fund’s illiquid investments and requires funds that do not primarily hold assets that are highly liquid investments to determine and maintain a minimum percentage of the fund’s net assets to be invested in highly liquid investments (highly liquid investment minimum or HLIM). The Program includes provisions reasonably designed to comply with the 15% limit on illiquid investments and for determining, periodically reviewing and complying with the HLIM requirement as applicable.
At a recent meeting of the Fund’s Board of Trustees, the LRM Committee provided a written report to the Board pertaining to the operation, adequacy, and effectiveness of implementation of the Program for the annual period from December 1, 2019 through November 30, 2020. The report concluded that the Program has been implemented and is operating effectively and is reasonably designed to assess and manage the Fund’s liquidity risk.
![]()
GCF-K6-SANN-0721
1.9893923.101
Item 2.
Code of Ethics
Not applicable.
Item 3.
Audit Committee Financial Expert
Not applicable.
Item 4.
Principal Accountant Fees and Services
Not applicable.
Item 5.
Audit Committee of Listed Registrants
Not applicable.
Item 6.
Investments
(a)
Not applicable.
(b)
Not applicable
Item 7.
Disclosure of Proxy Voting Policies and Procedures for Closed-End Management Investment Companies
Not applicable.
Item 8.
Portfolio Managers of Closed-End Management Investment Companies
Not applicable.
Item 9.
Purchase of Equity Securities by Closed-End Management Investment Company and Affiliated Purchasers
Not applicable.
Item 10.
Submission of Matters to a Vote of Security Holders
There were no material changes to the procedures by which shareholders may recommend nominees to the Fidelity Mt. Vernon Street Trust’s Board of Trustees.
Item 11.
Controls and Procedures
(a)(i) The President and Treasurer and the Chief Financial Officer have concluded that the Fidelity Mt. Vernon Street Trust’s (the “Trust”) disclosure controls and procedures (as defined in Rule 30a-3(c) under the Investment Company Act) provide reasonable
assurances that material information relating to the Trust is made known to them by the appropriate persons, based on their evaluation of these controls and procedures as of a date within 90 days of the filing date of this report.
(a)(ii) There was no change in the Trust’s internal control over financial reporting (as defined in Rule 30a-3(d) under the Investment Company Act) that occurred during the period covered by this report that has materially affected, or is reasonably likely to materially affect, the Trust’s internal control over financial reporting.
Item 12.
Disclosure of Securities Lending Activities for Closed-End Management
Investment Companies
Not applicable.
Item 13.
Exhibits
(a) | (1) | Not applicable. |
(a) | (2) | |
(a) | (3) | Not applicable. |
(b) |
SIGNATURES
Pursuant to the requirements of the Securities Exchange Act of 1934 and the Investment Company Act of 1940, the registrant has duly caused this report to be signed on its behalf by the undersigned, thereunto duly authorized.
Fidelity Mt. Vernon Street Trust
By: | /s/Stacie M. Smith |
Stacie M. Smith | |
President and Treasurer | |
Date: | July 22, 2021 |
Pursuant to the requirements of the Securities Exchange Act of 1934 and the Investment Company Act of 1940, this report has been signed below by the following persons on behalf of the registrant and in the capacities and on the dates indicated.
By: | /s/Stacie M. Smith |
Stacie M. Smith | |
President and Treasurer | |
Date: | July 22, 2021 |
By: | /s/John J. Burke III |
John J. Burke III | |
Chief Financial Officer | |
Date: | July 22, 2021 |